
| 2024-03-31 | 2023-12-31 | 2023-09-30 | 2023-06-30 | 2023-03-31 | 2022-12-31 | 2022-09-30 | 2022-06-30 | 2022-03-31 | 2021-12-31 | 2021-09-30 | 2021-06-30 | 2021-03-31 | 2020-12-31 | 2020-09-30 | 2020-06-30 | 2020-03-31 | 2019-12-31 | 2019-09-30 | 2019-06-30 | 2019-03-31 | 2018-12-31 | 2018-09-30 | 2018-06-30 | 2018-03-31 | 2017-12-31 | 2017-09-30 | 2017-06-30 | 2017-03-31 | 2016-12-31 | 2016-09-30 | 2016-06-30 | 2016-03-31 | 2015-12-31 | 2015-09-30 | 2015-06-30 | 2015-03-31 | 2014-12-31 | 2014-09-30 | 2014-06-30 | 2014-03-31 | 2013-12-31 | 2013-09-30 | 2013-06-30 | 2013-03-31 | 2012-12-31 | 2012-09-30 | 2012-06-30 | 2012-03-31 | 2011-12-31 | 2011-09-30 | 2011-06-30 | 2011-03-31 | 2010-12-31 | 2010-09-30 | 2010-06-30 | ||
|---|---|---|---|---|---|---|---|---|---|---|---|---|---|---|---|---|---|---|---|---|---|---|---|---|---|---|---|---|---|---|---|---|---|---|---|---|---|---|---|---|---|---|---|---|---|---|---|---|---|---|---|---|---|---|---|---|---|
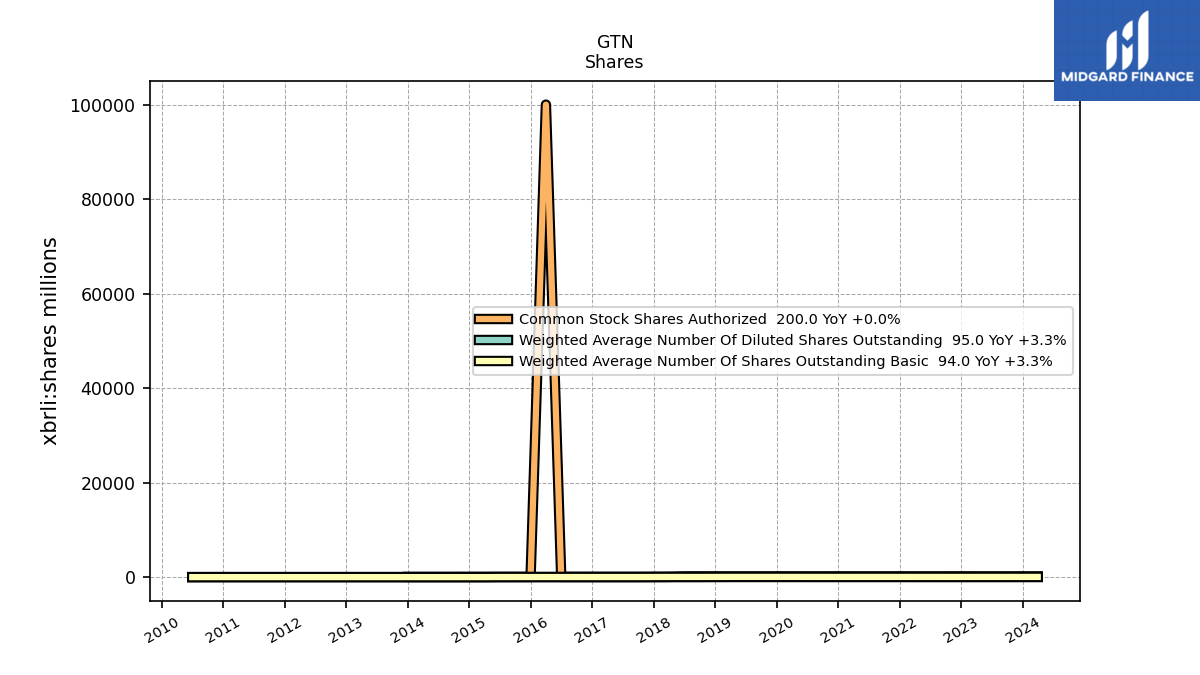
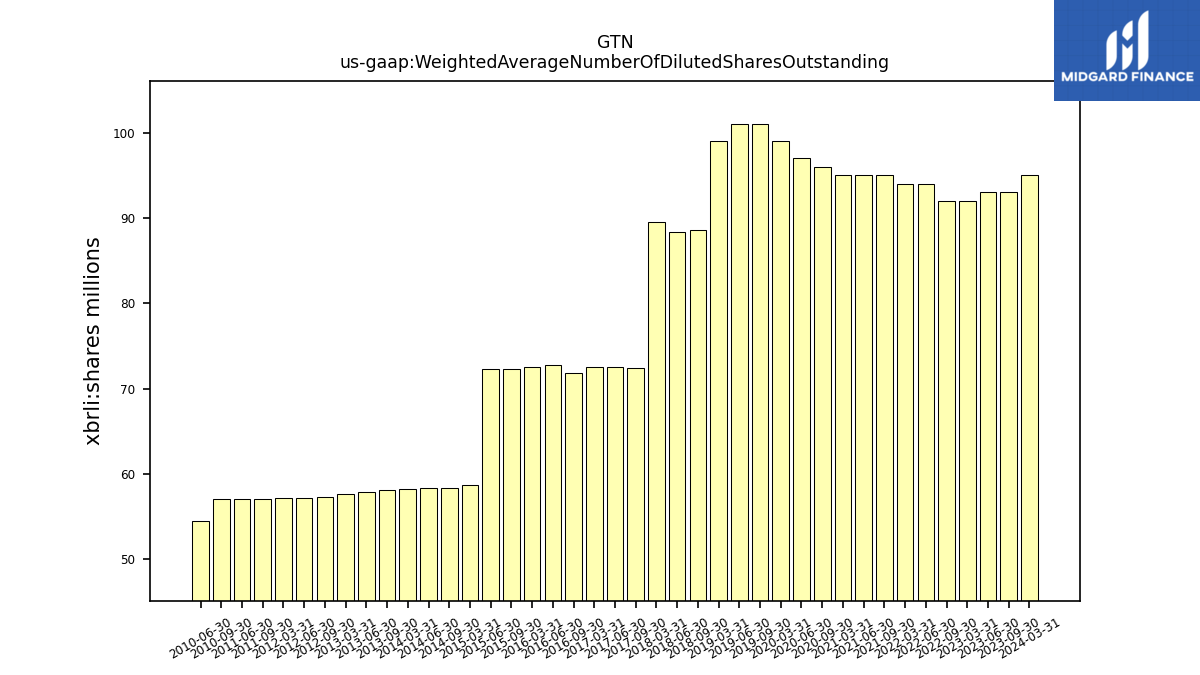
| Weighted Average Number Of Diluted Shares Outstanding | 95.00 | NA | 93.00 | 93.00 | 92.00 | NA | 92.00 | 94.00 | 94.00 | NA | 95.00 | 95.00 | 95.00 | NA | 96.00 | 97.00 | 99.00 | NA | 101.00 | 101.00 | 99.00 | NA | 88.56 | 88.31 | 89.58 | NA | 72.45 | 72.50 | 72.52 | NA | 71.88 | 72.75 | 72.58 | NA | 72.34 | 72.27 | 58.74 | NA | 58.39 | 58.31 | 58.29 | NA | 58.08 | 57.94 | 57.70 | NA | 57.29 | 57.19 | 57.15 | NA | 57.12 | 57.12 | NA | NA | 57.07 | 54.45 | |
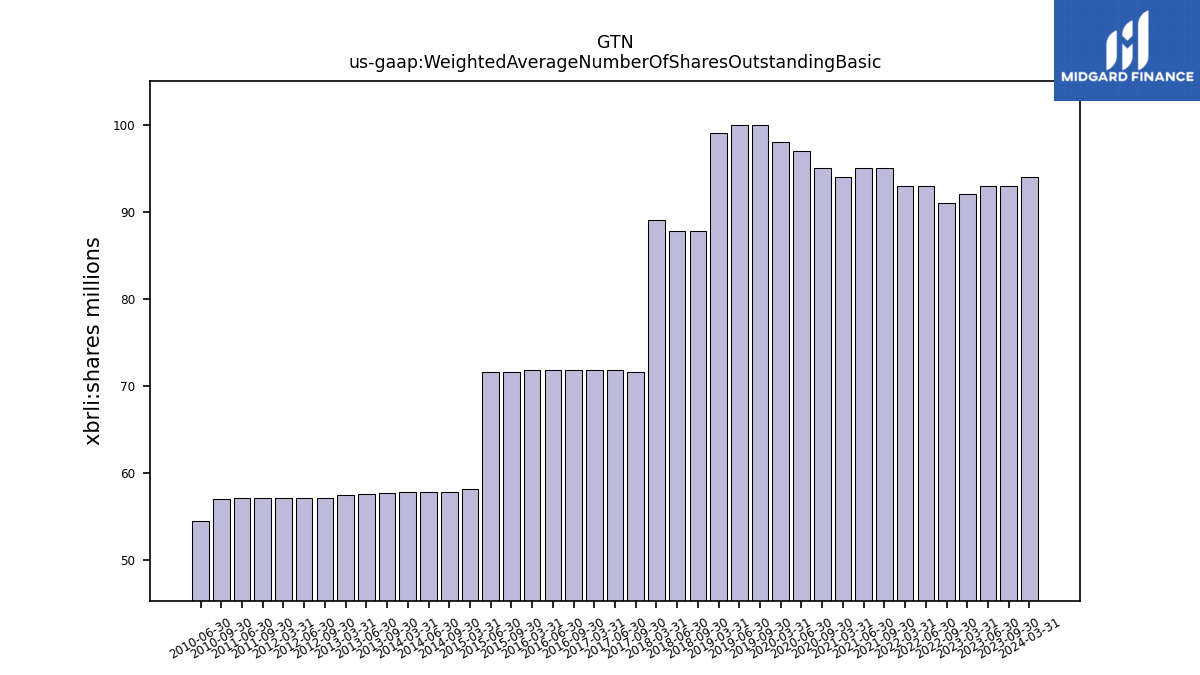
| Weighted Average Number Of Shares Outstanding Basic | 94.00 | NA | 93.00 | 93.00 | 92.00 | NA | 91.00 | 93.00 | 93.00 | NA | 95.00 | 95.00 | 94.00 | NA | 95.00 | 97.00 | 98.00 | NA | 100.00 | 100.00 | 99.00 | NA | 87.77 | 87.77 | 89.06 | NA | 71.64 | 71.82 | 71.88 | NA | 71.88 | 71.88 | 71.79 | NA | 71.64 | 71.64 | 58.22 | NA | 57.86 | 57.86 | 57.85 | NA | 57.71 | 57.56 | 57.52 | NA | 57.16 | 57.15 | 57.15 | NA | 57.12 | 57.12 | NA | NA | 57.07 | 54.45 |
| 2024-03-31 | 2023-12-31 | 2023-09-30 | 2023-06-30 | 2023-03-31 | 2022-12-31 | 2022-09-30 | 2022-06-30 | 2022-03-31 | 2021-12-31 | 2021-09-30 | 2021-06-30 | 2021-03-31 | 2020-12-31 | 2020-09-30 | 2020-06-30 | 2020-03-31 | 2019-12-31 | 2019-09-30 | 2019-06-30 | 2019-03-31 | 2018-12-31 | 2018-09-30 | 2018-06-30 | 2018-03-31 | 2017-12-31 | 2017-09-30 | 2017-06-30 | 2017-03-31 | 2016-12-31 | 2016-09-30 | 2016-06-30 | 2016-03-31 | 2015-12-31 | 2015-09-30 | 2015-06-30 | 2015-03-31 | 2014-12-31 | 2014-09-30 | 2014-06-30 | 2014-03-31 | 2013-12-31 | 2013-09-30 | 2013-06-30 | 2013-03-31 | 2012-12-31 | 2012-09-30 | 2012-06-30 | 2012-03-31 | 2011-12-31 | 2011-09-30 | 2011-06-30 | 2011-03-31 | 2010-12-31 | 2010-09-30 | 2010-06-30 | ||
|---|---|---|---|---|---|---|---|---|---|---|---|---|---|---|---|---|---|---|---|---|---|---|---|---|---|---|---|---|---|---|---|---|---|---|---|---|---|---|---|---|---|---|---|---|---|---|---|---|---|---|---|---|---|---|---|---|---|
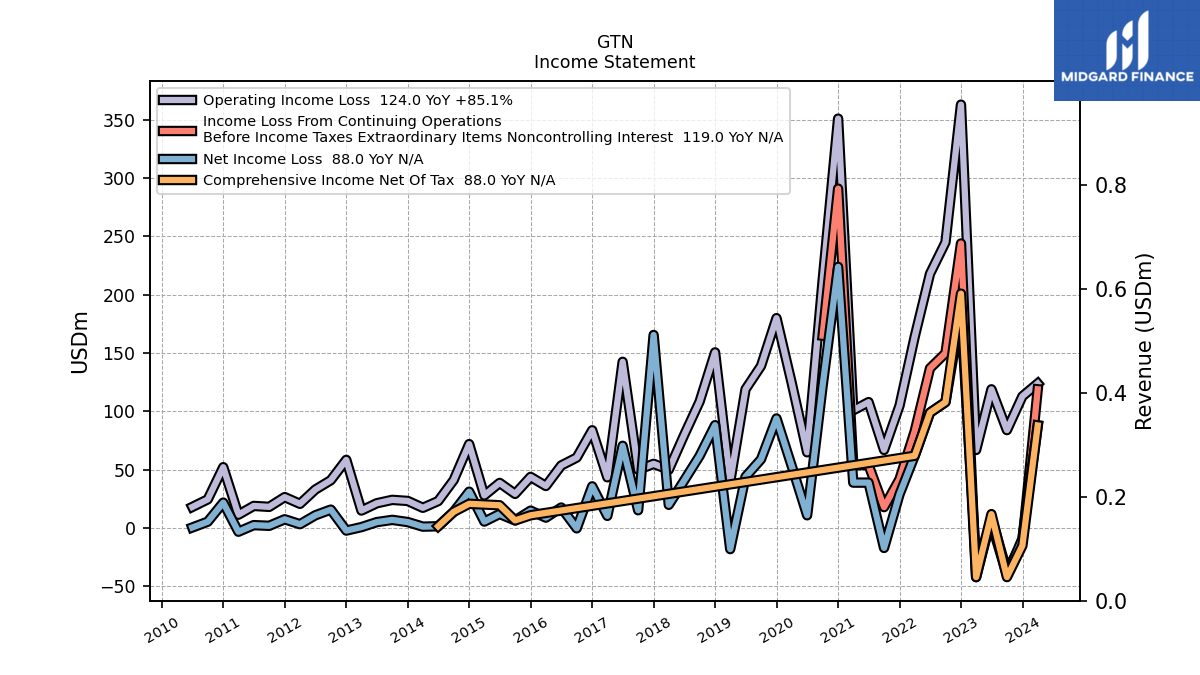
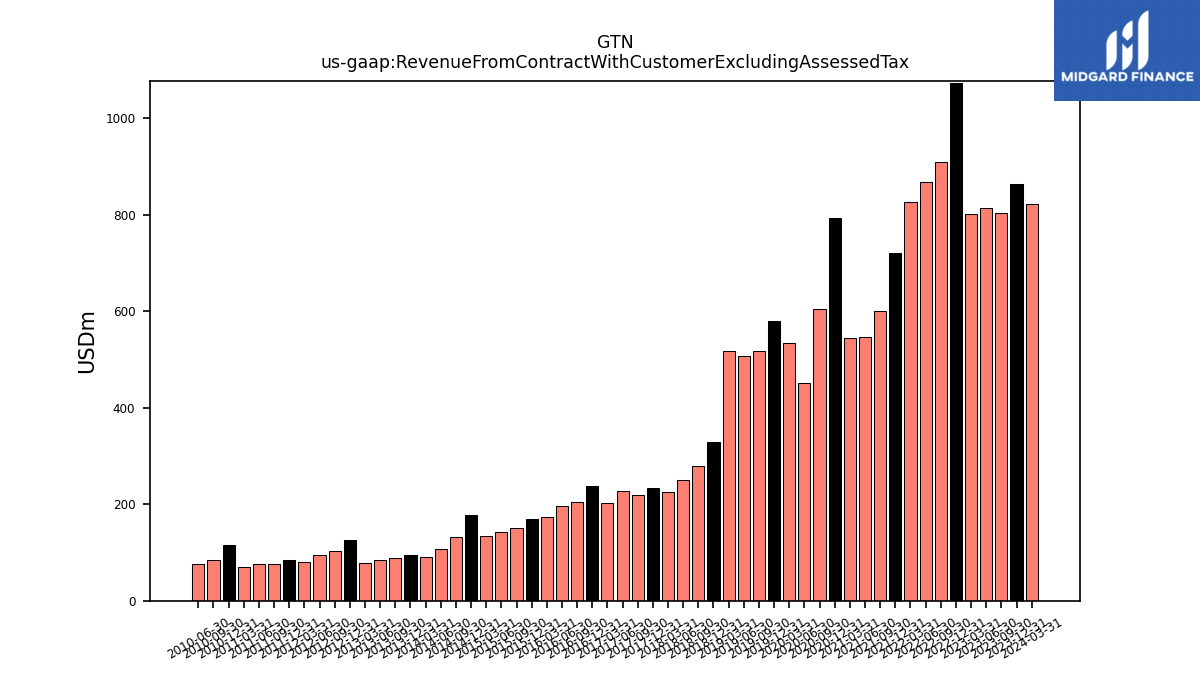
| Revenue From Contract With Customer Excluding Assessed Tax | 823.00 | 864.00 | 803.00 | 813.00 | 801.00 | 1072.00 | 909.00 | 868.00 | 827.00 | 721.00 | 601.00 | 547.00 | 544.00 | 792.00 | 604.00 | 451.00 | 534.00 | 579.00 | 517.00 | 508.00 | 518.00 | 328.22 | 279.31 | 250.34 | 226.26 | 233.61 | 218.98 | 226.68 | 203.46 | 237.62 | 204.49 | 196.63 | 173.72 | 169.49 | 151.10 | 143.46 | 133.30 | 177.89 | 131.70 | 107.25 | 91.30 | 95.56 | 88.29 | 84.28 | 78.17 | 126.59 | 102.88 | 94.69 | 80.67 | 84.67 | 76.52 | 76.20 | 69.74 | 114.59 | 85.34 | 75.64 | |
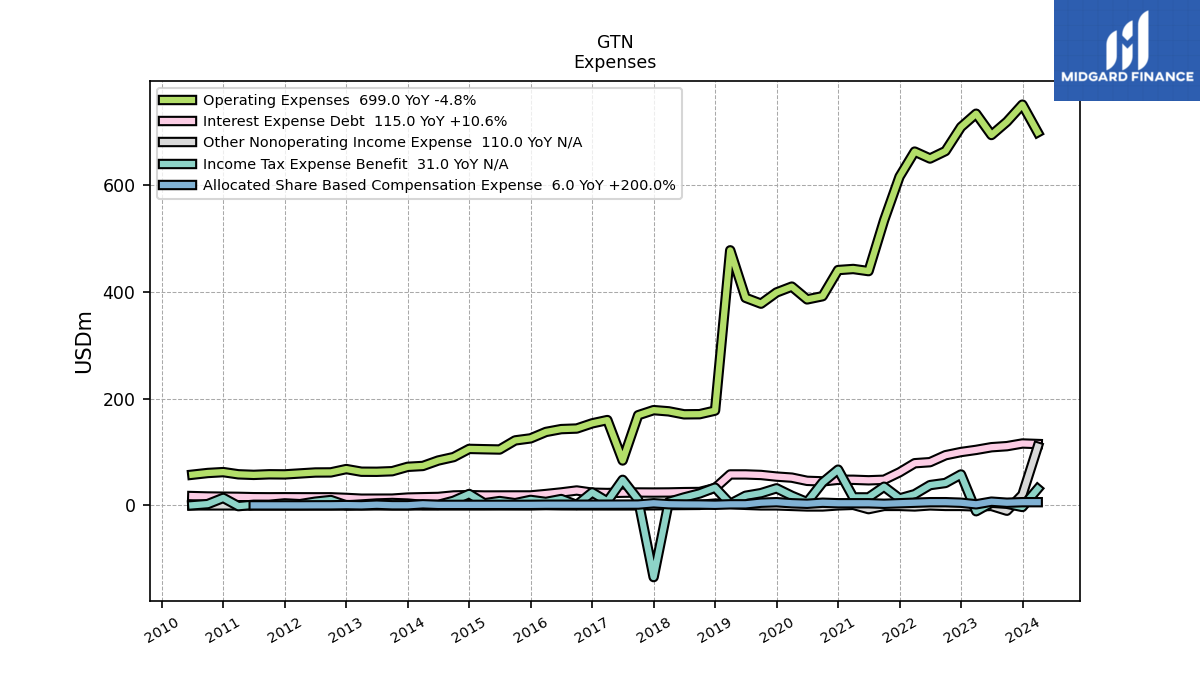
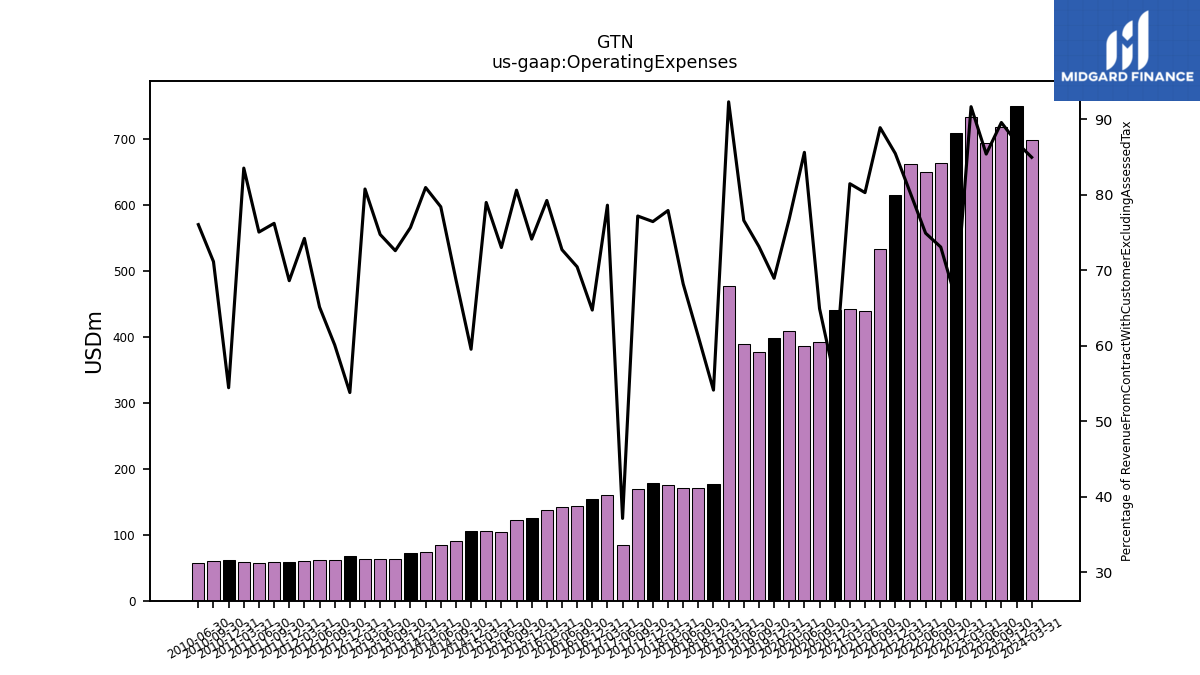
| Operating Expenses | 699.00 | 751.00 | 719.00 | 694.00 | 734.00 | 709.00 | 664.00 | 650.00 | 663.00 | 616.00 | 534.00 | 439.00 | 443.00 | 441.00 | 392.00 | 386.00 | 410.00 | 399.00 | 378.00 | 389.00 | 478.00 | 177.58 | 170.91 | 170.65 | 176.22 | 178.52 | 168.95 | 84.13 | 159.90 | 153.75 | 144.02 | 142.95 | 137.61 | 125.59 | 121.76 | 104.71 | 105.25 | 105.86 | 90.55 | 84.06 | 73.89 | 72.27 | 64.07 | 62.97 | 63.11 | 68.08 | 61.82 | 61.65 | 59.85 | 58.08 | 58.30 | 57.17 | 58.24 | 62.36 | 60.70 | 57.50 | |
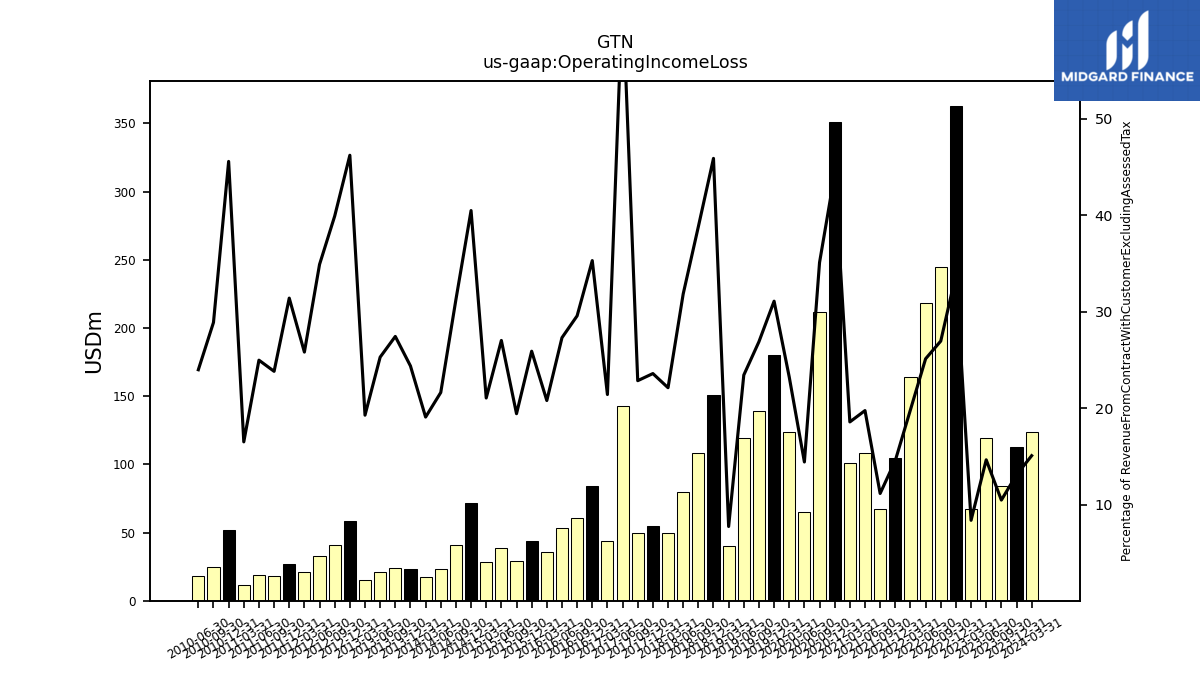
| Operating Income Loss | 124.00 | 113.00 | 84.00 | 119.00 | 67.00 | 363.00 | 245.00 | 218.00 | 164.00 | 105.00 | 67.00 | 108.00 | 101.00 | 351.00 | 212.00 | 65.00 | 124.00 | 180.00 | 139.00 | 119.00 | 40.00 | 150.64 | 108.40 | 79.69 | 50.03 | 55.09 | 50.02 | 142.56 | 43.56 | 83.87 | 60.47 | 53.69 | 36.11 | 43.90 | 29.34 | 38.76 | 28.06 | 72.02 | 41.16 | 23.19 | 17.41 | 23.29 | 24.22 | 21.31 | 15.06 | 58.51 | 41.06 | 33.05 | 20.82 | 26.59 | 18.22 | 19.03 | 11.51 | 52.23 | 24.65 | 18.14 | |
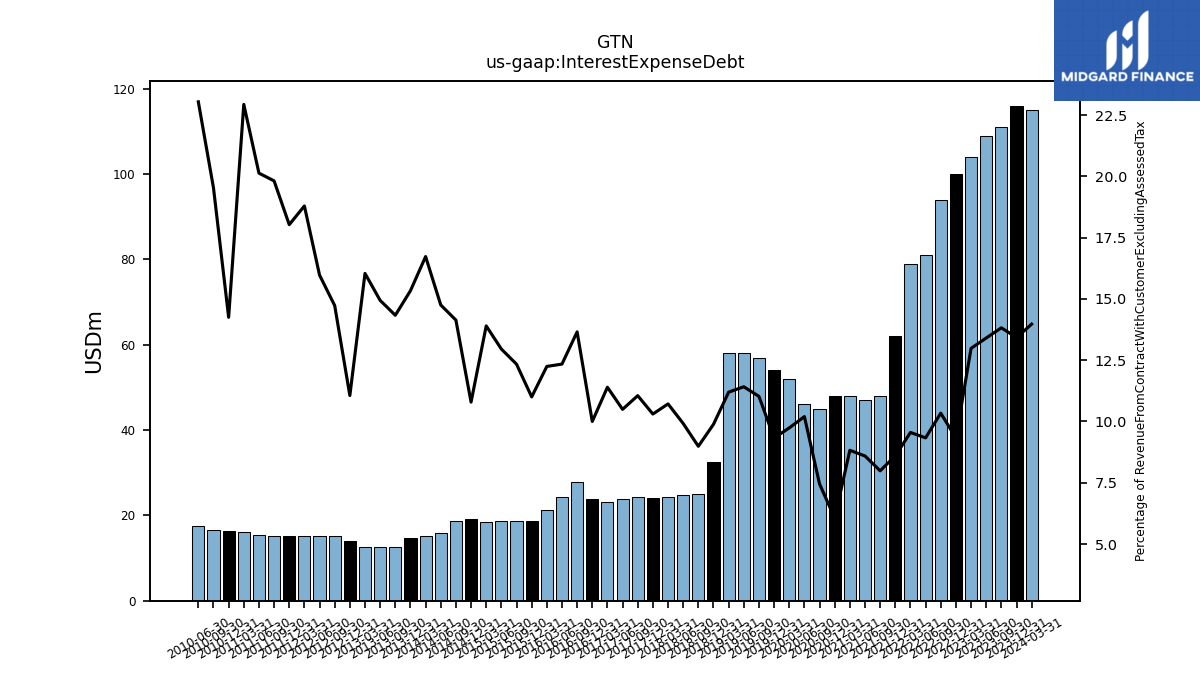
| Interest Expense Debt | 115.00 | 116.00 | 111.00 | 109.00 | 104.00 | 100.00 | 94.00 | 81.00 | 79.00 | 62.00 | 48.00 | 47.00 | 48.00 | 48.00 | 45.00 | 46.00 | 52.00 | 54.00 | 57.00 | 58.00 | 58.00 | 32.44 | 25.10 | 24.83 | 24.25 | 24.07 | 24.21 | 23.79 | 23.19 | 23.77 | 27.93 | 24.27 | 21.27 | 18.65 | 18.64 | 18.59 | 18.53 | 19.20 | 18.62 | 15.82 | 15.27 | 14.65 | 12.66 | 12.59 | 12.54 | 14.00 | 15.15 | 15.13 | 15.16 | 15.27 | 15.16 | 15.34 | 16.00 | 16.33 | 16.67 | 17.43 | |
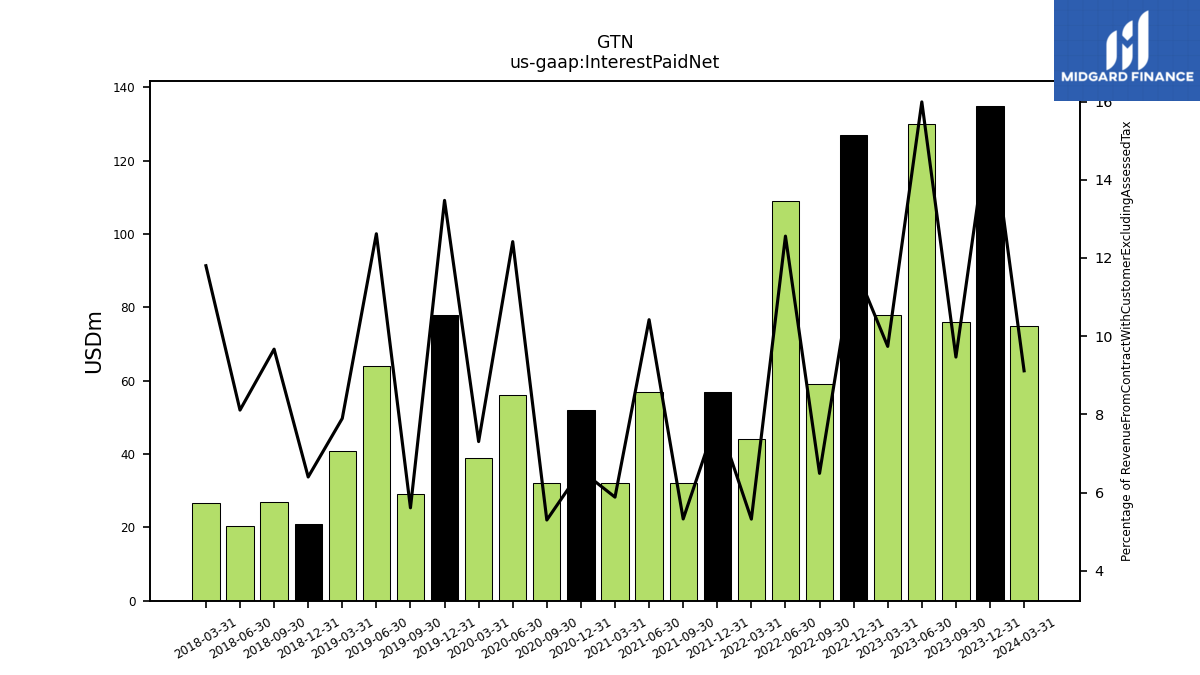
| Interest Paid Net | 75.00 | 135.00 | 76.00 | 130.00 | 78.00 | 127.00 | 59.00 | 109.00 | 44.00 | 57.00 | 32.00 | 57.00 | 32.00 | 52.00 | 32.00 | 56.00 | 39.00 | 78.00 | 29.00 | 64.10 | 40.90 | 21.00 | 27.00 | 20.30 | 26.70 | NA | NA | NA | NA | NA | NA | NA | NA | NA | NA | NA | NA | NA | NA | NA | NA | NA | NA | NA | NA | NA | NA | NA | NA | NA | NA | NA | NA | NA | NA | NA | |
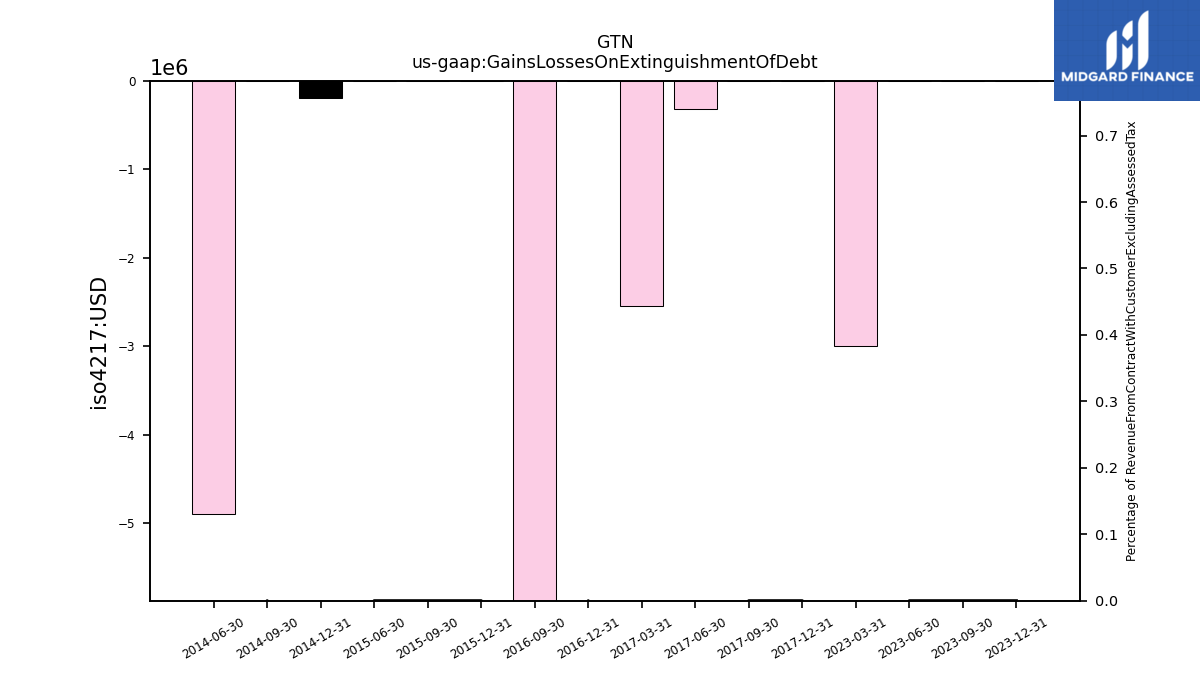
| Gains Losses On Extinguishment Of Debt | NA | 0.00 | 0.00 | 0.00 | -3.00 | NA | NA | NA | NA | NA | NA | NA | NA | NA | NA | NA | NA | NA | NA | NA | NA | NA | NA | NA | NA | 0.00 | 0.00 | -0.31 | -2.54 | 0.00 | -31.99 | NA | NA | 0.00 | 0.00 | 0.00 | NA | -0.19 | 0.00 | -4.90 | NA | NA | NA | NA | NA | NA | NA | NA | NA | NA | NA | NA | NA | NA | NA | NA | |
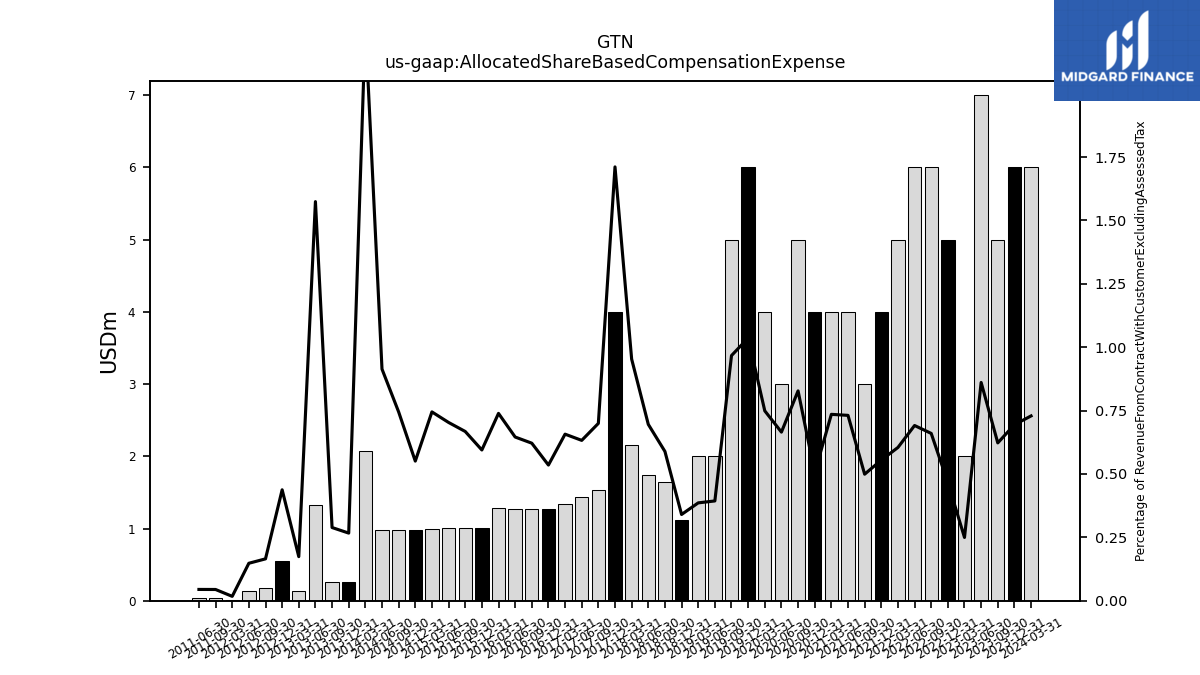
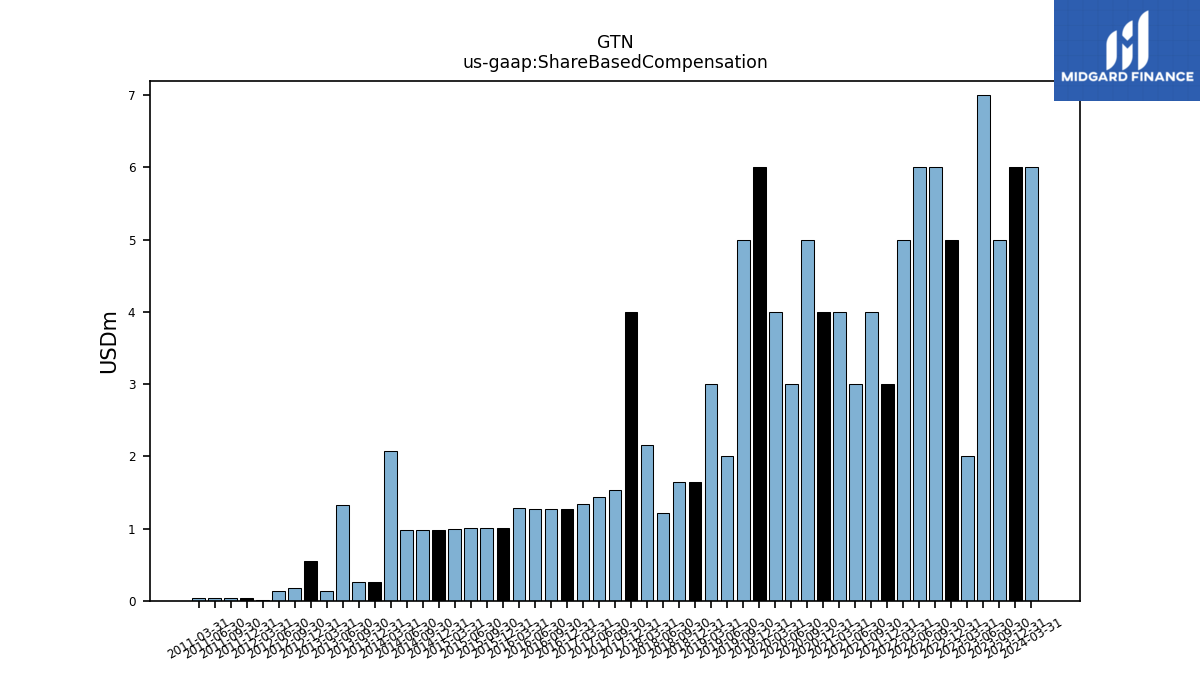
| Allocated Share Based Compensation Expense | 6.00 | 6.00 | 5.00 | 7.00 | 2.00 | 5.00 | 6.00 | 6.00 | 5.00 | 4.00 | 3.00 | 4.00 | 4.00 | 4.00 | 5.00 | 3.00 | 4.00 | 6.00 | 5.00 | 2.00 | 2.00 | 1.12 | 1.65 | 1.74 | 2.16 | 4.00 | 1.53 | 1.43 | 1.34 | 1.27 | 1.27 | 1.27 | 1.28 | 1.01 | 1.01 | 1.01 | 0.99 | 0.98 | 0.98 | 0.98 | 2.07 | 0.26 | 0.26 | 1.33 | 0.14 | 0.55 | 0.17 | 0.14 | 0.01 | NA | 0.03 | 0.03 | NA | NA | NA | NA | |
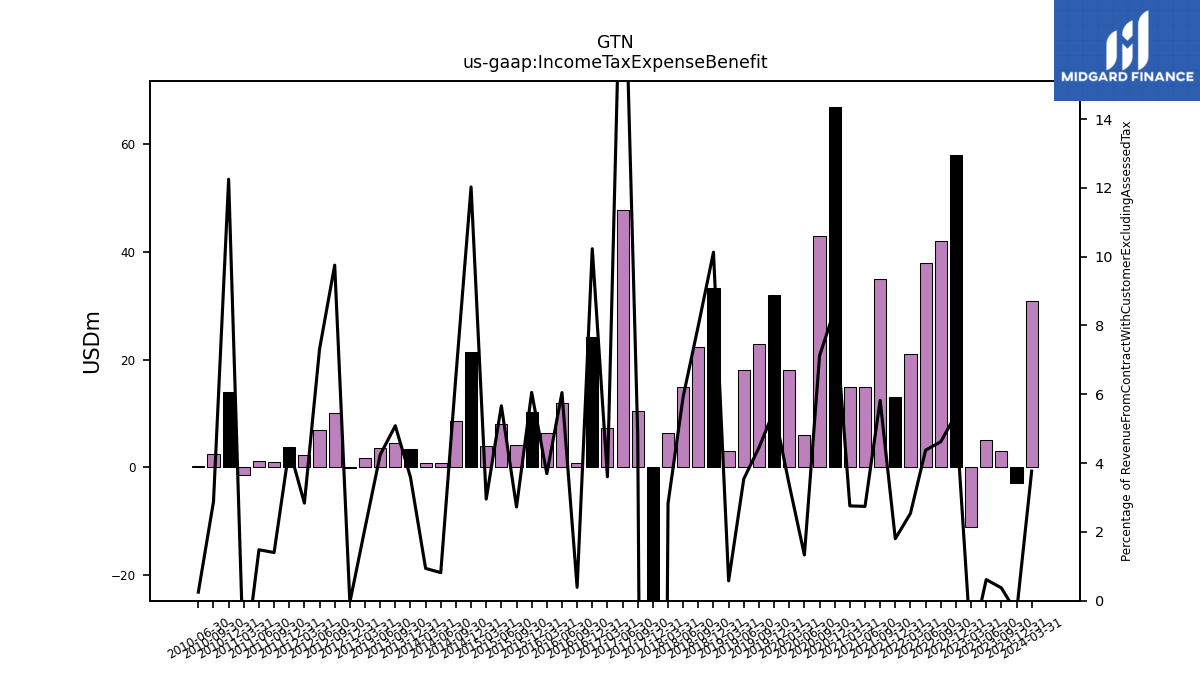
| Income Tax Expense Benefit | 31.00 | -3.00 | 3.00 | 5.00 | -11.00 | 58.00 | 42.00 | 38.00 | 21.00 | 13.00 | 35.00 | 15.00 | 15.00 | 67.00 | 43.00 | 6.00 | 18.00 | 32.00 | 23.00 | 18.00 | 3.00 | 33.25 | 22.34 | 14.86 | 6.40 | -134.43 | 10.53 | 47.89 | 7.33 | 24.31 | 0.80 | 11.90 | 6.42 | 10.26 | 4.12 | 8.13 | 3.94 | 21.39 | 8.61 | 0.88 | 0.86 | 3.43 | 4.49 | 3.57 | 1.65 | -0.06 | 10.04 | 6.93 | 2.29 | 3.75 | 1.07 | 1.13 | -1.41 | 14.04 | 2.46 | 0.19 | |
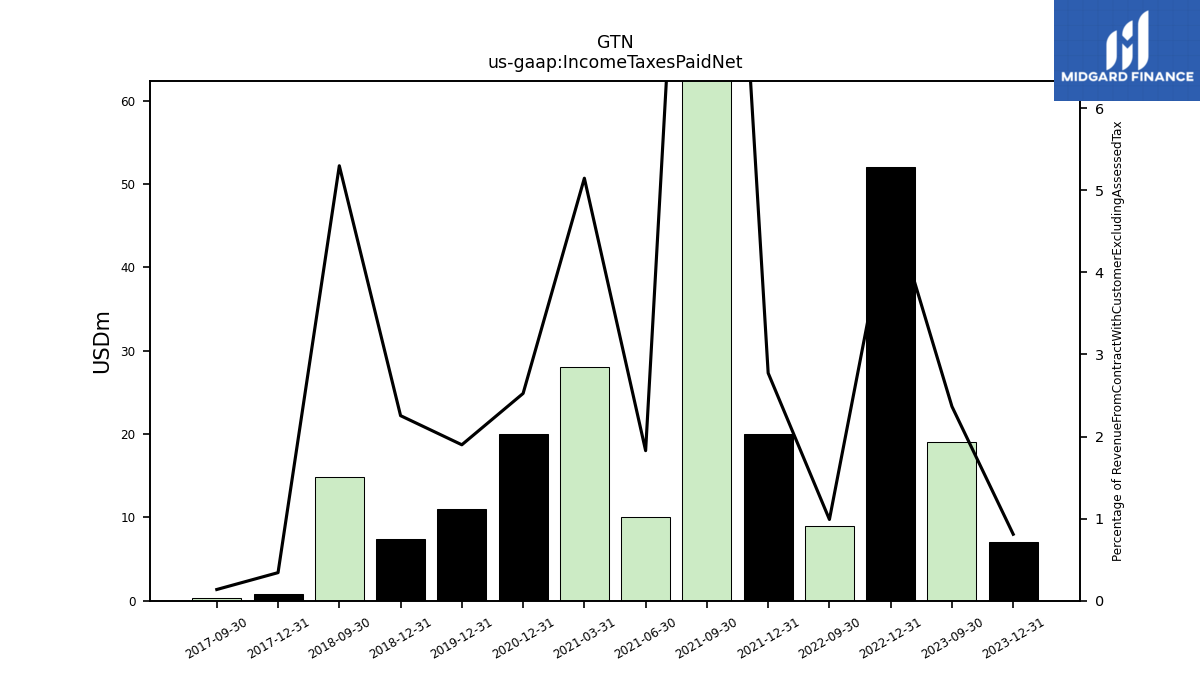
| Income Taxes Paid Net | NA | 7.00 | 19.00 | NA | NA | 52.00 | 9.00 | NA | NA | 20.00 | 91.00 | 10.00 | 28.00 | 20.00 | NA | NA | NA | 11.00 | NA | NA | NA | 7.40 | 14.80 | NA | NA | 0.80 | 0.30 | NA | NA | NA | NA | NA | NA | NA | NA | NA | NA | NA | NA | NA | NA | NA | NA | NA | NA | NA | NA | NA | NA | NA | NA | NA | NA | NA | NA | NA | |
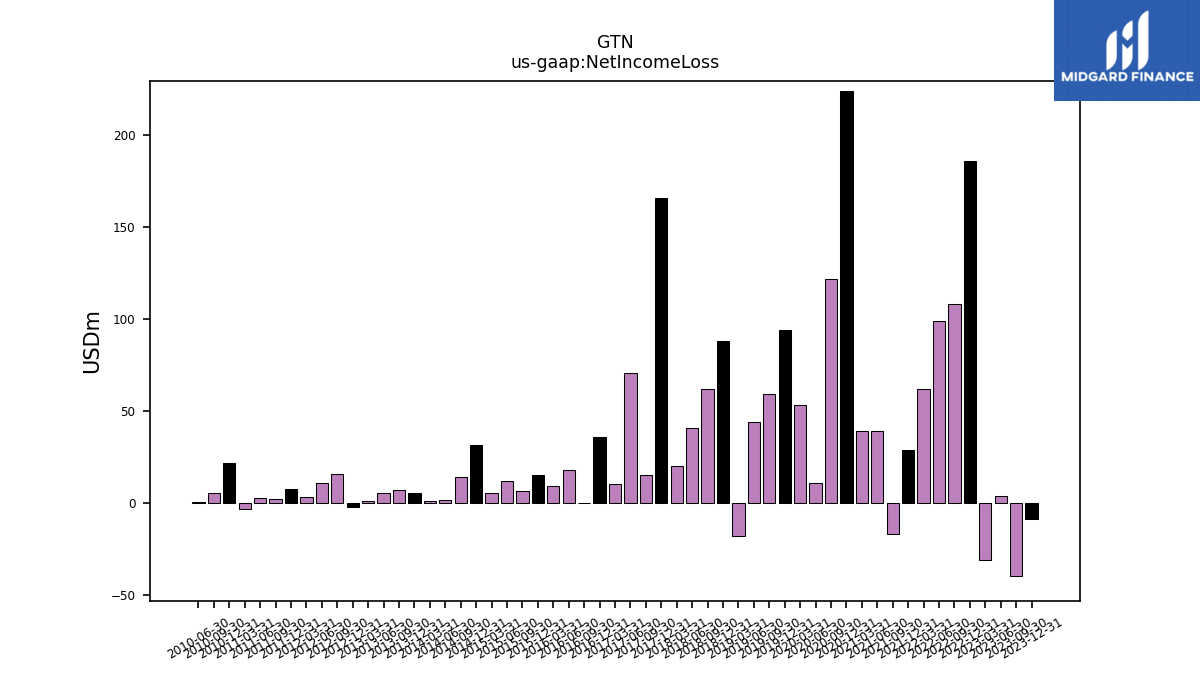
| Net Income Loss | 88.00 | -9.00 | -40.00 | 4.00 | -31.00 | 186.00 | 108.00 | 99.00 | 62.00 | 29.00 | -17.00 | 39.00 | 39.00 | 224.00 | 122.00 | 11.00 | 53.00 | 94.00 | 59.00 | 44.00 | -18.00 | 88.27 | 61.89 | 40.70 | 19.95 | 165.57 | 15.32 | 70.56 | 10.51 | 35.83 | -0.21 | 17.66 | 8.99 | 14.99 | 6.61 | 12.11 | 5.59 | 31.25 | 13.94 | 1.59 | 1.28 | 5.20 | 7.07 | 5.14 | 0.87 | -2.11 | 15.87 | 10.99 | 3.37 | 7.58 | 1.98 | 2.56 | -3.08 | 21.86 | 5.51 | 0.53 | |
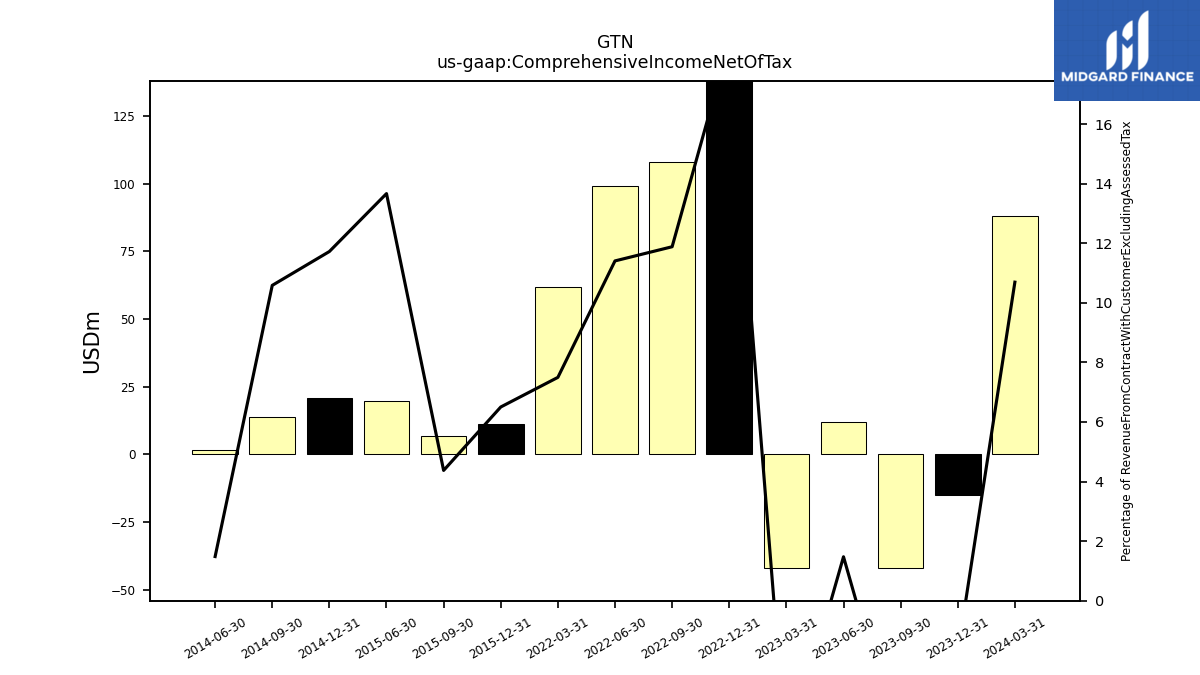
| Comprehensive Income Net Of Tax | 88.00 | -15.00 | -42.00 | 12.00 | -42.00 | 201.00 | 108.00 | 99.00 | 62.00 | NA | NA | NA | NA | NA | NA | NA | NA | NA | NA | NA | NA | NA | NA | NA | NA | NA | NA | NA | NA | NA | NA | NA | NA | 11.02 | 6.61 | 19.60 | NA | 20.85 | 13.94 | 1.59 | NA | NA | NA | NA | NA | NA | NA | NA | NA | NA | NA | NA | NA | NA | NA | NA | |
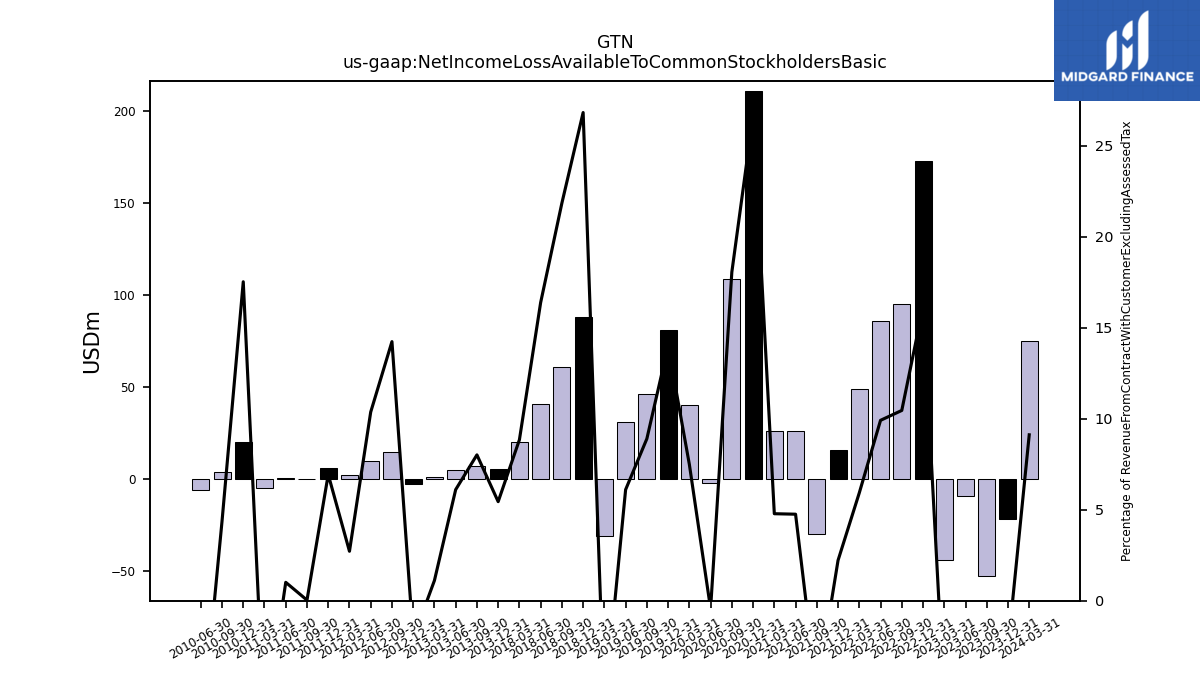
| Net Income Loss Available To Common Stockholders Basic | 75.00 | -22.00 | -53.00 | -9.00 | -44.00 | 173.00 | 95.00 | 86.00 | 49.00 | 16.00 | -30.00 | 26.00 | 26.00 | 211.00 | 109.00 | -2.00 | 40.00 | 81.00 | 46.00 | 31.00 | -31.00 | 88.00 | 61.00 | 41.00 | 20.00 | NA | NA | NA | NA | NA | NA | NA | NA | NA | NA | NA | NA | NA | NA | NA | NA | 5.20 | 7.07 | 5.14 | 0.87 | -2.61 | 14.64 | 9.81 | 2.19 | 5.87 | 0.03 | 0.77 | -4.87 | 20.07 | 3.72 | -5.92 |
| 2024-03-31 | 2023-12-31 | 2023-09-30 | 2023-06-30 | 2023-03-31 | 2022-12-31 | 2022-09-30 | 2022-06-30 | 2022-03-31 | 2021-12-31 | 2021-09-30 | 2021-06-30 | 2021-03-31 | 2020-12-31 | 2020-09-30 | 2020-06-30 | 2020-03-31 | 2019-12-31 | 2019-09-30 | 2019-06-30 | 2019-03-31 | 2018-12-31 | 2018-09-30 | 2018-06-30 | 2018-03-31 | 2017-12-31 | 2017-09-30 | 2017-06-30 | 2017-03-31 | 2016-12-31 | 2016-09-30 | 2016-06-30 | 2016-03-31 | 2015-12-31 | 2015-09-30 | 2015-06-30 | 2015-03-31 | 2014-12-31 | 2014-09-30 | 2014-06-30 | 2014-03-31 | 2013-12-31 | 2013-09-30 | 2013-06-30 | 2013-03-31 | 2012-12-31 | 2012-09-30 | 2012-06-30 | 2012-03-31 | 2011-12-31 | 2011-09-30 | 2011-06-30 | 2011-03-31 | 2010-12-31 | 2010-09-30 | 2010-06-30 | ||
|---|---|---|---|---|---|---|---|---|---|---|---|---|---|---|---|---|---|---|---|---|---|---|---|---|---|---|---|---|---|---|---|---|---|---|---|---|---|---|---|---|---|---|---|---|---|---|---|---|---|---|---|---|---|---|---|---|---|
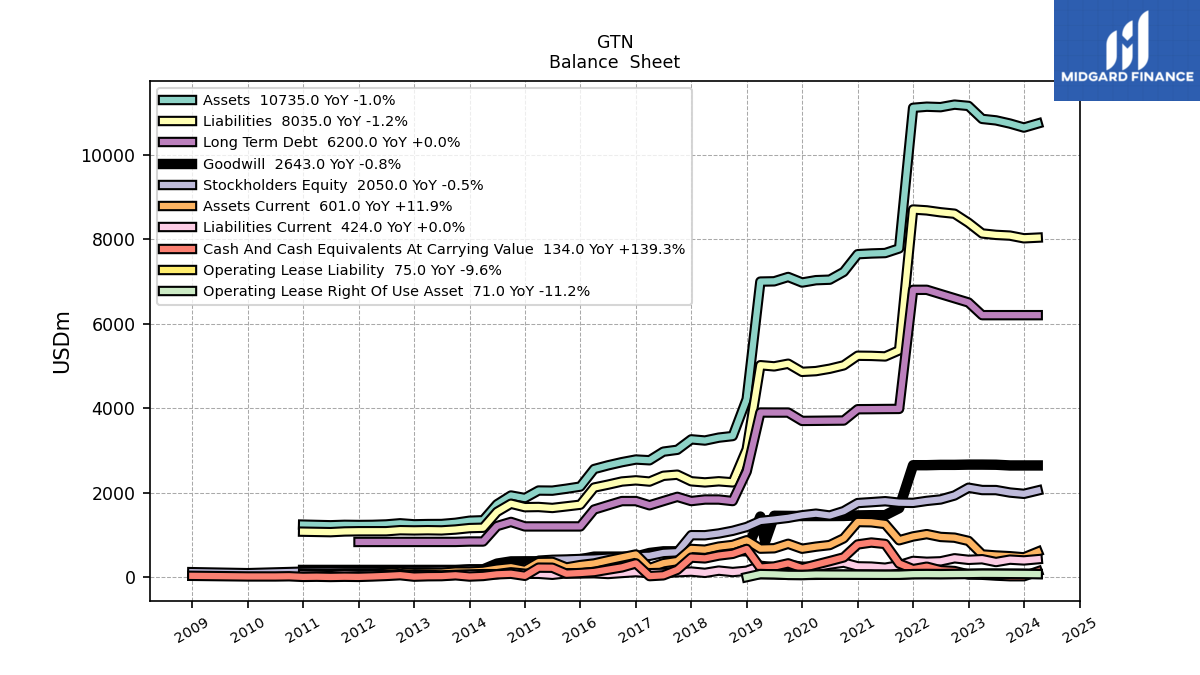
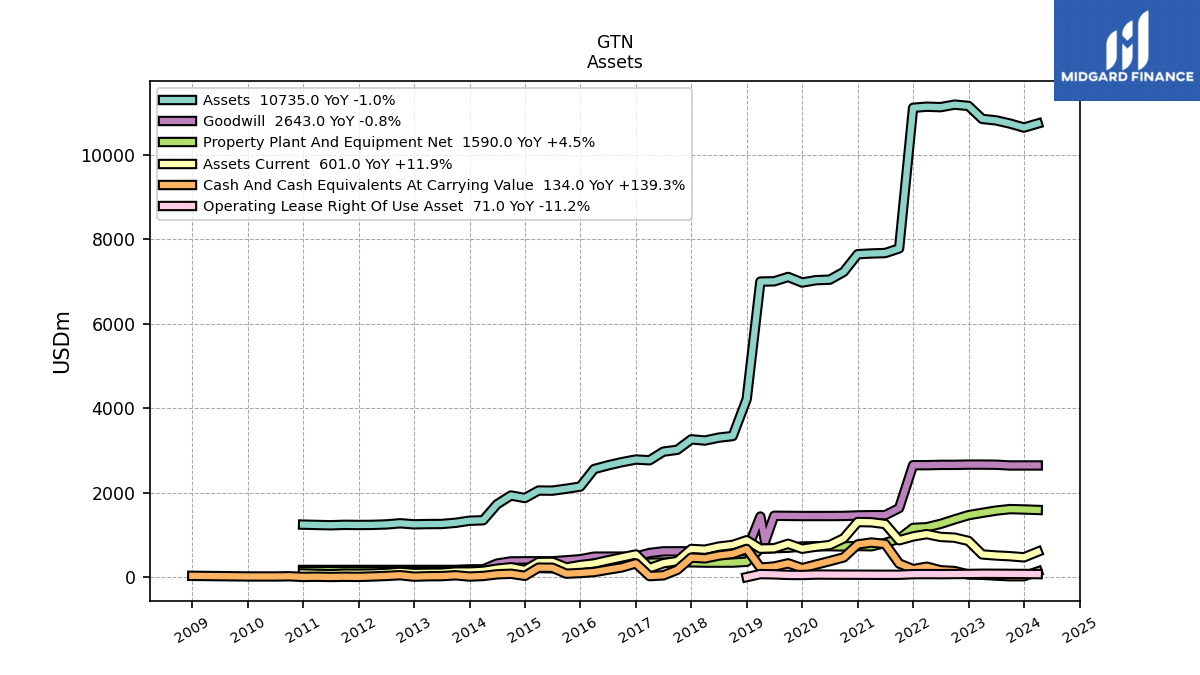
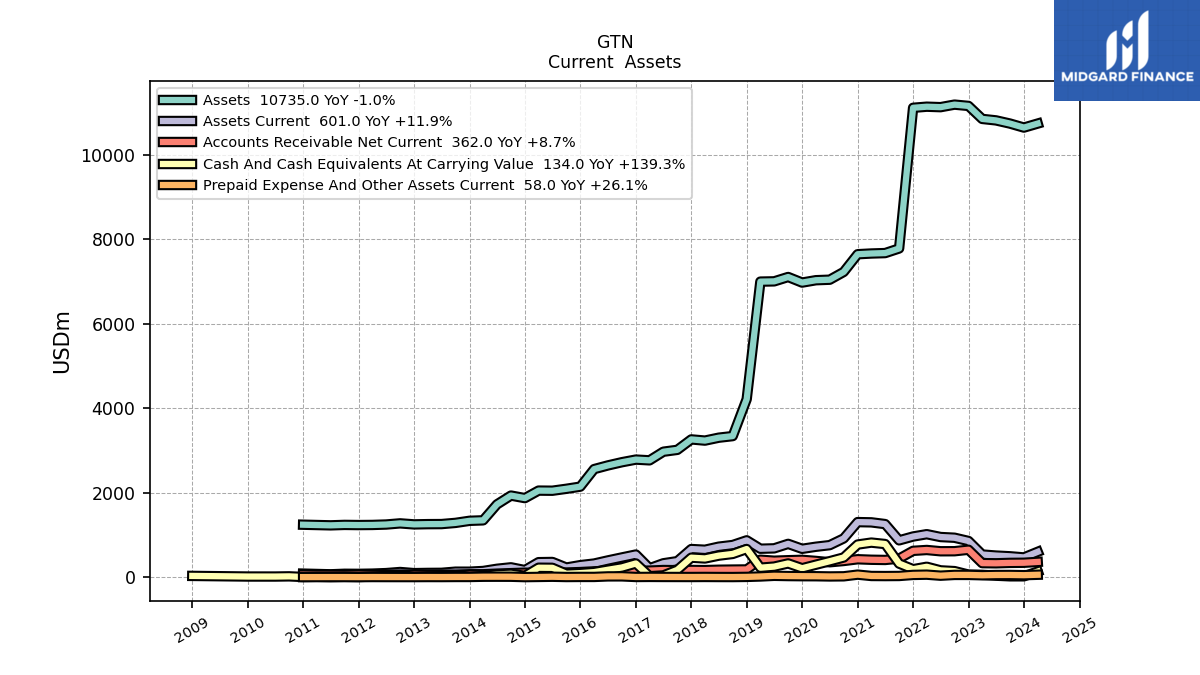
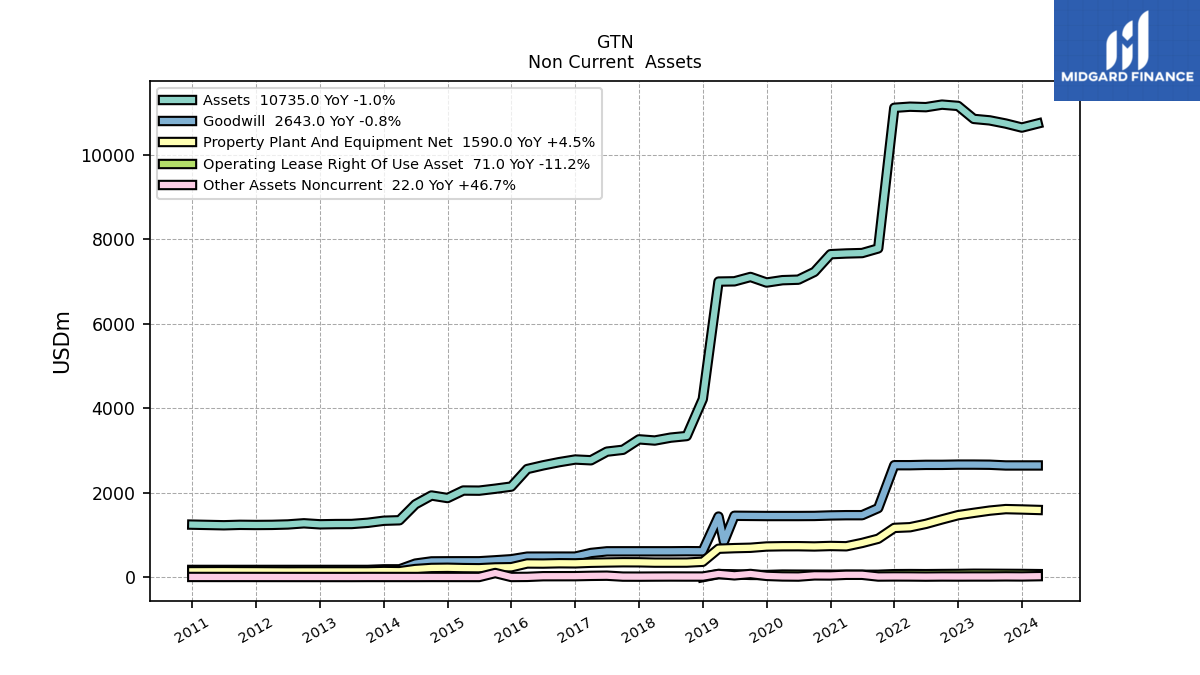
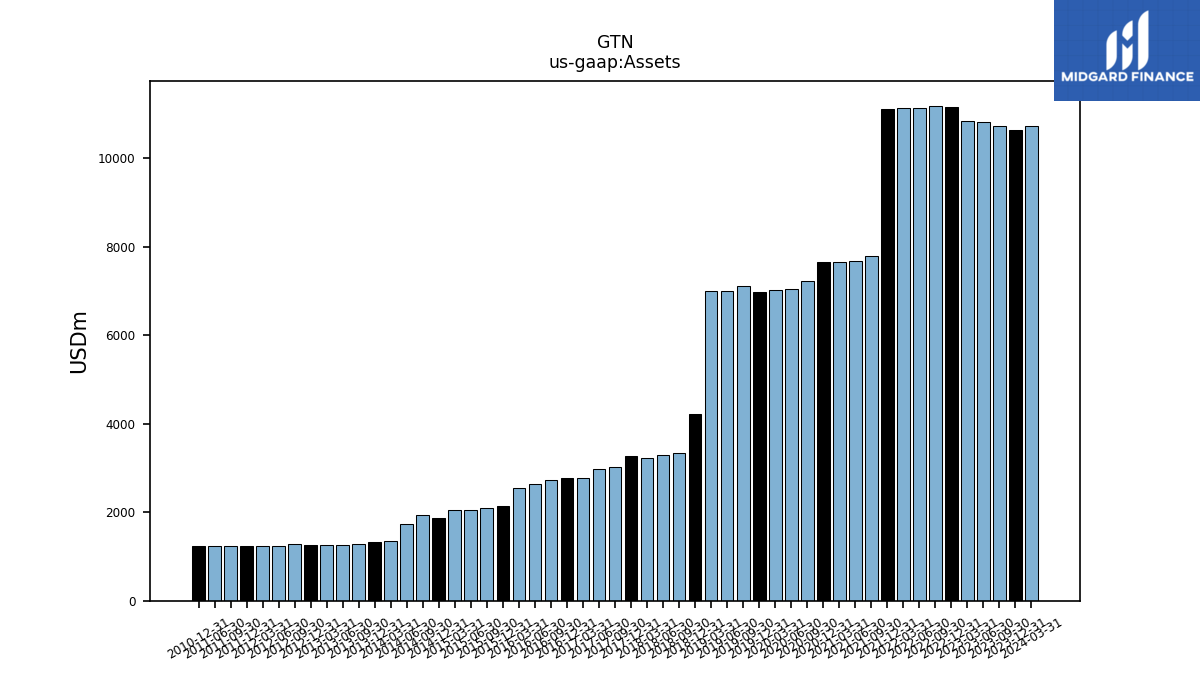
| Assets | 10735.00 | 10640.00 | 10735.00 | 10810.00 | 10845.00 | 11152.00 | 11183.00 | 11123.00 | 11134.00 | 11108.00 | 7779.00 | 7670.00 | 7660.00 | 7643.00 | 7224.00 | 7040.00 | 7028.00 | 6972.00 | 7104.00 | 7001.00 | 6995.00 | 4213.44 | 3339.20 | 3301.45 | 3232.71 | 3260.86 | 3013.61 | 2969.82 | 2765.51 | 2783.33 | 2721.21 | 2645.28 | 2558.10 | 2143.16 | 2092.08 | 2046.53 | 2049.34 | 1871.58 | 1931.84 | 1723.14 | 1345.93 | 1334.42 | 1285.33 | 1257.37 | 1255.65 | 1249.79 | 1274.00 | 1246.73 | 1236.55 | 1233.98 | 1237.63 | 1227.25 | NA | 1242.29 | NA | NA | |
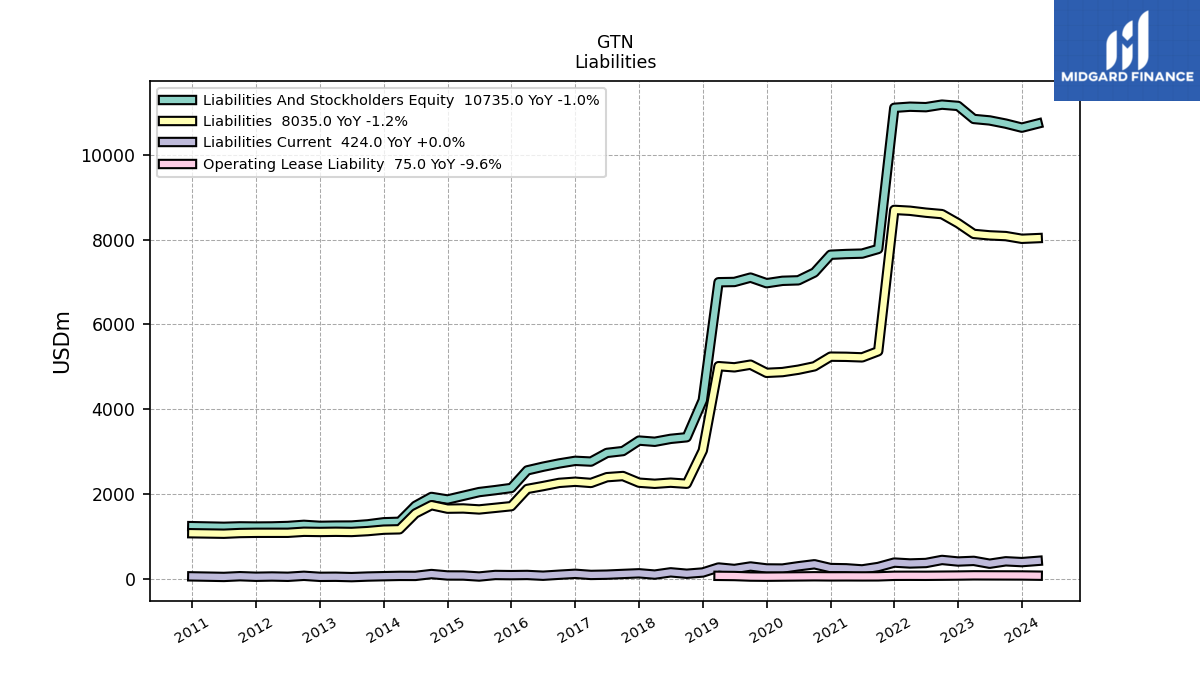
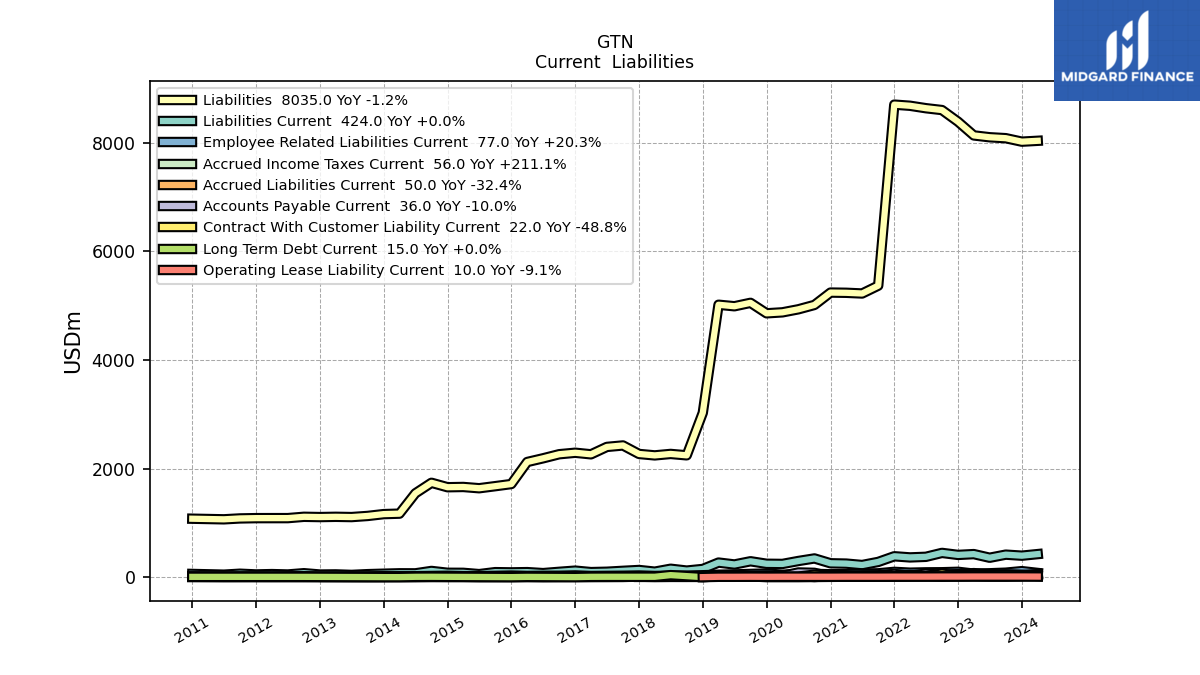
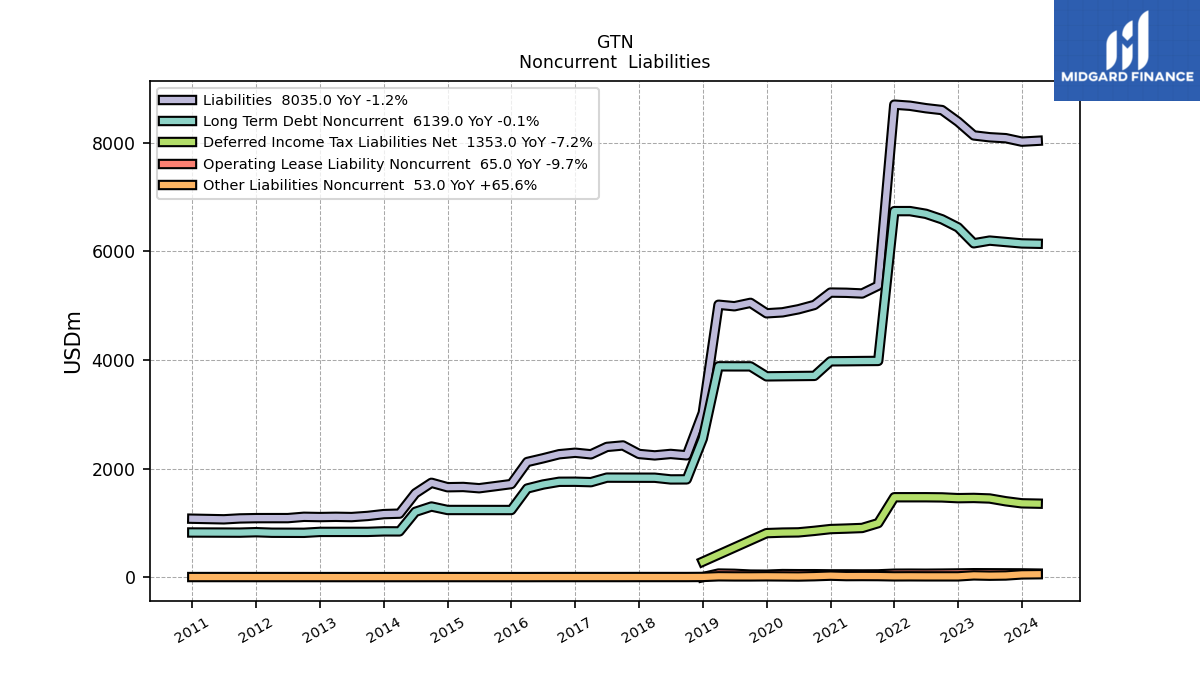
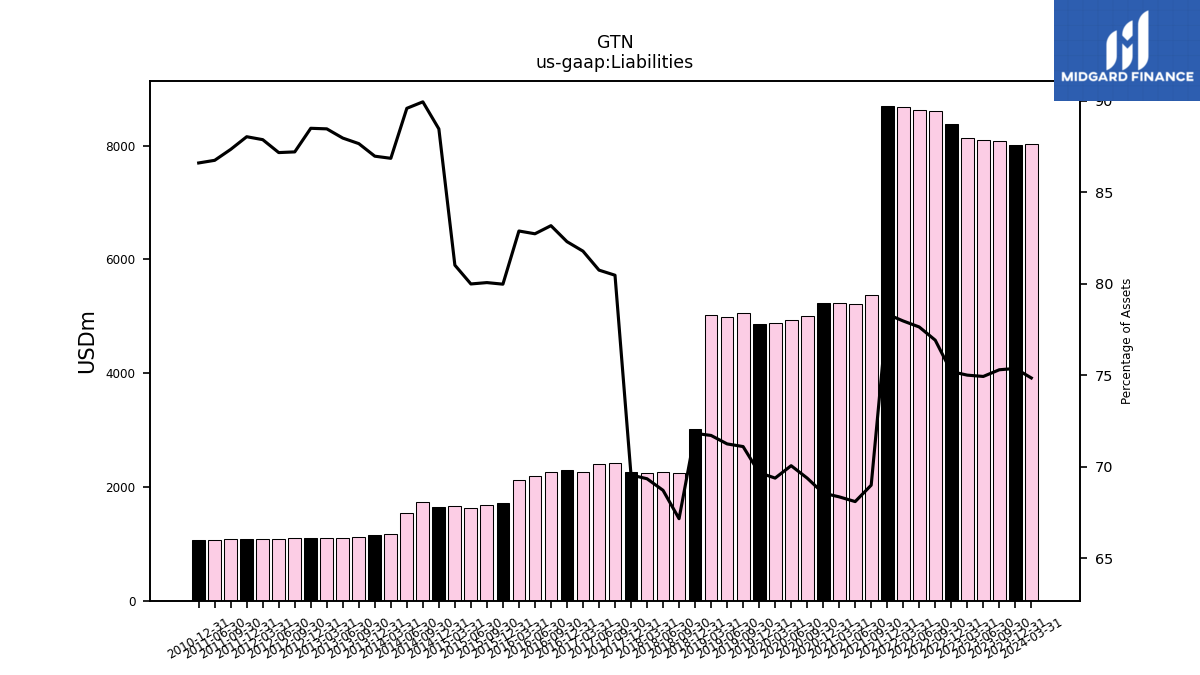
| Liabilities | 8035.00 | 8019.00 | 8083.00 | 8100.00 | 8134.00 | 8386.00 | 8601.00 | 8635.00 | 8680.00 | 8701.00 | 5367.00 | 5223.00 | 5236.00 | 5240.00 | 5012.00 | 4932.00 | 4876.00 | 4858.00 | 5051.00 | 4988.00 | 5016.00 | 3026.26 | 2242.70 | 2268.49 | 2241.67 | 2267.96 | 2424.71 | 2397.77 | 2261.46 | 2290.47 | 2263.10 | 2188.23 | 2120.00 | 1713.89 | 1674.84 | 1636.85 | 1660.13 | 1655.39 | 1737.26 | 1543.49 | 1168.86 | 1160.41 | 1126.54 | 1105.84 | 1110.65 | 1105.85 | 1110.86 | 1086.61 | 1086.46 | 1086.19 | 1080.84 | 1064.44 | NA | 1075.70 | NA | NA | |
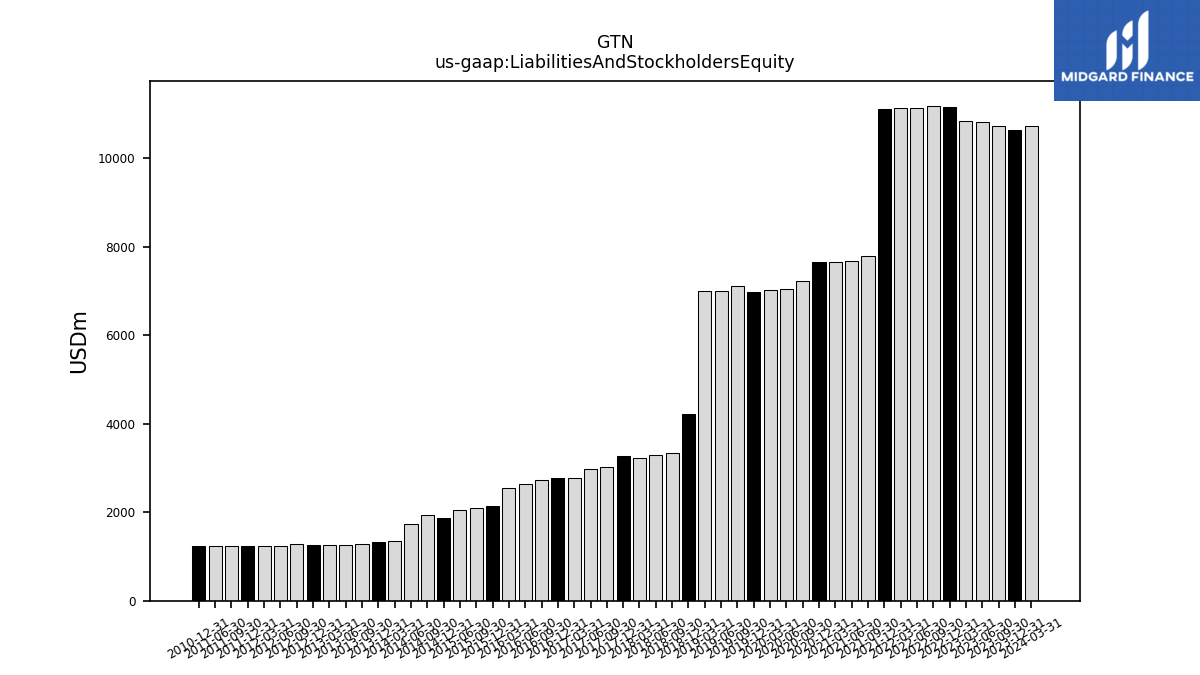
| Liabilities And Stockholders Equity | 10735.00 | 10640.00 | 10735.00 | 10810.00 | 10845.00 | 11152.00 | 11183.00 | 11123.00 | 11134.00 | 11108.00 | 7779.00 | 7670.00 | 7660.00 | 7643.00 | 7224.00 | 7040.00 | 7028.00 | 6972.00 | 7104.00 | 7001.00 | 6995.00 | 4213.44 | 3339.20 | 3301.45 | 3232.71 | 3260.86 | 3013.61 | 2969.82 | 2765.51 | 2783.33 | 2721.21 | 2645.28 | 2558.10 | 2143.16 | 2092.08 | 2046.53 | NA | 1871.58 | 1931.84 | 1723.14 | 1345.93 | 1334.42 | 1285.33 | 1257.37 | 1255.65 | 1249.79 | 1274.00 | 1246.73 | 1236.55 | 1233.98 | 1237.63 | 1227.25 | NA | 1242.29 | NA | NA | |
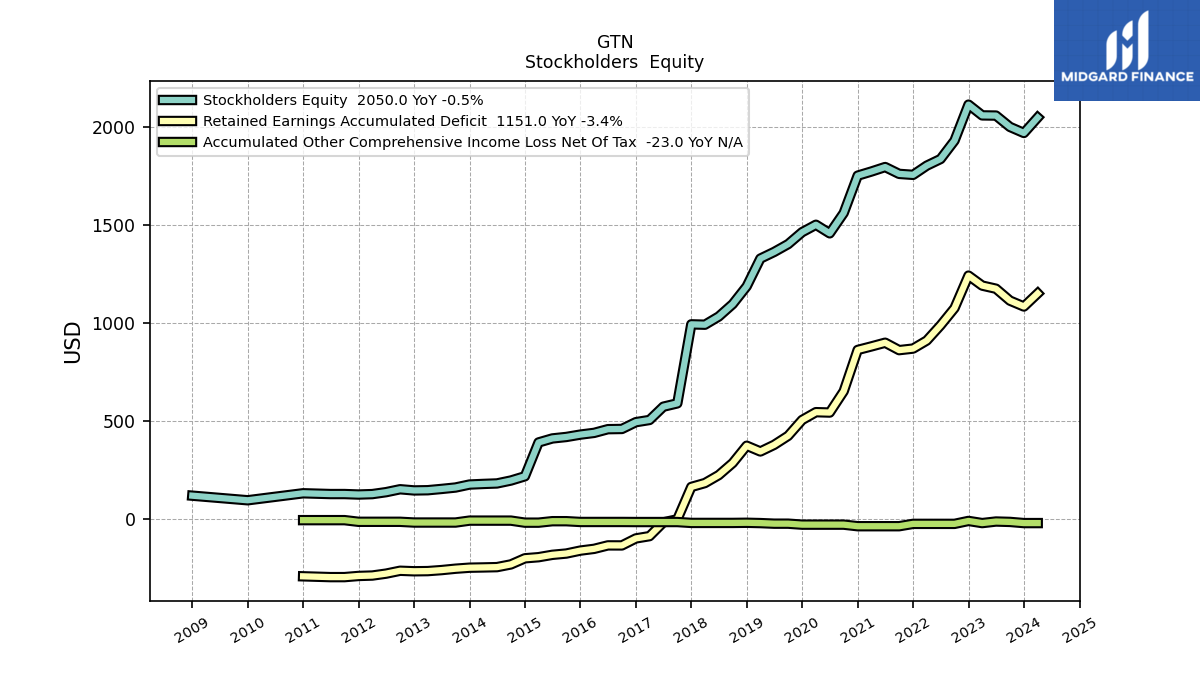
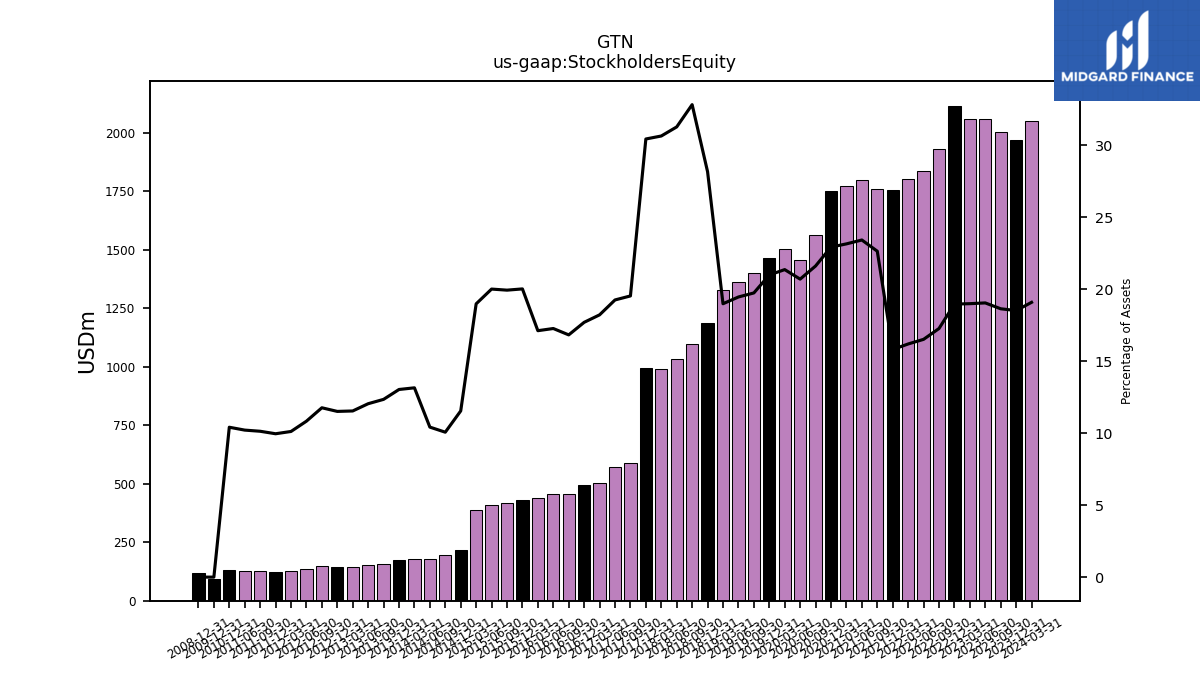
| Stockholders Equity | 2050.00 | 1971.00 | 2002.00 | 2060.00 | 2061.00 | 2116.00 | 1932.00 | 1838.00 | 1804.00 | 1757.00 | 1762.00 | 1797.00 | 1774.00 | 1753.00 | 1562.00 | 1458.00 | 1502.00 | 1464.00 | 1403.00 | 1363.00 | 1329.00 | 1187.19 | 1096.49 | 1032.96 | 991.04 | 992.90 | 588.90 | 572.05 | 504.05 | 492.86 | 458.11 | 457.04 | 438.10 | 429.27 | 417.24 | 409.68 | 389.21 | 216.19 | 194.58 | 179.65 | 177.07 | 174.01 | 158.79 | 151.53 | 145.00 | 143.94 | 149.94 | 135.13 | 125.17 | 122.95 | 125.46 | 125.39 | NA | 129.41 | NA | NA |
| 2024-03-31 | 2023-12-31 | 2023-09-30 | 2023-06-30 | 2023-03-31 | 2022-12-31 | 2022-09-30 | 2022-06-30 | 2022-03-31 | 2021-12-31 | 2021-09-30 | 2021-06-30 | 2021-03-31 | 2020-12-31 | 2020-09-30 | 2020-06-30 | 2020-03-31 | 2019-12-31 | 2019-09-30 | 2019-06-30 | 2019-03-31 | 2018-12-31 | 2018-09-30 | 2018-06-30 | 2018-03-31 | 2017-12-31 | 2017-09-30 | 2017-06-30 | 2017-03-31 | 2016-12-31 | 2016-09-30 | 2016-06-30 | 2016-03-31 | 2015-12-31 | 2015-09-30 | 2015-06-30 | 2015-03-31 | 2014-12-31 | 2014-09-30 | 2014-06-30 | 2014-03-31 | 2013-12-31 | 2013-09-30 | 2013-06-30 | 2013-03-31 | 2012-12-31 | 2012-09-30 | 2012-06-30 | 2012-03-31 | 2011-12-31 | 2011-09-30 | 2011-06-30 | 2011-03-31 | 2010-12-31 | 2010-09-30 | 2010-06-30 | ||
|---|---|---|---|---|---|---|---|---|---|---|---|---|---|---|---|---|---|---|---|---|---|---|---|---|---|---|---|---|---|---|---|---|---|---|---|---|---|---|---|---|---|---|---|---|---|---|---|---|---|---|---|---|---|---|---|---|---|
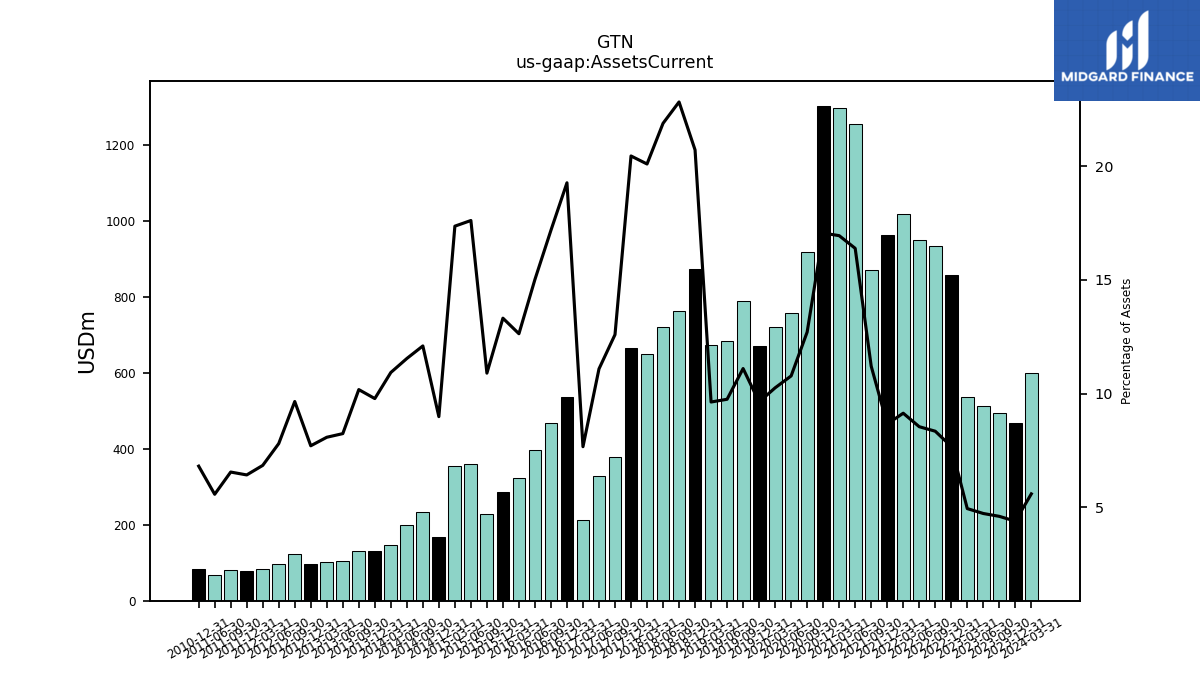
| Assets Current | 601.00 | 468.00 | 495.00 | 512.00 | 537.00 | 857.00 | 934.00 | 951.00 | 1018.00 | 963.00 | 872.00 | 1257.00 | 1298.00 | 1304.00 | 918.00 | 759.00 | 721.00 | 672.00 | 789.00 | 683.00 | 674.00 | 872.75 | 762.03 | 722.40 | 649.61 | 666.76 | 379.60 | 329.37 | 212.16 | 536.31 | 467.59 | 397.36 | 323.24 | 285.45 | 228.12 | 360.42 | 355.82 | 168.30 | 233.75 | 198.97 | 147.14 | 130.59 | 130.86 | 103.69 | 101.53 | 96.38 | 123.03 | 97.35 | 84.70 | 79.36 | 81.16 | 68.49 | NA | 84.69 | NA | NA | |
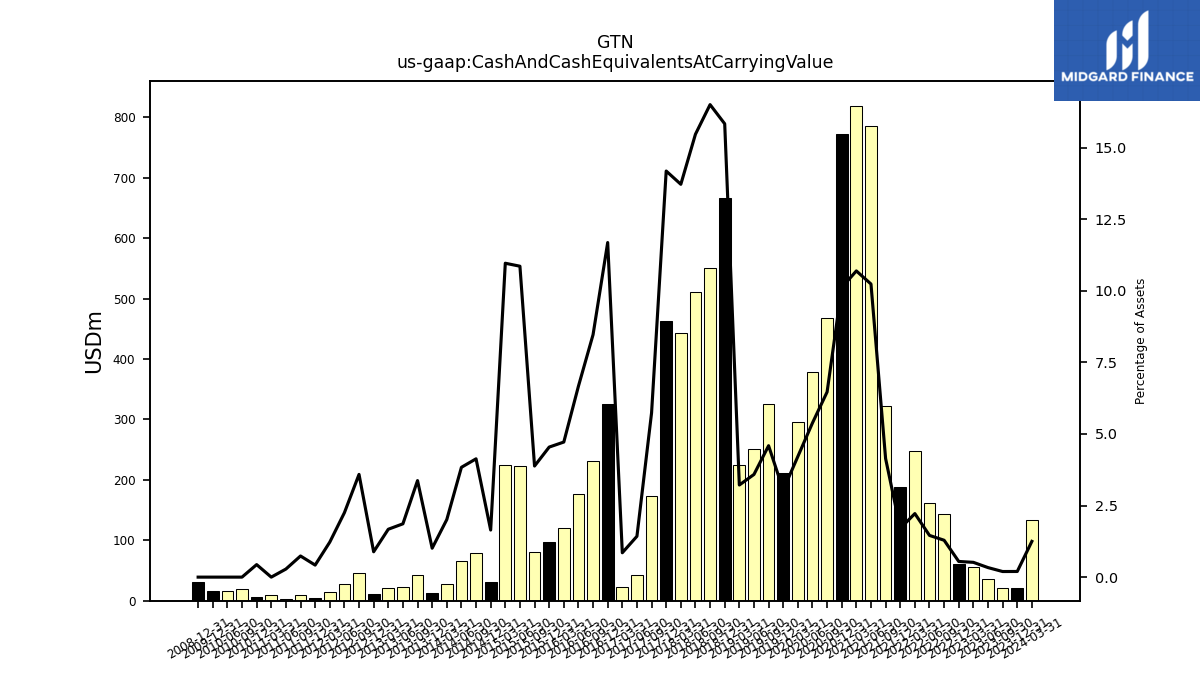
| Cash And Cash Equivalents At Carrying Value | 134.00 | 21.00 | 21.00 | 36.00 | 56.00 | 61.00 | 144.00 | 162.00 | 247.00 | 189.00 | 322.00 | 785.00 | 819.00 | 773.00 | 467.00 | 379.00 | 296.00 | 212.00 | 326.00 | 251.00 | 225.00 | 666.98 | 550.93 | 510.58 | 443.43 | 462.40 | 172.85 | 42.36 | 23.54 | 325.19 | 230.40 | 176.34 | 120.65 | 97.32 | 81.17 | 222.18 | 224.61 | 30.77 | 79.81 | 66.07 | 27.04 | 13.48 | 43.32 | 23.40 | 20.99 | 11.07 | 45.70 | 28.04 | 15.11 | 5.19 | 9.13 | 3.46 | 9.77 | 5.43 | 20.17 | 15.71 | |
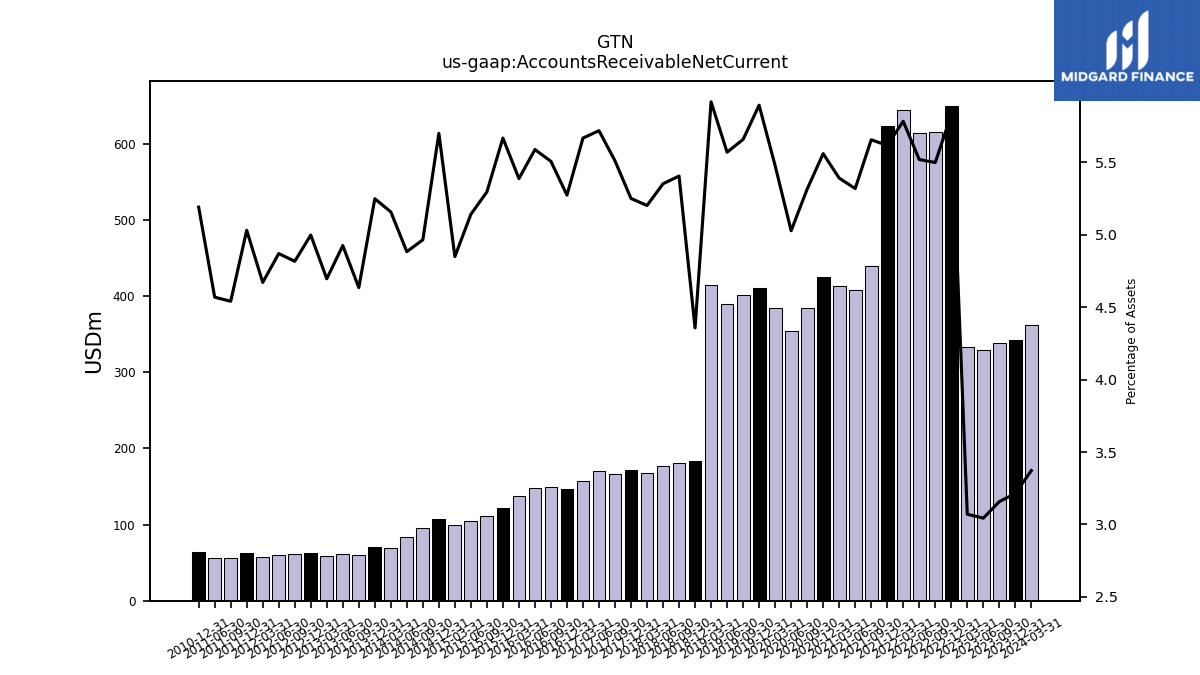
| Accounts Receivable Net Current | 362.00 | 342.00 | 339.00 | 329.00 | 333.00 | 650.00 | 615.00 | 614.00 | 644.00 | 624.00 | 440.00 | 408.00 | 413.00 | 425.00 | 384.00 | 354.00 | 385.00 | 411.00 | 402.00 | 390.00 | 414.00 | 183.59 | 180.51 | 176.71 | 168.19 | 171.23 | 166.07 | 169.85 | 156.76 | 146.81 | 149.86 | 147.84 | 137.84 | 121.47 | 110.81 | 105.23 | 99.39 | 106.69 | 95.93 | 84.15 | 69.43 | 70.05 | 59.58 | 61.93 | 58.97 | 62.47 | 61.37 | 60.72 | 57.77 | 62.09 | 56.20 | 56.08 | NA | 64.49 | NA | NA | |
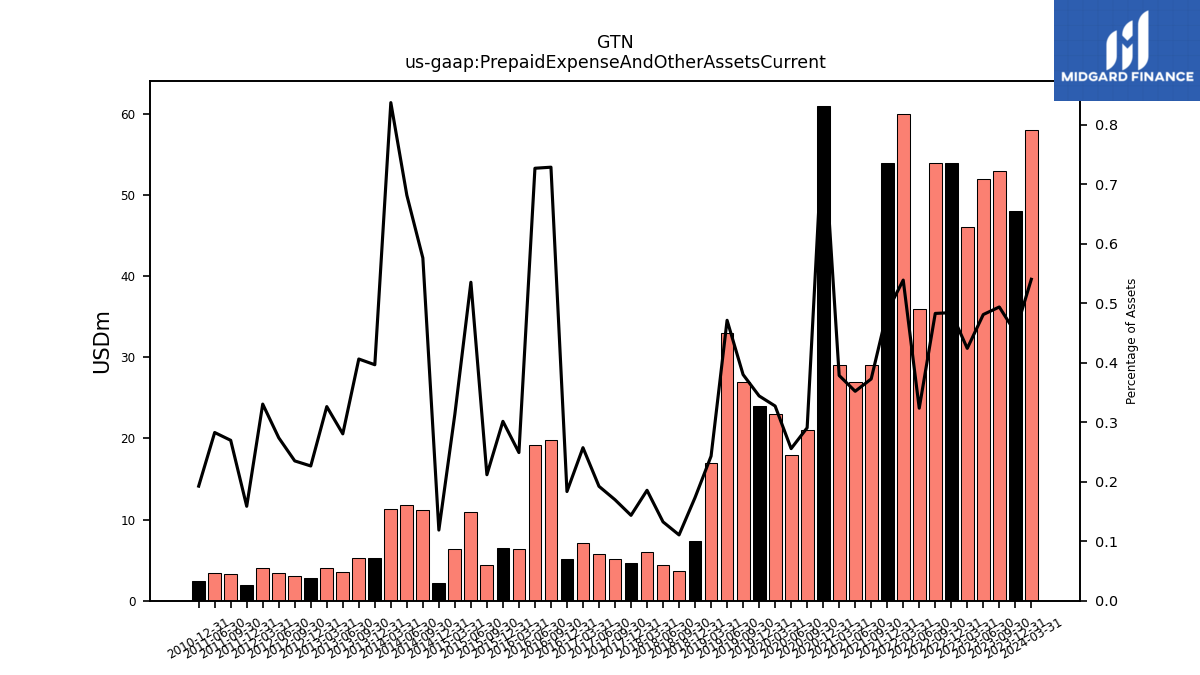
| Prepaid Expense And Other Assets Current | 58.00 | 48.00 | 53.00 | 52.00 | 46.00 | 54.00 | 54.00 | 36.00 | 60.00 | 54.00 | 29.00 | 27.00 | 29.00 | 61.00 | 21.00 | 18.00 | 23.00 | 24.00 | 27.00 | 33.00 | 17.00 | 7.31 | 3.69 | 4.38 | 6.00 | 4.68 | 5.12 | 5.71 | 7.11 | 5.11 | 19.83 | 19.23 | 6.37 | 6.46 | 4.43 | 10.96 | 6.43 | 2.22 | 11.13 | 11.74 | 11.27 | 5.29 | 5.22 | 3.53 | 4.10 | 2.83 | 2.99 | 3.42 | 4.09 | 1.96 | 3.34 | 3.47 | NA | 2.39 | NA | NA |
| 2024-03-31 | 2023-12-31 | 2023-09-30 | 2023-06-30 | 2023-03-31 | 2022-12-31 | 2022-09-30 | 2022-06-30 | 2022-03-31 | 2021-12-31 | 2021-09-30 | 2021-06-30 | 2021-03-31 | 2020-12-31 | 2020-09-30 | 2020-06-30 | 2020-03-31 | 2019-12-31 | 2019-09-30 | 2019-06-30 | 2019-03-31 | 2018-12-31 | 2018-09-30 | 2018-06-30 | 2018-03-31 | 2017-12-31 | 2017-09-30 | 2017-06-30 | 2017-03-31 | 2016-12-31 | 2016-09-30 | 2016-06-30 | 2016-03-31 | 2015-12-31 | 2015-09-30 | 2015-06-30 | 2015-03-31 | 2014-12-31 | 2014-09-30 | 2014-06-30 | 2014-03-31 | 2013-12-31 | 2013-09-30 | 2013-06-30 | 2013-03-31 | 2012-12-31 | 2012-09-30 | 2012-06-30 | 2012-03-31 | 2011-12-31 | 2011-09-30 | 2011-06-30 | 2011-03-31 | 2010-12-31 | 2010-09-30 | 2010-06-30 | ||
|---|---|---|---|---|---|---|---|---|---|---|---|---|---|---|---|---|---|---|---|---|---|---|---|---|---|---|---|---|---|---|---|---|---|---|---|---|---|---|---|---|---|---|---|---|---|---|---|---|---|---|---|---|---|---|---|---|---|
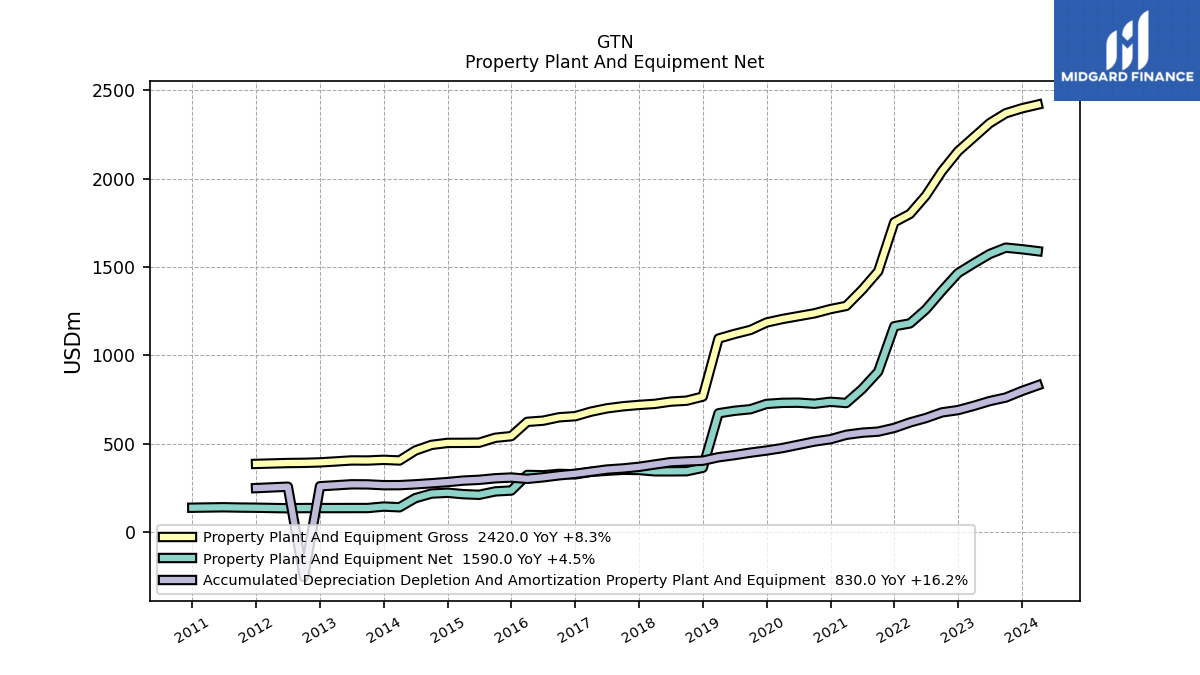
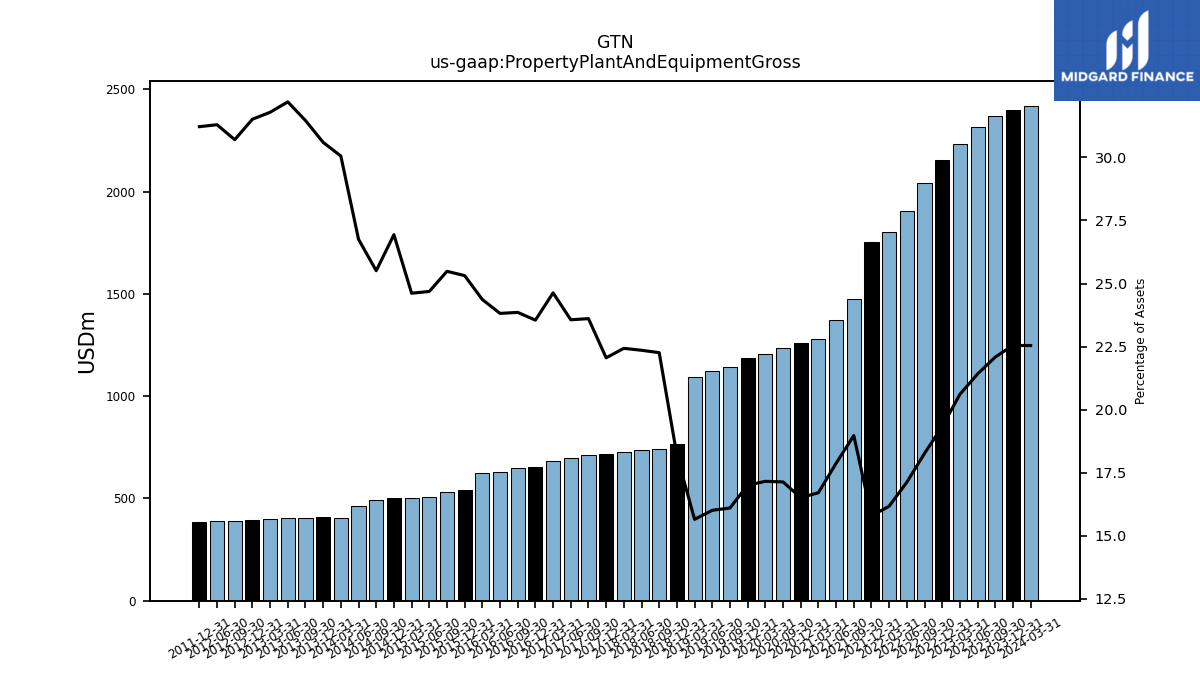
| Property Plant And Equipment Gross | 2420.00 | 2399.00 | 2371.00 | 2315.00 | 2235.00 | 2156.00 | 2043.00 | 1905.00 | 1801.00 | 1754.00 | 1476.00 | 1371.00 | 1280.00 | 1262.00 | 1238.00 | NA | 1206.00 | 1186.00 | 1144.00 | 1121.00 | 1095.00 | 766.42 | 743.32 | 738.05 | 725.17 | 719.26 | 711.50 | 699.82 | 681.16 | 655.49 | 649.21 | 630.03 | 623.34 | 542.53 | 533.18 | 505.23 | 504.48 | 504.13 | 492.80 | 461.03 | 404.52 | 408.28 | 404.41 | 404.89 | 399.15 | 393.85 | 391.15 | 390.17 | NA | 385.23 | NA | NA | NA | NA | NA | NA | |
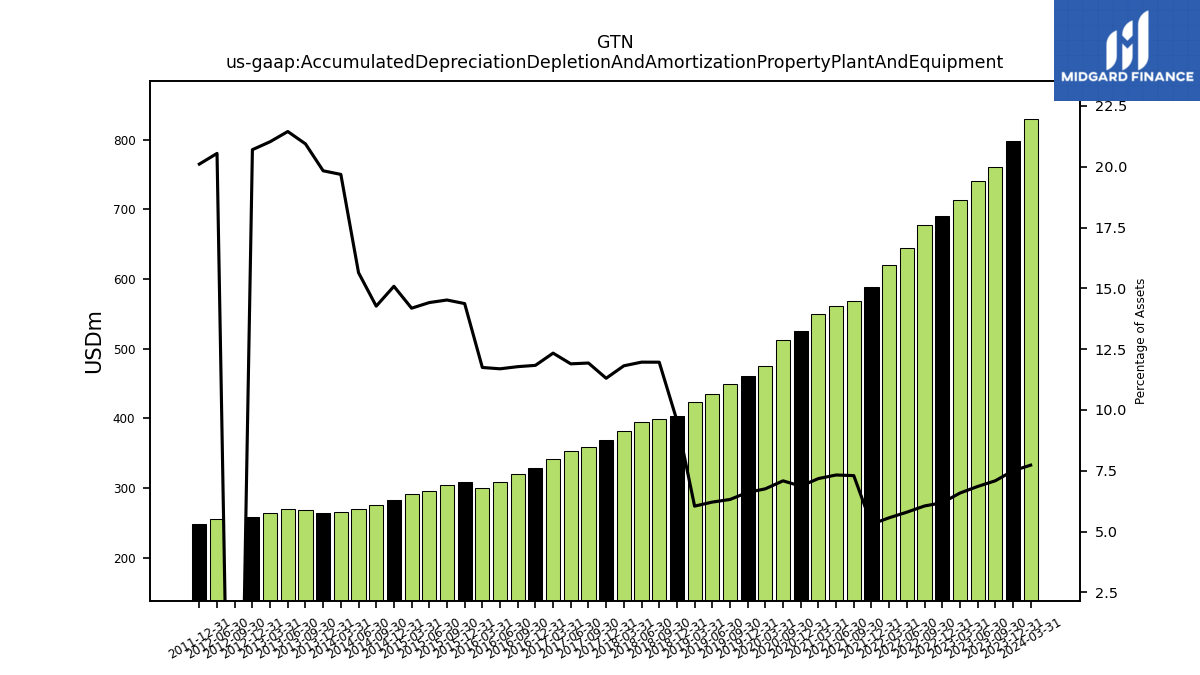
| Accumulated Depreciation Depletion And Amortization Property Plant And Equipment | 830.00 | 798.00 | 761.00 | 741.00 | 714.00 | 690.00 | 677.00 | 645.00 | 620.00 | 589.00 | 568.00 | 562.00 | 550.00 | 525.00 | 512.00 | NA | 475.00 | 461.00 | 449.00 | 435.00 | 423.00 | 403.28 | 399.52 | 395.06 | 381.99 | 368.60 | 359.54 | 353.32 | 341.18 | 329.39 | 320.58 | 309.31 | 300.51 | 308.06 | 303.80 | 295.03 | 290.69 | 282.32 | 275.66 | 269.58 | 264.94 | 264.66 | 269.14 | 269.67 | 264.04 | 258.71 | -256.01 | 256.18 | NA | 248.13 | NA | NA | NA | NA | NA | NA | |
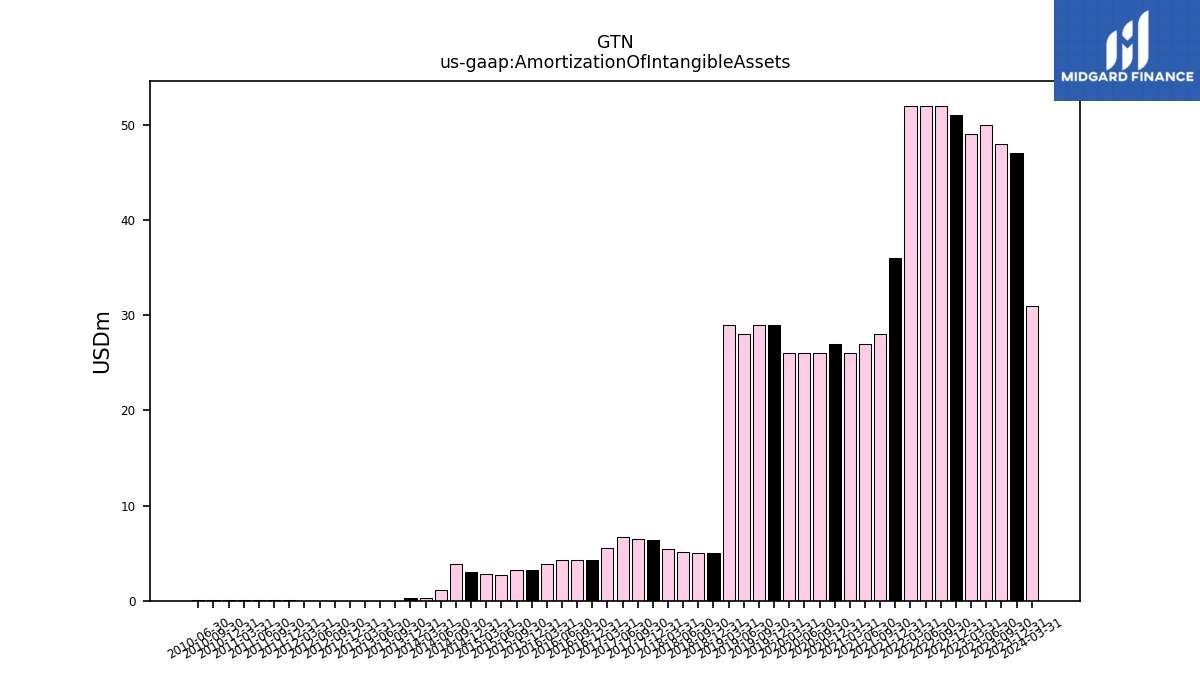
| Amortization Of Intangible Assets | 31.00 | 47.00 | 48.00 | 50.00 | 49.00 | 51.00 | 52.00 | 52.00 | 52.00 | 36.00 | 28.00 | 27.00 | 26.00 | 27.00 | 26.00 | 26.00 | 26.00 | 29.00 | 29.00 | 28.00 | 29.00 | 4.98 | 5.00 | 5.15 | 5.44 | 6.39 | 6.46 | 6.66 | 5.57 | 4.23 | 4.24 | 4.24 | 3.89 | 3.27 | 3.21 | 2.73 | 2.77 | 3.01 | 3.82 | 1.18 | 0.29 | 0.30 | 0.01 | 0.01 | 0.02 | 0.02 | 0.02 | 0.02 | 0.02 | 0.03 | 0.03 | 0.03 | 0.03 | 0.12 | 0.12 | 0.12 | |
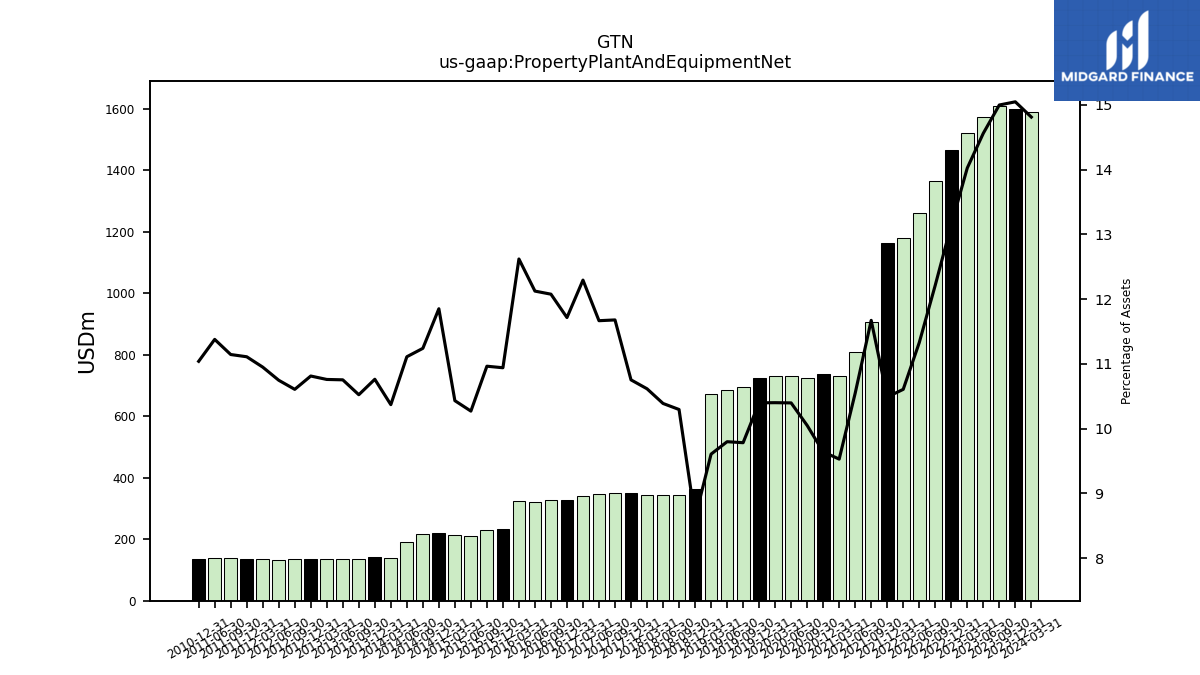
| Property Plant And Equipment Net | 1590.00 | 1601.00 | 1610.00 | 1574.00 | 1521.00 | 1466.00 | 1366.00 | 1260.00 | 1181.00 | 1165.00 | 908.00 | 809.00 | 730.00 | 737.00 | 726.00 | 732.00 | 731.00 | 725.00 | 695.00 | 686.00 | 672.00 | 363.14 | 343.80 | 343.00 | 343.18 | 350.66 | 351.96 | 346.50 | 339.98 | 326.09 | 328.63 | 320.72 | 322.83 | 234.47 | 229.38 | 210.20 | 213.79 | 221.81 | 217.15 | 191.45 | 139.59 | 143.62 | 135.27 | 135.22 | 135.11 | 135.14 | 135.14 | 133.99 | 135.41 | 137.10 | 137.93 | 139.64 | NA | 137.15 | NA | NA | |
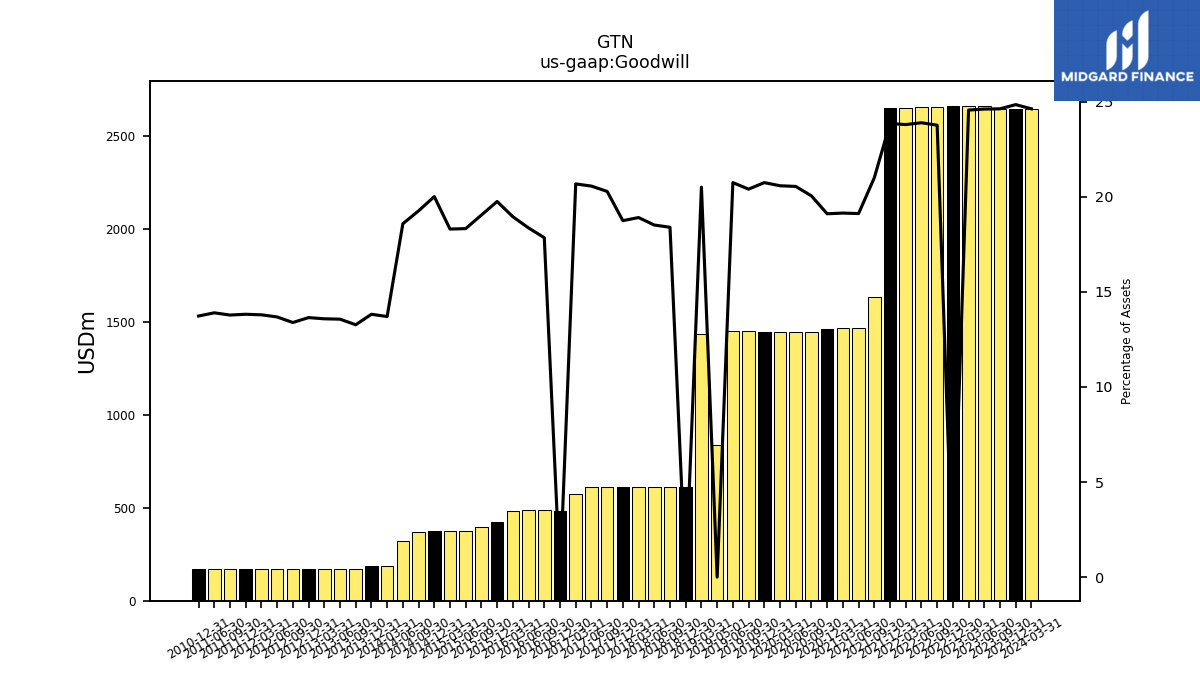
| Goodwill | 2643.00 | 2643.00 | 2643.00 | 2660.00 | 2663.00 | NA | 2657.00 | 2657.00 | 2649.00 | 2649.00 | 1633.00 | 1466.00 | 1466.00 | 1460.00 | 1448.00 | 1446.00 | 1446.00 | 1446.00 | 1449.00 | 1452.00 | 1434.00 | NA | 614.18 | 611.10 | 611.10 | 611.10 | 611.10 | 610.49 | 571.71 | NA | 485.61 | 485.60 | 484.66 | 423.24 | 398.24 | 374.98 | 374.98 | 374.39 | 372.00 | 320.13 | 184.39 | 184.41 | 170.52 | 170.52 | 170.52 | 170.52 | 170.52 | 170.52 | 170.52 | 170.52 | 170.52 | 170.52 | NA | 170.52 | NA | NA | |
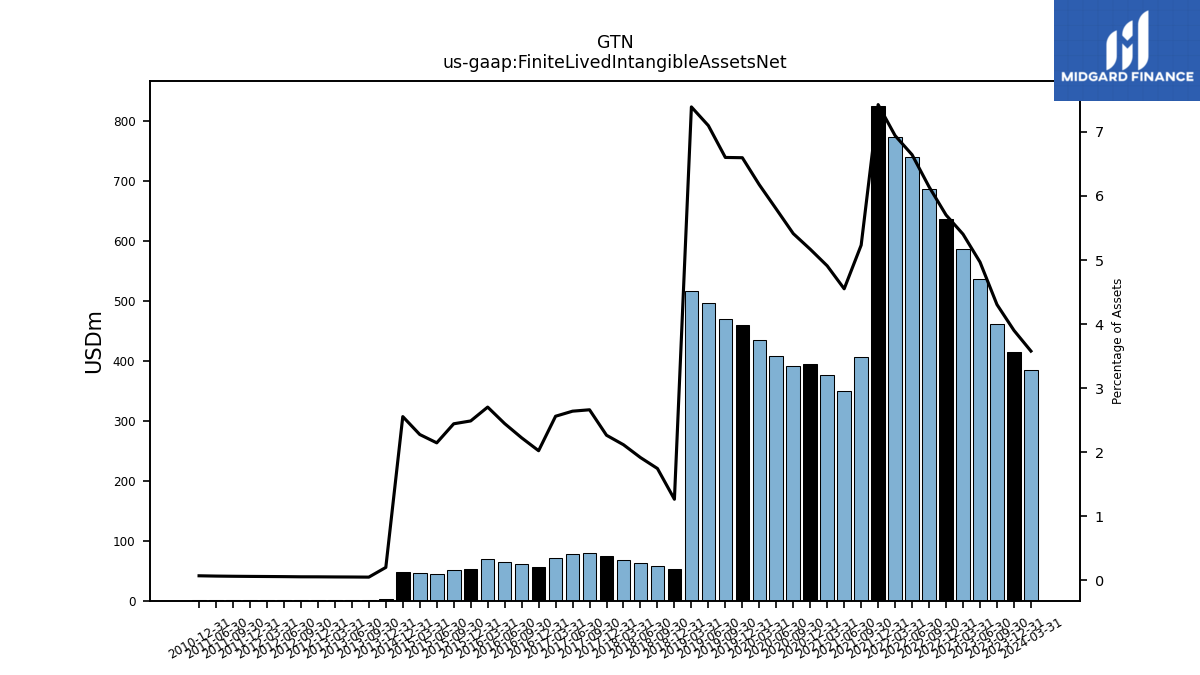
| Finite Lived Intangible Assets Net | 384.00 | 415.00 | 462.00 | 537.00 | 586.00 | 636.00 | 687.00 | 739.00 | 773.00 | 825.00 | 407.00 | 349.00 | 376.00 | 395.00 | 391.00 | 408.00 | 434.00 | 460.00 | 469.00 | 497.00 | 517.00 | 53.21 | 58.20 | 63.20 | 68.35 | 73.78 | 80.17 | 78.36 | 70.78 | 56.25 | 60.48 | 64.67 | 69.13 | 53.28 | 51.08 | 43.87 | 46.60 | 47.80 | NA | NA | NA | 2.64 | 0.60 | 0.61 | 0.62 | 0.64 | 0.66 | 0.68 | 0.69 | 0.71 | 0.74 | 0.77 | NA | 0.84 | NA | NA | |
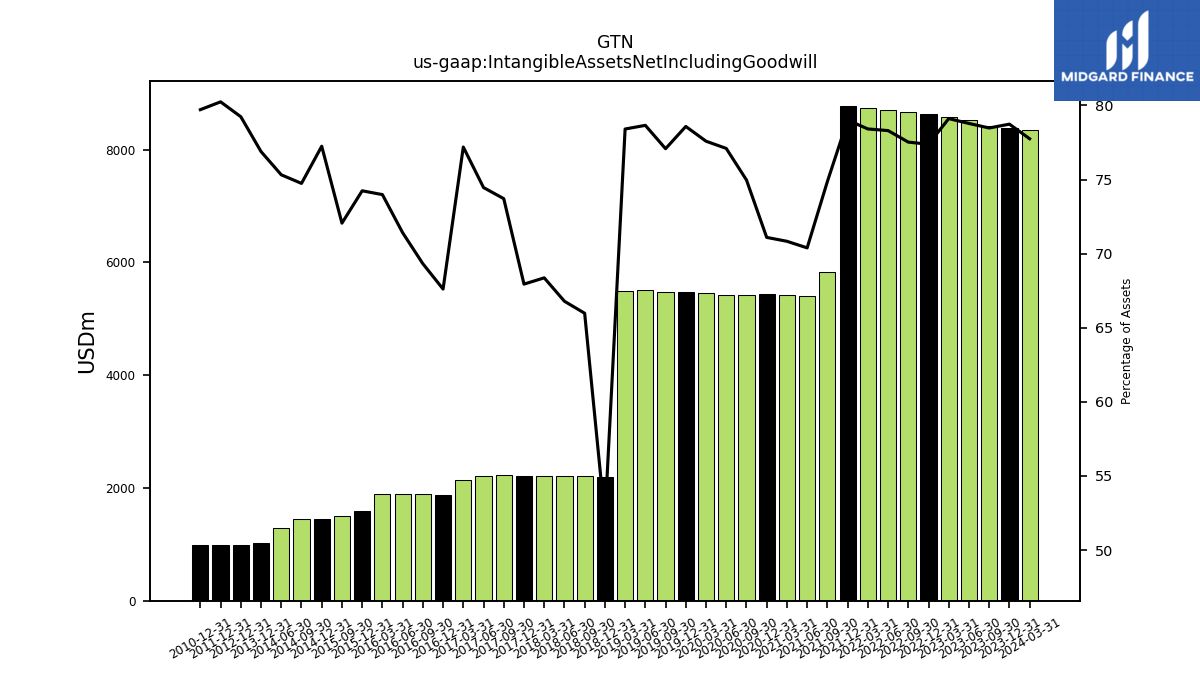
| Intangible Assets Net Including Goodwill | 8347.00 | 8378.00 | 8425.00 | 8517.00 | 8580.00 | 8630.00 | 8670.00 | 8710.00 | 8731.00 | 8777.00 | 5824.00 | 5399.00 | 5426.00 | 5434.00 | 5416.00 | 5428.00 | 5453.00 | 5479.00 | 5476.00 | 5507.00 | 5485.00 | 2195.21 | 2203.13 | 2205.00 | 2210.15 | 2215.59 | 2221.39 | 2211.39 | 2134.87 | 1881.87 | 1886.39 | 1889.13 | 1892.65 | 1591.14 | 1507.57 | NA | NA | 1445.77 | 1443.90 | 1297.90 | NA | 1026.04 | NA | NA | NA | 990.35 | NA | NA | NA | 990.22 | NA | NA | NA | 990.34 | NA | NA | |
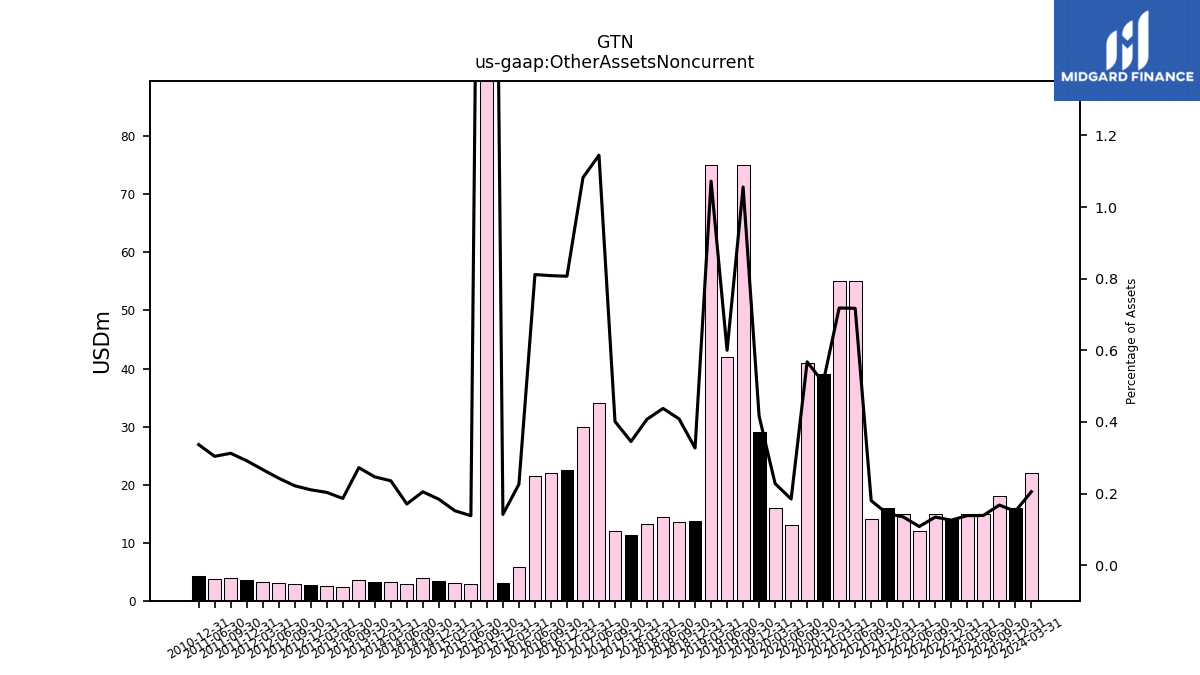
| Other Assets Noncurrent | 22.00 | 16.00 | 18.00 | 15.00 | 15.00 | 14.00 | 15.00 | 12.00 | 15.00 | 16.00 | 14.00 | 55.00 | 55.00 | 39.00 | 41.00 | 13.00 | 16.00 | 29.00 | 75.00 | 42.00 | 75.00 | 13.78 | 13.64 | 14.45 | 13.17 | 11.26 | 12.09 | 33.99 | 29.93 | 22.45 | 22.00 | 21.46 | 5.78 | 3.04 | 97.16 | 2.83 | 3.11 | 3.44 | 3.96 | 2.94 | 3.17 | 3.29 | 3.50 | 2.34 | 2.55 | 2.63 | 2.82 | 3.02 | 3.30 | 3.60 | 3.87 | 3.73 | NA | 4.18 | NA | NA |
| 2024-03-31 | 2023-12-31 | 2023-09-30 | 2023-06-30 | 2023-03-31 | 2022-12-31 | 2022-09-30 | 2022-06-30 | 2022-03-31 | 2021-12-31 | 2021-09-30 | 2021-06-30 | 2021-03-31 | 2020-12-31 | 2020-09-30 | 2020-06-30 | 2020-03-31 | 2019-12-31 | 2019-09-30 | 2019-06-30 | 2019-03-31 | 2018-12-31 | 2018-09-30 | 2018-06-30 | 2018-03-31 | 2017-12-31 | 2017-09-30 | 2017-06-30 | 2017-03-31 | 2016-12-31 | 2016-09-30 | 2016-06-30 | 2016-03-31 | 2015-12-31 | 2015-09-30 | 2015-06-30 | 2015-03-31 | 2014-12-31 | 2014-09-30 | 2014-06-30 | 2014-03-31 | 2013-12-31 | 2013-09-30 | 2013-06-30 | 2013-03-31 | 2012-12-31 | 2012-09-30 | 2012-06-30 | 2012-03-31 | 2011-12-31 | 2011-09-30 | 2011-06-30 | 2011-03-31 | 2010-12-31 | 2010-09-30 | 2010-06-30 | ||
|---|---|---|---|---|---|---|---|---|---|---|---|---|---|---|---|---|---|---|---|---|---|---|---|---|---|---|---|---|---|---|---|---|---|---|---|---|---|---|---|---|---|---|---|---|---|---|---|---|---|---|---|---|---|---|---|---|---|
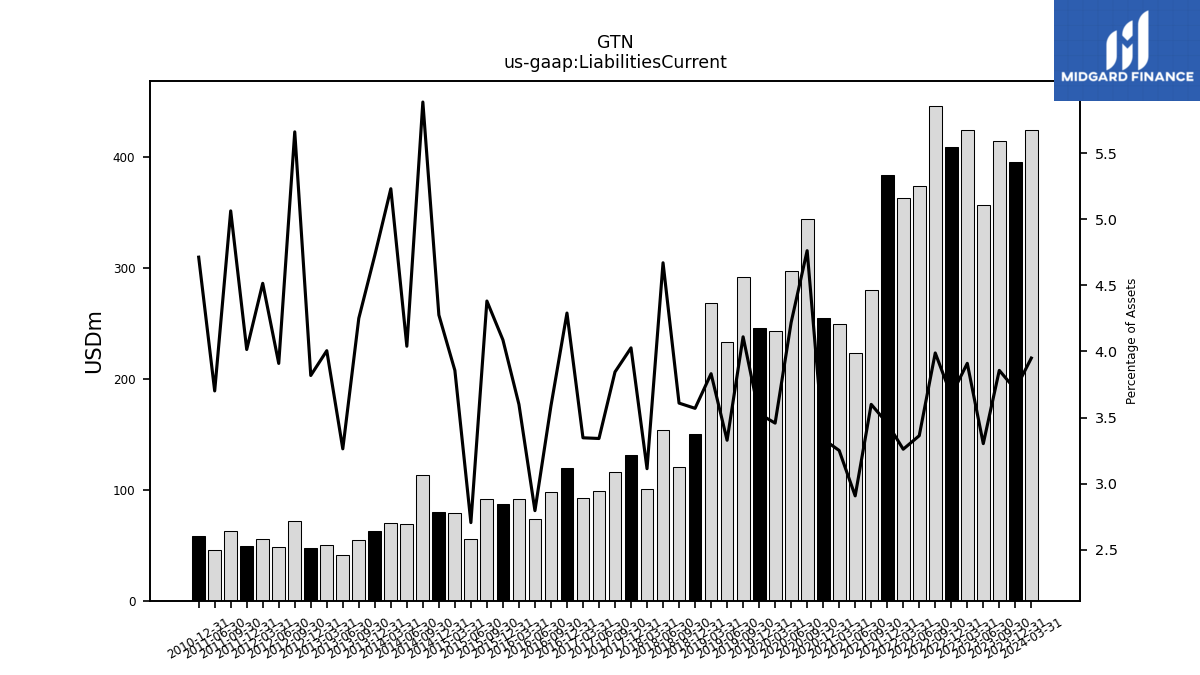
| Liabilities Current | 424.00 | 395.00 | 414.00 | 357.00 | 424.00 | 409.00 | 446.00 | 374.00 | 363.00 | 384.00 | 280.00 | 223.00 | 249.00 | 255.00 | 344.00 | 297.00 | 243.00 | 246.00 | 292.00 | 233.00 | 268.00 | 150.40 | 120.51 | 154.19 | 100.63 | 131.31 | 115.86 | 99.23 | 92.55 | 119.41 | 97.63 | 73.95 | 92.08 | 87.59 | 91.66 | 55.36 | 79.03 | 80.02 | 113.71 | 69.60 | 70.40 | 63.09 | 54.63 | 41.03 | 50.29 | 47.72 | 72.12 | 48.74 | 55.83 | 49.54 | 62.66 | 45.42 | NA | 58.55 | NA | NA | |
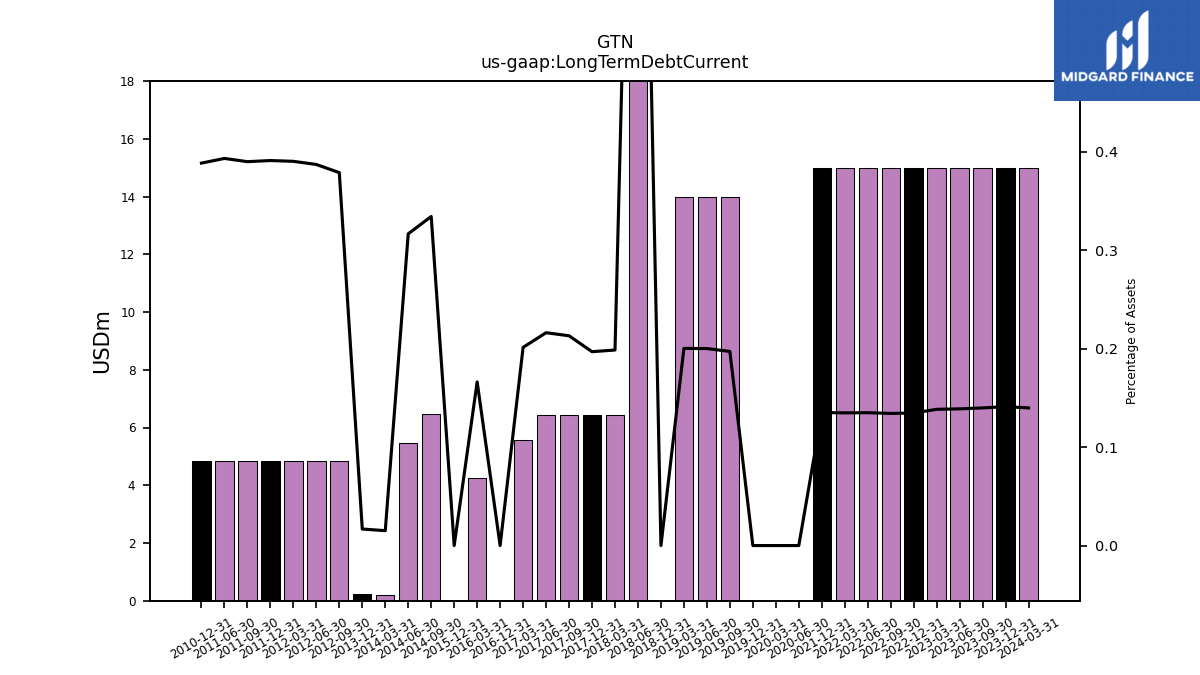
| Long Term Debt Current | 15.00 | 15.00 | 15.00 | 15.00 | 15.00 | 15.00 | 15.00 | 15.00 | 15.00 | 15.00 | NA | NA | NA | NA | NA | -0.00 | -0.00 | -0.00 | 14.00 | 14.00 | 14.00 | 0.00 | NA | 37.00 | 6.42 | 6.42 | 6.42 | 6.42 | 5.56 | 0.00 | NA | NA | 4.25 | 0.00 | NA | NA | NA | NA | 6.45 | 5.45 | 0.20 | 0.22 | NA | NA | NA | NA | 4.82 | 4.82 | 4.82 | 4.82 | 4.82 | 4.82 | NA | 4.82 | NA | NA | |
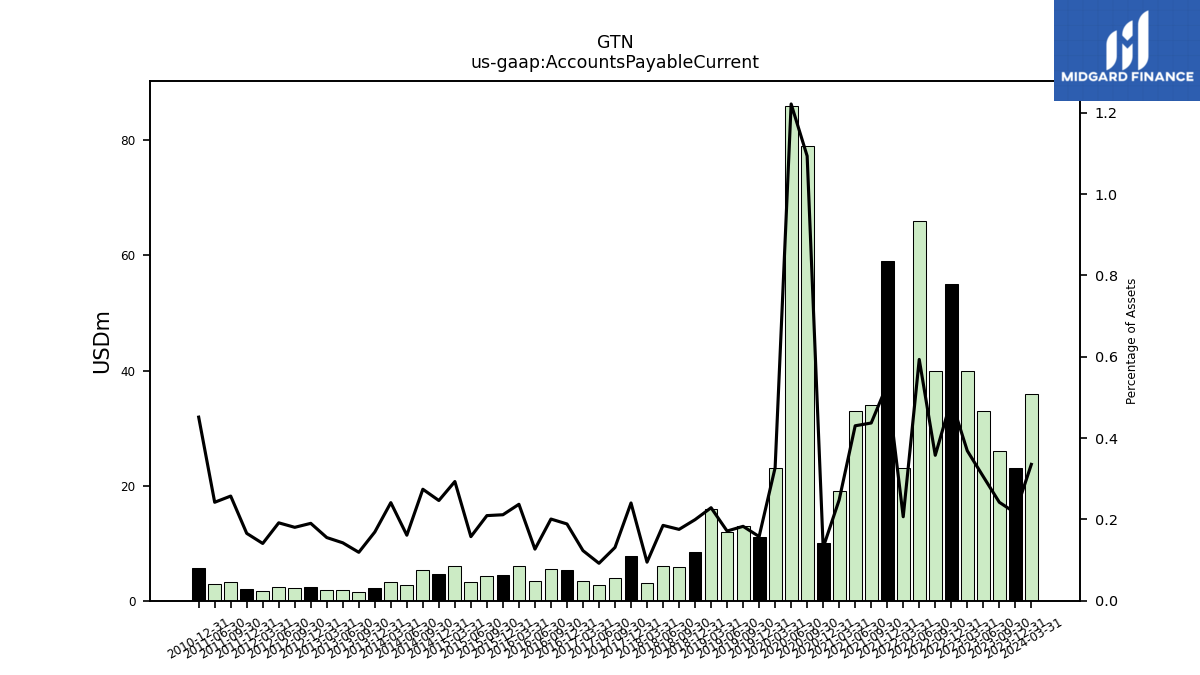
| Accounts Payable Current | 36.00 | 23.00 | 26.00 | 33.00 | 40.00 | 55.00 | 40.00 | 66.00 | 23.00 | 59.00 | 34.00 | 33.00 | 19.00 | 10.00 | 79.00 | 86.00 | 23.00 | 11.00 | 13.00 | 12.00 | 16.00 | 8.40 | 5.86 | 6.12 | 3.07 | 7.84 | 3.95 | 2.74 | 3.41 | 5.26 | 5.47 | 3.36 | 6.07 | 4.53 | 4.38 | 3.23 | 6.01 | 4.61 | 5.30 | 2.78 | 3.25 | 2.26 | 1.53 | 1.79 | 1.95 | 2.38 | 2.30 | 2.39 | 1.74 | 2.04 | 3.19 | 2.97 | NA | 5.61 | NA | NA | |
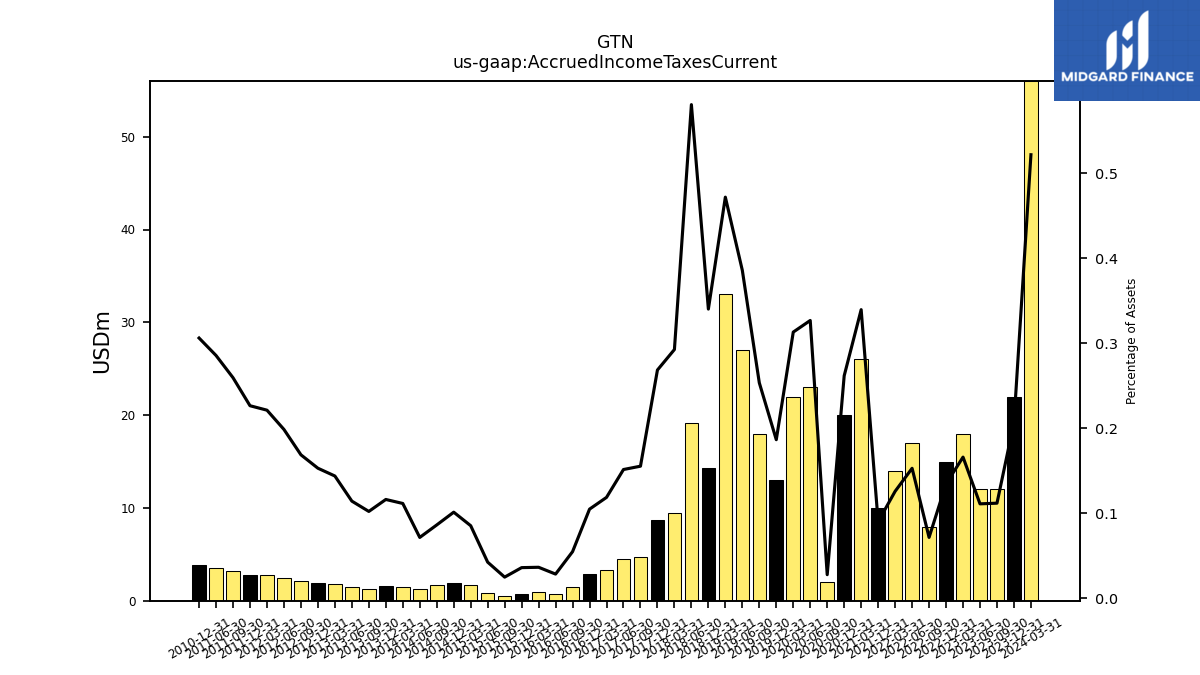
| Accrued Income Taxes Current | 56.00 | 22.00 | 12.00 | 12.00 | 18.00 | 15.00 | 8.00 | 17.00 | 14.00 | 10.00 | NA | NA | 26.00 | 20.00 | 2.00 | 23.00 | 22.00 | 13.00 | 18.00 | 27.00 | 33.00 | 14.33 | NA | 19.17 | 9.46 | 8.75 | 4.68 | 4.50 | 3.28 | 2.92 | 1.49 | 0.75 | 0.93 | 0.77 | 0.52 | 0.87 | 1.75 | 1.89 | 1.67 | 1.23 | 1.50 | 1.55 | 1.31 | 1.44 | 1.80 | 1.91 | 2.15 | 2.48 | 2.73 | 2.79 | 3.21 | 3.50 | NA | 3.80 | NA | NA | |
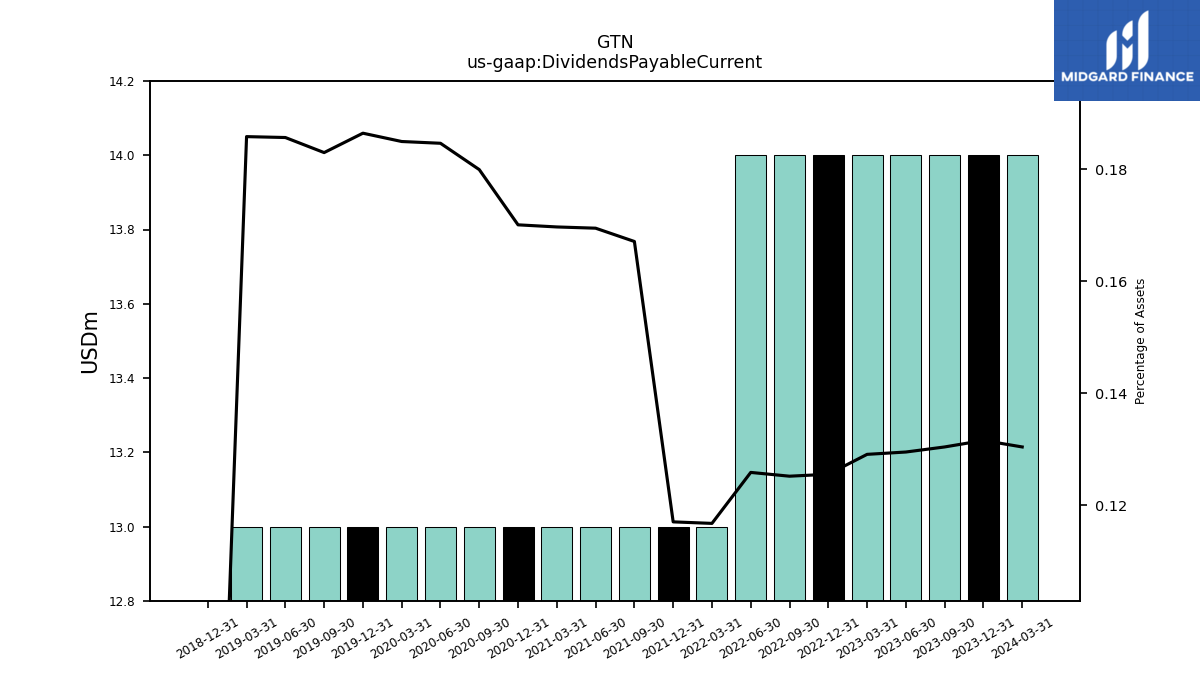
| Dividends Payable Current | 14.00 | 14.00 | 14.00 | 14.00 | 14.00 | 14.00 | 14.00 | 14.00 | 13.00 | 13.00 | 13.00 | 13.00 | 13.00 | 13.00 | 13.00 | 13.00 | 13.00 | 13.00 | 13.00 | 13.00 | 13.00 | 0.00 | NA | NA | NA | NA | NA | NA | NA | NA | NA | NA | NA | NA | NA | NA | NA | NA | NA | NA | NA | NA | NA | NA | NA | NA | NA | NA | NA | NA | NA | NA | NA | NA | NA | NA | |
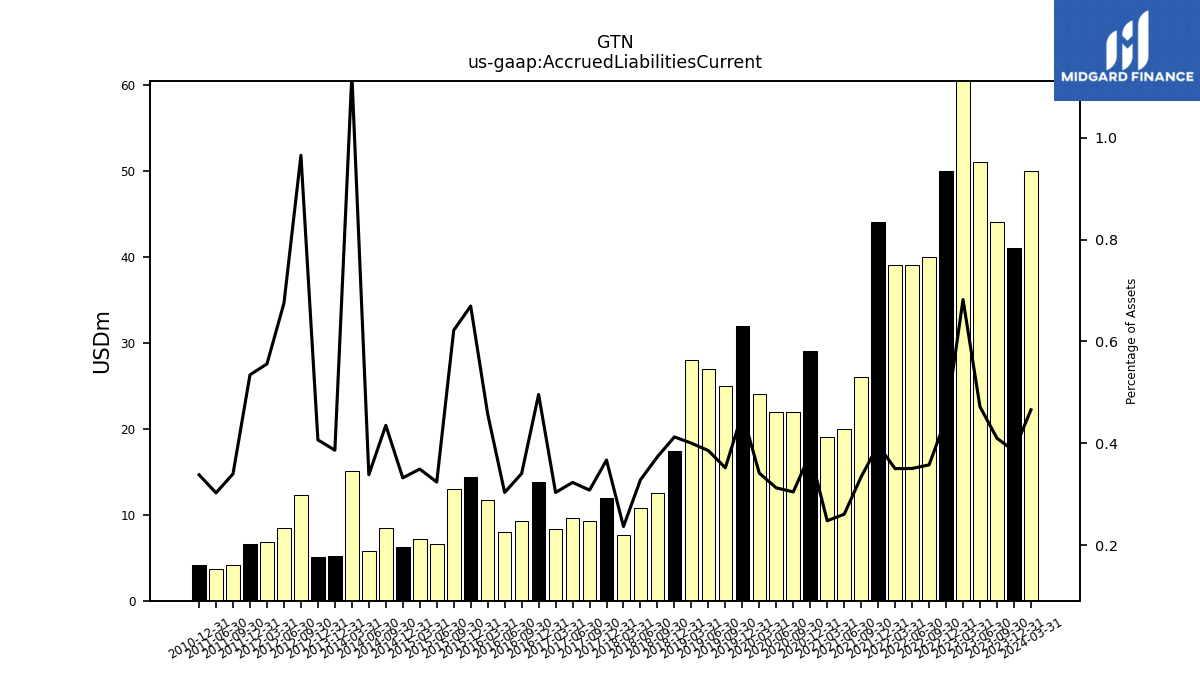
| Accrued Liabilities Current | 50.00 | 41.00 | 44.00 | 51.00 | 74.00 | 50.00 | 40.00 | 39.00 | 39.00 | 44.00 | 26.00 | 20.00 | 19.00 | 29.00 | 22.00 | 22.00 | 24.00 | 32.00 | 25.00 | 27.00 | 28.00 | 17.38 | 12.48 | 10.84 | 7.65 | 11.97 | 9.29 | 9.60 | 8.39 | 13.80 | 9.27 | 8.03 | 11.71 | 14.35 | 13.01 | 6.63 | 7.16 | 6.22 | 8.41 | 5.83 | 15.13 | 5.16 | NA | NA | NA | 5.08 | 12.30 | 8.42 | 6.87 | 6.60 | 4.21 | 3.71 | NA | 4.20 | NA | NA | |
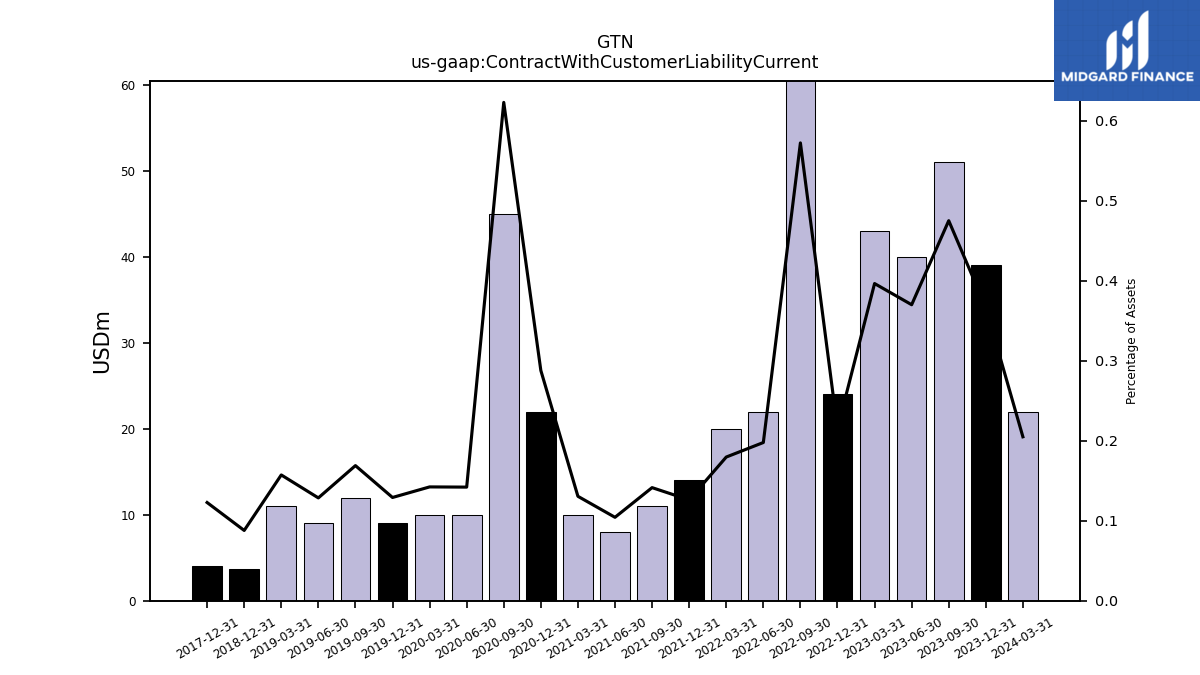
| Contract With Customer Liability Current | 22.00 | 39.00 | 51.00 | 40.00 | 43.00 | 24.00 | 64.00 | 22.00 | 20.00 | 14.00 | 11.00 | 8.00 | 10.00 | 22.00 | 45.00 | 10.00 | 10.00 | 9.00 | 12.00 | 9.00 | 11.00 | 3.70 | NA | NA | NA | 4.00 | NA | NA | NA | NA | NA | NA | NA | NA | NA | NA | NA | NA | NA | NA | NA | NA | NA | NA | NA | NA | NA | NA | NA | NA | NA | NA | NA | NA | NA | NA |
| 2024-03-31 | 2023-12-31 | 2023-09-30 | 2023-06-30 | 2023-03-31 | 2022-12-31 | 2022-09-30 | 2022-06-30 | 2022-03-31 | 2021-12-31 | 2021-09-30 | 2021-06-30 | 2021-03-31 | 2020-12-31 | 2020-09-30 | 2020-06-30 | 2020-03-31 | 2019-12-31 | 2019-09-30 | 2019-06-30 | 2019-03-31 | 2018-12-31 | 2018-09-30 | 2018-06-30 | 2018-03-31 | 2017-12-31 | 2017-09-30 | 2017-06-30 | 2017-03-31 | 2016-12-31 | 2016-09-30 | 2016-06-30 | 2016-03-31 | 2015-12-31 | 2015-09-30 | 2015-06-30 | 2015-03-31 | 2014-12-31 | 2014-09-30 | 2014-06-30 | 2014-03-31 | 2013-12-31 | 2013-09-30 | 2013-06-30 | 2013-03-31 | 2012-12-31 | 2012-09-30 | 2012-06-30 | 2012-03-31 | 2011-12-31 | 2011-09-30 | 2011-06-30 | 2011-03-31 | 2010-12-31 | 2010-09-30 | 2010-06-30 | ||
|---|---|---|---|---|---|---|---|---|---|---|---|---|---|---|---|---|---|---|---|---|---|---|---|---|---|---|---|---|---|---|---|---|---|---|---|---|---|---|---|---|---|---|---|---|---|---|---|---|---|---|---|---|---|---|---|---|---|
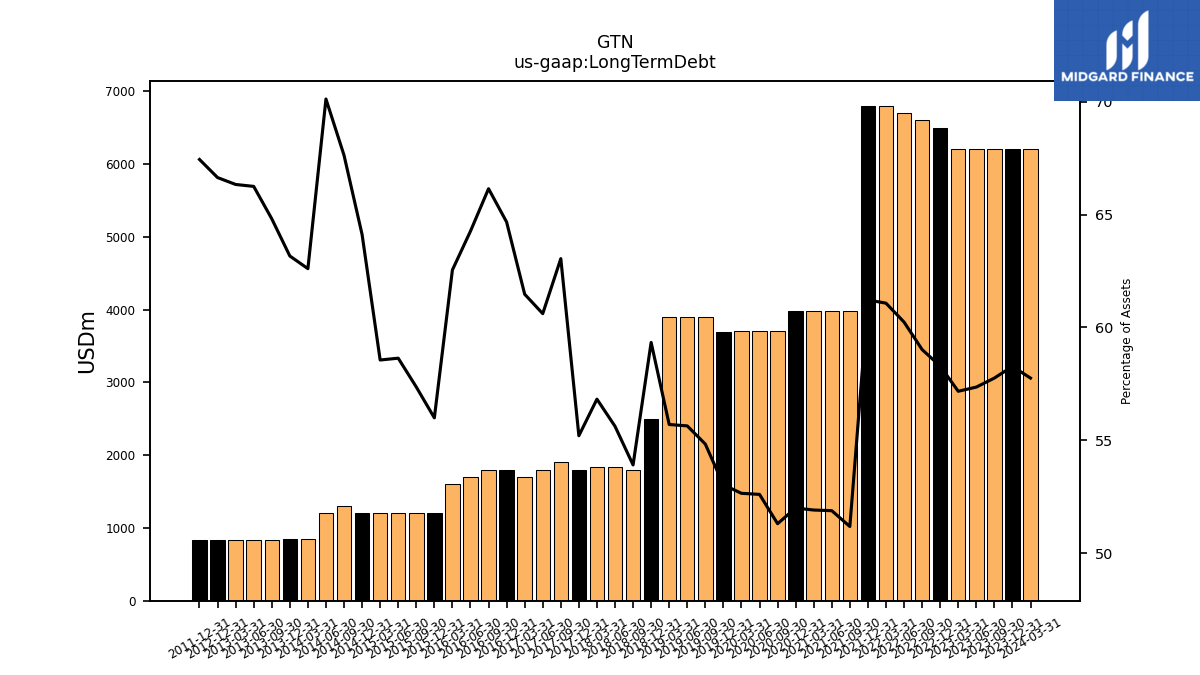
| Long Term Debt | 6200.00 | 6200.00 | 6200.00 | 6200.00 | 6200.00 | 6500.00 | 6600.00 | 6700.00 | 6800.00 | 6800.00 | 3981.00 | 3979.00 | 3976.00 | 3974.00 | 3706.00 | 3703.00 | 3700.00 | 3697.00 | 3895.00 | 3895.00 | 3896.00 | 2500.00 | 1800.00 | 1836.23 | 1836.83 | 1800.00 | 1900.00 | 1800.00 | 1700.00 | 1800.00 | 1800.00 | 1700.00 | 1600.00 | 1200.00 | 1200.00 | 1200.00 | 1200.00 | 1200.00 | 1306.50 | 1208.30 | 842.60 | 842.90 | 833.07 | 833.00 | 832.94 | 832.87 | NA | NA | NA | 832.23 | NA | NA | NA | NA | NA | NA | |
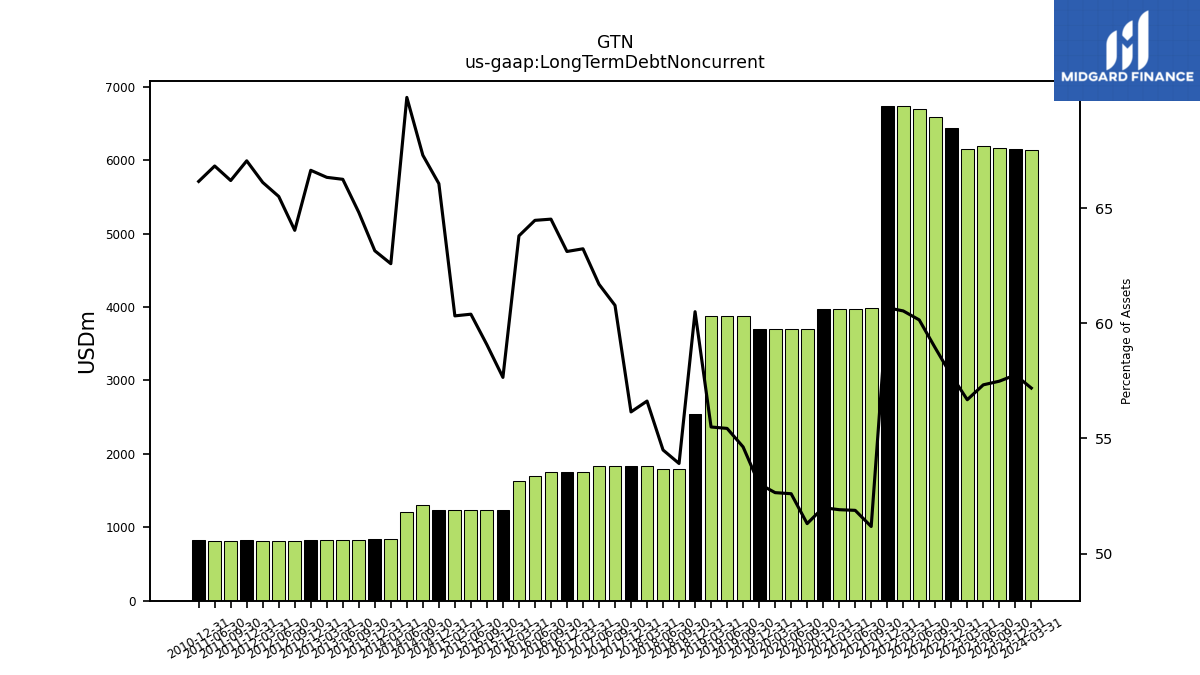
| Long Term Debt Noncurrent | 6139.00 | 6145.00 | 6171.00 | 6197.00 | 6147.00 | 6440.00 | 6590.00 | 6690.00 | 6740.00 | 6740.00 | 3981.00 | 3979.00 | 3976.00 | 3974.00 | 3706.00 | 3703.00 | 3700.00 | 3697.00 | 3881.00 | 3881.00 | 3882.00 | 2549.22 | 1800.23 | 1799.23 | 1830.41 | 1831.01 | 1831.61 | 1832.20 | 1748.72 | 1756.75 | 1755.72 | 1705.36 | 1631.93 | 1235.54 | 1235.75 | 1235.97 | 1236.18 | 1236.40 | 1300.02 | 1202.85 | 842.36 | 842.65 | 833.07 | 833.00 | 832.94 | 832.87 | 815.81 | 816.67 | 817.54 | 827.41 | 819.28 | 820.15 | NA | 821.88 | NA | NA | |
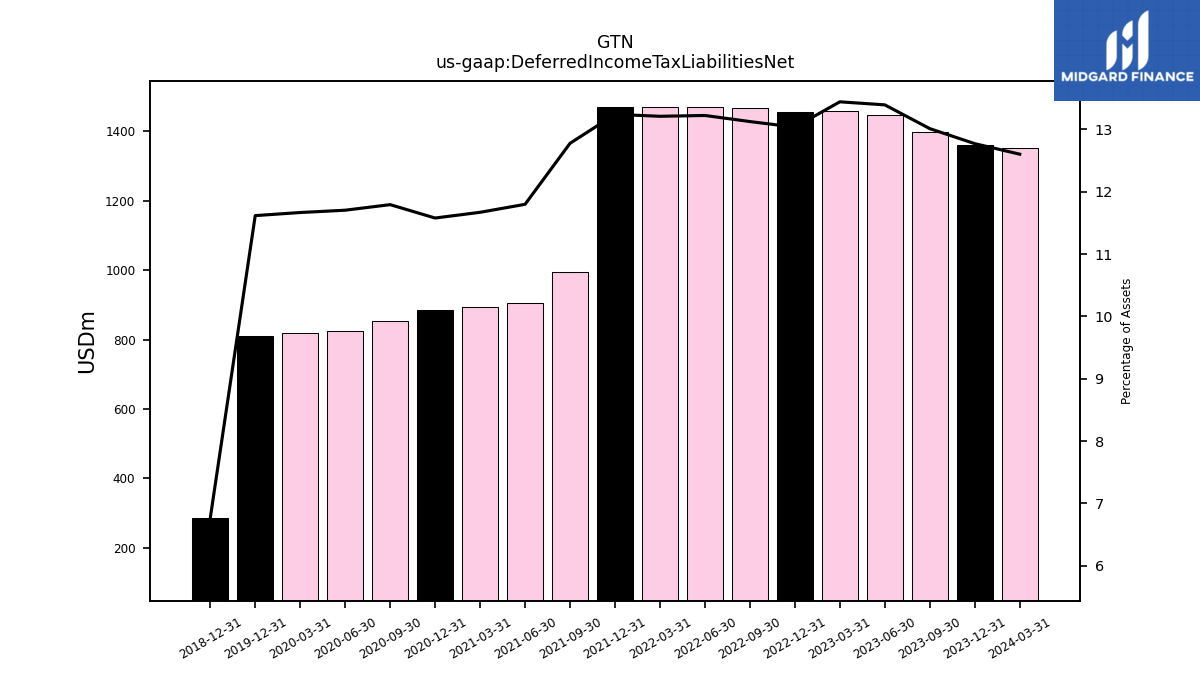
| Deferred Income Tax Liabilities Net | 1353.00 | 1359.00 | 1397.00 | 1448.00 | 1458.00 | 1454.00 | 1468.00 | 1471.00 | 1471.00 | 1471.00 | 994.00 | 905.00 | 894.00 | 885.00 | 852.00 | 824.00 | 820.00 | 810.00 | NA | NA | NA | 285.00 | NA | NA | NA | NA | NA | NA | NA | NA | NA | NA | NA | NA | NA | NA | NA | NA | NA | NA | NA | NA | NA | NA | NA | NA | NA | NA | NA | NA | NA | NA | NA | NA | NA | NA | |
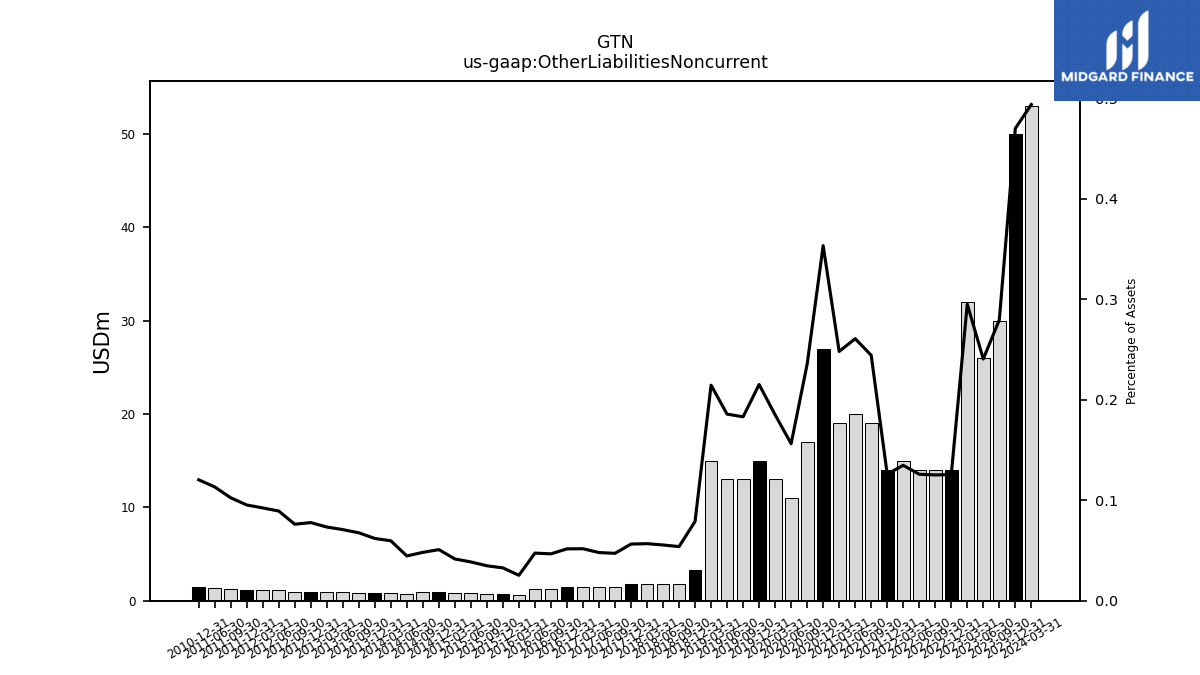
| Other Liabilities Noncurrent | 53.00 | 50.00 | 30.00 | 26.00 | 32.00 | 14.00 | 14.00 | 14.00 | 15.00 | 14.00 | 19.00 | 20.00 | 19.00 | 27.00 | 17.00 | 11.00 | 13.00 | 15.00 | 13.00 | 13.00 | 15.00 | 3.33 | 1.80 | 1.83 | 1.84 | 1.84 | 1.42 | 1.42 | 1.43 | 1.44 | 1.27 | 1.25 | 0.65 | 0.70 | 0.73 | 0.79 | 0.85 | 0.95 | 0.93 | 0.77 | 0.80 | 0.83 | 0.87 | 0.89 | 0.92 | 0.97 | 0.97 | 1.11 | 1.14 | 1.18 | 1.27 | 1.39 | NA | 1.50 | NA | NA | |
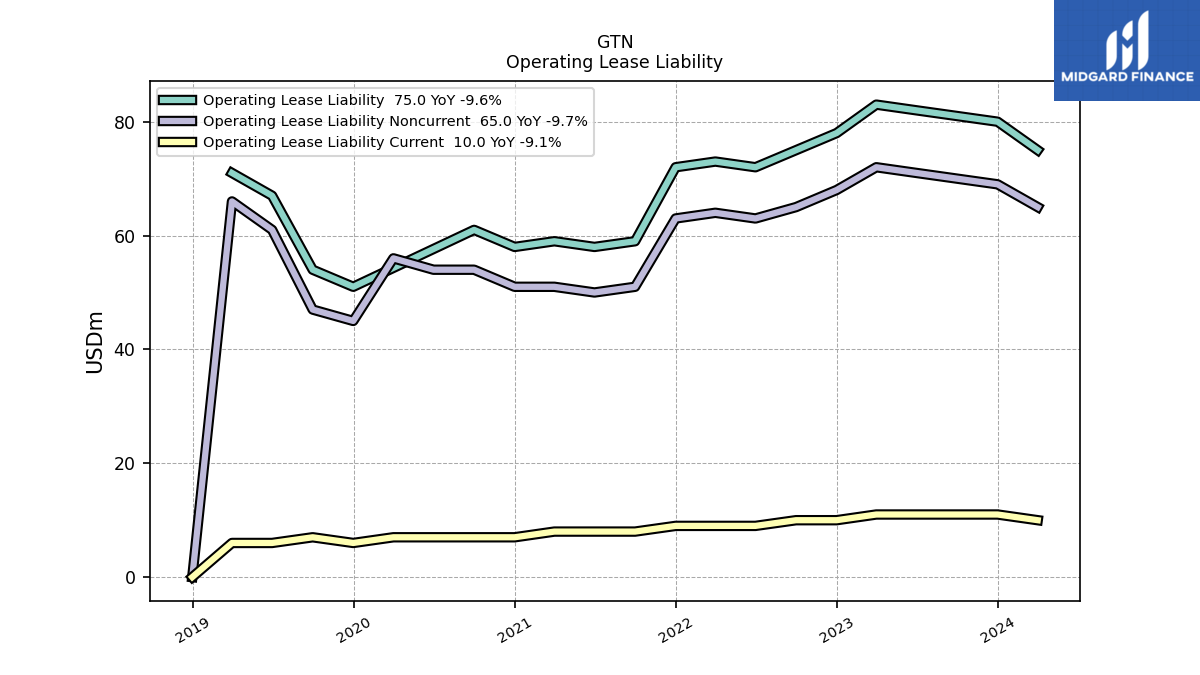
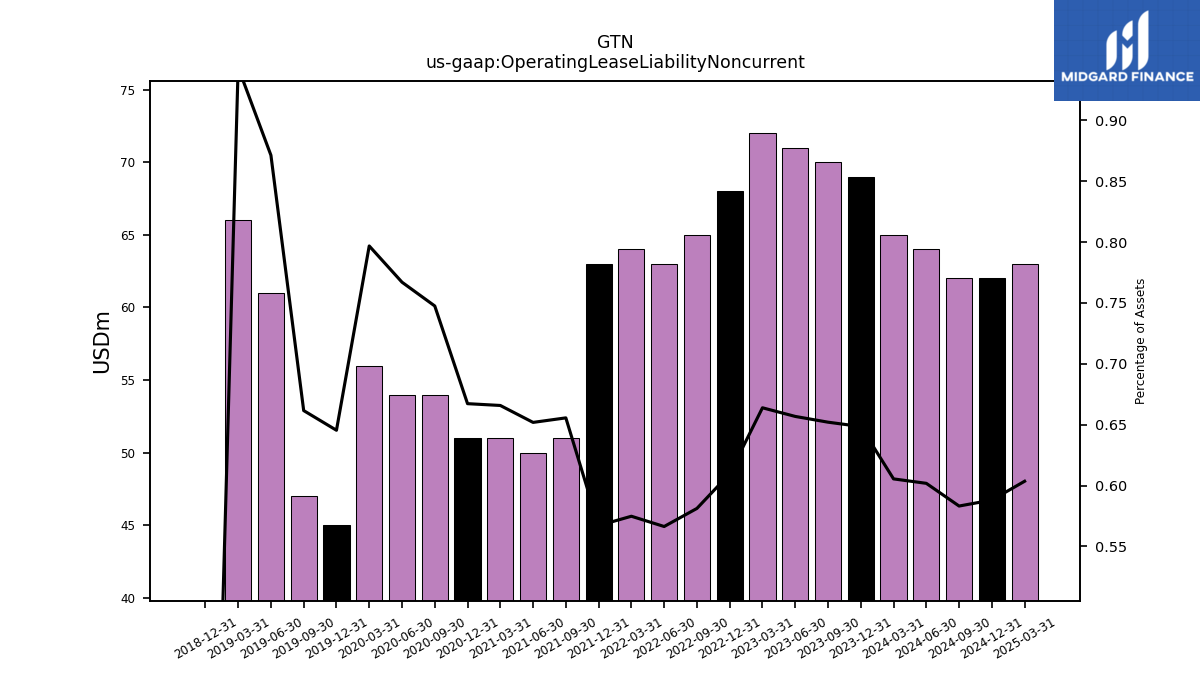
| Operating Lease Liability Noncurrent | 65.00 | 69.00 | 70.00 | 71.00 | 72.00 | 68.00 | 65.00 | 63.00 | 64.00 | 63.00 | 51.00 | 50.00 | 51.00 | 51.00 | 54.00 | 54.00 | 56.00 | 45.00 | 47.00 | 61.00 | 66.00 | 0.00 | NA | NA | NA | NA | NA | NA | NA | NA | NA | NA | NA | NA | NA | NA | NA | NA | NA | NA | NA | NA | NA | NA | NA | NA | NA | NA | NA | NA | NA | NA | NA | NA | NA | NA |
| 2024-03-31 | 2023-12-31 | 2023-09-30 | 2023-06-30 | 2023-03-31 | 2022-12-31 | 2022-09-30 | 2022-06-30 | 2022-03-31 | 2021-12-31 | 2021-09-30 | 2021-06-30 | 2021-03-31 | 2020-12-31 | 2020-09-30 | 2020-06-30 | 2020-03-31 | 2019-12-31 | 2019-09-30 | 2019-06-30 | 2019-03-31 | 2018-12-31 | 2018-09-30 | 2018-06-30 | 2018-03-31 | 2017-12-31 | 2017-09-30 | 2017-06-30 | 2017-03-31 | 2016-12-31 | 2016-09-30 | 2016-06-30 | 2016-03-31 | 2015-12-31 | 2015-09-30 | 2015-06-30 | 2015-03-31 | 2014-12-31 | 2014-09-30 | 2014-06-30 | 2014-03-31 | 2013-12-31 | 2013-09-30 | 2013-06-30 | 2013-03-31 | 2012-12-31 | 2012-09-30 | 2012-06-30 | 2012-03-31 | 2011-12-31 | 2011-09-30 | 2011-06-30 | 2011-03-31 | 2010-12-31 | 2010-09-30 | 2010-06-30 | ||
|---|---|---|---|---|---|---|---|---|---|---|---|---|---|---|---|---|---|---|---|---|---|---|---|---|---|---|---|---|---|---|---|---|---|---|---|---|---|---|---|---|---|---|---|---|---|---|---|---|---|---|---|---|---|---|---|---|---|
| Stockholders Equity | 2050.00 | 1971.00 | 2002.00 | 2060.00 | 2061.00 | 2116.00 | 1932.00 | 1838.00 | 1804.00 | 1757.00 | 1762.00 | 1797.00 | 1774.00 | 1753.00 | 1562.00 | 1458.00 | 1502.00 | 1464.00 | 1403.00 | 1363.00 | 1329.00 | 1187.19 | 1096.49 | 1032.96 | 991.04 | 992.90 | 588.90 | 572.05 | 504.05 | 492.86 | 458.11 | 457.04 | 438.10 | 429.27 | 417.24 | 409.68 | 389.21 | 216.19 | 194.58 | 179.65 | 177.07 | 174.01 | 158.79 | 151.53 | 145.00 | 143.94 | 149.94 | 135.13 | 125.17 | 122.95 | 125.46 | 125.39 | NA | 129.41 | NA | NA | |
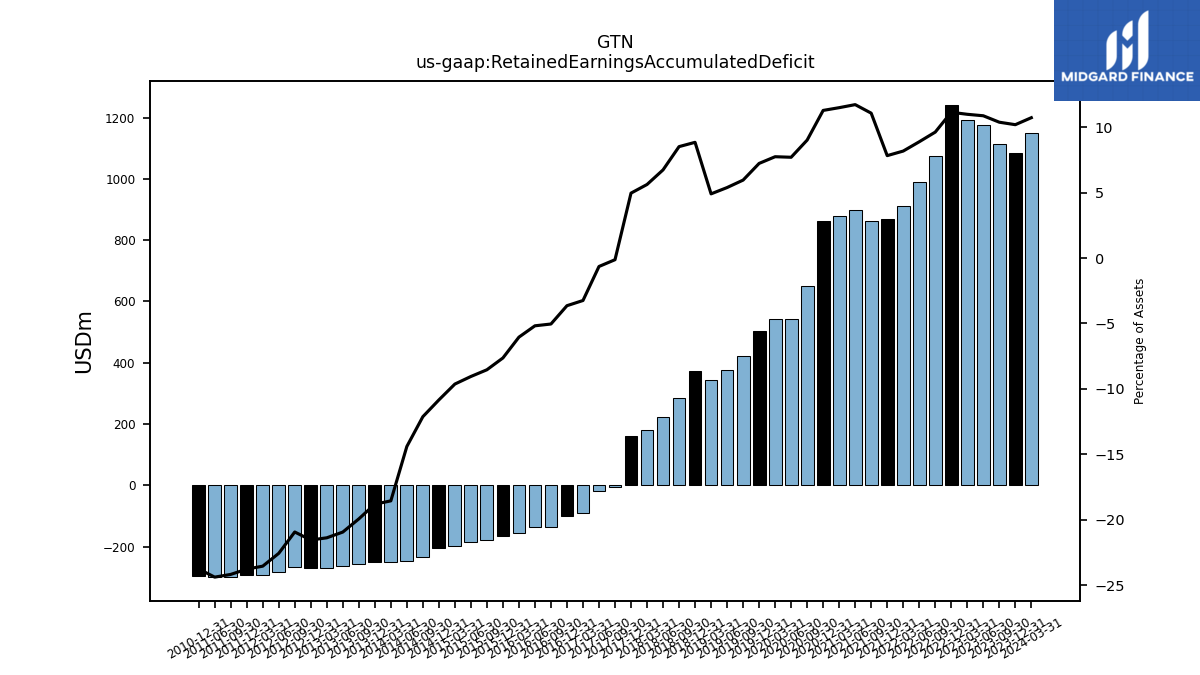
| Retained Earnings Accumulated Deficit | 1151.00 | 1084.00 | 1114.00 | 1175.00 | 1191.00 | 1242.00 | 1076.00 | 988.00 | 910.00 | 869.00 | 861.00 | 899.00 | 880.00 | 862.00 | 651.00 | 542.00 | 544.00 | 504.00 | 423.00 | 377.00 | 343.00 | 372.50 | 284.23 | 222.34 | 181.64 | 161.69 | -3.88 | -19.19 | -89.75 | -101.36 | -137.20 | -136.99 | -154.65 | -163.64 | -178.62 | -185.23 | -197.34 | -202.94 | -234.19 | -248.13 | -249.72 | -251.00 | -256.20 | -263.27 | -268.42 | -269.29 | -266.68 | -281.31 | -291.13 | -293.32 | -299.19 | -299.22 | NA | -295.12 | NA | NA | |
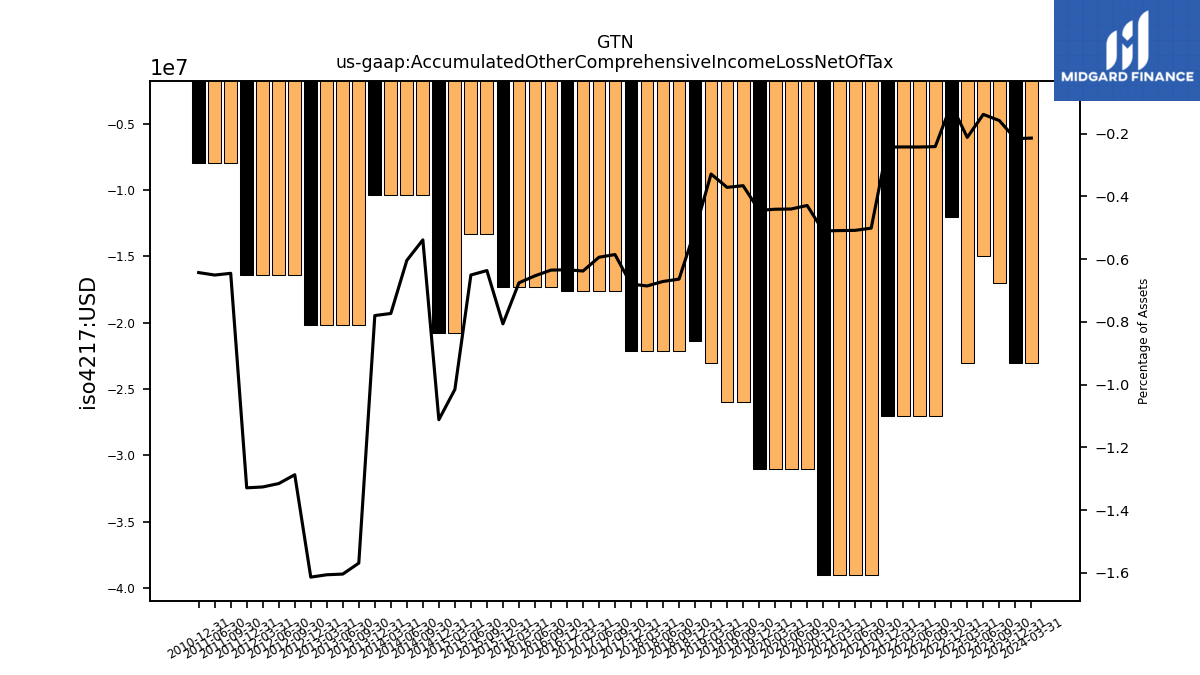
| Accumulated Other Comprehensive Income Loss Net Of Tax | -23.00 | -23.00 | -17.00 | -15.00 | -23.00 | -12.00 | -27.00 | -27.00 | -27.00 | -27.00 | -39.00 | -39.00 | -39.00 | -39.00 | -31.00 | -31.00 | -31.00 | -31.00 | -26.00 | -26.00 | -23.00 | -21.38 | -22.16 | -22.16 | -22.16 | -22.16 | -17.64 | -17.64 | -17.64 | -17.64 | -17.28 | -17.28 | -17.28 | -17.28 | -13.32 | -13.32 | -20.81 | -20.81 | -10.41 | -10.41 | -10.41 | -10.41 | -20.17 | -20.17 | -20.17 | -20.17 | -16.40 | -16.40 | -16.40 | -16.40 | -7.99 | -7.99 | NA | -7.99 | NA | NA |
| 2024-03-31 | 2023-12-31 | 2023-09-30 | 2023-06-30 | 2023-03-31 | 2022-12-31 | 2022-09-30 | 2022-06-30 | 2022-03-31 | 2021-12-31 | 2021-09-30 | 2021-06-30 | 2021-03-31 | 2020-12-31 | 2020-09-30 | 2020-06-30 | 2020-03-31 | 2019-12-31 | 2019-09-30 | 2019-06-30 | 2019-03-31 | 2018-12-31 | 2018-09-30 | 2018-06-30 | 2018-03-31 | 2017-12-31 | 2017-09-30 | 2017-06-30 | 2017-03-31 | 2016-12-31 | 2016-09-30 | 2016-06-30 | 2016-03-31 | 2015-12-31 | 2015-09-30 | 2015-06-30 | 2015-03-31 | 2014-12-31 | 2014-09-30 | 2014-06-30 | 2014-03-31 | 2013-12-31 | 2013-09-30 | 2013-06-30 | 2013-03-31 | 2012-12-31 | 2012-09-30 | 2012-06-30 | 2012-03-31 | 2011-12-31 | 2011-09-30 | 2011-06-30 | 2011-03-31 | 2010-12-31 | 2010-09-30 | 2010-06-30 | ||
|---|---|---|---|---|---|---|---|---|---|---|---|---|---|---|---|---|---|---|---|---|---|---|---|---|---|---|---|---|---|---|---|---|---|---|---|---|---|---|---|---|---|---|---|---|---|---|---|---|---|---|---|---|---|---|---|---|---|
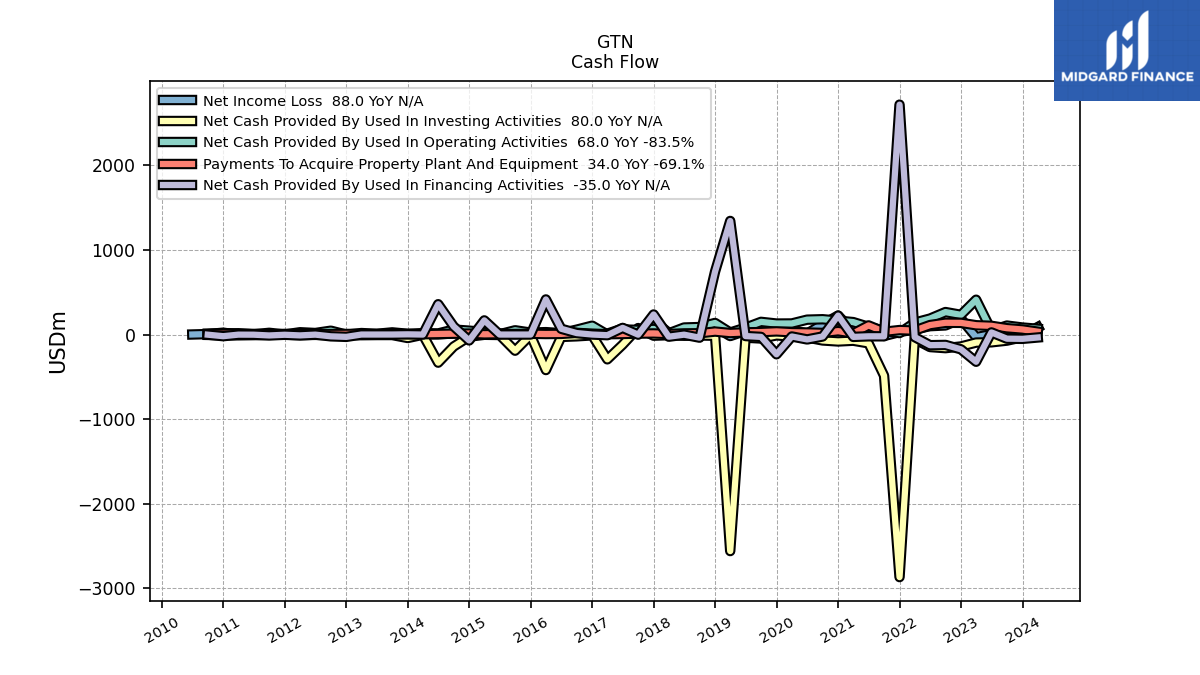
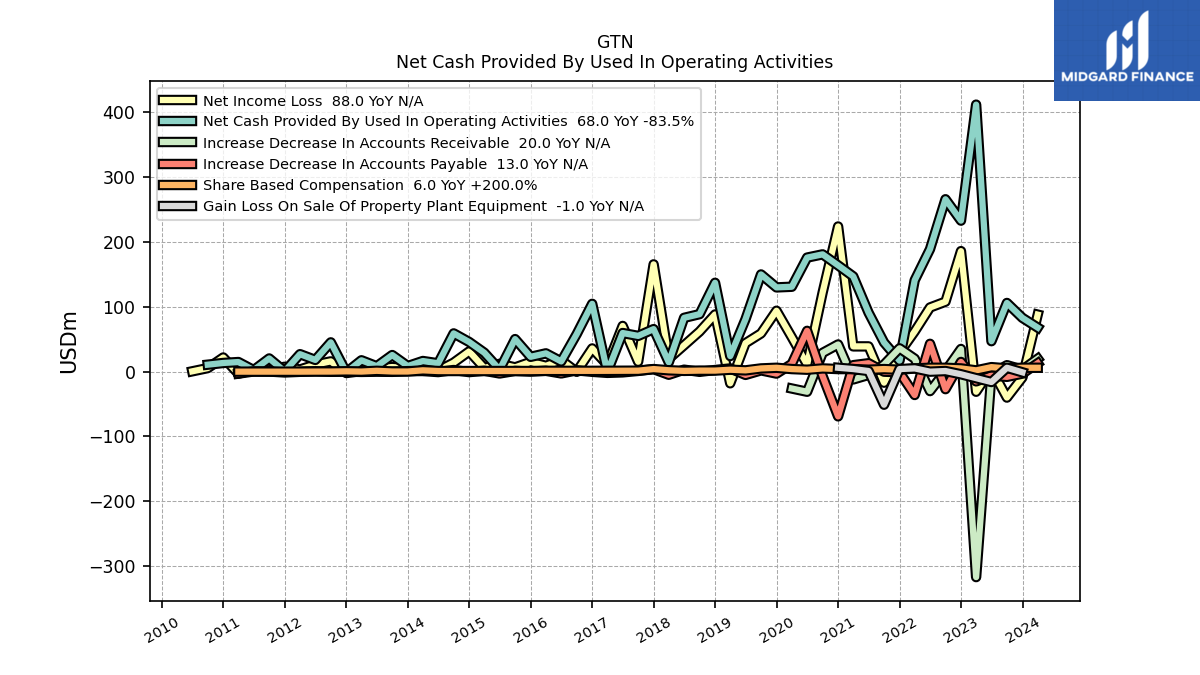
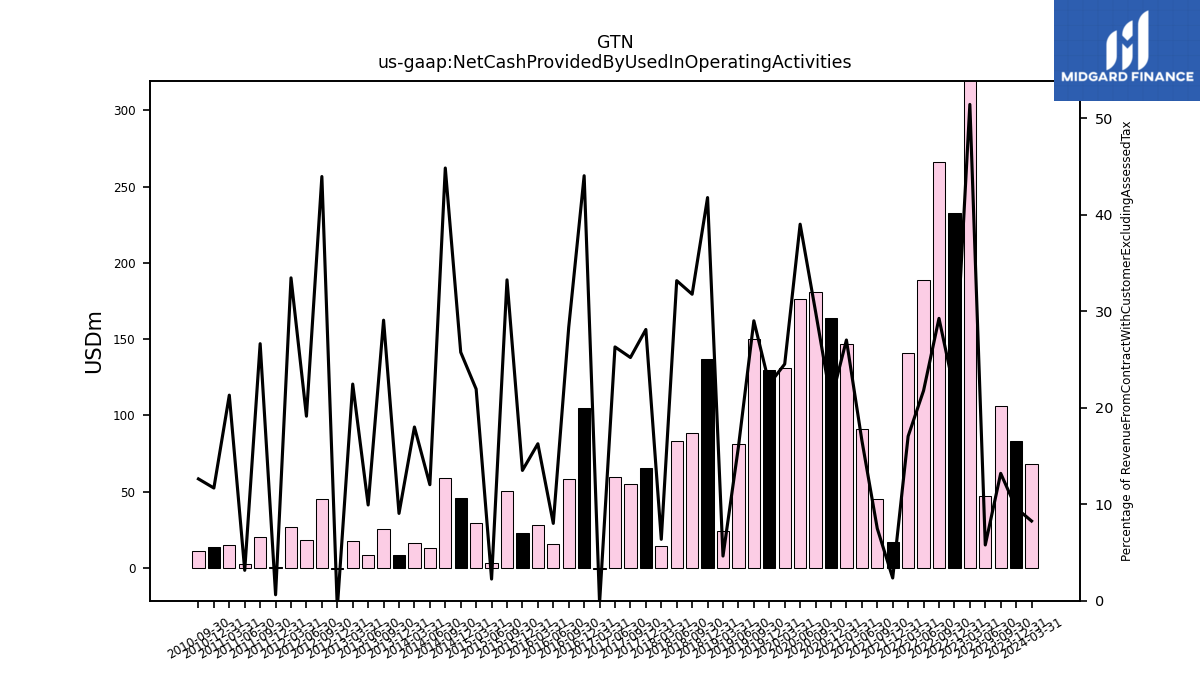
| Net Cash Provided By Used In Operating Activities | 68.00 | 83.00 | 106.00 | 47.00 | 412.00 | 233.00 | 266.00 | 189.00 | 141.00 | 17.00 | 45.00 | 91.00 | 147.00 | 164.00 | 181.00 | 176.00 | 131.00 | 130.00 | 150.00 | 81.00 | 24.00 | 137.14 | 88.72 | 83.05 | 14.41 | 65.67 | 55.20 | 59.63 | -0.48 | 104.67 | 57.94 | 15.76 | 28.26 | 22.90 | 50.25 | 3.23 | 29.24 | 45.81 | 59.06 | 12.90 | 16.44 | 8.65 | 25.67 | 8.37 | 17.55 | -0.97 | 45.23 | 18.11 | 27.00 | 0.53 | 20.39 | 2.40 | 14.86 | 13.39 | 10.78 | NA | |
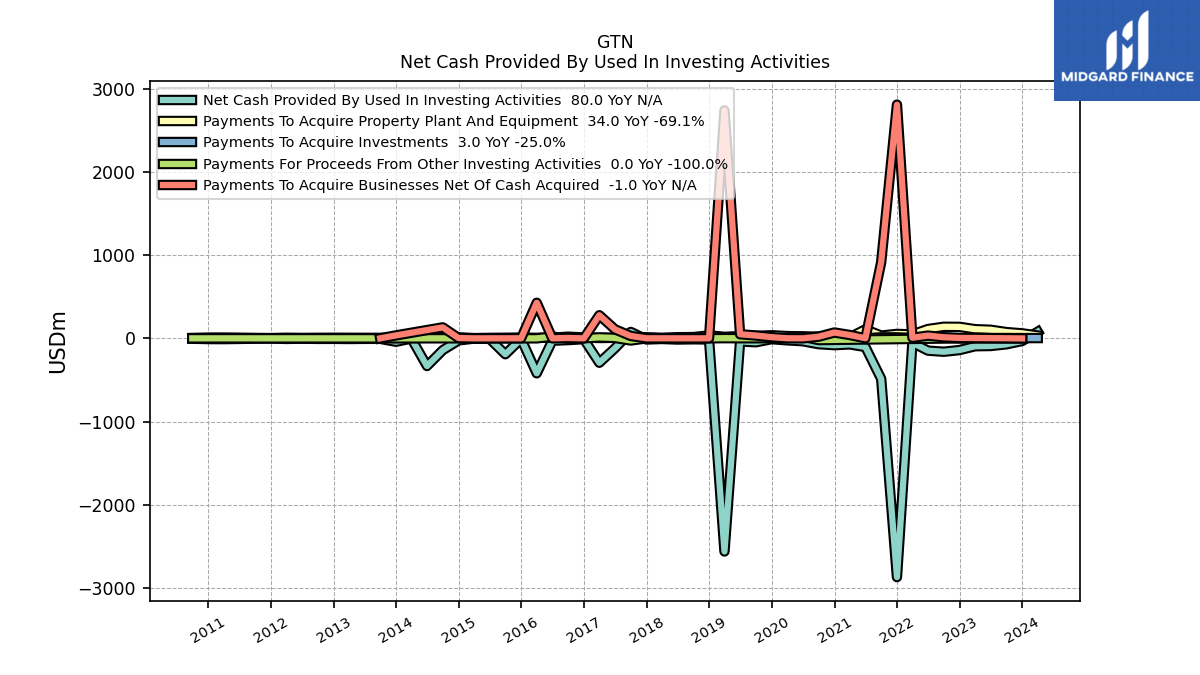
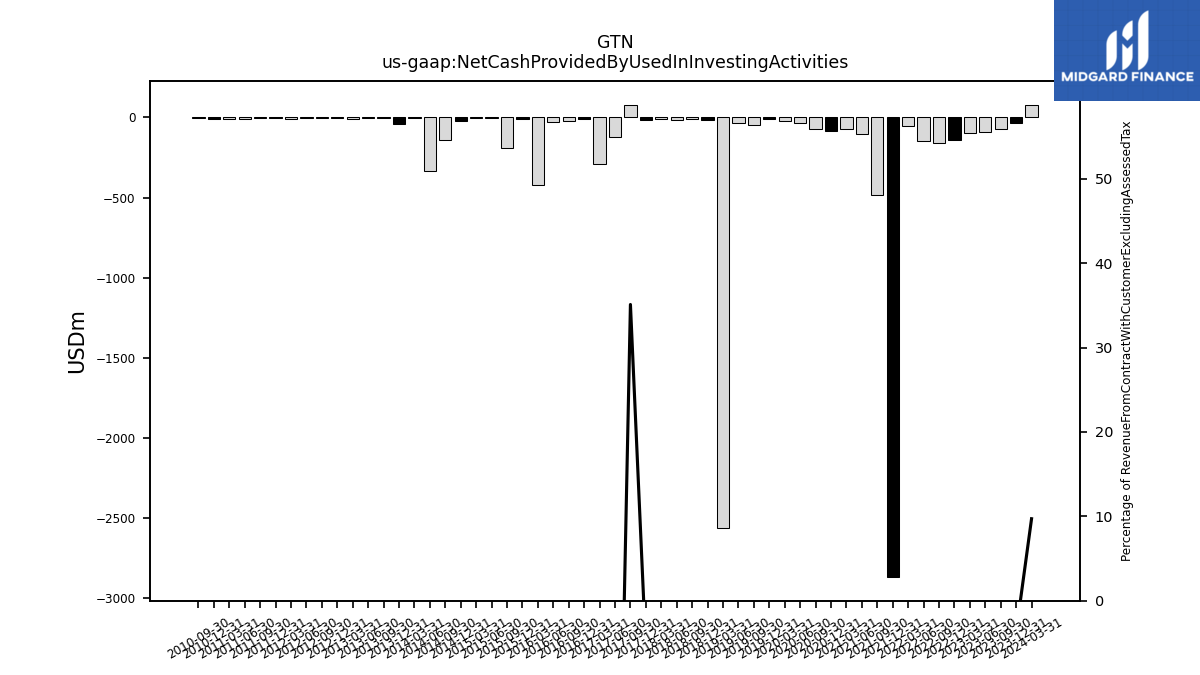
| Net Cash Provided By Used In Investing Activities | 80.00 | -32.00 | -72.00 | -92.00 | -95.00 | -141.00 | -161.00 | -148.00 | -53.00 | -2870.00 | -487.00 | -104.00 | -73.00 | -82.00 | -70.00 | -35.00 | -24.00 | -10.00 | -47.00 | -37.00 | -2562.00 | -13.90 | -11.37 | -14.29 | -7.82 | -13.46 | 76.88 | -119.82 | -293.39 | -9.83 | -21.07 | -28.27 | -420.16 | -6.75 | -191.20 | -5.51 | -2.93 | -24.83 | -141.74 | -332.66 | -2.66 | -40.92 | -5.93 | -5.99 | -7.68 | -6.08 | -6.38 | -3.98 | -6.87 | -1.79 | -3.88 | -6.89 | -9.31 | -8.59 | -4.62 | NA | |
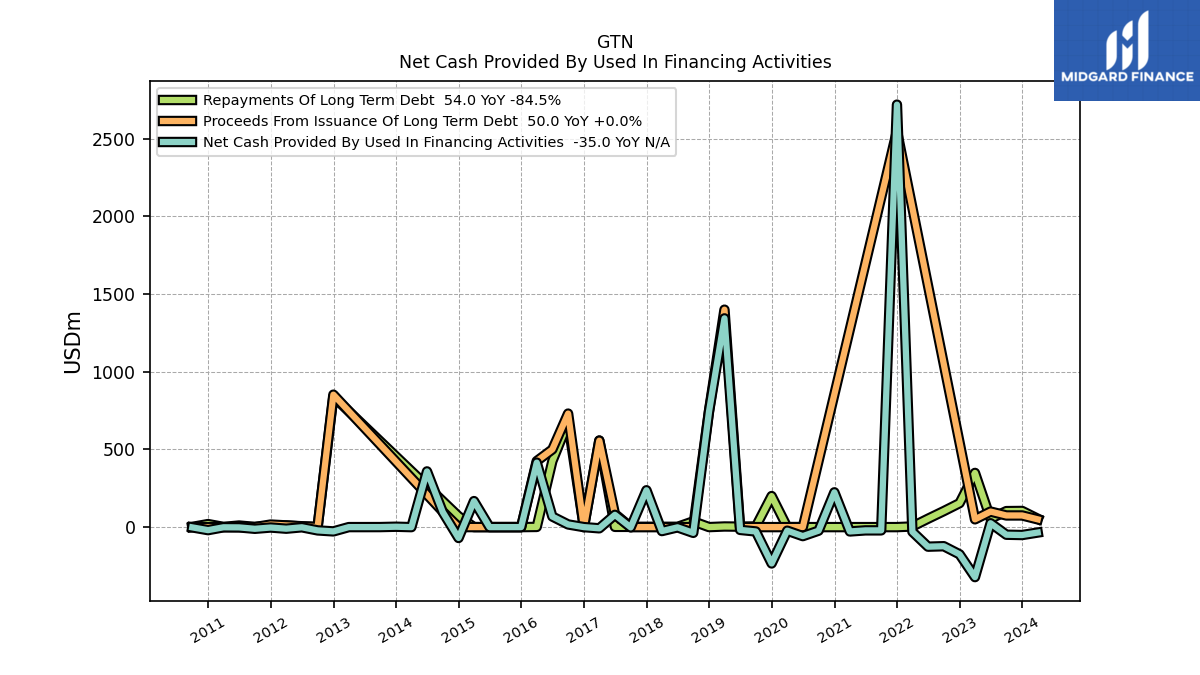
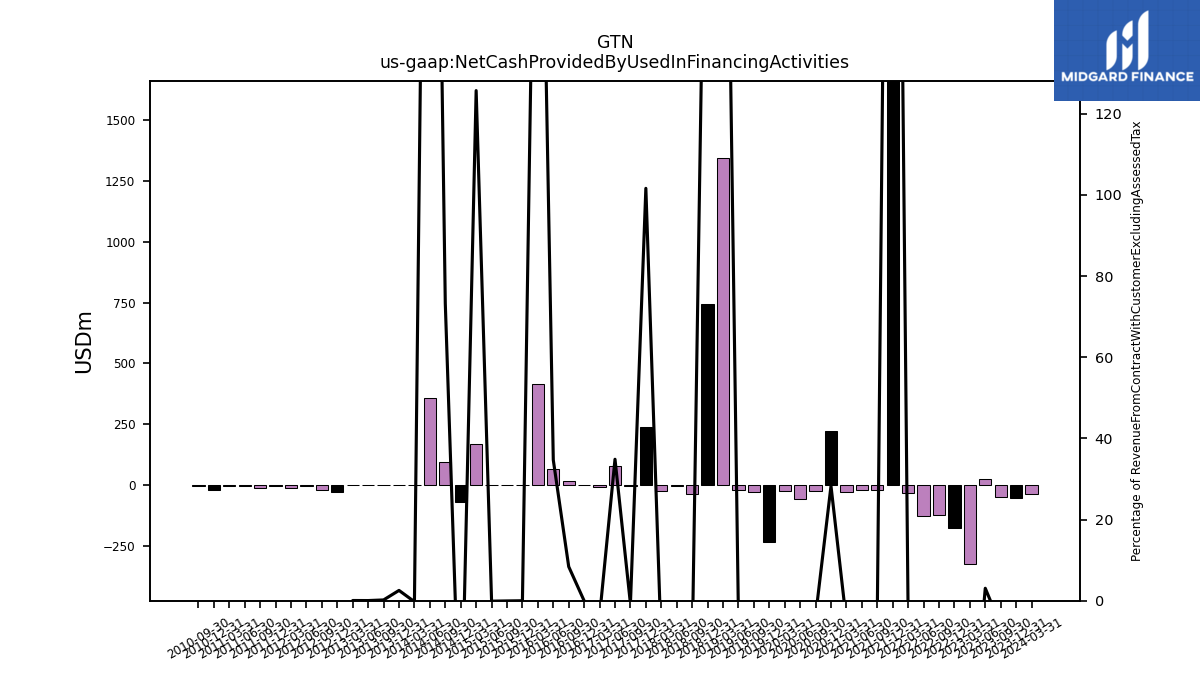
| Net Cash Provided By Used In Financing Activities | -35.00 | -51.00 | -49.00 | 25.00 | -322.00 | -175.00 | -123.00 | -126.00 | -30.00 | 2720.00 | -21.00 | -21.00 | -28.00 | 224.00 | -23.00 | -58.00 | -23.00 | -234.00 | -28.00 | -18.00 | 1344.00 | 744.77 | -37.00 | -1.60 | -25.56 | 237.34 | -1.59 | 79.02 | -7.77 | -0.04 | 17.18 | 68.20 | 415.24 | 0.00 | -0.07 | -0.15 | 167.53 | -70.03 | 96.42 | 358.79 | -0.21 | 2.43 | 0.18 | 0.04 | 0.05 | -27.58 | -21.20 | -1.21 | -10.21 | -2.68 | -10.83 | -1.83 | -1.21 | -19.54 | -1.70 | NA |
| 2024-03-31 | 2023-12-31 | 2023-09-30 | 2023-06-30 | 2023-03-31 | 2022-12-31 | 2022-09-30 | 2022-06-30 | 2022-03-31 | 2021-12-31 | 2021-09-30 | 2021-06-30 | 2021-03-31 | 2020-12-31 | 2020-09-30 | 2020-06-30 | 2020-03-31 | 2019-12-31 | 2019-09-30 | 2019-06-30 | 2019-03-31 | 2018-12-31 | 2018-09-30 | 2018-06-30 | 2018-03-31 | 2017-12-31 | 2017-09-30 | 2017-06-30 | 2017-03-31 | 2016-12-31 | 2016-09-30 | 2016-06-30 | 2016-03-31 | 2015-12-31 | 2015-09-30 | 2015-06-30 | 2015-03-31 | 2014-12-31 | 2014-09-30 | 2014-06-30 | 2014-03-31 | 2013-12-31 | 2013-09-30 | 2013-06-30 | 2013-03-31 | 2012-12-31 | 2012-09-30 | 2012-06-30 | 2012-03-31 | 2011-12-31 | 2011-09-30 | 2011-06-30 | 2011-03-31 | 2010-12-31 | 2010-09-30 | 2010-06-30 | ||
|---|---|---|---|---|---|---|---|---|---|---|---|---|---|---|---|---|---|---|---|---|---|---|---|---|---|---|---|---|---|---|---|---|---|---|---|---|---|---|---|---|---|---|---|---|---|---|---|---|---|---|---|---|---|---|---|---|---|
| Net Cash Provided By Used In Operating Activities | 68.00 | 83.00 | 106.00 | 47.00 | 412.00 | 233.00 | 266.00 | 189.00 | 141.00 | 17.00 | 45.00 | 91.00 | 147.00 | 164.00 | 181.00 | 176.00 | 131.00 | 130.00 | 150.00 | 81.00 | 24.00 | 137.14 | 88.72 | 83.05 | 14.41 | 65.67 | 55.20 | 59.63 | -0.48 | 104.67 | 57.94 | 15.76 | 28.26 | 22.90 | 50.25 | 3.23 | 29.24 | 45.81 | 59.06 | 12.90 | 16.44 | 8.65 | 25.67 | 8.37 | 17.55 | -0.97 | 45.23 | 18.11 | 27.00 | 0.53 | 20.39 | 2.40 | 14.86 | 13.39 | 10.78 | NA | |
| Net Income Loss | 88.00 | -9.00 | -40.00 | 4.00 | -31.00 | 186.00 | 108.00 | 99.00 | 62.00 | 29.00 | -17.00 | 39.00 | 39.00 | 224.00 | 122.00 | 11.00 | 53.00 | 94.00 | 59.00 | 44.00 | -18.00 | 88.27 | 61.89 | 40.70 | 19.95 | 165.57 | 15.32 | 70.56 | 10.51 | 35.83 | -0.21 | 17.66 | 8.99 | 14.99 | 6.61 | 12.11 | 5.59 | 31.25 | 13.94 | 1.59 | 1.28 | 5.20 | 7.07 | 5.14 | 0.87 | -2.11 | 15.87 | 10.99 | 3.37 | 7.58 | 1.98 | 2.56 | -3.08 | 21.86 | 5.51 | 0.53 | |
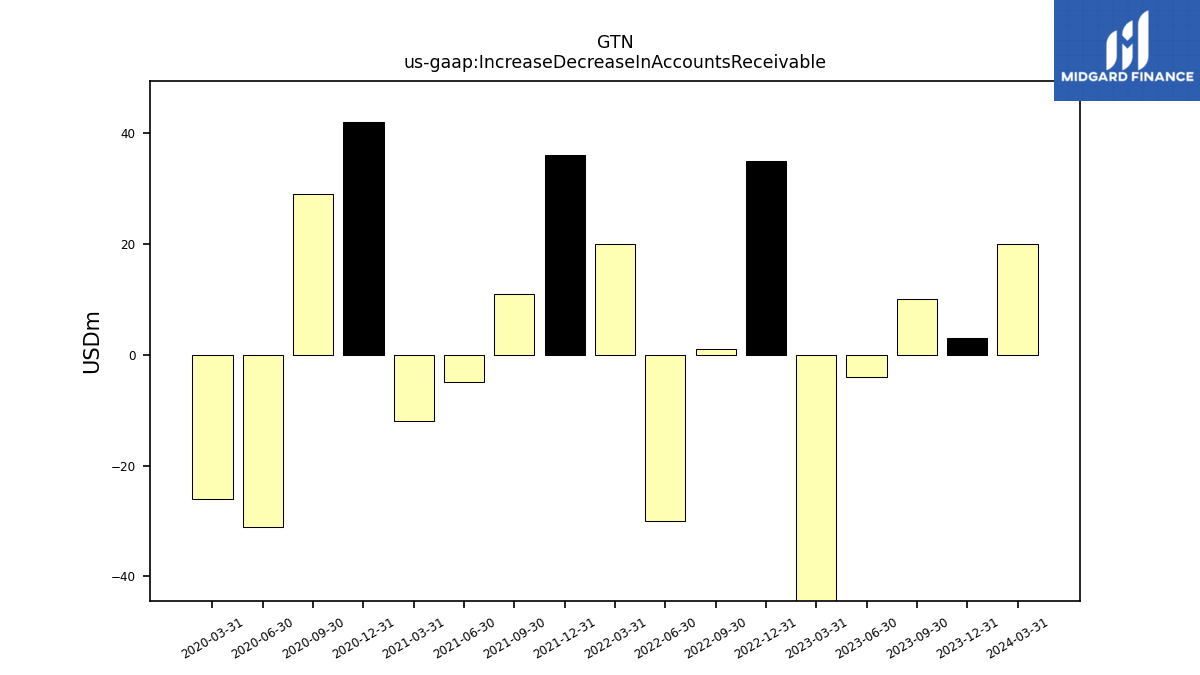
| Increase Decrease In Accounts Receivable | 20.00 | 3.00 | 10.00 | -4.00 | -317.00 | 35.00 | 1.00 | -30.00 | 20.00 | 36.00 | 11.00 | -5.00 | -12.00 | 42.00 | 29.00 | -31.00 | -26.00 | NA | NA | NA | NA | NA | NA | NA | NA | NA | NA | NA | NA | NA | NA | NA | NA | NA | NA | NA | NA | NA | NA | NA | NA | NA | NA | NA | NA | NA | NA | NA | NA | NA | NA | NA | NA | NA | NA | NA | |
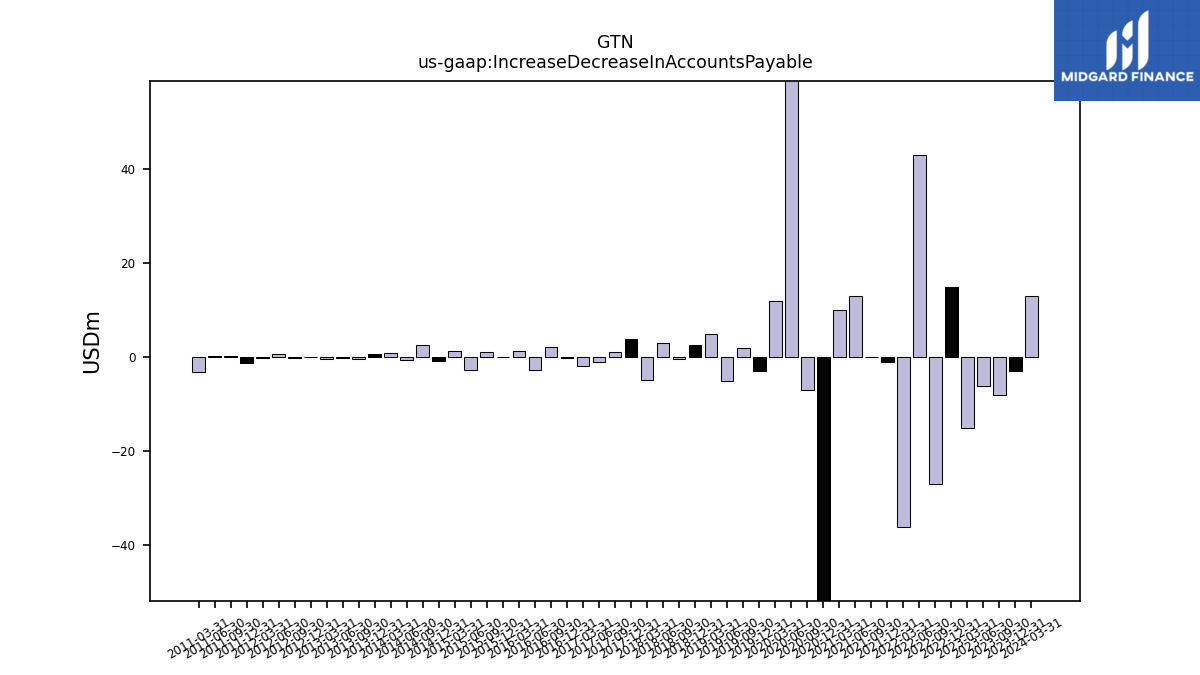
| Increase Decrease In Accounts Payable | 13.00 | -3.00 | -8.00 | -6.00 | -15.00 | 15.00 | -27.00 | 43.00 | -36.00 | -1.00 | 0.00 | 13.00 | 10.00 | -69.00 | -7.00 | 63.00 | 12.00 | -3.00 | 2.00 | -5.00 | 5.00 | 2.54 | -0.26 | 3.05 | -4.77 | 3.89 | 1.15 | -1.07 | -1.85 | -0.21 | 2.11 | -2.71 | 1.33 | 0.09 | 1.15 | -2.78 | 1.40 | -0.68 | 2.52 | -0.63 | 0.99 | 0.81 | -0.26 | -0.04 | -0.38 | 0.04 | -0.20 | 0.65 | -0.21 | -1.22 | 0.21 | 0.36 | -3.02 | NA | NA | NA | |
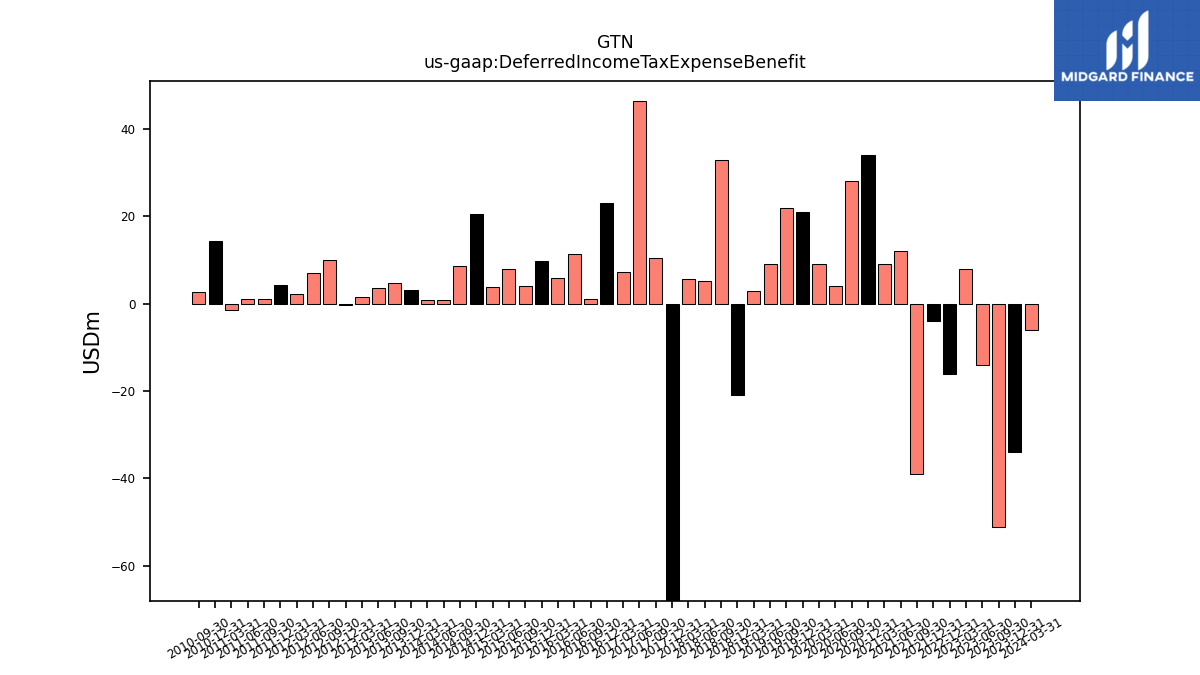
| Deferred Income Tax Expense Benefit | -6.00 | -34.00 | -51.00 | -14.00 | 8.00 | -16.00 | NA | NA | NA | -4.00 | -39.00 | 12.00 | 9.00 | 34.00 | 28.00 | 4.00 | 9.00 | 21.00 | 22.00 | 9.00 | 3.00 | -20.89 | 32.97 | 5.15 | 5.71 | -141.45 | 10.39 | 46.40 | 7.33 | 23.05 | 1.02 | 11.43 | 5.89 | 9.73 | 4.10 | 8.04 | 3.89 | 20.61 | 8.60 | 0.89 | 0.85 | 3.18 | 4.80 | 3.54 | 1.64 | -0.18 | 10.10 | 7.01 | 2.29 | 4.29 | 1.07 | 1.13 | -1.41 | 14.46 | 2.74 | NA | |
| Share Based Compensation | 6.00 | 6.00 | 5.00 | 7.00 | 2.00 | 5.00 | 6.00 | 6.00 | 5.00 | 3.00 | 4.00 | 3.00 | 4.00 | 4.00 | 5.00 | 3.00 | 4.00 | 6.00 | 5.00 | 2.00 | 3.00 | 1.65 | 1.65 | 1.21 | 2.16 | 4.00 | 1.53 | 1.43 | 1.34 | 1.27 | 1.27 | 1.27 | 1.28 | 1.01 | 1.01 | 1.01 | 0.99 | 0.98 | 0.98 | 0.98 | 2.07 | 0.26 | 0.26 | 1.33 | 0.14 | 0.55 | 0.17 | 0.14 | 0.01 | 0.03 | 0.03 | 0.03 | 0.03 | NA | NA | NA | |
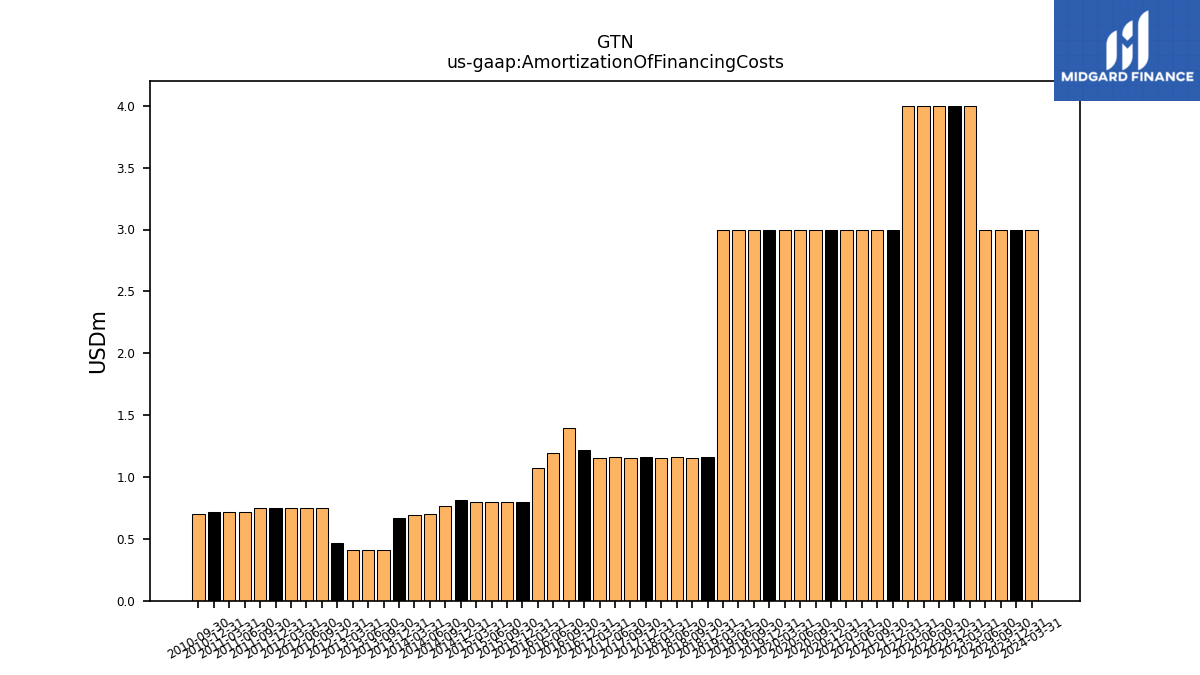
| Amortization Of Financing Costs | 3.00 | 3.00 | 3.00 | 3.00 | 4.00 | 4.00 | 4.00 | 4.00 | 4.00 | 3.00 | 3.00 | 3.00 | 3.00 | 3.00 | 3.00 | 3.00 | 3.00 | 3.00 | 3.00 | 3.00 | 3.00 | 1.16 | 1.16 | 1.16 | 1.16 | 1.16 | 1.16 | 1.16 | 1.15 | 1.22 | 1.40 | 1.20 | 1.07 | 0.80 | 0.80 | 0.80 | 0.80 | 0.81 | 0.76 | 0.70 | 0.69 | 0.67 | 0.41 | 0.41 | 0.41 | 0.46 | 0.75 | 0.75 | 0.75 | 0.75 | 0.75 | 0.72 | 0.72 | 0.72 | 0.70 | NA |
| 2024-03-31 | 2023-12-31 | 2023-09-30 | 2023-06-30 | 2023-03-31 | 2022-12-31 | 2022-09-30 | 2022-06-30 | 2022-03-31 | 2021-12-31 | 2021-09-30 | 2021-06-30 | 2021-03-31 | 2020-12-31 | 2020-09-30 | 2020-06-30 | 2020-03-31 | 2019-12-31 | 2019-09-30 | 2019-06-30 | 2019-03-31 | 2018-12-31 | 2018-09-30 | 2018-06-30 | 2018-03-31 | 2017-12-31 | 2017-09-30 | 2017-06-30 | 2017-03-31 | 2016-12-31 | 2016-09-30 | 2016-06-30 | 2016-03-31 | 2015-12-31 | 2015-09-30 | 2015-06-30 | 2015-03-31 | 2014-12-31 | 2014-09-30 | 2014-06-30 | 2014-03-31 | 2013-12-31 | 2013-09-30 | 2013-06-30 | 2013-03-31 | 2012-12-31 | 2012-09-30 | 2012-06-30 | 2012-03-31 | 2011-12-31 | 2011-09-30 | 2011-06-30 | 2011-03-31 | 2010-12-31 | 2010-09-30 | 2010-06-30 | ||
|---|---|---|---|---|---|---|---|---|---|---|---|---|---|---|---|---|---|---|---|---|---|---|---|---|---|---|---|---|---|---|---|---|---|---|---|---|---|---|---|---|---|---|---|---|---|---|---|---|---|---|---|---|---|---|---|---|---|
| Net Cash Provided By Used In Investing Activities | 80.00 | -32.00 | -72.00 | -92.00 | -95.00 | -141.00 | -161.00 | -148.00 | -53.00 | -2870.00 | -487.00 | -104.00 | -73.00 | -82.00 | -70.00 | -35.00 | -24.00 | -10.00 | -47.00 | -37.00 | -2562.00 | -13.90 | -11.37 | -14.29 | -7.82 | -13.46 | 76.88 | -119.82 | -293.39 | -9.83 | -21.07 | -28.27 | -420.16 | -6.75 | -191.20 | -5.51 | -2.93 | -24.83 | -141.74 | -332.66 | -2.66 | -40.92 | -5.93 | -5.99 | -7.68 | -6.08 | -6.38 | -3.98 | -6.87 | -1.79 | -3.88 | -6.89 | -9.31 | -8.59 | -4.62 | NA | |
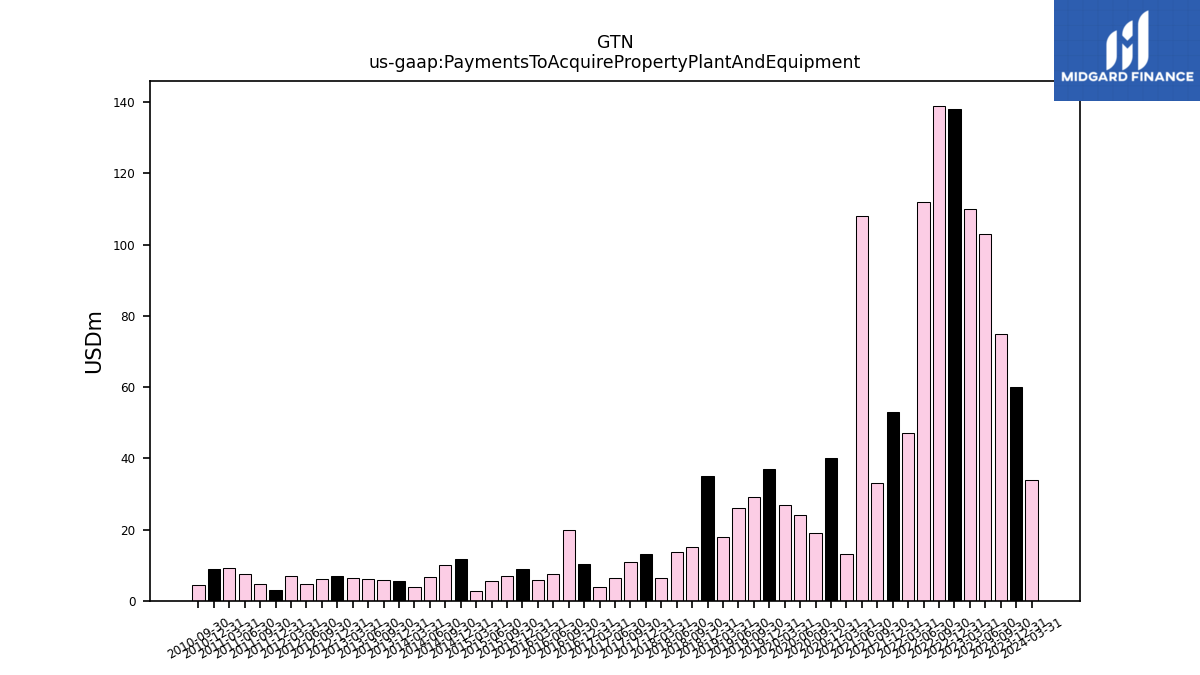
| Payments To Acquire Property Plant And Equipment | 34.00 | 60.00 | 75.00 | 103.00 | 110.00 | 138.00 | 139.00 | 112.00 | 47.00 | 53.00 | 33.00 | 108.00 | 13.00 | 40.00 | 19.00 | 24.00 | 27.00 | 37.00 | 29.00 | 26.00 | 18.00 | 35.08 | 14.98 | 13.63 | 6.28 | 13.09 | 11.01 | 6.44 | 3.98 | 10.37 | 19.76 | 7.54 | 5.93 | 8.97 | 6.85 | 5.55 | 2.85 | 11.76 | 10.00 | 6.65 | 3.80 | 5.61 | 5.95 | 6.03 | 6.46 | 6.86 | 6.10 | 4.72 | 6.84 | 2.89 | 4.73 | 7.45 | 9.20 | 8.92 | 4.33 | NA | |
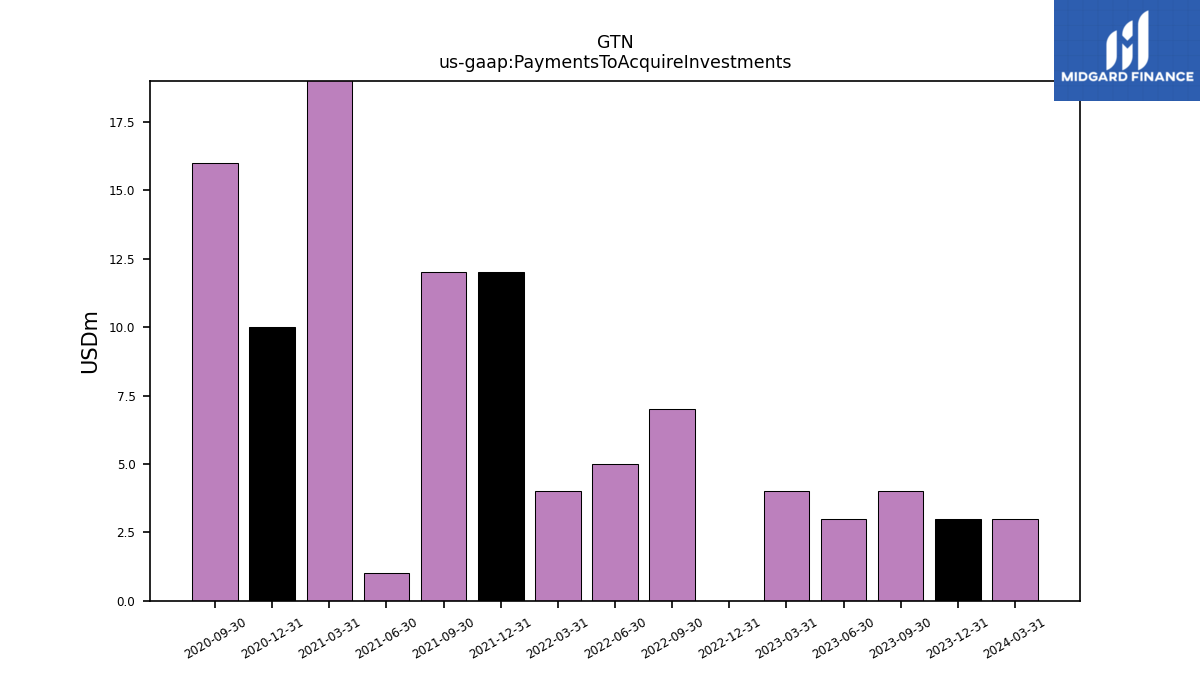
| Payments To Acquire Investments | 3.00 | 3.00 | 4.00 | 3.00 | 4.00 | 0.00 | 7.00 | 5.00 | 4.00 | 12.00 | 12.00 | 1.00 | 24.00 | 10.00 | 16.00 | NA | NA | NA | NA | NA | NA | NA | NA | NA | NA | NA | NA | NA | NA | NA | NA | NA | NA | NA | NA | NA | NA | NA | NA | NA | NA | NA | NA | NA | NA | NA | NA | NA | NA | NA | NA | NA | NA | NA | NA | NA |
| 2024-03-31 | 2023-12-31 | 2023-09-30 | 2023-06-30 | 2023-03-31 | 2022-12-31 | 2022-09-30 | 2022-06-30 | 2022-03-31 | 2021-12-31 | 2021-09-30 | 2021-06-30 | 2021-03-31 | 2020-12-31 | 2020-09-30 | 2020-06-30 | 2020-03-31 | 2019-12-31 | 2019-09-30 | 2019-06-30 | 2019-03-31 | 2018-12-31 | 2018-09-30 | 2018-06-30 | 2018-03-31 | 2017-12-31 | 2017-09-30 | 2017-06-30 | 2017-03-31 | 2016-12-31 | 2016-09-30 | 2016-06-30 | 2016-03-31 | 2015-12-31 | 2015-09-30 | 2015-06-30 | 2015-03-31 | 2014-12-31 | 2014-09-30 | 2014-06-30 | 2014-03-31 | 2013-12-31 | 2013-09-30 | 2013-06-30 | 2013-03-31 | 2012-12-31 | 2012-09-30 | 2012-06-30 | 2012-03-31 | 2011-12-31 | 2011-09-30 | 2011-06-30 | 2011-03-31 | 2010-12-31 | 2010-09-30 | 2010-06-30 | ||
|---|---|---|---|---|---|---|---|---|---|---|---|---|---|---|---|---|---|---|---|---|---|---|---|---|---|---|---|---|---|---|---|---|---|---|---|---|---|---|---|---|---|---|---|---|---|---|---|---|---|---|---|---|---|---|---|---|---|
| Net Cash Provided By Used In Financing Activities | -35.00 | -51.00 | -49.00 | 25.00 | -322.00 | -175.00 | -123.00 | -126.00 | -30.00 | 2720.00 | -21.00 | -21.00 | -28.00 | 224.00 | -23.00 | -58.00 | -23.00 | -234.00 | -28.00 | -18.00 | 1344.00 | 744.77 | -37.00 | -1.60 | -25.56 | 237.34 | -1.59 | 79.02 | -7.77 | -0.04 | 17.18 | 68.20 | 415.24 | 0.00 | -0.07 | -0.15 | 167.53 | -70.03 | 96.42 | 358.79 | -0.21 | 2.43 | 0.18 | 0.04 | 0.05 | -27.58 | -21.20 | -1.21 | -10.21 | -2.68 | -10.83 | -1.83 | -1.21 | -19.54 | -1.70 | NA | |
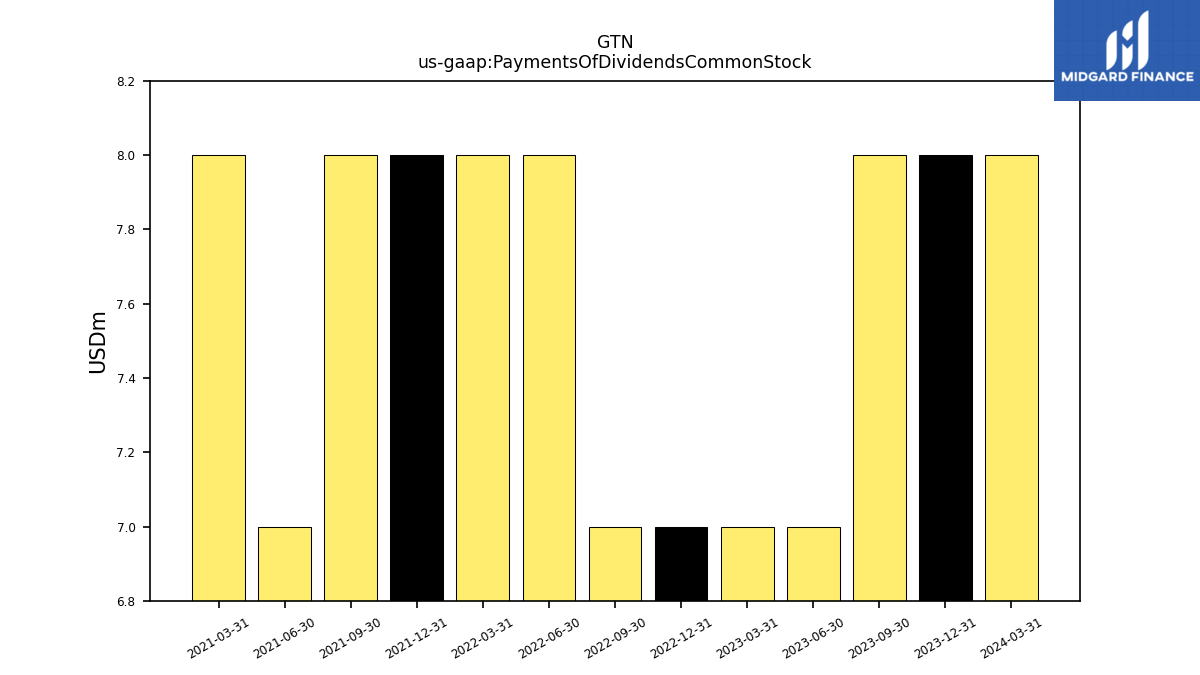
| Payments Of Dividends Common Stock | 8.00 | 8.00 | 8.00 | 7.00 | 7.00 | 7.00 | 7.00 | 8.00 | 8.00 | 8.00 | 8.00 | 7.00 | 8.00 | NA | NA | NA | NA | NA | NA | NA | NA | NA | NA | NA | NA | NA | NA | NA | NA | NA | NA | NA | NA | NA | NA | NA | NA | NA | NA | NA | NA | NA | NA | NA | NA | NA | NA | NA | NA | NA | NA | NA | NA | NA | NA | NA |
| 2024-03-31 | 2023-12-31 | 2023-09-30 | 2023-06-30 | 2023-03-31 | 2022-12-31 | 2022-09-30 | 2022-06-30 | 2022-03-31 | 2021-12-31 | 2021-09-30 | 2021-06-30 | 2021-03-31 | 2020-12-31 | 2020-09-30 | 2020-06-30 | 2020-03-31 | 2019-12-31 | 2019-09-30 | 2019-06-30 | 2019-03-31 | 2018-12-31 | 2018-09-30 | 2018-06-30 | 2018-03-31 | 2017-12-31 | 2017-09-30 | 2017-06-30 | 2017-03-31 | 2016-12-31 | 2016-09-30 | 2016-06-30 | 2016-03-31 | 2015-12-31 | 2015-09-30 | 2015-06-30 | 2015-03-31 | 2014-12-31 | 2014-09-30 | 2014-06-30 | 2014-03-31 | 2013-12-31 | 2013-09-30 | 2013-06-30 | 2013-03-31 | 2012-12-31 | 2012-09-30 | 2012-06-30 | 2012-03-31 | 2011-12-31 | 2011-09-30 | 2011-06-30 | 2011-03-31 | 2010-12-31 | 2010-09-30 | 2010-06-30 | ||
|---|---|---|---|---|---|---|---|---|---|---|---|---|---|---|---|---|---|---|---|---|---|---|---|---|---|---|---|---|---|---|---|---|---|---|---|---|---|---|---|---|---|---|---|---|---|---|---|---|---|---|---|---|---|---|---|---|---|
| Revenue From Contract With Customer Excluding Assessed Tax | 823.00 | 864.00 | 803.00 | 813.00 | 801.00 | 1072.00 | 909.00 | 868.00 | 827.00 | 721.00 | 601.00 | 547.00 | 544.00 | 792.00 | 604.00 | 451.00 | 534.00 | 579.00 | 517.00 | 508.00 | 518.00 | 328.22 | 279.31 | 250.34 | 226.26 | 233.61 | 218.98 | 226.68 | 203.46 | 237.62 | 204.49 | 196.63 | 173.72 | 169.49 | 151.10 | 143.46 | 133.30 | 177.89 | 131.70 | 107.25 | 91.30 | 95.56 | 88.29 | 84.28 | 78.17 | 126.59 | 102.88 | 94.69 | 80.67 | 84.67 | 76.52 | 76.20 | 69.74 | 114.59 | 85.34 | 75.64 | |
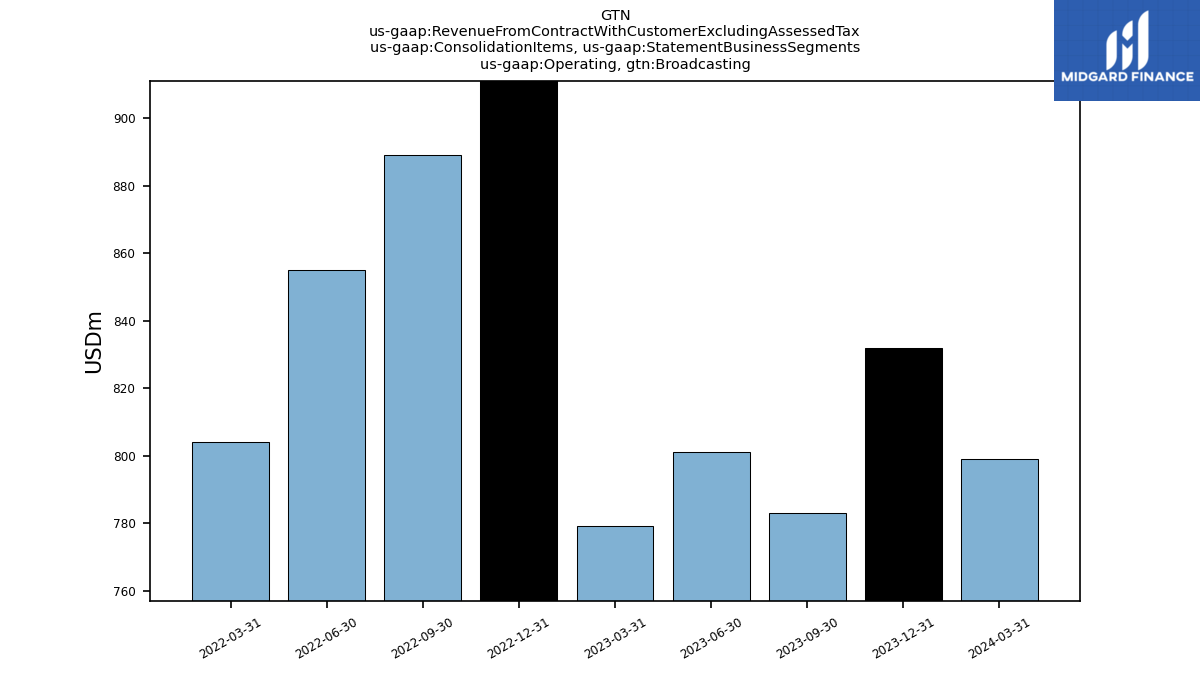
| Operating, Broadcasting | 799.00 | 832.00 | 783.00 | 801.00 | 779.00 | 1035.00 | 889.00 | 855.00 | 804.00 | NA | NA | NA | NA | NA | NA | NA | NA | NA | NA | NA | NA | NA | NA | NA | NA | NA | NA | NA | NA | NA | NA | NA | NA | NA | NA | NA | NA | NA | NA | NA | NA | NA | NA | NA | NA | NA | NA | NA | NA | NA | NA | NA | NA | NA | NA | NA | |
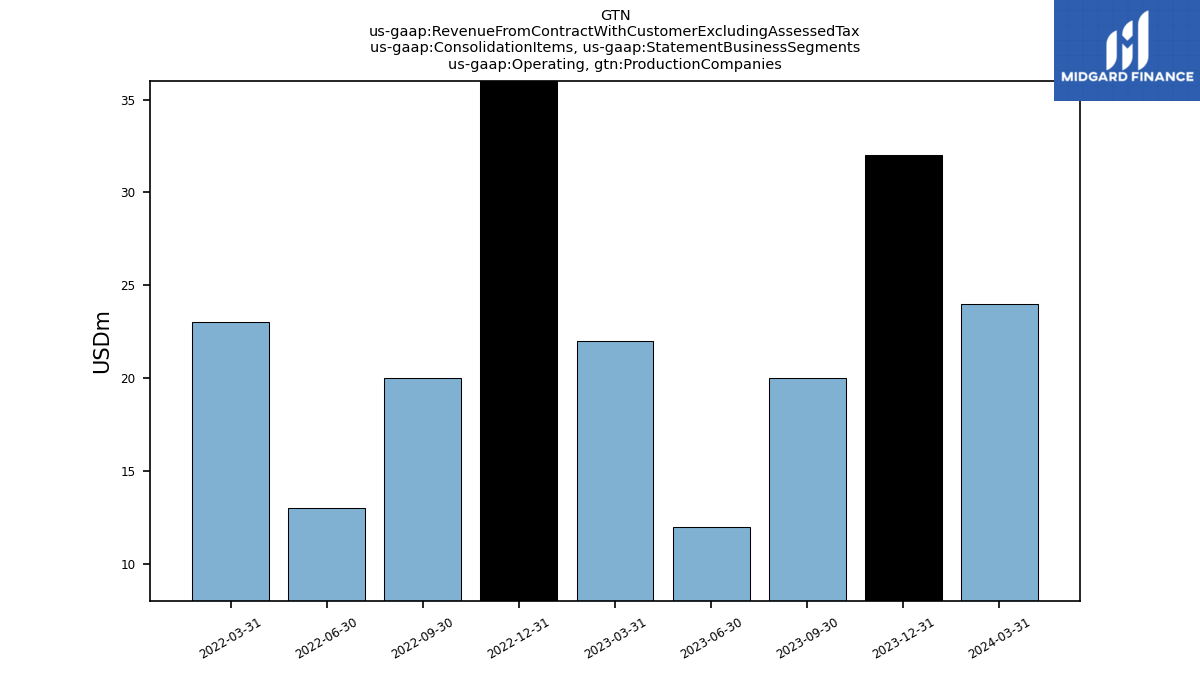
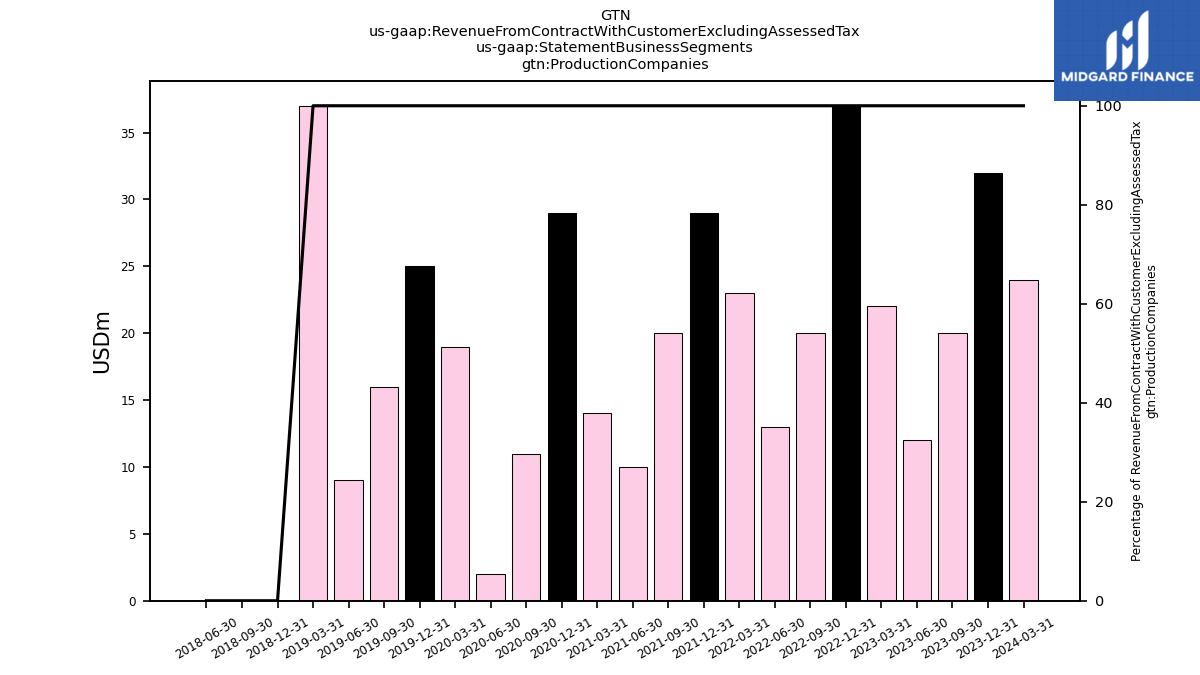
| Operating, Production Companies | 24.00 | 32.00 | 20.00 | 12.00 | 22.00 | 37.00 | 20.00 | 13.00 | 23.00 | NA | NA | NA | NA | NA | NA | NA | NA | NA | NA | NA | NA | NA | NA | NA | NA | NA | NA | NA | NA | NA | NA | NA | NA | NA | NA | NA | NA | NA | NA | NA | NA | NA | NA | NA | NA | NA | NA | NA | NA | NA | NA | NA | NA | NA | NA | NA | |
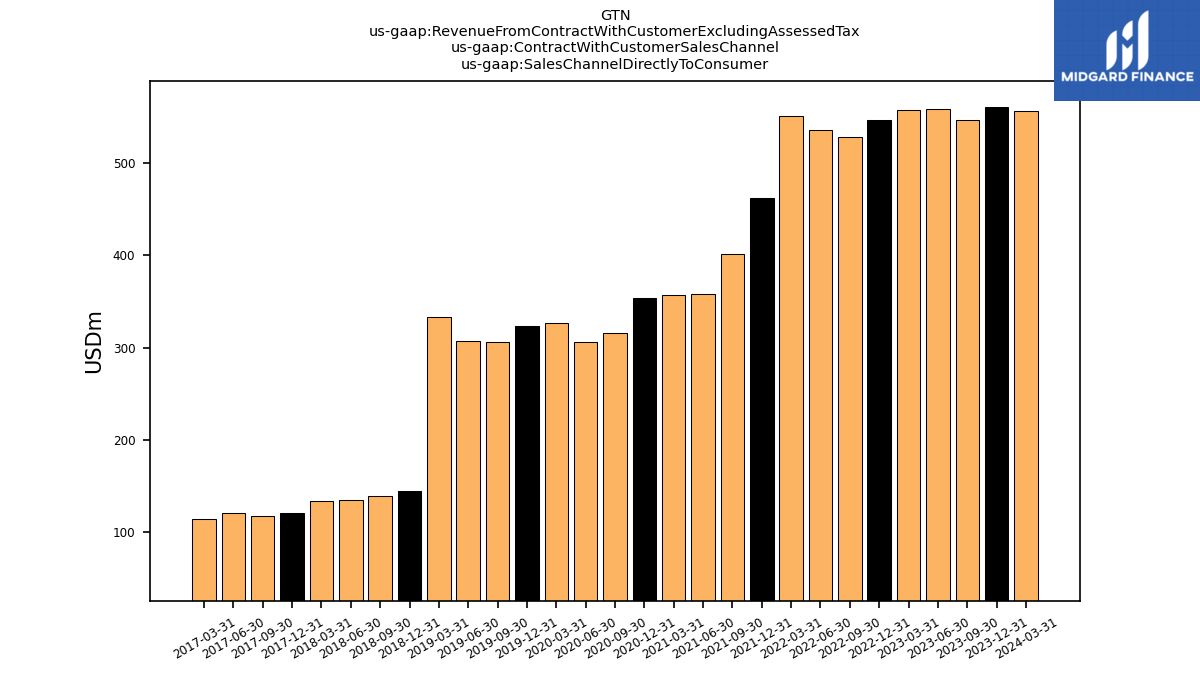
| Sales Channel Directly To Consumer | 556.00 | 561.00 | 547.00 | 559.00 | 558.00 | 547.00 | 528.00 | 536.00 | 551.00 | 462.00 | 402.00 | 358.00 | 357.00 | 354.00 | 316.00 | 306.00 | 327.00 | 324.00 | 306.00 | 307.00 | 333.00 | 144.43 | 138.73 | 135.30 | 133.42 | 120.84 | 118.00 | 120.29 | 114.52 | NA | NA | NA | NA | NA | NA | NA | NA | NA | NA | NA | NA | NA | NA | NA | NA | NA | NA | NA | NA | NA | NA | NA | NA | NA | NA | NA | |
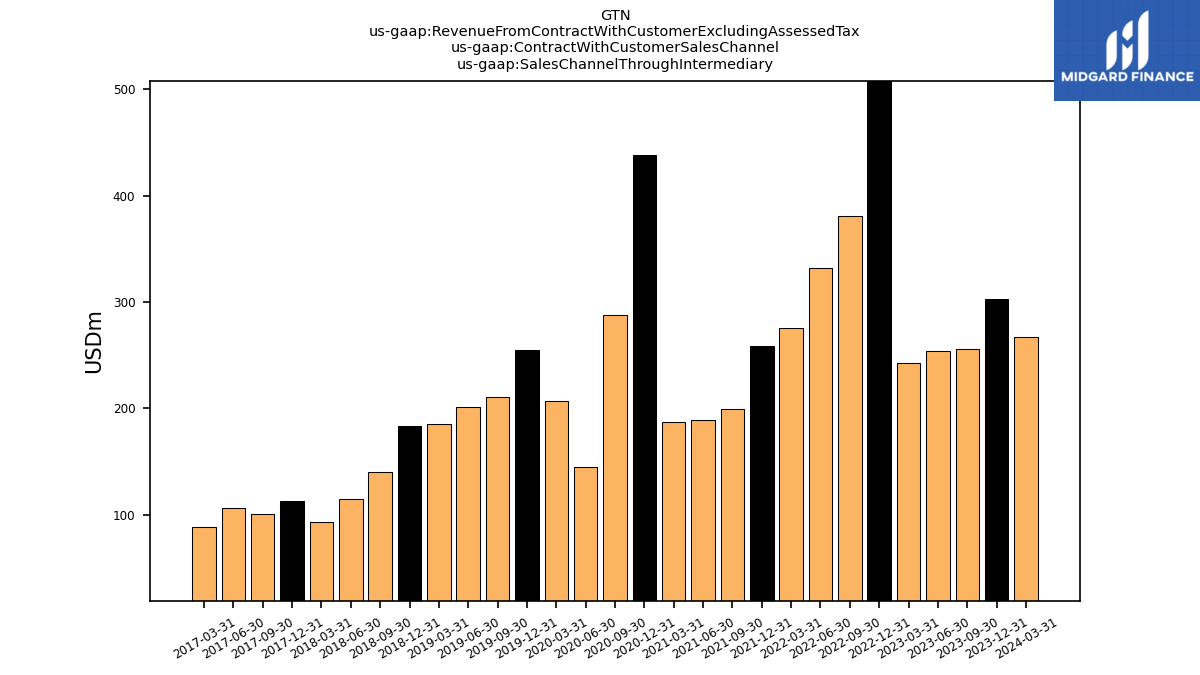
| Sales Channel Through Intermediary | 267.00 | 303.00 | 256.00 | 254.00 | 243.00 | 525.00 | 381.00 | 332.00 | 276.00 | 259.00 | 199.00 | 189.00 | 187.00 | 438.00 | 288.00 | 145.00 | 207.00 | 255.00 | 211.00 | 201.00 | 185.00 | 183.79 | 140.58 | 115.04 | 92.84 | 112.77 | 100.98 | 106.39 | 88.94 | NA | NA | NA | NA | NA | NA | NA | NA | NA | NA | NA | NA | NA | NA | NA | NA | NA | NA | NA | NA | NA | NA | NA | NA | NA | NA | NA | |
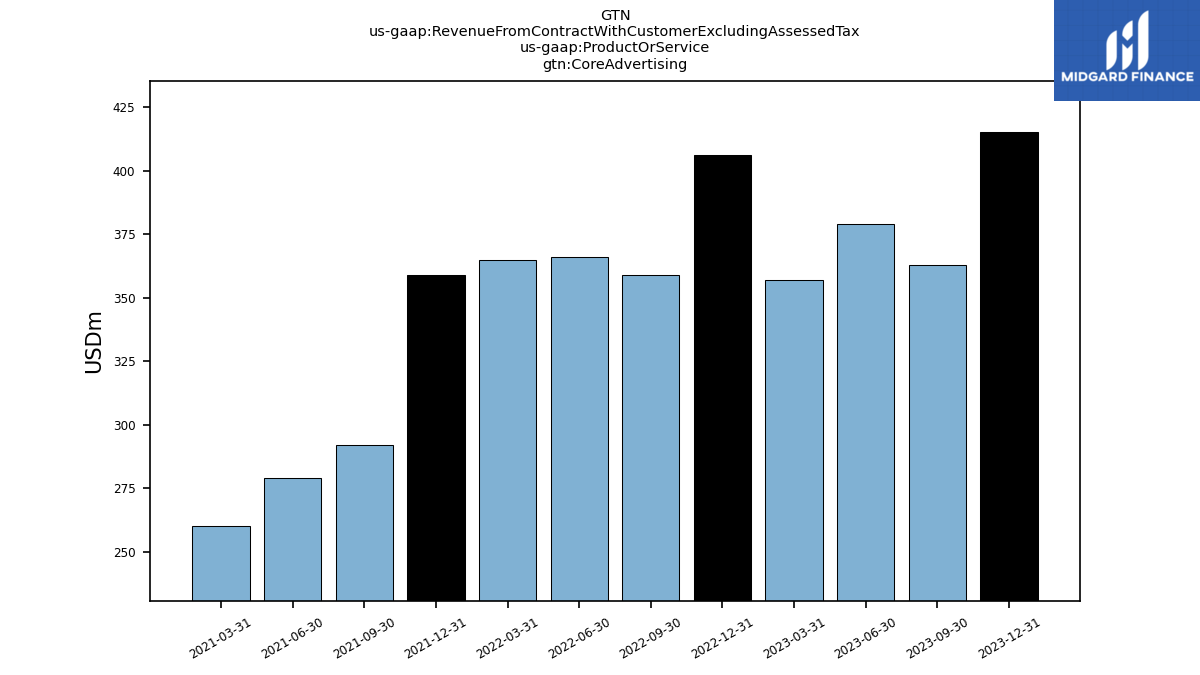
| Core Advertising | 372.00 | 415.00 | 363.00 | 379.00 | 357.00 | 406.00 | 359.00 | 366.00 | 365.00 | 359.00 | 292.00 | 279.00 | 260.00 | NA | NA | NA | NA | NA | NA | NA | NA | NA | NA | NA | NA | NA | NA | NA | NA | NA | NA | NA | NA | NA | NA | NA | NA | NA | NA | NA | NA | NA | NA | NA | NA | NA | NA | NA | NA | NA | NA | NA | NA | NA | NA | NA | |
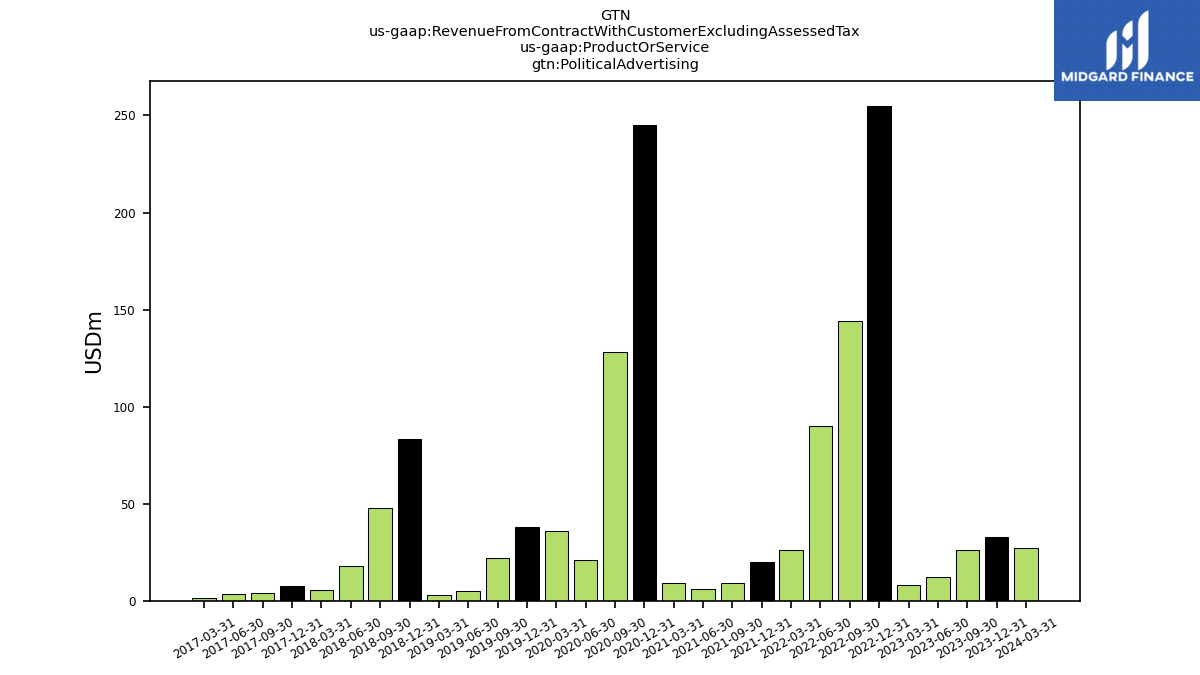
| Political Advertising | 27.00 | 33.00 | 26.00 | 12.00 | 8.00 | 255.00 | 144.00 | 90.00 | 26.00 | 20.00 | 9.00 | 6.00 | 9.00 | 245.00 | 128.00 | 21.00 | 36.00 | 38.00 | 22.00 | 5.00 | 3.00 | 83.21 | 48.02 | 18.07 | 5.78 | 7.46 | 4.00 | 3.71 | 1.32 | NA | NA | NA | NA | NA | NA | NA | NA | NA | NA | NA | NA | NA | NA | NA | NA | NA | NA | NA | NA | NA | NA | NA | NA | NA | NA | NA | |
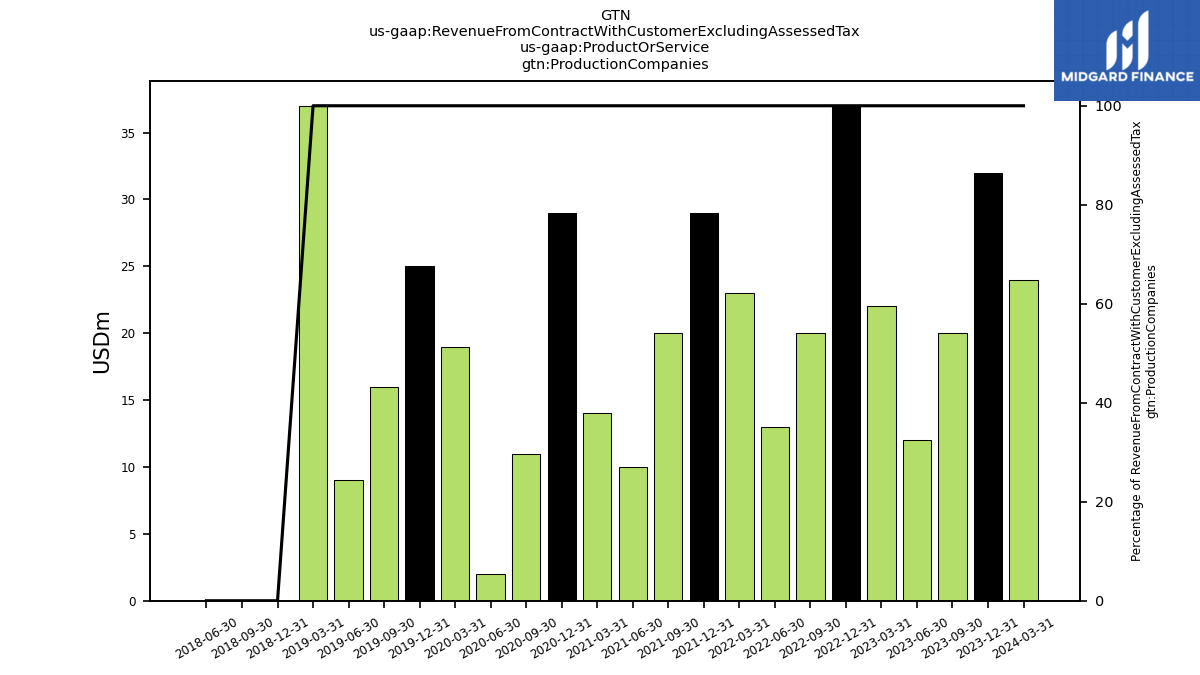
| Production Companies | 24.00 | 32.00 | 20.00 | 12.00 | 22.00 | 37.00 | 20.00 | 13.00 | 23.00 | 29.00 | 20.00 | 10.00 | 14.00 | 29.00 | 11.00 | 2.00 | 19.00 | 25.00 | 16.00 | 9.00 | 37.00 | 0.00 | 0.00 | 0.00 | NA | NA | NA | NA | NA | NA | NA | NA | NA | NA | NA | NA | NA | NA | NA | NA | NA | NA | NA | NA | NA | NA | NA | NA | NA | NA | NA | NA | NA | NA | NA | NA | |
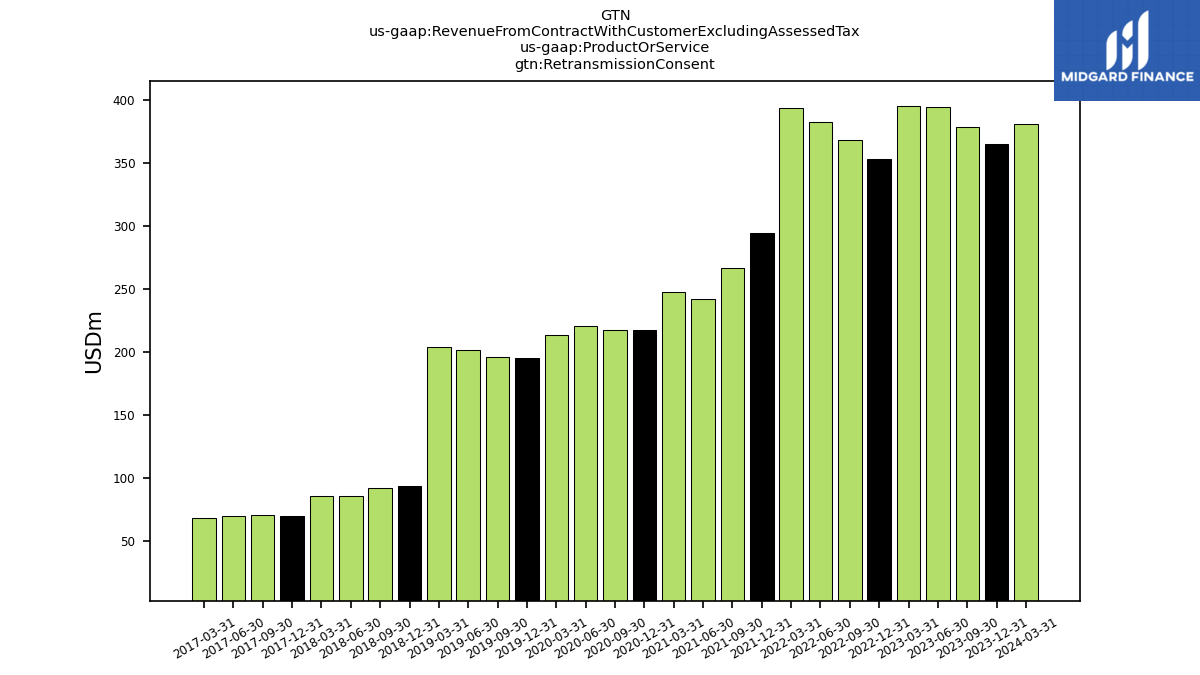
| Retransmission Consent | 381.00 | 365.00 | 378.00 | 394.00 | 395.00 | 353.00 | 368.00 | 382.00 | 393.00 | 294.00 | 266.00 | 242.00 | 247.00 | 217.00 | 217.00 | 220.00 | 213.00 | 195.00 | 196.00 | 201.00 | 204.00 | 92.96 | 91.60 | 85.31 | 85.55 | 69.51 | 70.15 | 69.37 | 67.57 | NA | NA | NA | NA | NA | NA | NA | NA | NA | NA | NA | NA | NA | NA | NA | NA | NA | NA | NA | NA | NA | NA | NA | NA | NA | NA | NA | |
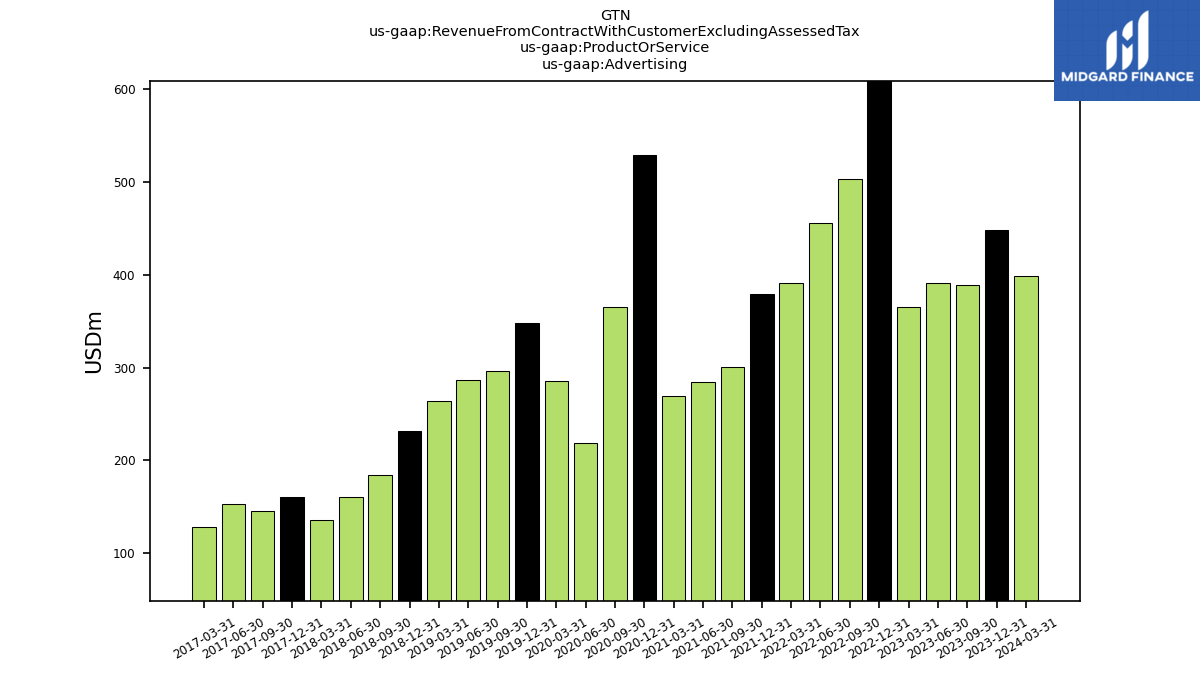
| Advertising | 399.00 | 448.00 | 389.00 | 391.00 | 365.00 | 661.00 | 503.00 | 456.00 | 391.00 | 379.00 | 301.00 | 285.00 | 269.00 | 529.00 | 365.00 | 219.00 | 286.00 | 348.00 | 296.00 | 287.00 | 264.00 | 231.23 | 184.15 | 160.86 | 135.76 | 160.17 | 145.06 | 152.61 | 128.73 | NA | NA | NA | NA | NA | NA | NA | NA | NA | NA | NA | NA | NA | NA | NA | NA | NA | NA | NA | NA | NA | NA | NA | NA | NA | NA | NA | |
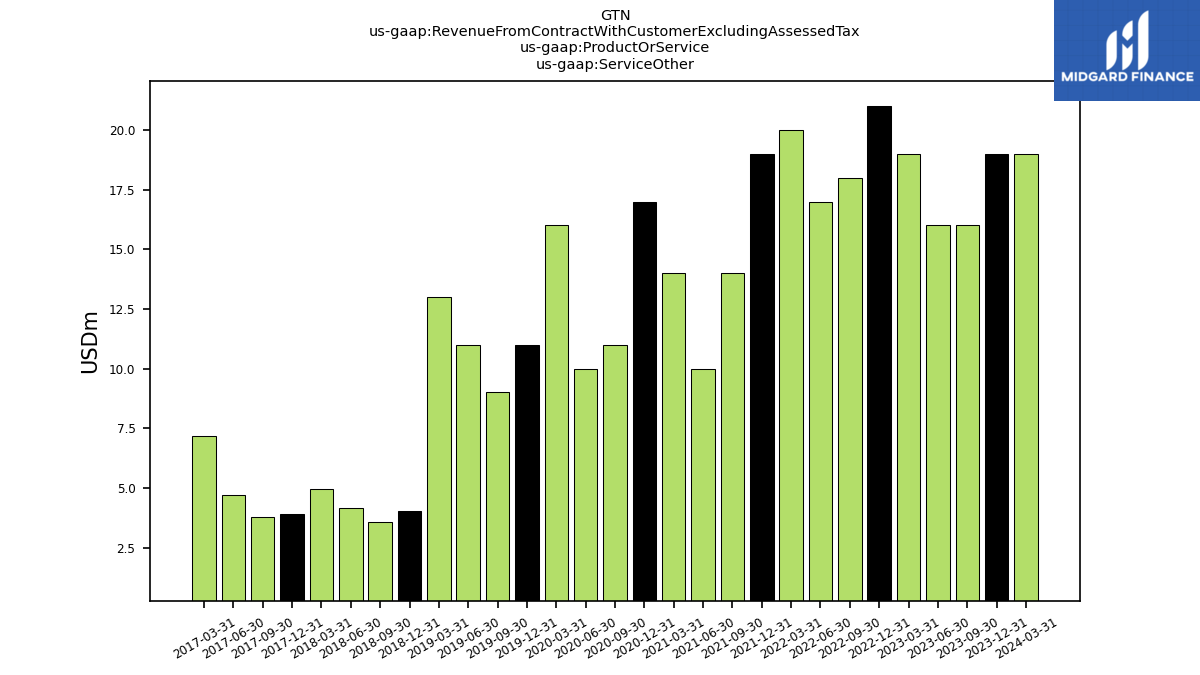
| Service Other | 19.00 | 19.00 | 16.00 | 16.00 | 19.00 | 21.00 | 18.00 | 17.00 | 20.00 | 19.00 | 14.00 | 10.00 | 14.00 | 17.00 | 11.00 | 10.00 | 16.00 | 11.00 | 9.00 | 11.00 | 13.00 | 4.03 | 3.56 | 4.17 | 4.95 | 3.93 | 3.76 | 4.70 | 7.16 | NA | NA | NA | NA | NA | NA | NA | NA | NA | NA | NA | NA | NA | NA | NA | NA | NA | NA | NA | NA | NA | NA | NA | NA | NA | NA | NA | |
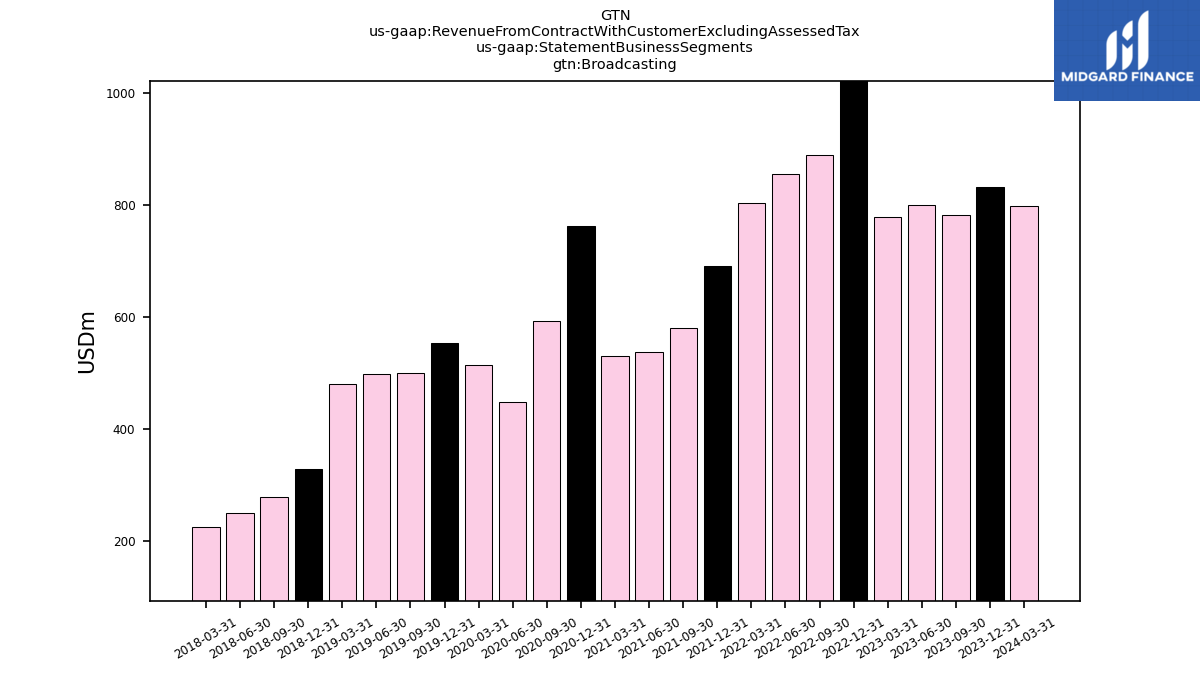
| Broadcasting | 799.00 | 832.00 | 783.00 | 801.00 | 779.00 | 1035.00 | 889.00 | 855.00 | 804.00 | 692.00 | 581.00 | 537.00 | 530.00 | 763.00 | 593.00 | 449.00 | 515.00 | 554.00 | 501.00 | 499.00 | 481.00 | 328.00 | 279.00 | 250.00 | 226.00 | NA | NA | NA | NA | NA | NA | NA | NA | NA | NA | NA | NA | NA | NA | NA | NA | NA | NA | NA | NA | NA | NA | NA | NA | NA | NA | NA | NA | NA | NA | NA | |
| Production Companies | 24.00 | 32.00 | 20.00 | 12.00 | 22.00 | 37.00 | 20.00 | 13.00 | 23.00 | 29.00 | 20.00 | 10.00 | 14.00 | 29.00 | 11.00 | 2.00 | 19.00 | 25.00 | 16.00 | 9.00 | 37.00 | 0.00 | 0.00 | 0.00 | NA | NA | NA | NA | NA | NA | NA | NA | NA | NA | NA | NA | NA | NA | NA | NA | NA | NA | NA | NA | NA | NA | NA | NA | NA | NA | NA | NA | NA | NA | NA | NA |