
| 2024-03-31 | 2023-12-31 | 2023-09-30 | 2023-06-30 | 2023-03-31 | 2022-12-31 | 2022-09-30 | 2022-06-30 | 2022-03-31 | 2021-12-31 | 2021-09-30 | 2021-06-30 | 2021-03-31 | 2020-12-31 | 2020-09-30 | 2020-06-30 | 2020-03-31 | 2019-12-31 | 2019-09-30 | 2019-06-30 | 2019-03-31 | 2018-12-31 | 2018-09-30 | 2018-06-30 | 2018-03-31 | 2017-12-31 | 2017-09-30 | 2017-06-30 | 2017-03-31 | 2016-12-31 | 2016-09-30 | 2016-06-30 | 2016-03-31 | 2015-12-31 | 2015-09-30 | 2015-06-30 | 2015-03-31 | 2014-12-31 | 2014-09-30 | 2014-06-30 | 2014-03-31 | 2013-12-31 | 2013-09-30 | 2013-06-30 | 2013-03-31 | 2012-12-31 | 2012-09-30 | 2012-06-30 | 2012-03-31 | 2011-12-31 | 2011-09-30 | 2011-06-30 | 2011-03-31 | 2010-12-31 | 2010-09-30 | 2010-06-30 | 2010-03-31 | ||
|---|---|---|---|---|---|---|---|---|---|---|---|---|---|---|---|---|---|---|---|---|---|---|---|---|---|---|---|---|---|---|---|---|---|---|---|---|---|---|---|---|---|---|---|---|---|---|---|---|---|---|---|---|---|---|---|---|---|---|
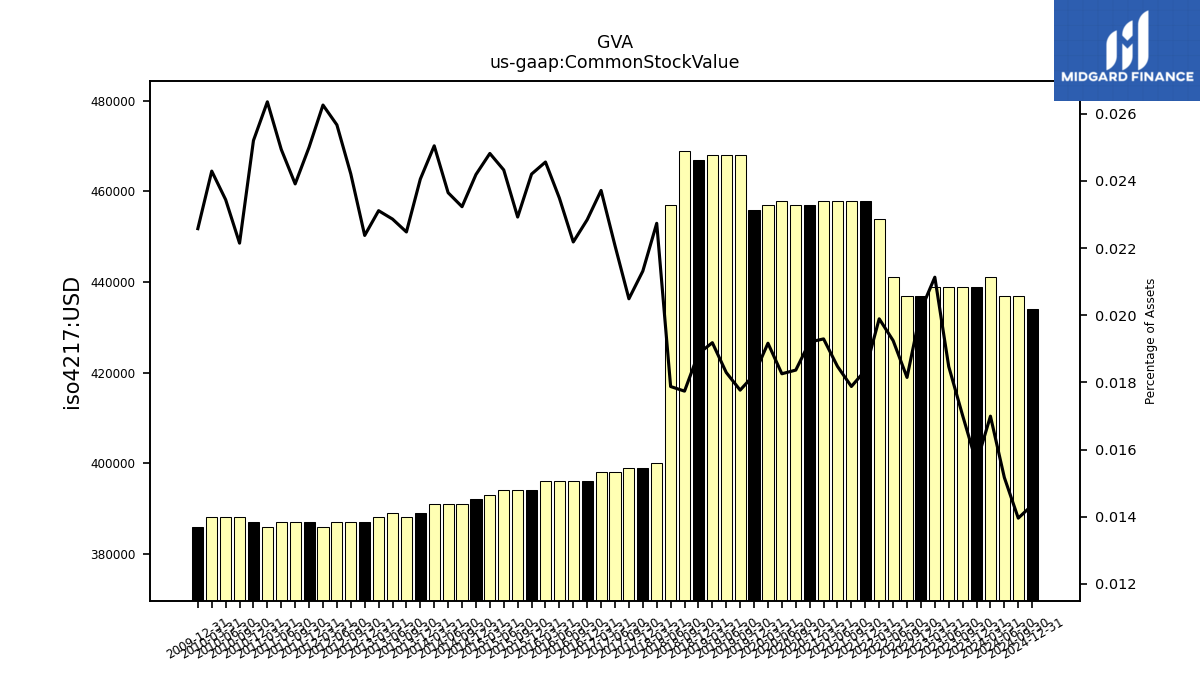
| Common Stock Value | 0.44 | 0.44 | 0.44 | 0.44 | 0.44 | 0.44 | 0.44 | 0.44 | 0.45 | 0.46 | 0.46 | 0.46 | 0.46 | 0.46 | 0.46 | 0.46 | 0.46 | 0.46 | 0.47 | 0.47 | 0.47 | 0.47 | 0.47 | 0.46 | 0.40 | 0.40 | 0.40 | 0.40 | 0.40 | 0.40 | 0.40 | 0.40 | 0.40 | 0.39 | 0.39 | 0.39 | 0.39 | 0.39 | 0.39 | 0.39 | 0.39 | 0.39 | 0.39 | 0.39 | 0.39 | 0.39 | 0.39 | 0.39 | 0.39 | 0.39 | 0.39 | 0.39 | 0.39 | 0.39 | 0.39 | 0.39 | 0.39 | |
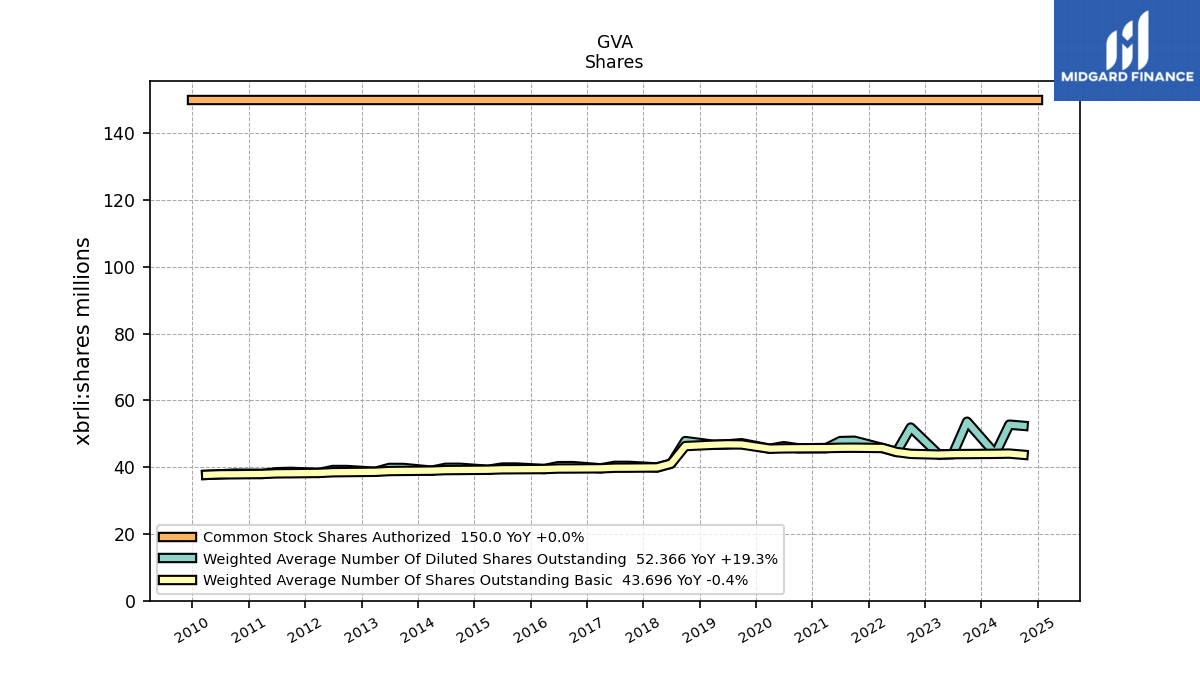
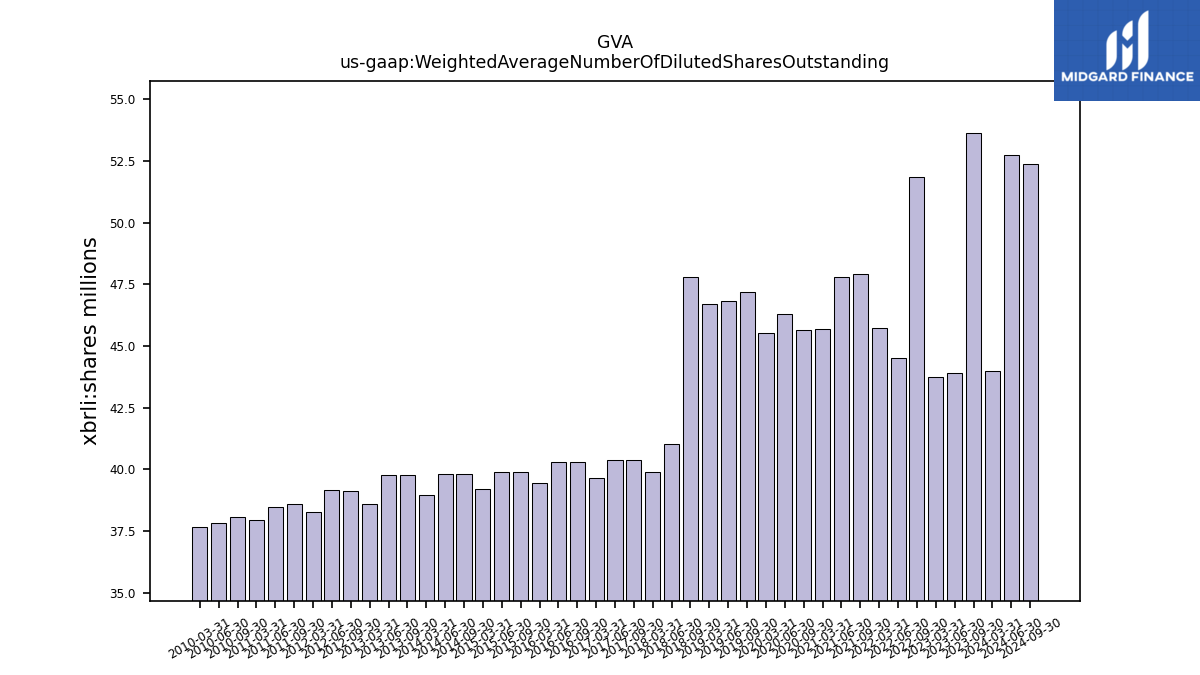
| Weighted Average Number Of Diluted Shares Outstanding | 43.99 | NA | 53.61 | 43.89 | 43.76 | NA | 51.86 | 44.53 | 45.73 | NA | 47.91 | 47.80 | 45.70 | NA | 45.65 | 46.28 | 45.52 | NA | 47.17 | 46.82 | 46.70 | NA | 47.81 | 41.04 | 39.91 | NA | 40.39 | 40.39 | 39.65 | NA | 40.31 | 40.30 | 39.43 | NA | 39.90 | 39.88 | 39.22 | NA | 39.81 | 39.81 | 38.95 | NA | 39.76 | 39.77 | 38.61 | NA | 39.14 | 39.15 | 38.27 | NA | 38.60 | 38.48 | 37.96 | NA | 38.07 | 37.85 | 37.69 | |
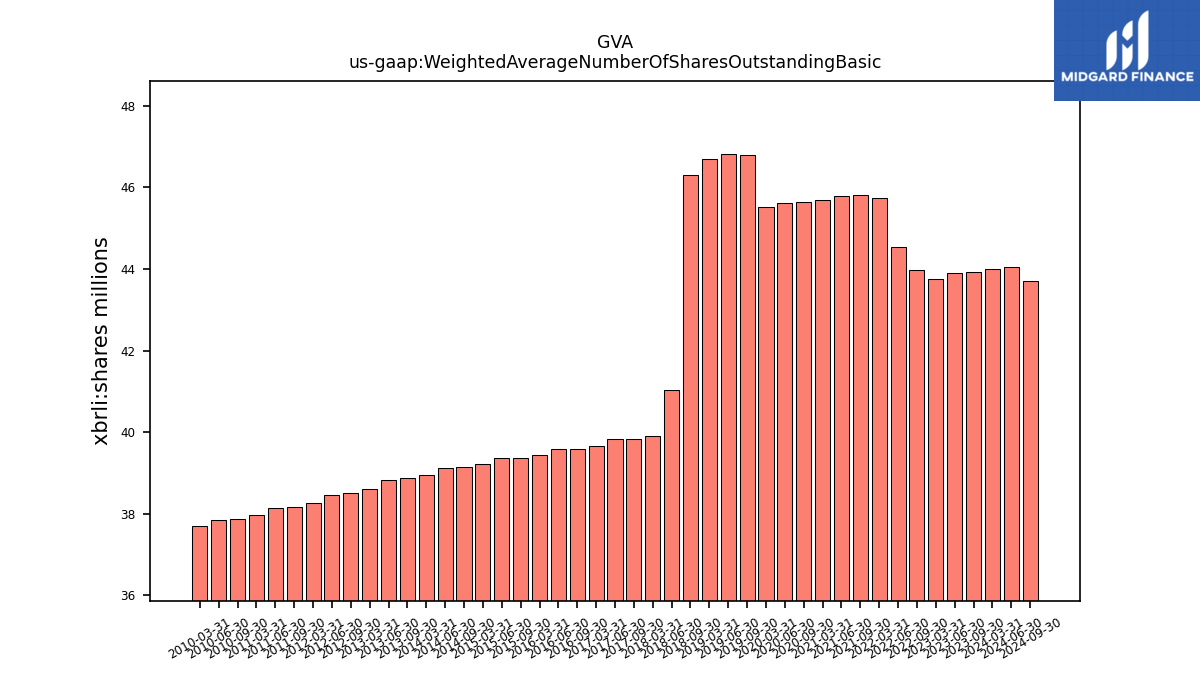
| Weighted Average Number Of Shares Outstanding Basic | 43.99 | NA | 43.92 | 43.89 | 43.76 | NA | 43.97 | 44.53 | 45.73 | NA | 45.82 | 45.80 | 45.70 | NA | 45.65 | 45.62 | 45.52 | NA | 46.79 | 46.82 | 46.70 | NA | 46.31 | 41.04 | 39.91 | NA | 39.84 | 39.83 | 39.65 | NA | 39.60 | 39.58 | 39.43 | NA | 39.38 | 39.36 | 39.22 | NA | 39.15 | 39.12 | 38.95 | NA | 38.88 | 38.83 | 38.61 | NA | 38.52 | 38.47 | 38.27 | NA | 38.17 | 38.14 | 37.96 | NA | 37.87 | 37.85 | 37.69 | |
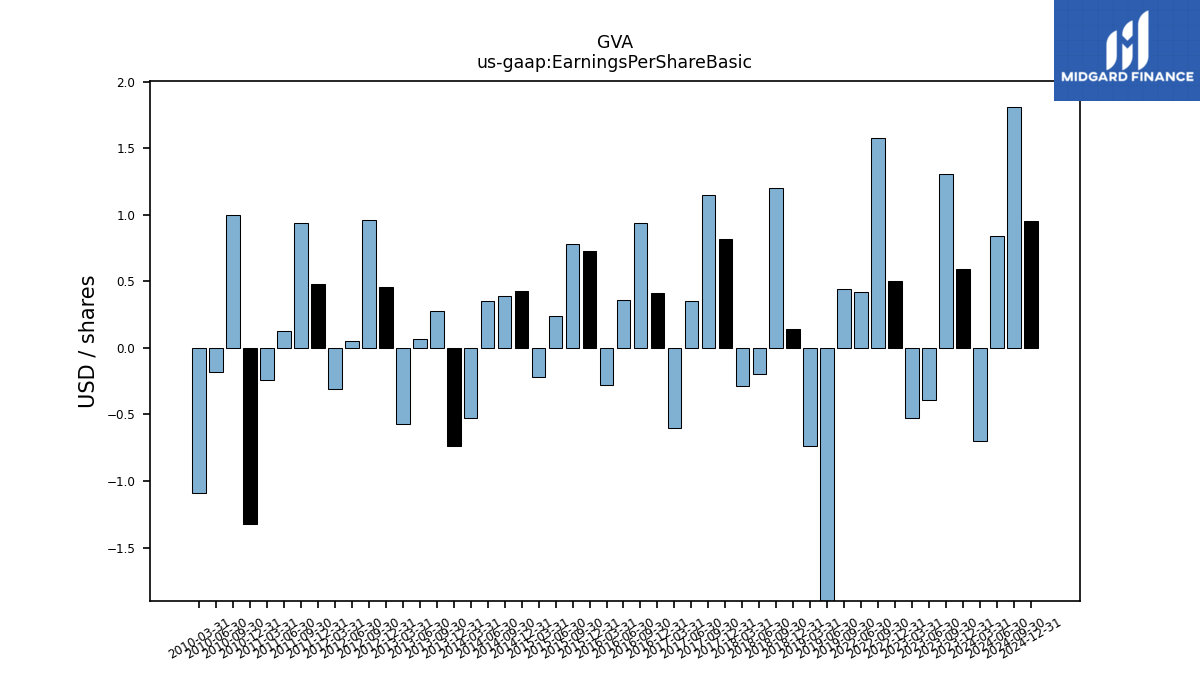
| Earnings Per Share Basic | -0.70 | 0.59 | 1.31 | -0.39 | -0.53 | 0.50 | 1.58 | 0.42 | NA | NA | NA | NA | NA | NA | NA | NA | NA | NA | 0.44 | -2.09 | -0.74 | 0.14 | 1.20 | -0.20 | -0.29 | 0.82 | 1.15 | 0.35 | -0.60 | 0.41 | 0.94 | 0.36 | -0.28 | 0.73 | 0.78 | 0.24 | -0.22 | 0.43 | 0.39 | 0.35 | -0.53 | -0.74 | 0.28 | 0.07 | -0.57 | 0.46 | 0.96 | 0.05 | -0.31 | 0.48 | 0.94 | 0.13 | -0.24 | -1.32 | 1.00 | -0.18 | -1.09 | |
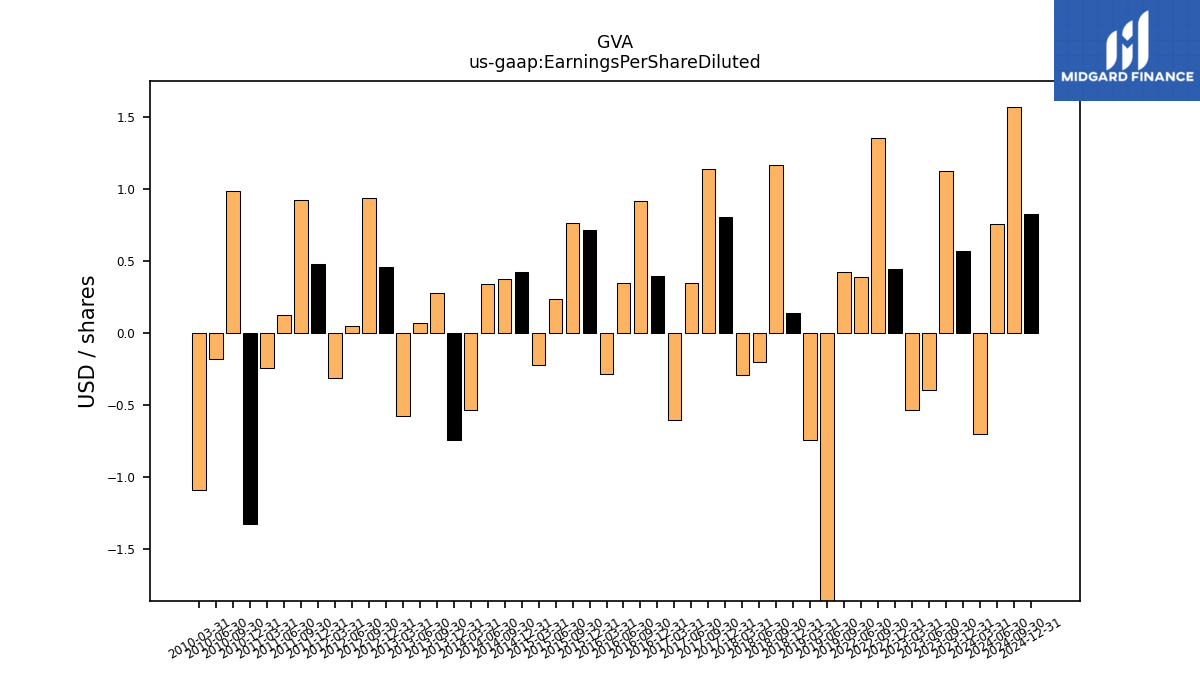
| Earnings Per Share Diluted | -0.70 | 0.57 | 1.13 | -0.39 | -0.53 | 0.45 | 1.36 | 0.39 | NA | NA | NA | NA | NA | NA | NA | NA | NA | NA | 0.43 | -2.09 | -0.74 | 0.14 | 1.17 | -0.20 | -0.29 | 0.81 | 1.14 | 0.35 | -0.60 | 0.40 | 0.92 | 0.35 | -0.28 | 0.72 | 0.77 | 0.24 | -0.22 | 0.43 | 0.38 | 0.34 | -0.53 | -0.74 | 0.28 | 0.07 | -0.57 | 0.46 | 0.94 | 0.05 | -0.31 | 0.48 | 0.93 | 0.13 | -0.24 | -1.32 | 0.99 | -0.18 | -1.09 |
| 2024-03-31 | 2023-12-31 | 2023-09-30 | 2023-06-30 | 2023-03-31 | 2022-12-31 | 2022-09-30 | 2022-06-30 | 2022-03-31 | 2021-12-31 | 2021-09-30 | 2021-06-30 | 2021-03-31 | 2020-12-31 | 2020-09-30 | 2020-06-30 | 2020-03-31 | 2019-12-31 | 2019-09-30 | 2019-06-30 | 2019-03-31 | 2018-12-31 | 2018-09-30 | 2018-06-30 | 2018-03-31 | 2017-12-31 | 2017-09-30 | 2017-06-30 | 2017-03-31 | 2016-12-31 | 2016-09-30 | 2016-06-30 | 2016-03-31 | 2015-12-31 | 2015-09-30 | 2015-06-30 | 2015-03-31 | 2014-12-31 | 2014-09-30 | 2014-06-30 | 2014-03-31 | 2013-12-31 | 2013-09-30 | 2013-06-30 | 2013-03-31 | 2012-12-31 | 2012-09-30 | 2012-06-30 | 2012-03-31 | 2011-12-31 | 2011-09-30 | 2011-06-30 | 2011-03-31 | 2010-12-31 | 2010-09-30 | 2010-06-30 | 2010-03-31 | ||
|---|---|---|---|---|---|---|---|---|---|---|---|---|---|---|---|---|---|---|---|---|---|---|---|---|---|---|---|---|---|---|---|---|---|---|---|---|---|---|---|---|---|---|---|---|---|---|---|---|---|---|---|---|---|---|---|---|---|---|
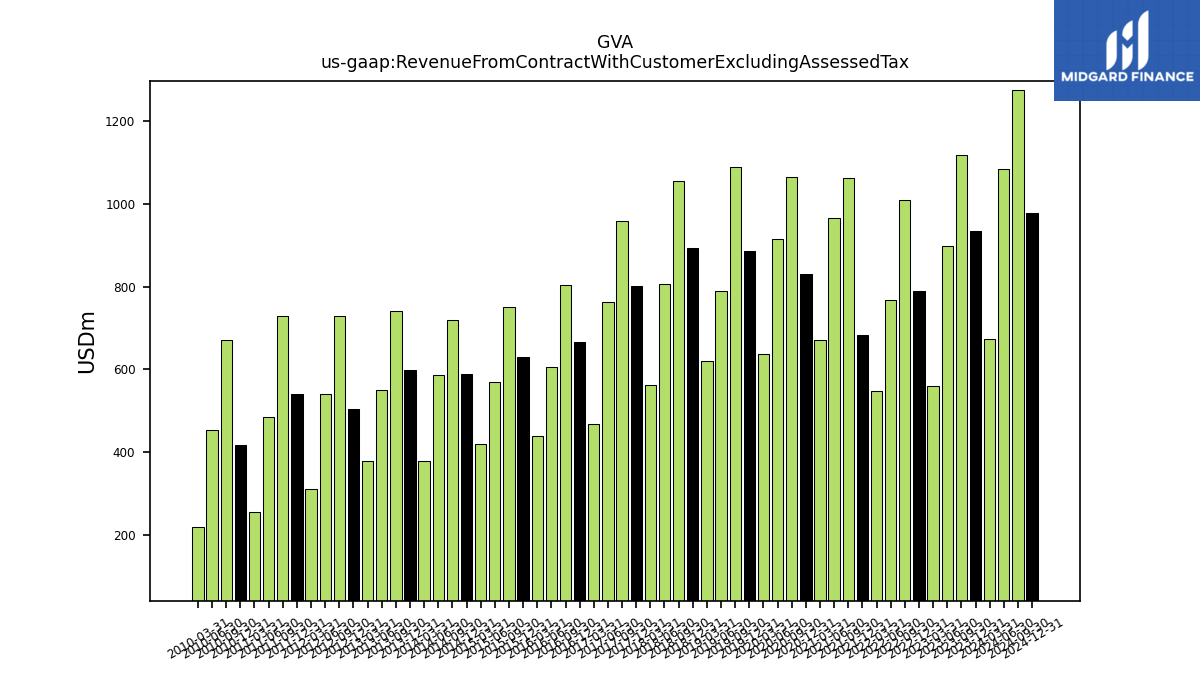
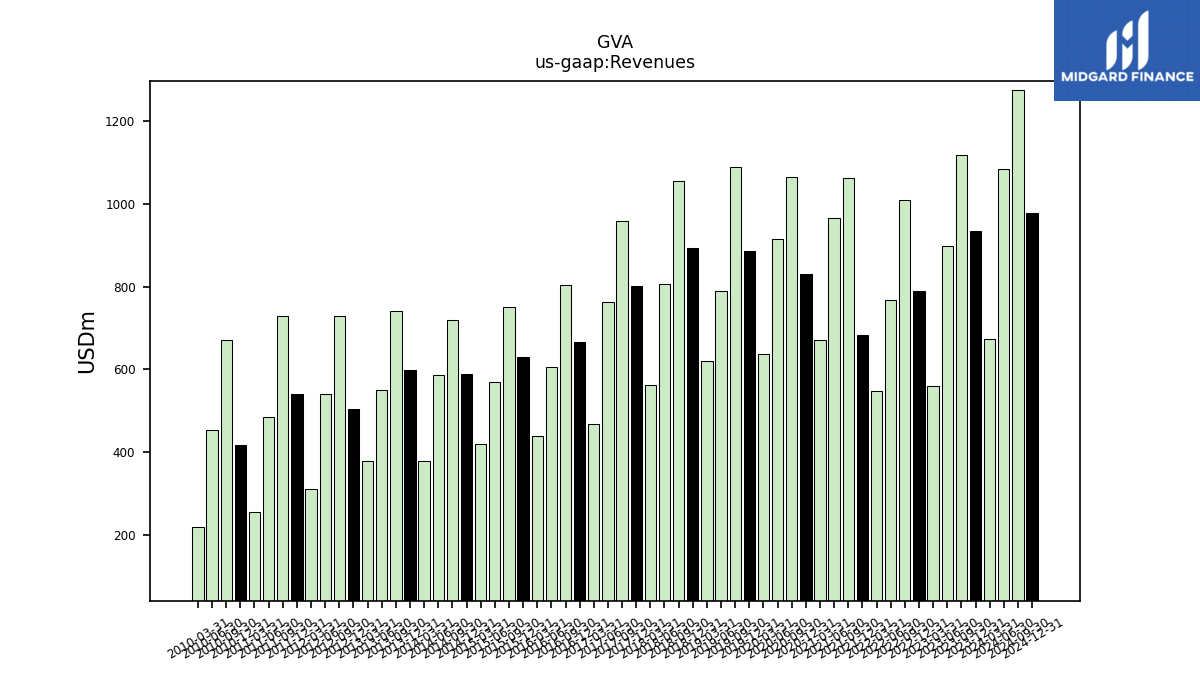
| Revenue From Contract With Customer Excluding Assessed Tax | 672.27 | 933.70 | 1116.82 | 898.55 | 560.07 | 789.21 | 1009.81 | 768.29 | 547.59 | 683.20 | 1062.13 | 964.17 | 669.91 | 830.39 | 1065.19 | 915.77 | 635.93 | 885.59 | 1088.11 | 789.54 | 619.80 | 892.33 | 1055.59 | 807.12 | 563.38 | 801.27 | 957.13 | 762.91 | 468.40 | 666.68 | 803.90 | 604.58 | 439.45 | 630.16 | 751.38 | 569.24 | 420.25 | 589.79 | 719.76 | 585.87 | 379.85 | 598.10 | 741.58 | 550.16 | 378.70 | 504.78 | 728.48 | 539.62 | 310.16 | 539.55 | 728.58 | 484.67 | 256.73 | 417.23 | 670.85 | 454.20 | 220.68 | |
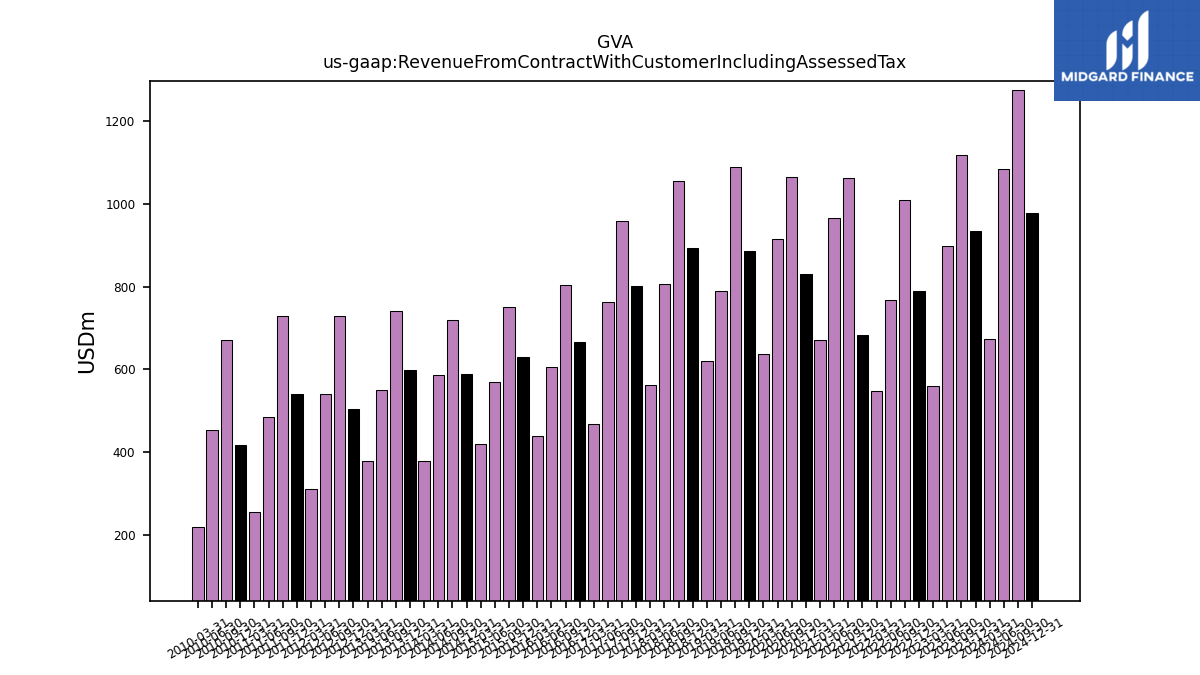
| Revenue From Contract With Customer Including Assessed Tax | 672.27 | 933.70 | 1116.82 | 898.55 | 560.07 | 789.21 | 1009.81 | 768.29 | 547.59 | 683.20 | 1062.13 | 964.17 | 669.91 | 830.39 | 1065.19 | 915.77 | 635.93 | 885.59 | 1088.11 | 789.54 | 619.80 | 892.33 | 1055.59 | 807.12 | 563.38 | 801.27 | 957.13 | 762.91 | 468.40 | 666.68 | 803.90 | 604.58 | 439.45 | 630.16 | 751.38 | 569.24 | 420.25 | 589.79 | 719.76 | 585.87 | 379.85 | 598.10 | 741.58 | 550.16 | 378.70 | 504.78 | 728.48 | 539.62 | 310.16 | 539.55 | 728.58 | 484.67 | 256.73 | 417.23 | 670.85 | 454.20 | 220.68 | |
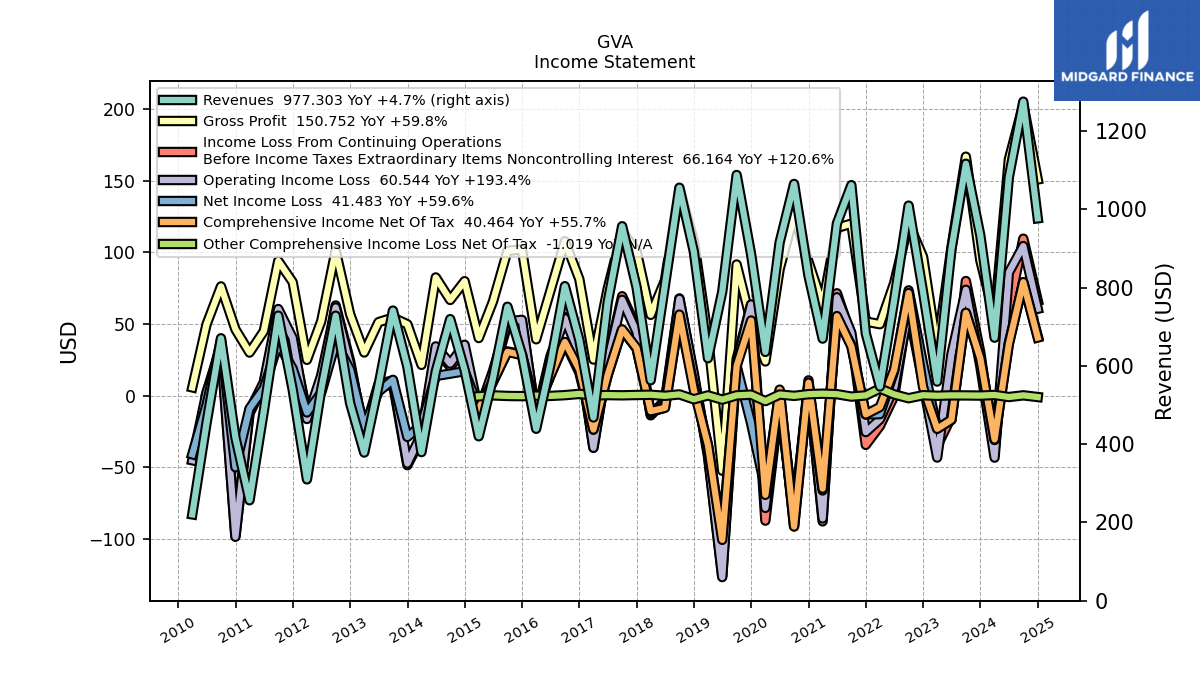
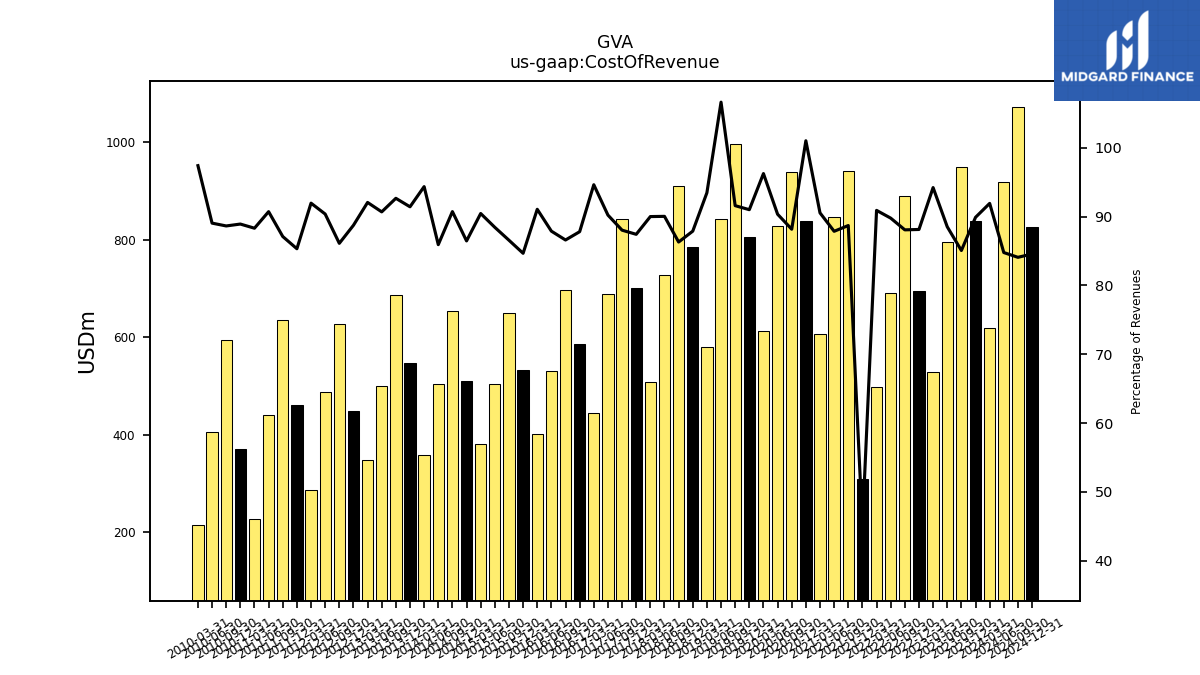
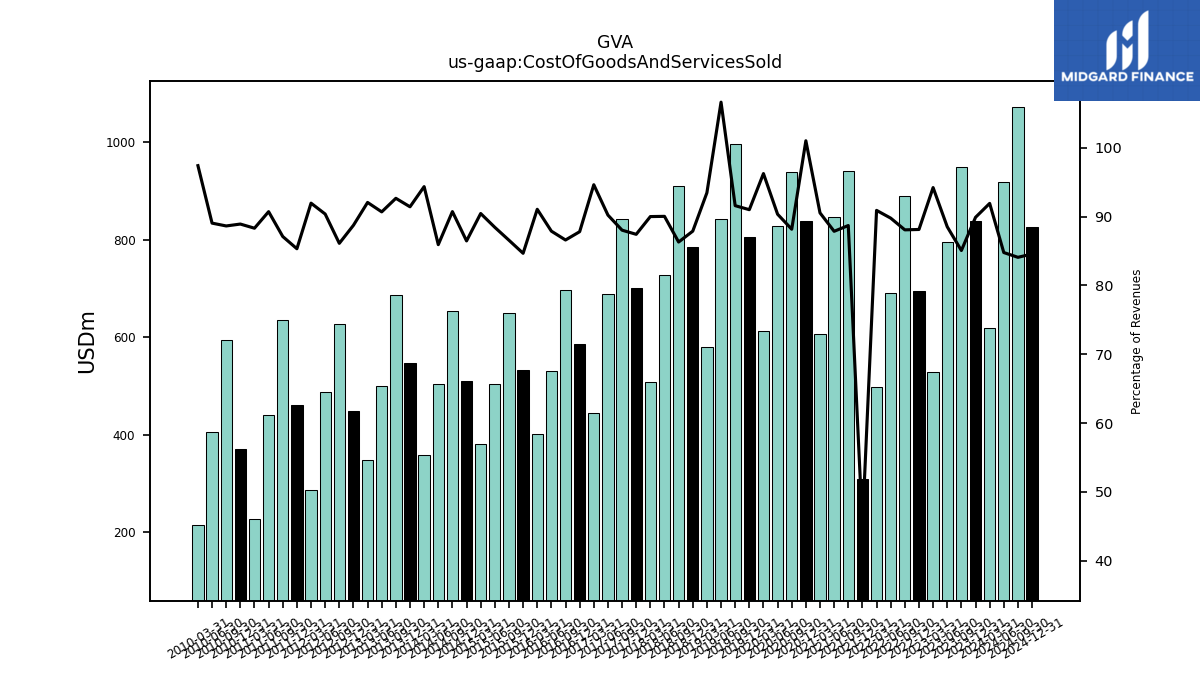
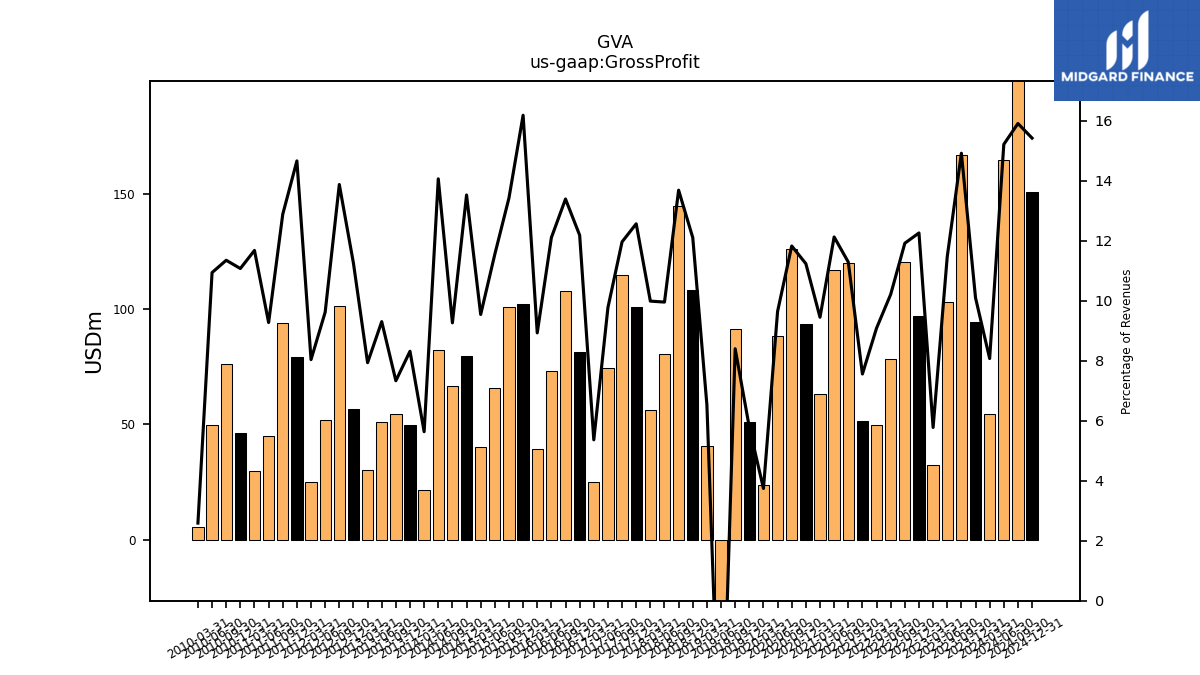
| Revenues | 672.27 | 933.70 | 1116.82 | 898.55 | 560.07 | 789.21 | 1009.81 | 768.29 | 547.59 | 683.20 | 1062.13 | 964.17 | 669.91 | 830.39 | 1065.19 | 915.77 | 635.93 | 885.59 | 1088.11 | 789.54 | 619.80 | 892.33 | 1055.59 | 807.12 | 563.38 | 801.27 | 957.13 | 762.91 | 468.40 | 666.68 | 803.90 | 604.58 | 439.45 | 630.16 | 751.38 | 569.24 | 420.25 | 589.79 | 719.76 | 585.87 | 379.85 | 598.10 | 741.58 | 550.16 | 378.70 | 504.78 | 728.48 | 539.62 | 310.16 | 539.55 | 728.58 | 484.67 | 256.73 | 417.23 | 670.85 | 454.20 | 220.68 | |
| Cost Of Revenue | 617.99 | 839.39 | 950.18 | 795.47 | 527.71 | 695.59 | 889.44 | 689.81 | 497.81 | 308.48 | 942.19 | 847.23 | 606.60 | 838.92 | 939.19 | 827.43 | 612.13 | 805.98 | 996.68 | 841.94 | 579.32 | 784.28 | 911.10 | 726.75 | 507.10 | 700.57 | 842.60 | 688.34 | 443.27 | 585.43 | 696.23 | 531.38 | 400.21 | 533.58 | 650.48 | 503.47 | 380.14 | 510.00 | 653.07 | 503.45 | 358.44 | 546.85 | 687.18 | 498.96 | 348.65 | 447.97 | 627.38 | 487.70 | 285.22 | 460.42 | 634.68 | 439.72 | 226.74 | 371.01 | 594.70 | 404.51 | 214.97 | |
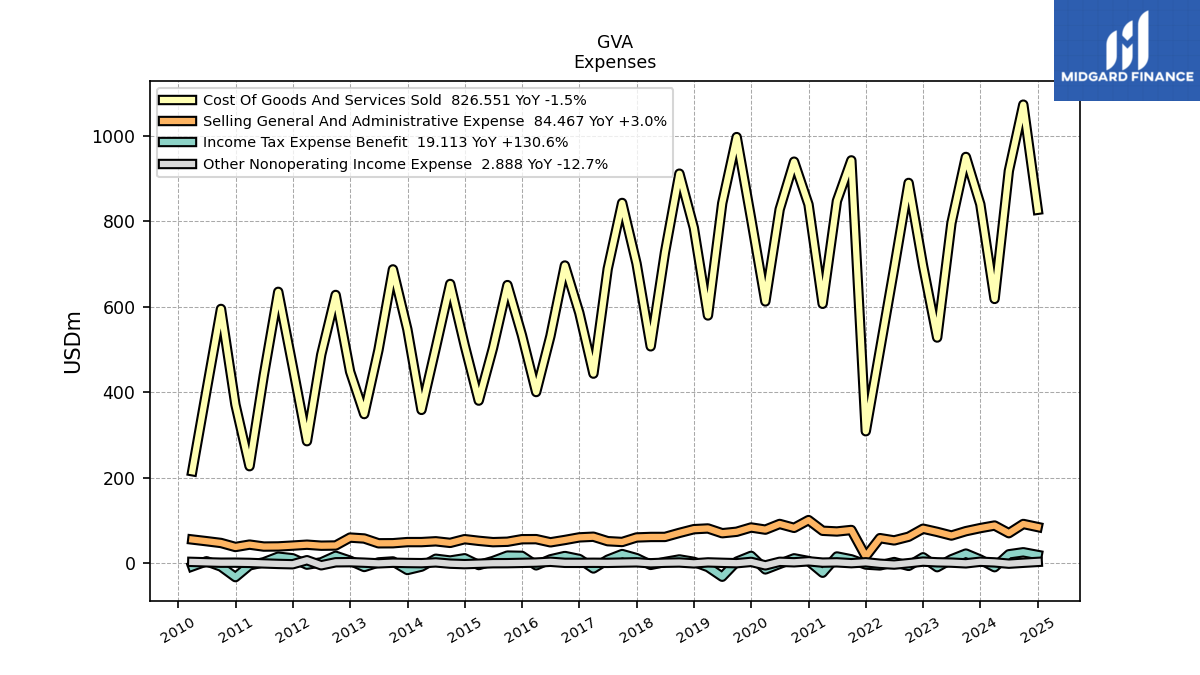
| Cost Of Goods And Services Sold | 617.99 | 839.39 | 950.18 | 795.47 | 527.71 | 695.59 | 889.44 | 689.81 | 497.81 | 308.48 | 942.19 | 847.23 | 606.60 | 838.92 | 939.19 | 827.43 | 612.13 | 805.98 | 996.68 | 841.94 | 579.32 | 784.28 | 911.10 | 726.75 | 507.10 | 700.57 | 842.60 | 688.34 | 443.27 | 585.43 | 696.23 | 531.38 | 400.21 | 533.58 | 650.48 | 503.47 | 380.14 | 510.00 | 653.07 | 503.45 | 358.44 | 546.85 | 687.18 | 498.96 | 348.65 | 447.97 | 627.38 | 487.70 | 285.22 | 460.42 | 634.68 | 439.72 | 226.74 | 371.01 | 594.70 | 404.51 | 214.97 | |
| Gross Profit | 54.28 | 94.31 | 166.64 | 103.09 | 32.36 | 96.78 | 120.37 | 78.48 | 49.77 | 51.65 | 119.94 | 116.95 | 63.32 | 93.32 | 126.00 | 88.34 | 23.80 | 51.22 | 91.43 | -52.40 | 40.48 | 108.05 | 144.49 | 80.37 | 56.28 | 100.71 | 114.53 | 74.57 | 25.13 | 81.25 | 107.67 | 73.20 | 39.24 | 102.01 | 100.90 | 65.77 | 40.11 | 79.79 | 66.69 | 82.42 | 21.41 | 49.75 | 54.40 | 51.20 | 30.06 | 56.81 | 101.10 | 51.92 | 24.94 | 79.13 | 93.89 | 44.96 | 29.99 | 46.22 | 76.16 | 49.70 | 5.71 | |
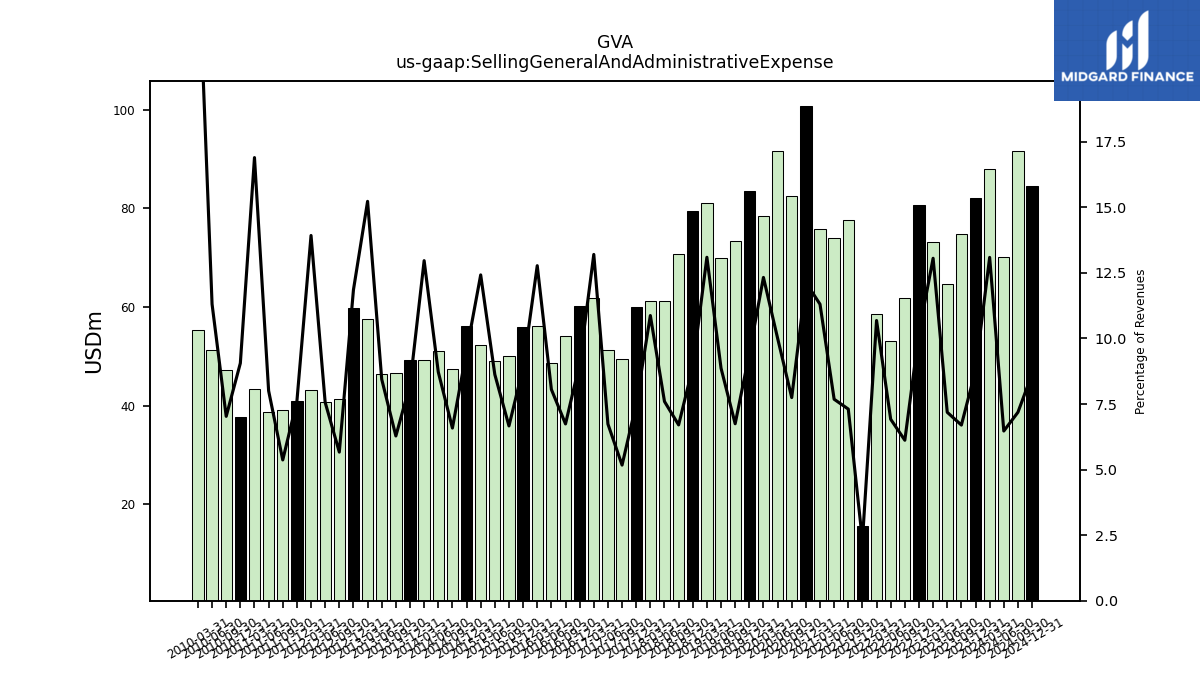
| Selling General And Administrative Expense | 87.99 | 81.99 | 74.79 | 64.56 | 73.12 | 80.57 | 61.80 | 53.16 | 58.50 | 15.68 | 77.60 | 74.07 | 75.73 | 100.75 | 82.50 | 91.68 | 78.38 | 83.40 | 73.42 | 70.00 | 81.16 | 79.44 | 70.77 | 61.32 | 61.25 | 60.09 | 49.50 | 51.39 | 61.84 | 60.27 | 54.19 | 48.70 | 56.13 | 55.97 | 50.08 | 49.09 | 52.20 | 56.09 | 47.39 | 51.10 | 49.25 | 49.25 | 46.59 | 46.45 | 57.66 | 59.83 | 41.28 | 40.81 | 43.19 | 41.02 | 39.11 | 38.79 | 43.37 | 37.78 | 47.16 | 51.36 | 55.29 | |
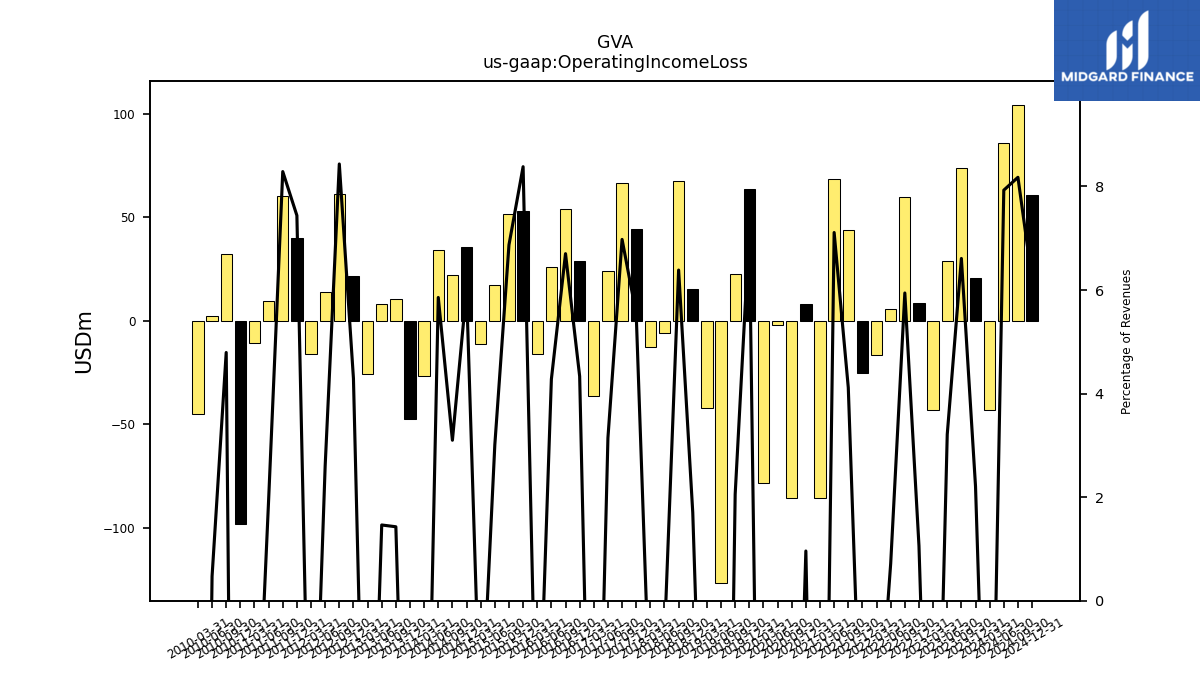
| Operating Income Loss | -43.30 | 20.63 | 73.82 | 28.86 | -43.25 | 8.38 | 60.01 | 5.53 | -16.61 | -25.50 | 43.73 | 68.56 | -85.69 | 7.98 | -85.80 | -2.15 | -78.37 | 63.48 | 22.36 | -126.64 | -42.10 | 15.20 | 67.41 | -5.73 | -12.84 | 44.38 | 66.78 | 23.99 | -36.44 | 28.90 | 53.88 | 25.86 | -16.29 | 52.82 | 51.62 | 17.15 | -11.28 | 35.42 | 22.31 | 34.31 | -26.95 | -47.32 | 10.60 | 8.05 | -26.02 | 21.66 | 61.44 | 14.06 | -16.34 | 40.14 | 60.38 | 9.43 | -10.68 | -98.52 | 32.16 | 2.14 | -45.13 | |
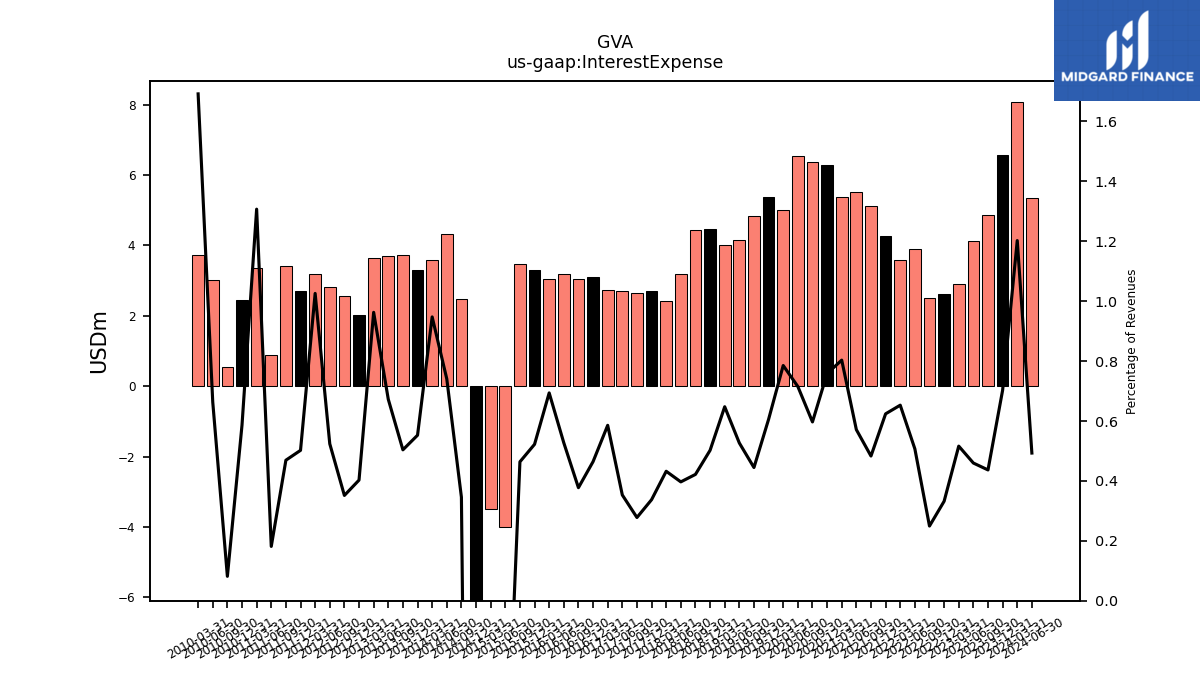
| Interest Expense | 8.08 | 6.56 | 4.88 | 4.13 | 2.89 | 2.62 | 2.52 | 3.90 | 3.58 | 4.26 | 5.13 | 5.51 | 5.38 | 6.30 | 6.36 | 6.55 | 4.99 | 5.36 | 4.84 | 4.16 | 4.01 | 4.48 | 4.45 | 3.20 | 2.44 | 2.70 | 2.66 | 2.69 | 2.74 | 3.10 | 3.03 | 3.19 | 3.05 | 3.29 | 3.48 | -3.98 | -3.50 | -24.59 | 2.49 | 4.34 | 3.60 | 3.31 | 3.74 | 3.70 | 3.65 | 2.03 | 2.56 | 2.83 | 3.18 | 2.71 | 3.42 | 0.88 | 3.36 | 2.45 | 0.55 | 3.01 | 3.73 | |
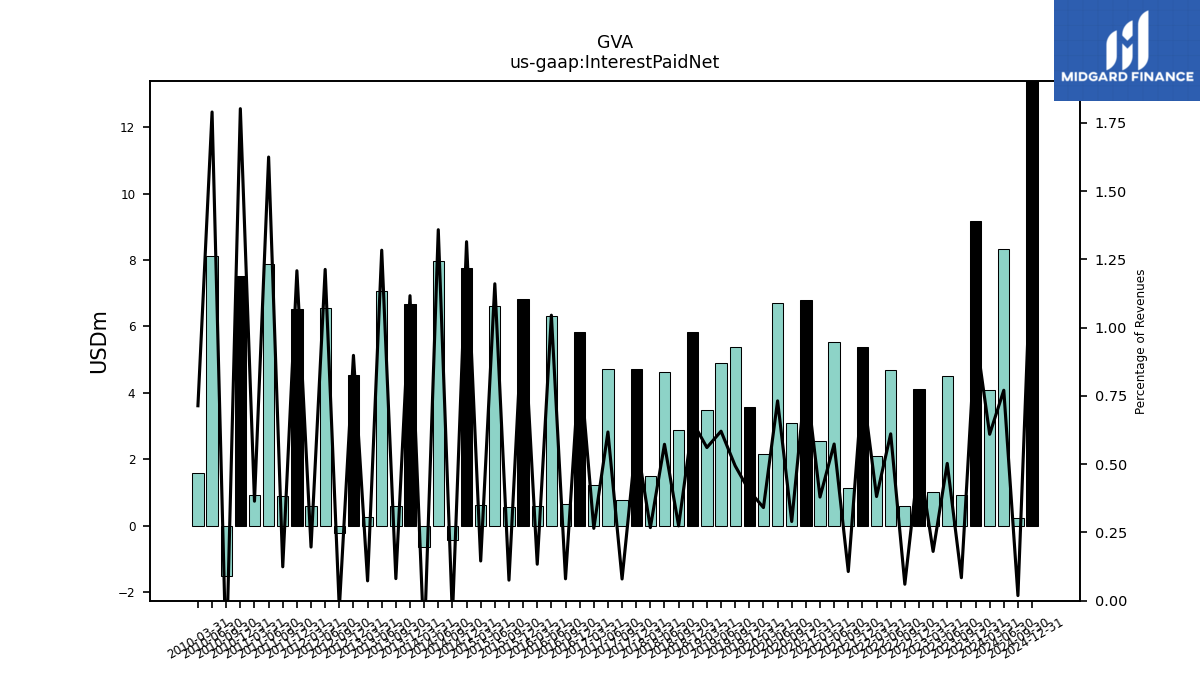
| Interest Paid Net | 4.10 | 9.17 | 0.94 | 4.52 | 1.01 | 4.11 | 0.61 | 4.70 | 2.09 | 5.38 | 1.14 | 5.53 | 2.54 | 6.79 | 3.09 | 6.70 | 2.17 | 3.56 | 5.38 | 4.90 | 3.48 | 5.83 | 2.90 | 4.62 | 1.51 | 4.73 | 0.76 | 4.71 | 1.24 | 5.83 | 0.65 | 6.32 | 0.59 | 6.81 | 0.57 | 6.61 | 0.61 | 7.75 | -0.43 | 7.96 | -0.62 | 6.68 | 0.60 | 7.06 | 0.28 | 4.54 | -0.21 | 6.55 | 0.61 | 6.52 | 0.91 | 7.88 | 0.94 | 7.52 | -1.51 | 8.13 | 1.58 | |
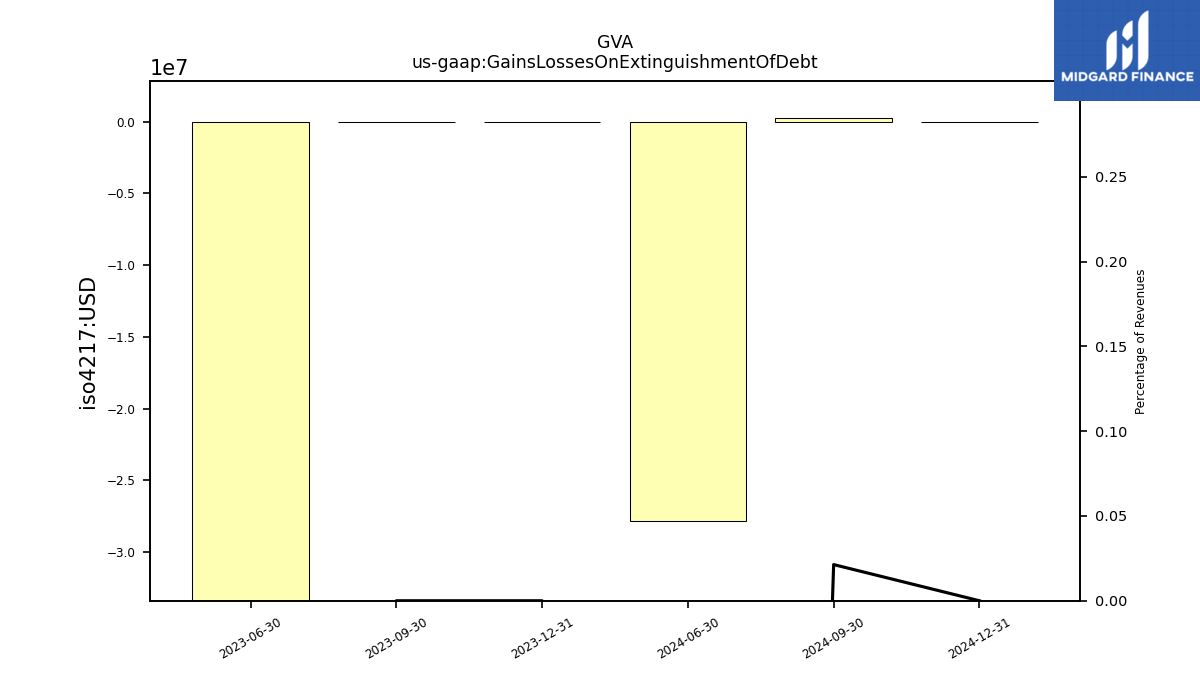
| Gains Losses On Extinguishment Of Debt | NA | 0.00 | 0.00 | -51.05 | NA | NA | NA | NA | NA | NA | NA | NA | NA | NA | NA | NA | NA | NA | NA | NA | NA | NA | NA | NA | NA | NA | NA | NA | NA | NA | NA | NA | NA | NA | NA | NA | NA | NA | NA | NA | NA | NA | NA | NA | NA | NA | NA | NA | NA | NA | NA | NA | NA | NA | NA | NA | NA | |
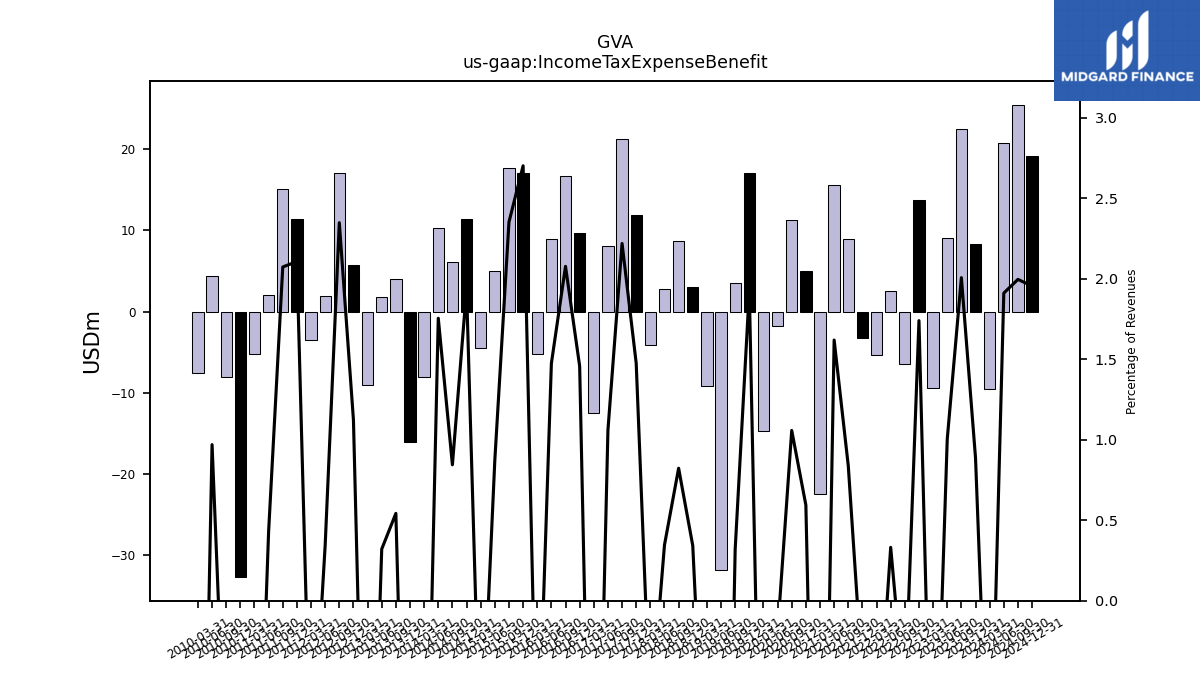
| Income Tax Expense Benefit | -9.53 | 8.29 | 22.42 | 9.02 | -9.47 | 13.74 | -6.49 | 2.55 | -5.33 | -3.31 | 8.90 | 15.62 | -22.45 | 4.94 | 11.27 | -1.78 | -14.71 | 17.07 | 3.47 | -31.76 | -9.16 | 3.06 | 8.69 | 2.80 | -4.13 | 11.82 | 21.25 | 8.09 | -12.50 | 9.72 | 16.70 | 8.92 | -5.18 | 17.03 | 17.68 | 4.97 | -4.51 | 11.42 | 6.08 | 10.28 | -8.06 | -16.03 | 4.03 | 1.77 | -9.03 | 5.67 | 17.11 | 1.86 | -3.53 | 11.38 | 15.11 | 2.09 | -5.22 | -32.70 | -8.03 | 4.41 | -7.61 | |
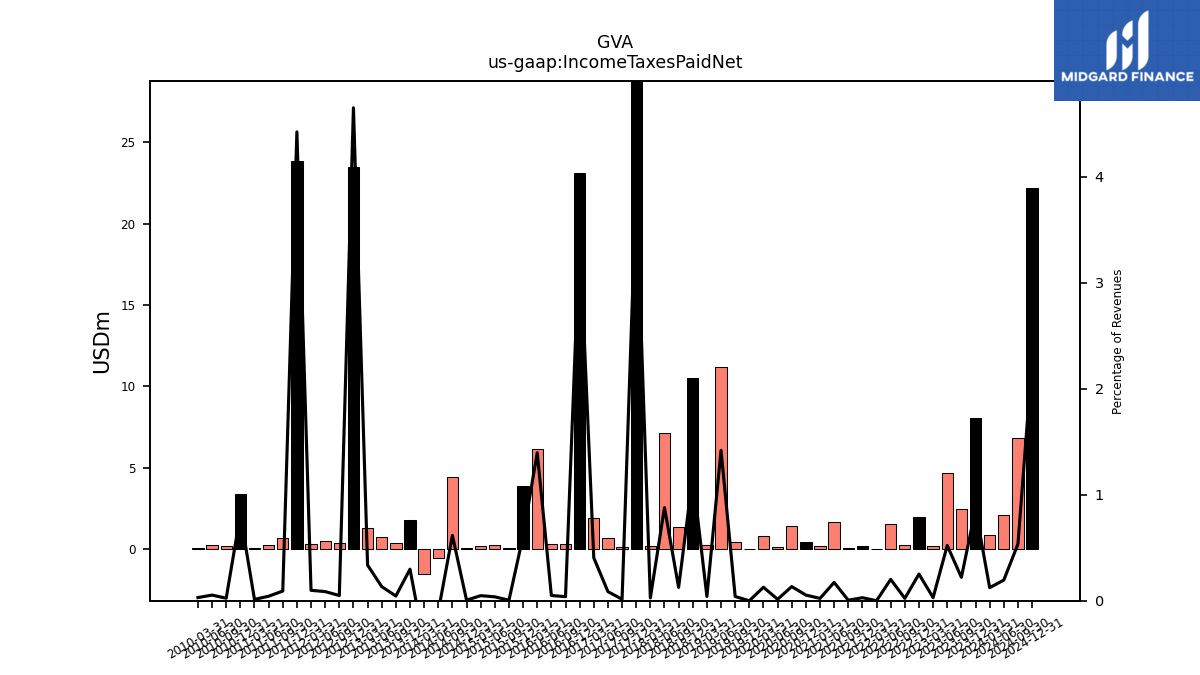
| Income Taxes Paid Net | 0.83 | 8.06 | 2.47 | 4.68 | 0.17 | 1.99 | 0.23 | 1.55 | 0.00 | 0.20 | 0.05 | 1.67 | 0.15 | 0.45 | 1.42 | 0.12 | 0.81 | -0.00 | 0.44 | 11.21 | 0.25 | 10.49 | 1.33 | 7.10 | 0.15 | 31.26 | 0.14 | 0.66 | 1.90 | 23.12 | 0.31 | 0.30 | 6.14 | 3.85 | 0.04 | 0.21 | 0.20 | 0.03 | 4.44 | -0.59 | -1.55 | 1.78 | 0.33 | 0.73 | 1.27 | 23.48 | 0.36 | 0.47 | 0.30 | 23.88 | 0.67 | 0.21 | 0.03 | 3.39 | 0.16 | 0.24 | 0.07 | |
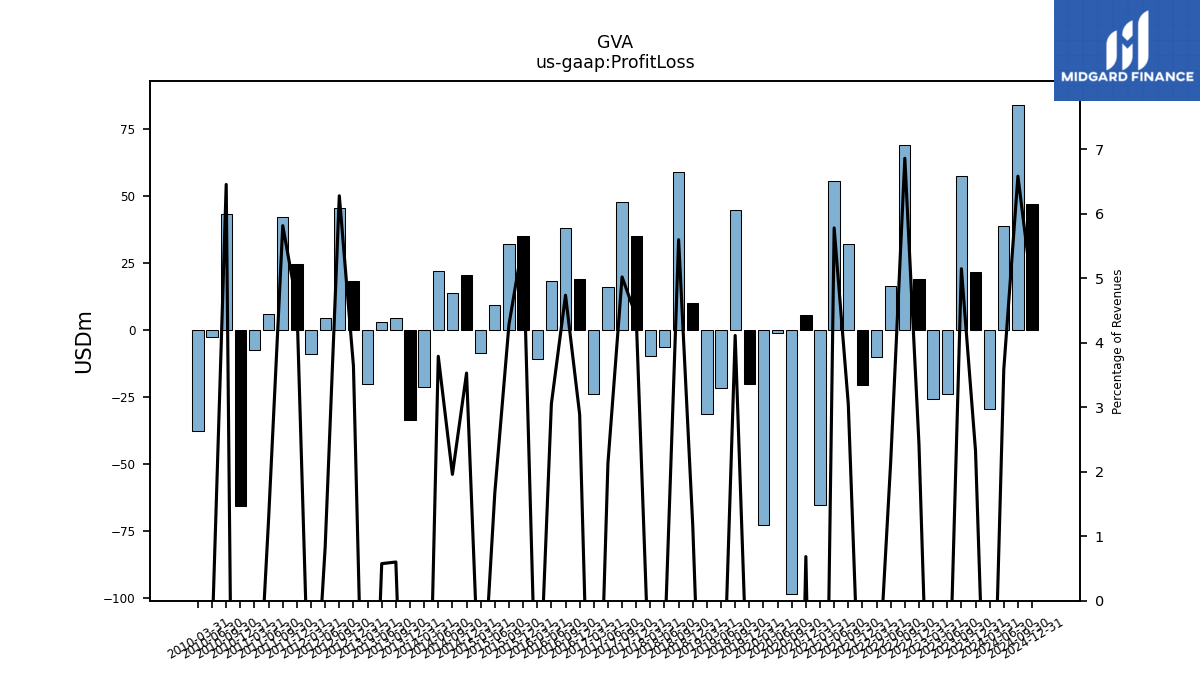
| Profit Loss | -29.44 | 21.71 | 57.50 | -23.85 | -25.77 | 19.18 | 69.29 | 16.57 | -9.82 | -20.43 | 32.42 | 55.75 | -65.32 | 5.69 | -98.36 | -0.97 | -72.54 | -20.06 | 44.77 | -21.65 | -31.08 | 10.39 | 59.10 | -6.08 | -9.66 | 35.33 | 48.05 | 16.27 | -23.85 | 19.26 | 38.09 | 18.46 | -10.51 | 35.14 | 32.18 | 9.54 | -8.61 | 20.82 | 14.11 | 22.21 | -21.26 | -33.26 | 4.46 | 3.17 | -19.83 | 18.37 | 45.75 | 4.49 | -8.69 | 24.79 | 42.38 | 6.17 | -7.26 | -65.39 | 43.30 | -2.63 | -37.73 | |
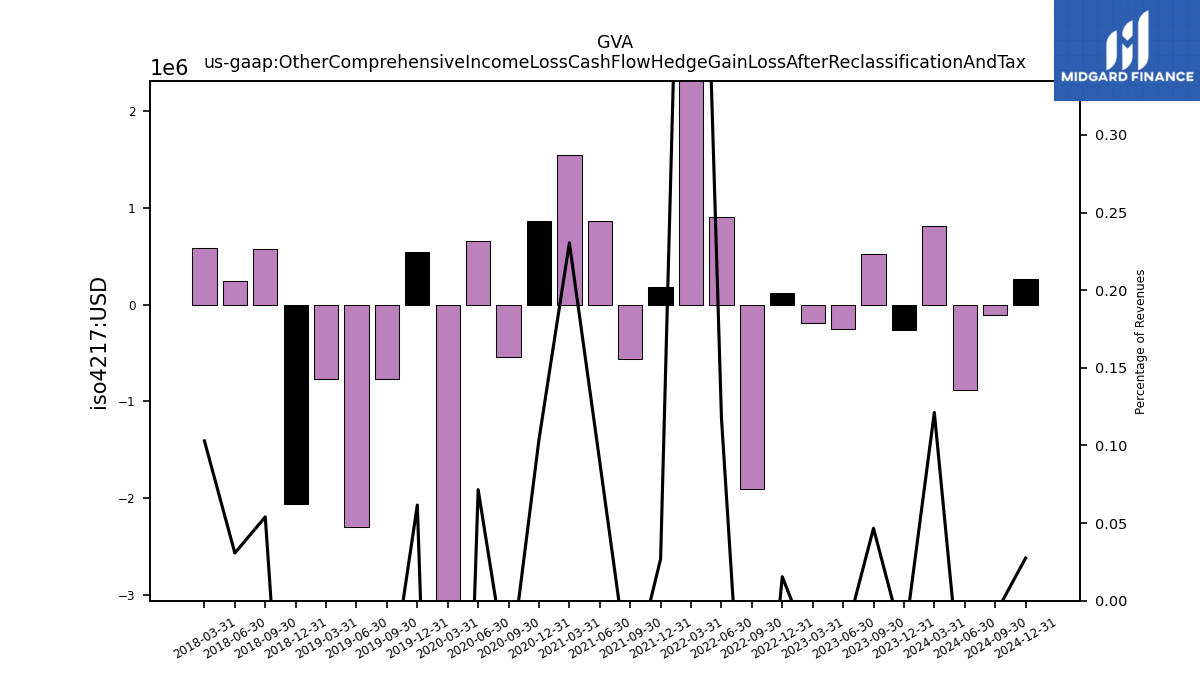
| Other Comprehensive Income Loss Cash Flow Hedge Gain Loss After Reclassification And Tax | 0.81 | -0.26 | 0.52 | -0.25 | -0.19 | 0.12 | -1.91 | 0.91 | 4.20 | 0.18 | -0.57 | 0.86 | 1.54 | 0.86 | -0.55 | 0.66 | -3.31 | 0.55 | -0.77 | -2.29 | -0.77 | -2.06 | 0.57 | 0.25 | 0.58 | NA | NA | NA | NA | NA | NA | NA | NA | NA | NA | NA | NA | NA | NA | NA | NA | NA | NA | NA | NA | NA | NA | NA | NA | NA | NA | NA | NA | NA | NA | NA | NA | |
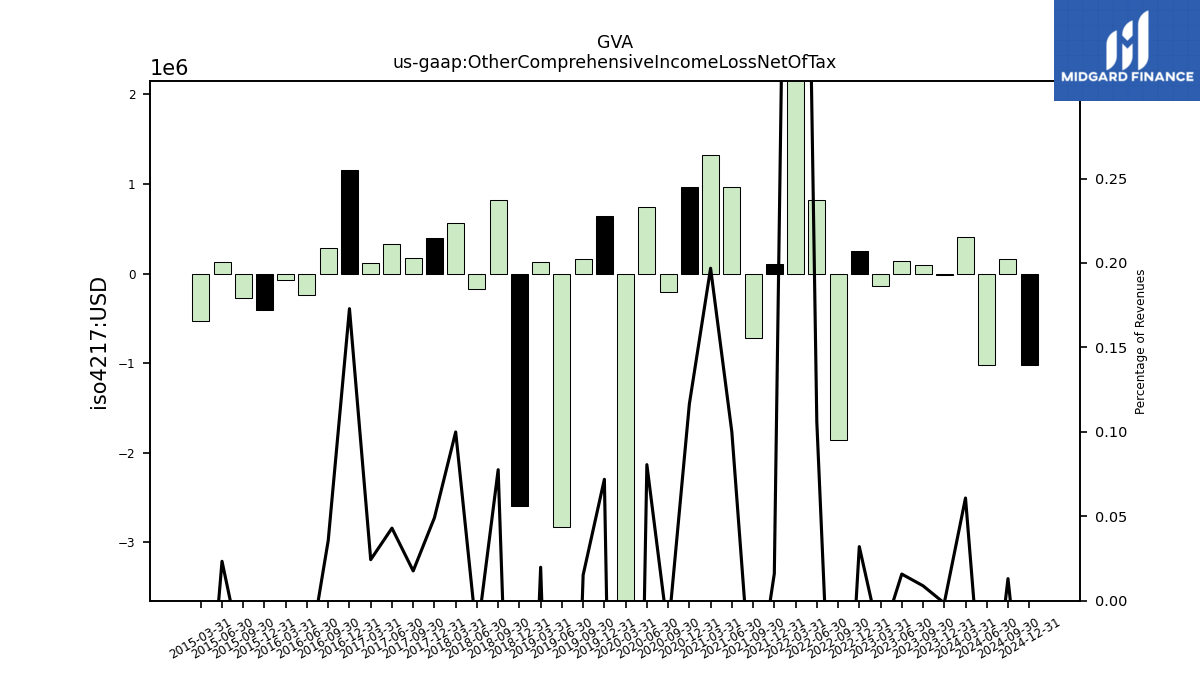
| Other Comprehensive Income Loss Net Of Tax | 0.41 | -0.01 | 0.10 | 0.14 | -0.14 | 0.25 | -1.85 | 0.81 | 4.93 | 0.11 | -0.72 | 0.96 | 1.32 | 0.97 | -0.20 | 0.74 | -3.89 | 0.64 | 0.17 | -2.82 | 0.12 | -2.59 | 0.82 | -0.17 | 0.56 | 0.39 | 0.17 | 0.33 | 0.11 | 1.15 | 0.29 | -0.24 | -0.07 | -0.40 | -0.27 | 0.13 | -0.53 | NA | NA | NA | NA | NA | NA | NA | NA | NA | NA | NA | NA | NA | NA | NA | NA | NA | NA | NA | NA | |
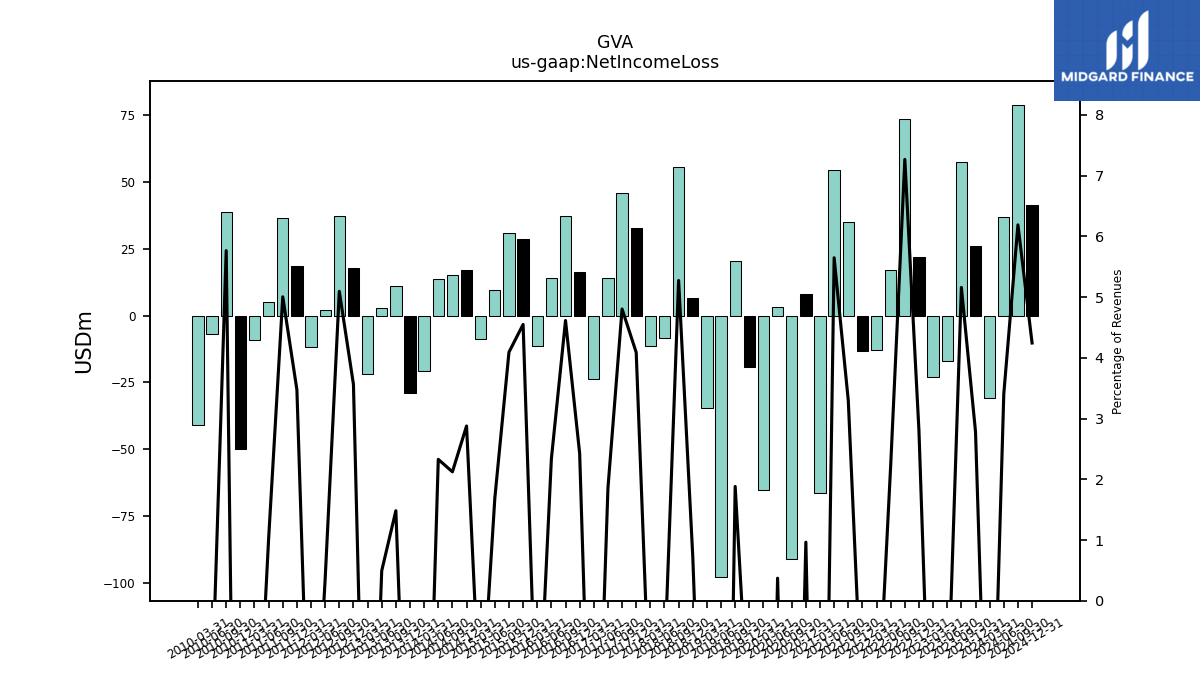
| Net Income Loss | -30.98 | 26.00 | 57.62 | -17.00 | -23.02 | 22.05 | 73.39 | 17.15 | -12.94 | -13.21 | 35.04 | 54.46 | -66.19 | 8.01 | -91.16 | 3.40 | -65.37 | -19.38 | 20.49 | -97.84 | -34.57 | 6.55 | 55.67 | -8.38 | -11.42 | 32.77 | 45.98 | 14.13 | -23.79 | 16.17 | 37.10 | 14.13 | -11.19 | 28.67 | 30.76 | 9.61 | -8.56 | 16.98 | 15.28 | 13.64 | -20.55 | -28.90 | 11.00 | 2.72 | -21.98 | 17.99 | 37.12 | 1.95 | -11.77 | 18.75 | 36.47 | 4.95 | -9.01 | -50.02 | 38.68 | -6.69 | -40.95 | |
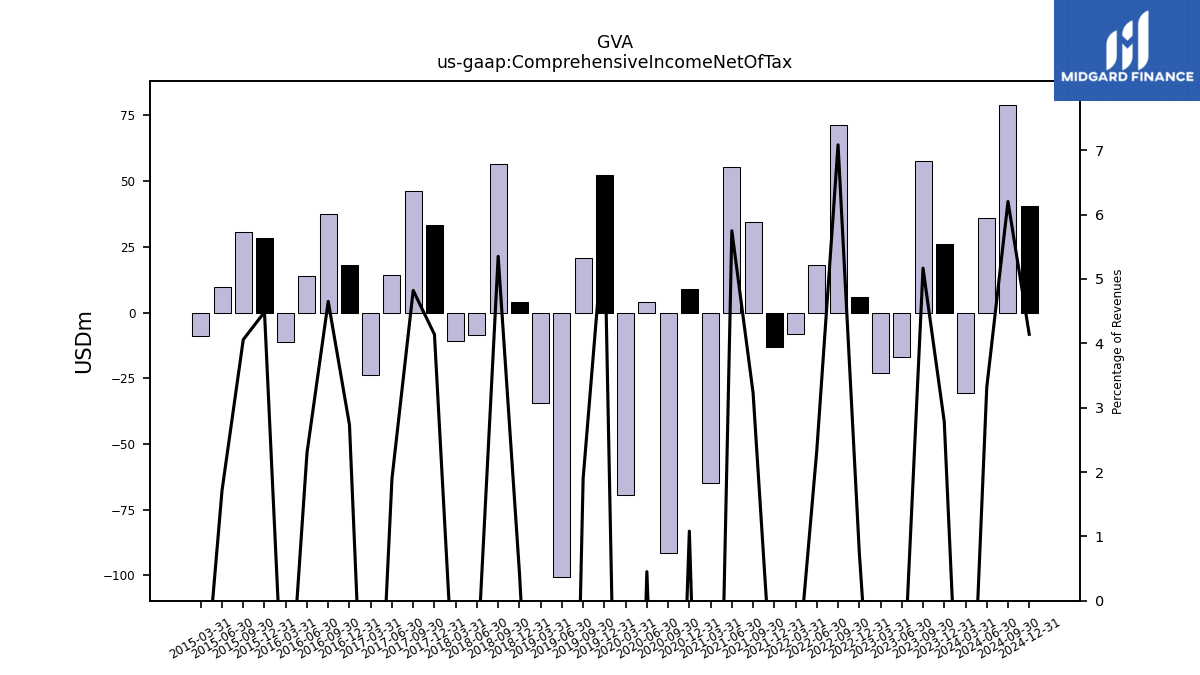
| Comprehensive Income Net Of Tax | -30.57 | 25.98 | 57.72 | -16.86 | -23.16 | 5.95 | 71.54 | 17.97 | -8.01 | -13.10 | 34.33 | 55.42 | -64.88 | 8.98 | -91.36 | 4.14 | -69.26 | 52.37 | 20.65 | -100.66 | -34.45 | 3.95 | 56.49 | -8.56 | -10.86 | 33.17 | 46.15 | 14.46 | -23.68 | 18.23 | 37.39 | 13.89 | -11.26 | 28.27 | 30.49 | 9.75 | -9.09 | NA | NA | NA | NA | NA | NA | NA | NA | NA | NA | NA | NA | NA | NA | NA | NA | NA | NA | NA | NA | |
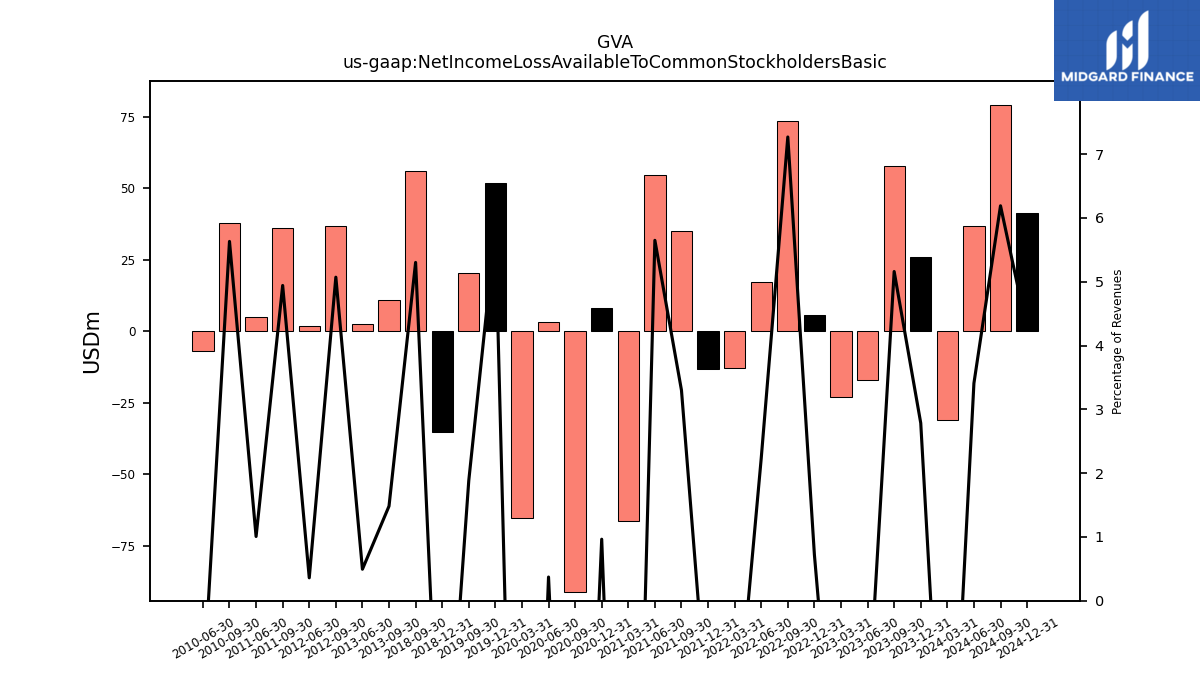
| Net Income Loss Available To Common Stockholders Basic | -30.98 | 26.00 | 57.62 | -17.00 | -23.02 | 5.70 | 73.39 | 17.15 | -12.94 | -13.21 | 35.04 | 54.46 | -66.19 | 8.01 | -91.16 | 3.40 | -65.37 | 51.73 | 20.49 | NA | NA | -35.28 | 55.97 | NA | NA | NA | NA | NA | NA | NA | NA | NA | NA | NA | NA | NA | NA | NA | NA | NA | NA | NA | 11.00 | 2.72 | NA | NA | 36.94 | 1.94 | NA | NA | 36.00 | 4.88 | NA | NA | 37.78 | -6.69 | NA | |
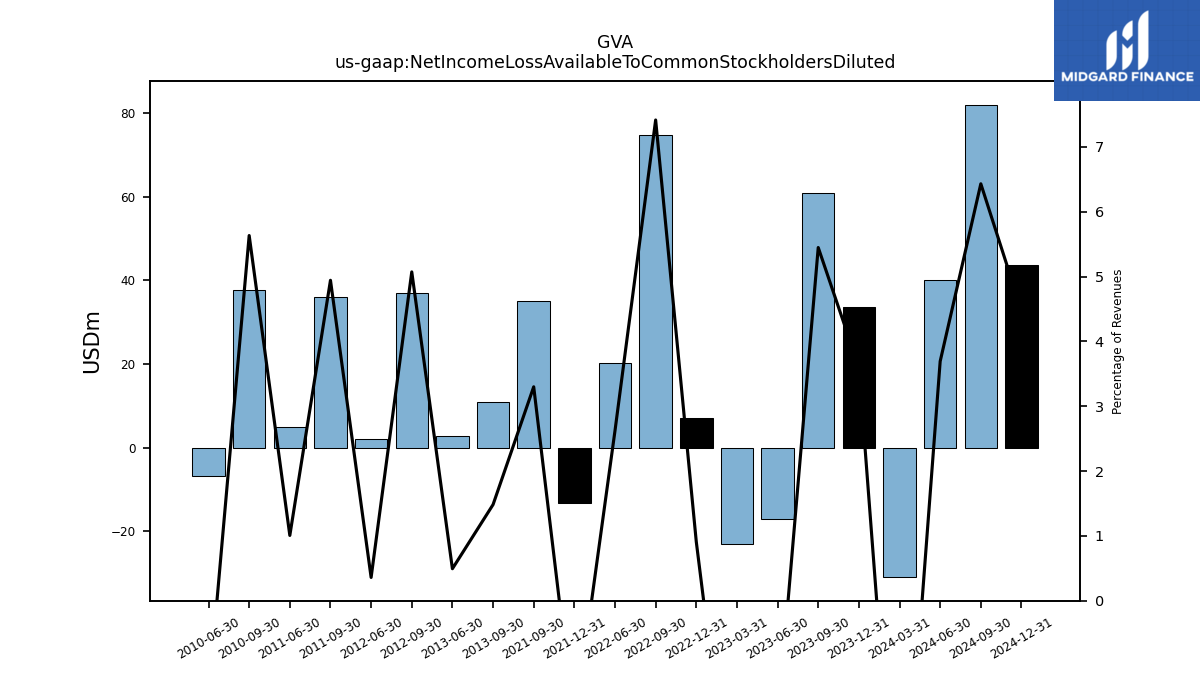
| Net Income Loss Available To Common Stockholders Diluted | -30.98 | 33.62 | 60.83 | -17.00 | -23.02 | 7.17 | 74.87 | 20.15 | NA | -13.21 | 35.04 | NA | NA | NA | NA | NA | NA | NA | NA | NA | NA | NA | NA | NA | NA | NA | NA | NA | NA | NA | NA | NA | NA | NA | NA | NA | NA | NA | NA | NA | NA | NA | 11.00 | 2.72 | NA | NA | 36.94 | 1.94 | NA | NA | 36.01 | 4.88 | NA | NA | 37.78 | -6.69 | NA |
| 2024-03-31 | 2023-12-31 | 2023-09-30 | 2023-06-30 | 2023-03-31 | 2022-12-31 | 2022-09-30 | 2022-06-30 | 2022-03-31 | 2021-12-31 | 2021-09-30 | 2021-06-30 | 2021-03-31 | 2020-12-31 | 2020-09-30 | 2020-06-30 | 2020-03-31 | 2019-12-31 | 2019-09-30 | 2019-06-30 | 2019-03-31 | 2018-12-31 | 2018-09-30 | 2018-06-30 | 2018-03-31 | 2017-12-31 | 2017-09-30 | 2017-06-30 | 2017-03-31 | 2016-12-31 | 2016-09-30 | 2016-06-30 | 2016-03-31 | 2015-12-31 | 2015-09-30 | 2015-06-30 | 2015-03-31 | 2014-12-31 | 2014-09-30 | 2014-06-30 | 2014-03-31 | 2013-12-31 | 2013-09-30 | 2013-06-30 | 2013-03-31 | 2012-12-31 | 2012-09-30 | 2012-06-30 | 2012-03-31 | 2011-12-31 | 2011-09-30 | 2011-06-30 | 2011-03-31 | 2010-12-31 | 2010-09-30 | 2010-06-30 | 2010-03-31 | ||
|---|---|---|---|---|---|---|---|---|---|---|---|---|---|---|---|---|---|---|---|---|---|---|---|---|---|---|---|---|---|---|---|---|---|---|---|---|---|---|---|---|---|---|---|---|---|---|---|---|---|---|---|---|---|---|---|---|---|---|
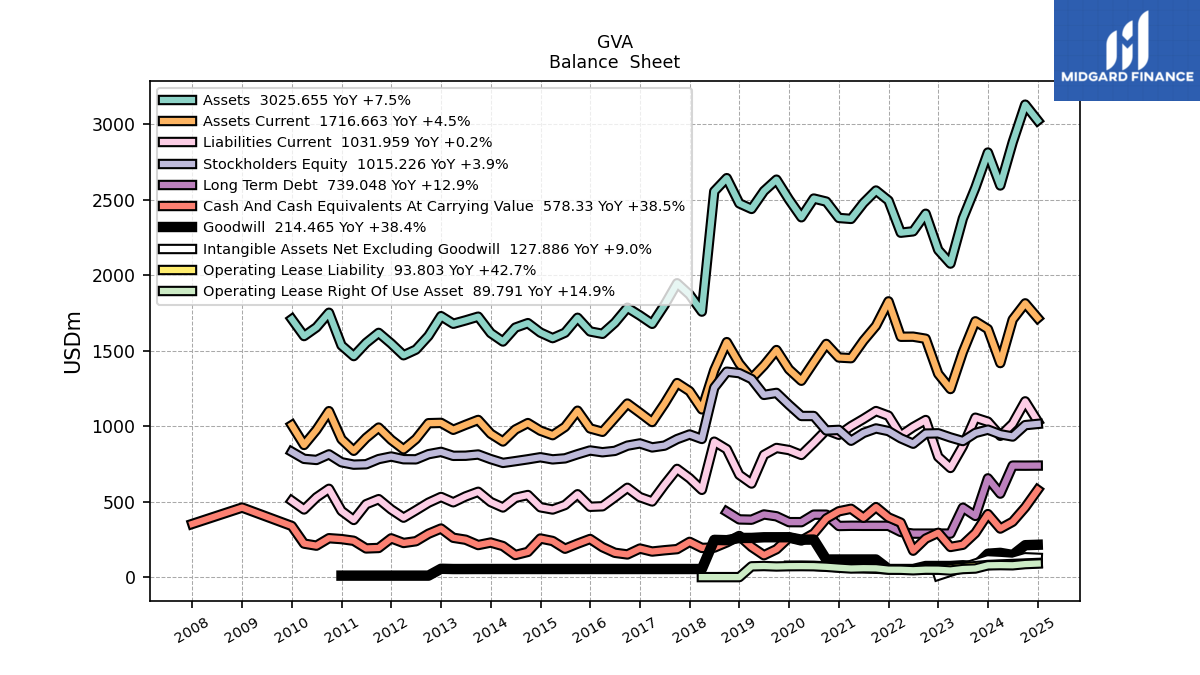
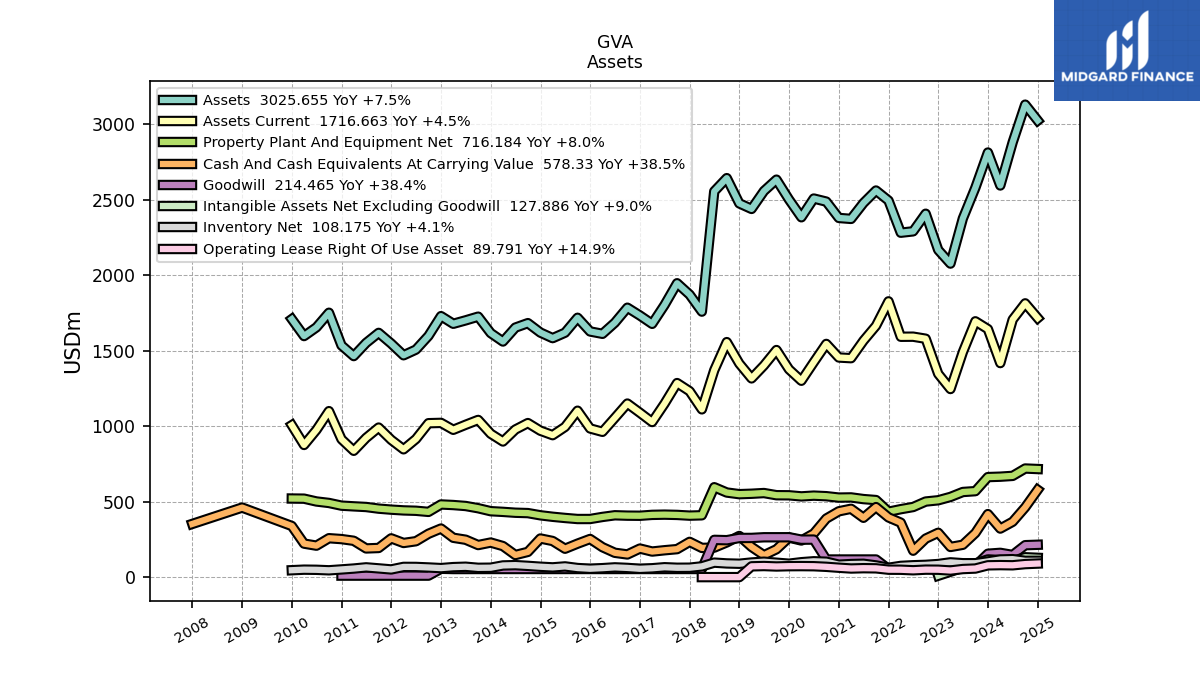
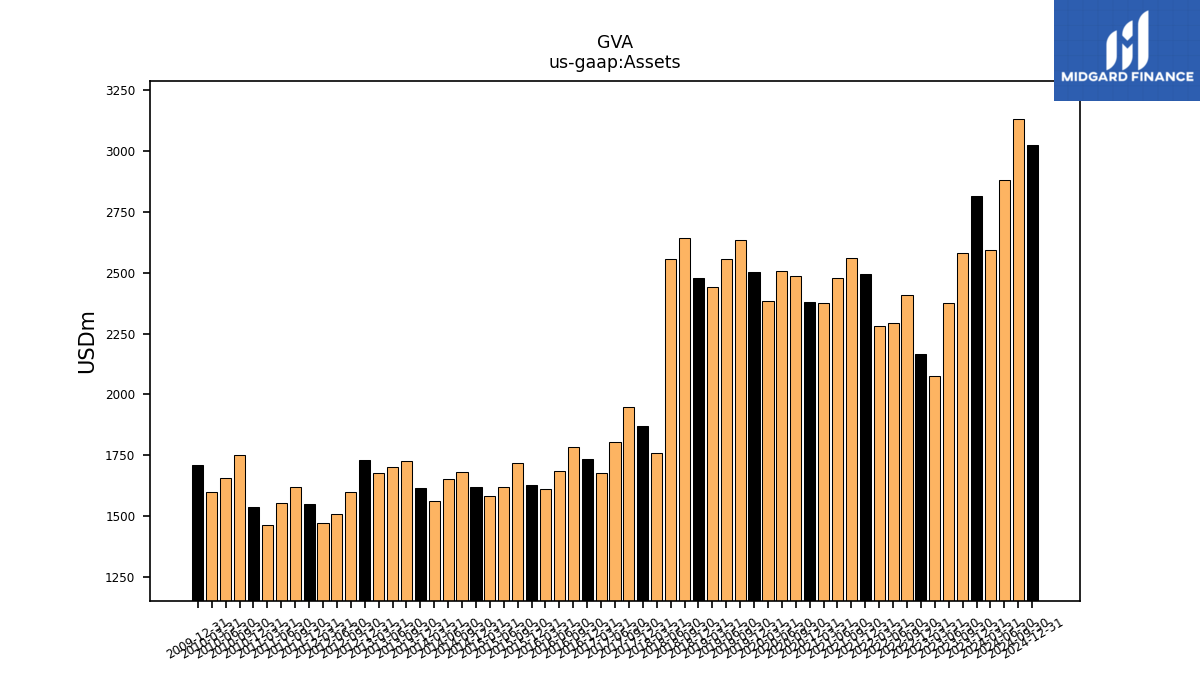
| Assets | 2595.03 | 2813.54 | 2580.32 | 2376.58 | 2077.39 | 2167.93 | 2407.96 | 2291.33 | 2282.14 | 2494.93 | 2561.76 | 2478.90 | 2373.68 | 2380.00 | 2488.27 | 2508.65 | 2384.38 | 2502.09 | 2633.77 | 2558.14 | 2439.78 | 2476.60 | 2643.85 | 2556.32 | 1759.23 | 1871.98 | 1947.29 | 1803.14 | 1678.22 | 1733.45 | 1785.27 | 1685.83 | 1612.23 | 1627.86 | 1718.71 | 1619.69 | 1583.53 | 1620.49 | 1683.04 | 1653.39 | 1561.17 | 1617.15 | 1726.00 | 1701.40 | 1678.71 | 1729.49 | 1598.63 | 1507.65 | 1469.95 | 1547.80 | 1618.47 | 1551.95 | 1464.59 | 1535.53 | 1751.97 | 1655.18 | 1597.25 | |
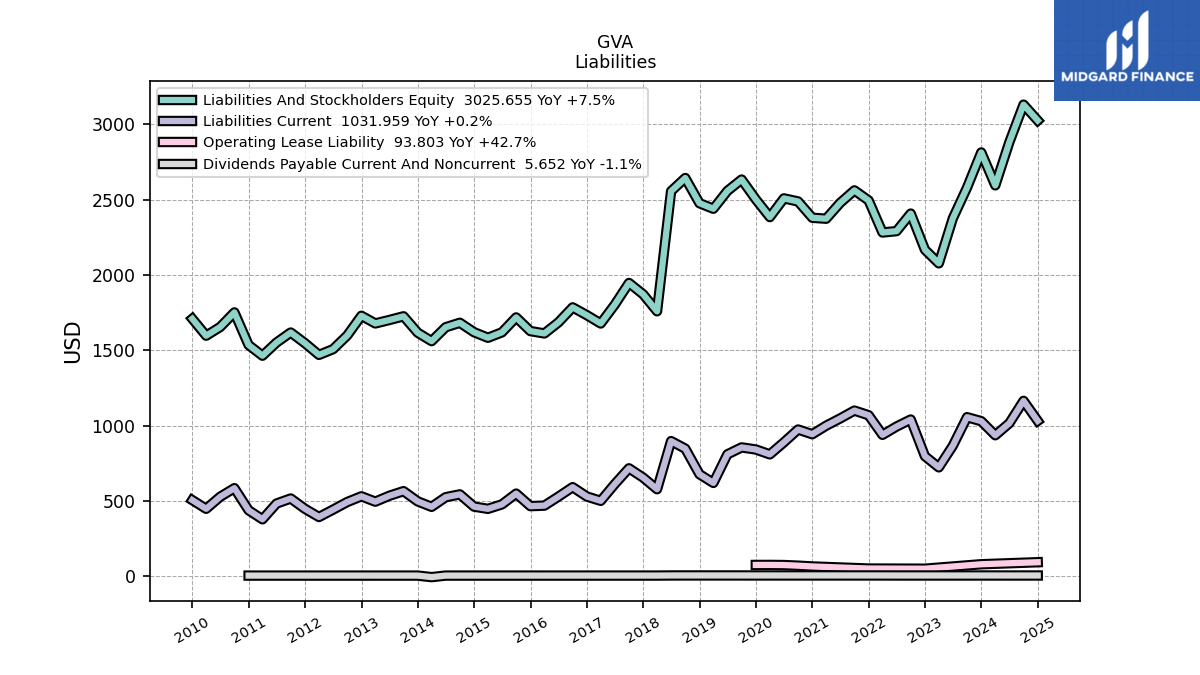
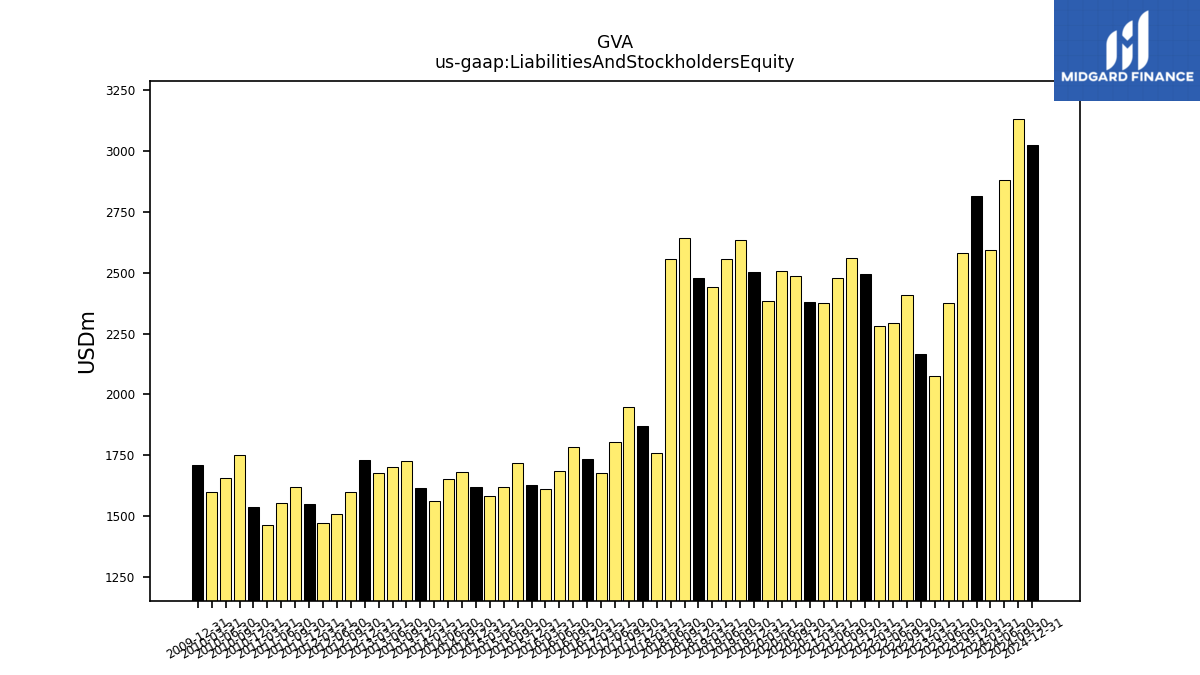
| Liabilities And Stockholders Equity | 2595.03 | 2813.54 | 2580.32 | 2376.58 | 2077.39 | 2167.93 | 2407.96 | 2291.33 | 2282.14 | 2494.93 | 2561.76 | 2478.90 | 2373.68 | 2380.00 | 2488.27 | 2508.65 | 2384.38 | 2502.09 | 2633.77 | 2558.14 | 2439.78 | 2476.60 | 2643.85 | 2556.32 | 1759.23 | 1871.98 | 1947.29 | 1803.14 | 1678.22 | 1733.45 | 1785.27 | 1685.83 | 1612.23 | 1627.86 | 1718.71 | 1619.69 | 1583.53 | 1620.49 | 1683.04 | 1653.39 | 1561.17 | 1617.15 | 1726.00 | 1701.40 | 1678.71 | 1729.49 | 1598.63 | 1507.65 | 1469.95 | 1547.80 | 1618.47 | 1551.95 | 1464.59 | 1535.53 | 1751.97 | 1655.18 | 1597.25 | |
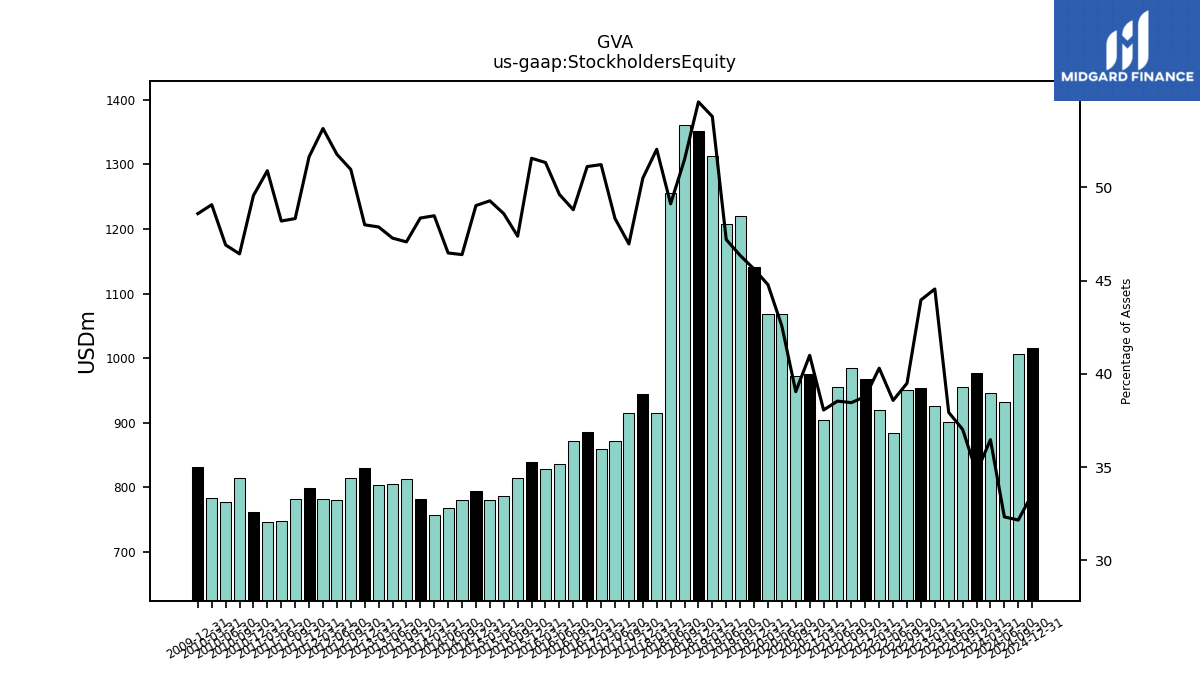
| Stockholders Equity | 946.46 | 977.30 | 955.35 | 901.54 | 925.46 | 953.02 | 951.12 | 883.92 | 919.84 | 967.68 | 985.18 | 955.38 | 903.54 | 975.66 | 971.61 | 1067.72 | 1067.75 | 1141.47 | 1220.71 | 1207.41 | 1312.44 | 1351.63 | 1361.29 | 1255.58 | 915.44 | 945.11 | 914.56 | 871.40 | 859.52 | 885.99 | 871.15 | 836.48 | 827.53 | 839.24 | 814.29 | 786.97 | 780.29 | 794.38 | 780.80 | 768.48 | 756.77 | 781.94 | 812.51 | 804.37 | 803.68 | 829.95 | 814.58 | 780.48 | 781.28 | 799.20 | 782.11 | 747.90 | 745.29 | 761.03 | 813.45 | 776.40 | 783.71 |
| 2024-03-31 | 2023-12-31 | 2023-09-30 | 2023-06-30 | 2023-03-31 | 2022-12-31 | 2022-09-30 | 2022-06-30 | 2022-03-31 | 2021-12-31 | 2021-09-30 | 2021-06-30 | 2021-03-31 | 2020-12-31 | 2020-09-30 | 2020-06-30 | 2020-03-31 | 2019-12-31 | 2019-09-30 | 2019-06-30 | 2019-03-31 | 2018-12-31 | 2018-09-30 | 2018-06-30 | 2018-03-31 | 2017-12-31 | 2017-09-30 | 2017-06-30 | 2017-03-31 | 2016-12-31 | 2016-09-30 | 2016-06-30 | 2016-03-31 | 2015-12-31 | 2015-09-30 | 2015-06-30 | 2015-03-31 | 2014-12-31 | 2014-09-30 | 2014-06-30 | 2014-03-31 | 2013-12-31 | 2013-09-30 | 2013-06-30 | 2013-03-31 | 2012-12-31 | 2012-09-30 | 2012-06-30 | 2012-03-31 | 2011-12-31 | 2011-09-30 | 2011-06-30 | 2011-03-31 | 2010-12-31 | 2010-09-30 | 2010-06-30 | 2010-03-31 | ||
|---|---|---|---|---|---|---|---|---|---|---|---|---|---|---|---|---|---|---|---|---|---|---|---|---|---|---|---|---|---|---|---|---|---|---|---|---|---|---|---|---|---|---|---|---|---|---|---|---|---|---|---|---|---|---|---|---|---|---|
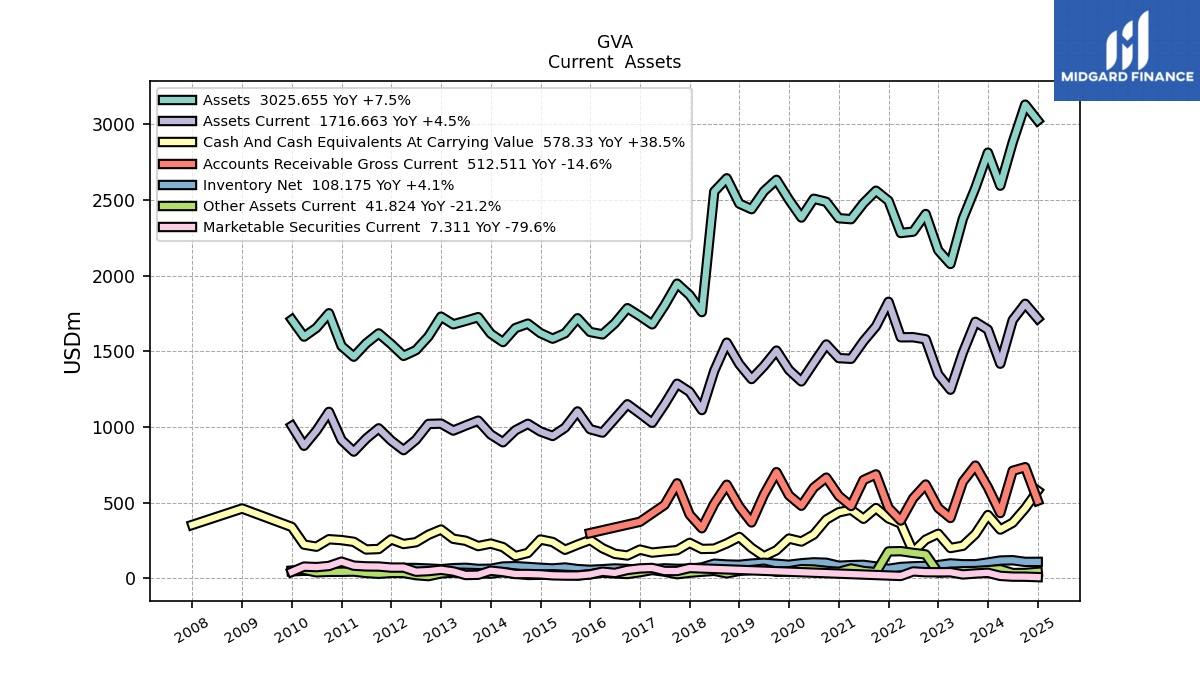
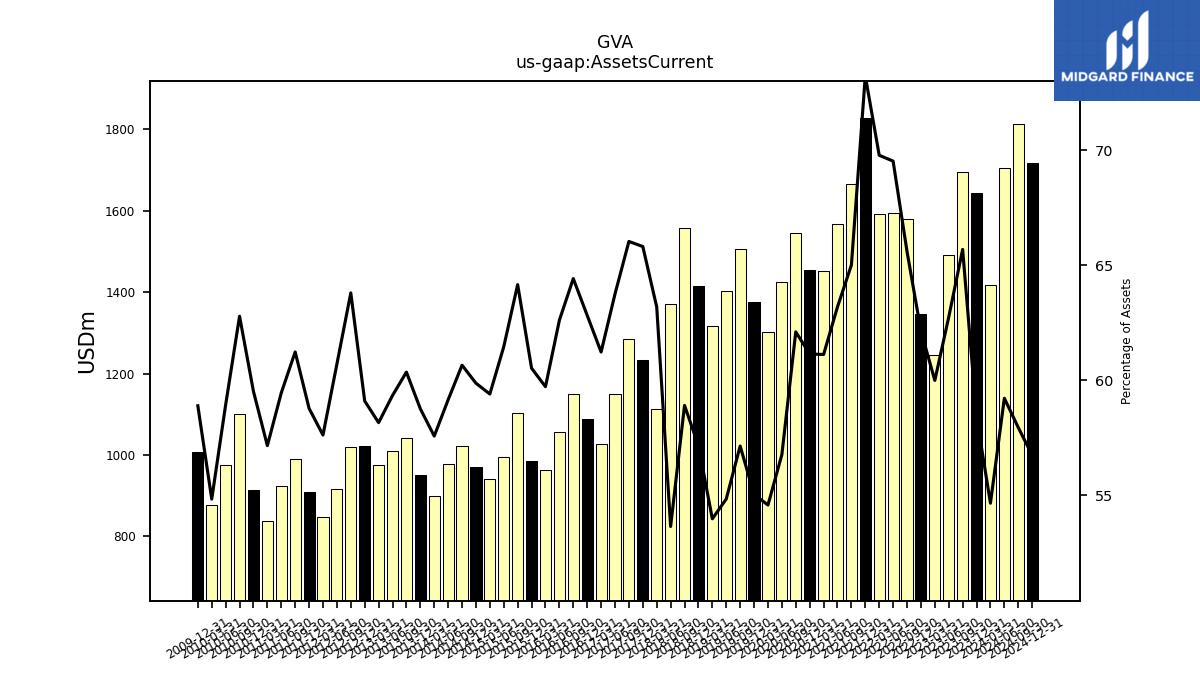
| Assets Current | 1418.11 | 1643.45 | 1695.05 | 1491.19 | 1246.23 | 1347.30 | 1579.69 | 1593.28 | 1592.73 | 1827.40 | 1665.43 | 1566.43 | 1450.74 | 1455.25 | 1545.30 | 1423.94 | 1301.06 | 1376.94 | 1504.81 | 1402.61 | 1316.72 | 1415.39 | 1557.28 | 1371.03 | 1111.63 | 1232.08 | 1285.97 | 1149.56 | 1027.53 | 1088.99 | 1150.11 | 1055.50 | 962.78 | 985.22 | 1102.74 | 995.41 | 940.58 | 970.18 | 1020.83 | 977.92 | 898.73 | 950.20 | 1041.67 | 1009.53 | 976.22 | 1022.06 | 1019.91 | 915.16 | 846.89 | 909.72 | 990.99 | 922.61 | 837.04 | 913.86 | 1099.98 | 975.36 | 875.70 | |
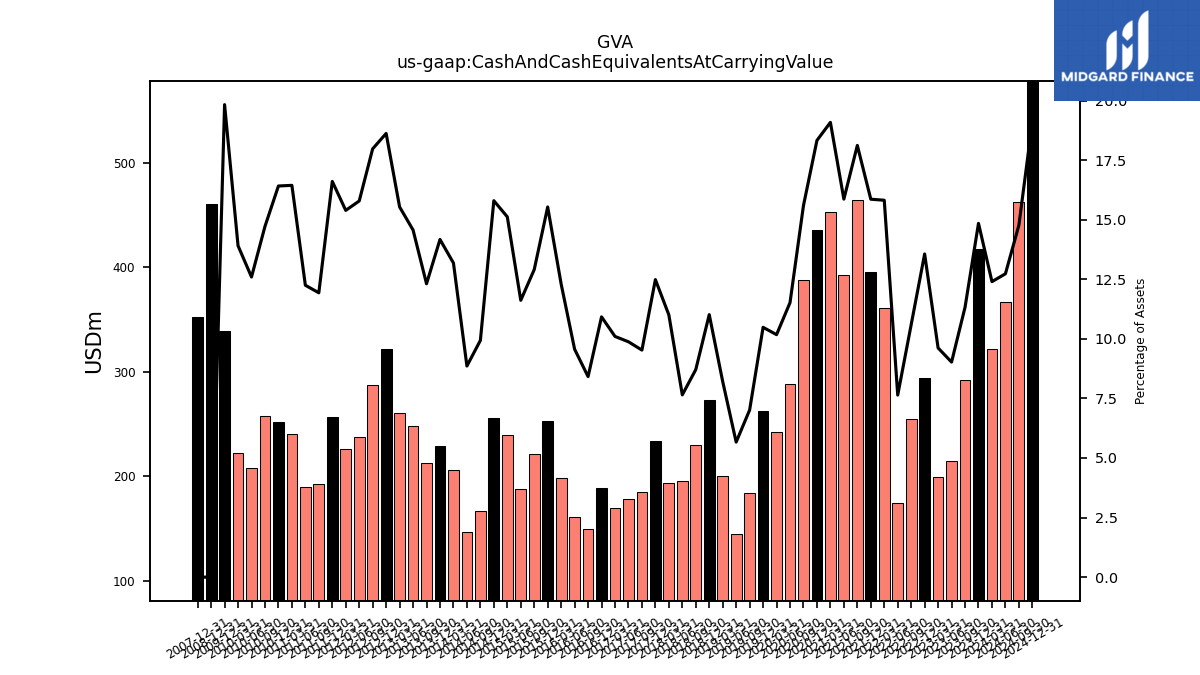
| Cash And Cash Equivalents At Carrying Value | 321.75 | 417.66 | 292.12 | 214.45 | 199.75 | 293.99 | 255.08 | 175.02 | 360.91 | 395.65 | 464.05 | 393.18 | 452.93 | 436.14 | 388.02 | 288.92 | 242.60 | 262.27 | 184.67 | 144.96 | 200.26 | 272.80 | 230.26 | 195.51 | 193.58 | 233.71 | 185.52 | 178.07 | 169.50 | 189.33 | 150.22 | 161.22 | 198.30 | 252.84 | 221.78 | 188.15 | 239.40 | 255.96 | 167.17 | 146.46 | 205.78 | 229.12 | 212.46 | 247.83 | 260.77 | 321.99 | 287.32 | 237.95 | 226.23 | 256.99 | 193.10 | 190.07 | 240.77 | 252.02 | 257.85 | 208.45 | 222.09 | |
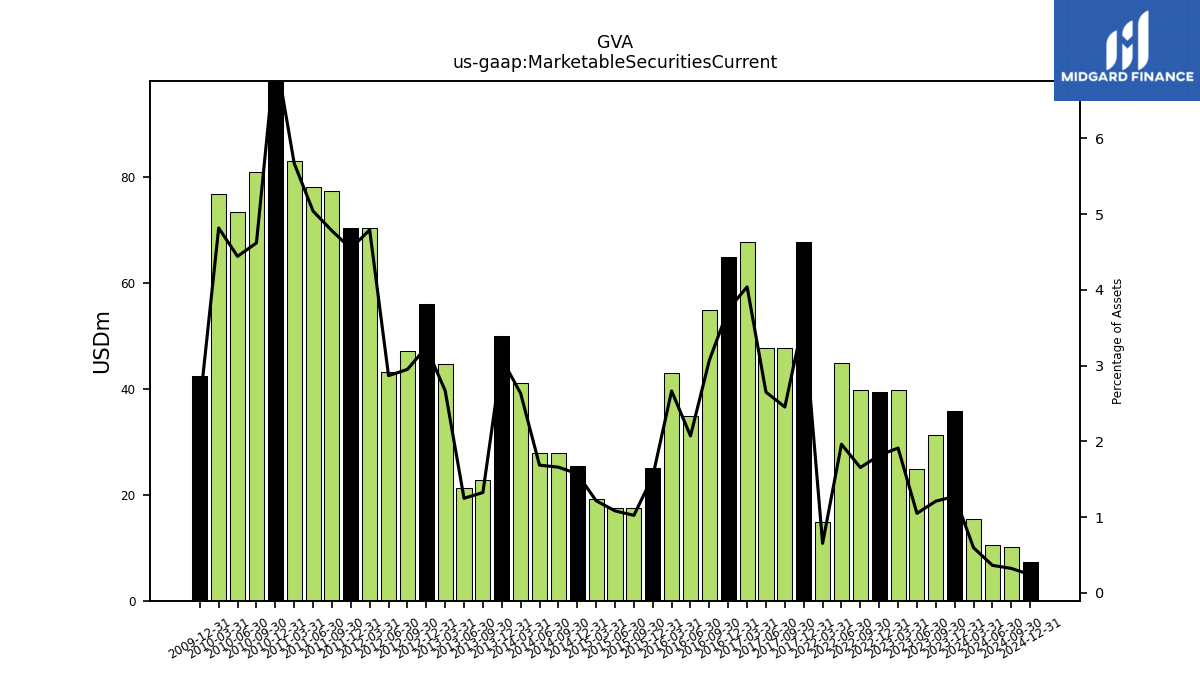
| Marketable Securities Current | 15.50 | 35.86 | 31.28 | 24.98 | 39.75 | 39.37 | 39.87 | 45.00 | 14.95 | NA | NA | NA | NA | NA | NA | NA | NA | NA | NA | NA | NA | NA | NA | NA | NA | 67.78 | 47.81 | 47.82 | 67.82 | 64.88 | 54.86 | 34.96 | 43.00 | 25.04 | 17.61 | 17.56 | 19.28 | 25.50 | 27.95 | 27.90 | 41.14 | 49.97 | 22.89 | 21.27 | 44.84 | 56.09 | 47.19 | 43.26 | 70.44 | 70.41 | 77.39 | 78.25 | 83.08 | 109.45 | 80.96 | 73.57 | 76.96 | |
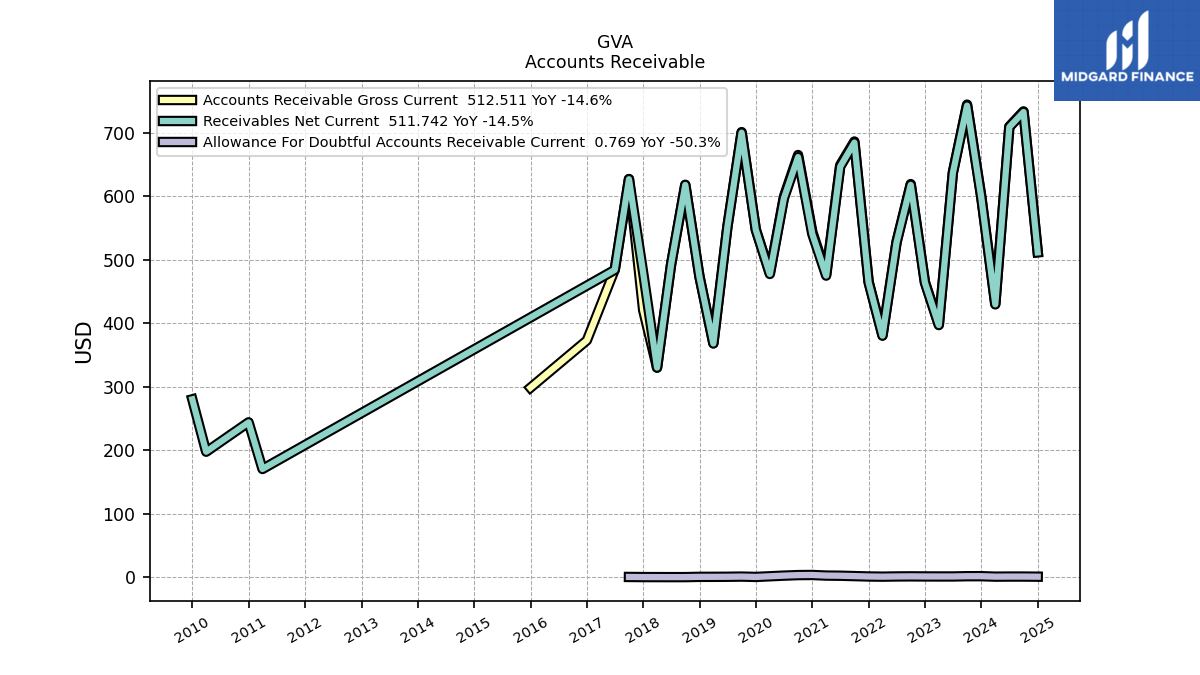
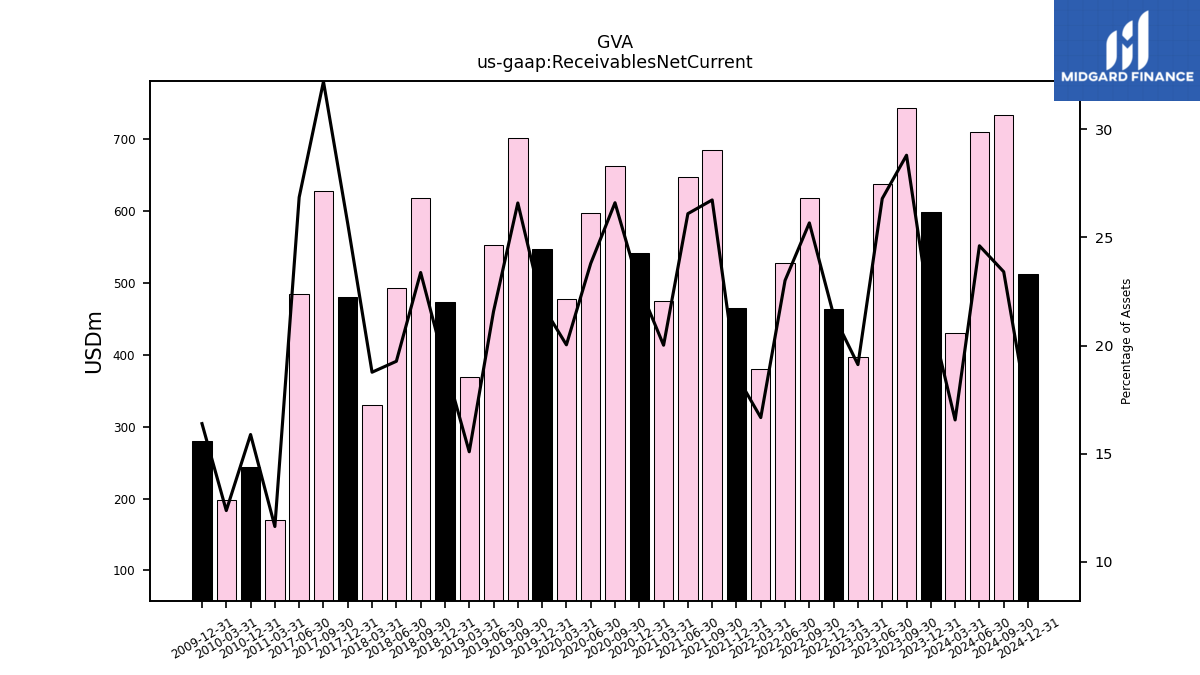
| Receivables Net Current | 429.83 | 598.71 | 743.09 | 636.80 | 397.23 | 463.99 | 618.14 | 527.28 | 380.50 | 464.59 | 684.82 | 646.94 | 475.16 | 540.81 | 661.95 | 596.92 | 477.72 | 547.42 | 700.39 | 551.96 | 368.21 | 473.25 | 618.07 | 492.72 | 330.19 | 479.79 | 627.08 | 484.25 | NA | NA | NA | NA | NA | NA | NA | NA | NA | NA | NA | NA | NA | NA | NA | NA | NA | NA | NA | NA | NA | NA | NA | NA | 170.44 | 243.99 | NA | NA | 197.66 | |
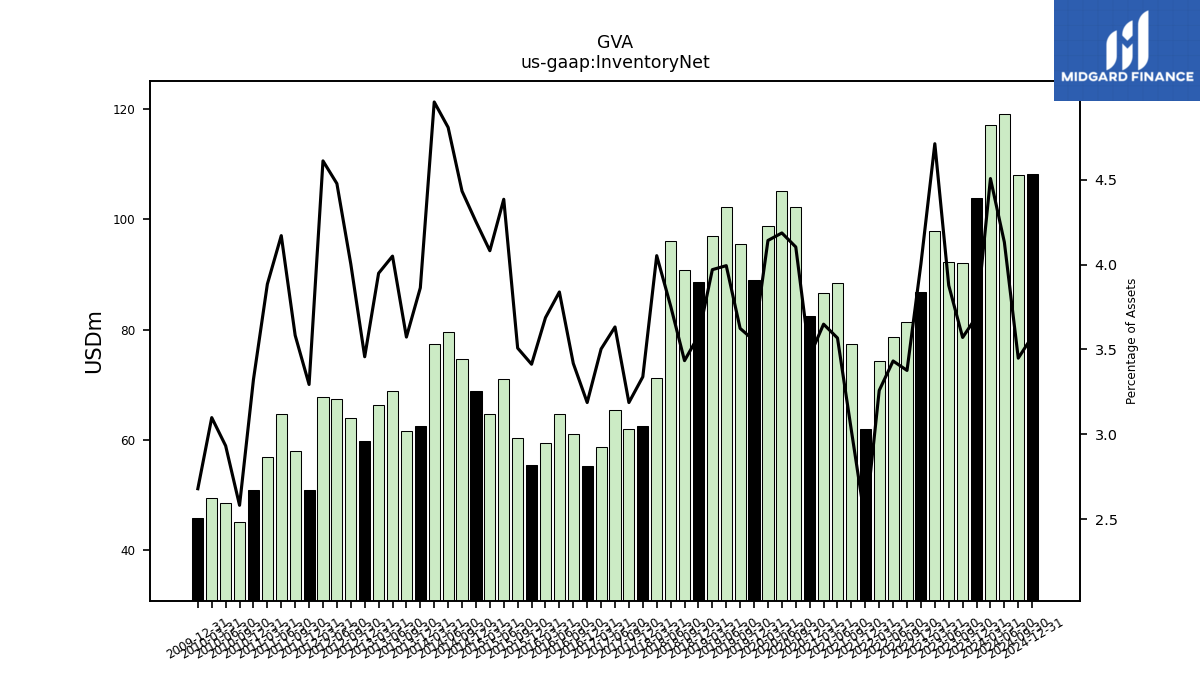
| Inventory Net | 116.96 | 103.90 | 92.13 | 92.15 | 97.89 | 86.81 | 81.30 | 78.63 | 74.36 | 61.97 | 77.41 | 88.42 | 86.61 | 82.36 | 102.11 | 105.02 | 98.77 | 88.89 | 95.44 | 102.16 | 96.86 | 88.62 | 90.79 | 96.02 | 71.30 | 62.50 | 62.06 | 65.50 | 58.78 | 55.24 | 61.02 | 64.71 | 59.44 | 55.55 | 60.29 | 71.02 | 64.64 | 68.92 | 74.61 | 79.50 | 77.41 | 62.47 | 61.67 | 68.91 | 66.29 | 59.78 | 64.00 | 67.50 | 67.78 | 50.98 | 57.99 | 64.73 | 56.90 | 51.02 | 45.22 | 48.53 | 49.48 | |
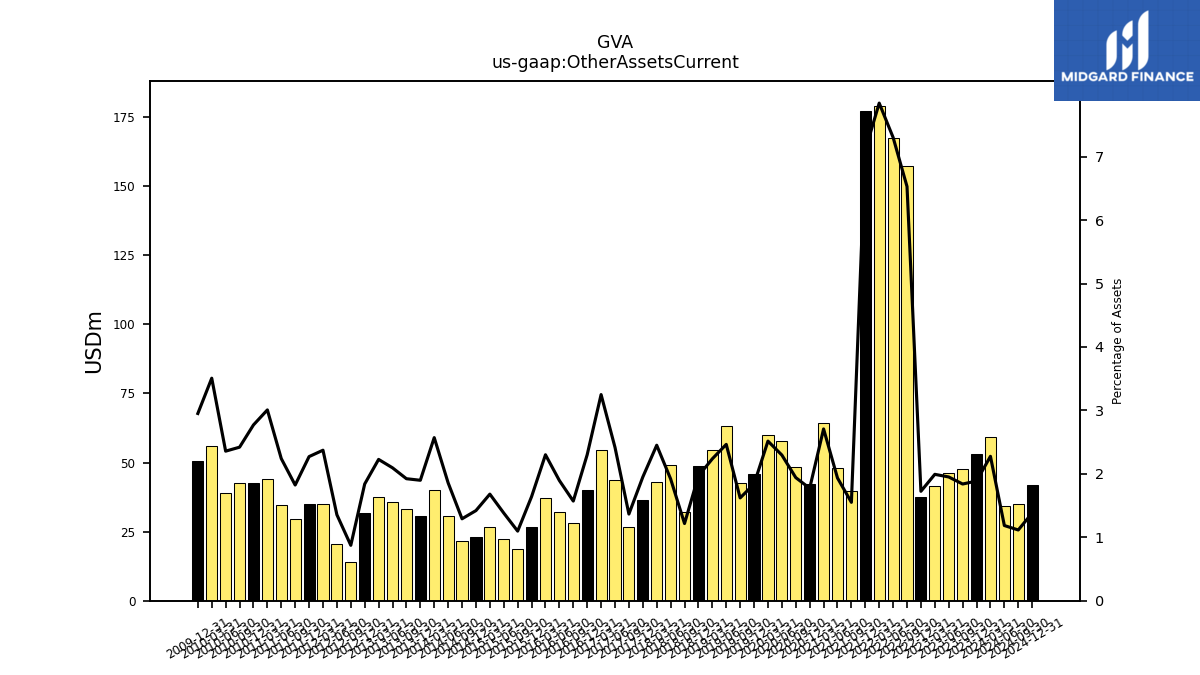
| Other Assets Current | 59.08 | 53.10 | 47.48 | 46.38 | 41.40 | 37.41 | 157.23 | 167.35 | 179.02 | 177.21 | 39.75 | 47.98 | 64.29 | 42.20 | 48.30 | 57.61 | 60.00 | 46.02 | 42.70 | 63.06 | 54.59 | 48.73 | 32.19 | 49.10 | 43.12 | 36.51 | 26.61 | 43.60 | 54.54 | 39.91 | 28.05 | 31.95 | 37.10 | 26.71 | 18.86 | 22.39 | 26.61 | 23.03 | 21.74 | 30.73 | 40.14 | 30.71 | 33.20 | 35.65 | 37.40 | 31.83 | 13.97 | 20.44 | 34.88 | 35.17 | 29.53 | 34.78 | 44.06 | 42.55 | 42.41 | 39.03 | 56.03 |
| 2024-03-31 | 2023-12-31 | 2023-09-30 | 2023-06-30 | 2023-03-31 | 2022-12-31 | 2022-09-30 | 2022-06-30 | 2022-03-31 | 2021-12-31 | 2021-09-30 | 2021-06-30 | 2021-03-31 | 2020-12-31 | 2020-09-30 | 2020-06-30 | 2020-03-31 | 2019-12-31 | 2019-09-30 | 2019-06-30 | 2019-03-31 | 2018-12-31 | 2018-09-30 | 2018-06-30 | 2018-03-31 | 2017-12-31 | 2017-09-30 | 2017-06-30 | 2017-03-31 | 2016-12-31 | 2016-09-30 | 2016-06-30 | 2016-03-31 | 2015-12-31 | 2015-09-30 | 2015-06-30 | 2015-03-31 | 2014-12-31 | 2014-09-30 | 2014-06-30 | 2014-03-31 | 2013-12-31 | 2013-09-30 | 2013-06-30 | 2013-03-31 | 2012-12-31 | 2012-09-30 | 2012-06-30 | 2012-03-31 | 2011-12-31 | 2011-09-30 | 2011-06-30 | 2011-03-31 | 2010-12-31 | 2010-09-30 | 2010-06-30 | 2010-03-31 | ||
|---|---|---|---|---|---|---|---|---|---|---|---|---|---|---|---|---|---|---|---|---|---|---|---|---|---|---|---|---|---|---|---|---|---|---|---|---|---|---|---|---|---|---|---|---|---|---|---|---|---|---|---|---|---|---|---|---|---|---|
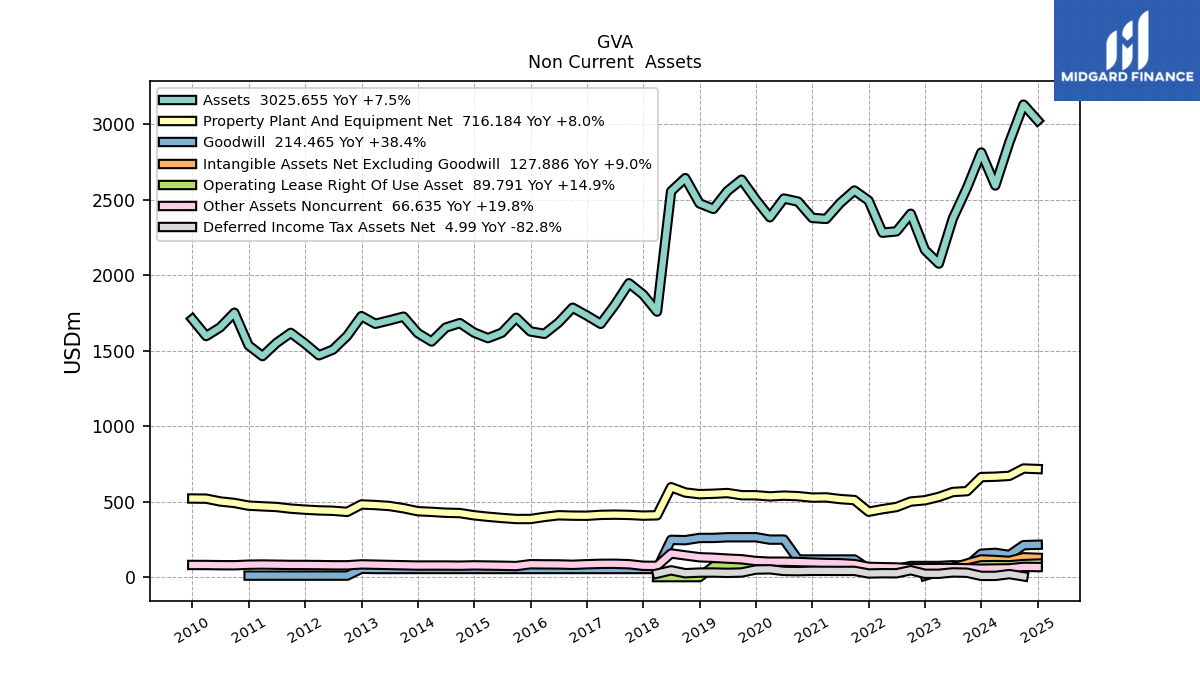
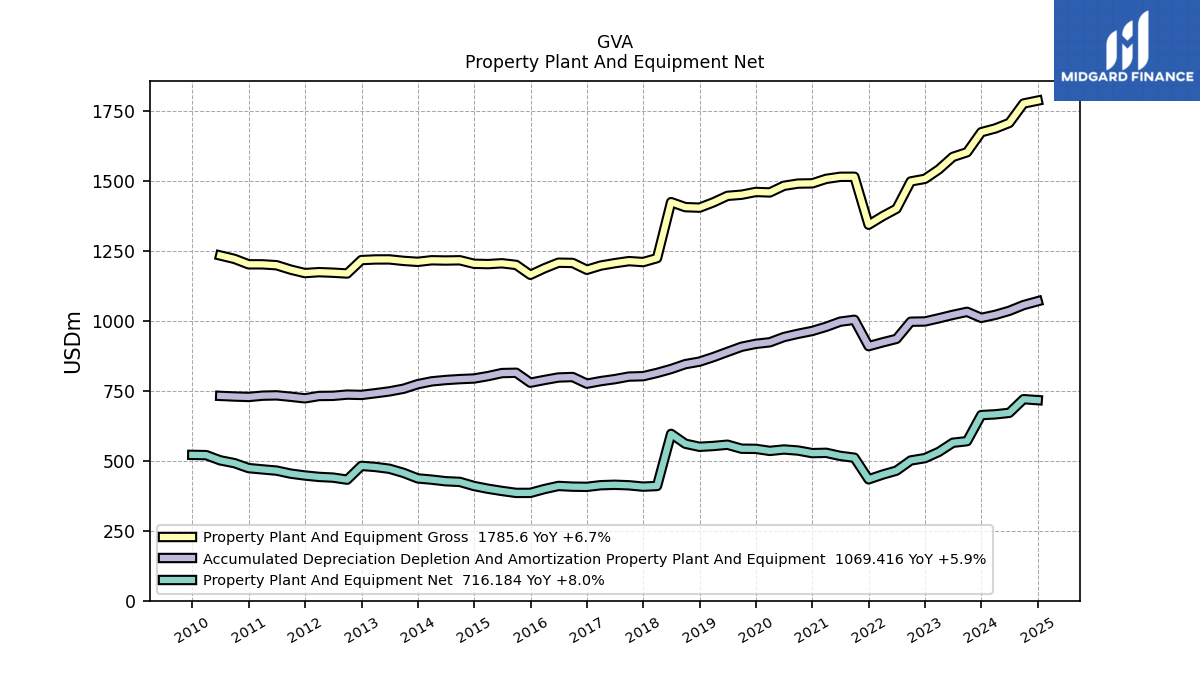
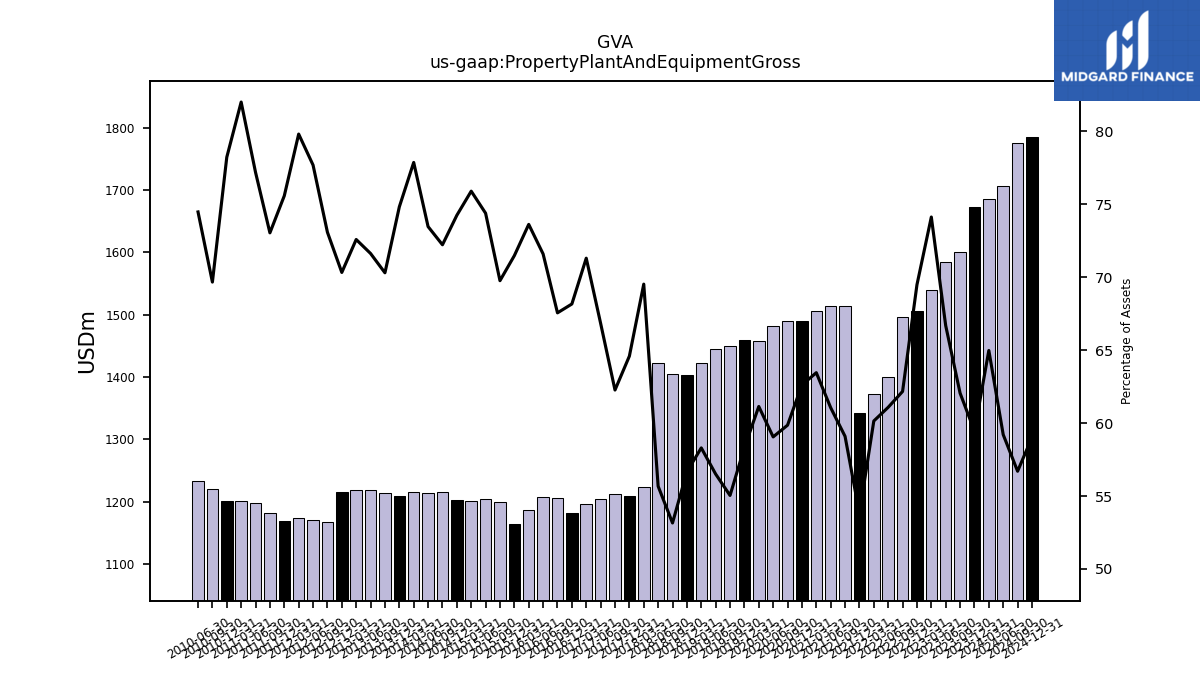
| Property Plant And Equipment Gross | 1686.19 | 1672.76 | 1601.23 | 1584.72 | 1539.88 | 1506.30 | 1497.02 | 1399.63 | 1372.60 | 1342.39 | 1513.79 | 1513.54 | 1506.24 | 1490.22 | 1489.40 | 1481.47 | 1457.75 | 1459.48 | 1449.64 | 1445.52 | 1422.39 | 1403.36 | 1405.31 | 1423.15 | 1223.11 | 1209.14 | 1212.53 | 1205.20 | 1196.62 | 1181.58 | 1206.07 | 1206.96 | 1186.93 | 1163.57 | 1199.01 | 1204.82 | 1201.86 | 1203.10 | 1215.55 | 1214.72 | 1215.62 | 1209.98 | 1213.42 | 1218.64 | 1218.49 | 1216.30 | 1168.30 | 1171.24 | 1173.18 | 1169.83 | 1182.15 | 1197.91 | 1201.06 | 1201.18 | 1220.53 | 1232.68 | NA | |
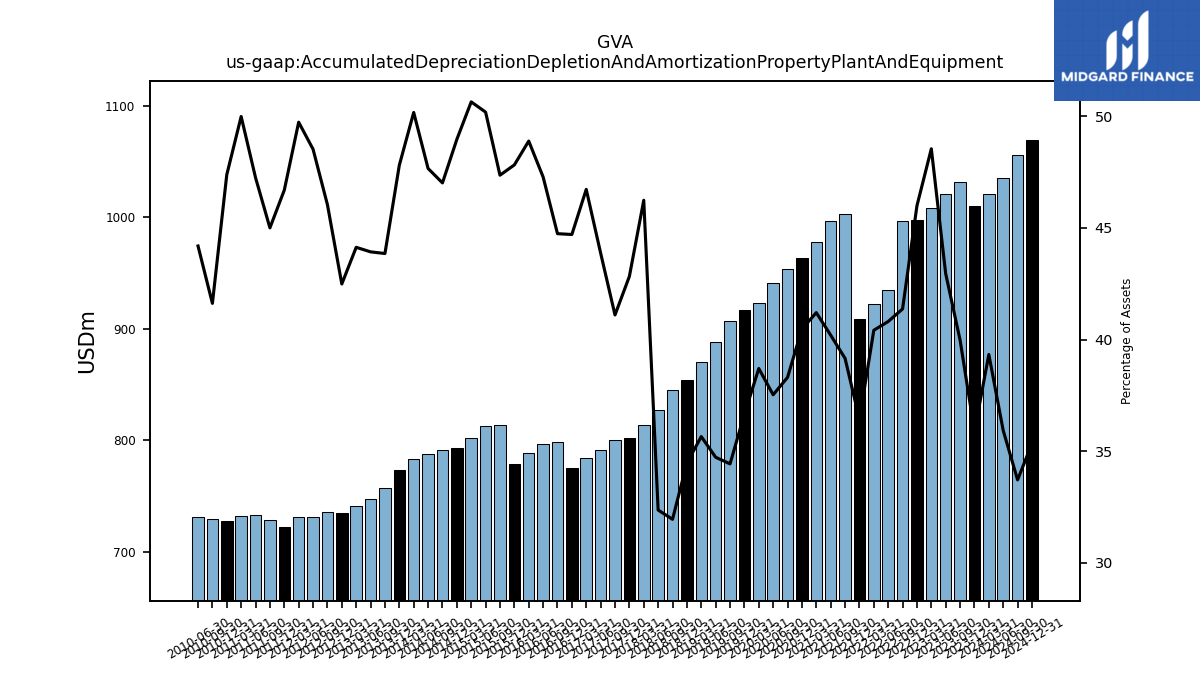
| Accumulated Depreciation Depletion And Amortization Property Plant And Equipment | 1020.66 | 1009.90 | 1031.50 | 1020.65 | 1008.42 | 997.09 | 996.20 | 935.04 | 922.35 | 908.89 | 1003.14 | 996.39 | 978.07 | 963.20 | 953.14 | 941.41 | 922.80 | 917.19 | 906.85 | 888.40 | 869.89 | 853.67 | 844.70 | 827.37 | 813.41 | 801.72 | 800.35 | 791.12 | 784.13 | 774.93 | 798.74 | 797.10 | 788.18 | 778.44 | 813.98 | 812.83 | 801.95 | 793.45 | 791.28 | 788.02 | 783.22 | 773.12 | 756.89 | 747.38 | 740.82 | 734.82 | 736.01 | 731.57 | 731.05 | 722.69 | 728.33 | 733.30 | 732.13 | 727.57 | 729.17 | 731.42 | NA | |
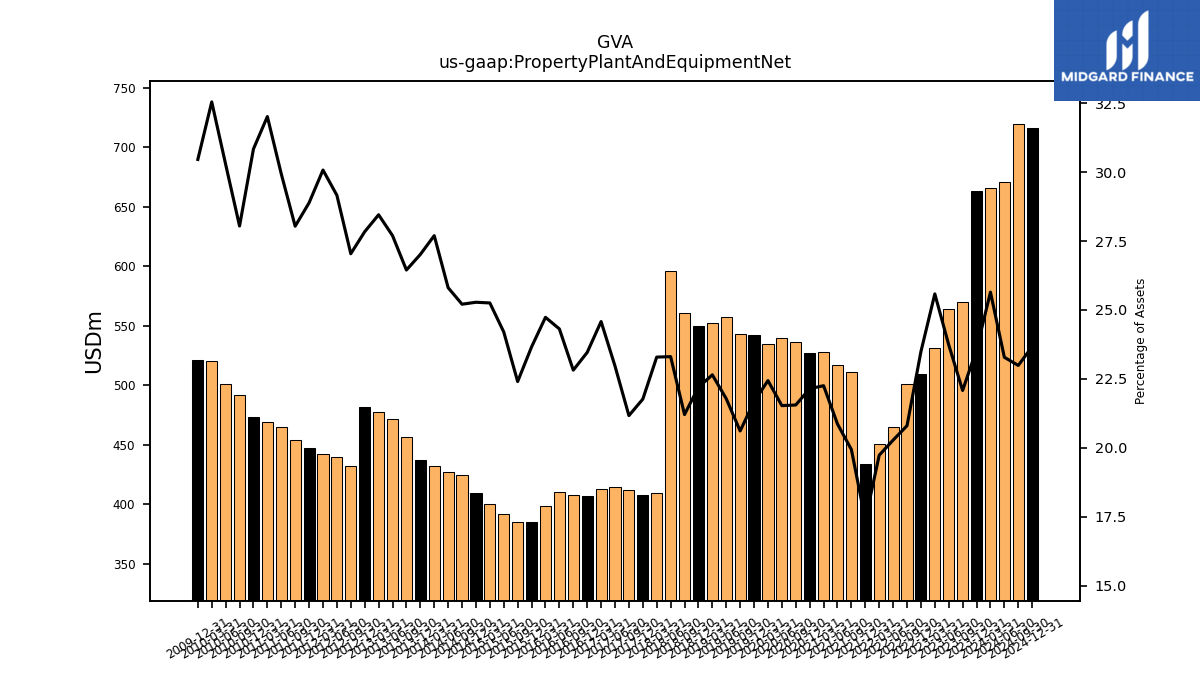
| Property Plant And Equipment Net | 665.52 | 662.86 | 569.72 | 564.08 | 531.46 | 509.21 | 500.83 | 464.59 | 450.25 | 433.50 | 510.66 | 517.14 | 528.17 | 527.02 | 536.26 | 540.05 | 534.96 | 542.30 | 542.80 | 557.12 | 552.50 | 549.69 | 560.62 | 595.79 | 409.71 | 407.42 | 412.17 | 414.08 | 412.49 | 406.65 | 407.33 | 409.86 | 398.75 | 385.13 | 385.04 | 391.99 | 399.91 | 409.65 | 424.27 | 426.70 | 432.40 | 436.86 | 456.52 | 471.26 | 477.67 | 481.48 | 432.29 | 439.66 | 442.13 | 447.14 | 453.82 | 464.62 | 468.93 | 473.61 | 491.36 | 501.26 | 519.91 | |
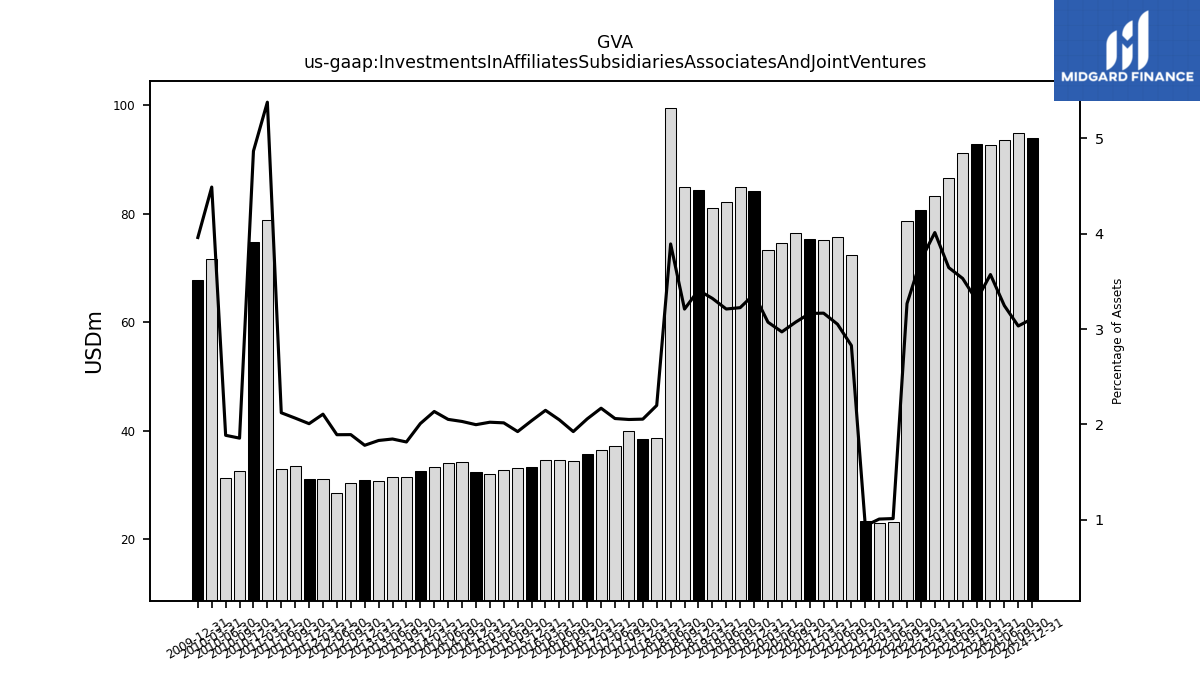
| Investments In Affiliates Subsidiaries Associates And Joint Ventures | 92.68 | 92.91 | 91.10 | 86.61 | 83.33 | 80.72 | 78.66 | 23.20 | 22.99 | 23.37 | 72.42 | 75.62 | 75.16 | 75.29 | 76.46 | 74.51 | 73.25 | 84.18 | 84.91 | 82.11 | 81.03 | 84.35 | 84.84 | 99.50 | 38.68 | 38.47 | 39.95 | 37.17 | 36.41 | 35.67 | 34.36 | 34.52 | 34.62 | 33.18 | 33.08 | 32.66 | 32.03 | 32.36 | 34.18 | 33.94 | 33.34 | 32.48 | 31.34 | 31.42 | 30.74 | 30.80 | 30.26 | 28.52 | 30.97 | 31.07 | 33.44 | 32.93 | 78.77 | 74.72 | 32.52 | 31.21 | 71.69 | |
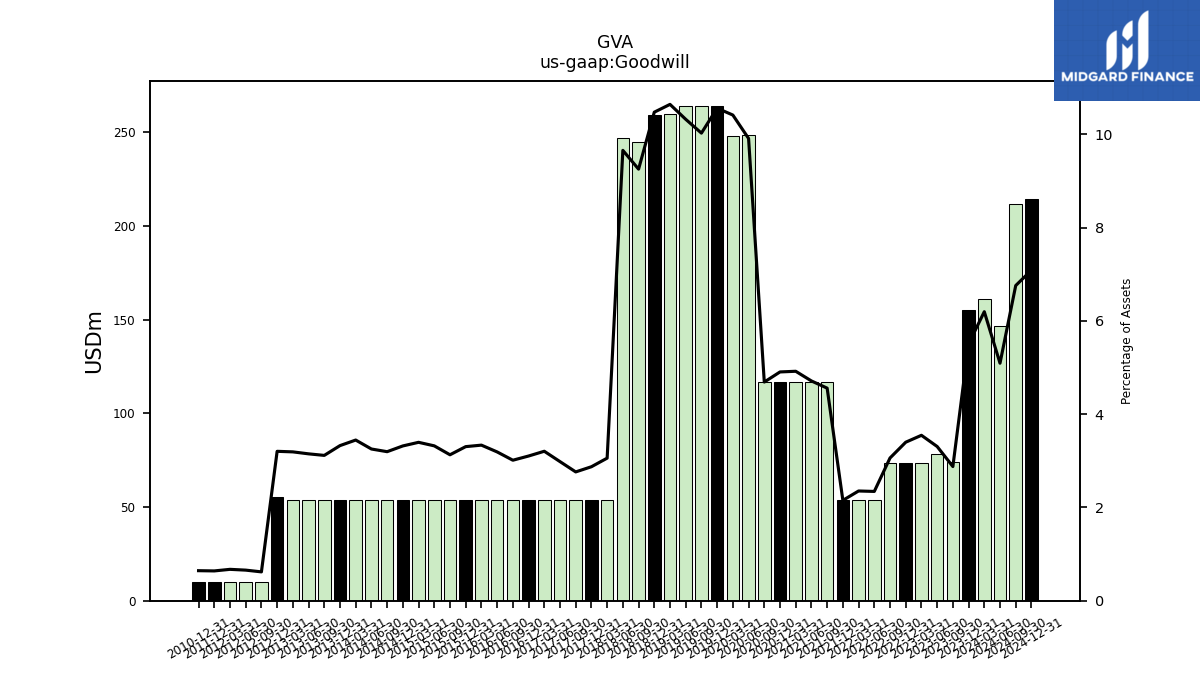
| Goodwill | 160.84 | 155.00 | 74.26 | 78.60 | 73.70 | 73.70 | 73.70 | 53.72 | 53.72 | 53.72 | 116.79 | 116.84 | 116.81 | 116.78 | 116.69 | 248.69 | 248.34 | 264.28 | 264.11 | 264.11 | 259.69 | 259.47 | 244.70 | 246.88 | 53.80 | 53.80 | 53.80 | 53.80 | 53.80 | 53.80 | 53.80 | 53.80 | 53.80 | 53.80 | 53.80 | 53.80 | 53.80 | 53.80 | 53.80 | 53.80 | 53.80 | 53.80 | 53.80 | 53.60 | 53.59 | 55.42 | 9.90 | 9.90 | 9.90 | 9.90 | NA | NA | NA | 9.90 | NA | NA | NA | |
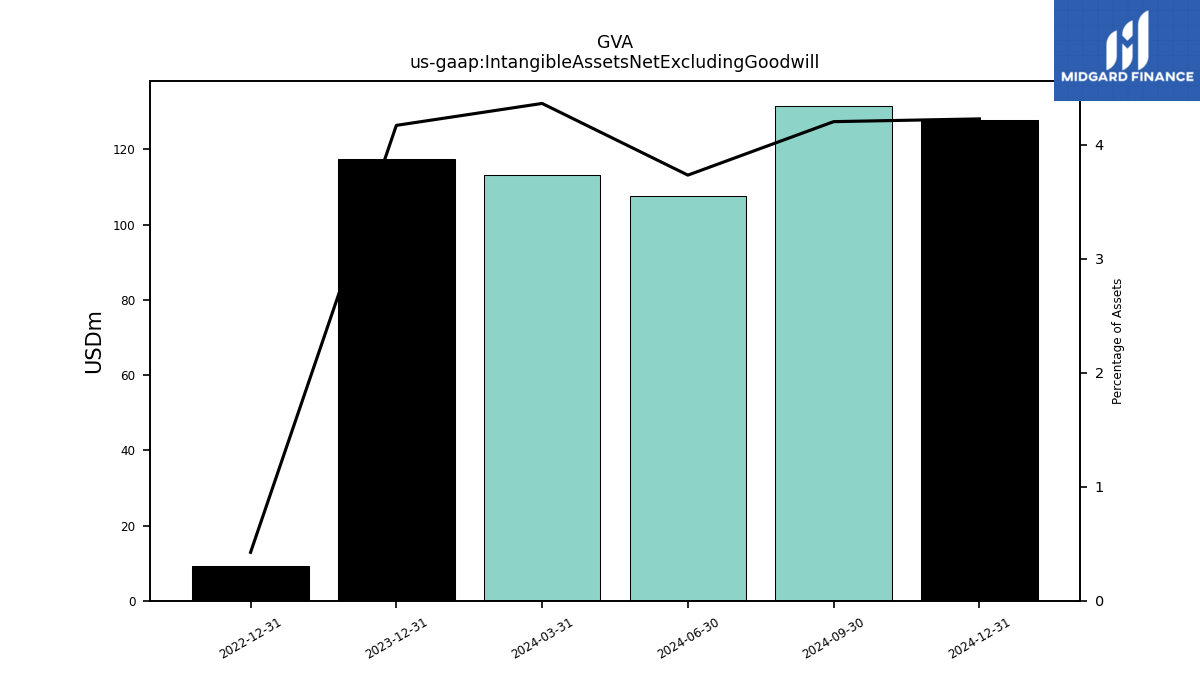
| Intangible Assets Net Excluding Goodwill | 113.20 | 117.32 | NA | NA | NA | 9.21 | NA | NA | NA | NA | NA | NA | NA | NA | NA | NA | NA | NA | NA | NA | NA | NA | NA | NA | NA | NA | NA | NA | NA | NA | NA | NA | NA | NA | NA | NA | NA | NA | NA | NA | NA | NA | NA | NA | NA | NA | NA | NA | NA | NA | NA | NA | NA | NA | NA | NA | NA | |
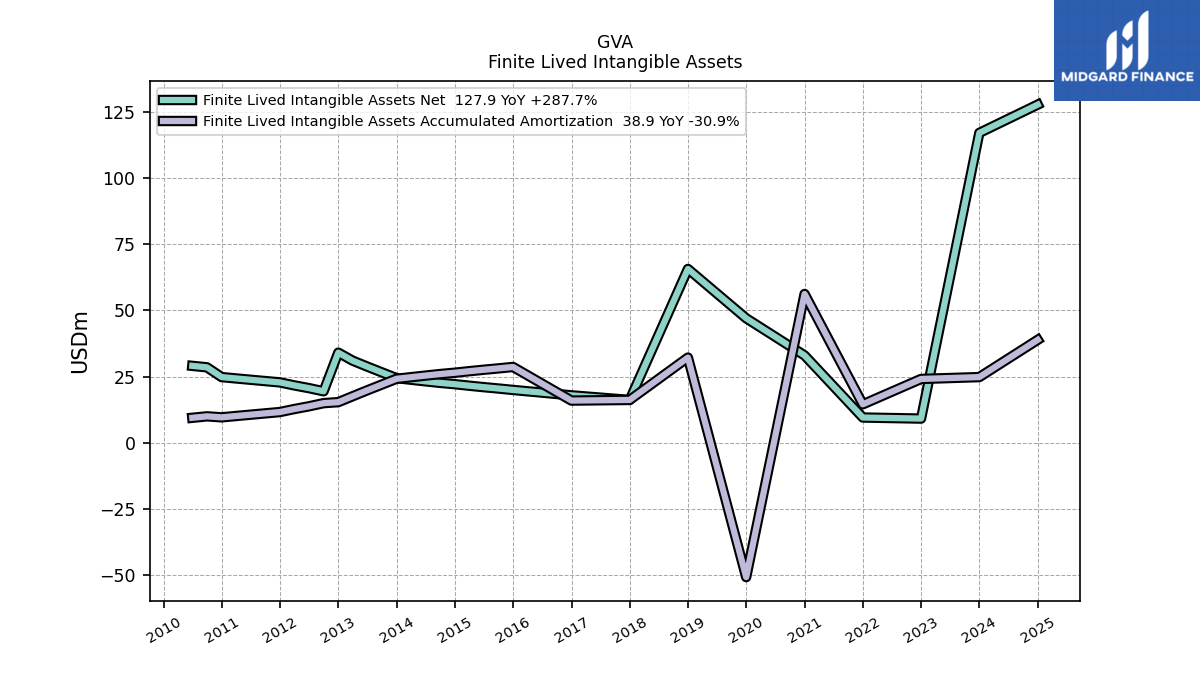
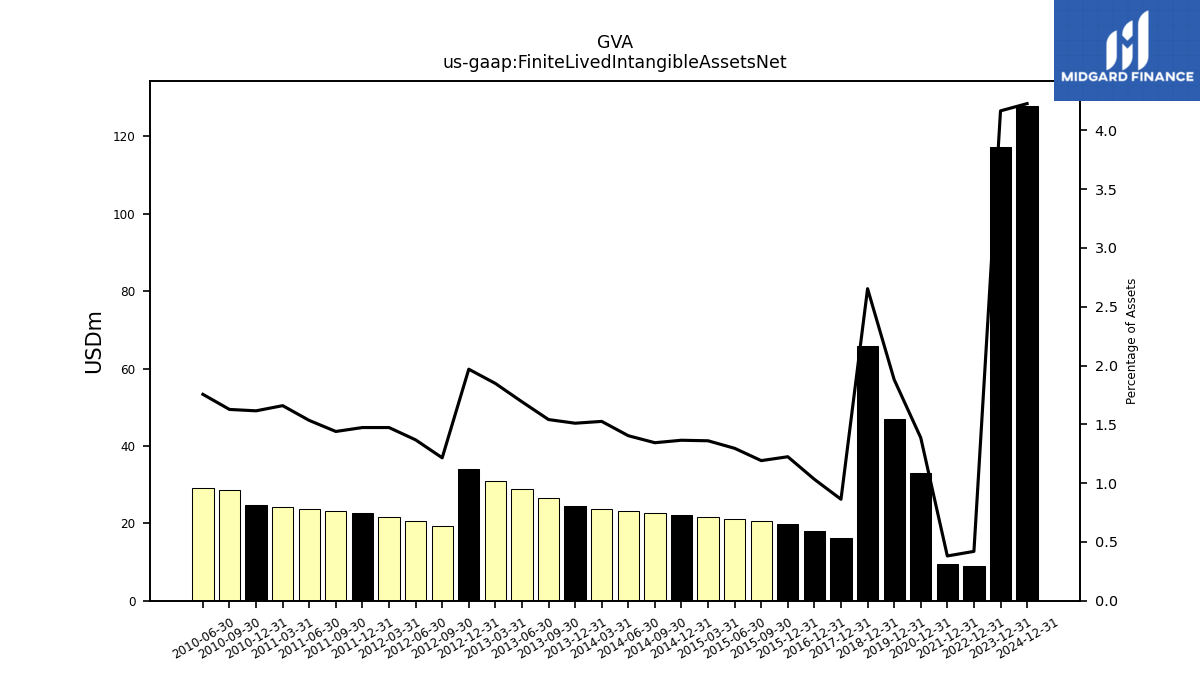
| Finite Lived Intangible Assets Net | NA | 117.20 | NA | NA | NA | 9.10 | NA | NA | NA | 9.50 | NA | NA | NA | 32.99 | NA | NA | NA | 47.06 | NA | NA | NA | 65.72 | NA | NA | NA | 16.15 | NA | NA | NA | 17.90 | NA | NA | NA | 19.93 | 20.48 | 21.00 | 21.54 | 22.12 | 22.62 | 23.20 | 23.81 | 24.41 | 26.59 | 28.79 | 31.02 | 34.05 | 19.43 | 20.63 | 21.65 | 22.80 | 23.30 | 23.80 | 24.30 | 24.80 | 28.50 | 29.05 | NA | |
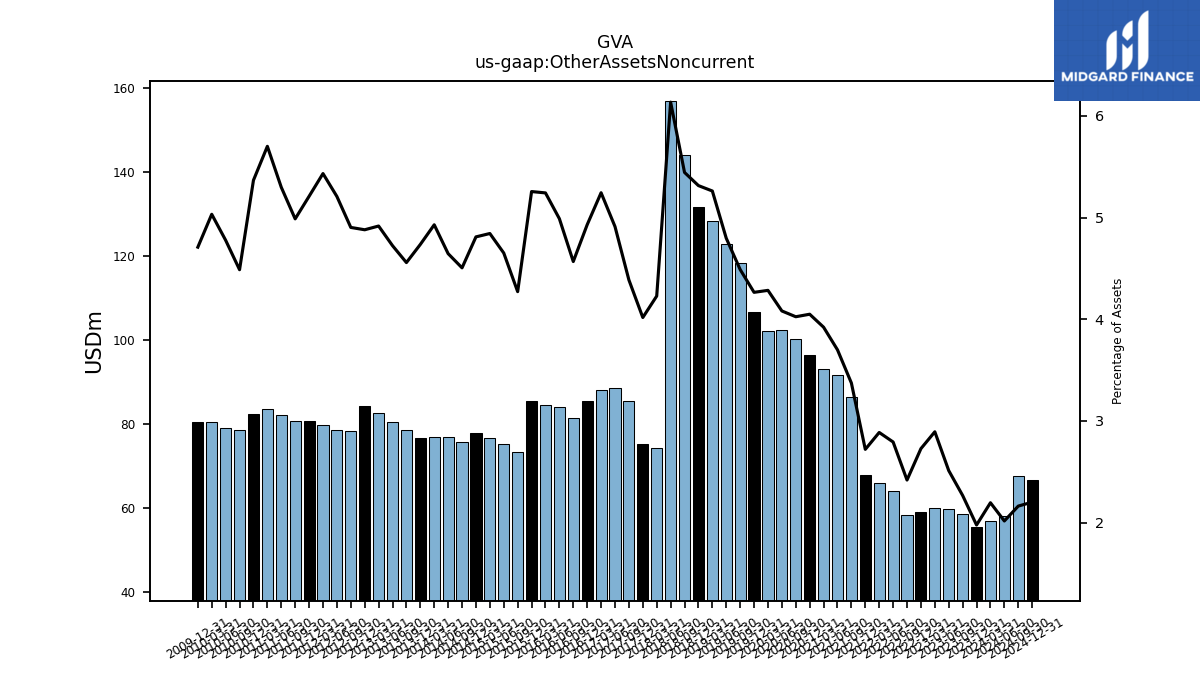
| Other Assets Noncurrent | 57.00 | 55.63 | 58.52 | 59.71 | 60.12 | 59.14 | 58.27 | 64.01 | 65.89 | 67.89 | 86.41 | 91.70 | 93.09 | 96.38 | 100.14 | 102.39 | 102.14 | 106.70 | 118.23 | 122.70 | 128.35 | 131.60 | 143.91 | 156.81 | 74.38 | 75.20 | 85.41 | 88.55 | 88.00 | 85.45 | 81.54 | 84.09 | 84.51 | 85.55 | 73.41 | 75.33 | 76.69 | 77.94 | 75.83 | 76.80 | 76.94 | 76.58 | 78.66 | 80.36 | 82.53 | 84.39 | 78.38 | 78.50 | 79.85 | 80.62 | 80.71 | 82.21 | 83.48 | 82.40 | 78.61 | 79.06 | 80.37 |
| 2024-03-31 | 2023-12-31 | 2023-09-30 | 2023-06-30 | 2023-03-31 | 2022-12-31 | 2022-09-30 | 2022-06-30 | 2022-03-31 | 2021-12-31 | 2021-09-30 | 2021-06-30 | 2021-03-31 | 2020-12-31 | 2020-09-30 | 2020-06-30 | 2020-03-31 | 2019-12-31 | 2019-09-30 | 2019-06-30 | 2019-03-31 | 2018-12-31 | 2018-09-30 | 2018-06-30 | 2018-03-31 | 2017-12-31 | 2017-09-30 | 2017-06-30 | 2017-03-31 | 2016-12-31 | 2016-09-30 | 2016-06-30 | 2016-03-31 | 2015-12-31 | 2015-09-30 | 2015-06-30 | 2015-03-31 | 2014-12-31 | 2014-09-30 | 2014-06-30 | 2014-03-31 | 2013-12-31 | 2013-09-30 | 2013-06-30 | 2013-03-31 | 2012-12-31 | 2012-09-30 | 2012-06-30 | 2012-03-31 | 2011-12-31 | 2011-09-30 | 2011-06-30 | 2011-03-31 | 2010-12-31 | 2010-09-30 | 2010-06-30 | 2010-03-31 | ||
|---|---|---|---|---|---|---|---|---|---|---|---|---|---|---|---|---|---|---|---|---|---|---|---|---|---|---|---|---|---|---|---|---|---|---|---|---|---|---|---|---|---|---|---|---|---|---|---|---|---|---|---|---|---|---|---|---|---|---|
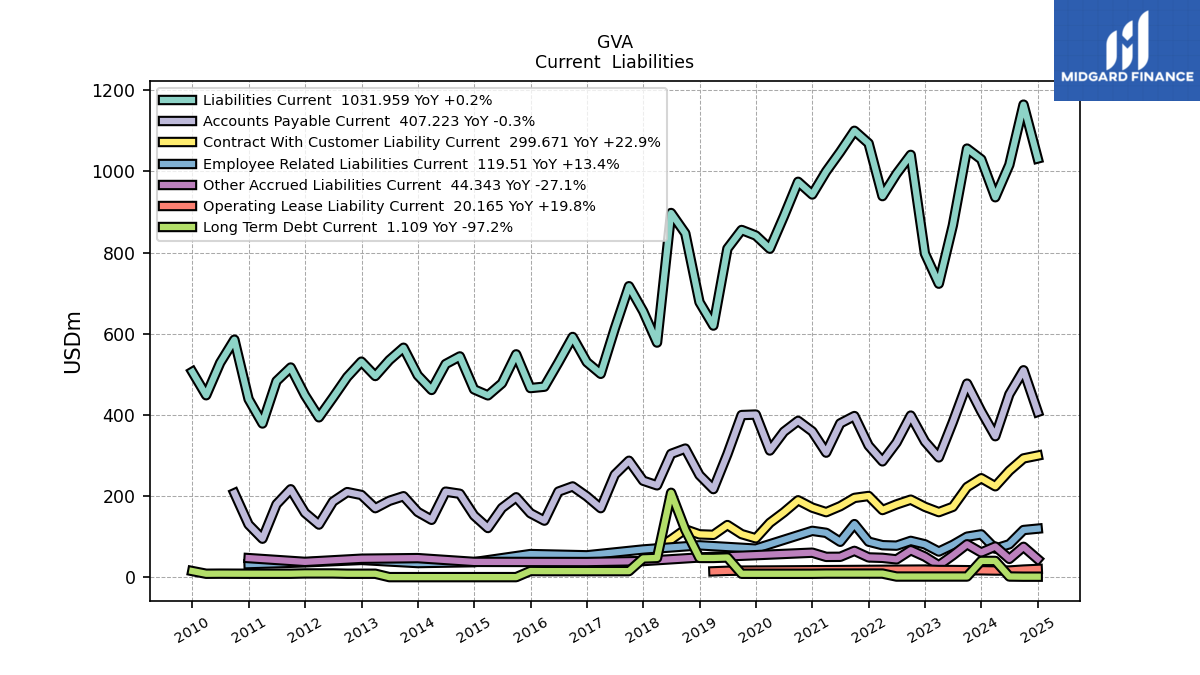
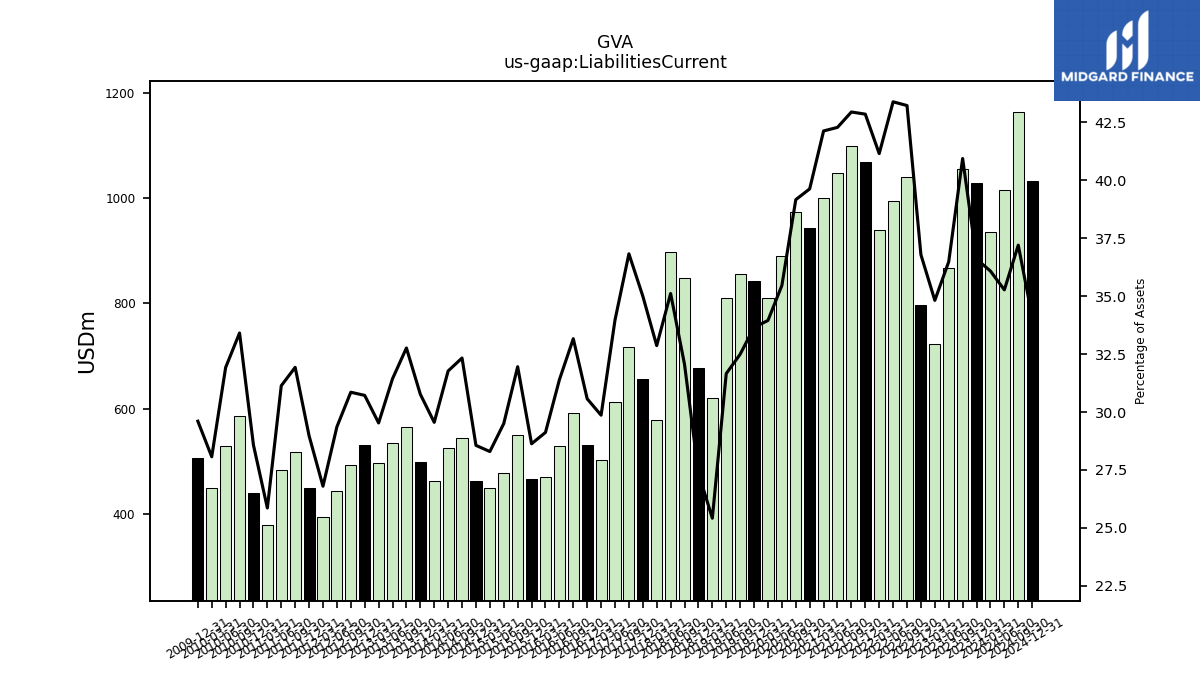
| Liabilities Current | 936.43 | 1029.88 | 1056.48 | 867.23 | 723.37 | 797.59 | 1040.98 | 994.25 | 939.25 | 1069.32 | 1100.35 | 1048.29 | 1000.13 | 943.26 | 974.59 | 889.60 | 809.56 | 842.06 | 855.84 | 809.86 | 620.10 | 677.84 | 847.50 | 897.69 | 578.22 | 655.27 | 717.19 | 612.55 | 501.18 | 529.93 | 592.09 | 529.19 | 469.47 | 466.05 | 549.24 | 477.84 | 448.05 | 462.83 | 544.17 | 525.33 | 461.41 | 497.57 | 565.52 | 534.86 | 495.72 | 531.27 | 493.26 | 442.67 | 393.91 | 448.47 | 516.77 | 483.21 | 378.71 | 438.78 | 585.37 | 528.40 | 448.33 | |
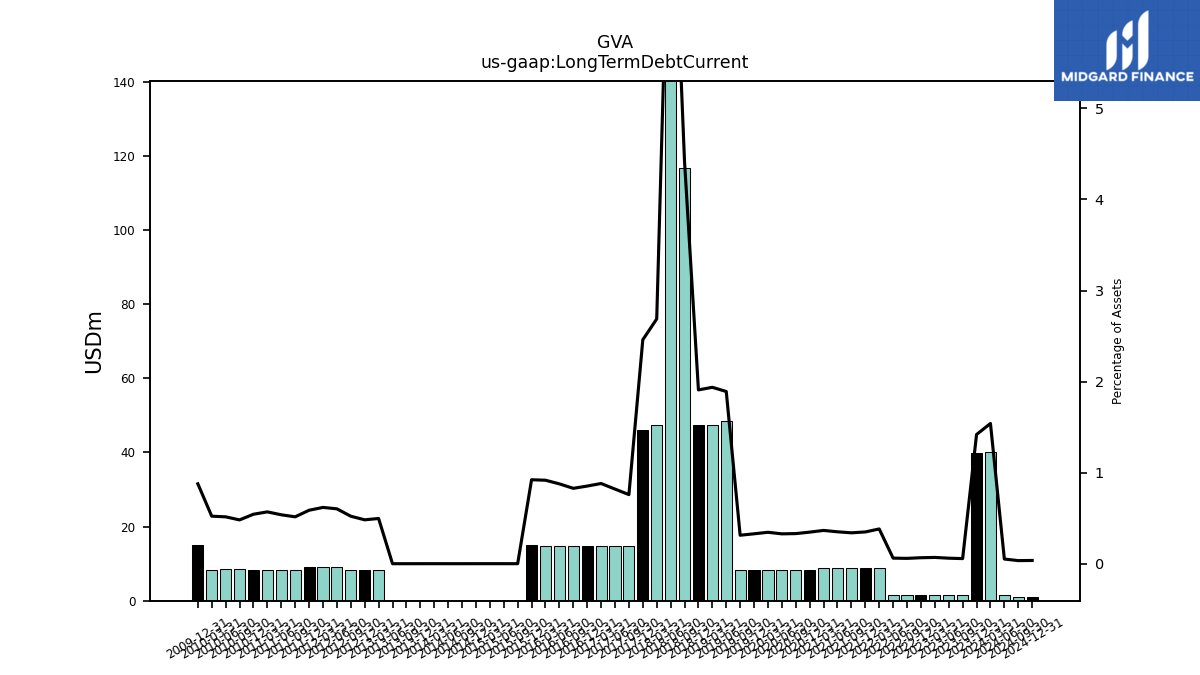
| Long Term Debt Current | 39.99 | 39.93 | 1.48 | 1.47 | 1.46 | 1.45 | 1.44 | 1.43 | 8.73 | 8.73 | 8.72 | 8.71 | 8.70 | 8.28 | 8.25 | 8.25 | 8.25 | 8.24 | 8.26 | 48.40 | 47.28 | 47.29 | 116.80 | 207.98 | 47.30 | 46.05 | 14.80 | 14.80 | 14.80 | 14.80 | 14.79 | 14.79 | 14.79 | 15.02 | 0.02 | 0.02 | 0.02 | 0.02 | 0.02 | 0.02 | 0.02 | 0.02 | 0.02 | 0.02 | 8.35 | 8.35 | 8.35 | 9.10 | 9.10 | 9.10 | 8.35 | 8.35 | 8.35 | 8.36 | 8.44 | 8.54 | 8.35 | |
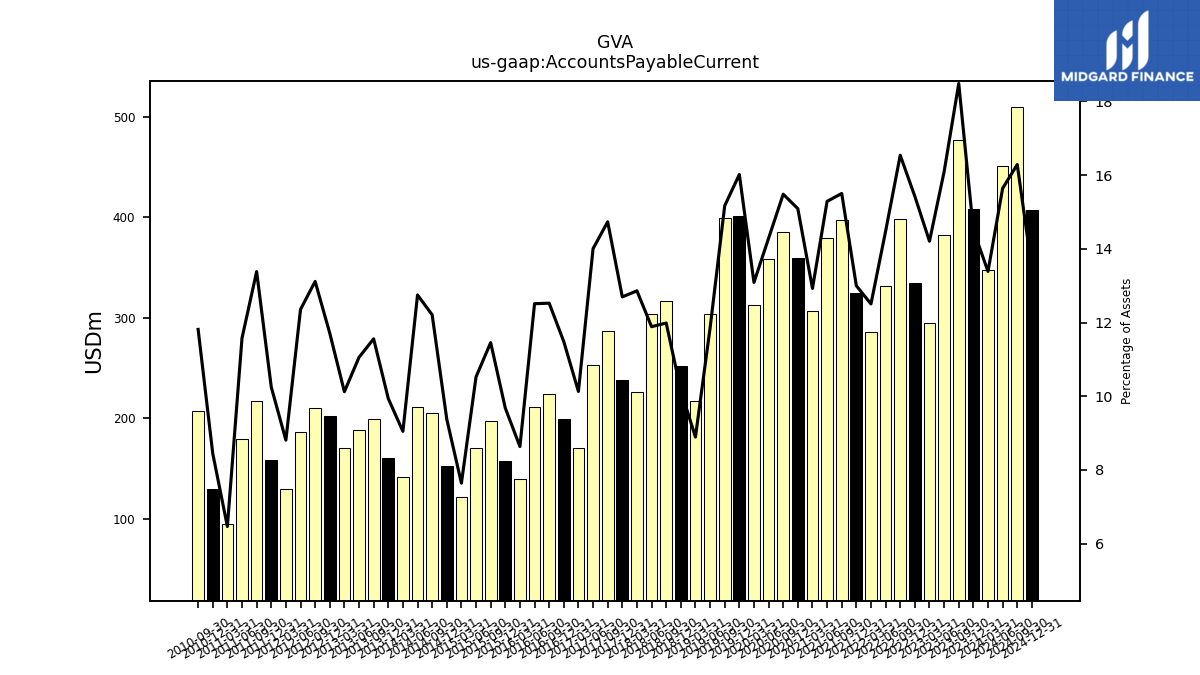
| Accounts Payable Current | 347.38 | 408.36 | 477.03 | 382.46 | 295.12 | 334.39 | 398.29 | 331.73 | 285.39 | 324.31 | 397.15 | 379.01 | 306.83 | 359.16 | 385.26 | 358.40 | 312.11 | 400.77 | 399.53 | 303.13 | 216.97 | 251.48 | 316.92 | 303.88 | 226.25 | 237.67 | 286.91 | 252.53 | 170.01 | 199.03 | 223.61 | 210.92 | 139.22 | 157.57 | 196.88 | 170.47 | 121.01 | 151.94 | 205.49 | 210.78 | 141.24 | 160.71 | 199.48 | 188.12 | 169.94 | 202.54 | 209.68 | 186.29 | 129.48 | 158.66 | 216.60 | 179.66 | 94.69 | 129.70 | 206.99 | NA | NA | |
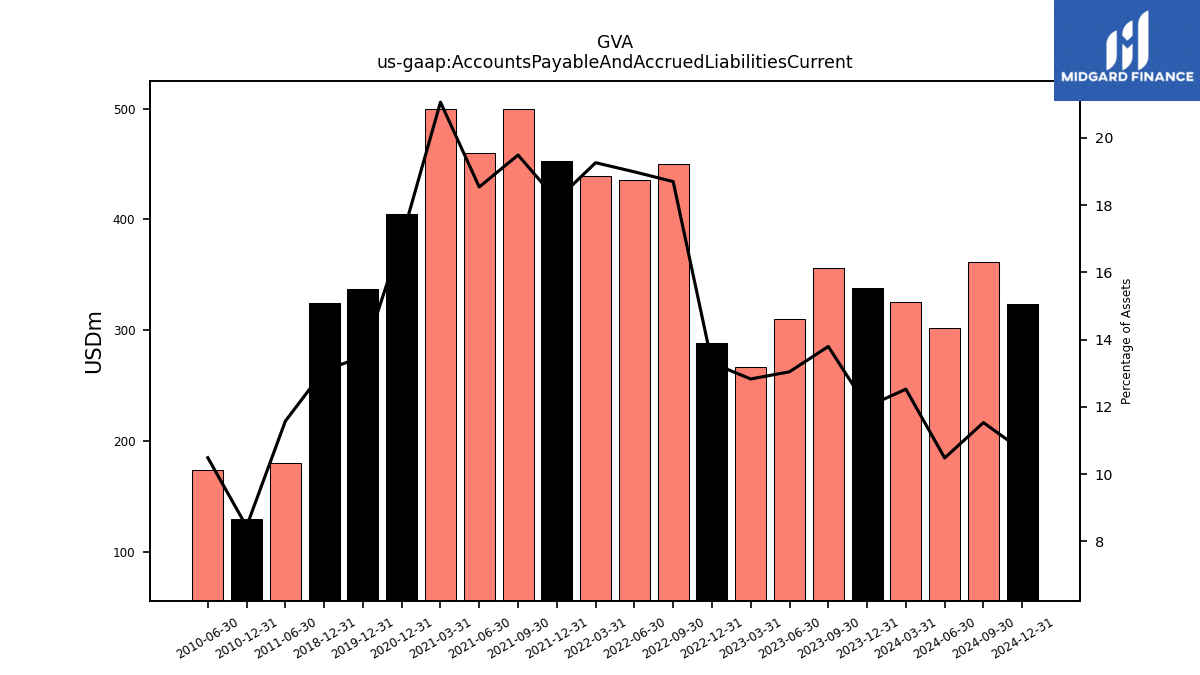
| Accounts Payable And Accrued Liabilities Current | 325.10 | 337.74 | 355.99 | 310.02 | 266.54 | 288.47 | 450.22 | 435.06 | 439.52 | 452.83 | 499.21 | 459.52 | 499.83 | 404.50 | NA | NA | NA | 337.30 | NA | NA | NA | 324.38 | NA | NA | NA | NA | NA | NA | NA | NA | NA | NA | NA | NA | NA | NA | NA | NA | NA | NA | NA | NA | NA | NA | NA | NA | NA | NA | NA | NA | NA | 179.66 | NA | 129.70 | NA | 173.64 | NA | |
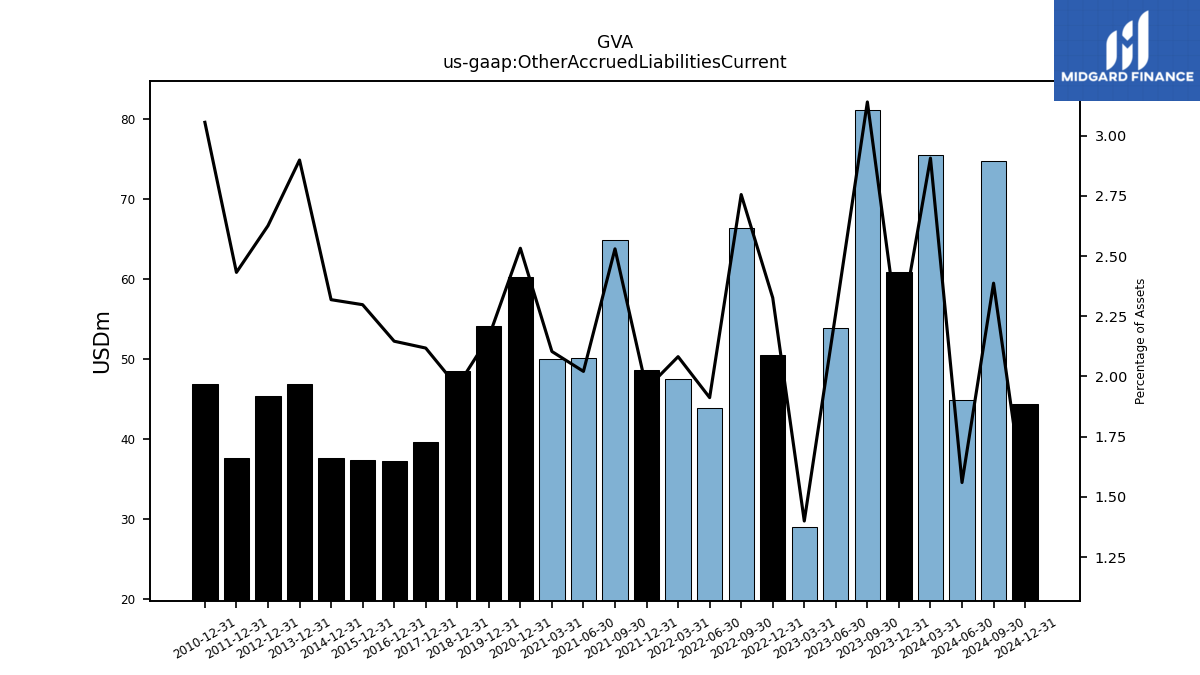
| Other Accrued Liabilities Current | 75.43 | 60.79 | 81.02 | 53.82 | 29.07 | 50.44 | 66.35 | 43.81 | 47.52 | 48.62 | 64.81 | 50.10 | 49.93 | 60.27 | NA | NA | NA | 54.14 | NA | NA | NA | 48.48 | NA | NA | NA | 39.65 | NA | NA | NA | 37.20 | NA | NA | NA | 37.41 | NA | NA | NA | 37.58 | NA | NA | NA | 46.88 | NA | NA | NA | 45.41 | NA | NA | NA | 37.65 | NA | NA | NA | 46.91 | NA | NA | NA | |
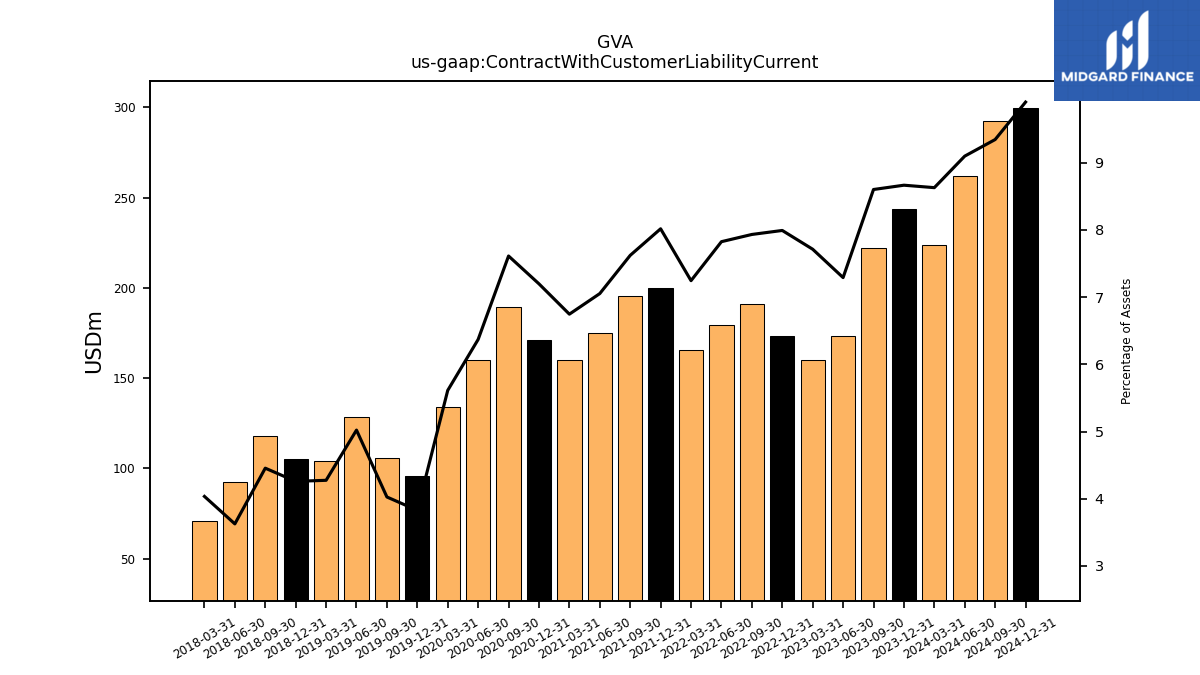
| Contract With Customer Liability Current | 223.96 | 243.85 | 221.98 | 173.29 | 160.25 | 173.29 | 191.04 | 179.32 | 165.36 | 200.04 | 195.27 | 174.85 | 160.15 | 171.32 | 189.43 | 159.82 | 133.81 | 95.74 | 106.01 | 128.44 | 104.26 | 105.45 | 117.76 | 92.66 | 70.96 | NA | NA | NA | NA | NA | NA | NA | NA | NA | NA | NA | NA | NA | NA | NA | NA | NA | NA | NA | NA | NA | NA | NA | NA | NA | NA | NA | NA | NA | NA | NA | NA |
| 2024-03-31 | 2023-12-31 | 2023-09-30 | 2023-06-30 | 2023-03-31 | 2022-12-31 | 2022-09-30 | 2022-06-30 | 2022-03-31 | 2021-12-31 | 2021-09-30 | 2021-06-30 | 2021-03-31 | 2020-12-31 | 2020-09-30 | 2020-06-30 | 2020-03-31 | 2019-12-31 | 2019-09-30 | 2019-06-30 | 2019-03-31 | 2018-12-31 | 2018-09-30 | 2018-06-30 | 2018-03-31 | 2017-12-31 | 2017-09-30 | 2017-06-30 | 2017-03-31 | 2016-12-31 | 2016-09-30 | 2016-06-30 | 2016-03-31 | 2015-12-31 | 2015-09-30 | 2015-06-30 | 2015-03-31 | 2014-12-31 | 2014-09-30 | 2014-06-30 | 2014-03-31 | 2013-12-31 | 2013-09-30 | 2013-06-30 | 2013-03-31 | 2012-12-31 | 2012-09-30 | 2012-06-30 | 2012-03-31 | 2011-12-31 | 2011-09-30 | 2011-06-30 | 2011-03-31 | 2010-12-31 | 2010-09-30 | 2010-06-30 | 2010-03-31 | ||
|---|---|---|---|---|---|---|---|---|---|---|---|---|---|---|---|---|---|---|---|---|---|---|---|---|---|---|---|---|---|---|---|---|---|---|---|---|---|---|---|---|---|---|---|---|---|---|---|---|---|---|---|---|---|---|---|---|---|---|
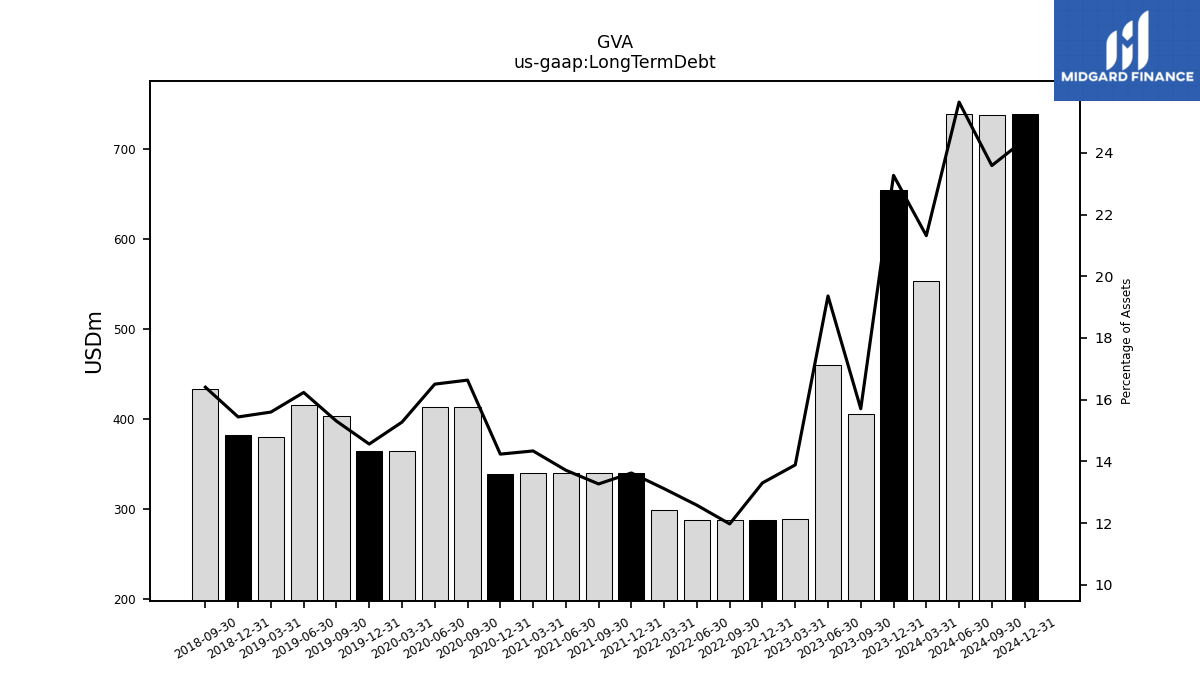
| Long Term Debt | 553.19 | 654.71 | 405.26 | 460.16 | 288.46 | 288.38 | 288.31 | 288.23 | 299.28 | 339.92 | 339.91 | 339.93 | 340.35 | 338.80 | 413.90 | 414.02 | 364.16 | 364.35 | 403.10 | 415.29 | 380.57 | 382.40 | 433.72 | NA | NA | NA | NA | NA | NA | NA | NA | NA | NA | NA | NA | NA | NA | NA | NA | NA | NA | NA | NA | NA | NA | NA | NA | NA | NA | NA | NA | NA | NA | NA | NA | NA | NA | |
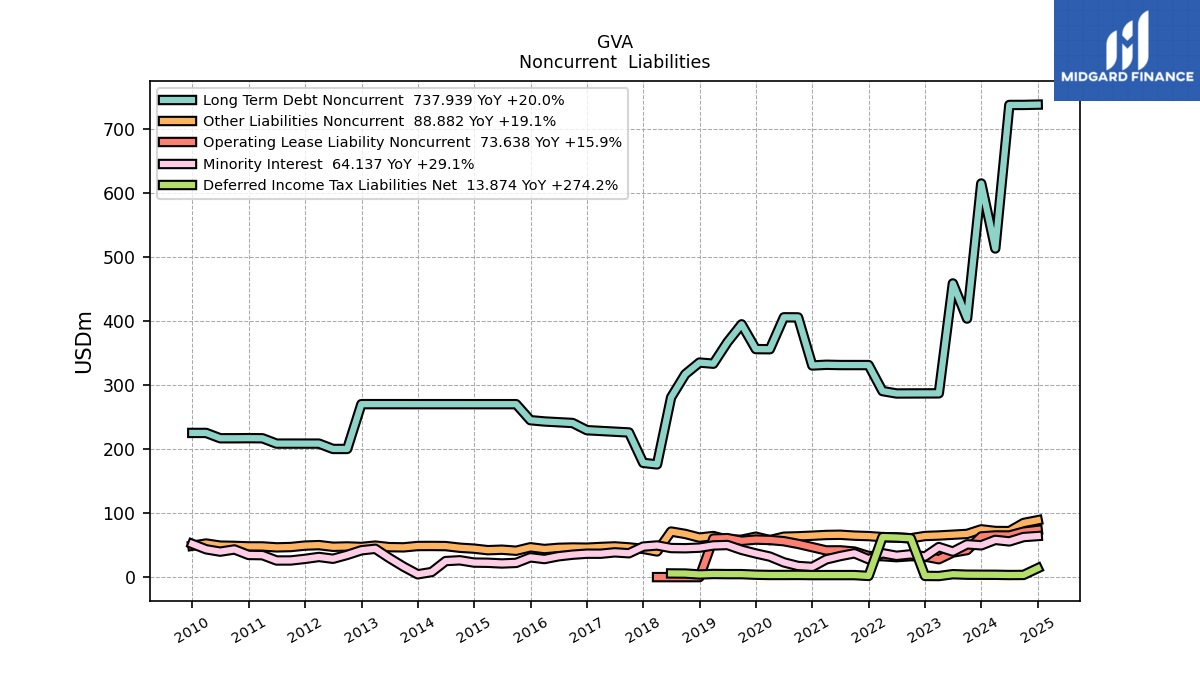
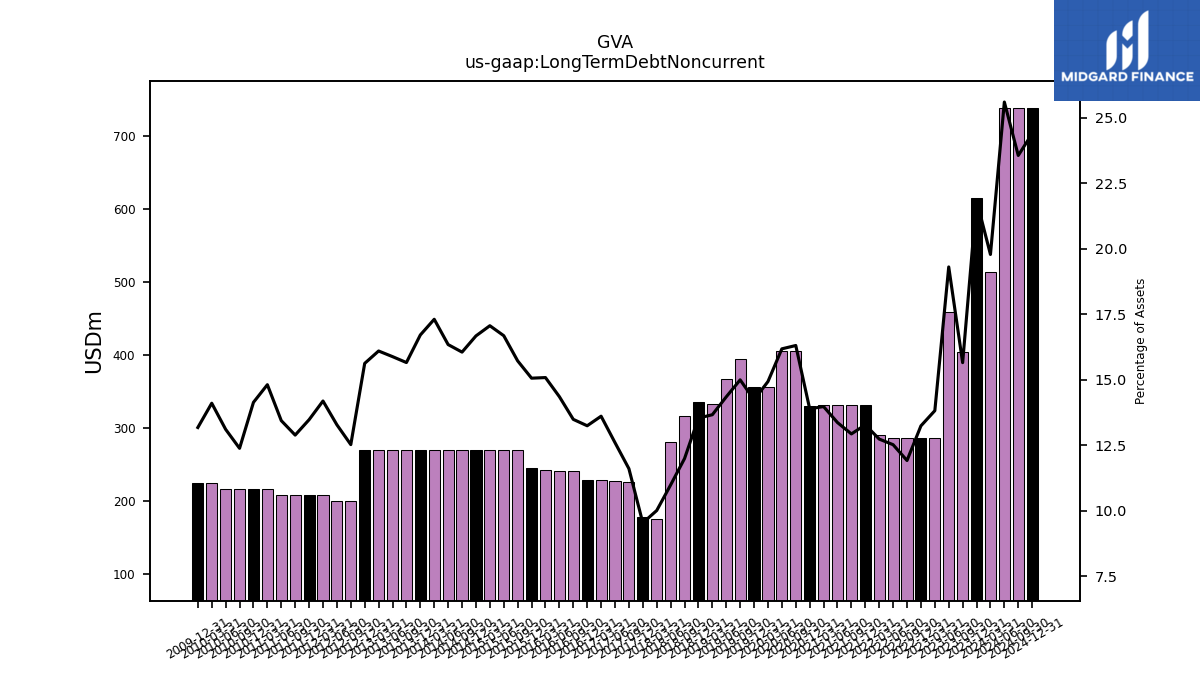
| Long Term Debt Noncurrent | 513.20 | 614.78 | 403.79 | 458.69 | 287.00 | 286.93 | 286.87 | 286.80 | 290.55 | 331.19 | 331.19 | 331.22 | 331.65 | 330.52 | 405.64 | 405.77 | 355.91 | 356.11 | 394.84 | 366.90 | 333.29 | 335.12 | 316.93 | 280.71 | 176.01 | 178.45 | 225.92 | 227.11 | 228.31 | 229.50 | 240.72 | 241.91 | 243.10 | 245.08 | 270.11 | 270.11 | 270.11 | 270.11 | 270.13 | 270.13 | 270.13 | 270.13 | 270.15 | 270.15 | 270.15 | 270.15 | 200.17 | 200.17 | 208.50 | 208.50 | 208.52 | 208.52 | 216.85 | 217.01 | 216.87 | 216.87 | 225.20 | |
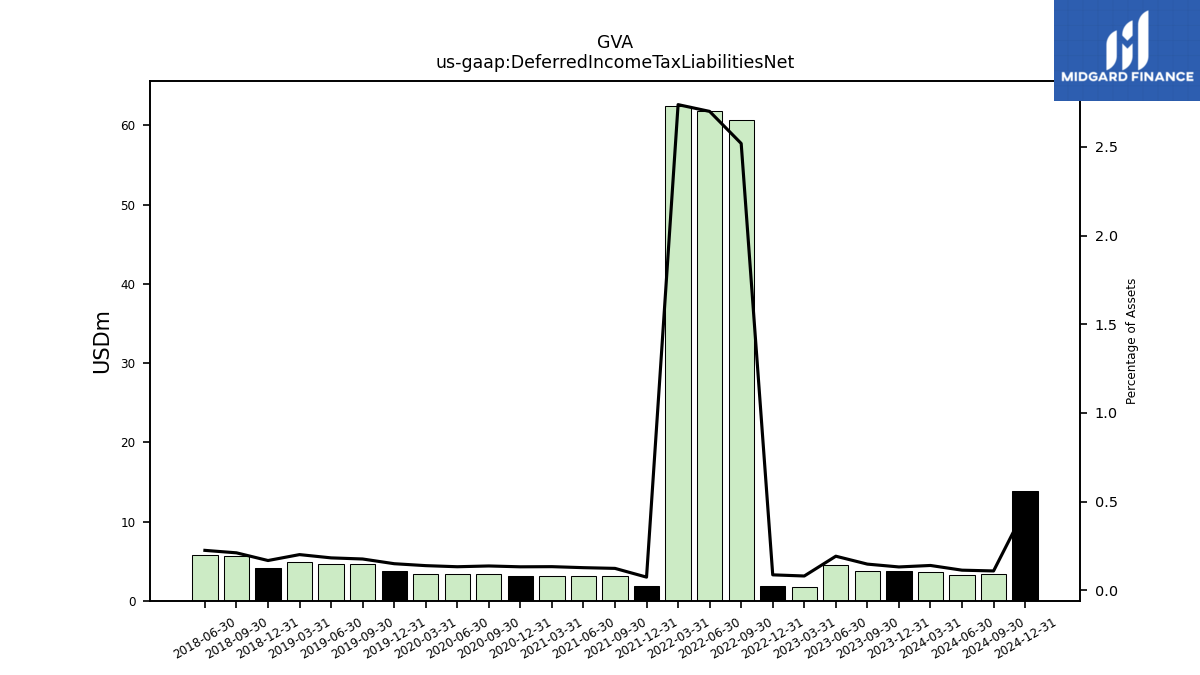
| Deferred Income Tax Liabilities Net | 3.64 | 3.71 | 3.81 | 4.57 | 1.68 | 1.89 | 60.66 | 61.87 | 62.49 | 1.86 | 3.17 | 3.17 | 3.17 | 3.15 | 3.42 | 3.33 | 3.32 | 3.75 | 4.65 | 4.68 | 4.91 | 4.16 | 5.59 | 5.76 | NA | NA | NA | NA | NA | NA | NA | NA | NA | NA | NA | NA | NA | NA | NA | NA | NA | NA | NA | NA | NA | NA | NA | NA | NA | NA | NA | NA | NA | NA | NA | NA | NA | |
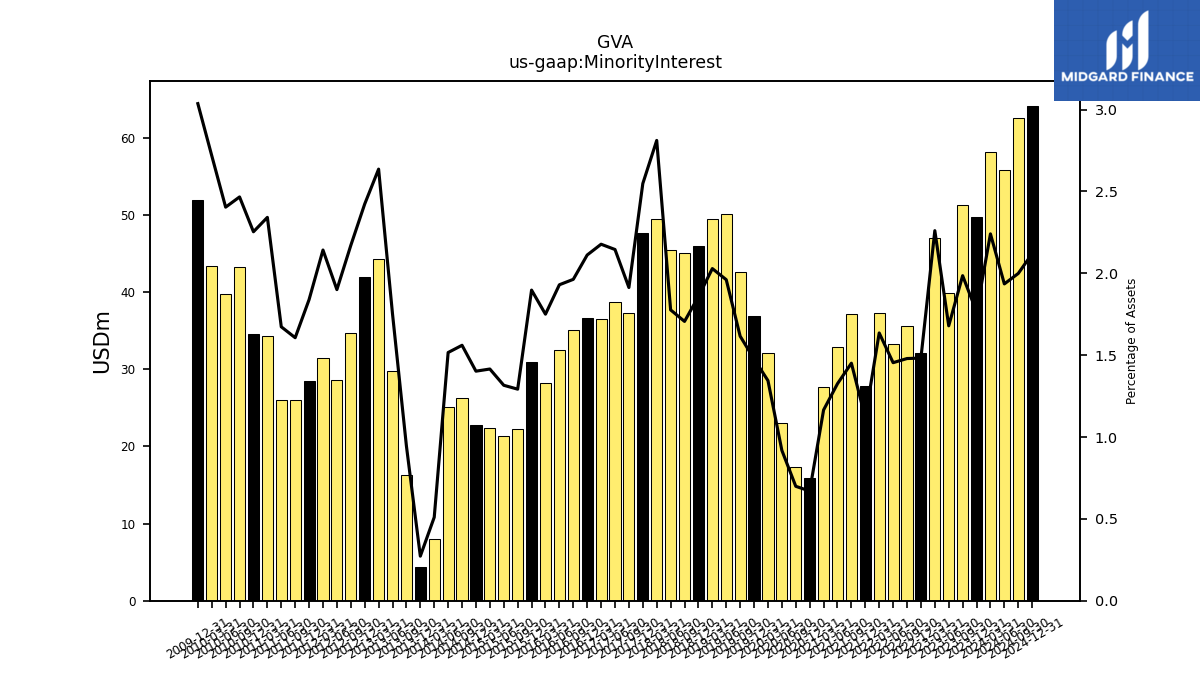
| Minority Interest | 58.15 | 49.67 | 51.23 | 39.91 | 46.95 | 32.13 | 35.62 | 33.32 | 37.32 | 27.88 | 37.17 | 32.86 | 27.66 | 15.95 | 17.39 | 23.04 | 32.06 | 36.95 | 42.56 | 50.16 | 49.49 | 46.00 | 45.11 | 45.41 | 49.46 | 47.70 | 37.25 | 38.68 | 36.54 | 36.60 | 35.04 | 32.53 | 28.22 | 30.88 | 22.21 | 21.32 | 22.41 | 22.72 | 26.26 | 25.07 | 7.96 | 4.40 | 16.31 | 29.81 | 44.25 | 41.91 | 34.69 | 28.65 | 31.49 | 28.47 | 26.00 | 25.97 | 34.29 | 34.60 | 43.21 | 39.79 | 43.42 | |
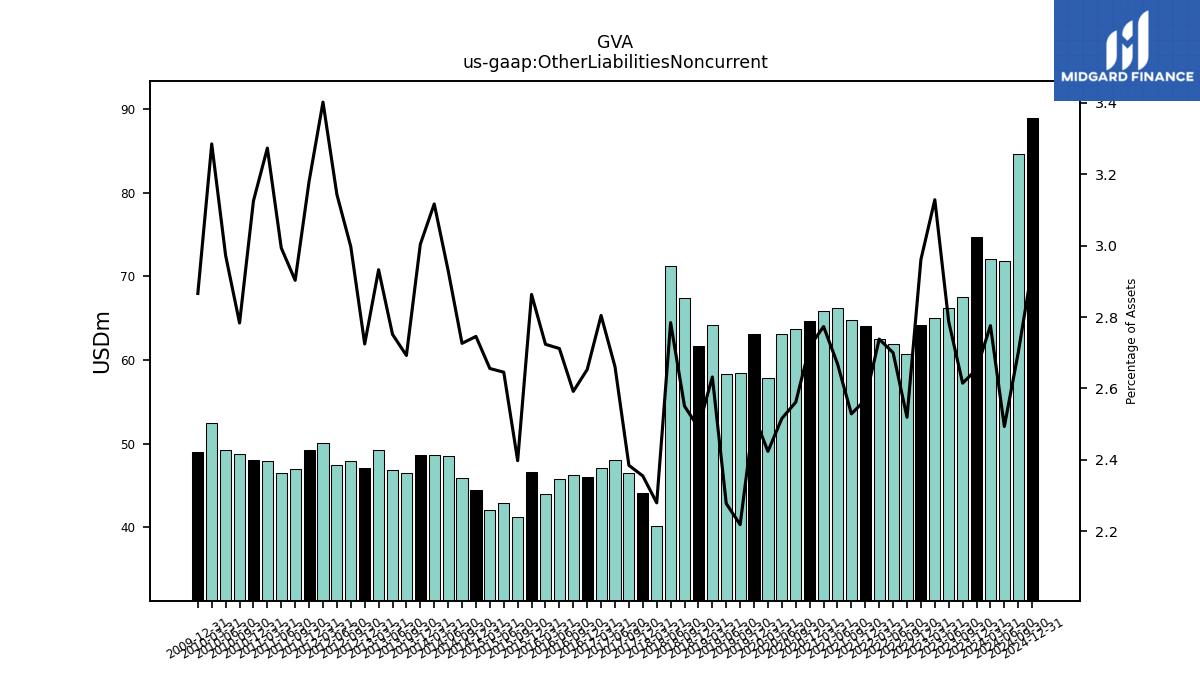
| Other Liabilities Noncurrent | 72.04 | 74.65 | 67.47 | 66.23 | 65.00 | 64.20 | 60.66 | 61.87 | 62.49 | 64.07 | 64.78 | 66.17 | 65.83 | 64.68 | 63.74 | 63.12 | 57.80 | 63.14 | 58.43 | 58.27 | 64.22 | 61.69 | 67.43 | 71.18 | 40.10 | 44.09 | 46.44 | 47.98 | 47.07 | 45.99 | 46.27 | 45.72 | 43.91 | 46.61 | 41.21 | 42.85 | 42.06 | 44.49 | 45.89 | 48.45 | 48.66 | 48.58 | 46.47 | 46.82 | 49.23 | 47.12 | 47.91 | 47.39 | 50.01 | 49.22 | 46.98 | 46.46 | 47.94 | 48.00 | 48.76 | 49.20 | 52.47 | |
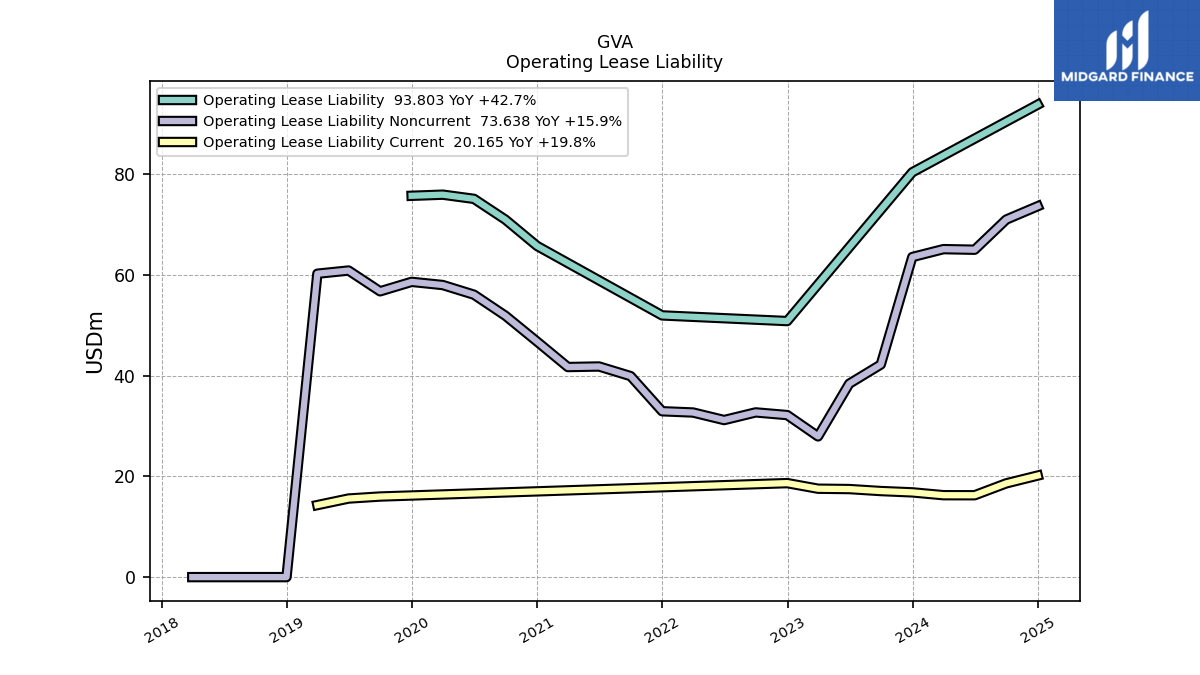
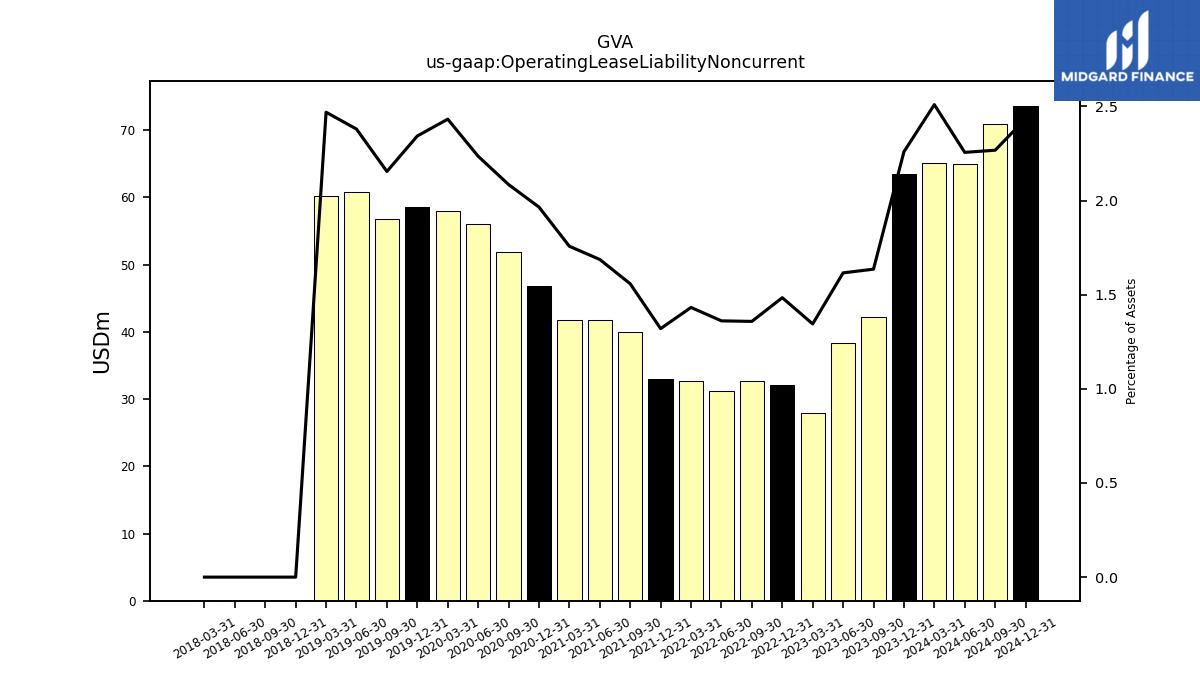
| Operating Lease Liability Noncurrent | 65.11 | 63.55 | 42.20 | 38.40 | 27.93 | 32.17 | 32.70 | 31.18 | 32.68 | 32.93 | 39.91 | 41.82 | 41.71 | 46.77 | 51.88 | 56.07 | 57.98 | 58.62 | 56.74 | 60.87 | 60.24 | 0.00 | 0.00 | 0.00 | 0.00 | NA | NA | NA | NA | NA | NA | NA | NA | NA | NA | NA | NA | NA | NA | NA | NA | NA | NA | NA | NA | NA | NA | NA | NA | NA | NA | NA | NA | NA | NA | NA | NA |
| 2024-03-31 | 2023-12-31 | 2023-09-30 | 2023-06-30 | 2023-03-31 | 2022-12-31 | 2022-09-30 | 2022-06-30 | 2022-03-31 | 2021-12-31 | 2021-09-30 | 2021-06-30 | 2021-03-31 | 2020-12-31 | 2020-09-30 | 2020-06-30 | 2020-03-31 | 2019-12-31 | 2019-09-30 | 2019-06-30 | 2019-03-31 | 2018-12-31 | 2018-09-30 | 2018-06-30 | 2018-03-31 | 2017-12-31 | 2017-09-30 | 2017-06-30 | 2017-03-31 | 2016-12-31 | 2016-09-30 | 2016-06-30 | 2016-03-31 | 2015-12-31 | 2015-09-30 | 2015-06-30 | 2015-03-31 | 2014-12-31 | 2014-09-30 | 2014-06-30 | 2014-03-31 | 2013-12-31 | 2013-09-30 | 2013-06-30 | 2013-03-31 | 2012-12-31 | 2012-09-30 | 2012-06-30 | 2012-03-31 | 2011-12-31 | 2011-09-30 | 2011-06-30 | 2011-03-31 | 2010-12-31 | 2010-09-30 | 2010-06-30 | 2010-03-31 | ||
|---|---|---|---|---|---|---|---|---|---|---|---|---|---|---|---|---|---|---|---|---|---|---|---|---|---|---|---|---|---|---|---|---|---|---|---|---|---|---|---|---|---|---|---|---|---|---|---|---|---|---|---|---|---|---|---|---|---|---|
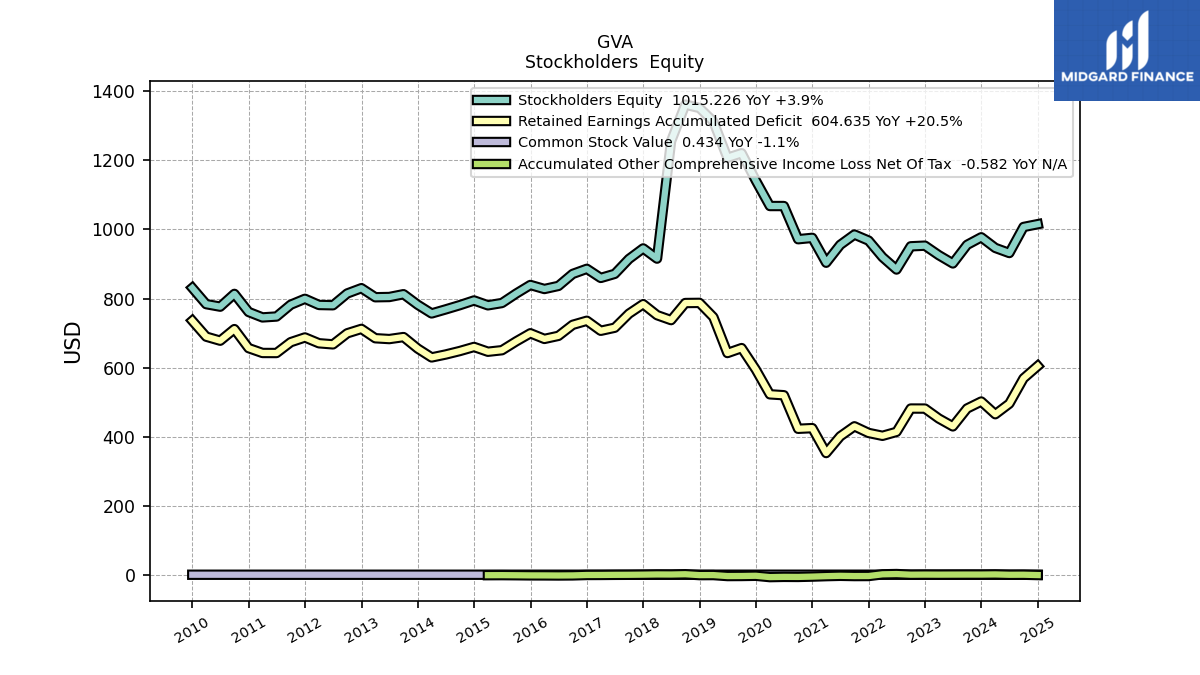
| Stockholders Equity | 946.46 | 977.30 | 955.35 | 901.54 | 925.46 | 953.02 | 951.12 | 883.92 | 919.84 | 967.68 | 985.18 | 955.38 | 903.54 | 975.66 | 971.61 | 1067.72 | 1067.75 | 1141.47 | 1220.71 | 1207.41 | 1312.44 | 1351.63 | 1361.29 | 1255.58 | 915.44 | 945.11 | 914.56 | 871.40 | 859.52 | 885.99 | 871.15 | 836.48 | 827.53 | 839.24 | 814.29 | 786.97 | 780.29 | 794.38 | 780.80 | 768.48 | 756.77 | 781.94 | 812.51 | 804.37 | 803.68 | 829.95 | 814.58 | 780.48 | 781.28 | 799.20 | 782.11 | 747.90 | 745.29 | 761.03 | 813.45 | 776.40 | 783.71 | |
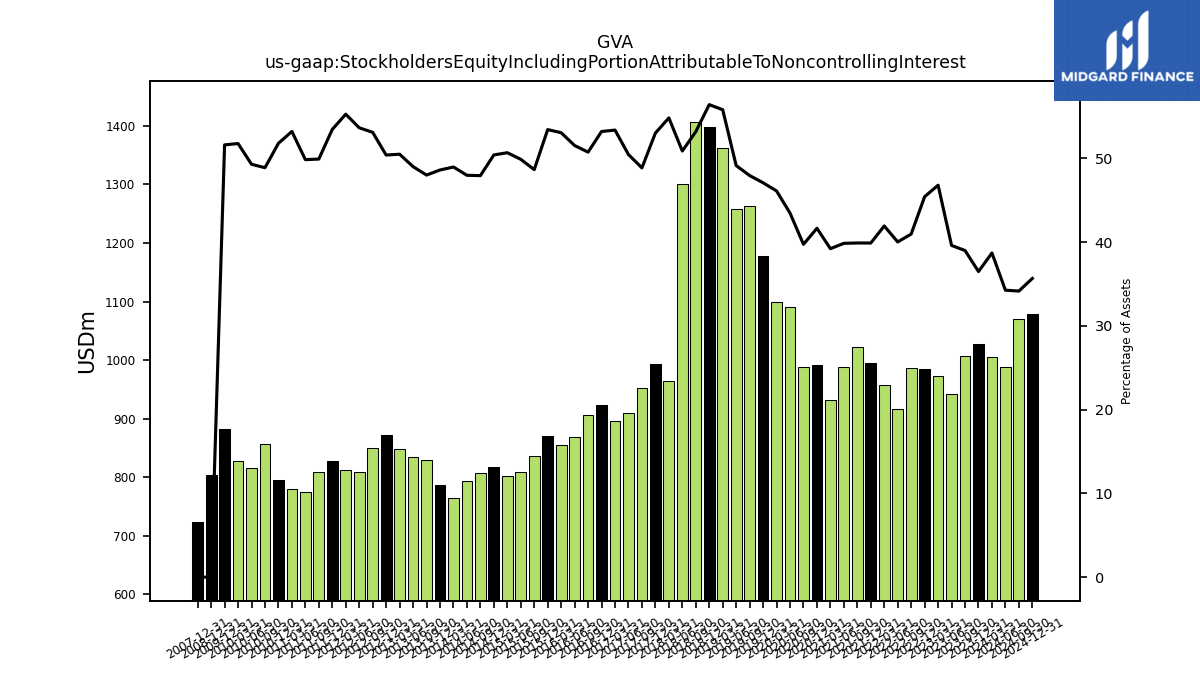
| Stockholders Equity Including Portion Attributable To Noncontrolling Interest | 1004.61 | 1026.97 | 1006.58 | 941.45 | 972.41 | 985.14 | 986.74 | 917.24 | 957.16 | 995.56 | 1022.35 | 988.24 | 931.20 | 991.61 | 989.00 | 1090.76 | 1099.80 | 1178.42 | 1263.27 | 1257.57 | 1361.93 | 1397.63 | 1406.40 | 1300.99 | 964.89 | 992.80 | 951.81 | 910.08 | 896.06 | 922.59 | 906.19 | 869.01 | 855.74 | 870.12 | 836.50 | 808.28 | 802.70 | 817.11 | 807.06 | 793.54 | 764.73 | 786.34 | 828.82 | 834.17 | 847.93 | 871.86 | 849.27 | 809.13 | 812.77 | 827.66 | 808.11 | 773.87 | 779.58 | 795.63 | 856.66 | 816.19 | 827.13 | |
| Common Stock Value | 0.44 | 0.44 | 0.44 | 0.44 | 0.44 | 0.44 | 0.44 | 0.44 | 0.45 | 0.46 | 0.46 | 0.46 | 0.46 | 0.46 | 0.46 | 0.46 | 0.46 | 0.46 | 0.47 | 0.47 | 0.47 | 0.47 | 0.47 | 0.46 | 0.40 | 0.40 | 0.40 | 0.40 | 0.40 | 0.40 | 0.40 | 0.40 | 0.40 | 0.39 | 0.39 | 0.39 | 0.39 | 0.39 | 0.39 | 0.39 | 0.39 | 0.39 | 0.39 | 0.39 | 0.39 | 0.39 | 0.39 | 0.39 | 0.39 | 0.39 | 0.39 | 0.39 | 0.39 | 0.39 | 0.39 | 0.39 | 0.39 | |
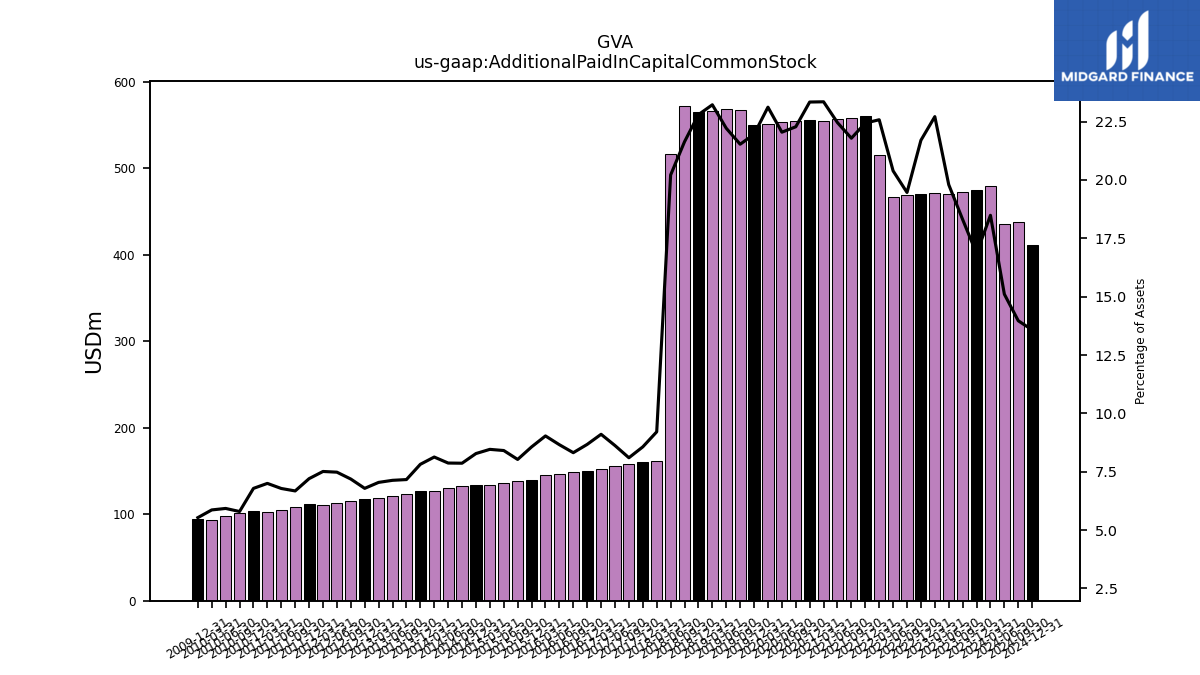
| Additional Paid In Capital Common Stock | 479.68 | 474.13 | 472.38 | 470.51 | 471.78 | 470.41 | 468.66 | 467.16 | 515.26 | 559.75 | 558.12 | 556.62 | 554.19 | 555.41 | 554.30 | 553.04 | 551.19 | 549.31 | 567.03 | 568.26 | 566.50 | 564.56 | 572.05 | 516.68 | 162.04 | 160.38 | 157.73 | 155.48 | 152.81 | 150.34 | 148.49 | 145.97 | 145.66 | 139.41 | 137.97 | 136.21 | 133.96 | 134.18 | 132.40 | 130.18 | 126.94 | 126.45 | 123.68 | 121.37 | 118.27 | 117.42 | 114.92 | 112.81 | 110.43 | 111.51 | 108.10 | 105.29 | 102.55 | 104.23 | 101.57 | 98.14 | 93.69 | |
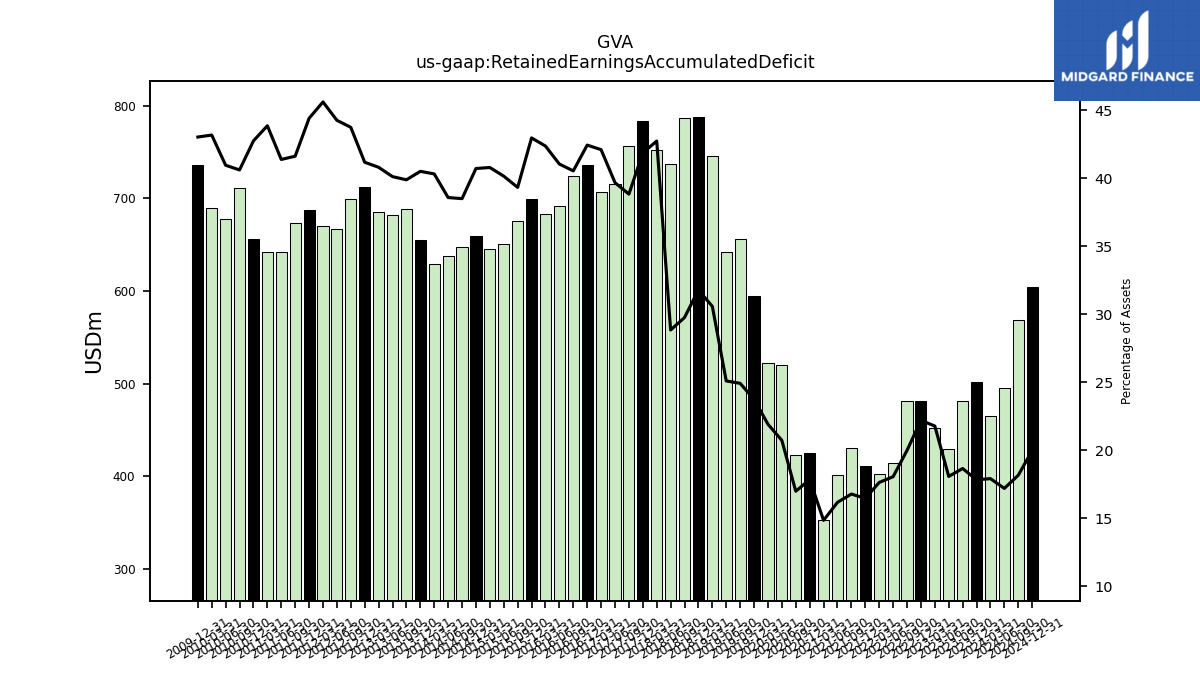
| Retained Earnings Accumulated Deficit | 465.05 | 501.84 | 481.64 | 429.80 | 452.58 | 481.38 | 481.49 | 413.93 | 402.55 | 410.83 | 430.07 | 401.06 | 352.61 | 424.83 | 422.85 | 520.02 | 522.64 | 594.35 | 656.49 | 642.12 | 746.10 | 787.36 | 786.94 | 737.42 | 751.80 | 783.70 | 756.18 | 715.45 | 706.57 | 735.63 | 723.79 | 691.92 | 683.04 | 699.43 | 675.93 | 650.36 | 645.93 | 659.82 | 648.02 | 637.90 | 629.44 | 655.10 | 688.44 | 682.61 | 685.02 | 712.14 | 699.28 | 667.28 | 670.46 | 687.30 | 673.63 | 642.23 | 642.35 | 656.41 | 711.50 | 677.87 | 689.63 | |
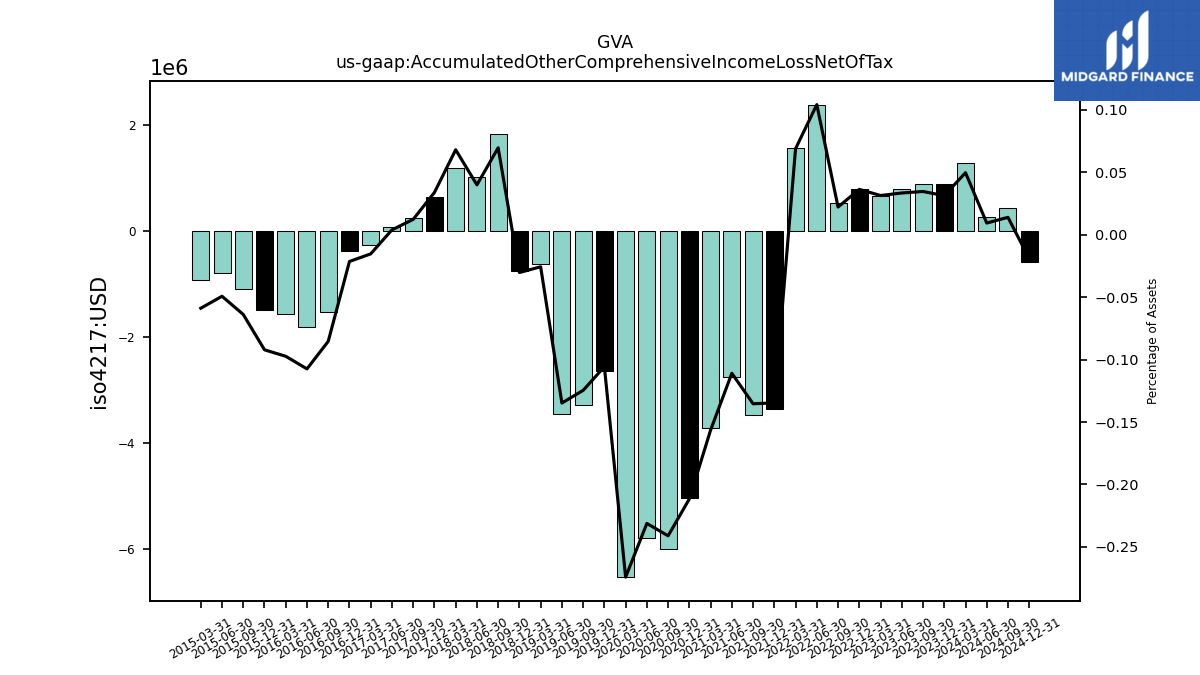
| Accumulated Other Comprehensive Income Loss Net Of Tax | 1.29 | 0.88 | 0.89 | 0.80 | 0.65 | 0.79 | 0.54 | 2.39 | 1.57 | -3.36 | -3.47 | -2.75 | -3.71 | -5.04 | -6.00 | -5.80 | -6.54 | -2.65 | -3.28 | -3.45 | -0.63 | -0.75 | 1.84 | 1.02 | 1.20 | 0.63 | 0.24 | 0.07 | -0.26 | -0.37 | -1.52 | -1.81 | -1.57 | -1.50 | -1.10 | -0.80 | -0.93 | NA | NA | NA | NA | NA | NA | NA | NA | NA | NA | NA | NA | NA | NA | NA | NA | NA | NA | NA | NA | |
| Minority Interest | 58.15 | 49.67 | 51.23 | 39.91 | 46.95 | 32.13 | 35.62 | 33.32 | 37.32 | 27.88 | 37.17 | 32.86 | 27.66 | 15.95 | 17.39 | 23.04 | 32.06 | 36.95 | 42.56 | 50.16 | 49.49 | 46.00 | 45.11 | 45.41 | 49.46 | 47.70 | 37.25 | 38.68 | 36.54 | 36.60 | 35.04 | 32.53 | 28.22 | 30.88 | 22.21 | 21.32 | 22.41 | 22.72 | 26.26 | 25.07 | 7.96 | 4.40 | 16.31 | 29.81 | 44.25 | 41.91 | 34.69 | 28.65 | 31.49 | 28.47 | 26.00 | 25.97 | 34.29 | 34.60 | 43.21 | 39.79 | 43.42 |
| 2024-03-31 | 2023-12-31 | 2023-09-30 | 2023-06-30 | 2023-03-31 | 2022-12-31 | 2022-09-30 | 2022-06-30 | 2022-03-31 | 2021-12-31 | 2021-09-30 | 2021-06-30 | 2021-03-31 | 2020-12-31 | 2020-09-30 | 2020-06-30 | 2020-03-31 | 2019-12-31 | 2019-09-30 | 2019-06-30 | 2019-03-31 | 2018-12-31 | 2018-09-30 | 2018-06-30 | 2018-03-31 | 2017-12-31 | 2017-09-30 | 2017-06-30 | 2017-03-31 | 2016-12-31 | 2016-09-30 | 2016-06-30 | 2016-03-31 | 2015-12-31 | 2015-09-30 | 2015-06-30 | 2015-03-31 | 2014-12-31 | 2014-09-30 | 2014-06-30 | 2014-03-31 | 2013-12-31 | 2013-09-30 | 2013-06-30 | 2013-03-31 | 2012-12-31 | 2012-09-30 | 2012-06-30 | 2012-03-31 | 2011-12-31 | 2011-09-30 | 2011-06-30 | 2011-03-31 | 2010-12-31 | 2010-09-30 | 2010-06-30 | 2010-03-31 | ||
|---|---|---|---|---|---|---|---|---|---|---|---|---|---|---|---|---|---|---|---|---|---|---|---|---|---|---|---|---|---|---|---|---|---|---|---|---|---|---|---|---|---|---|---|---|---|---|---|---|---|---|---|---|---|---|---|---|---|---|
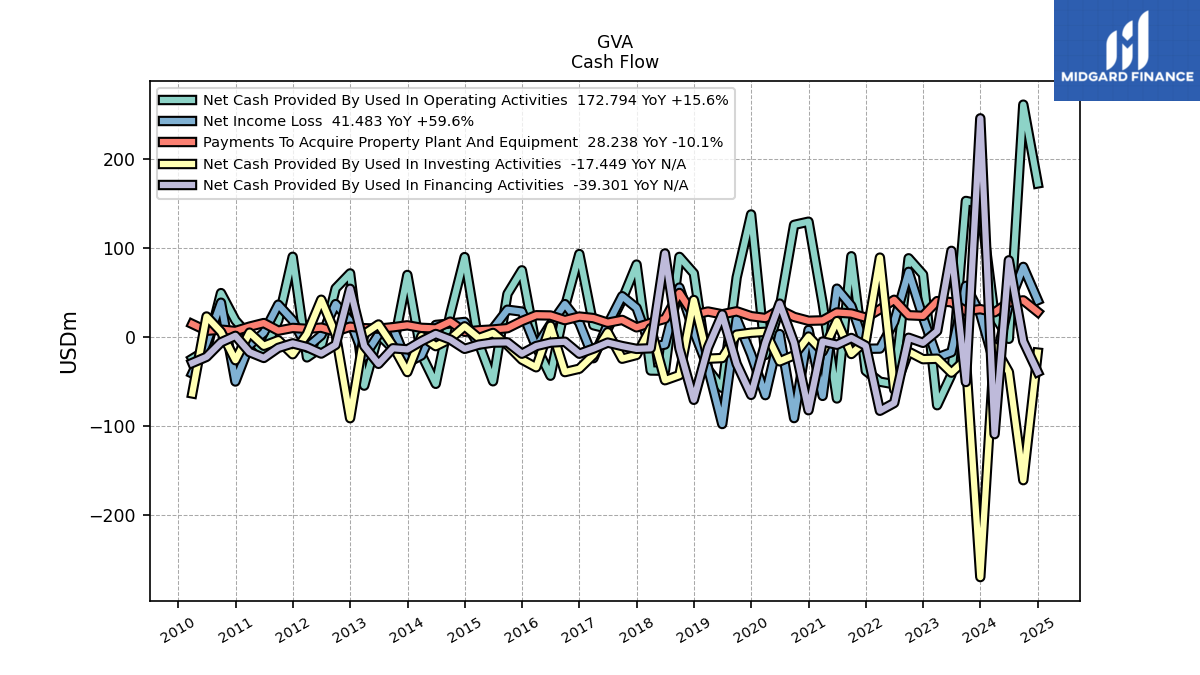
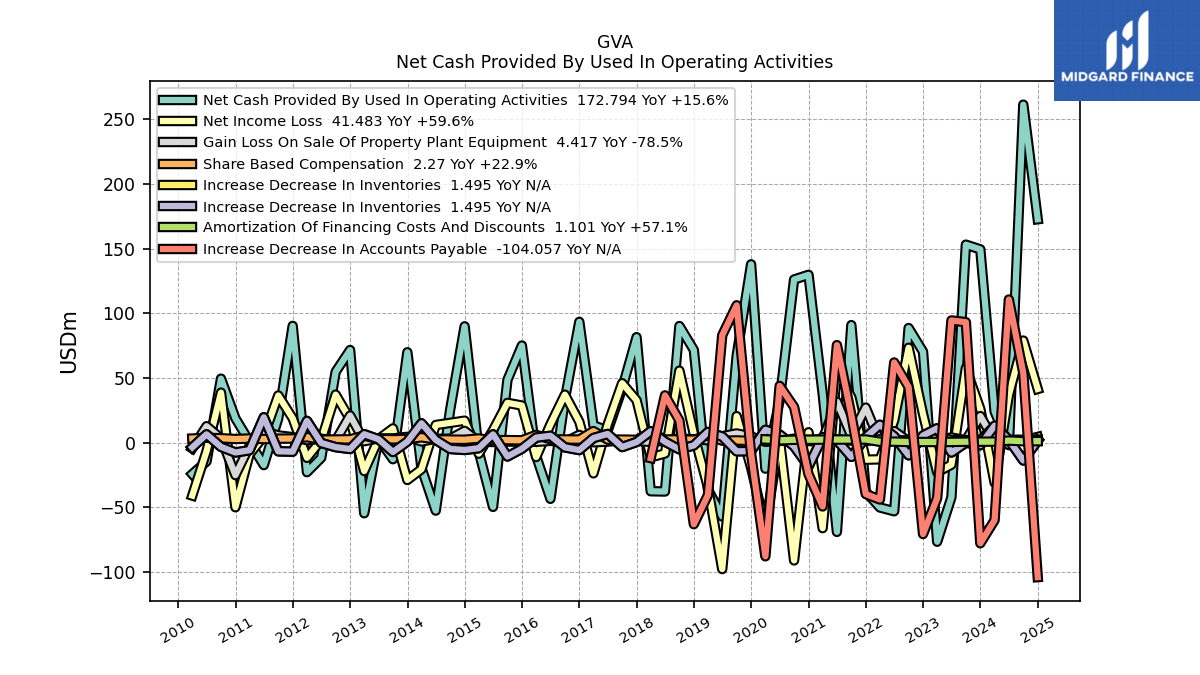
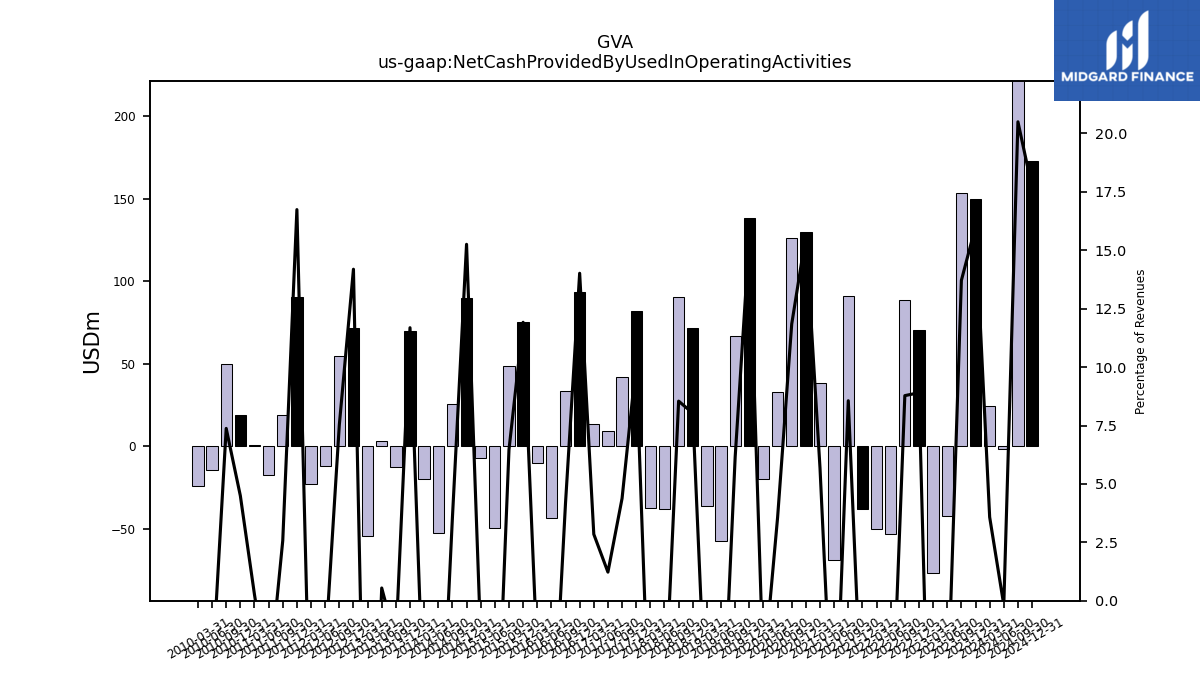
| Net Cash Provided By Used In Operating Activities | 24.07 | 149.51 | 153.15 | -42.26 | -76.69 | 70.28 | 88.65 | -53.10 | -50.18 | -37.99 | 90.93 | -69.09 | 38.09 | 129.79 | 126.18 | 32.61 | -20.12 | 137.94 | 67.02 | -57.15 | -36.36 | 71.65 | 90.19 | -37.83 | -37.62 | 81.58 | 41.93 | 9.35 | 13.34 | 93.45 | 33.63 | -43.49 | -10.43 | 75.11 | 48.53 | -49.74 | -6.92 | 89.97 | 25.55 | -52.61 | -19.78 | 69.89 | -12.87 | 3.00 | -54.65 | 71.63 | 54.79 | -11.75 | -22.87 | 90.33 | 18.75 | -17.41 | 0.68 | 18.75 | 49.48 | -14.56 | -24.35 | |
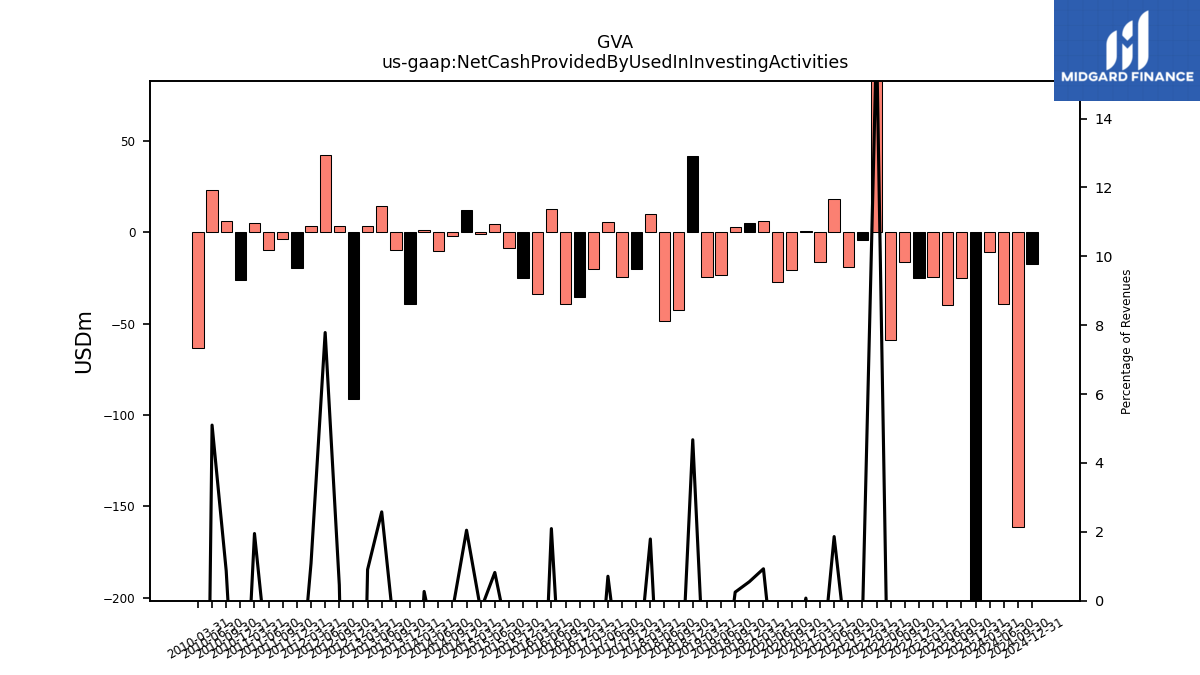
| Net Cash Provided By Used In Investing Activities | -10.76 | -270.02 | -24.89 | -40.04 | -24.34 | -24.87 | -16.44 | -59.08 | 89.40 | -4.10 | -19.04 | 17.96 | -16.30 | 0.64 | -20.49 | -27.31 | 5.90 | 4.89 | 2.72 | -23.58 | -24.34 | 41.72 | -42.83 | -48.58 | 10.10 | -20.10 | -24.36 | 5.43 | -20.16 | -35.61 | -39.43 | 12.67 | -34.02 | -25.34 | -8.92 | 4.67 | -1.12 | 12.08 | -2.10 | -10.22 | 1.02 | -39.36 | -9.91 | 14.20 | 3.43 | -91.28 | 3.33 | 42.02 | 3.38 | -19.36 | -3.57 | -9.81 | 5.01 | -26.03 | 5.83 | 23.16 | -63.40 | |
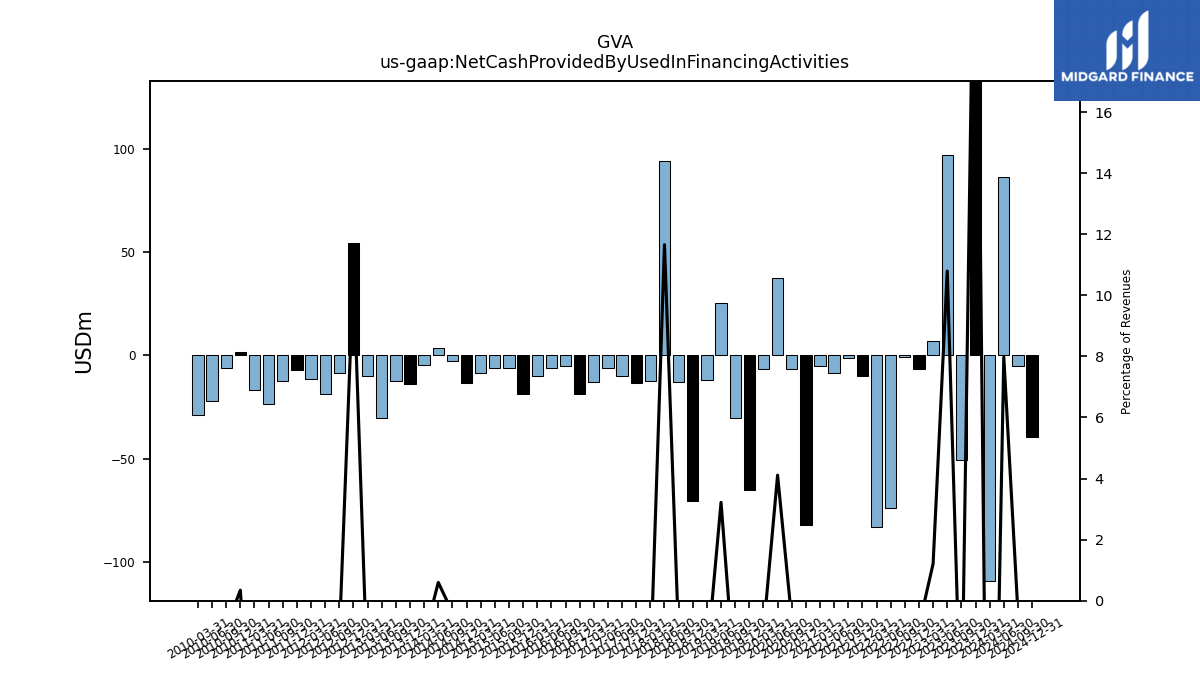
| Net Cash Provided By Used In Financing Activities | -109.22 | 246.05 | -50.58 | 97.00 | 6.78 | -6.50 | -0.76 | -74.15 | -82.90 | -9.82 | -1.02 | -8.62 | -4.99 | -82.32 | -6.59 | 37.65 | -6.40 | -65.05 | -30.19 | 25.43 | -11.83 | -70.59 | -12.76 | 94.09 | -12.61 | -13.29 | -10.12 | -6.21 | -13.01 | -18.73 | -5.19 | -6.25 | -10.09 | -18.72 | -5.98 | -6.18 | -8.52 | -13.27 | -2.74 | 3.51 | -4.59 | -13.88 | -12.59 | -30.14 | -9.99 | 54.32 | -8.74 | -18.55 | -11.27 | -7.08 | -12.16 | -23.48 | -16.94 | 1.45 | -5.91 | -22.25 | -29.11 |
| 2024-03-31 | 2023-12-31 | 2023-09-30 | 2023-06-30 | 2023-03-31 | 2022-12-31 | 2022-09-30 | 2022-06-30 | 2022-03-31 | 2021-12-31 | 2021-09-30 | 2021-06-30 | 2021-03-31 | 2020-12-31 | 2020-09-30 | 2020-06-30 | 2020-03-31 | 2019-12-31 | 2019-09-30 | 2019-06-30 | 2019-03-31 | 2018-12-31 | 2018-09-30 | 2018-06-30 | 2018-03-31 | 2017-12-31 | 2017-09-30 | 2017-06-30 | 2017-03-31 | 2016-12-31 | 2016-09-30 | 2016-06-30 | 2016-03-31 | 2015-12-31 | 2015-09-30 | 2015-06-30 | 2015-03-31 | 2014-12-31 | 2014-09-30 | 2014-06-30 | 2014-03-31 | 2013-12-31 | 2013-09-30 | 2013-06-30 | 2013-03-31 | 2012-12-31 | 2012-09-30 | 2012-06-30 | 2012-03-31 | 2011-12-31 | 2011-09-30 | 2011-06-30 | 2011-03-31 | 2010-12-31 | 2010-09-30 | 2010-06-30 | 2010-03-31 | ||
|---|---|---|---|---|---|---|---|---|---|---|---|---|---|---|---|---|---|---|---|---|---|---|---|---|---|---|---|---|---|---|---|---|---|---|---|---|---|---|---|---|---|---|---|---|---|---|---|---|---|---|---|---|---|---|---|---|---|---|
| Net Cash Provided By Used In Operating Activities | 24.07 | 149.51 | 153.15 | -42.26 | -76.69 | 70.28 | 88.65 | -53.10 | -50.18 | -37.99 | 90.93 | -69.09 | 38.09 | 129.79 | 126.18 | 32.61 | -20.12 | 137.94 | 67.02 | -57.15 | -36.36 | 71.65 | 90.19 | -37.83 | -37.62 | 81.58 | 41.93 | 9.35 | 13.34 | 93.45 | 33.63 | -43.49 | -10.43 | 75.11 | 48.53 | -49.74 | -6.92 | 89.97 | 25.55 | -52.61 | -19.78 | 69.89 | -12.87 | 3.00 | -54.65 | 71.63 | 54.79 | -11.75 | -22.87 | 90.33 | 18.75 | -17.41 | 0.68 | 18.75 | 49.48 | -14.56 | -24.35 | |
| Net Income Loss | -30.98 | 26.00 | 57.62 | -17.00 | -23.02 | 22.05 | 73.39 | 17.15 | -12.94 | -13.21 | 35.04 | 54.46 | -66.19 | 8.01 | -91.16 | 3.40 | -65.37 | -19.38 | 20.49 | -97.84 | -34.57 | 6.55 | 55.67 | -8.38 | -11.42 | 32.77 | 45.98 | 14.13 | -23.79 | 16.17 | 37.10 | 14.13 | -11.19 | 28.67 | 30.76 | 9.61 | -8.56 | 16.98 | 15.28 | 13.64 | -20.55 | -28.90 | 11.00 | 2.72 | -21.98 | 17.99 | 37.12 | 1.95 | -11.77 | 18.75 | 36.47 | 4.95 | -9.01 | -50.02 | 38.68 | -6.69 | -40.95 | |
| Profit Loss | -29.44 | 21.71 | 57.50 | -23.85 | -25.77 | 19.18 | 69.29 | 16.57 | -9.82 | -20.43 | 32.42 | 55.75 | -65.32 | 5.69 | -98.36 | -0.97 | -72.54 | -20.06 | 44.77 | -21.65 | -31.08 | 10.39 | 59.10 | -6.08 | -9.66 | 35.33 | 48.05 | 16.27 | -23.85 | 19.26 | 38.09 | 18.46 | -10.51 | 35.14 | 32.18 | 9.54 | -8.61 | 20.82 | 14.11 | 22.21 | -21.26 | -33.26 | 4.46 | 3.17 | -19.83 | 18.37 | 45.75 | 4.49 | -8.69 | 24.79 | 42.38 | 6.17 | -7.26 | -65.39 | 43.30 | -2.63 | -37.73 | |
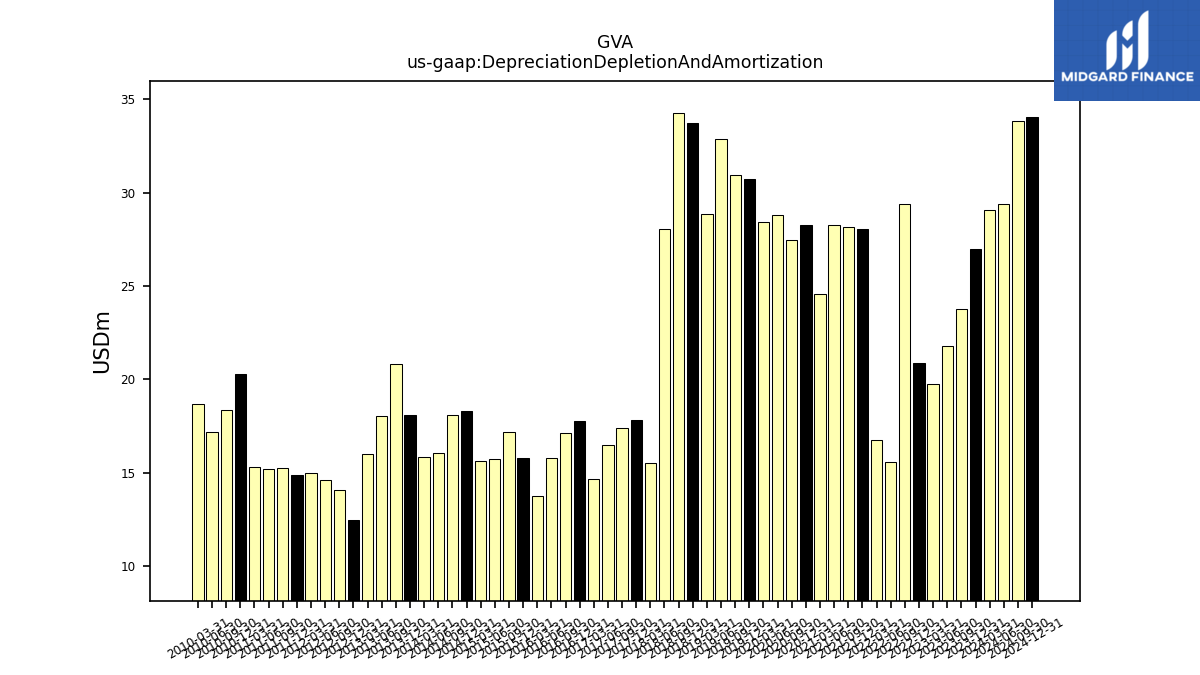
| Depreciation Depletion And Amortization | 29.07 | 26.97 | 23.77 | 21.80 | 19.73 | 20.86 | 29.39 | 15.59 | 16.74 | 28.04 | 28.16 | 28.27 | 24.58 | 28.25 | 27.44 | 28.82 | 28.45 | 30.72 | 30.95 | 32.90 | 28.85 | 33.73 | 34.27 | 28.04 | 15.51 | 17.82 | 17.37 | 16.50 | 14.65 | 17.74 | 17.14 | 15.77 | 13.74 | 15.79 | 17.19 | 15.70 | 15.63 | 18.28 | 18.09 | 16.05 | 15.83 | 18.11 | 20.80 | 18.02 | 15.97 | 12.45 | 14.08 | 14.61 | 14.96 | 14.86 | 15.23 | 15.17 | 15.29 | 20.27 | 18.33 | 17.18 | 18.66 | |
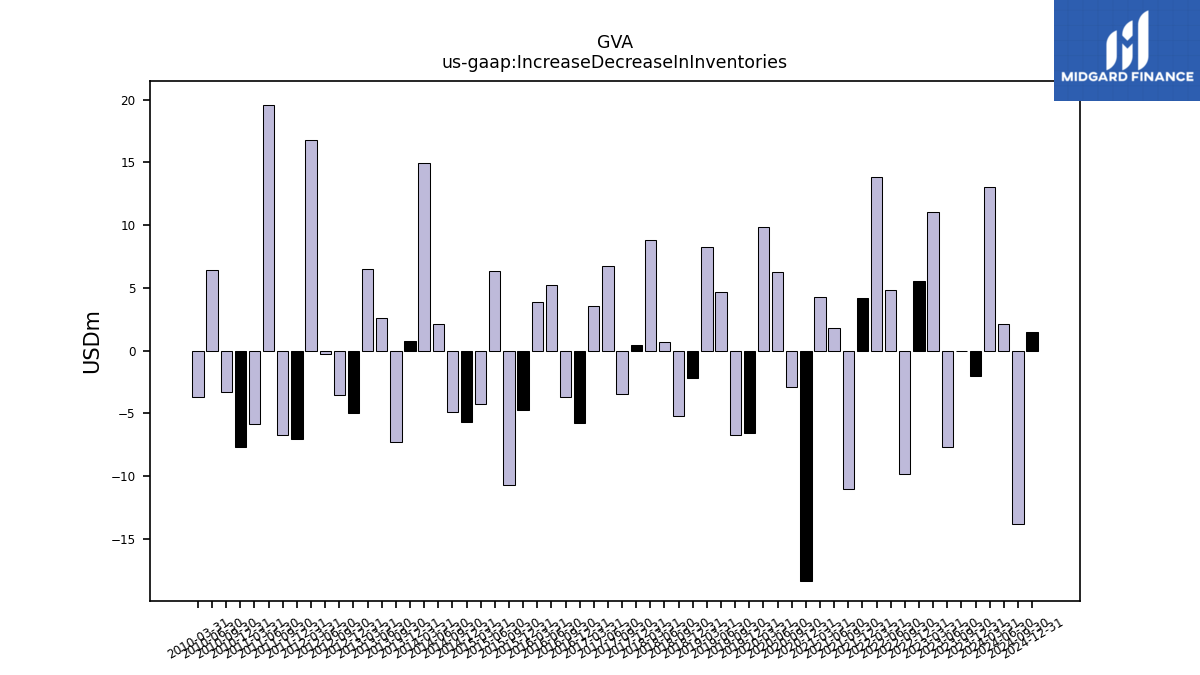
| Increase Decrease In Inventories | 13.07 | -1.99 | -0.02 | -7.64 | 11.08 | 5.51 | -9.82 | 4.81 | 13.80 | 4.18 | -11.01 | 1.81 | 4.25 | -18.36 | -2.91 | 6.26 | 9.88 | -6.56 | -6.73 | 4.67 | 8.24 | -2.16 | -5.24 | 0.73 | 8.80 | 0.44 | -3.44 | 6.71 | 3.54 | -5.77 | -3.70 | 5.27 | 3.89 | -4.74 | -10.73 | 6.39 | -4.28 | -5.68 | -4.90 | 2.09 | 14.93 | 0.81 | -7.24 | 2.61 | 6.51 | -4.95 | -3.50 | -0.28 | 16.81 | -7.01 | -6.74 | 19.59 | -5.88 | -7.64 | -3.31 | 6.41 | -3.68 | |
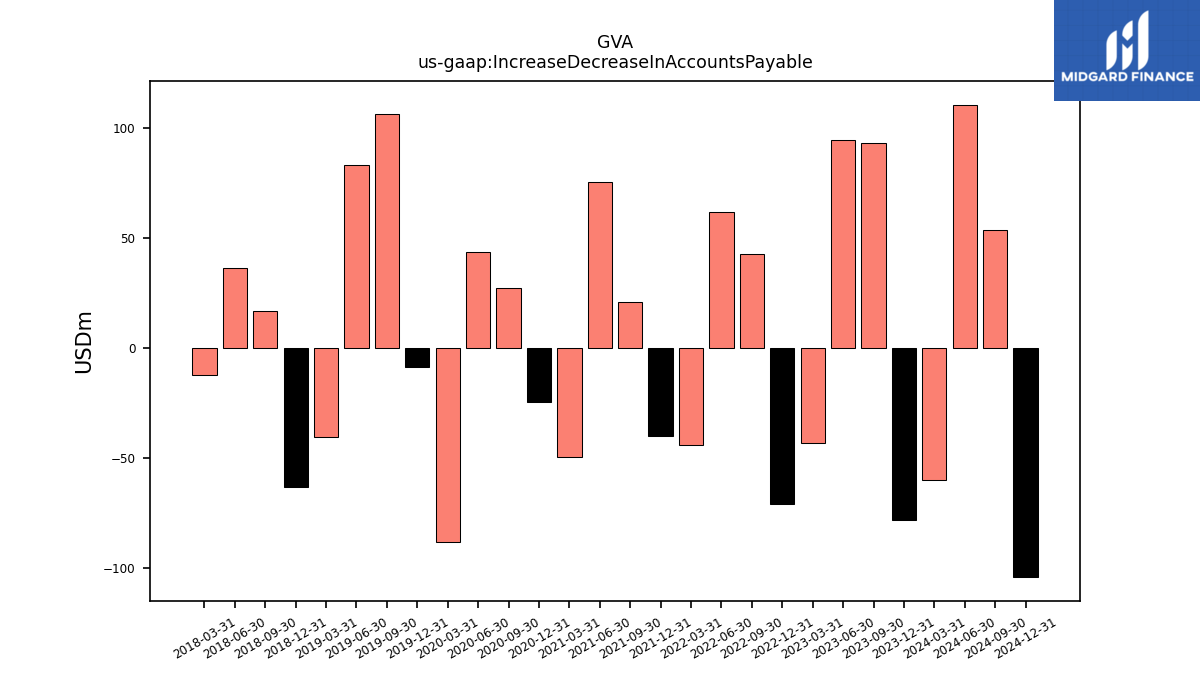
| Increase Decrease In Accounts Payable | -60.03 | -77.89 | 93.17 | 94.51 | -42.95 | -70.75 | 42.99 | 62.01 | -44.03 | -39.83 | 21.17 | 75.45 | -49.40 | -24.44 | 27.54 | 43.88 | -87.98 | -8.71 | 106.26 | 83.06 | -40.59 | -63.13 | 17.11 | 36.56 | -12.00 | NA | NA | NA | NA | NA | NA | NA | NA | NA | NA | NA | NA | NA | NA | NA | NA | NA | NA | NA | NA | NA | NA | NA | NA | NA | NA | NA | NA | NA | NA | NA | NA | |
| Deferred Income Tax Expense Benefit | NA | 25.01 | NA | NA | NA | 23.27 | -20.36 | 0.00 | 2.54 | NA | NA | NA | NA | 7.82 | NA | NA | NA | 14.41 | -2.15 | NA | NA | 22.22 | -2.21 | NA | NA | -4.82 | NA | NA | NA | NA | NA | NA | NA | NA | NA | NA | NA | NA | NA | NA | NA | NA | NA | NA | NA | NA | NA | NA | NA | NA | NA | NA | NA | NA | NA | NA | NA | |
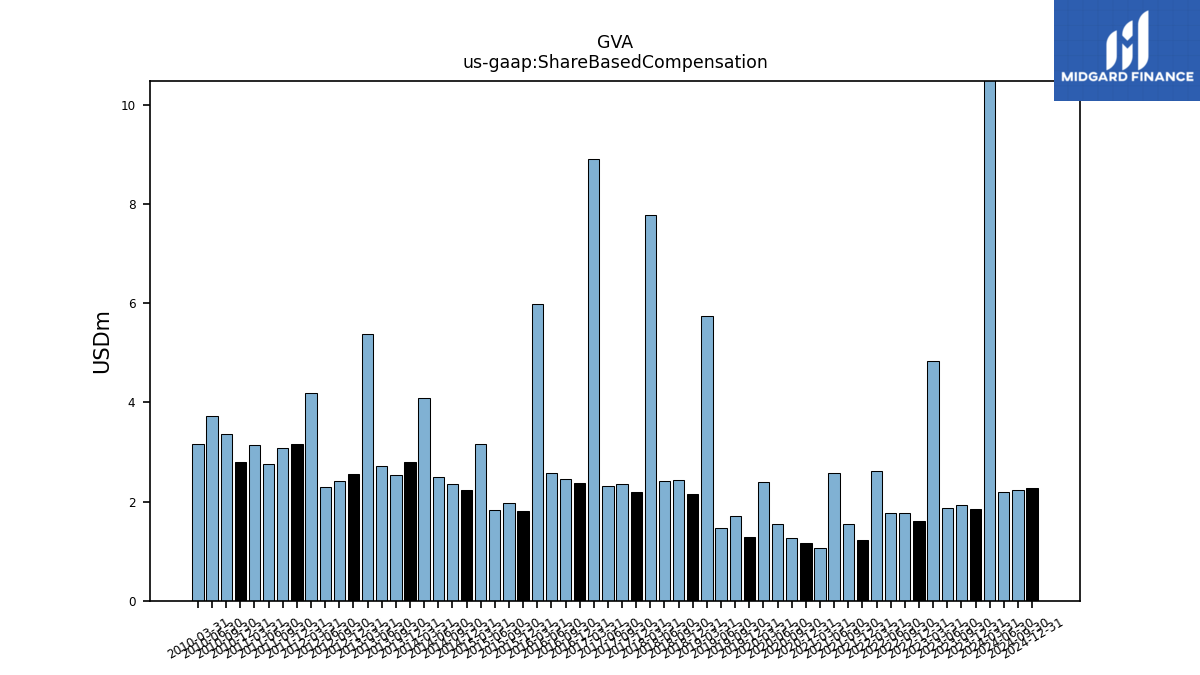
| Share Based Compensation | 12.89 | 1.85 | 1.93 | 1.87 | 4.83 | 1.61 | 1.77 | 1.76 | 2.61 | 1.23 | 1.54 | 2.58 | 1.06 | 1.17 | 1.27 | 1.54 | 2.40 | 1.29 | 1.70 | 1.47 | 5.75 | 2.16 | 2.43 | 2.42 | 7.77 | 2.18 | 2.36 | 2.31 | 8.91 | 2.37 | 2.45 | 2.58 | 5.99 | 1.80 | 1.97 | 1.83 | 3.16 | 2.23 | 2.35 | 2.49 | 4.09 | 2.80 | 2.54 | 2.71 | 5.39 | 2.56 | 2.42 | 2.30 | 4.20 | 3.16 | 3.08 | 2.76 | 3.15 | 2.80 | 3.36 | 3.73 | 3.16 |
| 2024-03-31 | 2023-12-31 | 2023-09-30 | 2023-06-30 | 2023-03-31 | 2022-12-31 | 2022-09-30 | 2022-06-30 | 2022-03-31 | 2021-12-31 | 2021-09-30 | 2021-06-30 | 2021-03-31 | 2020-12-31 | 2020-09-30 | 2020-06-30 | 2020-03-31 | 2019-12-31 | 2019-09-30 | 2019-06-30 | 2019-03-31 | 2018-12-31 | 2018-09-30 | 2018-06-30 | 2018-03-31 | 2017-12-31 | 2017-09-30 | 2017-06-30 | 2017-03-31 | 2016-12-31 | 2016-09-30 | 2016-06-30 | 2016-03-31 | 2015-12-31 | 2015-09-30 | 2015-06-30 | 2015-03-31 | 2014-12-31 | 2014-09-30 | 2014-06-30 | 2014-03-31 | 2013-12-31 | 2013-09-30 | 2013-06-30 | 2013-03-31 | 2012-12-31 | 2012-09-30 | 2012-06-30 | 2012-03-31 | 2011-12-31 | 2011-09-30 | 2011-06-30 | 2011-03-31 | 2010-12-31 | 2010-09-30 | 2010-06-30 | 2010-03-31 | ||
|---|---|---|---|---|---|---|---|---|---|---|---|---|---|---|---|---|---|---|---|---|---|---|---|---|---|---|---|---|---|---|---|---|---|---|---|---|---|---|---|---|---|---|---|---|---|---|---|---|---|---|---|---|---|---|---|---|---|---|
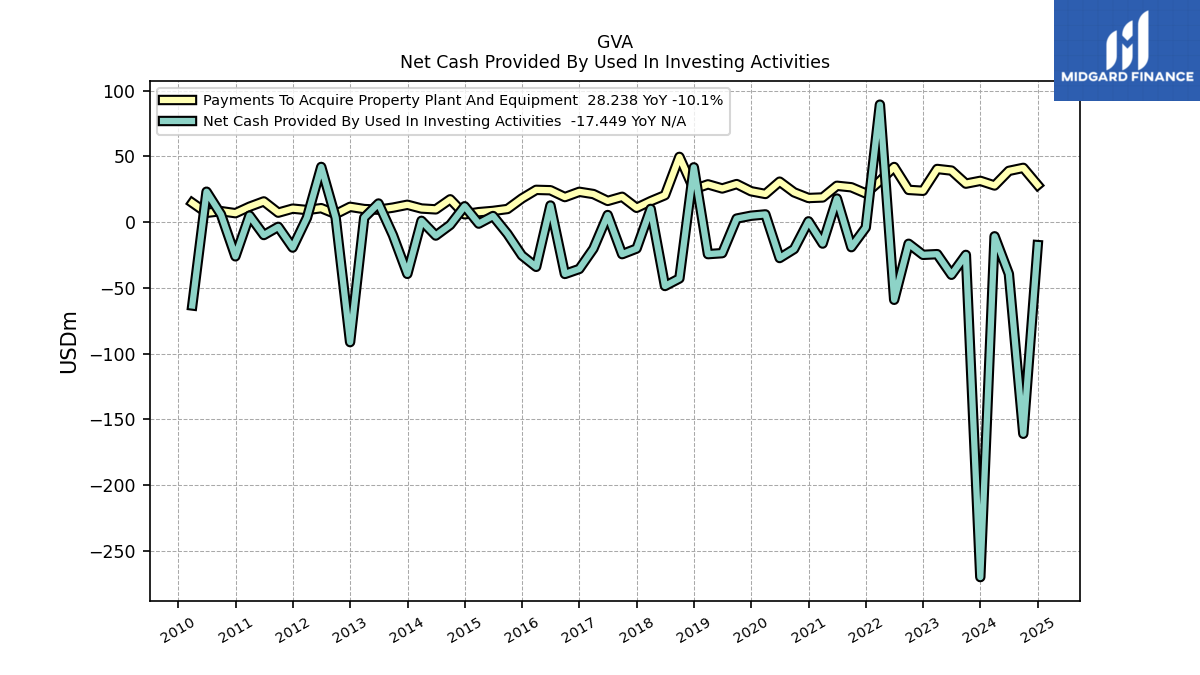
| Net Cash Provided By Used In Investing Activities | -10.76 | -270.02 | -24.89 | -40.04 | -24.34 | -24.87 | -16.44 | -59.08 | 89.40 | -4.10 | -19.04 | 17.96 | -16.30 | 0.64 | -20.49 | -27.31 | 5.90 | 4.89 | 2.72 | -23.58 | -24.34 | 41.72 | -42.83 | -48.58 | 10.10 | -20.10 | -24.36 | 5.43 | -20.16 | -35.61 | -39.43 | 12.67 | -34.02 | -25.34 | -8.92 | 4.67 | -1.12 | 12.08 | -2.10 | -10.22 | 1.02 | -39.36 | -9.91 | 14.20 | 3.43 | -91.28 | 3.33 | 42.02 | 3.38 | -19.36 | -3.57 | -9.81 | 5.01 | -26.03 | 5.83 | 23.16 | -63.40 | |
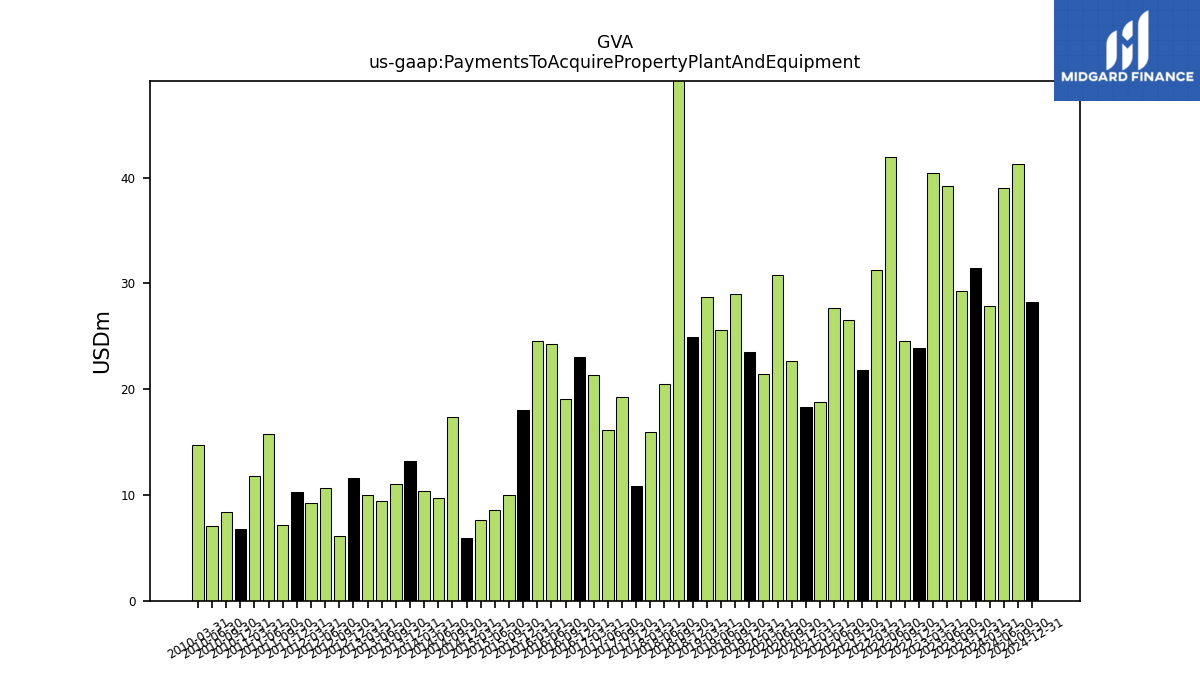
| Payments To Acquire Property Plant And Equipment | 27.87 | 31.42 | 29.27 | 39.23 | 40.46 | 23.86 | 24.54 | 41.95 | 31.27 | 21.85 | 26.53 | 27.66 | 18.78 | 18.35 | 22.66 | 30.80 | 21.43 | 23.50 | 28.98 | 25.61 | 28.74 | 24.97 | 49.66 | 20.50 | 15.97 | 10.89 | 19.29 | 16.15 | 21.37 | 23.08 | 19.05 | 24.27 | 24.57 | 18.04 | 9.99 | 8.54 | 7.61 | 5.96 | 17.38 | 9.72 | 10.38 | 13.21 | 11.04 | 9.47 | 9.96 | 11.65 | 6.12 | 10.63 | 9.22 | 10.29 | 7.21 | 15.78 | 11.76 | 6.82 | 8.37 | 7.10 | 14.71 |
| 2024-03-31 | 2023-12-31 | 2023-09-30 | 2023-06-30 | 2023-03-31 | 2022-12-31 | 2022-09-30 | 2022-06-30 | 2022-03-31 | 2021-12-31 | 2021-09-30 | 2021-06-30 | 2021-03-31 | 2020-12-31 | 2020-09-30 | 2020-06-30 | 2020-03-31 | 2019-12-31 | 2019-09-30 | 2019-06-30 | 2019-03-31 | 2018-12-31 | 2018-09-30 | 2018-06-30 | 2018-03-31 | 2017-12-31 | 2017-09-30 | 2017-06-30 | 2017-03-31 | 2016-12-31 | 2016-09-30 | 2016-06-30 | 2016-03-31 | 2015-12-31 | 2015-09-30 | 2015-06-30 | 2015-03-31 | 2014-12-31 | 2014-09-30 | 2014-06-30 | 2014-03-31 | 2013-12-31 | 2013-09-30 | 2013-06-30 | 2013-03-31 | 2012-12-31 | 2012-09-30 | 2012-06-30 | 2012-03-31 | 2011-12-31 | 2011-09-30 | 2011-06-30 | 2011-03-31 | 2010-12-31 | 2010-09-30 | 2010-06-30 | 2010-03-31 | ||
|---|---|---|---|---|---|---|---|---|---|---|---|---|---|---|---|---|---|---|---|---|---|---|---|---|---|---|---|---|---|---|---|---|---|---|---|---|---|---|---|---|---|---|---|---|---|---|---|---|---|---|---|---|---|---|---|---|---|---|
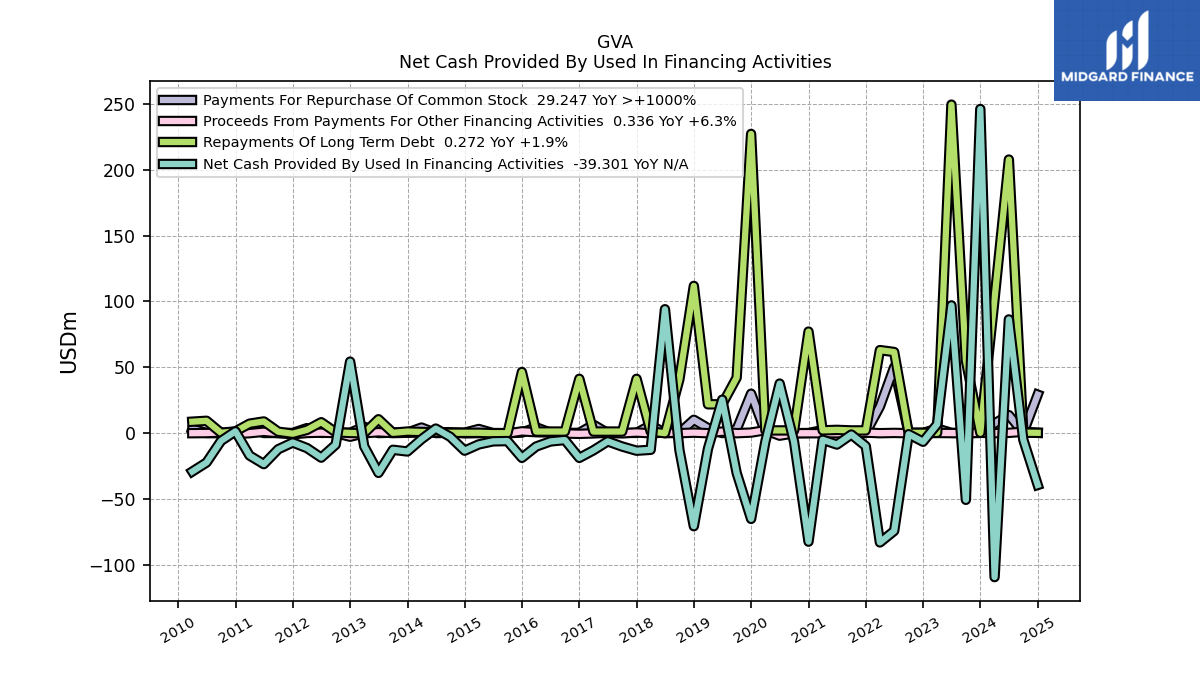
| Net Cash Provided By Used In Financing Activities | -109.22 | 246.05 | -50.58 | 97.00 | 6.78 | -6.50 | -0.76 | -74.15 | -82.90 | -9.82 | -1.02 | -8.62 | -4.99 | -82.32 | -6.59 | 37.65 | -6.40 | -65.05 | -30.19 | 25.43 | -11.83 | -70.59 | -12.76 | 94.09 | -12.61 | -13.29 | -10.12 | -6.21 | -13.01 | -18.73 | -5.19 | -6.25 | -10.09 | -18.72 | -5.98 | -6.18 | -8.52 | -13.27 | -2.74 | 3.51 | -4.59 | -13.88 | -12.59 | -30.14 | -9.99 | 54.32 | -8.74 | -18.55 | -11.27 | -7.08 | -12.16 | -23.48 | -16.94 | 1.45 | -5.91 | -22.25 | -29.11 | |
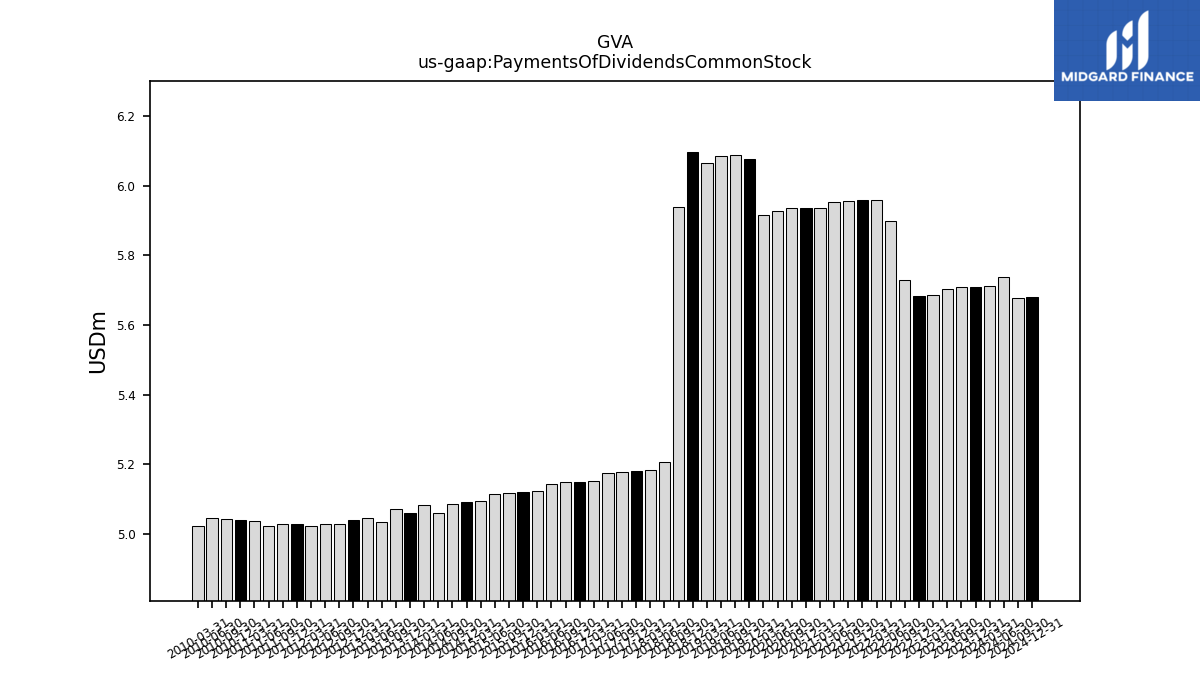
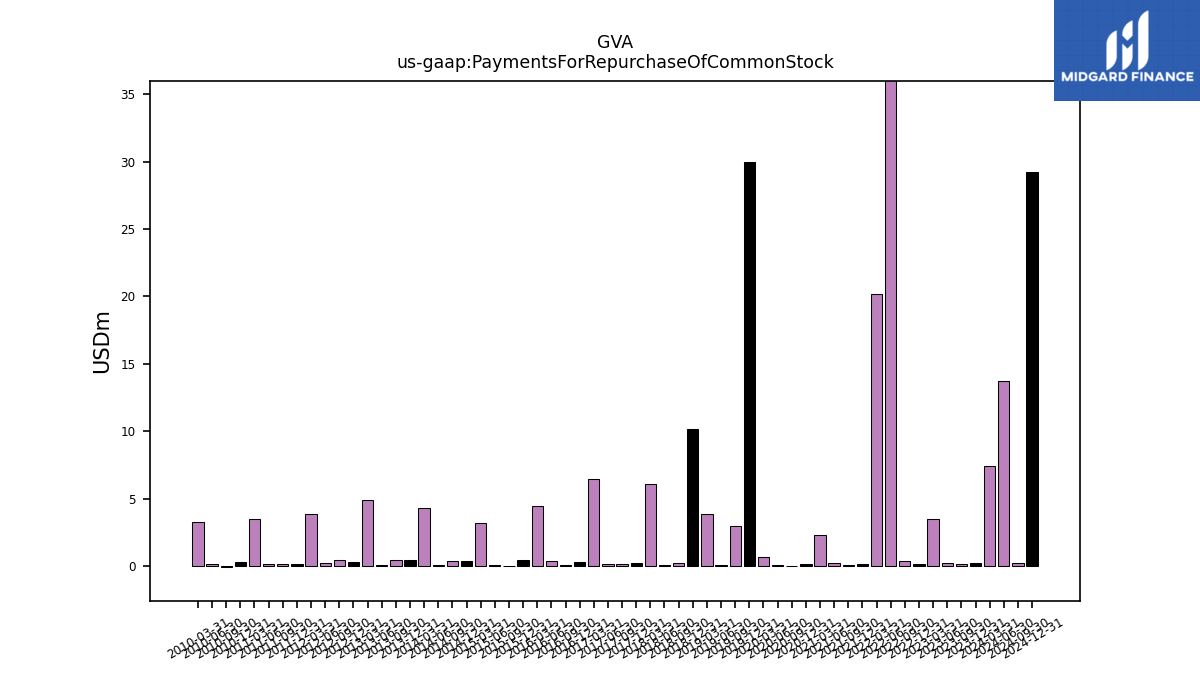
| Payments Of Dividends Common Stock | 5.71 | 5.71 | 5.71 | 5.70 | 5.69 | 5.68 | 5.73 | 5.90 | 5.96 | 5.96 | 5.96 | 5.95 | 5.94 | 5.93 | 5.93 | 5.93 | 5.92 | 6.08 | 6.09 | 6.08 | 6.07 | 6.10 | 5.94 | 5.21 | 5.18 | 5.18 | 5.18 | 5.18 | 5.15 | 5.15 | 5.15 | 5.14 | 5.12 | 5.12 | 5.12 | 5.11 | 5.09 | 5.09 | 5.09 | 5.06 | 5.08 | 5.06 | 5.07 | 5.03 | 5.04 | 5.04 | 5.03 | 5.03 | 5.02 | 5.03 | 5.03 | 5.02 | 5.04 | 5.04 | 5.04 | 5.04 | 5.02 | |
| Payments For Repurchase Of Common Stock | 7.42 | 0.22 | 0.13 | 0.24 | 3.52 | 0.17 | 0.35 | 50.16 | 20.21 | 0.13 | 0.11 | 0.20 | 2.30 | 0.13 | 0.03 | 0.07 | 0.65 | 29.98 | 2.97 | 0.08 | 3.87 | 10.19 | 0.20 | 0.05 | 6.12 | 0.26 | 0.14 | 0.12 | 6.45 | 0.28 | 0.10 | 0.39 | 4.46 | 0.45 | 0.03 | 0.10 | 3.19 | 0.37 | 0.38 | 0.09 | 4.28 | 0.44 | 0.43 | 0.12 | 4.91 | 0.33 | 0.47 | 0.22 | 3.84 | 0.19 | 0.18 | 0.15 | 3.52 | 0.27 | -0.06 | 0.14 | 3.30 |
| 2024-03-31 | 2023-12-31 | 2023-09-30 | 2023-06-30 | 2023-03-31 | 2022-12-31 | 2022-09-30 | 2022-06-30 | 2022-03-31 | 2021-12-31 | 2021-09-30 | 2021-06-30 | 2021-03-31 | 2020-12-31 | 2020-09-30 | 2020-06-30 | 2020-03-31 | 2019-12-31 | 2019-09-30 | 2019-06-30 | 2019-03-31 | 2018-12-31 | 2018-09-30 | 2018-06-30 | 2018-03-31 | 2017-12-31 | 2017-09-30 | 2017-06-30 | 2017-03-31 | 2016-12-31 | 2016-09-30 | 2016-06-30 | 2016-03-31 | 2015-12-31 | 2015-09-30 | 2015-06-30 | 2015-03-31 | 2014-12-31 | 2014-09-30 | 2014-06-30 | 2014-03-31 | 2013-12-31 | 2013-09-30 | 2013-06-30 | 2013-03-31 | 2012-12-31 | 2012-09-30 | 2012-06-30 | 2012-03-31 | 2011-12-31 | 2011-09-30 | 2011-06-30 | 2011-03-31 | 2010-12-31 | 2010-09-30 | 2010-06-30 | 2010-03-31 | ||
|---|---|---|---|---|---|---|---|---|---|---|---|---|---|---|---|---|---|---|---|---|---|---|---|---|---|---|---|---|---|---|---|---|---|---|---|---|---|---|---|---|---|---|---|---|---|---|---|---|---|---|---|---|---|---|---|---|---|---|
| Revenues | 672.27 | 933.70 | 1116.82 | 898.55 | 560.07 | 789.21 | 1009.81 | 768.29 | 547.59 | 683.20 | 1062.13 | 964.17 | 669.91 | 830.39 | 1065.19 | 915.77 | 635.93 | 885.59 | 1088.11 | 789.54 | 619.80 | 892.33 | 1055.59 | 807.12 | 563.38 | 801.27 | 957.13 | 762.91 | 468.40 | 666.68 | 803.90 | 604.58 | 439.45 | 630.16 | 751.38 | 569.24 | 420.25 | 589.79 | 719.76 | 585.87 | 379.85 | 598.10 | 741.58 | 550.16 | 378.70 | 504.78 | 728.48 | 539.62 | 310.16 | 539.55 | 728.58 | 484.67 | 256.73 | 417.23 | 670.85 | 454.20 | 220.68 | |
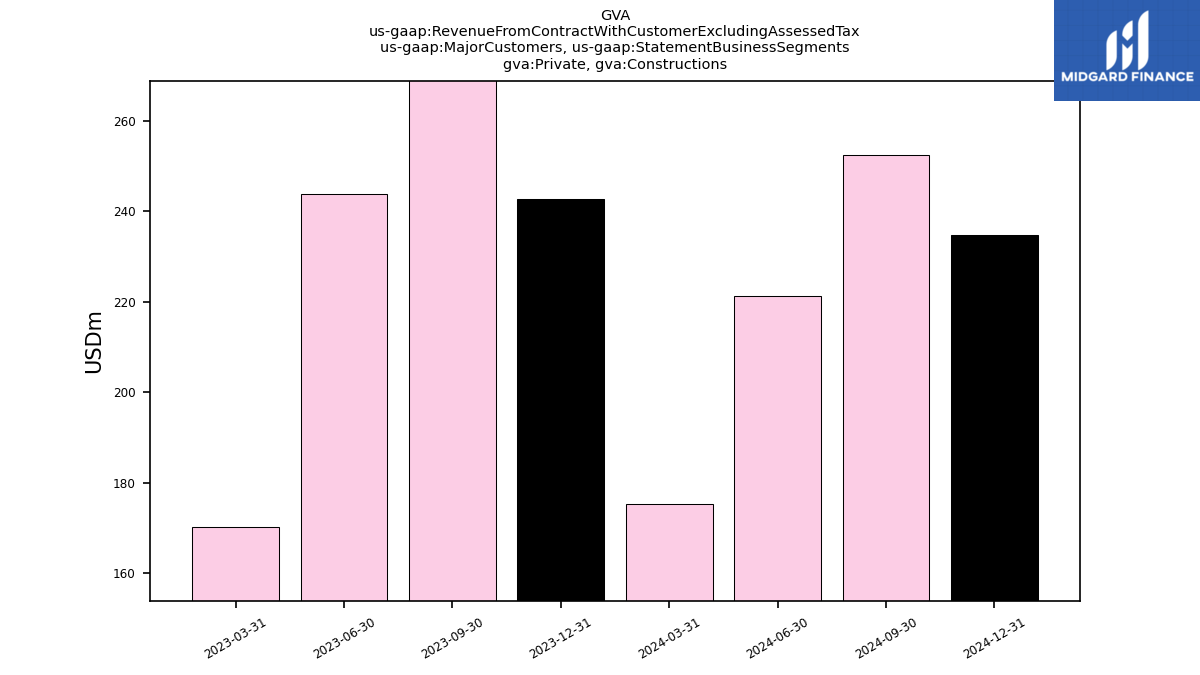
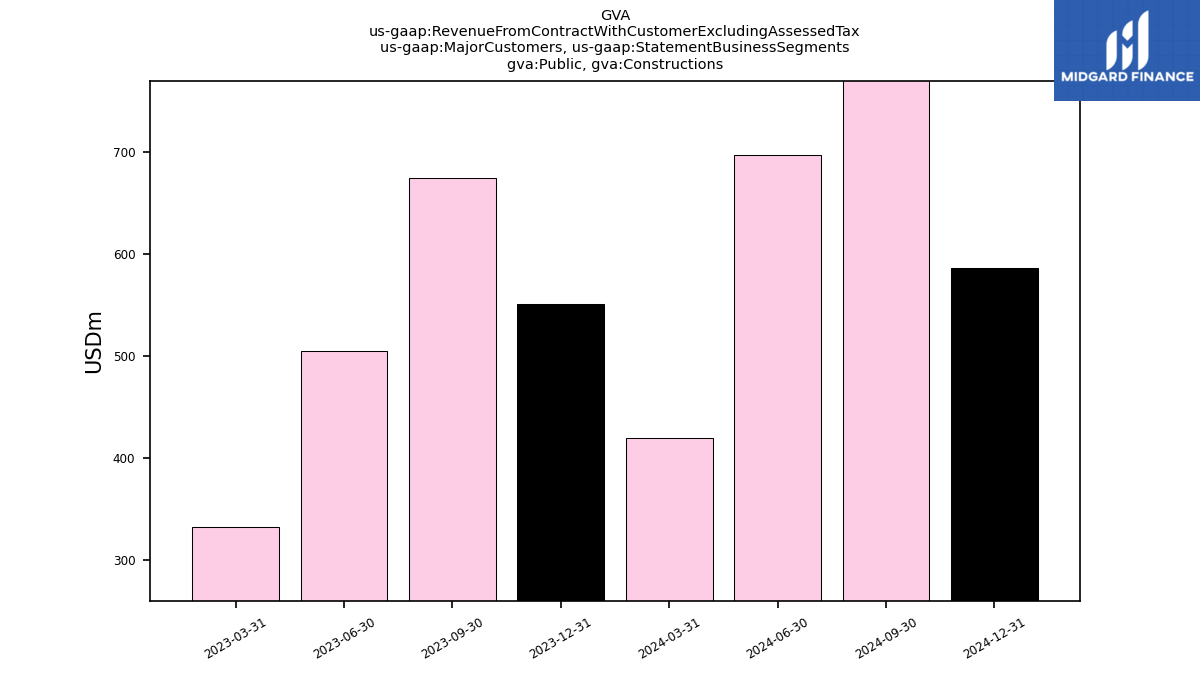
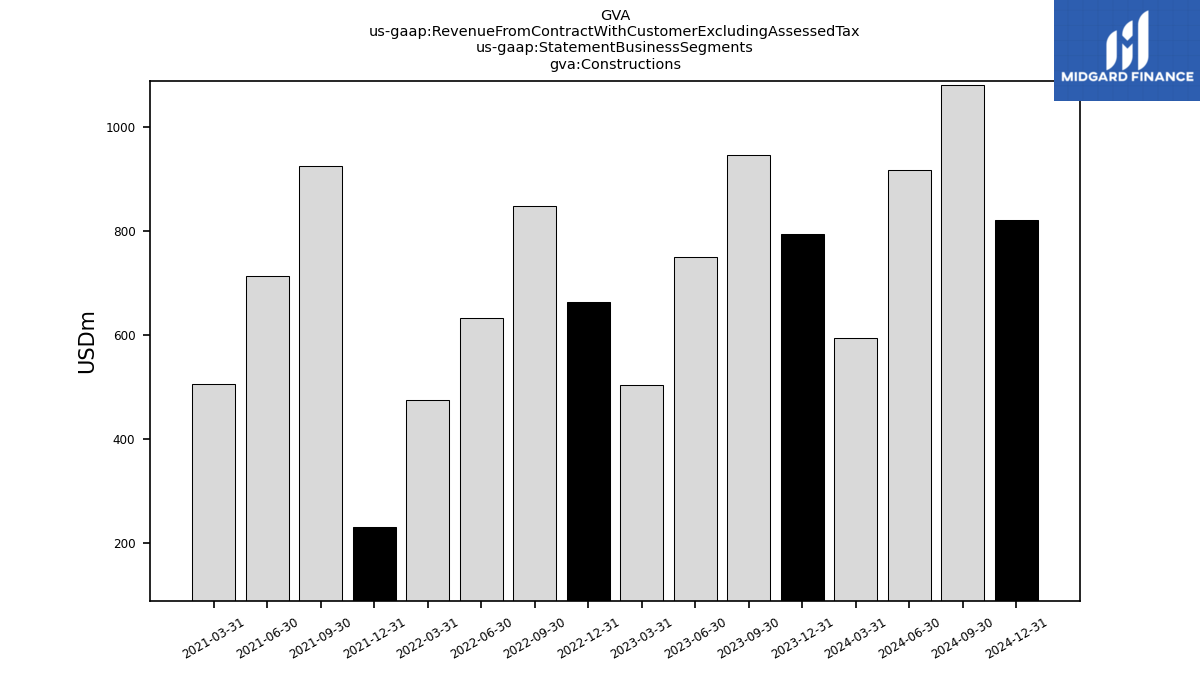
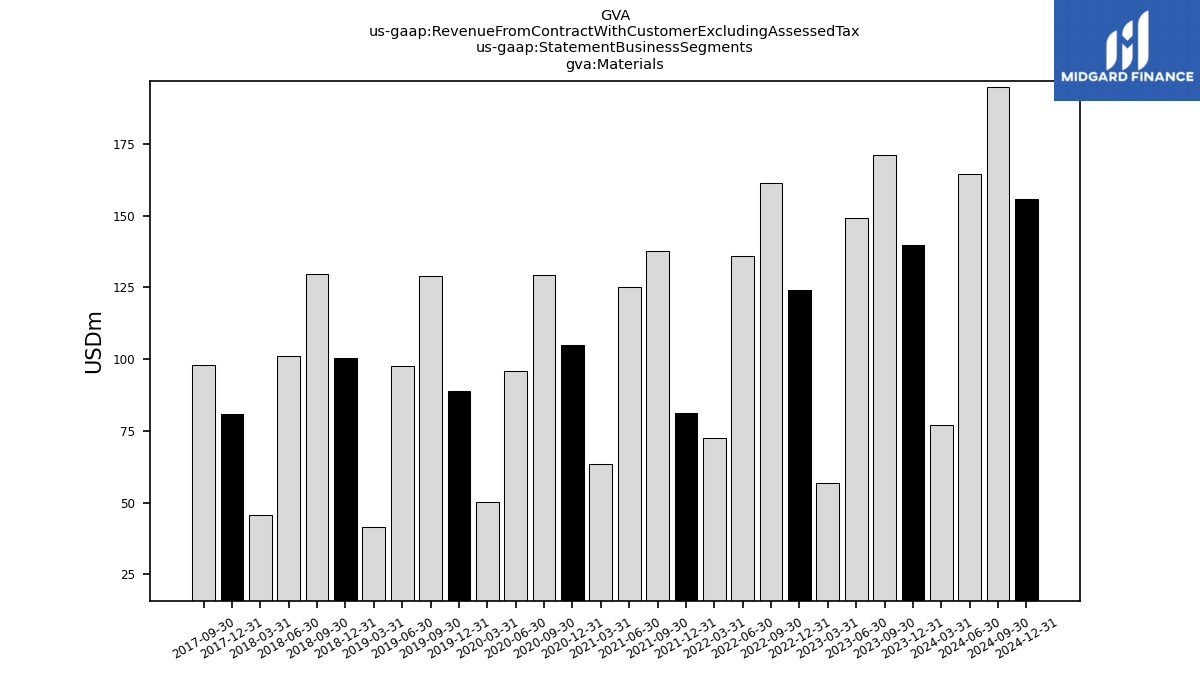
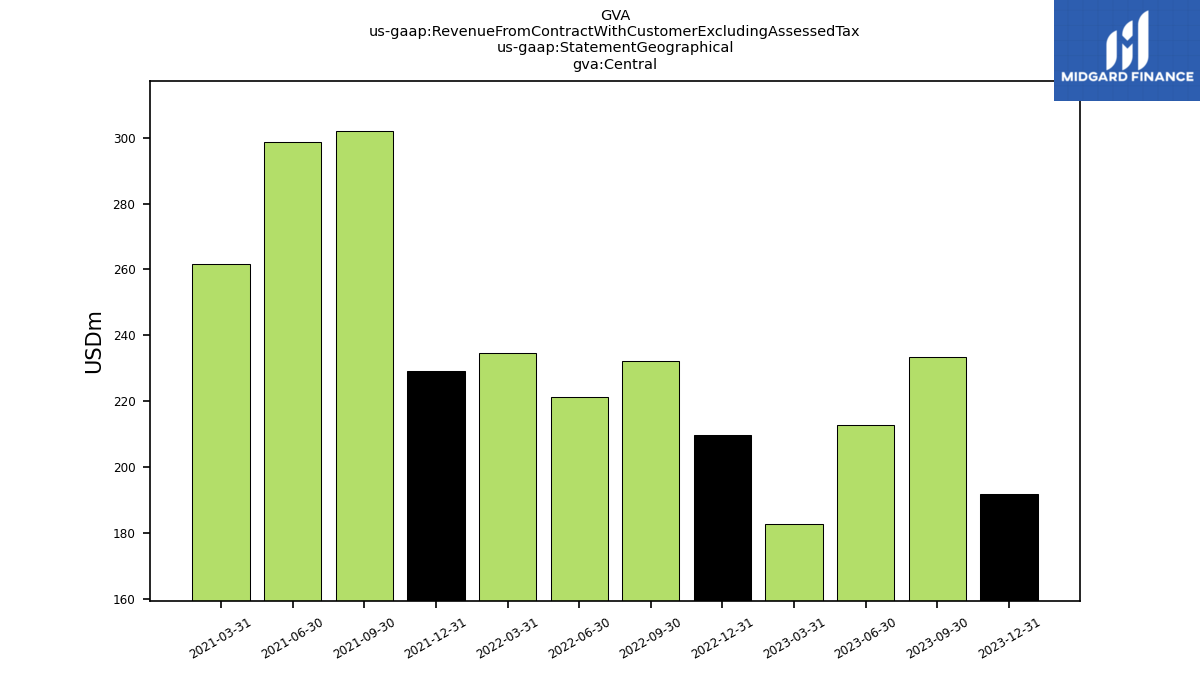
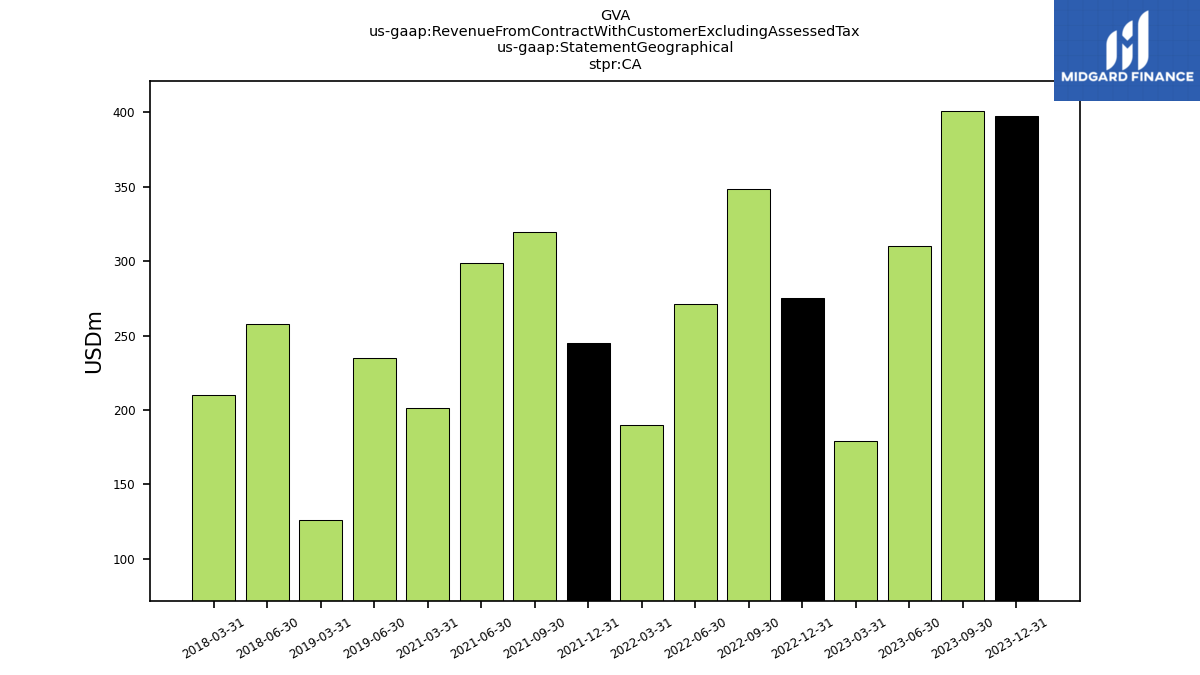
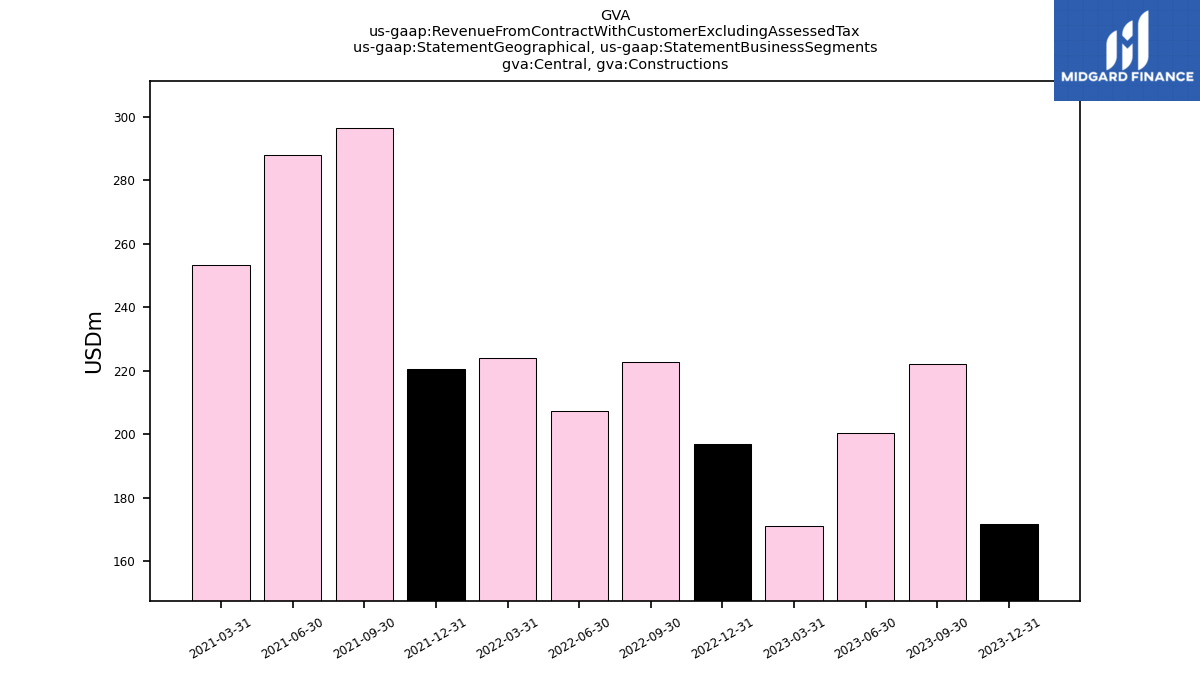
| Revenue From Contract With Customer Excluding Assessed Tax | 672.27 | 933.70 | 1116.82 | 898.55 | 560.07 | 789.21 | 1009.81 | 768.29 | 547.59 | 683.20 | 1062.13 | 964.17 | 669.91 | 830.39 | 1065.19 | 915.77 | 635.93 | 885.59 | 1088.11 | 789.54 | 619.80 | 892.33 | 1055.59 | 807.12 | 563.38 | 801.27 | 957.13 | 762.91 | 468.40 | 666.68 | 803.90 | 604.58 | 439.45 | 630.16 | 751.38 | 569.24 | 420.25 | 589.79 | 719.76 | 585.87 | 379.85 | 598.10 | 741.58 | 550.16 | 378.70 | 504.78 | 728.48 | 539.62 | 310.16 | 539.55 | 728.58 | 484.67 | 256.73 | 417.23 | 670.85 | 454.20 | 220.68 | |
| Private, Constructions | 175.40 | NA | NA | NA | 170.32 | NA | NA | NA | NA | NA | NA | NA | NA | NA | NA | NA | NA | NA | NA | NA | NA | NA | NA | NA | NA | NA | NA | NA | NA | NA | NA | NA | NA | NA | NA | NA | NA | NA | NA | NA | NA | NA | NA | NA | NA | NA | NA | NA | NA | NA | NA | NA | NA | NA | NA | NA | NA | |
| Public, Constructions | 419.82 | NA | NA | NA | 333.09 | NA | NA | NA | NA | NA | NA | NA | NA | NA | NA | NA | NA | NA | NA | NA | NA | NA | NA | NA | NA | NA | NA | NA | NA | NA | NA | NA | NA | NA | NA | NA | NA | NA | NA | NA | NA | NA | NA | NA | NA | NA | NA | NA | NA | NA | NA | NA | NA | NA | NA | NA | NA | |
| Constructions | 595.21 | 793.73 | 945.70 | 749.41 | 503.42 | 662.93 | 848.27 | 632.26 | 474.94 | 232.46 | 924.45 | 713.42 | 506.97 | NA | NA | NA | NA | NA | NA | NA | NA | NA | NA | NA | NA | NA | NA | NA | NA | NA | NA | NA | NA | NA | NA | NA | NA | NA | NA | NA | NA | NA | NA | NA | NA | NA | NA | NA | NA | NA | NA | NA | NA | NA | NA | NA | NA | |
| Materials | 77.06 | 139.97 | 171.12 | 149.14 | 56.65 | 124.14 | 161.54 | 136.03 | 72.65 | 81.38 | 137.68 | 125.23 | 63.46 | 104.94 | 129.46 | 96.03 | 50.33 | 88.80 | 129.10 | 97.65 | 41.64 | 100.52 | 129.62 | 100.95 | 45.72 | 80.94 | 98.14 | NA | NA | NA | NA | NA | NA | NA | NA | NA | NA | NA | NA | NA | NA | NA | NA | NA | NA | NA | NA | NA | NA | NA | NA | NA | NA | NA | NA | NA | NA | |
| Central | NA | 191.80 | 233.50 | 212.82 | 182.56 | 209.76 | 232.09 | 221.31 | 234.46 | 229.19 | 302.14 | 298.71 | 261.67 | NA | NA | NA | NA | NA | NA | NA | NA | NA | NA | NA | NA | NA | NA | NA | NA | NA | NA | NA | NA | NA | NA | NA | NA | NA | NA | NA | NA | NA | NA | NA | NA | NA | NA | NA | NA | NA | NA | NA | NA | NA | NA | NA | NA | |
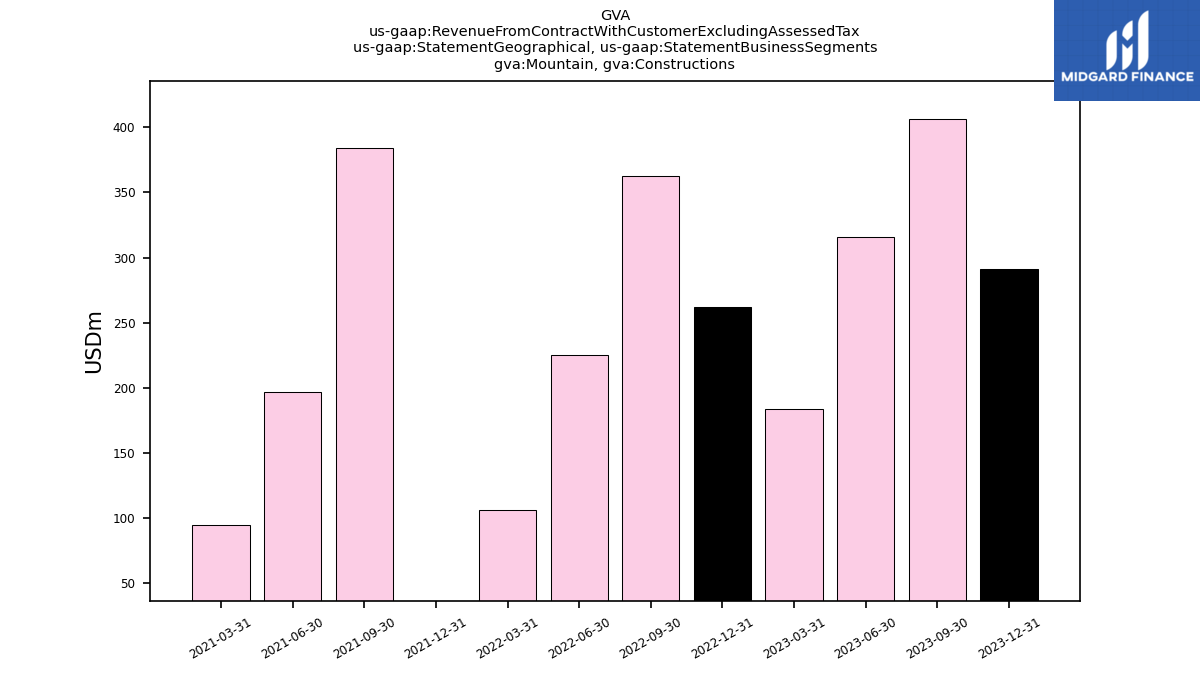
| Mountain | NA | 344.07 | 482.21 | 375.61 | 198.43 | 302.27 | 429.29 | 276.05 | 123.06 | -160.24 | 440.21 | 236.84 | 103.44 | NA | NA | NA | NA | NA | NA | NA | NA | NA | NA | NA | NA | NA | NA | NA | NA | NA | NA | NA | NA | NA | NA | NA | NA | NA | NA | NA | NA | NA | NA | NA | NA | NA | NA | NA | NA | NA | NA | NA | NA | NA | NA | NA | NA | |
| CA | NA | 397.82 | 401.11 | 310.12 | 179.09 | 275.03 | 348.43 | 270.93 | 190.07 | 244.89 | 319.77 | 299.12 | 201.22 | NA | NA | NA | NA | NA | NA | 234.99 | 126.10 | NA | NA | 257.99 | 209.90 | NA | NA | NA | NA | NA | NA | NA | NA | NA | NA | NA | NA | NA | NA | NA | NA | NA | NA | NA | NA | NA | NA | NA | NA | NA | NA | NA | NA | NA | NA | NA | NA | |
| Central, Constructions | NA | 171.93 | 222.14 | 200.49 | 171.00 | 196.87 | 222.75 | 207.41 | 224.09 | 220.66 | 296.50 | 287.99 | 253.29 | NA | NA | NA | NA | NA | NA | NA | NA | NA | NA | NA | NA | NA | NA | NA | NA | NA | NA | NA | NA | NA | NA | NA | NA | NA | NA | NA | NA | NA | NA | NA | NA | NA | NA | NA | NA | NA | NA | NA | NA | NA | NA | NA | NA | |
| Central, Materials | NA | 19.87 | 11.36 | 12.34 | 11.56 | 12.90 | 9.35 | 13.90 | 10.36 | 8.53 | 5.64 | 10.72 | 8.38 | NA | NA | NA | NA | NA | NA | NA | NA | NA | NA | NA | NA | NA | NA | NA | NA | NA | NA | NA | NA | NA | NA | NA | NA | NA | NA | NA | NA | NA | NA | NA | NA | NA | NA | NA | NA | NA | NA | NA | NA | NA | NA | NA | NA | |
| Mountain, Constructions | NA | 291.48 | 406.31 | 316.02 | 183.47 | 261.97 | 362.27 | 225.50 | 106.45 | -179.01 | 384.21 | 196.80 | 94.41 | NA | NA | NA | NA | NA | NA | NA | NA | NA | NA | NA | NA | NA | NA | NA | NA | NA | NA | NA | NA | NA | NA | NA | NA | NA | NA | NA | NA | NA | NA | NA | NA | NA | NA | NA | NA | NA | NA | NA | NA | NA | NA | NA | NA | |
| Mountain, Materials | NA | 52.59 | 75.90 | 59.59 | 14.96 | 40.30 | 67.02 | 50.55 | 16.60 | 18.77 | 56.01 | 40.04 | 9.03 | NA | NA | NA | NA | NA | NA | NA | NA | NA | NA | NA | NA | NA | NA | NA | NA | NA | NA | NA | NA | NA | NA | NA | NA | NA | NA | NA | NA | NA | NA | NA | NA | NA | NA | NA | NA | NA | NA | NA | NA | NA | NA | NA | NA | |
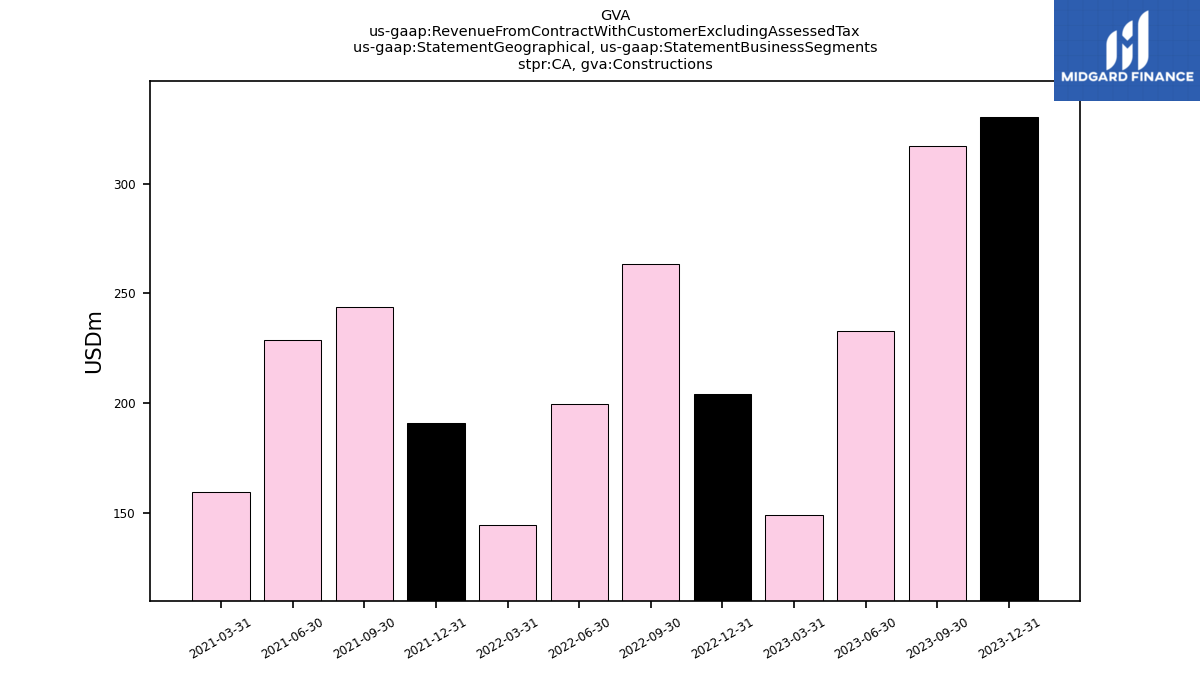
| CA, Constructions | NA | 330.32 | 317.24 | 232.90 | 148.95 | 204.09 | 263.25 | 199.36 | 144.39 | 190.81 | 243.74 | 228.63 | 159.27 | NA | NA | NA | NA | NA | NA | NA | NA | NA | NA | NA | NA | NA | NA | NA | NA | NA | NA | NA | NA | NA | NA | NA | NA | NA | NA | NA | NA | NA | NA | NA | NA | NA | NA | NA | NA | NA | NA | NA | NA | NA | NA | NA | NA | |
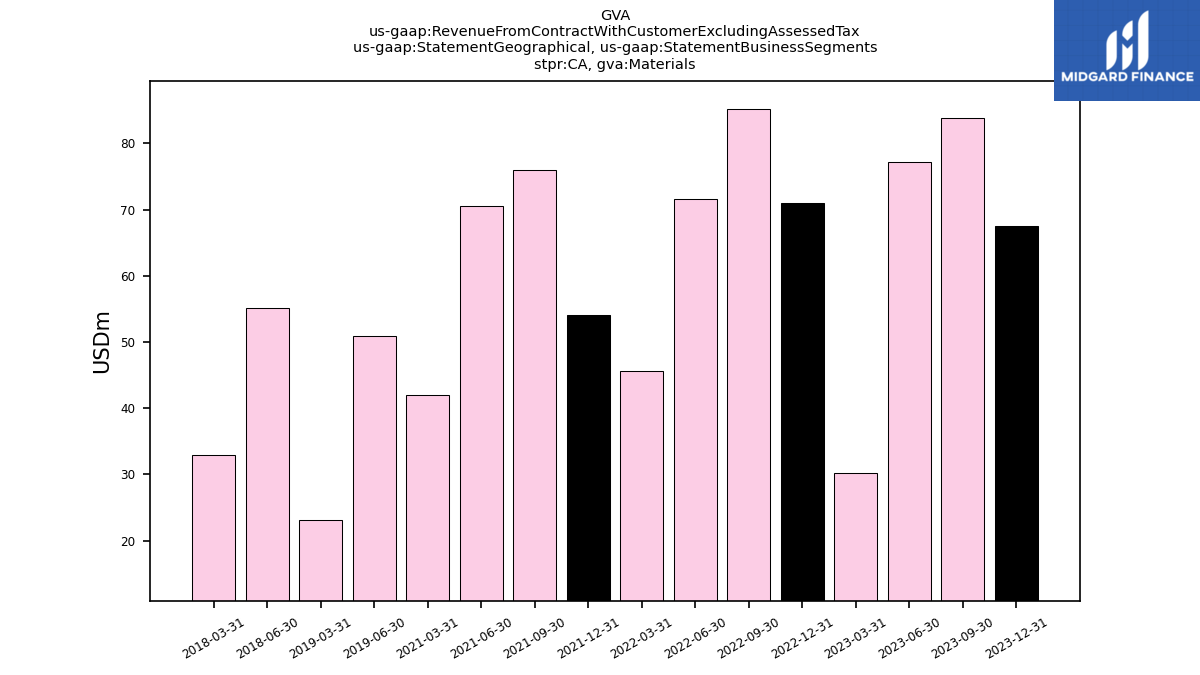
| CA, Materials | NA | 67.50 | 83.87 | 77.22 | 30.14 | 70.94 | 85.17 | 71.57 | 45.69 | 54.08 | 76.03 | 70.49 | 41.96 | NA | NA | NA | NA | NA | NA | 50.96 | 23.07 | NA | NA | 55.19 | 32.99 | NA | NA | NA | NA | NA | NA | NA | NA | NA | NA | NA | NA | NA | NA | NA | NA | NA | NA | NA | NA | NA | NA | NA | NA | NA | NA | NA | NA | NA | NA | NA | NA | |
| Revenue From Contract With Customer Including Assessed Tax | 672.27 | 933.70 | 1116.82 | 898.55 | 560.07 | 789.21 | 1009.81 | 768.29 | 547.59 | 683.20 | 1062.13 | 964.17 | 669.91 | 830.39 | 1065.19 | 915.77 | 635.93 | 885.59 | 1088.11 | 789.54 | 619.80 | 892.33 | 1055.59 | 807.12 | 563.38 | 801.27 | 957.13 | 762.91 | 468.40 | 666.68 | 803.90 | 604.58 | 439.45 | 630.16 | 751.38 | 569.24 | 420.25 | 589.79 | 719.76 | 585.87 | 379.85 | 598.10 | 741.58 | 550.16 | 378.70 | 504.78 | 728.48 | 539.62 | 310.16 | 539.55 | 728.58 | 484.67 | 256.73 | 417.23 | 670.85 | 454.20 | 220.68 |