
| 2024-03-31 | 2023-12-31 | 2023-09-30 | 2023-06-30 | 2023-03-31 | 2022-12-31 | 2022-09-30 | 2022-06-30 | 2022-03-31 | 2021-12-31 | 2021-09-30 | 2021-06-30 | 2021-03-31 | 2020-12-31 | 2020-09-30 | 2020-06-30 | 2020-03-31 | ||
|---|---|---|---|---|---|---|---|---|---|---|---|---|---|---|---|---|---|---|
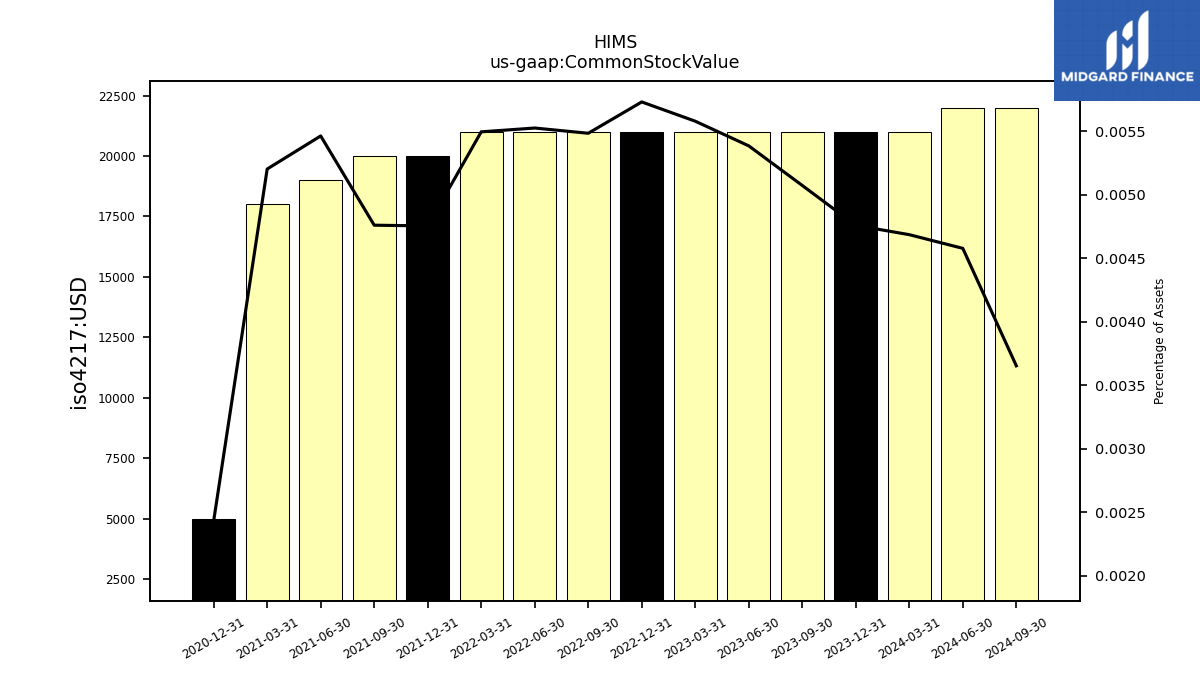
| Common Stock Value | 0.02 | 0.02 | 0.02 | 0.02 | 0.02 | 0.02 | 0.02 | 0.02 | 0.02 | 0.02 | 0.02 | 0.02 | 0.02 | 0.01 | NA | NA | NA | |
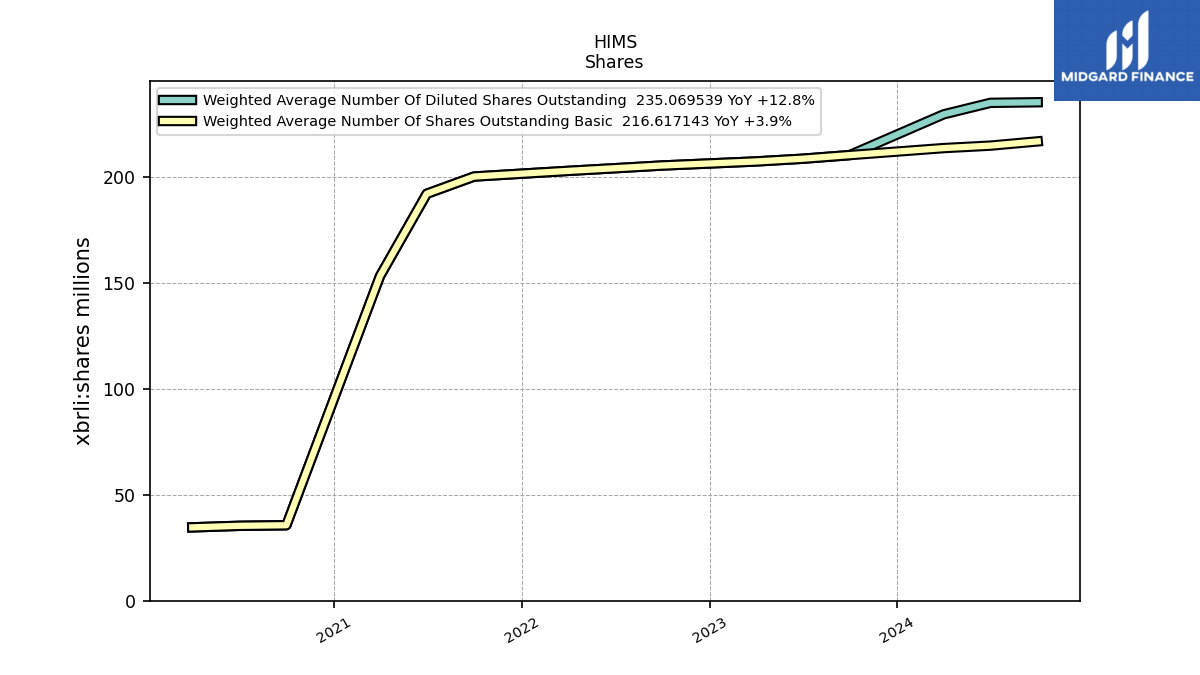
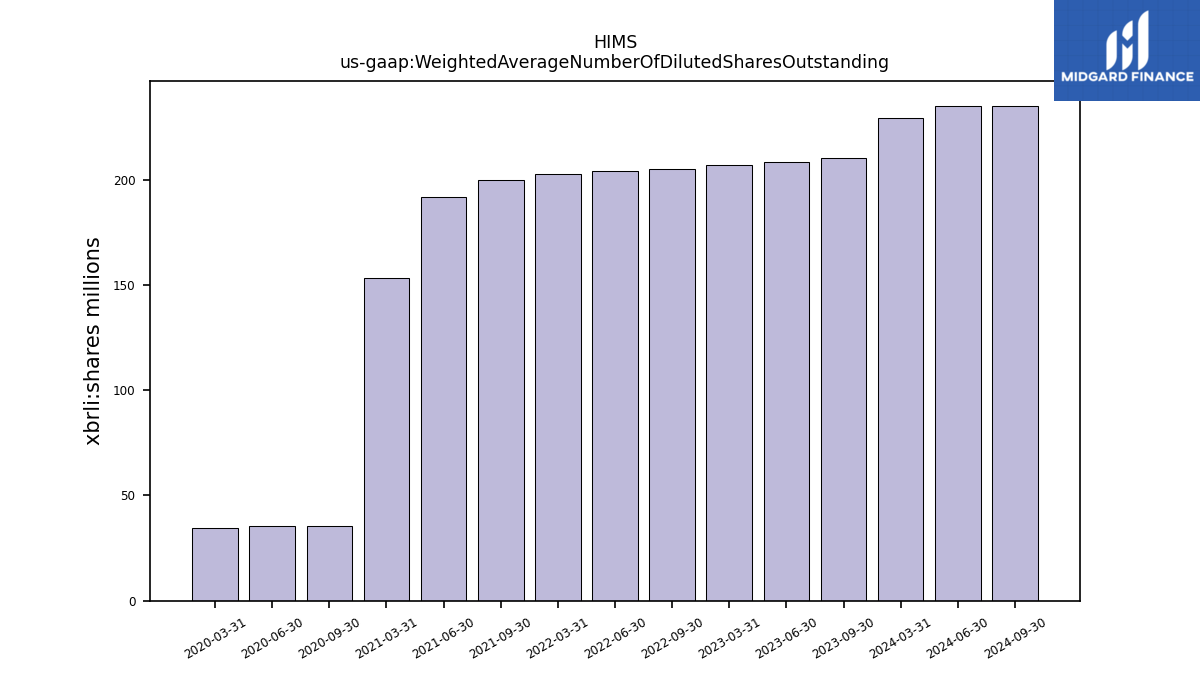
| Weighted Average Number Of Diluted Shares Outstanding | 229.36 | NA | 210.13 | 208.42 | 207.14 | NA | 205.23 | 203.95 | 202.70 | NA | 200.04 | 191.92 | 153.08 | NA | 35.61 | 35.33 | 34.61 | |
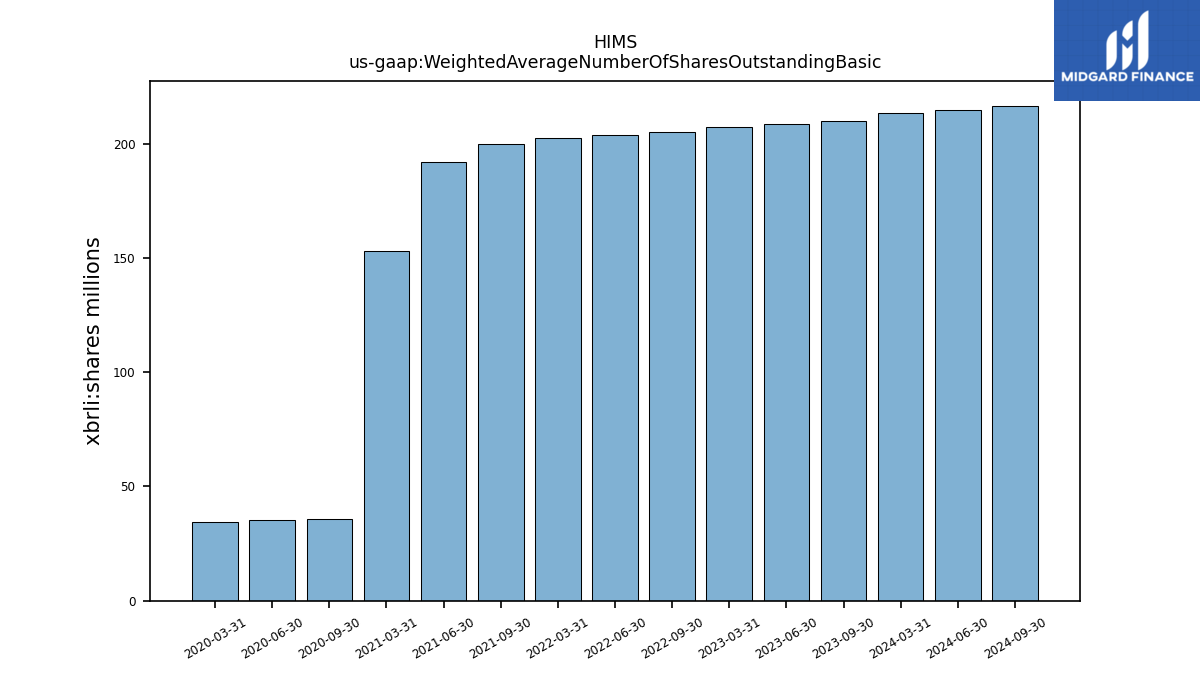
| Weighted Average Number Of Shares Outstanding Basic | 213.45 | NA | 210.13 | 208.42 | 207.14 | NA | 205.23 | 203.95 | 202.70 | NA | 200.04 | 191.92 | 153.08 | NA | 35.61 | 35.33 | 34.61 | |
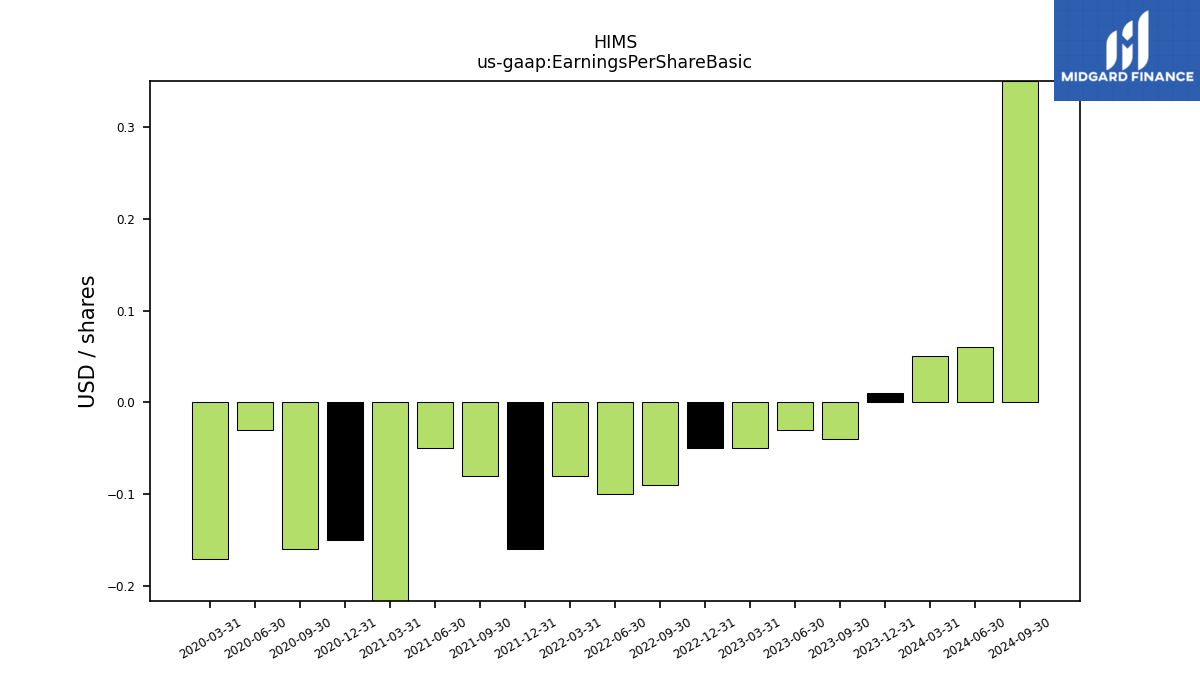
| Earnings Per Share Basic | 0.05 | 0.01 | -0.04 | -0.03 | -0.05 | -0.05 | -0.09 | -0.10 | -0.08 | -0.16 | -0.08 | -0.05 | -0.34 | -0.15 | -0.16 | -0.03 | -0.17 | |
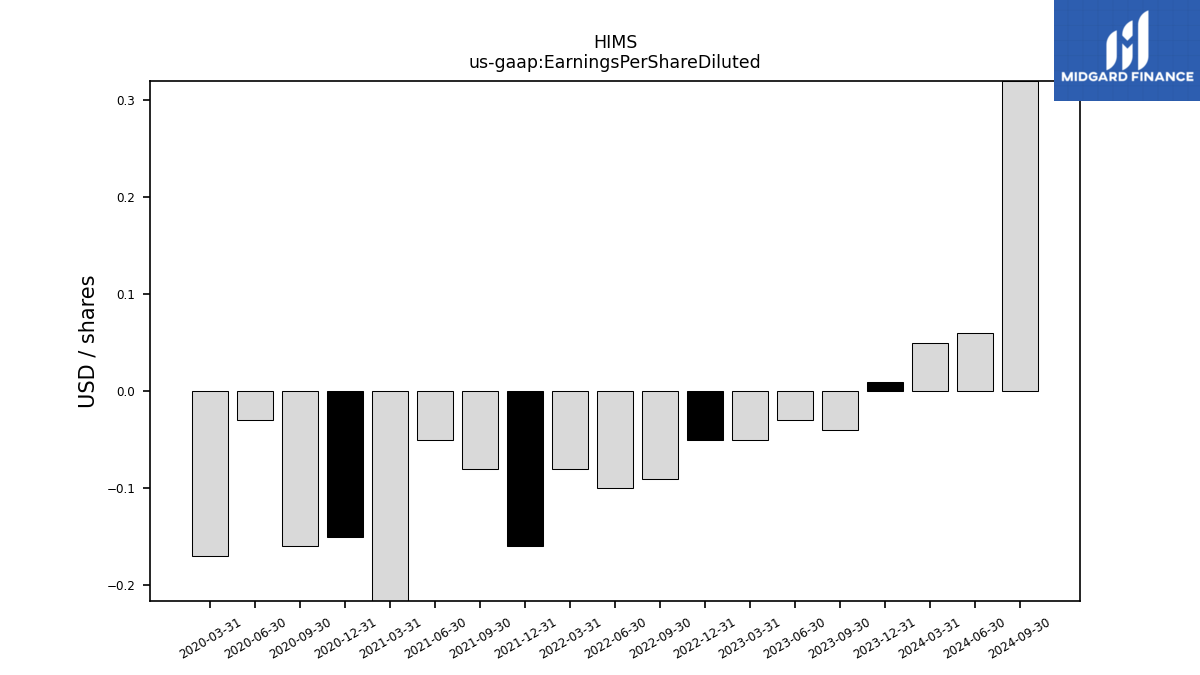
| Earnings Per Share Diluted | 0.05 | 0.01 | -0.04 | -0.03 | -0.05 | -0.05 | -0.09 | -0.10 | -0.08 | -0.16 | -0.08 | -0.05 | -0.34 | -0.15 | -0.16 | -0.03 | -0.17 |
| 2024-03-31 | 2023-12-31 | 2023-09-30 | 2023-06-30 | 2023-03-31 | 2022-12-31 | 2022-09-30 | 2022-06-30 | 2022-03-31 | 2021-12-31 | 2021-09-30 | 2021-06-30 | 2021-03-31 | 2020-12-31 | 2020-09-30 | 2020-06-30 | 2020-03-31 | ||
|---|---|---|---|---|---|---|---|---|---|---|---|---|---|---|---|---|---|---|
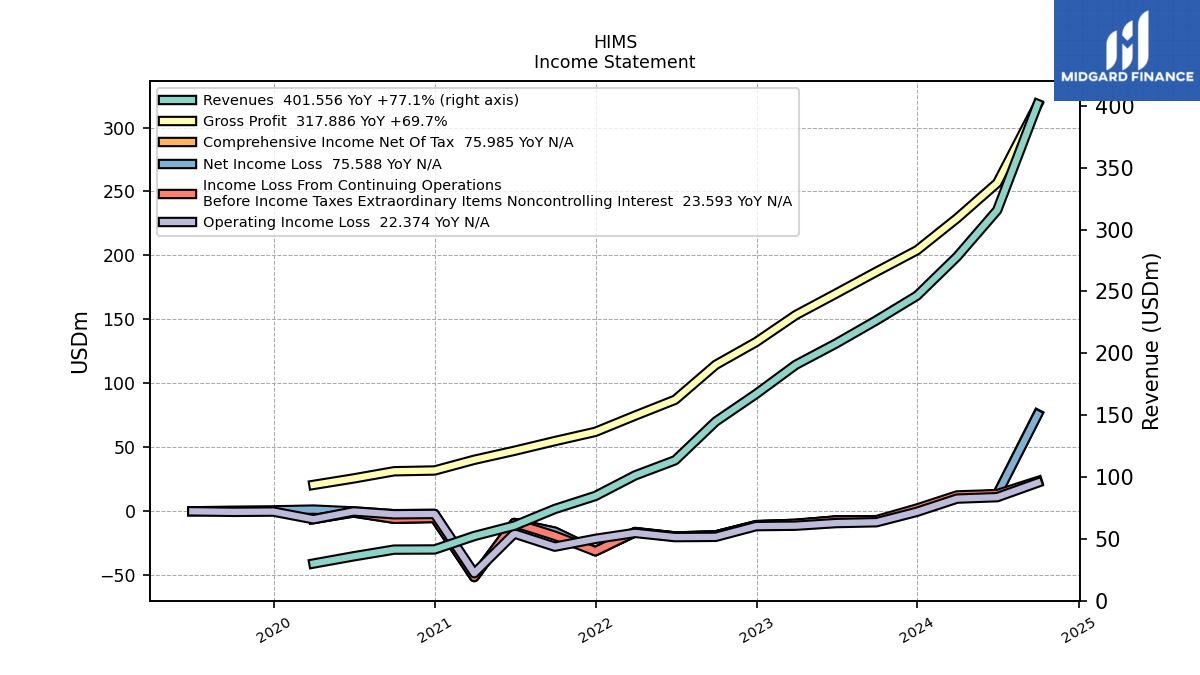
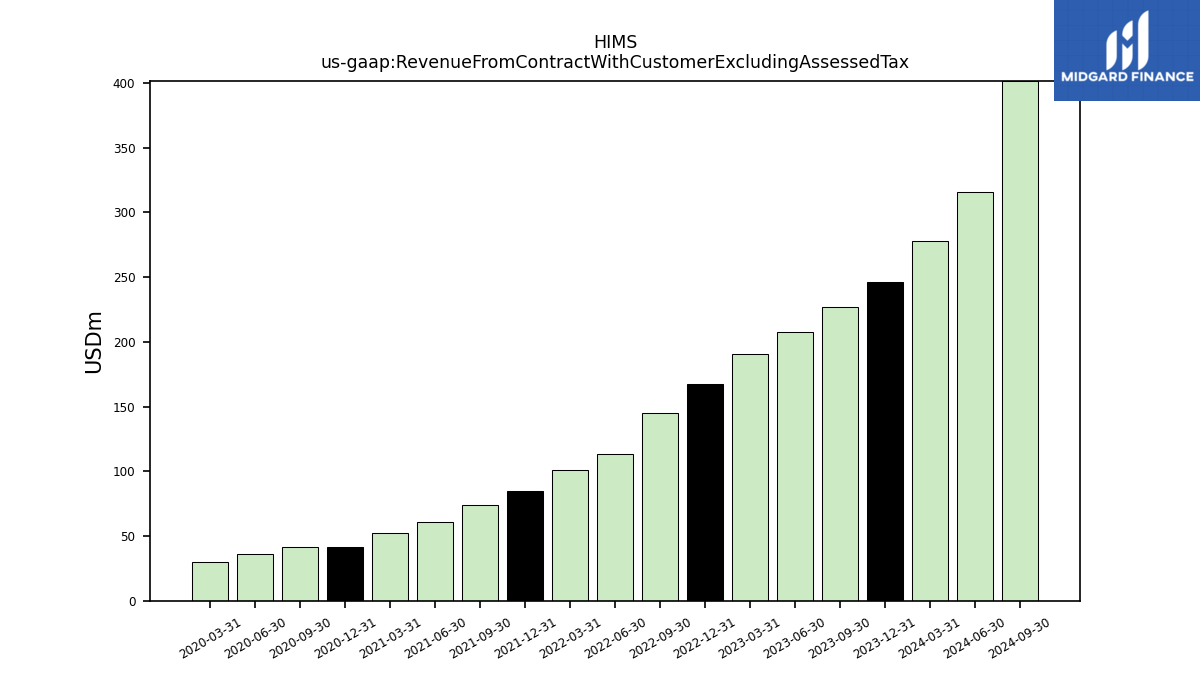
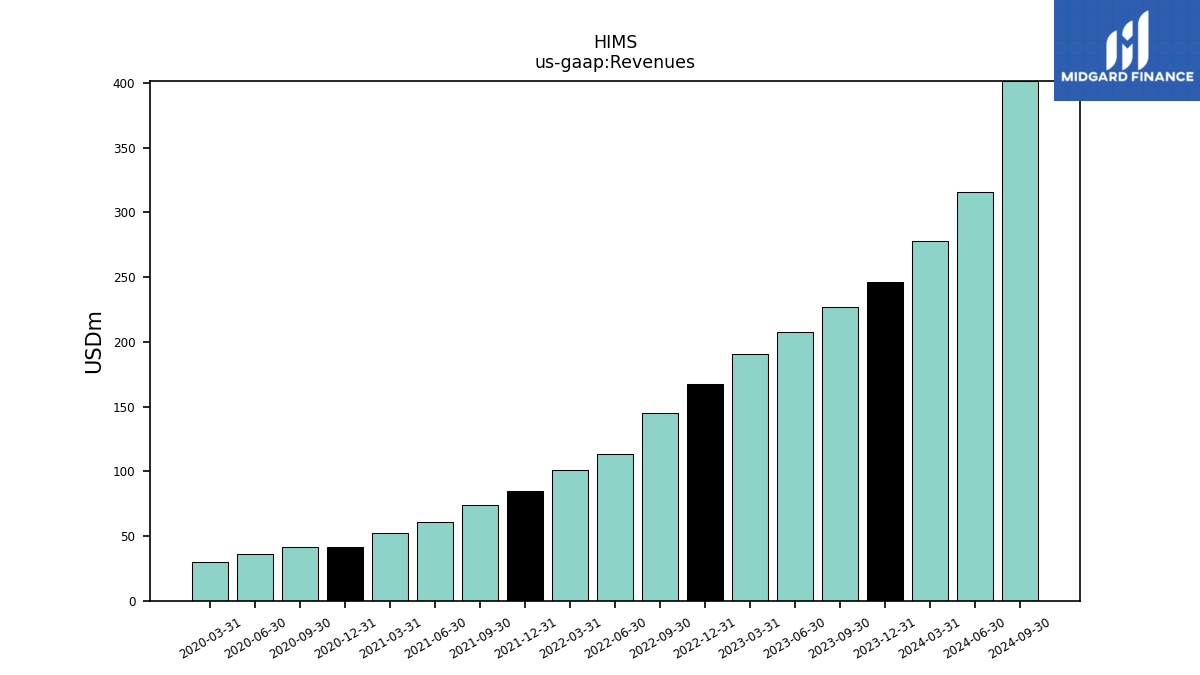
| Revenue From Contract With Customer Excluding Assessed Tax | 278.17 | 246.62 | 226.70 | 207.91 | 190.77 | 167.20 | 144.84 | 113.56 | 101.31 | 84.70 | 74.17 | 60.69 | 52.31 | 41.47 | 41.32 | 35.90 | 30.06 | |
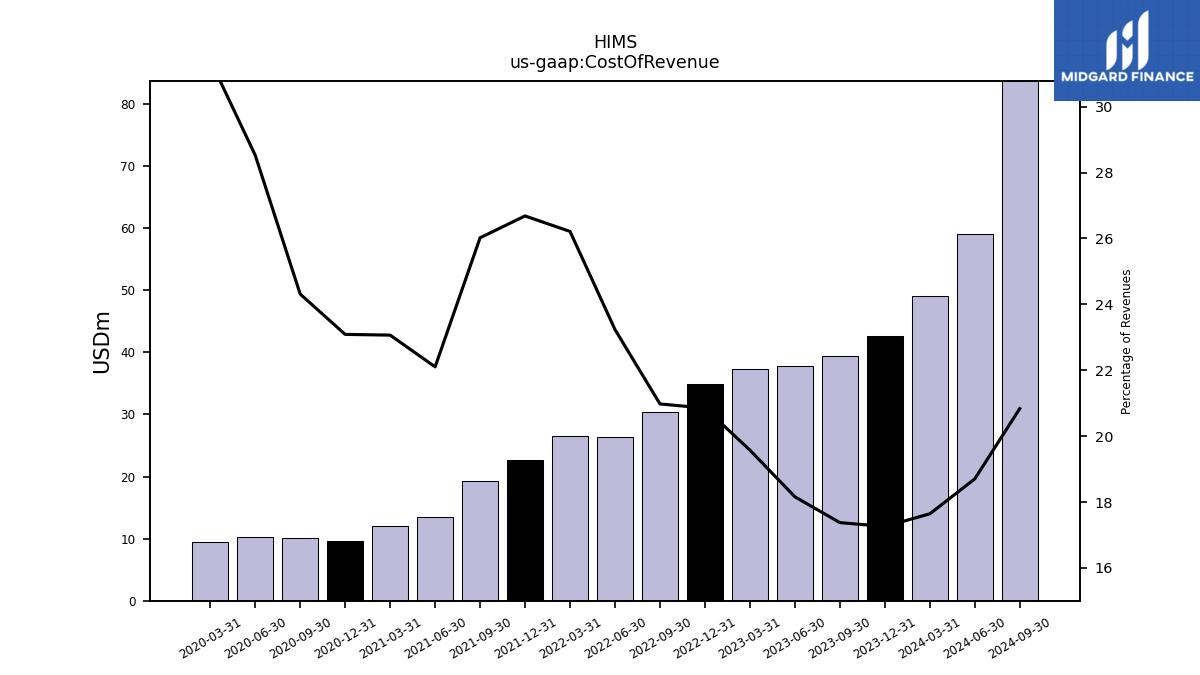
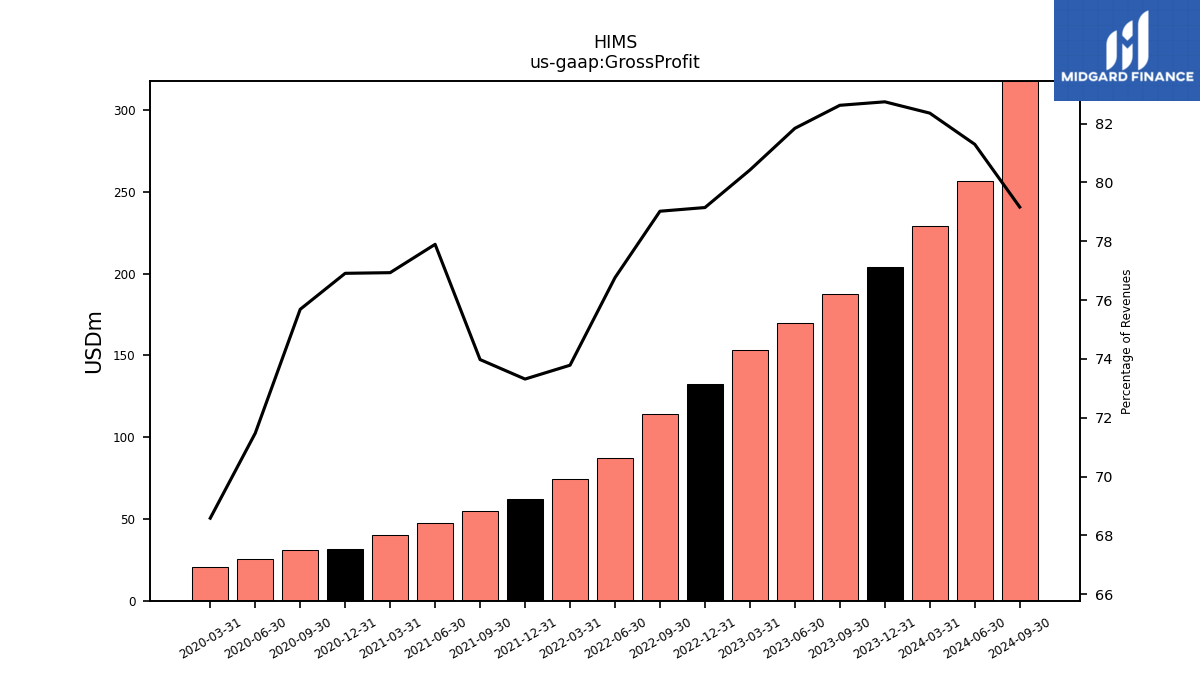
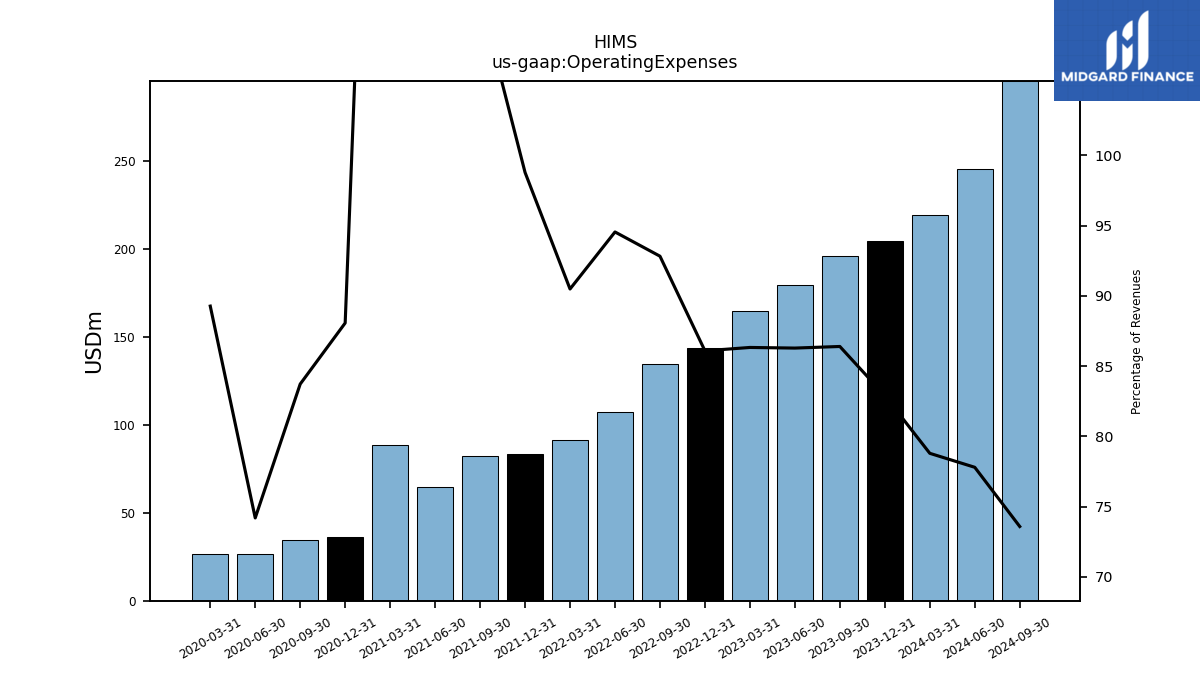
| Revenues | 278.17 | 246.62 | 226.70 | 207.91 | 190.77 | 167.20 | 144.84 | 113.56 | 101.31 | 84.70 | 74.17 | 60.69 | 52.31 | 41.47 | 41.32 | 35.90 | 30.06 | |
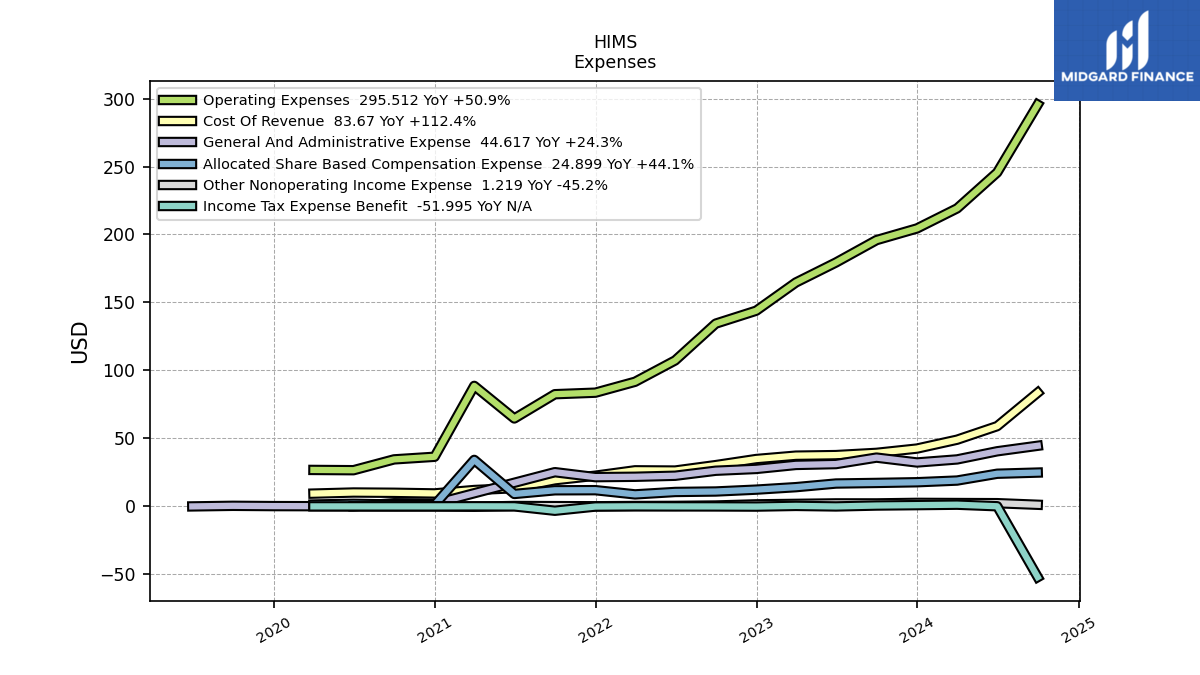
| Cost Of Revenue | 49.08 | 42.56 | 39.39 | 37.75 | 37.34 | 34.87 | 30.38 | 26.39 | 26.56 | 22.60 | 19.30 | 13.41 | 12.07 | 9.57 | 10.05 | 10.24 | 9.44 | |
| Gross Profit | 229.09 | 204.06 | 187.31 | 170.16 | 153.43 | 132.34 | 114.45 | 87.18 | 74.76 | 62.10 | 54.87 | 47.28 | 40.25 | 31.89 | 31.28 | 25.66 | 20.62 | |
| Operating Expenses | 219.19 | 204.46 | 195.86 | 179.39 | 164.69 | 143.94 | 134.44 | 107.37 | 91.67 | 83.66 | 82.53 | 64.68 | 88.66 | 36.52 | 34.60 | 26.64 | 26.84 | |
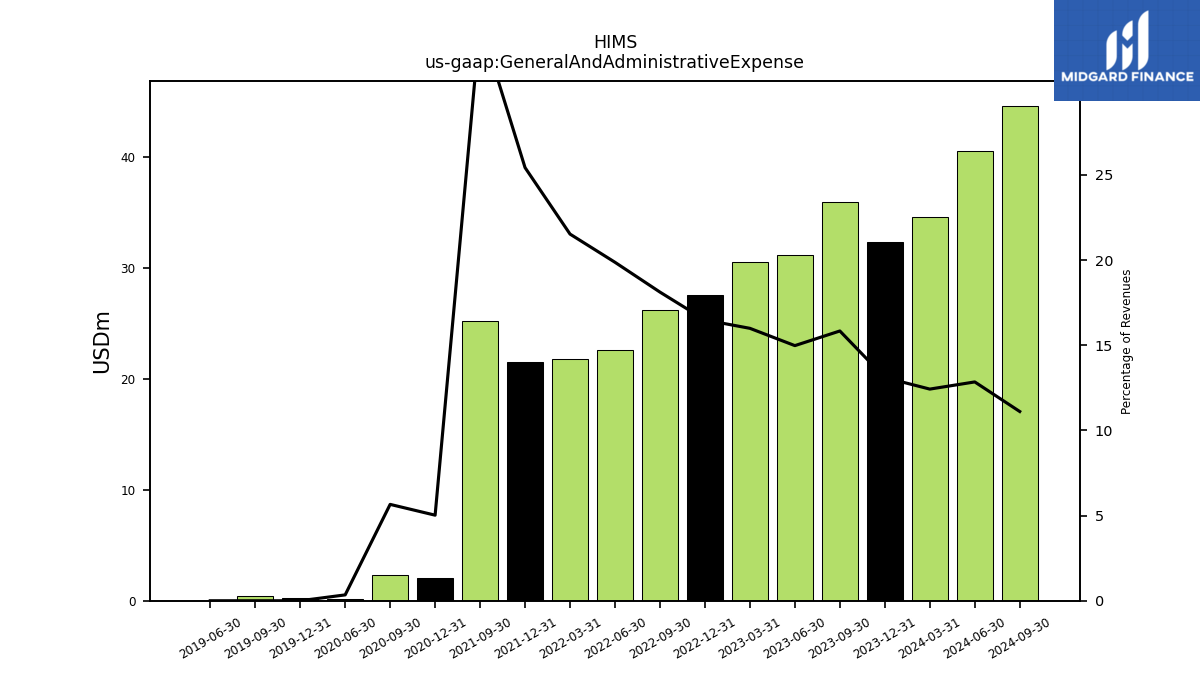
| General And Administrative Expense | 34.57 | 32.32 | 35.91 | 31.14 | 30.51 | 27.57 | 26.25 | 22.57 | 21.81 | 21.54 | 25.19 | NA | NA | 2.08 | 2.34 | 0.12 | NA | |
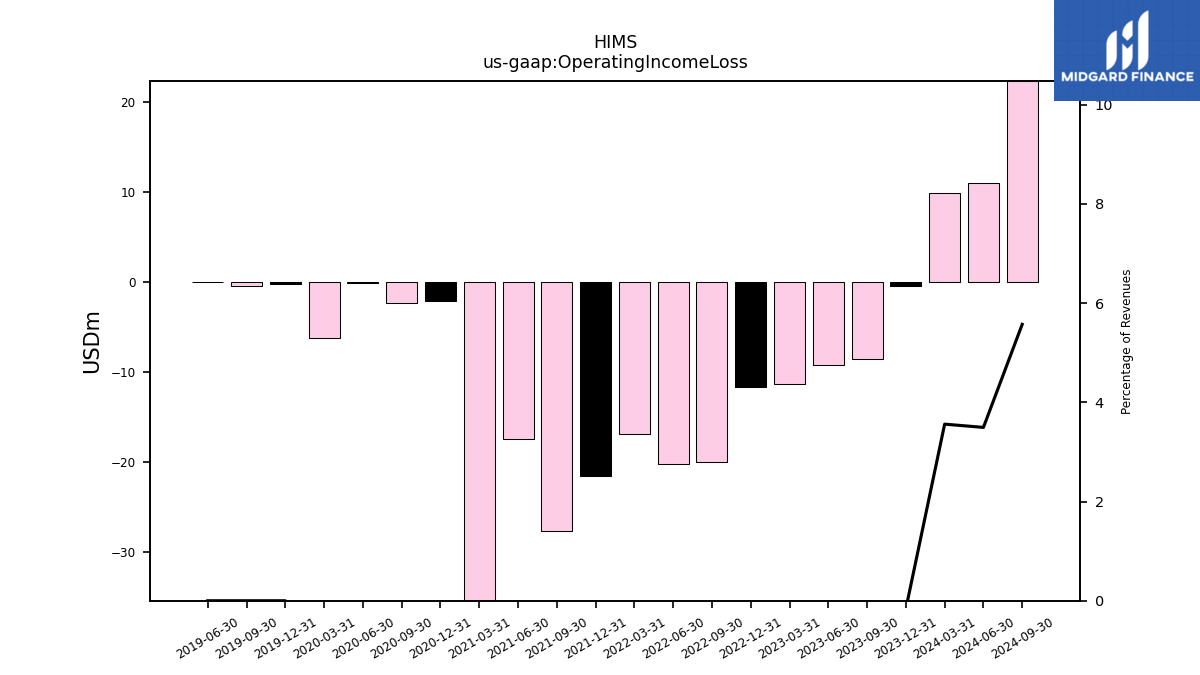
| Operating Income Loss | 9.90 | -0.40 | -8.55 | -9.24 | -11.26 | -11.61 | -19.98 | -20.19 | -16.92 | -21.57 | -27.66 | -17.41 | -48.41 | -2.08 | -2.34 | -0.12 | -6.22 | |
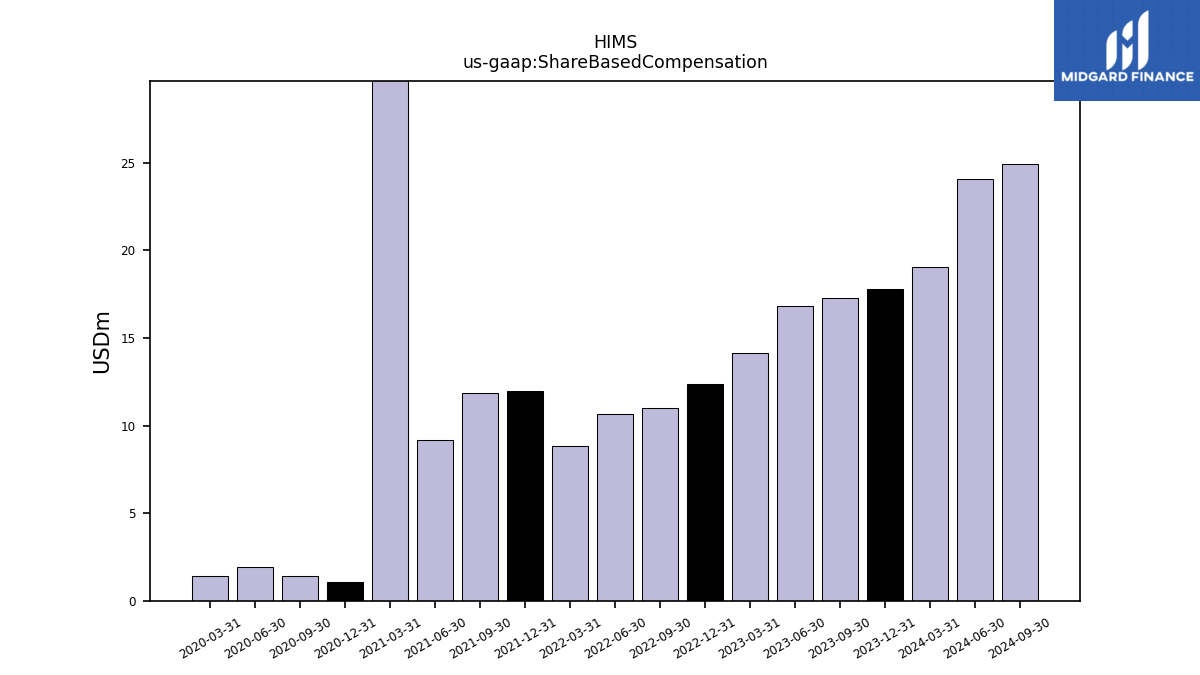
| Allocated Share Based Compensation Expense | 19.03 | 17.79 | 17.28 | 16.84 | 14.17 | 12.35 | 10.98 | 10.63 | 8.86 | 11.95 | 11.87 | 9.16 | 34.23 | 1.09 | 1.41 | 1.93 | 1.40 | |
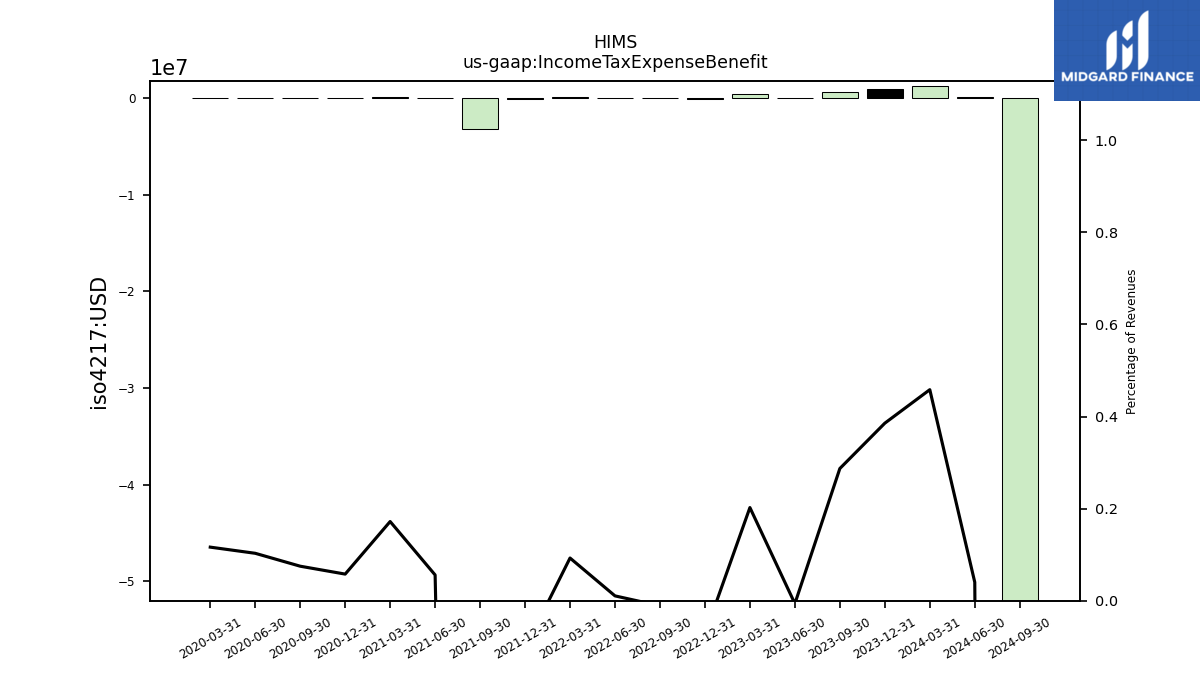
| Income Tax Expense Benefit | 1.27 | 0.95 | 0.65 | -0.01 | 0.39 | -0.12 | -0.02 | 0.01 | 0.09 | -0.09 | -3.17 | 0.03 | 0.09 | 0.02 | 0.03 | 0.04 | 0.04 | |
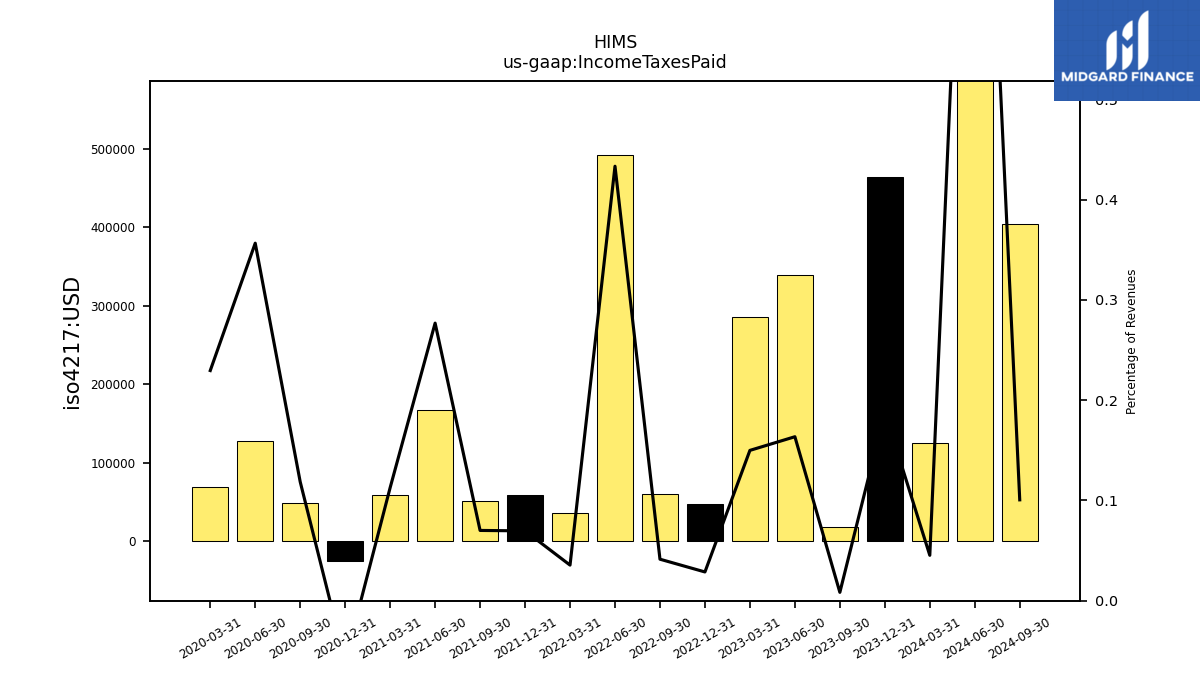
| Income Taxes Paid | 0.13 | 0.46 | 0.02 | 0.34 | 0.29 | 0.05 | 0.06 | 0.49 | 0.04 | 0.06 | 0.05 | 0.17 | 0.06 | -0.03 | 0.05 | 0.13 | 0.07 | |
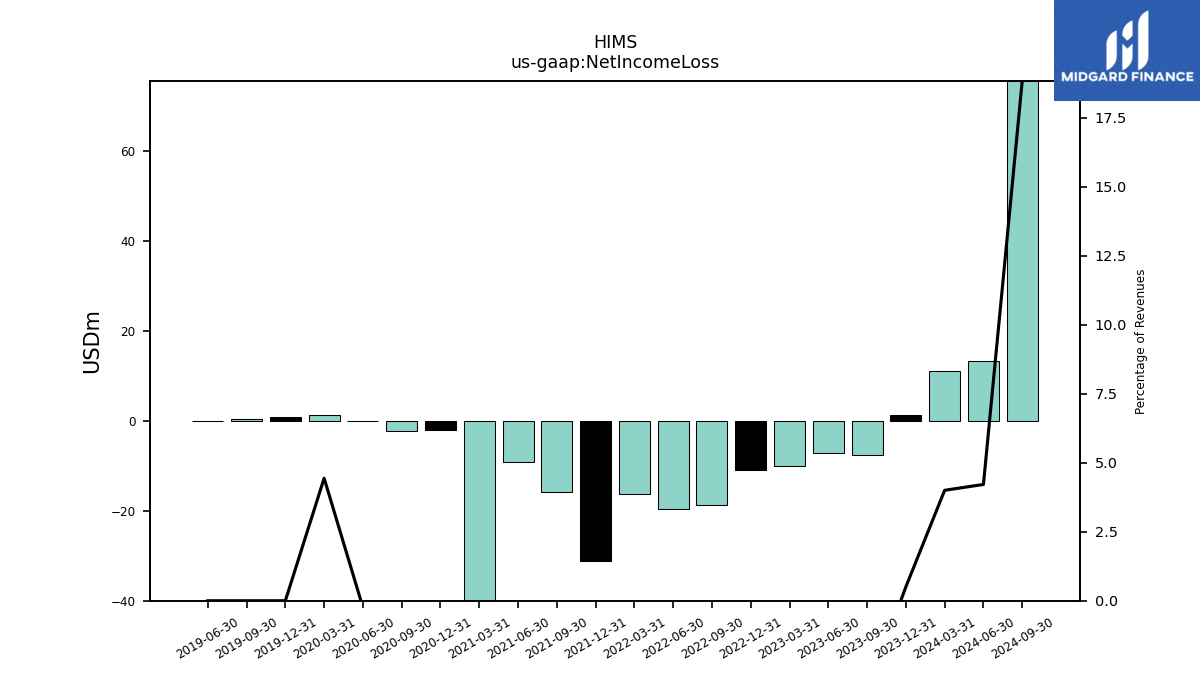
| Net Income Loss | 11.13 | 1.25 | -7.57 | -7.16 | -10.07 | -10.91 | -18.84 | -19.68 | -16.25 | -31.16 | -15.94 | -9.15 | -51.40 | -2.04 | -2.26 | -0.09 | 1.33 | |
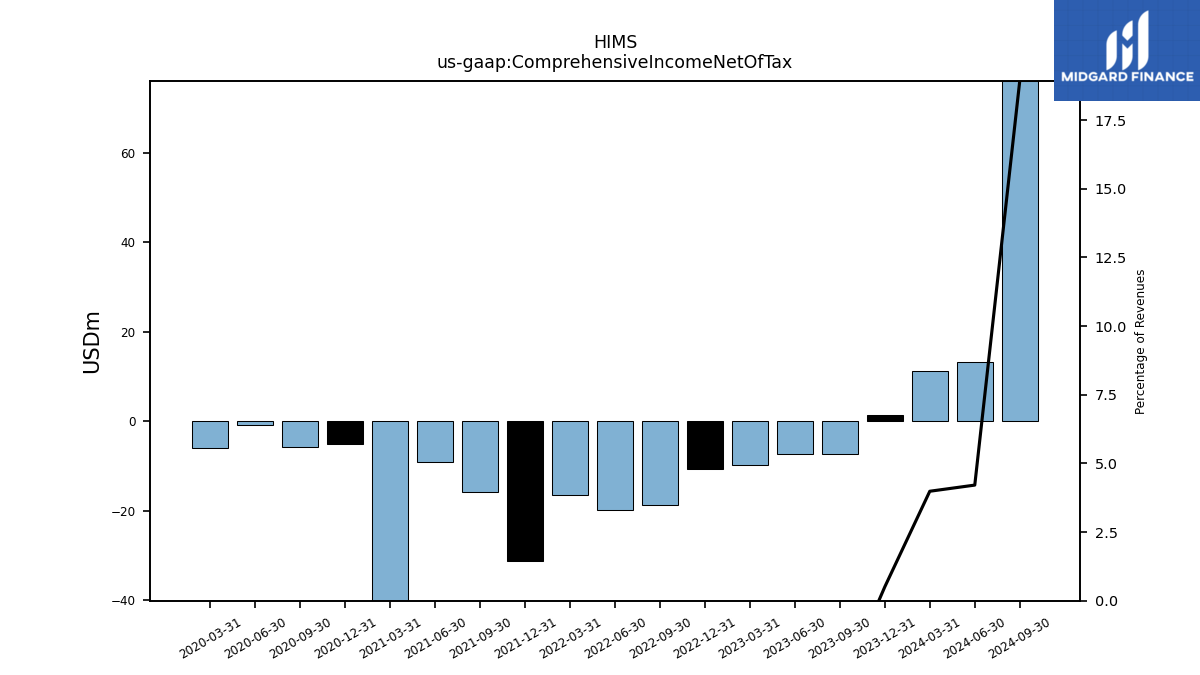
| Comprehensive Income Net Of Tax | 11.09 | 1.25 | -7.44 | -7.30 | -9.90 | -10.72 | -18.83 | -19.82 | -16.44 | -31.25 | -15.95 | -9.12 | -51.47 | -5.23 | -5.87 | -0.96 | -6.08 |
| 2024-03-31 | 2023-12-31 | 2023-09-30 | 2023-06-30 | 2023-03-31 | 2022-12-31 | 2022-09-30 | 2022-06-30 | 2022-03-31 | 2021-12-31 | 2021-09-30 | 2021-06-30 | 2021-03-31 | 2020-12-31 | 2020-09-30 | 2020-06-30 | 2020-03-31 | ||
|---|---|---|---|---|---|---|---|---|---|---|---|---|---|---|---|---|---|---|
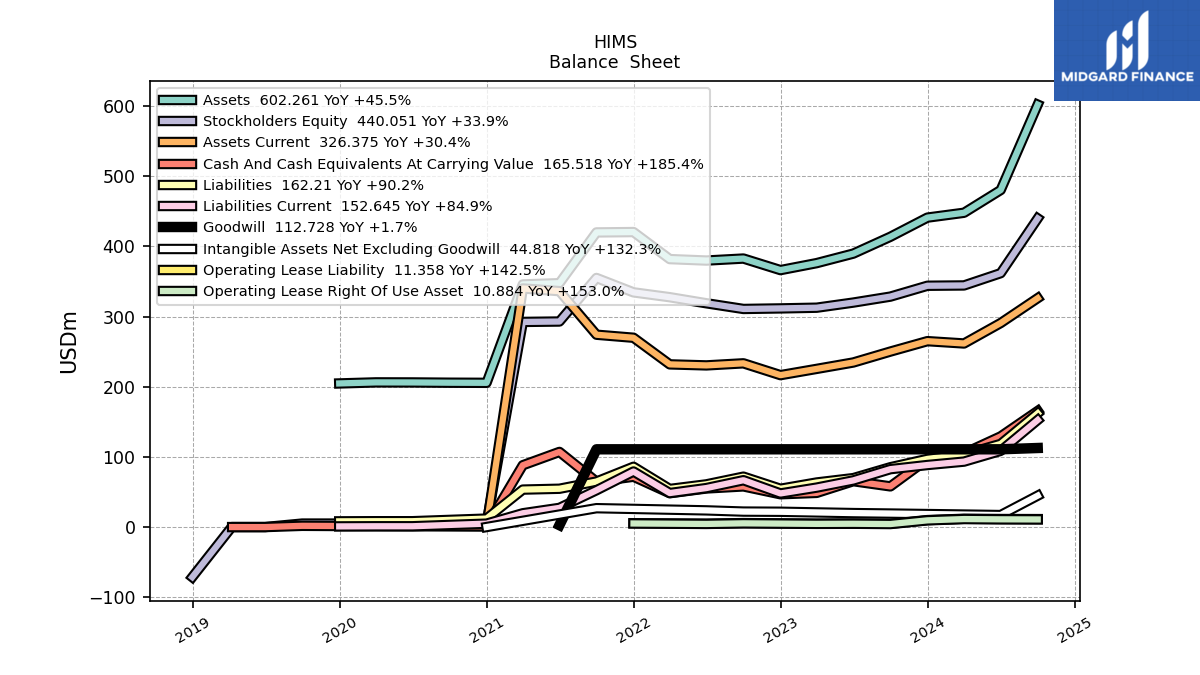
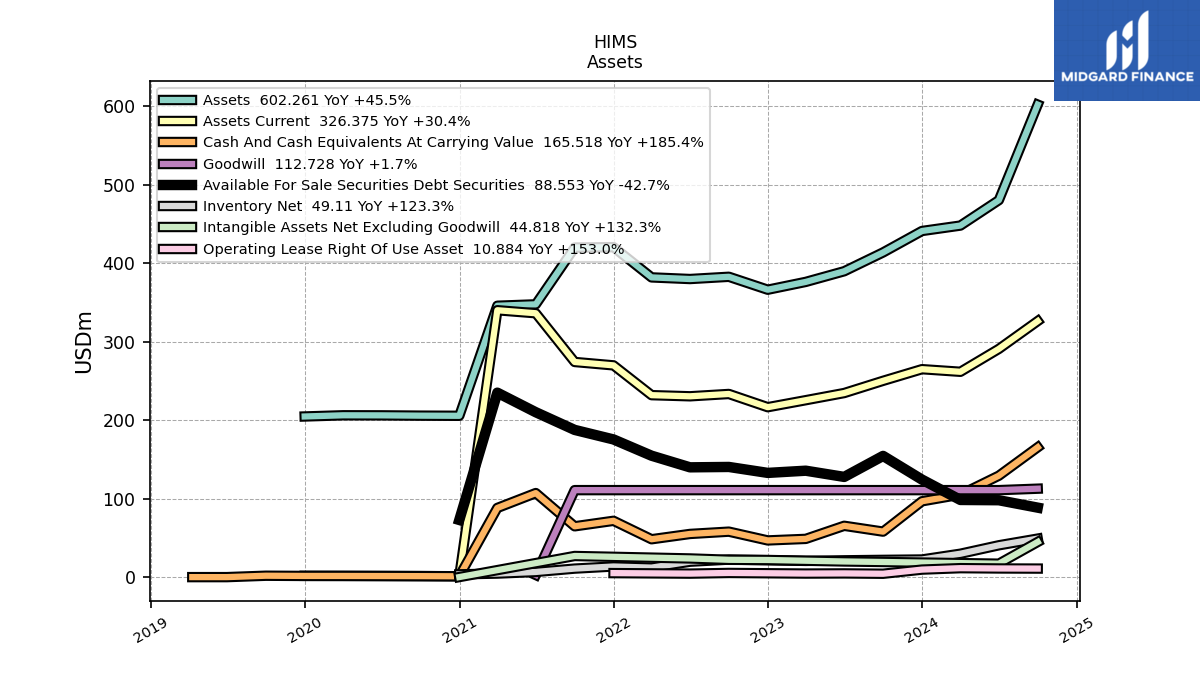
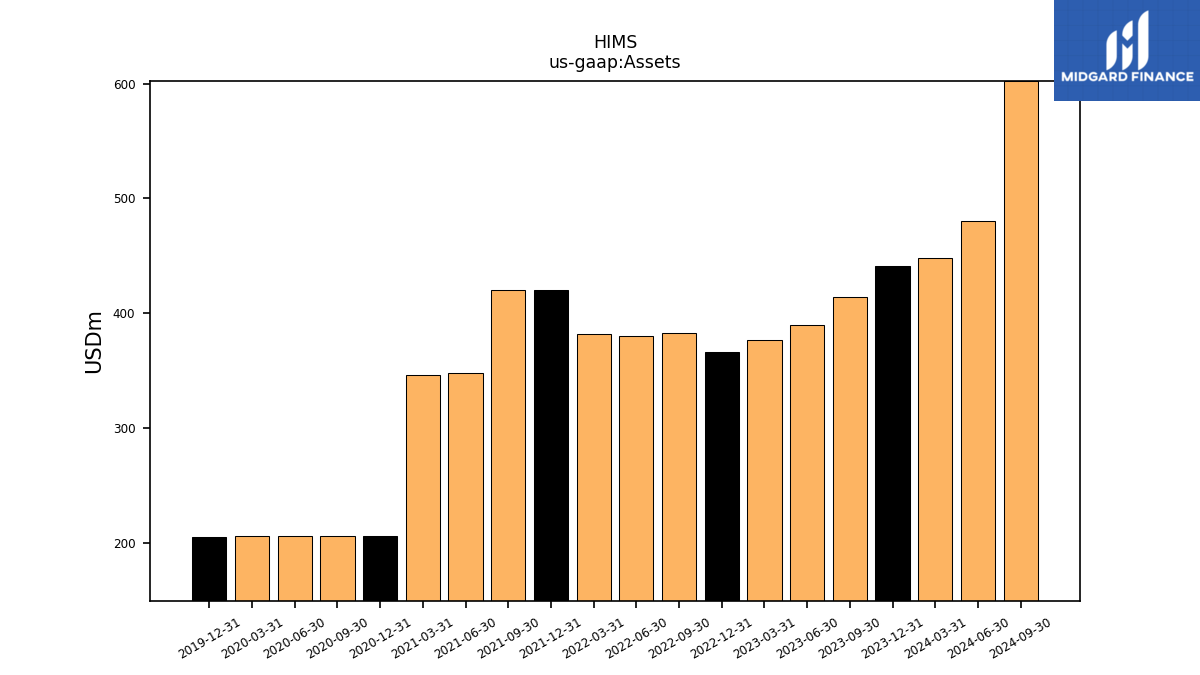
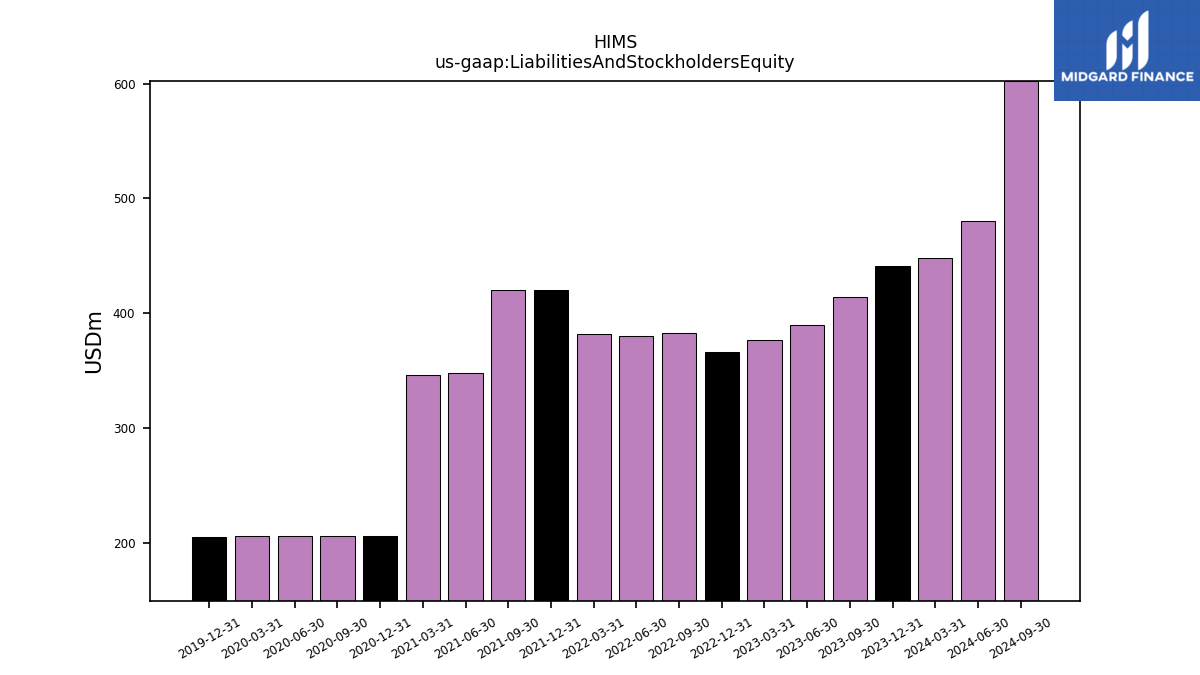
| Assets | 448.11 | 441.19 | 413.87 | 389.88 | 376.31 | 366.34 | 382.83 | 379.96 | 382.04 | 420.58 | 420.07 | 347.70 | 345.90 | 205.63 | 205.81 | 206.20 | 206.29 | |
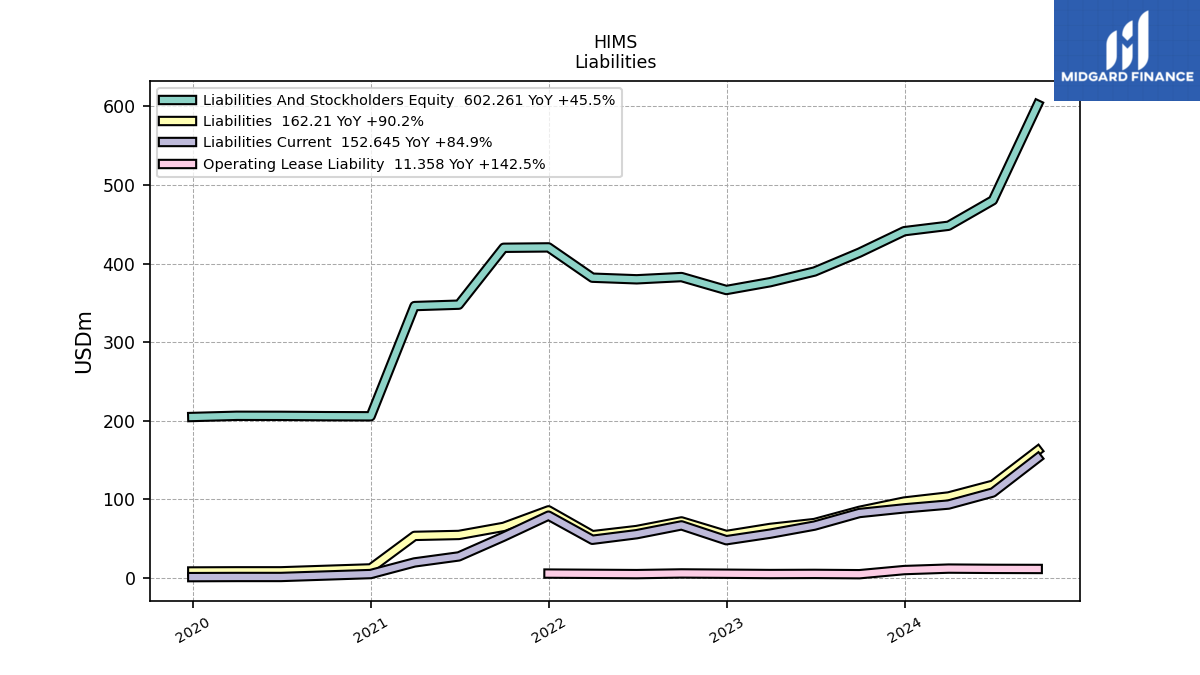
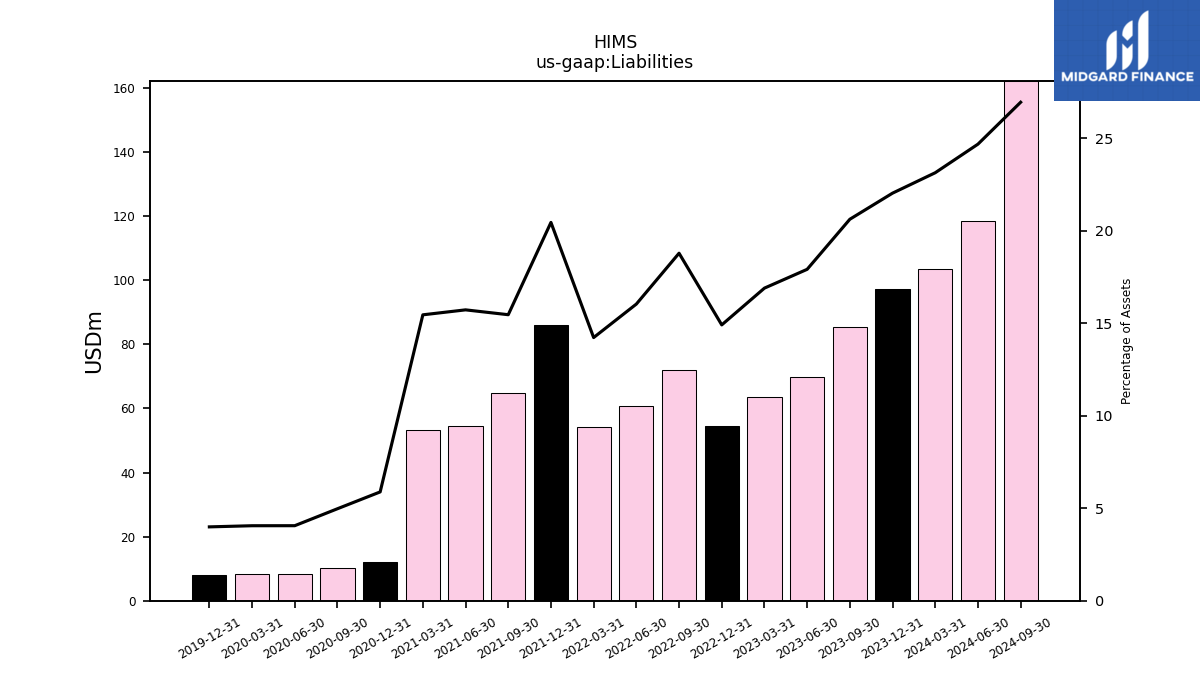
| Liabilities | 103.62 | 97.16 | 85.30 | 69.81 | 63.56 | 54.60 | 71.88 | 60.91 | 54.32 | 85.97 | 64.92 | 54.65 | 53.43 | 12.09 | 10.23 | 8.36 | 8.36 | |
| Liabilities And Stockholders Equity | 448.11 | 441.19 | 413.87 | 389.88 | 376.31 | 366.34 | 382.83 | 379.96 | 382.04 | 420.58 | 420.07 | 347.70 | 345.90 | 205.63 | 205.81 | 206.20 | 206.29 | |
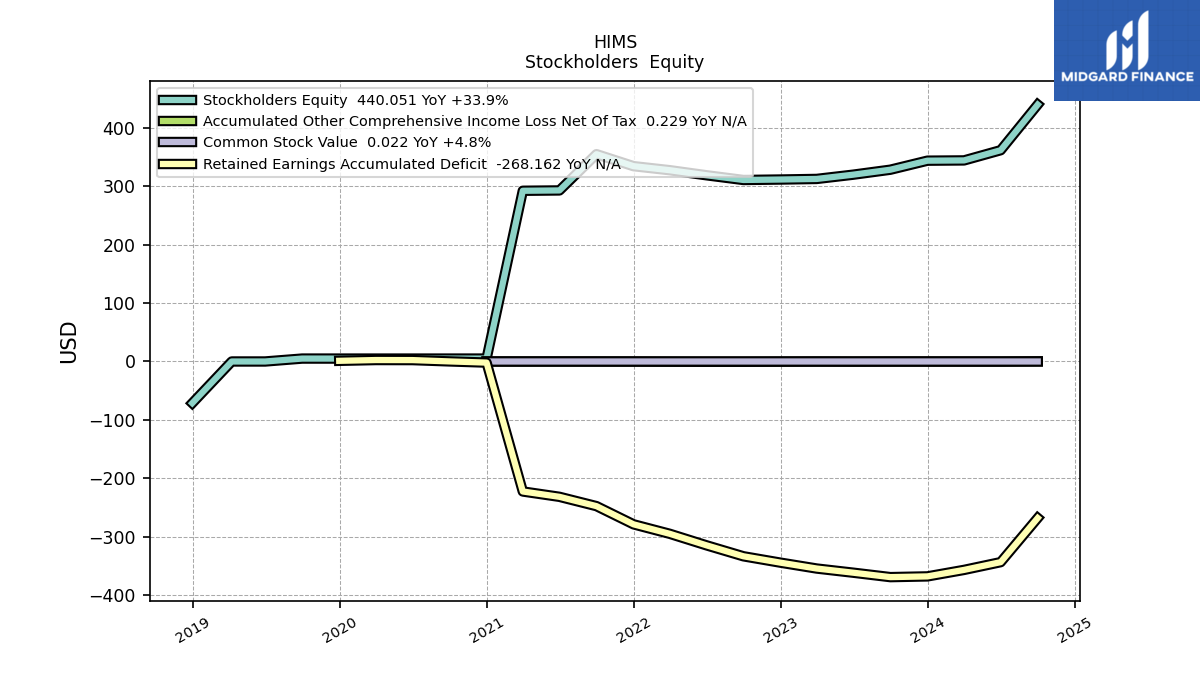
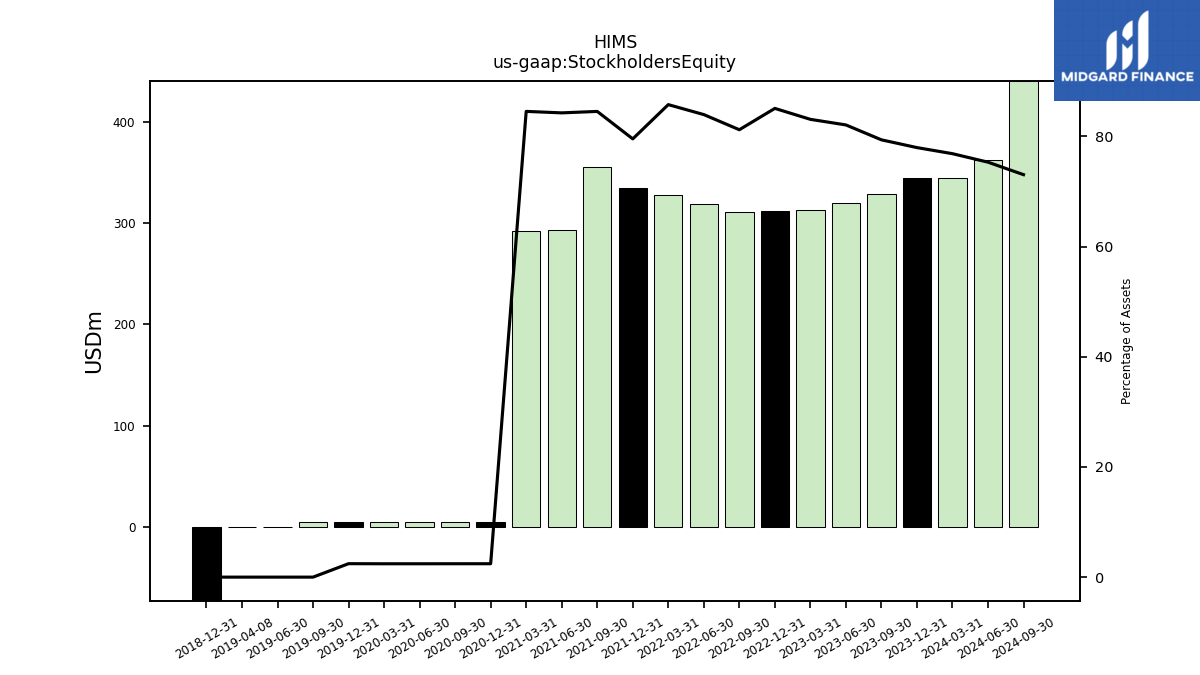
| Stockholders Equity | 344.48 | 344.03 | 328.56 | 320.07 | 312.75 | 311.74 | 310.95 | 319.06 | 327.71 | 334.62 | 355.15 | 293.05 | 292.47 | 5.00 | 5.00 | 5.00 | 5.00 |
| 2024-03-31 | 2023-12-31 | 2023-09-30 | 2023-06-30 | 2023-03-31 | 2022-12-31 | 2022-09-30 | 2022-06-30 | 2022-03-31 | 2021-12-31 | 2021-09-30 | 2021-06-30 | 2021-03-31 | 2020-12-31 | 2020-09-30 | 2020-06-30 | 2020-03-31 | ||
|---|---|---|---|---|---|---|---|---|---|---|---|---|---|---|---|---|---|---|
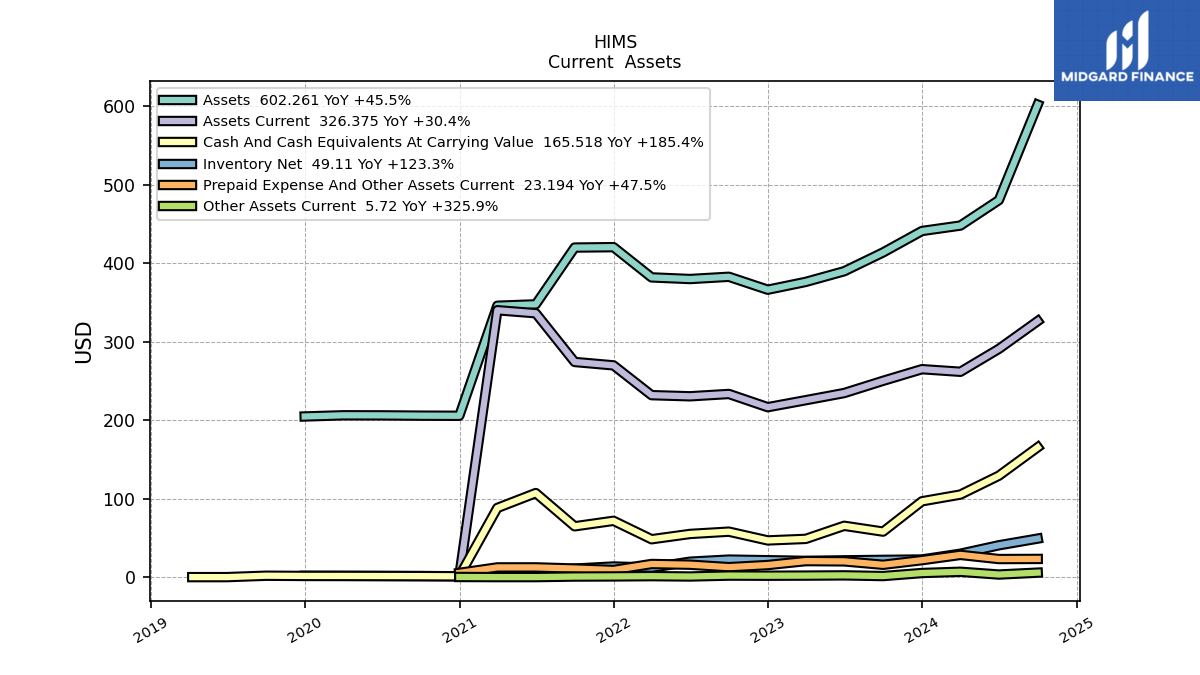
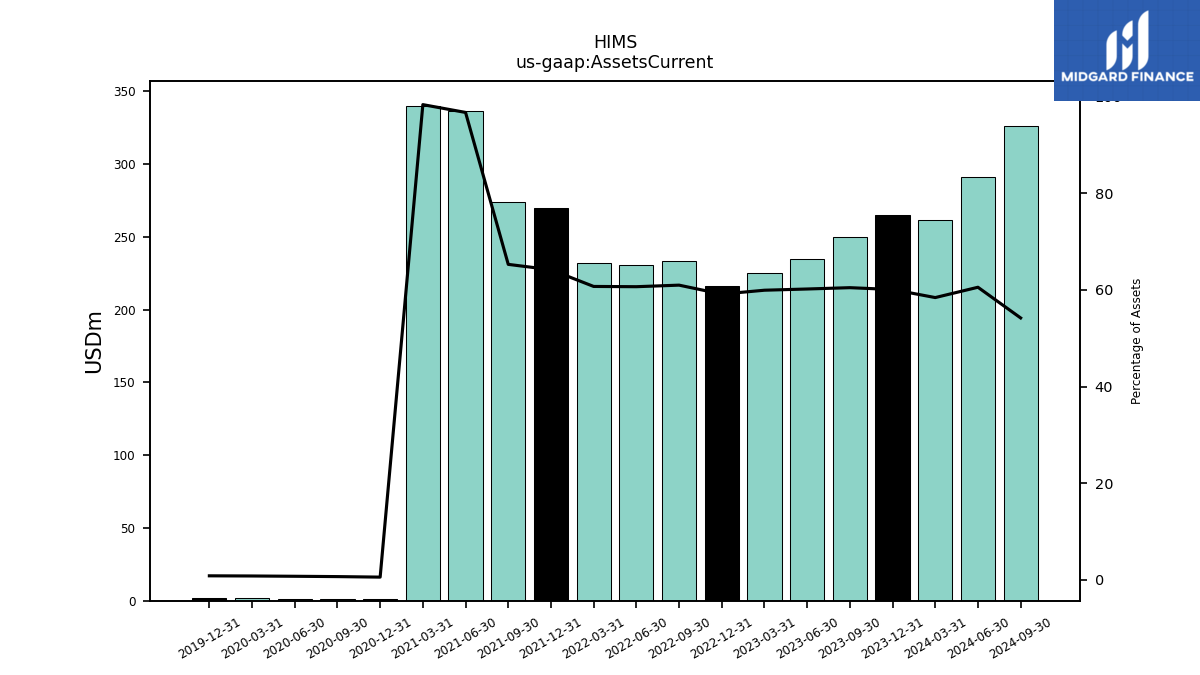
| Assets Current | 261.73 | 265.05 | 250.22 | 234.65 | 225.53 | 216.59 | 233.46 | 230.49 | 231.95 | 269.90 | 274.23 | 336.34 | 340.20 | 1.11 | 1.33 | 1.48 | 1.60 | |
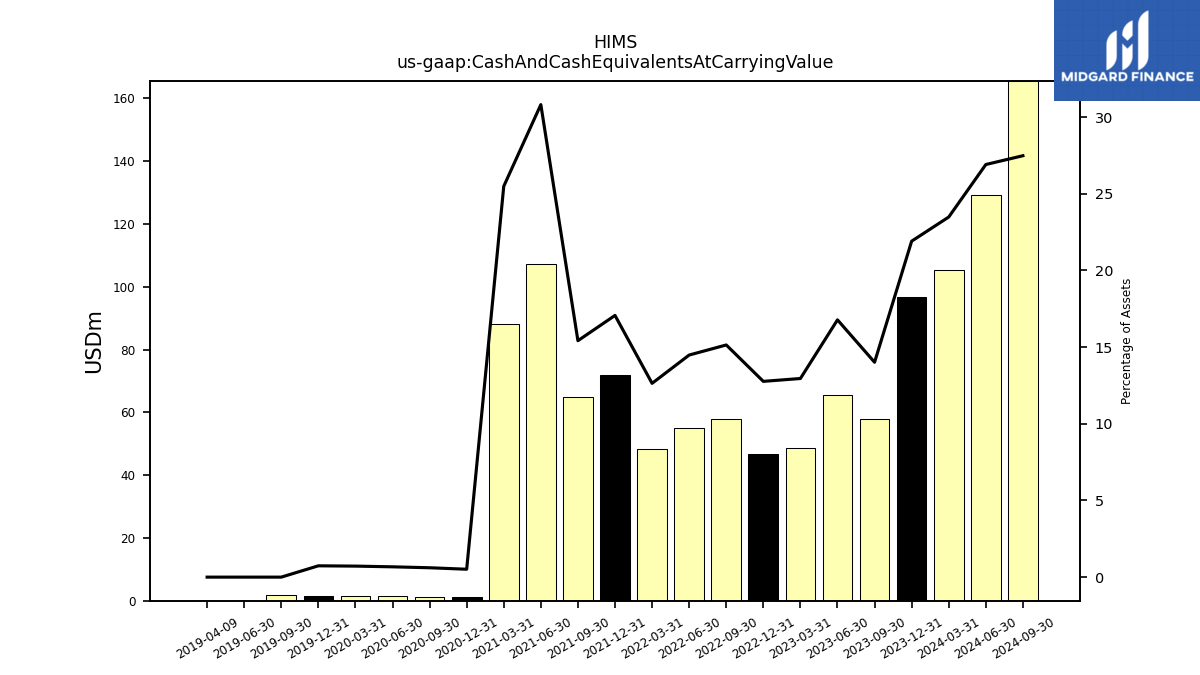
| Cash And Cash Equivalents At Carrying Value | 105.24 | 96.66 | 58.00 | 65.42 | 48.74 | 46.77 | 57.96 | 55.03 | 48.28 | 71.78 | 64.77 | 107.14 | 88.17 | 1.06 | 1.26 | 1.39 | 1.48 | |
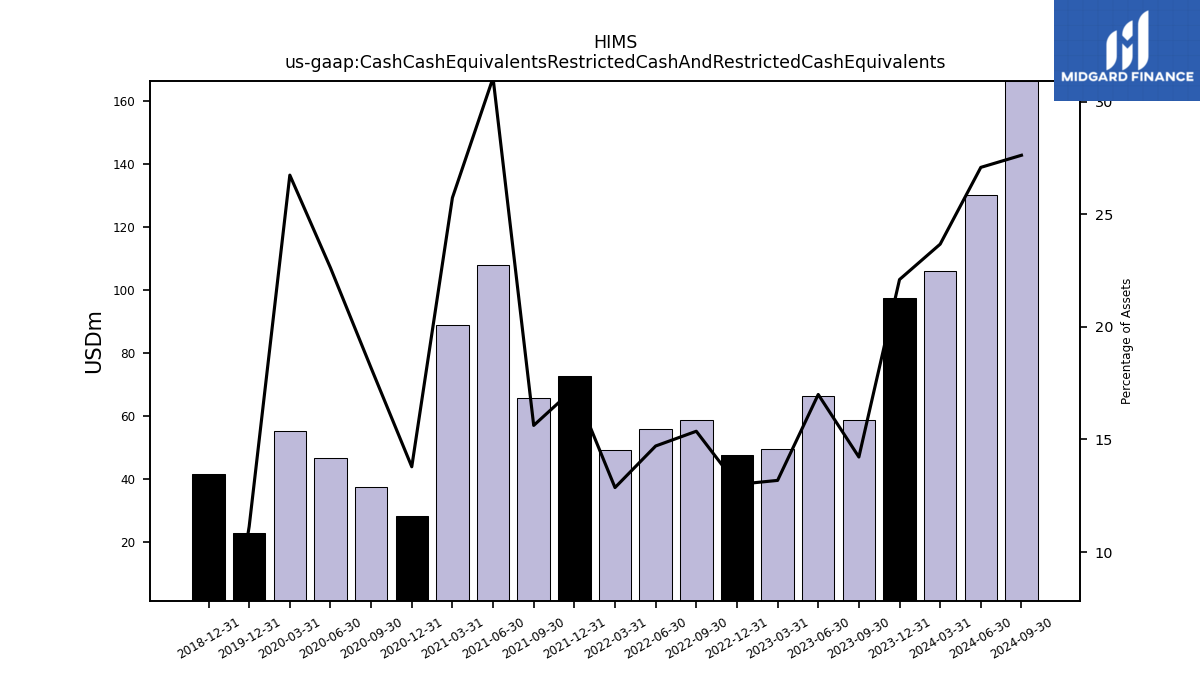
| Cash Cash Equivalents Restricted Cash And Restricted Cash Equivalents | 106.09 | 97.52 | 58.85 | 66.27 | 49.60 | 47.63 | 58.82 | 55.89 | 49.14 | 72.64 | 65.63 | 108.00 | 89.03 | 28.35 | 37.41 | 46.65 | 55.16 | |
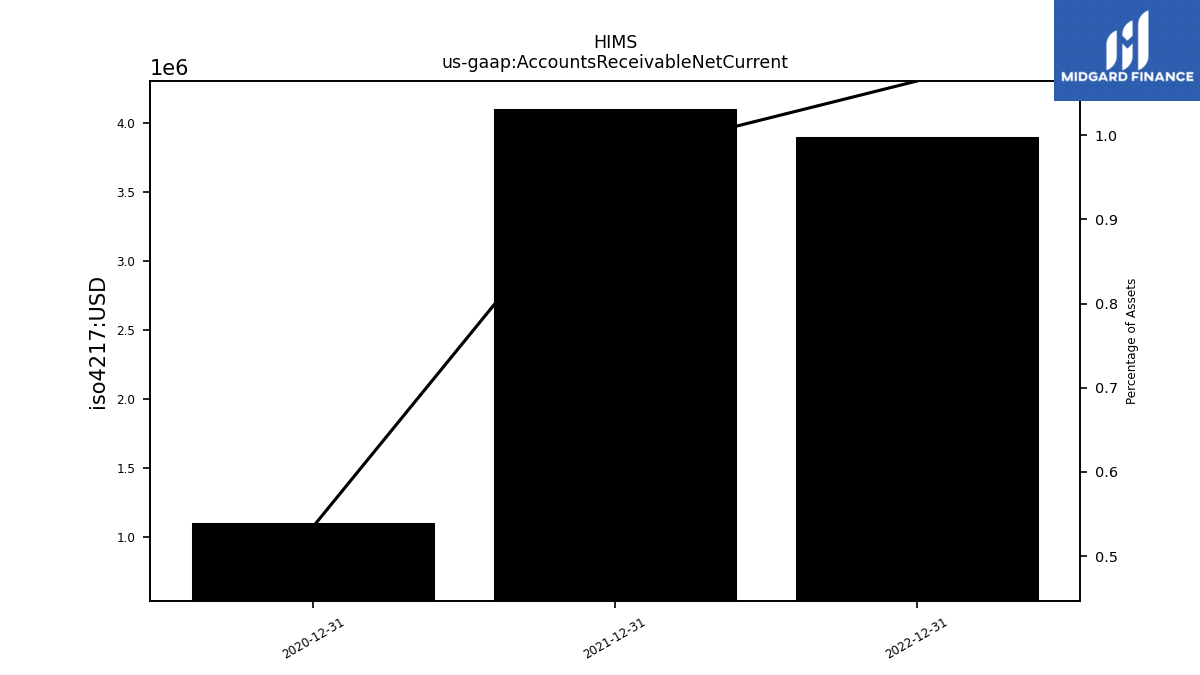
| Accounts Receivable Net Current | NA | 6.70 | NA | NA | NA | 3.90 | NA | NA | NA | 4.10 | NA | NA | NA | 1.10 | NA | NA | NA | |
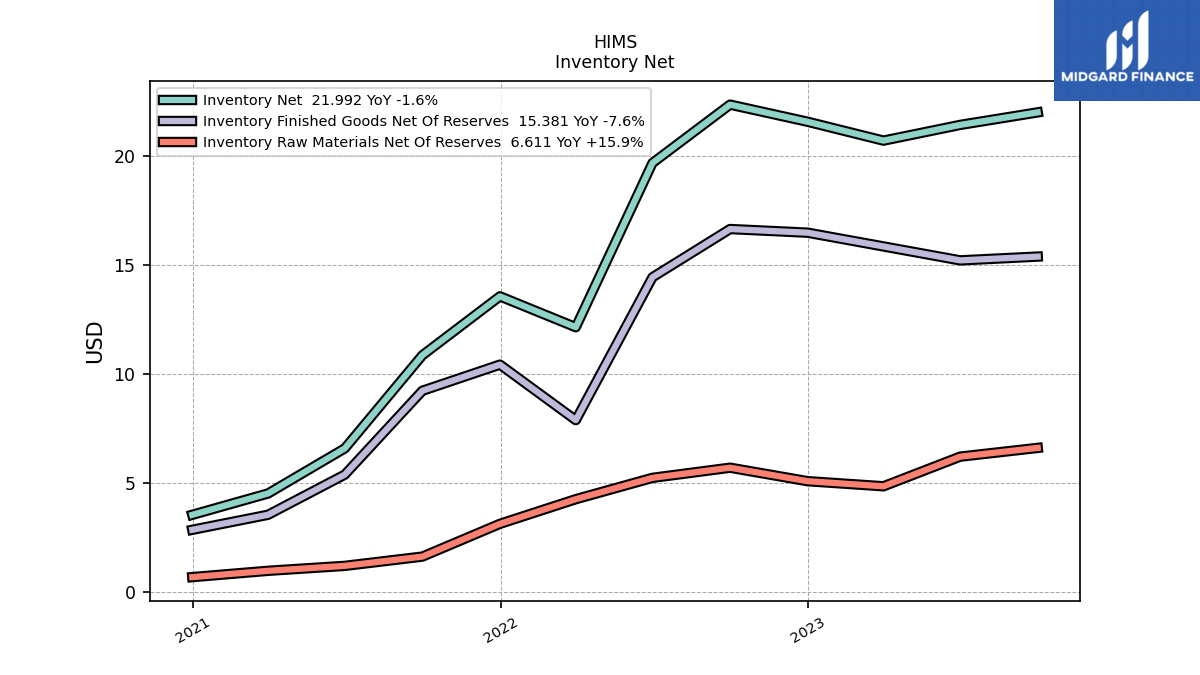
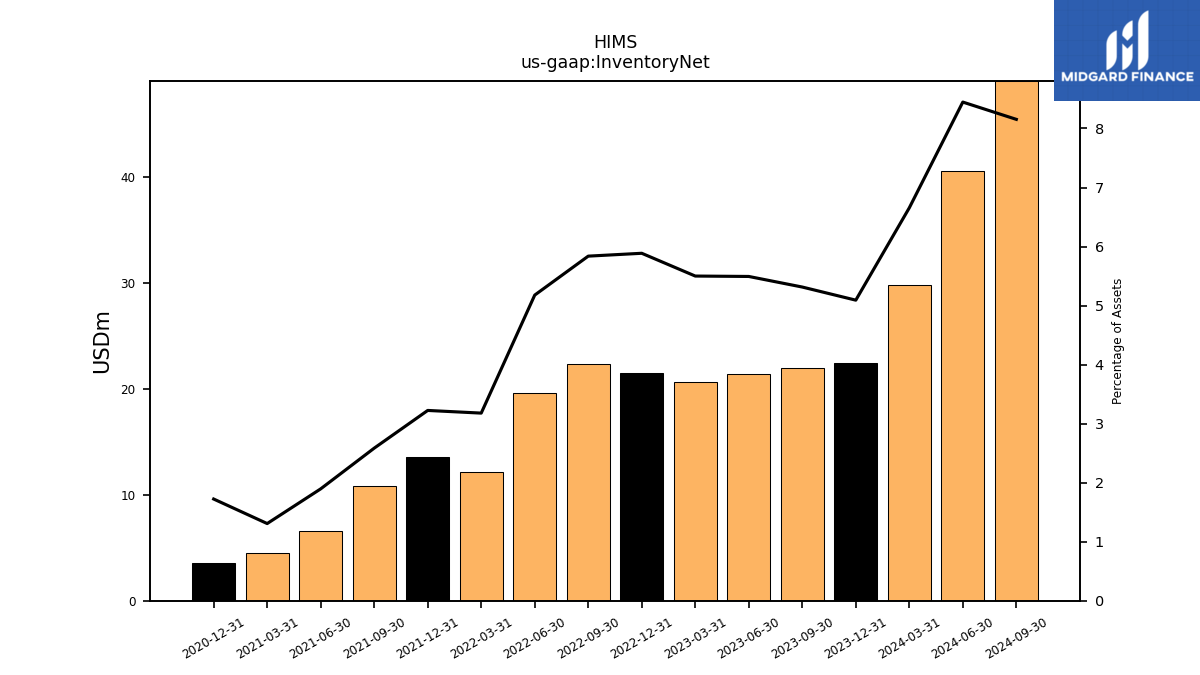
| Inventory Net | 29.83 | 22.46 | 21.99 | 21.42 | 20.70 | 21.56 | 22.35 | 19.67 | 12.14 | 13.56 | 10.86 | 6.59 | 4.52 | 3.54 | NA | NA | NA | |
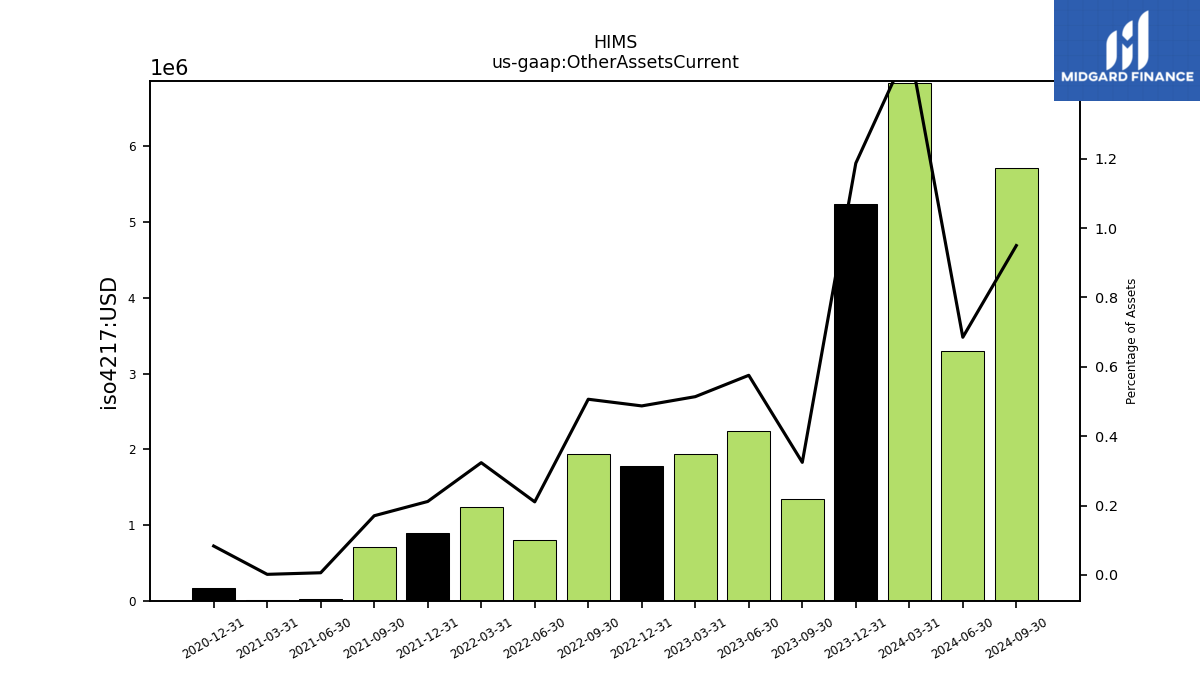
| Other Assets Current | 6.83 | 5.24 | 1.34 | 2.24 | 1.93 | 1.78 | 1.94 | 0.80 | 1.24 | 0.89 | 0.72 | 0.02 | 0.01 | 0.17 | NA | NA | NA | |
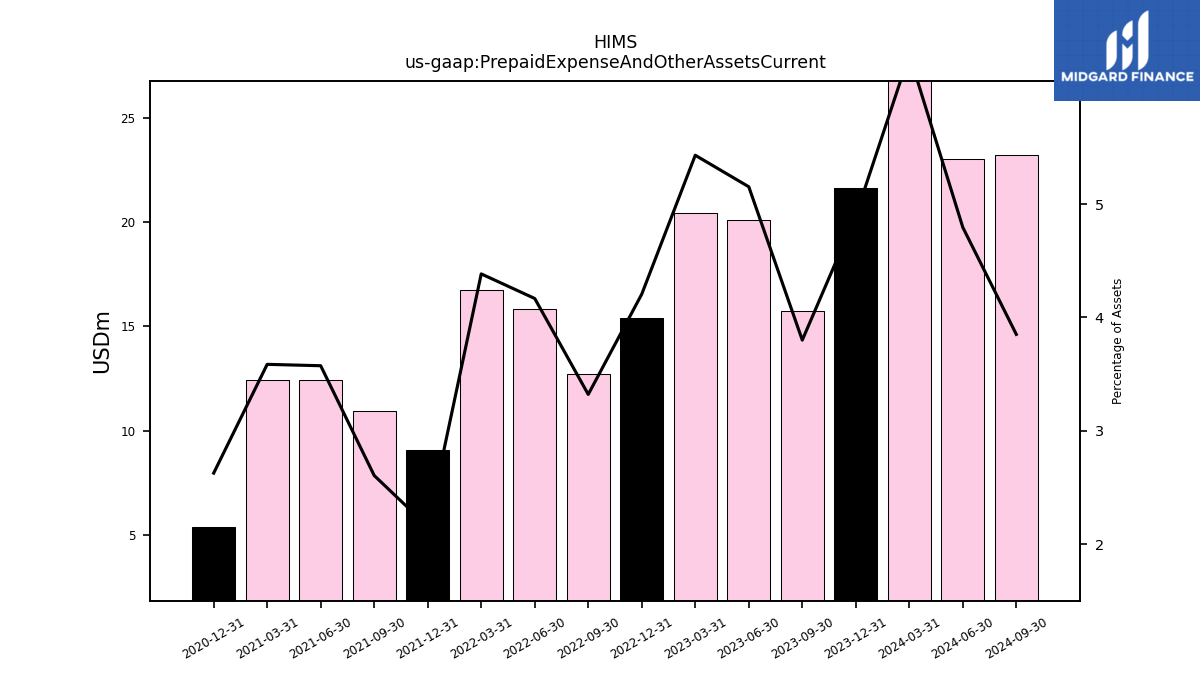
| Prepaid Expense And Other Assets Current | 28.32 | 21.61 | 15.73 | 20.09 | 20.43 | 15.41 | 12.72 | 15.84 | 16.75 | 9.07 | 10.95 | 12.43 | 12.41 | 5.40 | NA | NA | NA | |
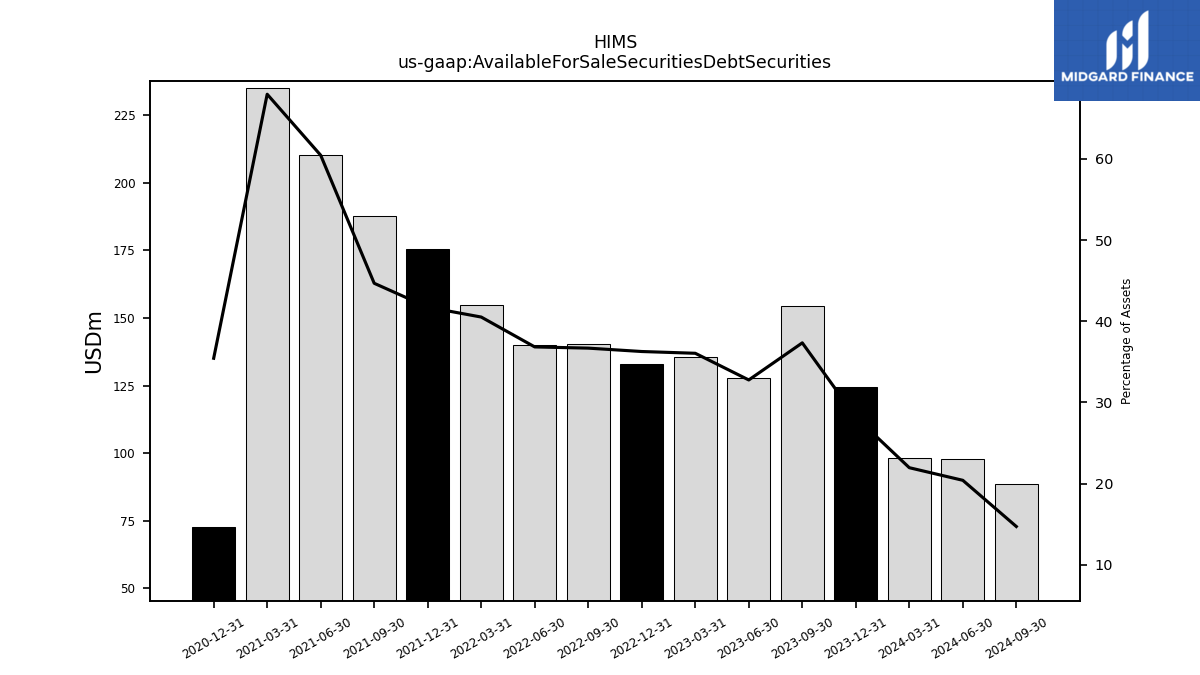
| Available For Sale Securities Debt Securities | 98.36 | 124.32 | 154.50 | 127.72 | 135.65 | 132.85 | 140.43 | 139.94 | 154.77 | 175.49 | 187.65 | 210.18 | 235.10 | 72.86 | NA | NA | NA |
| 2024-03-31 | 2023-12-31 | 2023-09-30 | 2023-06-30 | 2023-03-31 | 2022-12-31 | 2022-09-30 | 2022-06-30 | 2022-03-31 | 2021-12-31 | 2021-09-30 | 2021-06-30 | 2021-03-31 | 2020-12-31 | 2020-09-30 | 2020-06-30 | 2020-03-31 | ||
|---|---|---|---|---|---|---|---|---|---|---|---|---|---|---|---|---|---|---|
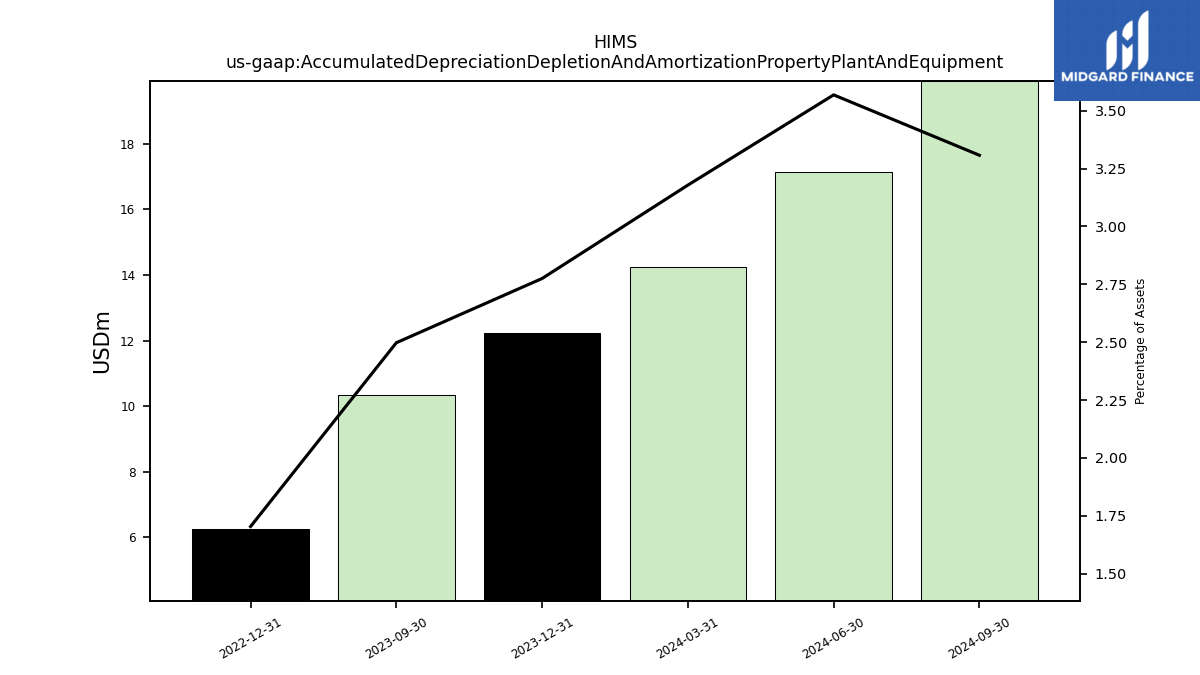
| Accumulated Depreciation Depletion And Amortization Property Plant And Equipment | 14.24 | 12.24 | 10.34 | NA | NA | 6.24 | NA | NA | NA | NA | NA | NA | NA | NA | NA | NA | NA | |
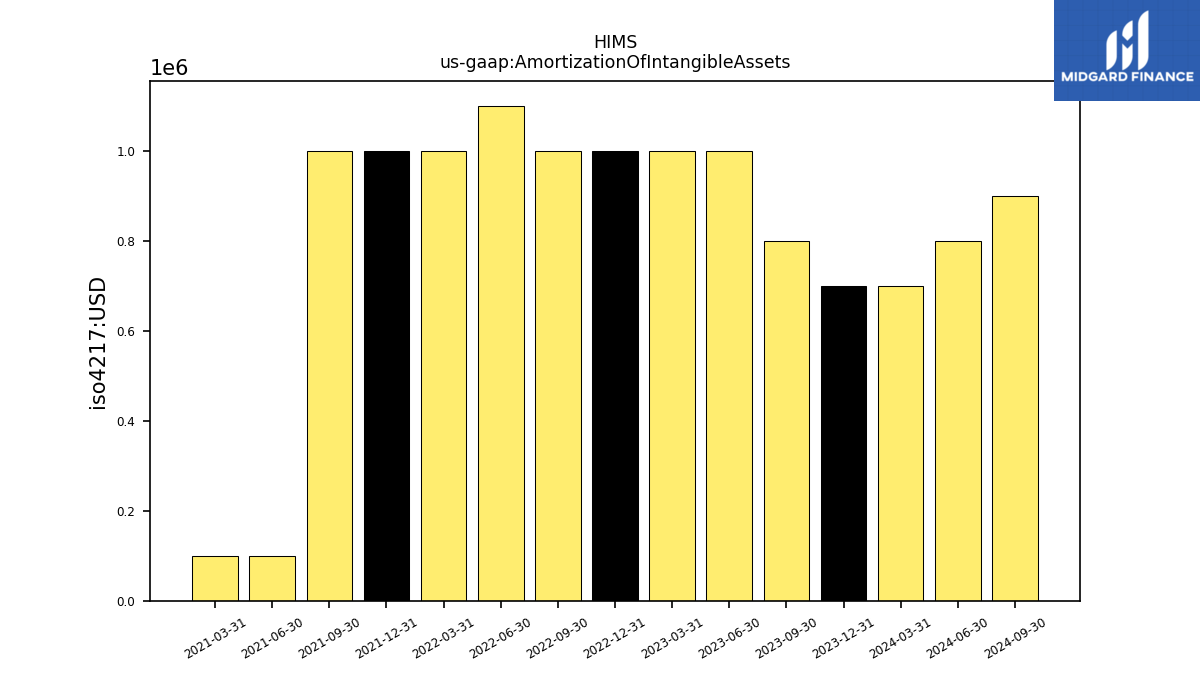
| Amortization Of Intangible Assets | 0.70 | 0.70 | 0.80 | 1.00 | 1.00 | 1.00 | 1.00 | 1.10 | 1.00 | 1.00 | 1.00 | 0.10 | 0.10 | NA | NA | NA | NA | |
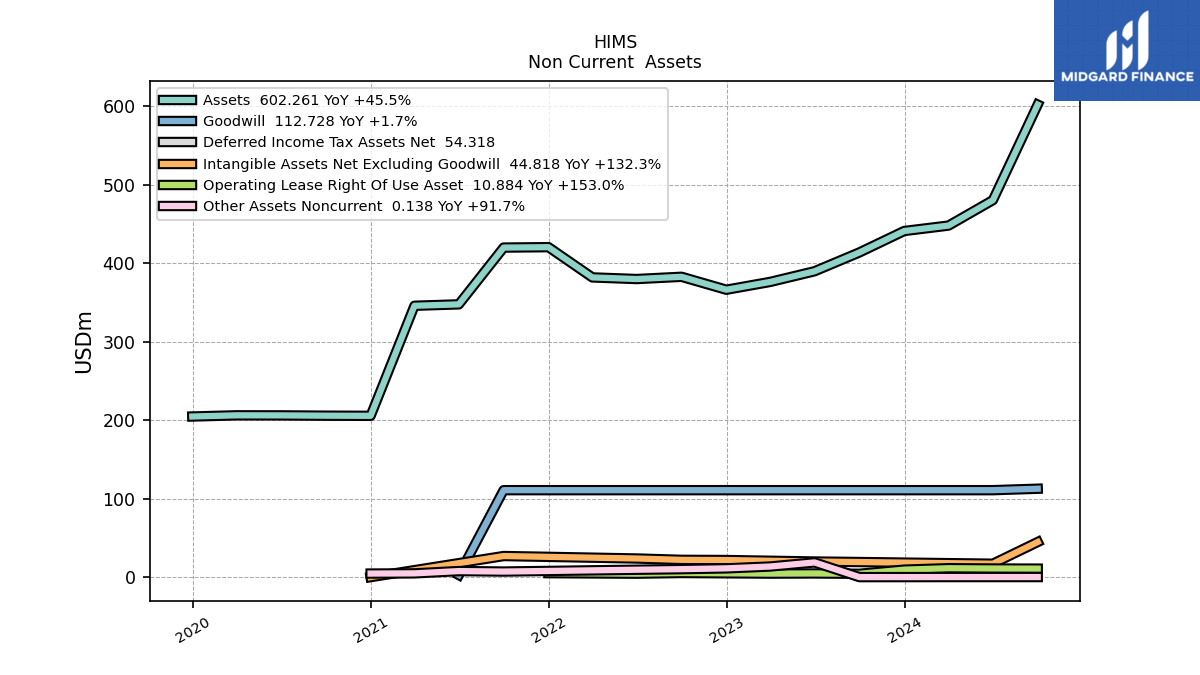
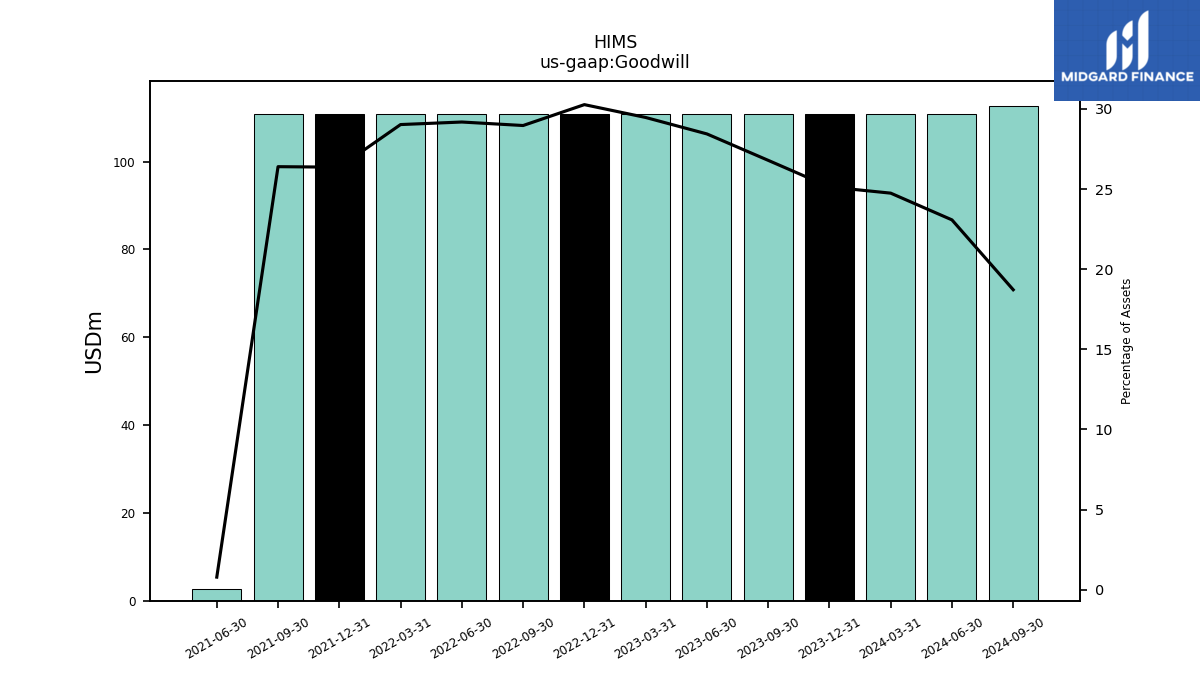
| Goodwill | 110.88 | 110.88 | 110.88 | 110.88 | 110.88 | 110.88 | 110.88 | 110.88 | 110.88 | 110.88 | 110.88 | 2.74 | NA | NA | NA | NA | NA | |
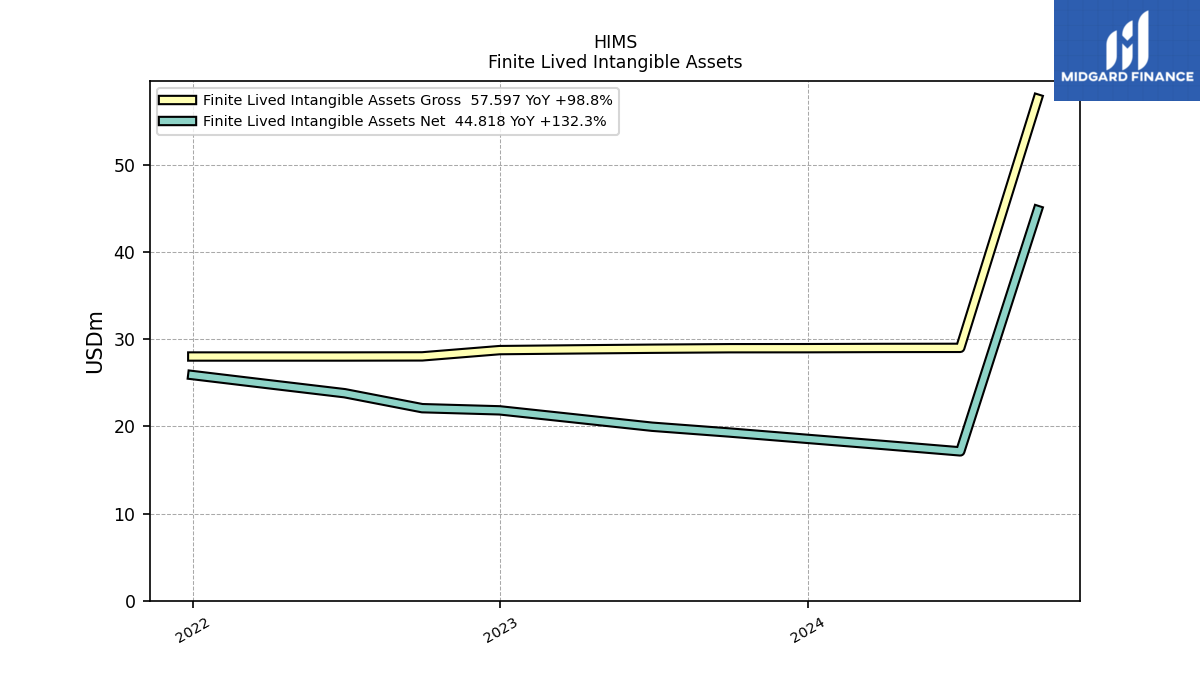
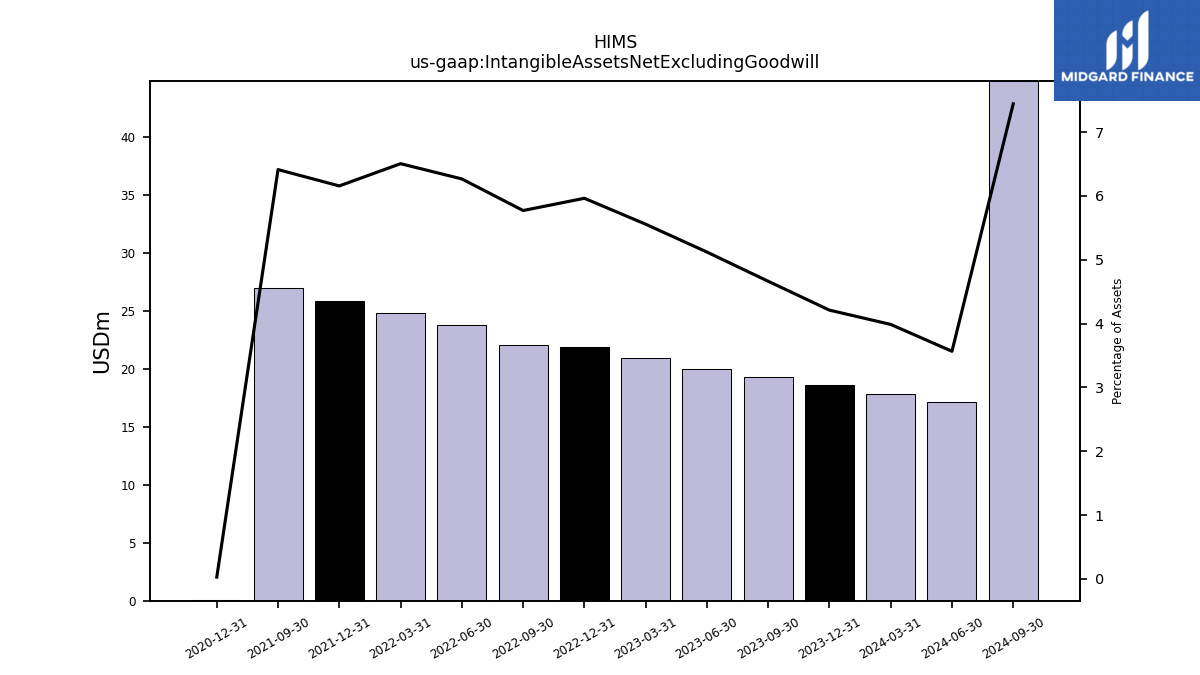
| Intangible Assets Net Excluding Goodwill | 17.86 | 18.57 | 19.30 | 19.96 | 20.91 | 21.84 | 22.09 | 23.81 | 24.85 | 25.89 | 26.93 | NA | NA | 0.06 | NA | NA | NA | |
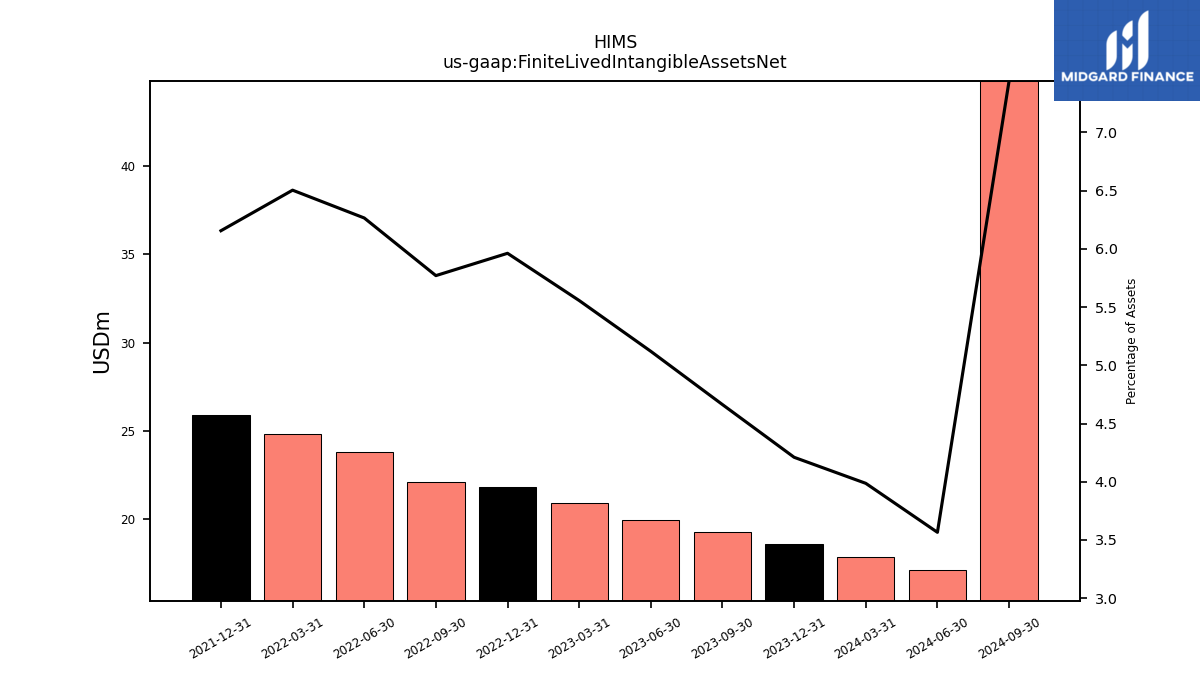
| Finite Lived Intangible Assets Net | 17.86 | 18.57 | 19.30 | 19.96 | 20.91 | 21.84 | 22.09 | 23.81 | 24.85 | 25.89 | NA | NA | NA | NA | NA | NA | NA | |
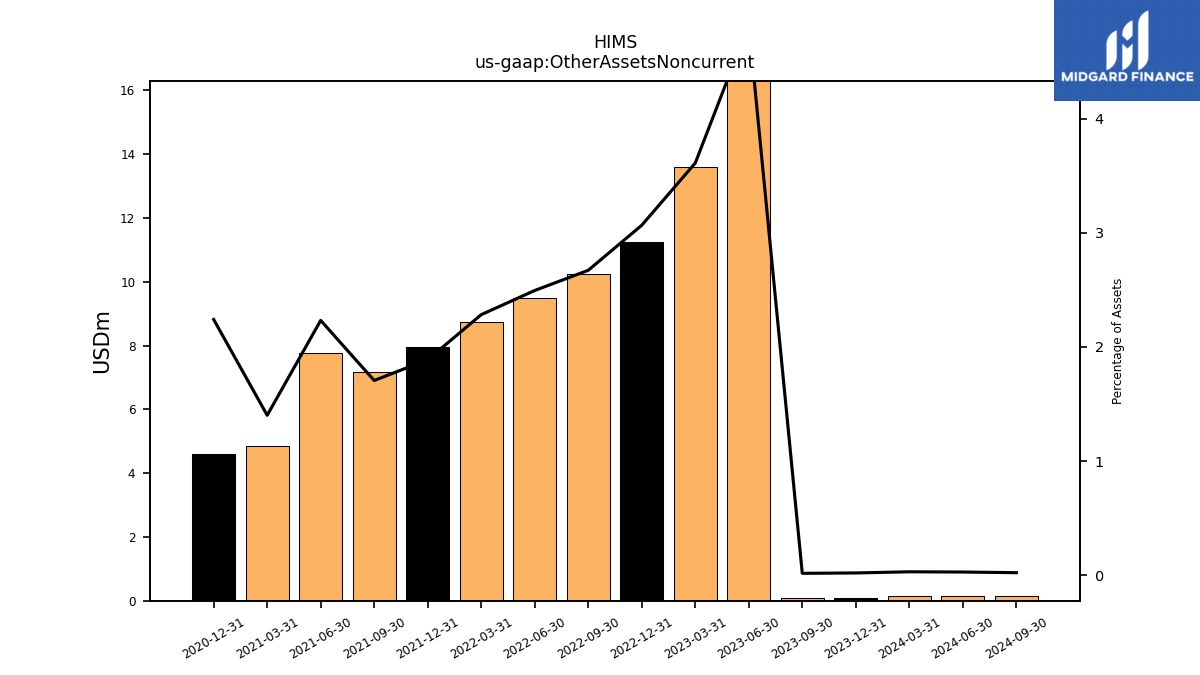
| Other Assets Noncurrent | 0.14 | 0.09 | 0.07 | 18.80 | 13.59 | 11.23 | 10.23 | 9.48 | 8.72 | 7.94 | 7.17 | 7.76 | 4.85 | 4.61 | NA | NA | NA | |
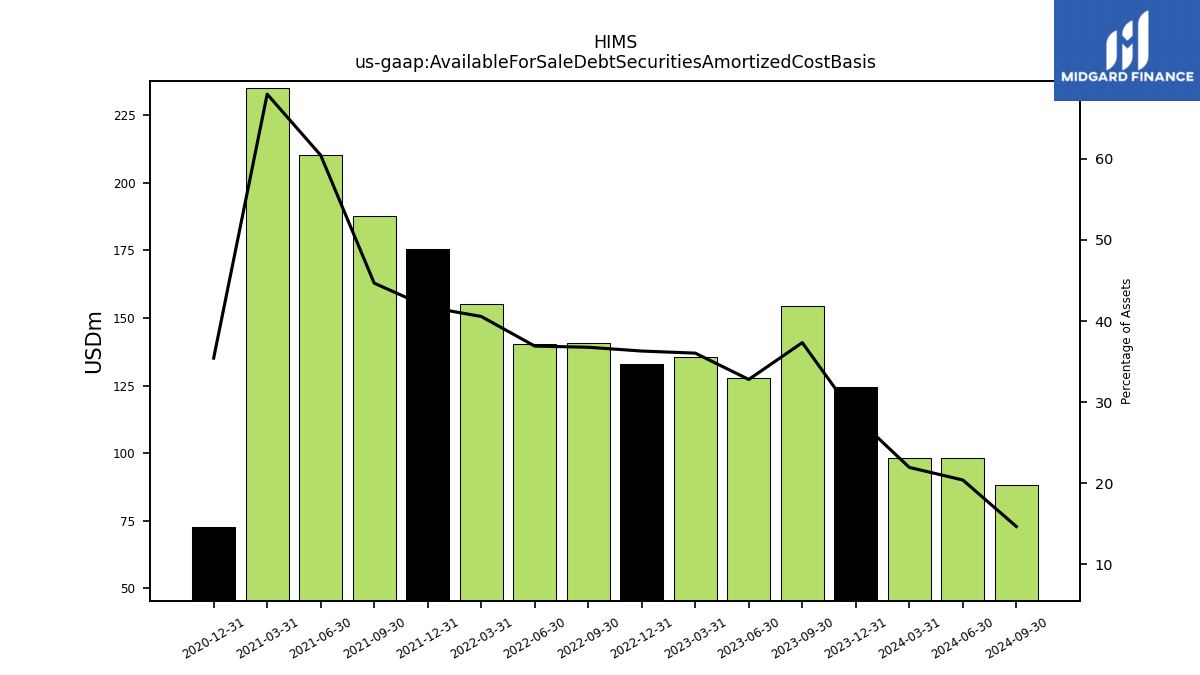
| Available For Sale Debt Securities Amortized Cost Basis | 98.37 | 124.29 | 154.53 | 127.87 | 135.63 | 132.99 | 140.76 | 140.27 | 154.98 | 175.54 | 187.66 | 210.18 | 235.16 | 72.86 | NA | NA | NA |
| 2024-03-31 | 2023-12-31 | 2023-09-30 | 2023-06-30 | 2023-03-31 | 2022-12-31 | 2022-09-30 | 2022-06-30 | 2022-03-31 | 2021-12-31 | 2021-09-30 | 2021-06-30 | 2021-03-31 | 2020-12-31 | 2020-09-30 | 2020-06-30 | 2020-03-31 | ||
|---|---|---|---|---|---|---|---|---|---|---|---|---|---|---|---|---|---|---|
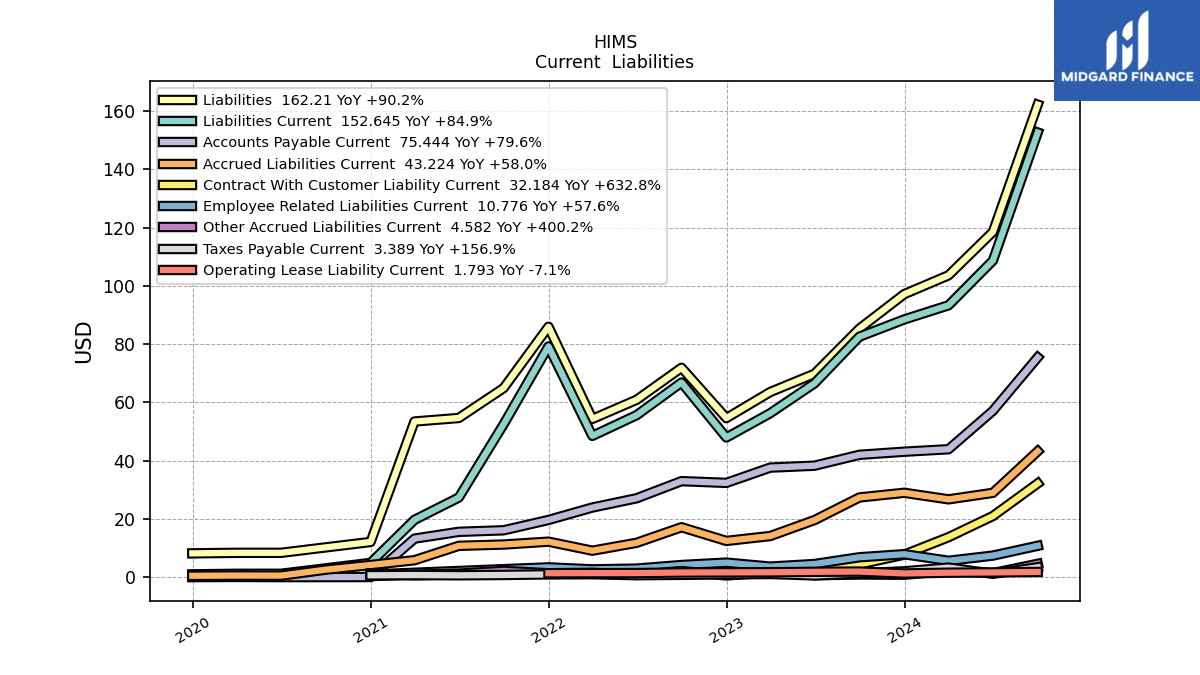
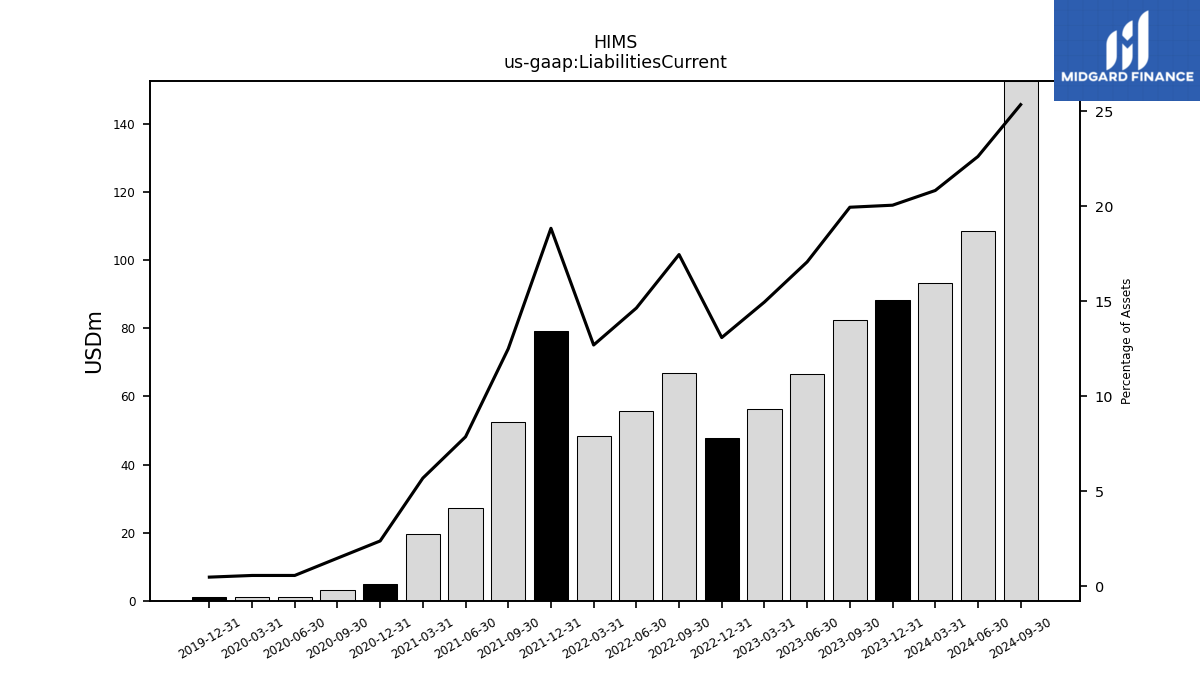
| Liabilities Current | 93.32 | 88.47 | 82.55 | 66.55 | 56.28 | 47.94 | 66.82 | 55.62 | 48.50 | 79.22 | 52.50 | 27.34 | 19.68 | 4.90 | 3.04 | 1.17 | 1.17 | |
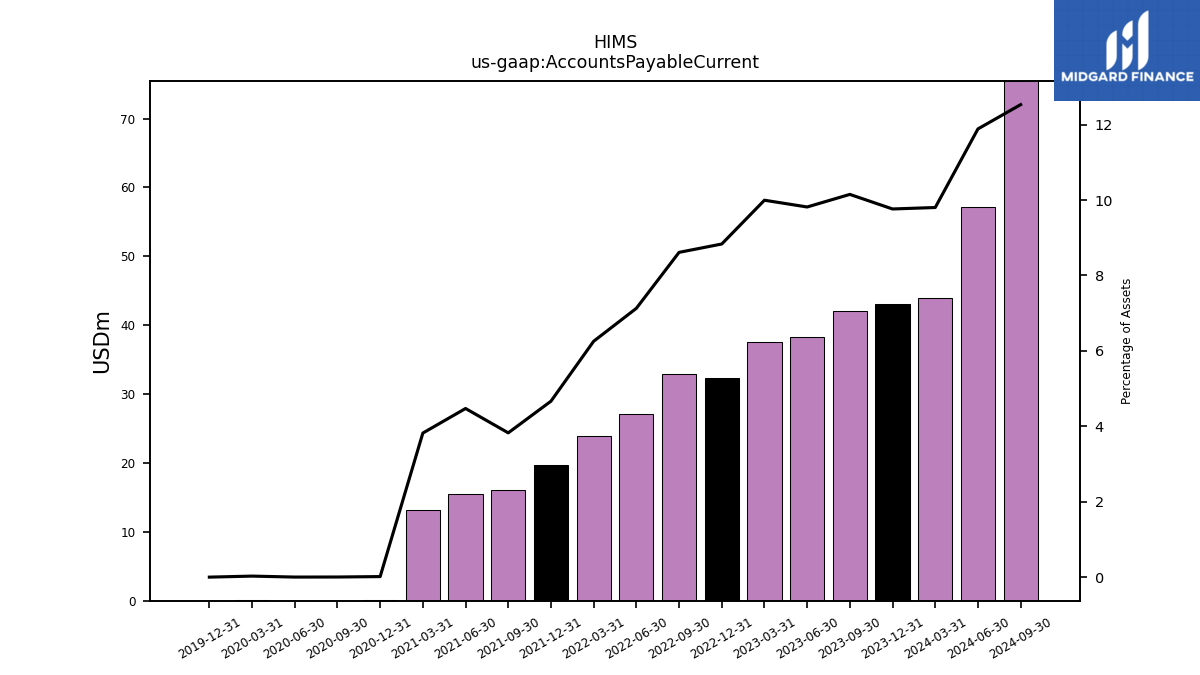
| Accounts Payable Current | 43.92 | 43.07 | 42.00 | 38.27 | 37.61 | 32.36 | 32.97 | 27.09 | 23.91 | 19.64 | 16.09 | 15.56 | 13.23 | 0.05 | 0.02 | 0.02 | 0.07 | |
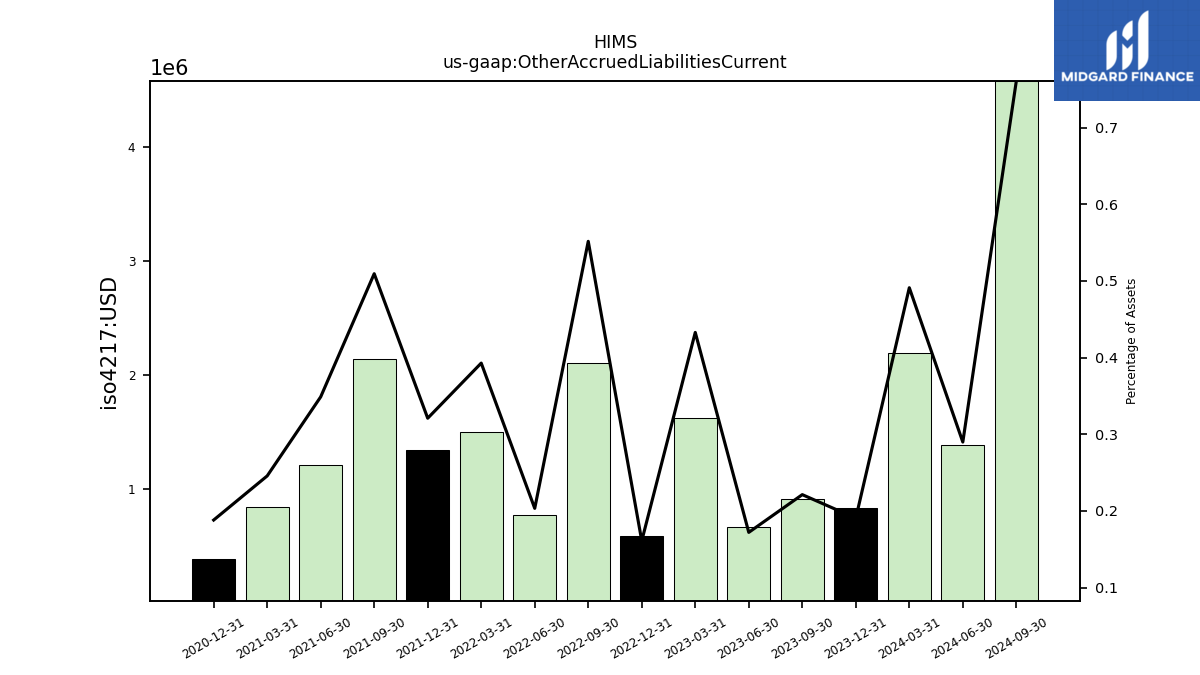
| Other Accrued Liabilities Current | 2.20 | 0.84 | 0.92 | 0.67 | 1.63 | 0.59 | 2.11 | 0.77 | 1.50 | 1.35 | 2.14 | 1.21 | 0.85 | 0.39 | NA | NA | NA | |
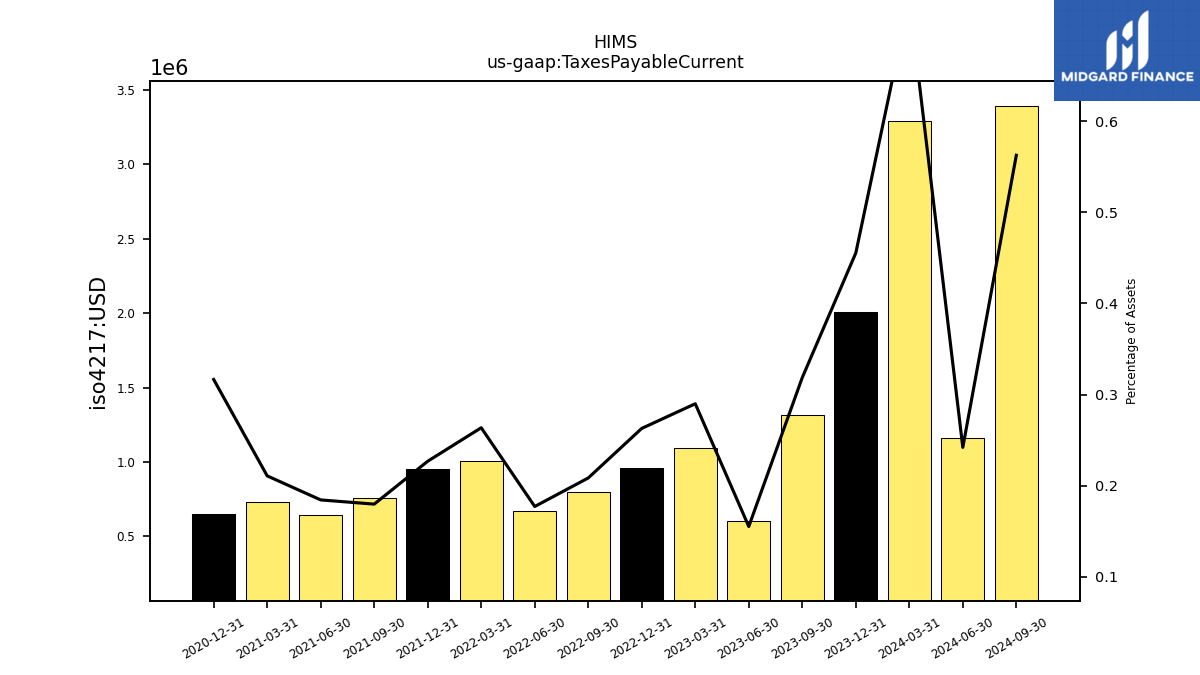
| Taxes Payable Current | 3.29 | 2.01 | 1.32 | 0.60 | 1.09 | 0.96 | 0.80 | 0.67 | 1.01 | 0.95 | 0.76 | 0.64 | 0.73 | 0.65 | NA | NA | NA | |
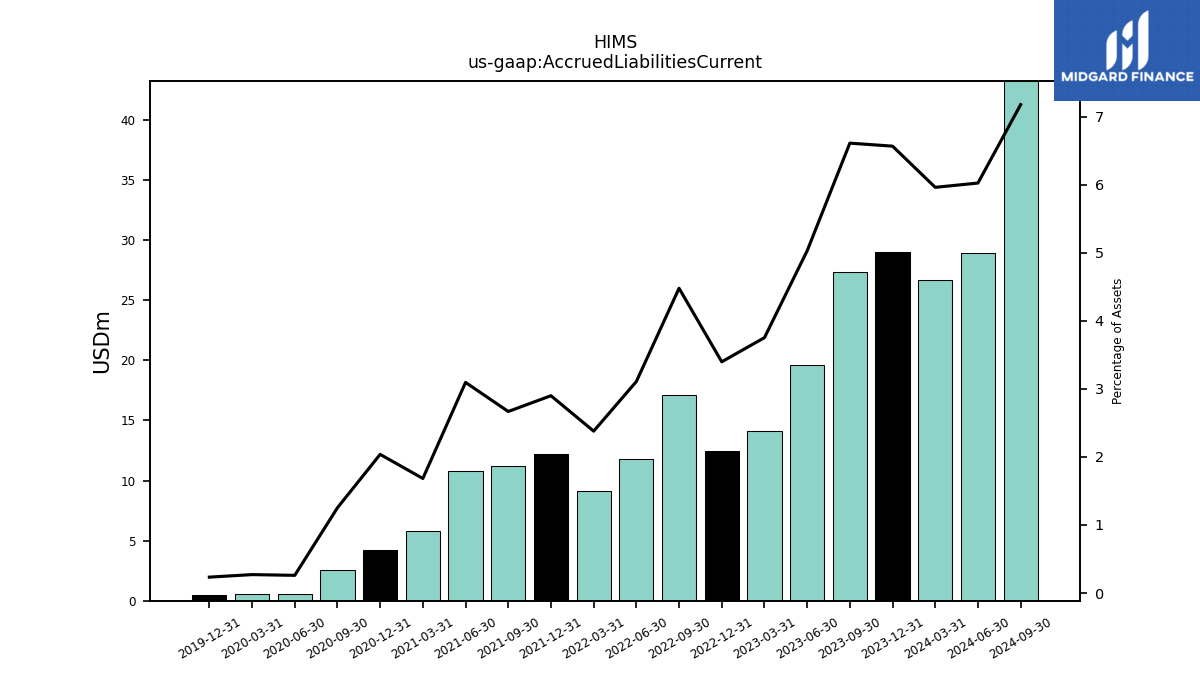
| Accrued Liabilities Current | 26.71 | 28.97 | 27.36 | 19.61 | 14.12 | 12.45 | 17.14 | 11.81 | 9.09 | 12.19 | 11.21 | 10.76 | 5.82 | 4.19 | 2.58 | 0.54 | 0.56 | |
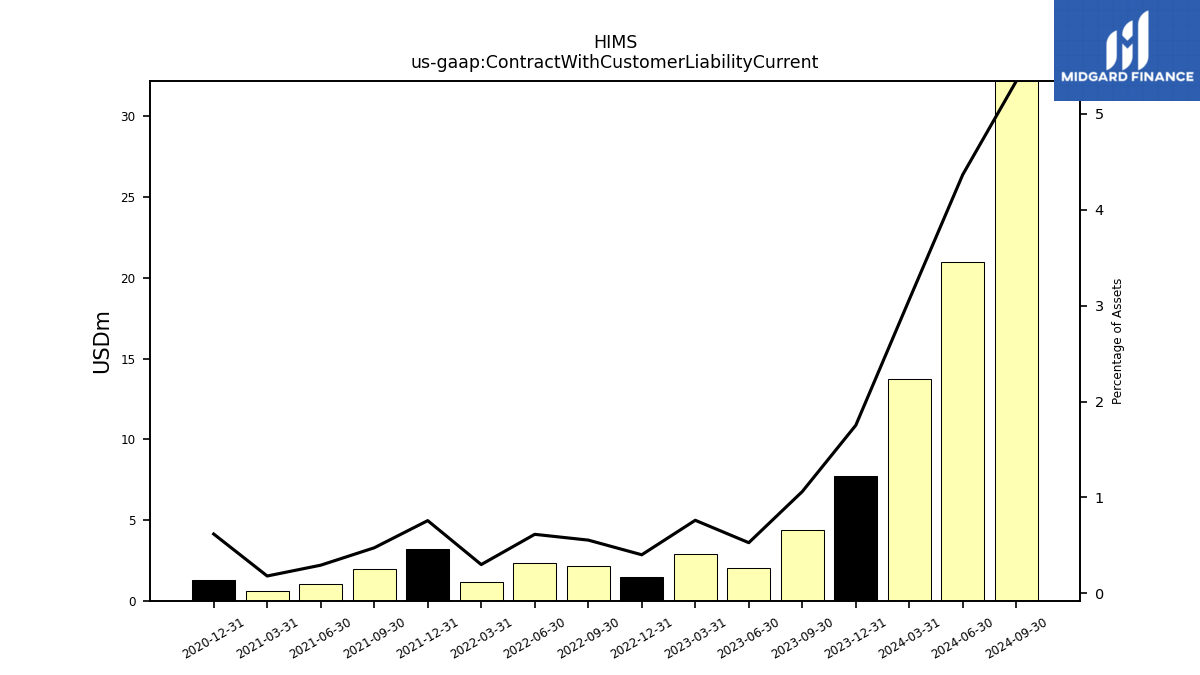
| Contract With Customer Liability Current | 13.73 | 7.73 | 4.39 | 2.06 | 2.87 | 1.47 | 2.12 | 2.34 | 1.15 | 3.19 | 1.99 | 1.02 | 0.62 | 1.27 | NA | NA | NA |
| 2024-03-31 | 2023-12-31 | 2023-09-30 | 2023-06-30 | 2023-03-31 | 2022-12-31 | 2022-09-30 | 2022-06-30 | 2022-03-31 | 2021-12-31 | 2021-09-30 | 2021-06-30 | 2021-03-31 | 2020-12-31 | 2020-09-30 | 2020-06-30 | 2020-03-31 | ||
|---|---|---|---|---|---|---|---|---|---|---|---|---|---|---|---|---|---|---|
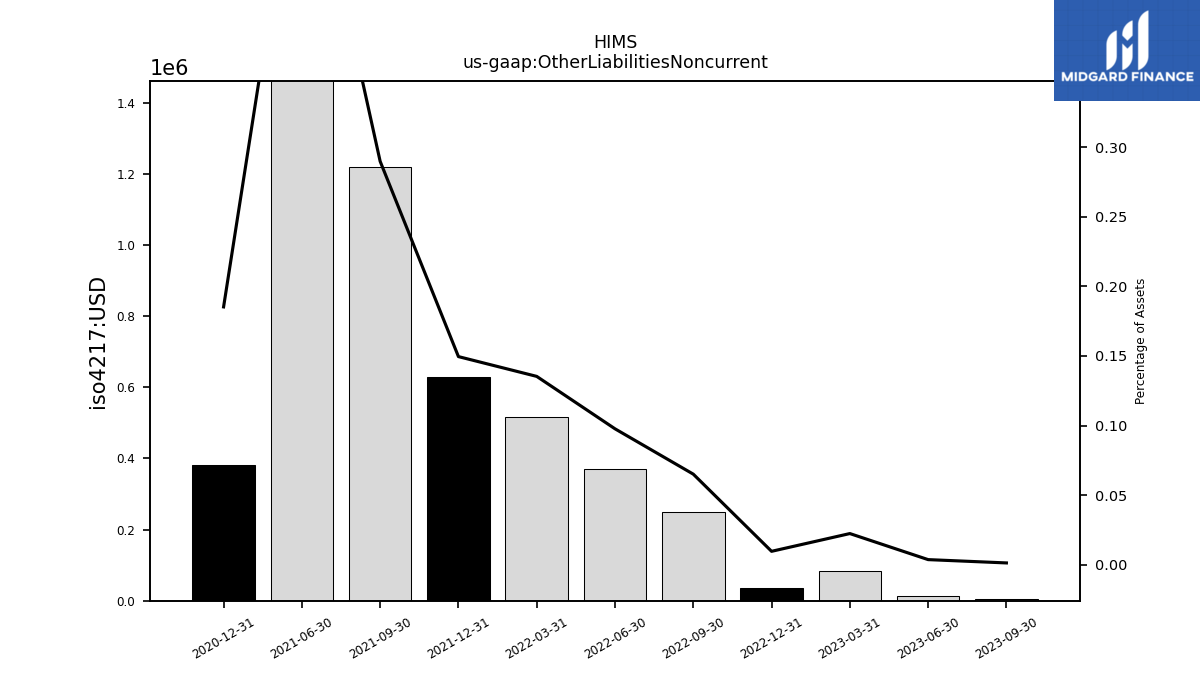
| Other Liabilities Noncurrent | 0.02 | 0.02 | 0.01 | 0.01 | 0.08 | 0.04 | 0.25 | 0.37 | 0.52 | 0.63 | 1.22 | 1.90 | NA | 0.38 | NA | NA | NA | |
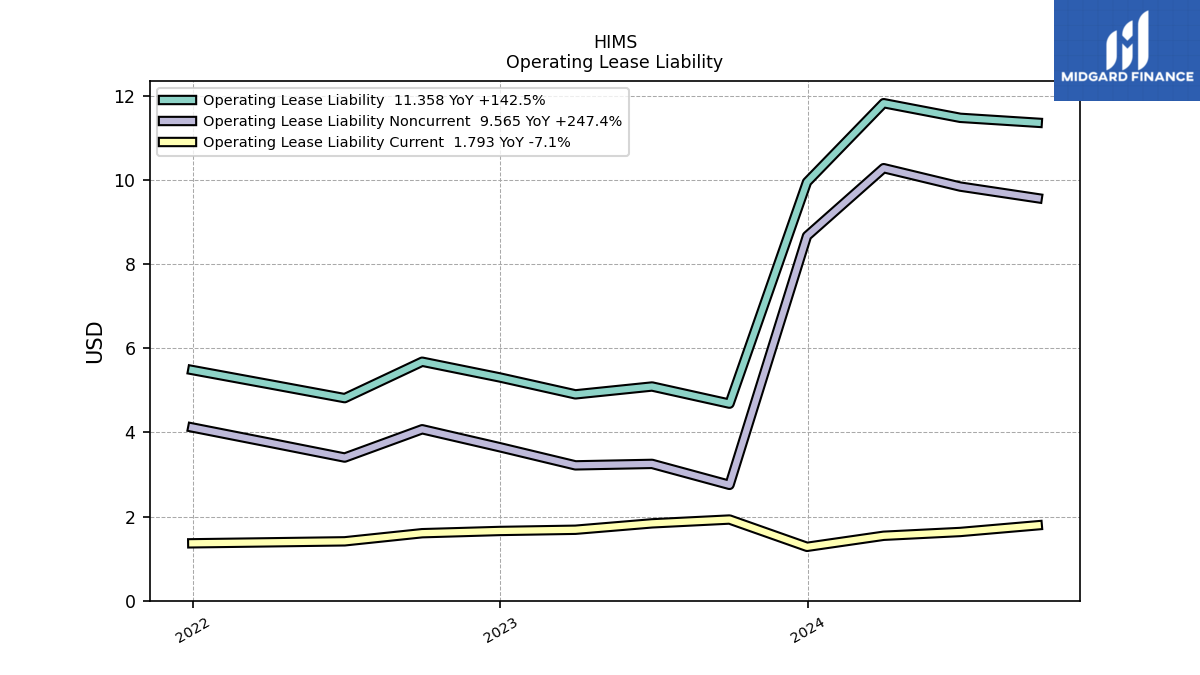
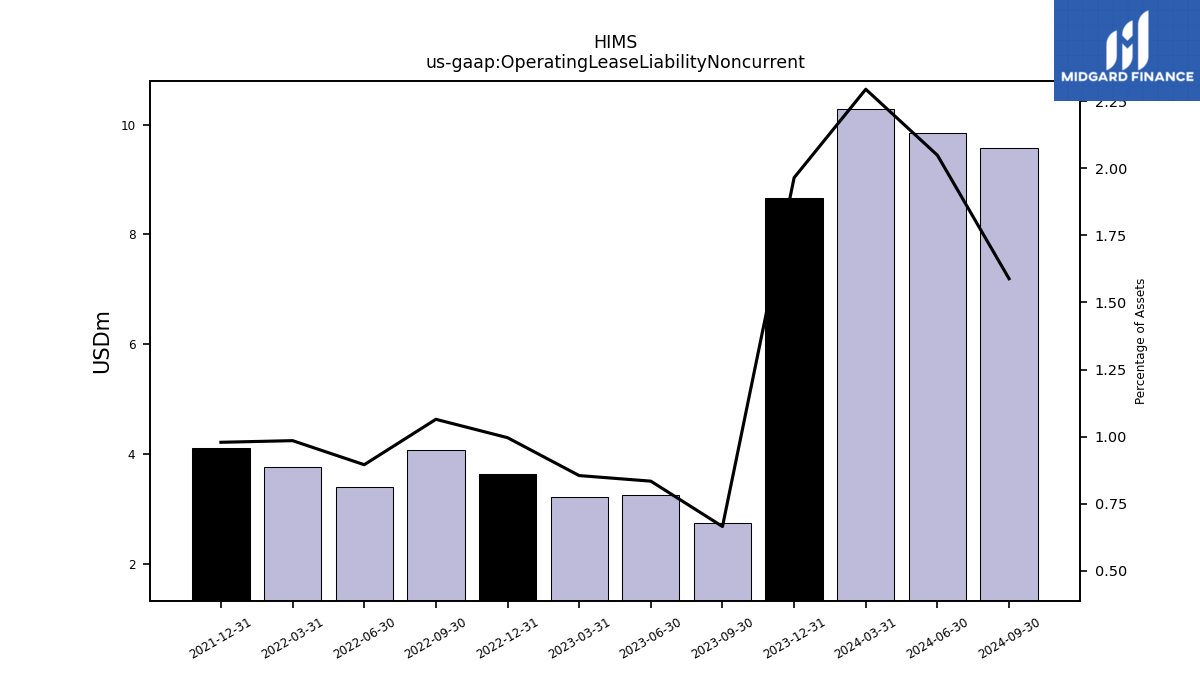
| Operating Lease Liability Noncurrent | 10.28 | 8.67 | 2.75 | 3.25 | 3.22 | 3.65 | 4.08 | 3.40 | 3.76 | 4.12 | NA | NA | NA | NA | NA | NA | NA |
| 2024-03-31 | 2023-12-31 | 2023-09-30 | 2023-06-30 | 2023-03-31 | 2022-12-31 | 2022-09-30 | 2022-06-30 | 2022-03-31 | 2021-12-31 | 2021-09-30 | 2021-06-30 | 2021-03-31 | 2020-12-31 | 2020-09-30 | 2020-06-30 | 2020-03-31 | ||
|---|---|---|---|---|---|---|---|---|---|---|---|---|---|---|---|---|---|---|
| Stockholders Equity | 344.48 | 344.03 | 328.56 | 320.07 | 312.75 | 311.74 | 310.95 | 319.06 | 327.71 | 334.62 | 355.15 | 293.05 | 292.47 | 5.00 | 5.00 | 5.00 | 5.00 | |
| Common Stock Value | 0.02 | 0.02 | 0.02 | 0.02 | 0.02 | 0.02 | 0.02 | 0.02 | 0.02 | 0.02 | 0.02 | 0.02 | 0.02 | 0.01 | NA | NA | NA | |
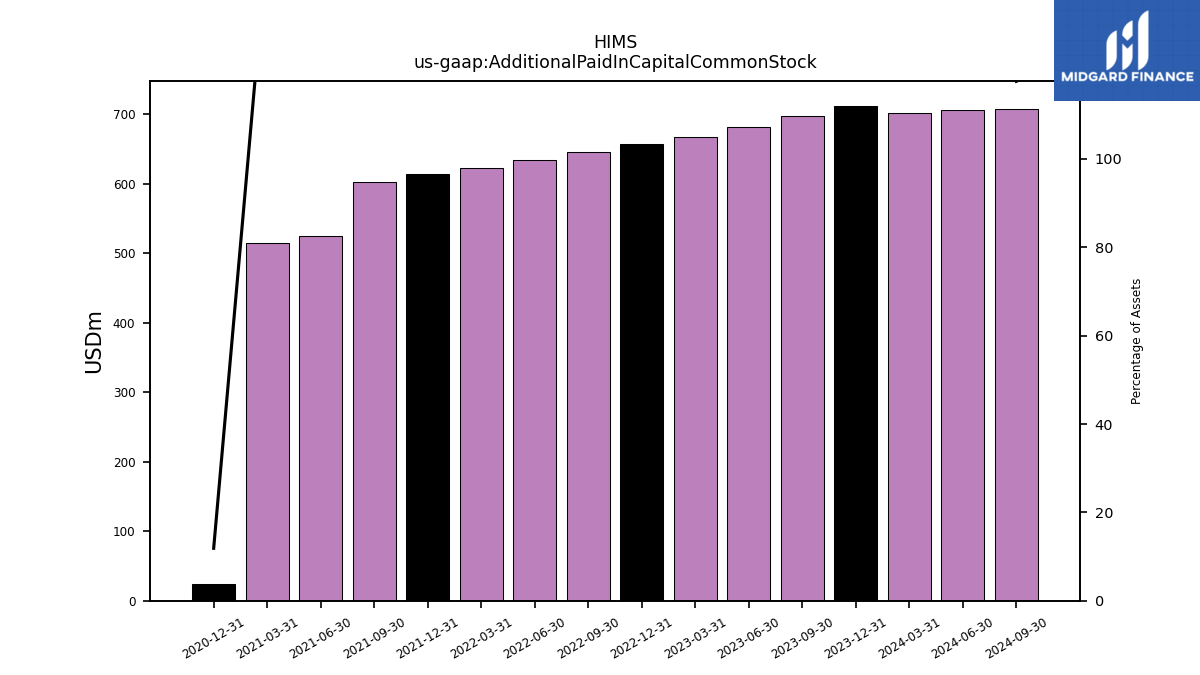
| Additional Paid In Capital Common Stock | 701.67 | 712.31 | 698.09 | 682.16 | 667.53 | 656.63 | 645.11 | 634.39 | 623.22 | 613.69 | 602.98 | 524.92 | 515.22 | 24.43 | NA | NA | NA | |
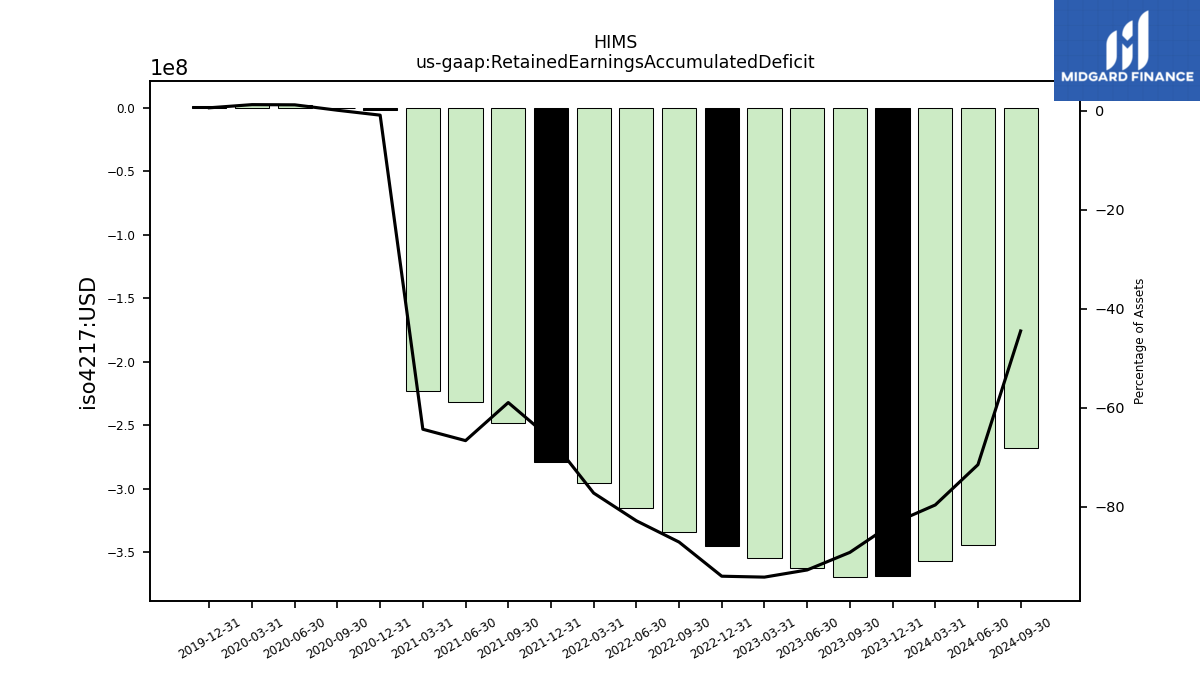
| Retained Earnings Accumulated Deficit | -357.05 | -368.18 | -369.42 | -361.85 | -354.70 | -344.63 | -333.72 | -314.88 | -295.20 | -278.95 | -247.79 | -231.85 | -222.70 | -1.90 | 0.14 | 2.39 | 2.48 | |
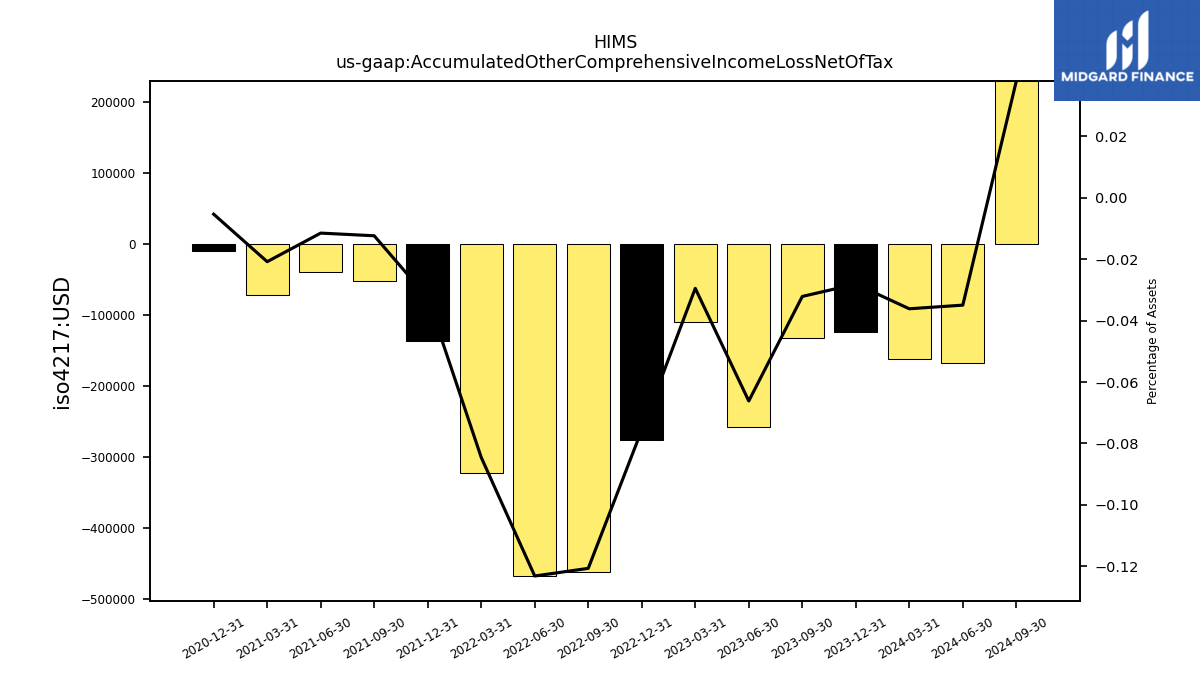
| Accumulated Other Comprehensive Income Loss Net Of Tax | -0.16 | -0.12 | -0.13 | -0.26 | -0.11 | -0.28 | -0.46 | -0.47 | -0.32 | -0.14 | -0.05 | -0.04 | -0.07 | -0.01 | NA | NA | NA | |
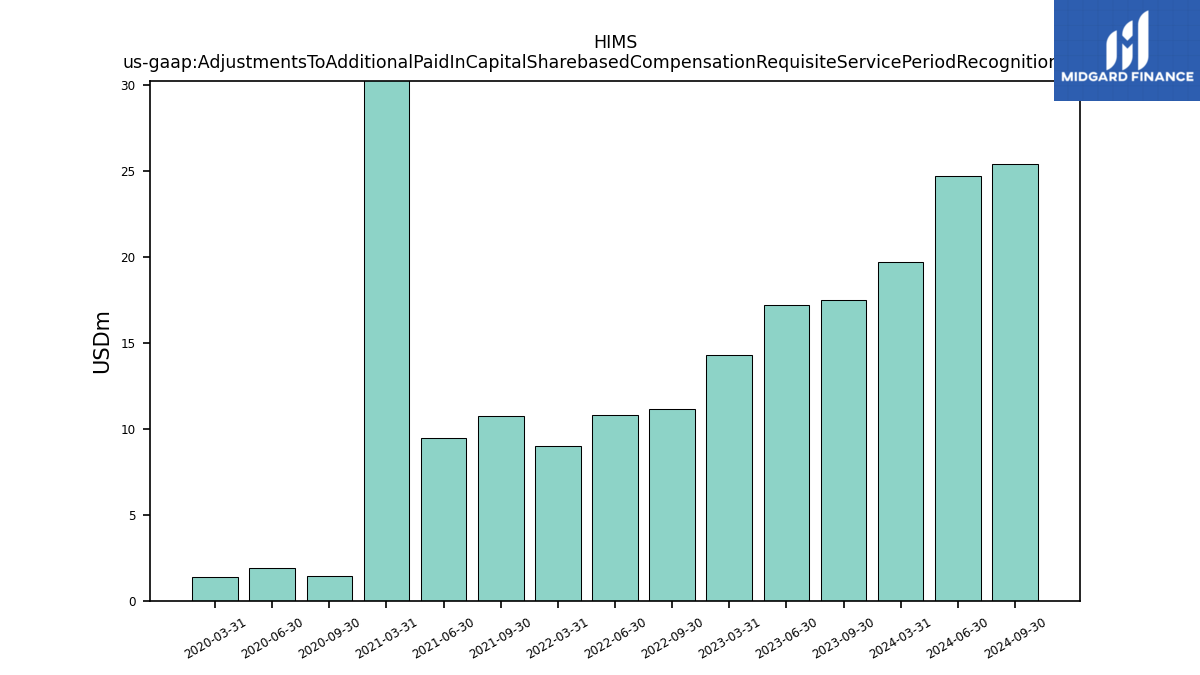
| Adjustments To Additional Paid In Capital Sharebased Compensation Requisite Service Period Recognition Value | 19.67 | NA | 17.49 | 17.17 | 14.32 | NA | 11.18 | 10.78 | 9.01 | NA | 10.72 | 9.49 | 34.23 | NA | 1.41 | 1.93 | 1.40 |
| 2024-03-31 | 2023-12-31 | 2023-09-30 | 2023-06-30 | 2023-03-31 | 2022-12-31 | 2022-09-30 | 2022-06-30 | 2022-03-31 | 2021-12-31 | 2021-09-30 | 2021-06-30 | 2021-03-31 | 2020-12-31 | 2020-09-30 | 2020-06-30 | 2020-03-31 | ||
|---|---|---|---|---|---|---|---|---|---|---|---|---|---|---|---|---|---|---|
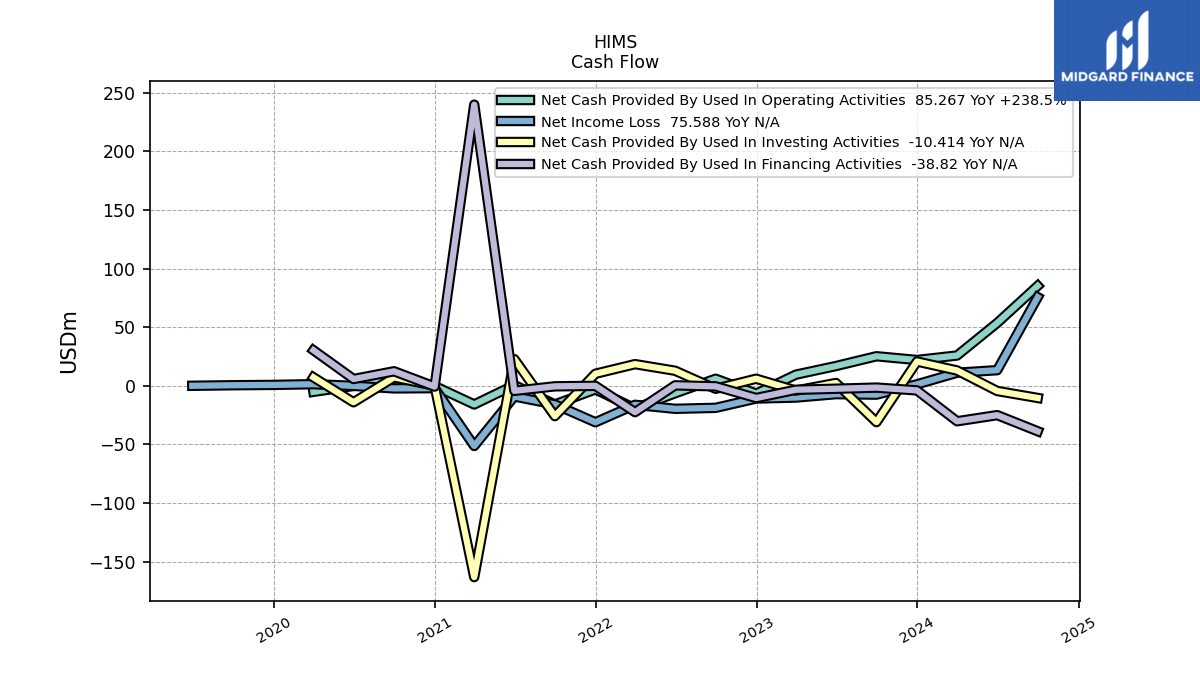
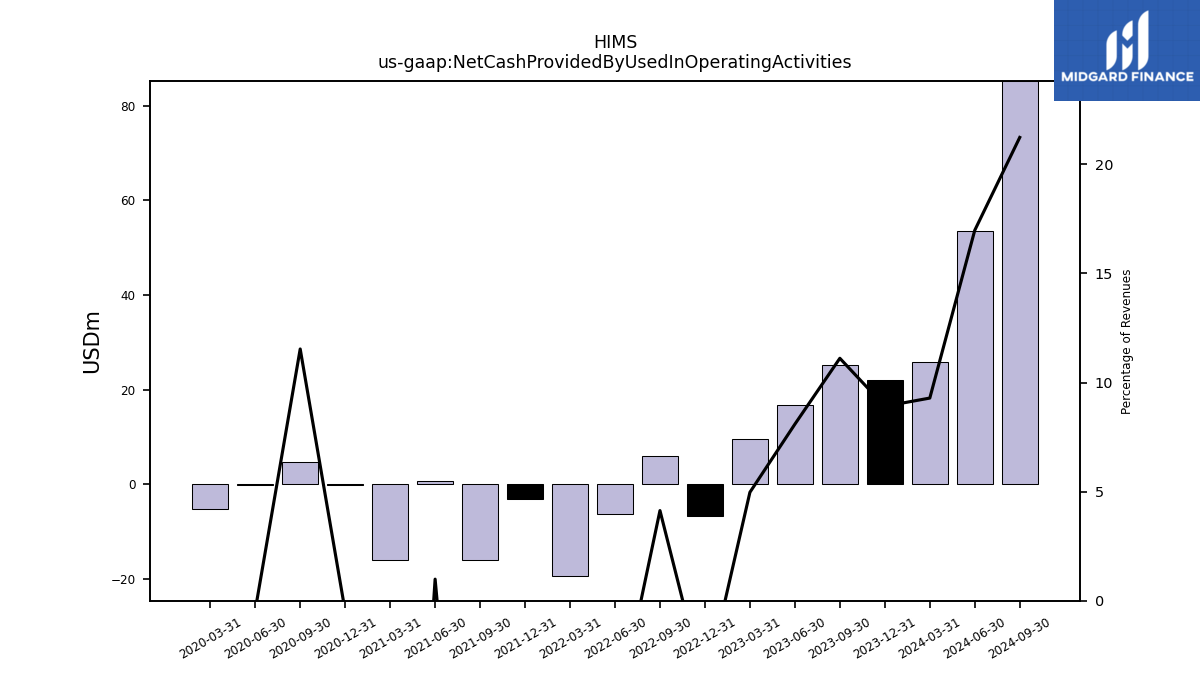
| Net Cash Provided By Used In Operating Activities | 25.84 | 21.98 | 25.19 | 16.83 | 9.48 | -6.72 | 5.99 | -6.39 | -19.40 | -3.10 | -15.96 | 0.60 | -15.95 | -0.20 | 4.77 | -0.15 | -5.19 | |
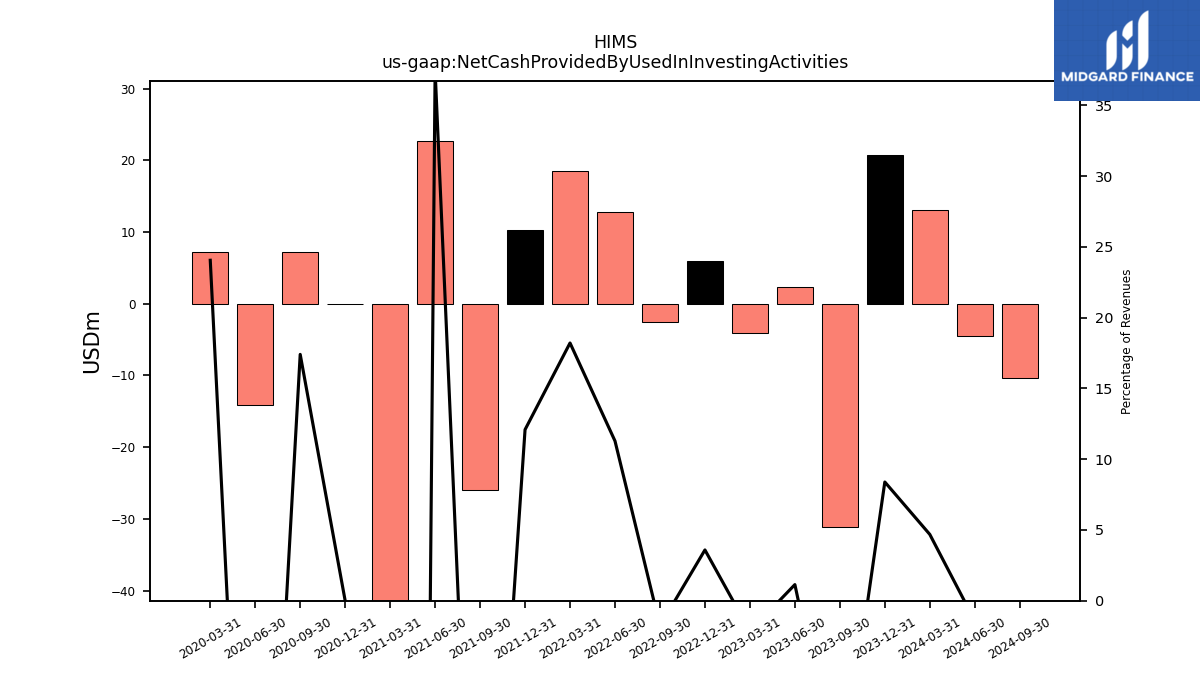
| Net Cash Provided By Used In Investing Activities | 13.04 | 20.70 | -31.06 | 2.37 | -4.11 | 6.00 | -2.58 | 12.82 | 18.45 | 10.24 | -25.92 | 22.74 | -163.32 | 0.00 | 7.19 | -14.10 | 7.23 | |
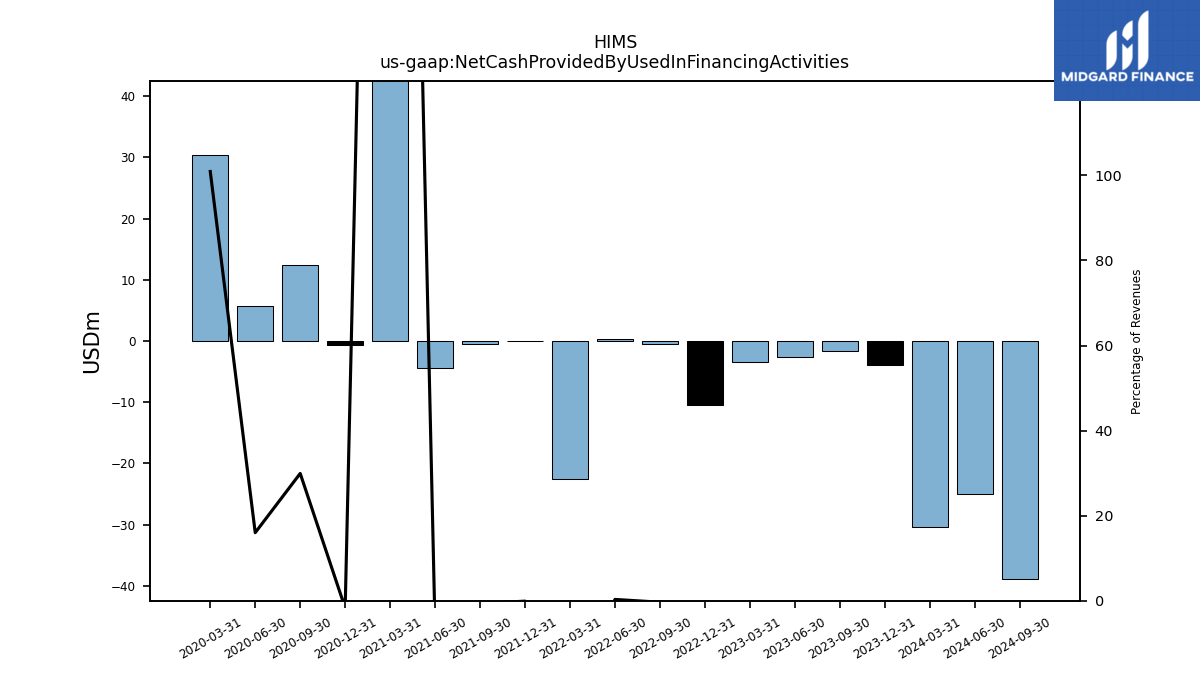
| Net Cash Provided By Used In Financing Activities | -30.31 | -3.96 | -1.56 | -2.54 | -3.41 | -10.46 | -0.49 | 0.35 | -22.53 | -0.08 | -0.48 | -4.34 | 239.94 | -0.71 | 12.37 | 5.75 | 30.34 |
| 2024-03-31 | 2023-12-31 | 2023-09-30 | 2023-06-30 | 2023-03-31 | 2022-12-31 | 2022-09-30 | 2022-06-30 | 2022-03-31 | 2021-12-31 | 2021-09-30 | 2021-06-30 | 2021-03-31 | 2020-12-31 | 2020-09-30 | 2020-06-30 | 2020-03-31 | ||
|---|---|---|---|---|---|---|---|---|---|---|---|---|---|---|---|---|---|---|
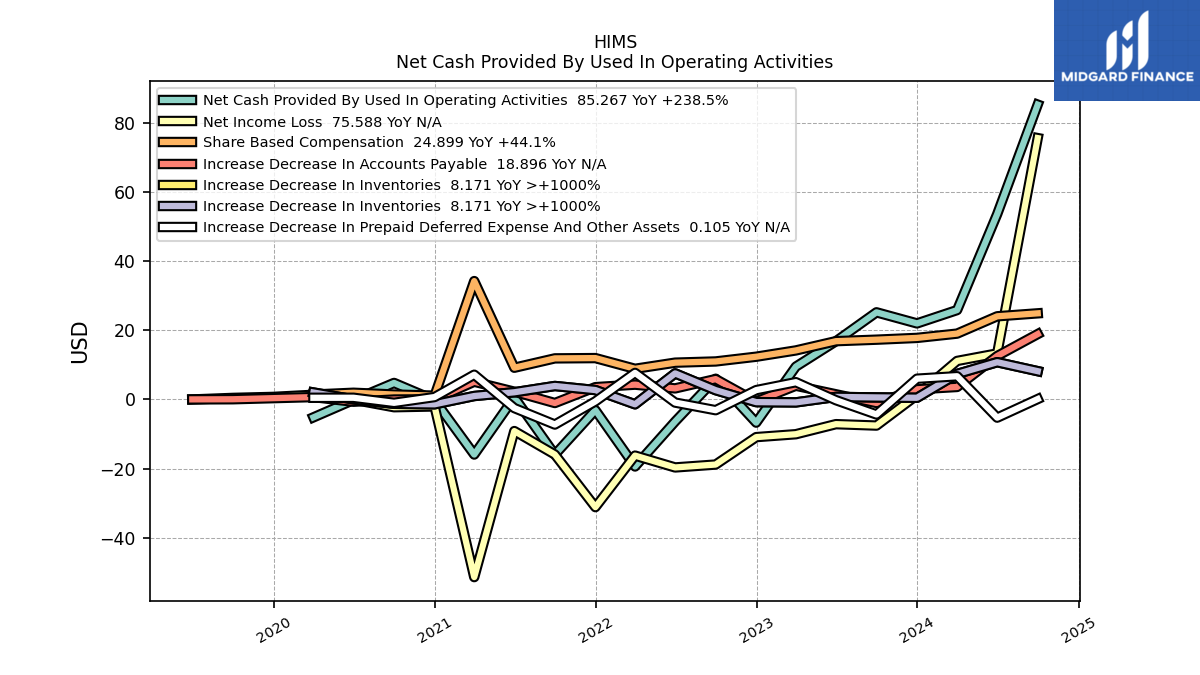
| Net Cash Provided By Used In Operating Activities | 25.84 | 21.98 | 25.19 | 16.83 | 9.48 | -6.72 | 5.99 | -6.39 | -19.40 | -3.10 | -15.96 | 0.60 | -15.95 | -0.20 | 4.77 | -0.15 | -5.19 | |
| Net Income Loss | 11.13 | 1.25 | -7.57 | -7.16 | -10.07 | -10.91 | -18.84 | -19.68 | -16.25 | -31.16 | -15.94 | -9.15 | -51.40 | -2.04 | -2.26 | -0.09 | 1.33 | |
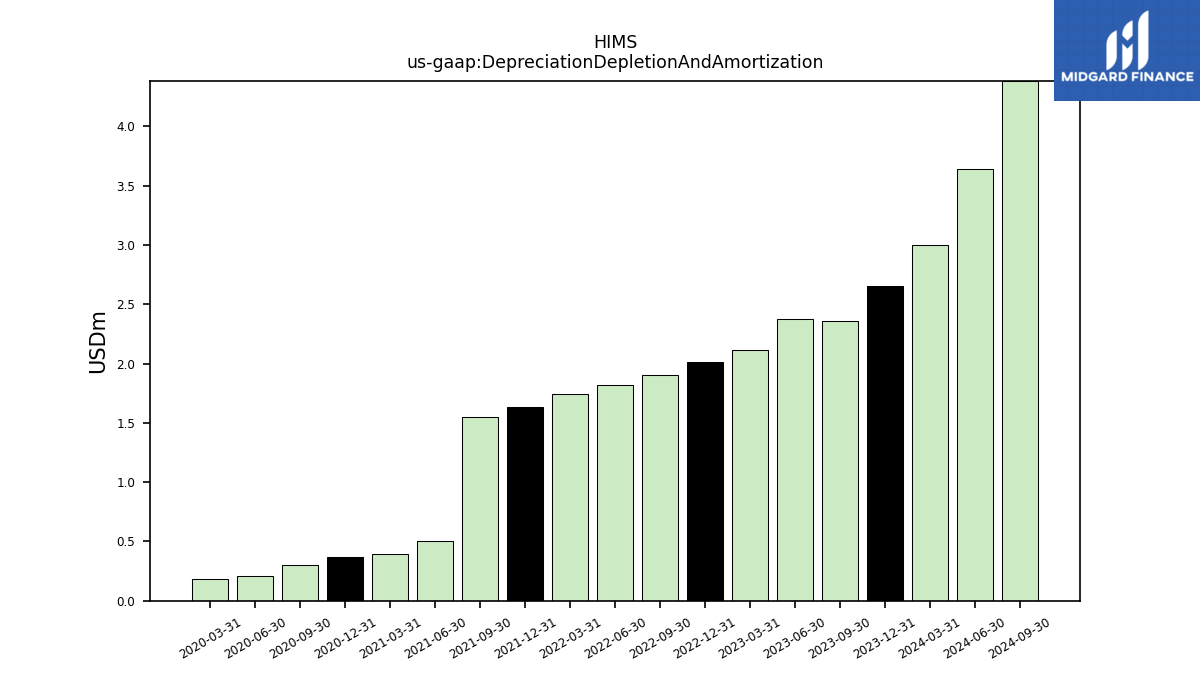
| Depreciation Depletion And Amortization | 3.00 | 2.66 | 2.36 | 2.38 | 2.12 | 2.01 | 1.90 | 1.82 | 1.74 | 1.63 | 1.55 | 0.51 | 0.39 | 0.36 | 0.30 | 0.21 | 0.18 | |
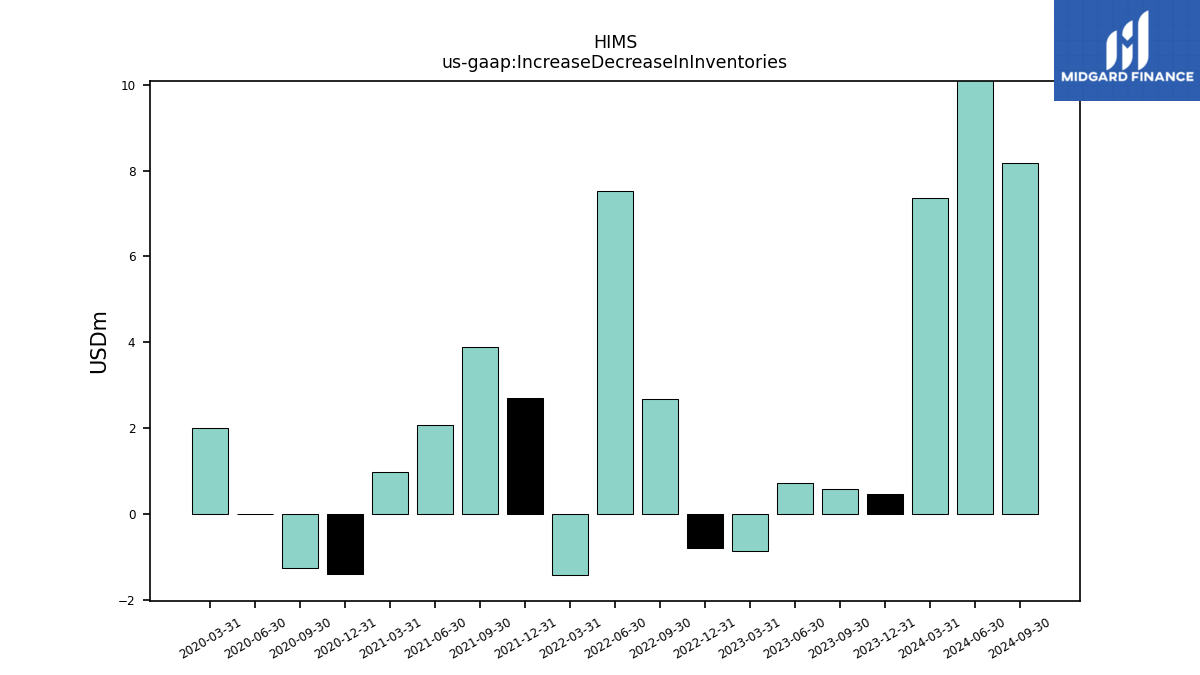
| Increase Decrease In Inventories | 7.36 | 0.47 | 0.57 | 0.72 | -0.86 | -0.79 | 2.67 | 7.53 | -1.42 | 2.70 | 3.88 | 2.07 | 0.98 | -1.41 | -1.27 | 0.00 | 2.00 | |
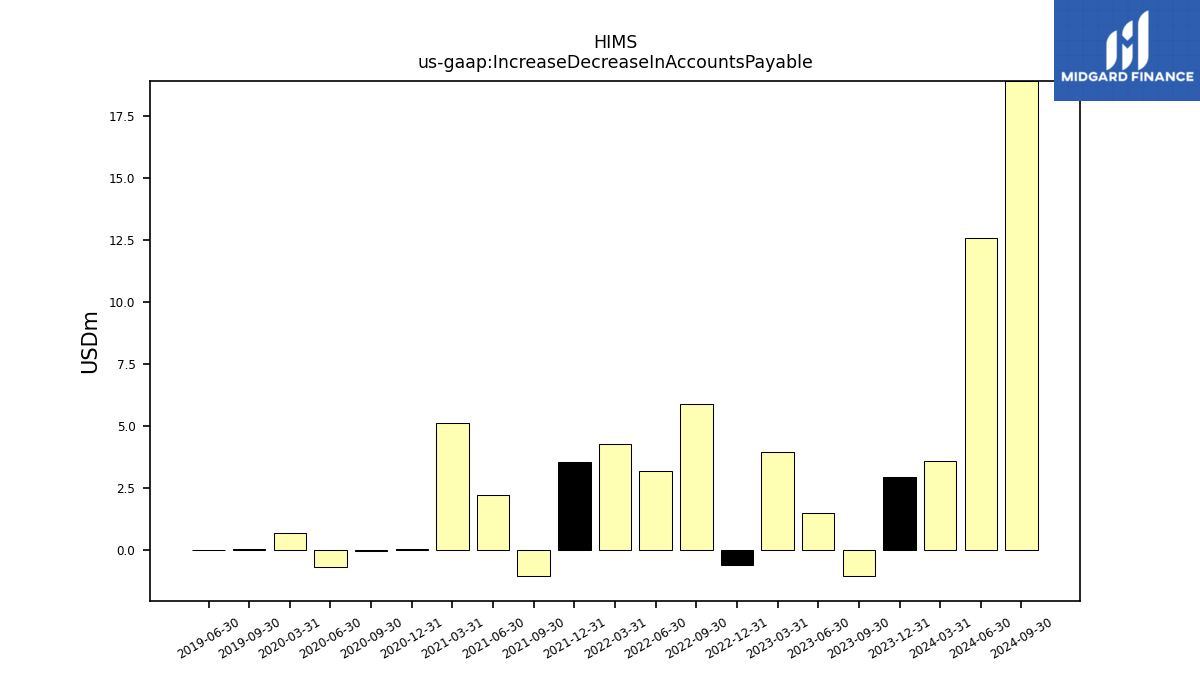
| Increase Decrease In Accounts Payable | 3.60 | 2.92 | -1.04 | 1.48 | 3.96 | -0.61 | 5.88 | 3.19 | 4.27 | 3.55 | -1.05 | 2.24 | 5.12 | 0.02 | -0.03 | -0.67 | 0.67 | |
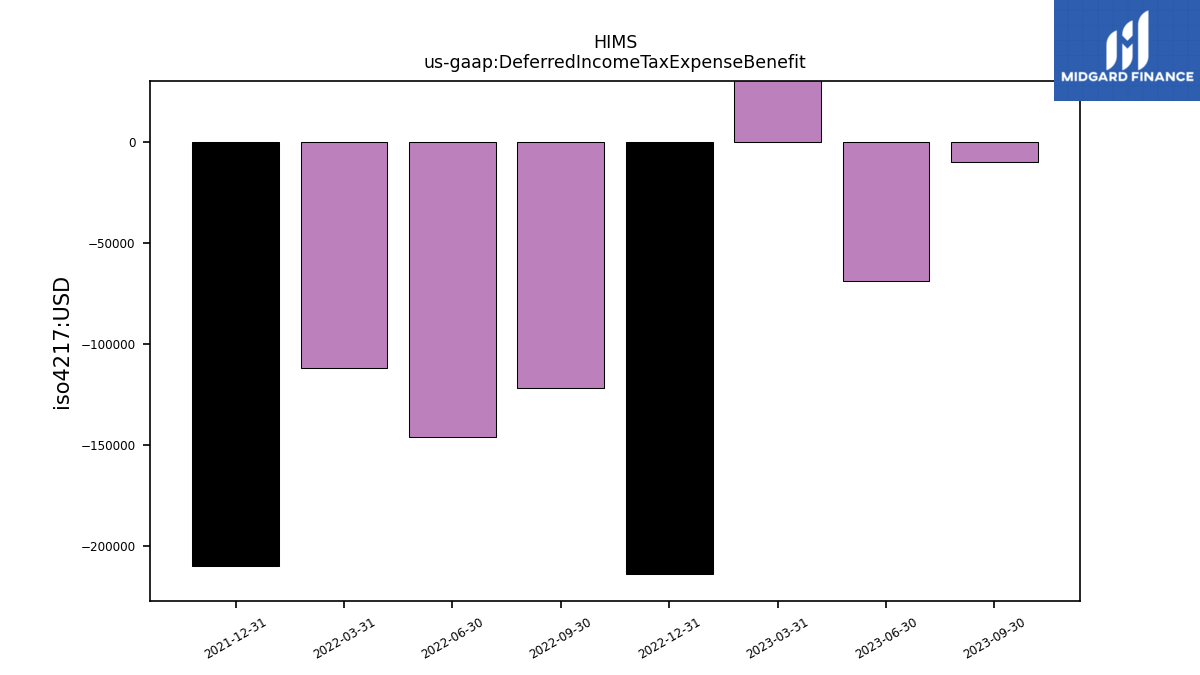
| Deferred Income Tax Expense Benefit | NA | 0.02 | -0.01 | -0.07 | 0.05 | -0.21 | -0.12 | -0.15 | -0.11 | -0.21 | NA | NA | NA | NA | NA | NA | NA | |
| Share Based Compensation | 19.03 | 17.79 | 17.28 | 16.84 | 14.17 | 12.35 | 10.98 | 10.63 | 8.86 | 11.95 | 11.87 | 9.16 | 34.23 | 1.09 | 1.41 | 1.93 | 1.40 |
| 2024-03-31 | 2023-12-31 | 2023-09-30 | 2023-06-30 | 2023-03-31 | 2022-12-31 | 2022-09-30 | 2022-06-30 | 2022-03-31 | 2021-12-31 | 2021-09-30 | 2021-06-30 | 2021-03-31 | 2020-12-31 | 2020-09-30 | 2020-06-30 | 2020-03-31 | ||
|---|---|---|---|---|---|---|---|---|---|---|---|---|---|---|---|---|---|---|
| Net Cash Provided By Used In Investing Activities | 13.04 | 20.70 | -31.06 | 2.37 | -4.11 | 6.00 | -2.58 | 12.82 | 18.45 | 10.24 | -25.92 | 22.74 | -163.32 | 0.00 | 7.19 | -14.10 | 7.23 |
| 2024-03-31 | 2023-12-31 | 2023-09-30 | 2023-06-30 | 2023-03-31 | 2022-12-31 | 2022-09-30 | 2022-06-30 | 2022-03-31 | 2021-12-31 | 2021-09-30 | 2021-06-30 | 2021-03-31 | 2020-12-31 | 2020-09-30 | 2020-06-30 | 2020-03-31 | ||
|---|---|---|---|---|---|---|---|---|---|---|---|---|---|---|---|---|---|---|
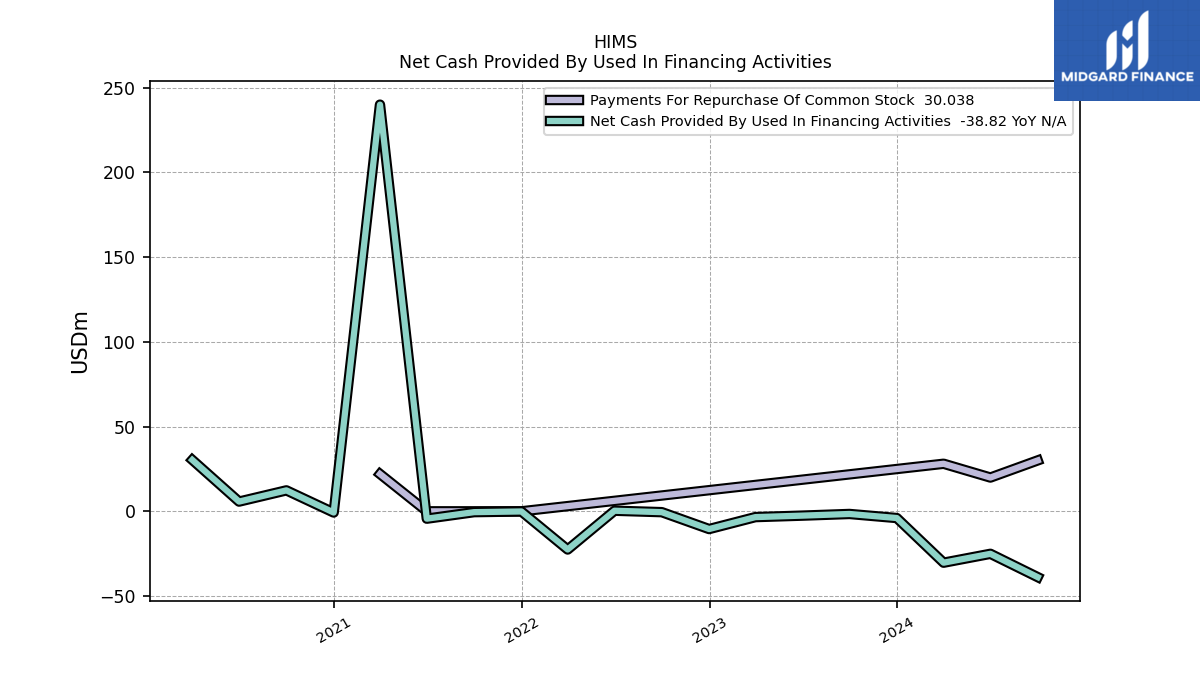
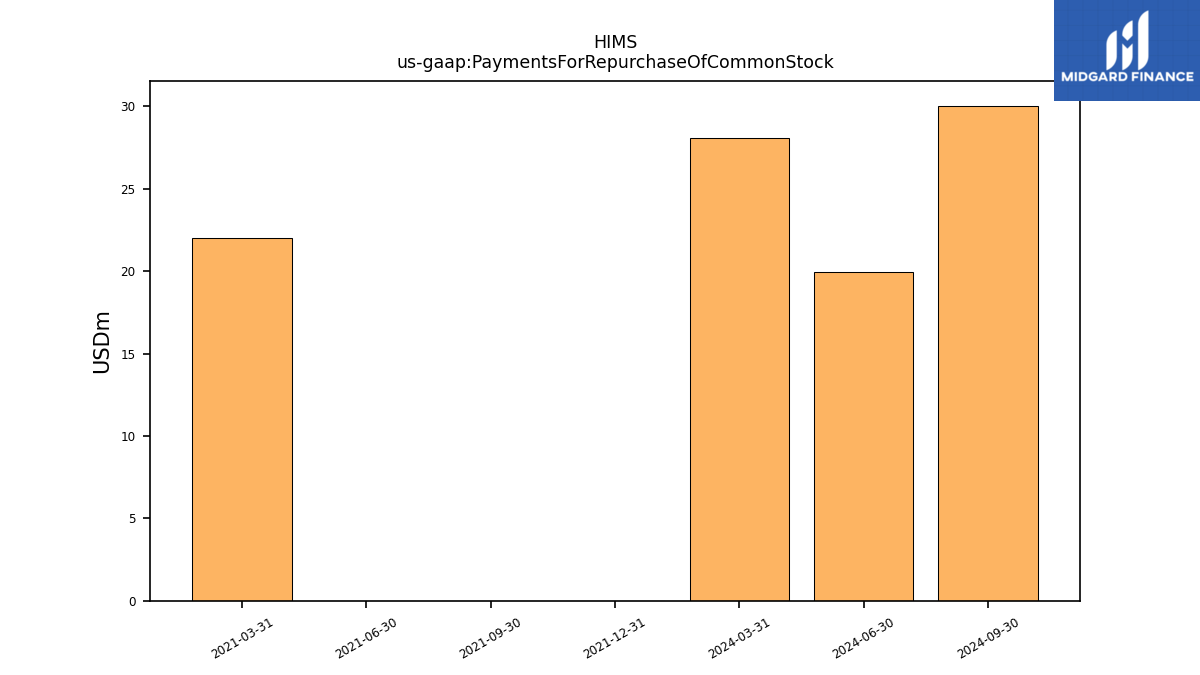
| Net Cash Provided By Used In Financing Activities | -30.31 | -3.96 | -1.56 | -2.54 | -3.41 | -10.46 | -0.49 | 0.35 | -22.53 | -0.08 | -0.48 | -4.34 | 239.94 | -0.71 | 12.37 | 5.75 | 30.34 | |
| Payments For Repurchase Of Common Stock | 28.06 | NA | NA | NA | NA | NA | NA | NA | NA | 0.00 | 0.00 | 0.00 | 22.03 | NA | NA | NA | NA |
| 2024-03-31 | 2023-12-31 | 2023-09-30 | 2023-06-30 | 2023-03-31 | 2022-12-31 | 2022-09-30 | 2022-06-30 | 2022-03-31 | 2021-12-31 | 2021-09-30 | 2021-06-30 | 2021-03-31 | 2020-12-31 | 2020-09-30 | 2020-06-30 | 2020-03-31 | ||
|---|---|---|---|---|---|---|---|---|---|---|---|---|---|---|---|---|---|---|
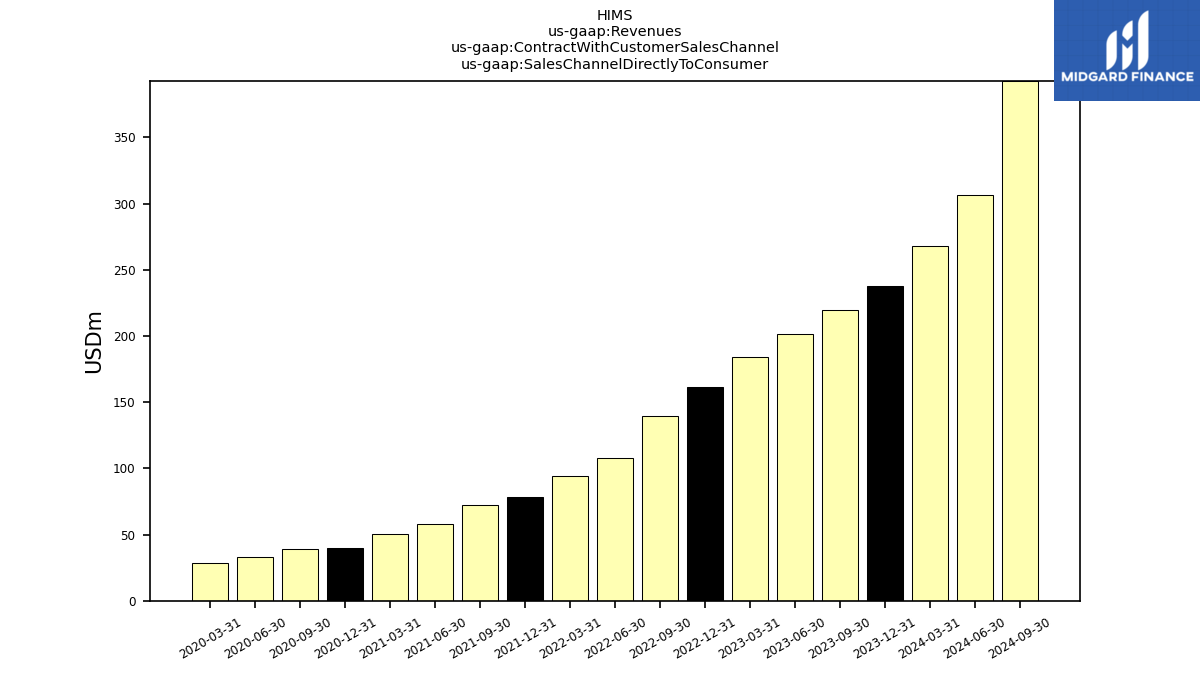
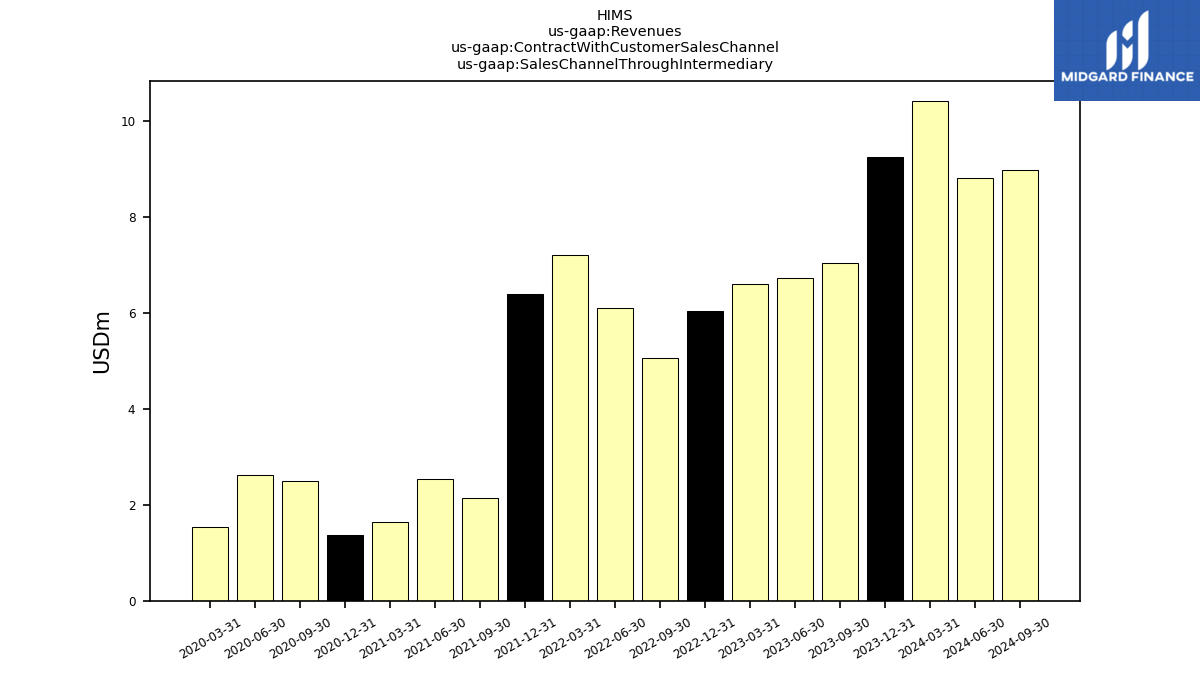
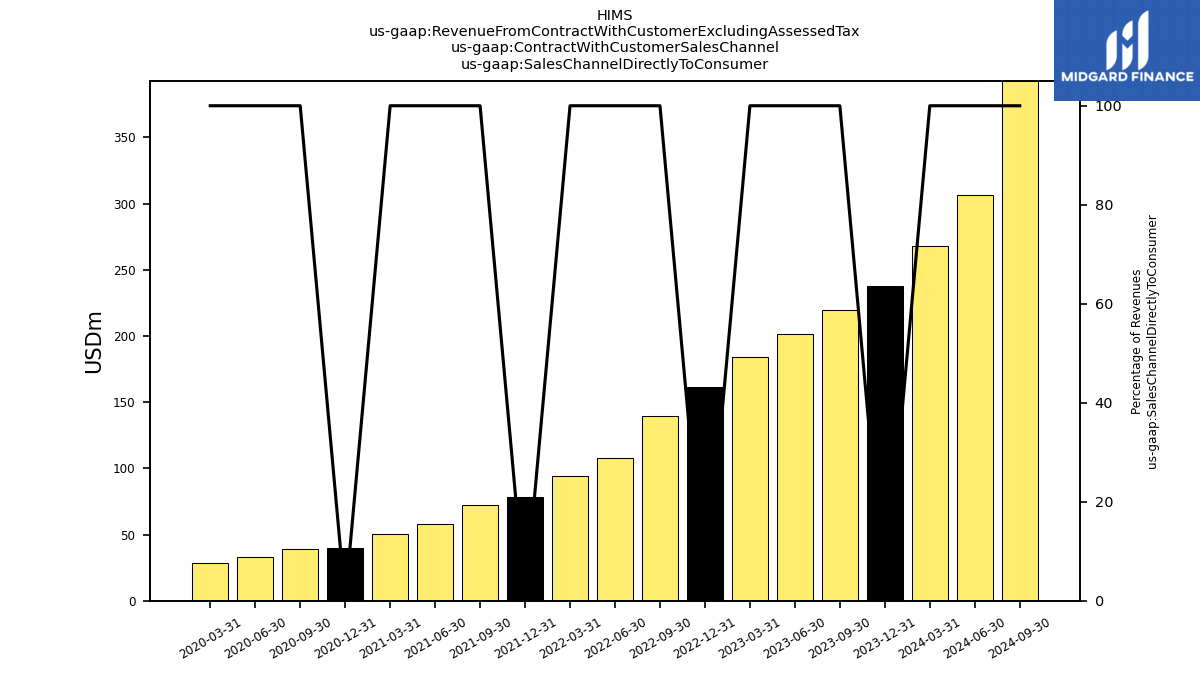
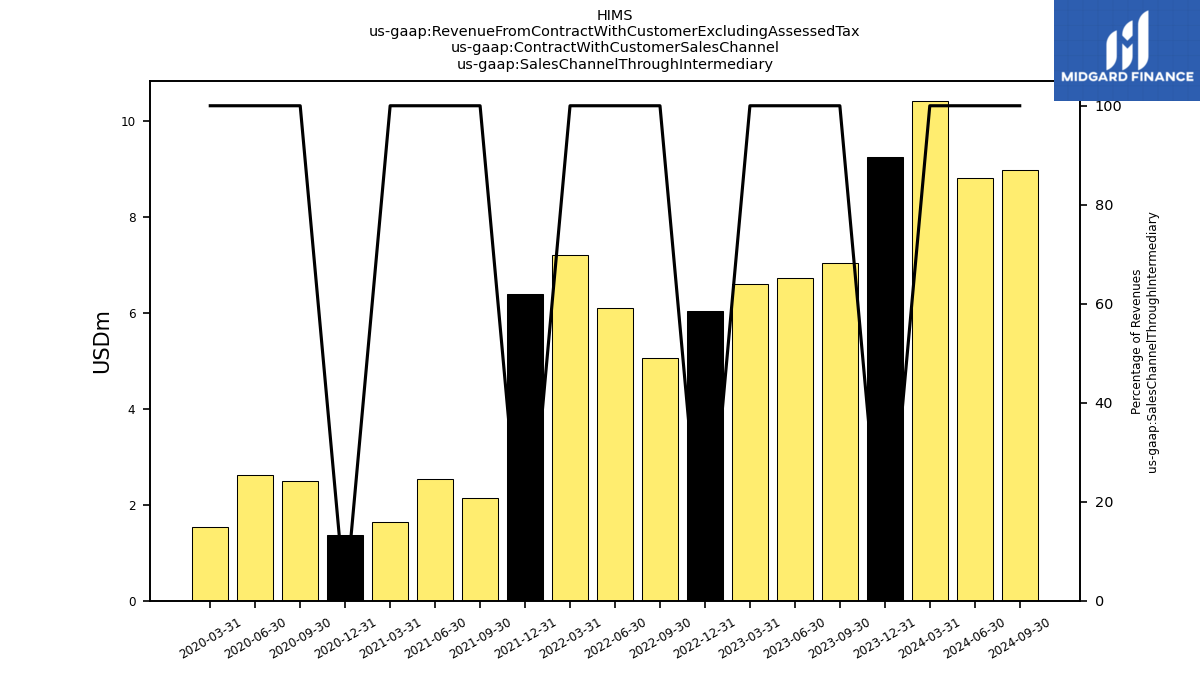
| Revenues | 278.17 | 246.62 | 226.70 | 207.91 | 190.77 | 167.20 | 144.84 | 113.56 | 101.31 | 84.70 | 74.17 | 60.69 | 52.31 | 41.47 | 41.32 | 35.90 | 30.06 | |
| Sales Channel Directly To Consumer | 267.76 | 237.36 | 219.66 | 201.18 | 184.18 | 161.16 | 139.78 | 107.46 | 94.10 | 78.31 | 72.03 | 58.15 | 50.68 | 40.09 | 38.83 | 33.28 | 28.52 | |
| Sales Channel Through Intermediary | 10.41 | 9.26 | 7.03 | 6.73 | 6.59 | 6.04 | 5.05 | 6.10 | 7.21 | 6.39 | 2.14 | 2.55 | 1.63 | 1.38 | 2.50 | 2.62 | 1.54 | |
| Revenue From Contract With Customer Excluding Assessed Tax | 278.17 | 246.62 | 226.70 | 207.91 | 190.77 | 167.20 | 144.84 | 113.56 | 101.31 | 84.70 | 74.17 | 60.69 | 52.31 | 41.47 | 41.32 | 35.90 | 30.06 | |
| Sales Channel Directly To Consumer | 267.76 | 237.36 | 219.66 | 201.18 | 184.18 | 161.16 | 139.78 | 107.46 | 94.10 | 78.31 | 72.03 | 58.15 | 50.68 | 40.09 | 38.83 | 33.28 | 28.52 | |
| Sales Channel Through Intermediary | 10.41 | 9.26 | 7.03 | 6.73 | 6.59 | 6.04 | 5.05 | 6.10 | 7.21 | 6.39 | 2.14 | 2.55 | 1.63 | 1.38 | 2.50 | 2.62 | 1.54 |