
| 2024-03-31 | 2023-12-31 | 2023-09-30 | 2023-06-30 | 2023-03-31 | 2022-12-31 | 2022-09-30 | 2022-06-30 | 2022-03-31 | 2021-12-31 | 2021-09-30 | 2021-06-30 | 2021-03-31 | 2020-12-31 | 2020-09-30 | 2020-06-30 | 2020-03-31 | 2019-12-31 | 2019-09-30 | 2019-06-30 | 2019-03-31 | 2018-12-31 | 2018-09-30 | 2018-06-30 | 2018-03-31 | 2017-12-31 | 2017-09-30 | 2017-06-30 | 2017-03-31 | 2016-12-31 | 2016-09-30 | 2016-06-30 | 2016-03-31 | 2015-12-31 | 2015-09-30 | 2015-06-30 | 2015-03-31 | 2014-12-31 | 2014-09-30 | 2014-06-30 | 2014-03-31 | 2013-12-31 | 2013-09-30 | 2013-06-30 | 2013-03-31 | 2012-12-31 | 2012-09-30 | 2012-06-30 | 2012-03-31 | 2011-12-31 | 2011-09-30 | 2011-06-30 | 2011-03-31 | 2010-12-31 | 2010-09-30 | 2010-06-30 | 2010-03-31 | ||
|---|---|---|---|---|---|---|---|---|---|---|---|---|---|---|---|---|---|---|---|---|---|---|---|---|---|---|---|---|---|---|---|---|---|---|---|---|---|---|---|---|---|---|---|---|---|---|---|---|---|---|---|---|---|---|---|---|---|---|
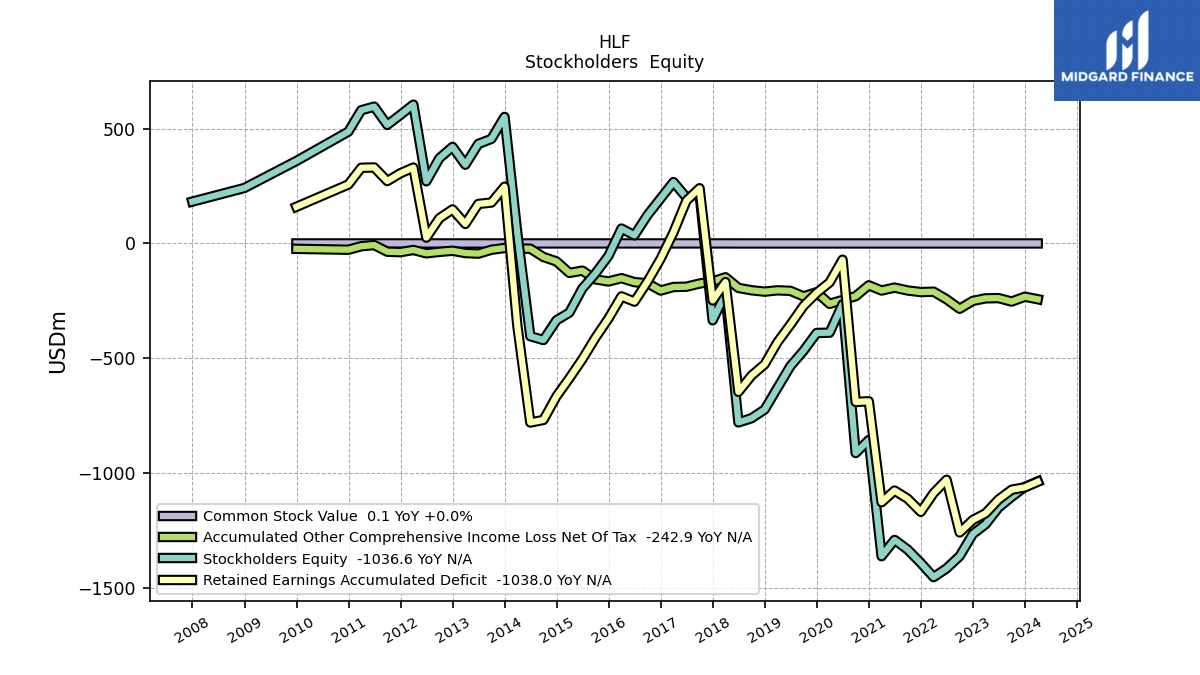
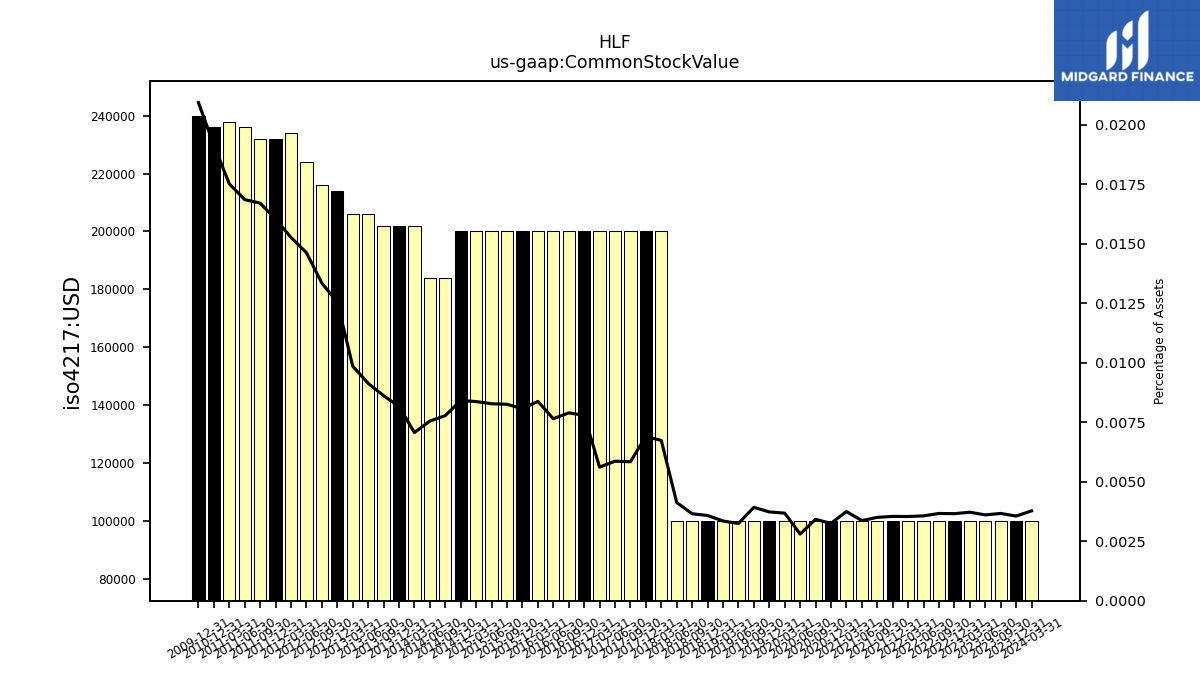
| Common Stock Value | 0.10 | 0.10 | 0.10 | 0.10 | 0.10 | 0.10 | 0.10 | 0.10 | 0.10 | 0.10 | 0.10 | 0.10 | 0.10 | 0.10 | 0.10 | 0.10 | 0.10 | 0.10 | 0.10 | 0.10 | 0.10 | 0.10 | 0.10 | 0.10 | 0.20 | 0.20 | 0.20 | 0.20 | 0.20 | 0.20 | 0.20 | 0.20 | 0.20 | 0.20 | 0.20 | 0.20 | 0.20 | 0.20 | 0.18 | 0.18 | 0.20 | 0.20 | 0.20 | 0.21 | 0.21 | 0.21 | 0.22 | 0.22 | 0.23 | 0.23 | 0.23 | 0.24 | 0.24 | 0.24 | NA | NA | NA | |
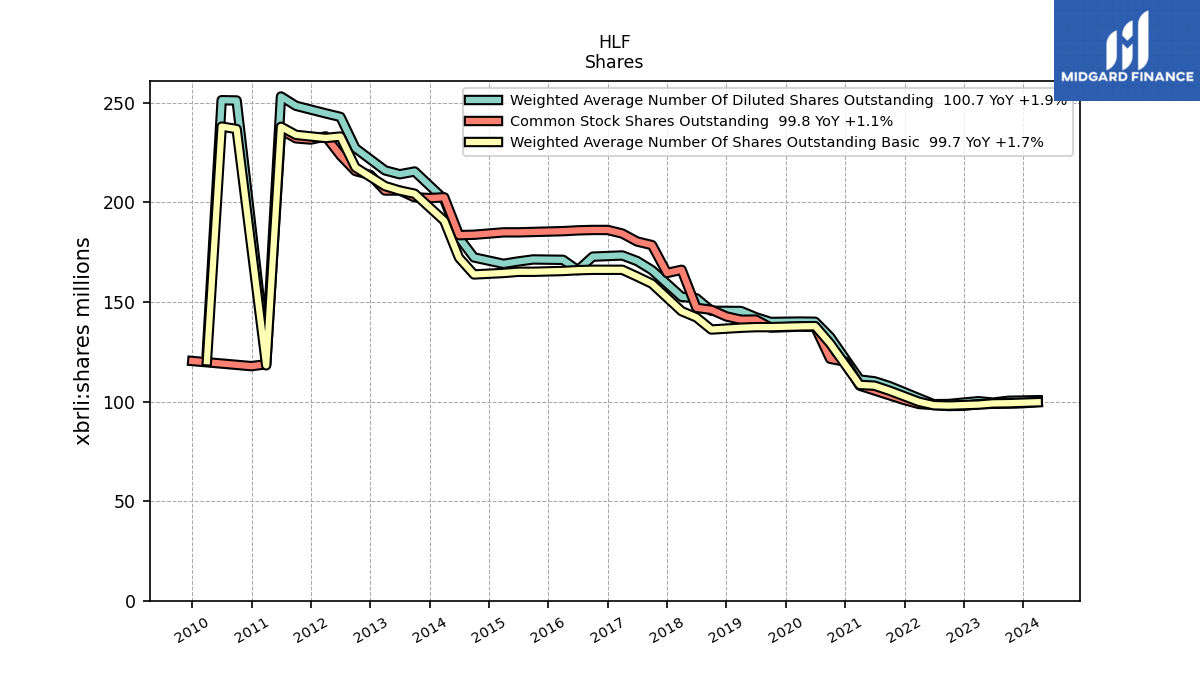
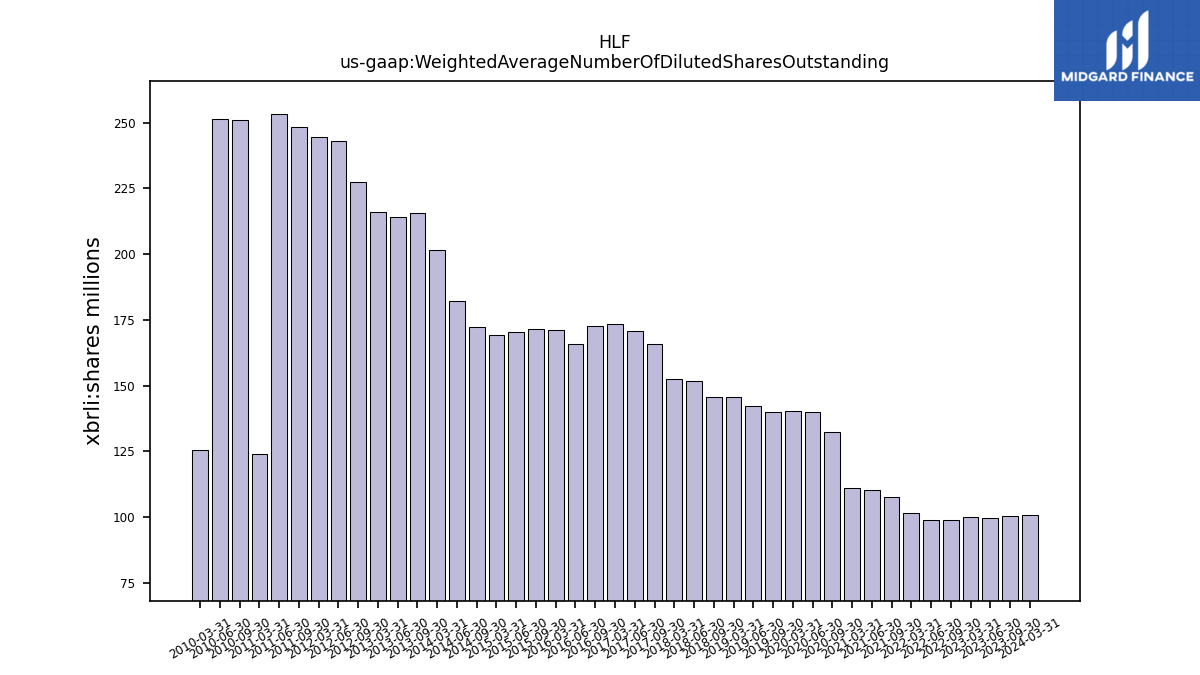
| Weighted Average Number Of Diluted Shares Outstanding | 100.70 | NA | 100.40 | 99.50 | 100.20 | NA | 98.80 | 98.70 | 101.70 | NA | 107.80 | 110.20 | 111.10 | NA | 132.50 | 140.10 | 140.20 | NA | 140.00 | 142.40 | 145.50 | NA | 145.60 | 151.90 | 152.60 | NA | 166.00 | 170.60 | 173.40 | NA | 172.80 | 166.00 | 171.20 | NA | 171.40 | 170.40 | 169.20 | NA | 172.40 | 182.34 | 201.56 | NA | 215.55 | 214.17 | 216.14 | NA | 227.29 | 242.96 | 244.75 | NA | 248.55 | 253.23 | 123.82 | NA | 251.23 | 251.37 | 125.34 | |
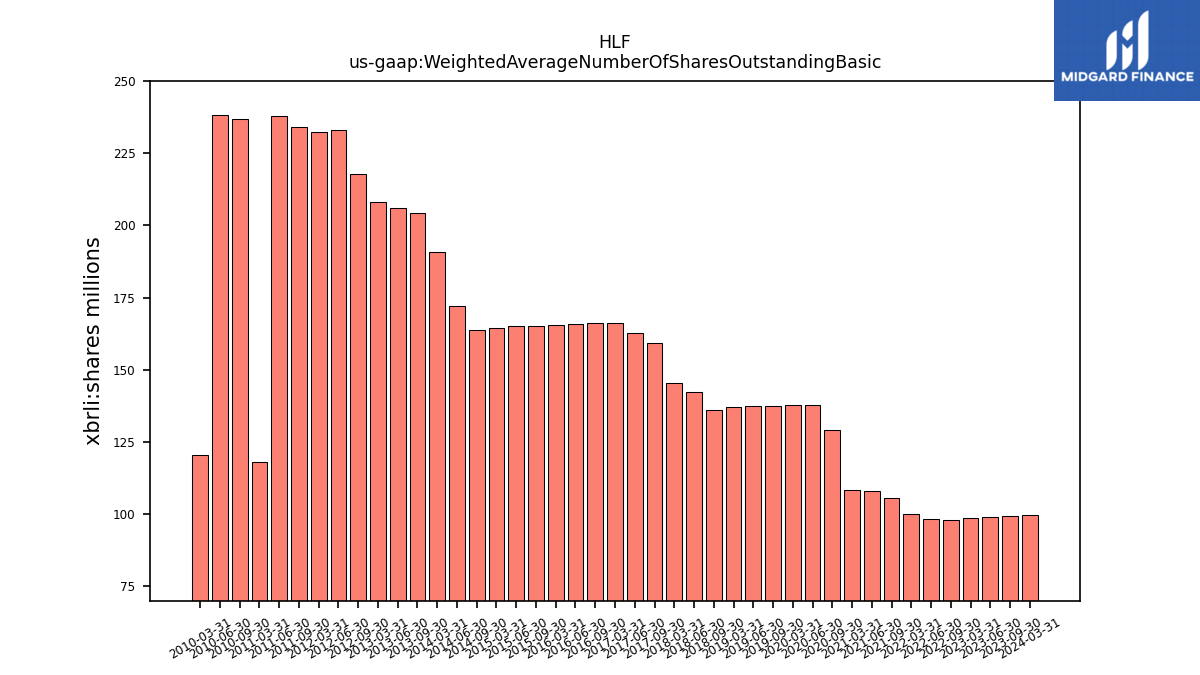
| Weighted Average Number Of Shares Outstanding Basic | 99.70 | NA | 99.20 | 99.10 | 98.50 | NA | 98.00 | 98.20 | 99.90 | NA | 105.50 | 108.00 | 108.40 | NA | 129.20 | 137.90 | 137.80 | NA | 137.40 | 137.40 | 137.10 | NA | 136.20 | 142.30 | 145.40 | NA | 159.20 | 162.80 | 166.20 | NA | 166.20 | 166.00 | 165.60 | NA | 165.20 | 165.20 | 164.60 | NA | 163.85 | 172.23 | 190.79 | NA | 204.40 | 205.99 | 208.24 | NA | 217.63 | 233.11 | 232.38 | NA | 233.95 | 238.01 | 118.21 | NA | 236.88 | 238.11 | 120.32 | |
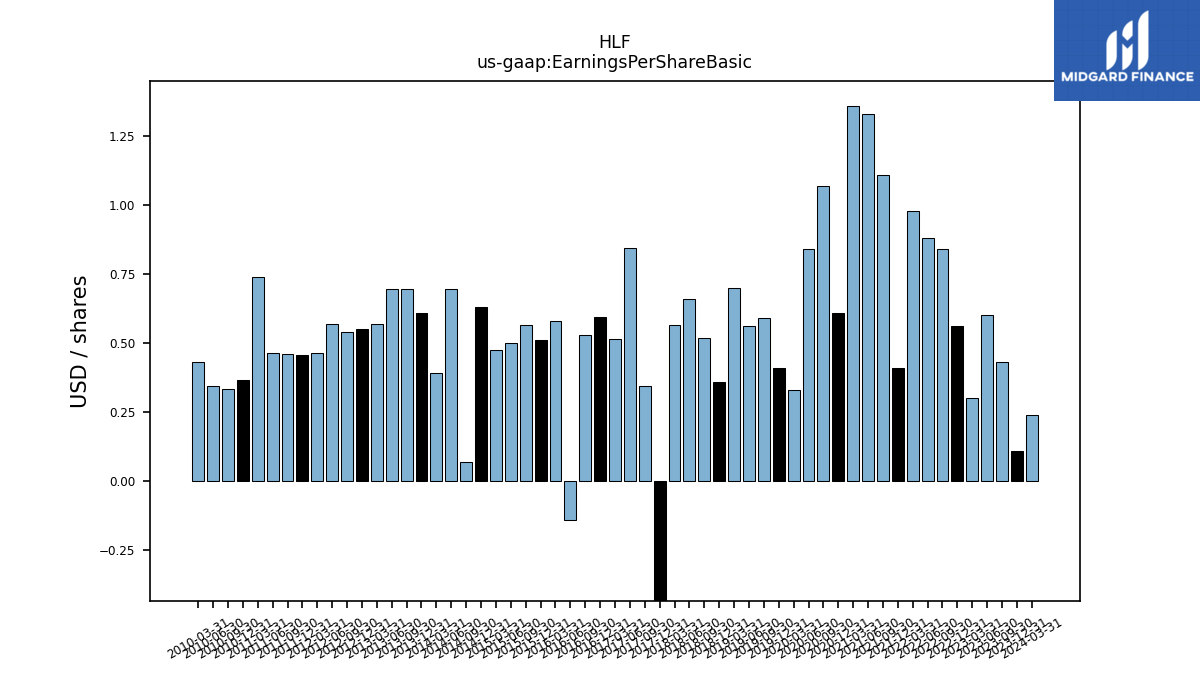
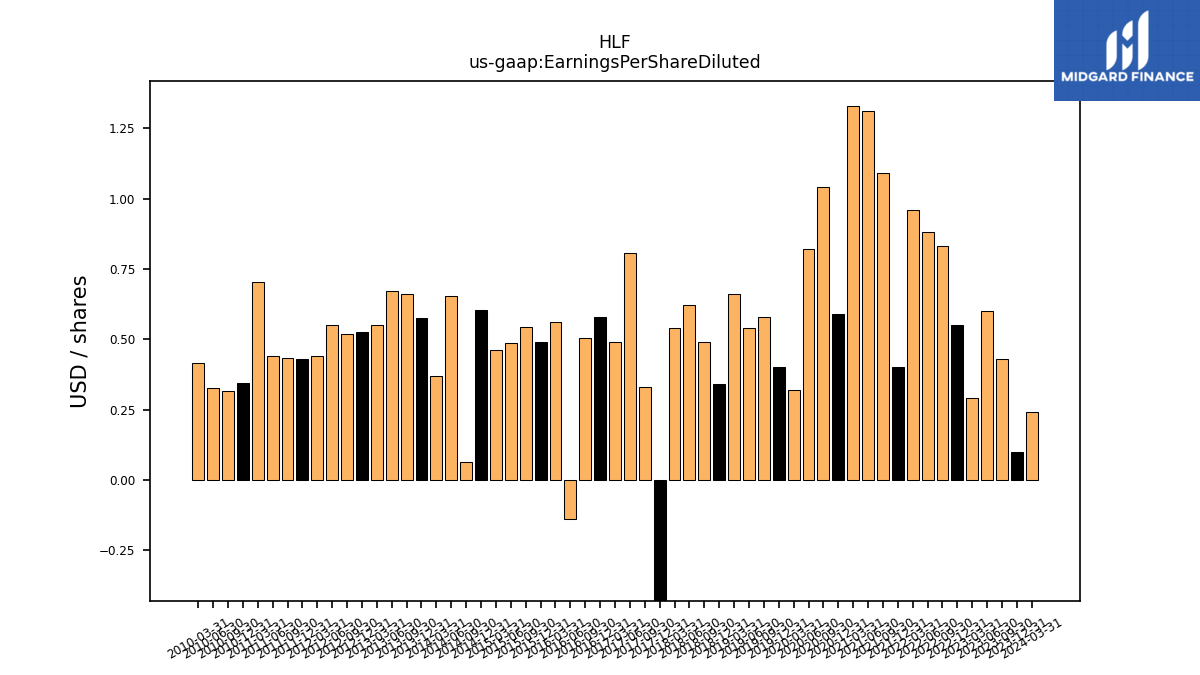
| Earnings Per Share Basic | 0.24 | 0.11 | 0.43 | 0.60 | 0.30 | 0.56 | 0.84 | 0.88 | 0.98 | 0.41 | 1.11 | 1.33 | 1.36 | 0.61 | 1.07 | 0.84 | 0.33 | 0.41 | 0.59 | 0.56 | 0.70 | 0.36 | 0.52 | 0.66 | 0.56 | -0.43 | 0.34 | 0.84 | 0.52 | 0.59 | 0.53 | -0.14 | 0.58 | 0.51 | 0.56 | 0.50 | 0.47 | 0.63 | 0.07 | 0.69 | 0.39 | 0.61 | 0.69 | 0.69 | 0.57 | 0.55 | 0.54 | 0.57 | 0.47 | 0.46 | 0.46 | 0.47 | 0.74 | 0.36 | 0.34 | 0.34 | 0.43 | |
| Earnings Per Share Diluted | 0.24 | 0.10 | 0.43 | 0.60 | 0.29 | 0.55 | 0.83 | 0.88 | 0.96 | 0.40 | 1.09 | 1.31 | 1.33 | 0.59 | 1.04 | 0.82 | 0.32 | 0.40 | 0.58 | 0.54 | 0.66 | 0.34 | 0.49 | 0.62 | 0.54 | -0.43 | 0.33 | 0.81 | 0.49 | 0.58 | 0.51 | -0.14 | 0.56 | 0.49 | 0.55 | 0.48 | 0.46 | 0.60 | 0.07 | 0.66 | 0.37 | 0.57 | 0.66 | 0.67 | 0.55 | 0.53 | 0.52 | 0.55 | 0.44 | 0.43 | 0.43 | 0.44 | 0.70 | 0.34 | 0.32 | 0.33 | 0.41 |
| 2024-03-31 | 2023-12-31 | 2023-09-30 | 2023-06-30 | 2023-03-31 | 2022-12-31 | 2022-09-30 | 2022-06-30 | 2022-03-31 | 2021-12-31 | 2021-09-30 | 2021-06-30 | 2021-03-31 | 2020-12-31 | 2020-09-30 | 2020-06-30 | 2020-03-31 | 2019-12-31 | 2019-09-30 | 2019-06-30 | 2019-03-31 | 2018-12-31 | 2018-09-30 | 2018-06-30 | 2018-03-31 | 2017-12-31 | 2017-09-30 | 2017-06-30 | 2017-03-31 | 2016-12-31 | 2016-09-30 | 2016-06-30 | 2016-03-31 | 2015-12-31 | 2015-09-30 | 2015-06-30 | 2015-03-31 | 2014-12-31 | 2014-09-30 | 2014-06-30 | 2014-03-31 | 2013-12-31 | 2013-09-30 | 2013-06-30 | 2013-03-31 | 2012-12-31 | 2012-09-30 | 2012-06-30 | 2012-03-31 | 2011-12-31 | 2011-09-30 | 2011-06-30 | 2011-03-31 | 2010-12-31 | 2010-09-30 | 2010-06-30 | 2010-03-31 | ||
|---|---|---|---|---|---|---|---|---|---|---|---|---|---|---|---|---|---|---|---|---|---|---|---|---|---|---|---|---|---|---|---|---|---|---|---|---|---|---|---|---|---|---|---|---|---|---|---|---|---|---|---|---|---|---|---|---|---|---|
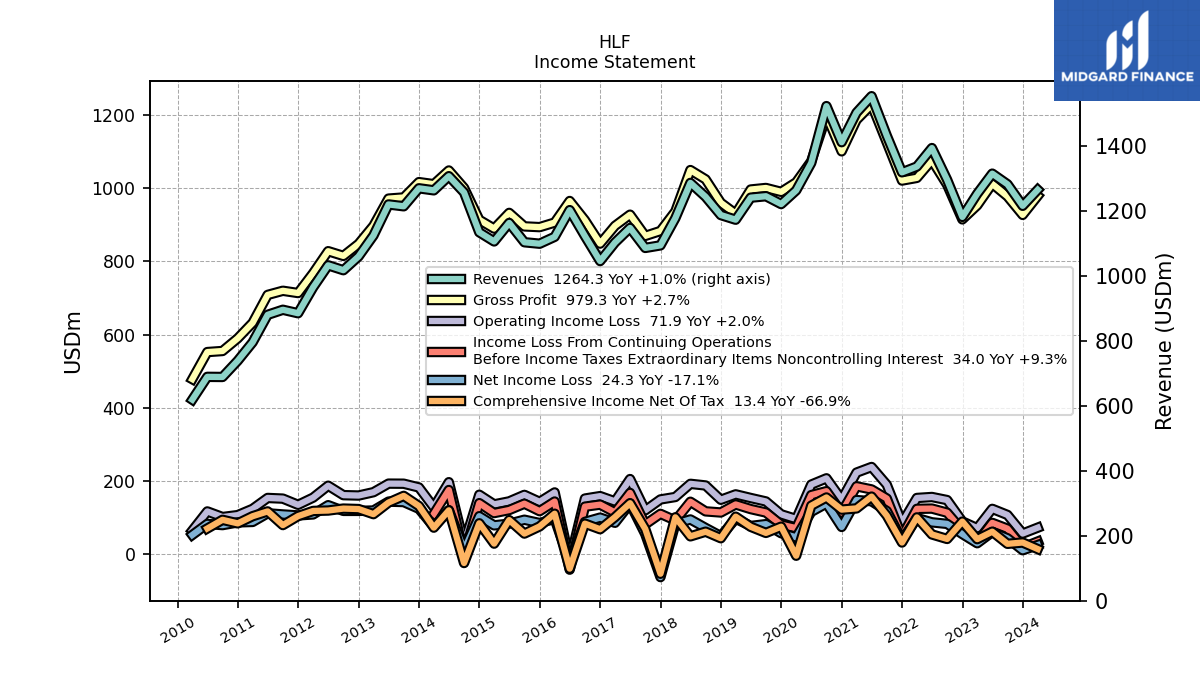
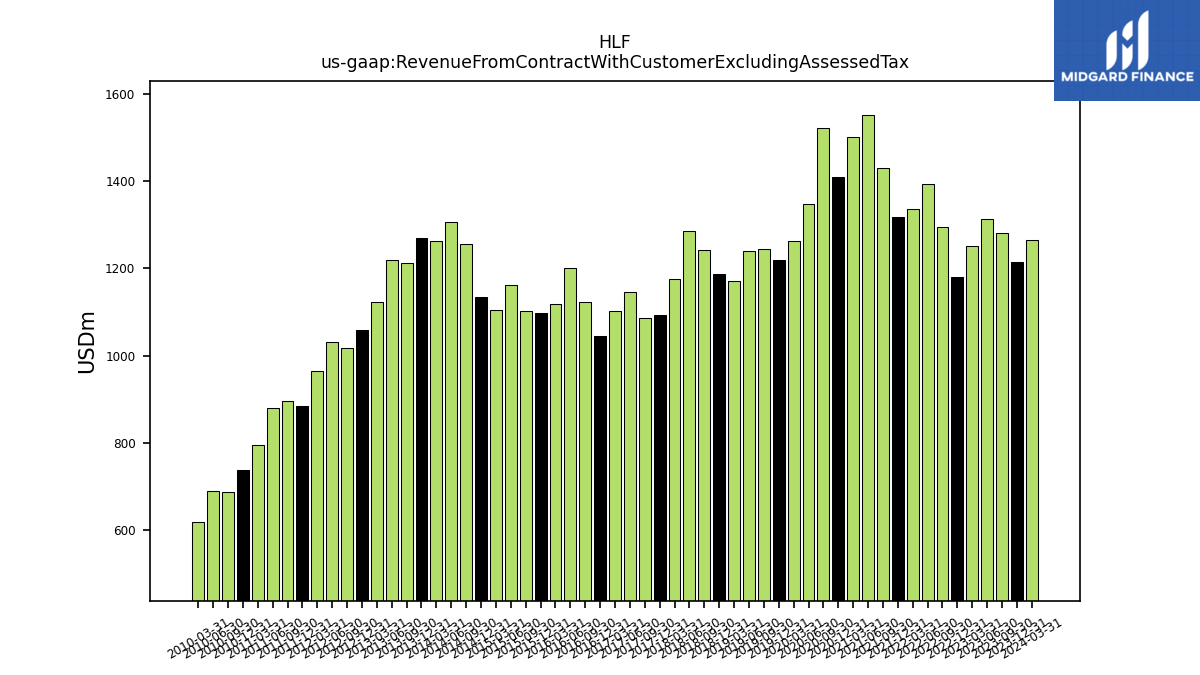
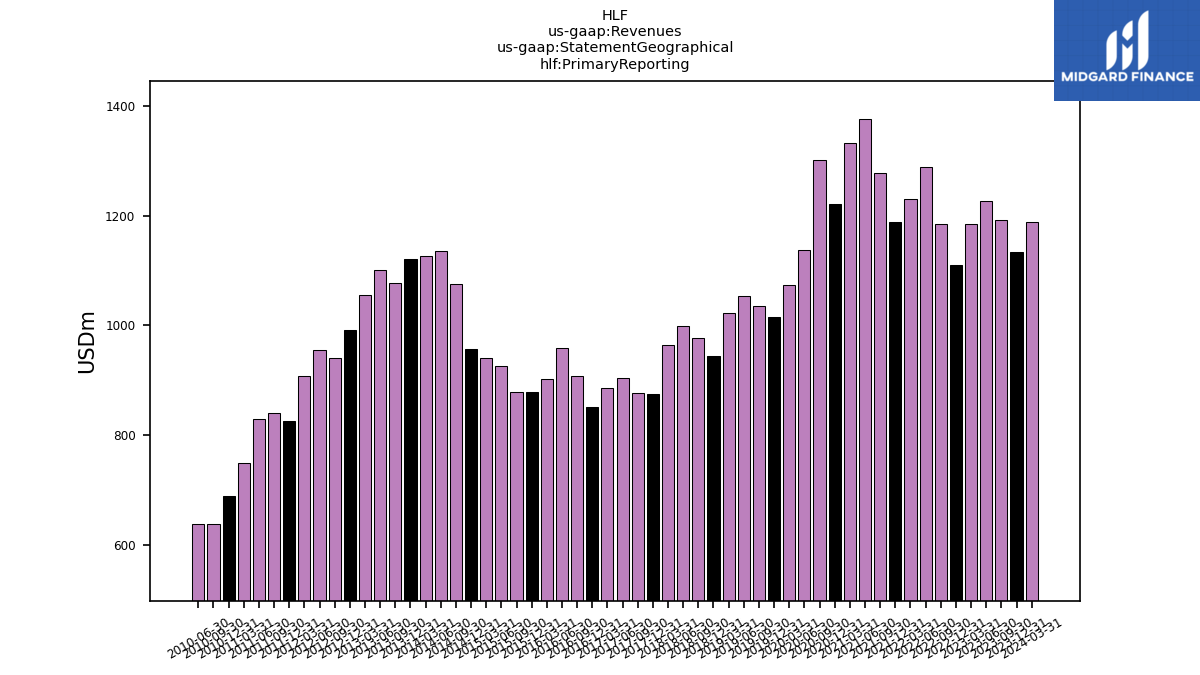
| Revenue From Contract With Customer Excluding Assessed Tax | 1264.30 | 1215.00 | 1281.30 | 1314.00 | 1252.10 | 1180.80 | 1295.10 | 1392.70 | 1335.80 | 1318.00 | 1430.90 | 1552.30 | 1501.60 | 1410.70 | 1521.80 | 1346.90 | 1262.40 | 1220.30 | 1244.50 | 1240.10 | 1172.20 | 1186.60 | 1242.80 | 1285.50 | 1176.90 | 1093.30 | 1085.40 | 1146.90 | 1102.10 | 1045.00 | 1122.00 | 1201.80 | 1119.60 | 1098.40 | 1102.90 | 1162.30 | 1105.40 | 1133.60 | 1256.16 | 1306.20 | 1262.65 | 1268.90 | 1213.54 | 1219.24 | 1123.65 | 1059.30 | 1016.89 | 1031.95 | 964.17 | 884.50 | 895.22 | 879.65 | 795.10 | 738.40 | 688.43 | 688.81 | 618.63 | |
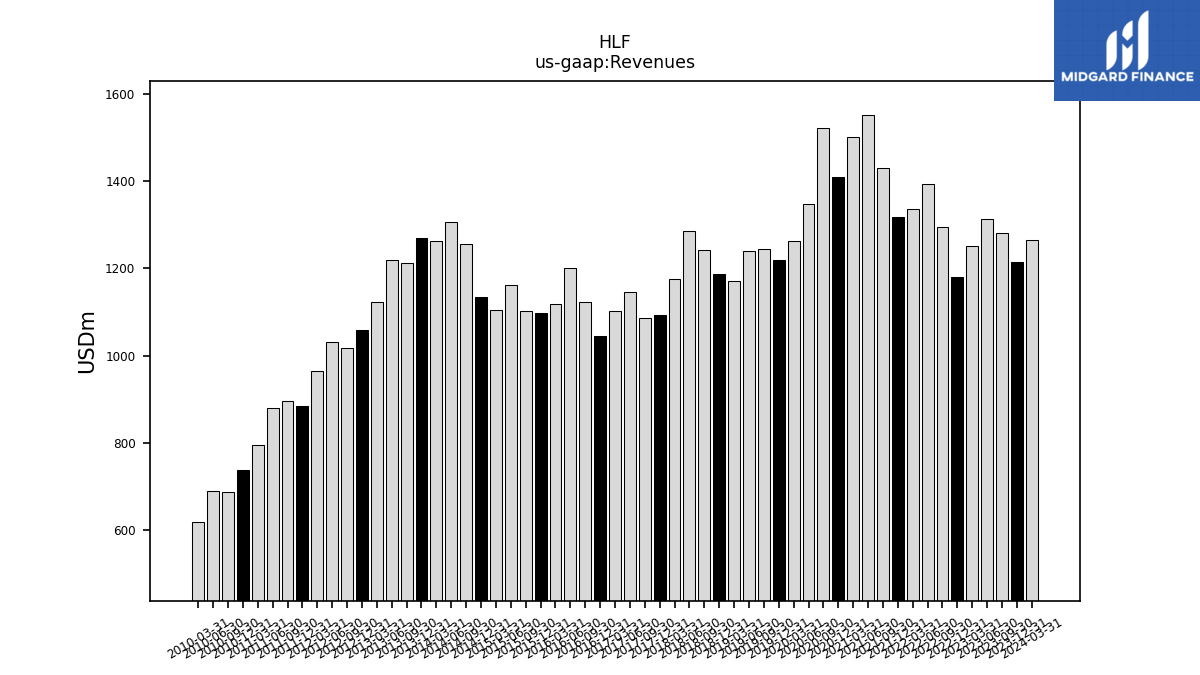
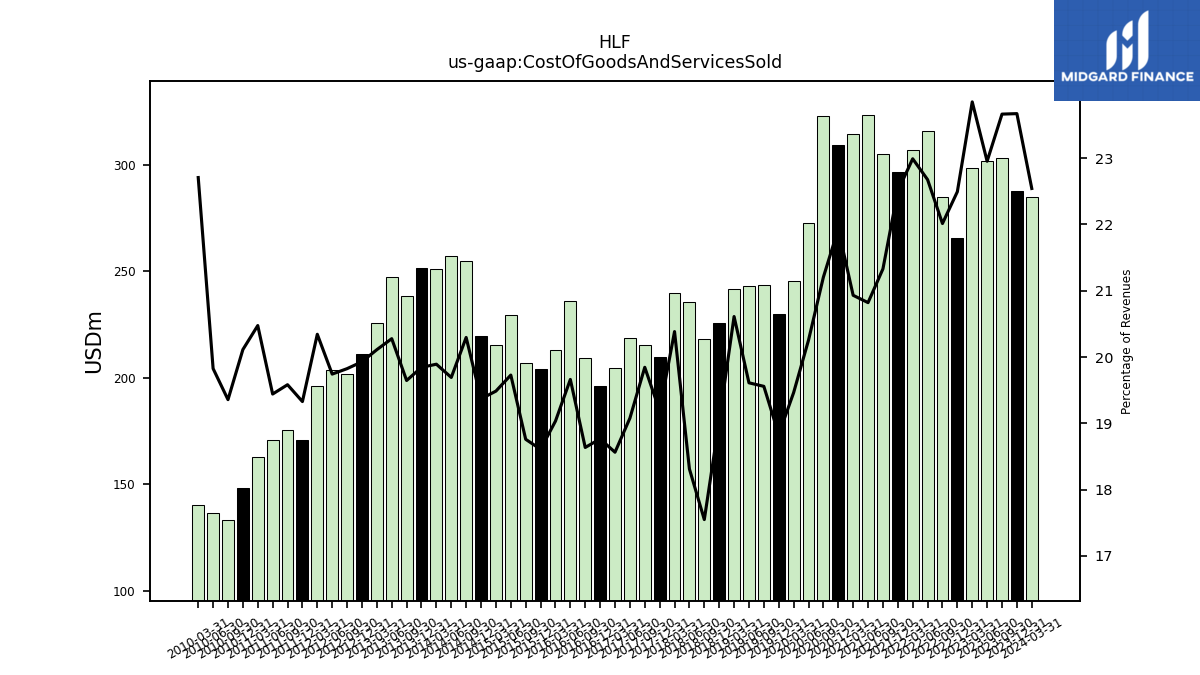
| Revenues | 1264.30 | 1215.00 | 1281.30 | 1314.00 | 1252.10 | 1180.80 | 1295.10 | 1392.70 | 1335.80 | 1318.00 | 1430.90 | 1552.30 | 1501.60 | 1410.70 | 1521.80 | 1346.90 | 1262.40 | 1220.30 | 1244.50 | 1240.10 | 1172.20 | 1186.60 | 1242.80 | 1285.50 | 1176.90 | 1093.30 | 1085.40 | 1146.90 | 1102.10 | 1045.00 | 1122.00 | 1201.80 | 1119.60 | 1098.40 | 1102.90 | 1162.30 | 1105.40 | 1133.60 | 1256.16 | 1306.20 | 1262.65 | 1268.90 | 1213.54 | 1219.24 | 1123.65 | 1059.30 | 1016.89 | 1031.95 | 964.17 | 884.50 | 895.22 | 879.65 | 795.10 | 738.40 | 688.43 | 688.81 | 618.63 | |
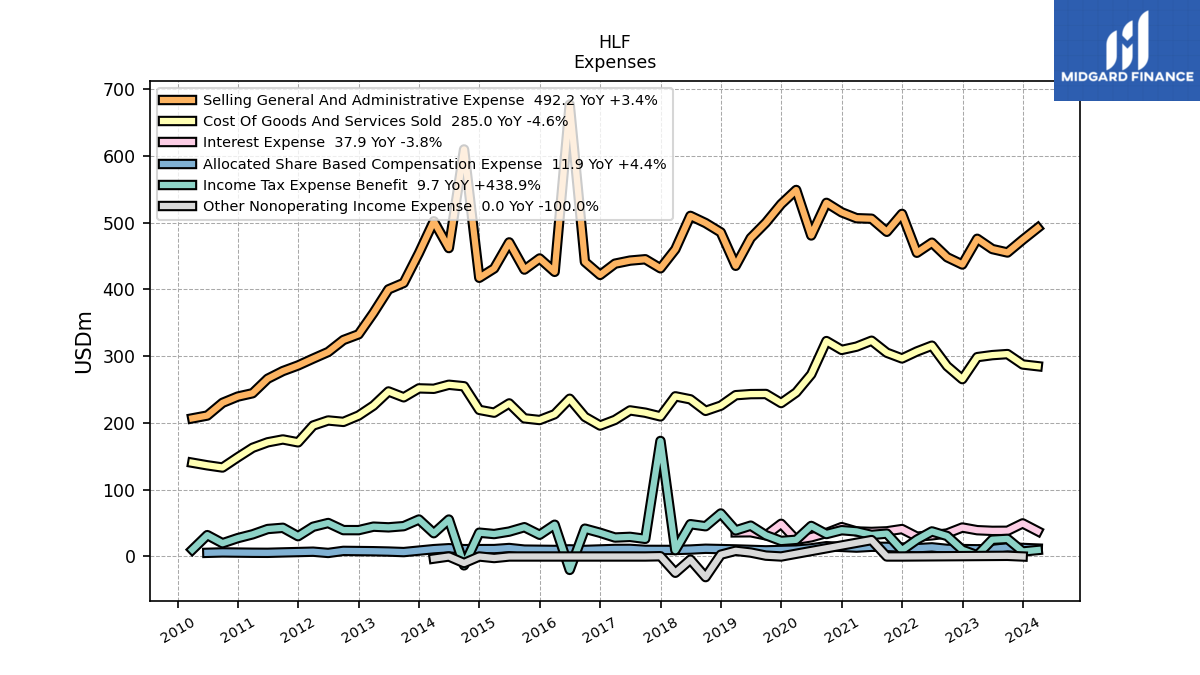
| Cost Of Goods And Services Sold | 285.00 | 287.60 | 303.20 | 301.60 | 298.60 | 265.60 | 285.10 | 315.80 | 307.10 | 296.60 | 305.20 | 323.20 | 314.30 | 309.40 | 322.70 | 272.80 | 245.70 | 229.80 | 243.40 | 243.20 | 241.60 | 225.90 | 218.10 | 235.40 | 239.90 | 209.80 | 215.40 | 218.80 | 204.60 | 196.10 | 209.10 | 236.30 | 213.10 | 204.40 | 206.90 | 229.30 | 215.40 | 219.57 | 254.94 | 257.22 | 251.16 | 251.81 | 238.41 | 247.22 | 225.98 | 211.10 | 201.60 | 203.74 | 196.14 | 170.96 | 175.31 | 171.02 | 162.79 | 148.51 | 133.26 | 136.56 | 140.47 | |
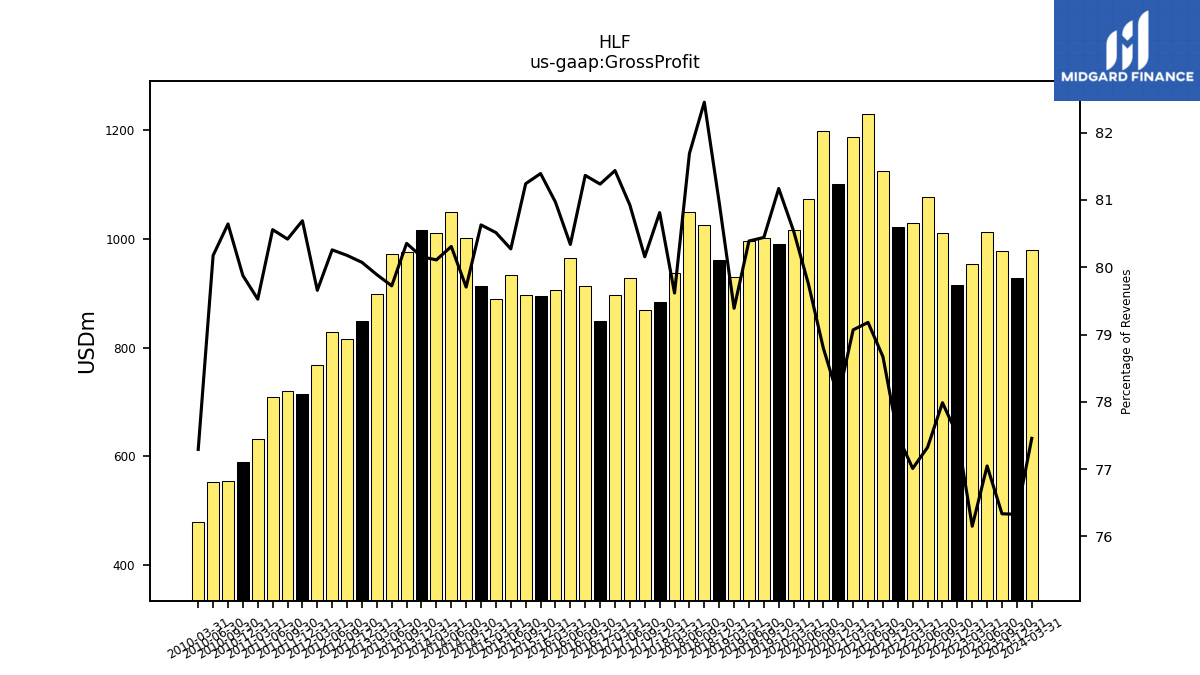
| Gross Profit | 979.30 | 927.40 | 978.10 | 1012.40 | 953.50 | 915.20 | 1010.00 | 1076.90 | 1028.70 | 1021.40 | 1125.70 | 1229.10 | 1187.30 | 1101.30 | 1199.10 | 1074.10 | 1016.70 | 990.50 | 1001.10 | 996.90 | 930.60 | 960.70 | 1024.70 | 1050.10 | 937.00 | 883.50 | 870.00 | 928.10 | 897.50 | 848.90 | 912.90 | 965.50 | 906.50 | 894.00 | 896.00 | 933.00 | 890.00 | 914.00 | 1001.22 | 1048.98 | 1011.48 | 1017.10 | 975.13 | 972.01 | 897.67 | 848.20 | 815.29 | 828.21 | 768.03 | 713.70 | 719.91 | 708.63 | 632.30 | 589.80 | 555.17 | 552.25 | 478.16 | |
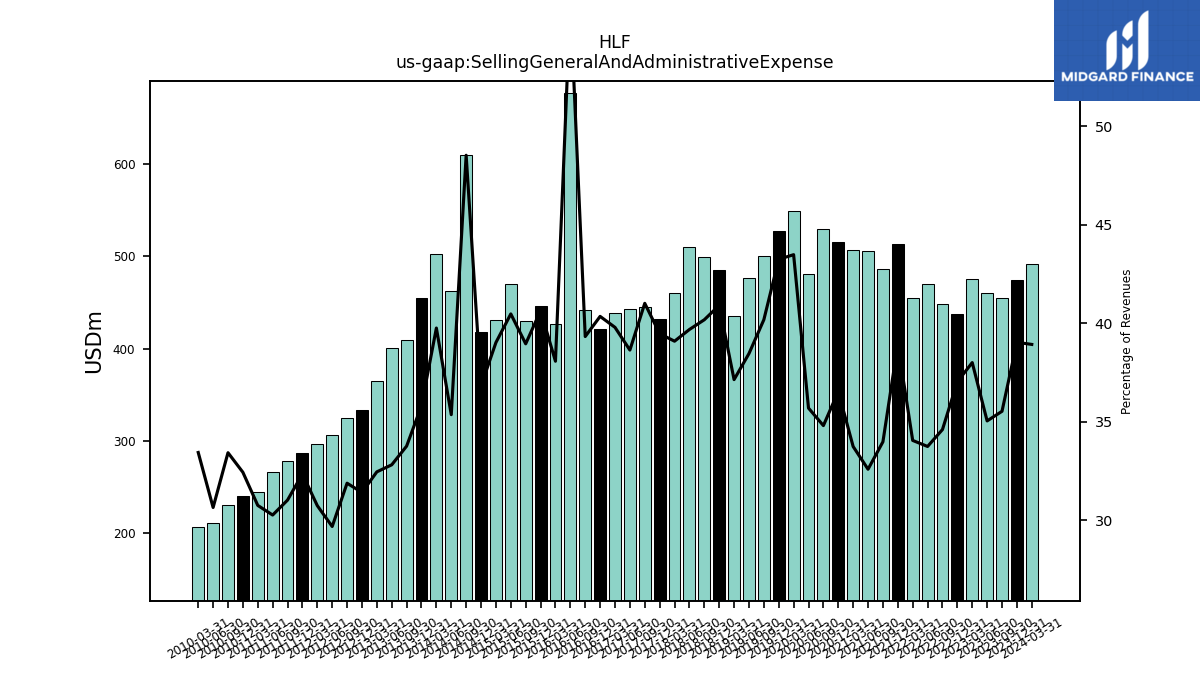
| Selling General And Administrative Expense | 492.20 | 474.30 | 455.30 | 460.50 | 475.90 | 437.30 | 448.20 | 470.00 | 454.90 | 513.20 | 486.30 | 505.90 | 506.70 | 515.50 | 529.70 | 480.80 | 549.00 | 527.80 | 500.10 | 477.00 | 435.40 | 485.50 | 499.40 | 510.20 | 460.10 | 431.60 | 445.20 | 443.20 | 438.60 | 421.70 | 441.30 | 676.80 | 426.30 | 446.40 | 429.70 | 470.50 | 431.40 | 417.40 | 609.72 | 461.92 | 502.06 | 454.48 | 409.75 | 400.11 | 364.72 | 332.76 | 324.20 | 306.31 | 296.39 | 286.15 | 277.72 | 266.23 | 244.53 | 239.51 | 230.15 | 211.11 | 206.88 | |
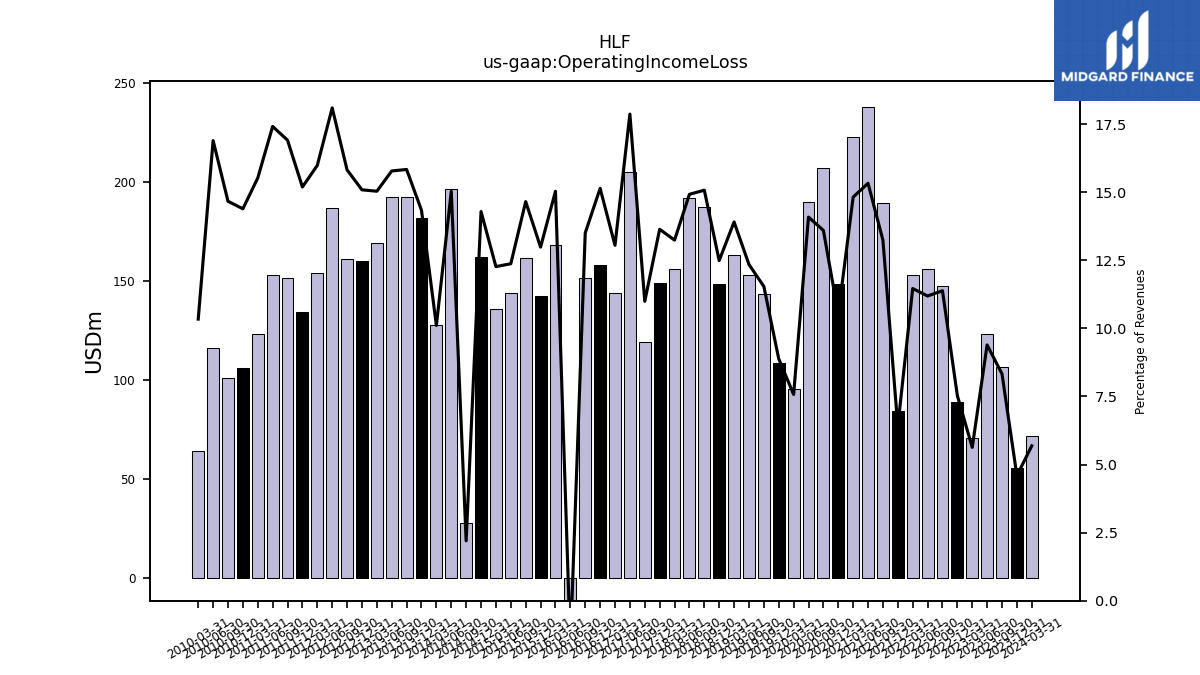
| Operating Income Loss | 71.90 | 55.80 | 106.70 | 123.40 | 70.50 | 88.90 | 147.40 | 155.80 | 153.10 | 84.30 | 189.40 | 237.90 | 222.50 | 148.40 | 206.90 | 189.70 | 95.60 | 108.40 | 143.60 | 153.10 | 163.00 | 148.20 | 187.30 | 191.80 | 155.80 | 149.10 | 119.30 | 204.90 | 143.80 | 158.20 | 151.50 | -19.90 | 168.30 | 142.60 | 161.60 | 143.80 | 135.60 | 161.97 | 27.64 | 196.29 | 127.60 | 181.86 | 192.14 | 192.36 | 168.92 | 159.79 | 160.84 | 186.71 | 154.10 | 134.35 | 151.35 | 153.17 | 123.40 | 106.24 | 100.95 | 116.36 | 63.96 | |
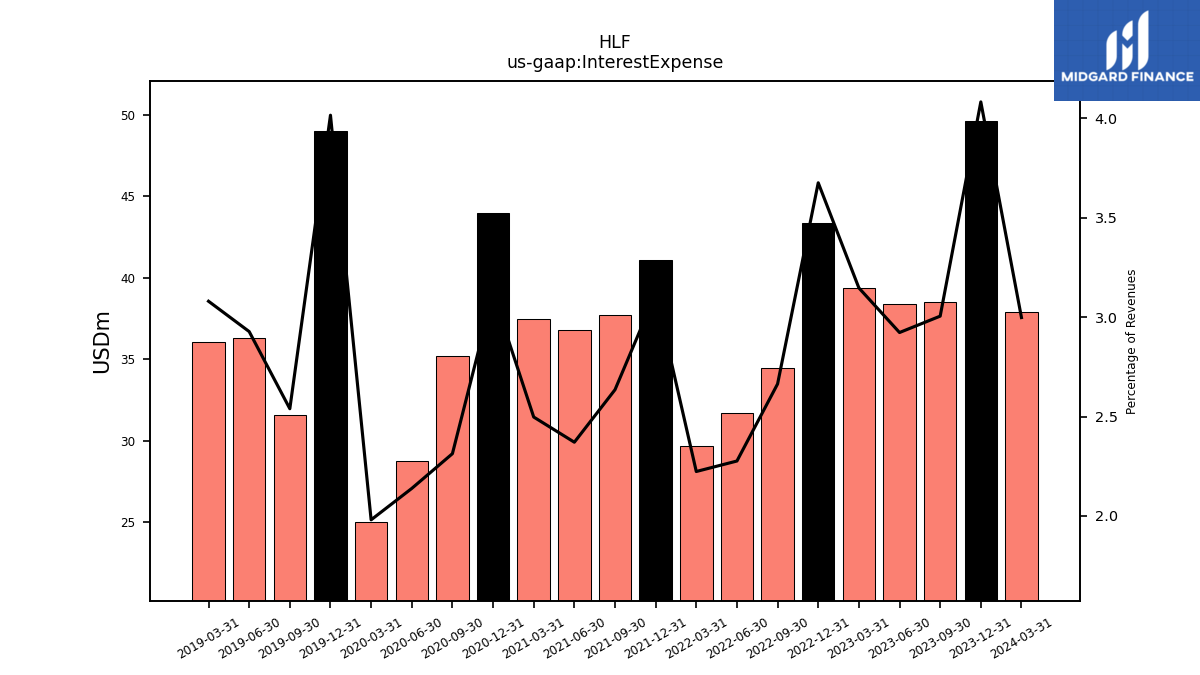
| Interest Expense | 37.90 | 49.60 | 38.50 | 38.40 | 39.40 | 43.40 | 34.50 | 31.70 | 29.70 | 41.10 | 37.70 | 36.80 | 37.50 | 44.00 | 35.20 | 28.80 | 25.00 | 49.00 | 31.60 | 36.30 | 36.10 | NA | NA | NA | NA | NA | NA | NA | NA | NA | NA | NA | NA | NA | NA | NA | NA | NA | NA | NA | NA | NA | NA | NA | NA | NA | NA | NA | NA | NA | NA | NA | NA | NA | NA | NA | NA | |
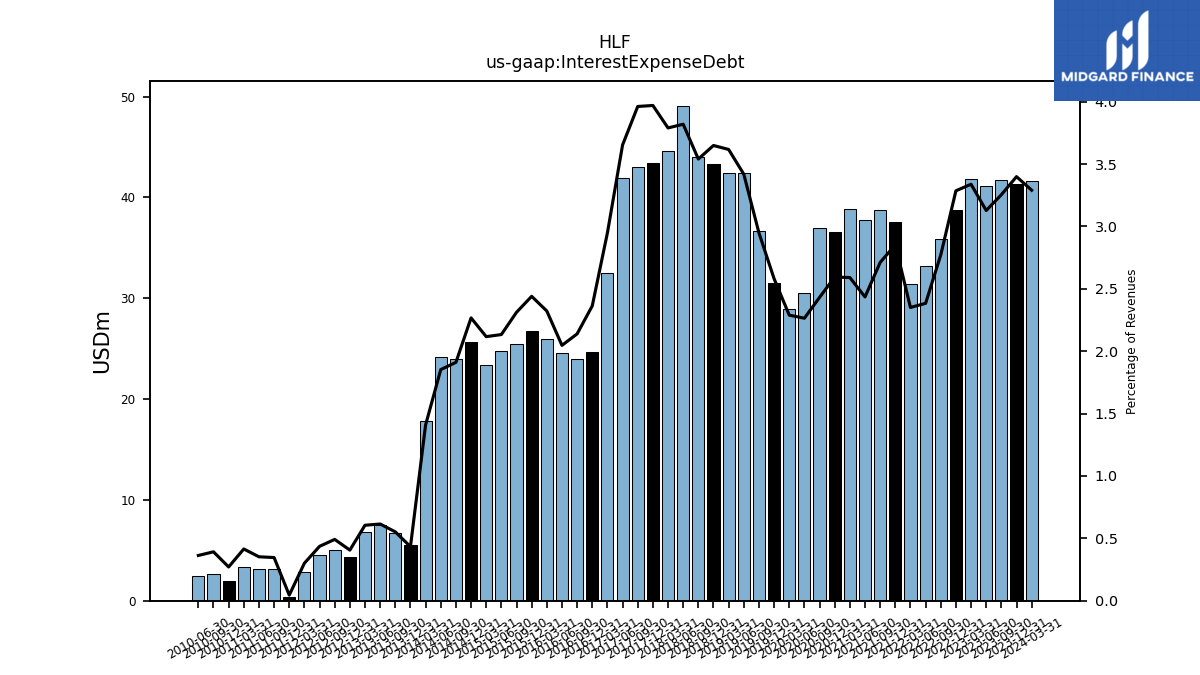
| Interest Expense Debt | 41.60 | 41.30 | 41.70 | 41.10 | 41.80 | 38.80 | 35.90 | 33.20 | 31.40 | 37.60 | 38.80 | 37.80 | 38.90 | 36.60 | 37.00 | 30.50 | 28.90 | 31.50 | 36.70 | 42.40 | 42.40 | 43.30 | 44.00 | 49.10 | 44.60 | 43.40 | 43.00 | 41.90 | 32.50 | 24.70 | 24.00 | 24.60 | 26.00 | 26.80 | 25.50 | 24.80 | 23.40 | 25.70 | 24.00 | 24.20 | 17.80 | 5.50 | 6.70 | 7.50 | 6.80 | 4.30 | 5.00 | 4.50 | 2.90 | 0.40 | 3.10 | 3.10 | 3.30 | 2.00 | 2.70 | 2.50 | NA | |
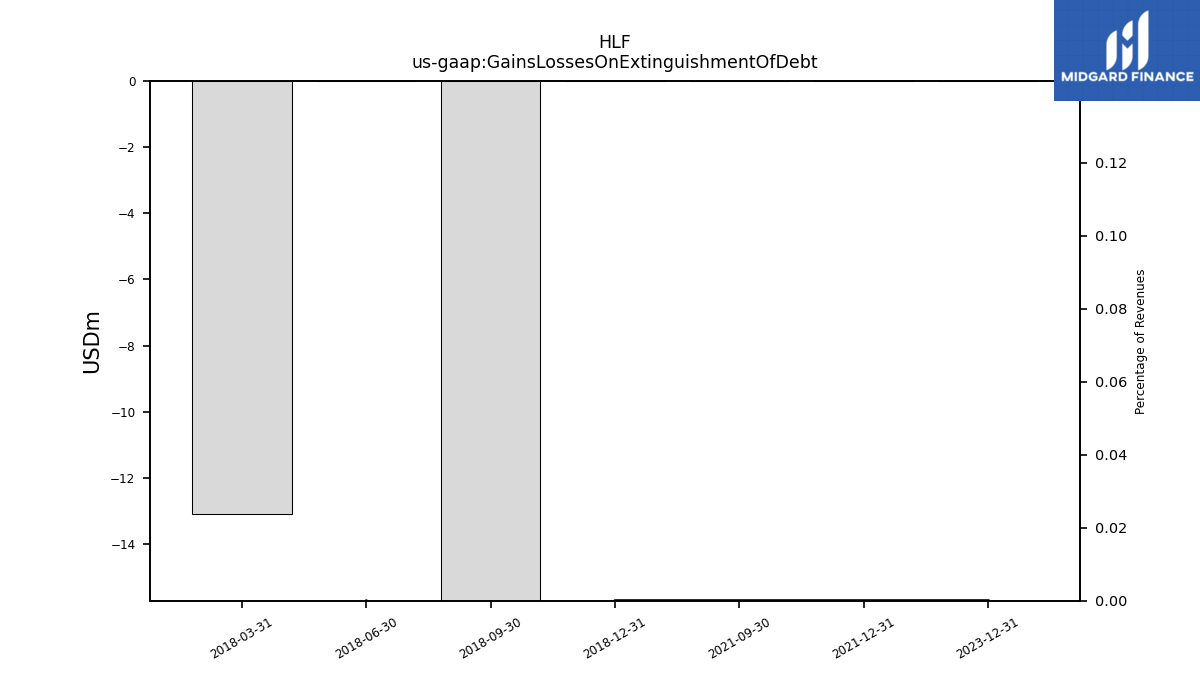
| Gains Losses On Extinguishment Of Debt | NA | 0.00 | NA | NA | NA | NA | NA | NA | NA | 0.00 | 0.00 | NA | NA | NA | NA | NA | NA | NA | NA | NA | NA | 0.00 | -35.40 | 0.00 | -13.10 | NA | NA | NA | NA | NA | NA | NA | NA | NA | NA | NA | NA | NA | NA | NA | NA | NA | NA | NA | NA | NA | NA | NA | NA | NA | NA | NA | NA | NA | NA | NA | NA | |
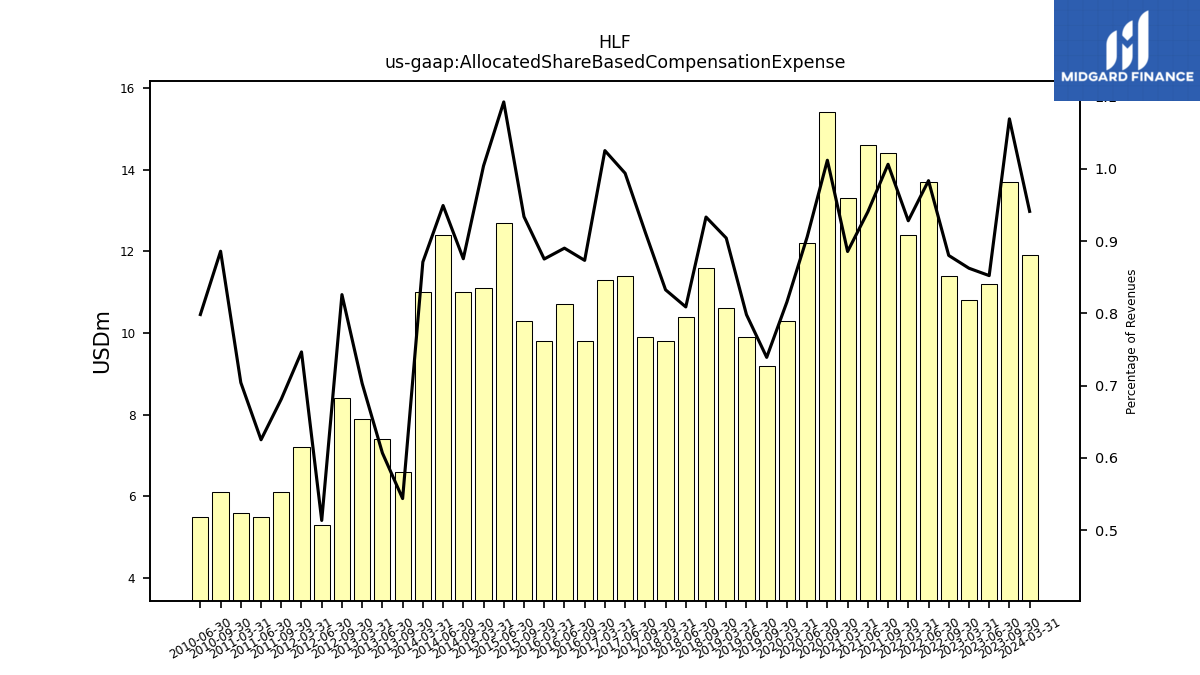
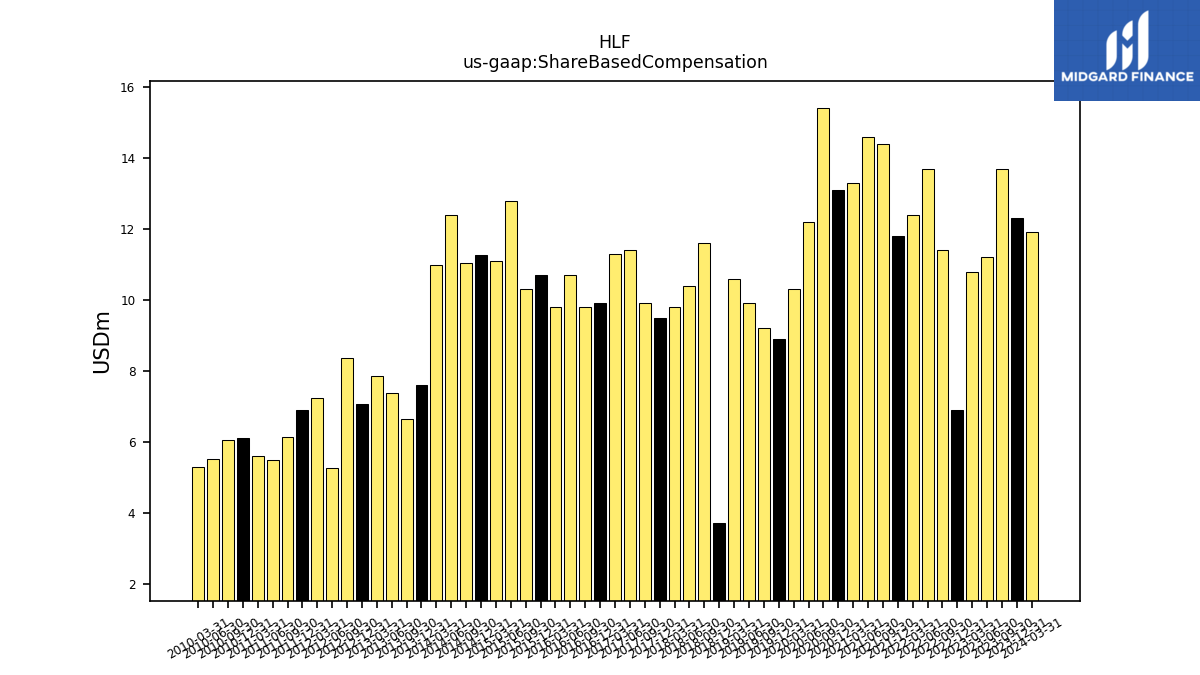
| Allocated Share Based Compensation Expense | 11.90 | NA | 13.70 | 11.20 | 10.80 | NA | 11.40 | 13.70 | 12.40 | NA | 14.40 | 14.60 | 13.30 | NA | 15.40 | 12.20 | 10.30 | NA | 9.20 | 9.90 | 10.60 | NA | 11.60 | 10.40 | 9.80 | NA | 9.90 | 11.40 | 11.30 | NA | 9.80 | 10.70 | 9.80 | NA | 10.30 | 12.70 | 11.10 | NA | 11.00 | 12.40 | 11.00 | NA | 6.60 | 7.40 | 7.90 | NA | 8.40 | 5.30 | 7.20 | NA | 6.10 | 5.50 | 5.60 | NA | 6.10 | 5.50 | NA | |
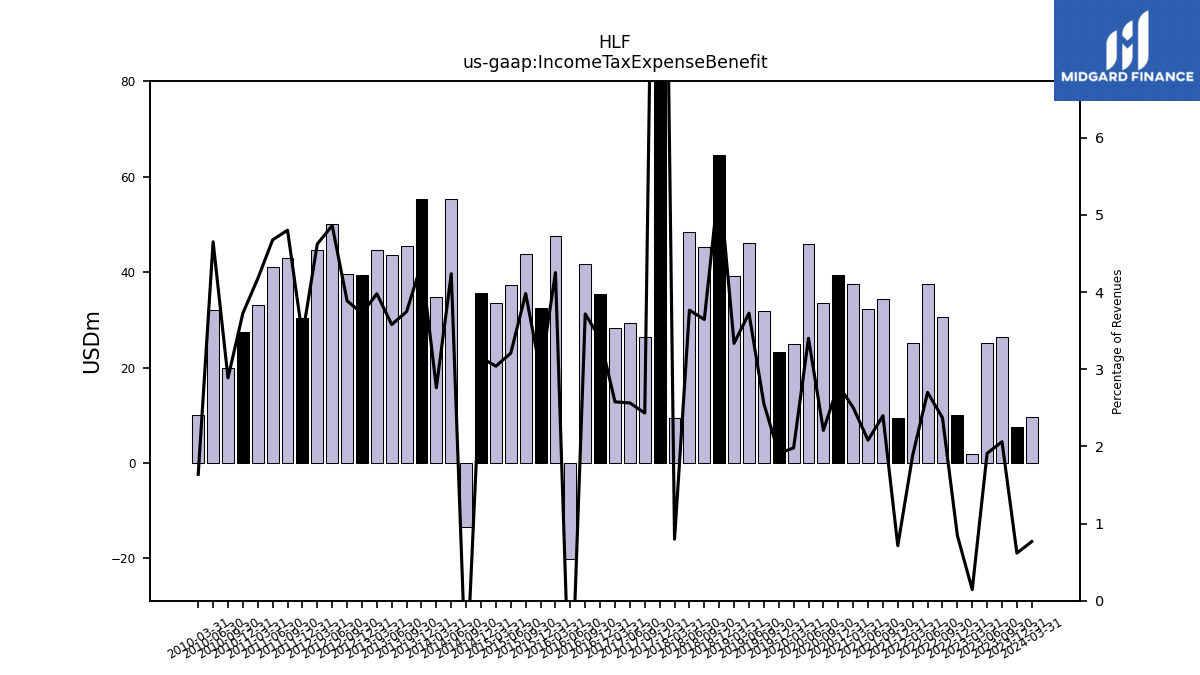
| Income Tax Expense Benefit | 9.70 | 7.50 | 26.40 | 25.10 | 1.80 | 10.00 | 30.70 | 37.60 | 25.20 | 9.40 | 34.30 | 32.30 | 37.60 | 39.40 | 33.60 | 45.80 | 25.00 | 23.30 | 31.80 | 46.20 | 39.10 | 64.50 | 45.30 | 48.40 | 9.40 | 173.10 | 26.40 | 29.40 | 28.40 | 35.50 | 41.70 | -20.10 | 47.60 | 32.50 | 43.90 | 37.30 | 33.60 | 35.70 | -13.30 | 55.35 | 34.85 | 55.42 | 45.46 | 43.64 | 44.69 | 39.46 | 39.52 | 50.17 | 44.57 | 30.35 | 42.98 | 41.14 | 33.18 | 27.51 | 19.88 | 32.03 | 10.13 | |
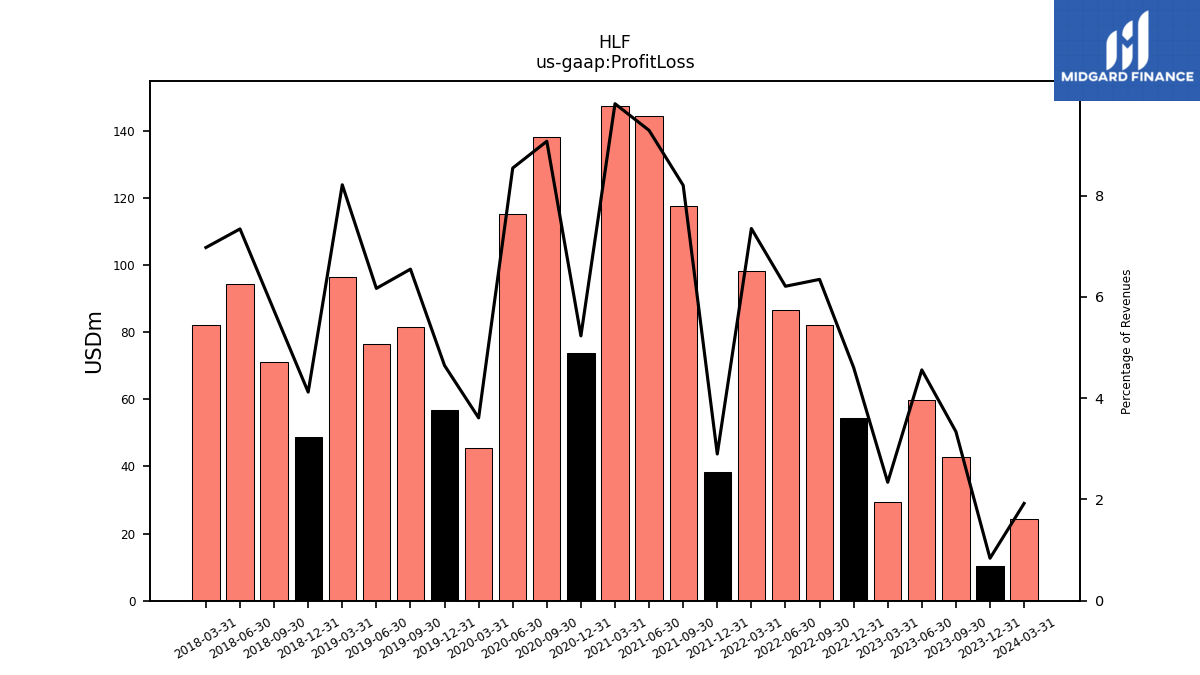
| Profit Loss | 24.30 | 10.20 | 42.80 | 59.90 | 29.30 | 54.40 | 82.20 | 86.50 | 98.20 | 38.20 | 117.40 | 144.20 | 147.40 | 73.80 | 138.10 | 115.10 | 45.60 | 56.70 | 81.50 | 76.50 | 96.30 | 48.90 | 71.20 | 94.40 | 82.10 | NA | NA | NA | NA | NA | NA | NA | NA | NA | NA | NA | NA | NA | NA | NA | NA | NA | NA | NA | NA | NA | NA | NA | NA | NA | NA | NA | NA | NA | NA | NA | NA | |
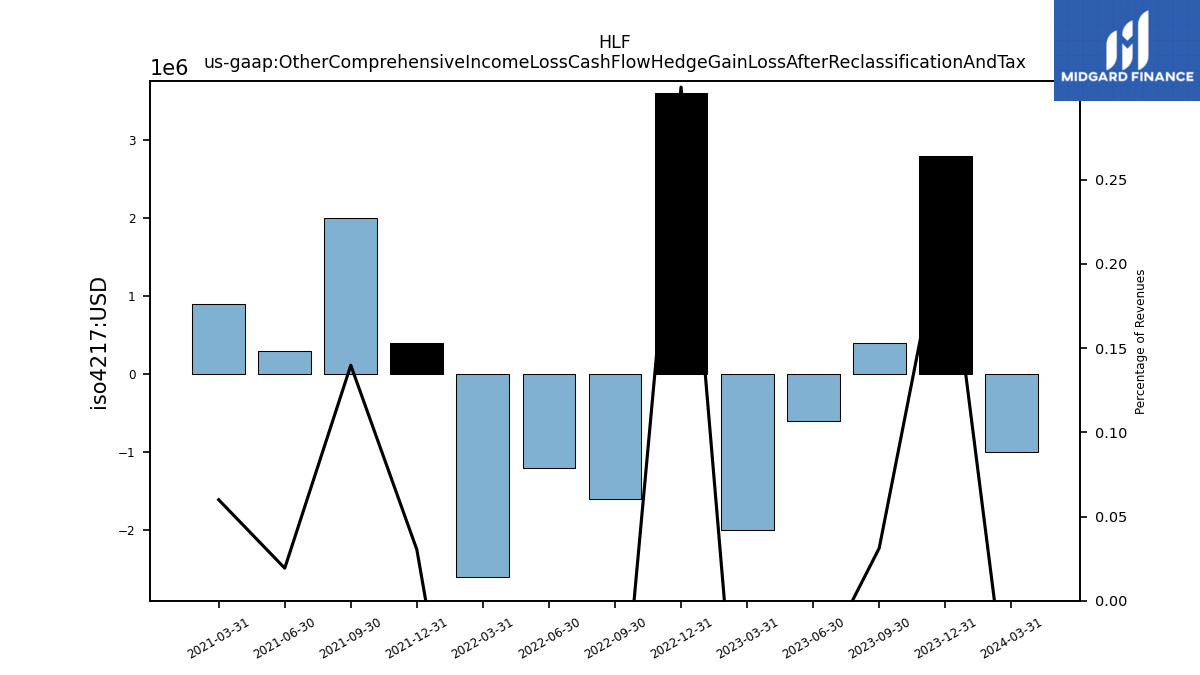
| Other Comprehensive Income Loss Cash Flow Hedge Gain Loss After Reclassification And Tax | -1.00 | 2.80 | 0.40 | -0.60 | -2.00 | 3.60 | -1.60 | -1.20 | -2.60 | 0.40 | 2.00 | 0.30 | 0.90 | NA | NA | NA | NA | NA | NA | NA | NA | NA | NA | NA | NA | NA | NA | NA | NA | NA | NA | NA | NA | NA | NA | NA | NA | NA | NA | NA | NA | NA | NA | NA | NA | NA | NA | NA | NA | NA | NA | NA | NA | NA | NA | NA | NA | |
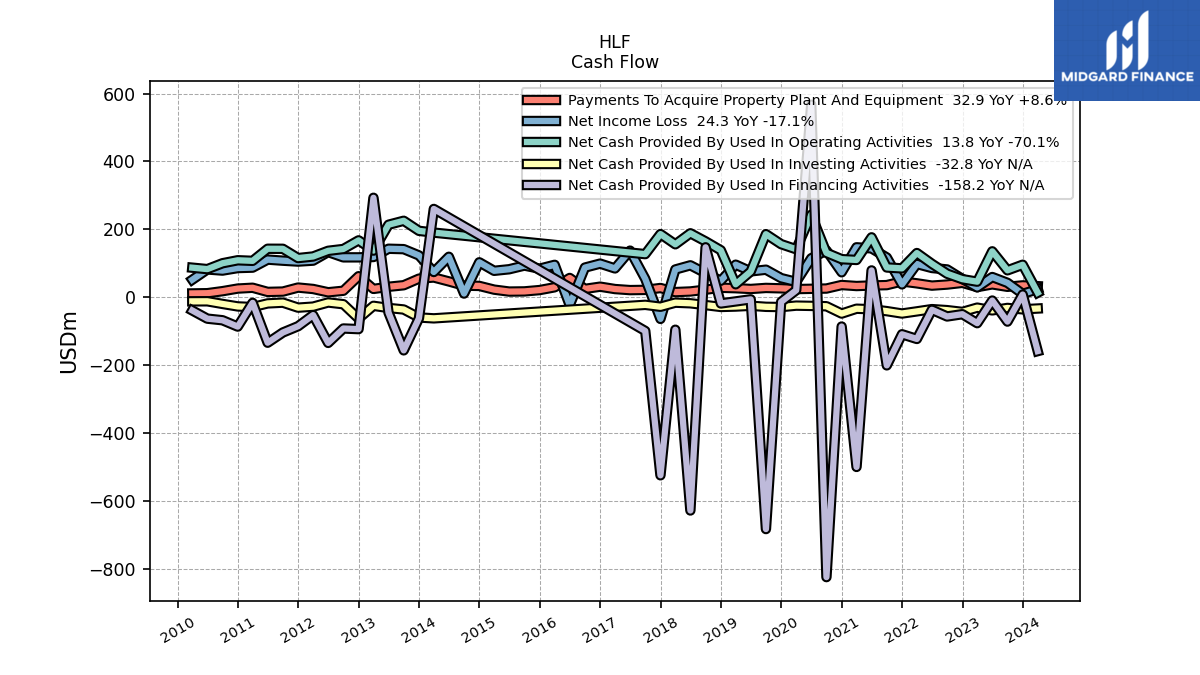
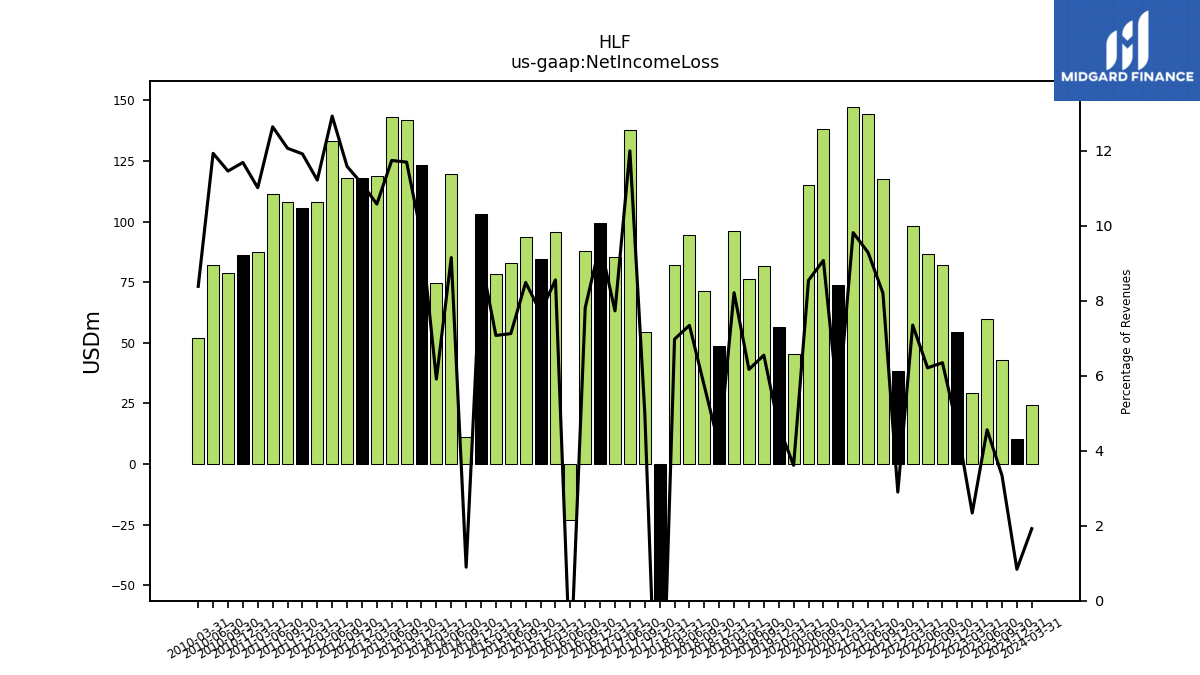
| Net Income Loss | 24.30 | 10.20 | 42.80 | 59.90 | 29.30 | 54.40 | 82.20 | 86.50 | 98.20 | 38.20 | 117.40 | 144.20 | 147.40 | 73.80 | 138.10 | 115.10 | 45.60 | 56.70 | 81.50 | 76.50 | 96.30 | 48.90 | 71.20 | 94.40 | 82.10 | -63.40 | 54.50 | 137.60 | 85.20 | 99.40 | 87.70 | -22.90 | 95.80 | 84.50 | 93.60 | 82.80 | 78.20 | 103.30 | 11.25 | 119.53 | 74.63 | 123.50 | 141.95 | 143.16 | 118.86 | 117.80 | 117.78 | 133.37 | 108.16 | 105.40 | 108.02 | 111.18 | 87.57 | 86.30 | 78.88 | 82.17 | 51.87 | |
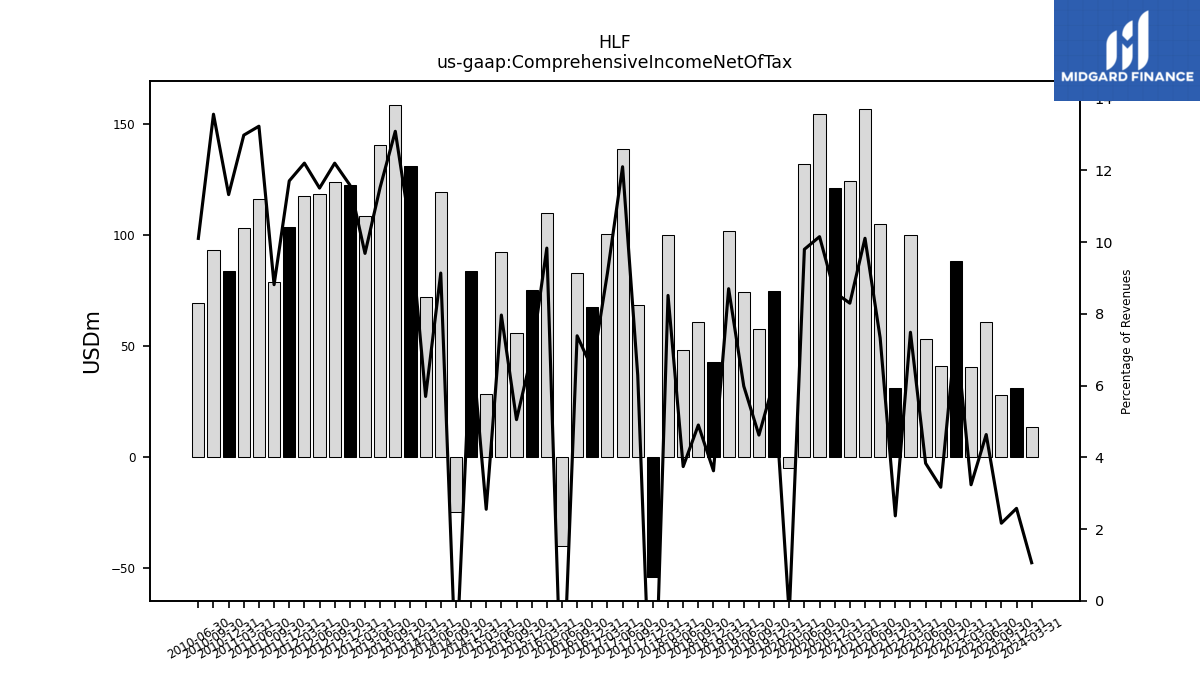
| Comprehensive Income Net Of Tax | 13.40 | 31.30 | 27.70 | 60.90 | 40.50 | 88.50 | 41.00 | 53.40 | 100.00 | 31.20 | 104.90 | 156.90 | 124.60 | 121.30 | 154.50 | 132.00 | -4.90 | 74.60 | 57.50 | 74.20 | 102.00 | 43.00 | 60.90 | 48.10 | 100.20 | -54.20 | 68.30 | 138.80 | 100.70 | 67.60 | 82.90 | -40.20 | 110.10 | 75.30 | 55.70 | 92.60 | 28.20 | 83.88 | -24.88 | 119.36 | 71.94 | 131.12 | 158.86 | 140.59 | 108.84 | 122.81 | 124.08 | 118.75 | 117.66 | 103.55 | 78.90 | 116.40 | 103.23 | 83.63 | 93.40 | 69.60 | NA |
| 2024-03-31 | 2023-12-31 | 2023-09-30 | 2023-06-30 | 2023-03-31 | 2022-12-31 | 2022-09-30 | 2022-06-30 | 2022-03-31 | 2021-12-31 | 2021-09-30 | 2021-06-30 | 2021-03-31 | 2020-12-31 | 2020-09-30 | 2020-06-30 | 2020-03-31 | 2019-12-31 | 2019-09-30 | 2019-06-30 | 2019-03-31 | 2018-12-31 | 2018-09-30 | 2018-06-30 | 2018-03-31 | 2017-12-31 | 2017-09-30 | 2017-06-30 | 2017-03-31 | 2016-12-31 | 2016-09-30 | 2016-06-30 | 2016-03-31 | 2015-12-31 | 2015-09-30 | 2015-06-30 | 2015-03-31 | 2014-12-31 | 2014-09-30 | 2014-06-30 | 2014-03-31 | 2013-12-31 | 2013-09-30 | 2013-06-30 | 2013-03-31 | 2012-12-31 | 2012-09-30 | 2012-06-30 | 2012-03-31 | 2011-12-31 | 2011-09-30 | 2011-06-30 | 2011-03-31 | 2010-12-31 | 2010-09-30 | 2010-06-30 | 2010-03-31 | ||
|---|---|---|---|---|---|---|---|---|---|---|---|---|---|---|---|---|---|---|---|---|---|---|---|---|---|---|---|---|---|---|---|---|---|---|---|---|---|---|---|---|---|---|---|---|---|---|---|---|---|---|---|---|---|---|---|---|---|---|
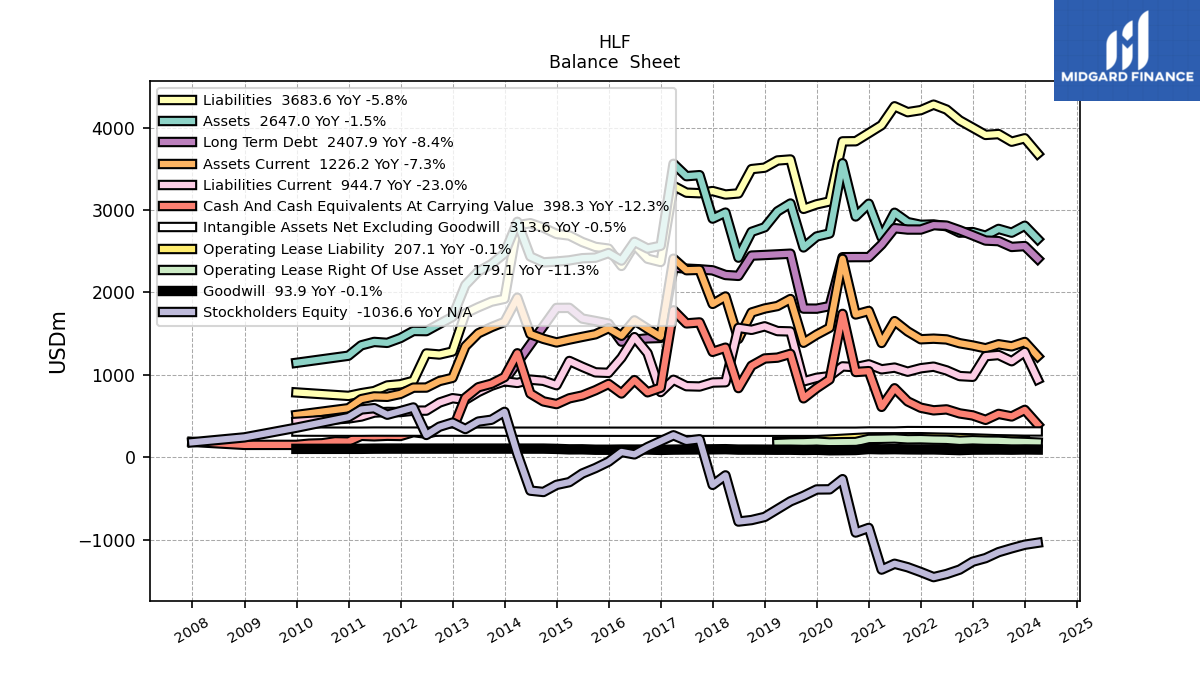
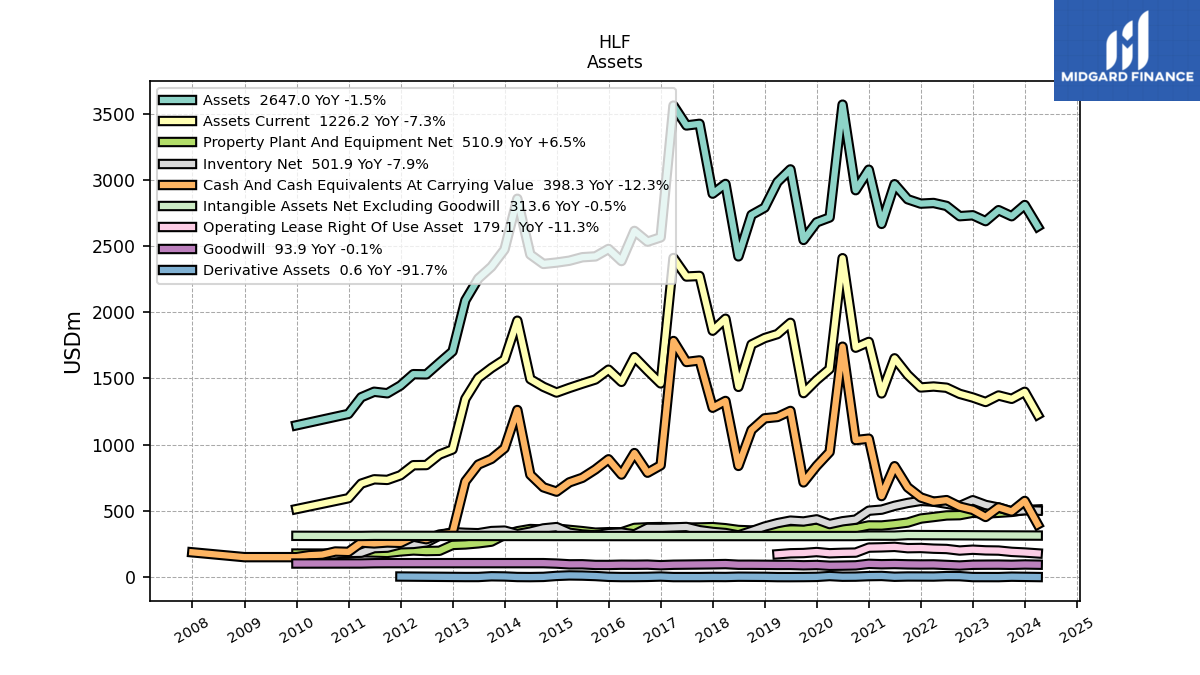
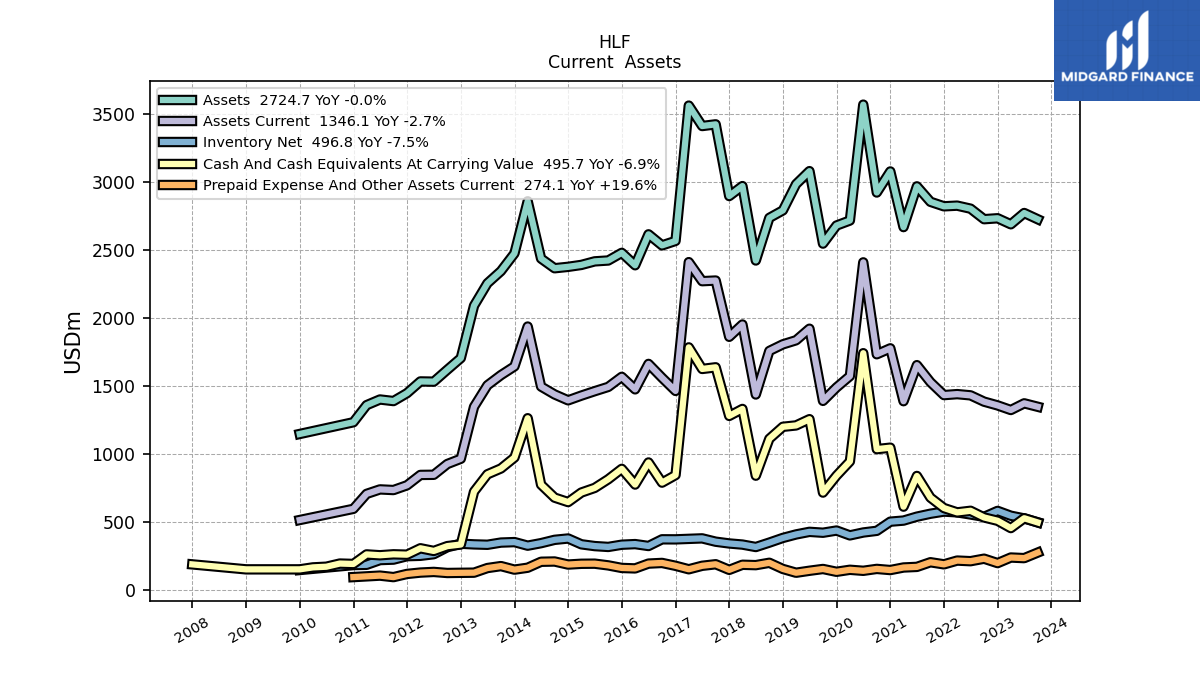
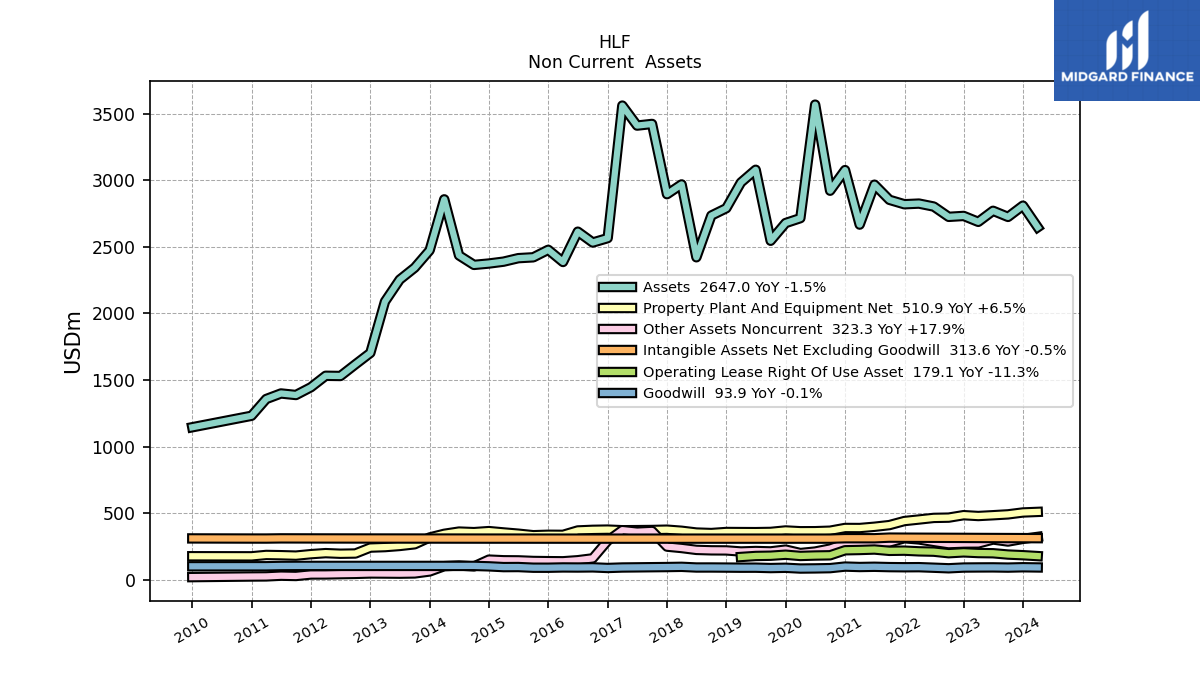
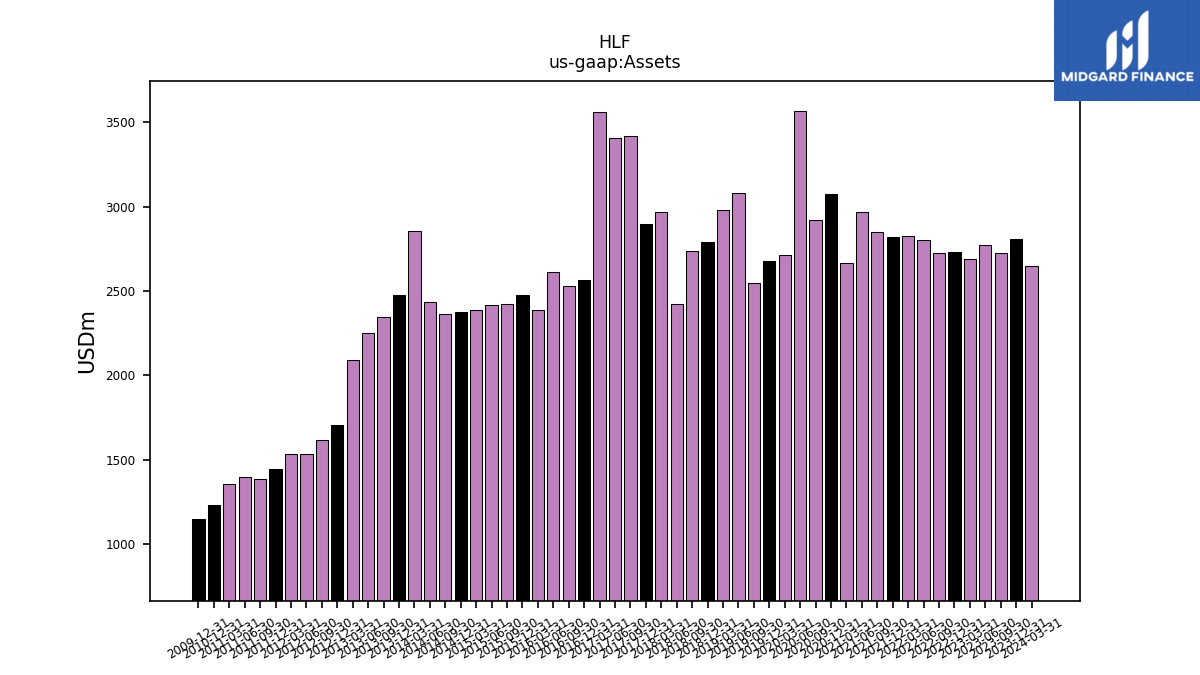
| Assets | 2647.00 | 2809.40 | 2724.70 | 2770.60 | 2687.60 | 2732.00 | 2725.10 | 2802.50 | 2824.70 | 2819.80 | 2853.00 | 2966.70 | 2666.80 | 3076.10 | 2921.20 | 3567.40 | 2715.30 | 2678.60 | 2545.60 | 3078.60 | 2982.80 | 2789.80 | 2734.80 | 2421.50 | 2968.70 | 2895.10 | 3422.50 | 3410.00 | 3560.30 | 2565.40 | 2532.60 | 2613.90 | 2386.30 | 2477.90 | 2421.50 | 2415.10 | 2388.90 | 2374.90 | 2364.50 | 2435.68 | 2856.59 | 2473.70 | 2343.45 | 2254.00 | 2089.30 | 1703.94 | 1618.10 | 1530.79 | 1532.41 | 1446.21 | 1388.06 | 1399.62 | 1358.00 | 1232.22 | NA | NA | NA | |
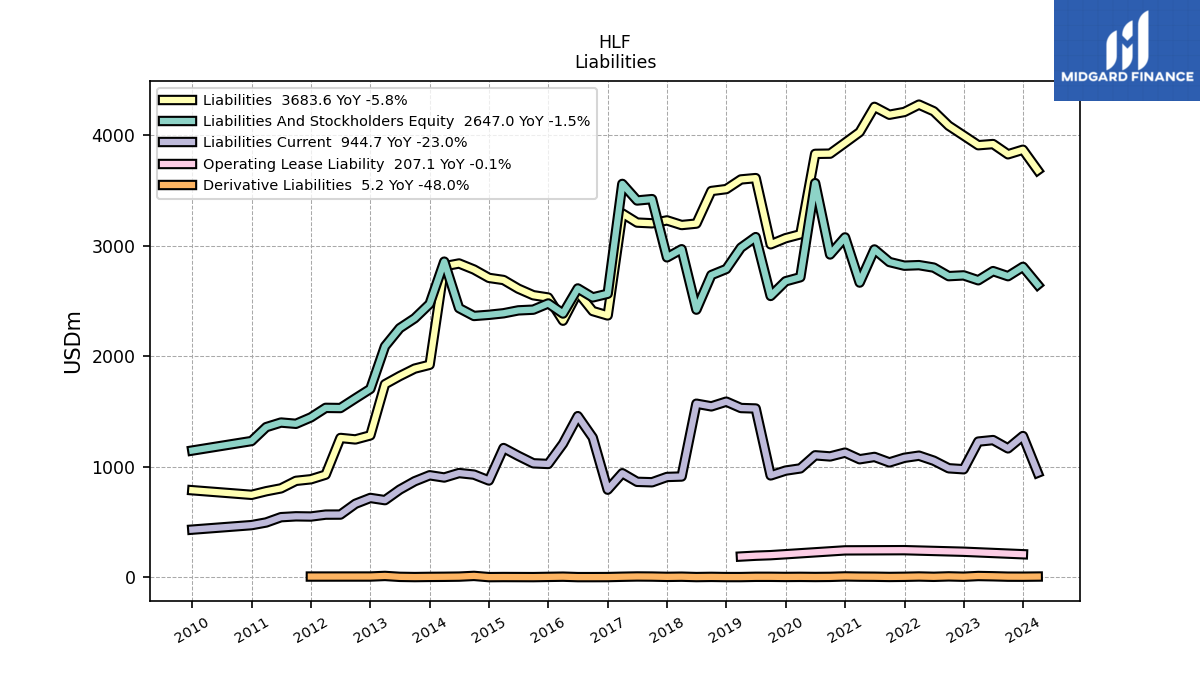
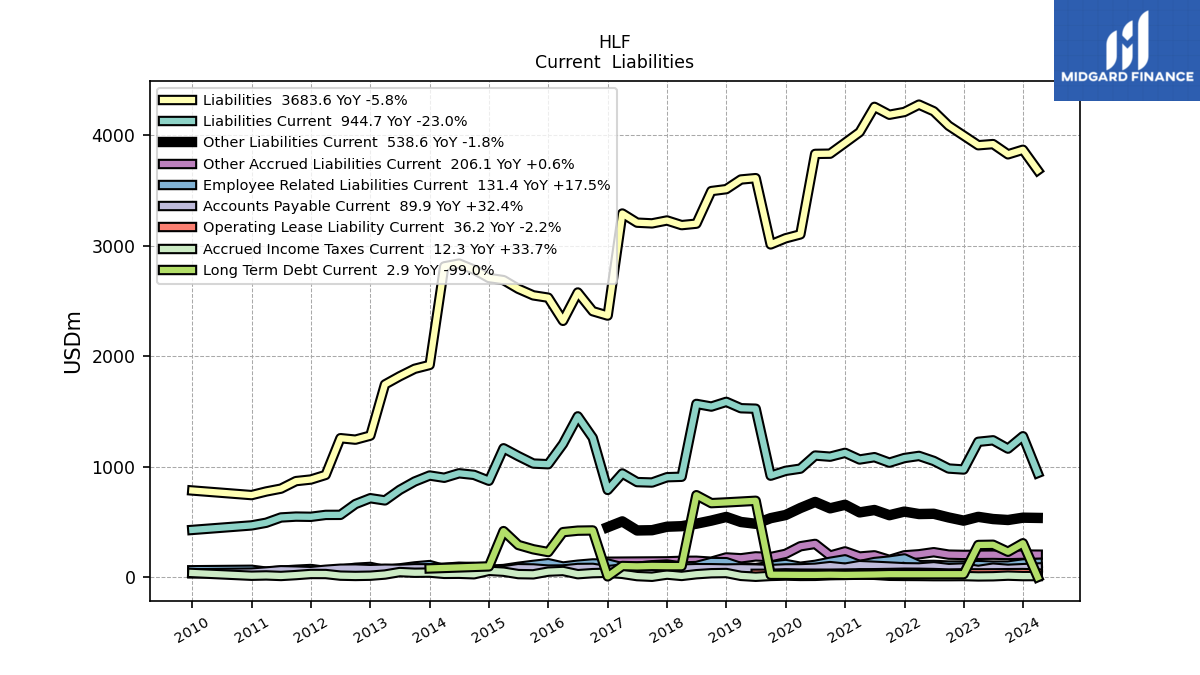
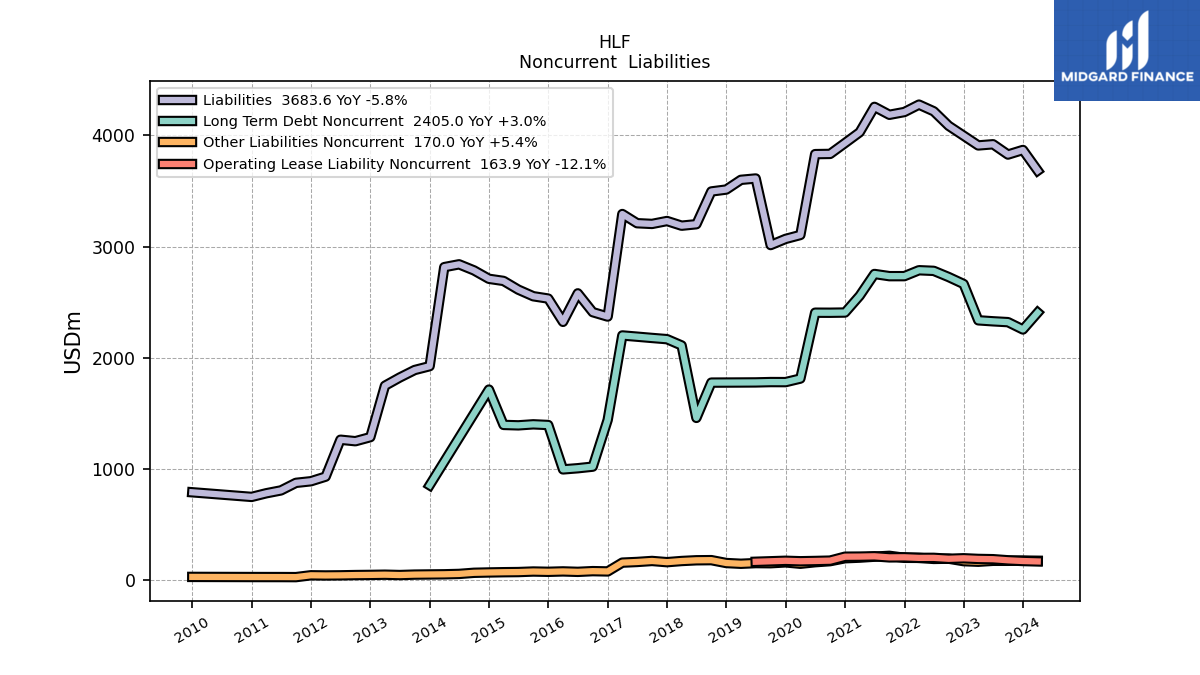
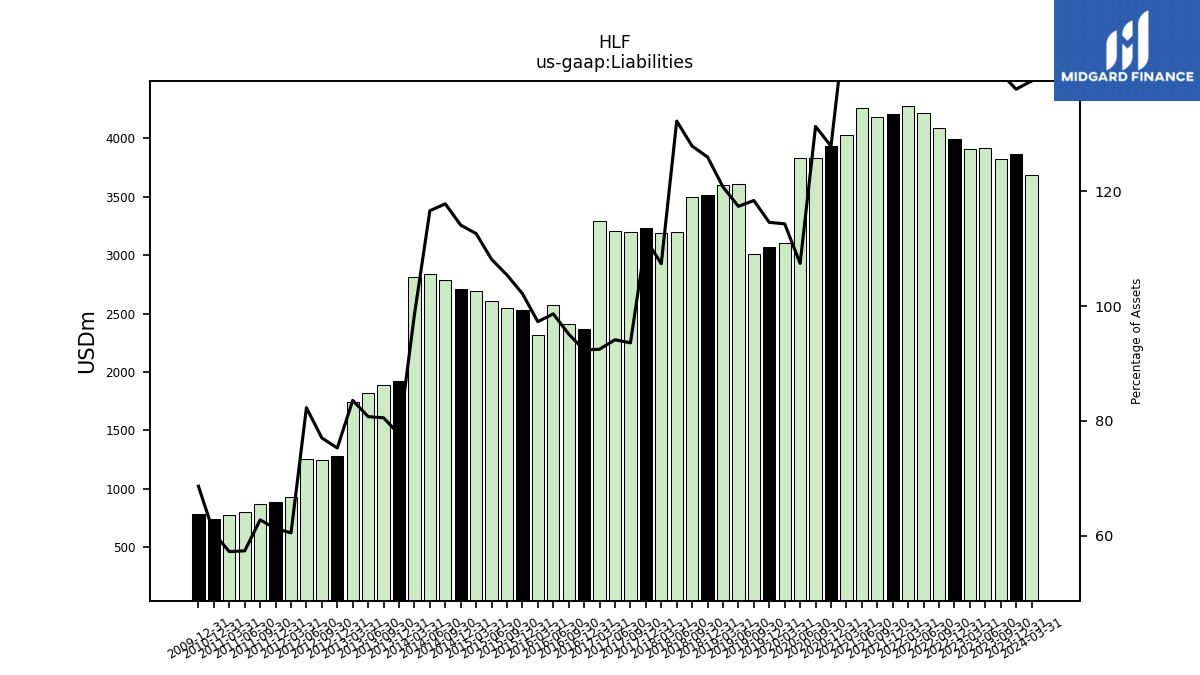
| Liabilities | 3683.60 | 3869.70 | 3828.20 | 3921.00 | 3910.40 | 3997.90 | 4087.00 | 4217.90 | 4278.00 | 4211.30 | 4186.40 | 4257.90 | 4029.10 | 3932.20 | 3834.10 | 3832.20 | 3103.80 | 3068.60 | 3013.10 | 3612.80 | 3600.60 | 3513.20 | 3495.90 | 3200.90 | 3187.70 | 3229.80 | 3203.50 | 3210.00 | 3292.90 | 2369.10 | 2408.90 | 2578.40 | 2321.40 | 2531.40 | 2552.20 | 2611.50 | 2690.10 | 2709.30 | 2785.06 | 2839.75 | 2814.48 | 1922.26 | 1887.86 | 1820.38 | 1746.36 | 1283.19 | 1246.69 | 1260.07 | 927.64 | 886.02 | 871.58 | 803.57 | 777.71 | 745.01 | NA | NA | NA | |
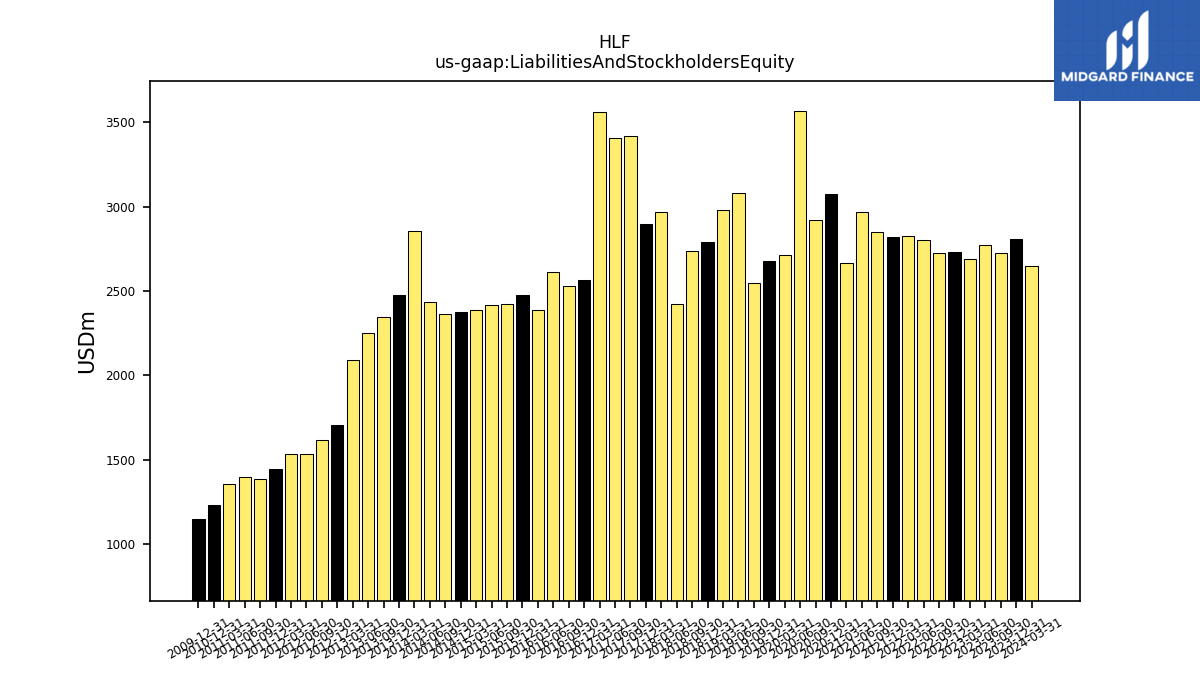
| Liabilities And Stockholders Equity | 2647.00 | 2809.40 | 2724.70 | 2770.60 | 2687.60 | 2732.00 | 2725.10 | 2802.50 | 2824.70 | 2819.80 | 2853.00 | 2966.70 | 2666.80 | 3076.10 | 2921.20 | 3567.40 | 2715.30 | 2678.60 | 2545.60 | 3078.60 | 2982.80 | 2789.80 | 2734.80 | 2421.50 | 2968.70 | 2895.10 | 3422.50 | 3410.00 | 3560.30 | 2565.40 | 2532.60 | 2613.90 | 2386.30 | 2477.90 | 2421.50 | 2415.10 | 2388.90 | 2374.90 | 2364.50 | 2435.68 | 2856.59 | 2473.70 | 2343.45 | 2254.00 | 2089.30 | 1703.94 | 1618.10 | 1530.79 | 1532.41 | 1446.21 | 1388.06 | 1399.62 | 1358.00 | 1232.22 | NA | NA | NA | |
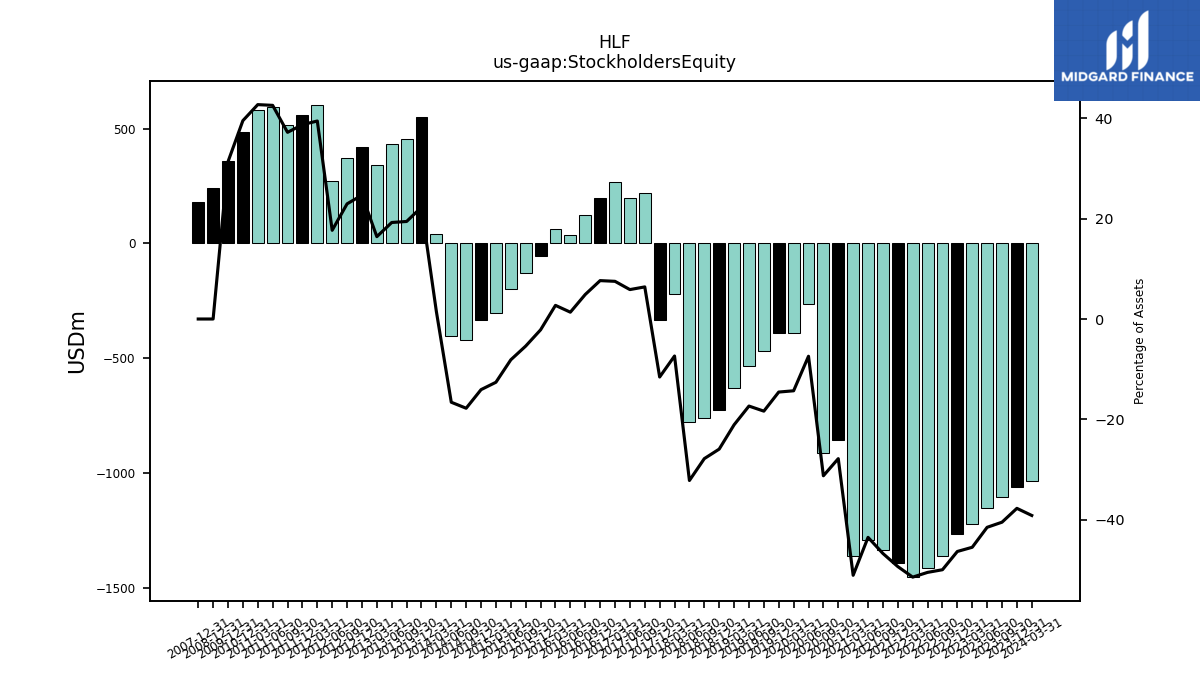
| Stockholders Equity | -1036.60 | -1060.30 | -1103.50 | -1150.40 | -1222.80 | -1265.90 | -1361.90 | -1415.40 | -1453.30 | -1391.50 | -1333.40 | -1291.20 | -1362.30 | -856.10 | -912.90 | -264.80 | -388.50 | -390.00 | -467.50 | -534.20 | -629.10 | -723.40 | -761.10 | -779.40 | -219.00 | -334.70 | 219.00 | 200.00 | 267.40 | 196.30 | 123.70 | 35.50 | 64.90 | -53.50 | -130.70 | -196.40 | -301.20 | -334.40 | -420.56 | -404.07 | 42.11 | 551.45 | 455.59 | 433.62 | 342.94 | 420.75 | 371.40 | 270.72 | 604.76 | 560.19 | 516.48 | 596.05 | 580.30 | 487.21 | NA | NA | NA |
| 2024-03-31 | 2023-12-31 | 2023-09-30 | 2023-06-30 | 2023-03-31 | 2022-12-31 | 2022-09-30 | 2022-06-30 | 2022-03-31 | 2021-12-31 | 2021-09-30 | 2021-06-30 | 2021-03-31 | 2020-12-31 | 2020-09-30 | 2020-06-30 | 2020-03-31 | 2019-12-31 | 2019-09-30 | 2019-06-30 | 2019-03-31 | 2018-12-31 | 2018-09-30 | 2018-06-30 | 2018-03-31 | 2017-12-31 | 2017-09-30 | 2017-06-30 | 2017-03-31 | 2016-12-31 | 2016-09-30 | 2016-06-30 | 2016-03-31 | 2015-12-31 | 2015-09-30 | 2015-06-30 | 2015-03-31 | 2014-12-31 | 2014-09-30 | 2014-06-30 | 2014-03-31 | 2013-12-31 | 2013-09-30 | 2013-06-30 | 2013-03-31 | 2012-12-31 | 2012-09-30 | 2012-06-30 | 2012-03-31 | 2011-12-31 | 2011-09-30 | 2011-06-30 | 2011-03-31 | 2010-12-31 | 2010-09-30 | 2010-06-30 | 2010-03-31 | ||
|---|---|---|---|---|---|---|---|---|---|---|---|---|---|---|---|---|---|---|---|---|---|---|---|---|---|---|---|---|---|---|---|---|---|---|---|---|---|---|---|---|---|---|---|---|---|---|---|---|---|---|---|---|---|---|---|---|---|---|
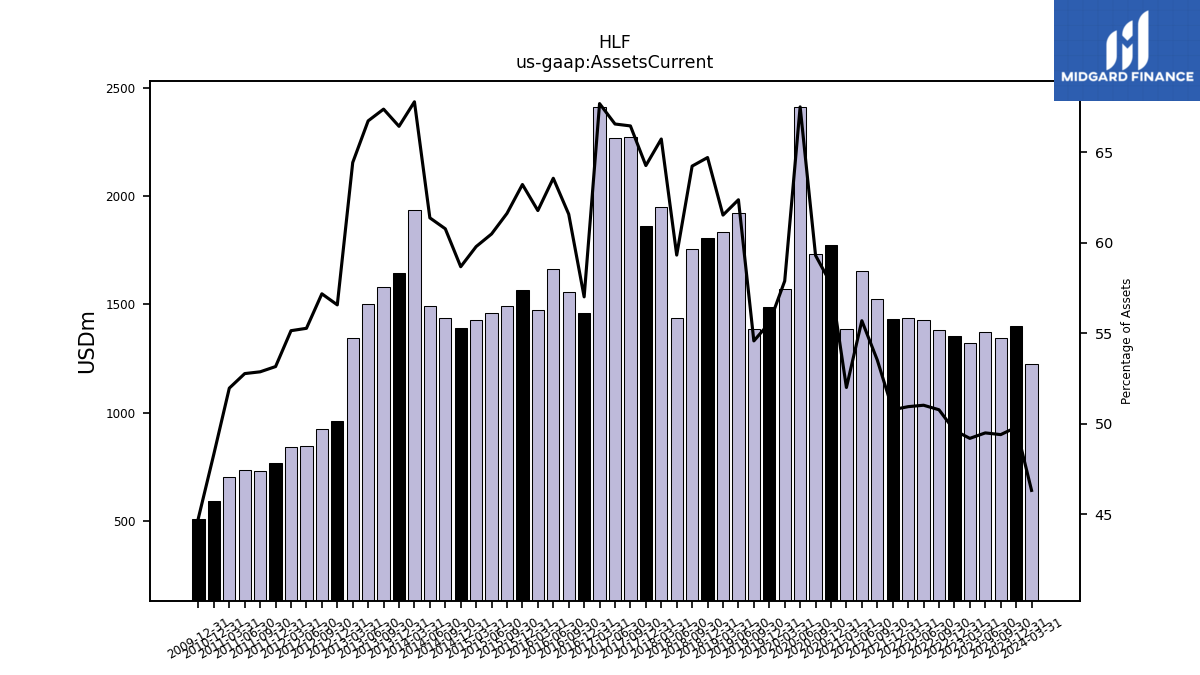
| Assets Current | 1226.20 | 1399.30 | 1346.10 | 1371.40 | 1322.20 | 1356.10 | 1383.70 | 1430.00 | 1439.10 | 1431.80 | 1527.00 | 1652.20 | 1386.90 | 1775.80 | 1732.10 | 2407.90 | 1571.70 | 1488.20 | 1389.30 | 1920.10 | 1835.10 | 1805.00 | 1756.50 | 1436.30 | 1951.10 | 1860.30 | 2274.10 | 2269.40 | 2409.50 | 1462.50 | 1559.40 | 1661.30 | 1474.10 | 1566.30 | 1492.10 | 1460.70 | 1428.20 | 1393.40 | 1436.83 | 1494.79 | 1936.10 | 1643.12 | 1578.83 | 1503.96 | 1346.01 | 963.85 | 925.19 | 846.10 | 844.98 | 768.82 | 733.87 | 738.62 | 705.74 | 595.59 | NA | NA | NA | |
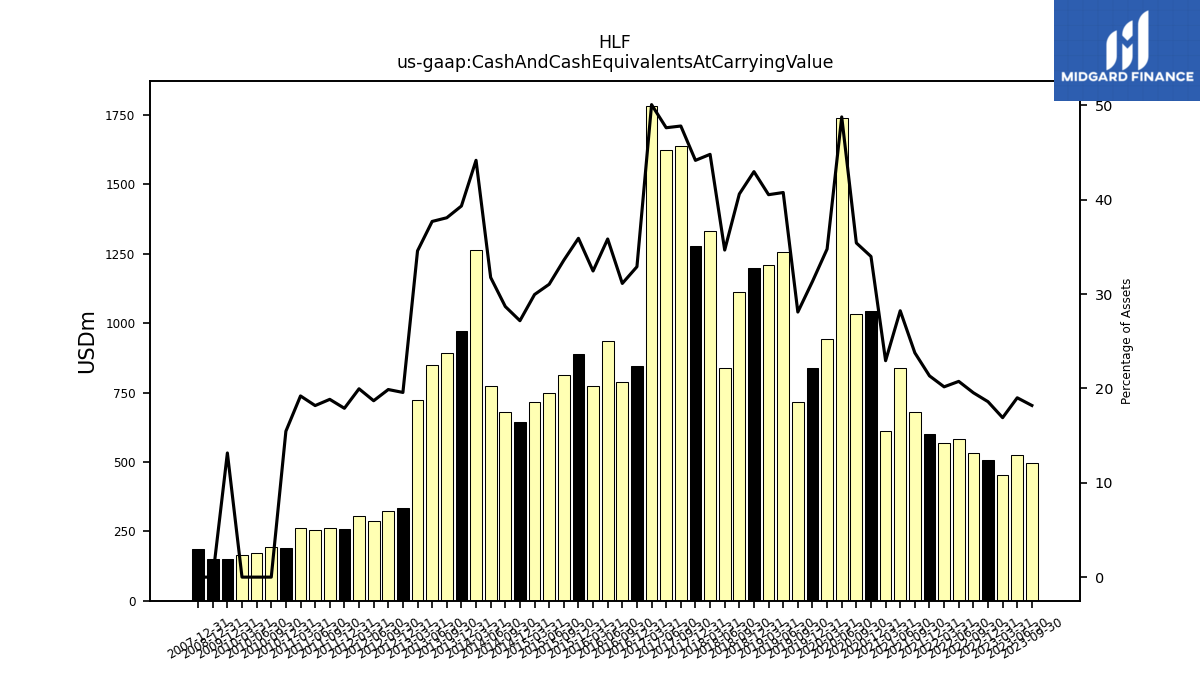
| Cash And Cash Equivalents At Carrying Value | 398.30 | 575.20 | 495.70 | 526.60 | 454.20 | 508.00 | 532.50 | 581.40 | 569.70 | 601.50 | 678.20 | 837.50 | 611.70 | 1045.40 | 1034.60 | 1740.00 | 944.20 | 839.40 | 715.20 | 1254.90 | 1209.00 | 1198.90 | 1110.50 | 839.40 | 1330.20 | 1278.80 | 1636.30 | 1624.10 | 1782.90 | 844.00 | 788.30 | 936.70 | 774.20 | 889.80 | 813.20 | 749.60 | 715.50 | 645.40 | 678.13 | 773.52 | 1261.92 | 972.97 | 892.55 | 849.70 | 722.47 | 333.53 | 321.72 | 286.17 | 305.86 | 258.77 | 261.52 | 254.47 | 260.77 | 190.55 | 193.49 | 170.22 | 165.27 | |
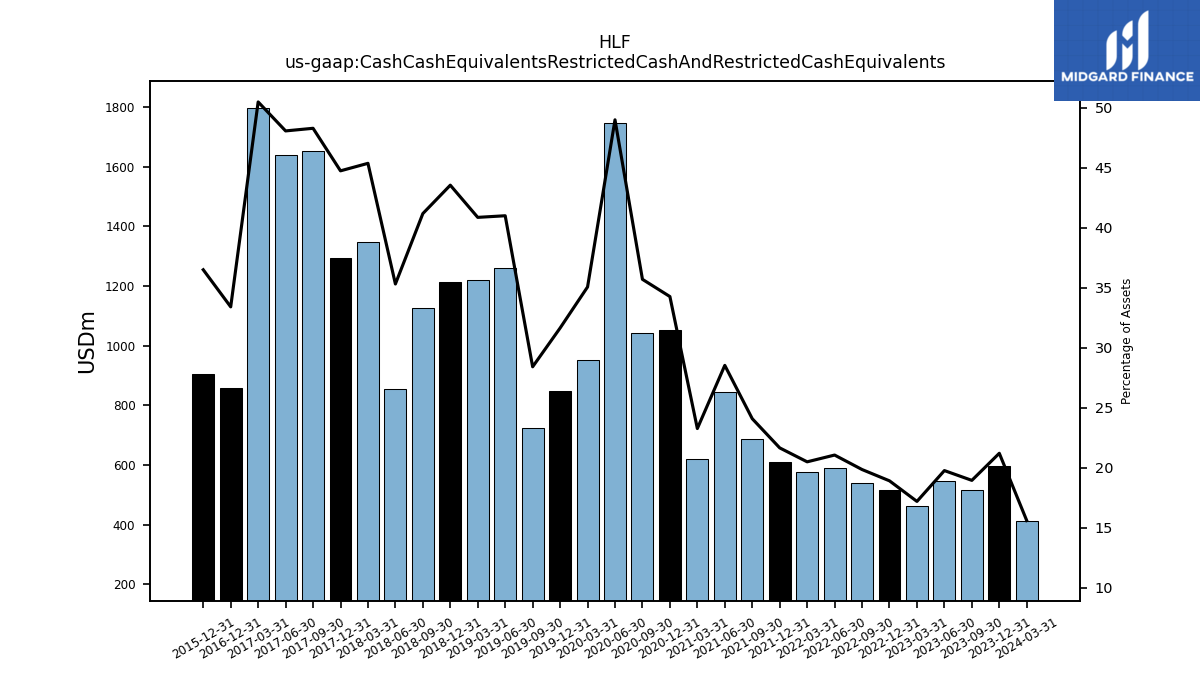
| Cash Cash Equivalents Restricted Cash And Restricted Cash Equivalents | 412.50 | 595.50 | 516.00 | 547.30 | 461.80 | 516.30 | 540.70 | 589.90 | 578.60 | 610.40 | 687.00 | 846.30 | 620.30 | 1054.00 | 1042.90 | 1748.10 | 952.10 | 847.50 | 723.20 | 1262.30 | 1219.00 | 1215.00 | 1126.30 | 855.10 | 1347.00 | 1295.50 | 1652.90 | 1639.40 | 1797.70 | 857.00 | NA | NA | NA | 904.40 | NA | NA | NA | NA | NA | NA | NA | NA | NA | NA | NA | NA | NA | NA | NA | NA | NA | NA | NA | NA | NA | NA | NA | |
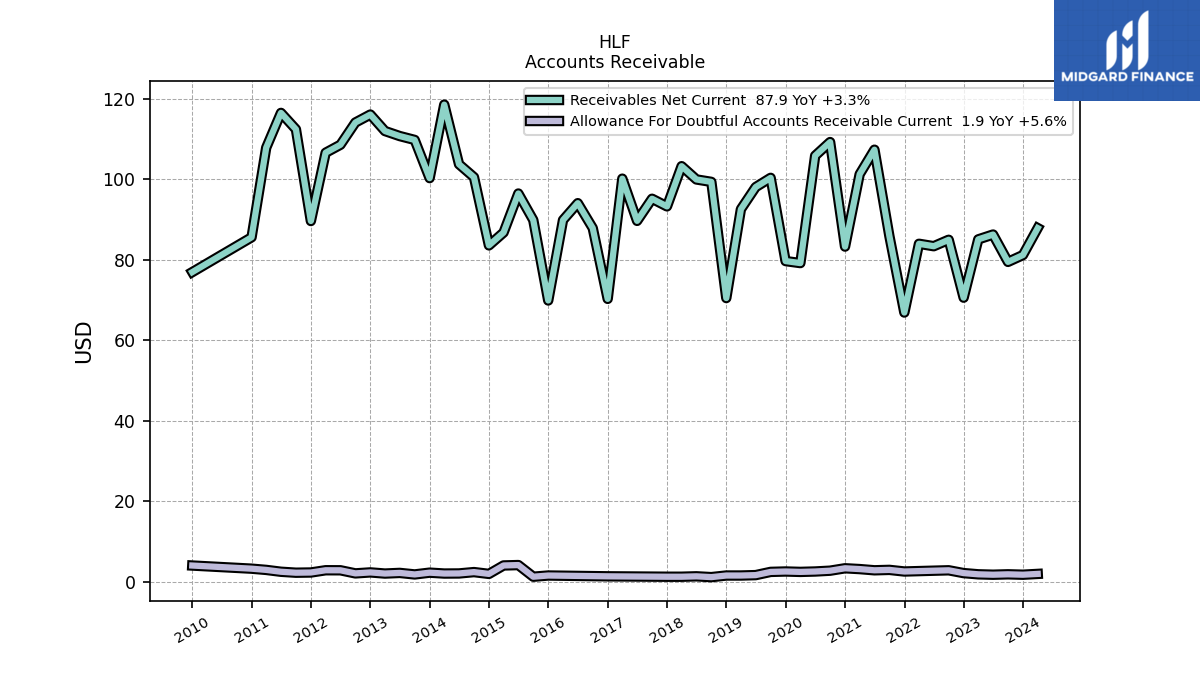
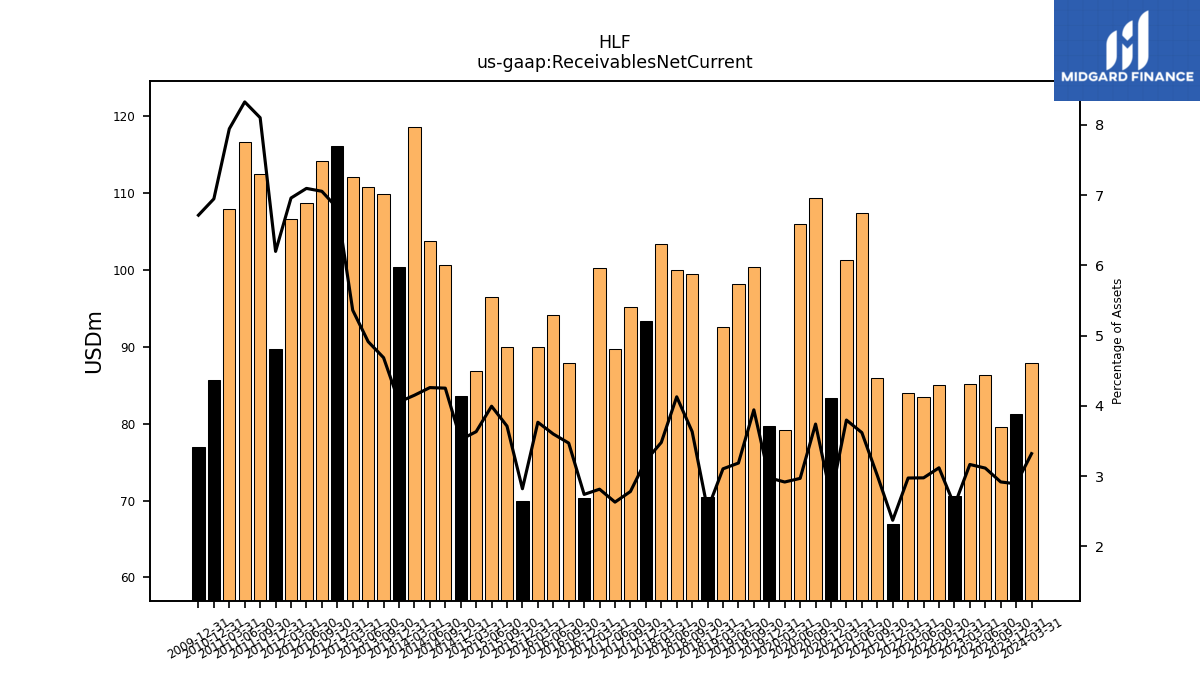
| Receivables Net Current | 87.90 | 81.20 | 79.50 | 86.30 | 85.10 | 70.60 | 85.00 | 83.40 | 84.00 | 66.90 | 85.90 | 107.40 | 101.30 | 83.30 | 109.30 | 105.90 | 79.20 | 79.70 | 100.40 | 98.10 | 92.60 | 70.50 | 99.40 | 100.00 | 103.30 | 93.30 | 95.20 | 89.70 | 100.20 | 70.30 | 87.90 | 94.10 | 89.90 | 69.90 | 89.90 | 96.50 | 86.80 | 83.60 | 100.56 | 103.78 | 118.61 | 100.33 | 109.83 | 110.79 | 112.04 | 116.14 | 114.16 | 108.63 | 106.65 | 89.66 | 112.47 | 116.56 | 107.89 | 85.61 | NA | NA | NA | |
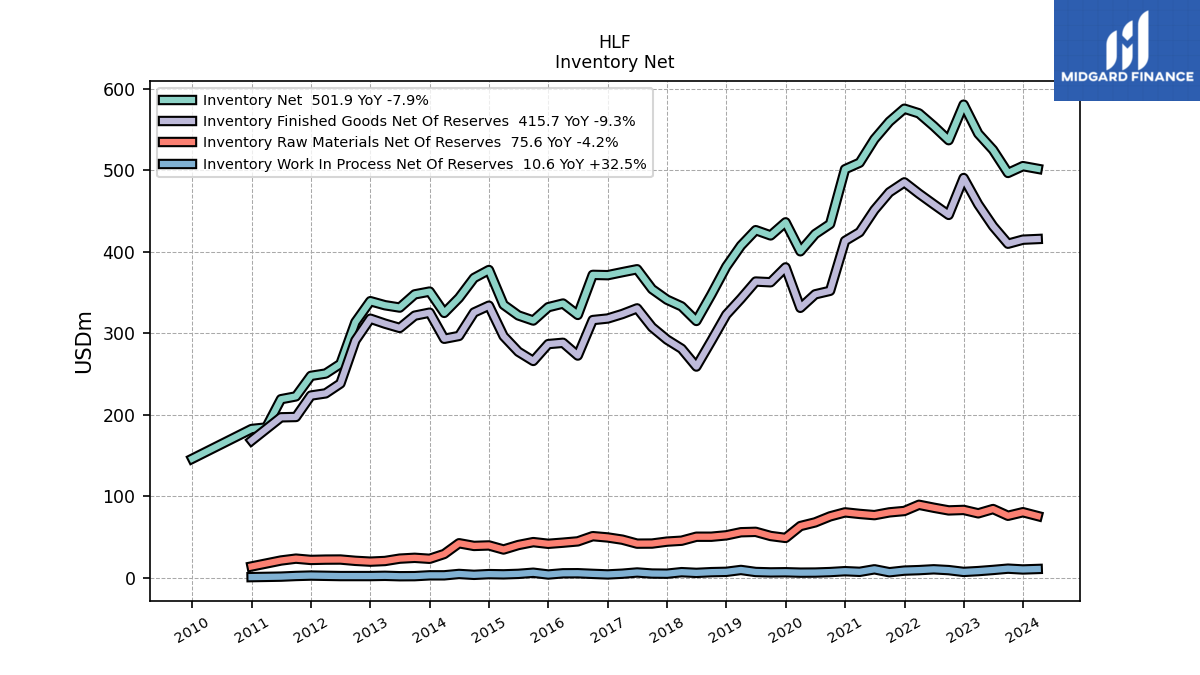
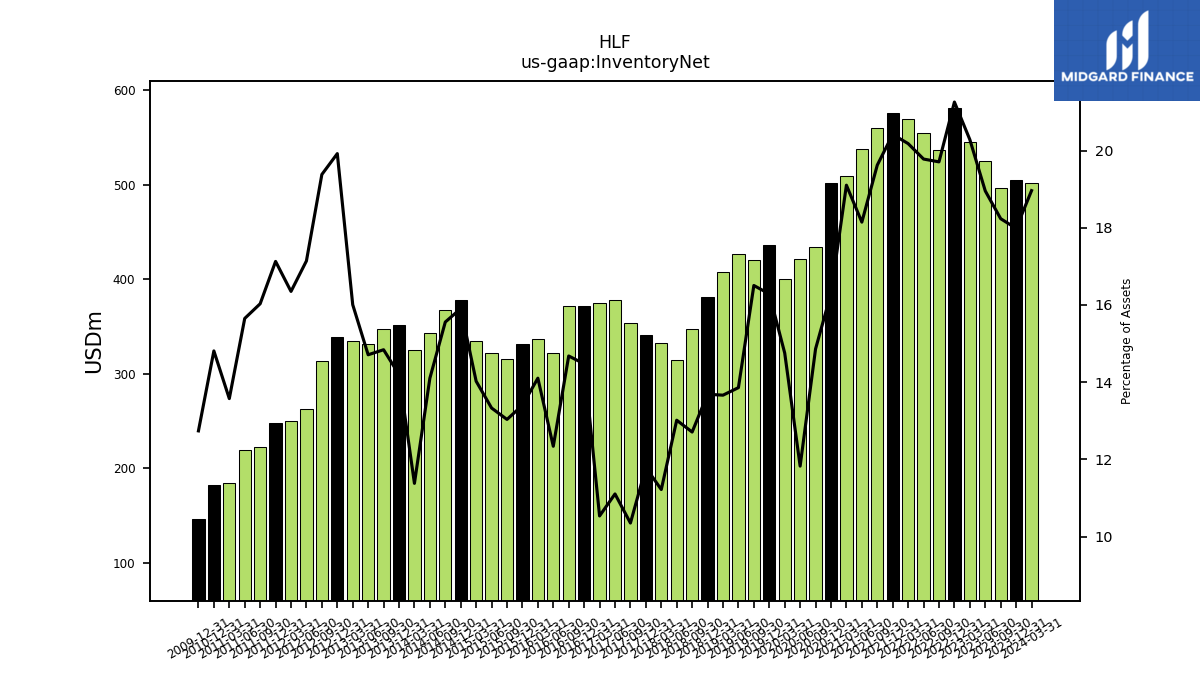
| Inventory Net | 501.90 | 505.20 | 496.80 | 525.10 | 545.10 | 580.70 | 537.00 | 554.30 | 570.00 | 575.70 | 559.80 | 538.30 | 509.40 | 501.40 | 434.10 | 421.80 | 400.60 | 436.20 | 420.10 | 426.60 | 407.50 | 381.80 | 347.50 | 315.10 | 333.00 | 341.20 | 354.20 | 378.60 | 375.00 | 371.30 | 371.70 | 322.50 | 336.50 | 332.00 | 315.60 | 321.90 | 335.00 | 377.70 | 367.83 | 343.45 | 324.99 | 351.20 | 347.74 | 331.53 | 334.41 | 339.41 | 313.58 | 262.39 | 250.54 | 247.70 | 222.50 | 219.03 | 184.32 | 182.47 | NA | NA | NA | |
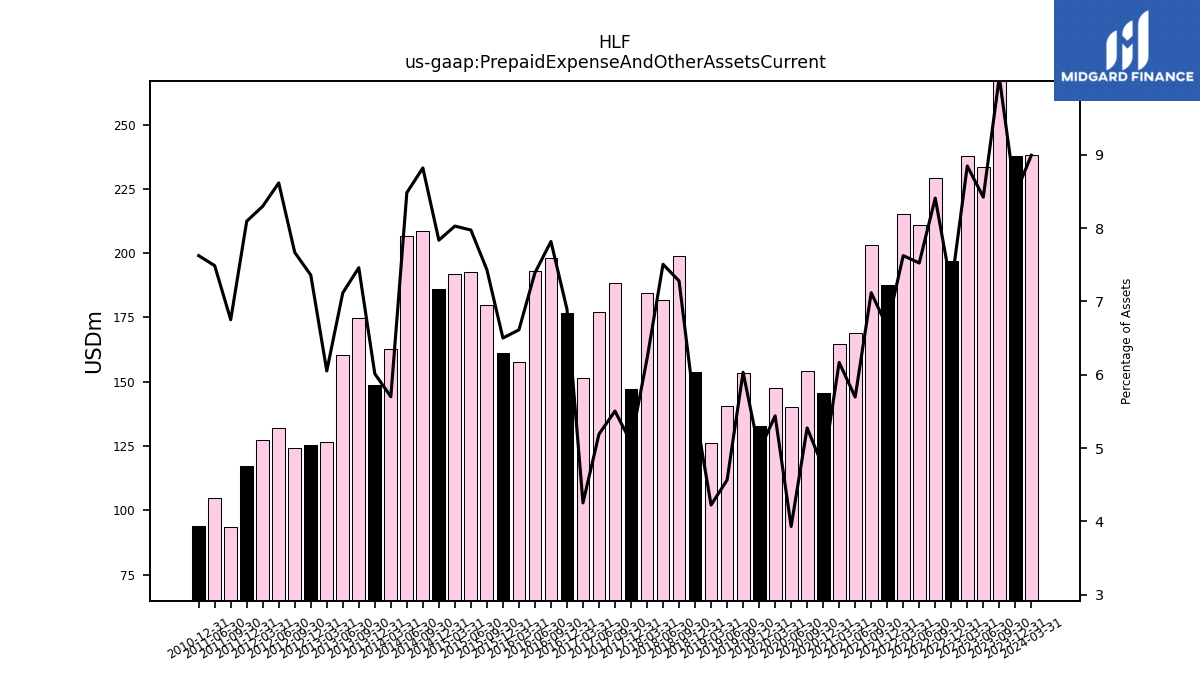
| Prepaid Expense And Other Assets Current | 238.10 | 237.70 | 274.10 | 233.40 | 237.80 | 196.80 | 229.20 | 210.90 | 215.40 | 187.70 | 203.10 | 169.00 | 164.50 | 145.70 | 154.10 | 140.20 | 147.70 | 132.90 | 153.60 | 140.50 | 126.00 | 153.80 | 199.10 | 181.80 | 184.60 | 147.00 | 188.40 | 177.00 | 151.40 | 176.90 | 198.00 | 193.20 | 157.80 | 161.10 | 180.00 | 192.60 | 191.80 | 186.10 | 208.59 | 206.65 | 162.84 | 148.77 | 174.84 | 160.44 | 126.47 | 125.42 | 124.09 | 131.92 | 127.18 | 117.07 | 93.72 | 104.81 | NA | 93.96 | NA | NA | NA | |
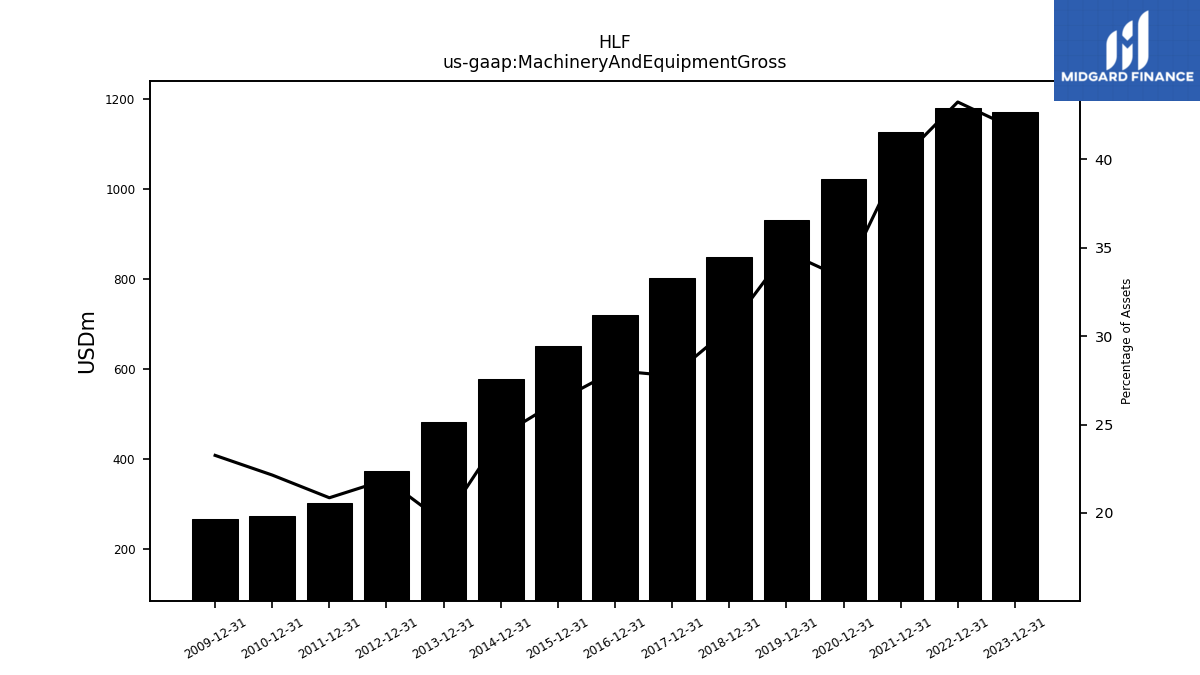
| Machinery And Equipment Gross | NA | 1172.20 | NA | NA | NA | 1181.50 | NA | NA | NA | 1127.10 | NA | NA | NA | 1023.70 | NA | NA | NA | 931.30 | NA | NA | NA | 849.40 | NA | NA | NA | 803.50 | NA | NA | NA | 719.80 | NA | NA | NA | 652.40 | NA | NA | NA | 578.50 | NA | NA | NA | 481.97 | NA | NA | NA | 373.03 | NA | NA | NA | 301.69 | NA | NA | NA | 272.88 | NA | NA | NA |
| 2024-03-31 | 2023-12-31 | 2023-09-30 | 2023-06-30 | 2023-03-31 | 2022-12-31 | 2022-09-30 | 2022-06-30 | 2022-03-31 | 2021-12-31 | 2021-09-30 | 2021-06-30 | 2021-03-31 | 2020-12-31 | 2020-09-30 | 2020-06-30 | 2020-03-31 | 2019-12-31 | 2019-09-30 | 2019-06-30 | 2019-03-31 | 2018-12-31 | 2018-09-30 | 2018-06-30 | 2018-03-31 | 2017-12-31 | 2017-09-30 | 2017-06-30 | 2017-03-31 | 2016-12-31 | 2016-09-30 | 2016-06-30 | 2016-03-31 | 2015-12-31 | 2015-09-30 | 2015-06-30 | 2015-03-31 | 2014-12-31 | 2014-09-30 | 2014-06-30 | 2014-03-31 | 2013-12-31 | 2013-09-30 | 2013-06-30 | 2013-03-31 | 2012-12-31 | 2012-09-30 | 2012-06-30 | 2012-03-31 | 2011-12-31 | 2011-09-30 | 2011-06-30 | 2011-03-31 | 2010-12-31 | 2010-09-30 | 2010-06-30 | 2010-03-31 | ||
|---|---|---|---|---|---|---|---|---|---|---|---|---|---|---|---|---|---|---|---|---|---|---|---|---|---|---|---|---|---|---|---|---|---|---|---|---|---|---|---|---|---|---|---|---|---|---|---|---|---|---|---|---|---|---|---|---|---|---|
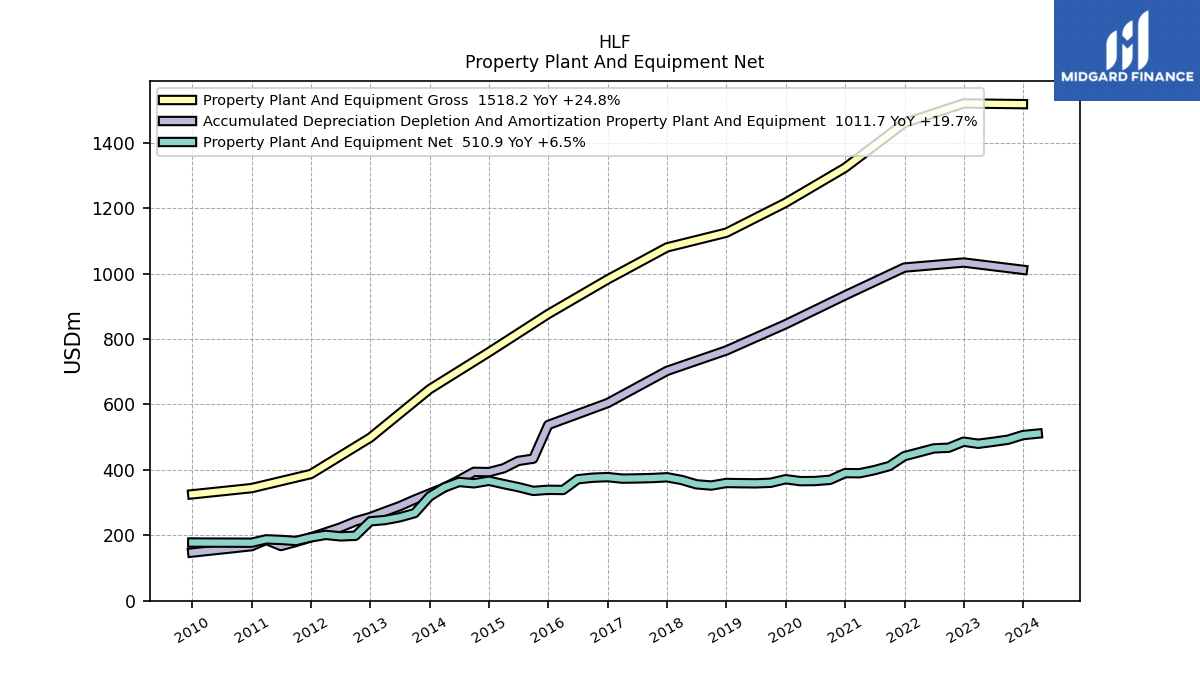
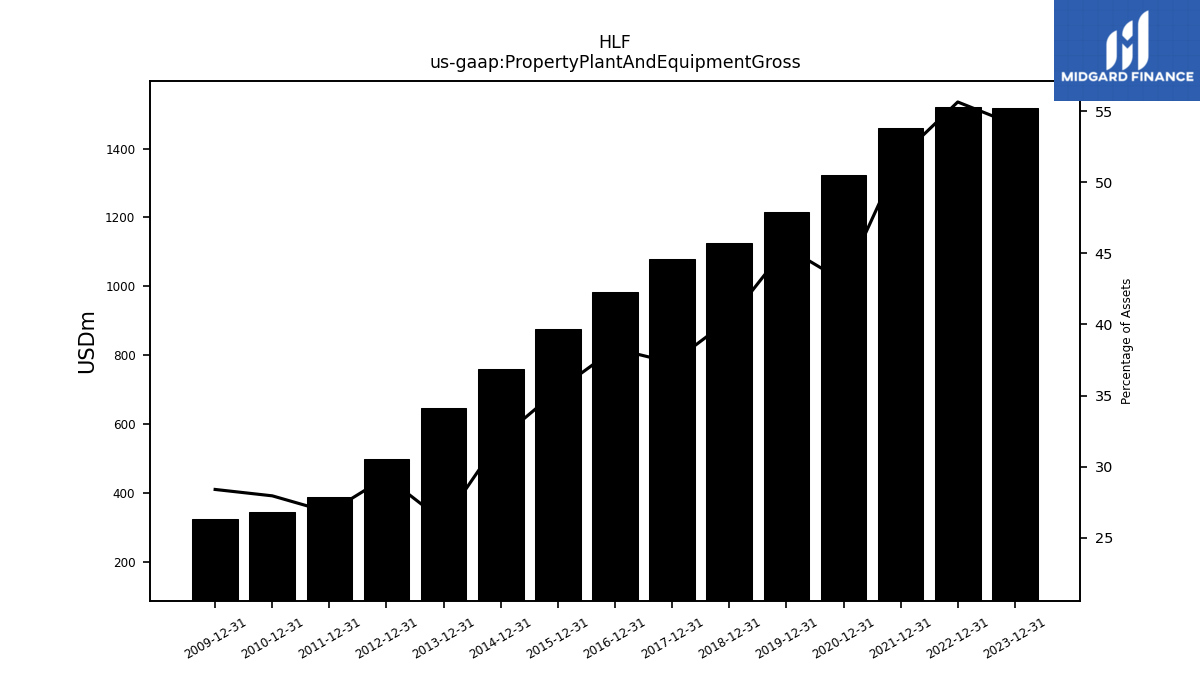
| Property Plant And Equipment Gross | NA | 1518.20 | NA | NA | NA | 1520.30 | NA | NA | NA | 1460.70 | NA | NA | NA | 1323.70 | NA | NA | NA | 1216.80 | NA | NA | NA | 1125.10 | NA | NA | NA | 1080.20 | NA | NA | NA | 982.40 | NA | NA | NA | 876.60 | NA | NA | NA | 759.90 | NA | NA | NA | 646.72 | NA | NA | NA | 498.75 | NA | NA | NA | 387.44 | NA | NA | NA | 344.34 | NA | NA | NA | |
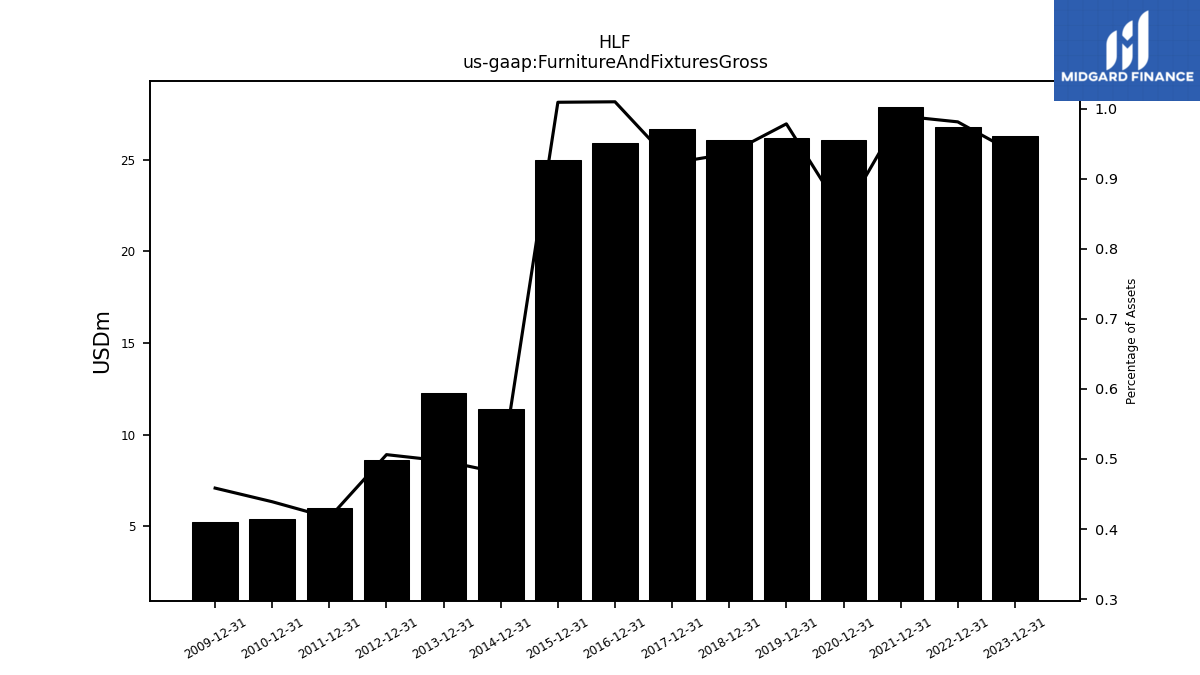
| Furniture And Fixtures Gross | NA | 26.30 | NA | NA | NA | 26.80 | NA | NA | NA | 27.90 | NA | NA | NA | 26.10 | NA | NA | NA | 26.20 | NA | NA | NA | 26.10 | NA | NA | NA | 26.70 | NA | NA | NA | 25.90 | NA | NA | NA | 25.00 | NA | NA | NA | 11.40 | NA | NA | NA | 12.30 | NA | NA | NA | 8.62 | NA | NA | NA | 6.02 | NA | NA | NA | 5.41 | NA | NA | NA | |
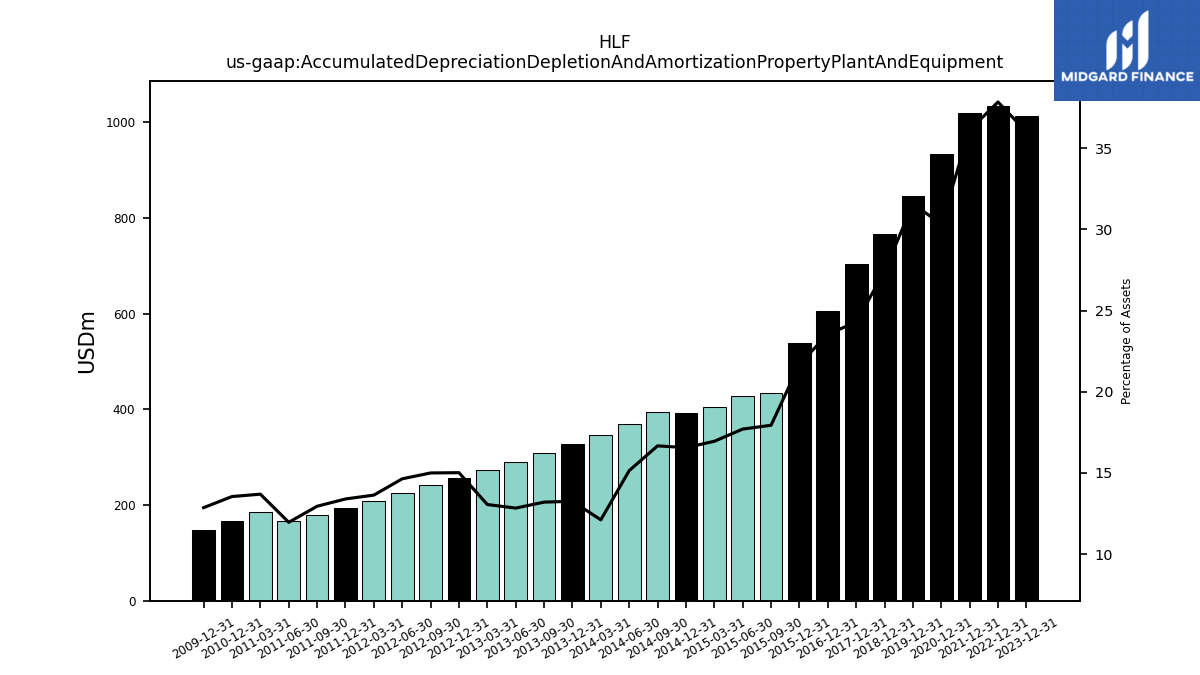
| Accumulated Depreciation Depletion And Amortization Property Plant And Equipment | NA | 1011.70 | NA | NA | NA | 1034.00 | NA | NA | NA | 1018.60 | NA | NA | NA | 933.50 | NA | NA | NA | 845.30 | NA | NA | NA | 765.10 | NA | NA | NA | 702.70 | NA | NA | NA | 604.40 | NA | NA | NA | 537.40 | 434.30 | 427.50 | 404.90 | 393.20 | 394.14 | 368.80 | 345.95 | 327.86 | 309.37 | 289.27 | 272.73 | 255.86 | 242.69 | 224.07 | 208.93 | 193.74 | 179.71 | 167.38 | 185.93 | 166.91 | NA | NA | NA | |
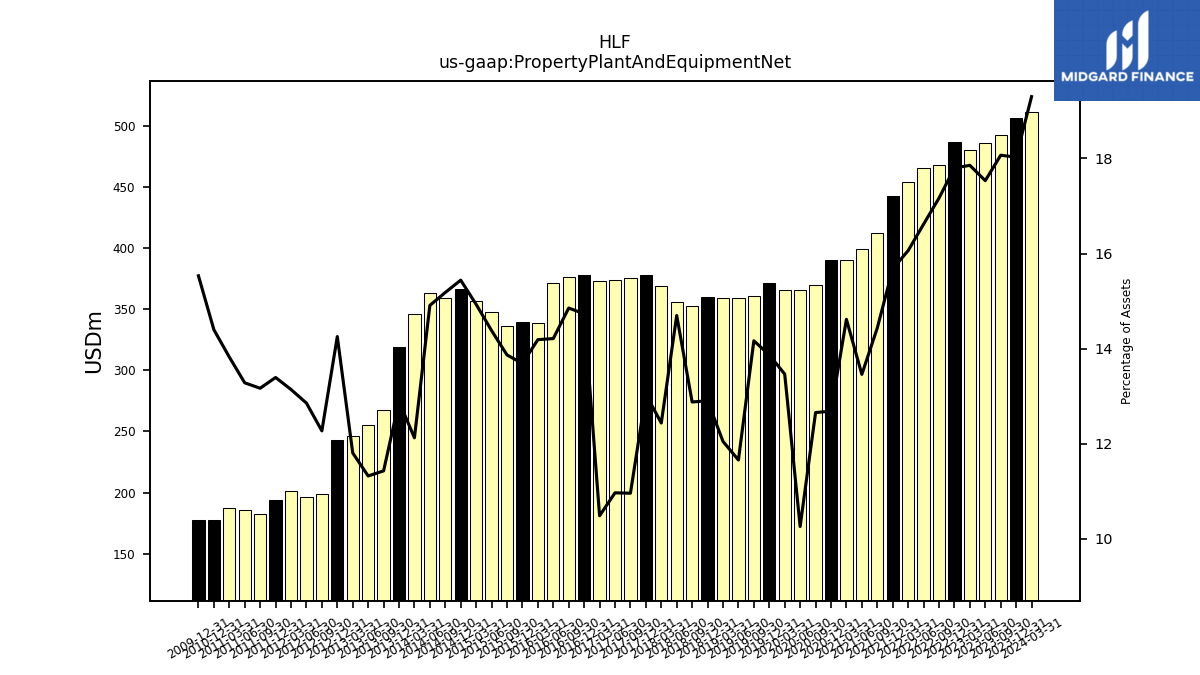
| Property Plant And Equipment Net | 510.90 | 506.50 | 492.30 | 485.80 | 479.90 | 486.30 | 467.80 | 465.70 | 453.70 | 442.10 | 411.80 | 399.30 | 389.80 | 390.20 | 369.70 | 366.00 | 365.60 | 371.50 | 360.60 | 358.90 | 359.40 | 360.00 | 352.20 | 355.90 | 369.20 | 377.50 | 375.10 | 374.00 | 373.30 | 378.00 | 376.20 | 371.50 | 338.60 | 339.20 | 335.80 | 347.30 | 356.70 | 366.70 | 358.98 | 363.17 | 346.36 | 318.86 | 267.85 | 255.21 | 246.68 | 242.89 | 198.56 | 196.79 | 201.38 | 193.70 | 182.77 | 185.89 | 187.73 | 177.43 | NA | NA | NA | |
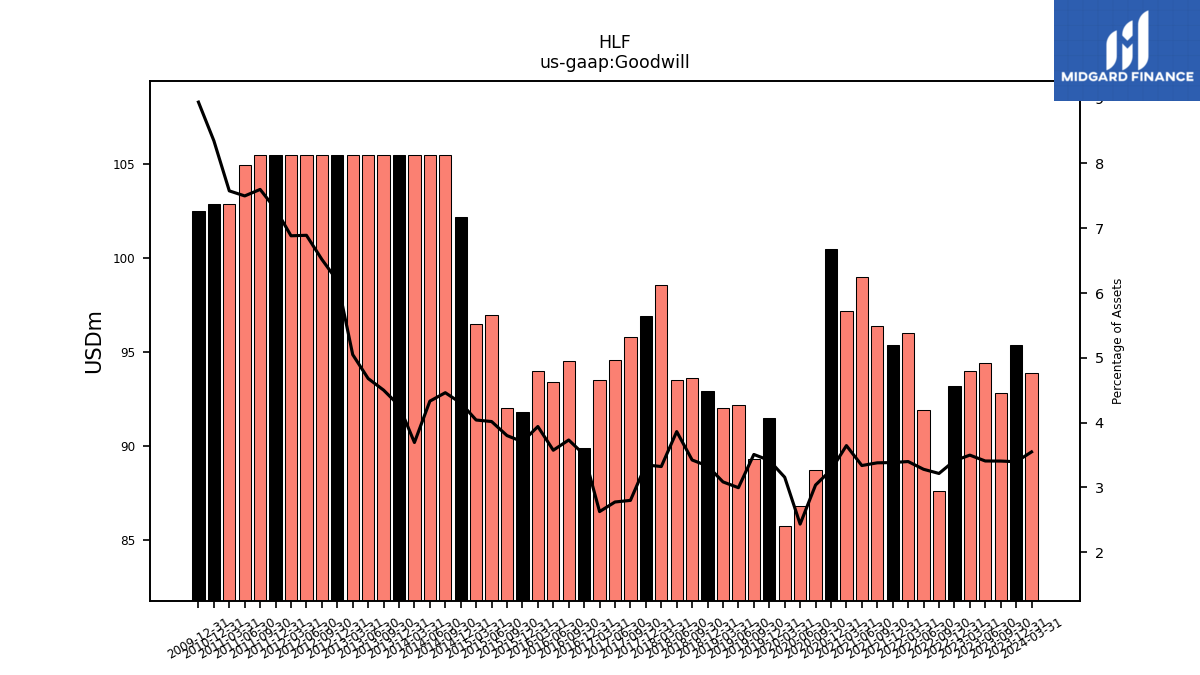
| Goodwill | 93.90 | 95.40 | 92.80 | 94.40 | 94.00 | 93.20 | 87.60 | 91.90 | 96.00 | 95.40 | 96.40 | 99.00 | 97.20 | 100.50 | 88.70 | 86.80 | 85.70 | 91.50 | 89.30 | 92.20 | 92.00 | 92.90 | 93.60 | 93.50 | 98.60 | 96.90 | 95.80 | 94.60 | 93.50 | 89.90 | 94.50 | 93.40 | 94.00 | 91.80 | 92.00 | 97.00 | 96.50 | 102.20 | 105.49 | 105.49 | 105.49 | 105.49 | 105.49 | 105.49 | 105.49 | 105.49 | 105.49 | 105.49 | 105.49 | 105.49 | 105.49 | 104.96 | 102.90 | 102.90 | NA | NA | NA | |
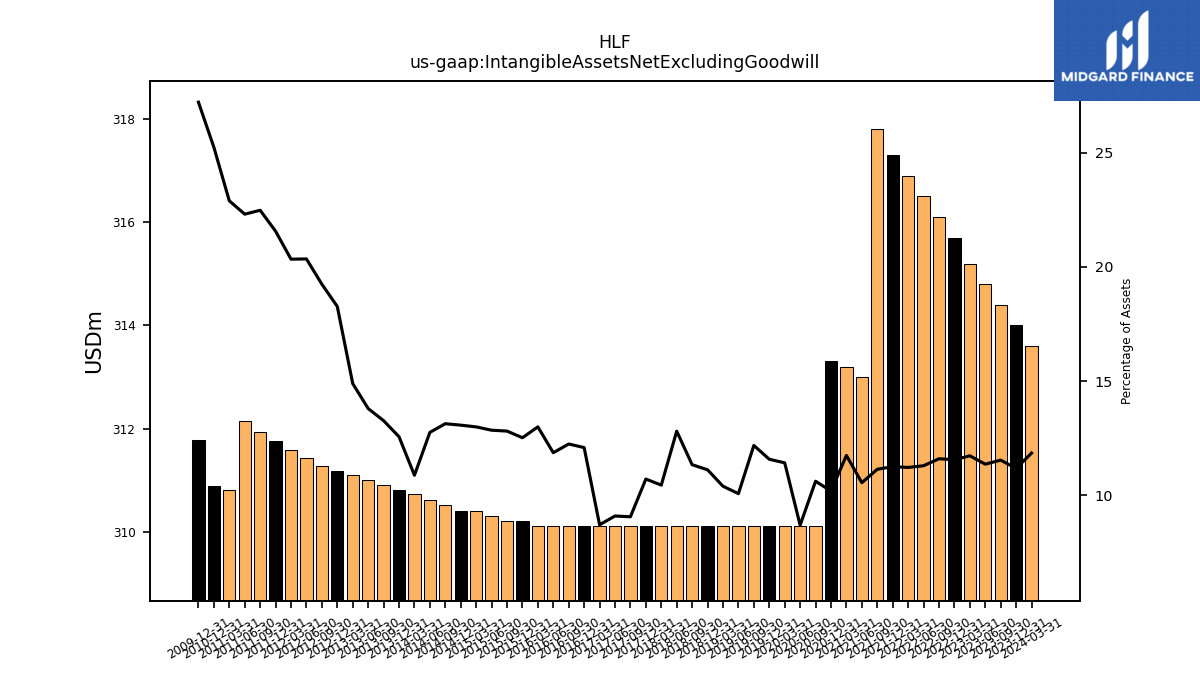
| Intangible Assets Net Excluding Goodwill | 313.60 | 314.00 | 314.40 | 314.80 | 315.20 | 315.70 | 316.10 | 316.50 | 316.90 | 317.30 | 317.80 | 313.00 | 313.20 | 313.30 | 310.10 | 310.10 | 310.10 | 310.10 | 310.10 | 310.10 | 310.10 | 310.10 | 310.10 | 310.10 | 310.10 | 310.10 | 310.10 | 310.10 | 310.10 | 310.10 | 310.10 | 310.10 | 310.10 | 310.20 | 310.20 | 310.30 | 310.40 | 310.40 | 310.52 | 310.61 | 310.73 | 310.80 | 310.90 | 310.99 | 311.09 | 311.19 | 311.28 | 311.43 | 311.59 | 311.76 | 311.94 | 312.15 | 310.81 | 310.89 | NA | NA | NA | |
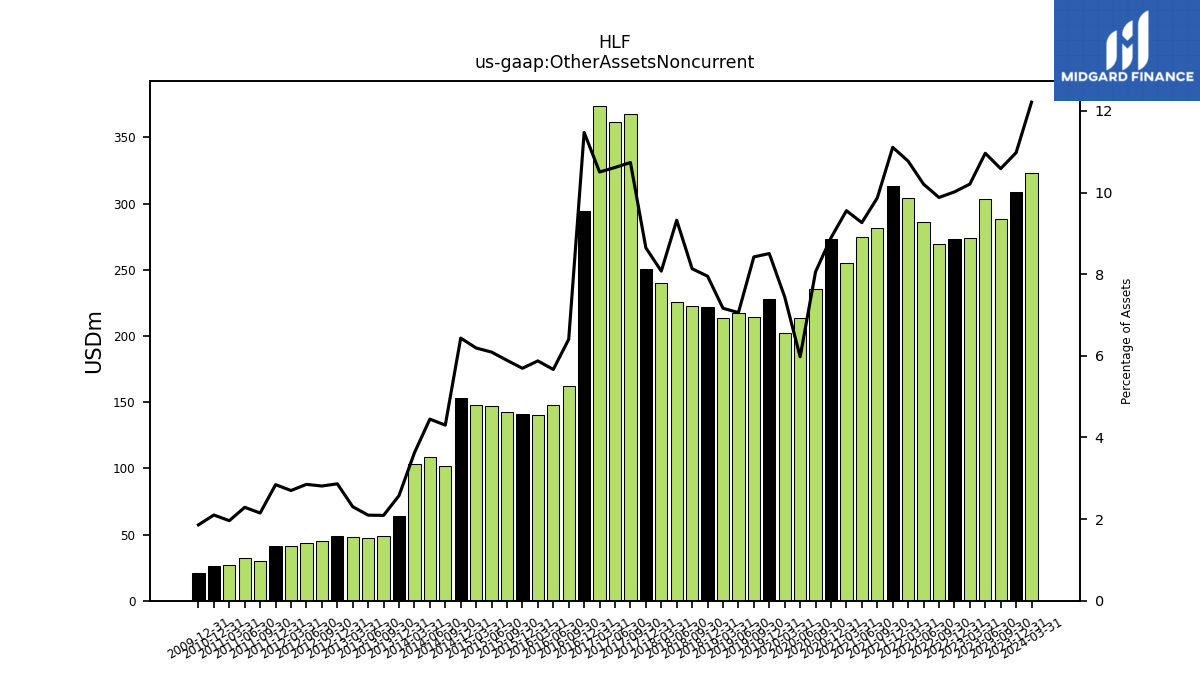
| Other Assets Noncurrent | 323.30 | 308.40 | 288.40 | 303.70 | 274.30 | 273.60 | 269.20 | 286.00 | 304.20 | 313.20 | 281.50 | 274.80 | 254.80 | 273.50 | 235.40 | 213.20 | 202.10 | 227.80 | 214.40 | 217.30 | 213.70 | 221.80 | 222.40 | 225.70 | 239.70 | 250.30 | 367.40 | 361.90 | 373.90 | 294.30 | 162.20 | 148.10 | 140.20 | 141.10 | 142.60 | 147.10 | 147.90 | 152.80 | 101.73 | 108.36 | 103.57 | 63.71 | 49.01 | 47.25 | 48.14 | 48.80 | 45.48 | 43.64 | 41.38 | 41.12 | 29.83 | 32.03 | 26.64 | 25.88 | NA | NA | NA |
| 2024-03-31 | 2023-12-31 | 2023-09-30 | 2023-06-30 | 2023-03-31 | 2022-12-31 | 2022-09-30 | 2022-06-30 | 2022-03-31 | 2021-12-31 | 2021-09-30 | 2021-06-30 | 2021-03-31 | 2020-12-31 | 2020-09-30 | 2020-06-30 | 2020-03-31 | 2019-12-31 | 2019-09-30 | 2019-06-30 | 2019-03-31 | 2018-12-31 | 2018-09-30 | 2018-06-30 | 2018-03-31 | 2017-12-31 | 2017-09-30 | 2017-06-30 | 2017-03-31 | 2016-12-31 | 2016-09-30 | 2016-06-30 | 2016-03-31 | 2015-12-31 | 2015-09-30 | 2015-06-30 | 2015-03-31 | 2014-12-31 | 2014-09-30 | 2014-06-30 | 2014-03-31 | 2013-12-31 | 2013-09-30 | 2013-06-30 | 2013-03-31 | 2012-12-31 | 2012-09-30 | 2012-06-30 | 2012-03-31 | 2011-12-31 | 2011-09-30 | 2011-06-30 | 2011-03-31 | 2010-12-31 | 2010-09-30 | 2010-06-30 | 2010-03-31 | ||
|---|---|---|---|---|---|---|---|---|---|---|---|---|---|---|---|---|---|---|---|---|---|---|---|---|---|---|---|---|---|---|---|---|---|---|---|---|---|---|---|---|---|---|---|---|---|---|---|---|---|---|---|---|---|---|---|---|---|---|
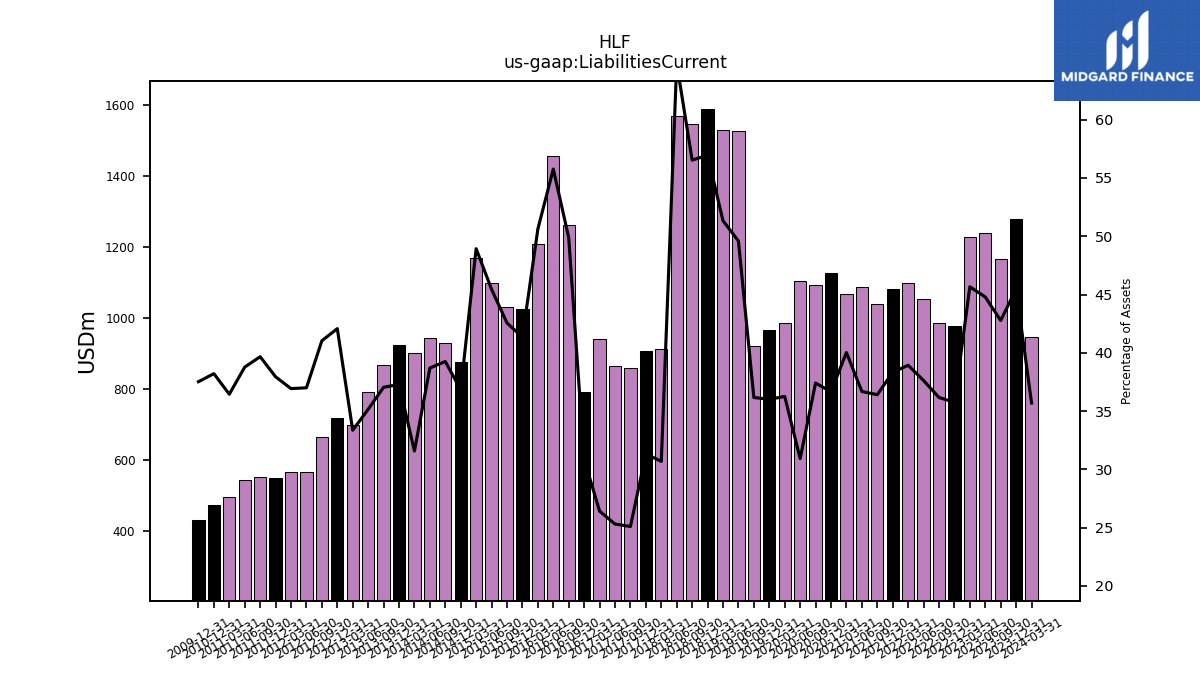
| Liabilities Current | 944.70 | 1277.60 | 1165.40 | 1240.80 | 1227.20 | 976.60 | 985.50 | 1054.30 | 1099.60 | 1080.40 | 1038.60 | 1088.20 | 1067.20 | 1127.30 | 1092.70 | 1103.00 | 984.40 | 964.40 | 920.60 | 1526.70 | 1531.10 | 1588.80 | 1546.00 | 1570.20 | 910.90 | 906.80 | 858.80 | 862.80 | 940.60 | 791.50 | 1263.30 | 1457.70 | 1207.90 | 1024.40 | 1030.50 | 1097.50 | 1168.90 | 874.80 | 928.03 | 942.37 | 901.90 | 922.18 | 867.96 | 792.25 | 696.87 | 716.89 | 663.95 | 566.33 | 565.84 | 548.69 | 550.54 | 542.66 | 494.88 | 470.82 | NA | NA | NA | |
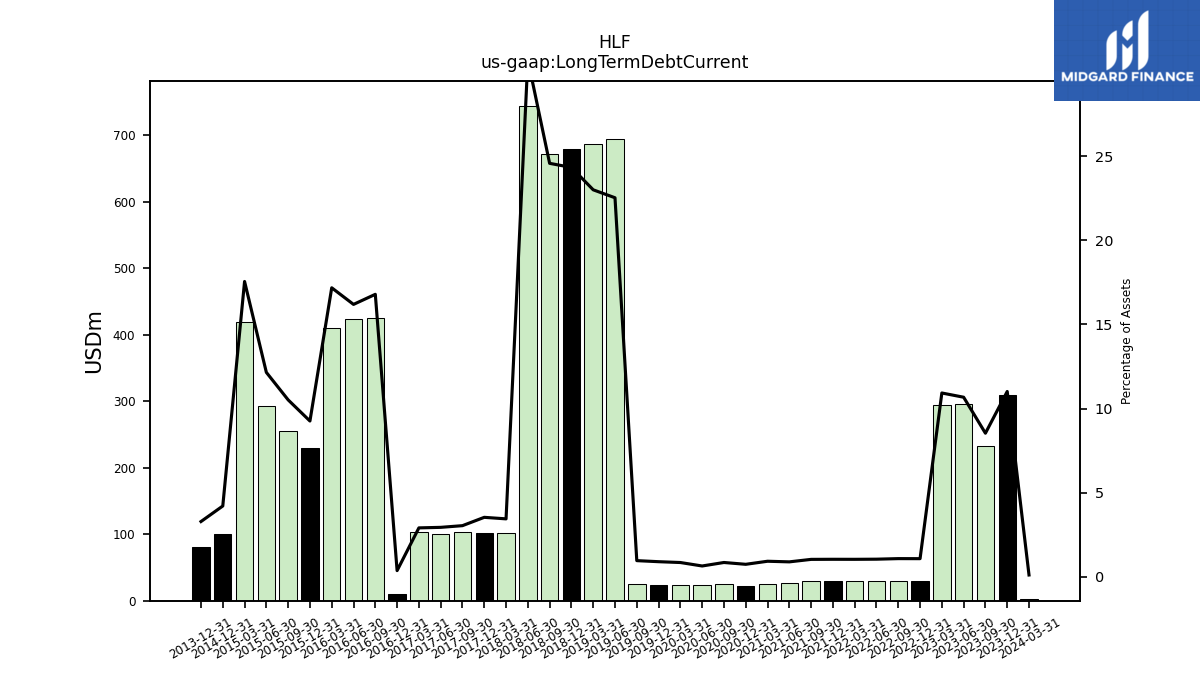
| Long Term Debt Current | 2.90 | 309.50 | 232.60 | 295.80 | 293.70 | 29.50 | 29.50 | 29.40 | 29.40 | 29.40 | 29.60 | 26.40 | 24.70 | 22.90 | 24.90 | 23.00 | 23.10 | 24.10 | 24.50 | 693.70 | 686.20 | 678.90 | 672.20 | 744.30 | 102.30 | 102.40 | 104.10 | 100.30 | 103.60 | 9.50 | 425.30 | 423.30 | 410.00 | 229.50 | 254.70 | 293.50 | 419.40 | 100.00 | NA | NA | NA | 81.30 | NA | NA | NA | NA | NA | NA | NA | NA | NA | NA | NA | NA | NA | NA | NA | |
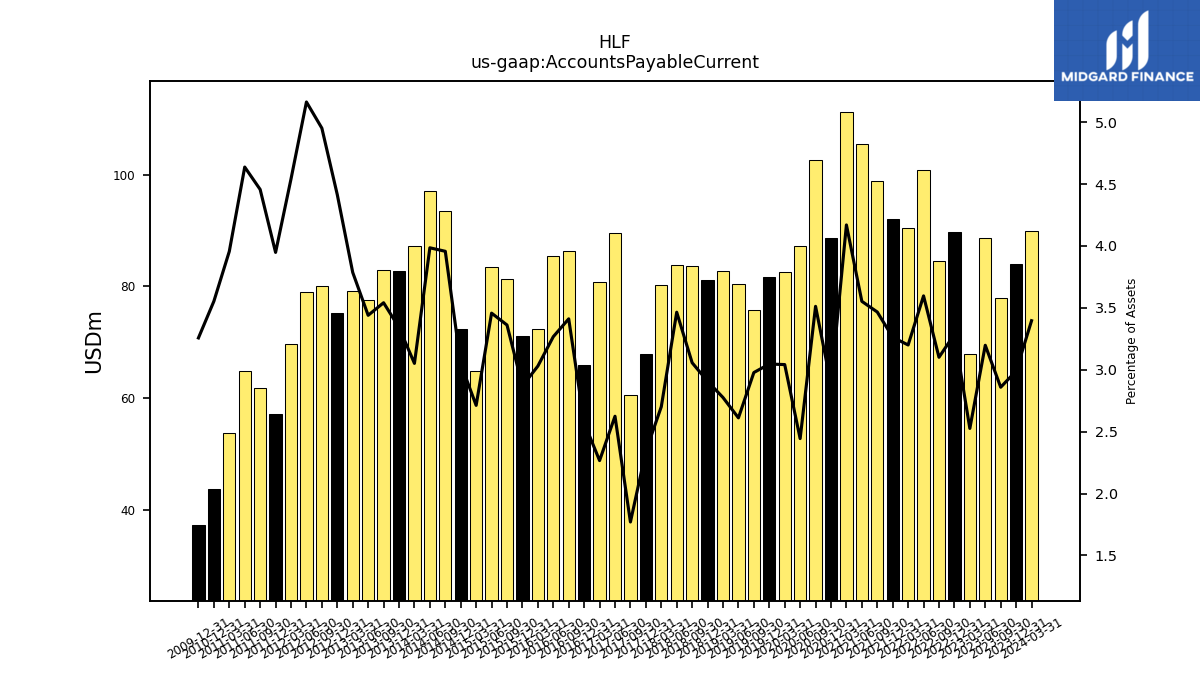
| Accounts Payable Current | 89.90 | 84.00 | 77.90 | 88.60 | 67.90 | 89.80 | 84.50 | 100.80 | 90.40 | 92.00 | 98.90 | 105.40 | 111.20 | 88.70 | 102.60 | 87.20 | 82.60 | 81.60 | 75.80 | 80.40 | 82.80 | 81.10 | 83.60 | 83.90 | 80.20 | 67.80 | 60.60 | 89.50 | 80.70 | 66.00 | 86.40 | 85.40 | 72.30 | 71.10 | 81.40 | 83.50 | 64.80 | 72.40 | 93.56 | 97.06 | 87.17 | 82.67 | 82.99 | 77.53 | 79.11 | 75.21 | 80.12 | 79.03 | 69.59 | 57.09 | 61.86 | 64.90 | 53.73 | 43.78 | NA | NA | NA | |
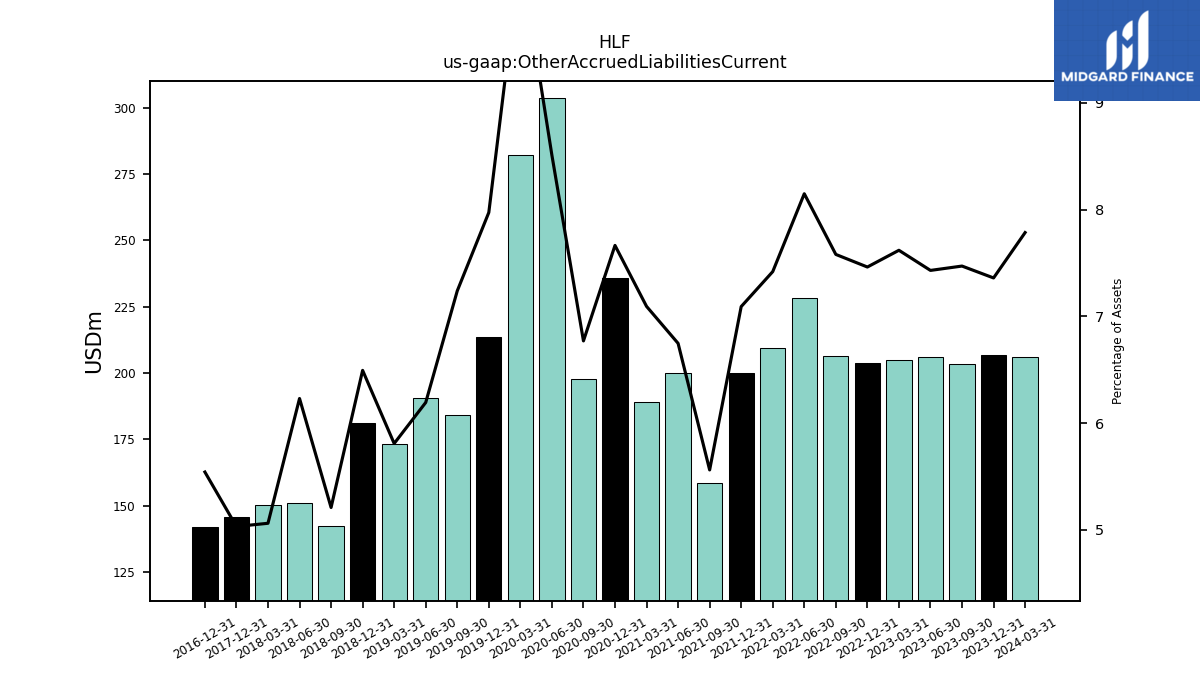
| Other Accrued Liabilities Current | 206.10 | 206.80 | 203.60 | 205.90 | 204.80 | 203.90 | 206.60 | 228.40 | 209.60 | 200.00 | 158.70 | 200.20 | 189.20 | 235.80 | 197.80 | 303.60 | 282.10 | 213.60 | 184.30 | 190.70 | 173.30 | 181.20 | 142.50 | 150.90 | 150.30 | 145.70 | NA | NA | NA | 142.20 | NA | NA | NA | NA | NA | NA | NA | NA | NA | NA | NA | NA | NA | NA | NA | NA | NA | NA | NA | NA | NA | NA | NA | NA | NA | NA | NA | |
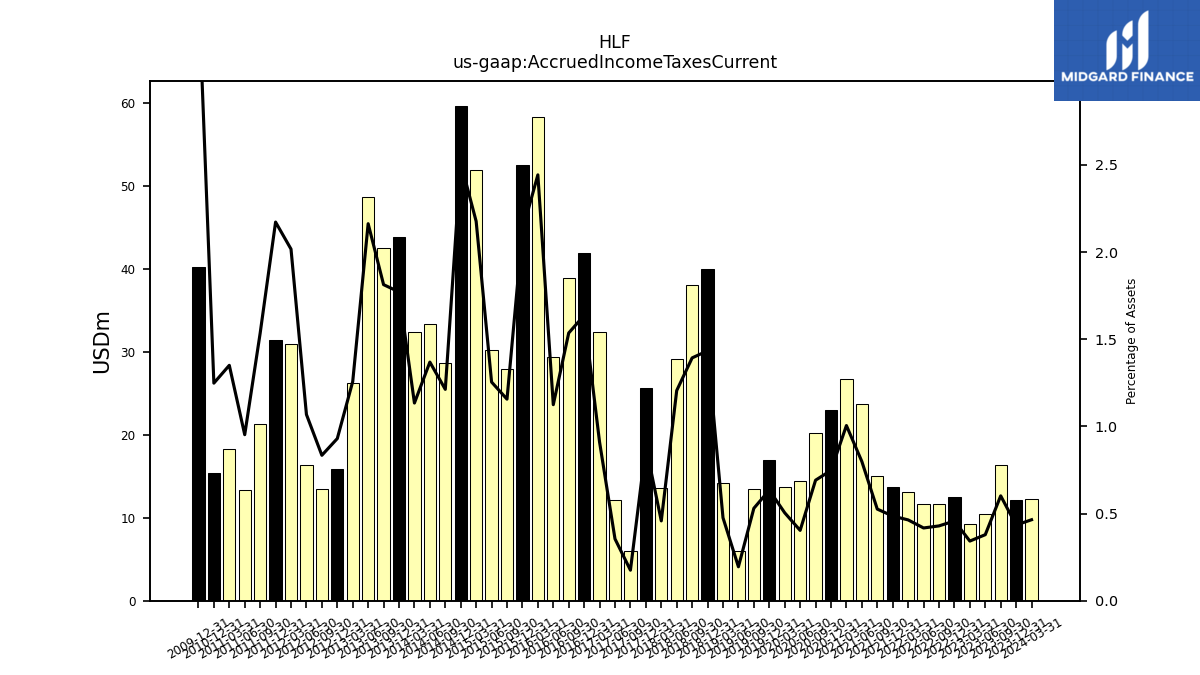
| Accrued Income Taxes Current | 12.30 | 12.20 | 16.40 | 10.50 | 9.20 | 12.50 | 11.70 | 11.70 | 13.10 | 13.70 | 15.00 | 23.70 | 26.80 | 23.00 | 20.20 | 14.40 | 13.70 | 17.00 | 13.50 | 6.00 | 14.20 | 40.00 | 38.10 | 29.20 | 13.60 | 25.70 | 6.00 | 12.10 | 32.40 | 42.00 | 38.90 | 29.40 | 58.30 | 52.60 | 28.00 | 30.30 | 52.00 | 59.70 | 28.67 | 33.34 | 32.40 | 43.83 | 42.49 | 48.75 | 26.27 | 15.85 | 13.50 | 16.36 | 30.91 | 31.41 | 21.30 | 13.33 | 18.34 | 15.38 | NA | NA | NA | |
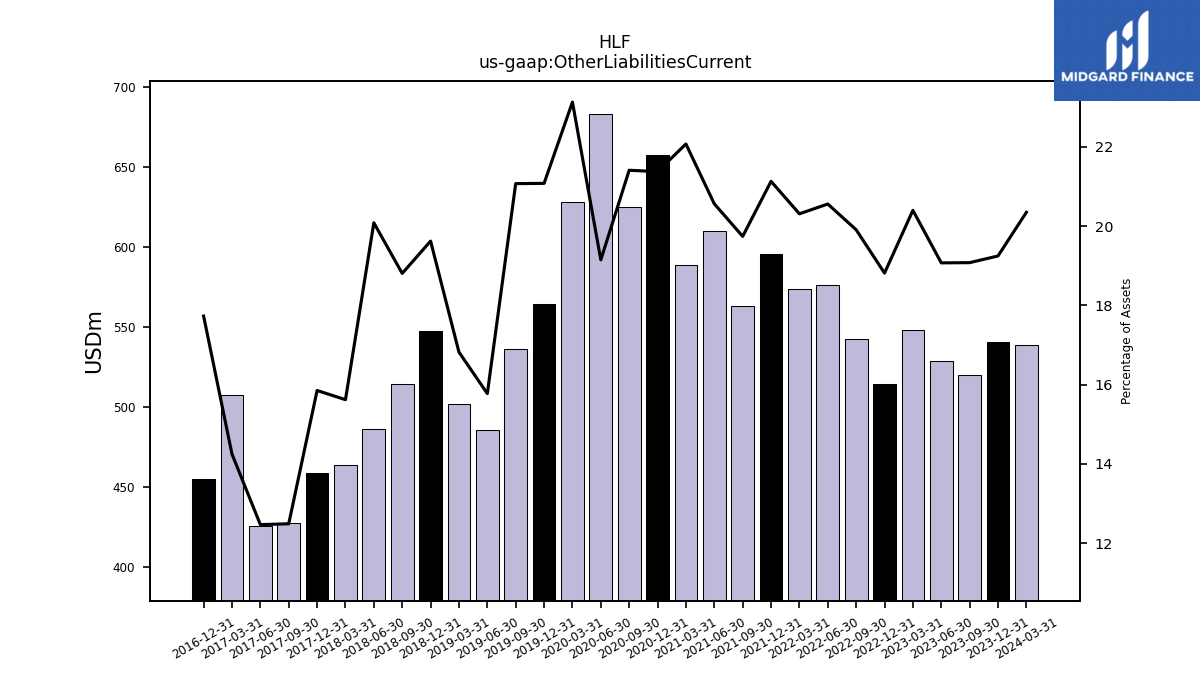
| Other Liabilities Current | 538.60 | 540.70 | 519.80 | 528.40 | 548.20 | 514.00 | 542.50 | 576.10 | 573.70 | 595.80 | 563.20 | 610.00 | 588.60 | 657.50 | 625.40 | 683.10 | 628.00 | 564.60 | 536.40 | 485.60 | 501.70 | 547.40 | 514.30 | 486.30 | 463.70 | 458.90 | 427.40 | 425.10 | 507.20 | 454.80 | NA | NA | NA | NA | NA | NA | NA | NA | NA | NA | NA | NA | NA | NA | NA | NA | NA | NA | NA | NA | NA | NA | NA | NA | NA | NA | NA | |
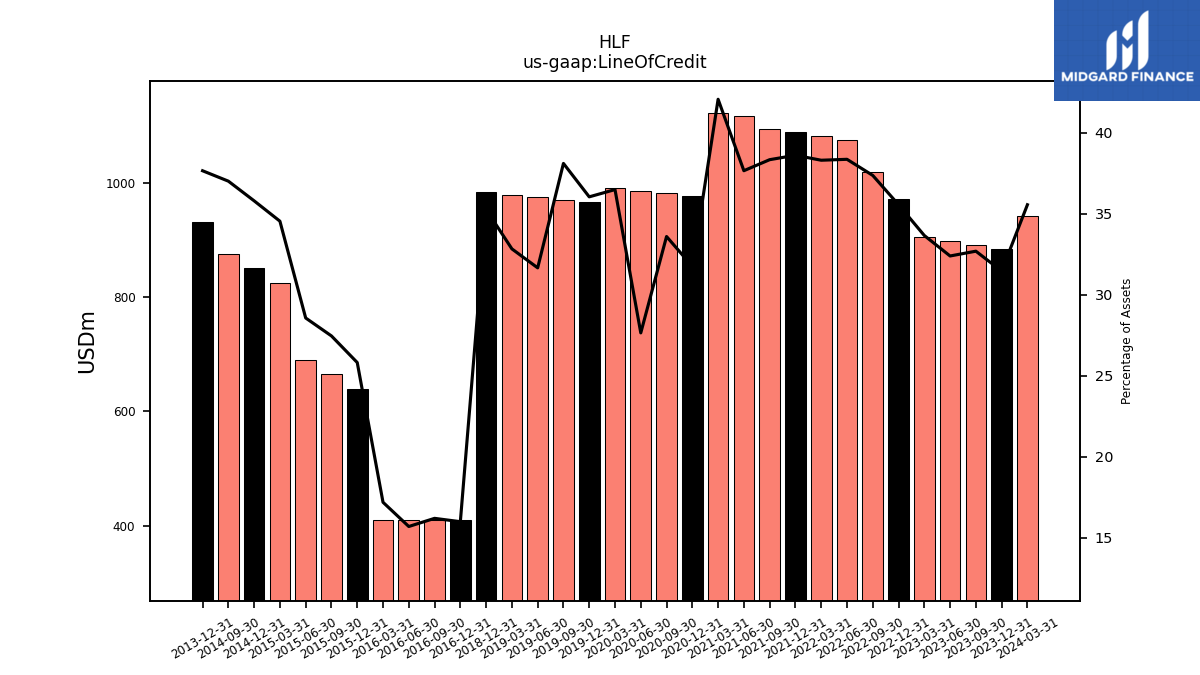
| Line Of Credit | 941.00 | 883.70 | 890.50 | 897.30 | 904.40 | 971.30 | 1018.10 | 1074.90 | 1081.80 | 1088.60 | 1093.60 | 1117.00 | 1121.70 | 976.50 | 981.20 | 986.00 | 990.70 | 965.30 | 969.90 | 974.50 | 979.10 | 983.60 | NA | NA | NA | NA | NA | NA | NA | 410.00 | 410.00 | 410.00 | 410.00 | 639.50 | 664.70 | 689.70 | 825.00 | 850.00 | 875.00 | NA | NA | 931.30 | NA | NA | NA | NA | NA | NA | NA | NA | NA | NA | NA | NA | NA | NA | NA |
| 2024-03-31 | 2023-12-31 | 2023-09-30 | 2023-06-30 | 2023-03-31 | 2022-12-31 | 2022-09-30 | 2022-06-30 | 2022-03-31 | 2021-12-31 | 2021-09-30 | 2021-06-30 | 2021-03-31 | 2020-12-31 | 2020-09-30 | 2020-06-30 | 2020-03-31 | 2019-12-31 | 2019-09-30 | 2019-06-30 | 2019-03-31 | 2018-12-31 | 2018-09-30 | 2018-06-30 | 2018-03-31 | 2017-12-31 | 2017-09-30 | 2017-06-30 | 2017-03-31 | 2016-12-31 | 2016-09-30 | 2016-06-30 | 2016-03-31 | 2015-12-31 | 2015-09-30 | 2015-06-30 | 2015-03-31 | 2014-12-31 | 2014-09-30 | 2014-06-30 | 2014-03-31 | 2013-12-31 | 2013-09-30 | 2013-06-30 | 2013-03-31 | 2012-12-31 | 2012-09-30 | 2012-06-30 | 2012-03-31 | 2011-12-31 | 2011-09-30 | 2011-06-30 | 2011-03-31 | 2010-12-31 | 2010-09-30 | 2010-06-30 | 2010-03-31 | ||
|---|---|---|---|---|---|---|---|---|---|---|---|---|---|---|---|---|---|---|---|---|---|---|---|---|---|---|---|---|---|---|---|---|---|---|---|---|---|---|---|---|---|---|---|---|---|---|---|---|---|---|---|---|---|---|---|---|---|---|
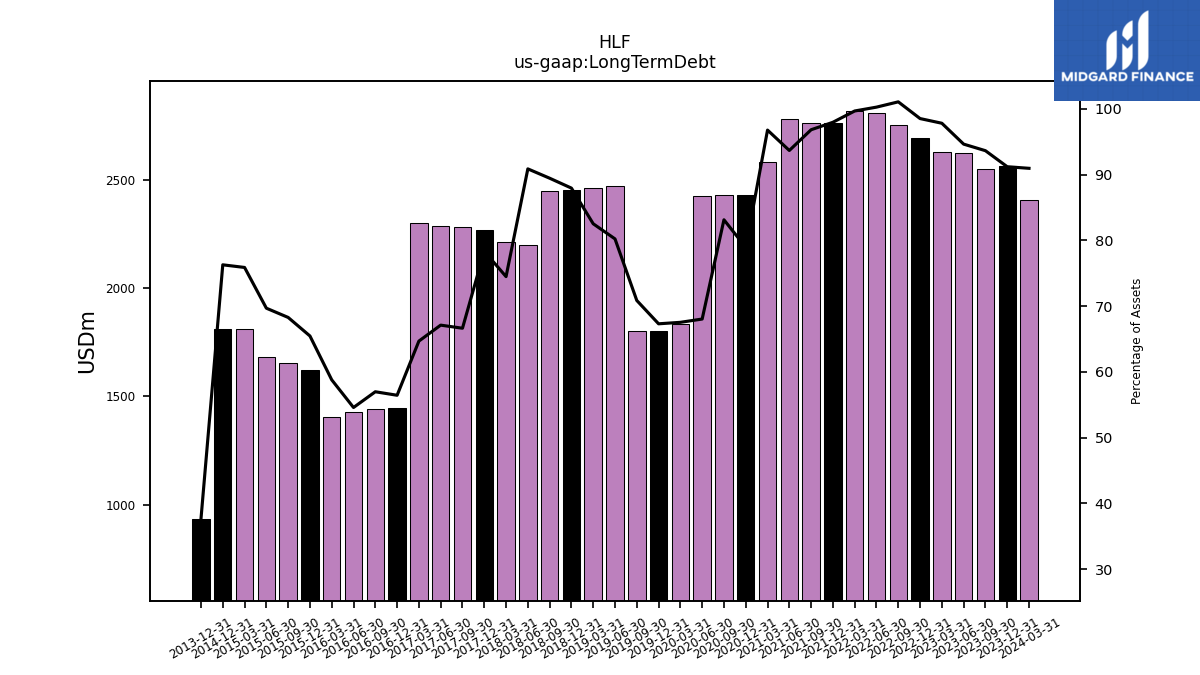
| Long Term Debt | 2407.90 | 2562.40 | 2551.60 | 2622.30 | 2629.10 | 2692.00 | 2754.50 | 2810.20 | 2815.90 | 2762.60 | 2762.70 | 2779.20 | 2581.00 | 2428.40 | 2428.60 | 2427.10 | 1833.80 | 1803.00 | 1803.80 | 2469.90 | 2461.70 | 2453.80 | 2446.60 | 2200.70 | 2211.40 | 2268.10 | 2280.70 | 2288.40 | 2302.80 | 1447.90 | 1442.90 | 1426.60 | 1402.80 | 1622.00 | 1653.40 | 1683.00 | 1812.80 | 1811.70 | NA | NA | NA | 931.30 | NA | NA | NA | NA | NA | NA | NA | NA | NA | NA | NA | NA | NA | NA | NA | |
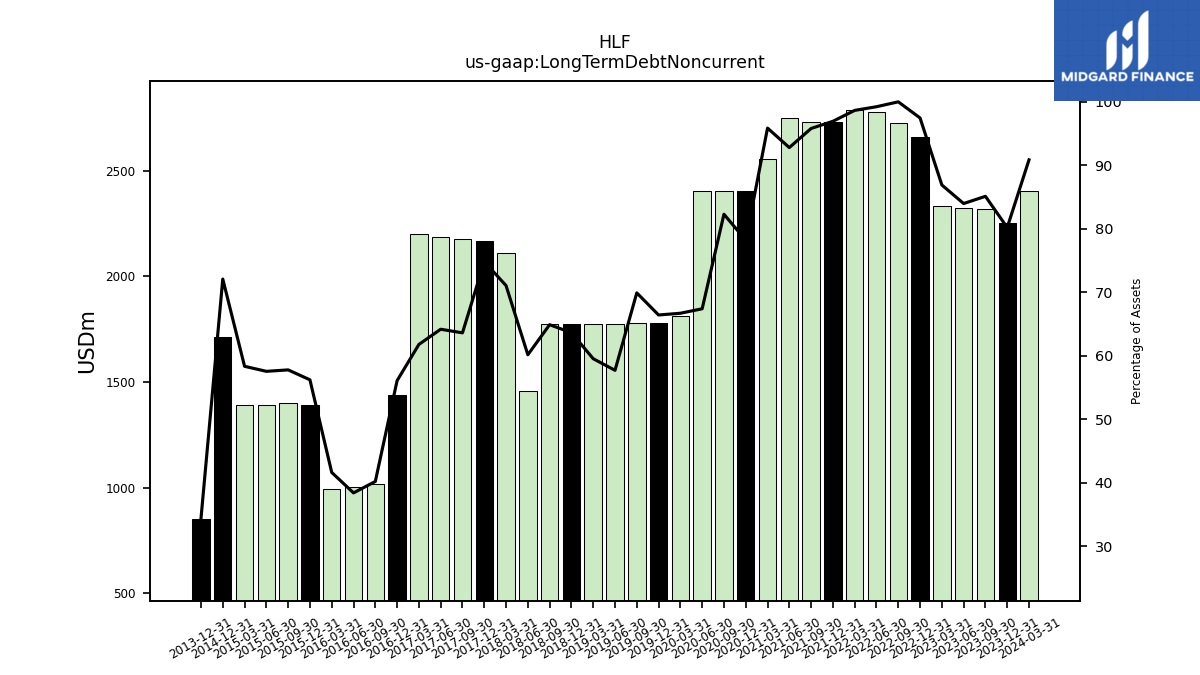
| Long Term Debt Noncurrent | 2405.00 | 2252.90 | 2319.00 | 2326.50 | 2335.40 | 2662.50 | 2725.00 | 2780.80 | 2786.50 | 2733.20 | 2733.10 | 2752.80 | 2556.30 | 2405.50 | 2403.70 | 2404.10 | 1810.70 | 1778.90 | 1779.30 | 1776.20 | 1775.50 | 1774.90 | 1774.40 | 1456.40 | 2109.10 | 2165.70 | 2176.60 | 2188.10 | 2199.20 | 1438.40 | 1017.60 | 1003.30 | 992.80 | 1392.50 | 1398.70 | 1389.50 | 1393.40 | 1711.70 | NA | NA | NA | 850.00 | NA | NA | NA | NA | NA | NA | NA | NA | NA | NA | NA | NA | NA | NA | NA | |
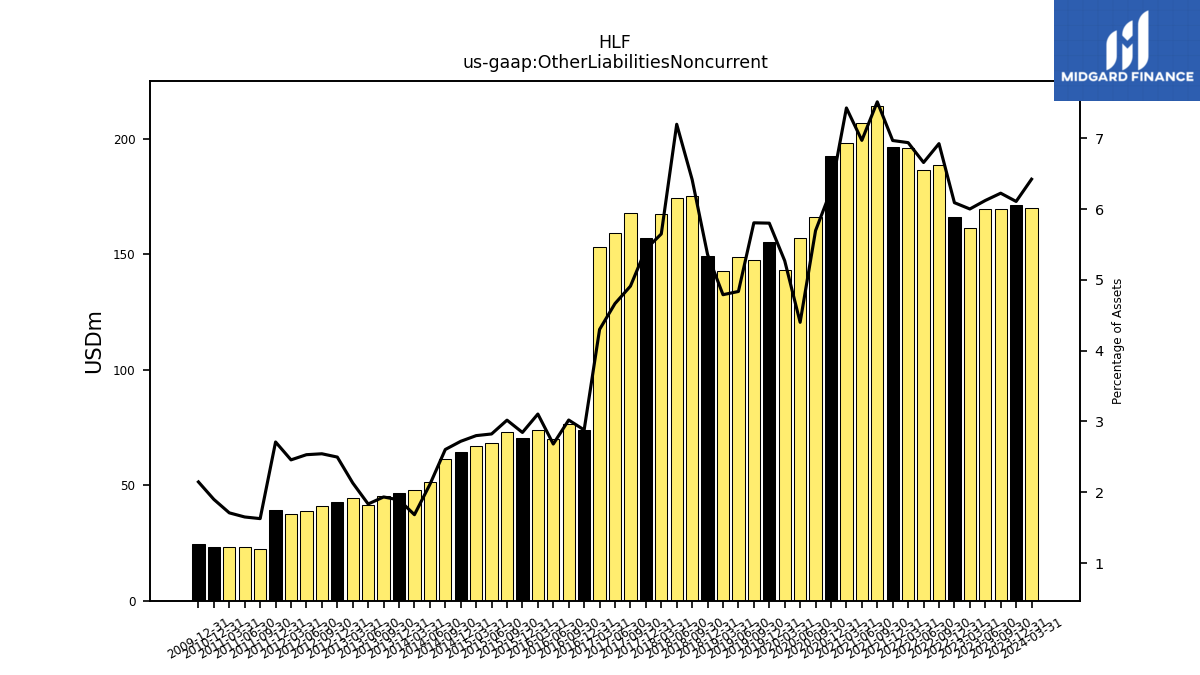
| Other Liabilities Noncurrent | 170.00 | 171.60 | 169.60 | 169.60 | 161.30 | 166.40 | 188.70 | 186.60 | 196.00 | 196.50 | 214.40 | 206.80 | 198.10 | 192.70 | 166.40 | 157.00 | 143.10 | 155.40 | 147.80 | 148.90 | 142.90 | 149.50 | 175.50 | 174.30 | 167.70 | 157.30 | 168.10 | 159.10 | 153.10 | 73.90 | 76.50 | 70.10 | 74.10 | 70.50 | 73.10 | 68.20 | 66.90 | 64.60 | 61.58 | 51.40 | 48.09 | 46.81 | 45.33 | 41.35 | 44.55 | 42.56 | 41.17 | 38.75 | 37.66 | 39.20 | 22.60 | 23.11 | 23.22 | 23.41 | NA | NA | NA | |
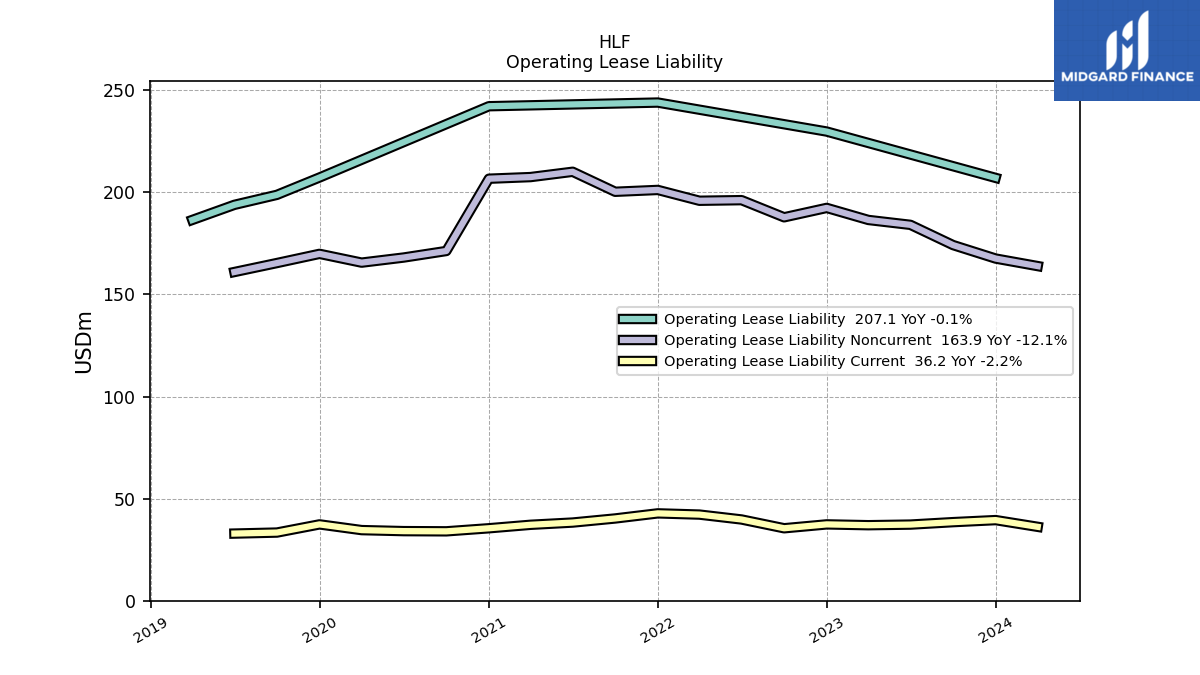
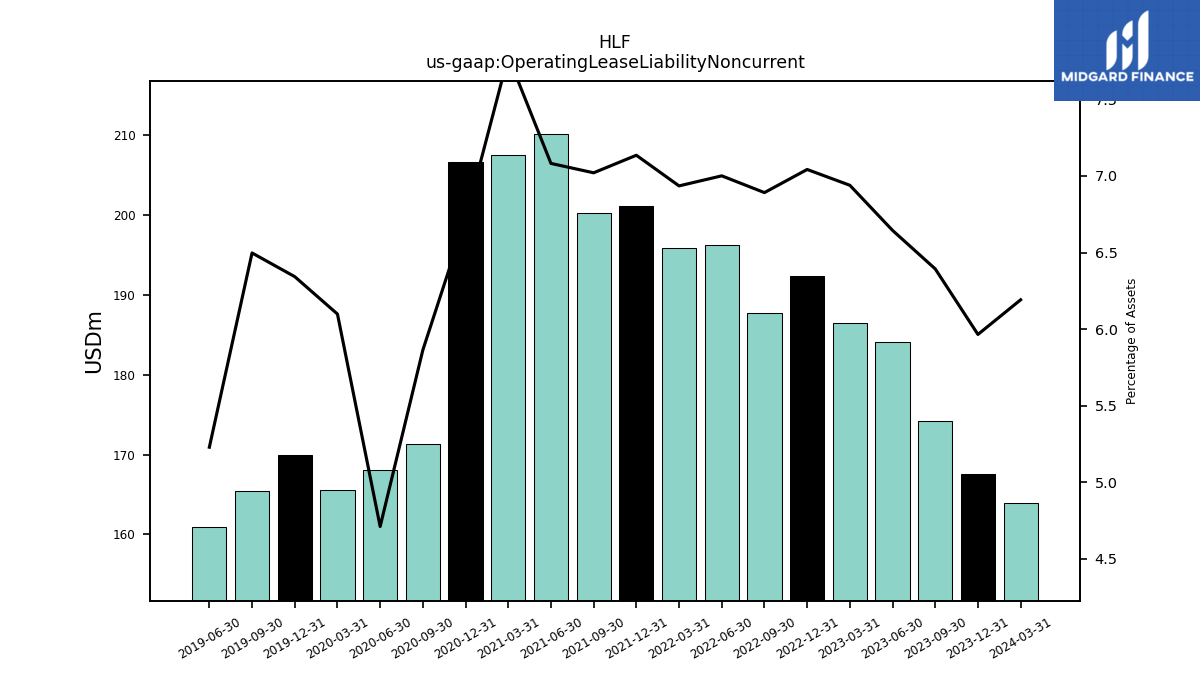
| Operating Lease Liability Noncurrent | 163.90 | 167.60 | 174.20 | 184.10 | 186.50 | 192.40 | 187.80 | 196.20 | 195.90 | 201.20 | 200.30 | 210.10 | 207.50 | 206.70 | 171.30 | 168.10 | 165.60 | 169.90 | 165.40 | 161.00 | NA | NA | NA | NA | NA | NA | NA | NA | NA | NA | NA | NA | NA | NA | NA | NA | NA | NA | NA | NA | NA | NA | NA | NA | NA | NA | NA | NA | NA | NA | NA | NA | NA | NA | NA | NA | NA |
| 2024-03-31 | 2023-12-31 | 2023-09-30 | 2023-06-30 | 2023-03-31 | 2022-12-31 | 2022-09-30 | 2022-06-30 | 2022-03-31 | 2021-12-31 | 2021-09-30 | 2021-06-30 | 2021-03-31 | 2020-12-31 | 2020-09-30 | 2020-06-30 | 2020-03-31 | 2019-12-31 | 2019-09-30 | 2019-06-30 | 2019-03-31 | 2018-12-31 | 2018-09-30 | 2018-06-30 | 2018-03-31 | 2017-12-31 | 2017-09-30 | 2017-06-30 | 2017-03-31 | 2016-12-31 | 2016-09-30 | 2016-06-30 | 2016-03-31 | 2015-12-31 | 2015-09-30 | 2015-06-30 | 2015-03-31 | 2014-12-31 | 2014-09-30 | 2014-06-30 | 2014-03-31 | 2013-12-31 | 2013-09-30 | 2013-06-30 | 2013-03-31 | 2012-12-31 | 2012-09-30 | 2012-06-30 | 2012-03-31 | 2011-12-31 | 2011-09-30 | 2011-06-30 | 2011-03-31 | 2010-12-31 | 2010-09-30 | 2010-06-30 | 2010-03-31 | ||
|---|---|---|---|---|---|---|---|---|---|---|---|---|---|---|---|---|---|---|---|---|---|---|---|---|---|---|---|---|---|---|---|---|---|---|---|---|---|---|---|---|---|---|---|---|---|---|---|---|---|---|---|---|---|---|---|---|---|---|
| Stockholders Equity | -1036.60 | -1060.30 | -1103.50 | -1150.40 | -1222.80 | -1265.90 | -1361.90 | -1415.40 | -1453.30 | -1391.50 | -1333.40 | -1291.20 | -1362.30 | -856.10 | -912.90 | -264.80 | -388.50 | -390.00 | -467.50 | -534.20 | -629.10 | -723.40 | -761.10 | -779.40 | -219.00 | -334.70 | 219.00 | 200.00 | 267.40 | 196.30 | 123.70 | 35.50 | 64.90 | -53.50 | -130.70 | -196.40 | -301.20 | -334.40 | -420.56 | -404.07 | 42.11 | 551.45 | 455.59 | 433.62 | 342.94 | 420.75 | 371.40 | 270.72 | 604.76 | 560.19 | 516.48 | 596.05 | 580.30 | 487.21 | NA | NA | NA | |
| Common Stock Value | 0.10 | 0.10 | 0.10 | 0.10 | 0.10 | 0.10 | 0.10 | 0.10 | 0.10 | 0.10 | 0.10 | 0.10 | 0.10 | 0.10 | 0.10 | 0.10 | 0.10 | 0.10 | 0.10 | 0.10 | 0.10 | 0.10 | 0.10 | 0.10 | 0.20 | 0.20 | 0.20 | 0.20 | 0.20 | 0.20 | 0.20 | 0.20 | 0.20 | 0.20 | 0.20 | 0.20 | 0.20 | 0.20 | 0.18 | 0.18 | 0.20 | 0.20 | 0.20 | 0.21 | 0.21 | 0.21 | 0.22 | 0.22 | 0.23 | 0.23 | 0.23 | 0.24 | 0.24 | 0.24 | NA | NA | NA | |
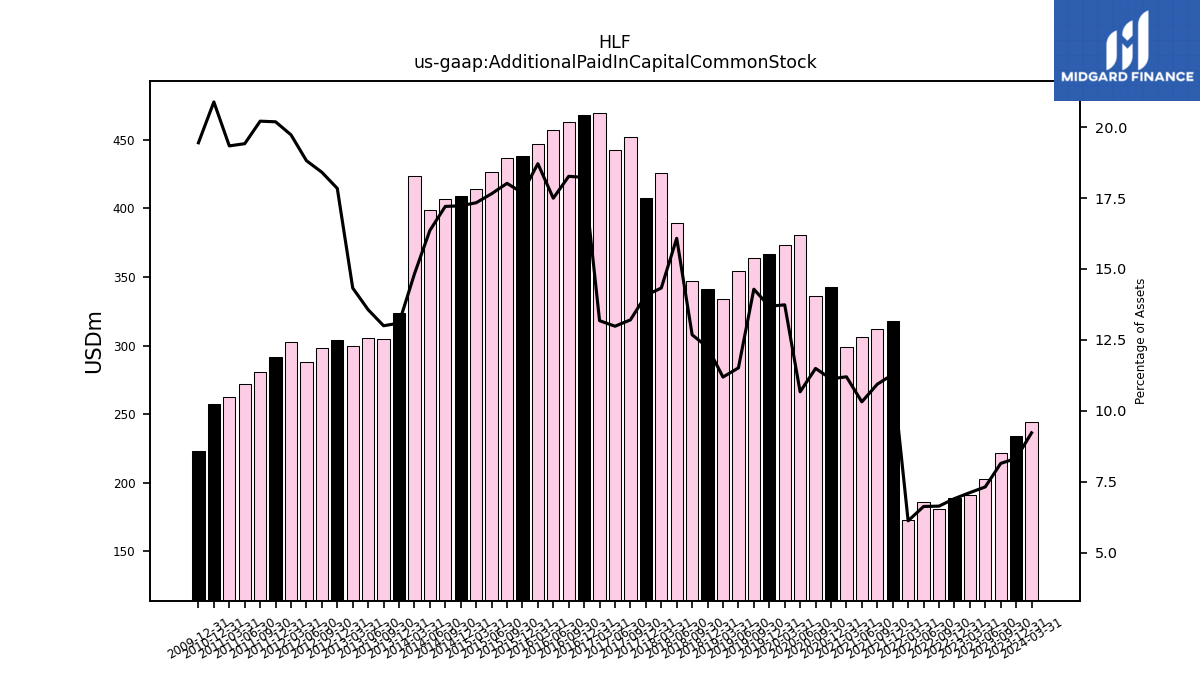
| Additional Paid In Capital Common Stock | 244.20 | 233.90 | 222.00 | 202.80 | 191.30 | 188.70 | 181.00 | 185.80 | 173.00 | 318.10 | 312.10 | 306.10 | 298.70 | 342.30 | 335.80 | 380.70 | 373.00 | 366.60 | 363.70 | 354.50 | 333.80 | 341.50 | 346.80 | 389.40 | 425.40 | 407.30 | 452.00 | 442.70 | 469.20 | 467.60 | 462.60 | 457.30 | 446.50 | 438.20 | 436.30 | 426.30 | 414.10 | 409.10 | 406.82 | 398.44 | 423.51 | 323.86 | 304.64 | 305.74 | 299.39 | 303.98 | 297.88 | 288.05 | 302.31 | 291.95 | 280.51 | 271.75 | 262.62 | 257.38 | NA | NA | NA | |
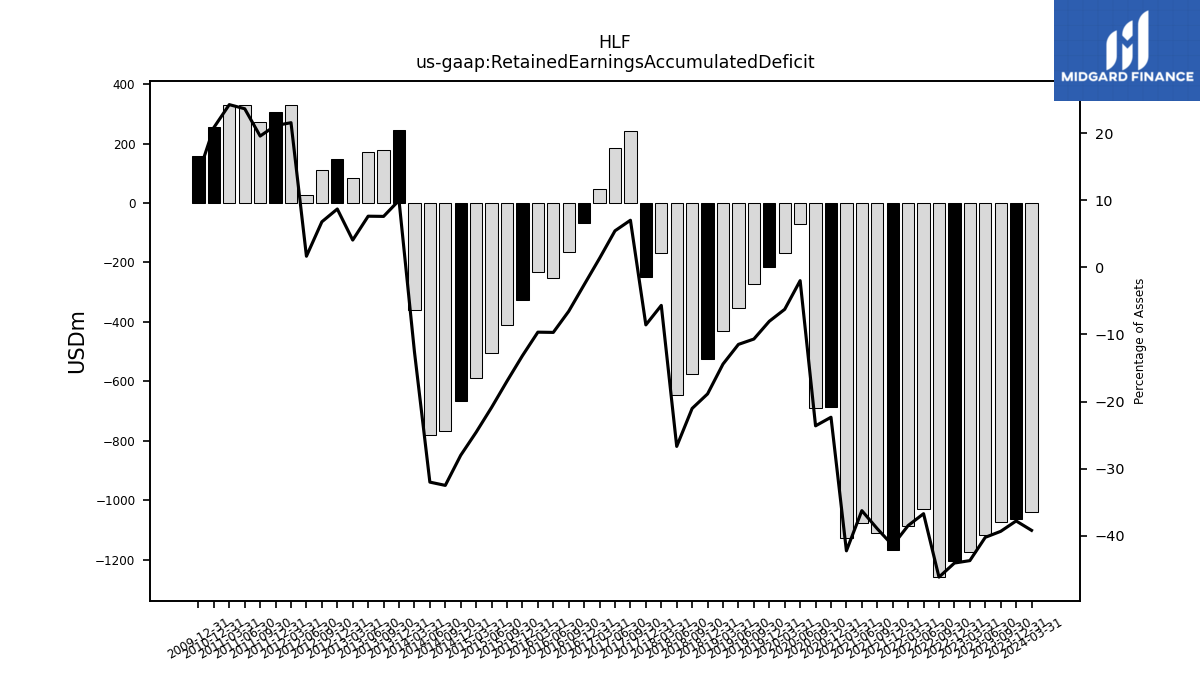
| Retained Earnings Accumulated Deficit | -1038.00 | -1062.30 | -1072.50 | -1115.30 | -1175.20 | -1204.50 | -1258.70 | -1029.30 | -1087.50 | -1169.00 | -1111.90 | -1076.20 | -1127.20 | -687.40 | -690.20 | -70.60 | -169.70 | -215.30 | -272.00 | -353.50 | -430.00 | -526.30 | -575.20 | -646.40 | -168.30 | -248.10 | 240.70 | 186.10 | 48.40 | -66.30 | -165.70 | -253.40 | -230.50 | -326.30 | -410.80 | -504.40 | -587.20 | -665.40 | -768.69 | -779.94 | -359.02 | 247.28 | 178.22 | 172.06 | 85.16 | 148.37 | 110.04 | 25.48 | 330.65 | 305.93 | 271.86 | 331.10 | 329.64 | 257.00 | NA | NA | NA | |
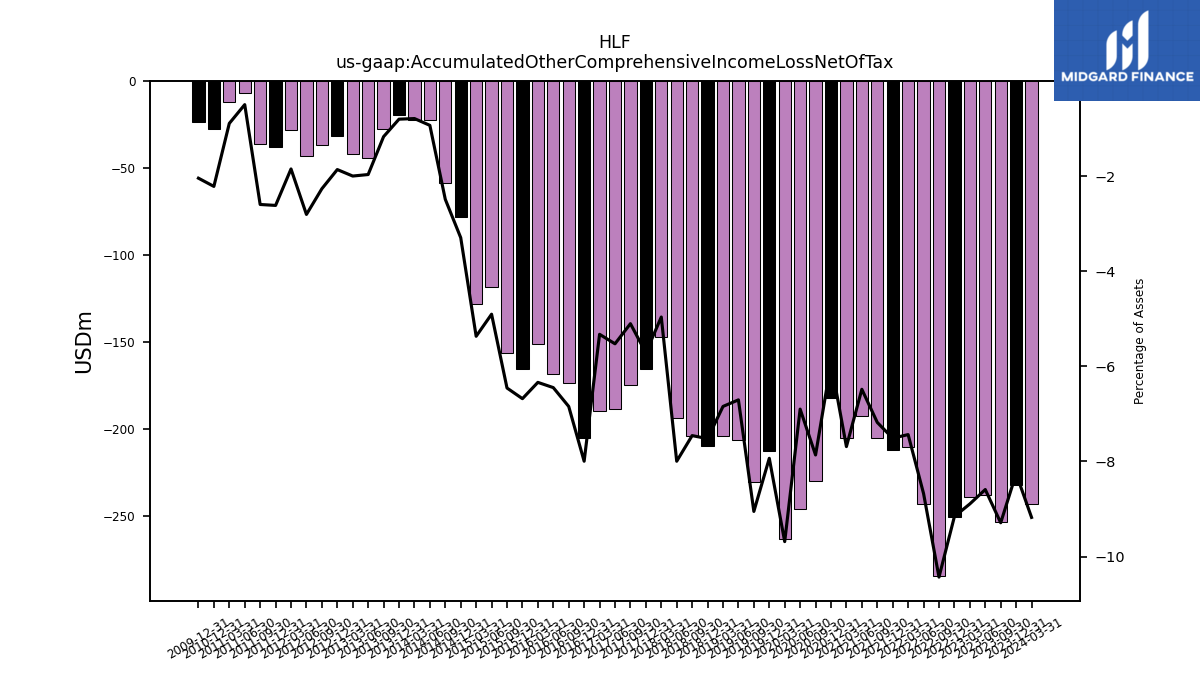
| Accumulated Other Comprehensive Income Loss Net Of Tax | -242.90 | -232.00 | -253.10 | -238.00 | -239.00 | -250.20 | -284.30 | -243.10 | -210.00 | -211.80 | -204.80 | -192.30 | -205.00 | -182.20 | -229.70 | -246.10 | -263.00 | -212.50 | -230.40 | -206.40 | -204.10 | -209.80 | -203.90 | -193.60 | -147.30 | -165.40 | -174.60 | -188.40 | -189.60 | -205.10 | -173.30 | -168.50 | -151.20 | -165.50 | -156.30 | -118.40 | -128.20 | -78.20 | -58.78 | -22.66 | -22.48 | -19.79 | -27.37 | -44.28 | -41.71 | -31.70 | -36.62 | -42.93 | -28.31 | -37.81 | -36.01 | -6.92 | -12.07 | -27.29 | NA | NA | NA | |
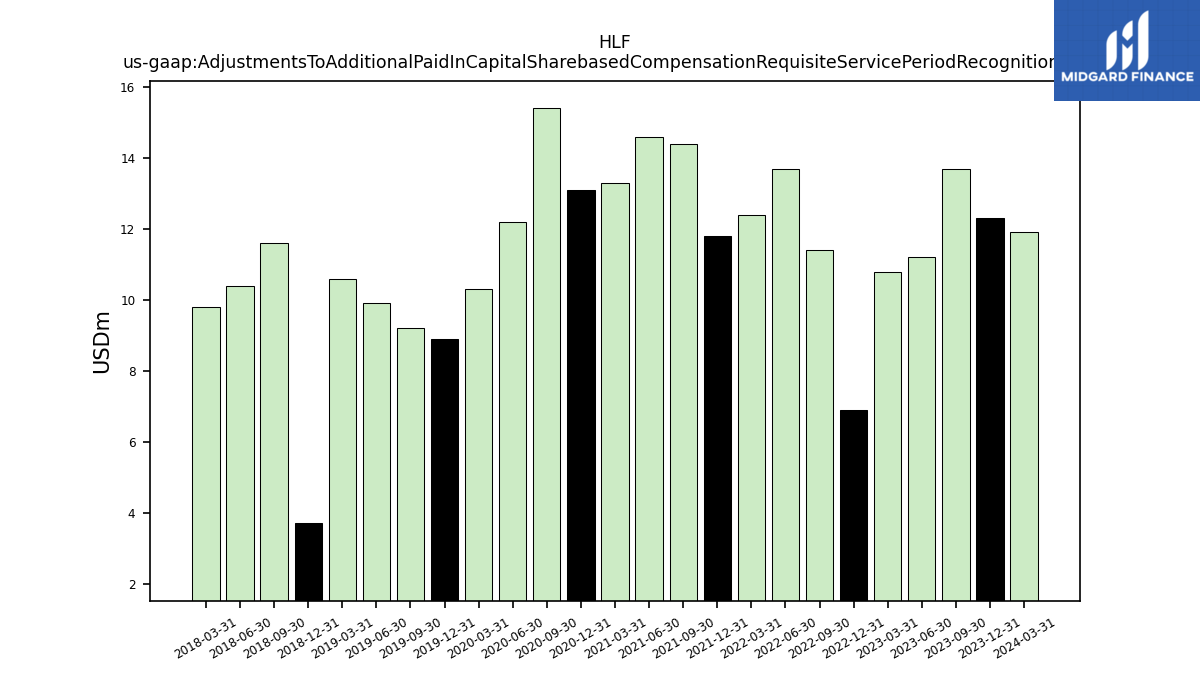
| Adjustments To Additional Paid In Capital Sharebased Compensation Requisite Service Period Recognition Value | 11.90 | 12.30 | 13.70 | 11.20 | 10.80 | 6.90 | 11.40 | 13.70 | 12.40 | 11.80 | 14.40 | 14.60 | 13.30 | 13.10 | 15.40 | 12.20 | 10.30 | 8.90 | 9.20 | 9.90 | 10.60 | 3.70 | 11.60 | 10.40 | 9.80 | NA | NA | NA | NA | NA | NA | NA | NA | NA | NA | NA | NA | NA | NA | NA | NA | NA | NA | NA | NA | NA | NA | NA | NA | NA | NA | NA | NA | NA | NA | NA | NA |
| 2024-03-31 | 2023-12-31 | 2023-09-30 | 2023-06-30 | 2023-03-31 | 2022-12-31 | 2022-09-30 | 2022-06-30 | 2022-03-31 | 2021-12-31 | 2021-09-30 | 2021-06-30 | 2021-03-31 | 2020-12-31 | 2020-09-30 | 2020-06-30 | 2020-03-31 | 2019-12-31 | 2019-09-30 | 2019-06-30 | 2019-03-31 | 2018-12-31 | 2018-09-30 | 2018-06-30 | 2018-03-31 | 2017-12-31 | 2017-09-30 | 2017-06-30 | 2017-03-31 | 2016-12-31 | 2016-09-30 | 2016-06-30 | 2016-03-31 | 2015-12-31 | 2015-09-30 | 2015-06-30 | 2015-03-31 | 2014-12-31 | 2014-09-30 | 2014-06-30 | 2014-03-31 | 2013-12-31 | 2013-09-30 | 2013-06-30 | 2013-03-31 | 2012-12-31 | 2012-09-30 | 2012-06-30 | 2012-03-31 | 2011-12-31 | 2011-09-30 | 2011-06-30 | 2011-03-31 | 2010-12-31 | 2010-09-30 | 2010-06-30 | 2010-03-31 | ||
|---|---|---|---|---|---|---|---|---|---|---|---|---|---|---|---|---|---|---|---|---|---|---|---|---|---|---|---|---|---|---|---|---|---|---|---|---|---|---|---|---|---|---|---|---|---|---|---|---|---|---|---|---|---|---|---|---|---|---|
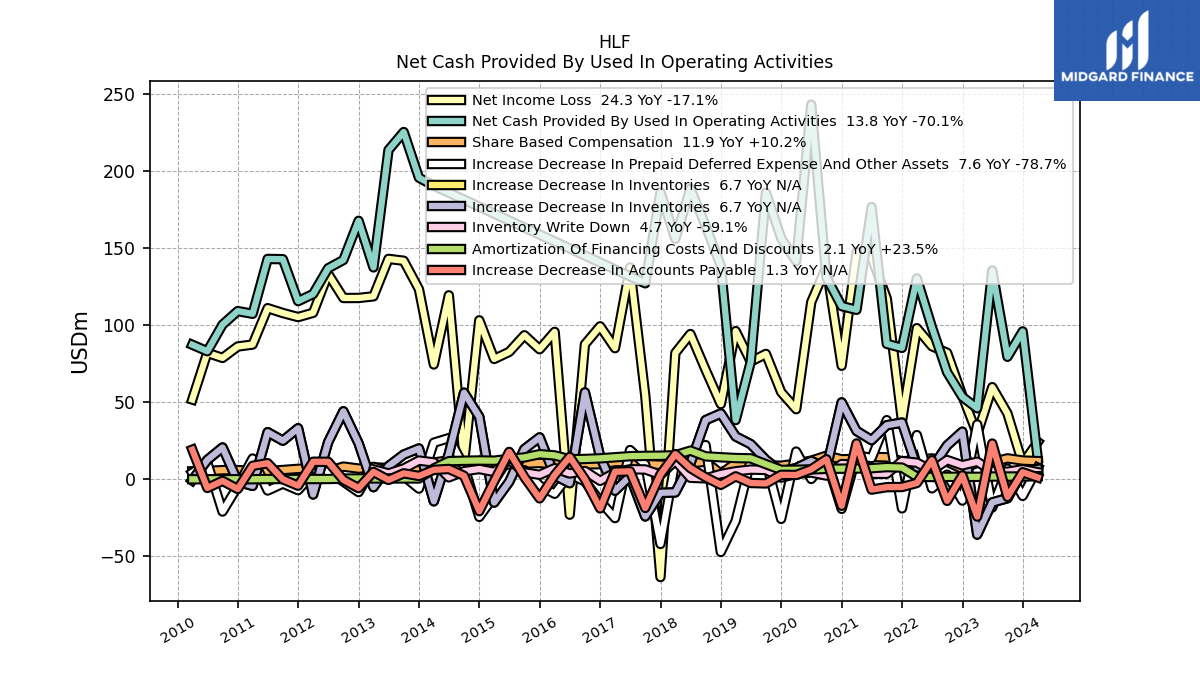
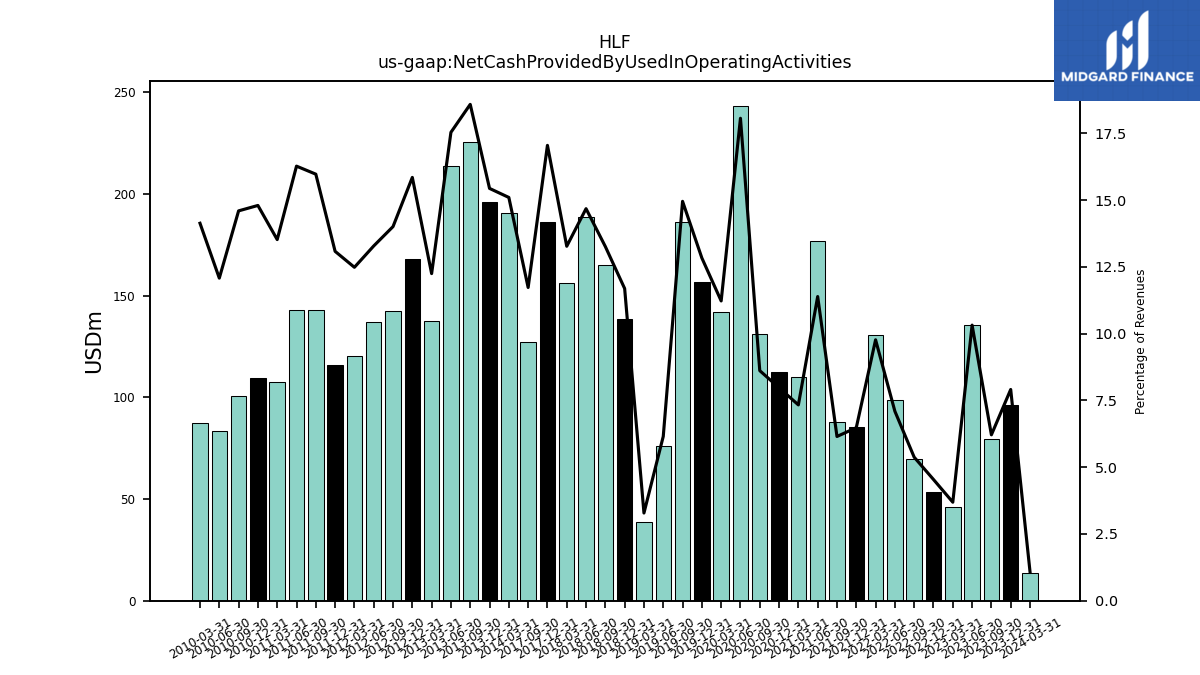
| Net Cash Provided By Used In Operating Activities | 13.80 | 96.10 | 79.60 | 135.60 | 46.20 | 53.60 | 69.60 | 98.80 | 130.50 | 85.40 | 88.00 | 176.80 | 110.10 | 112.50 | 131.10 | 243.30 | 141.70 | 156.60 | 186.10 | 76.30 | 38.50 | 138.70 | 164.80 | 188.70 | 156.20 | 186.40 | 127.30 | NA | NA | NA | NA | NA | NA | NA | NA | NA | NA | NA | NA | NA | 190.65 | 195.89 | 225.53 | 213.83 | 137.63 | 167.89 | 142.45 | 137.07 | 120.37 | 115.70 | 142.98 | 143.13 | 107.52 | 109.28 | 100.49 | 83.20 | 87.43 | |
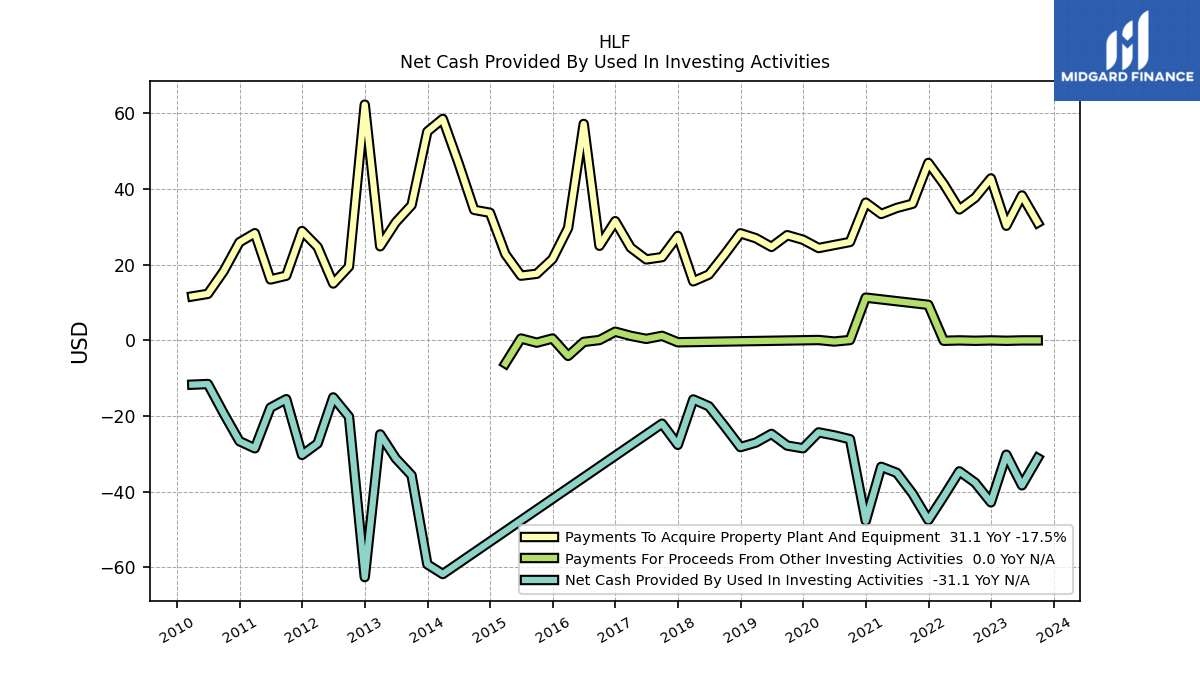
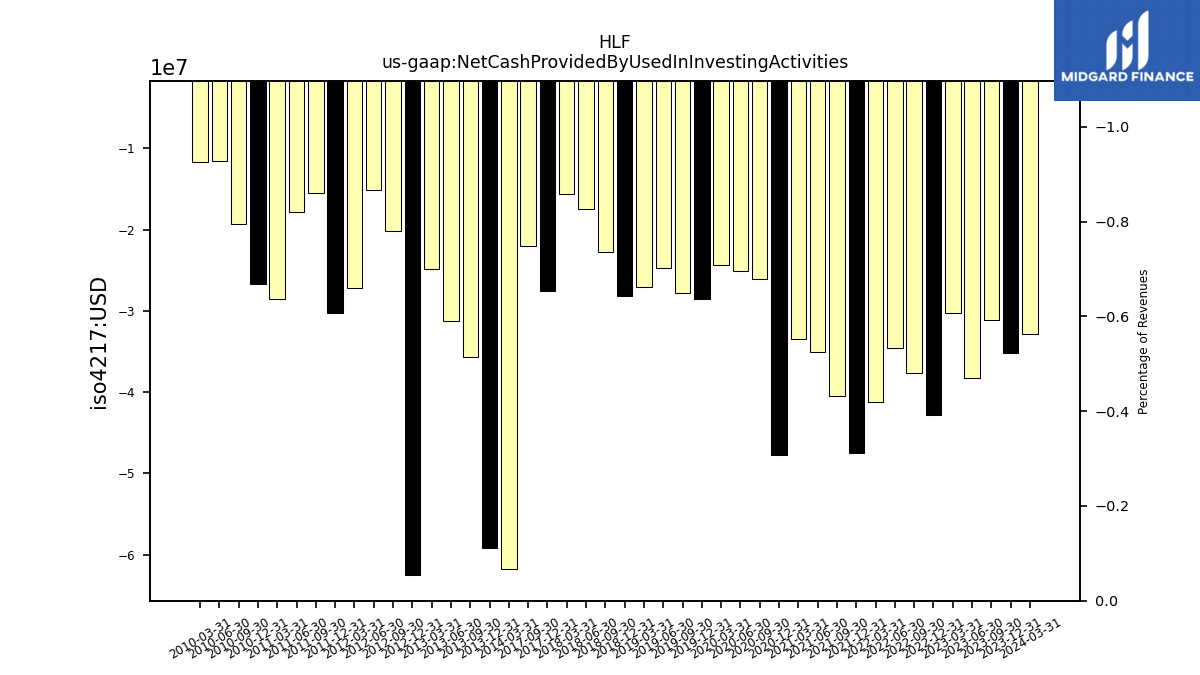
| Net Cash Provided By Used In Investing Activities | -32.80 | -35.20 | -31.10 | -38.30 | -30.20 | -42.80 | -37.60 | -34.60 | -41.20 | -47.50 | -40.50 | -35.00 | -33.40 | -47.70 | -26.10 | -25.10 | -24.30 | -28.50 | -27.80 | -24.70 | -27.00 | -28.20 | -22.70 | -17.40 | -15.60 | -27.60 | -22.00 | NA | NA | NA | NA | NA | NA | NA | NA | NA | NA | NA | NA | NA | -61.74 | -59.16 | -35.65 | -31.18 | -24.83 | -62.55 | -20.17 | -15.06 | -27.23 | -30.26 | -15.54 | -17.77 | -28.52 | -26.63 | -19.28 | -11.53 | -11.70 | |
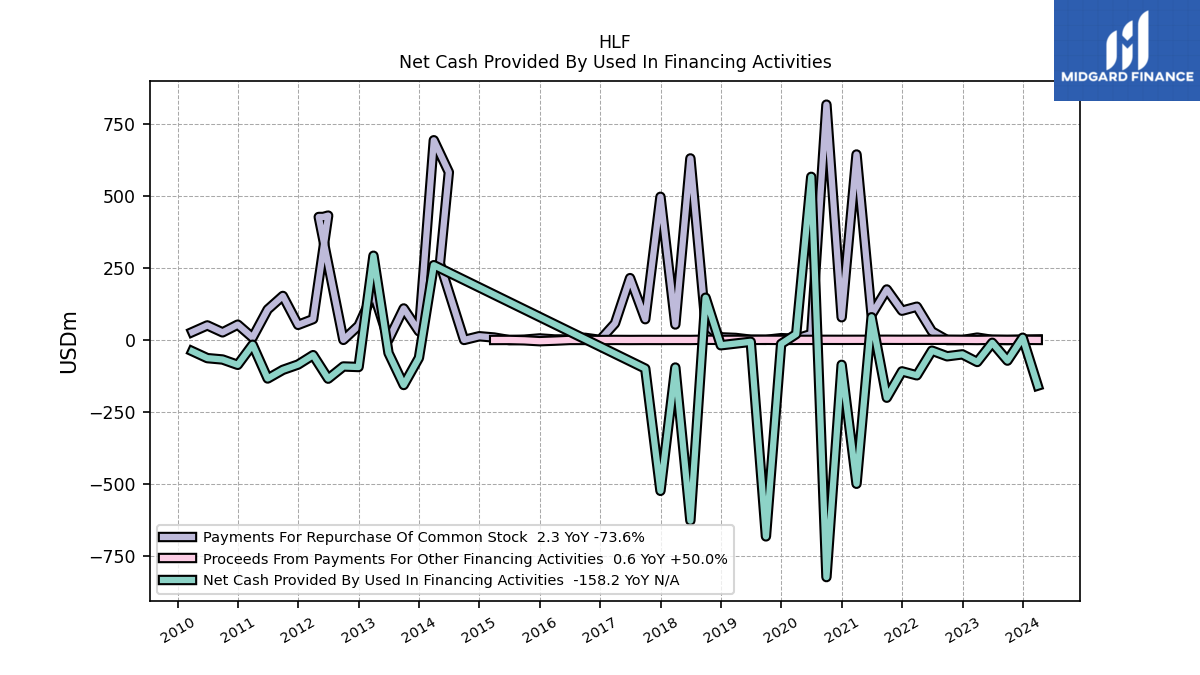
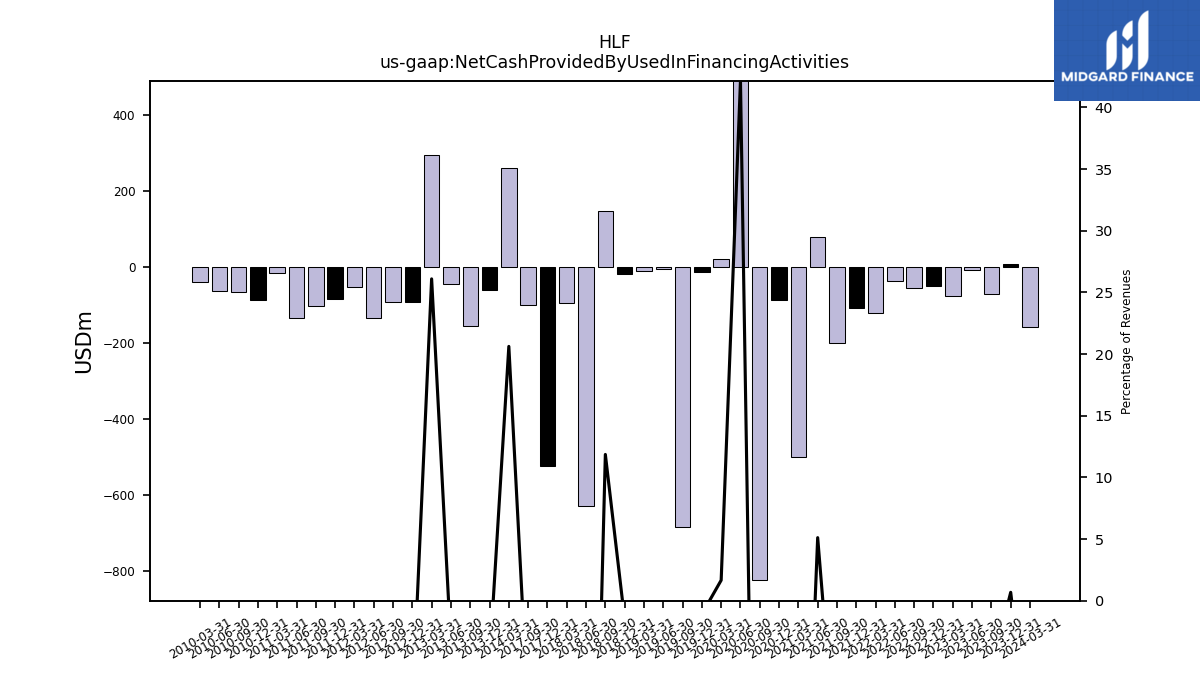
| Net Cash Provided By Used In Financing Activities | -158.20 | 8.30 | -71.30 | -9.30 | -76.00 | -49.50 | -56.20 | -36.60 | -122.40 | -108.60 | -200.20 | 79.40 | -499.20 | -85.80 | -823.50 | 567.40 | 21.00 | -13.20 | -682.10 | -5.80 | -11.90 | -17.90 | 147.40 | -627.40 | -95.20 | -523.80 | -98.90 | NA | NA | NA | NA | NA | NA | NA | NA | NA | NA | NA | NA | NA | 260.34 | -61.67 | -156.00 | -44.78 | 293.20 | -93.46 | -91.59 | -134.04 | -52.15 | -84.88 | -103.41 | -133.47 | -16.04 | -86.01 | -67.34 | -62.60 | -38.53 |
| 2024-03-31 | 2023-12-31 | 2023-09-30 | 2023-06-30 | 2023-03-31 | 2022-12-31 | 2022-09-30 | 2022-06-30 | 2022-03-31 | 2021-12-31 | 2021-09-30 | 2021-06-30 | 2021-03-31 | 2020-12-31 | 2020-09-30 | 2020-06-30 | 2020-03-31 | 2019-12-31 | 2019-09-30 | 2019-06-30 | 2019-03-31 | 2018-12-31 | 2018-09-30 | 2018-06-30 | 2018-03-31 | 2017-12-31 | 2017-09-30 | 2017-06-30 | 2017-03-31 | 2016-12-31 | 2016-09-30 | 2016-06-30 | 2016-03-31 | 2015-12-31 | 2015-09-30 | 2015-06-30 | 2015-03-31 | 2014-12-31 | 2014-09-30 | 2014-06-30 | 2014-03-31 | 2013-12-31 | 2013-09-30 | 2013-06-30 | 2013-03-31 | 2012-12-31 | 2012-09-30 | 2012-06-30 | 2012-03-31 | 2011-12-31 | 2011-09-30 | 2011-06-30 | 2011-03-31 | 2010-12-31 | 2010-09-30 | 2010-06-30 | 2010-03-31 | ||
|---|---|---|---|---|---|---|---|---|---|---|---|---|---|---|---|---|---|---|---|---|---|---|---|---|---|---|---|---|---|---|---|---|---|---|---|---|---|---|---|---|---|---|---|---|---|---|---|---|---|---|---|---|---|---|---|---|---|---|
| Net Cash Provided By Used In Operating Activities | 13.80 | 96.10 | 79.60 | 135.60 | 46.20 | 53.60 | 69.60 | 98.80 | 130.50 | 85.40 | 88.00 | 176.80 | 110.10 | 112.50 | 131.10 | 243.30 | 141.70 | 156.60 | 186.10 | 76.30 | 38.50 | 138.70 | 164.80 | 188.70 | 156.20 | 186.40 | 127.30 | NA | NA | NA | NA | NA | NA | NA | NA | NA | NA | NA | NA | NA | 190.65 | 195.89 | 225.53 | 213.83 | 137.63 | 167.89 | 142.45 | 137.07 | 120.37 | 115.70 | 142.98 | 143.13 | 107.52 | 109.28 | 100.49 | 83.20 | 87.43 | |
| Net Income Loss | 24.30 | 10.20 | 42.80 | 59.90 | 29.30 | 54.40 | 82.20 | 86.50 | 98.20 | 38.20 | 117.40 | 144.20 | 147.40 | 73.80 | 138.10 | 115.10 | 45.60 | 56.70 | 81.50 | 76.50 | 96.30 | 48.90 | 71.20 | 94.40 | 82.10 | -63.40 | 54.50 | 137.60 | 85.20 | 99.40 | 87.70 | -22.90 | 95.80 | 84.50 | 93.60 | 82.80 | 78.20 | 103.30 | 11.25 | 119.53 | 74.63 | 123.50 | 141.95 | 143.16 | 118.86 | 117.80 | 117.78 | 133.37 | 108.16 | 105.40 | 108.02 | 111.18 | 87.57 | 86.30 | 78.88 | 82.17 | 51.87 | |
| Profit Loss | 24.30 | 10.20 | 42.80 | 59.90 | 29.30 | 54.40 | 82.20 | 86.50 | 98.20 | 38.20 | 117.40 | 144.20 | 147.40 | 73.80 | 138.10 | 115.10 | 45.60 | 56.70 | 81.50 | 76.50 | 96.30 | 48.90 | 71.20 | 94.40 | 82.10 | NA | NA | NA | NA | NA | NA | NA | NA | NA | NA | NA | NA | NA | NA | NA | NA | NA | NA | NA | NA | NA | NA | NA | NA | NA | NA | NA | NA | NA | NA | NA | NA | |
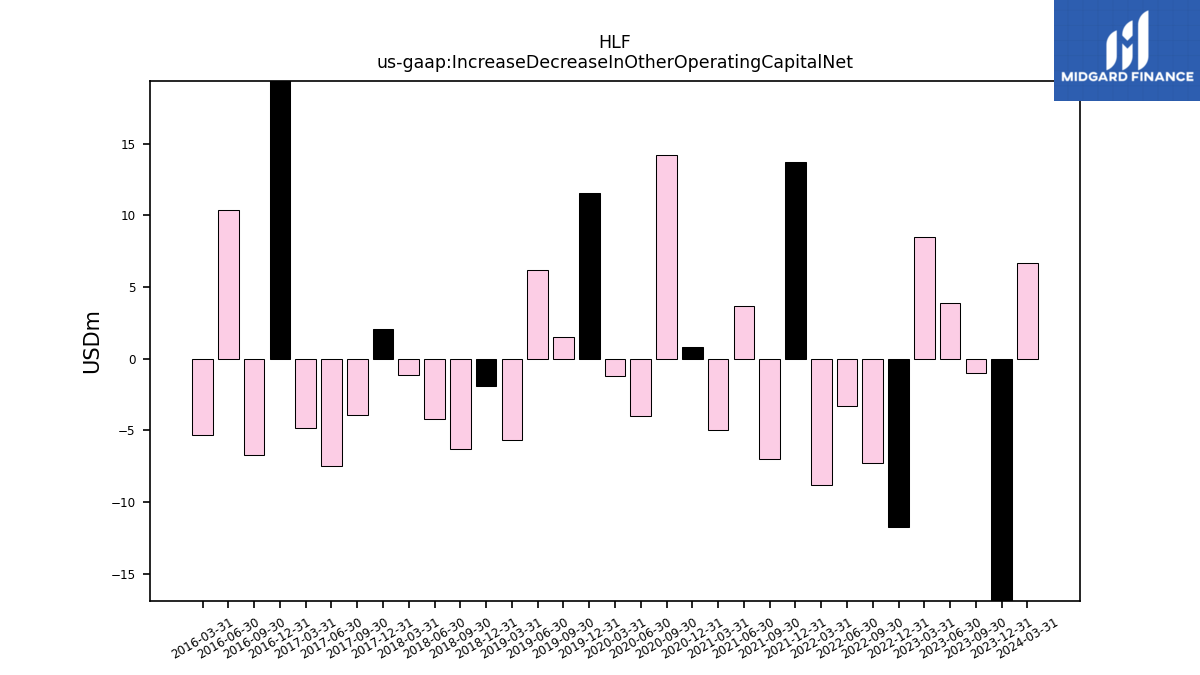
| Increase Decrease In Other Operating Capital Net | 6.70 | -18.10 | -1.00 | 3.90 | 8.50 | -11.70 | -7.30 | -3.30 | -8.80 | 13.70 | -7.00 | 3.70 | -5.00 | 0.80 | 14.20 | -4.00 | -1.20 | 11.60 | 1.50 | 6.20 | -5.70 | -1.90 | -6.30 | -4.20 | -1.10 | 2.10 | -3.90 | -7.50 | -4.80 | 21.10 | -6.70 | 10.40 | -5.30 | NA | NA | NA | NA | NA | NA | NA | NA | NA | NA | NA | NA | NA | NA | NA | NA | NA | NA | NA | NA | NA | NA | NA | NA | |
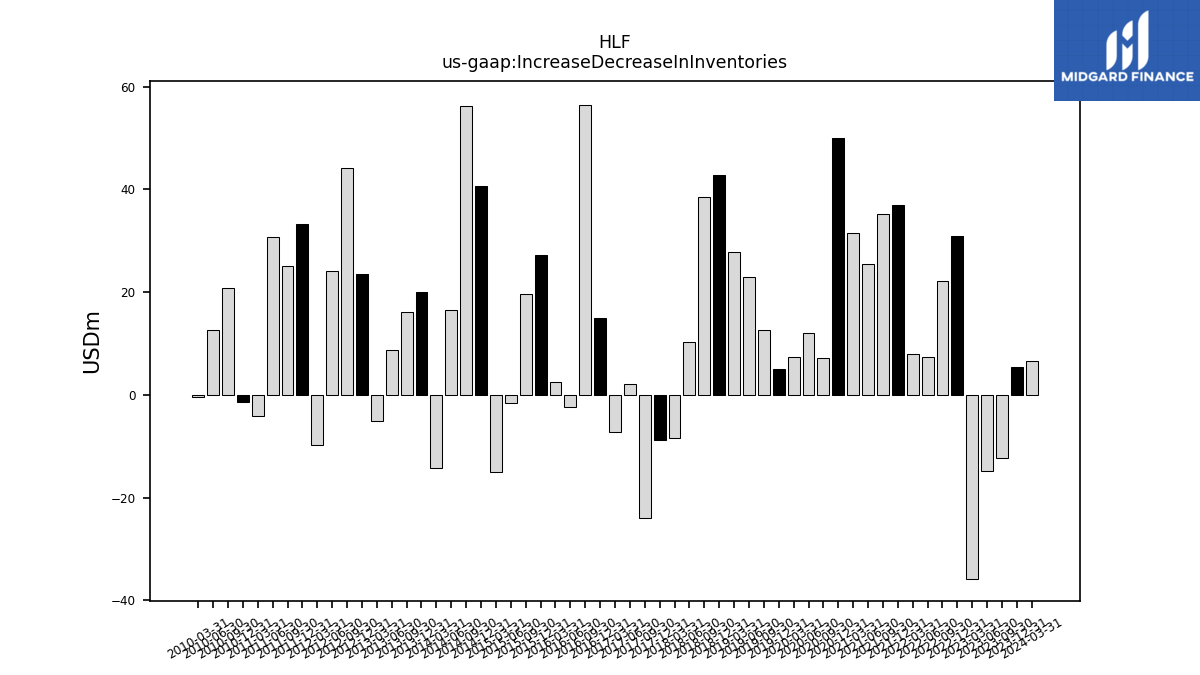
| Increase Decrease In Inventories | 6.70 | 5.40 | -12.20 | -14.90 | -35.80 | 31.00 | 22.10 | 7.40 | 7.90 | 36.90 | 35.20 | 25.50 | 31.50 | 50.00 | 7.20 | 12.00 | 7.40 | 5.10 | 12.70 | 22.90 | 27.90 | 42.80 | 38.50 | 10.40 | -8.40 | -8.70 | -24.00 | 2.10 | -7.30 | 14.90 | 56.50 | -2.40 | 2.60 | 27.30 | 19.70 | -1.50 | -15.00 | 40.68 | 56.31 | 16.61 | -14.20 | 20.10 | 16.13 | 8.66 | -5.01 | 23.47 | 44.23 | 24.22 | -9.74 | 33.23 | 25.16 | 30.67 | -4.18 | -1.41 | 20.75 | 12.65 | -0.47 | |
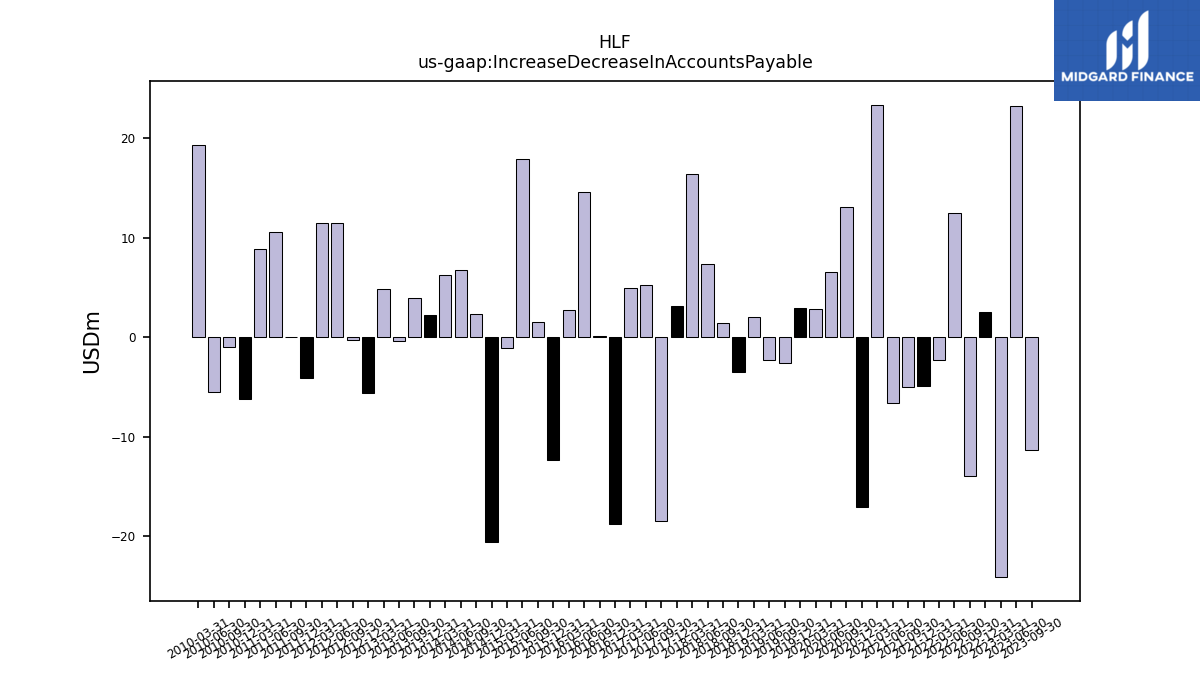
| Increase Decrease In Accounts Payable | 1.30 | 4.70 | -11.30 | 23.30 | -24.10 | 2.60 | -13.90 | 12.50 | -2.30 | -4.90 | -5.00 | -6.60 | 23.40 | -17.10 | 13.10 | 6.60 | 2.90 | 3.00 | -2.60 | -2.30 | 2.00 | -3.50 | 1.40 | 7.40 | 16.40 | 3.20 | -18.50 | 5.30 | 5.00 | -18.80 | 0.10 | 14.60 | 2.80 | -12.30 | 1.50 | 17.90 | -1.10 | -20.61 | 2.37 | 6.81 | 6.22 | 2.27 | 3.98 | -0.31 | 4.90 | -5.64 | -0.27 | 11.45 | 11.50 | -4.06 | 0.07 | 10.55 | 8.86 | -6.20 | -0.93 | -5.53 | 19.31 | |
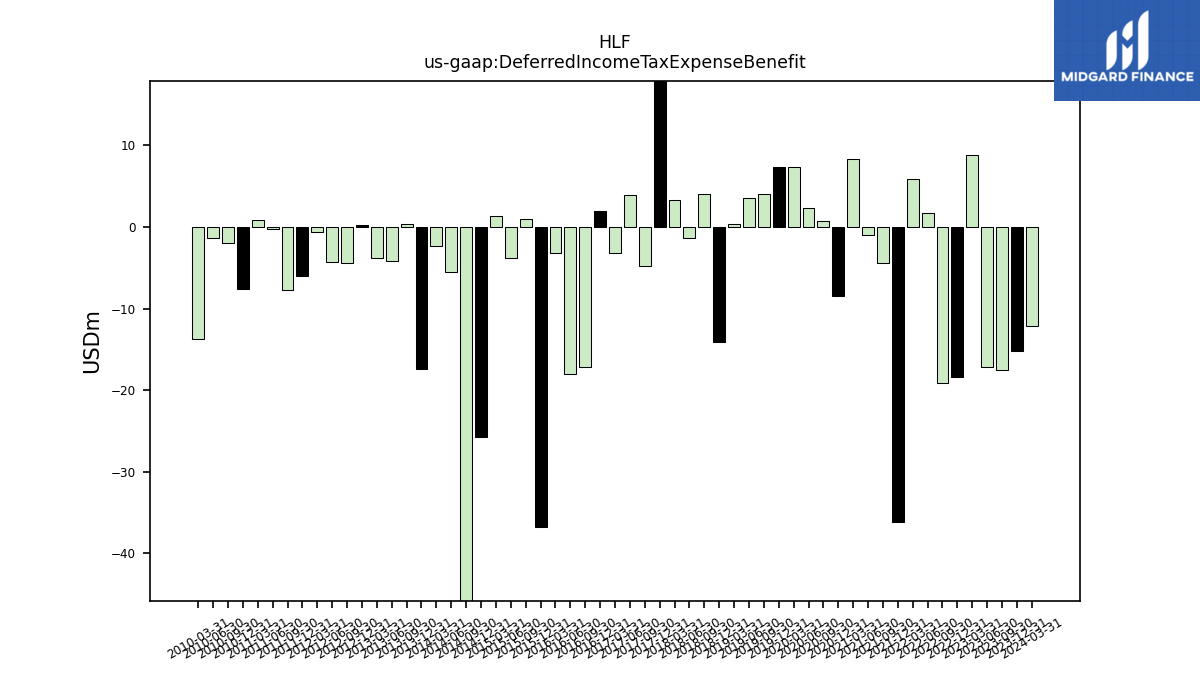
| Deferred Income Tax Expense Benefit | -12.10 | -15.20 | -17.50 | -17.20 | 8.80 | -18.40 | -19.10 | 1.70 | 5.90 | -36.20 | -4.40 | -1.00 | 8.30 | -8.50 | 0.80 | 2.30 | 7.40 | 7.40 | 4.10 | 3.50 | 0.40 | -14.10 | 4.00 | -1.30 | 3.30 | 101.90 | -4.80 | 3.90 | -3.20 | 2.00 | -17.20 | -18.00 | -3.20 | -36.70 | 1.00 | -3.80 | 1.30 | -25.78 | -51.18 | -5.53 | -2.31 | -17.38 | 0.41 | -4.17 | -3.77 | 0.20 | -4.35 | -4.30 | -0.60 | -5.98 | -7.67 | -0.25 | 0.92 | -7.64 | -1.94 | -1.38 | -13.67 | |
| Share Based Compensation | 11.90 | 12.30 | 13.70 | 11.20 | 10.80 | 6.90 | 11.40 | 13.70 | 12.40 | 11.80 | 14.40 | 14.60 | 13.30 | 13.10 | 15.40 | 12.20 | 10.30 | 8.90 | 9.20 | 9.90 | 10.60 | 3.70 | 11.60 | 10.40 | 9.80 | 9.50 | 9.90 | 11.40 | 11.30 | 9.90 | 9.80 | 10.70 | 9.80 | 10.70 | 10.30 | 12.80 | 11.10 | 11.27 | 11.03 | 12.40 | 10.99 | 7.61 | 6.63 | 7.39 | 7.87 | 7.06 | 8.35 | 5.27 | 7.23 | 6.89 | 6.14 | 5.50 | 5.60 | 6.10 | 6.05 | 5.53 | 5.29 |
| 2024-03-31 | 2023-12-31 | 2023-09-30 | 2023-06-30 | 2023-03-31 | 2022-12-31 | 2022-09-30 | 2022-06-30 | 2022-03-31 | 2021-12-31 | 2021-09-30 | 2021-06-30 | 2021-03-31 | 2020-12-31 | 2020-09-30 | 2020-06-30 | 2020-03-31 | 2019-12-31 | 2019-09-30 | 2019-06-30 | 2019-03-31 | 2018-12-31 | 2018-09-30 | 2018-06-30 | 2018-03-31 | 2017-12-31 | 2017-09-30 | 2017-06-30 | 2017-03-31 | 2016-12-31 | 2016-09-30 | 2016-06-30 | 2016-03-31 | 2015-12-31 | 2015-09-30 | 2015-06-30 | 2015-03-31 | 2014-12-31 | 2014-09-30 | 2014-06-30 | 2014-03-31 | 2013-12-31 | 2013-09-30 | 2013-06-30 | 2013-03-31 | 2012-12-31 | 2012-09-30 | 2012-06-30 | 2012-03-31 | 2011-12-31 | 2011-09-30 | 2011-06-30 | 2011-03-31 | 2010-12-31 | 2010-09-30 | 2010-06-30 | 2010-03-31 | ||
|---|---|---|---|---|---|---|---|---|---|---|---|---|---|---|---|---|---|---|---|---|---|---|---|---|---|---|---|---|---|---|---|---|---|---|---|---|---|---|---|---|---|---|---|---|---|---|---|---|---|---|---|---|---|---|---|---|---|---|
| Net Cash Provided By Used In Investing Activities | -32.80 | -35.20 | -31.10 | -38.30 | -30.20 | -42.80 | -37.60 | -34.60 | -41.20 | -47.50 | -40.50 | -35.00 | -33.40 | -47.70 | -26.10 | -25.10 | -24.30 | -28.50 | -27.80 | -24.70 | -27.00 | -28.20 | -22.70 | -17.40 | -15.60 | -27.60 | -22.00 | NA | NA | NA | NA | NA | NA | NA | NA | NA | NA | NA | NA | NA | -61.74 | -59.16 | -35.65 | -31.18 | -24.83 | -62.55 | -20.17 | -15.06 | -27.23 | -30.26 | -15.54 | -17.77 | -28.52 | -26.63 | -19.28 | -11.53 | -11.70 | |
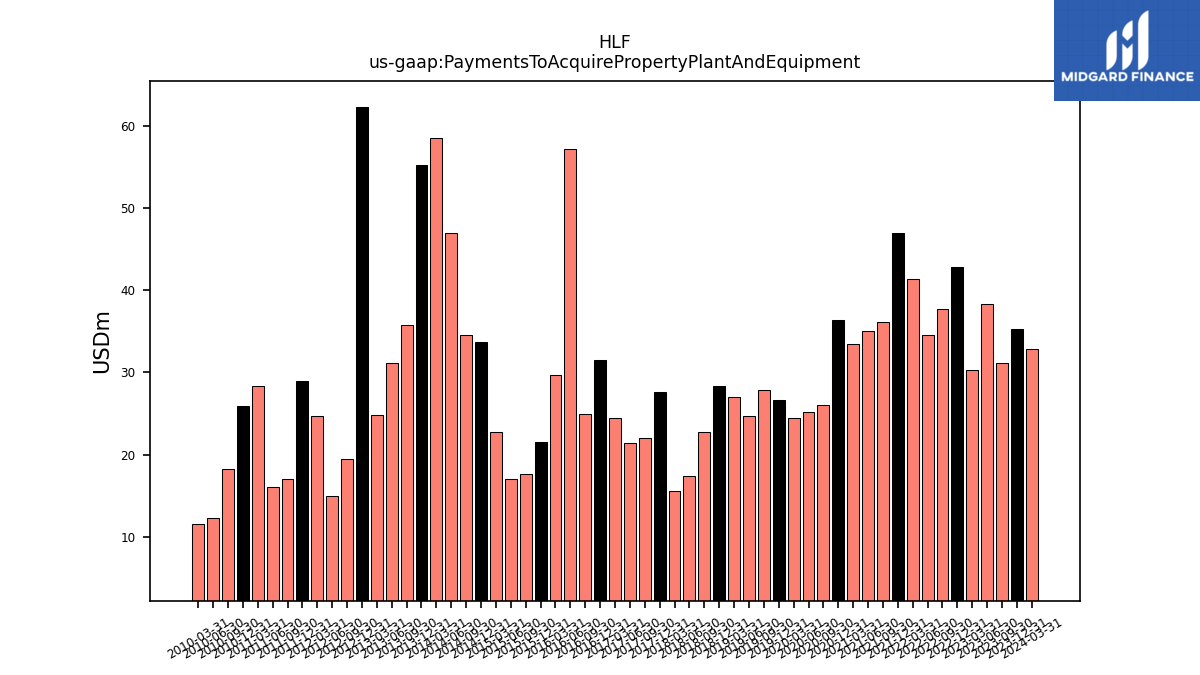
| Payments To Acquire Property Plant And Equipment | 32.90 | 35.30 | 31.10 | 38.30 | 30.30 | 42.80 | 37.70 | 34.60 | 41.30 | 46.90 | 36.10 | 35.00 | 33.40 | 36.40 | 26.00 | 25.20 | 24.40 | 26.60 | 27.80 | 24.70 | 27.00 | 28.30 | 22.70 | 17.40 | 15.60 | 27.60 | 22.00 | 21.40 | 24.50 | 31.50 | 25.00 | 57.20 | 29.70 | 21.50 | 17.60 | 17.10 | 22.80 | 33.73 | 34.49 | 46.97 | 58.52 | 55.18 | 35.73 | 31.19 | 24.86 | 62.30 | 19.51 | 15.03 | 24.69 | 28.89 | 17.09 | 16.10 | 28.32 | 25.93 | 18.28 | 12.29 | 11.62 |
| 2024-03-31 | 2023-12-31 | 2023-09-30 | 2023-06-30 | 2023-03-31 | 2022-12-31 | 2022-09-30 | 2022-06-30 | 2022-03-31 | 2021-12-31 | 2021-09-30 | 2021-06-30 | 2021-03-31 | 2020-12-31 | 2020-09-30 | 2020-06-30 | 2020-03-31 | 2019-12-31 | 2019-09-30 | 2019-06-30 | 2019-03-31 | 2018-12-31 | 2018-09-30 | 2018-06-30 | 2018-03-31 | 2017-12-31 | 2017-09-30 | 2017-06-30 | 2017-03-31 | 2016-12-31 | 2016-09-30 | 2016-06-30 | 2016-03-31 | 2015-12-31 | 2015-09-30 | 2015-06-30 | 2015-03-31 | 2014-12-31 | 2014-09-30 | 2014-06-30 | 2014-03-31 | 2013-12-31 | 2013-09-30 | 2013-06-30 | 2013-03-31 | 2012-12-31 | 2012-09-30 | 2012-06-30 | 2012-03-31 | 2011-12-31 | 2011-09-30 | 2011-06-30 | 2011-03-31 | 2010-12-31 | 2010-09-30 | 2010-06-30 | 2010-03-31 | ||
|---|---|---|---|---|---|---|---|---|---|---|---|---|---|---|---|---|---|---|---|---|---|---|---|---|---|---|---|---|---|---|---|---|---|---|---|---|---|---|---|---|---|---|---|---|---|---|---|---|---|---|---|---|---|---|---|---|---|---|
| Net Cash Provided By Used In Financing Activities | -158.20 | 8.30 | -71.30 | -9.30 | -76.00 | -49.50 | -56.20 | -36.60 | -122.40 | -108.60 | -200.20 | 79.40 | -499.20 | -85.80 | -823.50 | 567.40 | 21.00 | -13.20 | -682.10 | -5.80 | -11.90 | -17.90 | 147.40 | -627.40 | -95.20 | -523.80 | -98.90 | NA | NA | NA | NA | NA | NA | NA | NA | NA | NA | NA | NA | NA | 260.34 | -61.67 | -156.00 | -44.78 | 293.20 | -93.46 | -91.59 | -134.04 | -52.15 | -84.88 | -103.41 | -133.47 | -16.04 | -86.01 | -67.34 | -62.60 | -38.53 | |
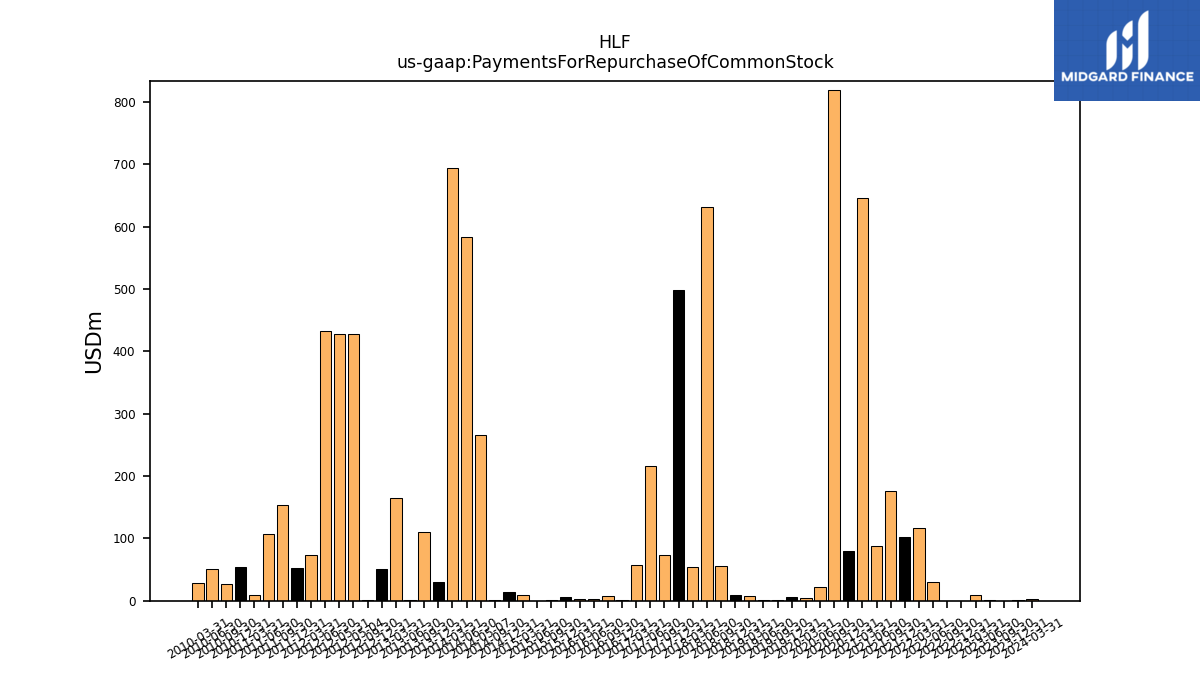
| Payments For Repurchase Of Common Stock | 2.30 | 1.30 | 0.30 | 0.70 | 8.70 | 0.10 | 0.10 | 30.30 | 116.20 | 102.10 | 176.00 | 88.20 | 645.00 | 79.30 | 818.20 | 21.30 | 4.70 | 6.80 | 0.90 | 1.40 | 7.60 | 9.70 | 55.00 | 631.40 | 54.20 | 498.00 | 72.60 | 215.50 | 58.10 | 0.70 | 8.00 | 2.20 | 2.30 | 5.90 | 1.60 | 0.10 | 9.00 | 13.48 | 0.49 | 583.43 | 694.50 | 30.62 | 110.09 | 1.24 | 164.49 | 50.40 | 0.69 | 432.69 | 72.94 | 52.84 | 153.51 | 106.32 | 8.96 | 53.84 | 26.94 | 51.21 | 28.01 |
| 2024-03-31 | 2023-12-31 | 2023-09-30 | 2023-06-30 | 2023-03-31 | 2022-12-31 | 2022-09-30 | 2022-06-30 | 2022-03-31 | 2021-12-31 | 2021-09-30 | 2021-06-30 | 2021-03-31 | 2020-12-31 | 2020-09-30 | 2020-06-30 | 2020-03-31 | 2019-12-31 | 2019-09-30 | 2019-06-30 | 2019-03-31 | 2018-12-31 | 2018-09-30 | 2018-06-30 | 2018-03-31 | 2017-12-31 | 2017-09-30 | 2017-06-30 | 2017-03-31 | 2016-12-31 | 2016-09-30 | 2016-06-30 | 2016-03-31 | 2015-12-31 | 2015-09-30 | 2015-06-30 | 2015-03-31 | 2014-12-31 | 2014-09-30 | 2014-06-30 | 2014-03-31 | 2013-12-31 | 2013-09-30 | 2013-06-30 | 2013-03-31 | 2012-12-31 | 2012-09-30 | 2012-06-30 | 2012-03-31 | 2011-12-31 | 2011-09-30 | 2011-06-30 | 2011-03-31 | 2010-12-31 | 2010-09-30 | 2010-06-30 | 2010-03-31 | ||
|---|---|---|---|---|---|---|---|---|---|---|---|---|---|---|---|---|---|---|---|---|---|---|---|---|---|---|---|---|---|---|---|---|---|---|---|---|---|---|---|---|---|---|---|---|---|---|---|---|---|---|---|---|---|---|---|---|---|---|
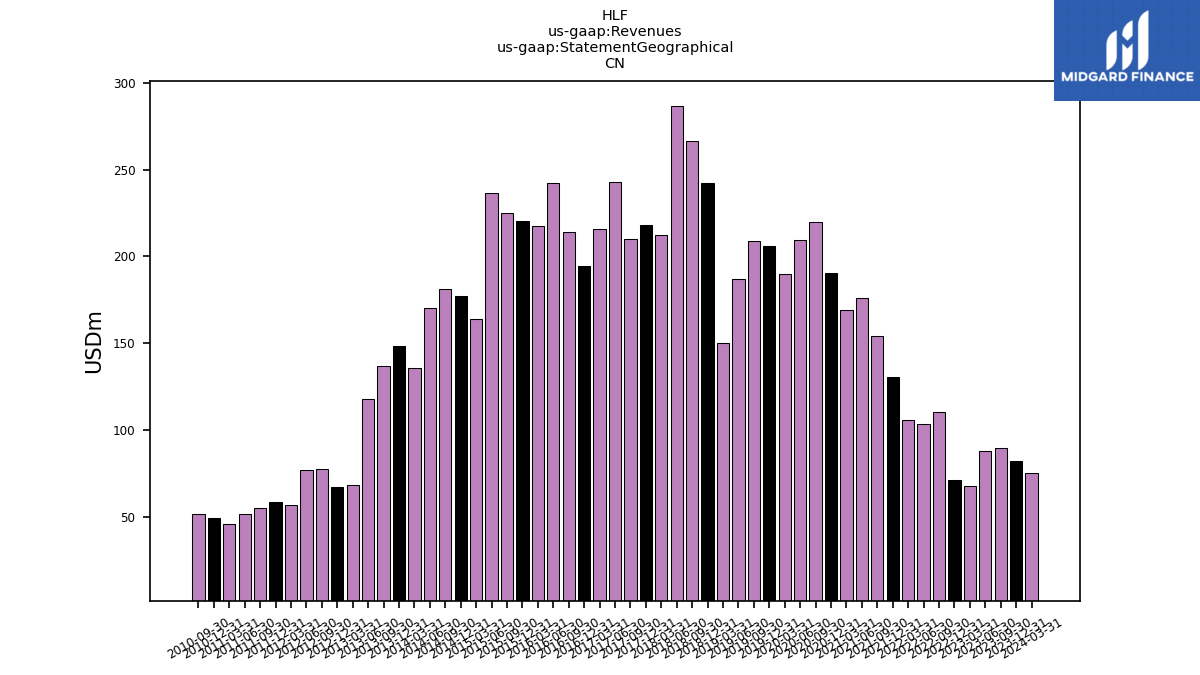
| Revenues | 1264.30 | 1215.00 | 1281.30 | 1314.00 | 1252.10 | 1180.80 | 1295.10 | 1392.70 | 1335.80 | 1318.00 | 1430.90 | 1552.30 | 1501.60 | 1410.70 | 1521.80 | 1346.90 | 1262.40 | 1220.30 | 1244.50 | 1240.10 | 1172.20 | 1186.60 | 1242.80 | 1285.50 | 1176.90 | 1093.30 | 1085.40 | 1146.90 | 1102.10 | 1045.00 | 1122.00 | 1201.80 | 1119.60 | 1098.40 | 1102.90 | 1162.30 | 1105.40 | 1133.60 | 1256.16 | 1306.20 | 1262.65 | 1268.90 | 1213.54 | 1219.24 | 1123.65 | 1059.30 | 1016.89 | 1031.95 | 964.17 | 884.50 | 895.22 | 879.65 | 795.10 | 738.40 | 688.43 | 688.81 | 618.63 | |
| 75.20 | 82.20 | 89.50 | 88.00 | 67.70 | 71.10 | 110.60 | 103.70 | 105.60 | 130.40 | 154.00 | 175.80 | 169.30 | 190.20 | 220.00 | 209.50 | 189.90 | 205.90 | 208.70 | 187.00 | 150.40 | 242.10 | 266.50 | 286.80 | 212.20 | 217.90 | 209.80 | 242.70 | 215.60 | 194.70 | 214.20 | 242.50 | 217.40 | 220.40 | 224.90 | 236.70 | 164.20 | 177.10 | 181.30 | 170.10 | 135.80 | 148.30 | 136.70 | 118.00 | 68.50 | 67.10 | 77.40 | 77.10 | 56.90 | 58.70 | 55.00 | 51.40 | 45.70 | 49.20 | 51.60 | NA | NA | ||
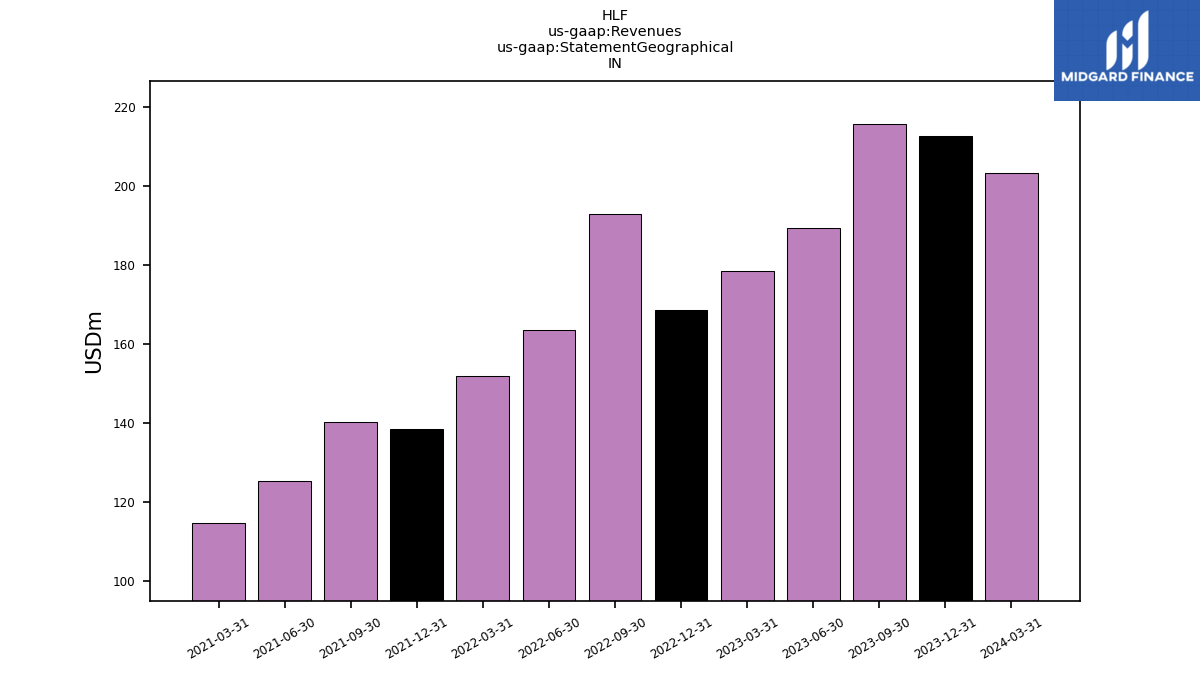
| 203.50 | 212.70 | 215.90 | 189.40 | 178.60 | 168.60 | 192.90 | 163.60 | 152.00 | 138.60 | 140.30 | 125.50 | 114.70 | NA | NA | NA | NA | NA | NA | NA | NA | NA | NA | NA | NA | NA | NA | NA | NA | NA | NA | NA | NA | NA | NA | NA | NA | NA | NA | NA | NA | NA | NA | NA | NA | NA | NA | NA | NA | NA | NA | NA | NA | NA | NA | NA | NA | ||
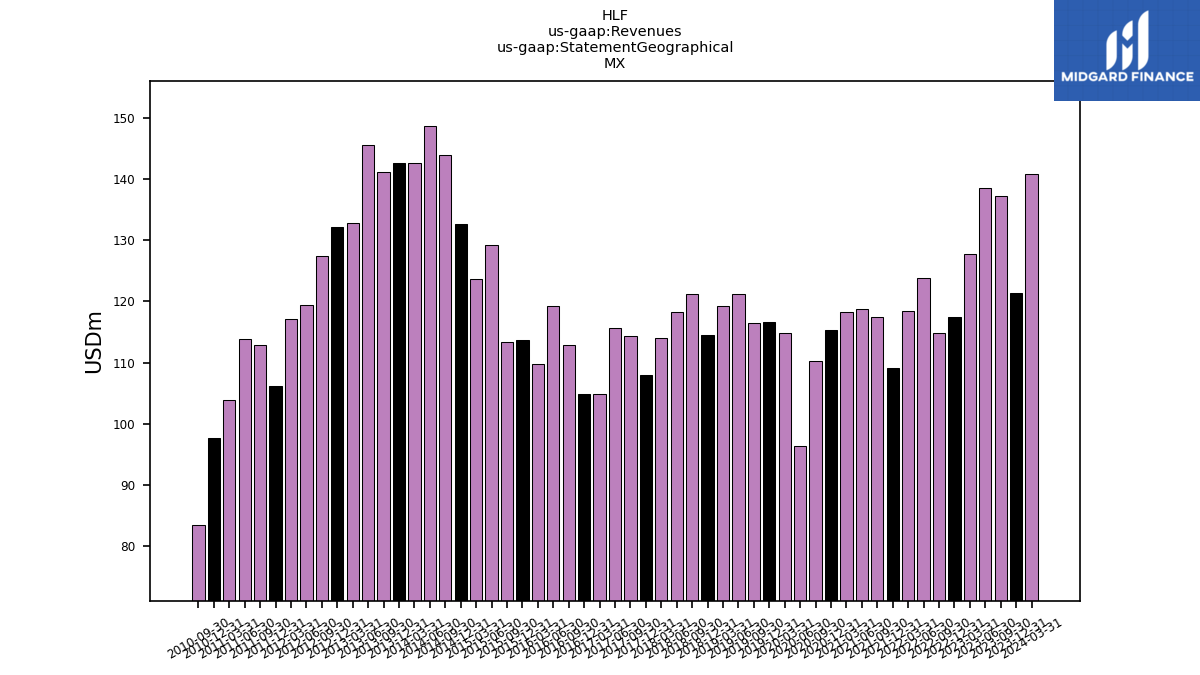
| 140.90 | 121.40 | 137.30 | 138.50 | 127.80 | 117.50 | 114.80 | 123.90 | 118.40 | 109.20 | 117.50 | 118.80 | 118.20 | 115.30 | 110.30 | 96.40 | 114.90 | 116.60 | 116.50 | 121.20 | 119.30 | 114.50 | 121.20 | 118.20 | 114.00 | 108.00 | 114.30 | 115.60 | 104.80 | 104.80 | 112.80 | 119.30 | 109.70 | 113.70 | 113.40 | 129.20 | 123.60 | 132.70 | 143.90 | 148.60 | 142.70 | 142.60 | 141.20 | 145.60 | 132.90 | 132.10 | 127.50 | 119.50 | 117.10 | 106.20 | 112.90 | 113.90 | 103.90 | 97.70 | 83.50 | NA | NA | ||
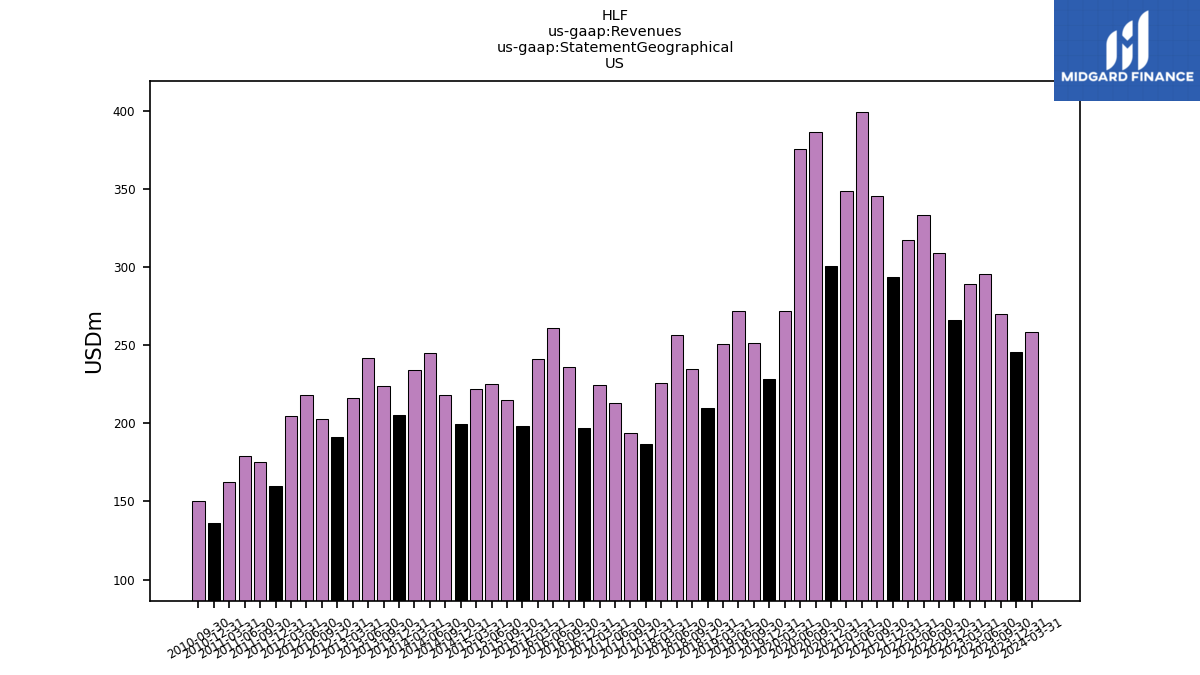
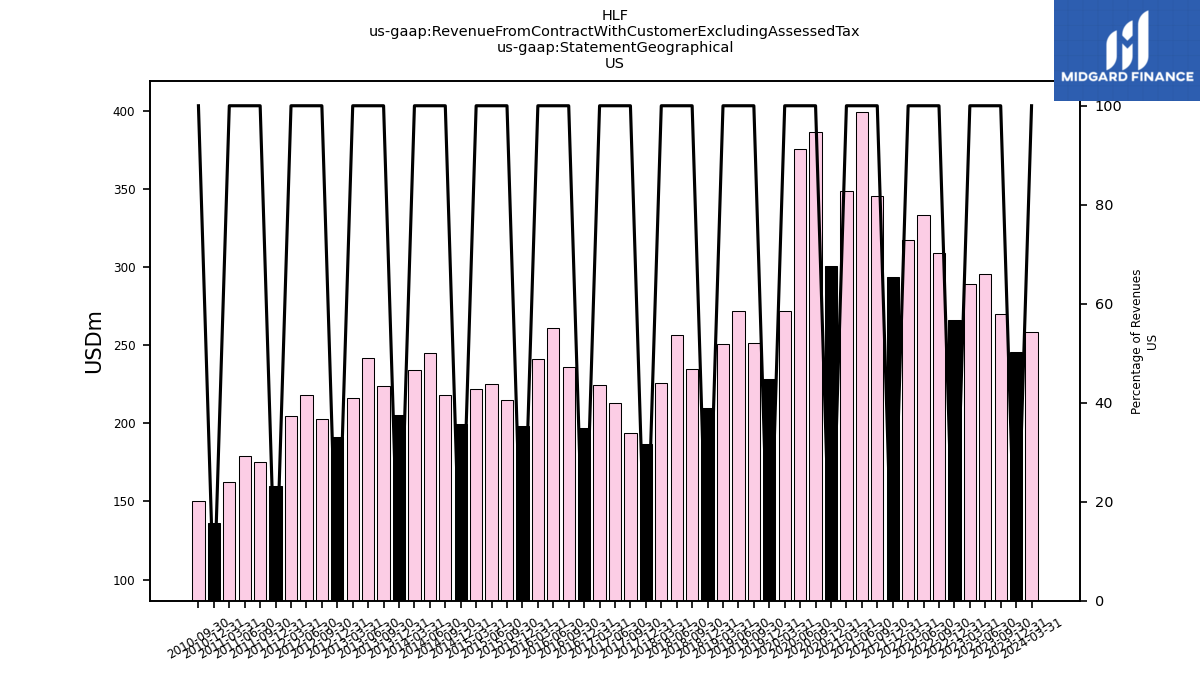
| US | 258.70 | 245.90 | 270.10 | 295.30 | 289.20 | 266.10 | 308.80 | 333.50 | 317.10 | 293.70 | 345.30 | 399.10 | 348.60 | 300.60 | 386.70 | 375.30 | 271.90 | 228.40 | 251.50 | 272.00 | 250.70 | 209.50 | 234.50 | 256.40 | 225.50 | 187.00 | 193.50 | 213.10 | 224.70 | 197.30 | 236.00 | 260.80 | 240.90 | 198.50 | 214.70 | 224.90 | 221.90 | 199.40 | 218.40 | 245.00 | 234.00 | 205.40 | 223.60 | 241.70 | 216.20 | 191.40 | 202.90 | 218.10 | 204.50 | 160.20 | 175.10 | 179.40 | 162.20 | 136.50 | 150.60 | NA | NA | |
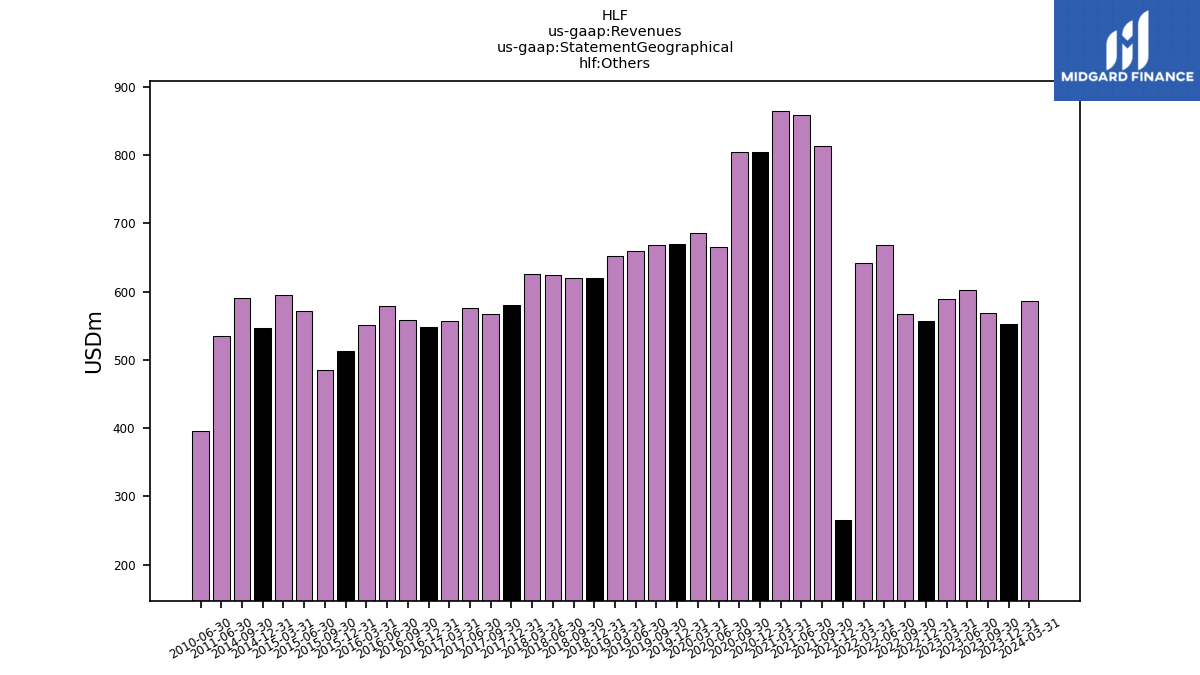
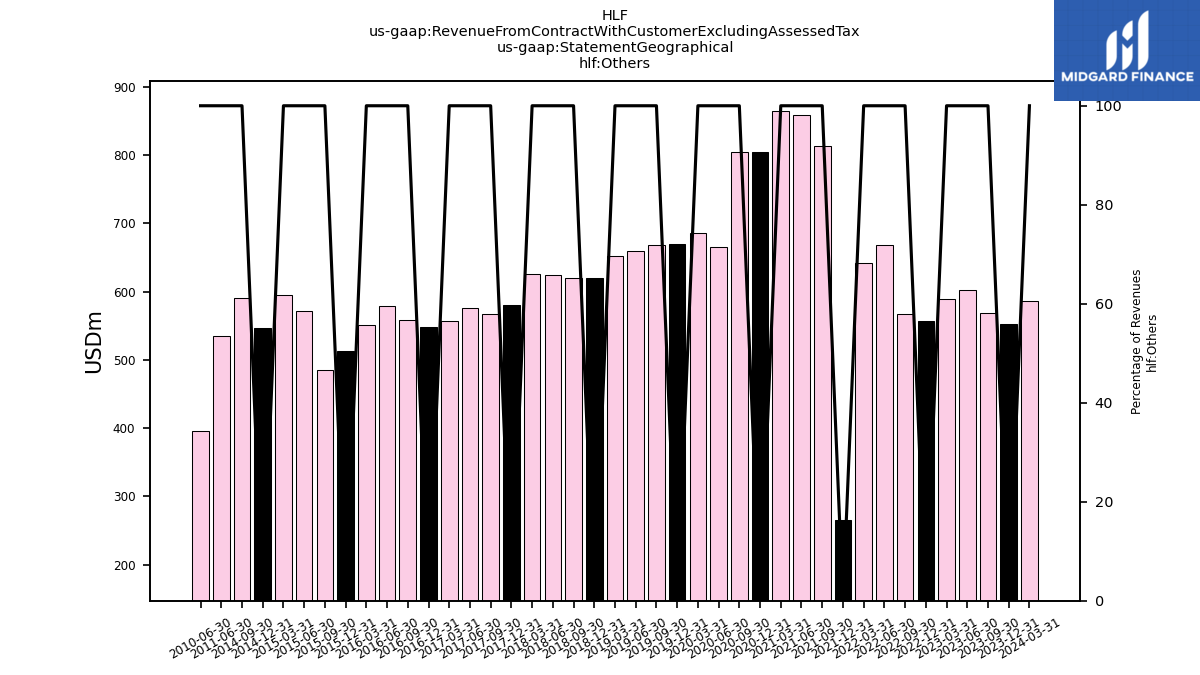
| Others | 586.00 | 552.80 | 568.50 | 602.80 | 588.80 | 557.50 | 568.00 | 668.00 | 642.70 | 265.60 | 814.10 | 858.60 | 865.50 | 804.60 | 804.80 | 665.70 | 685.70 | 669.40 | 667.80 | 659.90 | 651.80 | 620.50 | 620.60 | 624.10 | 625.20 | 580.40 | 567.80 | 575.50 | 557.00 | 548.20 | 559.00 | 579.20 | 551.60 | 513.20 | 484.70 | 571.50 | 595.70 | 546.60 | 591.30 | NA | NA | NA | NA | NA | NA | NA | NA | NA | NA | NA | NA | 535.00 | NA | NA | NA | 395.10 | NA | |
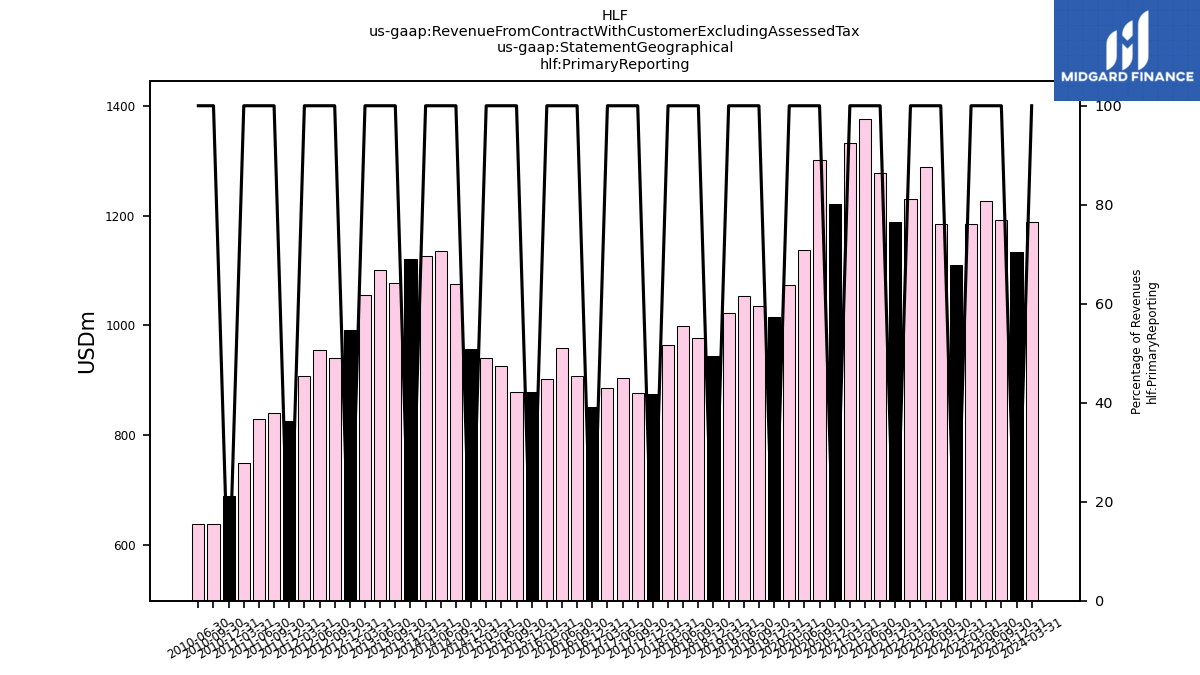
| Primary Reporting | 1189.10 | 1132.80 | 1191.80 | 1226.00 | 1184.40 | 1109.70 | 1184.50 | 1289.00 | 1230.20 | 1187.60 | 1276.90 | 1376.50 | 1332.30 | 1220.50 | 1301.80 | 1137.40 | 1072.50 | 1014.40 | 1035.80 | 1053.10 | 1021.80 | 944.50 | 976.30 | 998.70 | 964.70 | 875.40 | 875.60 | 904.20 | 886.50 | 850.30 | 907.80 | 959.30 | 902.20 | 878.00 | 878.00 | 925.60 | 941.20 | 956.50 | 1074.90 | 1136.10 | 1126.80 | 1120.60 | 1076.80 | 1101.20 | 1055.10 | 992.20 | 939.50 | 954.80 | 907.30 | 825.80 | 840.20 | 828.30 | 749.40 | 689.10 | 636.80 | 637.60 | NA | |
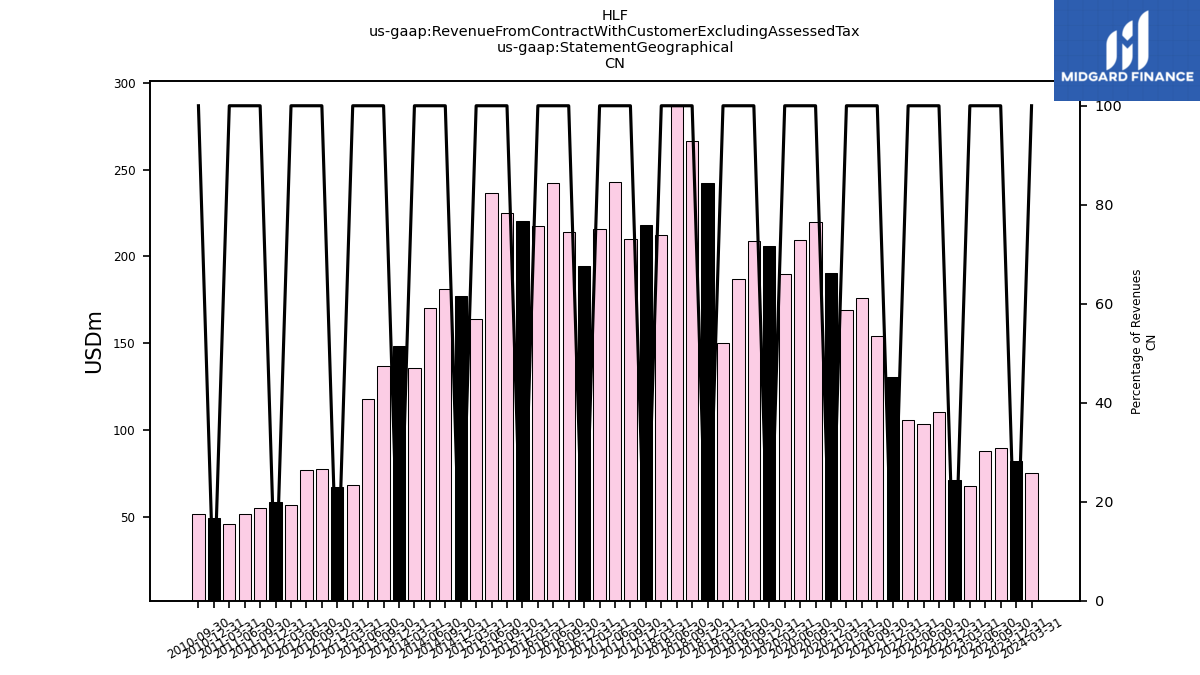
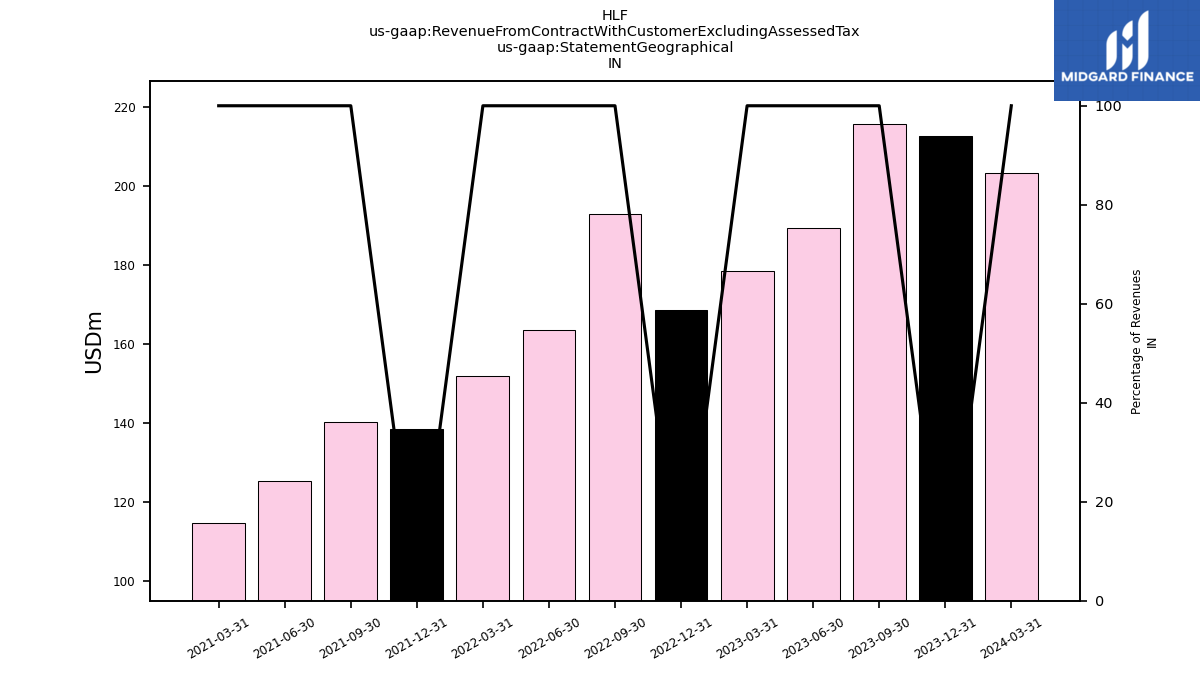
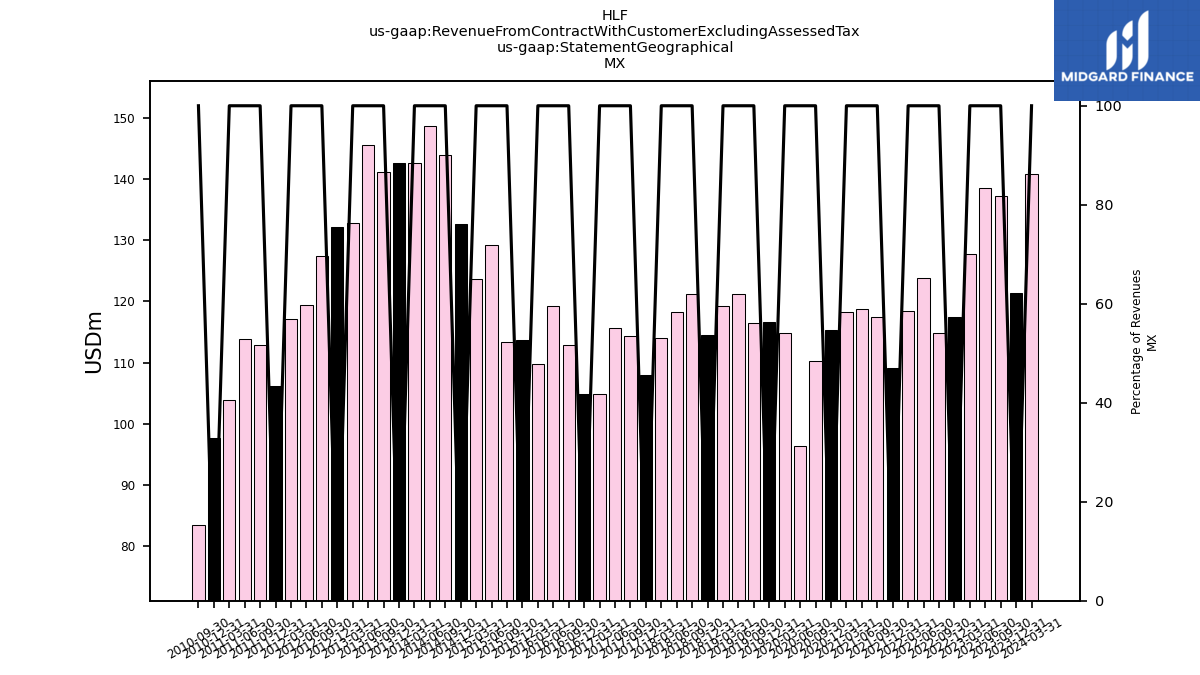
| Revenue From Contract With Customer Excluding Assessed Tax | 1264.30 | 1215.00 | 1281.30 | 1314.00 | 1252.10 | 1180.80 | 1295.10 | 1392.70 | 1335.80 | 1318.00 | 1430.90 | 1552.30 | 1501.60 | 1410.70 | 1521.80 | 1346.90 | 1262.40 | 1220.30 | 1244.50 | 1240.10 | 1172.20 | 1186.60 | 1242.80 | 1285.50 | 1176.90 | 1093.30 | 1085.40 | 1146.90 | 1102.10 | 1045.00 | 1122.00 | 1201.80 | 1119.60 | 1098.40 | 1102.90 | 1162.30 | 1105.40 | 1133.60 | 1256.16 | 1306.20 | 1262.65 | 1268.90 | 1213.54 | 1219.24 | 1123.65 | 1059.30 | 1016.89 | 1031.95 | 964.17 | 884.50 | 895.22 | 879.65 | 795.10 | 738.40 | 688.43 | 688.81 | 618.63 | |
| 75.20 | 82.20 | 89.50 | 88.00 | 67.70 | 71.10 | 110.60 | 103.70 | 105.60 | 130.40 | 154.00 | 175.80 | 169.30 | 190.20 | 220.00 | 209.50 | 189.90 | 205.90 | 208.70 | 187.00 | 150.40 | 242.10 | 266.50 | 286.80 | 212.20 | 217.90 | 209.80 | 242.70 | 215.60 | 194.70 | 214.20 | 242.50 | 217.40 | 220.40 | 224.90 | 236.70 | 164.20 | 177.10 | 181.30 | 170.10 | 135.80 | 148.30 | 136.70 | 118.00 | 68.50 | 67.10 | 77.40 | 77.10 | 56.90 | 58.70 | 55.00 | 51.40 | 45.70 | 49.20 | 51.60 | NA | NA | ||
| 203.50 | 212.70 | 215.90 | 189.40 | 178.60 | 168.60 | 192.90 | 163.60 | 152.00 | 138.60 | 140.30 | 125.50 | 114.70 | NA | NA | NA | NA | NA | NA | NA | NA | NA | NA | NA | NA | NA | NA | NA | NA | NA | NA | NA | NA | NA | NA | NA | NA | NA | NA | NA | NA | NA | NA | NA | NA | NA | NA | NA | NA | NA | NA | NA | NA | NA | NA | NA | NA | ||
| 140.90 | 121.40 | 137.30 | 138.50 | 127.80 | 117.50 | 114.80 | 123.90 | 118.40 | 109.20 | 117.50 | 118.80 | 118.20 | 115.30 | 110.30 | 96.40 | 114.90 | 116.60 | 116.50 | 121.20 | 119.30 | 114.50 | 121.20 | 118.20 | 114.00 | 108.00 | 114.30 | 115.60 | 104.80 | 104.80 | 112.80 | 119.30 | 109.70 | 113.70 | 113.40 | 129.20 | 123.60 | 132.70 | 143.90 | 148.60 | 142.70 | 142.60 | 141.20 | 145.60 | 132.90 | 132.10 | 127.50 | 119.50 | 117.10 | 106.20 | 112.90 | 113.90 | 103.90 | 97.70 | 83.50 | NA | NA | ||
| US | 258.70 | 245.90 | 270.10 | 295.30 | 289.20 | 266.10 | 308.80 | 333.50 | 317.10 | 293.70 | 345.30 | 399.10 | 348.60 | 300.60 | 386.70 | 375.30 | 271.90 | 228.40 | 251.50 | 272.00 | 250.70 | 209.50 | 234.50 | 256.40 | 225.50 | 187.00 | 193.50 | 213.10 | 224.70 | 197.30 | 236.00 | 260.80 | 240.90 | 198.50 | 214.70 | 224.90 | 221.90 | 199.40 | 218.40 | 245.00 | 234.00 | 205.40 | 223.60 | 241.70 | 216.20 | 191.40 | 202.90 | 218.10 | 204.50 | 160.20 | 175.10 | 179.40 | 162.20 | 136.50 | 150.60 | NA | NA | |
| Others | 586.00 | 552.80 | 568.50 | 602.80 | 588.80 | 557.50 | 568.00 | 668.00 | 642.70 | 265.60 | 814.10 | 858.60 | 865.50 | 804.60 | 804.80 | 665.70 | 685.70 | 669.40 | 667.80 | 659.90 | 651.80 | 620.50 | 620.60 | 624.10 | 625.20 | 580.40 | 567.80 | 575.50 | 557.00 | 548.20 | 559.00 | 579.20 | 551.60 | 513.20 | 484.70 | 571.50 | 595.70 | 546.60 | 591.30 | NA | NA | NA | NA | NA | NA | NA | NA | NA | NA | NA | NA | 535.00 | NA | NA | NA | 395.10 | NA | |
| Primary Reporting | 1189.10 | 1132.80 | 1191.80 | 1226.00 | 1184.40 | 1109.70 | 1184.50 | 1289.00 | 1230.20 | 1187.60 | 1276.90 | 1376.50 | 1332.30 | 1220.50 | 1301.80 | 1137.40 | 1072.50 | 1014.40 | 1035.80 | 1053.10 | 1021.80 | 944.50 | 976.30 | 998.70 | 964.70 | 875.40 | 875.60 | 904.20 | 886.50 | 850.30 | 907.80 | 959.30 | 902.20 | 878.00 | 878.00 | 925.60 | 941.20 | 956.50 | 1074.90 | 1136.10 | 1126.80 | 1120.60 | 1076.80 | 1101.20 | 1055.10 | 992.20 | 939.50 | 954.80 | 907.30 | 825.80 | 840.20 | 828.30 | 749.40 | 689.10 | 636.80 | 637.60 | NA |