
| 2024-01-28 | 2023-10-29 | 2023-07-30 | 2023-04-30 | 2023-01-29 | 2022-10-30 | 2022-07-31 | 2022-05-01 | 2022-01-30 | 2021-10-31 | 2021-07-25 | 2021-04-25 | 2021-01-24 | 2020-10-25 | 2020-07-26 | 2020-04-26 | 2020-01-26 | 2019-10-27 | 2019-07-28 | 2019-04-28 | 2019-01-27 | 2018-10-28 | 2018-07-29 | 2018-04-29 | 2018-01-28 | 2017-10-29 | 2017-07-30 | 2017-04-30 | 2017-01-29 | 2016-10-30 | 2016-07-24 | 2016-04-24 | 2016-01-24 | 2015-10-25 | 2015-07-26 | 2015-04-26 | 2015-01-25 | 2014-10-26 | 2014-07-27 | 2014-04-27 | 2014-01-26 | 2013-10-27 | 2013-07-28 | 2013-04-28 | 2013-01-27 | 2012-10-28 | 2012-07-29 | 2012-04-29 | 2012-01-29 | 2011-10-30 | 2011-07-31 | 2011-05-01 | 2011-01-31 | 2011-01-30 | 2010-10-31 | 2010-07-25 | 2010-04-25 | 2010-01-24 | ||
|---|---|---|---|---|---|---|---|---|---|---|---|---|---|---|---|---|---|---|---|---|---|---|---|---|---|---|---|---|---|---|---|---|---|---|---|---|---|---|---|---|---|---|---|---|---|---|---|---|---|---|---|---|---|---|---|---|---|---|---|
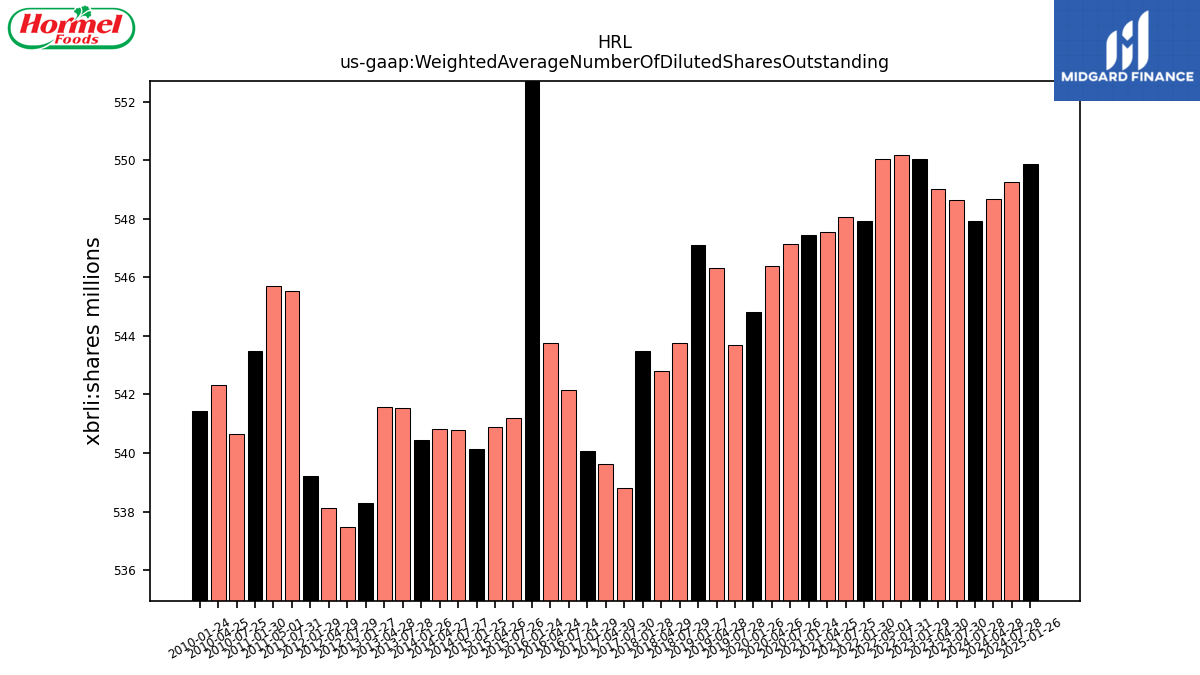
| Weighted Average Number Of Diluted Shares Outstanding | 547.92 | NA | 548.64 | 549.01 | 550.03 | NA | 550.17 | 550.04 | 547.93 | NA | 548.07 | 547.54 | 547.44 | NA | 547.15 | 546.37 | 544.82 | NA | 543.68 | 546.33 | 547.12 | NA | 543.76 | 542.81 | 543.48 | NA | 538.81 | 539.63 | 540.06 | NA | 542.16 | 543.77 | 542.74 | NA | 270.60 | 270.44 | 270.06 | NA | 270.40 | 270.41 | 270.22 | NA | 270.77 | 270.78 | 269.14 | NA | 268.75 | 269.06 | 269.61 | NA | 272.76 | 272.85 | NA | 271.74 | NA | 270.33 | 271.16 | 270.71 | |
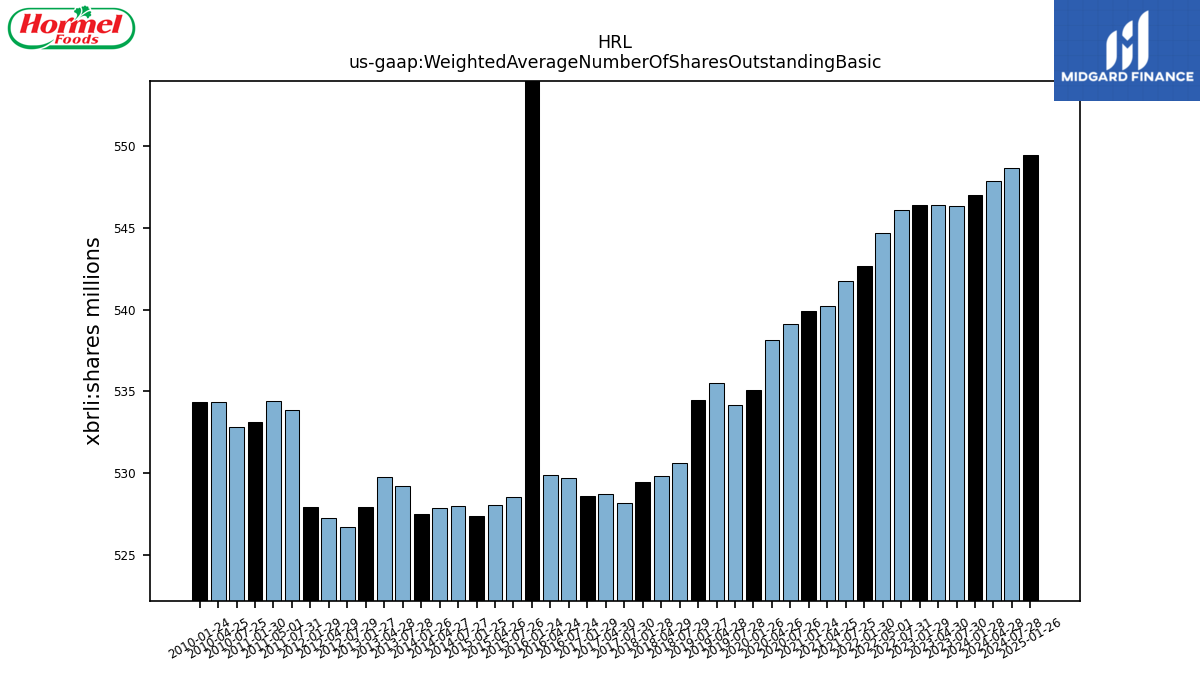
| Weighted Average Number Of Shares Outstanding Basic | 547.02 | NA | 546.36 | 546.42 | 546.38 | NA | 546.08 | 544.70 | 542.68 | NA | 541.75 | 540.20 | 539.91 | NA | 539.11 | 538.12 | 535.08 | NA | 534.19 | 535.48 | 534.50 | NA | 530.61 | 529.80 | 529.45 | NA | 528.16 | 528.71 | 528.59 | NA | 529.66 | 529.90 | 528.86 | NA | 264.26 | 264.03 | 263.68 | NA | 263.98 | 263.93 | 263.75 | NA | 264.61 | 264.87 | 263.94 | NA | 263.36 | 263.61 | 263.95 | NA | 266.93 | 267.21 | NA | 266.56 | NA | 266.40 | 267.19 | 267.18 | |
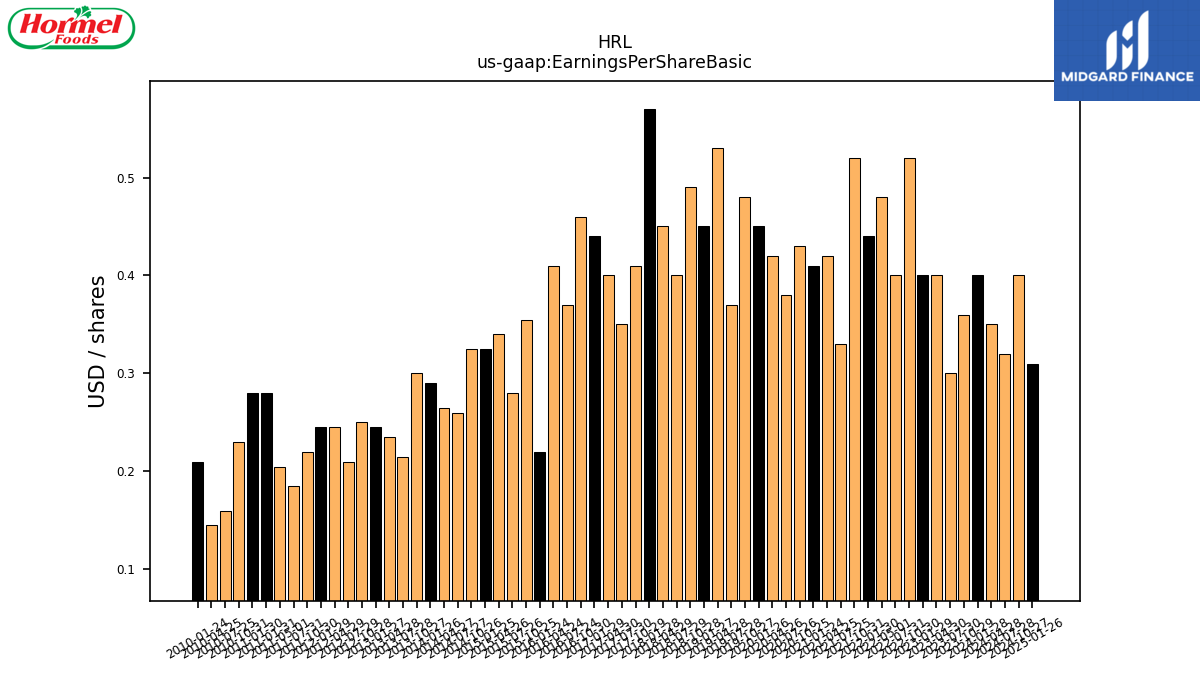
| Earnings Per Share Basic | 0.40 | 0.36 | 0.30 | 0.40 | 0.40 | 0.52 | 0.40 | 0.48 | 0.44 | 0.52 | 0.33 | 0.42 | 0.41 | 0.43 | 0.38 | 0.42 | 0.45 | 0.48 | 0.37 | 0.53 | 0.45 | 0.49 | 0.40 | 0.45 | 0.57 | 0.41 | 0.35 | 0.40 | 0.44 | 0.46 | 0.37 | 0.41 | 0.44 | 0.71 | 0.56 | 0.68 | 0.65 | 0.65 | 0.52 | 0.53 | 0.58 | 0.60 | 0.43 | 0.47 | 0.49 | 0.50 | 0.42 | 0.49 | 0.49 | 0.44 | 0.37 | 0.41 | 0.56 | 0.56 | 0.46 | 0.32 | 0.29 | 0.42 | |
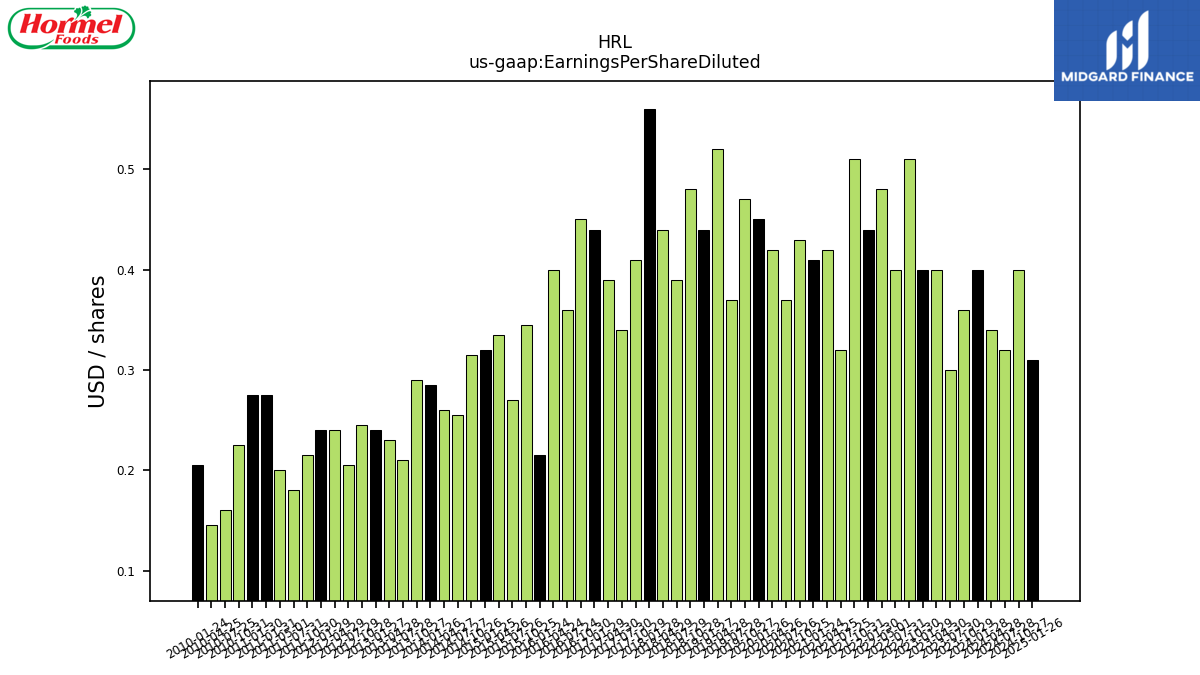
| Earnings Per Share Diluted | 0.40 | 0.36 | 0.30 | 0.40 | 0.40 | 0.51 | 0.40 | 0.48 | 0.44 | 0.51 | 0.32 | 0.42 | 0.41 | 0.43 | 0.37 | 0.42 | 0.45 | 0.47 | 0.37 | 0.52 | 0.44 | 0.48 | 0.39 | 0.44 | 0.56 | 0.41 | 0.34 | 0.39 | 0.44 | 0.45 | 0.36 | 0.40 | 0.43 | 0.69 | 0.54 | 0.67 | 0.64 | 0.63 | 0.51 | 0.52 | 0.57 | 0.58 | 0.42 | 0.46 | 0.48 | 0.49 | 0.41 | 0.48 | 0.48 | 0.43 | 0.36 | 0.40 | 0.55 | 0.55 | 0.45 | 0.32 | 0.29 | 0.41 |
| 2024-01-28 | 2023-10-29 | 2023-07-30 | 2023-04-30 | 2023-01-29 | 2022-10-30 | 2022-07-31 | 2022-05-01 | 2022-01-30 | 2021-10-31 | 2021-07-25 | 2021-04-25 | 2021-01-24 | 2020-10-25 | 2020-07-26 | 2020-04-26 | 2020-01-26 | 2019-10-27 | 2019-07-28 | 2019-04-28 | 2019-01-27 | 2018-10-28 | 2018-07-29 | 2018-04-29 | 2018-01-28 | 2017-10-29 | 2017-07-30 | 2017-04-30 | 2017-01-29 | 2016-10-30 | 2016-07-24 | 2016-04-24 | 2016-01-24 | 2015-10-25 | 2015-07-26 | 2015-04-26 | 2015-01-25 | 2014-10-26 | 2014-07-27 | 2014-04-27 | 2014-01-26 | 2013-10-27 | 2013-07-28 | 2013-04-28 | 2013-01-27 | 2012-10-28 | 2012-07-29 | 2012-04-29 | 2012-01-29 | 2011-10-30 | 2011-07-31 | 2011-05-01 | 2011-01-31 | 2011-01-30 | 2010-10-31 | 2010-07-25 | 2010-04-25 | 2010-01-24 | ||
|---|---|---|---|---|---|---|---|---|---|---|---|---|---|---|---|---|---|---|---|---|---|---|---|---|---|---|---|---|---|---|---|---|---|---|---|---|---|---|---|---|---|---|---|---|---|---|---|---|---|---|---|---|---|---|---|---|---|---|---|
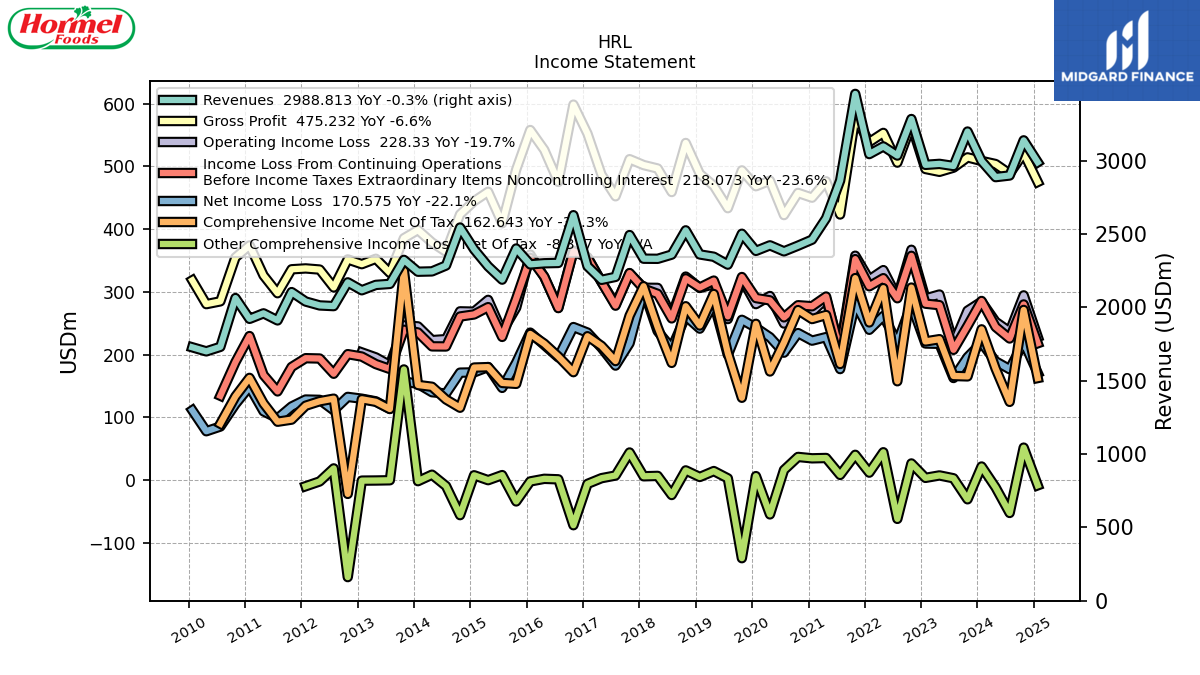
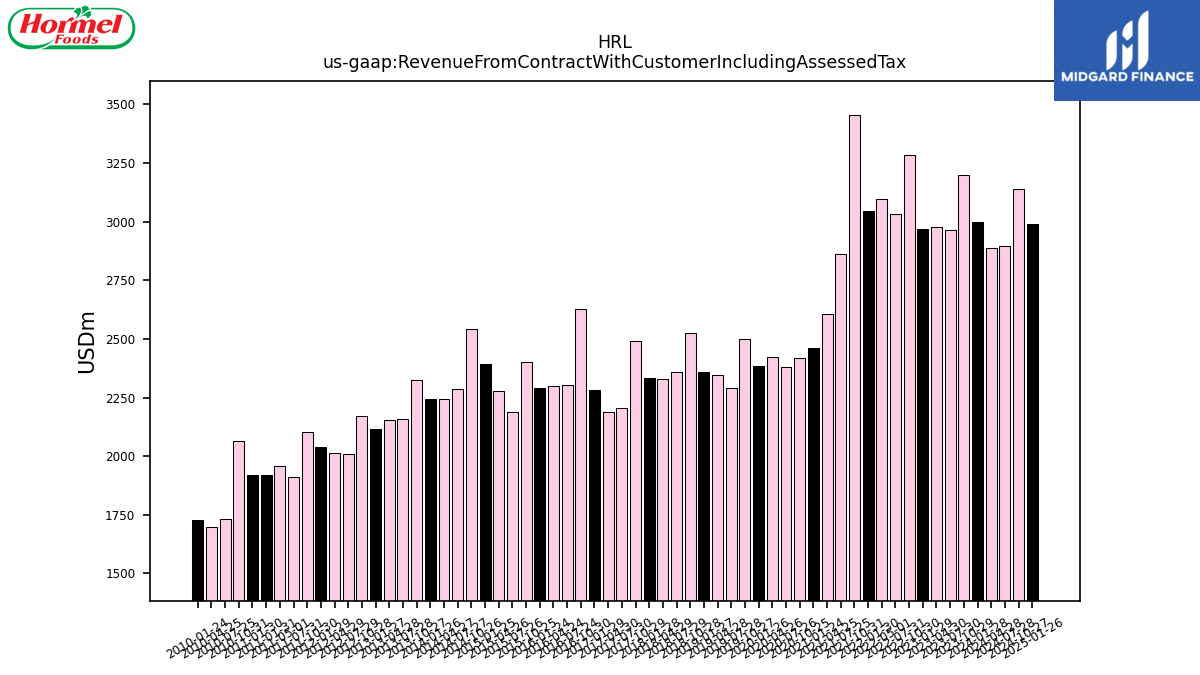
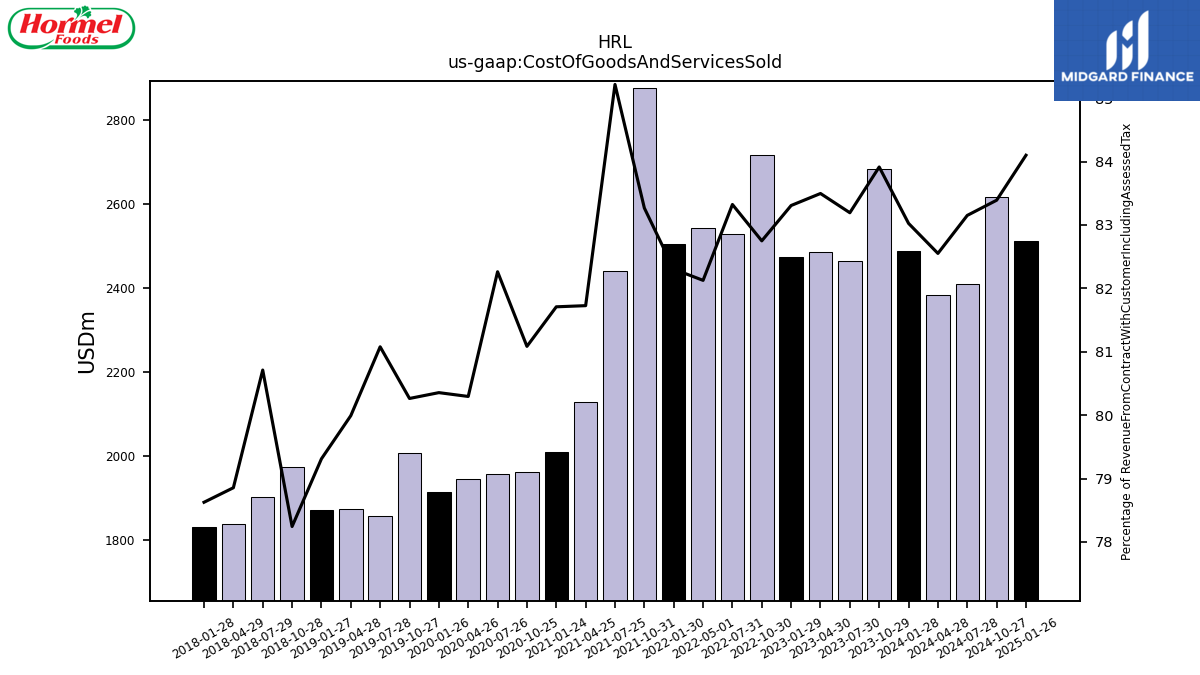
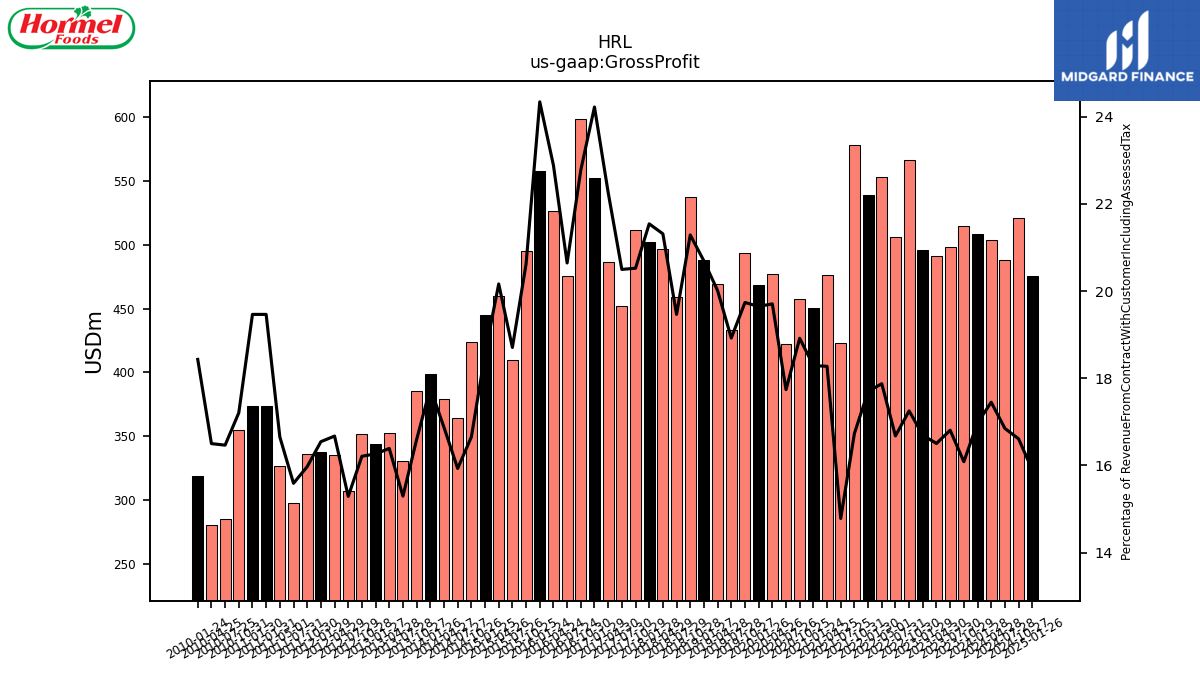
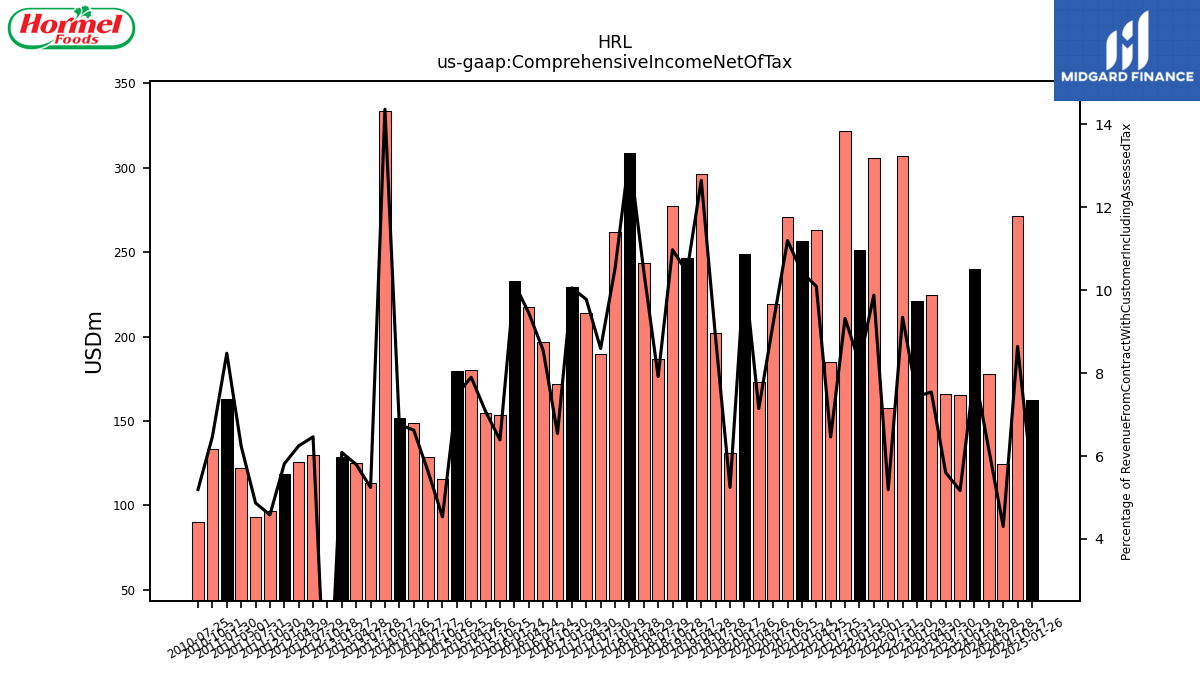
| Revenue From Contract With Customer Including Assessed Tax | 2996.91 | 3198.08 | 2963.30 | 2977.64 | 2970.99 | 3283.47 | 3034.41 | 3096.56 | 3044.36 | 3454.75 | 2863.67 | 2606.62 | 2461.15 | 2420.11 | 2381.46 | 2422.47 | 2384.43 | 2501.51 | 2290.70 | 2344.74 | 2360.36 | 2524.70 | 2359.14 | 2330.57 | 2331.29 | 2492.61 | 2207.38 | 2187.31 | 2280.23 | 2627.94 | 2302.38 | 2300.24 | 2292.67 | 2400.86 | 2188.59 | 2279.34 | 2395.07 | 2543.77 | 2284.95 | 2244.87 | 2242.67 | 2323.20 | 2159.53 | 2152.69 | 2116.24 | 2170.18 | 2008.19 | 2012.86 | 2039.44 | 2103.90 | 1910.59 | 1959.04 | 1921.56 | 1921.56 | 2063.04 | 1730.45 | 1699.78 | 1727.45 | |
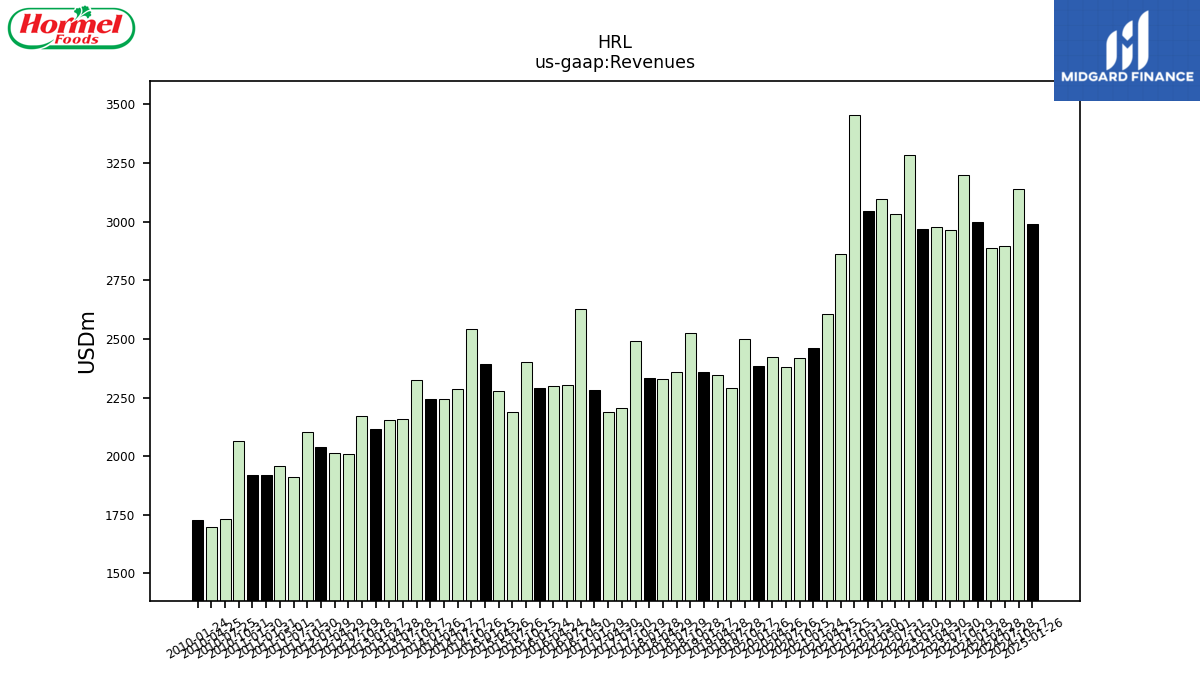
| Revenues | 2996.91 | 3198.08 | 2963.30 | 2977.64 | 2970.99 | 3283.47 | 3034.41 | 3096.56 | 3044.36 | 3454.75 | 2863.67 | 2606.62 | 2461.15 | 2420.11 | 2381.46 | 2422.47 | 2384.43 | 2501.51 | 2290.70 | 2344.74 | 2360.36 | 2524.70 | 2359.14 | 2330.57 | 2331.29 | 2492.61 | 2207.38 | 2187.31 | 2280.23 | 2627.94 | 2302.38 | 2300.24 | 2292.67 | 2400.86 | 2188.59 | 2279.34 | 2395.07 | 2543.77 | 2284.95 | 2244.87 | 2242.67 | 2323.20 | 2159.53 | 2152.69 | 2116.24 | 2170.18 | 2008.19 | 2012.86 | 2039.44 | 2103.90 | 1910.59 | 1959.04 | 1921.56 | 1921.56 | 2063.04 | 1730.45 | 1699.78 | 1727.45 | |
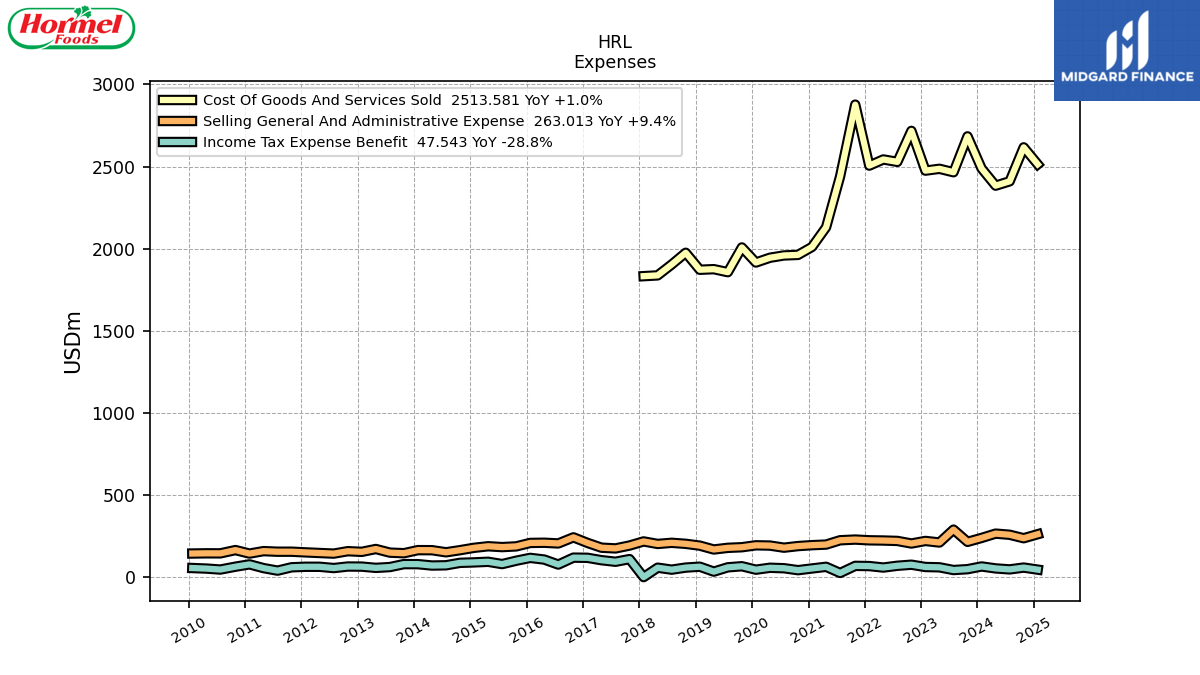
| Cost Of Goods And Services Sold | 2488.18 | 2683.66 | 2465.25 | 2486.22 | 2475.04 | 2717.06 | 2528.36 | 2543.09 | 2505.61 | 2876.67 | 2440.32 | 2130.31 | 2010.98 | 1962.34 | 1959.03 | 1945.11 | 1916.01 | 2007.79 | 1857.26 | 1875.60 | 1872.02 | 1975.41 | 1904.10 | 1837.77 | 1833.00 | NA | NA | NA | NA | NA | NA | NA | NA | NA | NA | NA | NA | NA | NA | NA | NA | NA | NA | NA | NA | NA | NA | NA | NA | NA | NA | NA | NA | NA | NA | NA | NA | NA | |
| Gross Profit | 508.73 | 514.42 | 498.05 | 491.42 | 495.95 | 566.42 | 506.05 | 553.47 | 538.75 | 578.08 | 423.35 | 476.31 | 450.17 | 457.76 | 422.43 | 477.35 | 468.42 | 493.72 | 433.44 | 469.15 | 488.33 | 537.40 | 459.17 | 496.69 | 502.18 | 511.55 | 452.41 | 486.92 | 552.28 | 598.52 | 475.29 | 526.36 | 558.01 | 495.03 | 409.39 | 459.56 | 444.61 | 423.58 | 364.00 | 378.76 | 398.64 | 385.52 | 330.31 | 352.80 | 344.19 | 351.78 | 307.06 | 335.61 | 337.41 | 336.03 | 297.86 | 326.23 | 374.00 | 374.00 | 354.97 | 284.92 | 280.47 | 318.39 | |
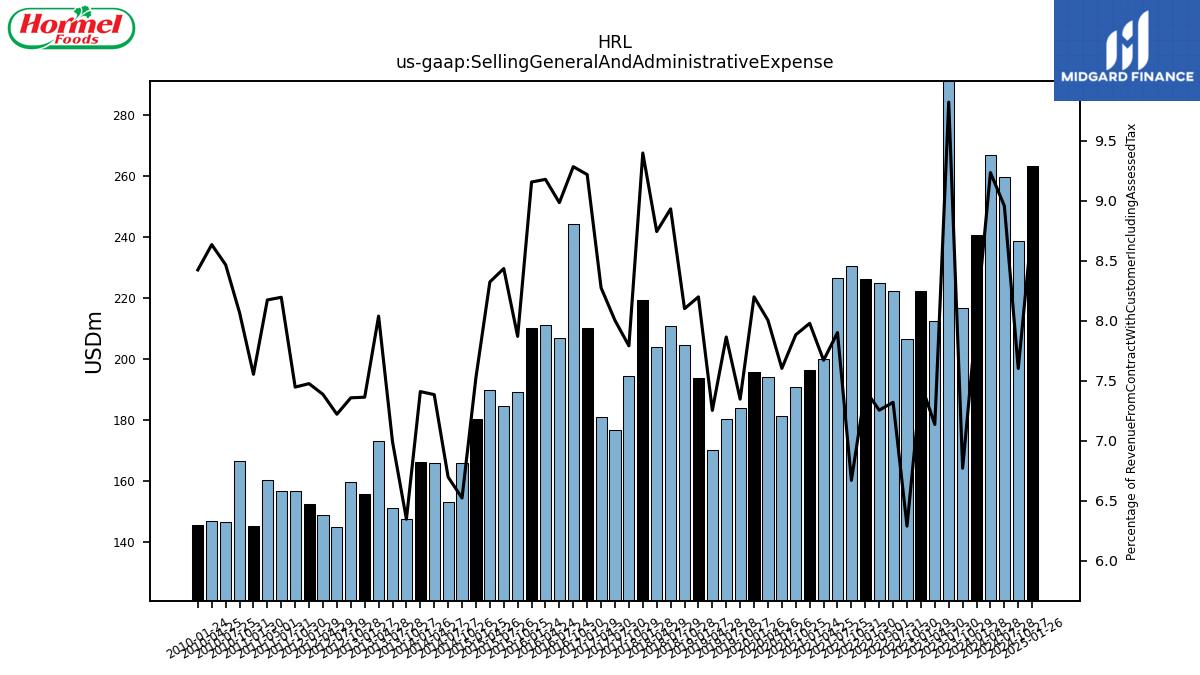
| Selling General And Administrative Expense | 240.39 | 216.55 | 291.07 | 212.49 | 222.06 | 206.49 | 222.15 | 224.66 | 225.97 | 230.44 | 226.28 | 199.97 | 196.38 | 190.80 | 181.09 | 193.91 | 195.52 | 183.79 | 180.17 | 170.08 | 193.54 | 204.54 | 210.75 | 203.80 | 219.12 | 194.22 | 176.66 | 181.01 | 210.22 | 244.01 | 206.88 | 211.14 | 209.95 | 188.95 | 184.63 | 189.73 | 180.30 | 165.94 | 153.03 | 165.78 | 166.19 | 147.44 | 151.00 | 173.07 | 155.83 | 159.69 | 145.02 | 148.68 | 152.48 | 156.69 | 156.59 | 160.14 | NA | 145.16 | 166.46 | 146.52 | 146.78 | 145.53 | |
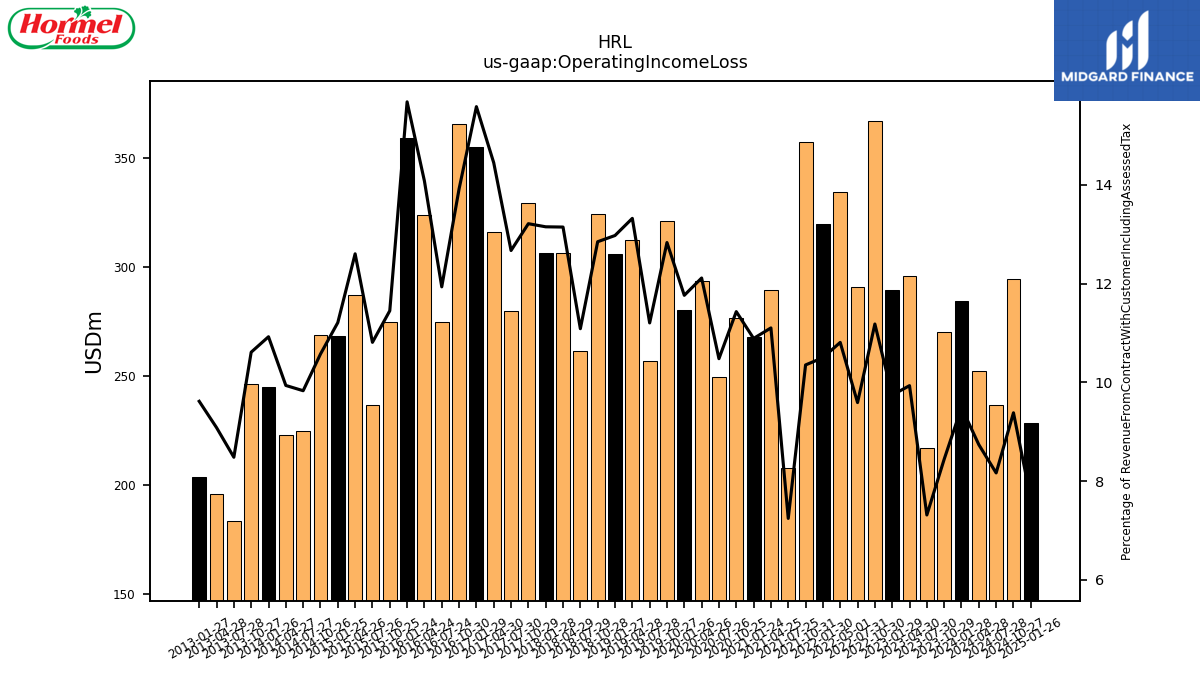
| Operating Income Loss | 284.44 | 270.04 | 216.76 | 295.80 | 289.45 | 367.16 | 291.04 | 334.73 | 319.68 | 357.68 | 207.48 | 289.42 | 268.02 | 276.70 | 249.58 | 293.46 | 280.49 | 321.00 | 256.66 | 312.36 | 306.25 | 324.39 | 261.57 | 306.37 | 306.59 | 329.37 | 279.70 | 316.03 | 355.36 | 365.75 | 274.79 | 323.82 | 359.54 | 274.91 | 236.62 | 287.29 | 268.51 | 268.98 | 224.64 | 223.09 | 245.00 | 246.52 | 183.22 | 195.56 | 203.52 | NA | NA | NA | NA | NA | NA | NA | NA | NA | NA | NA | NA | NA | |
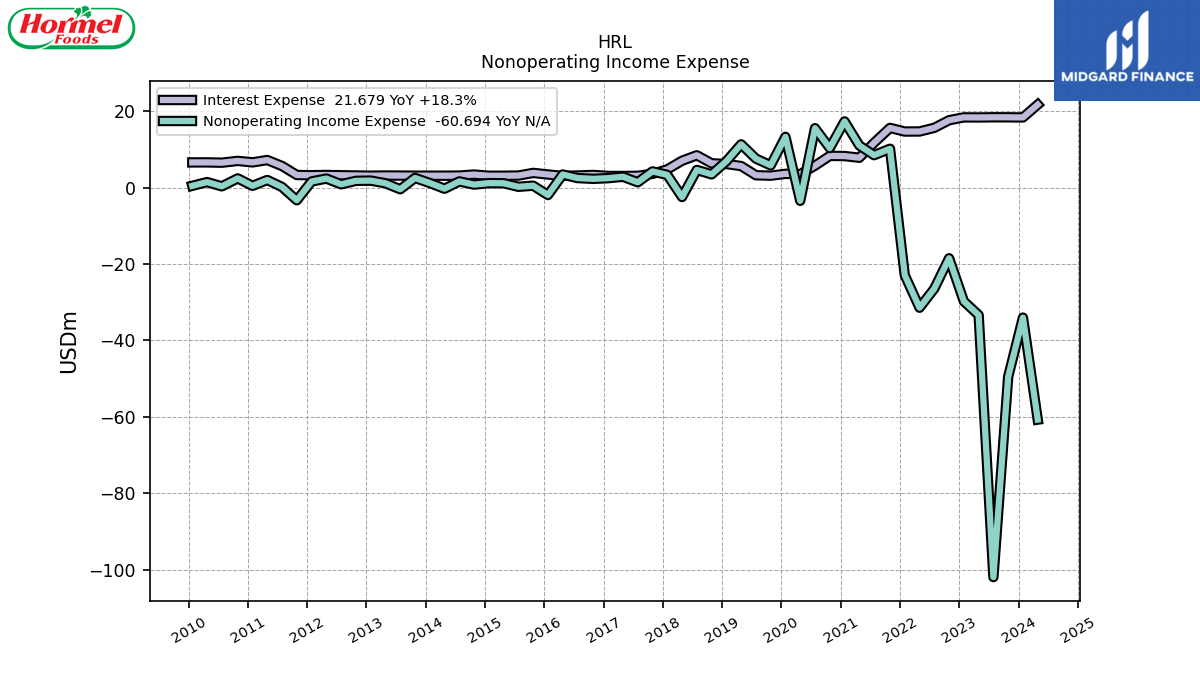
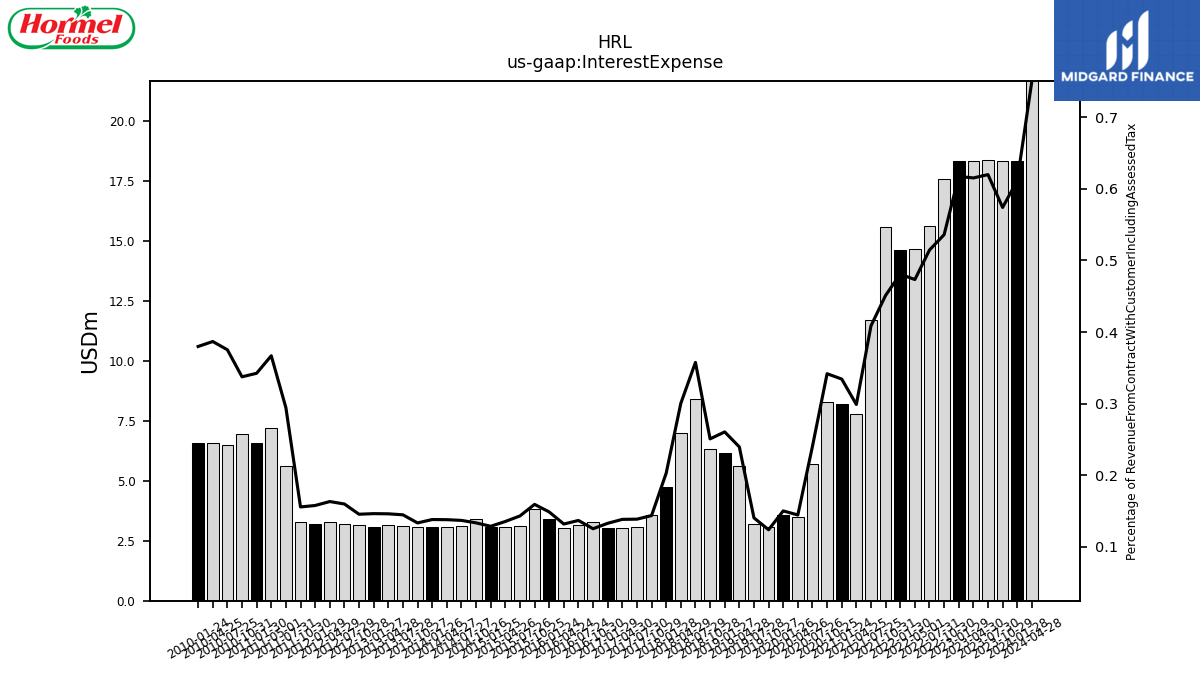
| Interest Expense | 18.33 | 18.36 | 18.37 | 18.32 | 18.35 | 17.60 | 15.62 | 14.66 | 14.64 | 15.59 | 11.70 | 7.79 | 8.23 | 8.27 | 5.72 | 3.50 | 3.58 | 3.10 | 3.21 | 5.62 | 6.15 | 6.33 | 8.44 | 7.00 | 4.73 | 3.58 | 3.06 | 3.02 | 3.03 | 3.29 | 3.15 | 3.03 | 3.41 | 3.82 | 3.13 | 3.08 | 3.08 | 3.39 | 3.12 | 3.09 | 3.09 | 3.10 | 3.12 | 3.14 | 3.09 | 3.15 | 3.21 | 3.28 | 3.21 | 3.27 | 5.62 | 7.19 | NA | 6.58 | 6.96 | 6.49 | 6.57 | 6.56 | |
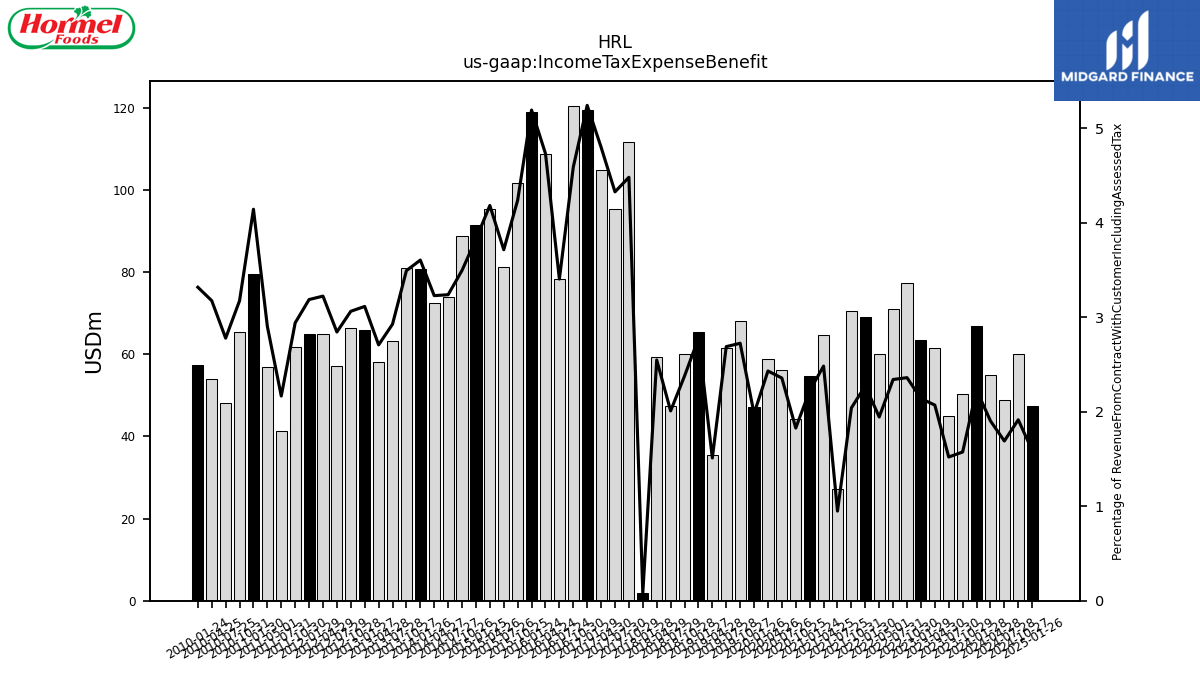
| Income Tax Expense Benefit | 66.82 | 50.32 | 45.05 | 61.62 | 63.55 | 77.48 | 71.01 | 60.19 | 69.19 | 70.48 | 27.16 | 64.70 | 54.69 | 44.21 | 56.10 | 58.87 | 47.21 | 68.13 | 61.57 | 35.41 | 65.46 | 60.01 | 47.38 | 59.36 | 1.95 | 111.65 | 95.47 | 104.94 | 119.48 | 120.54 | 78.34 | 108.81 | 119.00 | 101.71 | 81.26 | 95.30 | 91.61 | 88.89 | 73.97 | 72.45 | 80.81 | 81.12 | 63.17 | 58.26 | 65.88 | 66.45 | 57.09 | 64.86 | 64.98 | 61.84 | 41.37 | 56.85 | NA | 79.58 | 65.47 | 48.07 | 53.95 | 57.29 | |
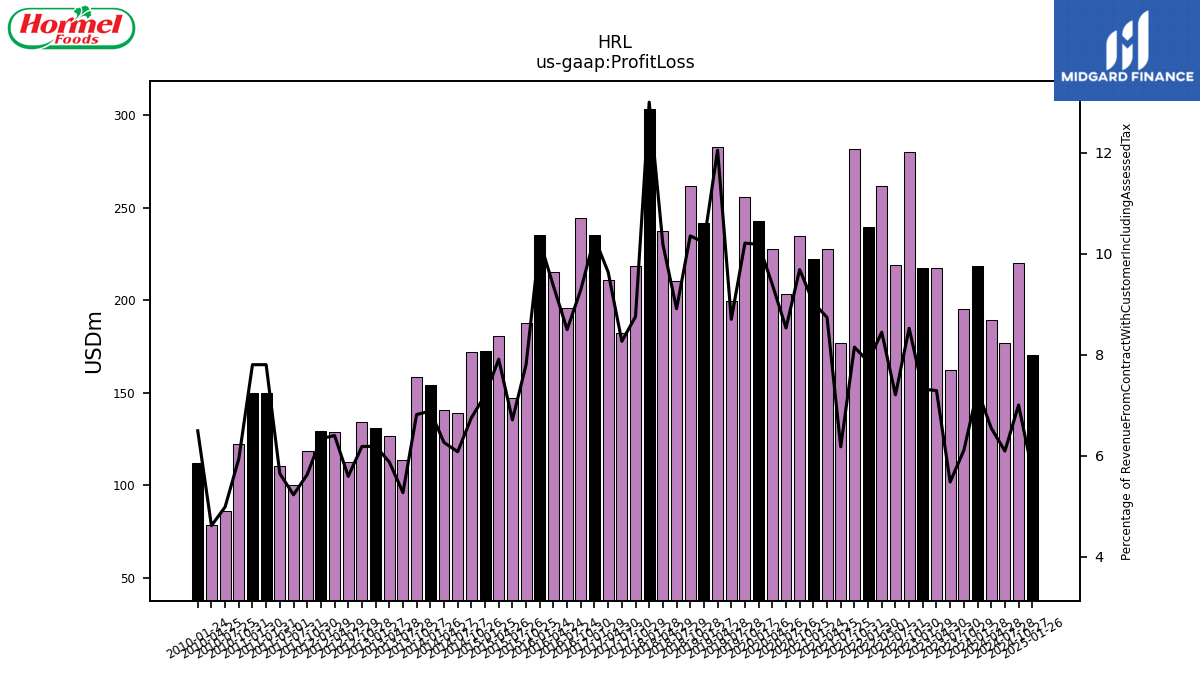
| Profit Loss | 218.73 | 195.48 | 162.57 | 217.22 | 217.65 | 280.01 | 218.83 | 261.68 | 239.71 | 281.75 | 177.07 | 227.92 | 222.40 | 234.53 | 203.26 | 227.62 | 242.95 | 255.57 | 199.43 | 282.64 | 241.52 | 261.50 | 210.35 | 237.52 | 303.21 | 218.36 | 182.55 | 210.89 | 235.30 | 244.19 | 195.78 | 215.38 | 235.17 | 187.44 | 146.96 | 180.44 | 172.43 | 171.85 | 139.01 | 140.71 | 154.46 | 158.49 | 113.91 | 126.64 | 131.04 | 134.29 | 112.41 | 128.94 | 129.33 | 118.50 | 99.96 | 110.70 | 150.03 | 150.03 | 122.61 | 86.36 | 78.53 | 112.27 | |
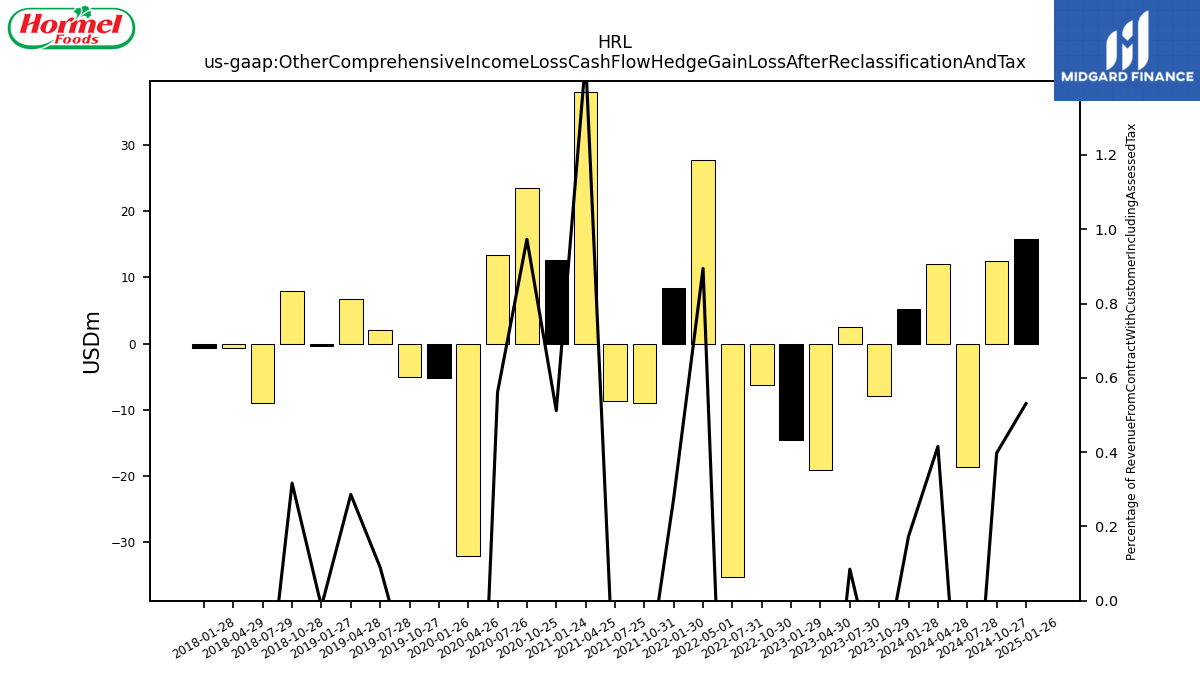
| Other Comprehensive Income Loss Cash Flow Hedge Gain Loss After Reclassification And Tax | 5.21 | -7.88 | 2.52 | -19.06 | -14.51 | -6.23 | -35.14 | 27.70 | 8.40 | -8.98 | -8.61 | 38.03 | 12.60 | 23.55 | 13.38 | -32.10 | -5.10 | -4.98 | 2.06 | 6.71 | -0.36 | 8.00 | -9.01 | -0.61 | -0.65 | NA | NA | NA | NA | NA | NA | NA | NA | NA | NA | NA | NA | NA | NA | NA | NA | NA | NA | NA | NA | NA | NA | NA | NA | NA | NA | NA | NA | NA | NA | NA | NA | NA | |
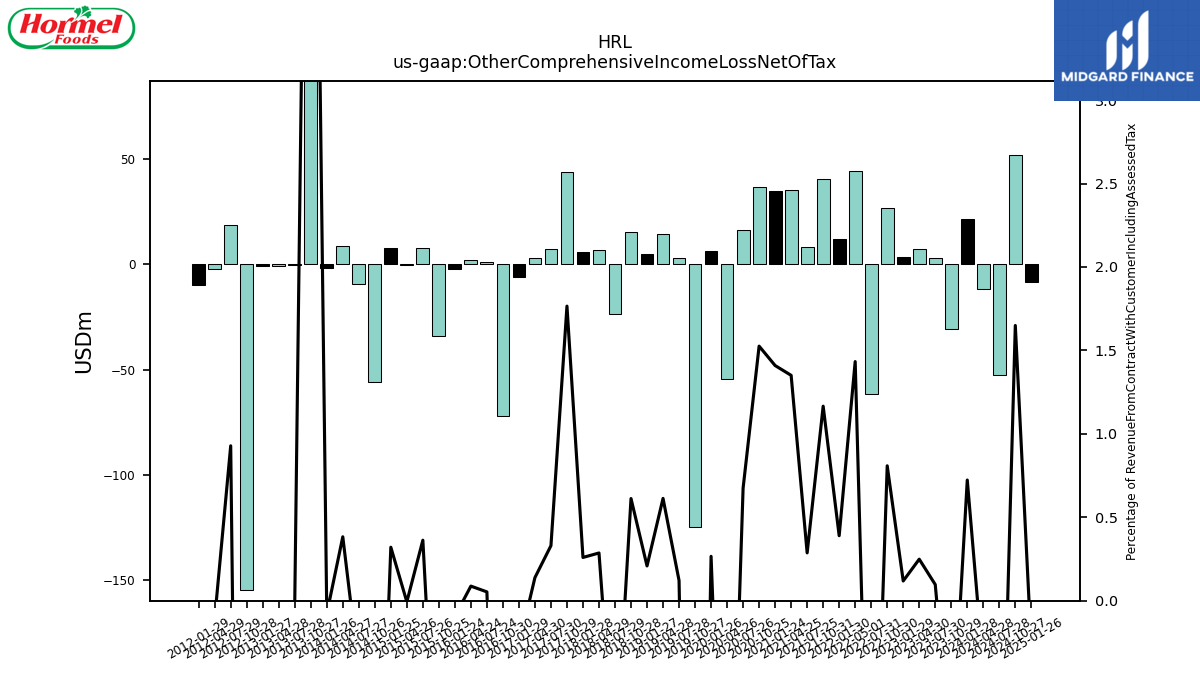
| Other Comprehensive Income Loss Net Of Tax | 21.68 | -30.69 | 2.88 | 7.42 | 3.52 | 26.55 | -61.86 | 44.38 | 11.86 | 40.28 | 8.21 | 35.20 | 34.69 | 36.92 | 16.07 | -54.73 | 6.35 | -124.56 | 2.78 | 14.38 | 4.92 | 15.46 | -23.83 | 6.67 | 6.05 | 44.00 | 7.29 | 3.04 | -6.08 | -71.99 | 1.22 | 2.02 | -2.15 | -34.07 | 7.94 | -0.14 | 7.68 | -55.91 | -9.44 | 8.60 | -1.74 | 176.40 | -0.29 | -0.68 | -0.87 | -154.70 | 18.64 | -2.16 | -9.82 | NA | NA | NA | NA | NA | NA | NA | NA | NA | |
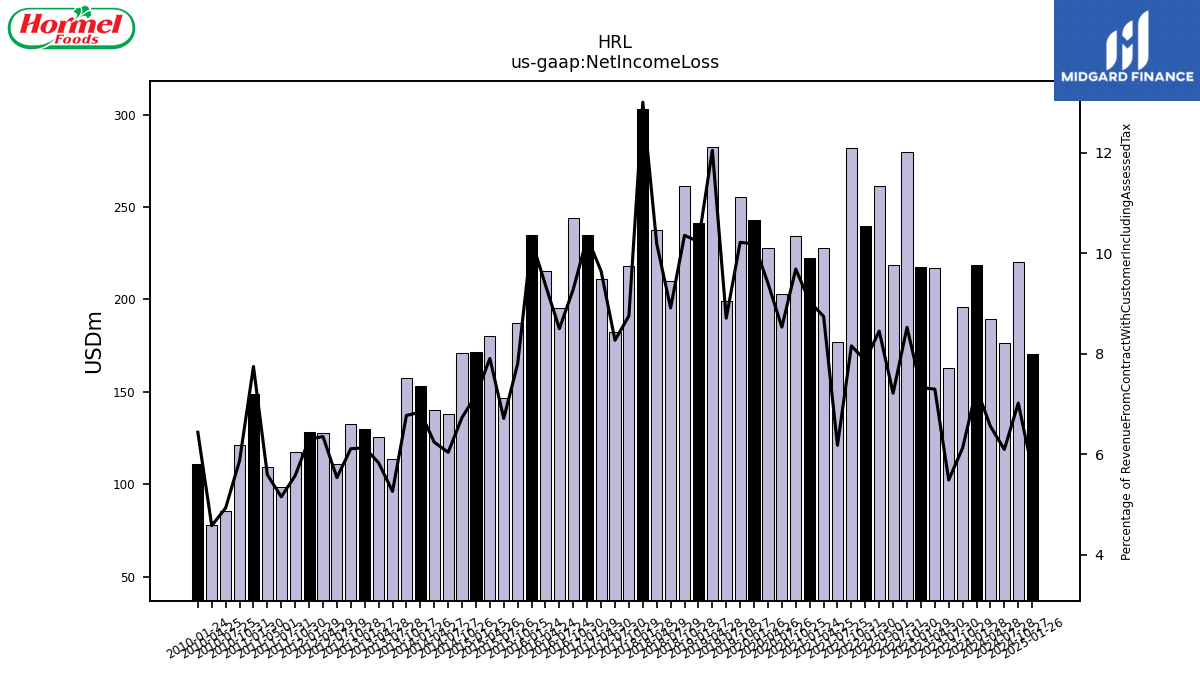
| Net Income Loss | 218.86 | 195.94 | 162.68 | 217.24 | 217.72 | 279.88 | 218.91 | 261.62 | 239.57 | 281.74 | 176.92 | 227.90 | 222.28 | 234.36 | 203.12 | 227.73 | 242.87 | 255.50 | 199.45 | 282.43 | 241.43 | 261.41 | 210.24 | 237.38 | 303.11 | 218.15 | 182.51 | 210.93 | 235.15 | 243.94 | 195.65 | 215.40 | 235.06 | 187.23 | 146.94 | 180.20 | 171.72 | 171.26 | 137.97 | 140.09 | 153.35 | 157.34 | 113.64 | 125.52 | 129.72 | 132.60 | 111.17 | 127.89 | 128.40 | 117.31 | 98.48 | 109.58 | NA | 148.83 | 121.15 | 85.37 | 77.86 | 111.21 | |
| Comprehensive Income Net Of Tax | 240.33 | 165.29 | 165.96 | 224.61 | 221.02 | 306.90 | 157.50 | 305.98 | 251.32 | 322.00 | 185.02 | 263.14 | 256.66 | 270.99 | 219.15 | 173.10 | 249.09 | 131.20 | 202.39 | 296.64 | 246.38 | 277.12 | 186.79 | 243.81 | 309.01 | 262.04 | 189.69 | 213.91 | 229.31 | 172.00 | 196.96 | 217.47 | 232.99 | 153.41 | 154.85 | 180.09 | 179.38 | 115.33 | 128.52 | 148.76 | 151.58 | 333.69 | 113.24 | 124.81 | 128.83 | -22.07 | 129.80 | 125.69 | 118.54 | 96.38 | 93.03 | 122.27 | NA | 162.94 | 133.41 | 89.86 | NA | NA |
| 2024-01-28 | 2023-10-29 | 2023-07-30 | 2023-04-30 | 2023-01-29 | 2022-10-30 | 2022-07-31 | 2022-05-01 | 2022-01-30 | 2021-10-31 | 2021-07-25 | 2021-04-25 | 2021-01-24 | 2020-10-25 | 2020-07-26 | 2020-04-26 | 2020-01-26 | 2019-10-27 | 2019-07-28 | 2019-04-28 | 2019-01-27 | 2018-10-28 | 2018-07-29 | 2018-04-29 | 2018-01-28 | 2017-10-29 | 2017-07-30 | 2017-04-30 | 2017-01-29 | 2016-10-30 | 2016-07-24 | 2016-04-24 | 2016-01-24 | 2015-10-25 | 2015-07-26 | 2015-04-26 | 2015-01-25 | 2014-10-26 | 2014-07-27 | 2014-04-27 | 2014-01-26 | 2013-10-27 | 2013-07-28 | 2013-04-28 | 2013-01-27 | 2012-10-28 | 2012-07-29 | 2012-04-29 | 2012-01-29 | 2011-10-30 | 2011-07-31 | 2011-05-01 | 2011-01-31 | 2011-01-30 | 2010-10-31 | 2010-07-25 | 2010-04-25 | 2010-01-24 | ||
|---|---|---|---|---|---|---|---|---|---|---|---|---|---|---|---|---|---|---|---|---|---|---|---|---|---|---|---|---|---|---|---|---|---|---|---|---|---|---|---|---|---|---|---|---|---|---|---|---|---|---|---|---|---|---|---|---|---|---|---|
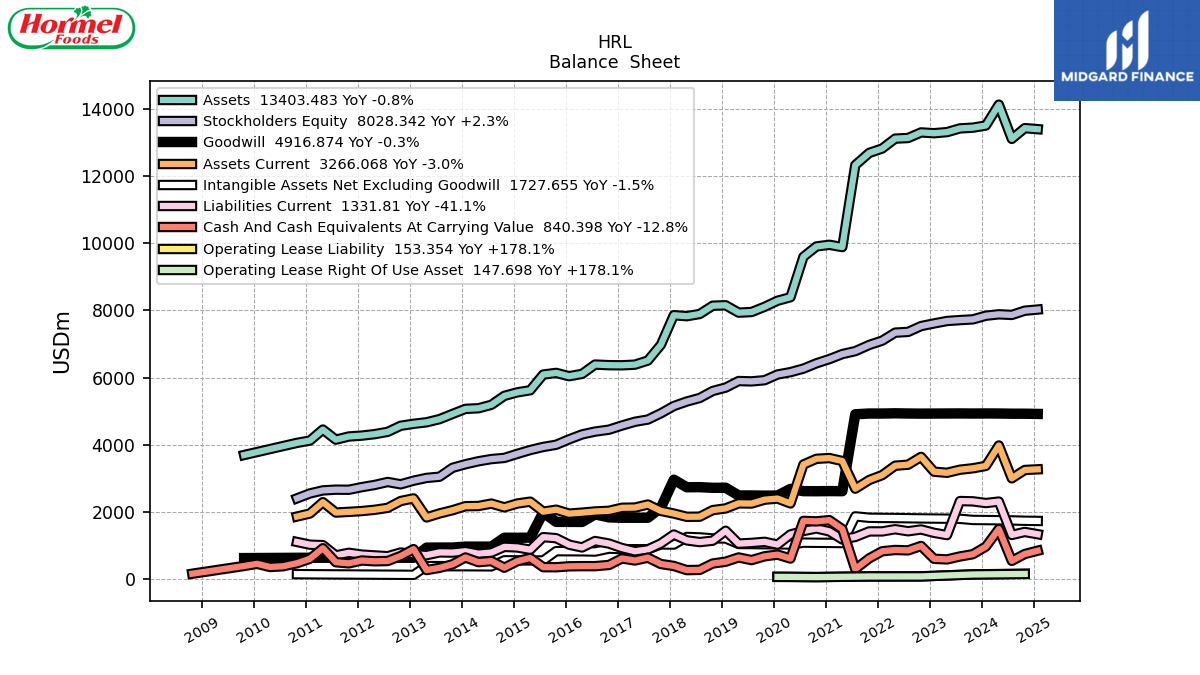
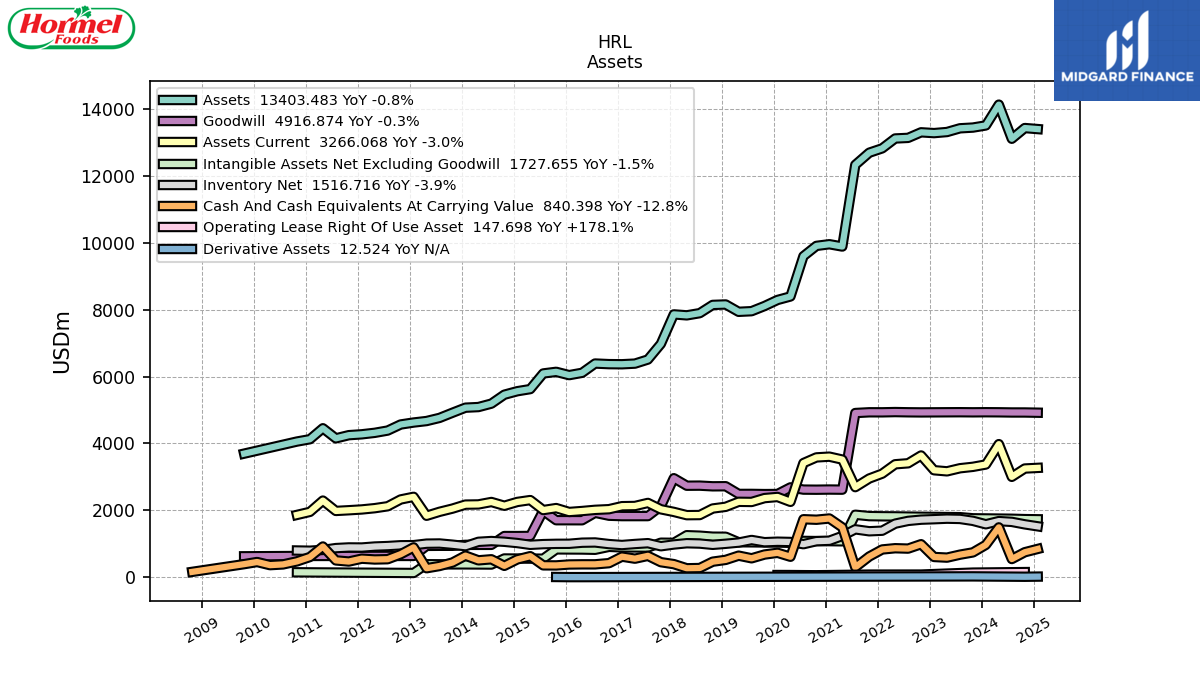
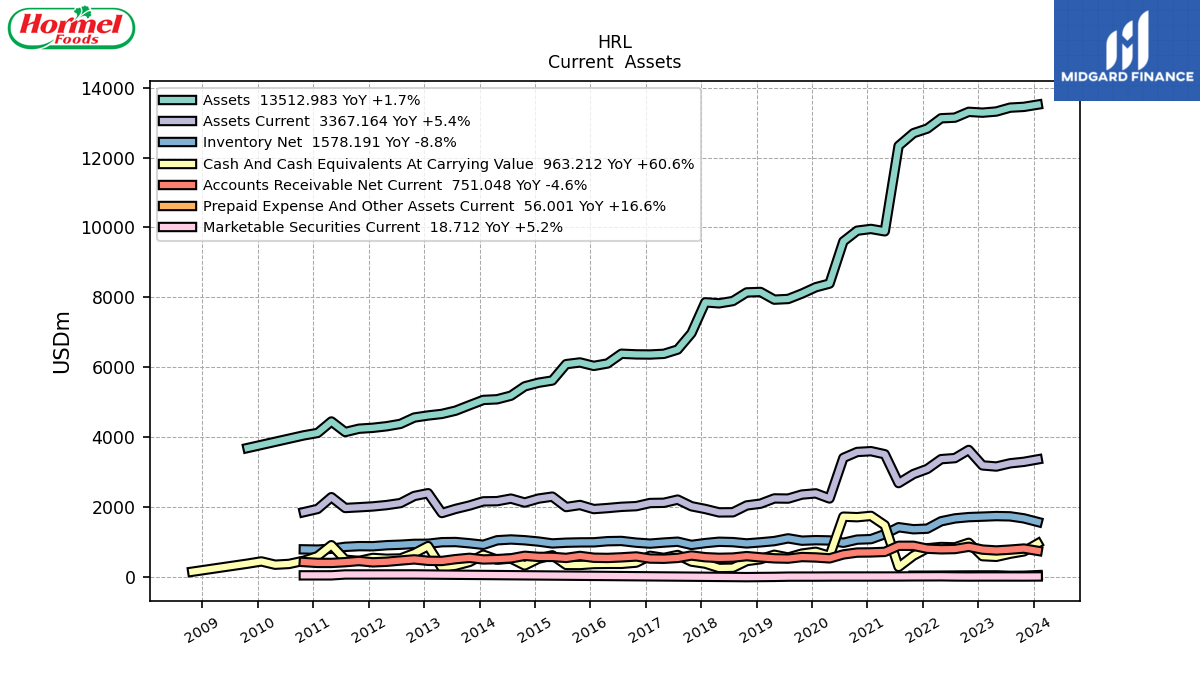
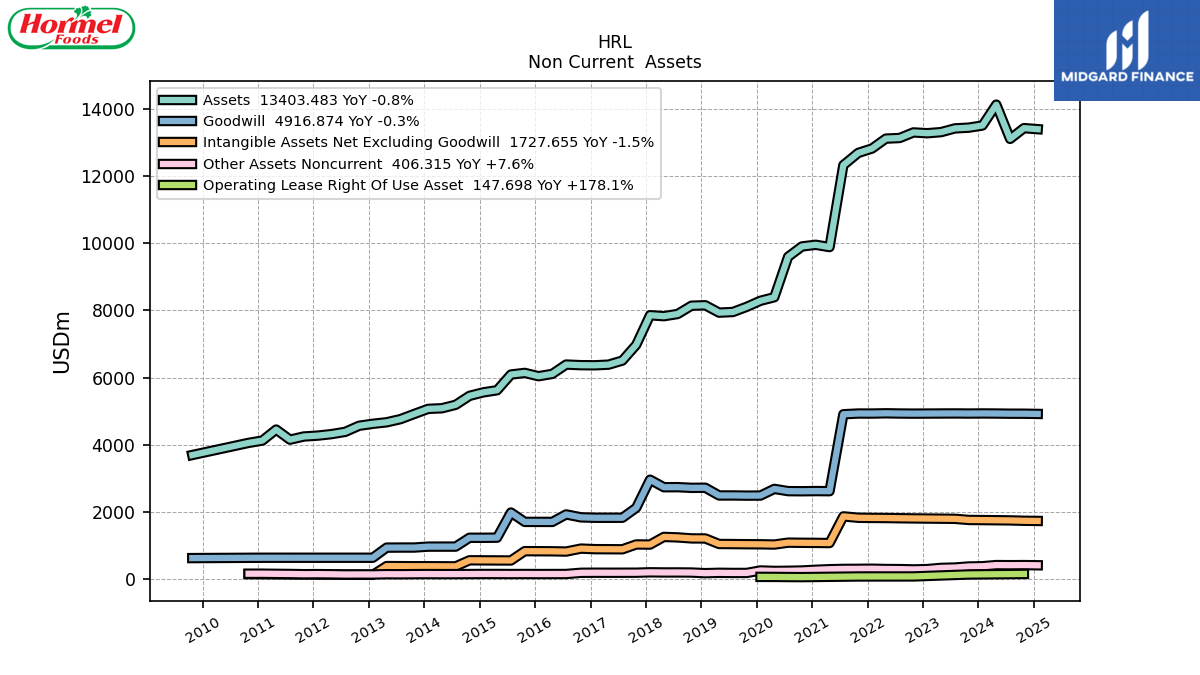
| Assets | 13512.98 | 13448.77 | 13426.76 | 13315.75 | 13283.05 | 13306.92 | 13140.42 | 13122.26 | 12827.01 | 12696.33 | 12332.18 | 9889.00 | 9957.93 | 9908.28 | 9600.47 | 8395.18 | 8290.11 | 8109.00 | 7954.58 | 7935.74 | 8155.40 | 8142.29 | 7895.37 | 7829.75 | 7858.85 | 6975.91 | 6507.97 | 6385.71 | 6366.40 | 6370.07 | 6388.30 | 6110.35 | 6040.89 | 6139.83 | 6091.08 | 5623.00 | 5559.62 | 5455.62 | 5188.43 | 5085.82 | 5067.17 | 4915.88 | 4761.25 | 4667.64 | 4622.83 | 4563.97 | 4382.62 | 4314.66 | 4270.29 | 4244.39 | 4149.53 | 4451.42 | NA | 4122.95 | 4053.92 | NA | NA | NA | |
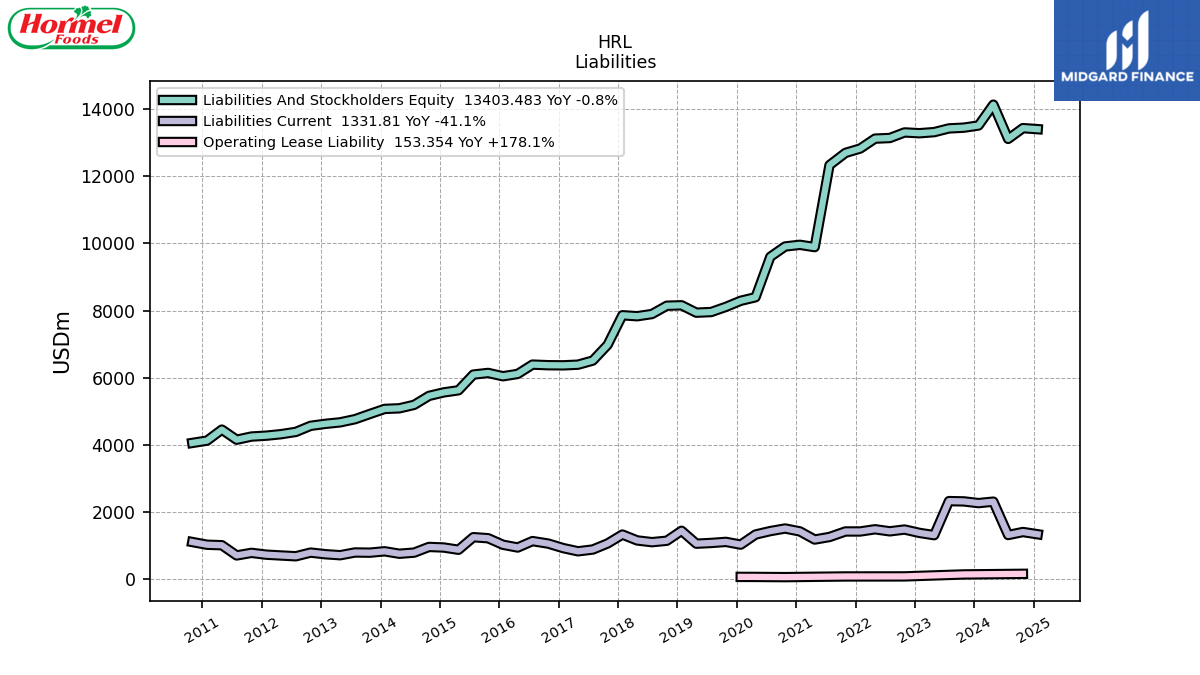
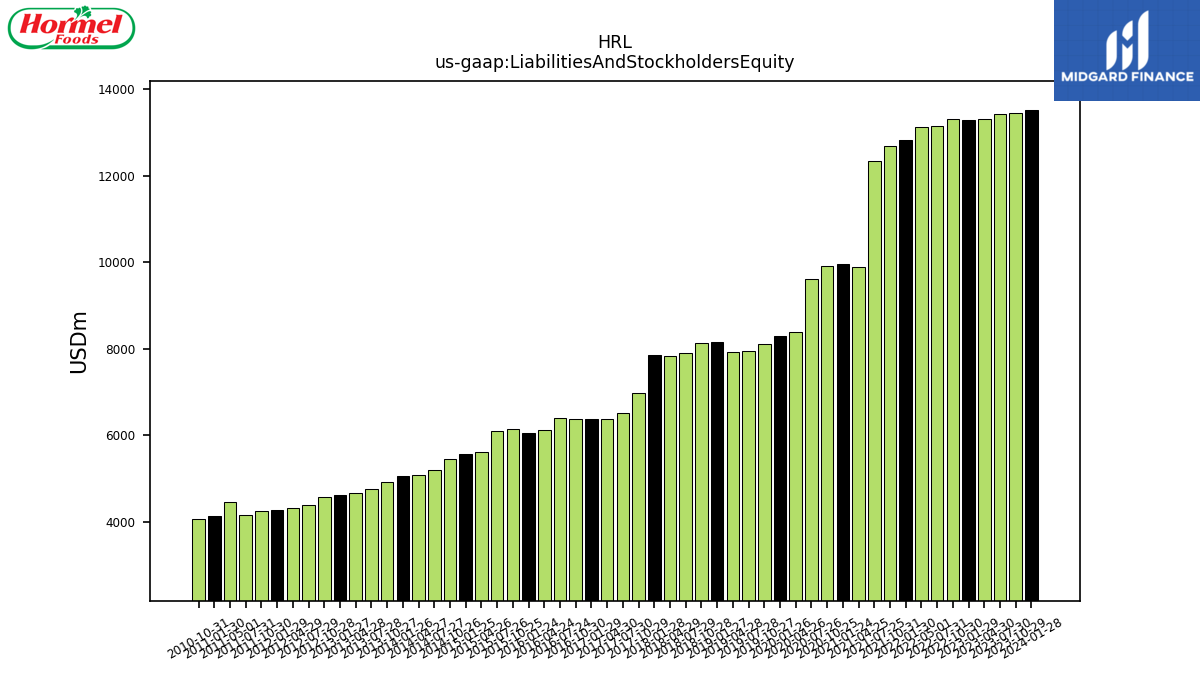
| Liabilities And Stockholders Equity | 13512.98 | 13448.77 | 13426.76 | 13315.75 | 13283.05 | 13306.92 | 13140.42 | 13122.26 | 12827.01 | 12696.33 | 12332.18 | 9889.00 | 9957.93 | 9908.28 | 9600.47 | 8395.18 | 8290.11 | 8109.00 | 7954.58 | 7935.74 | 8155.40 | 8142.29 | 7895.37 | 7829.75 | 7858.85 | 6975.91 | 6507.97 | 6385.71 | 6366.40 | 6370.07 | 6388.30 | 6110.35 | 6040.89 | 6139.83 | 6091.08 | 5623.00 | 5559.62 | 5455.62 | 5188.43 | 5085.82 | 5067.17 | 4915.88 | 4761.25 | 4667.64 | 4622.83 | 4563.97 | 4382.62 | 4314.66 | 4270.29 | 4244.39 | 4149.53 | 4451.42 | NA | 4122.95 | 4053.92 | NA | NA | NA | |
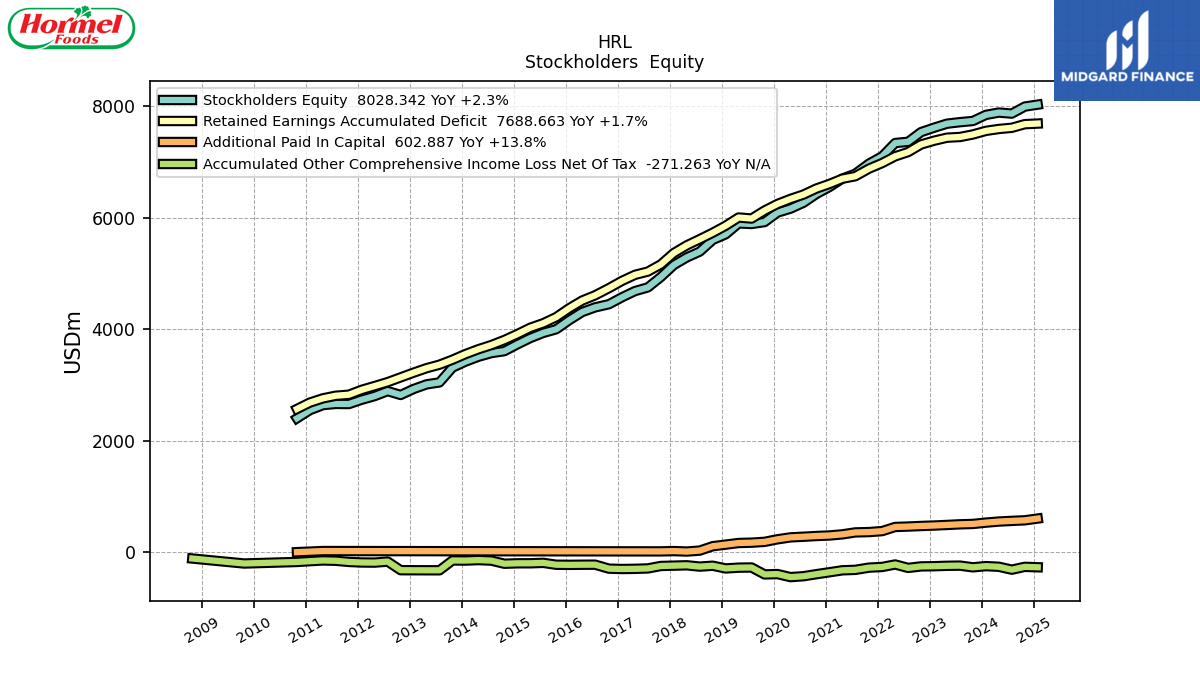
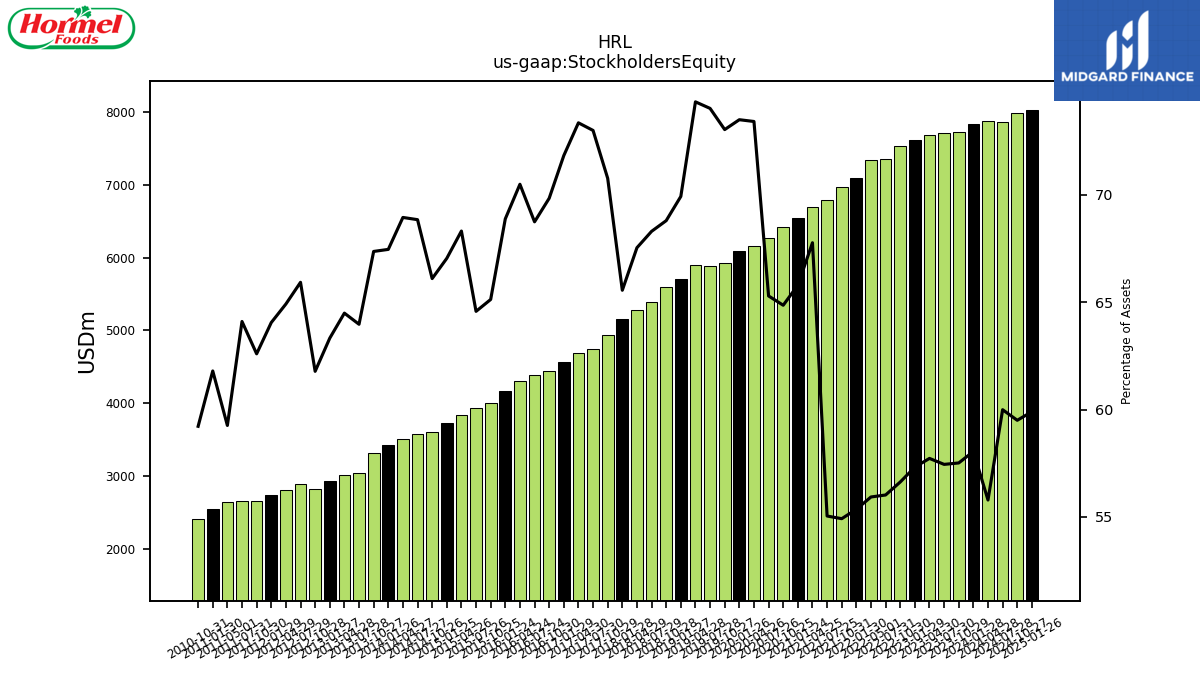
| Stockholders Equity | 7844.11 | 7734.89 | 7713.27 | 7686.51 | 7613.90 | 7535.28 | 7361.68 | 7339.40 | 7100.59 | 6972.88 | 6788.28 | 6700.67 | 6550.53 | 6425.55 | 6267.43 | 6162.06 | 6091.76 | 5921.46 | 5887.07 | 5897.34 | 5701.71 | 5600.81 | 5391.60 | 5287.20 | 5151.33 | 4935.91 | 4749.71 | 4683.10 | 4571.98 | 4448.01 | 4390.75 | 4306.48 | 4160.29 | 3998.20 | 3932.79 | 3840.63 | 3726.79 | 3605.68 | 3571.30 | 3505.92 | 3417.75 | 3311.04 | 3045.53 | 3009.86 | 2927.14 | 2819.45 | 2888.89 | 2800.54 | 2734.90 | 2656.58 | 2659.64 | 2637.82 | NA | 2547.71 | 2400.66 | NA | NA | NA |
| 2024-01-28 | 2023-10-29 | 2023-07-30 | 2023-04-30 | 2023-01-29 | 2022-10-30 | 2022-07-31 | 2022-05-01 | 2022-01-30 | 2021-10-31 | 2021-07-25 | 2021-04-25 | 2021-01-24 | 2020-10-25 | 2020-07-26 | 2020-04-26 | 2020-01-26 | 2019-10-27 | 2019-07-28 | 2019-04-28 | 2019-01-27 | 2018-10-28 | 2018-07-29 | 2018-04-29 | 2018-01-28 | 2017-10-29 | 2017-07-30 | 2017-04-30 | 2017-01-29 | 2016-10-30 | 2016-07-24 | 2016-04-24 | 2016-01-24 | 2015-10-25 | 2015-07-26 | 2015-04-26 | 2015-01-25 | 2014-10-26 | 2014-07-27 | 2014-04-27 | 2014-01-26 | 2013-10-27 | 2013-07-28 | 2013-04-28 | 2013-01-27 | 2012-10-28 | 2012-07-29 | 2012-04-29 | 2012-01-29 | 2011-10-30 | 2011-07-31 | 2011-05-01 | 2011-01-31 | 2011-01-30 | 2010-10-31 | 2010-07-25 | 2010-04-25 | 2010-01-24 | ||
|---|---|---|---|---|---|---|---|---|---|---|---|---|---|---|---|---|---|---|---|---|---|---|---|---|---|---|---|---|---|---|---|---|---|---|---|---|---|---|---|---|---|---|---|---|---|---|---|---|---|---|---|---|---|---|---|---|---|---|---|
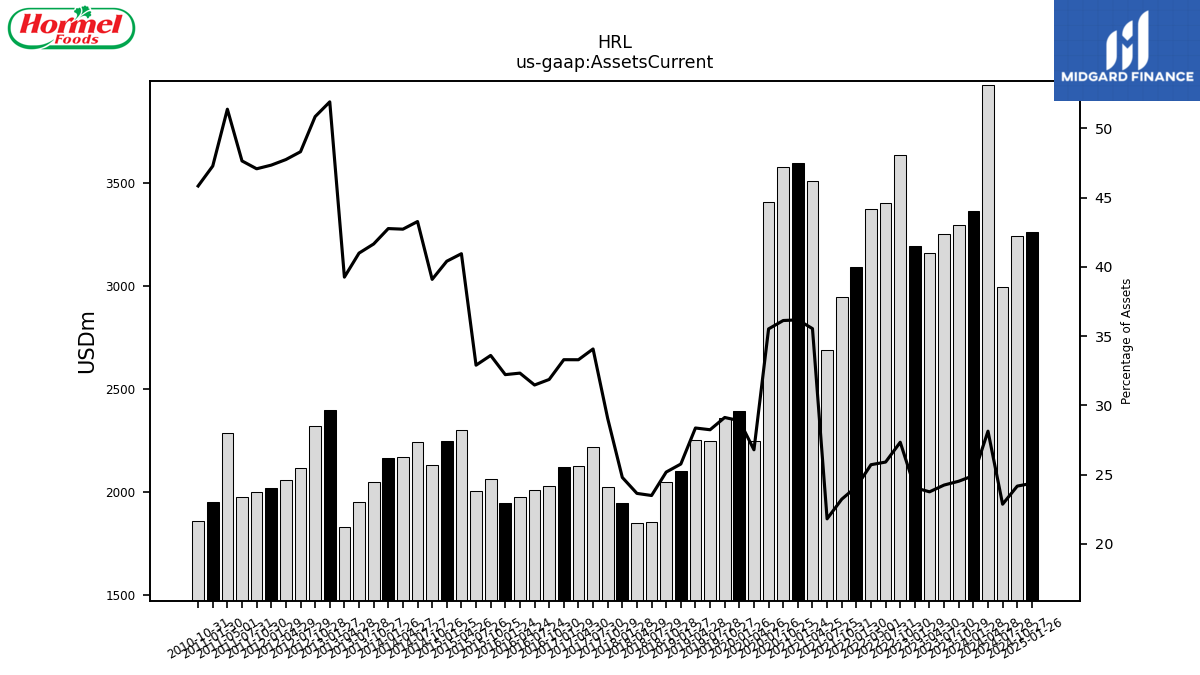
| Assets Current | 3367.16 | 3297.25 | 3254.77 | 3162.60 | 3195.31 | 3637.12 | 3403.48 | 3373.56 | 3093.35 | 2947.82 | 2688.67 | 3514.29 | 3601.66 | 3579.06 | 3409.77 | 2248.90 | 2394.97 | 2361.41 | 2245.97 | 2250.67 | 2100.69 | 2050.10 | 1854.31 | 1850.78 | 1948.27 | 2026.52 | 2217.09 | 2125.79 | 2119.59 | 2029.91 | 2010.11 | 1975.08 | 1946.08 | 2063.03 | 2003.78 | 2302.43 | 2246.33 | 2132.77 | 2245.04 | 2172.61 | 2166.83 | 2047.41 | 1951.59 | 1832.34 | 2399.84 | 2320.68 | 2117.26 | 2060.07 | 2021.73 | 1998.23 | 1977.12 | 2287.20 | NA | 1949.23 | 1858.17 | NA | NA | NA | |
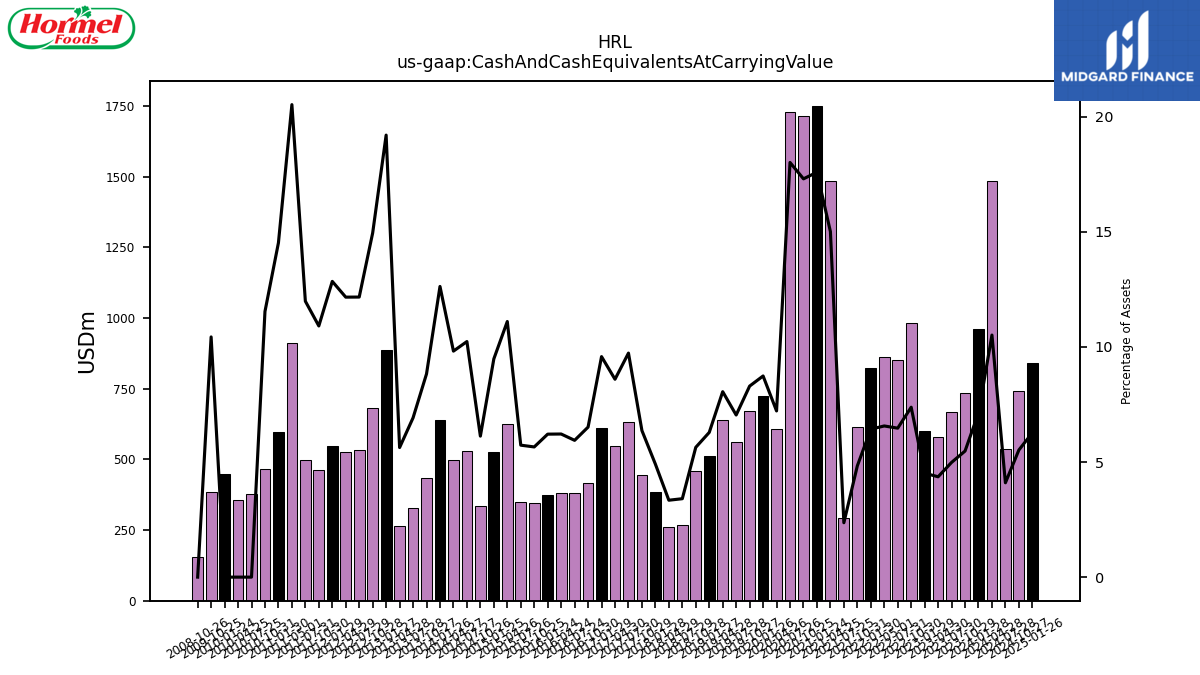
| Cash And Cash Equivalents At Carrying Value | 963.21 | 736.53 | 669.12 | 580.50 | 599.79 | 982.11 | 850.34 | 861.72 | 824.43 | 613.53 | 291.36 | 1484.53 | 1751.54 | 1714.31 | 1729.37 | 606.07 | 724.42 | 672.90 | 560.20 | 639.33 | 512.69 | 459.14 | 268.98 | 261.57 | 385.77 | 444.12 | 633.34 | 548.90 | 609.82 | 415.14 | 379.60 | 379.88 | 375.21 | 347.24 | 349.17 | 624.39 | 527.10 | 334.17 | 530.98 | 499.33 | 639.84 | 434.01 | 329.50 | 262.75 | 887.68 | 682.39 | 533.22 | 524.78 | 548.62 | 463.13 | 497.36 | 913.70 | NA | 598.81 | 467.85 | 376.92 | 355.18 | 449.09 | |
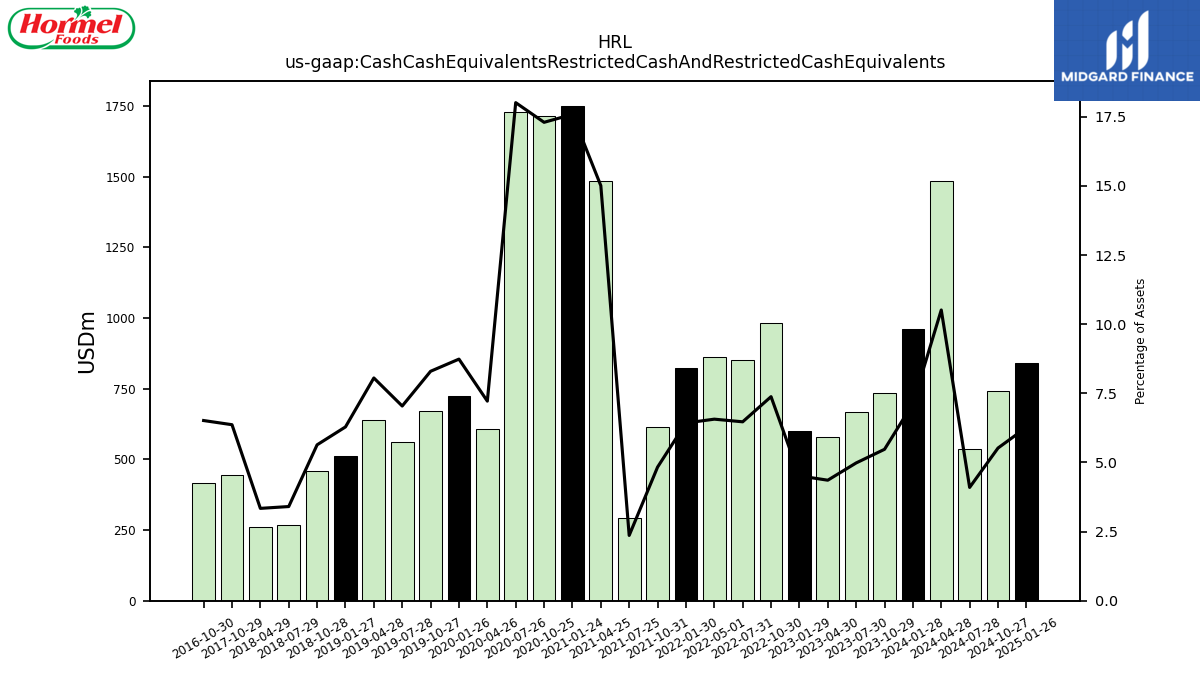
| Cash Cash Equivalents Restricted Cash And Restricted Cash Equivalents | 963.21 | 736.53 | 669.12 | 580.50 | 599.79 | 982.11 | 850.34 | 861.72 | 824.43 | 613.53 | 291.36 | 1484.53 | 1751.54 | 1714.31 | 1729.37 | 606.07 | 724.42 | 672.90 | 560.20 | 639.33 | 512.69 | 459.14 | 268.98 | 261.57 | NA | 444.12 | NA | NA | NA | 415.14 | NA | NA | NA | NA | NA | NA | NA | NA | NA | NA | NA | NA | NA | NA | NA | NA | NA | NA | NA | NA | NA | NA | NA | NA | NA | NA | NA | NA | |
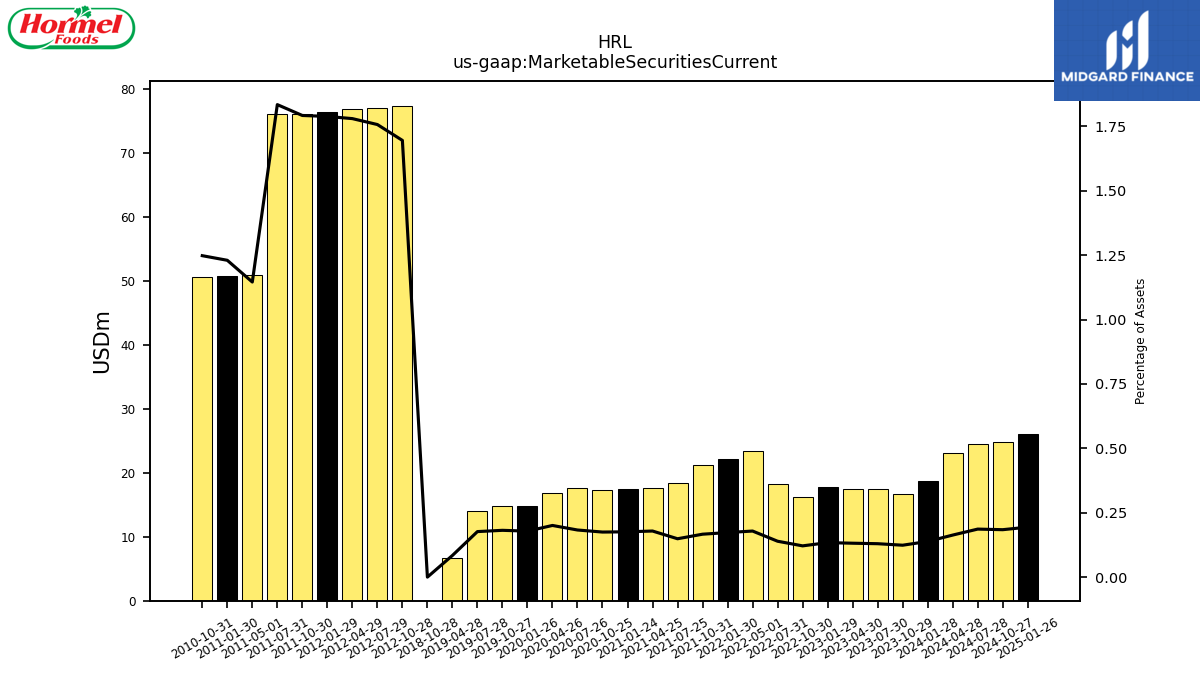
| Marketable Securities Current | 18.71 | 16.66 | 17.42 | 17.53 | 17.79 | 16.15 | 18.31 | 23.48 | 22.19 | 21.16 | 18.37 | 17.70 | 17.52 | 17.34 | 17.56 | 16.84 | 14.81 | 14.74 | 14.06 | 6.67 | NA | 0.00 | NA | NA | NA | NA | NA | NA | NA | NA | NA | NA | NA | NA | NA | NA | NA | NA | NA | NA | NA | NA | NA | NA | NA | 77.39 | 77.01 | 76.81 | 76.38 | 76.08 | 76.12 | 51.00 | NA | 50.72 | 50.59 | NA | NA | NA | |
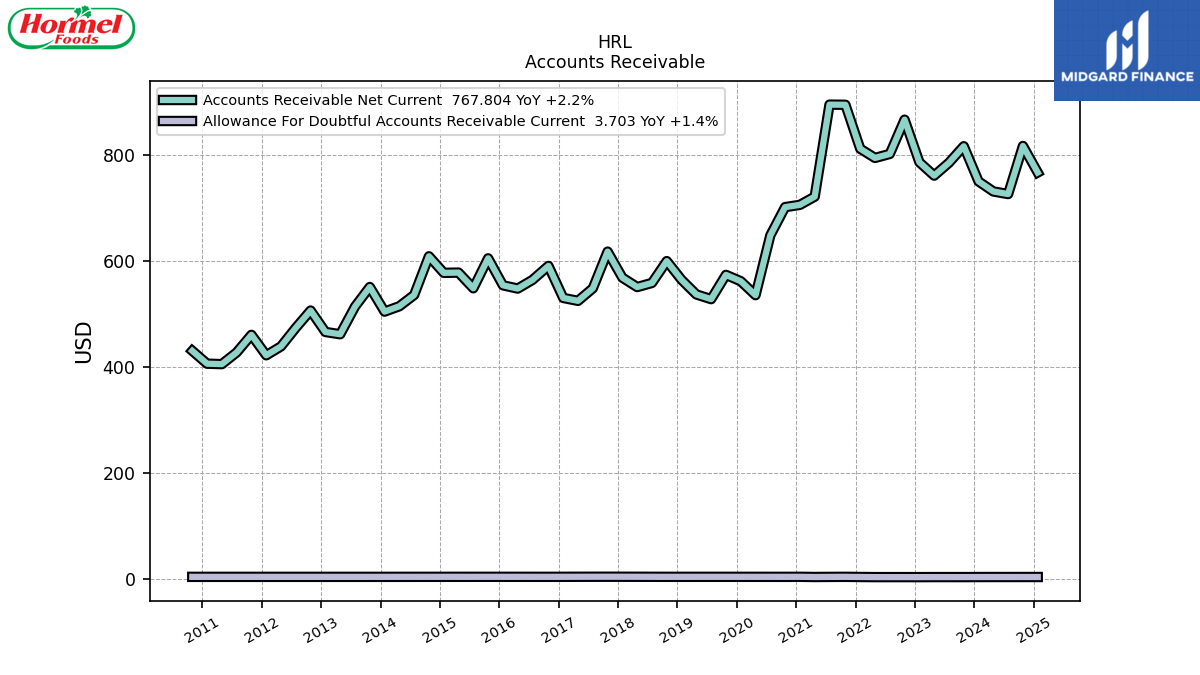
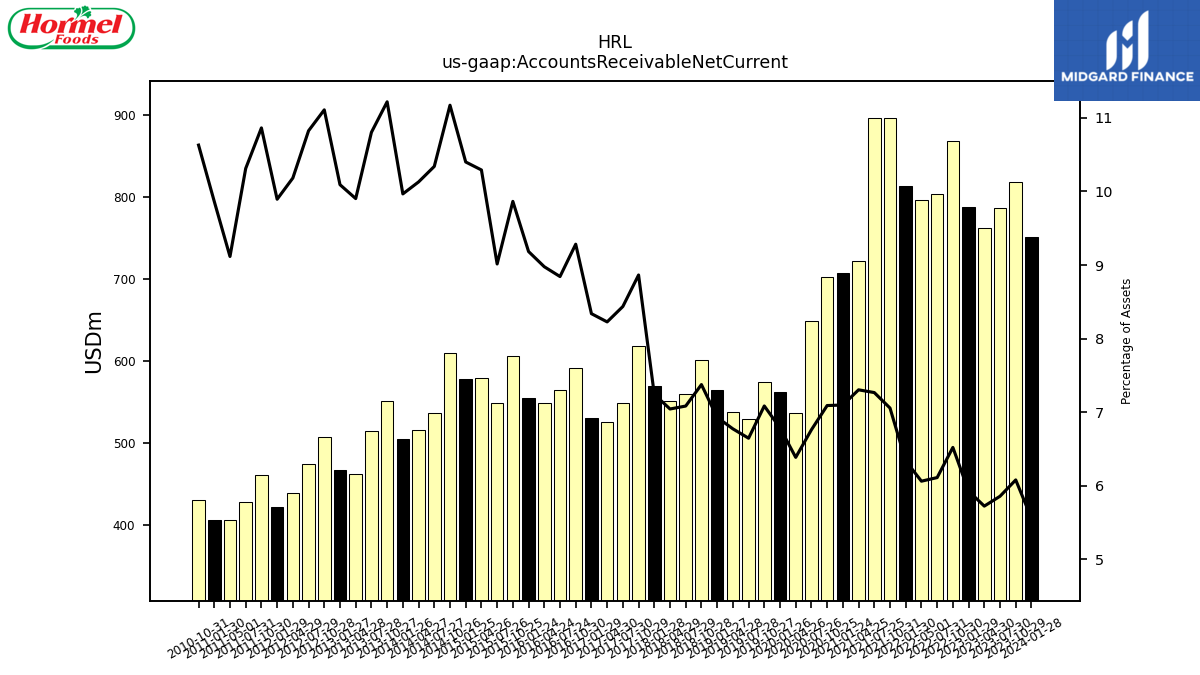
| Accounts Receivable Net Current | 751.05 | 817.39 | 786.25 | 761.90 | 787.21 | 867.59 | 802.85 | 795.29 | 812.71 | 895.72 | 896.01 | 722.18 | 706.65 | 702.42 | 648.99 | 536.01 | 562.48 | 574.40 | 528.58 | 537.45 | 565.06 | 600.44 | 559.18 | 551.39 | 569.10 | 618.35 | 549.01 | 525.32 | 530.85 | 591.31 | 564.92 | 548.50 | 554.74 | 605.69 | 549.06 | 578.73 | 578.24 | 609.53 | 536.50 | 515.16 | 505.02 | 551.50 | 514.40 | 462.24 | 466.54 | 507.04 | 474.43 | 439.35 | 422.50 | 461.11 | 427.93 | 405.79 | NA | 406.68 | 430.94 | NA | NA | NA | |
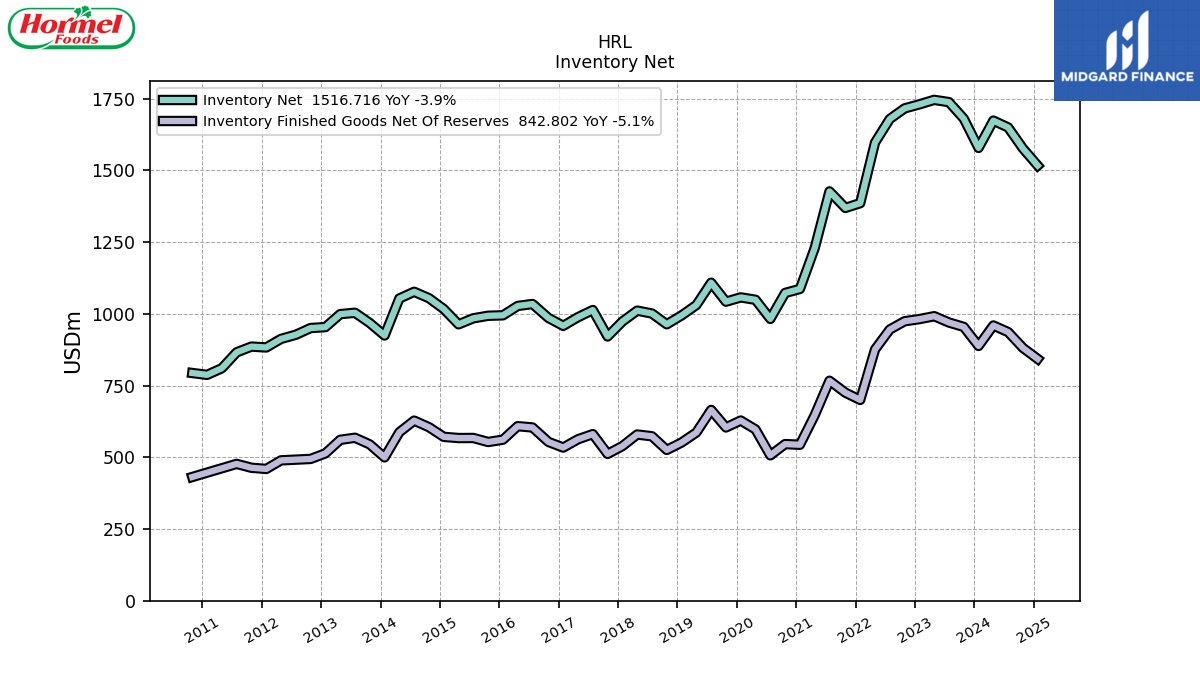
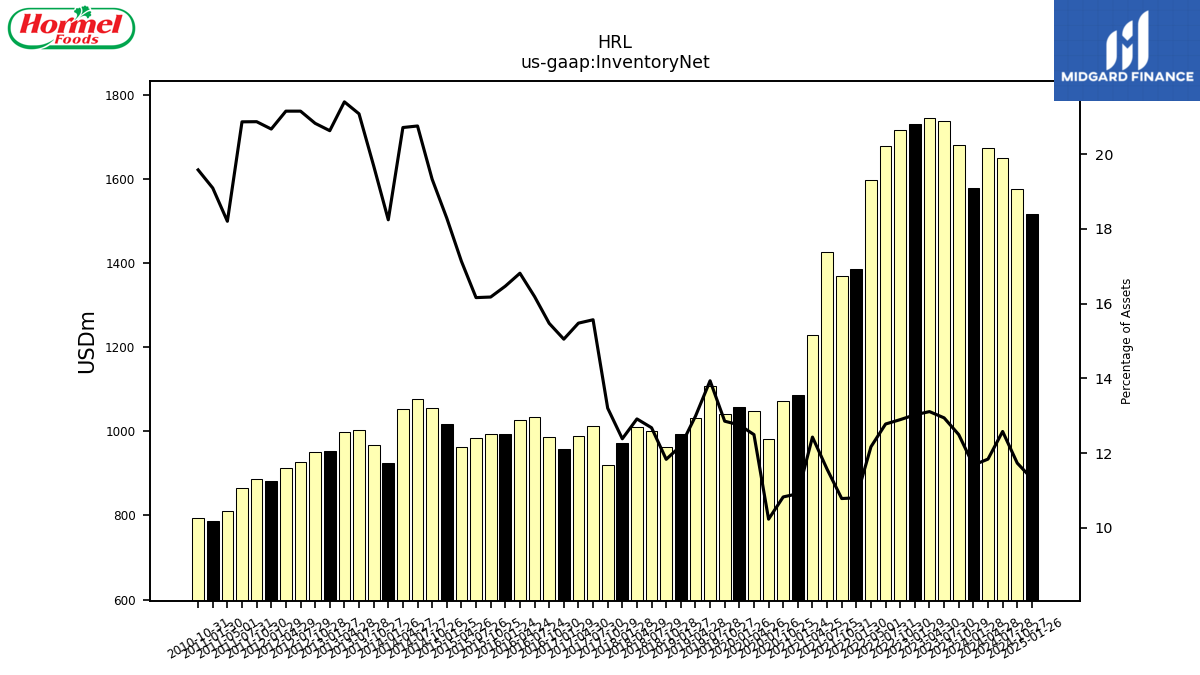
| Inventory Net | 1578.19 | 1680.41 | 1737.87 | 1745.79 | 1730.09 | 1716.06 | 1679.18 | 1597.00 | 1385.70 | 1369.20 | 1426.74 | 1229.03 | 1086.66 | 1072.76 | 982.36 | 1048.99 | 1057.28 | 1042.36 | 1108.51 | 1030.57 | 994.43 | 963.53 | 1001.04 | 1011.22 | 973.22 | 921.02 | 1013.21 | 988.41 | 958.13 | 985.68 | 1034.31 | 1027.44 | 994.83 | 993.26 | 984.45 | 963.48 | 1016.79 | 1054.55 | 1076.89 | 1053.50 | 924.50 | 967.98 | 1003.74 | 998.93 | 953.68 | 950.52 | 927.05 | 912.67 | 882.83 | 885.82 | 865.88 | 810.39 | NA | 787.28 | 793.77 | NA | NA | NA | |
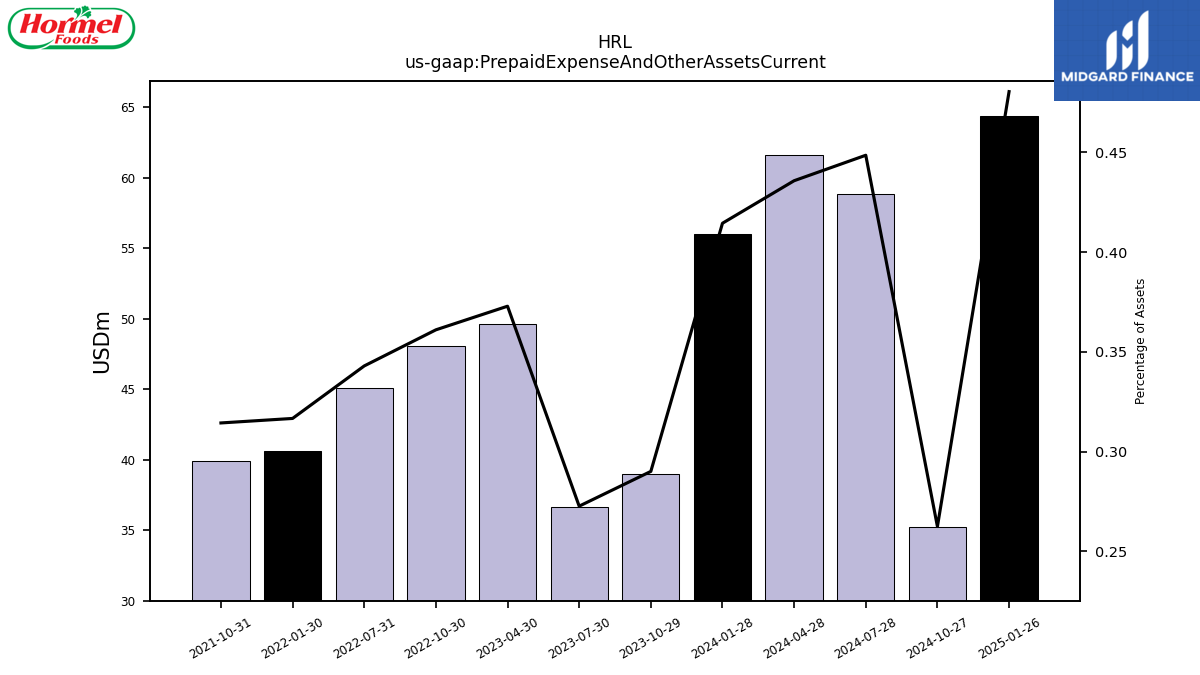
| Prepaid Expense And Other Assets Current | 56.00 | 39.01 | 36.61 | 49.65 | NA | 48.04 | 45.06 | NA | 40.61 | 39.91 | NA | NA | NA | NA | NA | NA | NA | NA | NA | NA | NA | NA | NA | NA | NA | NA | NA | NA | NA | NA | NA | NA | NA | NA | NA | NA | NA | NA | NA | NA | NA | NA | NA | NA | NA | NA | NA | NA | NA | NA | NA | NA | NA | NA | NA | NA | NA | NA | |
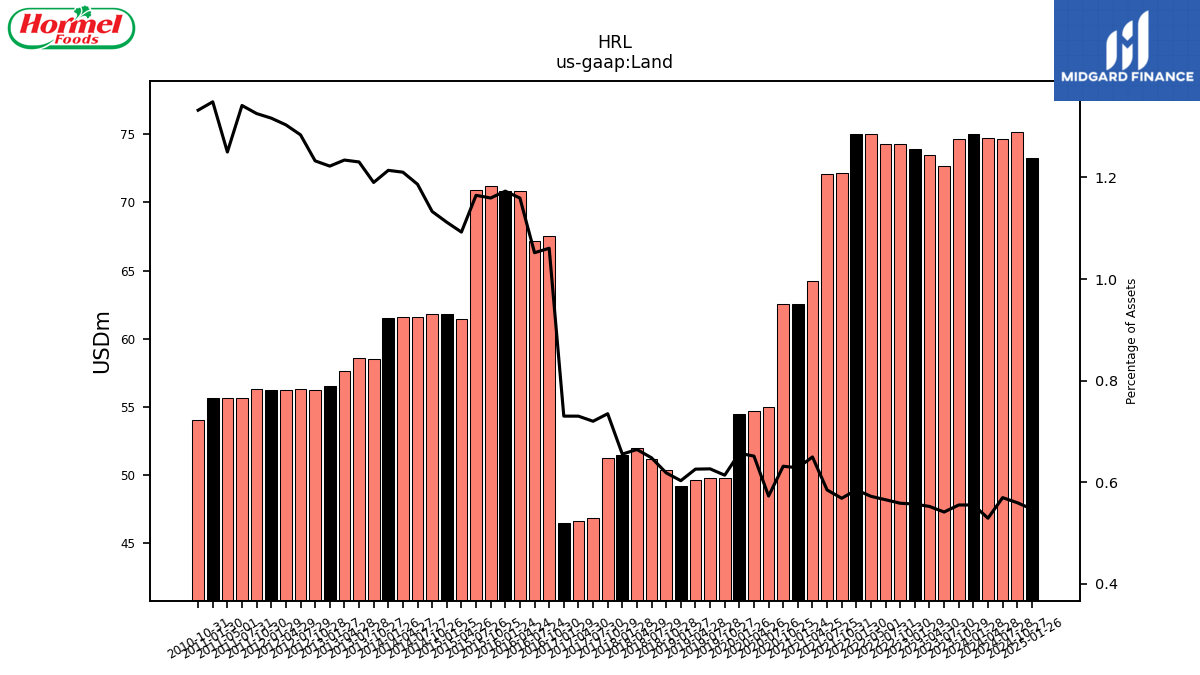
| Land | 75.00 | 74.63 | 72.65 | 73.51 | 73.95 | 74.30 | 74.27 | 75.05 | 74.99 | 72.13 | 72.08 | 64.23 | 62.56 | 62.54 | 54.97 | 54.67 | 54.45 | 49.76 | 49.80 | 49.64 | 49.16 | 50.33 | 51.15 | 52.01 | 51.48 | 51.25 | 46.85 | 46.61 | 46.47 | 67.56 | 67.19 | 70.85 | 70.86 | 71.19 | 70.95 | 61.43 | 61.81 | 61.81 | 61.56 | 61.56 | 61.52 | 58.51 | 58.59 | 57.61 | 56.51 | 56.26 | 56.27 | 56.24 | 56.23 | 56.27 | 55.68 | 55.65 | NA | 55.62 | 54.02 | NA | NA | NA |
| 2024-01-28 | 2023-10-29 | 2023-07-30 | 2023-04-30 | 2023-01-29 | 2022-10-30 | 2022-07-31 | 2022-05-01 | 2022-01-30 | 2021-10-31 | 2021-07-25 | 2021-04-25 | 2021-01-24 | 2020-10-25 | 2020-07-26 | 2020-04-26 | 2020-01-26 | 2019-10-27 | 2019-07-28 | 2019-04-28 | 2019-01-27 | 2018-10-28 | 2018-07-29 | 2018-04-29 | 2018-01-28 | 2017-10-29 | 2017-07-30 | 2017-04-30 | 2017-01-29 | 2016-10-30 | 2016-07-24 | 2016-04-24 | 2016-01-24 | 2015-10-25 | 2015-07-26 | 2015-04-26 | 2015-01-25 | 2014-10-26 | 2014-07-27 | 2014-04-27 | 2014-01-26 | 2013-10-27 | 2013-07-28 | 2013-04-28 | 2013-01-27 | 2012-10-28 | 2012-07-29 | 2012-04-29 | 2012-01-29 | 2011-10-30 | 2011-07-31 | 2011-05-01 | 2011-01-31 | 2011-01-30 | 2010-10-31 | 2010-07-25 | 2010-04-25 | 2010-01-24 | ||
|---|---|---|---|---|---|---|---|---|---|---|---|---|---|---|---|---|---|---|---|---|---|---|---|---|---|---|---|---|---|---|---|---|---|---|---|---|---|---|---|---|---|---|---|---|---|---|---|---|---|---|---|---|---|---|---|---|---|---|---|
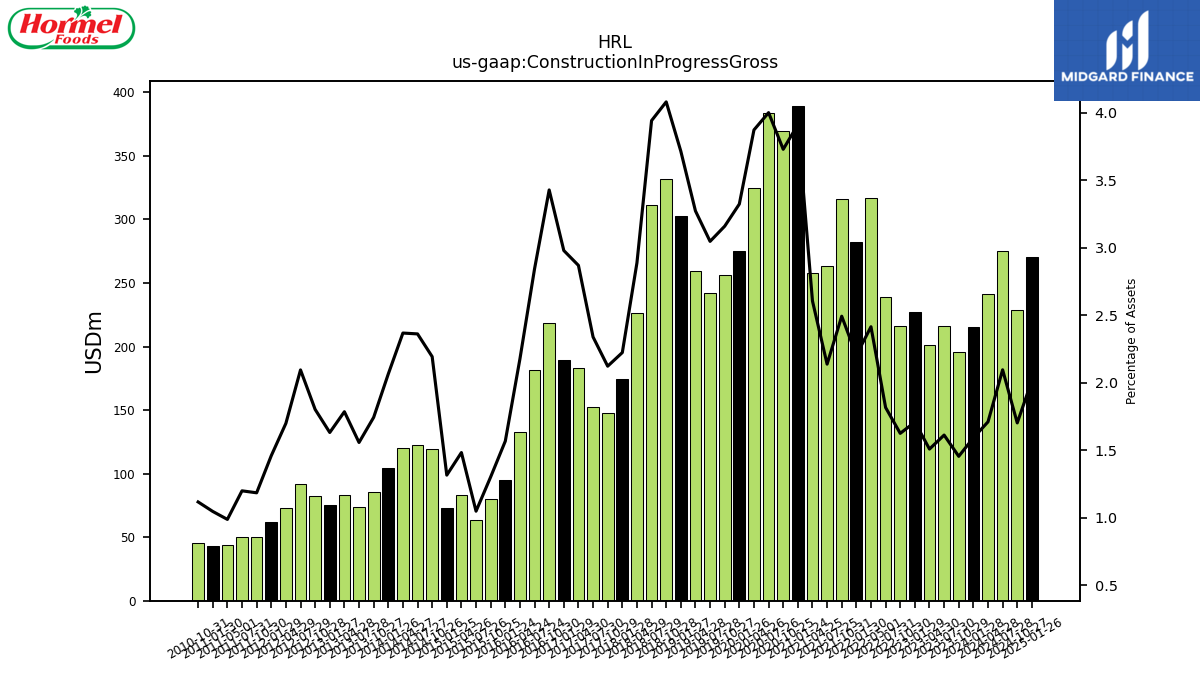
| Construction In Progress Gross | 215.09 | 195.66 | 216.48 | 200.90 | 226.91 | 216.25 | 238.69 | 316.84 | 282.66 | 316.45 | 263.63 | 257.66 | 389.48 | 369.45 | 384.05 | 325.07 | 275.50 | 256.19 | 242.37 | 259.68 | 302.93 | 332.20 | 311.18 | 226.12 | 174.73 | 148.06 | 152.22 | 183.20 | 189.66 | 218.35 | 181.65 | 132.97 | 94.68 | 79.96 | 63.88 | 83.38 | 73.15 | 119.66 | 122.53 | 120.43 | 104.61 | 85.70 | 74.15 | 83.33 | 75.42 | 82.25 | 91.81 | 73.31 | 62.32 | 50.29 | 49.77 | 43.97 | NA | 43.16 | 45.28 | NA | NA | NA | |
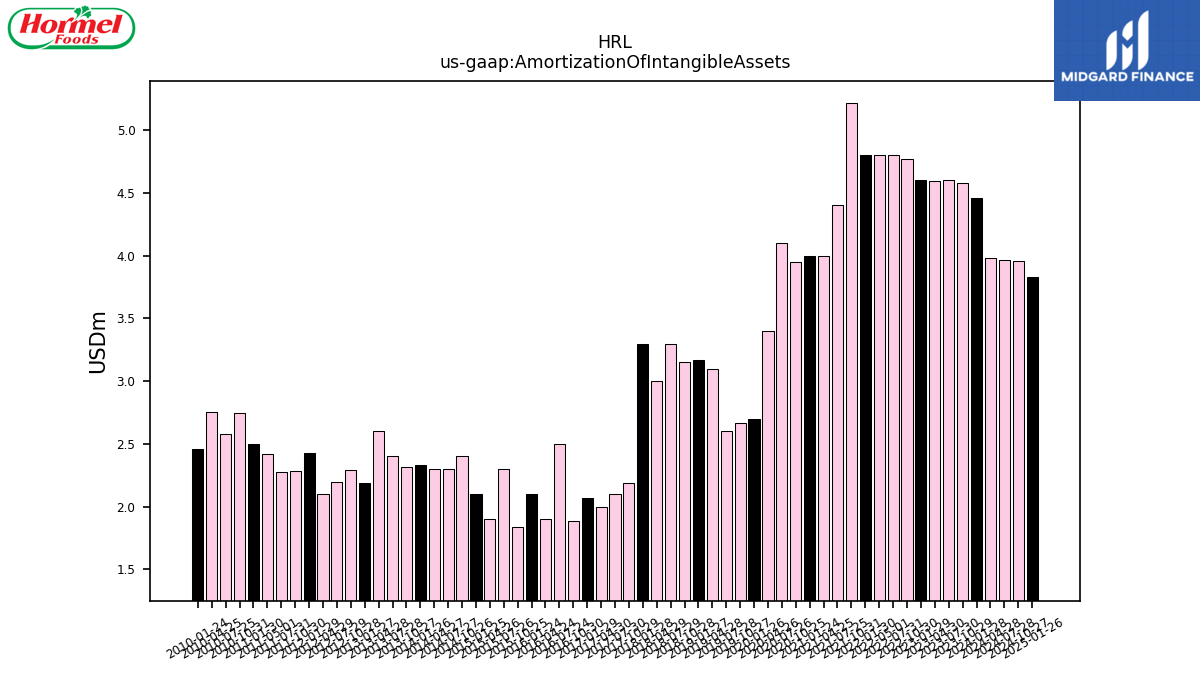
| Amortization Of Intangible Assets | 4.46 | 4.58 | 4.61 | 4.59 | 4.60 | 4.77 | 4.80 | 4.80 | 4.80 | 5.22 | 4.40 | 4.00 | 4.00 | 3.95 | 4.10 | 3.40 | 2.70 | 2.66 | 2.60 | 3.10 | 3.17 | 3.15 | 3.30 | 3.00 | 3.30 | 2.19 | 2.10 | 2.00 | 2.07 | 1.89 | 2.50 | 1.90 | 2.10 | 1.84 | 2.30 | 1.90 | 2.10 | 2.41 | 2.30 | 2.30 | 2.33 | 2.32 | 2.40 | 2.60 | 2.19 | 2.29 | 2.20 | 2.10 | 2.43 | 2.28 | 2.27 | 2.42 | NA | 2.50 | 2.75 | 2.58 | 2.75 | 2.46 | |
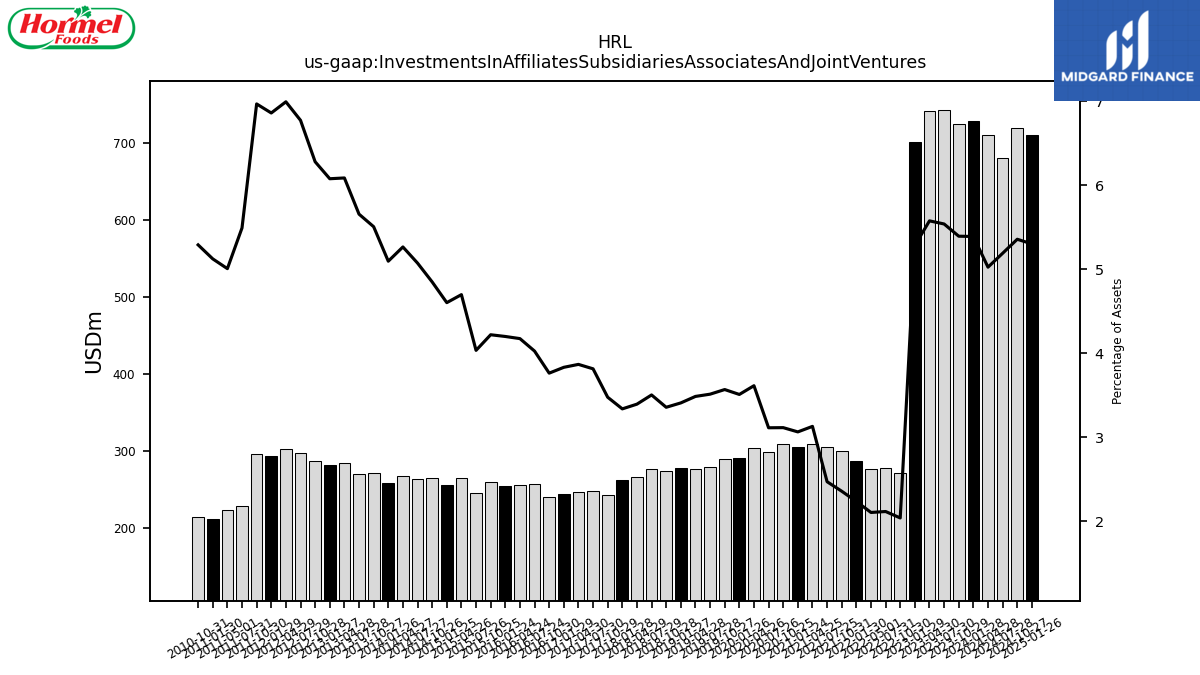
| Investments In Affiliates Subsidiaries Associates And Joint Ventures | 728.15 | 725.12 | 743.47 | 742.29 | 701.63 | 271.06 | 277.73 | 275.85 | 286.49 | 299.02 | 304.42 | 309.26 | 304.87 | 308.37 | 298.64 | 303.19 | 290.78 | 289.16 | 279.26 | 276.48 | 277.84 | 273.15 | 276.46 | 265.58 | 262.15 | 242.37 | 248.13 | 246.84 | 243.87 | 239.59 | 257.06 | 254.95 | 253.59 | 259.00 | 245.62 | 264.05 | 255.78 | 264.45 | 263.14 | 267.71 | 258.13 | 270.61 | 269.22 | 284.04 | 280.89 | 286.54 | 296.79 | 301.69 | 292.90 | 295.70 | 227.81 | 222.82 | NA | 211.17 | 214.39 | NA | NA | NA | |
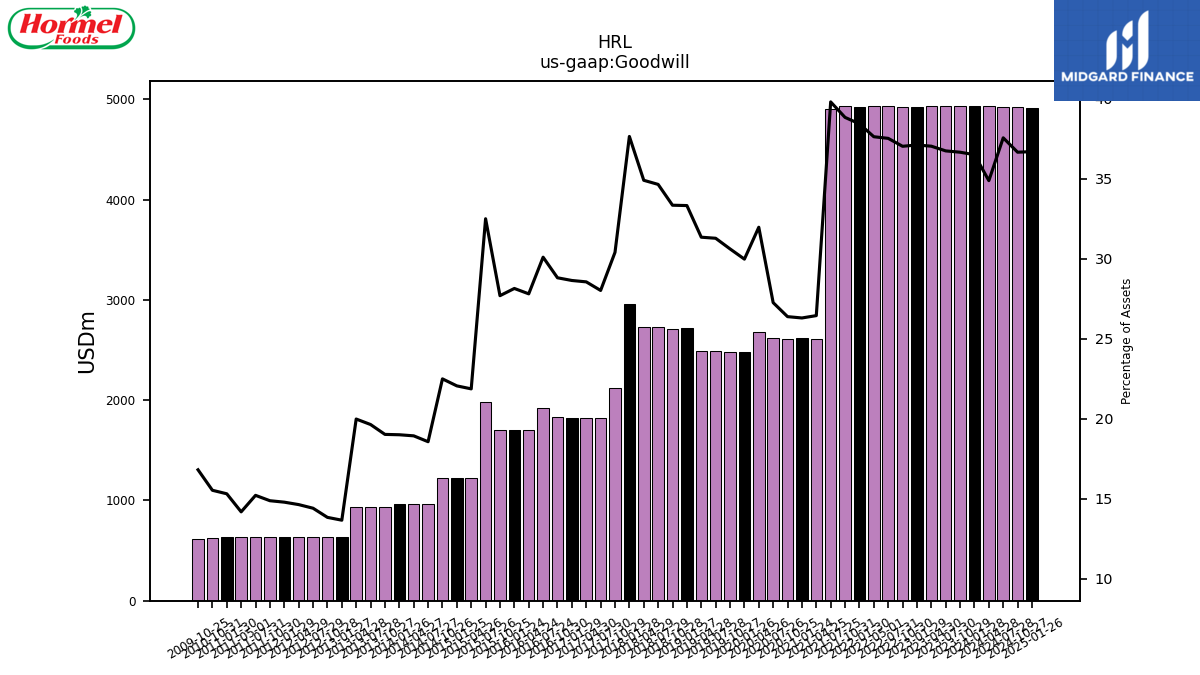
| Goodwill | 4931.26 | 4928.46 | 4931.59 | 4929.88 | 4927.92 | 4925.83 | 4929.34 | 4935.83 | 4928.14 | 4929.10 | 4907.07 | 2614.04 | 2617.59 | 2612.73 | 2615.69 | 2682.84 | 2484.09 | 2481.64 | 2487.29 | 2486.64 | 2716.75 | 2714.12 | 2734.57 | 2731.96 | 2957.46 | 2119.81 | 1822.67 | 1822.67 | 1822.67 | 1834.50 | 1921.97 | 1698.37 | 1699.36 | 1699.48 | 1978.91 | 1228.93 | 1225.45 | 1226.41 | 962.58 | 962.20 | 962.10 | 934.47 | 934.47 | 932.11 | 630.88 | 630.88 | 630.88 | 630.88 | 630.88 | 630.88 | 630.71 | 630.71 | NA | 630.71 | 629.02 | NA | NA | NA | |
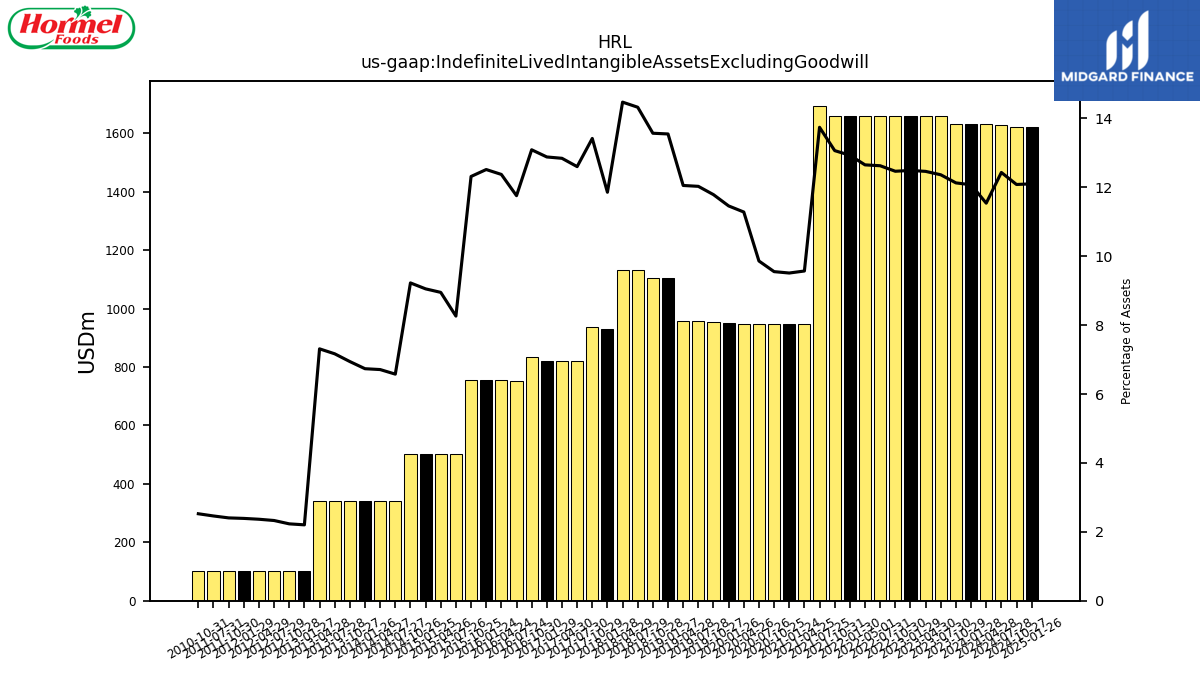
| Indefinite Lived Intangible Assets Excluding Goodwill | 1631.47 | 1631.10 | 1659.99 | 1659.42 | 1659.00 | 1658.78 | 1659.06 | 1660.10 | 1658.52 | 1658.73 | 1694.61 | 946.42 | 947.17 | 946.45 | 946.69 | 947.16 | 949.98 | 955.78 | 956.75 | 956.50 | 1104.90 | 1104.82 | 1130.92 | 1133.10 | 931.76 | 935.99 | 820.02 | 820.02 | 820.02 | 833.76 | 751.06 | 756.06 | 756.06 | 756.06 | 503.27 | 503.27 | 503.27 | 503.27 | 341.26 | 341.26 | 341.26 | 341.26 | 341.26 | 341.26 | 101.86 | 101.86 | 102.06 | 102.06 | 102.06 | 102.06 | 102.11 | NA | NA | NA | 102.36 | NA | NA | NA | |
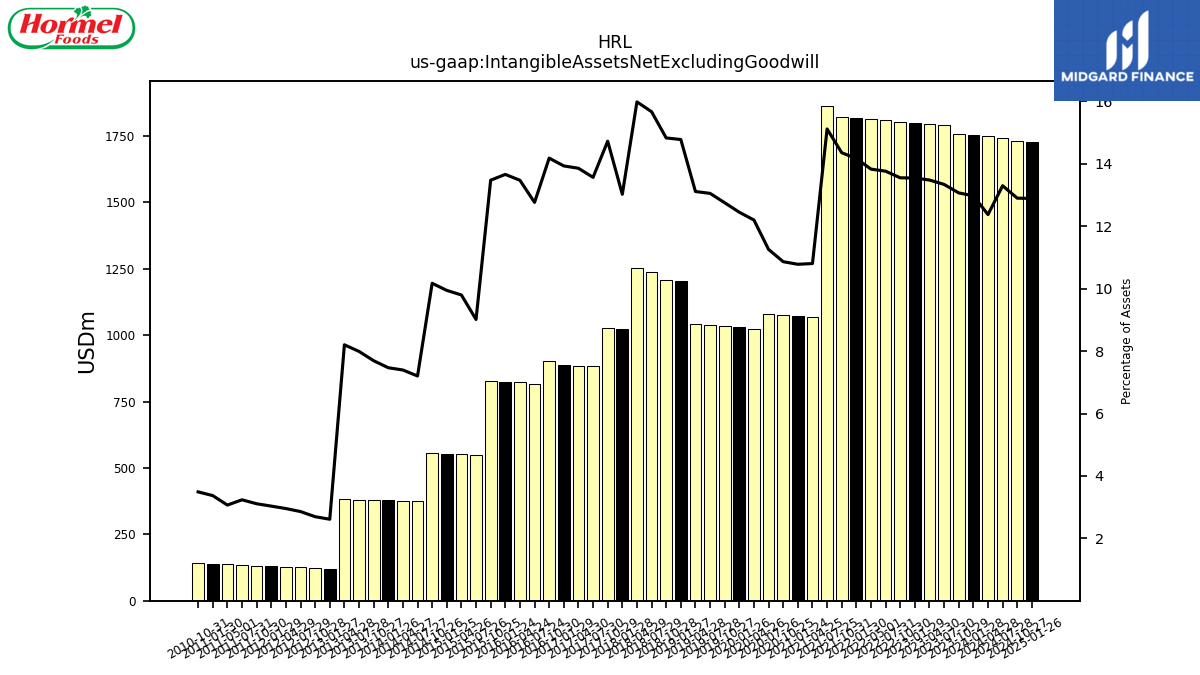
| Intangible Assets Net Excluding Goodwill | 1753.16 | 1757.17 | 1790.76 | 1794.67 | 1798.73 | 1803.03 | 1808.23 | 1814.50 | 1817.16 | 1822.27 | 1863.71 | 1068.40 | 1073.45 | 1076.29 | 1080.55 | 1023.94 | 1031.80 | 1033.86 | 1038.13 | 1040.39 | 1204.99 | 1207.22 | 1236.90 | 1251.30 | 1023.32 | 1027.01 | 882.72 | 884.74 | 886.80 | 903.26 | 815.24 | 823.13 | 825.07 | 827.22 | 548.97 | 550.85 | 552.82 | 554.89 | 373.72 | 376.06 | 378.36 | 378.09 | 380.41 | 382.82 | 120.88 | 123.07 | 125.37 | 127.59 | 129.62 | 132.05 | 134.33 | 136.60 | NA | 139.02 | 141.52 | NA | NA | NA | |
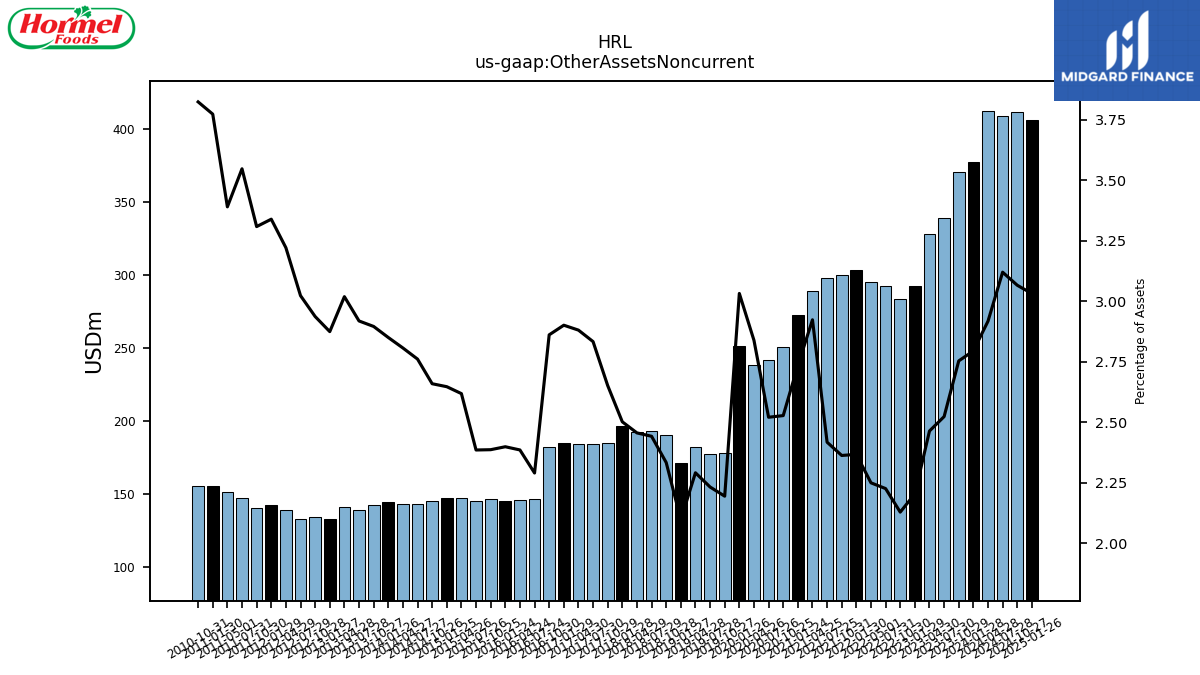
| Other Assets Noncurrent | 377.62 | 370.25 | 338.74 | 328.01 | 292.70 | 283.17 | 292.41 | 295.13 | 303.58 | 299.91 | 298.07 | 289.06 | 272.24 | 250.38 | 241.95 | 238.27 | 251.35 | 177.90 | 177.53 | 181.78 | 171.00 | 189.95 | 192.77 | 192.25 | 196.57 | 184.95 | 184.36 | 183.93 | 184.67 | 182.24 | 146.27 | 145.73 | 144.88 | 146.50 | 145.26 | 147.20 | 147.13 | 145.05 | 143.23 | 142.73 | 144.41 | 142.34 | 138.94 | 140.90 | 132.87 | 134.02 | 132.48 | 138.98 | 142.58 | 140.42 | 147.20 | 150.90 | NA | 155.57 | 155.02 | NA | NA | NA |
| 2024-01-28 | 2023-10-29 | 2023-07-30 | 2023-04-30 | 2023-01-29 | 2022-10-30 | 2022-07-31 | 2022-05-01 | 2022-01-30 | 2021-10-31 | 2021-07-25 | 2021-04-25 | 2021-01-24 | 2020-10-25 | 2020-07-26 | 2020-04-26 | 2020-01-26 | 2019-10-27 | 2019-07-28 | 2019-04-28 | 2019-01-27 | 2018-10-28 | 2018-07-29 | 2018-04-29 | 2018-01-28 | 2017-10-29 | 2017-07-30 | 2017-04-30 | 2017-01-29 | 2016-10-30 | 2016-07-24 | 2016-04-24 | 2016-01-24 | 2015-10-25 | 2015-07-26 | 2015-04-26 | 2015-01-25 | 2014-10-26 | 2014-07-27 | 2014-04-27 | 2014-01-26 | 2013-10-27 | 2013-07-28 | 2013-04-28 | 2013-01-27 | 2012-10-28 | 2012-07-29 | 2012-04-29 | 2012-01-29 | 2011-10-30 | 2011-07-31 | 2011-05-01 | 2011-01-31 | 2011-01-30 | 2010-10-31 | 2010-07-25 | 2010-04-25 | 2010-01-24 | ||
|---|---|---|---|---|---|---|---|---|---|---|---|---|---|---|---|---|---|---|---|---|---|---|---|---|---|---|---|---|---|---|---|---|---|---|---|---|---|---|---|---|---|---|---|---|---|---|---|---|---|---|---|---|---|---|---|---|---|---|---|
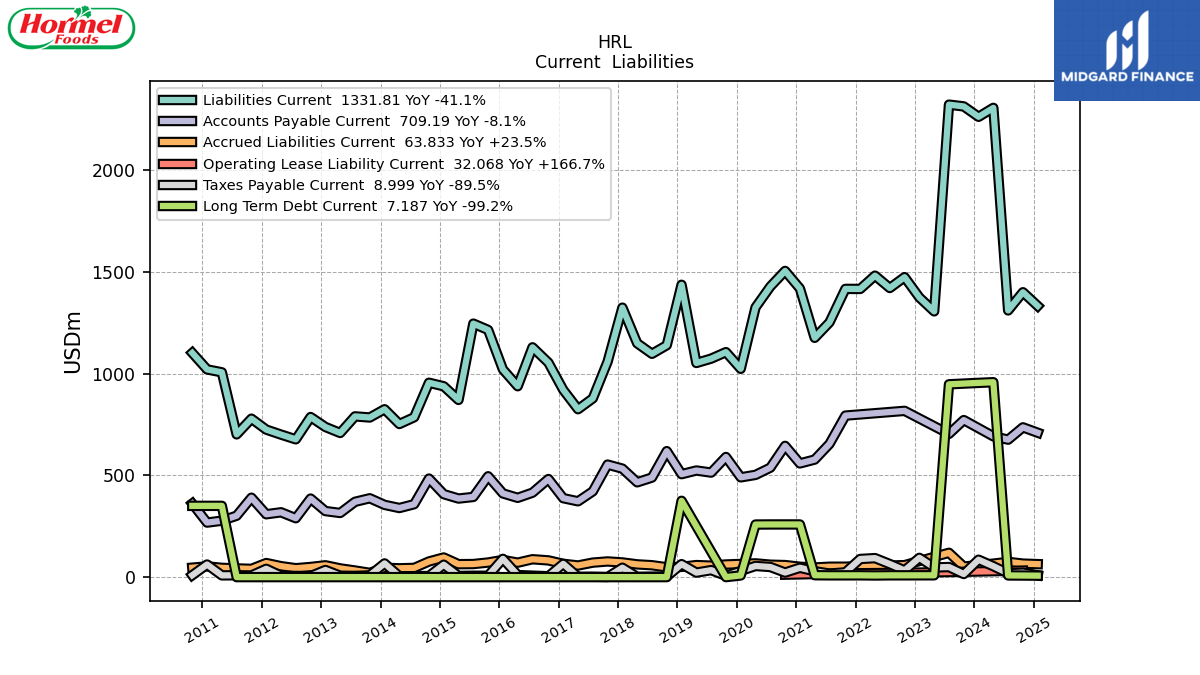
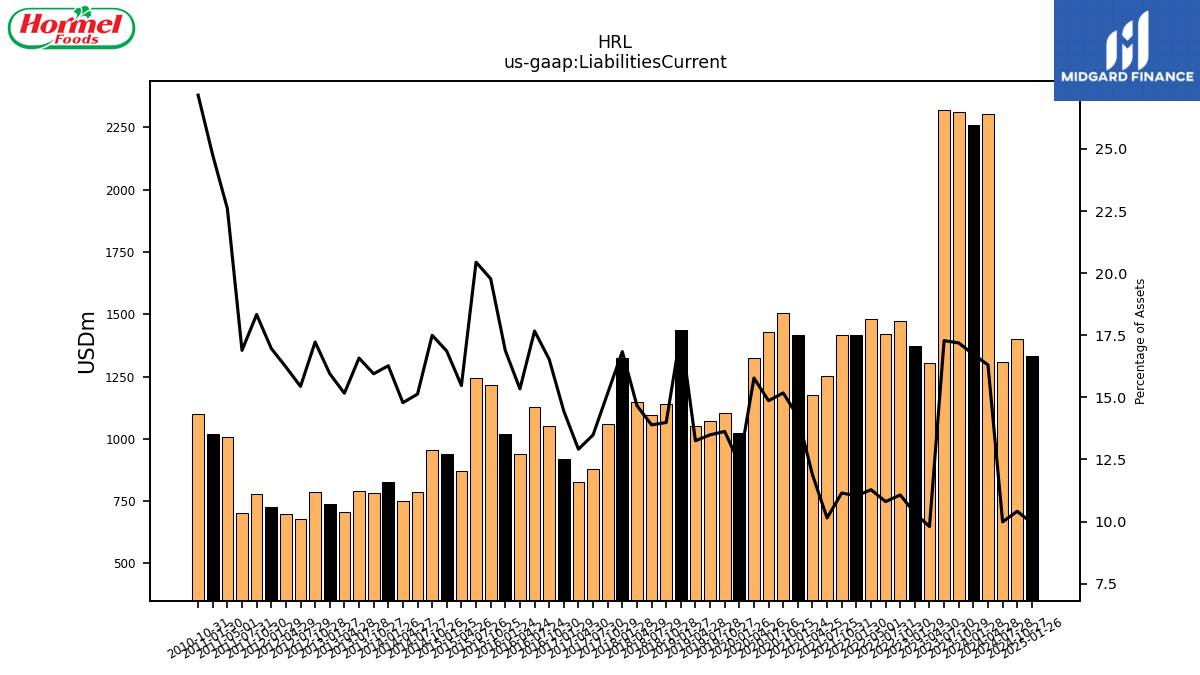
| Liabilities Current | 2260.78 | 2311.78 | 2320.62 | 1305.22 | 1373.38 | 1473.27 | 1419.90 | 1480.66 | 1415.33 | 1415.65 | 1251.19 | 1175.18 | 1417.47 | 1503.96 | 1427.05 | 1324.60 | 1023.09 | 1105.05 | 1073.09 | 1051.68 | 1435.81 | 1138.91 | 1096.83 | 1148.46 | 1323.51 | 1058.21 | 877.77 | 824.59 | 919.76 | 1053.20 | 1128.73 | 937.38 | 1020.10 | 1214.03 | 1245.11 | 870.18 | 937.30 | 954.69 | 785.10 | 751.99 | 824.52 | 784.01 | 789.48 | 707.89 | 737.39 | 786.30 | 676.71 | 699.97 | 724.59 | 778.19 | 700.96 | 1005.94 | NA | 1020.20 | 1101.21 | NA | NA | NA | |
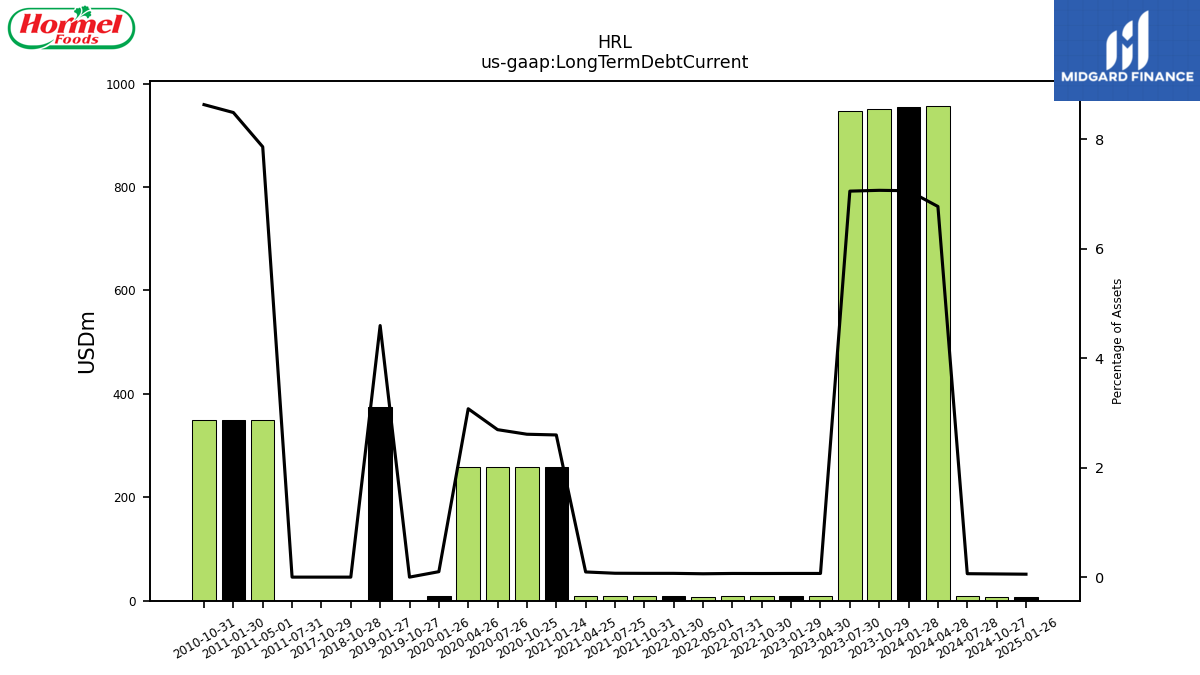
| Long Term Debt Current | 954.03 | 950.53 | 946.98 | 8.96 | 8.93 | 8.80 | 8.81 | 8.08 | 8.83 | 8.76 | 8.73 | 9.33 | 258.69 | 258.69 | 258.69 | 258.30 | 8.26 | 0.00 | NA | NA | 374.88 | 0.00 | NA | NA | NA | 0.00 | NA | NA | NA | NA | NA | NA | NA | NA | NA | NA | NA | NA | NA | NA | NA | NA | NA | NA | NA | NA | NA | NA | NA | NA | 0.00 | 350.00 | NA | 350.00 | 350.00 | NA | NA | NA | |
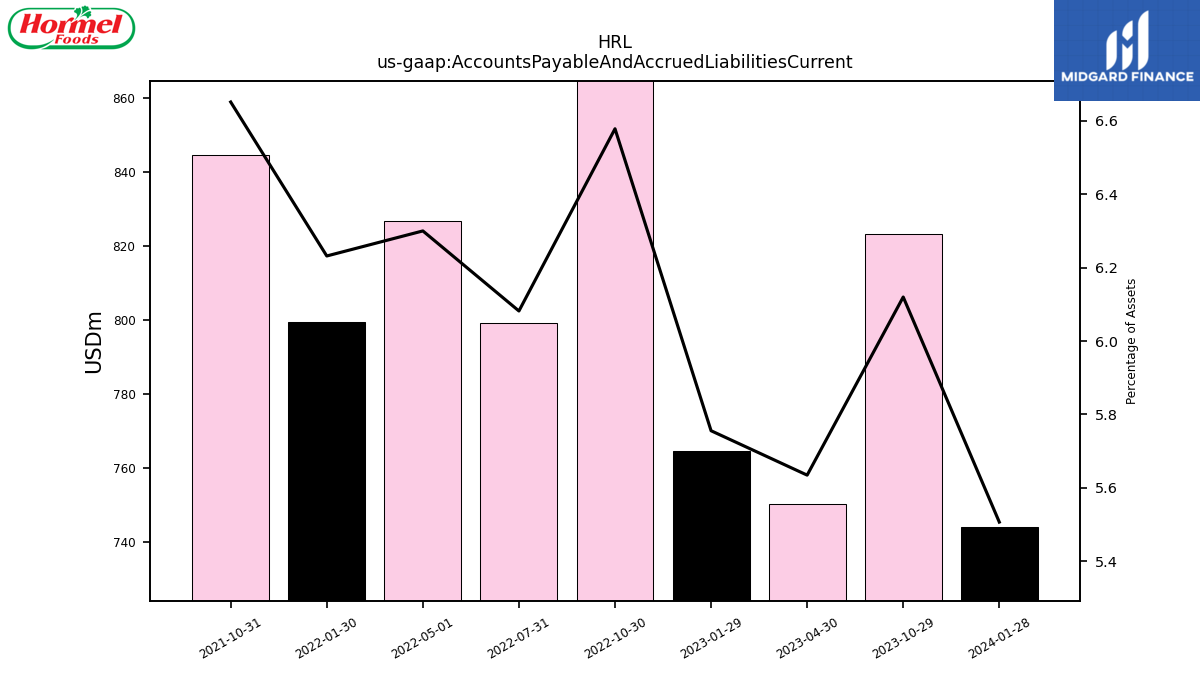
| Accounts Payable And Accrued Liabilities Current | 744.12 | 823.08 | NA | 750.29 | 764.52 | 875.40 | 799.20 | 826.73 | 799.37 | 844.50 | NA | NA | NA | NA | NA | NA | NA | NA | NA | NA | NA | NA | NA | NA | NA | NA | NA | NA | NA | NA | NA | NA | NA | NA | NA | NA | NA | NA | NA | NA | NA | NA | NA | NA | NA | NA | NA | NA | NA | NA | NA | NA | NA | NA | NA | NA | NA | NA | |
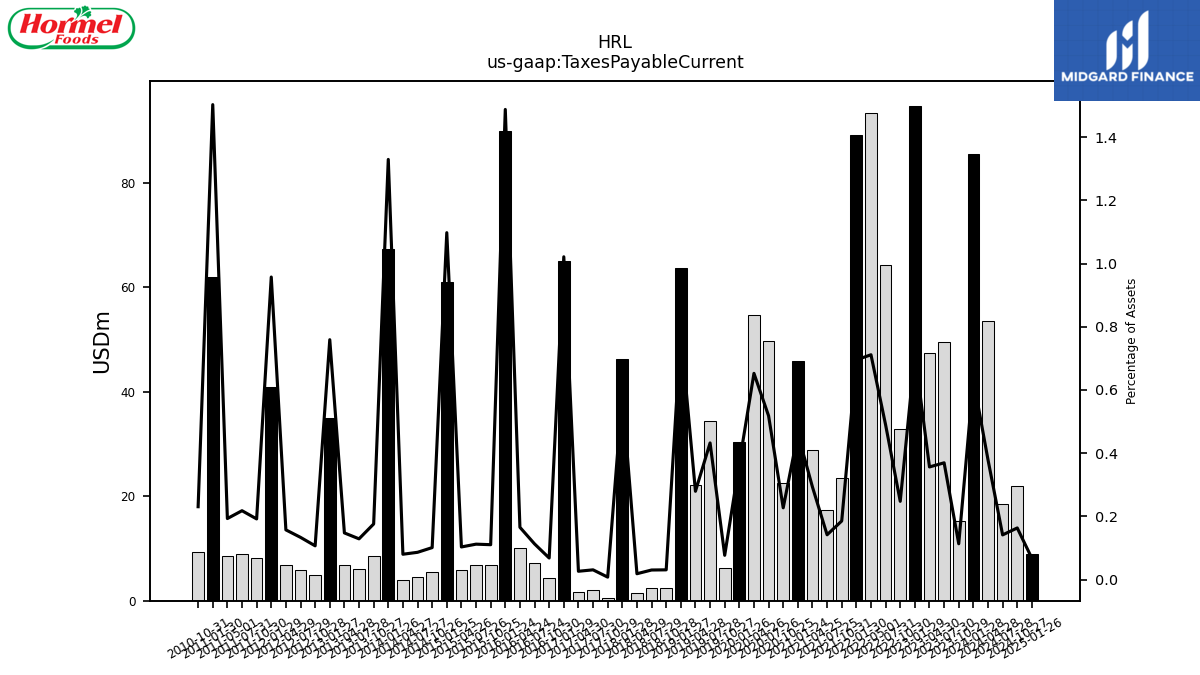
| Taxes Payable Current | 85.53 | 15.21 | 49.58 | 47.43 | 94.78 | 32.92 | 64.31 | 93.32 | 89.13 | 23.52 | 17.45 | 28.94 | 45.90 | 22.48 | 49.73 | 54.77 | 30.49 | 6.21 | 34.38 | 22.15 | 63.79 | 2.49 | 2.37 | 1.43 | 46.23 | 0.53 | 1.99 | 1.67 | 65.02 | 4.33 | 7.20 | 10.10 | 89.86 | 6.76 | 6.81 | 5.79 | 61.02 | 5.51 | 4.46 | 4.07 | 67.36 | 8.64 | 6.13 | 6.88 | 35.08 | 4.86 | 5.84 | 6.78 | 40.88 | 8.14 | 9.03 | 8.59 | NA | 61.96 | 9.34 | NA | NA | NA |
| 2024-01-28 | 2023-10-29 | 2023-07-30 | 2023-04-30 | 2023-01-29 | 2022-10-30 | 2022-07-31 | 2022-05-01 | 2022-01-30 | 2021-10-31 | 2021-07-25 | 2021-04-25 | 2021-01-24 | 2020-10-25 | 2020-07-26 | 2020-04-26 | 2020-01-26 | 2019-10-27 | 2019-07-28 | 2019-04-28 | 2019-01-27 | 2018-10-28 | 2018-07-29 | 2018-04-29 | 2018-01-28 | 2017-10-29 | 2017-07-30 | 2017-04-30 | 2017-01-29 | 2016-10-30 | 2016-07-24 | 2016-04-24 | 2016-01-24 | 2015-10-25 | 2015-07-26 | 2015-04-26 | 2015-01-25 | 2014-10-26 | 2014-07-27 | 2014-04-27 | 2014-01-26 | 2013-10-27 | 2013-07-28 | 2013-04-28 | 2013-01-27 | 2012-10-28 | 2012-07-29 | 2012-04-29 | 2012-01-29 | 2011-10-30 | 2011-07-31 | 2011-05-01 | 2011-01-31 | 2011-01-30 | 2010-10-31 | 2010-07-25 | 2010-04-25 | 2010-01-24 | ||
|---|---|---|---|---|---|---|---|---|---|---|---|---|---|---|---|---|---|---|---|---|---|---|---|---|---|---|---|---|---|---|---|---|---|---|---|---|---|---|---|---|---|---|---|---|---|---|---|---|---|---|---|---|---|---|---|---|---|---|---|
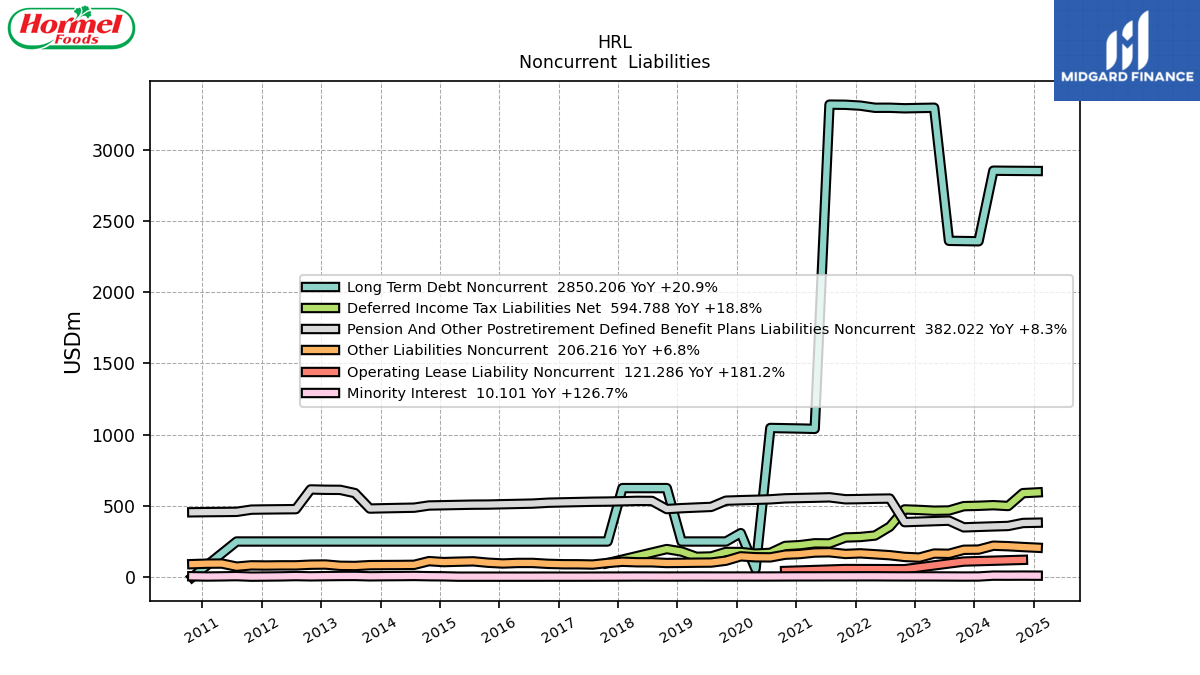
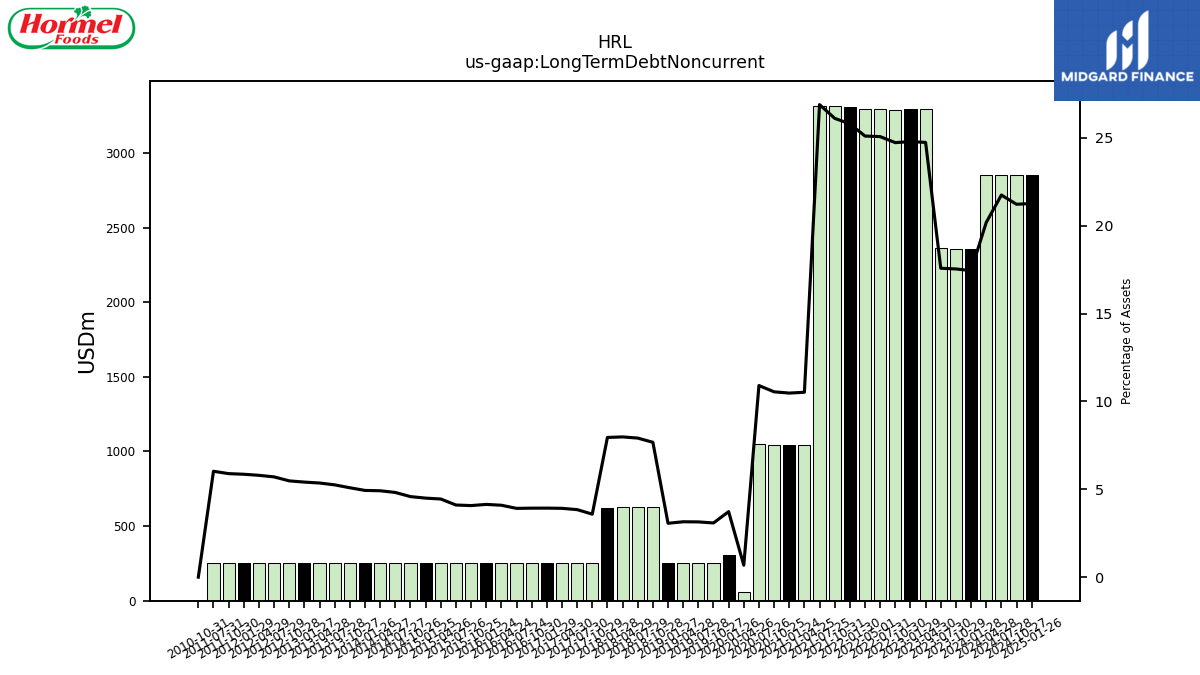
| Long Term Debt Noncurrent | 2357.18 | 2358.72 | 2360.38 | 3294.44 | 3292.56 | 3290.55 | 3294.29 | 3294.10 | 3309.15 | 3315.15 | 3316.26 | 1040.49 | 1043.05 | 1044.94 | 1046.82 | 56.86 | 308.97 | 250.00 | 250.00 | 250.00 | 250.00 | 624.84 | 624.80 | 624.76 | 624.73 | 250.00 | 250.00 | 250.00 | 250.00 | 250.00 | 250.00 | 250.00 | 250.00 | 250.00 | 250.00 | 250.00 | 250.00 | 250.00 | 250.00 | 250.00 | 250.00 | 250.00 | 250.00 | 250.00 | 250.00 | 250.00 | 250.00 | 250.00 | 250.00 | 250.00 | 250.00 | NA | NA | NA | 0.00 | NA | NA | NA | |
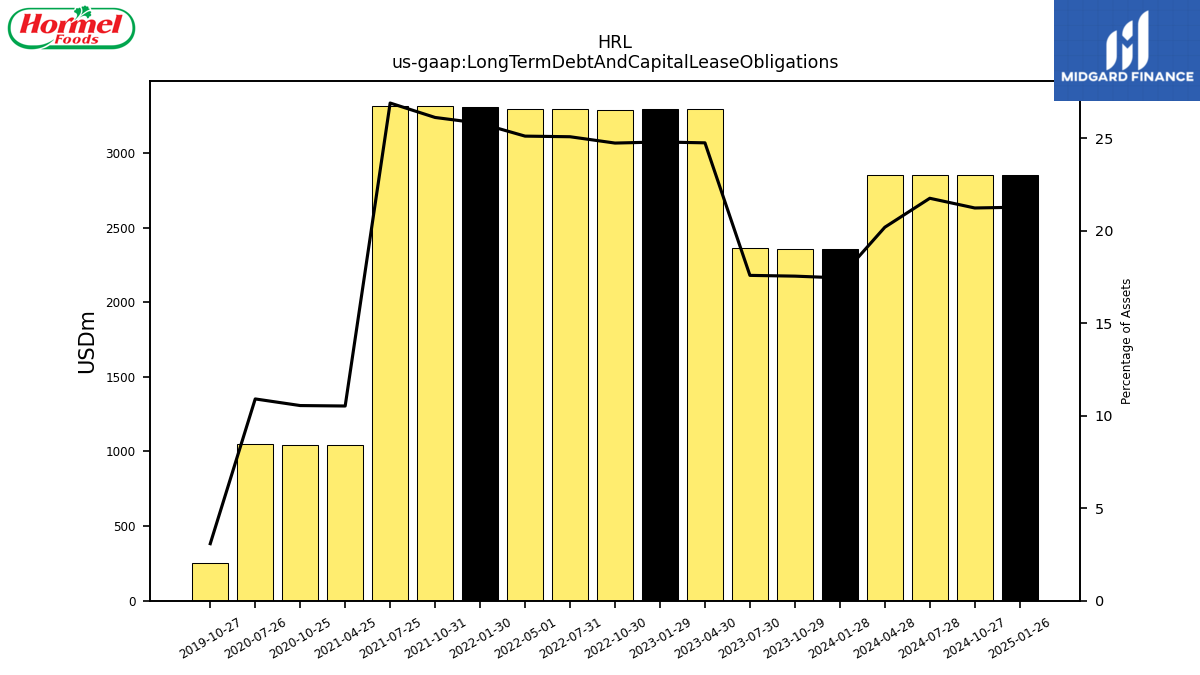
| Long Term Debt And Capital Lease Obligations | 2357.18 | 2358.72 | 2360.38 | 3294.44 | 3292.56 | 3290.55 | 3294.29 | 3294.10 | 3309.15 | 3315.15 | 3316.26 | 1040.49 | NA | 1044.94 | 1046.82 | NA | NA | 250.00 | NA | NA | NA | NA | NA | NA | NA | NA | NA | NA | NA | NA | NA | NA | NA | NA | NA | NA | NA | NA | NA | NA | NA | NA | NA | NA | NA | NA | NA | NA | NA | NA | NA | NA | NA | NA | NA | NA | NA | NA | |
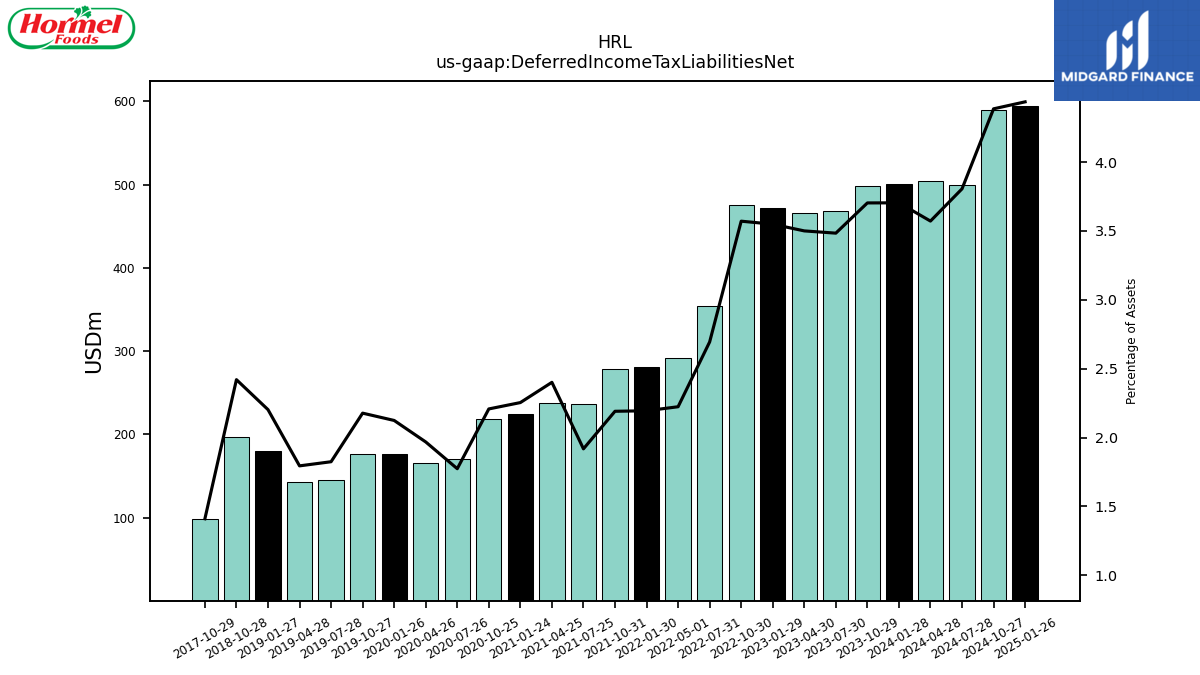
| Deferred Income Tax Liabilities Net | 500.58 | 498.11 | 467.83 | 466.13 | 471.46 | 475.21 | 354.05 | 291.84 | 281.51 | 278.18 | 236.57 | 237.46 | 224.48 | 218.78 | 170.32 | 165.25 | 176.11 | 176.57 | 145.15 | 142.43 | 179.67 | 197.09 | NA | NA | NA | 98.41 | NA | NA | NA | NA | NA | NA | NA | NA | NA | NA | NA | NA | NA | NA | NA | NA | NA | NA | NA | NA | NA | NA | NA | NA | NA | NA | NA | NA | NA | NA | NA | NA | |
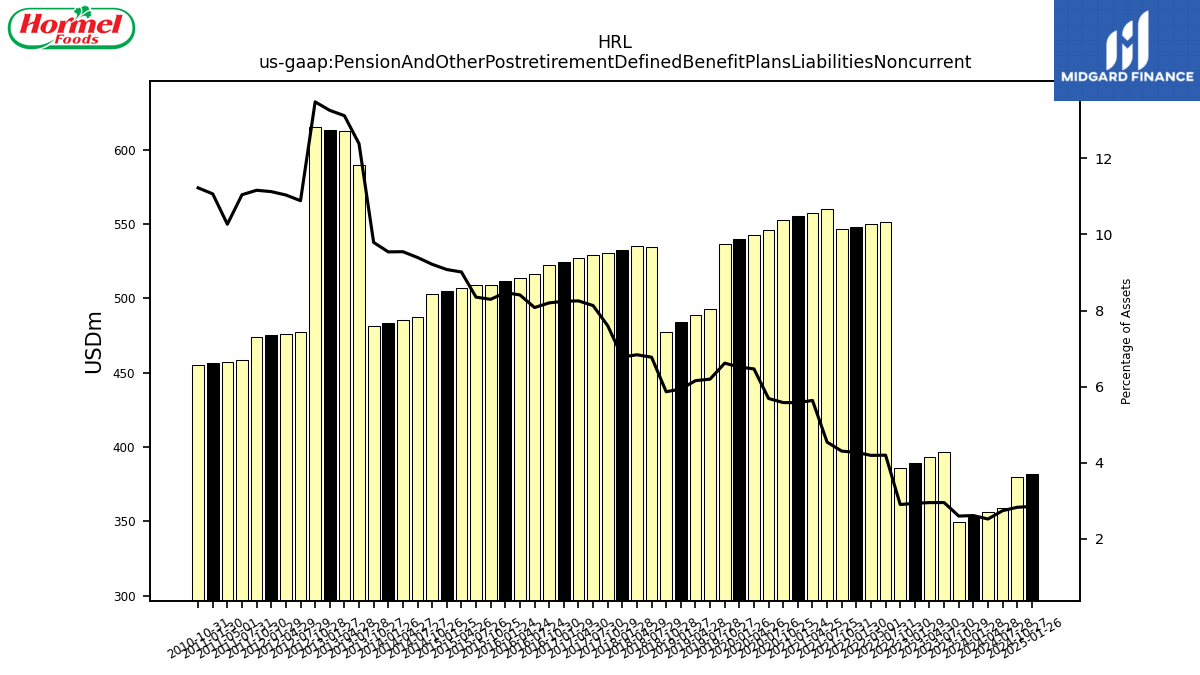
| Pension And Other Postretirement Defined Benefit Plans Liabilities Noncurrent | 352.71 | 349.27 | 396.30 | 392.91 | 389.42 | 385.83 | 551.46 | 550.05 | 547.78 | 546.36 | 559.96 | 557.40 | 555.22 | 552.88 | 545.99 | 542.75 | 539.97 | 536.49 | 492.86 | 488.48 | 484.00 | 477.56 | 534.70 | 535.28 | 532.65 | 530.25 | 529.11 | 526.99 | 524.75 | 522.36 | 516.05 | 513.84 | 511.62 | 509.26 | 508.67 | 506.74 | 504.65 | 502.69 | 487.38 | 485.47 | 483.45 | 481.23 | 589.66 | 612.45 | 613.01 | 615.43 | 477.10 | 476.17 | 475.06 | 473.69 | 458.26 | 457.06 | NA | 456.23 | 455.00 | NA | NA | NA | |
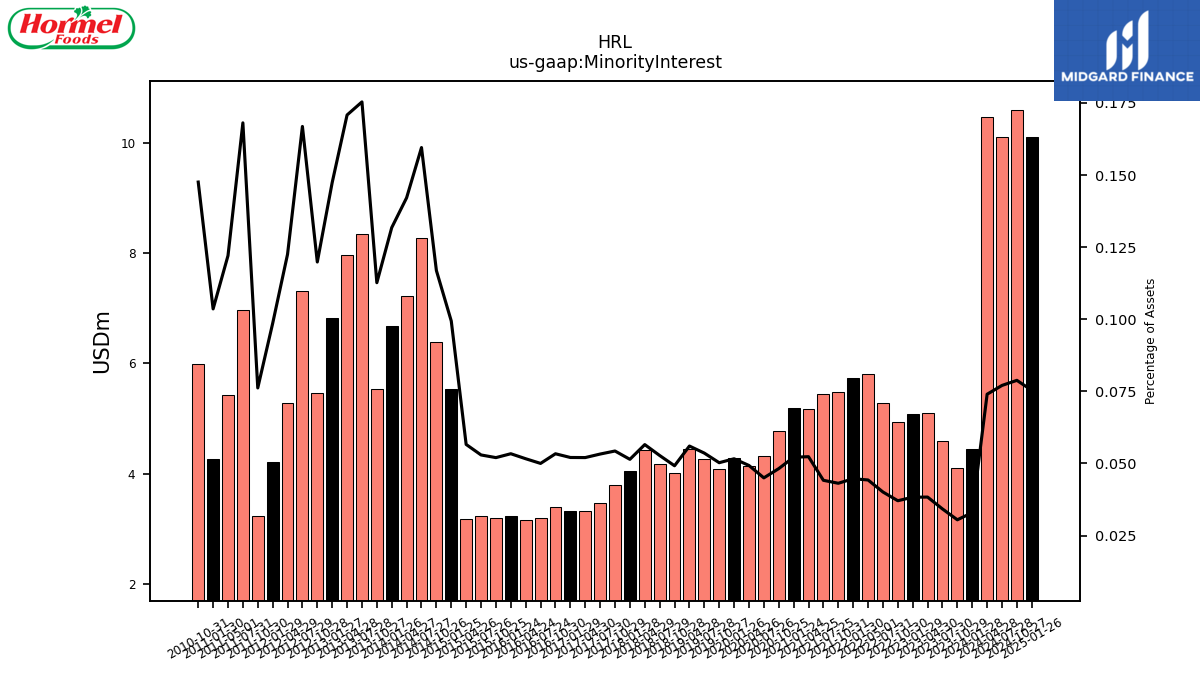
| Minority Interest | 4.46 | 4.10 | 4.60 | 5.11 | 5.09 | 4.94 | 5.27 | 5.81 | 5.74 | 5.48 | 5.45 | 5.18 | 5.20 | 4.78 | 4.32 | 4.14 | 4.28 | 4.08 | 4.26 | 4.45 | NA | 4.01 | 4.17 | 4.43 | 4.04 | 3.79 | 3.47 | 3.32 | 3.32 | 3.40 | 3.20 | 3.16 | 3.23 | 3.19 | 3.23 | 3.18 | 5.53 | 6.38 | 8.28 | 7.23 | 6.68 | 5.54 | 8.35 | 7.97 | 6.81 | 5.47 | 7.31 | 5.29 | 4.21 | 3.23 | 6.97 | 5.43 | NA | 4.27 | 5.98 | NA | NA | NA | |
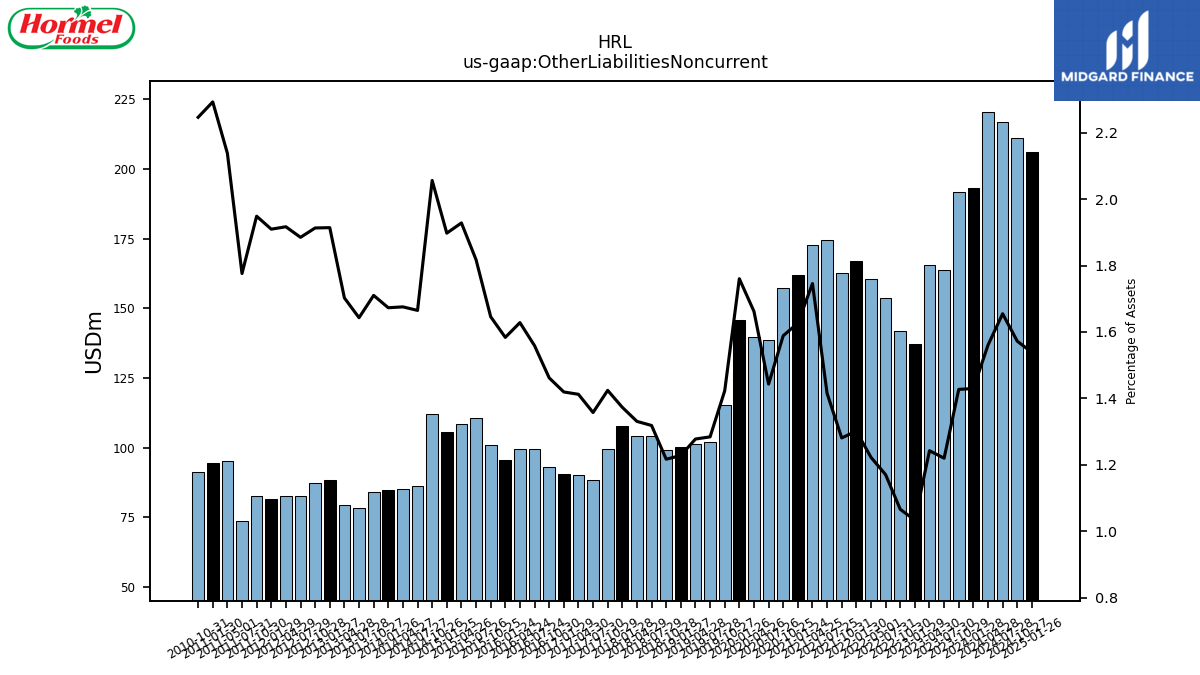
| Other Liabilities Noncurrent | 193.17 | 191.92 | 163.77 | 165.42 | 137.23 | 141.84 | 153.77 | 160.40 | 166.91 | 162.62 | 174.47 | 172.63 | 161.99 | 157.40 | 138.54 | 139.52 | 145.92 | 115.36 | 102.14 | 101.38 | 100.13 | 99.07 | 104.08 | 104.19 | 107.89 | 99.34 | 88.34 | 90.18 | 90.35 | 93.11 | 99.57 | 99.48 | 95.66 | 101.06 | 110.71 | 108.43 | 105.49 | 112.18 | 86.38 | 85.21 | 84.77 | 84.06 | 78.22 | 79.46 | 88.48 | 87.31 | 82.61 | 82.70 | 81.54 | 82.70 | 73.69 | 95.18 | NA | 94.53 | 91.07 | NA | NA | NA |
| 2024-01-28 | 2023-10-29 | 2023-07-30 | 2023-04-30 | 2023-01-29 | 2022-10-30 | 2022-07-31 | 2022-05-01 | 2022-01-30 | 2021-10-31 | 2021-07-25 | 2021-04-25 | 2021-01-24 | 2020-10-25 | 2020-07-26 | 2020-04-26 | 2020-01-26 | 2019-10-27 | 2019-07-28 | 2019-04-28 | 2019-01-27 | 2018-10-28 | 2018-07-29 | 2018-04-29 | 2018-01-28 | 2017-10-29 | 2017-07-30 | 2017-04-30 | 2017-01-29 | 2016-10-30 | 2016-07-24 | 2016-04-24 | 2016-01-24 | 2015-10-25 | 2015-07-26 | 2015-04-26 | 2015-01-25 | 2014-10-26 | 2014-07-27 | 2014-04-27 | 2014-01-26 | 2013-10-27 | 2013-07-28 | 2013-04-28 | 2013-01-27 | 2012-10-28 | 2012-07-29 | 2012-04-29 | 2012-01-29 | 2011-10-30 | 2011-07-31 | 2011-05-01 | 2011-01-31 | 2011-01-30 | 2010-10-31 | 2010-07-25 | 2010-04-25 | 2010-01-24 | ||
|---|---|---|---|---|---|---|---|---|---|---|---|---|---|---|---|---|---|---|---|---|---|---|---|---|---|---|---|---|---|---|---|---|---|---|---|---|---|---|---|---|---|---|---|---|---|---|---|---|---|---|---|---|---|---|---|---|---|---|---|
| Stockholders Equity | 7844.11 | 7734.89 | 7713.27 | 7686.51 | 7613.90 | 7535.28 | 7361.68 | 7339.40 | 7100.59 | 6972.88 | 6788.28 | 6700.67 | 6550.53 | 6425.55 | 6267.43 | 6162.06 | 6091.76 | 5921.46 | 5887.07 | 5897.34 | 5701.71 | 5600.81 | 5391.60 | 5287.20 | 5151.33 | 4935.91 | 4749.71 | 4683.10 | 4571.98 | 4448.01 | 4390.75 | 4306.48 | 4160.29 | 3998.20 | 3932.79 | 3840.63 | 3726.79 | 3605.68 | 3571.30 | 3505.92 | 3417.75 | 3311.04 | 3045.53 | 3009.86 | 2927.14 | 2819.45 | 2888.89 | 2800.54 | 2734.90 | 2656.58 | 2659.64 | 2637.82 | NA | 2547.71 | 2400.66 | NA | NA | NA | |
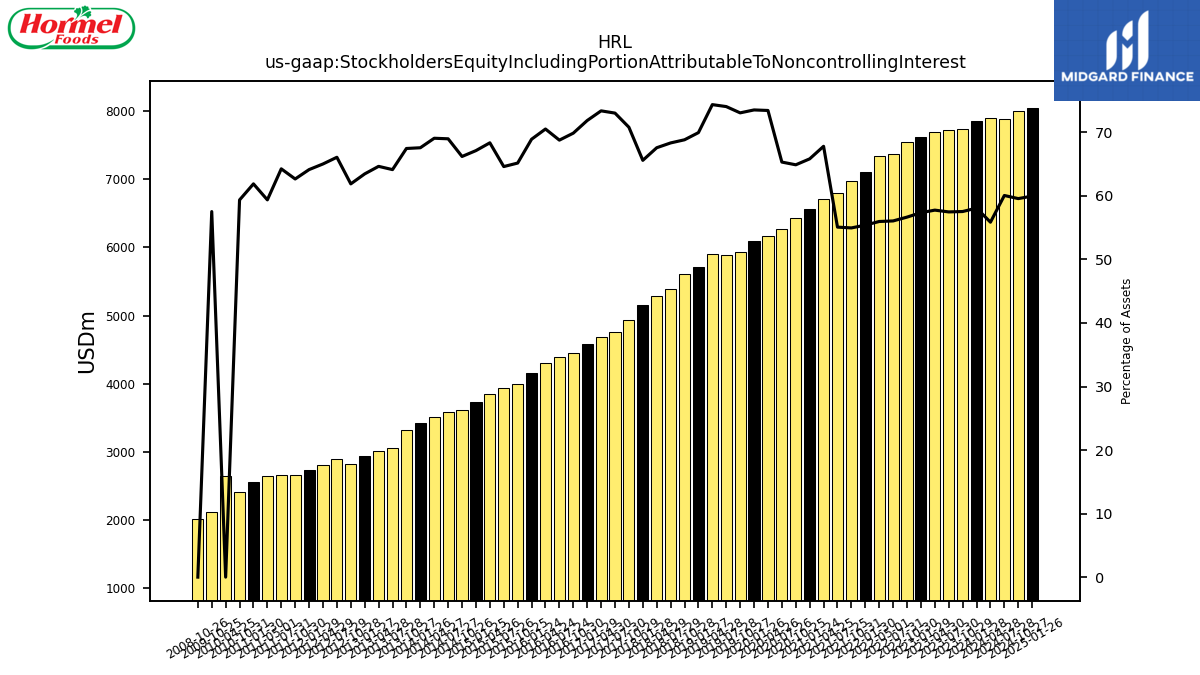
| Stockholders Equity Including Portion Attributable To Noncontrolling Interest | 7848.57 | 7738.98 | 7717.86 | 7691.61 | 7618.99 | 7540.22 | 7366.95 | 7345.21 | 7106.32 | 6978.36 | 6793.73 | 6705.85 | 6555.73 | 6430.33 | 6271.75 | 6166.20 | 6096.05 | 5925.53 | 5891.34 | 5901.78 | 5705.78 | 5604.82 | 5395.77 | 5291.63 | 5155.37 | 4939.70 | 4753.18 | 4686.43 | 4575.30 | 4451.41 | 4393.95 | 4309.64 | 4163.51 | 4001.39 | 3936.01 | 3843.82 | 3732.32 | 3612.06 | 3579.58 | 3513.14 | 3424.43 | 3316.58 | 3053.88 | 3017.83 | 2933.95 | 2824.93 | 2896.20 | 2805.82 | 2739.11 | 2659.82 | 2666.61 | 2643.25 | NA | 2551.98 | 2406.64 | NA | 2643.25 | NA | |
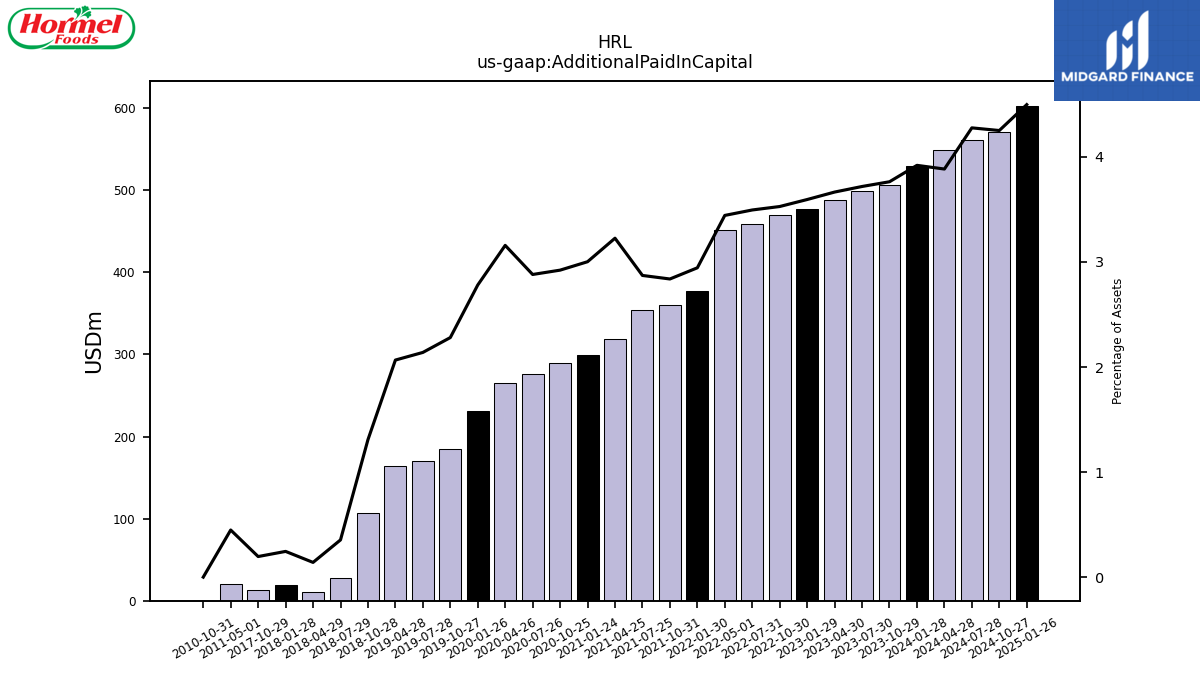
| Additional Paid In Capital | 529.72 | 506.18 | 499.30 | 488.10 | 477.47 | 469.47 | 459.27 | 451.84 | 377.71 | 360.34 | 354.16 | 319.05 | 298.99 | 289.55 | 276.59 | 265.13 | 230.53 | 184.92 | 170.14 | 163.98 | NA | 106.53 | 27.98 | 10.97 | 19.24 | 13.67 | NA | NA | NA | NA | NA | NA | NA | NA | NA | NA | NA | NA | NA | NA | NA | NA | NA | NA | NA | NA | NA | NA | NA | NA | NA | 19.96 | NA | NA | 0.00 | NA | NA | NA | |
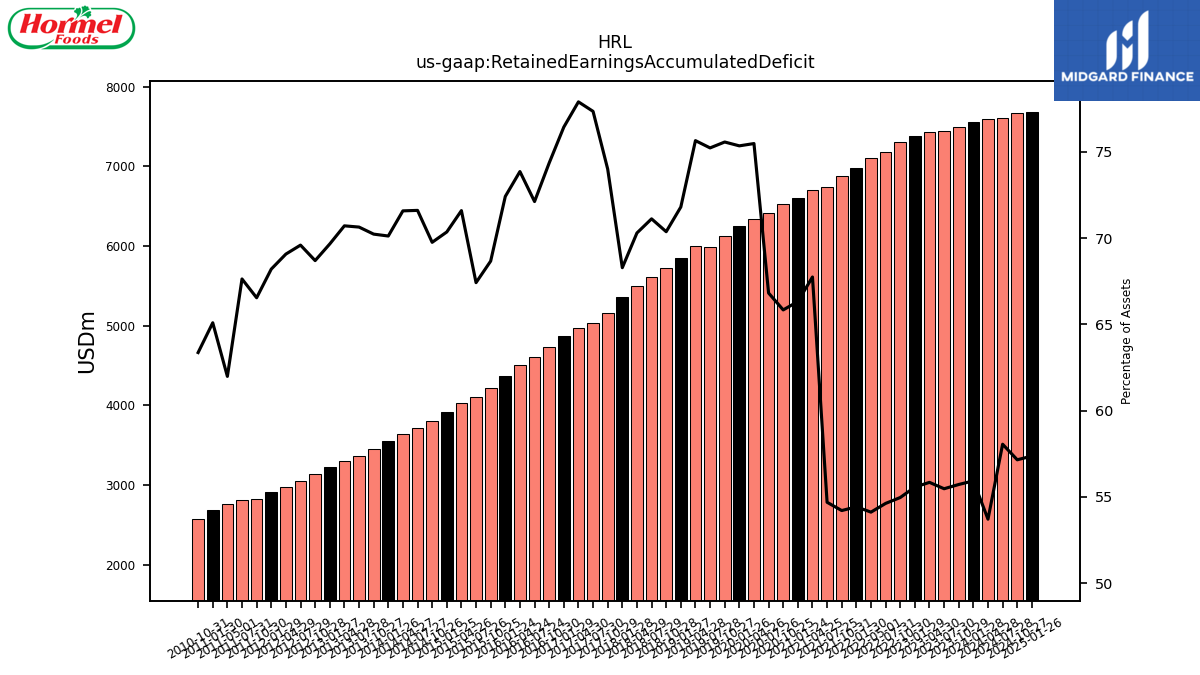
| Retained Earnings Accumulated Deficit | 7557.16 | 7492.95 | 7447.57 | 7435.29 | 7380.69 | 7313.37 | 7176.98 | 7100.73 | 6980.45 | 6881.87 | 6743.70 | 6699.34 | 6604.51 | 6523.34 | 6414.81 | 6336.95 | 6246.64 | 6128.21 | 5984.31 | 6003.64 | 5856.03 | 5729.96 | 5615.05 | 5504.22 | 5366.50 | 5162.57 | 5033.94 | 4974.51 | 4866.37 | 4736.57 | 4607.36 | 4513.10 | 4374.60 | 4216.12 | 4106.57 | 4025.77 | 3911.55 | 3805.65 | 3715.34 | 3640.46 | 3553.21 | 3452.53 | 3363.36 | 3300.60 | 3220.35 | 3135.32 | 3050.07 | 2980.35 | 2912.50 | 2824.33 | 2806.39 | 2759.12 | NA | 2683.69 | 2568.77 | NA | NA | NA | |
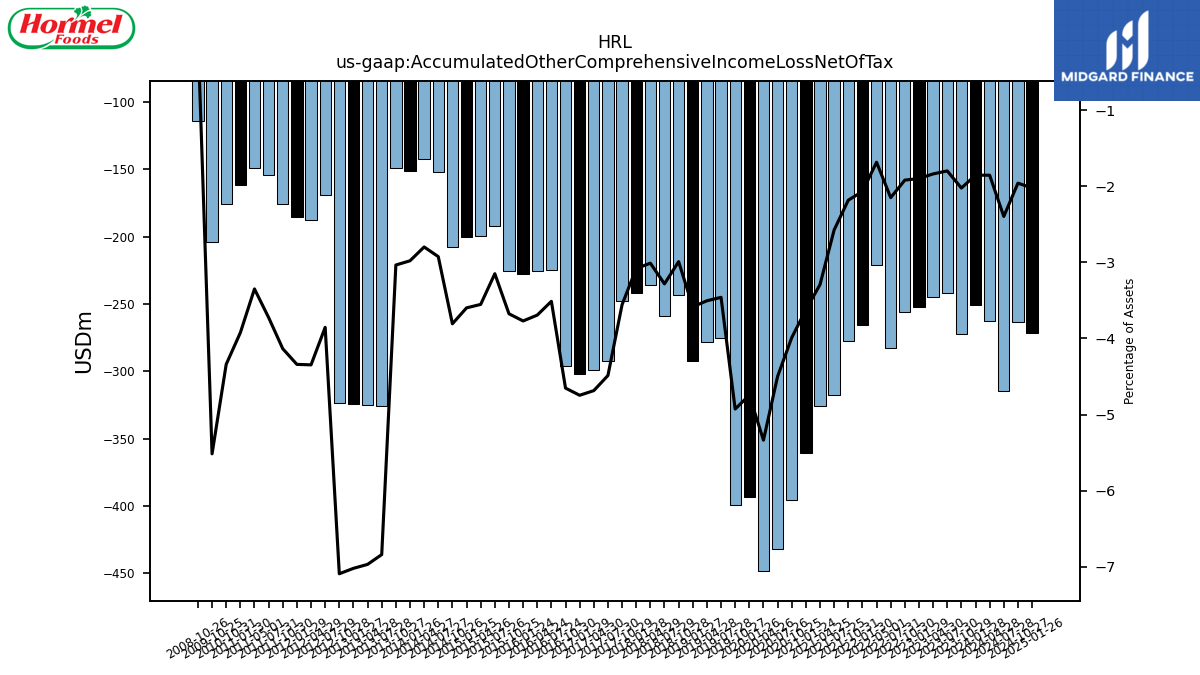
| Accumulated Other Comprehensive Income Loss Net Of Tax | -250.78 | -272.25 | -241.61 | -244.89 | -252.26 | -255.56 | -282.57 | -221.16 | -265.52 | -277.27 | -317.53 | -325.63 | -360.87 | -395.25 | -431.88 | -447.91 | -393.28 | -399.50 | -275.19 | -278.13 | -292.34 | -243.50 | -259.21 | -235.75 | -242.18 | -248.07 | -291.96 | -299.15 | -302.14 | -296.30 | -224.36 | -225.67 | -227.74 | -225.67 | -191.84 | -199.76 | -200.04 | -207.70 | -151.77 | -142.32 | -150.99 | -149.21 | -325.56 | -325.17 | -324.46 | -323.57 | -168.90 | -187.53 | -185.34 | -175.48 | -154.55 | -149.10 | NA | -161.79 | -175.91 | NA | NA | NA | |
| Minority Interest | 4.46 | 4.10 | 4.60 | 5.11 | 5.09 | 4.94 | 5.27 | 5.81 | 5.74 | 5.48 | 5.45 | 5.18 | 5.20 | 4.78 | 4.32 | 4.14 | 4.28 | 4.08 | 4.26 | 4.45 | NA | 4.01 | 4.17 | 4.43 | 4.04 | 3.79 | 3.47 | 3.32 | 3.32 | 3.40 | 3.20 | 3.16 | 3.23 | 3.19 | 3.23 | 3.18 | 5.53 | 6.38 | 8.28 | 7.23 | 6.68 | 5.54 | 8.35 | 7.97 | 6.81 | 5.47 | 7.31 | 5.29 | 4.21 | 3.23 | 6.97 | 5.43 | NA | 4.27 | 5.98 | NA | NA | NA | |
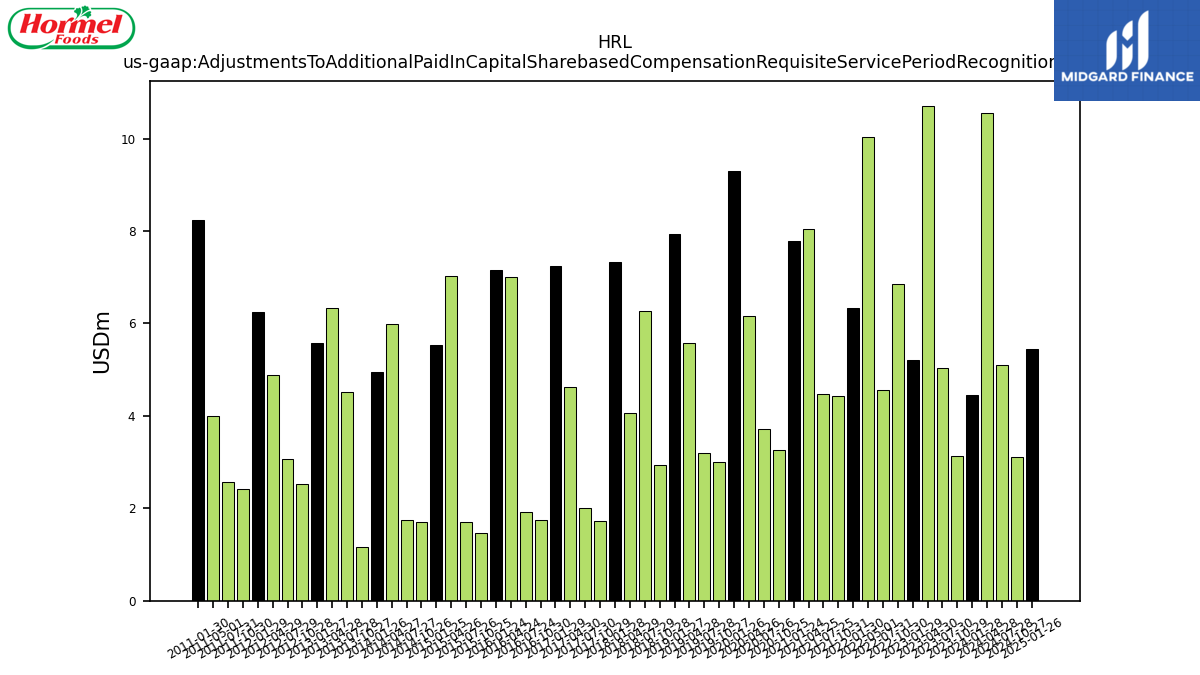
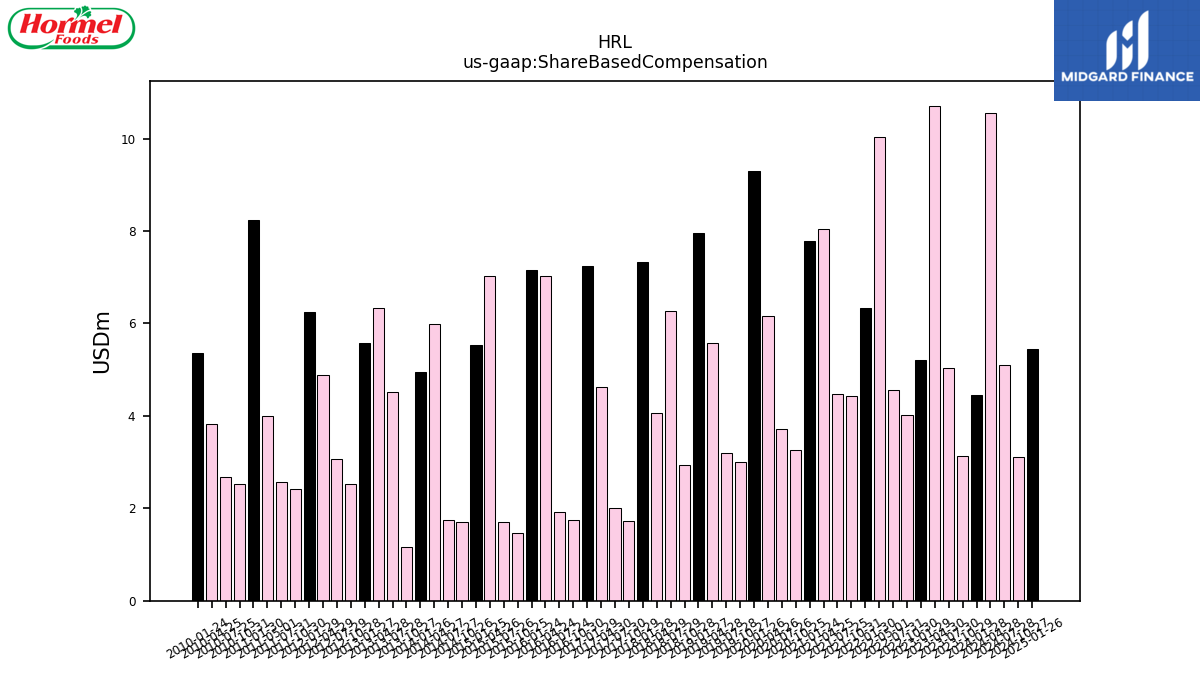
| Adjustments To Additional Paid In Capital Sharebased Compensation Requisite Service Period Recognition Value | 4.44 | 3.13 | 5.03 | 10.71 | 5.20 | 6.85 | 4.57 | 10.04 | 6.33 | 4.43 | 4.48 | 8.05 | 7.78 | 3.27 | 3.72 | 6.17 | 9.30 | 3.00 | 3.19 | 5.57 | 7.95 | 2.94 | 6.26 | 4.05 | 7.34 | 1.72 | 2.01 | 4.62 | 7.24 | 1.74 | 1.91 | 7.02 | 7.16 | 1.46 | 1.71 | 7.03 | 5.52 | 1.70 | 1.75 | 5.99 | 4.96 | 1.17 | 4.52 | 6.33 | 5.58 | 2.52 | 3.06 | 4.89 | 6.24 | 2.41 | 2.58 | 4.00 | NA | 8.24 | NA | NA | NA | NA |
| 2024-01-28 | 2023-10-29 | 2023-07-30 | 2023-04-30 | 2023-01-29 | 2022-10-30 | 2022-07-31 | 2022-05-01 | 2022-01-30 | 2021-10-31 | 2021-07-25 | 2021-04-25 | 2021-01-24 | 2020-10-25 | 2020-07-26 | 2020-04-26 | 2020-01-26 | 2019-10-27 | 2019-07-28 | 2019-04-28 | 2019-01-27 | 2018-10-28 | 2018-07-29 | 2018-04-29 | 2018-01-28 | 2017-10-29 | 2017-07-30 | 2017-04-30 | 2017-01-29 | 2016-10-30 | 2016-07-24 | 2016-04-24 | 2016-01-24 | 2015-10-25 | 2015-07-26 | 2015-04-26 | 2015-01-25 | 2014-10-26 | 2014-07-27 | 2014-04-27 | 2014-01-26 | 2013-10-27 | 2013-07-28 | 2013-04-28 | 2013-01-27 | 2012-10-28 | 2012-07-29 | 2012-04-29 | 2012-01-29 | 2011-10-30 | 2011-07-31 | 2011-05-01 | 2011-01-31 | 2011-01-30 | 2010-10-31 | 2010-07-25 | 2010-04-25 | 2010-01-24 | ||
|---|---|---|---|---|---|---|---|---|---|---|---|---|---|---|---|---|---|---|---|---|---|---|---|---|---|---|---|---|---|---|---|---|---|---|---|---|---|---|---|---|---|---|---|---|---|---|---|---|---|---|---|---|---|---|---|---|---|---|---|
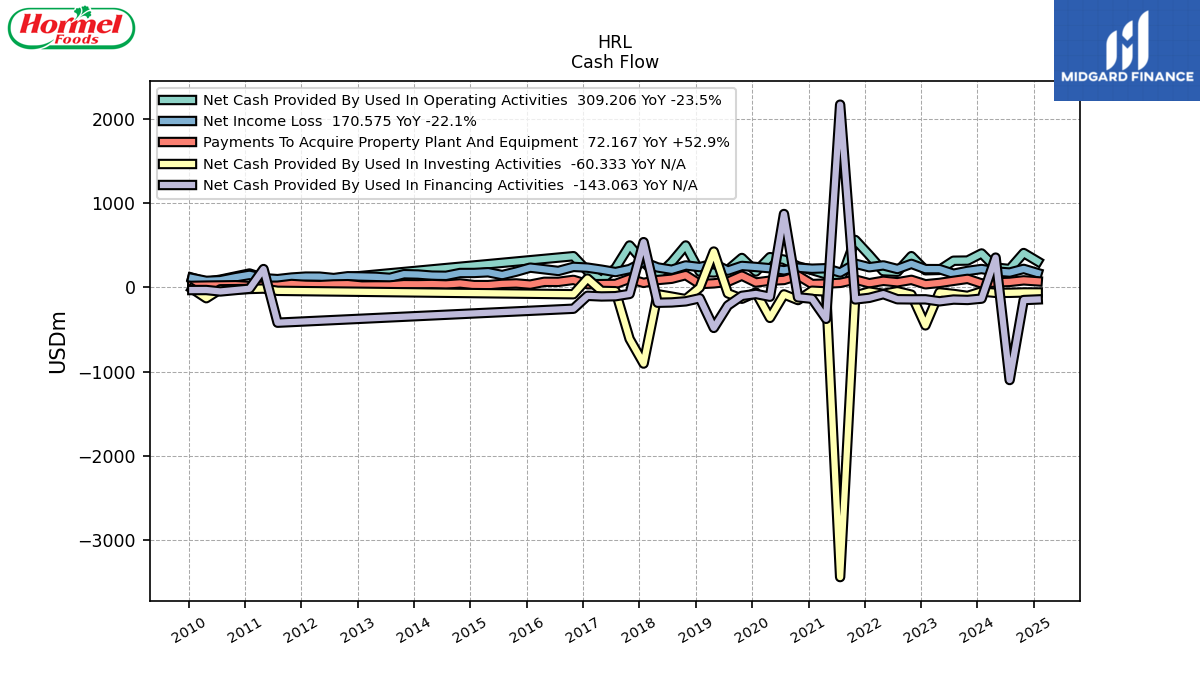
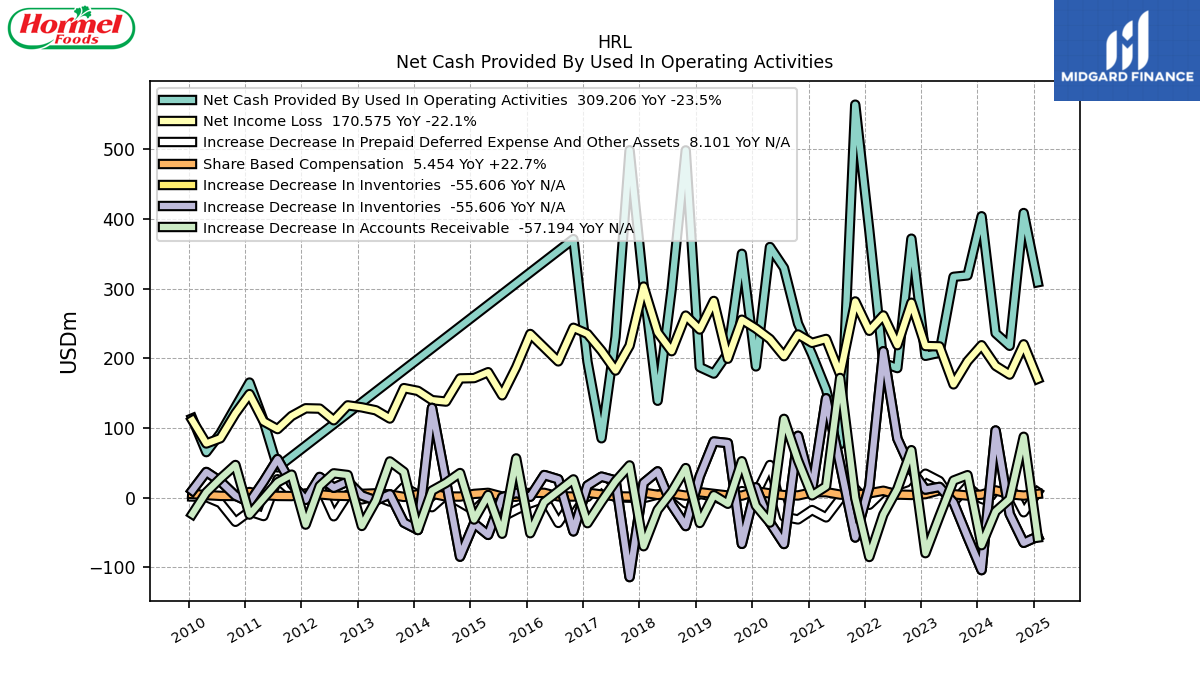
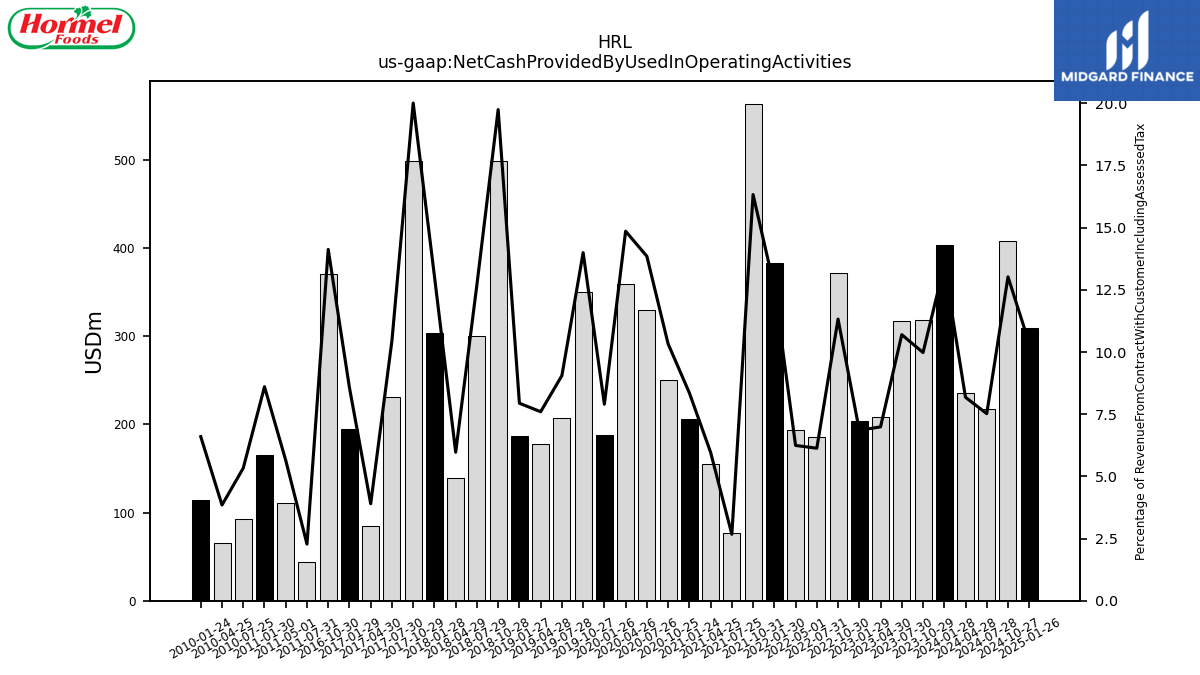
| Net Cash Provided By Used In Operating Activities | 403.98 | 319.09 | 317.00 | 208.12 | 203.63 | 371.82 | 186.05 | 193.35 | 383.76 | 564.15 | 76.53 | 155.57 | 205.69 | 249.94 | 329.80 | 359.87 | 188.42 | 350.08 | 207.32 | 178.17 | 187.43 | 498.52 | 299.86 | 139.16 | 304.18 | 498.72 | 230.92 | 85.30 | 195.25 | 371.16 | NA | NA | NA | NA | NA | NA | NA | NA | NA | NA | NA | NA | NA | NA | NA | NA | NA | NA | NA | NA | 43.51 | 110.59 | NA | 165.33 | NA | 92.28 | 65.40 | 113.94 | |
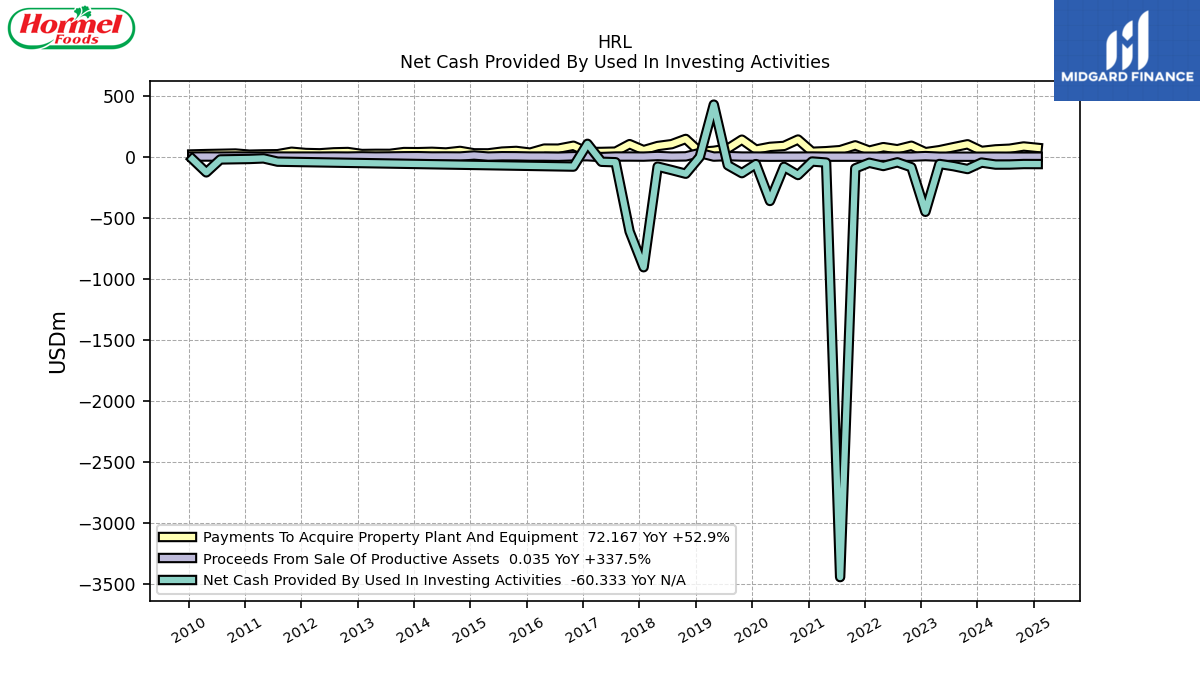
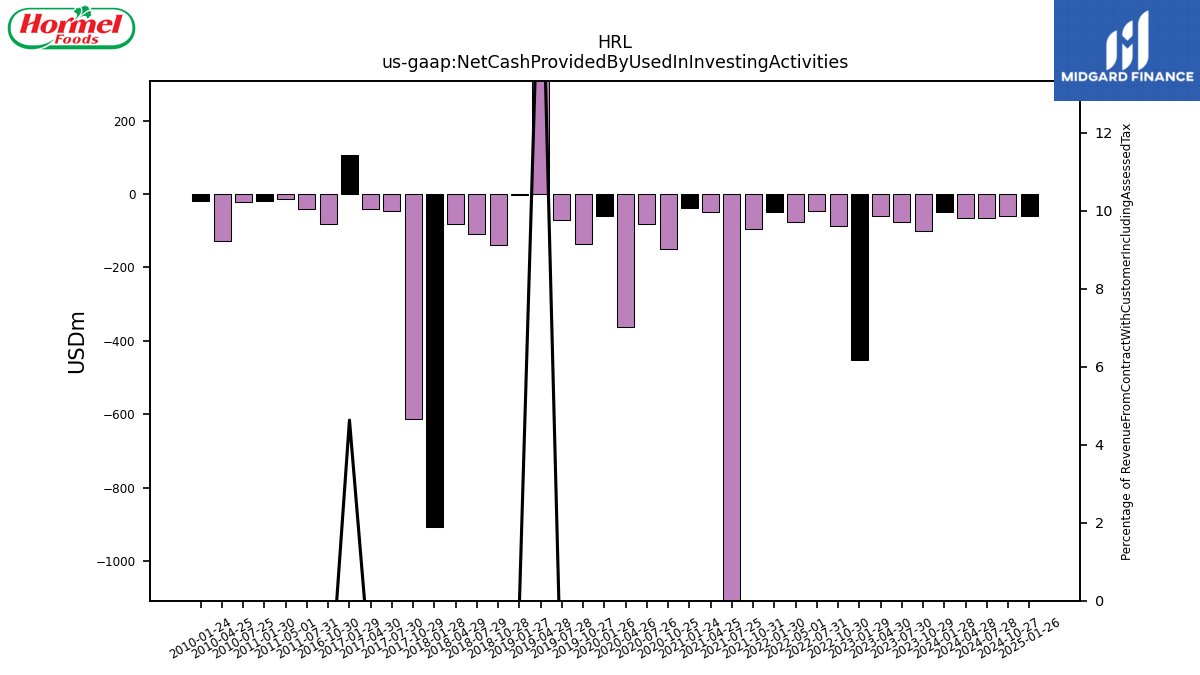
| Net Cash Provided By Used In Investing Activities | -48.15 | -101.06 | -77.42 | -59.60 | -451.47 | -86.21 | -46.02 | -76.13 | -49.68 | -95.52 | -3443.06 | -47.95 | -39.30 | -150.28 | -82.91 | -362.63 | -60.50 | -134.79 | -69.89 | 426.51 | -1.68 | -139.40 | -109.51 | -81.16 | -905.30 | -611.81 | -45.29 | -41.47 | 105.57 | -81.08 | NA | NA | NA | NA | NA | NA | NA | NA | NA | NA | NA | NA | NA | NA | NA | NA | NA | NA | NA | NA | -40.49 | -13.94 | NA | -18.52 | NA | -22.46 | -128.44 | -18.60 | |
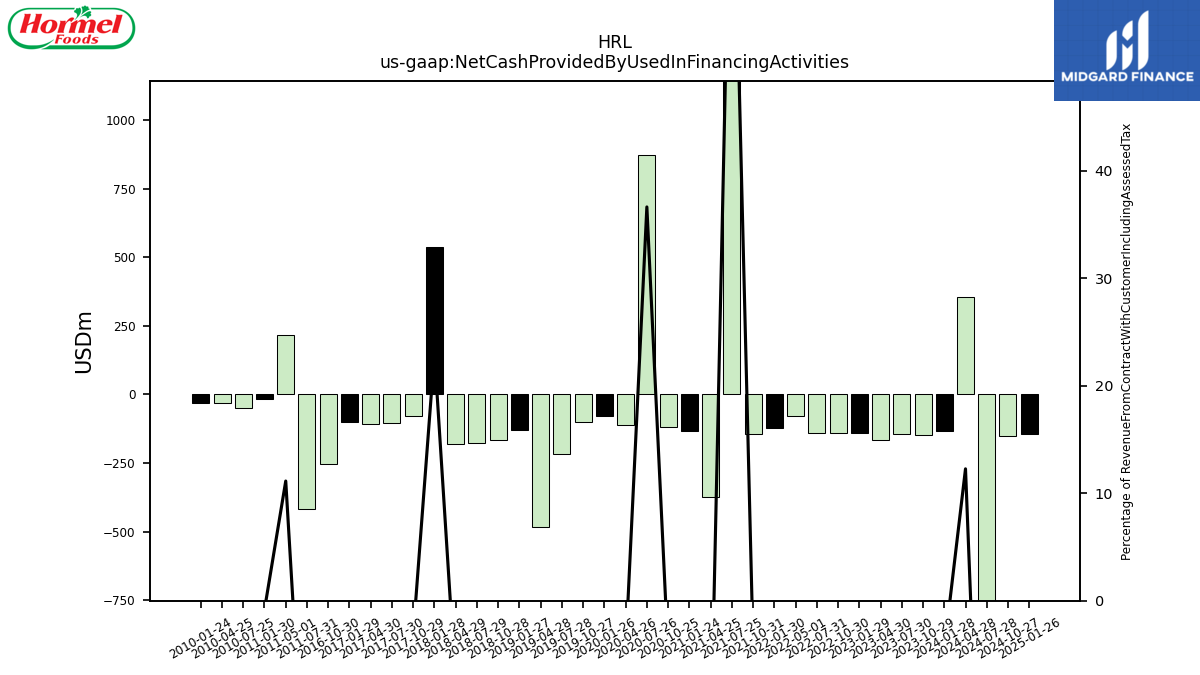
| Net Cash Provided By Used In Financing Activities | -133.37 | -149.09 | -144.24 | -165.17 | -141.57 | -142.22 | -140.46 | -79.98 | -124.02 | -143.38 | 2172.36 | -373.70 | -134.75 | -117.82 | 872.72 | -110.82 | -77.92 | -100.29 | -215.48 | -481.57 | -128.90 | -165.64 | -178.58 | -182.31 | 538.17 | -77.63 | -104.42 | -107.39 | -99.82 | -253.35 | NA | NA | NA | NA | NA | NA | NA | NA | NA | NA | NA | NA | NA | NA | NA | NA | NA | NA | NA | NA | -419.36 | 218.25 | NA | -15.84 | NA | -48.09 | -30.87 | -31.49 |
| 2024-01-28 | 2023-10-29 | 2023-07-30 | 2023-04-30 | 2023-01-29 | 2022-10-30 | 2022-07-31 | 2022-05-01 | 2022-01-30 | 2021-10-31 | 2021-07-25 | 2021-04-25 | 2021-01-24 | 2020-10-25 | 2020-07-26 | 2020-04-26 | 2020-01-26 | 2019-10-27 | 2019-07-28 | 2019-04-28 | 2019-01-27 | 2018-10-28 | 2018-07-29 | 2018-04-29 | 2018-01-28 | 2017-10-29 | 2017-07-30 | 2017-04-30 | 2017-01-29 | 2016-10-30 | 2016-07-24 | 2016-04-24 | 2016-01-24 | 2015-10-25 | 2015-07-26 | 2015-04-26 | 2015-01-25 | 2014-10-26 | 2014-07-27 | 2014-04-27 | 2014-01-26 | 2013-10-27 | 2013-07-28 | 2013-04-28 | 2013-01-27 | 2012-10-28 | 2012-07-29 | 2012-04-29 | 2012-01-29 | 2011-10-30 | 2011-07-31 | 2011-05-01 | 2011-01-31 | 2011-01-30 | 2010-10-31 | 2010-07-25 | 2010-04-25 | 2010-01-24 | ||
|---|---|---|---|---|---|---|---|---|---|---|---|---|---|---|---|---|---|---|---|---|---|---|---|---|---|---|---|---|---|---|---|---|---|---|---|---|---|---|---|---|---|---|---|---|---|---|---|---|---|---|---|---|---|---|---|---|---|---|---|
| Net Cash Provided By Used In Operating Activities | 403.98 | 319.09 | 317.00 | 208.12 | 203.63 | 371.82 | 186.05 | 193.35 | 383.76 | 564.15 | 76.53 | 155.57 | 205.69 | 249.94 | 329.80 | 359.87 | 188.42 | 350.08 | 207.32 | 178.17 | 187.43 | 498.52 | 299.86 | 139.16 | 304.18 | 498.72 | 230.92 | 85.30 | 195.25 | 371.16 | NA | NA | NA | NA | NA | NA | NA | NA | NA | NA | NA | NA | NA | NA | NA | NA | NA | NA | NA | NA | 43.51 | 110.59 | NA | 165.33 | NA | 92.28 | 65.40 | 113.94 | |
| Net Income Loss | 218.86 | 195.94 | 162.68 | 217.24 | 217.72 | 279.88 | 218.91 | 261.62 | 239.57 | 281.74 | 176.92 | 227.90 | 222.28 | 234.36 | 203.12 | 227.73 | 242.87 | 255.50 | 199.45 | 282.43 | 241.43 | 261.41 | 210.24 | 237.38 | 303.11 | 218.15 | 182.51 | 210.93 | 235.15 | 243.94 | 195.65 | 215.40 | 235.06 | 187.23 | 146.94 | 180.20 | 171.72 | 171.26 | 137.97 | 140.09 | 153.35 | 157.34 | 113.64 | 125.52 | 129.72 | 132.60 | 111.17 | 127.89 | 128.40 | 117.31 | 98.48 | 109.58 | NA | 148.83 | 121.15 | 85.37 | 77.86 | 111.21 | |
| Profit Loss | 218.73 | 195.48 | 162.57 | 217.22 | 217.65 | 280.01 | 218.83 | 261.68 | 239.71 | 281.75 | 177.07 | 227.92 | 222.40 | 234.53 | 203.26 | 227.62 | 242.95 | 255.57 | 199.43 | 282.64 | 241.52 | 261.50 | 210.35 | 237.52 | 303.21 | 218.36 | 182.55 | 210.89 | 235.30 | 244.19 | 195.78 | 215.38 | 235.17 | 187.44 | 146.96 | 180.44 | 172.43 | 171.85 | 139.01 | 140.71 | 154.46 | 158.49 | 113.91 | 126.64 | 131.04 | 134.29 | 112.41 | 128.94 | 129.33 | 118.50 | 99.96 | 110.70 | 150.03 | 150.03 | 122.61 | 86.36 | 78.53 | 112.27 | |
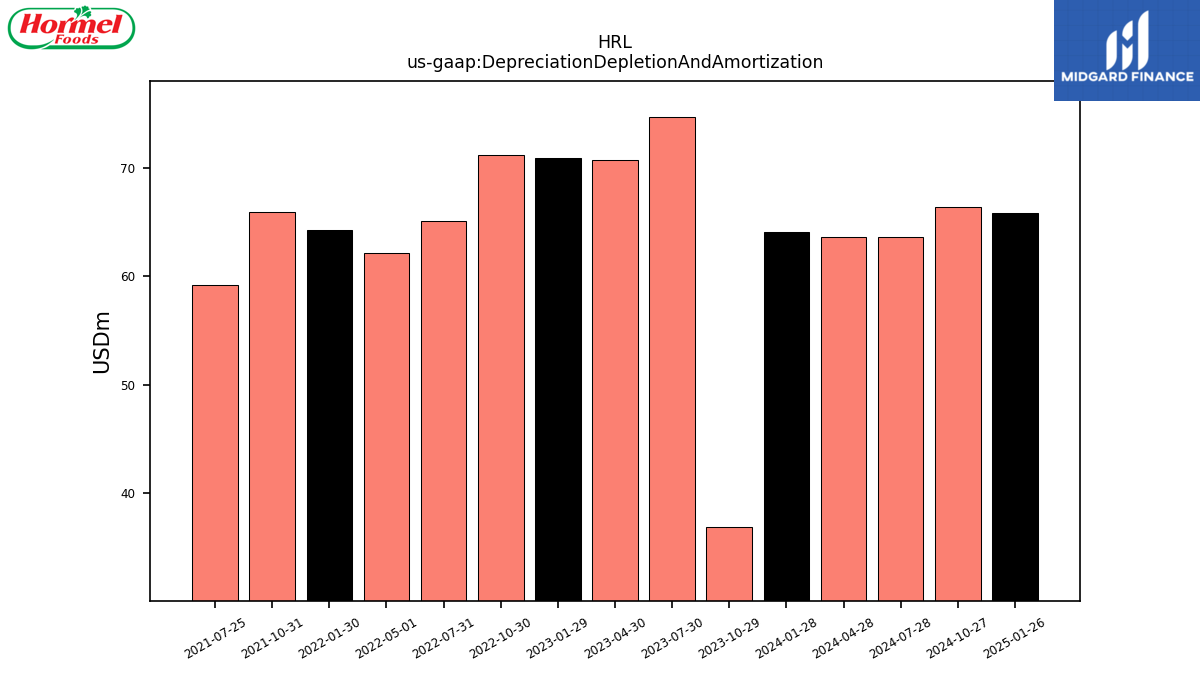
| Depreciation Depletion And Amortization | 64.07 | 36.88 | 74.75 | 70.78 | 70.89 | 71.19 | 65.13 | 62.16 | 64.28 | 65.92 | 59.18 | NA | NA | NA | NA | NA | NA | NA | NA | NA | NA | NA | NA | NA | NA | NA | NA | NA | NA | NA | NA | NA | NA | NA | NA | NA | NA | NA | NA | NA | NA | NA | NA | NA | NA | NA | NA | NA | NA | NA | NA | NA | NA | NA | NA | NA | NA | NA | |
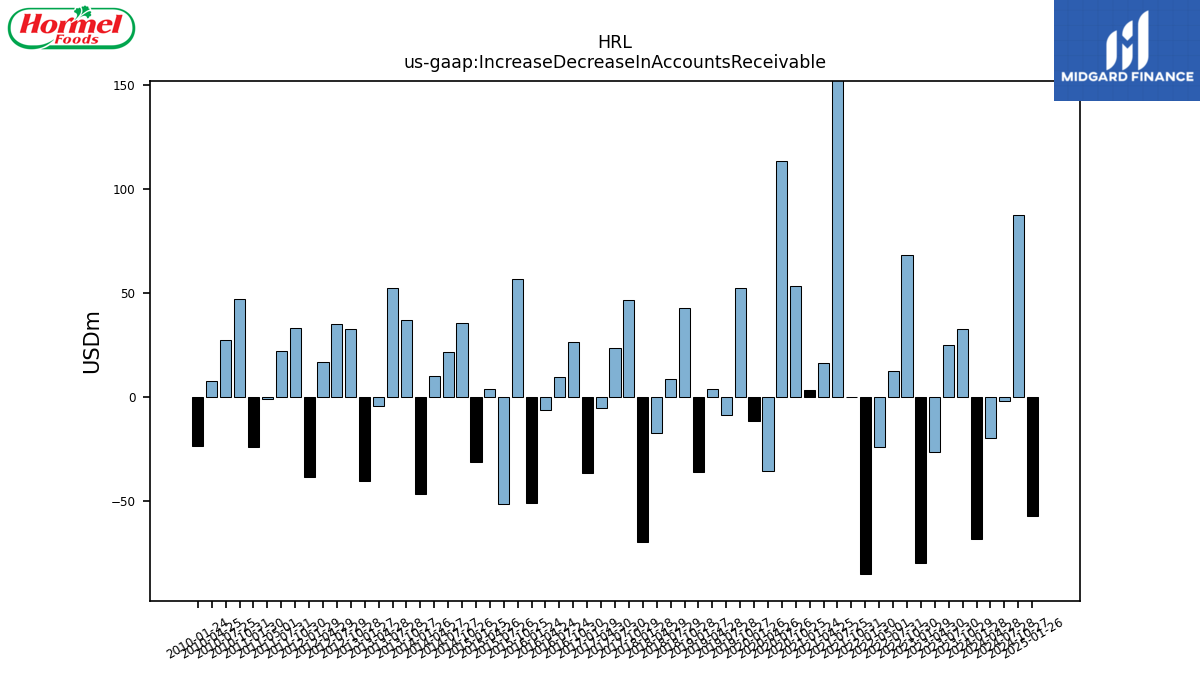
| Increase Decrease In Accounts Receivable | -68.09 | 32.42 | 24.71 | -26.57 | -79.56 | 68.31 | 12.62 | -24.22 | -85.08 | -0.16 | 171.96 | 16.38 | 3.44 | 53.46 | 113.23 | -35.68 | -11.49 | 52.45 | -8.68 | 3.63 | -36.26 | 42.60 | 8.41 | -17.51 | -69.63 | 46.44 | 23.69 | -5.53 | -36.51 | 26.38 | 9.42 | -6.24 | -50.95 | 56.52 | -51.65 | 3.97 | -31.29 | 35.48 | 21.34 | 10.14 | -46.48 | 37.10 | 52.16 | -4.30 | -40.51 | 32.62 | 35.08 | 16.84 | -38.60 | 33.18 | 22.14 | -0.89 | NA | -24.26 | 47.05 | 27.53 | 7.67 | -23.60 | |
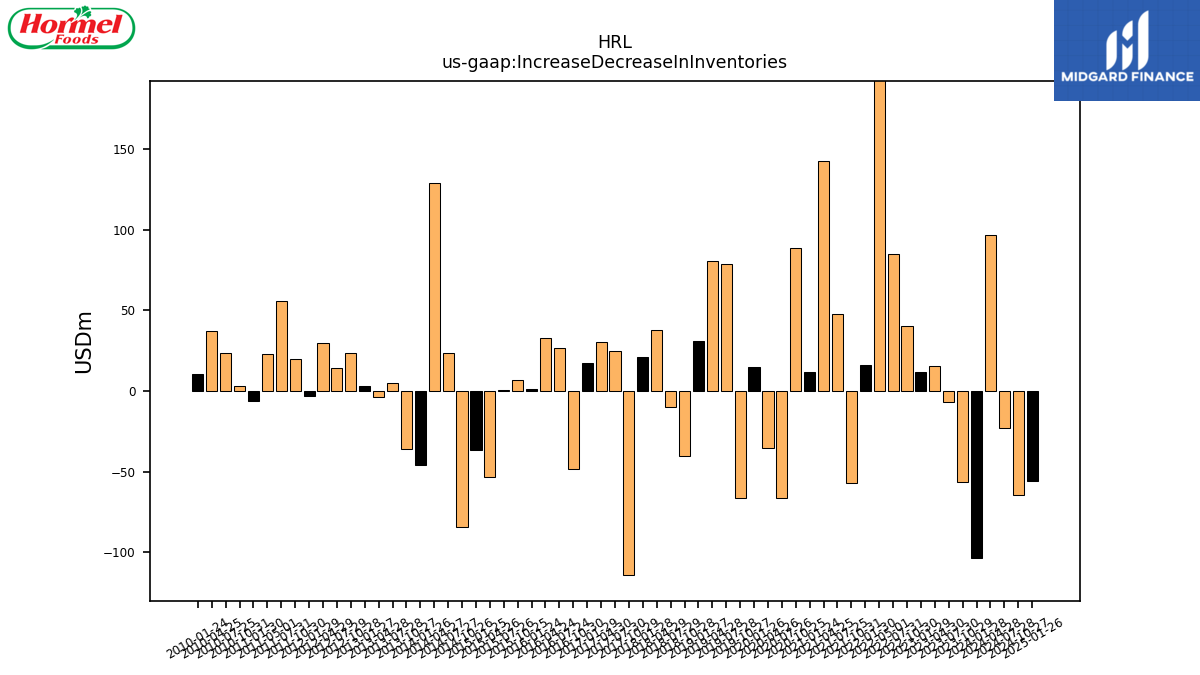
| Increase Decrease In Inventories | -103.89 | -56.25 | -6.77 | 15.54 | 11.77 | 40.35 | 84.89 | 210.17 | 16.25 | -57.04 | 47.57 | 142.77 | 11.88 | 88.87 | -66.41 | -35.54 | 14.91 | -66.22 | 78.46 | 80.70 | 30.90 | -40.63 | -10.17 | 37.84 | 21.25 | -113.91 | 24.81 | 30.28 | 17.51 | -48.30 | 26.53 | 32.61 | 1.44 | 6.94 | 0.76 | -53.31 | -36.82 | -84.59 | 23.39 | 129.00 | -46.16 | -35.76 | 4.88 | -3.98 | 3.16 | 23.47 | 14.38 | 29.84 | -3.00 | 19.95 | 55.49 | 23.11 | NA | -6.49 | 2.90 | 23.68 | 36.97 | 10.36 | |
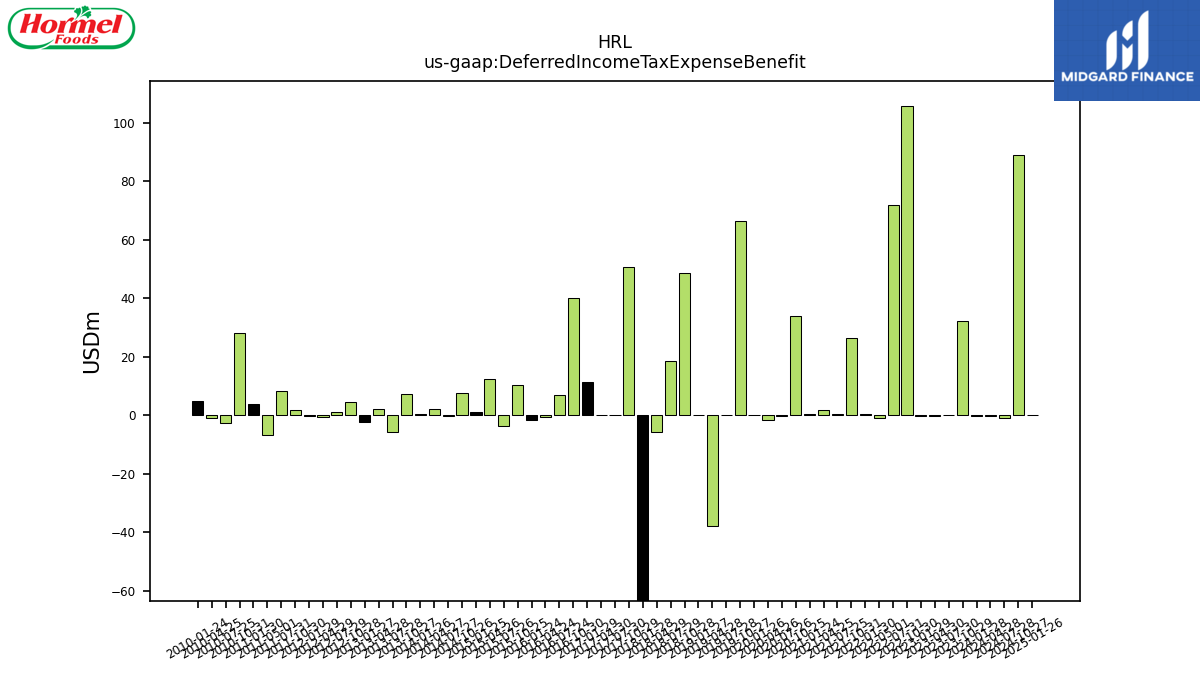
| Deferred Income Tax Expense Benefit | -0.18 | 32.07 | 0.21 | -0.17 | -0.31 | 105.57 | 71.95 | -0.89 | 0.37 | 26.30 | 0.37 | 1.67 | 0.34 | 33.93 | -0.28 | -1.66 | 0.05 | 66.56 | 0.02 | -38.06 | 0.12 | 48.67 | 18.38 | -5.63 | -68.86 | 50.81 | 0.02 | 0.12 | 11.21 | 39.90 | 6.83 | -0.66 | -1.74 | 10.36 | -3.82 | 12.28 | 1.16 | 7.42 | -0.26 | 2.21 | 0.43 | 7.08 | -5.74 | 2.13 | -2.40 | 4.49 | 0.98 | -0.59 | -0.20 | 1.71 | 8.23 | -6.88 | NA | 3.69 | 28.14 | -2.60 | -0.95 | 4.84 | |
| Share Based Compensation | 4.44 | 3.13 | 5.03 | 10.71 | 5.20 | 4.01 | 4.57 | 10.04 | 6.33 | 4.43 | 4.48 | 8.05 | 7.78 | 3.27 | 3.72 | 6.17 | 9.30 | 3.00 | 3.19 | 5.57 | 7.95 | 2.94 | 6.26 | 4.05 | 7.34 | 1.72 | 2.01 | 4.62 | 7.24 | 1.74 | 1.91 | 7.02 | 7.16 | 1.46 | 1.71 | 7.03 | 5.52 | 1.70 | 1.75 | 5.99 | 4.96 | 1.17 | 4.52 | 6.33 | 5.58 | 2.52 | 3.06 | 4.89 | 6.24 | 2.41 | 2.58 | 4.00 | NA | 8.24 | 2.53 | 2.68 | 3.82 | 5.36 |
| 2024-01-28 | 2023-10-29 | 2023-07-30 | 2023-04-30 | 2023-01-29 | 2022-10-30 | 2022-07-31 | 2022-05-01 | 2022-01-30 | 2021-10-31 | 2021-07-25 | 2021-04-25 | 2021-01-24 | 2020-10-25 | 2020-07-26 | 2020-04-26 | 2020-01-26 | 2019-10-27 | 2019-07-28 | 2019-04-28 | 2019-01-27 | 2018-10-28 | 2018-07-29 | 2018-04-29 | 2018-01-28 | 2017-10-29 | 2017-07-30 | 2017-04-30 | 2017-01-29 | 2016-10-30 | 2016-07-24 | 2016-04-24 | 2016-01-24 | 2015-10-25 | 2015-07-26 | 2015-04-26 | 2015-01-25 | 2014-10-26 | 2014-07-27 | 2014-04-27 | 2014-01-26 | 2013-10-27 | 2013-07-28 | 2013-04-28 | 2013-01-27 | 2012-10-28 | 2012-07-29 | 2012-04-29 | 2012-01-29 | 2011-10-30 | 2011-07-31 | 2011-05-01 | 2011-01-31 | 2011-01-30 | 2010-10-31 | 2010-07-25 | 2010-04-25 | 2010-01-24 | ||
|---|---|---|---|---|---|---|---|---|---|---|---|---|---|---|---|---|---|---|---|---|---|---|---|---|---|---|---|---|---|---|---|---|---|---|---|---|---|---|---|---|---|---|---|---|---|---|---|---|---|---|---|---|---|---|---|---|---|---|---|
| Net Cash Provided By Used In Investing Activities | -48.15 | -101.06 | -77.42 | -59.60 | -451.47 | -86.21 | -46.02 | -76.13 | -49.68 | -95.52 | -3443.06 | -47.95 | -39.30 | -150.28 | -82.91 | -362.63 | -60.50 | -134.79 | -69.89 | 426.51 | -1.68 | -139.40 | -109.51 | -81.16 | -905.30 | -611.81 | -45.29 | -41.47 | 105.57 | -81.08 | NA | NA | NA | NA | NA | NA | NA | NA | NA | NA | NA | NA | NA | NA | NA | NA | NA | NA | NA | NA | -40.49 | -13.94 | NA | -18.52 | NA | -22.46 | -128.44 | -18.60 | |
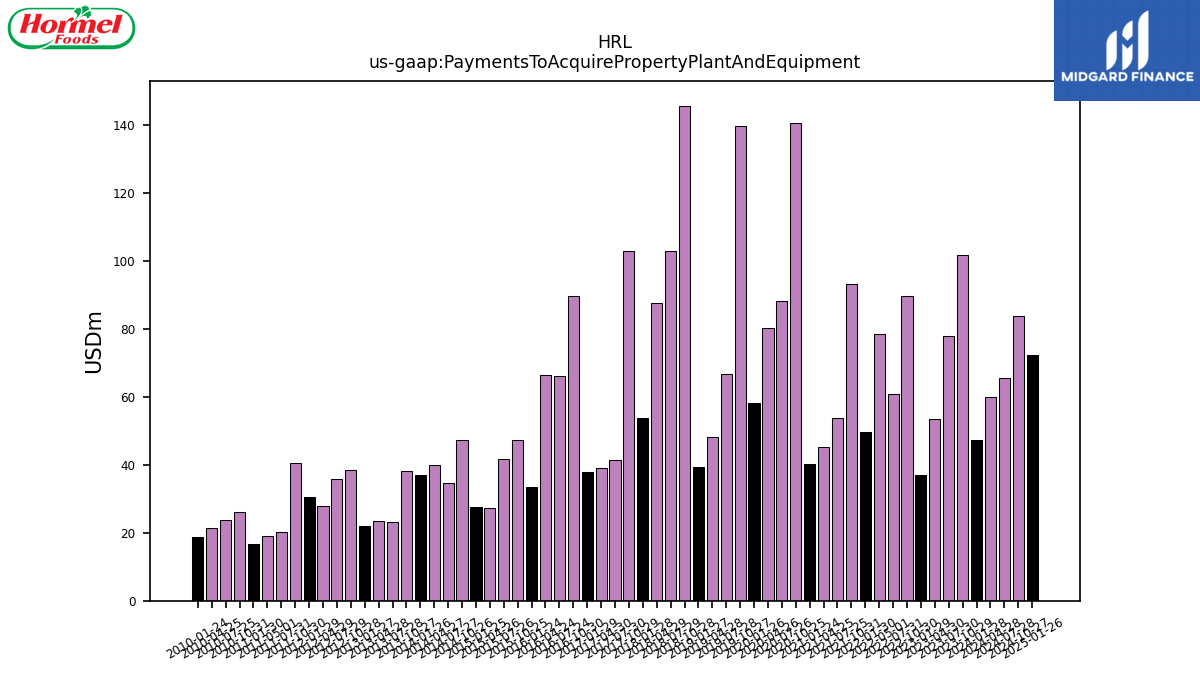
| Payments To Acquire Property Plant And Equipment | 47.21 | 101.68 | 77.95 | 53.53 | 37.05 | 89.73 | 60.97 | 78.47 | 49.75 | 93.06 | 53.82 | 45.18 | 40.36 | 140.67 | 88.27 | 80.35 | 58.21 | 139.61 | 66.61 | 48.19 | 39.43 | 145.63 | 102.81 | 87.47 | 53.69 | 102.78 | 41.54 | 39.08 | 37.90 | 89.70 | 65.98 | 66.37 | 33.48 | 47.26 | 41.82 | 27.31 | 27.67 | 47.31 | 34.76 | 40.02 | 37.04 | 38.03 | 23.24 | 23.44 | 22.05 | 38.39 | 35.70 | 27.76 | 30.46 | 40.66 | 20.36 | 19.16 | NA | 16.74 | 26.07 | 23.63 | 21.51 | 18.61 |
| 2024-01-28 | 2023-10-29 | 2023-07-30 | 2023-04-30 | 2023-01-29 | 2022-10-30 | 2022-07-31 | 2022-05-01 | 2022-01-30 | 2021-10-31 | 2021-07-25 | 2021-04-25 | 2021-01-24 | 2020-10-25 | 2020-07-26 | 2020-04-26 | 2020-01-26 | 2019-10-27 | 2019-07-28 | 2019-04-28 | 2019-01-27 | 2018-10-28 | 2018-07-29 | 2018-04-29 | 2018-01-28 | 2017-10-29 | 2017-07-30 | 2017-04-30 | 2017-01-29 | 2016-10-30 | 2016-07-24 | 2016-04-24 | 2016-01-24 | 2015-10-25 | 2015-07-26 | 2015-04-26 | 2015-01-25 | 2014-10-26 | 2014-07-27 | 2014-04-27 | 2014-01-26 | 2013-10-27 | 2013-07-28 | 2013-04-28 | 2013-01-27 | 2012-10-28 | 2012-07-29 | 2012-04-29 | 2012-01-29 | 2011-10-30 | 2011-07-31 | 2011-05-01 | 2011-01-31 | 2011-01-30 | 2010-10-31 | 2010-07-25 | 2010-04-25 | 2010-01-24 | ||
|---|---|---|---|---|---|---|---|---|---|---|---|---|---|---|---|---|---|---|---|---|---|---|---|---|---|---|---|---|---|---|---|---|---|---|---|---|---|---|---|---|---|---|---|---|---|---|---|---|---|---|---|---|---|---|---|---|---|---|---|
| Net Cash Provided By Used In Financing Activities | -133.37 | -149.09 | -144.24 | -165.17 | -141.57 | -142.22 | -140.46 | -79.98 | -124.02 | -143.38 | 2172.36 | -373.70 | -134.75 | -117.82 | 872.72 | -110.82 | -77.92 | -100.29 | -215.48 | -481.57 | -128.90 | -165.64 | -178.58 | -182.31 | 538.17 | -77.63 | -104.42 | -107.39 | -99.82 | -253.35 | NA | NA | NA | NA | NA | NA | NA | NA | NA | NA | NA | NA | NA | NA | NA | NA | NA | NA | NA | NA | -419.36 | 218.25 | NA | -15.84 | NA | -48.09 | -30.87 | -31.49 | |
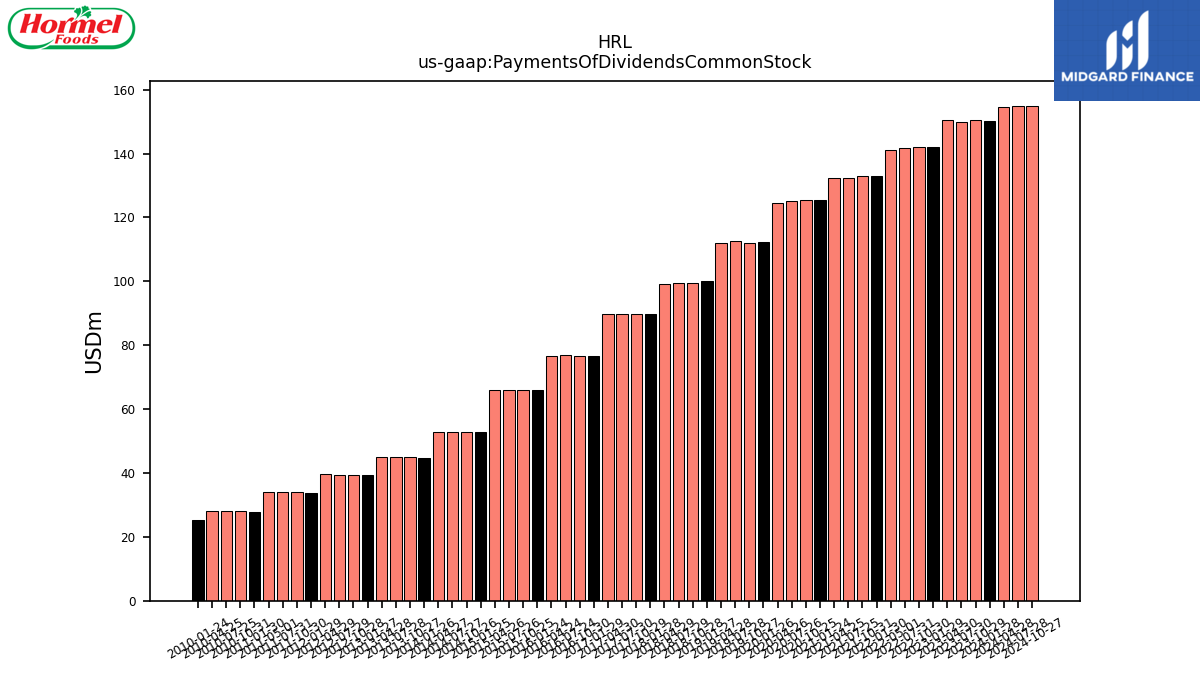
| Payments Of Dividends Common Stock | 150.29 | 150.37 | 149.94 | 150.60 | 142.02 | 141.92 | 141.86 | 141.15 | 132.91 | 132.91 | 132.42 | 132.27 | 125.52 | 125.37 | 125.25 | 124.50 | 112.25 | 112.08 | 112.68 | 112.16 | 100.12 | 99.59 | 99.38 | 99.33 | 89.81 | 89.67 | 89.83 | 89.88 | 76.63 | 76.75 | 76.87 | 76.74 | 66.14 | 66.07 | 66.05 | 65.91 | 52.80 | 52.80 | 52.77 | 52.76 | 44.83 | 44.89 | 45.02 | 44.97 | 39.44 | 39.52 | 39.50 | 39.59 | 33.60 | 33.98 | 34.07 | 34.02 | NA | 27.90 | 27.95 | 28.03 | 28.03 | 25.37 |
| 2024-01-28 | 2023-10-29 | 2023-07-30 | 2023-04-30 | 2023-01-29 | 2022-10-30 | 2022-07-31 | 2022-05-01 | 2022-01-30 | 2021-10-31 | 2021-07-25 | 2021-04-25 | 2021-01-24 | 2020-10-25 | 2020-07-26 | 2020-04-26 | 2020-01-26 | 2019-10-27 | 2019-07-28 | 2019-04-28 | 2019-01-27 | 2018-10-28 | 2018-07-29 | 2018-04-29 | 2018-01-28 | 2017-10-29 | 2017-07-30 | 2017-04-30 | 2017-01-29 | 2016-10-30 | 2016-07-24 | 2016-04-24 | 2016-01-24 | 2015-10-25 | 2015-07-26 | 2015-04-26 | 2015-01-25 | 2014-10-26 | 2014-07-27 | 2014-04-27 | 2014-01-26 | 2013-10-27 | 2013-07-28 | 2013-04-28 | 2013-01-27 | 2012-10-28 | 2012-07-29 | 2012-04-29 | 2012-01-29 | 2011-10-30 | 2011-07-31 | 2011-05-01 | 2011-01-31 | 2011-01-30 | 2010-10-31 | 2010-07-25 | 2010-04-25 | 2010-01-24 | ||
|---|---|---|---|---|---|---|---|---|---|---|---|---|---|---|---|---|---|---|---|---|---|---|---|---|---|---|---|---|---|---|---|---|---|---|---|---|---|---|---|---|---|---|---|---|---|---|---|---|---|---|---|---|---|---|---|---|---|---|---|
| Revenues | 2996.91 | 3198.08 | 2963.30 | 2977.64 | 2970.99 | 3283.47 | 3034.41 | 3096.56 | 3044.36 | 3454.75 | 2863.67 | 2606.62 | 2461.15 | 2420.11 | 2381.46 | 2422.47 | 2384.43 | 2501.51 | 2290.70 | 2344.74 | 2360.36 | 2524.70 | 2359.14 | 2330.57 | 2331.29 | 2492.61 | 2207.38 | 2187.31 | 2280.23 | 2627.94 | 2302.38 | 2300.24 | 2292.67 | 2400.86 | 2188.59 | 2279.34 | 2395.07 | 2543.77 | 2284.95 | 2244.87 | 2242.67 | 2323.20 | 2159.53 | 2152.69 | 2116.24 | 2170.18 | 2008.19 | 2012.86 | 2039.44 | 2103.90 | 1910.59 | 1959.04 | 1921.56 | 1921.56 | 2063.04 | 1730.45 | 1699.78 | 1727.45 | |
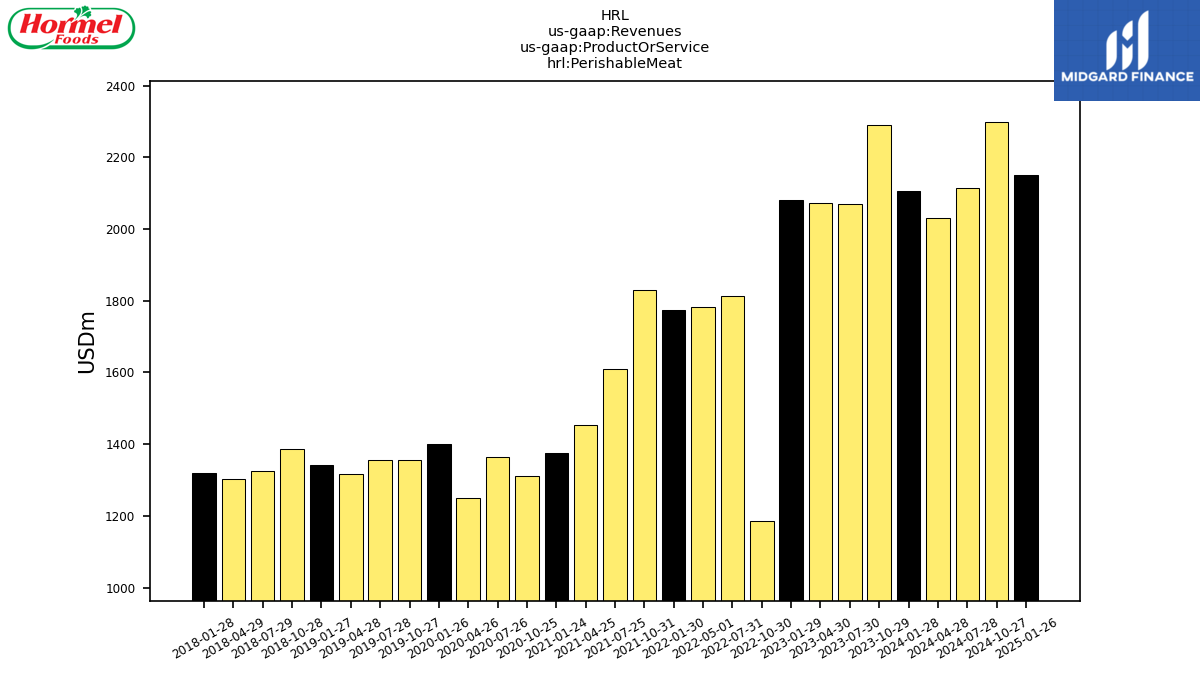
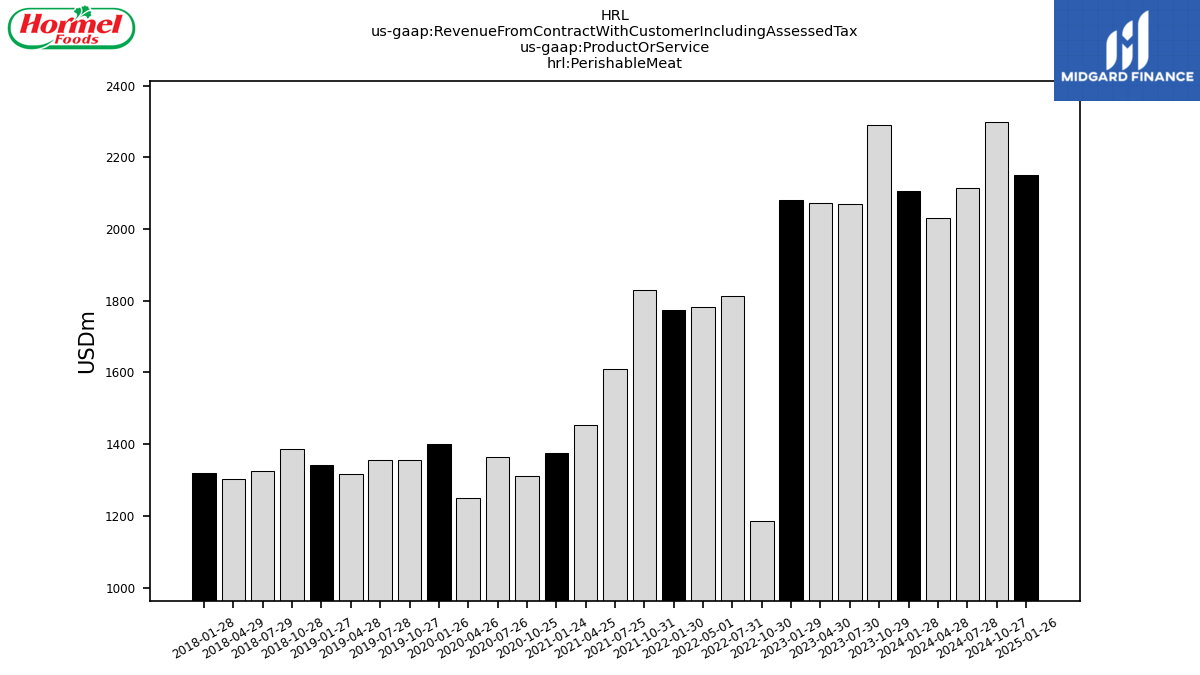
| Perishable Meat | 2106.57 | 2289.31 | 2068.79 | 2073.24 | 2080.46 | 1184.62 | 1813.51 | 1783.17 | 1773.20 | 1830.82 | 1610.38 | 1453.15 | 1376.82 | 1312.47 | 1365.74 | 1250.33 | 1400.19 | 1356.04 | 1355.77 | 1317.45 | 1341.15 | 1387.28 | 1325.89 | 1304.01 | 1318.87 | NA | NA | NA | NA | NA | NA | NA | NA | NA | NA | NA | NA | NA | NA | NA | NA | NA | NA | NA | NA | NA | NA | NA | NA | NA | NA | NA | NA | NA | NA | NA | NA | NA | |
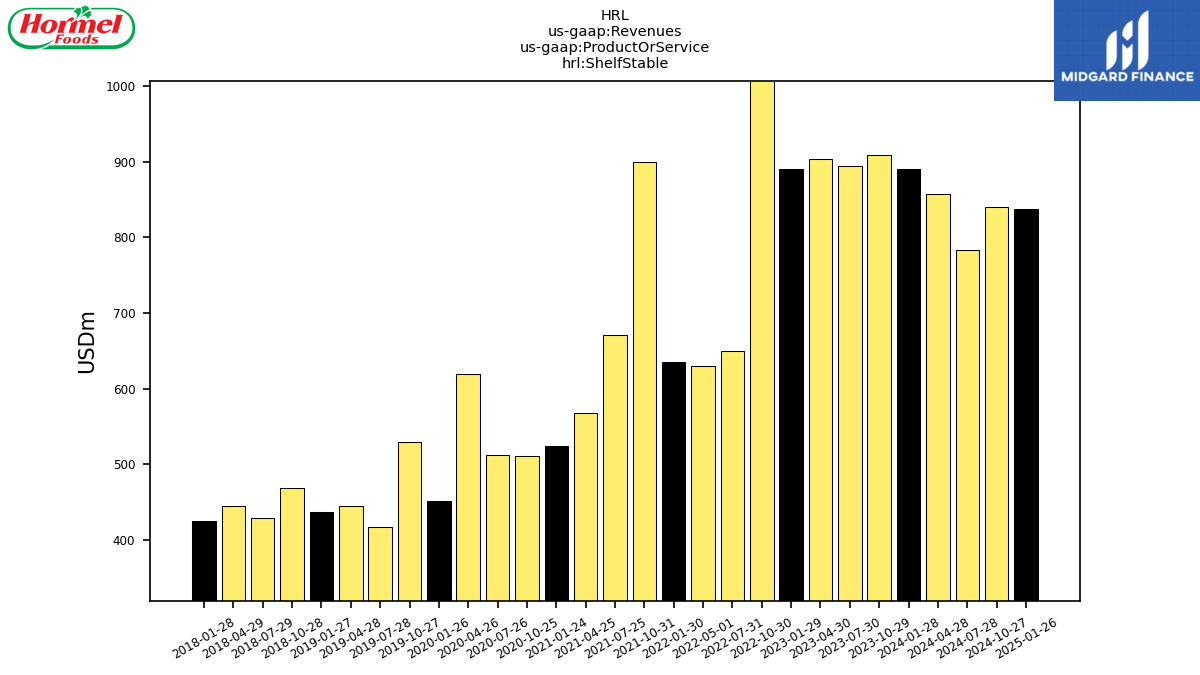
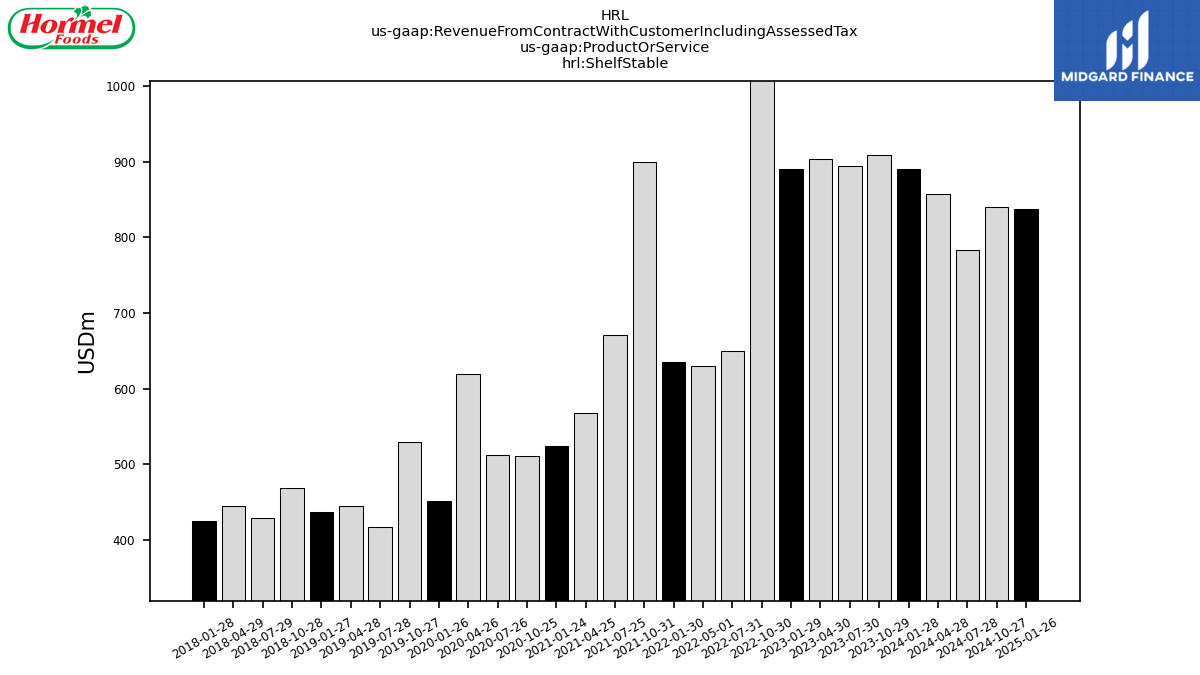
| Shelf Stable | 890.34 | 908.77 | 894.51 | 904.40 | 890.53 | 1487.58 | 649.85 | 629.41 | 635.24 | 899.31 | 670.45 | 567.50 | 523.94 | 510.76 | 511.73 | 619.35 | 450.70 | 529.88 | 417.54 | 444.83 | 436.90 | 468.48 | 428.13 | 444.75 | 424.59 | NA | NA | NA | NA | NA | NA | NA | NA | NA | NA | NA | NA | NA | NA | NA | NA | NA | NA | NA | NA | NA | NA | NA | NA | NA | NA | NA | NA | NA | NA | NA | NA | NA | |
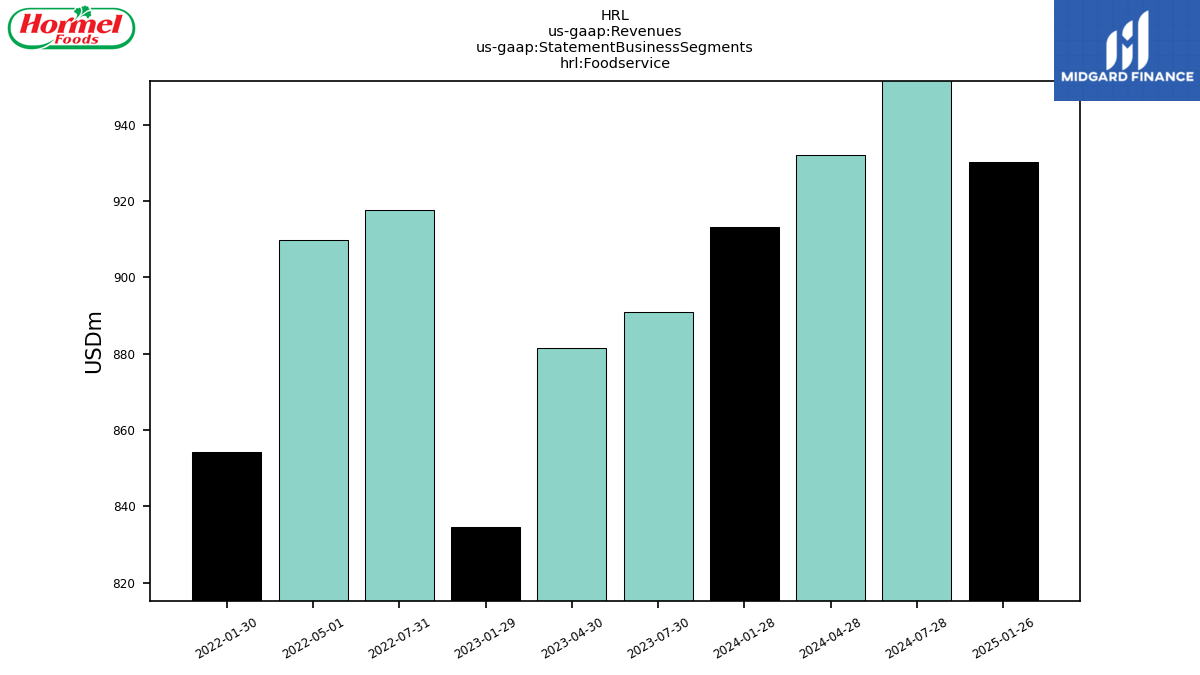
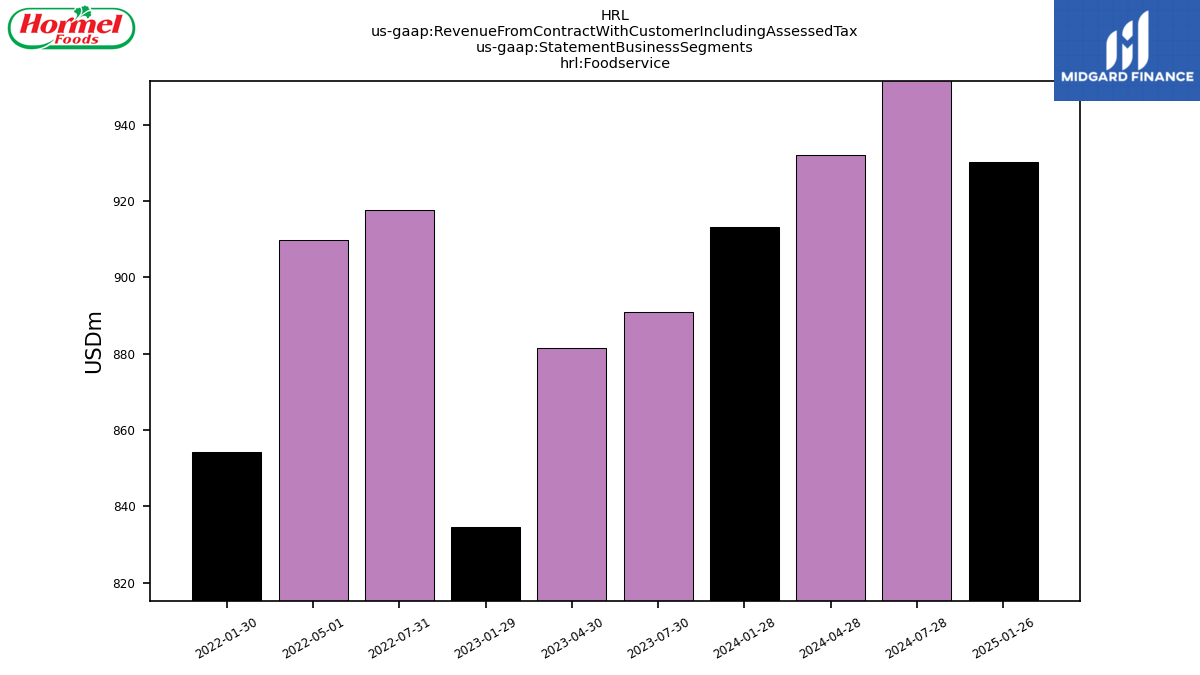
| Foodservice | 913.09 | NA | 890.95 | 881.44 | 834.75 | NA | 917.67 | 909.87 | 854.19 | NA | NA | NA | NA | NA | NA | NA | NA | NA | NA | NA | NA | NA | NA | NA | NA | NA | NA | NA | NA | NA | NA | NA | NA | NA | NA | NA | NA | NA | NA | NA | NA | NA | NA | NA | NA | NA | NA | NA | NA | NA | NA | NA | NA | NA | NA | NA | NA | NA | |
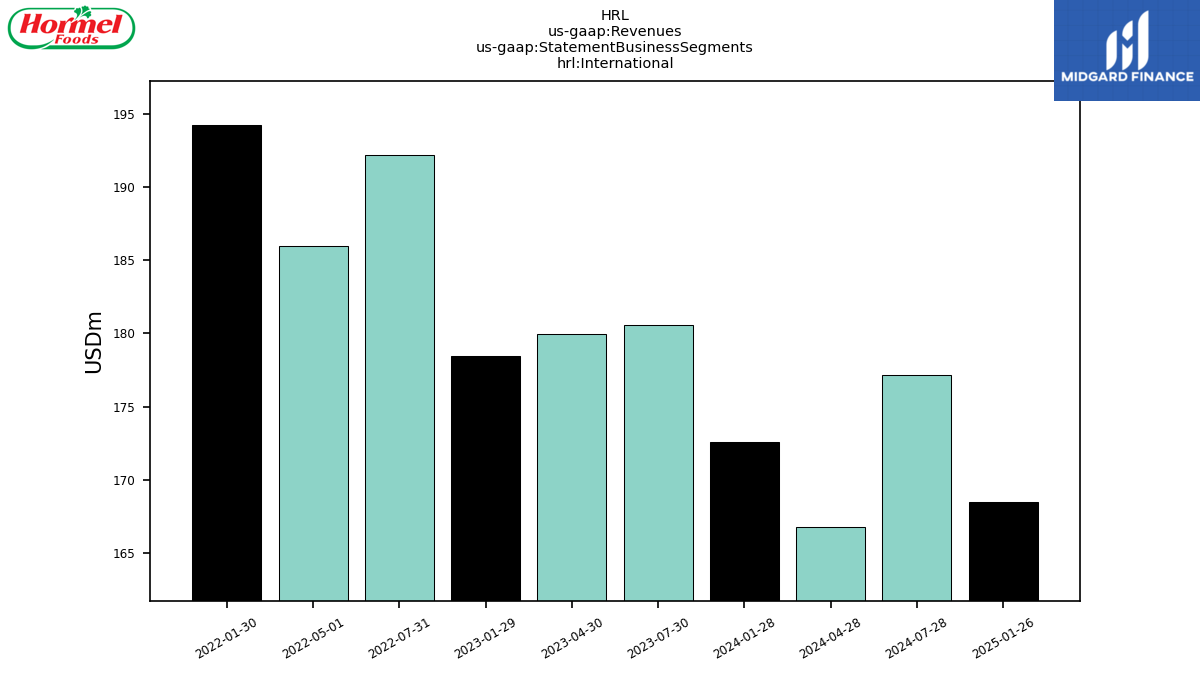
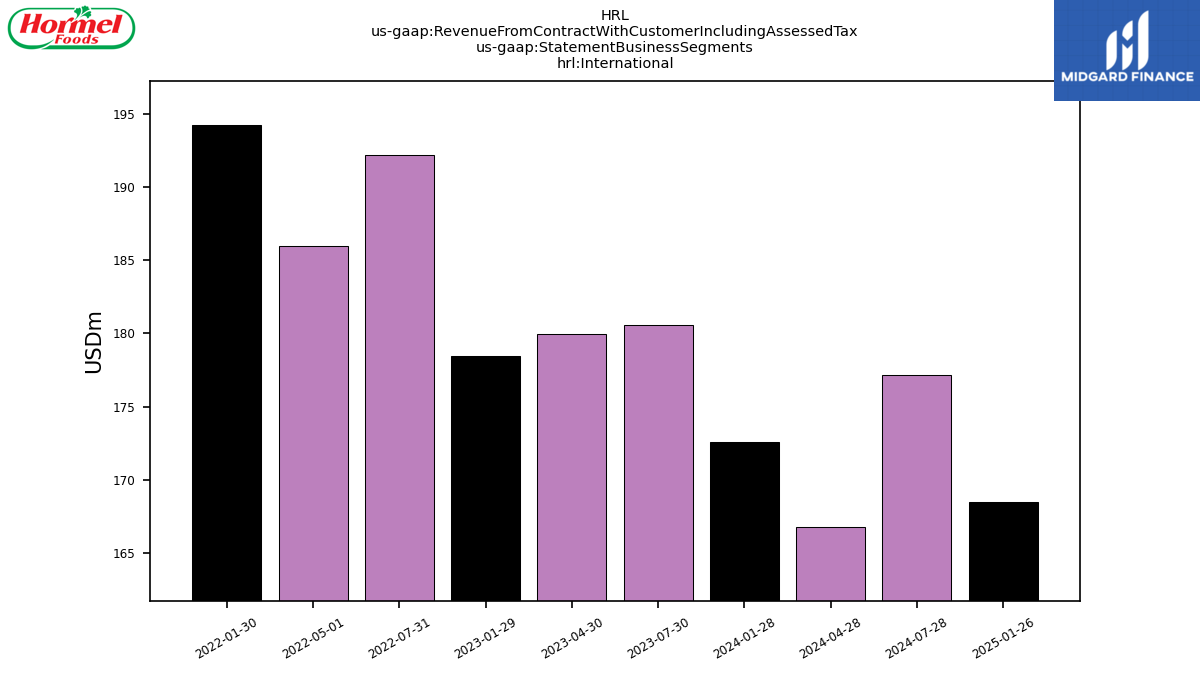
| International | 172.55 | NA | 180.60 | 179.96 | 178.44 | NA | 192.19 | 185.99 | 194.27 | NA | NA | NA | NA | NA | NA | NA | NA | NA | NA | NA | NA | NA | NA | NA | NA | NA | NA | NA | NA | NA | NA | NA | NA | NA | NA | NA | NA | NA | NA | NA | NA | NA | NA | NA | NA | NA | NA | NA | NA | NA | NA | NA | NA | NA | NA | NA | NA | NA | |
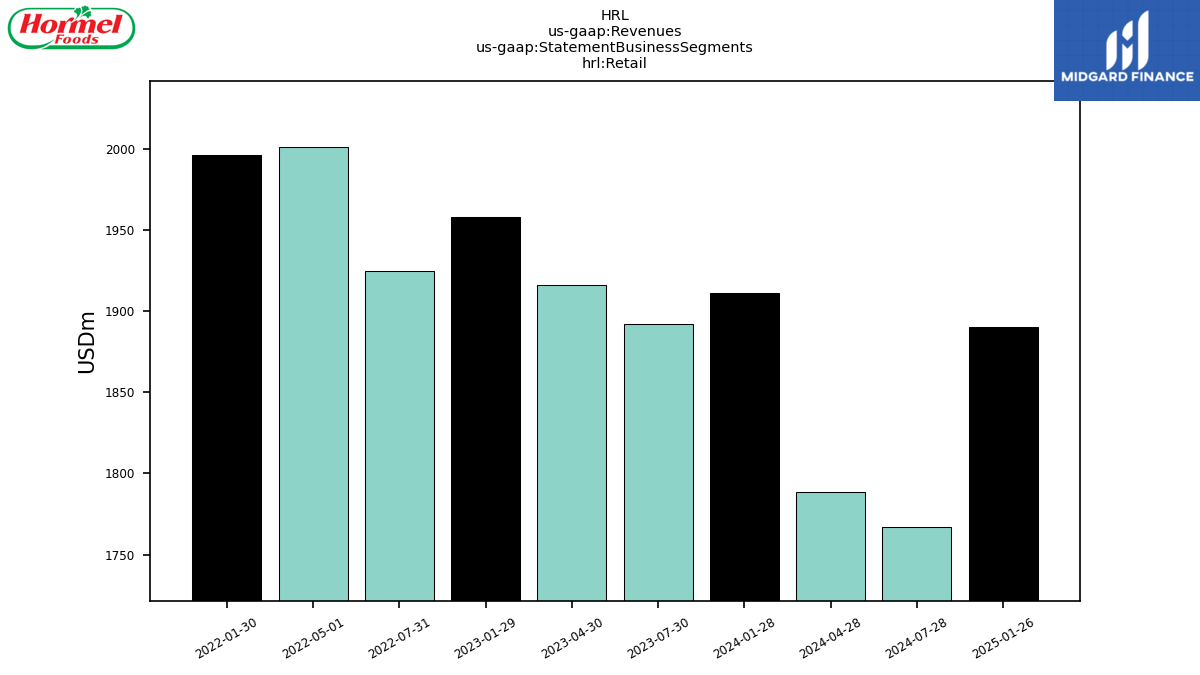
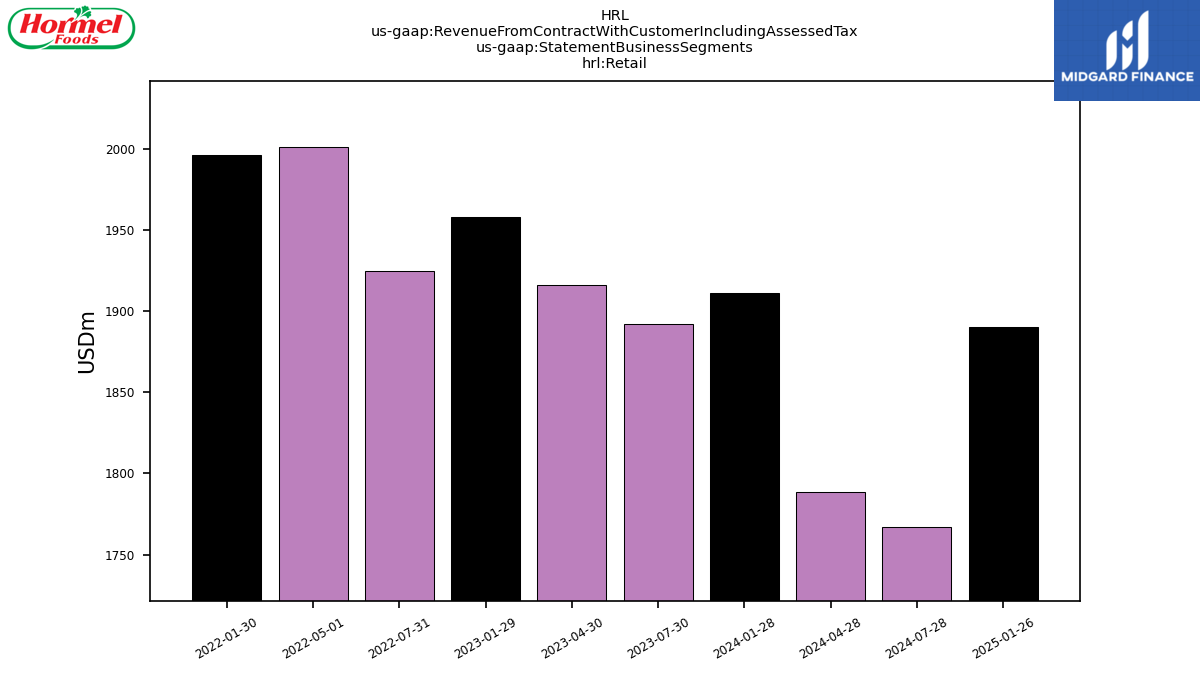
| Retail | 1911.27 | NA | 1891.75 | 1916.24 | 1957.80 | NA | 1924.55 | 2000.69 | 1995.90 | NA | NA | NA | NA | NA | NA | NA | NA | NA | NA | NA | NA | NA | NA | NA | NA | NA | NA | NA | NA | NA | NA | NA | NA | NA | NA | NA | NA | NA | NA | NA | NA | NA | NA | NA | NA | NA | NA | NA | NA | NA | NA | NA | NA | NA | NA | NA | NA | NA | |
| Revenue From Contract With Customer Including Assessed Tax | 2996.91 | 3198.08 | 2963.30 | 2977.64 | 2970.99 | 3283.47 | 3034.41 | 3096.56 | 3044.36 | 3454.75 | 2863.67 | 2606.62 | 2461.15 | 2420.11 | 2381.46 | 2422.47 | 2384.43 | 2501.51 | 2290.70 | 2344.74 | 2360.36 | 2524.70 | 2359.14 | 2330.57 | 2331.29 | 2492.61 | 2207.38 | 2187.31 | 2280.23 | 2627.94 | 2302.38 | 2300.24 | 2292.67 | 2400.86 | 2188.59 | 2279.34 | 2395.07 | 2543.77 | 2284.95 | 2244.87 | 2242.67 | 2323.20 | 2159.53 | 2152.69 | 2116.24 | 2170.18 | 2008.19 | 2012.86 | 2039.44 | 2103.90 | 1910.59 | 1959.04 | 1921.56 | 1921.56 | 2063.04 | 1730.45 | 1699.78 | 1727.45 | |
| Perishable Meat | 2106.57 | 2289.31 | 2068.79 | 2073.24 | 2080.46 | 1184.62 | 1813.51 | 1783.17 | 1773.20 | 1830.82 | 1610.38 | 1453.15 | 1376.82 | 1312.47 | 1365.74 | 1250.33 | 1400.19 | 1356.04 | 1355.77 | 1317.45 | 1341.15 | 1387.28 | 1325.89 | 1304.01 | 1318.87 | NA | NA | NA | NA | NA | NA | NA | NA | NA | NA | NA | NA | NA | NA | NA | NA | NA | NA | NA | NA | NA | NA | NA | NA | NA | NA | NA | NA | NA | NA | NA | NA | NA | |
| Shelf Stable | 890.34 | 908.77 | 894.51 | 904.40 | 890.53 | 1487.58 | 649.85 | 629.41 | 635.24 | 899.31 | 670.45 | 567.50 | 523.94 | 510.76 | 511.73 | 619.35 | 450.70 | 529.88 | 417.54 | 444.83 | 436.90 | 468.48 | 428.13 | 444.75 | 424.59 | NA | NA | NA | NA | NA | NA | NA | NA | NA | NA | NA | NA | NA | NA | NA | NA | NA | NA | NA | NA | NA | NA | NA | NA | NA | NA | NA | NA | NA | NA | NA | NA | NA | |
| Foodservice | 913.09 | NA | 890.95 | 881.44 | 834.75 | NA | 917.67 | 909.87 | 854.19 | NA | NA | NA | NA | NA | NA | NA | NA | NA | NA | NA | NA | NA | NA | NA | NA | NA | NA | NA | NA | NA | NA | NA | NA | NA | NA | NA | NA | NA | NA | NA | NA | NA | NA | NA | NA | NA | NA | NA | NA | NA | NA | NA | NA | NA | NA | NA | NA | NA | |
| International | 172.55 | NA | 180.60 | 179.96 | 178.44 | NA | 192.19 | 185.99 | 194.27 | NA | NA | NA | NA | NA | NA | NA | NA | NA | NA | NA | NA | NA | NA | NA | NA | NA | NA | NA | NA | NA | NA | NA | NA | NA | NA | NA | NA | NA | NA | NA | NA | NA | NA | NA | NA | NA | NA | NA | NA | NA | NA | NA | NA | NA | NA | NA | NA | NA | |
| Retail | 1911.27 | NA | 1891.75 | 1916.24 | 1957.80 | NA | 1924.55 | 2000.69 | 1995.90 | NA | NA | NA | NA | NA | NA | NA | NA | NA | NA | NA | NA | NA | NA | NA | NA | NA | NA | NA | NA | NA | NA | NA | NA | NA | NA | NA | NA | NA | NA | NA | NA | NA | NA | NA | NA | NA | NA | NA | NA | NA | NA | NA | NA | NA | NA | NA | NA | NA |
