
| 2023-06-30 | 2023-03-31 | 2022-12-31 | 2022-09-30 | 2022-06-30 | 2022-03-31 | 2021-12-31 | 2021-09-30 | ||
|---|---|---|---|---|---|---|---|---|---|
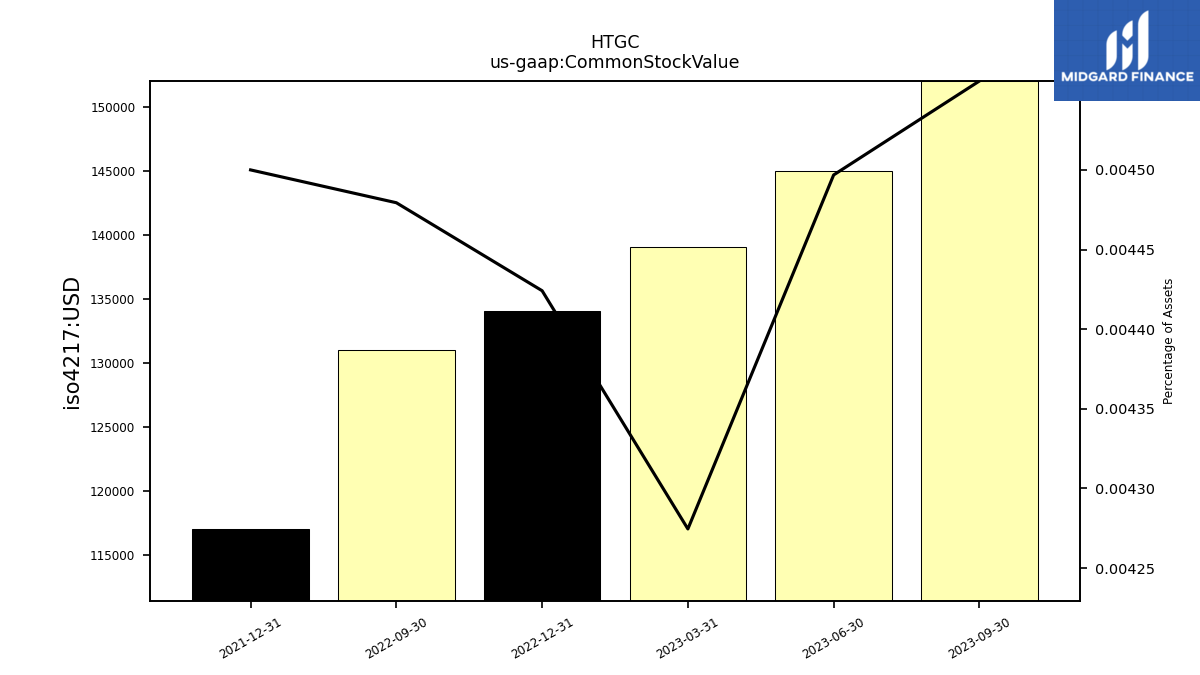
| Common Stock Value | 0.14 | 0.14 | 0.13 | 0.13 | NA | NA | 0.12 | NA | |
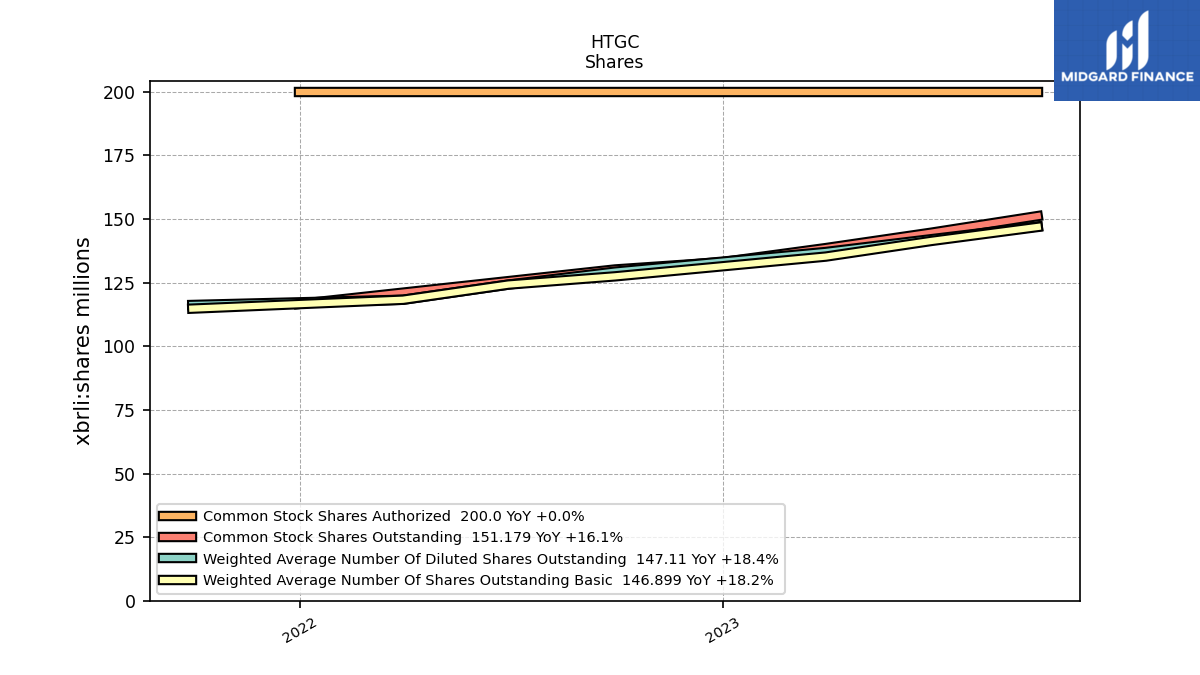
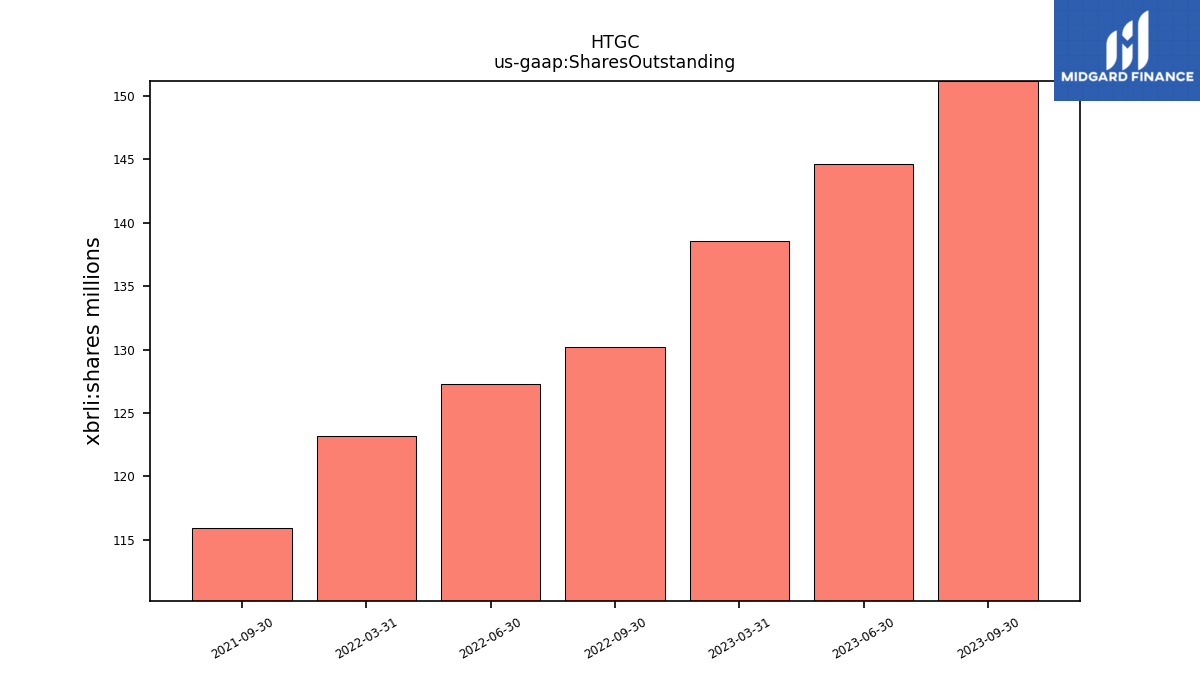
| Shares Outstanding | 144.64 | 138.60 | NA | 130.19 | 127.28 | 123.19 | NA | 115.92 | |
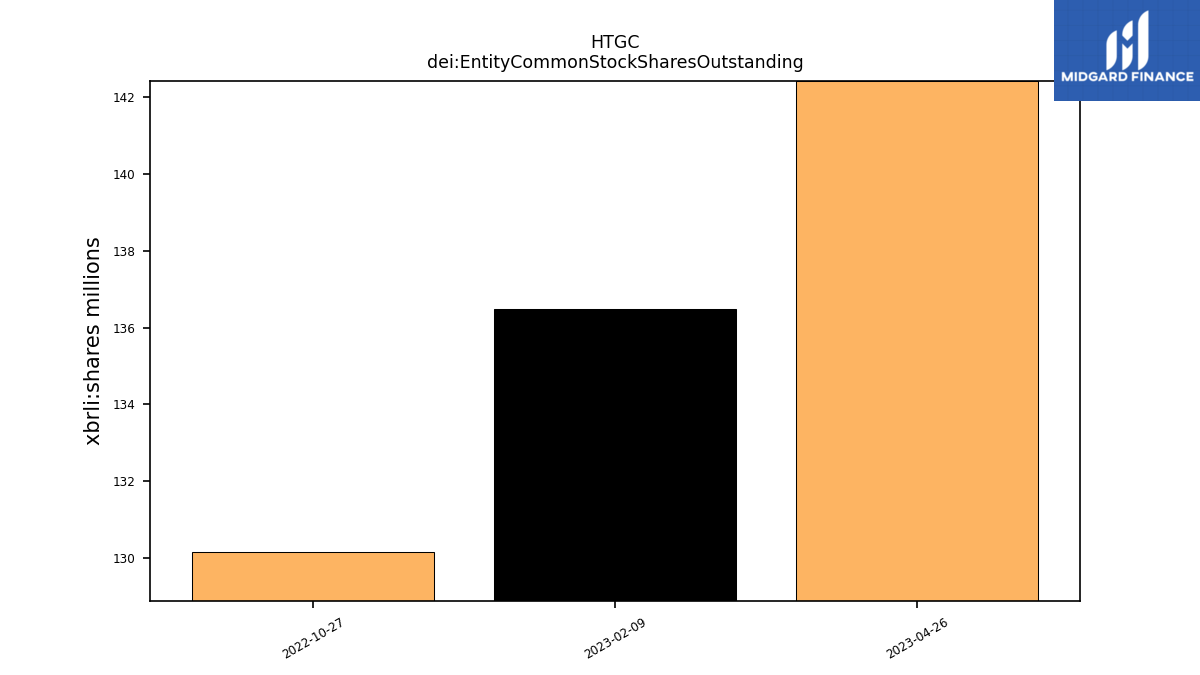
| dei: Entity Common Stock Shares Outstanding | NA | NA | NA | NA | NA | NA | NA | NA | |
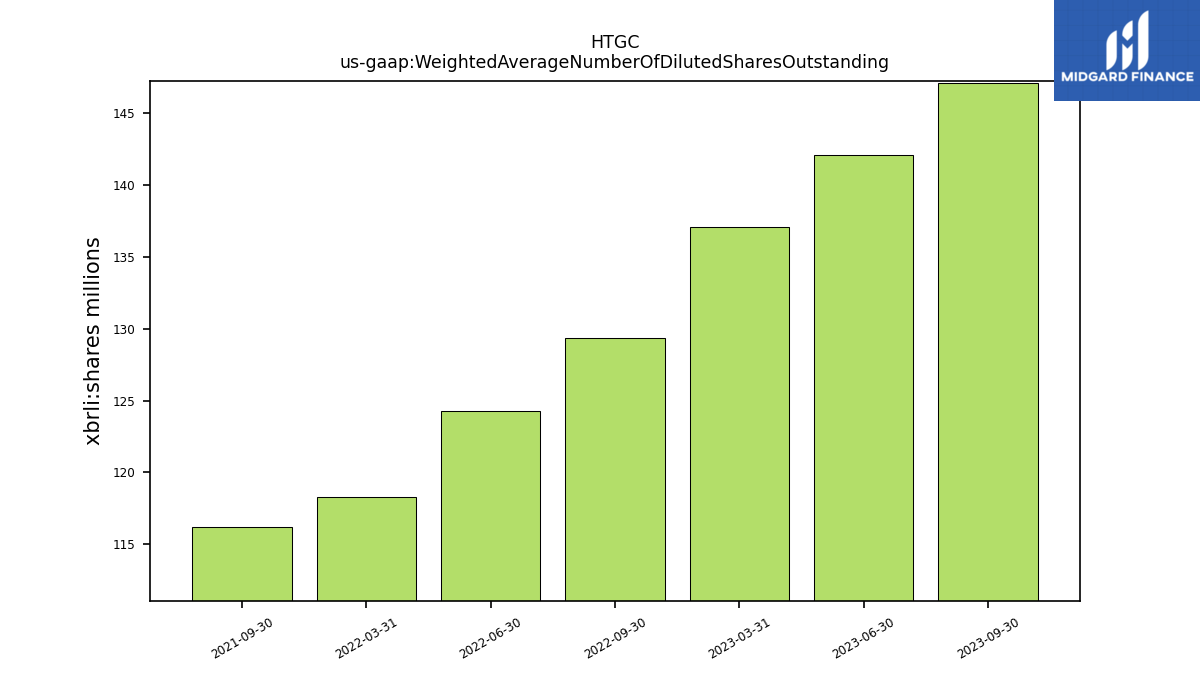
| Weighted Average Number Of Diluted Shares Outstanding | 142.08 | 137.06 | NA | 129.33 | 124.25 | 118.30 | NA | 116.24 | |
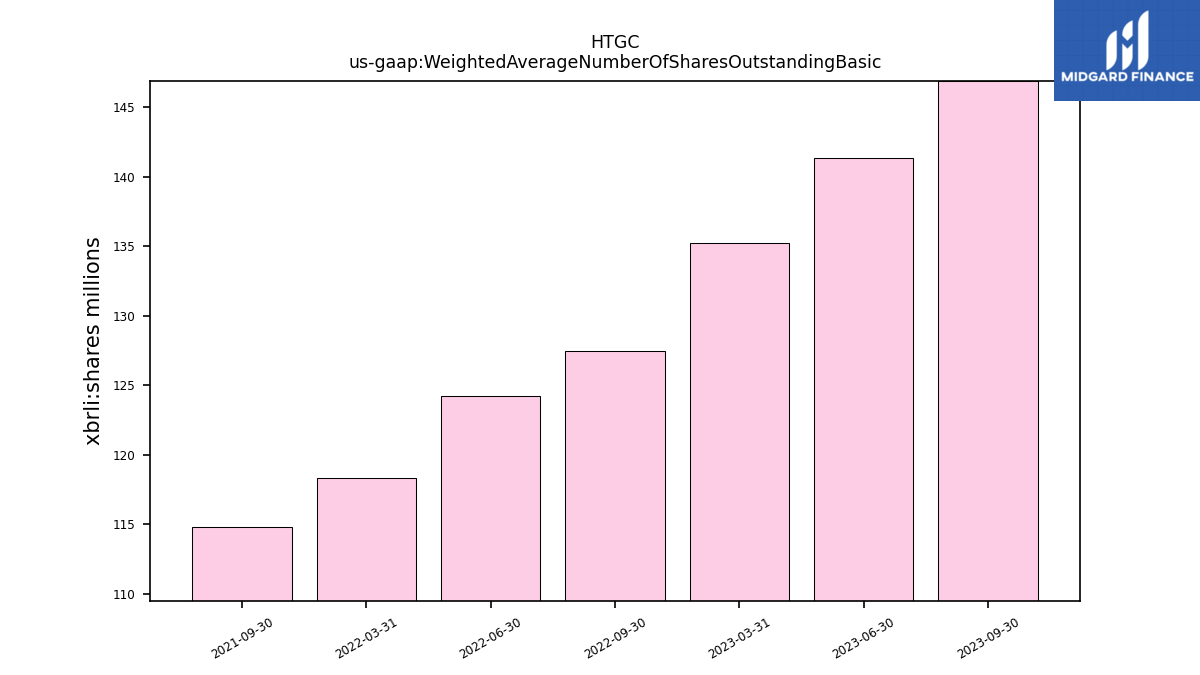
| Weighted Average Number Of Shares Outstanding Basic | 141.39 | 135.25 | NA | 127.48 | 124.25 | 118.30 | NA | 114.81 | |
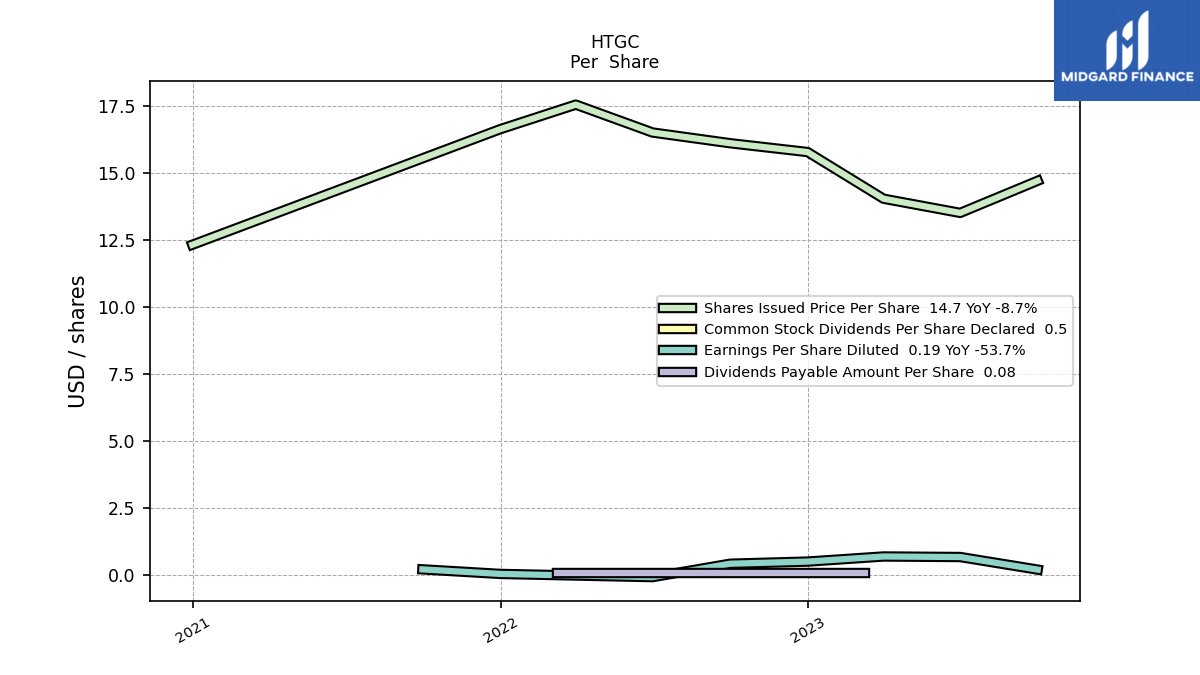
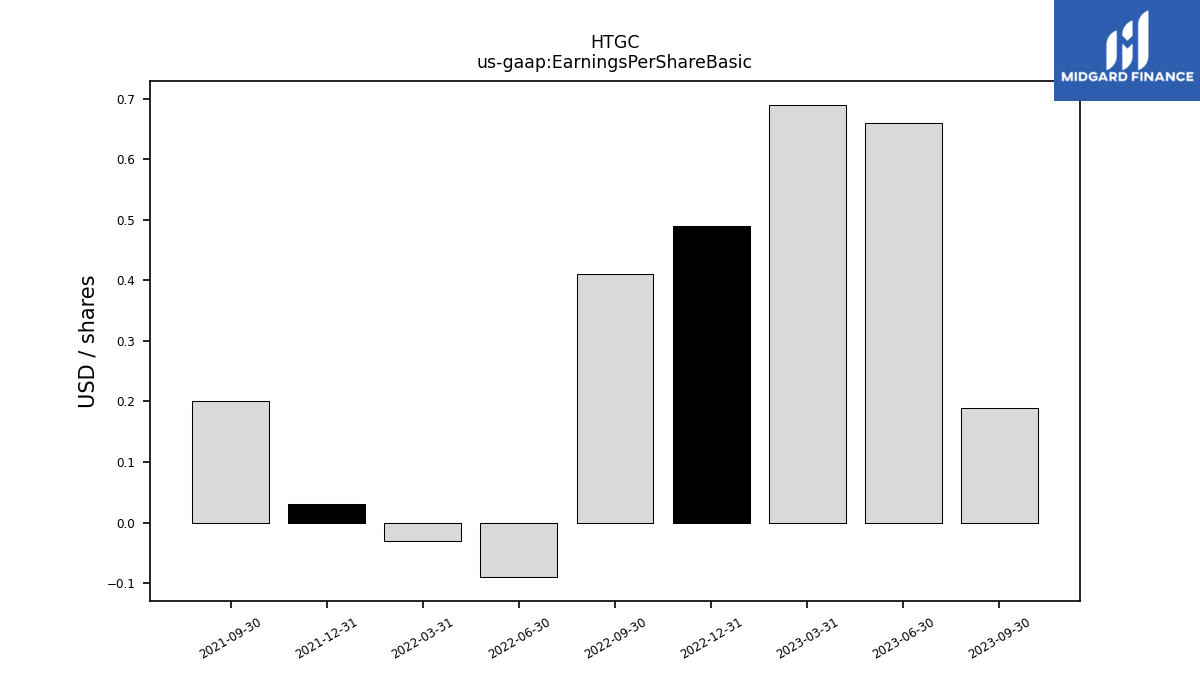
| Earnings Per Share Basic | 0.66 | 0.69 | 0.49 | 0.41 | -0.09 | -0.03 | 0.03 | 0.20 | |
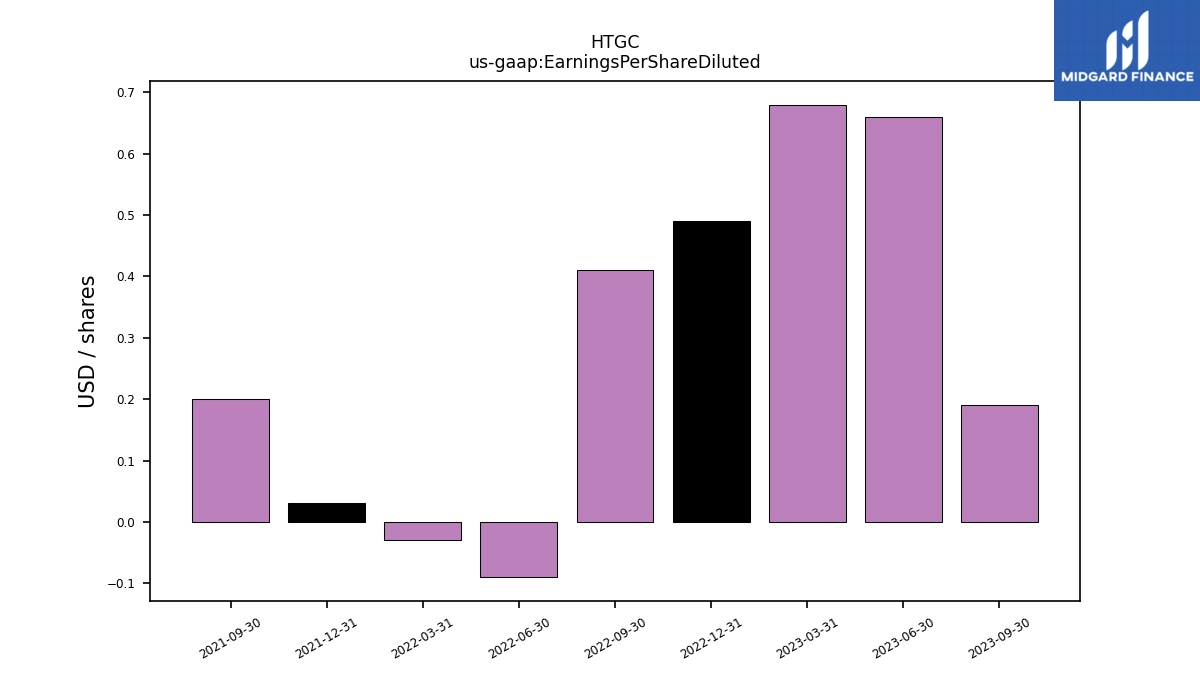
| Earnings Per Share Diluted | 0.66 | 0.68 | 0.49 | 0.41 | -0.09 | -0.03 | 0.03 | 0.20 |
| 2023-06-30 | 2023-03-31 | 2022-12-31 | 2022-09-30 | 2022-06-30 | 2022-03-31 | 2021-12-31 | 2021-09-30 | ||
|---|---|---|---|---|---|---|---|---|---|
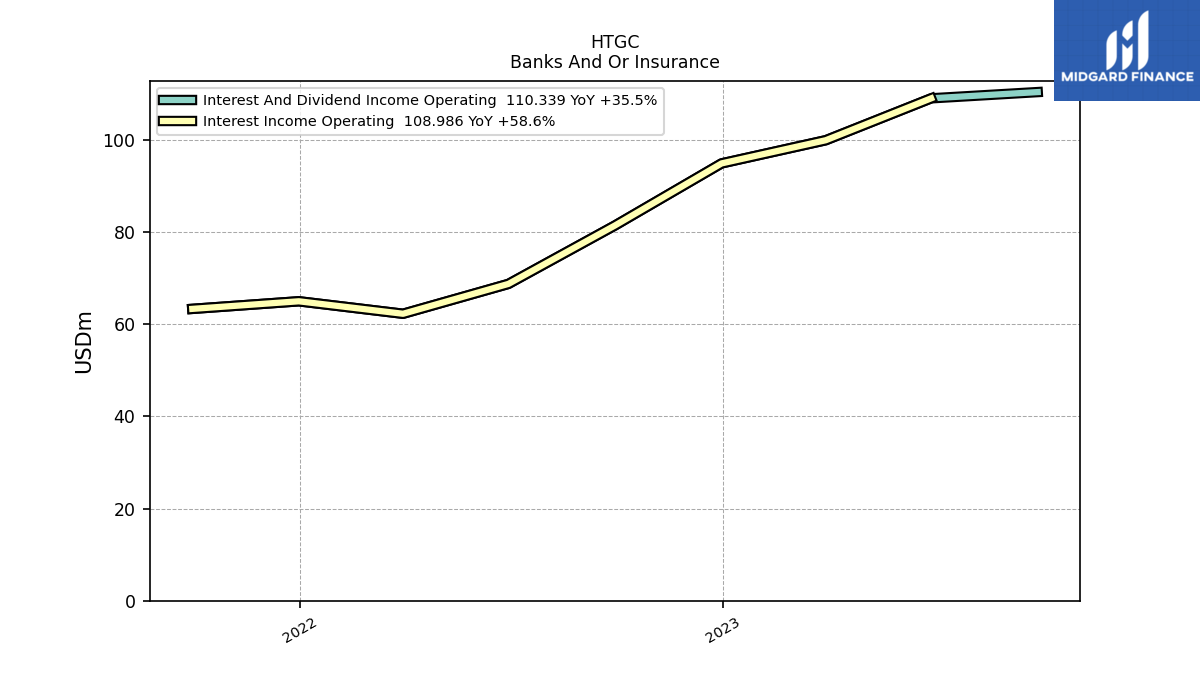
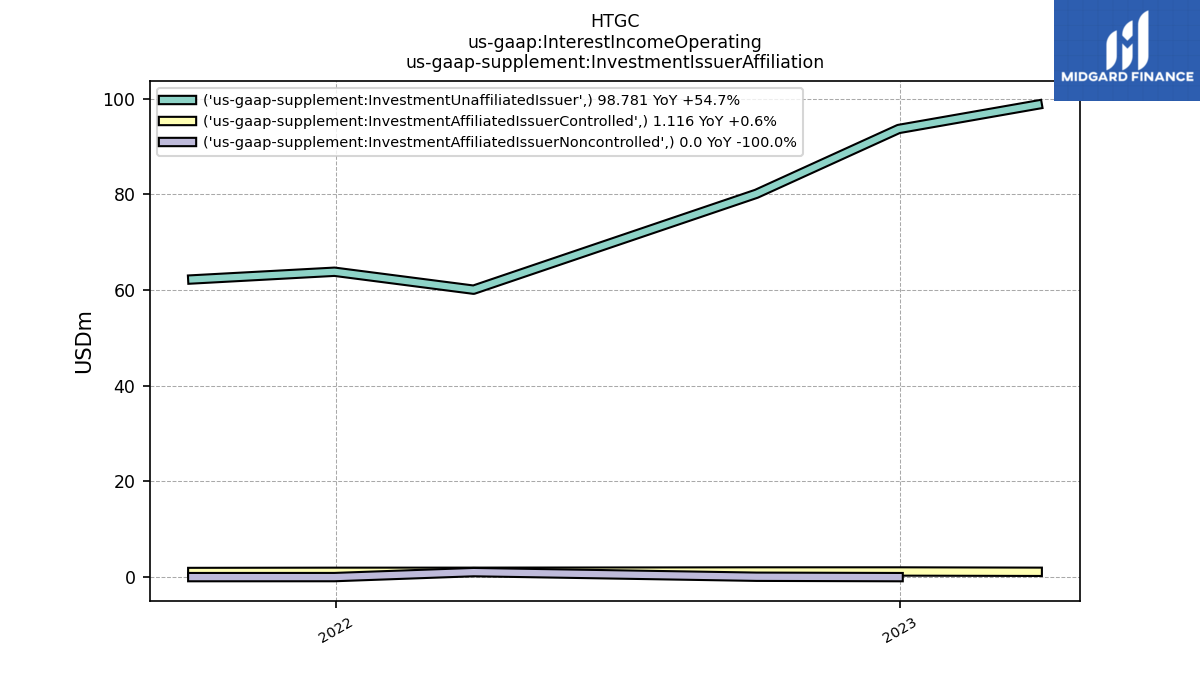
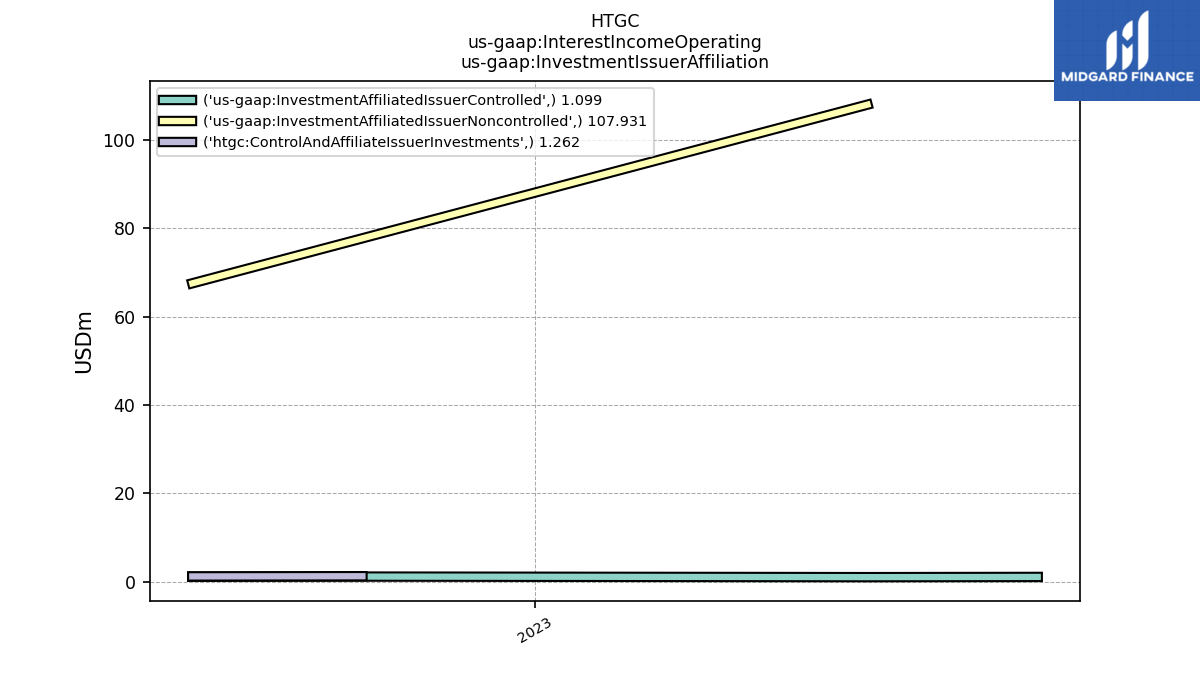
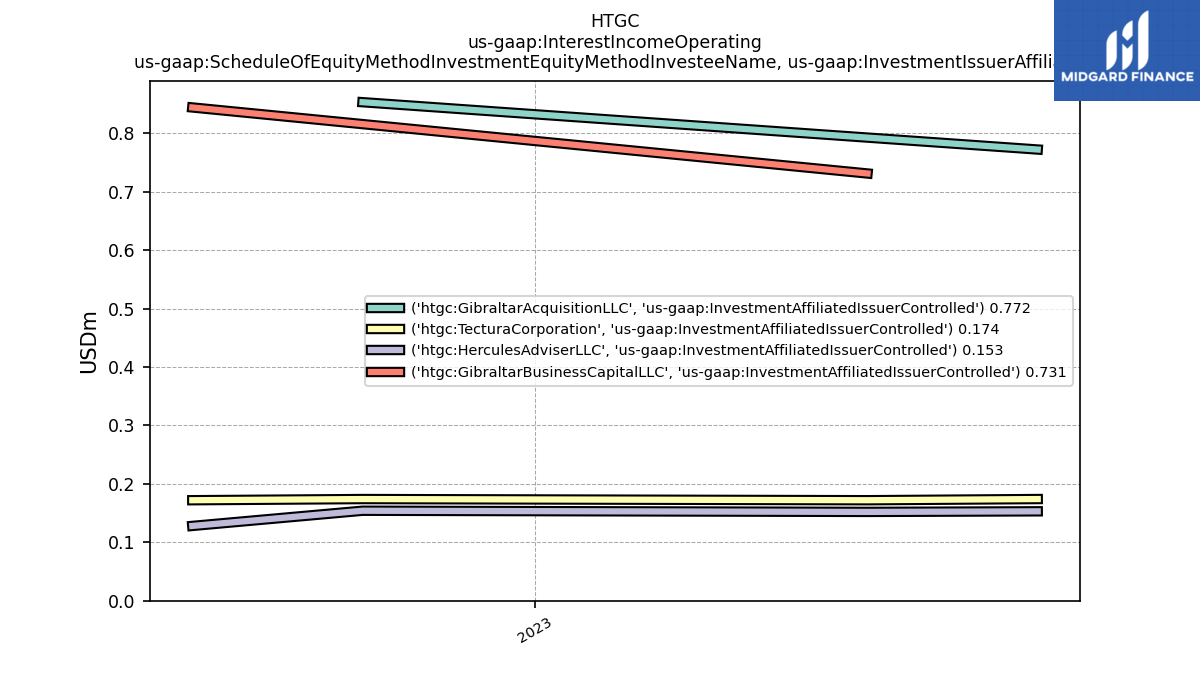
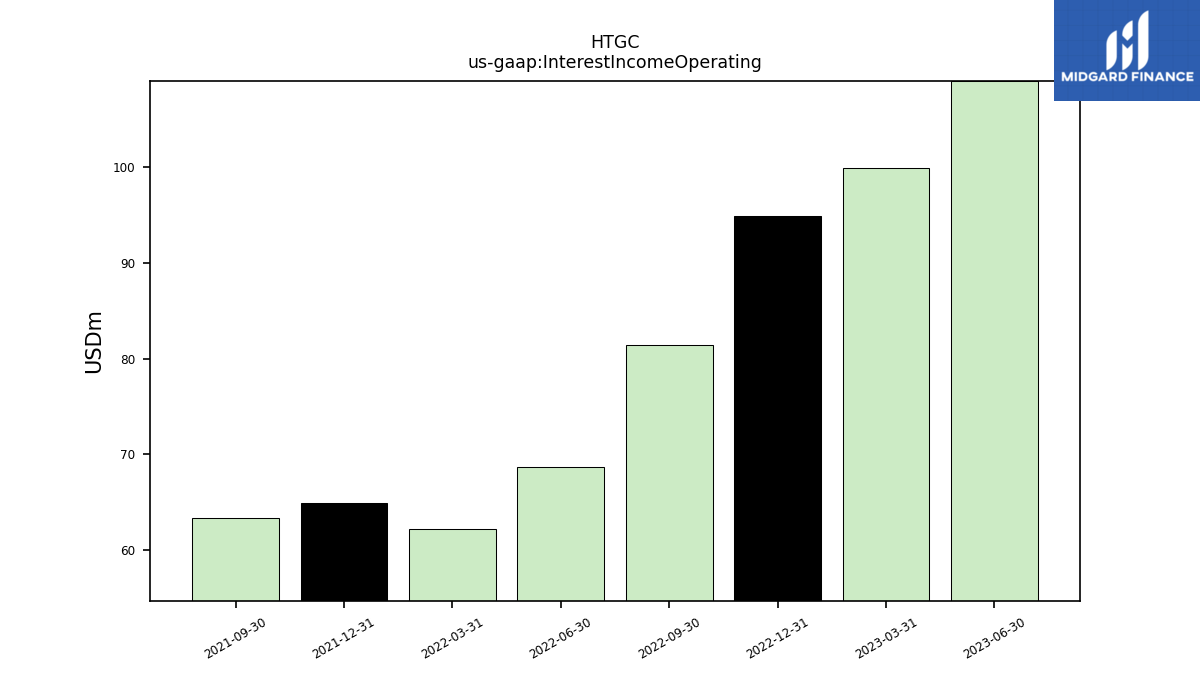
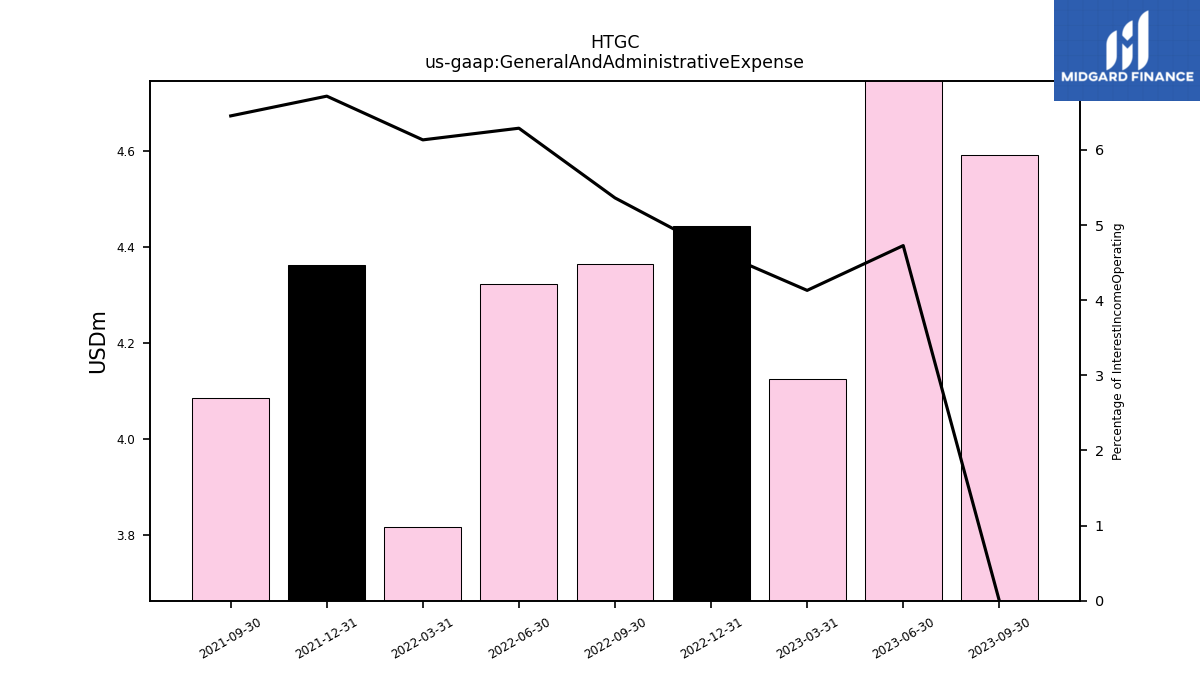
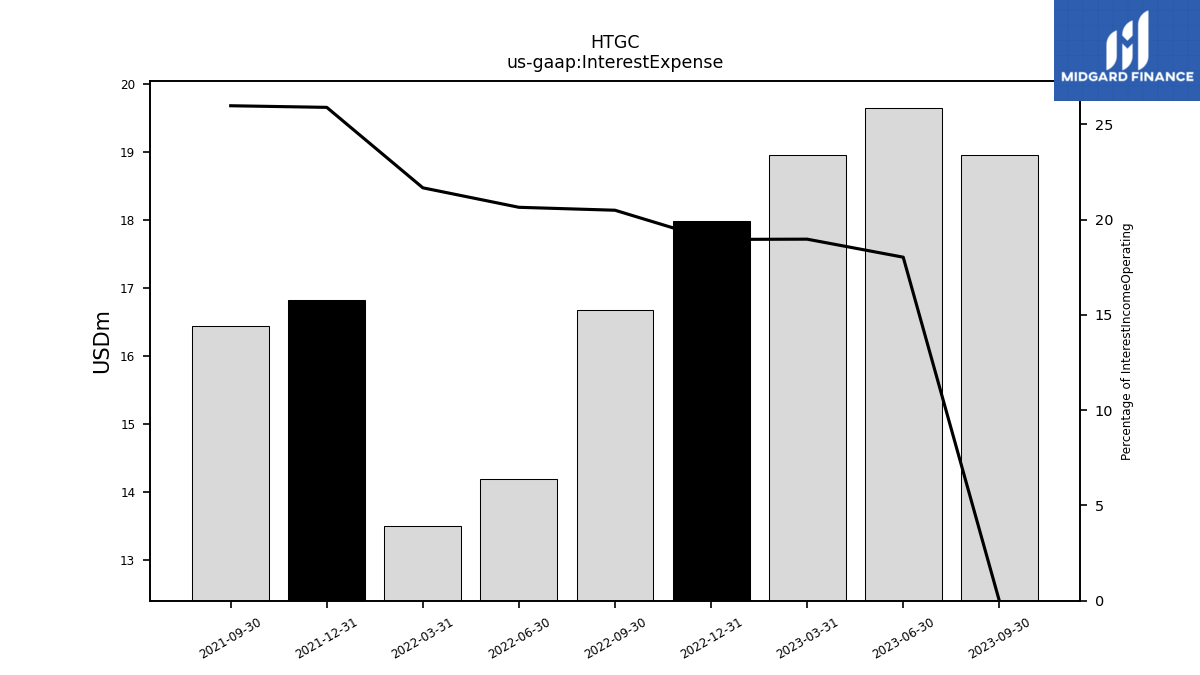
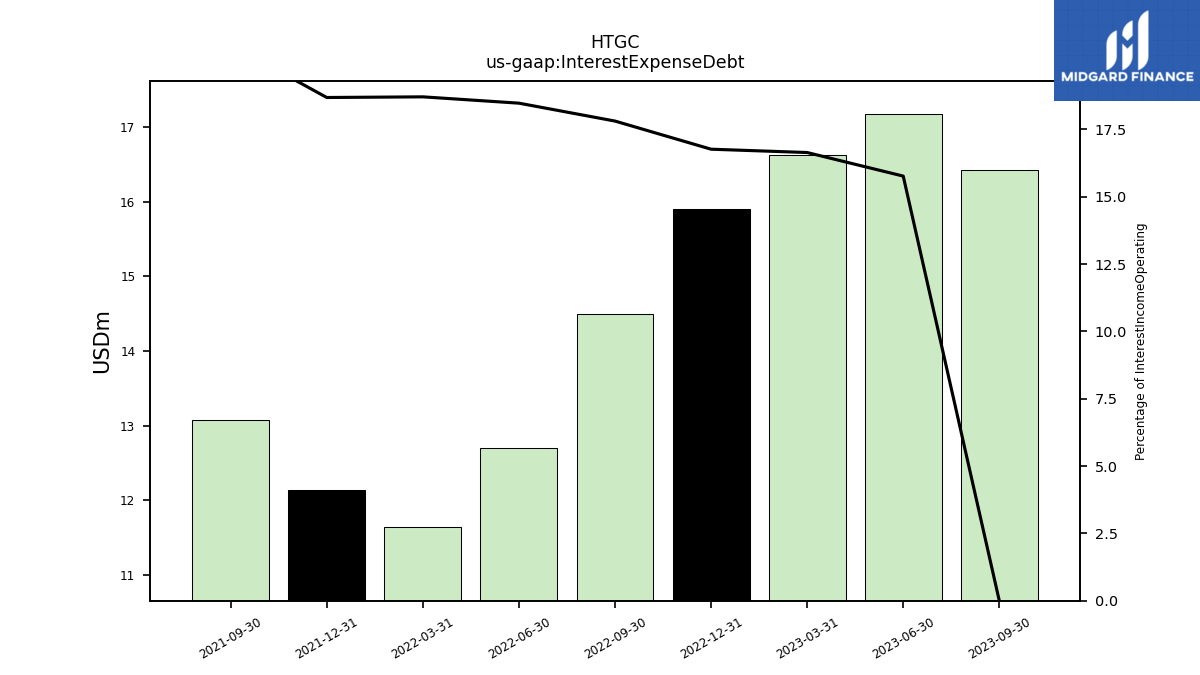
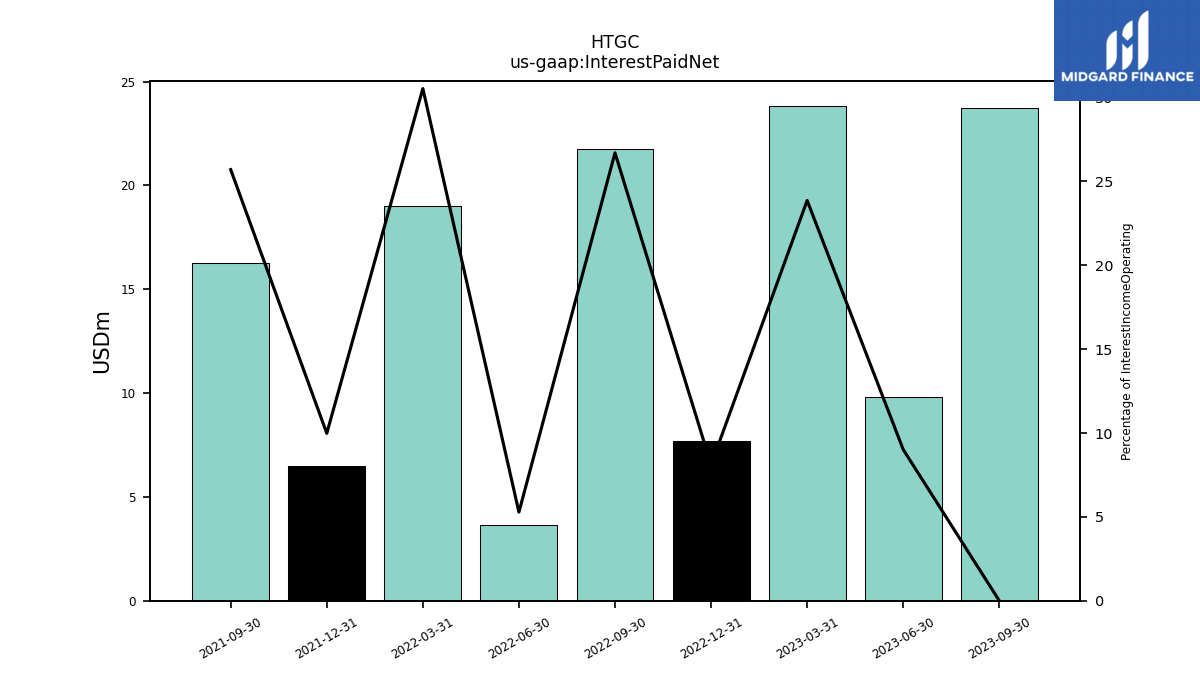
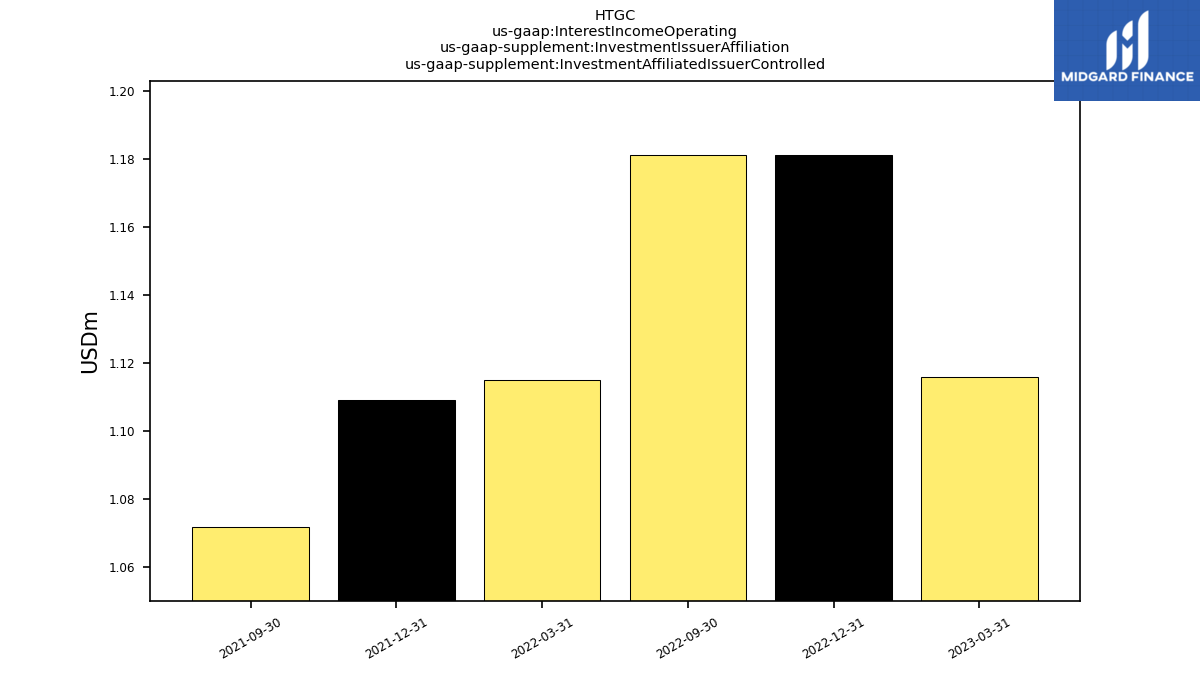
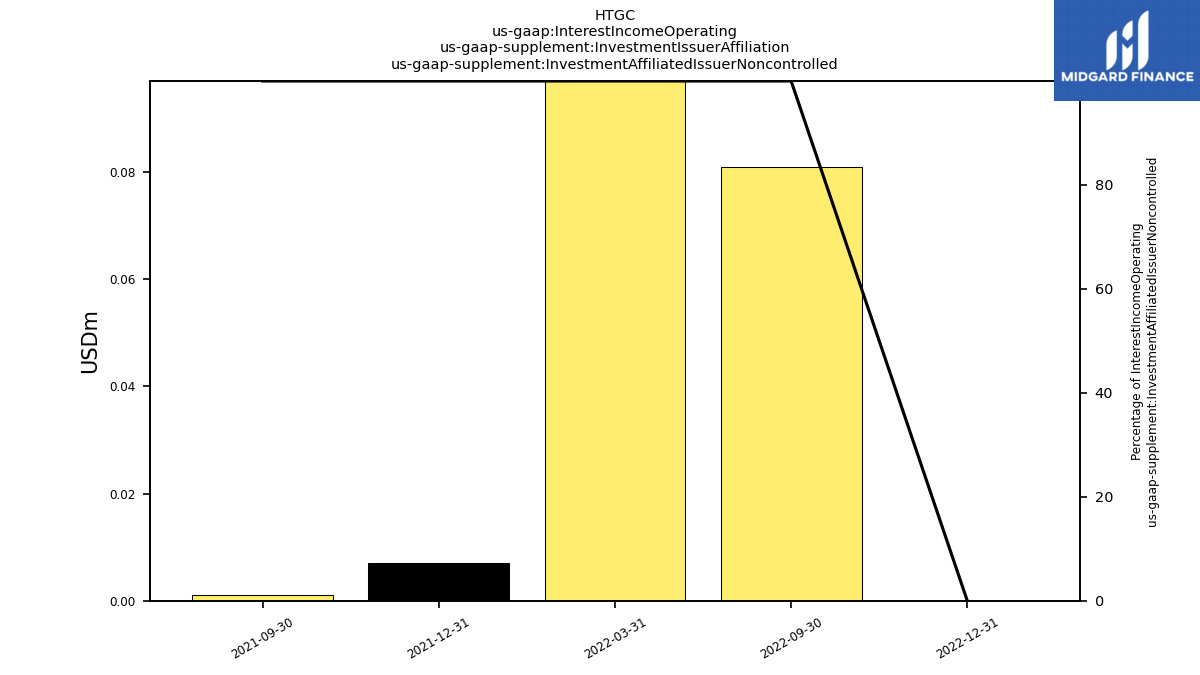
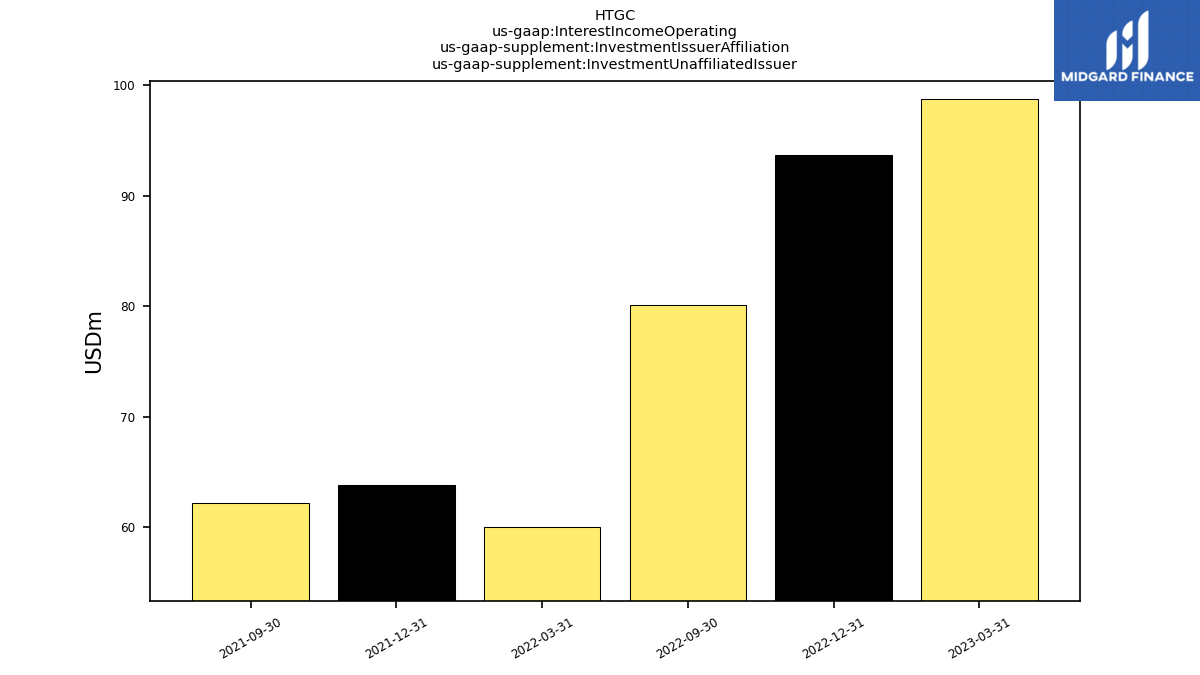
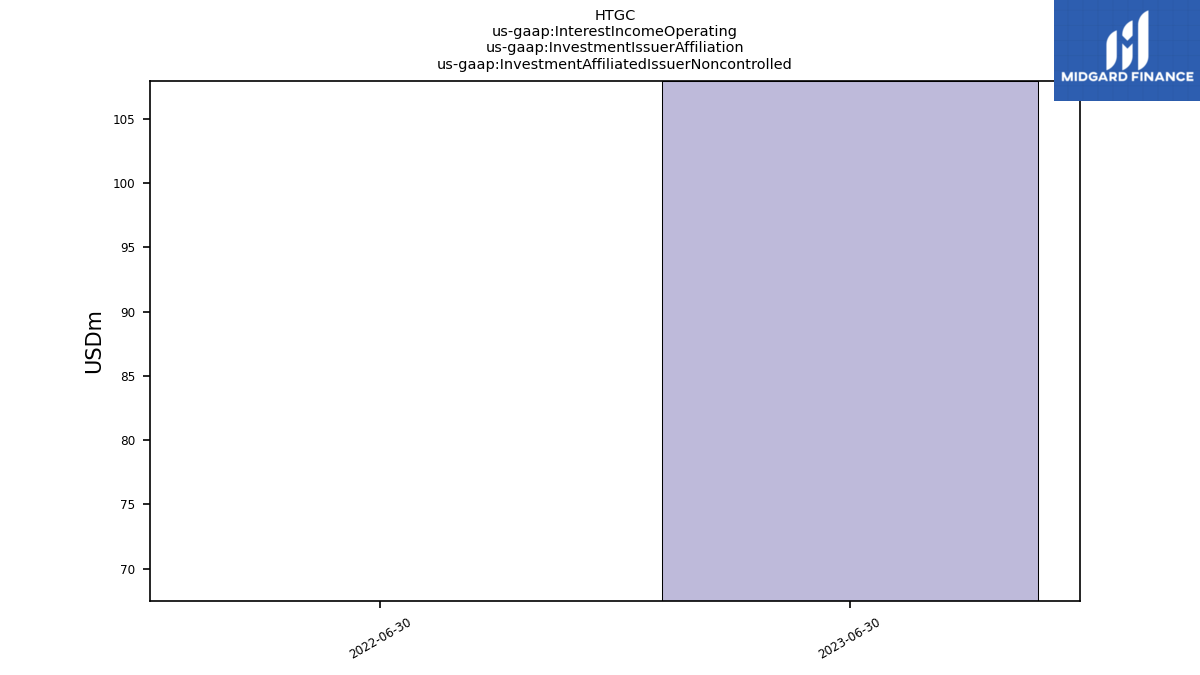
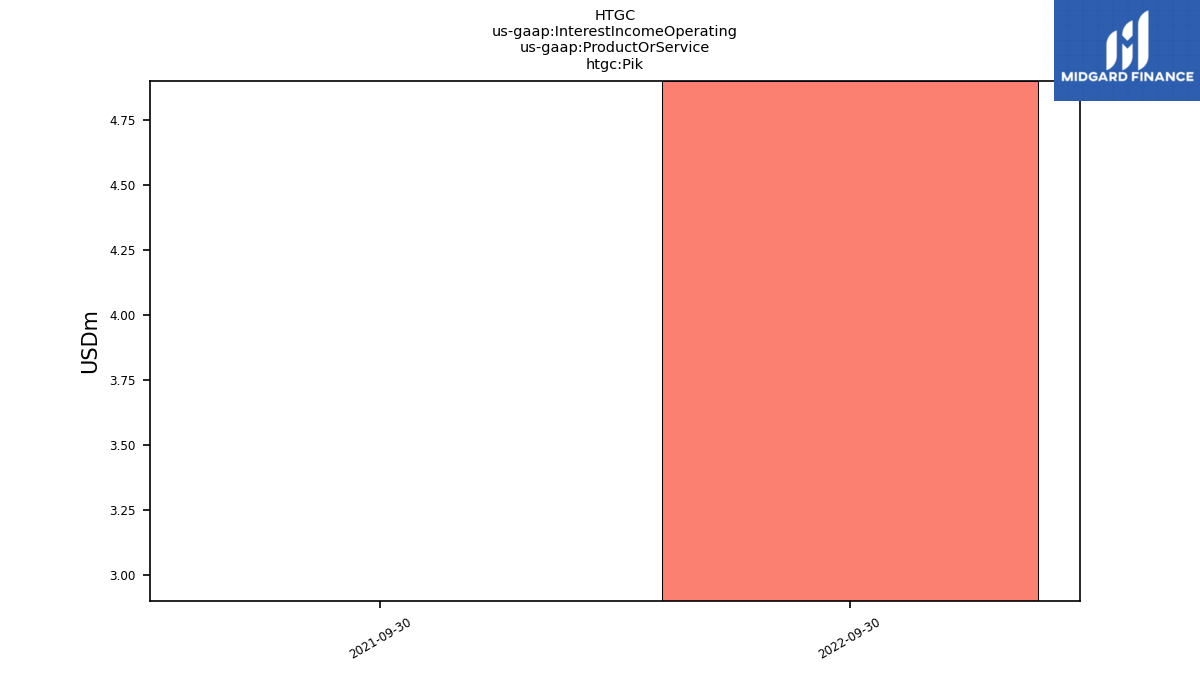
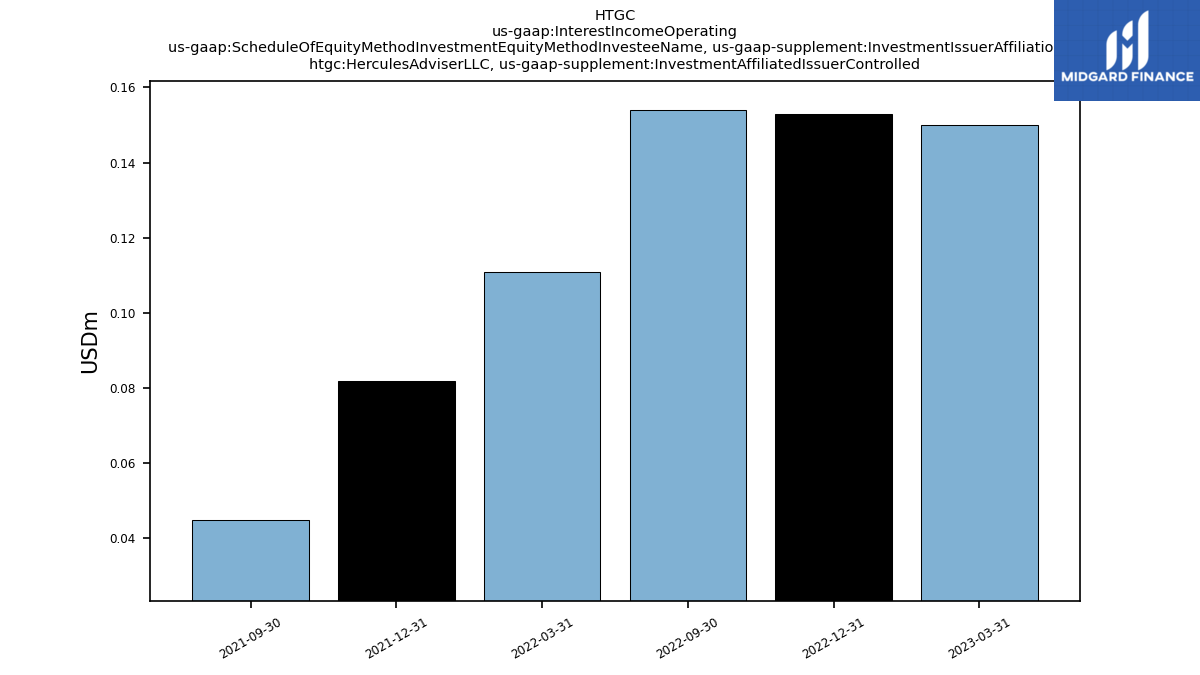
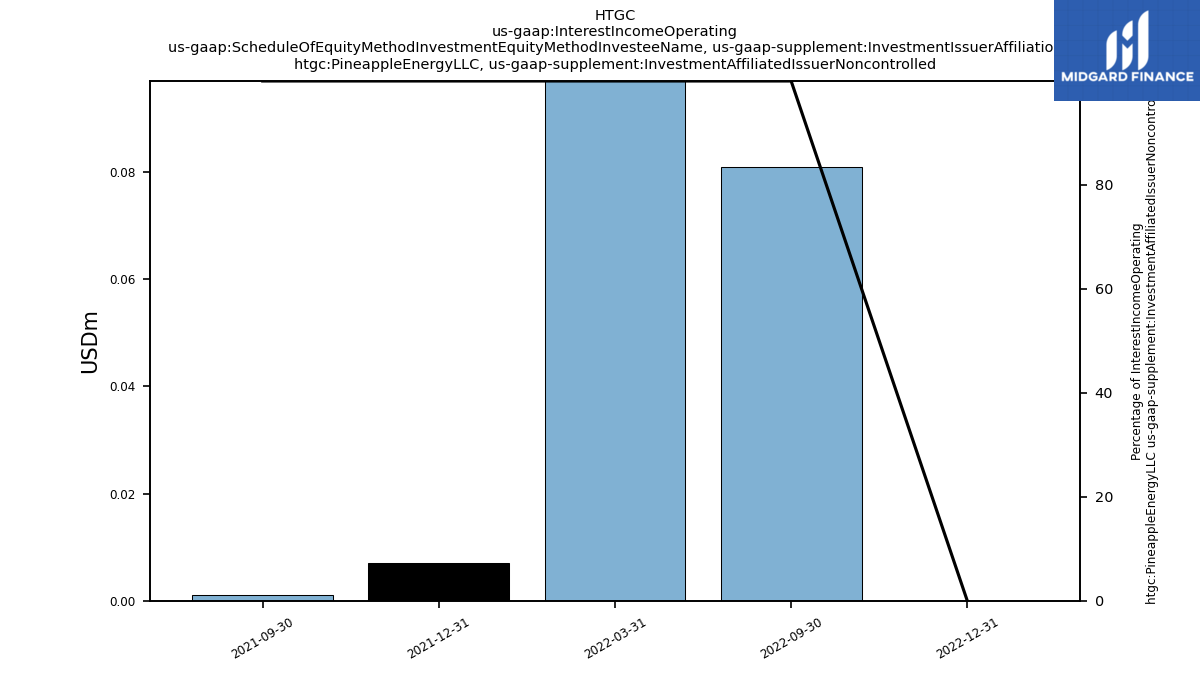
| Interest Income Operating | 108.99 | 99.90 | 94.87 | 81.41 | 68.73 | 62.25 | 64.96 | 63.31 | |
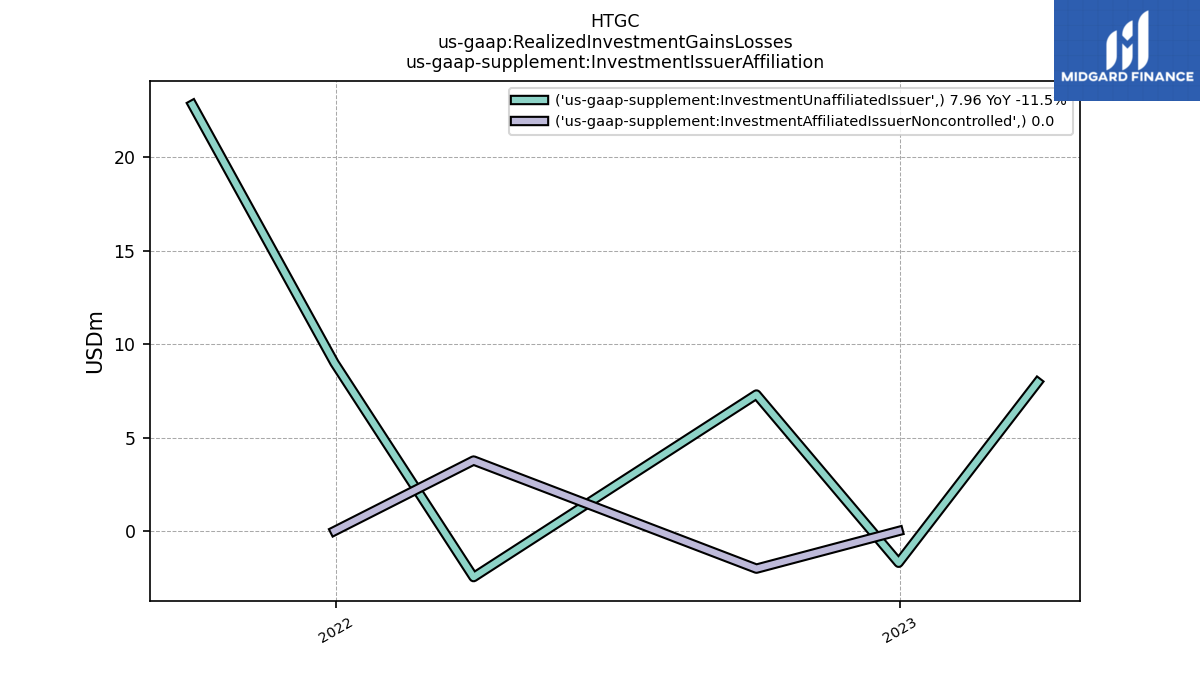
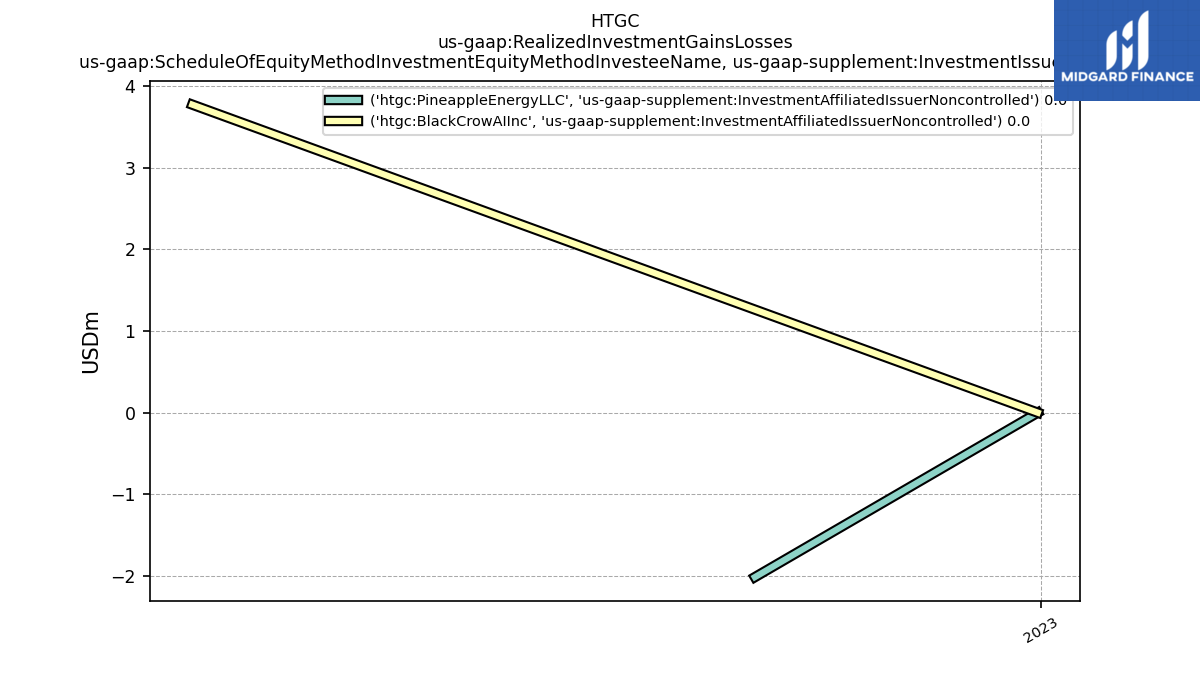
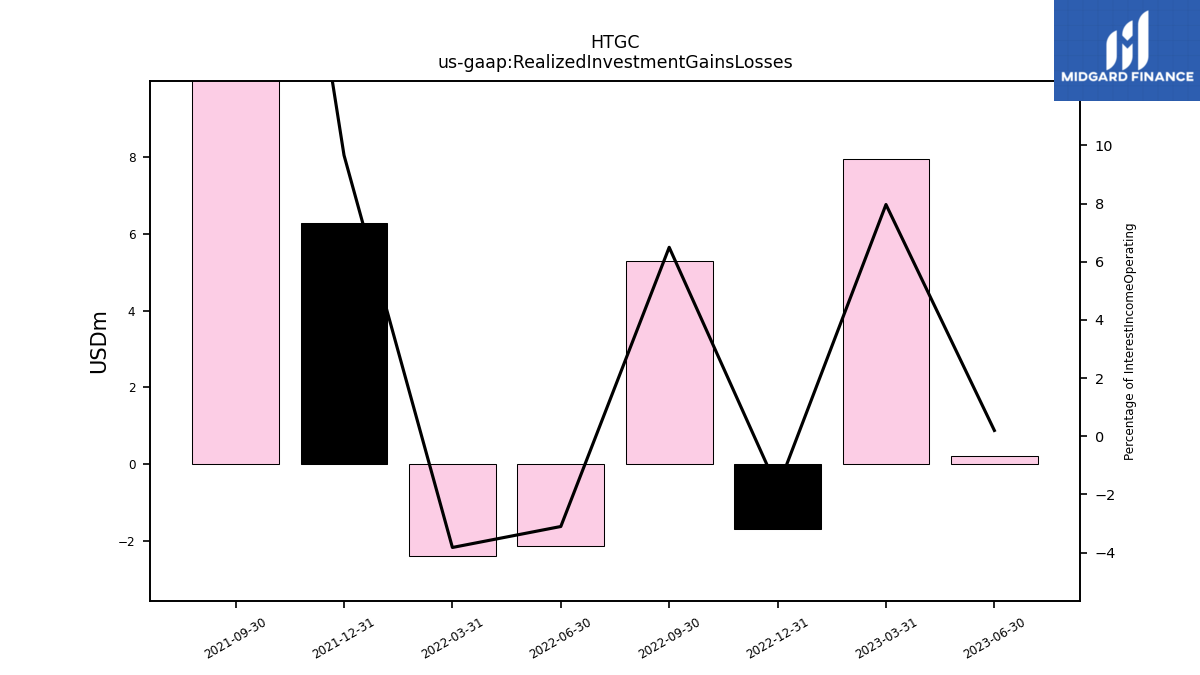
| Realized Investment Gains Losses | 0.22 | 7.96 | -1.70 | 5.29 | -2.13 | -2.38 | 6.28 | 21.11 | |
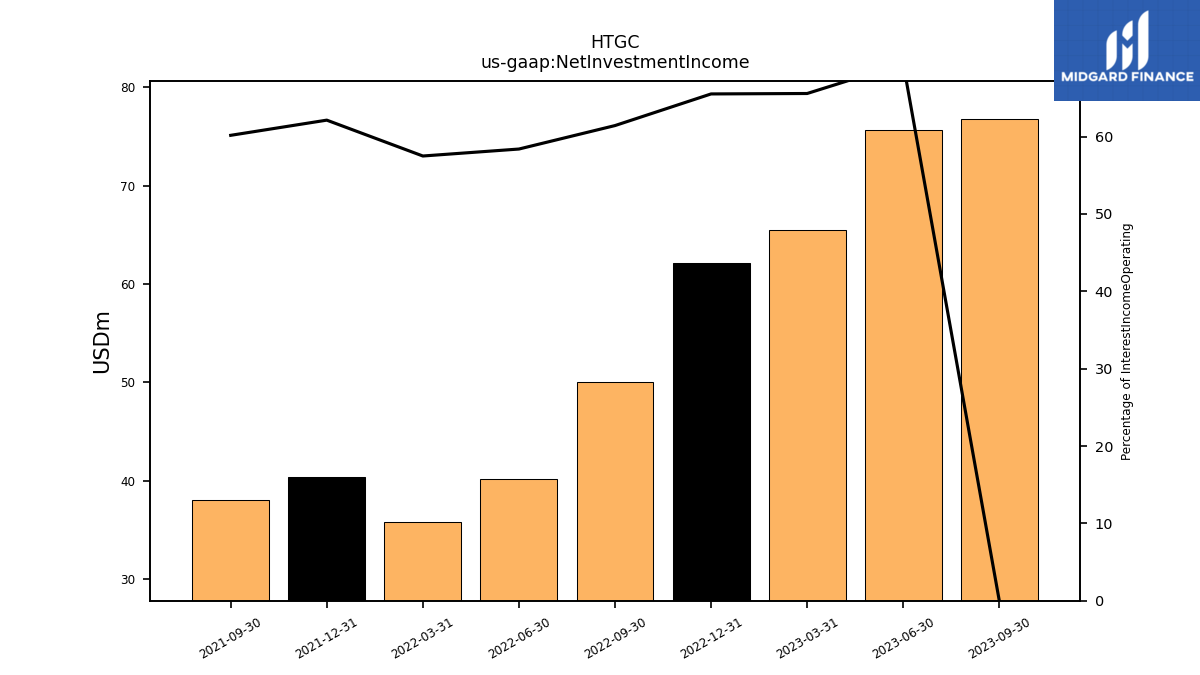
| Net Investment Income | 75.70 | 65.50 | 62.15 | 50.00 | 40.13 | 35.79 | 40.35 | 38.09 | |
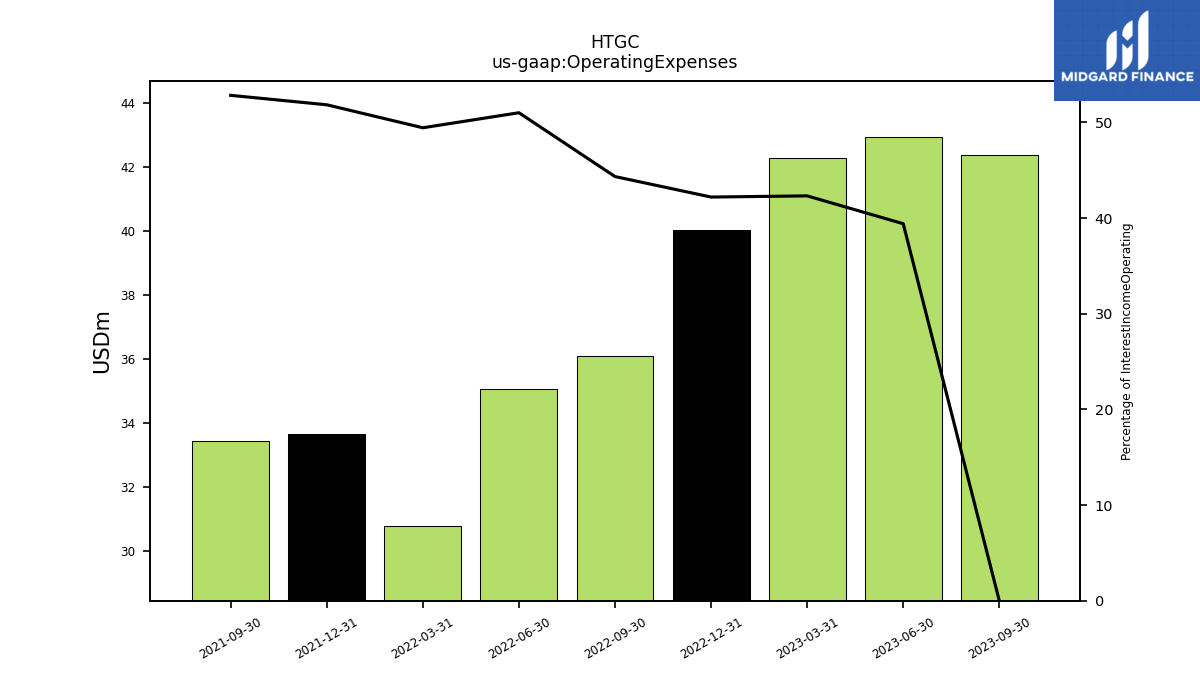
| Operating Expenses | 42.95 | 42.27 | 40.02 | 36.09 | 35.05 | 30.77 | 33.67 | 33.44 | |
| General And Administrative Expense | 5.15 | 4.13 | 4.44 | 4.36 | 4.32 | 3.82 | 4.36 | 4.08 | |
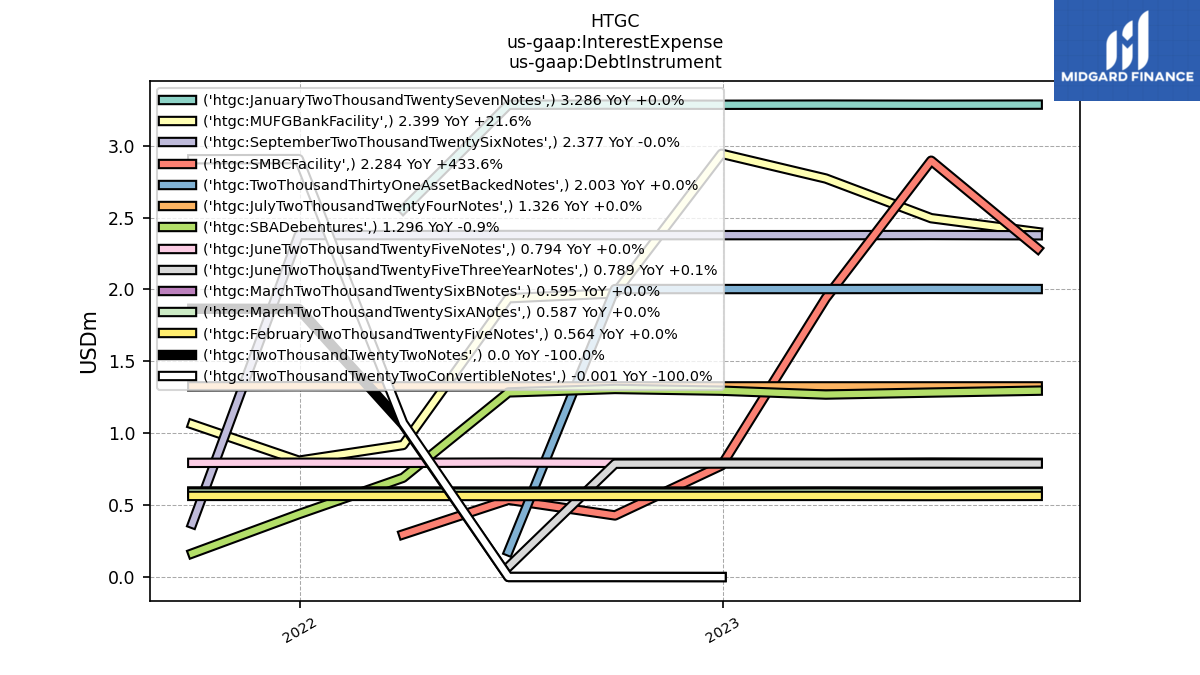
| Interest Expense | 19.65 | 18.95 | 17.99 | 16.68 | 14.19 | 13.49 | 16.82 | 16.45 | |
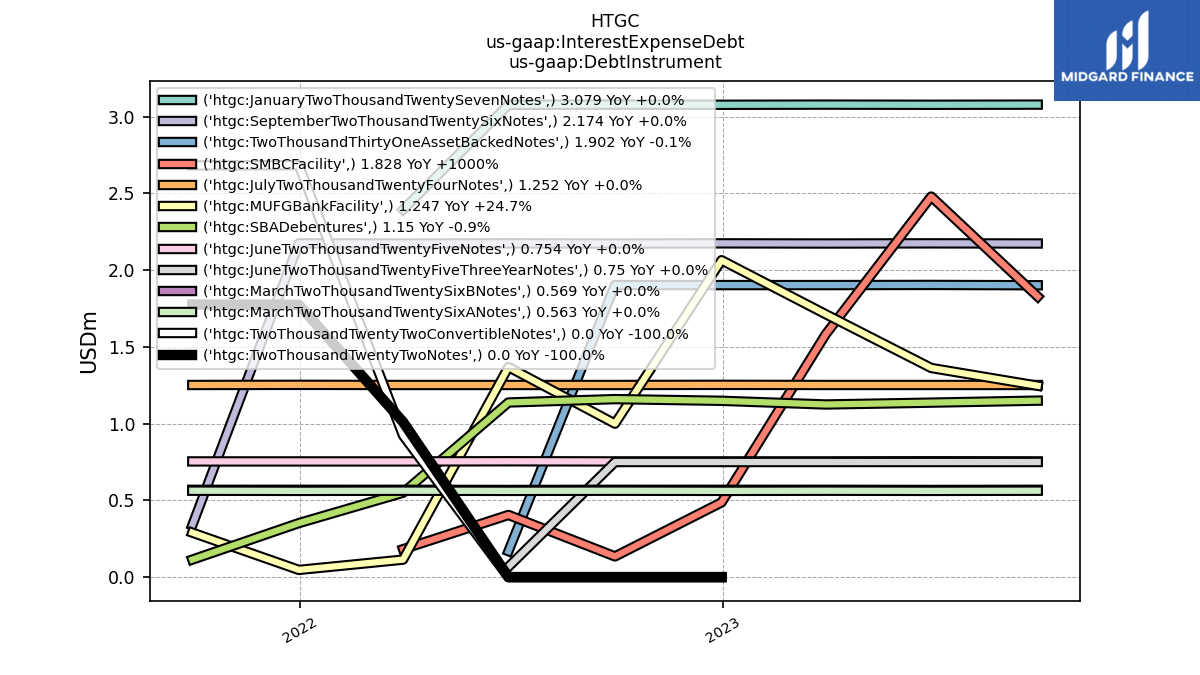
| Interest Expense Debt | 17.18 | 16.62 | 15.90 | 14.50 | 12.70 | 11.65 | 12.14 | 13.07 | |
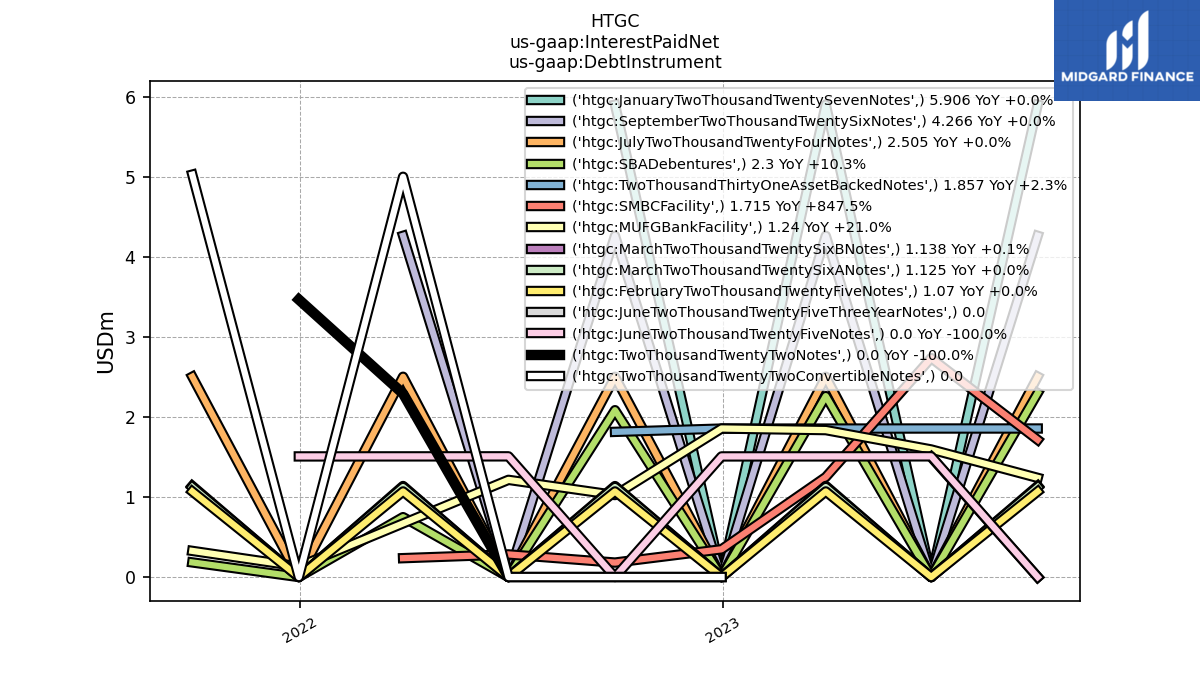
| Interest Paid Net | 9.82 | 23.84 | 7.69 | 21.74 | 3.63 | 19.01 | 6.48 | 16.27 | |
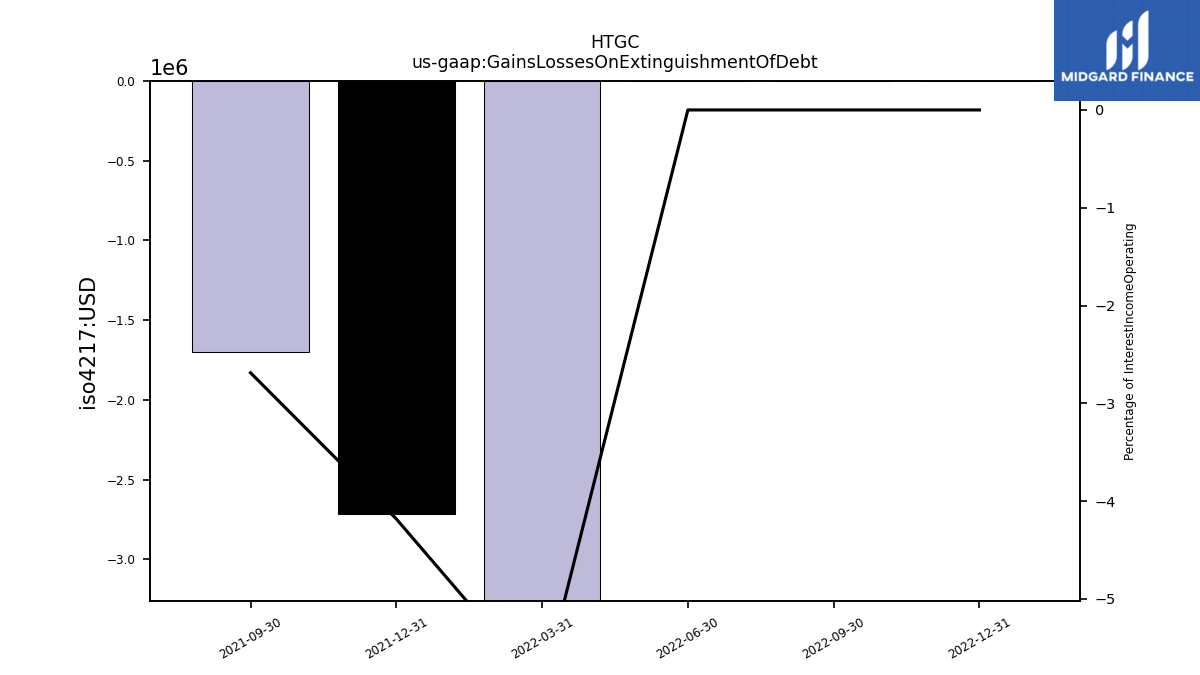
| Gains Losses On Extinguishment Of Debt | NA | NA | 0.00 | 0.00 | 0.00 | -3.69 | -2.72 | -1.70 | |
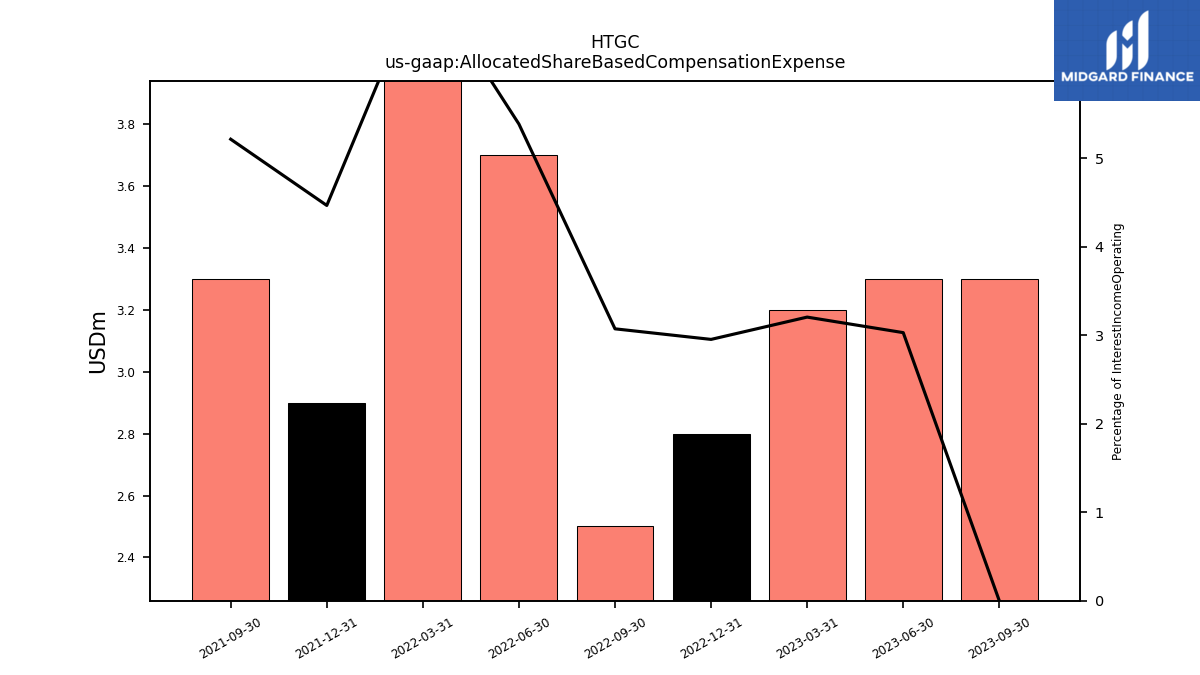
| Allocated Share Based Compensation Expense | 3.30 | 3.20 | 2.80 | 2.50 | 3.70 | 4.40 | 2.90 | 3.30 | |
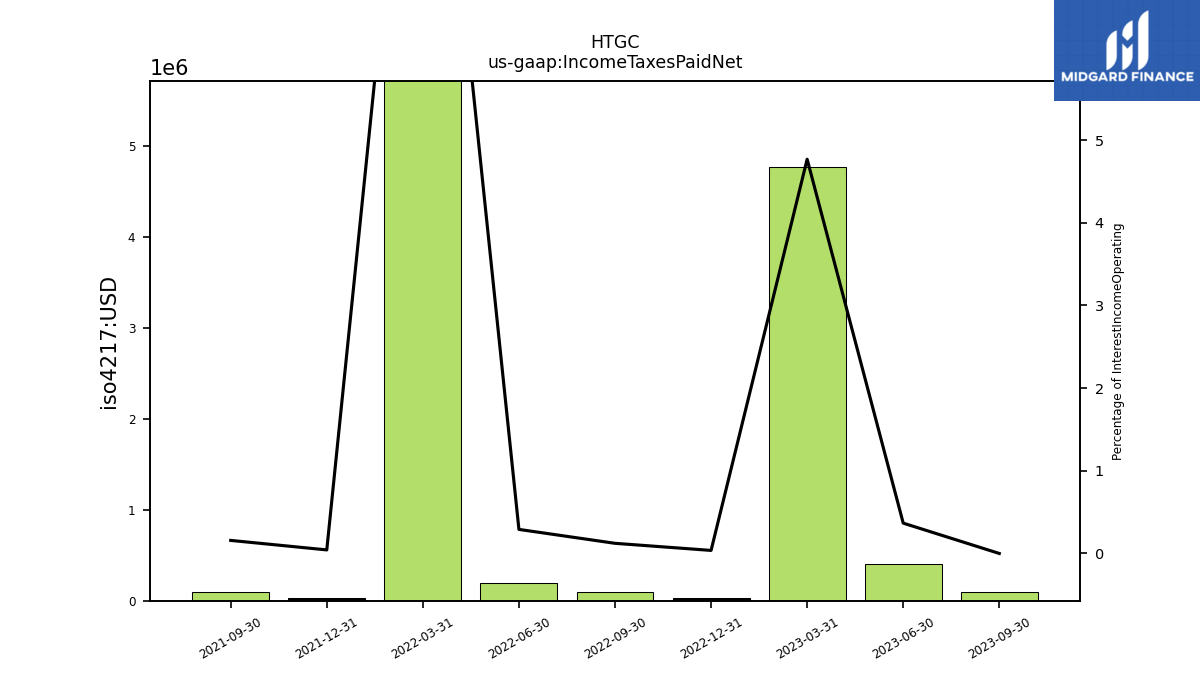
| Income Taxes Paid Net | 0.40 | 4.76 | 0.04 | 0.10 | 0.20 | 7.12 | 0.03 | 0.10 | |
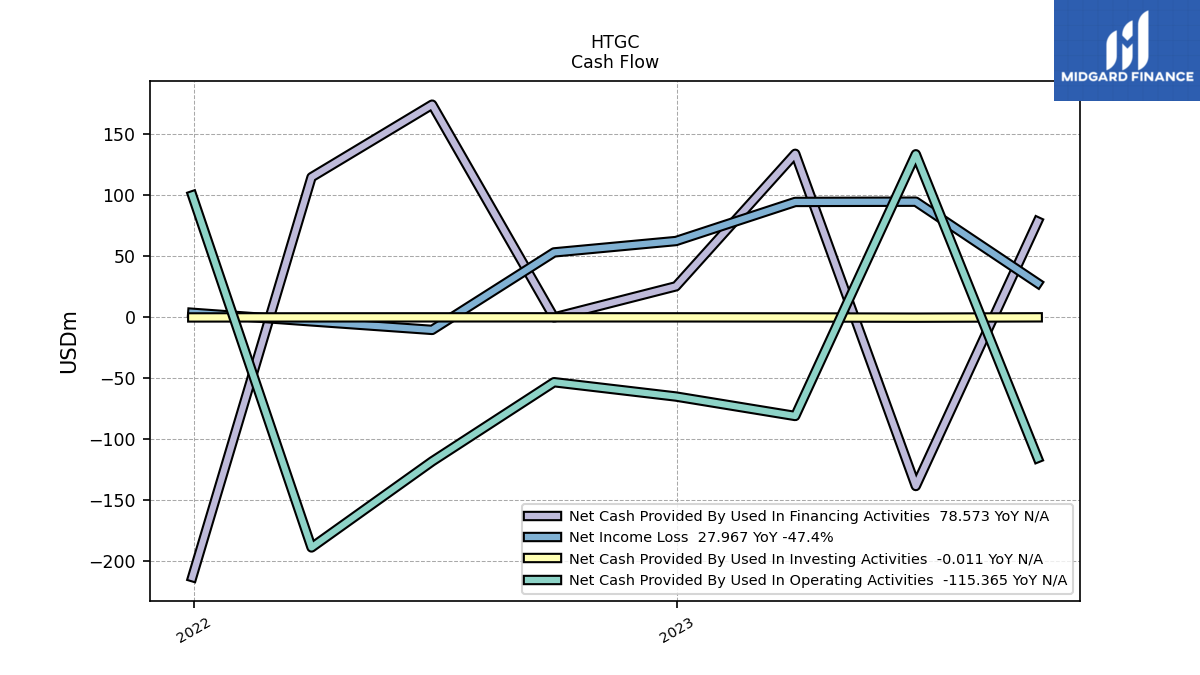
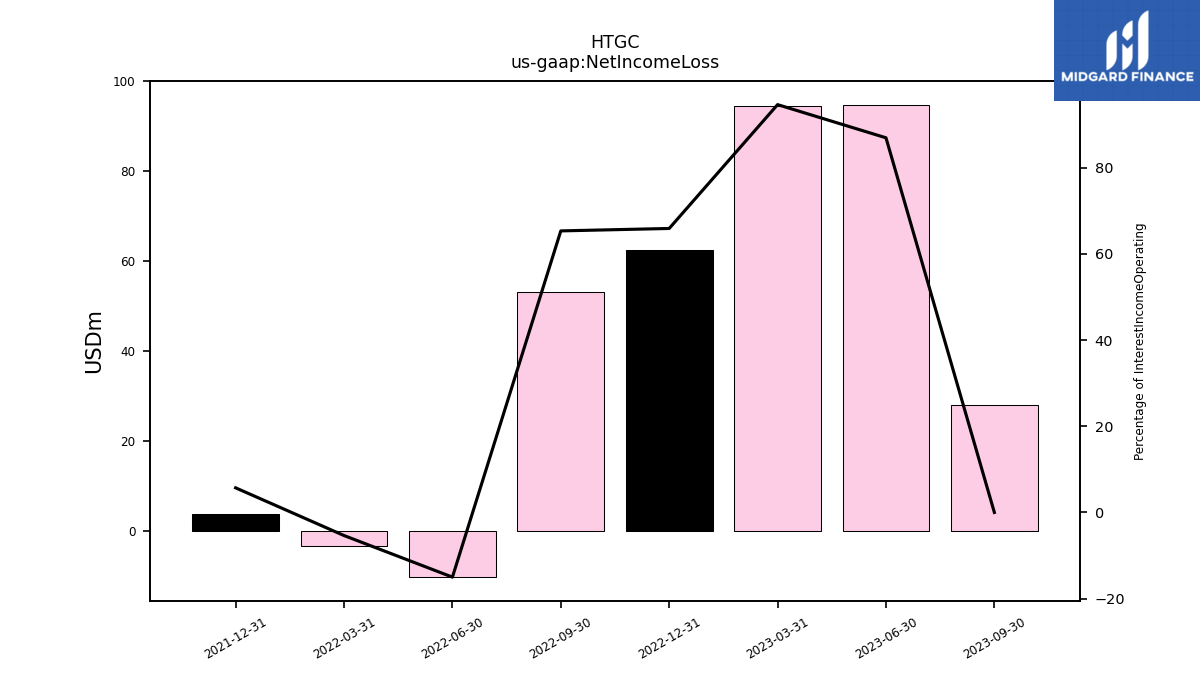
| Net Income Loss | 94.78 | 94.56 | 62.53 | 53.20 | -10.32 | -3.34 | 3.71 | NA | |
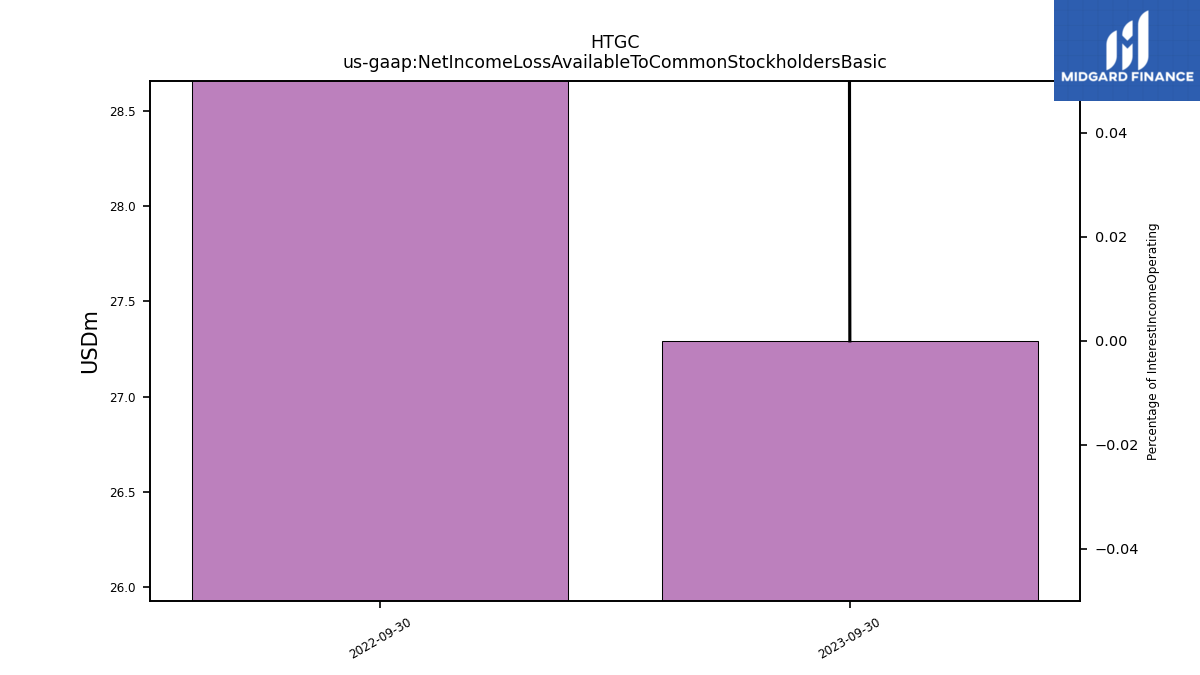
| Net Income Loss Available To Common Stockholders Basic | NA | NA | NA | 52.67 | NA | NA | NA | NA | |
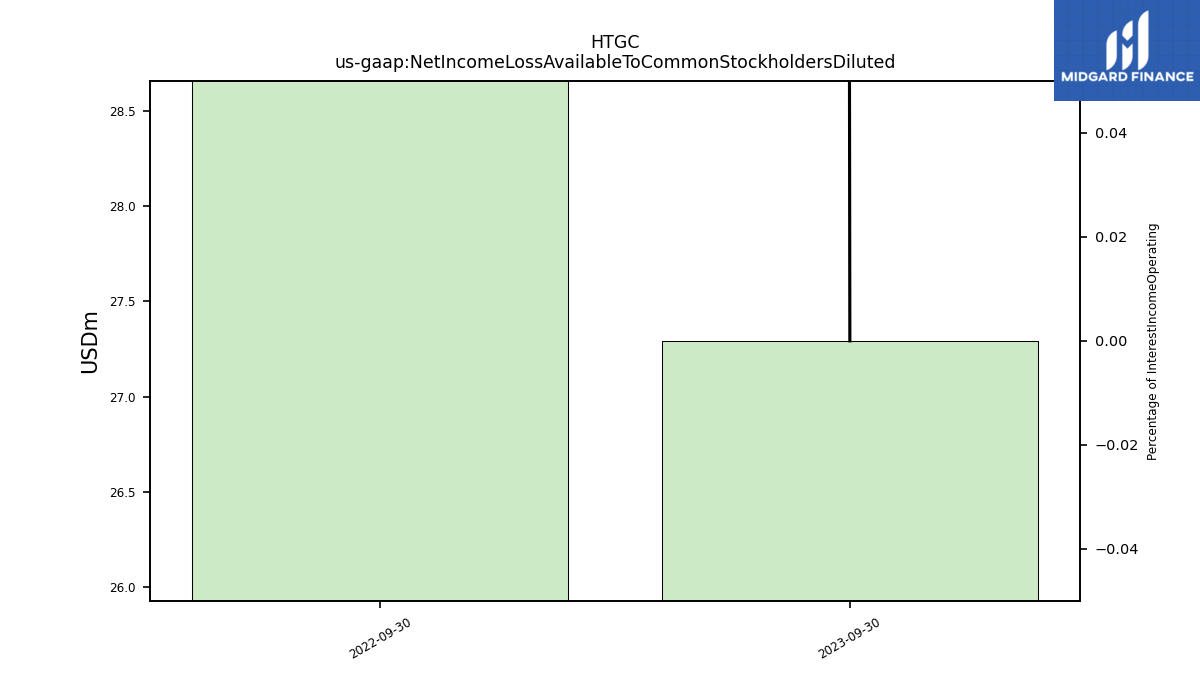
| Net Income Loss Available To Common Stockholders Diluted | NA | NA | NA | 52.67 | NA | NA | NA | NA |
| 2023-06-30 | 2023-03-31 | 2022-12-31 | 2022-09-30 | 2022-06-30 | 2022-03-31 | 2021-12-31 | 2021-09-30 | ||
|---|---|---|---|---|---|---|---|---|---|
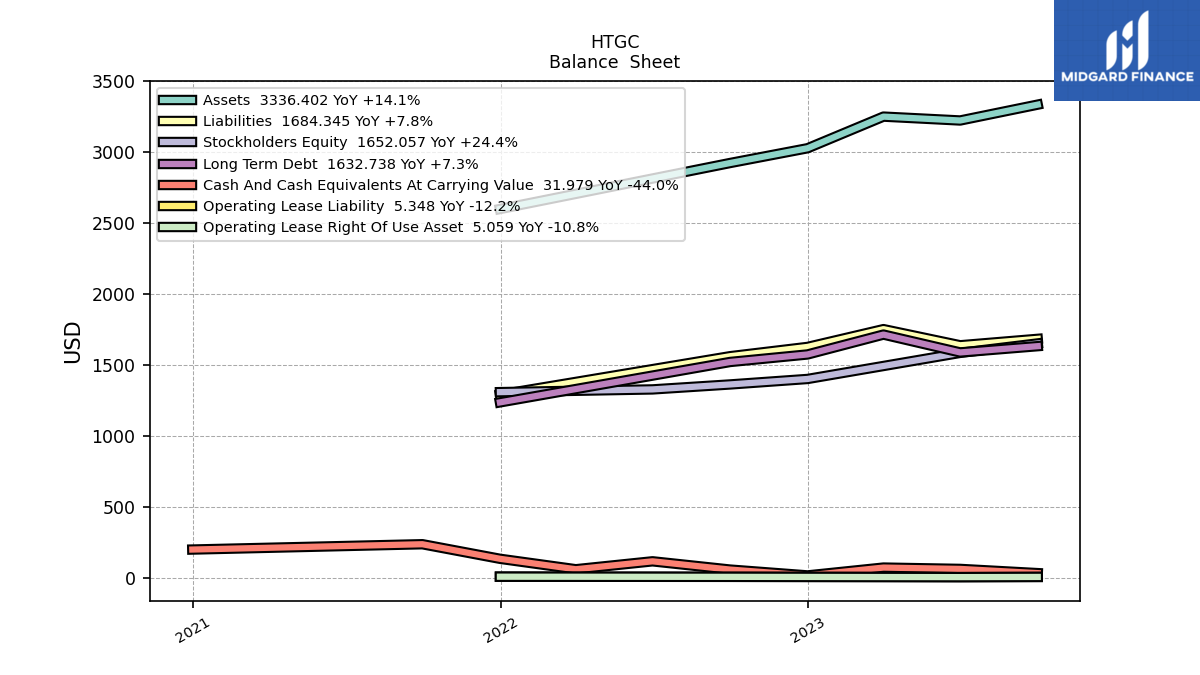
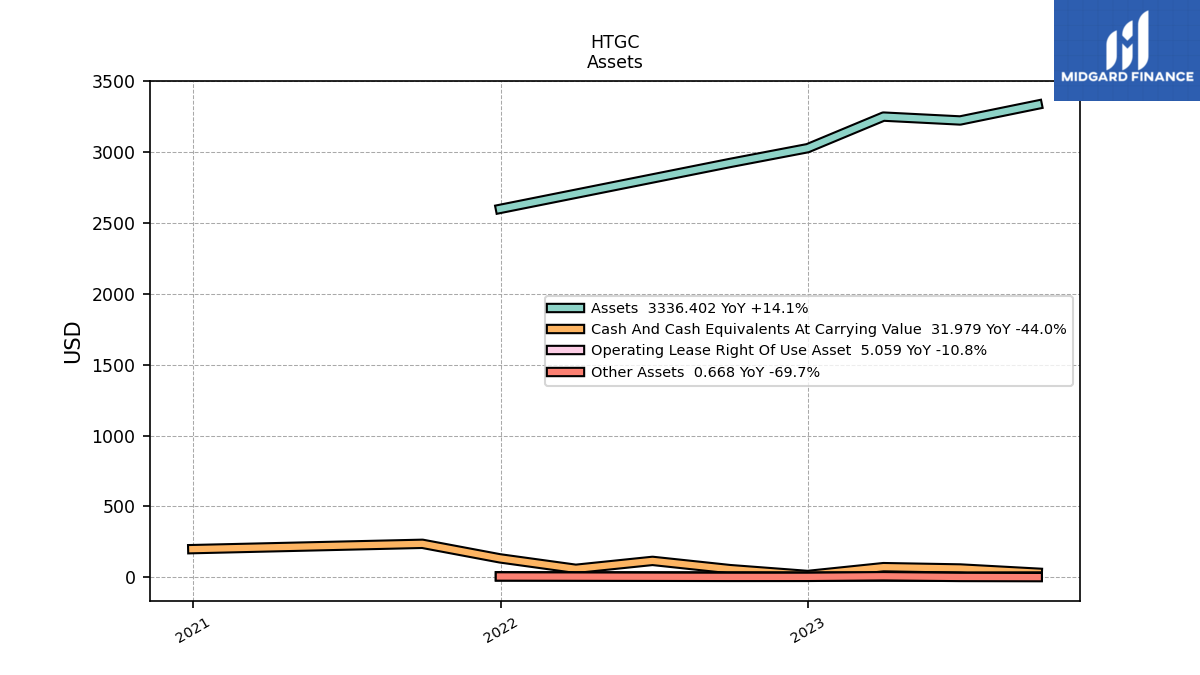
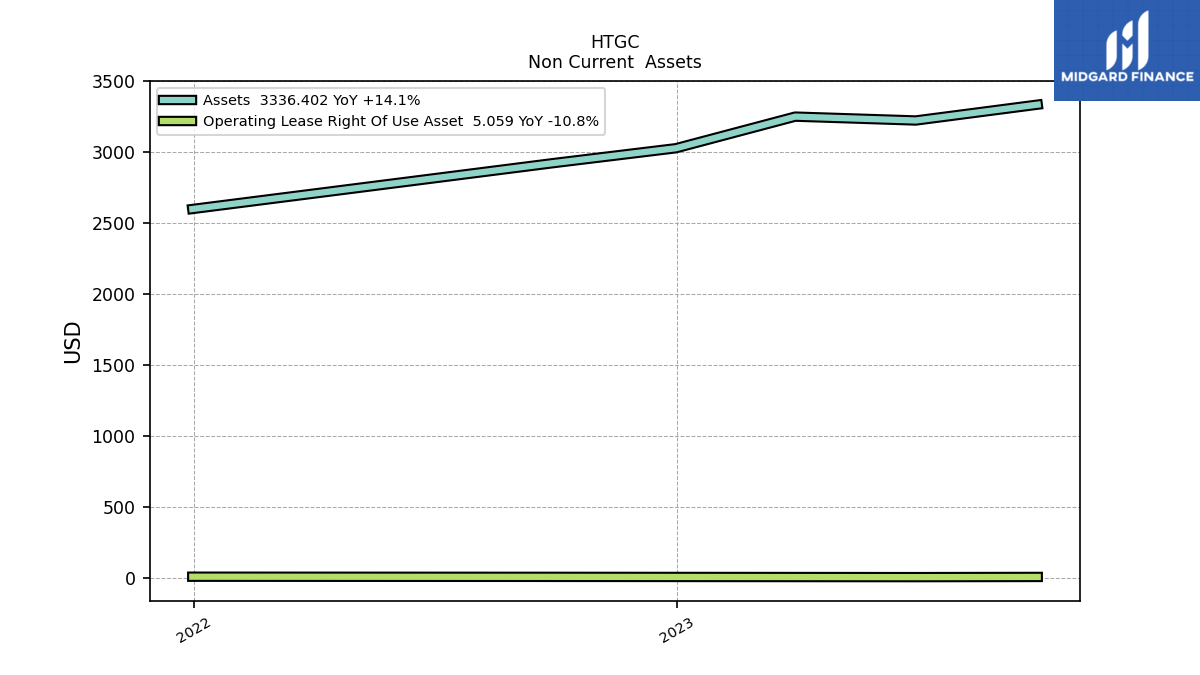
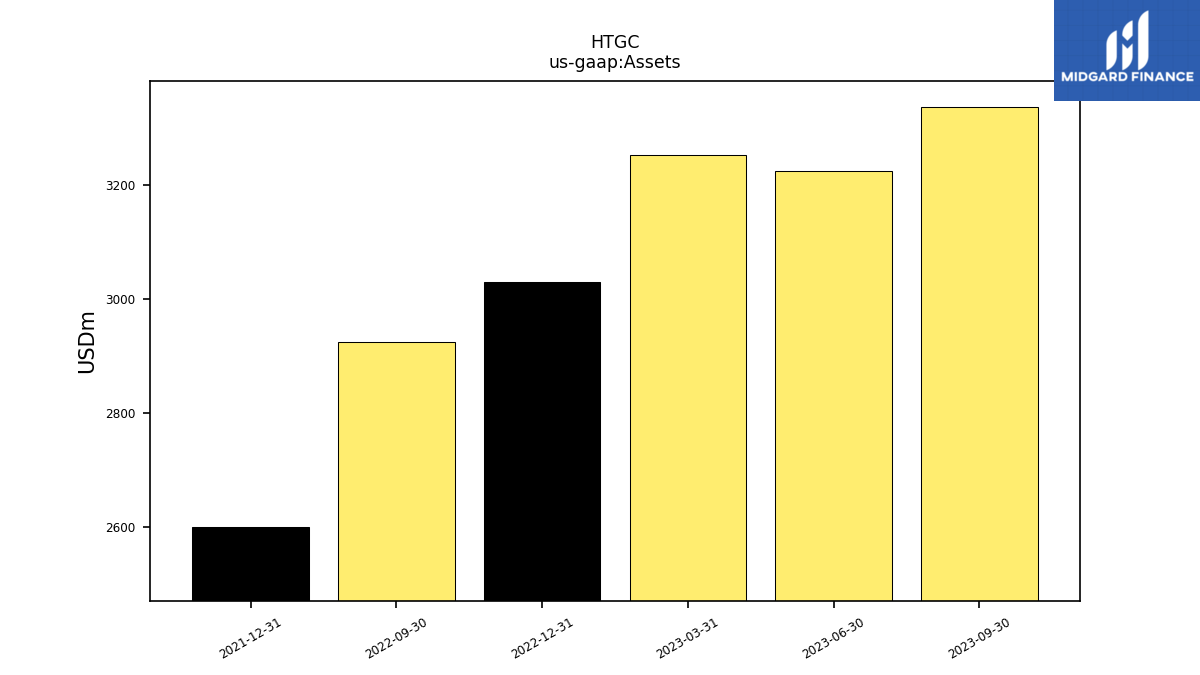
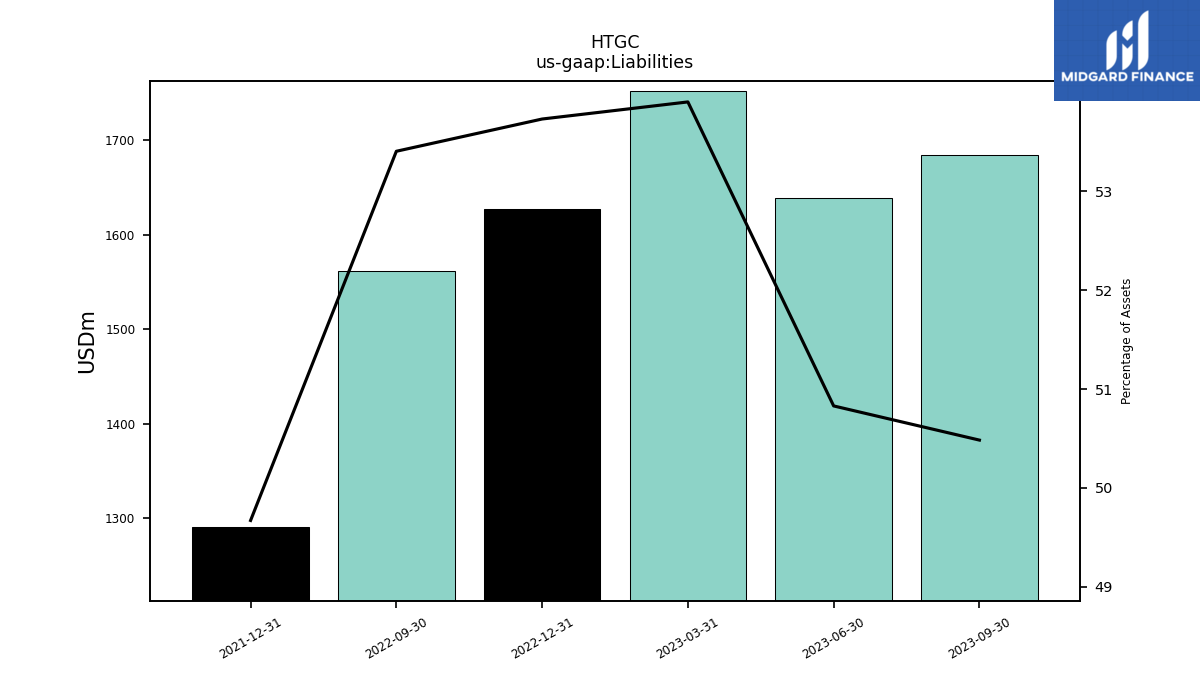
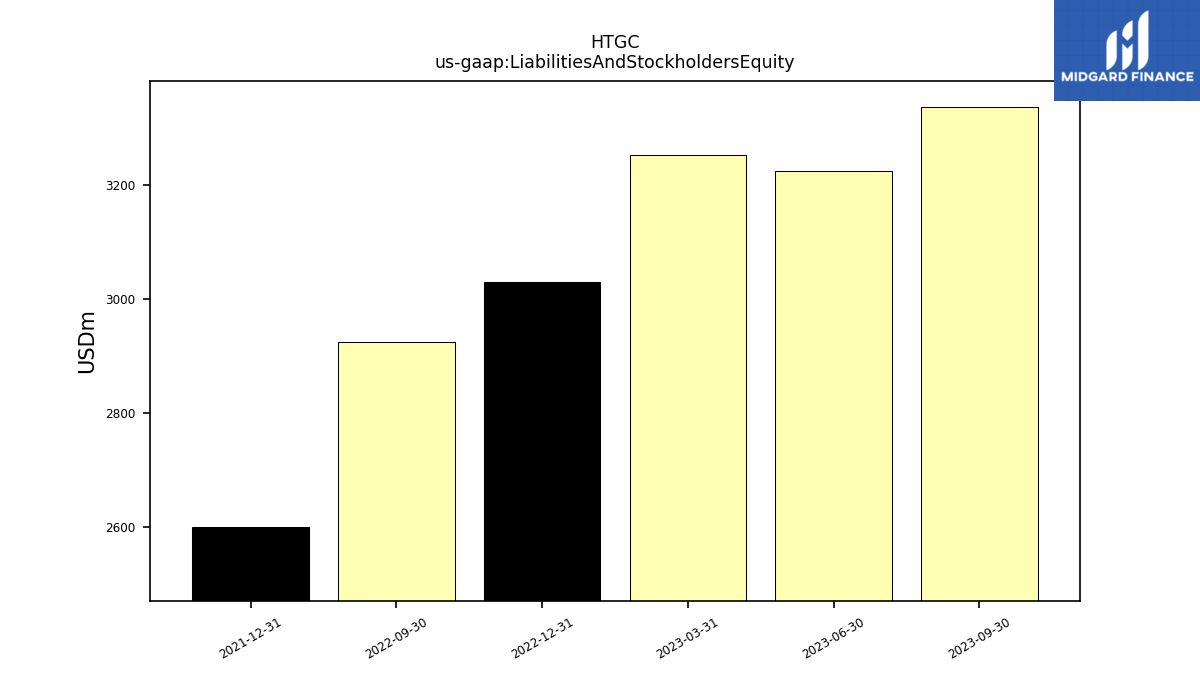
| Assets | 3224.50 | 3251.82 | 3028.86 | 2924.52 | NA | NA | 2600.01 | NA | |
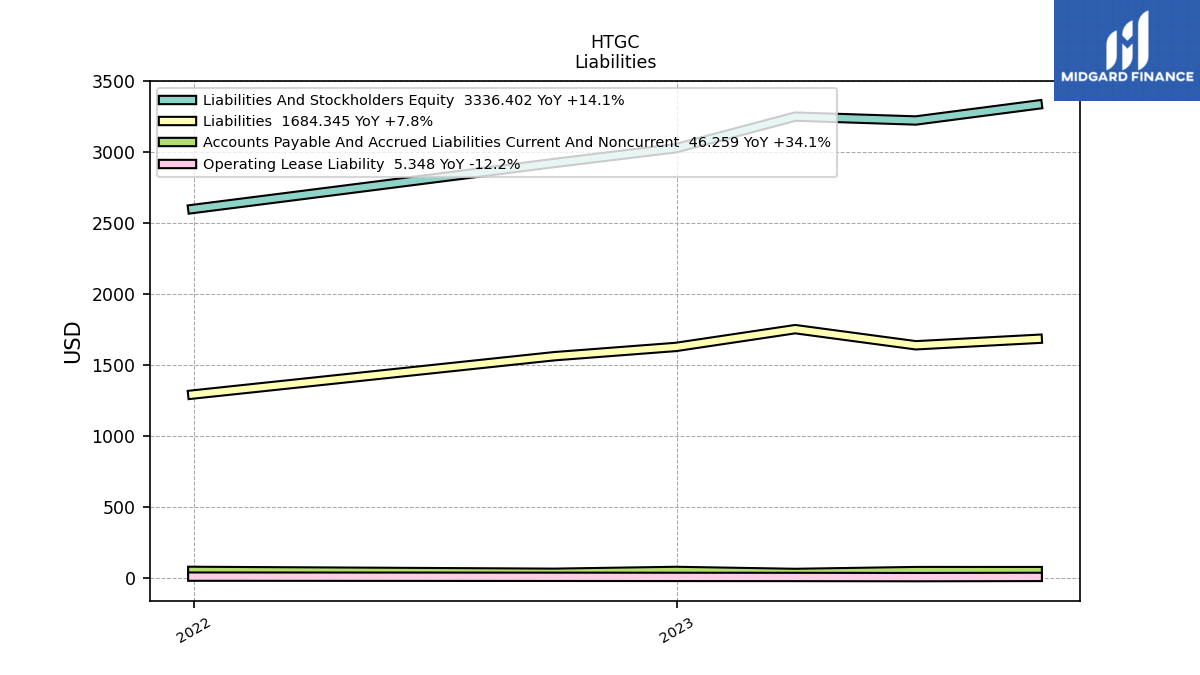
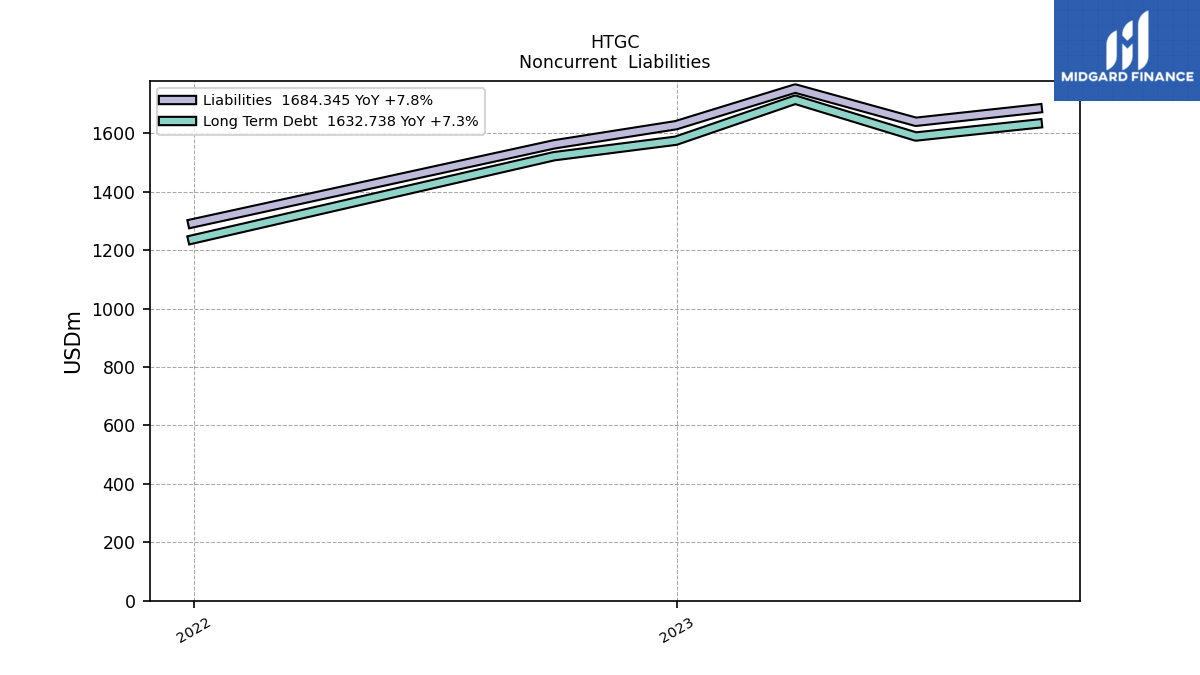
| Liabilities | 1638.99 | 1752.81 | 1627.40 | 1561.80 | NA | NA | 1291.47 | NA | |
| Liabilities And Stockholders Equity | 3224.50 | 3251.82 | 3028.86 | 2924.52 | NA | NA | 2600.01 | NA | |
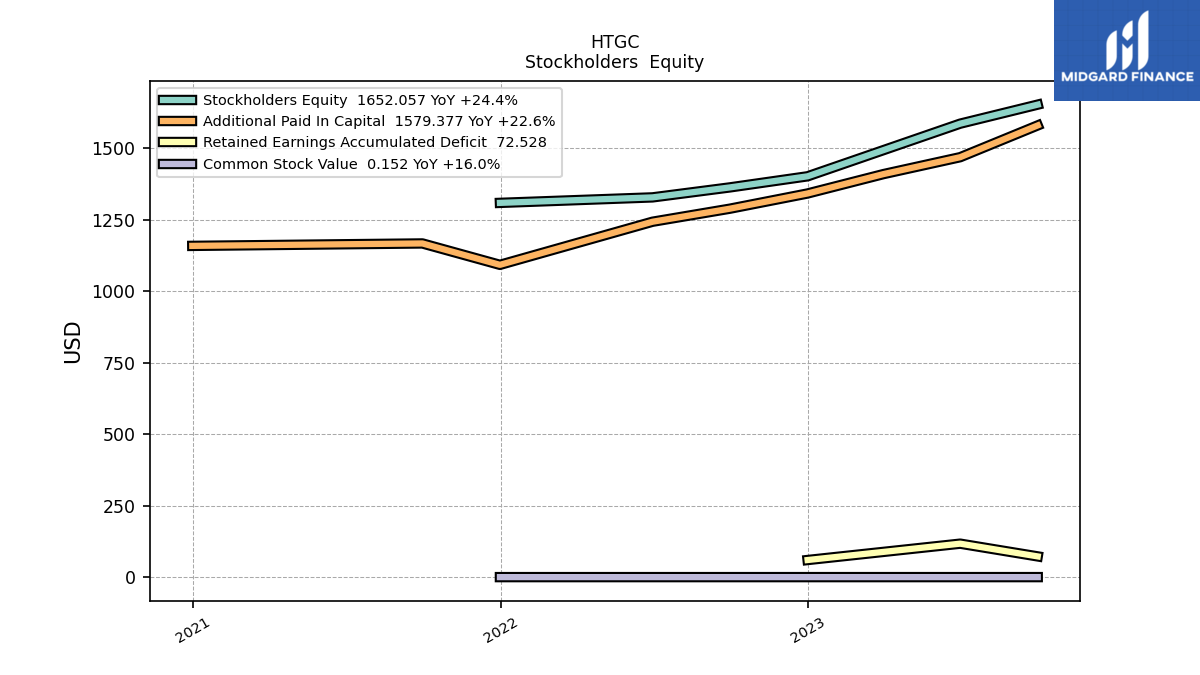
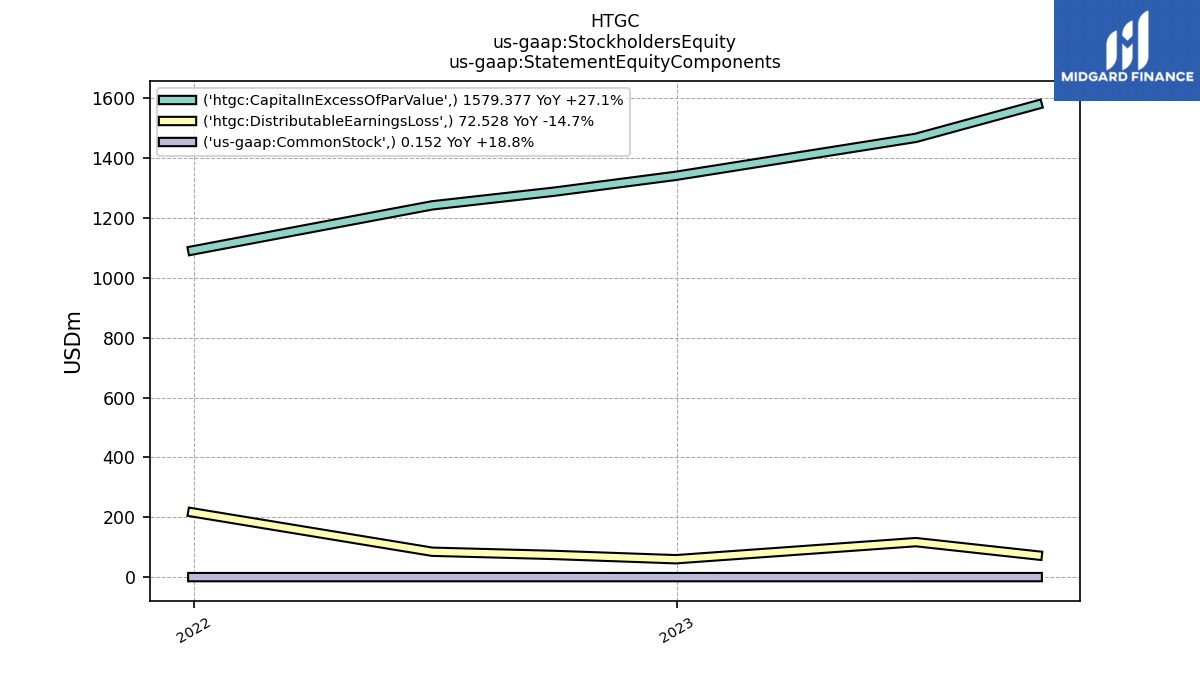
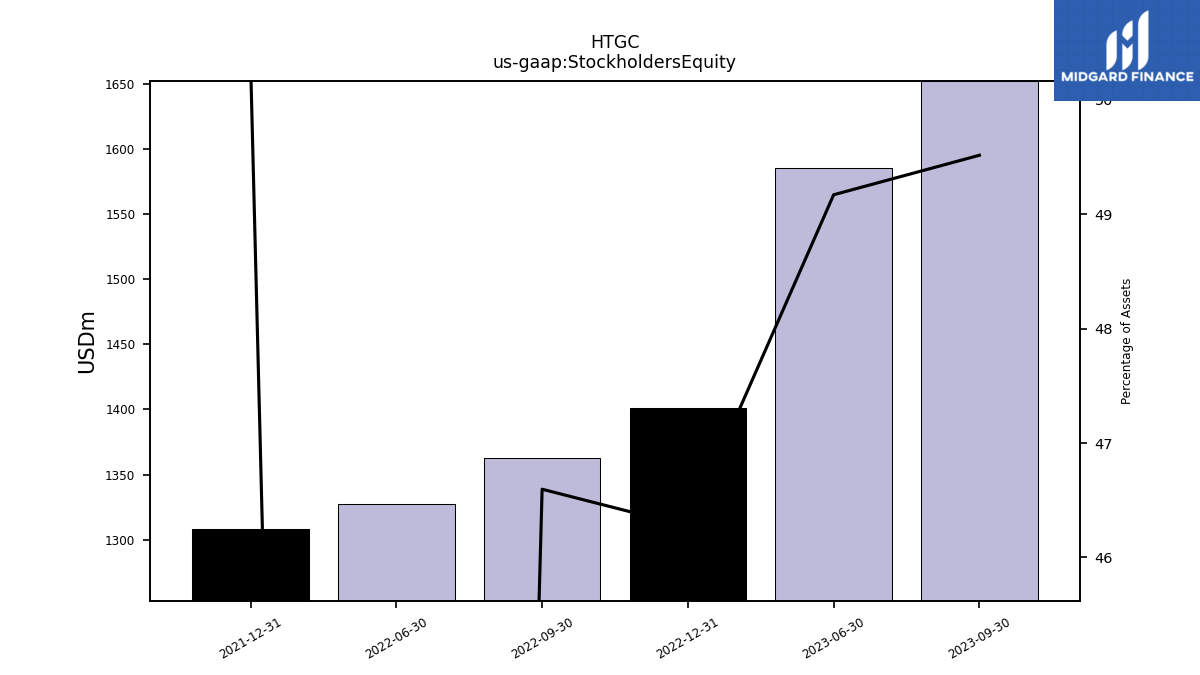
| Stockholders Equity | 1585.51 | NA | 1401.46 | 1362.72 | 1327.74 | NA | 1308.55 | NA |
| 2023-06-30 | 2023-03-31 | 2022-12-31 | 2022-09-30 | 2022-06-30 | 2022-03-31 | 2021-12-31 | 2021-09-30 | ||
|---|---|---|---|---|---|---|---|---|---|
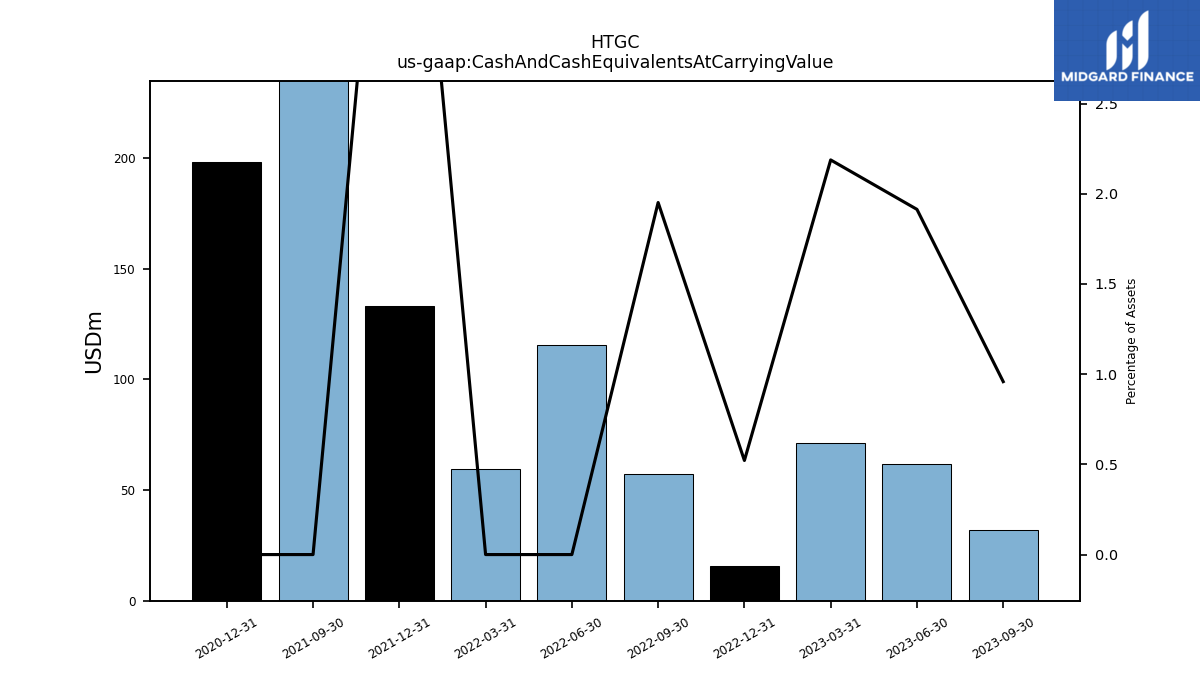
| Cash And Cash Equivalents At Carrying Value | 61.70 | 71.13 | 15.80 | 57.06 | 115.31 | 59.33 | 133.12 | 235.85 | |
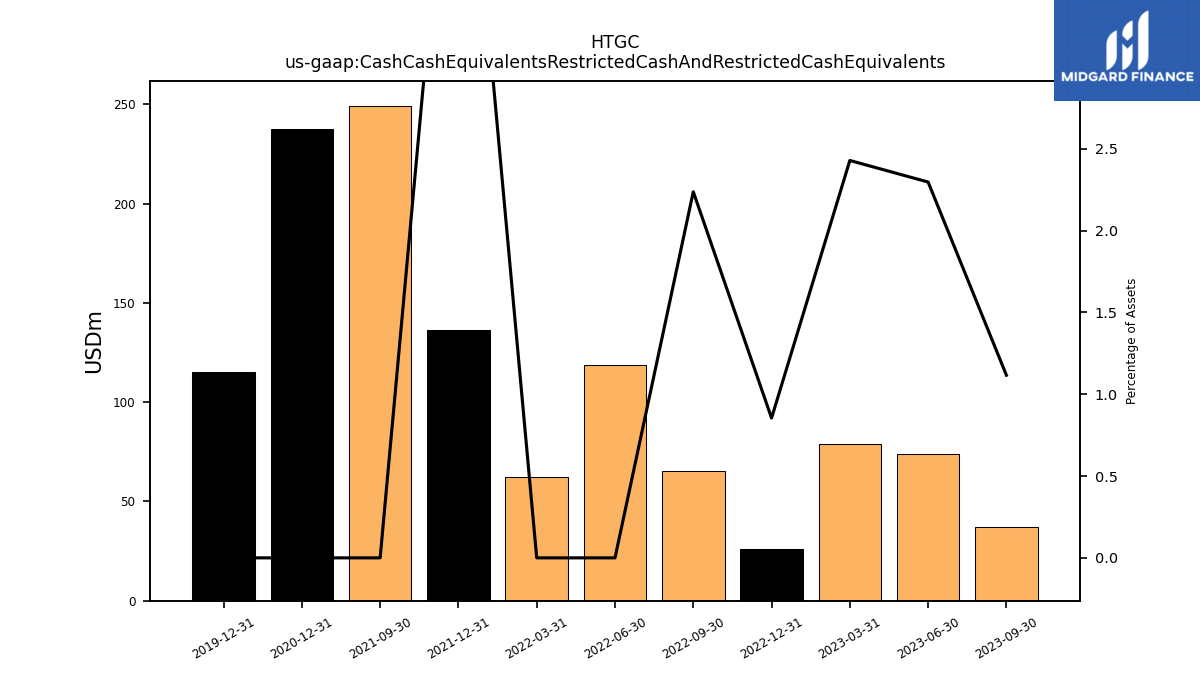
| Cash Cash Equivalents Restricted Cash And Restricted Cash Equivalents | 74.03 | 78.95 | 25.88 | 65.41 | 118.68 | 62.46 | 136.26 | 249.36 |
| 2023-06-30 | 2023-03-31 | 2022-12-31 | 2022-09-30 | 2022-06-30 | 2022-03-31 | 2021-12-31 | 2021-09-30 | ||
|---|---|---|---|---|---|---|---|---|---|
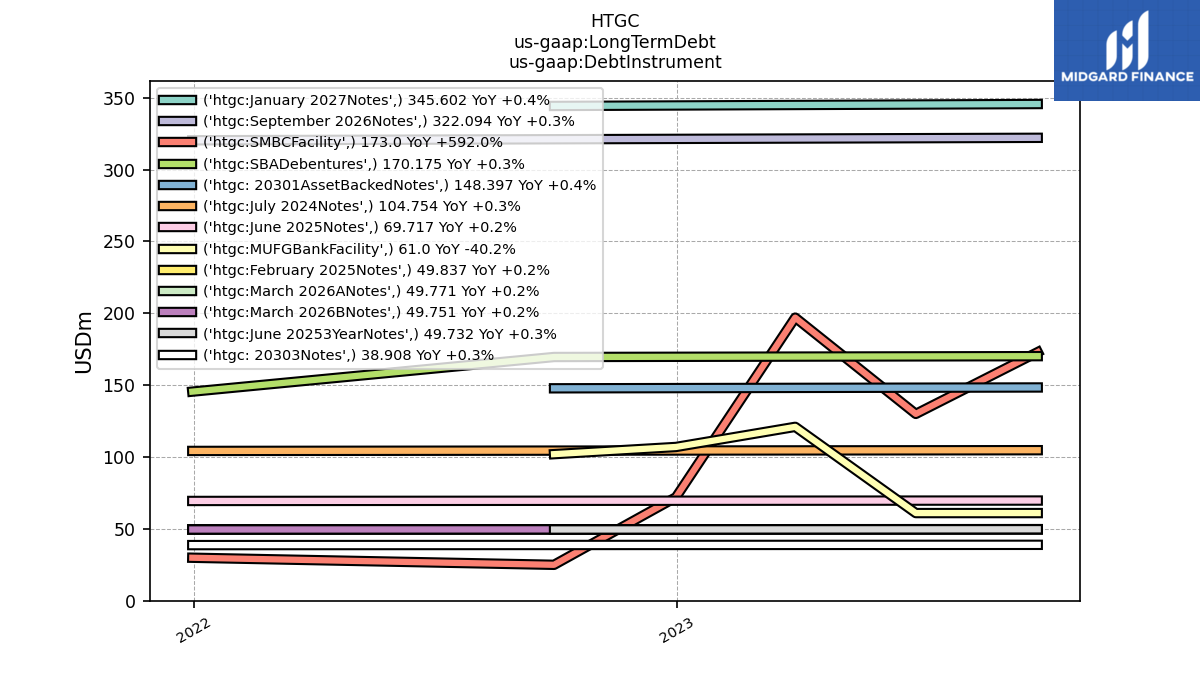
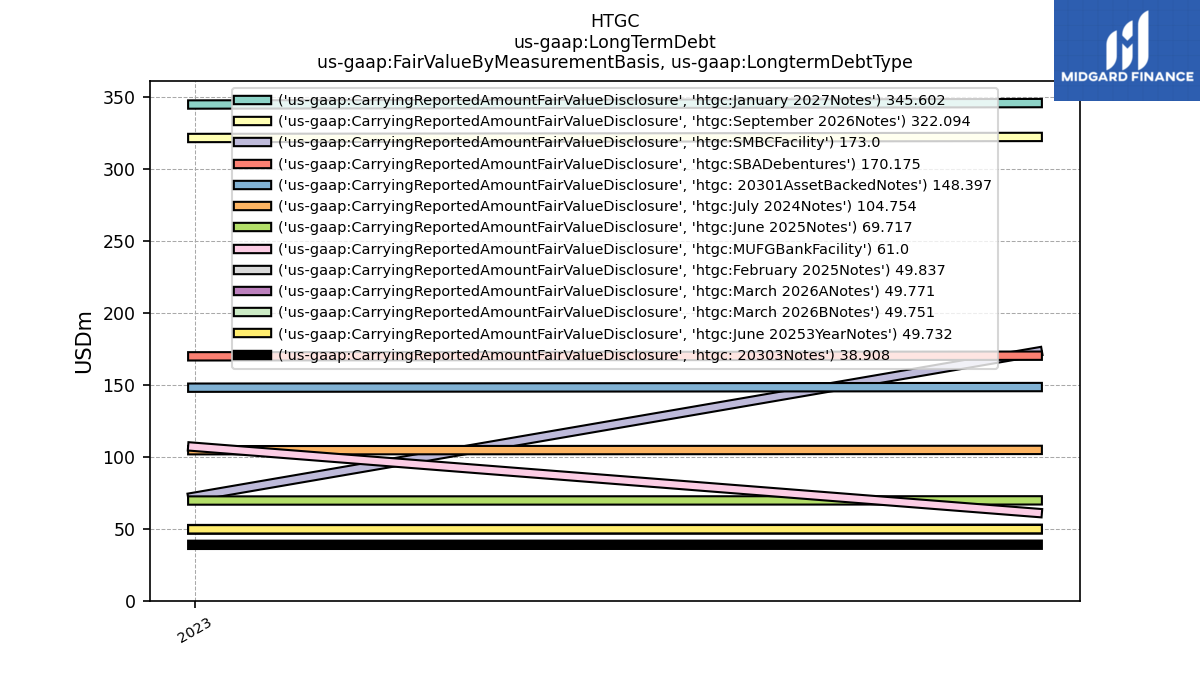
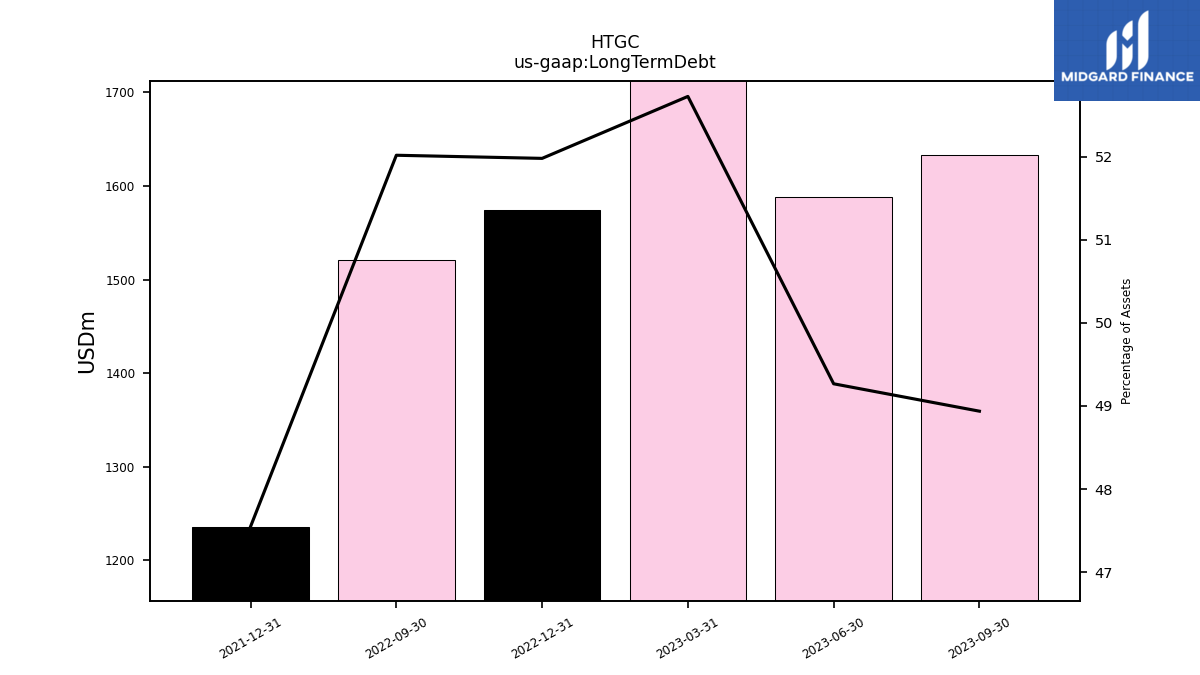
| Long Term Debt | 1588.61 | 1714.48 | 1574.35 | 1521.22 | NA | NA | 1236.30 | NA |
| 2023-06-30 | 2023-03-31 | 2022-12-31 | 2022-09-30 | 2022-06-30 | 2022-03-31 | 2021-12-31 | 2021-09-30 | ||
|---|---|---|---|---|---|---|---|---|---|
| Stockholders Equity | 1585.51 | NA | 1401.46 | 1362.72 | 1327.74 | NA | 1308.55 | NA | |
| Common Stock Value | 0.14 | 0.14 | 0.13 | 0.13 | NA | NA | 0.12 | NA | |
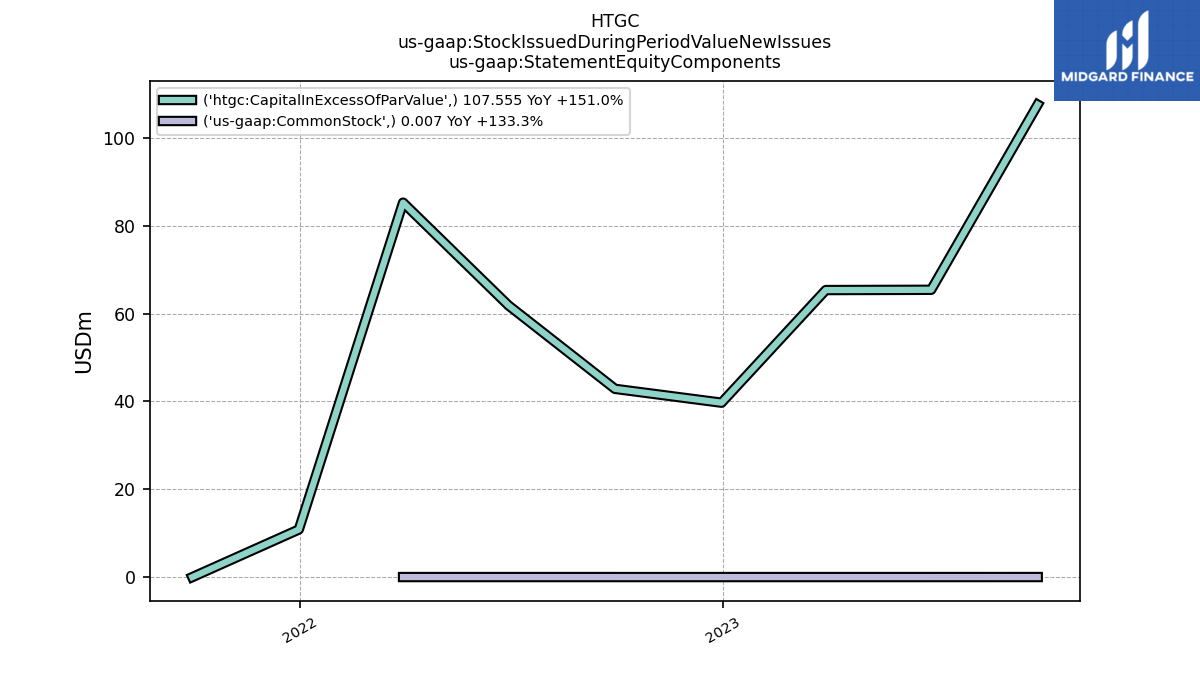
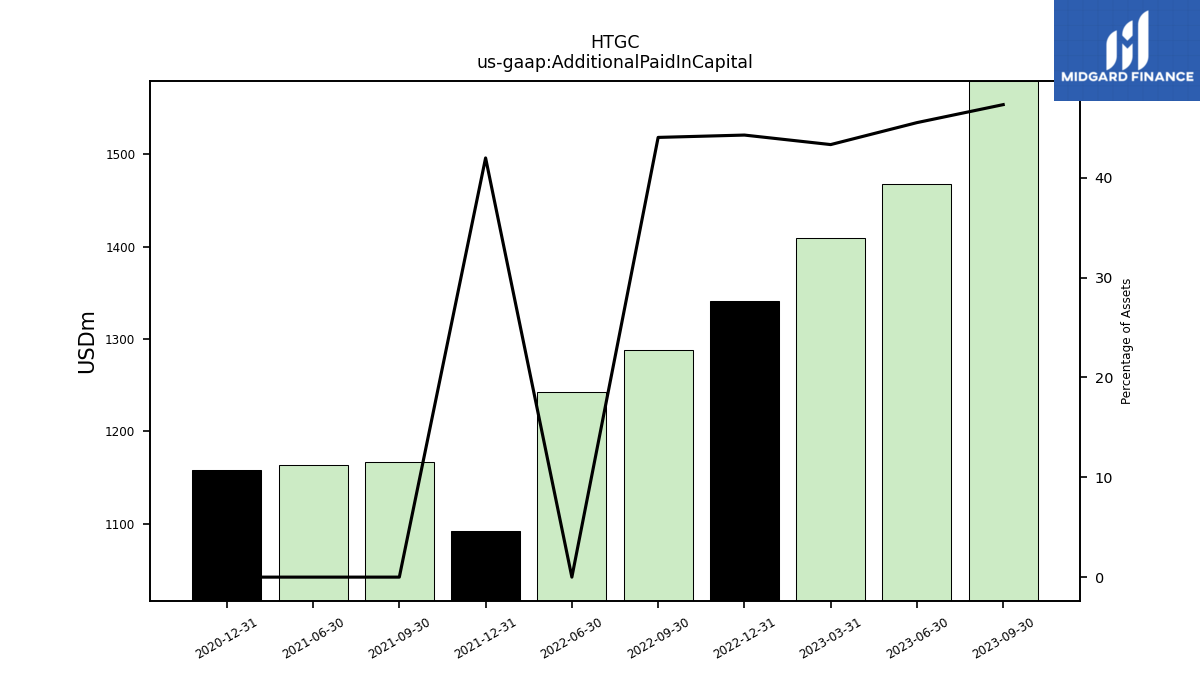
| Additional Paid In Capital | 1468.27 | 1409.17 | 1341.42 | 1288.34 | 1242.62 | NA | 1091.91 | 1166.72 | |
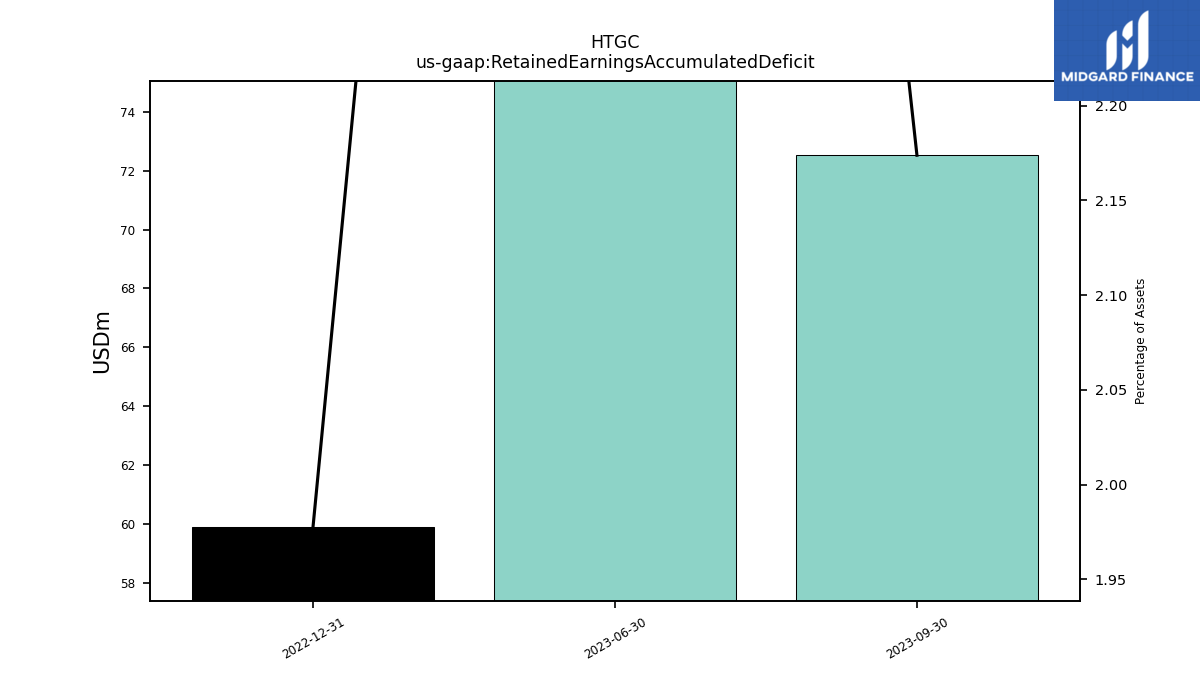
| Retained Earnings Accumulated Deficit | 117.09 | NA | 59.91 | NA | NA | NA | NA | NA | |
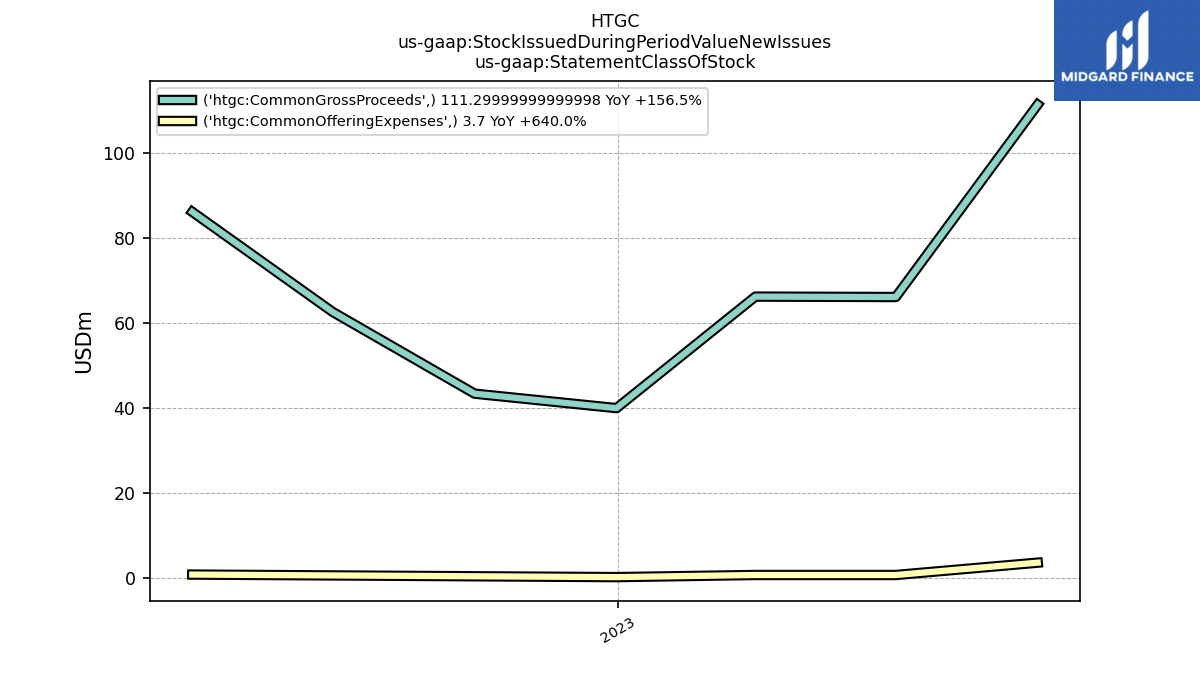
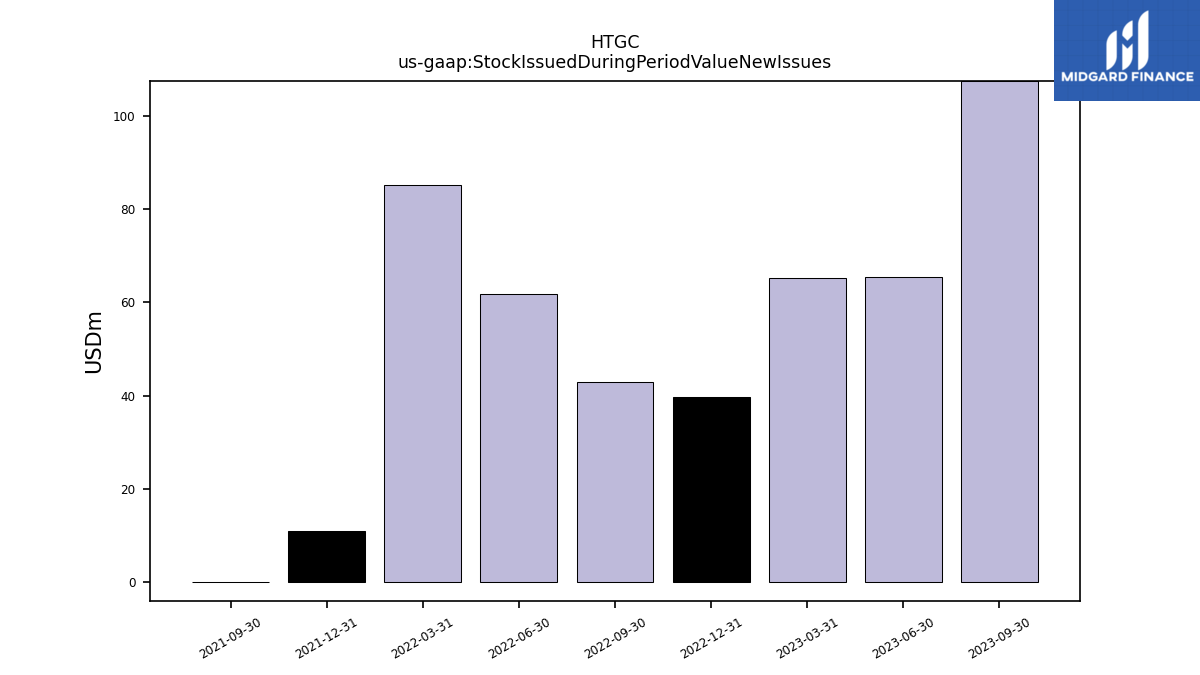
| Stock Issued During Period Value New Issues | 65.41 | 65.34 | 39.70 | 42.85 | 61.85 | 85.25 | 10.83 | -0.01 | |
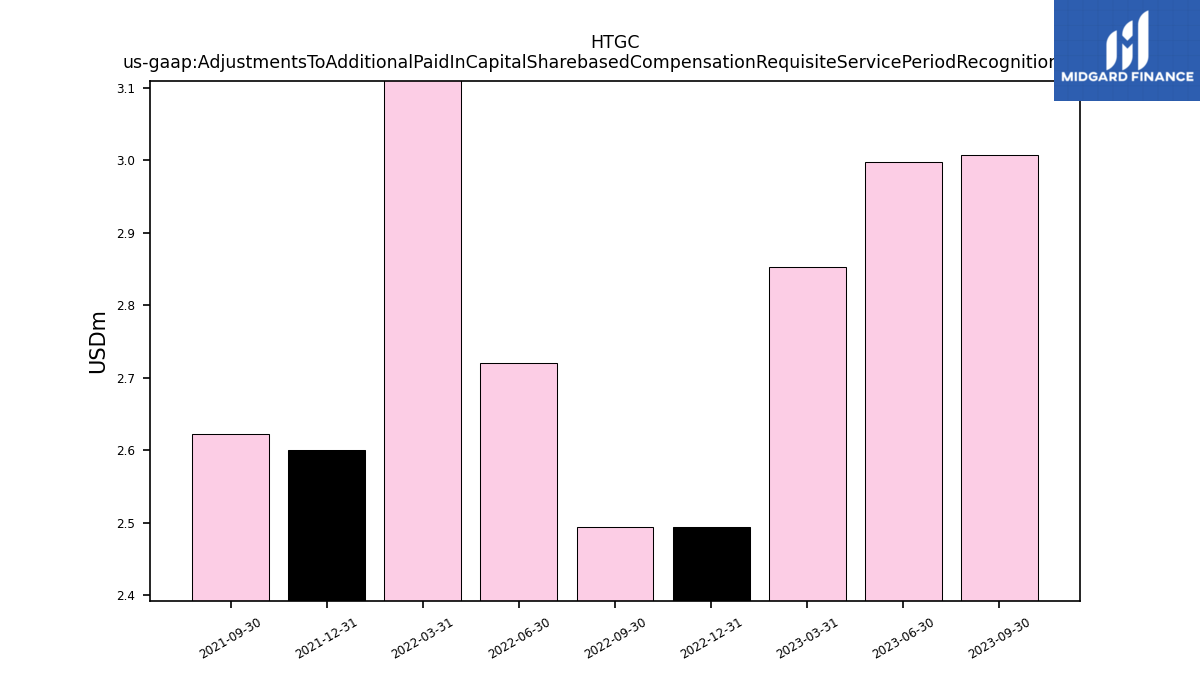
| Adjustments To Additional Paid In Capital Sharebased Compensation Requisite Service Period Recognition Value | 3.00 | 2.85 | 2.50 | 2.50 | 2.72 | 3.12 | 2.60 | 2.62 |
| 2023-06-30 | 2023-03-31 | 2022-12-31 | 2022-09-30 | 2022-06-30 | 2022-03-31 | 2021-12-31 | 2021-09-30 | ||
|---|---|---|---|---|---|---|---|---|---|
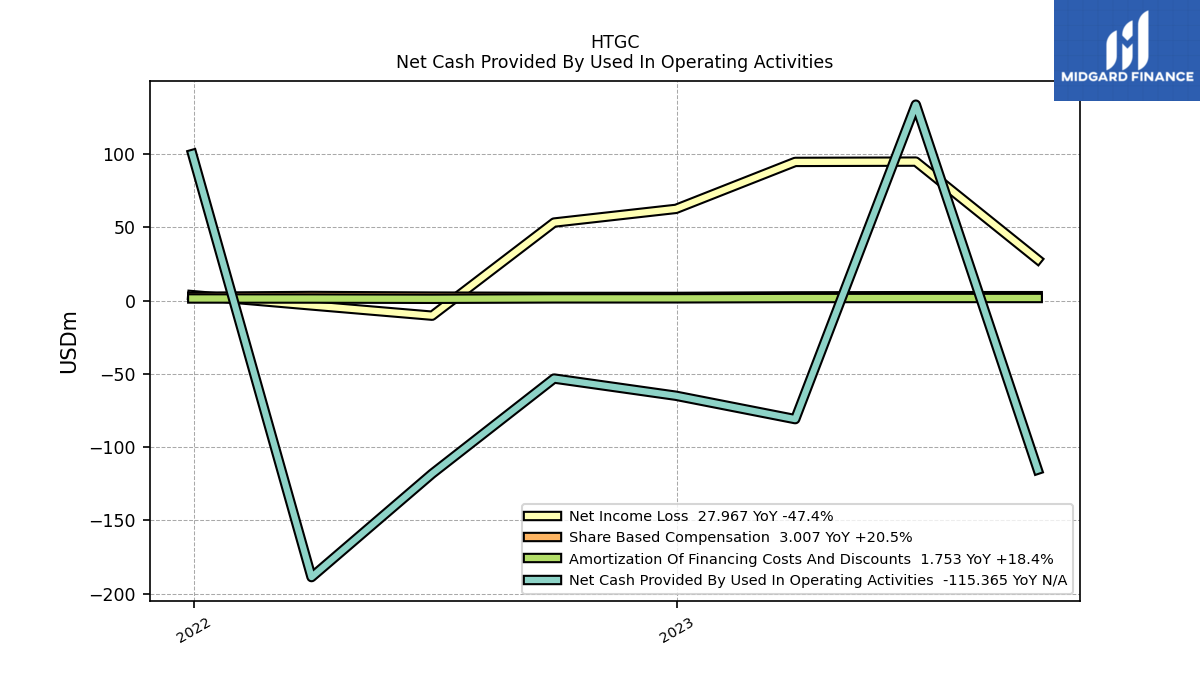
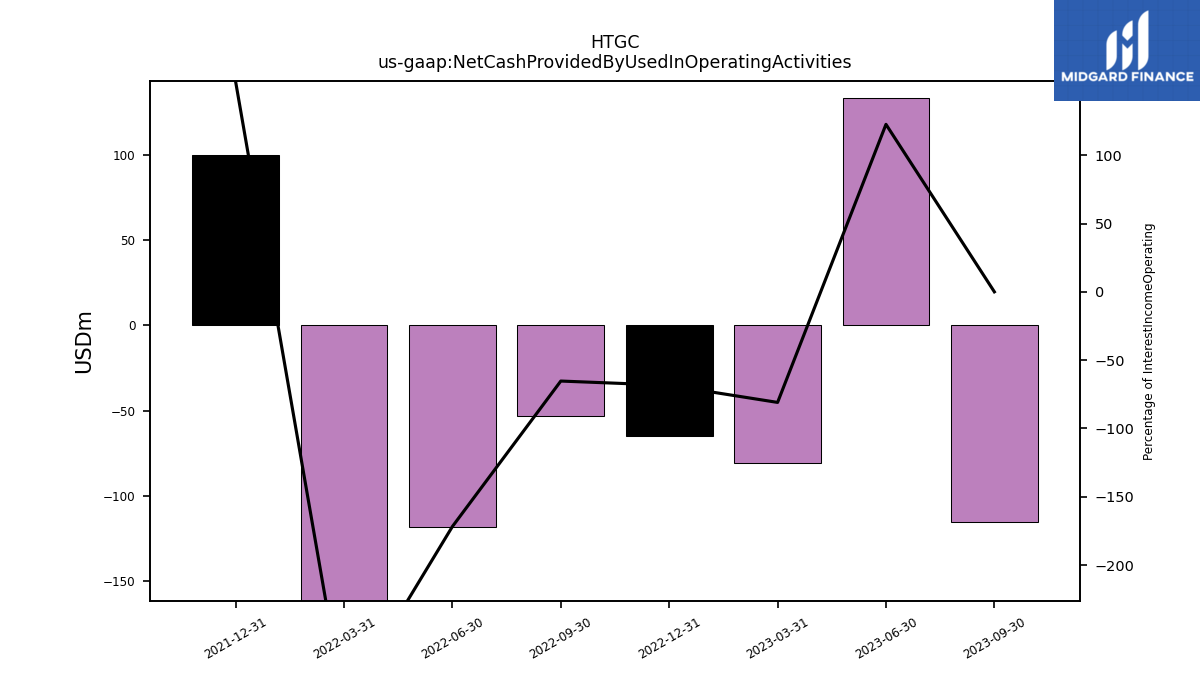
| Net Cash Provided By Used In Operating Activities | 133.64 | -80.87 | -64.92 | -53.17 | -118.08 | -188.62 | 99.94 | NA | |
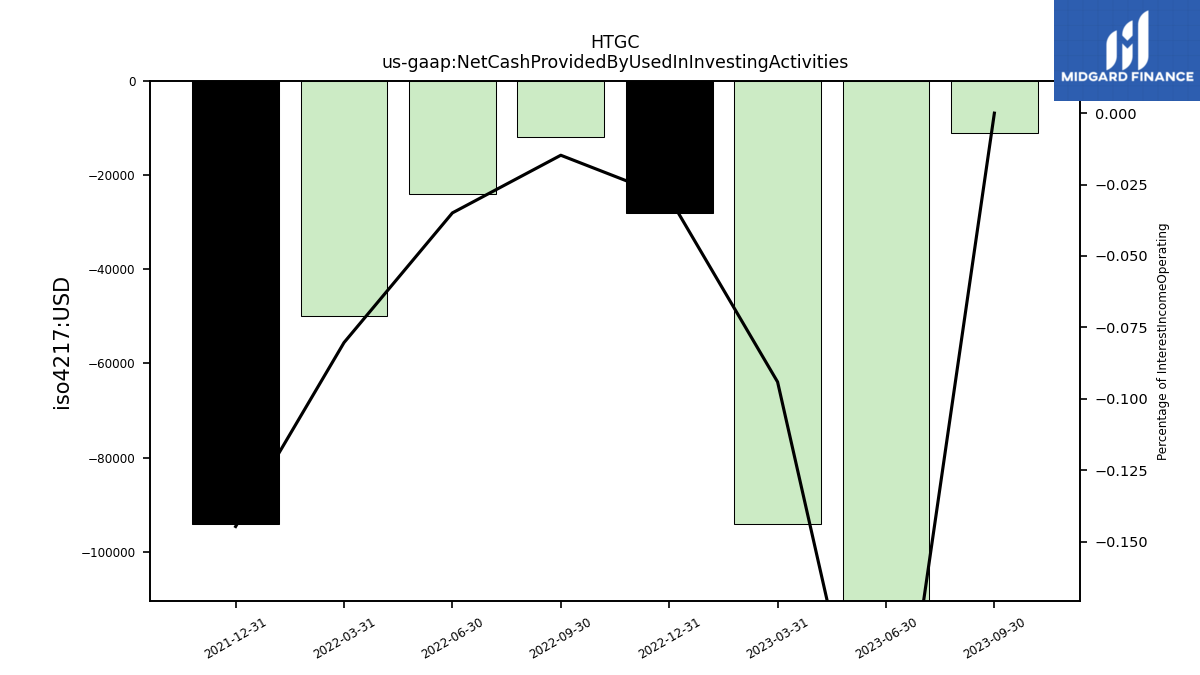
| Net Cash Provided By Used In Investing Activities | -0.28 | -0.09 | -0.03 | -0.01 | -0.02 | -0.05 | -0.09 | NA | |
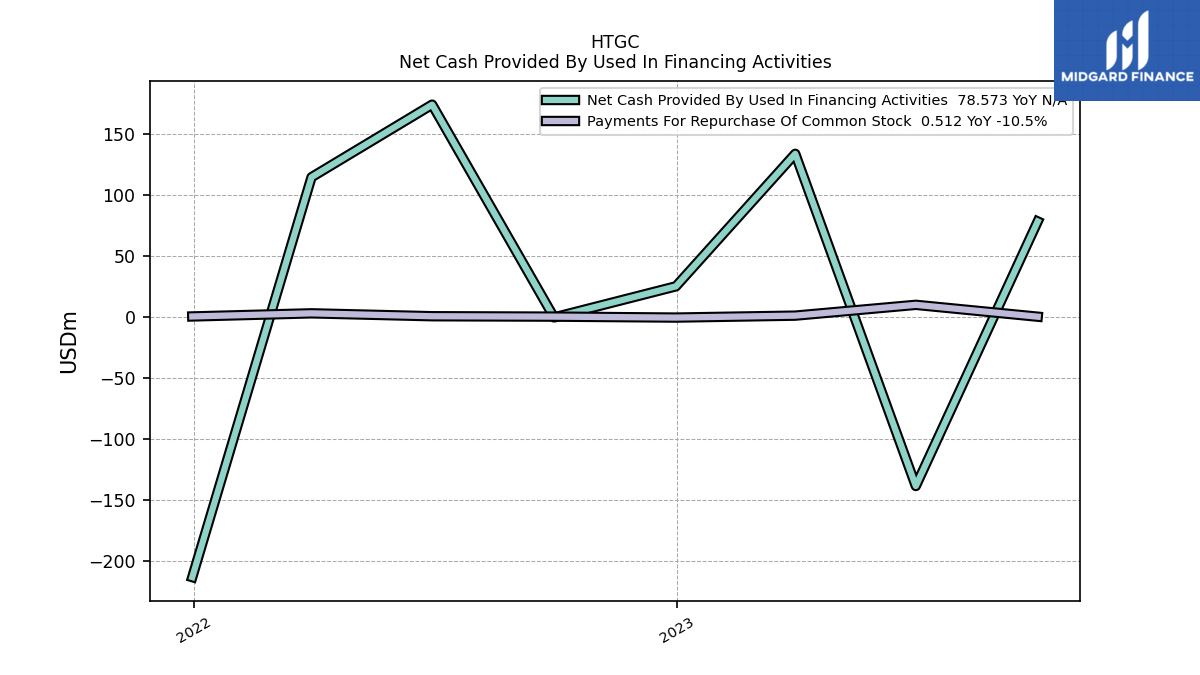
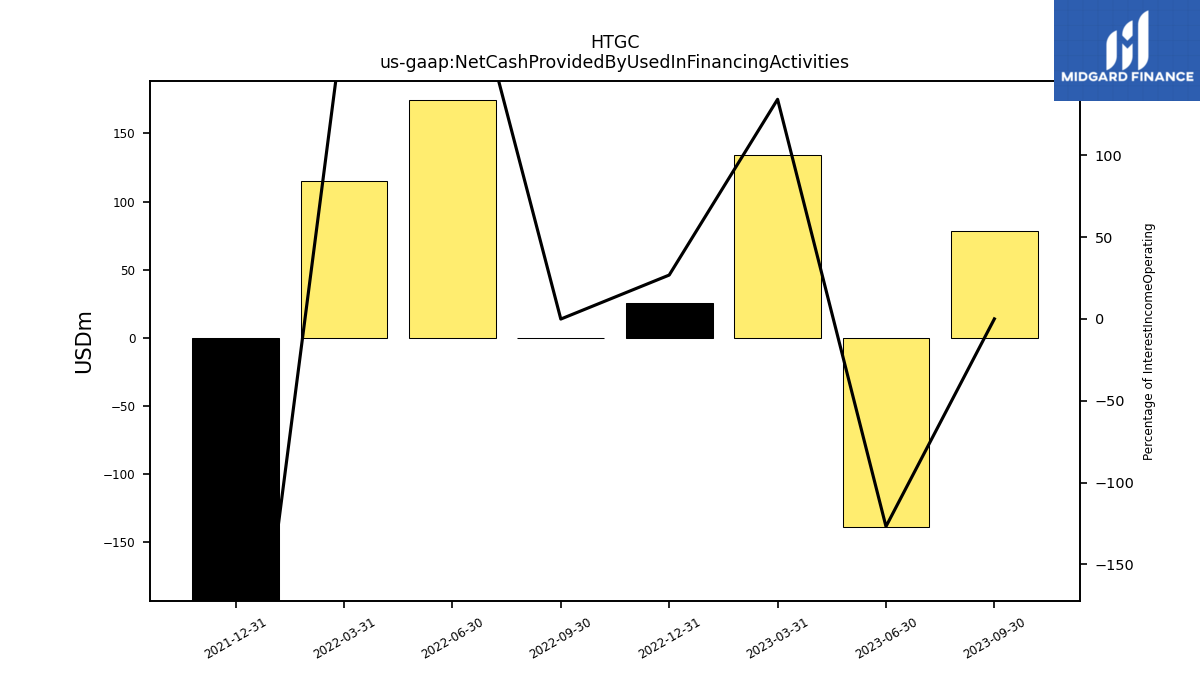
| Net Cash Provided By Used In Financing Activities | -138.27 | 134.04 | 25.41 | -0.08 | 174.33 | 114.86 | -212.94 | NA |
| 2023-06-30 | 2023-03-31 | 2022-12-31 | 2022-09-30 | 2022-06-30 | 2022-03-31 | 2021-12-31 | 2021-09-30 | ||
|---|---|---|---|---|---|---|---|---|---|
| Net Cash Provided By Used In Operating Activities | 133.64 | -80.87 | -64.92 | -53.17 | -118.08 | -188.62 | 99.94 | NA | |
| Net Income Loss | 94.78 | 94.56 | 62.53 | 53.20 | -10.32 | -3.34 | 3.71 | NA | |
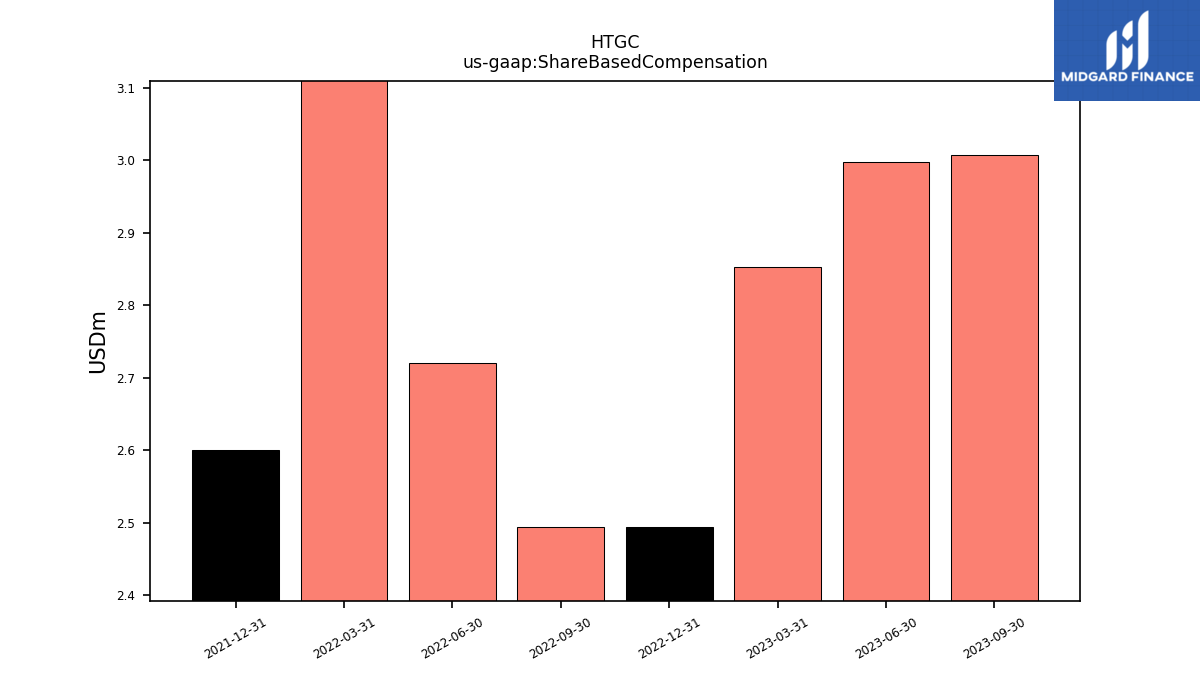
| Share Based Compensation | 3.00 | 2.85 | 2.50 | 2.50 | 2.72 | 3.12 | 2.60 | NA | |
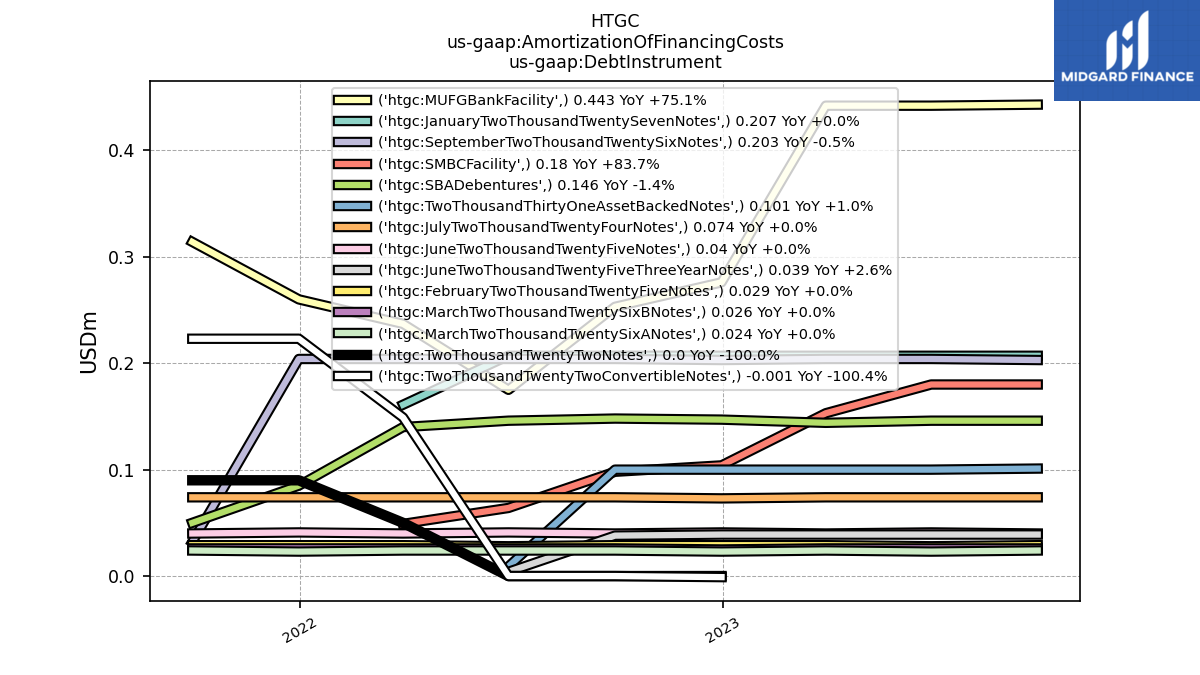
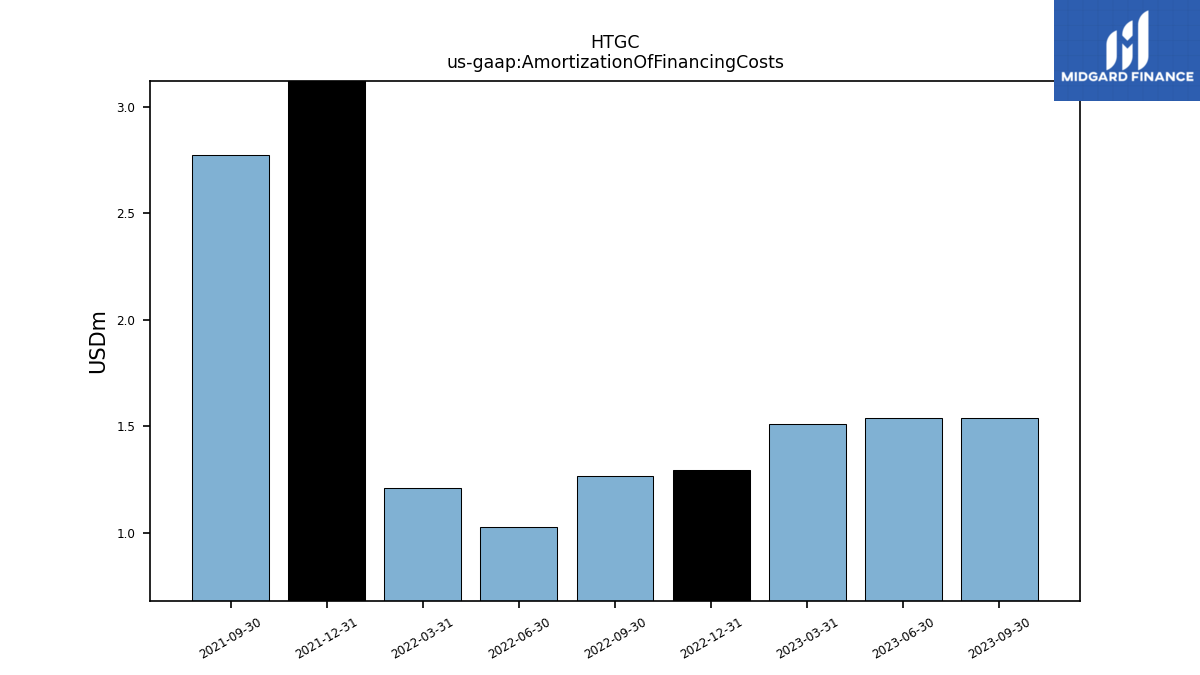
| Amortization Of Financing Costs | 1.54 | 1.51 | 1.29 | 1.27 | 1.03 | 1.21 | 3.92 | 2.77 |
| 2023-06-30 | 2023-03-31 | 2022-12-31 | 2022-09-30 | 2022-06-30 | 2022-03-31 | 2021-12-31 | 2021-09-30 | ||
|---|---|---|---|---|---|---|---|---|---|
| Net Cash Provided By Used In Investing Activities | -0.28 | -0.09 | -0.03 | -0.01 | -0.02 | -0.05 | -0.09 | NA | |
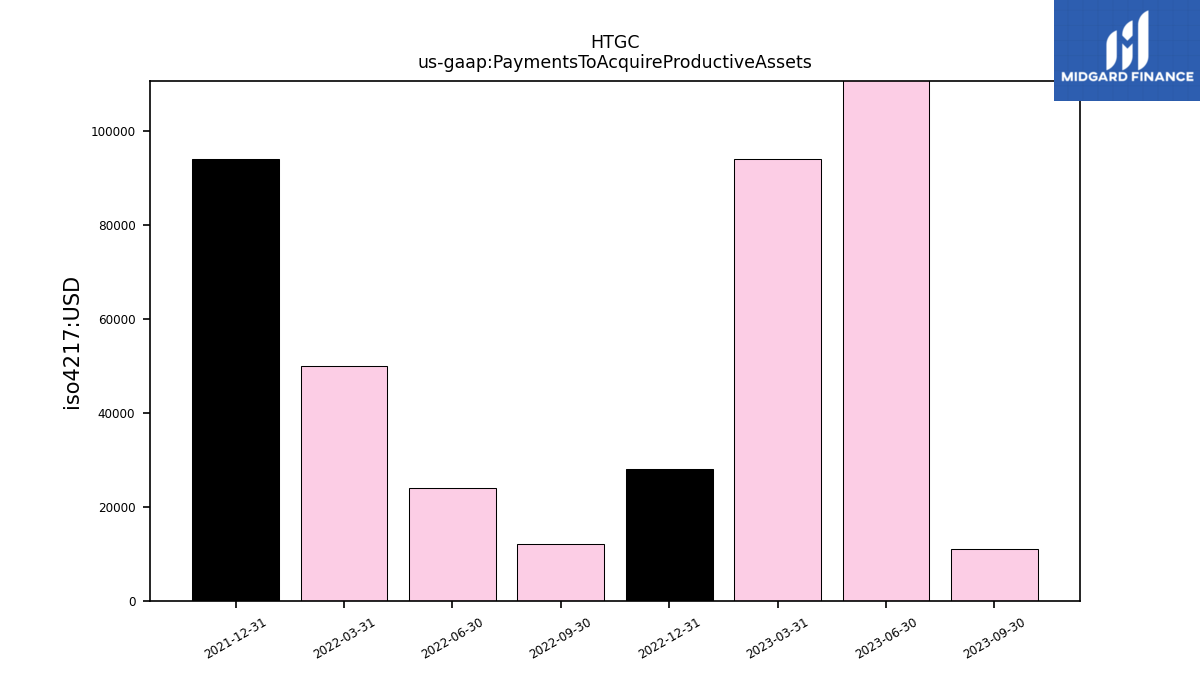
| Payments To Acquire Productive Assets | 0.28 | 0.09 | 0.03 | 0.01 | 0.02 | 0.05 | 0.09 | NA |
| 2023-06-30 | 2023-03-31 | 2022-12-31 | 2022-09-30 | 2022-06-30 | 2022-03-31 | 2021-12-31 | 2021-09-30 | ||
|---|---|---|---|---|---|---|---|---|---|
| Net Cash Provided By Used In Financing Activities | -138.27 | 134.04 | 25.41 | -0.08 | 174.33 | 114.86 | -212.94 | NA | |
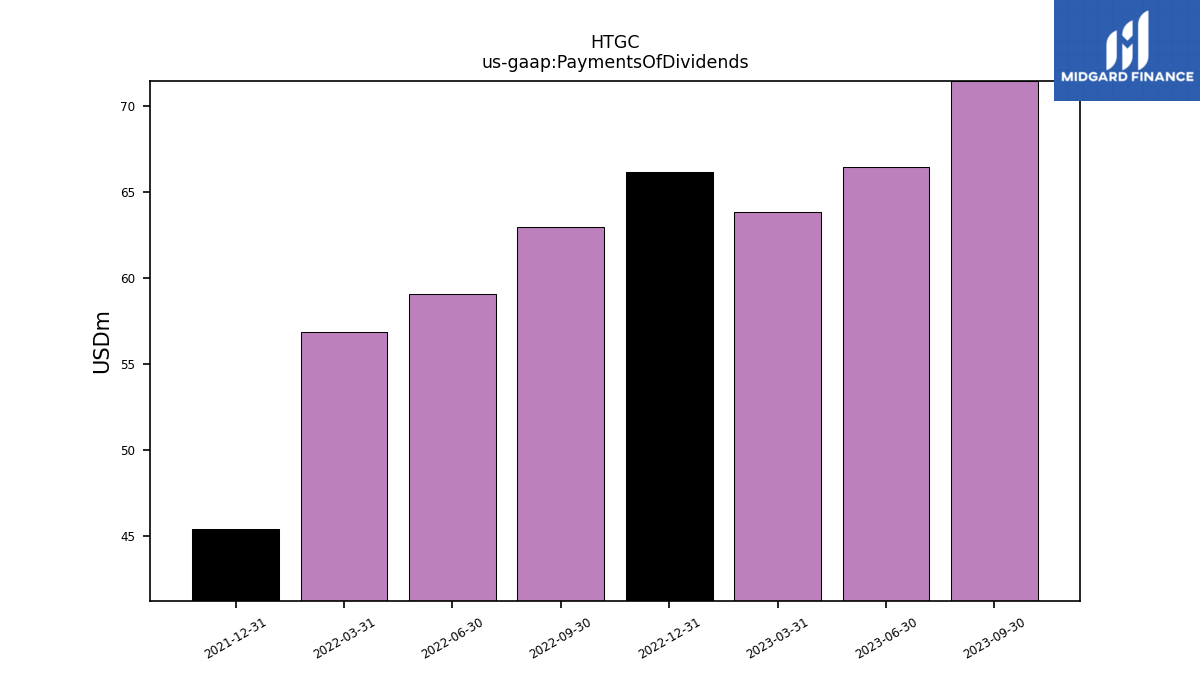
| Payments Of Dividends | 66.44 | 63.83 | 66.19 | 63.00 | 59.07 | 56.86 | 45.41 | NA | |
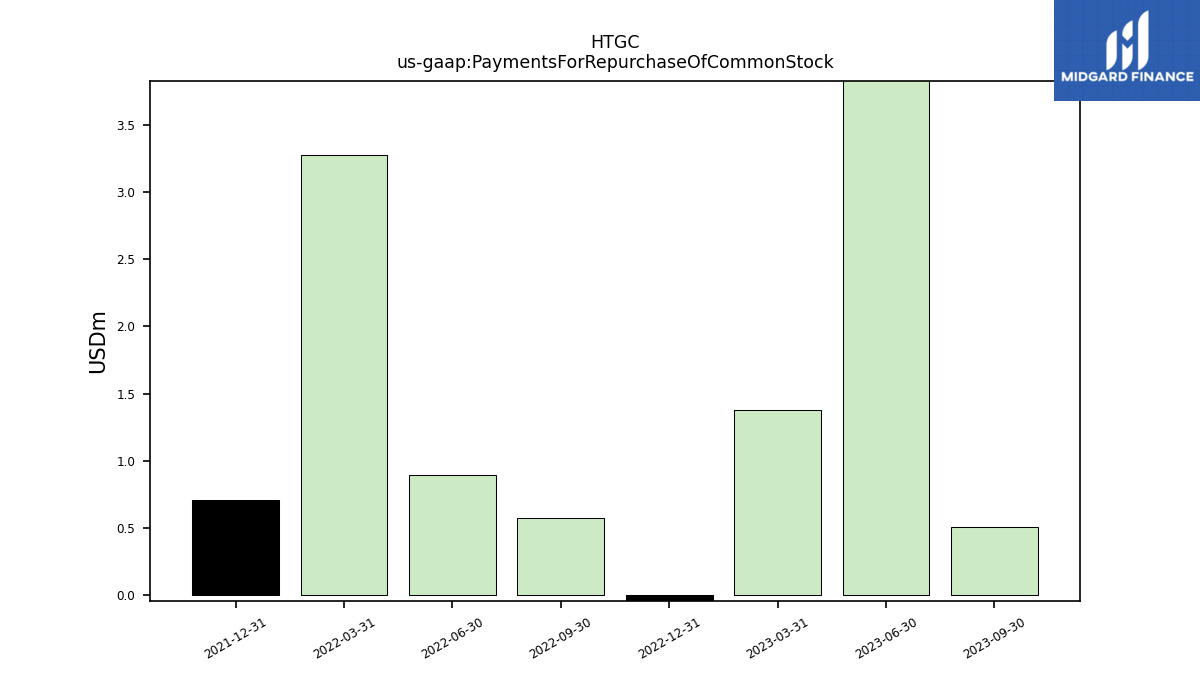
| Payments For Repurchase Of Common Stock | 10.23 | 1.38 | -0.21 | 0.57 | 0.89 | 3.27 | 0.71 | NA |
