
| 2024-03-31 | 2023-12-31 | 2023-09-30 | 2023-06-30 | 2023-03-31 | 2022-12-31 | 2022-09-30 | 2022-06-30 | 2022-03-31 | 2021-12-31 | 2021-09-30 | 2021-06-30 | 2021-03-31 | 2020-12-31 | 2020-09-30 | 2020-06-30 | 2020-03-31 | 2019-12-31 | 2019-09-30 | 2019-06-30 | 2019-03-31 | 2018-12-31 | 2018-09-30 | 2018-06-30 | 2018-03-31 | 2017-12-31 | 2017-09-30 | 2017-06-30 | 2017-03-31 | 2016-12-31 | 2016-09-30 | 2016-06-30 | 2016-03-31 | 2015-12-31 | 2015-09-30 | 2015-06-30 | 2015-03-31 | ||
|---|---|---|---|---|---|---|---|---|---|---|---|---|---|---|---|---|---|---|---|---|---|---|---|---|---|---|---|---|---|---|---|---|---|---|---|---|---|---|
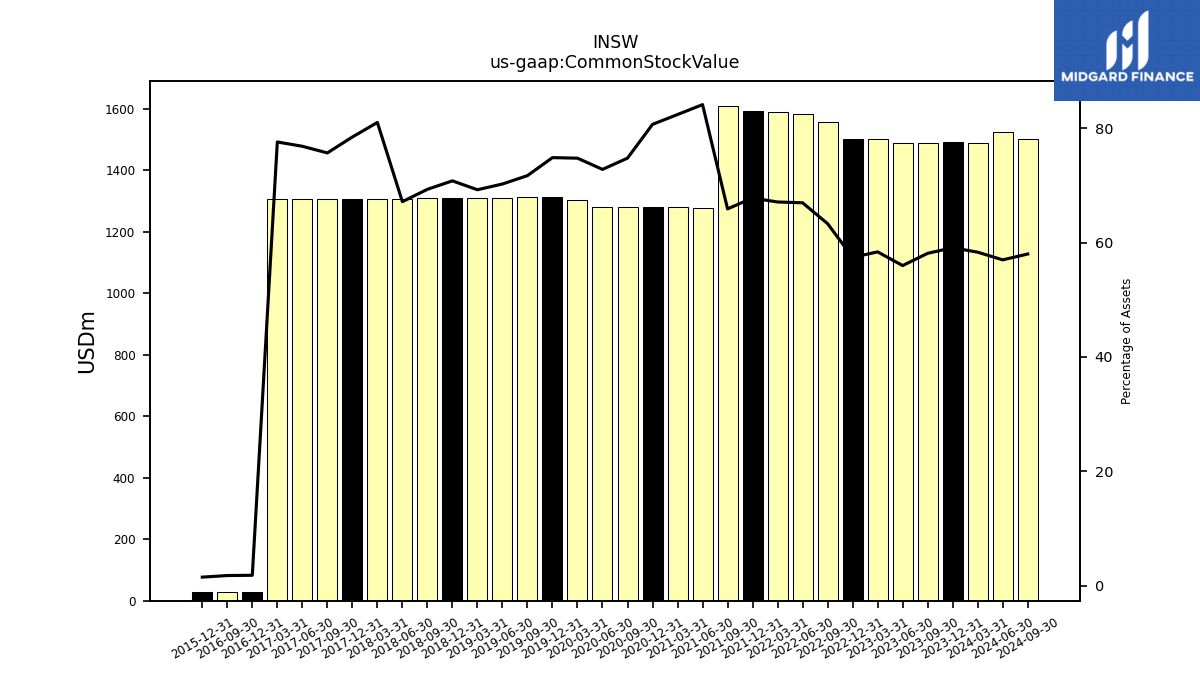
| Common Stock Value | 1488.53 | 1490.99 | 1489.04 | 1487.15 | 1501.52 | 1502.23 | 1557.88 | 1583.74 | 1588.61 | 1591.45 | 1609.60 | 1278.37 | 1279.37 | 1280.50 | 1280.81 | 1281.07 | 1301.94 | 1313.18 | 1311.81 | 1310.73 | 1309.88 | 1309.27 | 1308.31 | 1307.64 | 1306.87 | 1306.61 | 1305.53 | 1307.73 | 1306.75 | 29.82 | 29.82 | NA | NA | 29.82 | NA | NA | NA | |
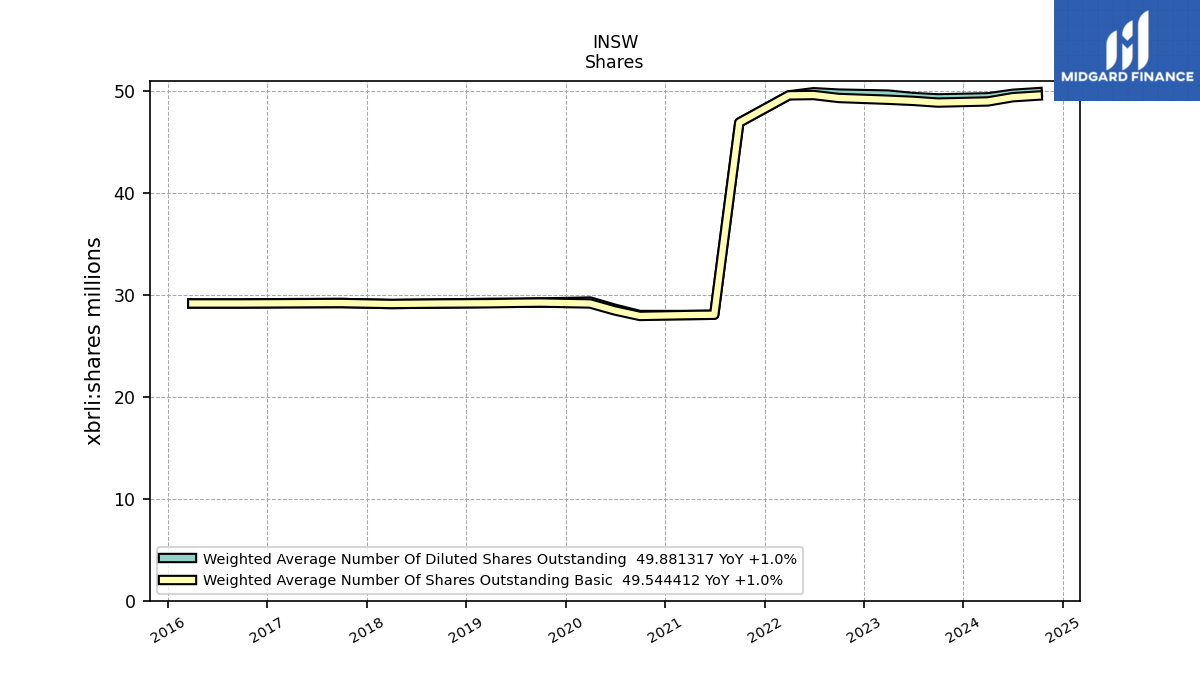
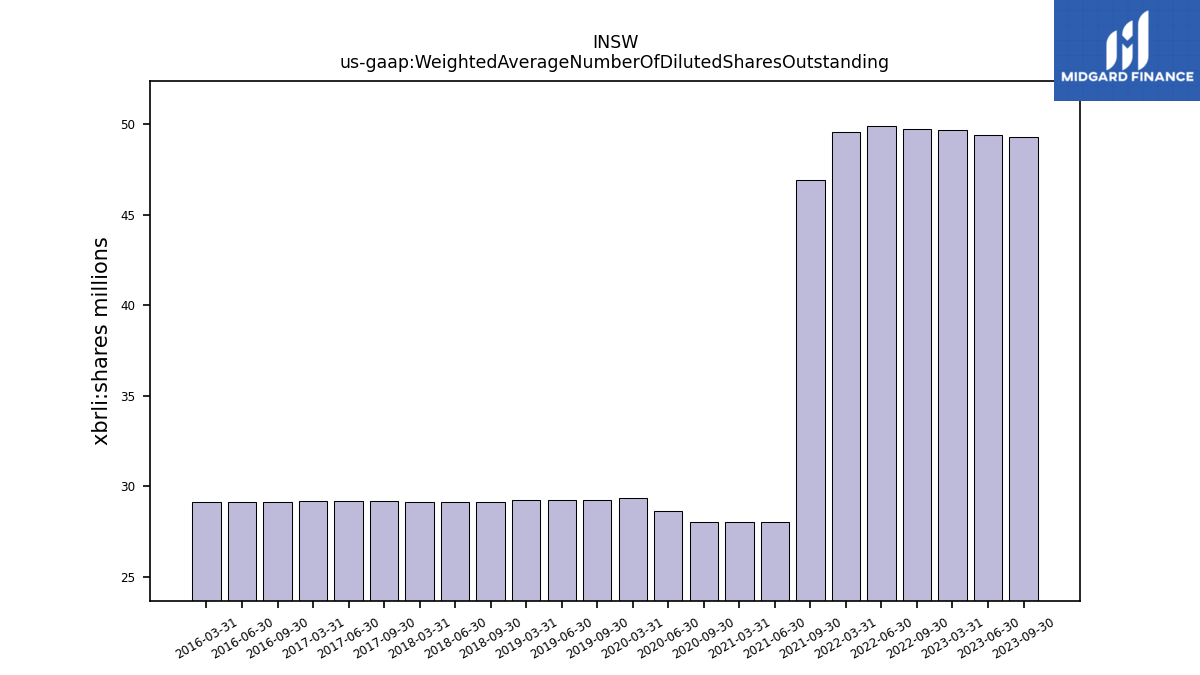
| Weighted Average Number Of Diluted Shares Outstanding | 49.38 | NA | 49.28 | 49.40 | 49.65 | NA | 49.74 | 49.88 | 49.57 | NA | 46.90 | 28.05 | 28.02 | NA | 28.03 | 28.64 | 29.35 | NA | 29.25 | 29.22 | 29.22 | NA | 29.15 | 29.13 | 29.11 | NA | 29.20 | 29.19 | 29.20 | NA | 29.16 | 29.16 | 29.16 | NA | NA | NA | NA | |
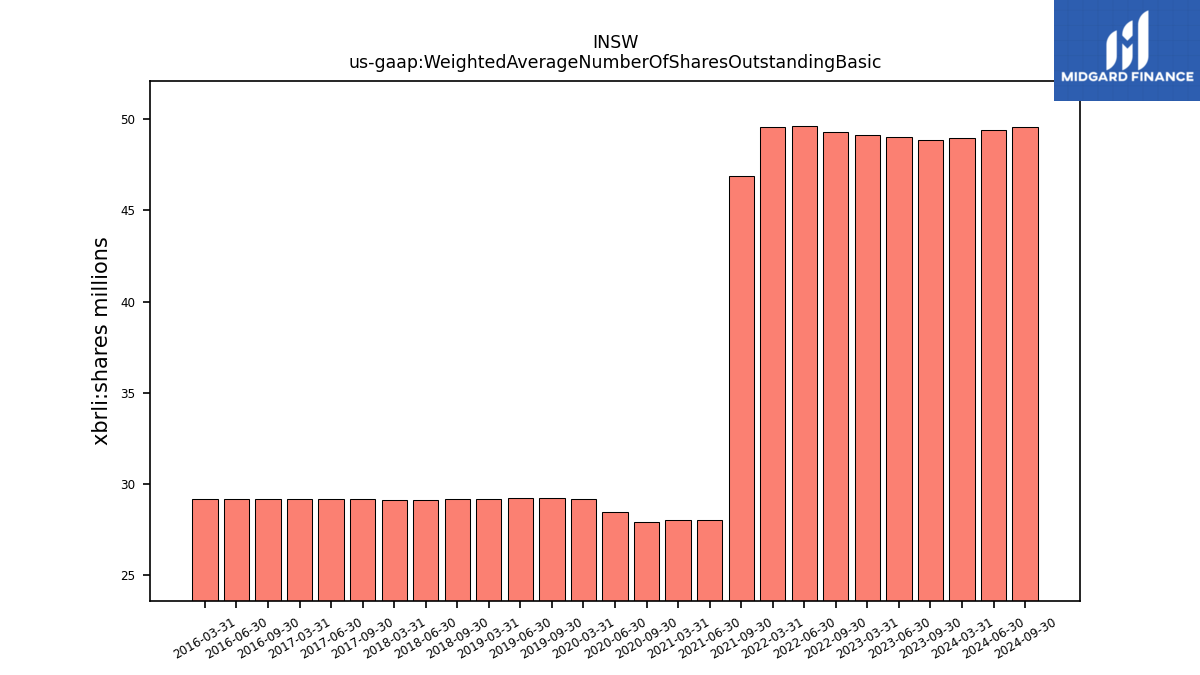
| Weighted Average Number Of Shares Outstanding Basic | 48.97 | NA | 48.86 | 49.03 | 49.14 | NA | 49.31 | 49.60 | 49.57 | NA | 46.90 | 28.05 | 28.02 | NA | 27.93 | 28.47 | 29.15 | NA | 29.25 | 29.22 | 29.18 | NA | 29.15 | 29.13 | 29.11 | NA | 29.20 | 29.19 | 29.18 | NA | 29.16 | 29.16 | 29.16 | NA | NA | NA | NA | |
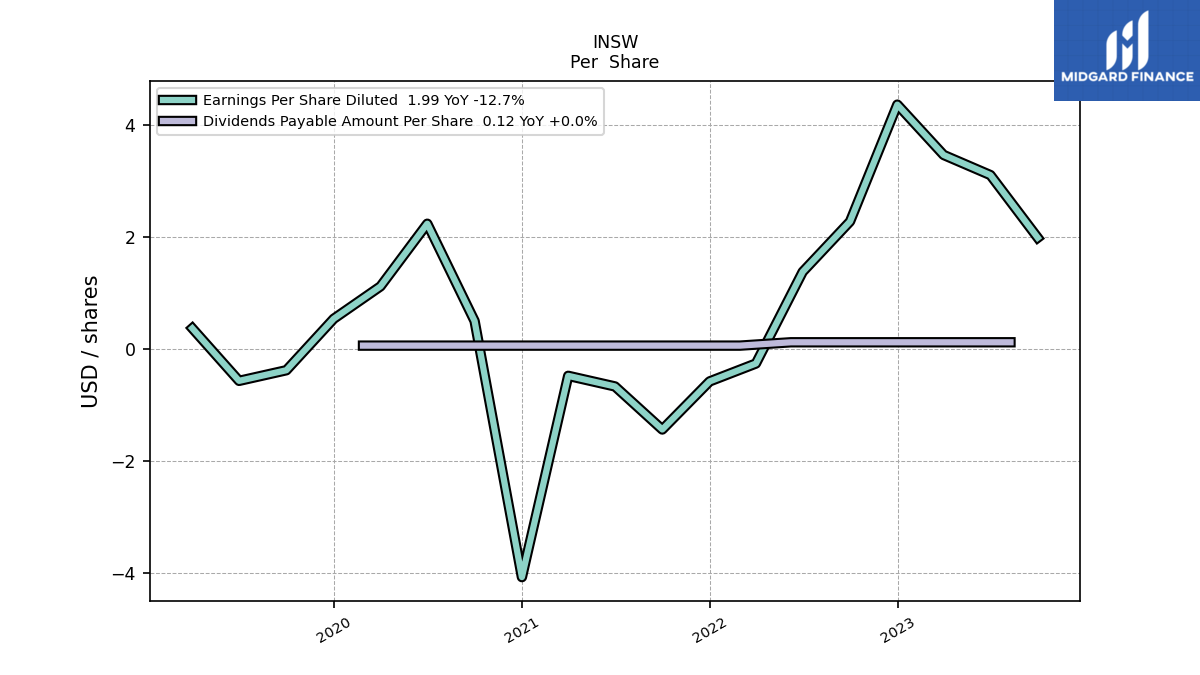
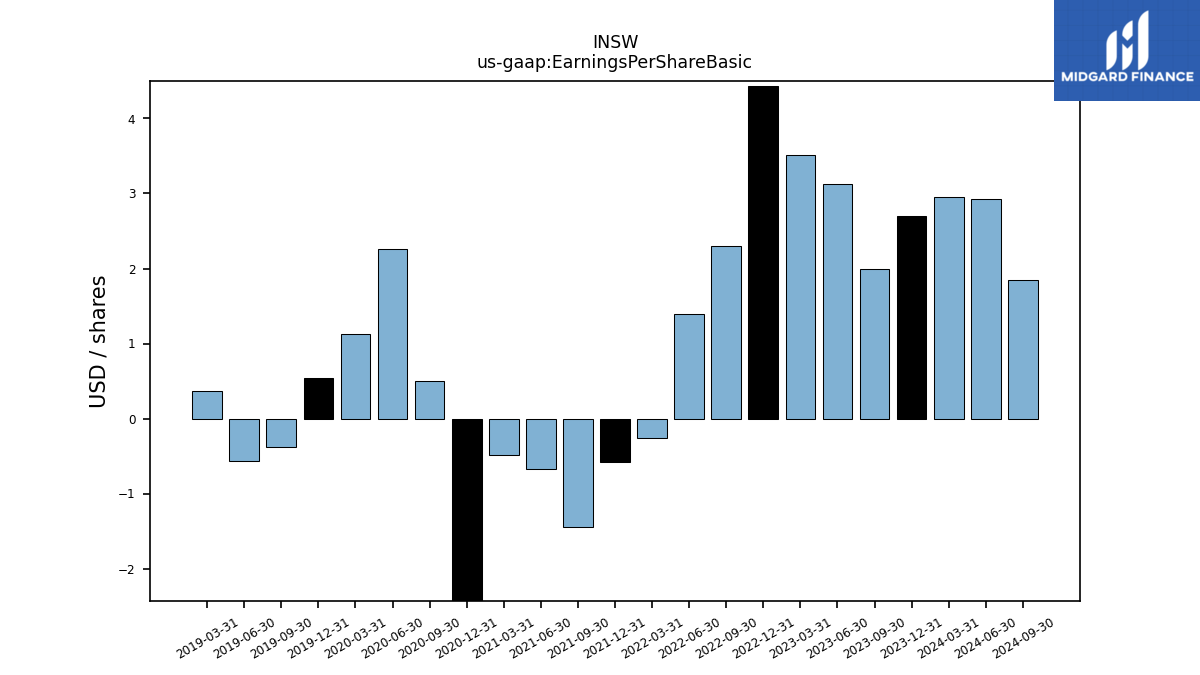
| Earnings Per Share Basic | 2.95 | 2.70 | 2.00 | 3.13 | 3.51 | 4.43 | 2.30 | 1.39 | -0.26 | -0.58 | -1.44 | -0.67 | -0.48 | -4.10 | 0.50 | 2.26 | 1.13 | 0.54 | -0.38 | -0.57 | 0.37 | NA | NA | NA | NA | NA | NA | NA | NA | NA | NA | NA | NA | NA | NA | NA | NA | |
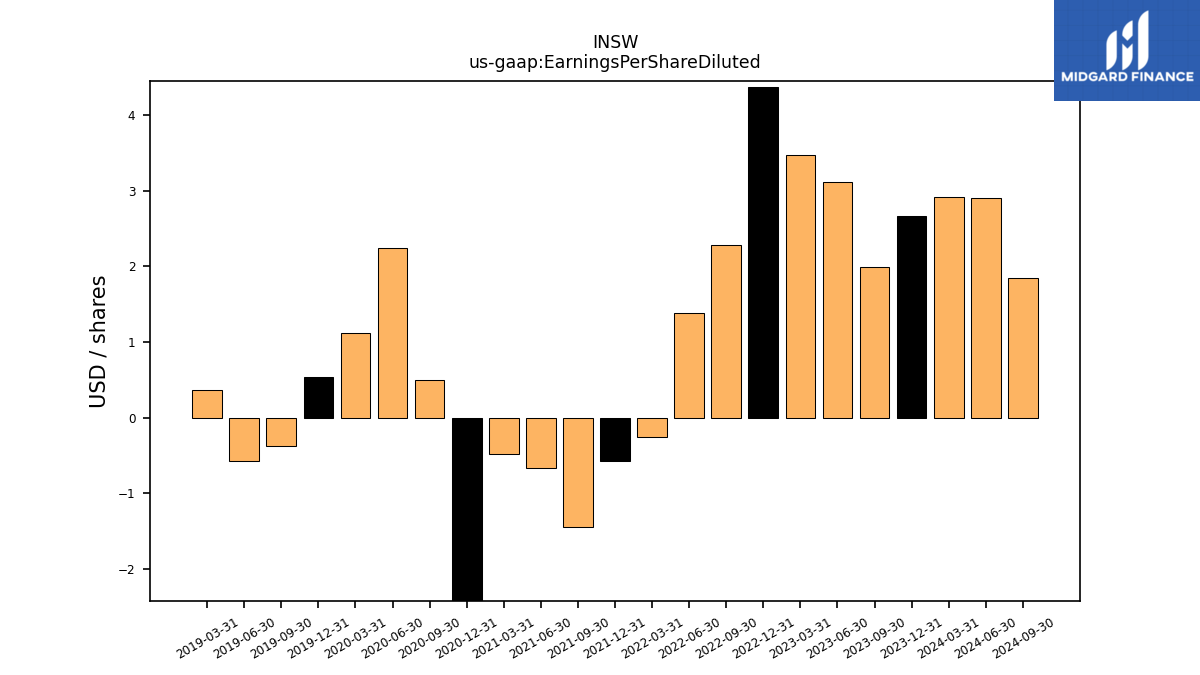
| Earnings Per Share Diluted | 2.92 | 2.67 | 1.99 | 3.11 | 3.47 | 4.37 | 2.28 | 1.38 | -0.26 | -0.58 | -1.44 | -0.67 | -0.48 | -4.08 | 0.50 | 2.24 | 1.12 | 0.54 | -0.38 | -0.57 | 0.37 | NA | NA | NA | NA | NA | NA | NA | NA | NA | NA | NA | NA | NA | NA | NA | NA |
| 2024-03-31 | 2023-12-31 | 2023-09-30 | 2023-06-30 | 2023-03-31 | 2022-12-31 | 2022-09-30 | 2022-06-30 | 2022-03-31 | 2021-12-31 | 2021-09-30 | 2021-06-30 | 2021-03-31 | 2020-12-31 | 2020-09-30 | 2020-06-30 | 2020-03-31 | 2019-12-31 | 2019-09-30 | 2019-06-30 | 2019-03-31 | 2018-12-31 | 2018-09-30 | 2018-06-30 | 2018-03-31 | 2017-12-31 | 2017-09-30 | 2017-06-30 | 2017-03-31 | 2016-12-31 | 2016-09-30 | 2016-06-30 | 2016-03-31 | 2015-12-31 | 2015-09-30 | 2015-06-30 | 2015-03-31 | ||
|---|---|---|---|---|---|---|---|---|---|---|---|---|---|---|---|---|---|---|---|---|---|---|---|---|---|---|---|---|---|---|---|---|---|---|---|---|---|---|
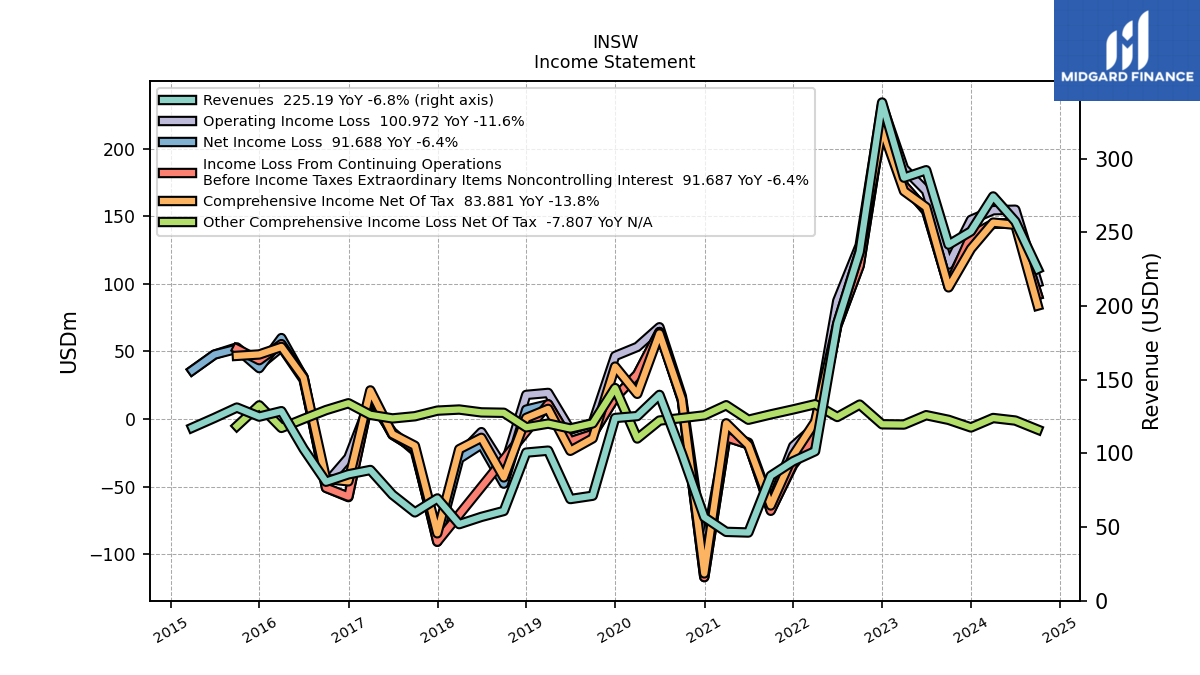
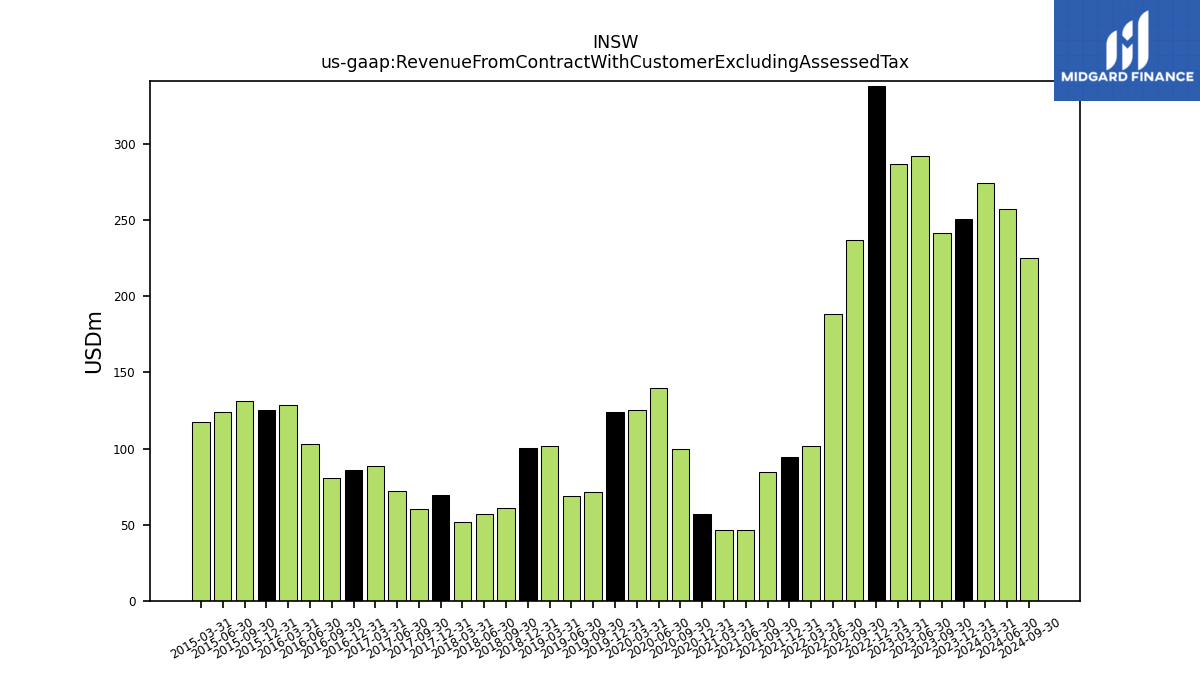
| Revenue From Contract With Customer Excluding Assessed Tax | 274.40 | 250.73 | 241.71 | 292.20 | 287.13 | 338.16 | 236.83 | 188.20 | 101.48 | 94.67 | 84.82 | 46.30 | 46.76 | 56.70 | 99.88 | 139.72 | 125.34 | 124.02 | 71.28 | 69.01 | 101.87 | 100.55 | 60.93 | 56.91 | 51.98 | 69.43 | 59.97 | 71.96 | 88.75 | 85.81 | 80.77 | 103.06 | 128.68 | 124.97 | 131.12 | 124.09 | 117.45 | |
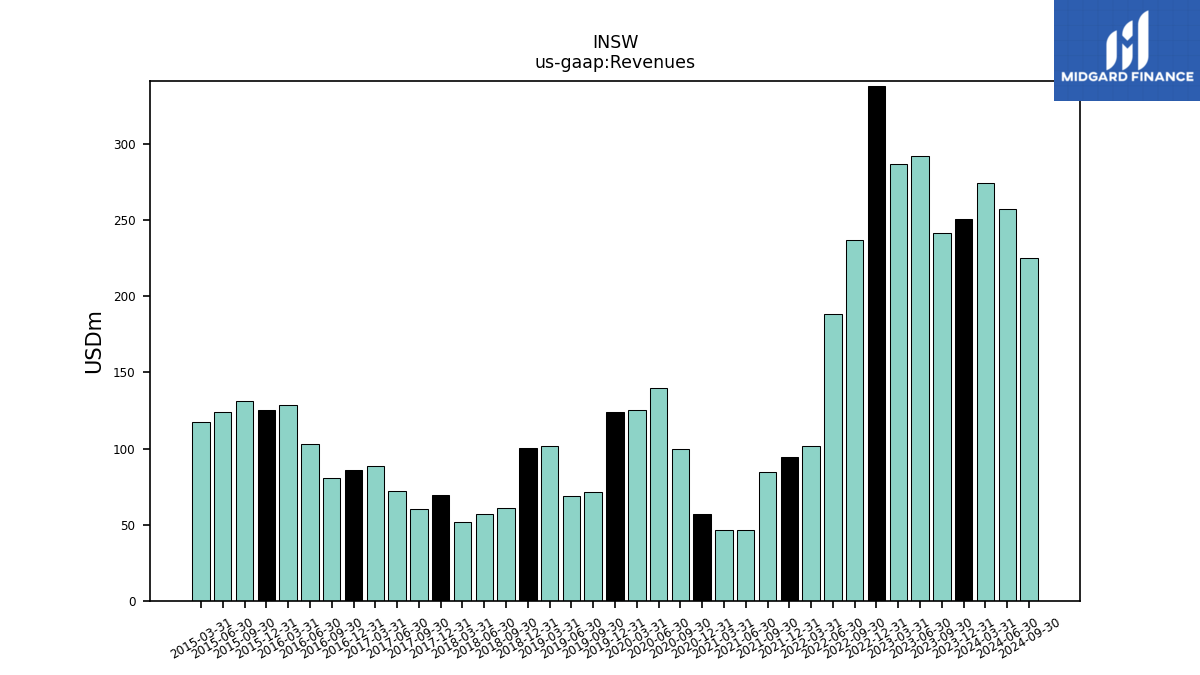
| Revenues | 274.40 | 250.73 | 241.71 | 292.20 | 287.13 | 338.16 | 236.83 | 188.20 | 101.48 | 94.67 | 84.82 | 46.30 | 46.76 | 56.70 | 99.88 | 139.72 | 125.34 | 124.02 | 71.28 | 69.01 | 101.87 | 100.55 | 60.93 | 56.91 | 51.98 | 69.43 | 59.97 | 71.96 | 88.75 | 85.81 | 80.77 | 103.06 | 128.68 | 124.97 | 131.12 | 124.09 | 117.45 | |
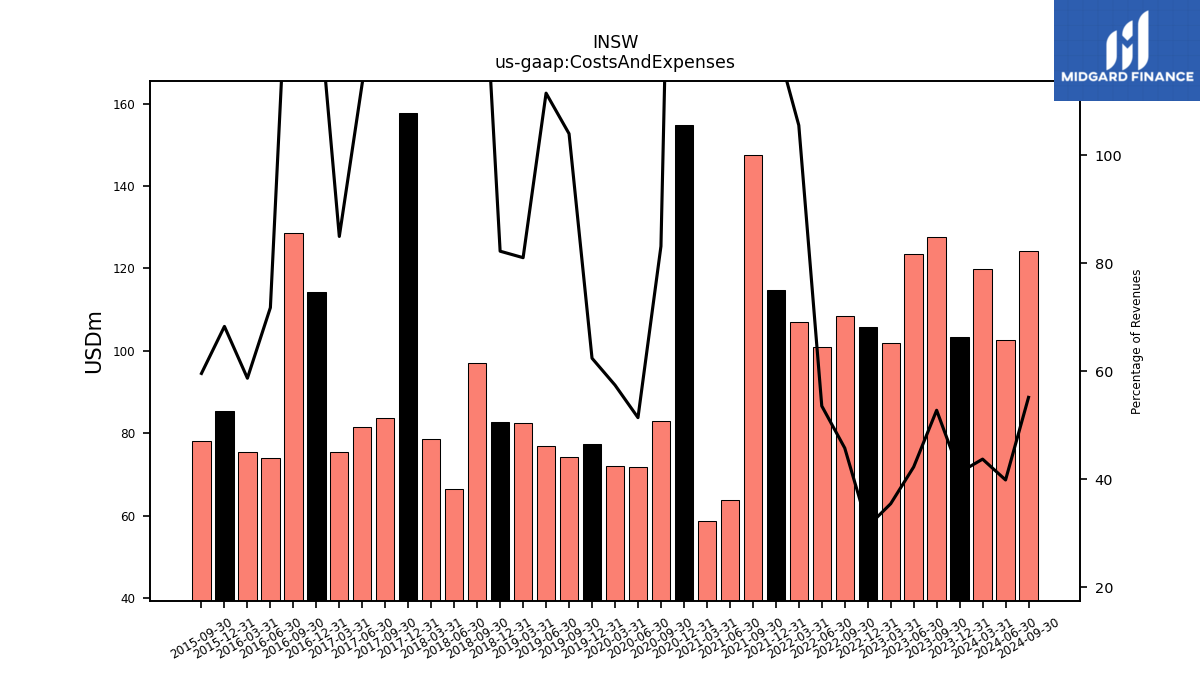
| Costs And Expenses | 119.98 | 103.44 | 127.55 | 123.53 | 101.83 | 105.66 | 108.42 | 100.81 | 107.11 | 114.72 | 147.64 | 63.72 | 58.60 | 154.90 | 83.05 | 71.83 | 71.99 | 77.40 | 74.12 | 76.94 | 82.55 | 82.68 | 96.95 | 66.58 | 78.68 | 157.60 | 83.72 | 81.60 | 75.41 | 114.32 | 128.53 | 73.98 | 75.55 | 85.36 | 78.14 | NA | NA | |
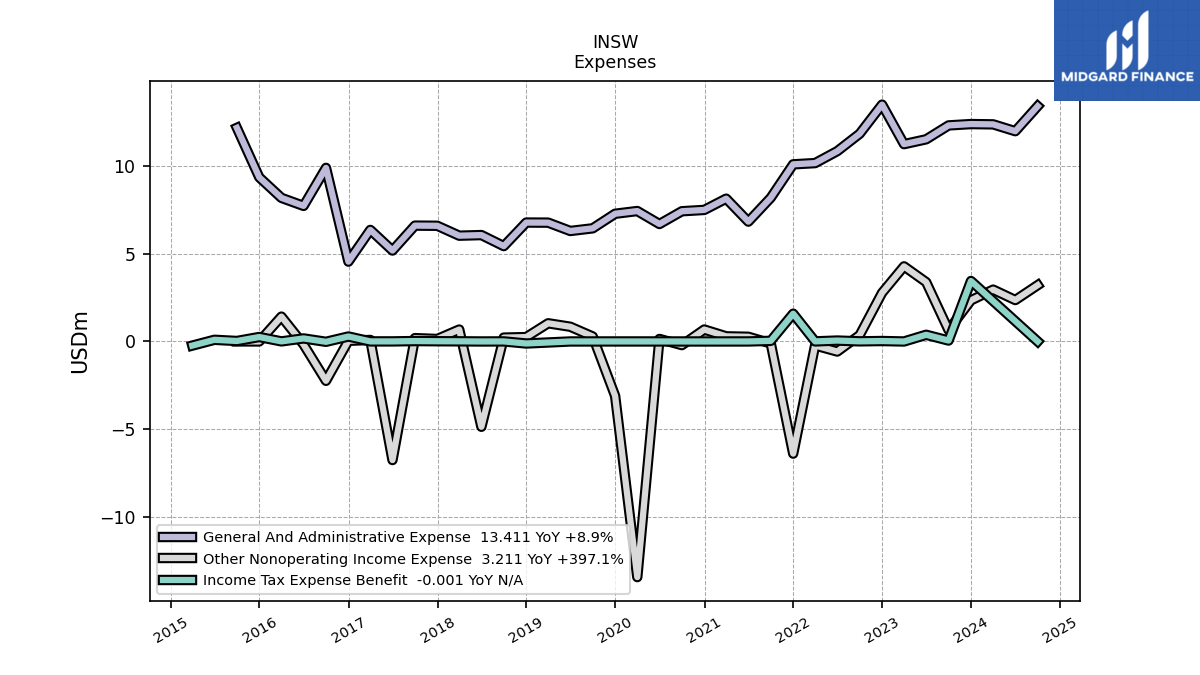
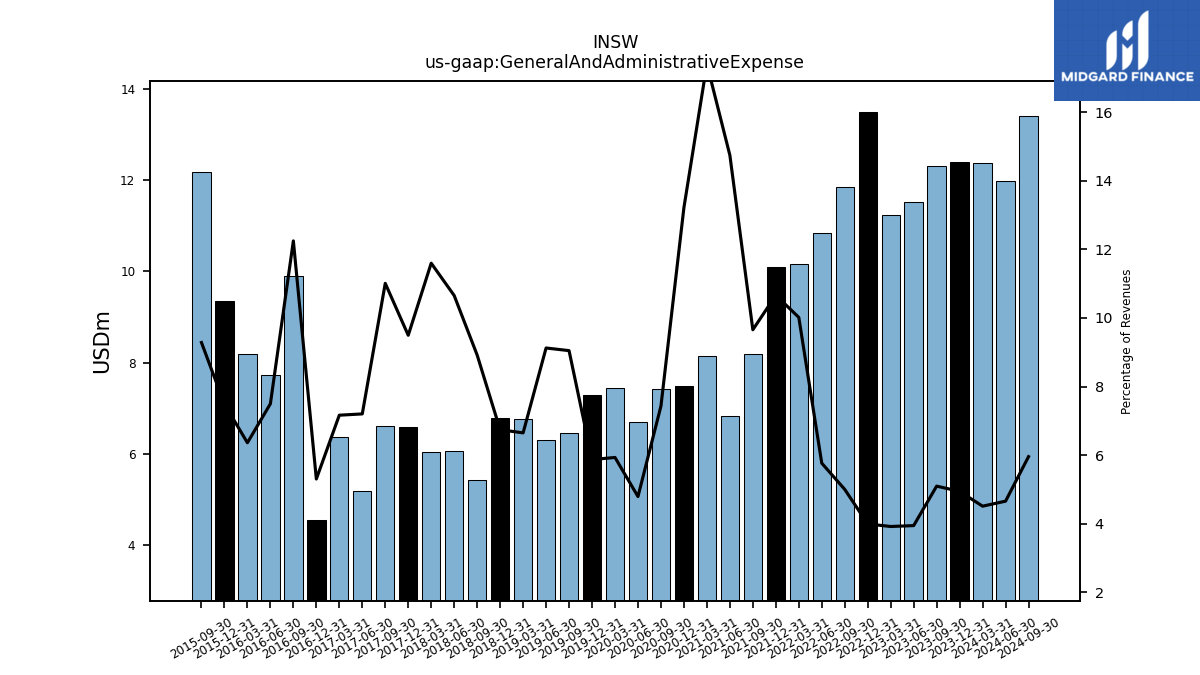
| General And Administrative Expense | 12.37 | 12.39 | 12.31 | 11.52 | 11.25 | 13.50 | 11.84 | 10.85 | 10.17 | 10.10 | 8.19 | 6.83 | 8.14 | 7.50 | 7.42 | 6.69 | 7.43 | 7.28 | 6.45 | 6.30 | 6.77 | 6.78 | 5.43 | 6.06 | 6.03 | 6.59 | 6.60 | 5.18 | 6.36 | 4.55 | 9.89 | 7.73 | 8.18 | 9.36 | 12.17 | NA | NA | |
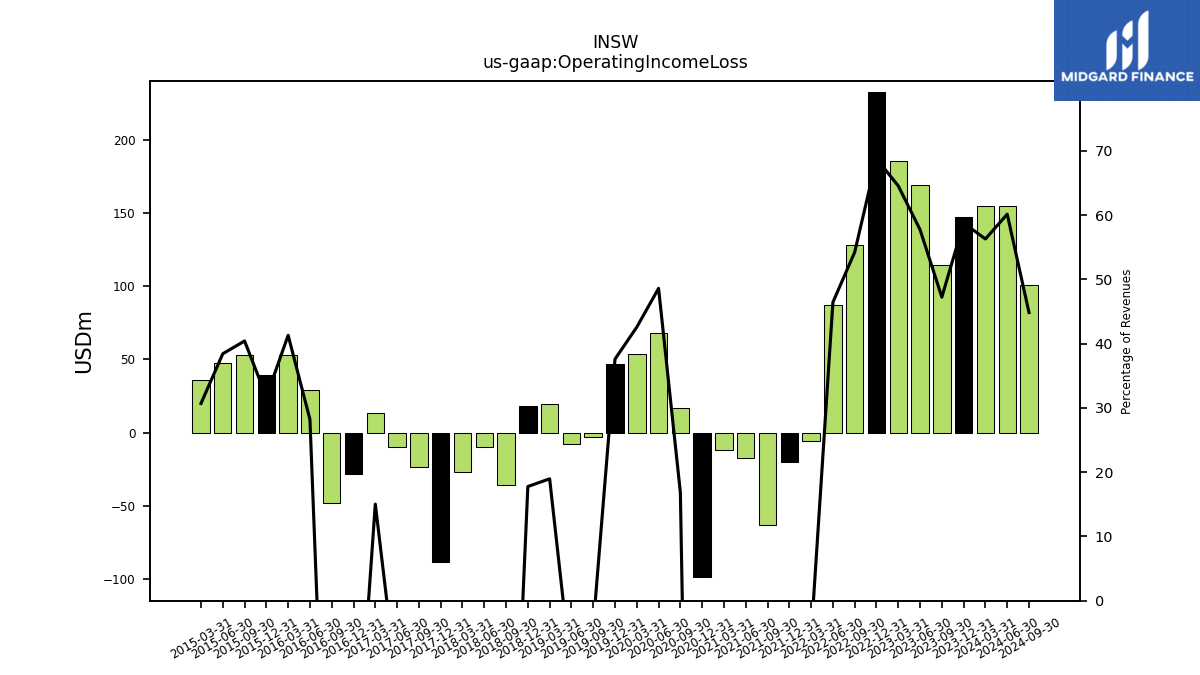
| Operating Income Loss | 154.42 | 147.30 | 114.16 | 168.68 | 185.30 | 232.49 | 128.41 | 87.38 | -5.63 | -20.05 | -62.82 | -17.42 | -11.85 | -98.19 | 16.83 | 67.89 | 53.35 | 46.62 | -2.84 | -7.93 | 19.32 | 17.86 | -36.02 | -9.67 | -26.71 | -88.18 | -23.75 | -9.64 | 13.34 | -28.51 | -47.76 | 29.08 | 53.13 | 39.61 | 52.98 | 47.68 | 36.05 | |
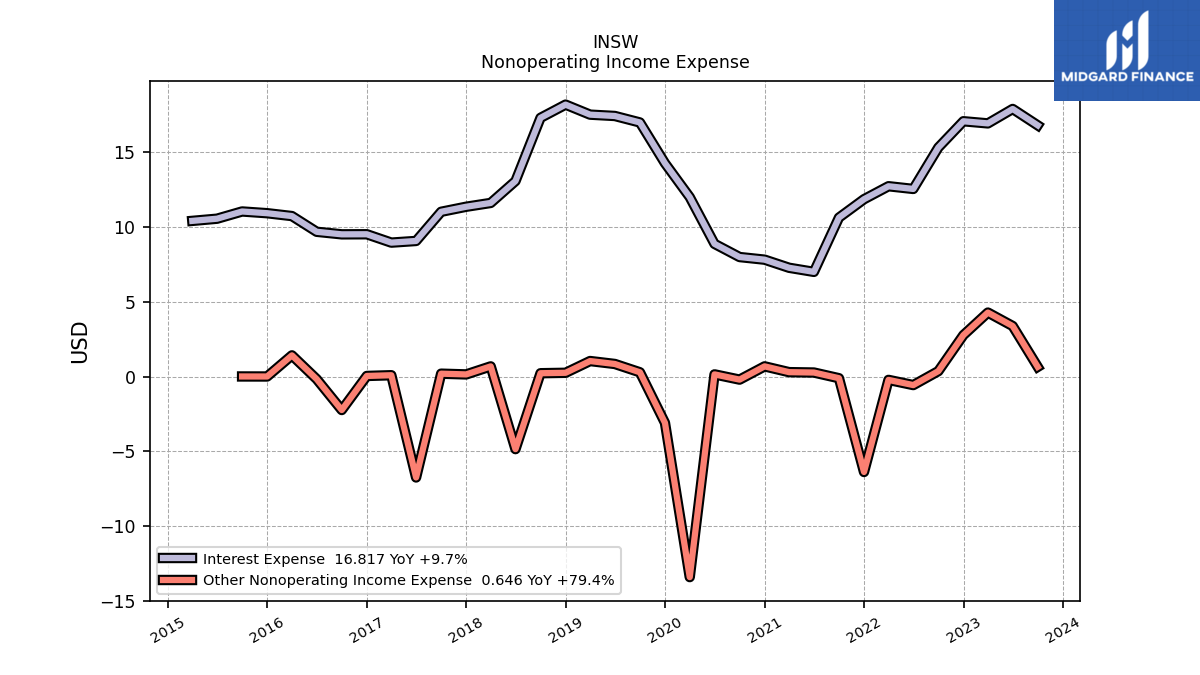
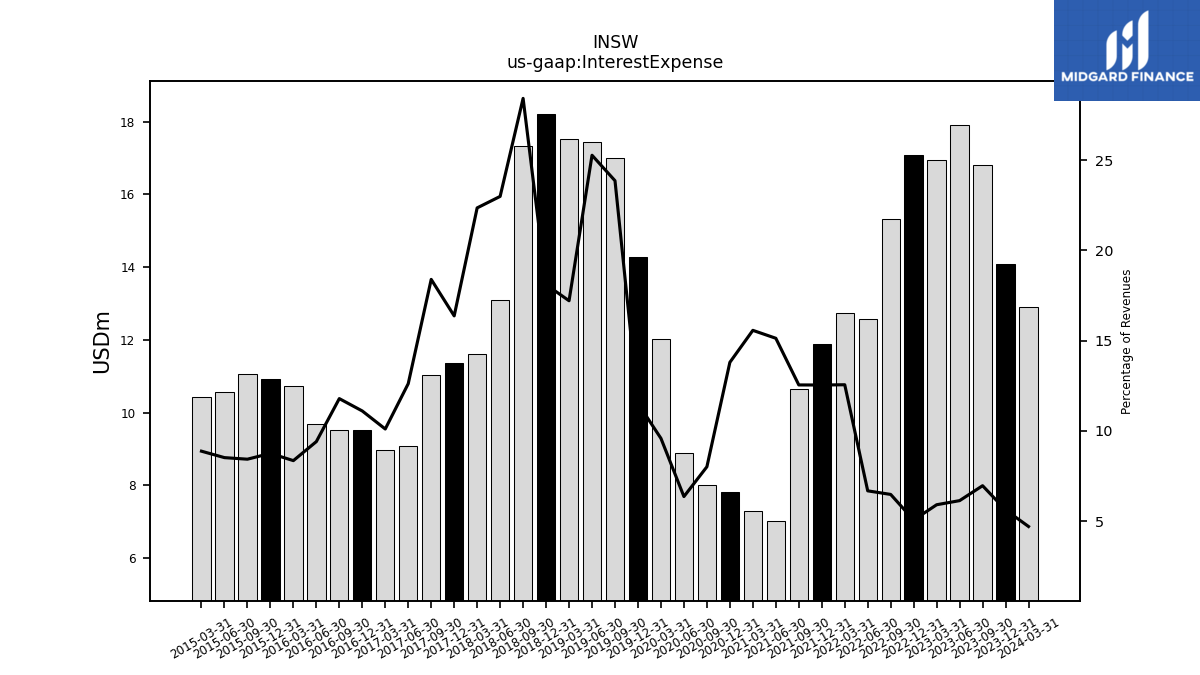
| Interest Expense | 12.89 | 14.08 | 16.82 | 17.91 | 16.95 | 17.09 | 15.33 | 12.56 | 12.74 | 11.87 | 10.64 | 7.01 | 7.28 | 7.82 | 8.00 | 8.88 | 12.01 | 14.28 | 17.01 | 17.44 | 17.53 | 18.20 | 17.32 | 13.09 | 11.62 | 11.37 | 11.03 | 9.08 | 8.96 | 9.53 | 9.52 | 9.69 | 10.74 | 10.93 | 11.05 | 10.57 | 10.42 | |
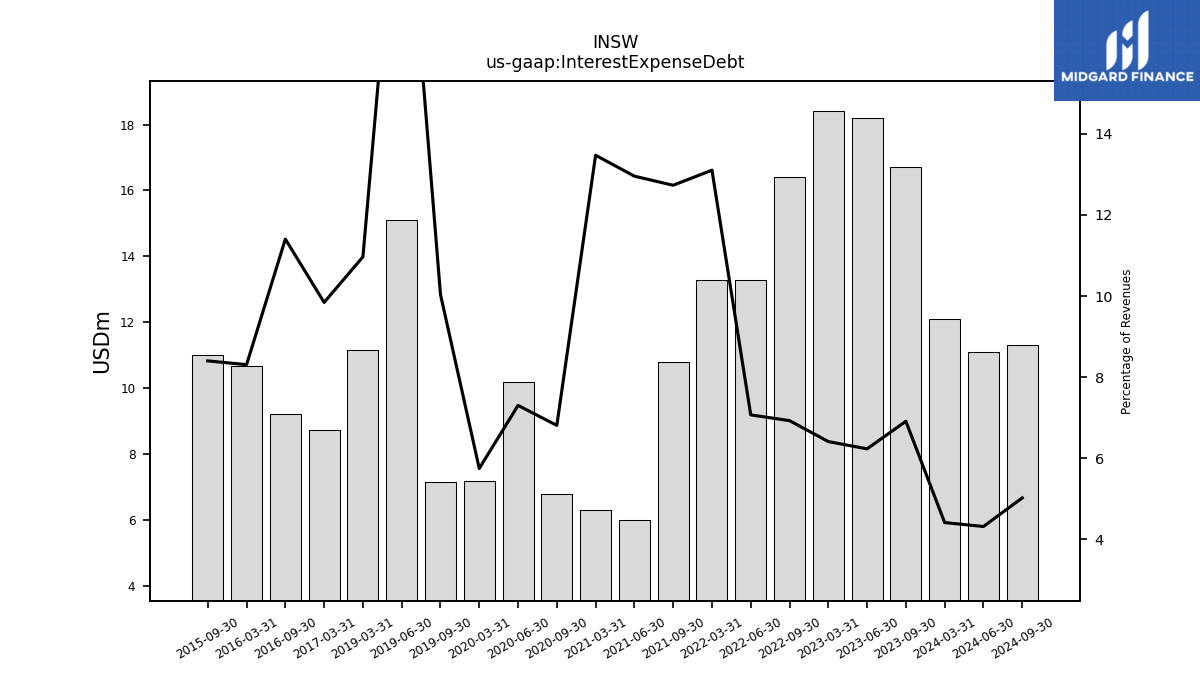
| Interest Expense Debt | 12.10 | NA | 16.70 | 18.20 | 18.40 | NA | 16.40 | 13.30 | 13.30 | NA | 10.80 | 6.00 | 6.30 | NA | 6.80 | 10.20 | 7.20 | NA | 7.16 | 15.10 | 11.17 | NA | NA | NA | NA | NA | NA | NA | 8.73 | NA | 9.21 | NA | 10.69 | NA | 11.01 | NA | NA | |
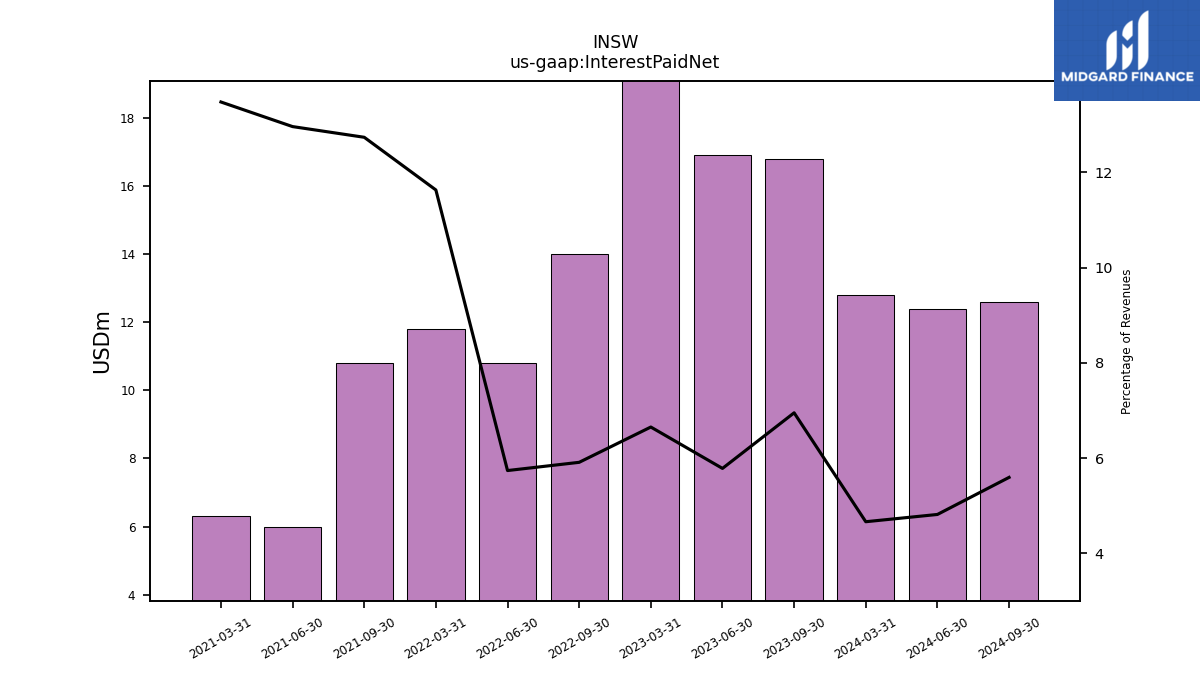
| Interest Paid Net | 12.80 | NA | 16.80 | 16.90 | 19.10 | NA | 14.00 | 10.80 | 11.80 | NA | 10.80 | 6.00 | 6.30 | NA | NA | NA | NA | NA | NA | NA | NA | NA | NA | NA | NA | NA | NA | NA | NA | NA | NA | NA | NA | NA | NA | NA | NA | |
| Gains Losses On Extinguishment Of Debt | NA | 0.00 | NA | NA | NA | NA | NA | NA | NA | NA | NA | NA | NA | -0.00 | -0.18 | -0.02 | -0.99 | -1.00 | -0.10 | NA | NA | 0.00 | NA | NA | NA | NA | NA | NA | NA | NA | NA | NA | NA | NA | NA | NA | NA | |
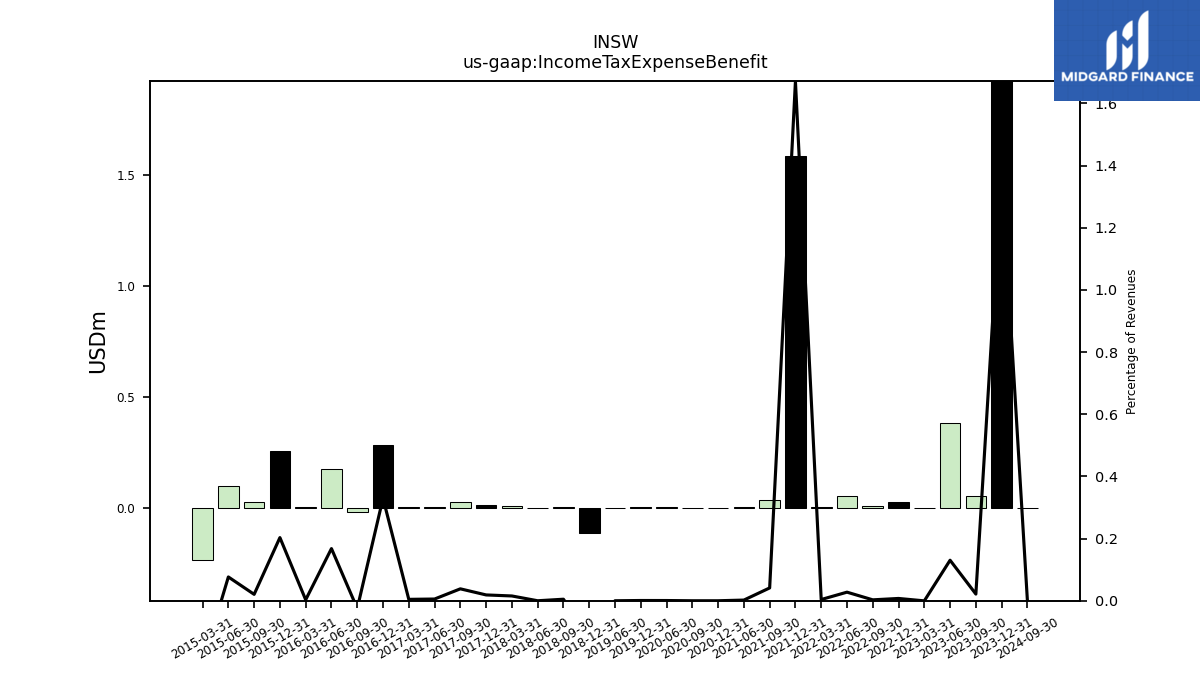
| Income Tax Expense Benefit | NA | 3.45 | 0.05 | 0.38 | -0.00 | 0.03 | 0.01 | 0.05 | 0.00 | 1.58 | 0.04 | 0.00 | NA | 0.00 | 0.00 | 0.00 | NA | 0.00 | NA | 0.00 | NA | -0.12 | 0.00 | 0.00 | 0.01 | 0.01 | 0.02 | 0.00 | 0.00 | 0.28 | -0.02 | 0.17 | 0.00 | 0.25 | 0.03 | 0.10 | -0.24 | |
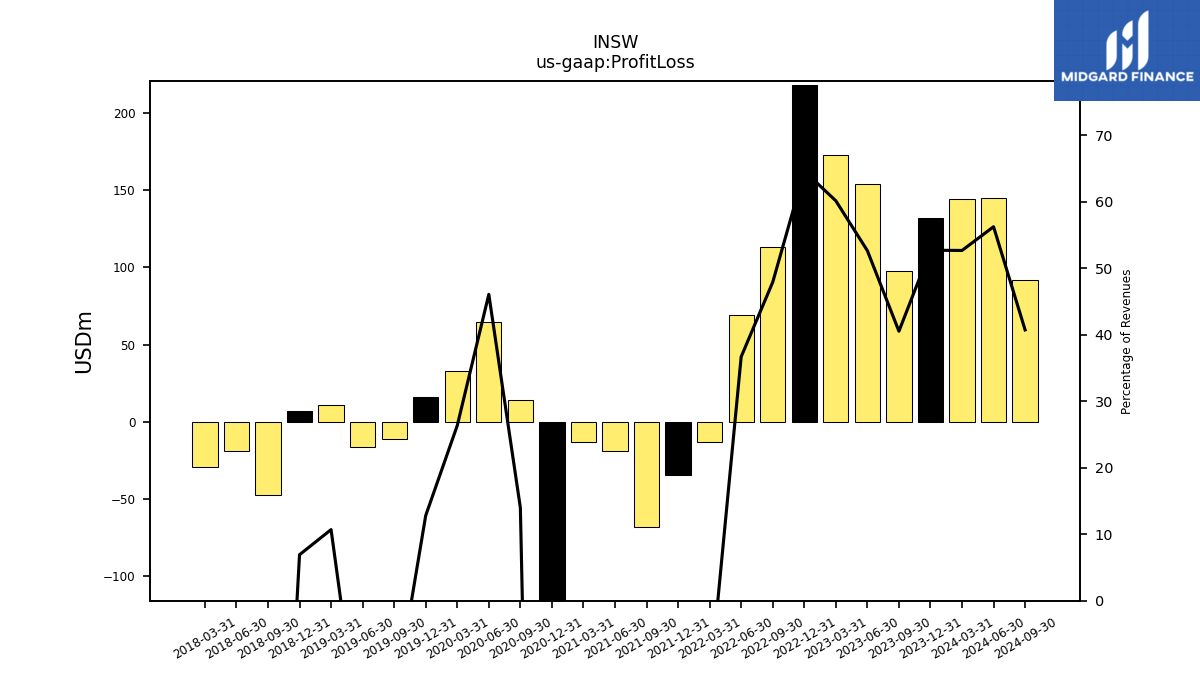
| Profit Loss | 144.49 | 132.11 | 97.94 | 153.76 | 172.63 | 218.43 | 113.43 | 69.04 | -13.00 | -34.63 | -67.88 | -18.78 | -13.37 | -116.89 | 13.98 | 64.36 | 33.02 | 15.89 | -11.10 | -16.52 | 10.90 | 6.96 | -47.79 | -18.80 | -29.32 | NA | NA | NA | NA | NA | NA | NA | NA | NA | NA | NA | NA | |
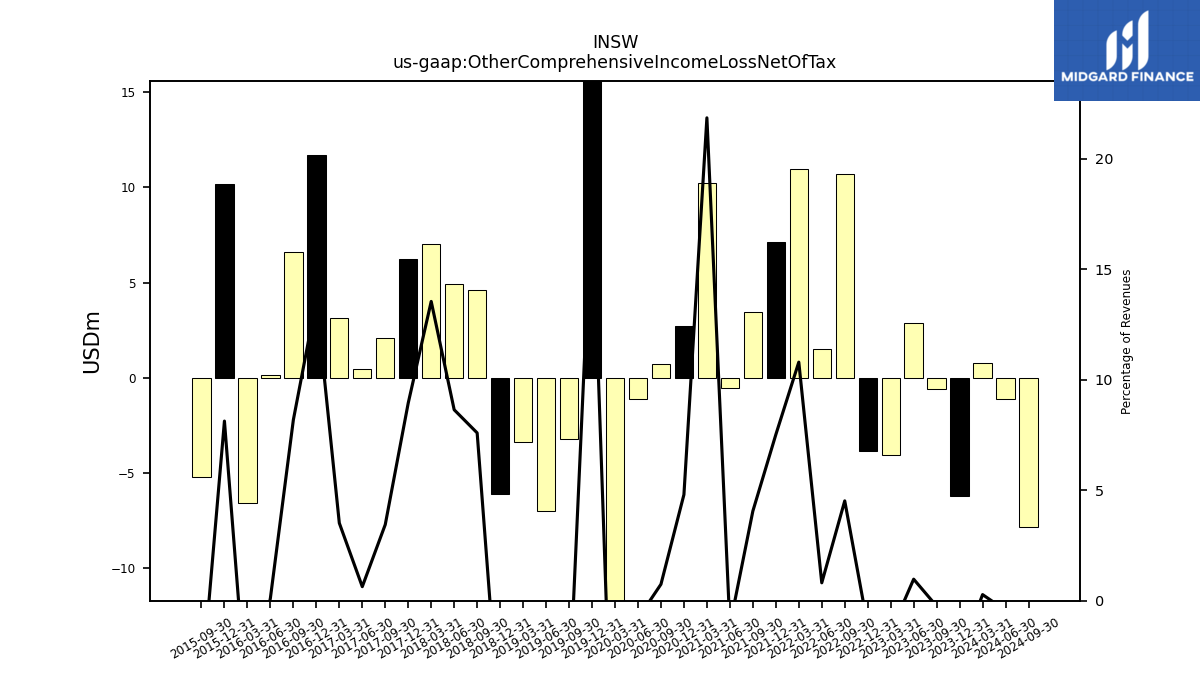
| Other Comprehensive Income Loss Net Of Tax | 0.76 | -6.22 | -0.60 | 2.85 | -4.06 | -3.87 | 10.71 | 1.53 | 10.96 | 7.12 | 3.44 | -0.52 | 10.22 | 2.72 | 0.74 | -1.12 | -14.39 | 22.91 | -3.20 | -6.98 | -3.38 | -6.11 | 4.63 | 4.92 | 7.04 | 6.21 | 2.07 | 0.46 | 3.12 | 11.68 | 6.61 | 0.12 | -6.56 | 10.16 | -5.20 | NA | NA | |
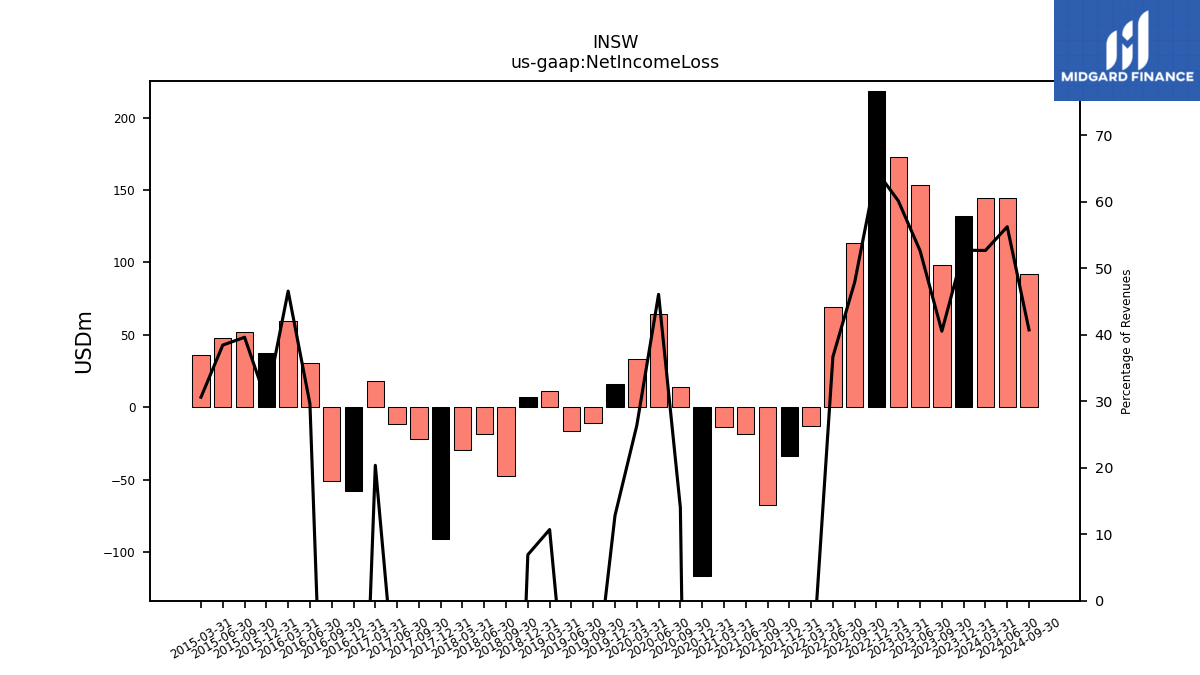
| Net Income Loss | 144.49 | 132.11 | 97.94 | 153.76 | 172.63 | 218.43 | 113.43 | 69.04 | -13.00 | -33.99 | -67.35 | -18.78 | -13.37 | -116.89 | 13.98 | 64.36 | 33.02 | 15.89 | -11.10 | -16.52 | 10.90 | 6.96 | -47.79 | -18.80 | -29.32 | -90.72 | -21.82 | -11.62 | 18.07 | -57.76 | -50.86 | 30.51 | 59.89 | 37.61 | 51.93 | 47.69 | 35.94 | |
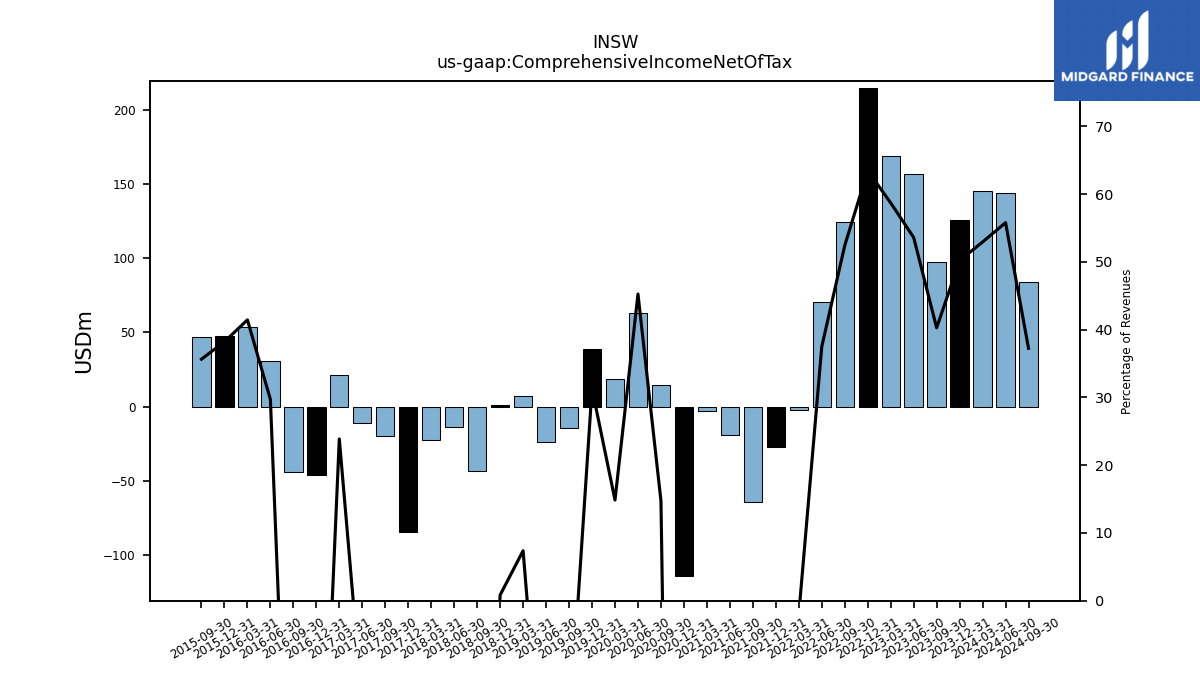
| Comprehensive Income Net Of Tax | 145.25 | 125.89 | 97.34 | 156.62 | 168.57 | 214.56 | 124.13 | 70.56 | -2.04 | -26.88 | -63.91 | -19.31 | -3.15 | -114.17 | 14.73 | 63.24 | 18.63 | 38.80 | -14.30 | -23.50 | 7.52 | 0.85 | -43.16 | -13.88 | -22.27 | -84.51 | -19.75 | -11.16 | 21.19 | -46.07 | -44.25 | 30.63 | 53.33 | 47.77 | 46.73 | NA | NA | |
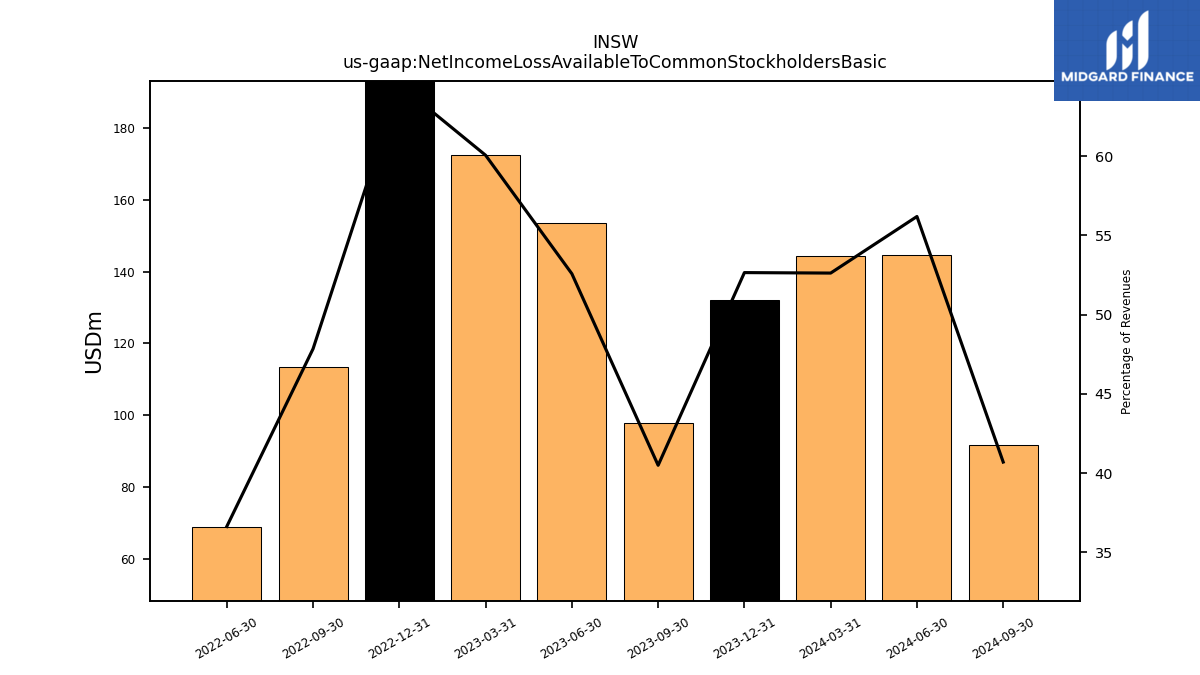
| Net Income Loss Available To Common Stockholders Basic | 144.41 | 132.03 | 97.88 | 153.66 | 172.47 | 218.17 | 113.31 | 68.94 | NA | NA | NA | NA | NA | NA | NA | NA | NA | NA | NA | NA | NA | NA | NA | NA | NA | NA | NA | NA | NA | NA | NA | NA | NA | NA | NA | NA | NA | |
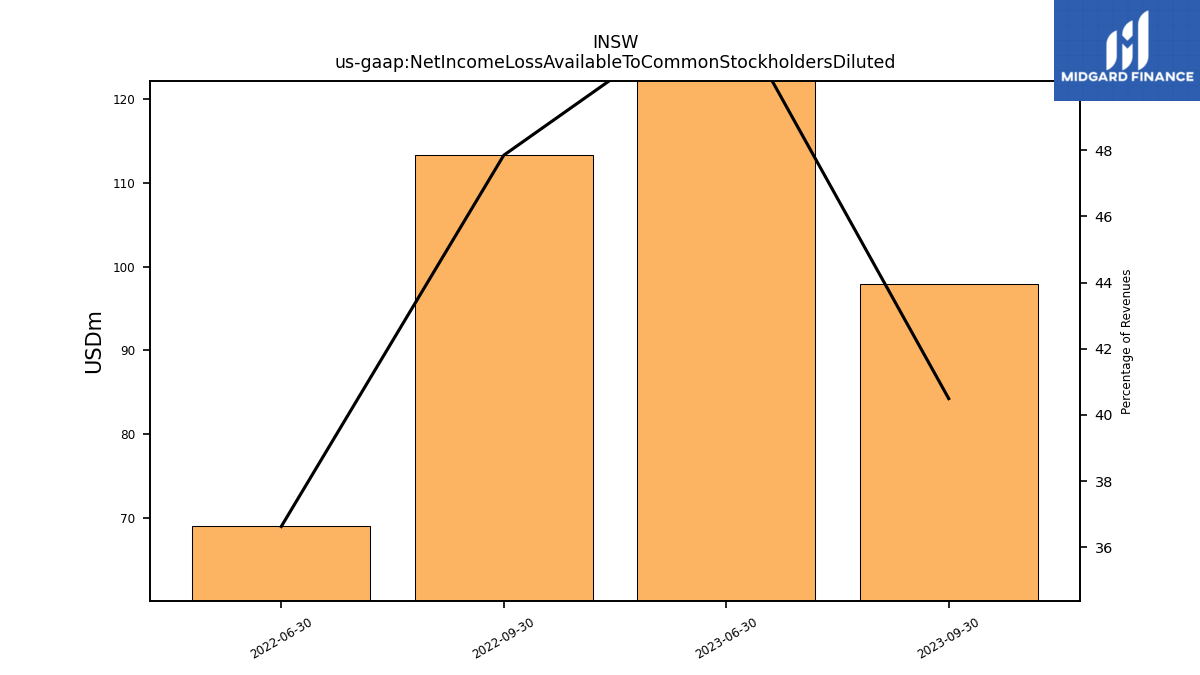
| Net Income Loss Available To Common Stockholders Diluted | NA | 132.03 | 97.88 | 153.66 | NA | 218.17 | 113.31 | 68.94 | NA | NA | NA | NA | NA | NA | NA | NA | NA | NA | NA | NA | NA | NA | NA | NA | NA | NA | NA | NA | NA | NA | NA | NA | NA | NA | NA | NA | NA |
| 2024-03-31 | 2023-12-31 | 2023-09-30 | 2023-06-30 | 2023-03-31 | 2022-12-31 | 2022-09-30 | 2022-06-30 | 2022-03-31 | 2021-12-31 | 2021-09-30 | 2021-06-30 | 2021-03-31 | 2020-12-31 | 2020-09-30 | 2020-06-30 | 2020-03-31 | 2019-12-31 | 2019-09-30 | 2019-06-30 | 2019-03-31 | 2018-12-31 | 2018-09-30 | 2018-06-30 | 2018-03-31 | 2017-12-31 | 2017-09-30 | 2017-06-30 | 2017-03-31 | 2016-12-31 | 2016-09-30 | 2016-06-30 | 2016-03-31 | 2015-12-31 | 2015-09-30 | 2015-06-30 | 2015-03-31 | ||
|---|---|---|---|---|---|---|---|---|---|---|---|---|---|---|---|---|---|---|---|---|---|---|---|---|---|---|---|---|---|---|---|---|---|---|---|---|---|---|
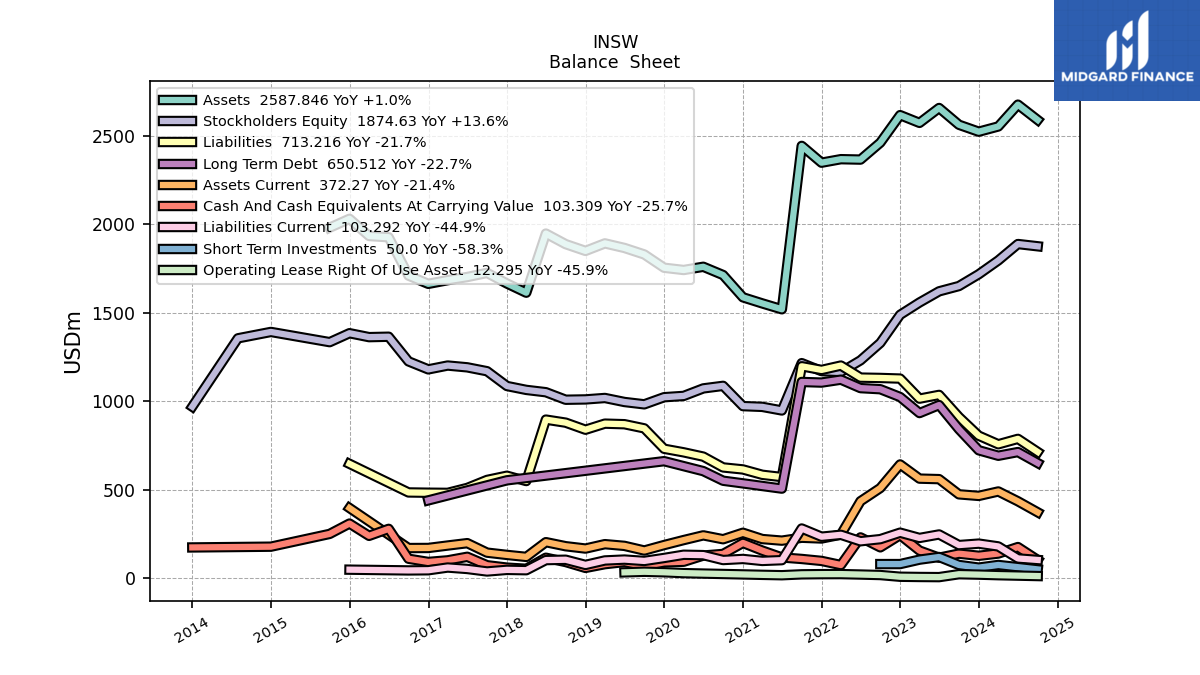
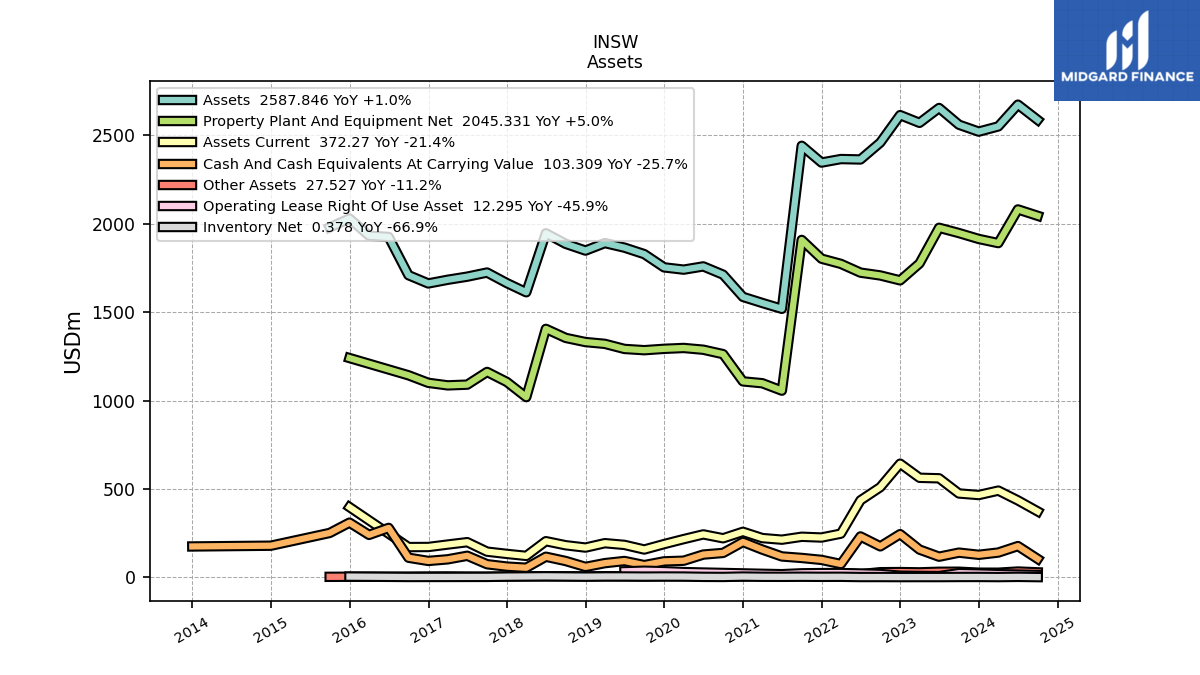
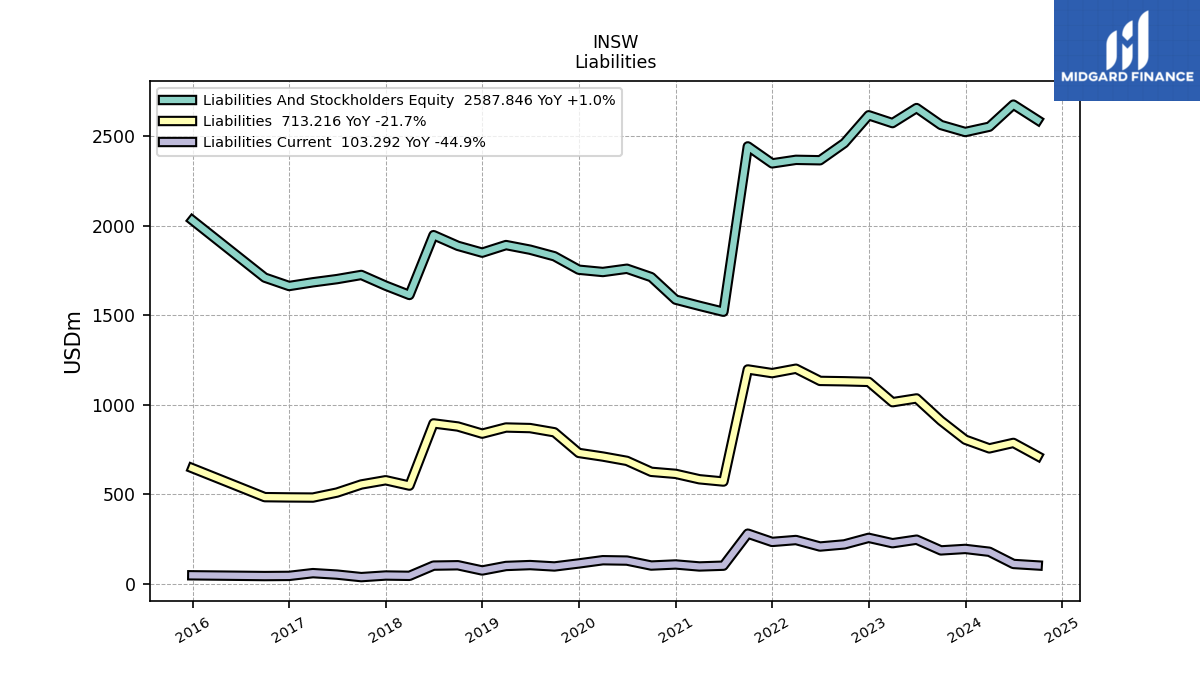
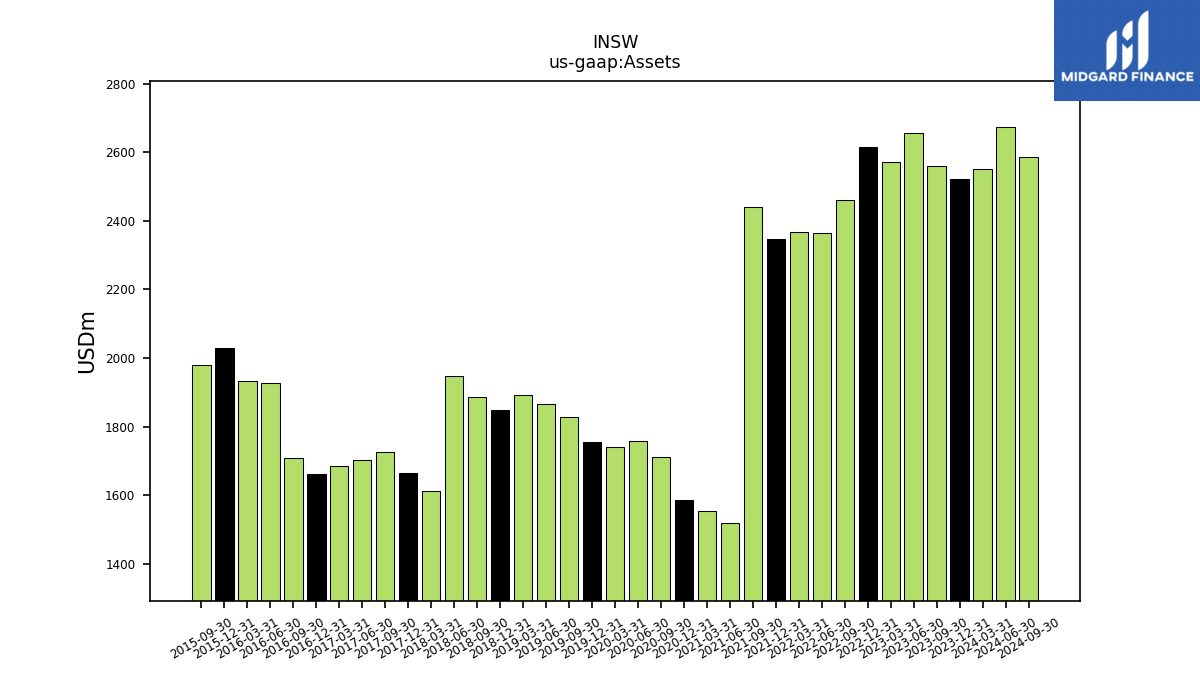
| Assets | 2551.42 | 2521.82 | 2561.02 | 2655.66 | 2571.53 | 2615.33 | 2459.90 | 2364.24 | 2366.59 | 2346.78 | 2441.83 | 1518.87 | 1552.05 | 1586.54 | 1712.31 | 1758.96 | 1740.73 | 1753.50 | 1828.55 | 1865.21 | 1891.07 | 1848.60 | 1886.71 | 1946.48 | 1612.47 | 1664.48 | 1724.33 | 1701.09 | 1683.33 | 1662.52 | 1709.31 | 1925.68 | 1932.79 | 2029.95 | 1979.69 | NA | NA | |
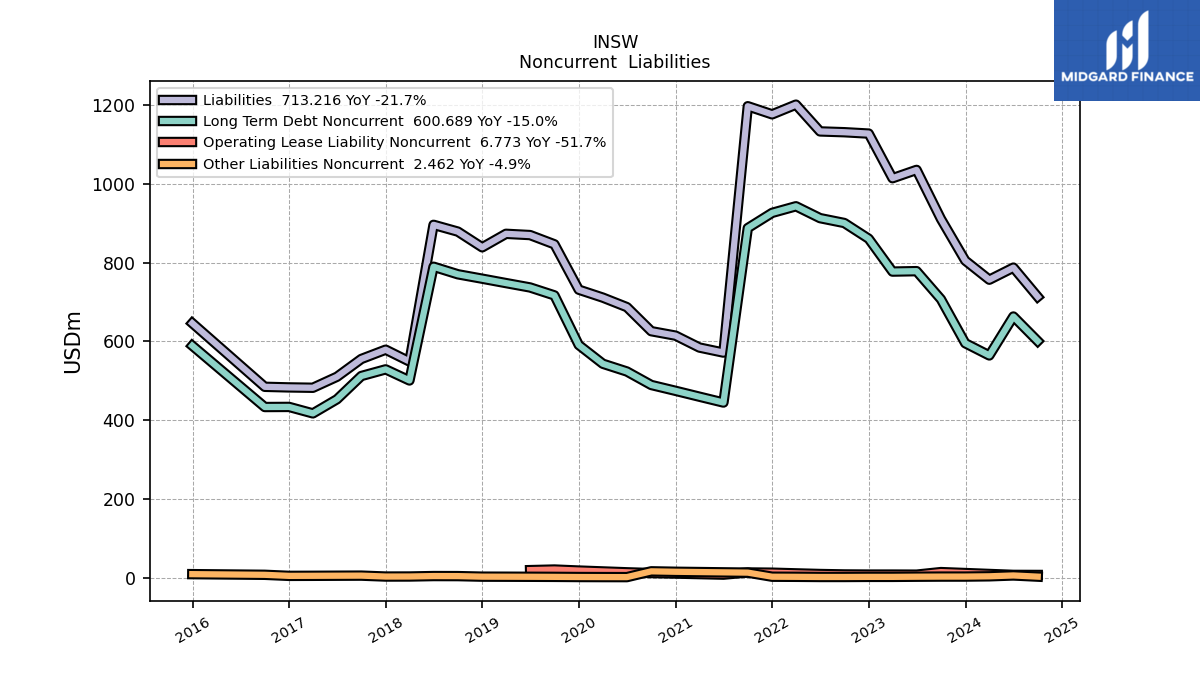
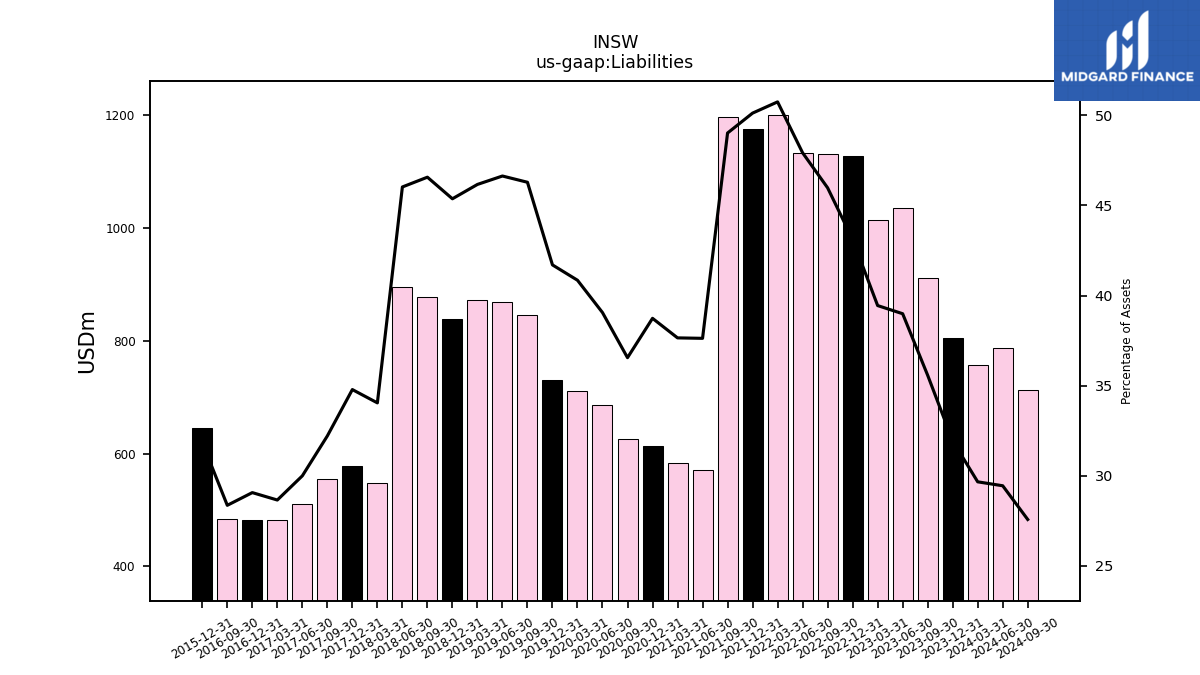
| Liabilities | 756.53 | 805.06 | 910.95 | 1035.38 | 1014.25 | 1127.58 | 1131.07 | 1133.09 | 1201.14 | 1176.45 | 1197.10 | 571.41 | 584.29 | 614.50 | 625.79 | 686.90 | 711.05 | 731.21 | 846.43 | 869.87 | 873.08 | 838.75 | 878.66 | 895.94 | 548.83 | 578.83 | 555.24 | 510.06 | 482.12 | 483.01 | 484.54 | NA | NA | 646.16 | NA | NA | NA | |
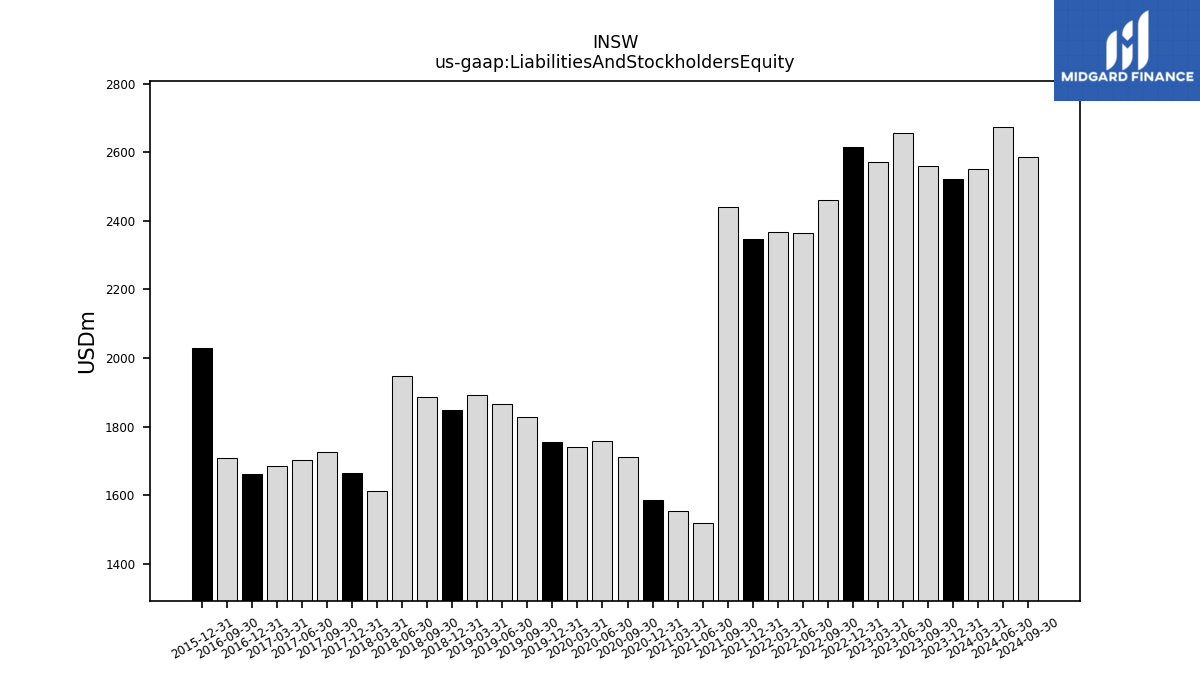
| Liabilities And Stockholders Equity | 2551.42 | 2521.82 | 2561.02 | 2655.66 | 2571.53 | 2615.33 | 2459.90 | 2364.24 | 2366.59 | 2346.78 | 2441.83 | 1518.87 | 1552.05 | 1586.54 | 1712.31 | 1758.96 | 1740.73 | 1753.50 | 1828.55 | 1865.21 | 1891.07 | 1848.60 | 1886.71 | 1946.48 | 1612.47 | 1664.48 | 1724.33 | 1701.09 | 1683.33 | 1662.52 | 1709.31 | NA | NA | 2029.95 | NA | NA | NA | |
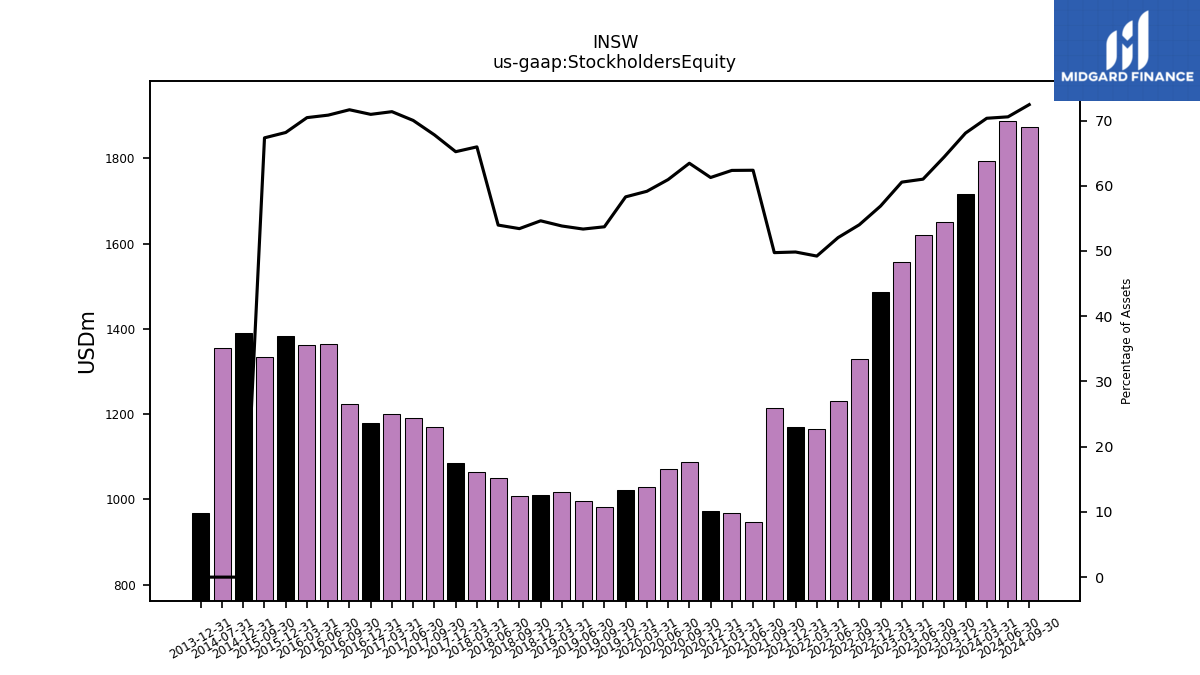
| Stockholders Equity | 1794.89 | 1716.76 | NA | NA | 1557.28 | 1487.75 | 1328.83 | 1230.56 | 1164.87 | 1169.75 | 1214.78 | 947.45 | 967.76 | 972.04 | 1086.52 | 1072.05 | 1029.68 | 1022.29 | 982.12 | 995.34 | 1017.99 | 1009.86 | 1008.05 | 1050.54 | 1063.64 | 1085.65 | 1169.09 | 1191.03 | 1201.21 | 1179.51 | 1224.77 | 1363.94 | 1361.59 | 1383.79 | 1333.28 | NA | NA |
| 2024-03-31 | 2023-12-31 | 2023-09-30 | 2023-06-30 | 2023-03-31 | 2022-12-31 | 2022-09-30 | 2022-06-30 | 2022-03-31 | 2021-12-31 | 2021-09-30 | 2021-06-30 | 2021-03-31 | 2020-12-31 | 2020-09-30 | 2020-06-30 | 2020-03-31 | 2019-12-31 | 2019-09-30 | 2019-06-30 | 2019-03-31 | 2018-12-31 | 2018-09-30 | 2018-06-30 | 2018-03-31 | 2017-12-31 | 2017-09-30 | 2017-06-30 | 2017-03-31 | 2016-12-31 | 2016-09-30 | 2016-06-30 | 2016-03-31 | 2015-12-31 | 2015-09-30 | 2015-06-30 | 2015-03-31 | ||
|---|---|---|---|---|---|---|---|---|---|---|---|---|---|---|---|---|---|---|---|---|---|---|---|---|---|---|---|---|---|---|---|---|---|---|---|---|---|---|
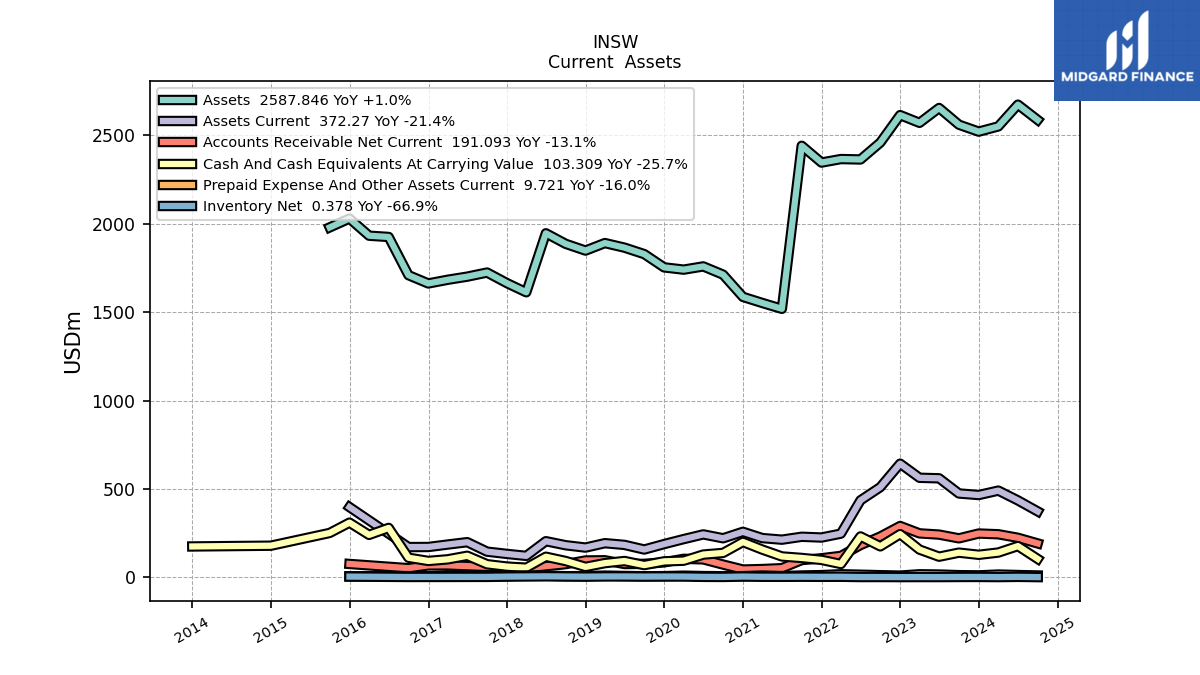
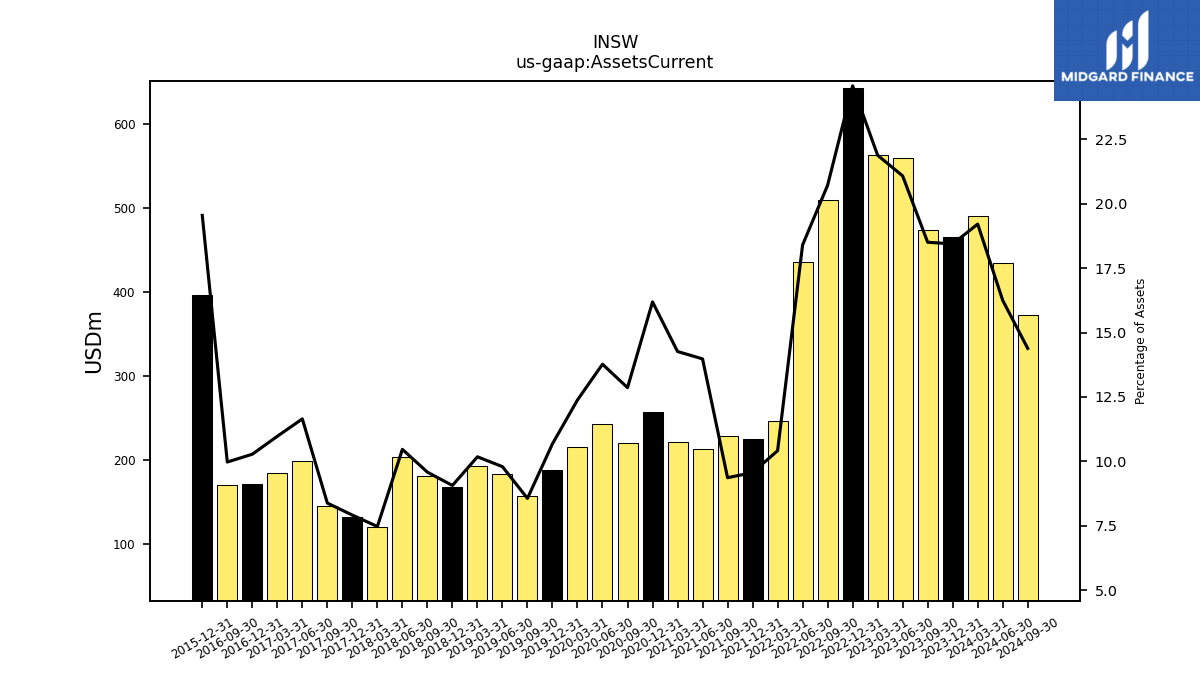
| Assets Current | 490.07 | 464.98 | 473.88 | 559.68 | 562.60 | 642.62 | 509.55 | 435.00 | 246.49 | 224.50 | 228.78 | 212.31 | 221.40 | 256.83 | 220.25 | 242.23 | 215.60 | 187.34 | 156.64 | 182.75 | 192.51 | 167.62 | 180.82 | 203.78 | 120.55 | 131.79 | 144.58 | 198.19 | 184.76 | 170.91 | 170.53 | NA | NA | 396.74 | NA | NA | NA | |
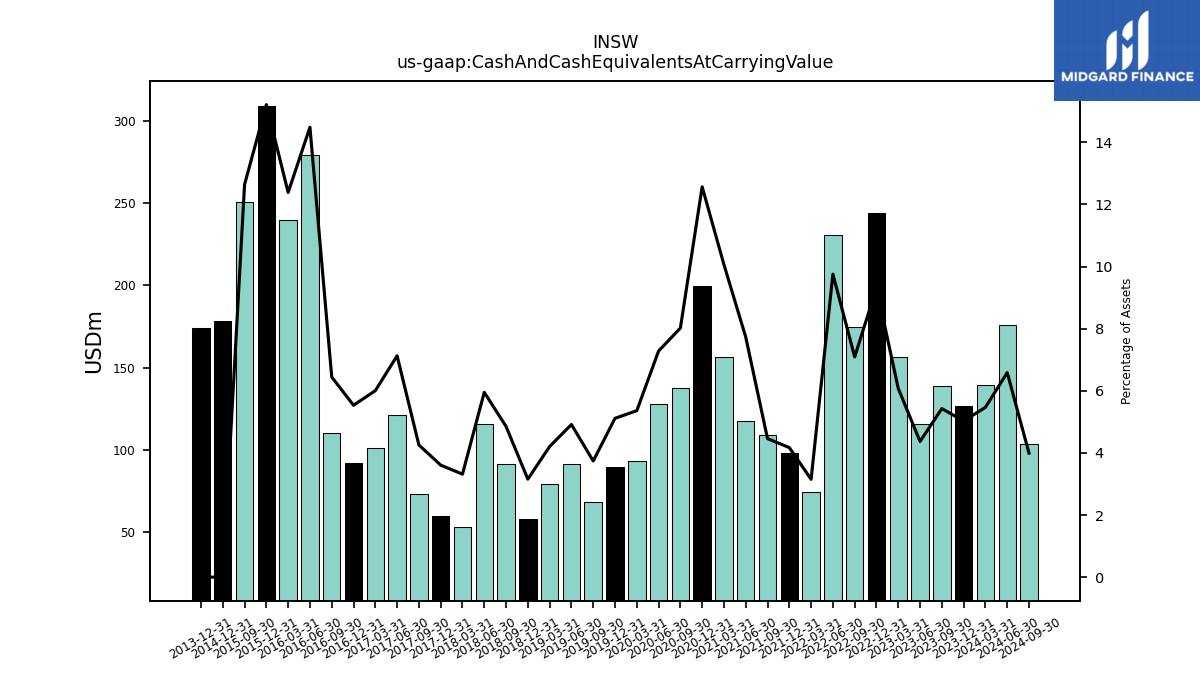
| Cash And Cash Equivalents At Carrying Value | 139.50 | 126.76 | 138.98 | 116.02 | 156.22 | 243.74 | 174.47 | 230.67 | 74.55 | 97.88 | 108.90 | 117.39 | 156.18 | 199.39 | 137.34 | 128.06 | 93.30 | 89.67 | 68.38 | 91.66 | 79.54 | 58.31 | 91.55 | 115.84 | 53.47 | 60.03 | 73.39 | 121.23 | 101.07 | 92.00 | 110.16 | 278.94 | 239.42 | 308.86 | 250.31 | NA | NA | |
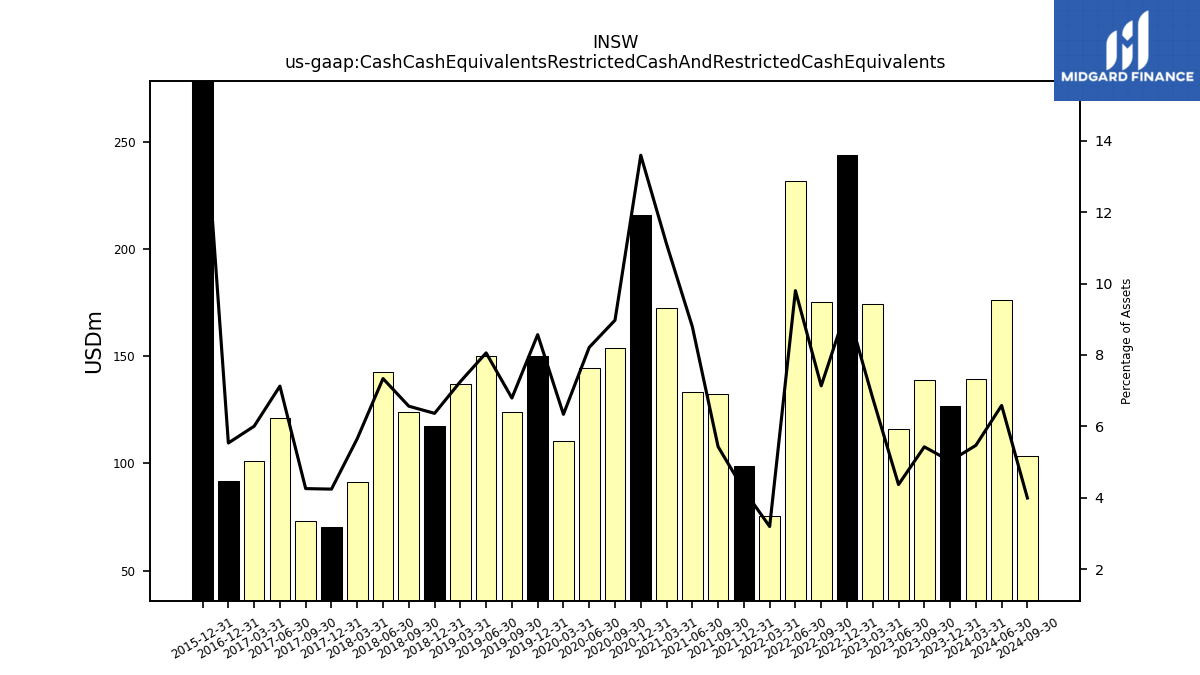
| Cash Cash Equivalents Restricted Cash And Restricted Cash Equivalents | 139.50 | 126.76 | 138.98 | 116.02 | 174.55 | 243.74 | 175.53 | 231.72 | 75.60 | 98.93 | 132.59 | 133.56 | 172.40 | 215.68 | 153.65 | 144.46 | 110.33 | 150.24 | 124.22 | 150.29 | 137.16 | 117.64 | 123.86 | 142.85 | 91.19 | 70.61 | 73.39 | 121.23 | 101.07 | 92.00 | NA | NA | NA | 317.85 | NA | NA | NA | |
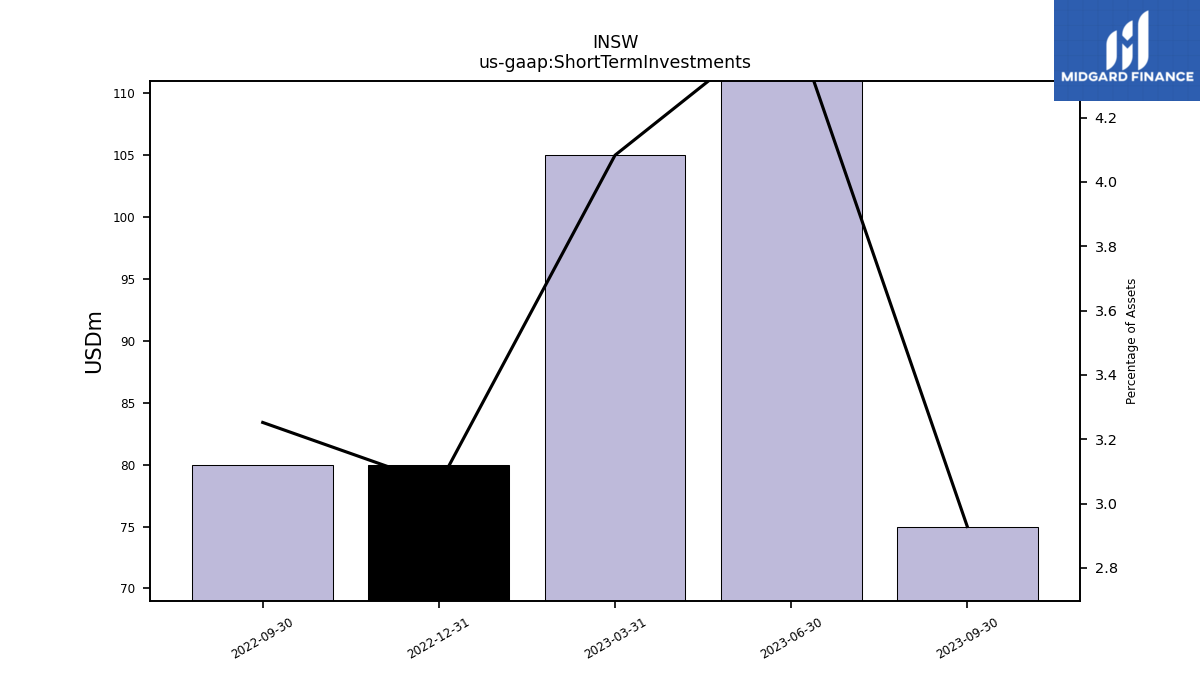
| Short Term Investments | 75.00 | 60.00 | 75.00 | 120.00 | 105.00 | 80.00 | 80.00 | NA | NA | NA | NA | NA | NA | NA | NA | NA | NA | NA | NA | NA | NA | NA | NA | NA | NA | NA | NA | NA | NA | NA | NA | NA | NA | NA | NA | NA | NA | |
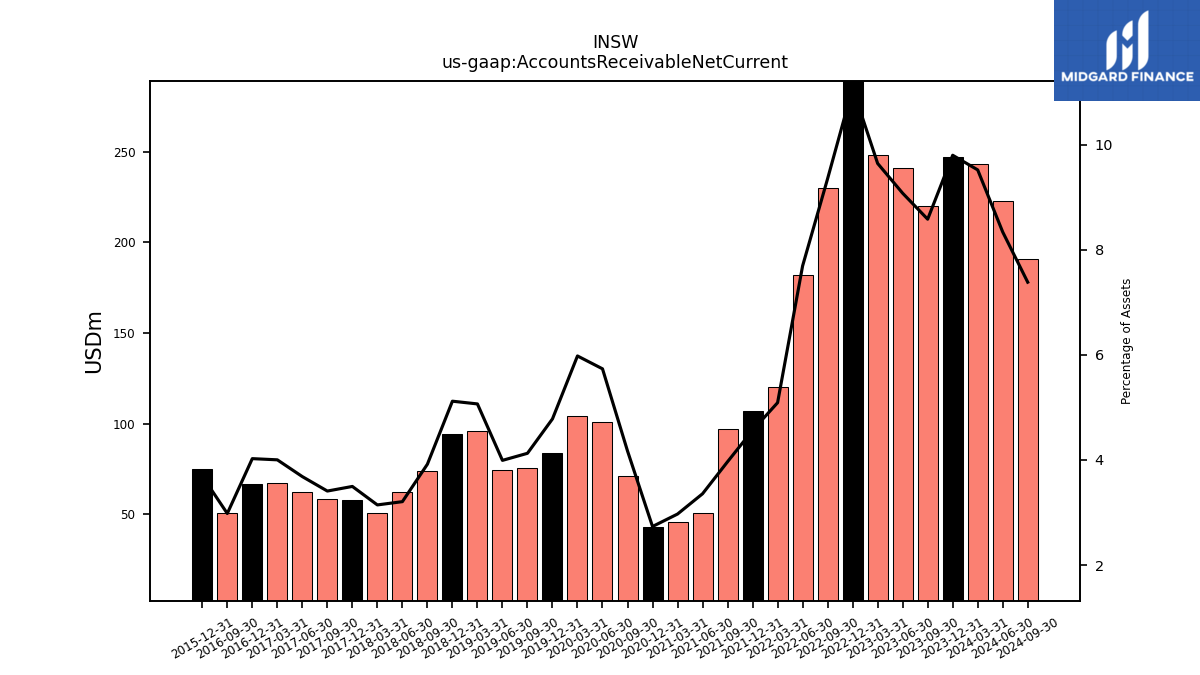
| Accounts Receivable Net Current | 242.96 | 247.16 | 219.83 | 241.09 | 248.03 | 289.77 | 230.14 | 181.91 | 120.47 | 107.10 | 96.86 | 50.98 | 46.10 | 43.36 | 71.43 | 100.88 | 104.09 | 83.84 | 75.46 | 74.46 | 95.82 | 94.62 | 73.95 | 62.41 | 50.70 | 58.19 | 58.76 | 62.65 | 67.38 | 66.92 | 50.95 | NA | NA | 74.95 | NA | NA | NA | |
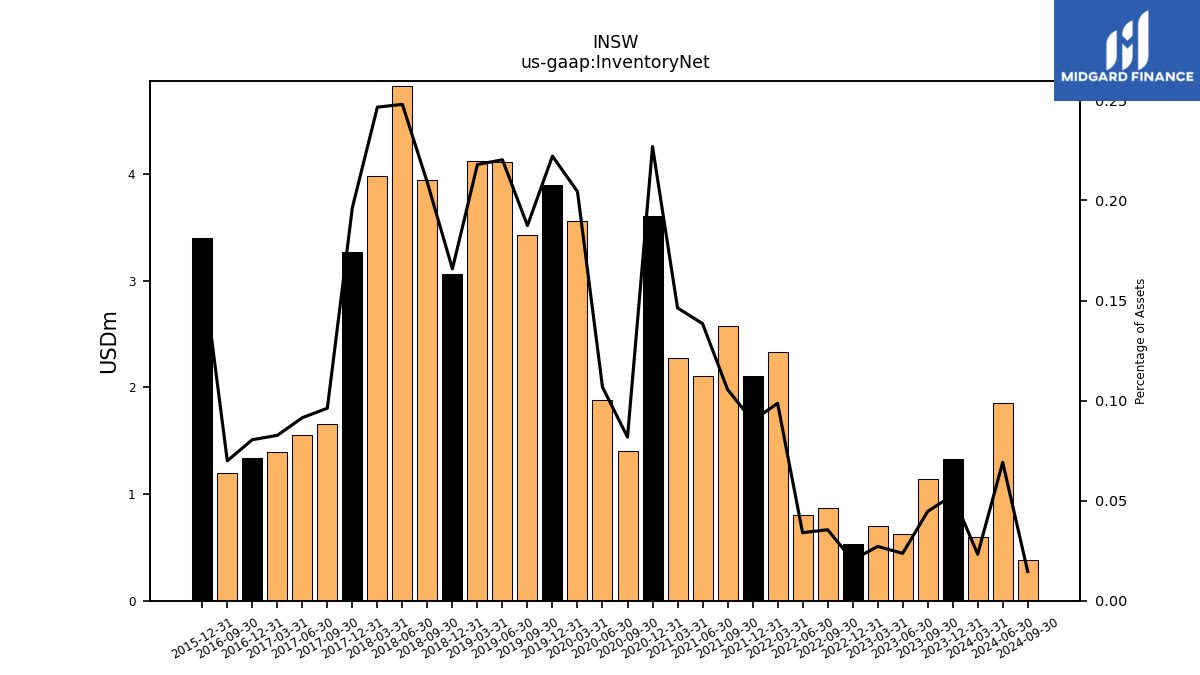
| Inventory Net | 0.59 | 1.33 | 1.14 | 0.63 | 0.70 | 0.53 | 0.87 | 0.80 | 2.33 | 2.11 | 2.58 | 2.10 | 2.27 | 3.60 | 1.40 | 1.88 | 3.56 | 3.90 | 3.43 | 4.11 | 4.12 | 3.07 | 3.94 | 4.83 | 3.98 | 3.27 | 1.66 | 1.56 | 1.39 | 1.34 | 1.20 | NA | NA | 3.40 | NA | NA | NA | |
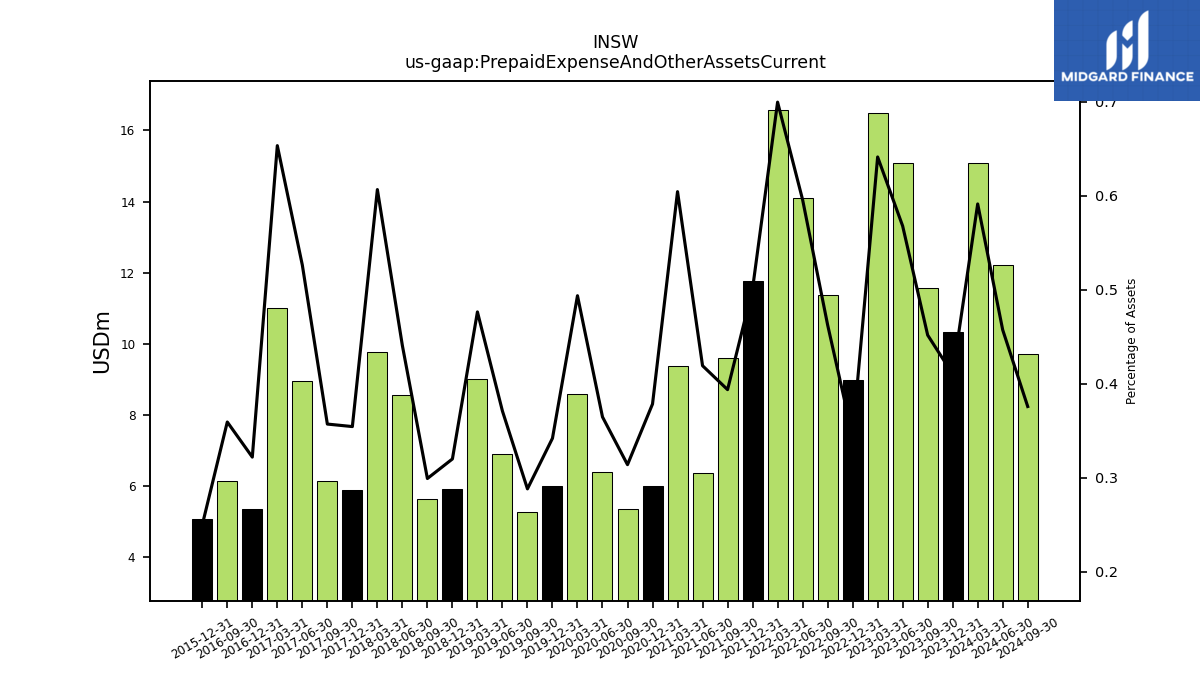
| Prepaid Expense And Other Assets Current | 15.09 | 10.34 | 11.57 | 15.08 | 16.49 | 8.99 | 11.38 | 14.09 | 16.56 | 11.76 | 9.61 | 6.37 | 9.38 | 6.00 | 5.37 | 6.41 | 8.59 | 5.99 | 5.27 | 6.92 | 9.01 | 5.91 | 5.64 | 8.57 | 9.78 | 5.90 | 6.16 | 8.95 | 11.00 | 5.35 | 6.14 | NA | NA | 5.07 | NA | NA | NA |
| 2024-03-31 | 2023-12-31 | 2023-09-30 | 2023-06-30 | 2023-03-31 | 2022-12-31 | 2022-09-30 | 2022-06-30 | 2022-03-31 | 2021-12-31 | 2021-09-30 | 2021-06-30 | 2021-03-31 | 2020-12-31 | 2020-09-30 | 2020-06-30 | 2020-03-31 | 2019-12-31 | 2019-09-30 | 2019-06-30 | 2019-03-31 | 2018-12-31 | 2018-09-30 | 2018-06-30 | 2018-03-31 | 2017-12-31 | 2017-09-30 | 2017-06-30 | 2017-03-31 | 2016-12-31 | 2016-09-30 | 2016-06-30 | 2016-03-31 | 2015-12-31 | 2015-09-30 | 2015-06-30 | 2015-03-31 | ||
|---|---|---|---|---|---|---|---|---|---|---|---|---|---|---|---|---|---|---|---|---|---|---|---|---|---|---|---|---|---|---|---|---|---|---|---|---|---|---|
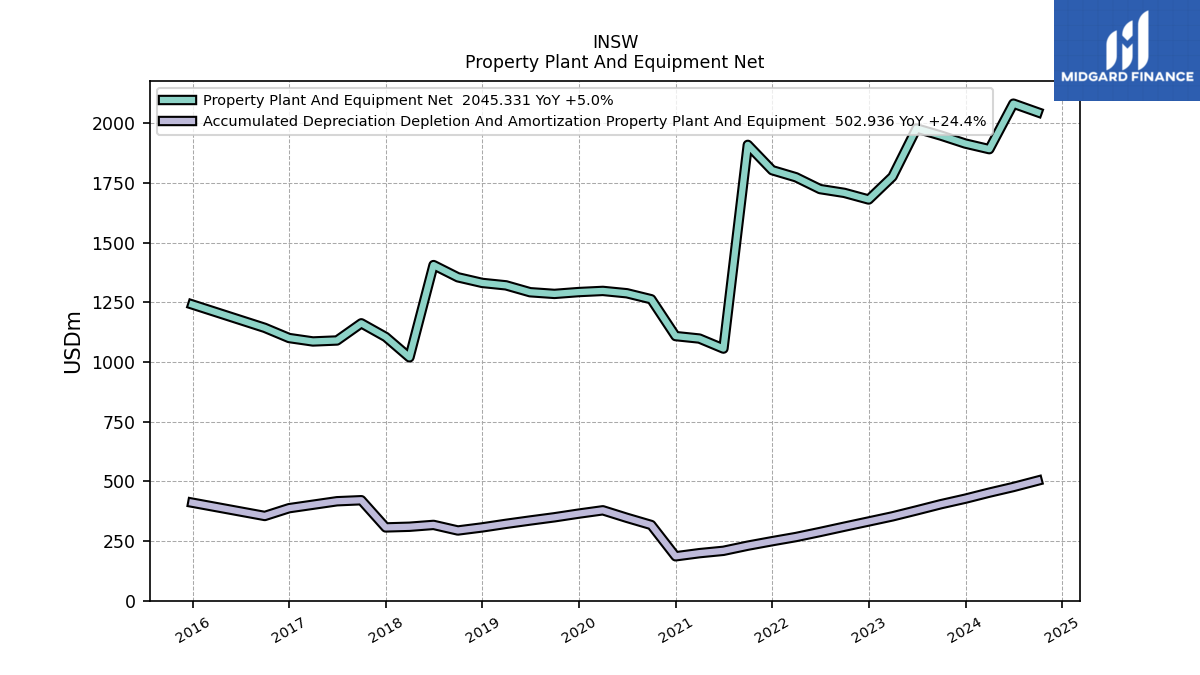
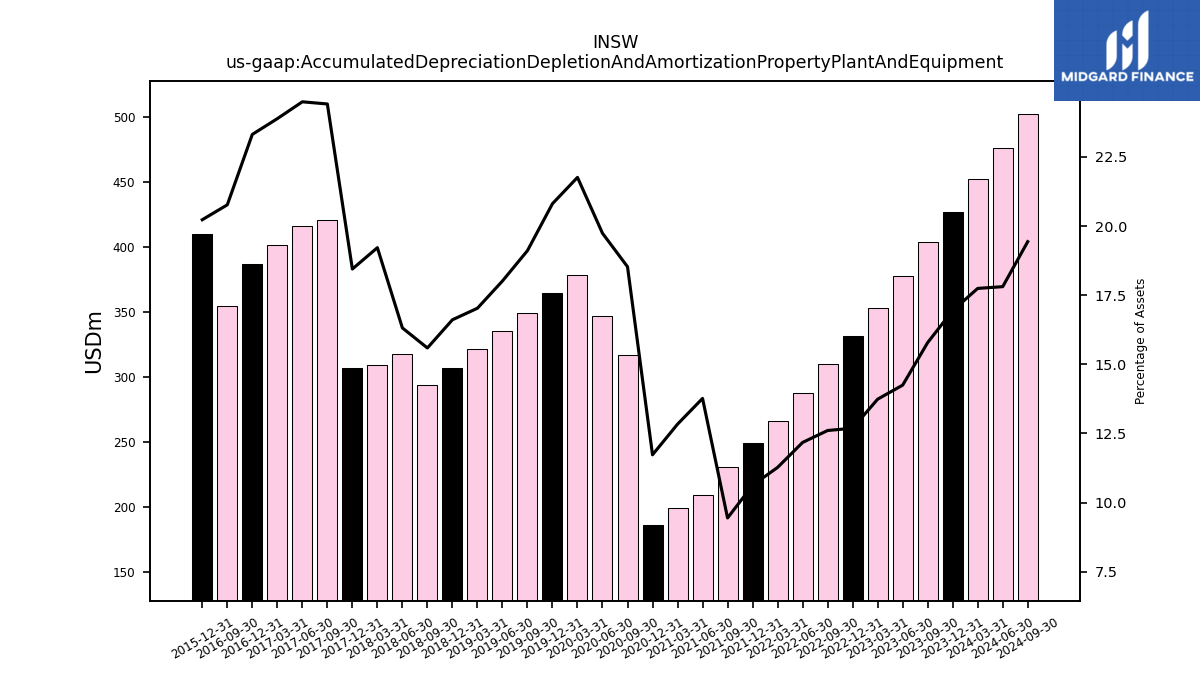
| Accumulated Depreciation Depletion And Amortization Property Plant And Equipment | 452.72 | 427.27 | 404.28 | 378.34 | 353.31 | 331.90 | 310.10 | 287.85 | 266.77 | 249.34 | 230.62 | 209.09 | 199.22 | 186.08 | 317.25 | 347.17 | 378.75 | 364.87 | 349.43 | 335.96 | 322.00 | 307.05 | 294.16 | 317.58 | 309.86 | 307.01 | 420.95 | 416.61 | 402.01 | 387.57 | 354.96 | NA | NA | 410.61 | NA | NA | NA | |
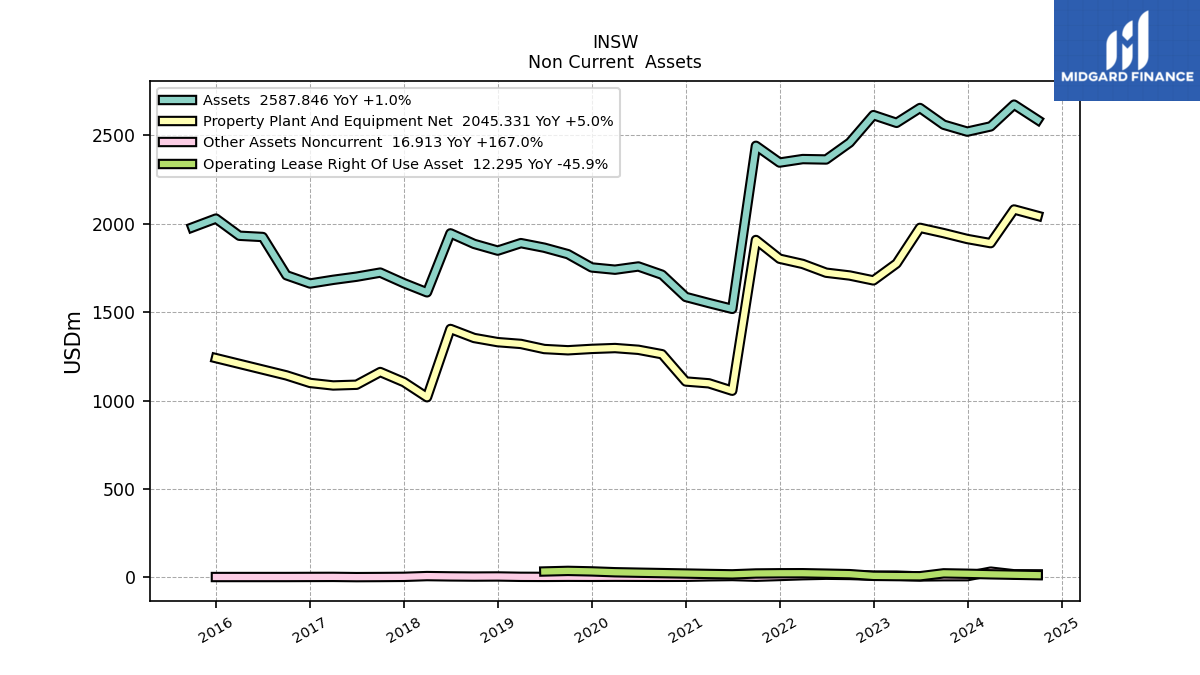
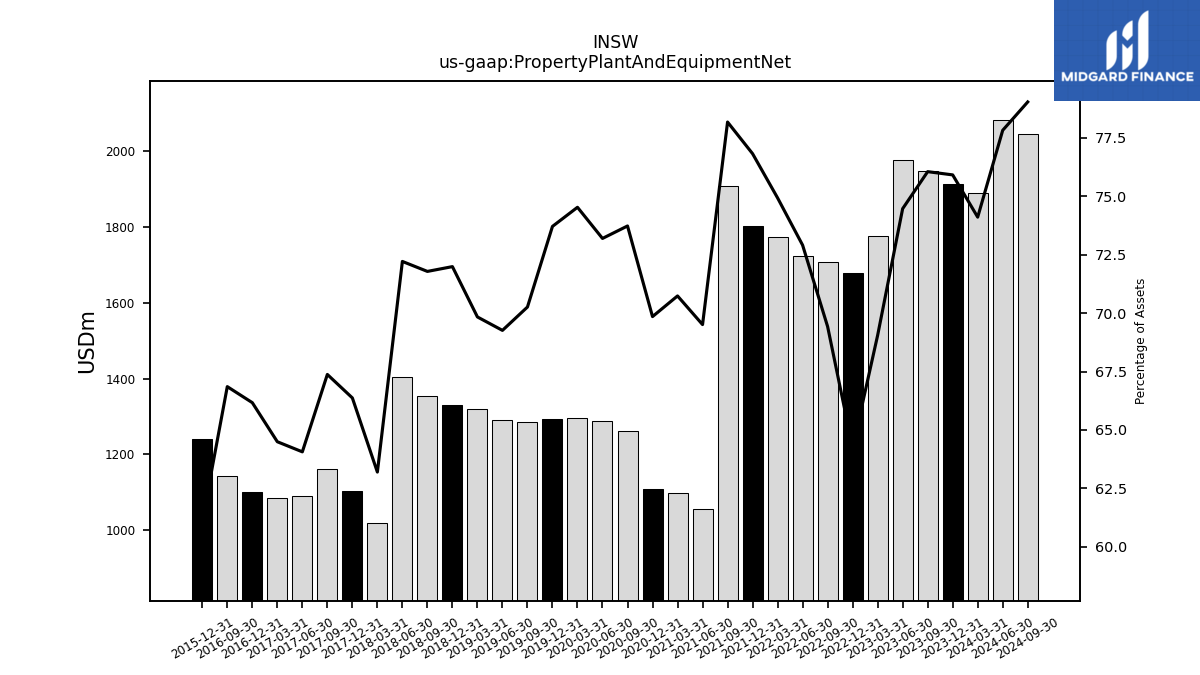
| Property Plant And Equipment Net | 1890.80 | 1914.43 | 1947.74 | 1977.64 | 1775.65 | 1680.01 | 1707.78 | 1723.74 | 1773.26 | 1802.85 | 1908.93 | 1055.75 | 1097.85 | 1108.21 | 1262.47 | 1287.48 | 1297.34 | 1292.52 | 1284.76 | 1291.86 | 1320.64 | 1330.80 | 1354.36 | 1405.58 | 1019.05 | 1104.73 | 1161.77 | 1089.78 | 1085.68 | 1100.05 | 1142.74 | NA | NA | 1240.41 | NA | NA | NA | |
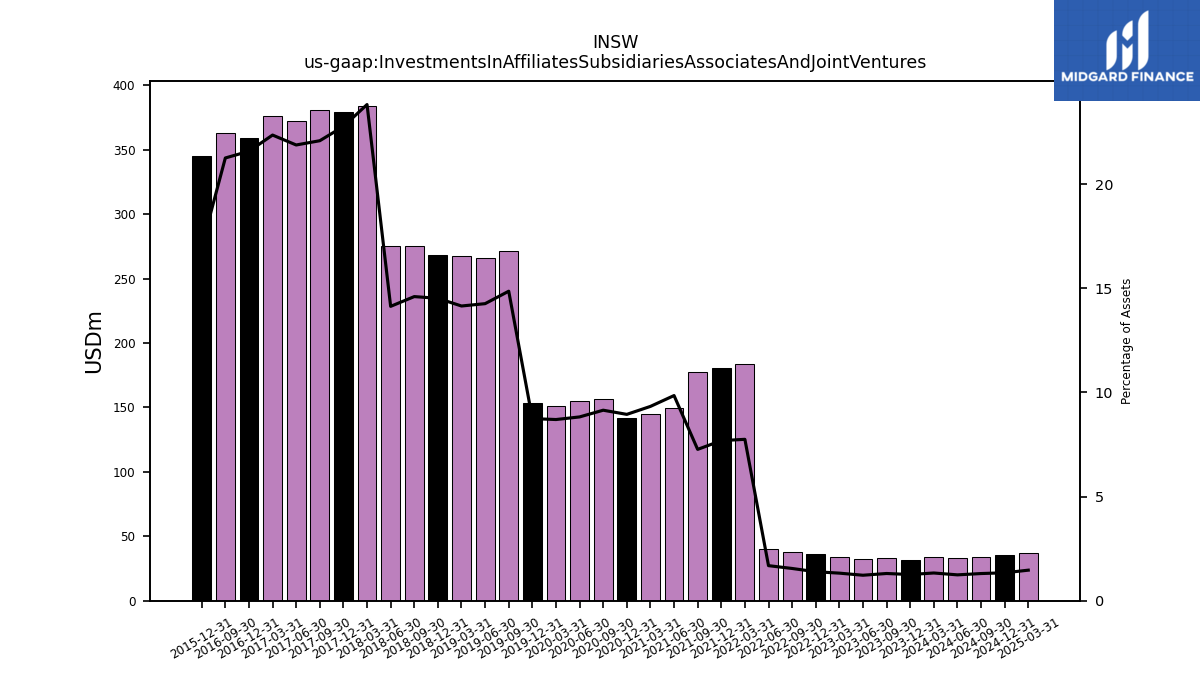
| Investments In Affiliates Subsidiaries Associates And Joint Ventures | 34.00 | 31.75 | 33.50 | 32.52 | 34.08 | 36.41 | 38.11 | 39.83 | 183.36 | 180.33 | 177.40 | 149.58 | 144.77 | 141.92 | 156.59 | 155.19 | 151.40 | 153.29 | 271.65 | 265.96 | 267.52 | 268.32 | 275.42 | 275.03 | 384.02 | 378.89 | 380.72 | 372.11 | 376.24 | 358.68 | 363.24 | NA | NA | 344.89 | NA | NA | NA | |
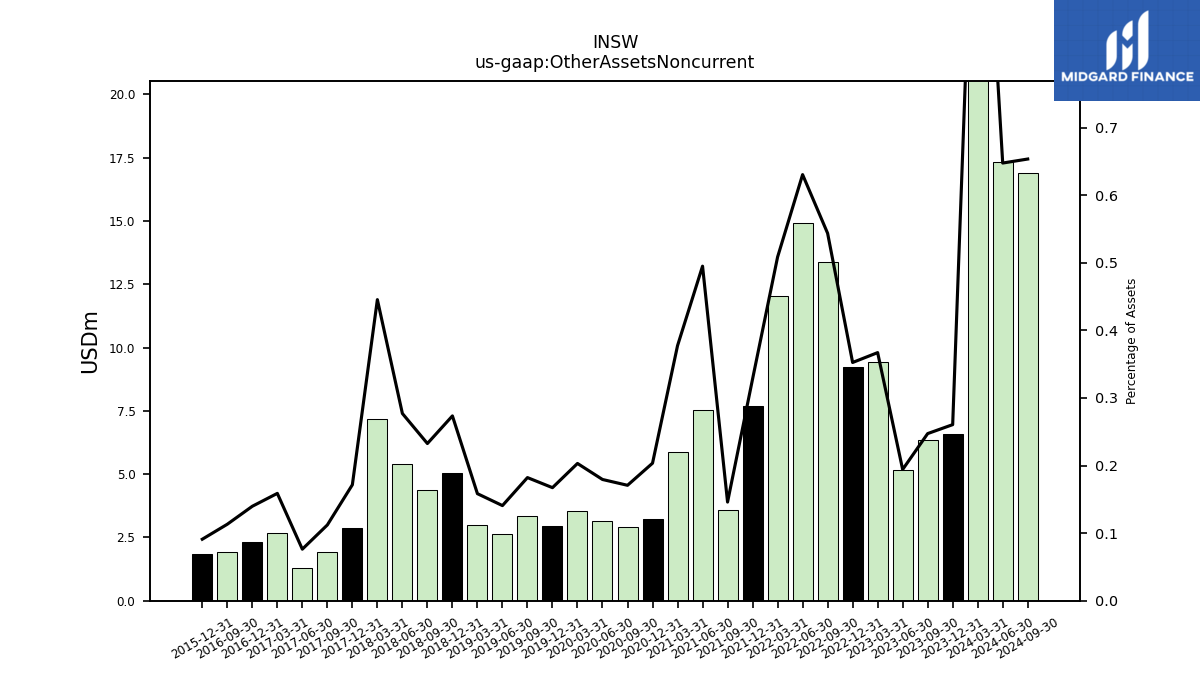
| Other Assets Noncurrent | 32.36 | 6.57 | 6.33 | 5.16 | 9.44 | 9.22 | 13.37 | 14.91 | 12.04 | 7.70 | 3.56 | 7.52 | 5.86 | 3.23 | 2.92 | 3.16 | 3.54 | 2.93 | 3.33 | 2.63 | 3.00 | 5.06 | 4.39 | 5.39 | 7.18 | 2.86 | 1.93 | 1.30 | 2.67 | 2.32 | 1.94 | NA | NA | 1.85 | NA | NA | NA |
| 2024-03-31 | 2023-12-31 | 2023-09-30 | 2023-06-30 | 2023-03-31 | 2022-12-31 | 2022-09-30 | 2022-06-30 | 2022-03-31 | 2021-12-31 | 2021-09-30 | 2021-06-30 | 2021-03-31 | 2020-12-31 | 2020-09-30 | 2020-06-30 | 2020-03-31 | 2019-12-31 | 2019-09-30 | 2019-06-30 | 2019-03-31 | 2018-12-31 | 2018-09-30 | 2018-06-30 | 2018-03-31 | 2017-12-31 | 2017-09-30 | 2017-06-30 | 2017-03-31 | 2016-12-31 | 2016-09-30 | 2016-06-30 | 2016-03-31 | 2015-12-31 | 2015-09-30 | 2015-06-30 | 2015-03-31 | ||
|---|---|---|---|---|---|---|---|---|---|---|---|---|---|---|---|---|---|---|---|---|---|---|---|---|---|---|---|---|---|---|---|---|---|---|---|---|---|---|
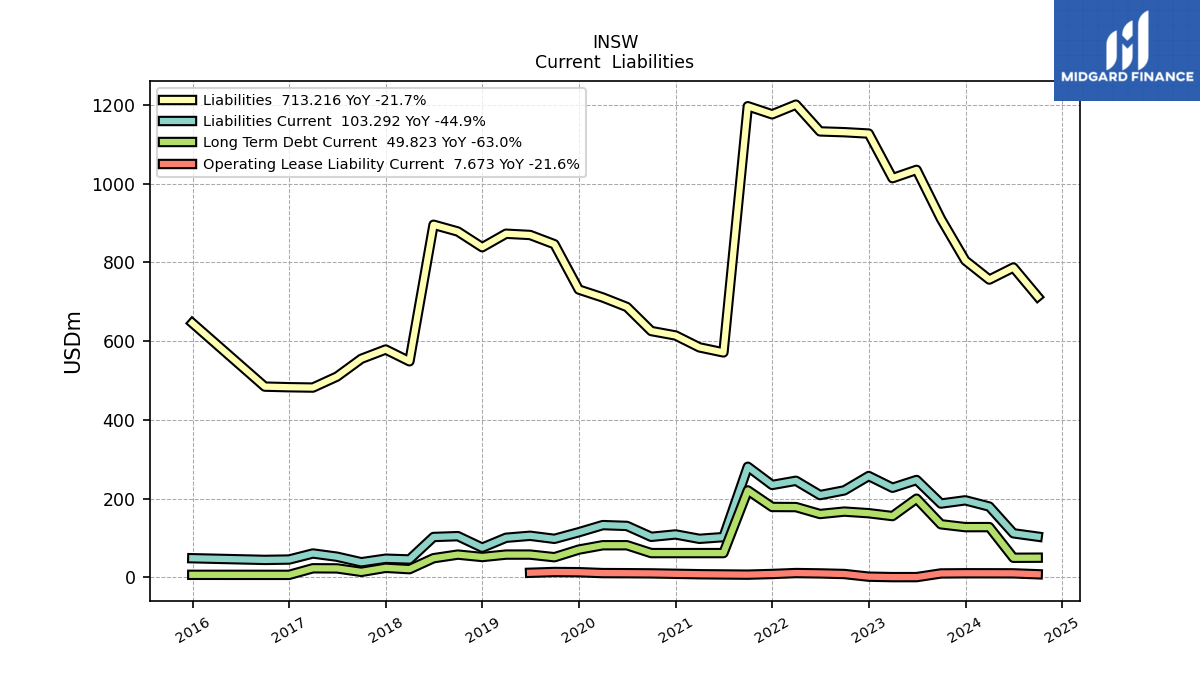
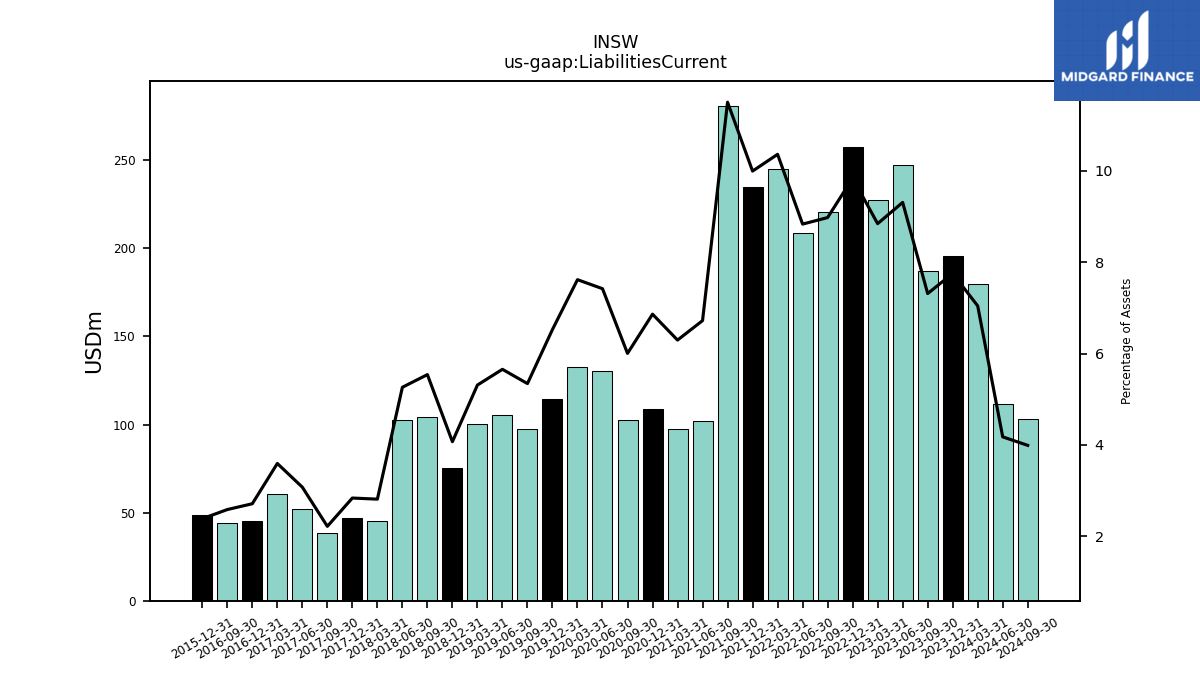
| Liabilities Current | 179.75 | 195.57 | 187.34 | 247.28 | 227.48 | 257.39 | 220.88 | 208.90 | 245.27 | 234.61 | 280.94 | 102.11 | 97.73 | 108.90 | 102.82 | 130.54 | 132.63 | 114.48 | 97.72 | 105.50 | 100.45 | 75.27 | 104.53 | 102.45 | 45.37 | 47.23 | 38.24 | 52.32 | 60.51 | 45.10 | 44.19 | NA | NA | 48.42 | NA | NA | NA | |
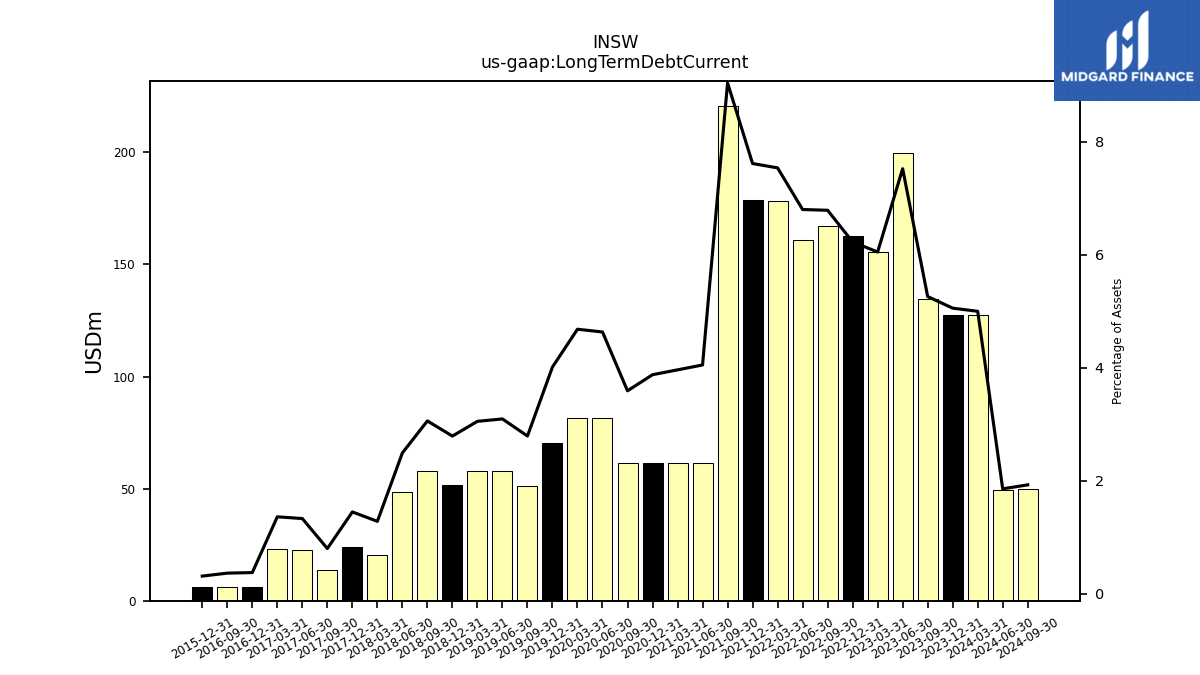
| Long Term Debt Current | 127.53 | 127.45 | 134.70 | 199.78 | 155.53 | 162.85 | 166.97 | 160.79 | 178.39 | 178.72 | 220.81 | 61.48 | 61.48 | 61.48 | 61.48 | 81.48 | 81.48 | 70.35 | 51.01 | 57.68 | 57.68 | 51.55 | 57.68 | 48.49 | 20.62 | 24.06 | 13.75 | 22.60 | 22.88 | 6.18 | 6.18 | NA | NA | 6.28 | NA | NA | NA | |
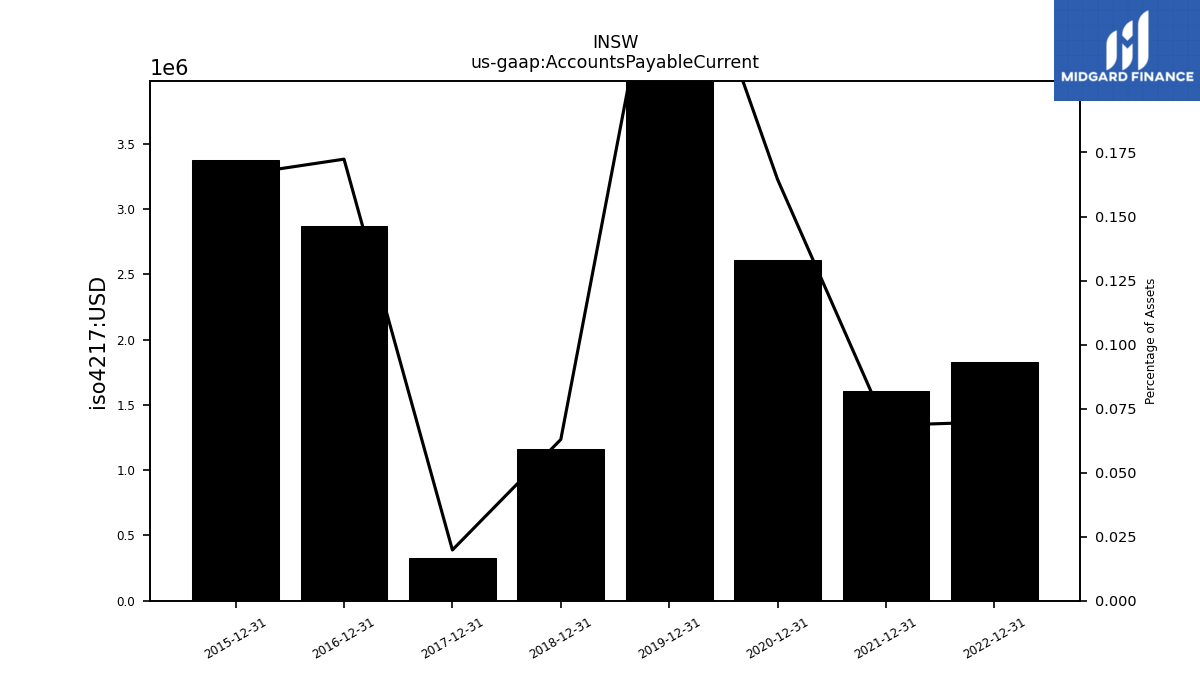
| Accounts Payable Current | NA | 6.57 | NA | NA | NA | 1.83 | NA | NA | NA | 1.61 | NA | NA | NA | 2.61 | NA | NA | NA | 4.99 | NA | NA | NA | 1.16 | NA | NA | NA | 0.33 | NA | NA | NA | 2.87 | NA | NA | NA | 3.37 | NA | NA | NA | |
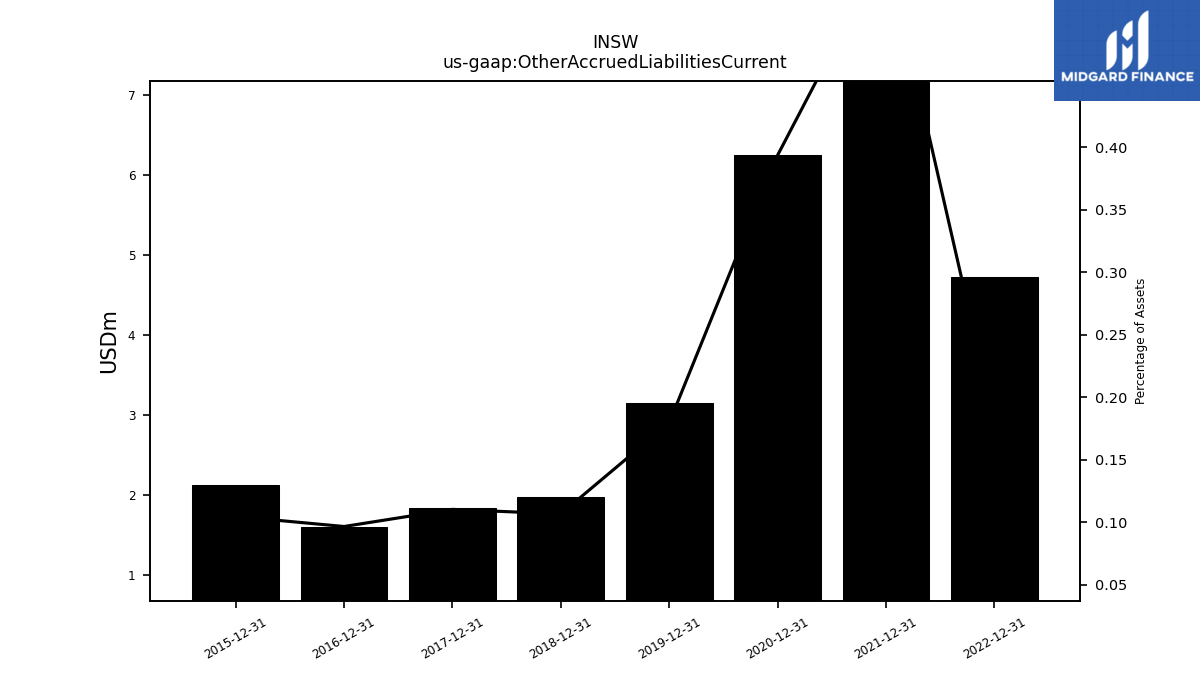
| Other Accrued Liabilities Current | NA | 5.21 | NA | NA | NA | 4.73 | NA | NA | NA | 13.14 | NA | NA | NA | 6.25 | NA | NA | NA | 3.15 | NA | NA | NA | 1.97 | NA | NA | NA | 1.84 | NA | NA | NA | 1.61 | NA | NA | NA | 2.13 | NA | NA | NA | |
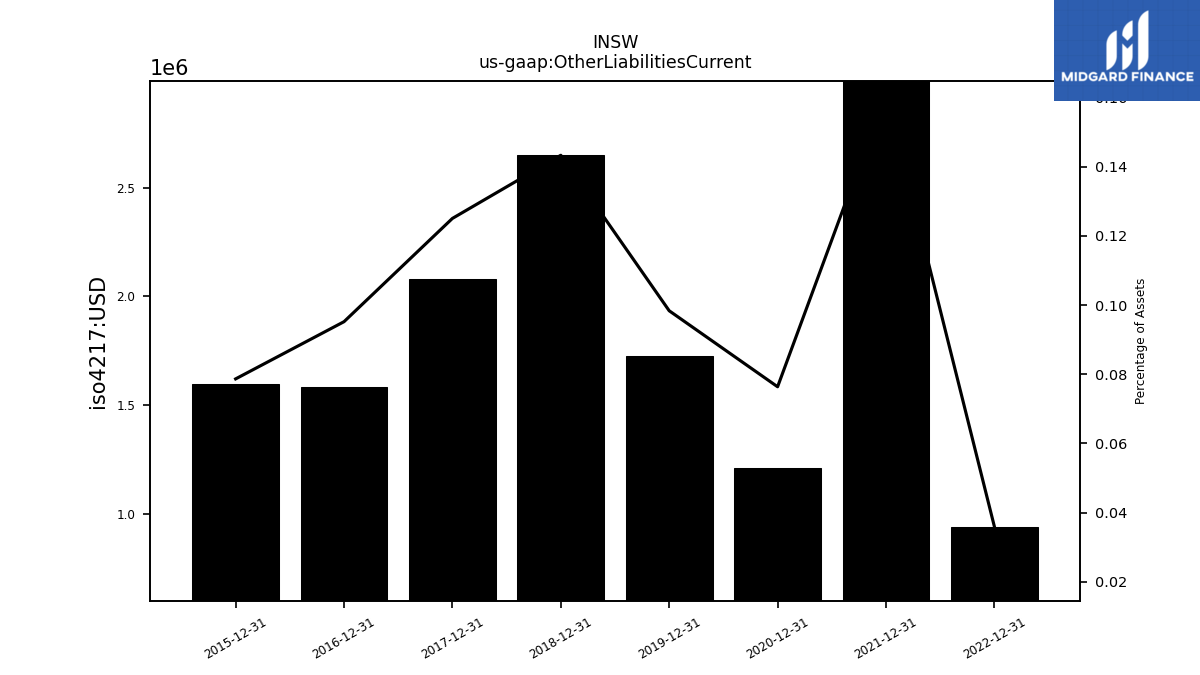
| Other Liabilities Current | NA | 5.45 | NA | NA | NA | 0.94 | NA | NA | NA | 3.79 | NA | NA | NA | 1.21 | NA | NA | NA | 1.73 | NA | NA | NA | 2.65 | NA | NA | NA | 2.08 | NA | NA | NA | 1.58 | NA | NA | NA | 1.60 | NA | NA | NA | |
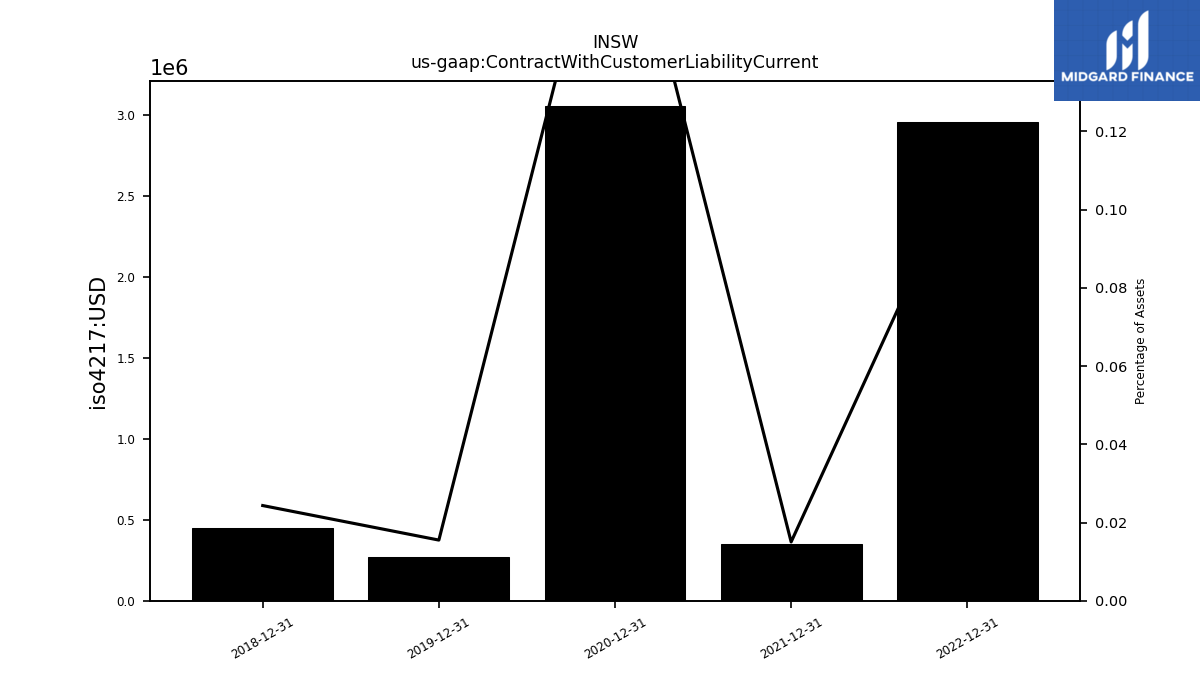
| Contract With Customer Liability Current | NA | 6.24 | NA | NA | NA | 2.96 | NA | NA | NA | 0.35 | NA | NA | NA | 3.06 | NA | NA | NA | 0.27 | NA | NA | NA | 0.45 | NA | NA | NA | NA | NA | NA | NA | NA | NA | NA | NA | NA | NA | NA | NA |
| 2024-03-31 | 2023-12-31 | 2023-09-30 | 2023-06-30 | 2023-03-31 | 2022-12-31 | 2022-09-30 | 2022-06-30 | 2022-03-31 | 2021-12-31 | 2021-09-30 | 2021-06-30 | 2021-03-31 | 2020-12-31 | 2020-09-30 | 2020-06-30 | 2020-03-31 | 2019-12-31 | 2019-09-30 | 2019-06-30 | 2019-03-31 | 2018-12-31 | 2018-09-30 | 2018-06-30 | 2018-03-31 | 2017-12-31 | 2017-09-30 | 2017-06-30 | 2017-03-31 | 2016-12-31 | 2016-09-30 | 2016-06-30 | 2016-03-31 | 2015-12-31 | 2015-09-30 | 2015-06-30 | 2015-03-31 | ||
|---|---|---|---|---|---|---|---|---|---|---|---|---|---|---|---|---|---|---|---|---|---|---|---|---|---|---|---|---|---|---|---|---|---|---|---|---|---|---|
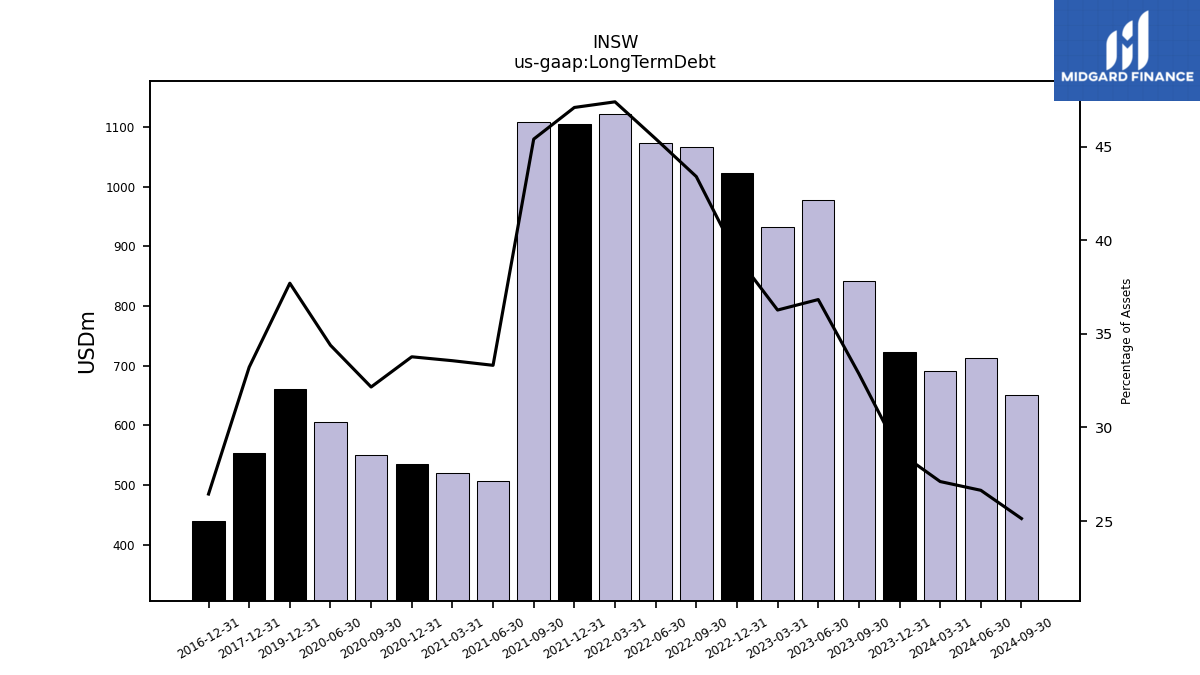
| Long Term Debt | 691.74 | 722.68 | 841.70 | 978.05 | 932.68 | 1023.43 | 1067.47 | 1073.69 | 1121.42 | 1104.98 | 1108.48 | 506.05 | 520.93 | 535.82 | 550.68 | 604.90 | NA | 661.10 | NA | NA | NA | NA | NA | NA | NA | 552.94 | NA | NA | NA | 439.65 | NA | NA | NA | NA | NA | NA | NA | |
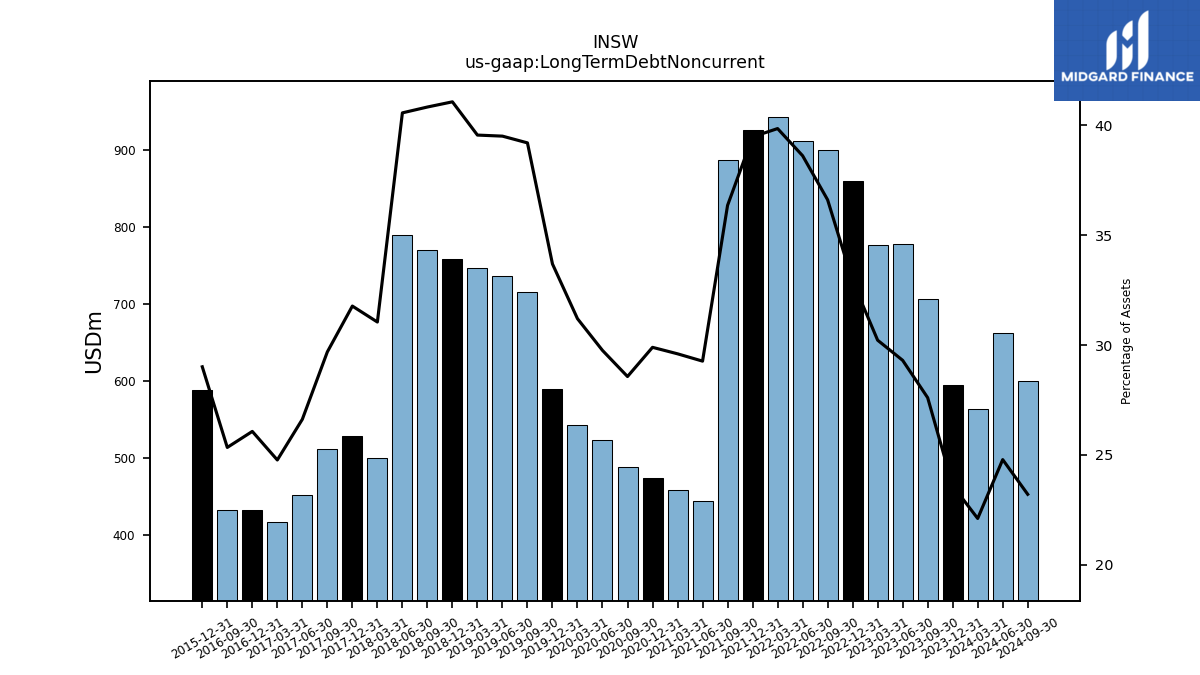
| Long Term Debt Noncurrent | 564.20 | 595.23 | 707.00 | 778.27 | 777.15 | 860.58 | 900.51 | 912.90 | 943.03 | 926.27 | 887.67 | 444.57 | 459.45 | 474.33 | 489.19 | 523.41 | 543.11 | 590.75 | 716.74 | 736.83 | 747.96 | 759.11 | 770.30 | 789.54 | 500.64 | 528.87 | 511.95 | 452.90 | 417.02 | 433.47 | 433.21 | NA | NA | 588.94 | NA | NA | NA | |
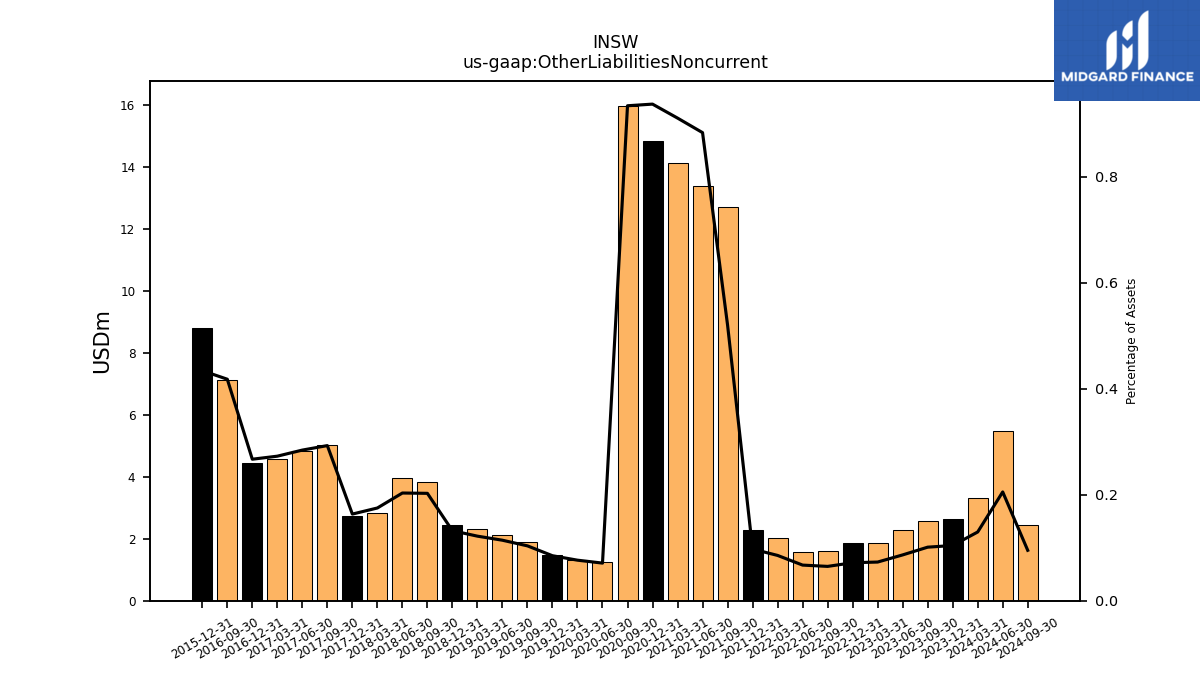
| Other Liabilities Noncurrent | 3.31 | 2.63 | 2.59 | 2.30 | 1.88 | 1.88 | 1.59 | 1.59 | 2.02 | 2.29 | 12.70 | 13.41 | 14.13 | 14.86 | 15.99 | 1.25 | 1.33 | 1.49 | 1.89 | 2.13 | 2.30 | 2.44 | 3.82 | 3.96 | 2.82 | 2.72 | 5.05 | 4.83 | 4.59 | 4.44 | 7.14 | NA | NA | 8.81 | NA | NA | NA | |
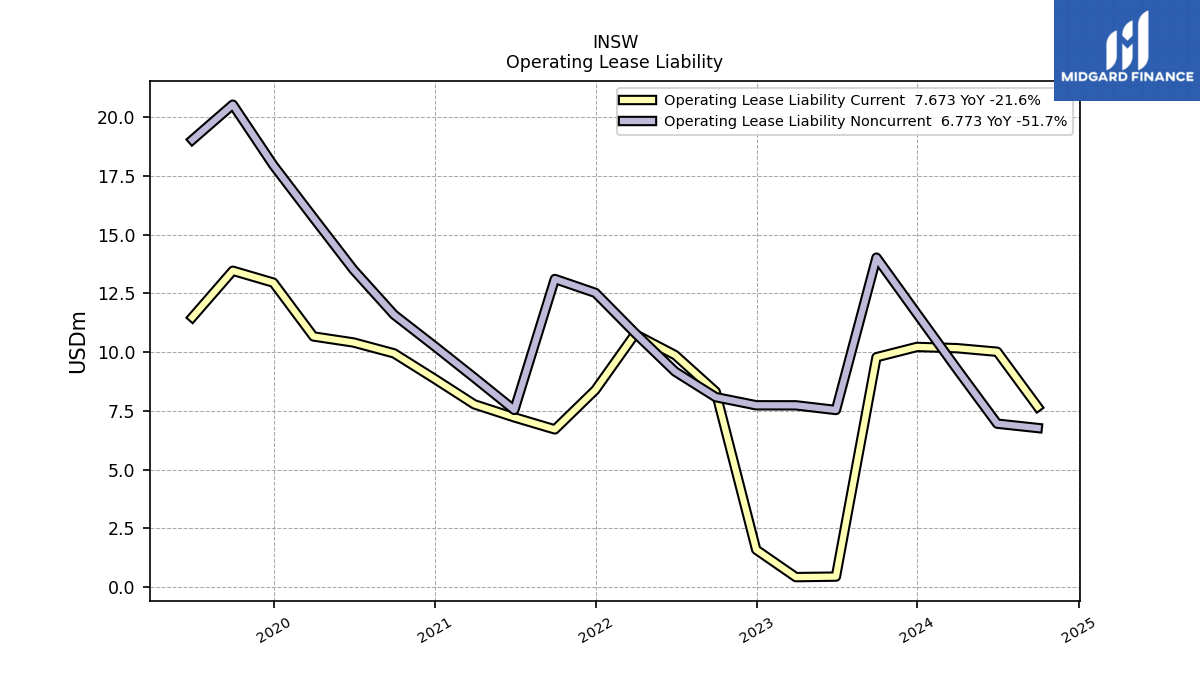
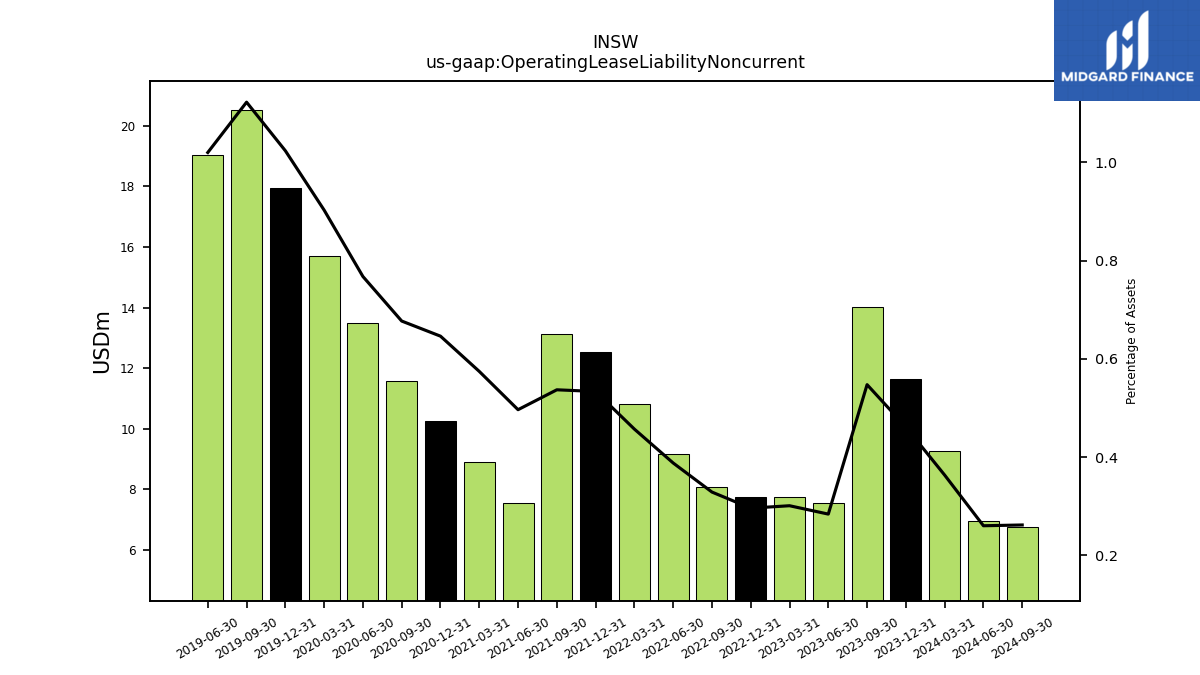
| Operating Lease Liability Noncurrent | 9.27 | 11.63 | 14.02 | 7.54 | 7.74 | 7.74 | 8.09 | 9.17 | 10.81 | 12.52 | 13.11 | 7.54 | 8.92 | 10.25 | 11.59 | 13.50 | 15.72 | 17.95 | 20.53 | 19.03 | NA | NA | NA | NA | NA | NA | NA | NA | NA | NA | NA | NA | NA | NA | NA | NA | NA |
| 2024-03-31 | 2023-12-31 | 2023-09-30 | 2023-06-30 | 2023-03-31 | 2022-12-31 | 2022-09-30 | 2022-06-30 | 2022-03-31 | 2021-12-31 | 2021-09-30 | 2021-06-30 | 2021-03-31 | 2020-12-31 | 2020-09-30 | 2020-06-30 | 2020-03-31 | 2019-12-31 | 2019-09-30 | 2019-06-30 | 2019-03-31 | 2018-12-31 | 2018-09-30 | 2018-06-30 | 2018-03-31 | 2017-12-31 | 2017-09-30 | 2017-06-30 | 2017-03-31 | 2016-12-31 | 2016-09-30 | 2016-06-30 | 2016-03-31 | 2015-12-31 | 2015-09-30 | 2015-06-30 | 2015-03-31 | ||
|---|---|---|---|---|---|---|---|---|---|---|---|---|---|---|---|---|---|---|---|---|---|---|---|---|---|---|---|---|---|---|---|---|---|---|---|---|---|---|
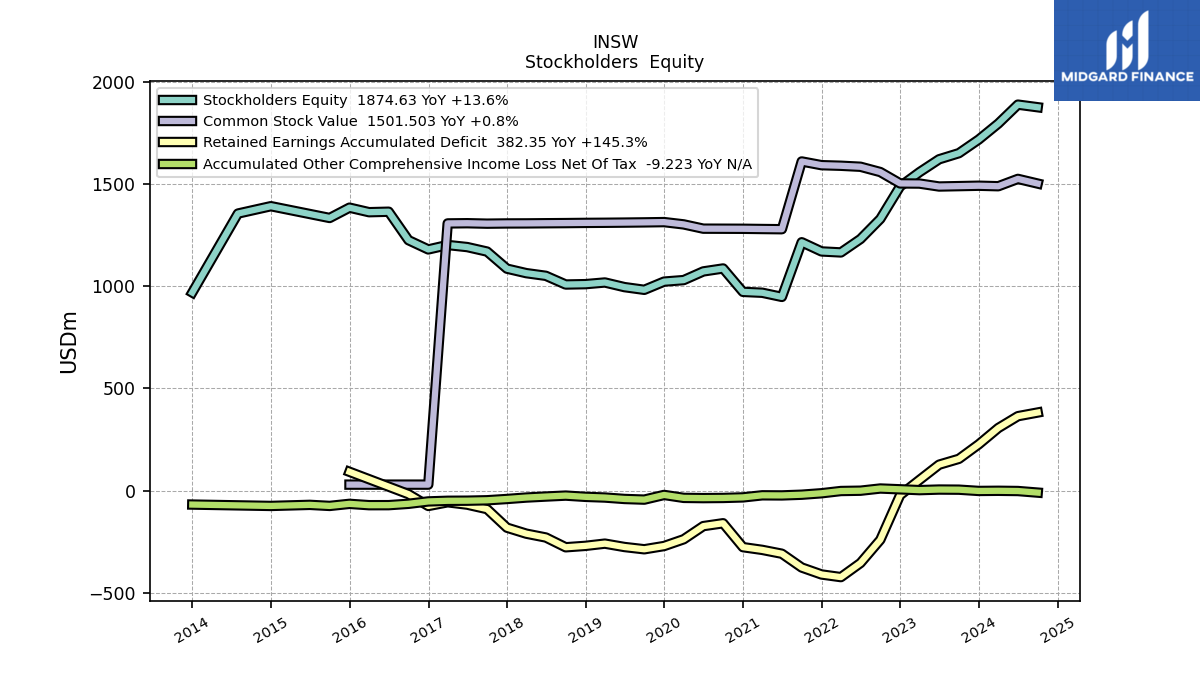
| Stockholders Equity | 1794.89 | 1716.76 | NA | NA | 1557.28 | 1487.75 | 1328.83 | 1230.56 | 1164.87 | 1169.75 | 1214.78 | 947.45 | 967.76 | 972.04 | 1086.52 | 1072.05 | 1029.68 | 1022.29 | 982.12 | 995.34 | 1017.99 | 1009.86 | 1008.05 | 1050.54 | 1063.64 | 1085.65 | 1169.09 | 1191.03 | 1201.21 | 1179.51 | 1224.77 | 1363.94 | 1361.59 | 1383.79 | 1333.28 | NA | NA | |
| Stockholders Equity Including Portion Attributable To Noncontrolling Interest | NA | 1716.76 | 1650.08 | 1620.27 | 1557.28 | 1487.75 | 1328.83 | 1231.15 | 1165.45 | 1170.33 | 1244.73 | 947.45 | 967.76 | 972.04 | 1086.52 | 1072.05 | NA | 1022.29 | NA | NA | NA | 1009.86 | NA | NA | NA | NA | NA | NA | NA | NA | NA | NA | NA | NA | NA | NA | NA | |
| Common Stock Value | 1488.53 | 1490.99 | 1489.04 | 1487.15 | 1501.52 | 1502.23 | 1557.88 | 1583.74 | 1588.61 | 1591.45 | 1609.60 | 1278.37 | 1279.37 | 1280.50 | 1280.81 | 1281.07 | 1301.94 | 1313.18 | 1311.81 | 1310.73 | 1309.88 | 1309.27 | 1308.31 | 1307.64 | 1306.87 | 1306.61 | 1305.53 | 1307.73 | 1306.75 | 29.82 | 29.82 | NA | NA | 29.82 | NA | NA | NA | |
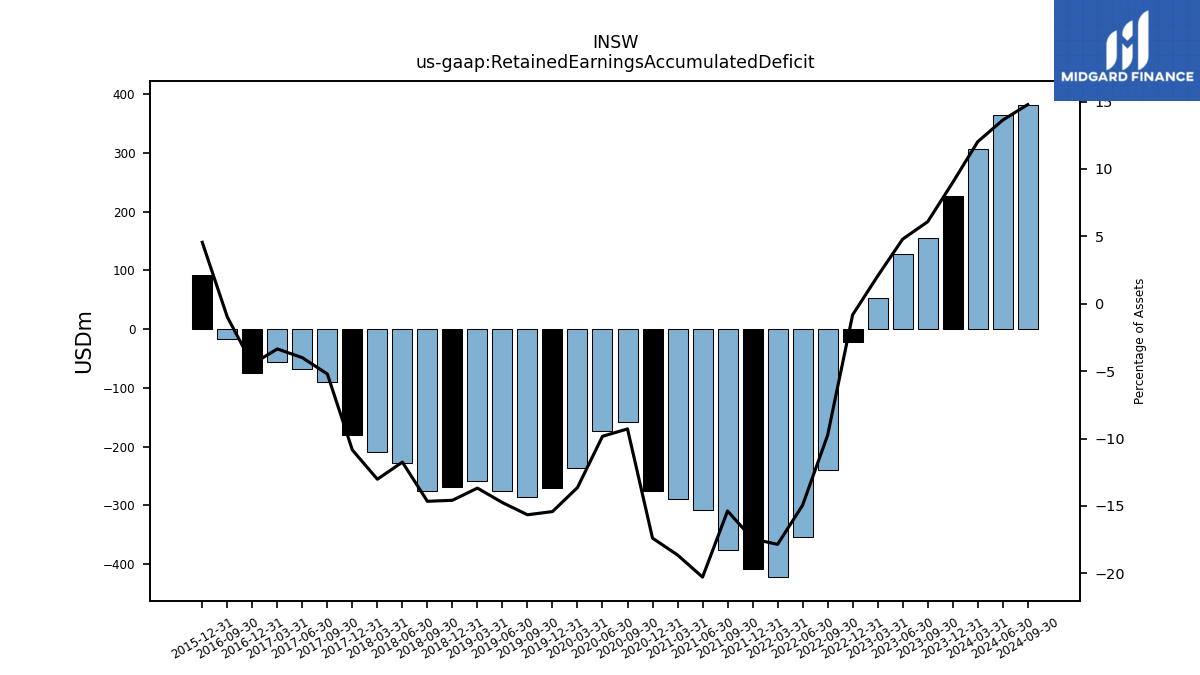
| Retained Earnings Accumulated Deficit | 306.66 | 226.83 | 155.88 | 127.37 | 52.87 | -21.45 | -239.88 | -353.30 | -422.34 | -409.34 | -375.35 | -307.99 | -289.21 | -275.85 | -158.96 | -172.94 | -237.30 | -270.31 | -286.21 | -275.11 | -258.59 | -269.49 | -276.44 | -228.66 | -209.86 | -180.54 | -89.83 | -68.01 | -56.39 | -74.46 | -16.70 | NA | NA | 92.58 | NA | NA | NA | |
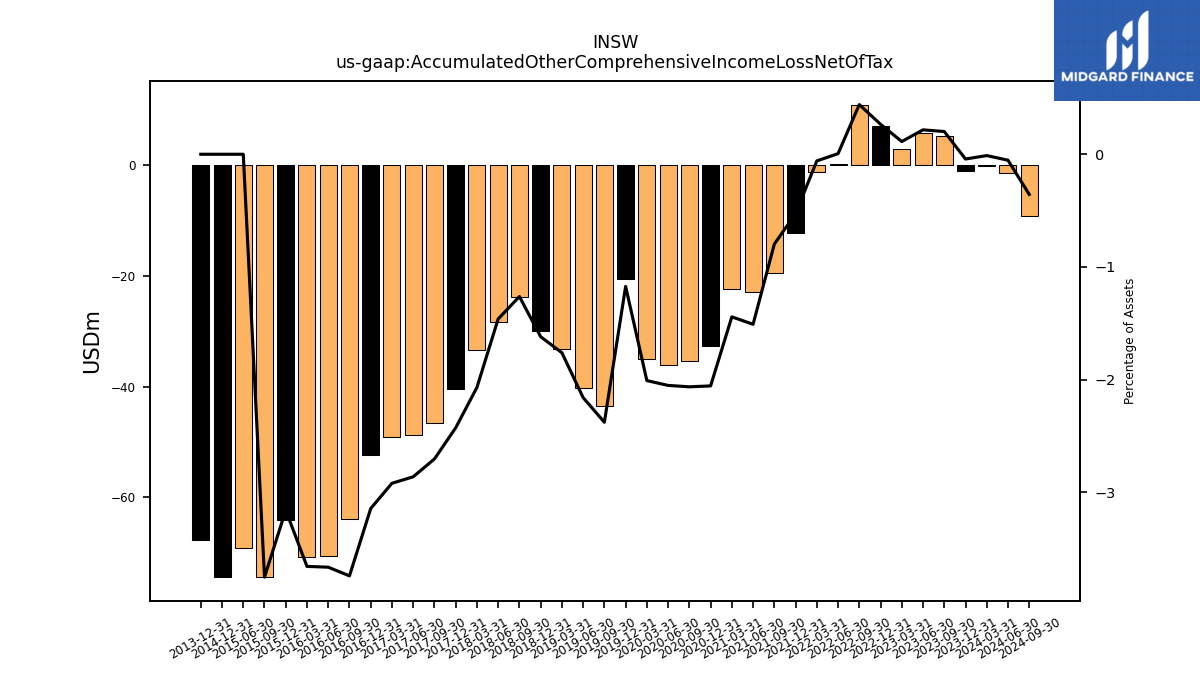
| Accumulated Other Comprehensive Income Loss Net Of Tax | -0.30 | -1.06 | 5.16 | 5.75 | 2.90 | 6.96 | 10.83 | 0.13 | -1.40 | -12.36 | -19.48 | -22.92 | -22.39 | -32.61 | -35.34 | -36.08 | -34.96 | -20.57 | -43.48 | -40.28 | -33.31 | -29.93 | -23.82 | -28.45 | -33.37 | -40.41 | -46.62 | -48.69 | -49.15 | -52.27 | -63.95 | -70.56 | -70.69 | -64.12 | -74.29 | -69.09 | NA |
| 2024-03-31 | 2023-12-31 | 2023-09-30 | 2023-06-30 | 2023-03-31 | 2022-12-31 | 2022-09-30 | 2022-06-30 | 2022-03-31 | 2021-12-31 | 2021-09-30 | 2021-06-30 | 2021-03-31 | 2020-12-31 | 2020-09-30 | 2020-06-30 | 2020-03-31 | 2019-12-31 | 2019-09-30 | 2019-06-30 | 2019-03-31 | 2018-12-31 | 2018-09-30 | 2018-06-30 | 2018-03-31 | 2017-12-31 | 2017-09-30 | 2017-06-30 | 2017-03-31 | 2016-12-31 | 2016-09-30 | 2016-06-30 | 2016-03-31 | 2015-12-31 | 2015-09-30 | 2015-06-30 | 2015-03-31 | ||
|---|---|---|---|---|---|---|---|---|---|---|---|---|---|---|---|---|---|---|---|---|---|---|---|---|---|---|---|---|---|---|---|---|---|---|---|---|---|---|
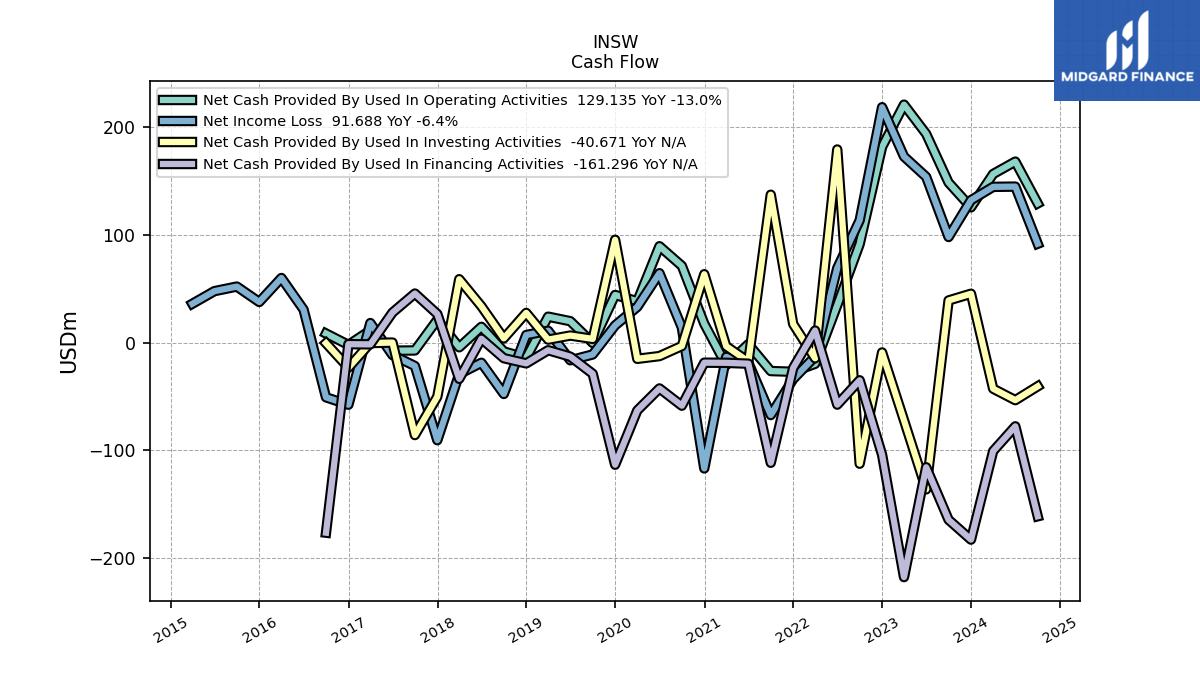
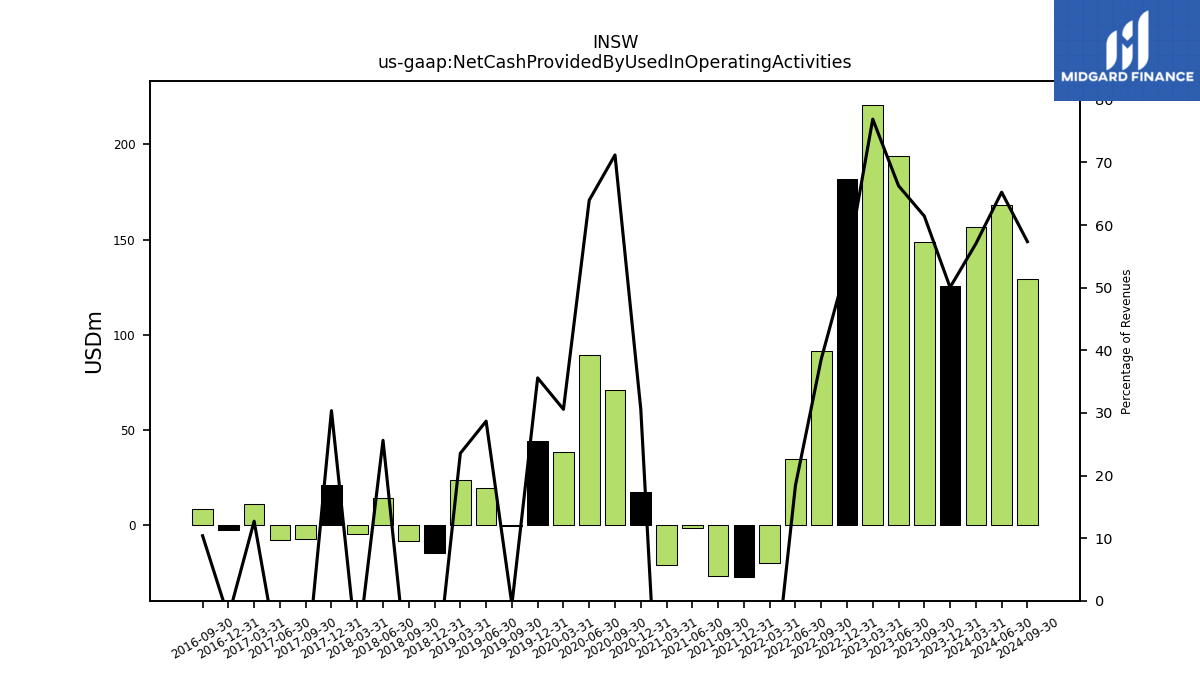
| Net Cash Provided By Used In Operating Activities | 156.44 | 125.48 | 148.46 | 193.63 | 220.82 | 181.60 | 91.36 | 34.63 | -19.78 | -27.16 | -26.52 | -1.51 | -21.01 | 17.35 | 71.10 | 89.37 | 38.32 | 44.13 | -0.42 | 19.79 | 23.99 | -14.33 | -8.28 | 14.58 | -4.45 | 21.08 | -7.37 | -7.58 | 11.27 | -2.21 | 8.38 | NA | NA | NA | NA | NA | NA | |
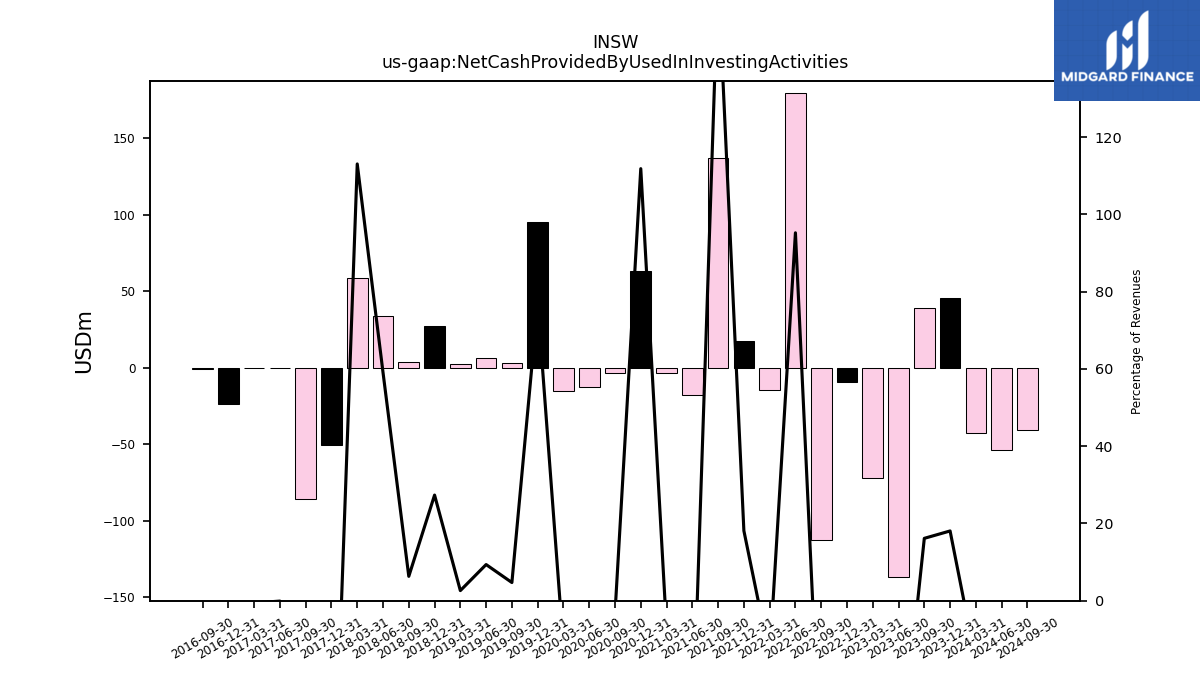
| Net Cash Provided By Used In Investing Activities | -42.90 | 45.28 | 39.03 | -136.36 | -72.22 | -9.23 | -112.51 | 179.18 | -14.65 | 17.15 | 137.21 | -17.65 | -3.42 | 63.40 | -3.27 | -12.61 | -15.16 | 95.38 | 3.36 | 6.46 | 2.68 | 27.49 | 3.85 | 33.62 | 58.75 | -50.30 | -85.93 | -0.06 | -0.50 | -23.39 | -0.62 | NA | NA | NA | NA | NA | NA | |
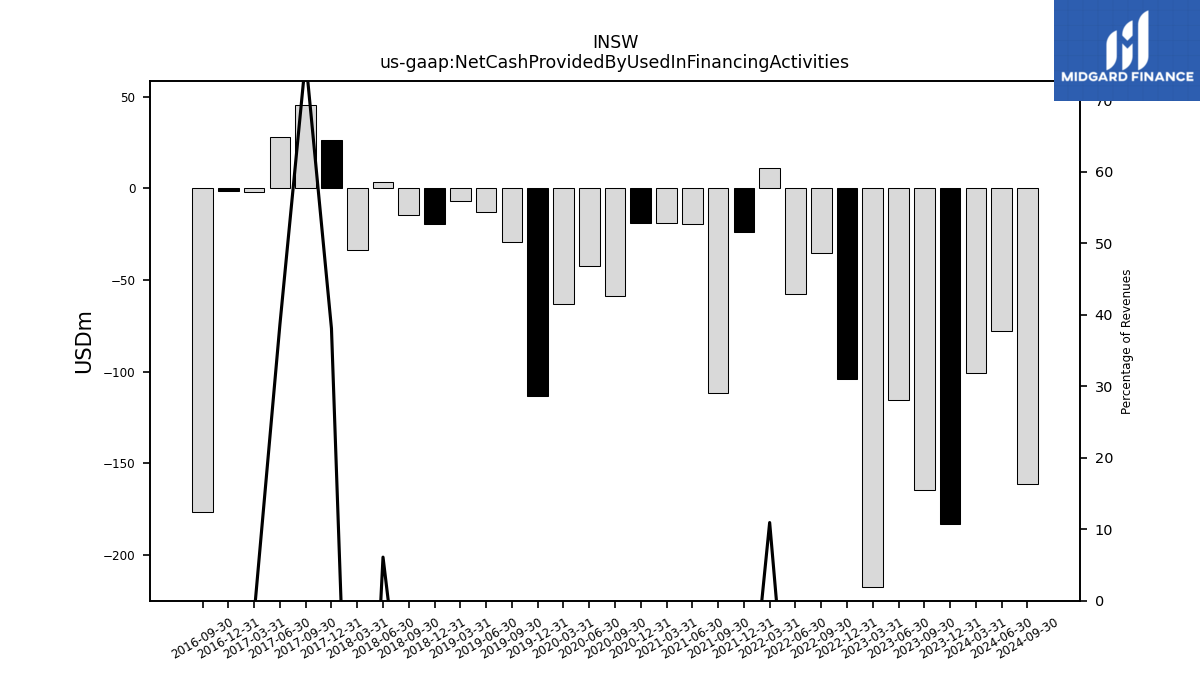
| Net Cash Provided By Used In Financing Activities | -100.80 | -182.98 | -164.54 | -115.80 | -217.79 | -104.15 | -35.04 | -57.69 | 11.10 | -23.65 | -111.66 | -19.68 | -18.85 | -18.73 | -58.64 | -42.63 | -63.08 | -113.48 | -29.01 | -13.11 | -7.16 | -19.38 | -14.57 | 3.47 | -33.72 | 26.45 | 45.46 | 27.81 | -1.71 | -1.54 | -176.55 | NA | NA | NA | NA | NA | NA |
| 2024-03-31 | 2023-12-31 | 2023-09-30 | 2023-06-30 | 2023-03-31 | 2022-12-31 | 2022-09-30 | 2022-06-30 | 2022-03-31 | 2021-12-31 | 2021-09-30 | 2021-06-30 | 2021-03-31 | 2020-12-31 | 2020-09-30 | 2020-06-30 | 2020-03-31 | 2019-12-31 | 2019-09-30 | 2019-06-30 | 2019-03-31 | 2018-12-31 | 2018-09-30 | 2018-06-30 | 2018-03-31 | 2017-12-31 | 2017-09-30 | 2017-06-30 | 2017-03-31 | 2016-12-31 | 2016-09-30 | 2016-06-30 | 2016-03-31 | 2015-12-31 | 2015-09-30 | 2015-06-30 | 2015-03-31 | ||
|---|---|---|---|---|---|---|---|---|---|---|---|---|---|---|---|---|---|---|---|---|---|---|---|---|---|---|---|---|---|---|---|---|---|---|---|---|---|---|
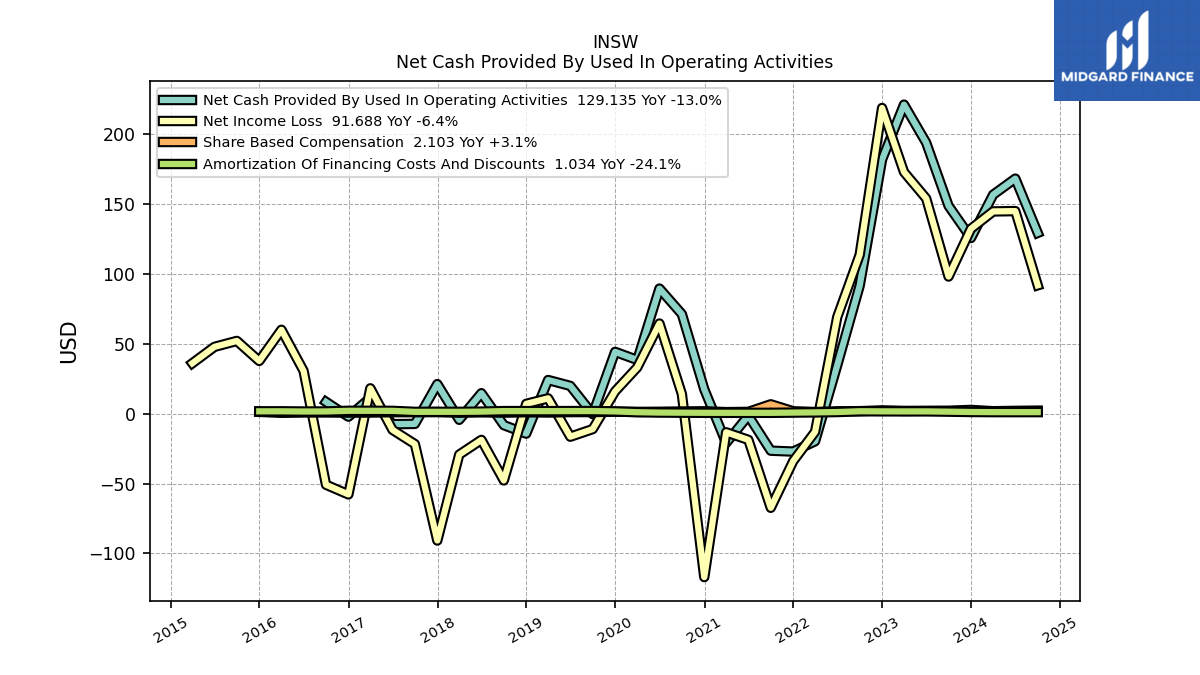
| Net Cash Provided By Used In Operating Activities | 156.44 | 125.48 | 148.46 | 193.63 | 220.82 | 181.60 | 91.36 | 34.63 | -19.78 | -27.16 | -26.52 | -1.51 | -21.01 | 17.35 | 71.10 | 89.37 | 38.32 | 44.13 | -0.42 | 19.79 | 23.99 | -14.33 | -8.28 | 14.58 | -4.45 | 21.08 | -7.37 | -7.58 | 11.27 | -2.21 | 8.38 | NA | NA | NA | NA | NA | NA | |
| Net Income Loss | 144.49 | 132.11 | 97.94 | 153.76 | 172.63 | 218.43 | 113.43 | 69.04 | -13.00 | -33.99 | -67.35 | -18.78 | -13.37 | -116.89 | 13.98 | 64.36 | 33.02 | 15.89 | -11.10 | -16.52 | 10.90 | 6.96 | -47.79 | -18.80 | -29.32 | -90.72 | -21.82 | -11.62 | 18.07 | -57.76 | -50.86 | 30.51 | 59.89 | 37.61 | 51.93 | 47.69 | 35.94 | |
| Profit Loss | 144.49 | 132.11 | 97.94 | 153.76 | 172.63 | 218.43 | 113.43 | 69.04 | -13.00 | -34.63 | -67.88 | -18.78 | -13.37 | -116.89 | 13.98 | 64.36 | 33.02 | 15.89 | -11.10 | -16.52 | 10.90 | 6.96 | -47.79 | -18.80 | -29.32 | NA | NA | NA | NA | NA | NA | NA | NA | NA | NA | NA | NA | |
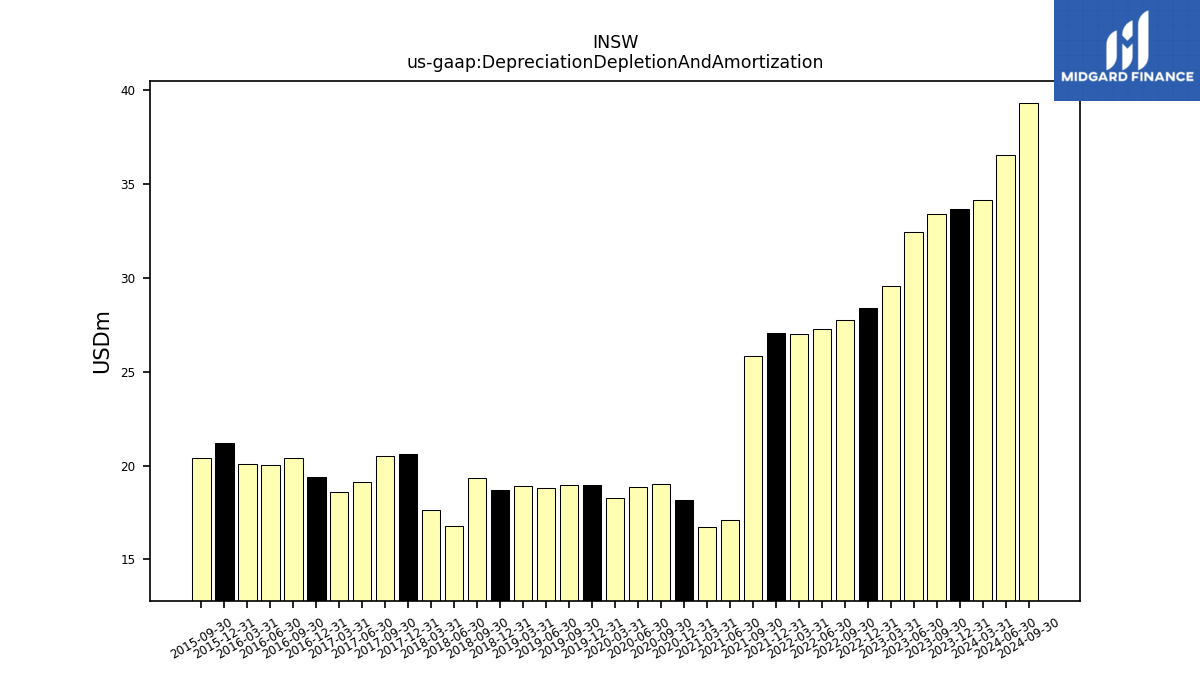
| Depreciation Depletion And Amortization | 34.15 | 33.68 | 33.36 | 32.45 | 29.55 | 28.40 | 27.73 | 27.26 | 27.00 | 27.04 | 25.81 | 17.08 | 16.75 | 18.18 | 19.01 | 18.88 | 18.27 | 18.95 | 18.96 | 18.82 | 18.93 | 18.68 | 19.32 | 16.80 | 17.62 | 20.61 | 20.53 | 19.10 | 18.62 | 19.40 | 20.38 | 20.02 | 20.08 | 21.20 | 20.40 | NA | NA | |
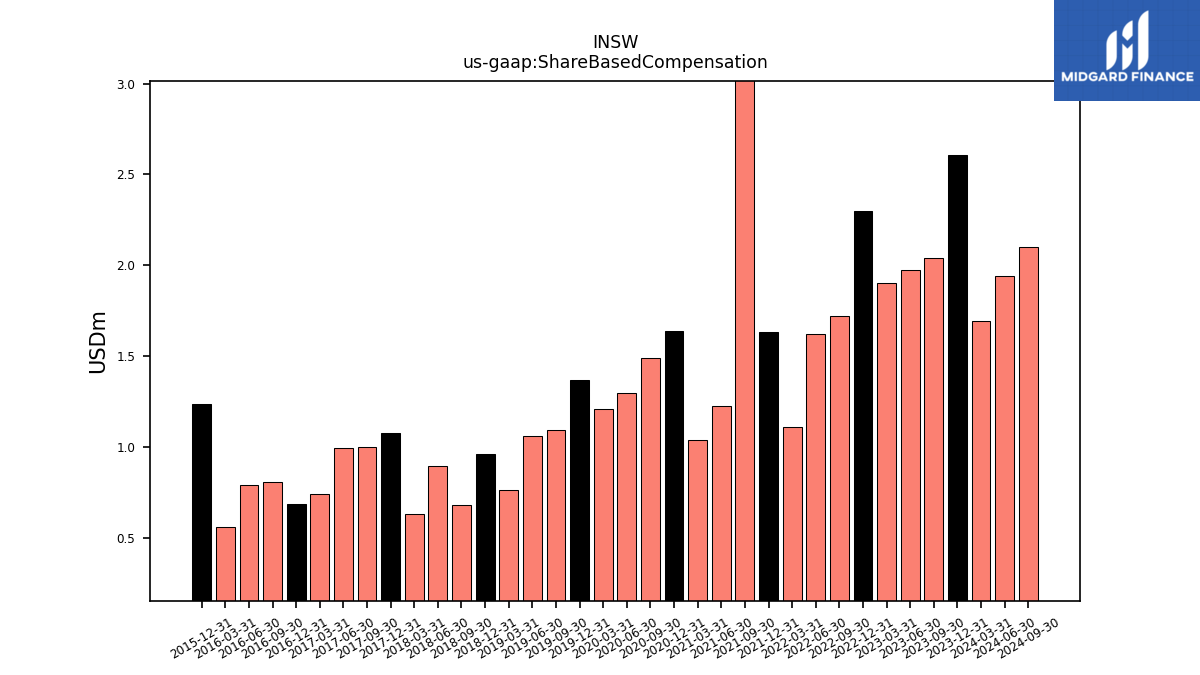
| Share Based Compensation | 1.69 | 2.61 | 2.04 | 1.97 | 1.90 | 2.30 | 1.72 | 1.62 | 1.11 | 1.64 | 6.63 | 1.23 | 1.04 | 1.64 | 1.49 | 1.30 | 1.21 | 1.37 | 1.09 | 1.06 | 0.76 | 0.96 | 0.68 | 0.90 | 0.63 | 1.07 | 1.00 | 0.99 | 0.74 | 0.68 | 0.81 | 0.79 | 0.56 | 1.23 | NA | NA | NA | |
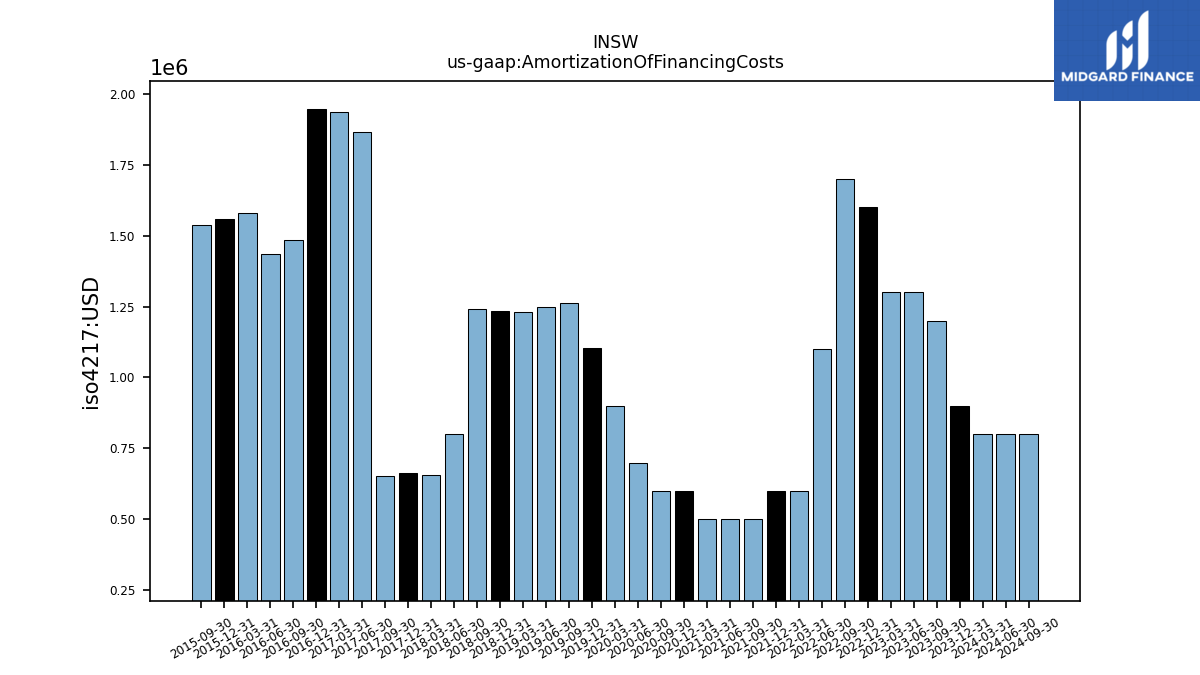
| Amortization Of Financing Costs | 0.80 | 0.90 | 1.20 | 1.30 | 1.30 | 1.60 | 1.70 | 1.10 | 0.60 | 0.60 | 0.50 | 0.50 | 0.50 | 0.60 | 0.60 | 0.70 | 0.90 | 1.10 | 1.26 | 1.25 | 1.23 | 1.23 | 1.24 | 0.80 | 0.66 | 0.66 | 0.65 | 1.86 | 1.94 | 1.95 | 1.48 | 1.44 | 1.58 | 1.56 | 1.54 | NA | NA |
| 2024-03-31 | 2023-12-31 | 2023-09-30 | 2023-06-30 | 2023-03-31 | 2022-12-31 | 2022-09-30 | 2022-06-30 | 2022-03-31 | 2021-12-31 | 2021-09-30 | 2021-06-30 | 2021-03-31 | 2020-12-31 | 2020-09-30 | 2020-06-30 | 2020-03-31 | 2019-12-31 | 2019-09-30 | 2019-06-30 | 2019-03-31 | 2018-12-31 | 2018-09-30 | 2018-06-30 | 2018-03-31 | 2017-12-31 | 2017-09-30 | 2017-06-30 | 2017-03-31 | 2016-12-31 | 2016-09-30 | 2016-06-30 | 2016-03-31 | 2015-12-31 | 2015-09-30 | 2015-06-30 | 2015-03-31 | ||
|---|---|---|---|---|---|---|---|---|---|---|---|---|---|---|---|---|---|---|---|---|---|---|---|---|---|---|---|---|---|---|---|---|---|---|---|---|---|---|
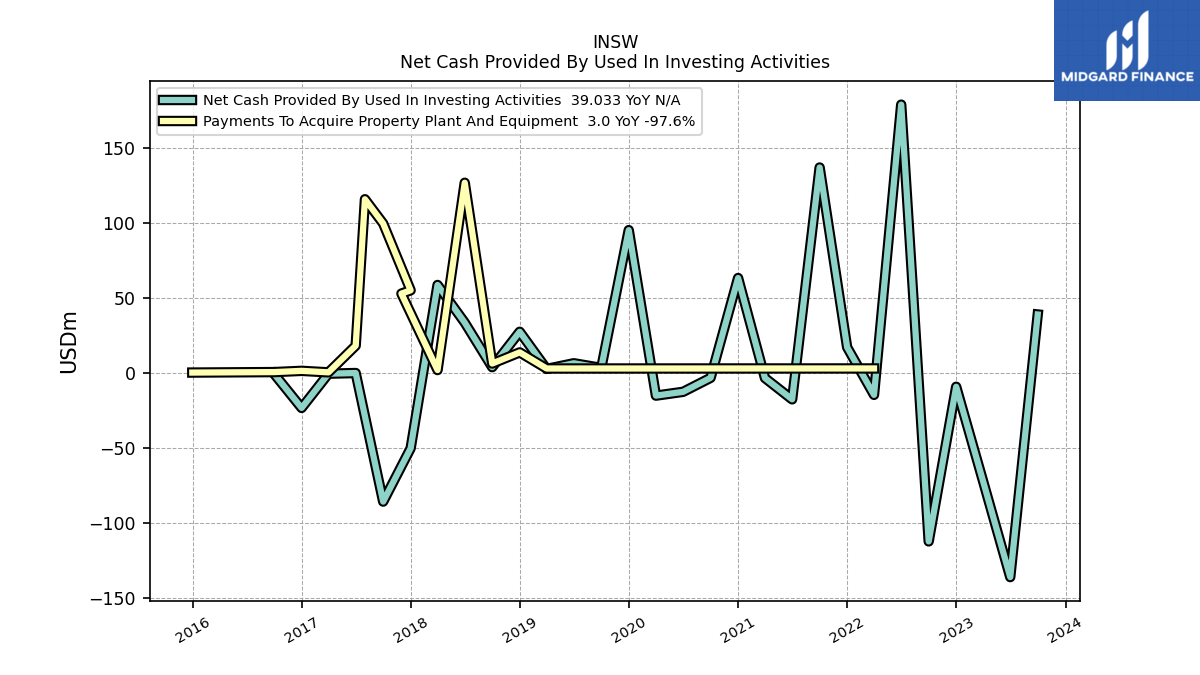
| Net Cash Provided By Used In Investing Activities | -42.90 | 45.28 | 39.03 | -136.36 | -72.22 | -9.23 | -112.51 | 179.18 | -14.65 | 17.15 | 137.21 | -17.65 | -3.42 | 63.40 | -3.27 | -12.61 | -15.16 | 95.38 | 3.36 | 6.46 | 2.68 | 27.49 | 3.85 | 33.62 | 58.75 | -50.30 | -85.93 | -0.06 | -0.50 | -23.39 | -0.62 | NA | NA | NA | NA | NA | NA |
| 2024-03-31 | 2023-12-31 | 2023-09-30 | 2023-06-30 | 2023-03-31 | 2022-12-31 | 2022-09-30 | 2022-06-30 | 2022-03-31 | 2021-12-31 | 2021-09-30 | 2021-06-30 | 2021-03-31 | 2020-12-31 | 2020-09-30 | 2020-06-30 | 2020-03-31 | 2019-12-31 | 2019-09-30 | 2019-06-30 | 2019-03-31 | 2018-12-31 | 2018-09-30 | 2018-06-30 | 2018-03-31 | 2017-12-31 | 2017-09-30 | 2017-06-30 | 2017-03-31 | 2016-12-31 | 2016-09-30 | 2016-06-30 | 2016-03-31 | 2015-12-31 | 2015-09-30 | 2015-06-30 | 2015-03-31 | ||
|---|---|---|---|---|---|---|---|---|---|---|---|---|---|---|---|---|---|---|---|---|---|---|---|---|---|---|---|---|---|---|---|---|---|---|---|---|---|---|
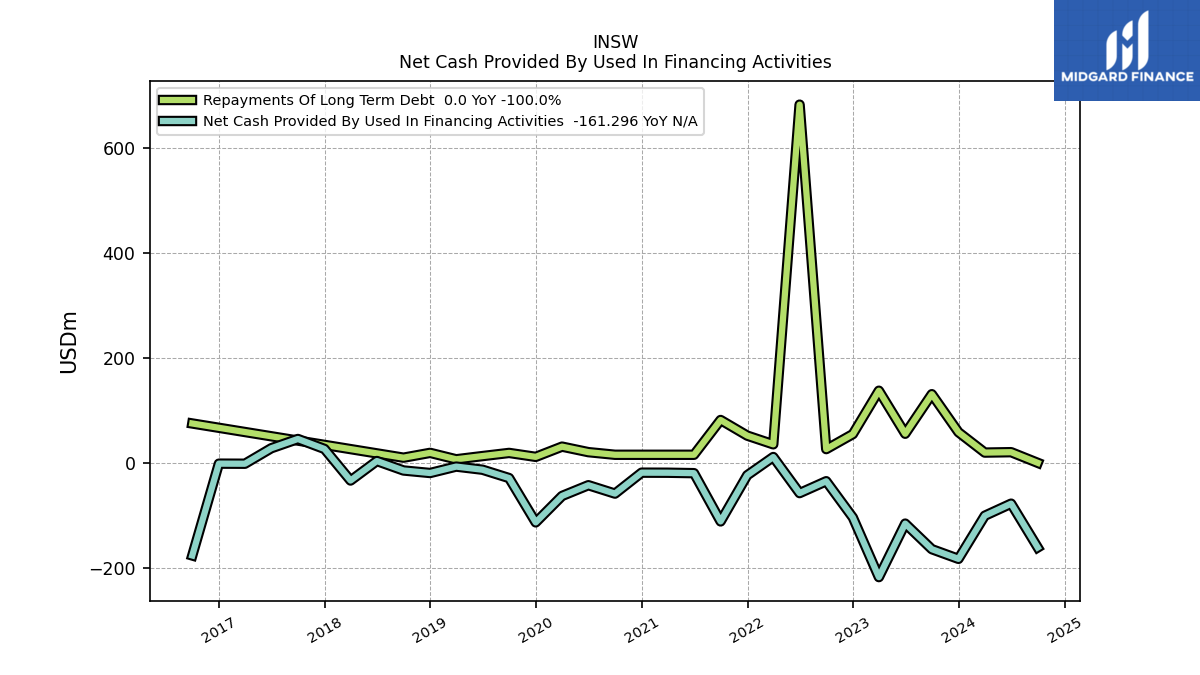
| Net Cash Provided By Used In Financing Activities | -100.80 | -182.98 | -164.54 | -115.80 | -217.79 | -104.15 | -35.04 | -57.69 | 11.10 | -23.65 | -111.66 | -19.68 | -18.85 | -18.73 | -58.64 | -42.63 | -63.08 | -113.48 | -29.01 | -13.11 | -7.16 | -19.38 | -14.57 | 3.47 | -33.72 | 26.45 | 45.46 | 27.81 | -1.71 | -1.54 | -176.55 | NA | NA | NA | NA | NA | NA | |
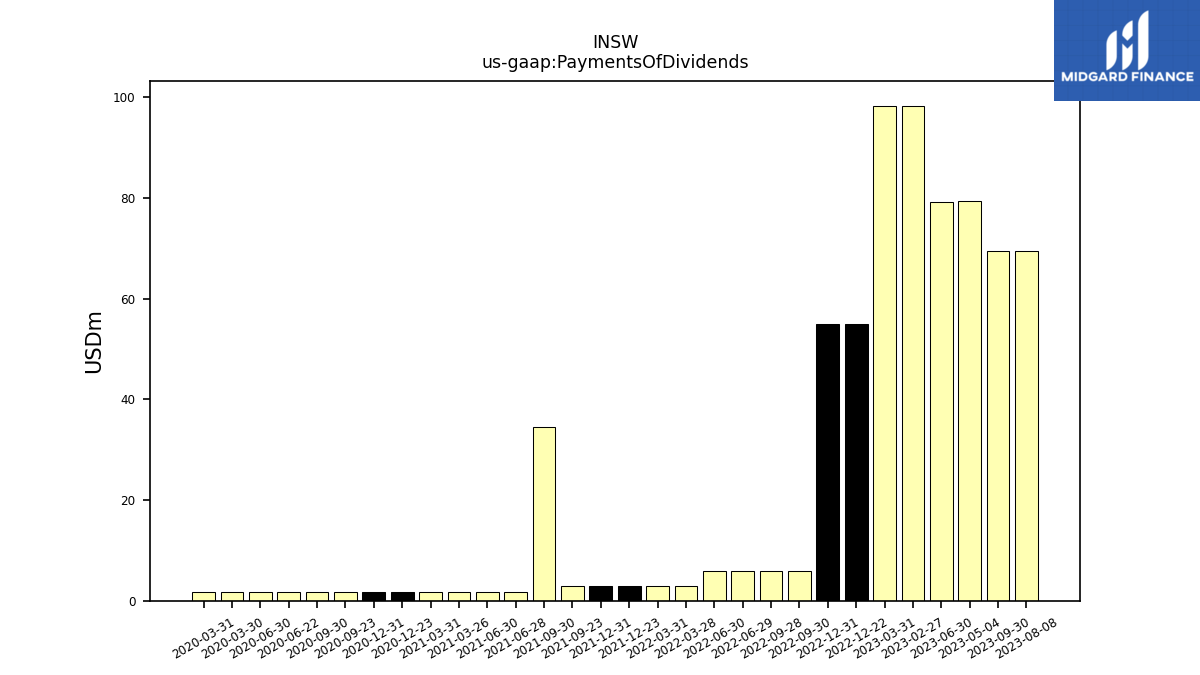
| Payments Of Dividends | 64.66 | 61.15 | 69.44 | 79.25 | 98.31 | 55.01 | 5.89 | 5.96 | 2.98 | 3.02 | 34.55 | 1.69 | 1.68 | 1.68 | 1.68 | 1.68 | 1.73 | NA | NA | NA | NA | NA | NA | NA | NA | NA | NA | NA | NA | NA | NA | NA | NA | NA | NA | NA | NA | |
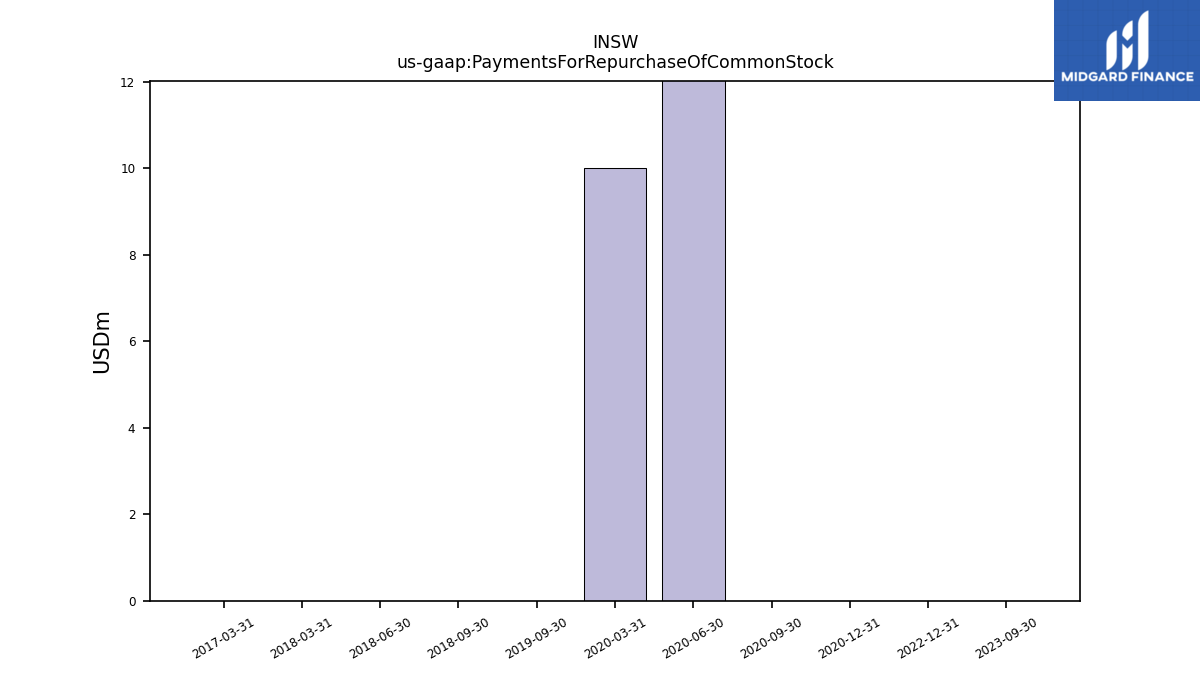
| Payments For Repurchase Of Common Stock | NA | 0.00 | 0.00 | NA | NA | 0.00 | NA | NA | NA | NA | NA | NA | NA | 0.00 | 0.00 | 19.98 | 10.01 | NA | 0.00 | NA | NA | NA | 0.00 | 0.00 | 0.00 | NA | NA | NA | 0.00 | NA | NA | NA | NA | NA | NA | NA | NA |
| 2024-03-31 | 2023-12-31 | 2023-09-30 | 2023-06-30 | 2023-03-31 | 2022-12-31 | 2022-09-30 | 2022-06-30 | 2022-03-31 | 2021-12-31 | 2021-09-30 | 2021-06-30 | 2021-03-31 | 2020-12-31 | 2020-09-30 | 2020-06-30 | 2020-03-31 | 2019-12-31 | 2019-09-30 | 2019-06-30 | 2019-03-31 | 2018-12-31 | 2018-09-30 | 2018-06-30 | 2018-03-31 | 2017-12-31 | 2017-09-30 | 2017-06-30 | 2017-03-31 | 2016-12-31 | 2016-09-30 | 2016-06-30 | 2016-03-31 | 2015-12-31 | 2015-09-30 | 2015-06-30 | 2015-03-31 | ||
|---|---|---|---|---|---|---|---|---|---|---|---|---|---|---|---|---|---|---|---|---|---|---|---|---|---|---|---|---|---|---|---|---|---|---|---|---|---|---|
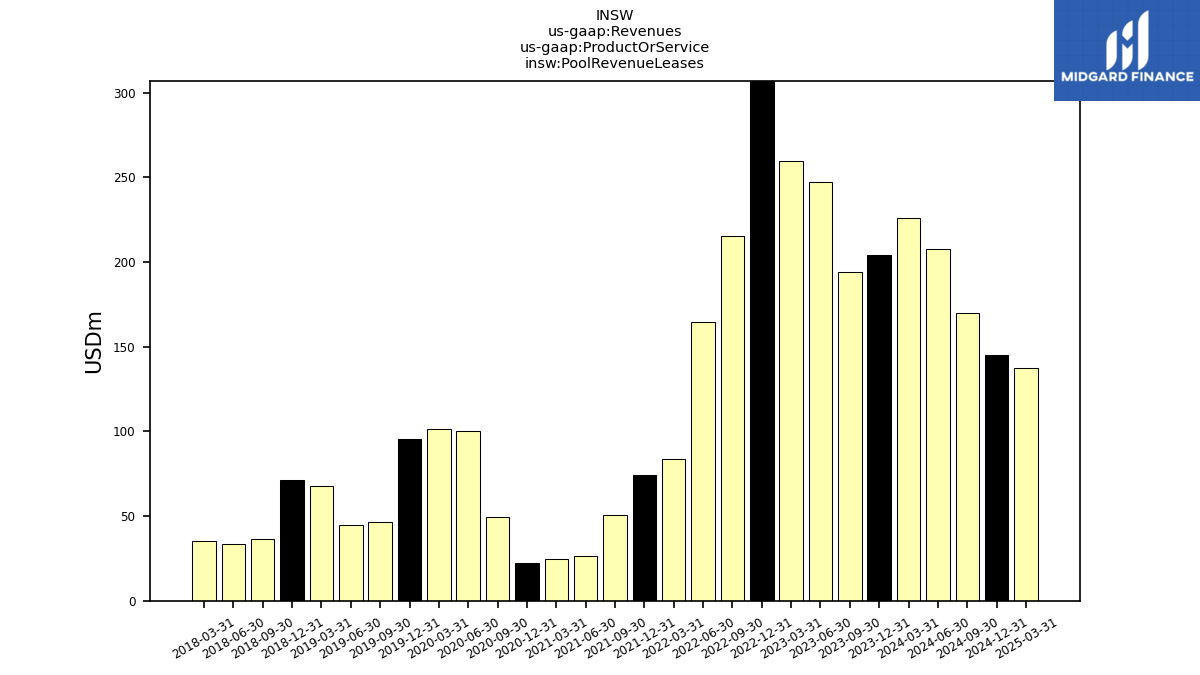
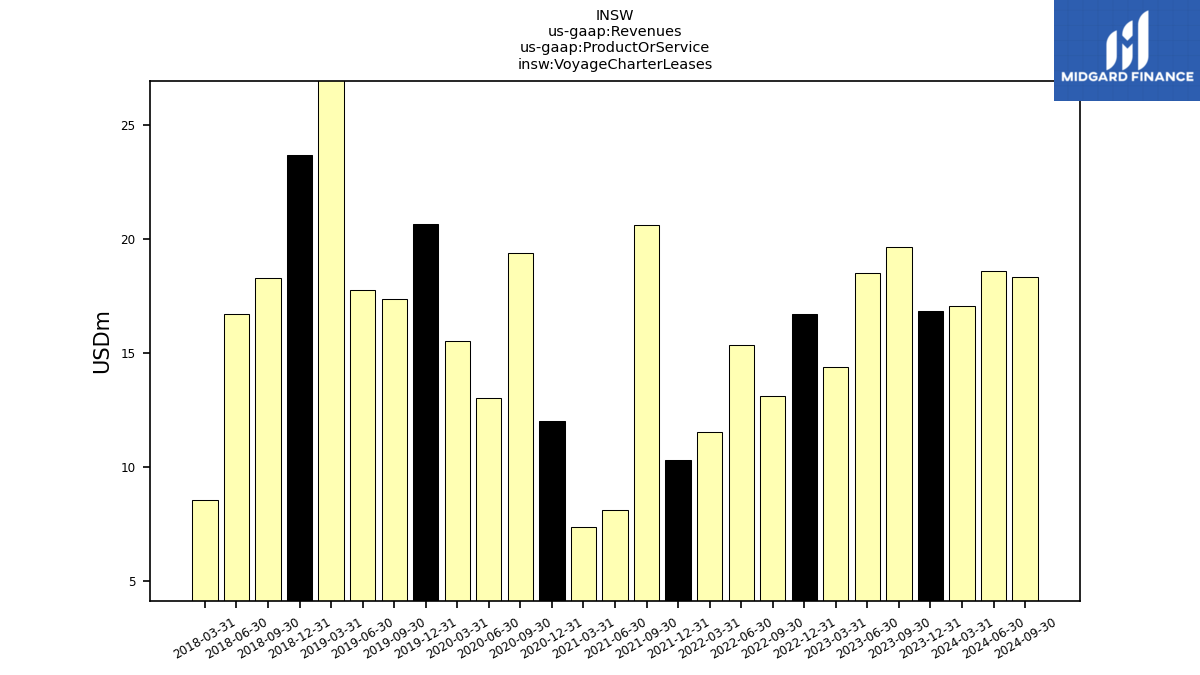
| Revenues | 274.40 | 250.73 | 241.71 | 292.20 | 287.13 | 338.16 | 236.83 | 188.20 | 101.48 | 94.67 | 84.82 | 46.30 | 46.76 | 56.70 | 99.88 | 139.72 | 125.34 | 124.02 | 71.28 | 69.01 | 101.87 | 100.55 | 60.93 | 56.91 | 51.98 | 69.43 | 59.97 | 71.96 | 88.75 | 85.81 | 80.77 | 103.06 | 128.68 | 124.97 | 131.12 | 124.09 | 117.45 | |
| Pool Revenue Leases | 226.28 | 204.17 | 194.47 | 247.59 | 259.58 | 311.19 | 215.24 | 164.73 | 83.76 | 74.34 | 50.54 | 26.45 | 24.66 | 22.50 | 49.22 | 100.06 | 101.21 | 95.43 | 46.28 | 44.71 | 67.64 | 71.37 | 36.72 | 33.60 | 35.51 | NA | NA | NA | NA | NA | NA | NA | NA | NA | NA | NA | NA | |
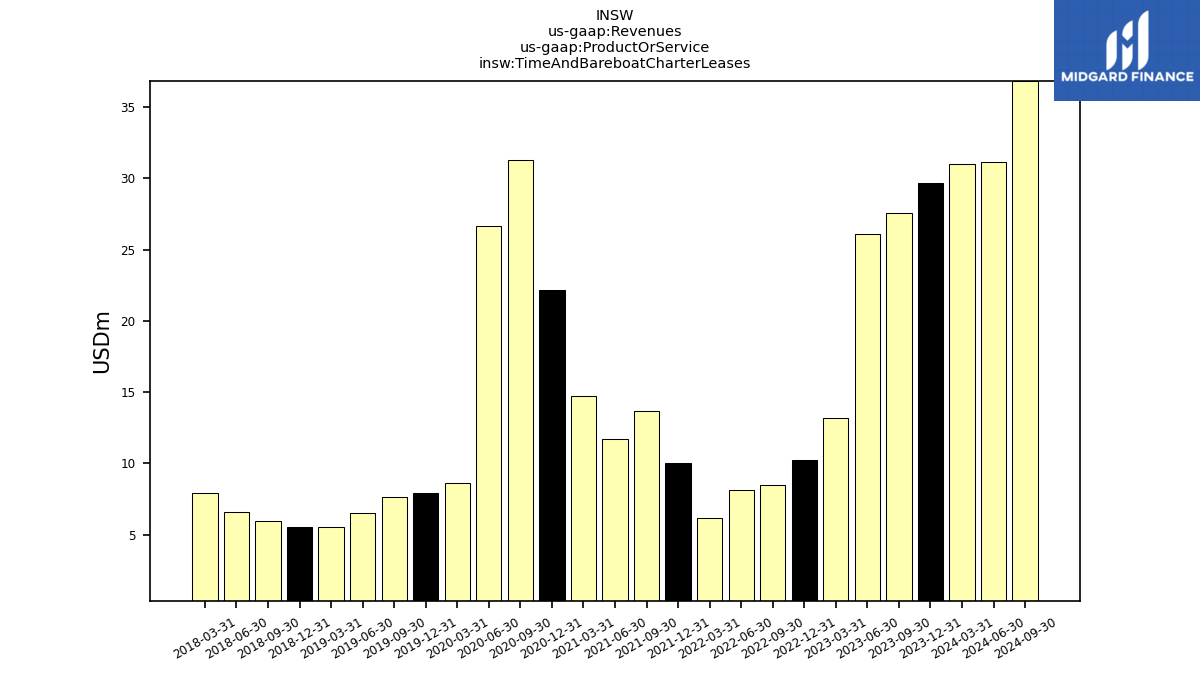
| Time And Bareboat Charter Leases | 31.05 | 29.70 | 27.59 | 26.11 | 13.15 | 10.24 | 8.49 | 8.13 | 6.17 | 10.02 | 13.66 | 11.71 | 14.70 | 22.17 | 31.29 | 26.66 | 8.60 | 7.93 | 7.64 | 6.54 | 5.52 | 5.51 | 5.93 | 6.61 | 7.91 | NA | NA | NA | NA | NA | NA | NA | NA | NA | NA | NA | NA | |
| Voyage Charter Leases | 17.07 | 16.86 | 19.66 | 18.50 | 14.40 | 16.73 | 13.10 | 15.34 | 11.54 | 10.31 | 20.61 | 8.13 | 7.40 | 12.04 | 19.37 | 13.01 | 15.52 | 20.67 | 17.36 | 17.76 | 28.72 | 23.67 | 18.27 | 16.70 | 8.55 | NA | NA | NA | NA | NA | NA | NA | NA | NA | NA | NA | NA | |
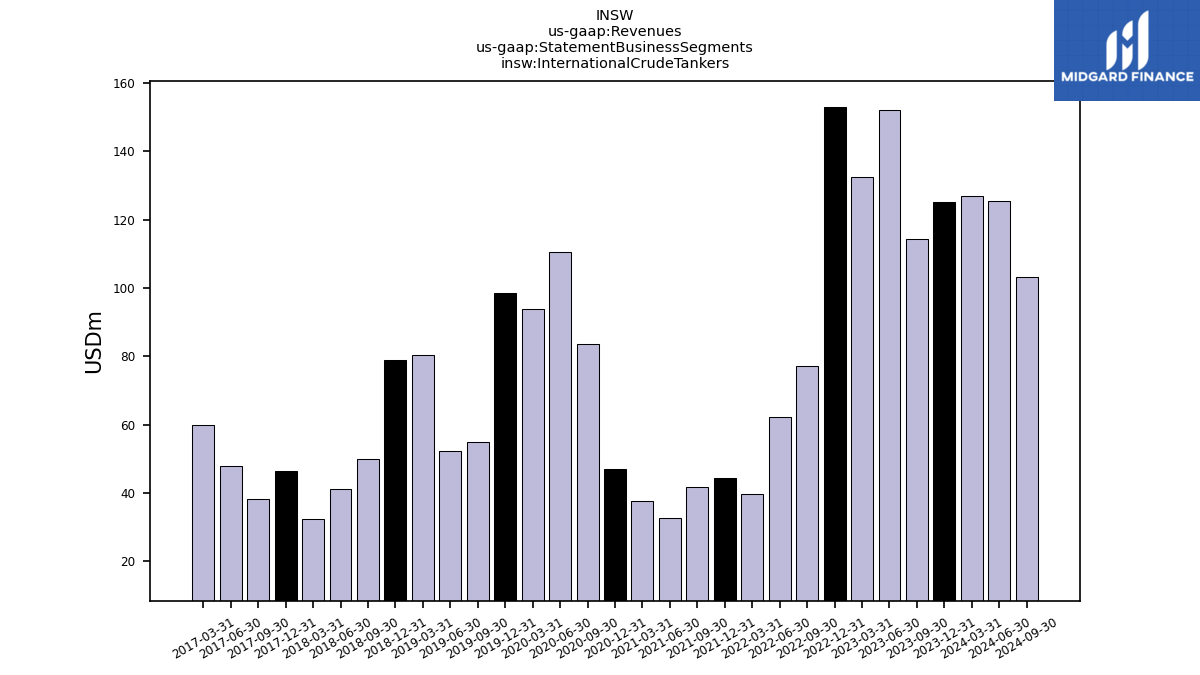
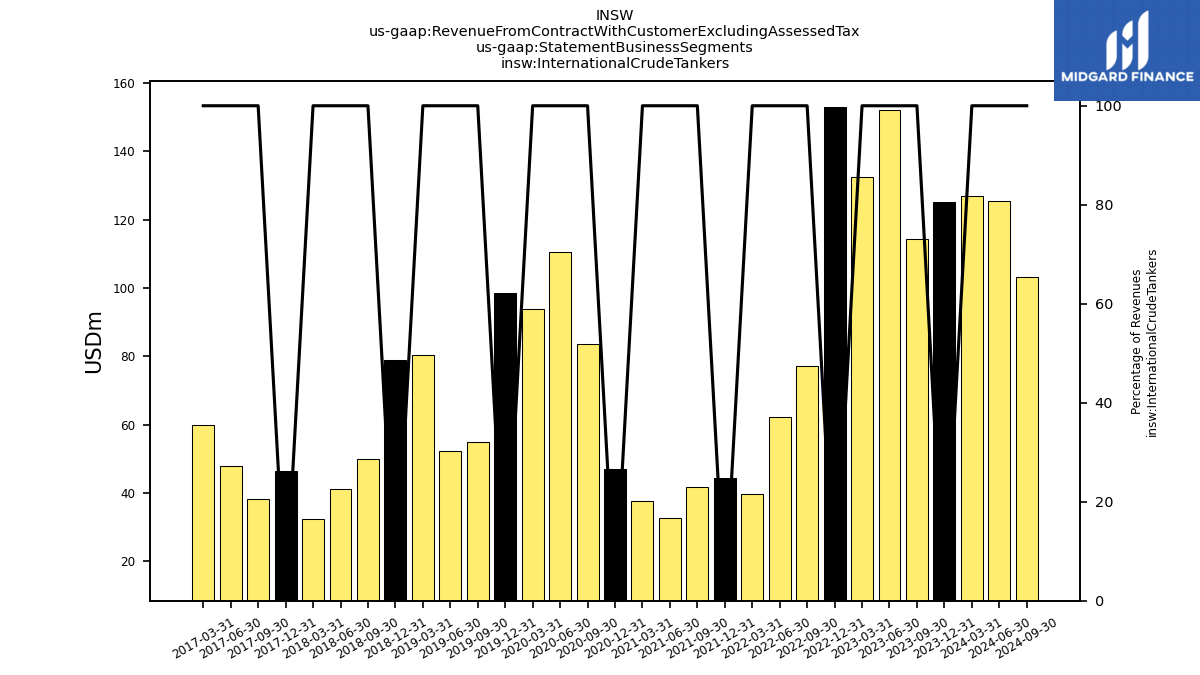
| International Crude Tankers | 126.87 | 125.18 | 114.25 | 152.17 | 132.41 | 152.91 | 77.07 | 62.11 | 39.61 | 44.46 | 41.76 | 32.55 | 37.51 | 47.05 | 83.64 | 110.41 | 93.68 | 98.64 | 54.87 | 52.13 | 80.39 | 78.96 | 49.92 | 41.15 | 32.37 | 46.30 | 38.32 | 47.91 | 59.89 | NA | NA | NA | NA | NA | NA | NA | NA | |
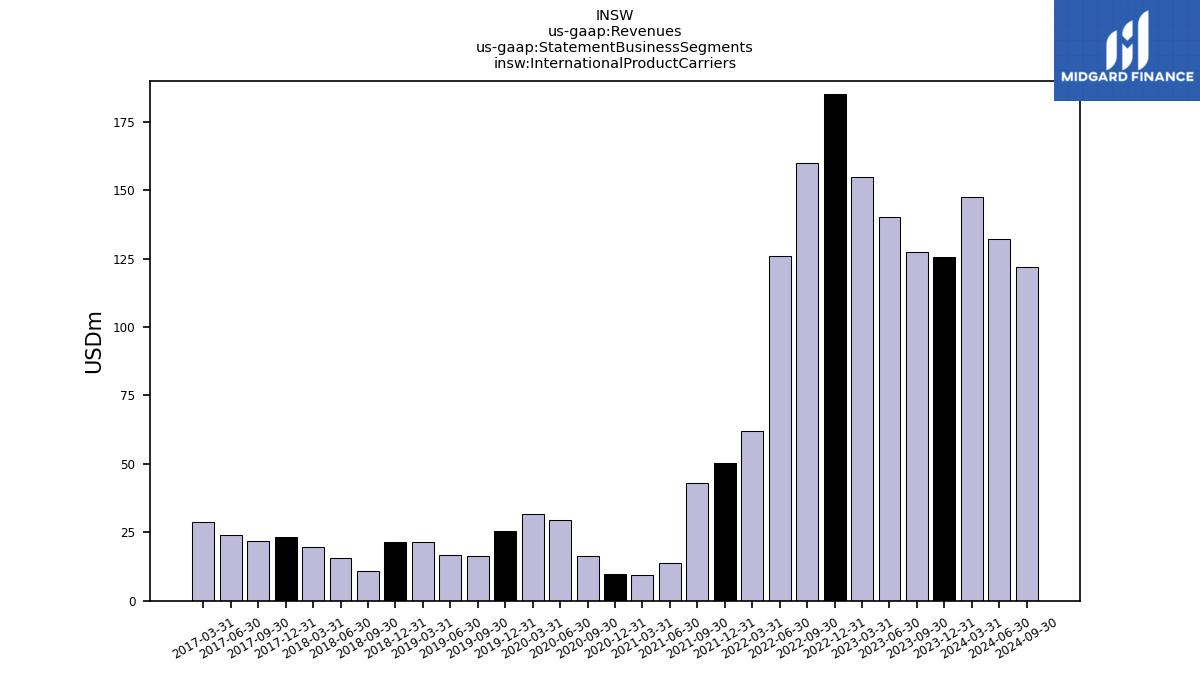
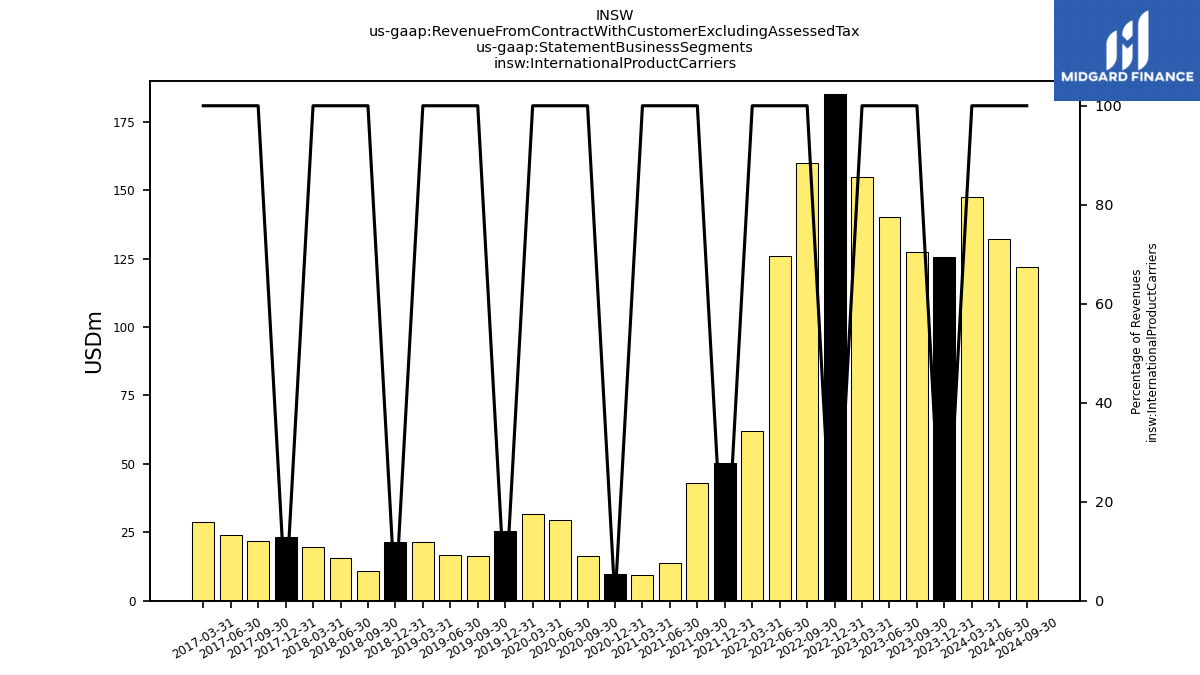
| International Product Carriers | 147.53 | 125.56 | 127.46 | 140.03 | 154.72 | 185.25 | 159.76 | 126.09 | 61.87 | 50.21 | 43.06 | 13.76 | 9.25 | 9.66 | 16.25 | 29.32 | 31.66 | 25.38 | 16.41 | 16.88 | 21.49 | 21.59 | 11.01 | 15.76 | 19.61 | 23.12 | 21.65 | 24.04 | 28.86 | NA | NA | NA | NA | NA | NA | NA | NA | |
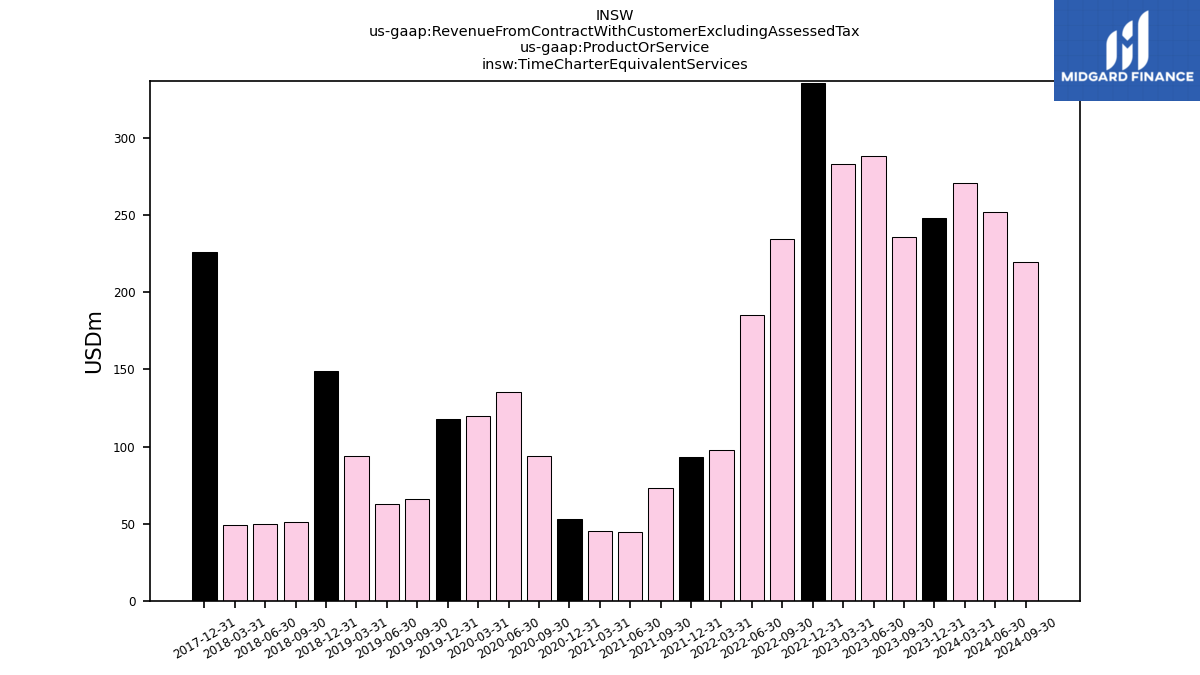
| Revenue From Contract With Customer Excluding Assessed Tax | 274.40 | 250.73 | 241.71 | 292.20 | 287.13 | 338.16 | 236.83 | 188.20 | 101.48 | 94.67 | 84.82 | 46.30 | 46.76 | 56.70 | 99.88 | 139.72 | 125.34 | 124.02 | 71.28 | 69.01 | 101.87 | 100.55 | 60.93 | 56.91 | 51.98 | 69.43 | 59.97 | 71.96 | 88.75 | 85.81 | 80.77 | 103.06 | 128.68 | 124.97 | 131.12 | 124.09 | 117.45 | |
| Time Charter Equivalent Services | 270.93 | 247.91 | 235.95 | 288.33 | 283.32 | 335.65 | 234.55 | 185.54 | 97.97 | 93.00 | 72.97 | 44.72 | 45.17 | 52.95 | 94.03 | 135.29 | 119.73 | 117.59 | 65.81 | 62.49 | 94.03 | 149.07 | 51.25 | 50.01 | 48.80 | 226.19 | NA | NA | NA | NA | NA | NA | NA | NA | NA | NA | NA | |
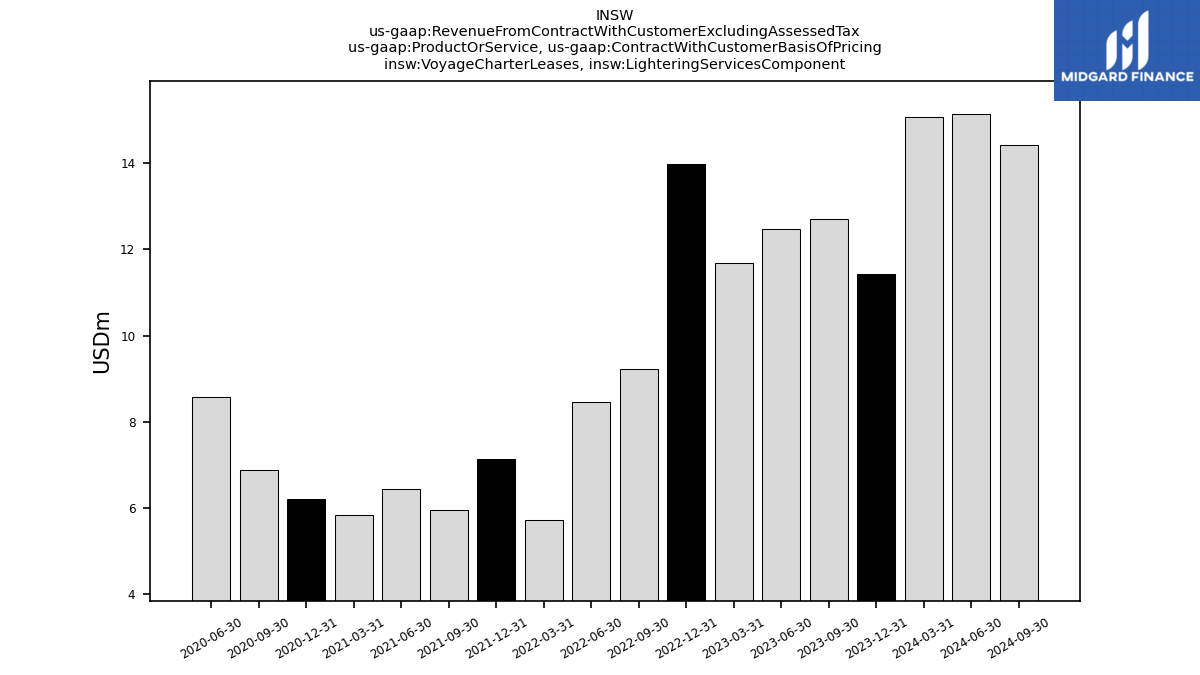
| Voyage Charter Leases, Lightering Services Component | 15.07 | 11.43 | 12.70 | 12.48 | 11.69 | 13.99 | 9.22 | 8.45 | 5.72 | 7.13 | 5.95 | 6.44 | 5.83 | 6.20 | 6.88 | 8.57 | NA | NA | NA | NA | NA | NA | NA | NA | NA | NA | NA | NA | NA | NA | NA | NA | NA | NA | NA | NA | NA | |
| Voyage Charter Leases, Lightering Services Component, International Crude Tankers | 15.07 | 11.43 | 12.70 | 12.48 | 11.69 | 13.99 | 9.22 | 8.45 | 5.72 | 7.13 | 5.95 | 6.44 | 5.83 | 6.20 | 6.88 | 8.57 | NA | NA | NA | NA | NA | NA | NA | NA | NA | NA | NA | NA | NA | NA | NA | NA | NA | NA | NA | NA | NA | |
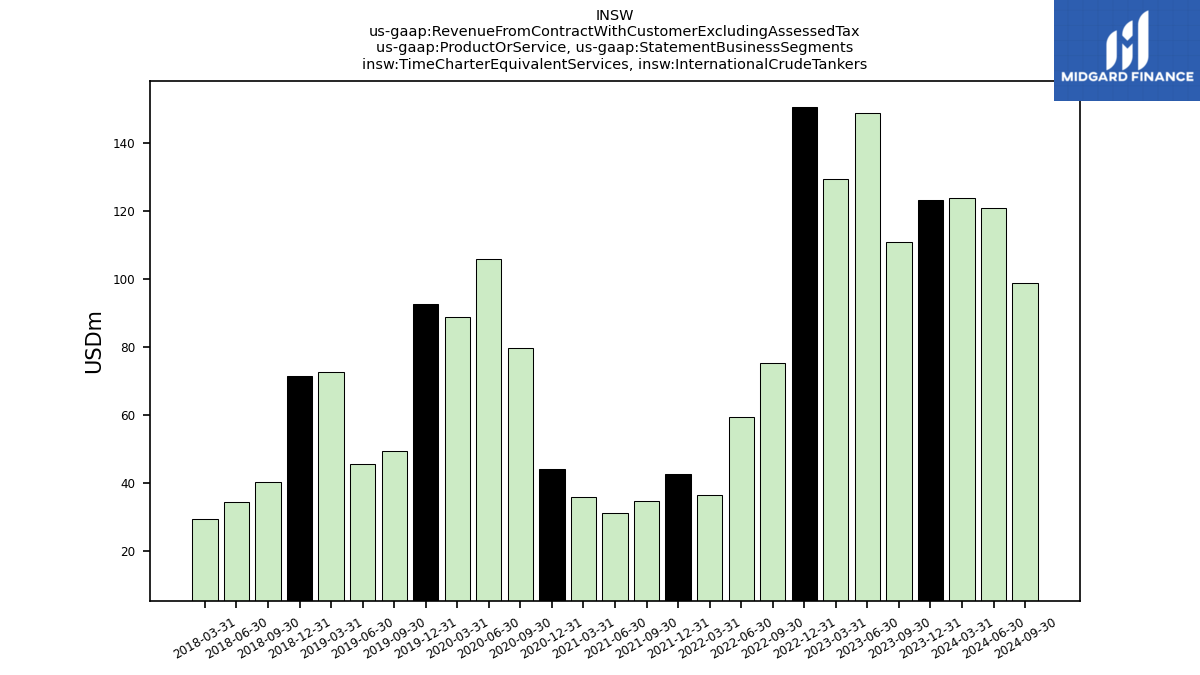
| Time Charter Equivalent Services, International Crude Tankers | 123.96 | 123.26 | 110.77 | 148.91 | 129.28 | 150.73 | 75.19 | 59.46 | 36.48 | 42.47 | 34.77 | 31.10 | 35.95 | 44.05 | 79.80 | 105.89 | 88.85 | 92.50 | 49.45 | 45.65 | 72.59 | 71.57 | 40.35 | 34.38 | 29.22 | NA | NA | NA | NA | NA | NA | NA | NA | NA | NA | NA | NA | |
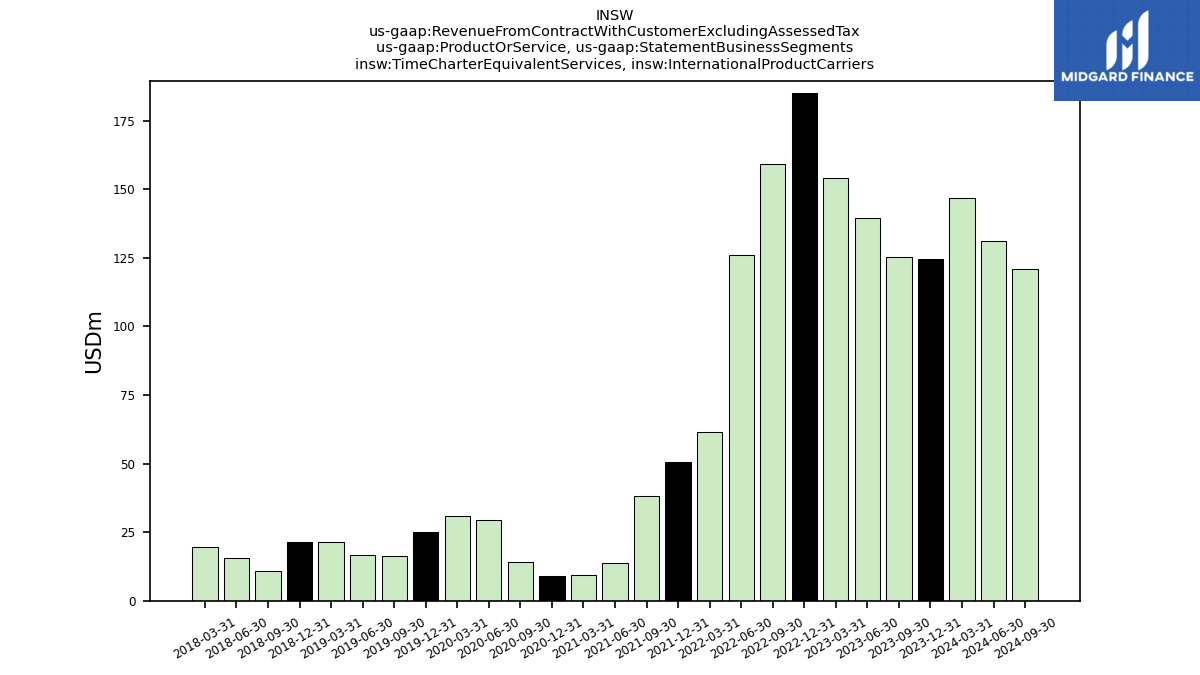
| Time Charter Equivalent Services, International Product Carriers | 146.97 | 124.66 | 125.19 | 139.42 | 154.03 | 184.92 | 159.35 | 126.08 | 61.50 | 50.54 | 38.20 | 13.62 | 9.22 | 8.91 | 14.23 | 29.40 | 30.88 | 25.09 | 16.36 | 16.83 | 21.44 | 21.46 | 10.90 | 15.63 | 19.58 | NA | NA | NA | NA | NA | NA | NA | NA | NA | NA | NA | NA | |
| International Crude Tankers | 126.87 | 125.18 | 114.25 | 152.17 | 132.41 | 152.91 | 77.07 | 62.11 | 39.61 | 44.46 | 41.76 | 32.55 | 37.51 | 47.05 | 83.64 | 110.41 | 93.68 | 98.64 | 54.87 | 52.13 | 80.39 | 78.96 | 49.92 | 41.15 | 32.37 | 46.30 | 38.32 | 47.91 | 59.89 | NA | NA | NA | NA | NA | NA | NA | NA | |
| International Product Carriers | 147.53 | 125.56 | 127.46 | 140.03 | 154.72 | 185.25 | 159.76 | 126.09 | 61.87 | 50.21 | 43.06 | 13.76 | 9.25 | 9.66 | 16.25 | 29.32 | 31.66 | 25.38 | 16.41 | 16.88 | 21.49 | 21.59 | 11.01 | 15.76 | 19.61 | 23.12 | 21.65 | 24.04 | 28.86 | NA | NA | NA | NA | NA | NA | NA | NA |