
| 2024-03-31 | 2023-12-31 | 2023-09-30 | 2023-06-30 | 2023-03-31 | 2022-12-31 | 2022-09-30 | 2022-06-30 | 2022-03-31 | 2021-12-31 | 2021-09-30 | 2021-06-30 | 2021-03-31 | 2020-12-31 | 2020-09-30 | 2020-06-30 | 2020-03-31 | 2019-12-31 | 2019-09-30 | 2019-06-30 | 2019-03-31 | 2018-12-31 | 2018-09-30 | 2018-06-30 | 2018-03-31 | 2017-12-31 | 2017-09-30 | 2017-06-30 | 2017-03-31 | 2016-12-31 | 2016-09-30 | 2016-06-30 | ||
|---|---|---|---|---|---|---|---|---|---|---|---|---|---|---|---|---|---|---|---|---|---|---|---|---|---|---|---|---|---|---|---|---|---|
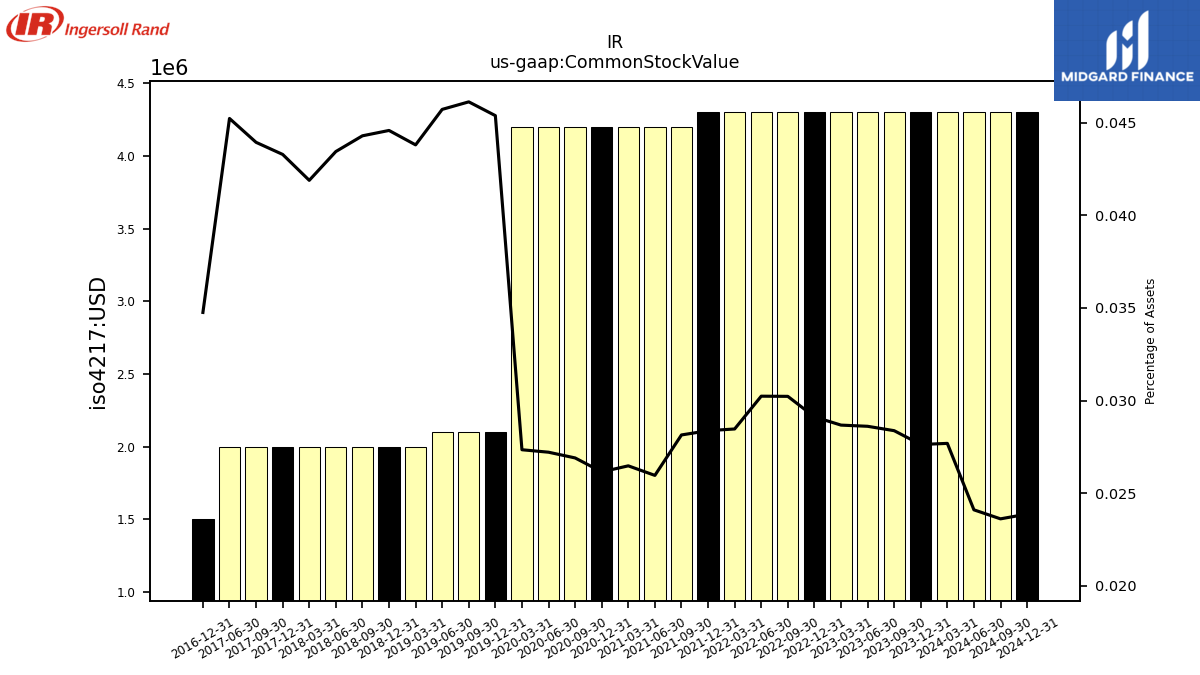
| Common Stock Value | 4.30 | 4.30 | 4.30 | 4.30 | 4.30 | 4.30 | 4.30 | 4.30 | 4.30 | 4.30 | 4.20 | 4.20 | 4.20 | 4.20 | 4.20 | 4.20 | 4.20 | 2.10 | 2.10 | 2.10 | 2.00 | 2.00 | 2.00 | 2.00 | 2.00 | 2.00 | 2.00 | 2.00 | NA | 1.50 | NA | NA | |
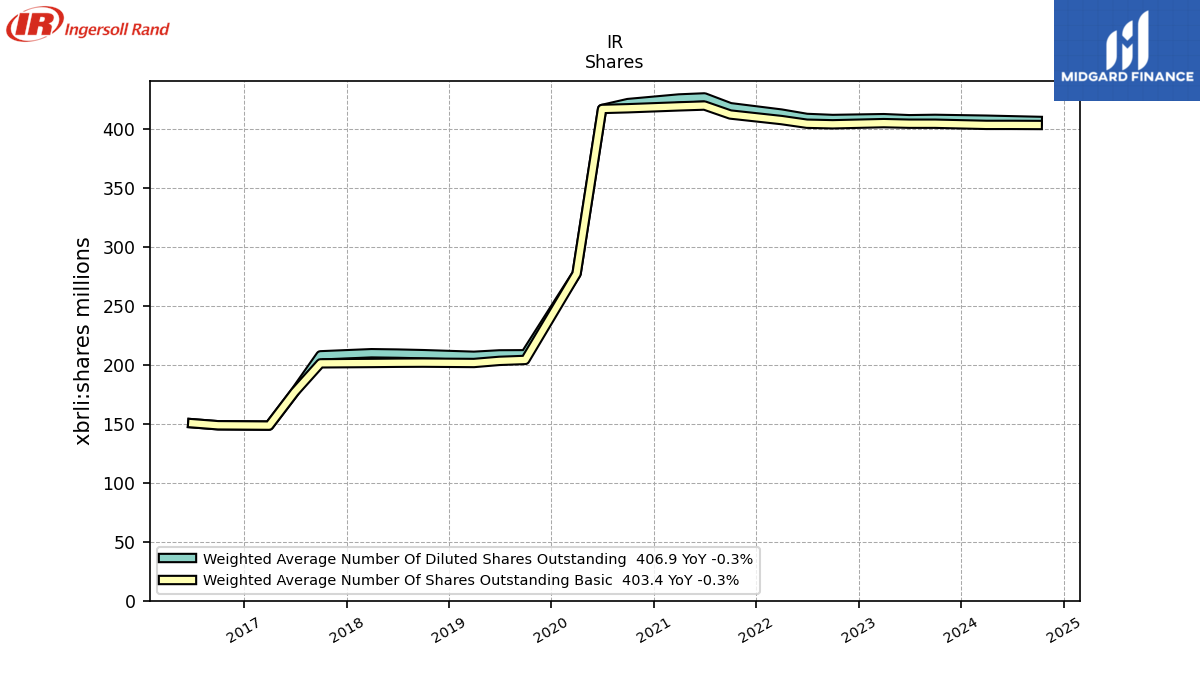
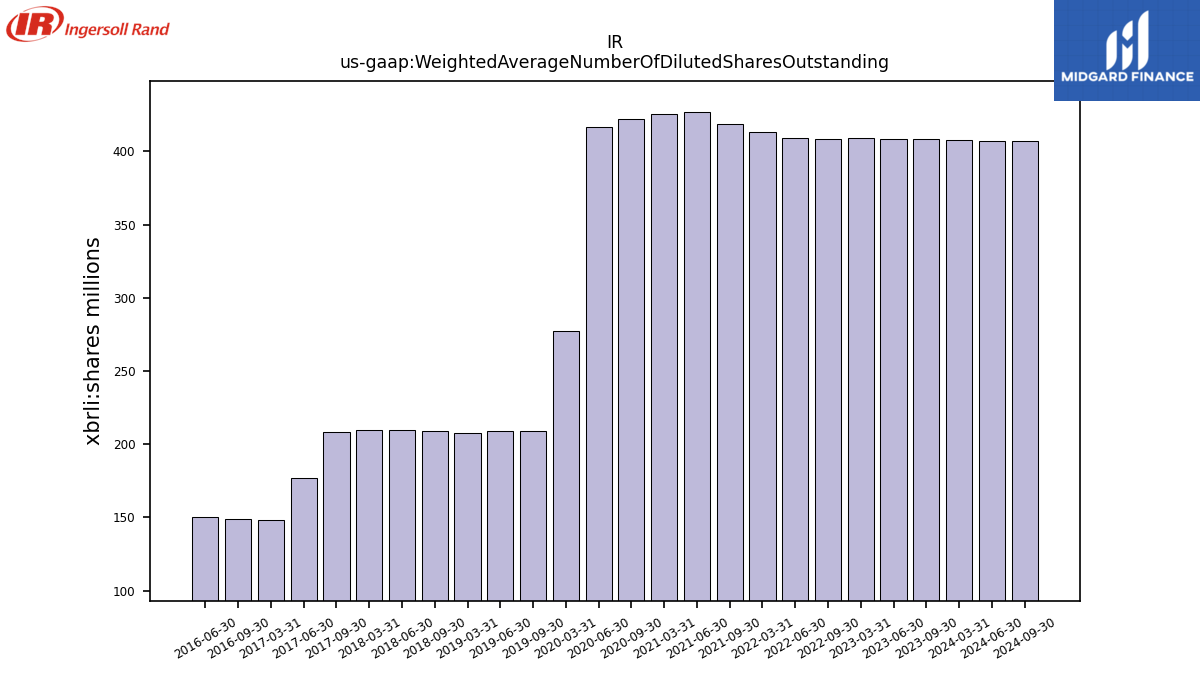
| Weighted Average Number Of Diluted Shares Outstanding | 407.90 | NA | 408.60 | 408.30 | 409.20 | NA | 408.50 | 409.40 | 413.10 | NA | 418.50 | 426.80 | 425.90 | NA | 422.00 | 417.00 | 277.30 | NA | 209.00 | 208.90 | 207.70 | NA | 209.10 | 209.60 | 209.90 | NA | 208.10 | 176.90 | 148.50 | NA | 148.80 | 150.50 | |
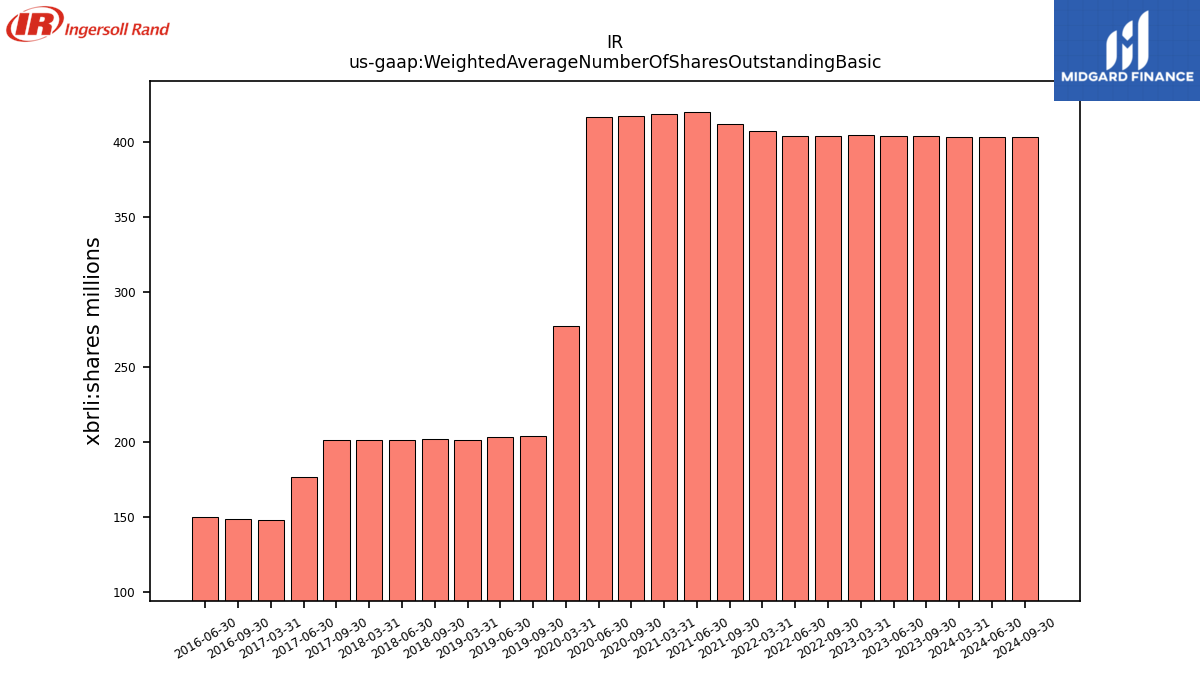
| Weighted Average Number Of Shares Outstanding Basic | 403.50 | NA | 404.50 | 404.50 | 405.00 | NA | 404.00 | 404.50 | 407.60 | NA | 412.30 | 419.90 | 419.20 | NA | 417.60 | 417.00 | 277.30 | NA | 204.20 | 203.40 | 201.60 | NA | 201.90 | 201.80 | 201.60 | NA | 201.30 | 176.90 | 148.50 | NA | 148.80 | 150.50 | |
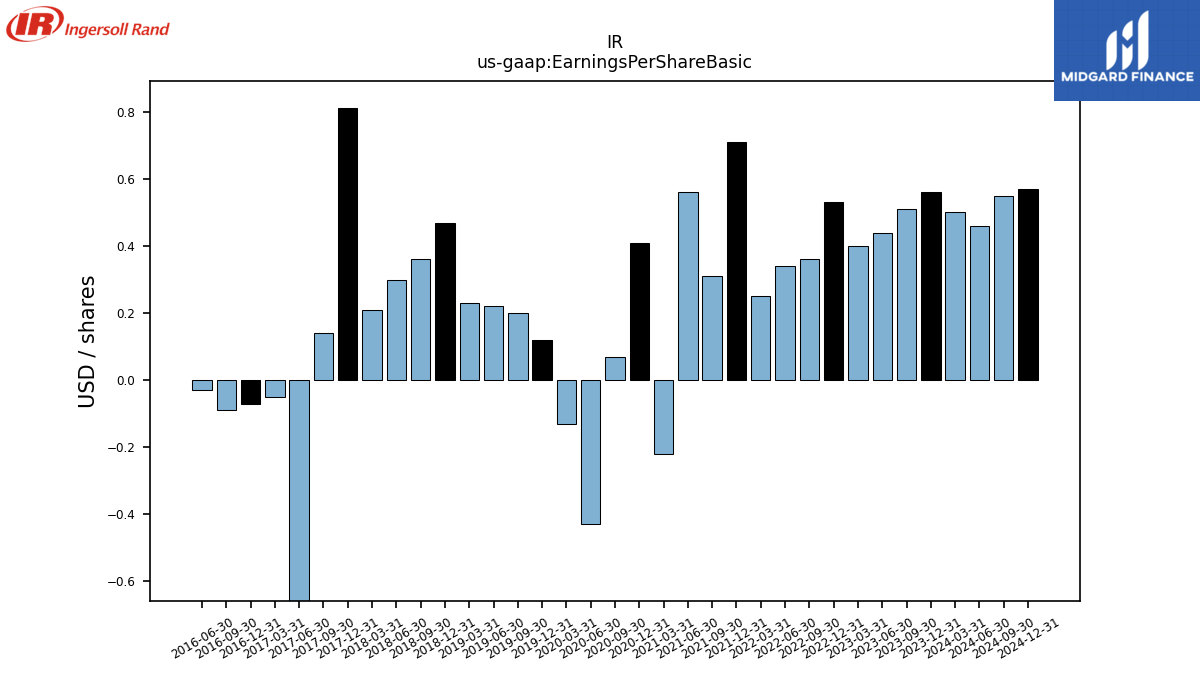
| Earnings Per Share Basic | 0.50 | 0.56 | 0.51 | 0.44 | 0.40 | 0.53 | 0.36 | 0.34 | 0.25 | 0.71 | 0.31 | 0.56 | -0.22 | 0.41 | 0.07 | -0.43 | -0.13 | 0.12 | 0.20 | 0.22 | 0.23 | 0.47 | 0.36 | 0.30 | 0.21 | 0.81 | 0.14 | -0.83 | -0.05 | -0.07 | -0.09 | -0.03 | |
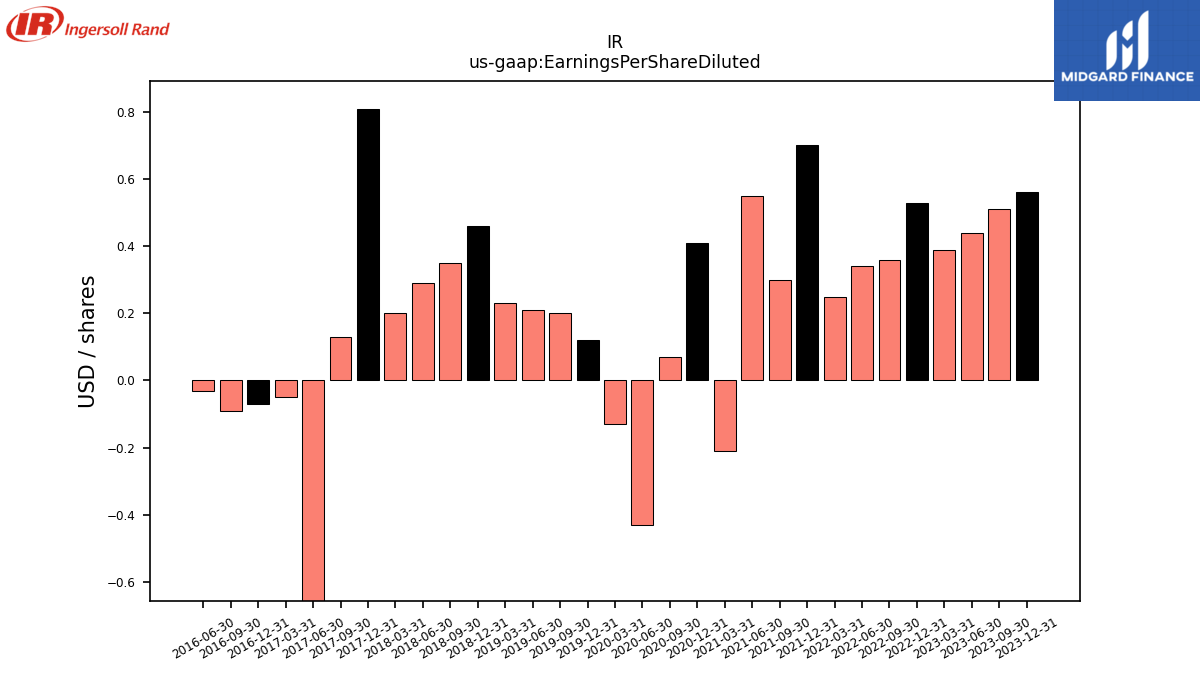
| Earnings Per Share Diluted | 0.50 | 0.56 | 0.51 | 0.44 | 0.39 | 0.53 | 0.36 | 0.34 | 0.25 | 0.70 | 0.30 | 0.55 | -0.21 | 0.41 | 0.07 | -0.43 | -0.13 | 0.12 | 0.20 | 0.21 | 0.23 | 0.46 | 0.35 | 0.29 | 0.20 | 0.81 | 0.13 | -0.83 | -0.05 | -0.07 | -0.09 | -0.03 | |
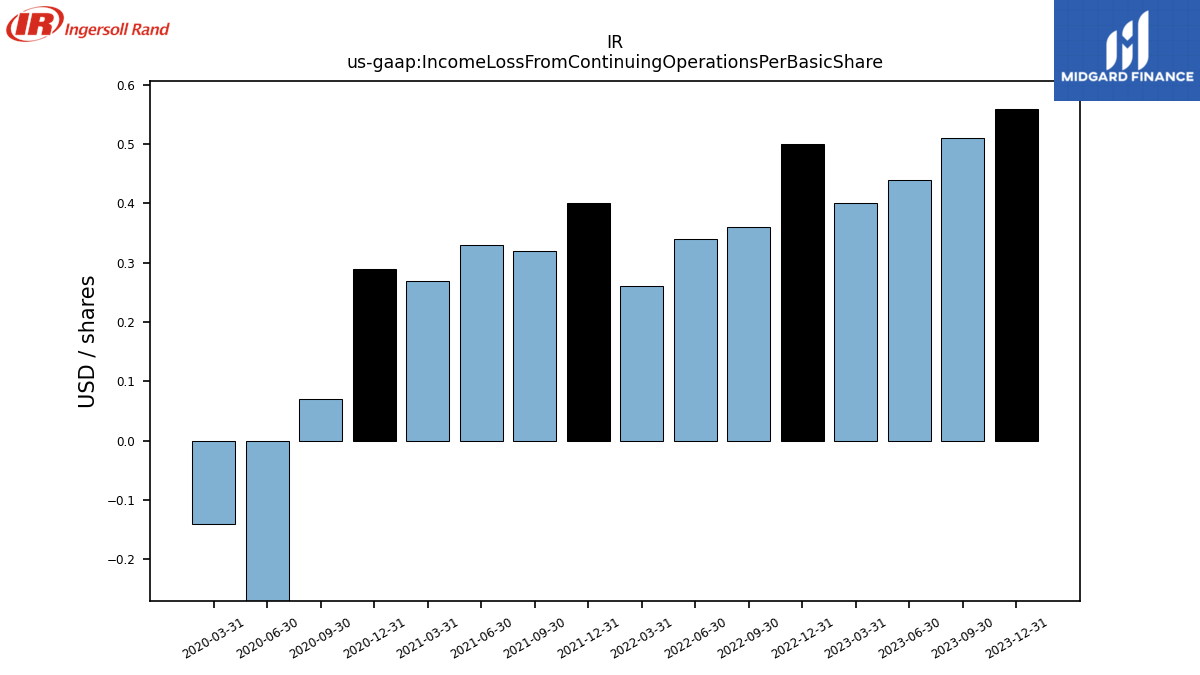
| Income Loss From Continuing Operations Per Basic Share | NA | 0.00 | 0.00 | 0.00 | 0.00 | 0.00 | 0.00 | 0.00 | 0.00 | 0.00 | 0.00 | 0.00 | 0.00 | 0.00 | 0.00 | -0.00 | -0.00 | NA | NA | NA | NA | NA | NA | NA | NA | NA | NA | NA | NA | NA | NA | NA | |
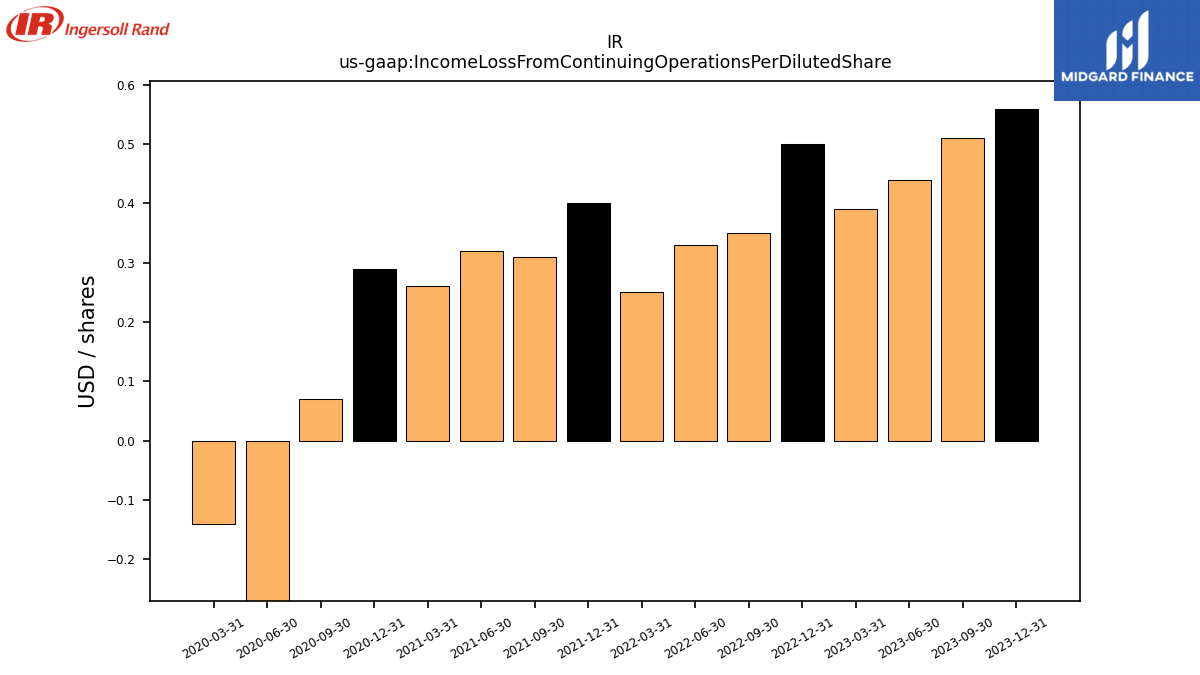
| Income Loss From Continuing Operations Per Diluted Share | NA | 0.00 | 0.00 | 0.00 | 0.00 | 0.00 | 0.00 | 0.00 | 0.00 | 0.00 | 0.00 | 0.00 | 0.00 | 0.00 | 0.00 | -0.00 | -0.00 | NA | NA | NA | NA | NA | NA | NA | NA | NA | NA | NA | NA | NA | NA | NA |
| 2024-03-31 | 2023-12-31 | 2023-09-30 | 2023-06-30 | 2023-03-31 | 2022-12-31 | 2022-09-30 | 2022-06-30 | 2022-03-31 | 2021-12-31 | 2021-09-30 | 2021-06-30 | 2021-03-31 | 2020-12-31 | 2020-09-30 | 2020-06-30 | 2020-03-31 | 2019-12-31 | 2019-09-30 | 2019-06-30 | 2019-03-31 | 2018-12-31 | 2018-09-30 | 2018-06-30 | 2018-03-31 | 2017-12-31 | 2017-09-30 | 2017-06-30 | 2017-03-31 | 2016-12-31 | 2016-09-30 | 2016-06-30 | ||
|---|---|---|---|---|---|---|---|---|---|---|---|---|---|---|---|---|---|---|---|---|---|---|---|---|---|---|---|---|---|---|---|---|---|
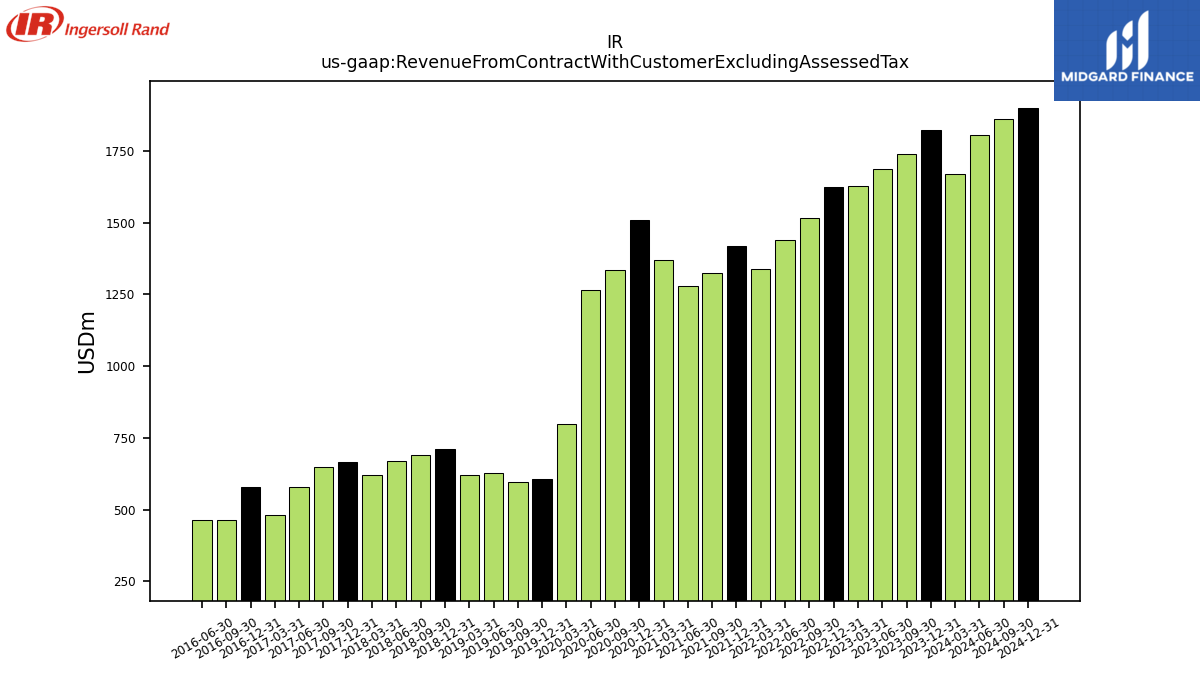
| Revenue From Contract With Customer Excluding Assessed Tax | 1670.10 | 1821.40 | 1738.90 | 1686.50 | 1629.30 | 1623.70 | 1515.70 | 1439.90 | 1337.00 | 1418.80 | 1325.00 | 1279.10 | 1369.80 | 1510.70 | 1335.20 | 1264.40 | 799.90 | 605.80 | 596.70 | 629.10 | 620.30 | 712.70 | 689.30 | 668.20 | 619.60 | 665.00 | 649.60 | 579.10 | 481.70 | 577.80 | 462.60 | 462.00 | |
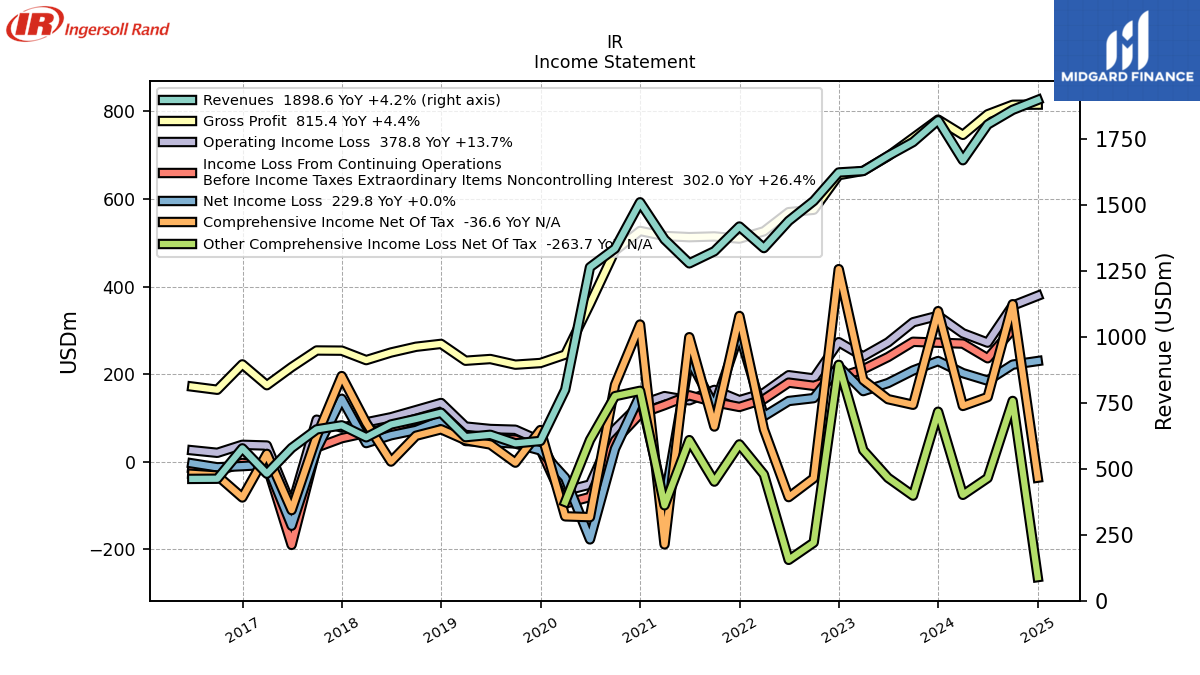
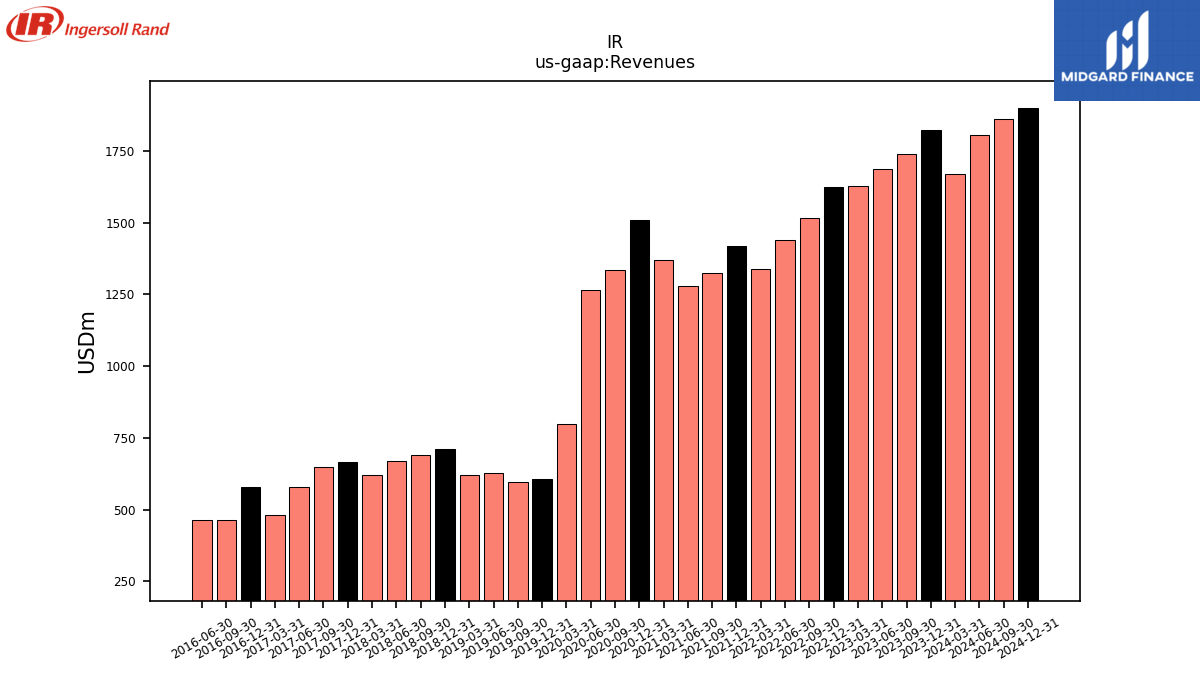
| Revenues | 1670.10 | 1821.40 | 1738.90 | 1686.50 | 1629.30 | 1623.70 | 1515.70 | 1439.90 | 1337.00 | 1418.80 | 1325.00 | 1279.10 | 1369.80 | 1510.70 | 1335.20 | 1264.40 | 799.90 | 605.80 | 596.70 | 629.10 | 620.30 | 712.70 | 689.30 | 668.20 | 619.60 | 665.00 | 649.60 | 579.10 | 481.70 | 577.80 | 462.60 | 462.00 | |
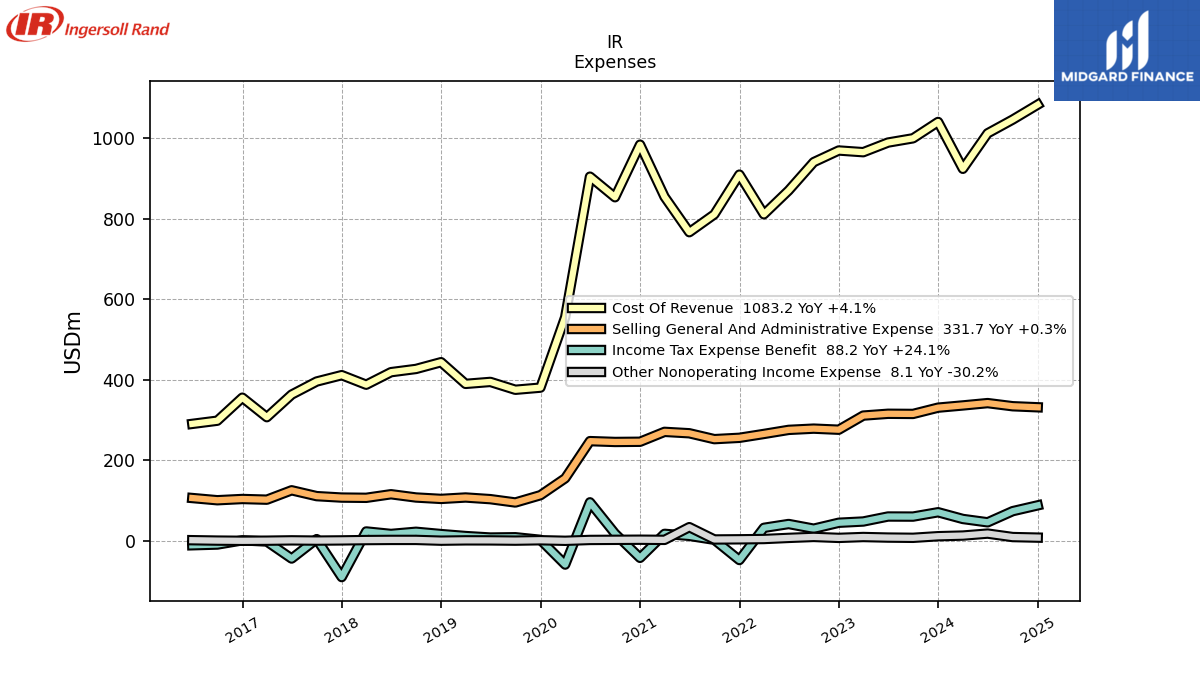
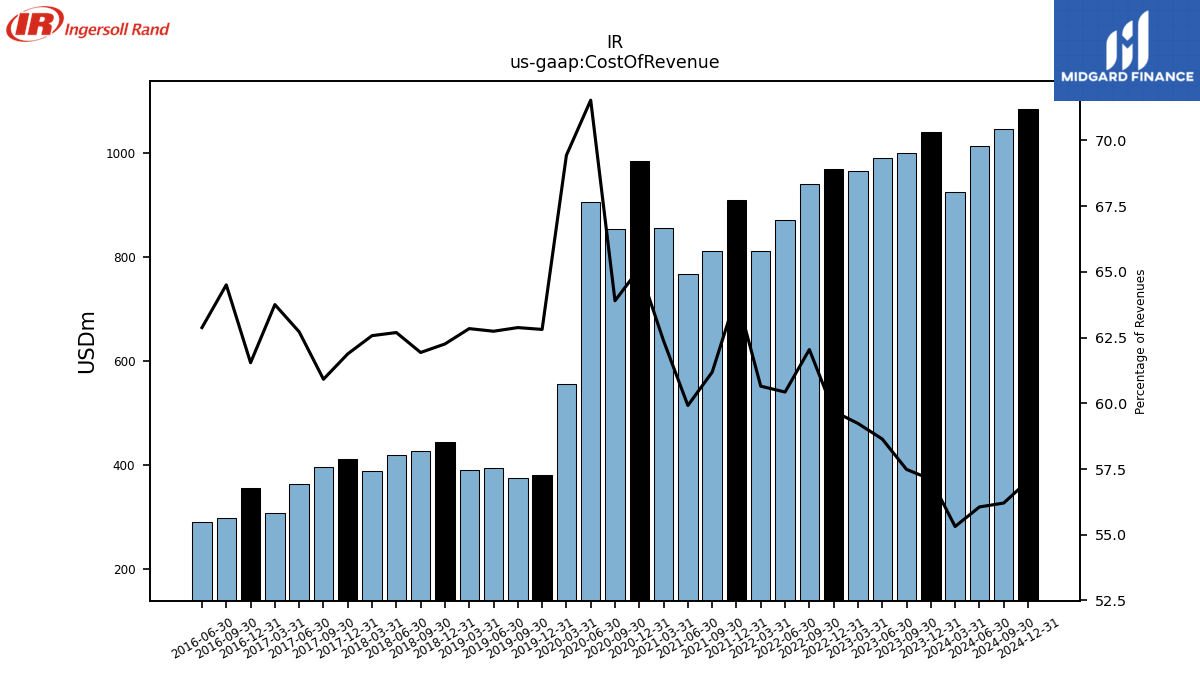
| Cost Of Revenue | 923.80 | 1040.20 | 999.60 | 989.00 | 965.10 | 969.30 | 940.40 | 870.10 | 810.90 | 909.40 | 810.70 | 766.40 | 854.40 | 983.80 | 853.20 | 904.40 | 555.40 | 380.50 | 375.20 | 394.70 | 389.80 | 443.70 | 426.90 | 418.90 | 387.70 | 411.50 | 395.70 | 363.20 | 307.10 | 355.60 | 298.40 | 290.50 | |
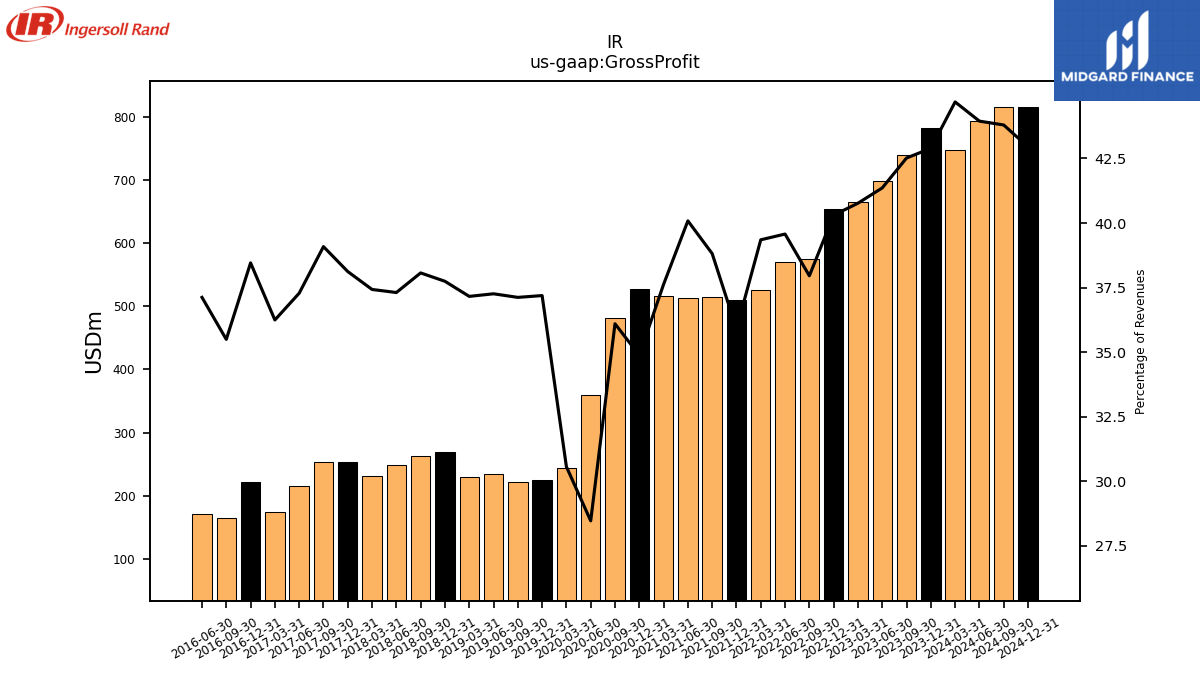
| Gross Profit | 746.30 | 781.20 | 739.30 | 697.50 | 664.20 | 654.40 | 575.30 | 569.80 | 526.10 | 509.40 | 514.30 | 512.70 | 515.40 | 526.90 | 482.00 | 360.00 | 244.50 | 225.30 | 221.50 | 234.40 | 230.50 | 269.00 | 262.40 | 249.30 | 231.90 | 253.50 | 253.90 | 215.90 | 174.60 | 222.20 | 164.20 | 171.50 | |
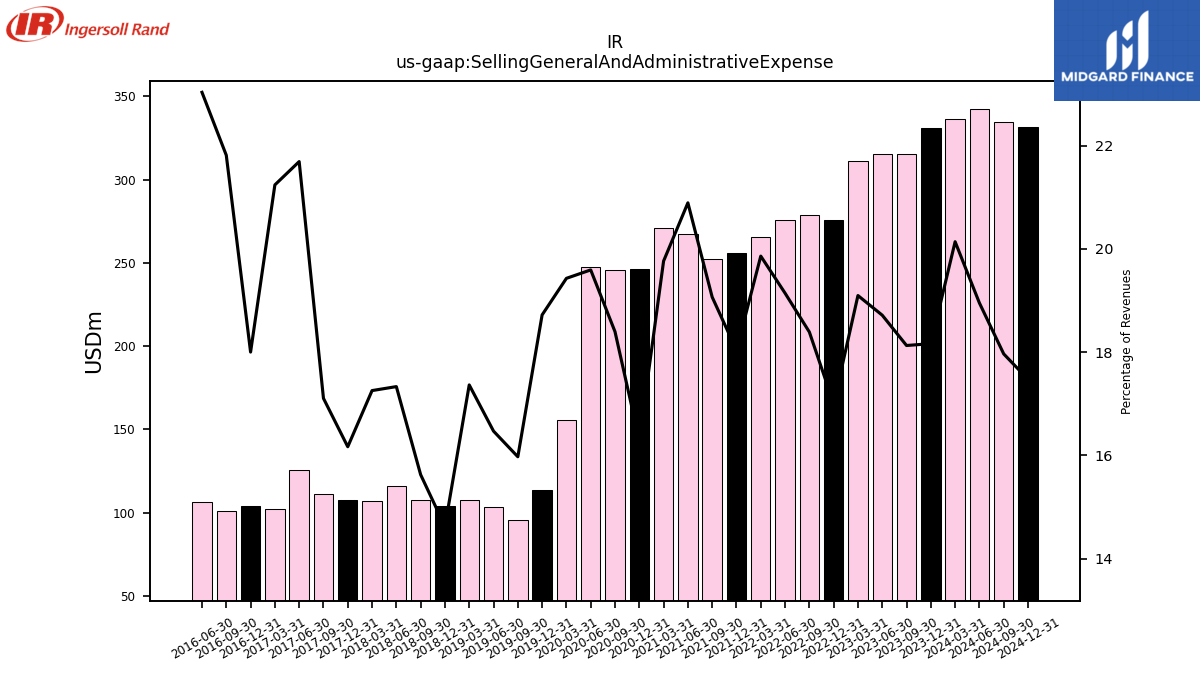
| Selling General And Administrative Expense | 336.30 | 330.80 | 315.20 | 315.60 | 311.10 | 276.00 | 278.70 | 275.60 | 265.50 | 255.90 | 252.60 | 267.20 | 270.70 | 246.10 | 245.60 | 247.70 | 155.40 | 113.40 | 95.30 | 103.60 | 107.70 | 104.20 | 107.70 | 115.80 | 106.90 | 107.50 | 111.10 | 125.60 | 102.30 | 104.00 | 100.90 | 106.40 | |
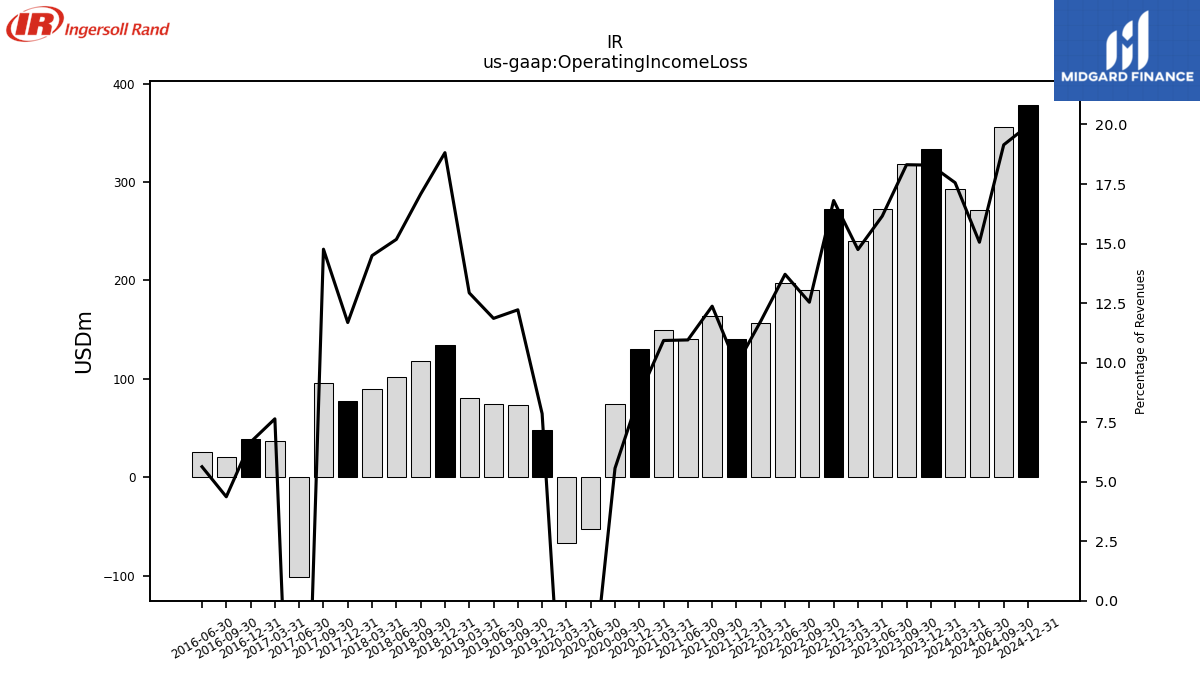
| Operating Income Loss | 293.20 | 333.20 | 318.40 | 272.40 | 240.30 | 272.90 | 190.00 | 197.40 | 157.00 | 140.40 | 163.90 | 140.10 | 149.70 | 130.40 | 74.30 | -52.20 | -66.80 | 47.60 | 72.90 | 74.60 | 80.20 | 134.10 | 117.70 | 101.40 | 89.80 | 77.70 | 95.90 | -101.60 | 36.80 | 38.50 | 20.20 | 26.00 | |
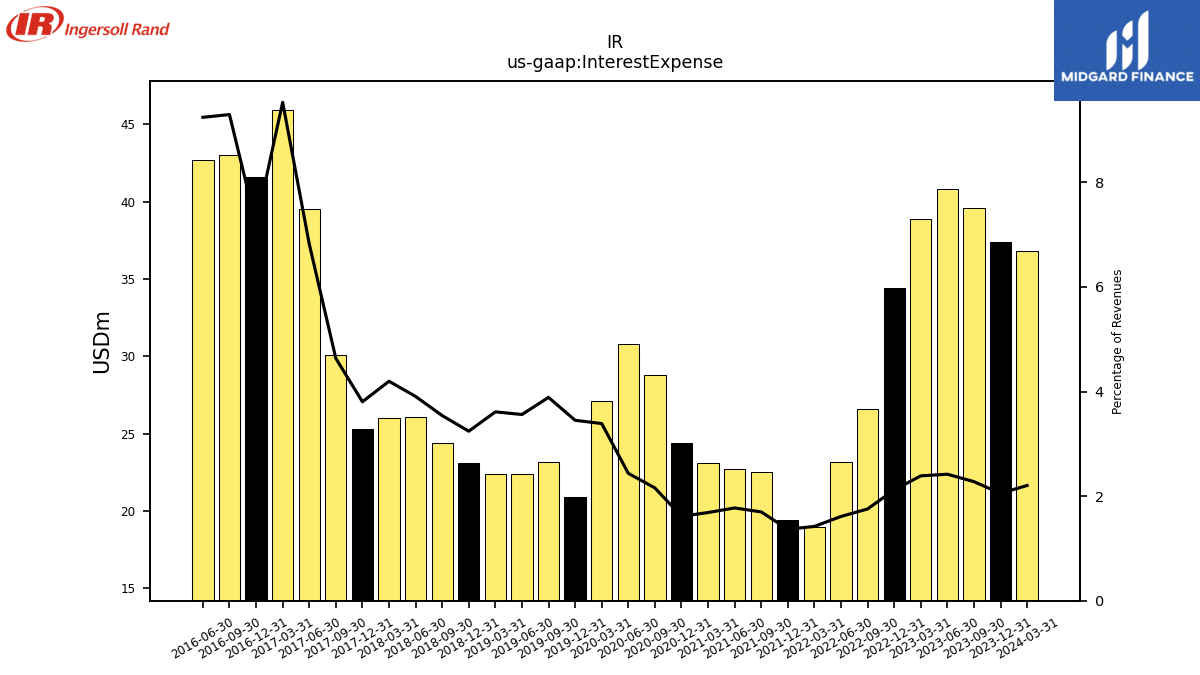
| Interest Expense | 36.80 | 37.40 | 39.60 | 40.80 | 38.90 | 34.40 | 26.60 | 23.20 | 19.00 | 19.40 | 22.50 | 22.70 | 23.10 | 24.40 | 28.80 | 30.80 | 27.10 | 20.90 | 23.20 | 22.40 | 22.40 | 23.10 | 24.40 | 26.10 | 26.00 | 25.30 | 30.10 | 39.50 | 45.90 | 41.60 | 43.00 | 42.70 | |
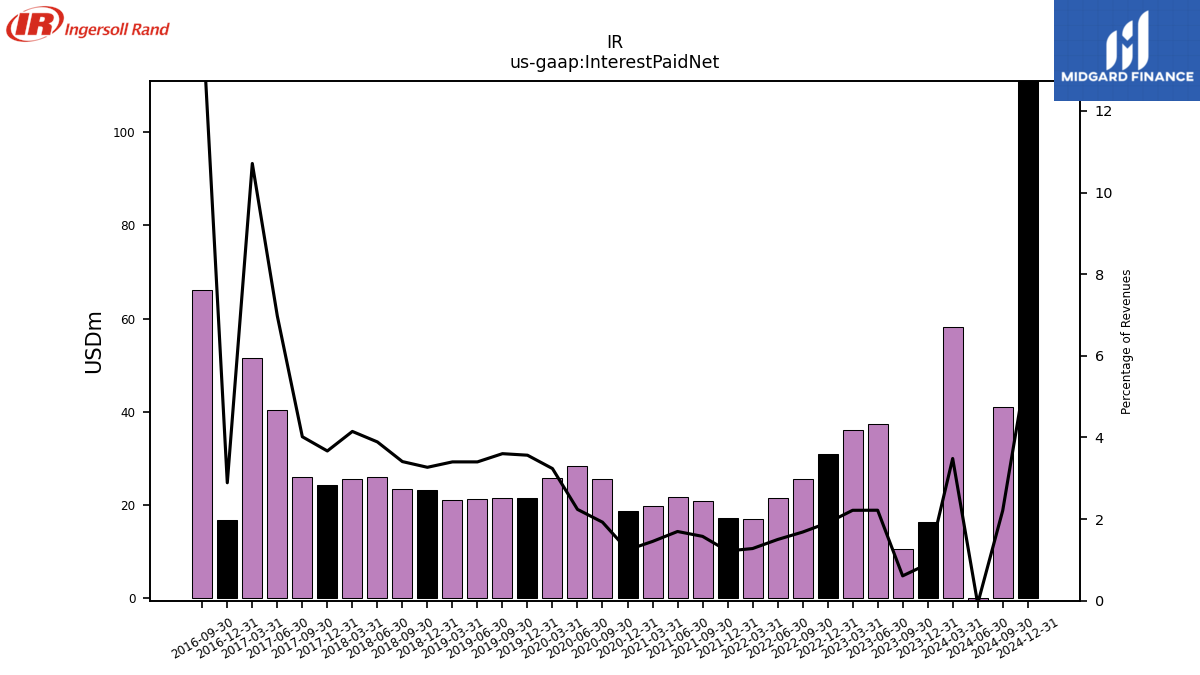
| Interest Paid Net | 58.20 | 16.40 | 10.60 | 37.40 | 36.10 | 31.00 | 25.50 | 21.60 | 17.10 | 17.30 | 20.90 | 21.70 | 19.90 | 18.80 | 25.70 | 28.30 | 25.90 | 21.60 | 21.50 | 21.40 | 21.10 | 23.30 | 23.50 | 26.00 | 25.70 | 24.40 | 26.10 | 40.40 | 51.60 | 16.70 | 66.20 | NA | |
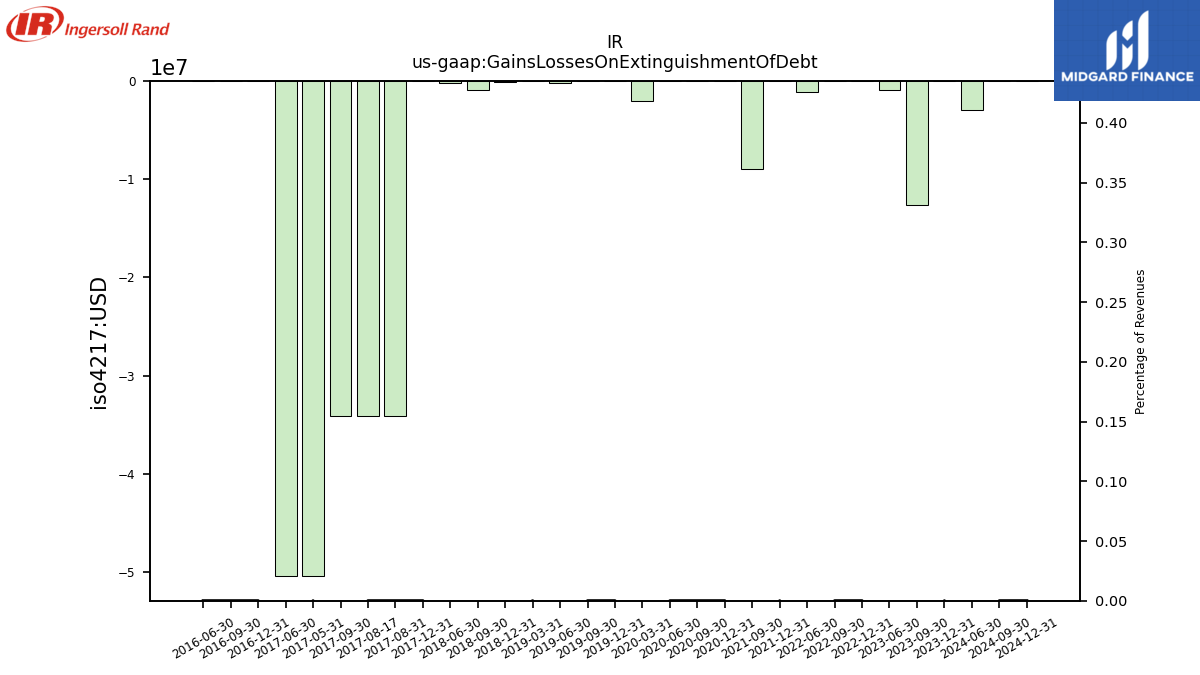
| Gains Losses On Extinguishment Of Debt | NA | 0.00 | -12.60 | -0.90 | NA | 0.00 | 0.00 | -1.10 | NA | 0.00 | -9.00 | NA | NA | 0.00 | 0.00 | 0.00 | -2.00 | 0.00 | 0.00 | -0.20 | 0.00 | -0.10 | -0.90 | -0.20 | NA | 0.00 | -34.10 | -50.40 | NA | 0.00 | 0.00 | 0.00 | |
| Income Loss From Continuing Operations | NA | 229.80 | 208.30 | 179.50 | 161.10 | 202.80 | 144.60 | 137.00 | 105.10 | 163.30 | 130.20 | 137.60 | 111.30 | 106.90 | 29.60 | -153.00 | -38.00 | NA | NA | NA | NA | NA | NA | NA | NA | NA | NA | NA | NA | NA | NA | NA | |
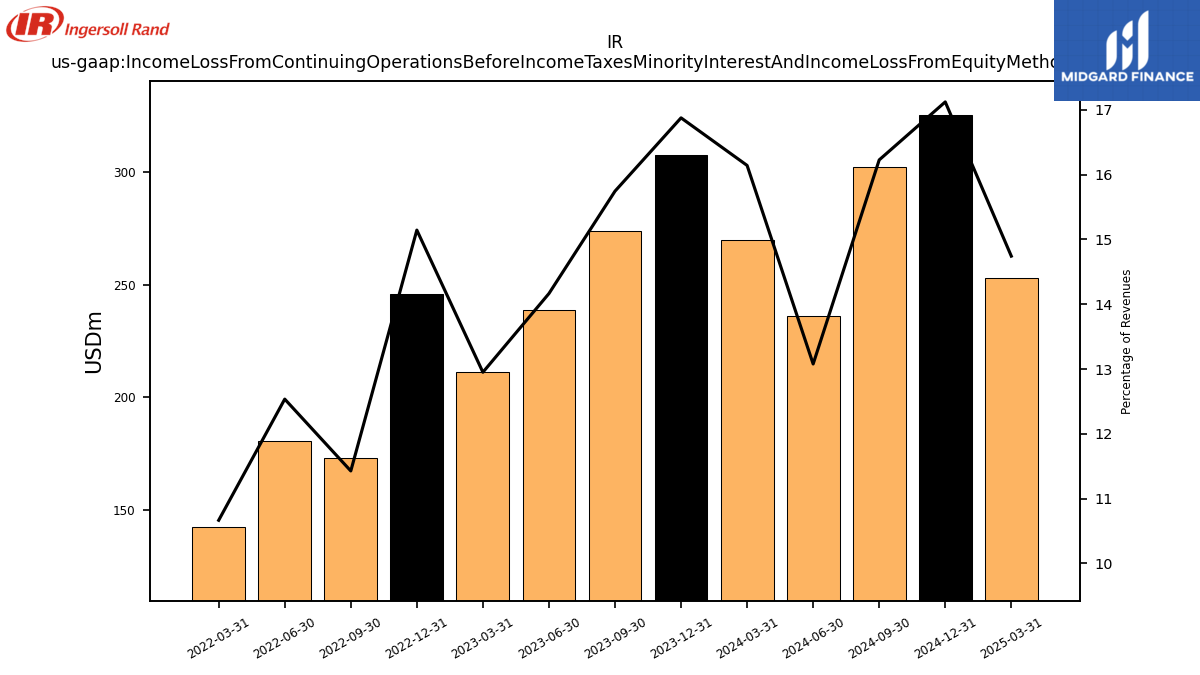
| Income Loss From Continuing Operations Before Income Taxes Minority Interest And Income Loss From Equity Method Investments | 269.60 | 307.40 | 273.80 | 238.90 | 211.00 | 245.90 | 173.20 | 180.50 | 142.60 | NA | NA | NA | NA | NA | NA | NA | NA | NA | NA | NA | NA | NA | NA | NA | NA | NA | NA | NA | NA | NA | NA | NA | |
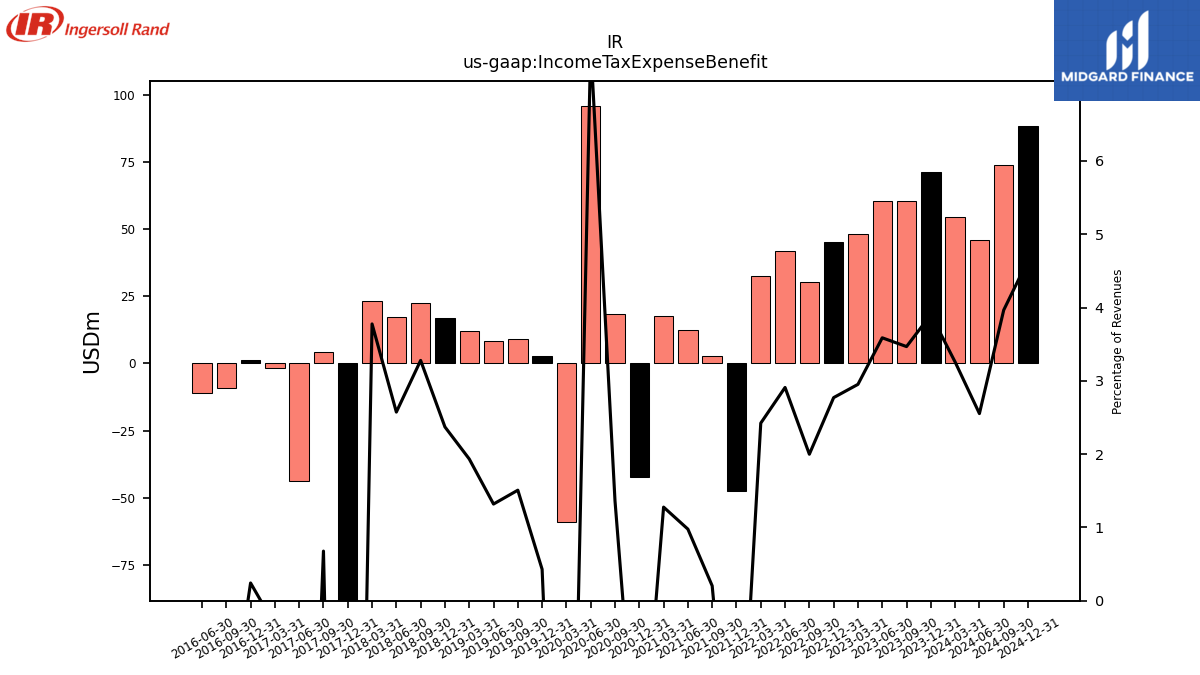
| Income Tax Expense Benefit | 54.40 | 71.10 | 60.30 | 60.50 | 48.10 | 45.00 | 30.30 | 41.90 | 32.40 | -47.60 | 2.70 | 12.50 | 17.50 | -42.20 | 18.20 | 95.80 | -58.90 | 2.60 | 9.00 | 8.30 | 12.00 | 16.90 | 22.60 | 17.20 | 23.40 | -90.00 | 4.40 | -43.90 | -1.60 | 1.40 | -9.10 | -10.90 | |
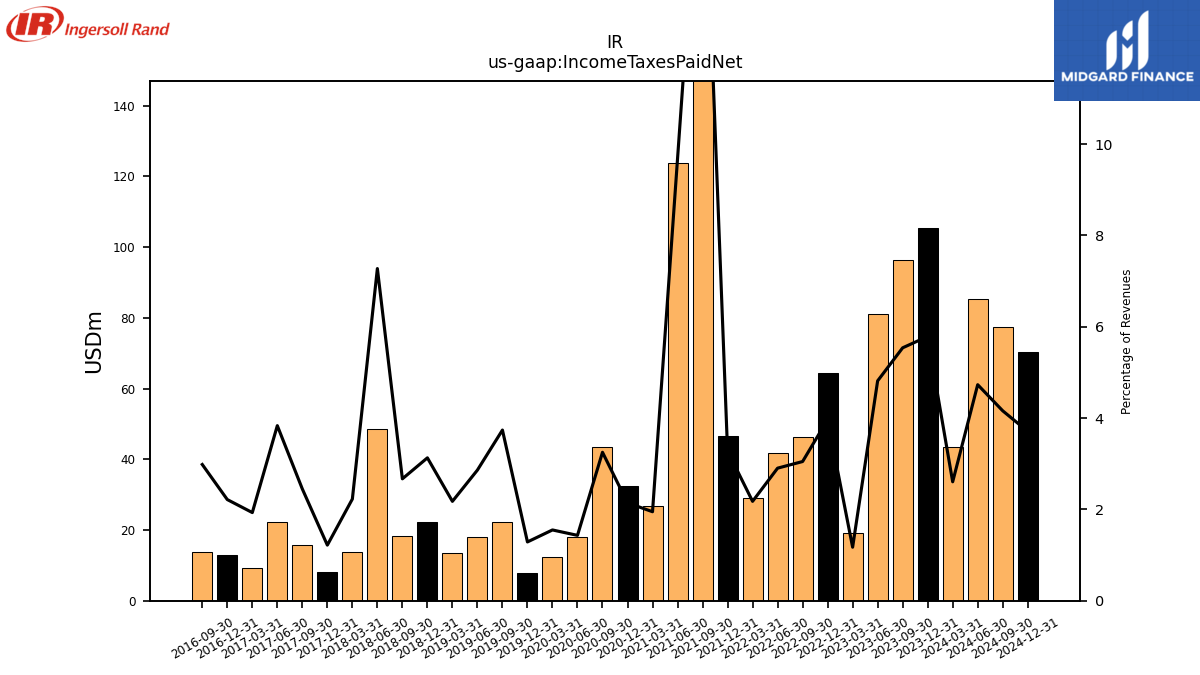
| Income Taxes Paid Net | 43.50 | 105.40 | 96.30 | 81.20 | 19.10 | 64.40 | 46.20 | 41.80 | 29.10 | 46.50 | 230.90 | 123.80 | 26.70 | 32.40 | 43.40 | 18.10 | 12.40 | 7.80 | 22.30 | 18.00 | 13.50 | 22.30 | 18.40 | 48.60 | 13.80 | 8.10 | 15.90 | 22.20 | 9.30 | 12.80 | 13.80 | NA | |
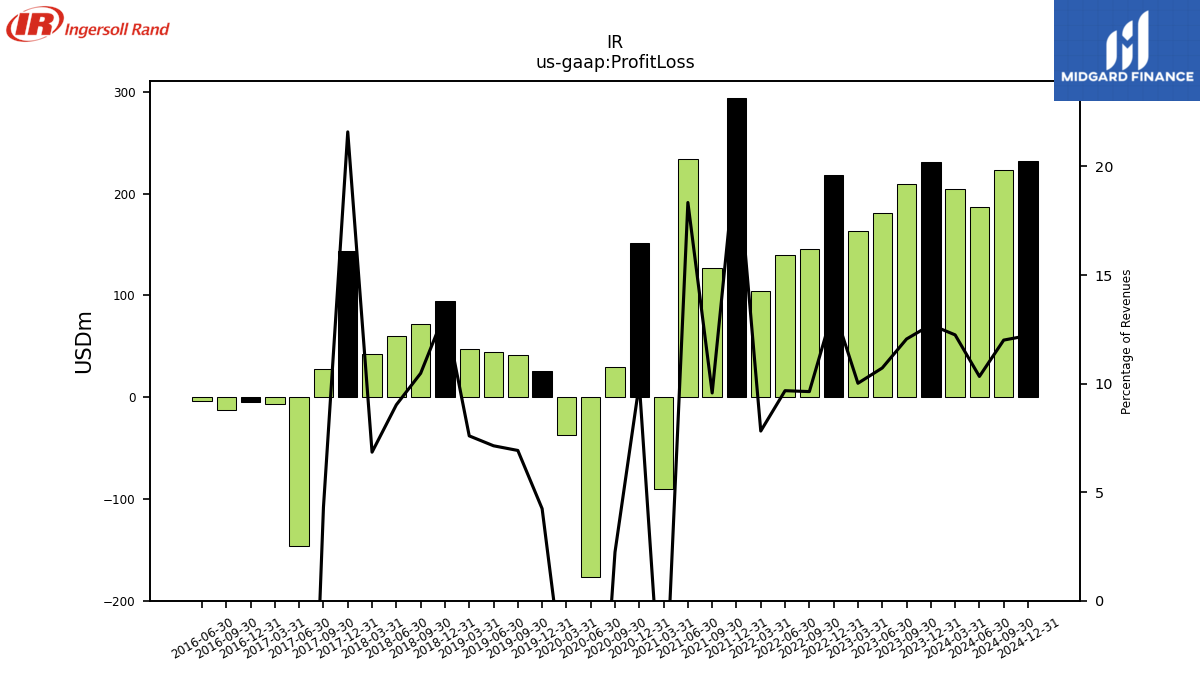
| Profit Loss | 204.50 | 231.50 | 209.60 | 180.80 | 163.20 | 218.70 | 146.00 | 139.30 | 104.50 | 293.70 | 126.80 | 234.60 | -90.10 | 151.10 | 29.90 | -176.50 | -36.80 | 25.70 | 41.30 | 44.90 | 47.10 | 94.50 | 72.20 | 60.30 | 42.40 | 143.60 | 28.00 | -146.30 | -7.00 | -4.30 | -13.00 | -4.10 | |
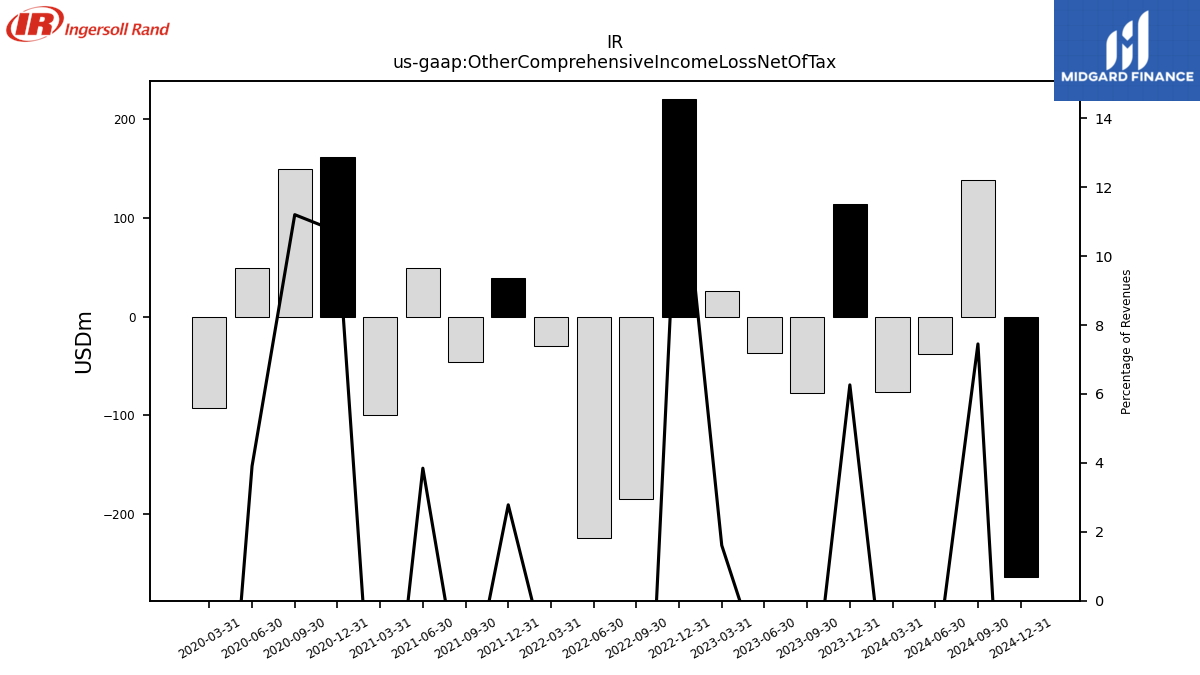
| Other Comprehensive Income Loss Net Of Tax | -75.80 | 114.10 | -77.60 | -36.90 | 26.20 | 221.20 | -184.90 | -224.30 | -29.30 | 39.50 | -45.60 | 49.20 | -99.70 | 161.80 | 149.60 | 49.40 | -92.10 | NA | NA | NA | NA | NA | NA | NA | NA | NA | NA | NA | NA | NA | NA | NA | |
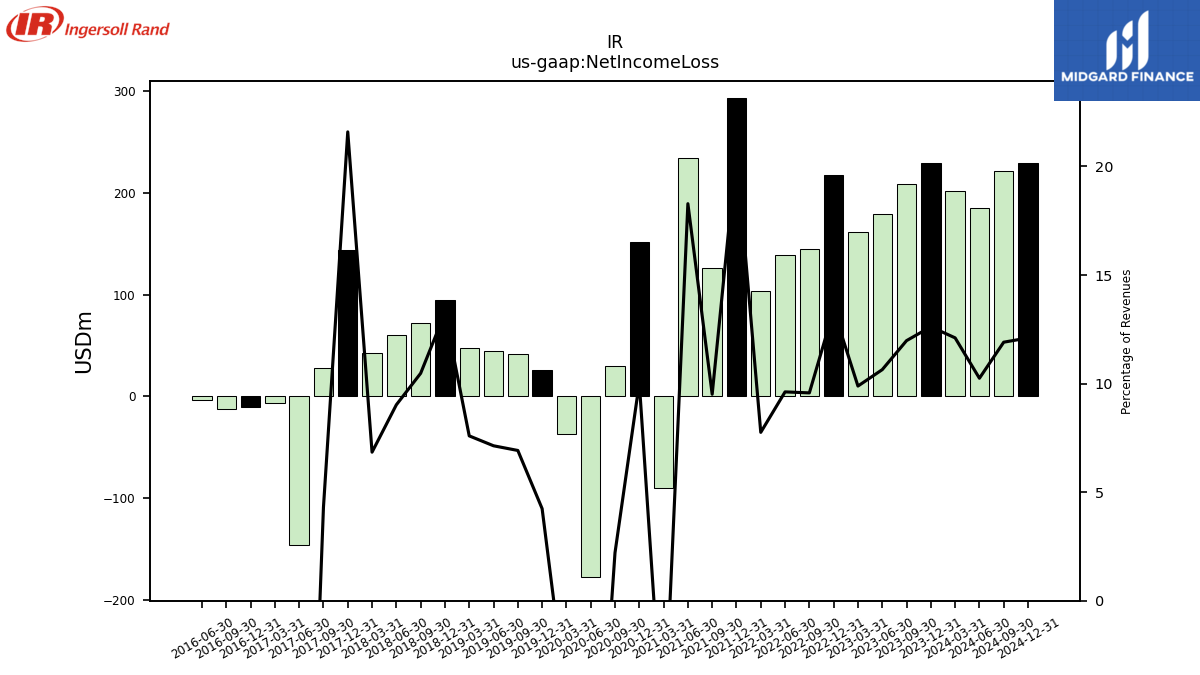
| Net Income Loss | 202.20 | 229.80 | 208.30 | 179.50 | 161.10 | 217.40 | 145.10 | 138.50 | 103.70 | 293.00 | 126.00 | 233.90 | -90.40 | 151.60 | 29.50 | -177.60 | -36.80 | 25.70 | 41.30 | 44.90 | 47.10 | 94.50 | 72.20 | 60.30 | 42.40 | 143.60 | 28.00 | -146.30 | -7.10 | -10.20 | -12.90 | -3.90 | |
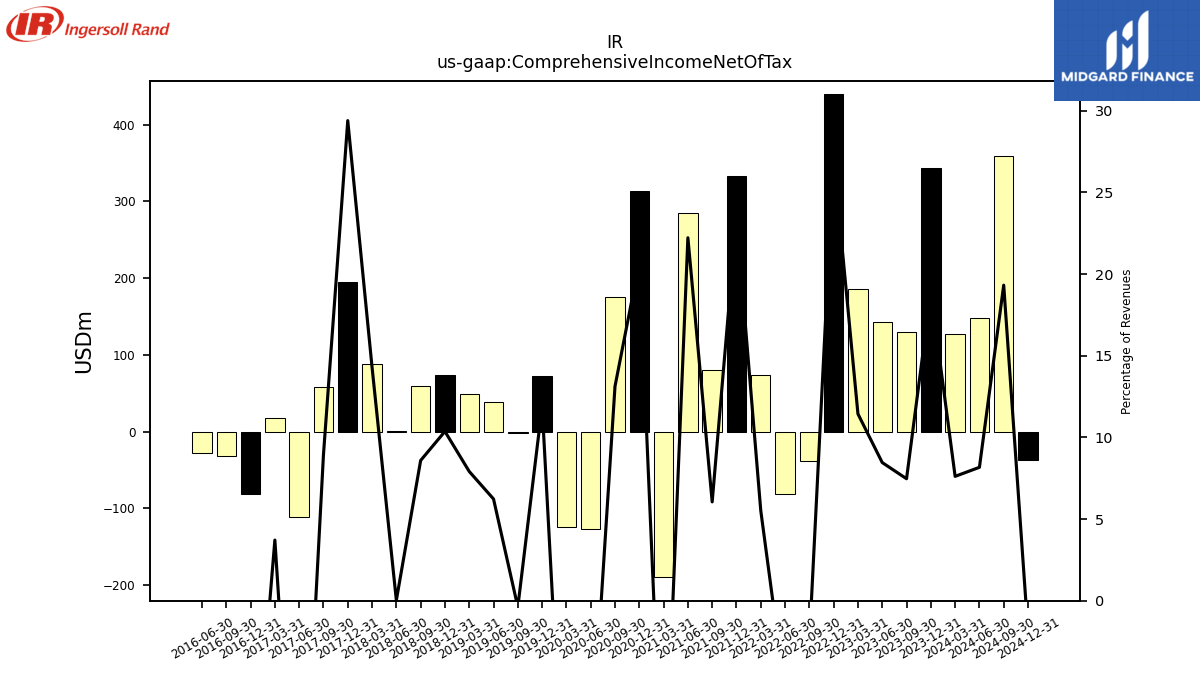
| Comprehensive Income Net Of Tax | 127.20 | 343.80 | 129.90 | 142.70 | 186.40 | 439.70 | -37.90 | -81.00 | 73.80 | 332.70 | 80.20 | 284.30 | -189.00 | 313.20 | 175.30 | -126.70 | -124.90 | 72.20 | -2.30 | 39.20 | 49.10 | 73.90 | 59.20 | 0.20 | 88.60 | 195.50 | 58.10 | -110.70 | 17.90 | -81.80 | -31.80 | -28.00 |
| 2024-03-31 | 2023-12-31 | 2023-09-30 | 2023-06-30 | 2023-03-31 | 2022-12-31 | 2022-09-30 | 2022-06-30 | 2022-03-31 | 2021-12-31 | 2021-09-30 | 2021-06-30 | 2021-03-31 | 2020-12-31 | 2020-09-30 | 2020-06-30 | 2020-03-31 | 2019-12-31 | 2019-09-30 | 2019-06-30 | 2019-03-31 | 2018-12-31 | 2018-09-30 | 2018-06-30 | 2018-03-31 | 2017-12-31 | 2017-09-30 | 2017-06-30 | 2017-03-31 | 2016-12-31 | 2016-09-30 | 2016-06-30 | ||
|---|---|---|---|---|---|---|---|---|---|---|---|---|---|---|---|---|---|---|---|---|---|---|---|---|---|---|---|---|---|---|---|---|---|
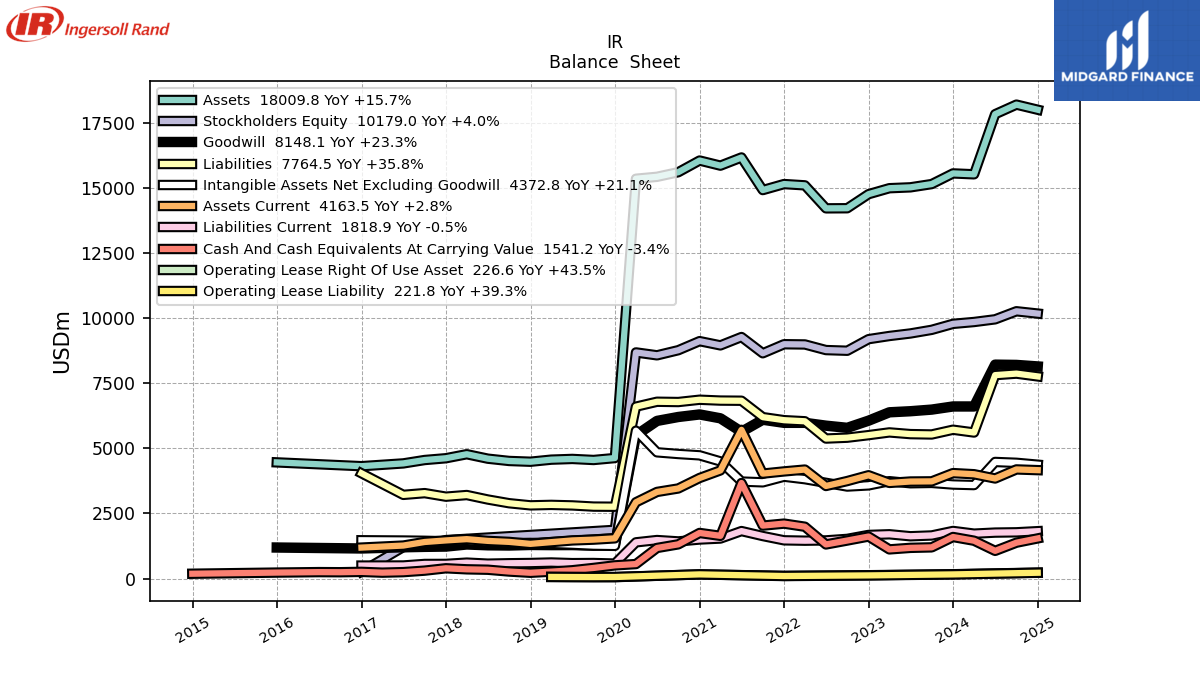
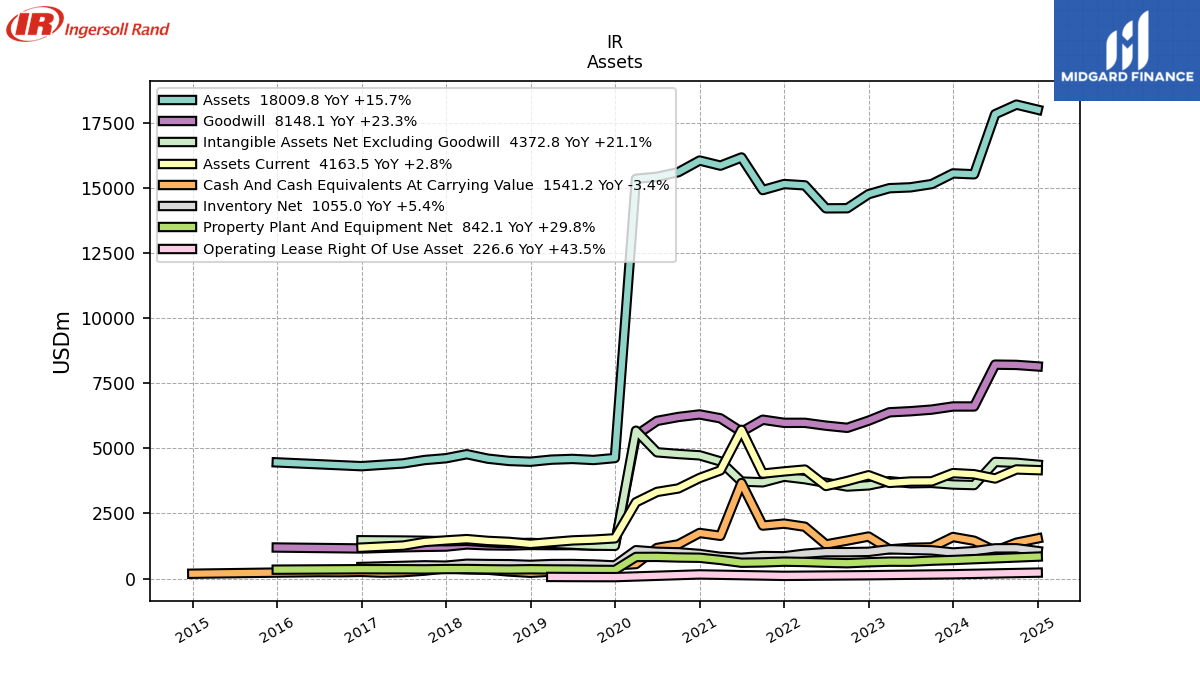
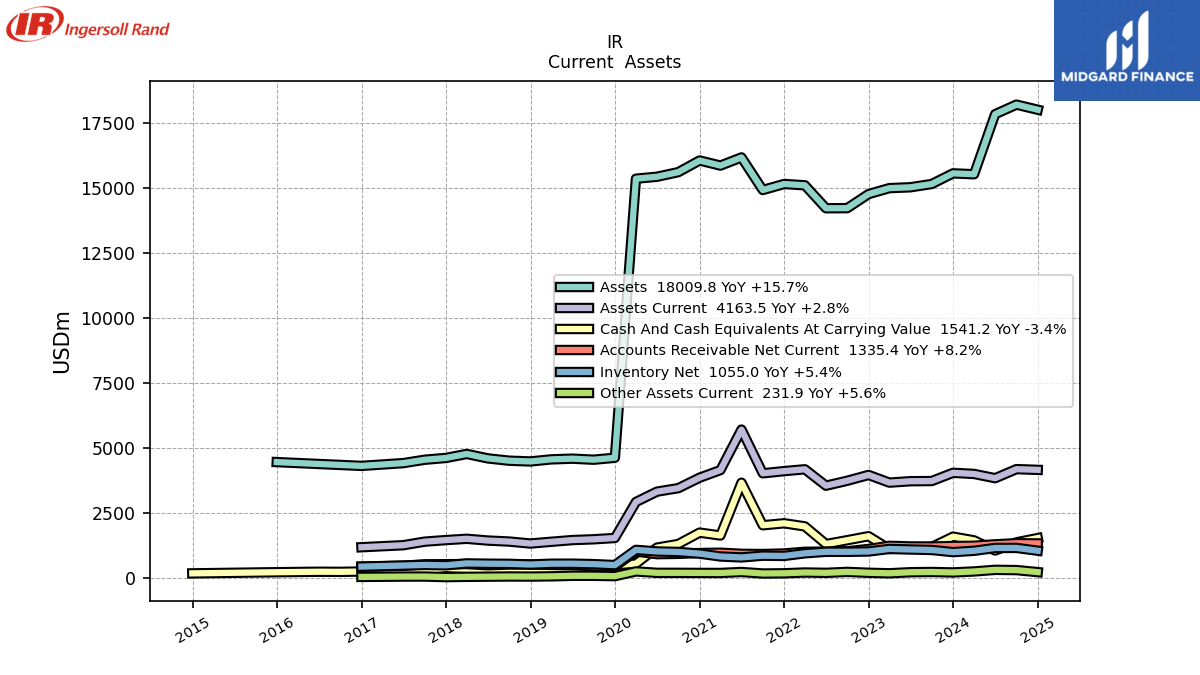
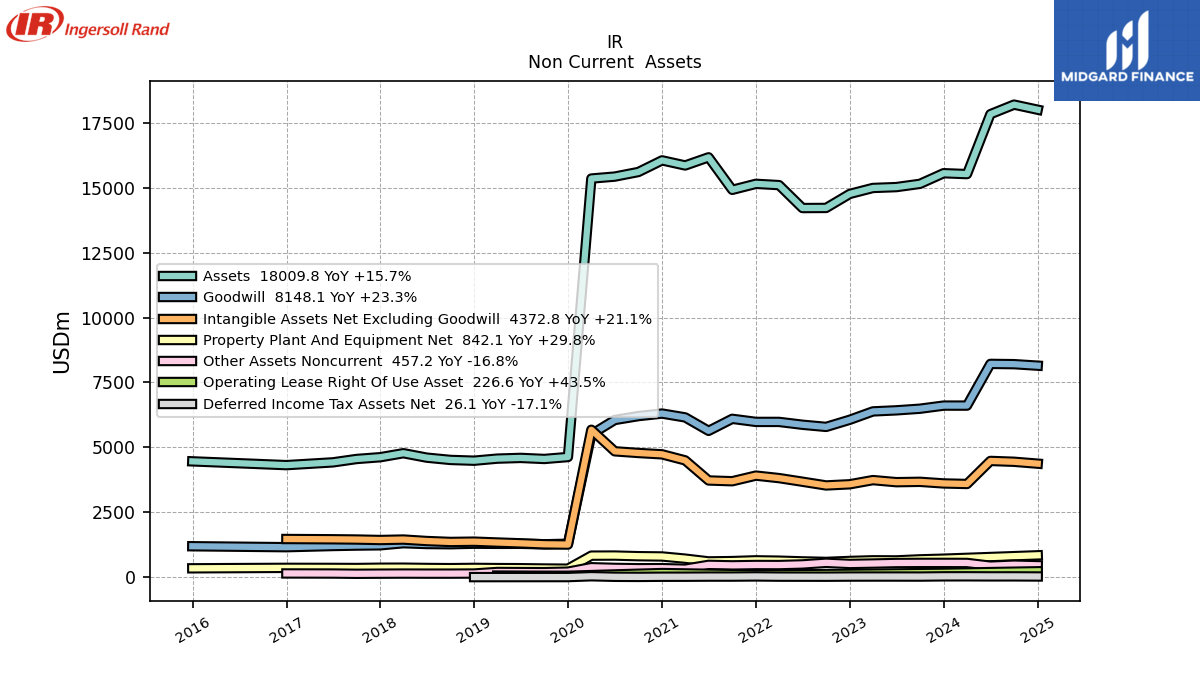
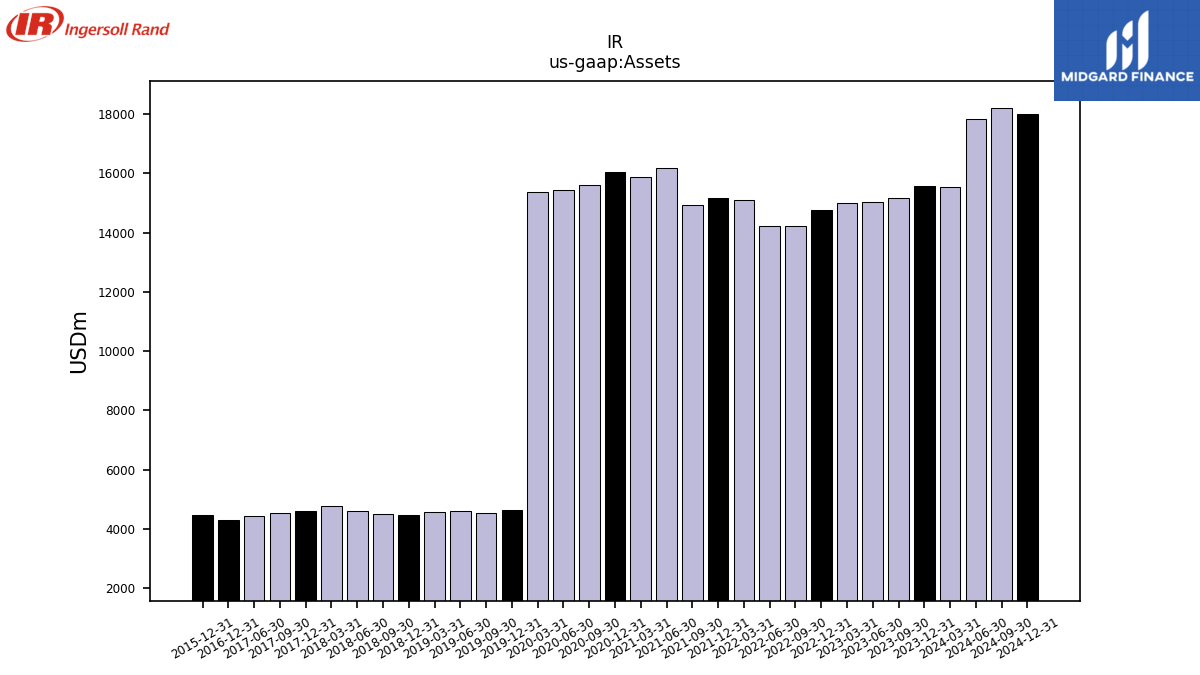
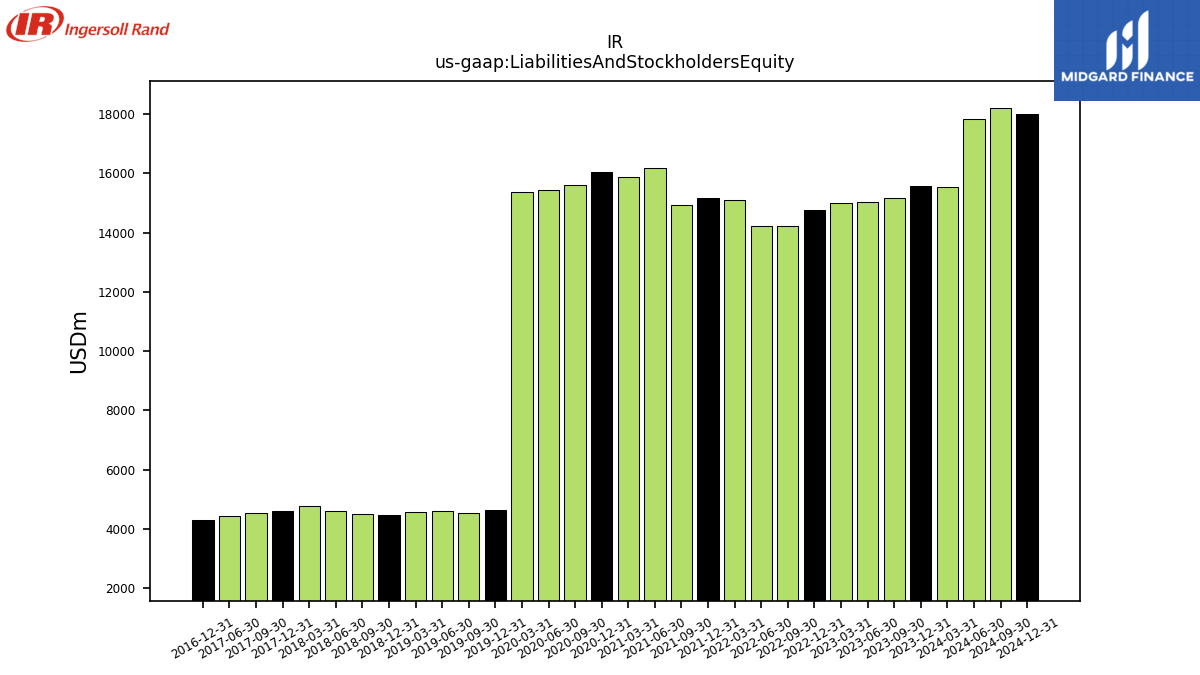
| Assets | 15529.00 | 15563.50 | 15154.00 | 15028.60 | 14995.00 | 14765.90 | 14225.60 | 14221.40 | 15104.80 | 15154.50 | 14922.80 | 16176.70 | 15861.90 | 16058.60 | 15610.50 | 15433.30 | 15358.30 | 4628.40 | 4553.80 | 4594.30 | 4566.80 | 4487.10 | 4516.40 | 4604.60 | 4775.40 | 4621.20 | 4552.60 | 4422.90 | NA | 4316.00 | NA | NA | |
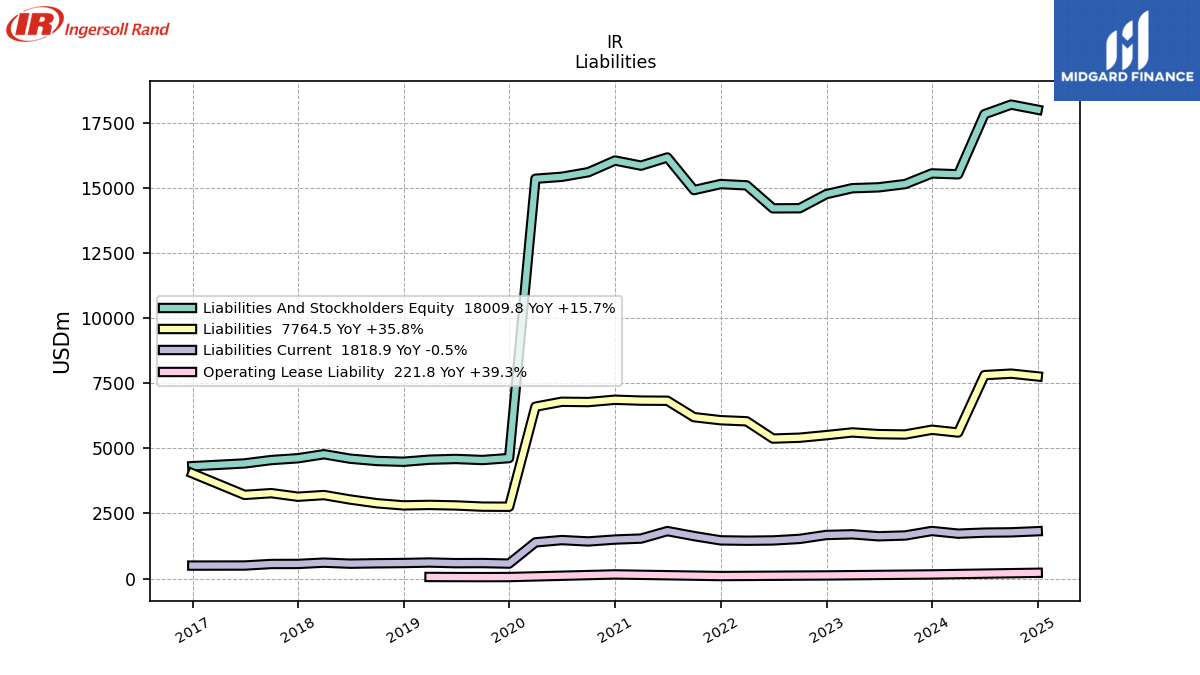
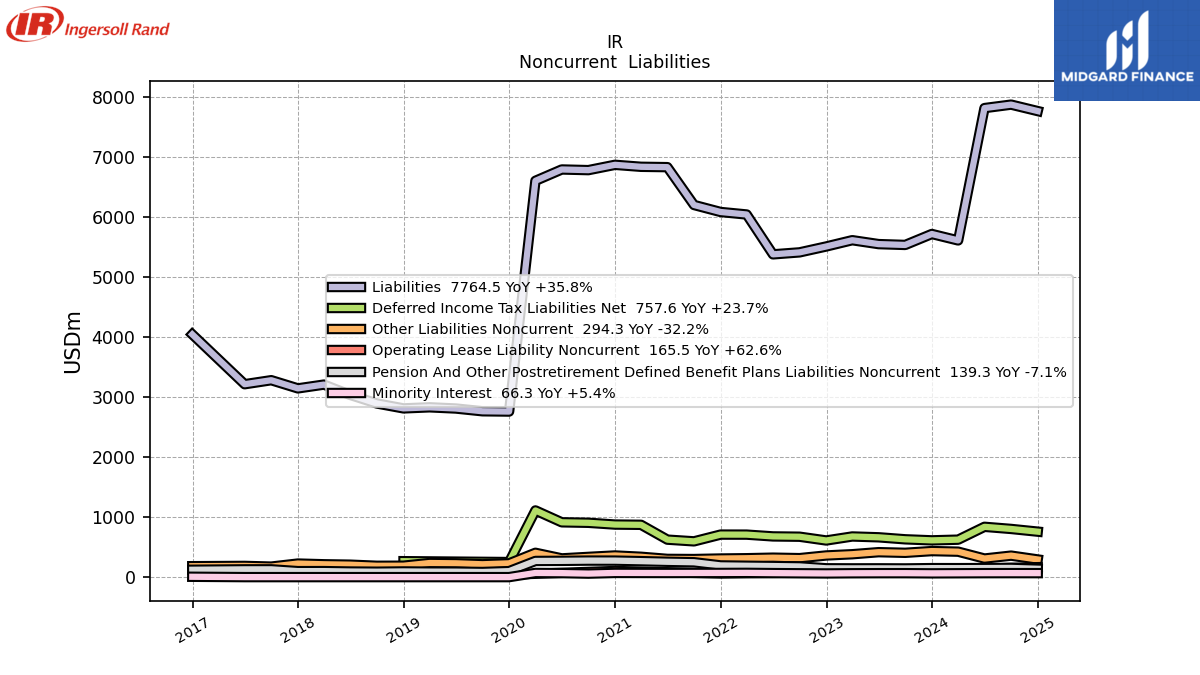
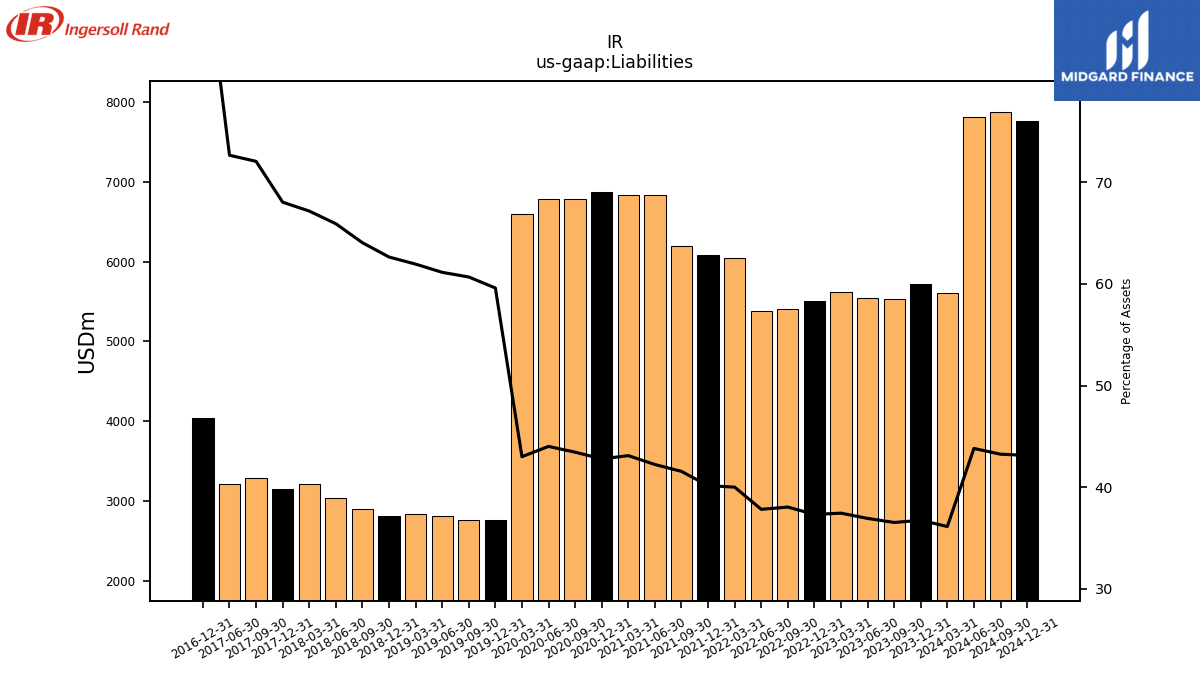
| Liabilities | 5609.30 | 5716.80 | 5534.20 | 5548.20 | 5613.30 | 5508.70 | 5410.60 | 5377.40 | 6041.50 | 6083.30 | 6200.00 | 6830.30 | 6836.20 | 6869.10 | 6780.60 | 6791.50 | 6602.80 | 2758.50 | 2763.30 | 2809.00 | 2829.10 | 2811.10 | 2893.00 | 3035.50 | 3207.70 | 3144.40 | 3280.80 | 3213.90 | NA | 4044.20 | NA | NA | |
| Liabilities And Stockholders Equity | 15529.00 | 15563.50 | 15154.00 | 15028.60 | 14995.00 | 14765.90 | 14225.60 | 14221.40 | 15104.80 | 15154.50 | 14922.80 | 16176.70 | 15861.90 | 16058.60 | 15610.50 | 15433.30 | 15358.30 | 4628.40 | 4553.80 | 4594.30 | 4566.80 | 4487.10 | 4516.40 | 4604.60 | 4775.40 | 4621.20 | 4552.60 | 4422.90 | NA | 4316.00 | NA | NA | |
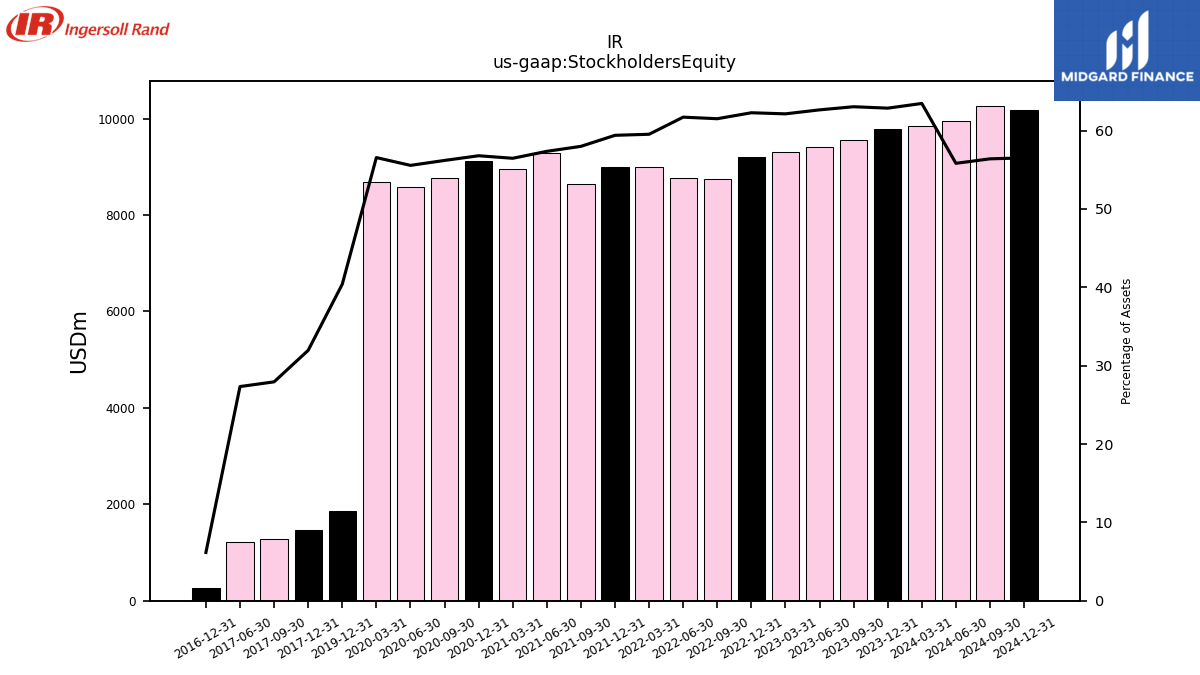
| Stockholders Equity | 9855.30 | 9783.80 | 9554.00 | 9414.80 | 9317.30 | 9195.80 | 8750.90 | 8776.90 | 8992.20 | 9001.50 | 8653.60 | 9277.90 | 8956.70 | 9119.70 | 8771.70 | 8574.90 | 8686.20 | 1869.90 | NA | NA | NA | NA | NA | NA | NA | 1476.80 | 1271.80 | 1209.00 | NA | 265.90 | NA | NA |
| 2024-03-31 | 2023-12-31 | 2023-09-30 | 2023-06-30 | 2023-03-31 | 2022-12-31 | 2022-09-30 | 2022-06-30 | 2022-03-31 | 2021-12-31 | 2021-09-30 | 2021-06-30 | 2021-03-31 | 2020-12-31 | 2020-09-30 | 2020-06-30 | 2020-03-31 | 2019-12-31 | 2019-09-30 | 2019-06-30 | 2019-03-31 | 2018-12-31 | 2018-09-30 | 2018-06-30 | 2018-03-31 | 2017-12-31 | 2017-09-30 | 2017-06-30 | 2017-03-31 | 2016-12-31 | 2016-09-30 | 2016-06-30 | ||
|---|---|---|---|---|---|---|---|---|---|---|---|---|---|---|---|---|---|---|---|---|---|---|---|---|---|---|---|---|---|---|---|---|---|
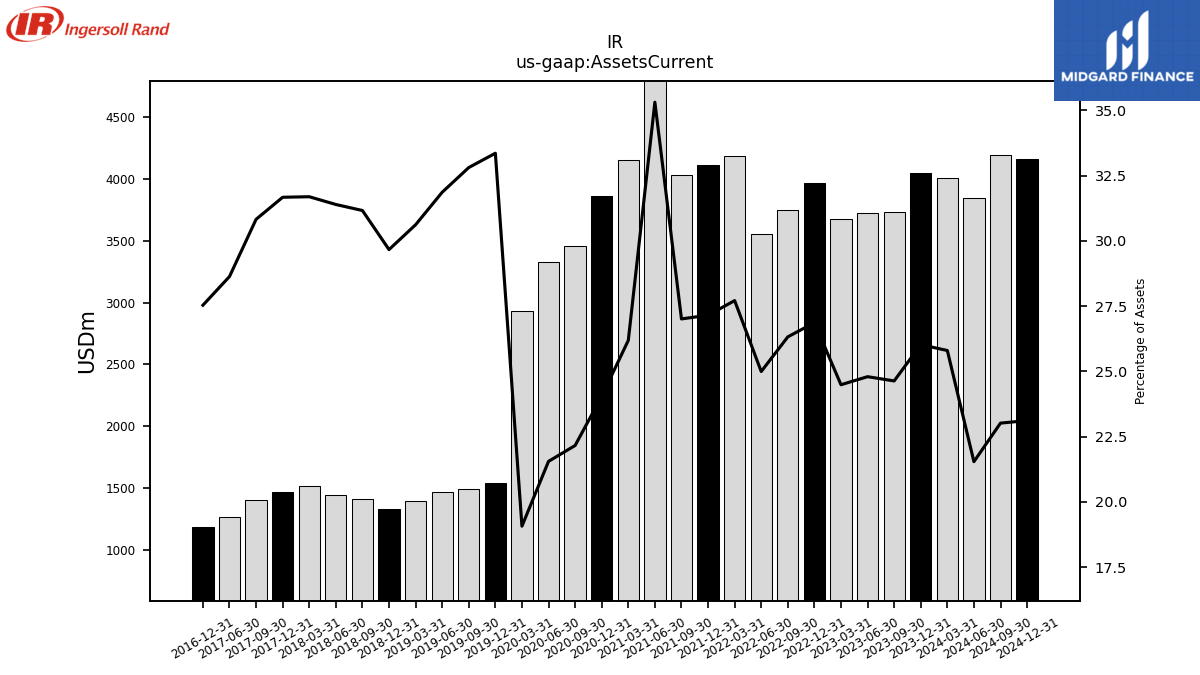
| Assets Current | 4006.80 | 4050.40 | 3733.40 | 3727.00 | 3672.40 | 3967.30 | 3744.80 | 3554.90 | 4186.00 | 4114.90 | 4030.90 | 5712.40 | 4153.90 | 3862.10 | 3459.80 | 3326.80 | 2929.40 | 1543.90 | 1494.10 | 1463.90 | 1398.30 | 1331.20 | 1407.50 | 1445.60 | 1513.40 | 1463.60 | 1403.40 | 1266.50 | NA | 1188.50 | NA | NA | |
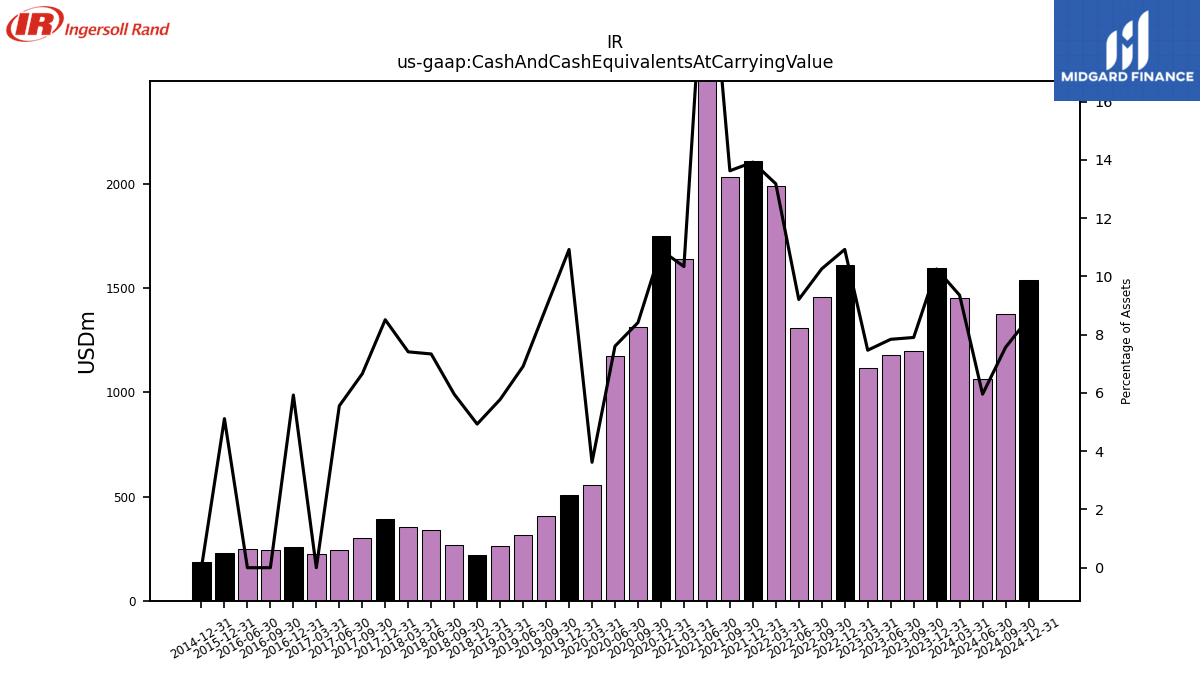
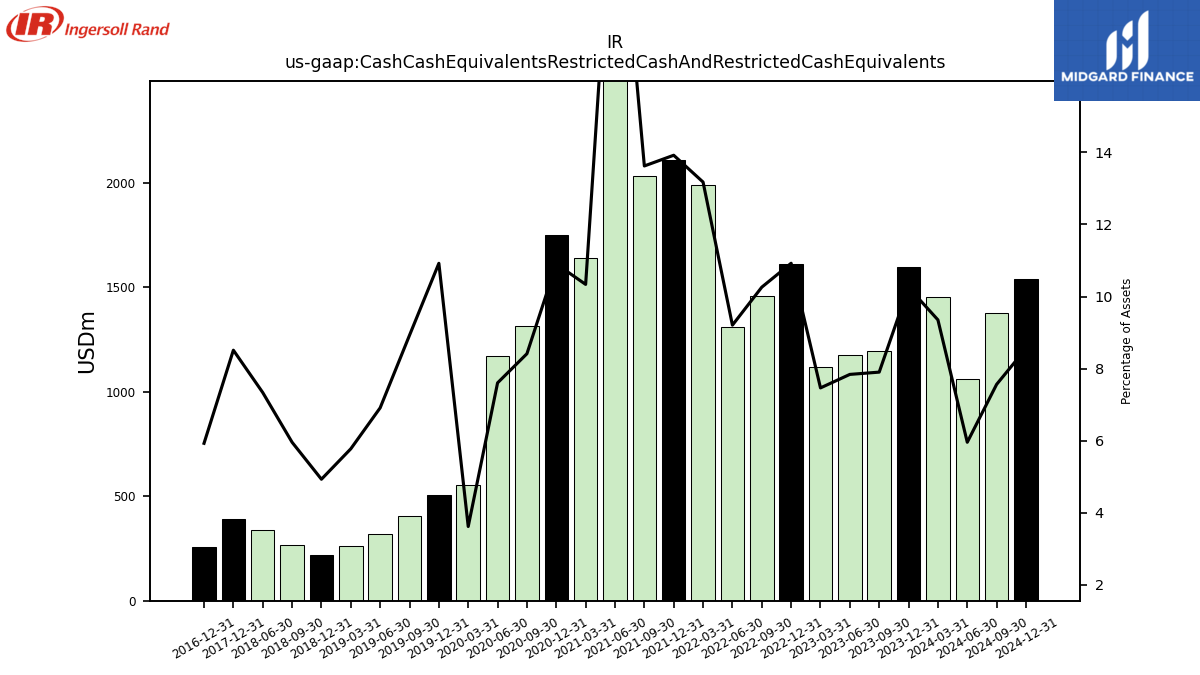
| Cash And Cash Equivalents At Carrying Value | 1452.30 | 1595.50 | 1197.50 | 1178.10 | 1119.30 | 1613.00 | 1459.50 | 1309.20 | 1990.20 | 2109.60 | 2033.00 | 3669.90 | 1639.60 | 1750.90 | 1313.30 | 1173.60 | 555.70 | 505.50 | 406.40 | 317.50 | 263.70 | 221.20 | 269.00 | 337.80 | 353.80 | 393.30 | 303.00 | 245.70 | 225.60 | 255.80 | 242.20 | 246.40 | |
| Cash Cash Equivalents Restricted Cash And Restricted Cash Equivalents | 1452.30 | 1595.50 | 1197.50 | 1178.10 | 1119.30 | 1613.00 | 1459.50 | 1309.20 | 1990.20 | 2109.60 | 2033.00 | 3669.90 | 1639.60 | 1750.90 | 1313.30 | 1173.60 | 555.70 | 505.50 | 406.40 | 317.50 | 263.70 | 221.20 | 269.00 | 337.80 | NA | 393.30 | NA | NA | NA | 255.80 | NA | NA | |
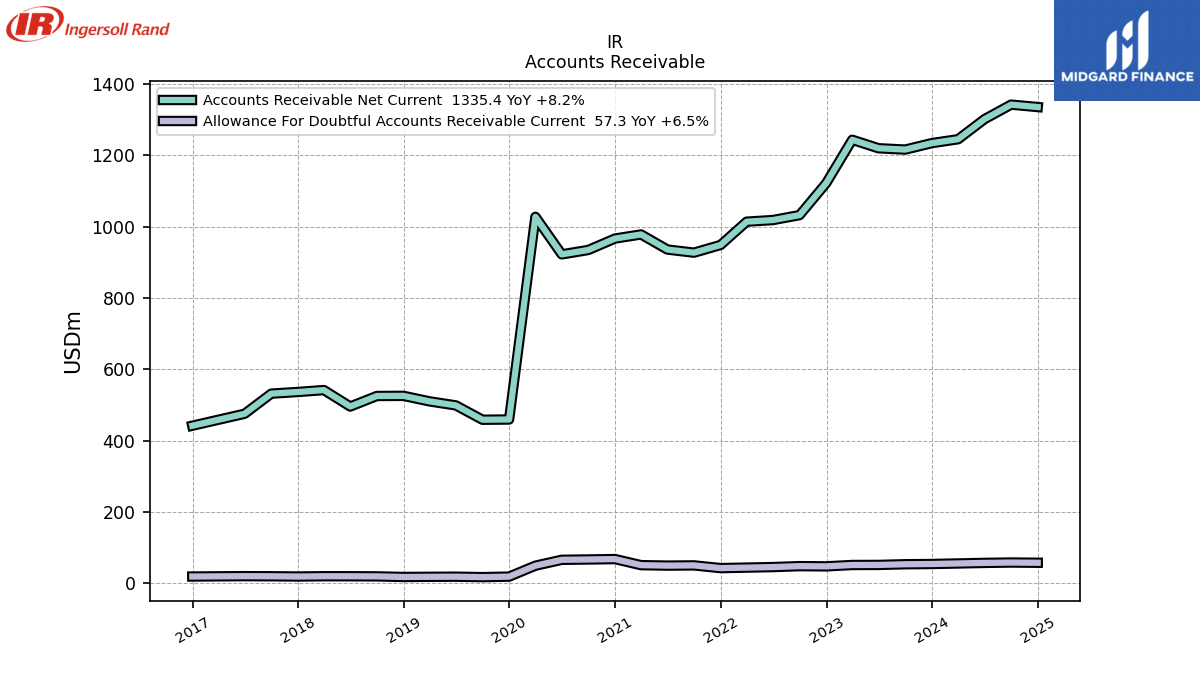
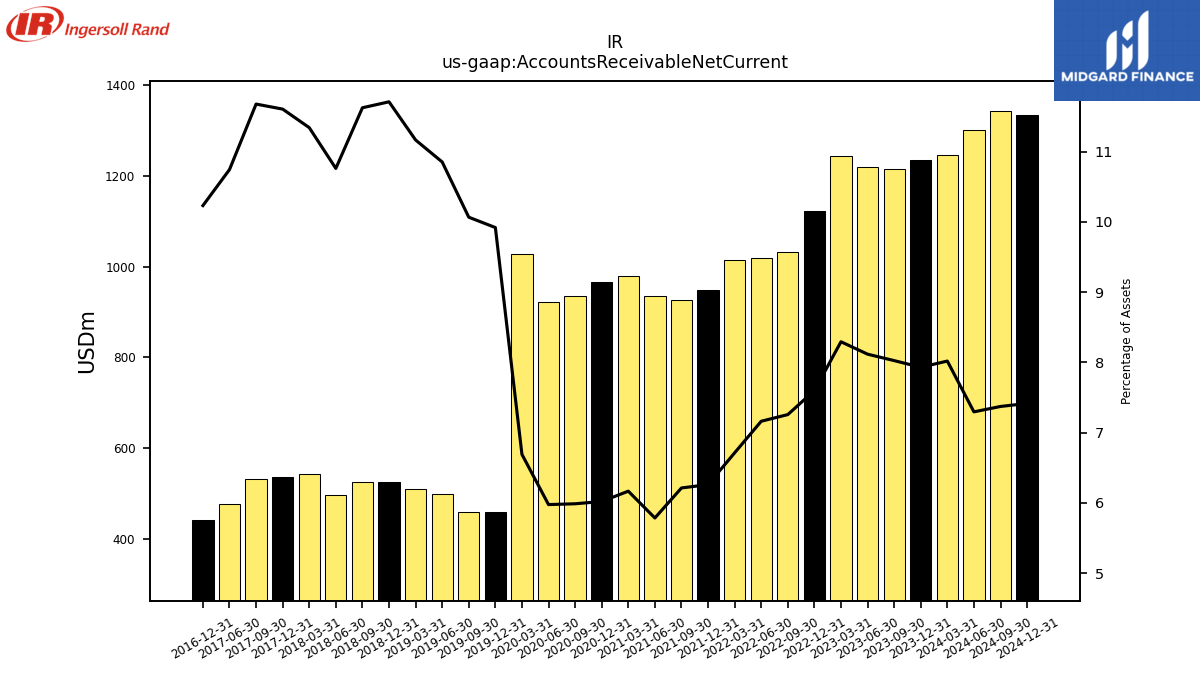
| Accounts Receivable Net Current | 1245.20 | 1234.20 | 1216.10 | 1219.80 | 1243.60 | 1122.00 | 1032.30 | 1018.50 | 1013.90 | 948.60 | 927.00 | 935.80 | 978.10 | 966.60 | 934.60 | 922.20 | 1027.50 | 459.10 | 458.40 | 498.60 | 509.90 | 525.40 | 525.00 | 495.50 | 541.60 | 536.30 | 531.60 | 475.20 | NA | 441.60 | NA | NA | |
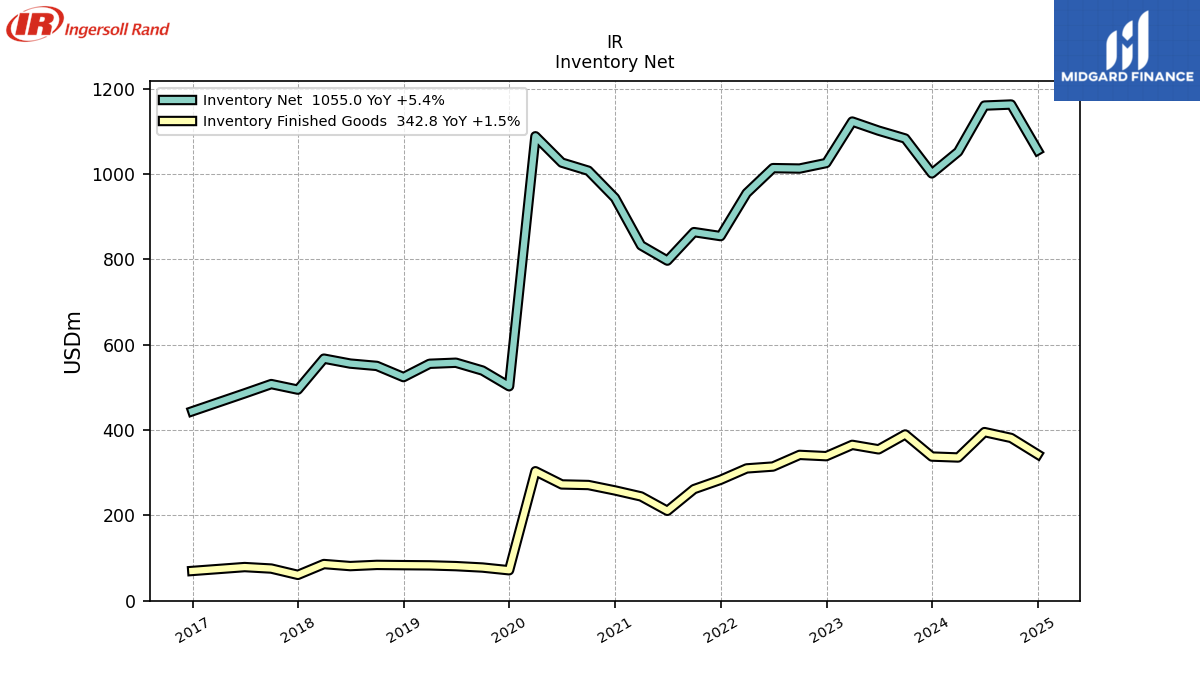
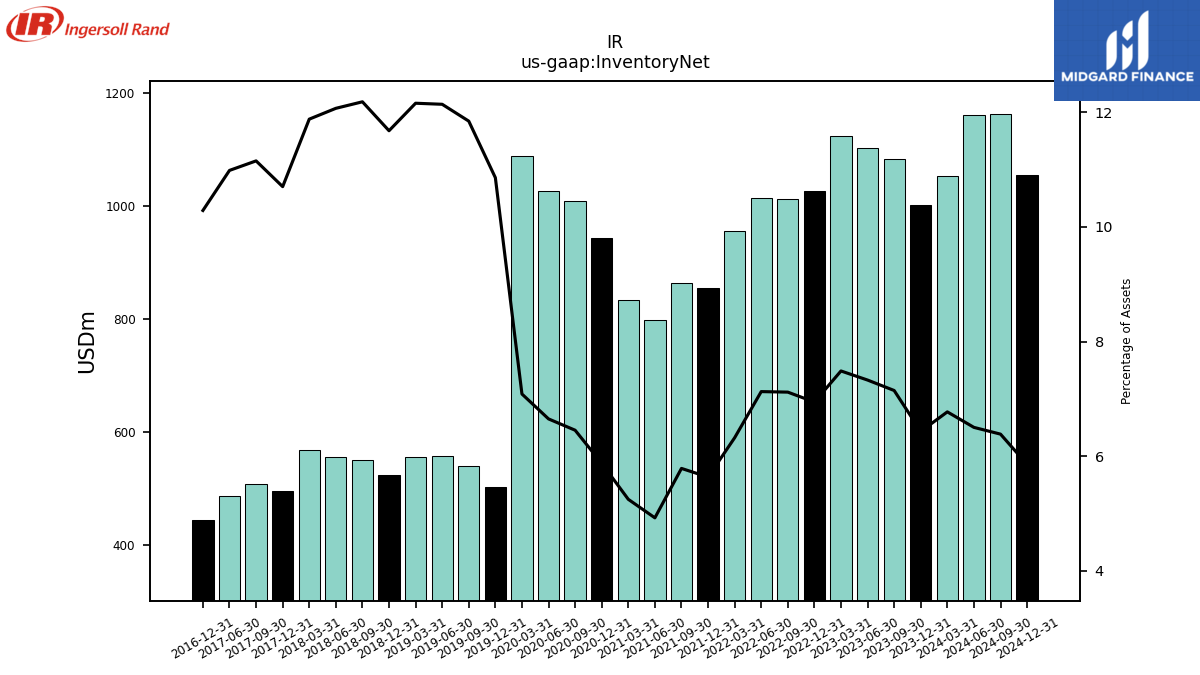
| Inventory Net | 1051.80 | 1001.10 | 1082.90 | 1101.30 | 1122.60 | 1025.40 | 1012.50 | 1013.50 | 954.90 | 854.20 | 863.60 | 796.80 | 832.50 | 943.60 | 1007.40 | 1026.40 | 1088.10 | 502.50 | 539.30 | 557.60 | 555.10 | 523.90 | 550.10 | 555.60 | 567.20 | 494.50 | 507.60 | 485.80 | NA | 443.90 | NA | NA | |
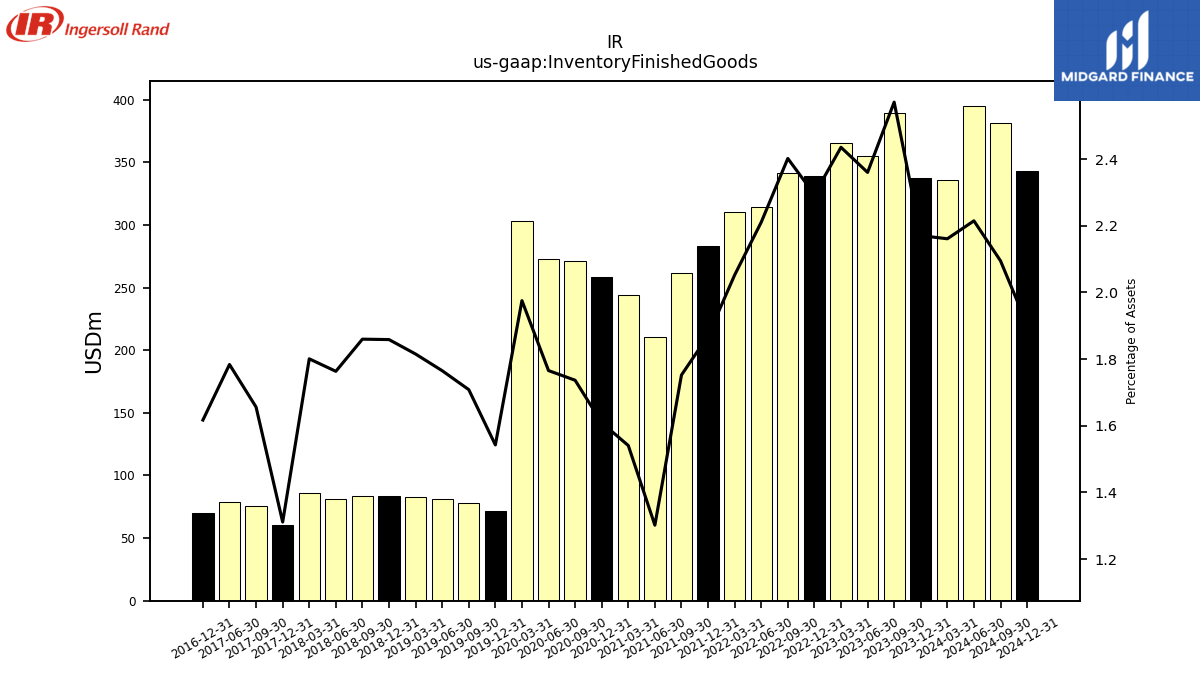
| Inventory Finished Goods | 335.60 | 337.80 | 389.60 | 354.70 | 365.20 | 338.70 | 341.70 | 314.40 | 310.00 | 283.40 | 261.50 | 210.60 | 244.40 | 258.40 | 271.10 | 272.50 | 303.40 | 71.40 | 77.80 | 81.10 | 82.90 | 83.40 | 84.00 | 81.20 | 86.00 | 60.60 | 75.40 | 78.90 | NA | 69.80 | NA | NA | |
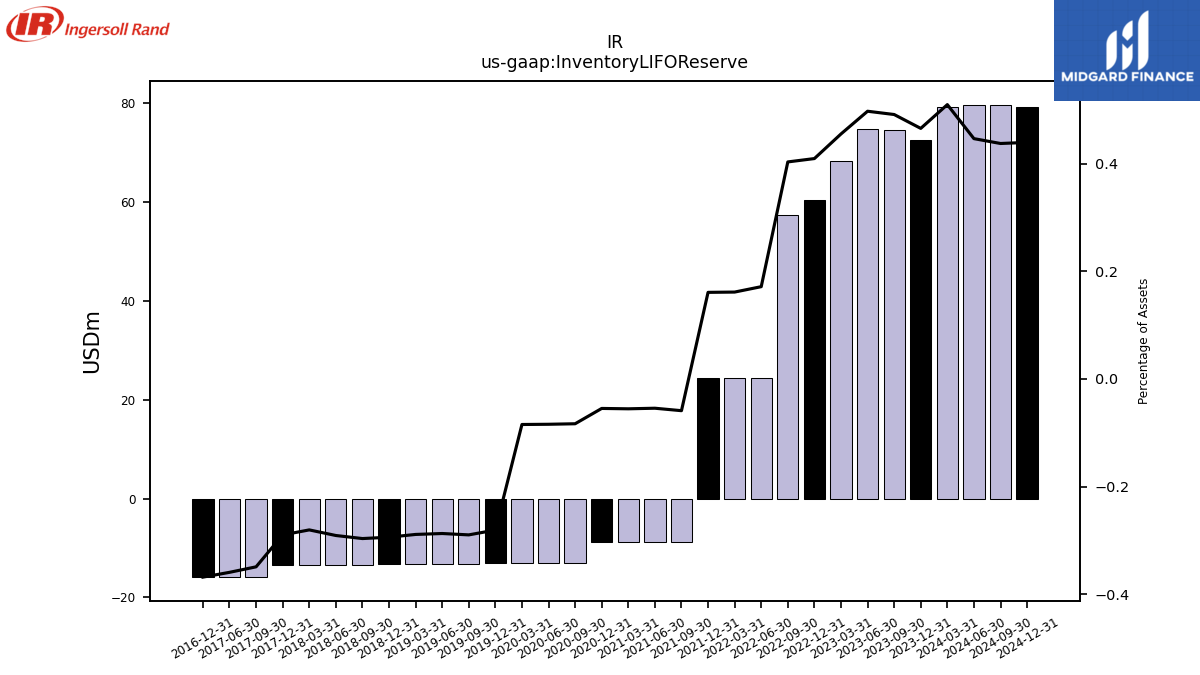
| Inventory L I F O Reserve | 79.20 | 72.50 | 74.50 | 74.80 | 68.30 | 60.50 | 57.40 | 24.40 | 24.40 | 24.40 | -8.80 | -8.80 | -8.80 | -8.80 | -13.00 | -13.00 | -13.00 | -13.00 | -13.20 | -13.20 | -13.20 | -13.20 | -13.40 | -13.40 | -13.40 | -13.40 | -15.90 | -15.90 | NA | -15.90 | NA | NA | |
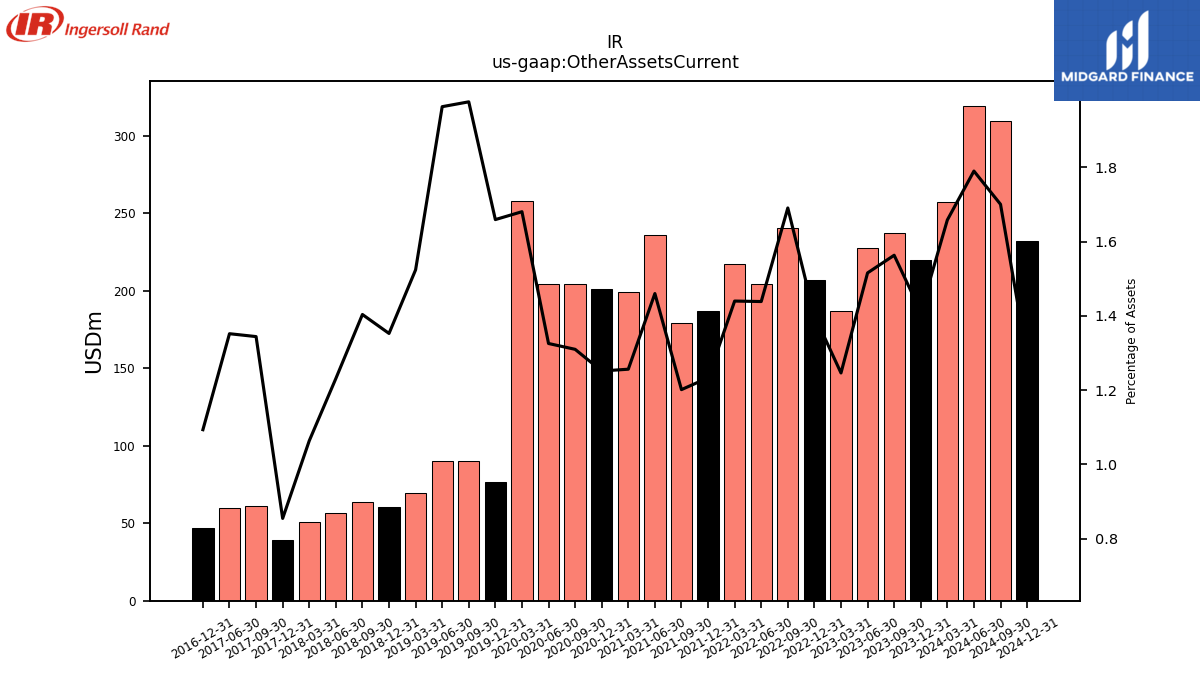
| Other Assets Current | 257.50 | 219.60 | 236.90 | 227.80 | 186.90 | 206.90 | 240.50 | 204.60 | 217.50 | 186.90 | 179.30 | 236.20 | 199.30 | 201.00 | 204.50 | 204.60 | 258.10 | 76.80 | 90.00 | 90.20 | 69.60 | 60.70 | 63.40 | 56.70 | 50.80 | 39.50 | 61.20 | 59.80 | NA | 47.20 | NA | NA | |
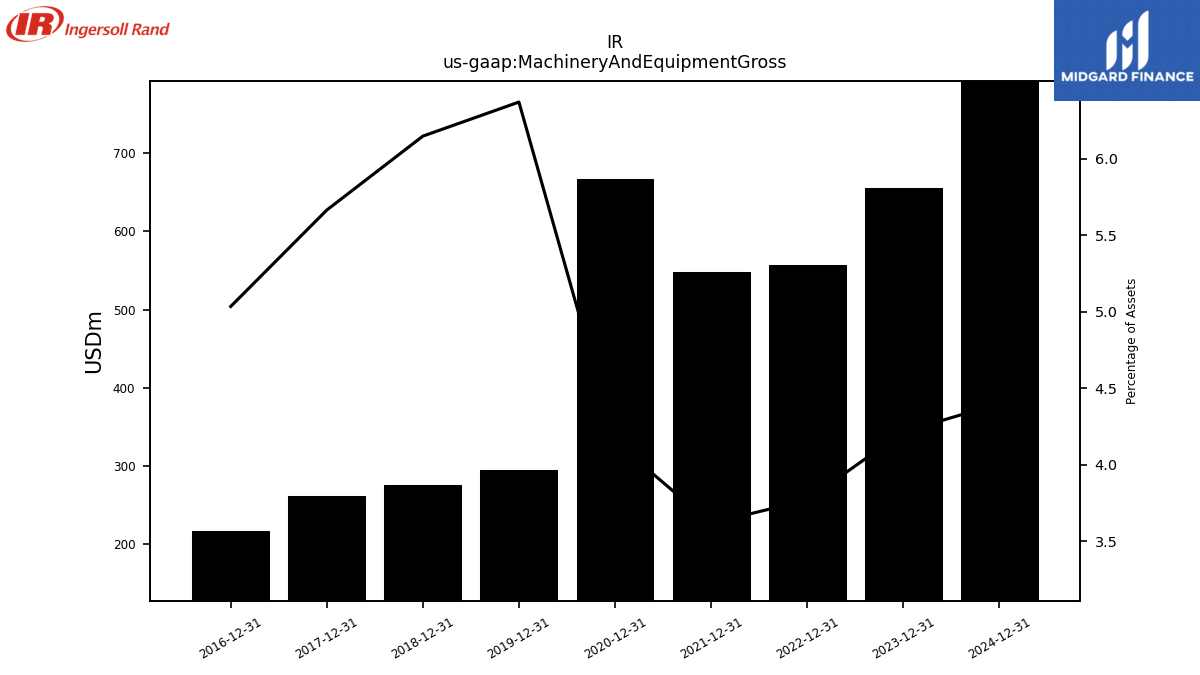
| Machinery And Equipment Gross | NA | 655.80 | NA | NA | NA | 556.60 | NA | NA | NA | 548.10 | NA | NA | NA | 666.60 | NA | NA | NA | 294.90 | NA | NA | NA | 275.90 | NA | NA | NA | 261.80 | NA | NA | NA | 217.30 | NA | NA |
| 2024-03-31 | 2023-12-31 | 2023-09-30 | 2023-06-30 | 2023-03-31 | 2022-12-31 | 2022-09-30 | 2022-06-30 | 2022-03-31 | 2021-12-31 | 2021-09-30 | 2021-06-30 | 2021-03-31 | 2020-12-31 | 2020-09-30 | 2020-06-30 | 2020-03-31 | 2019-12-31 | 2019-09-30 | 2019-06-30 | 2019-03-31 | 2018-12-31 | 2018-09-30 | 2018-06-30 | 2018-03-31 | 2017-12-31 | 2017-09-30 | 2017-06-30 | 2017-03-31 | 2016-12-31 | 2016-09-30 | 2016-06-30 | ||
|---|---|---|---|---|---|---|---|---|---|---|---|---|---|---|---|---|---|---|---|---|---|---|---|---|---|---|---|---|---|---|---|---|---|
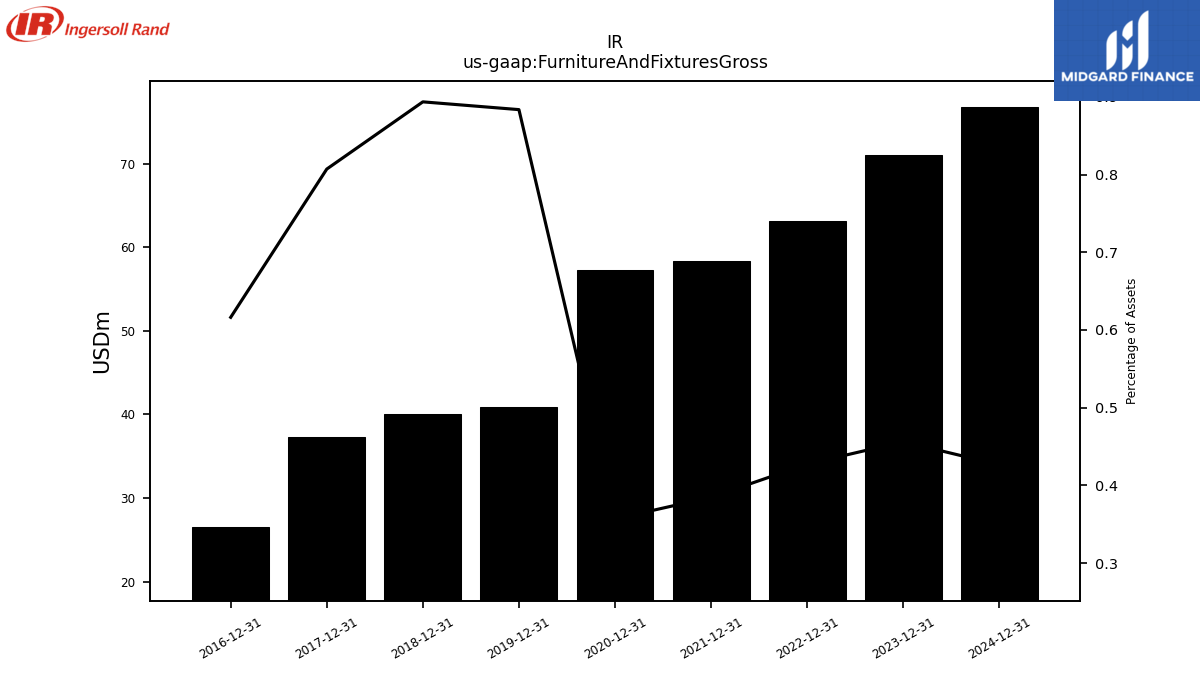
| Furniture And Fixtures Gross | NA | 71.00 | NA | NA | NA | 63.10 | NA | NA | NA | 58.30 | NA | NA | NA | 57.30 | NA | NA | NA | 40.90 | NA | NA | NA | 40.10 | NA | NA | NA | 37.30 | NA | NA | NA | 26.60 | NA | NA | |
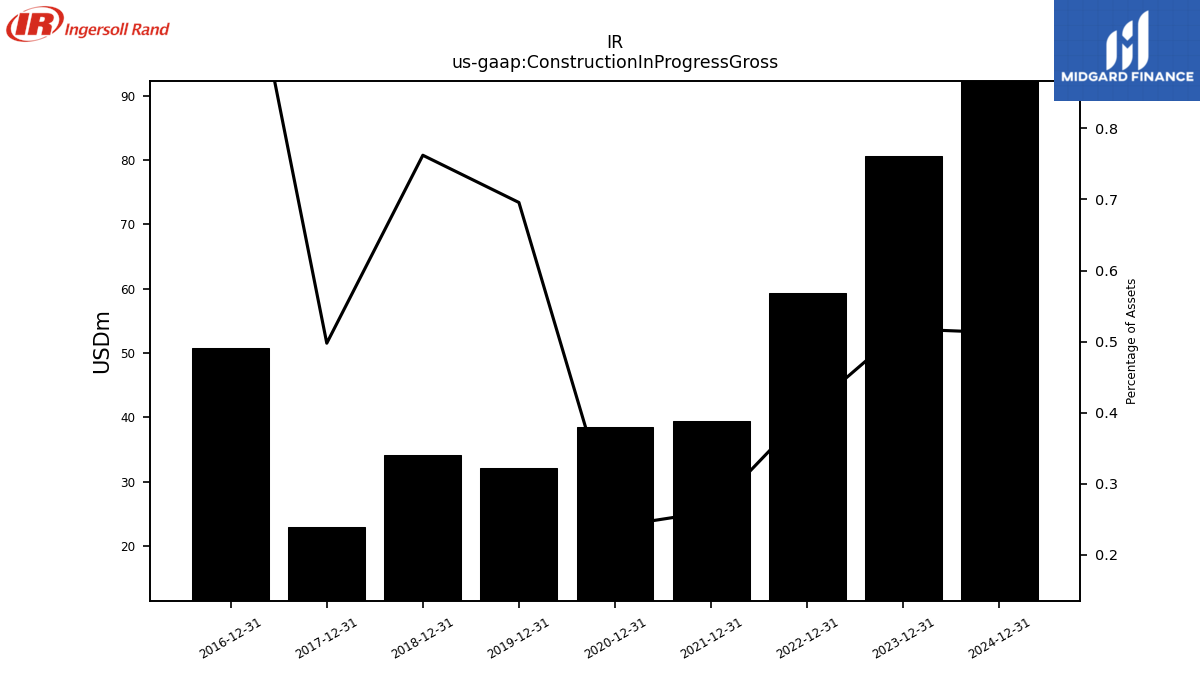
| Construction In Progress Gross | NA | 80.60 | NA | NA | NA | 59.30 | NA | NA | NA | 39.50 | NA | NA | NA | 38.50 | NA | NA | NA | 32.20 | NA | NA | NA | 34.20 | NA | NA | NA | 23.00 | NA | NA | NA | 50.80 | NA | NA | |
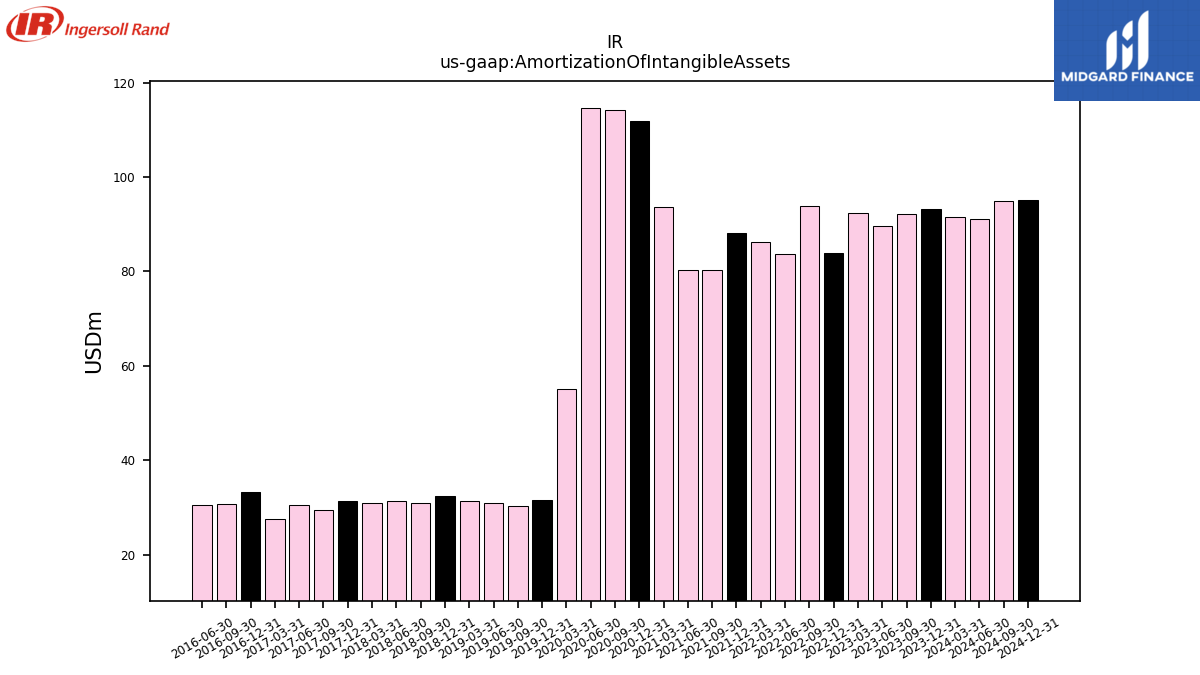
| Amortization Of Intangible Assets | 91.60 | 93.20 | 92.20 | 89.70 | 92.40 | 84.00 | 93.80 | 83.60 | 86.20 | 88.10 | 80.30 | 80.30 | 93.70 | 111.80 | 114.20 | 114.60 | 55.20 | 31.70 | 30.40 | 30.90 | 31.40 | 32.40 | 31.00 | 31.50 | 30.90 | 31.30 | 29.50 | 30.50 | 27.60 | 33.40 | 30.70 | 30.50 | |
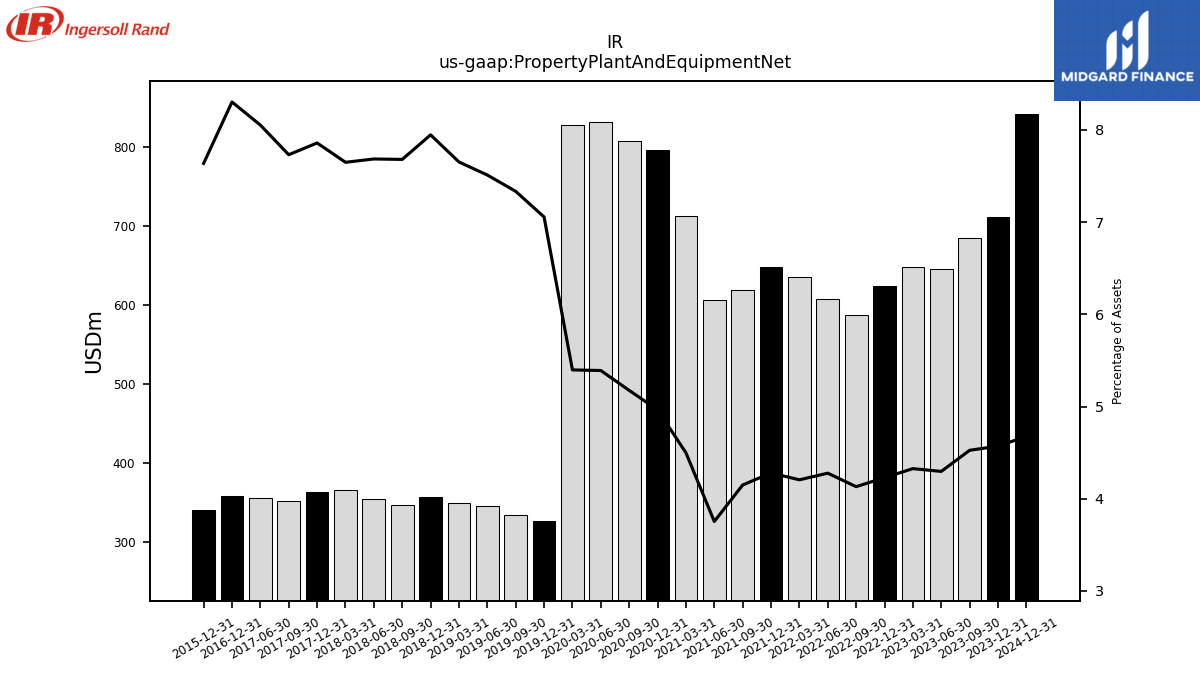
| Property Plant And Equipment Net | NA | 711.40 | 685.80 | 645.70 | 648.80 | 624.40 | 587.70 | 608.30 | 635.20 | 648.60 | 619.20 | 607.20 | 713.60 | 797.30 | 807.90 | 832.00 | 829.00 | 326.60 | 334.00 | 345.10 | 349.50 | 356.60 | 346.90 | 353.90 | 365.30 | 363.20 | 352.00 | 356.20 | NA | 358.40 | NA | NA | |
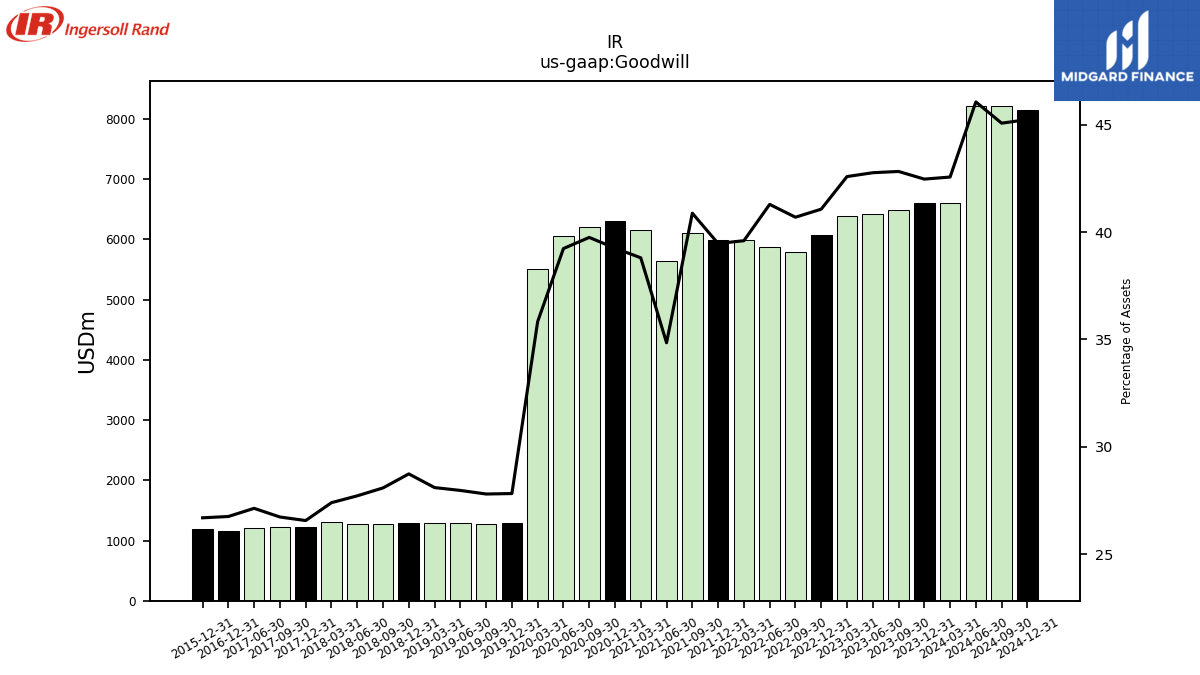
| Goodwill | 6609.90 | 6609.70 | 6489.80 | 6427.20 | 6385.90 | 6064.20 | 5789.00 | 5872.20 | 5981.40 | 5981.60 | 6100.60 | 5637.00 | 6154.90 | 6303.60 | 6205.70 | 6055.10 | 5503.40 | 1287.70 | 1266.00 | 1284.90 | 1283.30 | 1289.50 | 1268.40 | 1276.20 | 1308.30 | 1227.60 | 1216.90 | 1200.10 | NA | 1154.70 | NA | NA | |
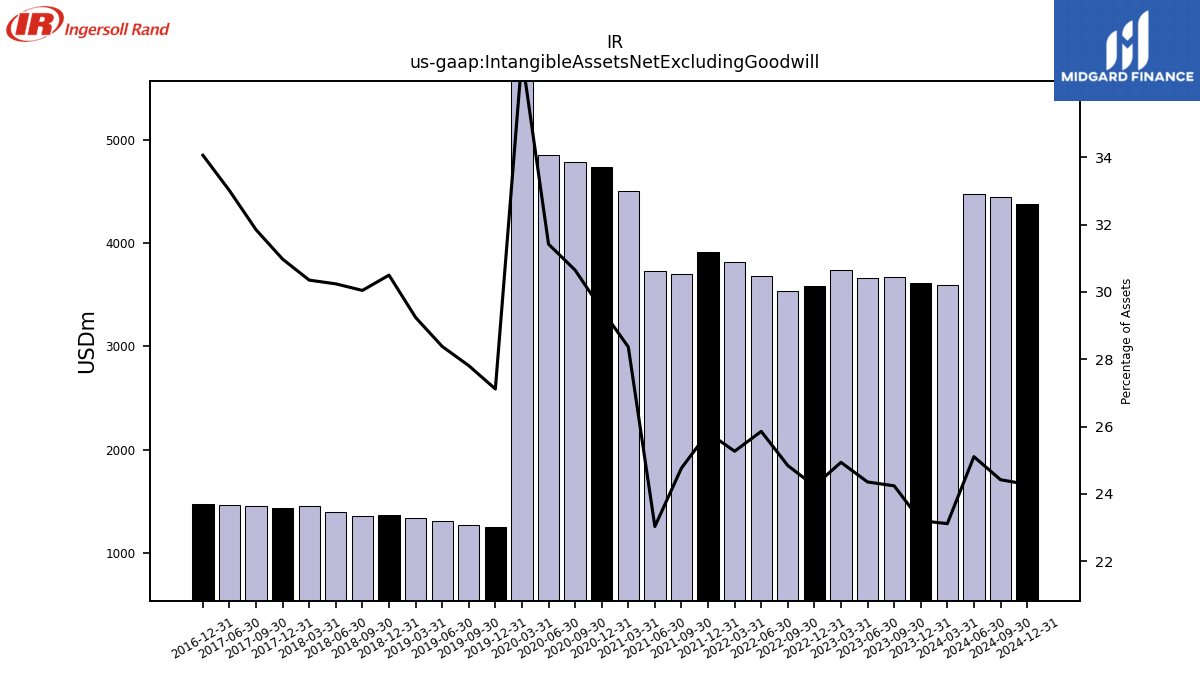
| Intangible Assets Net Excluding Goodwill | 3589.60 | 3611.10 | 3673.00 | 3659.80 | 3739.10 | 3578.60 | 3533.60 | 3676.90 | 3816.30 | 3912.70 | 3695.80 | 3725.50 | 4499.10 | 4732.60 | 4783.90 | 4848.70 | 5679.70 | 1255.00 | 1266.30 | 1303.80 | 1335.30 | 1368.40 | 1356.80 | 1392.30 | 1449.20 | 1431.20 | 1449.70 | 1459.80 | NA | 1469.90 | NA | NA | |
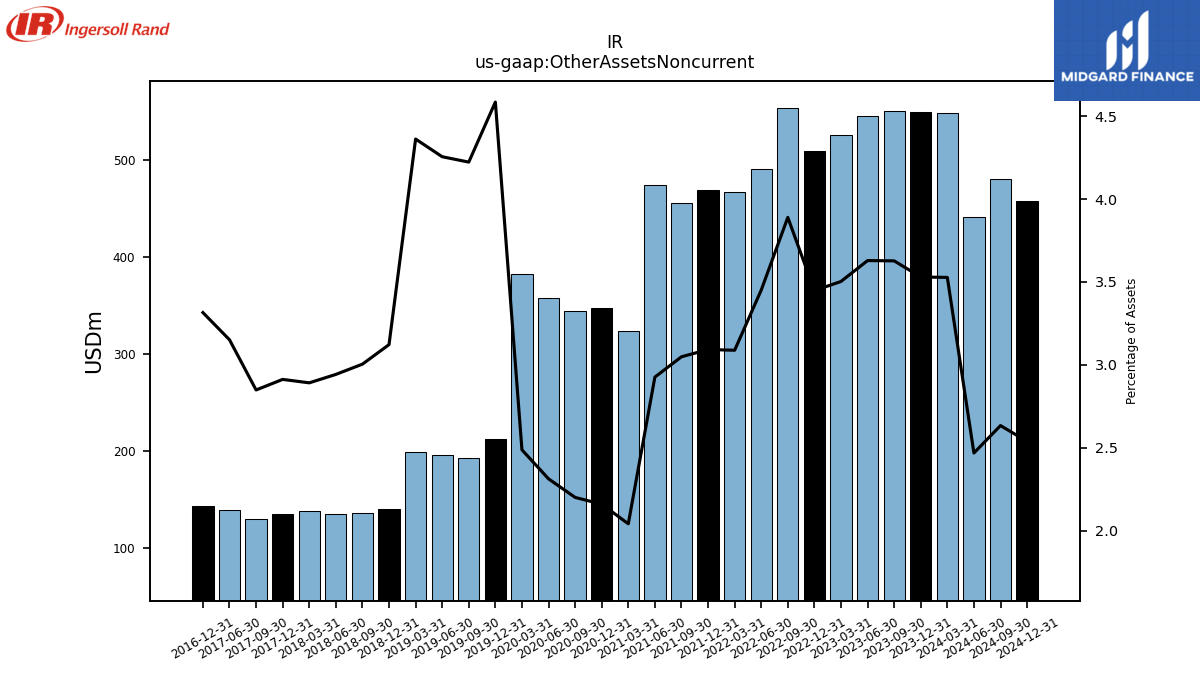
| Other Assets Noncurrent | 547.80 | 549.40 | 549.70 | 545.40 | 525.30 | 509.10 | 553.30 | 490.80 | 466.50 | 468.70 | 455.00 | 473.40 | 323.90 | 346.90 | 343.60 | 357.00 | 382.10 | 212.20 | 192.30 | 195.50 | 199.20 | 140.10 | 135.70 | 135.50 | 138.10 | 134.60 | 129.70 | 139.40 | NA | 143.10 | NA | NA |
| 2024-03-31 | 2023-12-31 | 2023-09-30 | 2023-06-30 | 2023-03-31 | 2022-12-31 | 2022-09-30 | 2022-06-30 | 2022-03-31 | 2021-12-31 | 2021-09-30 | 2021-06-30 | 2021-03-31 | 2020-12-31 | 2020-09-30 | 2020-06-30 | 2020-03-31 | 2019-12-31 | 2019-09-30 | 2019-06-30 | 2019-03-31 | 2018-12-31 | 2018-09-30 | 2018-06-30 | 2018-03-31 | 2017-12-31 | 2017-09-30 | 2017-06-30 | 2017-03-31 | 2016-12-31 | 2016-09-30 | 2016-06-30 | ||
|---|---|---|---|---|---|---|---|---|---|---|---|---|---|---|---|---|---|---|---|---|---|---|---|---|---|---|---|---|---|---|---|---|---|
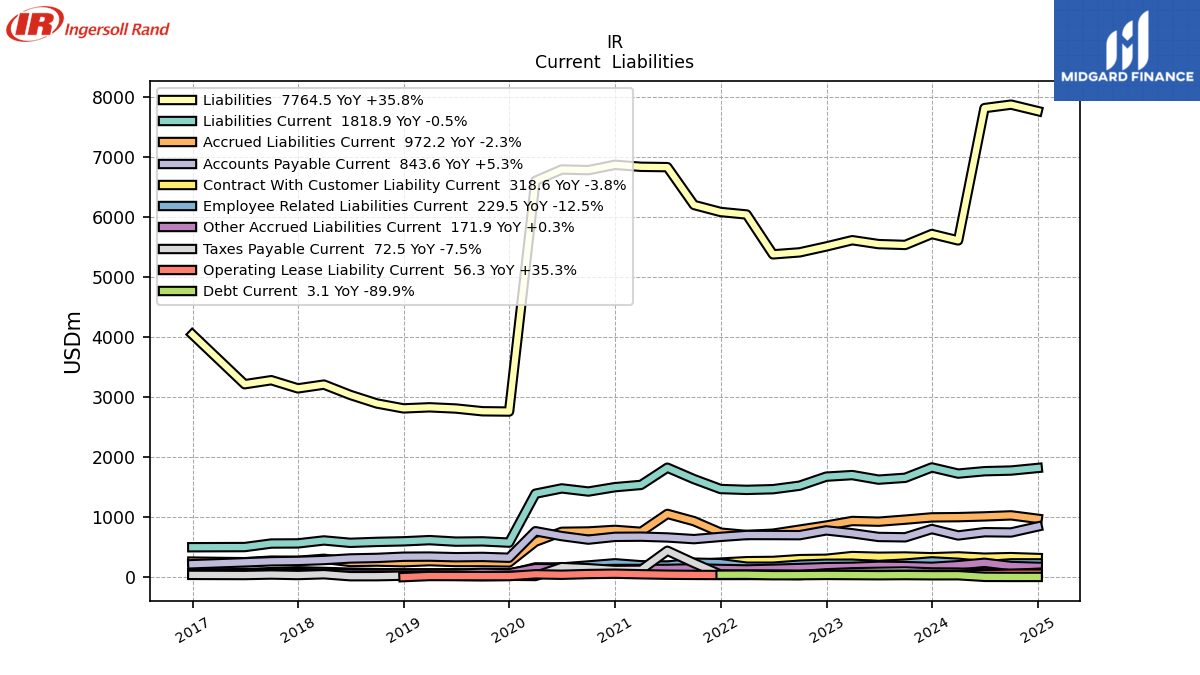
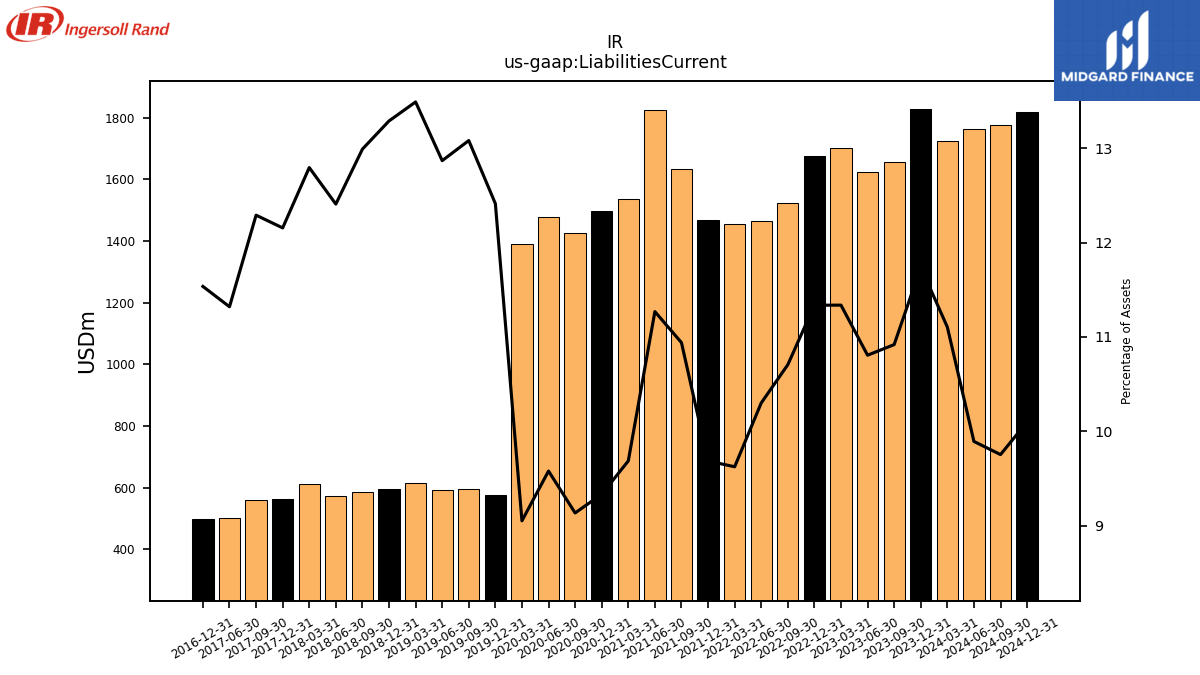
| Liabilities Current | 1724.60 | 1827.30 | 1654.70 | 1624.10 | 1700.10 | 1674.00 | 1523.00 | 1464.80 | 1453.60 | 1467.70 | 1632.60 | 1823.00 | 1536.30 | 1498.60 | 1425.80 | 1478.20 | 1390.00 | 574.60 | 595.80 | 591.30 | 616.20 | 596.40 | 586.80 | 571.40 | 611.10 | 561.80 | 559.60 | 500.70 | NA | 497.90 | NA | NA | |
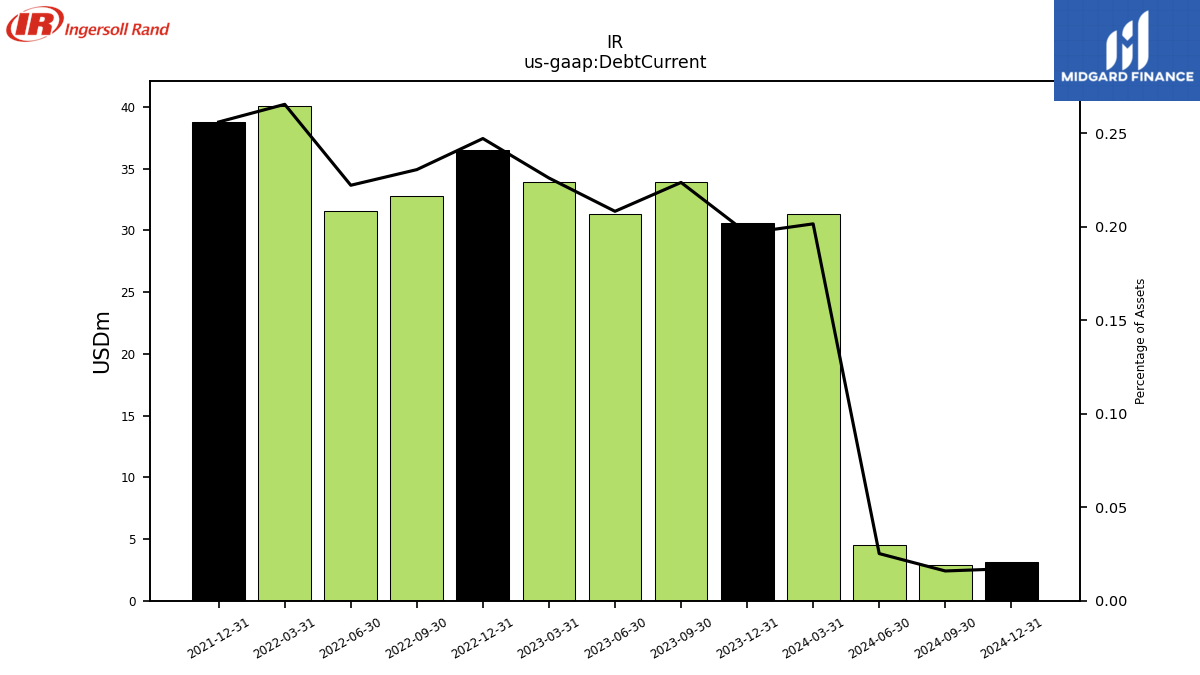
| Debt Current | 31.30 | 30.60 | 33.90 | 31.30 | 33.90 | 36.50 | 32.80 | 31.60 | 40.10 | 38.80 | NA | NA | NA | NA | NA | NA | NA | NA | NA | NA | NA | NA | NA | NA | NA | NA | NA | NA | NA | NA | NA | NA | |
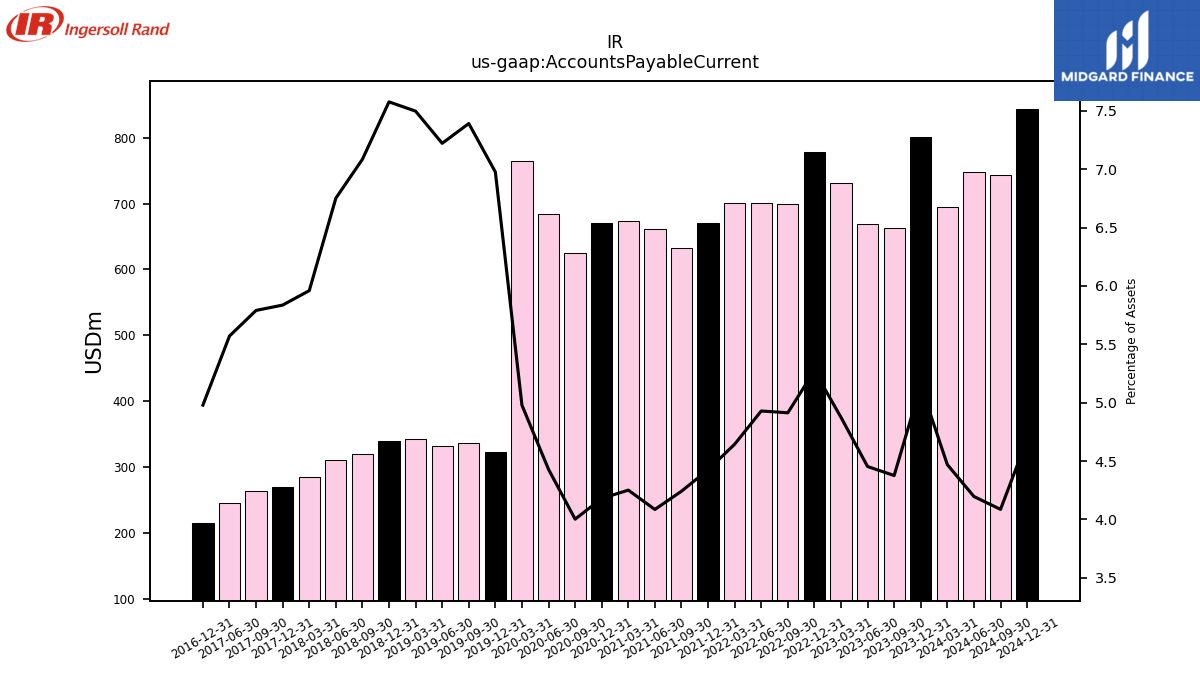
| Accounts Payable Current | 694.00 | 801.20 | 663.10 | 669.20 | 730.90 | 778.70 | 698.90 | 700.90 | 701.40 | 670.50 | 632.90 | 660.80 | 674.20 | 671.10 | 624.70 | 683.50 | 764.60 | 322.90 | 336.60 | 331.80 | 342.40 | 340.00 | 320.00 | 310.90 | 284.60 | 269.70 | 263.60 | 246.40 | NA | 214.90 | NA | NA | |
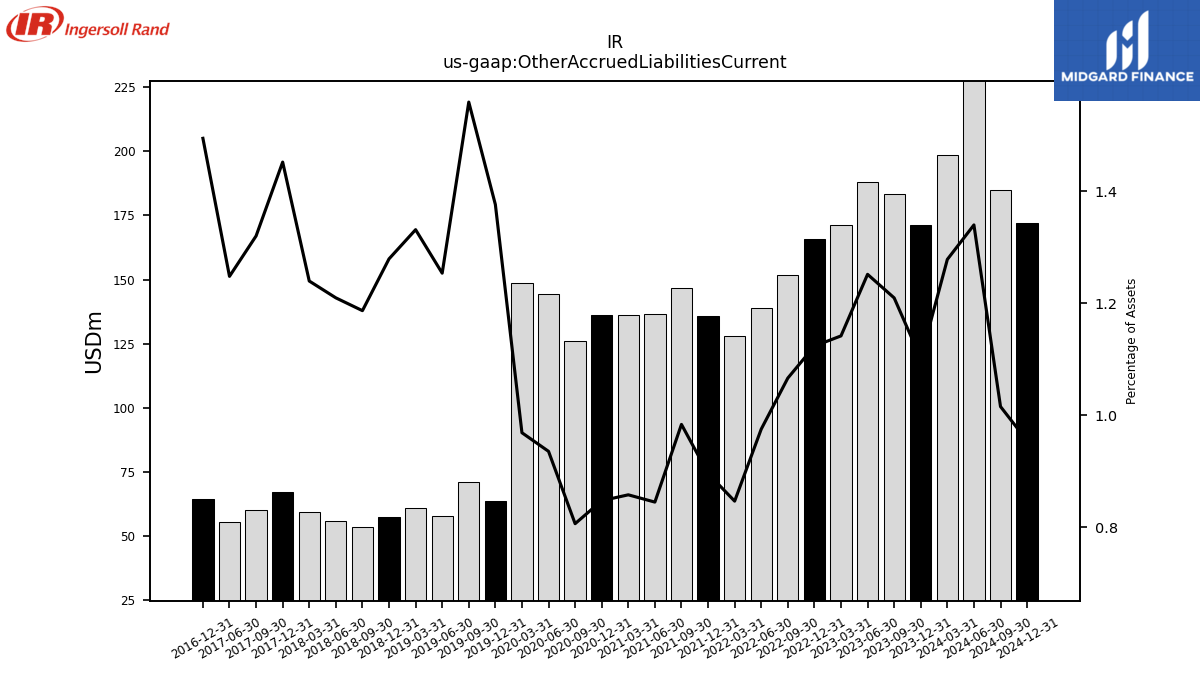
| Other Accrued Liabilities Current | 198.50 | 171.40 | 183.30 | 188.10 | 171.20 | 165.90 | 151.70 | 138.70 | 127.90 | 135.80 | 146.80 | 136.70 | 136.10 | 136.10 | 125.90 | 144.40 | 148.80 | 63.70 | 71.00 | 57.60 | 60.80 | 57.40 | 53.60 | 55.70 | 59.20 | 67.10 | 60.10 | 55.20 | NA | 64.50 | NA | NA | |
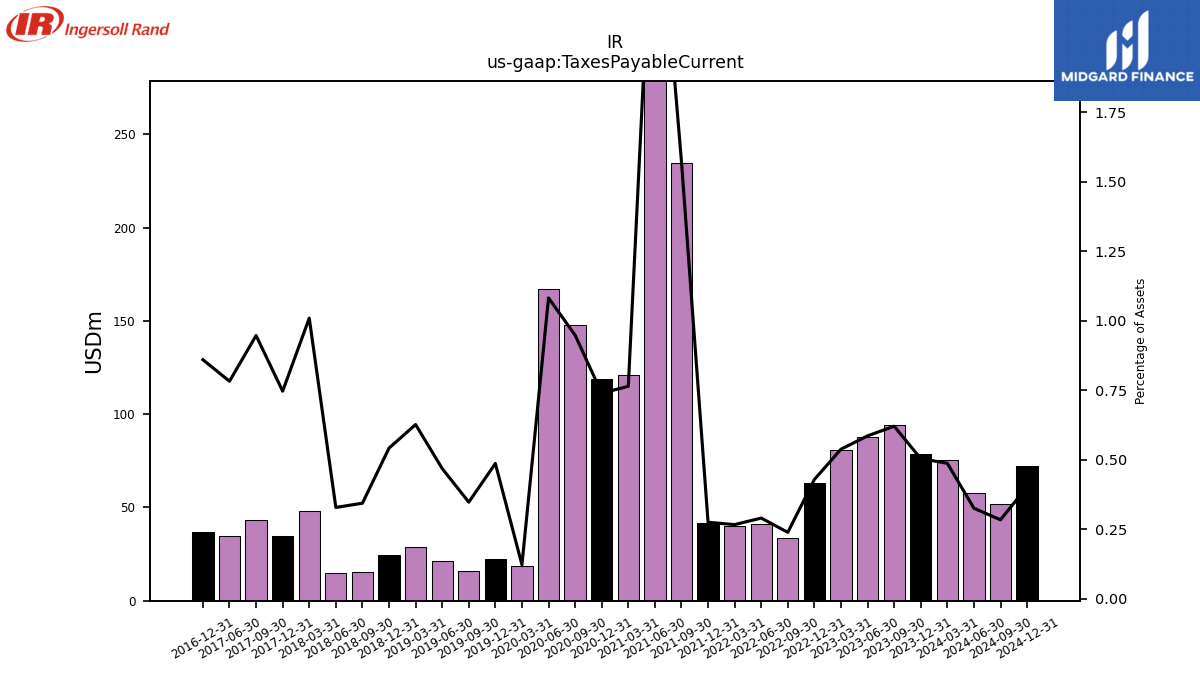
| Taxes Payable Current | 75.60 | 78.40 | 94.00 | 88.00 | 80.60 | 63.30 | 33.90 | 41.20 | 40.20 | 41.60 | 234.70 | 439.30 | 121.20 | 118.70 | 148.00 | 167.00 | 18.70 | 22.50 | 15.80 | 21.50 | 28.60 | 24.30 | 15.50 | 15.10 | 48.20 | 34.50 | 43.10 | 34.60 | NA | 37.10 | NA | NA | |
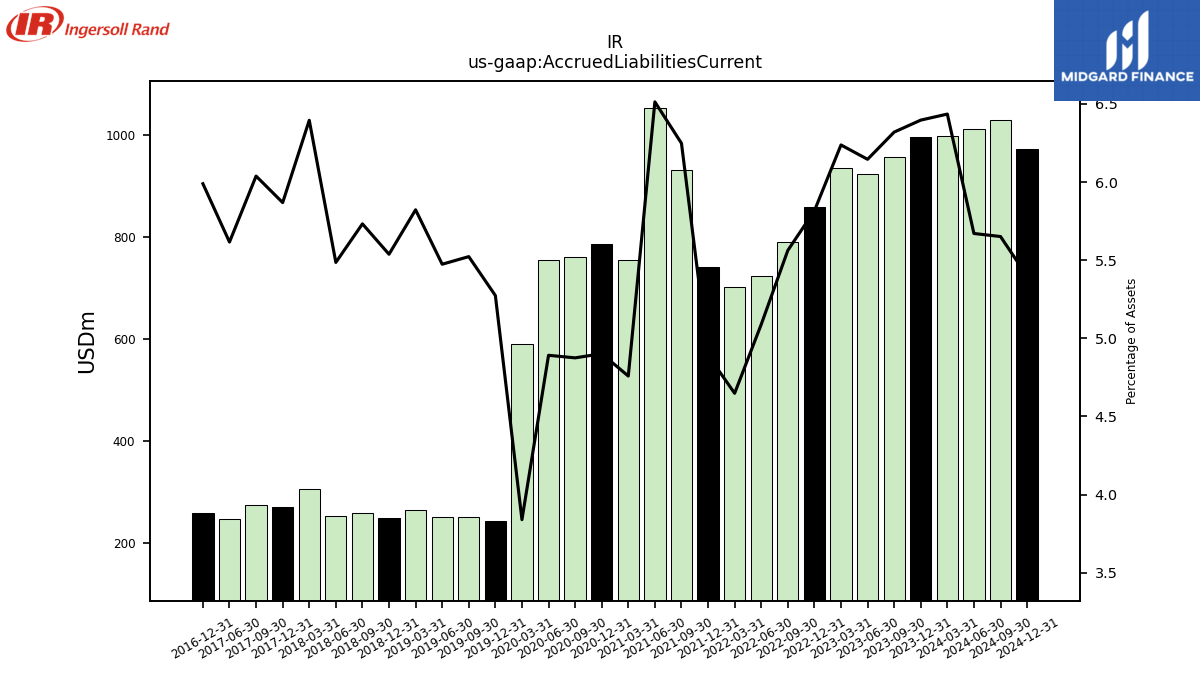
| Accrued Liabilities Current | 999.30 | 995.50 | 957.70 | 923.60 | 935.30 | 858.80 | 791.30 | 723.70 | 702.10 | 741.30 | 932.40 | 1053.60 | 754.80 | 787.10 | 761.00 | 754.90 | 589.70 | 244.10 | 251.50 | 251.50 | 265.90 | 248.50 | 258.90 | 252.60 | 305.40 | 271.20 | 274.90 | 248.40 | NA | 258.50 | NA | NA | |
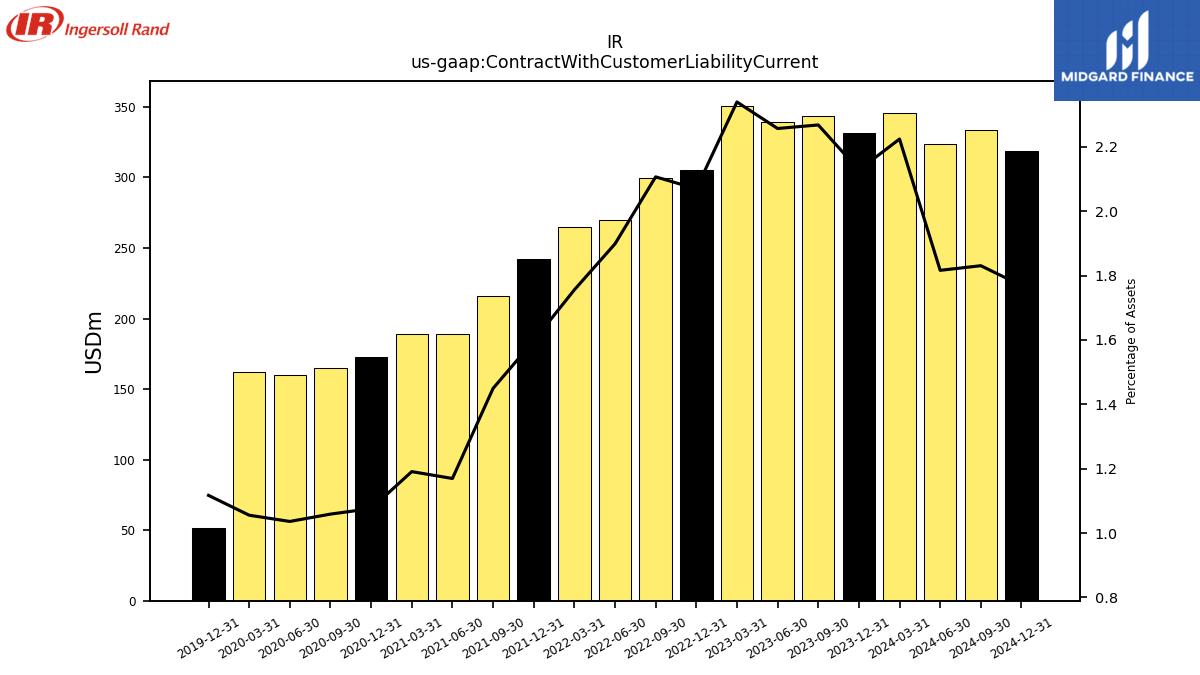
| Contract With Customer Liability Current | 345.40 | 331.20 | 343.70 | 339.20 | 350.80 | 305.60 | 299.70 | 270.00 | 265.20 | 242.10 | 216.30 | 189.20 | 188.90 | 172.80 | 165.30 | 159.90 | 162.10 | 51.70 | NA | NA | NA | NA | NA | NA | NA | NA | NA | NA | NA | NA | NA | NA |
| 2024-03-31 | 2023-12-31 | 2023-09-30 | 2023-06-30 | 2023-03-31 | 2022-12-31 | 2022-09-30 | 2022-06-30 | 2022-03-31 | 2021-12-31 | 2021-09-30 | 2021-06-30 | 2021-03-31 | 2020-12-31 | 2020-09-30 | 2020-06-30 | 2020-03-31 | 2019-12-31 | 2019-09-30 | 2019-06-30 | 2019-03-31 | 2018-12-31 | 2018-09-30 | 2018-06-30 | 2018-03-31 | 2017-12-31 | 2017-09-30 | 2017-06-30 | 2017-03-31 | 2016-12-31 | 2016-09-30 | 2016-06-30 | ||
|---|---|---|---|---|---|---|---|---|---|---|---|---|---|---|---|---|---|---|---|---|---|---|---|---|---|---|---|---|---|---|---|---|---|
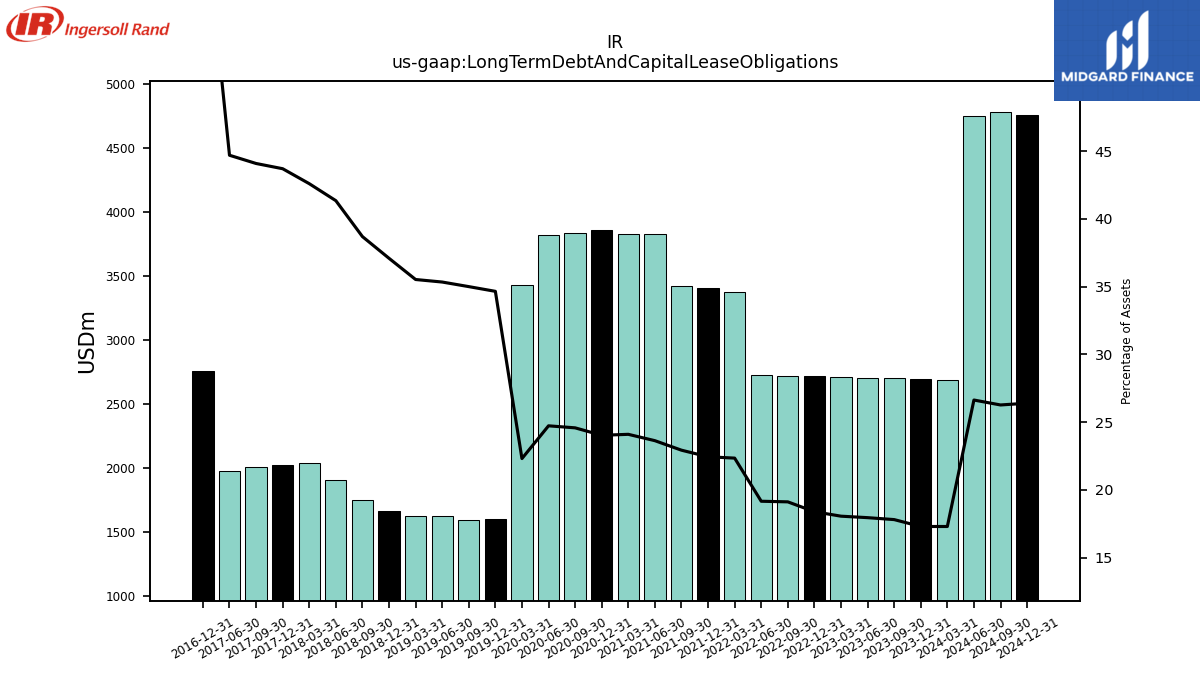
| Long Term Debt And Capital Lease Obligations | 2687.00 | 2693.00 | 2699.30 | 2698.50 | 2708.80 | 2716.10 | 2720.10 | 2725.70 | 3375.60 | 3401.80 | 3422.20 | 3823.30 | 3823.20 | 3859.10 | 3837.20 | 3816.70 | 3427.10 | 1603.80 | 1593.80 | 1623.50 | 1622.30 | 1664.20 | 1747.40 | 1903.50 | 2034.00 | 2019.30 | 2006.90 | 1976.60 | NA | 2753.80 | NA | NA | |
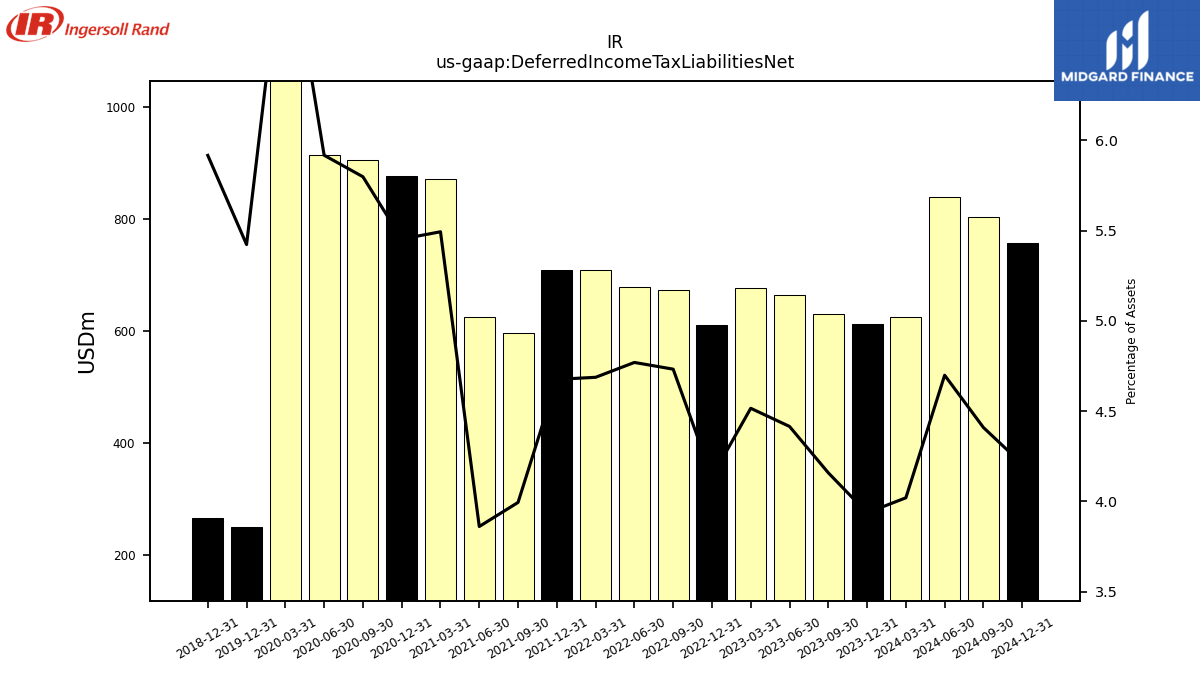
| Deferred Income Tax Liabilities Net | 624.20 | 612.60 | 630.10 | 663.50 | 677.10 | 610.60 | 673.20 | 678.30 | 708.00 | 708.60 | 596.00 | 624.50 | 871.40 | 875.70 | 905.20 | 913.30 | 1111.10 | 251.00 | NA | NA | NA | 265.50 | NA | NA | NA | NA | NA | NA | NA | NA | NA | NA | |
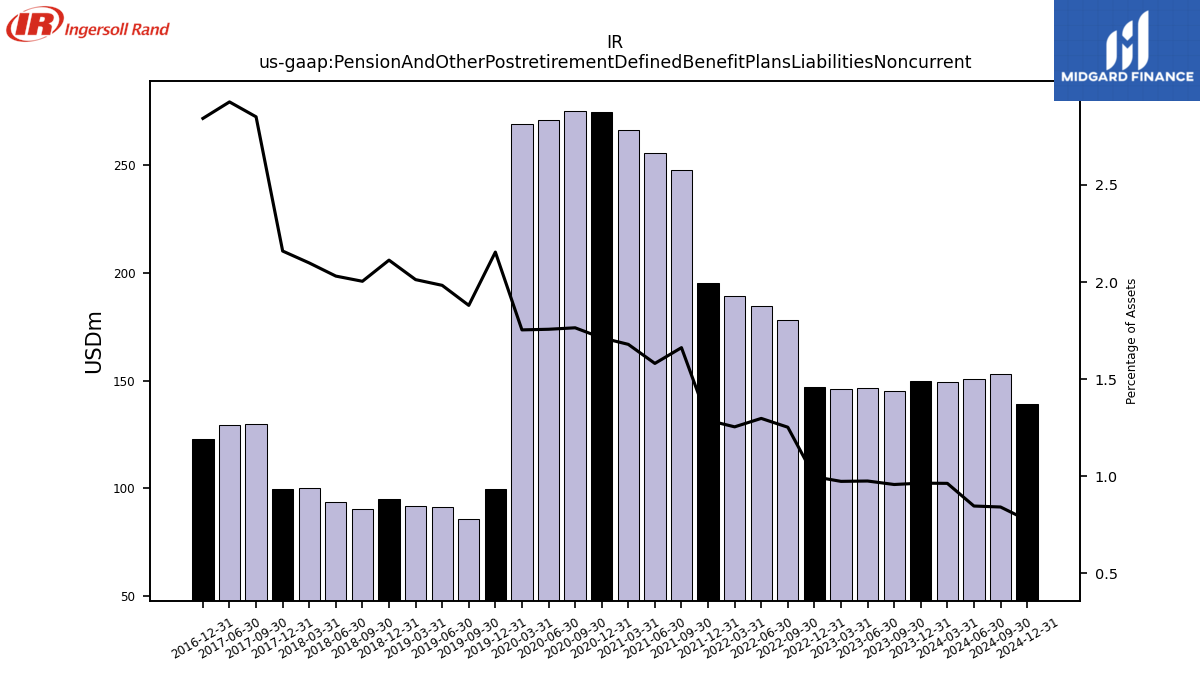
| Pension And Other Postretirement Defined Benefit Plans Liabilities Noncurrent | 149.50 | 150.00 | 145.00 | 146.50 | 145.90 | 147.20 | 178.10 | 184.50 | 189.40 | 195.10 | 248.00 | 255.70 | 266.30 | 275.00 | 275.40 | 271.10 | 269.30 | 99.70 | 85.60 | 91.10 | 91.90 | 94.80 | 90.50 | 93.50 | 100.20 | 99.80 | 129.80 | 129.50 | NA | 122.70 | NA | NA | |
| Minority Interest | 64.40 | 62.90 | 65.80 | 65.60 | 64.40 | 61.40 | 64.10 | 67.10 | 71.10 | 69.70 | 69.20 | 68.50 | 69.00 | 69.80 | 58.20 | 66.90 | 69.30 | 0.00 | NA | NA | NA | NA | NA | NA | NA | 0.00 | 0.00 | 0.00 | NA | 5.90 | NA | NA | |
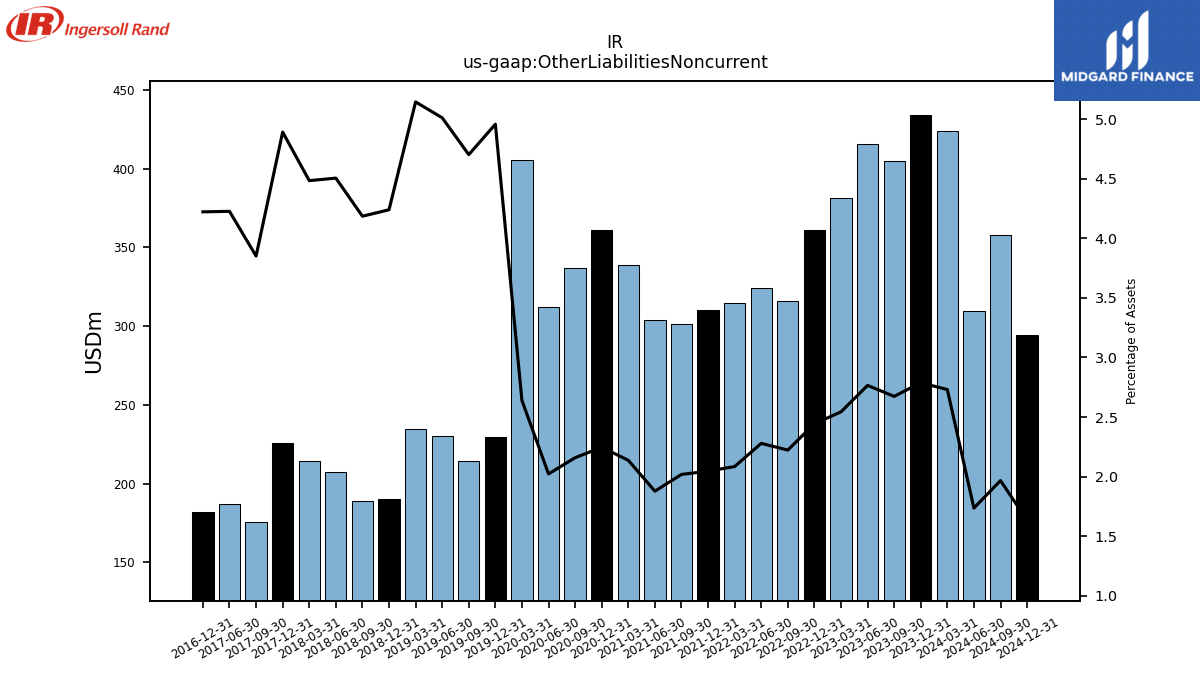
| Other Liabilities Noncurrent | 424.00 | 433.90 | 405.10 | 415.60 | 381.40 | 360.80 | 316.20 | 324.10 | 314.90 | 310.10 | 301.20 | 303.80 | 339.00 | 360.70 | 337.00 | 312.20 | 405.30 | 229.40 | 214.10 | 230.20 | 234.90 | 190.20 | 189.00 | 207.40 | 214.10 | 226.00 | 175.30 | 186.90 | NA | 182.20 | NA | NA | |
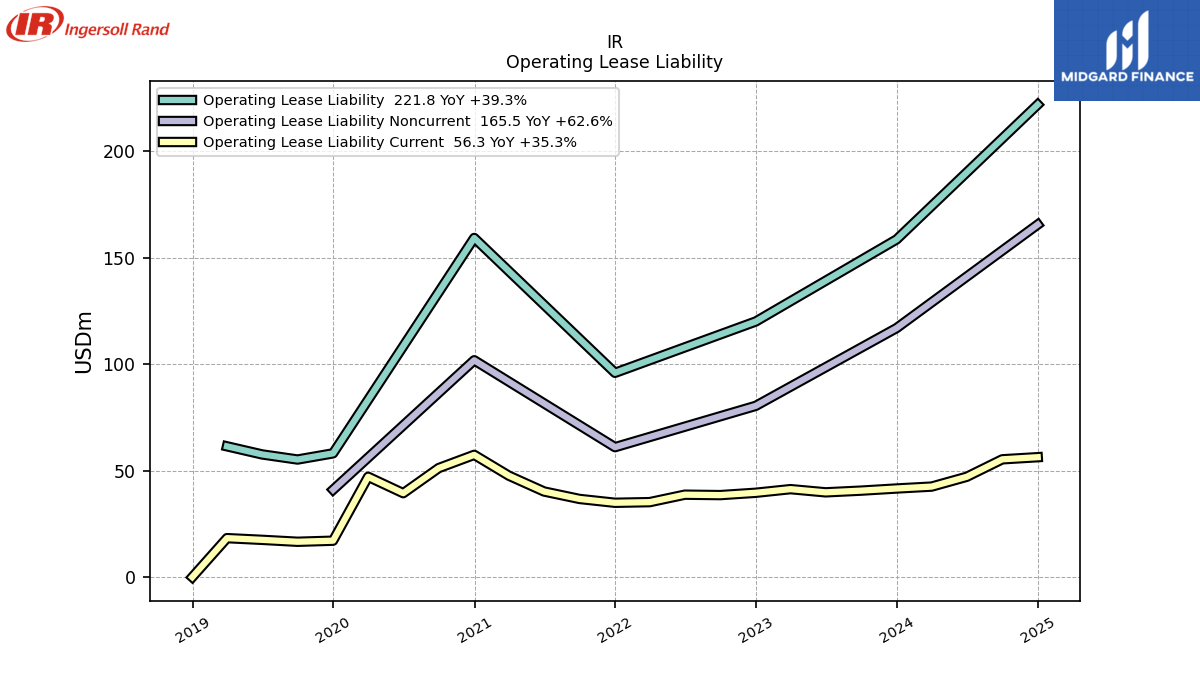
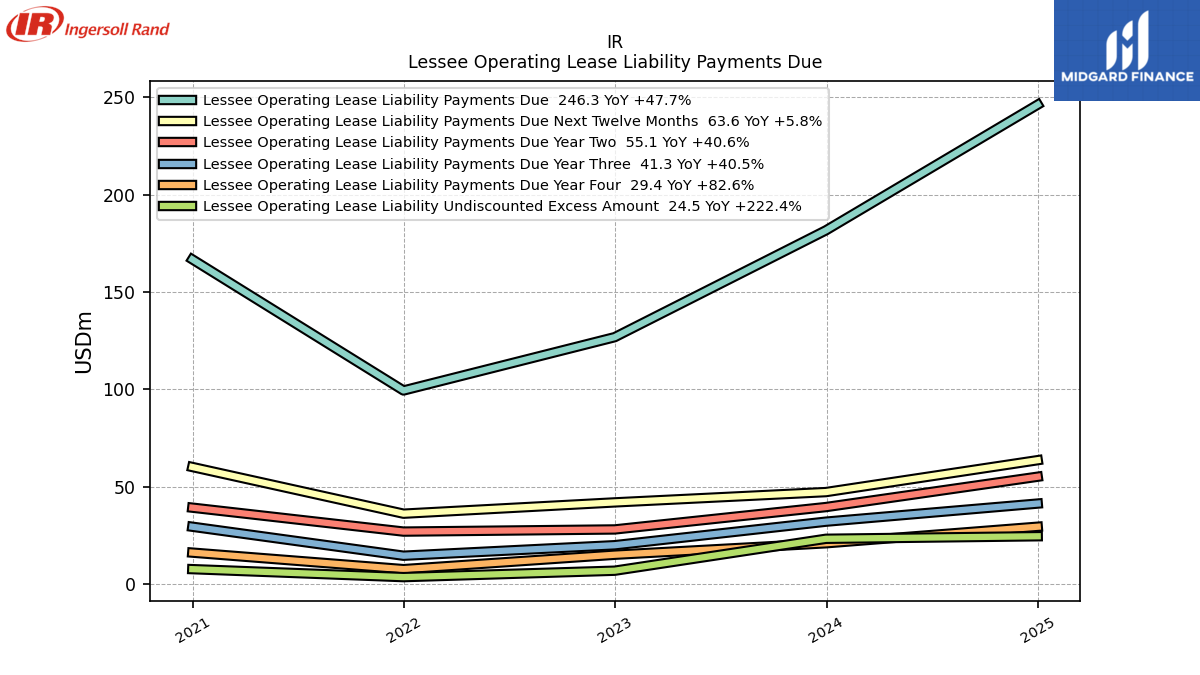
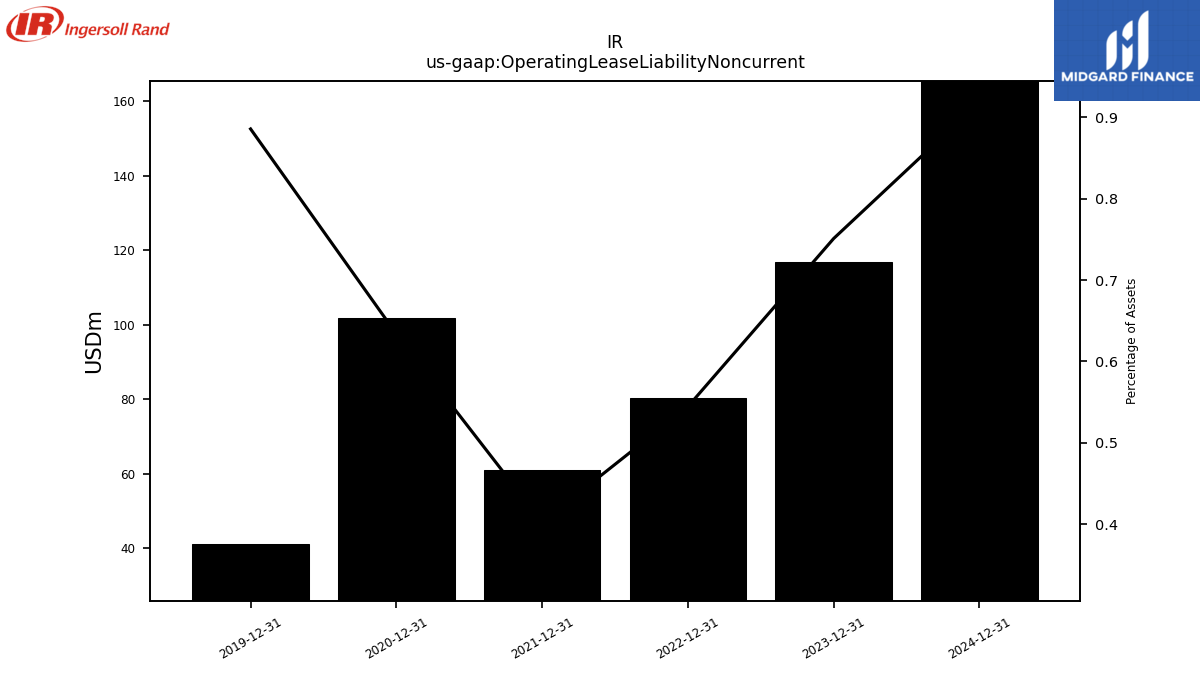
| Operating Lease Liability Noncurrent | NA | 116.90 | NA | NA | NA | 80.40 | NA | NA | NA | 61.00 | NA | NA | NA | 101.80 | NA | NA | NA | 41.00 | NA | NA | NA | NA | NA | NA | NA | NA | NA | NA | NA | NA | NA | NA |
| 2024-03-31 | 2023-12-31 | 2023-09-30 | 2023-06-30 | 2023-03-31 | 2022-12-31 | 2022-09-30 | 2022-06-30 | 2022-03-31 | 2021-12-31 | 2021-09-30 | 2021-06-30 | 2021-03-31 | 2020-12-31 | 2020-09-30 | 2020-06-30 | 2020-03-31 | 2019-12-31 | 2019-09-30 | 2019-06-30 | 2019-03-31 | 2018-12-31 | 2018-09-30 | 2018-06-30 | 2018-03-31 | 2017-12-31 | 2017-09-30 | 2017-06-30 | 2017-03-31 | 2016-12-31 | 2016-09-30 | 2016-06-30 | ||
|---|---|---|---|---|---|---|---|---|---|---|---|---|---|---|---|---|---|---|---|---|---|---|---|---|---|---|---|---|---|---|---|---|---|
| Stockholders Equity | 9855.30 | 9783.80 | 9554.00 | 9414.80 | 9317.30 | 9195.80 | 8750.90 | 8776.90 | 8992.20 | 9001.50 | 8653.60 | 9277.90 | 8956.70 | 9119.70 | 8771.70 | 8574.90 | 8686.20 | 1869.90 | NA | NA | NA | NA | NA | NA | NA | 1476.80 | 1271.80 | 1209.00 | NA | 265.90 | NA | NA | |
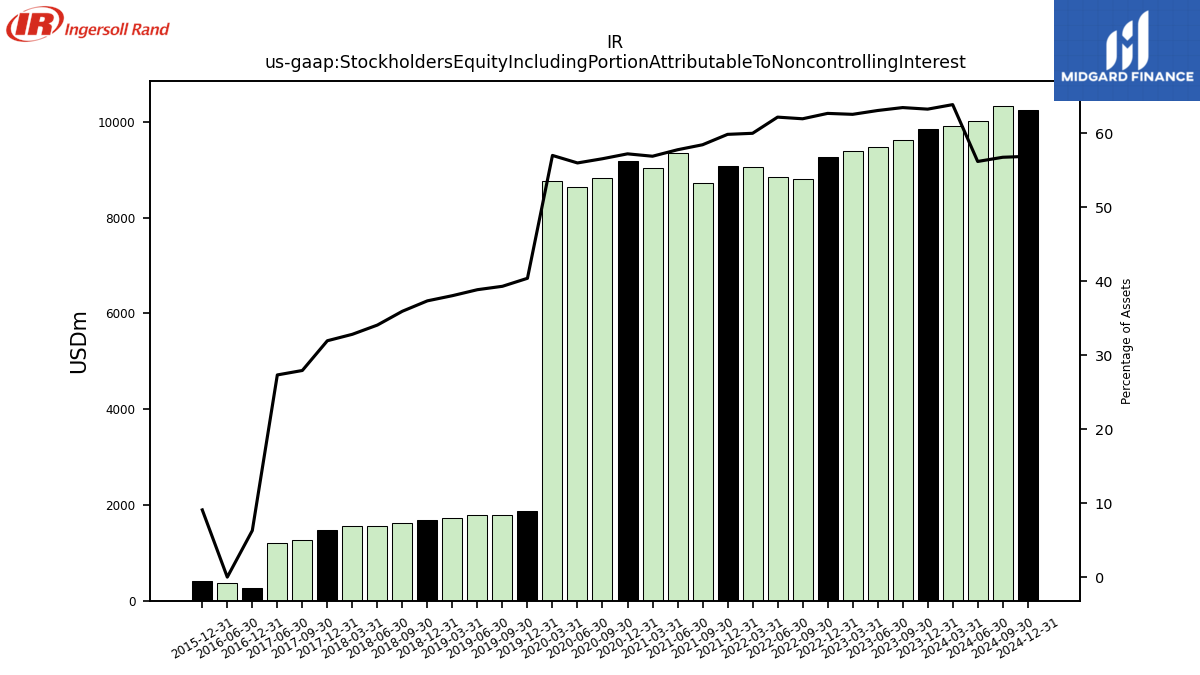
| Stockholders Equity Including Portion Attributable To Noncontrolling Interest | 9919.70 | 9846.70 | 9619.80 | 9480.40 | 9381.70 | 9257.20 | 8815.00 | 8844.00 | 9063.30 | 9071.20 | 8722.80 | 9346.40 | 9025.70 | 9189.50 | 8829.90 | 8641.80 | 8755.50 | 1869.90 | 1790.50 | 1785.30 | 1737.70 | 1676.00 | 1623.40 | 1569.10 | 1567.70 | 1476.80 | 1271.80 | 1209.00 | NA | 271.80 | NA | 372.90 | |
| Common Stock Value | 4.30 | 4.30 | 4.30 | 4.30 | 4.30 | 4.30 | 4.30 | 4.30 | 4.30 | 4.30 | 4.20 | 4.20 | 4.20 | 4.20 | 4.20 | 4.20 | 4.20 | 2.10 | 2.10 | 2.10 | 2.00 | 2.00 | 2.00 | 2.00 | 2.00 | 2.00 | 2.00 | 2.00 | NA | 1.50 | NA | NA | |
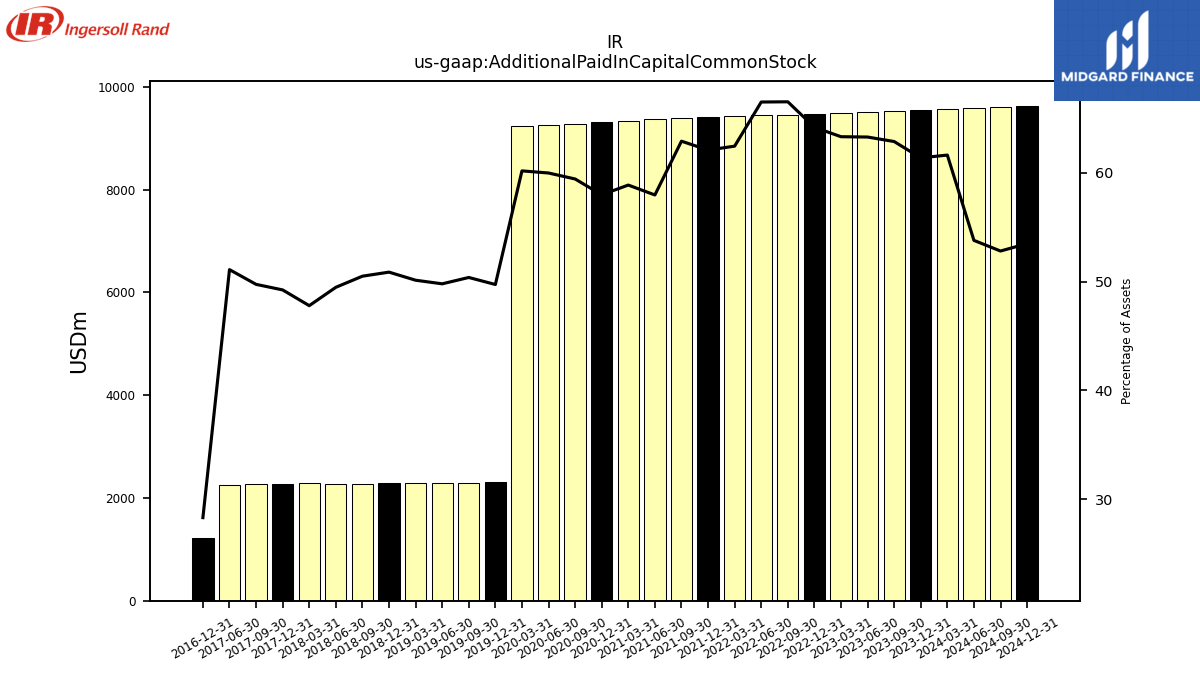
| Additional Paid In Capital Common Stock | 9569.80 | 9550.80 | 9527.10 | 9510.30 | 9493.60 | 9476.80 | 9462.70 | 9456.90 | 9432.10 | 9408.60 | 9386.50 | 9376.00 | 9337.80 | 9310.30 | 9277.00 | 9256.50 | 9241.50 | 2302.00 | 2294.30 | 2287.90 | 2289.30 | 2282.70 | 2280.80 | 2278.30 | 2282.30 | 2275.40 | 2264.90 | 2260.20 | NA | 1222.40 | NA | NA | |
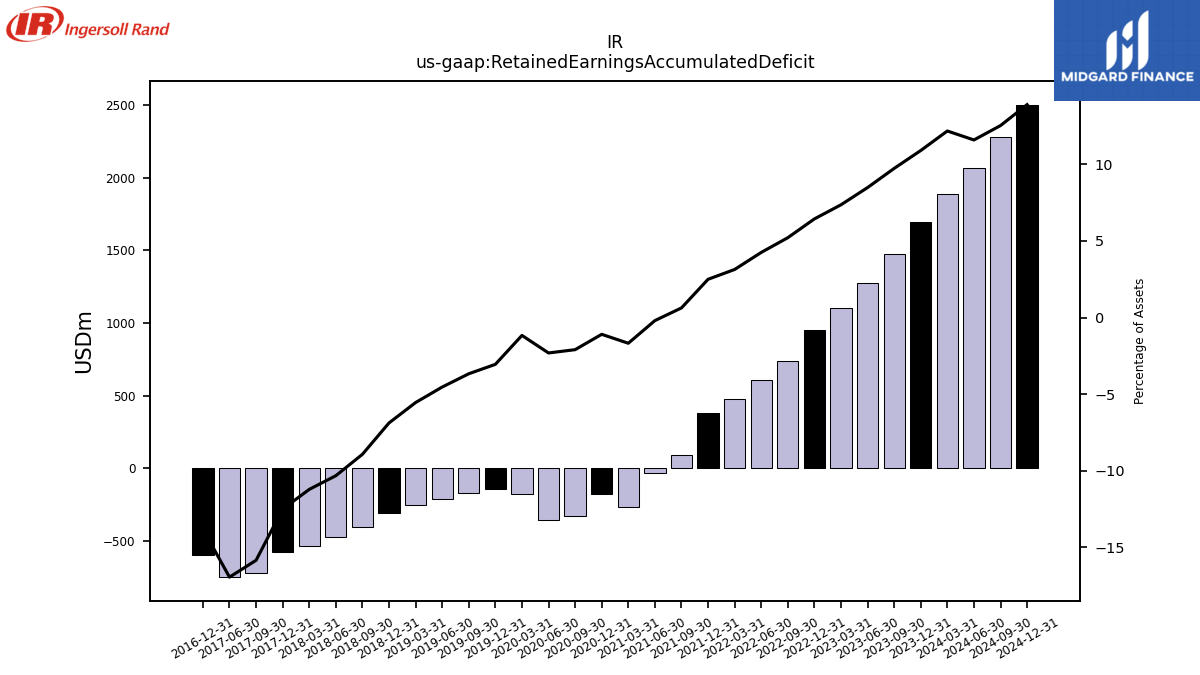
| Retained Earnings Accumulated Deficit | 1891.30 | 1697.20 | 1475.50 | 1275.30 | 1103.90 | 950.90 | 741.60 | 604.60 | 474.10 | 378.60 | 93.80 | -32.20 | -266.10 | -175.70 | -327.30 | -356.80 | -179.20 | -141.40 | -167.10 | -208.40 | -253.40 | -308.70 | -403.20 | -475.40 | -535.70 | -577.80 | -721.40 | -749.50 | NA | -596.20 | NA | NA | |
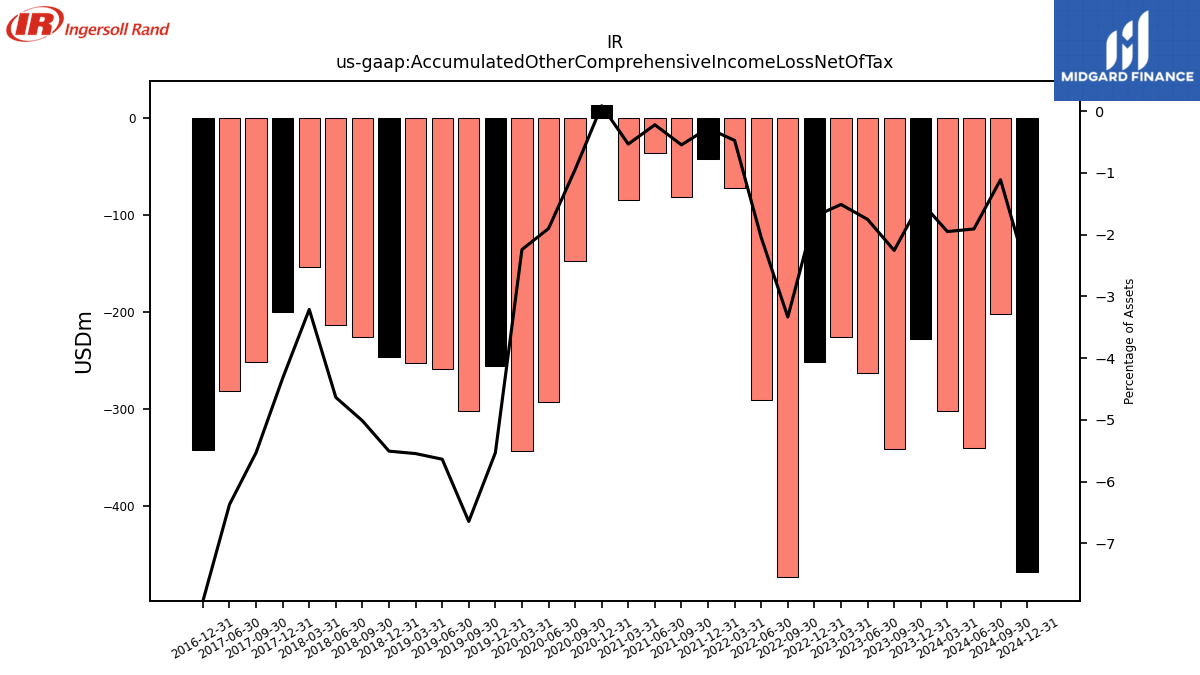
| Accumulated Other Comprehensive Income Loss Net Of Tax | -302.60 | -227.60 | -341.60 | -263.20 | -226.40 | -251.70 | -474.00 | -291.00 | -71.50 | -41.60 | -81.30 | -35.50 | -84.40 | 14.20 | -147.40 | -293.20 | -344.10 | -256.00 | -302.50 | -258.90 | -253.20 | -247.00 | -226.40 | -213.40 | -153.30 | -199.80 | -251.70 | -281.70 | NA | -342.40 | NA | NA | |
| Minority Interest | 64.40 | 62.90 | 65.80 | 65.60 | 64.40 | 61.40 | 64.10 | 67.10 | 71.10 | 69.70 | 69.20 | 68.50 | 69.00 | 69.80 | 58.20 | 66.90 | 69.30 | 0.00 | NA | NA | NA | NA | NA | NA | NA | 0.00 | 0.00 | 0.00 | NA | 5.90 | NA | NA | |
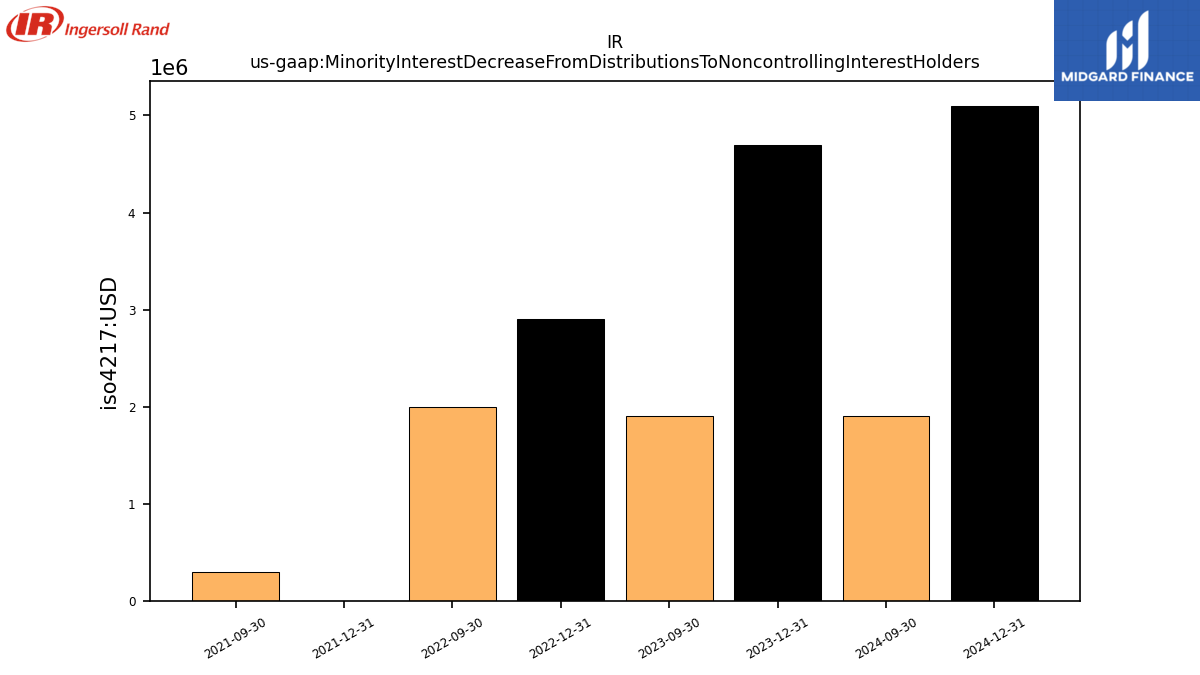
| Minority Interest Decrease From Distributions To Noncontrolling Interest Holders | NA | 4.70 | 1.90 | NA | NA | 2.90 | 2.00 | NA | NA | 0.00 | 0.30 | NA | NA | NA | NA | NA | NA | NA | NA | NA | NA | NA | NA | NA | NA | NA | NA | NA | NA | NA | NA | NA |
| 2024-03-31 | 2023-12-31 | 2023-09-30 | 2023-06-30 | 2023-03-31 | 2022-12-31 | 2022-09-30 | 2022-06-30 | 2022-03-31 | 2021-12-31 | 2021-09-30 | 2021-06-30 | 2021-03-31 | 2020-12-31 | 2020-09-30 | 2020-06-30 | 2020-03-31 | 2019-12-31 | 2019-09-30 | 2019-06-30 | 2019-03-31 | 2018-12-31 | 2018-09-30 | 2018-06-30 | 2018-03-31 | 2017-12-31 | 2017-09-30 | 2017-06-30 | 2017-03-31 | 2016-12-31 | 2016-09-30 | 2016-06-30 | ||
|---|---|---|---|---|---|---|---|---|---|---|---|---|---|---|---|---|---|---|---|---|---|---|---|---|---|---|---|---|---|---|---|---|---|
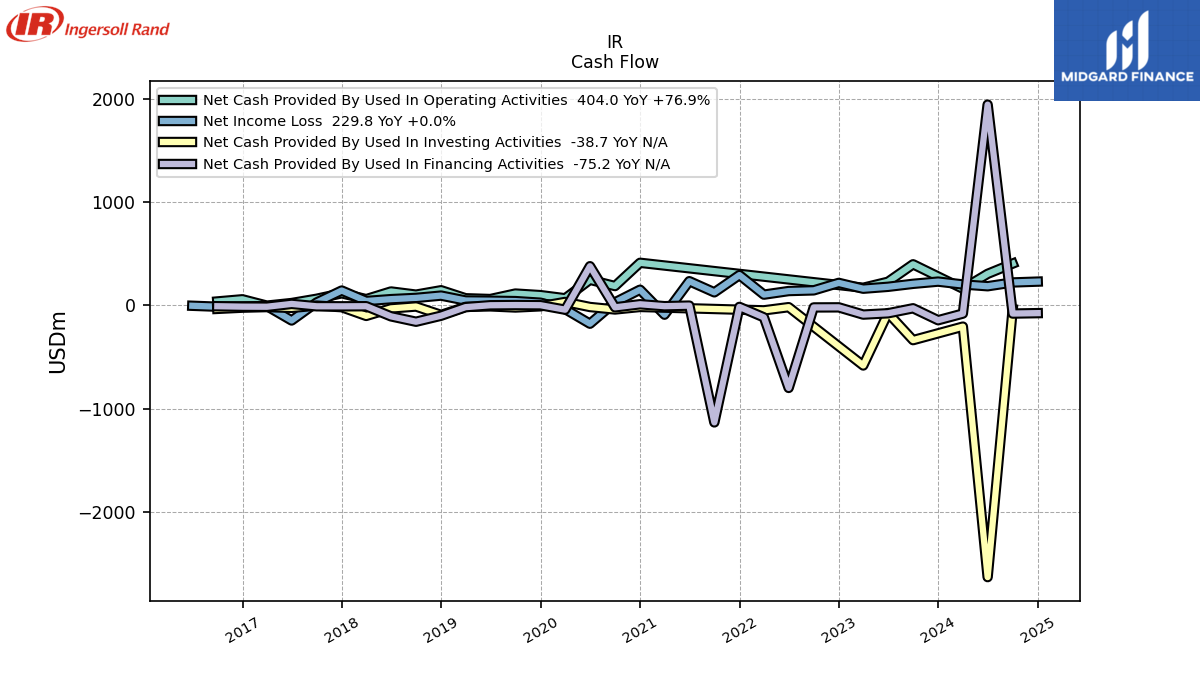
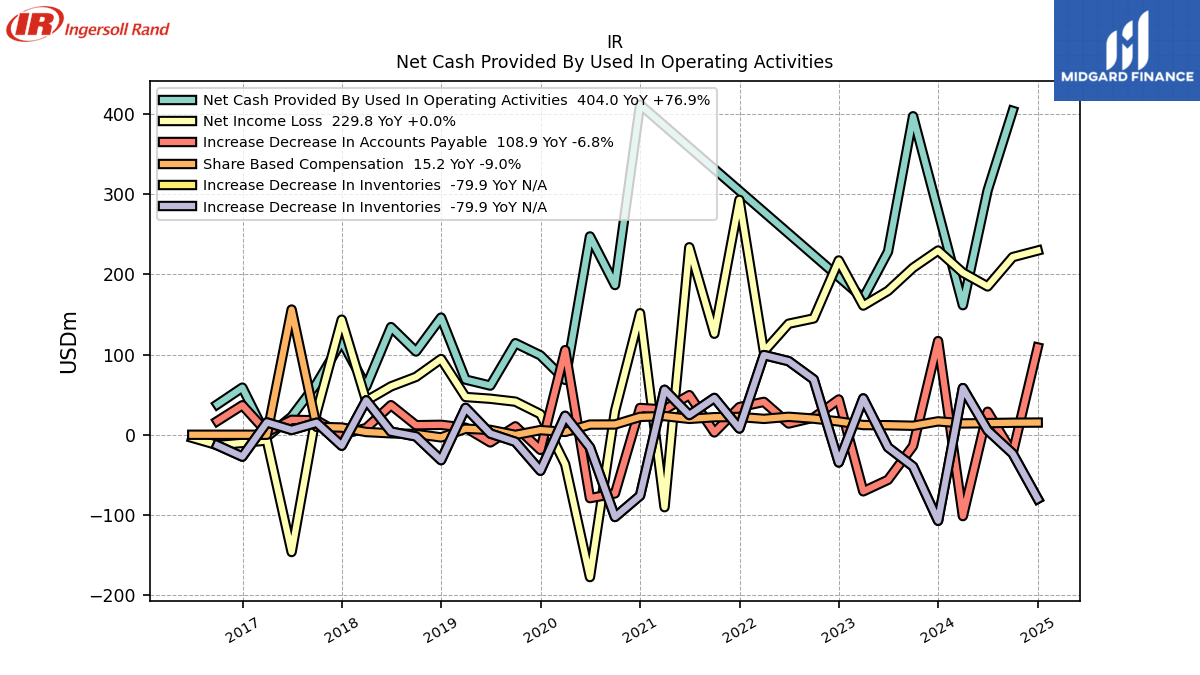
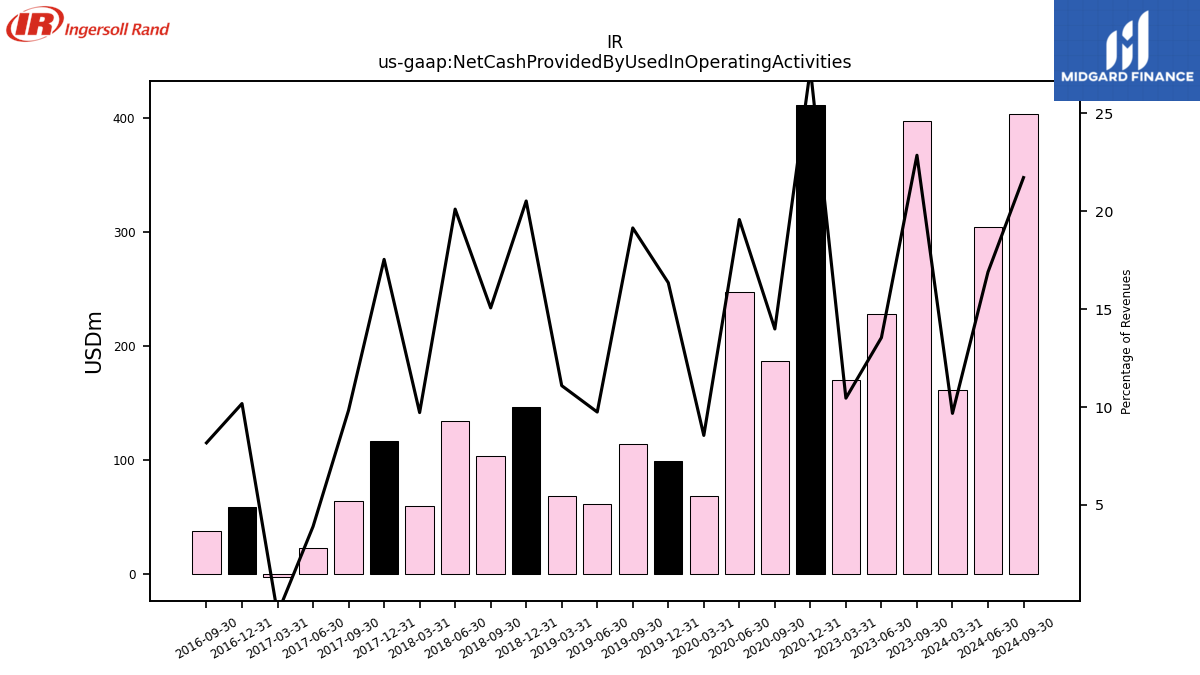
| Net Cash Provided By Used In Operating Activities | 161.60 | NA | NA | NA | 170.30 | NA | NA | NA | NA | NA | NA | NA | NA | 411.80 | 186.70 | 247.40 | 68.40 | 99.00 | 114.20 | 61.30 | 68.80 | 146.20 | 103.80 | 134.30 | 60.20 | 116.60 | 63.90 | 22.60 | -2.60 | 58.80 | 37.80 | NA | |
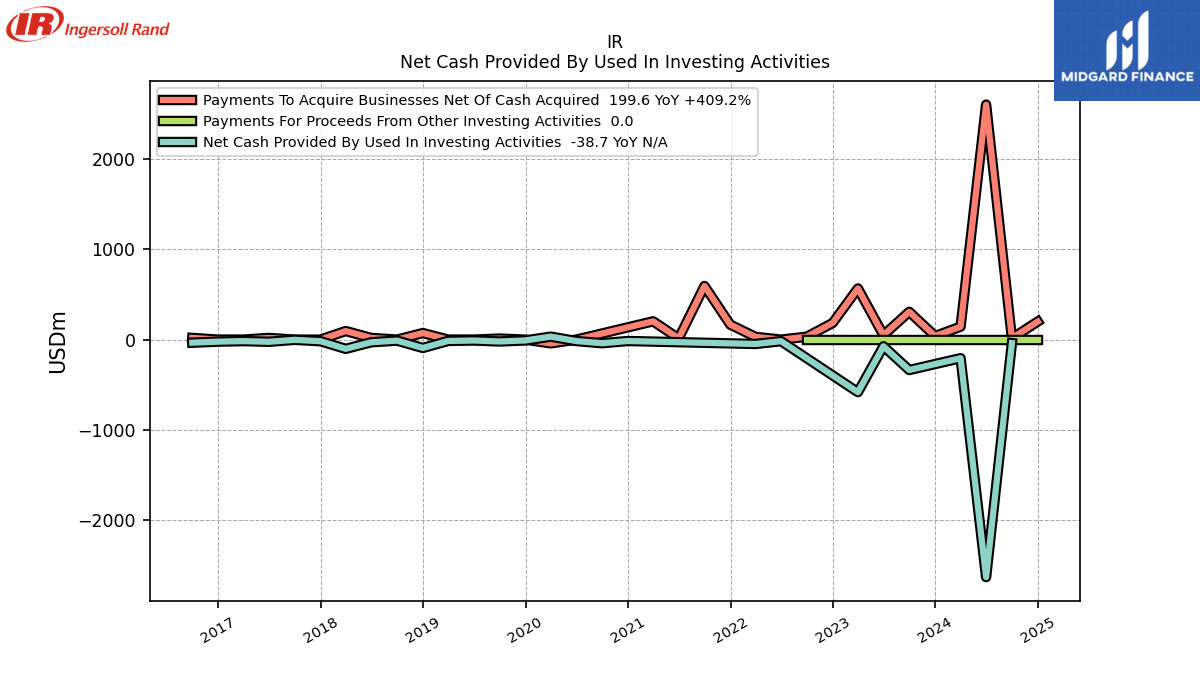
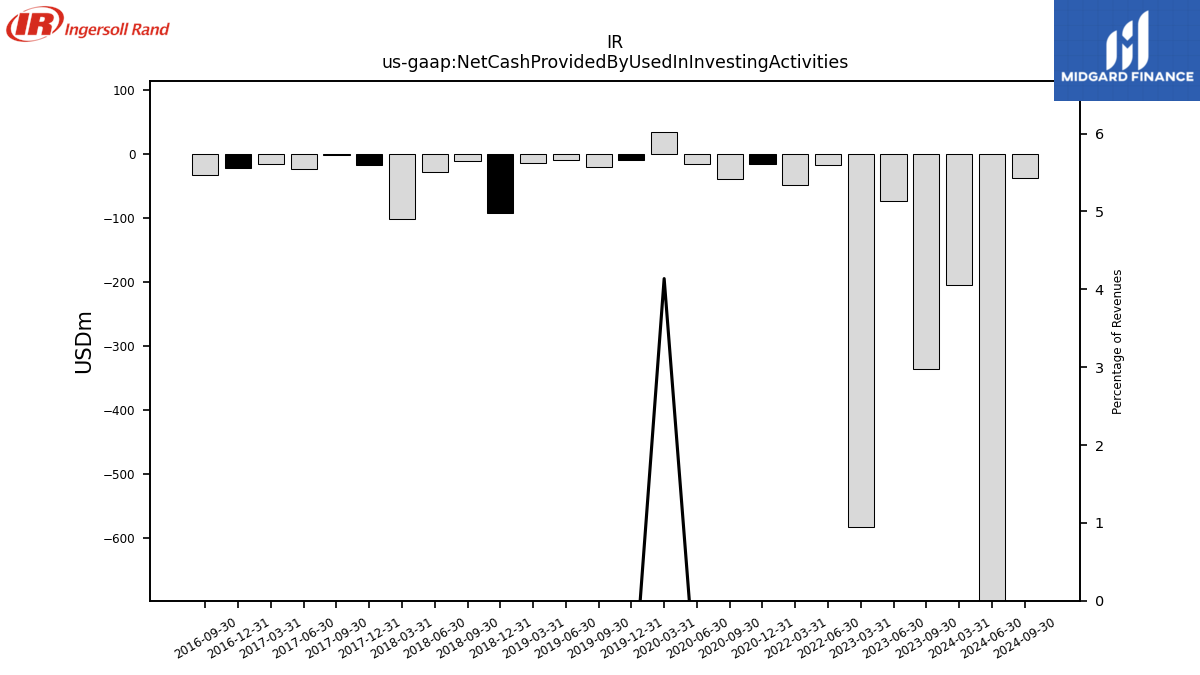
| Net Cash Provided By Used In Investing Activities | -205.60 | NA | NA | -73.90 | -581.50 | NA | NA | -17.30 | -48.20 | NA | NA | NA | NA | -15.40 | -39.80 | -15.80 | 33.10 | -9.20 | -20.60 | -9.80 | -14.70 | -92.40 | -11.20 | -29.40 | -102.00 | -17.70 | -2.50 | -24.00 | -16.60 | -22.30 | -34.00 | NA | |
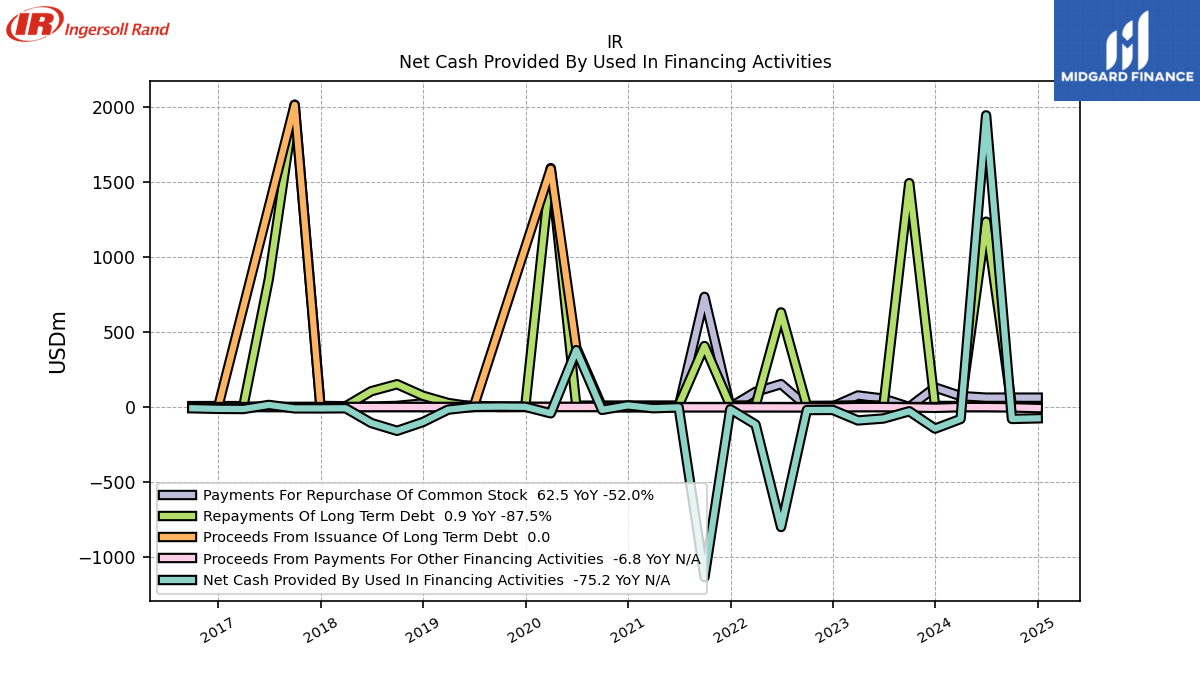
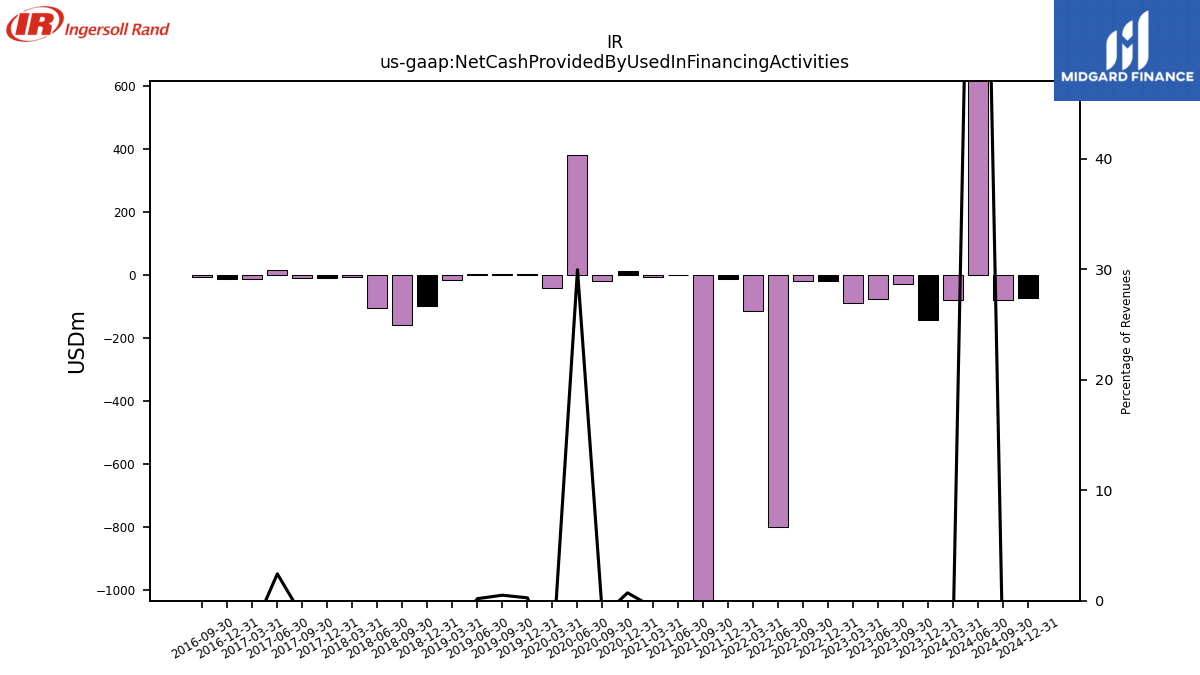
| Net Cash Provided By Used In Financing Activities | -79.60 | -143.70 | -28.10 | -76.40 | -89.30 | -19.20 | -20.00 | -798.70 | -116.10 | -14.80 | -1132.10 | -2.30 | -7.80 | 10.80 | -19.00 | 378.80 | -41.90 | 1.60 | 3.00 | 1.20 | -17.30 | -100.20 | -158.30 | -106.30 | -8.20 | -9.20 | -9.00 | 14.10 | -13.30 | -12.20 | -8.30 | NA |
| 2024-03-31 | 2023-12-31 | 2023-09-30 | 2023-06-30 | 2023-03-31 | 2022-12-31 | 2022-09-30 | 2022-06-30 | 2022-03-31 | 2021-12-31 | 2021-09-30 | 2021-06-30 | 2021-03-31 | 2020-12-31 | 2020-09-30 | 2020-06-30 | 2020-03-31 | 2019-12-31 | 2019-09-30 | 2019-06-30 | 2019-03-31 | 2018-12-31 | 2018-09-30 | 2018-06-30 | 2018-03-31 | 2017-12-31 | 2017-09-30 | 2017-06-30 | 2017-03-31 | 2016-12-31 | 2016-09-30 | 2016-06-30 | ||
|---|---|---|---|---|---|---|---|---|---|---|---|---|---|---|---|---|---|---|---|---|---|---|---|---|---|---|---|---|---|---|---|---|---|
| Net Cash Provided By Used In Operating Activities | 161.60 | NA | NA | NA | 170.30 | NA | NA | NA | NA | NA | NA | NA | NA | 411.80 | 186.70 | 247.40 | 68.40 | 99.00 | 114.20 | 61.30 | 68.80 | 146.20 | 103.80 | 134.30 | 60.20 | 116.60 | 63.90 | 22.60 | -2.60 | 58.80 | 37.80 | NA | |
| Net Income Loss | 202.20 | 229.80 | 208.30 | 179.50 | 161.10 | 217.40 | 145.10 | 138.50 | 103.70 | 293.00 | 126.00 | 233.90 | -90.40 | 151.60 | 29.50 | -177.60 | -36.80 | 25.70 | 41.30 | 44.90 | 47.10 | 94.50 | 72.20 | 60.30 | 42.40 | 143.60 | 28.00 | -146.30 | -7.10 | -10.20 | -12.90 | -3.90 | |
| Profit Loss | 204.50 | 231.50 | 209.60 | 180.80 | 163.20 | 218.70 | 146.00 | 139.30 | 104.50 | 293.70 | 126.80 | 234.60 | -90.10 | 151.10 | 29.90 | -176.50 | -36.80 | 25.70 | 41.30 | 44.90 | 47.10 | 94.50 | 72.20 | 60.30 | 42.40 | 143.60 | 28.00 | -146.30 | -7.00 | -4.30 | -13.00 | -4.10 | |
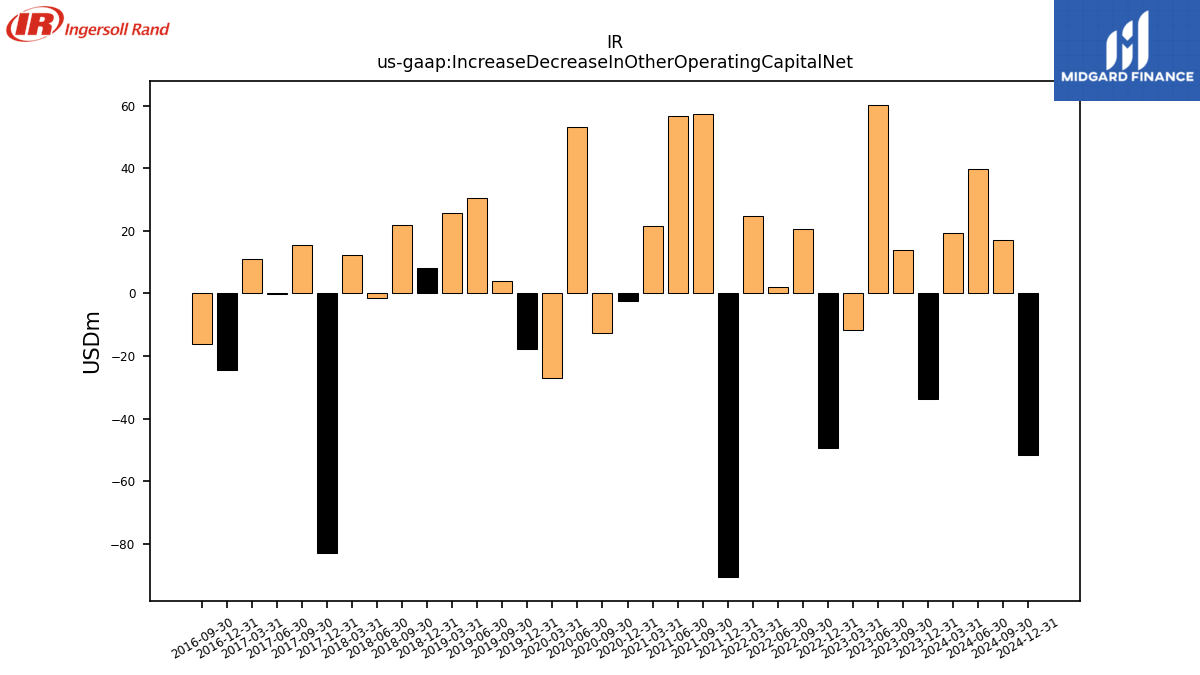
| Increase Decrease In Other Operating Capital Net | 19.30 | -33.60 | 14.00 | 60.40 | -11.80 | -49.30 | 20.50 | 2.10 | 24.90 | -90.70 | 57.50 | 56.70 | 21.60 | -2.40 | -12.70 | 53.10 | -27.10 | -17.70 | 4.10 | 30.50 | 25.60 | 8.30 | 22.00 | -1.30 | 12.30 | -83.00 | 15.50 | -0.20 | 11.00 | -24.60 | -16.10 | NA | |
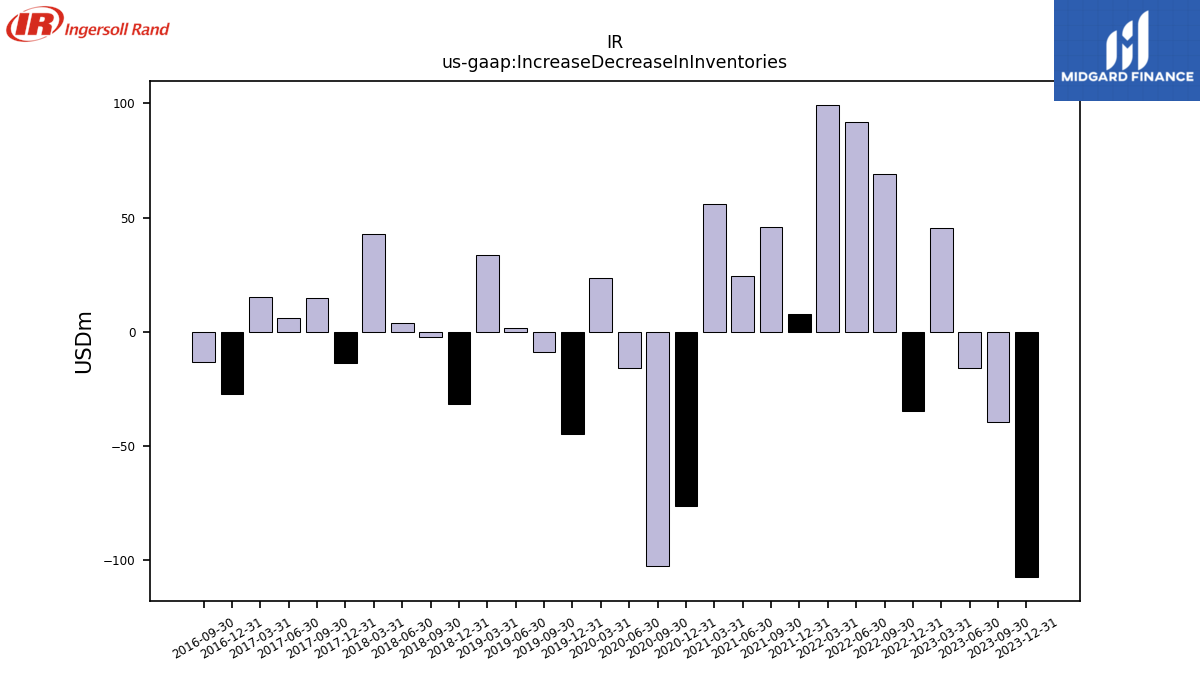
| Increase Decrease In Inventories | 58.20 | -107.30 | -39.60 | -15.70 | 45.30 | -34.60 | 69.00 | 91.80 | 99.40 | 7.80 | 45.90 | 24.60 | 56.10 | -76.00 | -102.60 | -15.80 | 23.60 | -44.90 | -8.80 | 1.50 | 33.50 | -31.70 | -2.10 | 3.90 | 42.90 | -13.70 | 15.00 | 6.00 | 15.40 | -27.30 | -13.20 | NA | |
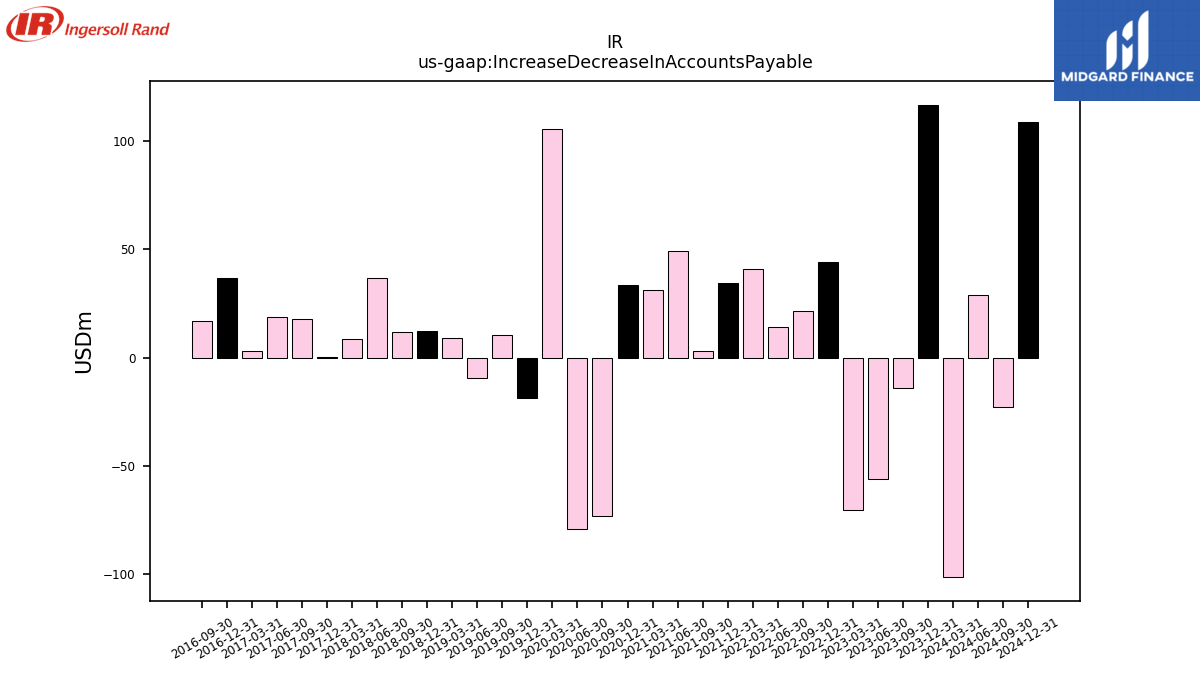
| Increase Decrease In Accounts Payable | -101.50 | 116.90 | -14.00 | -56.20 | -70.60 | 44.00 | 21.40 | 14.00 | 41.00 | 34.50 | 2.90 | 49.40 | 31.40 | 33.40 | -73.20 | -79.10 | 105.60 | -18.90 | 10.50 | -9.60 | 8.80 | 12.40 | 11.90 | 36.90 | 8.40 | 0.10 | 18.00 | 18.60 | 3.20 | 36.80 | 17.00 | NA | |
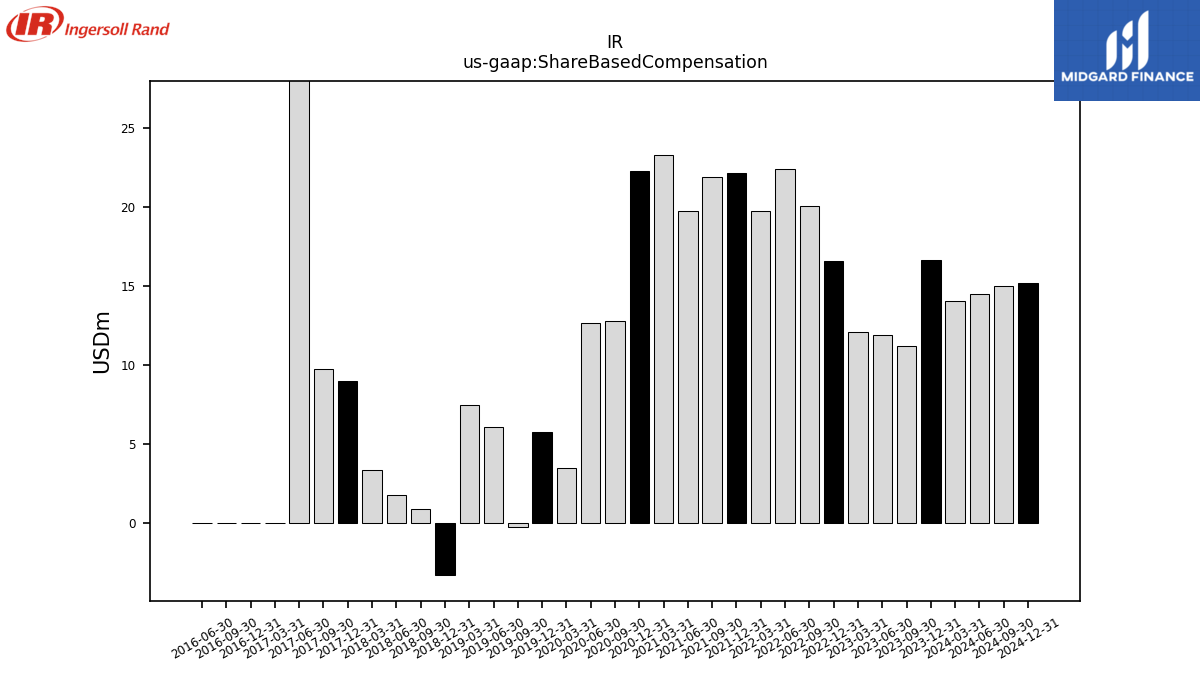
| Share Based Compensation | 14.10 | 16.70 | 11.20 | 11.90 | 12.10 | 16.60 | 20.10 | 22.40 | 19.80 | 22.20 | 21.90 | 19.80 | 23.30 | 22.30 | 12.80 | 12.70 | 3.50 | 5.80 | -0.20 | 6.10 | 7.50 | -3.30 | 0.90 | 1.80 | 3.40 | 9.00 | 9.80 | 156.20 | 0.00 | 0.00 | 0.00 | 0.00 |
| 2024-03-31 | 2023-12-31 | 2023-09-30 | 2023-06-30 | 2023-03-31 | 2022-12-31 | 2022-09-30 | 2022-06-30 | 2022-03-31 | 2021-12-31 | 2021-09-30 | 2021-06-30 | 2021-03-31 | 2020-12-31 | 2020-09-30 | 2020-06-30 | 2020-03-31 | 2019-12-31 | 2019-09-30 | 2019-06-30 | 2019-03-31 | 2018-12-31 | 2018-09-30 | 2018-06-30 | 2018-03-31 | 2017-12-31 | 2017-09-30 | 2017-06-30 | 2017-03-31 | 2016-12-31 | 2016-09-30 | 2016-06-30 | ||
|---|---|---|---|---|---|---|---|---|---|---|---|---|---|---|---|---|---|---|---|---|---|---|---|---|---|---|---|---|---|---|---|---|---|
| Net Cash Provided By Used In Investing Activities | -205.60 | NA | NA | -73.90 | -581.50 | NA | NA | -17.30 | -48.20 | NA | NA | NA | NA | -15.40 | -39.80 | -15.80 | 33.10 | -9.20 | -20.60 | -9.80 | -14.70 | -92.40 | -11.20 | -29.40 | -102.00 | -17.70 | -2.50 | -24.00 | -16.60 | -22.30 | -34.00 | NA | |
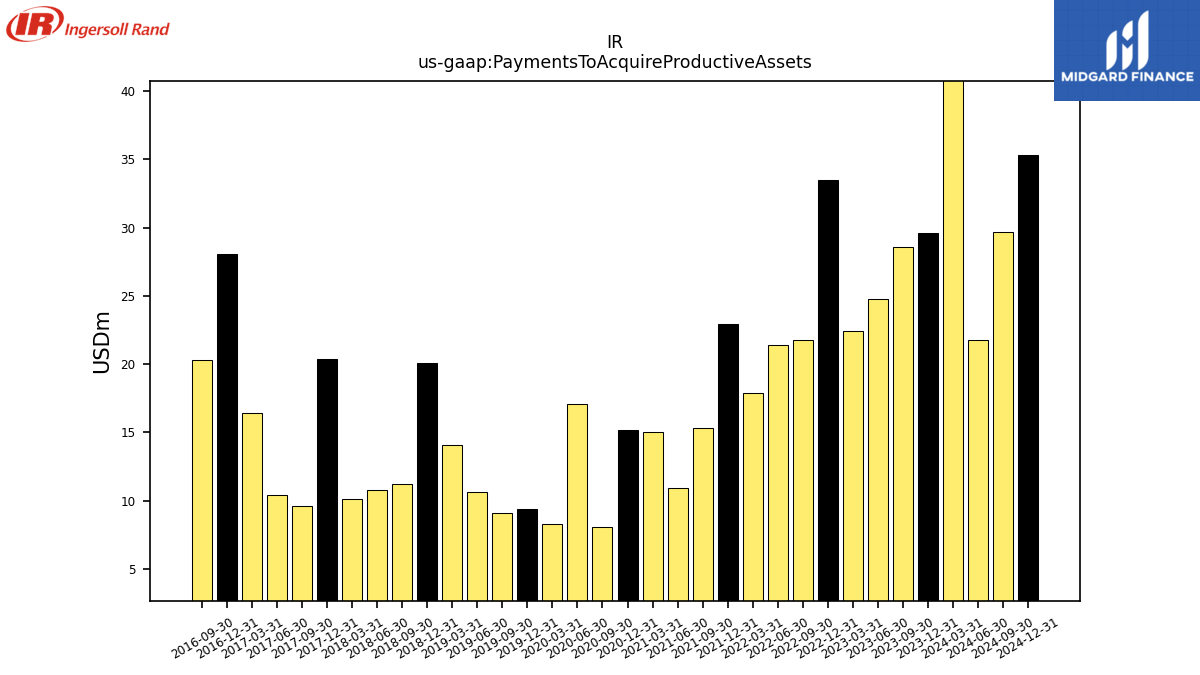
| Payments To Acquire Productive Assets | 62.30 | 29.60 | 28.60 | 24.80 | 22.40 | 33.50 | 21.80 | 21.40 | 17.90 | 22.90 | 15.30 | 10.90 | 15.00 | 15.20 | 8.10 | 17.10 | 8.30 | 9.40 | 9.10 | 10.60 | 14.10 | 20.10 | 11.20 | 10.80 | 10.10 | 20.40 | 9.60 | 10.40 | 16.40 | 28.10 | 20.30 | NA |
| 2024-03-31 | 2023-12-31 | 2023-09-30 | 2023-06-30 | 2023-03-31 | 2022-12-31 | 2022-09-30 | 2022-06-30 | 2022-03-31 | 2021-12-31 | 2021-09-30 | 2021-06-30 | 2021-03-31 | 2020-12-31 | 2020-09-30 | 2020-06-30 | 2020-03-31 | 2019-12-31 | 2019-09-30 | 2019-06-30 | 2019-03-31 | 2018-12-31 | 2018-09-30 | 2018-06-30 | 2018-03-31 | 2017-12-31 | 2017-09-30 | 2017-06-30 | 2017-03-31 | 2016-12-31 | 2016-09-30 | 2016-06-30 | ||
|---|---|---|---|---|---|---|---|---|---|---|---|---|---|---|---|---|---|---|---|---|---|---|---|---|---|---|---|---|---|---|---|---|---|
| Net Cash Provided By Used In Financing Activities | -79.60 | -143.70 | -28.10 | -76.40 | -89.30 | -19.20 | -20.00 | -798.70 | -116.10 | -14.80 | -1132.10 | -2.30 | -7.80 | 10.80 | -19.00 | 378.80 | -41.90 | 1.60 | 3.00 | 1.20 | -17.30 | -100.20 | -158.30 | -106.30 | -8.20 | -9.20 | -9.00 | 14.10 | -13.30 | -12.20 | -8.30 | NA | |
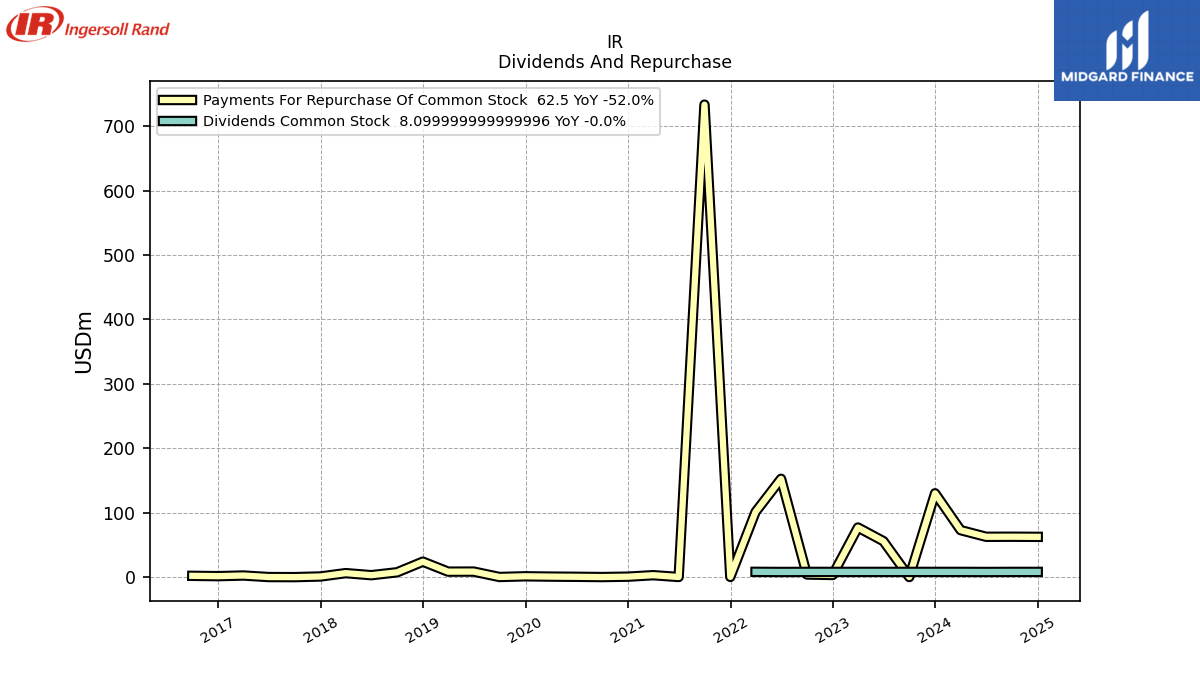
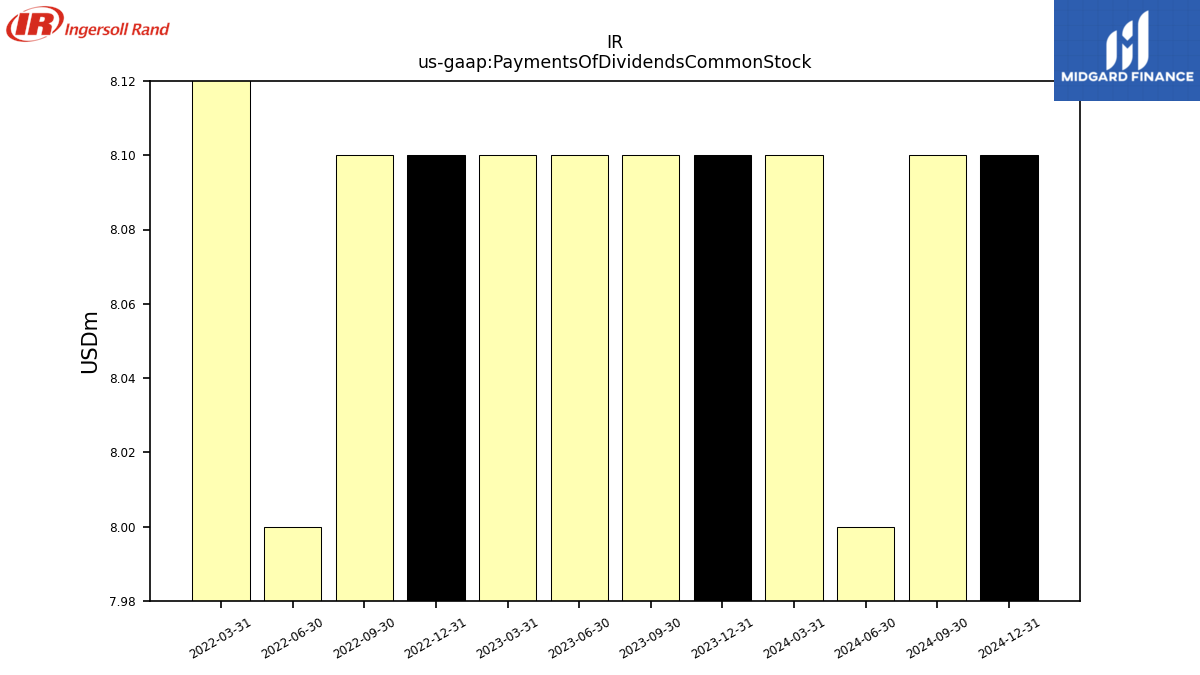
| Payments Of Dividends Common Stock | 8.10 | 8.10 | 8.10 | 8.10 | 8.10 | 8.10 | 8.10 | 8.00 | 8.20 | NA | NA | NA | NA | NA | NA | NA | NA | NA | NA | NA | NA | NA | NA | NA | NA | NA | NA | NA | NA | NA | NA | NA | |
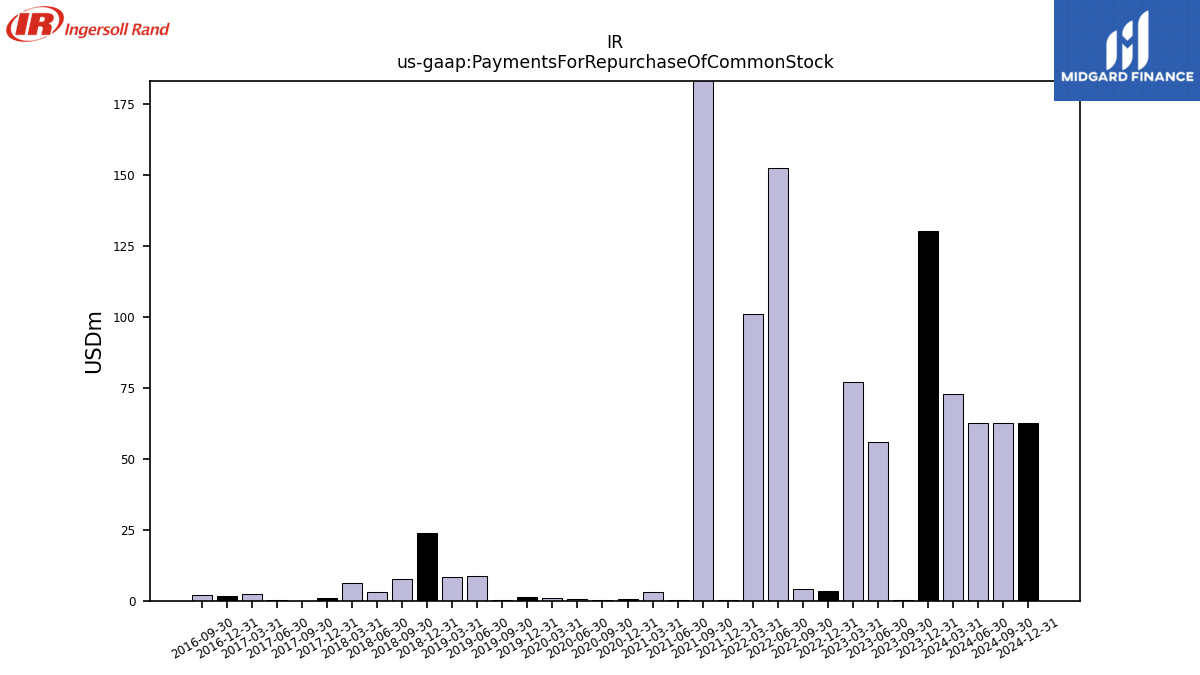
| Payments For Repurchase Of Common Stock | 72.90 | 130.10 | 0.10 | 55.80 | 77.00 | 3.30 | 4.10 | 152.60 | 101.10 | 0.30 | 733.30 | 0.20 | 3.00 | 0.70 | 0.10 | 0.50 | 0.80 | 1.30 | 0.20 | 8.60 | 8.50 | 24.00 | 7.50 | 3.00 | 6.20 | 1.00 | 0.00 | 0.10 | 2.50 | 1.50 | 2.00 | NA |
| 2024-03-31 | 2023-12-31 | 2023-09-30 | 2023-06-30 | 2023-03-31 | 2022-12-31 | 2022-09-30 | 2022-06-30 | 2022-03-31 | 2021-12-31 | 2021-09-30 | 2021-06-30 | 2021-03-31 | 2020-12-31 | 2020-09-30 | 2020-06-30 | 2020-03-31 | 2019-12-31 | 2019-09-30 | 2019-06-30 | 2019-03-31 | 2018-12-31 | 2018-09-30 | 2018-06-30 | 2018-03-31 | 2017-12-31 | 2017-09-30 | 2017-06-30 | 2017-03-31 | 2016-12-31 | 2016-09-30 | 2016-06-30 | ||
|---|---|---|---|---|---|---|---|---|---|---|---|---|---|---|---|---|---|---|---|---|---|---|---|---|---|---|---|---|---|---|---|---|---|
| Revenues | 1670.10 | 1821.40 | 1738.90 | 1686.50 | 1629.30 | 1623.70 | 1515.70 | 1439.90 | 1337.00 | 1418.80 | 1325.00 | 1279.10 | 1369.80 | 1510.70 | 1335.20 | 1264.40 | 799.90 | 605.80 | 596.70 | 629.10 | 620.30 | 712.70 | 689.30 | 668.20 | 619.60 | 665.00 | 649.60 | 579.10 | 481.70 | 577.80 | 462.60 | 462.00 | |
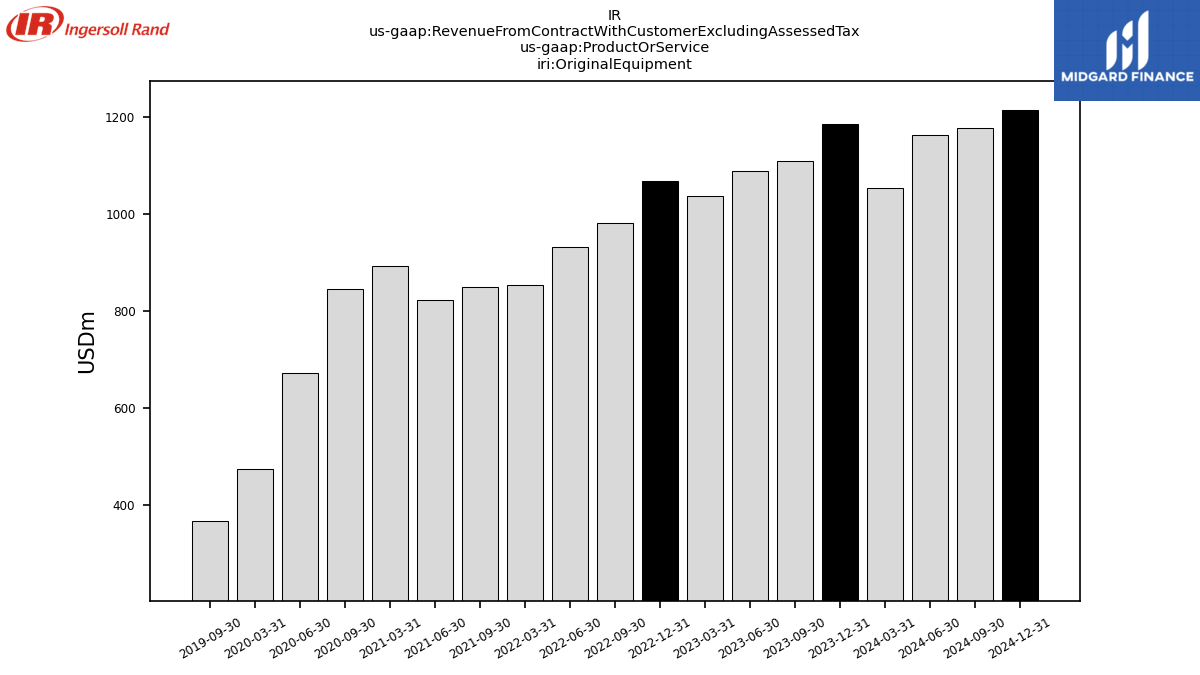
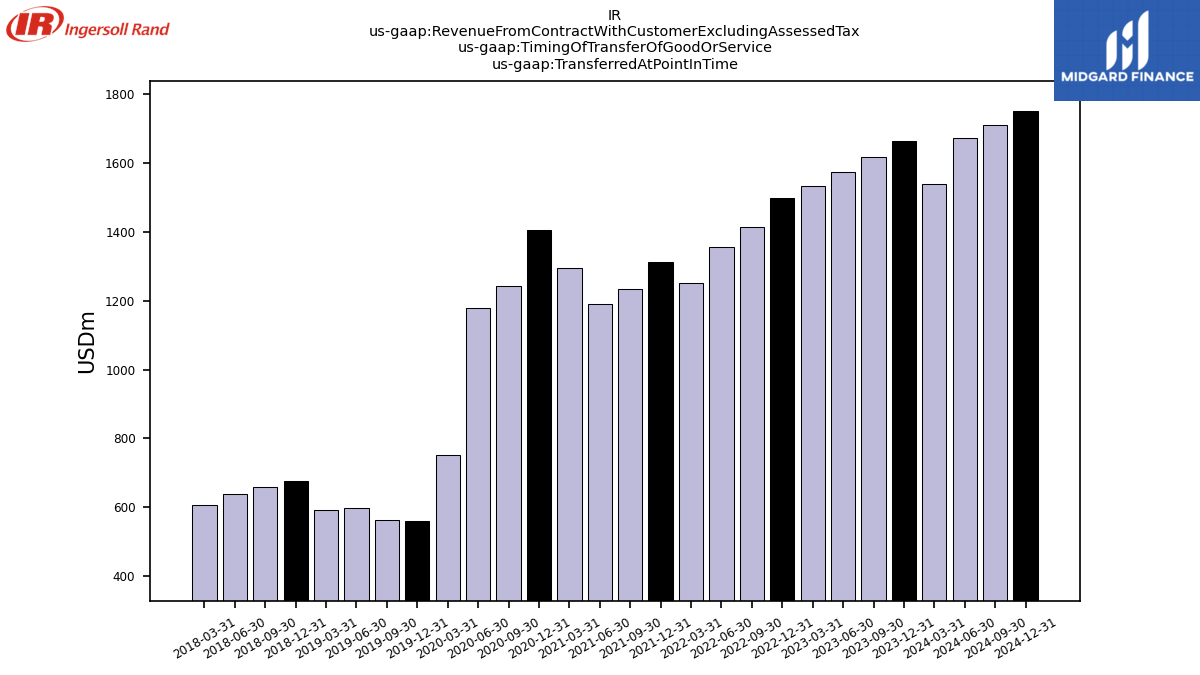
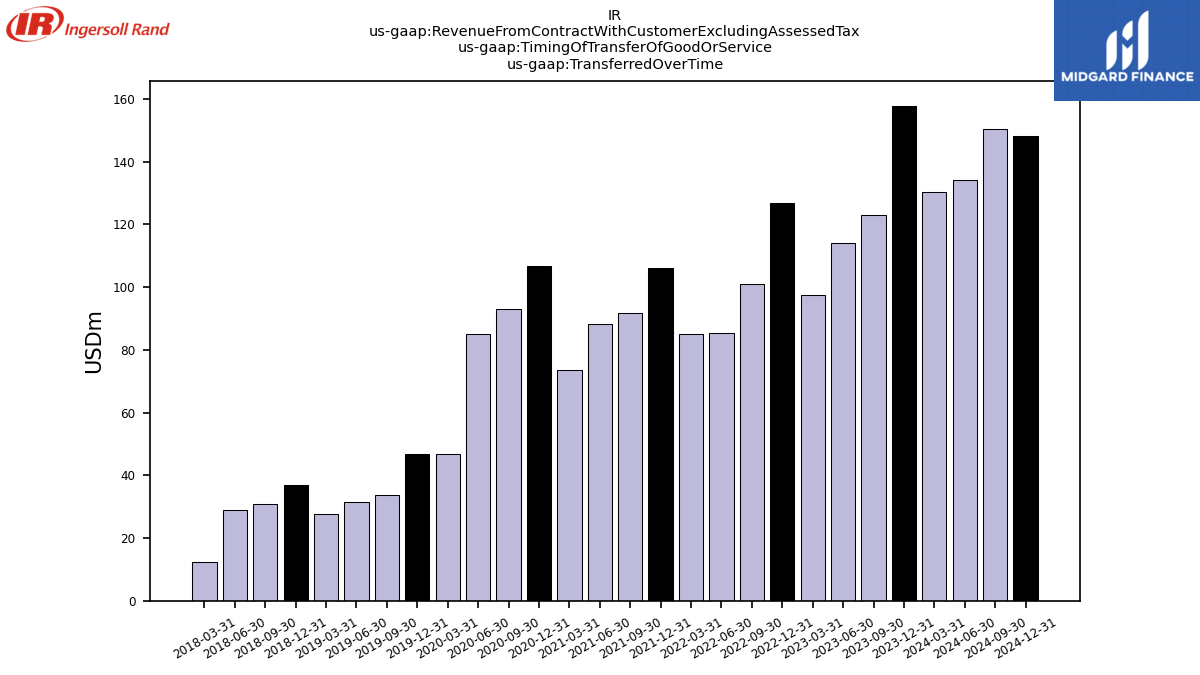
| Revenue From Contract With Customer Excluding Assessed Tax | 1670.10 | 1821.40 | 1738.90 | 1686.50 | 1629.30 | 1623.70 | 1515.70 | 1439.90 | 1337.00 | 1418.80 | 1325.00 | 1279.10 | 1369.80 | 1510.70 | 1335.20 | 1264.40 | 799.90 | 605.80 | 596.70 | 629.10 | 620.30 | 712.70 | 689.30 | 668.20 | 619.60 | 665.00 | 649.60 | 579.10 | 481.70 | 577.80 | 462.60 | 462.00 | |
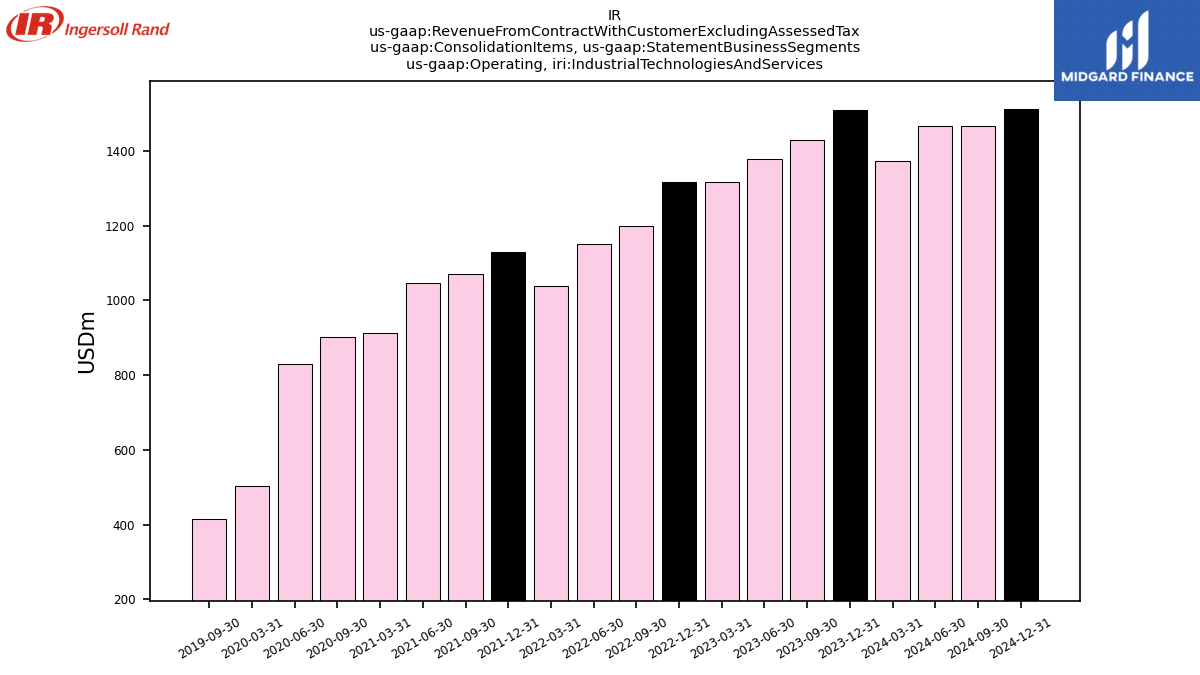
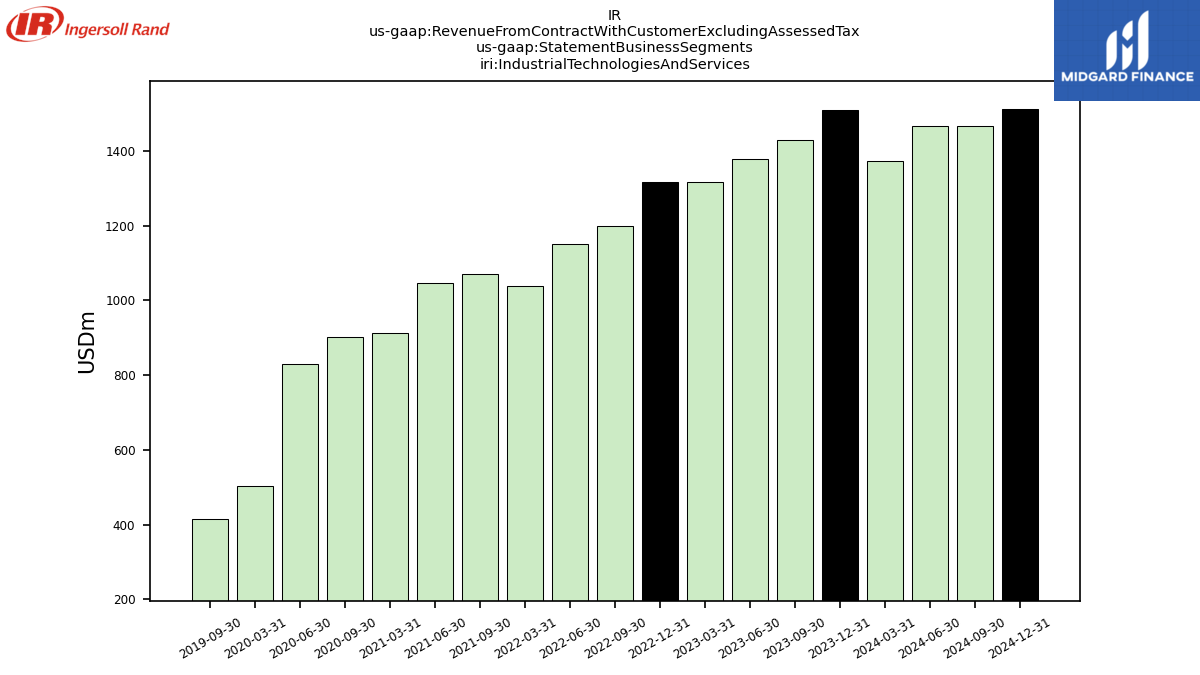
| Operating, Industrial Technologies And Services | 1373.40 | 1508.80 | 1428.40 | 1378.40 | 1317.20 | 1315.40 | 1199.60 | 1150.50 | 1039.60 | 1129.00 | 1070.70 | 1047.50 | 913.80 | NA | 902.60 | 829.60 | 504.00 | NA | 415.30 | NA | NA | NA | NA | NA | NA | NA | NA | NA | NA | NA | NA | NA | |
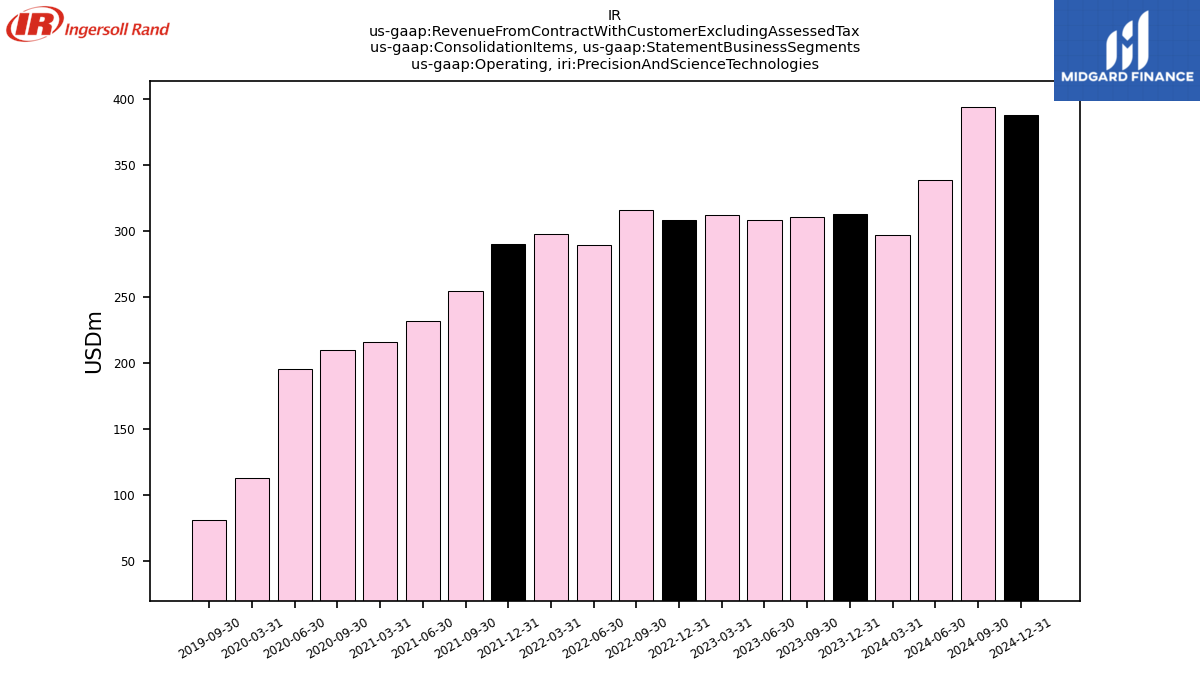
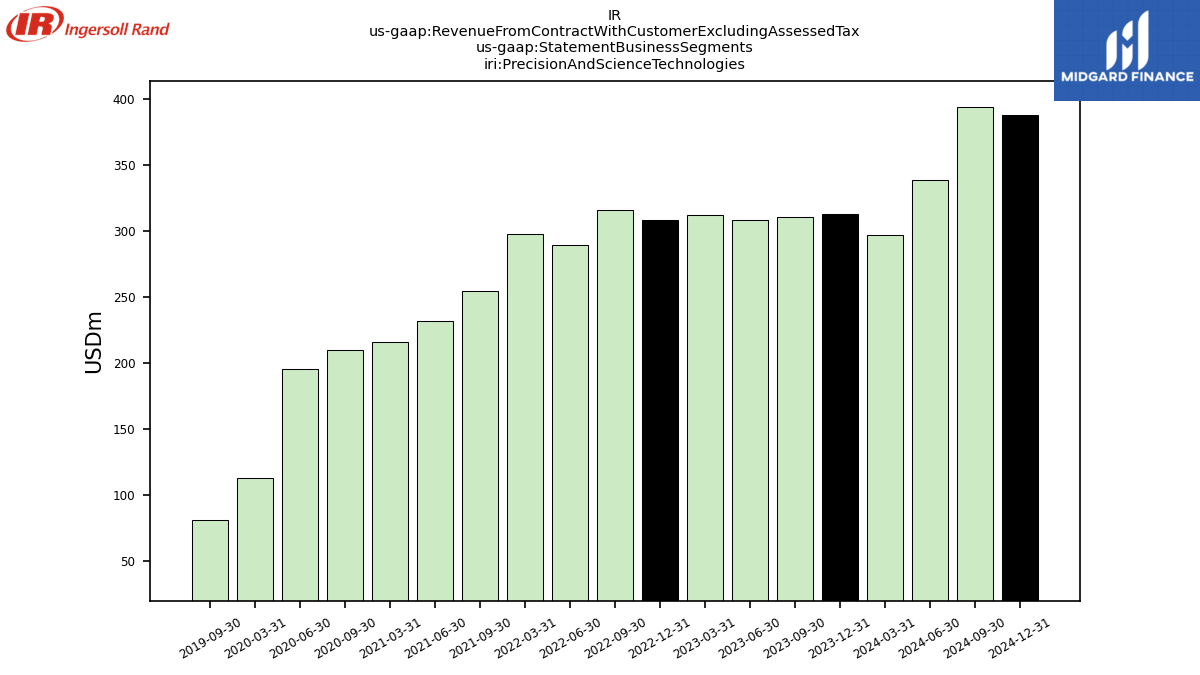
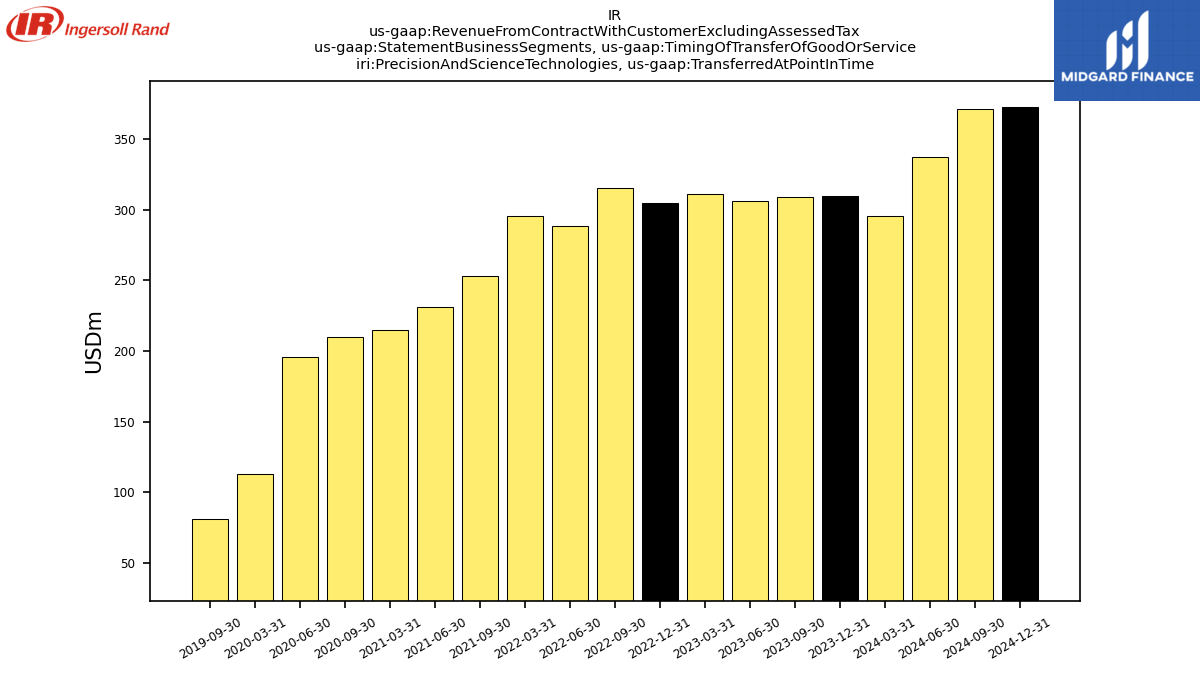
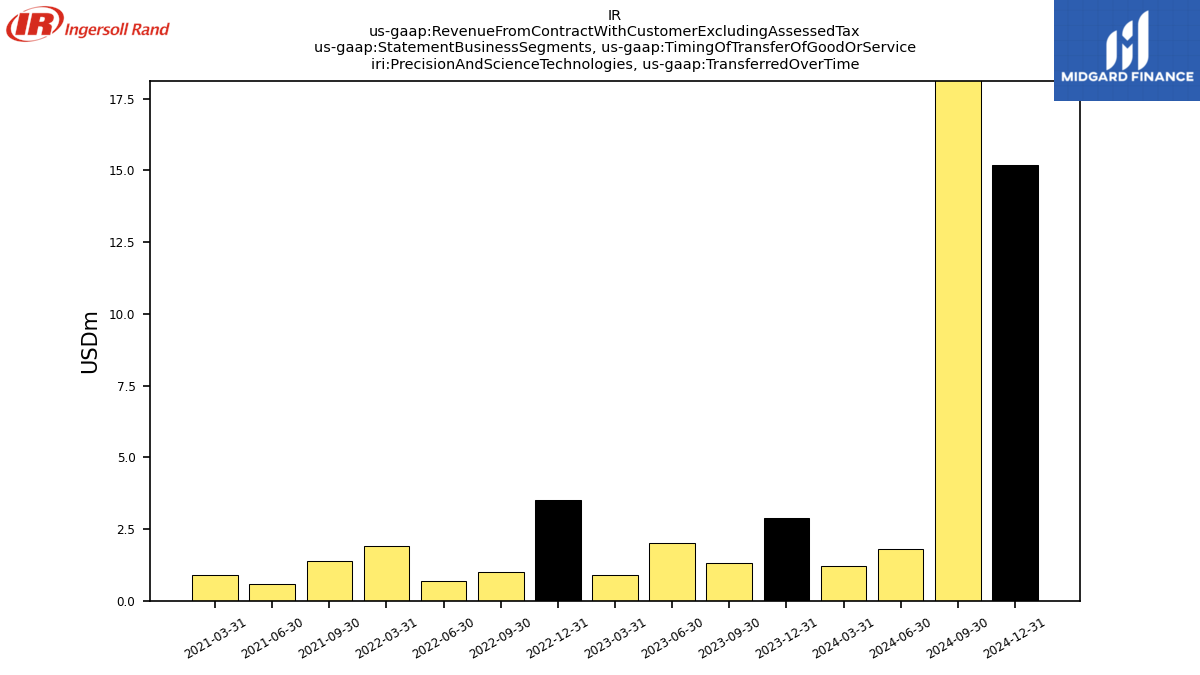
| Operating, Precision And Science Technologies | 296.70 | 312.60 | 310.50 | 308.10 | 312.10 | 308.30 | 316.10 | 289.40 | 297.40 | 289.80 | 254.30 | 231.60 | 215.70 | NA | 209.90 | 195.80 | 112.90 | NA | 81.40 | NA | NA | NA | NA | NA | NA | NA | NA | NA | NA | NA | NA | NA | |
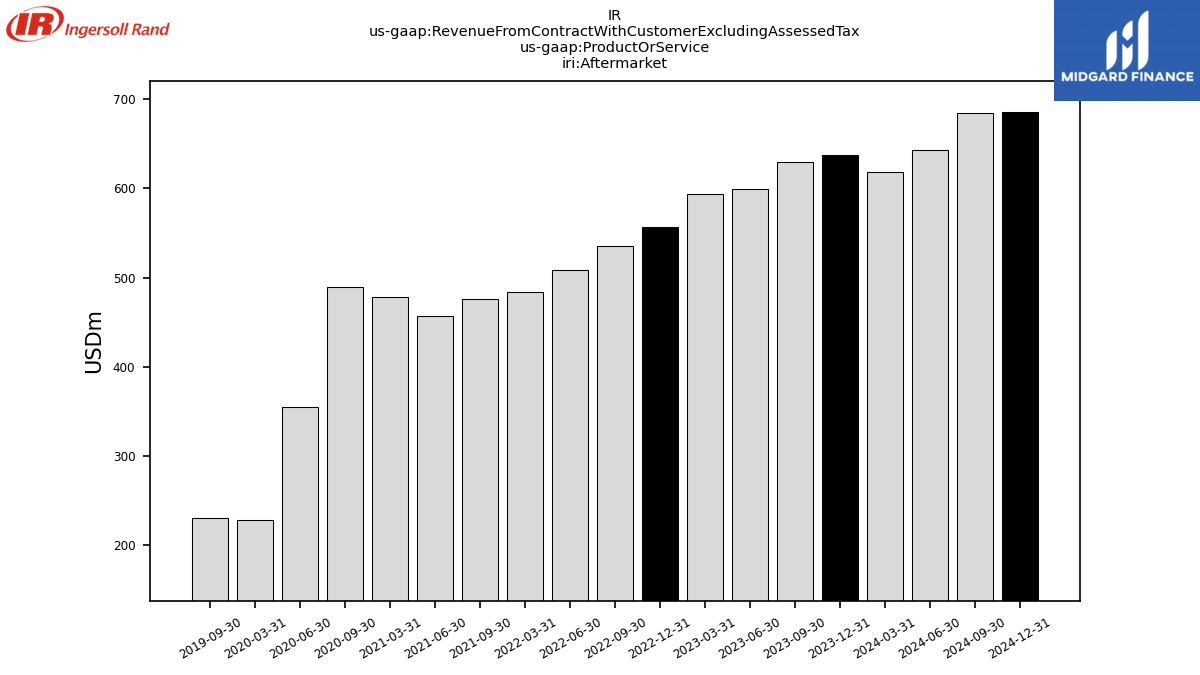
| Aftermarket | 618.00 | 637.00 | 629.60 | 598.80 | 593.90 | 556.80 | 535.00 | 507.90 | 483.80 | NA | 476.40 | 456.90 | 477.80 | NA | 489.50 | 354.30 | 228.60 | NA | 230.20 | NA | NA | NA | NA | NA | NA | NA | NA | NA | NA | NA | NA | NA | |
| Original Equipment | 1052.10 | 1184.40 | 1109.30 | 1087.70 | 1035.40 | 1066.90 | 980.70 | 932.00 | 853.20 | NA | 848.60 | 822.20 | 892.00 | NA | 845.70 | 671.10 | 474.90 | NA | 366.50 | NA | NA | NA | NA | NA | NA | NA | NA | NA | NA | NA | NA | NA | |
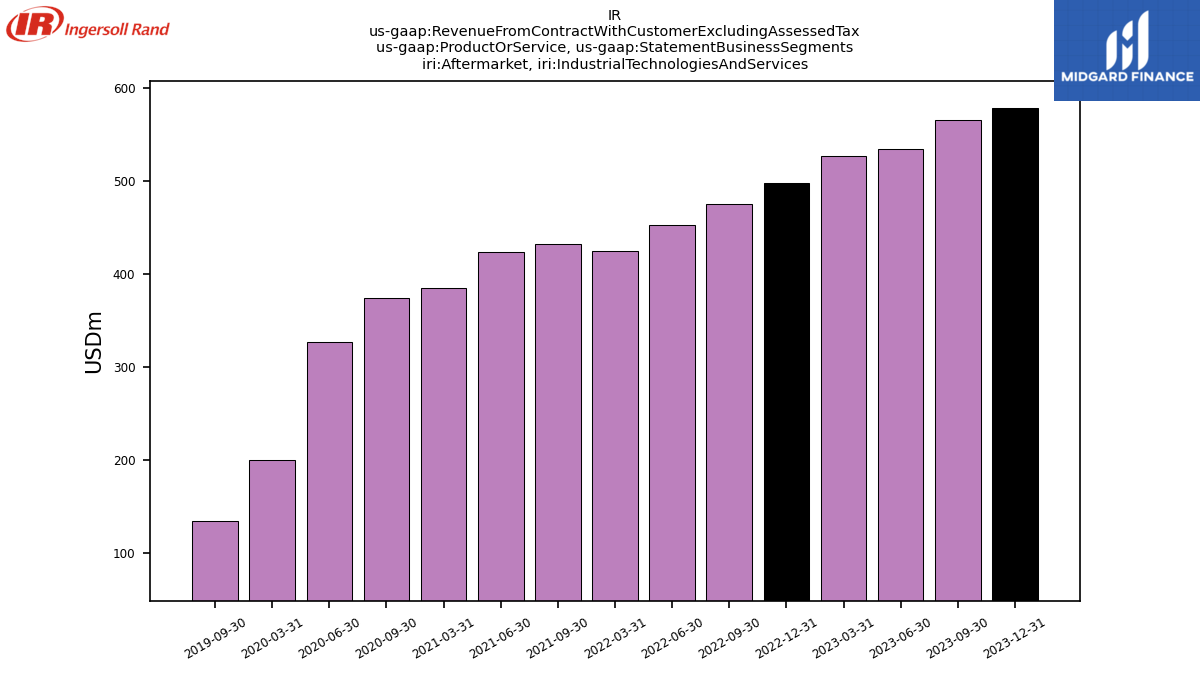
| Aftermarket, Industrial Technologies And Services | 546.30 | 578.90 | 565.70 | 535.20 | 527.10 | 498.60 | 475.90 | 452.70 | 425.40 | NA | 432.30 | 423.80 | 385.10 | NA | 374.30 | 327.60 | 200.70 | NA | 135.20 | NA | NA | NA | NA | NA | NA | NA | NA | NA | NA | NA | NA | NA | |
| Aftermarket, Precision And Science Technologies | 71.70 | 58.10 | 63.90 | 63.60 | 66.80 | 58.20 | 59.10 | 55.20 | 58.40 | NA | 44.10 | 33.10 | 37.00 | NA | 30.50 | 26.70 | 13.90 | NA | 3.00 | NA | NA | NA | NA | NA | NA | NA | NA | NA | NA | NA | NA | NA | |
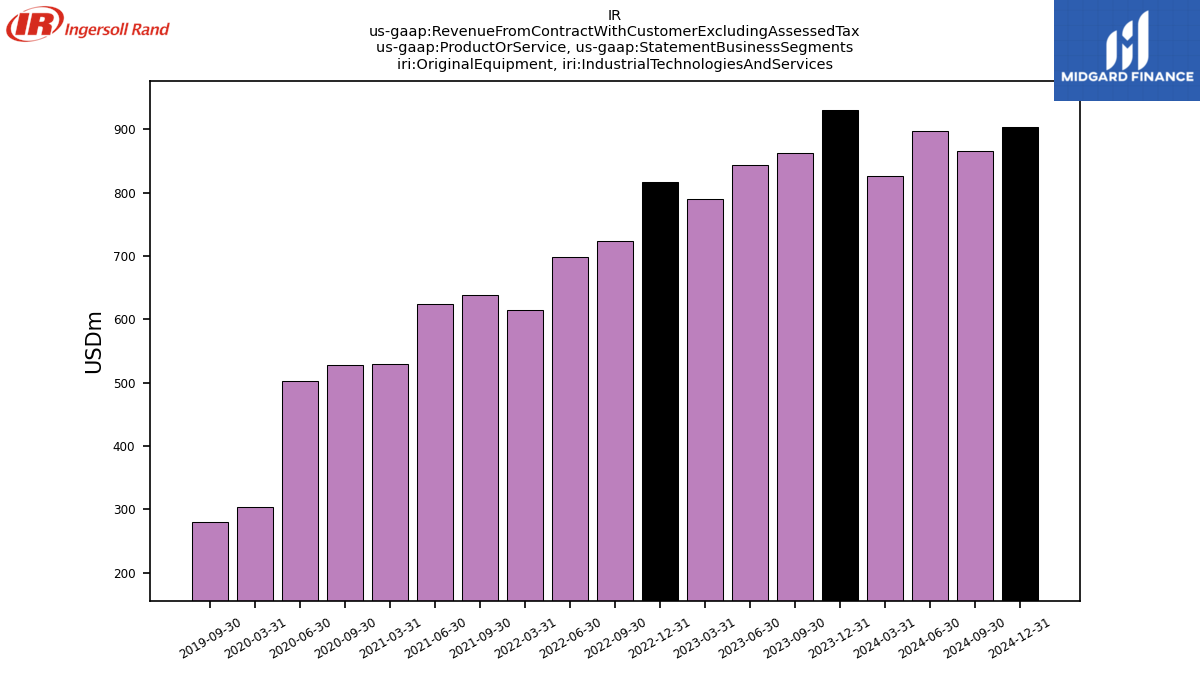
| Original Equipment, Industrial Technologies And Services | 827.10 | 929.90 | 862.70 | 843.20 | 790.10 | 816.80 | 723.70 | 697.80 | 614.20 | NA | 638.40 | 623.70 | 528.70 | NA | 528.30 | 502.00 | 303.30 | NA | 280.10 | NA | NA | NA | NA | NA | NA | NA | NA | NA | NA | NA | NA | NA | |
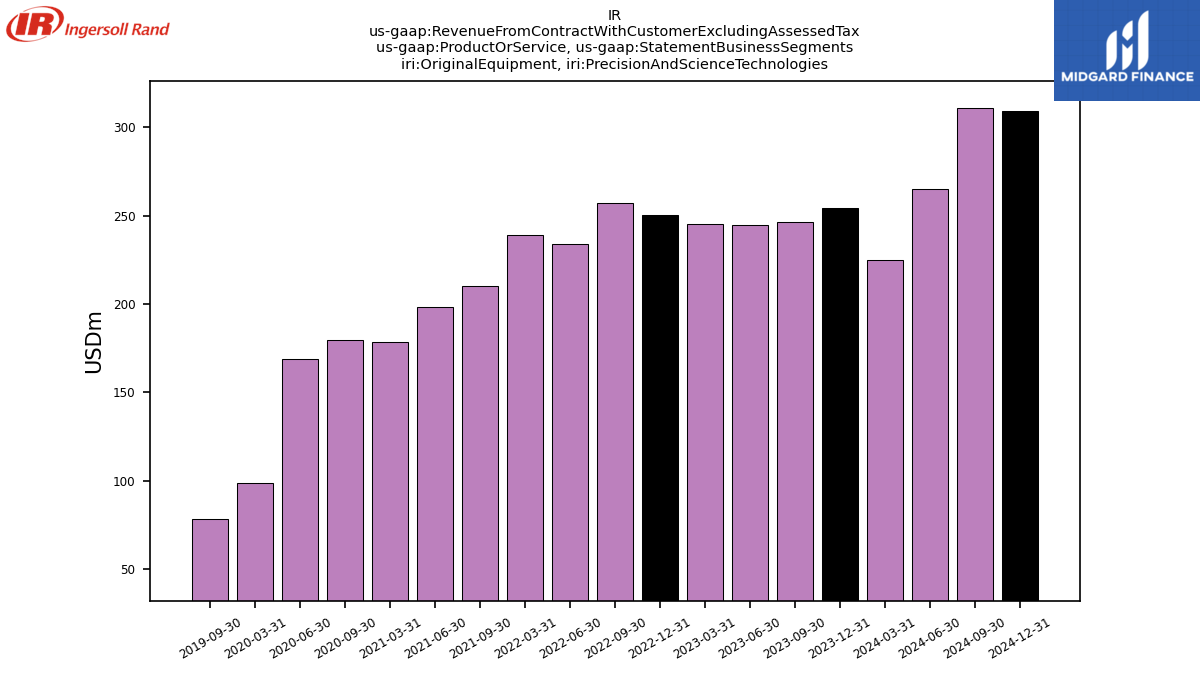
| Original Equipment, Precision And Science Technologies | 225.00 | 254.50 | 246.60 | 244.50 | 245.30 | 250.10 | 257.00 | 234.20 | 239.00 | NA | 210.20 | 198.50 | 178.70 | NA | 179.40 | 169.10 | 99.00 | NA | 78.40 | NA | NA | NA | NA | NA | NA | NA | NA | NA | NA | NA | NA | NA | |
| Industrial Technologies And Services | 1373.40 | 1508.80 | 1428.40 | 1378.40 | 1317.20 | 1315.40 | 1199.60 | 1150.50 | 1039.60 | NA | 1070.70 | 1047.50 | 913.80 | NA | 902.60 | 829.60 | 504.00 | NA | 415.30 | NA | NA | NA | NA | NA | NA | NA | NA | NA | NA | NA | NA | NA | |
| Precision And Science Technologies | 296.70 | 312.60 | 310.50 | 308.10 | 312.10 | 308.30 | 316.10 | 289.40 | 297.40 | NA | 254.30 | 231.60 | 215.70 | NA | 209.90 | 195.80 | 112.90 | NA | 81.40 | NA | NA | NA | NA | NA | NA | NA | NA | NA | NA | NA | NA | NA | |
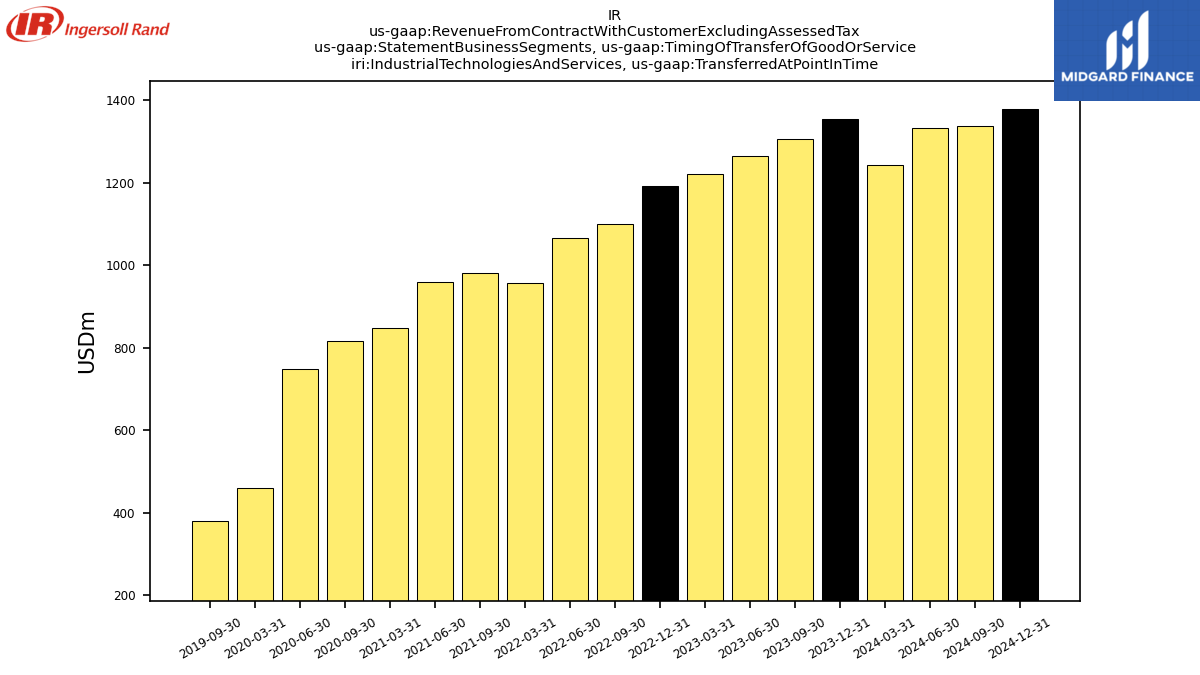
| Industrial Technologies And Services, Transferred At Point In Time | 1244.40 | 1353.90 | 1306.60 | 1266.20 | 1220.50 | 1192.20 | 1099.60 | 1065.90 | 956.60 | NA | 980.40 | 959.90 | 847.90 | NA | 816.70 | 750.10 | 459.40 | NA | 381.70 | NA | NA | NA | NA | NA | NA | NA | NA | NA | NA | NA | NA | NA | |
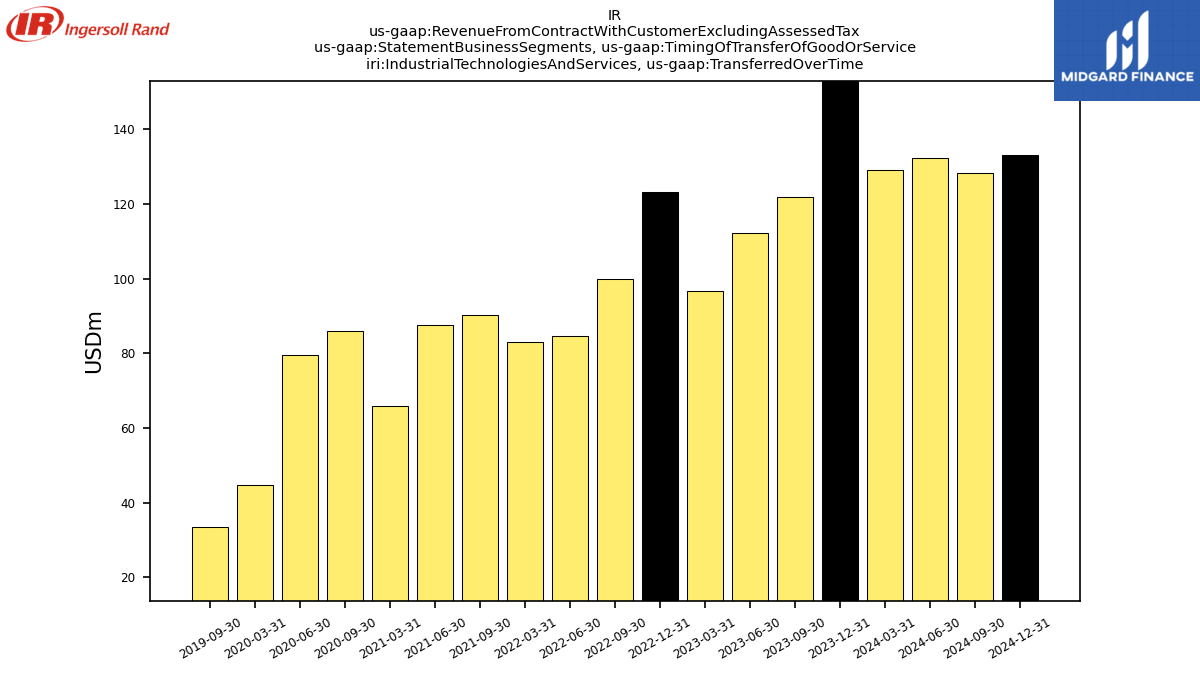
| Industrial Technologies And Services, Transferred Over Time | 129.00 | 154.90 | 121.80 | 112.20 | 96.70 | 123.20 | 100.00 | 84.60 | 83.00 | NA | 90.30 | 87.60 | 65.90 | NA | 85.90 | 79.50 | 44.60 | NA | 33.60 | NA | NA | NA | NA | NA | NA | NA | NA | NA | NA | NA | NA | NA | |
| Precision And Science Technologies, Transferred At Point In Time | 295.50 | 309.70 | 309.20 | 306.10 | 311.20 | 304.80 | 315.10 | 288.70 | 295.50 | NA | 252.90 | 231.00 | 214.80 | NA | 209.90 | 195.80 | 112.90 | NA | 81.40 | NA | NA | NA | NA | NA | NA | NA | NA | NA | NA | NA | NA | NA | |
| Precision And Science Technologies, Transferred Over Time | 1.20 | 2.90 | 1.30 | 2.00 | 0.90 | 3.50 | 1.00 | 0.70 | 1.90 | NA | 1.40 | 0.60 | 0.90 | NA | NA | NA | NA | NA | NA | NA | NA | NA | NA | NA | NA | NA | NA | NA | NA | NA | NA | NA | |
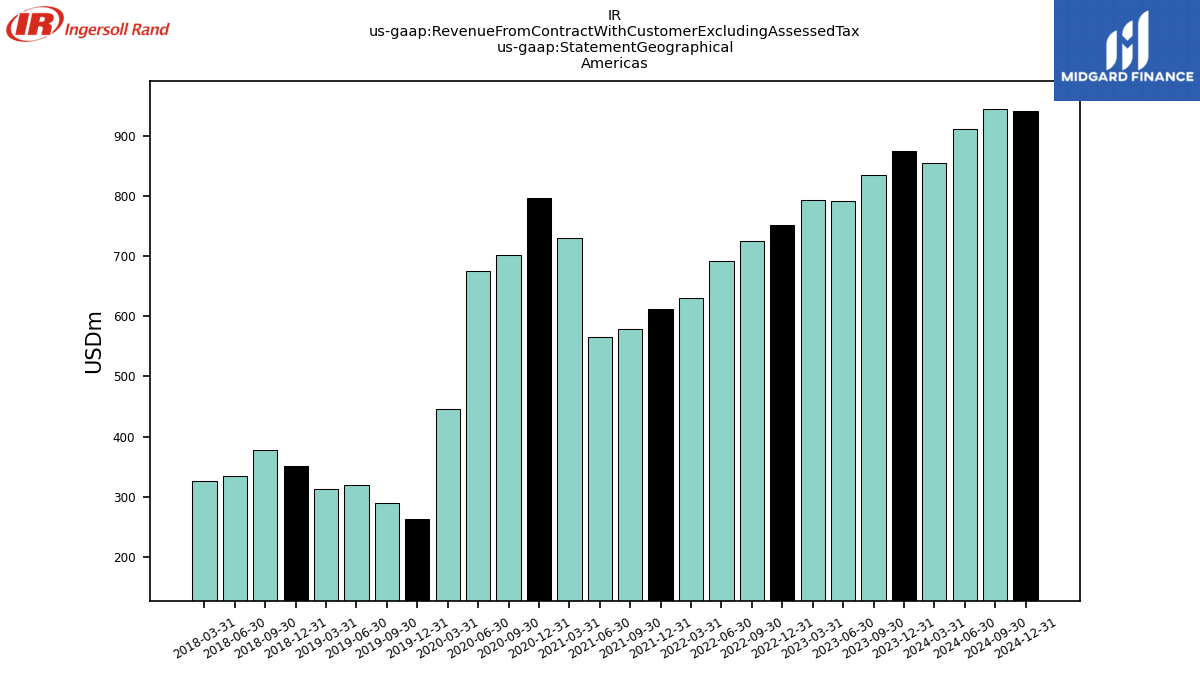
| 855.00 | 876.00 | 835.00 | 792.70 | 793.60 | 751.40 | 725.80 | 692.50 | 630.90 | 612.60 | 579.60 | 565.10 | 729.90 | 796.30 | 701.40 | 675.00 | 446.00 | 262.70 | 289.80 | 320.10 | 313.20 | 350.90 | 377.90 | 334.50 | 326.70 | NA | NA | NA | NA | NA | NA | NA | ||
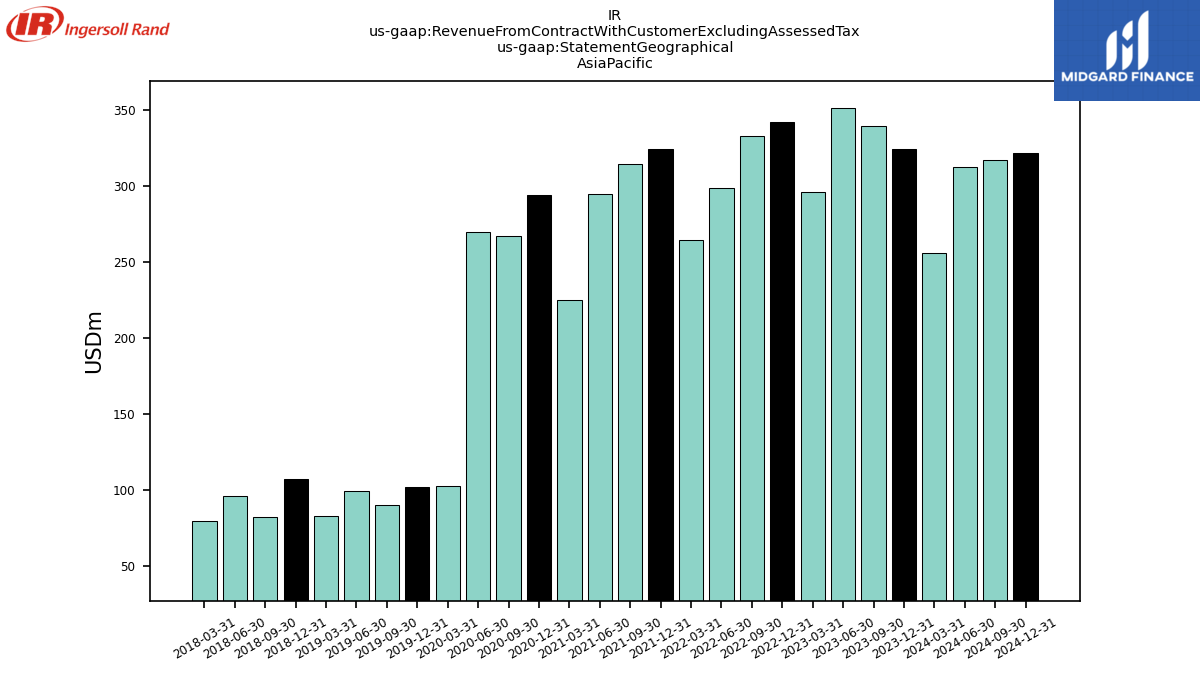
| 256.00 | 324.00 | 339.60 | 351.40 | 296.30 | 342.00 | 332.90 | 298.90 | 264.60 | 324.30 | 314.70 | 294.60 | 224.70 | 294.30 | 266.80 | 269.60 | 102.90 | 102.00 | 90.50 | 99.70 | 82.80 | 107.60 | 82.60 | 96.10 | 79.70 | NA | NA | NA | NA | NA | NA | NA | ||
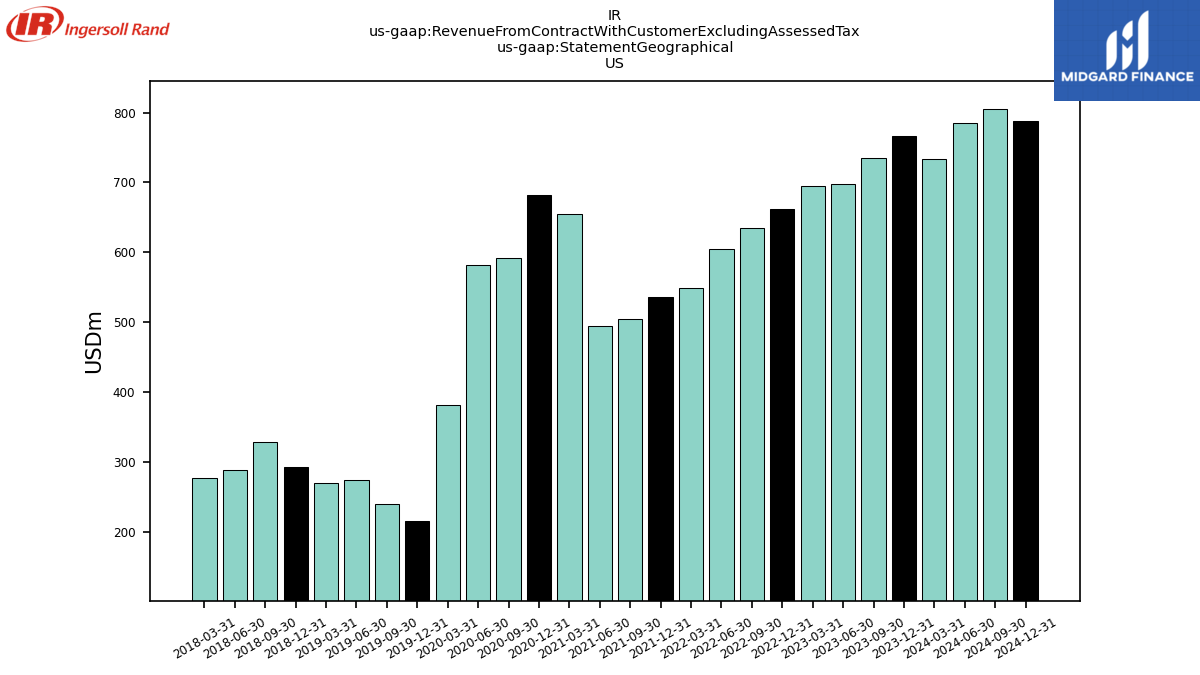
| US | 734.20 | 767.10 | 735.10 | 697.60 | 695.40 | 661.80 | 634.90 | 604.60 | 549.10 | 536.60 | 504.00 | 495.00 | 654.10 | 681.30 | 591.60 | 581.90 | 380.80 | 215.60 | 239.20 | 274.00 | 269.20 | 291.90 | 327.90 | 288.90 | 277.10 | NA | NA | NA | NA | NA | NA | NA | |
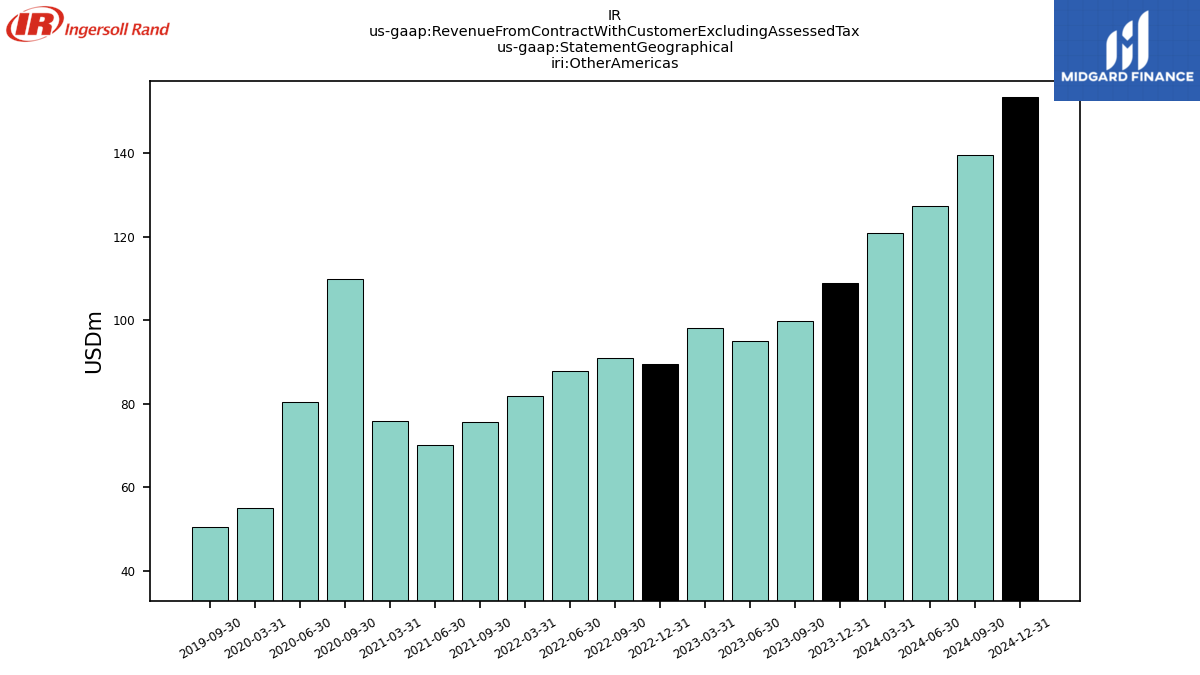
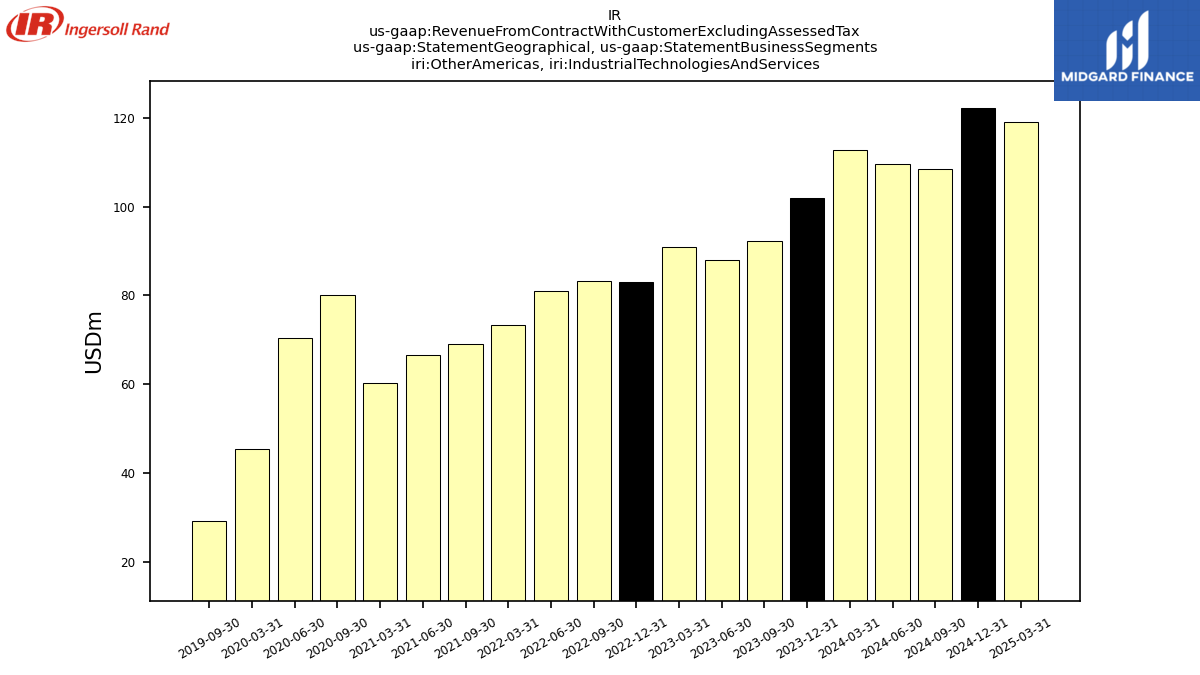
| Other Americas | 120.80 | 108.90 | 99.90 | 95.10 | 98.20 | 89.60 | 90.90 | 87.90 | 81.80 | NA | 75.60 | 70.10 | 75.80 | NA | 109.80 | 80.40 | 55.00 | NA | 50.60 | NA | NA | NA | NA | NA | NA | NA | NA | NA | NA | NA | NA | NA | |
| EMEA | 559.10 | 621.40 | 564.30 | 542.40 | 539.40 | 530.30 | 457.00 | 448.50 | 441.50 | 481.90 | 430.70 | 419.40 | 415.20 | 420.10 | 367.00 | 319.80 | 251.00 | 241.10 | 216.40 | 209.30 | 224.30 | 254.20 | 228.80 | 237.60 | 213.20 | NA | NA | NA | NA | NA | NA | NA | |
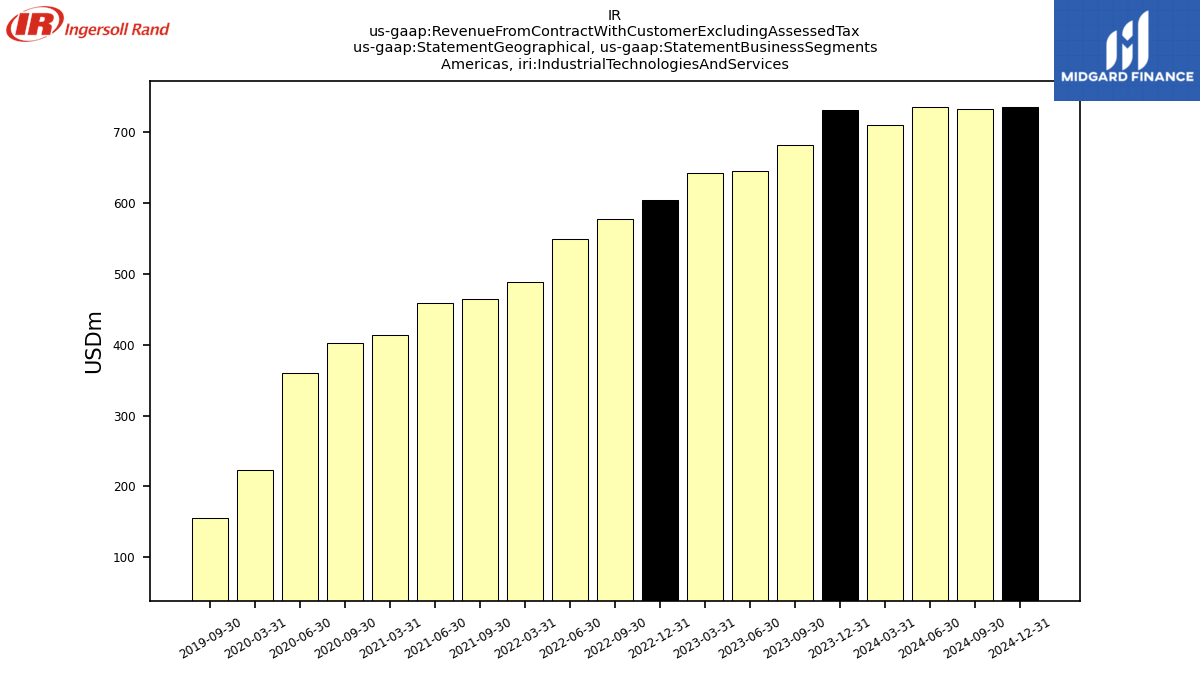
| , Industrial Technologies And Services | 709.80 | 731.60 | 682.60 | 644.80 | 642.10 | 605.10 | 577.70 | 549.90 | 488.10 | NA | 464.10 | 458.50 | 413.30 | NA | 403.10 | 360.30 | 222.50 | NA | 154.50 | NA | NA | NA | NA | NA | NA | NA | NA | NA | NA | NA | NA | NA | |
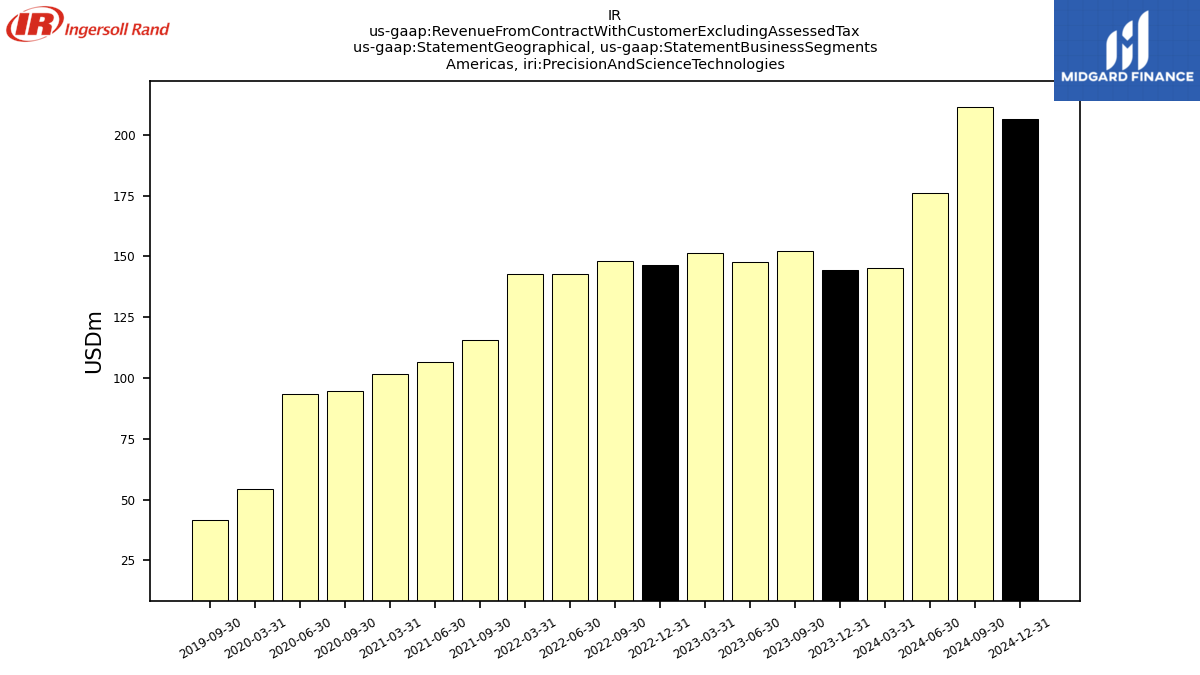
| , Precision And Science Technologies | 145.20 | 144.40 | 152.40 | 147.90 | 151.50 | 146.30 | 148.10 | 142.60 | 142.80 | NA | 115.50 | 106.60 | 101.60 | NA | 94.70 | 93.60 | 54.20 | NA | 41.40 | NA | NA | NA | NA | NA | NA | NA | NA | NA | NA | NA | NA | NA | |
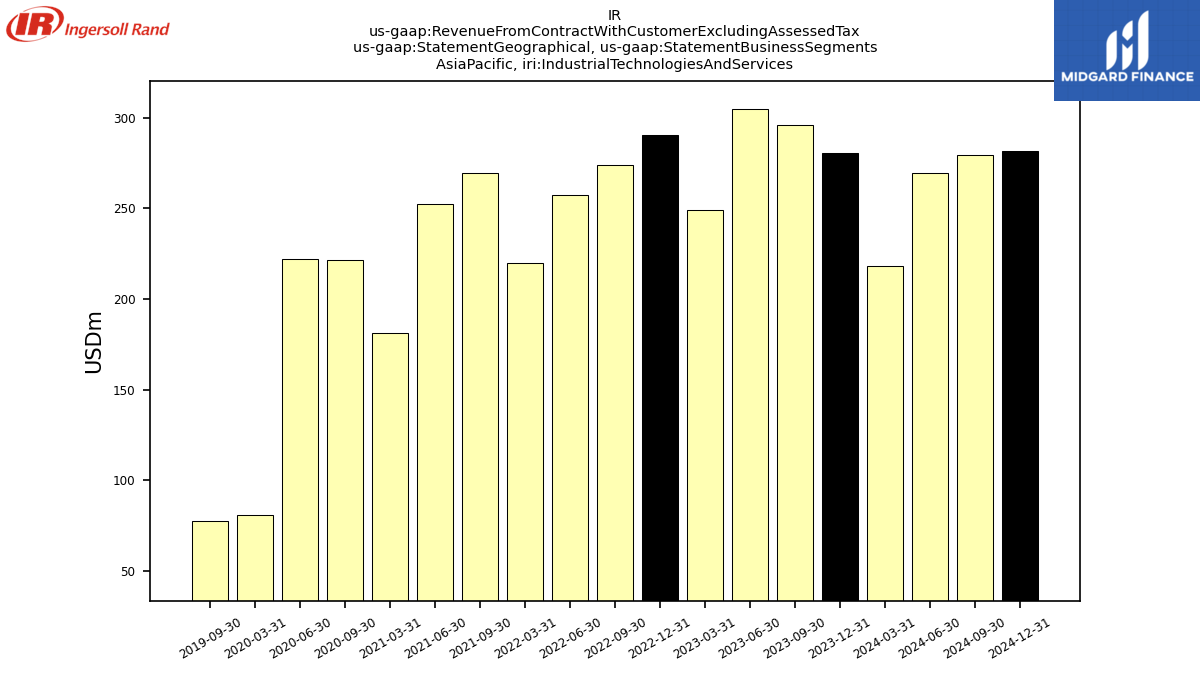
| , Industrial Technologies And Services | 218.20 | 280.60 | 296.10 | 305.10 | 249.10 | 290.50 | 274.00 | 257.30 | 219.70 | NA | 269.40 | 252.70 | 181.10 | NA | 221.80 | 222.20 | 80.90 | NA | 77.30 | NA | NA | NA | NA | NA | NA | NA | NA | NA | NA | NA | NA | NA | |
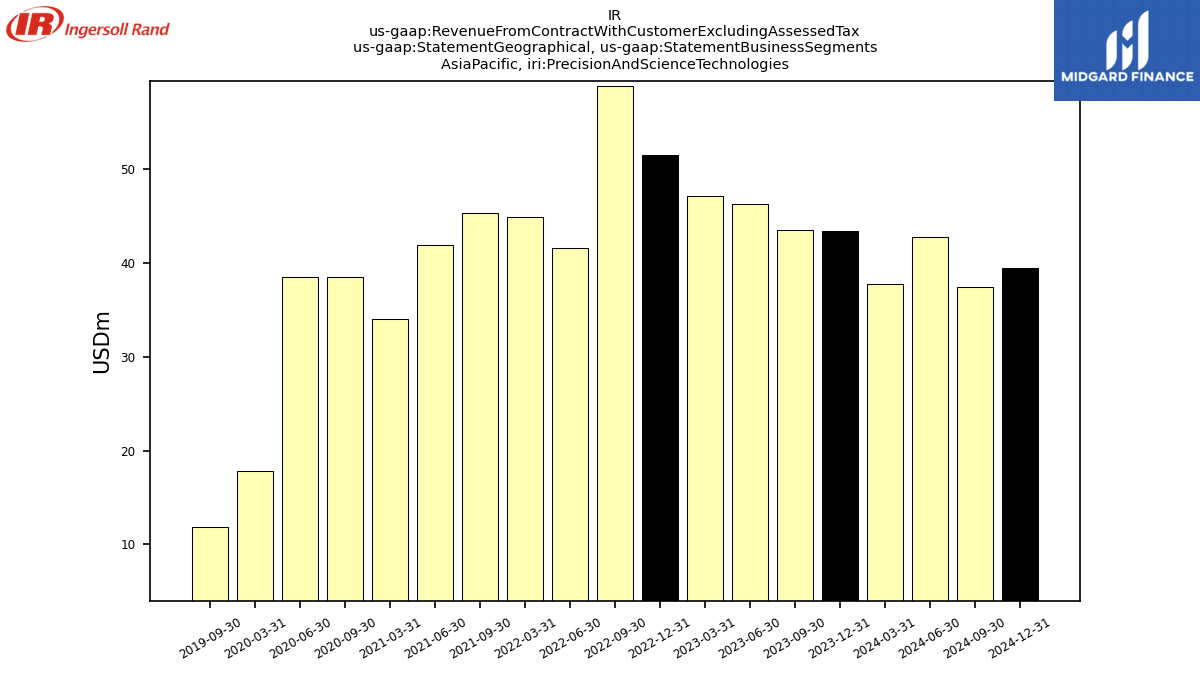
| , Precision And Science Technologies | 37.80 | 43.40 | 43.50 | 46.30 | 47.20 | 51.50 | 58.90 | 41.60 | 44.90 | NA | 45.30 | 41.90 | 34.00 | NA | 38.50 | 38.50 | 17.80 | NA | 11.90 | NA | NA | NA | NA | NA | NA | NA | NA | NA | NA | NA | NA | NA | |
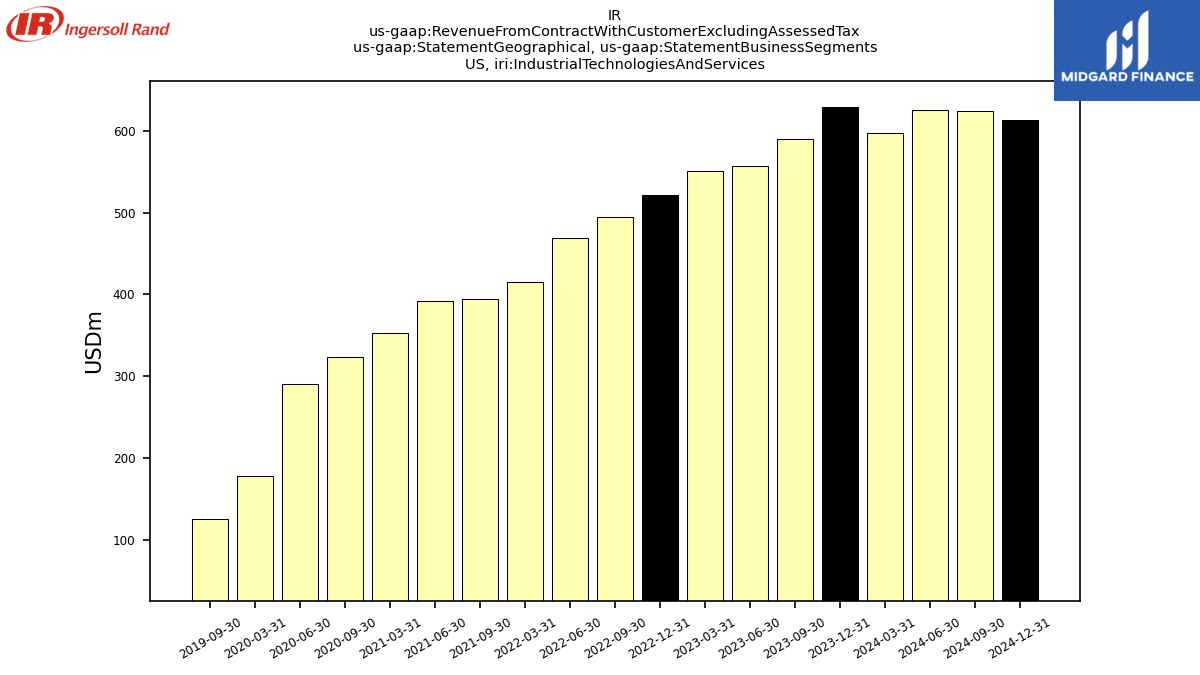
| US, Industrial Technologies And Services | 597.10 | 629.70 | 590.30 | 556.80 | 551.20 | 522.10 | 494.50 | 468.90 | 414.80 | NA | 395.00 | 391.90 | 353.10 | NA | 323.00 | 289.80 | 177.20 | NA | 125.30 | NA | NA | NA | NA | NA | NA | NA | NA | NA | NA | NA | NA | NA | |
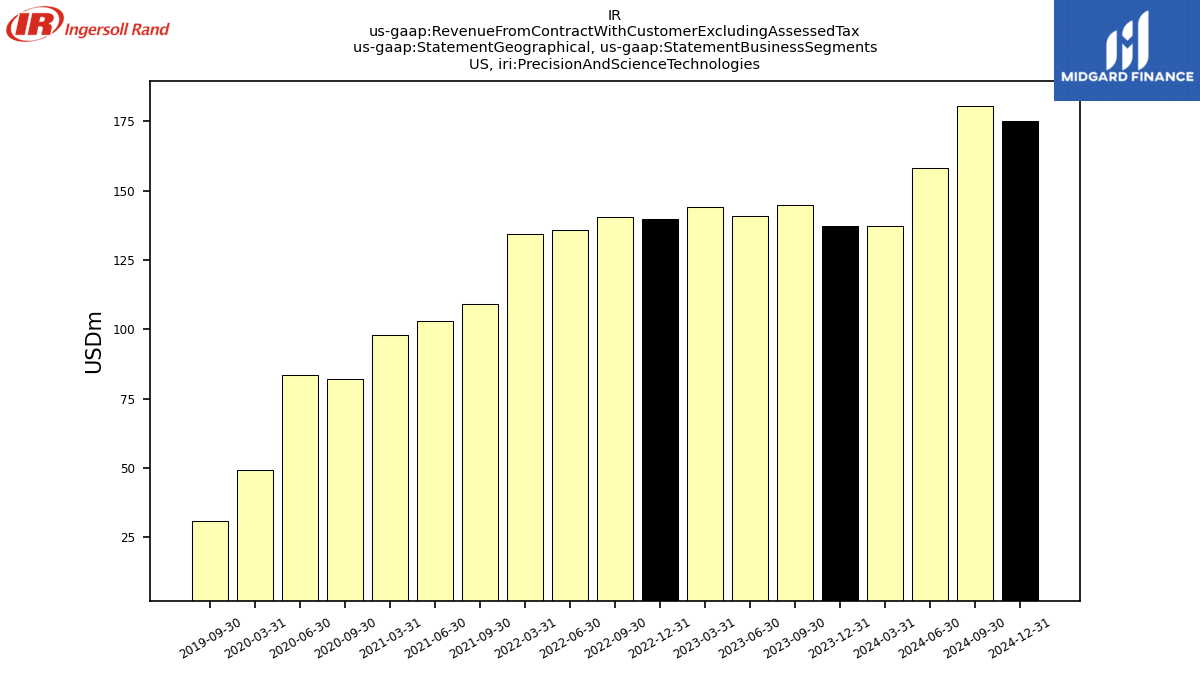
| US, Precision And Science Technologies | 137.10 | 137.40 | 144.80 | 140.80 | 144.20 | 139.70 | 140.40 | 135.70 | 134.30 | NA | 109.00 | 103.10 | 98.10 | NA | 82.20 | 83.70 | 49.30 | NA | 31.00 | NA | NA | NA | NA | NA | NA | NA | NA | NA | NA | NA | NA | NA | |
| Other Americas, Industrial Technologies And Services | 112.70 | 101.90 | 92.30 | 88.00 | 90.90 | 83.00 | 83.20 | 81.00 | 73.30 | NA | 69.10 | 66.60 | 60.20 | NA | 80.10 | 70.50 | 45.30 | NA | 29.20 | NA | NA | NA | NA | NA | NA | NA | NA | NA | NA | NA | NA | NA | |
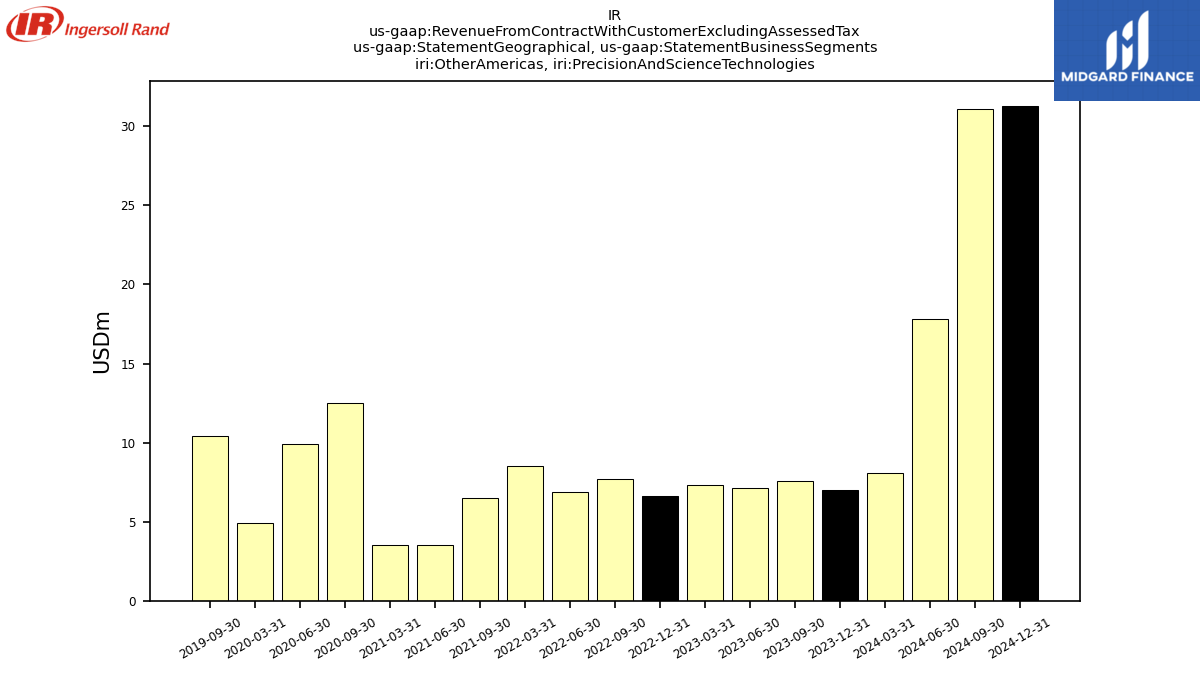
| Other Americas, Precision And Science Technologies | 8.10 | 7.00 | 7.60 | 7.10 | 7.30 | 6.60 | 7.70 | 6.90 | 8.50 | NA | 6.50 | 3.50 | 3.50 | NA | 12.50 | 9.90 | 4.90 | NA | 10.40 | NA | NA | NA | NA | NA | NA | NA | NA | NA | NA | NA | NA | NA | |
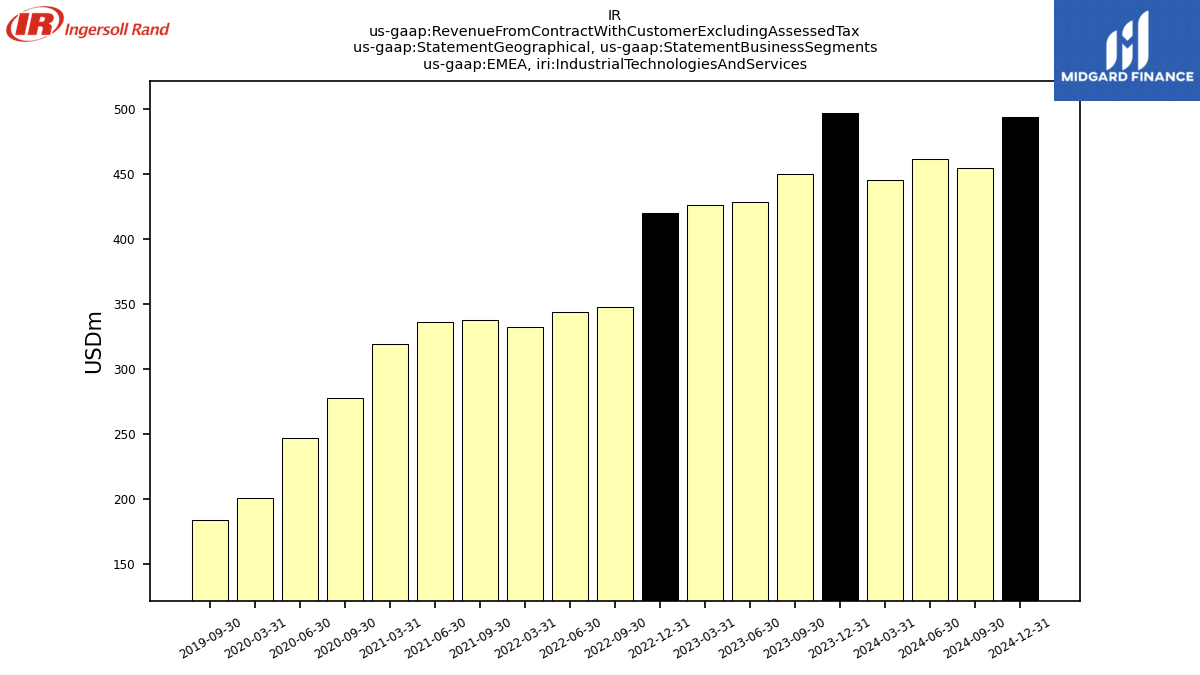
| EMEA, Industrial Technologies And Services | 445.40 | 496.60 | 449.70 | 428.50 | 426.00 | 419.80 | 347.90 | 343.30 | 331.80 | NA | 337.20 | 336.30 | 319.40 | NA | 277.70 | 247.10 | 200.60 | NA | 183.50 | NA | NA | NA | NA | NA | NA | NA | NA | NA | NA | NA | NA | NA | |
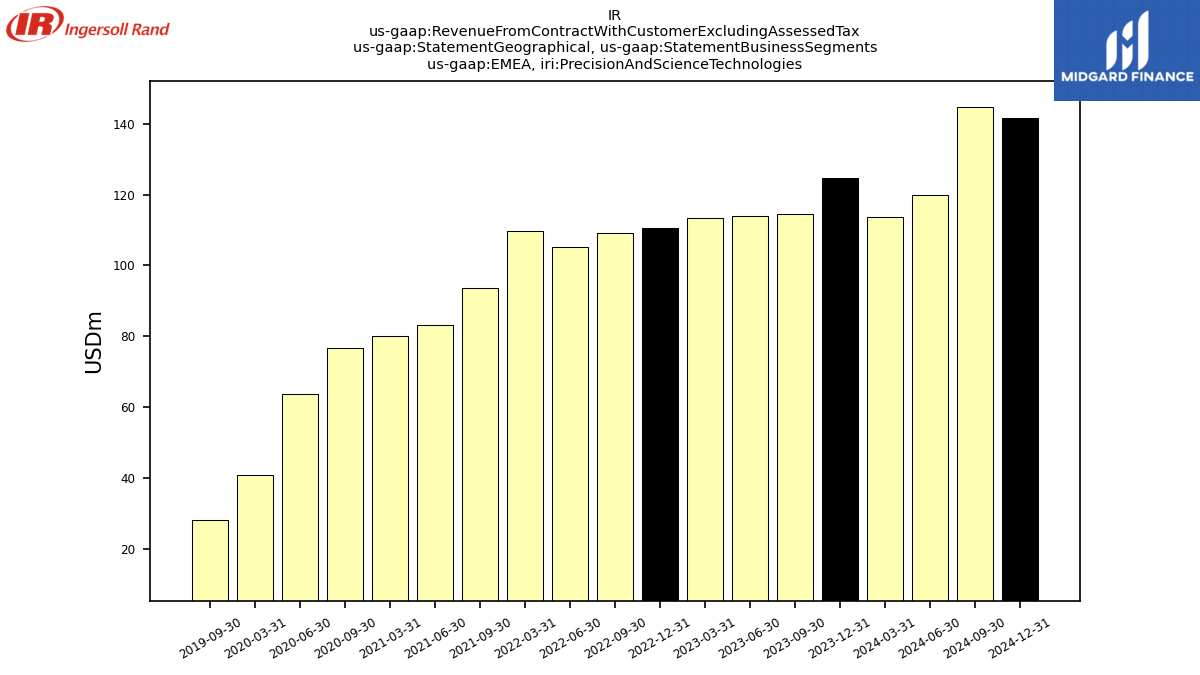
| EMEA, Precision And Science Technologies | 113.70 | 124.80 | 114.60 | 113.90 | 113.40 | 110.50 | 109.10 | 105.20 | 109.70 | NA | 93.50 | 83.10 | 80.10 | NA | 76.70 | 63.70 | 40.90 | NA | 28.10 | NA | NA | NA | NA | NA | NA | NA | NA | NA | NA | NA | NA | NA | |
| Transferred At Point In Time | 1539.90 | 1663.60 | 1615.80 | 1572.30 | 1531.70 | 1497.00 | 1414.70 | 1354.60 | 1252.10 | 1312.70 | 1233.30 | 1190.90 | 1296.10 | 1404.10 | 1242.30 | 1179.40 | 753.20 | 558.90 | 563.10 | 597.70 | 592.80 | 675.70 | 658.40 | 639.40 | 607.10 | NA | NA | NA | NA | NA | NA | NA | |
| Transferred Over Time | 130.20 | 157.80 | 123.10 | 114.20 | 97.60 | 126.70 | 101.00 | 85.30 | 84.90 | 106.10 | 91.70 | 88.20 | 73.70 | 106.60 | 92.90 | 85.00 | 46.70 | 46.90 | 33.60 | 31.40 | 27.50 | 37.00 | 30.90 | 28.80 | 12.50 | NA | NA | NA | NA | NA | NA | NA |
