
| 2023-12-31 | 2023-09-30 | 2023-06-30 | 2023-03-31 | 2022-12-31 | 2022-09-30 | 2022-06-30 | 2022-03-31 | 2021-12-31 | 2021-09-30 | 2021-06-30 | 2021-03-31 | 2020-12-31 | 2020-09-30 | 2020-06-30 | 2020-03-31 | 2019-12-31 | 2019-09-30 | 2019-06-30 | 2019-03-31 | 2018-12-31 | 2018-09-30 | 2018-06-30 | 2018-03-31 | 2017-12-31 | 2017-09-30 | 2017-06-30 | 2017-03-31 | 2016-12-31 | 2016-09-30 | 2016-06-30 | 2016-03-31 | 2015-12-31 | 2015-09-30 | 2015-06-30 | 2015-03-31 | 2014-12-31 | 2014-09-30 | 2014-06-30 | 2014-03-31 | 2013-12-31 | 2013-09-30 | 2013-06-30 | 2013-03-31 | 2012-12-31 | 2012-09-30 | 2012-06-30 | 2012-03-31 | 2011-12-31 | 2011-09-30 | 2011-06-30 | 2011-03-31 | 2010-12-31 | 2010-09-30 | 2010-06-30 | 2010-03-31 | ||
|---|---|---|---|---|---|---|---|---|---|---|---|---|---|---|---|---|---|---|---|---|---|---|---|---|---|---|---|---|---|---|---|---|---|---|---|---|---|---|---|---|---|---|---|---|---|---|---|---|---|---|---|---|---|---|---|---|---|
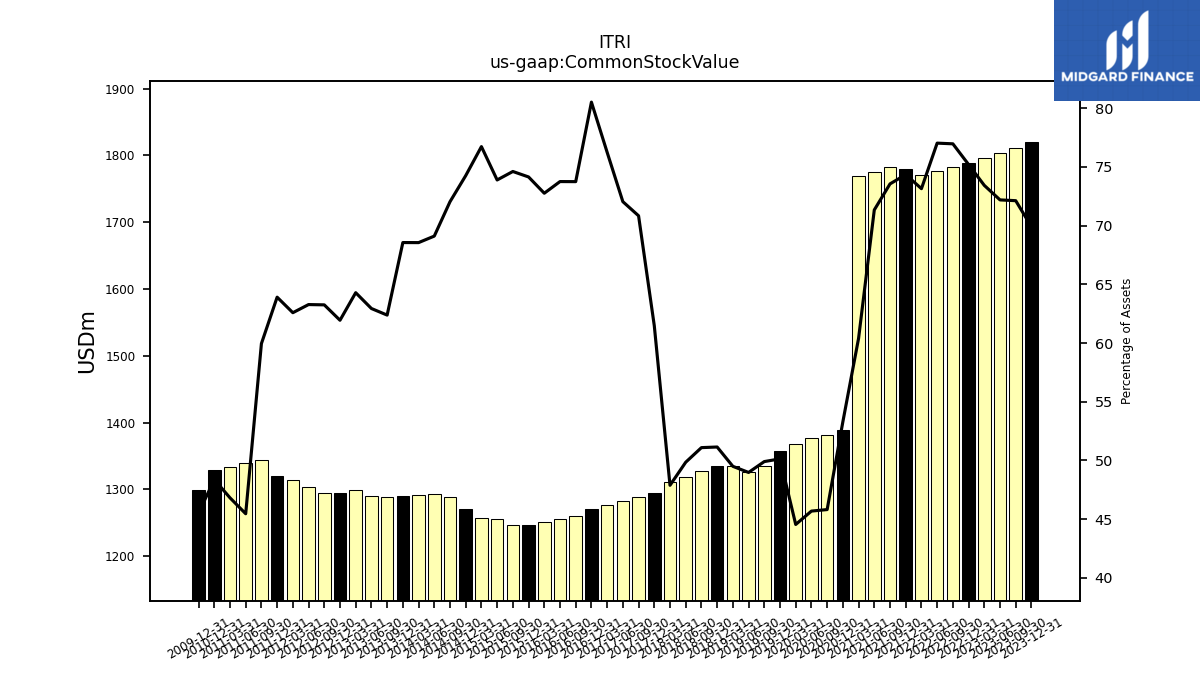
| Common Stock Value | 1820.51 | 1811.37 | 1803.81 | 1796.01 | 1788.48 | 1783.19 | 1777.48 | 1770.06 | 1779.78 | 1782.06 | 1775.32 | 1768.52 | 1389.42 | 1381.77 | 1376.13 | 1368.33 | 1357.60 | 1335.35 | 1325.51 | 1334.79 | 1334.36 | 1326.72 | 1317.78 | 1310.38 | 1294.77 | 1287.80 | 1282.09 | 1276.30 | 1270.47 | 1259.70 | 1255.31 | 1251.23 | 1246.67 | 1246.18 | 1255.15 | 1257.80 | 1270.05 | 1287.96 | 1293.55 | 1291.69 | 1290.63 | 1288.22 | 1290.23 | 1299.61 | 1294.21 | 1294.99 | 1304.09 | 1313.32 | 1319.22 | 1343.94 | 1339.50 | 1334.16 | 1328.25 | NA | NA | NA | |
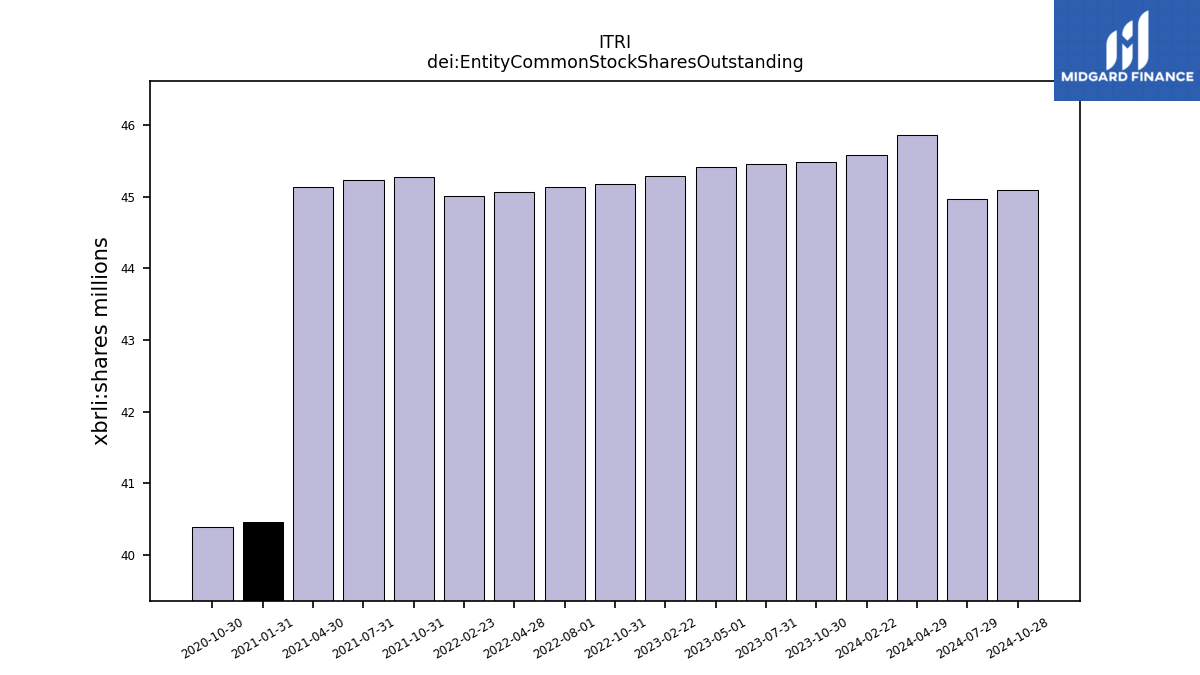
| dei: Entity Common Stock Shares Outstanding | NA | NA | NA | NA | NA | NA | NA | NA | NA | NA | NA | NA | NA | NA | NA | NA | NA | NA | NA | NA | NA | NA | NA | NA | NA | NA | NA | NA | NA | NA | NA | NA | NA | NA | NA | NA | NA | NA | NA | NA | NA | NA | NA | NA | NA | NA | NA | NA | NA | NA | NA | NA | NA | NA | NA | NA | |
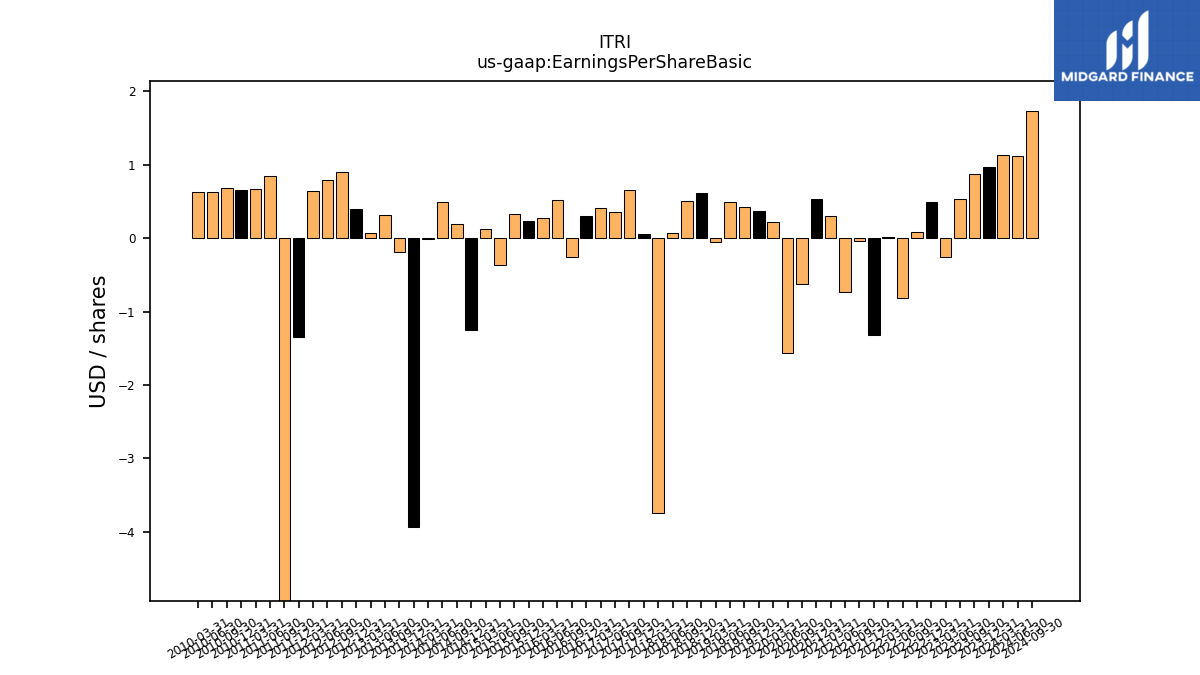
| Earnings Per Share Basic | 0.97 | 0.88 | 0.53 | -0.26 | 0.49 | 0.09 | -0.82 | 0.02 | -1.32 | -0.04 | -0.73 | 0.30 | 0.54 | -0.63 | -1.56 | 0.22 | 0.37 | 0.43 | 0.49 | -0.05 | 0.61 | 0.51 | 0.07 | -3.74 | 0.05 | 0.66 | 0.36 | 0.41 | 0.30 | -0.26 | 0.52 | 0.27 | 0.23 | 0.33 | -0.37 | 0.13 | -1.25 | 0.19 | 0.49 | -0.01 | -3.93 | -0.19 | 0.31 | 0.07 | 0.40 | 0.90 | 0.79 | 0.64 | -1.35 | -12.70 | 0.85 | 0.67 | 0.66 | 0.68 | 0.63 | 0.63 | |
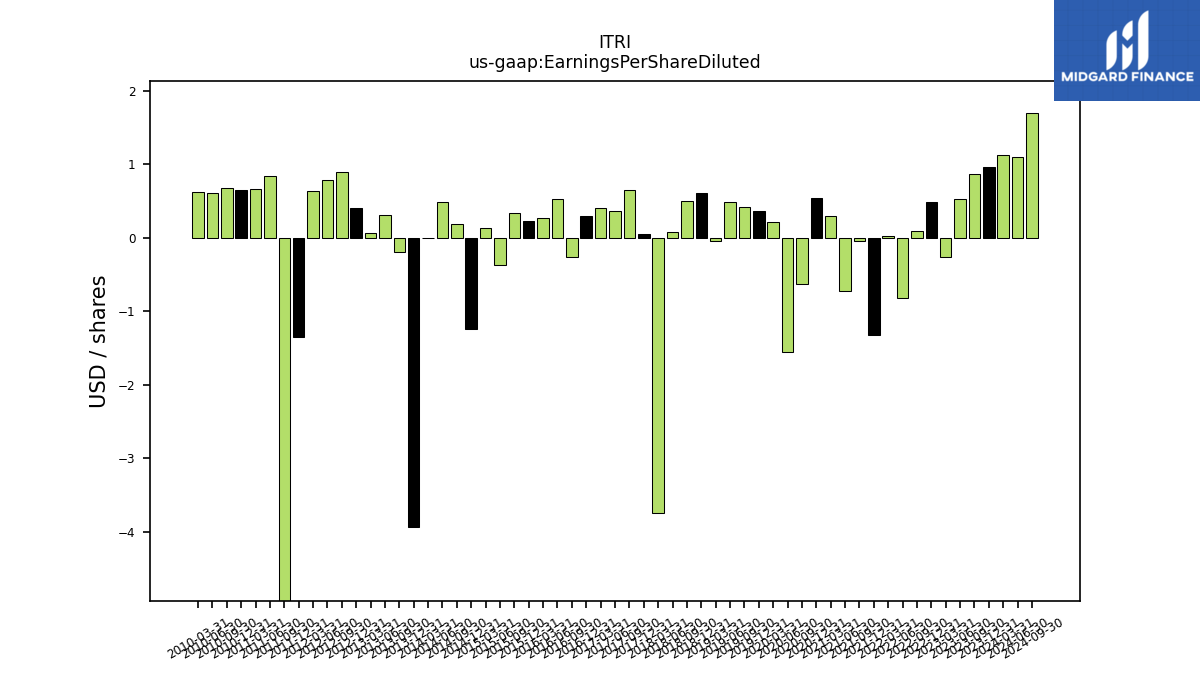
| Earnings Per Share Diluted | 0.96 | 0.87 | 0.53 | -0.26 | 0.49 | 0.09 | -0.82 | 0.02 | -1.32 | -0.04 | -0.73 | 0.30 | 0.54 | -0.63 | -1.56 | 0.21 | 0.36 | 0.42 | 0.49 | -0.05 | 0.60 | 0.50 | 0.07 | -3.74 | 0.05 | 0.65 | 0.36 | 0.40 | 0.30 | -0.26 | 0.52 | 0.26 | 0.23 | 0.33 | -0.37 | 0.13 | -1.25 | 0.19 | 0.49 | -0.01 | -3.93 | -0.19 | 0.31 | 0.06 | 0.40 | 0.89 | 0.79 | 0.63 | -1.35 | -12.70 | 0.84 | 0.66 | 0.65 | 0.68 | 0.61 | 0.62 |
| 2023-12-31 | 2023-09-30 | 2023-06-30 | 2023-03-31 | 2022-12-31 | 2022-09-30 | 2022-06-30 | 2022-03-31 | 2021-12-31 | 2021-09-30 | 2021-06-30 | 2021-03-31 | 2020-12-31 | 2020-09-30 | 2020-06-30 | 2020-03-31 | 2019-12-31 | 2019-09-30 | 2019-06-30 | 2019-03-31 | 2018-12-31 | 2018-09-30 | 2018-06-30 | 2018-03-31 | 2017-12-31 | 2017-09-30 | 2017-06-30 | 2017-03-31 | 2016-12-31 | 2016-09-30 | 2016-06-30 | 2016-03-31 | 2015-12-31 | 2015-09-30 | 2015-06-30 | 2015-03-31 | 2014-12-31 | 2014-09-30 | 2014-06-30 | 2014-03-31 | 2013-12-31 | 2013-09-30 | 2013-06-30 | 2013-03-31 | 2012-12-31 | 2012-09-30 | 2012-06-30 | 2012-03-31 | 2011-12-31 | 2011-09-30 | 2011-06-30 | 2011-03-31 | 2010-12-31 | 2010-09-30 | 2010-06-30 | 2010-03-31 | ||
|---|---|---|---|---|---|---|---|---|---|---|---|---|---|---|---|---|---|---|---|---|---|---|---|---|---|---|---|---|---|---|---|---|---|---|---|---|---|---|---|---|---|---|---|---|---|---|---|---|---|---|---|---|---|---|---|---|---|
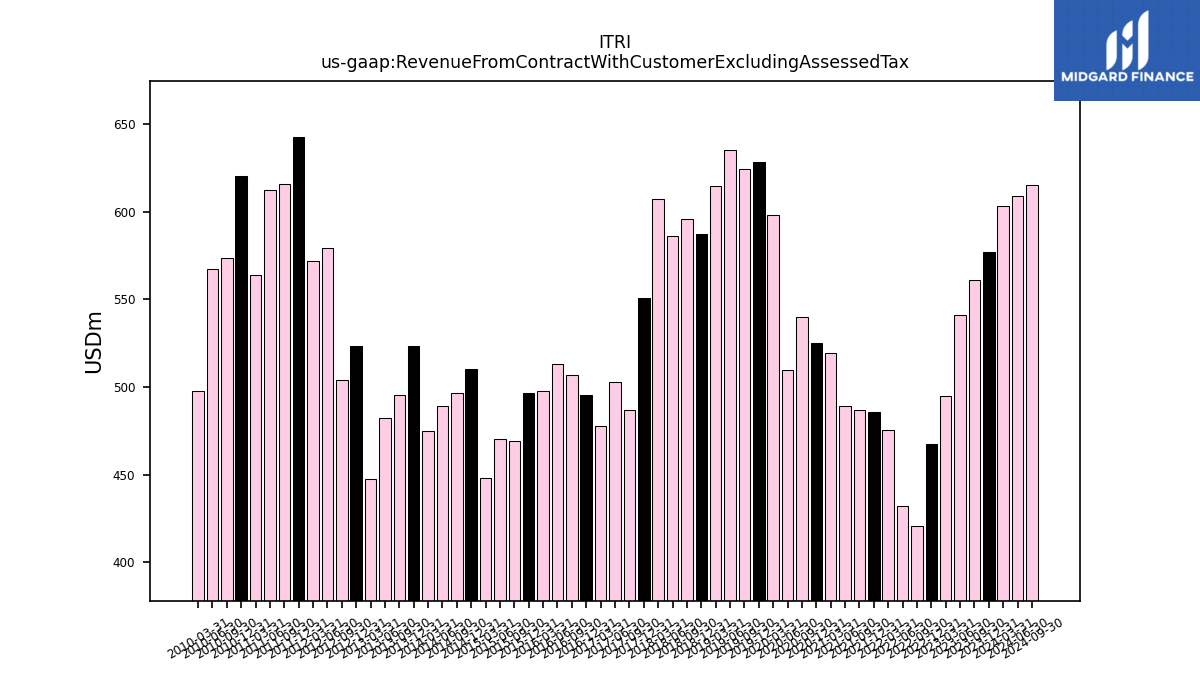
| Revenue From Contract With Customer Excluding Assessed Tax | 577.17 | 560.77 | 541.07 | 494.62 | 467.49 | 420.86 | 431.88 | 475.33 | 485.64 | 486.95 | 489.41 | 519.57 | 525.16 | 540.18 | 509.59 | 598.41 | 628.38 | 624.47 | 635.04 | 614.58 | 587.04 | 595.96 | 585.89 | 607.22 | 550.78 | 486.75 | 503.08 | 477.59 | 495.71 | 506.86 | 513.02 | 497.59 | 496.45 | 469.09 | 470.10 | 448.25 | 510.10 | 496.45 | 489.35 | 474.80 | 523.53 | 495.49 | 482.18 | 447.54 | 523.34 | 504.06 | 579.14 | 571.64 | 642.48 | 615.55 | 612.40 | 563.69 | 620.66 | 573.65 | 567.34 | 497.62 | |
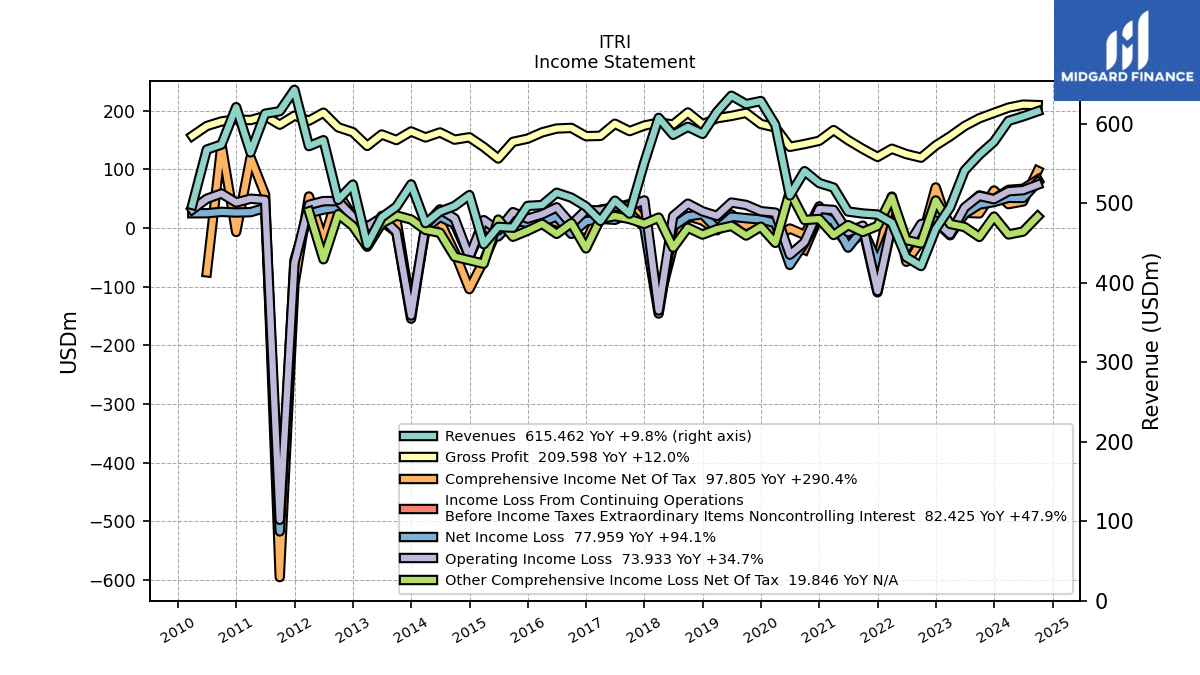
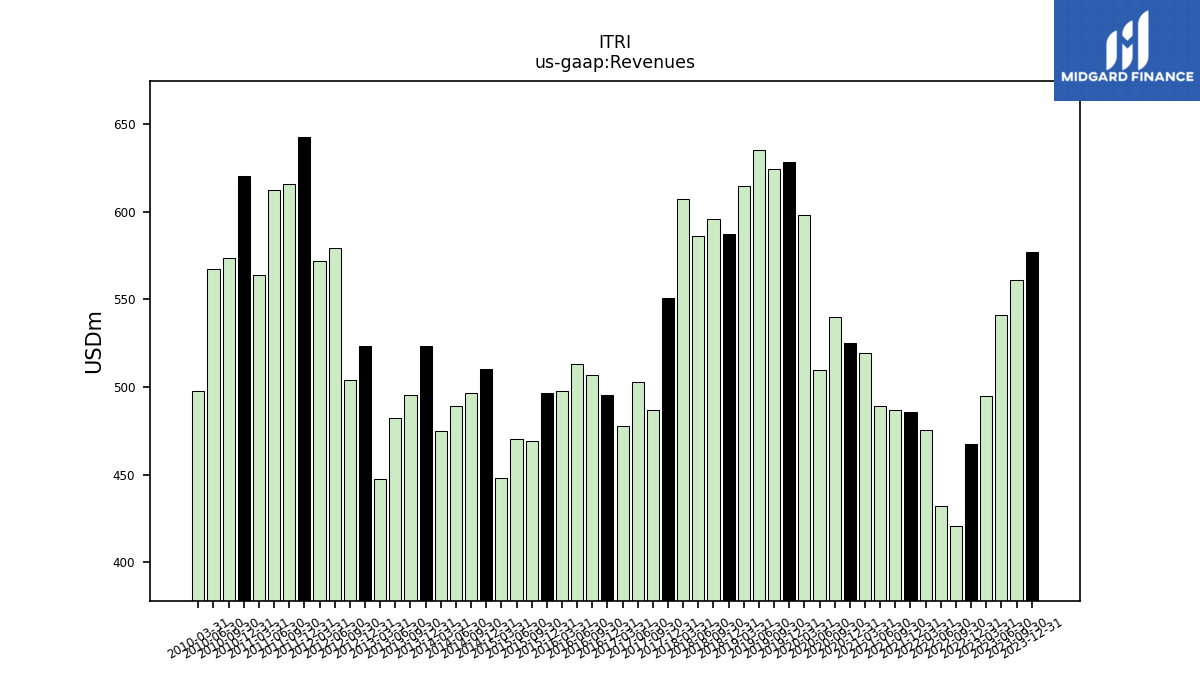
| Revenues | 577.17 | 560.77 | 541.07 | 494.62 | 467.49 | 420.86 | 431.88 | 475.33 | 485.64 | 486.95 | 489.41 | 519.57 | 525.16 | 540.18 | 509.59 | 598.41 | 628.38 | 624.47 | 635.04 | 614.58 | 587.04 | 595.96 | 585.89 | 607.22 | 550.78 | 486.75 | 503.08 | 477.59 | 495.71 | 506.86 | 513.02 | 497.59 | 496.45 | 469.09 | 470.10 | 448.25 | 510.10 | 496.45 | 489.35 | 474.80 | 523.53 | 495.49 | 482.18 | 447.54 | 523.34 | 504.06 | 579.14 | 571.64 | 642.48 | 615.55 | 612.40 | 563.69 | 620.66 | 573.65 | 567.34 | 497.62 | |
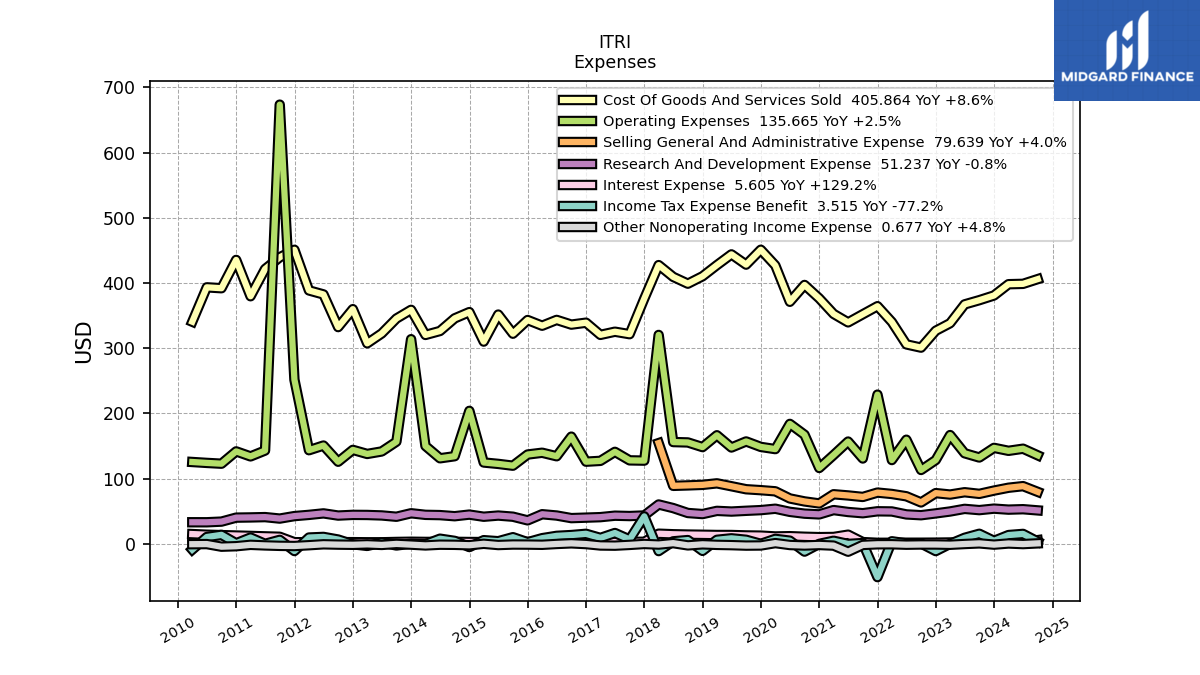
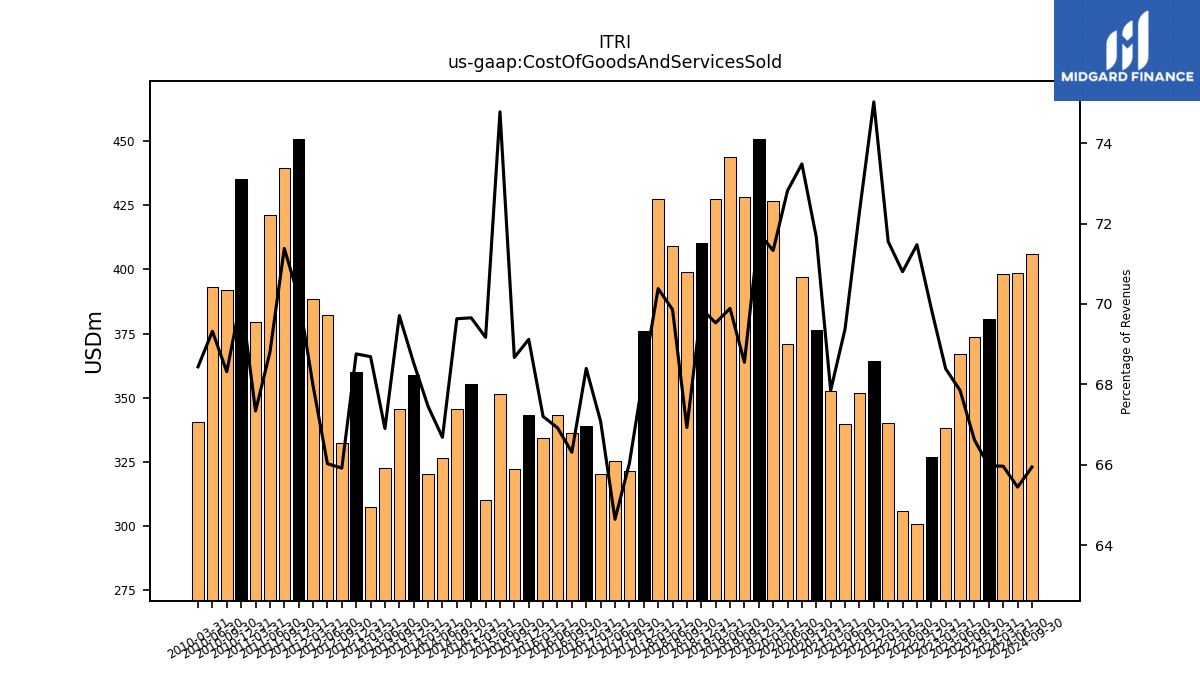
| Cost Of Goods And Services Sold | 380.78 | 373.57 | 367.12 | 338.25 | 326.69 | 300.80 | 305.78 | 340.11 | 364.35 | 351.99 | 339.54 | 352.53 | 376.32 | 396.93 | 371.08 | 426.85 | 450.94 | 428.07 | 443.82 | 427.31 | 410.25 | 398.87 | 409.31 | 427.37 | 376.02 | 321.43 | 325.22 | 320.37 | 339.05 | 336.11 | 343.32 | 334.39 | 343.14 | 322.13 | 351.53 | 310.05 | 355.31 | 345.69 | 326.31 | 320.26 | 358.79 | 345.41 | 322.59 | 307.41 | 359.83 | 332.27 | 382.39 | 388.54 | 450.87 | 439.38 | 421.32 | 379.58 | 435.30 | 391.89 | 393.28 | 340.56 | |
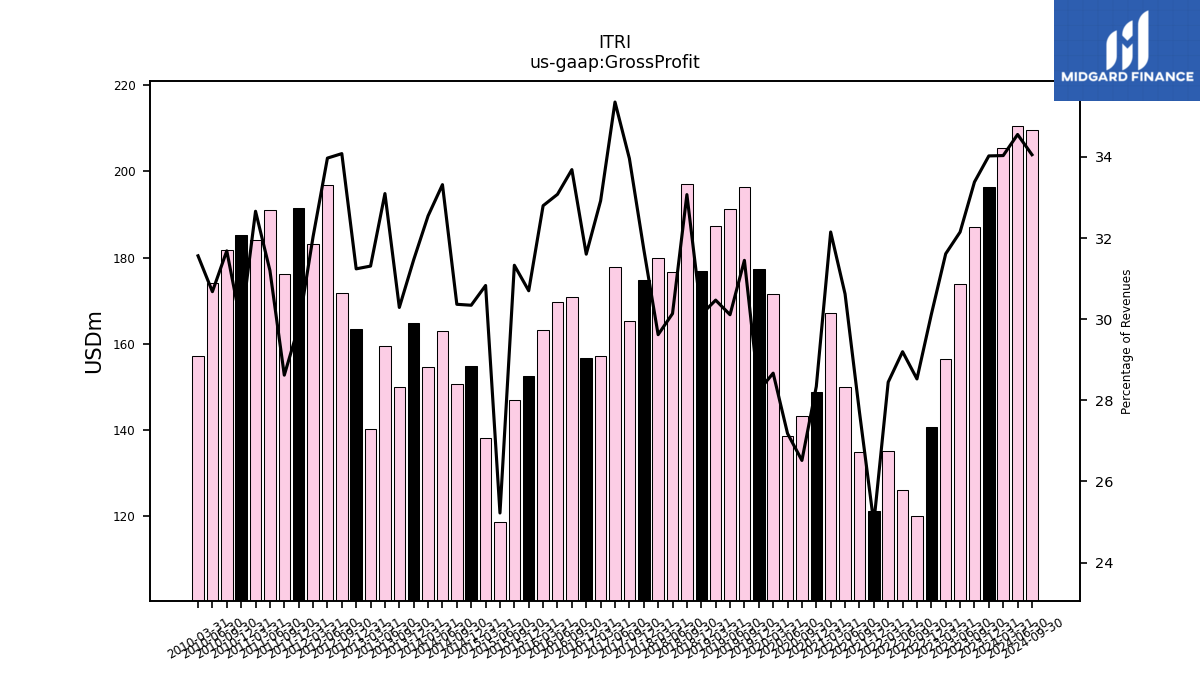
| Gross Profit | 196.39 | 187.20 | 173.95 | 156.37 | 140.80 | 120.06 | 126.11 | 135.22 | 121.29 | 134.96 | 149.88 | 167.04 | 148.83 | 143.25 | 138.52 | 171.57 | 177.44 | 196.40 | 191.21 | 187.26 | 176.79 | 197.10 | 176.58 | 179.85 | 174.75 | 165.32 | 177.86 | 157.22 | 156.66 | 170.75 | 169.71 | 163.20 | 152.42 | 146.97 | 118.57 | 138.20 | 154.79 | 150.76 | 163.04 | 154.53 | 164.74 | 150.08 | 159.59 | 140.12 | 163.50 | 171.80 | 196.75 | 183.10 | 191.61 | 176.18 | 191.08 | 184.11 | 185.36 | 181.76 | 174.06 | 157.06 | |
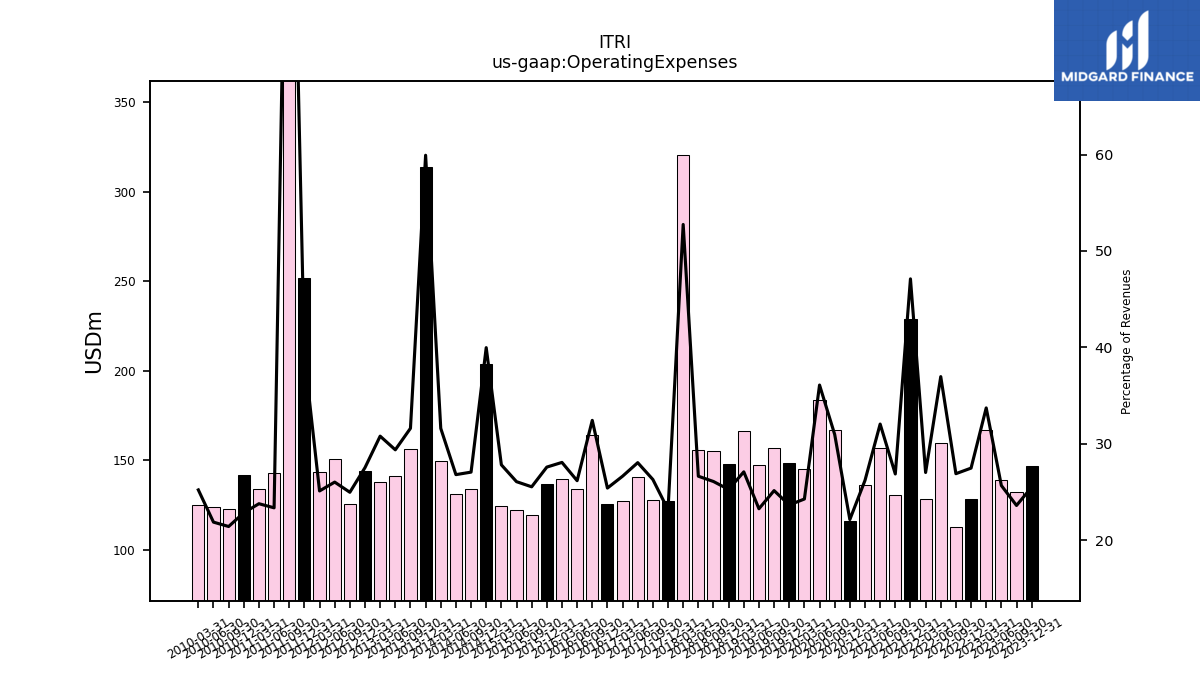
| Operating Expenses | 147.12 | 132.31 | 138.85 | 166.76 | 128.42 | 113.17 | 159.63 | 128.41 | 228.76 | 130.80 | 156.81 | 136.10 | 116.23 | 167.23 | 183.90 | 145.20 | 148.57 | 156.97 | 147.66 | 166.44 | 148.27 | 155.42 | 156.01 | 320.30 | 127.55 | 127.95 | 141.04 | 127.18 | 125.91 | 164.34 | 134.23 | 139.63 | 136.90 | 119.76 | 122.52 | 124.66 | 203.88 | 134.30 | 131.11 | 150.00 | 313.75 | 156.57 | 141.61 | 137.78 | 144.03 | 125.83 | 150.68 | 143.48 | 251.71 | 673.43 | 143.00 | 134.02 | 141.72 | 122.83 | 124.05 | 125.44 | |
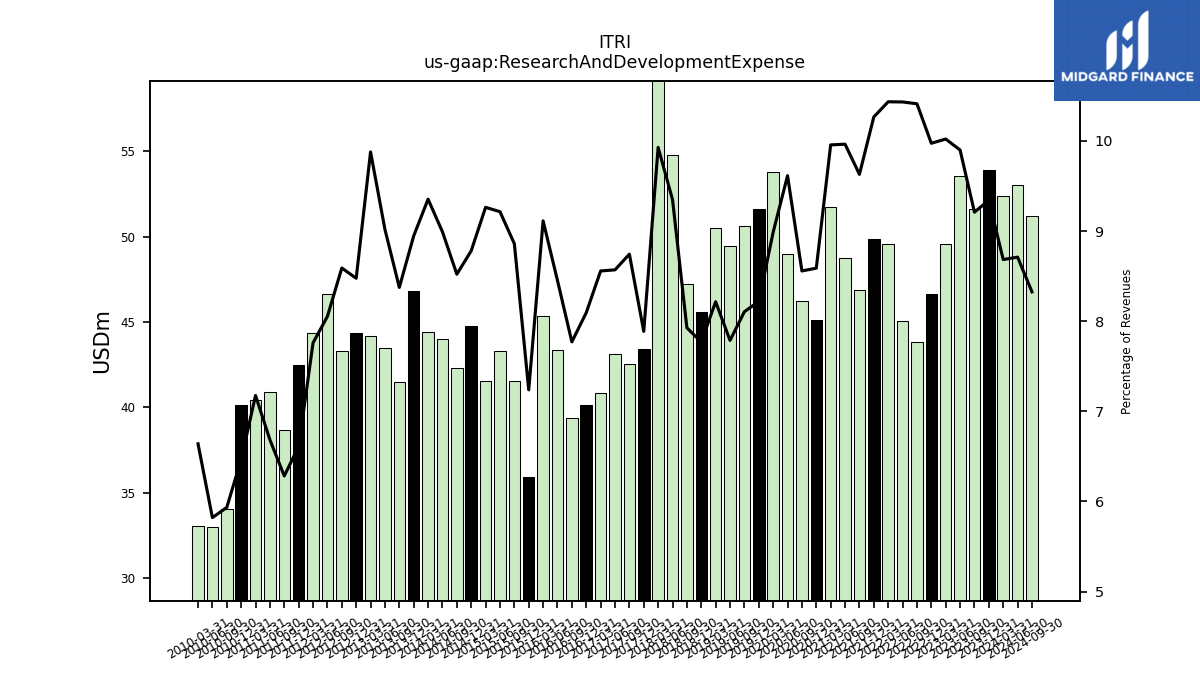
| Research And Development Expense | 53.92 | 51.64 | 53.56 | 49.56 | 46.63 | 43.82 | 45.05 | 49.60 | 49.86 | 46.89 | 48.76 | 51.73 | 45.10 | 46.22 | 48.99 | 53.78 | 51.65 | 50.61 | 49.45 | 50.49 | 45.61 | 47.24 | 54.77 | 60.28 | 43.44 | 42.56 | 43.11 | 40.87 | 40.12 | 39.39 | 43.35 | 45.35 | 35.94 | 41.56 | 43.32 | 41.52 | 44.79 | 42.30 | 44.00 | 44.41 | 46.84 | 41.49 | 43.48 | 44.21 | 44.36 | 43.30 | 46.64 | 44.36 | 42.48 | 38.67 | 40.93 | 40.45 | 40.13 | 34.04 | 33.02 | 33.04 | |
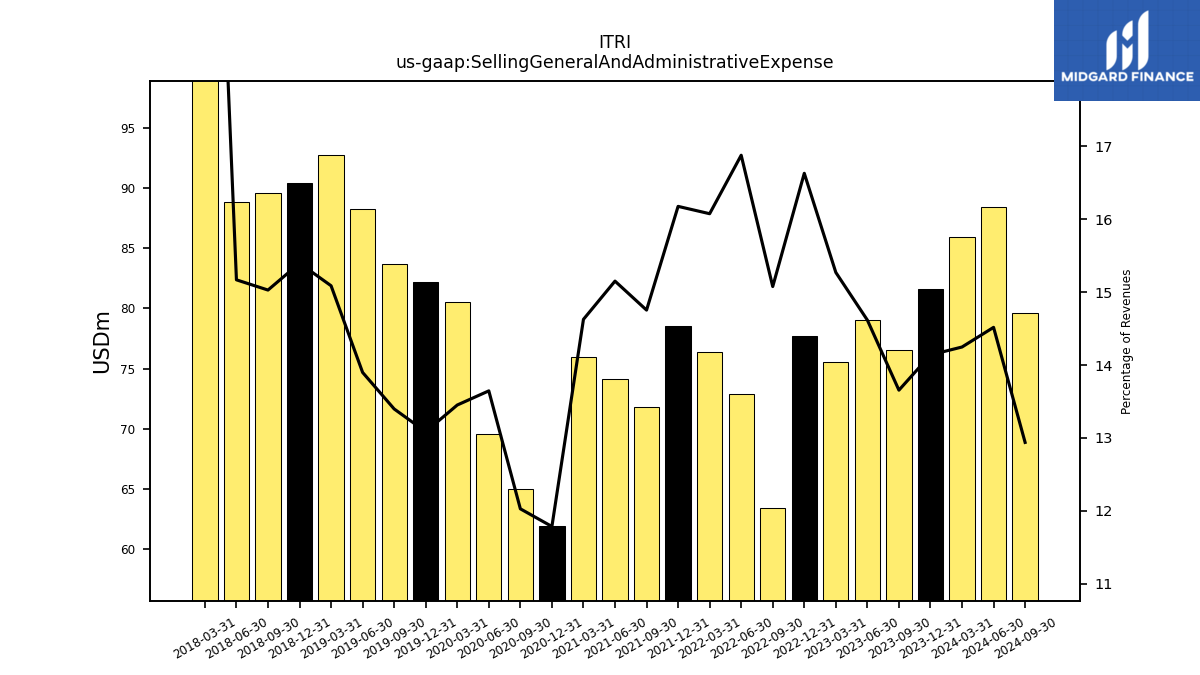
| Selling General And Administrative Expense | 81.60 | 76.58 | 79.08 | 75.52 | 77.73 | 63.45 | 72.88 | 76.40 | 78.55 | 71.84 | 74.14 | 75.99 | 61.90 | 64.98 | 69.54 | 80.50 | 82.23 | 83.67 | 88.26 | 92.72 | 90.38 | 89.56 | 88.86 | 154.41 | NA | NA | NA | NA | NA | NA | NA | NA | NA | NA | NA | NA | NA | NA | NA | NA | NA | NA | NA | NA | NA | NA | NA | NA | NA | NA | NA | NA | NA | NA | NA | NA | |
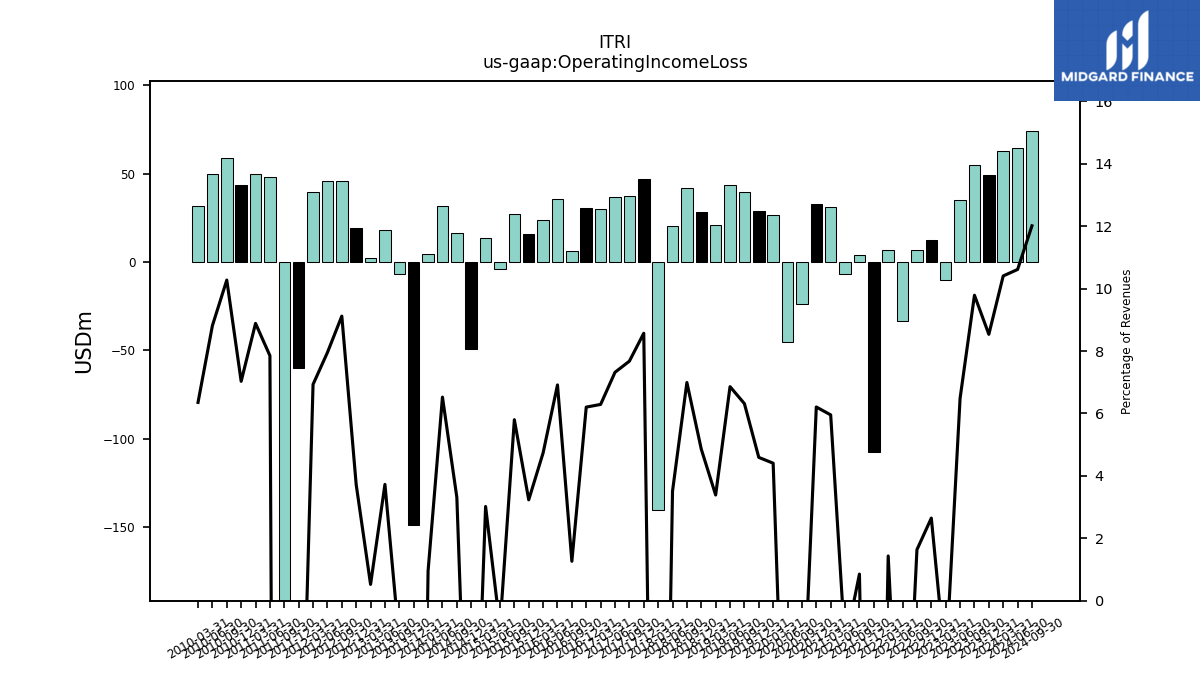
| Operating Income Loss | 49.27 | 54.89 | 35.10 | -10.39 | 12.38 | 6.89 | -33.53 | 6.82 | -107.47 | 4.16 | -6.93 | 30.94 | 32.60 | -23.98 | -45.39 | 26.37 | 28.86 | 39.44 | 43.56 | 20.82 | 28.52 | 41.68 | 20.56 | -140.45 | 47.20 | 37.36 | 36.82 | 30.04 | 30.75 | 6.41 | 35.47 | 23.57 | 16.05 | 27.21 | -3.95 | 13.54 | -49.09 | 16.46 | 31.93 | 4.54 | -149.02 | -6.49 | 17.98 | 2.35 | 19.48 | 45.97 | 46.06 | 39.62 | -60.10 | -497.25 | 48.09 | 50.09 | 43.63 | 58.94 | 50.01 | 31.62 | |
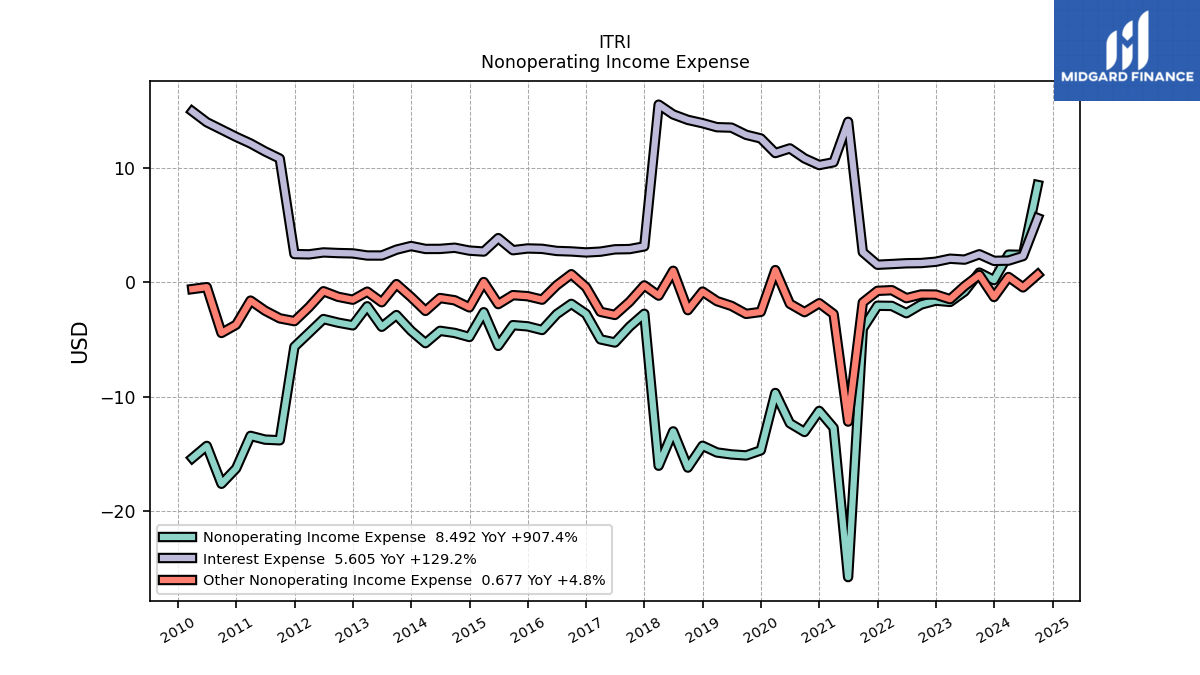
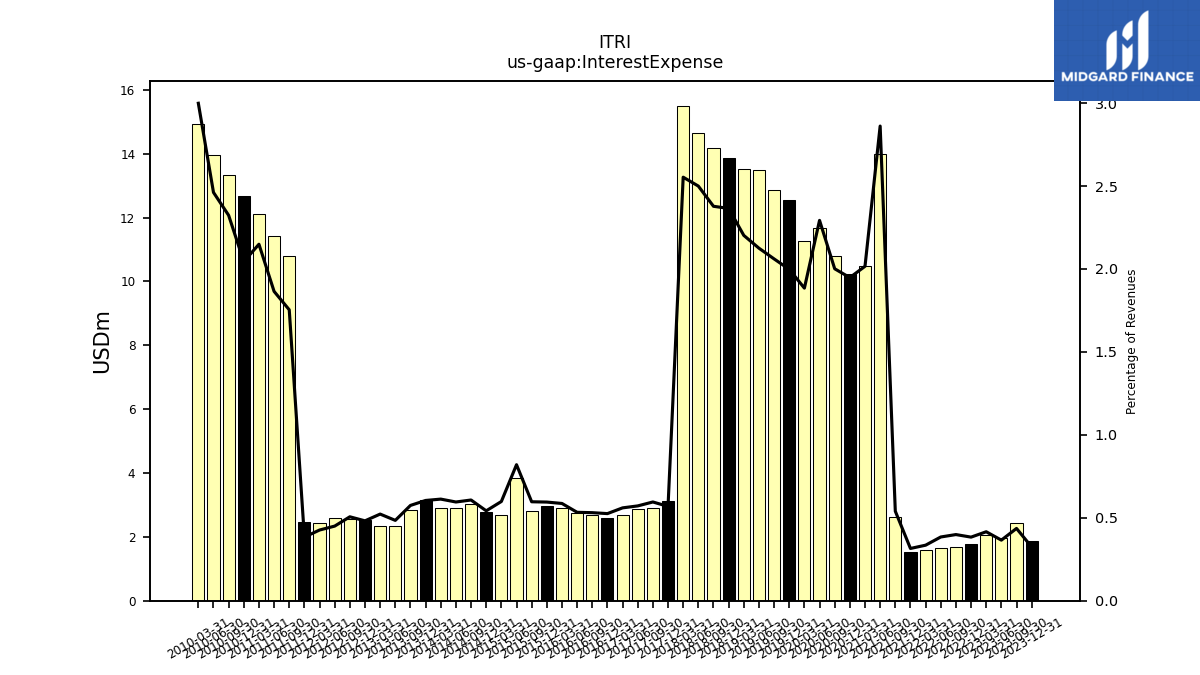
| Interest Expense | 1.87 | 2.44 | 1.98 | 2.06 | 1.79 | 1.68 | 1.66 | 1.59 | 1.53 | 2.63 | 14.00 | 10.47 | 10.23 | 10.81 | 11.68 | 11.28 | 12.55 | 12.87 | 13.50 | 13.54 | 13.88 | 14.17 | 14.64 | 15.50 | 3.13 | 2.90 | 2.88 | 2.67 | 2.60 | 2.69 | 2.73 | 2.92 | 2.95 | 2.80 | 3.85 | 2.68 | 2.77 | 3.02 | 2.91 | 2.91 | 3.17 | 2.85 | 2.34 | 2.34 | 2.52 | 2.55 | 2.61 | 2.44 | 2.46 | 10.80 | 11.42 | 12.11 | 12.69 | 13.33 | 13.96 | 14.92 | |
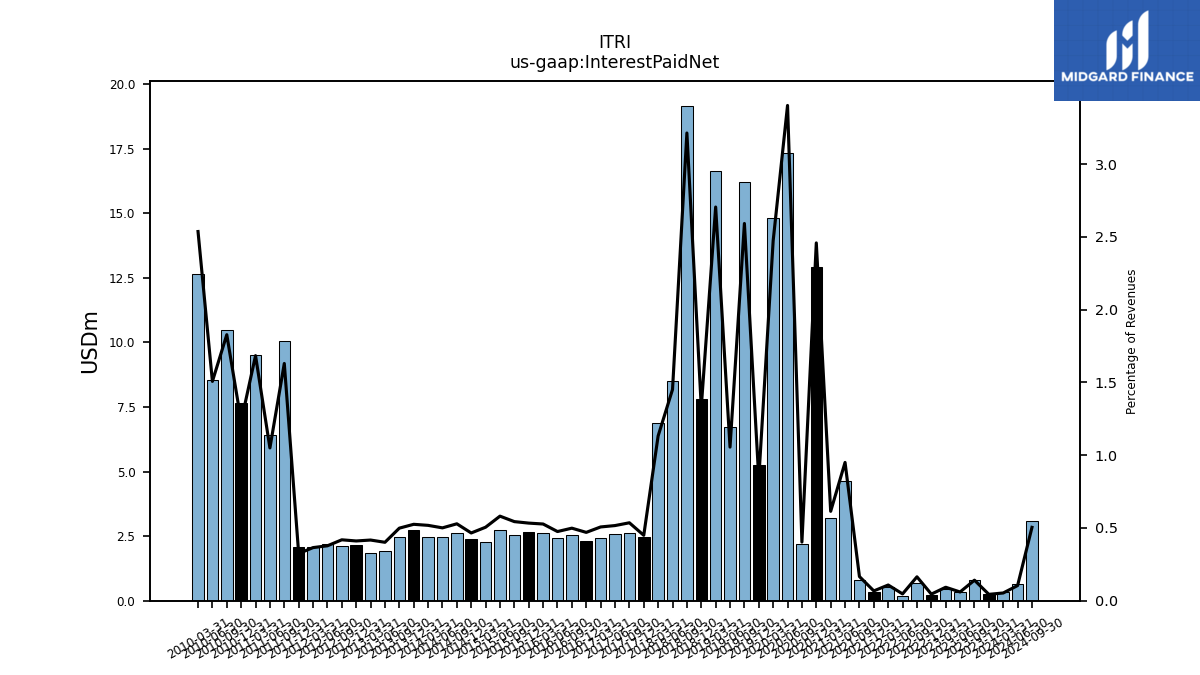
| Interest Paid Net | 0.25 | 0.79 | 0.33 | 0.46 | 0.21 | 0.69 | 0.20 | 0.51 | 0.33 | 0.81 | 4.65 | 3.19 | 12.91 | 2.18 | 17.34 | 14.80 | 5.26 | 16.19 | 6.71 | 16.63 | 7.81 | 19.16 | 8.51 | 6.88 | 2.48 | 2.61 | 2.60 | 2.42 | 2.33 | 2.53 | 2.44 | 2.62 | 2.65 | 2.55 | 2.73 | 2.27 | 2.38 | 2.62 | 2.45 | 2.46 | 2.75 | 2.47 | 1.94 | 1.87 | 2.15 | 2.11 | 2.19 | 2.09 | 2.08 | 10.04 | 6.43 | 9.49 | 7.65 | 10.49 | 8.55 | 12.63 | |
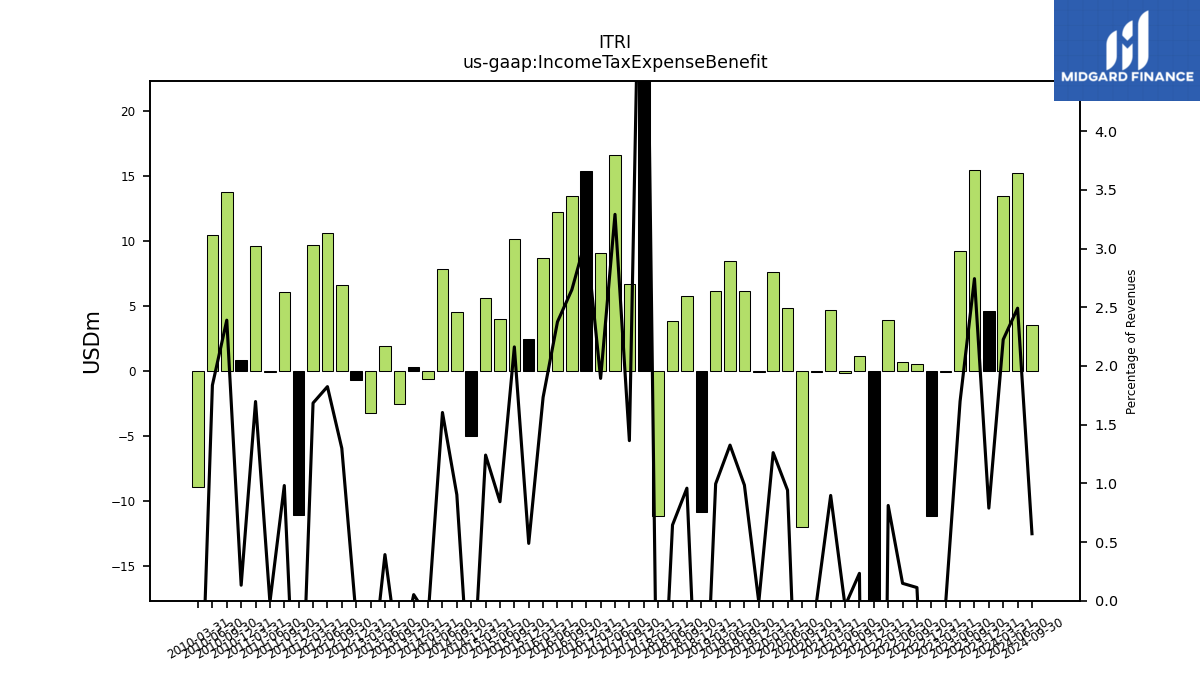
| Income Tax Expense Benefit | 4.55 | 15.39 | 9.20 | -0.07 | -11.17 | 0.47 | 0.64 | 3.86 | -51.09 | 1.14 | -0.22 | 4.66 | -0.13 | -11.98 | 4.80 | 7.55 | -0.07 | 6.15 | 8.42 | 6.12 | -10.88 | 5.71 | 3.78 | -11.19 | 42.08 | 6.64 | 16.56 | 9.05 | 15.32 | 13.43 | 12.19 | 8.63 | 2.43 | 10.14 | 3.97 | 5.56 | -5.04 | 4.48 | 7.85 | -0.65 | 0.27 | -2.59 | 1.90 | -3.24 | -0.74 | 6.55 | 10.56 | 9.63 | -11.10 | 6.04 | -0.08 | 9.57 | 0.82 | 13.71 | 10.42 | -8.98 | |
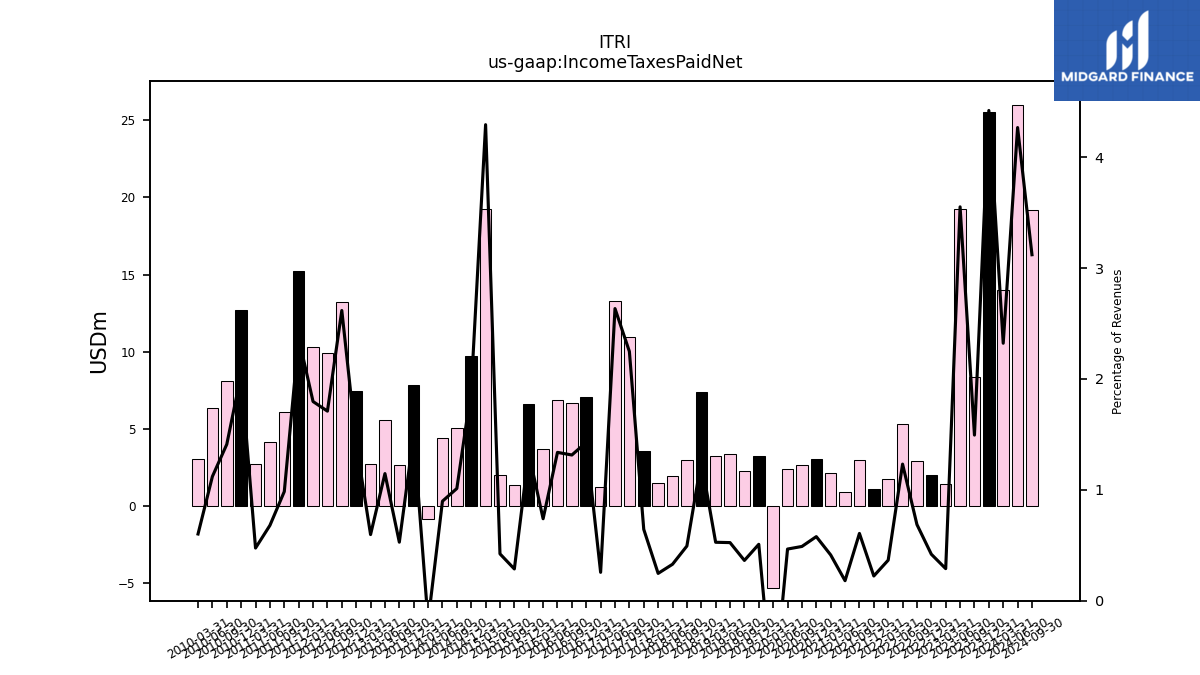
| Income Taxes Paid Net | 25.52 | 8.38 | 19.22 | 1.43 | 1.96 | 2.89 | 5.32 | 1.74 | 1.08 | 2.96 | 0.89 | 2.15 | 3.04 | 2.65 | 2.38 | -5.37 | 3.20 | 2.27 | 3.33 | 3.24 | 7.40 | 2.94 | 1.93 | 1.50 | 3.55 | 10.94 | 13.26 | 1.22 | 7.08 | 6.66 | 6.87 | 3.68 | 6.61 | 1.34 | 1.99 | 19.25 | 9.69 | 5.03 | 4.39 | -0.89 | 7.84 | 2.62 | 5.53 | 2.67 | 7.43 | 13.20 | 9.90 | 10.27 | 15.22 | 6.06 | 4.16 | 2.68 | 12.70 | 8.09 | 6.36 | 3.00 | |
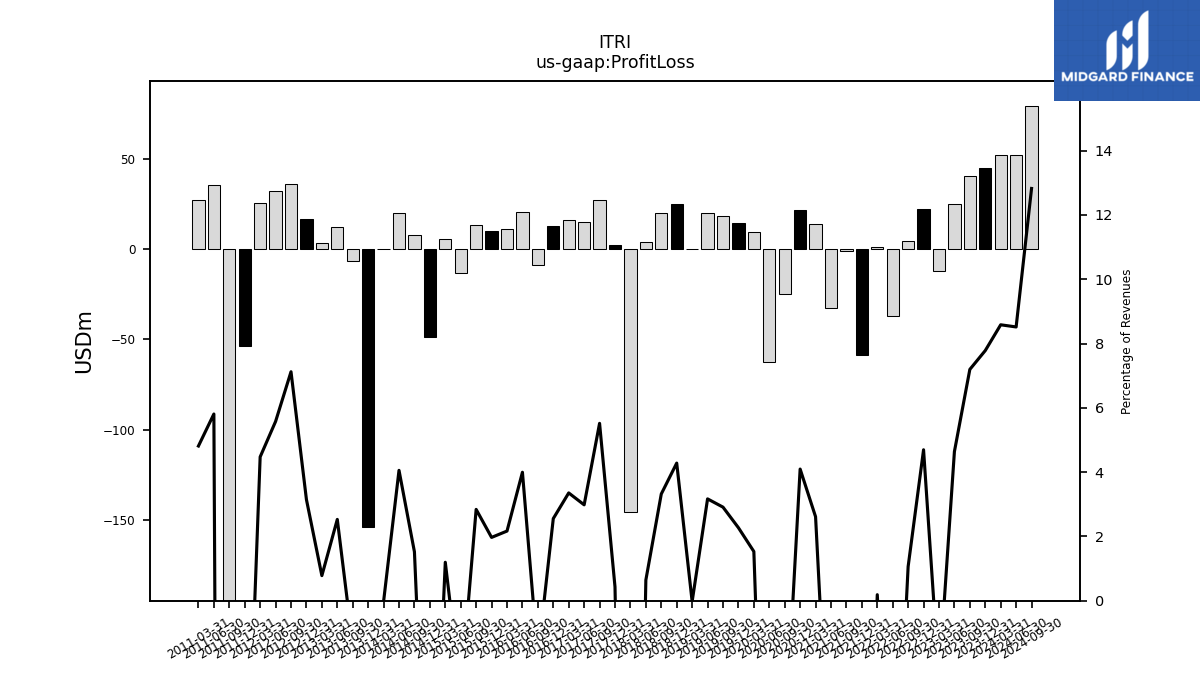
| Profit Loss | 44.91 | 40.34 | 25.10 | -12.04 | 21.95 | 4.47 | -36.87 | 0.90 | -58.42 | -1.01 | -32.45 | 13.58 | 21.51 | -25.06 | -62.49 | 9.16 | 14.27 | 18.18 | 20.12 | -0.15 | 25.13 | 19.79 | 3.77 | -145.27 | 2.37 | 26.85 | 15.01 | 16.01 | 12.67 | -8.90 | 20.50 | 10.78 | 9.78 | 13.32 | -13.47 | 5.37 | -48.83 | 7.55 | 19.84 | -0.12 | -153.52 | -6.76 | 12.20 | 3.50 | 16.46 | 35.90 | 32.29 | 25.57 | -53.55 | -515.34 | 35.56 | 27.13 | NA | NA | NA | NA | |
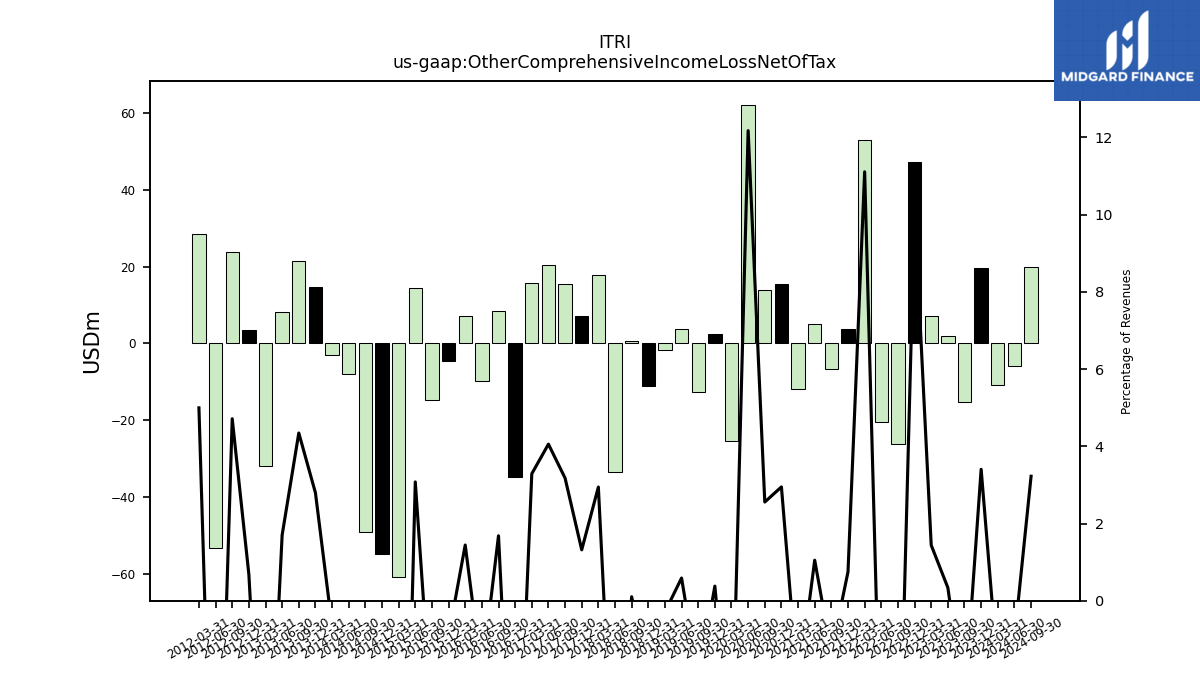
| Other Comprehensive Income Loss Net Of Tax | 19.65 | -15.12 | 1.83 | 7.12 | 47.15 | -26.12 | -20.42 | 52.81 | 3.64 | -6.57 | 5.14 | -11.78 | 15.49 | 13.81 | 62.06 | -25.21 | 2.38 | -12.71 | 3.74 | -1.78 | -11.06 | 0.62 | -33.27 | 17.88 | 7.26 | 15.47 | 20.41 | 15.71 | -34.63 | 8.53 | -9.80 | 7.18 | -4.52 | -14.80 | 14.47 | -60.70 | -54.79 | -48.89 | -8.00 | -3.11 | 14.64 | 21.53 | 8.21 | -31.75 | 3.58 | 23.76 | -53.16 | 28.56 | NA | NA | NA | NA | NA | NA | NA | NA | |
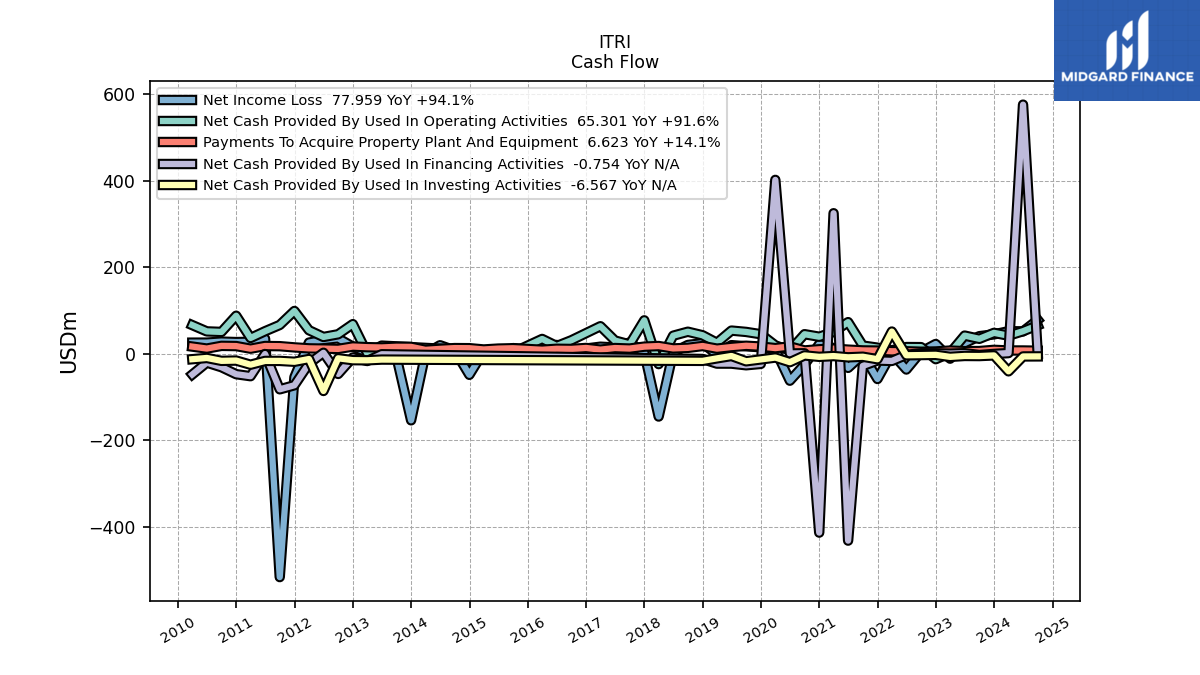
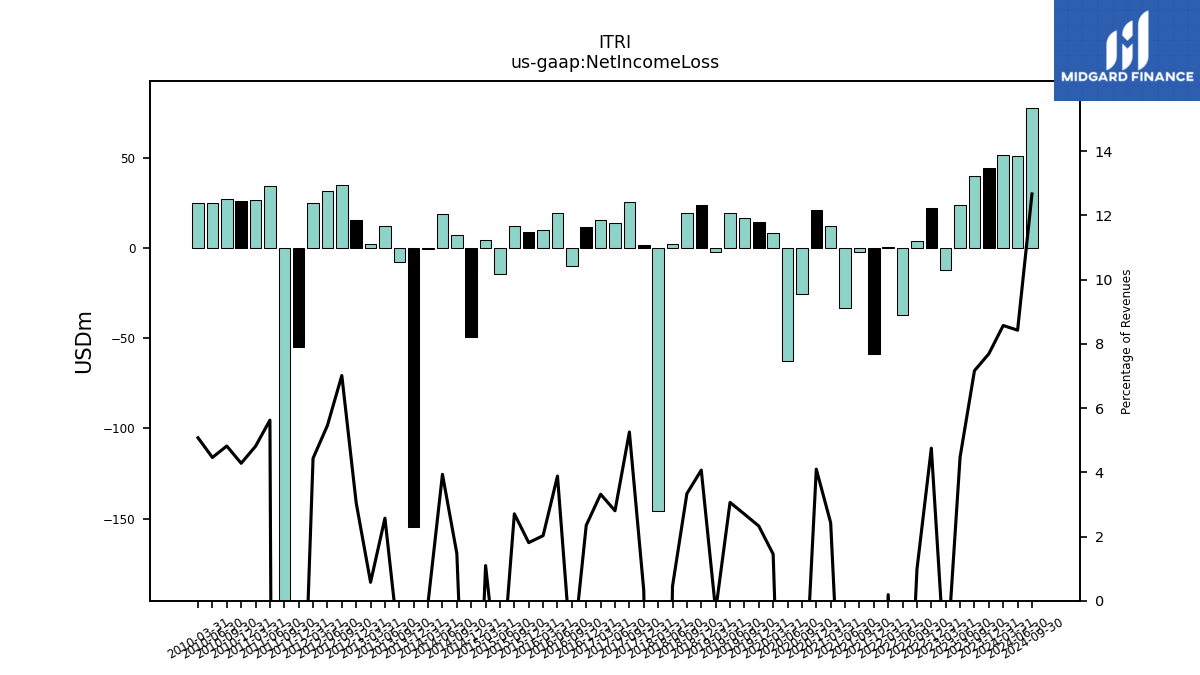
| Net Income Loss | 44.39 | 40.17 | 24.20 | -11.84 | 22.21 | 4.12 | -36.97 | 0.91 | -58.87 | -1.87 | -33.12 | 12.60 | 21.52 | -25.36 | -62.80 | 8.68 | 14.62 | 16.85 | 19.45 | -1.91 | 23.88 | 19.88 | 2.66 | -145.67 | 1.78 | 25.58 | 14.10 | 15.85 | 11.65 | -9.88 | 19.92 | 10.09 | 8.99 | 12.70 | -14.20 | 4.91 | -49.23 | 7.31 | 19.26 | -0.25 | -154.43 | -7.35 | 12.40 | 2.57 | 15.96 | 35.35 | 31.61 | 25.35 | -54.63 | -517.08 | 34.44 | 27.12 | 26.57 | 27.64 | 25.31 | 25.25 | |
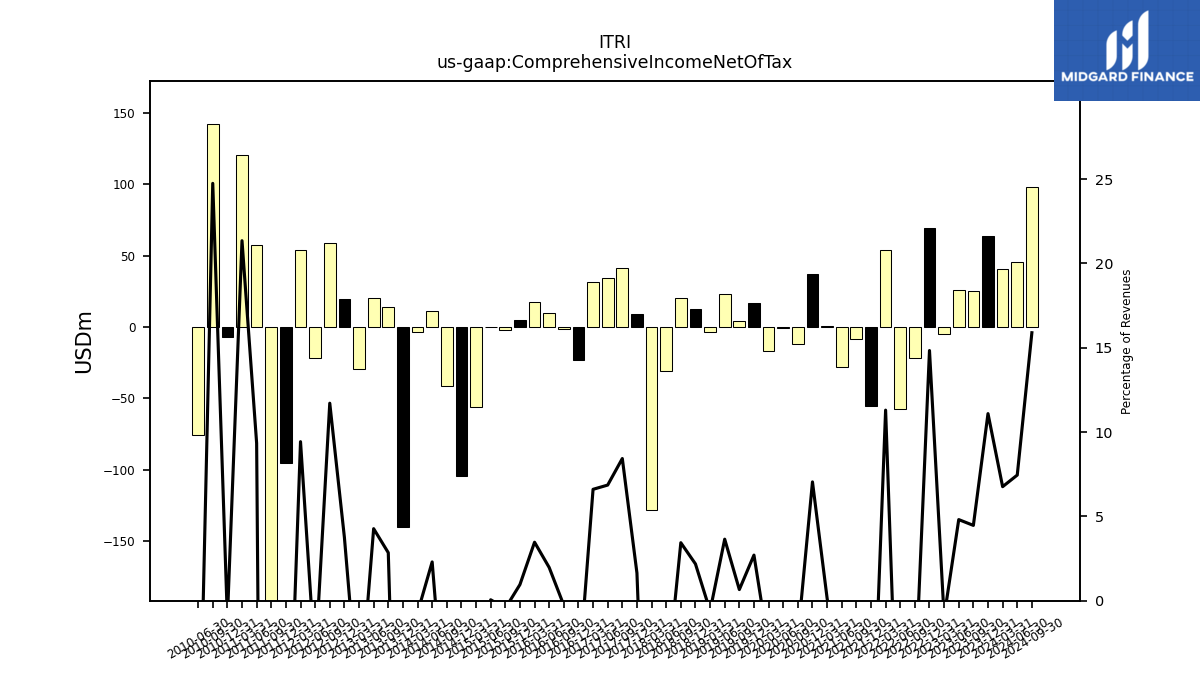
| Comprehensive Income Net Of Tax | 64.04 | 25.05 | 26.03 | -4.72 | 69.36 | -22.00 | -57.39 | 53.72 | -55.23 | -8.44 | -27.99 | 0.82 | 37.01 | -11.54 | -0.75 | -16.53 | 17.00 | 4.14 | 23.18 | -3.69 | 12.82 | 20.50 | -30.62 | -127.78 | 9.04 | 41.04 | 34.51 | 31.55 | -22.98 | -1.36 | 10.12 | 17.27 | 4.75 | -2.11 | 0.27 | -55.79 | -104.02 | -41.59 | 11.26 | -3.37 | -139.69 | 14.12 | 20.60 | -29.18 | 19.68 | 59.04 | -21.58 | 53.92 | -95.34 | -594.92 | 57.21 | 120.33 | -6.68 | 141.96 | -75.44 | NA |
| 2023-12-31 | 2023-09-30 | 2023-06-30 | 2023-03-31 | 2022-12-31 | 2022-09-30 | 2022-06-30 | 2022-03-31 | 2021-12-31 | 2021-09-30 | 2021-06-30 | 2021-03-31 | 2020-12-31 | 2020-09-30 | 2020-06-30 | 2020-03-31 | 2019-12-31 | 2019-09-30 | 2019-06-30 | 2019-03-31 | 2018-12-31 | 2018-09-30 | 2018-06-30 | 2018-03-31 | 2017-12-31 | 2017-09-30 | 2017-06-30 | 2017-03-31 | 2016-12-31 | 2016-09-30 | 2016-06-30 | 2016-03-31 | 2015-12-31 | 2015-09-30 | 2015-06-30 | 2015-03-31 | 2014-12-31 | 2014-09-30 | 2014-06-30 | 2014-03-31 | 2013-12-31 | 2013-09-30 | 2013-06-30 | 2013-03-31 | 2012-12-31 | 2012-09-30 | 2012-06-30 | 2012-03-31 | 2011-12-31 | 2011-09-30 | 2011-06-30 | 2011-03-31 | 2010-12-31 | 2010-09-30 | 2010-06-30 | 2010-03-31 | ||
|---|---|---|---|---|---|---|---|---|---|---|---|---|---|---|---|---|---|---|---|---|---|---|---|---|---|---|---|---|---|---|---|---|---|---|---|---|---|---|---|---|---|---|---|---|---|---|---|---|---|---|---|---|---|---|---|---|---|
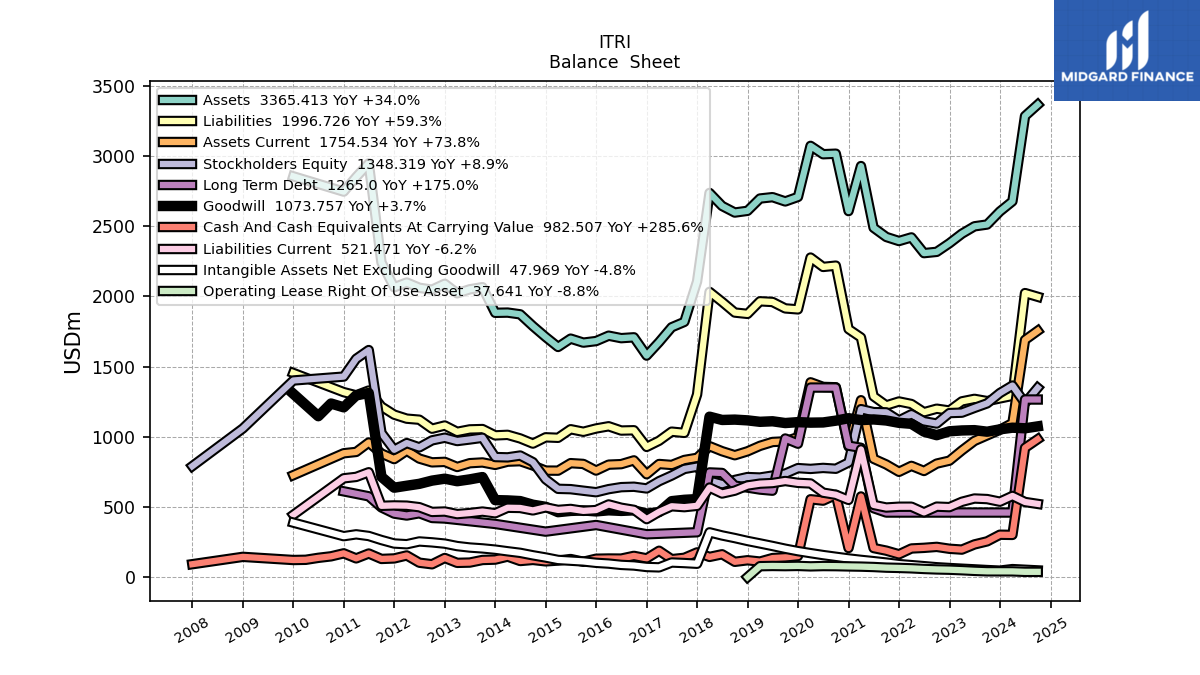
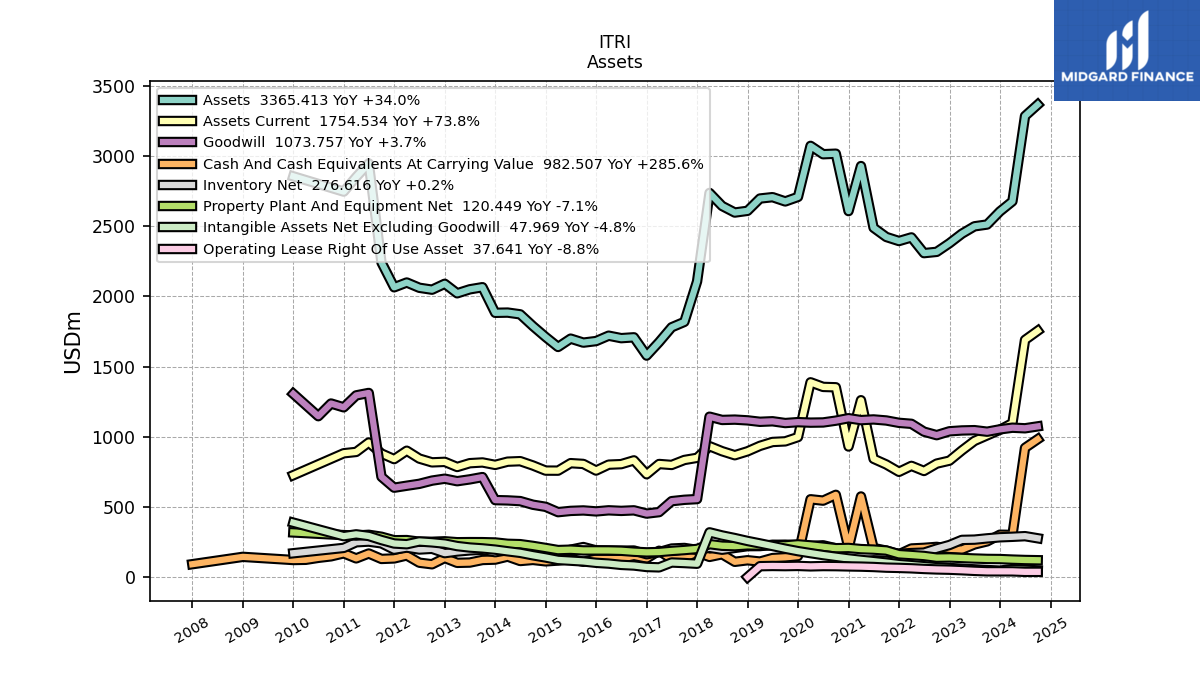
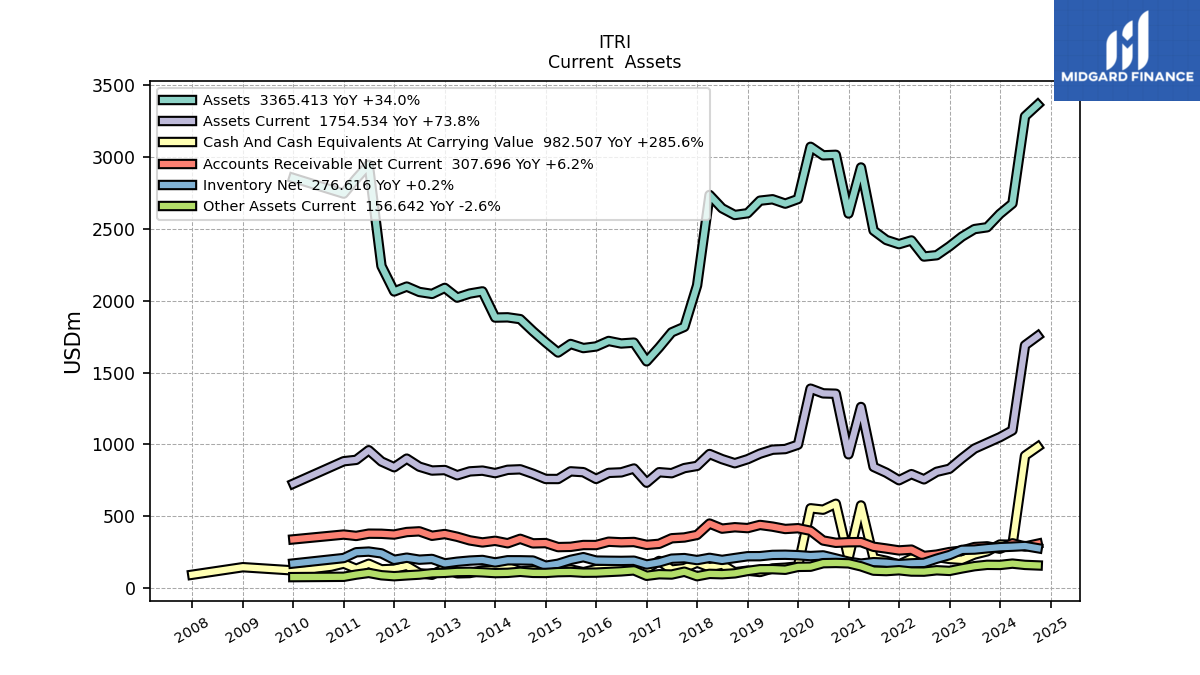
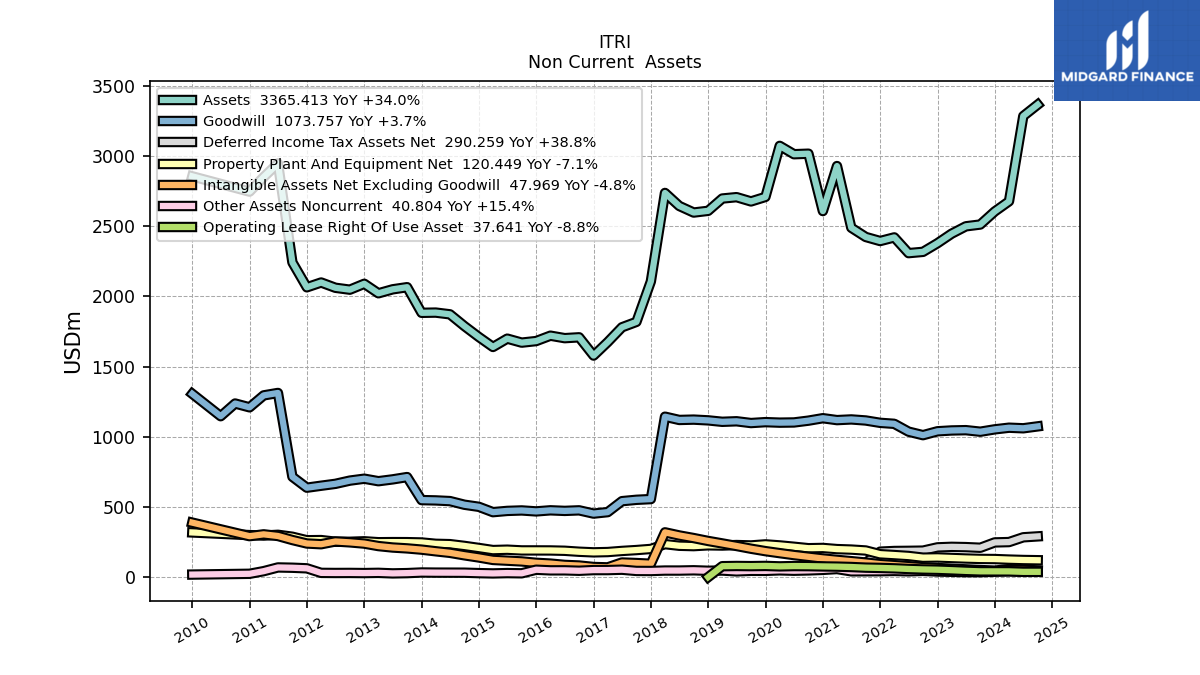
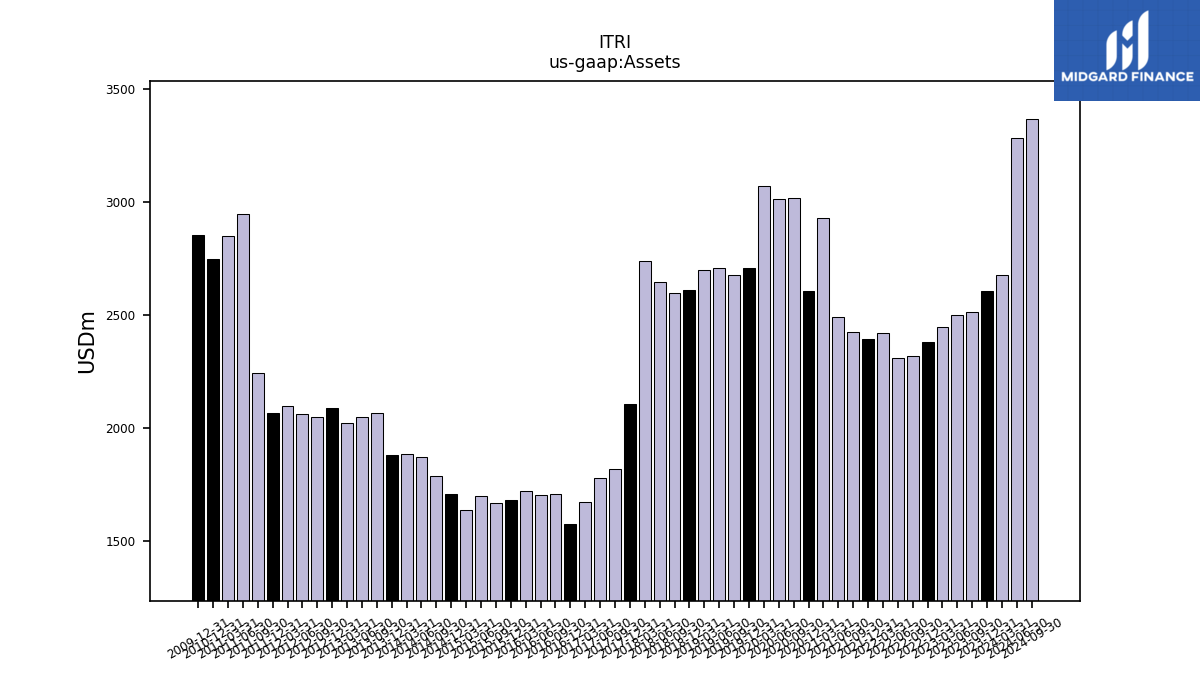
| Assets | 2604.26 | 2511.41 | 2498.64 | 2445.91 | 2378.08 | 2316.78 | 2307.60 | 2419.82 | 2393.79 | 2422.77 | 2488.59 | 2927.97 | 2607.02 | 3015.92 | 3012.14 | 3071.75 | 2707.84 | 2675.89 | 2706.35 | 2696.62 | 2608.98 | 2596.74 | 2643.57 | 2736.53 | 2106.15 | 1817.94 | 1779.62 | 1673.92 | 1577.81 | 1708.12 | 1702.03 | 1719.68 | 1681.36 | 1670.20 | 1698.67 | 1639.22 | 1710.31 | 1787.93 | 1871.75 | 1884.20 | 1882.51 | 2065.09 | 2049.91 | 2021.53 | 2089.44 | 2047.34 | 2060.91 | 2098.48 | 2064.28 | 2241.68 | 2946.68 | 2849.72 | 2745.80 | NA | NA | NA | |
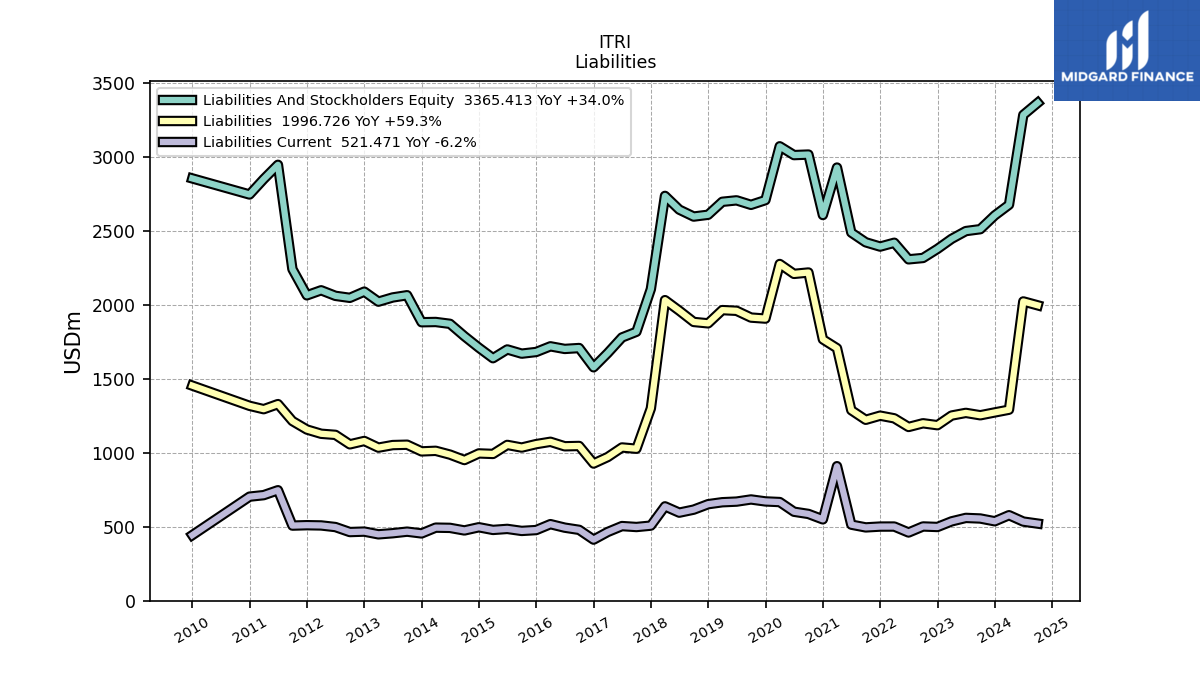
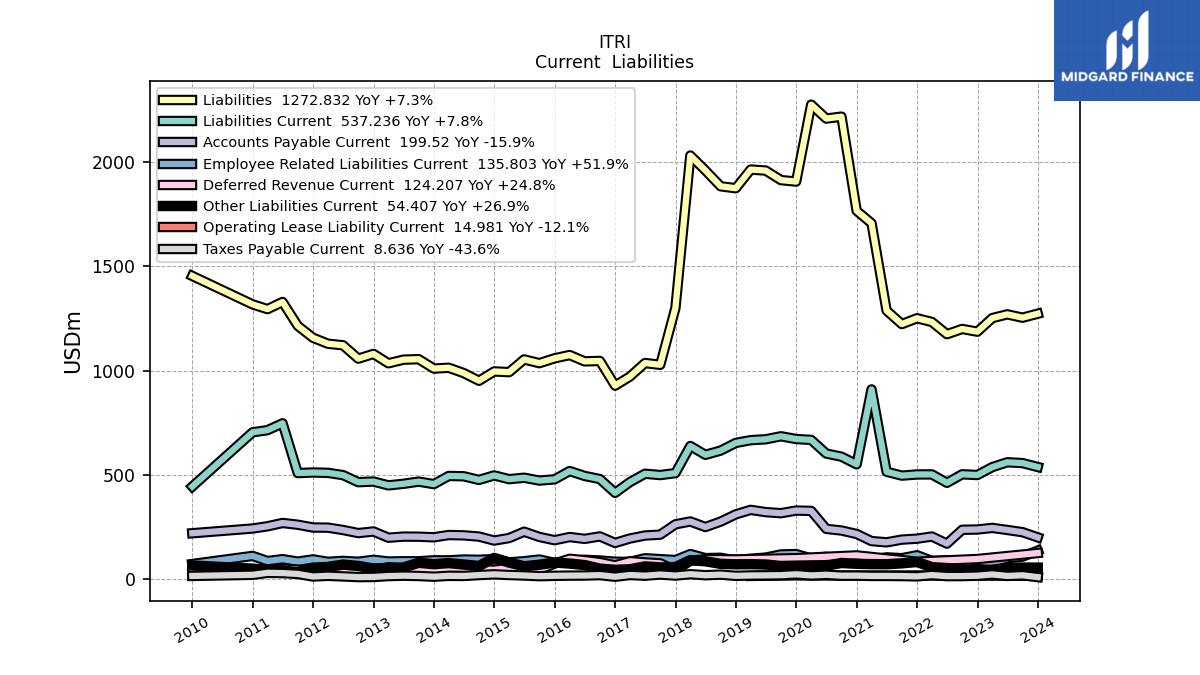
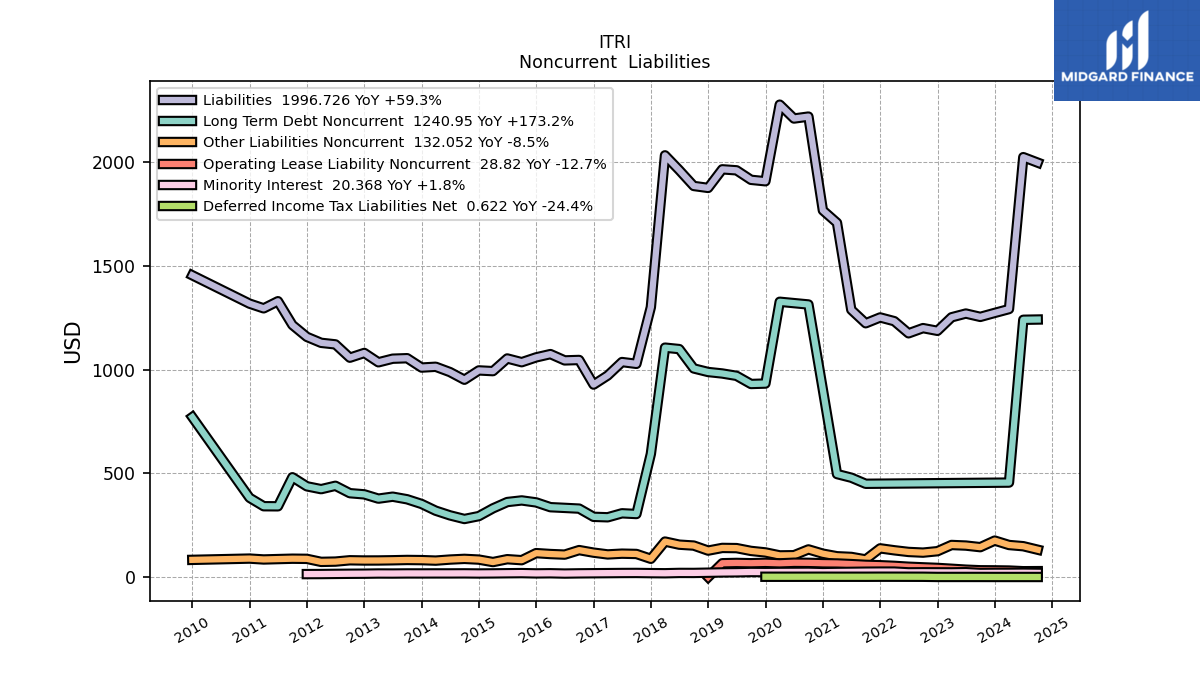
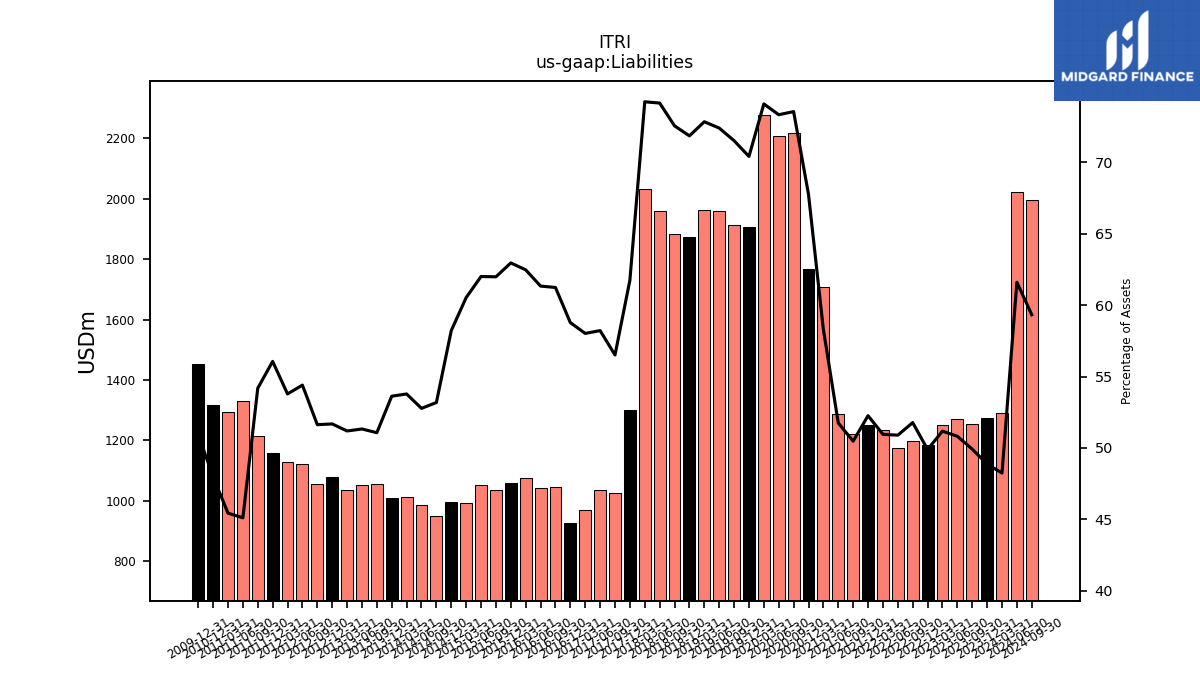
| Liabilities | 1272.83 | 1253.68 | 1269.75 | 1251.77 | 1186.52 | 1199.61 | 1174.50 | 1233.06 | 1251.03 | 1222.94 | 1287.93 | 1706.80 | 1766.75 | 2218.66 | 2209.27 | 2276.25 | 1907.03 | 1913.97 | 1959.76 | 1964.59 | 1874.93 | 1884.41 | 1960.59 | 2031.93 | 1300.52 | 1027.42 | 1036.13 | 971.32 | 927.46 | 1046.13 | 1044.06 | 1074.45 | 1058.66 | 1035.39 | 1053.41 | 992.32 | 995.82 | 950.92 | 987.81 | 1013.40 | 1009.54 | 1054.65 | 1052.23 | 1034.87 | 1079.93 | 1057.09 | 1121.23 | 1128.70 | 1157.36 | 1214.70 | 1329.21 | 1294.80 | 1317.50 | NA | NA | NA | |
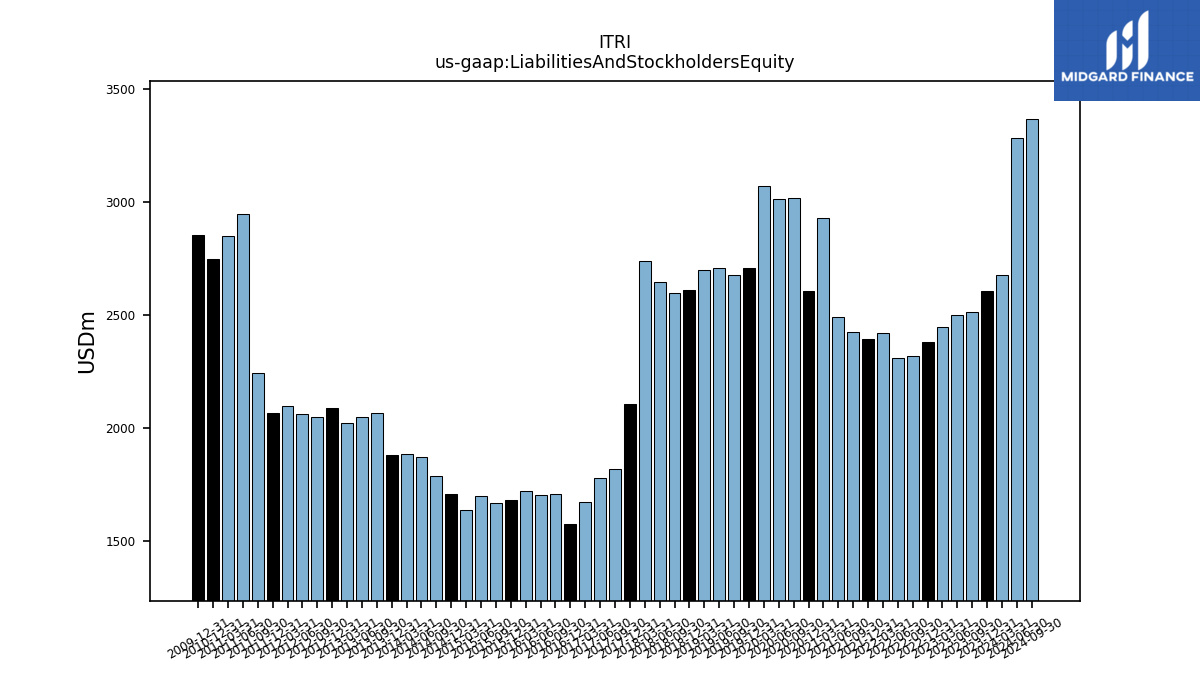
| Liabilities And Stockholders Equity | 2604.26 | 2511.41 | 2498.64 | 2445.91 | 2378.08 | 2316.78 | 2307.60 | 2419.82 | 2393.79 | 2422.77 | 2488.59 | 2927.97 | 2607.02 | 3015.92 | 3012.14 | 3071.75 | 2707.84 | 2675.89 | 2706.35 | 2696.62 | 2608.98 | 2596.74 | 2643.57 | 2736.53 | 2106.15 | 1817.94 | 1779.62 | 1673.92 | 1577.81 | 1708.12 | 1702.03 | 1719.68 | 1681.36 | 1670.20 | 1698.67 | 1639.22 | 1710.31 | 1787.93 | 1871.75 | 1884.20 | 1882.51 | 2065.09 | 2049.91 | 2021.53 | 2089.44 | 2047.34 | 2060.91 | 2098.48 | 2064.28 | 2241.68 | 2946.68 | 2849.72 | 2745.80 | NA | NA | NA | |
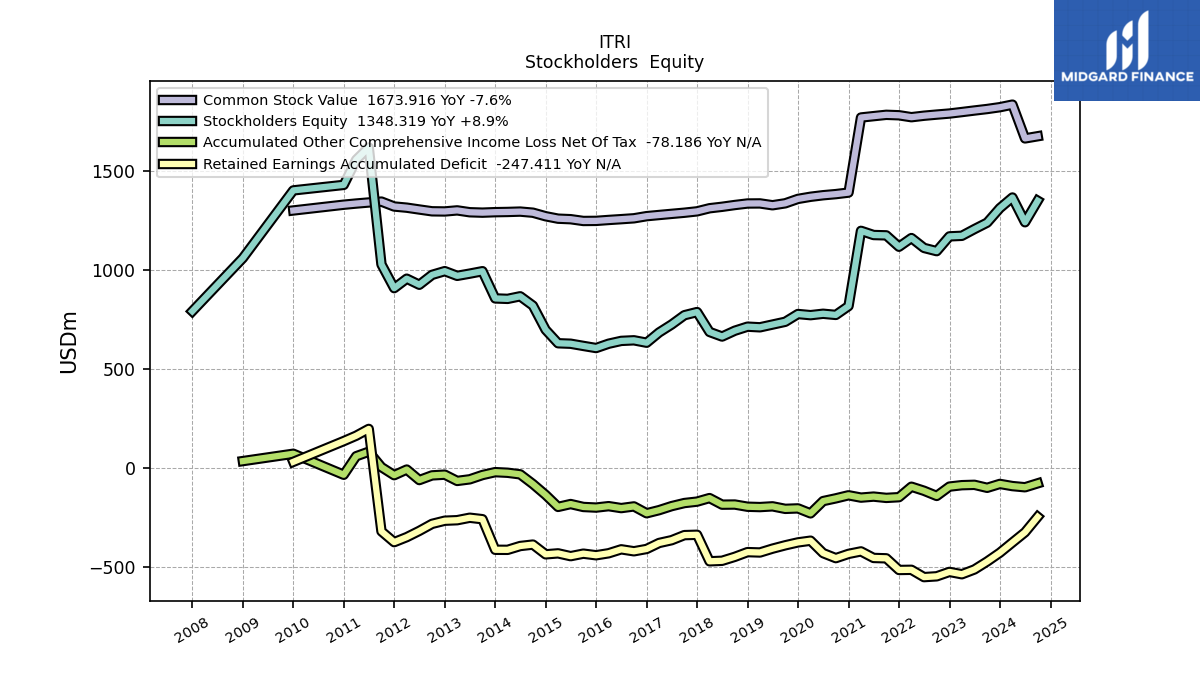
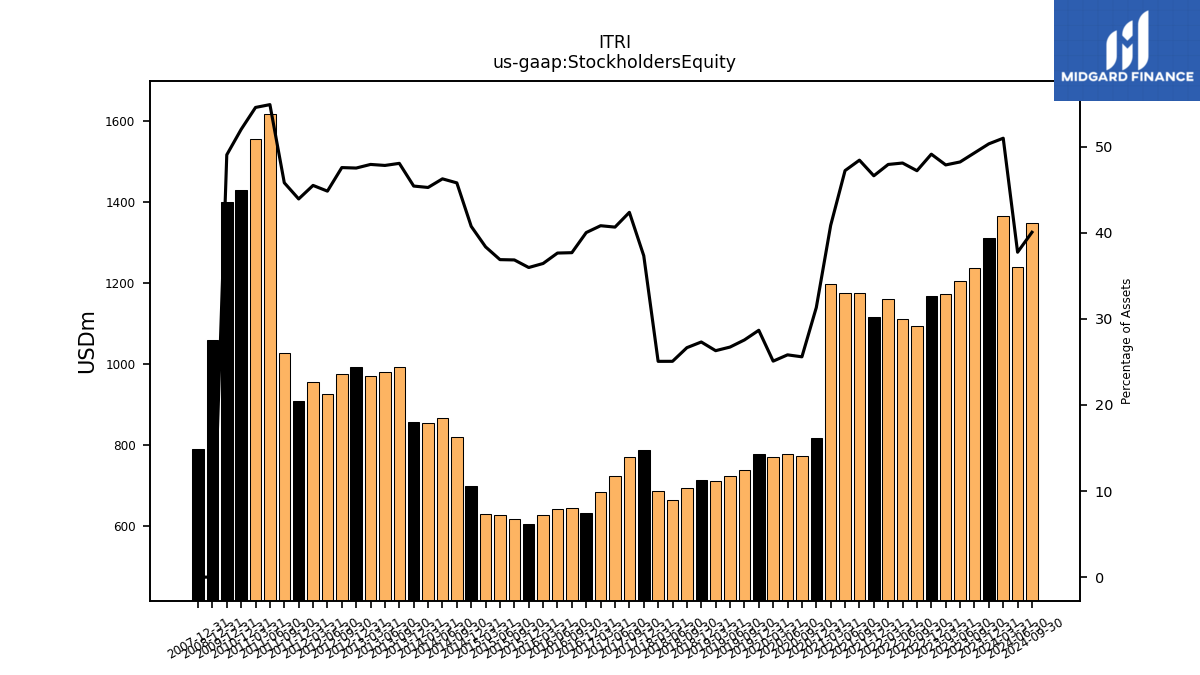
| Stockholders Equity | 1310.91 | 1237.73 | 1205.12 | 1171.28 | 1168.47 | 1093.83 | 1110.11 | 1160.08 | 1116.08 | 1173.59 | 1175.28 | 1196.47 | 816.55 | 771.90 | 777.80 | 770.74 | 776.54 | 737.29 | 723.30 | 709.40 | 712.66 | 692.20 | 662.76 | 685.97 | 786.42 | 770.41 | 723.65 | 683.35 | 631.60 | 643.83 | 640.79 | 626.59 | 604.76 | 615.45 | 626.53 | 628.90 | 696.94 | 818.88 | 866.05 | 852.93 | 855.24 | 992.65 | 980.40 | 969.19 | 992.97 | 974.07 | 924.13 | 954.94 | 906.92 | 1026.98 | 1617.47 | 1554.92 | 1428.30 | NA | NA | NA |
| 2023-12-31 | 2023-09-30 | 2023-06-30 | 2023-03-31 | 2022-12-31 | 2022-09-30 | 2022-06-30 | 2022-03-31 | 2021-12-31 | 2021-09-30 | 2021-06-30 | 2021-03-31 | 2020-12-31 | 2020-09-30 | 2020-06-30 | 2020-03-31 | 2019-12-31 | 2019-09-30 | 2019-06-30 | 2019-03-31 | 2018-12-31 | 2018-09-30 | 2018-06-30 | 2018-03-31 | 2017-12-31 | 2017-09-30 | 2017-06-30 | 2017-03-31 | 2016-12-31 | 2016-09-30 | 2016-06-30 | 2016-03-31 | 2015-12-31 | 2015-09-30 | 2015-06-30 | 2015-03-31 | 2014-12-31 | 2014-09-30 | 2014-06-30 | 2014-03-31 | 2013-12-31 | 2013-09-30 | 2013-06-30 | 2013-03-31 | 2012-12-31 | 2012-09-30 | 2012-06-30 | 2012-03-31 | 2011-12-31 | 2011-09-30 | 2011-06-30 | 2011-03-31 | 2010-12-31 | 2010-09-30 | 2010-06-30 | 2010-03-31 | ||
|---|---|---|---|---|---|---|---|---|---|---|---|---|---|---|---|---|---|---|---|---|---|---|---|---|---|---|---|---|---|---|---|---|---|---|---|---|---|---|---|---|---|---|---|---|---|---|---|---|---|---|---|---|---|---|---|---|---|
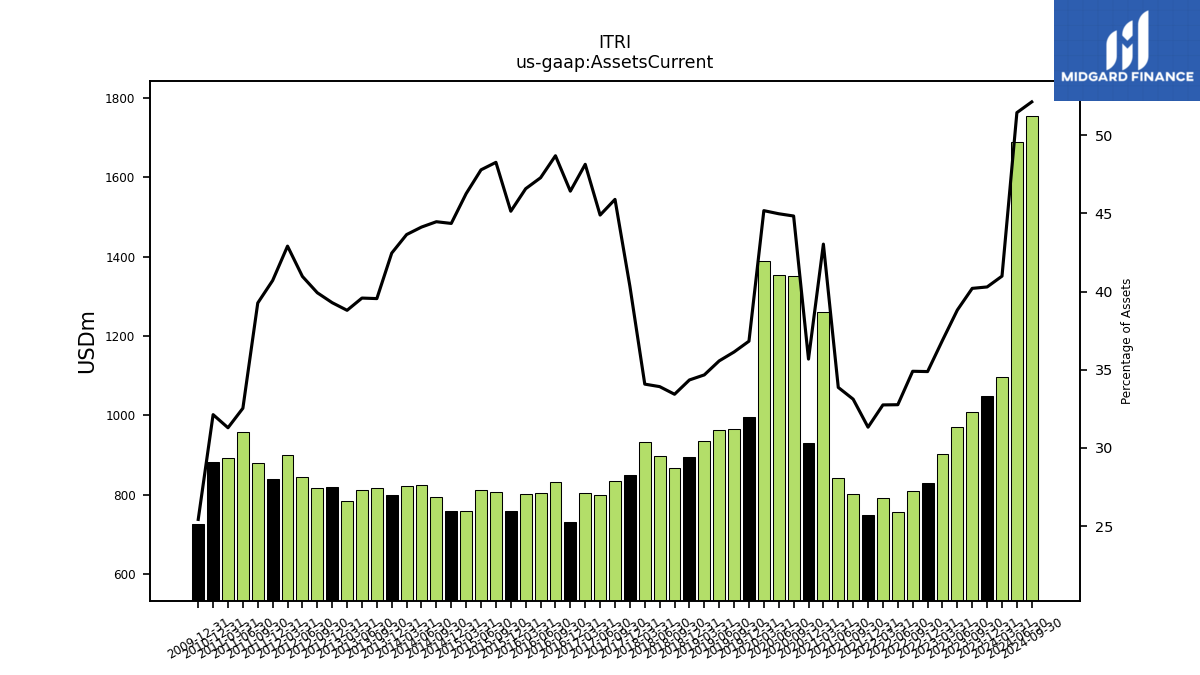
| Assets Current | 1049.44 | 1009.74 | 969.99 | 902.06 | 829.58 | 808.64 | 756.09 | 792.53 | 749.93 | 802.39 | 842.90 | 1260.10 | 930.26 | 1352.17 | 1354.83 | 1387.73 | 997.25 | 967.02 | 962.60 | 934.98 | 896.14 | 868.18 | 896.75 | 932.64 | 849.74 | 834.39 | 798.96 | 805.82 | 732.47 | 831.68 | 804.75 | 801.05 | 758.94 | 806.15 | 811.77 | 758.42 | 758.69 | 795.07 | 825.94 | 822.41 | 799.37 | 816.79 | 811.47 | 784.41 | 820.95 | 817.42 | 844.35 | 900.43 | 840.35 | 880.35 | 958.84 | 891.72 | 882.22 | NA | NA | NA | |
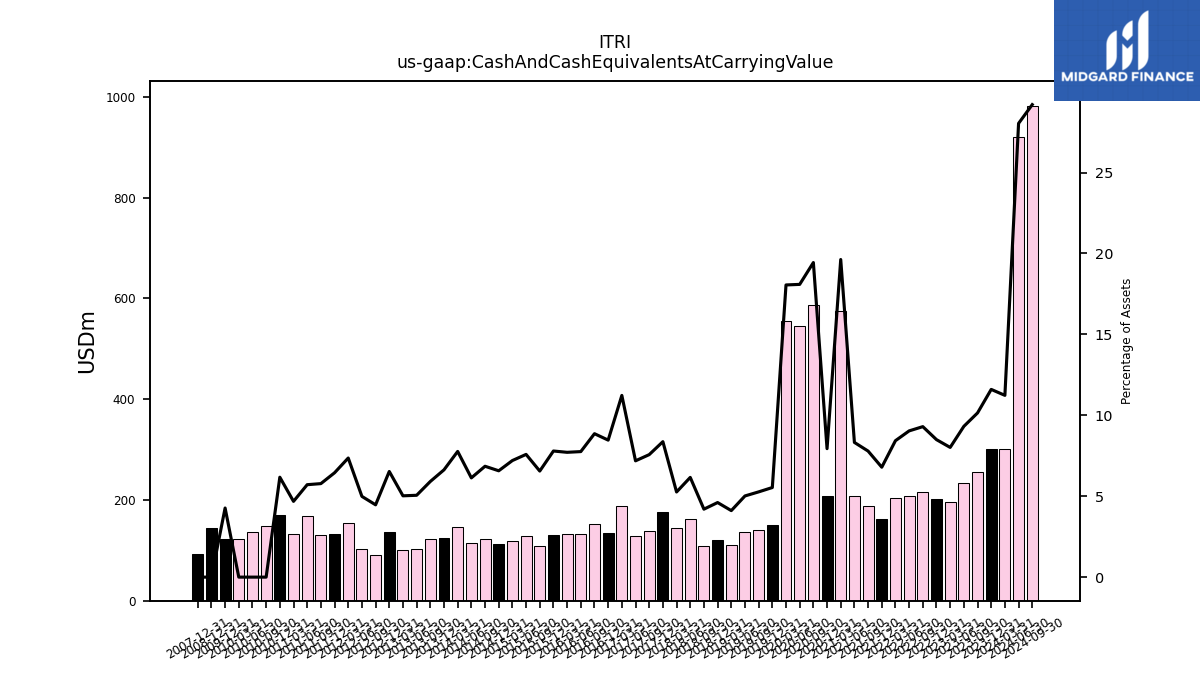
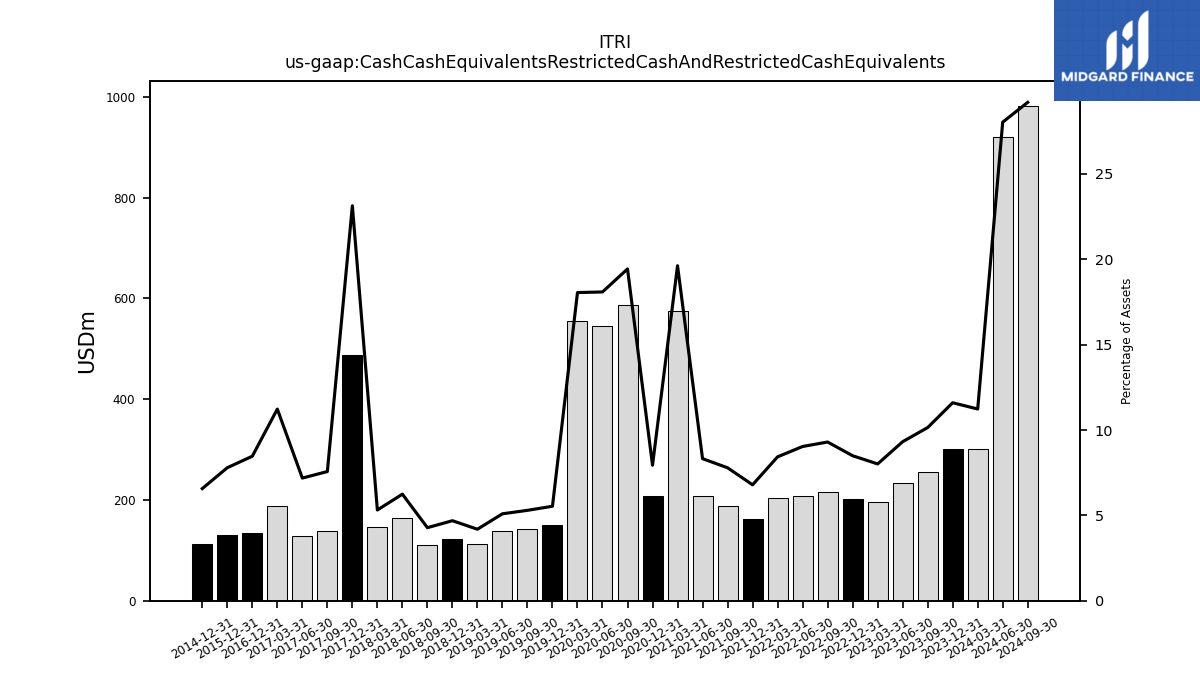
| Cash And Cash Equivalents At Carrying Value | 302.05 | 254.77 | 232.79 | 196.01 | 202.01 | 215.41 | 208.50 | 204.00 | 162.58 | 188.69 | 207.13 | 574.59 | 206.93 | 586.17 | 544.82 | 554.52 | 149.90 | 140.94 | 135.74 | 110.83 | 120.22 | 109.04 | 162.88 | 143.95 | 176.27 | 137.58 | 127.88 | 187.93 | 133.56 | 151.38 | 132.01 | 132.62 | 131.02 | 109.46 | 128.81 | 118.08 | 112.37 | 122.47 | 114.78 | 146.33 | 124.81 | 122.05 | 103.66 | 101.56 | 136.41 | 91.47 | 102.80 | 154.44 | 133.09 | 129.51 | 168.28 | 133.41 | 169.48 | 148.11 | 137.37 | 123.42 | |
| Cash Cash Equivalents Restricted Cash And Restricted Cash Equivalents | 302.05 | 254.77 | 232.79 | 196.01 | 202.01 | 215.41 | 208.50 | 204.00 | 162.58 | 188.69 | 207.13 | 574.59 | 206.93 | 586.17 | 544.82 | 554.52 | 149.90 | 141.70 | 137.85 | 112.97 | 122.33 | 111.15 | 165.04 | 145.47 | 487.33 | 137.58 | 127.88 | 187.93 | 133.56 | NA | NA | NA | 131.02 | NA | NA | NA | 112.37 | NA | NA | NA | NA | NA | NA | NA | NA | NA | NA | NA | NA | NA | NA | NA | NA | NA | NA | NA | |
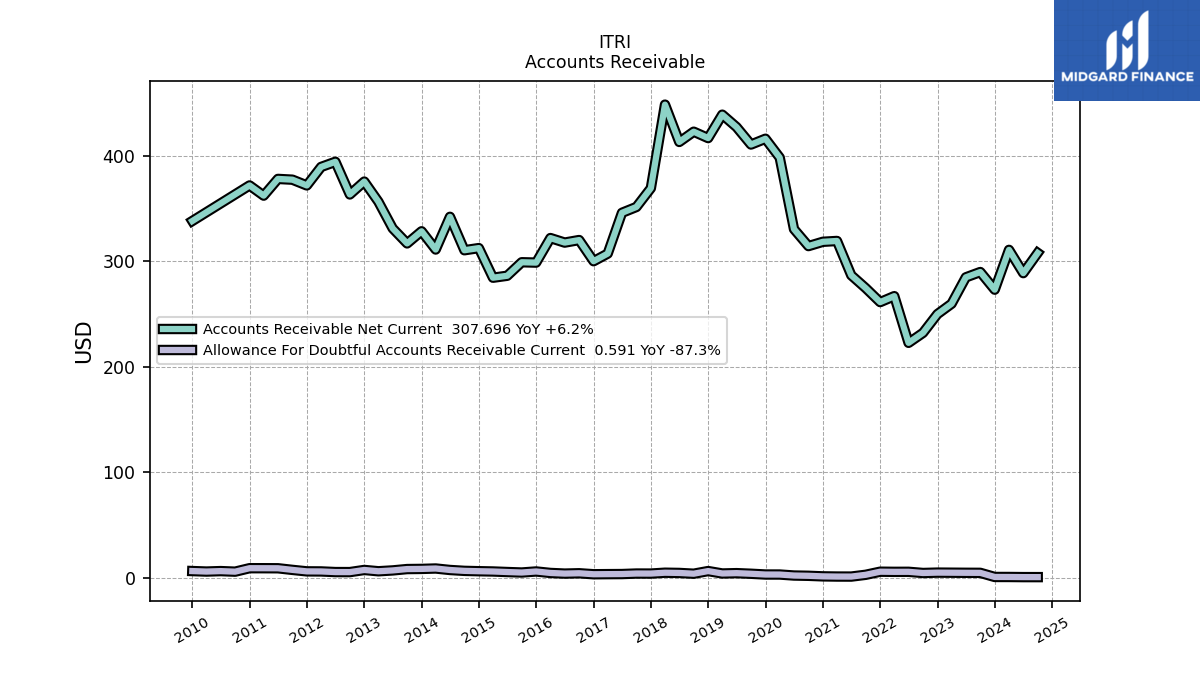
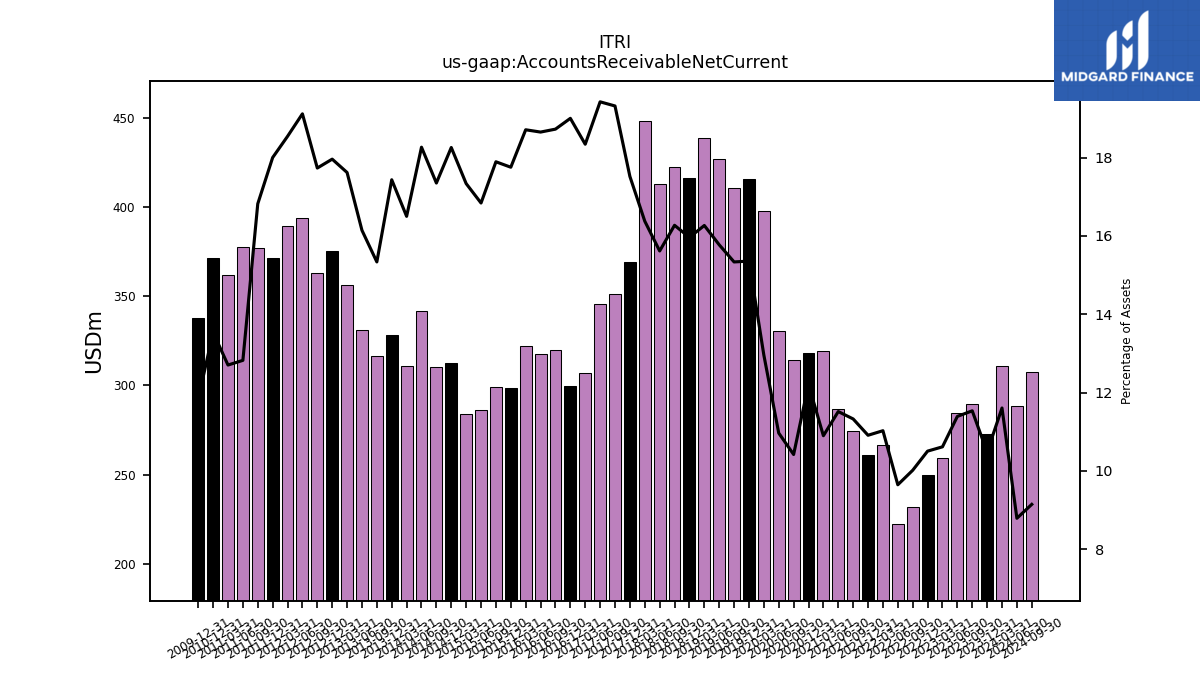
| Accounts Receivable Net Current | 272.89 | 289.64 | 284.60 | 259.59 | 249.77 | 232.00 | 222.54 | 266.77 | 261.12 | 274.38 | 286.54 | 319.05 | 318.27 | 314.18 | 330.28 | 398.02 | 415.89 | 410.39 | 426.94 | 438.69 | 416.50 | 422.57 | 412.85 | 448.21 | 369.05 | 351.25 | 345.74 | 307.06 | 299.87 | 319.93 | 317.51 | 321.81 | 298.55 | 298.89 | 286.09 | 284.22 | 312.30 | 310.26 | 341.94 | 310.93 | 328.24 | 316.73 | 330.96 | 356.23 | 375.33 | 363.11 | 394.06 | 389.18 | 371.64 | 377.11 | 377.83 | 361.99 | 371.66 | NA | NA | NA | |
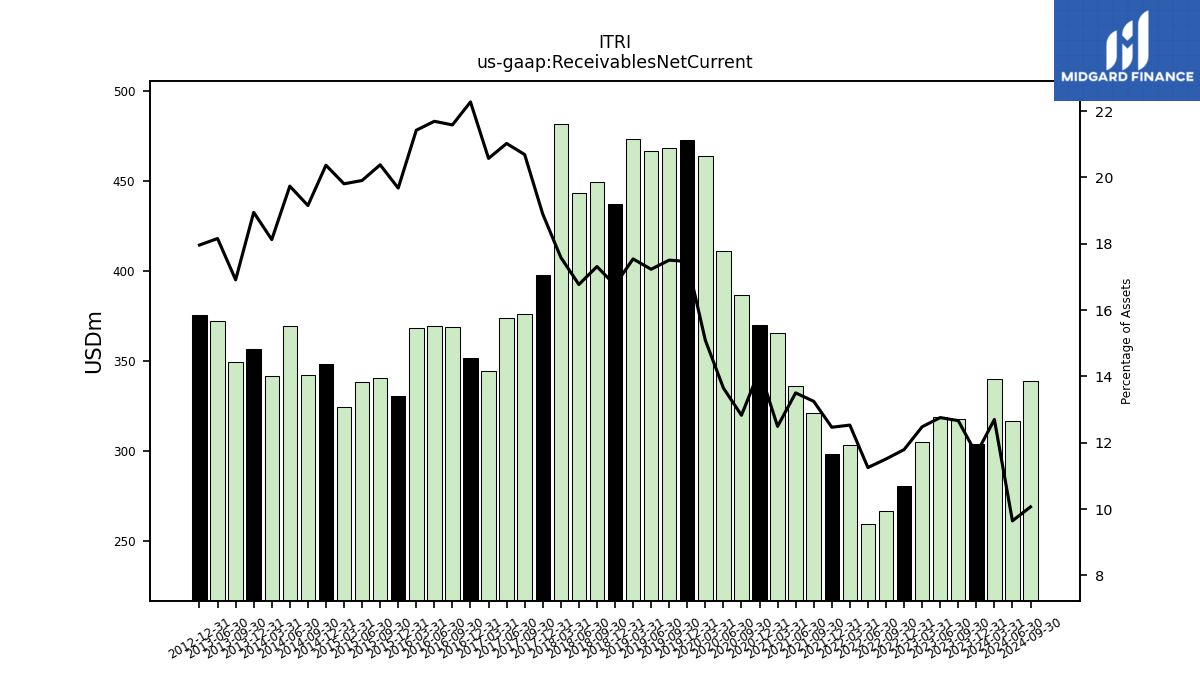
| Receivables Net Current | 303.82 | 318.10 | 318.81 | 305.27 | 280.44 | 266.67 | 259.66 | 303.25 | 298.46 | 320.99 | 336.07 | 365.83 | 369.83 | 386.92 | 411.20 | 463.61 | 472.93 | 468.48 | 466.37 | 473.08 | 437.16 | 449.59 | 443.39 | 481.39 | 398.03 | 376.15 | 374.18 | 344.41 | 351.51 | 368.71 | 369.25 | 368.43 | 330.89 | 340.42 | 338.20 | 324.71 | 348.39 | 342.48 | 369.47 | 341.55 | 356.71 | 349.29 | 372.24 | NA | 375.33 | NA | NA | NA | NA | NA | NA | NA | NA | NA | NA | NA | |
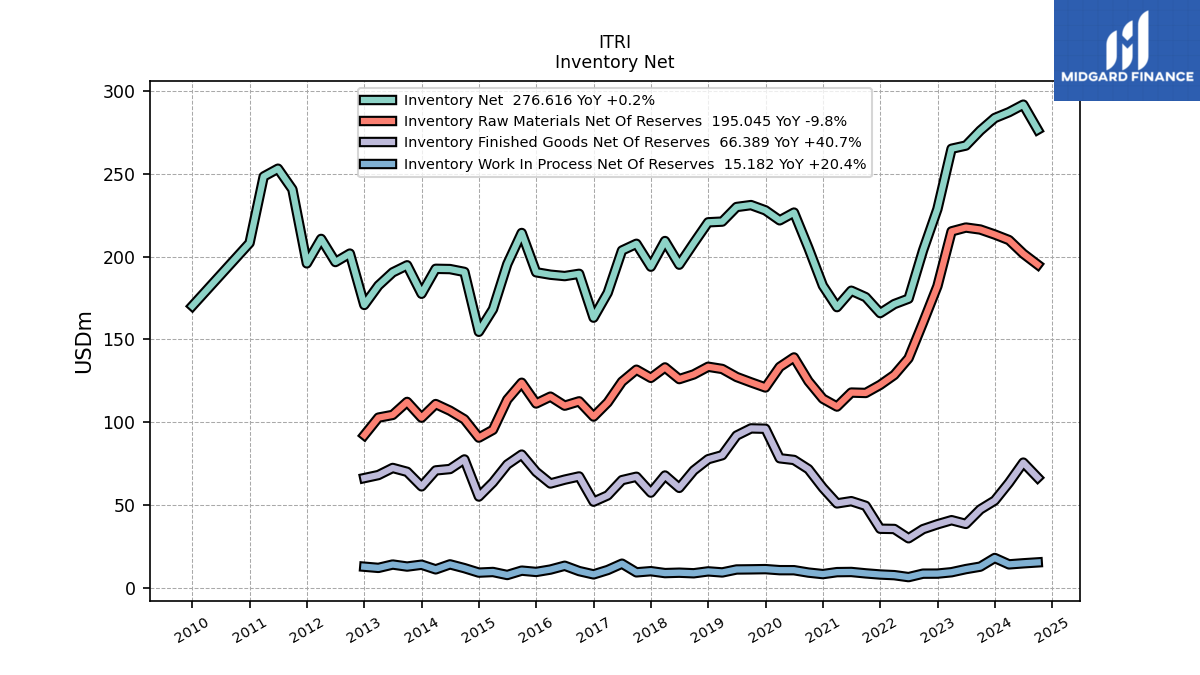
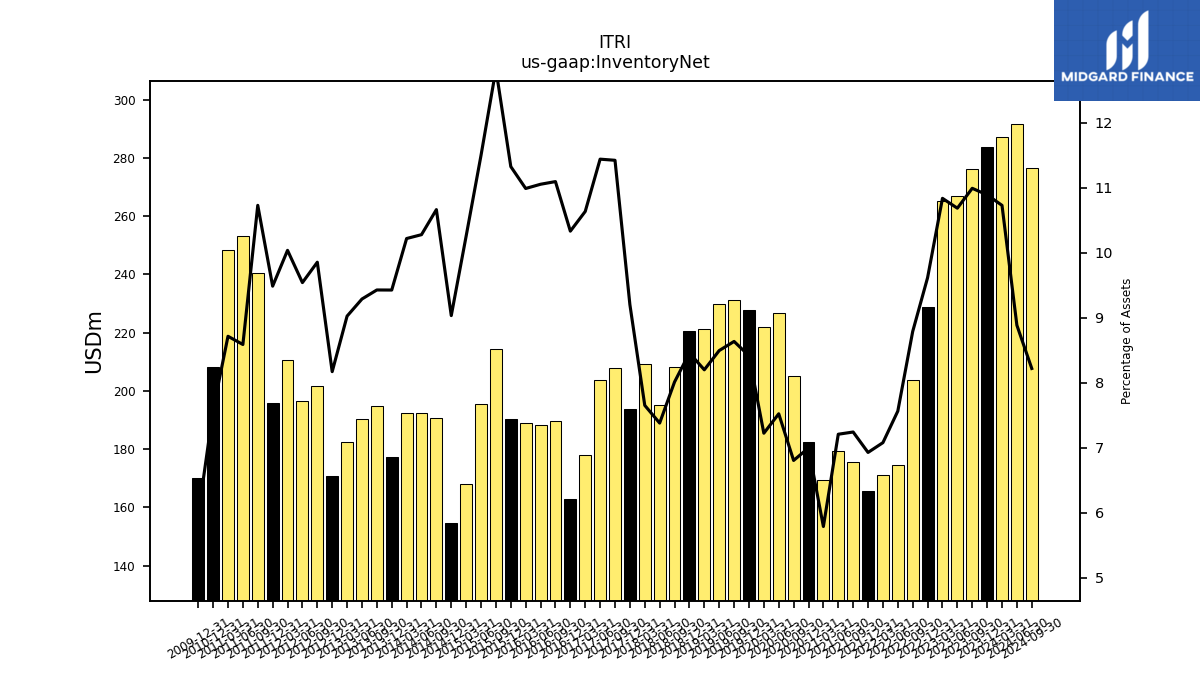
| Inventory Net | 283.69 | 276.10 | 267.04 | 265.12 | 228.70 | 203.61 | 174.52 | 171.26 | 165.80 | 175.43 | 179.35 | 169.41 | 182.38 | 205.18 | 226.56 | 221.85 | 227.90 | 231.08 | 229.91 | 221.10 | 220.67 | 208.04 | 195.06 | 209.37 | 193.84 | 207.70 | 203.63 | 178.06 | 163.05 | 189.55 | 188.18 | 189.01 | 190.47 | 214.24 | 195.39 | 168.16 | 154.50 | 190.69 | 192.41 | 192.57 | 177.47 | 194.70 | 190.41 | 182.45 | 170.72 | 201.78 | 196.65 | 210.66 | 195.84 | 240.56 | 253.08 | 248.36 | 208.16 | NA | NA | NA | |
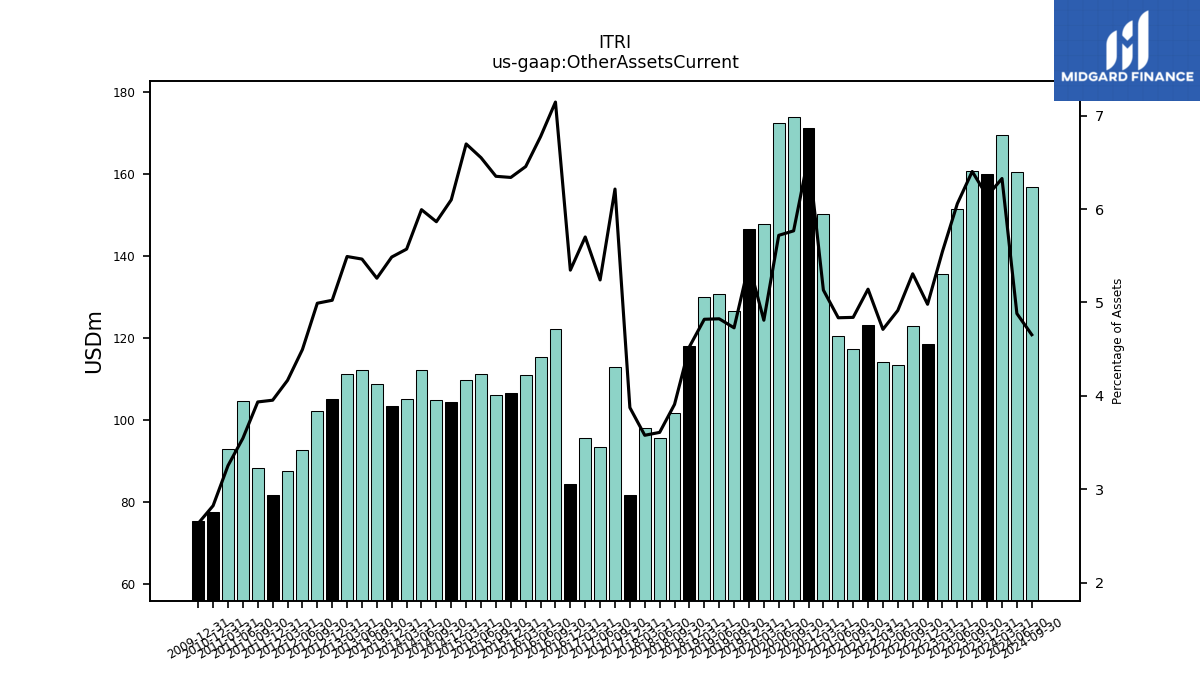
| Other Assets Current | 159.88 | 160.77 | 151.35 | 135.65 | 118.44 | 122.95 | 113.41 | 114.02 | 123.09 | 117.27 | 120.35 | 150.27 | 171.12 | 173.91 | 172.24 | 147.74 | 146.53 | 126.53 | 130.58 | 129.97 | 118.08 | 101.51 | 95.42 | 97.92 | 81.60 | 112.96 | 93.27 | 95.42 | 84.35 | 122.04 | 115.30 | 111.00 | 106.56 | 106.06 | 111.25 | 109.77 | 104.31 | 104.85 | 112.17 | 104.97 | 103.28 | 108.61 | 112.01 | 111.02 | 104.96 | 102.19 | 92.66 | 87.43 | 81.62 | 88.21 | 104.50 | 92.72 | 77.57 | NA | NA | NA | |
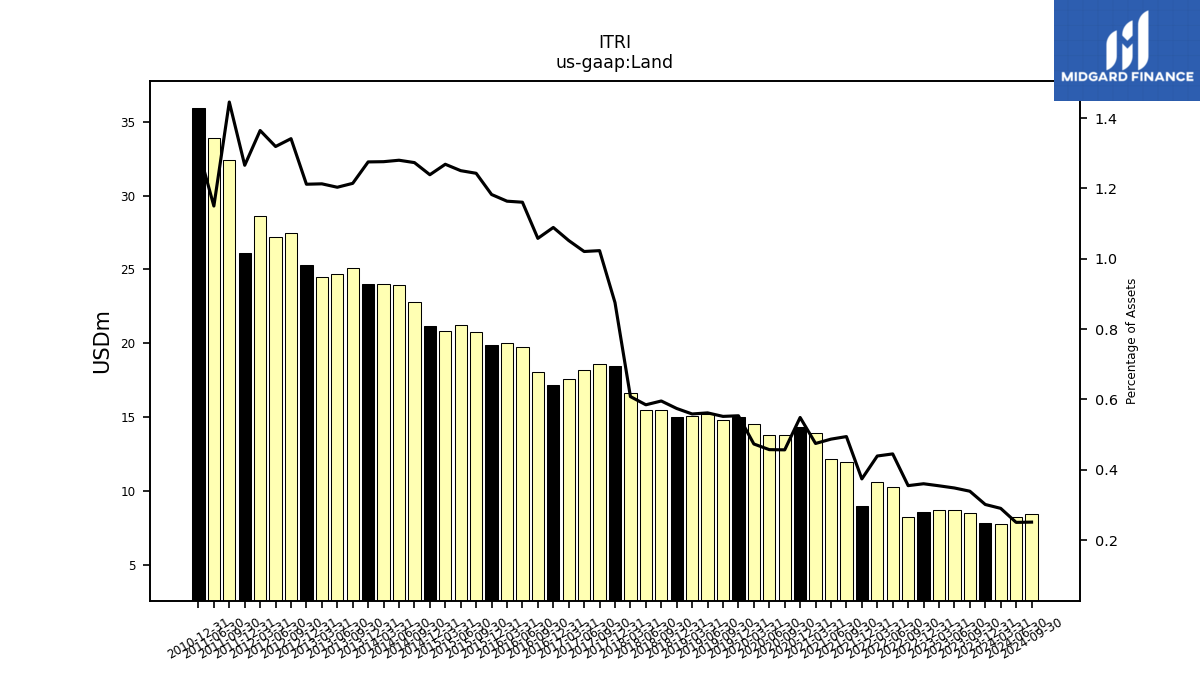
| Land | 7.85 | 8.51 | 8.70 | 8.67 | 8.57 | 8.22 | 10.27 | 10.62 | 8.95 | 11.98 | 12.12 | 13.90 | 14.30 | 13.77 | 13.77 | 14.54 | 14.99 | 14.76 | 15.20 | 15.06 | 14.98 | 15.46 | 15.46 | 16.64 | 18.43 | 18.60 | 18.16 | 17.60 | 17.18 | 18.07 | 19.75 | 20.01 | 19.88 | 20.76 | 21.24 | 20.79 | 21.19 | 22.76 | 23.96 | 24.04 | 24.00 | 25.07 | 24.66 | 24.52 | 25.32 | 27.46 | 27.18 | 28.63 | 26.13 | 32.40 | 33.88 | NA | 35.97 | NA | NA | NA | |
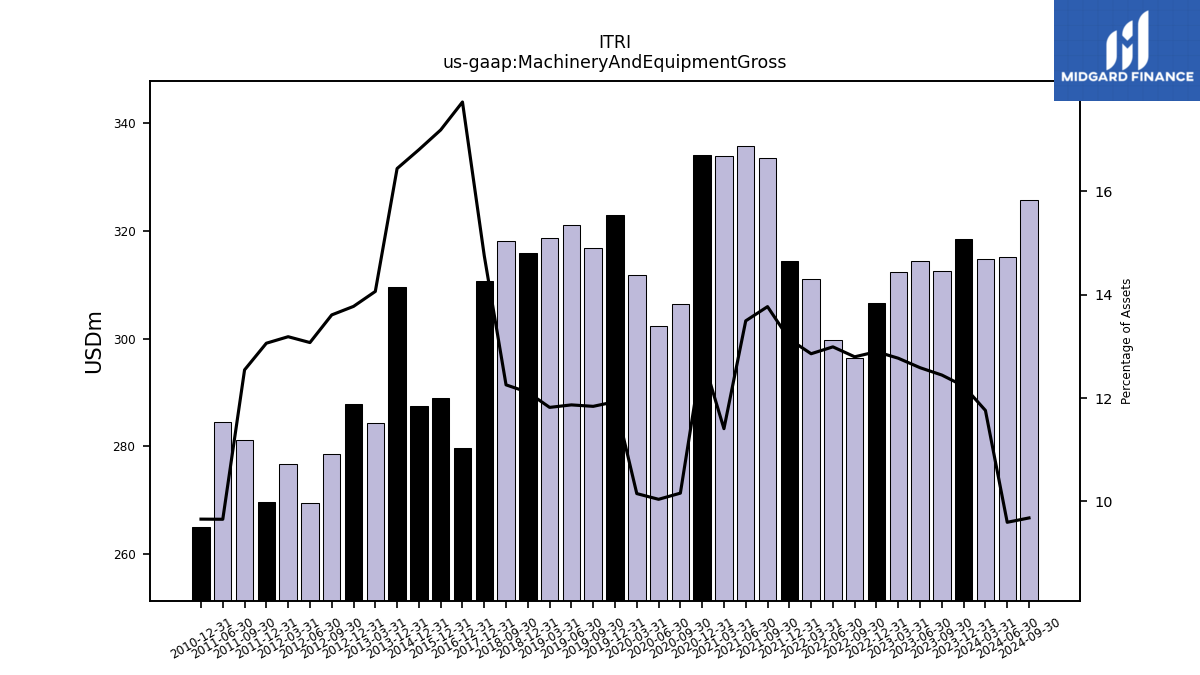
| Machinery And Equipment Gross | 318.55 | 312.53 | 314.50 | 312.34 | 306.70 | 296.49 | 299.76 | 311.12 | 314.50 | 333.58 | 335.81 | 333.97 | 334.05 | 306.37 | 302.38 | 311.77 | 323.00 | 316.79 | 321.15 | 318.69 | 315.97 | 318.22 | NA | NA | 310.75 | NA | NA | NA | 279.75 | NA | NA | NA | 289.01 | NA | NA | NA | 287.45 | NA | NA | NA | 309.52 | NA | NA | 284.29 | 287.79 | 278.62 | 269.43 | 276.72 | 269.61 | 281.20 | 284.43 | NA | 265.11 | NA | NA | NA |
| 2023-12-31 | 2023-09-30 | 2023-06-30 | 2023-03-31 | 2022-12-31 | 2022-09-30 | 2022-06-30 | 2022-03-31 | 2021-12-31 | 2021-09-30 | 2021-06-30 | 2021-03-31 | 2020-12-31 | 2020-09-30 | 2020-06-30 | 2020-03-31 | 2019-12-31 | 2019-09-30 | 2019-06-30 | 2019-03-31 | 2018-12-31 | 2018-09-30 | 2018-06-30 | 2018-03-31 | 2017-12-31 | 2017-09-30 | 2017-06-30 | 2017-03-31 | 2016-12-31 | 2016-09-30 | 2016-06-30 | 2016-03-31 | 2015-12-31 | 2015-09-30 | 2015-06-30 | 2015-03-31 | 2014-12-31 | 2014-09-30 | 2014-06-30 | 2014-03-31 | 2013-12-31 | 2013-09-30 | 2013-06-30 | 2013-03-31 | 2012-12-31 | 2012-09-30 | 2012-06-30 | 2012-03-31 | 2011-12-31 | 2011-09-30 | 2011-06-30 | 2011-03-31 | 2010-12-31 | 2010-09-30 | 2010-06-30 | 2010-03-31 | ||
|---|---|---|---|---|---|---|---|---|---|---|---|---|---|---|---|---|---|---|---|---|---|---|---|---|---|---|---|---|---|---|---|---|---|---|---|---|---|---|---|---|---|---|---|---|---|---|---|---|---|---|---|---|---|---|---|---|---|
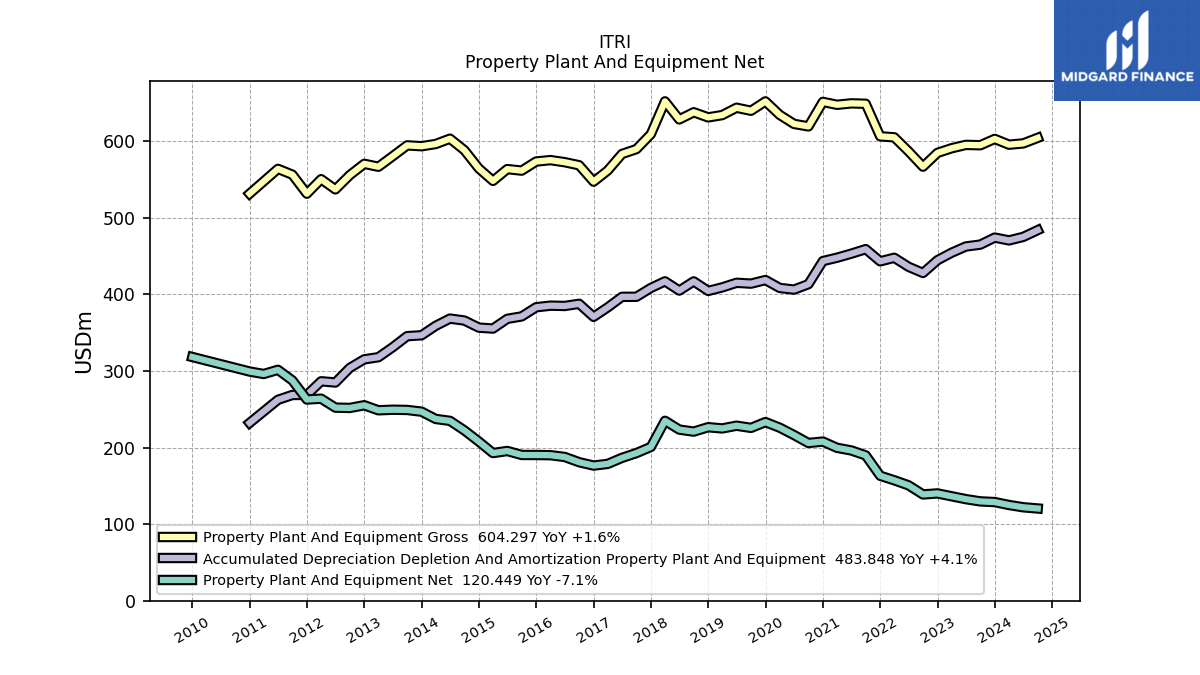
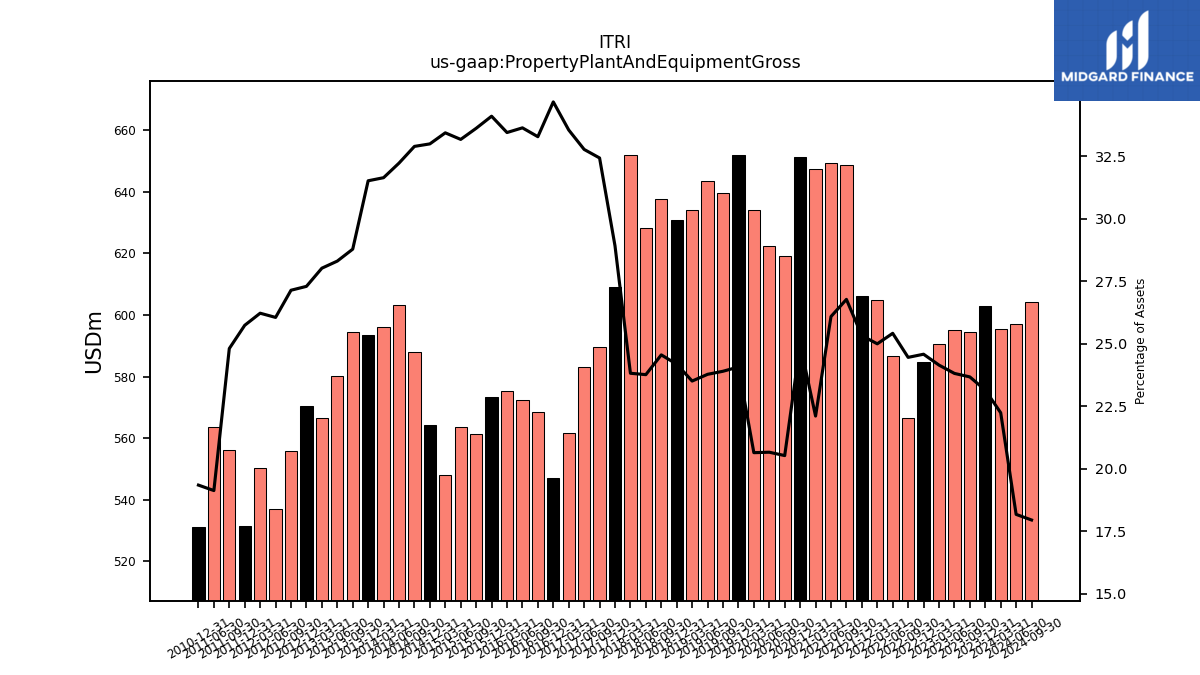
| Property Plant And Equipment Gross | 602.90 | 594.63 | 595.12 | 590.69 | 584.64 | 566.65 | 586.61 | 604.97 | 606.28 | 648.76 | 649.30 | 647.45 | 651.23 | 619.23 | 622.50 | 634.25 | 651.88 | 639.63 | 643.59 | 634.02 | 631.00 | 637.72 | 628.33 | 651.93 | 609.08 | 589.60 | 583.25 | 561.62 | 547.09 | 568.51 | 572.50 | 575.22 | 573.38 | 561.49 | 563.52 | 548.11 | 564.31 | 588.13 | 603.20 | 596.23 | 593.37 | 594.46 | 580.30 | 566.53 | 570.38 | 555.71 | 537.00 | 550.32 | 531.37 | 556.21 | 563.79 | NA | 531.35 | NA | NA | NA | |
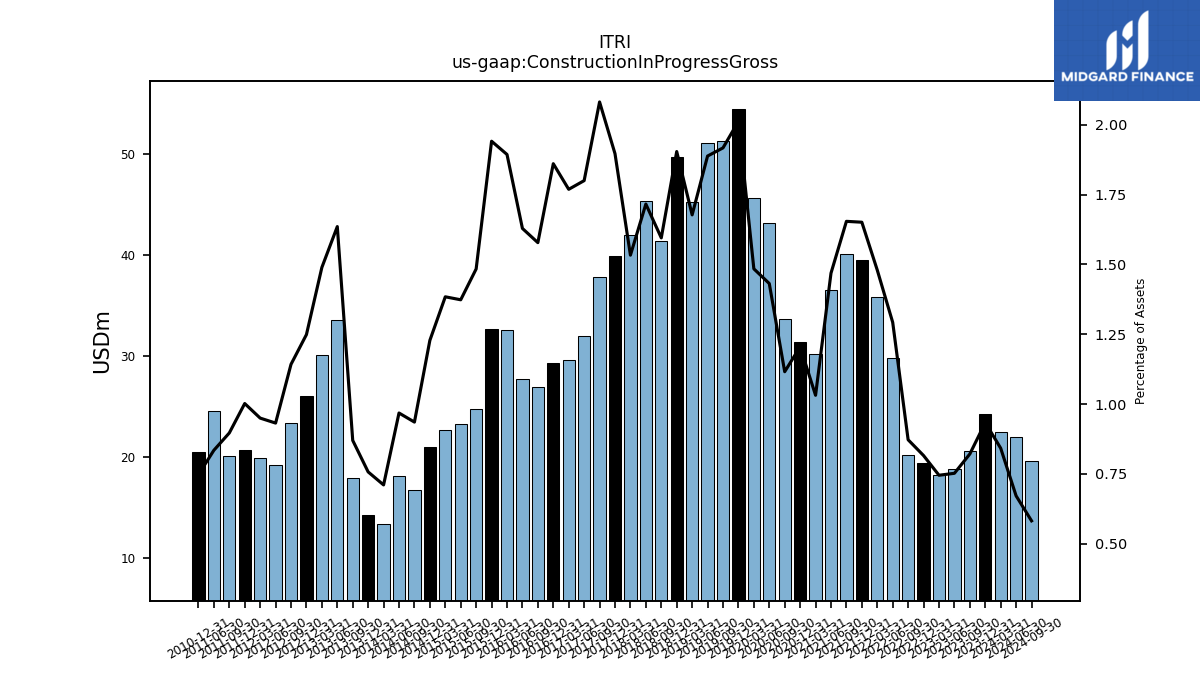
| Construction In Progress Gross | 24.32 | 20.63 | 18.80 | 18.23 | 19.40 | 20.21 | 29.83 | 35.81 | 39.53 | 40.08 | 36.55 | 30.21 | 31.43 | 33.66 | 43.12 | 45.60 | 54.49 | 51.31 | 51.10 | 45.24 | 49.68 | 41.42 | 45.37 | 41.96 | 39.95 | 37.85 | 32.04 | 29.61 | 29.36 | 26.96 | 27.73 | 32.57 | 32.64 | 24.78 | 23.33 | 22.69 | 21.01 | 16.73 | 18.12 | 13.39 | 14.26 | 17.97 | 33.53 | 30.11 | 26.10 | 23.39 | 19.21 | 19.94 | 20.69 | 20.10 | 24.60 | NA | 20.53 | NA | NA | NA | |
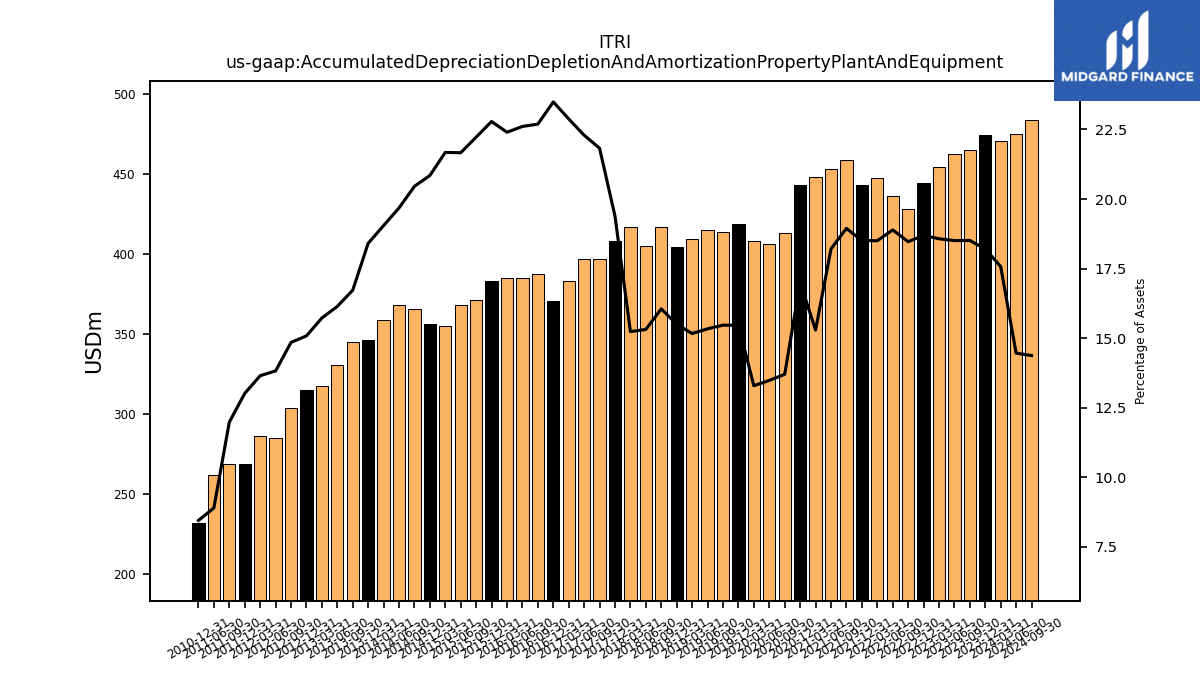
| Accumulated Depreciation Depletion And Amortization Property Plant And Equipment | 474.09 | 464.92 | 462.47 | 454.30 | 444.52 | 427.89 | 435.94 | 447.72 | 443.10 | 459.01 | 453.10 | 447.80 | 443.41 | 413.30 | 406.18 | 408.33 | 418.65 | 413.98 | 415.08 | 409.08 | 404.45 | 416.92 | 404.90 | 417.00 | 408.31 | 396.81 | 396.74 | 382.98 | 370.63 | 387.64 | 384.80 | 385.21 | 383.12 | 371.19 | 368.01 | 355.33 | 356.52 | 365.78 | 368.36 | 358.90 | 346.55 | 345.39 | 330.93 | 317.92 | 315.17 | 304.01 | 284.91 | 286.52 | 268.70 | 268.64 | 262.33 | NA | 232.11 | NA | NA | NA | |
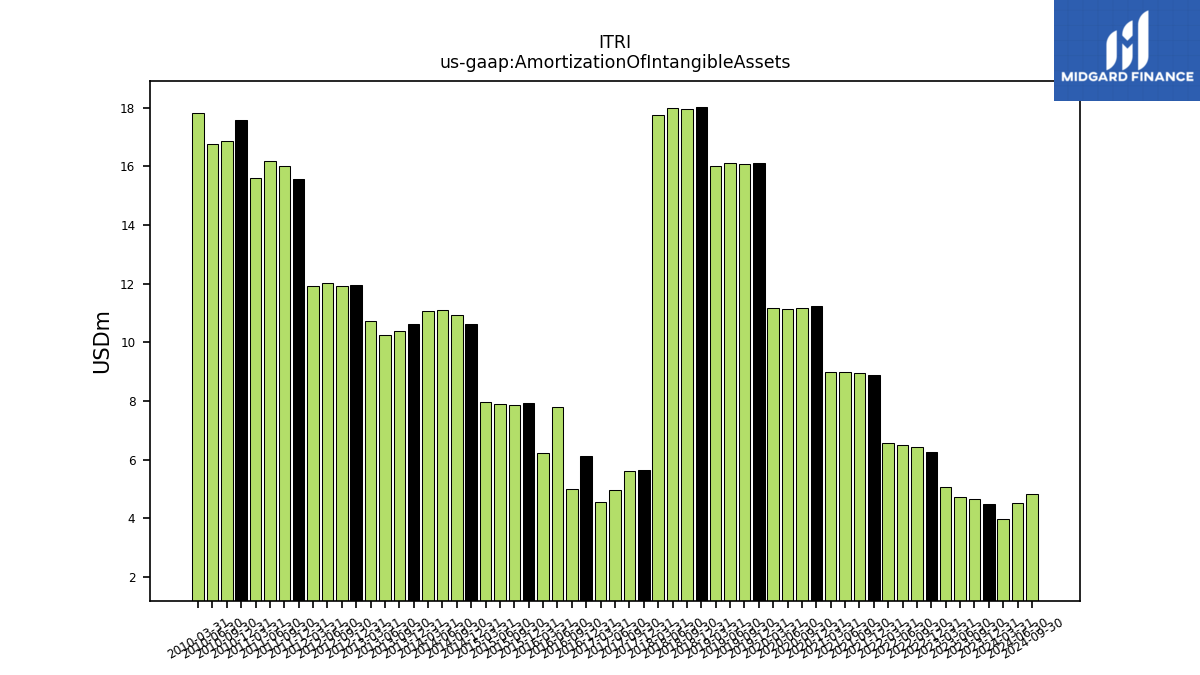
| Amortization Of Intangible Assets | 4.49 | 4.66 | 4.72 | 5.05 | 6.27 | 6.41 | 6.49 | 6.55 | 8.89 | 8.94 | 9.00 | 8.97 | 11.22 | 11.18 | 11.14 | 11.16 | 16.10 | 16.09 | 16.12 | 16.00 | 18.01 | 17.96 | 18.00 | 17.74 | 5.64 | 5.62 | 4.97 | 4.55 | 6.11 | 5.00 | 7.80 | 6.21 | 7.94 | 7.87 | 7.89 | 7.97 | 10.61 | 10.92 | 11.11 | 11.07 | 10.64 | 10.39 | 10.25 | 10.74 | 11.94 | 11.93 | 12.03 | 11.91 | 15.59 | 16.01 | 16.20 | 15.60 | 17.59 | 16.88 | 16.77 | 17.81 | |
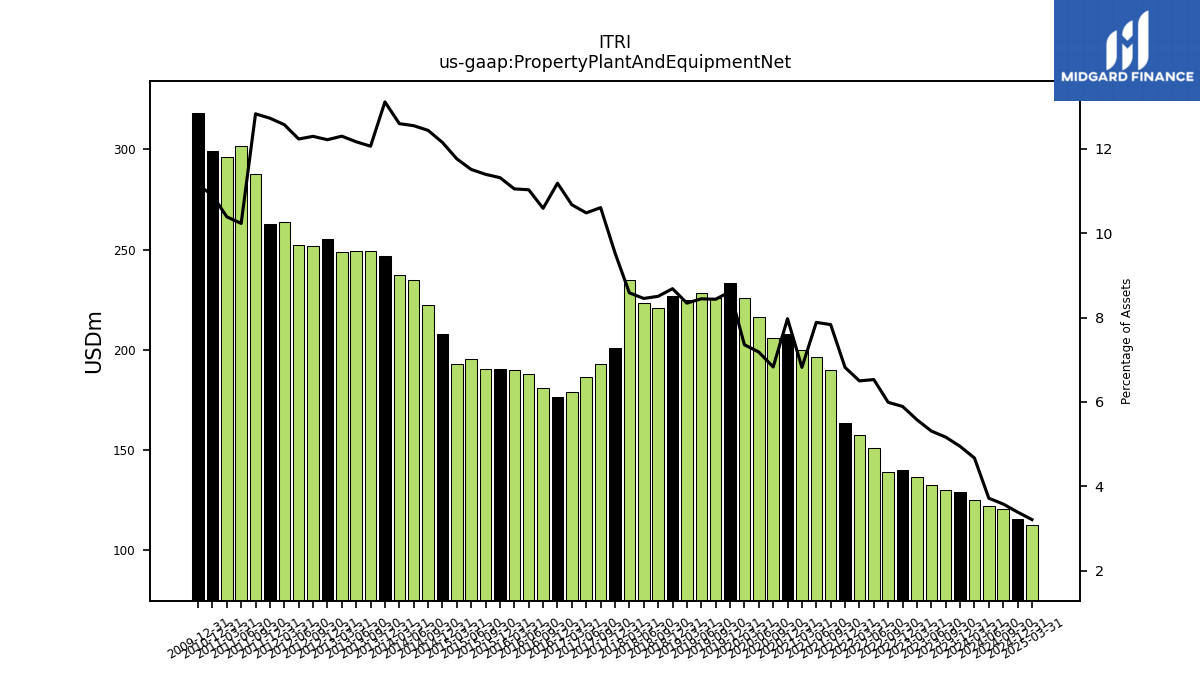
| Property Plant And Equipment Net | 128.81 | 129.71 | 132.65 | 136.40 | 140.12 | 138.77 | 150.66 | 157.24 | 163.18 | 189.75 | 196.21 | 199.65 | 207.82 | 205.93 | 216.32 | 225.93 | 233.23 | 225.66 | 228.51 | 224.94 | 226.55 | 220.79 | 223.44 | 234.92 | 200.77 | 192.78 | 186.51 | 178.65 | 176.46 | 180.87 | 187.70 | 190.00 | 190.26 | 190.29 | 195.51 | 192.78 | 207.79 | 222.35 | 234.84 | 237.33 | 246.82 | 249.07 | 249.37 | 248.61 | 255.21 | 251.70 | 252.09 | 263.80 | 262.67 | 287.56 | 301.46 | 296.01 | 299.24 | NA | NA | NA | |
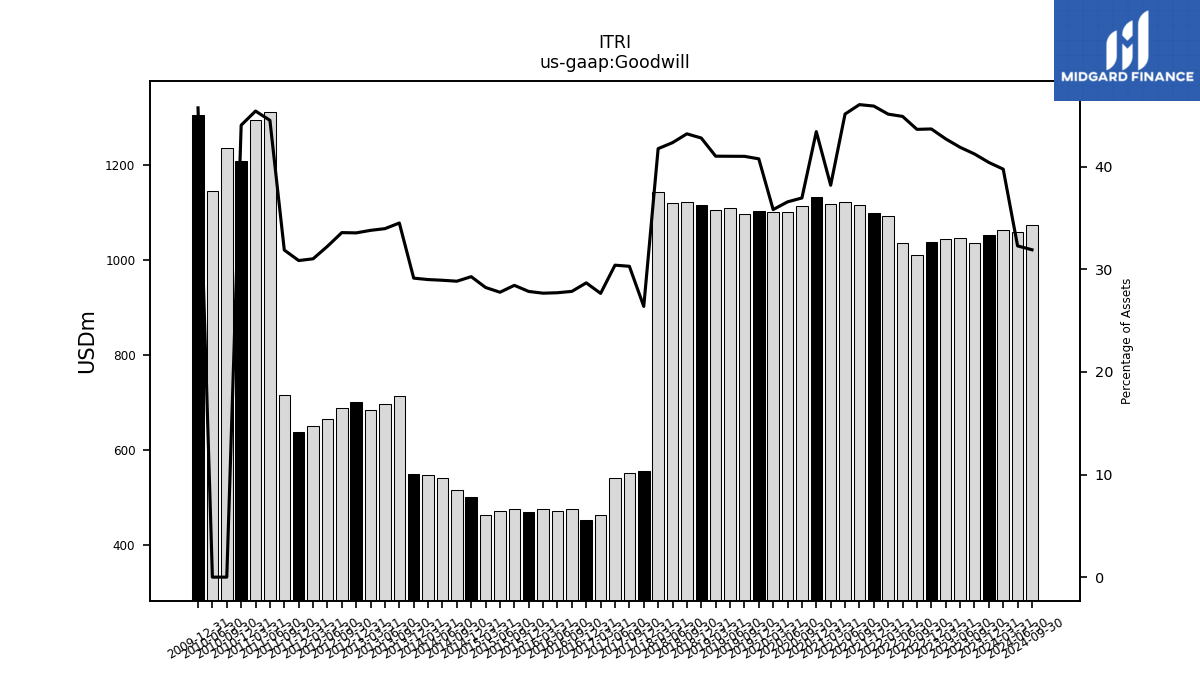
| Goodwill | 1052.50 | 1035.76 | 1046.76 | 1044.66 | 1038.72 | 1011.05 | 1036.16 | 1091.89 | 1098.97 | 1115.70 | 1123.15 | 1118.32 | 1131.92 | 1114.51 | 1101.65 | 1100.33 | 1103.91 | 1097.41 | 1110.06 | 1106.31 | 1116.53 | 1121.89 | 1119.41 | 1142.76 | 555.76 | 550.73 | 541.07 | 462.91 | 452.49 | 475.70 | 471.75 | 475.87 | 468.12 | 474.96 | 471.65 | 462.72 | 500.82 | 515.64 | 541.54 | 546.44 | 548.58 | 712.71 | 696.22 | 683.22 | 701.02 | 687.43 | 664.44 | 651.00 | 636.91 | 714.61 | 1311.77 | 1294.45 | 1209.38 | 1236.58 | 1146.08 | NA | |
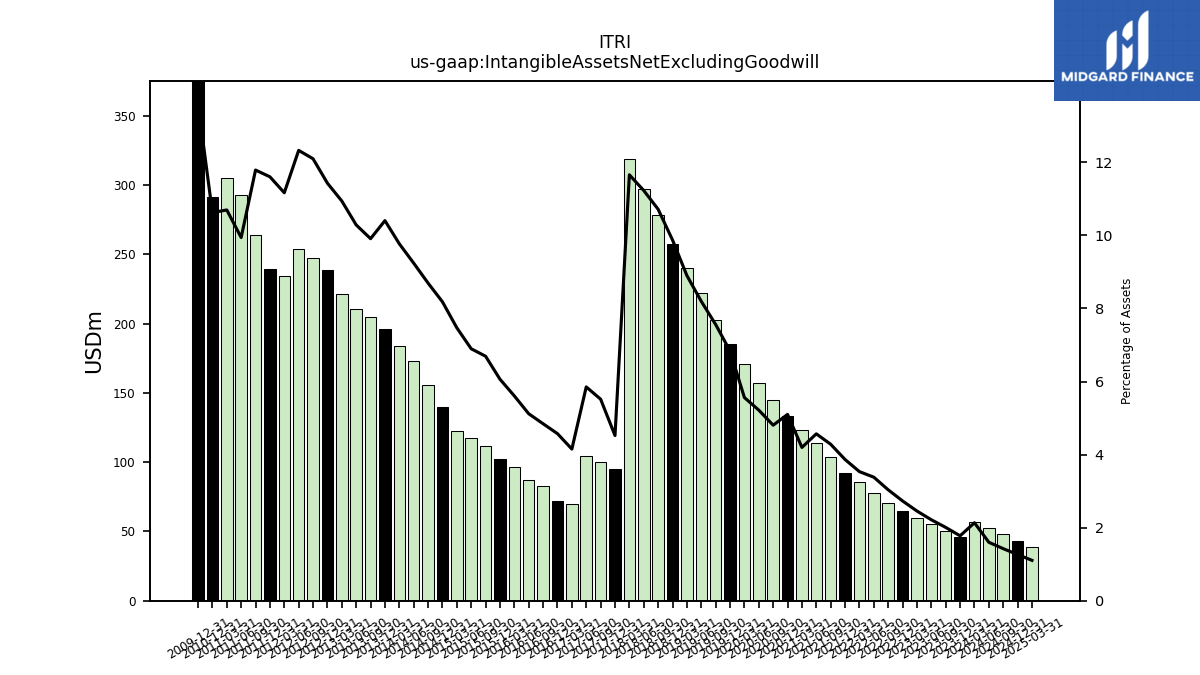
| Intangible Assets Net Excluding Goodwill | 46.28 | 50.41 | 55.38 | 60.05 | 64.94 | 70.35 | 78.03 | 85.51 | 92.53 | 103.76 | 113.67 | 122.86 | 132.96 | 144.89 | 157.12 | 170.81 | 185.10 | 202.32 | 221.77 | 239.99 | 257.58 | 278.19 | 296.78 | 318.98 | 95.23 | 100.29 | 104.14 | 69.48 | 72.15 | 82.73 | 87.11 | 96.39 | 101.93 | 111.77 | 117.14 | 122.43 | 139.91 | 155.43 | 172.93 | 184.05 | 195.84 | 204.63 | 210.85 | 221.15 | 238.77 | 247.64 | 254.02 | 234.31 | 239.50 | 264.22 | 292.93 | 304.78 | 291.67 | NA | NA | NA | |
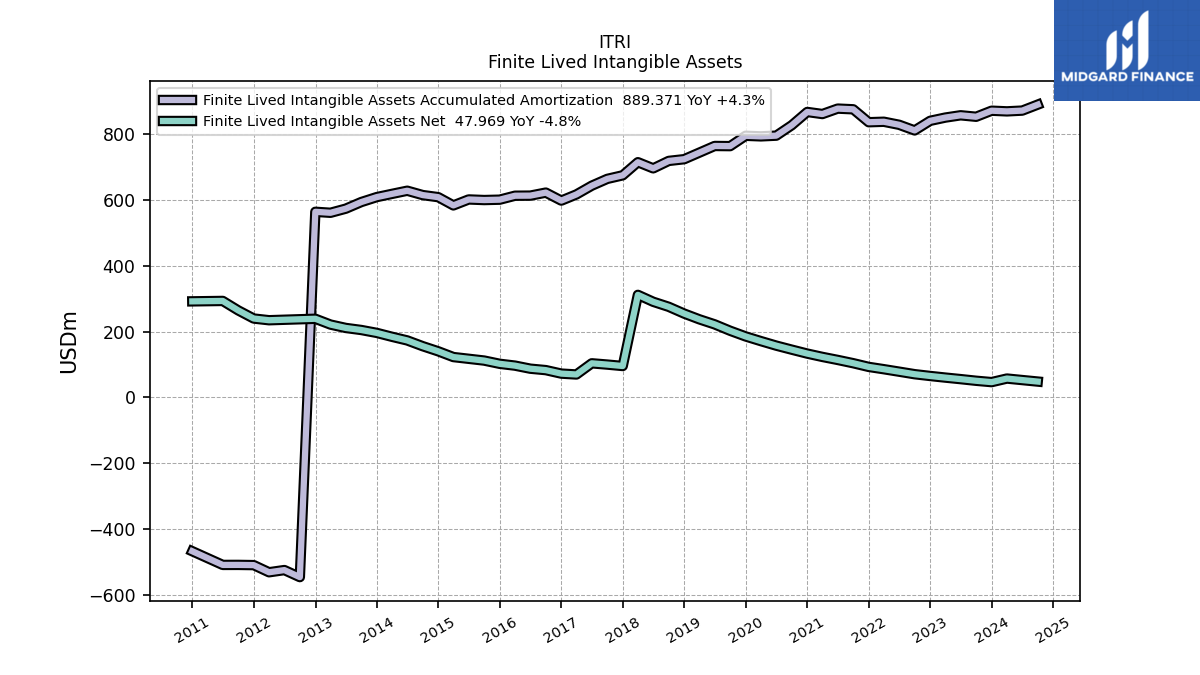
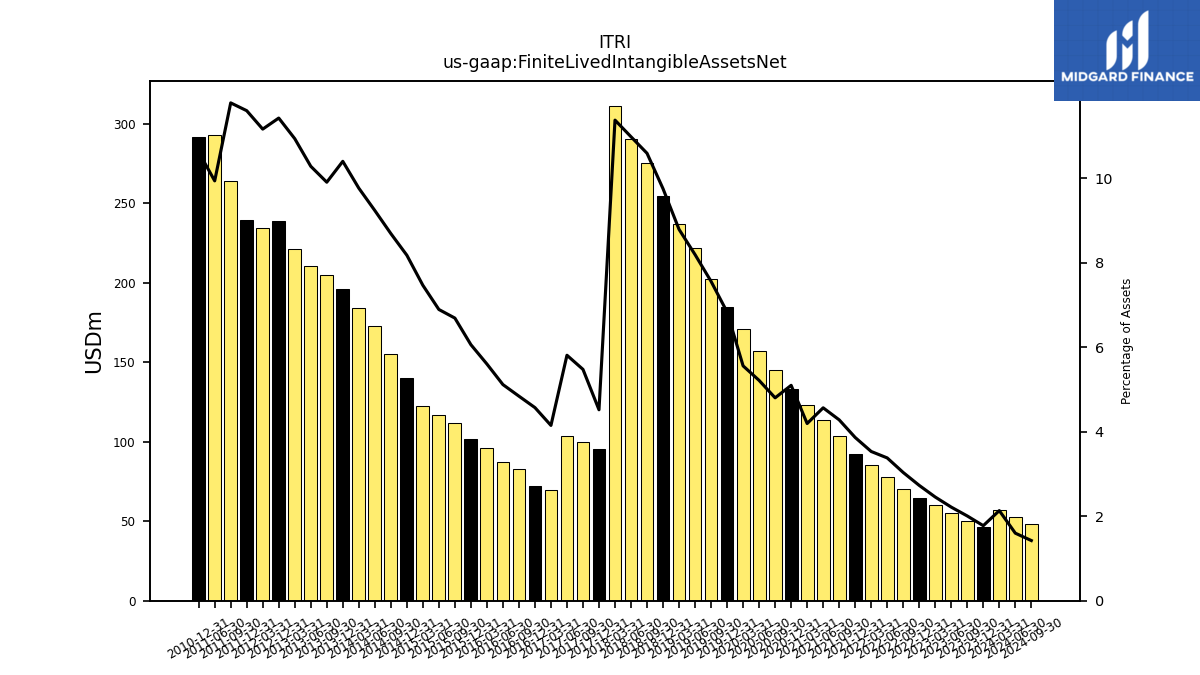
| Finite Lived Intangible Assets Net | 46.28 | 50.41 | 55.38 | 60.05 | 64.94 | 70.35 | 78.03 | 85.51 | 92.53 | 103.76 | 113.67 | 122.86 | 132.96 | 144.89 | 157.12 | 170.81 | 185.10 | 202.32 | 221.77 | 237.09 | 254.48 | 275.09 | 290.38 | 311.38 | 95.23 | 99.58 | 103.43 | 69.48 | 72.15 | 82.73 | 87.11 | 96.39 | 101.93 | 111.77 | 117.14 | 122.43 | 139.91 | 155.43 | 172.93 | 184.05 | 195.84 | 204.63 | 210.85 | 221.15 | 238.77 | NA | NA | 234.31 | 239.50 | 264.22 | 292.93 | NA | 291.67 | NA | NA | NA | |
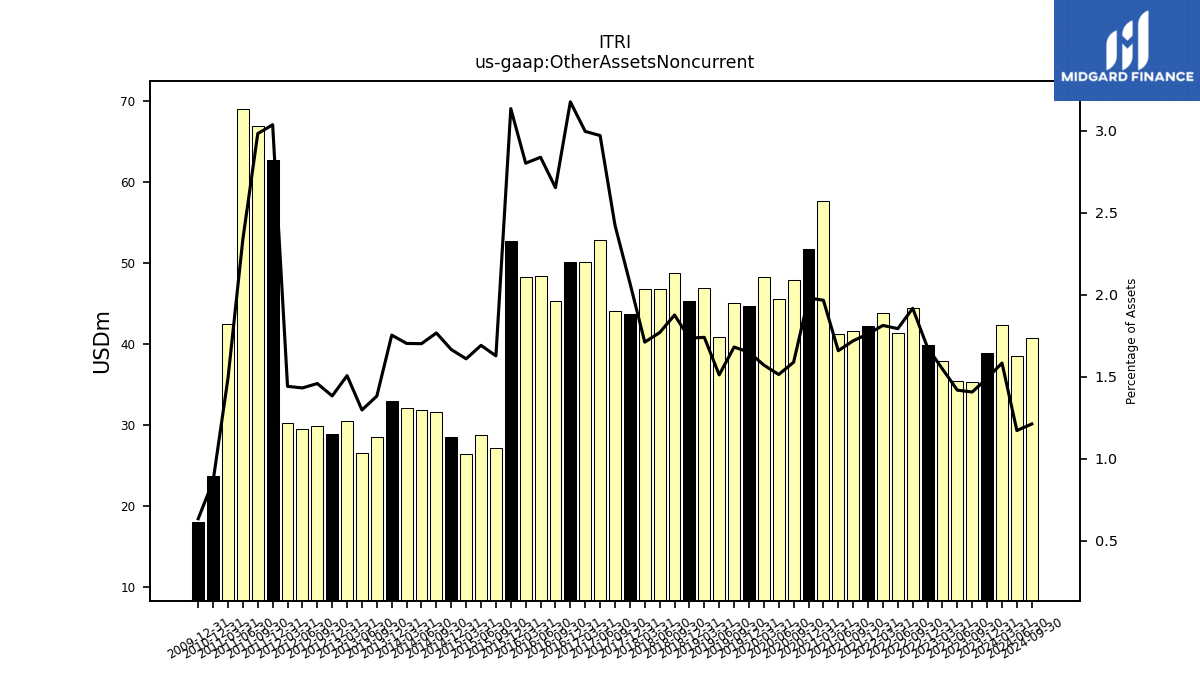
| Other Assets Noncurrent | 38.84 | 35.35 | 35.45 | 37.86 | 39.90 | 44.43 | 41.40 | 43.88 | 42.18 | 41.67 | 41.29 | 57.60 | 51.66 | 47.93 | 45.61 | 48.28 | 44.69 | 45.00 | 40.92 | 46.94 | 45.29 | 48.75 | 46.79 | 46.84 | 43.67 | 44.07 | 52.88 | 50.17 | 50.13 | 45.33 | 48.32 | 48.20 | 52.73 | 27.19 | 28.74 | 26.39 | 28.50 | 31.60 | 31.86 | 32.10 | 33.03 | 28.56 | 26.61 | 30.47 | 28.91 | 29.88 | 29.52 | 30.26 | 62.70 | 66.88 | 68.97 | 42.52 | 23.76 | NA | NA | NA |
| 2023-12-31 | 2023-09-30 | 2023-06-30 | 2023-03-31 | 2022-12-31 | 2022-09-30 | 2022-06-30 | 2022-03-31 | 2021-12-31 | 2021-09-30 | 2021-06-30 | 2021-03-31 | 2020-12-31 | 2020-09-30 | 2020-06-30 | 2020-03-31 | 2019-12-31 | 2019-09-30 | 2019-06-30 | 2019-03-31 | 2018-12-31 | 2018-09-30 | 2018-06-30 | 2018-03-31 | 2017-12-31 | 2017-09-30 | 2017-06-30 | 2017-03-31 | 2016-12-31 | 2016-09-30 | 2016-06-30 | 2016-03-31 | 2015-12-31 | 2015-09-30 | 2015-06-30 | 2015-03-31 | 2014-12-31 | 2014-09-30 | 2014-06-30 | 2014-03-31 | 2013-12-31 | 2013-09-30 | 2013-06-30 | 2013-03-31 | 2012-12-31 | 2012-09-30 | 2012-06-30 | 2012-03-31 | 2011-12-31 | 2011-09-30 | 2011-06-30 | 2011-03-31 | 2010-12-31 | 2010-09-30 | 2010-06-30 | 2010-03-31 | ||
|---|---|---|---|---|---|---|---|---|---|---|---|---|---|---|---|---|---|---|---|---|---|---|---|---|---|---|---|---|---|---|---|---|---|---|---|---|---|---|---|---|---|---|---|---|---|---|---|---|---|---|---|---|---|---|---|---|---|
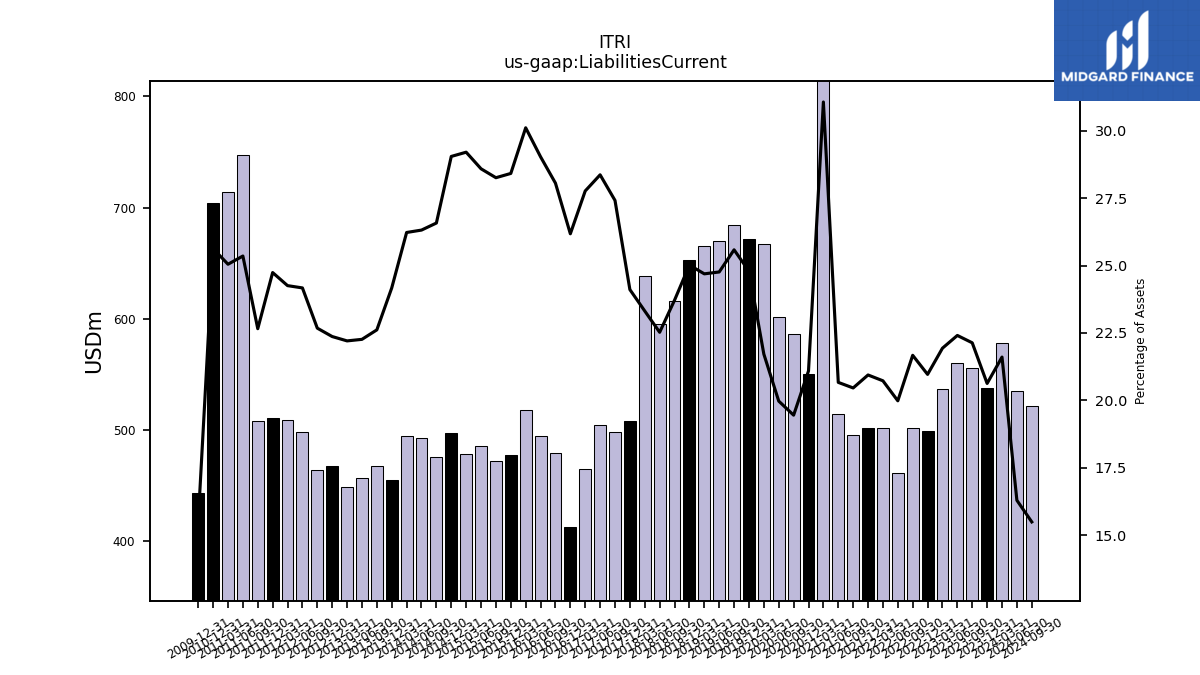
| Liabilities Current | 537.24 | 555.92 | 559.92 | 536.55 | 498.57 | 502.12 | 461.19 | 501.57 | 501.34 | 495.75 | 514.37 | 909.56 | 549.90 | 586.71 | 601.68 | 667.09 | 671.39 | 684.60 | 670.16 | 665.88 | 652.71 | 615.85 | 595.50 | 638.01 | 507.78 | 498.39 | 504.79 | 464.79 | 413.05 | 479.22 | 494.14 | 517.76 | 477.77 | 471.95 | 485.62 | 478.71 | 496.77 | 475.18 | 492.56 | 494.16 | 455.01 | 467.04 | 456.40 | 448.92 | 467.37 | 464.32 | 498.15 | 509.01 | 510.72 | 507.94 | 747.09 | 713.82 | 703.73 | NA | NA | NA | |
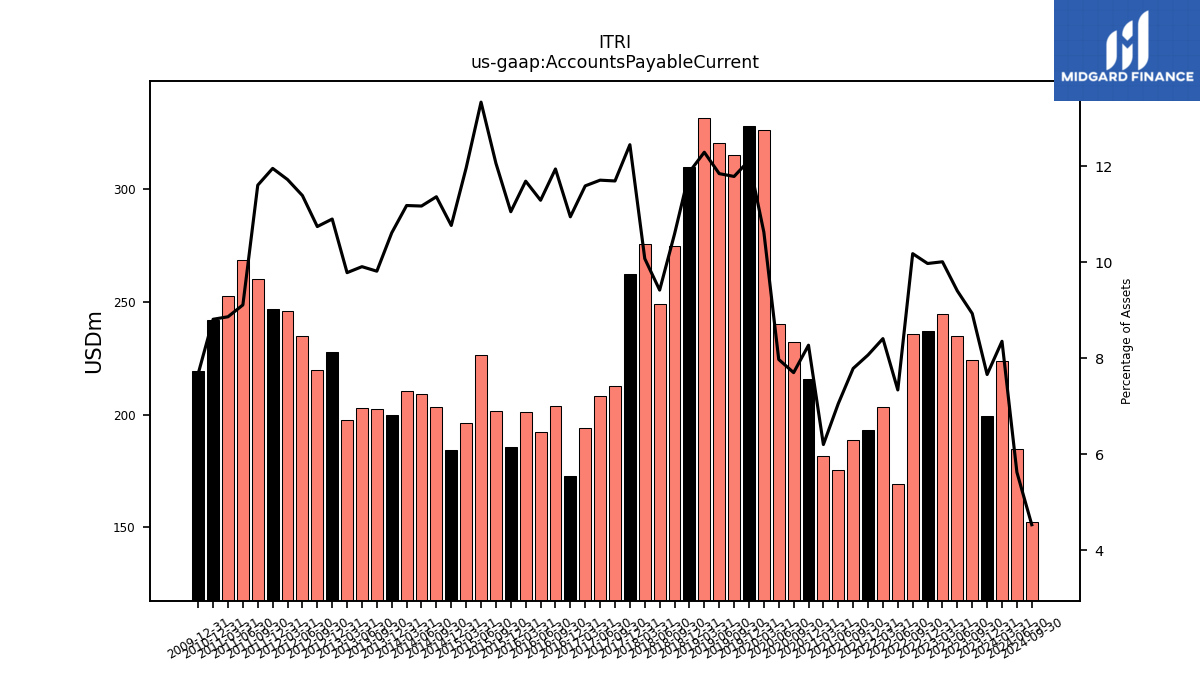
| Accounts Payable Current | 199.52 | 224.31 | 234.93 | 244.82 | 237.18 | 235.81 | 169.37 | 203.47 | 193.13 | 188.66 | 175.55 | 181.61 | 215.64 | 232.24 | 240.22 | 326.43 | 328.13 | 315.39 | 320.58 | 331.44 | 309.95 | 274.95 | 249.01 | 275.70 | 262.17 | 212.56 | 208.38 | 194.01 | 172.71 | 203.99 | 192.17 | 201.00 | 185.83 | 201.45 | 226.51 | 196.12 | 184.13 | 203.18 | 209.08 | 210.68 | 199.77 | 202.65 | 203.09 | 197.76 | 227.74 | 219.94 | 234.71 | 245.98 | 246.78 | 260.15 | 268.46 | 252.59 | 241.95 | NA | NA | NA | |
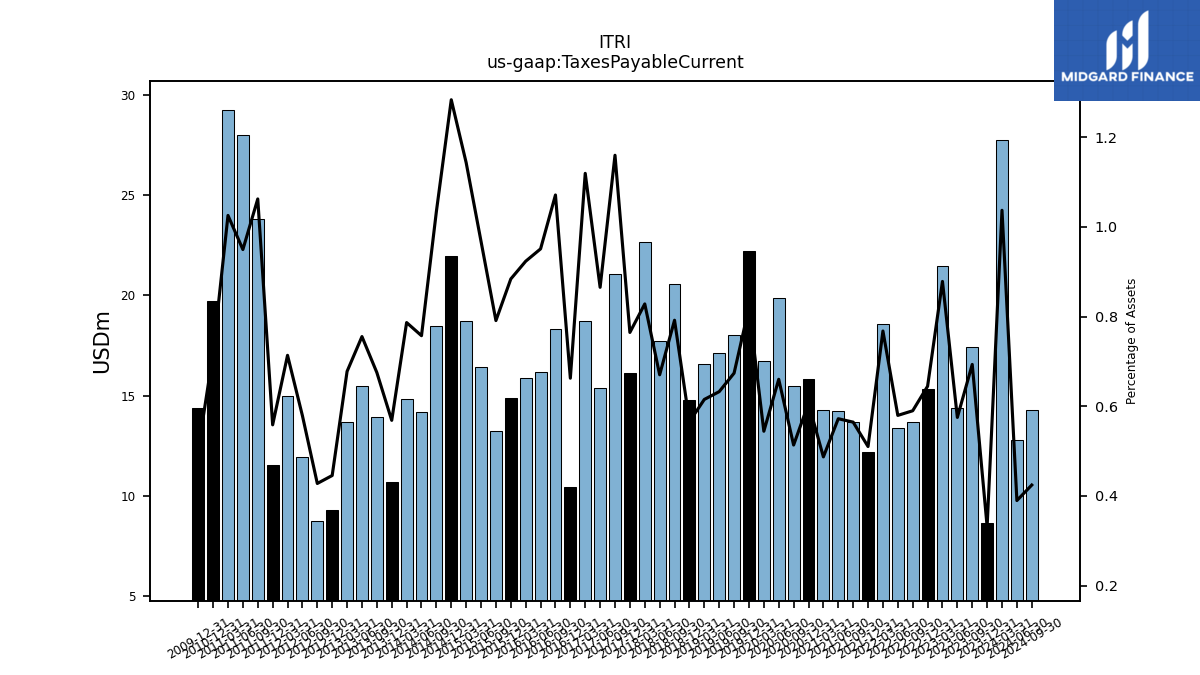
| Taxes Payable Current | 8.64 | 17.41 | 14.37 | 21.48 | 15.32 | 13.66 | 13.37 | 18.58 | 12.21 | 13.67 | 14.23 | 14.26 | 15.80 | 15.48 | 19.88 | 16.71 | 22.19 | 18.03 | 17.11 | 16.59 | 14.75 | 20.56 | 17.71 | 22.66 | 16.10 | 21.08 | 15.39 | 18.74 | 10.45 | 18.30 | 16.18 | 15.88 | 14.86 | 13.21 | 16.43 | 18.74 | 21.95 | 18.49 | 14.17 | 14.82 | 10.70 | 13.94 | 15.48 | 13.70 | 9.30 | 8.75 | 11.93 | 14.97 | 11.53 | 23.81 | 27.98 | 29.22 | 19.73 | NA | NA | NA | |
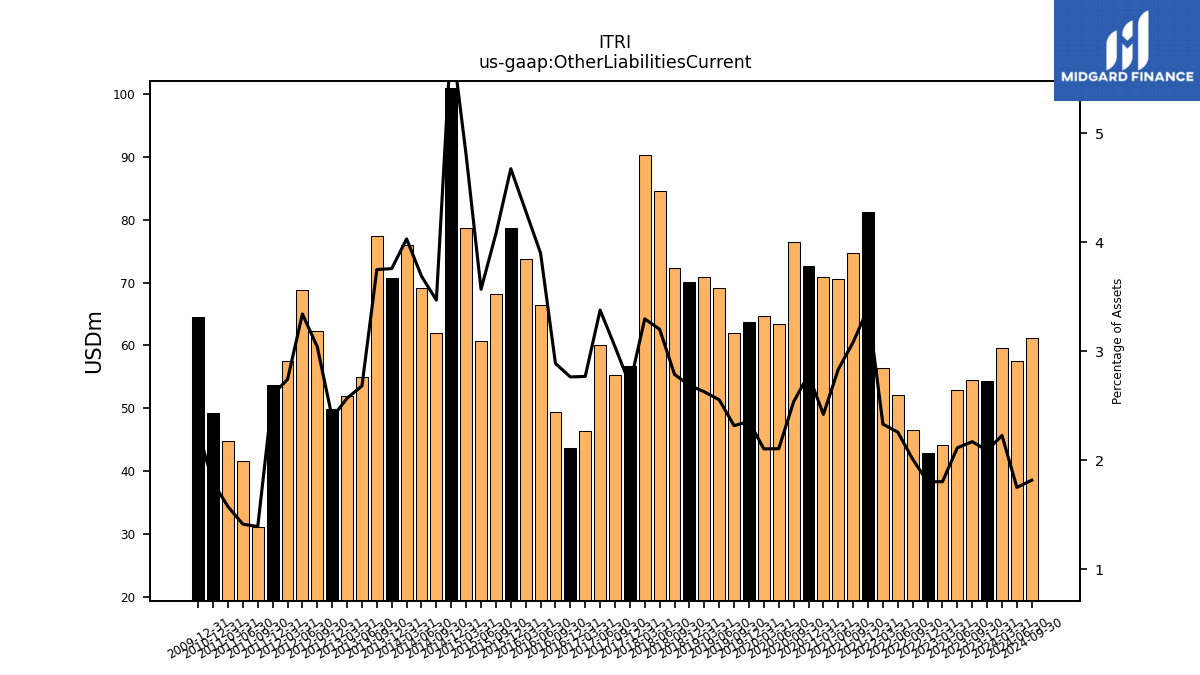
| Other Liabilities Current | 54.41 | 54.51 | 52.83 | 44.10 | 42.87 | 46.55 | 52.10 | 56.41 | 81.25 | 74.72 | 70.53 | 70.89 | 72.59 | 76.51 | 63.43 | 64.64 | 63.78 | 62.02 | 69.14 | 70.88 | 70.14 | 72.39 | 84.65 | 90.26 | 56.74 | 55.30 | 60.12 | 46.36 | 43.62 | 49.34 | 66.40 | 73.75 | 78.63 | 68.14 | 60.63 | 78.68 | 100.94 | 62.04 | 69.06 | 75.97 | 70.77 | 77.45 | 54.99 | 51.95 | 49.95 | 62.25 | 68.89 | 57.54 | 53.73 | 31.20 | 41.63 | 44.85 | 49.24 | NA | NA | NA |
| 2023-12-31 | 2023-09-30 | 2023-06-30 | 2023-03-31 | 2022-12-31 | 2022-09-30 | 2022-06-30 | 2022-03-31 | 2021-12-31 | 2021-09-30 | 2021-06-30 | 2021-03-31 | 2020-12-31 | 2020-09-30 | 2020-06-30 | 2020-03-31 | 2019-12-31 | 2019-09-30 | 2019-06-30 | 2019-03-31 | 2018-12-31 | 2018-09-30 | 2018-06-30 | 2018-03-31 | 2017-12-31 | 2017-09-30 | 2017-06-30 | 2017-03-31 | 2016-12-31 | 2016-09-30 | 2016-06-30 | 2016-03-31 | 2015-12-31 | 2015-09-30 | 2015-06-30 | 2015-03-31 | 2014-12-31 | 2014-09-30 | 2014-06-30 | 2014-03-31 | 2013-12-31 | 2013-09-30 | 2013-06-30 | 2013-03-31 | 2012-12-31 | 2012-09-30 | 2012-06-30 | 2012-03-31 | 2011-12-31 | 2011-09-30 | 2011-06-30 | 2011-03-31 | 2010-12-31 | 2010-09-30 | 2010-06-30 | 2010-03-31 | ||
|---|---|---|---|---|---|---|---|---|---|---|---|---|---|---|---|---|---|---|---|---|---|---|---|---|---|---|---|---|---|---|---|---|---|---|---|---|---|---|---|---|---|---|---|---|---|---|---|---|---|---|---|---|---|---|---|---|---|
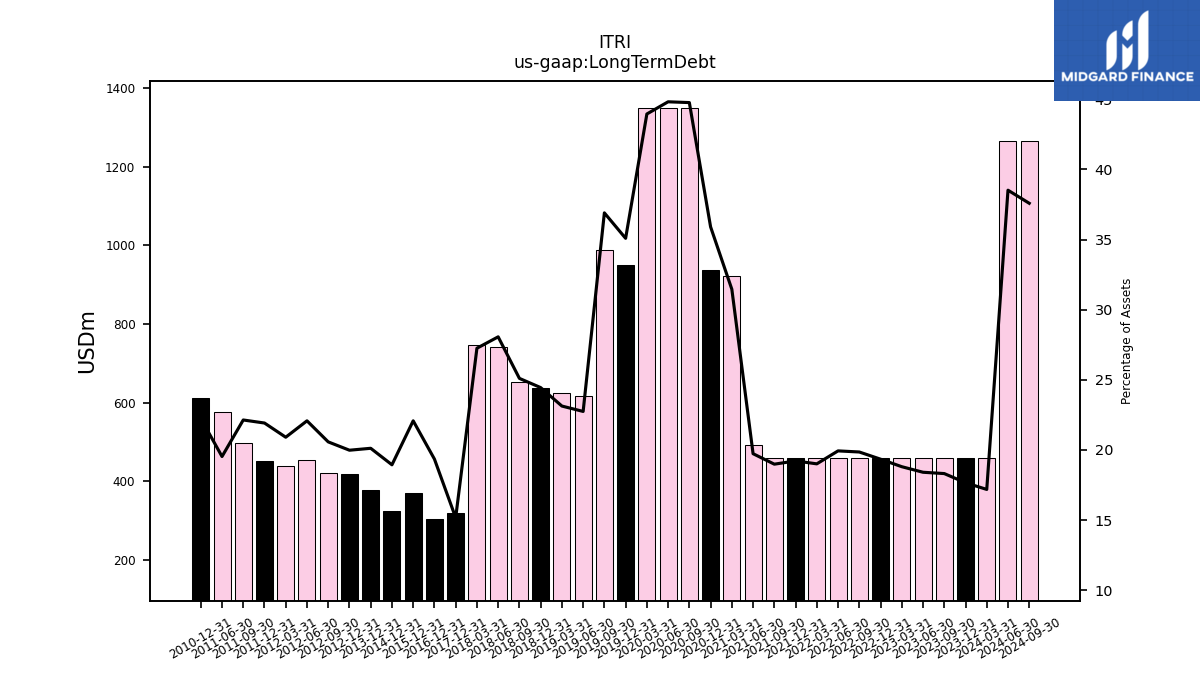
| Long Term Debt | 460.00 | 460.00 | 460.00 | 460.00 | 460.00 | 460.00 | 460.00 | 460.00 | 460.00 | 460.00 | 491.09 | 921.09 | 936.09 | 1350.16 | 1350.16 | 1350.16 | 950.16 | 987.50 | 615.62 | 623.75 | 637.81 | 651.88 | 741.94 | 745.78 | 319.48 | NA | NA | NA | 305.29 | NA | NA | NA | 371.21 | NA | NA | NA | 323.97 | NA | NA | NA | 378.75 | NA | NA | NA | 417.50 | 421.25 | 455.00 | 438.75 | 452.50 | 496.25 | 575.57 | NA | 610.94 | NA | NA | NA | |
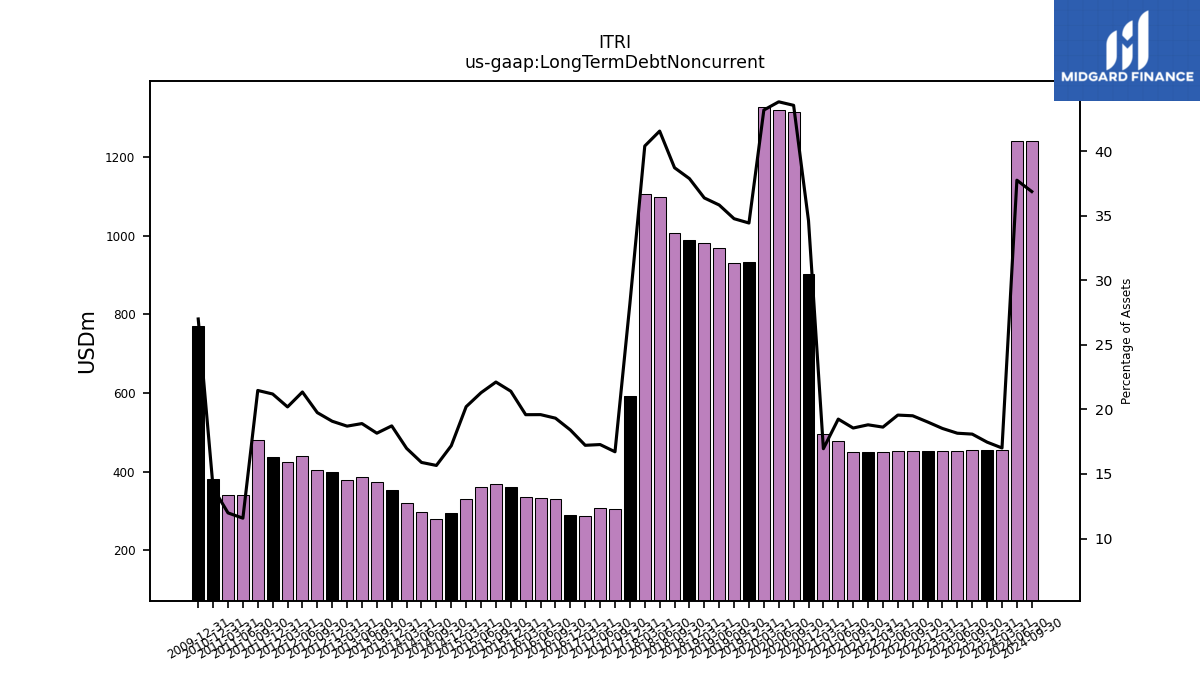
| Long Term Debt Noncurrent | 454.83 | 454.25 | 453.67 | 453.09 | 452.53 | 451.95 | 451.37 | 450.80 | 450.23 | 449.63 | 479.03 | 496.53 | 902.58 | 1313.46 | 1320.00 | 1326.56 | 932.48 | 930.39 | 969.71 | 980.98 | 988.18 | 1005.38 | 1098.57 | 1105.54 | 593.57 | 303.95 | 307.48 | 288.27 | 290.46 | 330.04 | 333.54 | 336.91 | 359.96 | 369.46 | 361.71 | 331.31 | 293.97 | 280.00 | 297.50 | 320.00 | 352.50 | 375.00 | 387.50 | 378.12 | 398.75 | 404.38 | 440.00 | 423.75 | 437.50 | 481.25 | 341.12 | 341.56 | 382.22 | NA | NA | NA | |
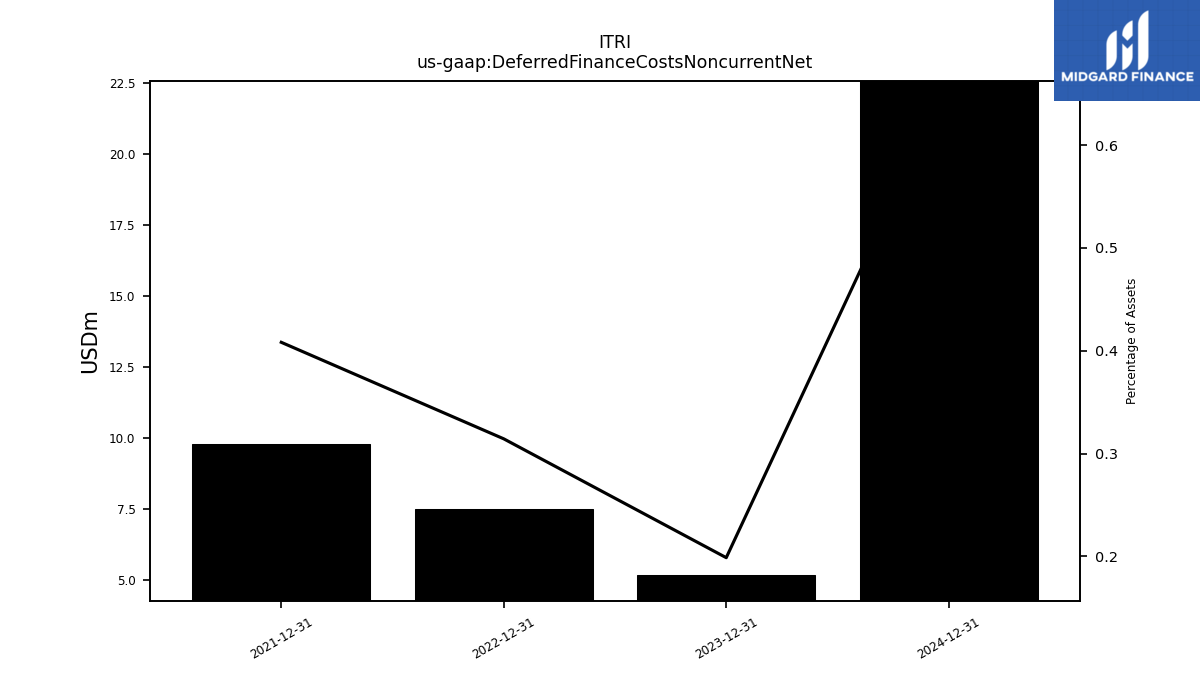
| Deferred Finance Costs Noncurrent Net | 5.17 | NA | NA | NA | 7.47 | NA | NA | NA | 9.77 | NA | NA | NA | NA | NA | NA | NA | NA | NA | NA | NA | NA | NA | NA | NA | NA | NA | NA | NA | NA | NA | NA | NA | NA | NA | NA | NA | NA | NA | NA | NA | NA | NA | NA | NA | NA | NA | NA | NA | NA | NA | NA | NA | NA | NA | NA | NA | |
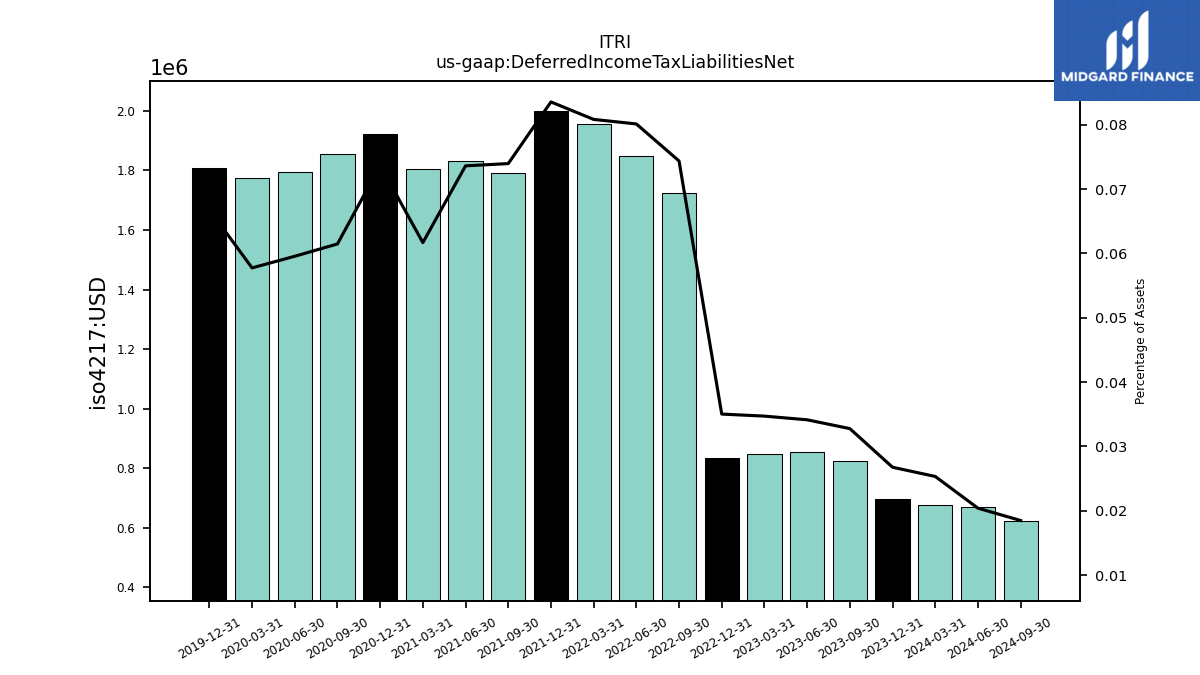
| Deferred Income Tax Liabilities Net | 0.70 | 0.82 | 0.85 | 0.85 | 0.83 | 1.72 | 1.85 | 1.96 | 2.00 | 1.79 | 1.83 | 1.81 | 1.92 | 1.85 | 1.79 | 1.77 | 1.81 | NA | NA | NA | NA | NA | NA | NA | NA | NA | NA | NA | NA | NA | NA | NA | NA | NA | NA | NA | NA | NA | NA | NA | NA | NA | NA | NA | NA | NA | NA | NA | NA | NA | NA | NA | NA | NA | NA | NA | |
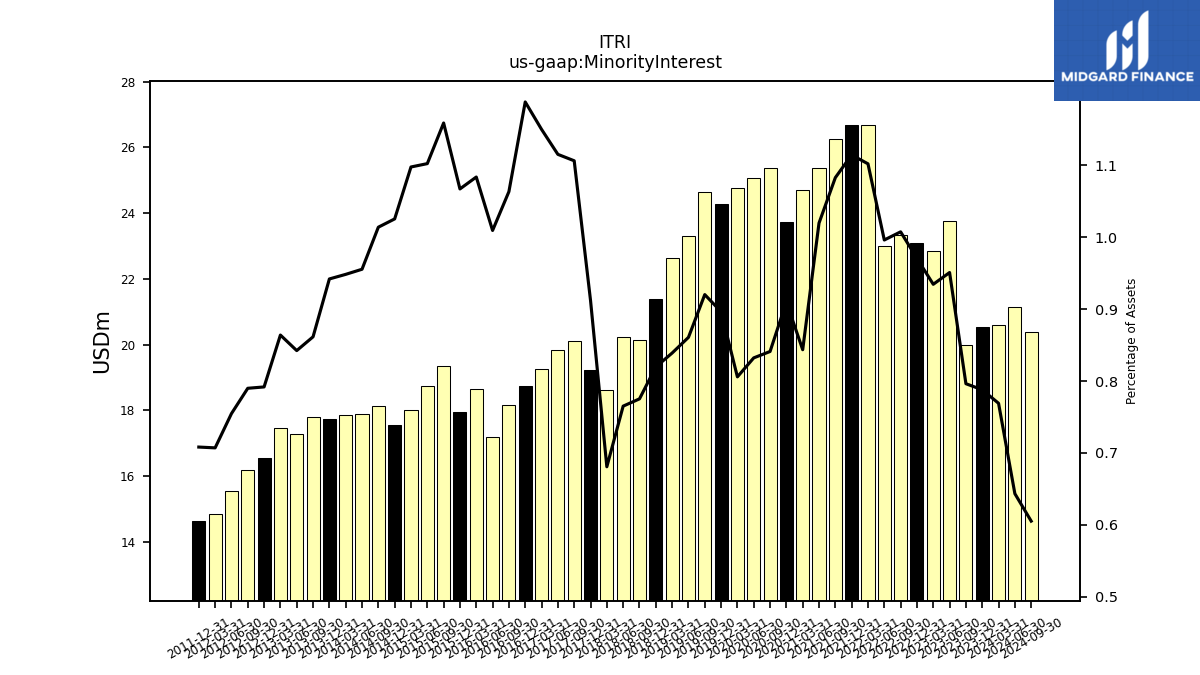
| Minority Interest | 20.52 | 20.00 | 23.76 | 22.86 | 23.08 | 23.34 | 22.99 | 26.67 | 26.68 | 26.24 | 25.38 | 24.70 | 23.73 | 25.37 | 25.07 | 24.75 | 24.28 | 24.63 | 23.30 | 22.63 | 21.39 | 20.13 | 20.23 | 18.63 | 19.22 | 20.11 | 19.85 | 19.25 | 18.75 | 18.17 | 17.18 | 18.64 | 17.95 | 19.36 | 18.73 | 18.00 | 17.54 | 18.13 | 17.89 | 17.87 | 17.73 | 17.79 | 17.27 | 17.47 | 16.55 | 16.17 | 15.55 | 14.84 | 14.62 | NA | NA | NA | NA | NA | NA | NA | |
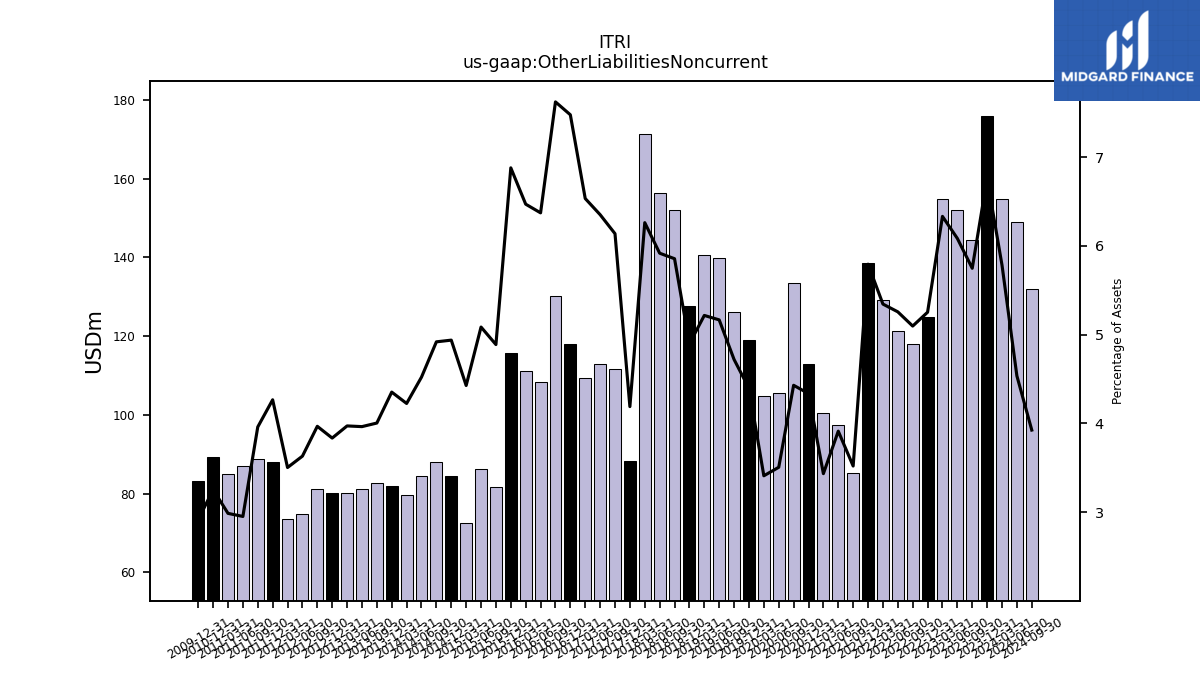
| Other Liabilities Noncurrent | 176.03 | 144.32 | 151.99 | 154.85 | 124.89 | 118.05 | 121.28 | 129.30 | 138.67 | 85.25 | 97.33 | 100.51 | 113.01 | 133.55 | 105.56 | 104.71 | 118.98 | 126.27 | 139.79 | 140.64 | 127.74 | 152.02 | 156.41 | 171.32 | 88.21 | 111.55 | 113.02 | 109.35 | 117.95 | 130.18 | 108.44 | 111.24 | 115.64 | 81.63 | 86.37 | 72.55 | 84.44 | 87.93 | 84.61 | 79.58 | 81.92 | 82.66 | 81.23 | 80.26 | 80.10 | 81.20 | 74.81 | 73.48 | 88.04 | 88.74 | 86.94 | 85.07 | 89.31 | NA | NA | NA | |
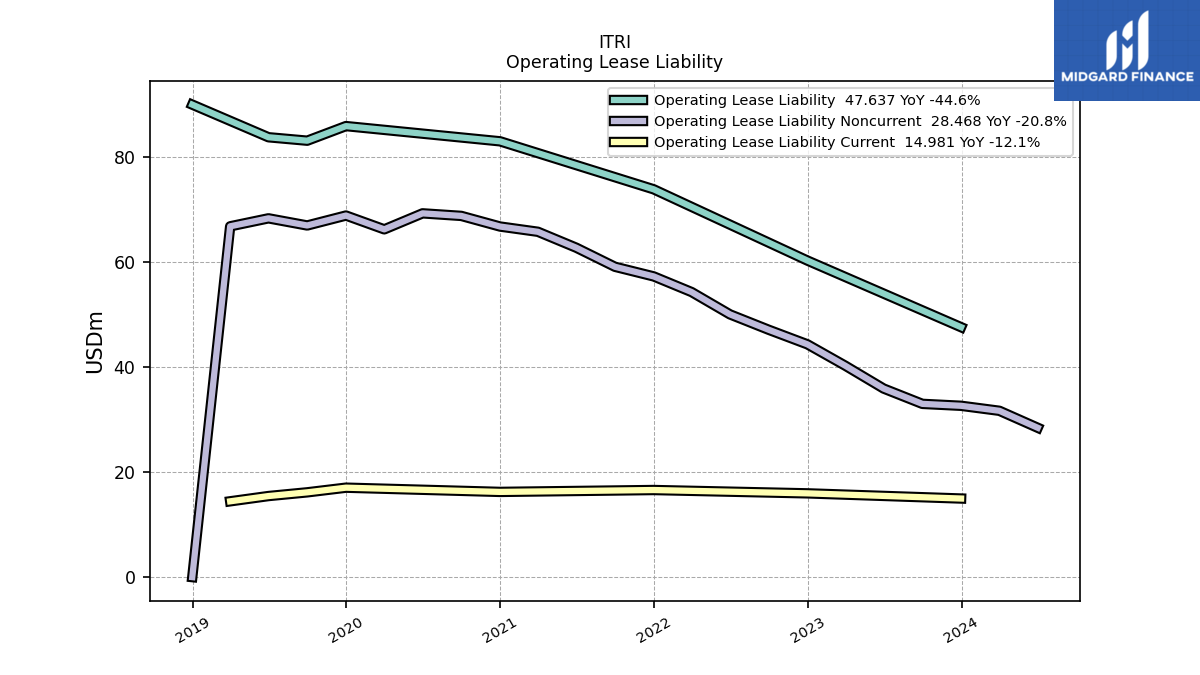
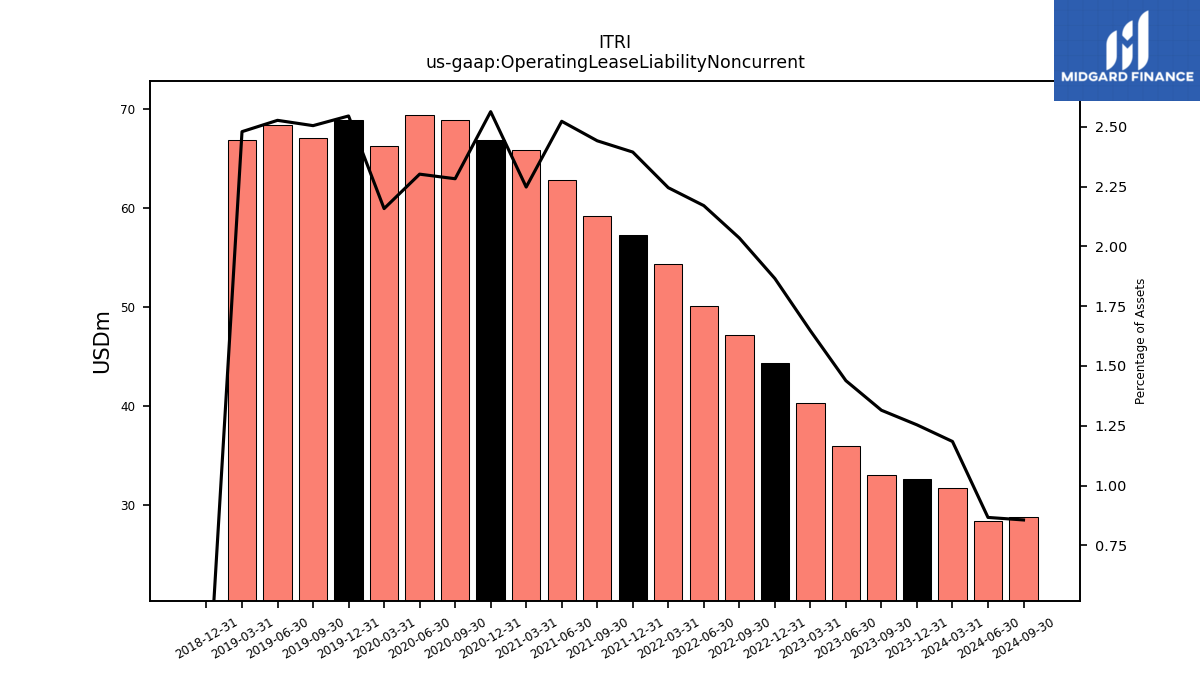
| Operating Lease Liability Noncurrent | 32.66 | 33.02 | 35.94 | 40.29 | 44.37 | 47.15 | 50.08 | 54.33 | 57.31 | 59.15 | 62.78 | 65.82 | 66.82 | 68.85 | 69.34 | 66.29 | 68.92 | 67.02 | 68.39 | 66.86 | 0.00 | NA | NA | NA | NA | NA | NA | NA | NA | NA | NA | NA | NA | NA | NA | NA | NA | NA | NA | NA | NA | NA | NA | NA | NA | NA | NA | NA | NA | NA | NA | NA | NA | NA | NA | NA |
| 2023-12-31 | 2023-09-30 | 2023-06-30 | 2023-03-31 | 2022-12-31 | 2022-09-30 | 2022-06-30 | 2022-03-31 | 2021-12-31 | 2021-09-30 | 2021-06-30 | 2021-03-31 | 2020-12-31 | 2020-09-30 | 2020-06-30 | 2020-03-31 | 2019-12-31 | 2019-09-30 | 2019-06-30 | 2019-03-31 | 2018-12-31 | 2018-09-30 | 2018-06-30 | 2018-03-31 | 2017-12-31 | 2017-09-30 | 2017-06-30 | 2017-03-31 | 2016-12-31 | 2016-09-30 | 2016-06-30 | 2016-03-31 | 2015-12-31 | 2015-09-30 | 2015-06-30 | 2015-03-31 | 2014-12-31 | 2014-09-30 | 2014-06-30 | 2014-03-31 | 2013-12-31 | 2013-09-30 | 2013-06-30 | 2013-03-31 | 2012-12-31 | 2012-09-30 | 2012-06-30 | 2012-03-31 | 2011-12-31 | 2011-09-30 | 2011-06-30 | 2011-03-31 | 2010-12-31 | 2010-09-30 | 2010-06-30 | 2010-03-31 | ||
|---|---|---|---|---|---|---|---|---|---|---|---|---|---|---|---|---|---|---|---|---|---|---|---|---|---|---|---|---|---|---|---|---|---|---|---|---|---|---|---|---|---|---|---|---|---|---|---|---|---|---|---|---|---|---|---|---|---|
| Stockholders Equity | 1310.91 | 1237.73 | 1205.12 | 1171.28 | 1168.47 | 1093.83 | 1110.11 | 1160.08 | 1116.08 | 1173.59 | 1175.28 | 1196.47 | 816.55 | 771.90 | 777.80 | 770.74 | 776.54 | 737.29 | 723.30 | 709.40 | 712.66 | 692.20 | 662.76 | 685.97 | 786.42 | 770.41 | 723.65 | 683.35 | 631.60 | 643.83 | 640.79 | 626.59 | 604.76 | 615.45 | 626.53 | 628.90 | 696.94 | 818.88 | 866.05 | 852.93 | 855.24 | 992.65 | 980.40 | 969.19 | 992.97 | 974.07 | 924.13 | 954.94 | 906.92 | 1026.98 | 1617.47 | 1554.92 | 1428.30 | NA | NA | NA | |
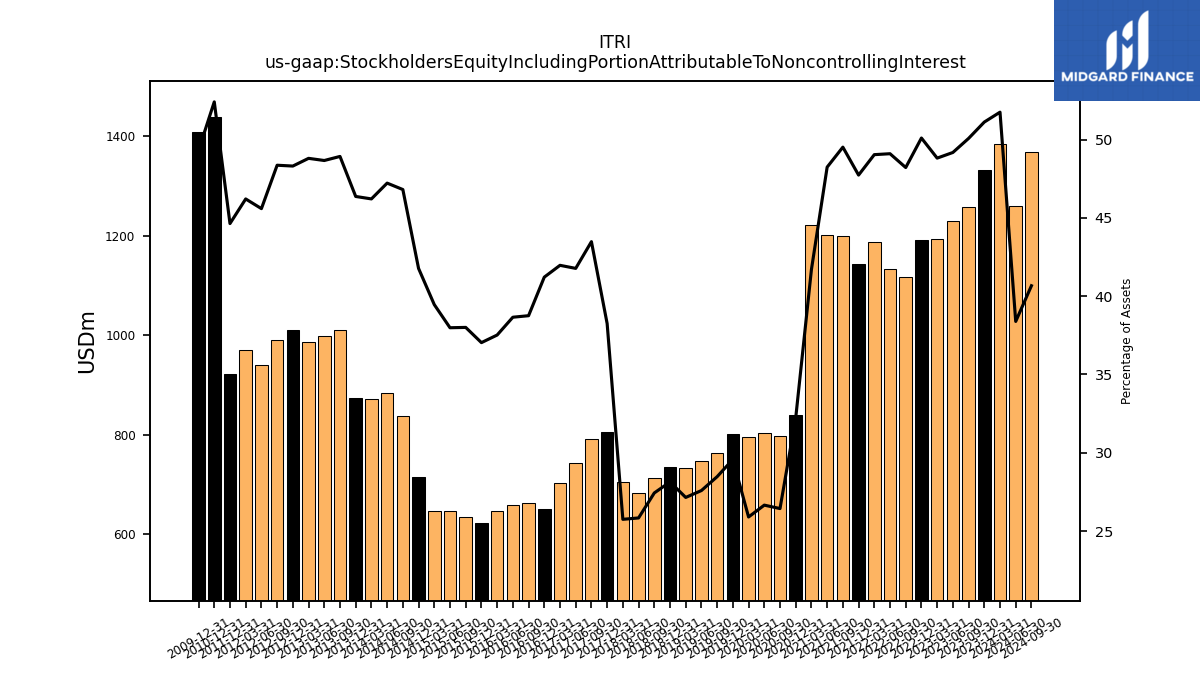
| Stockholders Equity Including Portion Attributable To Noncontrolling Interest | 1331.43 | 1257.73 | 1228.89 | 1194.14 | 1191.56 | 1117.17 | 1133.10 | 1186.75 | 1142.76 | 1199.83 | 1200.66 | 1221.17 | 840.27 | 797.26 | 802.87 | 795.50 | 800.82 | 761.92 | 746.60 | 732.03 | 734.05 | 712.33 | 682.99 | 704.60 | 805.63 | 790.52 | 743.50 | 702.61 | 650.35 | 661.99 | 657.97 | 645.23 | 622.70 | 634.81 | 645.26 | 646.90 | 714.48 | 837.01 | 883.94 | 870.80 | 872.97 | 1010.44 | 997.67 | 986.65 | 1009.51 | 990.24 | 939.68 | 969.77 | 921.54 | NA | NA | NA | 1439.21 | NA | NA | NA | |
| Common Stock Value | 1820.51 | 1811.37 | 1803.81 | 1796.01 | 1788.48 | 1783.19 | 1777.48 | 1770.06 | 1779.78 | 1782.06 | 1775.32 | 1768.52 | 1389.42 | 1381.77 | 1376.13 | 1368.33 | 1357.60 | 1335.35 | 1325.51 | 1334.79 | 1334.36 | 1326.72 | 1317.78 | 1310.38 | 1294.77 | 1287.80 | 1282.09 | 1276.30 | 1270.47 | 1259.70 | 1255.31 | 1251.23 | 1246.67 | 1246.18 | 1255.15 | 1257.80 | 1270.05 | 1287.96 | 1293.55 | 1291.69 | 1290.63 | 1288.22 | 1290.23 | 1299.61 | 1294.21 | 1294.99 | 1304.09 | 1313.32 | 1319.22 | 1343.94 | 1339.50 | 1334.16 | 1328.25 | NA | NA | NA | |
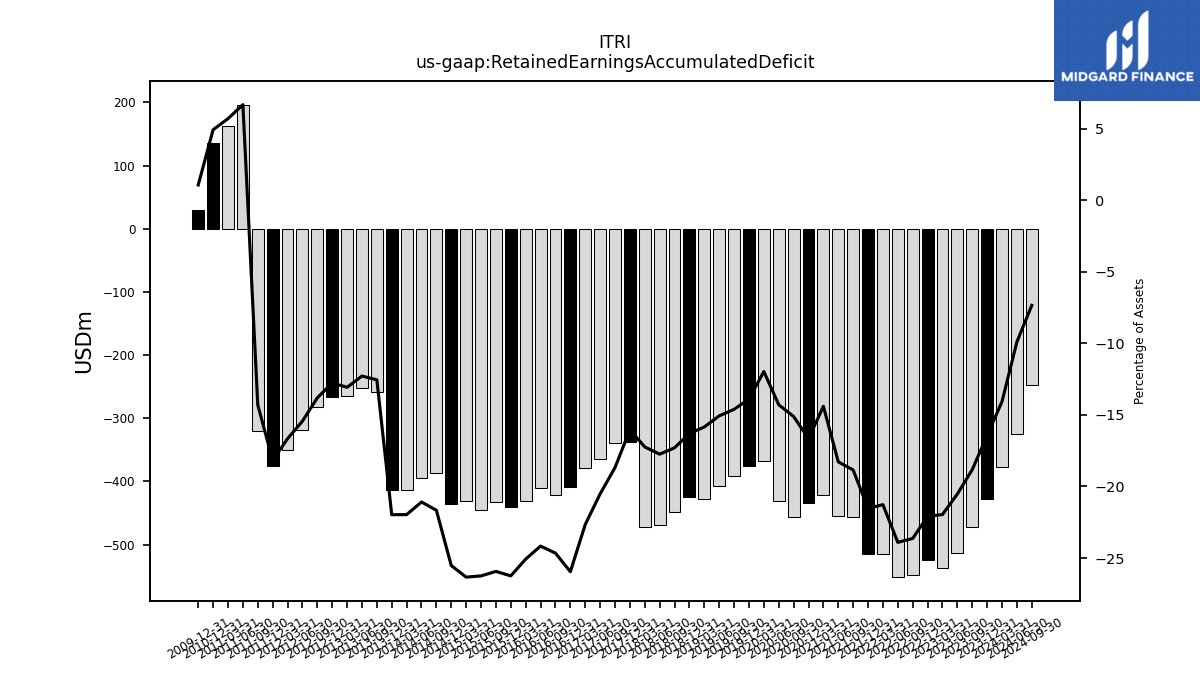
| Retained Earnings Accumulated Deficit | -428.41 | -472.80 | -512.97 | -537.17 | -525.33 | -547.54 | -551.66 | -514.69 | -515.60 | -456.73 | -454.87 | -421.74 | -434.35 | -455.87 | -430.51 | -367.71 | -376.39 | -391.01 | -407.86 | -427.30 | -425.40 | -449.27 | -469.15 | -471.81 | -337.87 | -339.65 | -365.23 | -379.33 | -409.54 | -421.19 | -411.30 | -431.22 | -441.31 | -433.18 | -445.88 | -431.68 | -436.59 | -387.36 | -394.67 | -413.93 | -413.67 | -259.24 | -251.89 | -264.29 | -266.86 | -282.82 | -318.17 | -349.78 | -375.14 | -320.51 | 196.58 | 162.14 | 135.02 | NA | NA | NA | |
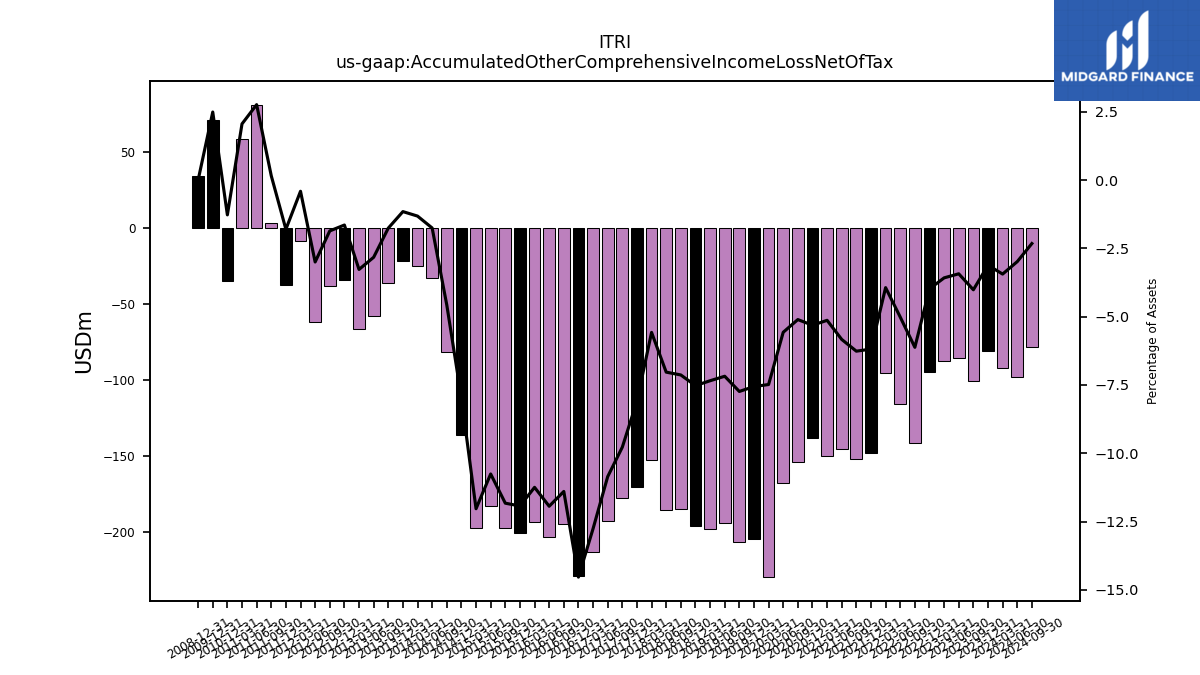
| Accumulated Other Comprehensive Income Loss Net Of Tax | -81.19 | -100.84 | -85.72 | -87.56 | -94.67 | -141.82 | -115.70 | -95.28 | -148.10 | -151.74 | -145.17 | -150.31 | -138.53 | -154.01 | -167.83 | -229.88 | -204.67 | -207.05 | -194.35 | -198.09 | -196.31 | -185.25 | -185.87 | -152.59 | -170.48 | -177.74 | -193.21 | -213.62 | -229.33 | -194.69 | -203.22 | -193.43 | -200.61 | -197.54 | -182.74 | -197.21 | -136.51 | -81.72 | -32.83 | -24.84 | -21.72 | -36.33 | -57.93 | -66.13 | -34.38 | -38.10 | -61.79 | -8.60 | -37.16 | 3.55 | 81.39 | 58.61 | -34.97 | NA | NA | NA | |
| Minority Interest | 20.52 | 20.00 | 23.76 | 22.86 | 23.08 | 23.34 | 22.99 | 26.67 | 26.68 | 26.24 | 25.38 | 24.70 | 23.73 | 25.37 | 25.07 | 24.75 | 24.28 | 24.63 | 23.30 | 22.63 | 21.39 | 20.13 | 20.23 | 18.63 | 19.22 | 20.11 | 19.85 | 19.25 | 18.75 | 18.17 | 17.18 | 18.64 | 17.95 | 19.36 | 18.73 | 18.00 | 17.54 | 18.13 | 17.89 | 17.87 | 17.73 | 17.79 | 17.27 | 17.47 | 16.55 | 16.17 | 15.55 | 14.84 | 14.62 | NA | NA | NA | NA | NA | NA | NA |
| 2023-12-31 | 2023-09-30 | 2023-06-30 | 2023-03-31 | 2022-12-31 | 2022-09-30 | 2022-06-30 | 2022-03-31 | 2021-12-31 | 2021-09-30 | 2021-06-30 | 2021-03-31 | 2020-12-31 | 2020-09-30 | 2020-06-30 | 2020-03-31 | 2019-12-31 | 2019-09-30 | 2019-06-30 | 2019-03-31 | 2018-12-31 | 2018-09-30 | 2018-06-30 | 2018-03-31 | 2017-12-31 | 2017-09-30 | 2017-06-30 | 2017-03-31 | 2016-12-31 | 2016-09-30 | 2016-06-30 | 2016-03-31 | 2015-12-31 | 2015-09-30 | 2015-06-30 | 2015-03-31 | 2014-12-31 | 2014-09-30 | 2014-06-30 | 2014-03-31 | 2013-12-31 | 2013-09-30 | 2013-06-30 | 2013-03-31 | 2012-12-31 | 2012-09-30 | 2012-06-30 | 2012-03-31 | 2011-12-31 | 2011-09-30 | 2011-06-30 | 2011-03-31 | 2010-12-31 | 2010-09-30 | 2010-06-30 | 2010-03-31 | ||
|---|---|---|---|---|---|---|---|---|---|---|---|---|---|---|---|---|---|---|---|---|---|---|---|---|---|---|---|---|---|---|---|---|---|---|---|---|---|---|---|---|---|---|---|---|---|---|---|---|---|---|---|---|---|---|---|---|---|
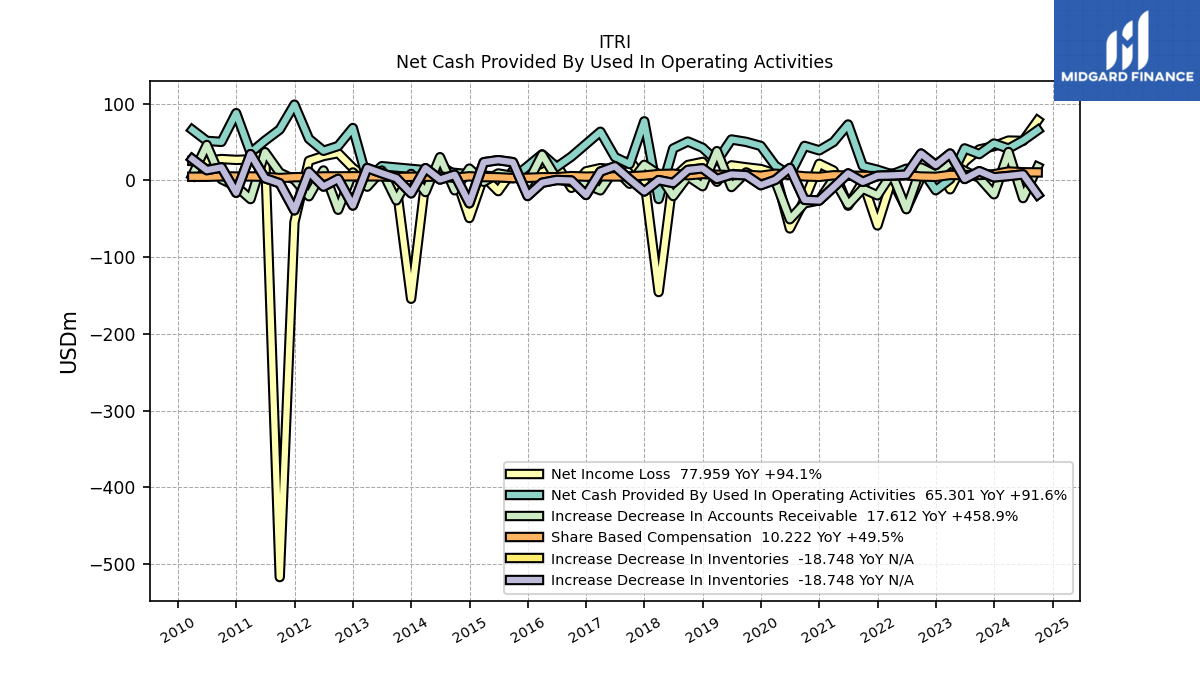
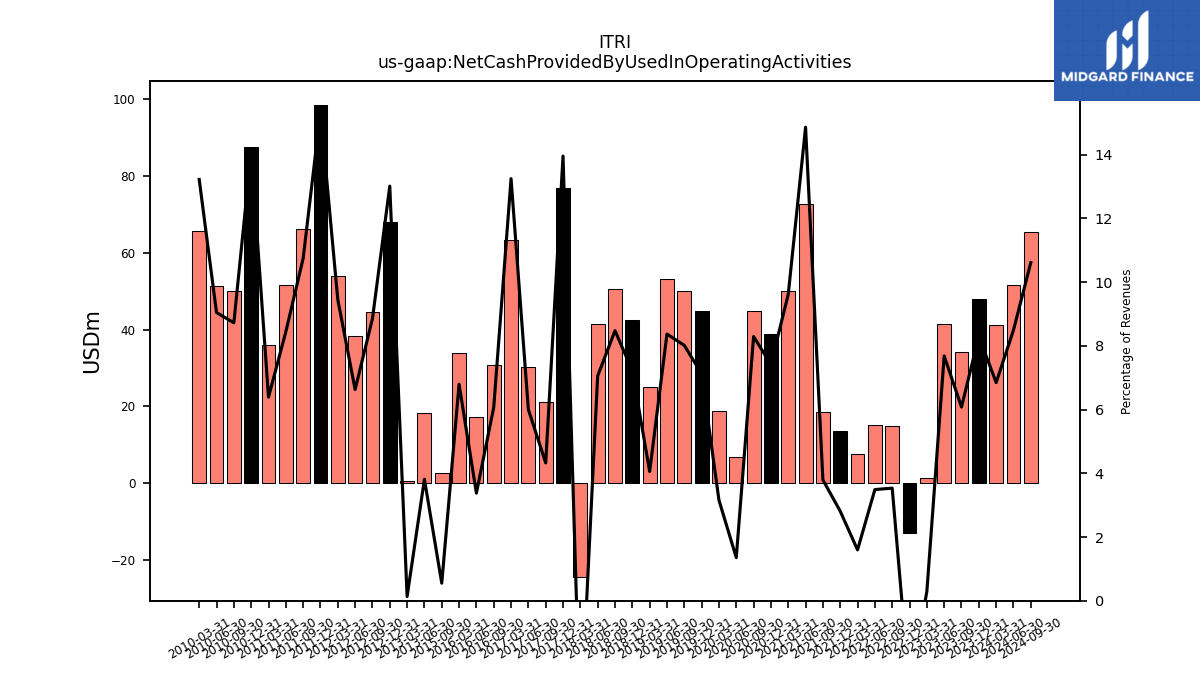
| Net Cash Provided By Used In Operating Activities | 47.90 | 34.09 | 41.56 | 1.43 | -13.03 | 14.87 | 15.06 | 7.59 | 13.65 | 18.47 | 72.72 | 49.95 | 38.94 | 44.78 | 6.89 | 18.89 | 44.74 | 50.04 | 53.14 | 24.92 | 42.37 | 50.50 | 41.33 | -24.45 | 76.85 | 21.06 | 30.19 | 63.26 | NA | 30.75 | 17.32 | 33.80 | NA | 2.59 | NA | NA | NA | NA | NA | NA | NA | NA | 18.38 | 0.59 | 68.09 | 44.61 | 38.39 | 54.00 | 98.56 | 66.11 | 51.68 | 36.01 | 87.47 | 50.03 | 51.31 | 65.78 | |
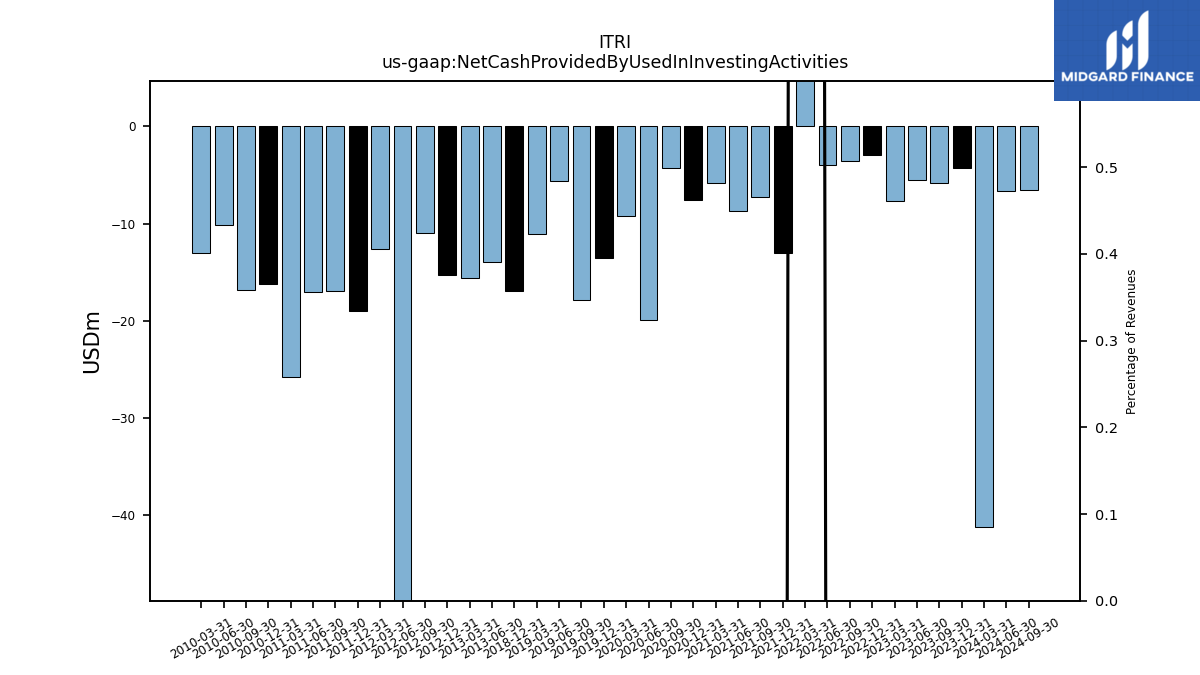
| Net Cash Provided By Used In Investing Activities | -4.30 | -5.78 | -5.56 | -7.66 | -2.98 | -3.52 | -3.93 | 50.95 | -13.06 | -7.30 | -8.71 | -5.81 | -7.56 | -4.31 | -19.90 | -9.26 | -13.59 | -17.86 | -5.62 | -11.12 | -16.91 | NA | NA | NA | NA | NA | NA | NA | NA | NA | NA | NA | NA | NA | NA | NA | NA | NA | NA | NA | NA | NA | -13.95 | -15.57 | -15.30 | -10.99 | -86.54 | -12.62 | -18.94 | -16.97 | -17.06 | -25.77 | -16.18 | -16.87 | -10.17 | -13.05 | |
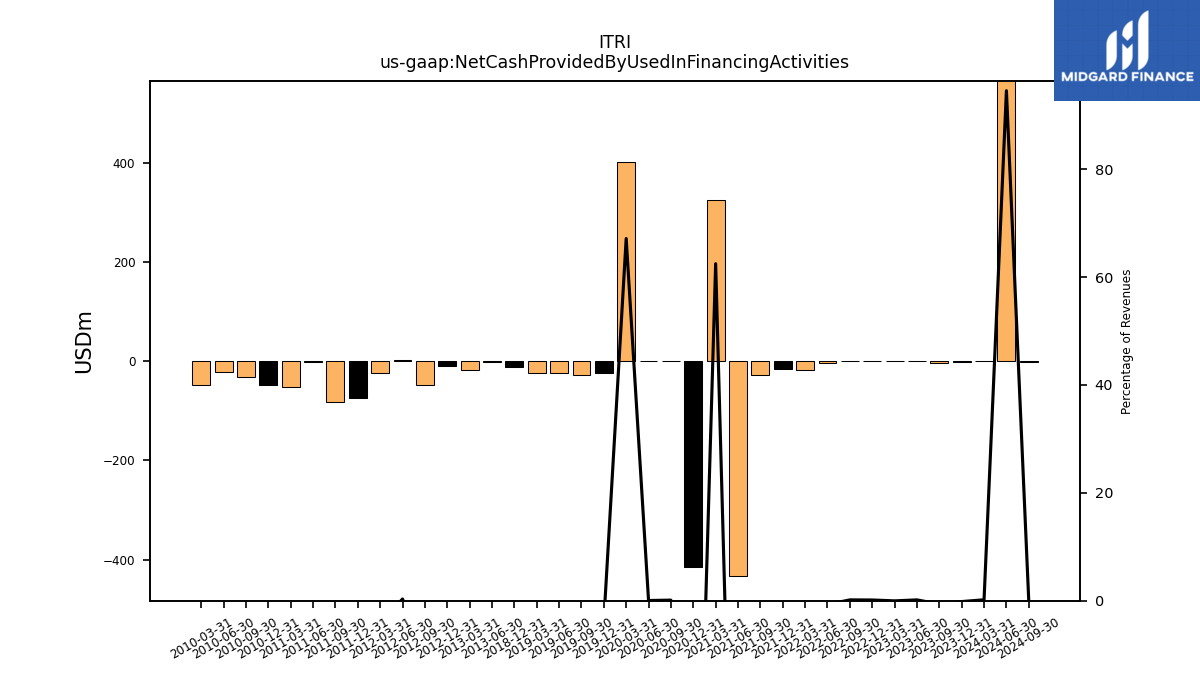
| Net Cash Provided By Used In Financing Activities | -0.87 | -3.41 | 0.86 | -0.10 | 0.66 | 0.68 | -2.97 | -17.11 | -16.08 | -28.66 | -432.73 | 324.58 | -414.17 | 0.63 | 0.23 | 401.74 | -23.93 | -27.07 | -23.28 | -23.24 | -12.54 | NA | NA | NA | NA | NA | NA | NA | NA | NA | NA | NA | NA | NA | NA | NA | NA | NA | NA | NA | NA | NA | -1.57 | -17.24 | -9.01 | -47.17 | 1.88 | -23.23 | -73.34 | -82.72 | -1.03 | -52.37 | -47.71 | -31.62 | -20.91 | -48.39 |
| 2023-12-31 | 2023-09-30 | 2023-06-30 | 2023-03-31 | 2022-12-31 | 2022-09-30 | 2022-06-30 | 2022-03-31 | 2021-12-31 | 2021-09-30 | 2021-06-30 | 2021-03-31 | 2020-12-31 | 2020-09-30 | 2020-06-30 | 2020-03-31 | 2019-12-31 | 2019-09-30 | 2019-06-30 | 2019-03-31 | 2018-12-31 | 2018-09-30 | 2018-06-30 | 2018-03-31 | 2017-12-31 | 2017-09-30 | 2017-06-30 | 2017-03-31 | 2016-12-31 | 2016-09-30 | 2016-06-30 | 2016-03-31 | 2015-12-31 | 2015-09-30 | 2015-06-30 | 2015-03-31 | 2014-12-31 | 2014-09-30 | 2014-06-30 | 2014-03-31 | 2013-12-31 | 2013-09-30 | 2013-06-30 | 2013-03-31 | 2012-12-31 | 2012-09-30 | 2012-06-30 | 2012-03-31 | 2011-12-31 | 2011-09-30 | 2011-06-30 | 2011-03-31 | 2010-12-31 | 2010-09-30 | 2010-06-30 | 2010-03-31 | ||
|---|---|---|---|---|---|---|---|---|---|---|---|---|---|---|---|---|---|---|---|---|---|---|---|---|---|---|---|---|---|---|---|---|---|---|---|---|---|---|---|---|---|---|---|---|---|---|---|---|---|---|---|---|---|---|---|---|---|
| Net Cash Provided By Used In Operating Activities | 47.90 | 34.09 | 41.56 | 1.43 | -13.03 | 14.87 | 15.06 | 7.59 | 13.65 | 18.47 | 72.72 | 49.95 | 38.94 | 44.78 | 6.89 | 18.89 | 44.74 | 50.04 | 53.14 | 24.92 | 42.37 | 50.50 | 41.33 | -24.45 | 76.85 | 21.06 | 30.19 | 63.26 | NA | 30.75 | 17.32 | 33.80 | NA | 2.59 | NA | NA | NA | NA | NA | NA | NA | NA | 18.38 | 0.59 | 68.09 | 44.61 | 38.39 | 54.00 | 98.56 | 66.11 | 51.68 | 36.01 | 87.47 | 50.03 | 51.31 | 65.78 | |
| Net Income Loss | 44.39 | 40.17 | 24.20 | -11.84 | 22.21 | 4.12 | -36.97 | 0.91 | -58.87 | -1.87 | -33.12 | 12.60 | 21.52 | -25.36 | -62.80 | 8.68 | 14.62 | 16.85 | 19.45 | -1.91 | 23.88 | 19.88 | 2.66 | -145.67 | 1.78 | 25.58 | 14.10 | 15.85 | 11.65 | -9.88 | 19.92 | 10.09 | 8.99 | 12.70 | -14.20 | 4.91 | -49.23 | 7.31 | 19.26 | -0.25 | -154.43 | -7.35 | 12.40 | 2.57 | 15.96 | 35.35 | 31.61 | 25.35 | -54.63 | -517.08 | 34.44 | 27.12 | 26.57 | 27.64 | 25.31 | 25.25 | |
| Profit Loss | 44.91 | 40.34 | 25.10 | -12.04 | 21.95 | 4.47 | -36.87 | 0.90 | -58.42 | -1.01 | -32.45 | 13.58 | 21.51 | -25.06 | -62.49 | 9.16 | 14.27 | 18.18 | 20.12 | -0.15 | 25.13 | 19.79 | 3.77 | -145.27 | 2.37 | 26.85 | 15.01 | 16.01 | 12.67 | -8.90 | 20.50 | 10.78 | 9.78 | 13.32 | -13.47 | 5.37 | -48.83 | 7.55 | 19.84 | -0.12 | -153.52 | -6.76 | 12.20 | 3.50 | 16.46 | 35.90 | 32.29 | 25.57 | -53.55 | -515.34 | 35.56 | 27.13 | NA | NA | NA | NA | |
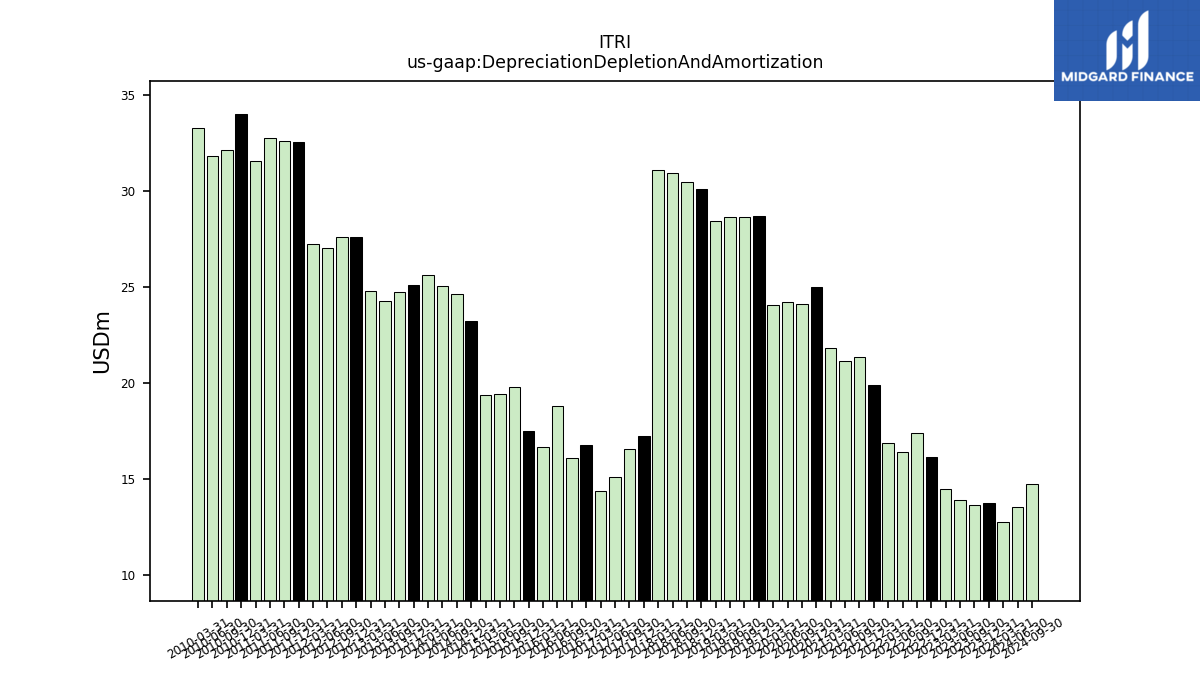
| Depreciation Depletion And Amortization | 13.75 | 13.64 | 13.90 | 14.46 | 16.15 | 17.36 | 16.41 | 16.84 | 19.90 | 21.33 | 21.11 | 21.81 | 24.98 | 24.08 | 24.20 | 24.03 | 28.71 | 28.62 | 28.64 | 28.43 | 30.07 | 30.45 | 30.91 | 31.07 | 17.21 | 16.53 | 15.09 | 14.38 | 16.75 | 16.08 | 18.81 | 16.67 | 17.48 | 19.75 | 19.42 | 19.34 | 23.23 | 24.63 | 25.01 | 25.59 | 25.10 | 24.72 | 24.27 | 24.76 | 27.61 | 27.59 | 27.04 | 27.23 | 32.55 | 32.62 | 32.77 | 31.53 | 34.02 | 32.11 | 31.79 | 33.28 | |
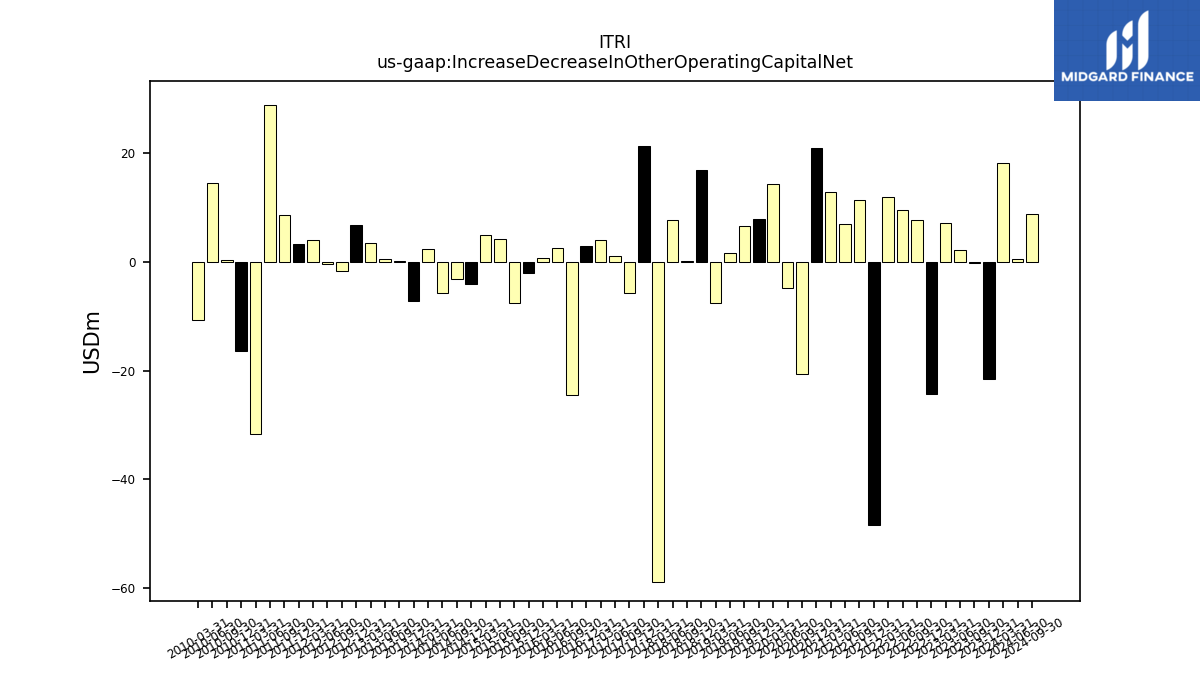
| Increase Decrease In Other Operating Capital Net | -21.49 | -0.14 | 2.12 | 7.09 | -24.36 | 7.69 | 9.62 | 11.93 | -48.45 | 11.44 | 6.98 | 12.95 | 21.00 | -20.56 | -4.74 | 14.44 | 7.84 | 6.55 | 1.71 | -7.51 | 16.88 | 0.25 | 7.75 | -58.95 | 21.34 | -5.74 | 1.12 | 3.96 | 2.99 | -24.47 | 2.65 | 0.75 | -2.11 | -7.57 | 4.24 | 4.99 | -4.10 | -3.06 | -5.75 | 2.40 | -7.19 | 0.11 | 0.48 | 3.46 | 6.77 | -1.62 | -0.39 | 3.99 | 3.28 | 8.73 | 28.95 | -31.67 | -16.44 | 0.44 | 14.61 | -10.66 | |
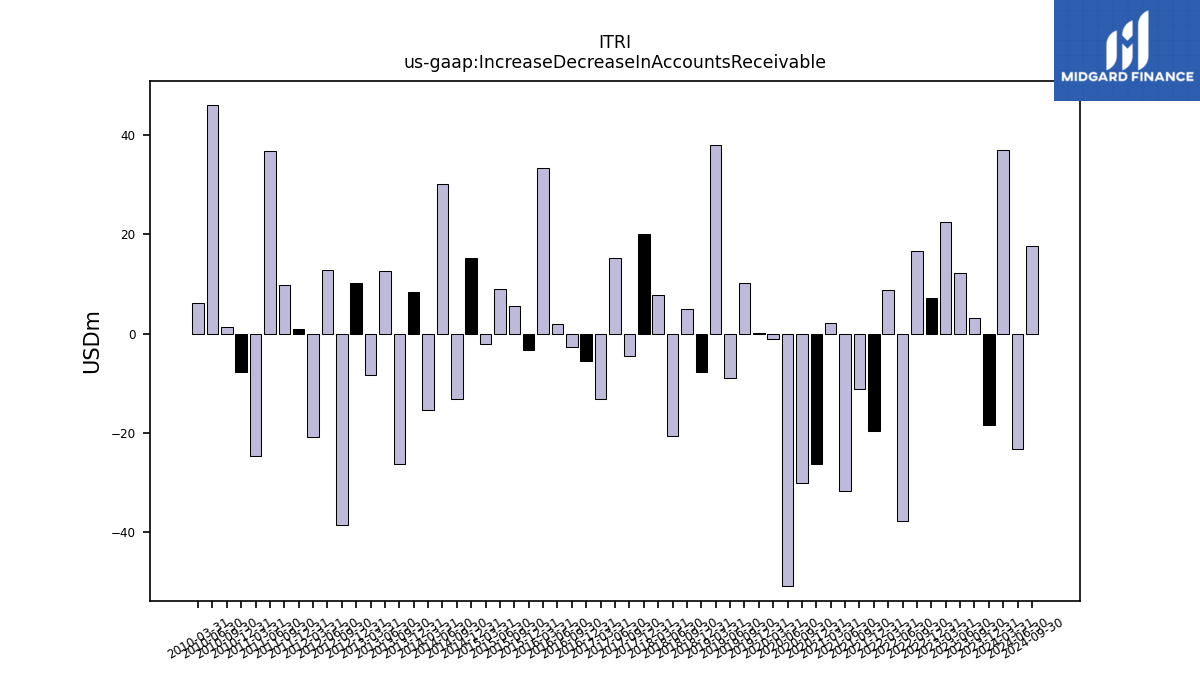
| Increase Decrease In Accounts Receivable | -18.34 | 3.15 | 12.18 | 22.50 | 7.21 | 16.65 | -37.74 | 8.82 | -19.62 | -11.07 | -31.63 | 2.08 | -26.17 | -30.06 | -50.85 | -1.19 | 0.08 | 10.26 | -8.86 | 37.98 | -7.75 | 5.03 | -20.57 | 7.77 | 20.11 | -4.57 | 15.15 | -13.12 | -5.49 | -2.63 | 1.98 | 33.31 | -3.39 | 5.55 | 8.88 | -2.03 | 15.21 | -13.14 | 30.10 | -15.39 | 8.27 | -26.20 | 12.64 | -8.36 | 10.19 | -38.45 | 12.78 | -20.82 | 0.83 | 9.83 | 36.65 | -24.55 | -7.81 | 1.30 | 45.96 | 6.17 | |
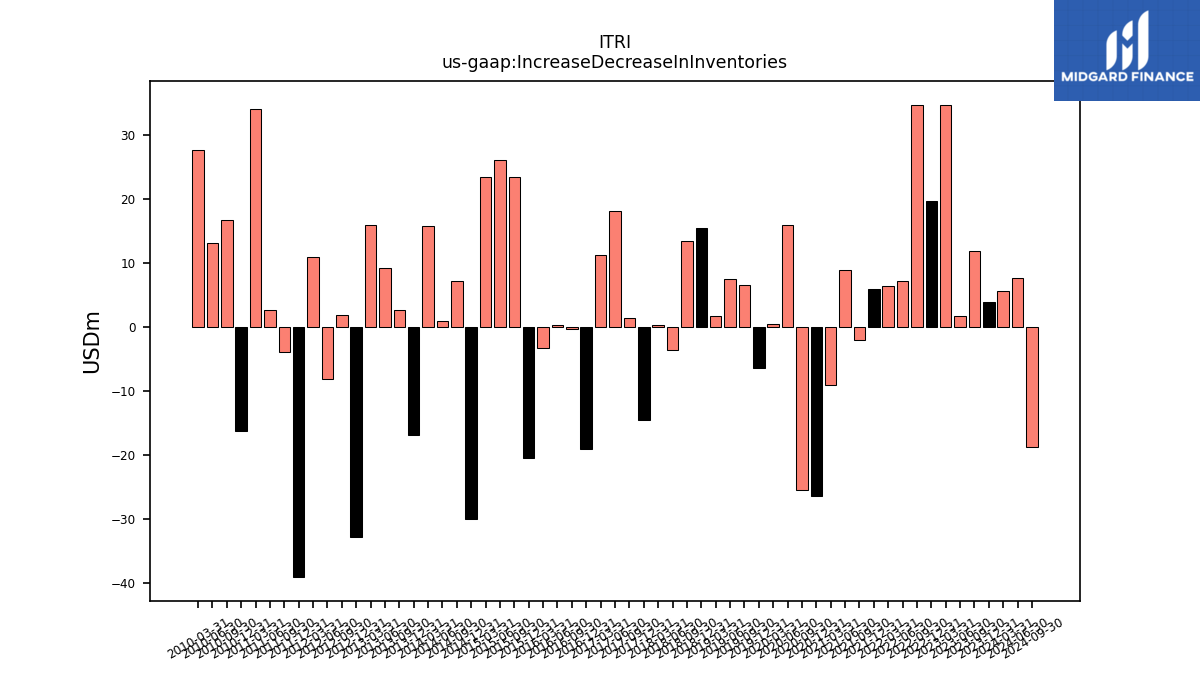
| Increase Decrease In Inventories | 3.84 | 11.81 | 1.68 | 34.79 | 19.75 | 34.78 | 7.25 | 6.34 | 5.87 | -2.08 | 8.94 | -9.01 | -26.43 | -25.51 | 15.99 | 0.54 | -6.37 | 6.56 | 7.54 | 1.66 | 15.54 | 13.46 | -3.64 | 0.25 | -14.60 | 1.37 | 18.20 | 11.27 | -19.14 | -0.33 | 0.36 | -3.24 | -20.48 | 23.54 | 26.20 | 23.48 | -30.01 | 7.18 | 0.97 | 15.83 | -16.97 | 2.71 | 9.18 | 15.94 | -32.87 | 1.83 | -8.21 | 10.99 | -39.14 | -3.92 | 2.59 | 34.07 | -16.28 | 16.77 | 13.18 | 27.75 | |
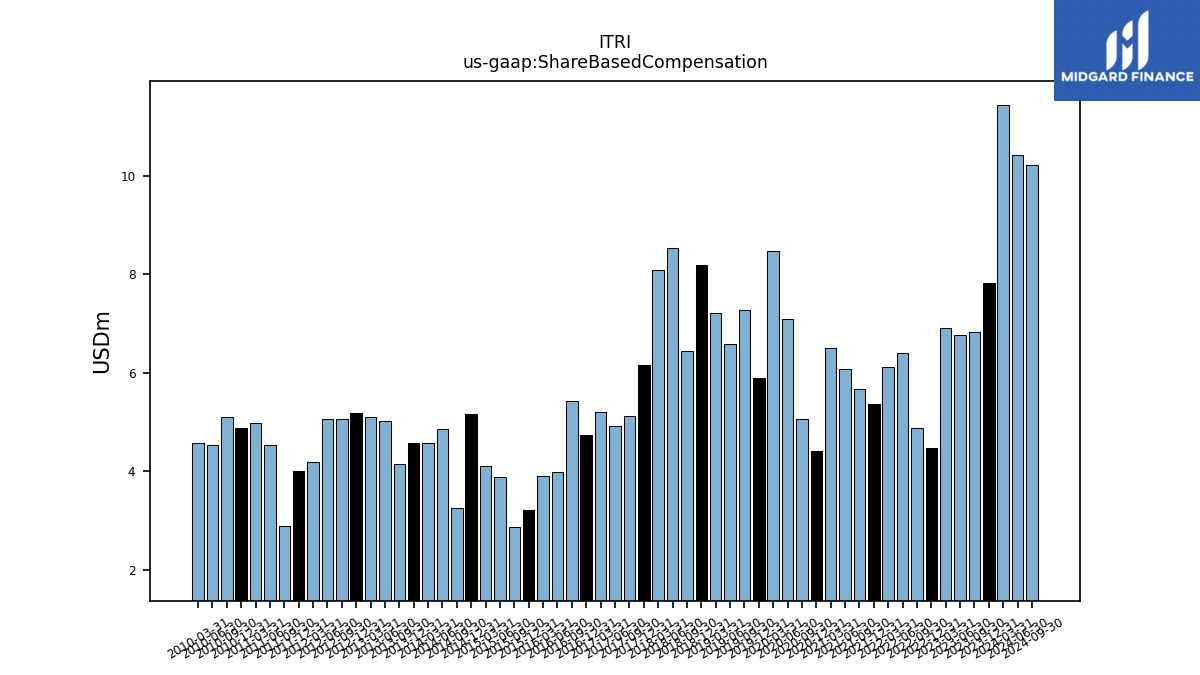
| Share Based Compensation | 7.83 | 6.84 | 6.78 | 6.92 | 4.46 | 4.88 | 6.41 | 6.13 | 5.37 | 5.67 | 6.09 | 6.50 | 4.42 | 5.06 | 7.10 | 8.48 | 5.90 | 7.28 | 6.58 | 7.21 | 8.19 | 6.45 | 8.52 | 8.10 | 6.15 | 5.12 | 4.92 | 5.21 | 4.74 | 5.42 | 3.98 | 3.90 | 3.21 | 2.88 | 3.89 | 4.11 | 5.16 | 3.25 | 4.87 | 4.58 | 4.57 | 4.15 | 5.03 | 5.10 | 5.19 | 5.06 | 5.06 | 4.20 | 4.01 | 2.88 | 4.54 | 4.97 | 4.88 | 5.10 | 4.54 | 4.58 | |
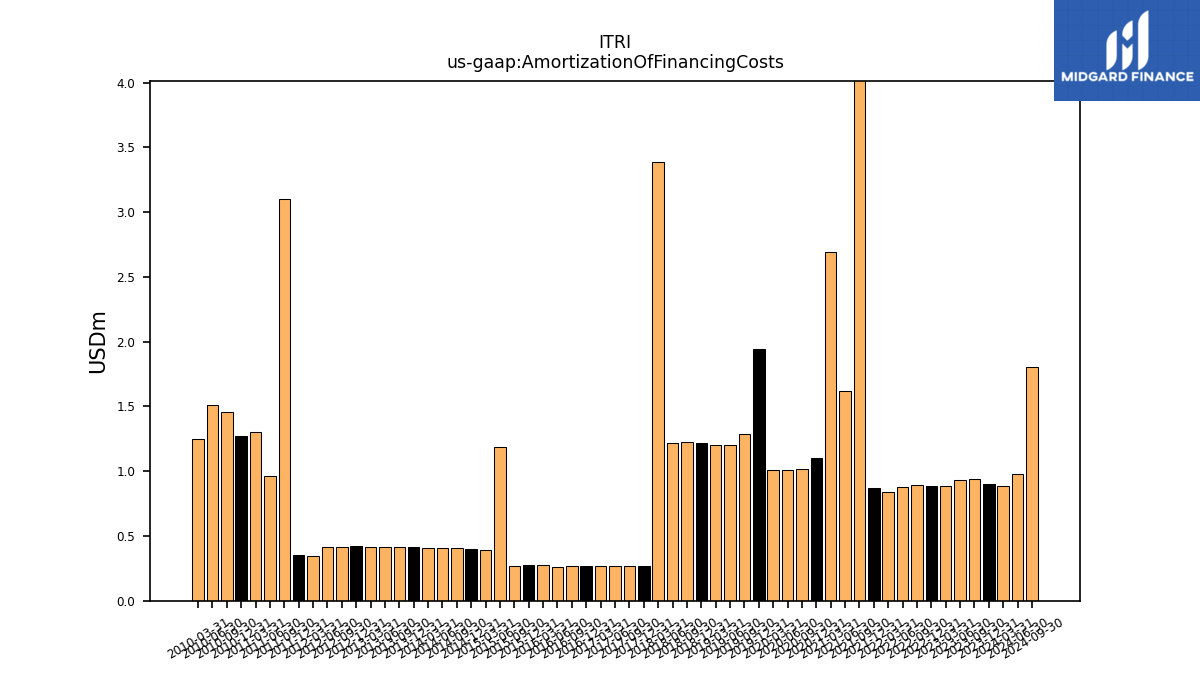
| Amortization Of Financing Costs | 0.90 | 0.94 | 0.93 | 0.89 | 0.89 | 0.89 | 0.88 | 0.84 | 0.87 | 13.07 | 1.62 | 2.69 | 1.10 | 1.02 | 1.01 | 1.01 | 1.95 | 1.28 | 1.20 | 1.20 | 1.22 | 1.22 | 1.22 | 3.39 | 0.27 | 0.27 | 0.27 | 0.27 | 0.27 | 0.27 | 0.26 | 0.28 | 0.28 | 0.27 | 1.19 | 0.39 | 0.40 | 0.40 | 0.40 | 0.40 | 0.41 | 0.41 | 0.41 | 0.41 | 0.42 | 0.41 | 0.41 | 0.35 | 0.35 | 3.10 | 0.96 | 1.30 | 1.27 | 1.46 | 1.51 | 1.25 |
| 2023-12-31 | 2023-09-30 | 2023-06-30 | 2023-03-31 | 2022-12-31 | 2022-09-30 | 2022-06-30 | 2022-03-31 | 2021-12-31 | 2021-09-30 | 2021-06-30 | 2021-03-31 | 2020-12-31 | 2020-09-30 | 2020-06-30 | 2020-03-31 | 2019-12-31 | 2019-09-30 | 2019-06-30 | 2019-03-31 | 2018-12-31 | 2018-09-30 | 2018-06-30 | 2018-03-31 | 2017-12-31 | 2017-09-30 | 2017-06-30 | 2017-03-31 | 2016-12-31 | 2016-09-30 | 2016-06-30 | 2016-03-31 | 2015-12-31 | 2015-09-30 | 2015-06-30 | 2015-03-31 | 2014-12-31 | 2014-09-30 | 2014-06-30 | 2014-03-31 | 2013-12-31 | 2013-09-30 | 2013-06-30 | 2013-03-31 | 2012-12-31 | 2012-09-30 | 2012-06-30 | 2012-03-31 | 2011-12-31 | 2011-09-30 | 2011-06-30 | 2011-03-31 | 2010-12-31 | 2010-09-30 | 2010-06-30 | 2010-03-31 | ||
|---|---|---|---|---|---|---|---|---|---|---|---|---|---|---|---|---|---|---|---|---|---|---|---|---|---|---|---|---|---|---|---|---|---|---|---|---|---|---|---|---|---|---|---|---|---|---|---|---|---|---|---|---|---|---|---|---|---|
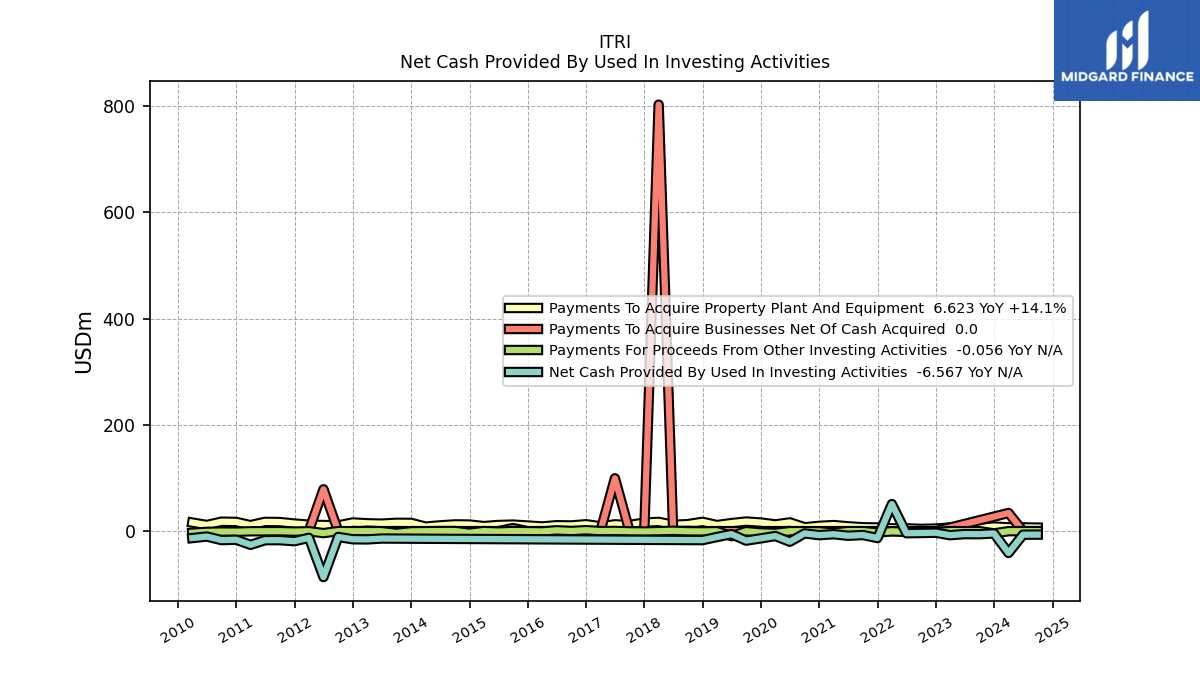
| Net Cash Provided By Used In Investing Activities | -4.30 | -5.78 | -5.56 | -7.66 | -2.98 | -3.52 | -3.93 | 50.95 | -13.06 | -7.30 | -8.71 | -5.81 | -7.56 | -4.31 | -19.90 | -9.26 | -13.59 | -17.86 | -5.62 | -11.12 | -16.91 | NA | NA | NA | NA | NA | NA | NA | NA | NA | NA | NA | NA | NA | NA | NA | NA | NA | NA | NA | NA | NA | -13.95 | -15.57 | -15.30 | -10.99 | -86.54 | -12.62 | -18.94 | -16.97 | -17.06 | -25.77 | -16.18 | -16.87 | -10.17 | -13.05 | |
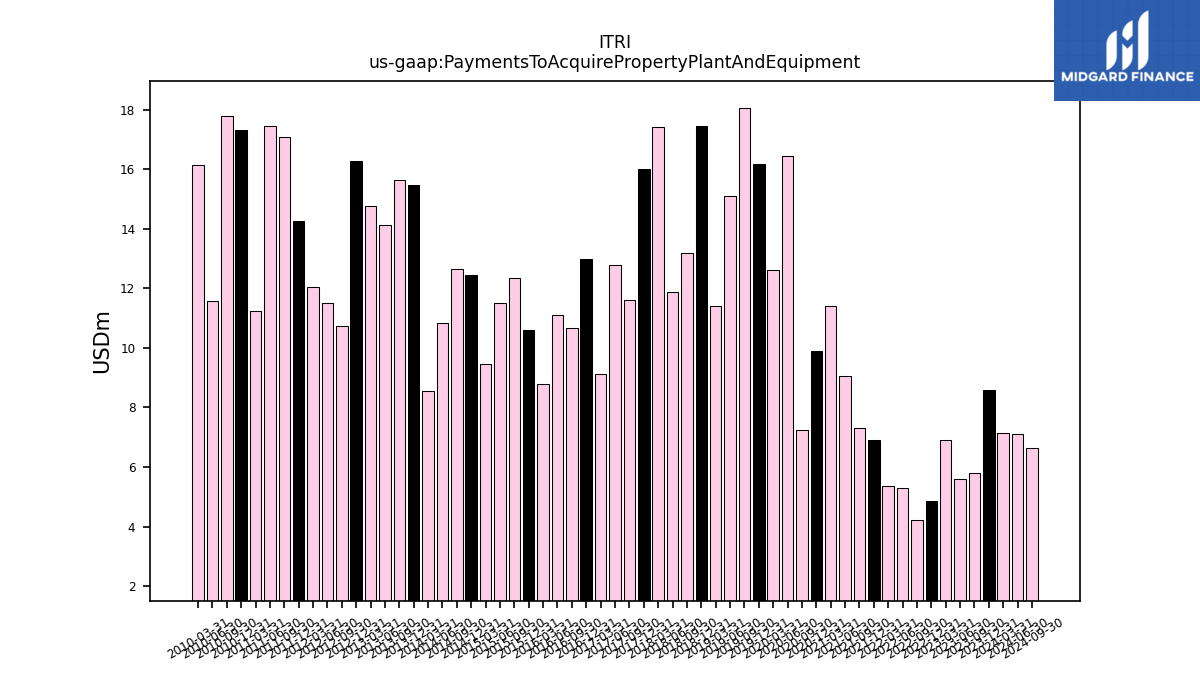
| Payments To Acquire Property Plant And Equipment | 8.58 | 5.81 | 5.60 | 6.90 | 4.86 | 4.22 | 5.29 | 5.37 | 6.90 | 7.30 | 9.06 | 11.41 | 9.91 | 7.25 | 16.45 | 12.60 | 16.18 | 18.06 | 15.10 | 11.41 | 17.46 | 13.18 | 11.88 | 17.43 | 16.00 | 11.60 | 12.78 | 9.12 | 12.98 | 10.68 | 11.09 | 8.79 | 10.59 | 12.33 | 11.52 | 9.47 | 12.44 | 12.66 | 10.84 | 8.56 | 15.47 | 15.65 | 14.13 | 14.77 | 16.27 | 10.73 | 11.50 | 12.04 | 14.28 | 17.09 | 17.46 | 11.25 | 17.32 | 17.79 | 11.56 | 16.15 |
| 2023-12-31 | 2023-09-30 | 2023-06-30 | 2023-03-31 | 2022-12-31 | 2022-09-30 | 2022-06-30 | 2022-03-31 | 2021-12-31 | 2021-09-30 | 2021-06-30 | 2021-03-31 | 2020-12-31 | 2020-09-30 | 2020-06-30 | 2020-03-31 | 2019-12-31 | 2019-09-30 | 2019-06-30 | 2019-03-31 | 2018-12-31 | 2018-09-30 | 2018-06-30 | 2018-03-31 | 2017-12-31 | 2017-09-30 | 2017-06-30 | 2017-03-31 | 2016-12-31 | 2016-09-30 | 2016-06-30 | 2016-03-31 | 2015-12-31 | 2015-09-30 | 2015-06-30 | 2015-03-31 | 2014-12-31 | 2014-09-30 | 2014-06-30 | 2014-03-31 | 2013-12-31 | 2013-09-30 | 2013-06-30 | 2013-03-31 | 2012-12-31 | 2012-09-30 | 2012-06-30 | 2012-03-31 | 2011-12-31 | 2011-09-30 | 2011-06-30 | 2011-03-31 | 2010-12-31 | 2010-09-30 | 2010-06-30 | 2010-03-31 | ||
|---|---|---|---|---|---|---|---|---|---|---|---|---|---|---|---|---|---|---|---|---|---|---|---|---|---|---|---|---|---|---|---|---|---|---|---|---|---|---|---|---|---|---|---|---|---|---|---|---|---|---|---|---|---|---|---|---|---|
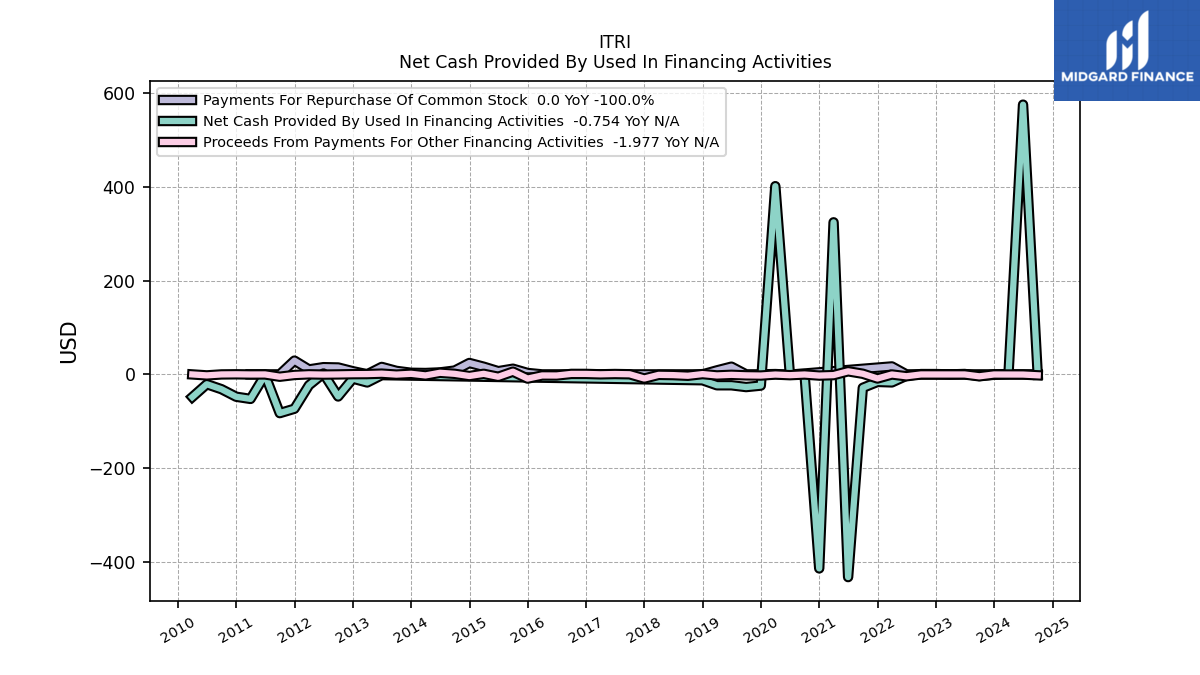
| Net Cash Provided By Used In Financing Activities | -0.87 | -3.41 | 0.86 | -0.10 | 0.66 | 0.68 | -2.97 | -17.11 | -16.08 | -28.66 | -432.73 | 324.58 | -414.17 | 0.63 | 0.23 | 401.74 | -23.93 | -27.07 | -23.28 | -23.24 | -12.54 | NA | NA | NA | NA | NA | NA | NA | NA | NA | NA | NA | NA | NA | NA | NA | NA | NA | NA | NA | NA | NA | -1.57 | -17.24 | -9.01 | -47.17 | 1.88 | -23.23 | -73.34 | -82.72 | -1.03 | -52.37 | -47.71 | -31.62 | -20.91 | -48.39 |
| 2023-12-31 | 2023-09-30 | 2023-06-30 | 2023-03-31 | 2022-12-31 | 2022-09-30 | 2022-06-30 | 2022-03-31 | 2021-12-31 | 2021-09-30 | 2021-06-30 | 2021-03-31 | 2020-12-31 | 2020-09-30 | 2020-06-30 | 2020-03-31 | 2019-12-31 | 2019-09-30 | 2019-06-30 | 2019-03-31 | 2018-12-31 | 2018-09-30 | 2018-06-30 | 2018-03-31 | 2017-12-31 | 2017-09-30 | 2017-06-30 | 2017-03-31 | 2016-12-31 | 2016-09-30 | 2016-06-30 | 2016-03-31 | 2015-12-31 | 2015-09-30 | 2015-06-30 | 2015-03-31 | 2014-12-31 | 2014-09-30 | 2014-06-30 | 2014-03-31 | 2013-12-31 | 2013-09-30 | 2013-06-30 | 2013-03-31 | 2012-12-31 | 2012-09-30 | 2012-06-30 | 2012-03-31 | 2011-12-31 | 2011-09-30 | 2011-06-30 | 2011-03-31 | 2010-12-31 | 2010-09-30 | 2010-06-30 | 2010-03-31 | ||
|---|---|---|---|---|---|---|---|---|---|---|---|---|---|---|---|---|---|---|---|---|---|---|---|---|---|---|---|---|---|---|---|---|---|---|---|---|---|---|---|---|---|---|---|---|---|---|---|---|---|---|---|---|---|---|---|---|---|
| Revenues | 577.17 | 560.77 | 541.07 | 494.62 | 467.49 | 420.86 | 431.88 | 475.33 | 485.64 | 486.95 | 489.41 | 519.57 | 525.16 | 540.18 | 509.59 | 598.41 | 628.38 | 624.47 | 635.04 | 614.58 | 587.04 | 595.96 | 585.89 | 607.22 | 550.78 | 486.75 | 503.08 | 477.59 | 495.71 | 506.86 | 513.02 | 497.59 | 496.45 | 469.09 | 470.10 | 448.25 | 510.10 | 496.45 | 489.35 | 474.80 | 523.53 | 495.49 | 482.18 | 447.54 | 523.34 | 504.06 | 579.14 | 571.64 | 642.48 | 615.55 | 612.40 | 563.69 | 620.66 | 573.65 | 567.34 | 497.62 | |
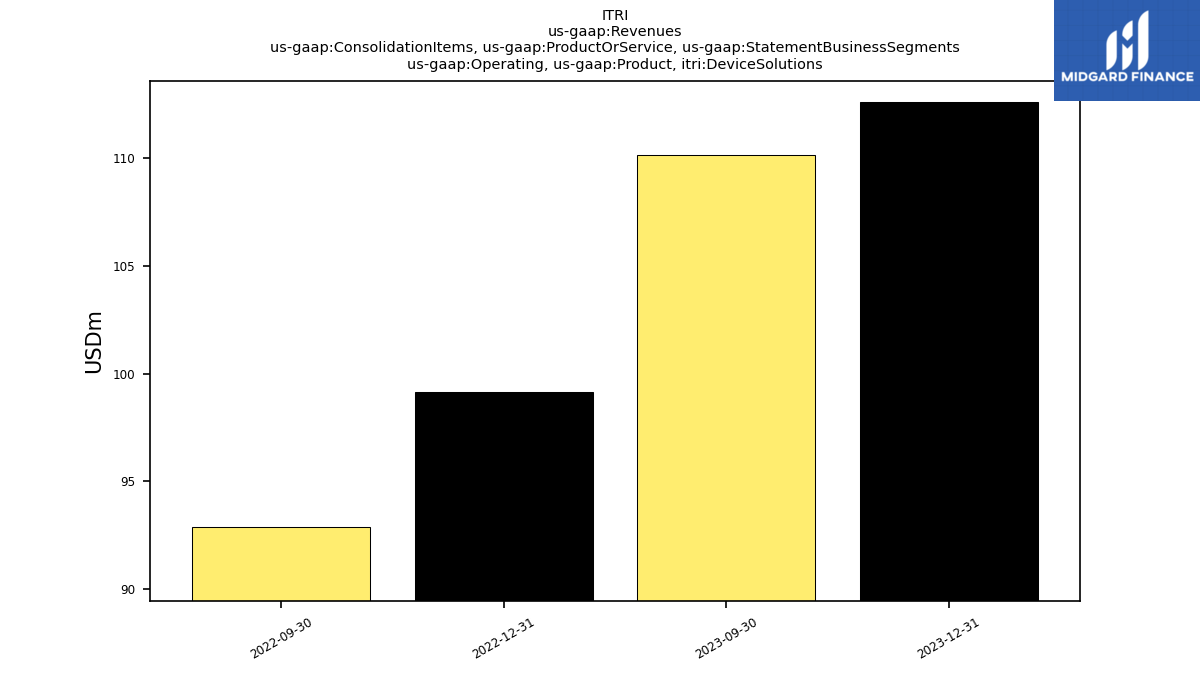
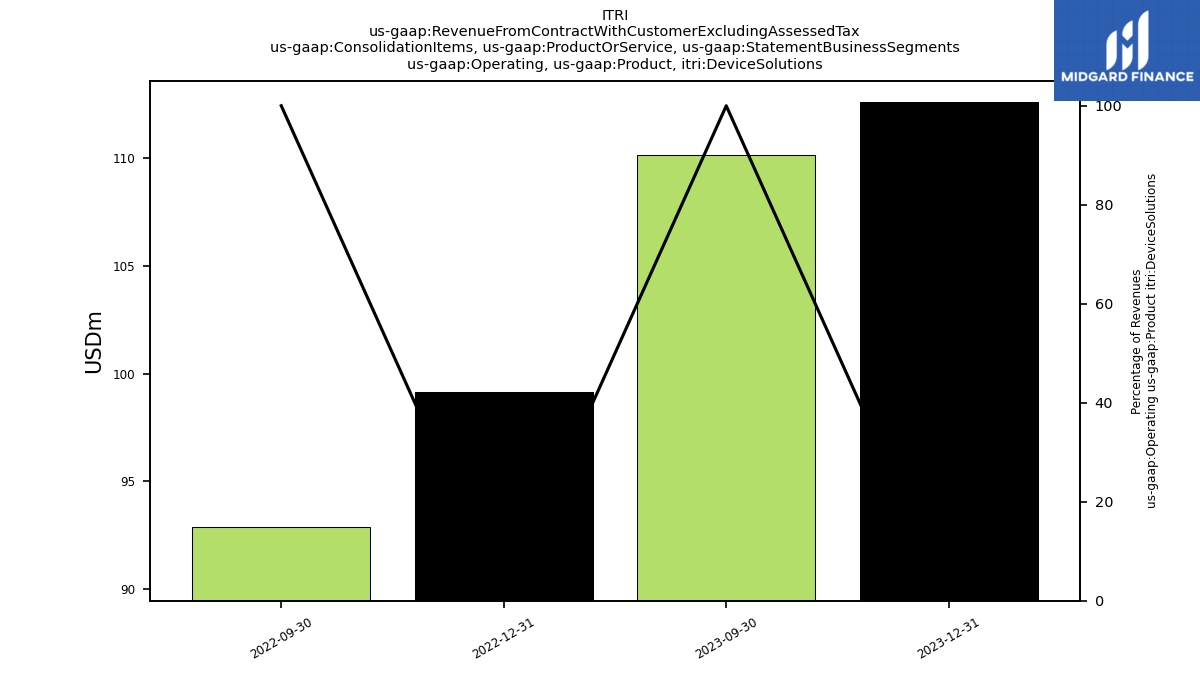
| Operating, Product, Device Solutions | 112.62 | 110.14 | NA | NA | 99.14 | 92.89 | NA | NA | NA | NA | NA | NA | NA | NA | NA | NA | NA | NA | NA | NA | NA | NA | NA | NA | NA | NA | NA | NA | NA | NA | NA | NA | NA | NA | NA | NA | NA | NA | NA | NA | NA | NA | NA | NA | NA | NA | NA | NA | NA | NA | NA | NA | NA | NA | NA | NA | |
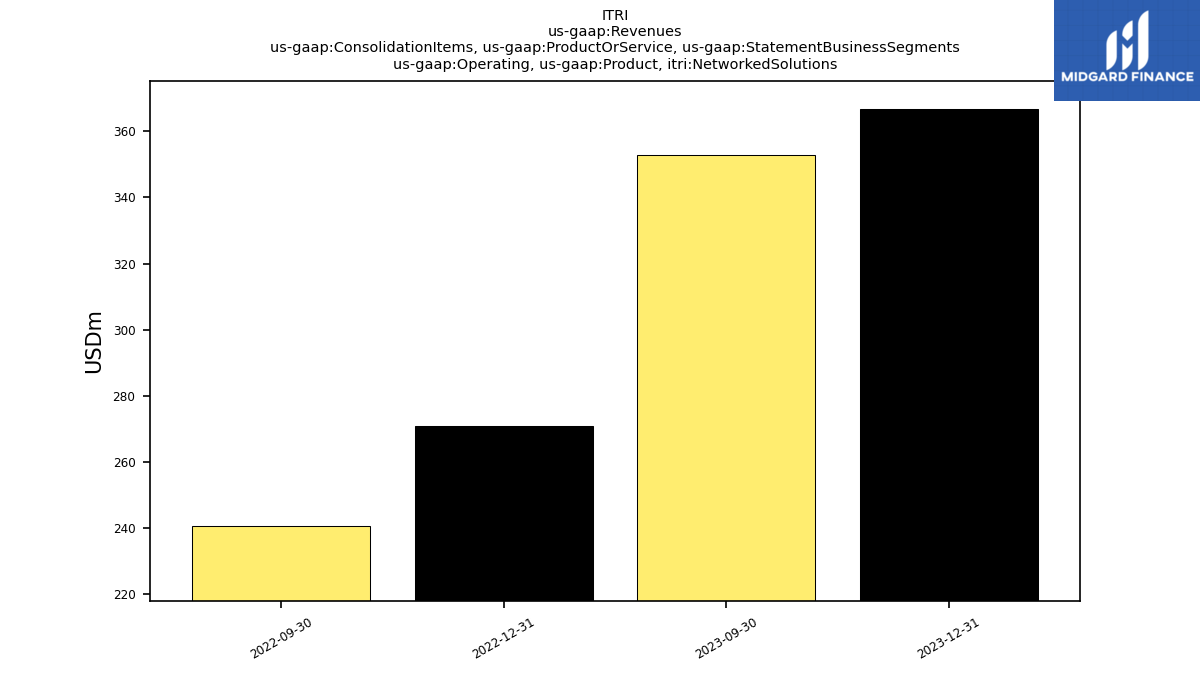
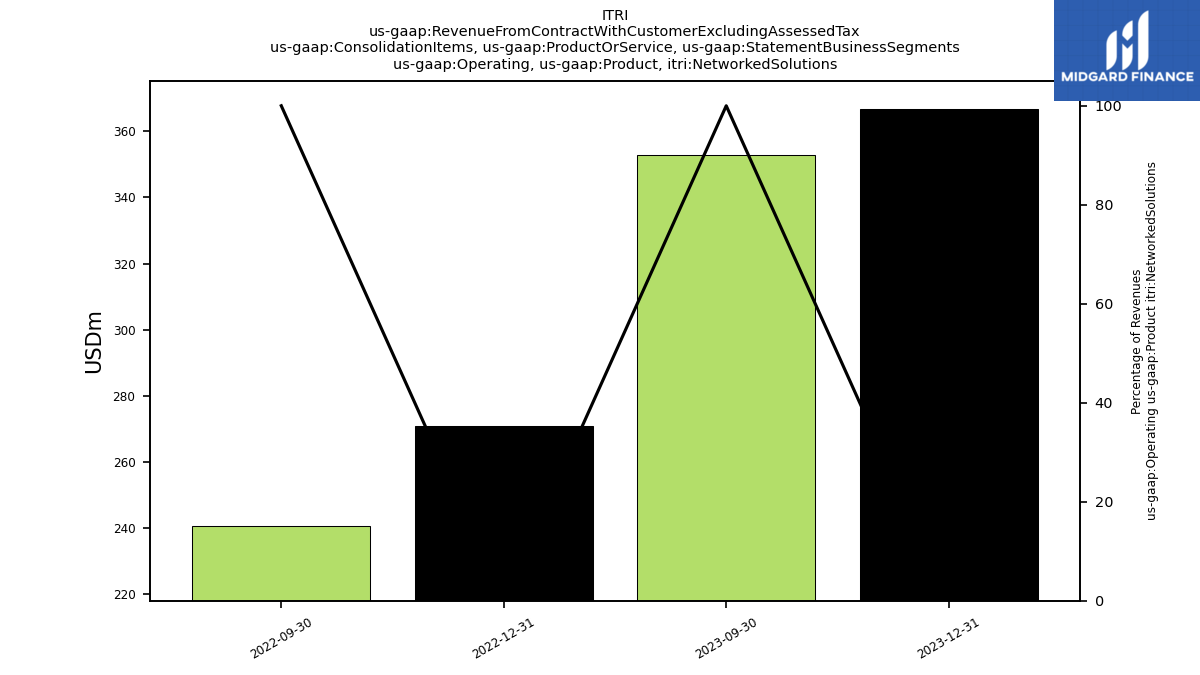
| Operating, Product, Networked Solutions | 366.64 | 352.77 | NA | NA | 270.80 | 240.50 | NA | NA | NA | NA | NA | NA | NA | NA | NA | NA | NA | NA | NA | NA | NA | NA | NA | NA | NA | NA | NA | NA | NA | NA | NA | NA | NA | NA | NA | NA | NA | NA | NA | NA | NA | NA | NA | NA | NA | NA | NA | NA | NA | NA | NA | NA | NA | NA | NA | NA | |
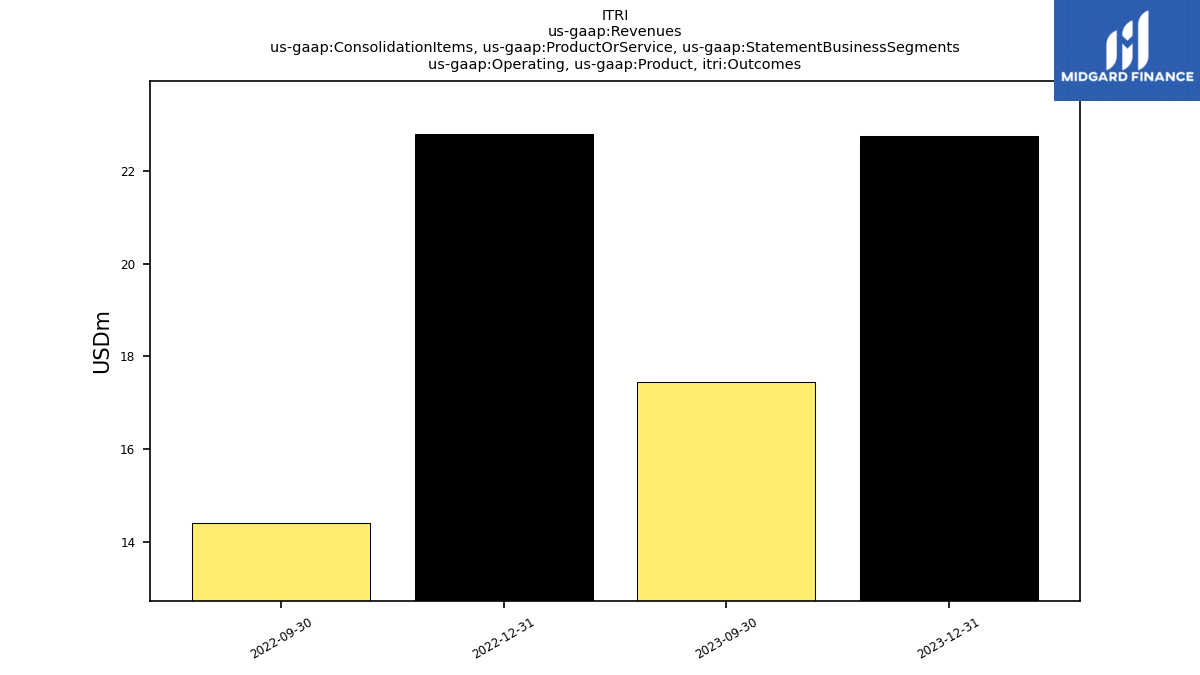
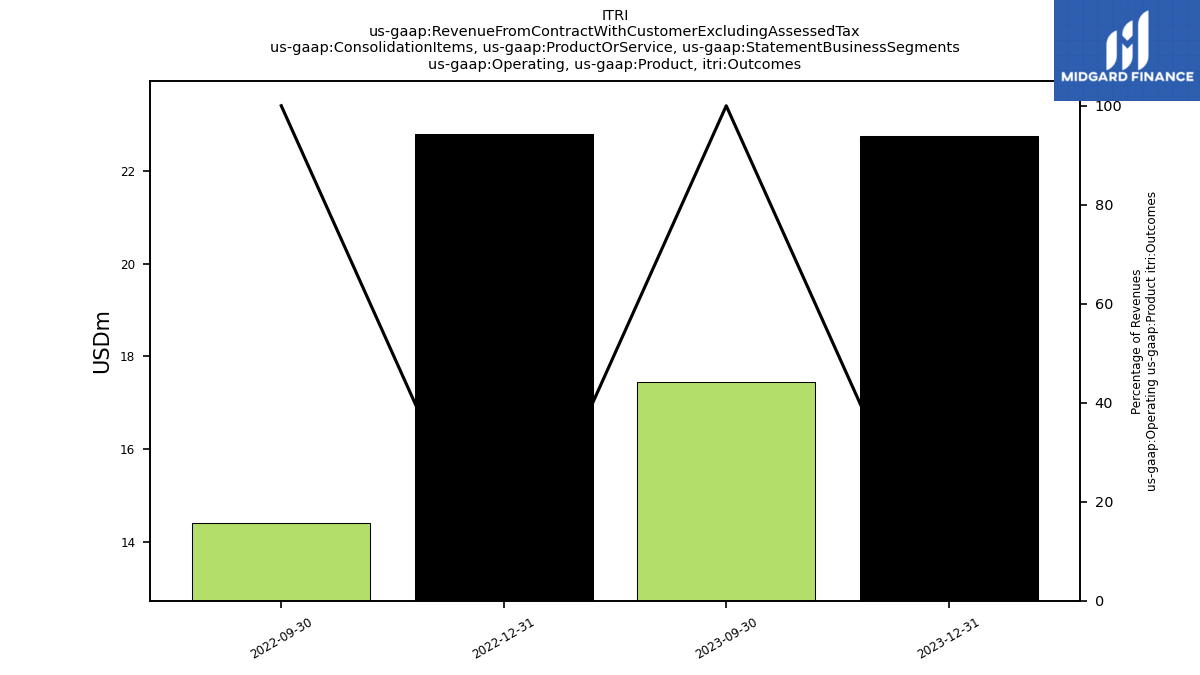
| Operating, Product, Outcomes | 22.75 | 17.45 | NA | NA | 22.80 | 14.40 | NA | NA | NA | NA | NA | NA | NA | NA | NA | NA | NA | NA | NA | NA | NA | NA | NA | NA | NA | NA | NA | NA | NA | NA | NA | NA | NA | NA | NA | NA | NA | NA | NA | NA | NA | NA | NA | NA | NA | NA | NA | NA | NA | NA | NA | NA | NA | NA | NA | NA | |
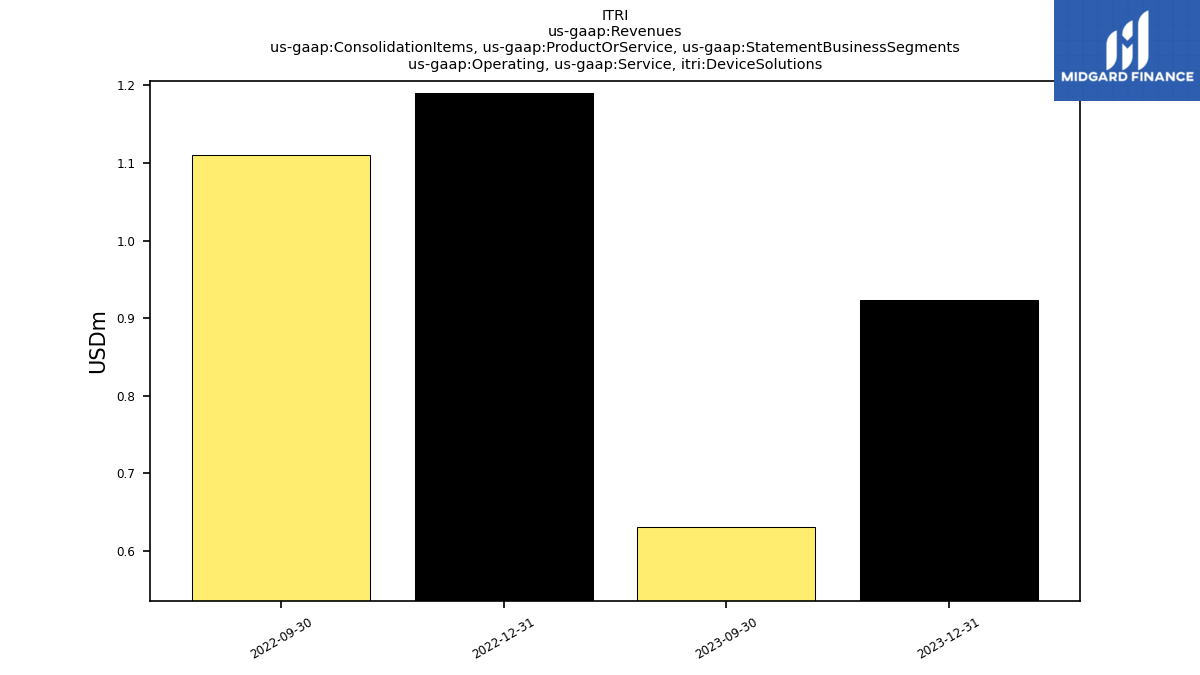
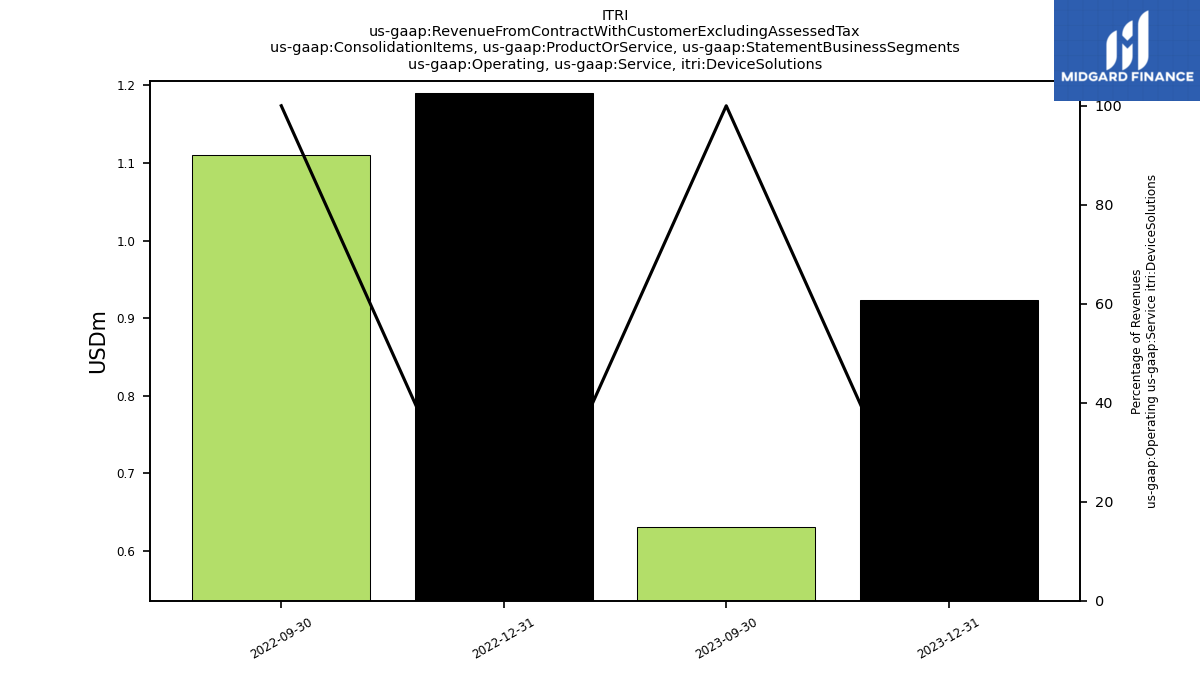
| Operating, Service, Device Solutions | 0.92 | 0.63 | NA | NA | 1.19 | 1.11 | NA | NA | NA | NA | NA | NA | NA | NA | NA | NA | NA | NA | NA | NA | NA | NA | NA | NA | NA | NA | NA | NA | NA | NA | NA | NA | NA | NA | NA | NA | NA | NA | NA | NA | NA | NA | NA | NA | NA | NA | NA | NA | NA | NA | NA | NA | NA | NA | NA | NA | |
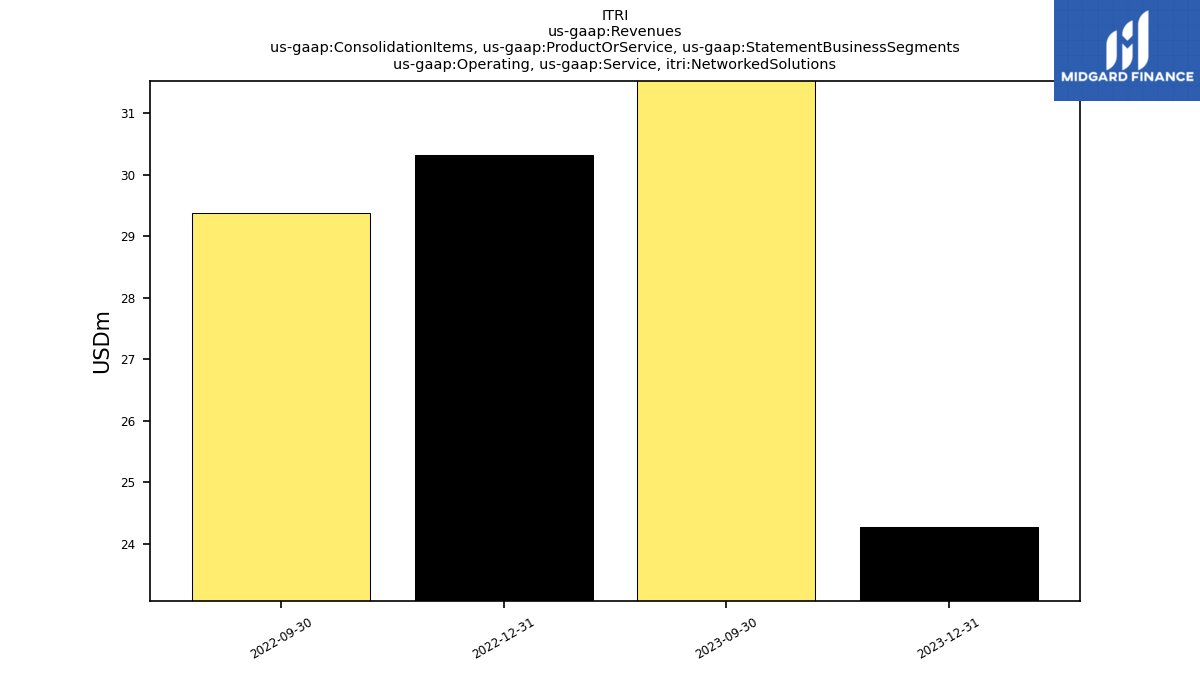
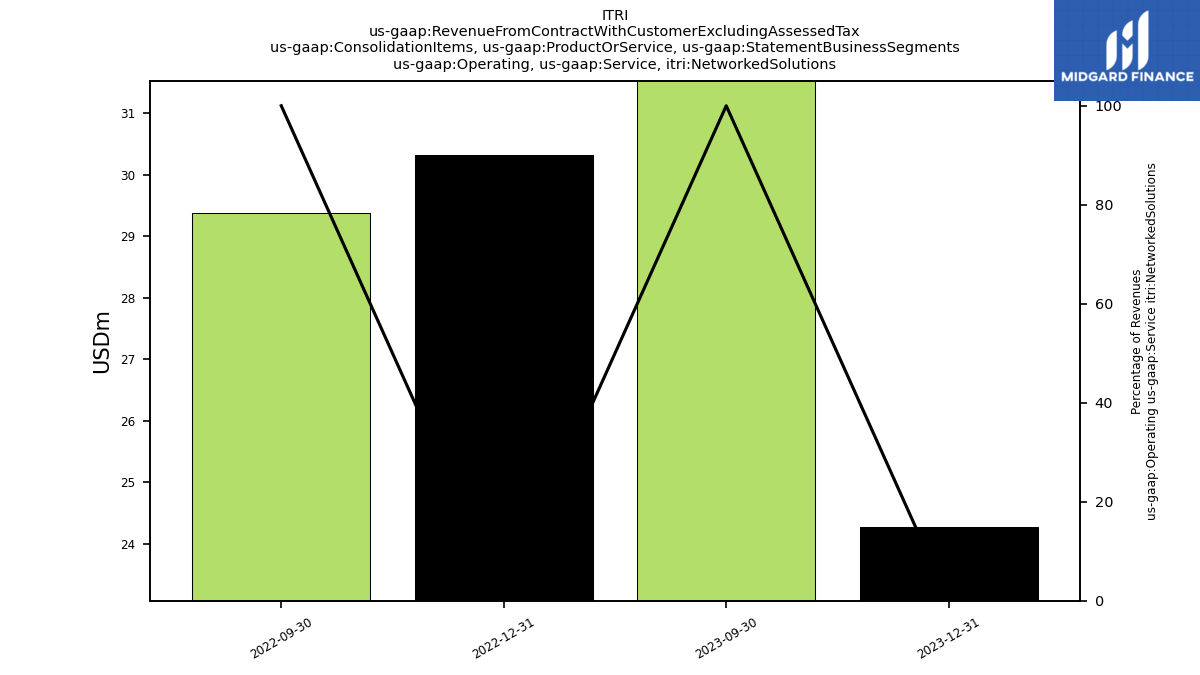
| Operating, Service, Networked Solutions | 24.29 | 32.20 | NA | NA | 30.32 | 29.37 | NA | NA | NA | NA | NA | NA | NA | NA | NA | NA | NA | NA | NA | NA | NA | NA | NA | NA | NA | NA | NA | NA | NA | NA | NA | NA | NA | NA | NA | NA | NA | NA | NA | NA | NA | NA | NA | NA | NA | NA | NA | NA | NA | NA | NA | NA | NA | NA | NA | NA | |
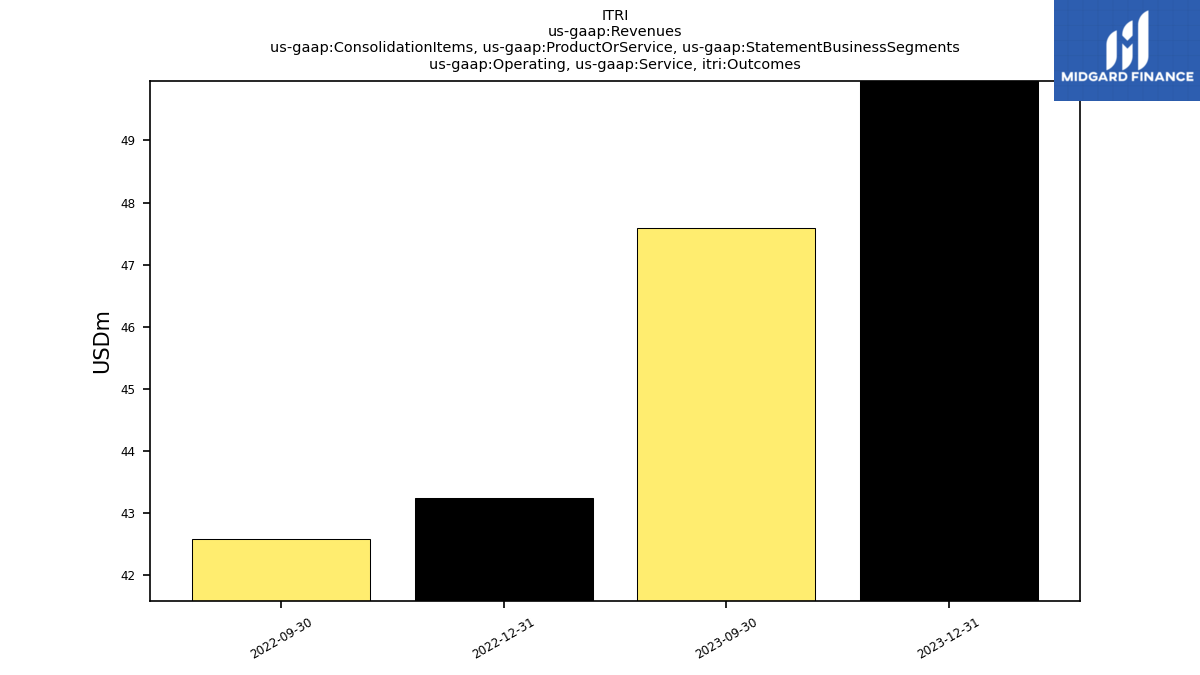
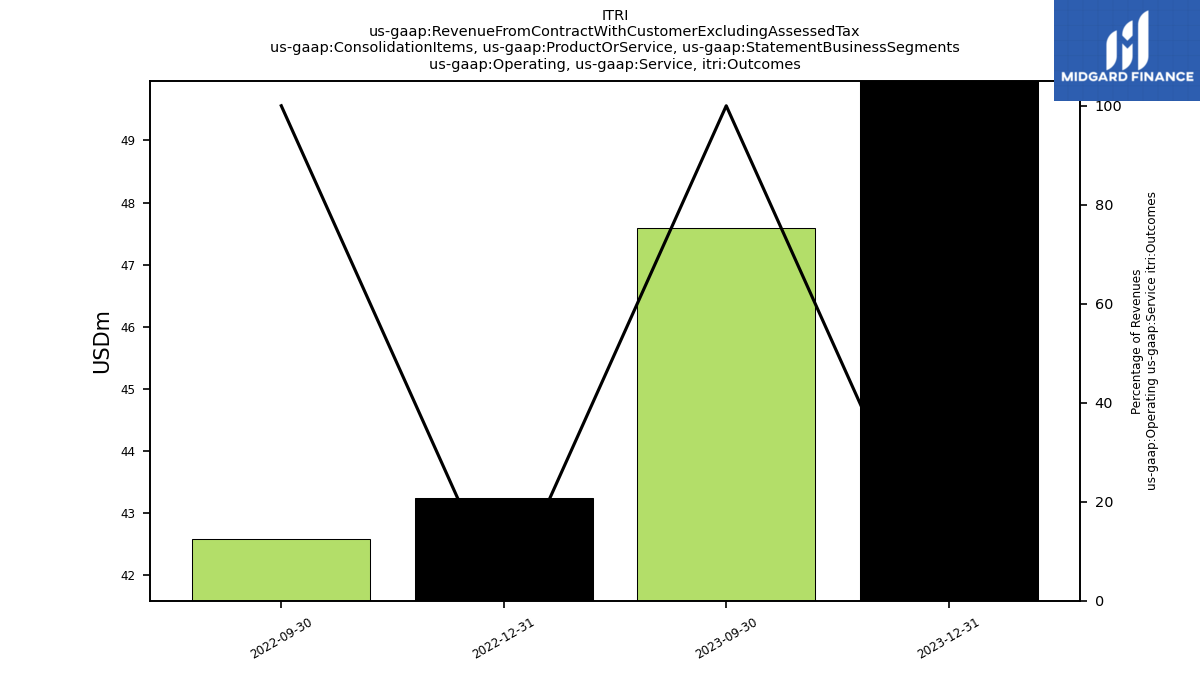
| Operating, Service, Outcomes | 49.96 | 47.59 | NA | NA | 43.24 | 42.59 | NA | NA | NA | NA | NA | NA | NA | NA | NA | NA | NA | NA | NA | NA | NA | NA | NA | NA | NA | NA | NA | NA | NA | NA | NA | NA | NA | NA | NA | NA | NA | NA | NA | NA | NA | NA | NA | NA | NA | NA | NA | NA | NA | NA | NA | NA | NA | NA | NA | NA | |
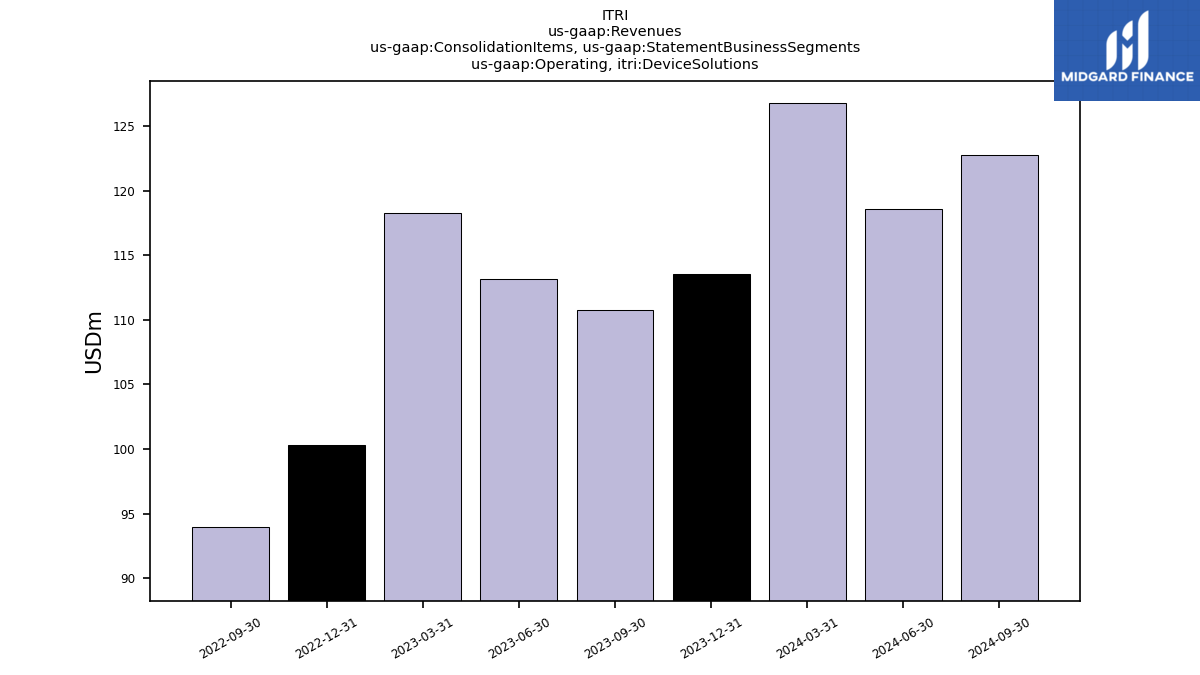
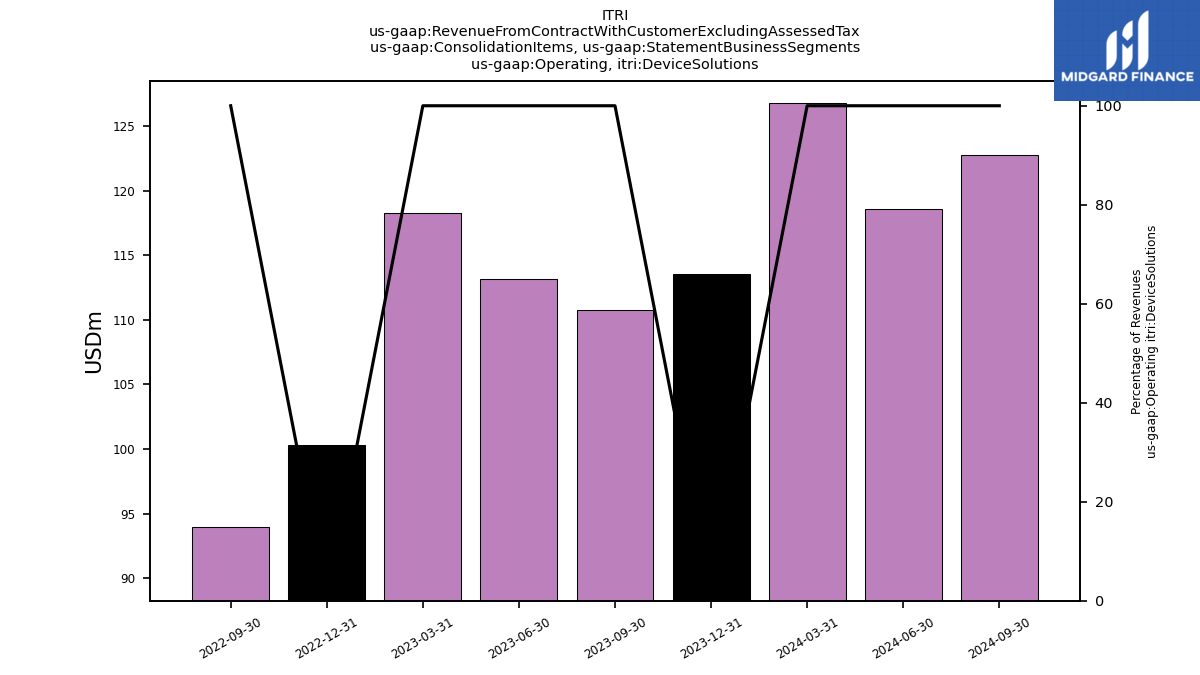
| Operating, Device Solutions | 113.54 | 110.77 | NA | NA | 100.33 | 94.00 | NA | NA | NA | NA | NA | NA | NA | NA | NA | NA | NA | NA | NA | NA | NA | NA | NA | NA | NA | NA | NA | NA | NA | NA | NA | NA | NA | NA | NA | NA | NA | NA | NA | NA | NA | NA | NA | NA | NA | NA | NA | NA | NA | NA | NA | NA | NA | NA | NA | NA | |
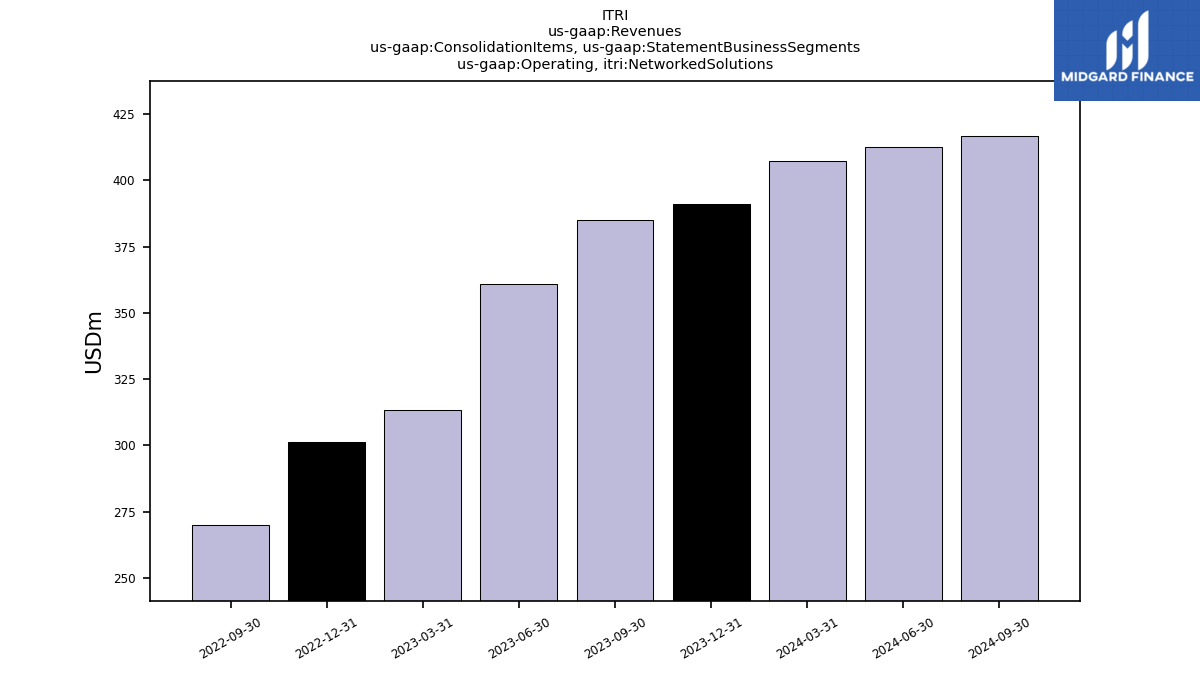
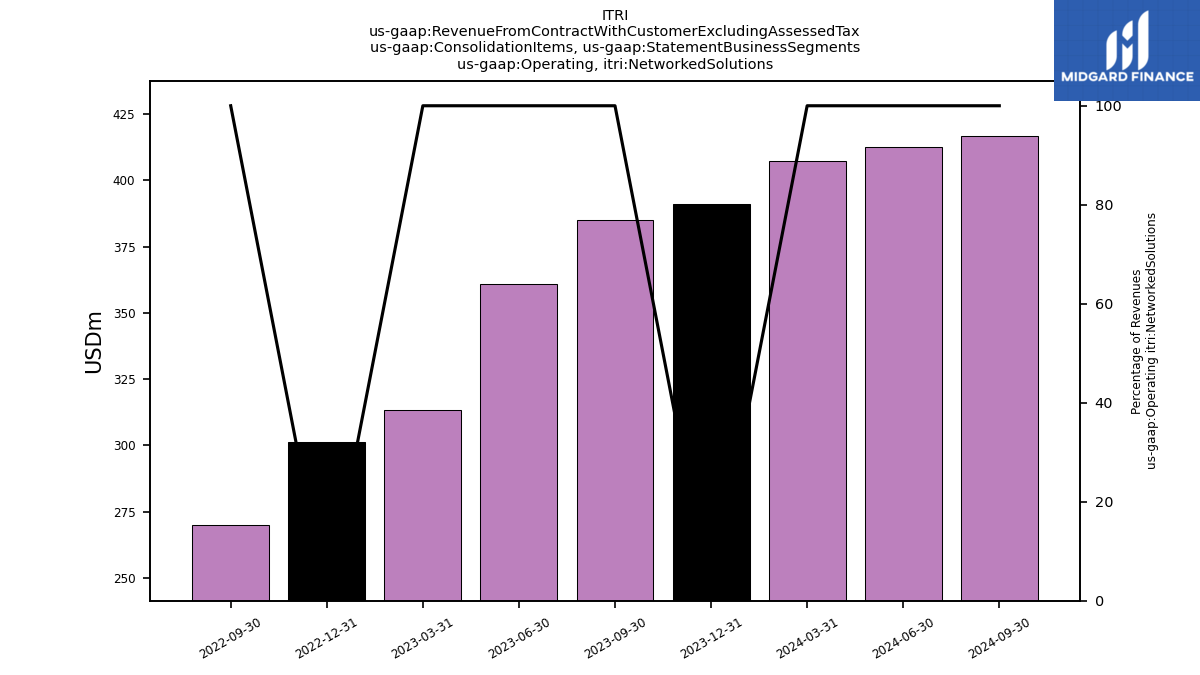
| Operating, Networked Solutions | 390.92 | 384.97 | NA | NA | 301.11 | 269.87 | NA | NA | NA | NA | NA | NA | NA | NA | NA | NA | NA | NA | NA | NA | NA | NA | NA | NA | NA | NA | NA | NA | NA | NA | NA | NA | NA | NA | NA | NA | NA | NA | NA | NA | NA | NA | NA | NA | NA | NA | NA | NA | NA | NA | NA | NA | NA | NA | NA | NA | |
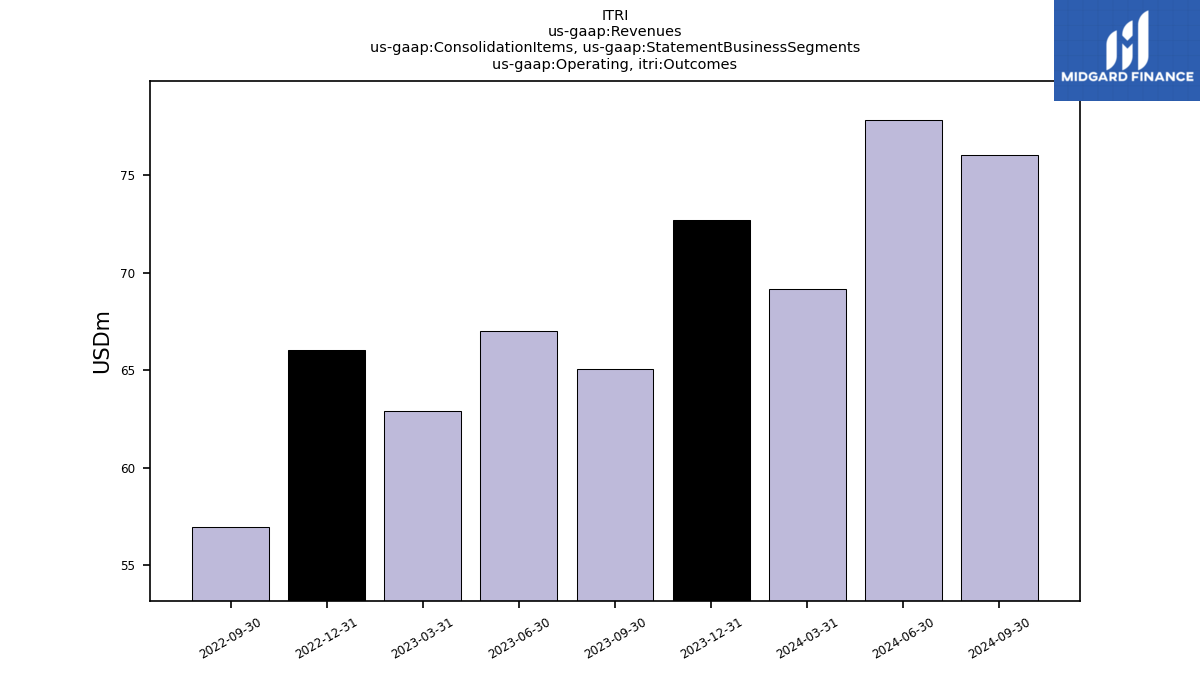
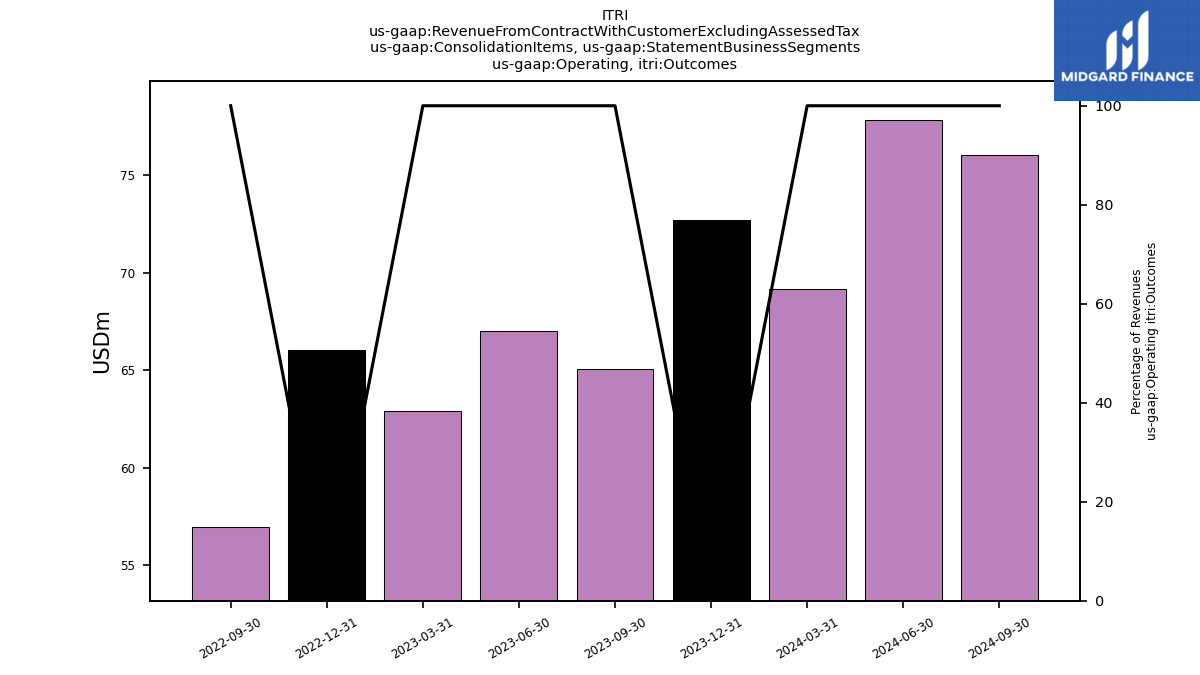
| Operating, Outcomes | 72.71 | 65.03 | NA | NA | 66.05 | 56.98 | NA | NA | NA | NA | NA | NA | NA | NA | NA | NA | NA | NA | NA | NA | NA | NA | NA | NA | NA | NA | NA | NA | NA | NA | NA | NA | NA | NA | NA | NA | NA | NA | NA | NA | NA | NA | NA | NA | NA | NA | NA | NA | NA | NA | NA | NA | NA | NA | NA | NA | |
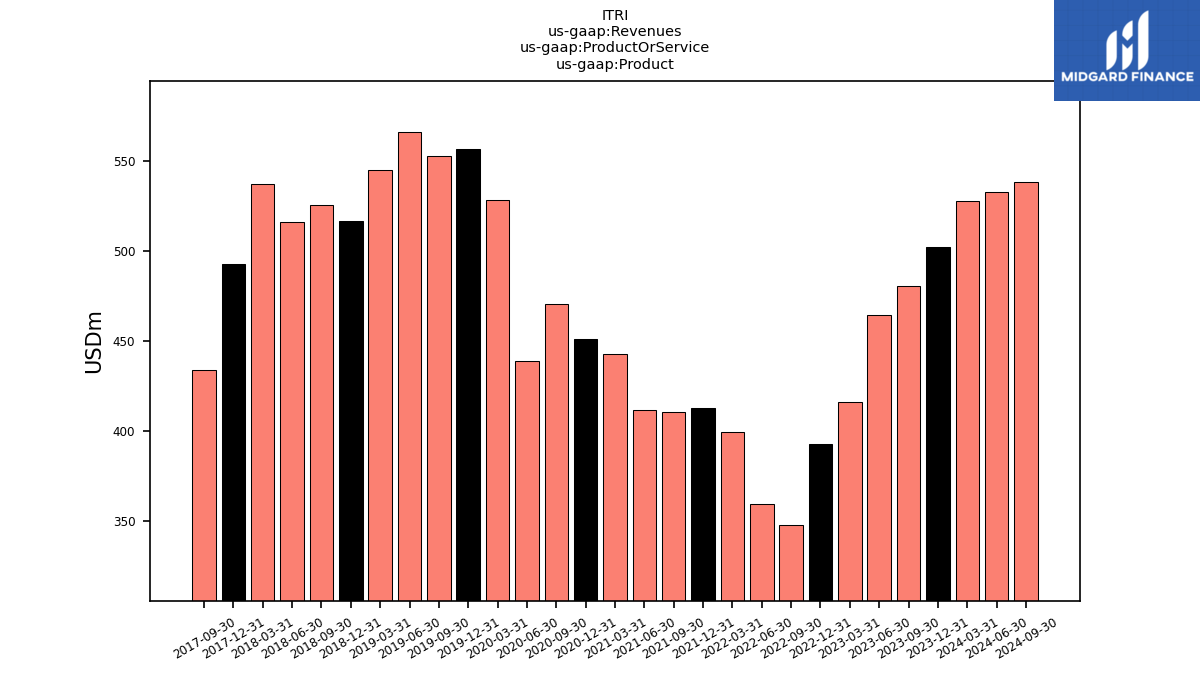
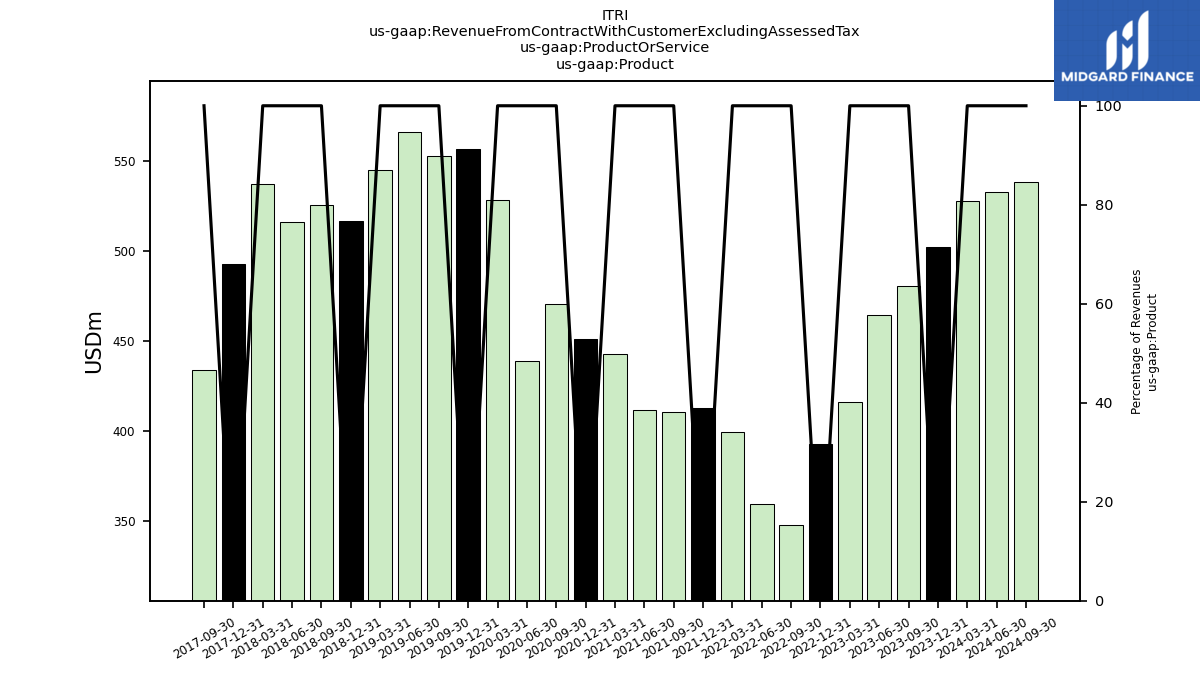
| Product | 502.01 | 480.36 | 464.80 | 416.32 | 392.74 | 347.79 | 359.90 | 399.81 | 412.73 | 410.95 | 411.72 | 442.80 | 451.39 | 470.66 | 438.99 | 528.14 | 556.60 | 552.90 | 566.05 | 544.85 | 516.72 | 525.72 | 515.91 | 537.11 | 492.86 | 433.98 | NA | NA | NA | NA | NA | NA | NA | NA | NA | NA | NA | NA | NA | NA | NA | NA | NA | NA | NA | NA | NA | NA | NA | NA | NA | NA | NA | NA | NA | NA | |
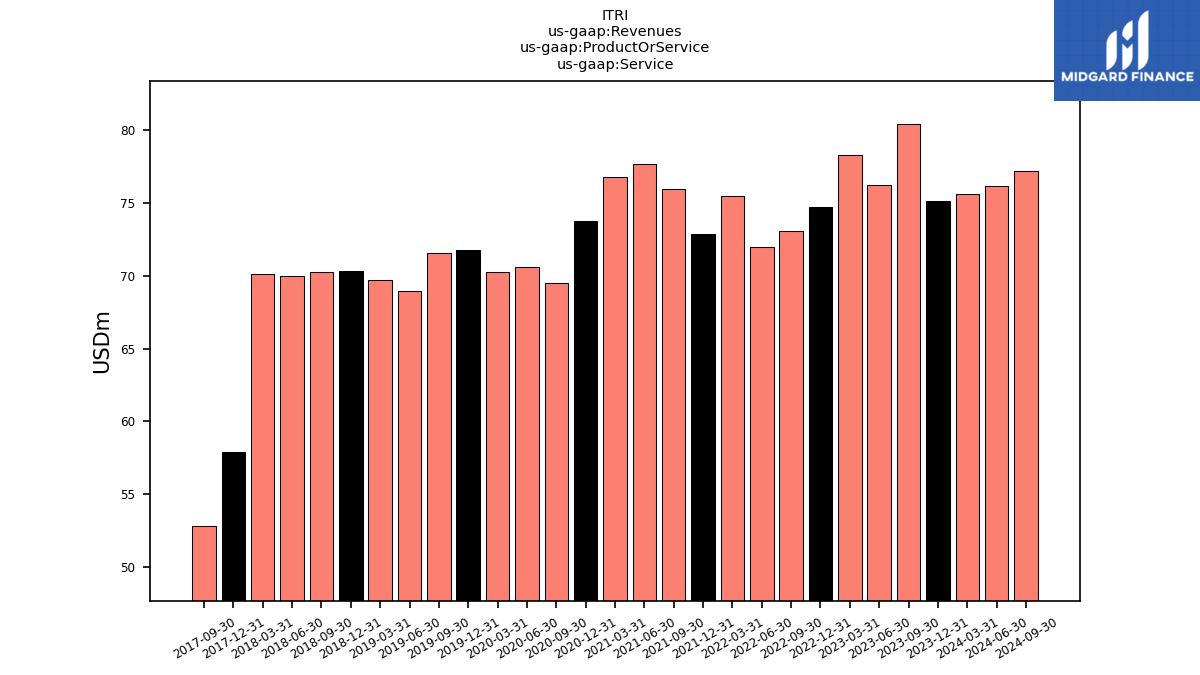
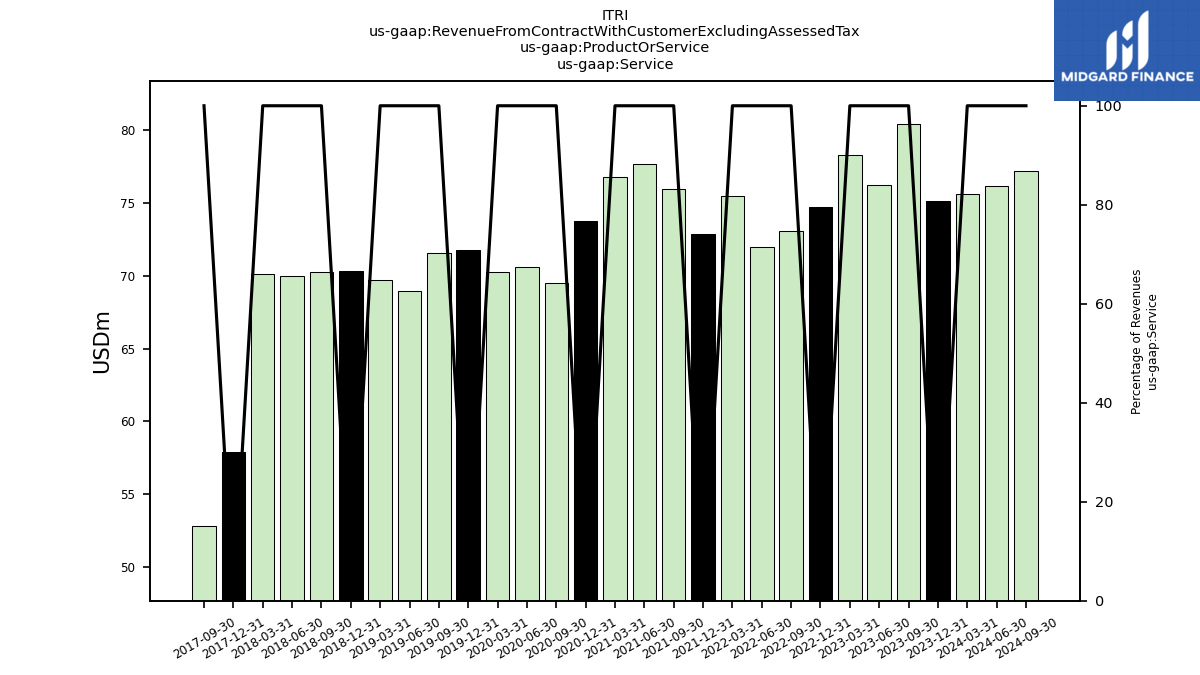
| Service | 75.17 | 80.42 | 76.27 | 78.29 | 74.75 | 73.07 | 71.98 | 75.52 | 72.91 | 76.00 | 77.69 | 76.77 | 73.76 | 69.53 | 70.61 | 70.28 | 71.78 | 71.58 | 68.99 | 69.73 | 70.33 | 70.25 | 69.98 | 70.11 | 57.91 | 52.76 | NA | NA | NA | NA | NA | NA | NA | NA | NA | NA | NA | NA | NA | NA | NA | NA | NA | NA | NA | NA | NA | NA | NA | NA | NA | NA | NA | NA | NA | NA | |
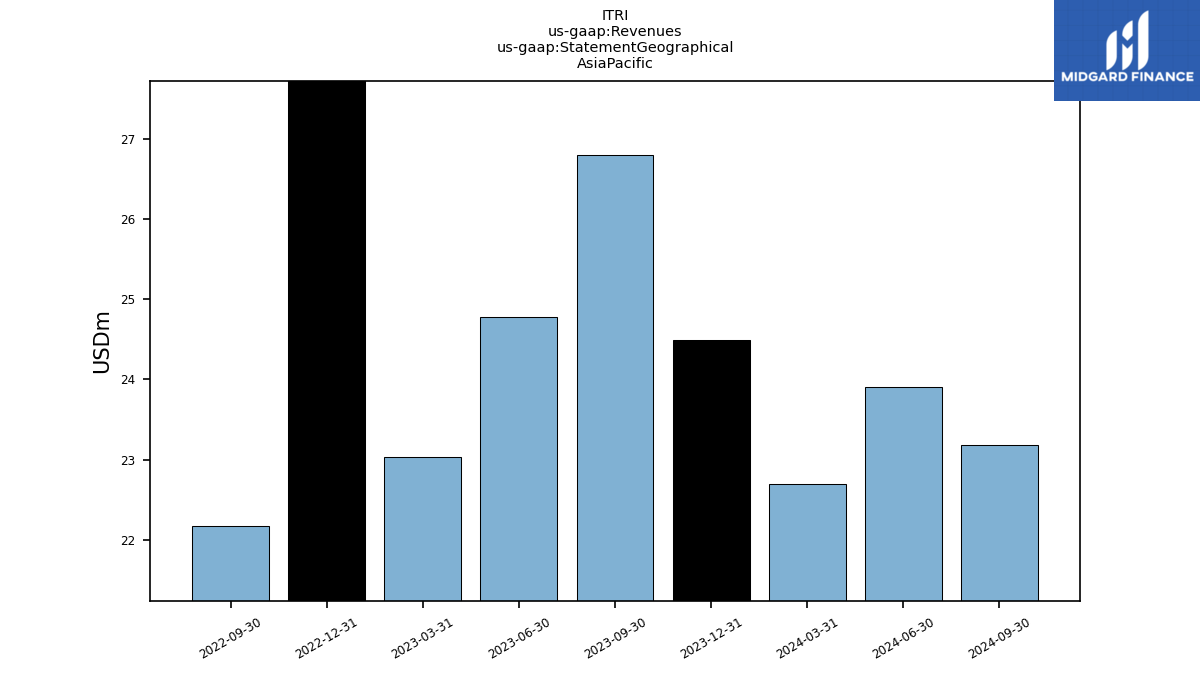
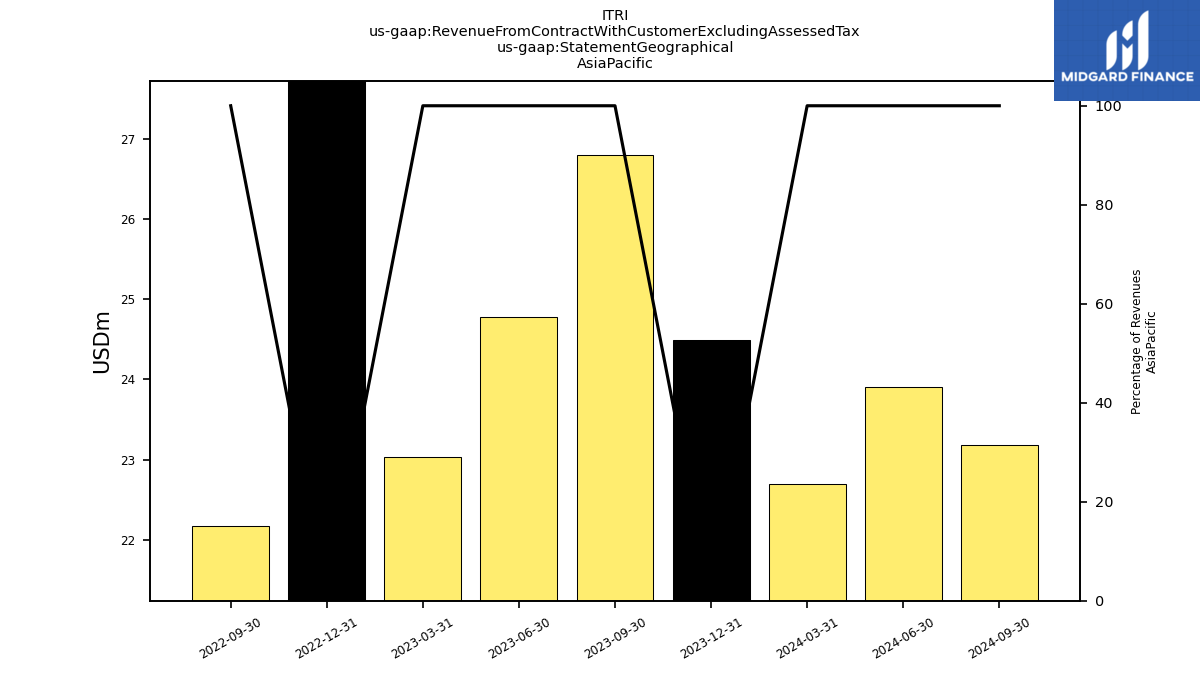
| 24.50 | 26.80 | NA | NA | 28.34 | 22.16 | NA | NA | NA | NA | NA | NA | NA | NA | NA | NA | NA | NA | NA | NA | NA | NA | NA | NA | NA | NA | NA | NA | NA | NA | NA | NA | NA | NA | NA | NA | NA | NA | NA | NA | NA | NA | NA | NA | NA | NA | NA | NA | NA | NA | NA | NA | NA | NA | NA | NA | ||
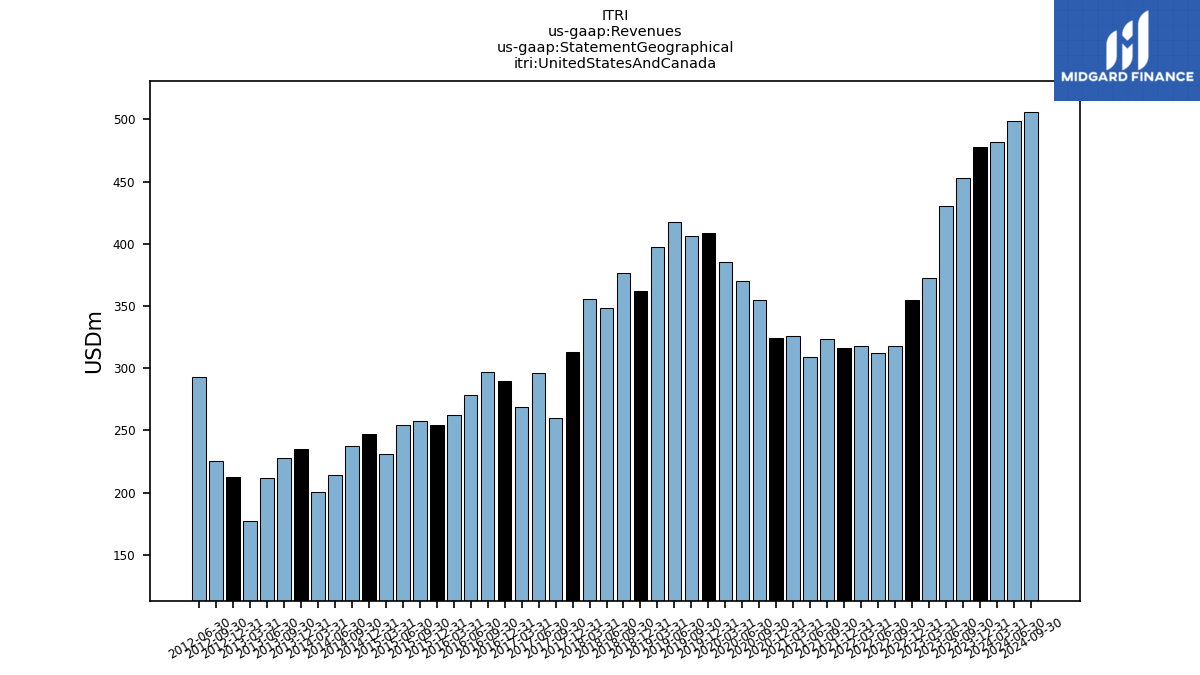
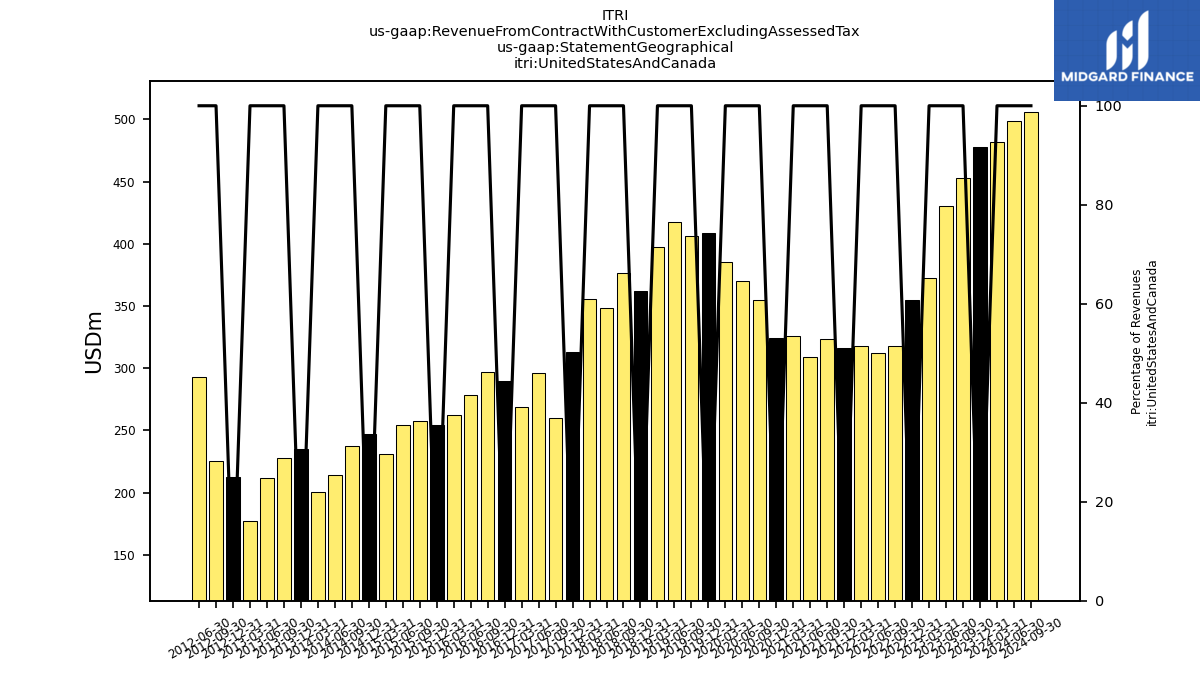
| United States And Canada | 477.64 | 452.58 | 430.62 | 372.84 | 354.56 | 317.96 | 311.83 | 317.89 | 315.88 | 323.78 | 308.67 | 325.54 | 324.55 | 354.84 | 369.86 | 385.32 | 408.29 | 405.97 | 417.91 | 397.57 | 362.08 | 376.68 | 348.10 | 355.93 | 312.88 | 259.80 | 295.74 | 269.10 | 289.32 | 297.12 | 278.31 | 262.04 | 254.37 | 257.90 | 253.89 | 231.14 | 247.01 | 237.68 | 214.34 | 200.37 | 234.74 | 227.78 | 211.56 | 177.21 | 212.20 | 224.96 | 293.00 | NA | NA | NA | NA | NA | NA | NA | NA | NA | |
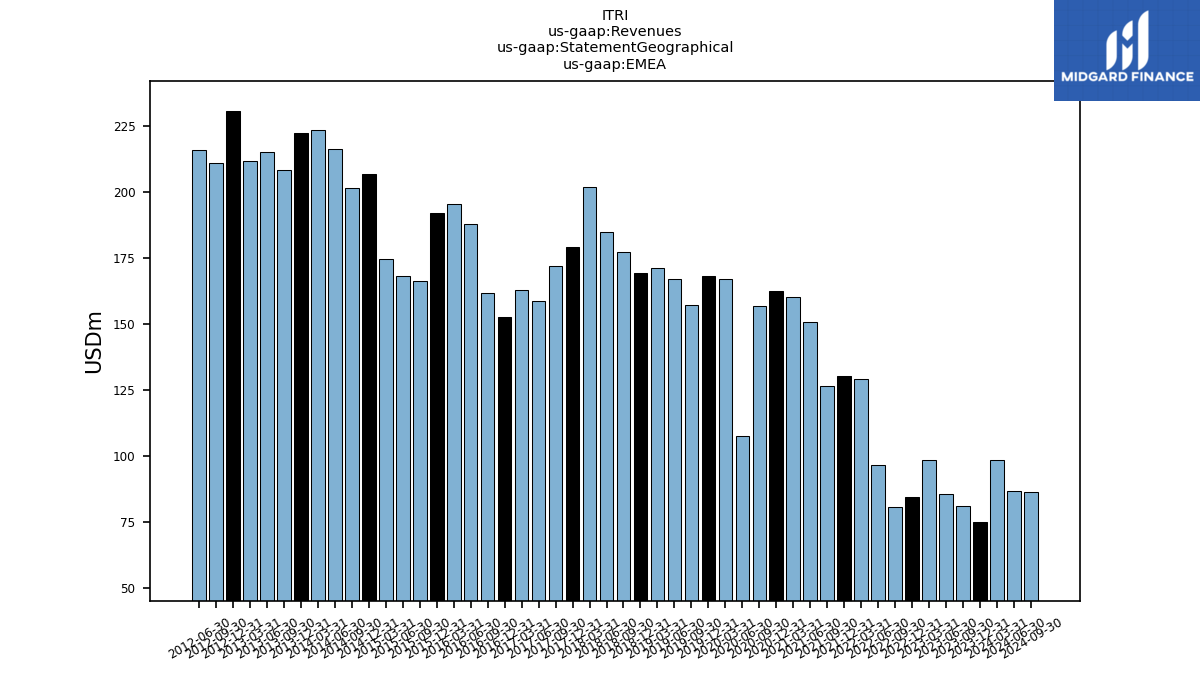
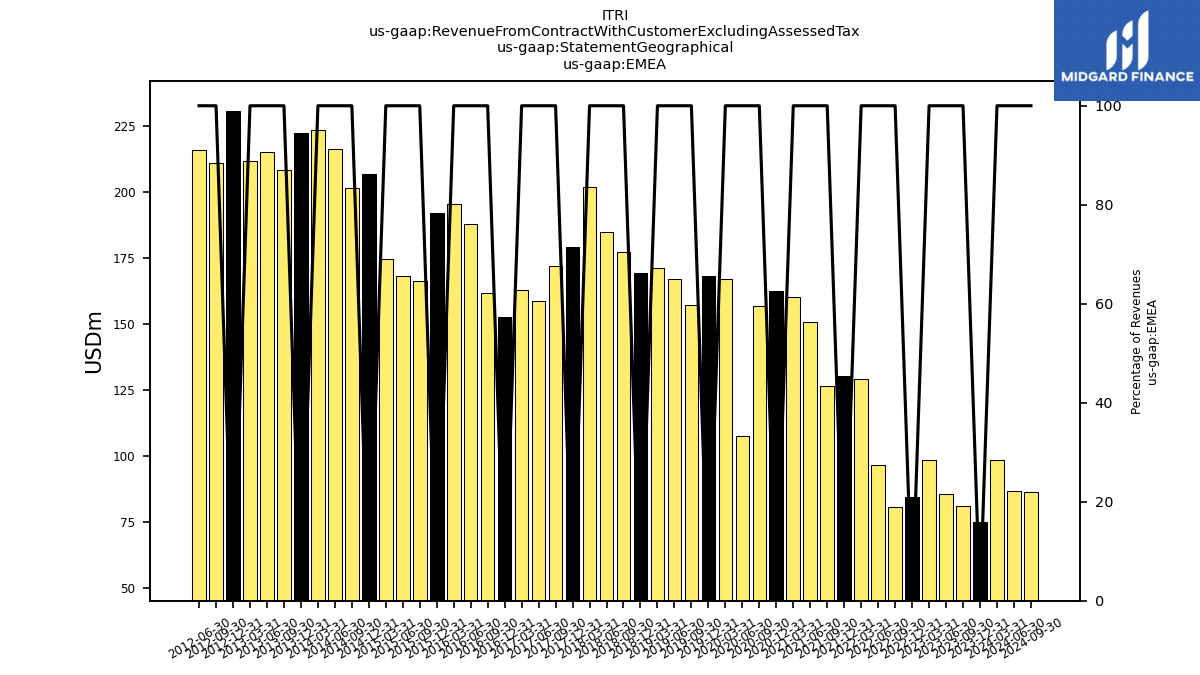
| EMEA | 75.04 | 81.39 | 85.68 | 98.74 | 84.59 | 80.73 | 96.92 | 129.31 | 130.24 | 126.55 | 150.85 | 160.37 | 162.67 | 156.81 | 107.80 | 166.98 | 168.14 | 157.16 | 167.31 | 171.24 | 169.55 | 177.36 | 184.75 | 202.07 | 179.44 | 171.92 | 158.77 | 162.81 | 152.59 | 161.96 | 187.85 | 195.71 | 191.98 | 166.23 | 168.44 | 174.65 | 207.07 | 201.67 | 216.26 | 223.50 | 222.34 | 208.55 | 215.25 | 211.90 | 230.56 | 211.19 | 215.90 | NA | NA | NA | NA | NA | NA | NA | NA | NA | |
| Revenue From Contract With Customer Excluding Assessed Tax | 577.17 | 560.77 | 541.07 | 494.62 | 467.49 | 420.86 | 431.88 | 475.33 | 485.64 | 486.95 | 489.41 | 519.57 | 525.16 | 540.18 | 509.59 | 598.41 | 628.38 | 624.47 | 635.04 | 614.58 | 587.04 | 595.96 | 585.89 | 607.22 | 550.78 | 486.75 | 503.08 | 477.59 | 495.71 | 506.86 | 513.02 | 497.59 | 496.45 | 469.09 | 470.10 | 448.25 | 510.10 | 496.45 | 489.35 | 474.80 | 523.53 | 495.49 | 482.18 | 447.54 | 523.34 | 504.06 | 579.14 | 571.64 | 642.48 | 615.55 | 612.40 | 563.69 | 620.66 | 573.65 | 567.34 | 497.62 | |
| Operating, Product, Device Solutions | 112.62 | 110.14 | NA | NA | 99.14 | 92.89 | NA | NA | NA | NA | NA | NA | NA | NA | NA | NA | NA | NA | NA | NA | NA | NA | NA | NA | NA | NA | NA | NA | NA | NA | NA | NA | NA | NA | NA | NA | NA | NA | NA | NA | NA | NA | NA | NA | NA | NA | NA | NA | NA | NA | NA | NA | NA | NA | NA | NA | |
| Operating, Product, Networked Solutions | 366.64 | 352.77 | NA | NA | 270.80 | 240.50 | NA | NA | NA | NA | NA | NA | NA | NA | NA | NA | NA | NA | NA | NA | NA | NA | NA | NA | NA | NA | NA | NA | NA | NA | NA | NA | NA | NA | NA | NA | NA | NA | NA | NA | NA | NA | NA | NA | NA | NA | NA | NA | NA | NA | NA | NA | NA | NA | NA | NA | |
| Operating, Product, Outcomes | 22.75 | 17.45 | NA | NA | 22.80 | 14.40 | NA | NA | NA | NA | NA | NA | NA | NA | NA | NA | NA | NA | NA | NA | NA | NA | NA | NA | NA | NA | NA | NA | NA | NA | NA | NA | NA | NA | NA | NA | NA | NA | NA | NA | NA | NA | NA | NA | NA | NA | NA | NA | NA | NA | NA | NA | NA | NA | NA | NA | |
| Operating, Service, Device Solutions | 0.92 | 0.63 | NA | NA | 1.19 | 1.11 | NA | NA | NA | NA | NA | NA | NA | NA | NA | NA | NA | NA | NA | NA | NA | NA | NA | NA | NA | NA | NA | NA | NA | NA | NA | NA | NA | NA | NA | NA | NA | NA | NA | NA | NA | NA | NA | NA | NA | NA | NA | NA | NA | NA | NA | NA | NA | NA | NA | NA | |
| Operating, Service, Networked Solutions | 24.29 | 32.20 | NA | NA | 30.32 | 29.37 | NA | NA | NA | NA | NA | NA | NA | NA | NA | NA | NA | NA | NA | NA | NA | NA | NA | NA | NA | NA | NA | NA | NA | NA | NA | NA | NA | NA | NA | NA | NA | NA | NA | NA | NA | NA | NA | NA | NA | NA | NA | NA | NA | NA | NA | NA | NA | NA | NA | NA | |
| Operating, Service, Outcomes | 49.96 | 47.59 | NA | NA | 43.24 | 42.59 | NA | NA | NA | NA | NA | NA | NA | NA | NA | NA | NA | NA | NA | NA | NA | NA | NA | NA | NA | NA | NA | NA | NA | NA | NA | NA | NA | NA | NA | NA | NA | NA | NA | NA | NA | NA | NA | NA | NA | NA | NA | NA | NA | NA | NA | NA | NA | NA | NA | NA | |
| Operating, Device Solutions | 113.54 | 110.77 | NA | NA | 100.33 | 94.00 | NA | NA | NA | NA | NA | NA | NA | NA | NA | NA | NA | NA | NA | NA | NA | NA | NA | NA | NA | NA | NA | NA | NA | NA | NA | NA | NA | NA | NA | NA | NA | NA | NA | NA | NA | NA | NA | NA | NA | NA | NA | NA | NA | NA | NA | NA | NA | NA | NA | NA | |
| Operating, Networked Solutions | 390.92 | 384.97 | NA | NA | 301.11 | 269.87 | NA | NA | NA | NA | NA | NA | NA | NA | NA | NA | NA | NA | NA | NA | NA | NA | NA | NA | NA | NA | NA | NA | NA | NA | NA | NA | NA | NA | NA | NA | NA | NA | NA | NA | NA | NA | NA | NA | NA | NA | NA | NA | NA | NA | NA | NA | NA | NA | NA | NA | |
| Operating, Outcomes | 72.71 | 65.03 | NA | NA | 66.05 | 56.98 | NA | NA | NA | NA | NA | NA | NA | NA | NA | NA | NA | NA | NA | NA | NA | NA | NA | NA | NA | NA | NA | NA | NA | NA | NA | NA | NA | NA | NA | NA | NA | NA | NA | NA | NA | NA | NA | NA | NA | NA | NA | NA | NA | NA | NA | NA | NA | NA | NA | NA | |
| Product | 502.01 | 480.36 | 464.80 | 416.32 | 392.74 | 347.79 | 359.90 | 399.81 | 412.73 | 410.95 | 411.72 | 442.80 | 451.39 | 470.66 | 438.99 | 528.14 | 556.60 | 552.90 | 566.05 | 544.85 | 516.72 | 525.72 | 515.91 | 537.11 | 492.86 | 433.98 | NA | NA | NA | NA | NA | NA | NA | NA | NA | NA | NA | NA | NA | NA | NA | NA | NA | NA | NA | NA | NA | NA | NA | NA | NA | NA | NA | NA | NA | NA | |
| Service | 75.17 | 80.42 | 76.27 | 78.29 | 74.75 | 73.07 | 71.98 | 75.52 | 72.91 | 76.00 | 77.69 | 76.77 | 73.76 | 69.53 | 70.61 | 70.28 | 71.78 | 71.58 | 68.99 | 69.73 | 70.33 | 70.25 | 69.98 | 70.11 | 57.91 | 52.76 | NA | NA | NA | NA | NA | NA | NA | NA | NA | NA | NA | NA | NA | NA | NA | NA | NA | NA | NA | NA | NA | NA | NA | NA | NA | NA | NA | NA | NA | NA | |
| 24.50 | 26.80 | NA | NA | 28.34 | 22.16 | NA | NA | NA | NA | NA | NA | NA | NA | NA | NA | NA | NA | NA | NA | NA | NA | NA | NA | NA | NA | NA | NA | NA | NA | NA | NA | NA | NA | NA | NA | NA | NA | NA | NA | NA | NA | NA | NA | NA | NA | NA | NA | NA | NA | NA | NA | NA | NA | NA | NA | ||
| United States And Canada | 477.64 | 452.58 | 430.62 | 372.84 | 354.56 | 317.96 | 311.83 | 317.89 | 315.88 | 323.78 | 308.67 | 325.54 | 324.55 | 354.84 | 369.86 | 385.32 | 408.29 | 405.97 | 417.91 | 397.57 | 362.08 | 376.68 | 348.10 | 355.93 | 312.88 | 259.80 | 295.74 | 269.10 | 289.32 | 297.12 | 278.31 | 262.04 | 254.37 | 257.90 | 253.89 | 231.14 | 247.01 | 237.68 | 214.34 | 200.37 | 234.74 | 227.78 | 211.56 | 177.21 | 212.20 | 224.96 | 293.00 | NA | NA | NA | NA | NA | NA | NA | NA | NA | |
| EMEA | 75.04 | 81.39 | 85.68 | 98.74 | 84.59 | 80.73 | 96.92 | 129.31 | 130.24 | 126.55 | 150.85 | 160.37 | 162.67 | 156.81 | 107.80 | 166.98 | 168.14 | 157.16 | 167.31 | 171.24 | 169.55 | 177.36 | 184.75 | 202.07 | 179.44 | 171.92 | 158.77 | 162.81 | 152.59 | 161.96 | 187.85 | 195.71 | 191.98 | 166.23 | 168.44 | 174.65 | 207.07 | 201.67 | 216.26 | 223.50 | 222.34 | 208.55 | 215.25 | 211.90 | 230.56 | 211.19 | 215.90 | NA | NA | NA | NA | NA | NA | NA | NA | NA |