
| 2024-03-31 | 2023-12-31 | 2023-09-30 | 2023-06-30 | 2023-03-31 | 2022-12-31 | 2022-09-30 | 2022-06-30 | 2022-03-31 | 2021-12-31 | 2021-09-30 | 2021-06-30 | 2021-03-31 | 2020-12-31 | 2020-09-30 | 2020-06-30 | 2020-03-31 | 2019-12-31 | 2019-09-30 | 2019-06-30 | 2019-03-31 | 2018-12-31 | 2018-09-30 | 2018-06-30 | 2018-03-31 | 2017-12-31 | 2017-09-30 | 2017-06-30 | 2017-03-31 | 2016-12-31 | 2016-09-30 | 2016-06-30 | 2016-03-31 | 2015-12-31 | 2015-09-30 | 2015-06-30 | 2015-03-31 | 2014-12-31 | 2014-09-30 | 2014-06-30 | 2014-03-31 | 2013-12-31 | 2013-09-30 | 2013-06-30 | 2013-03-31 | 2012-12-31 | 2012-09-30 | 2012-06-30 | 2012-03-31 | 2011-12-31 | 2011-09-30 | 2011-06-30 | 2011-03-31 | 2010-12-31 | 2010-09-30 | 2010-06-30 | 2010-03-31 | ||
|---|---|---|---|---|---|---|---|---|---|---|---|---|---|---|---|---|---|---|---|---|---|---|---|---|---|---|---|---|---|---|---|---|---|---|---|---|---|---|---|---|---|---|---|---|---|---|---|---|---|---|---|---|---|---|---|---|---|---|
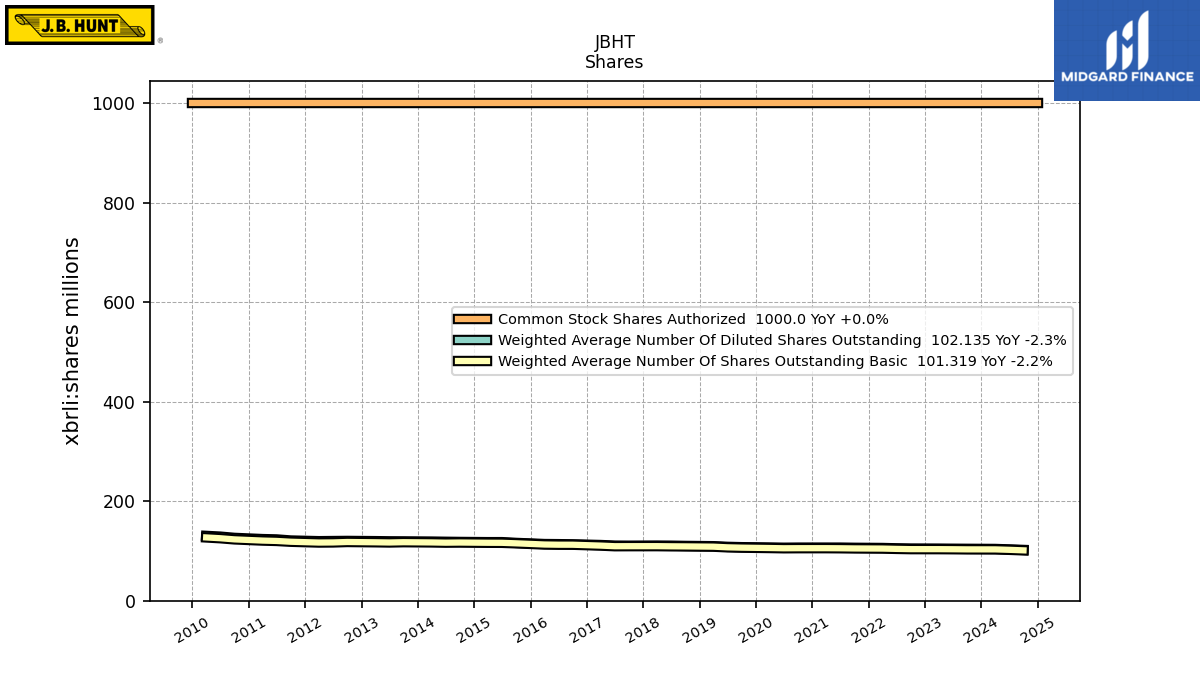
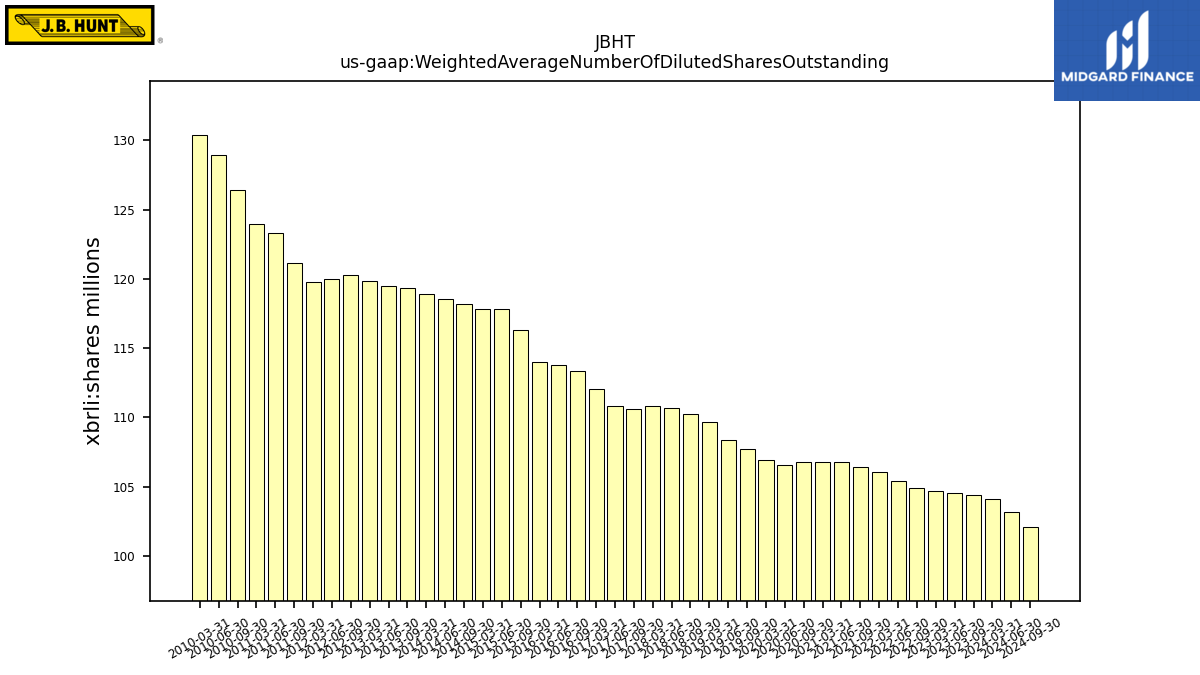
| Weighted Average Number Of Diluted Shares Outstanding | 104.11 | NA | 104.39 | 104.57 | 104.73 | NA | 104.92 | 105.39 | 106.08 | NA | 106.44 | 106.82 | 106.82 | NA | 106.80 | 106.58 | 106.95 | NA | 107.69 | 108.37 | 109.66 | NA | 110.23 | 110.68 | 110.86 | NA | 110.63 | 110.82 | 112.03 | NA | 113.36 | 113.76 | 114.00 | NA | 116.28 | 117.81 | 117.80 | NA | 118.22 | 118.54 | 118.94 | NA | 119.36 | 119.47 | 119.83 | NA | 120.28 | 120.03 | 119.75 | NA | 121.13 | 123.28 | 123.97 | NA | 126.40 | 128.92 | 130.40 | |
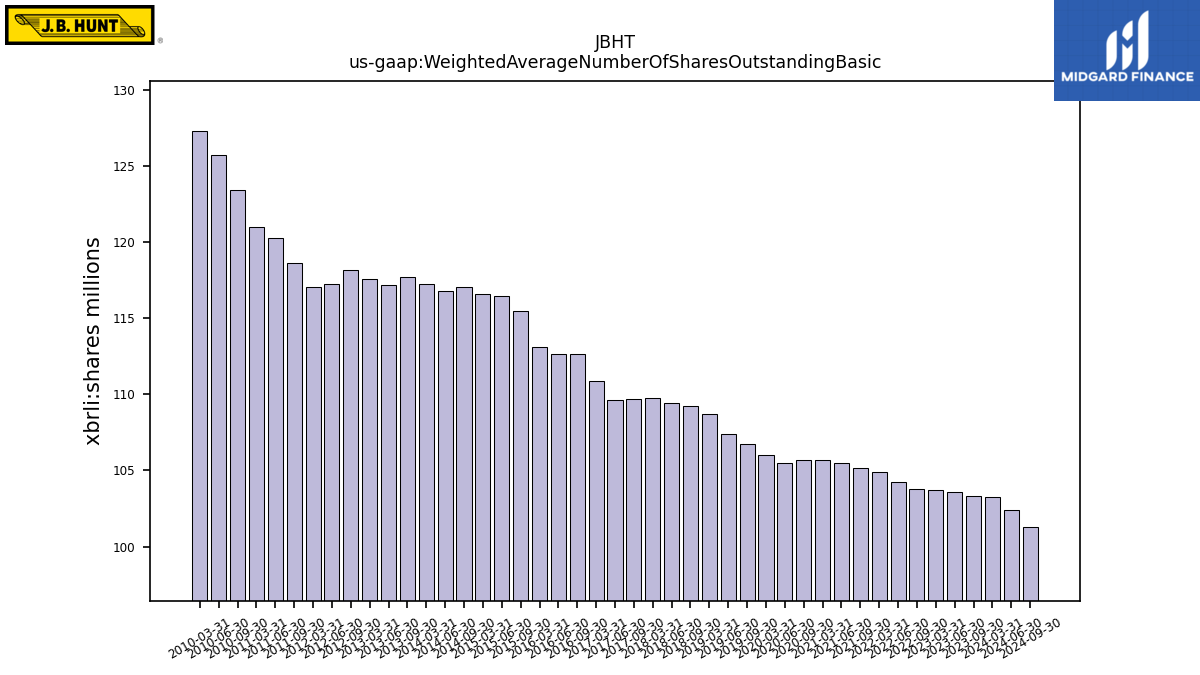
| Weighted Average Number Of Shares Outstanding Basic | 103.24 | NA | 103.30 | 103.56 | 103.72 | NA | 103.76 | 104.25 | 104.89 | NA | 105.17 | 105.51 | 105.68 | NA | 105.65 | 105.50 | 105.98 | NA | 106.73 | 107.39 | 108.73 | NA | 109.25 | 109.45 | 109.75 | NA | 109.70 | 109.63 | 110.88 | NA | 112.63 | 112.67 | 113.07 | NA | 115.46 | 116.47 | 116.56 | NA | 117.05 | 116.76 | 117.25 | NA | 117.72 | 117.14 | 117.55 | NA | 118.13 | 117.23 | 117.02 | NA | 118.63 | 120.24 | 120.98 | NA | 123.39 | 125.69 | 127.28 |
| 2024-03-31 | 2023-12-31 | 2023-09-30 | 2023-06-30 | 2023-03-31 | 2022-12-31 | 2022-09-30 | 2022-06-30 | 2022-03-31 | 2021-12-31 | 2021-09-30 | 2021-06-30 | 2021-03-31 | 2020-12-31 | 2020-09-30 | 2020-06-30 | 2020-03-31 | 2019-12-31 | 2019-09-30 | 2019-06-30 | 2019-03-31 | 2018-12-31 | 2018-09-30 | 2018-06-30 | 2018-03-31 | 2017-12-31 | 2017-09-30 | 2017-06-30 | 2017-03-31 | 2016-12-31 | 2016-09-30 | 2016-06-30 | 2016-03-31 | 2015-12-31 | 2015-09-30 | 2015-06-30 | 2015-03-31 | 2014-12-31 | 2014-09-30 | 2014-06-30 | 2014-03-31 | 2013-12-31 | 2013-09-30 | 2013-06-30 | 2013-03-31 | 2012-12-31 | 2012-09-30 | 2012-06-30 | 2012-03-31 | 2011-12-31 | 2011-09-30 | 2011-06-30 | 2011-03-31 | 2010-12-31 | 2010-09-30 | 2010-06-30 | 2010-03-31 | ||
|---|---|---|---|---|---|---|---|---|---|---|---|---|---|---|---|---|---|---|---|---|---|---|---|---|---|---|---|---|---|---|---|---|---|---|---|---|---|---|---|---|---|---|---|---|---|---|---|---|---|---|---|---|---|---|---|---|---|---|
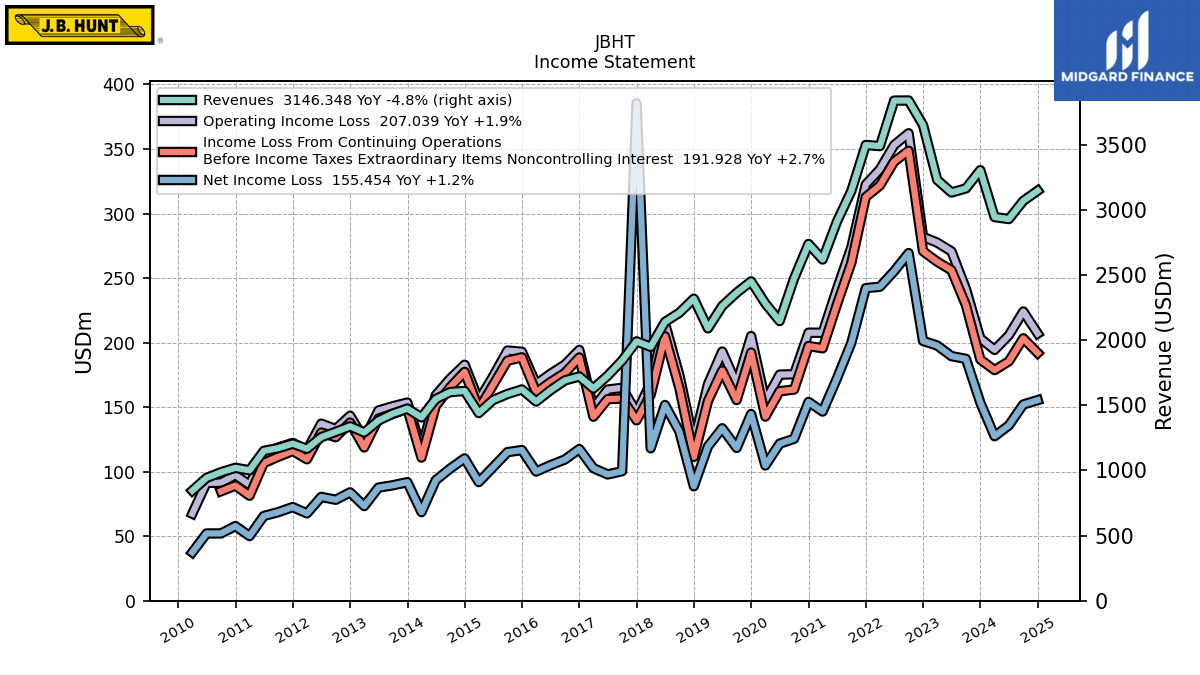
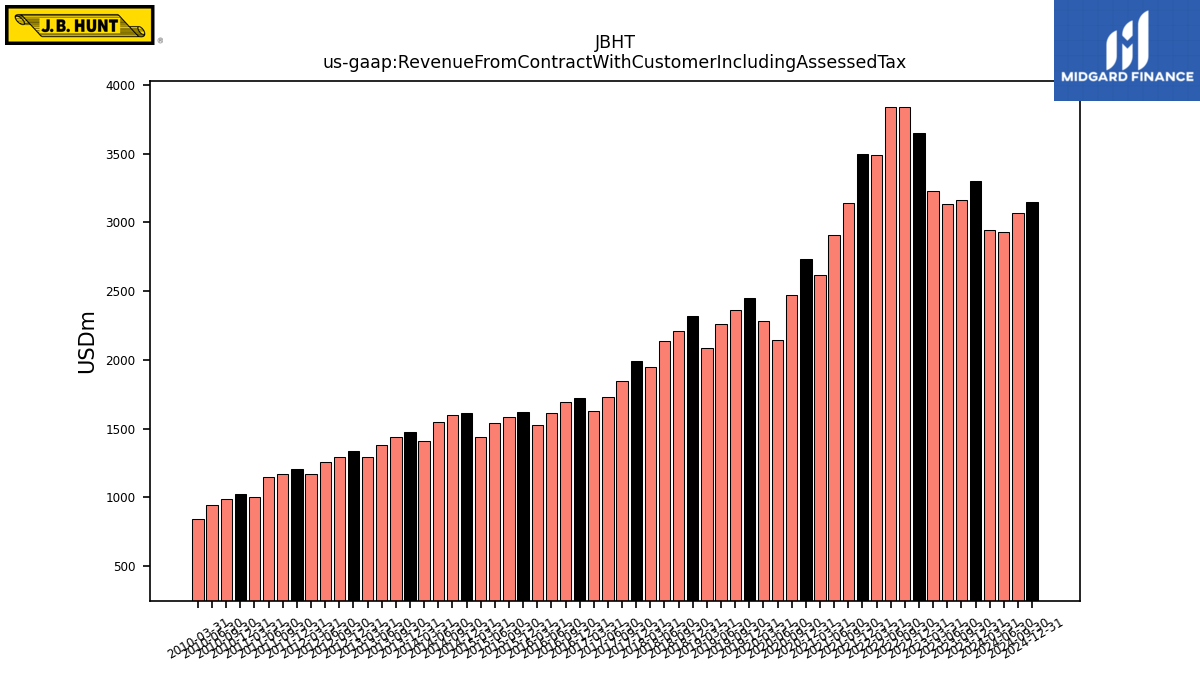
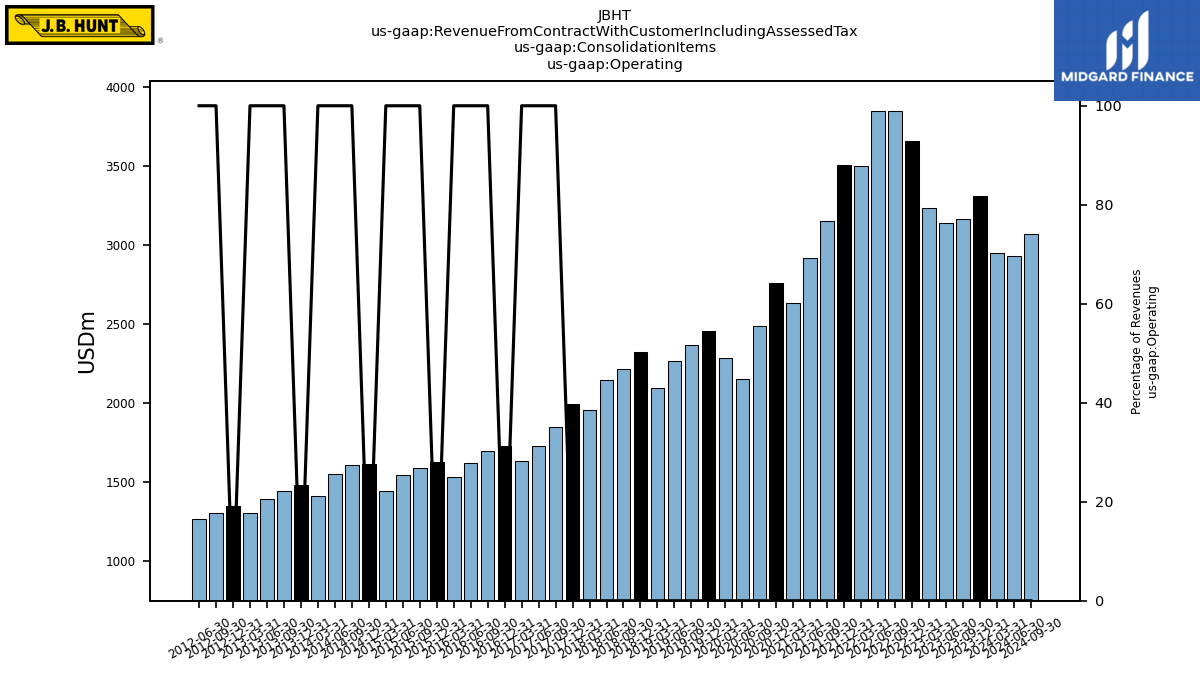
| Revenue From Contract With Customer Including Assessed Tax | 2944.00 | 3303.70 | 3163.75 | 3132.62 | 3229.59 | 3649.62 | 3838.26 | 3837.53 | 3488.59 | 3496.97 | 3144.81 | 2908.37 | 2618.15 | 2737.65 | 2472.52 | 2145.57 | 2280.83 | 2450.32 | 2363.66 | 2261.65 | 2089.63 | 2317.84 | 2209.76 | 2139.03 | 1948.24 | 1990.16 | 1843.33 | 1726.91 | 1629.16 | 1721.06 | 1690.66 | 1615.03 | 1528.71 | 1621.02 | 1586.49 | 1539.96 | 1440.18 | 1609.51 | 1601.16 | 1547.87 | 1406.91 | 1474.28 | 1435.85 | 1382.86 | 1291.59 | 1338.14 | 1295.79 | 1255.13 | 1165.92 | 1204.94 | 1171.27 | 1149.86 | 1000.78 | 1020.01 | 986.02 | 942.78 | 844.67 | |
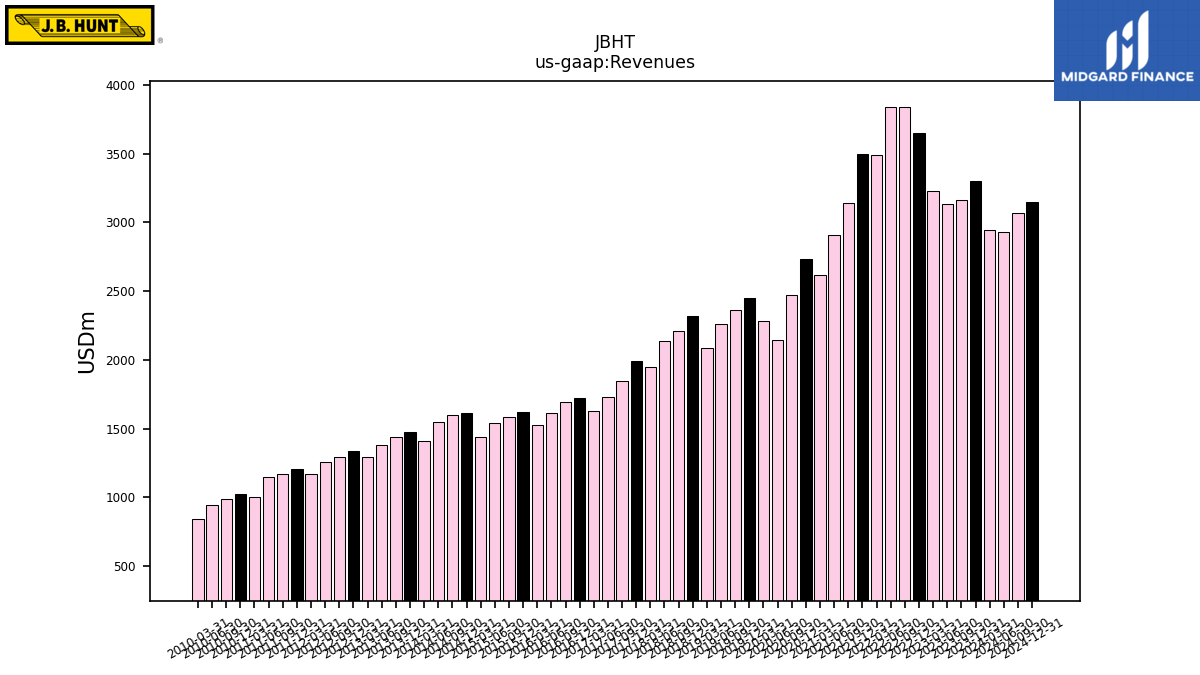
| Revenues | 2944.00 | 3303.70 | 3163.75 | 3132.62 | 3229.59 | 3649.62 | 3838.26 | 3837.53 | 3488.59 | 3496.97 | 3144.81 | 2908.37 | 2618.15 | 2737.65 | 2472.52 | 2145.57 | 2280.83 | 2450.32 | 2363.66 | 2261.65 | 2089.63 | 2317.84 | 2209.76 | 2139.03 | 1948.24 | 1990.16 | 1843.33 | 1726.91 | 1629.16 | 1721.06 | 1690.66 | 1615.03 | 1528.71 | 1621.02 | 1586.49 | 1539.96 | 1440.18 | 1609.51 | 1601.16 | 1547.87 | 1406.91 | 1474.28 | 1435.85 | 1382.86 | 1291.59 | 1338.14 | 1295.79 | 1255.13 | 1165.92 | 1204.94 | 1171.27 | 1149.86 | 1000.78 | 1020.01 | 986.02 | 942.78 | 844.67 | |
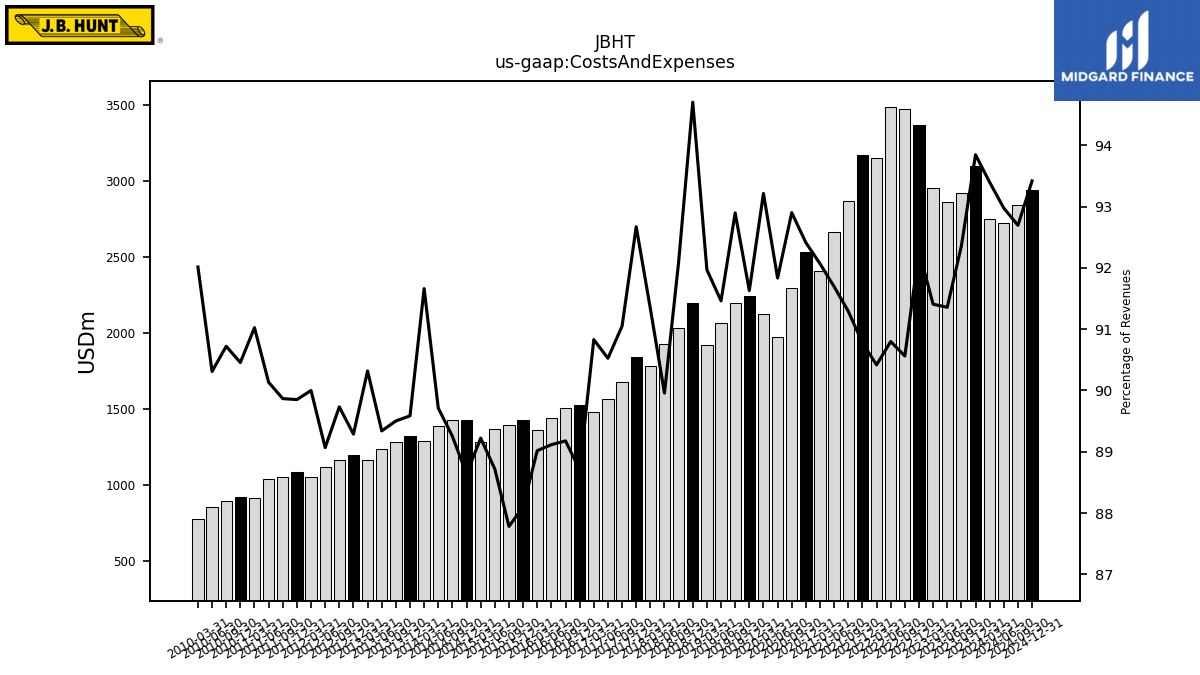
| Costs And Expenses | 2749.63 | 3100.42 | 2922.04 | 2861.91 | 2952.10 | 3367.67 | 3476.03 | 3484.45 | 3154.29 | 3174.47 | 2870.98 | 2666.82 | 2410.50 | 2529.96 | 2297.02 | 1970.39 | 2126.09 | 2245.25 | 2195.80 | 2068.55 | 1921.83 | 2195.10 | 2035.07 | 1924.21 | 1779.46 | 1844.35 | 1678.36 | 1563.30 | 1479.77 | 1526.70 | 1507.68 | 1439.23 | 1360.82 | 1428.12 | 1392.65 | 1366.22 | 1284.96 | 1426.61 | 1429.06 | 1388.64 | 1289.60 | 1320.74 | 1285.12 | 1235.45 | 1166.55 | 1194.80 | 1162.74 | 1117.91 | 1049.33 | 1082.65 | 1052.59 | 1036.41 | 910.96 | 922.66 | 894.53 | 851.43 | 777.23 | |
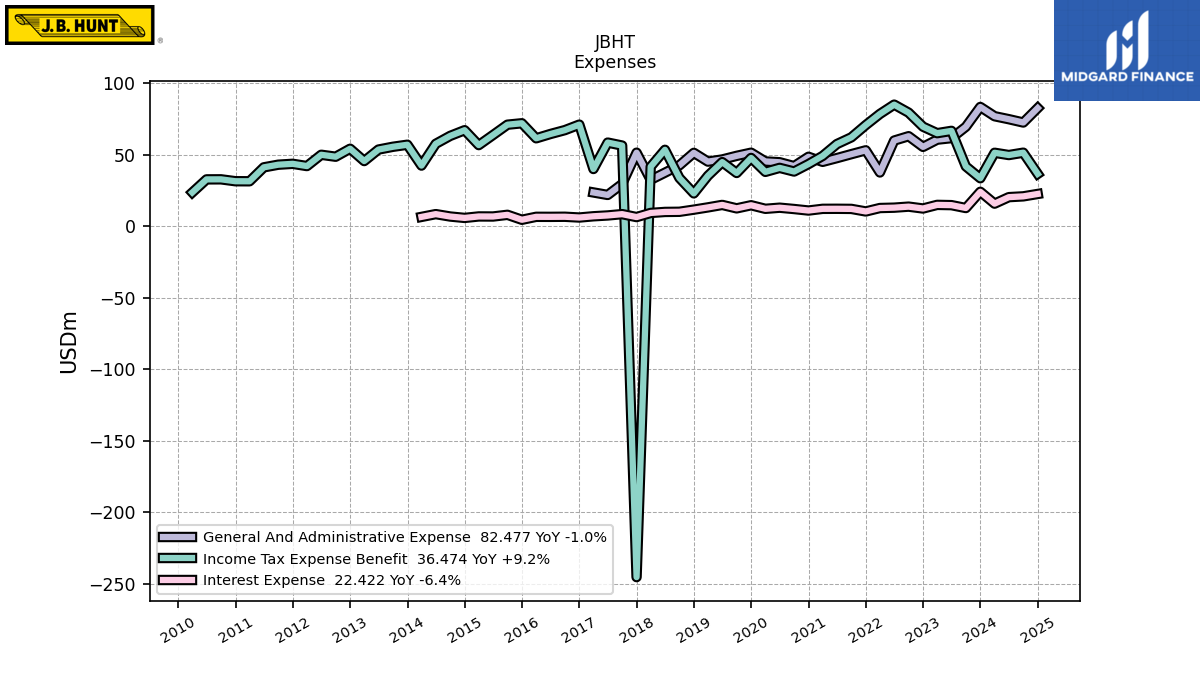
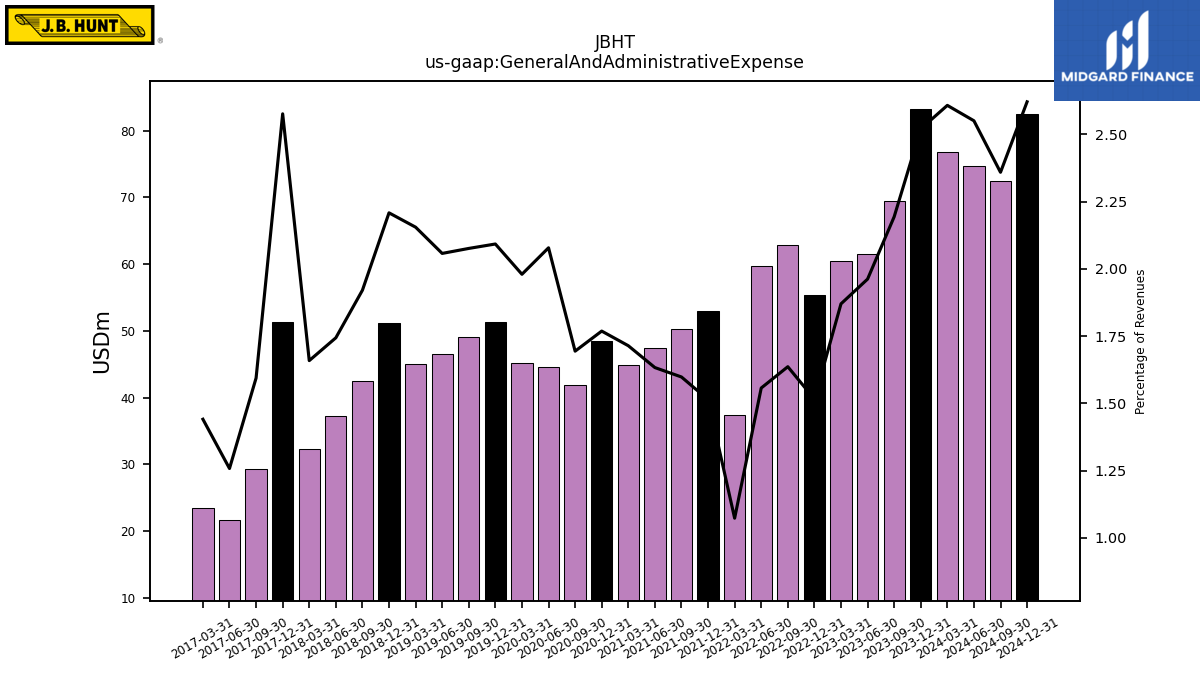
| General And Administrative Expense | 76.78 | 83.27 | 69.41 | 61.47 | 60.40 | 55.34 | 62.81 | 59.76 | 37.45 | 52.95 | 50.27 | 47.51 | 44.89 | 48.43 | 41.89 | 44.60 | 45.16 | 51.28 | 49.08 | 46.54 | 45.04 | 51.19 | 42.45 | 37.31 | 32.33 | 51.28 | 29.39 | 21.73 | 23.48 | NA | NA | NA | NA | NA | NA | NA | NA | NA | NA | NA | NA | NA | NA | NA | NA | NA | NA | NA | NA | NA | NA | NA | NA | NA | NA | NA | NA | |
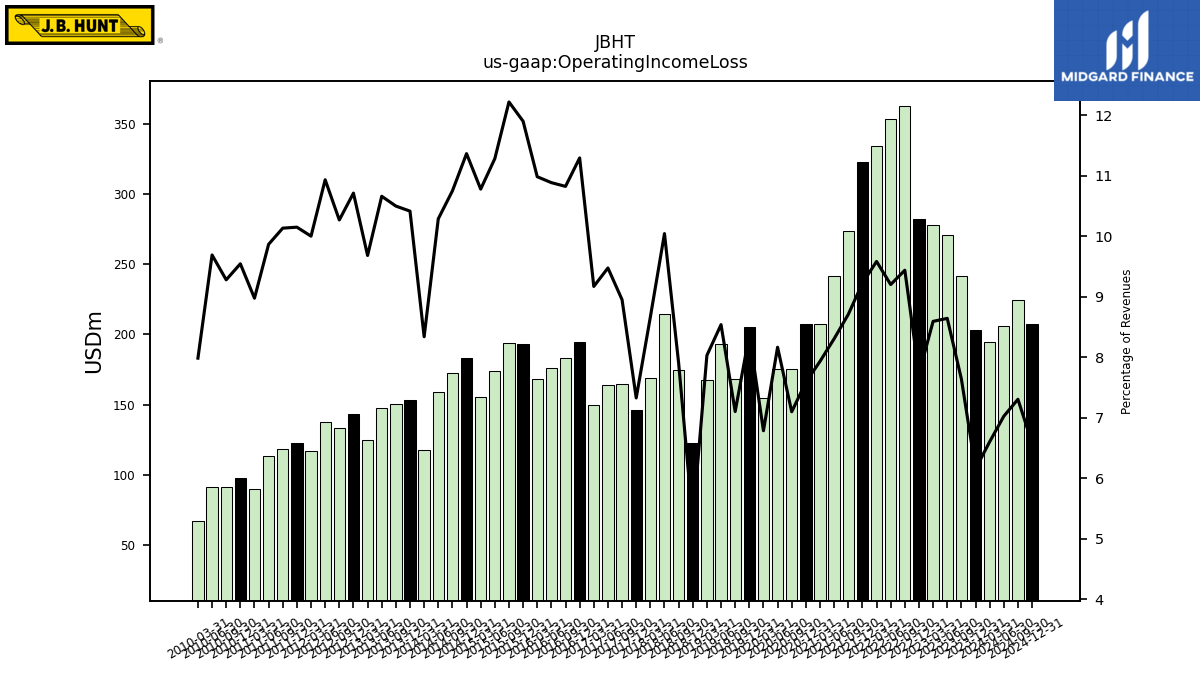
| Operating Income Loss | 194.37 | 203.28 | 241.72 | 270.71 | 277.49 | 281.95 | 362.23 | 353.08 | 334.29 | 322.50 | 273.83 | 241.55 | 207.65 | 207.69 | 175.50 | 175.18 | 154.74 | 205.07 | 167.86 | 193.09 | 167.79 | 122.74 | 174.69 | 214.81 | 168.78 | 145.81 | 164.97 | 163.62 | 149.39 | 194.36 | 182.98 | 175.79 | 167.89 | 192.89 | 193.85 | 173.74 | 155.22 | 182.91 | 172.10 | 159.23 | 117.31 | 153.53 | 150.73 | 147.41 | 125.04 | 143.34 | 133.05 | 137.22 | 116.60 | 122.29 | 118.68 | 113.44 | 89.82 | 97.35 | 91.49 | 91.35 | 67.44 | |
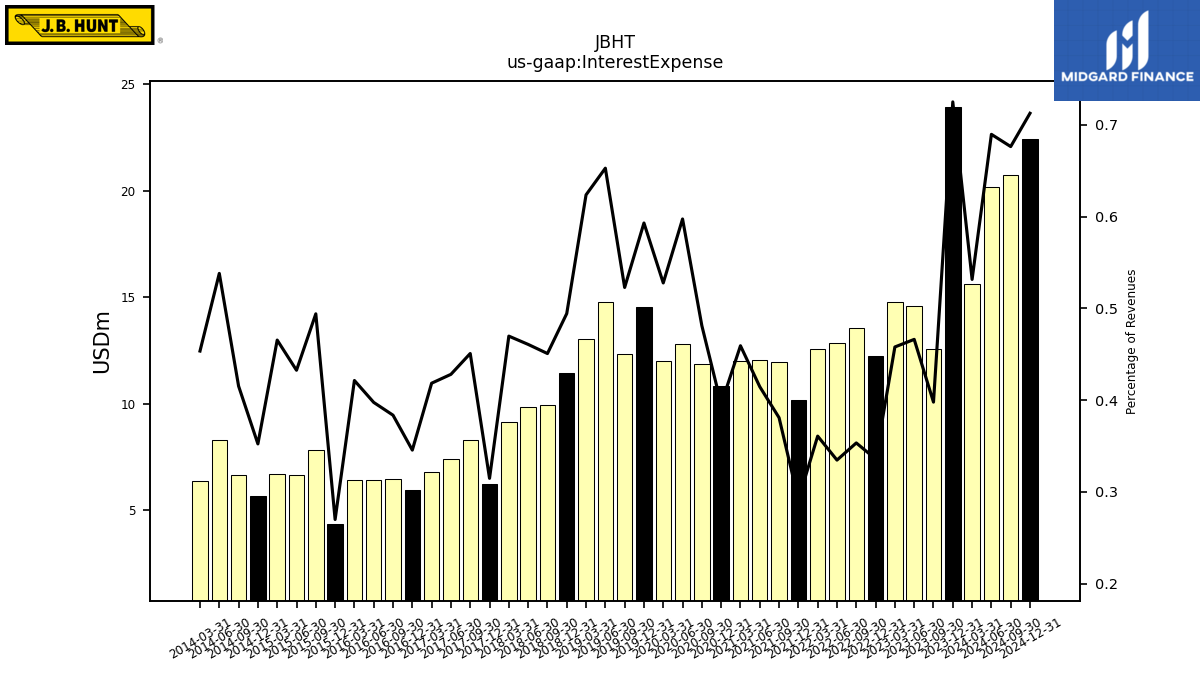
| Interest Expense | 15.65 | 23.95 | 12.59 | 14.60 | 14.79 | 12.26 | 13.56 | 12.84 | 12.59 | 10.19 | 11.98 | 12.06 | 12.02 | 10.83 | 11.89 | 12.82 | 12.04 | 14.53 | 12.36 | 14.76 | 13.03 | 11.46 | 9.96 | 9.86 | 9.15 | 6.26 | 8.31 | 7.39 | 6.82 | 5.95 | 6.49 | 6.42 | 6.44 | 4.38 | 7.84 | 6.66 | 6.70 | 5.67 | 6.65 | 8.33 | 6.38 | NA | NA | NA | NA | NA | NA | NA | NA | NA | NA | NA | NA | NA | NA | NA | NA | |
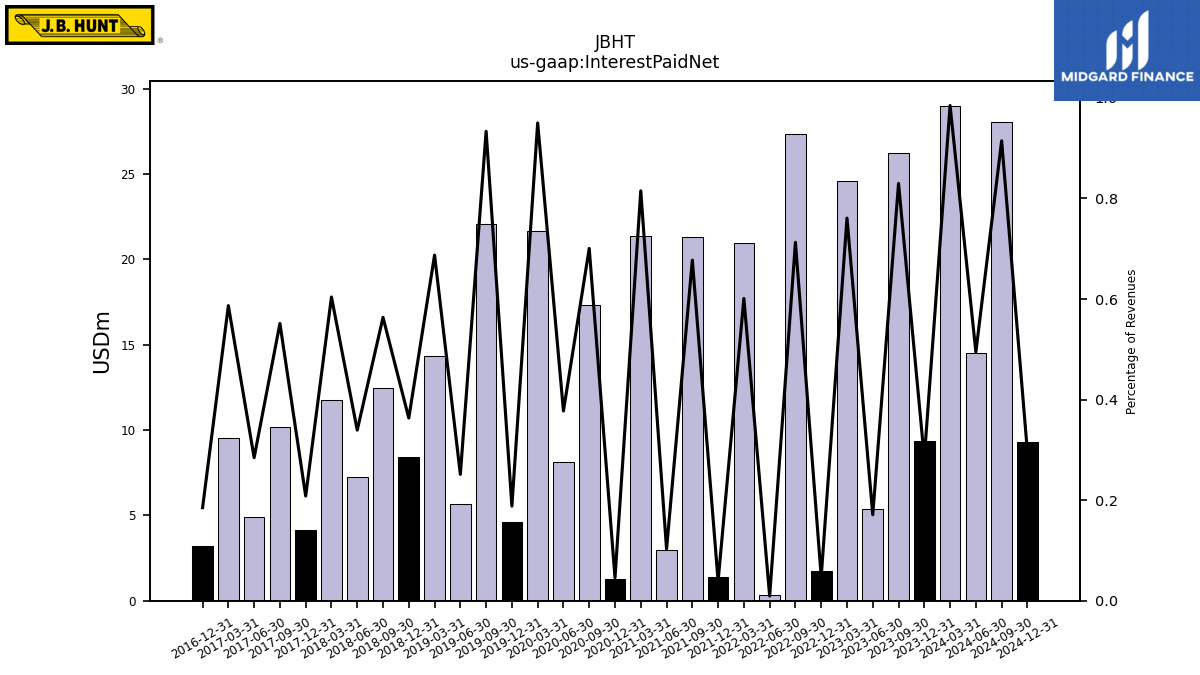
| Interest Paid Net | 28.99 | 9.37 | 26.25 | 5.36 | 24.58 | 1.74 | 27.36 | 0.36 | 20.97 | 1.37 | 21.30 | 3.00 | 21.34 | 1.26 | 17.32 | 8.10 | 21.67 | 4.61 | 22.07 | 5.68 | 14.36 | 8.42 | 12.45 | 7.26 | 11.77 | 4.14 | 10.16 | 4.92 | 9.56 | 3.19 | NA | NA | NA | NA | NA | NA | NA | NA | NA | NA | NA | NA | NA | NA | NA | NA | NA | NA | NA | NA | NA | NA | NA | NA | NA | NA | NA | |
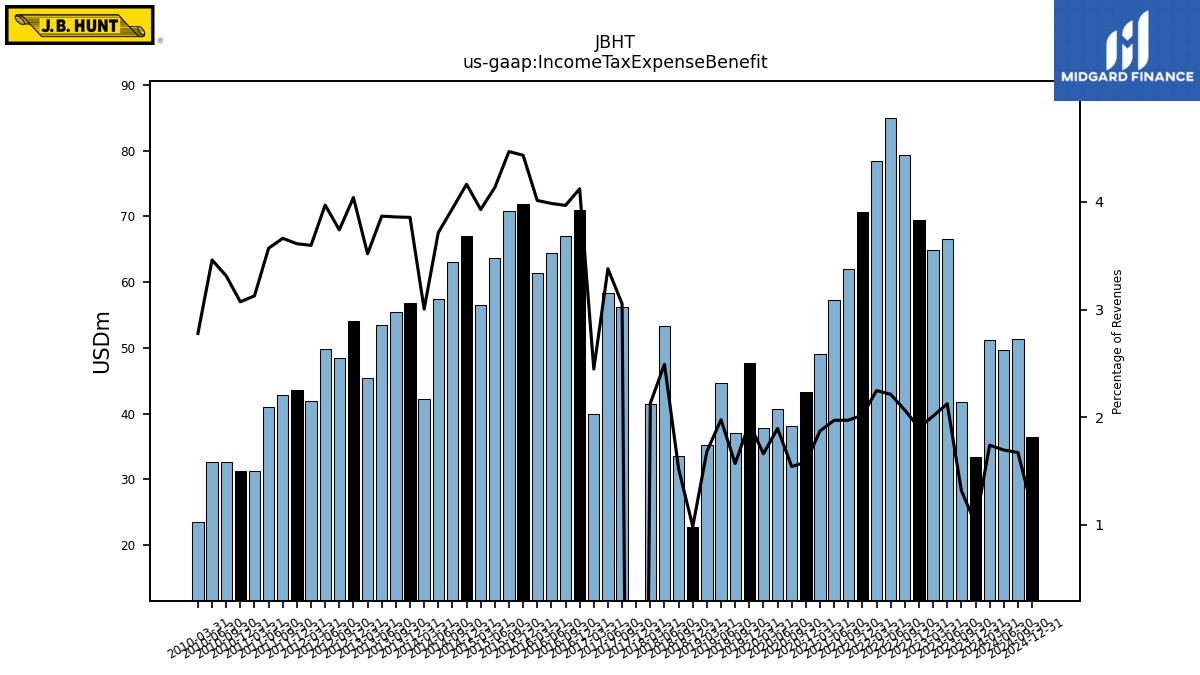
| Income Tax Expense Benefit | 51.23 | 33.41 | 41.70 | 66.56 | 64.93 | 69.46 | 79.28 | 84.90 | 78.38 | 70.60 | 62.02 | 57.33 | 49.02 | 43.34 | 38.11 | 40.67 | 37.87 | 47.62 | 37.09 | 44.70 | 35.16 | 22.82 | 33.62 | 53.30 | 41.49 | -245.52 | 56.28 | 58.35 | 39.87 | 70.93 | 67.07 | 64.36 | 61.35 | 71.86 | 70.87 | 63.66 | 56.59 | 67.02 | 63.04 | 57.49 | 42.26 | 56.85 | 55.42 | 53.48 | 45.43 | 54.06 | 48.47 | 49.84 | 41.93 | 43.51 | 42.88 | 41.04 | 31.29 | 31.33 | 32.66 | 32.62 | 23.46 | |
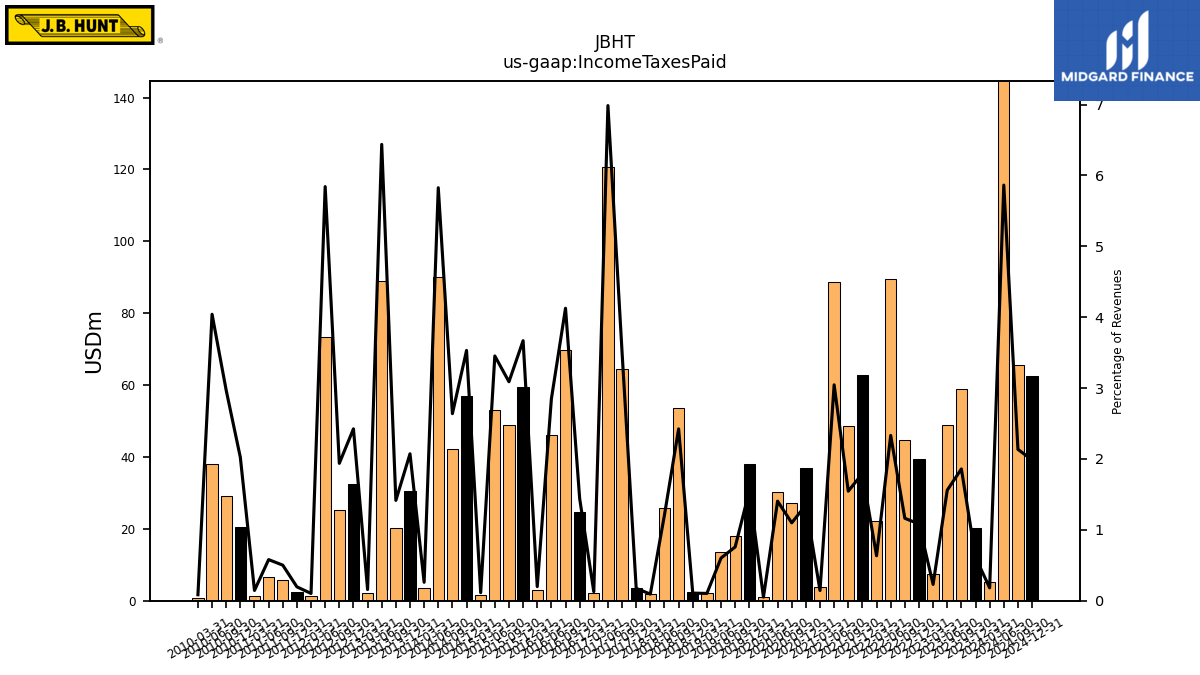
| Income Taxes Paid | 5.35 | 20.24 | 58.83 | 48.86 | 7.46 | 39.52 | 44.66 | 89.49 | 22.15 | 62.75 | 48.62 | 88.59 | 3.78 | 36.96 | 27.18 | 30.15 | 1.17 | 37.94 | 17.94 | 13.63 | 2.16 | 2.49 | 53.57 | 25.93 | 1.83 | 3.47 | 64.59 | 120.64 | 2.08 | 24.83 | 69.76 | 45.99 | 3.05 | 59.47 | 49.02 | 53.18 | 1.64 | 56.84 | 42.26 | 90.19 | 3.66 | 30.56 | 20.33 | 89.03 | 2.05 | 32.45 | 25.12 | 73.33 | 1.20 | 2.37 | 5.88 | 6.67 | 1.45 | 20.63 | 29.27 | 38.10 | 0.72 | |
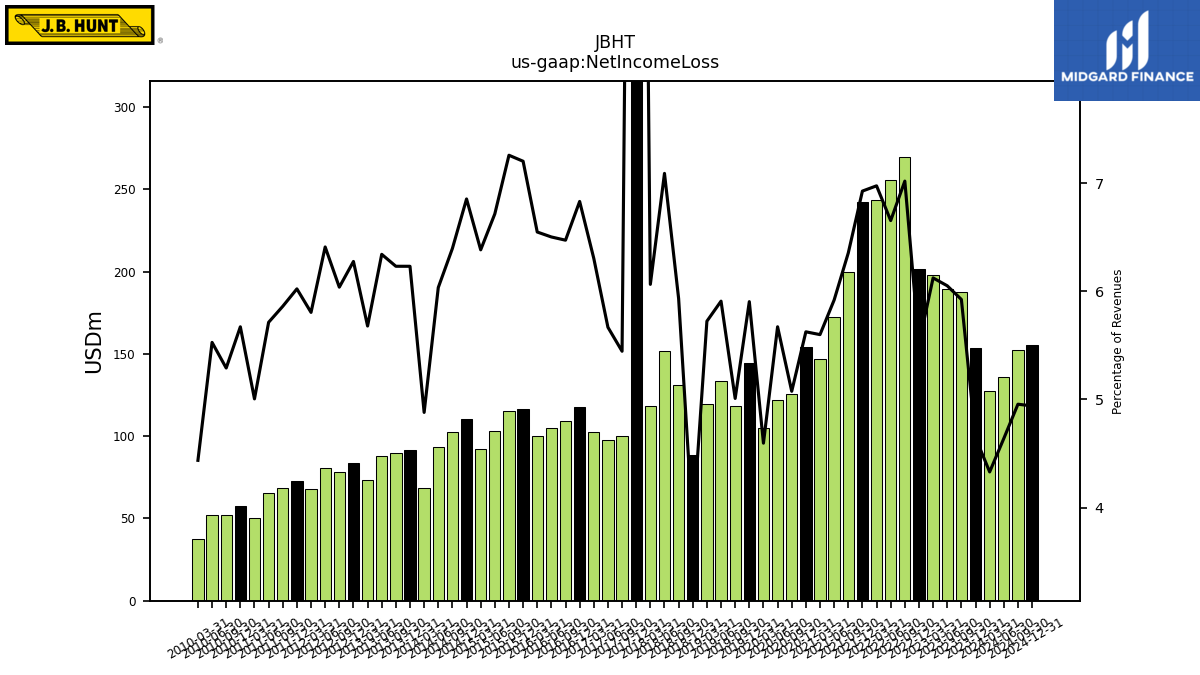
| Net Income Loss | 127.49 | 153.53 | 187.43 | 189.55 | 197.77 | 201.30 | 269.38 | 255.34 | 243.32 | 242.21 | 199.83 | 172.16 | 146.61 | 154.01 | 125.50 | 121.70 | 104.83 | 144.68 | 118.41 | 133.63 | 119.60 | 88.68 | 131.11 | 151.65 | 118.14 | 385.31 | 100.39 | 97.87 | 102.70 | 117.56 | 109.42 | 105.01 | 100.10 | 116.75 | 115.14 | 103.42 | 91.93 | 110.31 | 102.41 | 93.41 | 68.66 | 91.86 | 89.47 | 87.70 | 73.35 | 83.98 | 78.24 | 80.45 | 67.68 | 72.56 | 68.65 | 65.70 | 50.09 | 57.85 | 52.17 | 52.11 | 37.48 |
| 2024-03-31 | 2023-12-31 | 2023-09-30 | 2023-06-30 | 2023-03-31 | 2022-12-31 | 2022-09-30 | 2022-06-30 | 2022-03-31 | 2021-12-31 | 2021-09-30 | 2021-06-30 | 2021-03-31 | 2020-12-31 | 2020-09-30 | 2020-06-30 | 2020-03-31 | 2019-12-31 | 2019-09-30 | 2019-06-30 | 2019-03-31 | 2018-12-31 | 2018-09-30 | 2018-06-30 | 2018-03-31 | 2017-12-31 | 2017-09-30 | 2017-06-30 | 2017-03-31 | 2016-12-31 | 2016-09-30 | 2016-06-30 | 2016-03-31 | 2015-12-31 | 2015-09-30 | 2015-06-30 | 2015-03-31 | 2014-12-31 | 2014-09-30 | 2014-06-30 | 2014-03-31 | 2013-12-31 | 2013-09-30 | 2013-06-30 | 2013-03-31 | 2012-12-31 | 2012-09-30 | 2012-06-30 | 2012-03-31 | 2011-12-31 | 2011-09-30 | 2011-06-30 | 2011-03-31 | 2010-12-31 | 2010-09-30 | 2010-06-30 | 2010-03-31 | ||
|---|---|---|---|---|---|---|---|---|---|---|---|---|---|---|---|---|---|---|---|---|---|---|---|---|---|---|---|---|---|---|---|---|---|---|---|---|---|---|---|---|---|---|---|---|---|---|---|---|---|---|---|---|---|---|---|---|---|---|
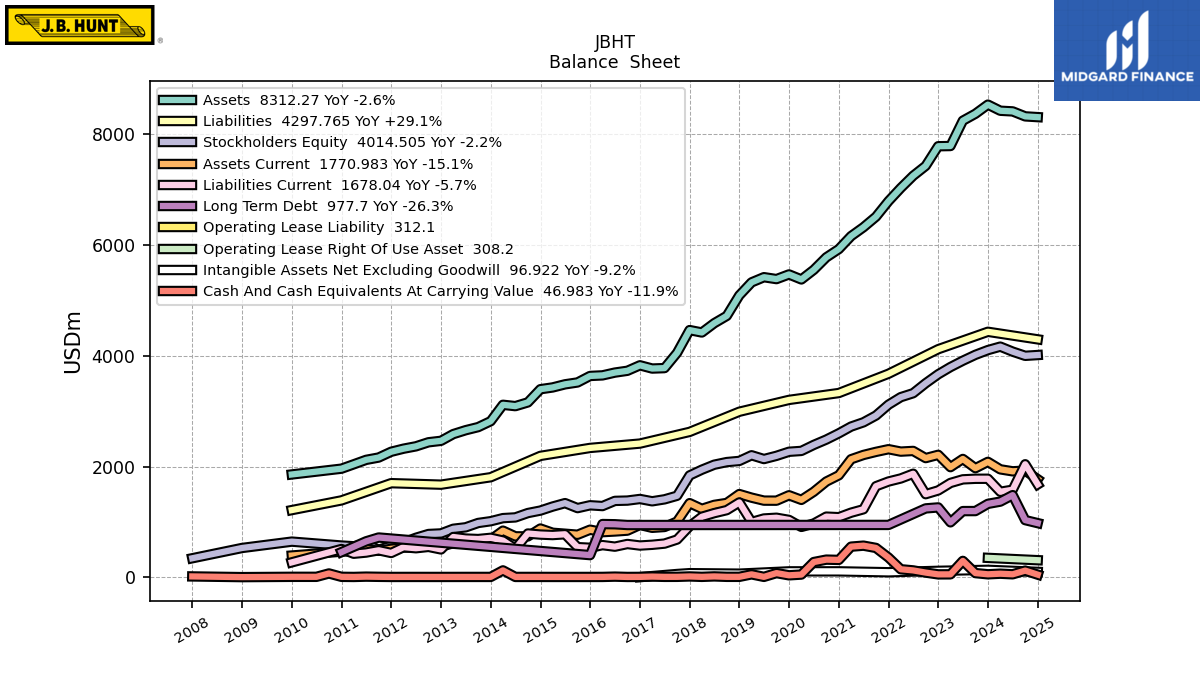
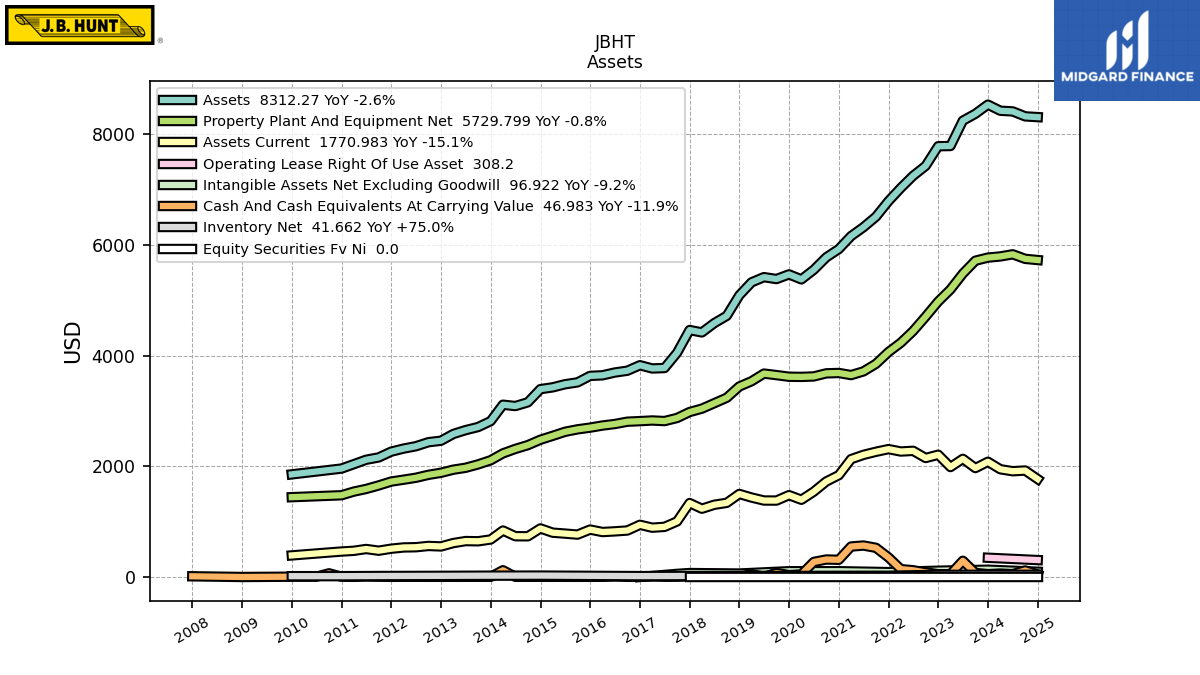
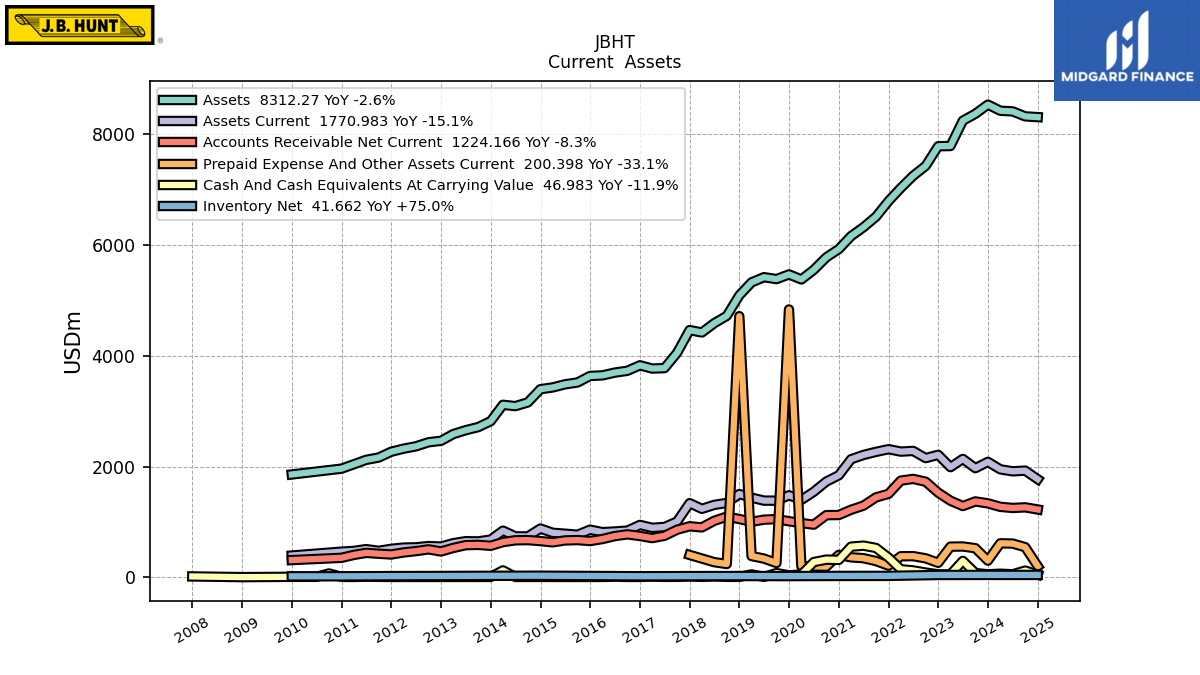
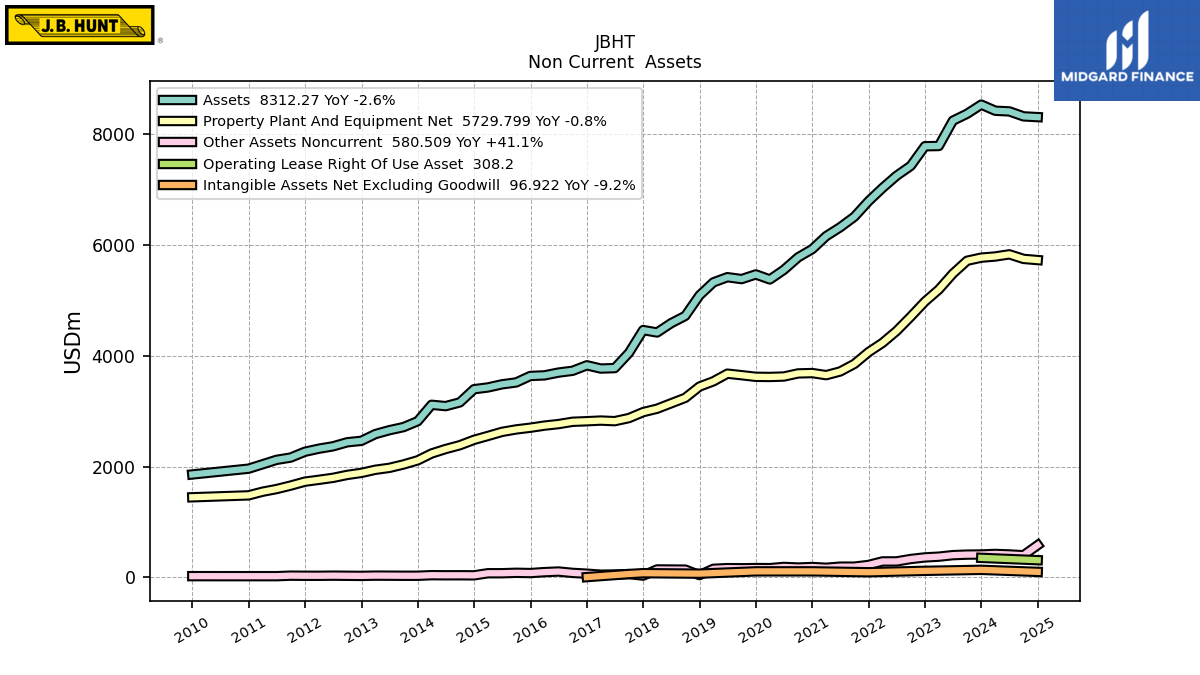
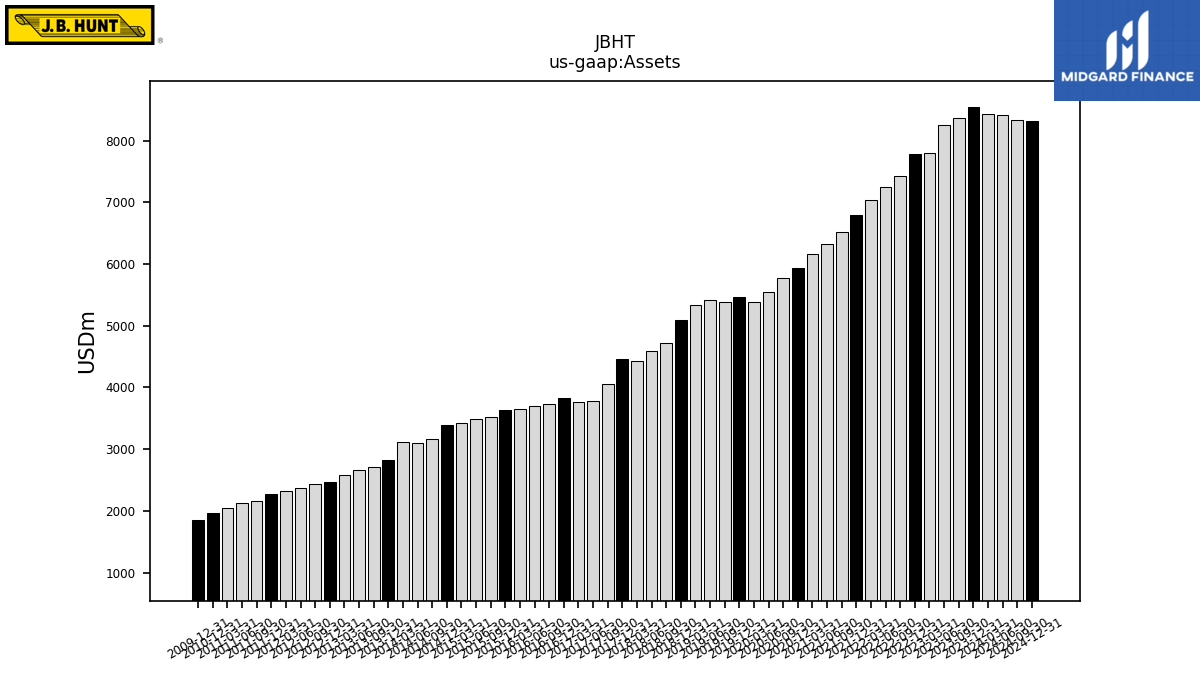
| Assets | 8427.78 | 8538.26 | 8372.97 | 8247.73 | 7790.40 | 7786.58 | 7431.56 | 7252.56 | 7031.94 | 6794.35 | 6513.19 | 6323.39 | 6162.61 | 5928.35 | 5779.06 | 5553.63 | 5380.04 | 5470.85 | 5386.34 | 5420.74 | 5327.28 | 5091.65 | 4721.67 | 4589.24 | 4421.66 | 4465.35 | 4053.92 | 3778.38 | 3770.39 | 3828.99 | 3729.99 | 3697.36 | 3646.96 | 3636.57 | 3519.26 | 3485.35 | 3429.00 | 3397.12 | 3158.92 | 3091.36 | 3115.72 | 2819.40 | 2712.43 | 2656.32 | 2586.12 | 2464.64 | 2438.34 | 2365.28 | 2322.86 | 2267.33 | 2162.66 | 2120.86 | 2040.37 | 1961.66 | NA | NA | NA | |
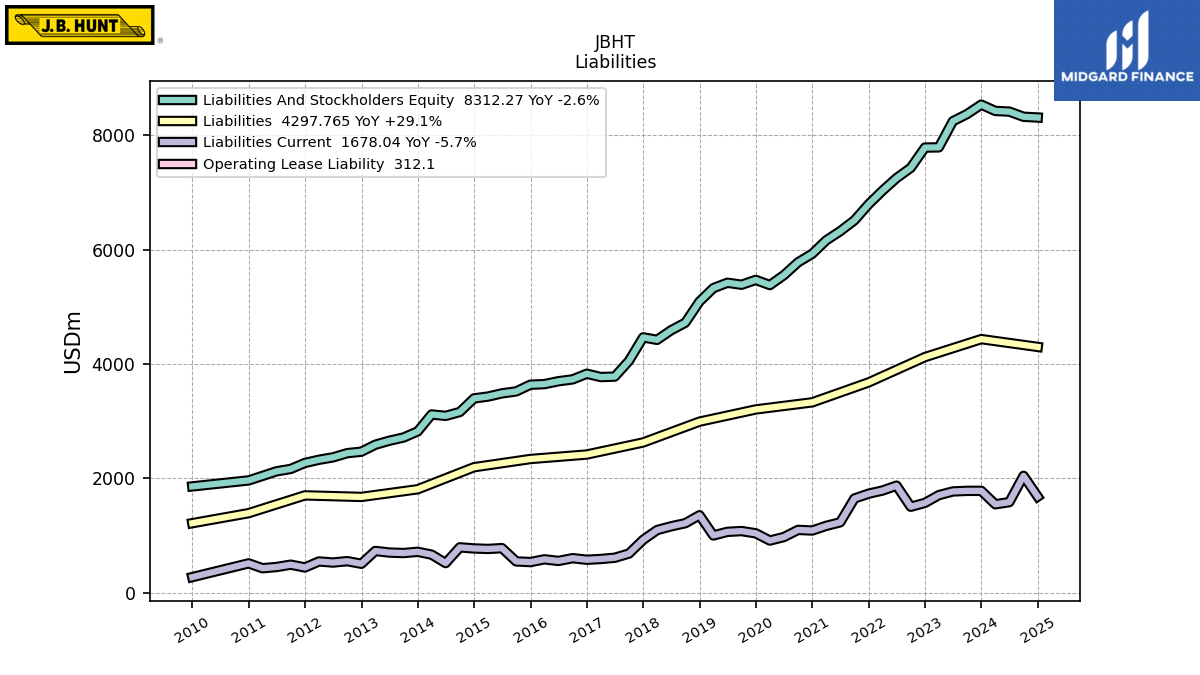
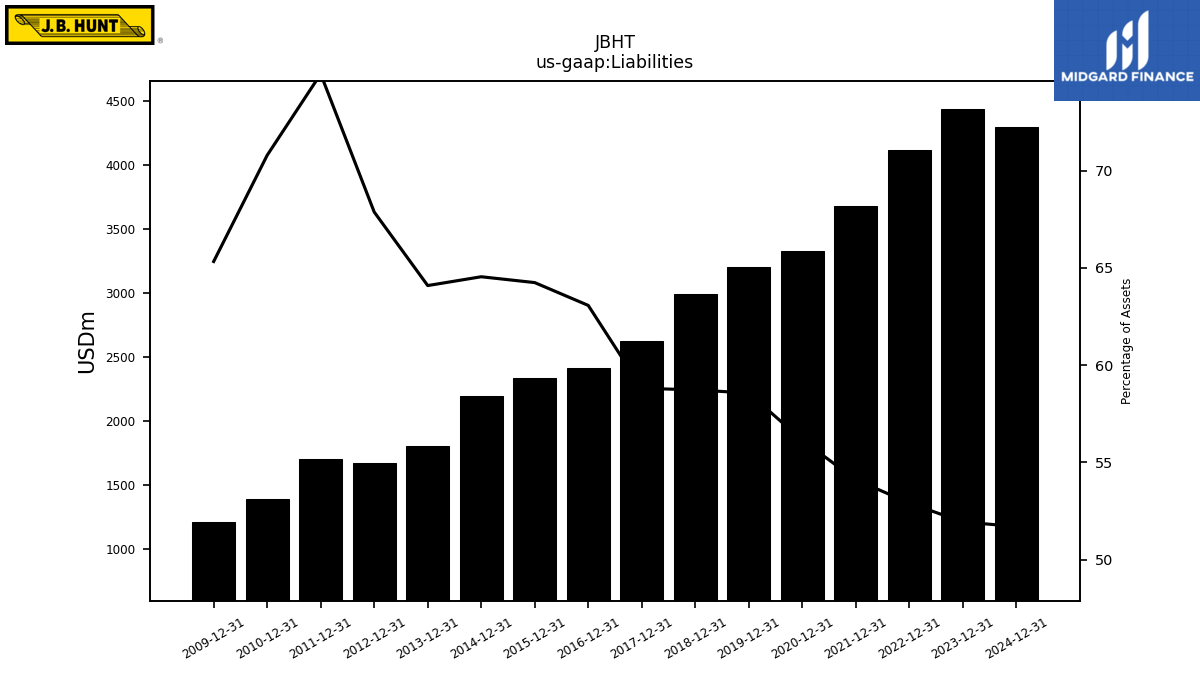
| Liabilities | NA | 4434.50 | NA | NA | NA | 4119.81 | NA | NA | NA | 3676.53 | NA | NA | NA | 3328.21 | NA | NA | NA | 3203.82 | NA | NA | NA | 2990.26 | NA | NA | NA | 2626.02 | NA | NA | NA | 2414.93 | NA | NA | NA | 2336.22 | NA | NA | NA | 2192.59 | NA | NA | NA | 1806.95 | NA | NA | NA | 1672.78 | NA | NA | NA | 1699.79 | NA | NA | NA | 1388.64 | NA | NA | NA | |
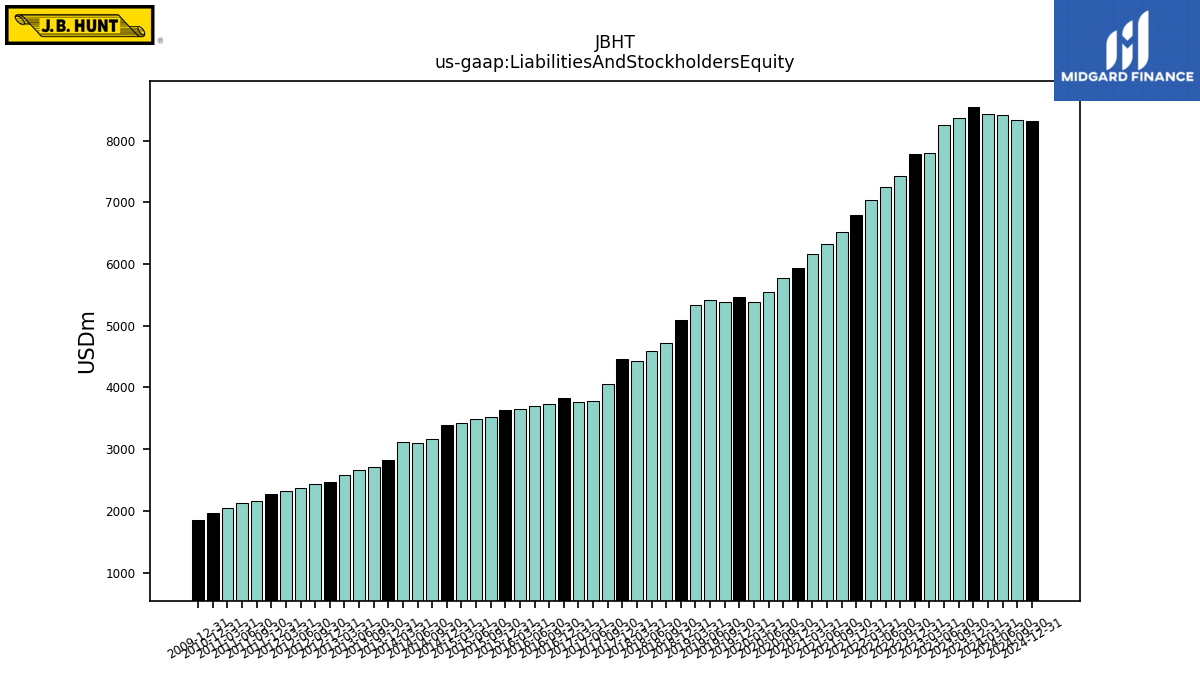
| Liabilities And Stockholders Equity | 8427.78 | 8538.26 | 8372.97 | 8247.73 | 7790.40 | 7786.58 | 7431.56 | 7252.56 | 7031.94 | 6794.35 | 6513.19 | 6323.39 | 6162.61 | 5928.35 | 5779.06 | 5553.63 | 5380.04 | 5470.85 | 5386.34 | 5420.74 | 5327.28 | 5091.65 | 4721.67 | 4589.24 | 4421.66 | 4465.35 | 4053.92 | 3778.38 | 3770.39 | 3828.99 | 3729.99 | 3697.36 | 3646.96 | 3636.57 | 3519.26 | 3485.35 | 3429.00 | 3397.12 | 3158.92 | 3091.36 | 3115.72 | 2819.40 | 2712.43 | 2656.32 | 2586.12 | 2464.64 | 2438.34 | 2365.28 | 2322.86 | 2267.33 | 2162.66 | 2120.86 | 2040.37 | 1961.66 | NA | NA | NA | |
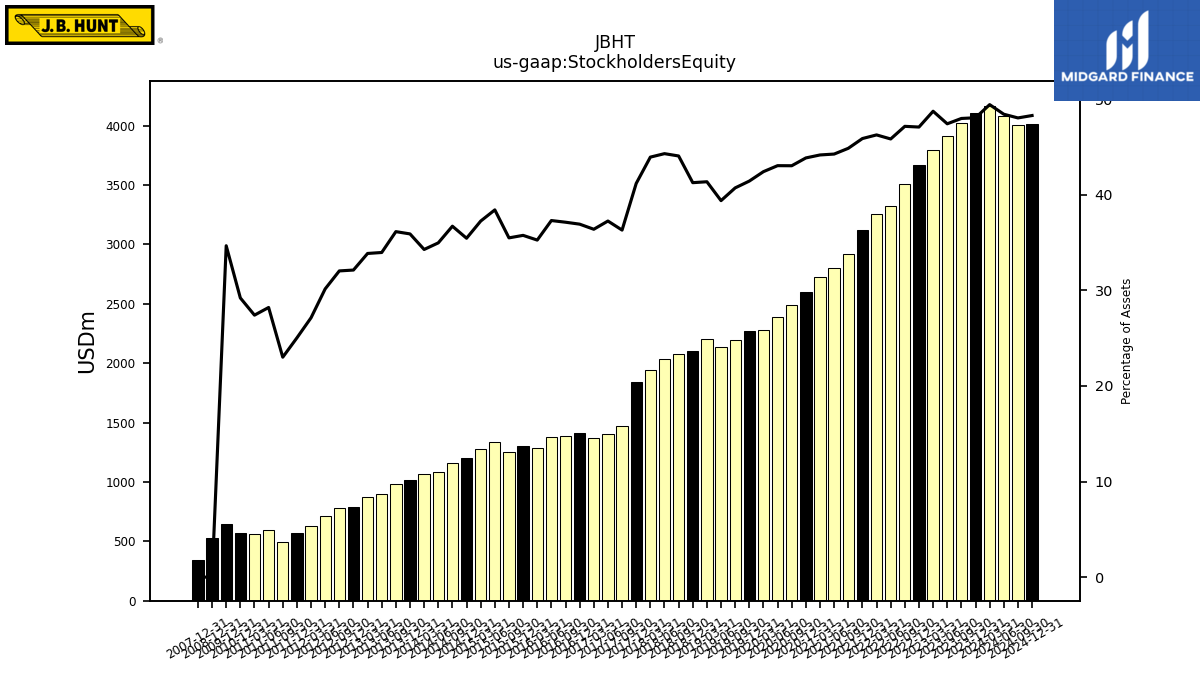
| Stockholders Equity | 4166.43 | 4103.76 | 4018.10 | 3911.92 | 3797.37 | 3666.77 | 3505.11 | 3324.86 | 3253.54 | 3117.82 | 2922.23 | 2799.03 | 2722.07 | 2600.14 | 2487.42 | 2390.84 | 2282.42 | 2267.03 | 2193.53 | 2135.36 | 2203.76 | 2101.38 | 2080.58 | 2033.36 | 1943.06 | 1839.33 | 1471.97 | 1407.72 | 1372.29 | 1414.06 | 1385.08 | 1379.42 | 1286.08 | 1300.35 | 1249.19 | 1339.20 | 1277.38 | 1204.52 | 1159.82 | 1081.12 | 1068.12 | 1012.45 | 980.48 | 902.24 | 875.77 | 791.86 | 781.19 | 713.27 | 630.30 | 567.54 | 497.63 | 598.34 | 559.27 | 573.02 | NA | NA | NA |
| 2024-03-31 | 2023-12-31 | 2023-09-30 | 2023-06-30 | 2023-03-31 | 2022-12-31 | 2022-09-30 | 2022-06-30 | 2022-03-31 | 2021-12-31 | 2021-09-30 | 2021-06-30 | 2021-03-31 | 2020-12-31 | 2020-09-30 | 2020-06-30 | 2020-03-31 | 2019-12-31 | 2019-09-30 | 2019-06-30 | 2019-03-31 | 2018-12-31 | 2018-09-30 | 2018-06-30 | 2018-03-31 | 2017-12-31 | 2017-09-30 | 2017-06-30 | 2017-03-31 | 2016-12-31 | 2016-09-30 | 2016-06-30 | 2016-03-31 | 2015-12-31 | 2015-09-30 | 2015-06-30 | 2015-03-31 | 2014-12-31 | 2014-09-30 | 2014-06-30 | 2014-03-31 | 2013-12-31 | 2013-09-30 | 2013-06-30 | 2013-03-31 | 2012-12-31 | 2012-09-30 | 2012-06-30 | 2012-03-31 | 2011-12-31 | 2011-09-30 | 2011-06-30 | 2011-03-31 | 2010-12-31 | 2010-09-30 | 2010-06-30 | 2010-03-31 | ||
|---|---|---|---|---|---|---|---|---|---|---|---|---|---|---|---|---|---|---|---|---|---|---|---|---|---|---|---|---|---|---|---|---|---|---|---|---|---|---|---|---|---|---|---|---|---|---|---|---|---|---|---|---|---|---|---|---|---|---|
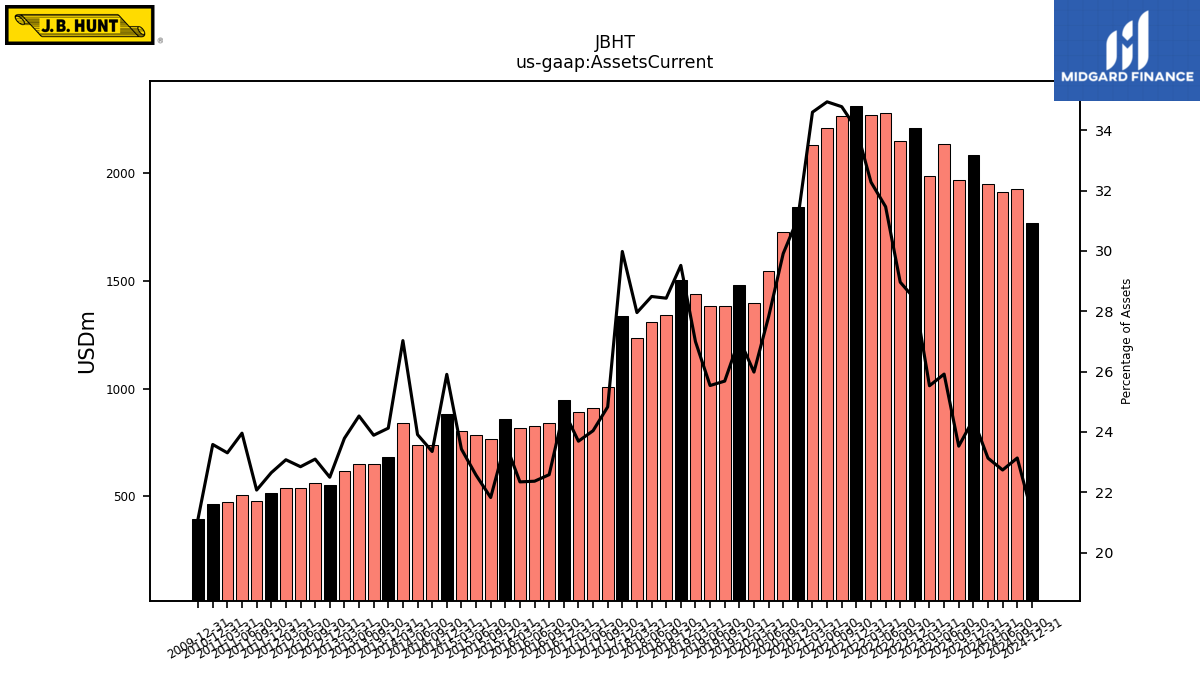
| Assets Current | 1949.56 | 2084.91 | 1970.17 | 2137.58 | 1988.93 | 2211.78 | 2152.42 | 2281.92 | 2269.80 | 2313.37 | 2265.15 | 2209.30 | 2132.00 | 1842.12 | 1728.60 | 1544.70 | 1397.97 | 1481.30 | 1383.46 | 1384.36 | 1438.16 | 1502.98 | 1342.48 | 1307.42 | 1236.06 | 1338.73 | 1006.59 | 908.35 | 893.34 | 945.68 | 842.40 | 827.01 | 814.93 | 859.37 | 768.17 | 786.63 | 803.51 | 880.13 | 737.68 | 739.23 | 842.07 | 680.20 | 648.03 | 651.56 | 615.20 | 554.53 | 563.26 | 540.42 | 536.09 | 513.54 | 477.39 | 508.15 | 475.57 | 462.64 | NA | NA | NA | |
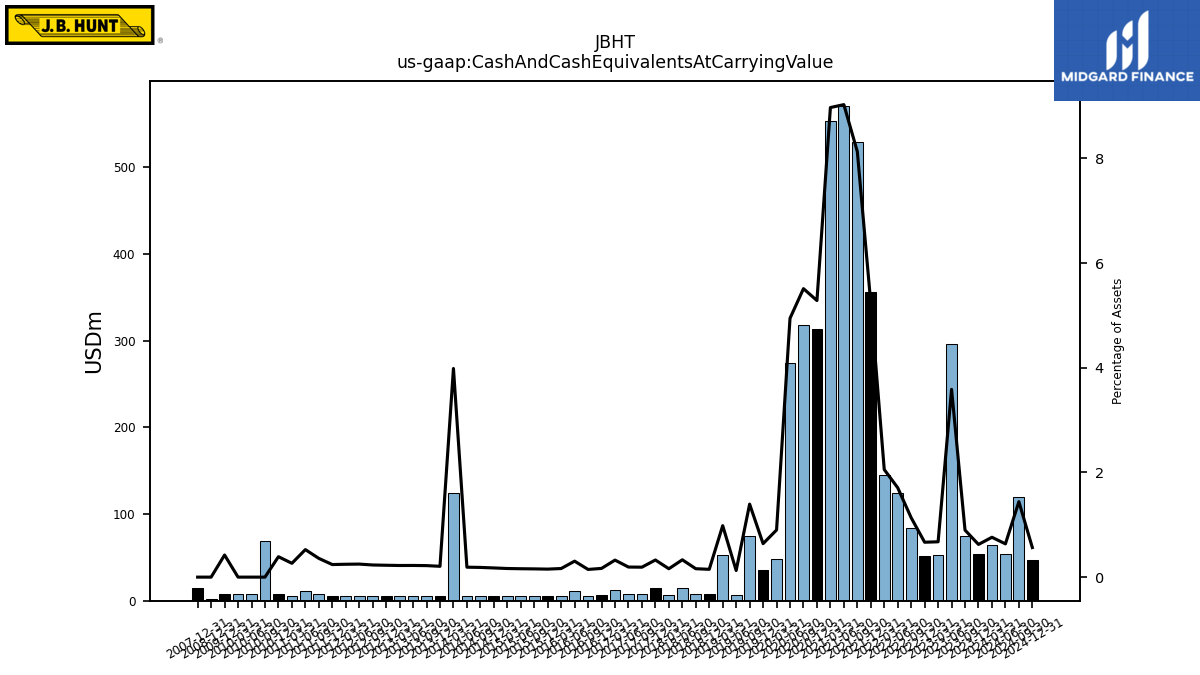
| Cash And Cash Equivalents At Carrying Value | 64.19 | 53.34 | 75.20 | 295.93 | 52.60 | 51.93 | 84.33 | 123.84 | 144.53 | 355.55 | 529.60 | 570.92 | 552.97 | 313.30 | 318.55 | 274.65 | 48.45 | 35.00 | 75.13 | 6.88 | 52.36 | 7.60 | 7.59 | 15.19 | 7.08 | 14.61 | 7.71 | 7.27 | 12.26 | 6.38 | 5.48 | 11.28 | 5.99 | 5.57 | 5.54 | 5.59 | 5.65 | 5.96 | 5.86 | 5.87 | 124.21 | 5.83 | 5.97 | 5.92 | 5.75 | 5.59 | 5.66 | 5.89 | 5.71 | 5.45 | 7.75 | 11.15 | 5.39 | 7.65 | 68.56 | 7.71 | 7.79 | |
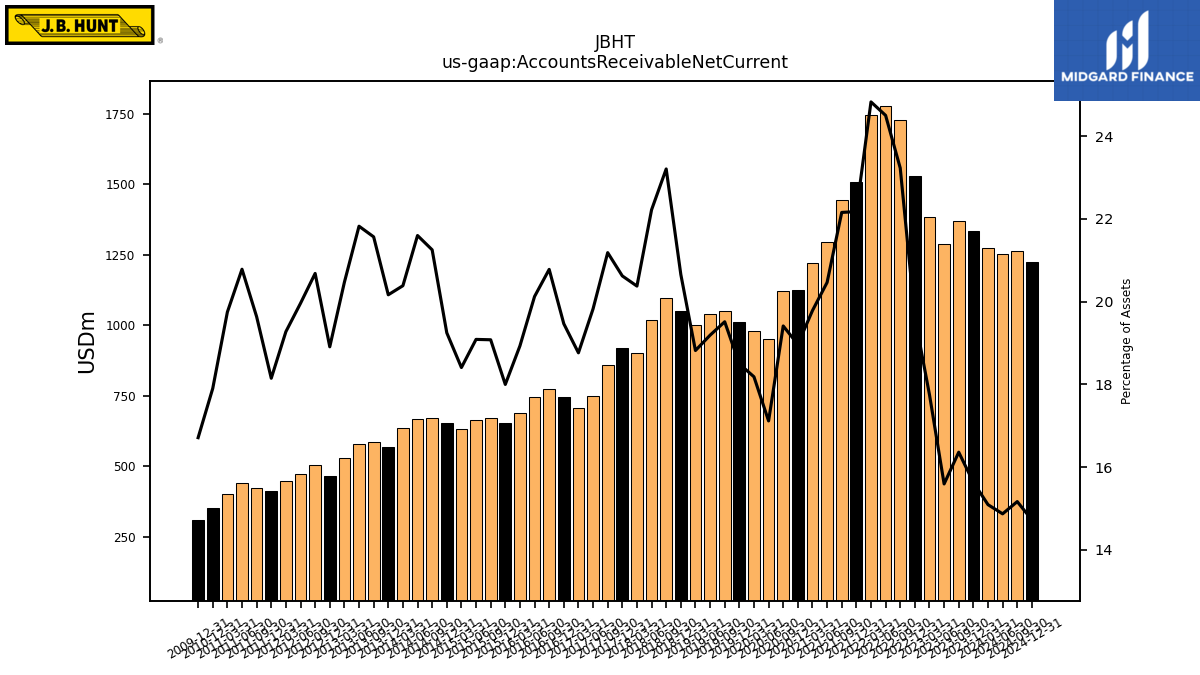
| Accounts Receivable Net Current | 1272.12 | 1334.91 | 1369.97 | 1286.24 | 1382.90 | 1528.08 | 1726.15 | 1776.77 | 1745.65 | 1506.62 | 1442.95 | 1293.92 | 1219.16 | 1124.40 | 1121.83 | 950.64 | 978.28 | 1011.83 | 1051.03 | 1040.15 | 1002.48 | 1051.70 | 1095.64 | 1019.62 | 900.90 | 920.77 | 858.72 | 749.04 | 707.43 | 745.29 | 775.02 | 744.03 | 690.35 | 654.54 | 671.40 | 665.24 | 631.17 | 653.79 | 671.30 | 667.62 | 635.11 | 568.52 | 584.91 | 579.64 | 529.33 | 466.01 | 504.25 | 472.08 | 447.71 | 411.48 | 424.63 | 440.75 | 402.92 | 351.19 | NA | NA | NA | |
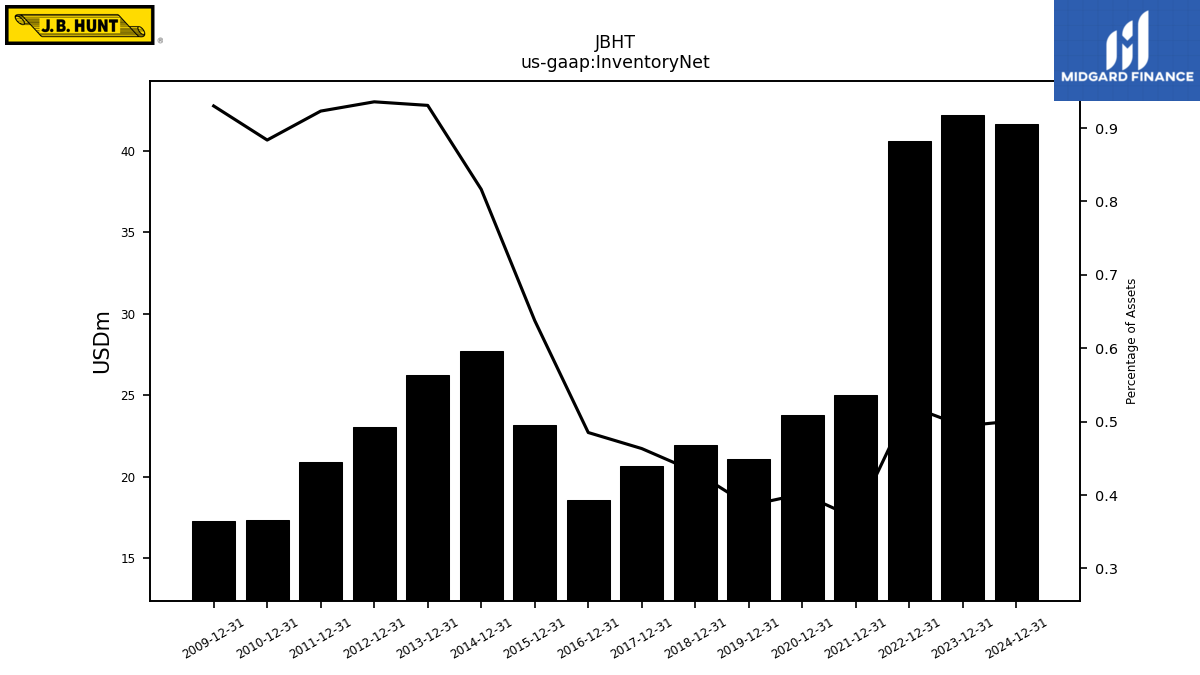
| Inventory Net | NA | 42.19 | NA | NA | NA | 40.60 | NA | NA | NA | 25.03 | NA | NA | NA | 23.80 | NA | NA | NA | 21.11 | NA | NA | NA | 21.98 | NA | NA | NA | 20.69 | NA | NA | NA | 18.58 | NA | NA | NA | 23.19 | NA | NA | NA | 27.74 | NA | NA | NA | 26.25 | NA | NA | NA | 23.07 | NA | NA | NA | 20.93 | NA | NA | NA | 17.34 | NA | NA | NA | |
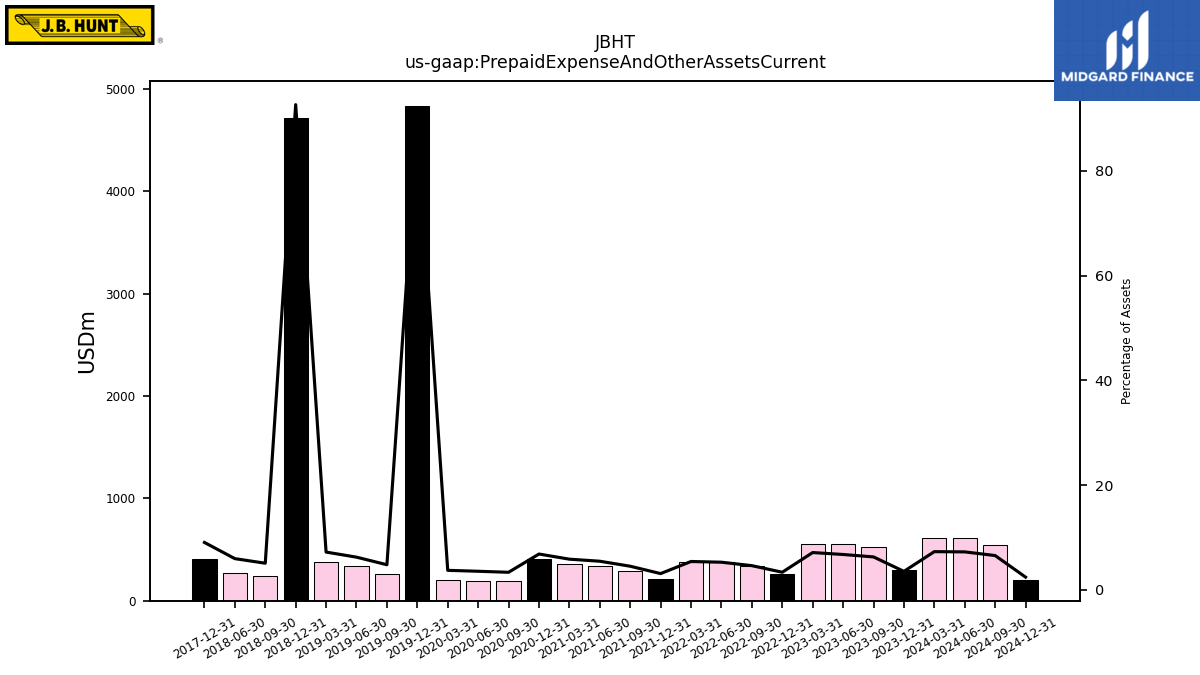
| Prepaid Expense And Other Assets Current | 613.26 | 299.50 | 525.00 | 555.41 | 553.43 | 260.41 | 341.93 | 381.30 | 379.62 | 209.55 | 292.60 | 344.46 | 359.87 | 404.41 | 192.65 | 196.04 | 199.44 | 4837.75 | 257.30 | 337.34 | 383.31 | 4716.86 | 239.26 | 272.61 | NA | 403.35 | NA | NA | NA | NA | NA | NA | NA | NA | NA | NA | NA | NA | NA | NA | NA | NA | NA | NA | NA | NA | NA | NA | NA | NA | NA | NA | NA | NA | NA | NA | NA | |
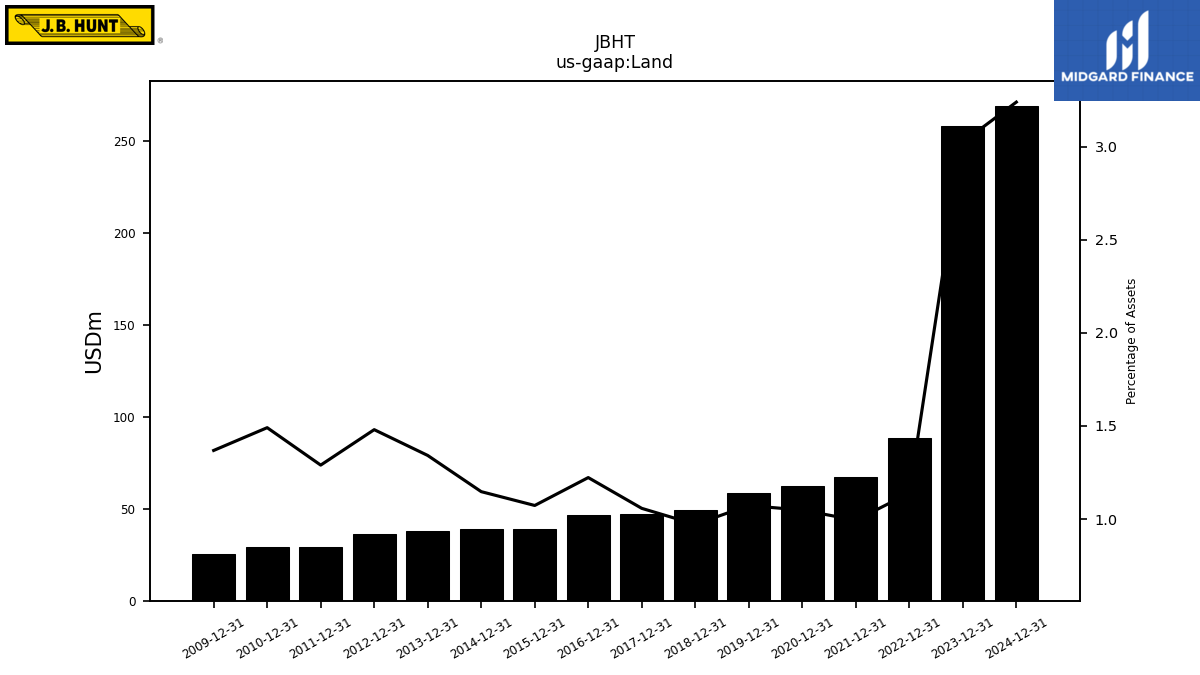
| Land | NA | 258.14 | NA | NA | NA | 88.70 | NA | NA | NA | 67.54 | NA | NA | NA | 62.15 | NA | NA | NA | 58.69 | NA | NA | NA | 49.49 | NA | NA | NA | 47.23 | NA | NA | NA | 46.83 | NA | NA | NA | 39.03 | NA | NA | NA | 38.98 | NA | NA | NA | 37.83 | NA | NA | NA | 36.48 | NA | NA | NA | 29.25 | NA | NA | NA | 29.25 | NA | NA | NA | |
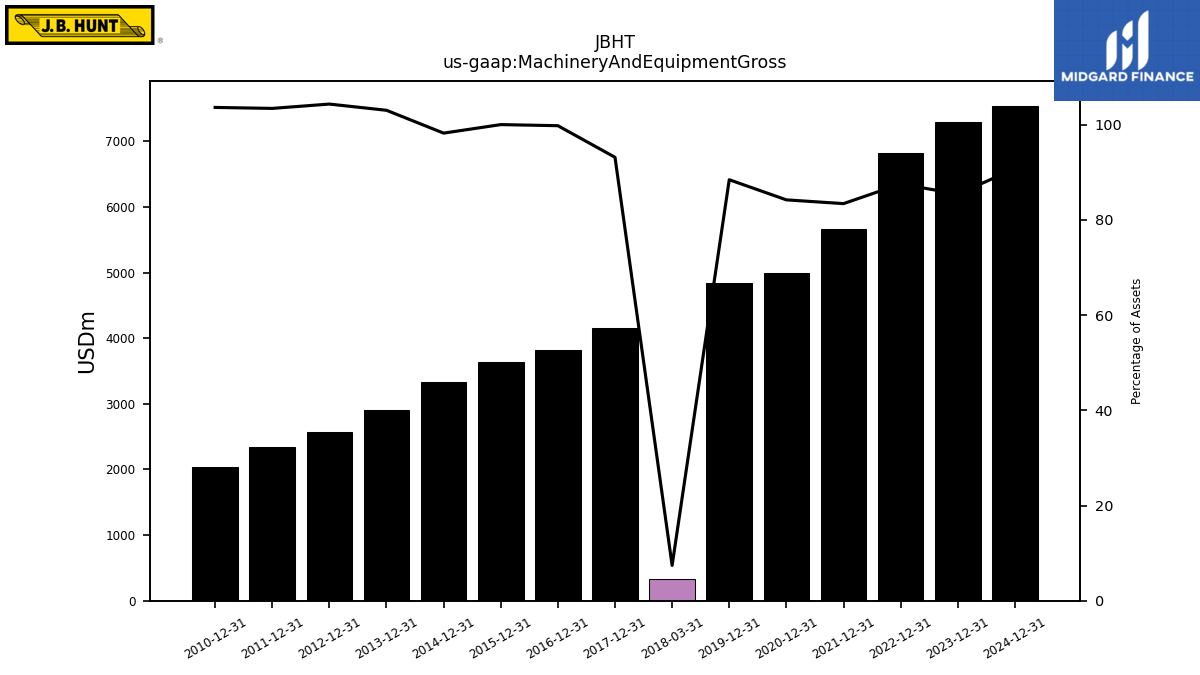
| Machinery And Equipment Gross | NA | 7293.09 | NA | NA | NA | 6815.78 | NA | NA | NA | 5667.13 | NA | NA | NA | 4991.66 | NA | NA | NA | 4837.75 | NA | NA | NA | NA | NA | NA | 328.08 | 4158.88 | NA | NA | NA | 3820.44 | NA | NA | NA | 3636.77 | NA | NA | NA | 3336.53 | NA | NA | NA | 2904.29 | NA | NA | NA | 2571.08 | NA | NA | NA | 2344.60 | NA | NA | NA | 2032.49 | NA | NA | NA |
| 2024-03-31 | 2023-12-31 | 2023-09-30 | 2023-06-30 | 2023-03-31 | 2022-12-31 | 2022-09-30 | 2022-06-30 | 2022-03-31 | 2021-12-31 | 2021-09-30 | 2021-06-30 | 2021-03-31 | 2020-12-31 | 2020-09-30 | 2020-06-30 | 2020-03-31 | 2019-12-31 | 2019-09-30 | 2019-06-30 | 2019-03-31 | 2018-12-31 | 2018-09-30 | 2018-06-30 | 2018-03-31 | 2017-12-31 | 2017-09-30 | 2017-06-30 | 2017-03-31 | 2016-12-31 | 2016-09-30 | 2016-06-30 | 2016-03-31 | 2015-12-31 | 2015-09-30 | 2015-06-30 | 2015-03-31 | 2014-12-31 | 2014-09-30 | 2014-06-30 | 2014-03-31 | 2013-12-31 | 2013-09-30 | 2013-06-30 | 2013-03-31 | 2012-12-31 | 2012-09-30 | 2012-06-30 | 2012-03-31 | 2011-12-31 | 2011-09-30 | 2011-06-30 | 2011-03-31 | 2010-12-31 | 2010-09-30 | 2010-06-30 | 2010-03-31 | ||
|---|---|---|---|---|---|---|---|---|---|---|---|---|---|---|---|---|---|---|---|---|---|---|---|---|---|---|---|---|---|---|---|---|---|---|---|---|---|---|---|---|---|---|---|---|---|---|---|---|---|---|---|---|---|---|---|---|---|---|
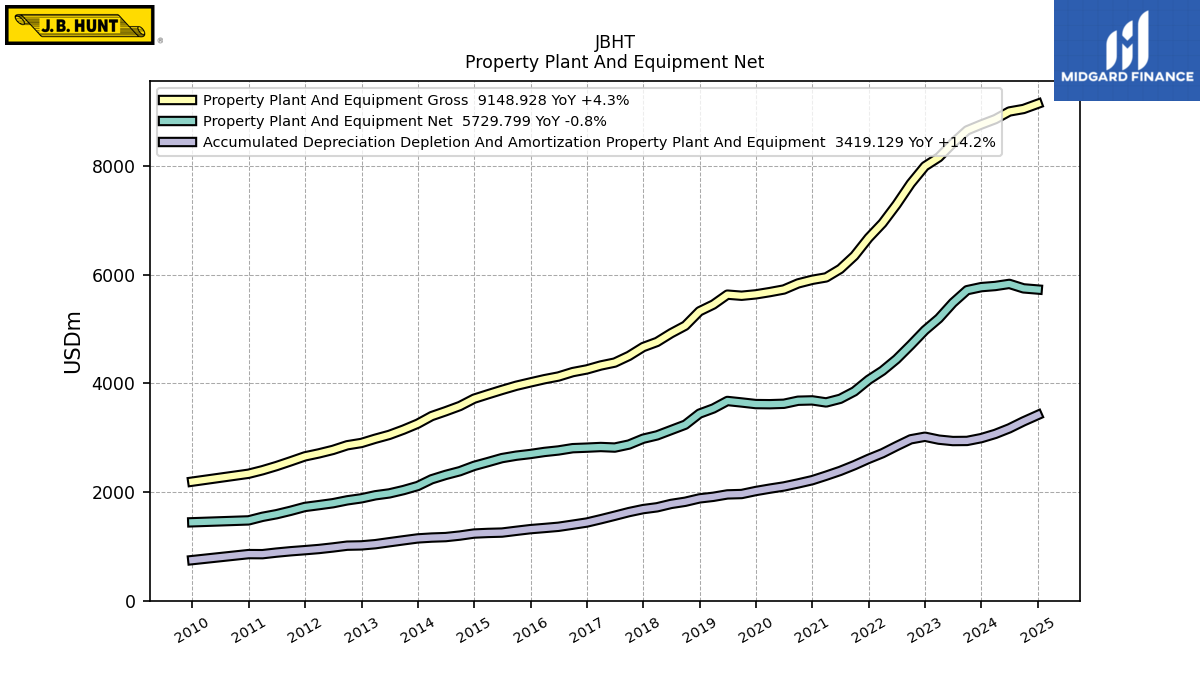
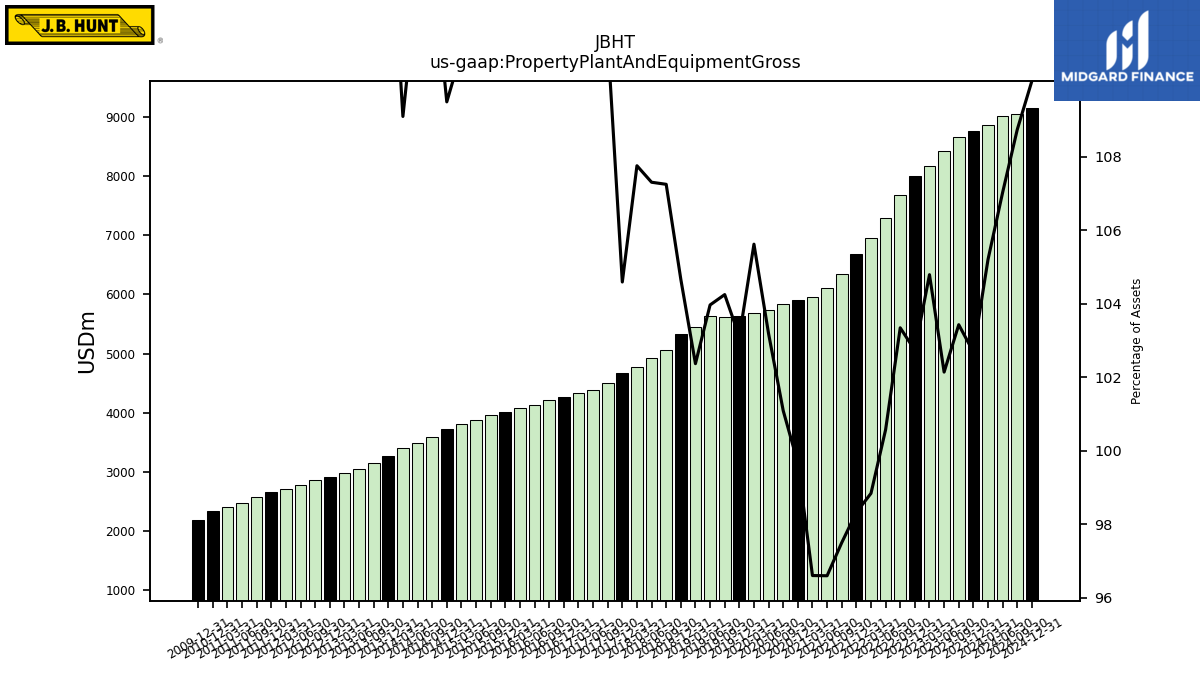
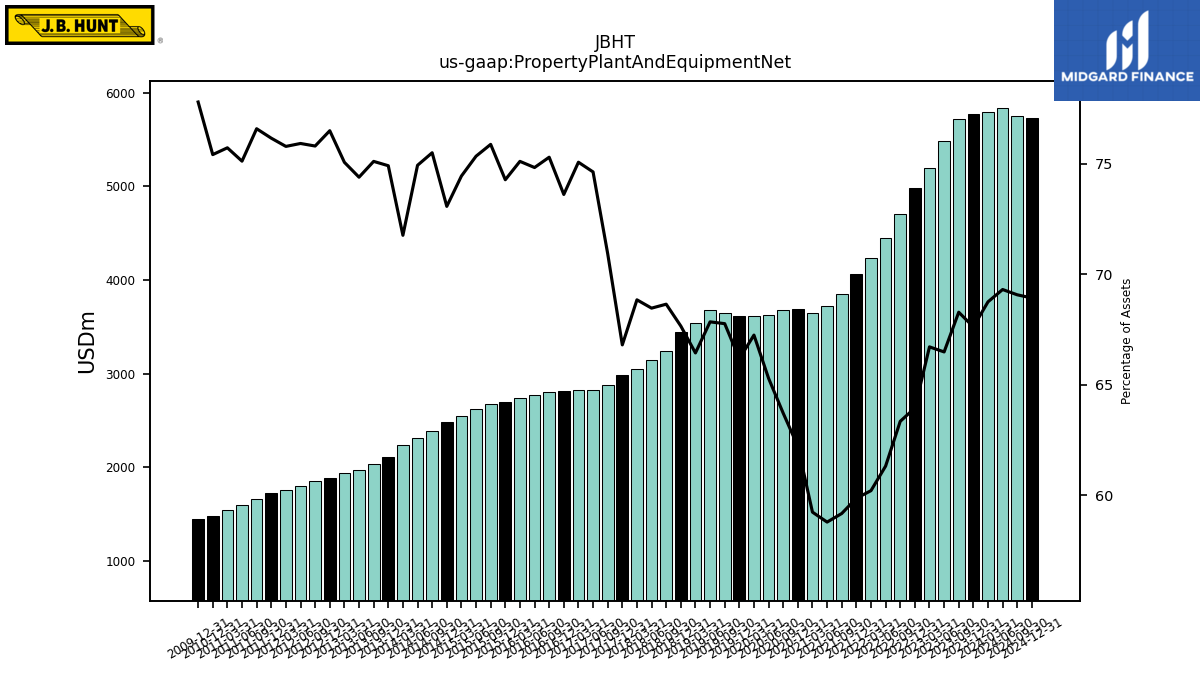
| Property Plant And Equipment Gross | 8866.28 | 8767.87 | 8660.21 | 8424.33 | 8163.78 | 7999.48 | 7680.24 | 7294.08 | 6950.33 | 6680.32 | 6350.14 | 6108.19 | 5953.23 | 5908.71 | 5842.11 | 5730.54 | 5682.57 | 5640.81 | 5615.29 | 5635.87 | 5453.57 | 5329.24 | 5064.13 | 4924.68 | 4764.72 | 4670.46 | 4507.92 | 4384.98 | 4331.10 | 4258.91 | 4209.08 | 4128.54 | 4078.64 | 4019.45 | 3957.72 | 3881.08 | 3801.19 | 3719.76 | 3584.95 | 3488.61 | 3399.27 | 3259.81 | 3150.32 | 3053.62 | 2982.70 | 2904.71 | 2862.39 | 2777.11 | 2713.19 | 2658.14 | 2567.67 | 2479.87 | 2402.56 | 2338.34 | NA | NA | NA | |
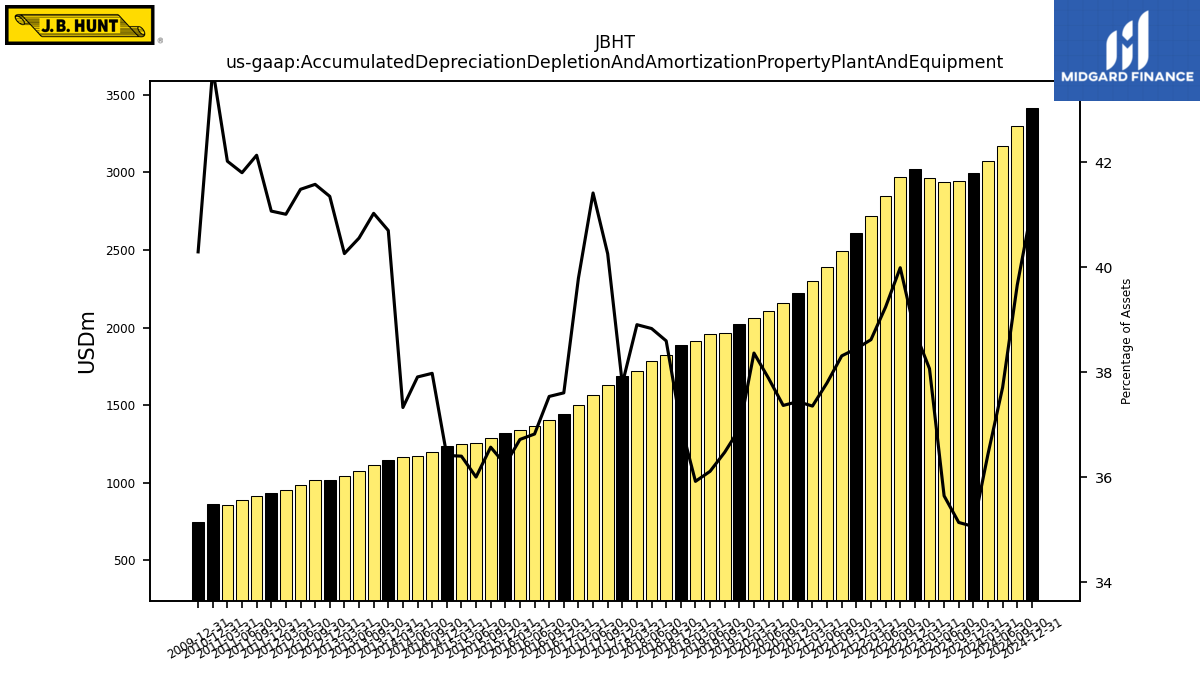
| Accumulated Depreciation Depletion And Amortization Property Plant And Equipment | 3071.49 | 2993.96 | 2942.44 | 2940.25 | 2965.98 | 3019.66 | 2972.23 | 2846.38 | 2716.06 | 2612.66 | 2495.56 | 2390.47 | 2302.31 | 2219.82 | 2159.71 | 2104.15 | 2064.27 | 2019.94 | 1964.93 | 1957.78 | 1913.83 | 1884.13 | 1822.62 | 1782.30 | 1720.45 | 1687.13 | 1632.11 | 1564.95 | 1500.47 | 1440.12 | 1400.34 | 1361.63 | 1339.28 | 1318.12 | 1287.21 | 1254.97 | 1248.33 | 1237.22 | 1199.85 | 1172.06 | 1163.17 | 1147.61 | 1112.93 | 1077.39 | 1041.27 | 1019.23 | 1013.93 | 981.32 | 952.68 | 931.27 | 911.28 | 886.62 | 857.43 | 858.85 | NA | NA | NA | |
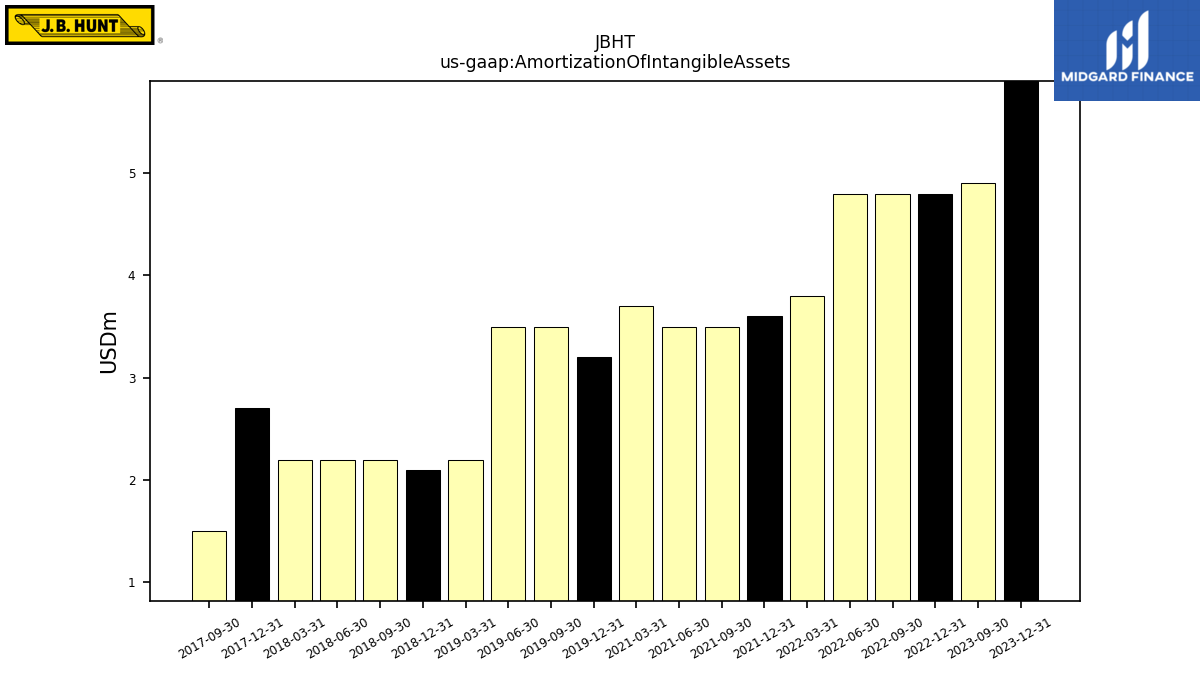
| Amortization Of Intangible Assets | NA | 5.90 | 4.90 | NA | NA | 4.80 | 4.80 | 4.80 | 3.80 | 3.60 | 3.50 | 3.50 | 3.70 | NA | NA | NA | NA | 3.20 | 3.50 | 3.50 | 2.20 | 2.10 | 2.20 | 2.20 | 2.20 | 2.70 | 1.50 | NA | NA | NA | NA | NA | NA | NA | NA | NA | NA | NA | NA | NA | NA | NA | NA | NA | NA | NA | NA | NA | NA | NA | NA | NA | NA | NA | NA | NA | NA | |
| Property Plant And Equipment Net | 5794.80 | 5773.91 | 5717.77 | 5484.08 | 5197.80 | 4979.82 | 4708.01 | 4447.69 | 4234.27 | 4067.66 | 3854.58 | 3717.73 | 3650.92 | 3688.89 | 3682.40 | 3626.40 | 3618.30 | 3620.87 | 3650.36 | 3678.09 | 3539.74 | 3445.11 | 3241.51 | 3142.39 | 3044.28 | 2983.33 | 2875.81 | 2820.03 | 2830.63 | 2818.79 | 2808.74 | 2766.91 | 2739.37 | 2701.33 | 2670.51 | 2626.10 | 2552.86 | 2482.53 | 2385.11 | 2316.55 | 2236.10 | 2112.20 | 2037.39 | 1976.23 | 1941.43 | 1885.47 | 1848.45 | 1795.79 | 1760.51 | 1726.87 | 1656.38 | 1593.25 | 1545.12 | 1479.48 | NA | NA | NA | |
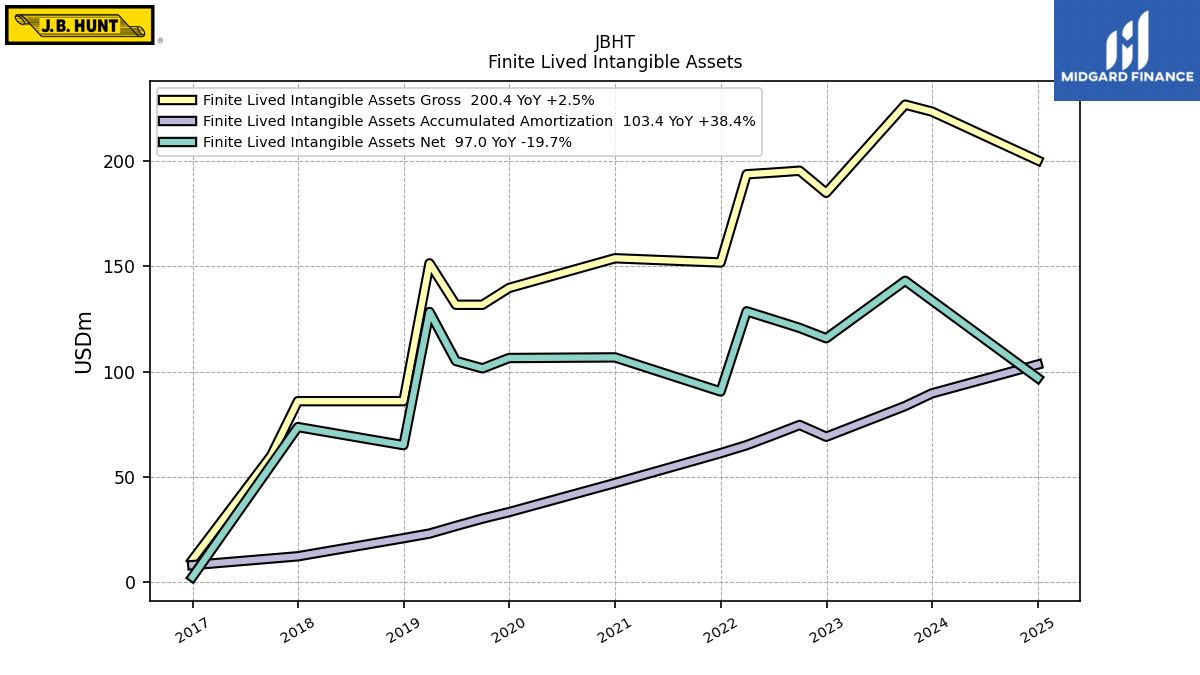
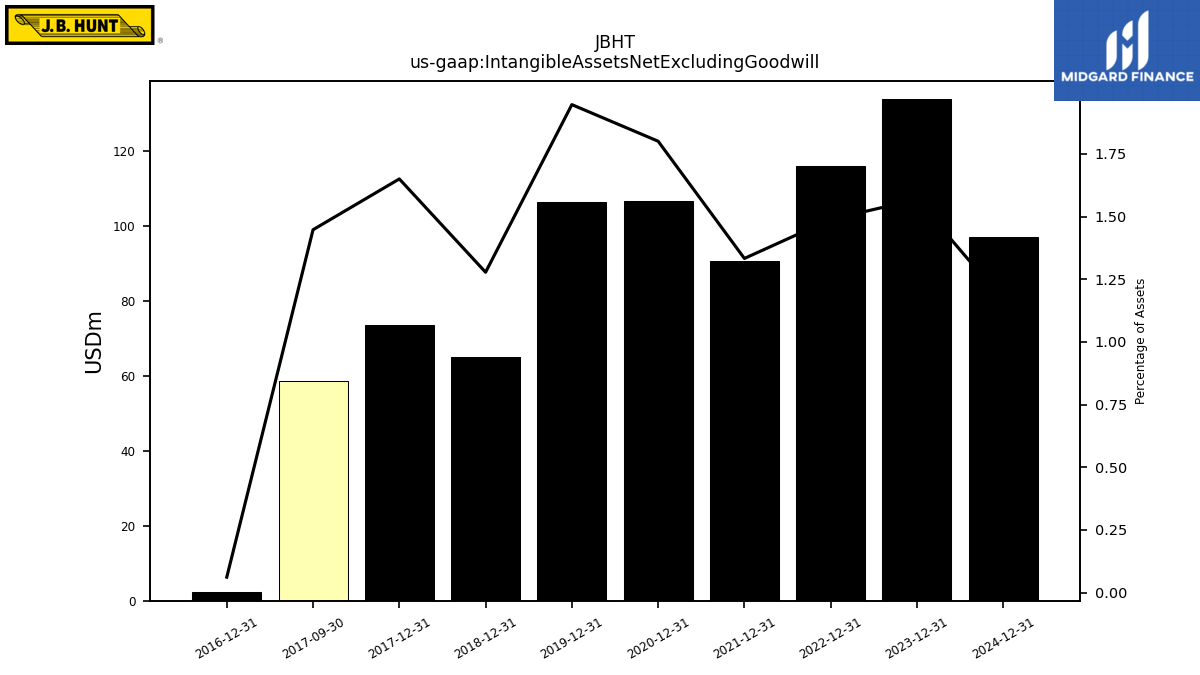
| Intangible Assets Net Excluding Goodwill | NA | 133.90 | NA | NA | NA | 115.94 | NA | NA | NA | 90.57 | NA | NA | NA | 106.75 | NA | NA | NA | 106.51 | NA | NA | NA | 65.07 | NA | NA | NA | 73.69 | 58.69 | NA | NA | 2.36 | NA | NA | NA | NA | NA | NA | NA | NA | NA | NA | NA | NA | NA | NA | NA | NA | NA | NA | NA | NA | NA | NA | NA | NA | NA | NA | NA | |
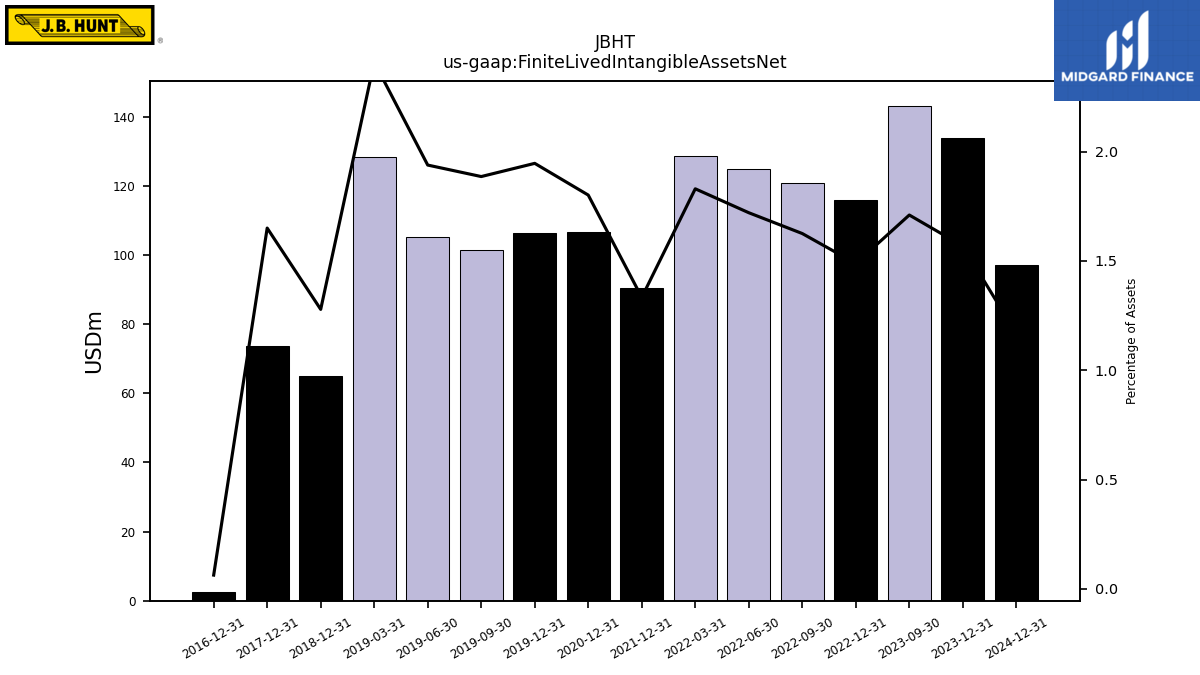
| Finite Lived Intangible Assets Net | NA | 133.90 | 143.20 | NA | NA | 115.90 | 120.80 | 124.80 | 128.70 | 90.60 | NA | NA | NA | 106.80 | NA | NA | NA | 106.50 | 101.60 | 105.10 | 128.40 | 65.10 | NA | NA | NA | 73.70 | NA | NA | NA | 2.40 | NA | NA | NA | NA | NA | NA | NA | NA | NA | NA | NA | NA | NA | NA | NA | NA | NA | NA | NA | NA | NA | NA | NA | NA | NA | NA | NA | |
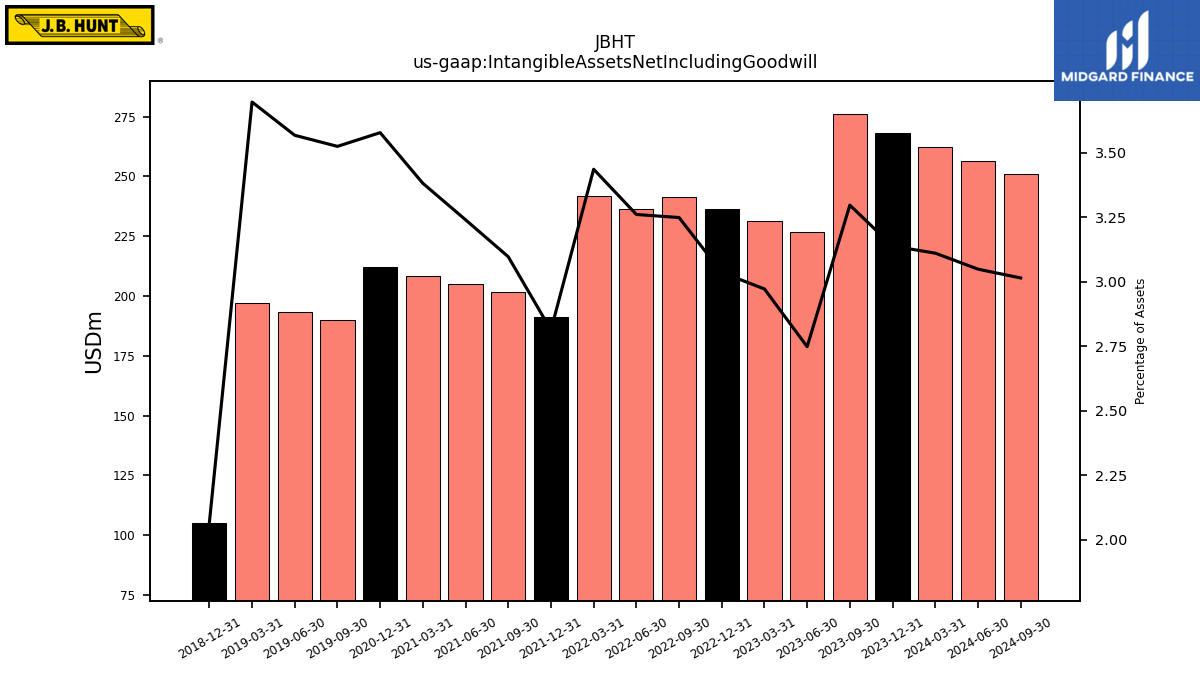
| Intangible Assets Net Including Goodwill | 262.17 | 267.95 | 276.05 | 226.65 | 231.52 | 236.39 | 241.44 | 236.49 | 241.63 | 191.09 | 201.71 | 204.89 | 208.40 | 212.12 | NA | NA | NA | NA | 189.86 | 193.40 | 196.94 | 105.16 | NA | NA | NA | NA | NA | NA | NA | NA | NA | NA | NA | NA | NA | NA | NA | NA | NA | NA | NA | NA | NA | NA | NA | NA | NA | NA | NA | NA | NA | NA | NA | NA | NA | NA | NA | |
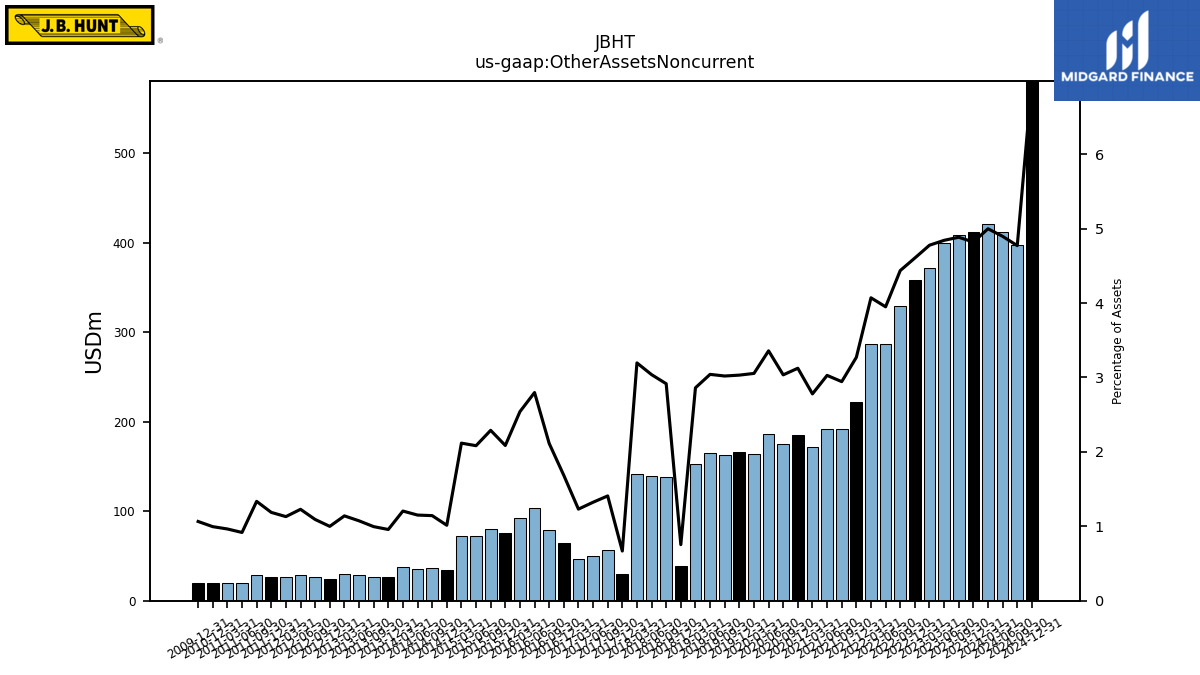
| Other Assets Noncurrent | 421.25 | 411.48 | 408.98 | 399.43 | 372.16 | 358.60 | 329.69 | 286.46 | 286.25 | 222.23 | 191.75 | 191.48 | 171.29 | 185.22 | 175.41 | 186.50 | 164.34 | 165.86 | 162.66 | 164.89 | 152.44 | 38.40 | 137.68 | 139.44 | 141.32 | 29.84 | 57.10 | 50.00 | 46.43 | 64.52 | 78.85 | 103.44 | 92.66 | 75.87 | 80.58 | 72.62 | 72.62 | 34.45 | 36.13 | 35.59 | 37.56 | 27.00 | 27.02 | 28.53 | 29.50 | 24.64 | 26.63 | 29.06 | 26.26 | 26.92 | 28.88 | 19.46 | 19.68 | 19.53 | NA | NA | NA |
| 2024-03-31 | 2023-12-31 | 2023-09-30 | 2023-06-30 | 2023-03-31 | 2022-12-31 | 2022-09-30 | 2022-06-30 | 2022-03-31 | 2021-12-31 | 2021-09-30 | 2021-06-30 | 2021-03-31 | 2020-12-31 | 2020-09-30 | 2020-06-30 | 2020-03-31 | 2019-12-31 | 2019-09-30 | 2019-06-30 | 2019-03-31 | 2018-12-31 | 2018-09-30 | 2018-06-30 | 2018-03-31 | 2017-12-31 | 2017-09-30 | 2017-06-30 | 2017-03-31 | 2016-12-31 | 2016-09-30 | 2016-06-30 | 2016-03-31 | 2015-12-31 | 2015-09-30 | 2015-06-30 | 2015-03-31 | 2014-12-31 | 2014-09-30 | 2014-06-30 | 2014-03-31 | 2013-12-31 | 2013-09-30 | 2013-06-30 | 2013-03-31 | 2012-12-31 | 2012-09-30 | 2012-06-30 | 2012-03-31 | 2011-12-31 | 2011-09-30 | 2011-06-30 | 2011-03-31 | 2010-12-31 | 2010-09-30 | 2010-06-30 | 2010-03-31 | ||
|---|---|---|---|---|---|---|---|---|---|---|---|---|---|---|---|---|---|---|---|---|---|---|---|---|---|---|---|---|---|---|---|---|---|---|---|---|---|---|---|---|---|---|---|---|---|---|---|---|---|---|---|---|---|---|---|---|---|---|
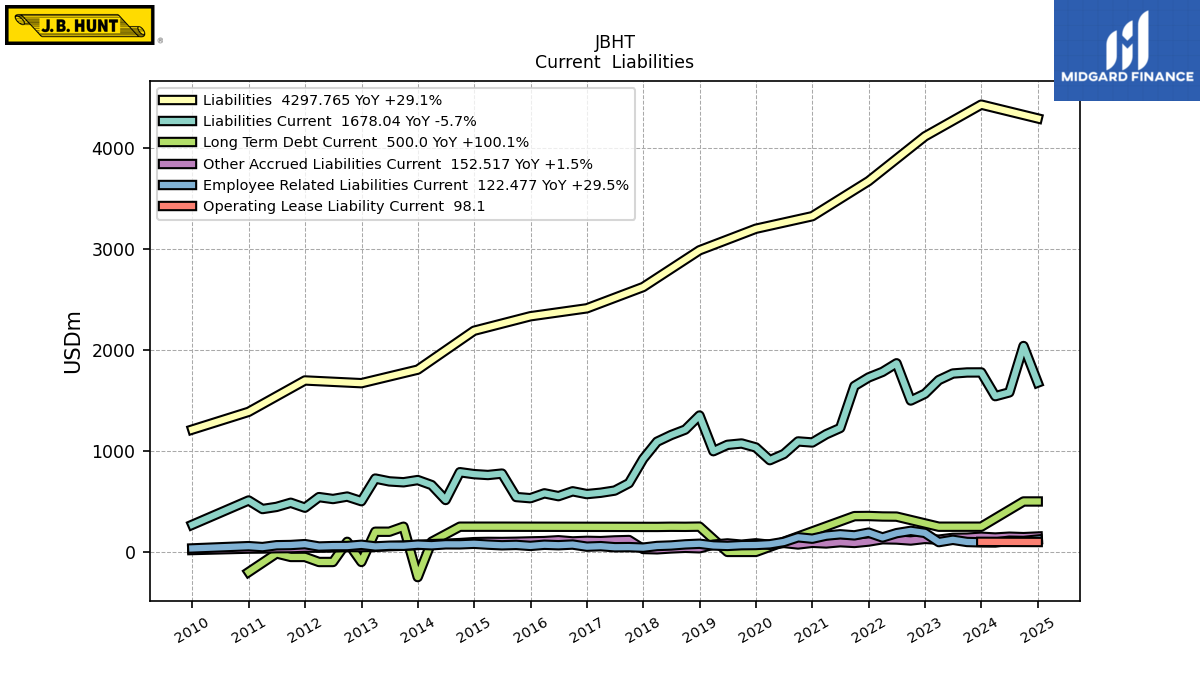
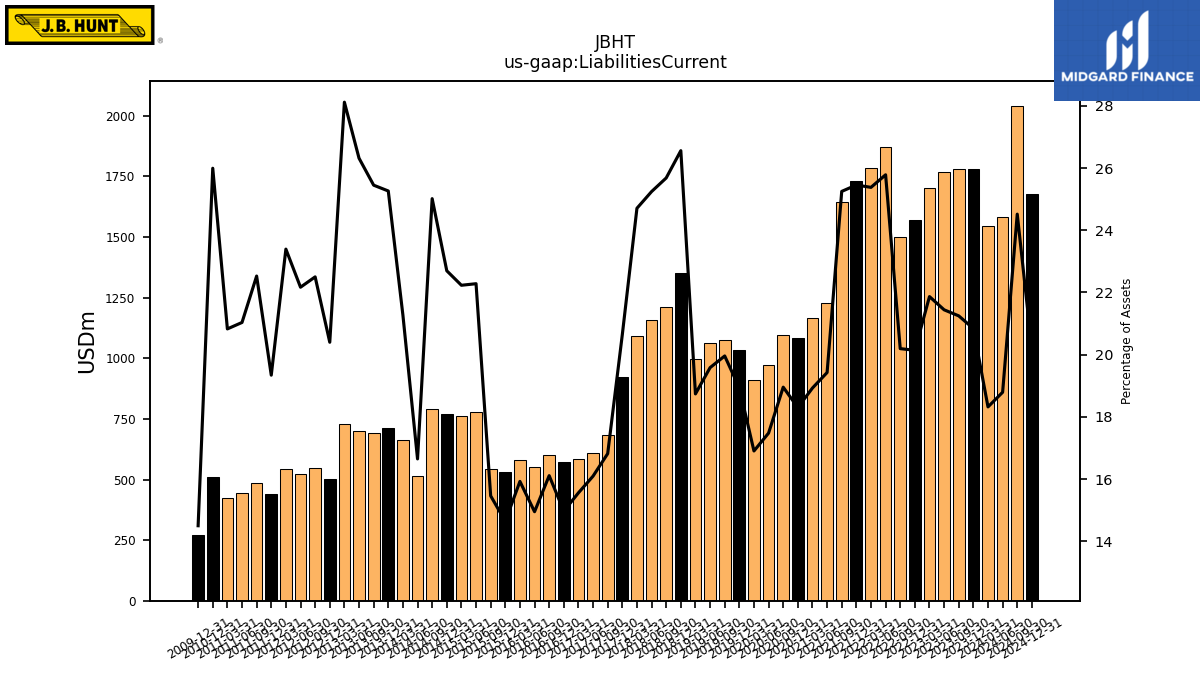
| Liabilities Current | 1543.98 | 1779.42 | 1779.08 | 1768.52 | 1703.58 | 1568.23 | 1500.72 | 1870.07 | 1784.73 | 1729.60 | 1644.63 | 1228.36 | 1166.40 | 1084.80 | 1095.42 | 970.68 | 909.38 | 1035.77 | 1075.02 | 1061.52 | 998.24 | 1352.35 | 1212.66 | 1158.54 | 1092.52 | 921.84 | 681.75 | 608.09 | 586.52 | 573.13 | 600.85 | 552.72 | 580.71 | 532.42 | 544.05 | 776.61 | 762.33 | 771.07 | 790.29 | 514.63 | 662.80 | 712.30 | 690.34 | 699.11 | 727.22 | 502.76 | 548.67 | 524.36 | 543.42 | 438.51 | 487.21 | 446.13 | 424.98 | 509.95 | NA | NA | NA | |
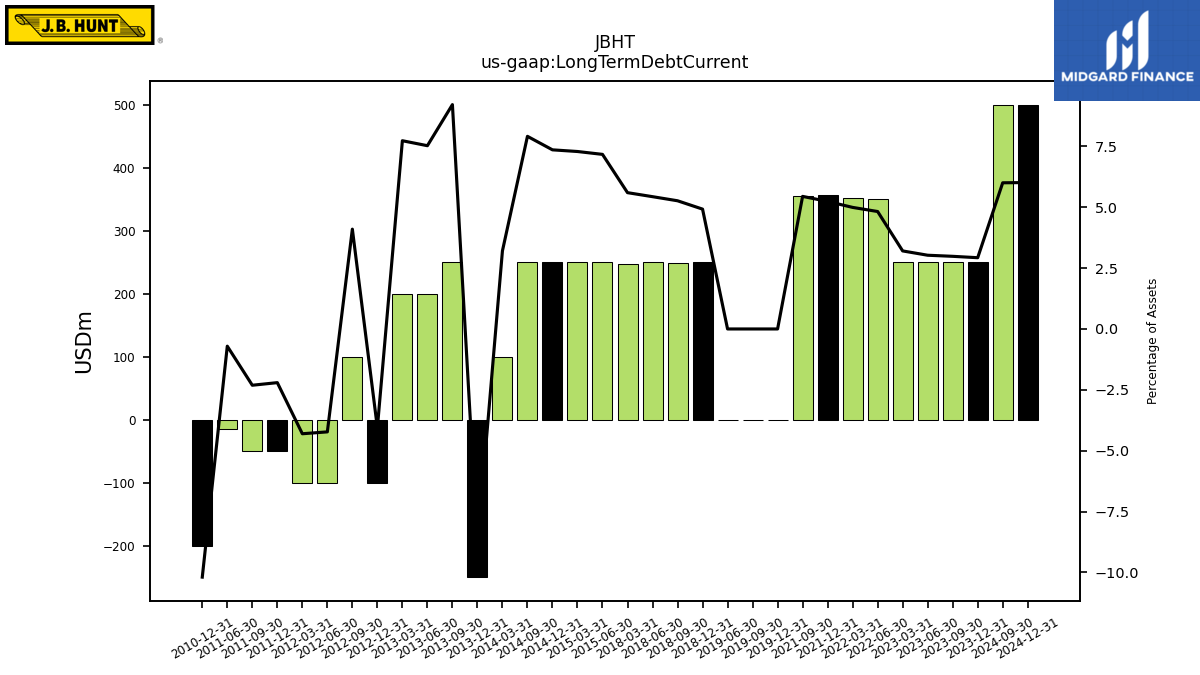
| Long Term Debt Current | NA | 249.96 | 249.90 | 249.84 | 249.78 | NA | NA | 349.95 | 351.21 | 355.97 | 354.75 | NA | NA | NA | NA | NA | NA | 0.00 | 0.00 | 0.00 | NA | 250.71 | 248.68 | 249.44 | 247.61 | NA | NA | NA | NA | NA | NA | NA | NA | NA | NA | 250.00 | 250.00 | 250.00 | 250.00 | NA | 100.00 | -250.00 | 250.00 | 200.00 | 200.00 | -100.00 | 100.00 | -100.00 | -100.00 | -50.00 | -50.00 | -15.00 | NA | -200.00 | NA | NA | NA | |
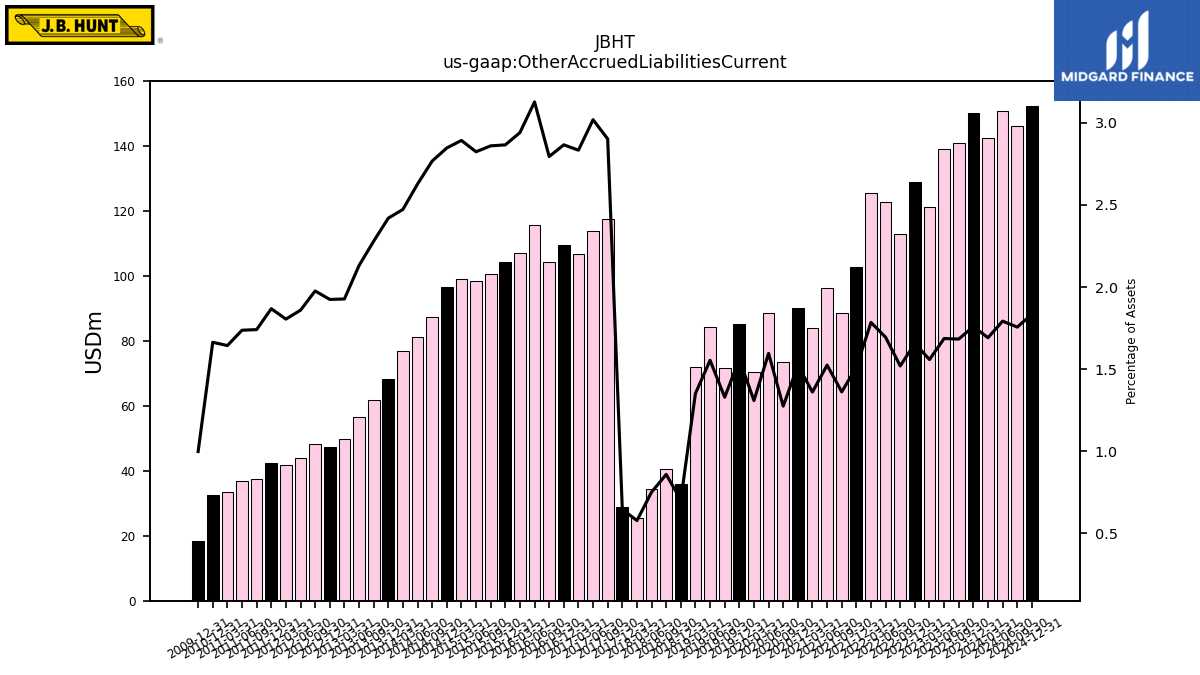
| Other Accrued Liabilities Current | 142.58 | 150.26 | 140.97 | 139.13 | 121.44 | 129.05 | 112.95 | 122.91 | 125.51 | 102.73 | 88.72 | 96.45 | 83.89 | 90.29 | 73.70 | 88.65 | 70.45 | 85.36 | 71.61 | 84.25 | 72.06 | 35.84 | 40.59 | 34.52 | 25.58 | 28.89 | 117.64 | 114.07 | 106.83 | 109.75 | 104.24 | 115.63 | 107.24 | 104.22 | 100.65 | 98.42 | 99.20 | 96.72 | 87.41 | 81.22 | 77.05 | 68.22 | 61.82 | 56.61 | 49.85 | 47.44 | 48.19 | 43.98 | 41.93 | 42.36 | 37.66 | 36.85 | 33.55 | 32.64 | NA | NA | NA |
| 2024-03-31 | 2023-12-31 | 2023-09-30 | 2023-06-30 | 2023-03-31 | 2022-12-31 | 2022-09-30 | 2022-06-30 | 2022-03-31 | 2021-12-31 | 2021-09-30 | 2021-06-30 | 2021-03-31 | 2020-12-31 | 2020-09-30 | 2020-06-30 | 2020-03-31 | 2019-12-31 | 2019-09-30 | 2019-06-30 | 2019-03-31 | 2018-12-31 | 2018-09-30 | 2018-06-30 | 2018-03-31 | 2017-12-31 | 2017-09-30 | 2017-06-30 | 2017-03-31 | 2016-12-31 | 2016-09-30 | 2016-06-30 | 2016-03-31 | 2015-12-31 | 2015-09-30 | 2015-06-30 | 2015-03-31 | 2014-12-31 | 2014-09-30 | 2014-06-30 | 2014-03-31 | 2013-12-31 | 2013-09-30 | 2013-06-30 | 2013-03-31 | 2012-12-31 | 2012-09-30 | 2012-06-30 | 2012-03-31 | 2011-12-31 | 2011-09-30 | 2011-06-30 | 2011-03-31 | 2010-12-31 | 2010-09-30 | 2010-06-30 | 2010-03-31 | ||
|---|---|---|---|---|---|---|---|---|---|---|---|---|---|---|---|---|---|---|---|---|---|---|---|---|---|---|---|---|---|---|---|---|---|---|---|---|---|---|---|---|---|---|---|---|---|---|---|---|---|---|---|---|---|---|---|---|---|---|
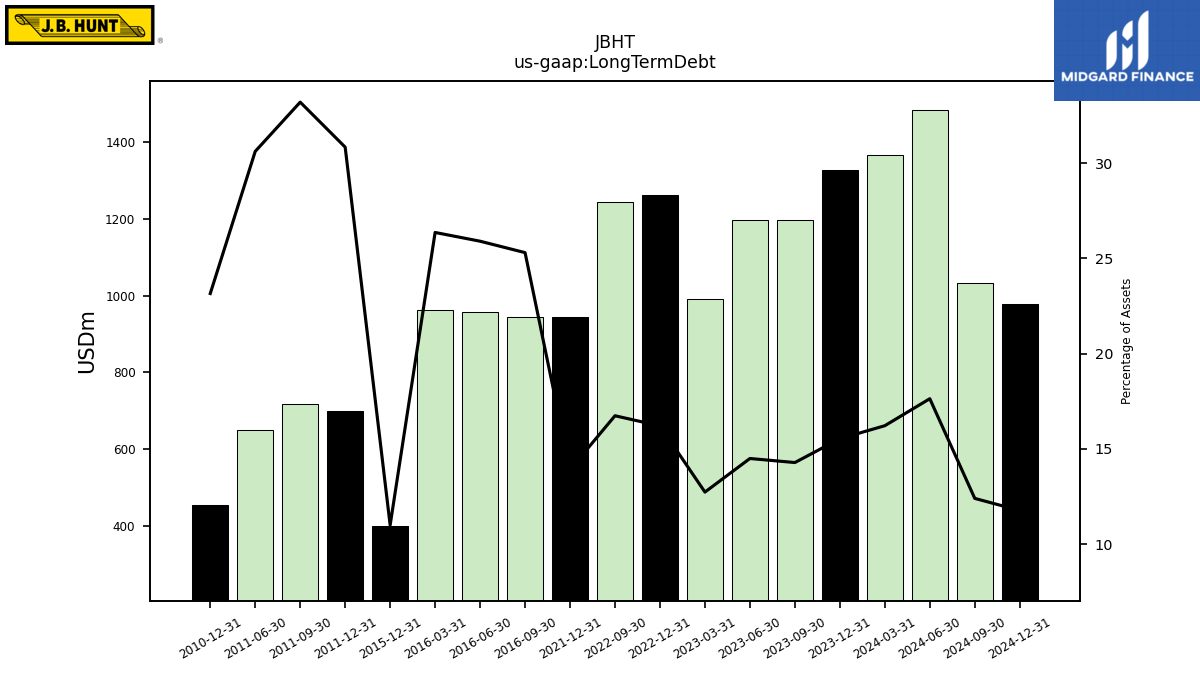
| Long Term Debt | 1366.50 | 1326.10 | 1195.70 | 1195.30 | 991.70 | 1261.70 | 1243.80 | NA | NA | 945.20 | NA | NA | NA | NA | NA | NA | NA | NA | NA | NA | NA | NA | NA | NA | NA | NA | NA | NA | NA | NA | 943.70 | 957.60 | 961.30 | 399.80 | NA | NA | NA | NA | NA | NA | NA | NA | NA | NA | NA | NA | NA | NA | NA | 699.20 | 718.00 | 649.30 | NA | 454.20 | NA | NA | NA | |
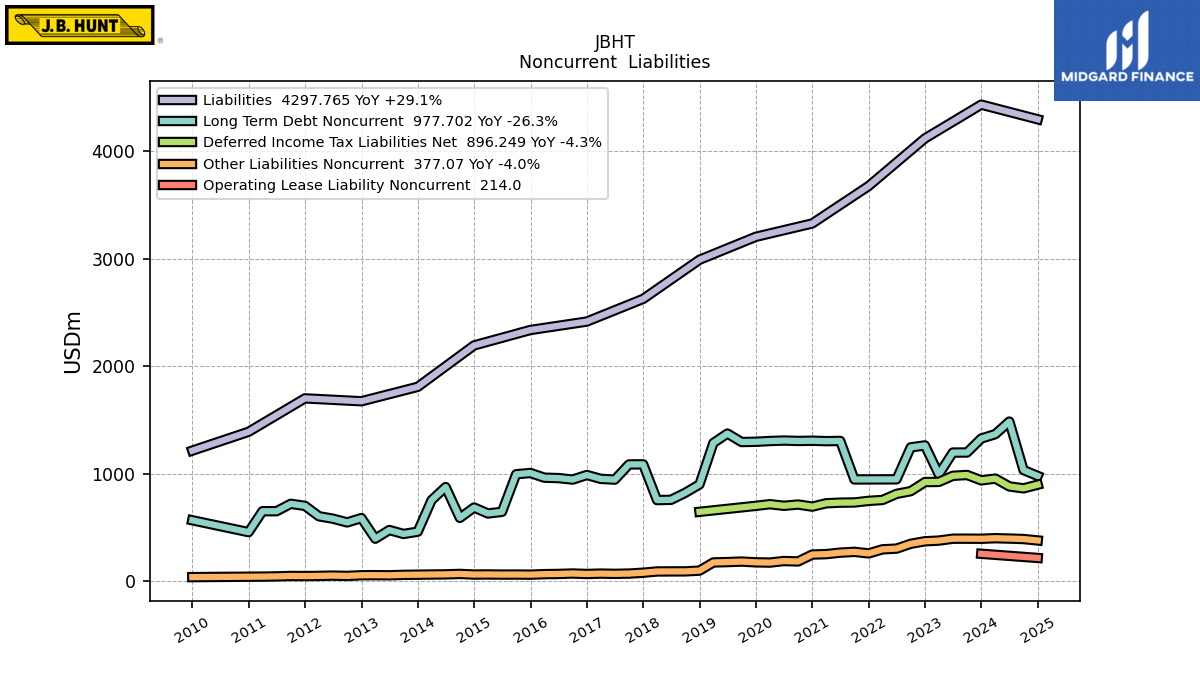
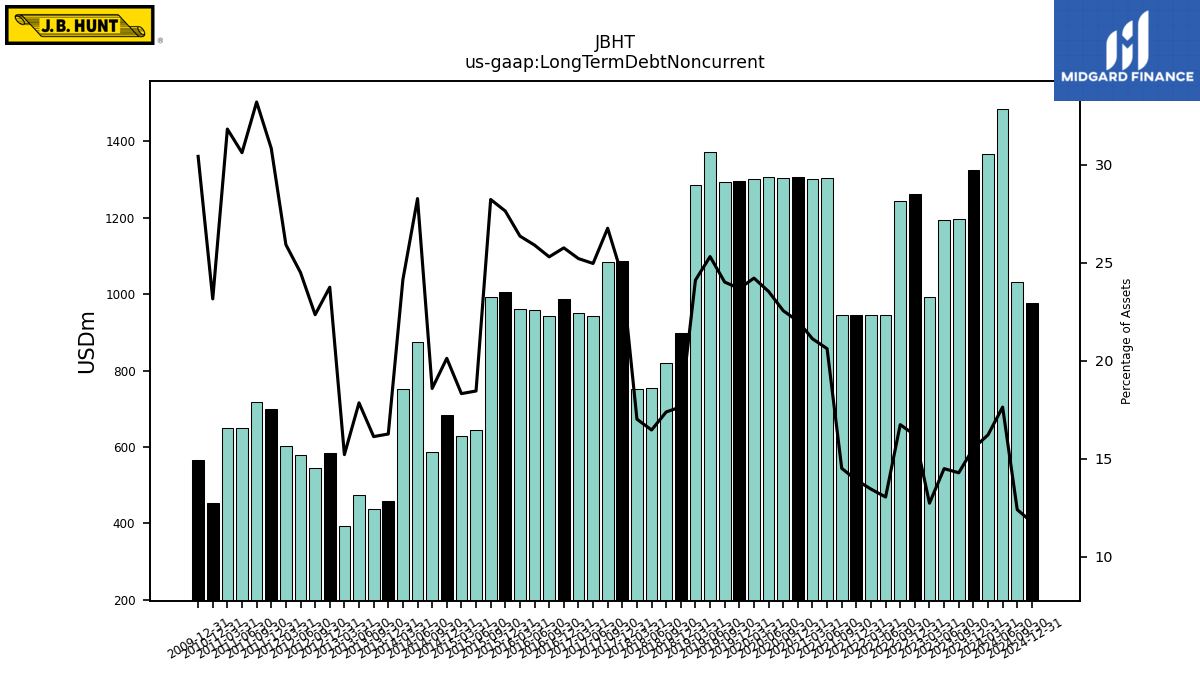
| Long Term Debt Noncurrent | 1366.51 | 1326.11 | 1195.71 | 1195.31 | 991.71 | 1261.74 | 1243.81 | 946.00 | 945.63 | 945.26 | 944.89 | 1303.47 | 1301.43 | 1305.42 | 1303.35 | 1307.02 | 1302.76 | 1295.74 | 1293.31 | 1372.14 | 1284.55 | 898.40 | 820.86 | 755.58 | 752.42 | 1085.65 | 1084.80 | 943.17 | 950.56 | 986.28 | 943.70 | 957.57 | 961.35 | 1005.03 | 993.35 | 643.20 | 628.20 | 683.54 | 587.07 | 874.03 | 752.21 | 458.42 | 437.47 | 474.13 | 393.29 | 585.35 | 544.90 | 579.46 | 602.12 | 699.18 | 718.03 | 649.29 | 649.25 | 454.21 | NA | NA | NA | |
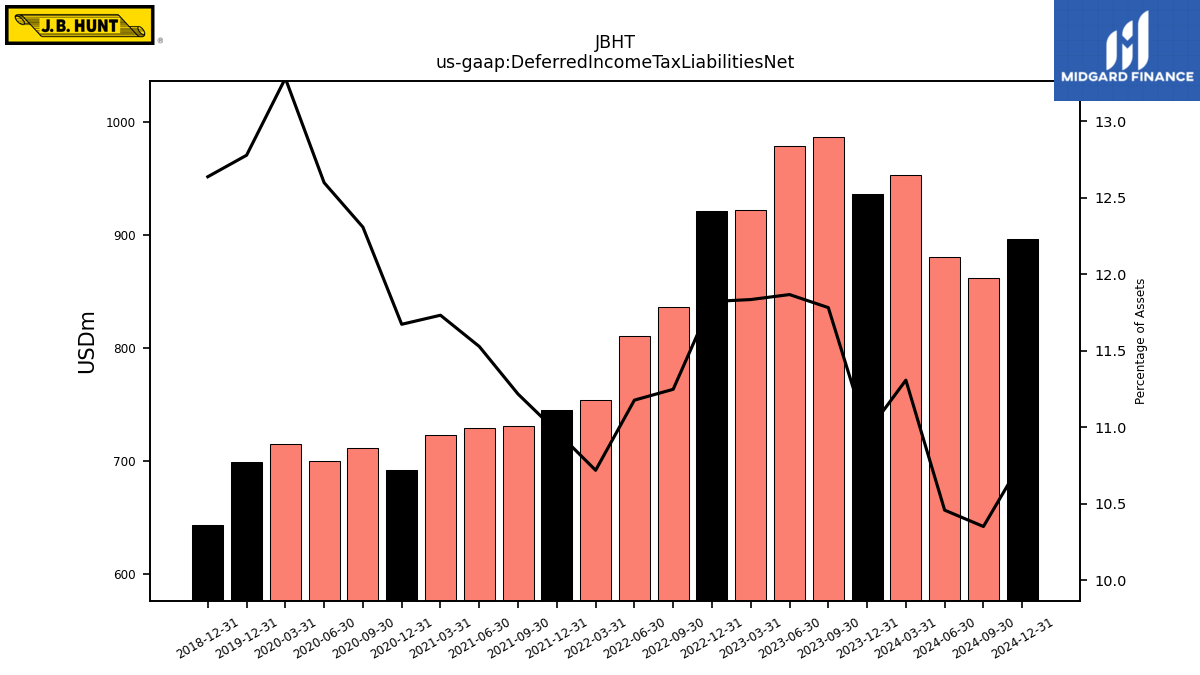
| Deferred Income Tax Liabilities Net | 953.00 | 936.21 | 986.52 | 978.79 | 921.98 | 920.53 | 835.90 | 810.63 | 753.73 | 745.44 | 730.59 | 728.97 | 723.02 | 692.02 | 711.30 | 699.70 | 714.55 | 699.08 | NA | NA | NA | 643.46 | NA | NA | NA | NA | NA | NA | NA | NA | NA | NA | NA | NA | NA | NA | NA | NA | NA | NA | NA | NA | NA | NA | NA | NA | NA | NA | NA | NA | NA | NA | NA | NA | NA | NA | NA | |
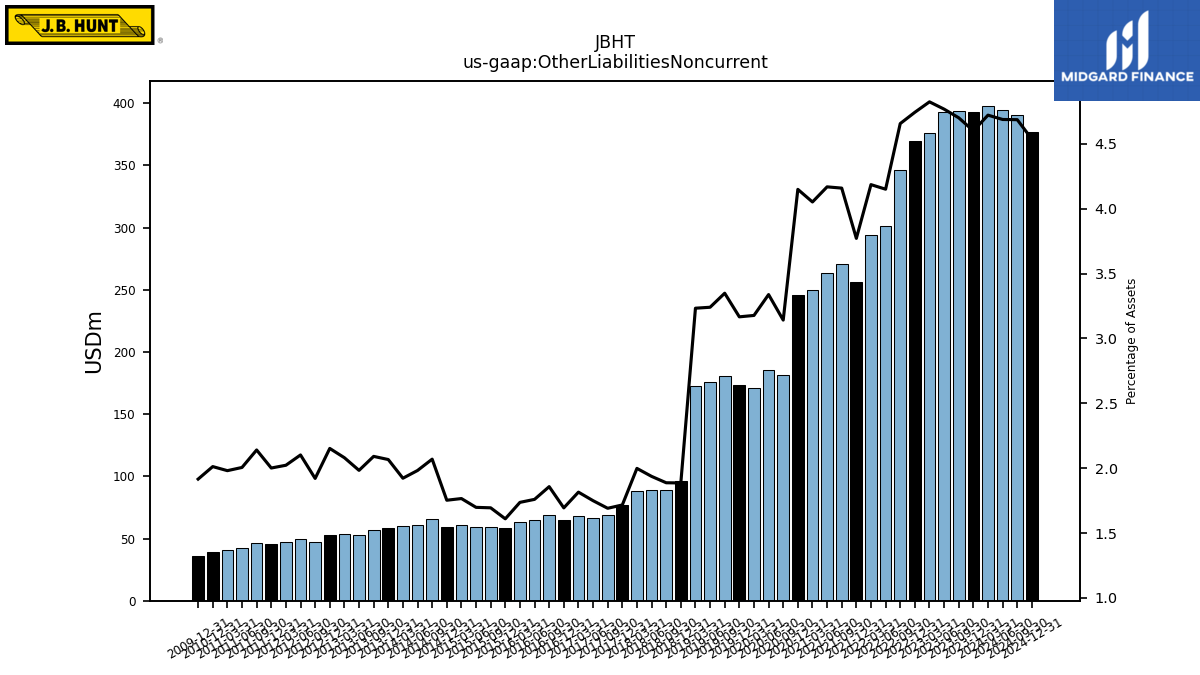
| Other Liabilities Noncurrent | 397.87 | 392.77 | 393.56 | 393.18 | 375.76 | 369.31 | 346.01 | 301.00 | 294.31 | 256.23 | 270.86 | 263.58 | 249.69 | 245.96 | 181.56 | 185.39 | 170.94 | 173.24 | 180.37 | 175.66 | 172.24 | 96.06 | 89.14 | 88.90 | 88.37 | 76.66 | 68.56 | 66.12 | 68.46 | 64.88 | 69.30 | 65.08 | 63.34 | 58.55 | 59.65 | 59.20 | 60.56 | 59.56 | 65.38 | 61.29 | 59.91 | 58.27 | 56.72 | 52.69 | 53.81 | 53.05 | 46.85 | 49.72 | 46.99 | 45.38 | 46.29 | 42.54 | 40.42 | 39.48 | NA | NA | NA |
| 2024-03-31 | 2023-12-31 | 2023-09-30 | 2023-06-30 | 2023-03-31 | 2022-12-31 | 2022-09-30 | 2022-06-30 | 2022-03-31 | 2021-12-31 | 2021-09-30 | 2021-06-30 | 2021-03-31 | 2020-12-31 | 2020-09-30 | 2020-06-30 | 2020-03-31 | 2019-12-31 | 2019-09-30 | 2019-06-30 | 2019-03-31 | 2018-12-31 | 2018-09-30 | 2018-06-30 | 2018-03-31 | 2017-12-31 | 2017-09-30 | 2017-06-30 | 2017-03-31 | 2016-12-31 | 2016-09-30 | 2016-06-30 | 2016-03-31 | 2015-12-31 | 2015-09-30 | 2015-06-30 | 2015-03-31 | 2014-12-31 | 2014-09-30 | 2014-06-30 | 2014-03-31 | 2013-12-31 | 2013-09-30 | 2013-06-30 | 2013-03-31 | 2012-12-31 | 2012-09-30 | 2012-06-30 | 2012-03-31 | 2011-12-31 | 2011-09-30 | 2011-06-30 | 2011-03-31 | 2010-12-31 | 2010-09-30 | 2010-06-30 | 2010-03-31 | ||
|---|---|---|---|---|---|---|---|---|---|---|---|---|---|---|---|---|---|---|---|---|---|---|---|---|---|---|---|---|---|---|---|---|---|---|---|---|---|---|---|---|---|---|---|---|---|---|---|---|---|---|---|---|---|---|---|---|---|---|
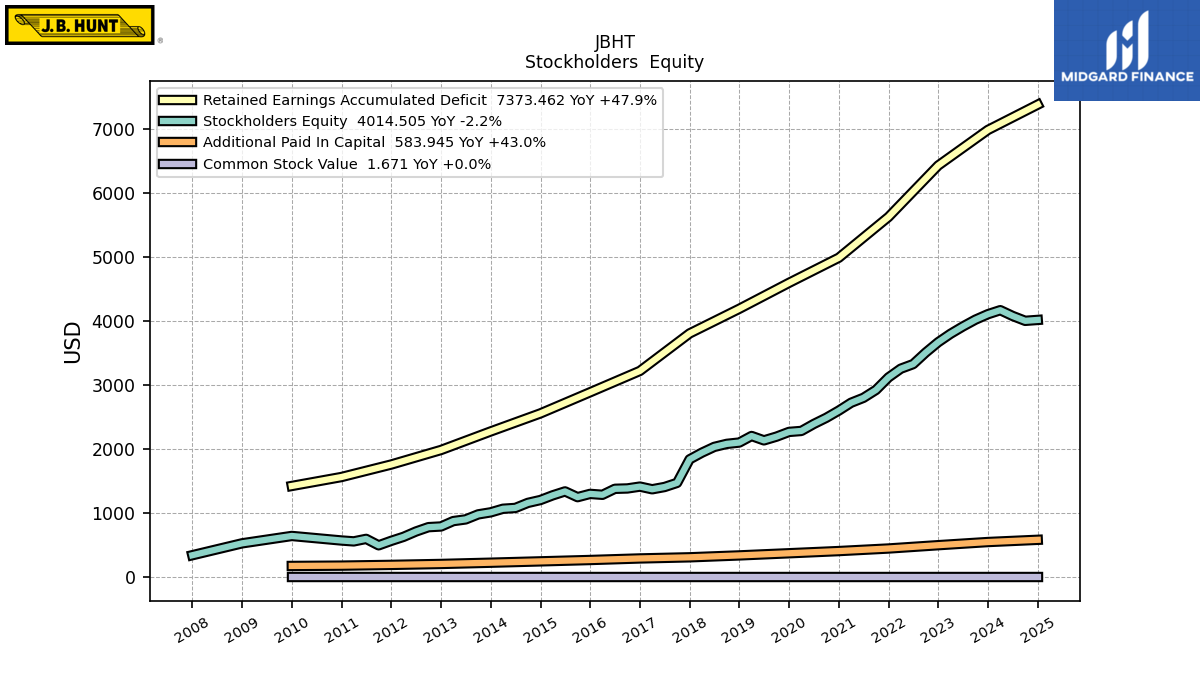
| Stockholders Equity | 4166.43 | 4103.76 | 4018.10 | 3911.92 | 3797.37 | 3666.77 | 3505.11 | 3324.86 | 3253.54 | 3117.82 | 2922.23 | 2799.03 | 2722.07 | 2600.14 | 2487.42 | 2390.84 | 2282.42 | 2267.03 | 2193.53 | 2135.36 | 2203.76 | 2101.38 | 2080.58 | 2033.36 | 1943.06 | 1839.33 | 1471.97 | 1407.72 | 1372.29 | 1414.06 | 1385.08 | 1379.42 | 1286.08 | 1300.35 | 1249.19 | 1339.20 | 1277.38 | 1204.52 | 1159.82 | 1081.12 | 1068.12 | 1012.45 | 980.48 | 902.24 | 875.77 | 791.86 | 781.19 | 713.27 | 630.30 | 567.54 | 497.63 | 598.34 | 559.27 | 573.02 | NA | NA | NA | |
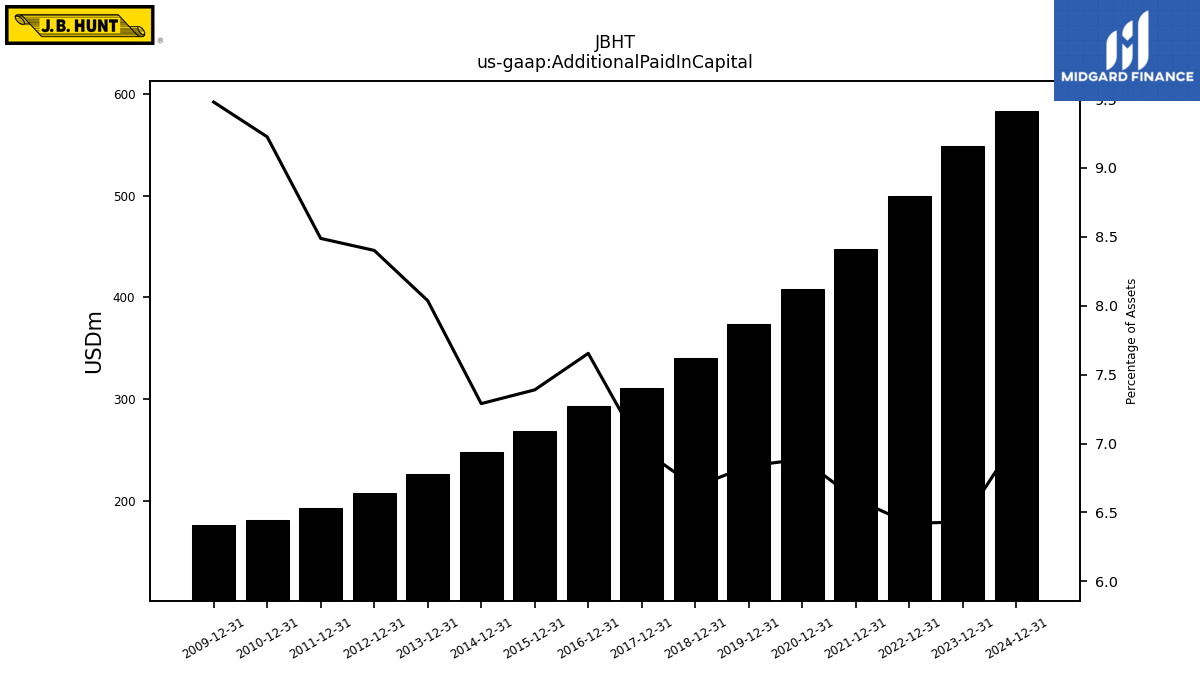
| Additional Paid In Capital | NA | 549.13 | NA | NA | NA | 499.90 | NA | NA | NA | 448.22 | NA | NA | NA | 408.24 | NA | NA | NA | 374.05 | NA | NA | NA | 340.46 | NA | NA | NA | 310.81 | NA | NA | NA | 293.09 | NA | NA | NA | 268.73 | NA | NA | NA | 247.64 | NA | NA | NA | 226.59 | NA | NA | NA | 207.07 | NA | NA | NA | 192.47 | NA | NA | NA | 180.99 | NA | NA | NA | |
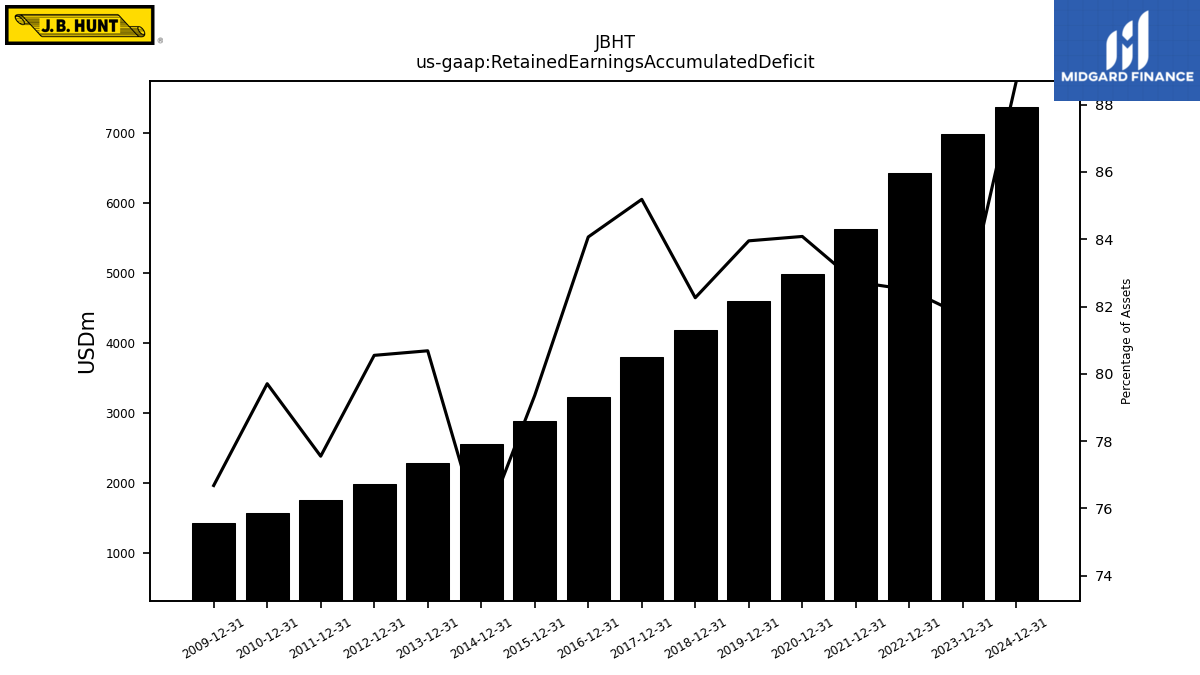
| Retained Earnings Accumulated Deficit | NA | 6978.12 | NA | NA | NA | 6423.73 | NA | NA | NA | 5621.10 | NA | NA | NA | 4984.74 | NA | NA | NA | 4592.94 | NA | NA | NA | 4188.44 | NA | NA | NA | 3803.84 | NA | NA | NA | 3218.94 | NA | NA | NA | 2885.84 | NA | NA | NA | 2555.97 | NA | NA | NA | 2274.78 | NA | NA | NA | 1985.21 | NA | NA | NA | 1758.29 | NA | NA | NA | 1563.53 | NA | NA | NA | |
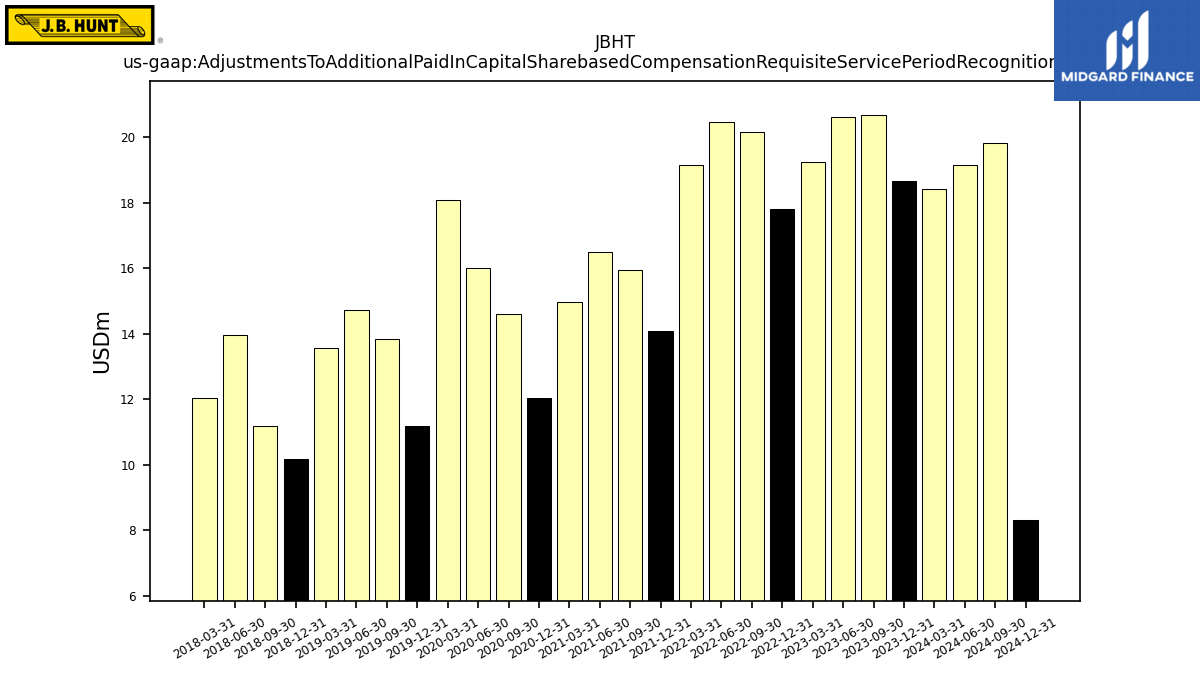
| Adjustments To Additional Paid In Capital Sharebased Compensation Requisite Service Period Recognition Value | 18.41 | 18.67 | 20.67 | 20.60 | 19.25 | 17.80 | 20.15 | 20.44 | 19.14 | 14.09 | 15.95 | 16.50 | 14.97 | 12.04 | 14.59 | 16.00 | 18.06 | 11.17 | 13.85 | 14.73 | 13.57 | 10.19 | 11.18 | 13.96 | 12.04 | NA | NA | NA | NA | NA | NA | NA | NA | NA | NA | NA | NA | NA | NA | NA | NA | NA | NA | NA | NA | NA | NA | NA | NA | NA | NA | NA | NA | NA | NA | NA | NA |
| 2024-03-31 | 2023-12-31 | 2023-09-30 | 2023-06-30 | 2023-03-31 | 2022-12-31 | 2022-09-30 | 2022-06-30 | 2022-03-31 | 2021-12-31 | 2021-09-30 | 2021-06-30 | 2021-03-31 | 2020-12-31 | 2020-09-30 | 2020-06-30 | 2020-03-31 | 2019-12-31 | 2019-09-30 | 2019-06-30 | 2019-03-31 | 2018-12-31 | 2018-09-30 | 2018-06-30 | 2018-03-31 | 2017-12-31 | 2017-09-30 | 2017-06-30 | 2017-03-31 | 2016-12-31 | 2016-09-30 | 2016-06-30 | 2016-03-31 | 2015-12-31 | 2015-09-30 | 2015-06-30 | 2015-03-31 | 2014-12-31 | 2014-09-30 | 2014-06-30 | 2014-03-31 | 2013-12-31 | 2013-09-30 | 2013-06-30 | 2013-03-31 | 2012-12-31 | 2012-09-30 | 2012-06-30 | 2012-03-31 | 2011-12-31 | 2011-09-30 | 2011-06-30 | 2011-03-31 | 2010-12-31 | 2010-09-30 | 2010-06-30 | 2010-03-31 | ||
|---|---|---|---|---|---|---|---|---|---|---|---|---|---|---|---|---|---|---|---|---|---|---|---|---|---|---|---|---|---|---|---|---|---|---|---|---|---|---|---|---|---|---|---|---|---|---|---|---|---|---|---|---|---|---|---|---|---|---|
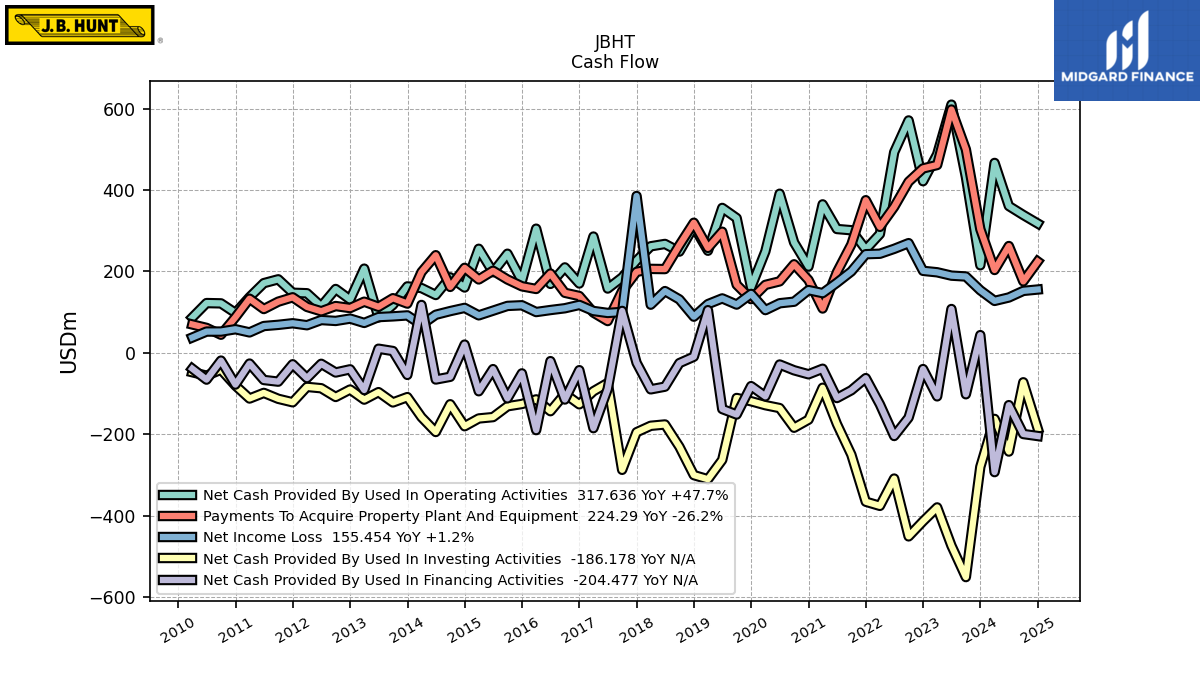
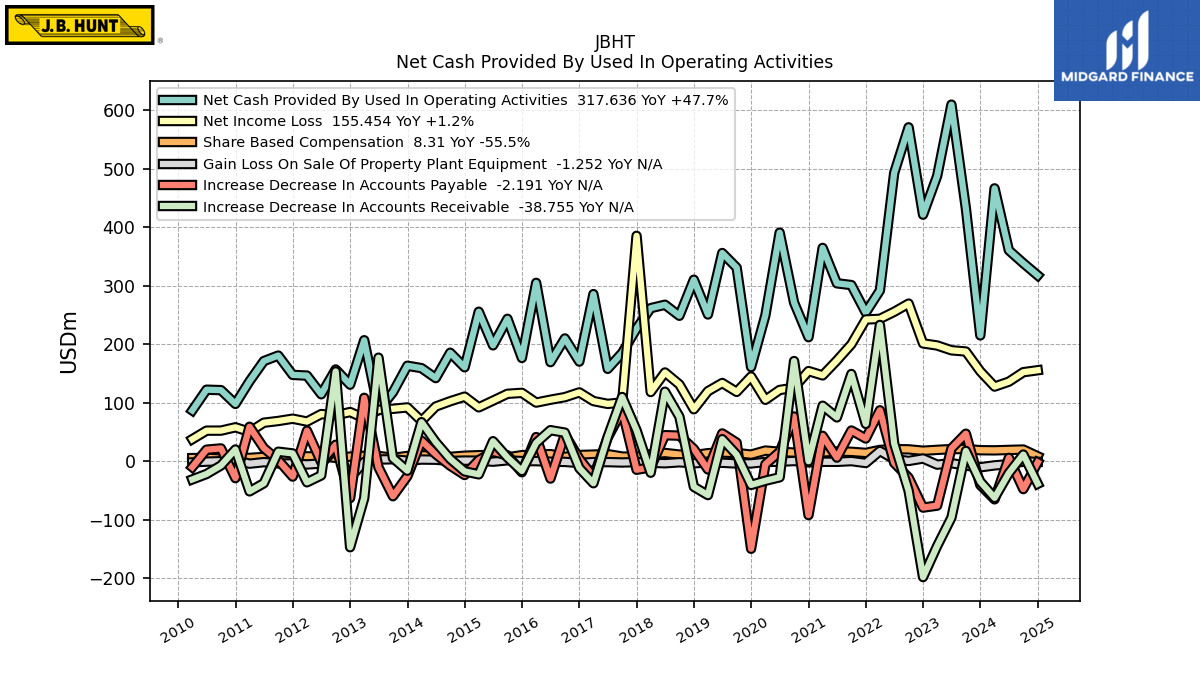
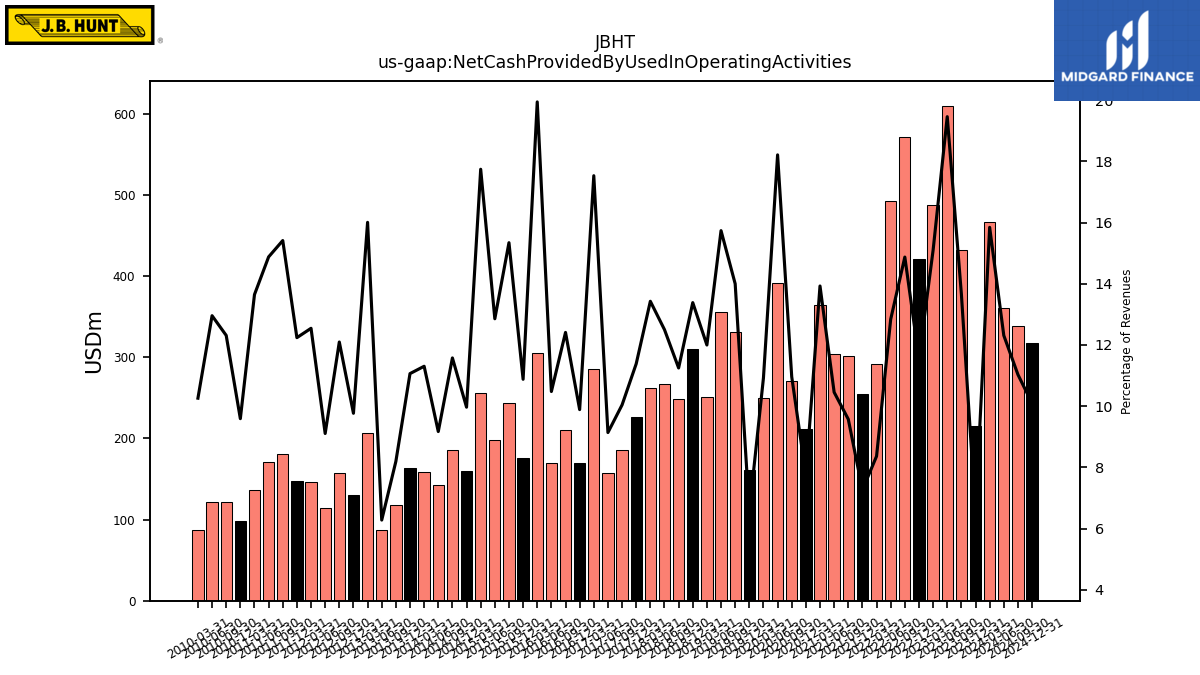
| Net Cash Provided By Used In Operating Activities | 466.47 | 215.01 | 432.32 | 609.67 | 487.62 | 421.48 | 570.88 | 492.74 | 291.79 | 254.05 | 301.10 | 304.09 | 364.66 | 211.87 | 271.04 | 390.79 | 249.16 | 160.75 | 330.93 | 355.92 | 250.74 | 310.24 | 248.57 | 267.42 | 261.62 | 226.60 | 185.10 | 157.81 | 285.63 | 170.18 | 209.82 | 169.24 | 304.90 | 176.35 | 243.42 | 197.99 | 255.54 | 160.41 | 185.36 | 141.96 | 159.04 | 163.12 | 117.66 | 86.81 | 206.76 | 130.71 | 156.76 | 114.31 | 146.27 | 147.48 | 180.54 | 171.09 | 136.58 | 97.84 | 121.41 | 122.16 | 86.67 | |
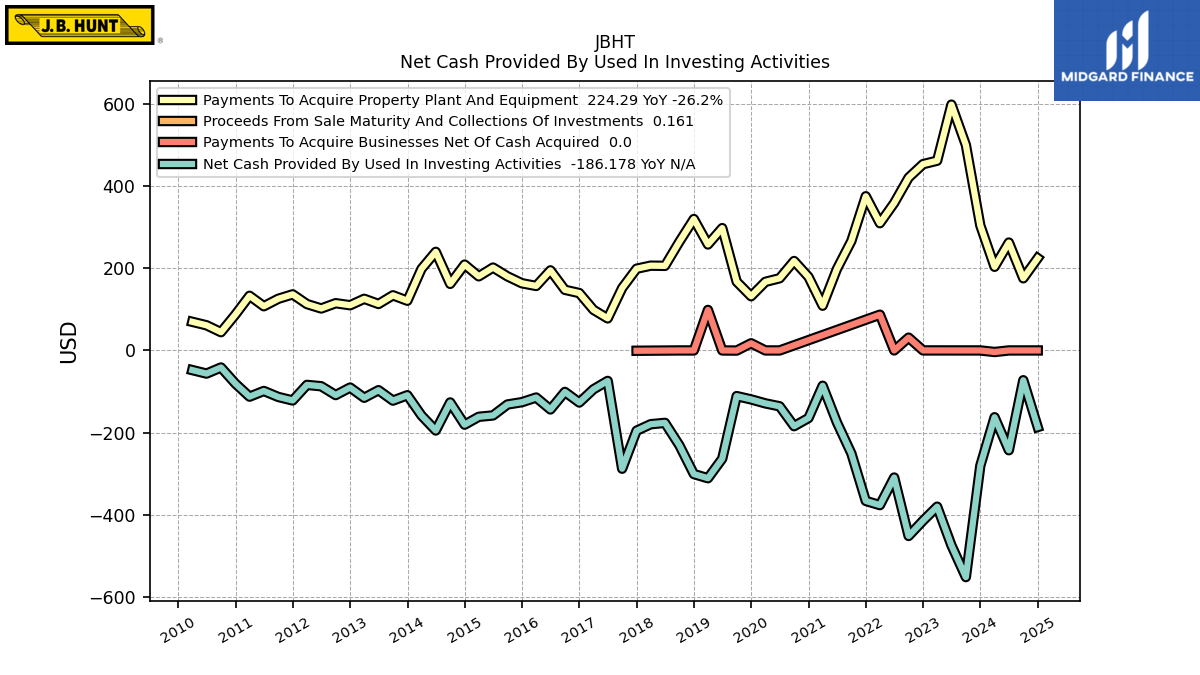
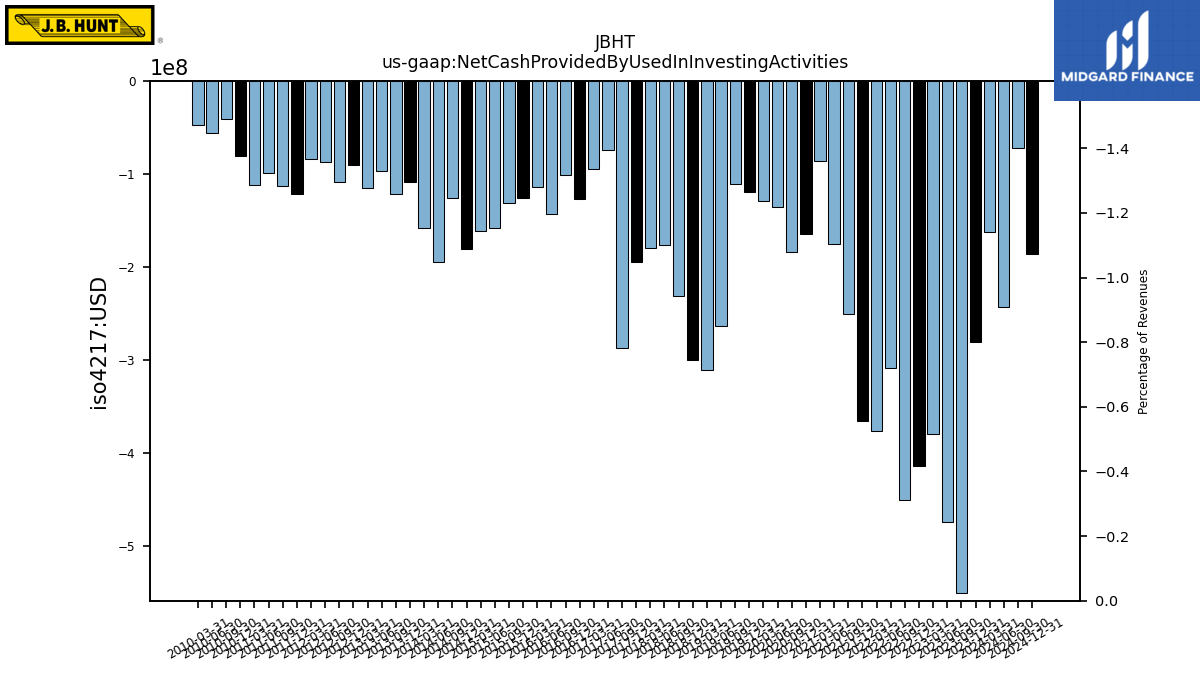
| Net Cash Provided By Used In Investing Activities | -162.40 | -280.31 | -551.13 | -473.95 | -379.83 | -413.94 | -451.10 | -308.97 | -376.06 | -365.86 | -250.35 | -174.95 | -85.85 | -164.28 | -184.15 | -135.82 | -128.71 | -119.05 | -111.00 | -263.21 | -310.70 | -300.52 | -230.83 | -176.08 | -179.34 | -195.17 | -287.55 | -74.08 | -94.47 | -126.62 | -100.81 | -143.50 | -114.46 | -125.78 | -131.41 | -158.00 | -161.34 | -180.48 | -126.36 | -194.63 | -158.21 | -108.88 | -121.97 | -96.62 | -115.07 | -90.19 | -108.55 | -87.09 | -83.77 | -121.61 | -113.04 | -98.52 | -112.36 | -80.61 | -41.41 | -56.26 | -47.74 | |
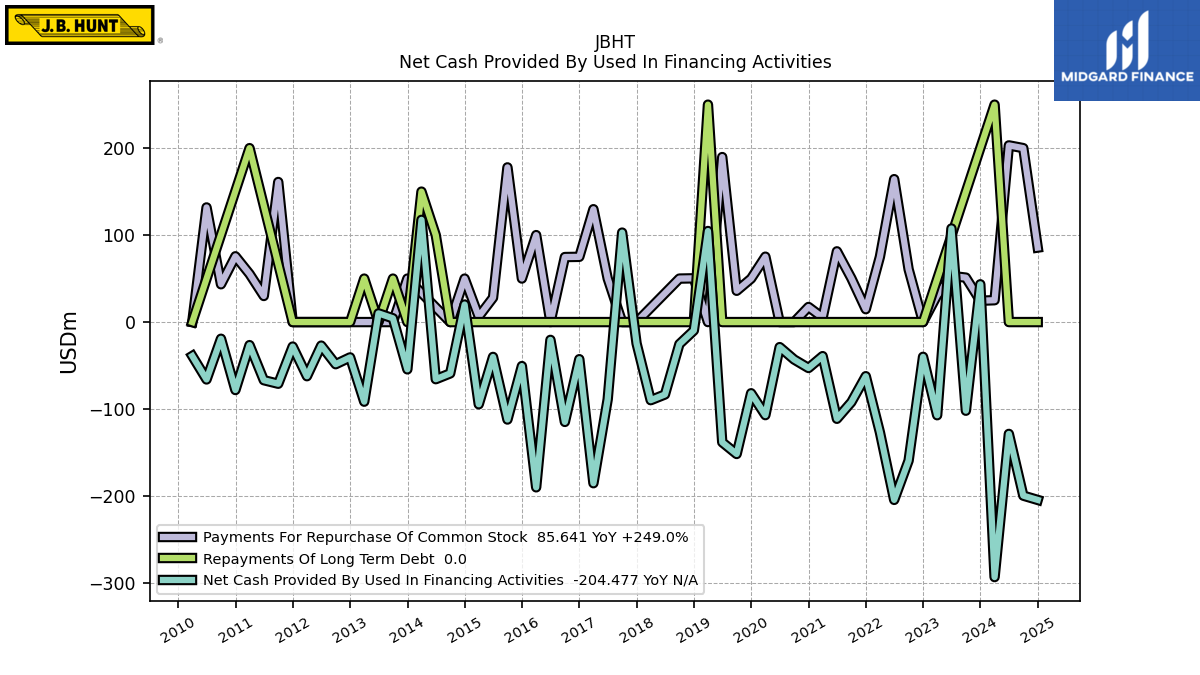
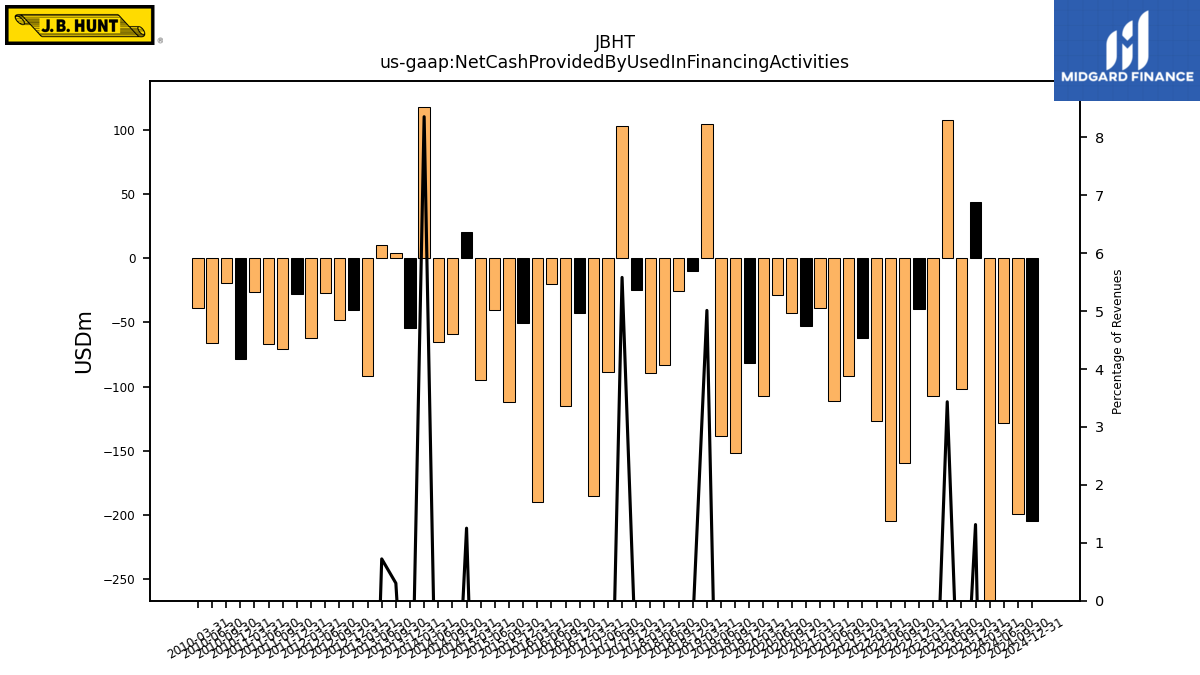
| Net Cash Provided By Used In Financing Activities | -293.23 | 43.45 | -101.93 | 107.60 | -107.11 | -39.94 | -159.29 | -204.46 | -126.74 | -62.23 | -92.07 | -111.19 | -39.14 | -52.83 | -43.00 | -28.77 | -107.00 | -81.84 | -151.68 | -138.19 | 104.73 | -9.71 | -25.34 | -83.23 | -89.80 | -24.53 | 102.88 | -88.72 | -185.28 | -42.67 | -114.81 | -20.45 | -190.01 | -50.55 | -112.06 | -40.06 | -94.51 | 20.16 | -59.01 | -65.67 | 117.55 | -54.38 | 4.35 | 9.99 | -91.53 | -40.59 | -48.44 | -27.04 | -62.24 | -28.17 | -70.90 | -66.81 | -26.48 | -78.14 | -19.15 | -65.97 | -38.99 |
| 2024-03-31 | 2023-12-31 | 2023-09-30 | 2023-06-30 | 2023-03-31 | 2022-12-31 | 2022-09-30 | 2022-06-30 | 2022-03-31 | 2021-12-31 | 2021-09-30 | 2021-06-30 | 2021-03-31 | 2020-12-31 | 2020-09-30 | 2020-06-30 | 2020-03-31 | 2019-12-31 | 2019-09-30 | 2019-06-30 | 2019-03-31 | 2018-12-31 | 2018-09-30 | 2018-06-30 | 2018-03-31 | 2017-12-31 | 2017-09-30 | 2017-06-30 | 2017-03-31 | 2016-12-31 | 2016-09-30 | 2016-06-30 | 2016-03-31 | 2015-12-31 | 2015-09-30 | 2015-06-30 | 2015-03-31 | 2014-12-31 | 2014-09-30 | 2014-06-30 | 2014-03-31 | 2013-12-31 | 2013-09-30 | 2013-06-30 | 2013-03-31 | 2012-12-31 | 2012-09-30 | 2012-06-30 | 2012-03-31 | 2011-12-31 | 2011-09-30 | 2011-06-30 | 2011-03-31 | 2010-12-31 | 2010-09-30 | 2010-06-30 | 2010-03-31 | ||
|---|---|---|---|---|---|---|---|---|---|---|---|---|---|---|---|---|---|---|---|---|---|---|---|---|---|---|---|---|---|---|---|---|---|---|---|---|---|---|---|---|---|---|---|---|---|---|---|---|---|---|---|---|---|---|---|---|---|---|
| Net Cash Provided By Used In Operating Activities | 466.47 | 215.01 | 432.32 | 609.67 | 487.62 | 421.48 | 570.88 | 492.74 | 291.79 | 254.05 | 301.10 | 304.09 | 364.66 | 211.87 | 271.04 | 390.79 | 249.16 | 160.75 | 330.93 | 355.92 | 250.74 | 310.24 | 248.57 | 267.42 | 261.62 | 226.60 | 185.10 | 157.81 | 285.63 | 170.18 | 209.82 | 169.24 | 304.90 | 176.35 | 243.42 | 197.99 | 255.54 | 160.41 | 185.36 | 141.96 | 159.04 | 163.12 | 117.66 | 86.81 | 206.76 | 130.71 | 156.76 | 114.31 | 146.27 | 147.48 | 180.54 | 171.09 | 136.58 | 97.84 | 121.41 | 122.16 | 86.67 | |
| Net Income Loss | 127.49 | 153.53 | 187.43 | 189.55 | 197.77 | 201.30 | 269.38 | 255.34 | 243.32 | 242.21 | 199.83 | 172.16 | 146.61 | 154.01 | 125.50 | 121.70 | 104.83 | 144.68 | 118.41 | 133.63 | 119.60 | 88.68 | 131.11 | 151.65 | 118.14 | 385.31 | 100.39 | 97.87 | 102.70 | 117.56 | 109.42 | 105.01 | 100.10 | 116.75 | 115.14 | 103.42 | 91.93 | 110.31 | 102.41 | 93.41 | 68.66 | 91.86 | 89.47 | 87.70 | 73.35 | 83.98 | 78.24 | 80.45 | 67.68 | 72.56 | 68.65 | 65.70 | 50.09 | 57.85 | 52.17 | 52.11 | 37.48 | |
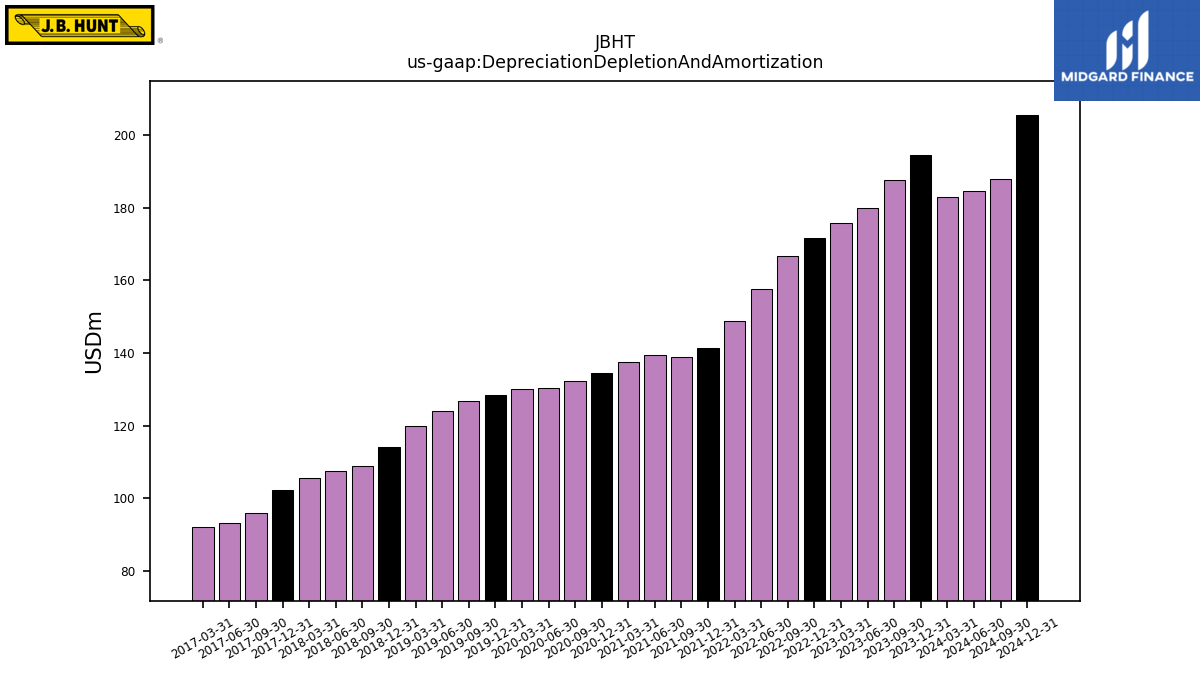
| Depreciation Depletion And Amortization | 183.00 | 194.46 | 187.71 | 179.97 | 175.81 | 171.61 | 166.58 | 157.57 | 148.76 | 141.25 | 138.92 | 139.37 | 137.54 | 134.59 | 132.39 | 130.30 | 130.09 | 128.42 | 126.80 | 123.99 | 119.93 | 114.09 | 108.80 | 107.42 | 105.58 | 102.32 | 95.96 | 93.05 | 92.19 | NA | NA | NA | NA | NA | NA | NA | NA | NA | NA | NA | NA | NA | NA | NA | NA | NA | NA | NA | NA | NA | NA | NA | NA | NA | NA | NA | NA | |
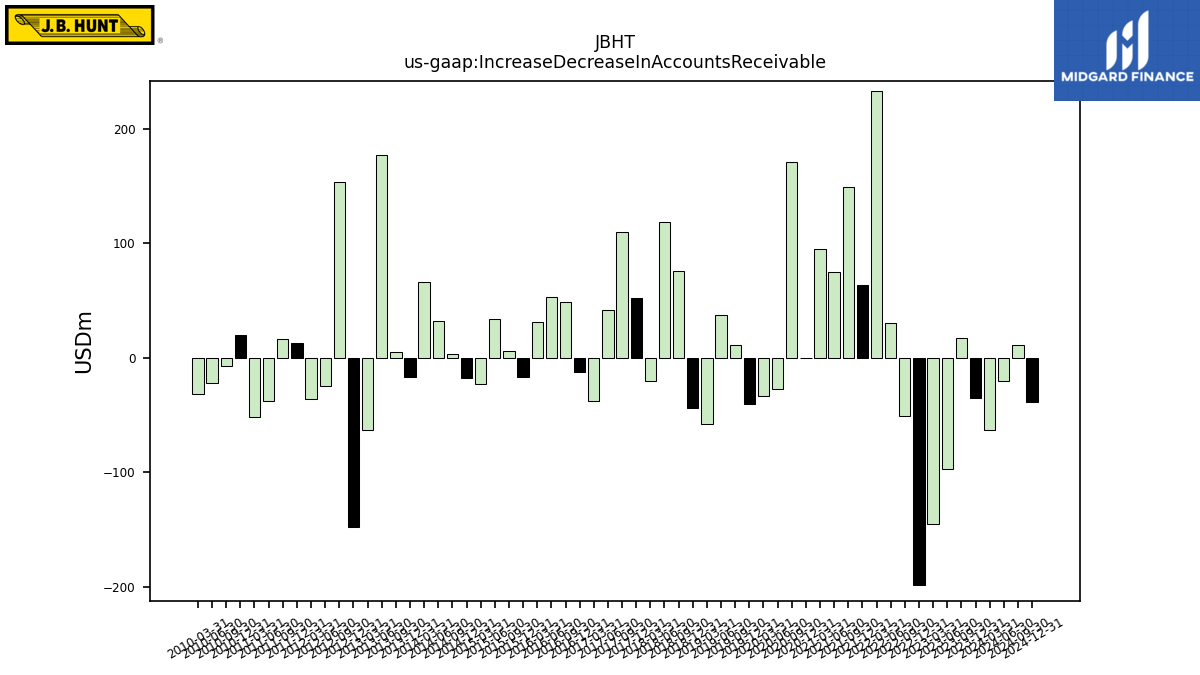
| Increase Decrease In Accounts Receivable | -62.80 | -35.06 | 17.45 | -96.65 | -145.18 | -198.38 | -50.62 | 30.02 | 232.92 | 63.67 | 149.02 | 74.76 | 94.76 | -0.24 | 171.19 | -27.64 | -33.55 | -40.73 | 10.93 | 37.60 | -58.11 | -43.94 | 76.02 | 118.72 | -19.86 | 52.68 | 109.68 | 41.61 | -37.85 | -11.94 | 48.75 | 52.93 | 31.25 | -16.86 | 6.16 | 34.07 | -22.62 | -17.50 | 3.68 | 32.51 | 66.59 | -16.39 | 5.27 | 176.95 | -63.32 | -147.31 | 153.37 | -24.37 | -36.23 | 13.15 | 16.12 | -37.83 | -51.73 | 19.93 | -7.45 | -22.01 | -31.32 | |
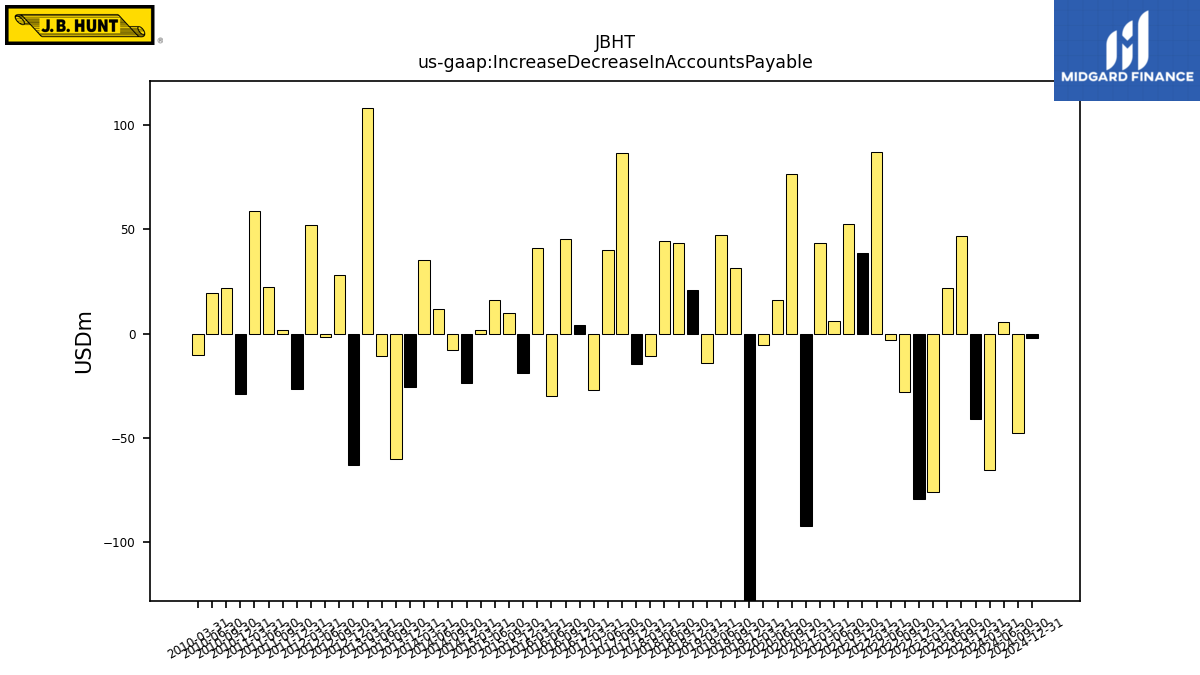
| Increase Decrease In Accounts Payable | -65.40 | -40.78 | 46.93 | 21.61 | -76.11 | -79.48 | -28.22 | -3.10 | 86.96 | 38.66 | 52.36 | 5.99 | 43.28 | -92.35 | 76.34 | 15.92 | -5.39 | -149.91 | 31.56 | 47.34 | -14.32 | 20.78 | 43.54 | 44.37 | -10.65 | -14.78 | 86.75 | 40.17 | -26.90 | 3.99 | 45.56 | -29.90 | 41.17 | -19.04 | 9.94 | 15.96 | 1.74 | -23.79 | -7.79 | 11.82 | 35.04 | -25.87 | -60.08 | -10.77 | 108.25 | -63.27 | 27.95 | -1.64 | 52.06 | -26.49 | 1.62 | 22.30 | 58.75 | -29.17 | 21.73 | 19.60 | -10.29 | |
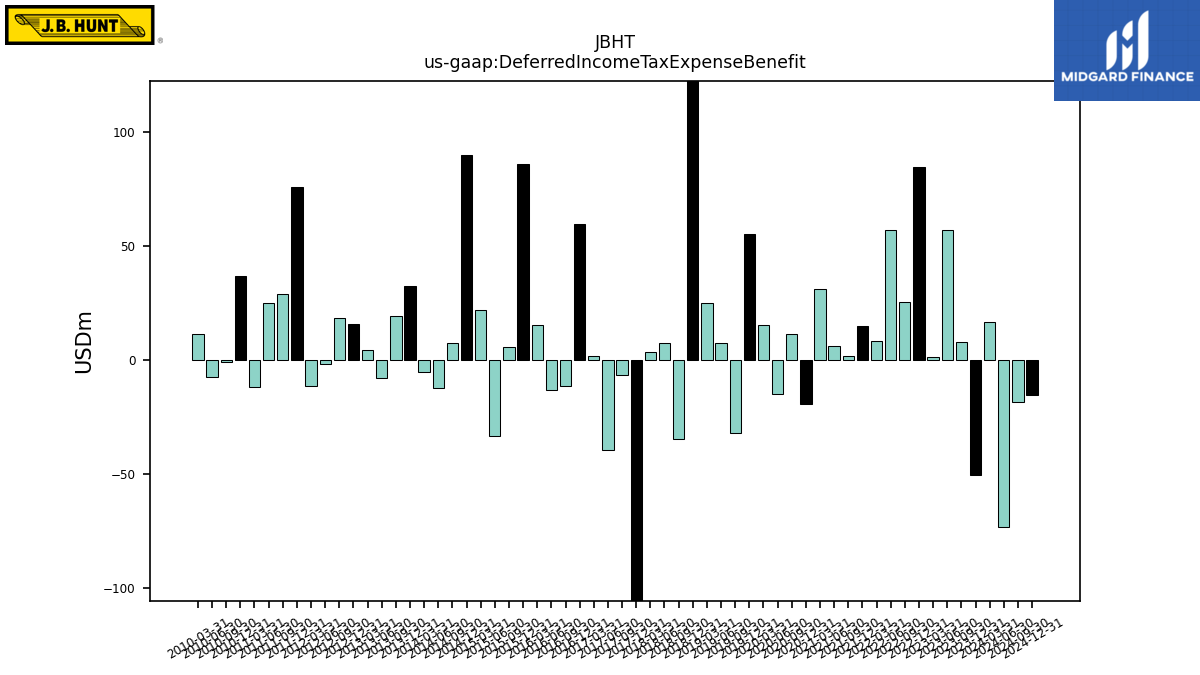
| Deferred Income Tax Expense Benefit | 16.79 | -50.31 | 7.72 | 56.82 | 1.45 | 84.63 | 25.27 | 56.90 | 8.29 | 14.85 | 1.62 | 5.95 | 31.00 | -19.28 | 11.60 | -14.85 | 15.47 | 54.97 | -31.96 | 7.57 | 25.03 | 125.03 | -34.44 | 7.58 | 3.41 | -204.96 | -6.44 | -39.28 | 1.93 | 59.57 | -11.51 | -12.90 | 15.26 | 85.82 | 5.89 | -33.38 | 22.09 | 89.66 | 7.36 | -12.38 | -5.29 | 32.28 | 19.27 | -7.87 | 4.40 | 15.91 | 18.27 | -1.58 | -11.54 | 75.73 | 28.93 | 24.88 | -11.83 | 36.70 | -0.82 | -7.30 | 11.52 | |
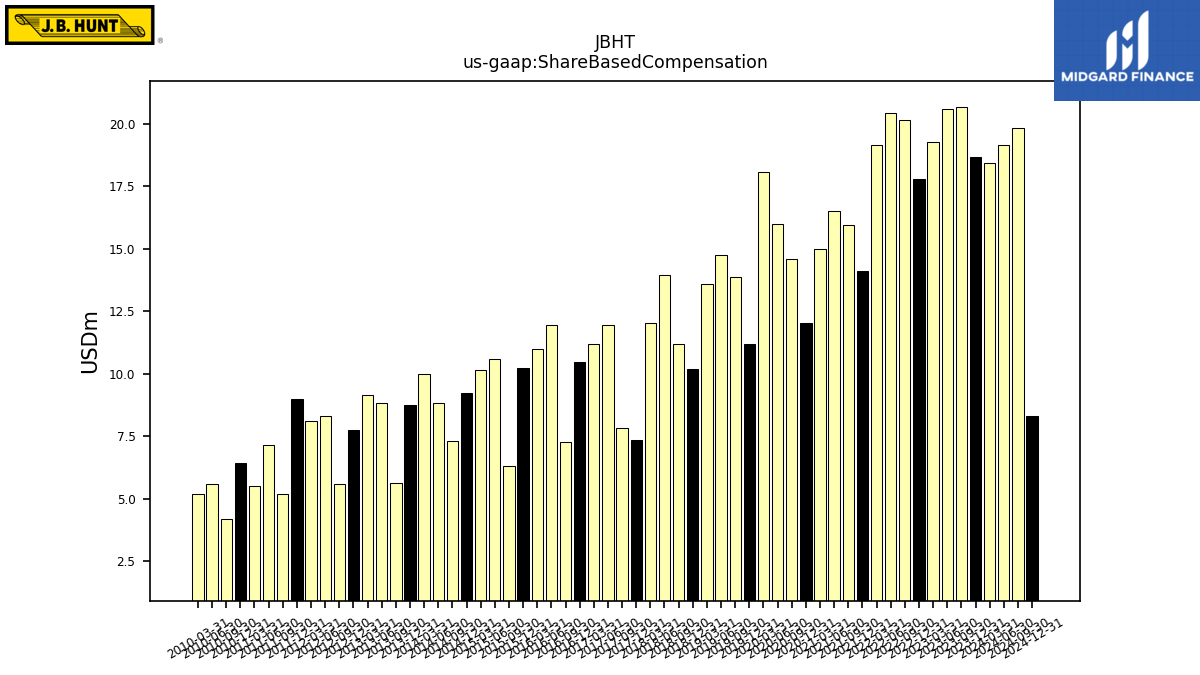
| Share Based Compensation | 18.41 | 18.67 | 20.67 | 20.60 | 19.25 | 17.80 | 20.15 | 20.44 | 19.14 | 14.09 | 15.95 | 16.50 | 14.97 | 12.04 | 14.59 | 16.00 | 18.06 | 11.17 | 13.85 | 14.73 | 13.57 | 10.19 | 11.18 | 13.96 | 12.04 | 7.34 | 7.84 | 11.94 | 11.17 | 10.45 | 7.26 | 11.94 | 10.97 | 10.22 | 6.31 | 10.57 | 10.13 | 9.21 | 7.31 | 8.84 | 9.97 | 8.75 | 5.62 | 8.84 | 9.14 | 7.74 | 5.59 | 8.29 | 8.10 | 9.00 | 5.21 | 7.13 | 5.50 | 6.42 | 4.20 | 5.59 | 5.19 |
| 2024-03-31 | 2023-12-31 | 2023-09-30 | 2023-06-30 | 2023-03-31 | 2022-12-31 | 2022-09-30 | 2022-06-30 | 2022-03-31 | 2021-12-31 | 2021-09-30 | 2021-06-30 | 2021-03-31 | 2020-12-31 | 2020-09-30 | 2020-06-30 | 2020-03-31 | 2019-12-31 | 2019-09-30 | 2019-06-30 | 2019-03-31 | 2018-12-31 | 2018-09-30 | 2018-06-30 | 2018-03-31 | 2017-12-31 | 2017-09-30 | 2017-06-30 | 2017-03-31 | 2016-12-31 | 2016-09-30 | 2016-06-30 | 2016-03-31 | 2015-12-31 | 2015-09-30 | 2015-06-30 | 2015-03-31 | 2014-12-31 | 2014-09-30 | 2014-06-30 | 2014-03-31 | 2013-12-31 | 2013-09-30 | 2013-06-30 | 2013-03-31 | 2012-12-31 | 2012-09-30 | 2012-06-30 | 2012-03-31 | 2011-12-31 | 2011-09-30 | 2011-06-30 | 2011-03-31 | 2010-12-31 | 2010-09-30 | 2010-06-30 | 2010-03-31 | ||
|---|---|---|---|---|---|---|---|---|---|---|---|---|---|---|---|---|---|---|---|---|---|---|---|---|---|---|---|---|---|---|---|---|---|---|---|---|---|---|---|---|---|---|---|---|---|---|---|---|---|---|---|---|---|---|---|---|---|---|
| Net Cash Provided By Used In Investing Activities | -162.40 | -280.31 | -551.13 | -473.95 | -379.83 | -413.94 | -451.10 | -308.97 | -376.06 | -365.86 | -250.35 | -174.95 | -85.85 | -164.28 | -184.15 | -135.82 | -128.71 | -119.05 | -111.00 | -263.21 | -310.70 | -300.52 | -230.83 | -176.08 | -179.34 | -195.17 | -287.55 | -74.08 | -94.47 | -126.62 | -100.81 | -143.50 | -114.46 | -125.78 | -131.41 | -158.00 | -161.34 | -180.48 | -126.36 | -194.63 | -158.21 | -108.88 | -121.97 | -96.62 | -115.07 | -90.19 | -108.55 | -87.09 | -83.77 | -121.61 | -113.04 | -98.52 | -112.36 | -80.61 | -41.41 | -56.26 | -47.74 | |
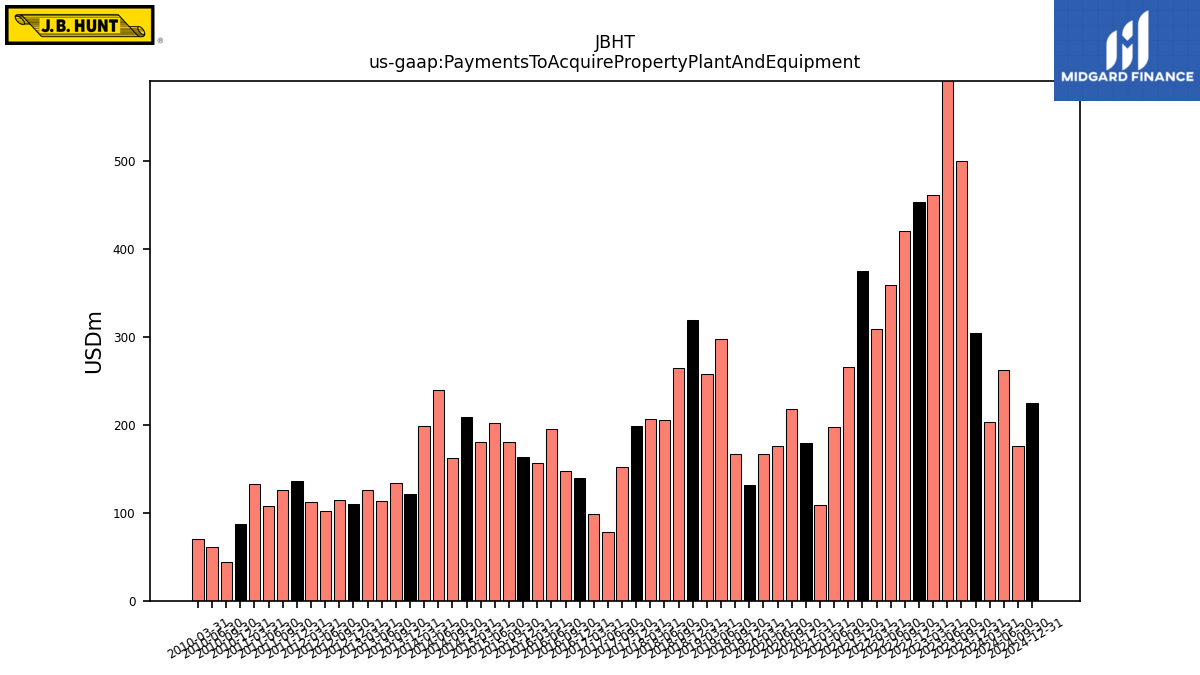
| Payments To Acquire Property Plant And Equipment | 203.39 | 303.84 | 499.62 | 597.66 | 461.31 | 452.92 | 420.14 | 358.40 | 309.34 | 374.85 | 265.99 | 197.95 | 108.78 | 178.78 | 217.45 | 175.50 | 166.81 | 131.74 | 167.24 | 297.47 | 257.66 | 319.55 | 264.35 | 205.64 | 206.11 | 198.71 | 151.56 | 77.89 | 98.78 | 139.52 | 147.41 | 194.72 | 156.79 | 163.35 | 180.09 | 201.52 | 180.16 | 208.75 | 161.81 | 239.75 | 198.26 | 120.87 | 134.07 | 112.96 | 125.54 | 109.90 | 114.85 | 102.03 | 112.72 | 136.36 | 125.57 | 107.44 | 132.91 | 87.29 | 44.39 | 61.16 | 69.61 |
| 2024-03-31 | 2023-12-31 | 2023-09-30 | 2023-06-30 | 2023-03-31 | 2022-12-31 | 2022-09-30 | 2022-06-30 | 2022-03-31 | 2021-12-31 | 2021-09-30 | 2021-06-30 | 2021-03-31 | 2020-12-31 | 2020-09-30 | 2020-06-30 | 2020-03-31 | 2019-12-31 | 2019-09-30 | 2019-06-30 | 2019-03-31 | 2018-12-31 | 2018-09-30 | 2018-06-30 | 2018-03-31 | 2017-12-31 | 2017-09-30 | 2017-06-30 | 2017-03-31 | 2016-12-31 | 2016-09-30 | 2016-06-30 | 2016-03-31 | 2015-12-31 | 2015-09-30 | 2015-06-30 | 2015-03-31 | 2014-12-31 | 2014-09-30 | 2014-06-30 | 2014-03-31 | 2013-12-31 | 2013-09-30 | 2013-06-30 | 2013-03-31 | 2012-12-31 | 2012-09-30 | 2012-06-30 | 2012-03-31 | 2011-12-31 | 2011-09-30 | 2011-06-30 | 2011-03-31 | 2010-12-31 | 2010-09-30 | 2010-06-30 | 2010-03-31 | ||
|---|---|---|---|---|---|---|---|---|---|---|---|---|---|---|---|---|---|---|---|---|---|---|---|---|---|---|---|---|---|---|---|---|---|---|---|---|---|---|---|---|---|---|---|---|---|---|---|---|---|---|---|---|---|---|---|---|---|---|
| Net Cash Provided By Used In Financing Activities | -293.23 | 43.45 | -101.93 | 107.60 | -107.11 | -39.94 | -159.29 | -204.46 | -126.74 | -62.23 | -92.07 | -111.19 | -39.14 | -52.83 | -43.00 | -28.77 | -107.00 | -81.84 | -151.68 | -138.19 | 104.73 | -9.71 | -25.34 | -83.23 | -89.80 | -24.53 | 102.88 | -88.72 | -185.28 | -42.67 | -114.81 | -20.45 | -190.01 | -50.55 | -112.06 | -40.06 | -94.51 | 20.16 | -59.01 | -65.67 | 117.55 | -54.38 | 4.35 | 9.99 | -91.53 | -40.59 | -48.44 | -27.04 | -62.24 | -28.17 | -70.90 | -66.81 | -26.48 | -78.14 | -19.15 | -65.97 | -38.99 | |
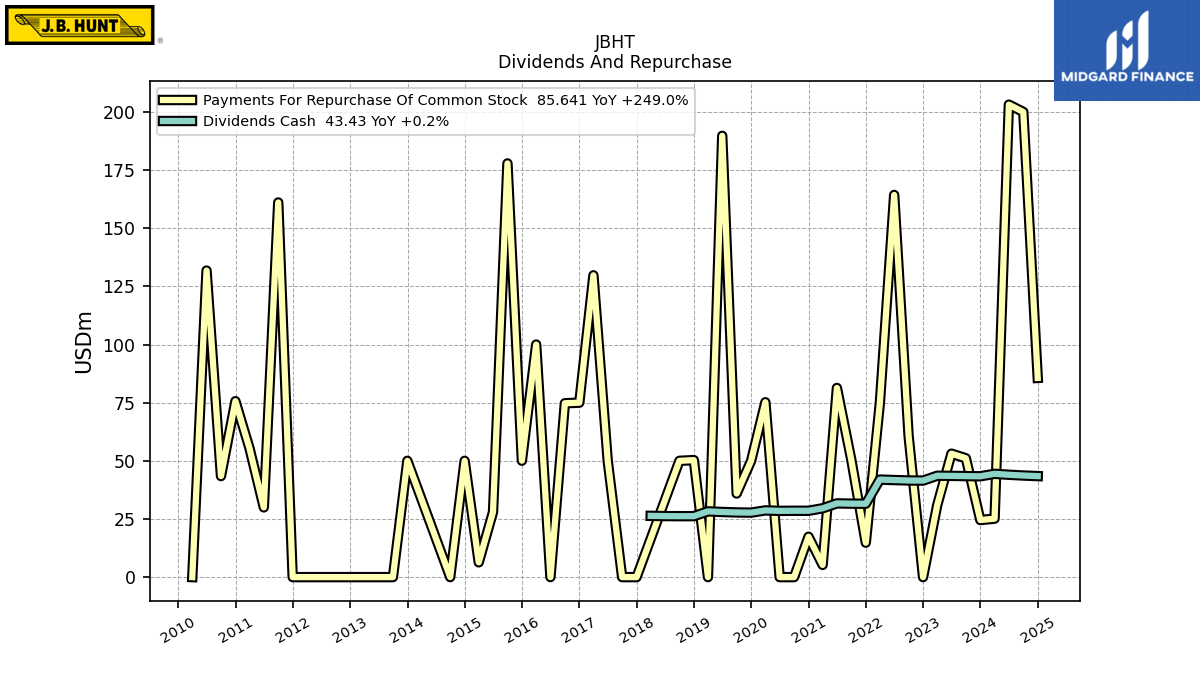
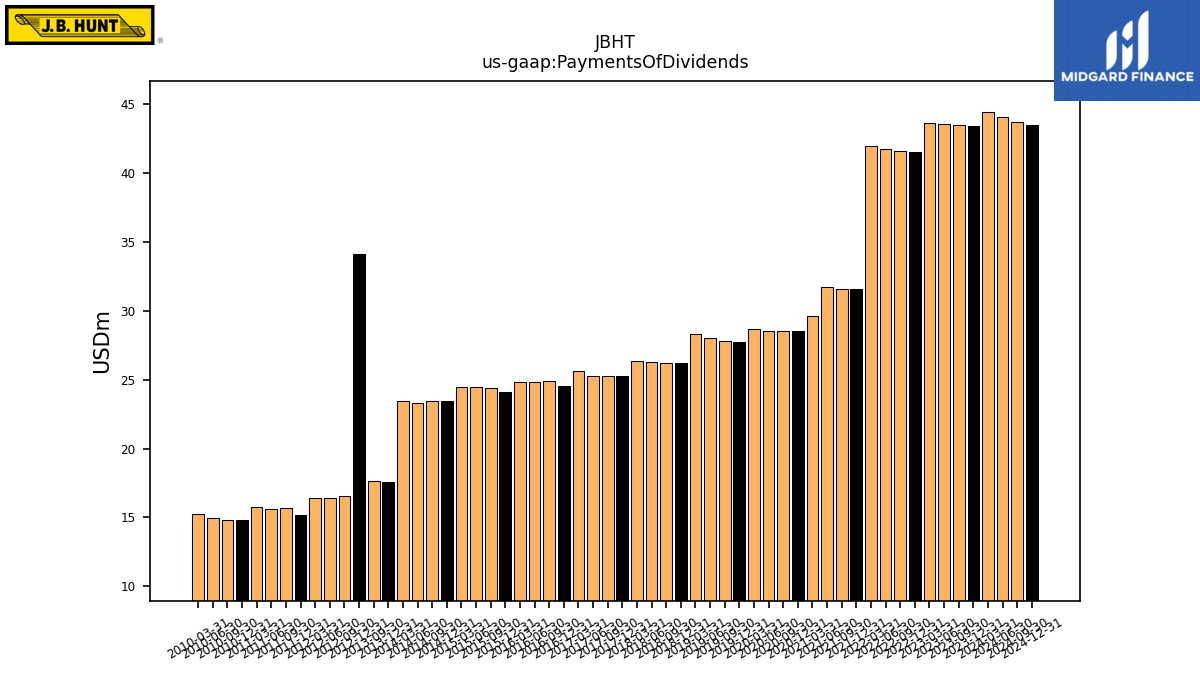
| Payments Of Dividends | 44.42 | 43.35 | 43.43 | 43.53 | 43.58 | 41.50 | 41.55 | 41.73 | 41.94 | 31.55 | 31.59 | 31.70 | 29.60 | 28.53 | 28.53 | 28.49 | 28.69 | 27.73 | 27.81 | 28.01 | 28.27 | 26.21 | 26.20 | 26.24 | 26.34 | 25.24 | 25.24 | 25.27 | 25.60 | 24.51 | 24.88 | 24.79 | 24.81 | 24.07 | 24.35 | 24.48 | 24.47 | 23.44 | 23.42 | 23.30 | 23.45 | 17.59 | 17.67 | NA | NA | 34.11 | 16.55 | 16.39 | 16.39 | 15.19 | 15.66 | 15.64 | 15.75 | 14.80 | 14.85 | 14.98 | 15.27 | |
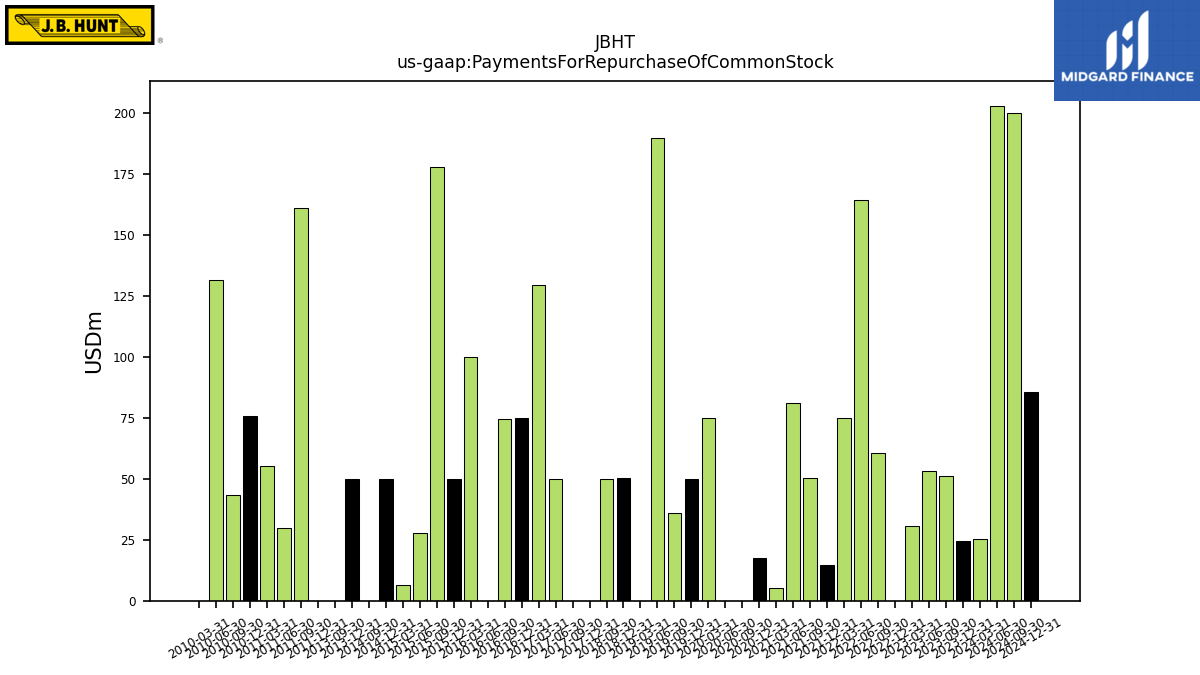
| Payments For Repurchase Of Common Stock | 25.14 | 24.54 | 51.10 | 53.09 | 30.85 | 0.00 | 60.69 | 164.32 | 75.02 | 14.80 | 50.34 | 81.34 | 5.24 | 17.36 | 0.00 | 0.00 | 75.19 | 49.98 | 35.95 | 189.73 | -0.00 | 50.31 | 50.00 | NA | NA | 0.00 | 0.00 | 50.05 | 129.76 | 75.00 | 74.76 | 0.00 | 100.00 | 50.05 | 177.87 | 28.00 | 6.35 | 50.00 | 0.00 | NA | NA | 50.00 | 0.00 | NA | NA | NA | NA | NA | NA | 0.00 | 161.07 | 29.98 | 55.35 | 75.64 | 43.44 | 131.81 | 0.00 |
| 2024-03-31 | 2023-12-31 | 2023-09-30 | 2023-06-30 | 2023-03-31 | 2022-12-31 | 2022-09-30 | 2022-06-30 | 2022-03-31 | 2021-12-31 | 2021-09-30 | 2021-06-30 | 2021-03-31 | 2020-12-31 | 2020-09-30 | 2020-06-30 | 2020-03-31 | 2019-12-31 | 2019-09-30 | 2019-06-30 | 2019-03-31 | 2018-12-31 | 2018-09-30 | 2018-06-30 | 2018-03-31 | 2017-12-31 | 2017-09-30 | 2017-06-30 | 2017-03-31 | 2016-12-31 | 2016-09-30 | 2016-06-30 | 2016-03-31 | 2015-12-31 | 2015-09-30 | 2015-06-30 | 2015-03-31 | 2014-12-31 | 2014-09-30 | 2014-06-30 | 2014-03-31 | 2013-12-31 | 2013-09-30 | 2013-06-30 | 2013-03-31 | 2012-12-31 | 2012-09-30 | 2012-06-30 | 2012-03-31 | 2011-12-31 | 2011-09-30 | 2011-06-30 | 2011-03-31 | 2010-12-31 | 2010-09-30 | 2010-06-30 | 2010-03-31 | ||
|---|---|---|---|---|---|---|---|---|---|---|---|---|---|---|---|---|---|---|---|---|---|---|---|---|---|---|---|---|---|---|---|---|---|---|---|---|---|---|---|---|---|---|---|---|---|---|---|---|---|---|---|---|---|---|---|---|---|---|
| Revenues | 2944.00 | 3303.70 | 3163.75 | 3132.62 | 3229.59 | 3649.62 | 3838.26 | 3837.53 | 3488.59 | 3496.97 | 3144.81 | 2908.37 | 2618.15 | 2737.65 | 2472.52 | 2145.57 | 2280.83 | 2450.32 | 2363.66 | 2261.65 | 2089.63 | 2317.84 | 2209.76 | 2139.03 | 1948.24 | 1990.16 | 1843.33 | 1726.91 | 1629.16 | 1721.06 | 1690.66 | 1615.03 | 1528.71 | 1621.02 | 1586.49 | 1539.96 | 1440.18 | 1609.51 | 1601.16 | 1547.87 | 1406.91 | 1474.28 | 1435.85 | 1382.86 | 1291.59 | 1338.14 | 1295.79 | 1255.13 | 1165.92 | 1204.94 | 1171.27 | 1149.86 | 1000.78 | 1020.01 | 986.02 | 942.78 | 844.67 | |
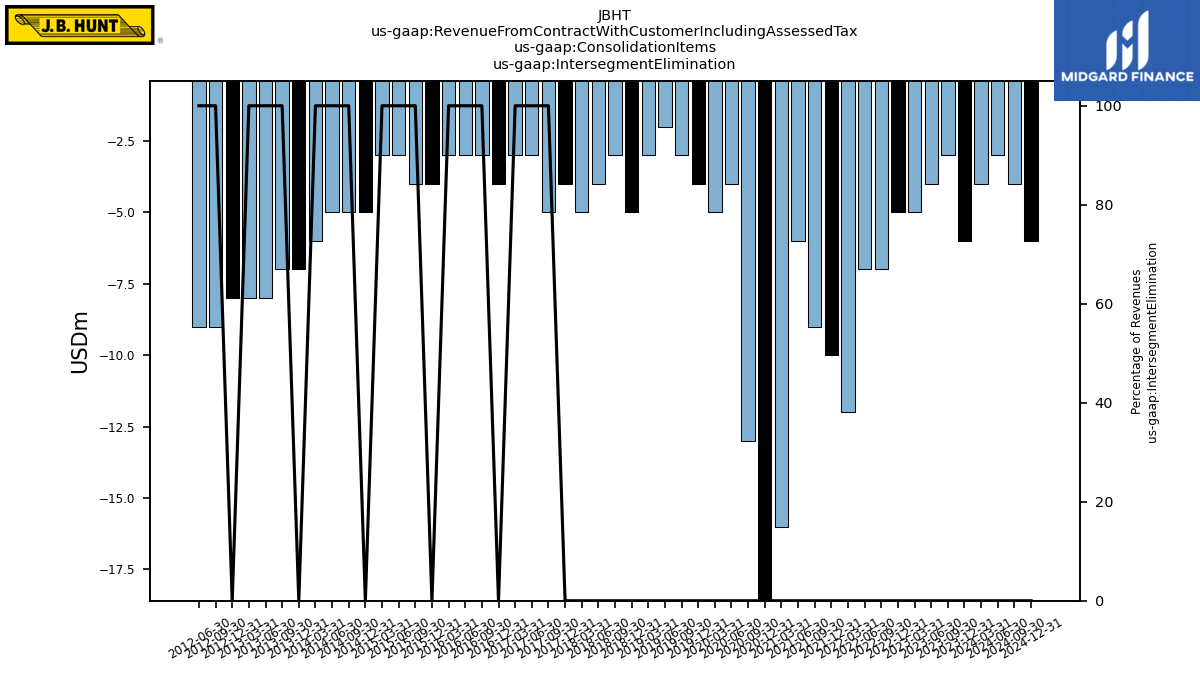
| Revenue From Contract With Customer Including Assessed Tax | 2944.00 | 3303.70 | 3163.75 | 3132.62 | 3229.59 | 3649.62 | 3838.26 | 3837.53 | 3488.59 | 3496.97 | 3144.81 | 2908.37 | 2618.15 | 2737.65 | 2472.52 | 2145.57 | 2280.83 | 2450.32 | 2363.66 | 2261.65 | 2089.63 | 2317.84 | 2209.76 | 2139.03 | 1948.24 | 1990.16 | 1843.33 | 1726.91 | 1629.16 | 1721.06 | 1690.66 | 1615.03 | 1528.71 | 1621.02 | 1586.49 | 1539.96 | 1440.18 | 1609.51 | 1601.16 | 1547.87 | 1406.91 | 1474.28 | 1435.85 | 1382.86 | 1291.59 | 1338.14 | 1295.79 | 1255.13 | 1165.92 | 1204.94 | 1171.27 | 1149.86 | 1000.78 | 1020.01 | 986.02 | 942.78 | 844.67 | |
| Intersegment Elimination | -4.00 | -6.00 | -3.00 | -4.00 | -5.00 | -5.00 | -7.00 | -7.00 | -12.00 | -10.00 | -9.00 | -6.00 | -16.00 | -21.00 | -13.00 | -4.00 | -5.00 | -4.00 | -3.00 | -2.00 | -3.00 | -5.00 | -3.00 | -4.00 | -5.00 | -4.00 | -5.00 | -3.00 | -3.00 | -4.00 | -3.00 | -3.00 | -3.00 | -4.00 | -4.00 | -3.00 | -3.00 | -5.00 | -5.00 | -5.00 | -6.00 | -7.00 | -7.00 | -8.00 | -8.00 | -8.00 | -9.00 | -9.00 | NA | NA | NA | NA | NA | NA | NA | NA | NA | |
| Operating | 2948.00 | 3310.00 | 3167.00 | 3137.00 | 3235.00 | 3655.00 | 3845.00 | 3845.00 | 3501.00 | 3507.00 | 3154.00 | 2914.00 | 2634.00 | 2759.00 | 2486.00 | 2150.00 | 2286.00 | 2454.00 | 2367.00 | 2264.00 | 2093.00 | 2323.00 | 2213.00 | 2143.00 | 1953.00 | 1995.00 | 1848.00 | 1730.00 | 1632.00 | 1725.00 | 1694.00 | 1618.00 | 1532.00 | 1625.00 | 1590.00 | 1543.00 | 1443.00 | 1614.00 | 1606.00 | 1553.00 | 1413.00 | 1482.00 | 1443.00 | 1391.00 | 1300.00 | 1346.00 | 1305.00 | 1264.00 | NA | NA | NA | NA | NA | NA | NA | NA | NA | |
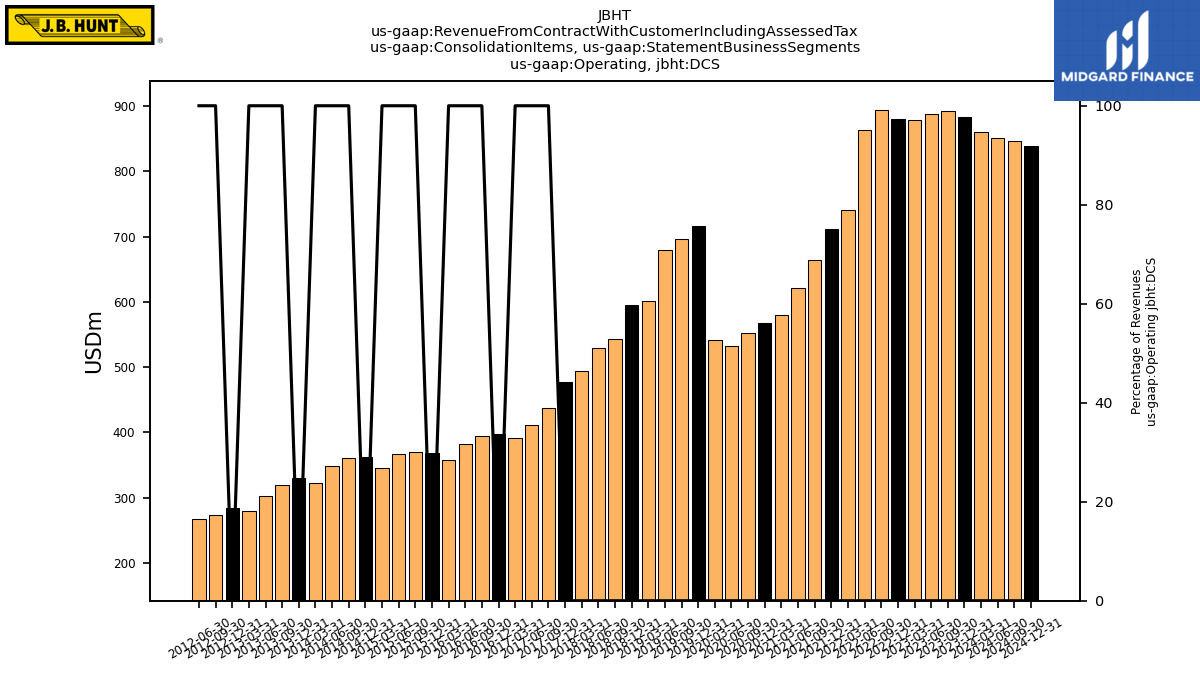
| Operating,DCS | 860.00 | 884.00 | 892.00 | 888.00 | 879.00 | 880.00 | 894.00 | 863.00 | 741.00 | 712.00 | 665.00 | 621.00 | 580.00 | 568.00 | 553.00 | 533.00 | 542.00 | 717.00 | 696.00 | 680.00 | 602.00 | 596.00 | 543.00 | 530.00 | 494.00 | 477.00 | 438.00 | 412.00 | 392.00 | 398.00 | 394.00 | 383.00 | 358.00 | 369.00 | 370.00 | 367.00 | 345.00 | 363.00 | 361.00 | 348.00 | 322.00 | 330.00 | 319.00 | 303.00 | 279.00 | 284.00 | 273.00 | 267.00 | NA | NA | NA | NA | NA | NA | NA | NA | NA | |
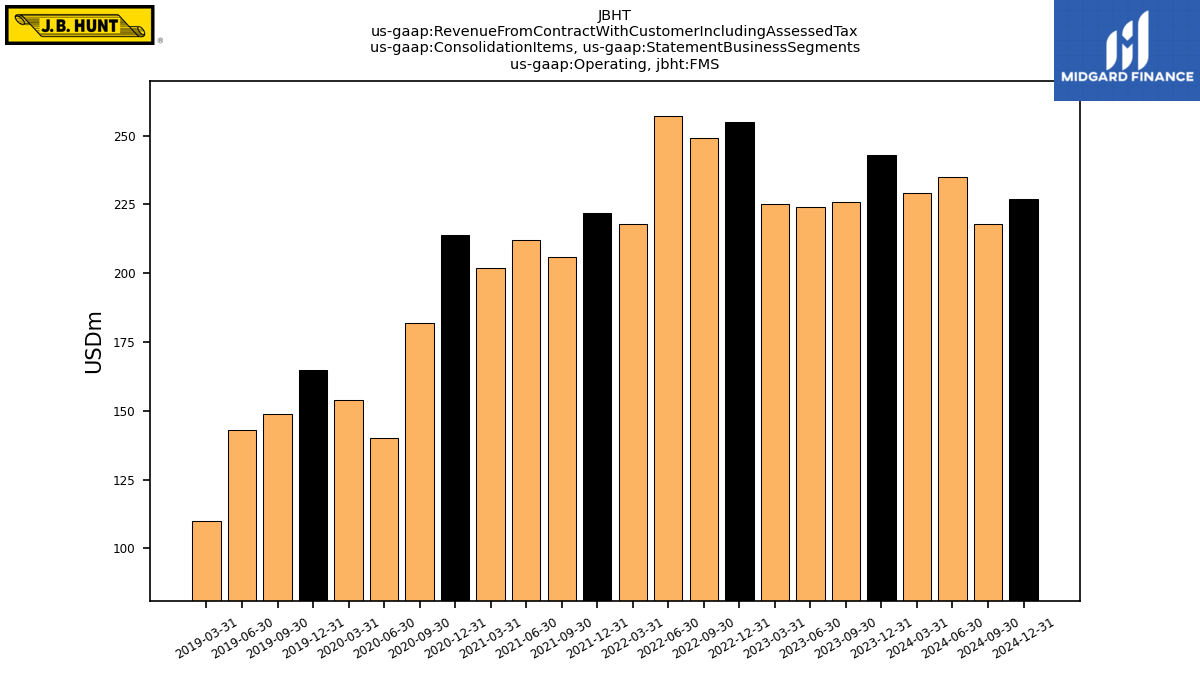
| Operating,FMS | 229.00 | 243.00 | 226.00 | 224.00 | 225.00 | 255.00 | 249.00 | 257.00 | 218.00 | 222.00 | 206.00 | 212.00 | 202.00 | 214.00 | 182.00 | 140.00 | 154.00 | 165.00 | 149.00 | 143.00 | 110.00 | NA | NA | NA | NA | NA | NA | NA | NA | NA | NA | NA | NA | NA | NA | NA | NA | NA | NA | NA | NA | NA | NA | NA | NA | NA | NA | NA | NA | NA | NA | NA | NA | NA | NA | NA | NA | |
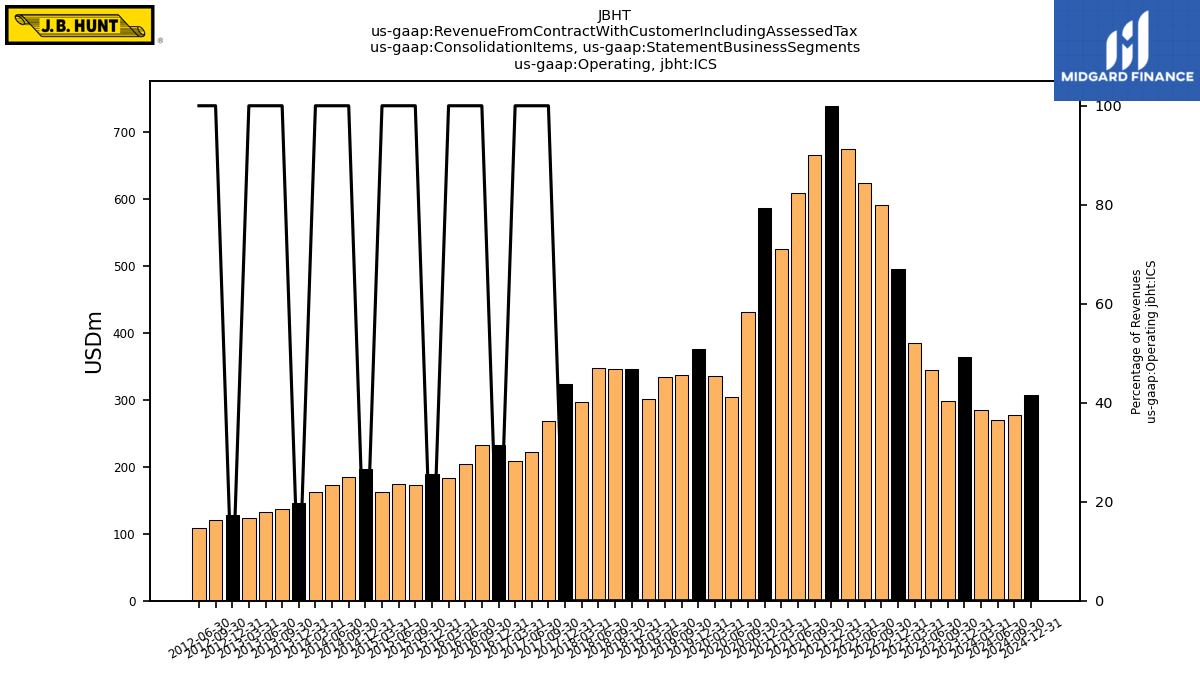
| Operating,ICS | 285.00 | 364.00 | 298.00 | 344.00 | 385.00 | 496.00 | 591.00 | 623.00 | 675.00 | 739.00 | 666.00 | 608.00 | 525.00 | 587.00 | 431.00 | 304.00 | 335.00 | 376.00 | 337.00 | 334.00 | 301.00 | 346.00 | 346.00 | 347.00 | 296.00 | 324.00 | 269.00 | 222.00 | 209.00 | 232.00 | 233.00 | 204.00 | 183.00 | 189.00 | 173.00 | 174.00 | 163.00 | 197.00 | 185.00 | 173.00 | 163.00 | 146.00 | 137.00 | 132.00 | 123.00 | 128.00 | 121.00 | 109.00 | NA | NA | NA | NA | NA | NA | NA | NA | NA | |
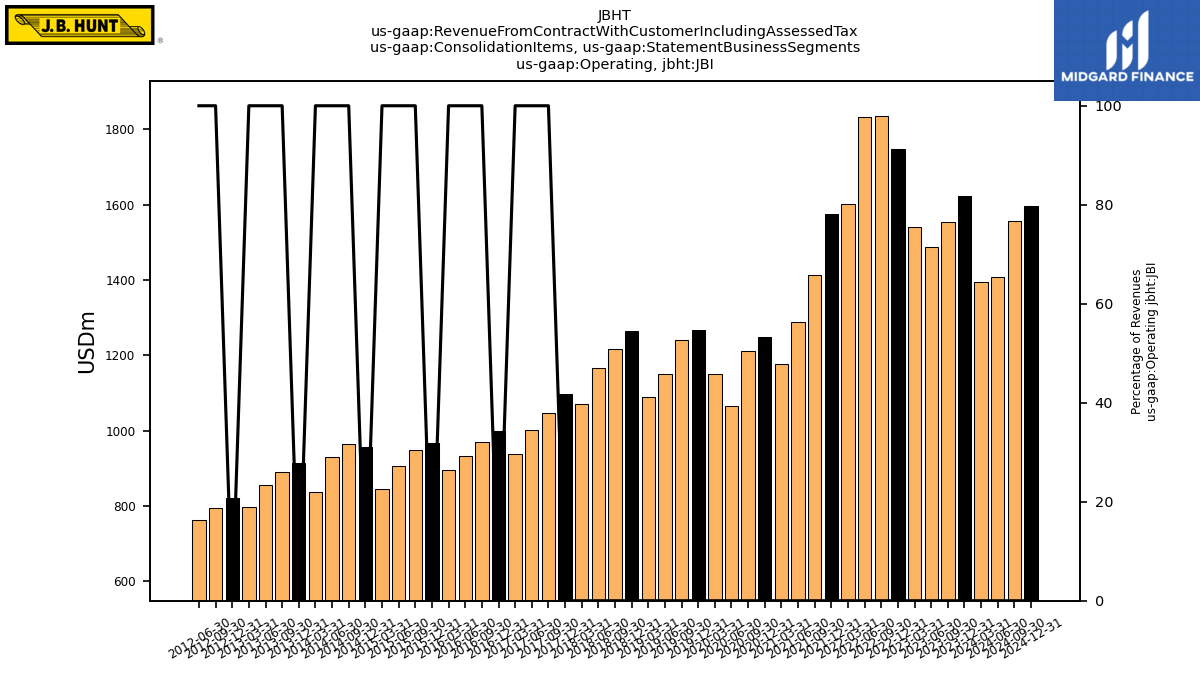
| Operating,JBI | 1396.00 | 1624.00 | 1555.00 | 1489.00 | 1540.00 | 1749.00 | 1837.00 | 1833.00 | 1603.00 | 1575.00 | 1413.00 | 1289.00 | 1177.00 | 1249.00 | 1211.00 | 1065.00 | 1150.00 | 1268.00 | 1240.00 | 1150.00 | 1088.00 | 1264.00 | 1218.00 | 1165.00 | 1070.00 | 1097.00 | 1048.00 | 1001.00 | 937.00 | 998.00 | 970.00 | 933.00 | 895.00 | 967.00 | 949.00 | 905.00 | 844.00 | 957.00 | 964.00 | 931.00 | 836.00 | 915.00 | 890.00 | 855.00 | 796.00 | 821.00 | 794.00 | 762.00 | NA | NA | NA | NA | NA | NA | NA | NA | NA | |
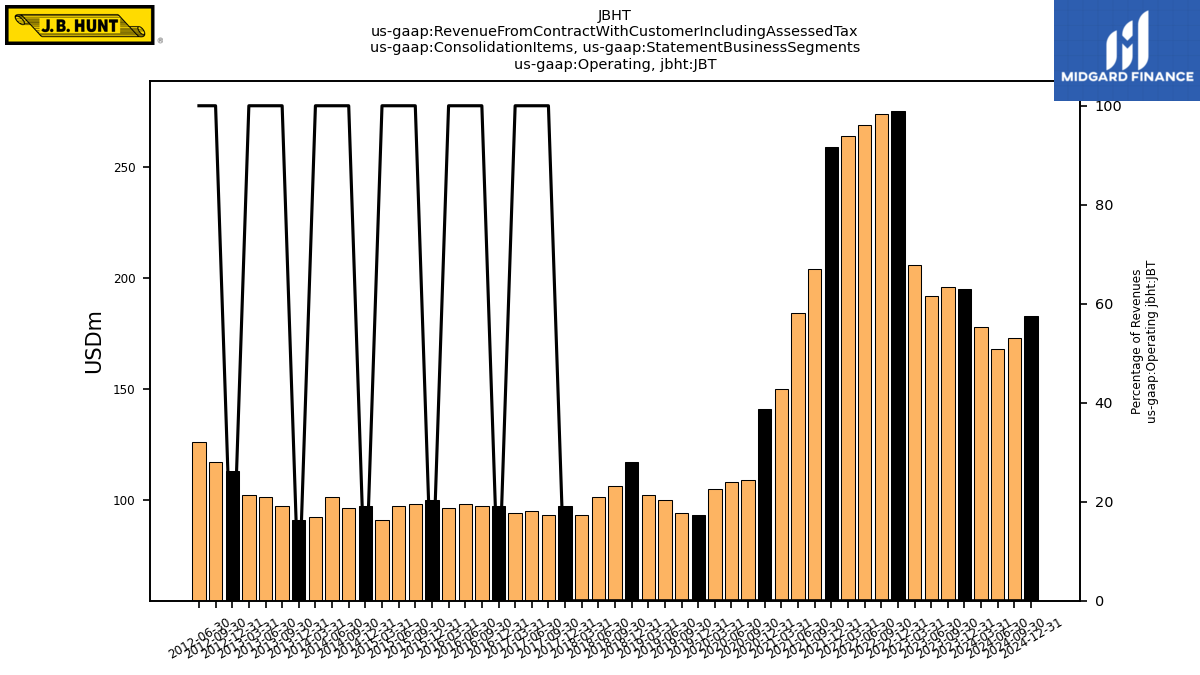
| Operating,JBT | 178.00 | 195.00 | 196.00 | 192.00 | 206.00 | 275.00 | 274.00 | 269.00 | 264.00 | 259.00 | 204.00 | 184.00 | 150.00 | 141.00 | 109.00 | 108.00 | 105.00 | 93.00 | 94.00 | 100.00 | 102.00 | 117.00 | 106.00 | 101.00 | 93.00 | 97.00 | 93.00 | 95.00 | 94.00 | 97.00 | 97.00 | 98.00 | 96.00 | 100.00 | 98.00 | 97.00 | 91.00 | 97.00 | 96.00 | 101.00 | 92.00 | 91.00 | 97.00 | 101.00 | 102.00 | 113.00 | 117.00 | 126.00 | NA | NA | NA | NA | NA | NA | NA | NA | NA | |
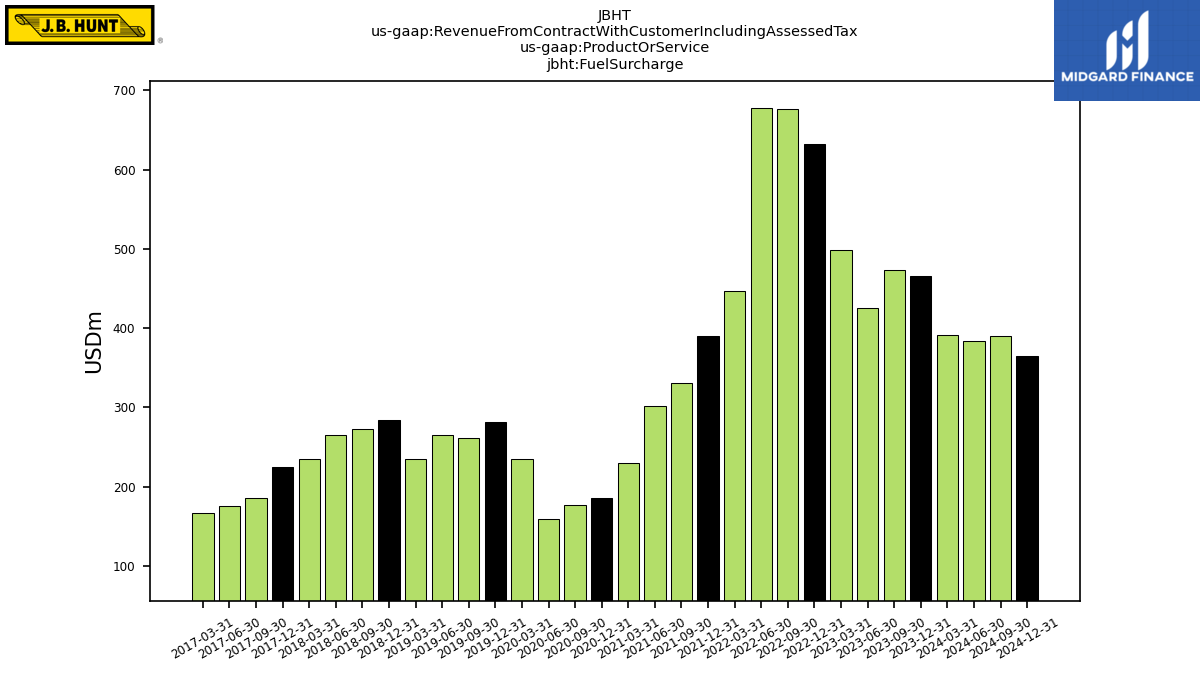
| Fuel Surcharge | 391.51 | 466.27 | 472.86 | 425.06 | 498.13 | 632.35 | 676.15 | 677.77 | 446.37 | 390.48 | 330.87 | 301.39 | 230.12 | 185.88 | 176.47 | 159.44 | 235.13 | 281.83 | 261.17 | 265.38 | 234.29 | 284.17 | 273.11 | 264.64 | 235.31 | 224.50 | 185.95 | 175.86 | 167.39 | NA | NA | NA | NA | NA | NA | NA | NA | NA | NA | NA | NA | NA | NA | NA | NA | NA | NA | NA | NA | NA | NA | NA | NA | NA | NA | NA | NA | |
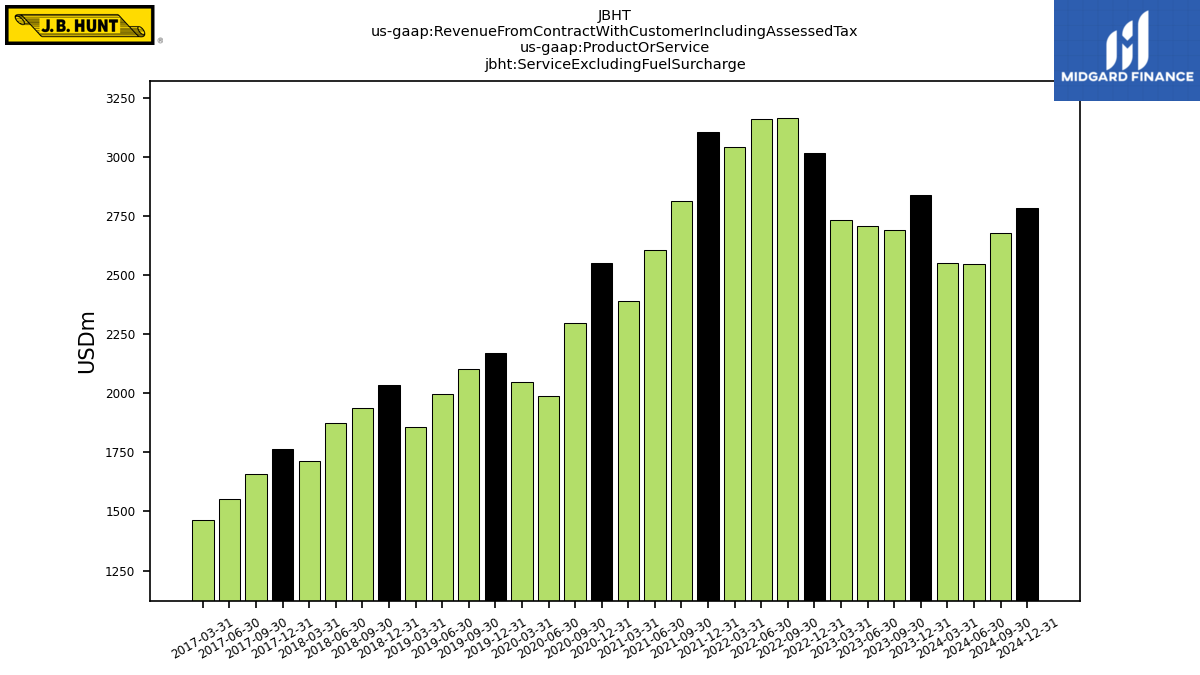
| Service Excluding Fuel Surcharge | 2552.49 | 2837.43 | 2690.89 | 2707.56 | 2731.45 | 3017.28 | 3162.11 | 3159.76 | 3042.22 | 3106.49 | 2813.94 | 2606.98 | 2388.03 | 2551.78 | 2296.05 | 1986.13 | 2045.69 | 2168.50 | 2102.49 | 1996.27 | 1855.34 | 2033.67 | 1936.65 | 1874.39 | 1712.93 | 1765.66 | 1657.38 | 1551.05 | 1461.77 | NA | NA | NA | NA | NA | NA | NA | NA | NA | NA | NA | NA | NA | NA | NA | NA | NA | NA | NA | NA | NA | NA | NA | NA | NA | NA | NA | NA |