
| 2023-11-30 | 2023-08-31 | 2023-05-31 | 2023-02-28 | 2022-11-30 | 2022-08-31 | 2022-05-31 | 2022-02-28 | 2021-11-30 | 2021-08-31 | 2021-05-31 | 2021-02-28 | 2020-11-30 | 2020-08-31 | 2020-05-31 | 2020-02-29 | 2019-11-30 | 2019-08-31 | 2019-05-31 | 2019-02-28 | 2018-09-30 | 2018-06-30 | 2018-03-31 | 2017-12-31 | 2017-09-30 | 2017-06-30 | 2017-03-31 | 2016-12-31 | 2016-09-30 | 2016-06-30 | 2016-03-31 | 2015-12-31 | 2015-09-30 | 2015-06-30 | 2015-03-31 | 2014-12-31 | 2014-09-30 | 2014-06-30 | 2014-03-31 | 2013-12-31 | 2013-09-30 | 2013-06-30 | 2013-03-31 | 2012-12-31 | 2012-09-30 | 2012-06-30 | 2012-03-31 | 2011-12-31 | 2011-09-30 | 2011-06-30 | 2011-03-31 | 2010-12-31 | 2010-09-30 | 2010-06-30 | 2010-03-31 | 2009-12-31 | 2009-09-30 | 2009-06-30 | 2009-03-31 | ||
|---|---|---|---|---|---|---|---|---|---|---|---|---|---|---|---|---|---|---|---|---|---|---|---|---|---|---|---|---|---|---|---|---|---|---|---|---|---|---|---|---|---|---|---|---|---|---|---|---|---|---|---|---|---|---|---|---|---|---|---|---|
| Common Stock Value | NA | NA | 231.41 | 233.53 | 226.13 | 228.81 | 232.32 | 240.17 | 243.54 | 245.56 | 247.03 | 246.70 | 249.75 | 259.25 | 267.11 | 277.11 | 291.64 | 299.87 | 290.69 | 298.31 | 331.42 | 333.31 | 357.22 | 356.23 | 356.19 | 358.64 | 359.82 | 359.43 | 359.67 | 360.40 | 362.33 | 362.62 | 362.29 | 366.62 | 366.72 | 367.50 | 368.46 | 368.54 | 363.96 | 364.54 | 364.57 | 364.38 | 363.94 | 244.58 | 244.58 | 244.58 | 244.58 | 244.58 | 244.58 | 244.57 | 244.38 | 243.81 | NA | NA | NA | 243.29 | NA | NA | NA | |
| Weighted Average Number Of Diluted Shares Outstanding | NA | 232.04 | 245.41 | 248.09 | NA | 251.24 | 251.98 | 266.57 | NA | 271.40 | 271.09 | 272.88 | 277.34 | 285.14 | 286.76 | 308.28 | 316.57 | 311.90 | 312.53 | 318.75 | 350.31 | 356.07 | 373.46 | 366.00 | 370.20 | 371.55 | 375.72 | 374.69 | 374.57 | 372.56 | 372.37 | 369.84 | 372.55 | 373.66 | 377.71 | 373.62 | 373.38 | 373.18 | 377.35 | 368.26 | 367.69 | 367.84 | 281.59 | 248.92 | 248.91 | 244.58 | 248.94 | 248.87 | 244.58 | 249.03 | 244.62 | 247.85 | 247.57 | 243.31 | 247.59 | 243.17 | 247.71 | 248.13 | 238.50 | |
| Weighted Average Number Of Shares Outstanding Basic | NA | 228.35 | 242.57 | 239.10 | NA | 243.85 | 249.14 | 257.55 | NA | 263.09 | 263.28 | 266.39 | 272.90 | 280.69 | 286.76 | 302.41 | 310.27 | 310.29 | 307.01 | 315.18 | 341.43 | 352.05 | 356.58 | 366.00 | 367.83 | 369.21 | 369.27 | 369.30 | 370.40 | 372.56 | 372.37 | 369.84 | 372.55 | 373.65 | 373.54 | 373.62 | 373.35 | 371.98 | 368.49 | 368.15 | 367.64 | 367.75 | 275.74 | 244.58 | 244.58 | 244.58 | 244.58 | 244.58 | 244.58 | 244.52 | 244.08 | 243.55 | 243.32 | 243.31 | 243.29 | 243.17 | 243.24 | 241.09 | 238.50 | |
| Earnings Per Share Basic | 0.29 | 0.22 | 0.05 | 0.56 | 0.59 | 0.80 | 0.46 | 1.26 | 1.24 | 1.54 | 1.33 | 2.17 | 1.12 | 1.08 | 0.16 | 0.37 | 0.63 | 0.16 | 2.17 | 0.14 | 0.56 | 2.05 | 0.34 | -0.74 | 0.27 | 0.16 | 0.76 | 0.37 | 0.41 | 0.15 | -0.60 | 0.15 | -0.47 | 0.04 | 1.00 | -0.03 | 0.14 | 0.17 | 0.25 | 0.02 | 0.01 | 0.14 | 1.10 | 1.86 | 0.44 | -0.81 | 2.01 | 0.49 | -1.19 | 0.76 | 0.04 | 6.96 | 1.18 | -0.97 | 0.79 | -0.37 | 1.52 | 1.70 | -0.59 | |
| Earnings Per Share Diluted | 0.28 | 0.22 | 0.05 | 0.54 | 0.58 | 0.78 | 0.45 | 1.23 | 1.20 | 1.50 | 1.30 | 2.13 | 1.11 | 1.07 | 0.16 | 0.37 | 0.62 | 0.15 | 2.14 | 0.14 | 0.55 | 2.03 | 0.34 | -0.74 | 0.27 | 0.16 | 0.75 | 0.37 | 0.41 | 0.15 | -0.60 | 0.15 | -0.47 | 0.04 | 0.99 | -0.03 | 0.14 | 0.17 | 0.25 | 0.02 | 0.01 | 0.14 | 1.08 | 1.83 | 0.43 | -0.81 | 1.97 | 0.48 | -1.19 | 0.75 | 0.04 | 6.84 | 1.17 | -0.97 | 0.78 | -0.37 | 1.50 | 1.67 | -0.59 |
| 2023-11-30 | 2023-08-31 | 2023-05-31 | 2023-02-28 | 2022-11-30 | 2022-08-31 | 2022-05-31 | 2022-02-28 | 2021-11-30 | 2021-08-31 | 2021-05-31 | 2021-02-28 | 2020-11-30 | 2020-08-31 | 2020-05-31 | 2020-02-29 | 2019-11-30 | 2019-08-31 | 2019-05-31 | 2019-02-28 | 2018-09-30 | 2018-06-30 | 2018-03-31 | 2017-12-31 | 2017-09-30 | 2017-06-30 | 2017-03-31 | 2016-12-31 | 2016-09-30 | 2016-06-30 | 2016-03-31 | 2015-12-31 | 2015-09-30 | 2015-06-30 | 2015-03-31 | 2014-12-31 | 2014-09-30 | 2014-06-30 | 2014-03-31 | 2013-12-31 | 2013-09-30 | 2013-06-30 | 2013-03-31 | 2012-12-31 | 2012-09-30 | 2012-06-30 | 2012-03-31 | 2011-12-31 | 2011-09-30 | 2011-06-30 | 2011-03-31 | 2010-12-31 | 2010-09-30 | 2010-06-30 | 2010-03-31 | 2009-12-31 | 2009-09-30 | 2009-06-30 | 2009-03-31 | ||
|---|---|---|---|---|---|---|---|---|---|---|---|---|---|---|---|---|---|---|---|---|---|---|---|---|---|---|---|---|---|---|---|---|---|---|---|---|---|---|---|---|---|---|---|---|---|---|---|---|---|---|---|---|---|---|---|---|---|---|---|---|
| Revenue From Contract With Customer Excluding Assessed Tax | 859.84 | 844.96 | 753.40 | 775.01 | 1025.65 | 1177.20 | 1132.96 | 1407.04 | 1582.74 | 1634.07 | 1492.35 | 1432.64 | 1285.75 | 974.74 | 749.92 | 912.82 | 735.69 | 734.43 | 750.21 | 569.99 | 780.08 | 834.55 | 728.42 | 3195.88 | 3141.89 | 2989.72 | 3080.37 | 2942.92 | 2883.71 | 2841.32 | 2207.31 | 2686.26 | 2566.02 | 3055.12 | 3376.52 | 2884.42 | 3213.66 | 3097.83 | 3139.87 | 2921.92 | 2742.07 | 2914.74 | 2144.04 | 2511.14 | 2187.49 | 2141.64 | 2424.29 | 297.24 | 236.06 | 753.44 | 284.03 | 585.64 | 185.87 | 289.20 | 259.30 | 192.80 | 143.43 | 135.99 | 102.99 | |
| Revenues | 1968.74 | 2040.91 | 1651.18 | 1780.56 | 1751.39 | 1836.93 | 1618.15 | 1942.80 | 2029.37 | 2140.59 | 2166.33 | 2703.59 | 2060.64 | 1825.50 | 1377.53 | 1692.26 | 1430.12 | 1223.16 | 1510.37 | 1195.01 | 1458.98 | 1243.83 | 2946.47 | 3195.88 | 3141.89 | 2989.72 | 3080.37 | 2942.92 | 2883.71 | 2841.32 | 2207.31 | 2686.26 | 2566.02 | 3055.12 | 3376.52 | 2884.42 | 3213.66 | 3097.83 | 3139.87 | 2921.92 | 2742.07 | 2914.74 | 2144.04 | 2511.14 | 2187.49 | 2141.64 | 2424.29 | 297.24 | 236.06 | 753.44 | 284.03 | 585.64 | 185.87 | 289.20 | 259.30 | 192.80 | 143.43 | 135.99 | 102.99 | |
| Revenues Net Of Interest Expense | 1197.21 | 1182.11 | 1037.61 | 1283.49 | 1352.95 | 1524.89 | 1369.08 | 1731.91 | 1808.90 | 1938.98 | 1950.51 | 2486.94 | 1860.79 | 1616.17 | 1147.59 | 1386.33 | 1106.10 | 856.78 | 1101.66 | 828.44 | 1150.85 | 911.16 | 2680.79 | 2939.51 | 2896.52 | 2732.38 | 2867.98 | 2745.78 | 2676.38 | 2625.36 | 2015.11 | 2496.22 | 2366.10 | 2839.46 | 3184.68 | 2688.36 | 3003.64 | 2852.05 | 2943.31 | 2920.82 | 2565.08 | 2705.15 | 2297.61 | 2683.19 | 2216.92 | 1746.04 | NA | NA | NA | NA | NA | NA | NA | NA | NA | NA | NA | NA | NA | |
| Gain Loss On Investments | NA | -0.40 | -80.30 | -33.20 | NA | NA | NA | NA | NA | NA | NA | NA | NA | NA | NA | NA | NA | NA | NA | NA | NA | NA | NA | 1.75 | 19.71 | 1.11 | 0.46 | 21.34 | 0.06 | 7.41 | 0.73 | 38.54 | 0.24 | 9.09 | 15.09 | 9.49 | 3.85 | 11.66 | 5.39 | -0.42 | 4.99 | 9.50 | 229.89 | 8.91 | 154.21 | 2.53 | 424.94 | 102.26 | 7.28 | 529.64 | 2.30 | 9.08 | -0.06 | 71.41 | 99.07 | NA | NA | NA | NA | |
| Other Income | NA | NA | NA | NA | NA | 391.10 | 284.71 | 241.44 | NA | NA | NA | NA | NA | NA | NA | NA | NA | NA | NA | NA | NA | NA | 155.70 | 168.44 | 119.19 | 133.97 | 326.91 | 121.76 | 164.12 | 143.38 | 58.92 | 116.52 | 155.32 | 153.02 | 124.37 | 135.43 | 185.01 | 117.29 | 133.62 | 41.73 | 173.03 | 154.86 | 119.62 | -450.04 | 119.79 | 188.26 | 164.00 | NA | NA | NA | NA | NA | NA | NA | NA | NA | NA | NA | NA | |
| Cost Of Goods And Services Sold | 23.29 | 1.62 | 2.36 | 2.17 | 91.28 | 123.44 | 130.45 | 95.67 | 79.95 | 151.51 | 143.85 | 95.56 | 102.72 | 82.66 | 80.77 | 72.44 | 86.53 | 85.77 | 80.42 | 66.92 | 84.88 | 90.69 | 81.94 | 70.12 | 71.60 | 69.98 | NA | NA | NA | NA | NA | NA | NA | NA | NA | NA | NA | NA | NA | NA | NA | NA | NA | NA | NA | NA | NA | NA | NA | NA | NA | NA | NA | NA | NA | NA | NA | NA | NA | |
| Costs And Expenses | NA | NA | NA | NA | NA | 1218.21 | 1180.84 | 1309.60 | 1350.18 | 1358.19 | 1452.84 | 1675.59 | 1433.29 | 1208.98 | 1065.36 | 1160.68 | 954.78 | 915.80 | 940.35 | 806.44 | 897.02 | 907.00 | 2606.24 | 2658.01 | 2726.55 | 2621.80 | 2341.31 | 2562.91 | 2462.97 | 2537.79 | 2337.12 | 2470.84 | 2662.52 | 2868.81 | 2638.03 | 2754.54 | 2914.40 | 2780.78 | 2823.57 | 2845.44 | 2562.56 | 2659.70 | 2008.79 | 2119.20 | 2045.36 | 2070.05 | 2065.84 | 233.80 | 217.23 | 234.25 | 204.50 | 286.09 | 244.55 | 208.91 | 211.46 | NA | NA | NA | NA | |
| General And Administrative Expense | NA | NA | NA | NA | NA | 398.22 | 328.28 | 285.26 | 387.69 | 277.26 | 341.56 | 271.94 | 294.29 | 237.71 | 249.12 | 297.84 | 290.73 | 268.74 | 229.06 | 221.11 | 245.18 | 236.56 | 234.20 | 241.60 | 208.04 | 186.69 | 181.28 | 194.64 | 239.16 | 186.26 | 187.25 | 214.30 | 217.02 | 156.53 | 166.98 | 185.29 | 263.99 | 187.42 | 192.42 | 217.24 | 232.93 | 221.51 | 81.27 | 86.22 | 56.69 | 59.94 | 76.25 | 64.62 | 57.59 | 51.10 | 44.54 | 94.07 | 69.13 | 42.86 | 42.37 | NA | NA | NA | NA | |
| Interest Expense | 771.53 | 858.81 | 613.57 | 497.07 | 1141.81 | 10.22 | 9.31 | 9.09 | 17.26 | 19.52 | 19.94 | 20.37 | 20.64 | 21.51 | 21.16 | 21.55 | 17.36 | 23.66 | 23.14 | 23.02 | 28.84 | 24.28 | 23.61 | 25.32 | 27.32 | 27.83 | 27.38 | 40.56 | 23.12 | 22.71 | 22.32 | 21.34 | 28.95 | 30.67 | 30.45 | 29.95 | 29.50 | 29.14 | 28.58 | 25.20 | 17.23 | 21.21 | 21.32 | 21.29 | 21.11 | 21.37 | 28.87 | 27.52 | 27.54 | 27.84 | 28.98 | 30.48 | 31.35 | 31.49 | 31.49 | NA | NA | NA | NA | |
| Interest Paid Net | 682.37 | 824.12 | 348.57 | 493.00 | 283.71 | 329.21 | 230.15 | 321.01 | 198.34 | 293.00 | 202.91 | 242.03 | 199.51 | 296.84 | 218.17 | 365.84 | 305.84 | 448.57 | 409.39 | 399.35 | 404.77 | 331.60 | 322.77 | 283.17 | 301.06 | 287.75 | 248.21 | 230.03 | 261.25 | 270.56 | 195.30 | 273.79 | 249.45 | 252.25 | 204.77 | 204.61 | 316.19 | 251.23 | 266.18 | 201.30 | 282.63 | 201.18 | 37.59 | 4.75 | 36.98 | 5.80 | 56.47 | 2.12 | 52.42 | 2.76 | 55.47 | 3.46 | 58.82 | 2.73 | 58.84 | NA | NA | NA | NA | |
| Allocated Share Based Compensation Expense | 151.60 | 75.00 | 67.50 | 87.50 | 218.00 | 10.00 | 13.30 | 9.70 | 390.30 | 7.00 | 10.10 | 20.70 | NA | NA | NA | NA | NA | NA | NA | NA | NA | NA | NA | NA | NA | NA | NA | NA | NA | NA | NA | NA | NA | NA | NA | NA | NA | NA | NA | NA | NA | NA | NA | NA | NA | NA | NA | NA | NA | NA | NA | NA | NA | NA | NA | NA | NA | NA | NA | |
| Income Loss From Continuing Operations Before Income Taxes Minority Interest And Income Loss From Equity Method Investments | NA | NA | NA | NA | NA | 306.68 | 188.24 | 422.32 | 458.71 | 580.79 | 497.67 | 811.35 | 427.50 | 407.19 | 82.23 | 225.65 | 151.32 | -59.02 | 161.31 | 22.00 | 253.82 | 4.16 | 74.55 | 281.50 | 169.97 | 110.58 | 526.67 | 182.87 | 213.41 | 87.57 | -322.01 | 25.37 | -296.43 | -29.34 | 546.66 | -66.18 | 89.24 | 71.28 | 119.75 | -72.25 | 32.84 | 48.95 | 323.12 | NA | NA | NA | NA | NA | NA | NA | NA | NA | NA | NA | NA | NA | NA | NA | NA | |
| Income Tax Expense Benefit | 16.83 | 37.12 | 9.23 | 28.69 | 53.90 | 105.91 | 49.68 | 64.36 | 91.97 | 145.70 | 120.82 | 218.24 | 113.53 | 107.40 | 31.96 | 45.77 | 38.67 | -36.13 | -488.80 | 2.30 | 90.39 | 9.60 | -32.49 | 542.91 | 63.26 | 50.62 | 104.17 | 62.92 | 73.70 | 68.85 | -83.36 | 2.11 | -90.27 | -14.57 | 212.68 | 2.09 | 59.91 | 43.77 | 50.19 | 24.48 | 16.18 | 22.07 | 67.60 | 145.47 | 61.21 | 33.95 | 133.52 | 27.06 | 14.04 | 190.11 | 39.05 | -1150.25 | 3.54 | 4.67 | 2.70 | NA | NA | NA | NA | |
| Income Taxes Paid Net | 8.04 | 28.01 | 113.78 | 9.54 | 75.60 | 37.42 | 84.33 | 16.71 | 210.41 | 178.99 | 317.37 | 20.35 | 13.54 | -8.18 | 5.37 | -10.70 | -1.24 | 4.42 | 14.21 | 7.21 | 12.40 | 17.72 | -1.92 | 6.18 | -0.79 | 7.25 | 2.73 | 0.20 | 0.72 | -6.06 | -8.60 | -4.88 | 0.76 | 3.80 | 0.83 | 4.41 | -2.98 | 9.81 | -1.36 | 33.53 | 36.30 | -1.63 | 7.73 | 0.73 | 13.47 | 8.20 | 14.94 | 1.76 | 11.38 | 0.83 | 12.21 | 2.16 | 17.23 | 0.53 | 2.31 | NA | NA | NA | NA | |
| Profit Loss | 70.43 | 53.95 | 8.68 | 129.32 | 140.94 | 195.94 | 116.86 | 327.98 | 333.59 | 407.92 | 353.32 | 582.55 | 308.00 | 304.84 | 43.55 | 112.02 | 193.88 | 49.39 | 672.28 | 47.02 | 182.30 | 748.94 | 139.15 | -251.91 | 136.77 | 74.06 | 293.92 | 166.10 | 176.21 | 70.61 | -218.60 | 42.83 | -180.18 | 15.03 | 374.43 | -19.62 | 60.26 | 66.45 | 91.94 | -11.02 | 14.38 | 58.54 | 300.29 | 450.84 | 114.33 | -187.77 | 487.24 | 119.06 | -291.35 | 186.46 | 10.79 | 1695.04 | 289.97 | -236.28 | 191.50 | NA | NA | NA | NA | |
| Other Comprehensive Income Loss Net Of Tax | 2.71 | -28.20 | 51.05 | -41.69 | -29.05 | -33.39 | 13.33 | 41.84 | -14.17 | 6.03 | -17.45 | -57.63 | -92.51 | -61.88 | 123.87 | 14.64 | -6.59 | -23.63 | -581.44 | 50.33 | -27.23 | -42.34 | 12.18 | 18.44 | 13.04 | 34.80 | 4.94 | -49.98 | -52.59 | 19.27 | -44.79 | 22.94 | -9.21 | -2.05 | -19.96 | -86.18 | -28.04 | 3.25 | 20.01 | 50.90 | 46.20 | -65.92 | -198.26 | 186.42 | -23.02 | -129.86 | -240.84 | NA | NA | NA | NA | NA | NA | NA | NA | NA | NA | NA | NA | |
| Net Income Loss | NA | 57.72 | NA | NA | NA | 195.46 | NA | NA | NA | NA | NA | NA | 307.27 | 304.41 | 44.92 | 113.01 | 195.54 | 48.48 | 670.76 | 44.81 | 192.63 | 725.53 | 124.53 | -271.60 | 99.35 | 58.19 | 281.41 | 137.17 | 154.36 | 57.29 | -222.88 | 55.59 | -173.17 | 16.41 | 380.76 | -9.76 | 54.68 | 65.07 | 94.32 | 8.55 | 2.97 | 52.61 | 305.10 | 454.17 | 106.67 | -197.25 | 490.88 | 119.44 | -291.02 | 186.31 | 10.51 | 1695.22 | 287.75 | -235.14 | 191.48 | -90.94 | 370.20 | 411.02 | -140.01 | |
| Comprehensive Income Net Of Tax | 68.34 | 23.22 | 63.45 | 91.93 | 111.20 | 162.07 | 127.34 | 369.28 | 310.74 | 413.48 | 335.14 | 524.81 | 214.76 | 242.53 | 168.79 | 127.65 | 188.95 | 24.85 | 89.32 | 95.14 | 165.41 | 683.18 | 136.70 | -253.16 | 112.39 | 93.00 | 286.35 | 87.19 | 101.77 | 76.56 | -267.67 | 78.53 | -182.38 | 14.35 | 360.80 | -95.94 | 26.64 | 68.32 | 114.33 | 59.45 | 49.17 | -13.31 | 106.84 | 640.59 | 83.66 | -327.11 | 250.03 | 207.68 | -781.59 | -121.25 | -54.55 | NA | NA | NA | NA | NA | NA | NA | NA | |
| Preferred Stock Dividends Income Statement Impact | 6.30 | 6.30 | 0.00 | 2.02 | 2.07 | 2.07 | 2.07 | 2.07 | 1.85 | 1.85 | 1.63 | 1.63 | 1.40 | 1.40 | 1.40 | 1.42 | 1.28 | 1.27 | 1.28 | 1.28 | 1.28 | 1.17 | 1.17 | 1.17 | 1.17 | 1.01 | 1.02 | 1.02 | 1.02 | 1.01 | 1.02 | 1.02 | 1.02 | 1.01 | 1.02 | 1.01 | 1.02 | 1.01 | 1.02 | 1.02 | 1.03 | 1.01 | 0.34 | NA | NA | NA | NA | NA | NA | NA | NA | NA | NA | NA | NA | NA | NA | NA | NA | |
| Net Income Loss Available To Common Stockholders Basic | 64.55 | 51.35 | 12.39 | 133.09 | 139.90 | 194.89 | 113.65 | 325.47 | 322.93 | 404.97 | 350.42 | 579.22 | 305.39 | 302.46 | 44.63 | 112.31 | 194.63 | 48.16 | 666.68 | 44.56 | 191.58 | 721.66 | 124.03 | -270.52 | 98.98 | 57.97 | 280.27 | 136.60 | 152.30 | 56.52 | -222.88 | 54.76 | -173.17 | 16.13 | 373.67 | -9.36 | 53.41 | 63.52 | 91.92 | 8.24 | 2.88 | 51.02 | 303.11 | 454.17 | 106.67 | -197.25 | 490.88 | NA | NA | NA | NA | NA | NA | NA | NA | NA | NA | NA | NA | |
| Net Income Loss Available To Common Stockholders Diluted | 64.55 | 51.35 | 12.39 | 135.05 | 141.97 | 196.96 | 113.64 | 327.58 | 324.82 | 406.87 | 352.09 | 580.89 | 306.81 | 303.88 | 44.62 | 113.73 | 195.87 | 48.15 | 668.00 | 44.55 | 192.86 | 721.70 | 125.20 | -273.74 | 98.98 | 57.97 | 281.29 | 136.58 | 153.32 | 56.51 | -222.88 | 54.74 | -173.17 | 16.11 | 374.74 | -9.40 | 53.40 | 63.60 | 93.58 | 9.87 | 2.82 | 50.99 | 304.12 | 454.82 | 107.33 | -197.25 | 491.53 | 119.44 | -291.02 | 186.96 | 10.51 | 1696.18 | 288.60 | -235.14 | 192.44 | NA | NA | NA | NA | |
| Noninterest Expense | 1109.94 | 1091.04 | 1019.69 | 1125.47 | 1243.24 | 1207.99 | 1171.53 | 1300.51 | NA | NA | NA | NA | NA | NA | NA | NA | NA | NA | NA | NA | NA | NA | NA | NA | NA | NA | NA | NA | NA | NA | NA | NA | NA | NA | NA | NA | NA | NA | NA | NA | NA | NA | NA | NA | NA | NA | NA | NA | NA | NA | NA | NA | NA | NA | NA | NA | NA | NA | NA |
| 2023-11-30 | 2023-08-31 | 2023-05-31 | 2023-02-28 | 2022-11-30 | 2022-08-31 | 2022-05-31 | 2022-02-28 | 2021-11-30 | 2021-08-31 | 2021-05-31 | 2021-02-28 | 2020-11-30 | 2020-08-31 | 2020-05-31 | 2020-02-29 | 2019-11-30 | 2019-08-31 | 2019-05-31 | 2019-02-28 | 2018-09-30 | 2018-06-30 | 2018-03-31 | 2017-12-31 | 2017-09-30 | 2017-06-30 | 2017-03-31 | 2016-12-31 | 2016-09-30 | 2016-06-30 | 2016-03-31 | 2015-12-31 | 2015-09-30 | 2015-06-30 | 2015-03-31 | 2014-12-31 | 2014-09-30 | 2014-06-30 | 2014-03-31 | 2013-12-31 | 2013-09-30 | 2013-06-30 | 2013-03-31 | 2012-12-31 | 2012-09-30 | 2012-06-30 | 2012-03-31 | 2011-12-31 | 2011-09-30 | 2011-06-30 | 2011-03-31 | 2010-12-31 | 2010-09-30 | 2010-06-30 | 2010-03-31 | 2009-12-31 | 2009-09-30 | 2009-06-30 | 2009-03-31 | ||
|---|---|---|---|---|---|---|---|---|---|---|---|---|---|---|---|---|---|---|---|---|---|---|---|---|---|---|---|---|---|---|---|---|---|---|---|---|---|---|---|---|---|---|---|---|---|---|---|---|---|---|---|---|---|---|---|---|---|---|---|---|
| Assets | 57905.16 | 56044.56 | 53740.01 | 52032.94 | 51057.68 | 55229.81 | 57213.81 | 60036.45 | 60404.11 | 58037.40 | 57978.97 | 56868.92 | 53118.35 | 51773.99 | 50283.21 | 51778.12 | 49460.23 | 49263.21 | 48523.94 | 48959.35 | 48948.67 | 49401.80 | 49001.49 | 47169.11 | 47666.94 | 48376.10 | 45980.00 | 45071.31 | 46106.01 | 45041.93 | 43134.36 | 46339.81 | 50513.74 | 52555.96 | 52322.69 | 52623.91 | 52727.80 | 51407.74 | 51130.01 | 47866.78 | 45541.07 | 46179.28 | 47349.29 | 9349.12 | 8740.18 | 8603.28 | 8986.64 | 9263.19 | 8215.05 | 9192.18 | 9224.39 | 9350.30 | NA | NA | NA | 6762.36 | NA | NA | NA | |
| Liabilities | 48102.62 | 46279.02 | 43974.35 | 42219.71 | 40630.74 | 44731.06 | 46701.83 | 49348.50 | 49674.07 | 47473.44 | 47724.09 | 46934.58 | 43530.15 | 42180.26 | 40774.84 | 42242.46 | 39706.94 | 39063.36 | 38502.64 | 38858.02 | 38155.53 | 38695.11 | 38173.55 | 36478.54 | 36511.79 | 37262.99 | 34920.68 | 34305.85 | 35397.46 | 34418.58 | 32551.41 | 35557.29 | 39783.62 | 41532.82 | 41308.78 | 41942.20 | 41922.70 | 40679.22 | 40577.00 | 37327.65 | 35084.84 | 35807.57 | 36606.58 | 2339.83 | 2310.94 | 2261.59 | 2323.73 | 2849.02 | 2186.65 | 2386.70 | 2316.27 | 2386.92 | NA | NA | NA | 2387.87 | NA | NA | NA | |
| Liabilities And Stockholders Equity | 57905.16 | 56044.56 | 53740.01 | 52032.94 | 51057.68 | 55229.81 | 57213.81 | 60036.45 | 60404.11 | 58037.40 | 57978.97 | 56868.92 | 53118.35 | 51773.99 | 50283.21 | 51778.12 | 49460.23 | 49263.21 | 48523.94 | 48959.35 | 48948.67 | 49401.80 | 49001.49 | 47169.11 | 47666.94 | 48376.10 | 45980.00 | 45071.31 | 46106.01 | 45041.93 | 43134.36 | 46339.81 | 50513.74 | 52555.96 | 52322.69 | 52623.91 | 52727.80 | 51407.74 | 51130.01 | 47866.78 | 45541.07 | 46179.28 | 47349.29 | 9349.12 | 8740.18 | 8603.28 | 8986.64 | 9263.19 | 8215.05 | 9192.18 | 9224.39 | 9350.30 | NA | NA | NA | 6762.36 | NA | NA | NA | |
| Stockholders Equity | 9709.83 | 9698.85 | 9695.66 | 9755.24 | 10232.85 | 10292.53 | 10300.18 | 10490.30 | 10553.75 | 10381.88 | 10072.63 | 9745.86 | 9403.89 | 9410.67 | 9326.55 | 9348.95 | 9579.70 | 10020.44 | 9853.87 | 9932.95 | 10621.18 | 10538.19 | 10259.08 | 10105.96 | 10451.91 | 10491.31 | 10398.16 | 10128.10 | 10059.67 | 10086.52 | 10091.31 | 10401.21 | 10365.48 | 10655.01 | 10651.84 | 10302.16 | 10385.11 | 10350.68 | 10187.78 | 10102.46 | 10101.35 | 10023.61 | 10041.56 | 6767.27 | 6191.94 | 6092.28 | 6427.68 | 6174.40 | 6023.44 | 6800.73 | 6902.67 | 6956.76 | NA | NA | NA | 4361.65 | NA | NA | NA |
| 2023-11-30 | 2023-08-31 | 2023-05-31 | 2023-02-28 | 2022-11-30 | 2022-08-31 | 2022-05-31 | 2022-02-28 | 2021-11-30 | 2021-08-31 | 2021-05-31 | 2021-02-28 | 2020-11-30 | 2020-08-31 | 2020-05-31 | 2020-02-29 | 2019-11-30 | 2019-08-31 | 2019-05-31 | 2019-02-28 | 2018-09-30 | 2018-06-30 | 2018-03-31 | 2017-12-31 | 2017-09-30 | 2017-06-30 | 2017-03-31 | 2016-12-31 | 2016-09-30 | 2016-06-30 | 2016-03-31 | 2015-12-31 | 2015-09-30 | 2015-06-30 | 2015-03-31 | 2014-12-31 | 2014-09-30 | 2014-06-30 | 2014-03-31 | 2013-12-31 | 2013-09-30 | 2013-06-30 | 2013-03-31 | 2012-12-31 | 2012-09-30 | 2012-06-30 | 2012-03-31 | 2011-12-31 | 2011-09-30 | 2011-06-30 | 2011-03-31 | 2010-12-31 | 2010-09-30 | 2010-06-30 | 2010-03-31 | 2009-12-31 | 2009-09-30 | 2009-06-30 | 2009-03-31 | ||
|---|---|---|---|---|---|---|---|---|---|---|---|---|---|---|---|---|---|---|---|---|---|---|---|---|---|---|---|---|---|---|---|---|---|---|---|---|---|---|---|---|---|---|---|---|---|---|---|---|---|---|---|---|---|---|---|---|---|---|---|---|
| Cash And Cash Equivalents At Carrying Value | 8526.36 | 8817.36 | 8004.88 | 7508.51 | 9703.11 | 9477.54 | 8523.12 | 8500.78 | 10755.13 | 9480.91 | 8443.21 | 8648.96 | 9055.15 | 8426.83 | 6883.88 | 6710.66 | 7678.82 | 6011.35 | 5393.74 | 5517.12 | 4895.79 | 4741.06 | 5144.62 | 5275.48 | 5016.93 | 4661.94 | 4261.43 | 3807.56 | 3278.97 | 3030.94 | 2604.07 | 3638.65 | 3559.30 | 3491.03 | 3524.52 | 4276.77 | 4247.88 | 4186.73 | 3590.53 | 3907.59 | 4410.09 | 3553.64 | 3140.42 | 145.96 | 772.14 | 186.66 | 205.29 | 168.49 | 306.27 | 539.09 | 313.93 | 441.34 | NA | NA | NA | 130.47 | NA | NA | NA | |
| Cash Cash Equivalents Restricted Cash And Restricted Cash Equivalents | 9830.76 | 9578.90 | 8966.42 | 8572.35 | 10707.24 | 10519.47 | 9538.31 | 9424.05 | 11828.30 | 10072.40 | 9335.32 | 9210.23 | 9664.97 | 9397.89 | 7495.01 | 7193.95 | 8480.43 | 6681.78 | 5939.01 | 6278.42 | 5801.96 | 5447.78 | 5989.58 | 5774.51 | 5849.67 | 5511.43 | NA | 4597.11 | NA | NA | NA | 4462.71 | NA | NA | NA | NA | NA | NA | NA | NA | NA | NA | NA | NA | NA | NA | NA | NA | NA | NA | NA | NA | NA | NA | NA | NA | NA | NA | NA |
| 2023-11-30 | 2023-08-31 | 2023-05-31 | 2023-02-28 | 2022-11-30 | 2022-08-31 | 2022-05-31 | 2022-02-28 | 2021-11-30 | 2021-08-31 | 2021-05-31 | 2021-02-28 | 2020-11-30 | 2020-08-31 | 2020-05-31 | 2020-02-29 | 2019-11-30 | 2019-08-31 | 2019-05-31 | 2019-02-28 | 2018-09-30 | 2018-06-30 | 2018-03-31 | 2017-12-31 | 2017-09-30 | 2017-06-30 | 2017-03-31 | 2016-12-31 | 2016-09-30 | 2016-06-30 | 2016-03-31 | 2015-12-31 | 2015-09-30 | 2015-06-30 | 2015-03-31 | 2014-12-31 | 2014-09-30 | 2014-06-30 | 2014-03-31 | 2013-12-31 | 2013-09-30 | 2013-06-30 | 2013-03-31 | 2012-12-31 | 2012-09-30 | 2012-06-30 | 2012-03-31 | 2011-12-31 | 2011-09-30 | 2011-06-30 | 2011-03-31 | 2010-12-31 | 2010-09-30 | 2010-06-30 | 2010-03-31 | 2009-12-31 | 2009-09-30 | 2009-06-30 | 2009-03-31 | ||
|---|---|---|---|---|---|---|---|---|---|---|---|---|---|---|---|---|---|---|---|---|---|---|---|---|---|---|---|---|---|---|---|---|---|---|---|---|---|---|---|---|---|---|---|---|---|---|---|---|---|---|---|---|---|---|---|---|---|---|---|---|
| Accumulated Depreciation Depletion And Amortization Property Plant And Equipment | 551.50 | NA | NA | NA | 524.60 | NA | NA | NA | 526.00 | NA | NA | NA | NA | NA | NA | NA | NA | NA | NA | NA | NA | NA | NA | 611.46 | NA | NA | NA | 518.13 | NA | NA | NA | 538.68 | NA | NA | NA | 421.76 | NA | NA | NA | 413.78 | NA | NA | NA | 385.63 | NA | NA | NA | 369.37 | NA | NA | NA | 311.79 | NA | NA | NA | 251.90 | NA | NA | NA | |
| Amortization Of Intangible Assets | 2.30 | 2.30 | 2.30 | 2.40 | 2.40 | 2.50 | 2.50 | 3.50 | 3.50 | 3.60 | 3.60 | 3.60 | 3.80 | 3.70 | 3.90 | 3.80 | 4.00 | 4.00 | 3.30 | 3.30 | 3.30 | 3.30 | 14.60 | 14.60 | 15.40 | 14.50 | 13.70 | 16.30 | 15.80 | 15.60 | 15.80 | 15.60 | 15.80 | 16.20 | 16.30 | 16.60 | 16.30 | 16.70 | 16.70 | 20.40 | 20.90 | 20.00 | 13.50 | 13.90 | 13.60 | 12.90 | 13.20 | NA | NA | NA | NA | NA | NA | NA | NA | NA | NA | NA | NA | |
| Investments In Affiliates Subsidiaries Associates And Joint Ventures | 1239.35 | 1380.50 | 1412.54 | 1369.11 | 1426.82 | 1753.32 | 1803.54 | 1803.40 | 1745.79 | 1744.96 | 1728.12 | 1689.05 | 1686.56 | 1539.36 | 1559.79 | 1562.63 | 1652.96 | 2346.30 | 2415.89 | 2381.03 | 2450.90 | 2522.94 | 2233.07 | 2066.83 | 2350.98 | 2239.42 | 2122.48 | 2125.10 | 2105.09 | 1737.34 | 1843.47 | 1757.37 | 1703.75 | 1681.47 | 1762.71 | 1712.57 | 1509.00 | 1295.87 | 1490.74 | 1258.34 | 1075.45 | 991.98 | 1240.62 | 807.47 | NA | NA | NA | NA | NA | NA | NA | NA | NA | NA | NA | NA | NA | NA | NA | |
| Goodwill | 1847.86 | 1739.47 | 1738.19 | 1735.87 | 1736.11 | 1733.02 | 1739.76 | 1745.74 | 1745.10 | 1748.48 | 1751.51 | 1750.02 | 1746.31 | 1743.42 | 1736.49 | 1739.30 | 1739.98 | 1734.95 | 1701.30 | 1705.11 | 1703.13 | 1705.61 | 1723.95 | 1722.15 | 1718.46 | 1718.33 | 1715.26 | 1715.71 | 1729.78 | 1737.75 | 1729.30 | 1736.34 | 1740.23 | 1739.95 | 1741.14 | 1742.39 | 1749.37 | 1750.87 | 1750.64 | 1748.10 | 1747.86 | 1722.55 | 1738.74 | 24.20 | 18.80 | 18.80 | 19.03 | 18.12 | 9.20 | 9.20 | 8.15 | 8.15 | NA | NA | NA | 8.15 | NA | NA | NA | |
| Intangible Assets Net Excluding Goodwill | 196.92 | 132.68 | 134.93 | 136.99 | 139.46 | 141.41 | 145.28 | 148.98 | 152.40 | 156.68 | 160.97 | 164.30 | 167.15 | 171.12 | 173.71 | 178.77 | 182.95 | 186.84 | 181.63 | 185.84 | 191.77 | 195.74 | 727.01 | 741.03 | 754.83 | 770.21 | 783.84 | 797.96 | 864.55 | 883.88 | 893.05 | 912.02 | 927.64 | 944.62 | 961.16 | 978.37 | 1004.93 | 999.24 | 1015.91 | 1020.53 | 1039.22 | 1059.86 | 1087.70 | 829.83 | NA | NA | NA | NA | NA | NA | NA | NA | NA | NA | NA | NA | NA | NA | NA | |
| Intangible Assets Net Including Goodwill | NA | NA | NA | NA | NA | 1874.43 | 1885.04 | 1894.72 | 1897.50 | 1905.16 | 1912.48 | 1914.32 | 1913.47 | 1914.54 | 1910.20 | 1918.07 | 1922.93 | 1921.79 | 1882.93 | 1890.95 | 1894.90 | 1901.35 | 2450.96 | 2463.18 | 2473.29 | 2488.54 | 2499.10 | 2513.68 | 2594.33 | 2621.63 | 2622.35 | 2648.36 | 2667.87 | 2684.57 | 2702.30 | 2720.76 | NA | NA | NA | 2768.63 | NA | NA | NA | NA | NA | NA | NA | NA | NA | NA | NA | NA | NA | NA | NA | NA | NA | NA | NA |
| 2023-11-30 | 2023-08-31 | 2023-05-31 | 2023-02-28 | 2022-11-30 | 2022-08-31 | 2022-05-31 | 2022-02-28 | 2021-11-30 | 2021-08-31 | 2021-05-31 | 2021-02-28 | 2020-11-30 | 2020-08-31 | 2020-05-31 | 2020-02-29 | 2019-11-30 | 2019-08-31 | 2019-05-31 | 2019-02-28 | 2018-09-30 | 2018-06-30 | 2018-03-31 | 2017-12-31 | 2017-09-30 | 2017-06-30 | 2017-03-31 | 2016-12-31 | 2016-09-30 | 2016-06-30 | 2016-03-31 | 2015-12-31 | 2015-09-30 | 2015-06-30 | 2015-03-31 | 2014-12-31 | 2014-09-30 | 2014-06-30 | 2014-03-31 | 2013-12-31 | 2013-09-30 | 2013-06-30 | 2013-03-31 | 2012-12-31 | 2012-09-30 | 2012-06-30 | 2012-03-31 | 2011-12-31 | 2011-09-30 | 2011-06-30 | 2011-03-31 | 2010-12-31 | 2010-09-30 | 2010-06-30 | 2010-03-31 | 2009-12-31 | 2009-09-30 | 2009-06-30 | 2009-03-31 | ||
|---|---|---|---|---|---|---|---|---|---|---|---|---|---|---|---|---|---|---|---|---|---|---|---|---|---|---|---|---|---|---|---|---|---|---|---|---|---|---|---|---|---|---|---|---|---|---|---|---|---|---|---|---|---|---|---|---|---|---|---|---|
| Contract With Customer Liability Current | 48.30 | 27.90 | 26.40 | 29.00 | 27.00 | NA | NA | NA | 49.70 | NA | NA | NA | NA | NA | NA | NA | NA | NA | NA | NA | NA | NA | NA | NA | NA | NA | NA | NA | NA | NA | NA | NA | NA | NA | NA | NA | NA | NA | NA | NA | NA | NA | NA | NA | NA | NA | NA | NA | NA | NA | NA | NA | NA | NA | NA | NA | NA | NA | NA |
| 2023-11-30 | 2023-08-31 | 2023-05-31 | 2023-02-28 | 2022-11-30 | 2022-08-31 | 2022-05-31 | 2022-02-28 | 2021-11-30 | 2021-08-31 | 2021-05-31 | 2021-02-28 | 2020-11-30 | 2020-08-31 | 2020-05-31 | 2020-02-29 | 2019-11-30 | 2019-08-31 | 2019-05-31 | 2019-02-28 | 2018-09-30 | 2018-06-30 | 2018-03-31 | 2017-12-31 | 2017-09-30 | 2017-06-30 | 2017-03-31 | 2016-12-31 | 2016-09-30 | 2016-06-30 | 2016-03-31 | 2015-12-31 | 2015-09-30 | 2015-06-30 | 2015-03-31 | 2014-12-31 | 2014-09-30 | 2014-06-30 | 2014-03-31 | 2013-12-31 | 2013-09-30 | 2013-06-30 | 2013-03-31 | 2012-12-31 | 2012-09-30 | 2012-06-30 | 2012-03-31 | 2011-12-31 | 2011-09-30 | 2011-06-30 | 2011-03-31 | 2010-12-31 | 2010-09-30 | 2010-06-30 | 2010-03-31 | 2009-12-31 | 2009-09-30 | 2009-06-30 | 2009-03-31 | ||
|---|---|---|---|---|---|---|---|---|---|---|---|---|---|---|---|---|---|---|---|---|---|---|---|---|---|---|---|---|---|---|---|---|---|---|---|---|---|---|---|---|---|---|---|---|---|---|---|---|---|---|---|---|---|---|---|---|---|---|---|---|
| Long Term Debt | 9698.75 | 9462.49 | 8785.54 | 8625.55 | 8774.09 | 8635.47 | 8882.09 | 8896.03 | 9125.75 | 8670.73 | 8823.25 | 8243.15 | 8352.04 | 8419.84 | 8020.44 | 8451.50 | 8337.06 | 7968.78 | 7860.98 | 7685.91 | 7777.43 | 7714.97 | 8499.72 | 7885.78 | 8092.64 | 8084.89 | 8198.42 | 7380.44 | 7232.26 | 7169.81 | 7620.46 | 7407.59 | 7856.75 | 8454.48 | 8558.78 | 8527.93 | 8619.20 | 8798.06 | 8331.27 | 8180.86 | 7350.56 | 7559.48 | 7753.95 | 1358.69 | NA | NA | NA | 1905.70 | NA | NA | NA | 1691.13 | NA | NA | NA | 1771.79 | NA | NA | NA | |
| Minority Interest | 92.31 | 66.28 | 69.59 | 56.19 | 62.63 | 67.84 | 67.96 | 58.62 | 25.89 | 18.83 | 22.73 | 32.50 | 34.63 | 33.79 | 34.56 | 36.95 | 21.98 | 27.34 | 23.49 | 23.18 | 25.57 | 29.25 | 29.05 | 33.02 | 189.67 | 188.86 | 193.59 | 175.55 | 177.81 | 178.04 | 157.88 | 64.68 | 60.58 | 69.47 | 68.53 | 67.86 | 63.91 | 13.04 | 3.48 | 70.59 | 26.26 | 9.46 | 356.39 | 0.37 | 1.17 | 2.86 | 2.52 | 3.87 | 4.96 | 4.75 | 5.44 | 6.62 | NA | NA | NA | 12.85 | NA | NA | NA |
| 2023-11-30 | 2023-08-31 | 2023-05-31 | 2023-02-28 | 2022-11-30 | 2022-08-31 | 2022-05-31 | 2022-02-28 | 2021-11-30 | 2021-08-31 | 2021-05-31 | 2021-02-28 | 2020-11-30 | 2020-08-31 | 2020-05-31 | 2020-02-29 | 2019-11-30 | 2019-08-31 | 2019-05-31 | 2019-02-28 | 2018-09-30 | 2018-06-30 | 2018-03-31 | 2017-12-31 | 2017-09-30 | 2017-06-30 | 2017-03-31 | 2016-12-31 | 2016-09-30 | 2016-06-30 | 2016-03-31 | 2015-12-31 | 2015-09-30 | 2015-06-30 | 2015-03-31 | 2014-12-31 | 2014-09-30 | 2014-06-30 | 2014-03-31 | 2013-12-31 | 2013-09-30 | 2013-06-30 | 2013-03-31 | 2012-12-31 | 2012-09-30 | 2012-06-30 | 2012-03-31 | 2011-12-31 | 2011-09-30 | 2011-06-30 | 2011-03-31 | 2010-12-31 | 2010-09-30 | 2010-06-30 | 2010-03-31 | 2009-12-31 | 2009-09-30 | 2009-06-30 | 2009-03-31 | ||
|---|---|---|---|---|---|---|---|---|---|---|---|---|---|---|---|---|---|---|---|---|---|---|---|---|---|---|---|---|---|---|---|---|---|---|---|---|---|---|---|---|---|---|---|---|---|---|---|---|---|---|---|---|---|---|---|---|---|---|---|---|
| Stockholders Equity | 9709.83 | 9698.85 | 9695.66 | 9755.24 | 10232.85 | 10292.53 | 10300.18 | 10490.30 | 10553.75 | 10381.88 | 10072.63 | 9745.86 | 9403.89 | 9410.67 | 9326.55 | 9348.95 | 9579.70 | 10020.44 | 9853.87 | 9932.95 | 10621.18 | 10538.19 | 10259.08 | 10105.96 | 10451.91 | 10491.31 | 10398.16 | 10128.10 | 10059.67 | 10086.52 | 10091.31 | 10401.21 | 10365.48 | 10655.01 | 10651.84 | 10302.16 | 10385.11 | 10350.68 | 10187.78 | 10102.46 | 10101.35 | 10023.61 | 10041.56 | 6767.27 | 6191.94 | 6092.28 | 6427.68 | 6174.40 | 6023.44 | 6800.73 | 6902.67 | 6956.76 | NA | NA | NA | 4361.65 | NA | NA | NA | |
| Stockholders Equity Including Portion Attributable To Noncontrolling Interest | 9802.14 | 9765.13 | 9765.25 | 9811.43 | 10295.48 | 10360.38 | 10368.14 | 10548.92 | 10579.64 | 10400.71 | 10095.36 | 9778.36 | 9438.52 | 9444.45 | 9361.11 | 9385.91 | 9601.68 | 10047.78 | 9877.36 | 9956.13 | 10646.75 | 10567.44 | 10288.13 | 10138.98 | 10641.58 | 10680.17 | 10591.75 | 10303.65 | 10237.48 | 10264.56 | 10249.18 | 10465.89 | 10426.05 | 10724.48 | 10720.37 | 10370.02 | 10449.02 | 10363.72 | 10191.26 | 10173.05 | 10127.62 | 10033.07 | 10397.95 | 6767.64 | 6193.11 | 6095.14 | 6430.20 | 6178.26 | 6028.40 | 6805.48 | 6908.11 | 6963.38 | 4789.50 | 3984.87 | 4579.52 | 4374.50 | NA | NA | NA | |
| Common Stock Value | NA | NA | 231.41 | 233.53 | 226.13 | 228.81 | 232.32 | 240.17 | 243.54 | 245.56 | 247.03 | 246.70 | 249.75 | 259.25 | 267.11 | 277.11 | 291.64 | 299.87 | 290.69 | 298.31 | 331.42 | 333.31 | 357.22 | 356.23 | 356.19 | 358.64 | 359.82 | 359.43 | 359.67 | 360.40 | 362.33 | 362.62 | 362.29 | 366.62 | 366.72 | 367.50 | 368.46 | 368.54 | 363.96 | 364.54 | 364.57 | 364.38 | 363.94 | 244.58 | 244.58 | 244.58 | 244.58 | 244.58 | 244.58 | 244.57 | 244.38 | 243.81 | NA | NA | NA | 243.29 | NA | NA | NA | |
| Additional Paid In Capital Common Stock | 2044.86 | 2034.11 | 1965.53 | 2012.21 | 1967.78 | 2063.46 | 2156.37 | 2390.79 | 2742.24 | 2812.81 | 2849.49 | 2804.24 | 2911.22 | 3083.14 | 3191.89 | 3329.63 | 3627.71 | 3731.71 | 3559.16 | 3681.09 | 4329.66 | 4366.63 | 4711.22 | 4676.04 | 4731.81 | 4843.97 | 4819.28 | 4812.59 | 4807.99 | 4912.58 | 4968.45 | 4986.82 | 5006.50 | 5085.64 | 5073.03 | 5059.51 | 5021.75 | 4990.10 | 4876.31 | 4881.03 | 4915.75 | 4864.03 | 4846.28 | 1577.53 | 1581.65 | 1565.64 | 1573.93 | 1570.68 | 1566.26 | 1561.97 | 1542.86 | 1542.96 | NA | NA | NA | 1529.06 | NA | NA | NA | |
| Retained Earnings Accumulated Deficit | 7849.84 | 7852.52 | 7868.77 | 7930.61 | 8418.35 | 8350.63 | 8228.47 | 8189.65 | 7940.11 | 7681.49 | 7340.11 | 7041.46 | 6531.84 | 6264.69 | 6002.08 | 6000.61 | 5933.39 | 6255.31 | 6246.85 | 5614.94 | 5672.36 | 5523.28 | 4833.33 | 4700.97 | 5000.42 | 4938.25 | 4903.42 | 4645.39 | 4531.33 | 4400.26 | 4366.52 | 4612.98 | 4580.83 | 4777.70 | 4784.97 | 4428.07 | 4461.63 | 4430.74 | 4389.45 | 4318.84 | 4333.89 | 4354.24 | 4324.47 | 4240.03 | 3847.01 | 3740.33 | 3937.59 | 3446.71 | 3388.42 | 3679.44 | 3493.13 | 3482.62 | NA | NA | NA | 1604.26 | NA | NA | NA | |
| Accumulated Other Comprehensive Income Loss Net Of Tax | -395.55 | -398.25 | -370.05 | -421.11 | -379.42 | -350.37 | -316.98 | -330.31 | -372.14 | -357.97 | -364.00 | -346.54 | -288.92 | -196.41 | -134.53 | -258.40 | -273.04 | -266.45 | -242.82 | 338.62 | 287.75 | 314.97 | 357.32 | 372.72 | 363.49 | 350.44 | 315.64 | 310.70 | 360.68 | 413.27 | 394.00 | 438.79 | 415.86 | 425.06 | 427.12 | 447.08 | 533.26 | 561.30 | 558.06 | 538.05 | 487.15 | 440.95 | 506.87 | 705.13 | 518.71 | 541.72 | 671.58 | 912.42 | 824.18 | 1314.74 | 1622.31 | 1687.36 | NA | NA | NA | 985.03 | NA | NA | NA | |
| Minority Interest | 92.31 | 66.28 | 69.59 | 56.19 | 62.63 | 67.84 | 67.96 | 58.62 | 25.89 | 18.83 | 22.73 | 32.50 | 34.63 | 33.79 | 34.56 | 36.95 | 21.98 | 27.34 | 23.49 | 23.18 | 25.57 | 29.25 | 29.05 | 33.02 | 189.67 | 188.86 | 193.59 | 175.55 | 177.81 | 178.04 | 157.88 | 64.68 | 60.58 | 69.47 | 68.53 | 67.86 | 63.91 | 13.04 | 3.48 | 70.59 | 26.26 | 9.46 | 356.39 | 0.37 | 1.17 | 2.86 | 2.52 | 3.87 | 4.96 | 4.75 | 5.44 | 6.62 | NA | NA | NA | 12.85 | NA | NA | NA | |
| Adjustments To Additional Paid In Capital Sharebased Compensation Requisite Service Period Recognition Value | NA | NA | NA | NA | NA | 9.96 | 13.25 | 9.75 | 6.94 | 6.96 | 43.58 | 20.68 | 10.48 | 8.87 | 10.74 | 9.95 | 12.81 | 12.15 | 13.07 | 11.81 | 12.78 | 12.77 | 12.43 | 16.89 | 11.12 | 10.39 | 9.98 | 8.66 | 8.88 | 9.12 | 6.93 | 2.23 | 18.98 | 20.07 | 32.79 | 22.34 | 24.71 | 24.57 | 38.21 | 27.09 | 27.77 | 30.61 | 1.83 | 3.73 | 3.39 | 3.45 | 3.89 | 4.42 | 4.38 | 13.44 | 1.02 | NA | NA | NA | NA | NA | NA | NA | NA |
| 2023-11-30 | 2023-08-31 | 2023-05-31 | 2023-02-28 | 2022-11-30 | 2022-08-31 | 2022-05-31 | 2022-02-28 | 2021-11-30 | 2021-08-31 | 2021-05-31 | 2021-02-28 | 2020-11-30 | 2020-08-31 | 2020-05-31 | 2020-02-29 | 2019-11-30 | 2019-08-31 | 2019-05-31 | 2019-02-28 | 2018-09-30 | 2018-06-30 | 2018-03-31 | 2017-12-31 | 2017-09-30 | 2017-06-30 | 2017-03-31 | 2016-12-31 | 2016-09-30 | 2016-06-30 | 2016-03-31 | 2015-12-31 | 2015-09-30 | 2015-06-30 | 2015-03-31 | 2014-12-31 | 2014-09-30 | 2014-06-30 | 2014-03-31 | 2013-12-31 | 2013-09-30 | 2013-06-30 | 2013-03-31 | 2012-12-31 | 2012-09-30 | 2012-06-30 | 2012-03-31 | 2011-12-31 | 2011-09-30 | 2011-06-30 | 2011-03-31 | 2010-12-31 | 2010-09-30 | 2010-06-30 | 2010-03-31 | 2009-12-31 | 2009-09-30 | 2009-06-30 | 2009-03-31 | ||
|---|---|---|---|---|---|---|---|---|---|---|---|---|---|---|---|---|---|---|---|---|---|---|---|---|---|---|---|---|---|---|---|---|---|---|---|---|---|---|---|---|---|---|---|---|---|---|---|---|---|---|---|---|---|---|---|---|---|---|---|---|
| Net Cash Provided By Used In Operating Activities | -43.65 | -488.31 | 417.18 | -1818.85 | 357.66 | 1437.77 | 1224.75 | -1215.33 | 1486.47 | 1068.13 | 514.35 | -1495.94 | 768.09 | 1146.90 | 1079.04 | -918.08 | 423.49 | 189.04 | -656.41 | -783.96 | 724.02 | -118.86 | -405.25 | 61.17 | 602.61 | 602.03 | -192.98 | 277.92 | 357.07 | 896.66 | -922.79 | 418.51 | 513.65 | 33.47 | -1727.39 | 277.11 | -152.09 | -77.71 | -1034.48 | -236.39 | 491.22 | 610.77 | -163.26 | -41.26 | 199.94 | 105.86 | -42.69 | -13.87 | 21.03 | 19.70 | -17.77 | 385.37 | 103.54 | 14.40 | -72.05 | NA | NA | NA | NA | |
| Net Cash Provided By Used In Investing Activities | 243.83 | -138.74 | -81.20 | -36.09 | 45.57 | 127.37 | -128.40 | -105.08 | -143.93 | -127.85 | -96.47 | -32.34 | 2.21 | -24.99 | -114.11 | -49.31 | 603.92 | -99.61 | 127.93 | 1074.85 | -126.66 | 264.88 | -256.76 | -25.23 | -222.91 | 76.07 | 124.81 | -81.11 | -79.02 | 32.93 | -512.46 | -162.67 | 533.44 | 142.47 | 267.92 | -53.36 | -224.07 | 159.02 | 567.49 | -1071.97 | 638.24 | 646.67 | 3110.68 | -522.60 | 421.51 | -31.24 | 539.66 | -62.55 | -90.27 | 157.04 | -179.52 | -163.81 | -162.98 | -9.02 | 127.09 | NA | NA | NA | NA | |
| Net Cash Provided By Used In Financing Activities | 42.24 | 1242.39 | 57.13 | -281.64 | -213.49 | -573.60 | -972.76 | -1083.38 | 418.45 | -200.14 | -293.67 | 1069.65 | -501.81 | 747.70 | -653.25 | -316.17 | 754.07 | 667.69 | 206.16 | -38.34 | -236.29 | -675.65 | 874.51 | 216.82 | -25.29 | -282.44 | 525.71 | 345.37 | -18.33 | -507.16 | 411.02 | -173.44 | -978.68 | -208.17 | 708.31 | -181.97 | 439.82 | 514.01 | 145.92 | 796.18 | -273.86 | -839.87 | 47.04 | -62.33 | -35.97 | -93.24 | -460.17 | -61.36 | -163.59 | 48.42 | 69.89 | -115.39 | 146.37 | 23.87 | 9.81 | NA | NA | NA | NA |
| 2023-11-30 | 2023-08-31 | 2023-05-31 | 2023-02-28 | 2022-11-30 | 2022-08-31 | 2022-05-31 | 2022-02-28 | 2021-11-30 | 2021-08-31 | 2021-05-31 | 2021-02-28 | 2020-11-30 | 2020-08-31 | 2020-05-31 | 2020-02-29 | 2019-11-30 | 2019-08-31 | 2019-05-31 | 2019-02-28 | 2018-09-30 | 2018-06-30 | 2018-03-31 | 2017-12-31 | 2017-09-30 | 2017-06-30 | 2017-03-31 | 2016-12-31 | 2016-09-30 | 2016-06-30 | 2016-03-31 | 2015-12-31 | 2015-09-30 | 2015-06-30 | 2015-03-31 | 2014-12-31 | 2014-09-30 | 2014-06-30 | 2014-03-31 | 2013-12-31 | 2013-09-30 | 2013-06-30 | 2013-03-31 | 2012-12-31 | 2012-09-30 | 2012-06-30 | 2012-03-31 | 2011-12-31 | 2011-09-30 | 2011-06-30 | 2011-03-31 | 2010-12-31 | 2010-09-30 | 2010-06-30 | 2010-03-31 | 2009-12-31 | 2009-09-30 | 2009-06-30 | 2009-03-31 | ||
|---|---|---|---|---|---|---|---|---|---|---|---|---|---|---|---|---|---|---|---|---|---|---|---|---|---|---|---|---|---|---|---|---|---|---|---|---|---|---|---|---|---|---|---|---|---|---|---|---|---|---|---|---|---|---|---|---|---|---|---|---|
| Net Cash Provided By Used In Operating Activities | -43.65 | -488.31 | 417.18 | -1818.85 | 357.66 | 1437.77 | 1224.75 | -1215.33 | 1486.47 | 1068.13 | 514.35 | -1495.94 | 768.09 | 1146.90 | 1079.04 | -918.08 | 423.49 | 189.04 | -656.41 | -783.96 | 724.02 | -118.86 | -405.25 | 61.17 | 602.61 | 602.03 | -192.98 | 277.92 | 357.07 | 896.66 | -922.79 | 418.51 | 513.65 | 33.47 | -1727.39 | 277.11 | -152.09 | -77.71 | -1034.48 | -236.39 | 491.22 | 610.77 | -163.26 | -41.26 | 199.94 | 105.86 | -42.69 | -13.87 | 21.03 | 19.70 | -17.77 | 385.37 | 103.54 | 14.40 | -72.05 | NA | NA | NA | NA | |
| Net Income Loss | NA | 57.72 | NA | NA | NA | 195.46 | NA | NA | NA | NA | NA | NA | 307.27 | 304.41 | 44.92 | 113.01 | 195.54 | 48.48 | 670.76 | 44.81 | 192.63 | 725.53 | 124.53 | -271.60 | 99.35 | 58.19 | 281.41 | 137.17 | 154.36 | 57.29 | -222.88 | 55.59 | -173.17 | 16.41 | 380.76 | -9.76 | 54.68 | 65.07 | 94.32 | 8.55 | 2.97 | 52.61 | 305.10 | 454.17 | 106.67 | -197.25 | 490.88 | 119.44 | -291.02 | 186.31 | 10.51 | 1695.22 | 287.75 | -235.14 | 191.48 | -90.94 | 370.20 | 411.02 | -140.01 | |
| Profit Loss | 70.43 | 53.95 | 8.68 | 129.32 | 140.94 | 195.94 | 116.86 | 327.98 | 333.59 | 407.92 | 353.32 | 582.55 | 308.00 | 304.84 | 43.55 | 112.02 | 193.88 | 49.39 | 672.28 | 47.02 | 182.30 | 748.94 | 139.15 | -251.91 | 136.77 | 74.06 | 293.92 | 166.10 | 176.21 | 70.61 | -218.60 | 42.83 | -180.18 | 15.03 | 374.43 | -19.62 | 60.26 | 66.45 | 91.94 | -11.02 | 14.38 | 58.54 | 300.29 | 450.84 | 114.33 | -187.77 | 487.24 | 119.06 | -291.35 | 186.46 | 10.79 | 1695.04 | 289.97 | -236.28 | 191.50 | NA | NA | NA | NA | |
| Depreciation Depletion And Amortization | 28.31 | 25.29 | 25.31 | 33.29 | 43.47 | 43.19 | 40.31 | 45.94 | 40.54 | 38.68 | 39.44 | 38.77 | 39.08 | 39.52 | 40.37 | 39.47 | 42.27 | 39.88 | 36.79 | 33.93 | 32.30 | 31.91 | 28.16 | NA | NA | NA | NA | NA | NA | NA | NA | NA | NA | NA | NA | NA | NA | NA | NA | NA | NA | NA | NA | NA | NA | 43.62 | 42.28 | 23.42 | 21.97 | 21.23 | 20.55 | 22.35 | 24.05 | 22.94 | NA | NA | NA | NA | NA | |
| Increase Decrease In Other Operating Capital Net | NA | NA | NA | NA | NA | 147.34 | 310.25 | 145.19 | 35.03 | -8.84 | -20.32 | 96.77 | -36.18 | -84.73 | -60.87 | -74.90 | 30.94 | -5.63 | -53.36 | -33.51 | 2.84 | 53.96 | 33.64 | 73.29 | -51.37 | -41.86 | 19.70 | 71.02 | 7.74 | -8.21 | -8.64 | 33.27 | -10.98 | 8.82 | 62.86 | 35.18 | 30.55 | 1.49 | 0.95 | 6.32 | 0.22 | 2.10 | 0.02 | -1.74 | -0.28 | 1.75 | 0.42 | 0.06 | 1.08 | 0.04 | -0.55 | -2.76 | 1.63 | -0.30 | -0.22 | NA | NA | NA | NA | |
| Deferred Income Tax Expense Benefit | NA | NA | NA | NA | -23.39 | 32.96 | -12.69 | -67.27 | 129.75 | 7.67 | -49.69 | 9.15 | -41.83 | 81.33 | 12.94 | 12.24 | -1.76 | -32.24 | 38.44 | 1.95 | NA | NA | -28.49 | 526.06 | 54.04 | 32.60 | 99.36 | 66.39 | 69.43 | 64.33 | -81.52 | 29.57 | -92.49 | -20.65 | 214.61 | 2.79 | 59.79 | 24.56 | 39.75 | -2.81 | 14.19 | 18.97 | 39.70 | 251.39 | 70.74 | -100.29 | 263.13 | 53.43 | -152.62 | 103.54 | 18.07 | -1156.64 | -4.43 | -10.61 | 5.26 | NA | NA | NA | NA | |
| Share Based Compensation | 9.88 | 11.26 | 10.49 | 13.73 | 10.96 | 9.96 | 13.25 | 9.75 | 6.94 | 7.00 | 10.10 | 20.68 | 10.48 | 8.90 | 10.70 | 9.95 | 12.81 | 12.20 | 13.10 | 11.81 | 12.80 | 12.80 | 12.43 | 16.91 | 11.10 | 10.40 | 9.98 | 8.66 | 8.90 | 9.10 | 6.93 | 2.23 | 19.00 | 20.10 | 32.79 | 22.34 | 24.70 | 24.60 | 38.21 | 27.09 | 27.80 | 30.60 | 1.83 | 3.73 | 3.39 | 3.45 | 3.89 | 4.42 | 4.38 | 13.44 | 1.02 | 0.86 | 0.69 | 0.70 | 2.01 | NA | NA | NA | NA |
| 2023-11-30 | 2023-08-31 | 2023-05-31 | 2023-02-28 | 2022-11-30 | 2022-08-31 | 2022-05-31 | 2022-02-28 | 2021-11-30 | 2021-08-31 | 2021-05-31 | 2021-02-28 | 2020-11-30 | 2020-08-31 | 2020-05-31 | 2020-02-29 | 2019-11-30 | 2019-08-31 | 2019-05-31 | 2019-02-28 | 2018-09-30 | 2018-06-30 | 2018-03-31 | 2017-12-31 | 2017-09-30 | 2017-06-30 | 2017-03-31 | 2016-12-31 | 2016-09-30 | 2016-06-30 | 2016-03-31 | 2015-12-31 | 2015-09-30 | 2015-06-30 | 2015-03-31 | 2014-12-31 | 2014-09-30 | 2014-06-30 | 2014-03-31 | 2013-12-31 | 2013-09-30 | 2013-06-30 | 2013-03-31 | 2012-12-31 | 2012-09-30 | 2012-06-30 | 2012-03-31 | 2011-12-31 | 2011-09-30 | 2011-06-30 | 2011-03-31 | 2010-12-31 | 2010-09-30 | 2010-06-30 | 2010-03-31 | 2009-12-31 | 2009-09-30 | 2009-06-30 | 2009-03-31 | ||
|---|---|---|---|---|---|---|---|---|---|---|---|---|---|---|---|---|---|---|---|---|---|---|---|---|---|---|---|---|---|---|---|---|---|---|---|---|---|---|---|---|---|---|---|---|---|---|---|---|---|---|---|---|---|---|---|---|---|---|---|---|
| Net Cash Provided By Used In Investing Activities | 243.83 | -138.74 | -81.20 | -36.09 | 45.57 | 127.37 | -128.40 | -105.08 | -143.93 | -127.85 | -96.47 | -32.34 | 2.21 | -24.99 | -114.11 | -49.31 | 603.92 | -99.61 | 127.93 | 1074.85 | -126.66 | 264.88 | -256.76 | -25.23 | -222.91 | 76.07 | 124.81 | -81.11 | -79.02 | 32.93 | -512.46 | -162.67 | 533.44 | 142.47 | 267.92 | -53.36 | -224.07 | 159.02 | 567.49 | -1071.97 | 638.24 | 646.67 | 3110.68 | -522.60 | 421.51 | -31.24 | 539.66 | -62.55 | -90.27 | 157.04 | -179.52 | -163.81 | -162.98 | -9.02 | 127.09 | NA | NA | NA | NA | |
| Payments To Acquire Property Plant And Equipment | -79.06 | 30.00 | 25.06 | 25.15 | 92.31 | 47.23 | 57.13 | 27.63 | NA | NA | NA | NA | NA | NA | NA | NA | NA | NA | NA | NA | NA | NA | NA | NA | NA | NA | NA | NA | NA | NA | NA | NA | NA | NA | NA | NA | NA | NA | 74.13 | 47.74 | 35.05 | 33.55 | 20.78 | 20.16 | 18.34 | 14.25 | 18.57 | 7.70 | 9.62 | 17.21 | 4.05 | 24.24 | 7.53 | 6.06 | 6.52 | NA | NA | NA | NA |
| 2023-11-30 | 2023-08-31 | 2023-05-31 | 2023-02-28 | 2022-11-30 | 2022-08-31 | 2022-05-31 | 2022-02-28 | 2021-11-30 | 2021-08-31 | 2021-05-31 | 2021-02-28 | 2020-11-30 | 2020-08-31 | 2020-05-31 | 2020-02-29 | 2019-11-30 | 2019-08-31 | 2019-05-31 | 2019-02-28 | 2018-09-30 | 2018-06-30 | 2018-03-31 | 2017-12-31 | 2017-09-30 | 2017-06-30 | 2017-03-31 | 2016-12-31 | 2016-09-30 | 2016-06-30 | 2016-03-31 | 2015-12-31 | 2015-09-30 | 2015-06-30 | 2015-03-31 | 2014-12-31 | 2014-09-30 | 2014-06-30 | 2014-03-31 | 2013-12-31 | 2013-09-30 | 2013-06-30 | 2013-03-31 | 2012-12-31 | 2012-09-30 | 2012-06-30 | 2012-03-31 | 2011-12-31 | 2011-09-30 | 2011-06-30 | 2011-03-31 | 2010-12-31 | 2010-09-30 | 2010-06-30 | 2010-03-31 | 2009-12-31 | 2009-09-30 | 2009-06-30 | 2009-03-31 | ||
|---|---|---|---|---|---|---|---|---|---|---|---|---|---|---|---|---|---|---|---|---|---|---|---|---|---|---|---|---|---|---|---|---|---|---|---|---|---|---|---|---|---|---|---|---|---|---|---|---|---|---|---|---|---|---|---|---|---|---|---|---|
| Net Cash Provided By Used In Financing Activities | 42.24 | 1242.39 | 57.13 | -281.64 | -213.49 | -573.60 | -972.76 | -1083.38 | 418.45 | -200.14 | -293.67 | 1069.65 | -501.81 | 747.70 | -653.25 | -316.17 | 754.07 | 667.69 | 206.16 | -38.34 | -236.29 | -675.65 | 874.51 | 216.82 | -25.29 | -282.44 | 525.71 | 345.37 | -18.33 | -507.16 | 411.02 | -173.44 | -978.68 | -208.17 | 708.31 | -181.97 | 439.82 | 514.01 | 145.92 | 796.18 | -273.86 | -839.87 | 47.04 | -62.33 | -35.97 | -93.24 | -460.17 | -61.36 | -163.59 | 48.42 | 69.89 | -115.39 | 146.37 | 23.87 | 9.81 | NA | NA | NA | NA | |
| Payments Of Dividends Common Stock | 69.98 | 69.92 | 69.93 | 68.77 | 68.33 | 69.25 | 70.19 | 72.33 | 61.47 | 61.83 | 49.73 | 49.77 | 38.07 | 39.44 | 40.64 | 42.79 | 37.19 | 37.89 | 36.75 | 37.82 | 41.73 | 34.06 | 35.99 | 35.96 | 36.04 | 22.70 | 22.71 | 22.66 | 22.73 | 22.90 | 23.00 | 22.89 | 23.13 | 23.17 | 23.36 | 23.29 | 23.30 | 23.30 | 23.19 | 23.05 | 23.09 | 22.20 | 23.00 | NA | NA | NA | NA | NA | NA | NA | NA | NA | NA | NA | NA | NA | NA | NA | NA | |
| Payments For Repurchase Of Common Stock | 4.13 | 0.28 | 114.13 | 50.86 | 121.02 | 116.35 | 284.17 | 338.06 | 87.53 | 51.77 | 0.00 | 130.10 | 193.40 | 128.22 | 185.07 | 310.19 | 137.06 | 8.14 | 150.05 | 214.66 | 73.41 | 559.73 | 2.70 | 24.55 | 43.80 | 28.67 | 3.46 | 35.24 | 25.43 | 24.73 | 9.62 | 4.13 | 91.26 | 3.35 | 27.01 | 21.54 | 3.14 | 4.34 | 46.71 | 8.84 | 7.67 | NA | NA | NA | NA | NA | NA | NA | NA | NA | NA | NA | NA | NA | NA | NA | NA | NA | NA |
| 2023-11-30 | 2023-08-31 | 2023-05-31 | 2023-02-28 | 2022-11-30 | 2022-08-31 | 2022-05-31 | 2022-02-28 | 2021-11-30 | 2021-08-31 | 2021-05-31 | 2021-02-28 | 2020-11-30 | 2020-08-31 | 2020-05-31 | 2020-02-29 | 2019-11-30 | 2019-08-31 | 2019-05-31 | 2019-02-28 | 2018-09-30 | 2018-06-30 | 2018-03-31 | 2017-12-31 | 2017-09-30 | 2017-06-30 | 2017-03-31 | 2016-12-31 | 2016-09-30 | 2016-06-30 | 2016-03-31 | 2015-12-31 | 2015-09-30 | 2015-06-30 | 2015-03-31 | 2014-12-31 | 2014-09-30 | 2014-06-30 | 2014-03-31 | 2013-12-31 | 2013-09-30 | 2013-06-30 | 2013-03-31 | 2012-12-31 | 2012-09-30 | 2012-06-30 | 2012-03-31 | 2011-12-31 | 2011-09-30 | 2011-06-30 | 2011-03-31 | 2010-12-31 | 2010-09-30 | 2010-06-30 | 2010-03-31 | 2009-12-31 | 2009-09-30 | 2009-06-30 | 2009-03-31 | ||
|---|---|---|---|---|---|---|---|---|---|---|---|---|---|---|---|---|---|---|---|---|---|---|---|---|---|---|---|---|---|---|---|---|---|---|---|---|---|---|---|---|---|---|---|---|---|---|---|---|---|---|---|---|---|---|---|---|---|---|---|---|
| Revenues | 1968.74 | 2040.91 | 1651.18 | 1780.56 | 1751.39 | 1836.93 | 1618.15 | 1942.80 | 2029.37 | 2140.59 | 2166.33 | 2703.59 | 2060.64 | 1825.50 | 1377.53 | 1692.26 | 1430.12 | 1223.16 | 1510.37 | 1195.01 | 1458.98 | 1243.83 | 2946.47 | 3195.88 | 3141.89 | 2989.72 | 3080.37 | 2942.92 | 2883.71 | 2841.32 | 2207.31 | 2686.26 | 2566.02 | 3055.12 | 3376.52 | 2884.42 | 3213.66 | 3097.83 | 3139.87 | 2921.92 | 2742.07 | 2914.74 | 2144.04 | 2511.14 | 2187.49 | 2141.64 | 2424.29 | 297.24 | 236.06 | 753.44 | 284.03 | 585.64 | 185.87 | 289.20 | 259.30 | 192.80 | 143.43 | 135.99 | 102.99 | |
| Commission And Other Fees | NA | NA | NA | NA | NA | 221.40 | 254.71 | 229.32 | 222.26 | 214.36 | 222.62 | 236.77 | 195.81 | 204.03 | 242.97 | 179.43 | 182.21 | 171.00 | 159.69 | 147.13 | 155.42 | 157.70 | 147.90 | 155.71 | 139.08 | 152.64 | NA | NA | NA | NA | NA | NA | NA | NA | NA | NA | NA | NA | NA | NA | NA | NA | NA | NA | NA | NA | NA | NA | NA | NA | NA | NA | NA | NA | NA | NA | NA | NA | NA | |
| Commissions And Other Fees | 233.37 | 223.71 | 235.31 | 213.27 | 220.07 | 221.40 | 254.71 | 229.32 | NA | NA | NA | NA | NA | NA | NA | NA | NA | NA | NA | NA | NA | NA | NA | NA | NA | NA | NA | NA | NA | NA | NA | NA | NA | NA | NA | NA | NA | NA | NA | NA | NA | NA | NA | NA | NA | NA | NA | NA | NA | NA | NA | NA | NA | NA | NA | NA | NA | NA | NA | |
| Interest Revenue | 806.57 | 898.04 | 632.68 | 531.38 | 406.74 | 318.22 | 244.70 | 213.98 | 252.11 | 220.28 | 230.45 | 240.50 | 214.61 | 219.84 | 236.73 | 326.37 | 360.66 | 410.47 | 445.97 | 386.84 | 336.74 | 327.31 | 275.22 | 266.23 | 253.92 | 249.54 | NA | NA | NA | NA | NA | NA | NA | NA | NA | NA | NA | NA | NA | NA | NA | NA | NA | NA | NA | NA | NA | NA | NA | NA | NA | NA | NA | NA | NA | NA | NA | NA | NA | |
| Investment Banking | 573.90 | 600.19 | 492.48 | 502.80 | 552.58 | 709.33 | 600.86 | 945.05 | 1180.77 | 1180.62 | 1000.70 | 1003.61 | 906.16 | 615.84 | 387.49 | 592.00 | 400.51 | 410.80 | 430.09 | 285.60 | 460.04 | 500.30 | 439.99 | 528.70 | 475.70 | 351.86 | NA | NA | NA | NA | NA | NA | NA | NA | NA | NA | NA | NA | NA | NA | NA | NA | NA | NA | NA | NA | NA | NA | NA | NA | NA | NA | NA | NA | NA | NA | NA | NA | NA | |
| Other Sources Of Revenue Miscellaneous | NA | -64.92 | -64.93 | -44.30 | NA | 148.38 | 10.61 | 21.34 | NA | NA | NA | NA | NA | NA | NA | NA | NA | NA | NA | NA | NA | NA | NA | NA | NA | NA | NA | NA | NA | NA | NA | NA | NA | NA | NA | NA | NA | NA | NA | NA | NA | NA | NA | NA | NA | NA | NA | NA | NA | NA | NA | NA | NA | NA | NA | NA | NA | NA | NA | |
| Principal Transactions Revenue | 241.71 | 353.37 | 320.96 | 497.25 | 179.12 | 200.89 | 204.59 | 249.16 | 110.68 | 232.11 | 361.02 | 919.90 | 495.02 | 623.28 | 393.34 | 404.86 | 93.85 | -20.92 | 240.19 | 246.18 | 116.20 | 53.76 | 145.66 | 197.64 | 84.14 | 225.23 | NA | NA | NA | NA | NA | NA | NA | NA | NA | NA | NA | NA | NA | NA | NA | NA | NA | NA | NA | NA | NA | NA | NA | NA | NA | NA | NA | NA | NA | NA | NA | NA | NA | |
| Strategic Affiliates Revenue | NA | 9.47 | 9.07 | 21.23 | NA | 8.94 | 10.83 | 26.98 | NA | NA | NA | NA | NA | NA | NA | NA | NA | NA | NA | NA | NA | NA | NA | NA | NA | NA | NA | NA | NA | NA | NA | NA | NA | NA | NA | NA | NA | NA | NA | NA | NA | NA | NA | NA | NA | NA | NA | NA | NA | NA | NA | NA | NA | NA | NA | NA | NA | NA | NA | |
| Asset Management1 | 14.84 | 14.81 | 13.93 | 38.99 | 13.89 | 12.70 | 14.13 | 39.55 | NA | NA | NA | NA | NA | NA | NA | NA | NA | NA | NA | NA | NA | NA | NA | NA | NA | NA | NA | NA | NA | NA | NA | NA | NA | NA | NA | NA | NA | NA | NA | NA | NA | NA | NA | NA | NA | NA | NA | NA | NA | NA | NA | NA | NA | NA | NA | NA | NA | NA | NA | |
| Product And Service Other | 98.35 | -49.21 | -44.18 | -3.12 | 312.60 | 387.09 | 313.29 | 305.30 | 704.41 | 174.31 | 167.44 | 164.96 | 110.32 | 42.75 | 31.62 | 112.00 | 316.45 | 169.25 | 144.21 | 53.83 | 296.55 | 90.02 | 53.97 | 82.22 | 67.81 | 53.58 | NA | NA | NA | NA | NA | NA | NA | NA | NA | NA | NA | NA | NA | NA | NA | NA | NA | NA | NA | NA | NA | NA | NA | NA | NA | NA | NA | NA | NA | NA | NA | NA | NA | |
| Principal Transactions Revenue, Monashees Separate Managed Accounts | -0.50 | 0.70 | -0.60 | 0.30 | -0.20 | -0.60 | -0.30 | -2.10 | NA | NA | NA | NA | NA | NA | NA | NA | NA | NA | NA | NA | NA | NA | NA | NA | NA | NA | NA | NA | NA | NA | NA | NA | NA | NA | NA | NA | NA | NA | NA | NA | NA | NA | NA | NA | NA | NA | NA | NA | NA | NA | NA | NA | NA | NA | NA | NA | NA | NA | NA | |
| Principal Transactions Revenue, Reclassification Out Of Accumulated Other Comprehensive Income, Accumulated Gain Loss Financial Liability Fair Value Option Including Portion Attributable To Noncontrolling Interest | NA | 0.01 | 0.08 | -0.25 | 0.03 | -0.14 | -0.00 | -0.02 | 0.00 | -1.00 | 2.64 | 0.22 | -0.50 | -0.66 | 1.30 | 0.25 | 0.07 | 0.00 | -0.20 | -0.29 | 0.10 | 0.27 | 0.00 | NA | NA | NA | NA | NA | NA | NA | NA | NA | NA | NA | NA | NA | NA | NA | NA | NA | NA | NA | NA | NA | NA | NA | NA | NA | NA | NA | NA | NA | NA | NA | NA | NA | NA | NA | NA | |
| NA | NA | NA | NA | NA | -4.83 | -21.70 | -29.98 | NA | NA | NA | NA | NA | NA | NA | NA | NA | NA | NA | NA | NA | NA | NA | NA | NA | NA | NA | NA | NA | NA | NA | NA | NA | NA | NA | NA | NA | NA | NA | NA | NA | NA | NA | NA | NA | NA | NA | NA | NA | NA | NA | NA | NA | NA | NA | NA | NA | NA | NA | ||
| NA | NA | NA | NA | NA | 1836.93 | 1618.15 | 1942.80 | NA | NA | NA | NA | NA | NA | NA | NA | NA | NA | NA | NA | NA | NA | NA | NA | NA | NA | NA | NA | NA | NA | NA | NA | NA | NA | NA | NA | NA | NA | NA | NA | NA | NA | NA | NA | NA | NA | NA | NA | NA | NA | NA | NA | NA | NA | NA | NA | NA | NA | NA | ||
| Revenue From Contract With Customer Excluding Assessed Tax | 859.84 | 844.96 | 753.40 | 775.01 | 1025.65 | 1177.20 | 1132.96 | 1407.04 | 1582.74 | 1634.07 | 1492.35 | 1432.64 | 1285.75 | 974.74 | 749.92 | 912.82 | 735.69 | 734.43 | 750.21 | 569.99 | 780.08 | 834.55 | 728.42 | 3195.88 | 3141.89 | 2989.72 | 3080.37 | 2942.92 | 2883.71 | 2841.32 | 2207.31 | 2686.26 | 2566.02 | 3055.12 | 3376.52 | 2884.42 | 3213.66 | 3097.83 | 3139.87 | 2921.92 | 2742.07 | 2914.74 | 2144.04 | 2511.14 | 2187.49 | 2141.64 | 2424.29 | 297.24 | 236.06 | 753.44 | 284.03 | 585.64 | 185.87 | 289.20 | 259.30 | 192.80 | 143.43 | 135.99 | 102.99 | |
| Material Reconciling Items | NA | NA | NA | NA | NA | -5.42 | -0.51 | -0.14 | -0.33 | -0.09 | -0.02 | -0.22 | -0.33 | -0.28 | -0.29 | -0.10 | -0.25 | -1.74 | -0.09 | -0.19 | 152.27 | 163.73 | 0.00 | NA | NA | NA | NA | NA | NA | NA | NA | NA | NA | NA | NA | NA | NA | NA | NA | NA | NA | NA | NA | NA | NA | NA | NA | NA | NA | NA | NA | NA | NA | NA | NA | NA | NA | NA | NA | |
| Material Reconciling Items, Equities | NA | NA | NA | NA | NA | -0.07 | -0.15 | -0.14 | -0.08 | -0.03 | -0.02 | -0.17 | -0.33 | -0.28 | -0.29 | -0.10 | -0.25 | -0.00 | -0.09 | -0.19 | -0.12 | -0.40 | 0.00 | NA | NA | NA | NA | NA | NA | NA | NA | NA | NA | NA | NA | NA | NA | NA | NA | NA | NA | NA | NA | NA | NA | NA | NA | NA | NA | NA | NA | NA | NA | NA | NA | NA | NA | NA | NA | |
| Material Reconciling Items, Investment Banking Advisory | NA | NA | NA | NA | NA | -5.34 | NA | NA | NA | NA | NA | NA | NA | NA | 0.00 | 0.00 | 0.00 | 0.00 | 0.00 | 0.00 | -5.28 | 0.00 | 0.00 | NA | NA | NA | NA | NA | NA | NA | NA | NA | NA | NA | NA | NA | NA | NA | NA | NA | NA | NA | NA | NA | NA | NA | NA | NA | NA | NA | NA | NA | NA | NA | NA | NA | NA | NA | NA | |
| Material Reconciling Items, Investment Banking Underwriting | NA | NA | NA | NA | NA | 0.00 | -0.36 | NA | -0.25 | -0.06 | 0.00 | -0.05 | NA | NA | 0.00 | 0.00 | 0.00 | -1.74 | 0.00 | 0.00 | NA | NA | NA | NA | NA | NA | NA | NA | NA | NA | NA | NA | NA | NA | NA | NA | NA | NA | NA | NA | NA | NA | NA | NA | NA | NA | NA | NA | NA | NA | NA | NA | NA | NA | NA | NA | NA | NA | NA | |
| Operating, Equities, Investment Banking And Capital Markets | NA | NA | NA | NA | NA | 218.01 | 251.43 | 226.07 | 218.45 | 210.11 | 219.85 | 233.54 | 193.26 | 201.16 | 236.68 | 176.25 | 179.03 | 167.53 | 164.17 | 152.07 | NA | NA | NA | NA | NA | NA | NA | NA | NA | NA | NA | NA | NA | NA | NA | NA | NA | NA | NA | NA | NA | NA | NA | NA | NA | NA | NA | NA | NA | NA | NA | NA | NA | NA | NA | NA | NA | NA | NA | |
| Operating, Fixed Income Services, Investment Banking And Capital Markets | NA | NA | NA | NA | NA | 3.46 | 3.43 | 3.38 | 3.88 | 4.28 | 2.79 | 3.40 | 2.88 | 3.16 | 6.58 | 3.29 | 3.43 | 3.48 | 3.53 | 3.07 | NA | NA | NA | NA | NA | NA | NA | NA | NA | NA | NA | NA | NA | NA | NA | NA | NA | NA | NA | NA | NA | NA | NA | NA | NA | NA | NA | NA | NA | NA | NA | NA | NA | NA | NA | NA | NA | NA | NA | |
| Operating, Investment Banking Advisory, Investment Banking And Capital Markets | NA | NA | NA | NA | NA | 486.76 | 371.76 | 543.77 | 587.73 | 583.89 | 390.51 | 311.44 | 356.82 | 171.44 | 182.08 | 343.16 | 195.03 | 213.35 | 178.55 | 180.48 | NA | NA | NA | NA | NA | NA | NA | NA | NA | NA | NA | NA | NA | NA | NA | NA | NA | NA | NA | NA | NA | NA | NA | NA | NA | NA | NA | NA | NA | NA | NA | NA | NA | NA | NA | NA | NA | NA | NA | |
| Operating, Investment Banking Underwriting, Investment Banking And Capital Markets | NA | NA | NA | NA | NA | 227.91 | 229.46 | 401.28 | 593.29 | 596.79 | 610.19 | 692.22 | 549.34 | 444.40 | 205.41 | 248.84 | 205.48 | 199.18 | 251.53 | 105.11 | NA | NA | NA | NA | NA | NA | NA | NA | NA | NA | NA | NA | NA | NA | NA | NA | NA | NA | NA | NA | NA | NA | NA | NA | NA | NA | NA | NA | NA | NA | NA | NA | NA | NA | NA | NA | NA | NA | NA | |
| Operating, Manufacturing Revenues, Merchant Banking | NA | NA | NA | NA | NA | 105.47 | 166.03 | 141.11 | 97.77 | 118.92 | 184.09 | 137.85 | 138.70 | 119.75 | 85.38 | 77.61 | 76.43 | 82.56 | 90.24 | 75.42 | 94.03 | 114.73 | 98.36 | NA | NA | NA | NA | NA | NA | NA | NA | NA | NA | NA | NA | NA | NA | NA | NA | NA | NA | NA | NA | NA | NA | NA | NA | NA | NA | NA | NA | NA | NA | NA | NA | NA | NA | NA | NA | |
| Operating, Oil And Gas Production And Development Revenues, Merchant Banking | NA | NA | NA | NA | NA | 84.49 | 83.24 | 57.92 | 56.12 | 49.81 | 45.03 | 32.01 | 23.51 | 20.95 | 15.54 | 42.21 | 44.60 | 45.01 | 47.65 | 36.37 | 46.51 | 39.91 | 20.33 | NA | NA | NA | NA | NA | NA | NA | NA | NA | NA | NA | NA | NA | NA | NA | NA | NA | NA | NA | NA | NA | NA | NA | NA | NA | NA | NA | NA | NA | NA | NA | NA | NA | NA | NA | NA | |
| Operating, Revenue From Contract With Customer Miscellaneous, Merchant Banking | NA | NA | NA | NA | NA | 52.75 | 24.82 | 21.08 | 23.58 | 67.50 | 37.59 | 14.98 | 19.58 | 11.05 | 15.04 | 15.47 | 29.27 | 21.71 | 9.88 | 10.99 | 11.74 | 9.09 | 10.21 | NA | NA | NA | NA | NA | NA | NA | NA | NA | NA | NA | NA | NA | NA | NA | NA | NA | NA | NA | NA | NA | NA | NA | NA | NA | NA | NA | NA | NA | NA | NA | NA | NA | NA | NA | NA | |
| Operating, Asset Management1, Asset Management | NA | NA | NA | NA | NA | 3.76 | 3.30 | 12.57 | 2.24 | 2.85 | 2.31 | 7.43 | 1.99 | 3.13 | 3.50 | 6.09 | 4.05 | 4.65 | 6.17 | 8.32 | NA | NA | NA | NA | NA | NA | NA | NA | NA | NA | NA | NA | NA | NA | NA | NA | NA | NA | NA | NA | NA | NA | NA | NA | NA | NA | NA | NA | NA | NA | NA | NA | NA | NA | NA | NA | NA | NA | NA | |
| Operating, Asset Management | NA | NA | NA | NA | NA | 3.76 | 3.30 | 12.57 | 2.24 | 2.85 | 2.31 | 7.43 | 1.99 | 3.13 | 3.50 | 6.09 | 4.05 | 4.65 | 6.17 | 8.32 | NA | NA | NA | NA | NA | NA | NA | NA | NA | NA | NA | NA | NA | NA | NA | NA | NA | NA | NA | NA | NA | NA | NA | NA | NA | NA | NA | NA | NA | NA | NA | NA | NA | NA | NA | NA | NA | NA | NA | |
| Operating, Investment Banking And Capital Markets | NA | NA | NA | NA | NA | 936.15 | 856.08 | 1174.50 | 1403.36 | 1395.07 | 1223.34 | 1240.60 | 1102.31 | 820.15 | 630.76 | 771.54 | 582.98 | 583.54 | 597.78 | 440.74 | NA | NA | NA | NA | NA | NA | NA | NA | NA | NA | NA | NA | NA | NA | NA | NA | NA | NA | NA | NA | NA | NA | NA | NA | NA | NA | NA | NA | NA | NA | NA | NA | NA | NA | NA | NA | NA | NA | NA | |
| Operating, Merchant Banking | NA | NA | NA | NA | NA | 242.72 | 274.09 | 220.11 | 177.47 | 236.23 | 266.71 | 184.84 | 181.78 | 151.75 | 115.96 | 135.29 | 150.30 | 149.29 | 147.77 | 122.78 | 152.27 | 163.73 | 128.91 | NA | NA | NA | NA | NA | NA | NA | NA | NA | NA | NA | NA | NA | NA | NA | NA | NA | NA | NA | NA | NA | NA | NA | NA | NA | NA | NA | NA | NA | NA | NA | NA | NA | NA | NA | NA | |
| Material Reconciling Items, | NA | NA | NA | NA | NA | -5.42 | -0.51 | -0.14 | -0.33 | -0.09 | -0.02 | -0.22 | -0.33 | -0.28 | -0.29 | -0.10 | -0.25 | -0.05 | -0.09 | -0.19 | 151.69 | 163.45 | 0.00 | NA | NA | NA | NA | NA | NA | NA | NA | NA | NA | NA | NA | NA | NA | NA | NA | NA | NA | NA | NA | NA | NA | NA | NA | NA | NA | NA | NA | NA | NA | NA | NA | NA | NA | NA | NA | |
| Operating,, Asset Management | NA | NA | NA | NA | NA | 3.76 | 3.30 | 12.57 | 2.26 | 2.85 | 2.01 | 7.10 | 3.50 | 1.76 | 1.82 | 2.57 | 2.94 | 3.24 | 5.12 | 5.03 | NA | NA | NA | NA | NA | NA | NA | NA | NA | NA | NA | NA | NA | NA | NA | NA | NA | NA | NA | NA | NA | NA | NA | NA | NA | NA | NA | NA | NA | NA | NA | NA | NA | NA | NA | NA | NA | NA | NA | |
| Operating,, Investment Banking And Capital Markets | NA | NA | NA | NA | NA | 681.33 | 683.80 | 937.07 | 1145.94 | 1114.88 | 962.56 | 1026.92 | 884.16 | 684.44 | 524.63 | 649.07 | 463.52 | 476.98 | 487.67 | 323.39 | NA | NA | NA | NA | NA | NA | NA | NA | NA | NA | NA | NA | NA | NA | NA | NA | NA | NA | NA | NA | NA | NA | NA | NA | NA | NA | NA | NA | NA | NA | NA | NA | NA | NA | NA | NA | NA | NA | NA | |
| Operating,, Merchant Banking | NA | NA | NA | NA | NA | 241.54 | 273.03 | 219.23 | 176.60 | 235.45 | 265.97 | 184.34 | 181.24 | 151.09 | 115.62 | 134.78 | 149.86 | 148.81 | 147.50 | 122.53 | 151.69 | 163.45 | 128.58 | NA | NA | NA | NA | NA | NA | NA | NA | NA | NA | NA | NA | NA | NA | NA | NA | NA | NA | NA | NA | NA | NA | NA | NA | NA | NA | NA | NA | NA | NA | NA | NA | NA | NA | NA | NA | |
| Operating,, Investment Banking And Capital Markets | NA | NA | NA | NA | NA | 63.01 | 65.88 | 71.26 | 66.45 | 65.04 | 63.90 | 49.95 | 53.95 | 45.58 | 38.05 | 43.03 | NA | NA | NA | NA | NA | NA | NA | NA | NA | NA | NA | NA | NA | NA | NA | NA | NA | NA | NA | NA | NA | NA | NA | NA | NA | NA | NA | NA | NA | NA | NA | NA | NA | NA | NA | NA | NA | NA | NA | NA | NA | NA | NA | |
| Operating,, Merchant Banking | NA | NA | NA | NA | NA | 0.44 | 0.41 | 0.32 | 0.36 | 0.34 | 0.20 | 0.13 | 0.15 | 0.02 | 0.04 | 0.15 | NA | NA | NA | NA | NA | NA | NA | NA | NA | NA | NA | NA | NA | NA | NA | NA | NA | NA | NA | NA | NA | NA | NA | NA | NA | NA | NA | NA | NA | NA | NA | NA | NA | NA | NA | NA | NA | NA | NA | NA | NA | NA | NA | |
| Operating,, Investment Banking And Capital Markets | NA | NA | NA | NA | NA | 191.81 | 106.39 | 166.17 | 190.97 | 215.15 | 196.89 | 163.74 | 164.20 | 90.13 | 68.08 | 79.44 | NA | NA | NA | NA | NA | NA | NA | NA | NA | NA | NA | NA | NA | NA | NA | NA | NA | NA | NA | NA | NA | NA | NA | NA | NA | NA | NA | NA | NA | NA | NA | NA | NA | NA | NA | NA | NA | NA | NA | NA | NA | NA | NA | |
| Operating,, Merchant Banking | NA | NA | NA | NA | NA | 0.74 | 0.65 | 0.56 | 0.51 | 0.45 | 0.54 | 0.37 | 0.40 | 0.64 | 0.30 | 0.36 | NA | NA | NA | NA | NA | NA | NA | NA | NA | NA | NA | NA | NA | NA | NA | NA | NA | NA | NA | NA | NA | NA | NA | NA | NA | NA | NA | NA | NA | NA | NA | NA | NA | NA | NA | NA | NA | NA | NA | NA | NA | NA | NA | |
| Asset Management Services | 5.90 | 5.34 | 4.86 | 17.76 | 3.90 | 3.76 | 3.30 | 12.57 | NA | NA | NA | NA | NA | NA | NA | NA | NA | 3.34 | 4.55 | 6.67 | 5.18 | 6.02 | 4.93 | NA | NA | NA | NA | NA | NA | NA | NA | NA | NA | NA | NA | NA | NA | NA | NA | NA | NA | NA | NA | NA | NA | NA | NA | NA | NA | NA | NA | NA | NA | NA | NA | NA | NA | NA | NA | |
| Commission And Other Fees | NA | NA | NA | NA | NA | 221.40 | 254.71 | 229.32 | 222.26 | 214.36 | 222.62 | 236.77 | 195.81 | 204.03 | 242.97 | 179.43 | 182.21 | 171.00 | 159.69 | 147.13 | 155.42 | 157.70 | 147.90 | 155.71 | 139.08 | 152.64 | NA | NA | NA | NA | NA | NA | NA | NA | NA | NA | NA | NA | NA | NA | NA | NA | NA | NA | NA | NA | NA | NA | NA | NA | NA | NA | NA | NA | NA | NA | NA | NA | NA | |
| Commissions And Other Fees | 233.37 | 223.71 | 235.31 | 213.27 | 220.07 | 221.40 | 254.71 | 229.32 | NA | NA | NA | NA | NA | NA | NA | NA | NA | NA | NA | NA | NA | NA | NA | NA | NA | NA | NA | NA | NA | NA | NA | NA | NA | NA | NA | NA | NA | NA | NA | NA | NA | NA | NA | NA | NA | NA | NA | NA | NA | NA | NA | NA | NA | NA | NA | NA | NA | NA | NA | |
| Equities | 230.65 | 221.19 | 232.30 | 210.46 | 215.11 | 217.93 | 251.28 | 225.93 | 218.38 | 210.08 | 219.84 | 233.37 | 192.93 | 200.88 | 236.39 | 176.14 | 178.78 | 167.53 | 164.27 | 151.87 | 159.57 | 159.96 | 151.63 | NA | NA | NA | NA | NA | NA | NA | NA | NA | NA | NA | NA | NA | NA | NA | NA | NA | NA | NA | NA | NA | NA | NA | NA | NA | NA | NA | NA | NA | NA | NA | NA | NA | NA | NA | NA | |
| Fixed Income Services | 2.24 | 2.52 | 3.01 | 2.81 | 4.96 | 3.46 | 3.43 | 3.38 | 3.88 | 4.28 | 2.79 | 3.40 | 2.88 | 3.16 | 6.58 | 3.29 | 3.43 | 3.48 | 3.53 | 3.07 | 3.01 | 4.55 | 2.96 | NA | NA | NA | NA | NA | NA | NA | NA | NA | NA | NA | NA | NA | NA | NA | NA | NA | NA | NA | NA | NA | NA | NA | NA | NA | NA | NA | NA | NA | NA | NA | NA | NA | NA | NA | NA | |
| Investment Banking | 573.90 | 600.19 | 492.48 | 502.80 | 552.58 | 709.33 | 600.86 | 945.05 | 1180.77 | 1180.62 | 1000.70 | 1003.61 | 906.16 | 615.84 | 387.49 | 592.00 | 400.51 | 410.80 | 430.09 | 285.60 | 460.04 | 500.30 | 439.99 | 528.70 | 475.70 | 351.86 | NA | NA | NA | NA | NA | NA | NA | NA | NA | NA | NA | NA | NA | NA | NA | NA | NA | NA | NA | NA | NA | NA | NA | NA | NA | NA | NA | NA | NA | NA | NA | NA | NA | |
| Investment Banking Advisory | 312.31 | 335.27 | 254.16 | 297.18 | 381.06 | 481.42 | 371.76 | 543.77 | 587.73 | 583.89 | 390.51 | 311.44 | 356.82 | 171.44 | 182.08 | 343.16 | 195.03 | 213.35 | 178.55 | 180.48 | 182.31 | 216.98 | 191.16 | NA | NA | NA | NA | NA | NA | NA | NA | NA | NA | NA | NA | NA | NA | NA | NA | NA | NA | NA | NA | NA | NA | NA | NA | NA | NA | NA | NA | NA | NA | NA | NA | NA | NA | NA | NA | |
| Investment Banking Underwriting | 261.59 | 264.92 | 238.32 | 205.62 | 171.53 | 227.91 | 229.10 | 401.28 | 593.04 | 596.73 | 610.19 | 692.17 | 549.34 | 444.40 | 205.41 | 248.84 | 205.48 | 197.45 | 251.53 | 105.11 | NA | NA | NA | NA | NA | NA | NA | NA | NA | NA | NA | NA | NA | NA | NA | NA | NA | NA | NA | NA | NA | NA | NA | NA | NA | NA | NA | NA | NA | NA | NA | NA | NA | NA | NA | NA | NA | NA | NA | |
| Manufacturing Revenues | NA | NA | NA | NA | NA | 105.47 | 166.03 | 141.11 | 97.77 | 118.92 | 184.09 | 137.85 | 138.70 | 119.75 | 85.38 | 77.61 | 76.43 | 82.56 | 90.24 | 75.42 | 94.03 | 114.73 | 98.36 | 82.72 | 81.94 | 81.33 | NA | NA | NA | NA | NA | NA | NA | NA | NA | NA | NA | NA | NA | NA | NA | NA | NA | NA | NA | NA | NA | NA | NA | NA | NA | NA | NA | NA | NA | NA | NA | NA | NA | |
| Merchant Banking | 47.15 | 15.71 | 20.75 | 41.18 | 249.10 | 242.72 | 274.09 | 220.11 | NA | NA | NA | NA | NA | NA | NA | NA | NA | NA | NA | NA | NA | NA | NA | NA | NA | NA | NA | NA | NA | NA | NA | NA | NA | NA | NA | NA | NA | NA | NA | NA | NA | NA | NA | NA | NA | NA | NA | NA | NA | NA | NA | NA | NA | NA | NA | NA | NA | NA | NA | |
| Oil And Gas Production And Development Revenues | NA | NA | NA | NA | NA | 84.49 | 83.24 | 57.92 | 56.12 | 49.81 | 45.03 | 32.01 | 23.51 | 20.95 | 15.54 | 42.21 | 44.60 | 45.01 | 47.65 | 36.37 | 46.51 | 39.91 | 20.33 | NA | NA | NA | NA | NA | NA | NA | NA | NA | NA | NA | NA | NA | NA | NA | NA | NA | NA | NA | NA | NA | NA | NA | NA | NA | NA | NA | NA | NA | NA | NA | NA | NA | NA | NA | NA | |
| Revenue From Contract With Customer Miscellaneous | NA | NA | NA | NA | NA | 52.75 | 24.82 | 21.08 | 23.58 | 67.50 | 37.59 | 14.98 | 19.58 | 11.05 | 15.04 | 15.47 | 29.27 | 21.71 | 9.88 | 10.99 | 11.74 | 9.09 | 10.21 | NA | NA | NA | NA | NA | NA | NA | NA | NA | NA | NA | NA | NA | NA | NA | NA | NA | NA | NA | NA | NA | NA | NA | NA | NA | NA | NA | NA | NA | NA | NA | NA | NA | NA | NA | NA | |
| Revenue From Contract With Customer Other | NA | NA | NA | NA | NA | 246.47 | 277.39 | 232.68 | 620.57 | 120.17 | 84.94 | 54.41 | 45.08 | 35.12 | 34.08 | 63.78 | 76.53 | 70.07 | 70.20 | 61.83 | 70.59 | 61.82 | 42.16 | NA | NA | NA | NA | NA | NA | NA | NA | NA | NA | NA | NA | NA | NA | NA | NA | NA | NA | NA | NA | NA | NA | NA | NA | NA | NA | NA | NA | NA | NA | NA | NA | NA | NA | NA | NA | |
| Asset Management1 | 5.90 | 5.34 | 4.86 | 17.76 | 3.90 | 3.76 | 3.30 | 12.57 | 2.24 | 2.85 | 2.31 | 7.43 | 1.99 | 3.13 | 3.50 | 6.09 | -1.92 | 4.65 | 6.17 | 8.32 | NA | NA | NA | NA | NA | NA | NA | NA | NA | NA | NA | NA | NA | NA | NA | NA | NA | NA | NA | NA | NA | NA | NA | NA | NA | NA | NA | NA | NA | NA | NA | NA | NA | NA | NA | NA | NA | NA | NA | |
| Oil And Gas | 0.29 | 0.23 | 0.26 | 25.51 | 76.48 | 84.49 | 83.24 | 57.92 | NA | NA | NA | NA | NA | NA | NA | NA | NA | NA | NA | NA | NA | NA | NA | NA | NA | NA | NA | NA | NA | NA | NA | NA | NA | NA | NA | NA | NA | NA | NA | NA | NA | NA | NA | NA | NA | NA | NA | NA | NA | NA | NA | NA | NA | NA | NA | NA | NA | NA | NA | |
| Product | NA | NA | NA | NA | 0.00 | 105.47 | 166.03 | 141.11 | NA | NA | NA | NA | NA | NA | NA | NA | NA | NA | NA | NA | NA | NA | NA | NA | NA | NA | NA | NA | NA | NA | NA | NA | NA | NA | NA | NA | NA | NA | NA | NA | NA | NA | NA | NA | NA | NA | NA | NA | NA | NA | NA | NA | NA | NA | NA | NA | NA | NA | NA | |
| Product And Service Other | 13.66 | 13.58 | 13.03 | 12.93 | 12.99 | 12.25 | 11.87 | 10.84 | NA | NA | NA | NA | NA | NA | NA | NA | NA | NA | NA | NA | NA | NA | NA | NA | NA | NA | NA | NA | NA | NA | NA | NA | NA | NA | NA | NA | NA | NA | NA | NA | NA | NA | NA | NA | NA | NA | NA | NA | NA | NA | NA | NA | NA | NA | NA | NA | NA | NA | NA | |
| Real Estate | 32.72 | 1.90 | 7.46 | 2.75 | 159.62 | 40.51 | 12.96 | 10.24 | NA | NA | NA | NA | NA | NA | NA | NA | NA | NA | NA | NA | NA | NA | NA | NA | NA | NA | NA | NA | NA | NA | NA | NA | NA | NA | NA | NA | NA | NA | NA | NA | NA | NA | NA | NA | NA | NA | NA | NA | NA | NA | NA | NA | NA | NA | NA | NA | NA | NA | NA | |
| Asset Management Services, Asset Management | 5.90 | 5.34 | 4.86 | 17.76 | 3.90 | 3.76 | 3.30 | 12.57 | NA | NA | NA | NA | NA | NA | NA | NA | NA | NA | NA | NA | NA | NA | NA | NA | NA | NA | NA | NA | NA | NA | NA | NA | NA | NA | NA | NA | NA | NA | NA | NA | NA | NA | NA | NA | NA | NA | NA | NA | NA | NA | NA | NA | NA | NA | NA | NA | NA | NA | NA | |
| Equities, Investment Banking And Capital Markets | 230.65 | 221.19 | 232.30 | 210.46 | 215.11 | 217.93 | 251.28 | 225.93 | NA | NA | NA | NA | NA | NA | NA | NA | NA | NA | NA | NA | NA | NA | NA | NA | NA | NA | NA | NA | NA | NA | NA | NA | NA | NA | NA | NA | NA | NA | NA | NA | NA | NA | NA | NA | NA | NA | NA | NA | NA | NA | NA | NA | NA | NA | NA | NA | NA | NA | NA | |
| Fixed Income Services, Investment Banking And Capital Markets | 2.24 | 2.52 | 3.01 | 2.81 | 4.96 | 3.46 | 3.43 | 3.38 | NA | NA | NA | NA | NA | NA | NA | NA | NA | NA | NA | NA | NA | NA | NA | NA | NA | NA | NA | NA | NA | NA | NA | NA | NA | NA | NA | NA | NA | NA | NA | NA | NA | NA | NA | NA | NA | NA | NA | NA | NA | NA | NA | NA | NA | NA | NA | NA | NA | NA | NA | |
| Investment Banking Advisory, Investment Banking And Capital Markets | 312.31 | 335.27 | 254.16 | 297.18 | 381.41 | 481.42 | 371.76 | 543.77 | NA | NA | NA | NA | NA | NA | NA | NA | NA | NA | NA | NA | NA | NA | NA | NA | NA | NA | NA | NA | NA | NA | NA | NA | NA | NA | NA | NA | NA | NA | NA | NA | NA | NA | NA | NA | NA | NA | NA | NA | NA | NA | NA | NA | NA | NA | NA | NA | NA | NA | NA | |
| Investment Banking Underwriting, Investment Banking And Capital Markets | 261.59 | 264.92 | 238.32 | 205.62 | 171.17 | 227.91 | 229.10 | 401.28 | NA | NA | NA | NA | NA | NA | NA | NA | NA | NA | NA | NA | NA | NA | NA | NA | NA | NA | NA | NA | NA | NA | NA | NA | NA | NA | NA | NA | NA | NA | NA | NA | NA | NA | NA | NA | NA | NA | NA | NA | NA | NA | NA | NA | NA | NA | NA | NA | NA | NA | NA | |
| Merchant Banking, Asset Management | 47.15 | 15.71 | 20.75 | 41.18 | 249.10 | 242.72 | 274.09 | 220.11 | NA | NA | NA | NA | NA | NA | NA | NA | NA | NA | NA | NA | NA | NA | NA | NA | NA | NA | NA | NA | NA | NA | NA | NA | NA | NA | NA | NA | NA | NA | NA | NA | NA | NA | NA | NA | NA | NA | NA | NA | NA | NA | NA | NA | NA | NA | NA | NA | NA | NA | NA | |
| Asset Management | 53.05 | 21.06 | 25.61 | 58.94 | 253.00 | 246.47 | 277.39 | 232.68 | NA | NA | NA | NA | NA | NA | NA | NA | NA | NA | NA | NA | NA | NA | NA | NA | NA | NA | NA | NA | NA | NA | NA | NA | NA | NA | NA | NA | NA | NA | NA | NA | NA | NA | NA | NA | NA | NA | NA | NA | NA | NA | NA | NA | NA | NA | NA | NA | NA | NA | NA | |
| Investment Banking And Capital Markets | 806.79 | 823.90 | 727.79 | 716.07 | 772.66 | 930.73 | 855.57 | 1174.36 | NA | NA | NA | NA | NA | NA | NA | NA | NA | NA | NA | NA | NA | NA | NA | NA | NA | NA | NA | NA | NA | NA | NA | NA | NA | NA | NA | NA | NA | NA | NA | NA | NA | NA | NA | NA | NA | NA | NA | NA | NA | NA | NA | NA | NA | NA | NA | NA | NA | NA | NA | |
| 656.01 | 668.28 | 564.43 | 613.72 | 865.96 | 921.21 | 959.62 | 1168.73 | 1324.46 | 1353.10 | 1230.52 | 1218.13 | 1068.57 | 837.00 | 641.78 | 786.31 | 614.78 | 627.68 | 638.78 | 449.09 | 697.68 | 735.43 | 649.43 | NA | NA | NA | NA | NA | NA | NA | NA | NA | NA | NA | NA | NA | NA | NA | NA | NA | NA | NA | NA | NA | NA | NA | NA | NA | NA | NA | NA | NA | NA | NA | NA | NA | NA | NA | NA | ||
| NA | 75.63 | 66.46 | 44.49 | NA | 63.45 | 66.29 | 71.58 | NA | NA | NA | NA | NA | 45.59 | 38.09 | 43.18 | 25.73 | 17.92 | 18.64 | 17.17 | 18.97 | 20.05 | 17.40 | NA | NA | NA | NA | NA | NA | NA | NA | NA | NA | NA | NA | NA | NA | NA | NA | NA | NA | NA | NA | NA | NA | NA | NA | NA | NA | NA | NA | NA | NA | NA | NA | NA | NA | NA | NA | ||
| NA | NA | NA | NA | 48.41 | 63.45 | 66.29 | 71.58 | 66.80 | 65.38 | 64.10 | 50.08 | 54.10 | 45.59 | 38.09 | 43.18 | NA | NA | NA | NA | NA | NA | NA | NA | NA | NA | NA | NA | NA | NA | NA | NA | NA | NA | NA | NA | NA | NA | NA | NA | NA | NA | NA | NA | NA | NA | NA | NA | NA | NA | NA | NA | NA | NA | NA | NA | NA | NA | NA | ||
| 147.72 | 101.05 | 122.51 | 116.80 | 111.29 | 192.55 | 107.04 | 166.73 | 191.47 | 215.59 | 197.73 | 164.44 | 163.08 | 92.14 | 70.05 | 83.32 | NA | NA | NA | NA | NA | NA | NA | NA | NA | NA | NA | NA | NA | NA | NA | NA | NA | NA | NA | NA | NA | NA | NA | NA | NA | NA | NA | NA | NA | NA | NA | NA | NA | NA | NA | NA | NA | NA | NA | NA | NA | NA | NA | ||
| , Asset Management | 51.29 | 19.77 | 24.43 | 57.79 | 251.78 | 245.29 | 276.33 | 231.80 | NA | NA | NA | NA | NA | NA | NA | NA | NA | NA | NA | NA | NA | NA | NA | NA | NA | NA | NA | NA | NA | NA | NA | NA | NA | NA | NA | NA | NA | NA | NA | NA | NA | NA | NA | NA | NA | NA | NA | NA | NA | NA | NA | NA | NA | NA | NA | NA | NA | NA | NA | |
| , Investment Banking And Capital Markets | 604.72 | 648.51 | 540.00 | 555.93 | 614.18 | 675.91 | 683.29 | 936.93 | NA | NA | NA | NA | NA | NA | NA | NA | NA | NA | NA | NA | NA | NA | NA | NA | NA | NA | NA | NA | NA | NA | NA | NA | NA | NA | NA | NA | NA | NA | NA | NA | NA | NA | NA | NA | NA | NA | NA | NA | NA | NA | NA | NA | NA | NA | NA | NA | NA | NA | NA | |
| , Asset Management | NA | 0.66 | 0.58 | 0.57 | NA | 0.44 | 0.41 | 0.32 | NA | NA | NA | NA | NA | NA | NA | NA | NA | NA | NA | NA | NA | NA | NA | NA | NA | NA | NA | NA | NA | NA | NA | NA | NA | NA | NA | NA | NA | NA | NA | NA | NA | NA | NA | NA | NA | NA | NA | NA | NA | NA | NA | NA | NA | NA | NA | NA | NA | NA | NA | |
| , Investment Banking And Capital Markets | NA | 74.97 | 65.87 | 43.92 | NA | 63.01 | 65.88 | 71.26 | NA | NA | NA | NA | NA | NA | NA | NA | NA | NA | NA | NA | NA | NA | NA | NA | NA | NA | NA | NA | NA | NA | NA | NA | NA | NA | NA | NA | NA | NA | NA | NA | NA | NA | NA | NA | NA | NA | NA | NA | NA | NA | NA | NA | NA | NA | NA | NA | NA | NA | NA | |
| , Asset Management | 0.84 | 0.63 | 0.60 | 0.58 | 0.65 | 0.74 | 0.65 | 0.56 | NA | NA | NA | NA | NA | NA | NA | NA | NA | NA | NA | NA | NA | NA | NA | NA | NA | NA | NA | NA | NA | NA | NA | NA | NA | NA | NA | NA | NA | NA | NA | NA | NA | NA | NA | NA | NA | NA | NA | NA | NA | NA | NA | NA | NA | NA | NA | NA | NA | NA | NA | |
| , Investment Banking And Capital Markets | 146.88 | 100.42 | 121.91 | 116.22 | 110.64 | 191.81 | 106.39 | 166.17 | NA | NA | NA | NA | NA | NA | NA | NA | NA | NA | NA | NA | NA | NA | NA | NA | NA | NA | NA | NA | NA | NA | NA | NA | NA | NA | NA | NA | NA | NA | NA | NA | NA | NA | NA | NA | NA | NA | NA | NA | NA | NA | NA | NA | NA | NA | NA | NA | NA | NA | NA | |
| Revenues Net Of Interest Expense | 1197.21 | 1182.11 | 1037.61 | 1283.49 | 1352.95 | 1524.89 | 1369.08 | 1731.91 | 1808.90 | 1938.98 | 1950.51 | 2486.94 | 1860.79 | 1616.17 | 1147.59 | 1386.33 | 1106.10 | 856.78 | 1101.66 | 828.44 | 1150.85 | 911.16 | 2680.79 | 2939.51 | 2896.52 | 2732.38 | 2867.98 | 2745.78 | 2676.38 | 2625.36 | 2015.11 | 2496.22 | 2366.10 | 2839.46 | 3184.68 | 2688.36 | 3003.64 | 2852.05 | 2943.31 | 2920.82 | 2565.08 | 2705.15 | 2297.61 | 2683.19 | 2216.92 | 1746.04 | NA | NA | NA | NA | NA | NA | NA | NA | NA | NA | NA | NA | NA | |
| NA | NA | NA | NA | NA | -0.08 | -0.52 | -0.14 | -0.83 | 3.02 | 3.44 | 2.61 | 1.25 | 2.02 | 2.68 | 2.82 | 0.39 | -4.84 | 3.51 | 2.19 | -4.79 | -0.81 | -2.78 | NA | NA | NA | NA | NA | NA | NA | NA | NA | NA | NA | NA | NA | NA | NA | NA | NA | NA | NA | NA | NA | NA | NA | NA | NA | NA | NA | NA | NA | NA | NA | NA | NA | NA | NA | NA | ||
| Material Reconciling Items | -1.40 | 3.70 | 7.50 | -2.10 | -2.80 | -4.40 | -1.10 | 3.60 | NA | NA | NA | NA | NA | NA | NA | NA | NA | NA | NA | NA | 367.40 | 84.42 | 66.07 | 200.61 | 32.59 | 72.85 | 501.45 | 145.58 | 271.83 | 95.30 | 13.01 | 255.54 | -80.99 | 38.32 | NA | NA | NA | NA | NA | NA | NA | NA | NA | NA | NA | NA | NA | NA | NA | NA | NA | NA | NA | NA | NA | NA | NA | NA | NA | |
| Operating | 1198.60 | 1178.30 | 1030.10 | 1285.60 | 1357.28 | 1524.97 | 1369.60 | 1732.06 | 1809.73 | 1935.96 | 1947.07 | 2484.34 | 1859.54 | 1614.15 | 1144.91 | 1383.51 | 1105.71 | 861.62 | 1098.15 | 826.25 | 783.44 | 826.74 | 2614.72 | 2738.90 | 2863.93 | 2659.53 | 2366.53 | 2600.20 | 2404.54 | 2530.06 | 2002.09 | 2240.67 | 2447.09 | 2801.14 | 737.91 | -7776.32 | 2833.85 | 2717.91 | 110.95 | NA | NA | NA | NA | NA | NA | NA | NA | NA | NA | NA | NA | NA | NA | NA | NA | NA | NA | NA | NA | |
| Operating, Asset Management | 140.60 | 10.10 | -22.40 | 78.30 | 1180.40 | -13.80 | 31.15 | 59.96 | 42.80 | 12.60 | 54.55 | 226.73 | 88.98 | 118.56 | 7.39 | 20.33 | -10.55 | 20.34 | 44.36 | 30.75 | NA | NA | NA | NA | NA | NA | NA | NA | NA | NA | NA | NA | NA | NA | NA | NA | NA | NA | NA | NA | NA | NA | NA | NA | NA | NA | NA | NA | NA | NA | NA | NA | NA | NA | NA | NA | NA | NA | NA | |
| Operating, Investment Banking And Capital Markets | 1058.00 | 1168.20 | 1052.50 | 1207.30 | 1011.27 | 1134.73 | 1098.38 | 1481.82 | 1613.36 | 1650.80 | 1572.96 | 1959.51 | 1537.36 | 1274.12 | 1028.83 | 1148.83 | 761.10 | 757.36 | 859.27 | 658.25 | NA | NA | NA | NA | NA | NA | NA | NA | NA | NA | NA | NA | NA | NA | NA | NA | NA | NA | NA | NA | NA | NA | NA | NA | NA | NA | NA | NA | NA | NA | NA | NA | NA | NA | NA | NA | NA | NA | NA | |
| Operating, Merchant Banking | NA | NA | NA | NA | NA | 397.85 | 238.25 | 189.53 | 152.79 | 271.61 | 318.83 | 297.50 | 231.85 | 220.89 | 107.16 | 204.56 | 347.21 | 75.50 | 187.32 | 136.34 | 369.31 | 86.42 | 73.90 | NA | NA | NA | NA | NA | NA | NA | NA | NA | NA | NA | NA | NA | NA | NA | NA | NA | NA | NA | NA | NA | NA | NA | NA | NA | NA | NA | NA | NA | NA | NA | NA | NA | NA | NA | NA | |
| Operating, Corporate | NA | NA | NA | NA | NA | 6.19 | 1.82 | 0.75 | 0.77 | 0.95 | 0.72 | 0.59 | 1.35 | 0.59 | 1.52 | 9.79 | 10.70 | 8.97 | 8.97 | 4.19 | 8.69 | 2.99 | 3.07 | 2.05 | 1.92 | 1.24 | NA | NA | NA | NA | NA | NA | NA | NA | NA | NA | NA | NA | NA | NA | NA | NA | NA | NA | NA | NA | NA | NA | NA | NA | NA | NA | NA | NA | NA | NA | NA | NA | NA | |
| NA | NA | NA | NA | NA | 1509.90 | NA | NA | NA | NA | NA | NA | NA | NA | NA | NA | NA | NA | NA | NA | NA | NA | NA | NA | NA | NA | NA | NA | NA | NA | NA | NA | NA | NA | NA | NA | NA | NA | NA | NA | NA | NA | NA | NA | NA | NA | NA | NA | NA | NA | NA | NA | NA | NA | NA | NA | NA | NA | NA | ||
| NA | NA | NA | NA | NA | -15.05 | -31.01 | -39.07 | NA | NA | NA | NA | NA | NA | NA | NA | NA | NA | NA | NA | NA | NA | NA | NA | NA | NA | NA | NA | NA | NA | NA | NA | NA | NA | NA | NA | NA | NA | NA | NA | NA | NA | NA | NA | NA | NA | NA | NA | NA | NA | NA | NA | NA | NA | NA | NA | NA | NA | NA | ||
| NA | NA | NA | NA | NA | 1524.89 | 1369.08 | 1731.91 | NA | NA | NA | NA | NA | NA | NA | NA | NA | NA | NA | NA | NA | NA | NA | NA | NA | NA | NA | NA | NA | NA | NA | NA | NA | NA | NA | NA | NA | NA | NA | NA | NA | NA | NA | NA | NA | NA | NA | NA | NA | NA | NA | NA | NA | NA | NA | NA | NA | NA | NA | ||
| 874.20 | 936.90 | 832.20 | 982.30 | 1176.10 | 1150.80 | 1064.20 | 1424.30 | NA | NA | NA | NA | NA | NA | NA | NA | NA | NA | NA | NA | NA | NA | NA | NA | NA | NA | NA | NA | NA | NA | NA | NA | NA | NA | NA | NA | NA | NA | NA | NA | NA | NA | NA | NA | NA | NA | NA | NA | NA | NA | NA | NA | NA | NA | NA | NA | NA | NA | NA | ||
| 81.90 | 71.30 | 62.40 | 83.30 | 47.10 | 68.40 | 80.20 | 42.30 | NA | NA | NA | NA | NA | NA | NA | NA | NA | NA | NA | NA | NA | NA | NA | NA | NA | NA | NA | NA | NA | NA | NA | NA | NA | NA | NA | NA | NA | NA | NA | NA | NA | NA | NA | NA | NA | NA | NA | NA | NA | NA | NA | NA | NA | NA | NA | NA | NA | NA | NA | ||
| 241.10 | 173.90 | 143.00 | 217.90 | 214.80 | 290.70 | 193.70 | 226.20 | NA | NA | NA | NA | NA | NA | NA | NA | NA | NA | NA | NA | NA | NA | NA | NA | NA | NA | NA | NA | NA | NA | NA | NA | NA | NA | NA | NA | NA | NA | NA | NA | NA | NA | NA | NA | NA | NA | NA | NA | NA | NA | NA | NA | NA | NA | NA | NA | NA | NA | NA |
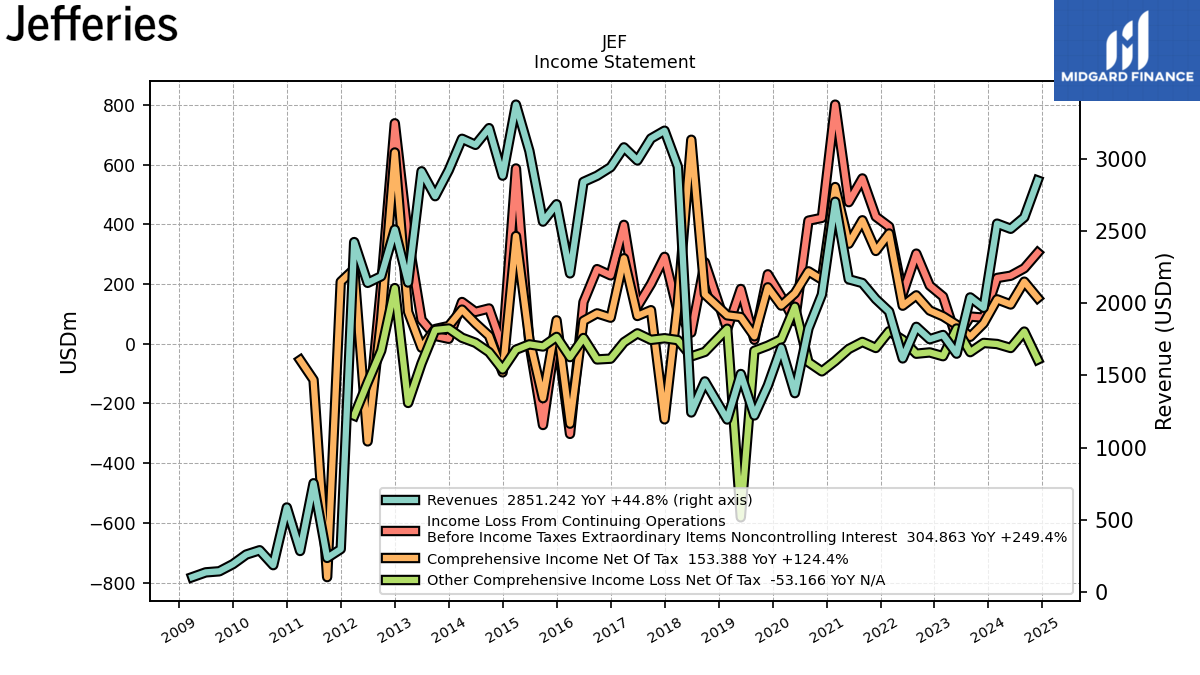
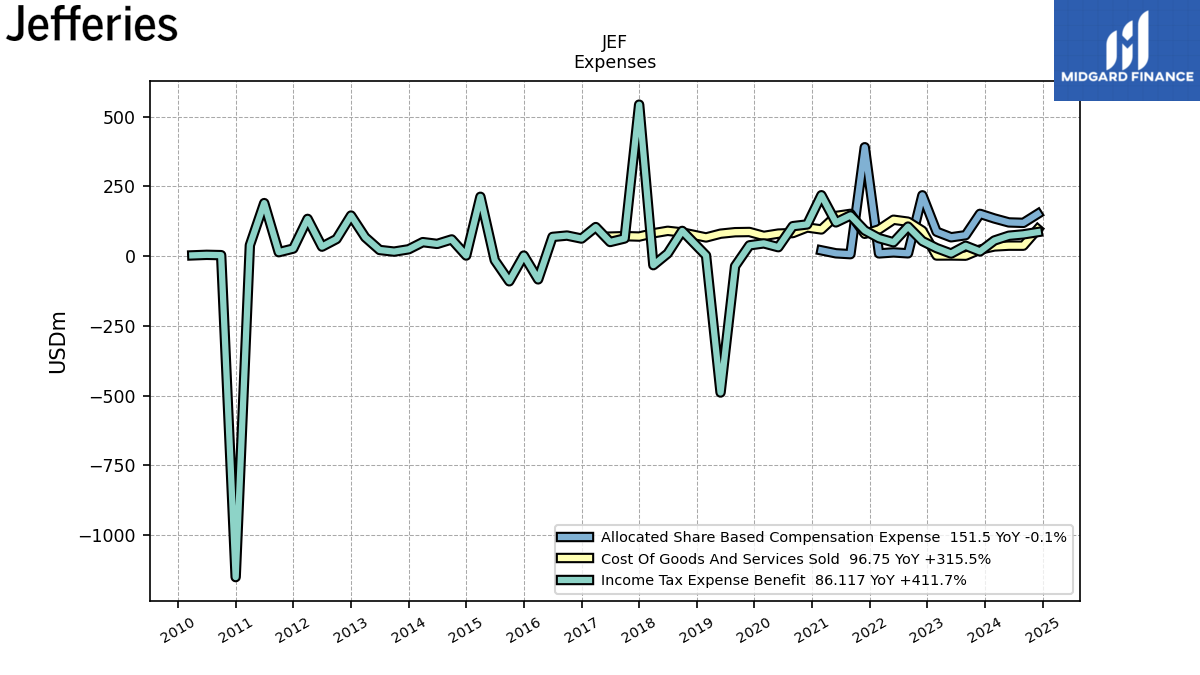
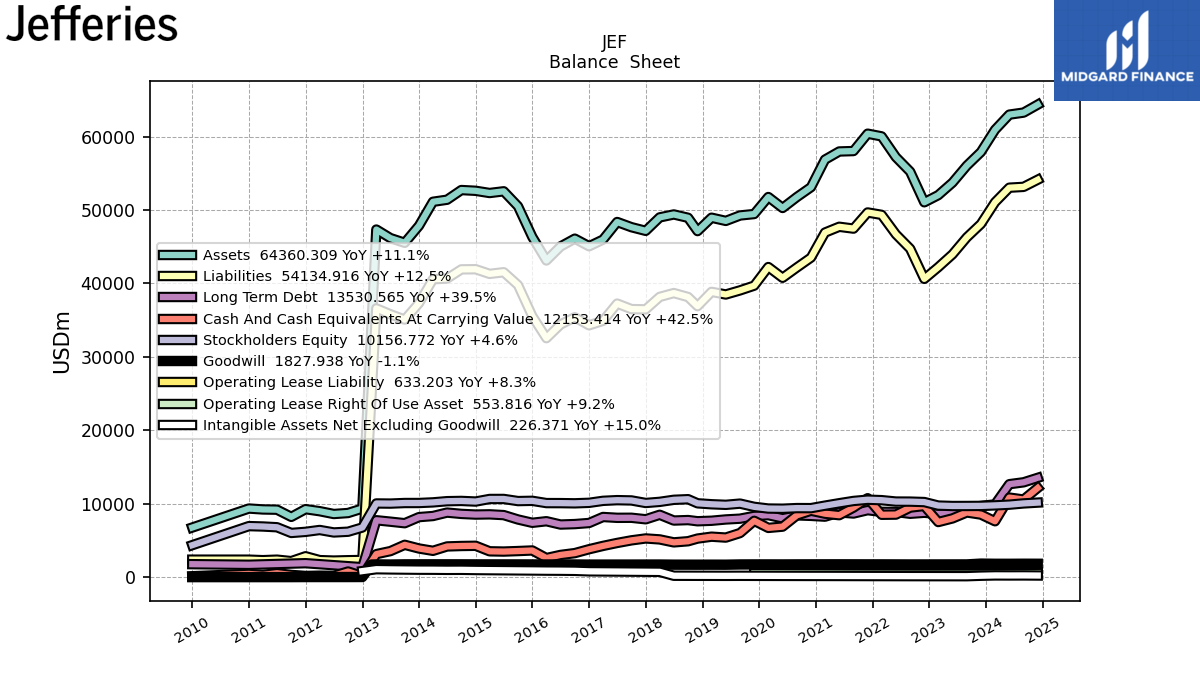
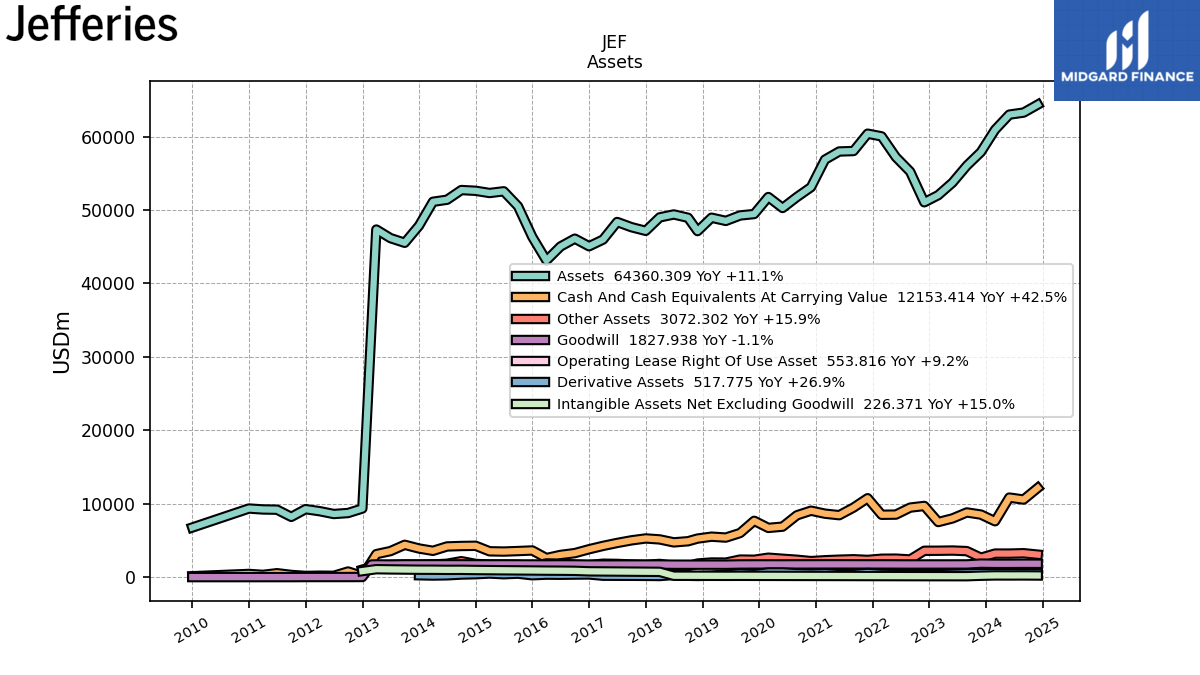
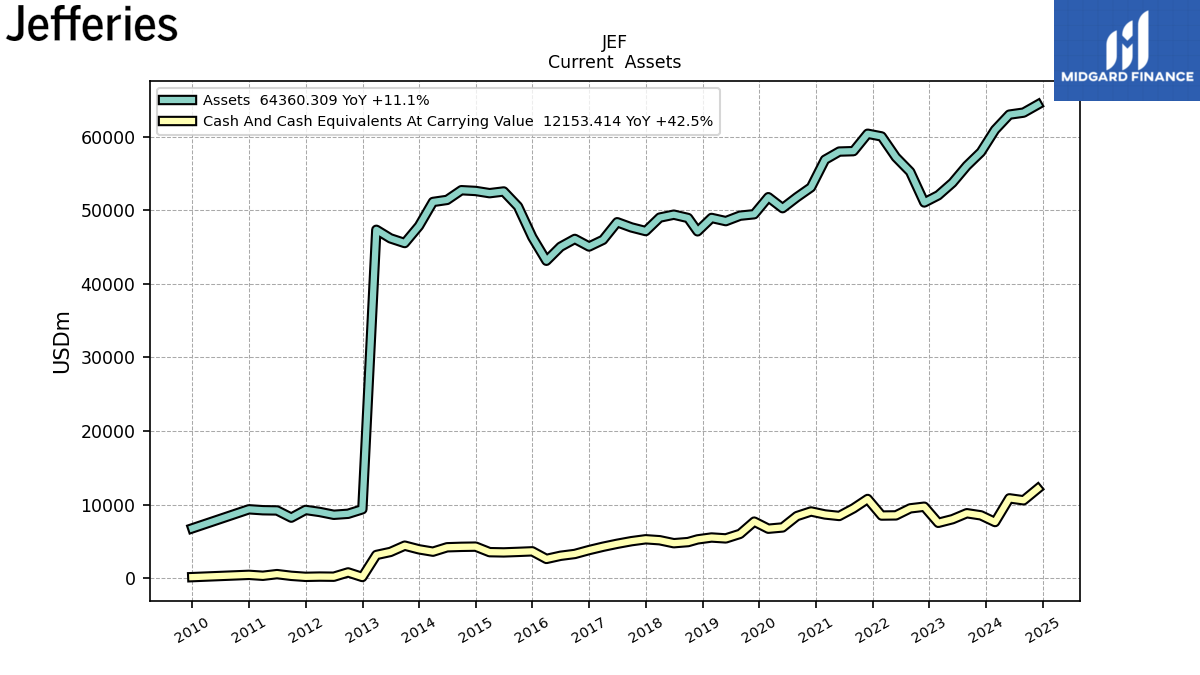
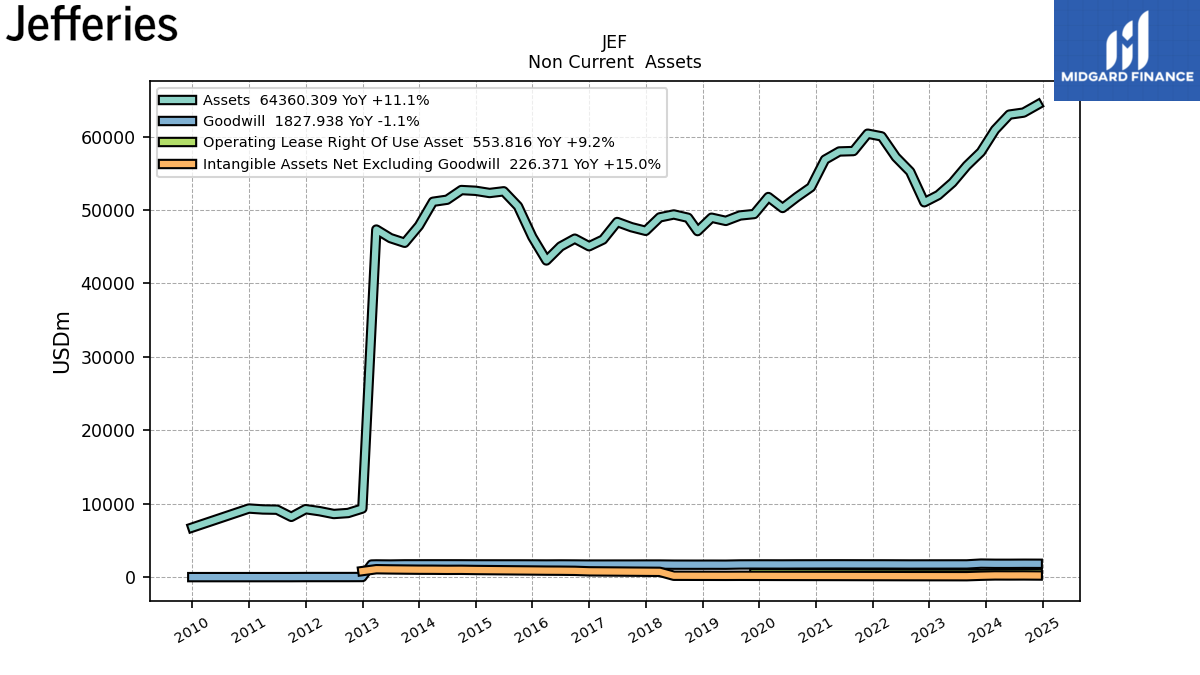
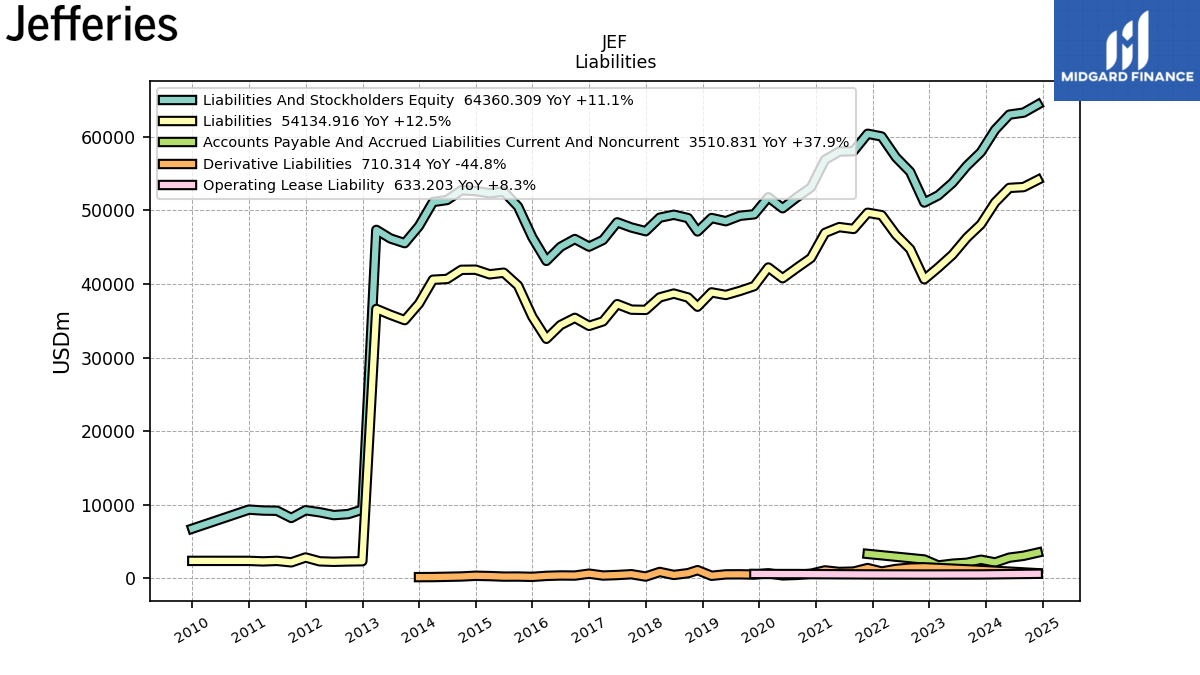
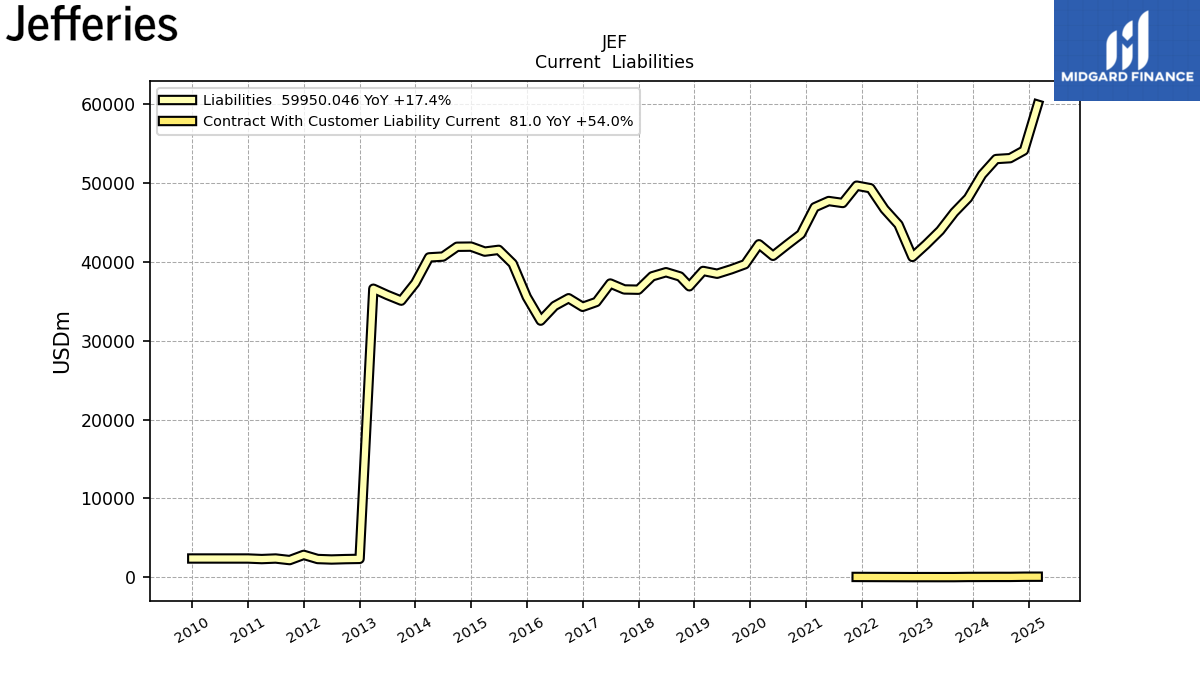
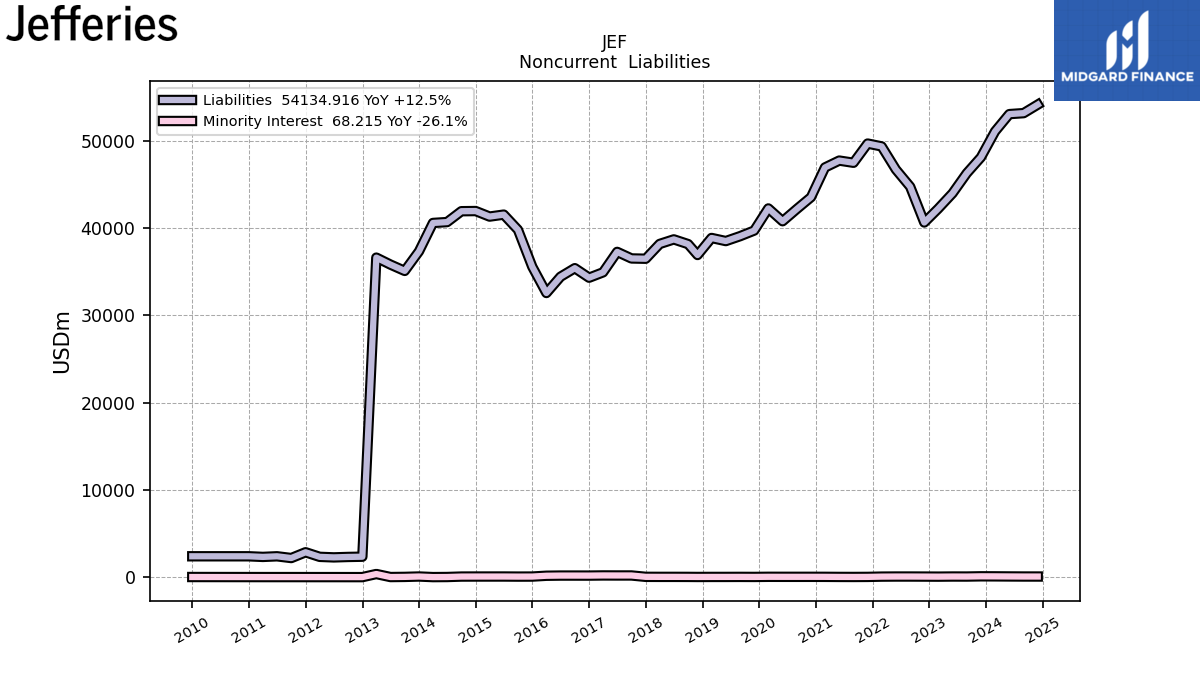
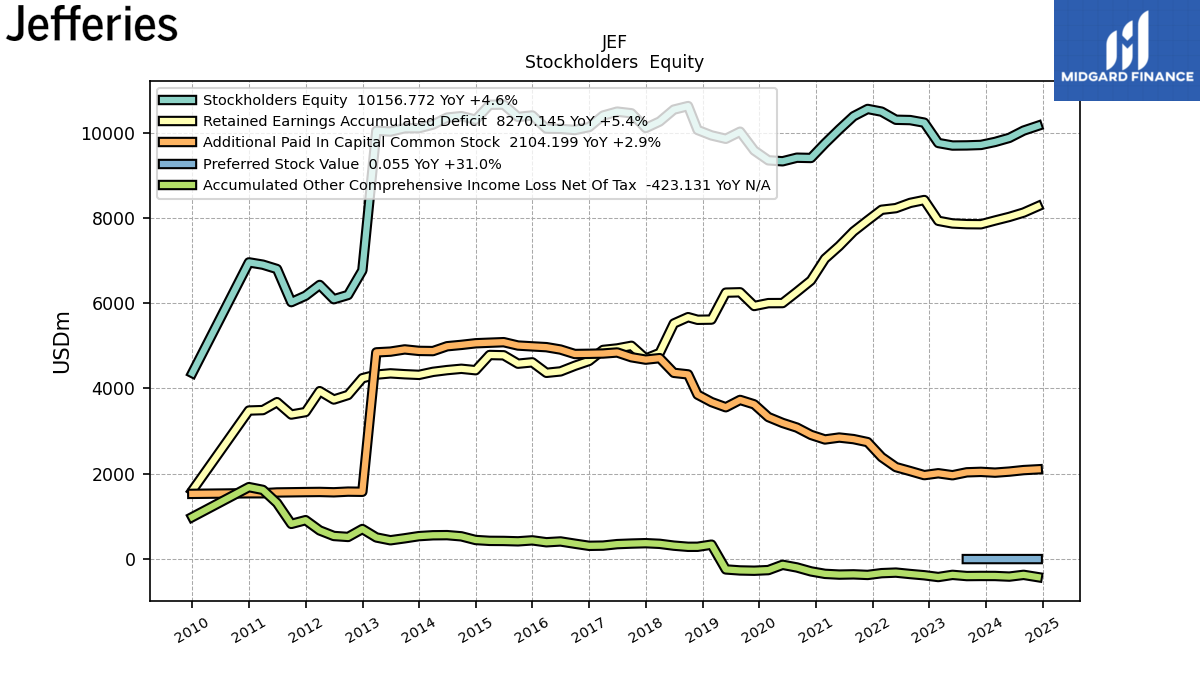
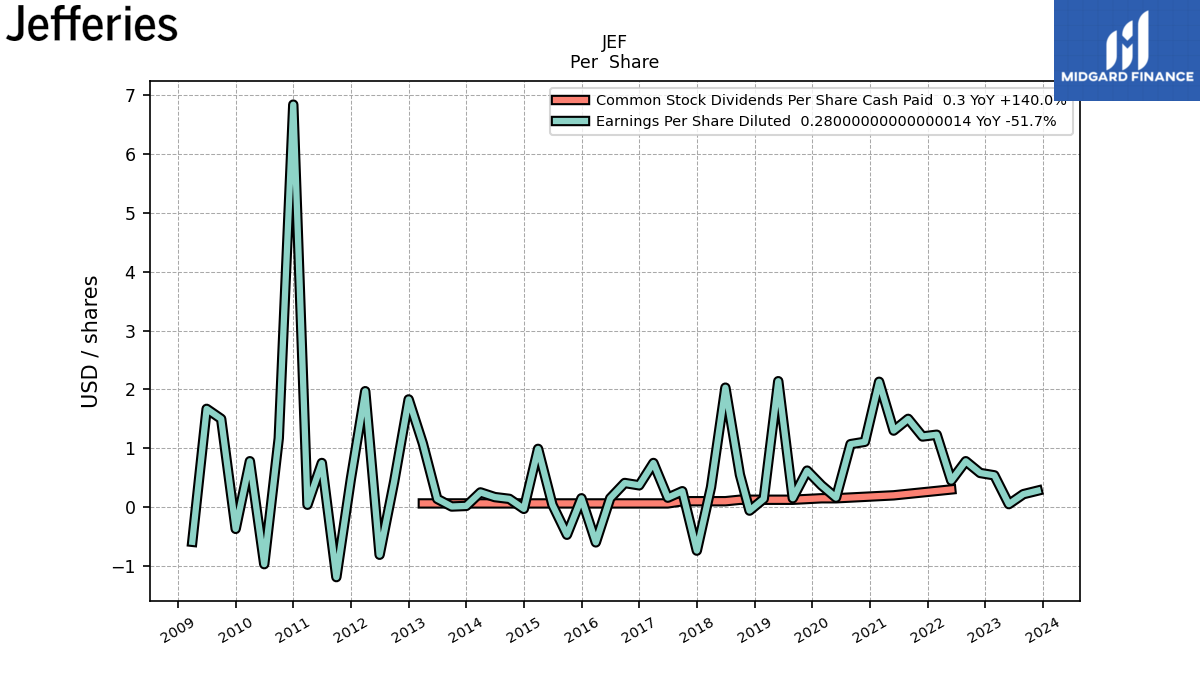
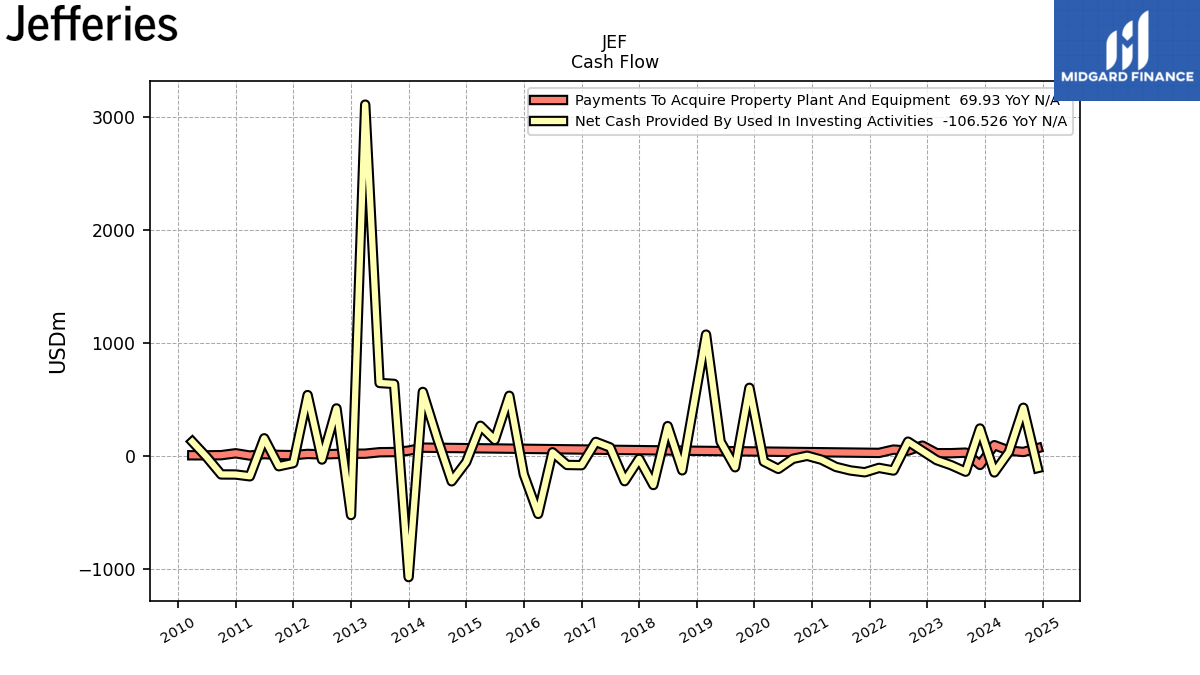
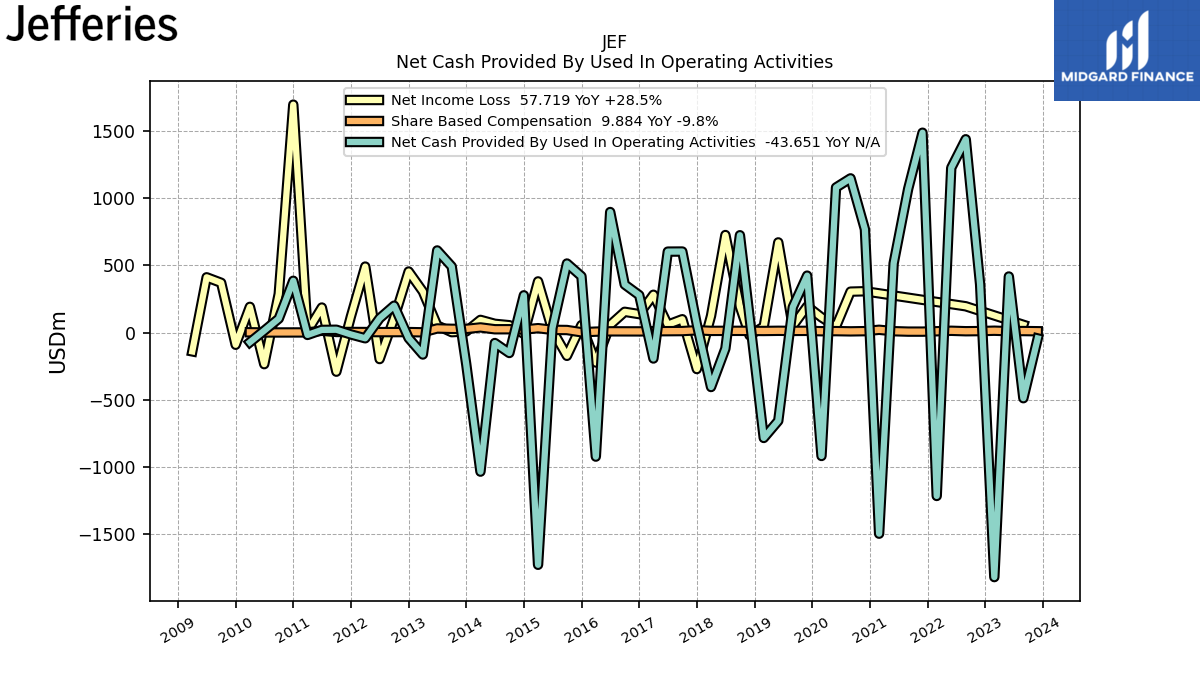
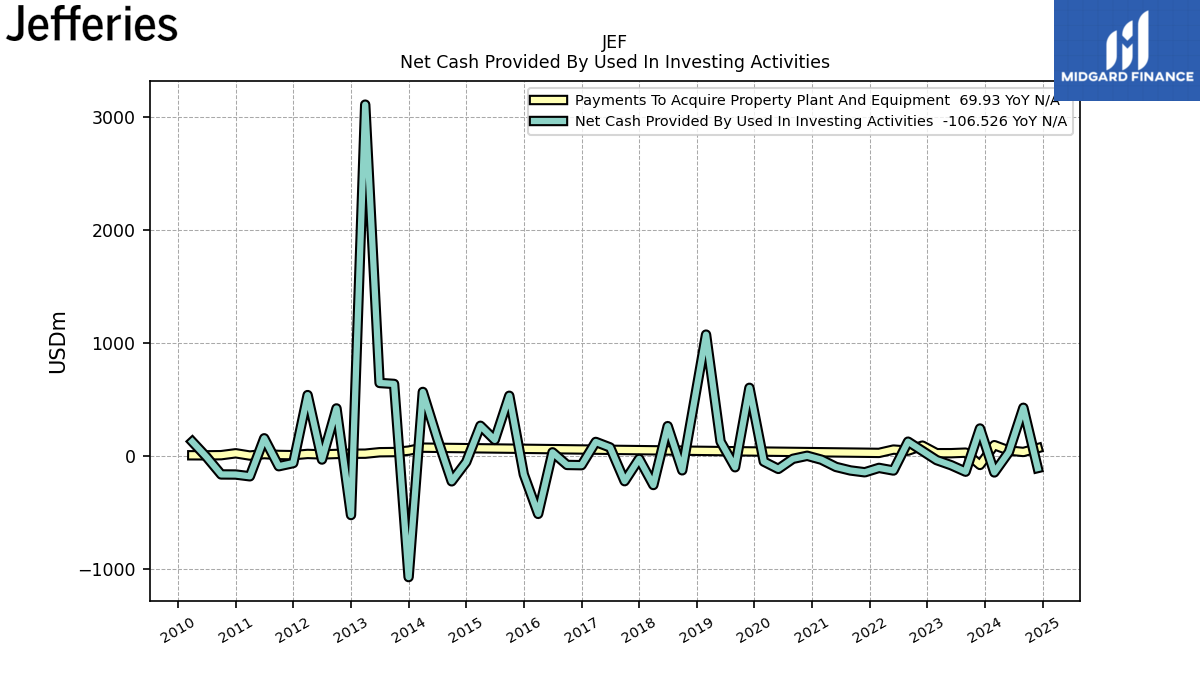
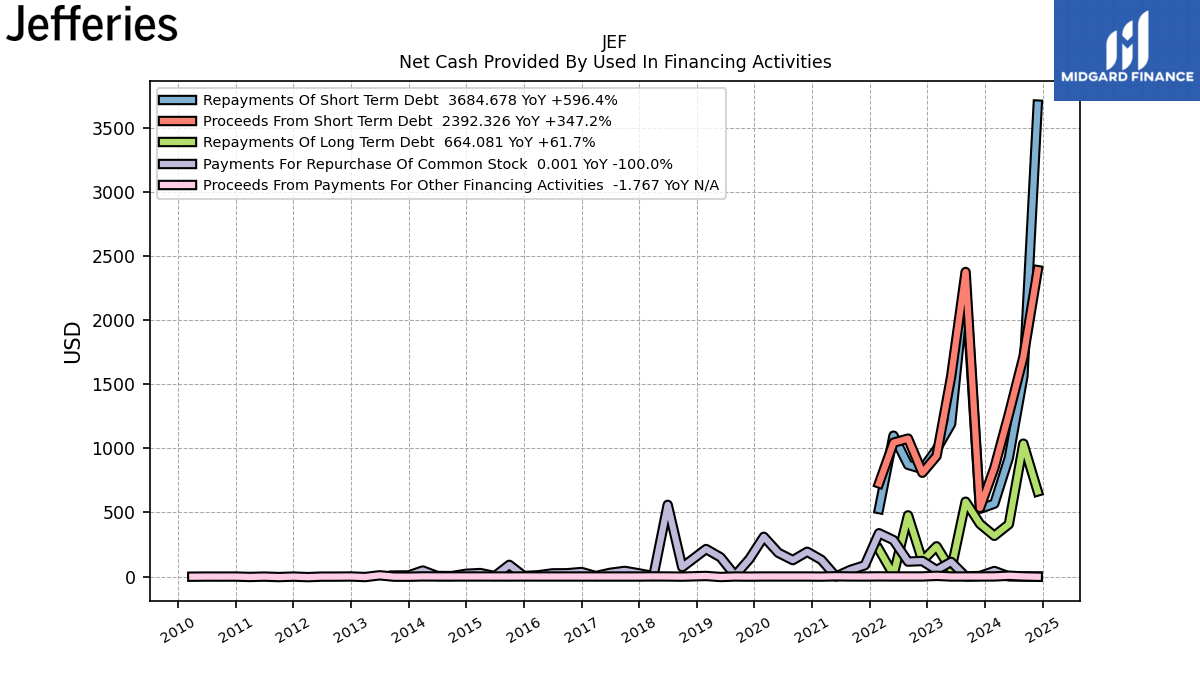

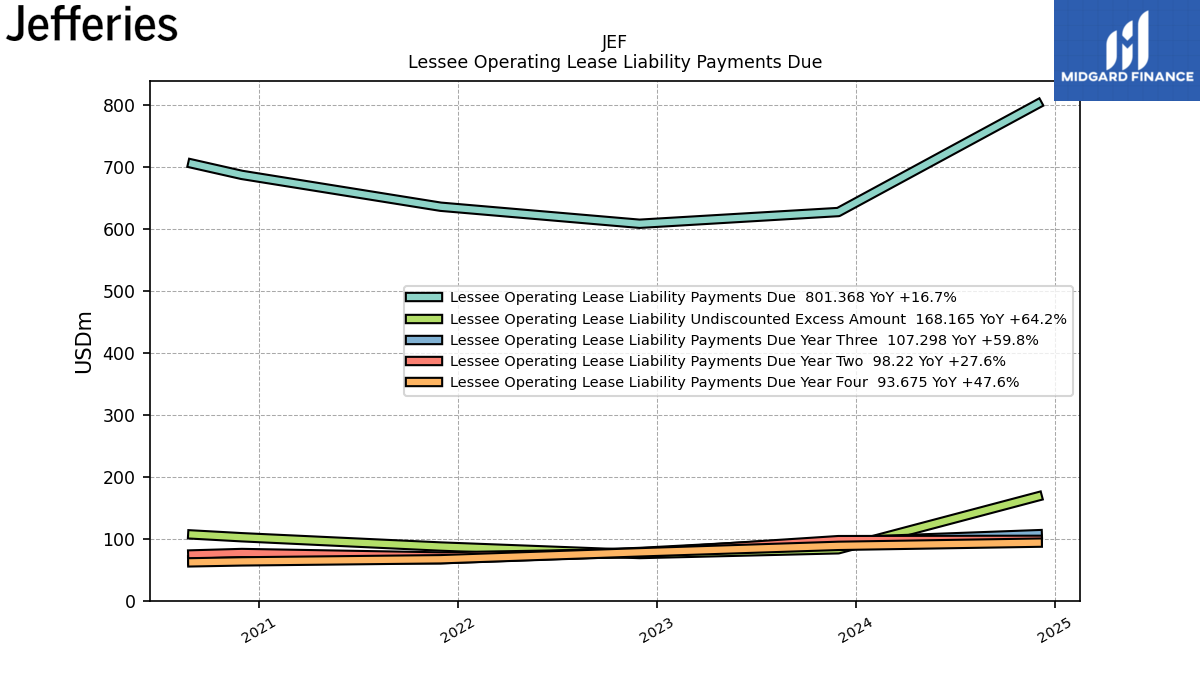
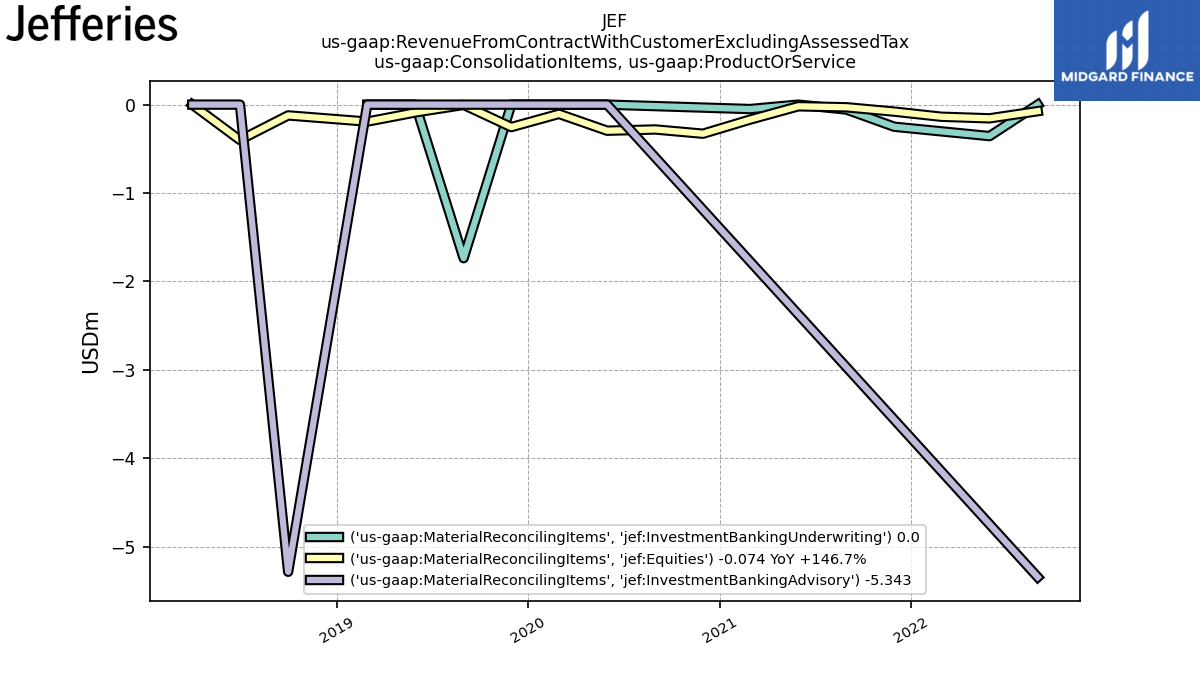
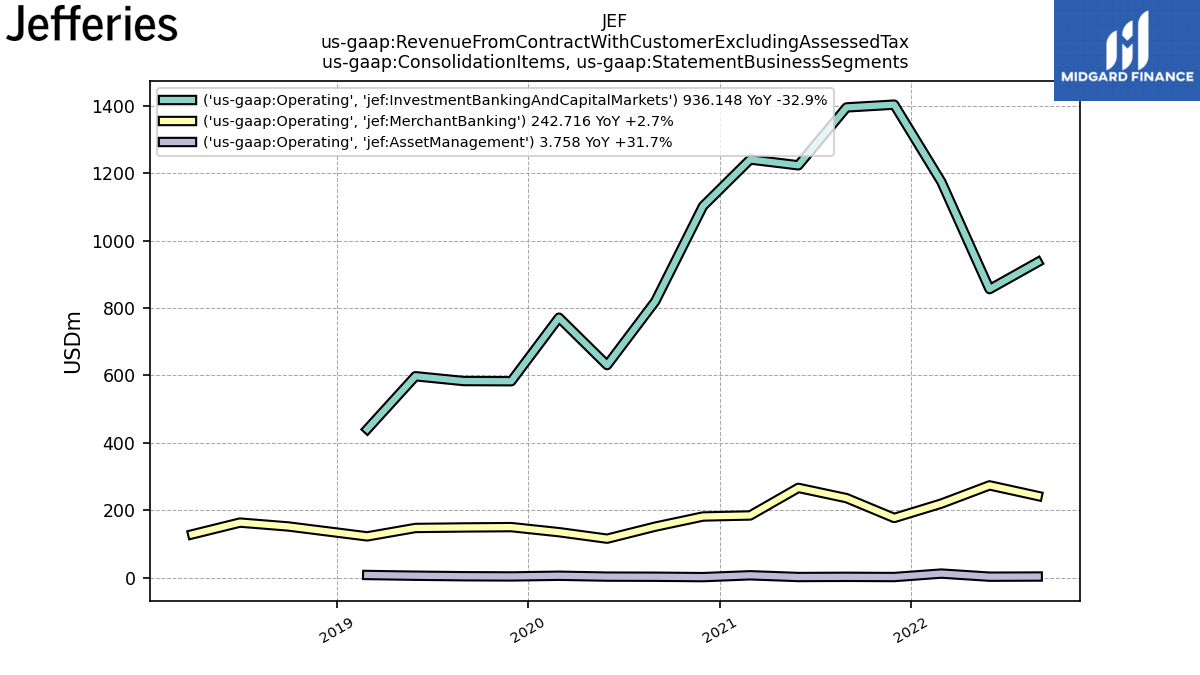
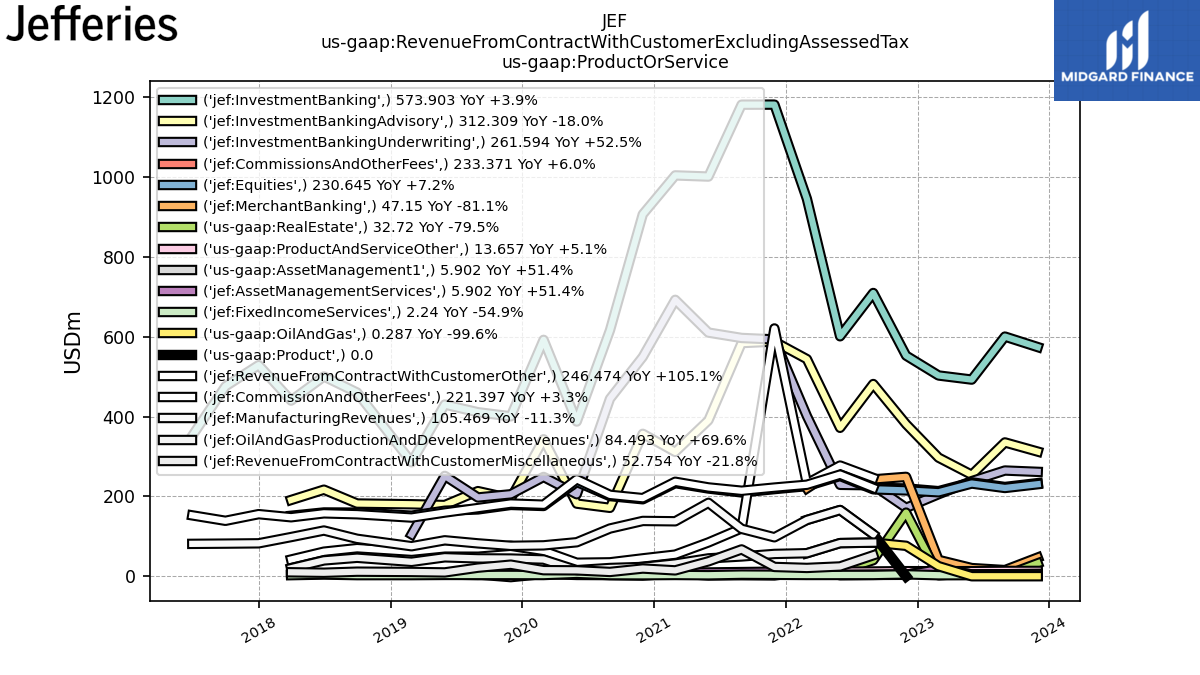
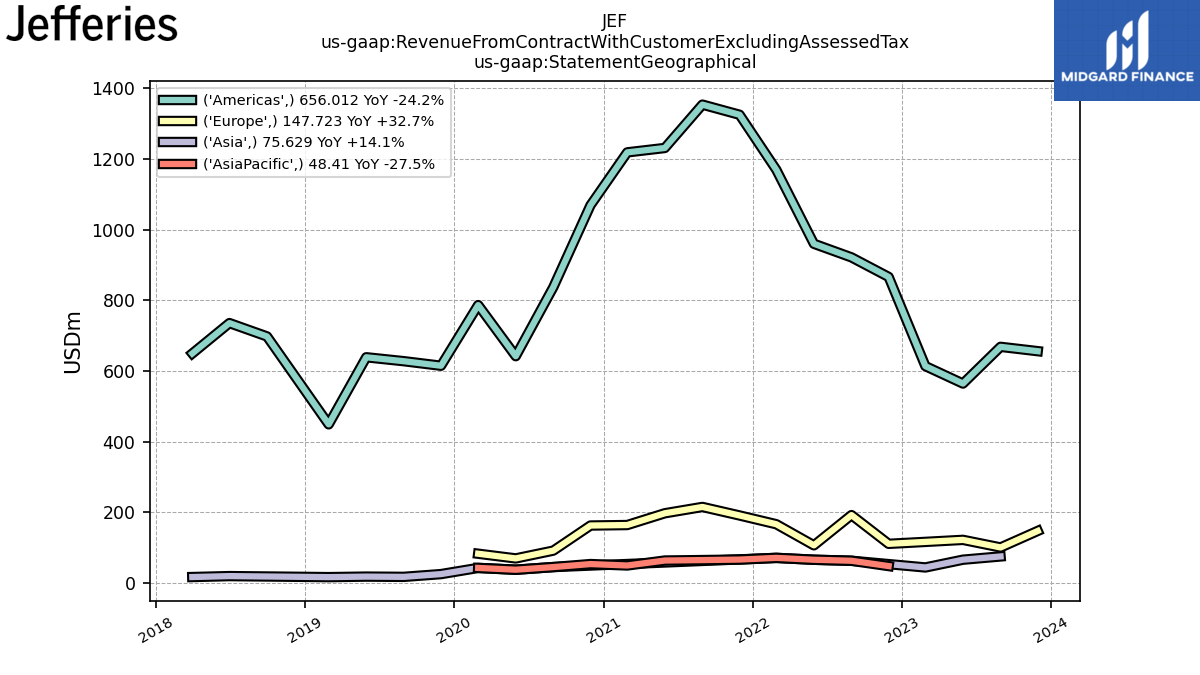
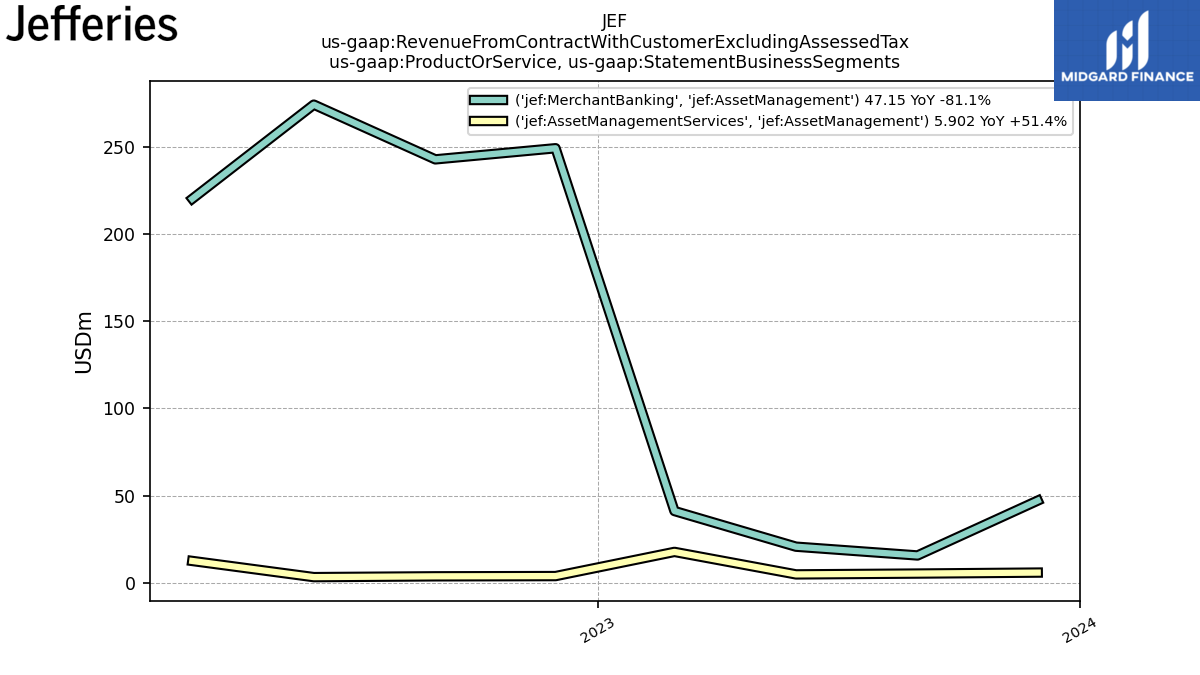
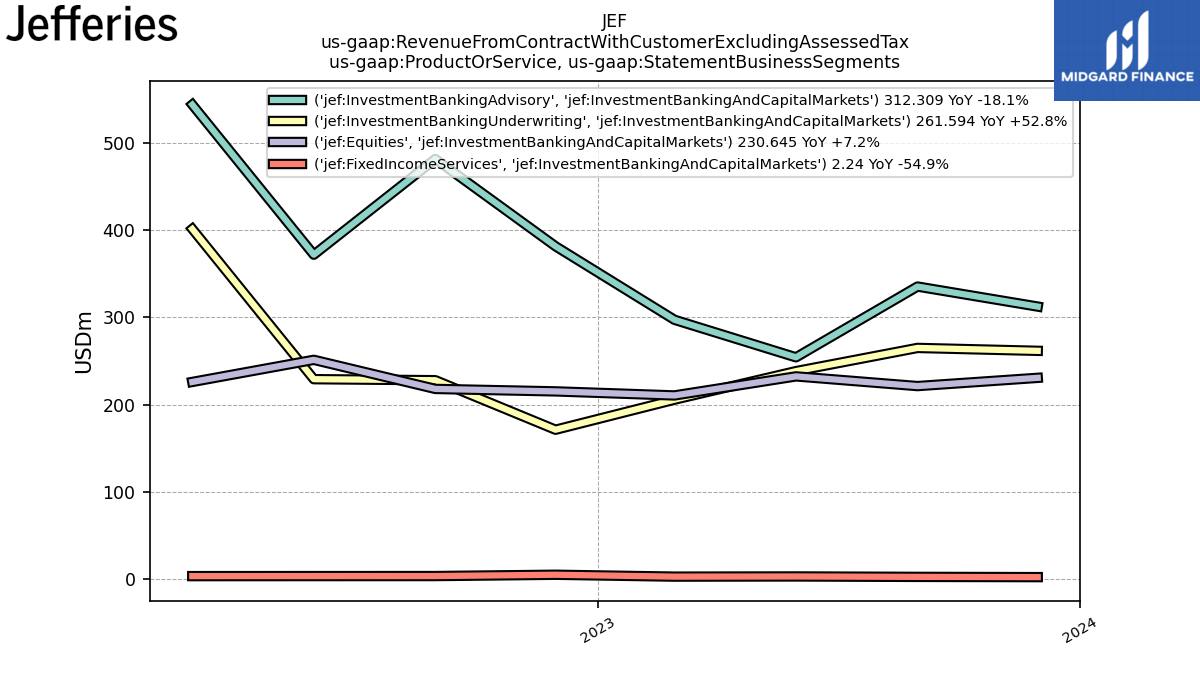
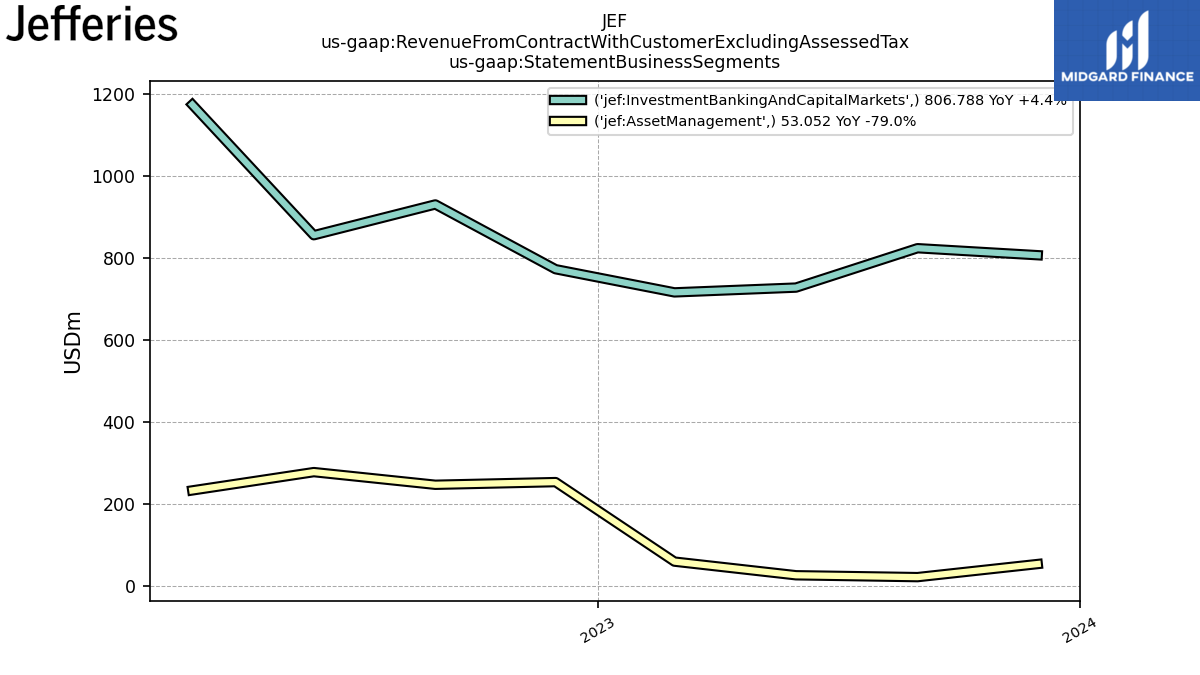
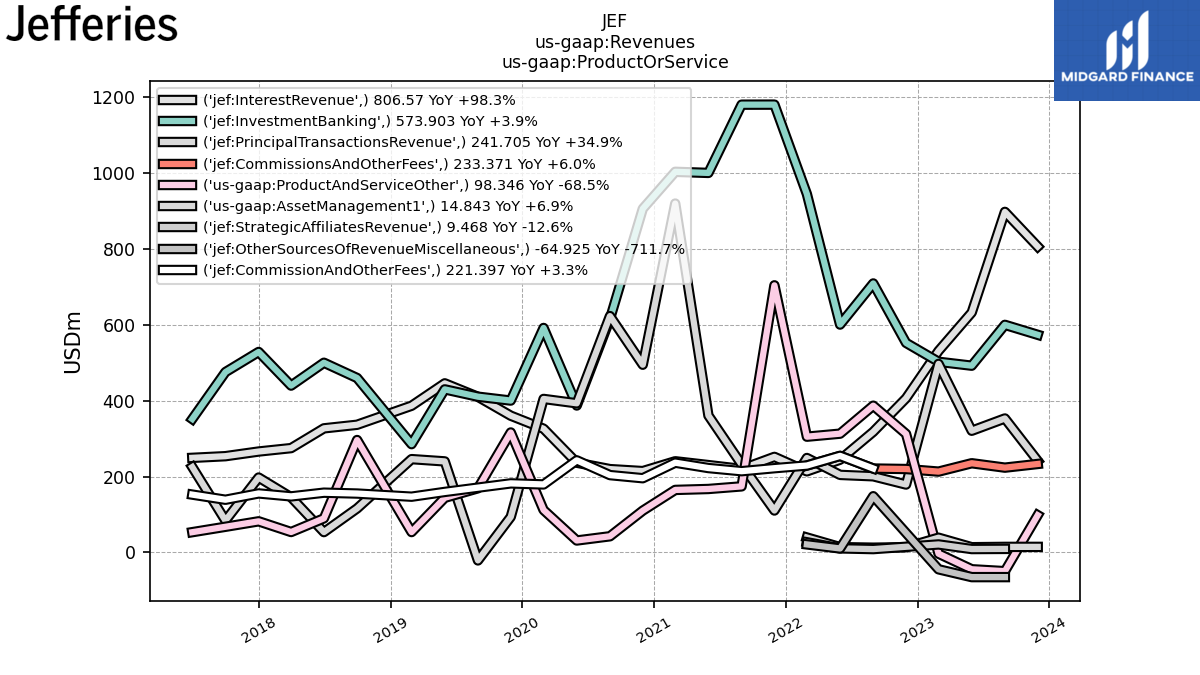
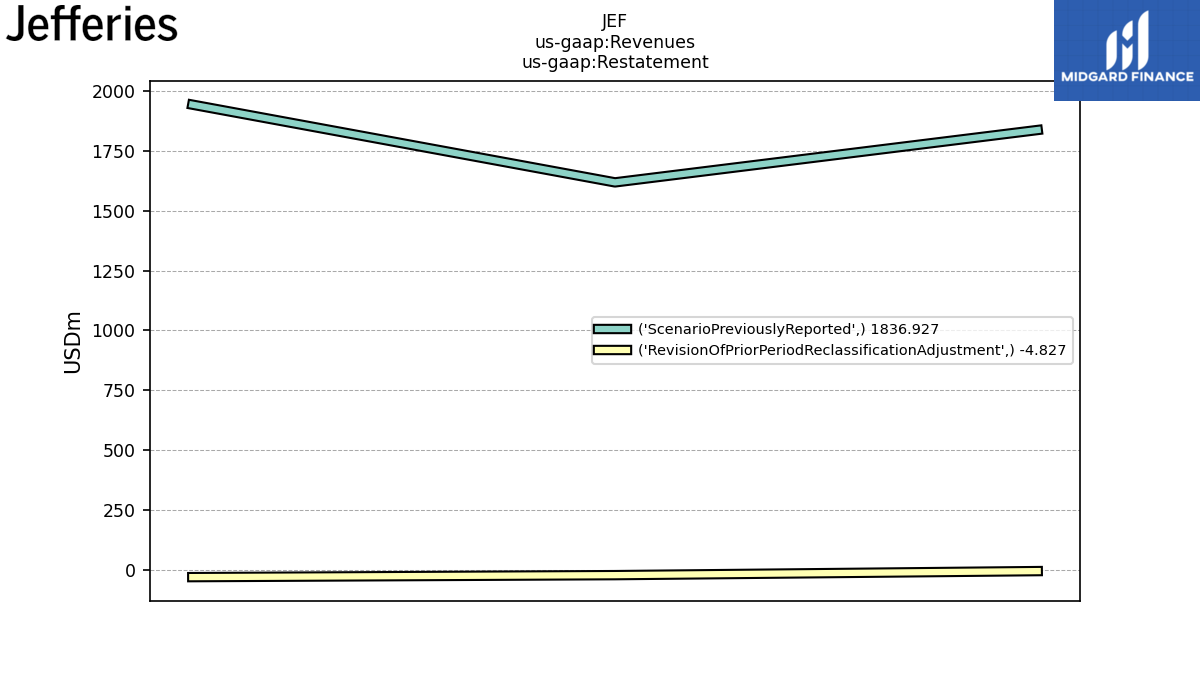
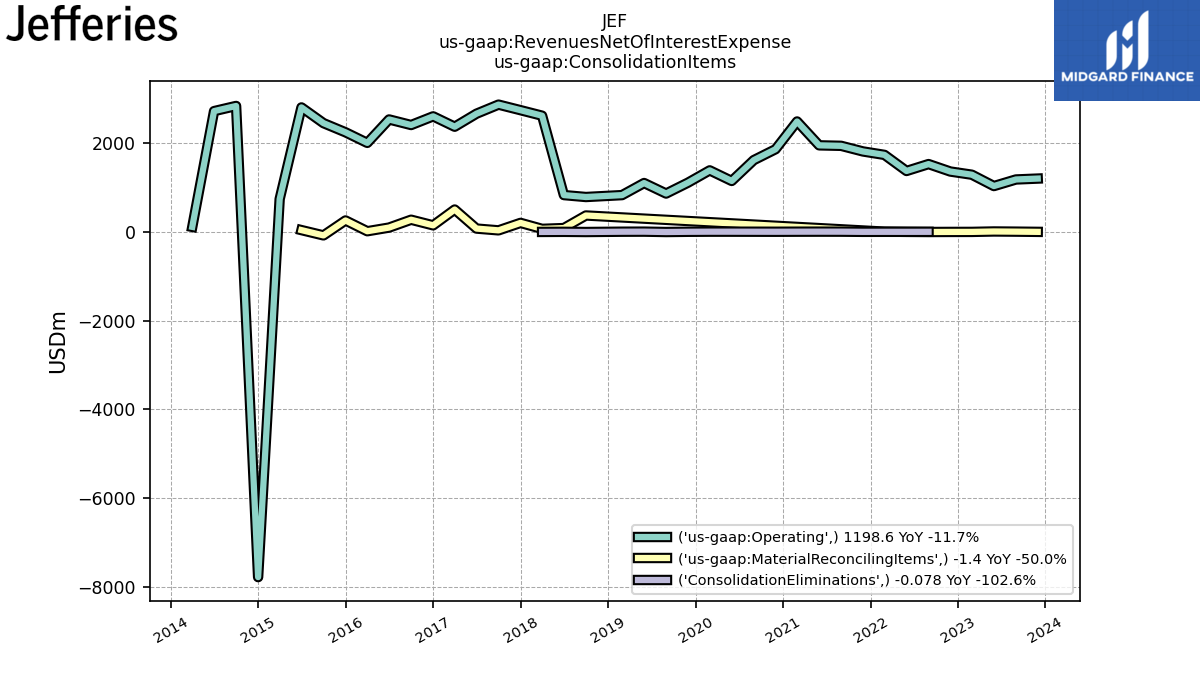
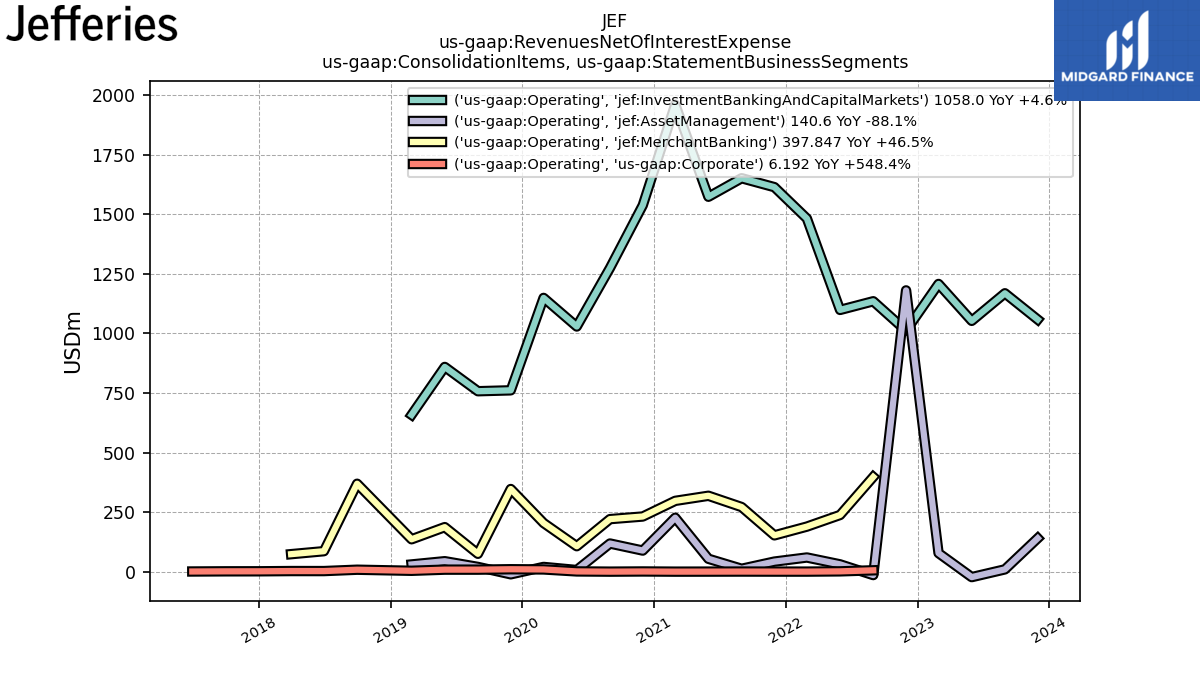
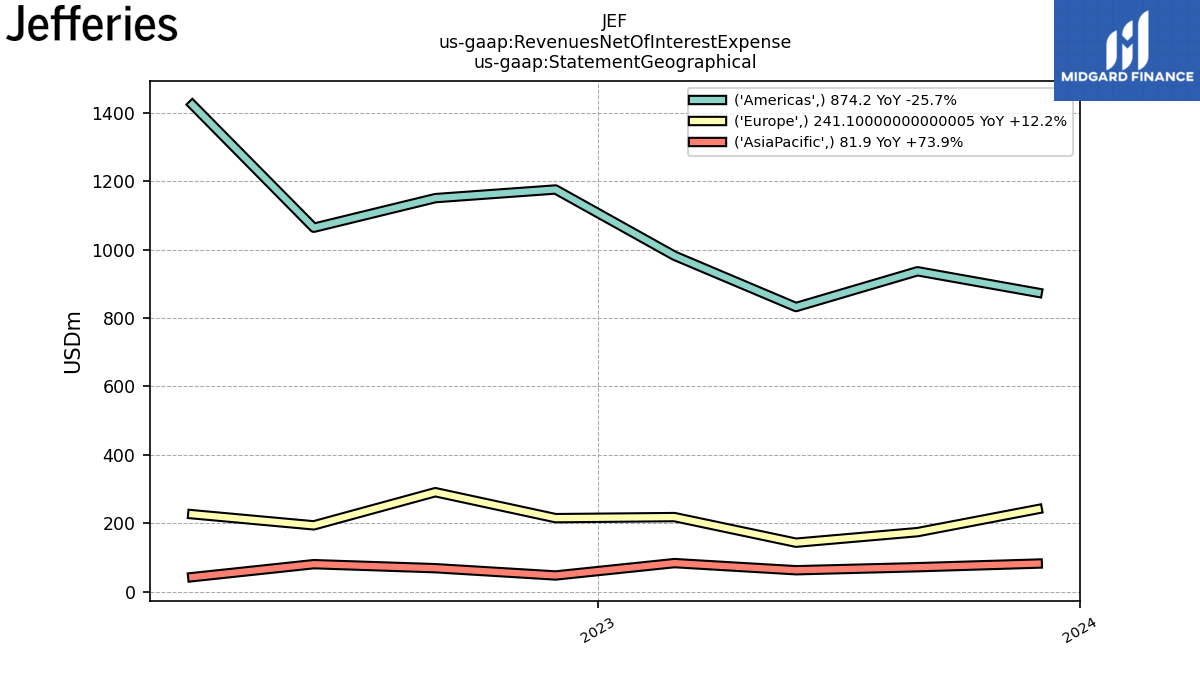
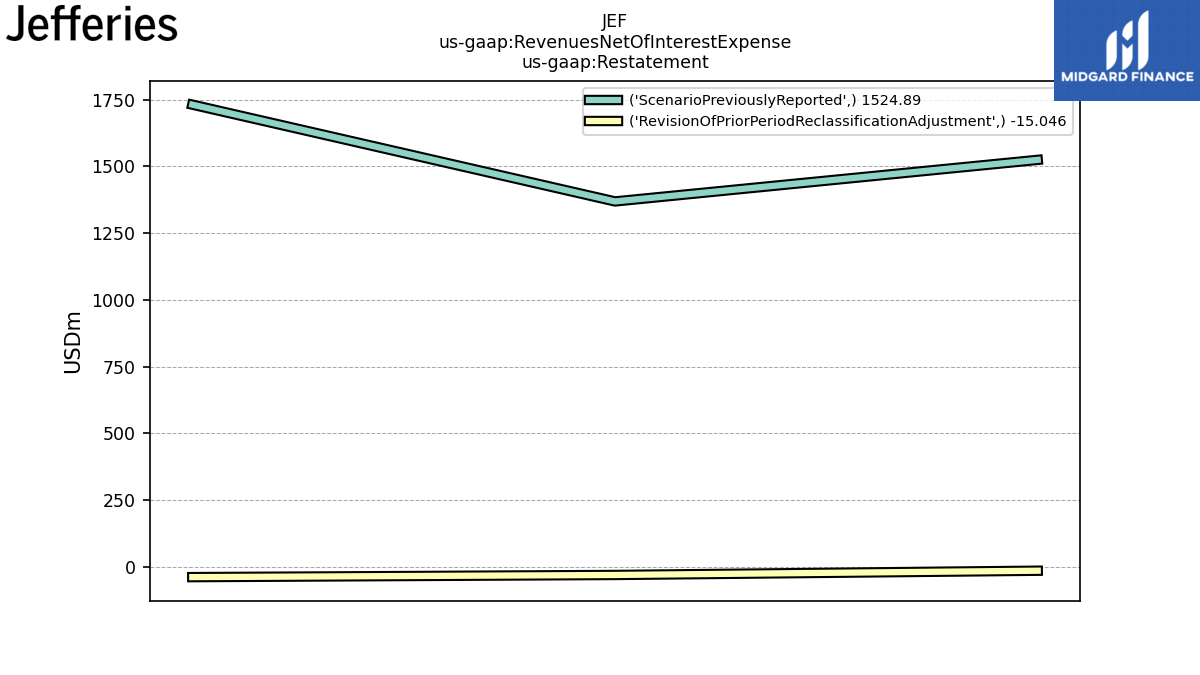
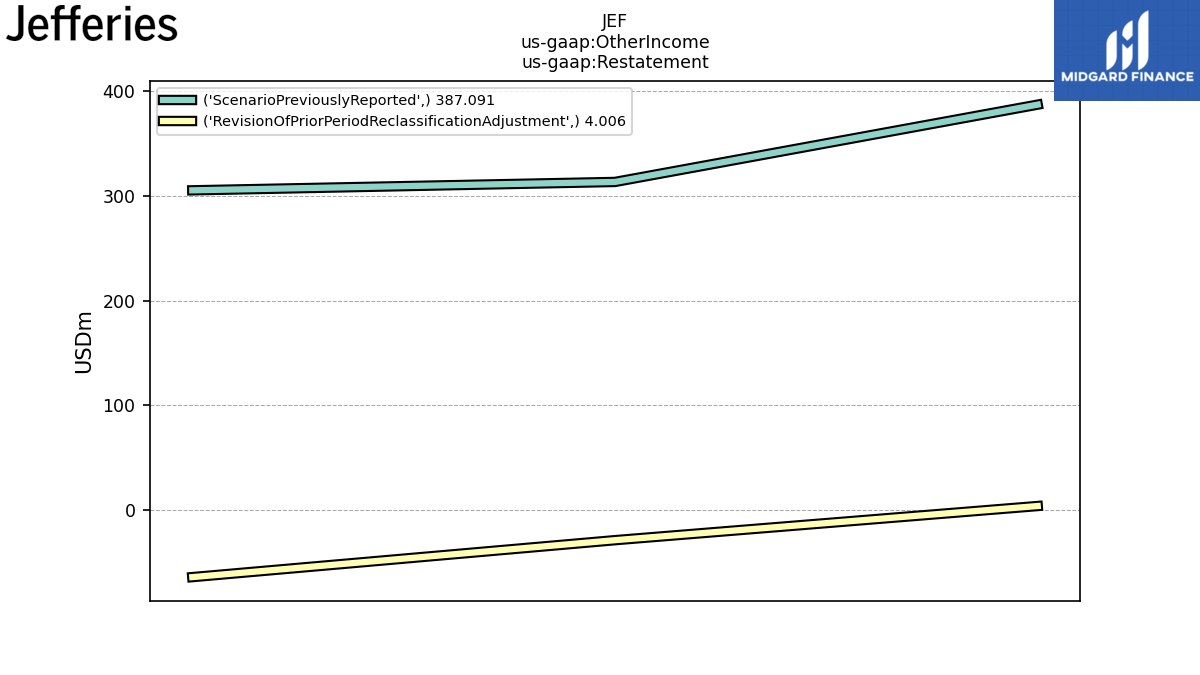
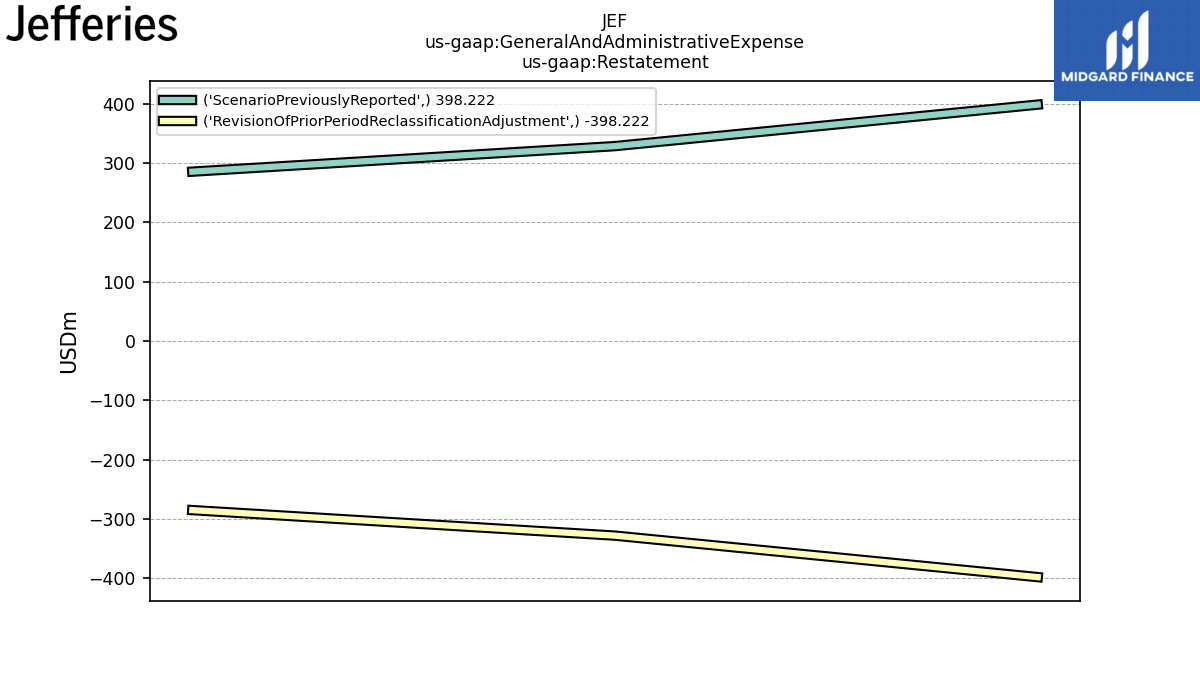
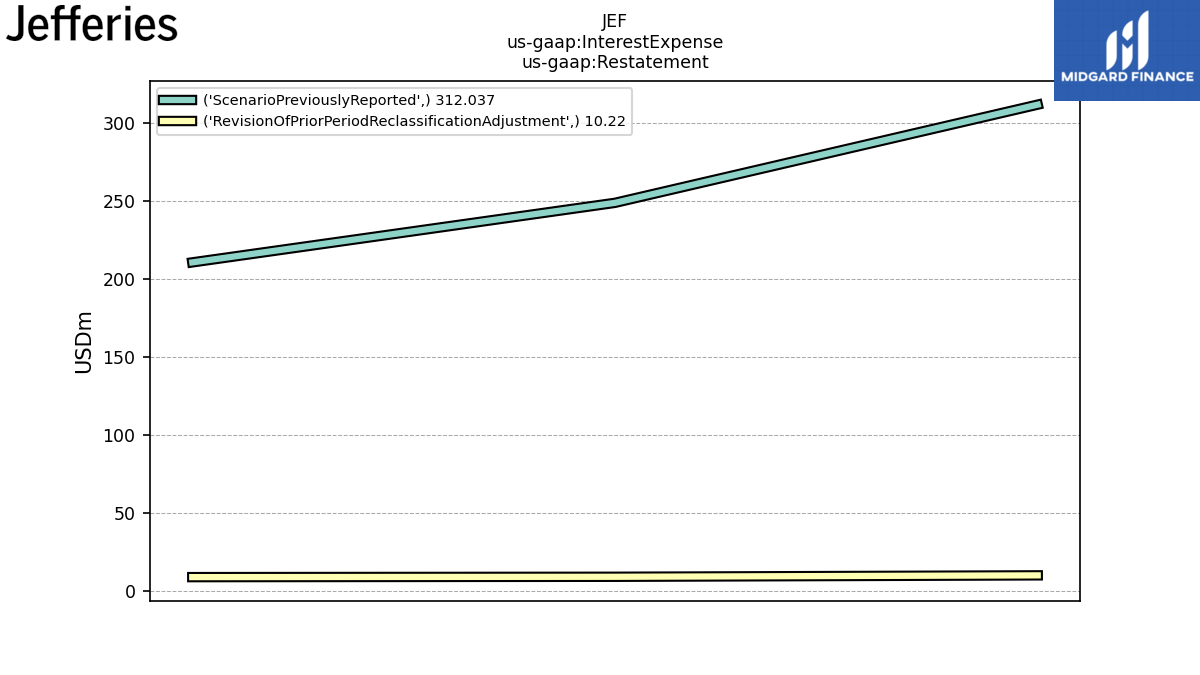

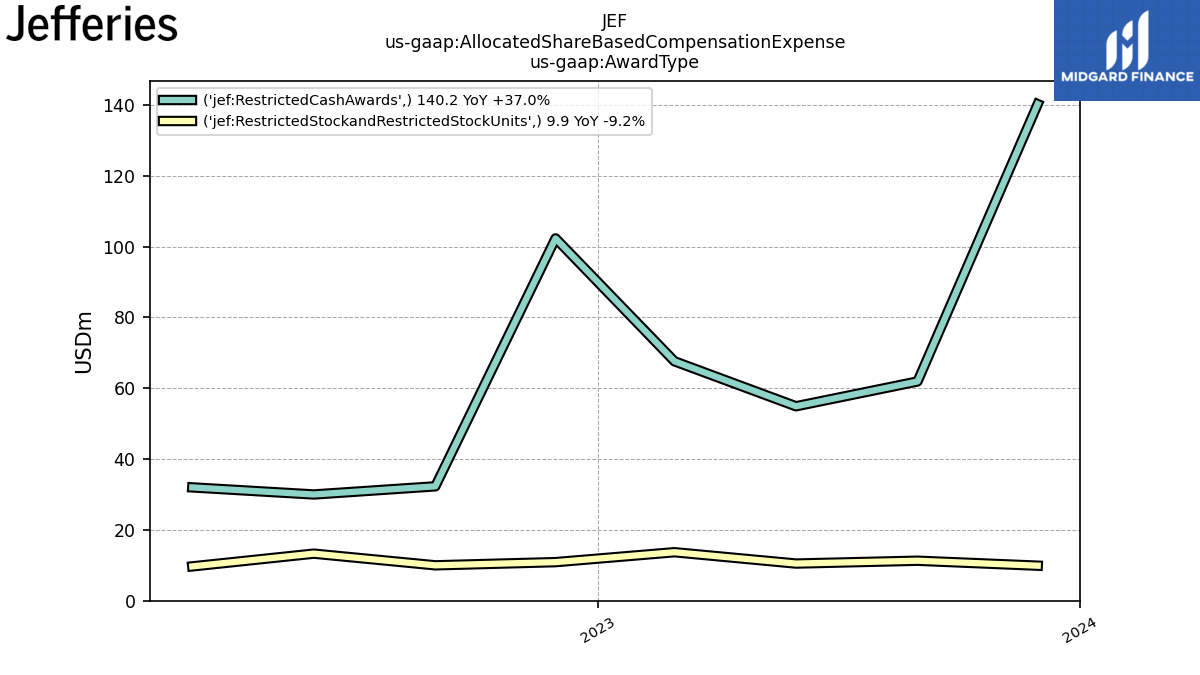
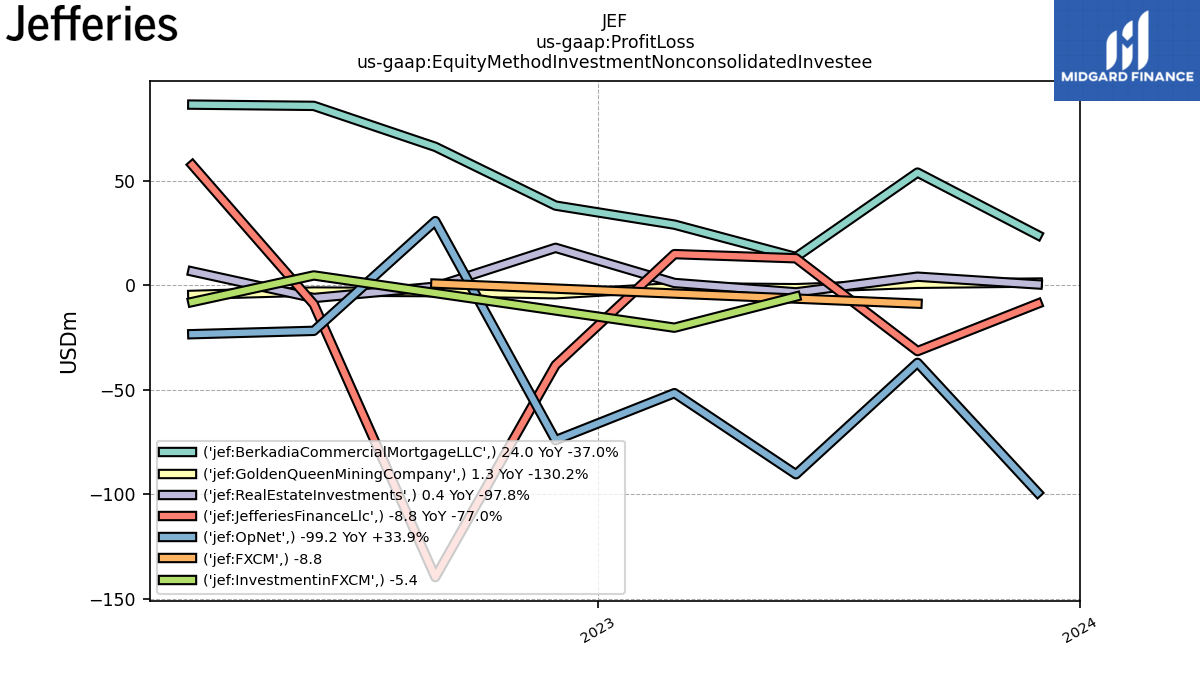
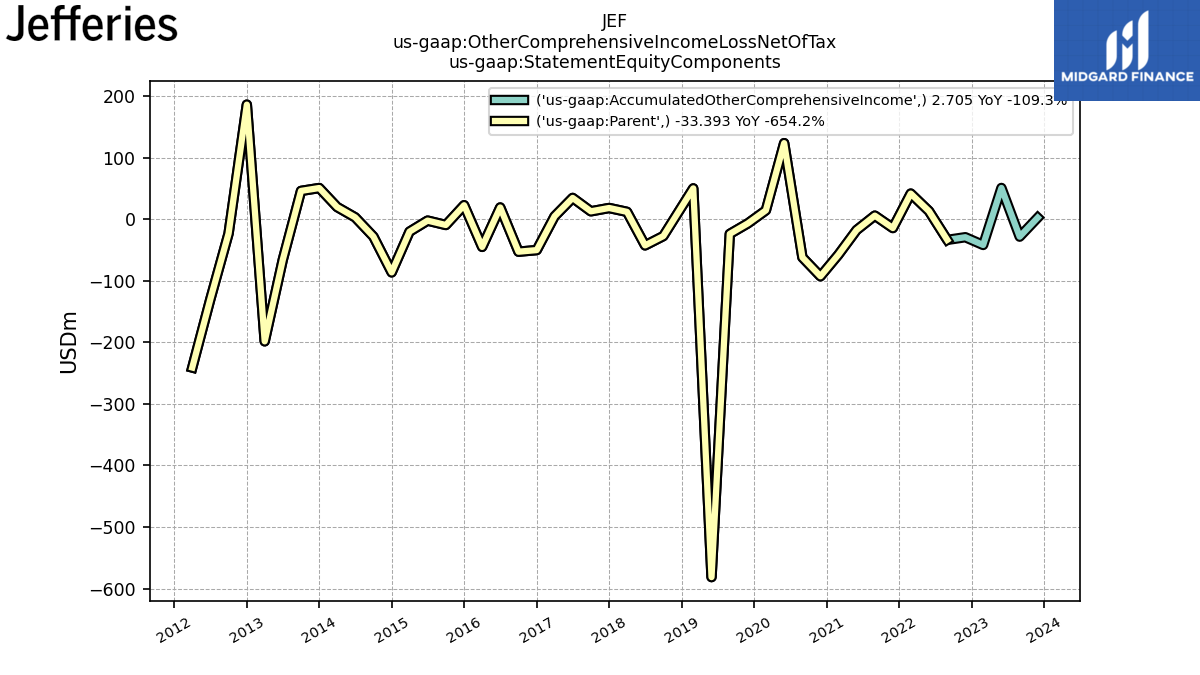
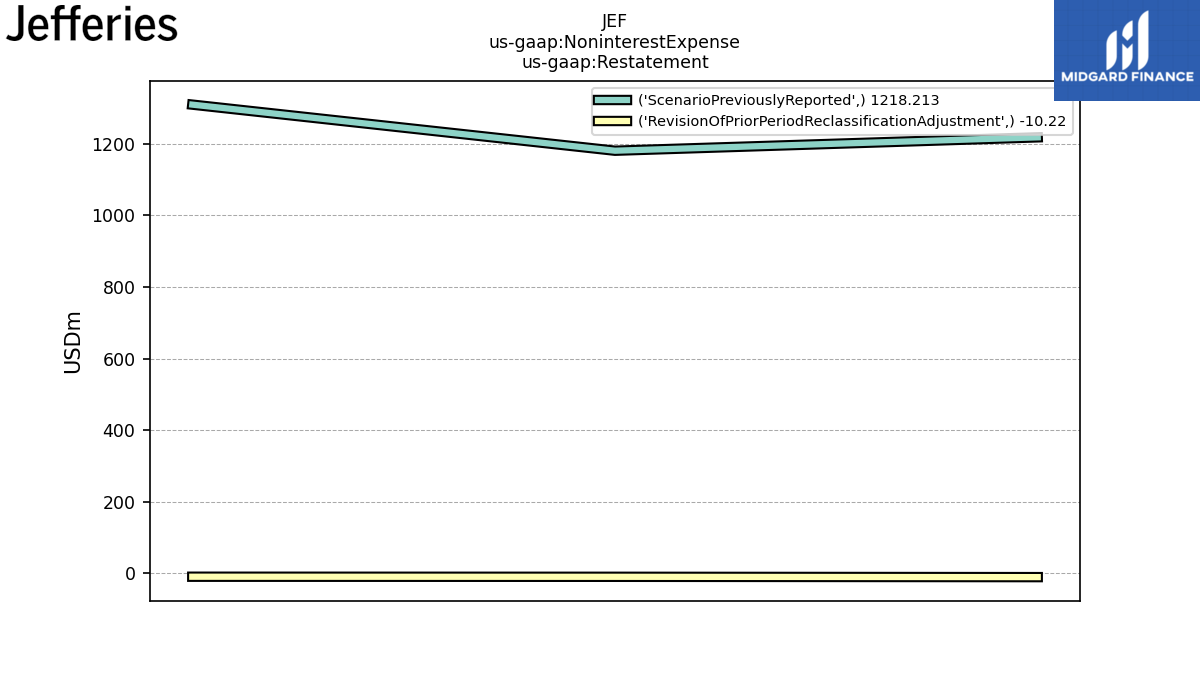
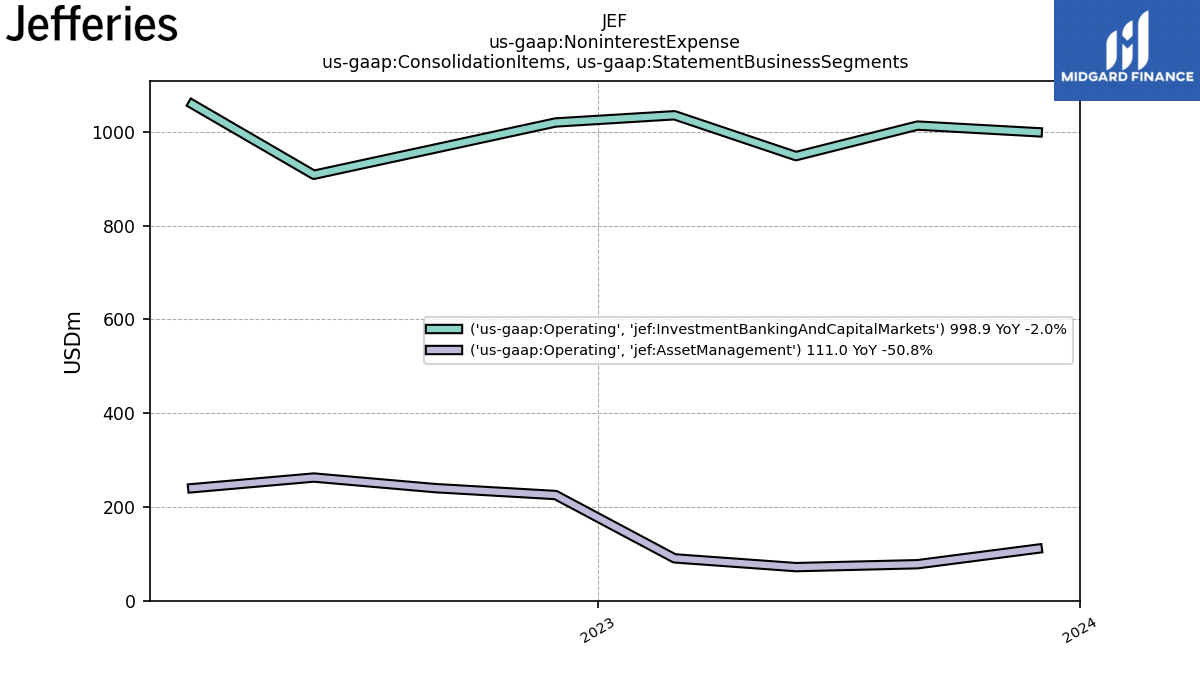
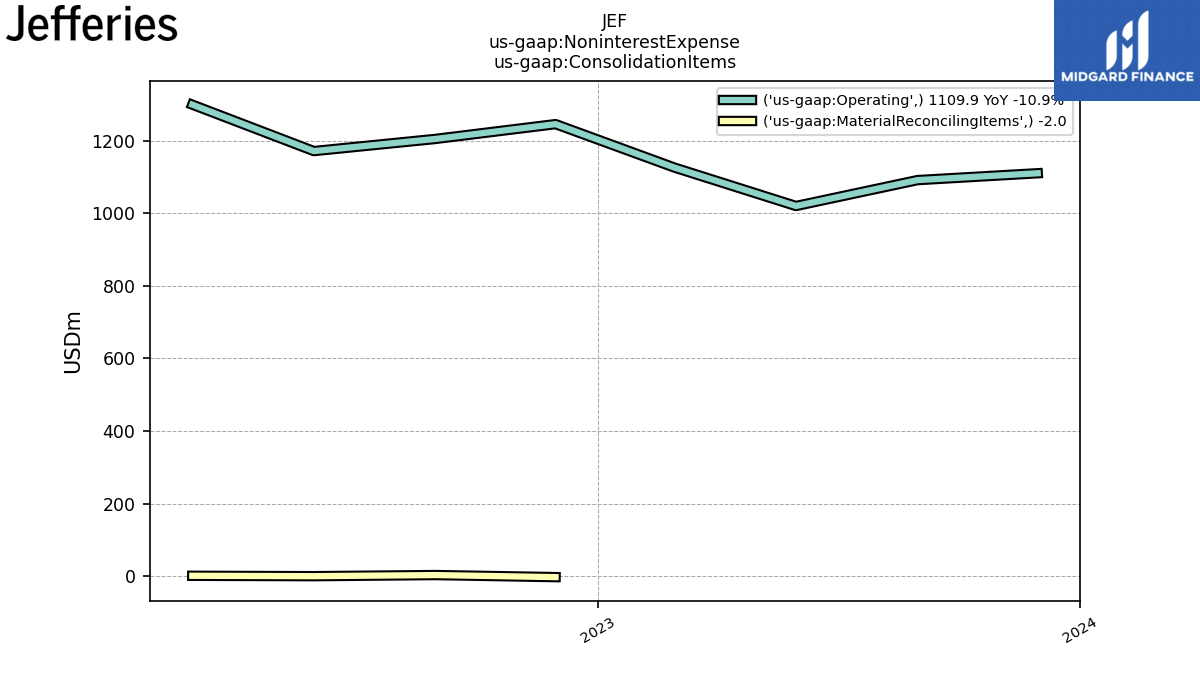
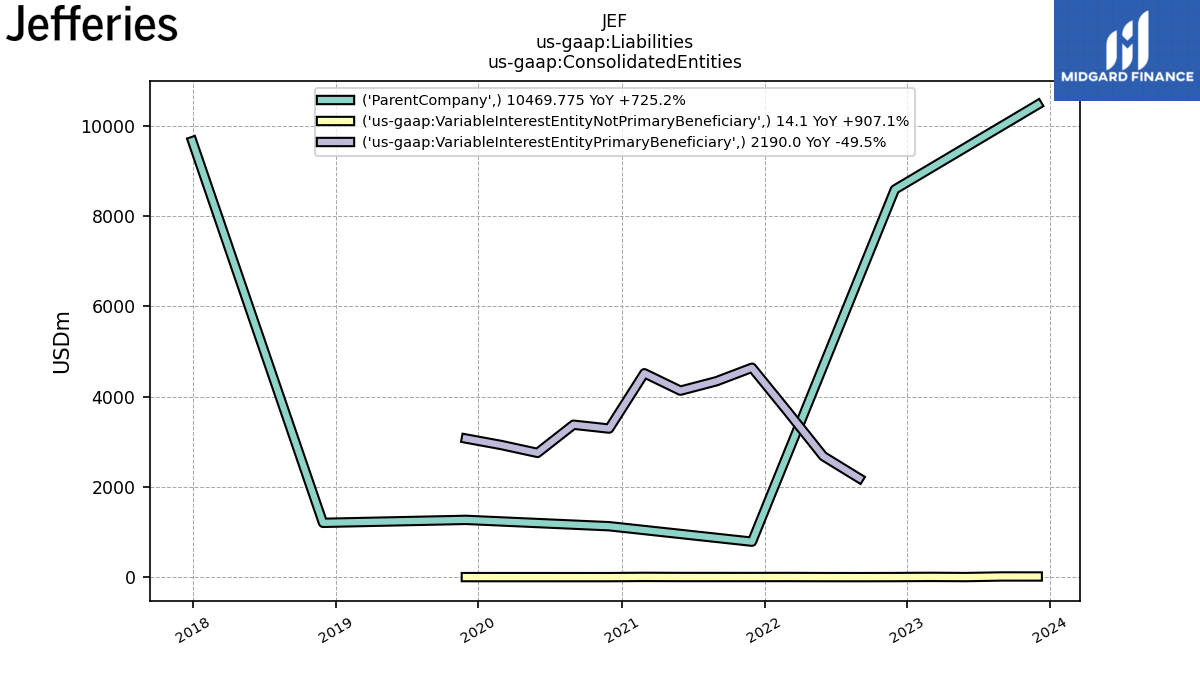
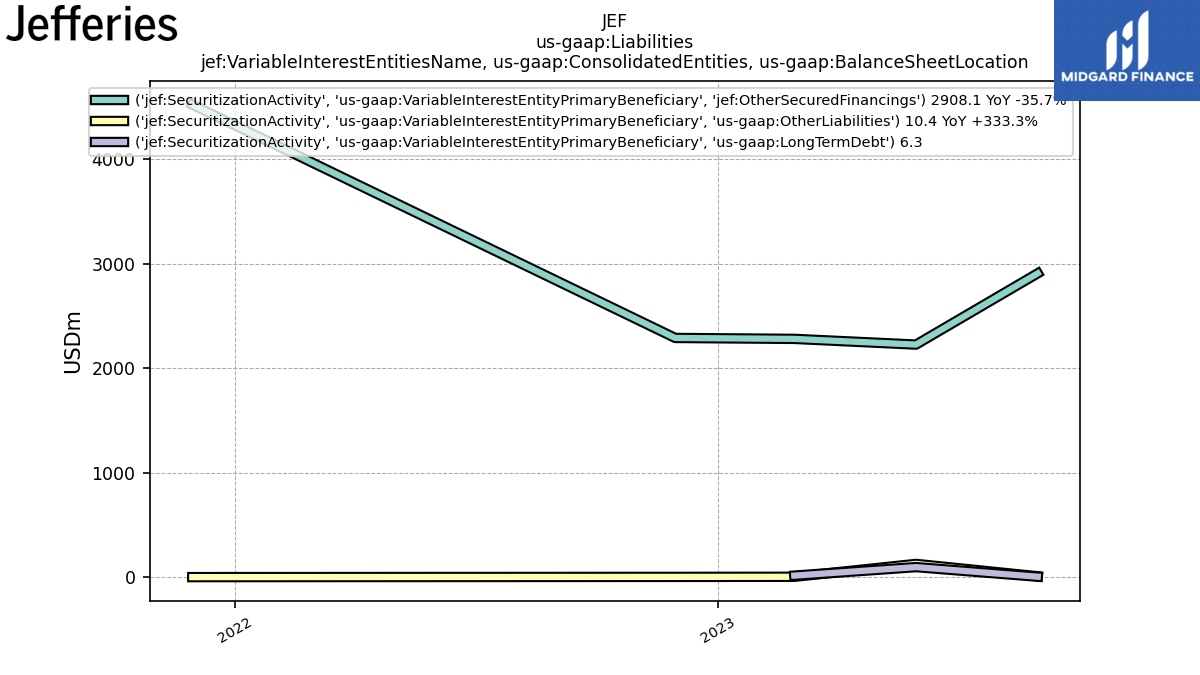
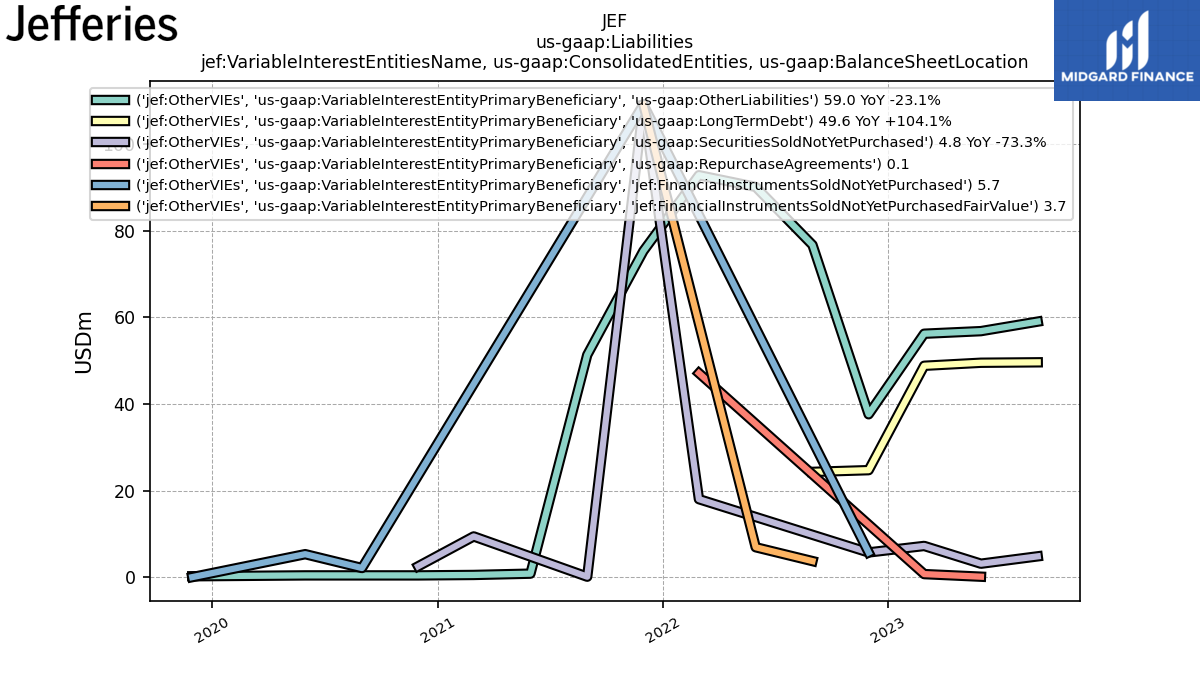
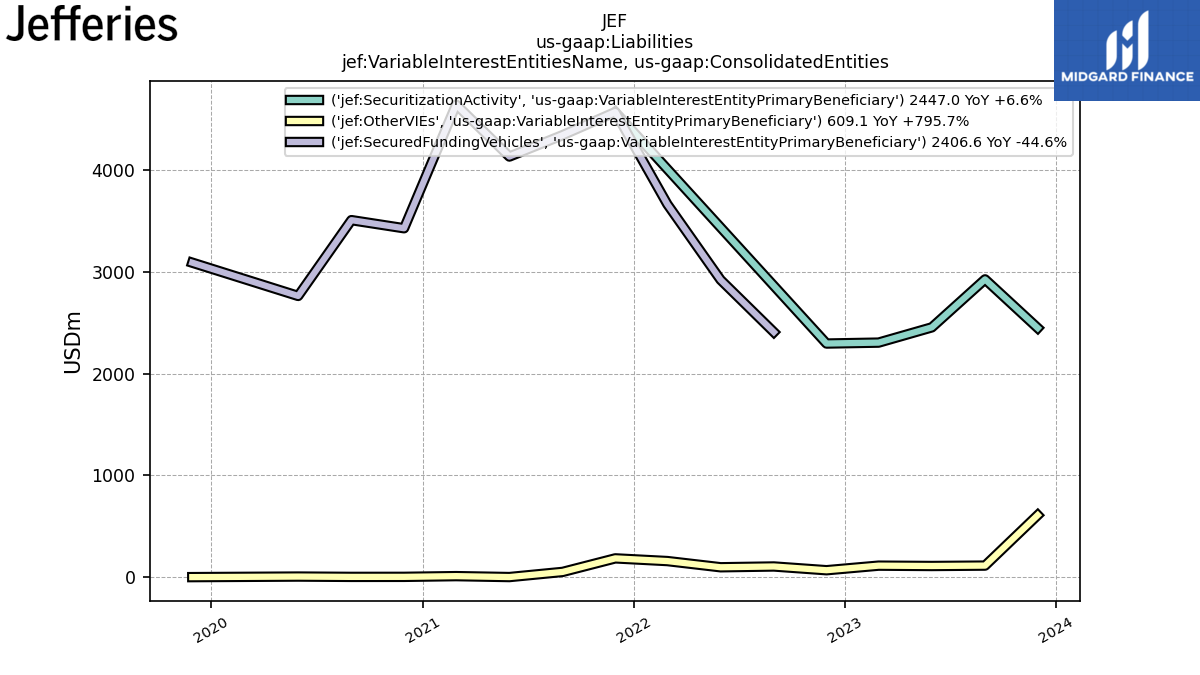
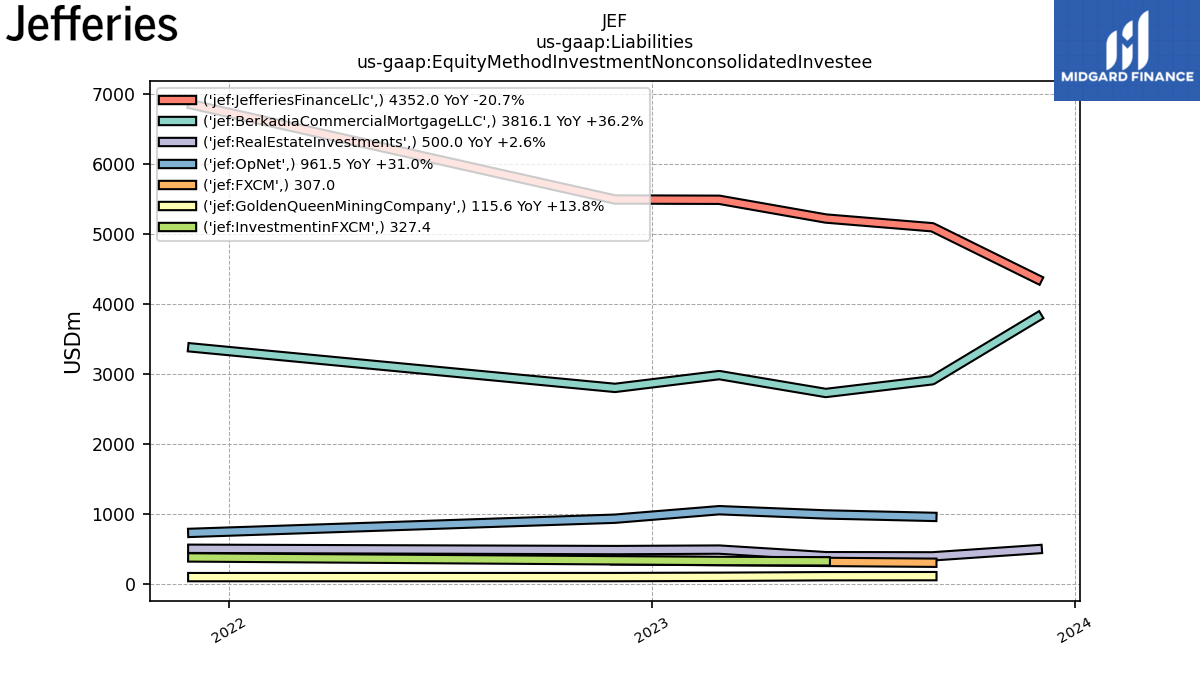
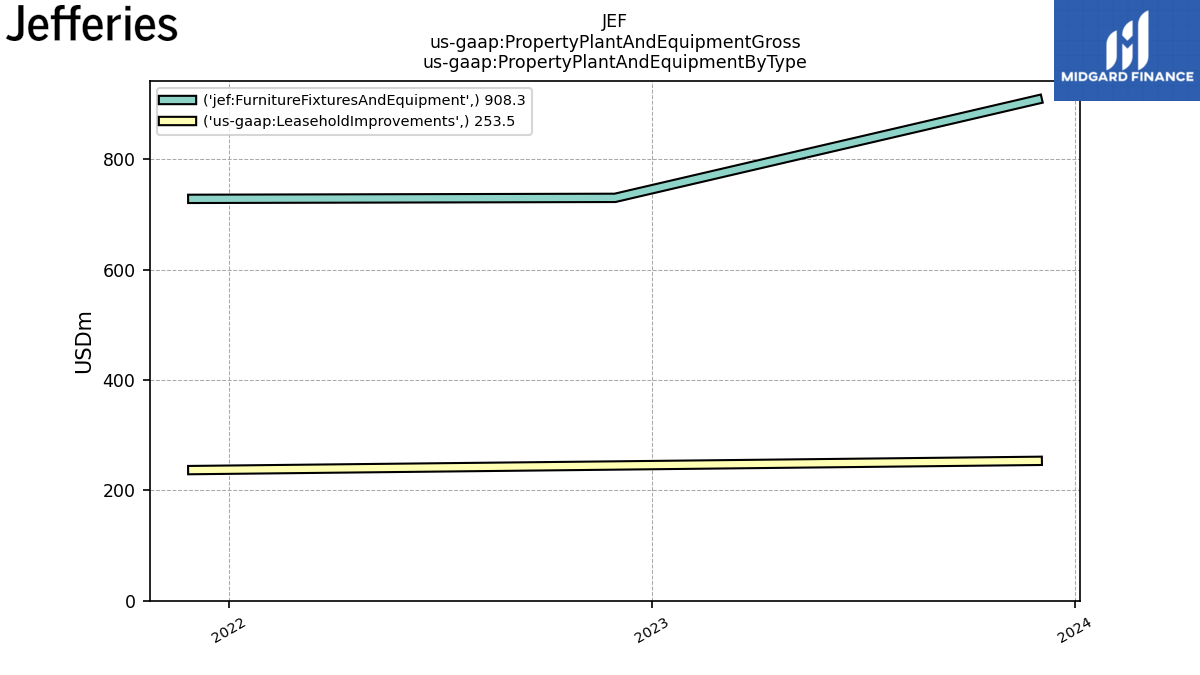
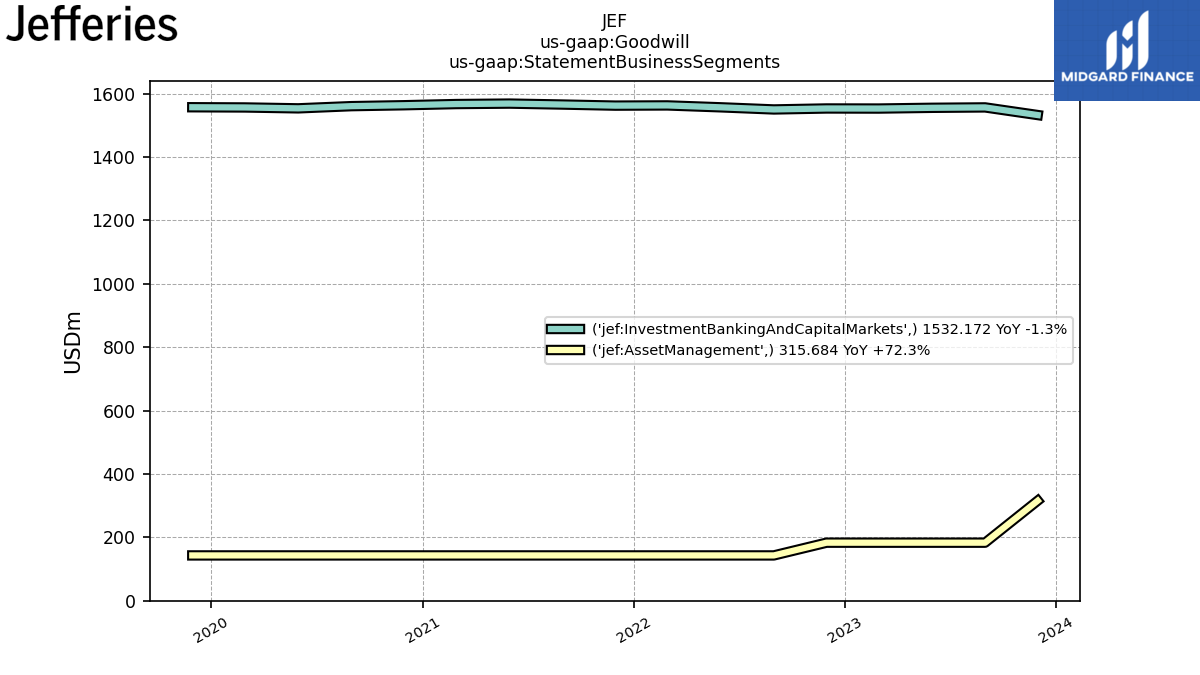
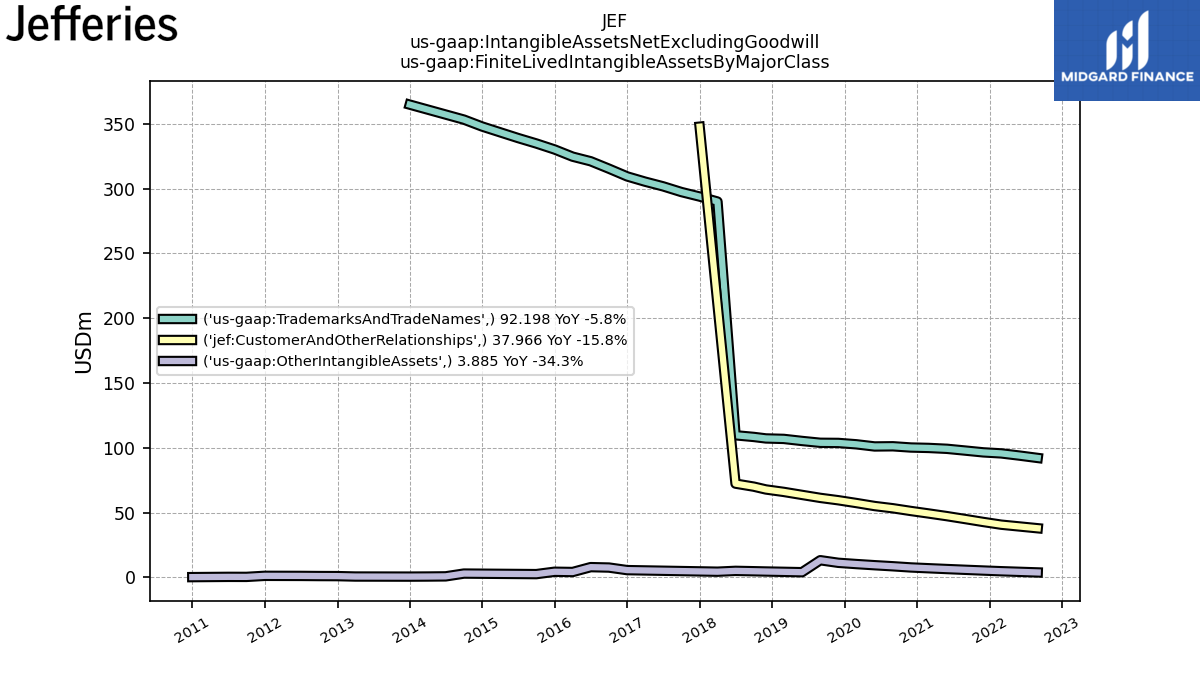
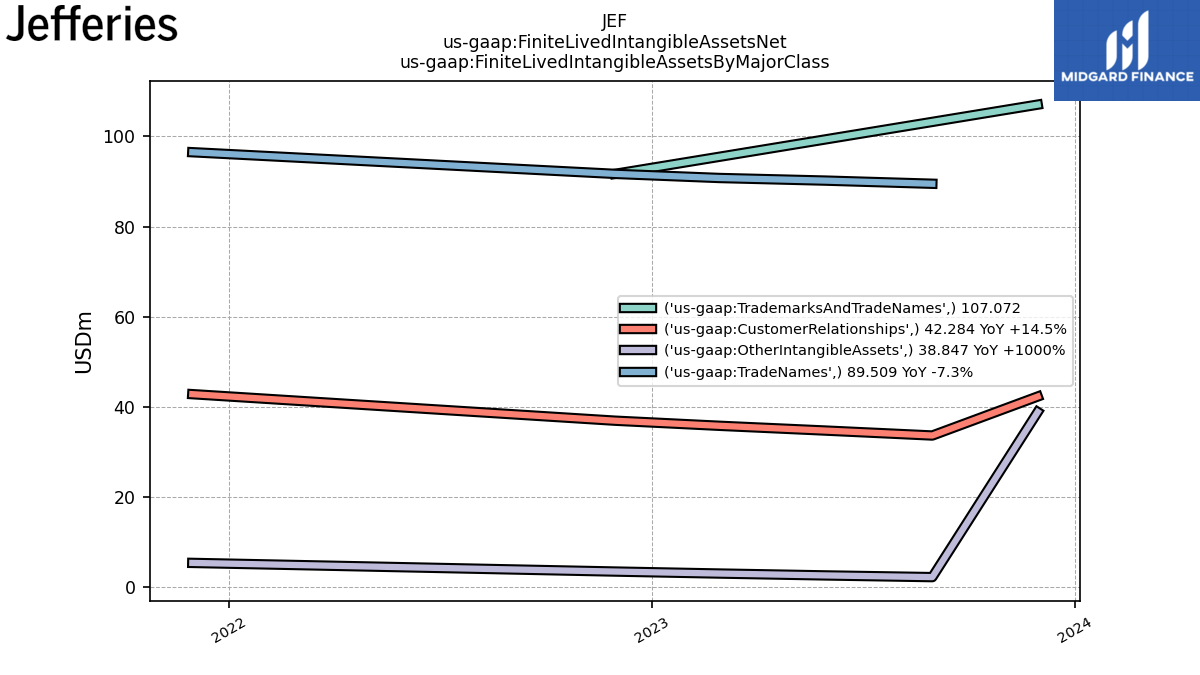
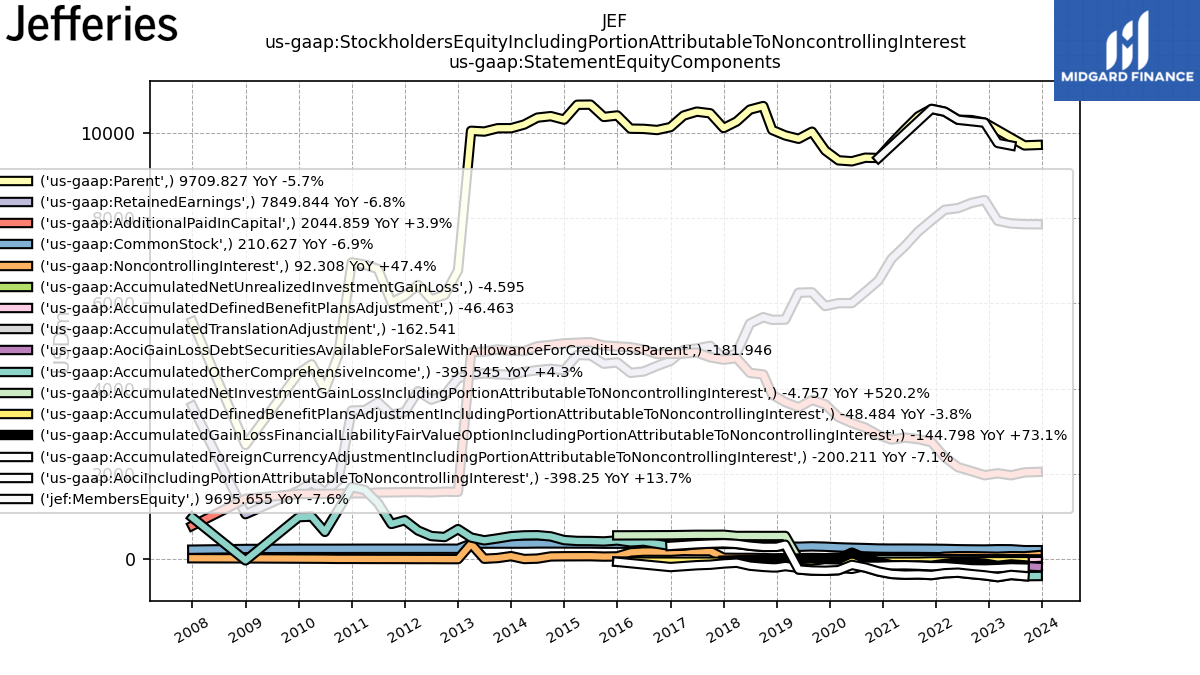
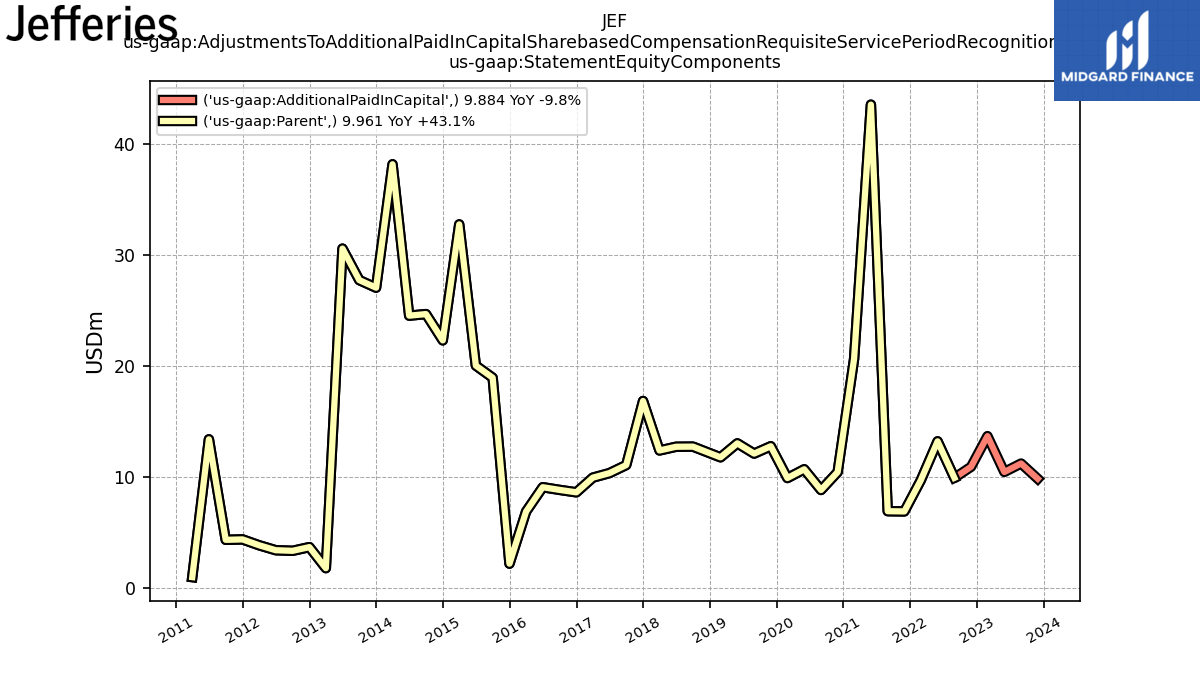
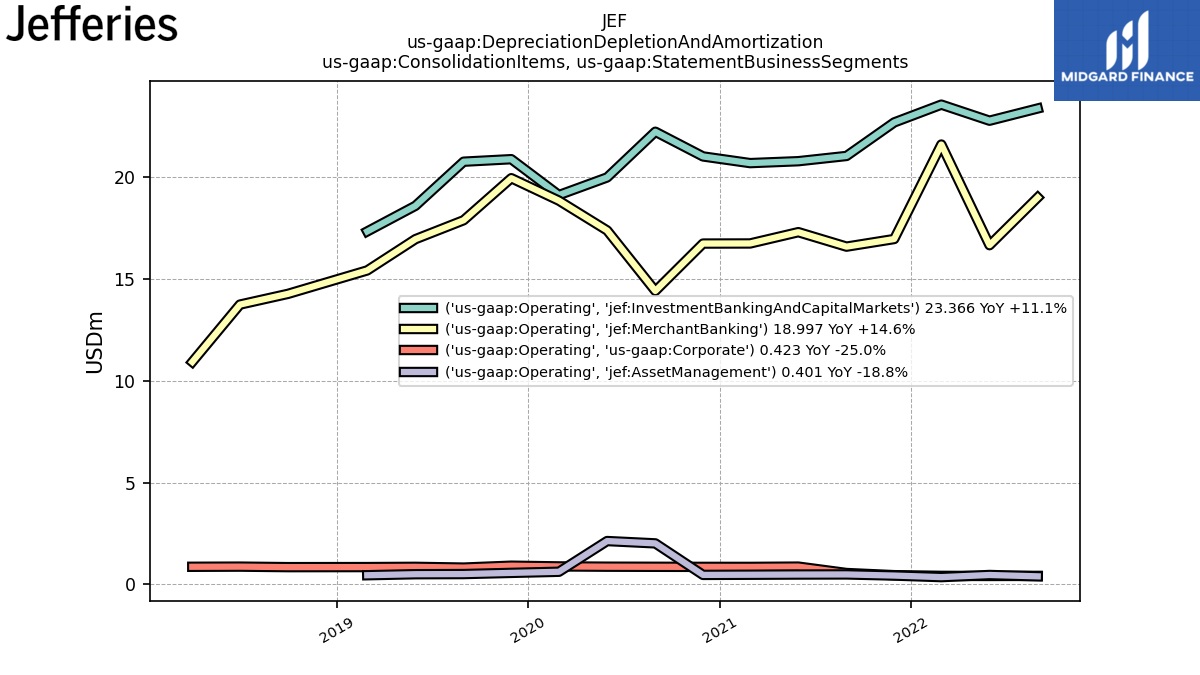
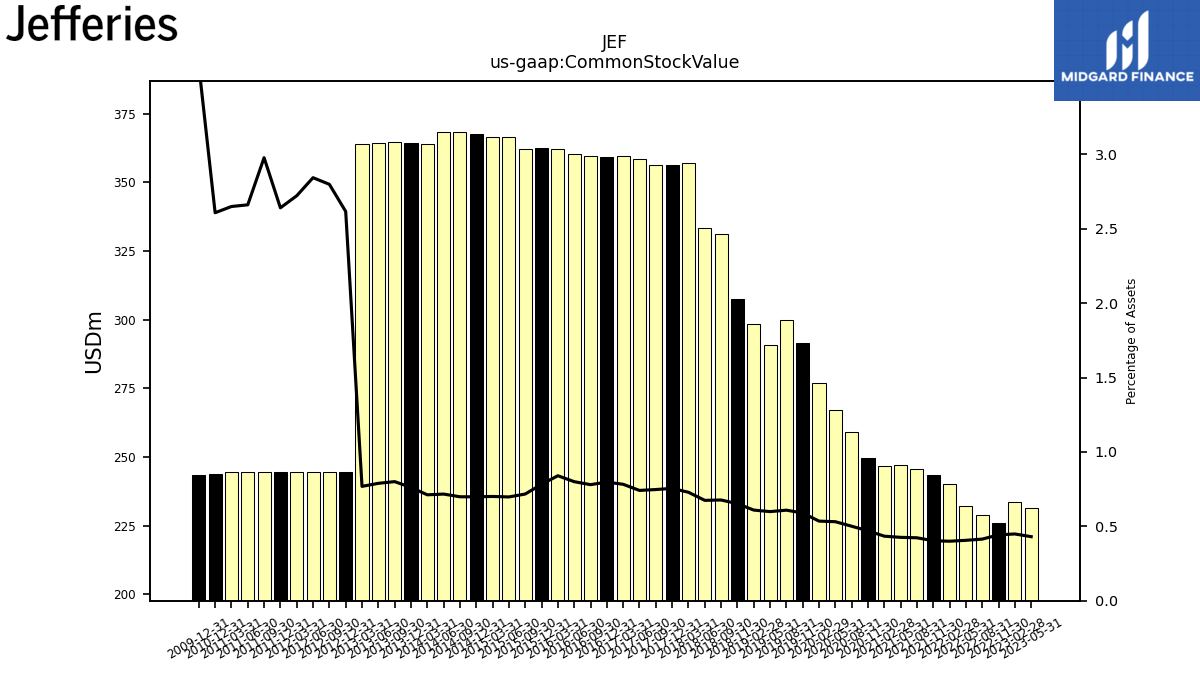
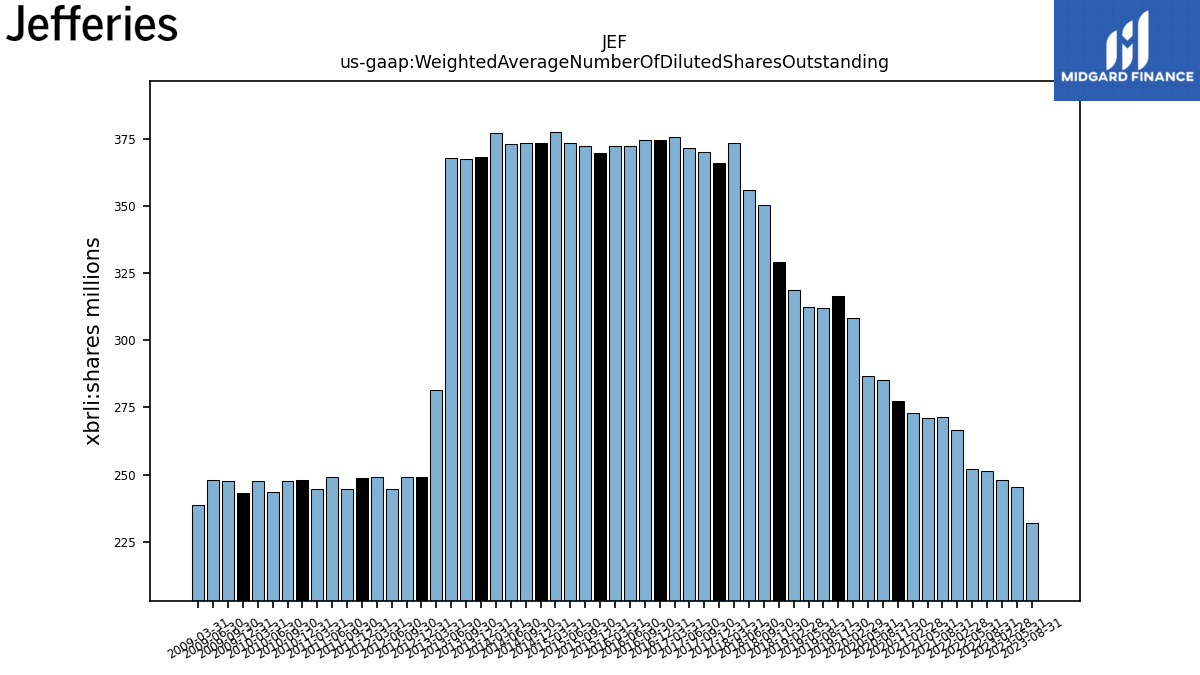
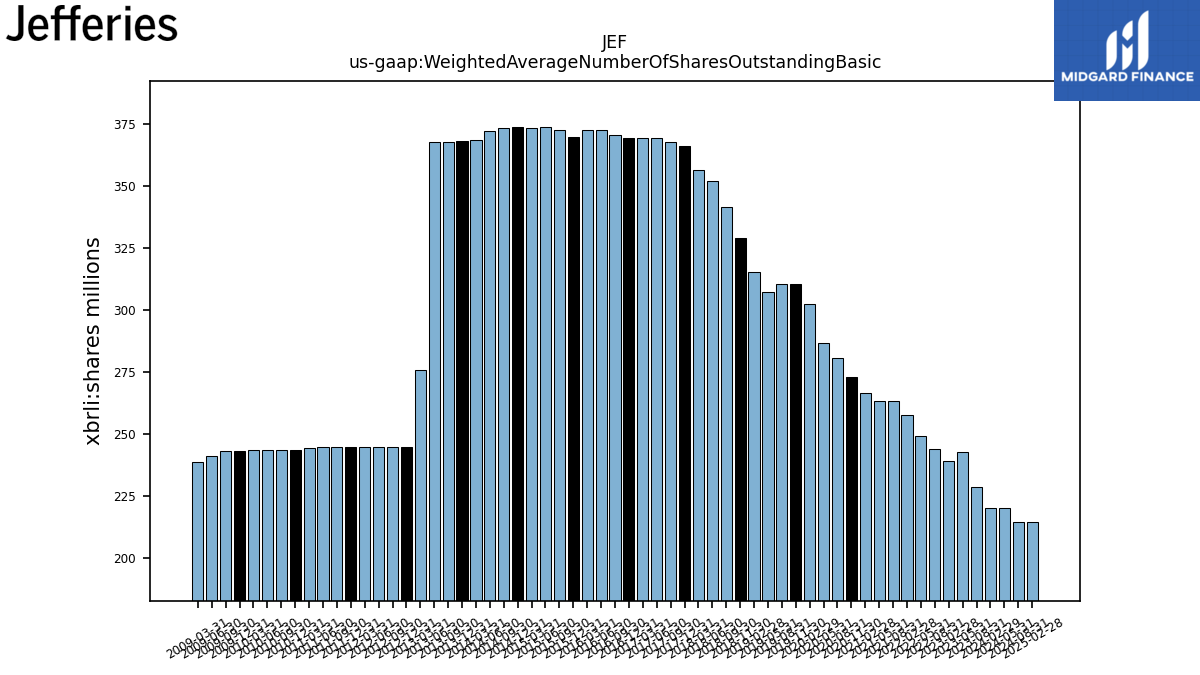
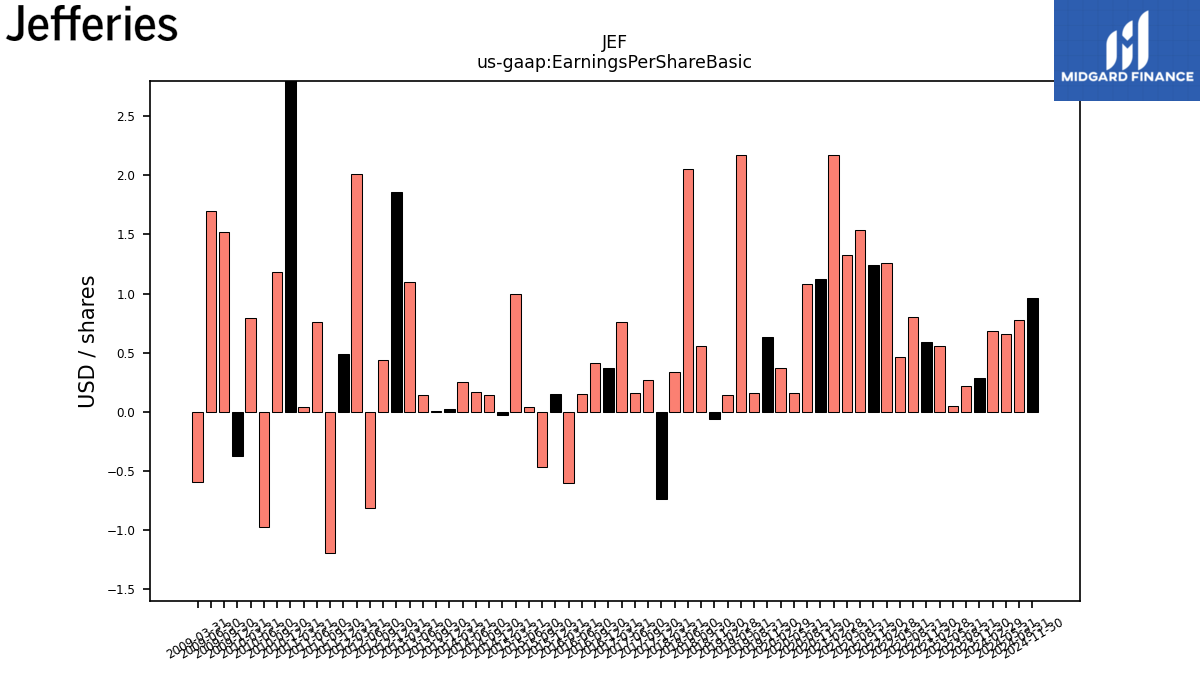
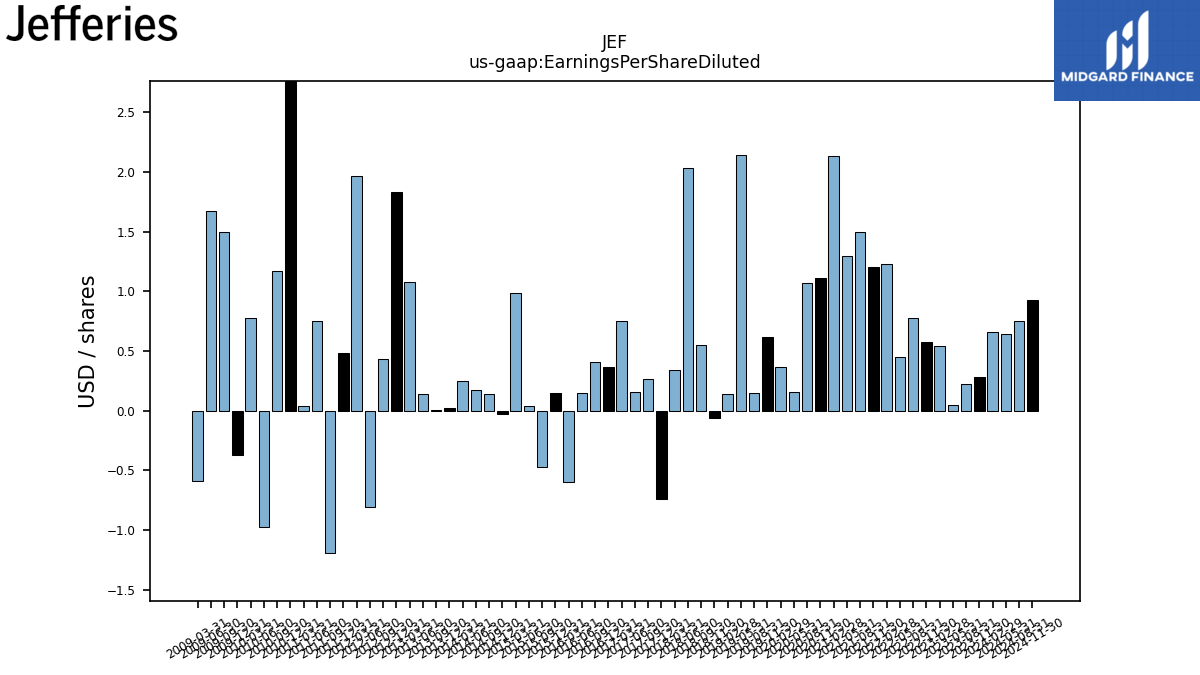
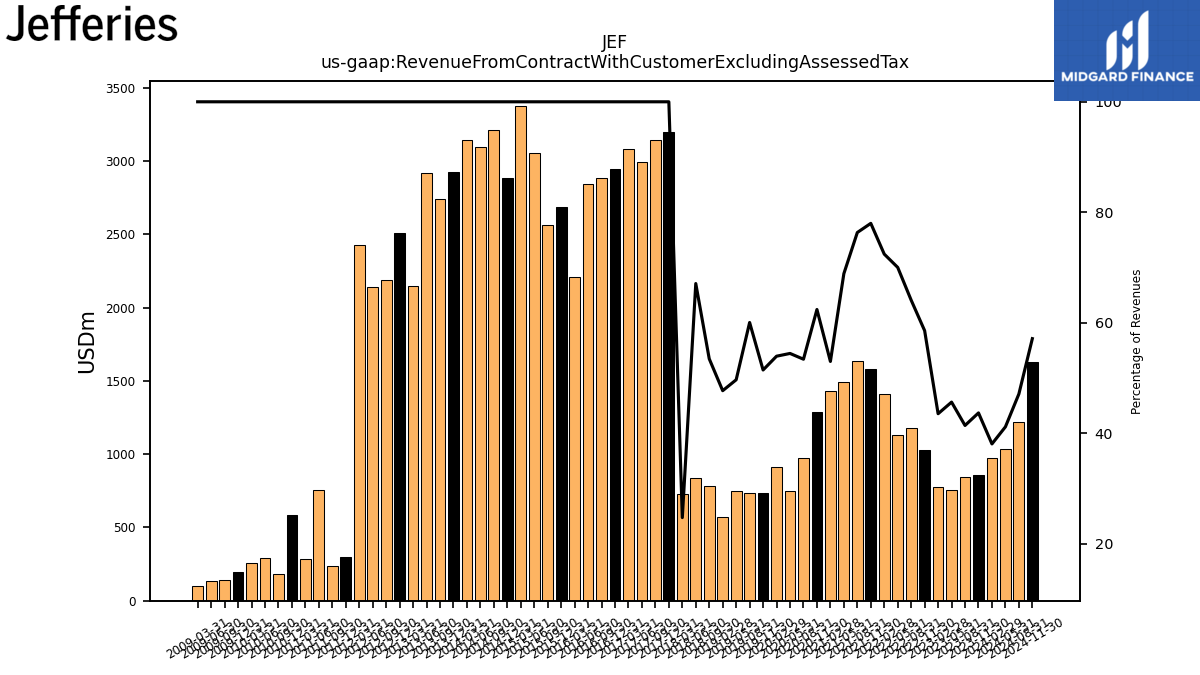
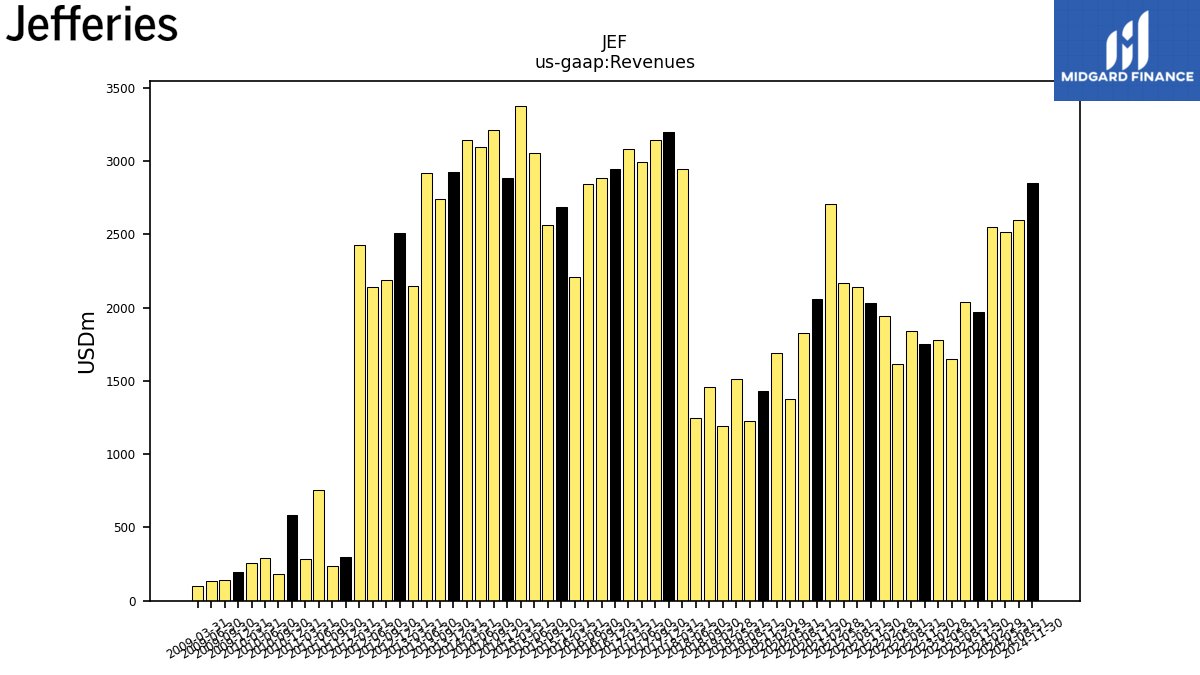
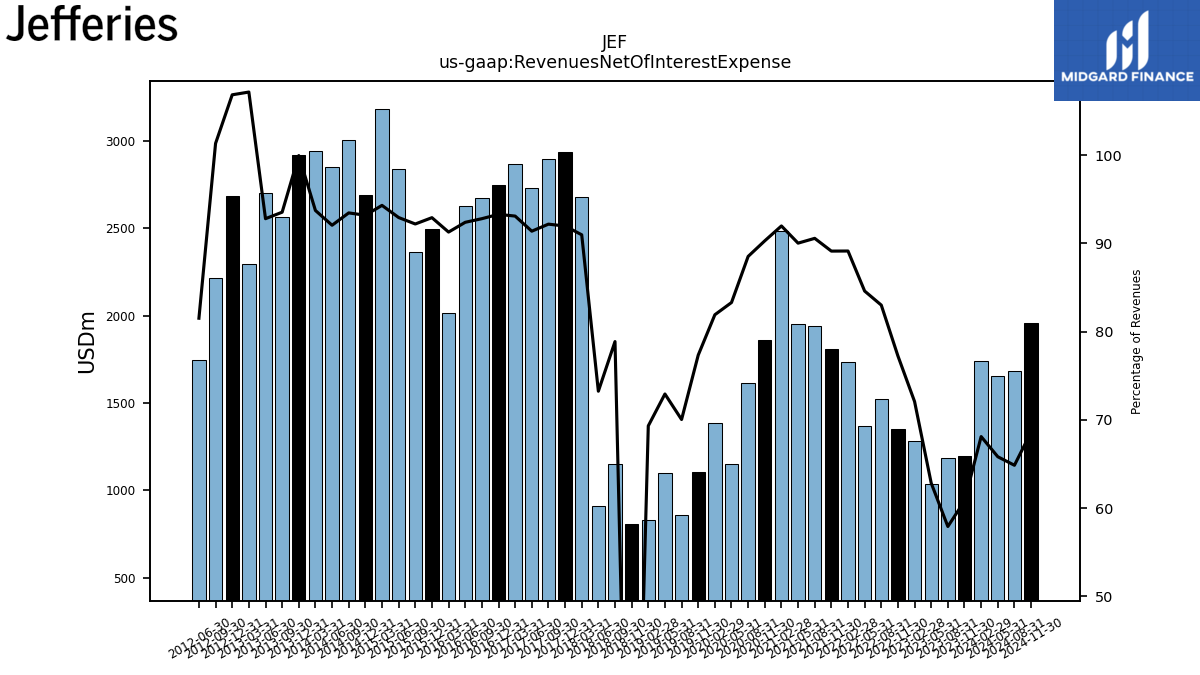
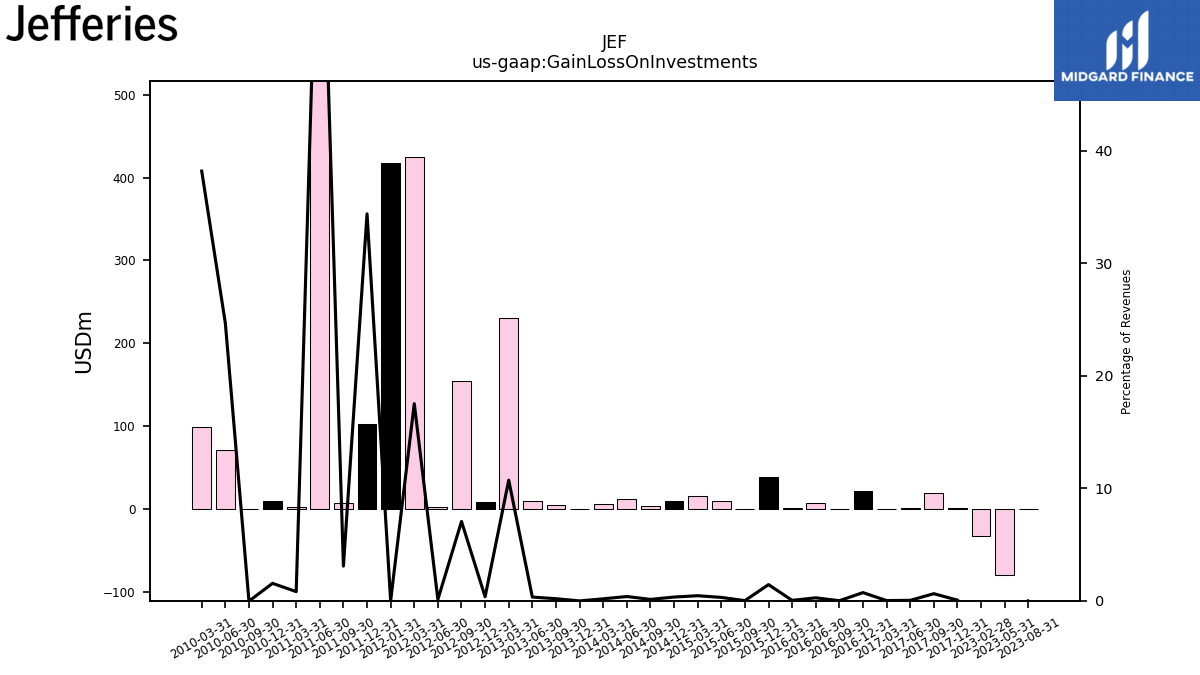
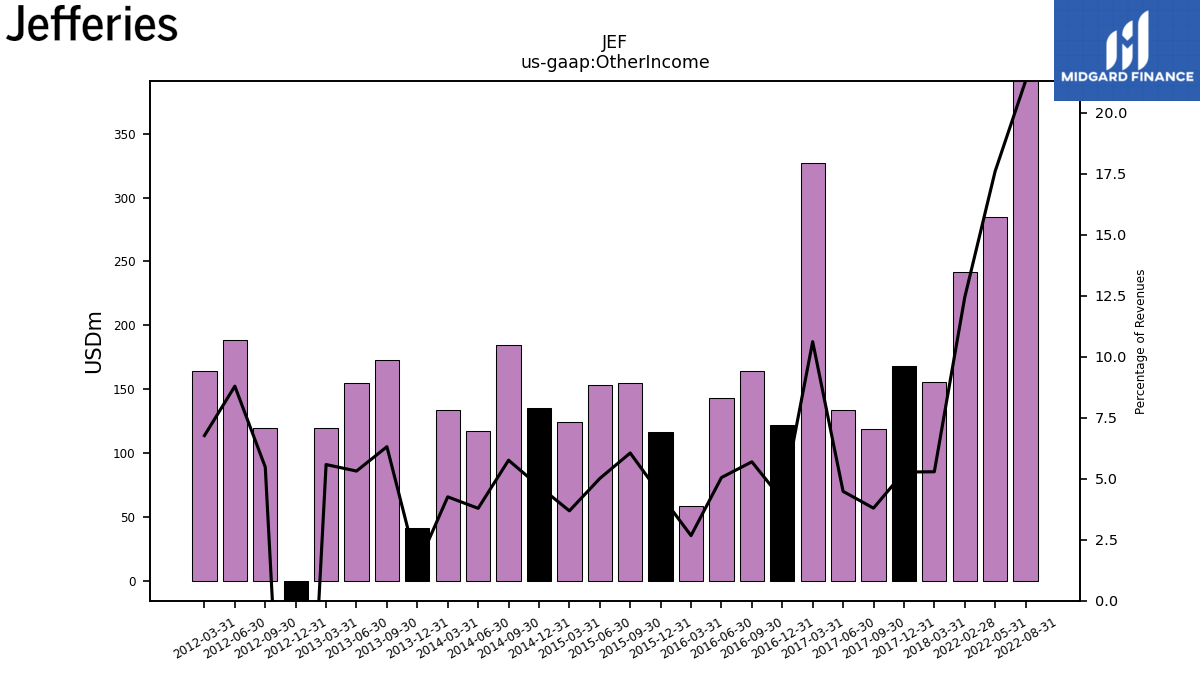
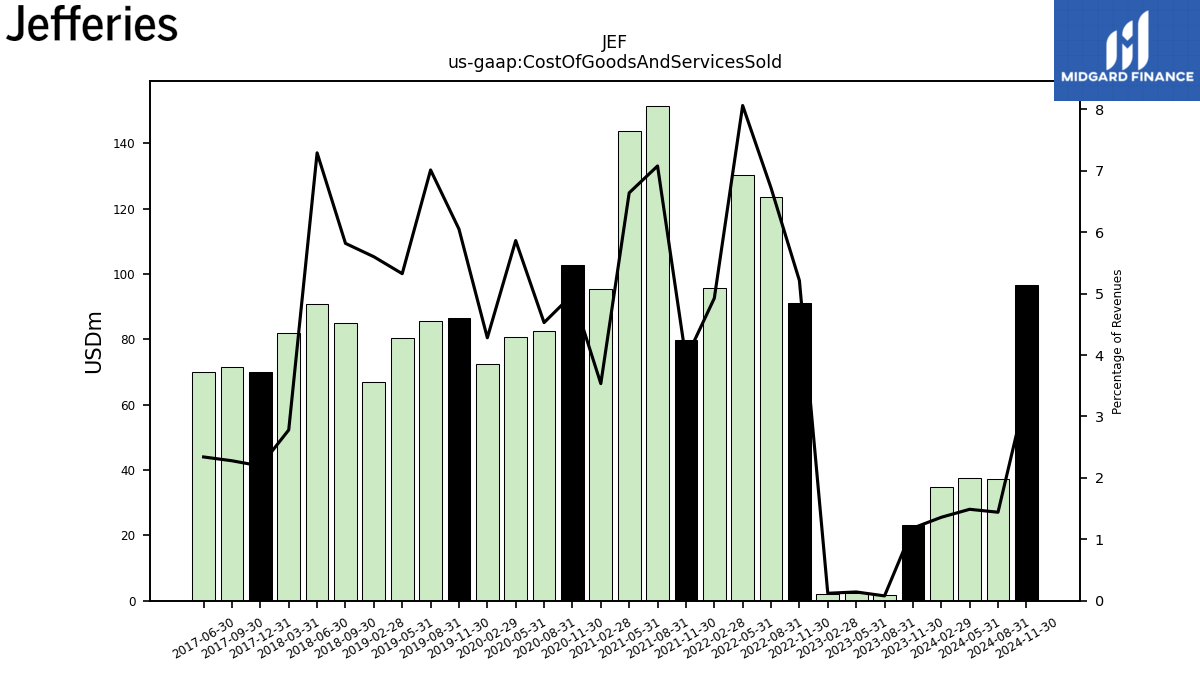
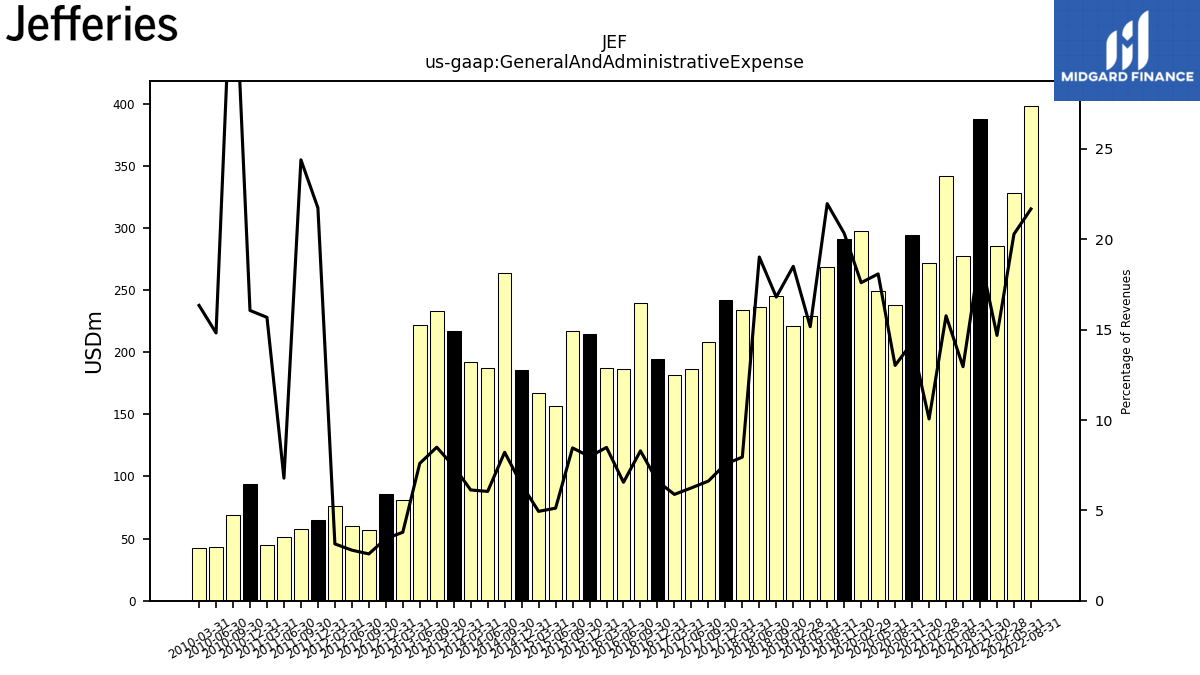
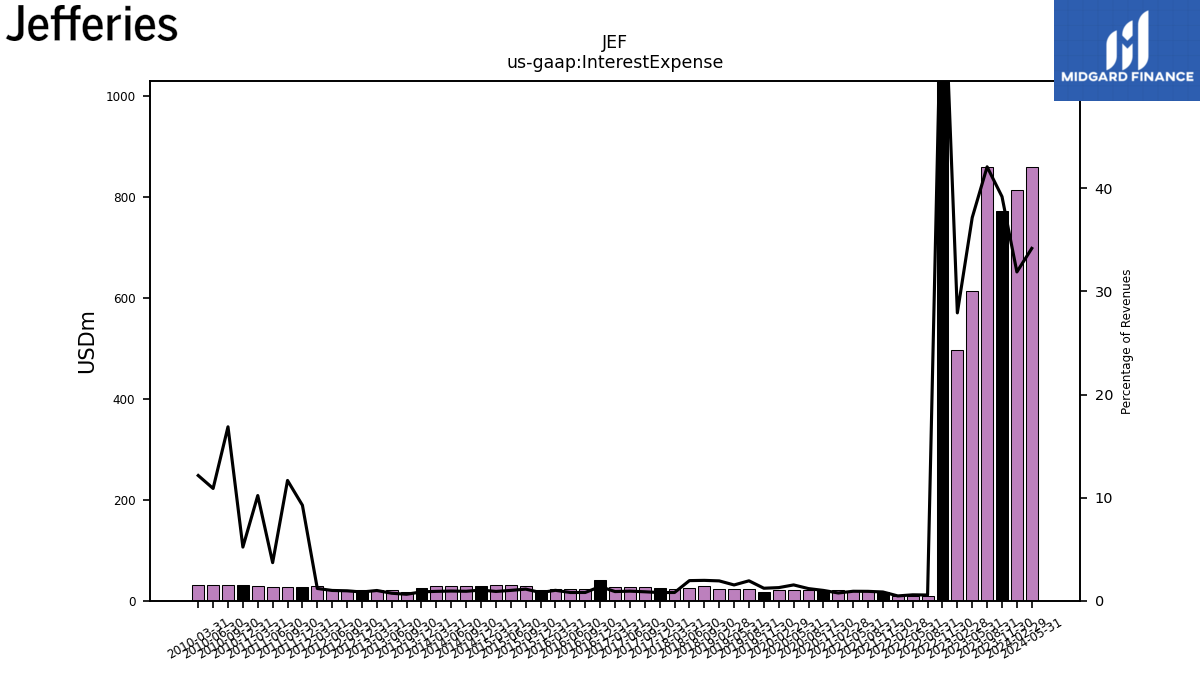
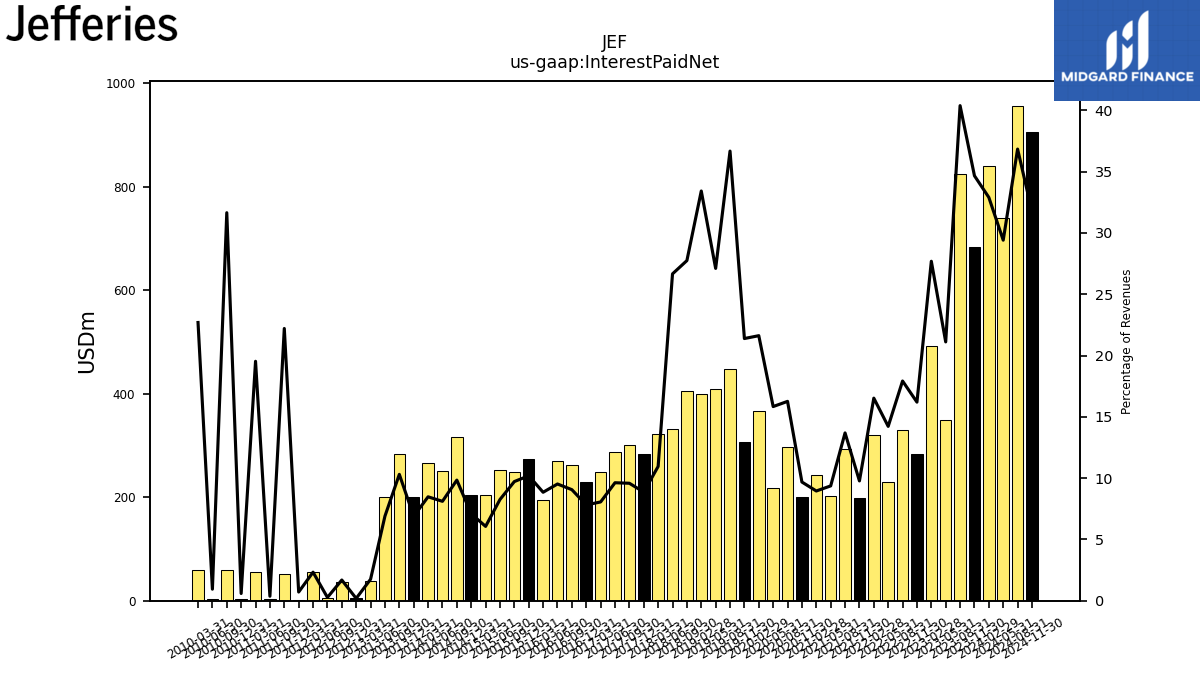
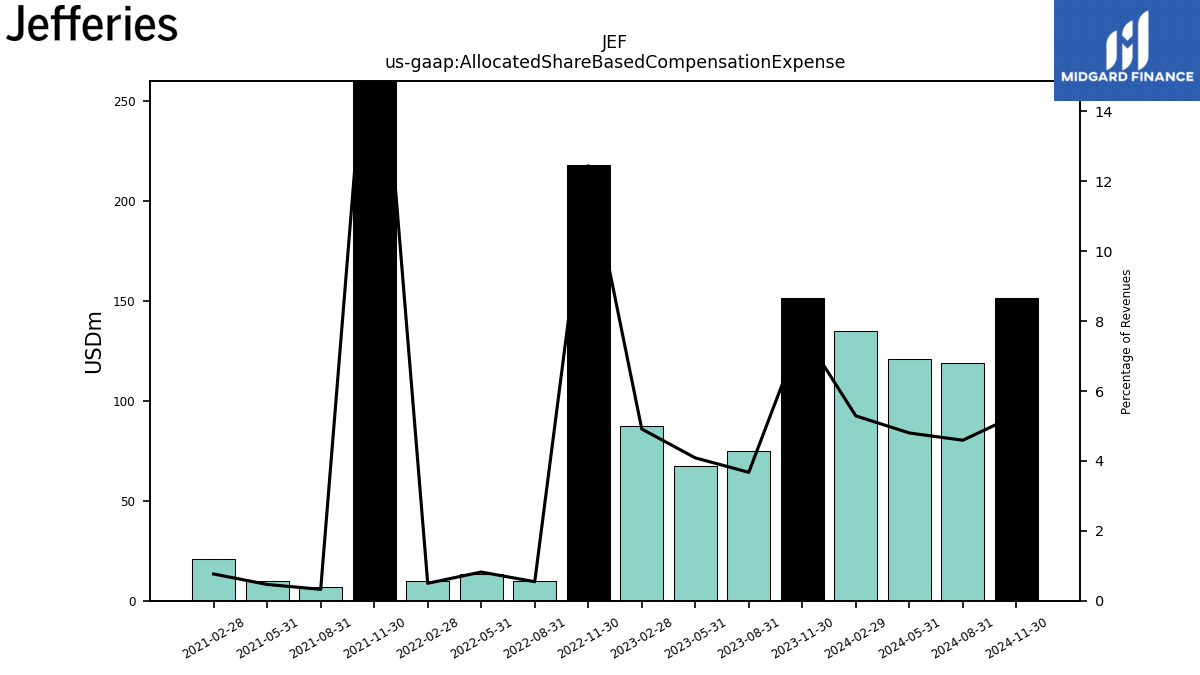
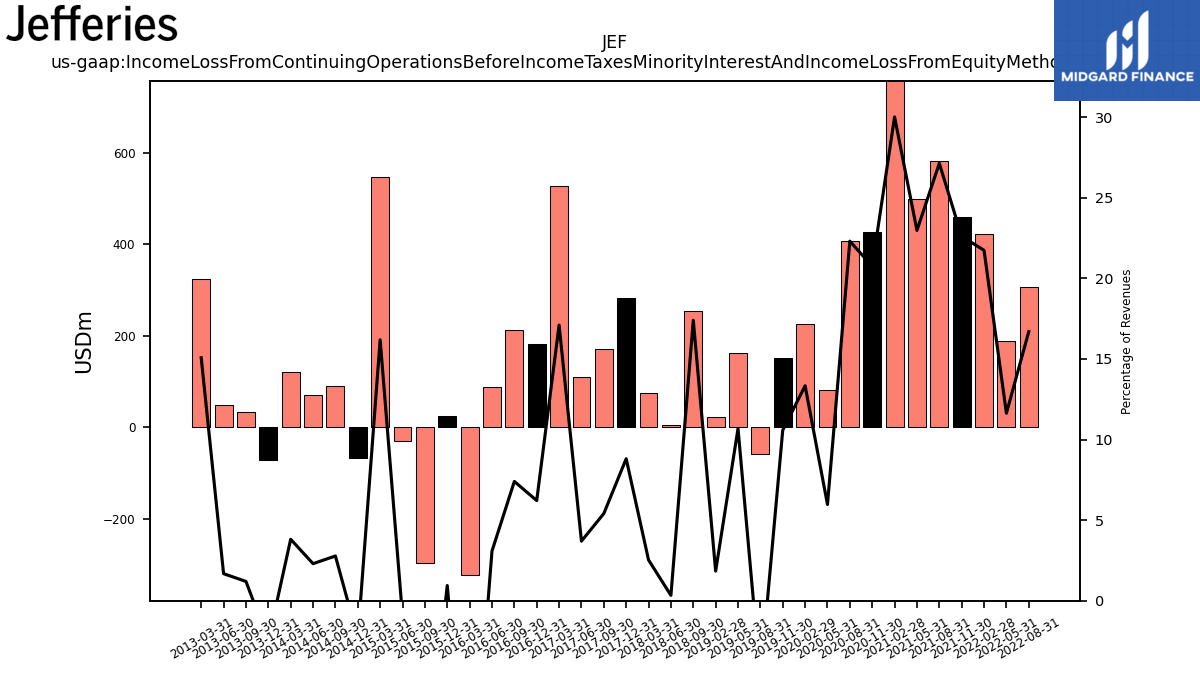
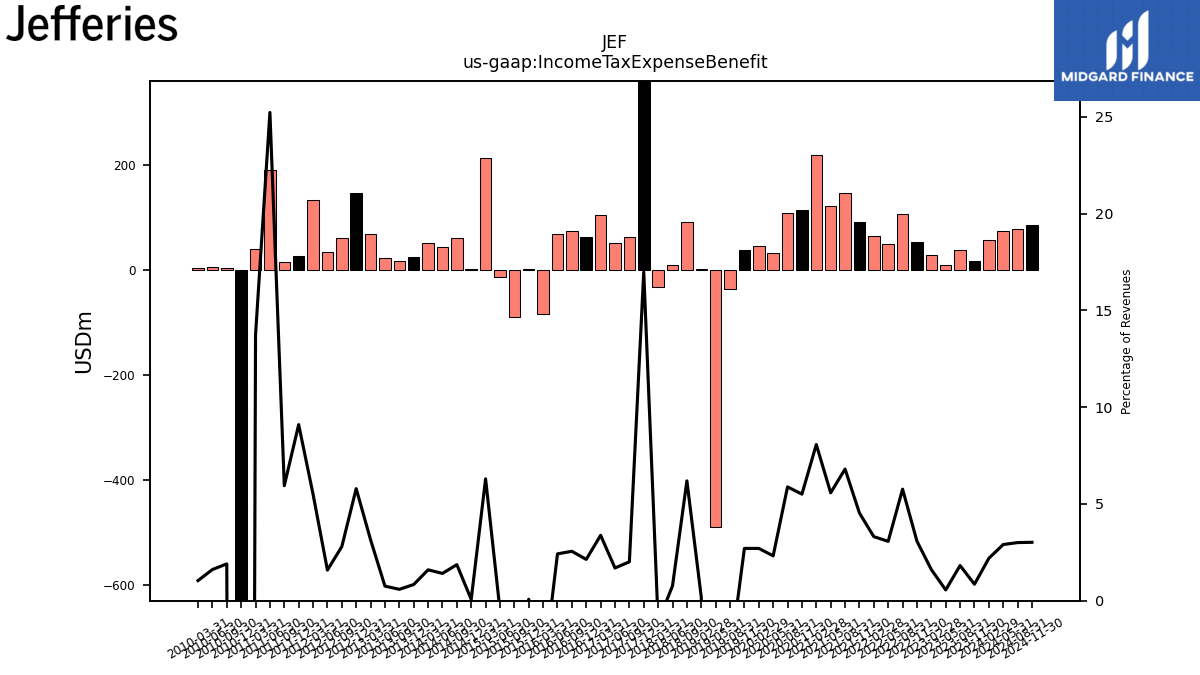
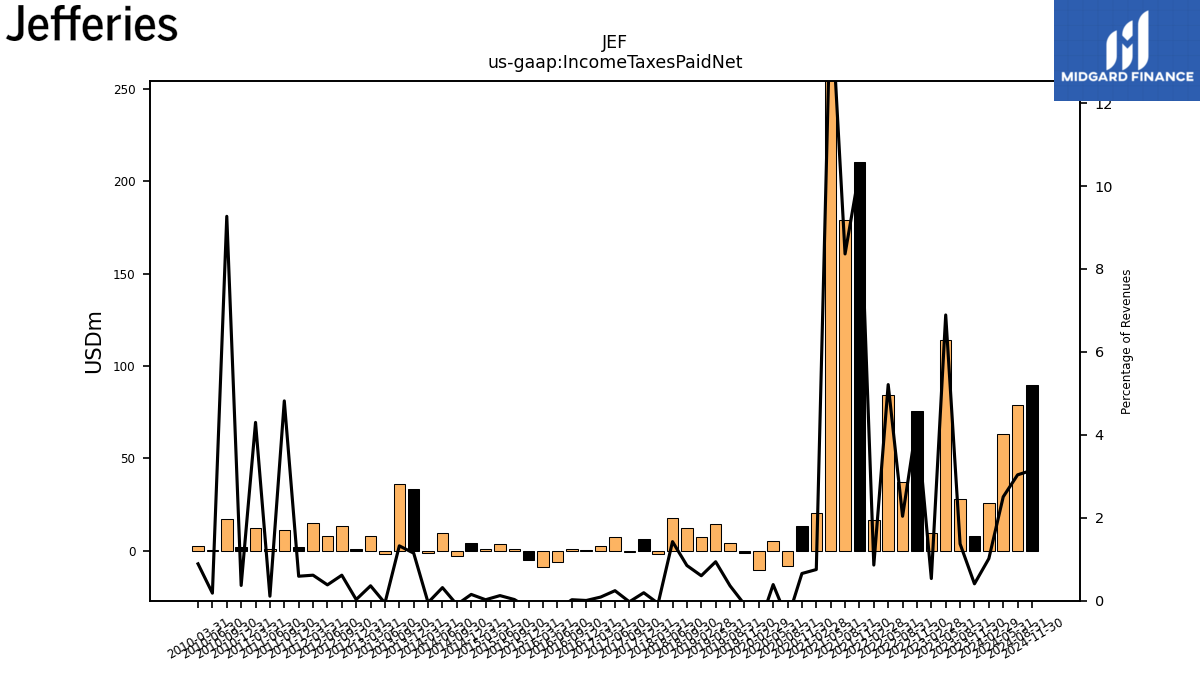
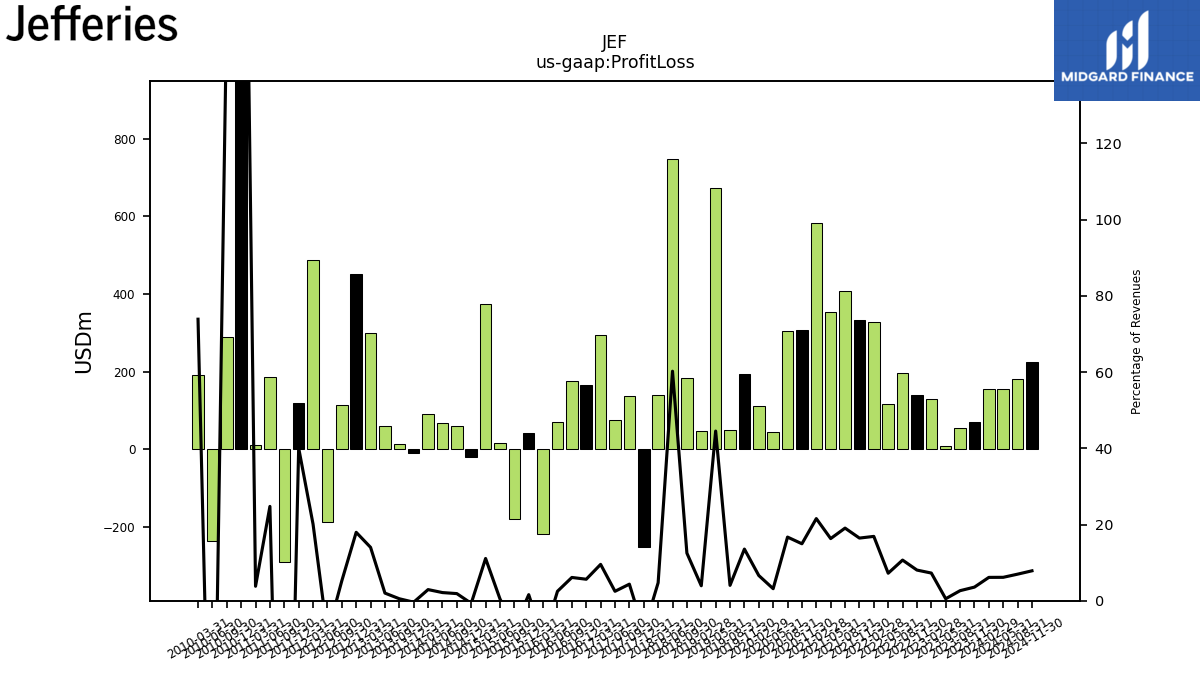
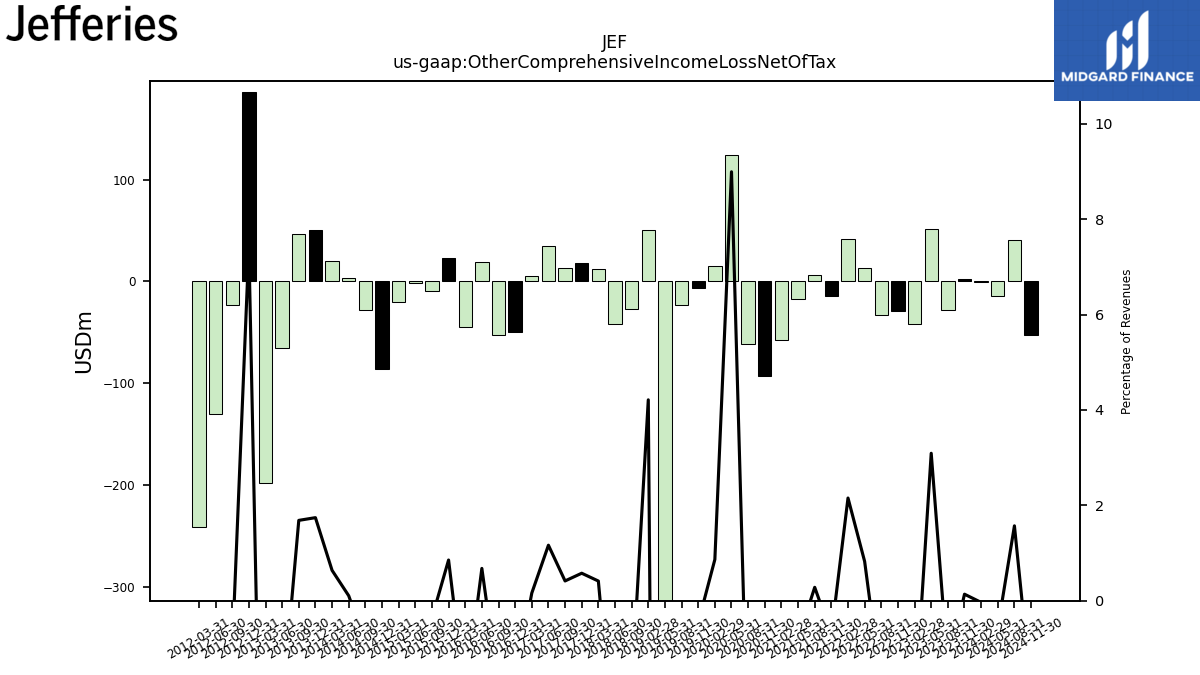
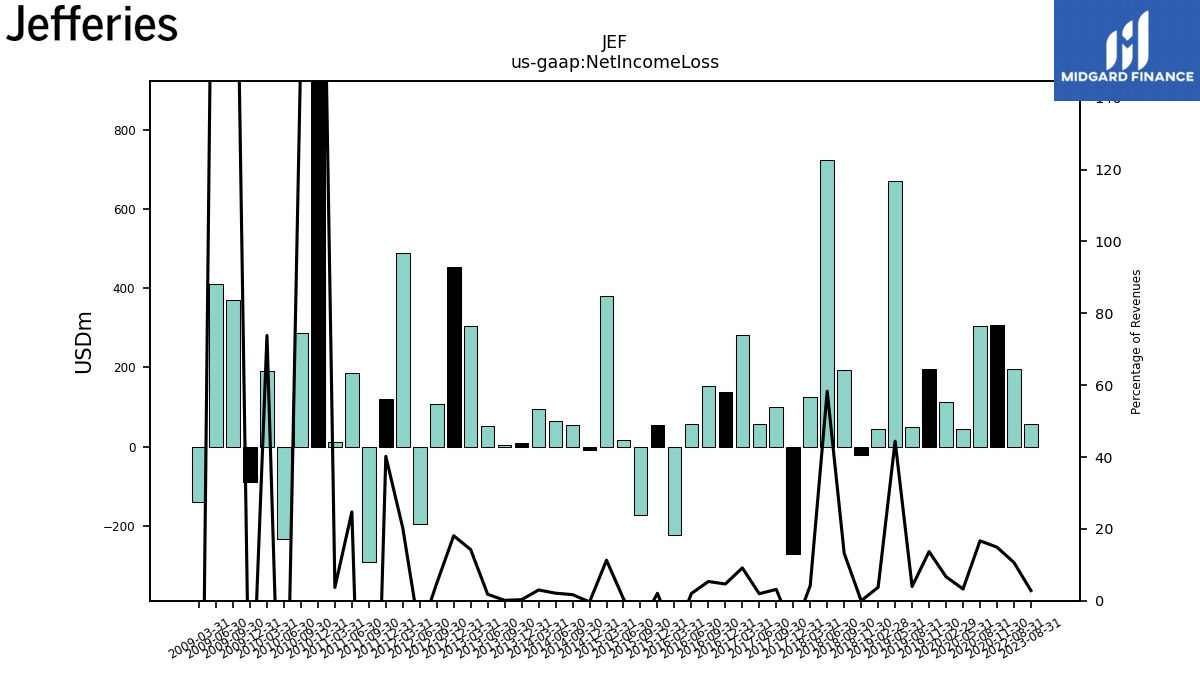
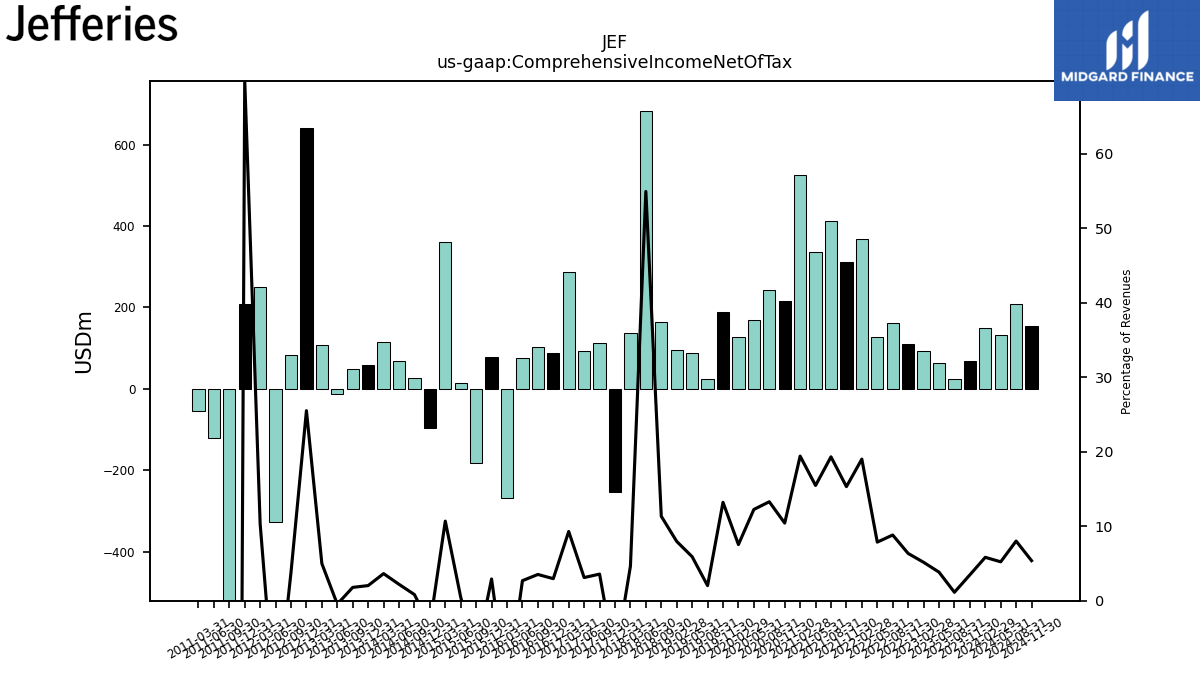
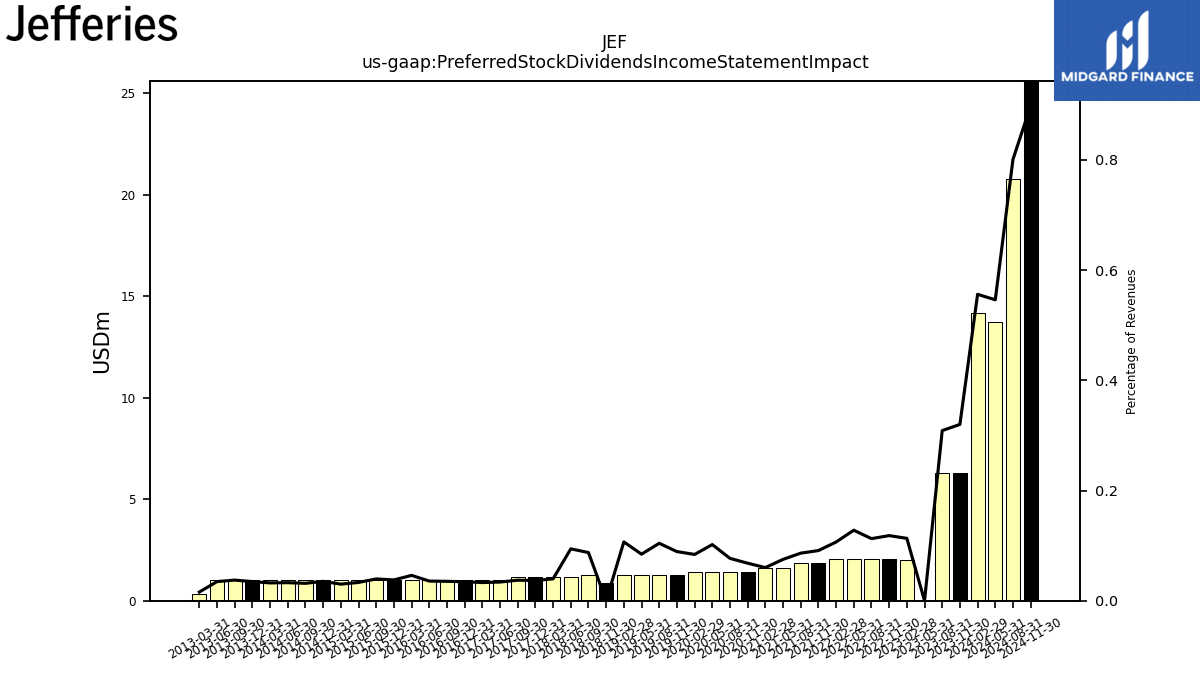
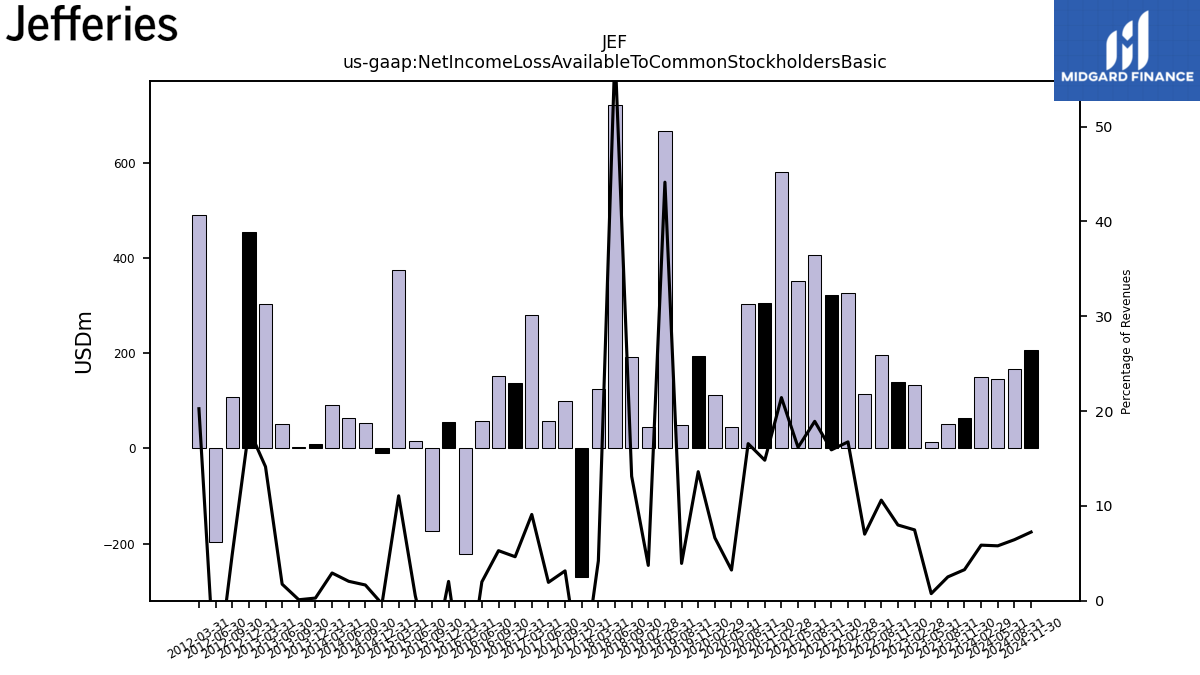
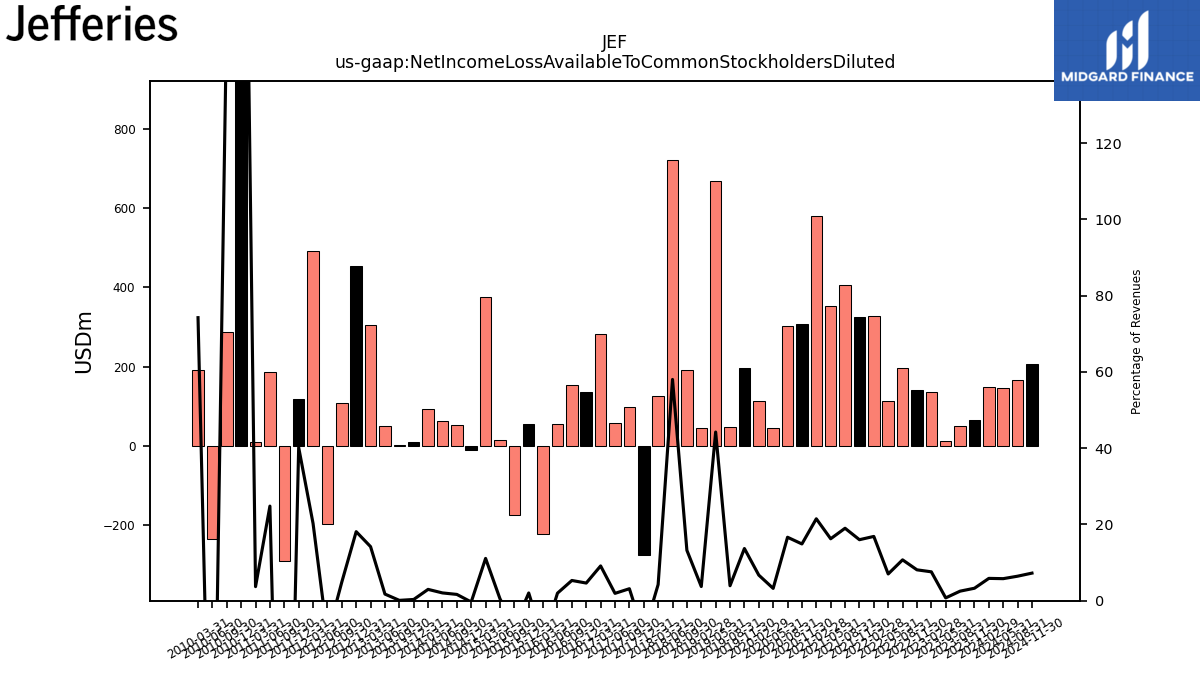
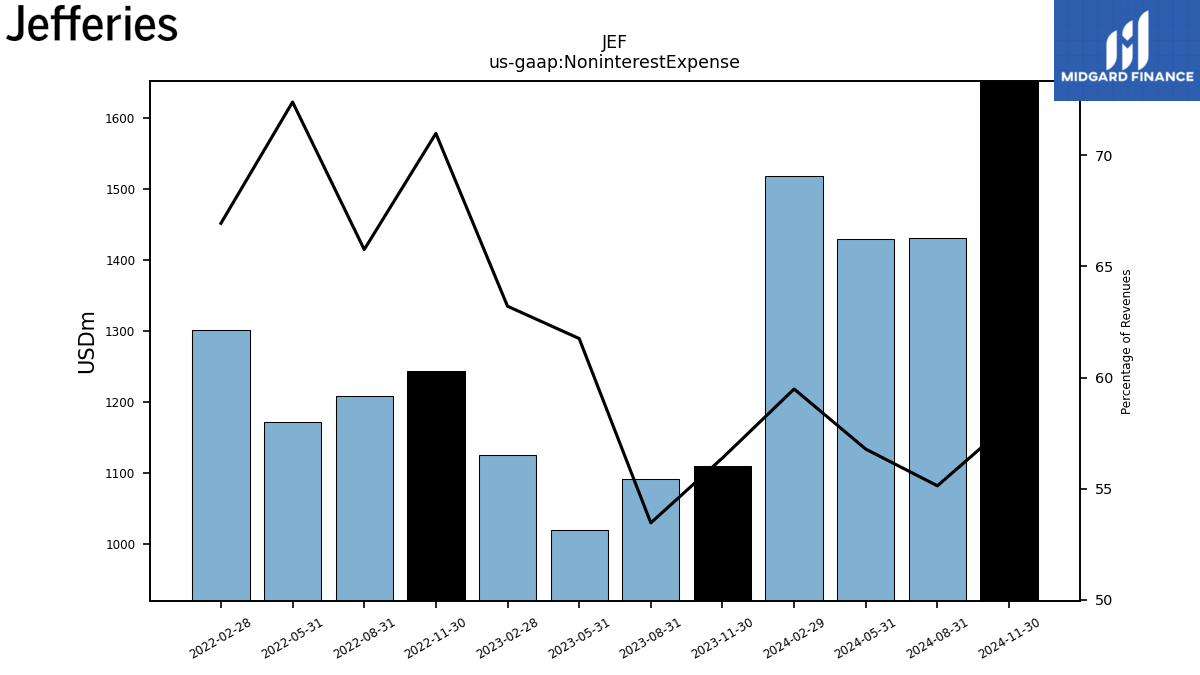
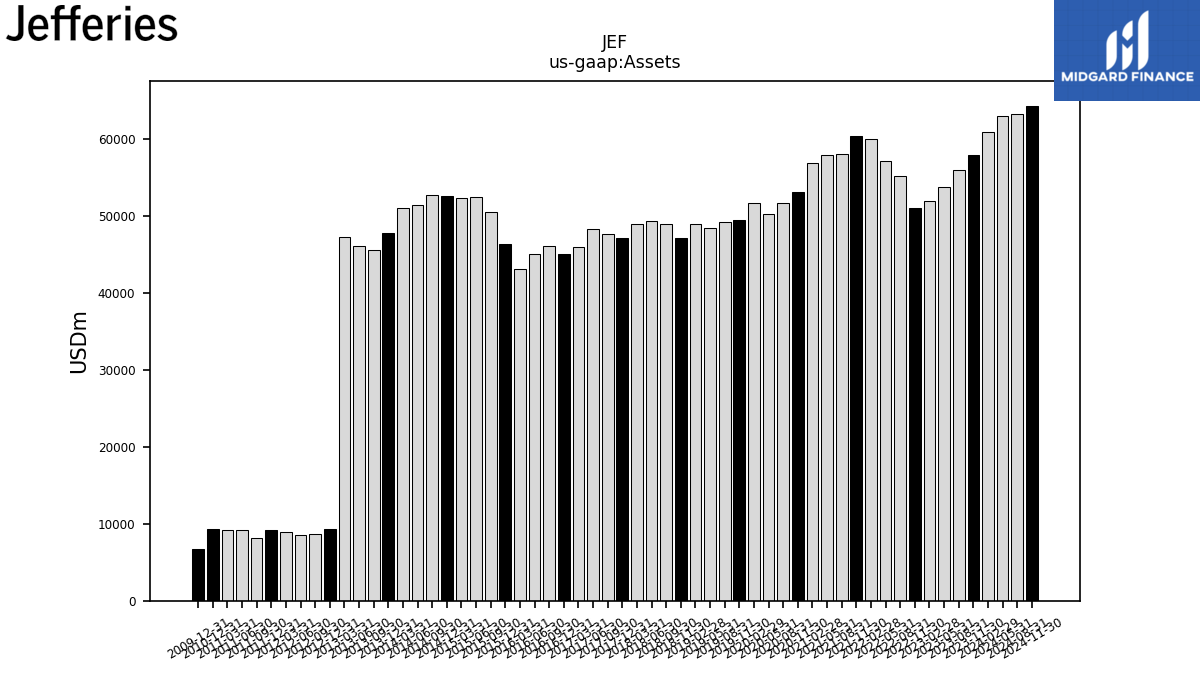
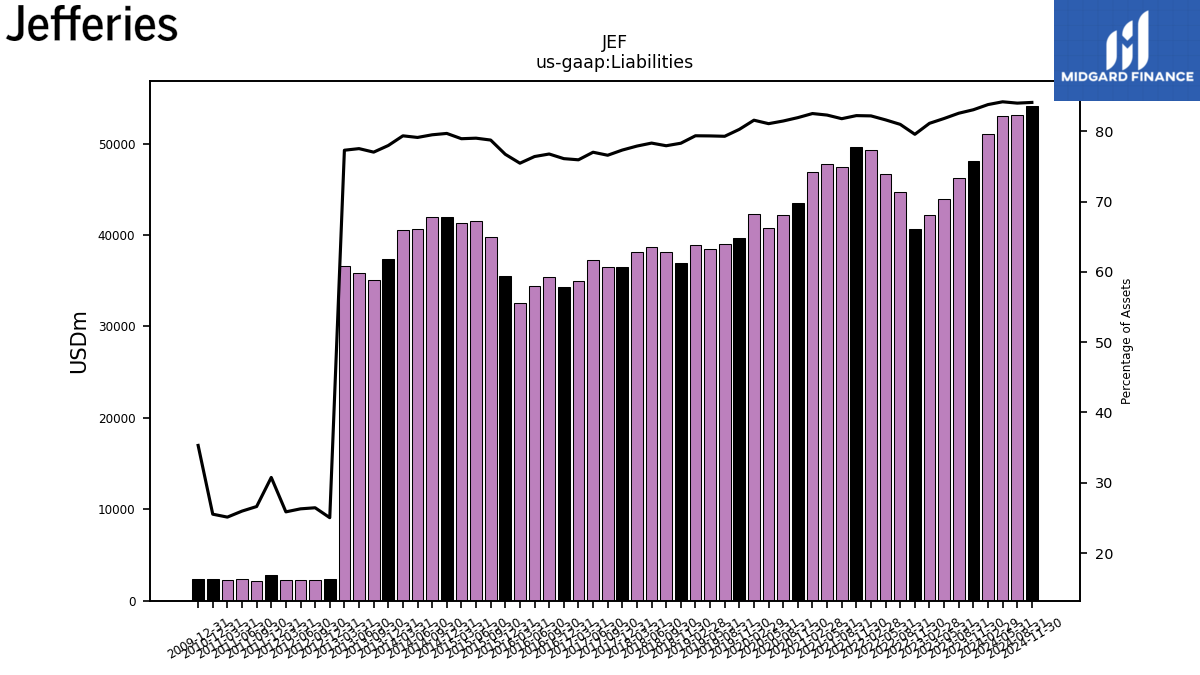
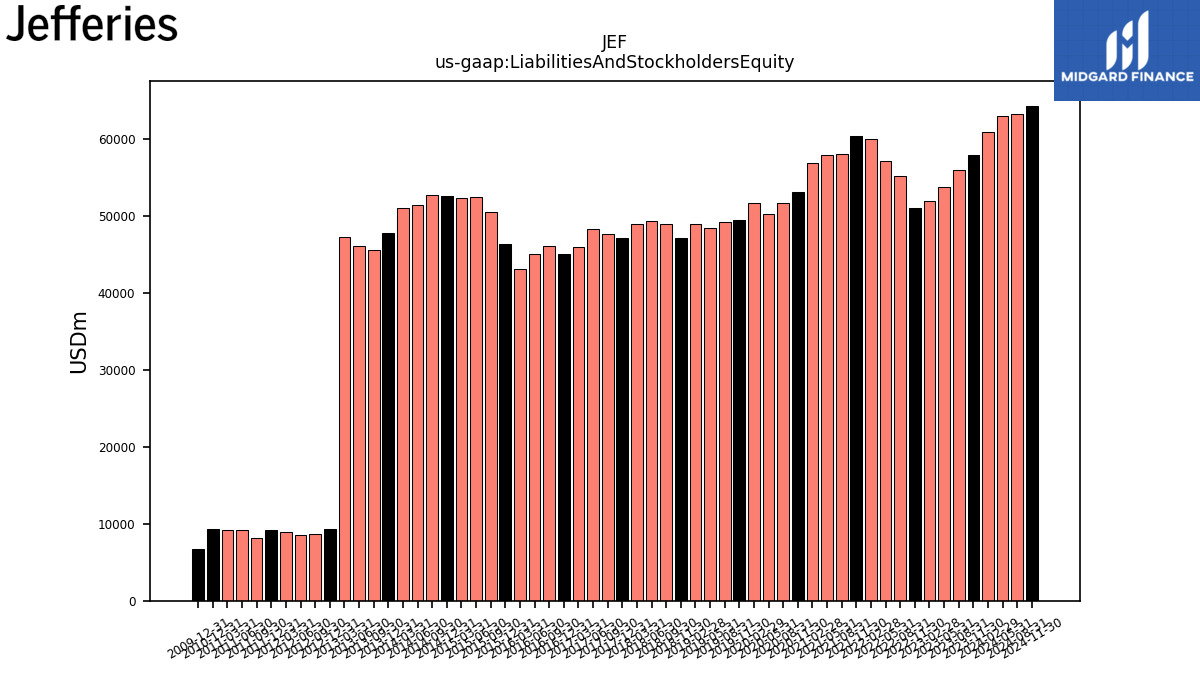
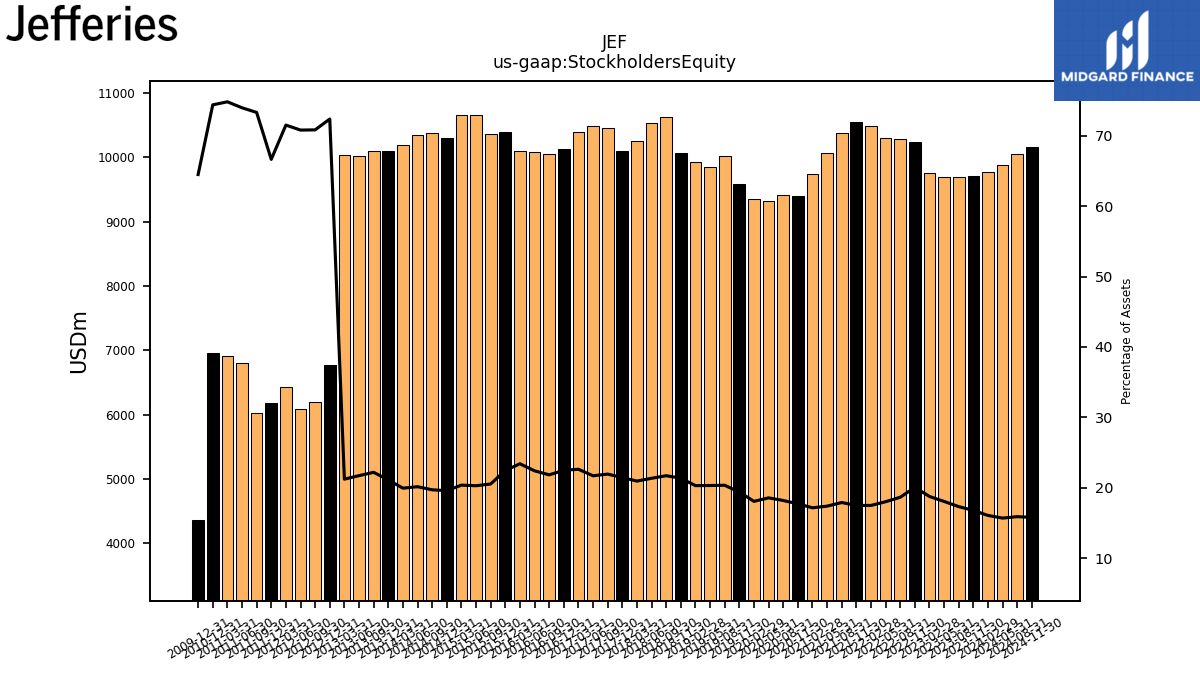
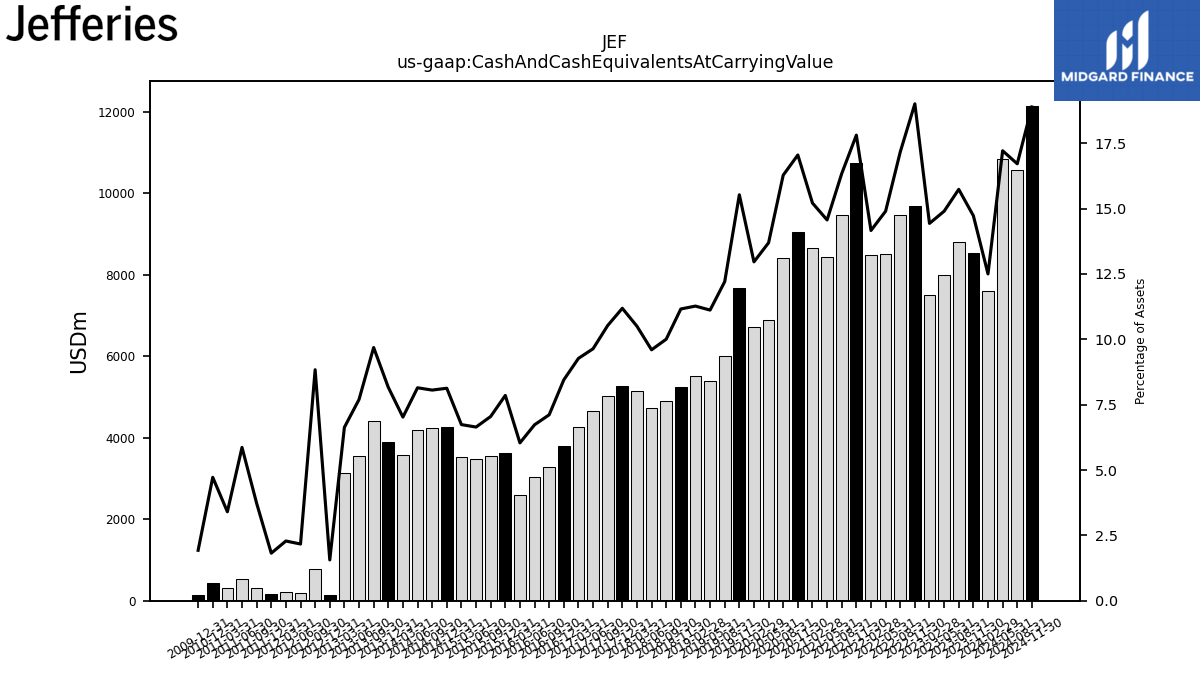
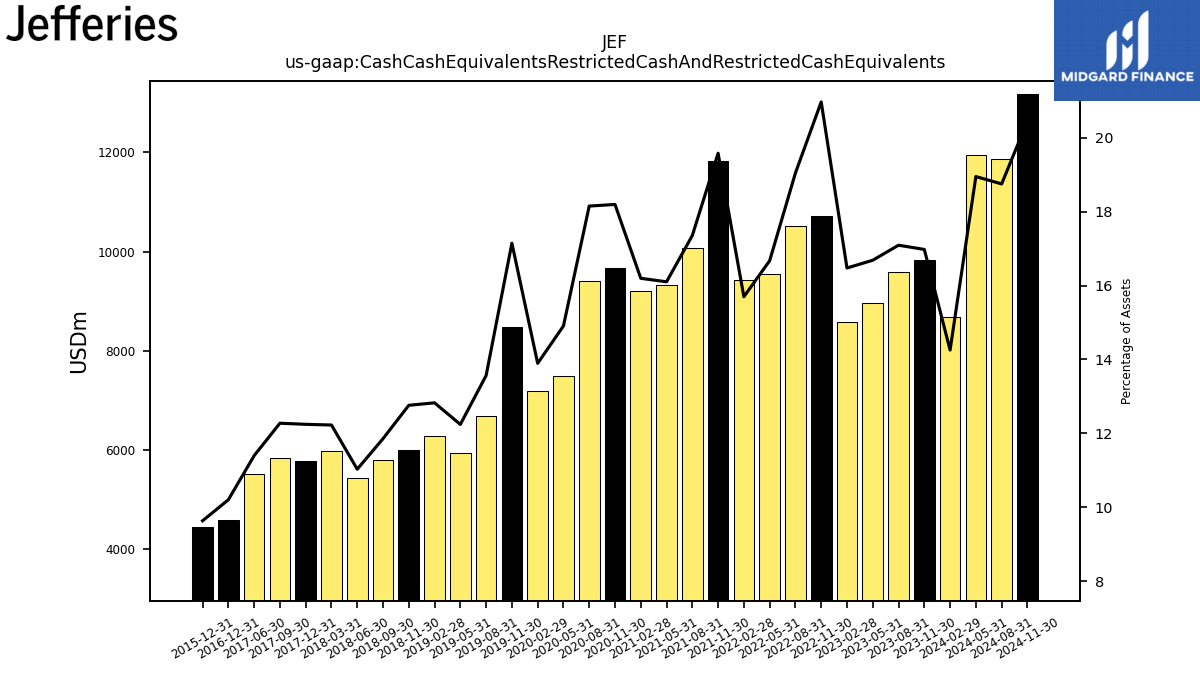
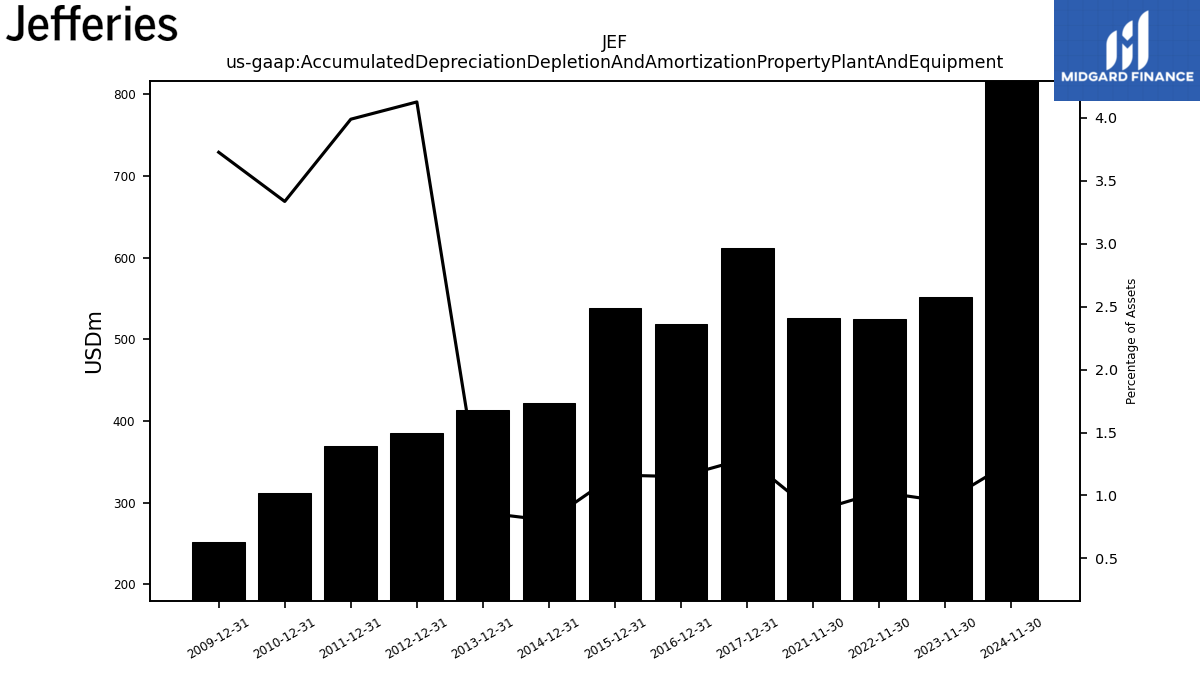
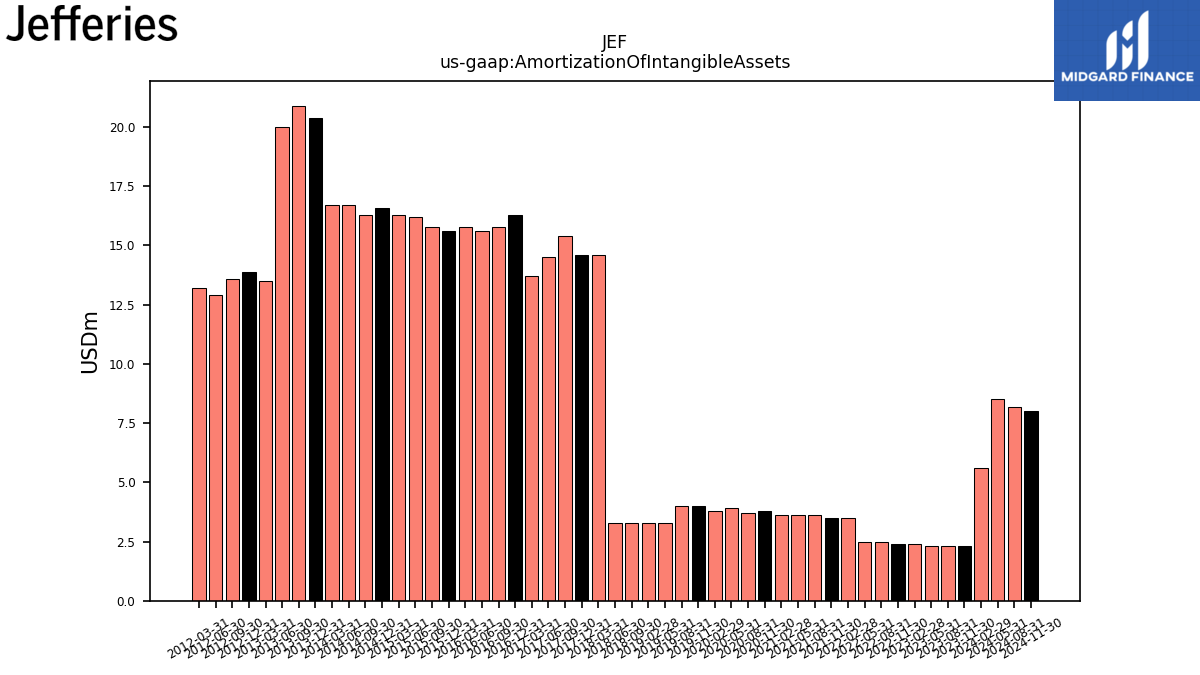
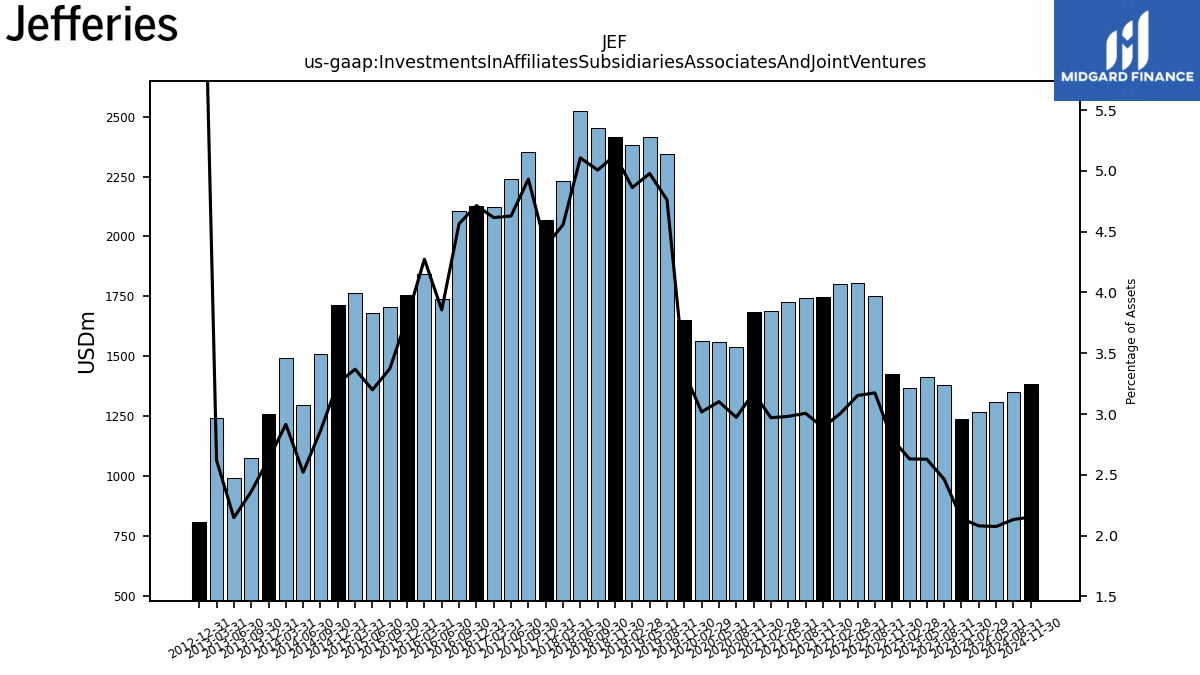
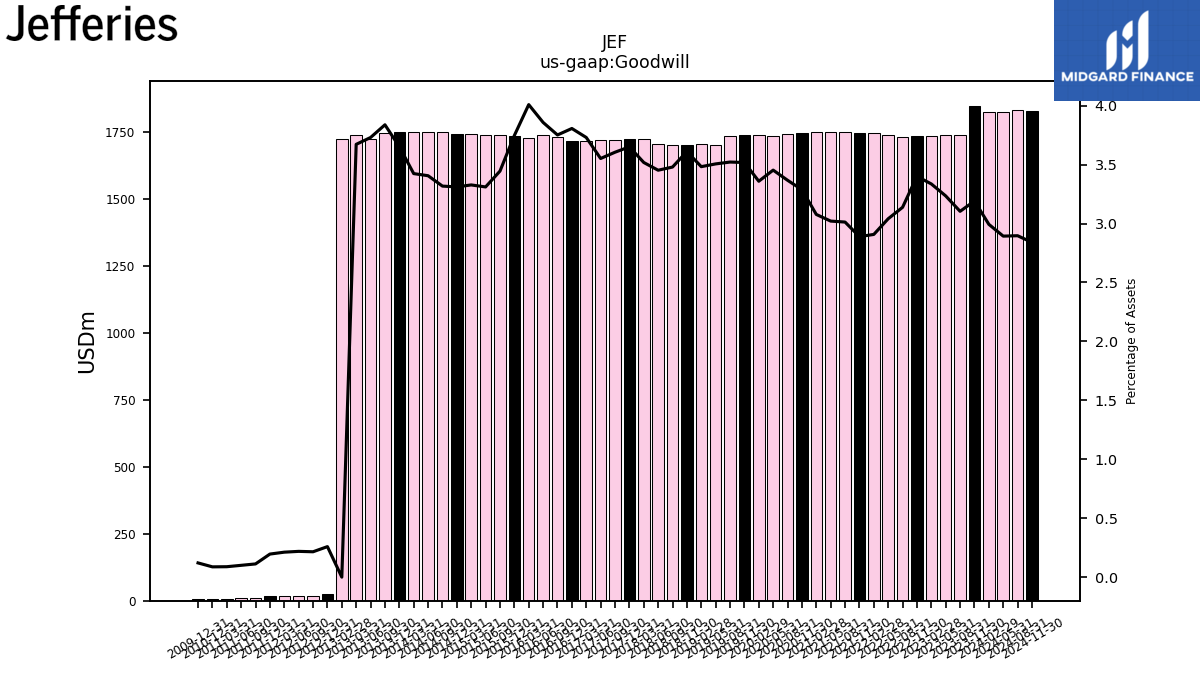
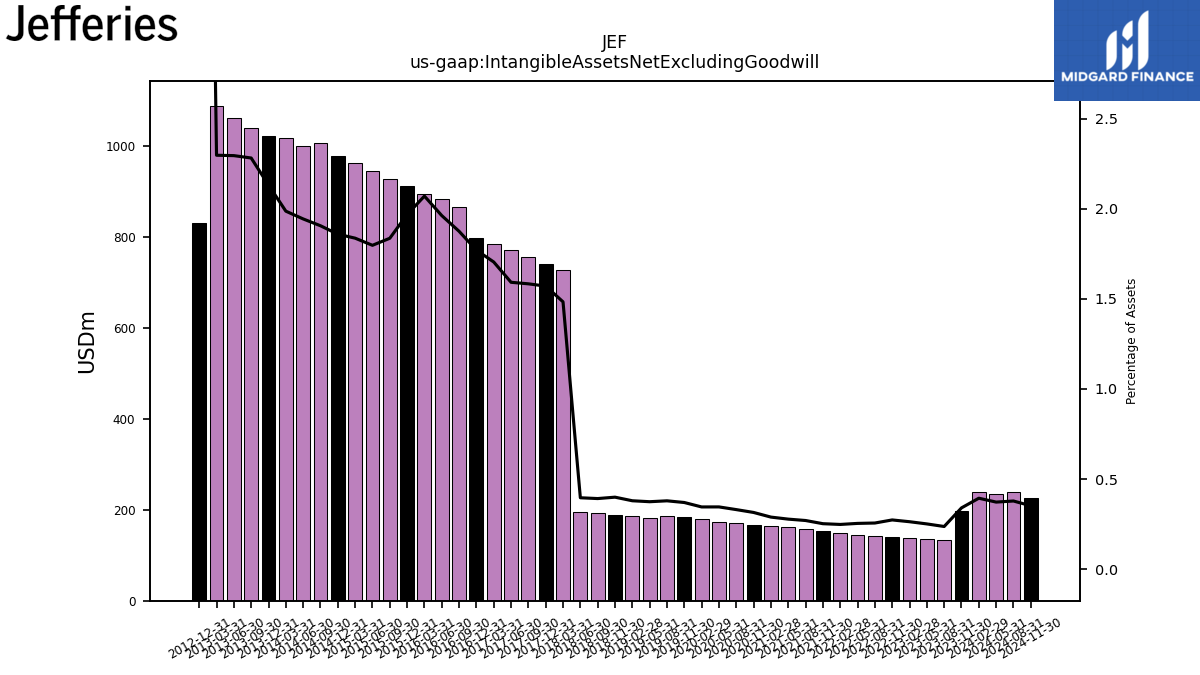
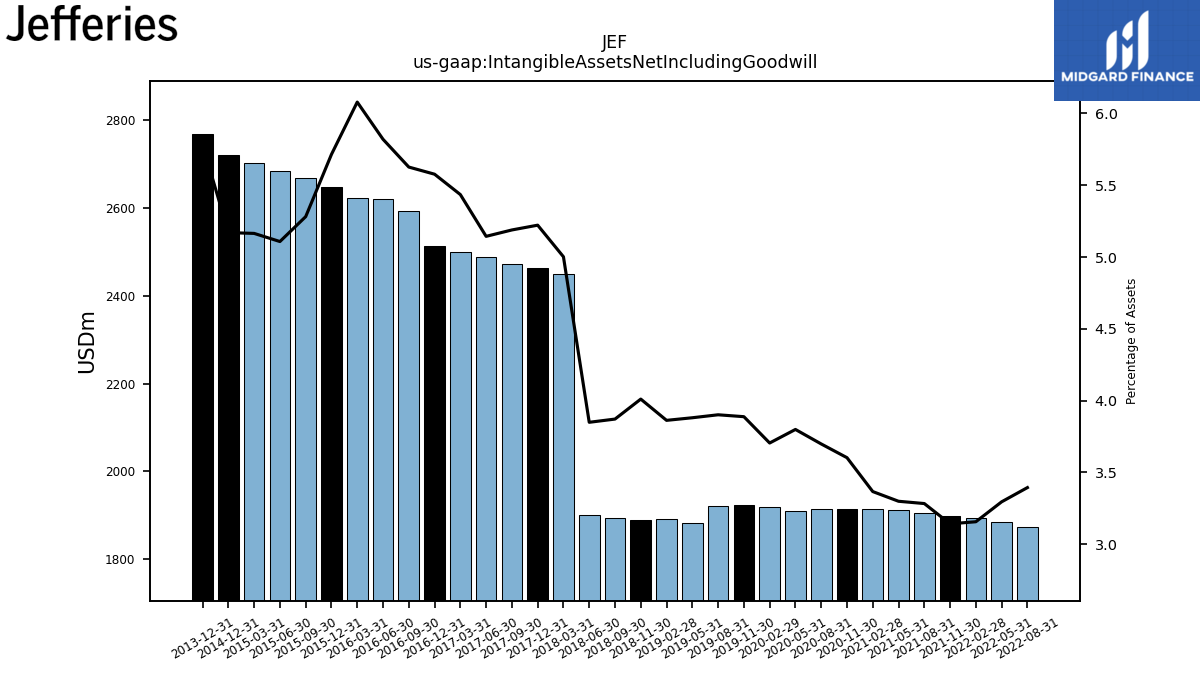
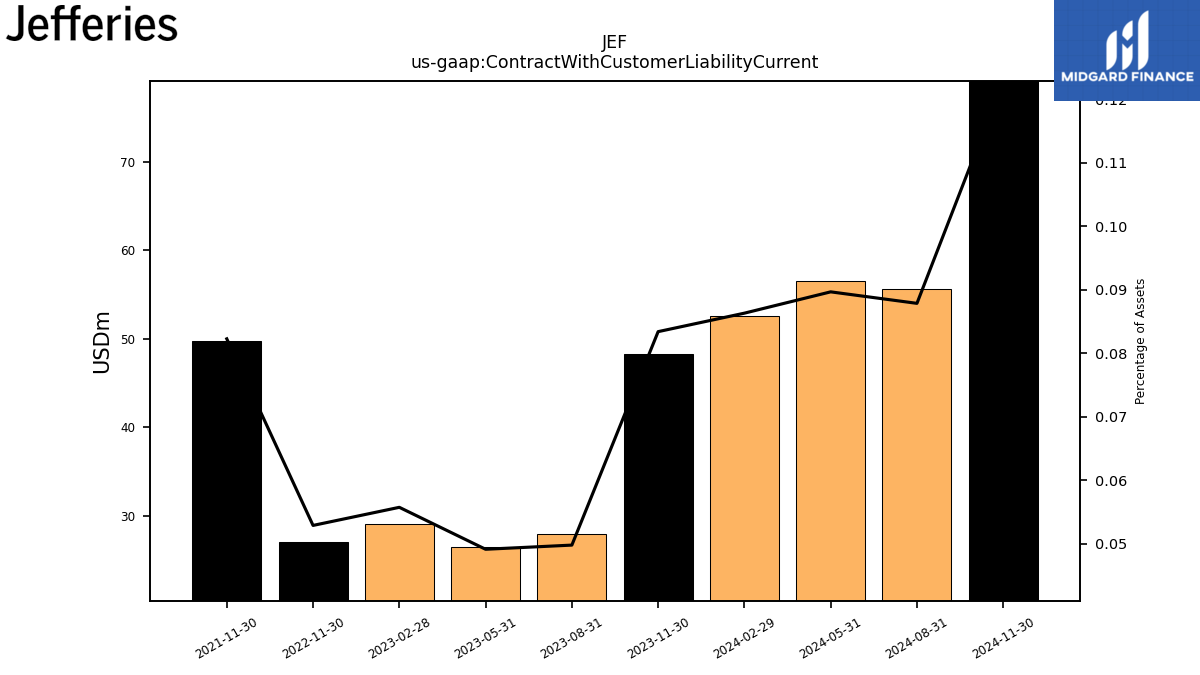
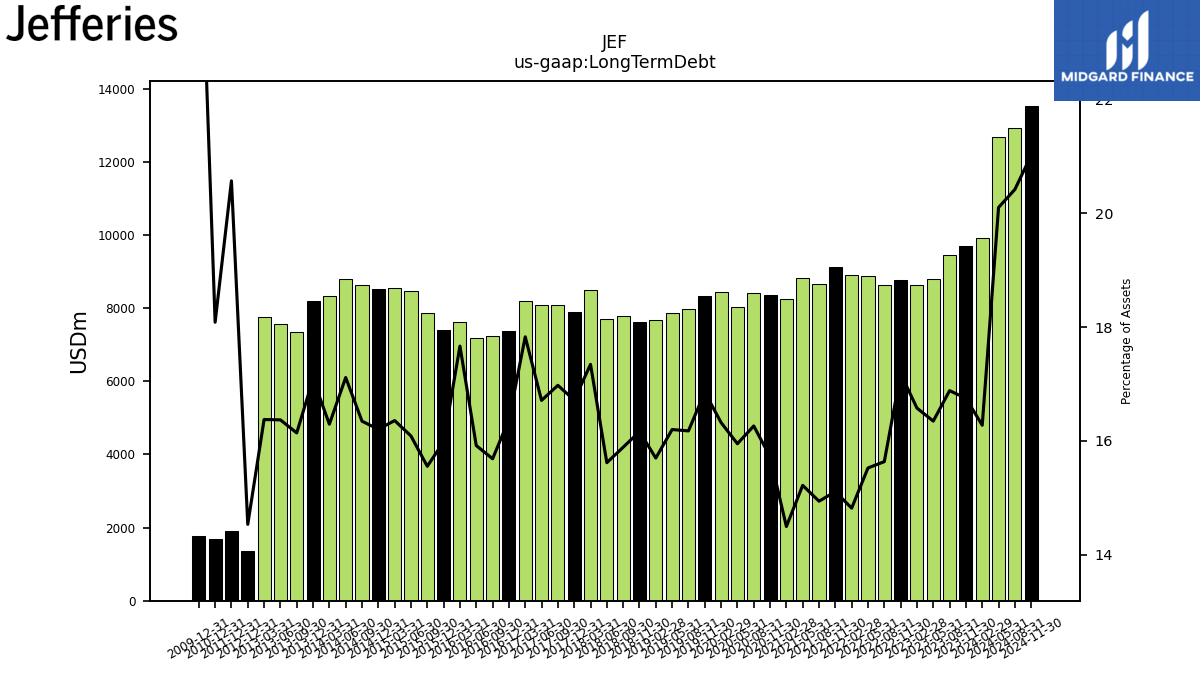
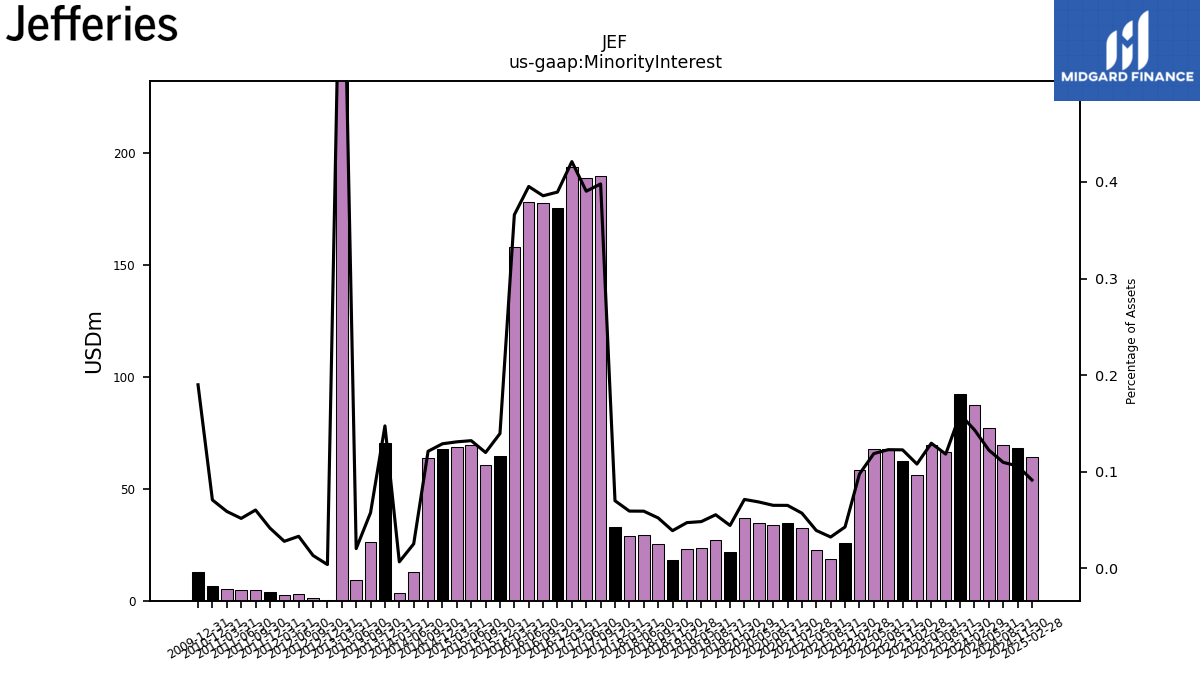
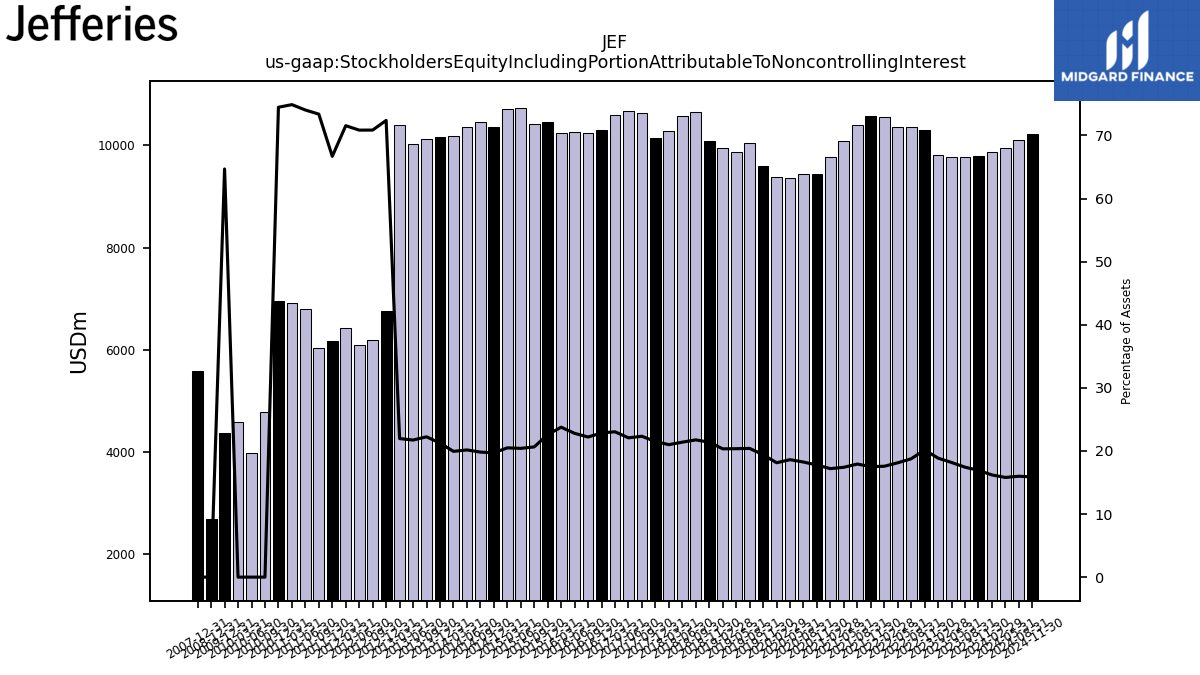
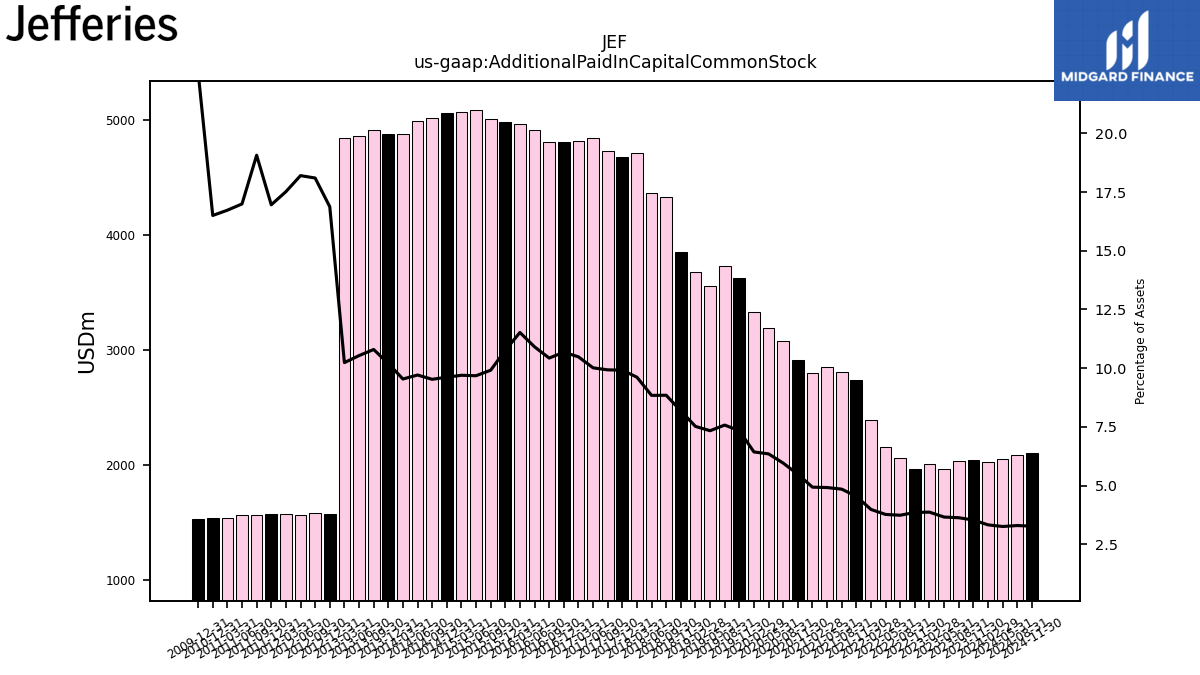
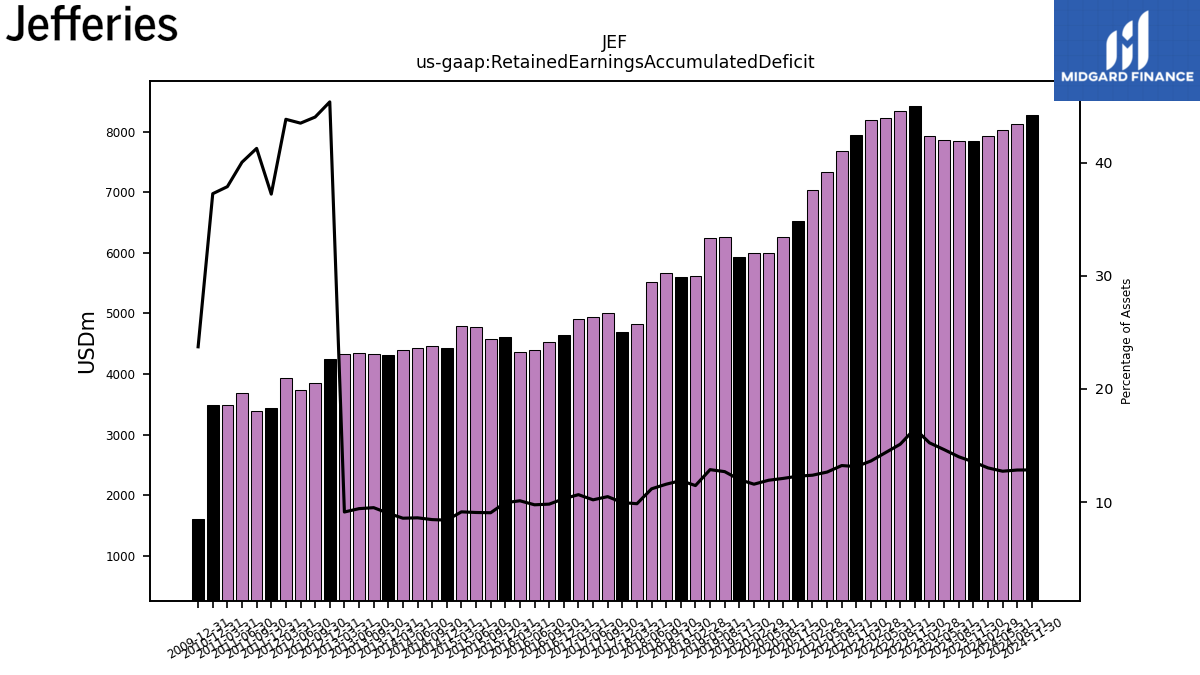
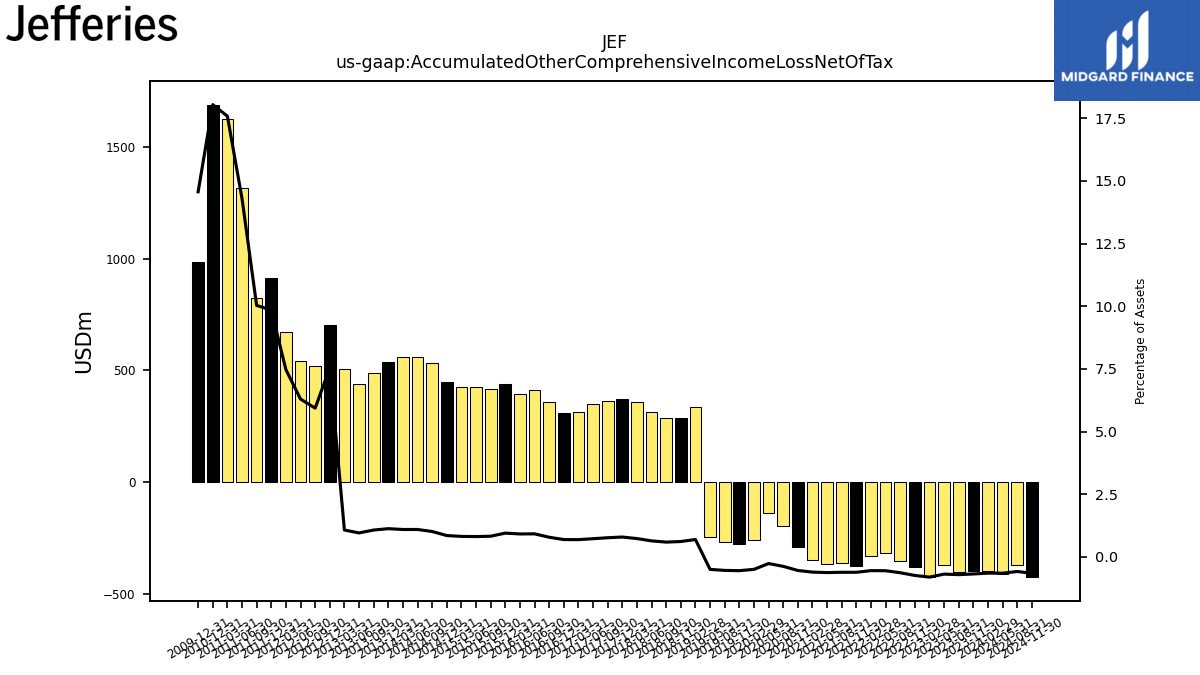
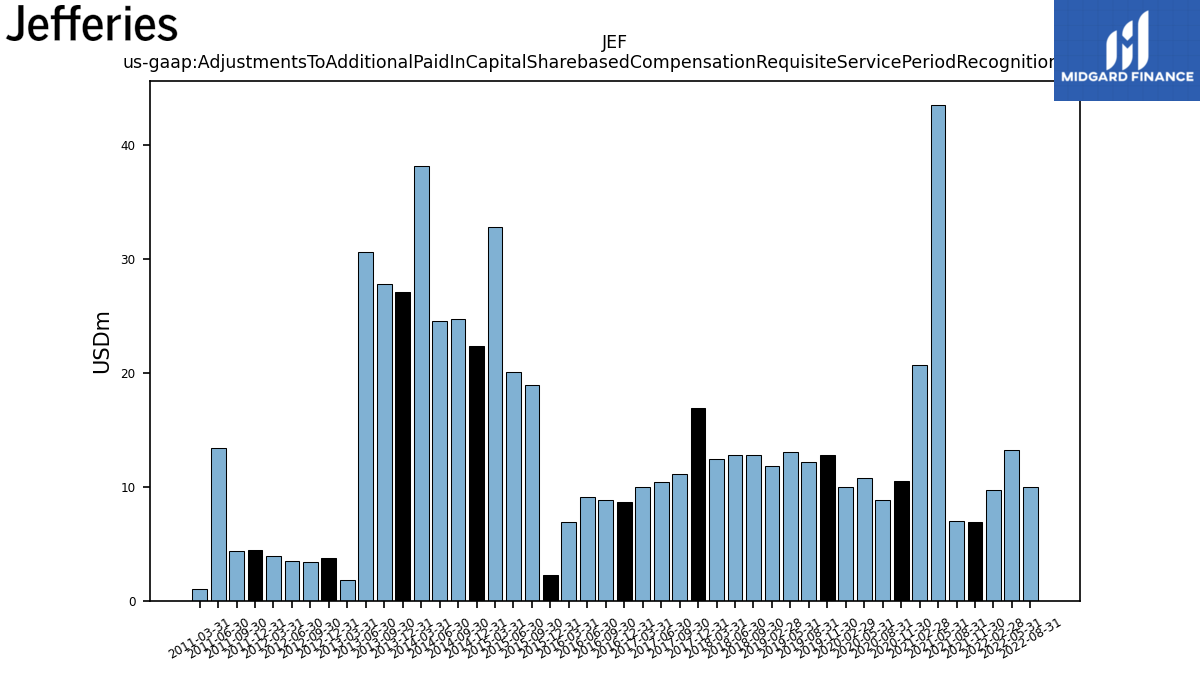
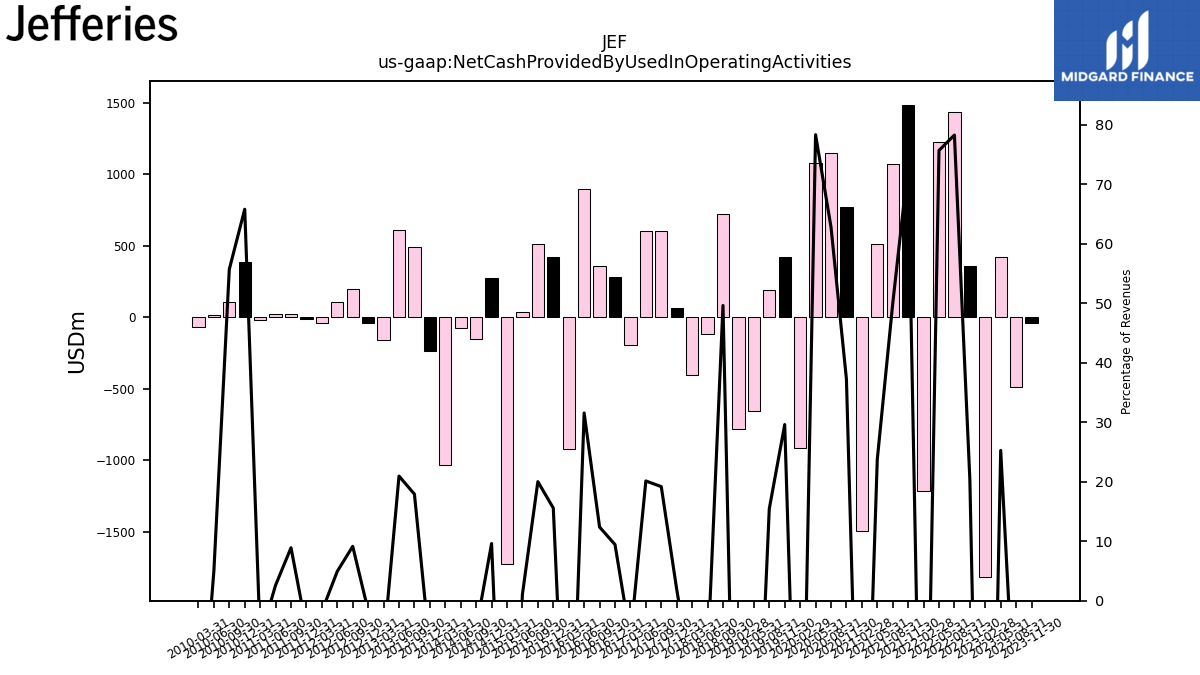
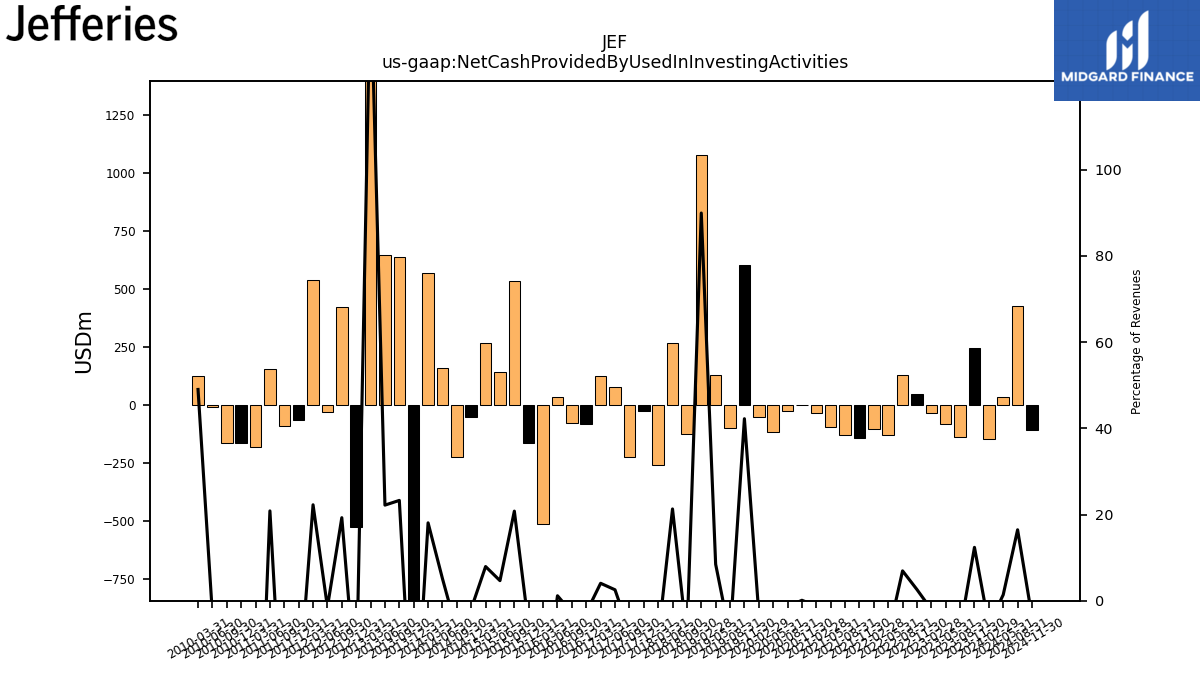
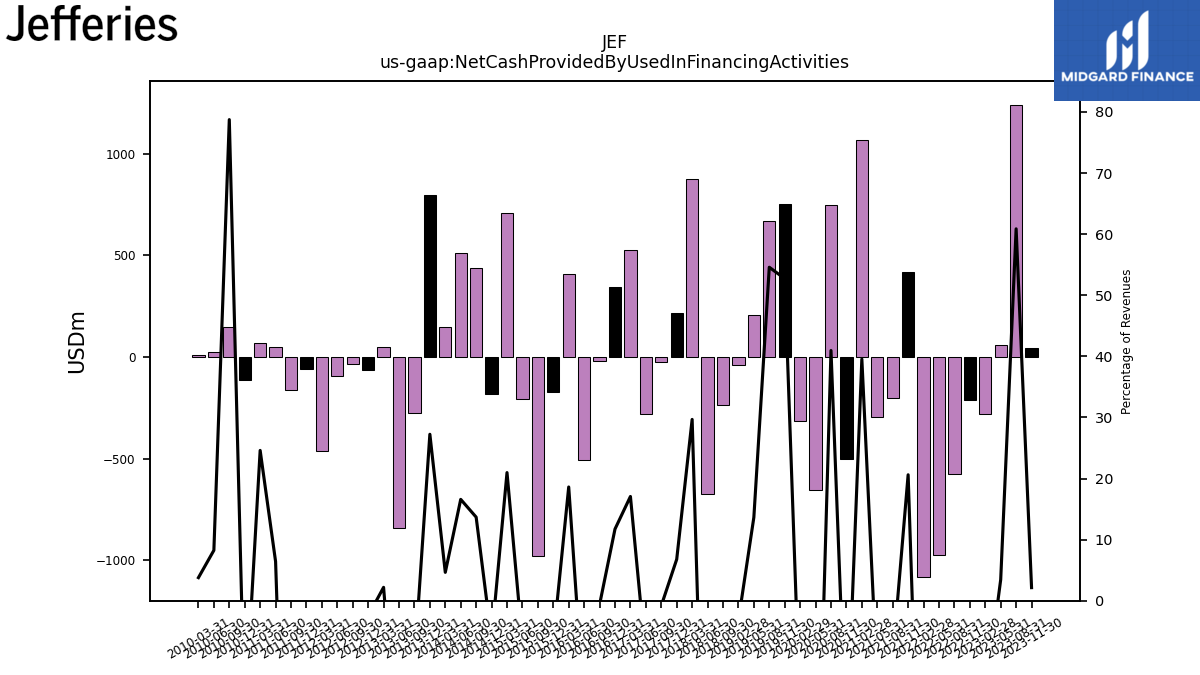
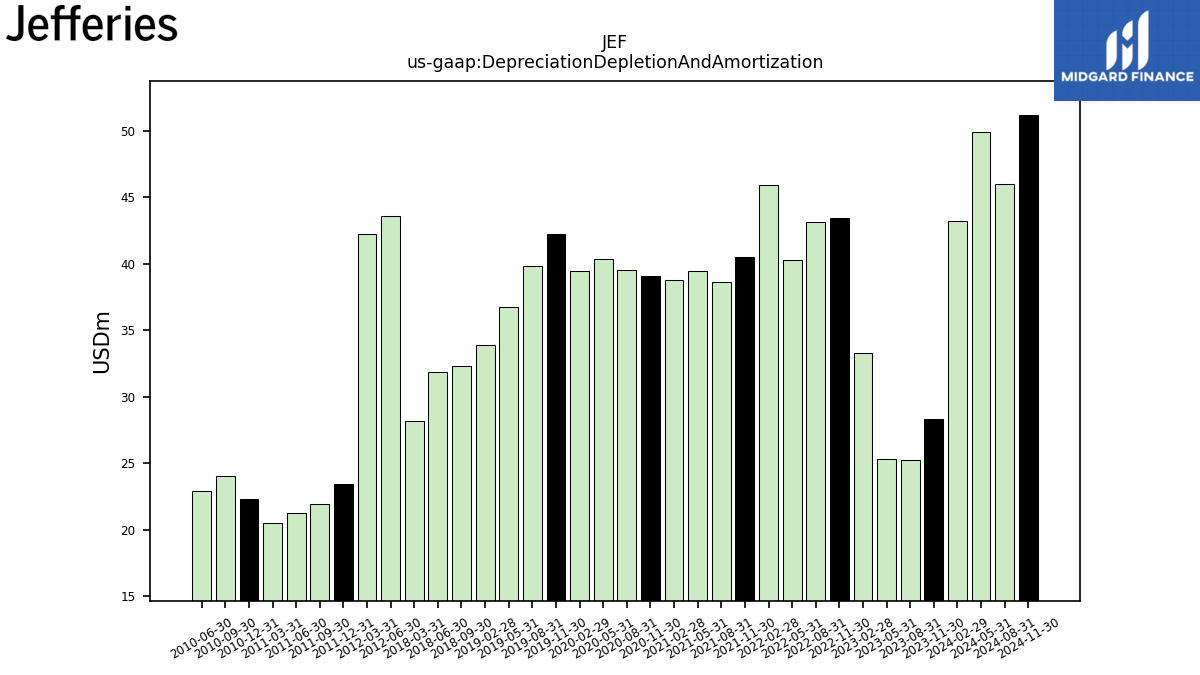
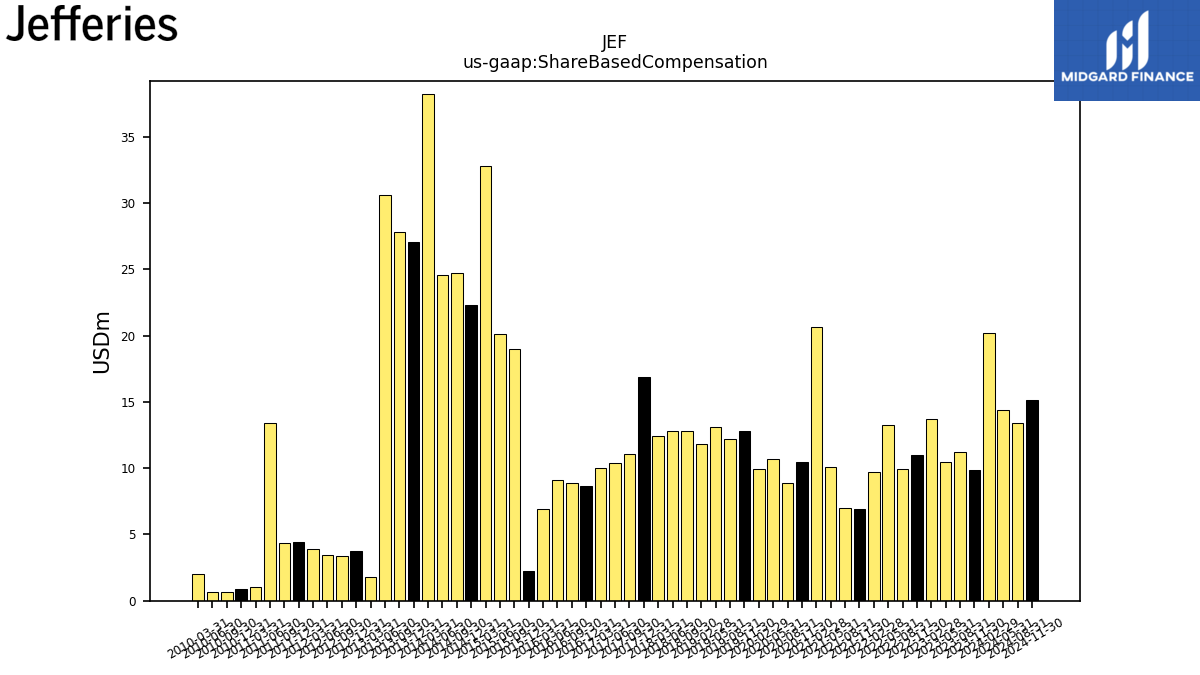
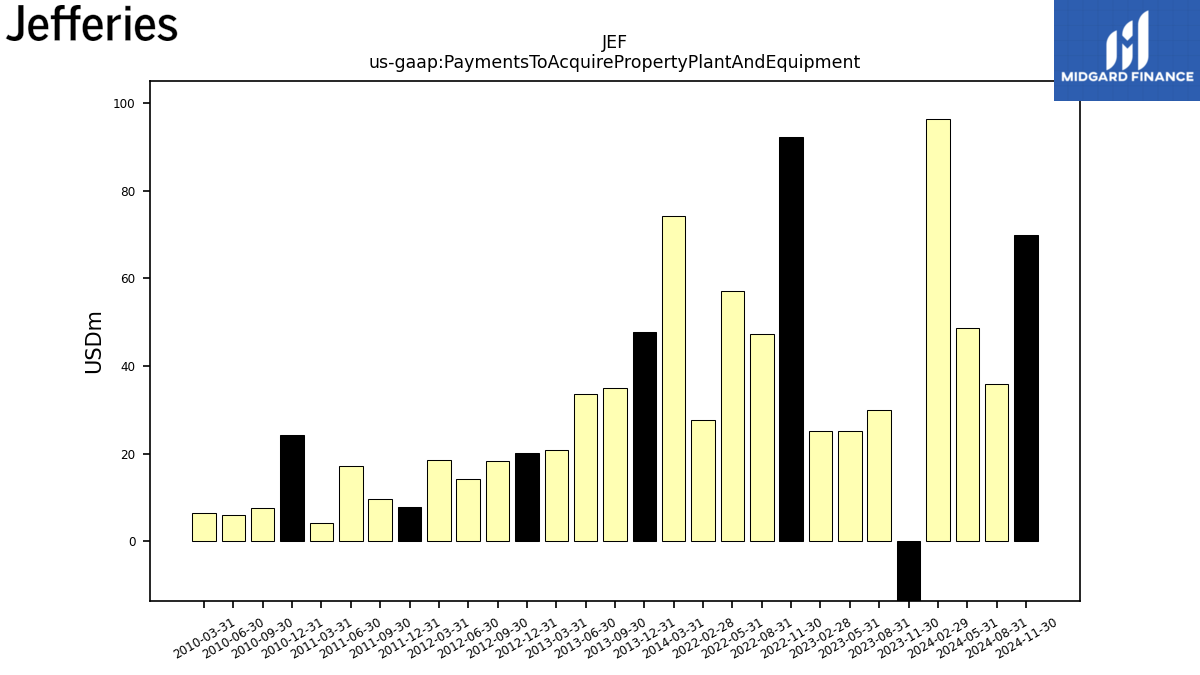
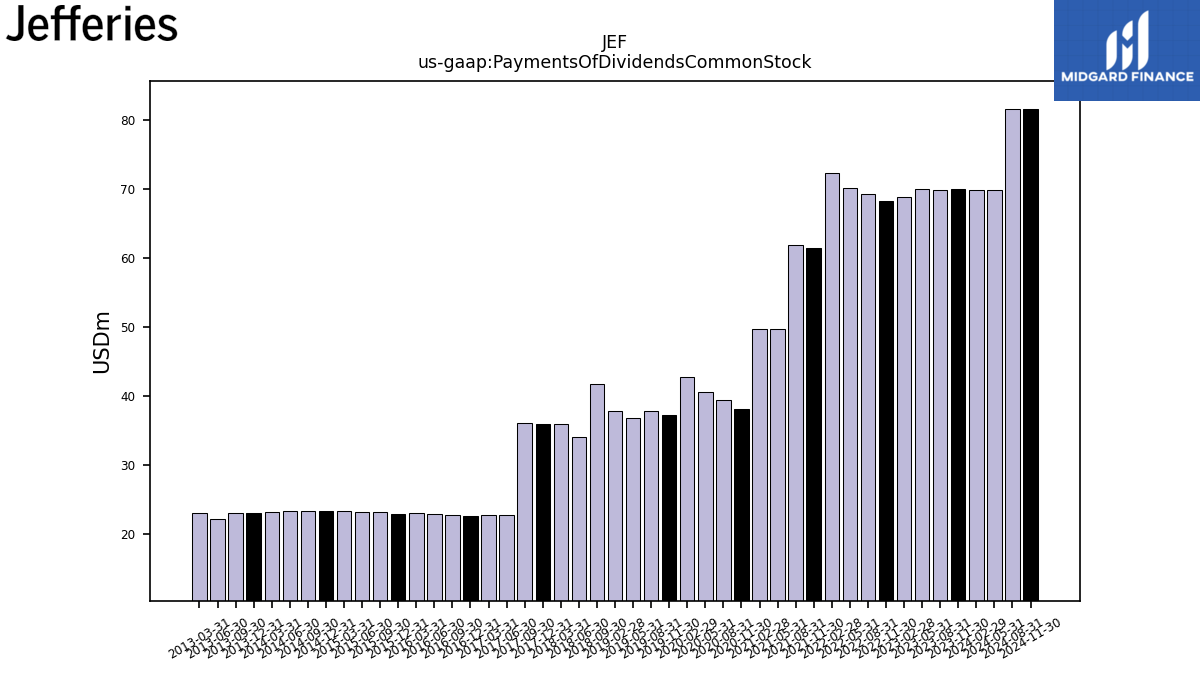
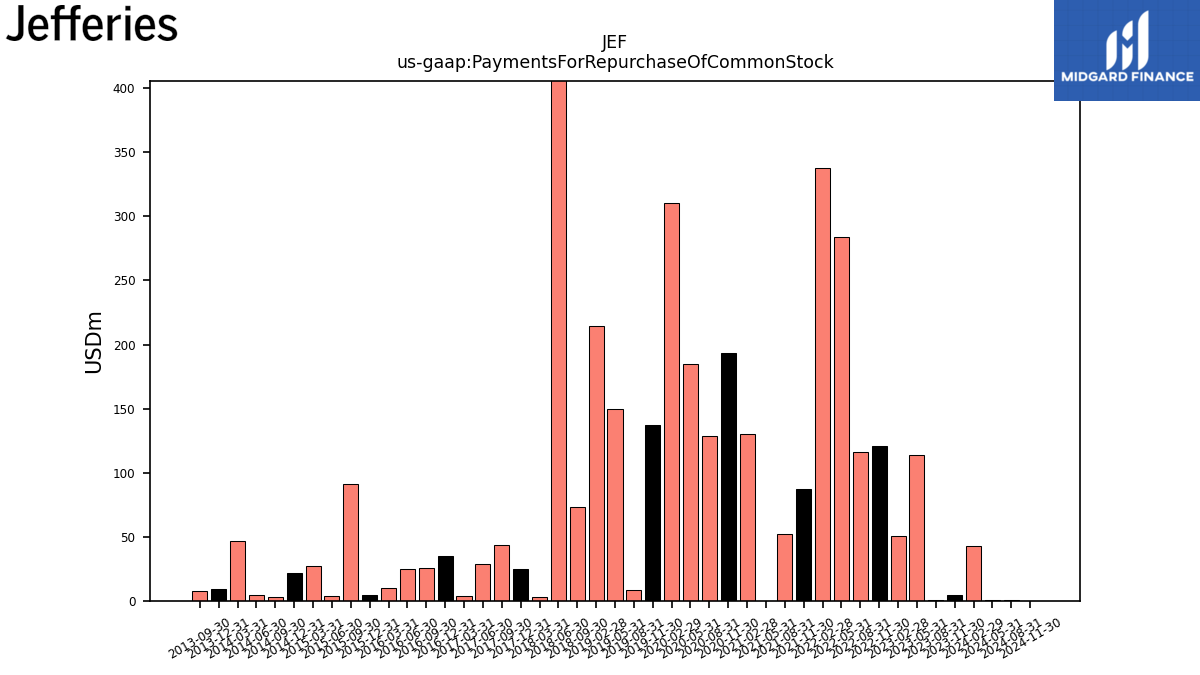
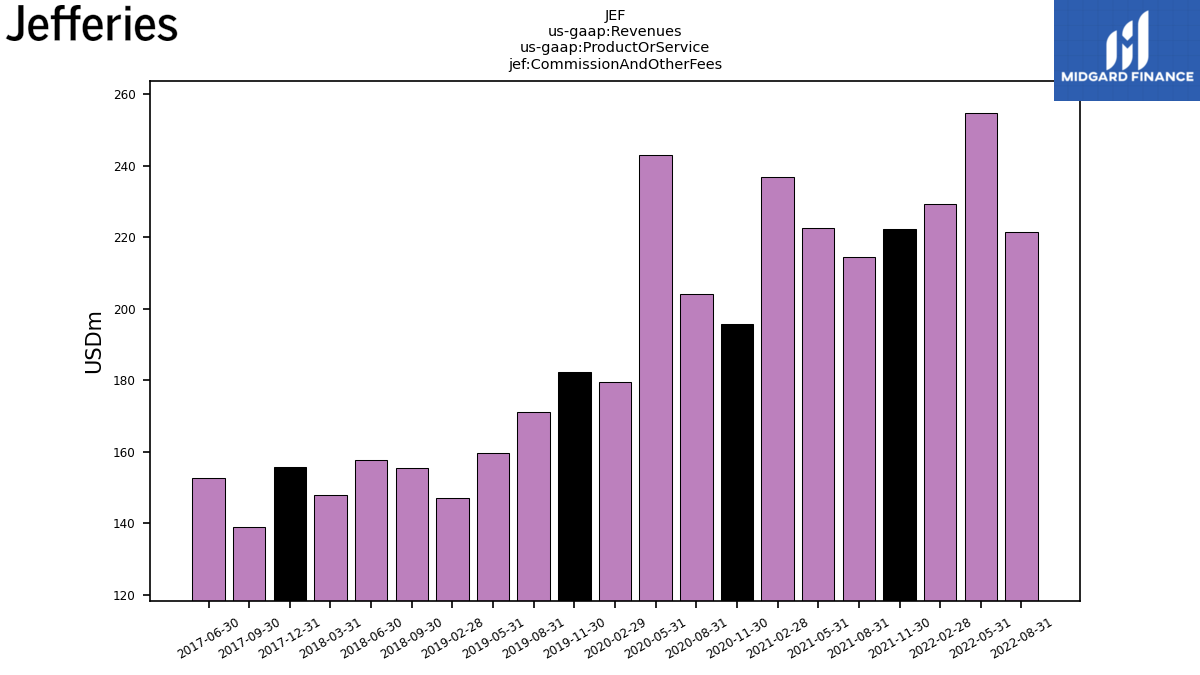
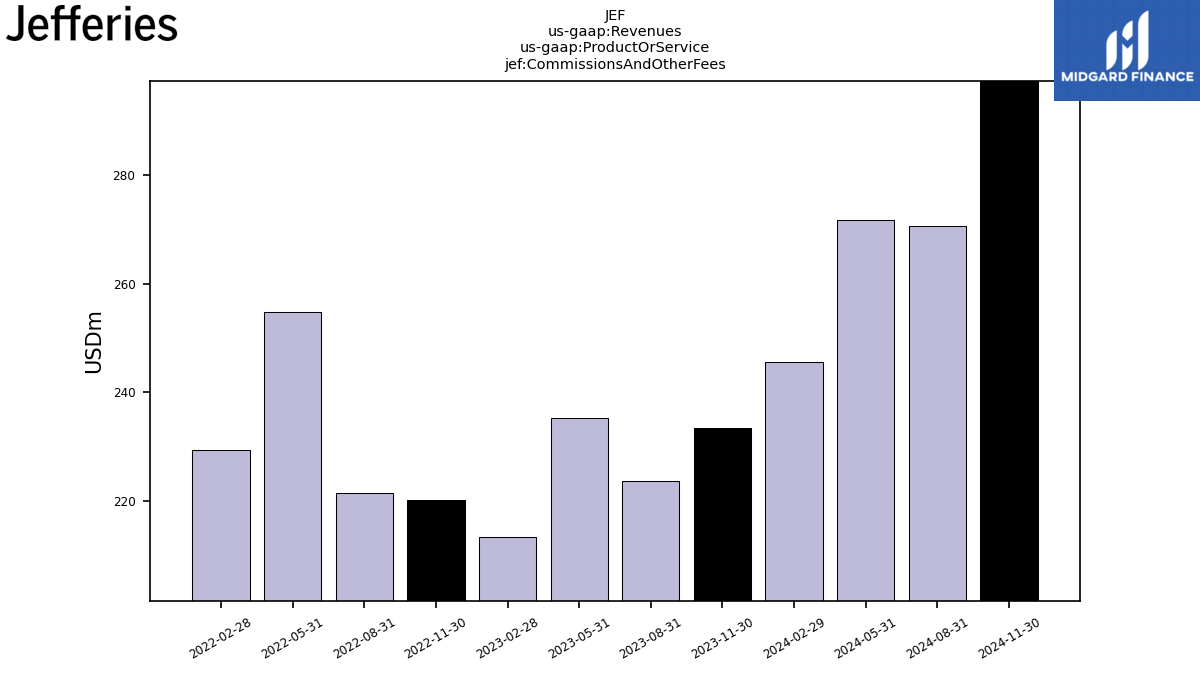
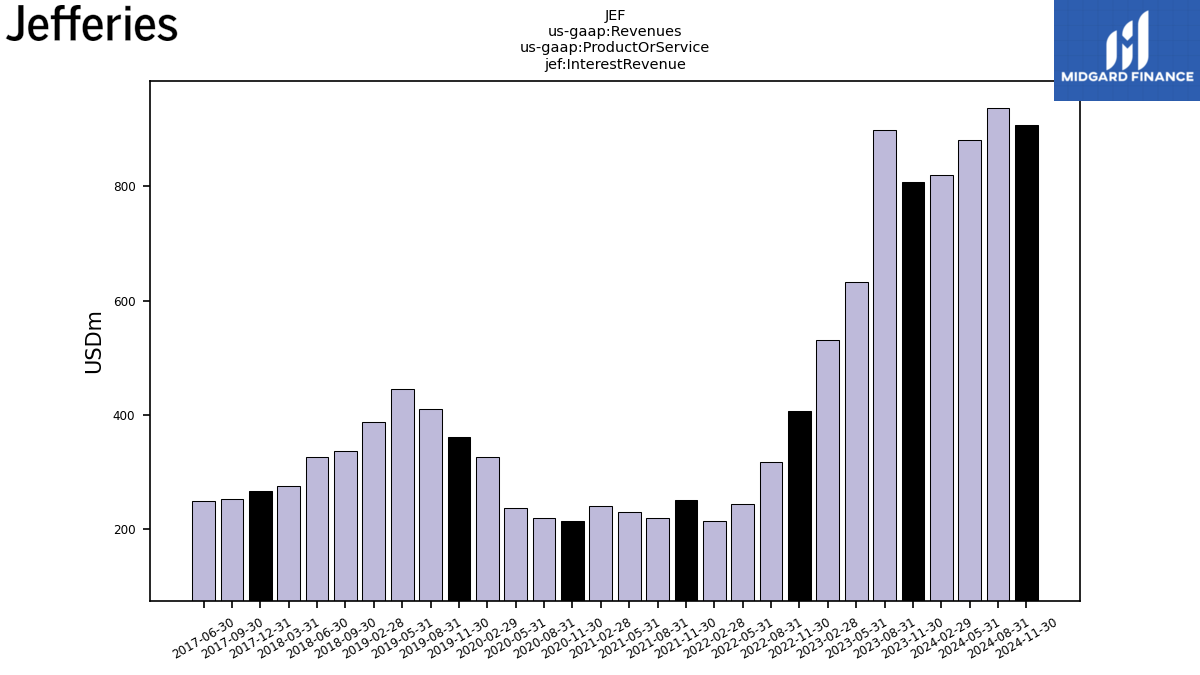
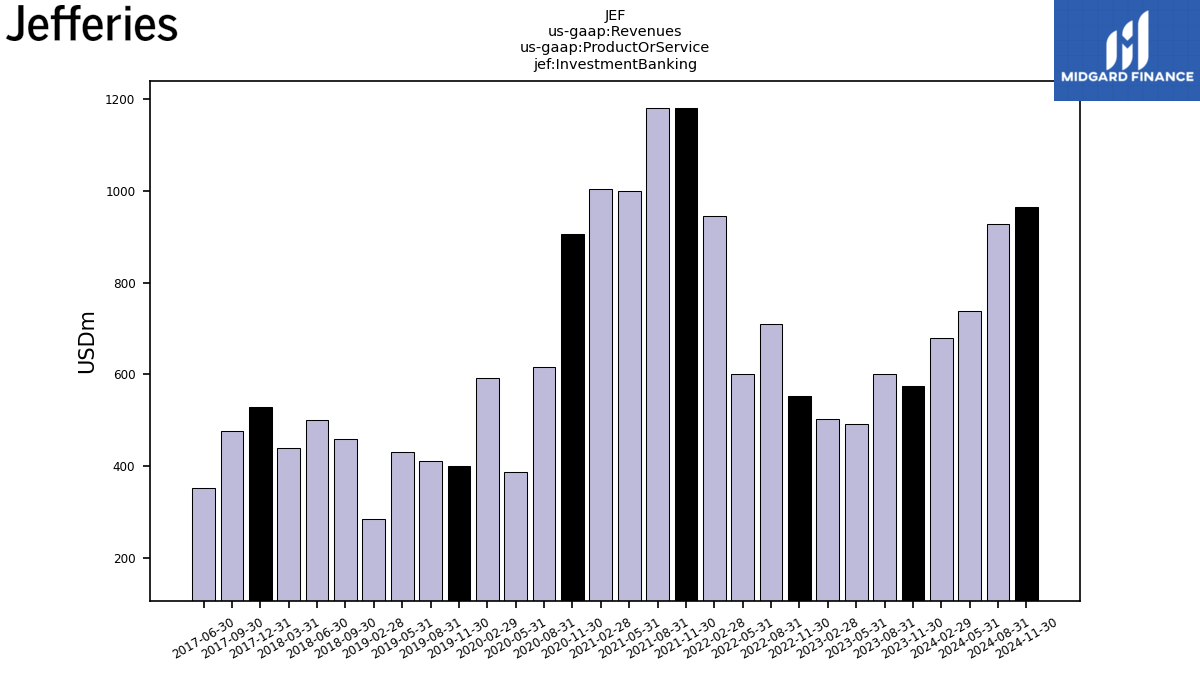
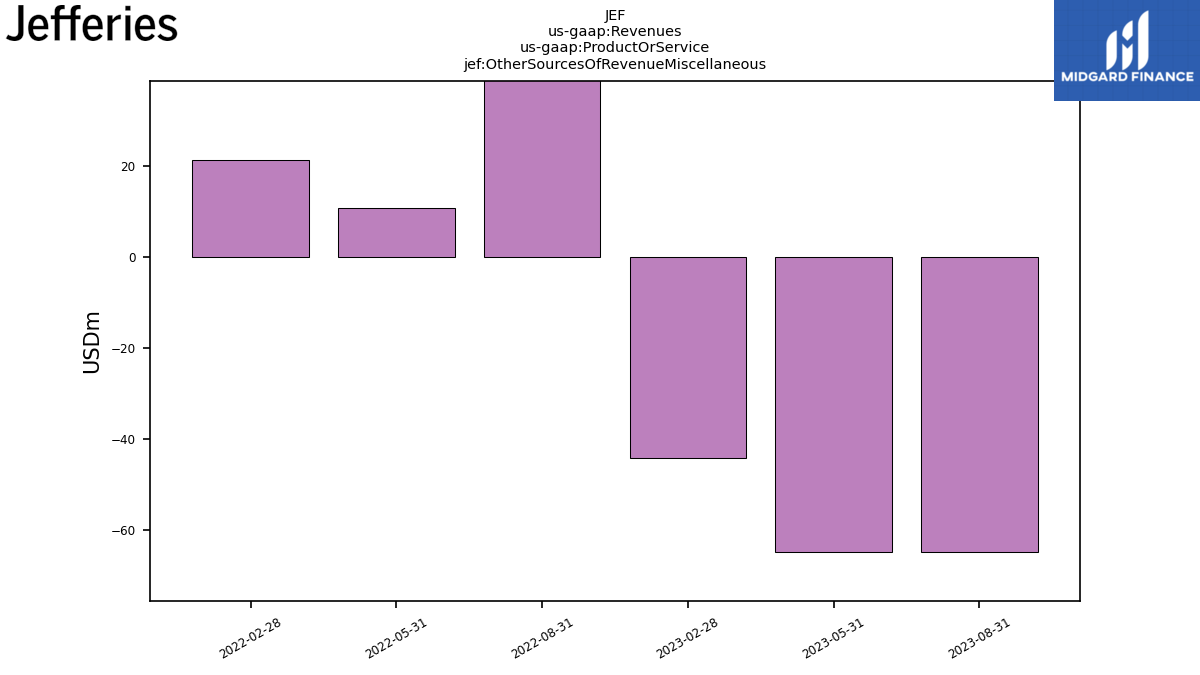
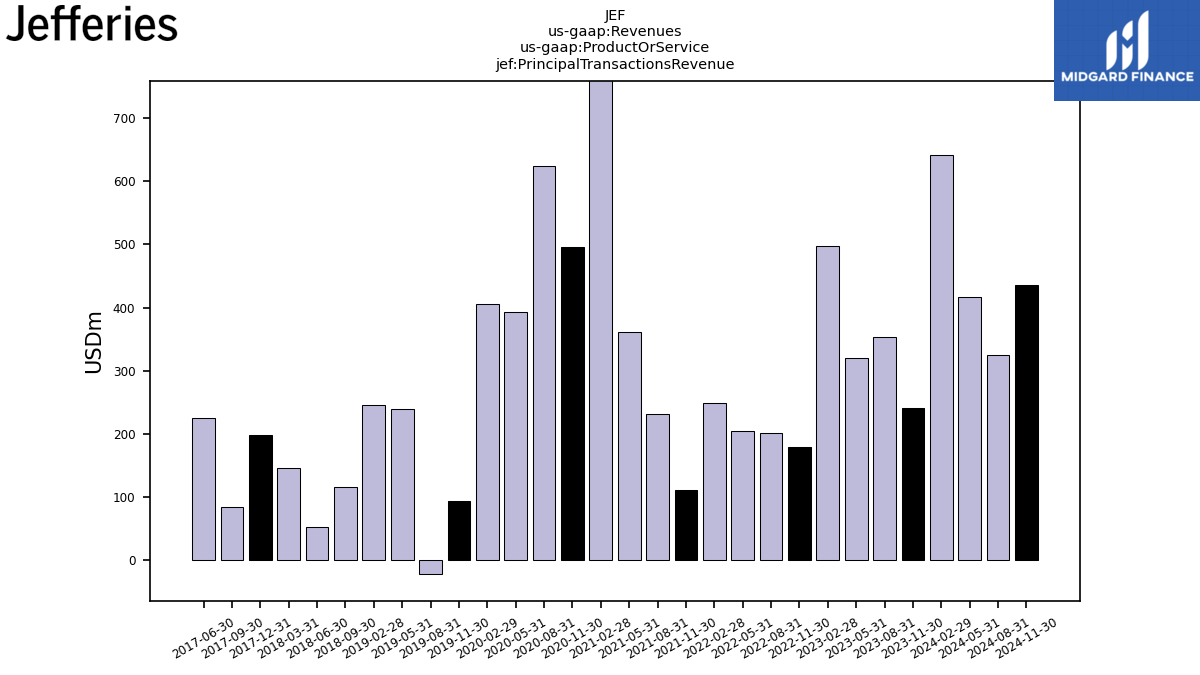
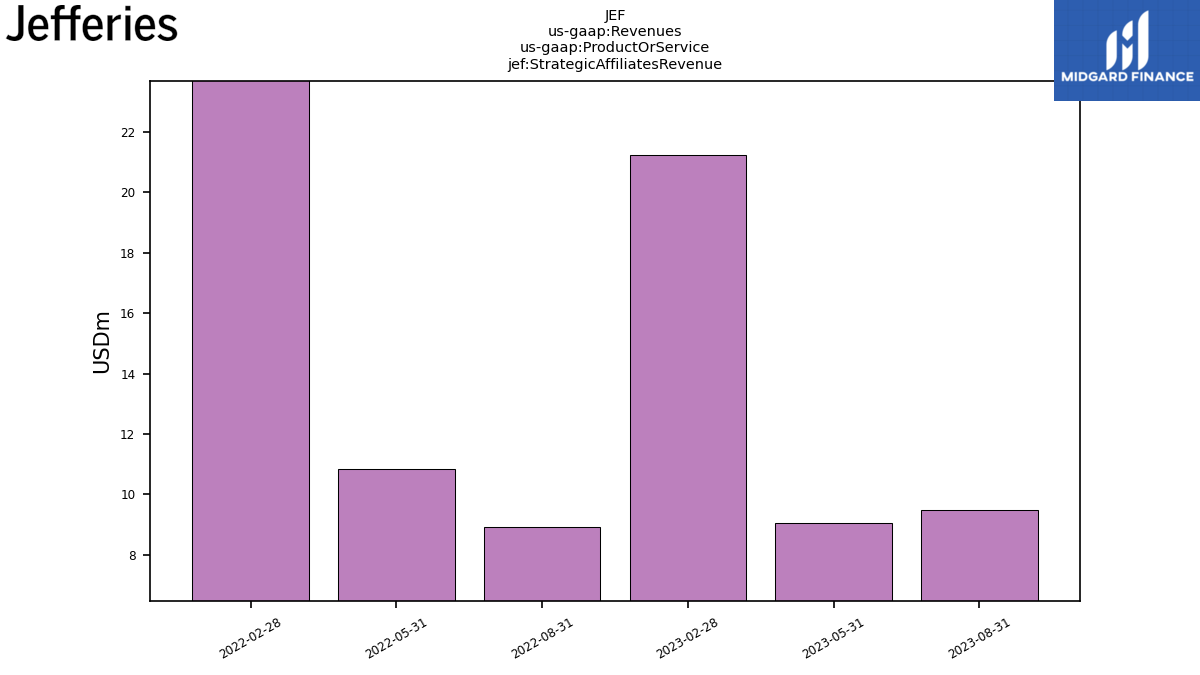
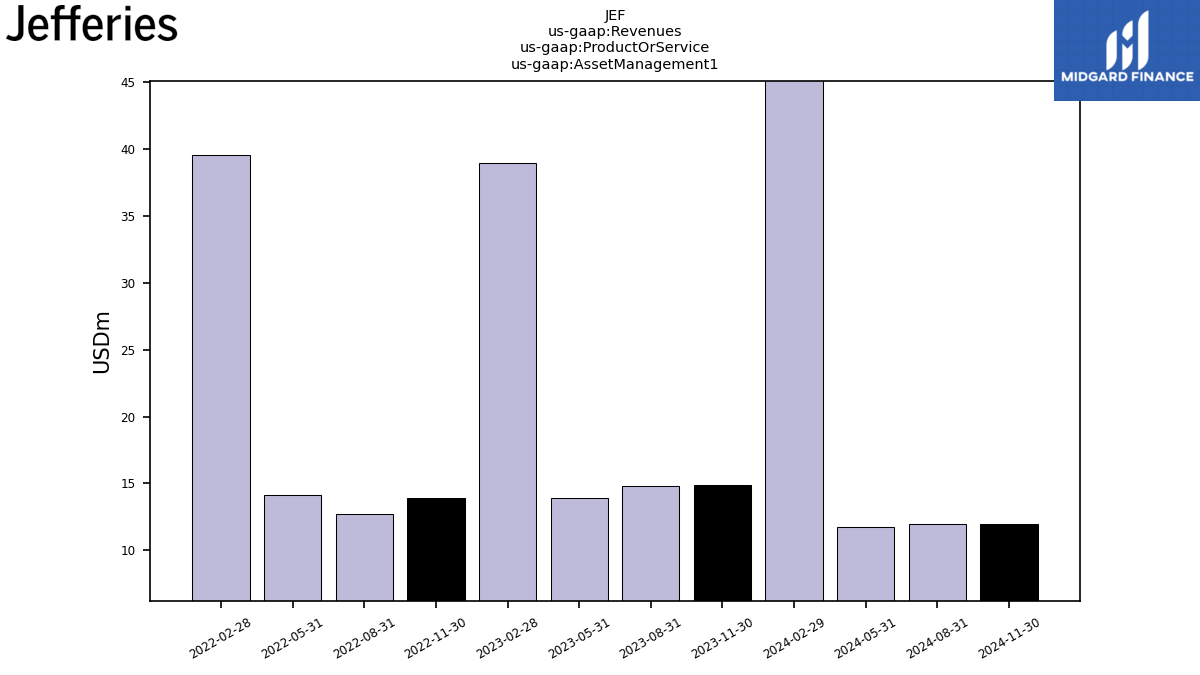
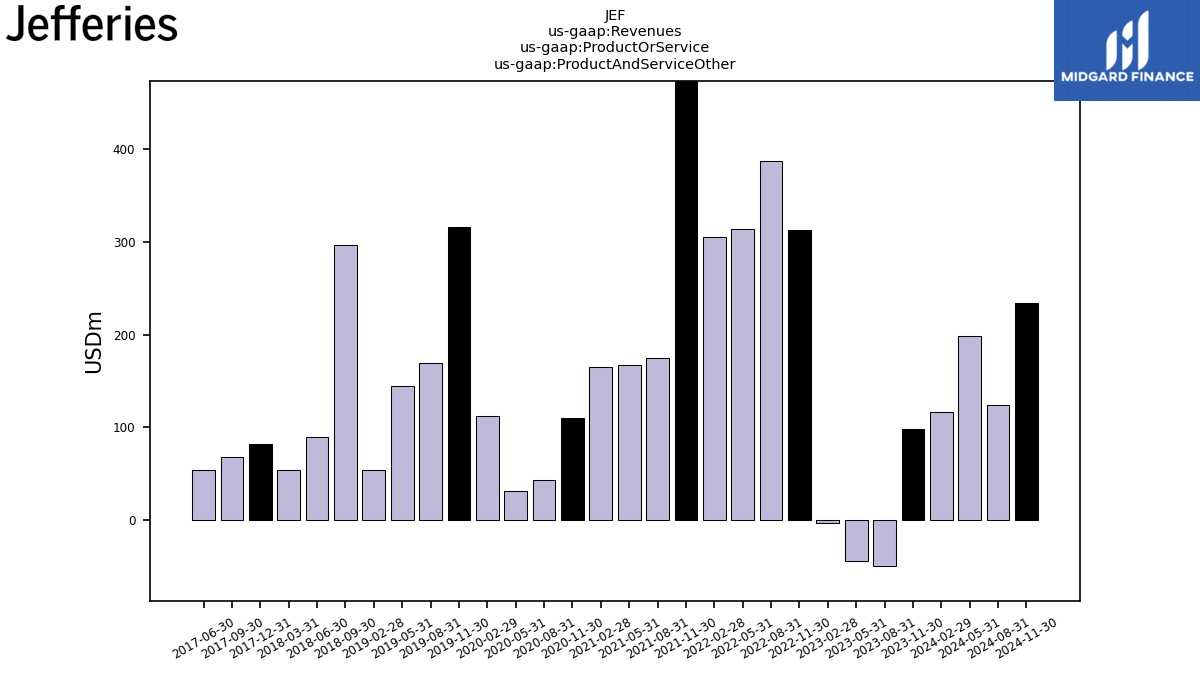
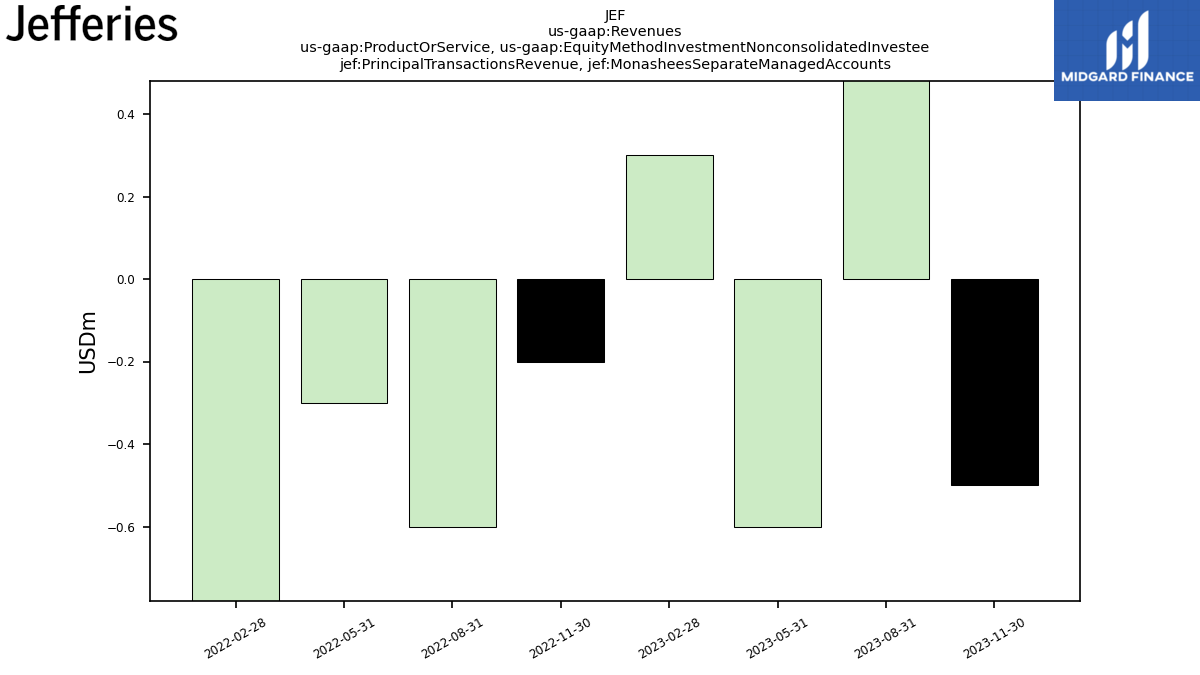
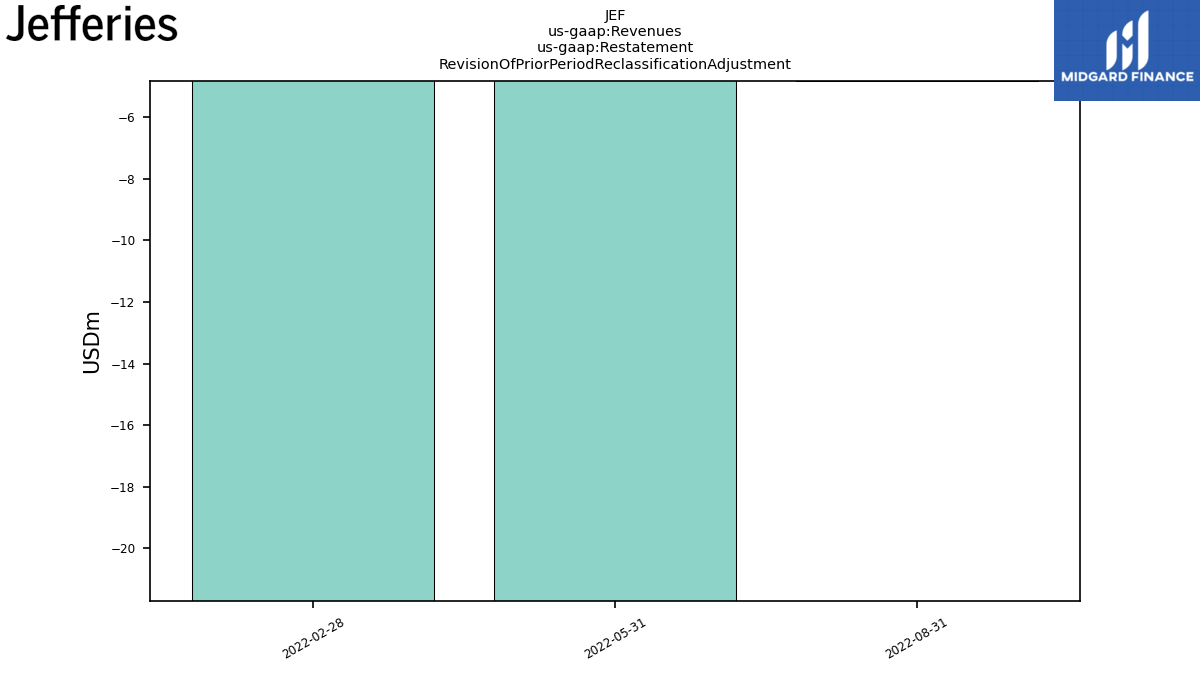
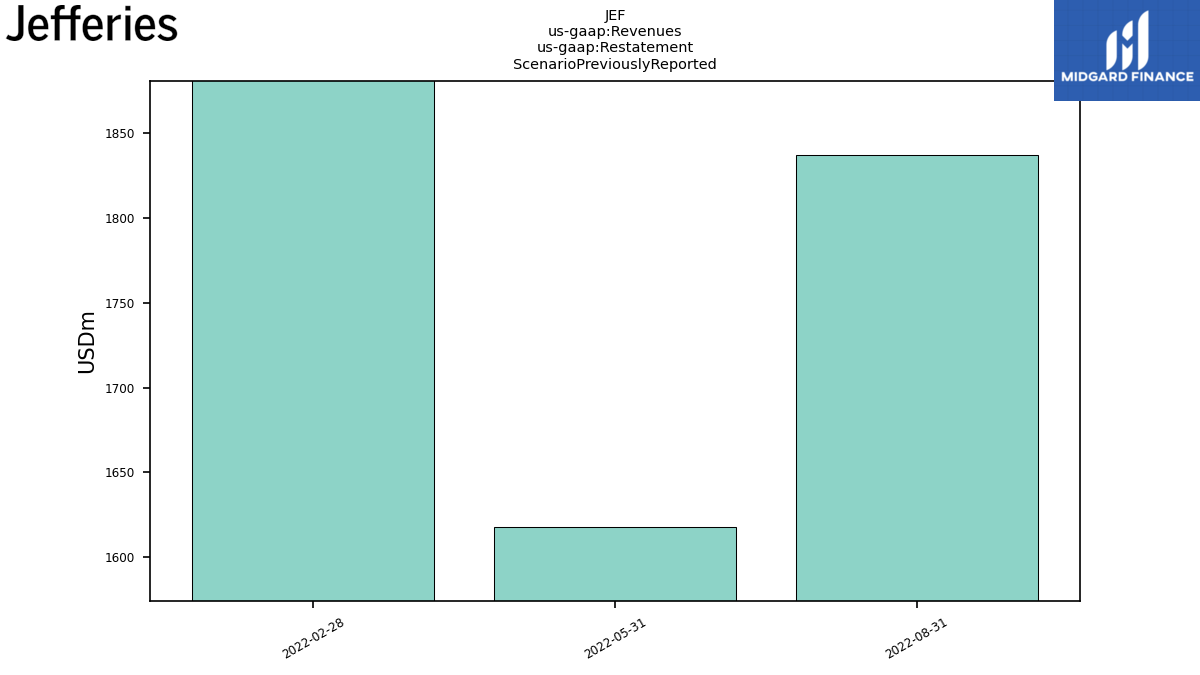
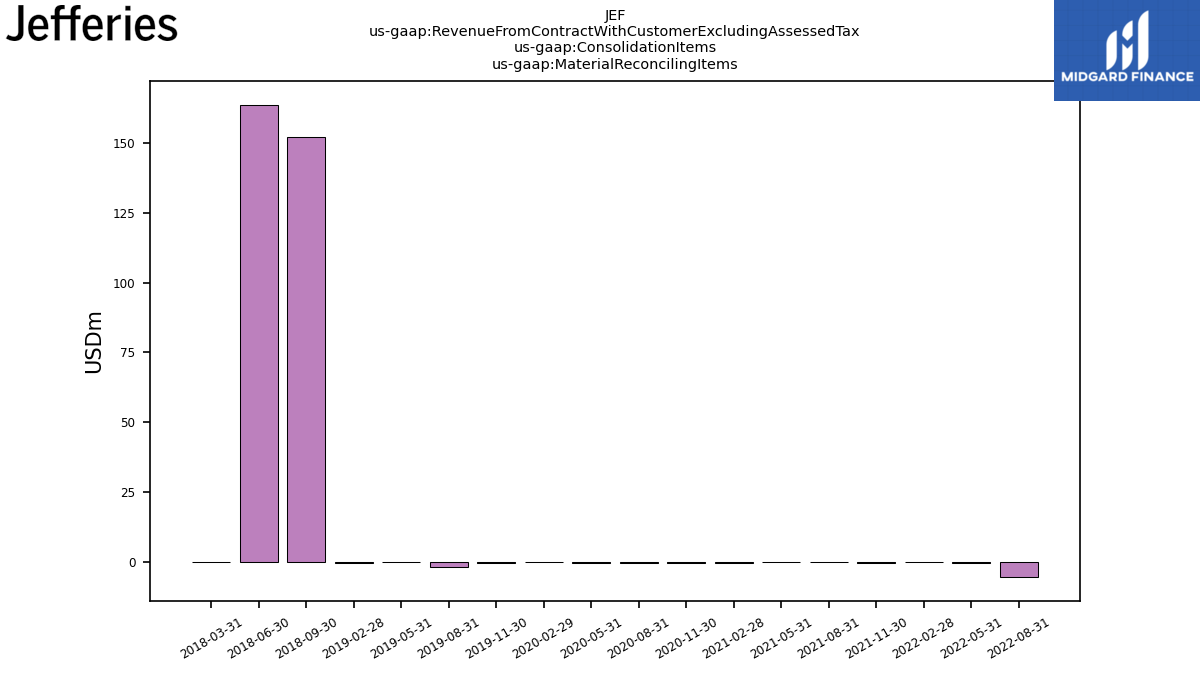
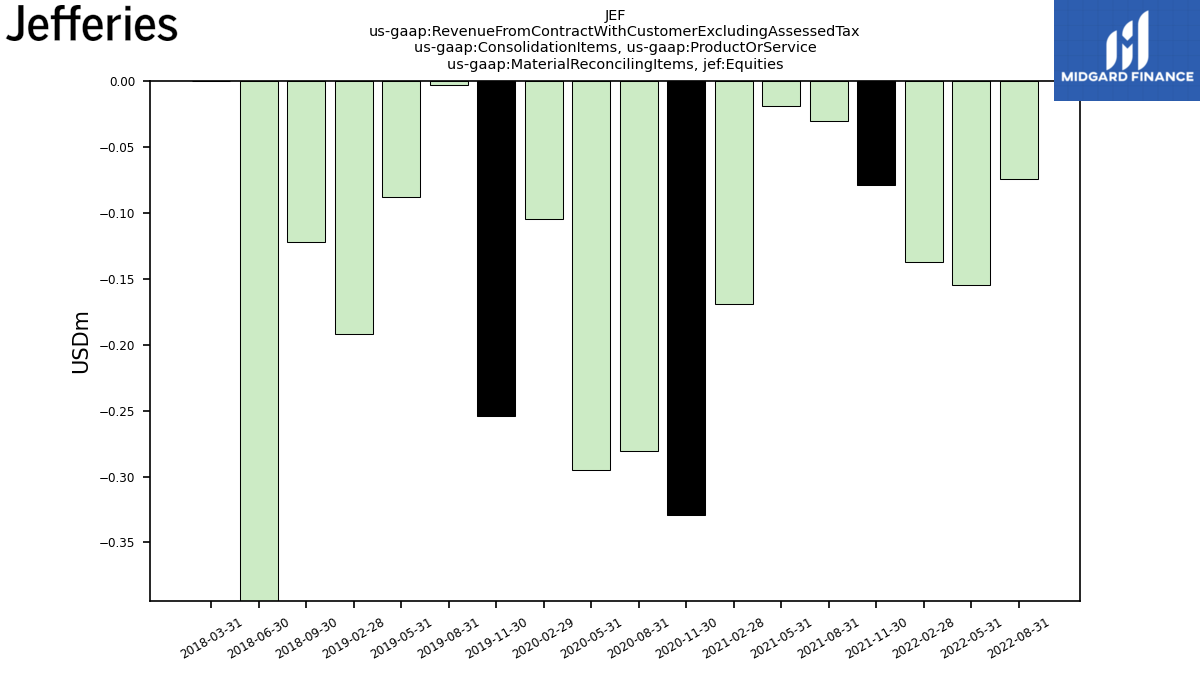
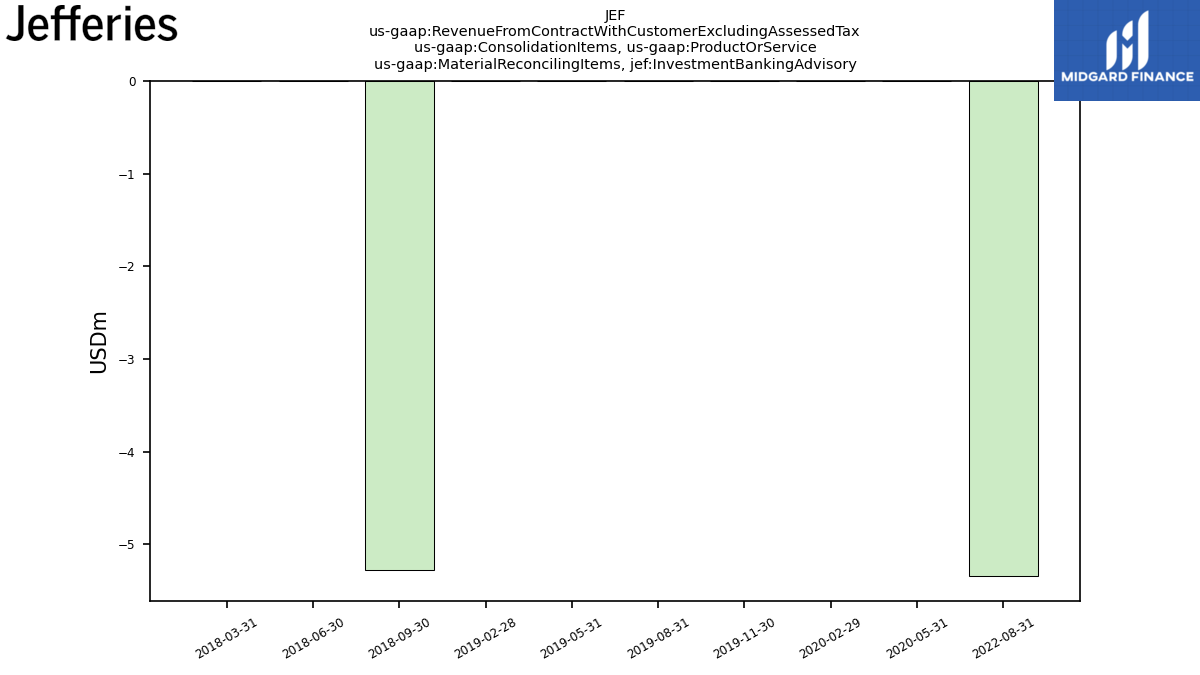
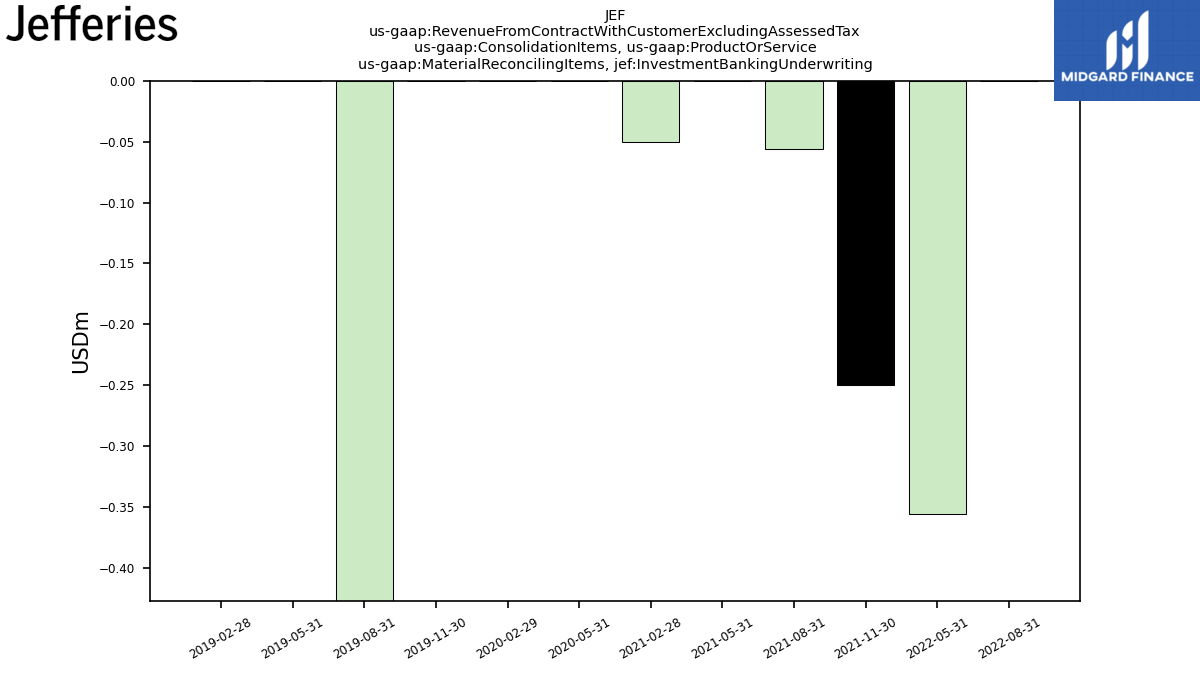
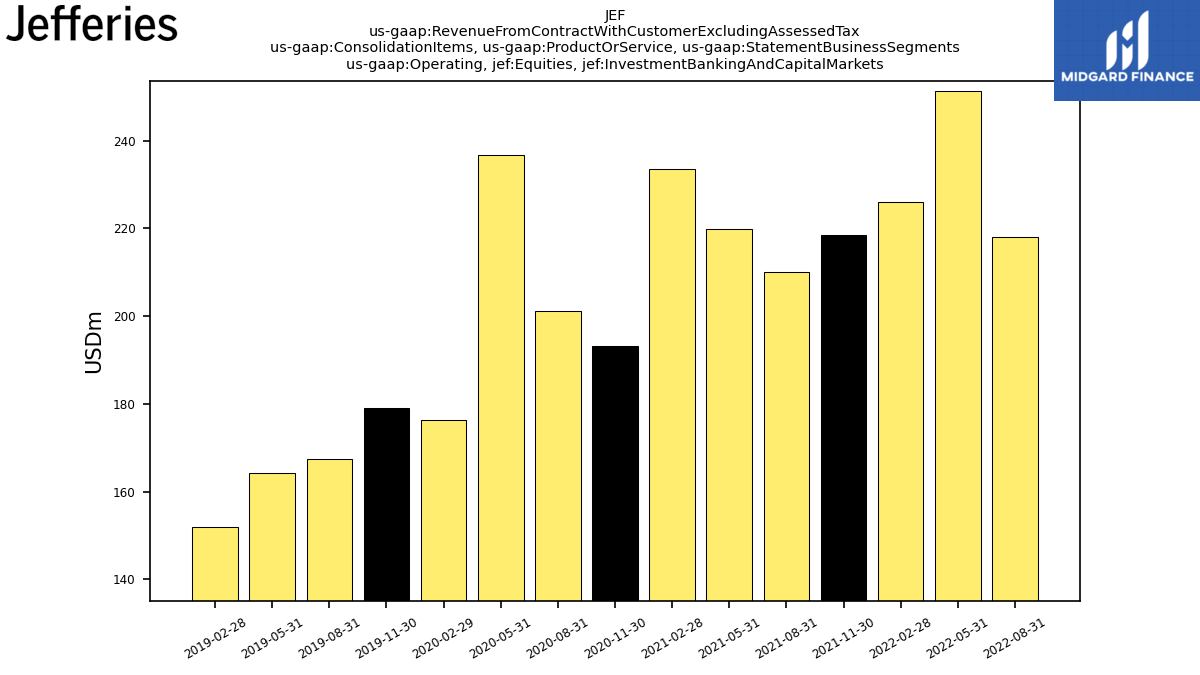
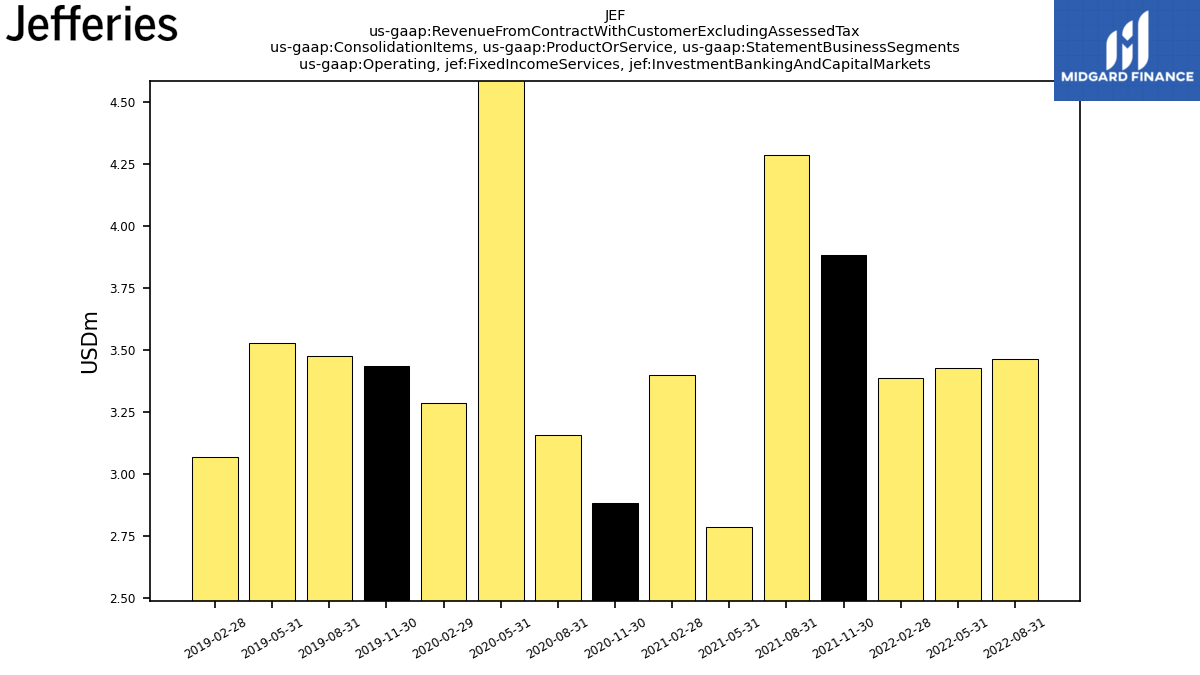
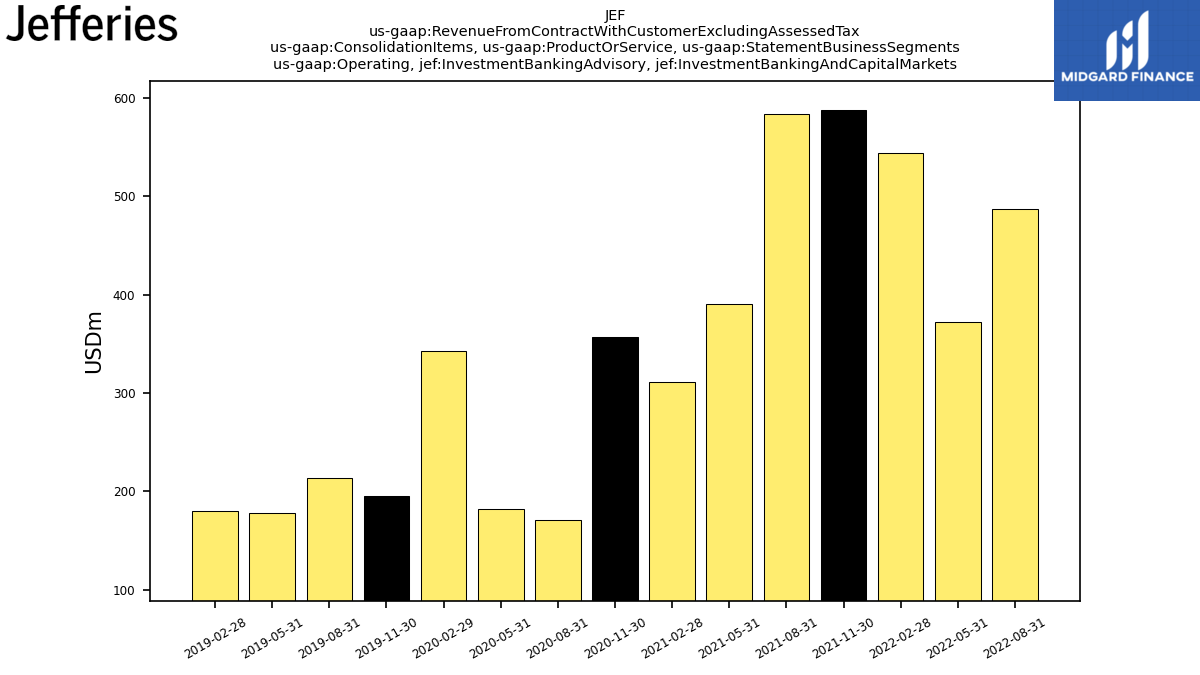
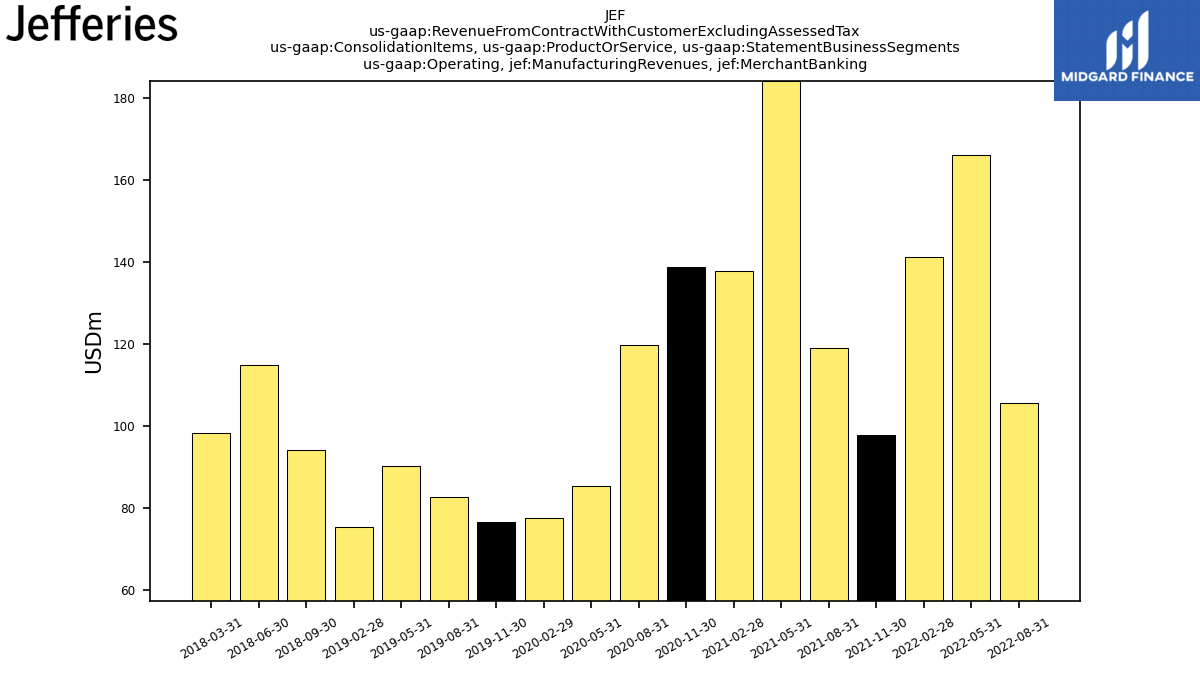
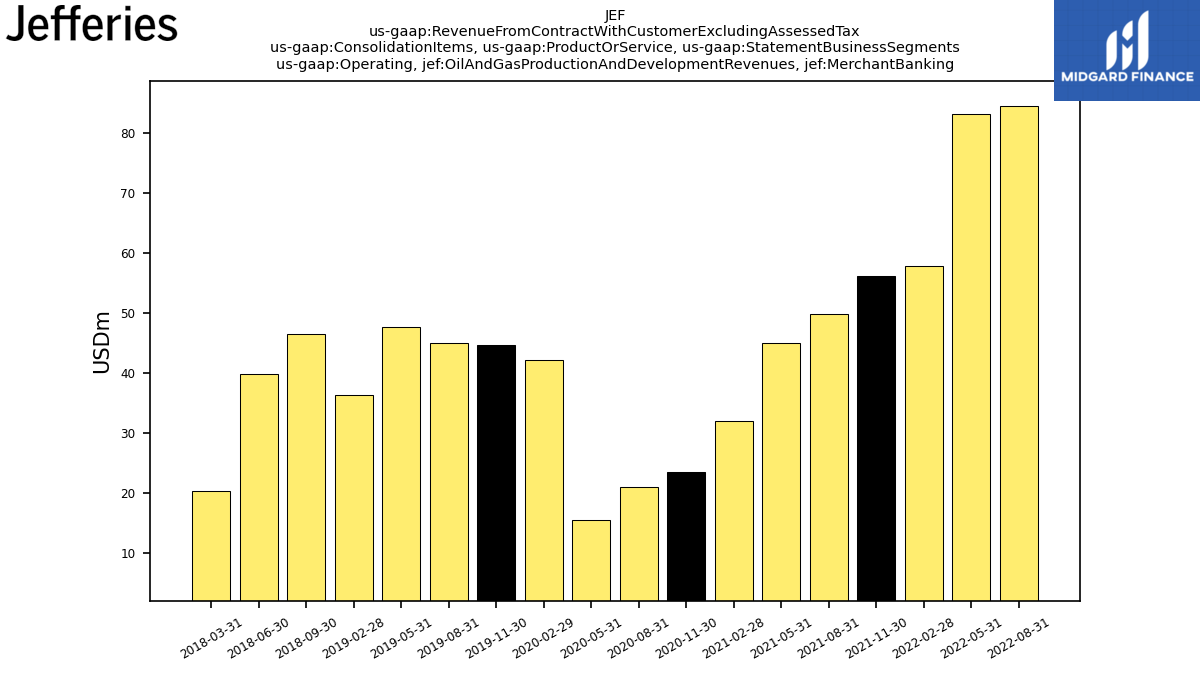
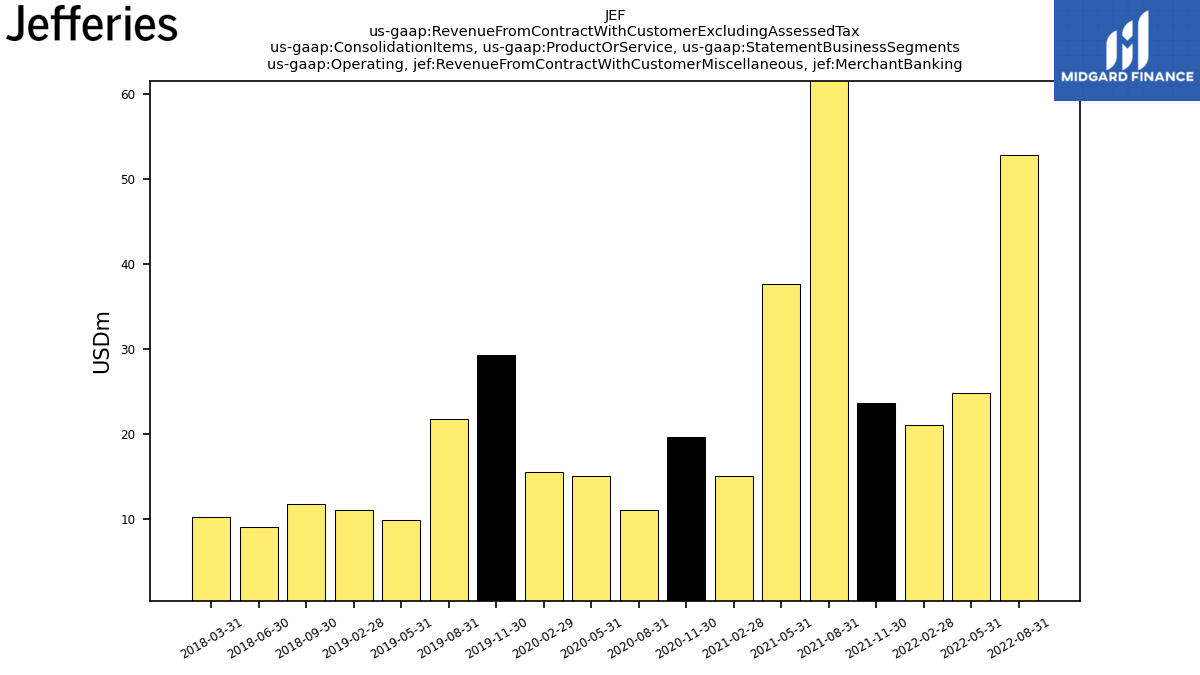
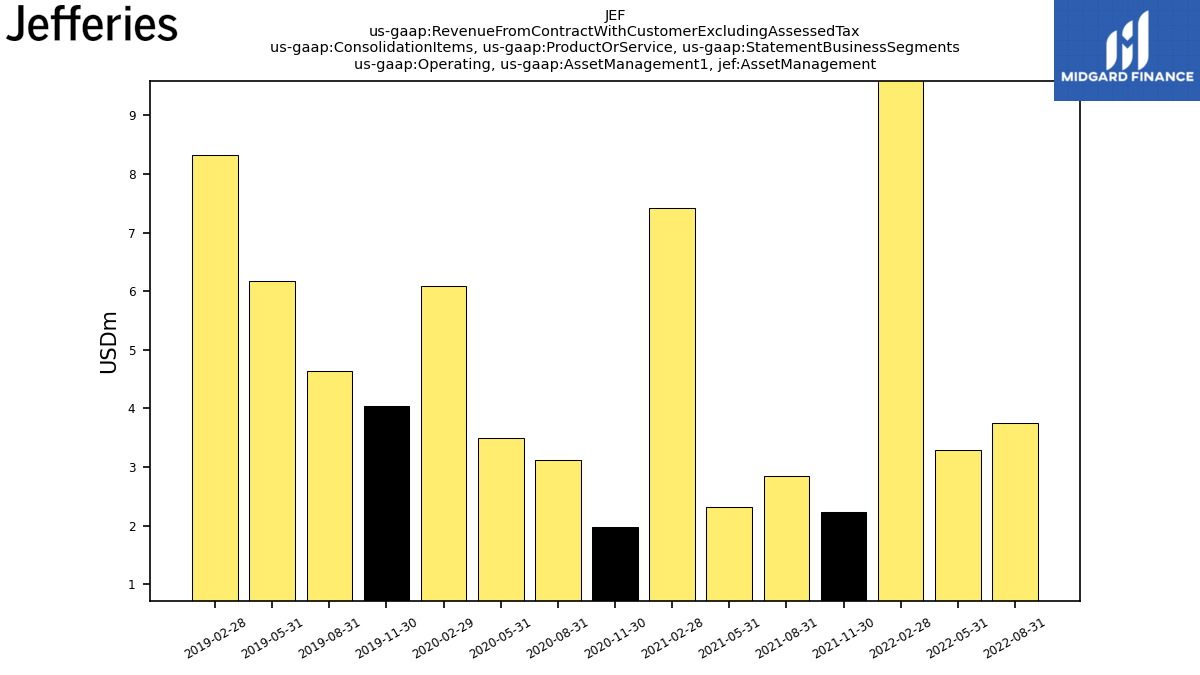
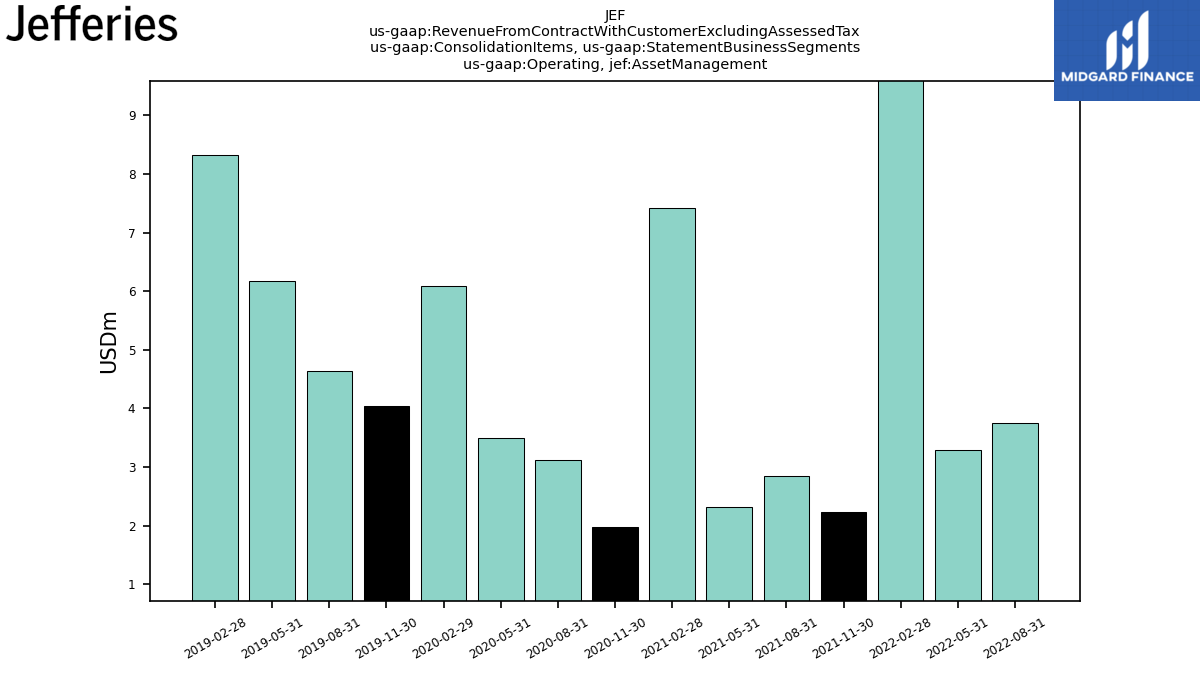
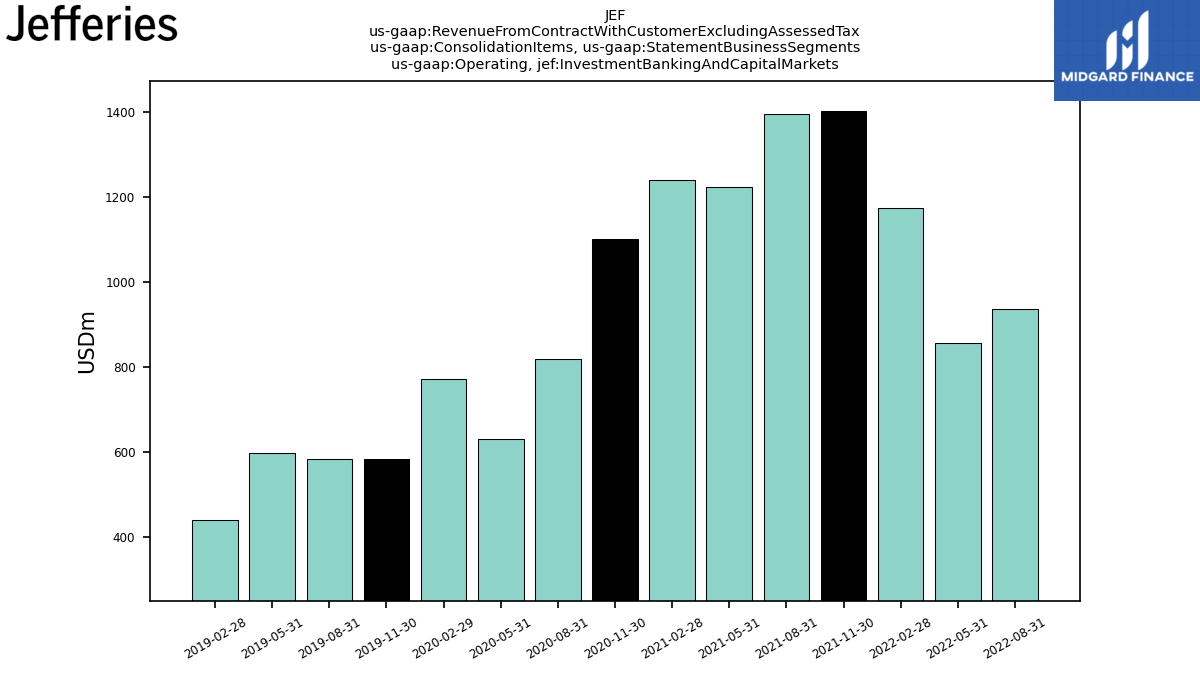
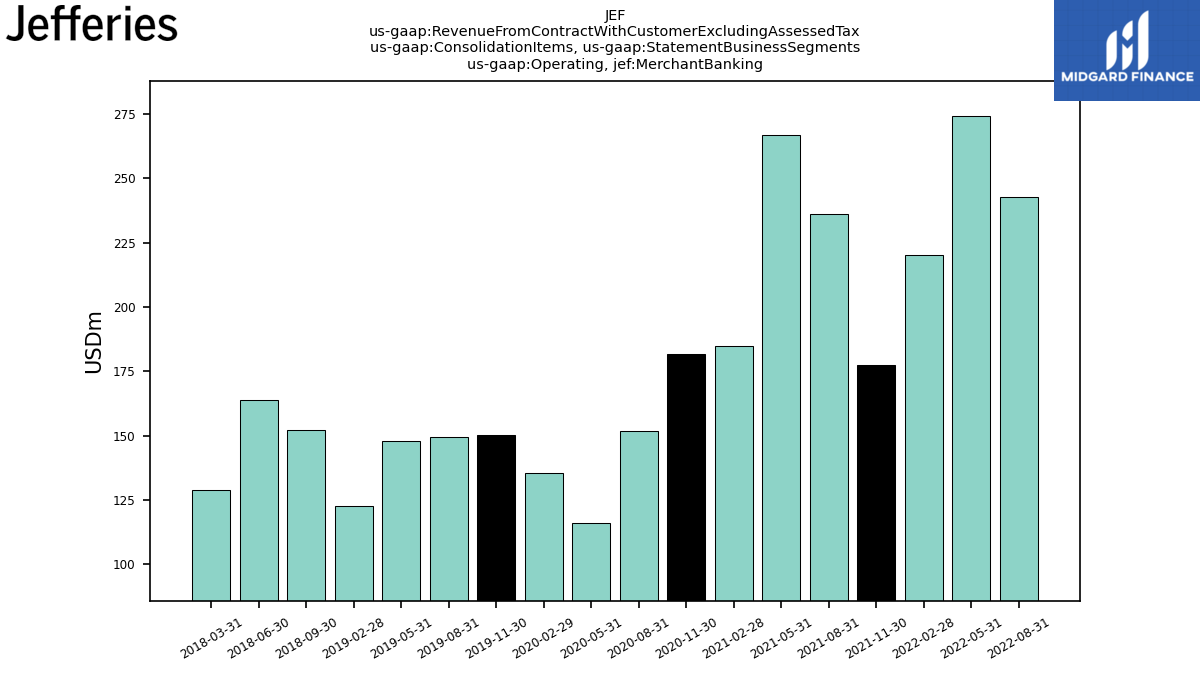
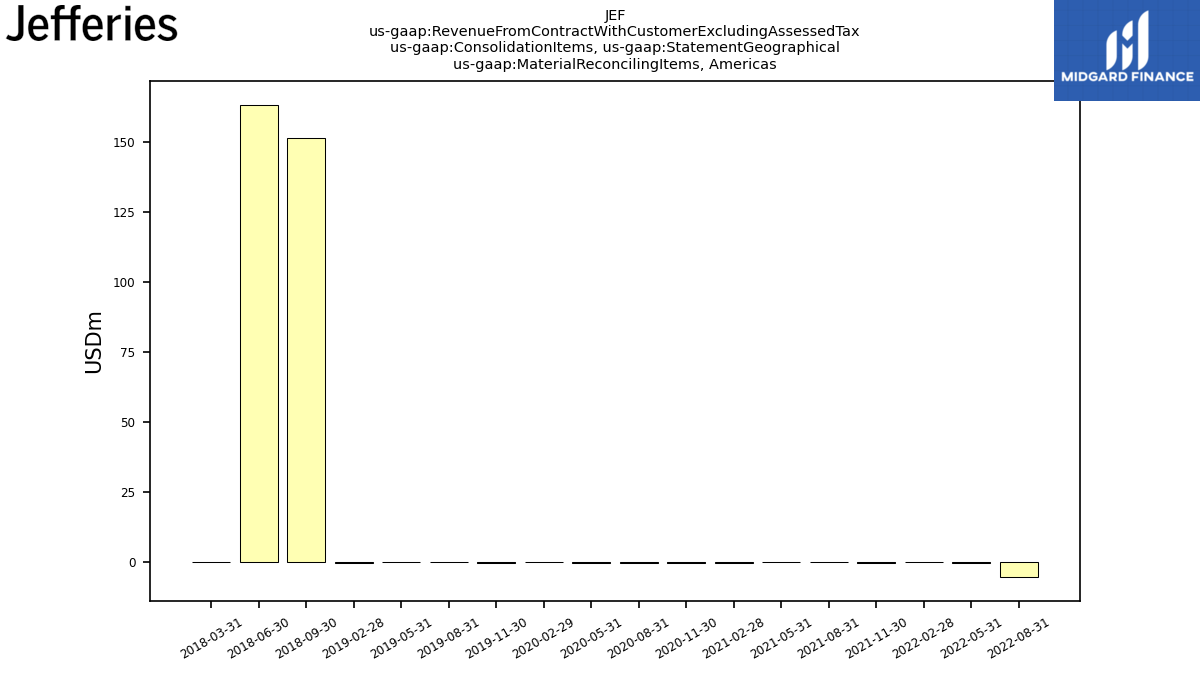
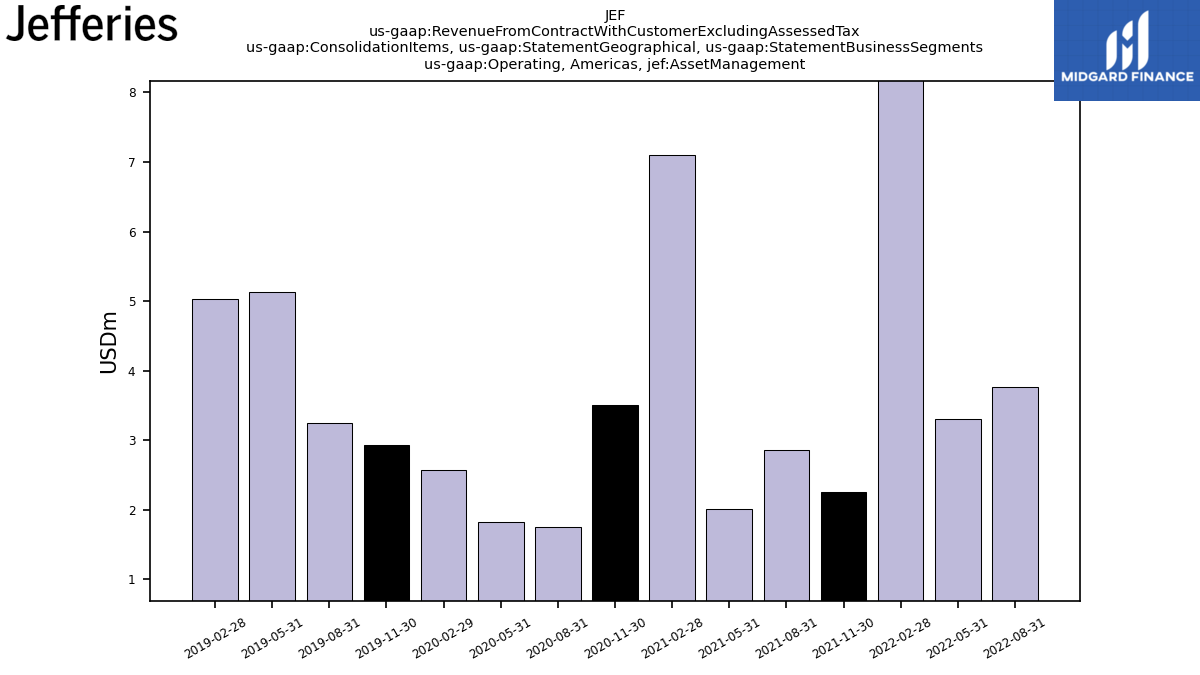
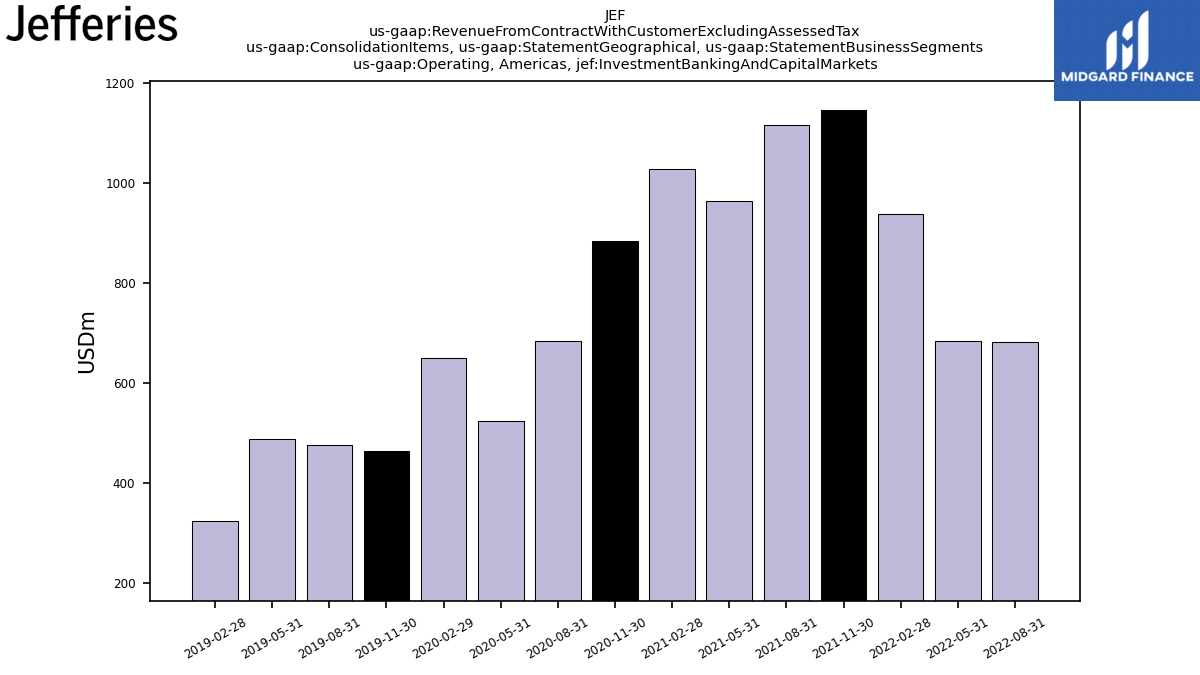
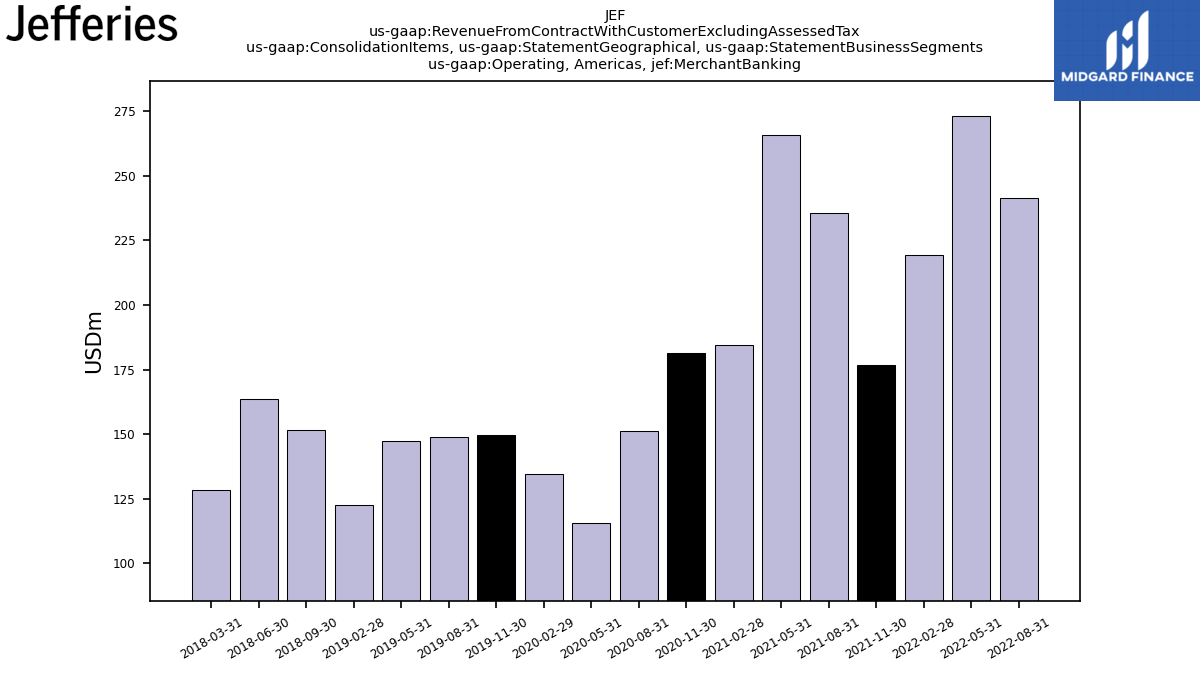
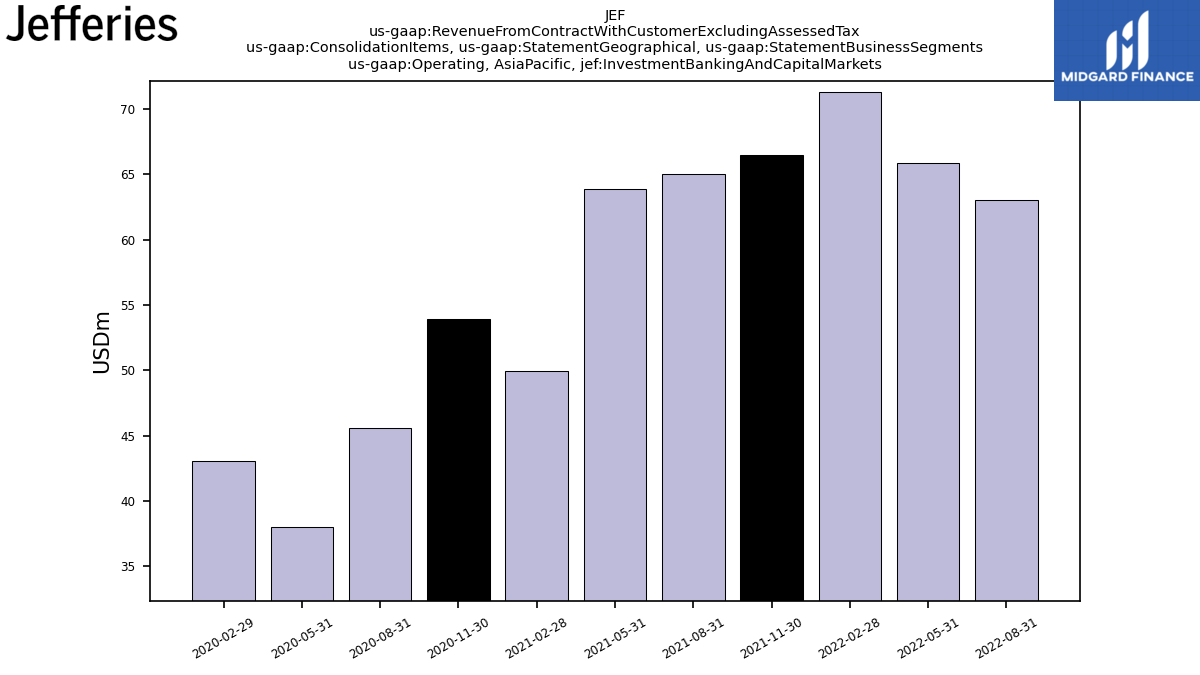
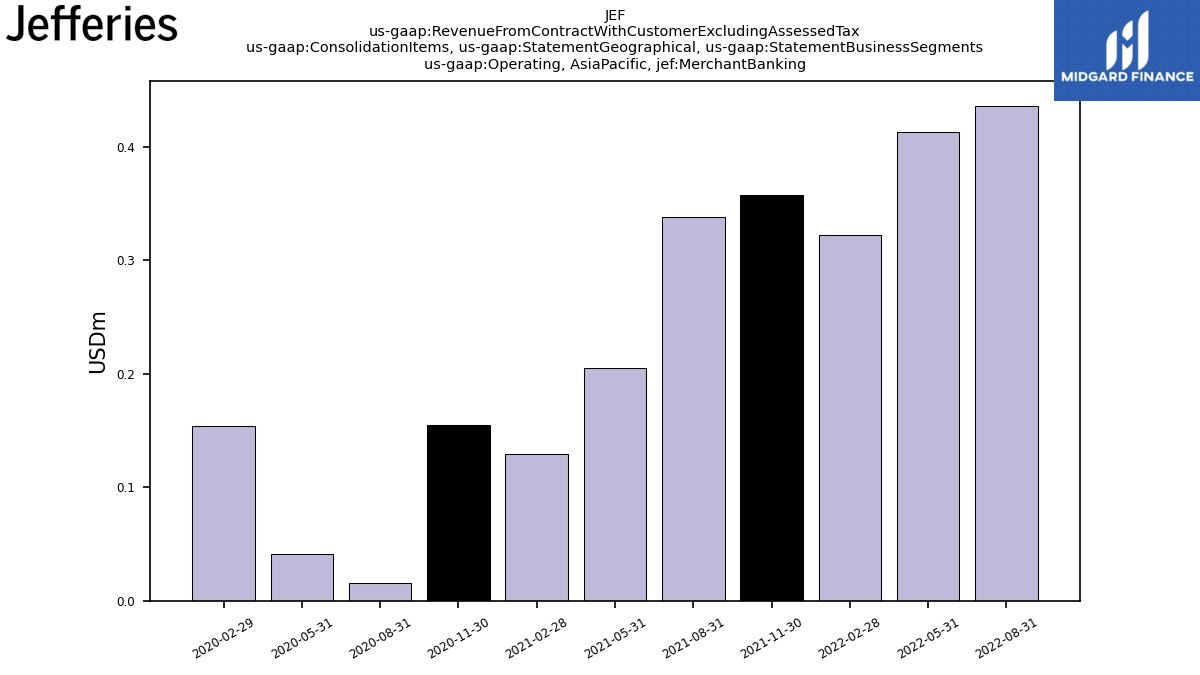
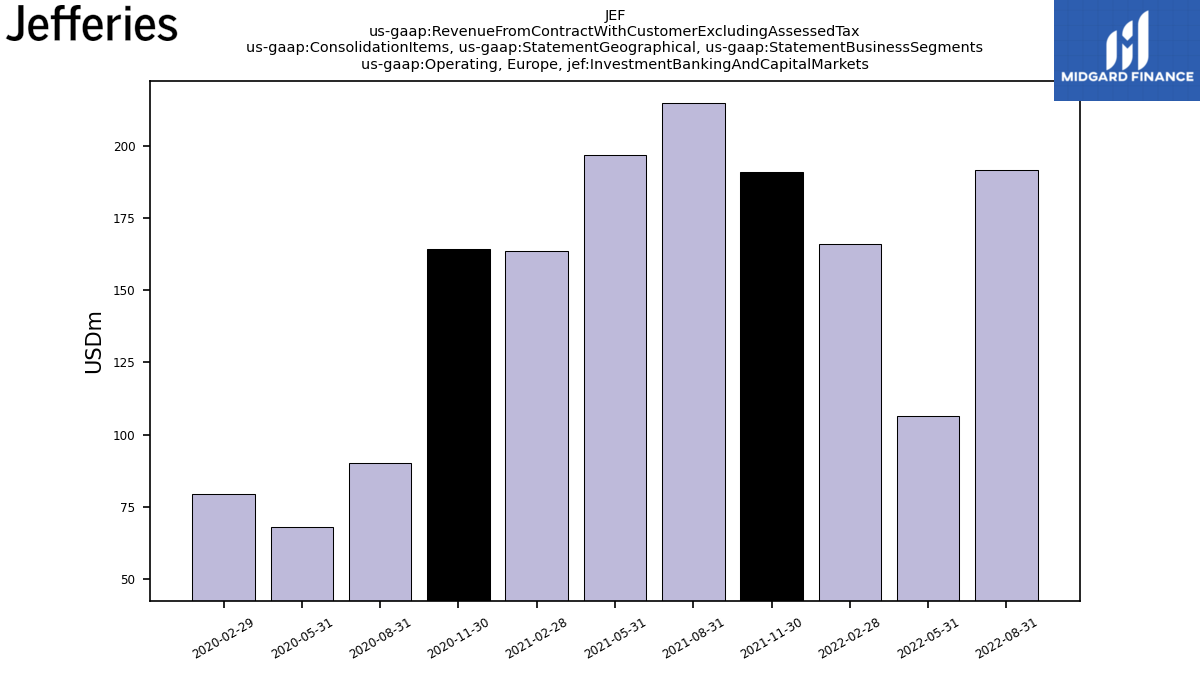
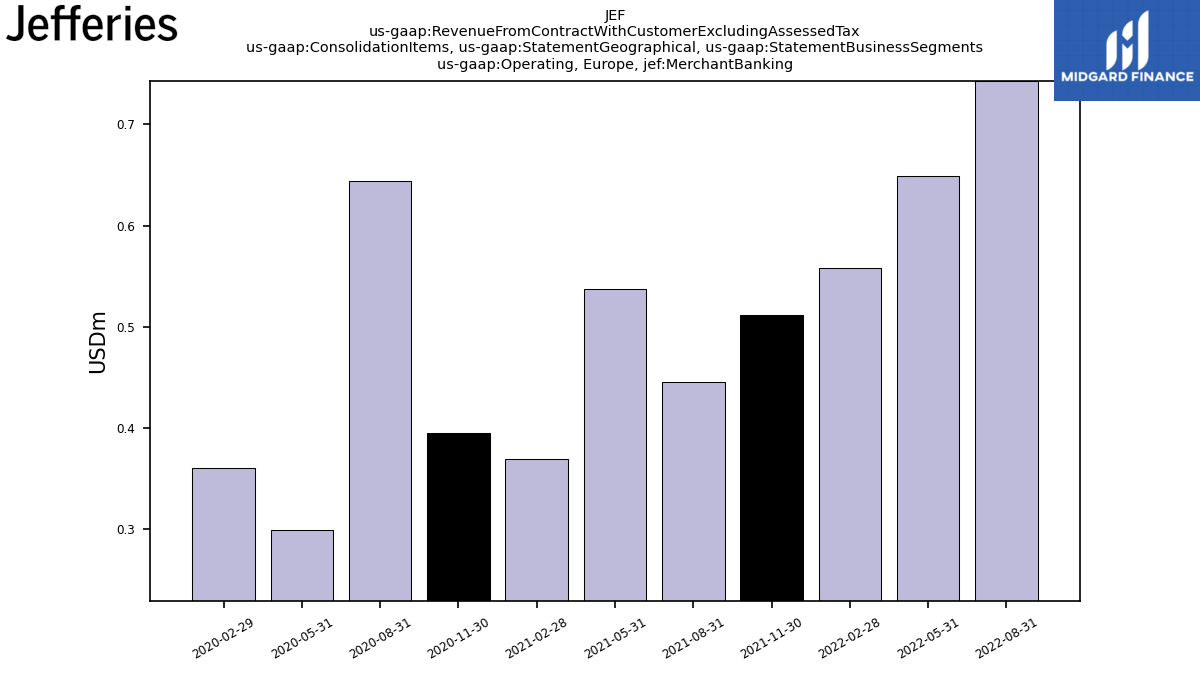
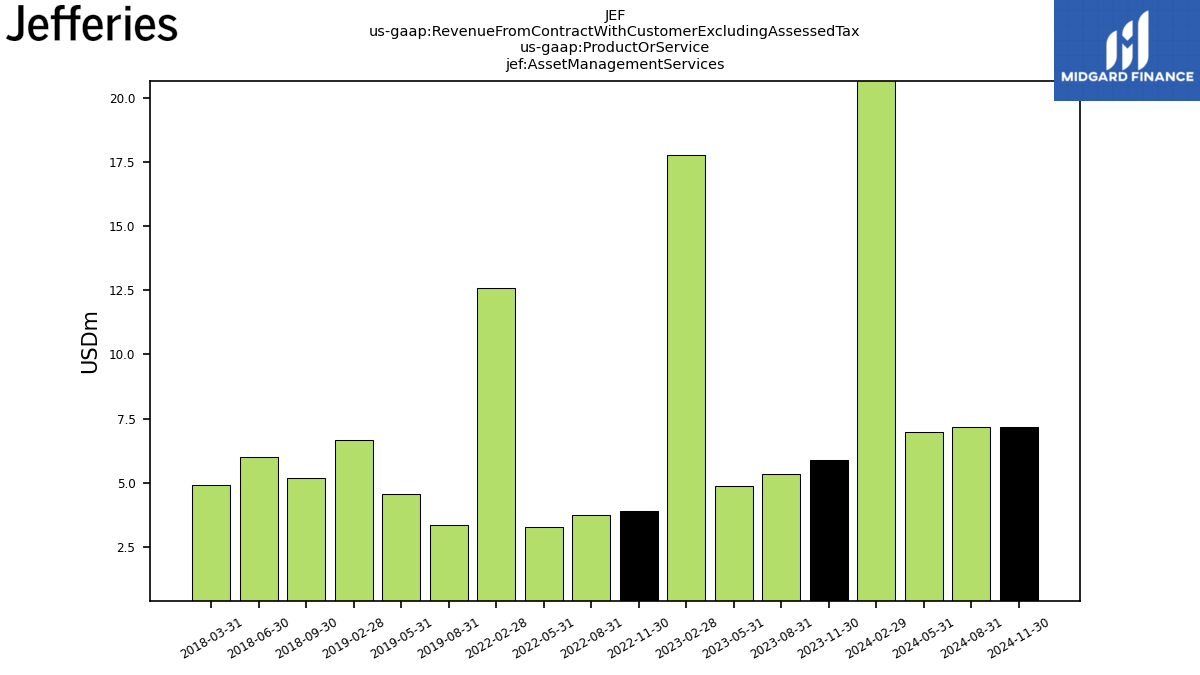
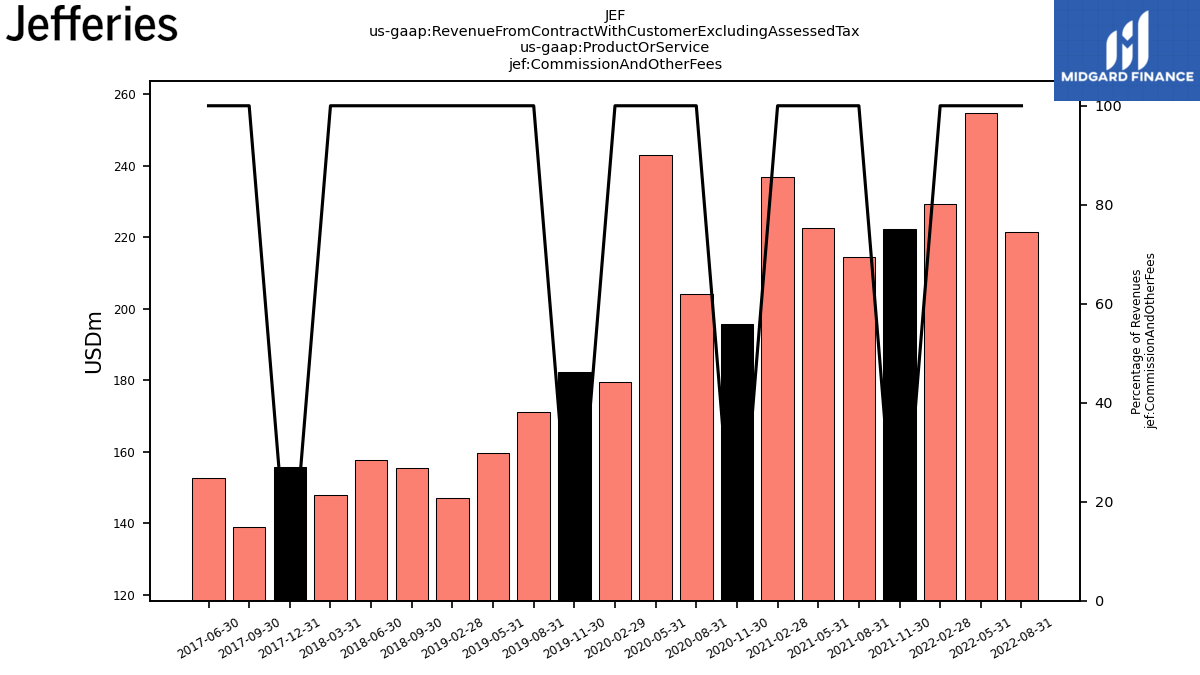
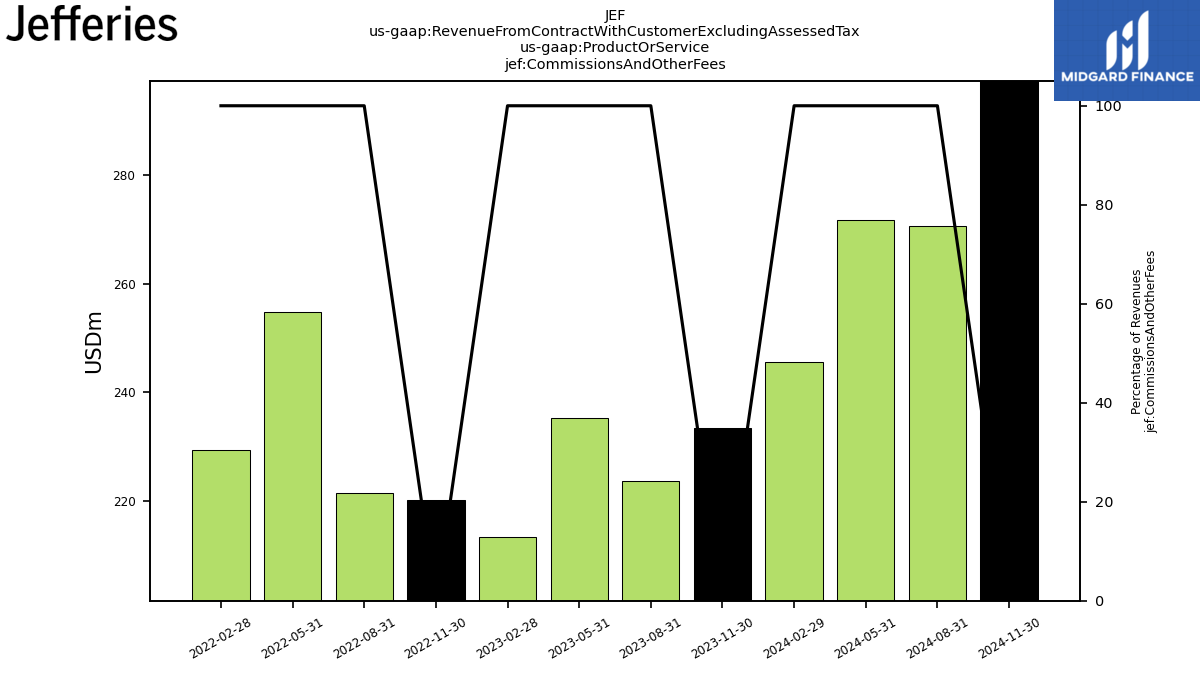
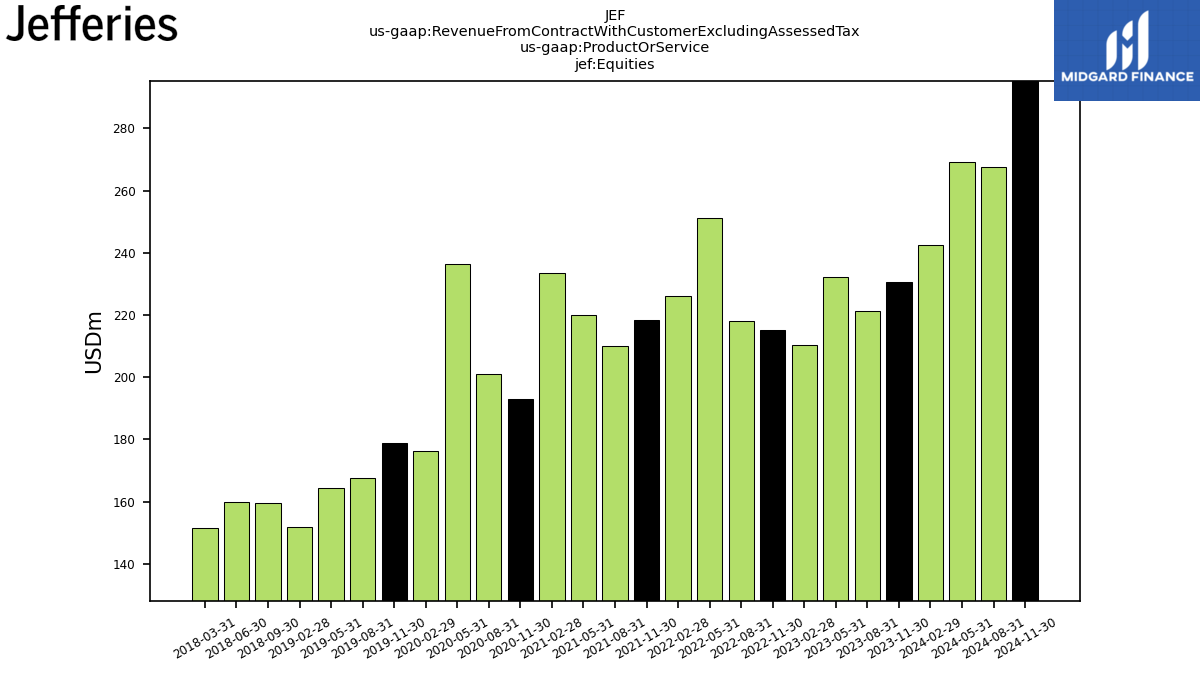
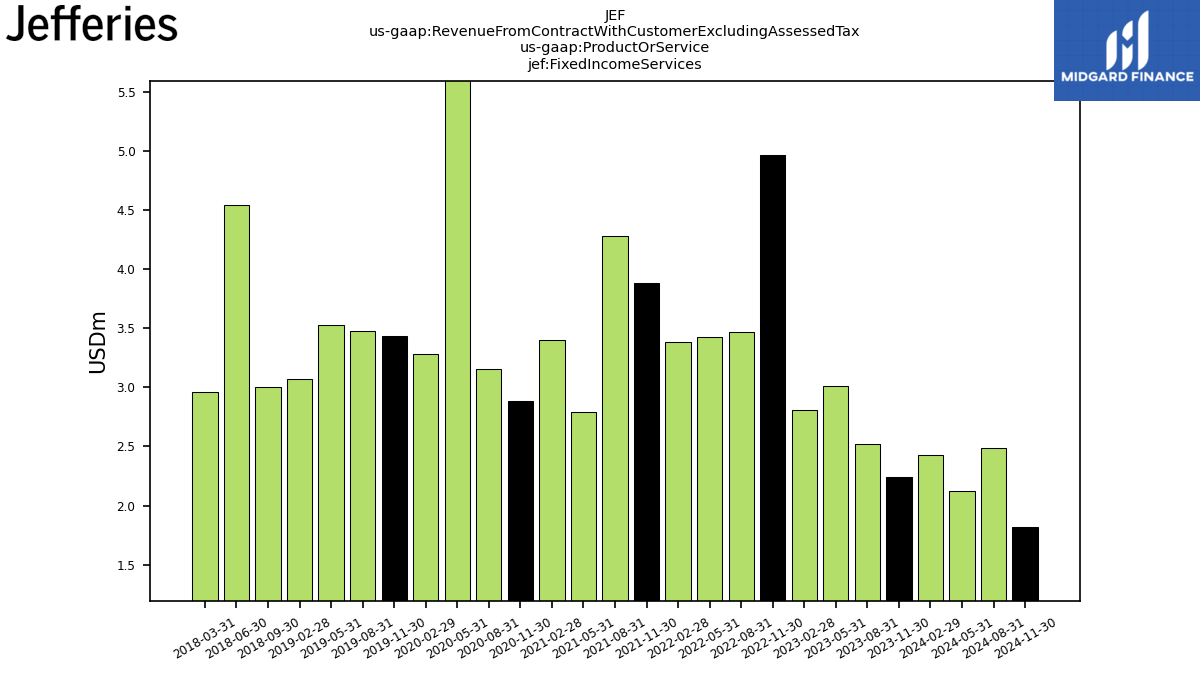
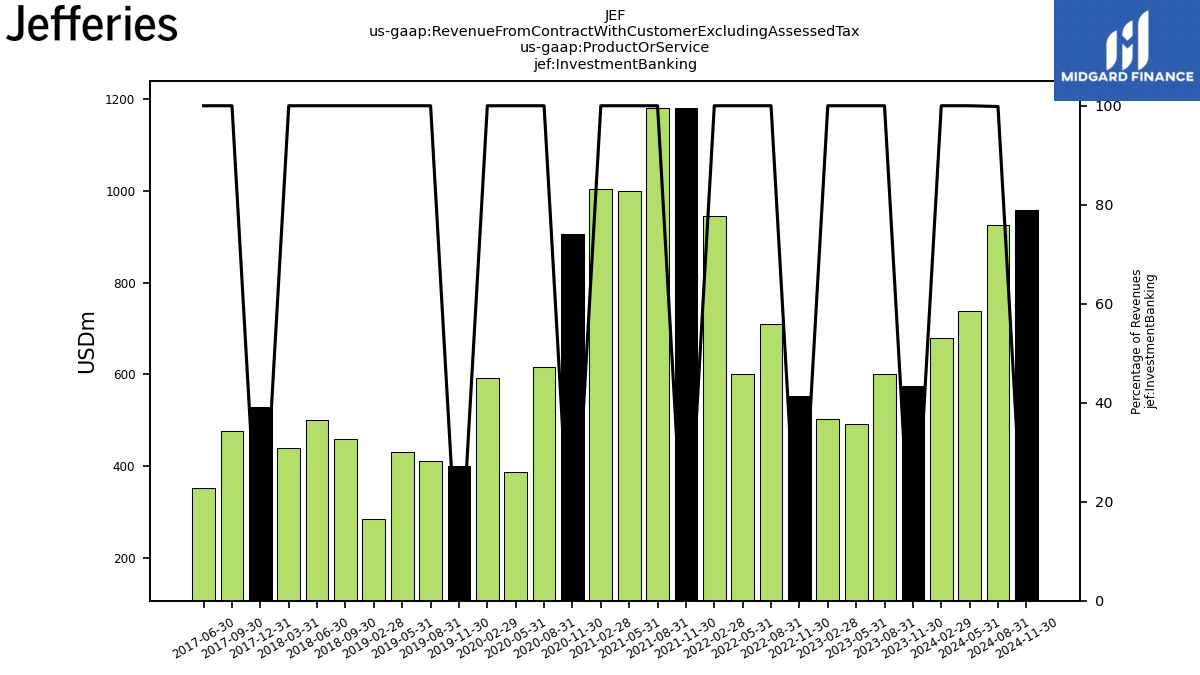
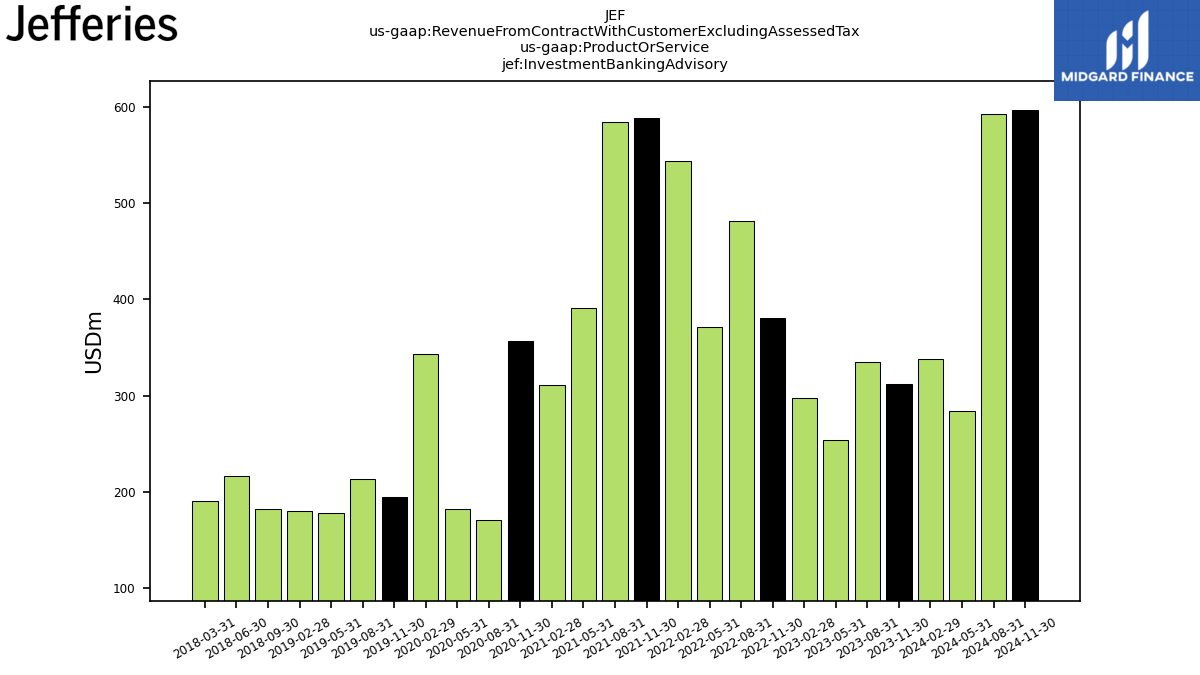
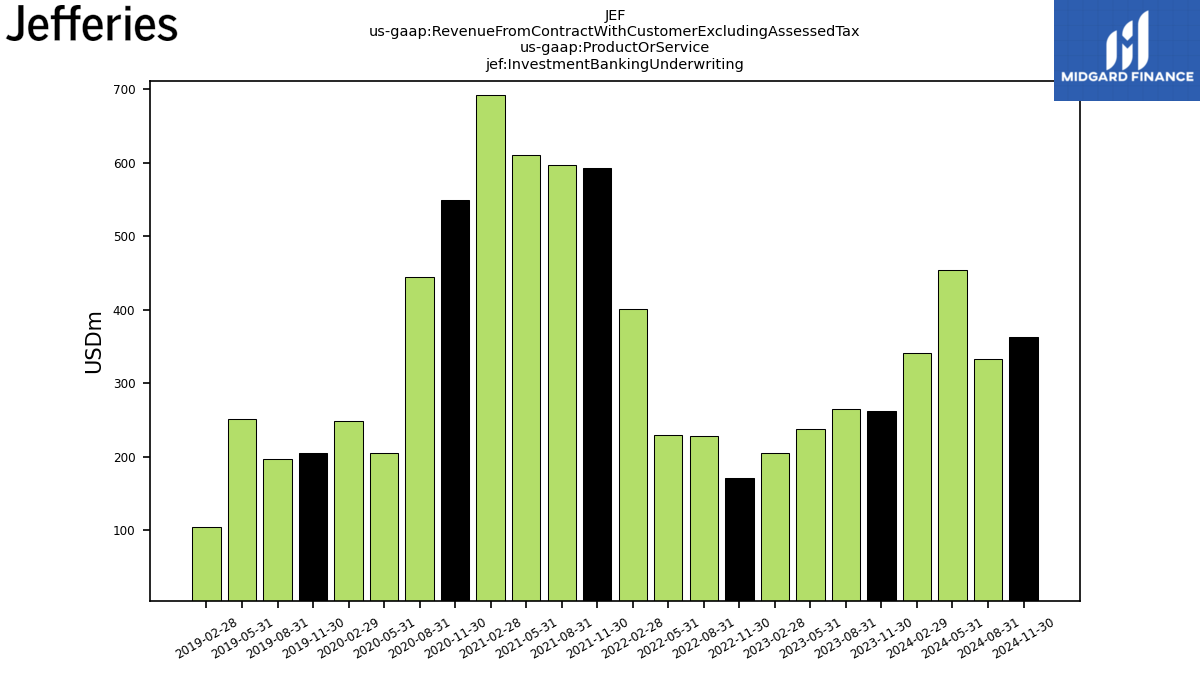
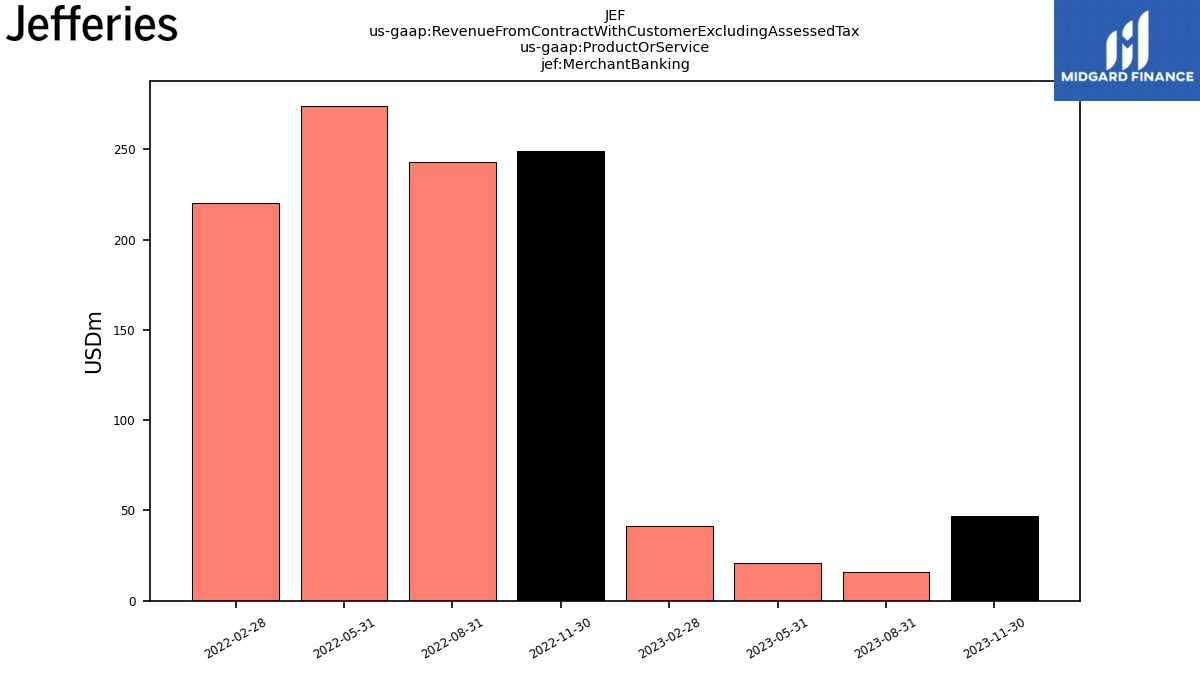
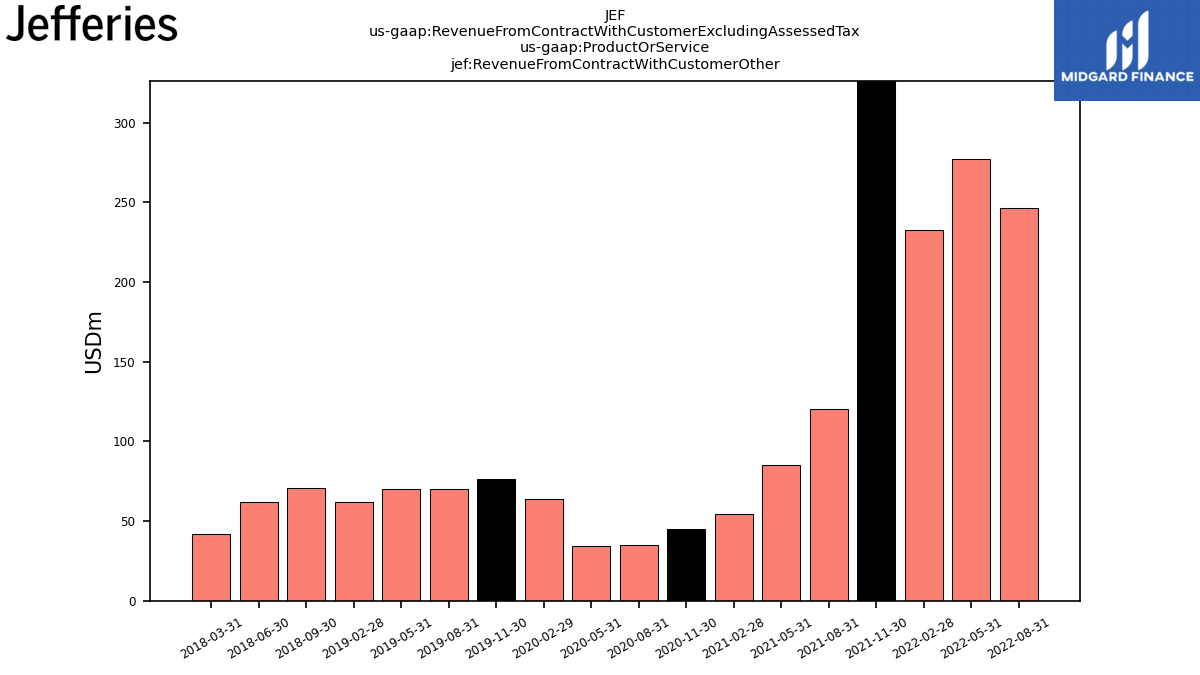
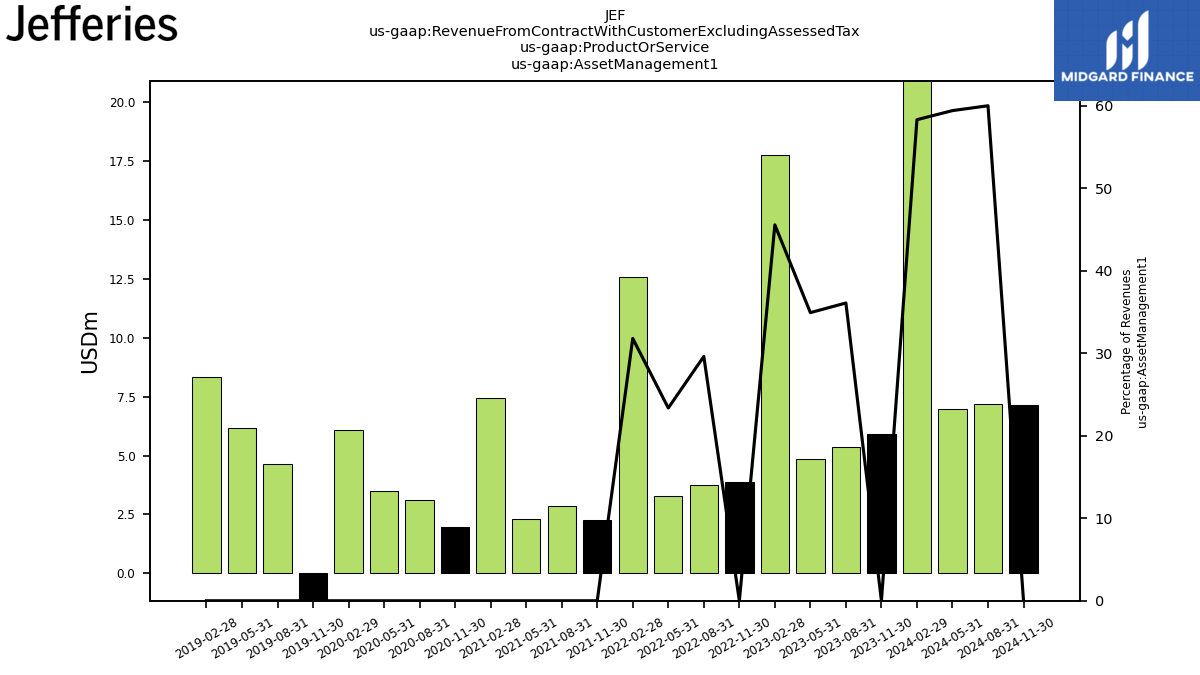
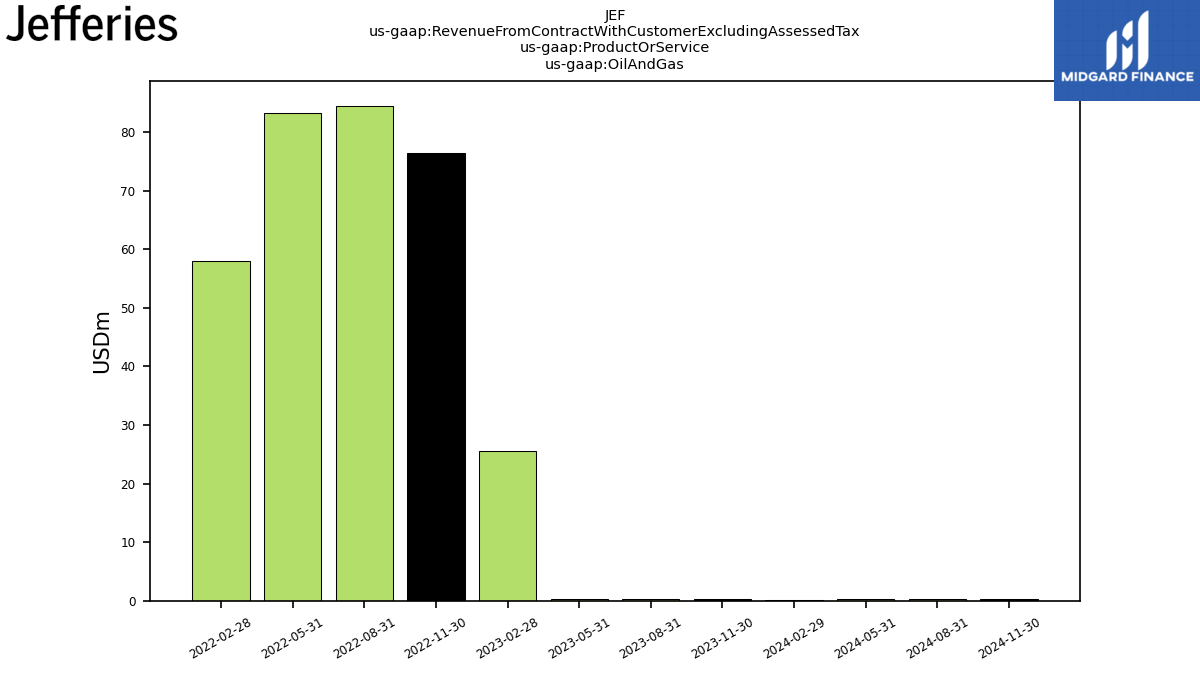
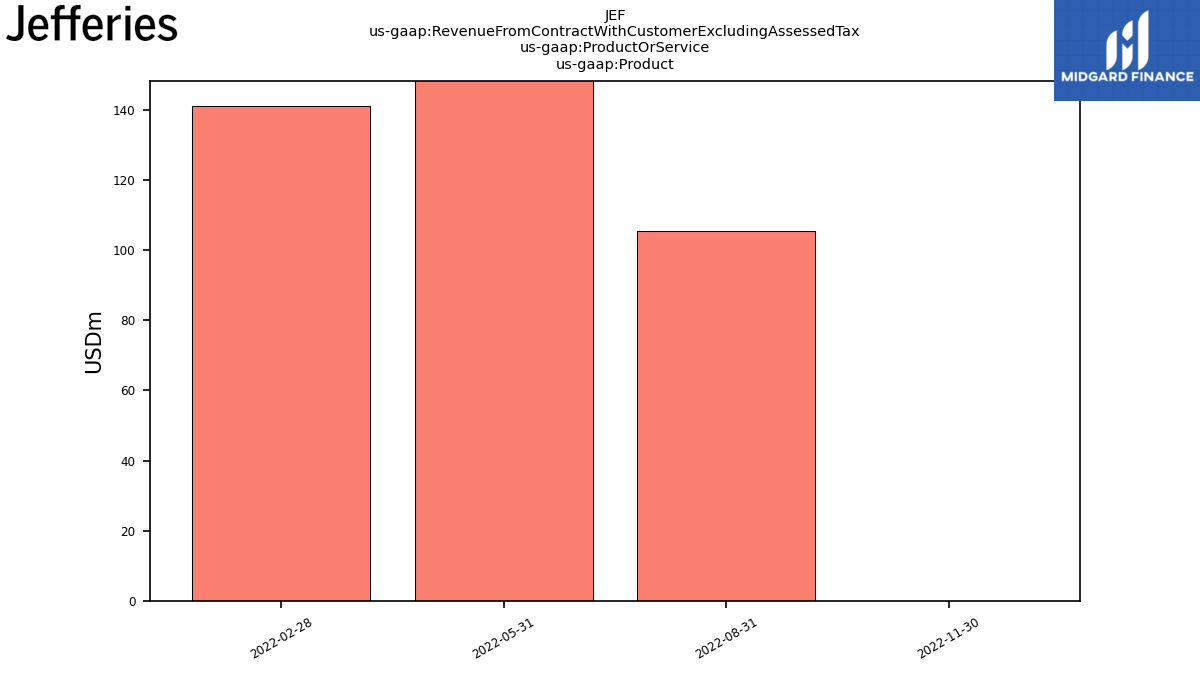
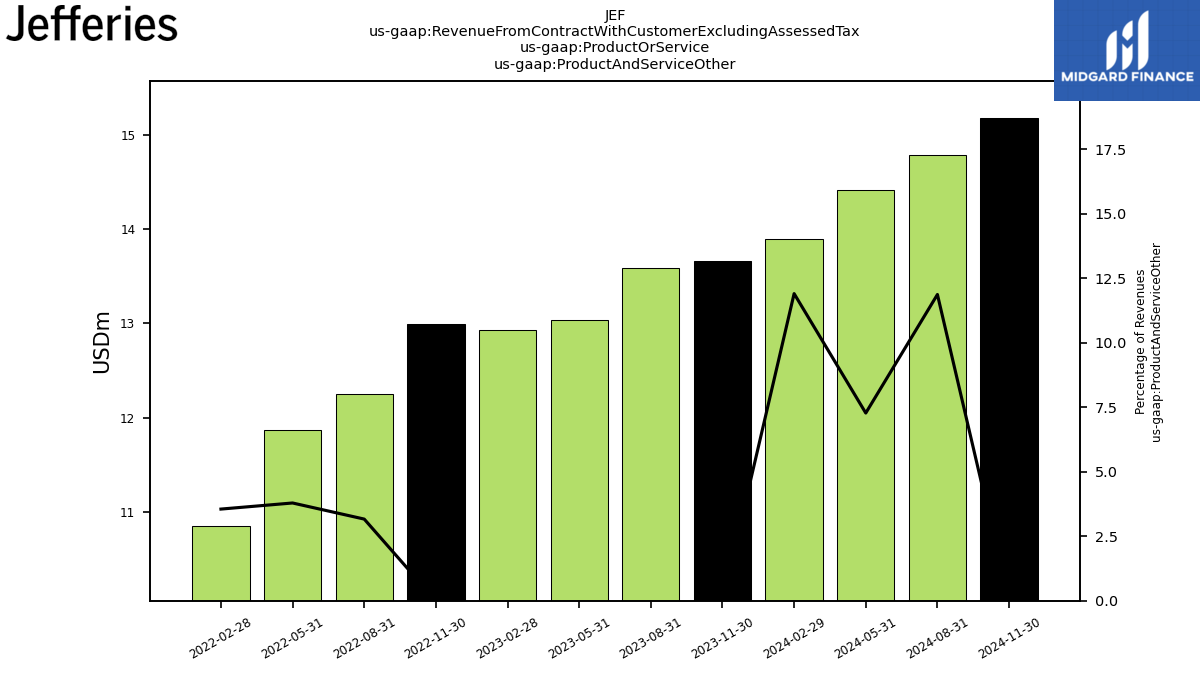
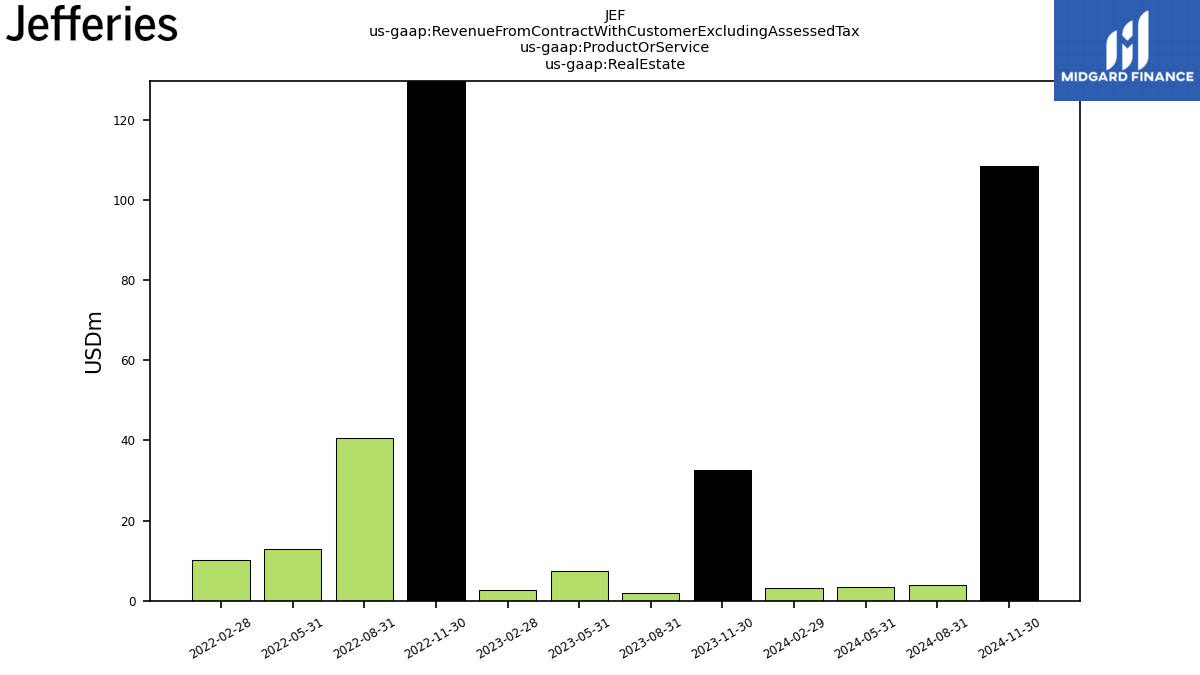
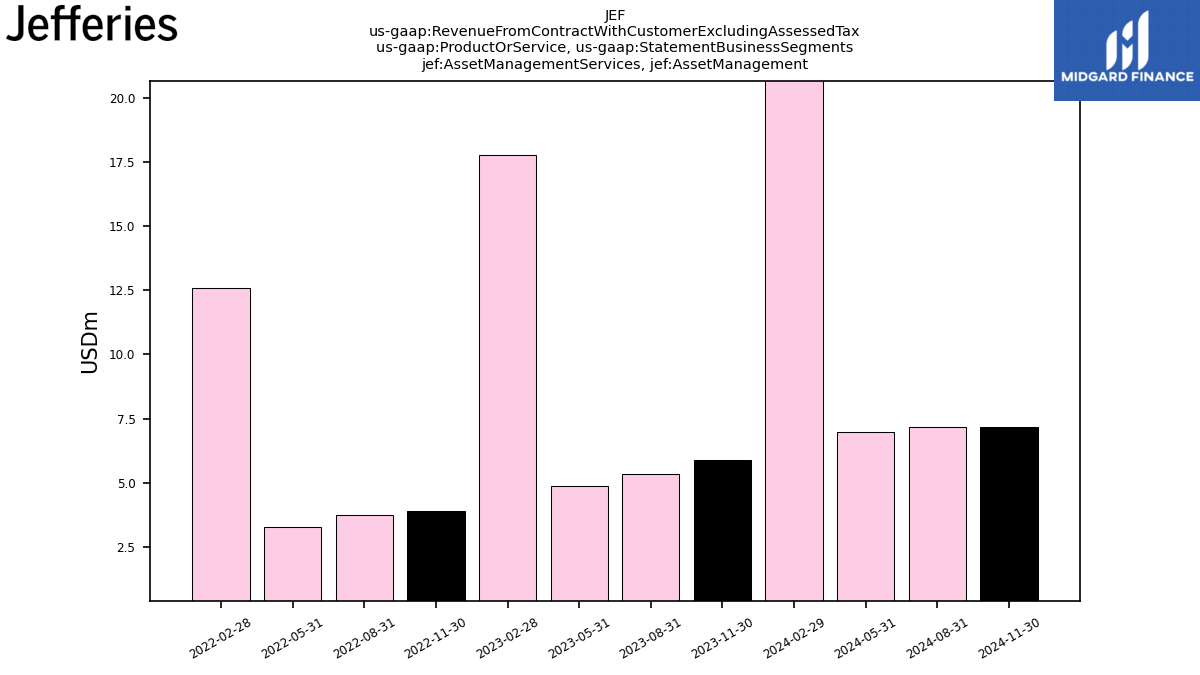
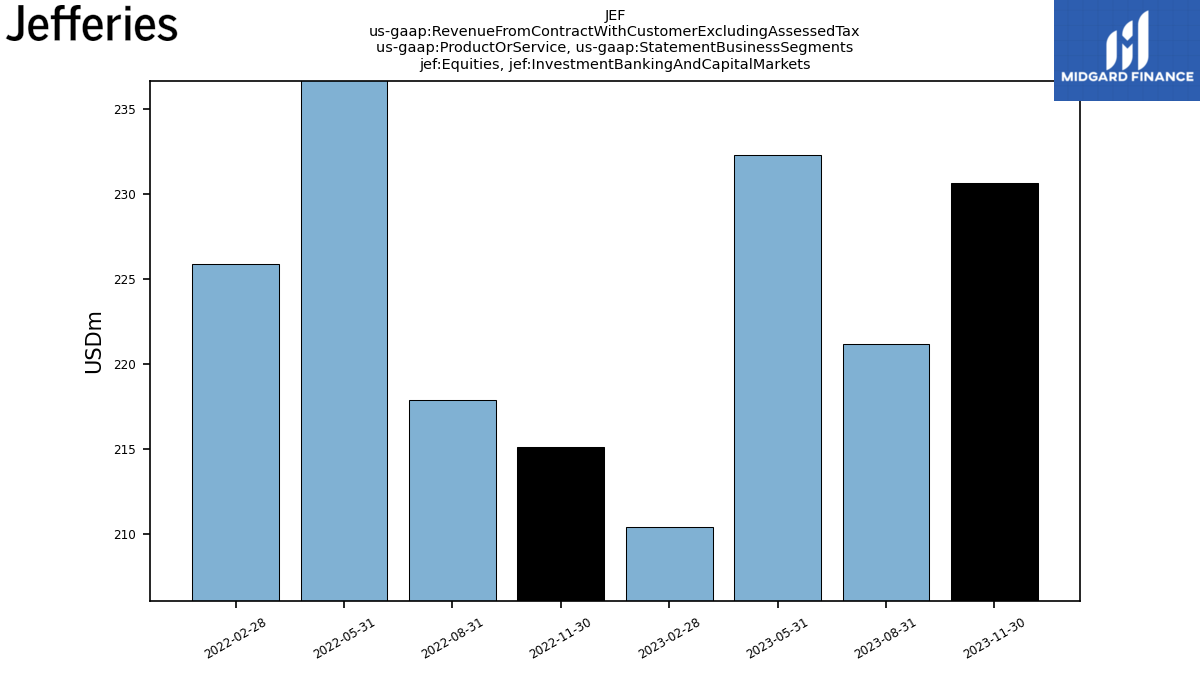
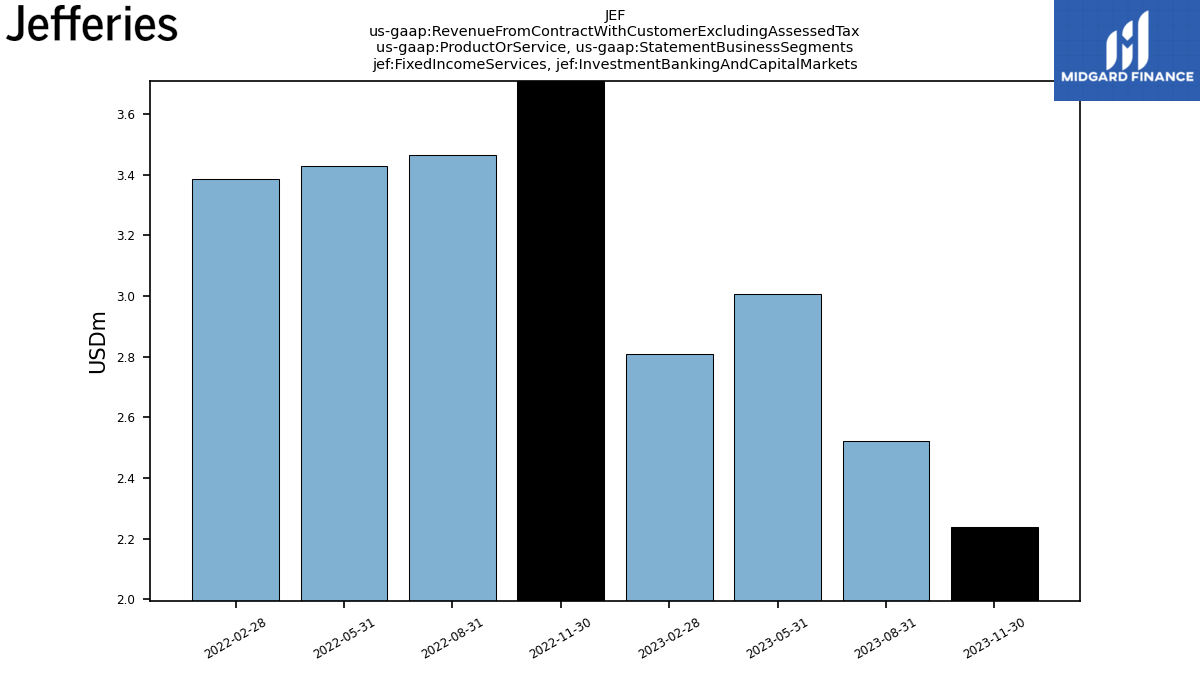
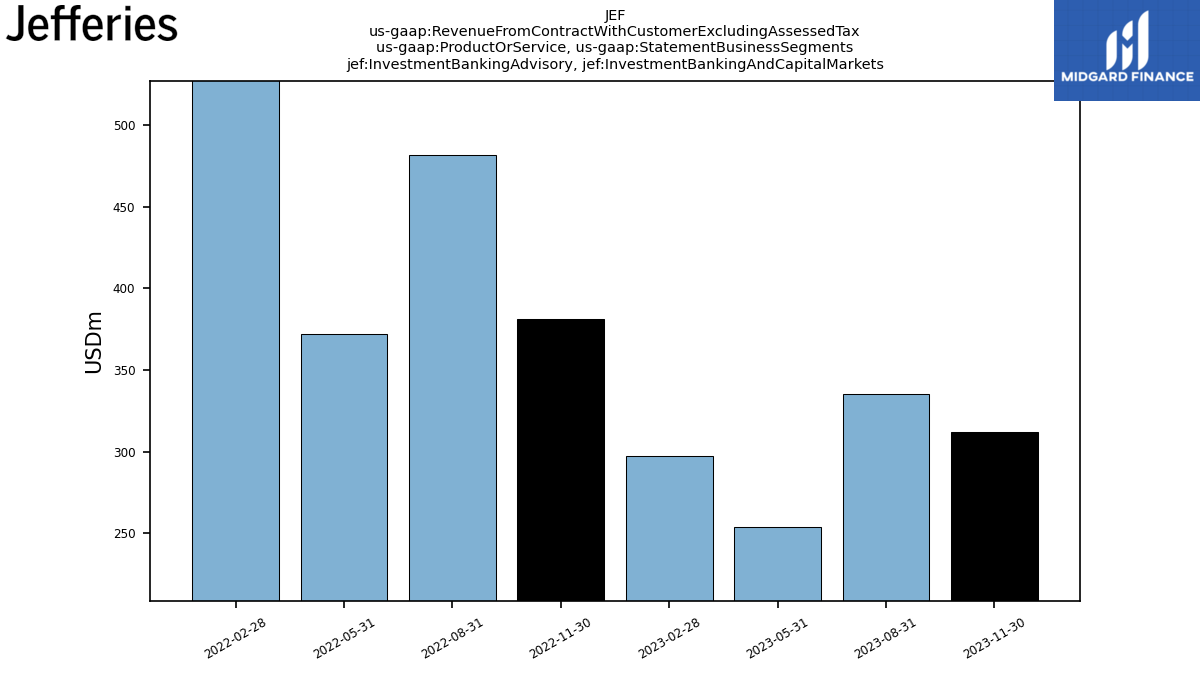
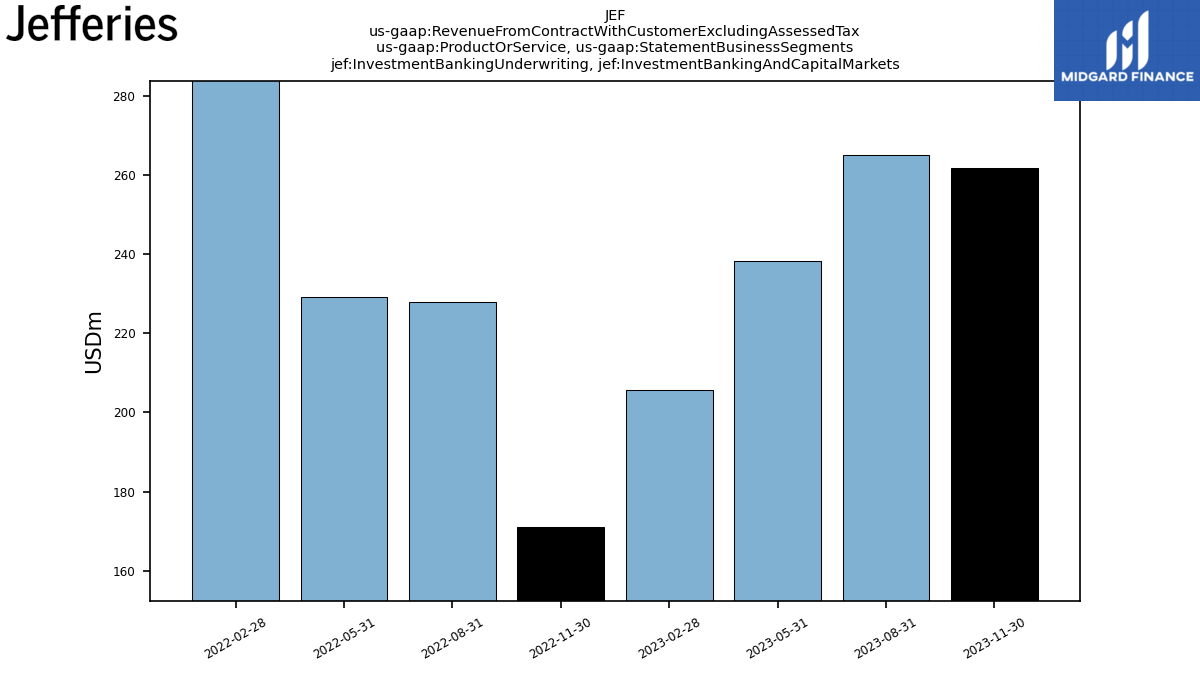
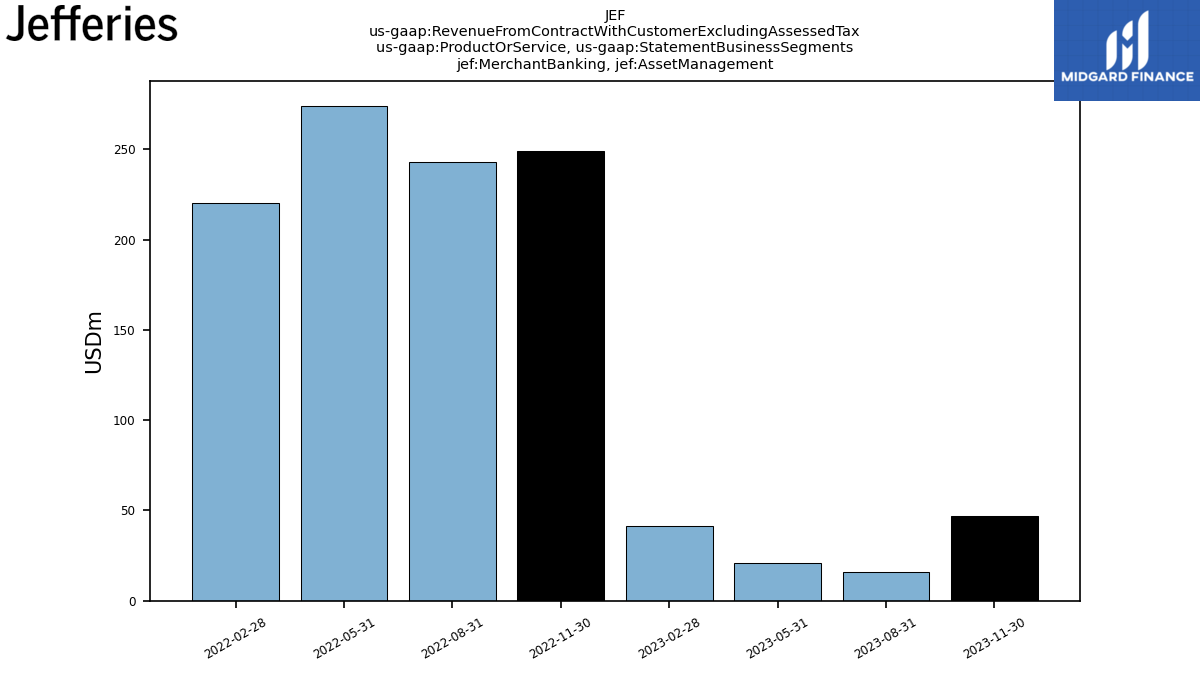
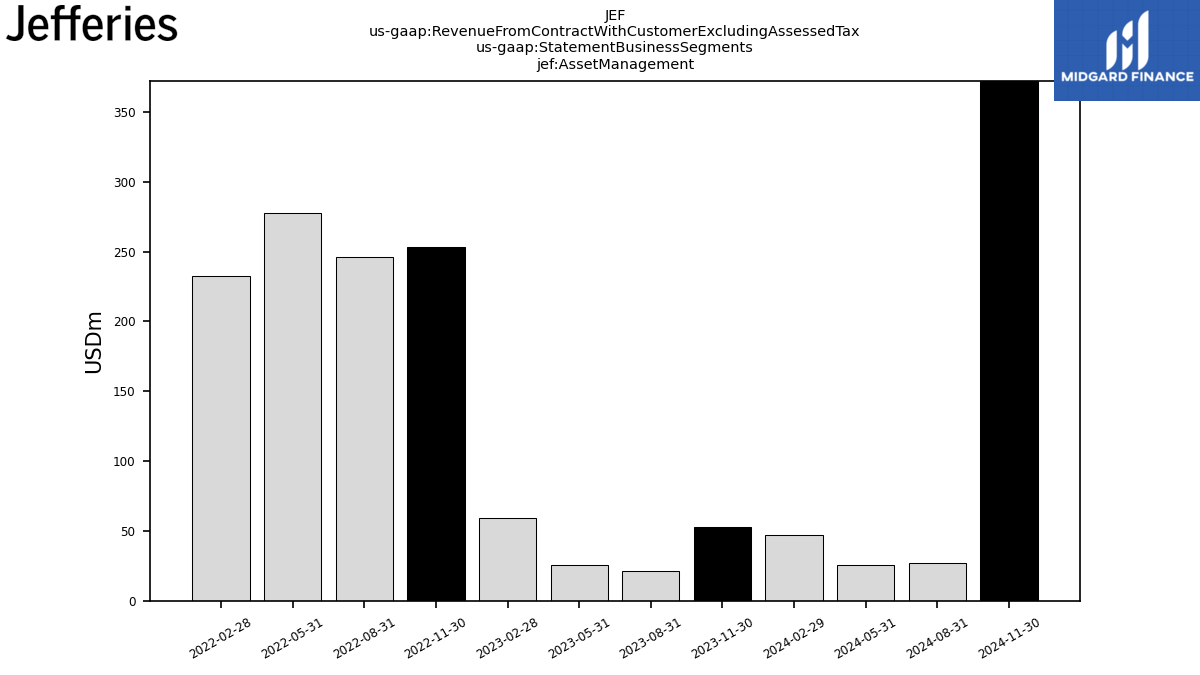
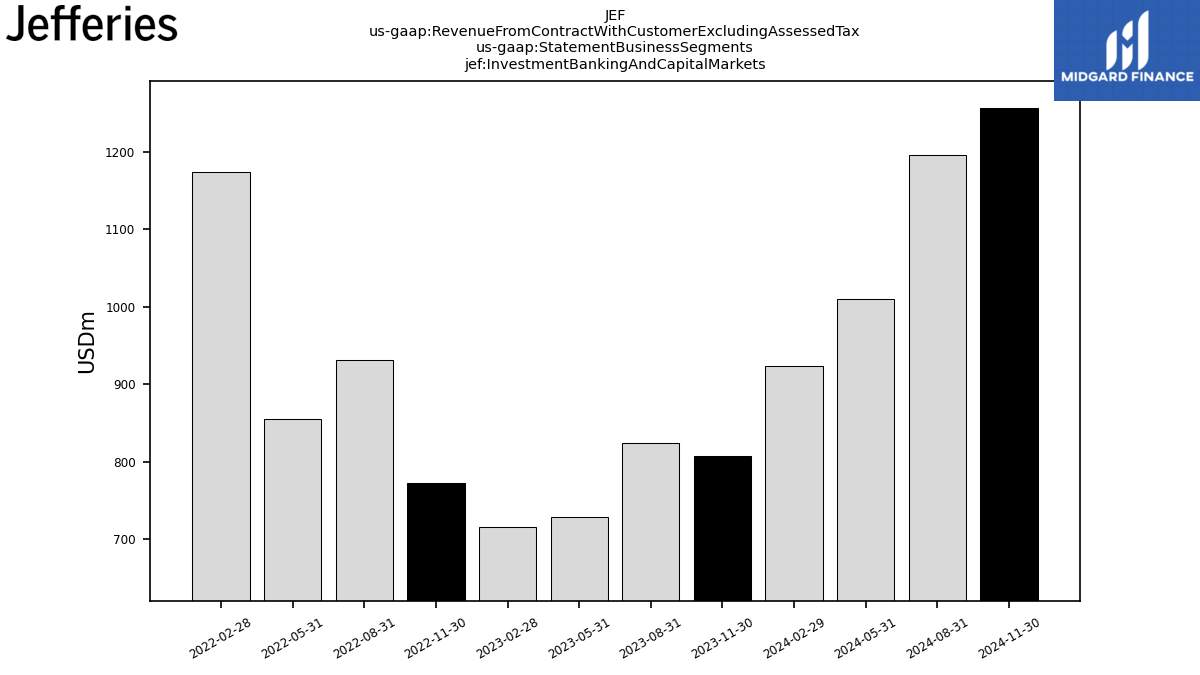
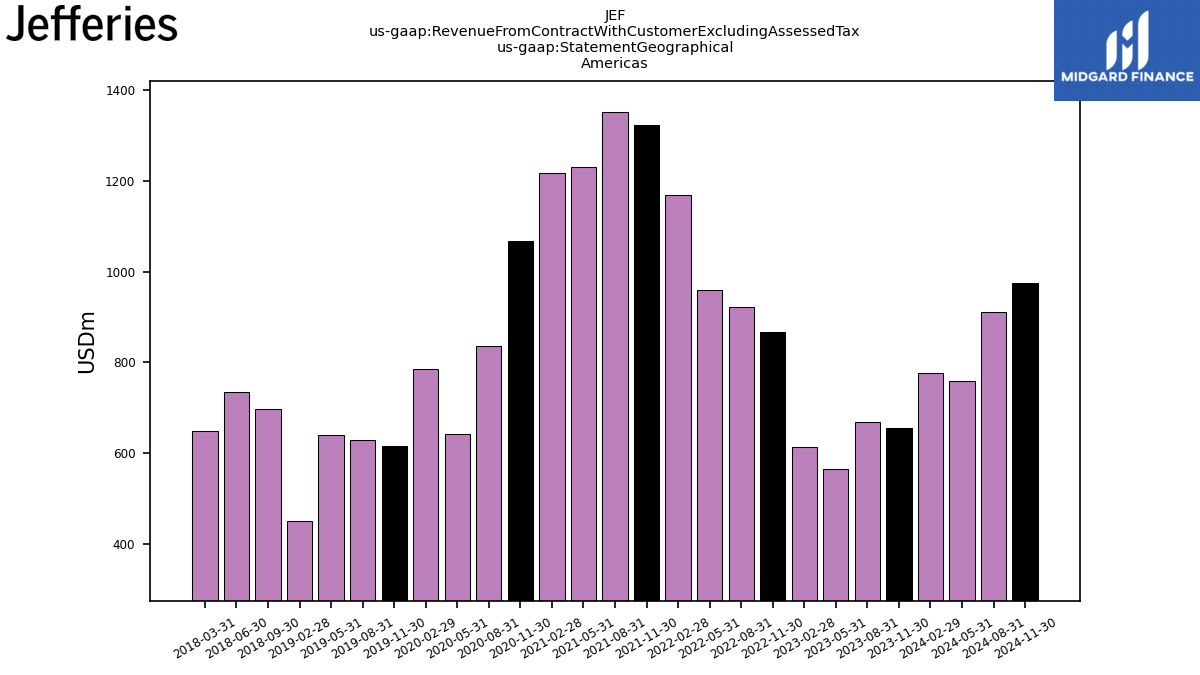
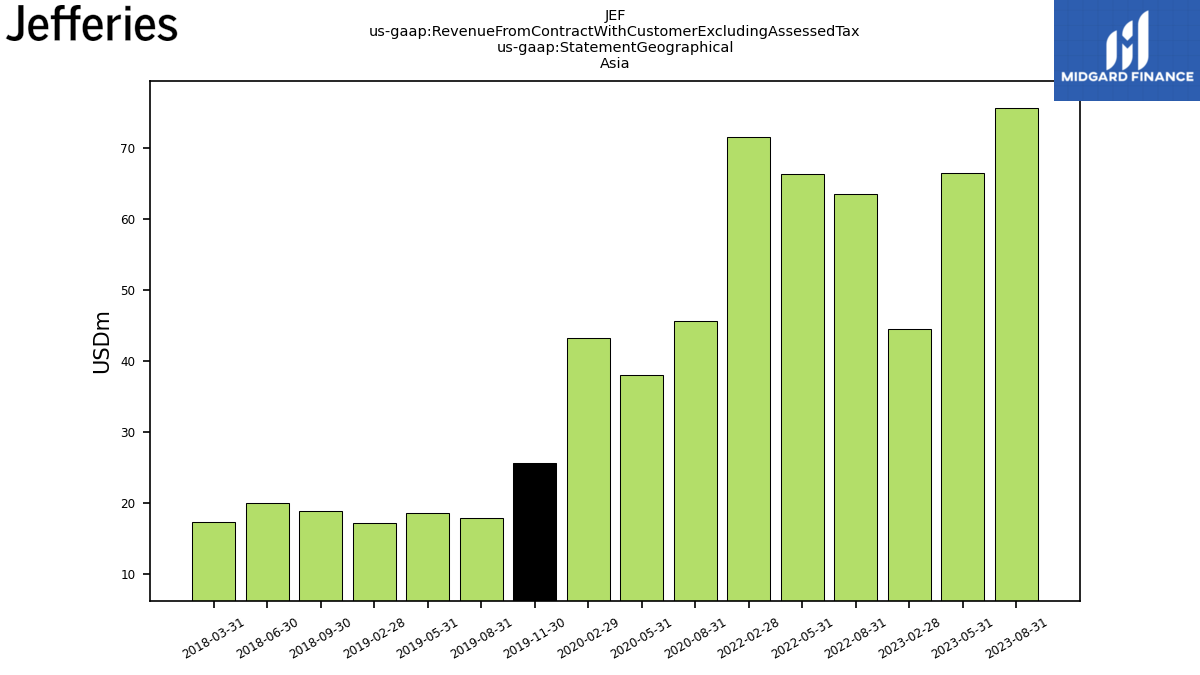
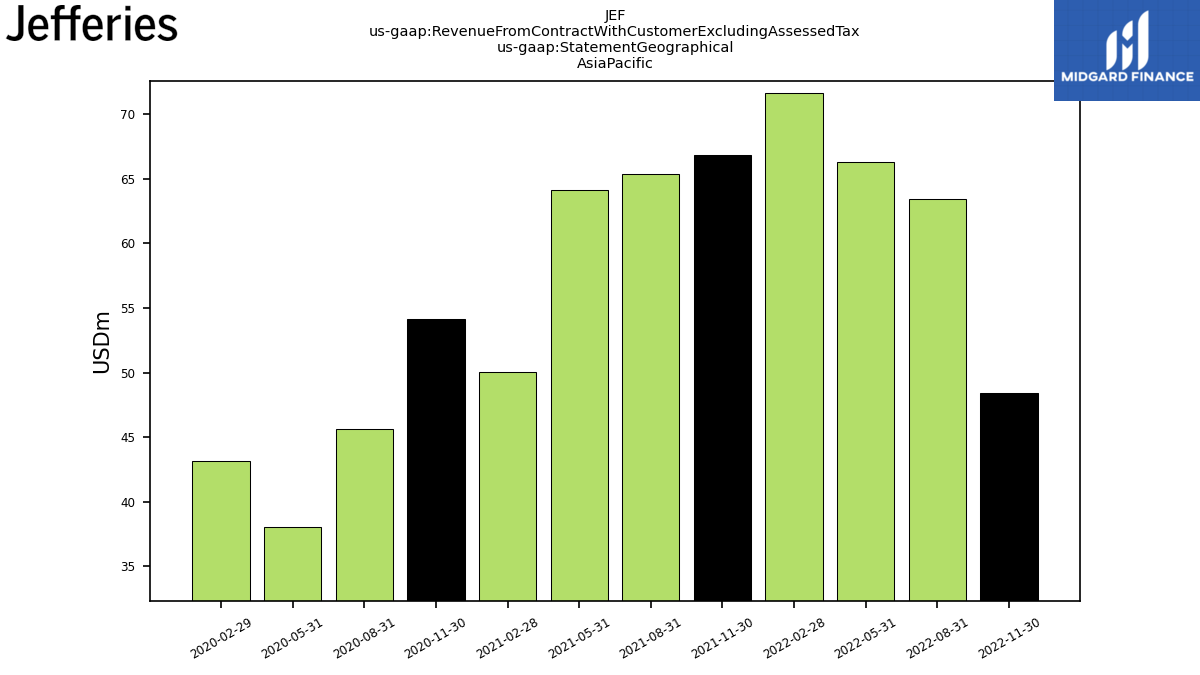
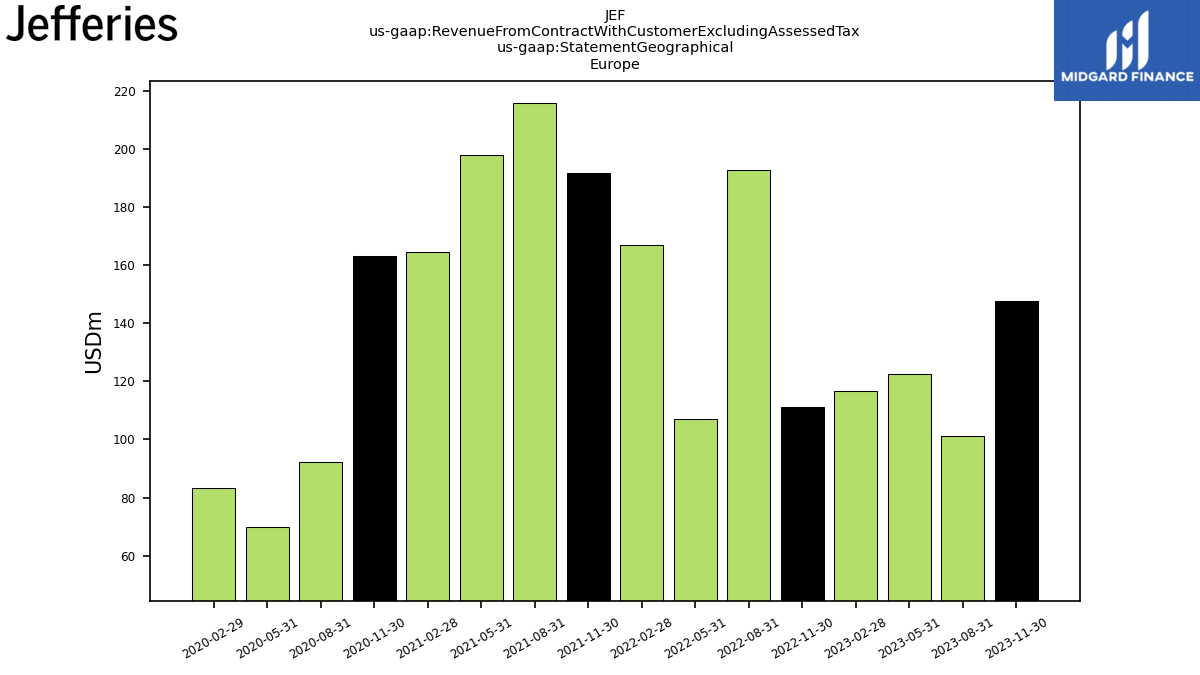
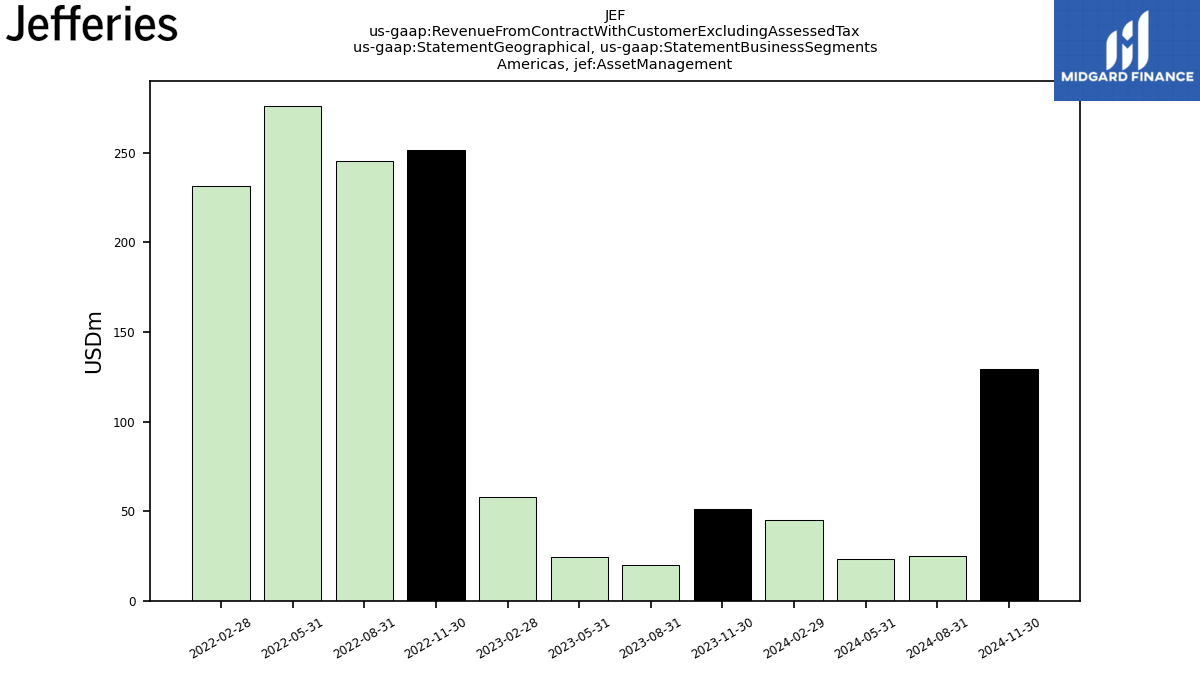
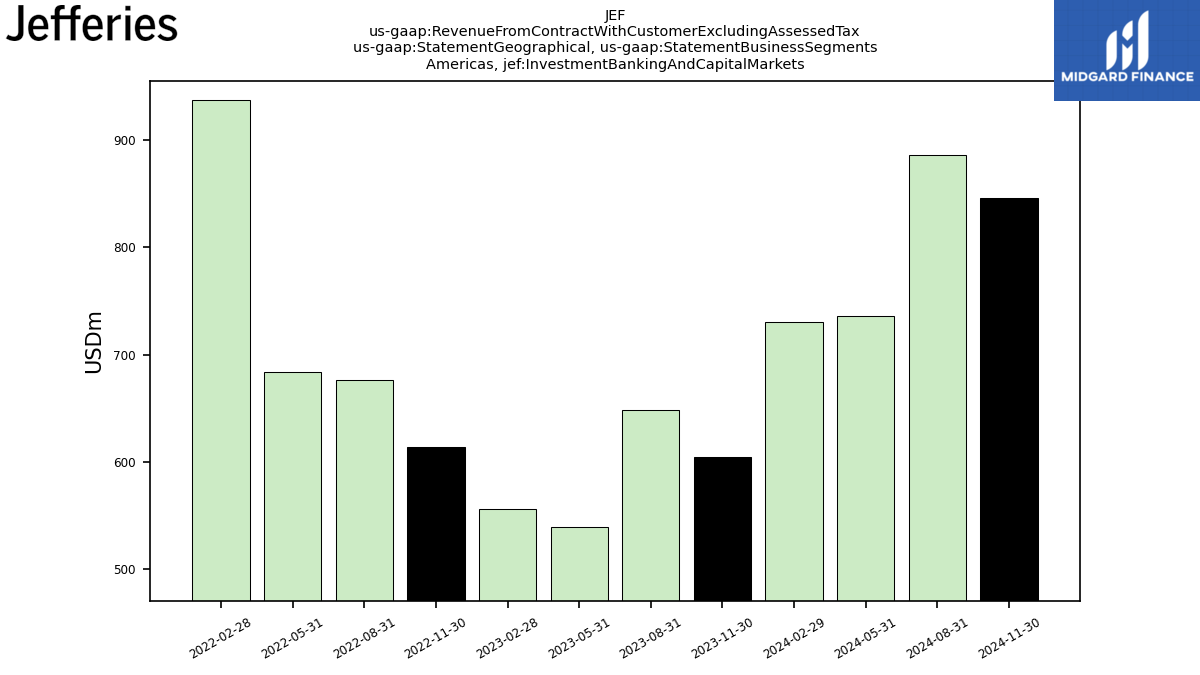
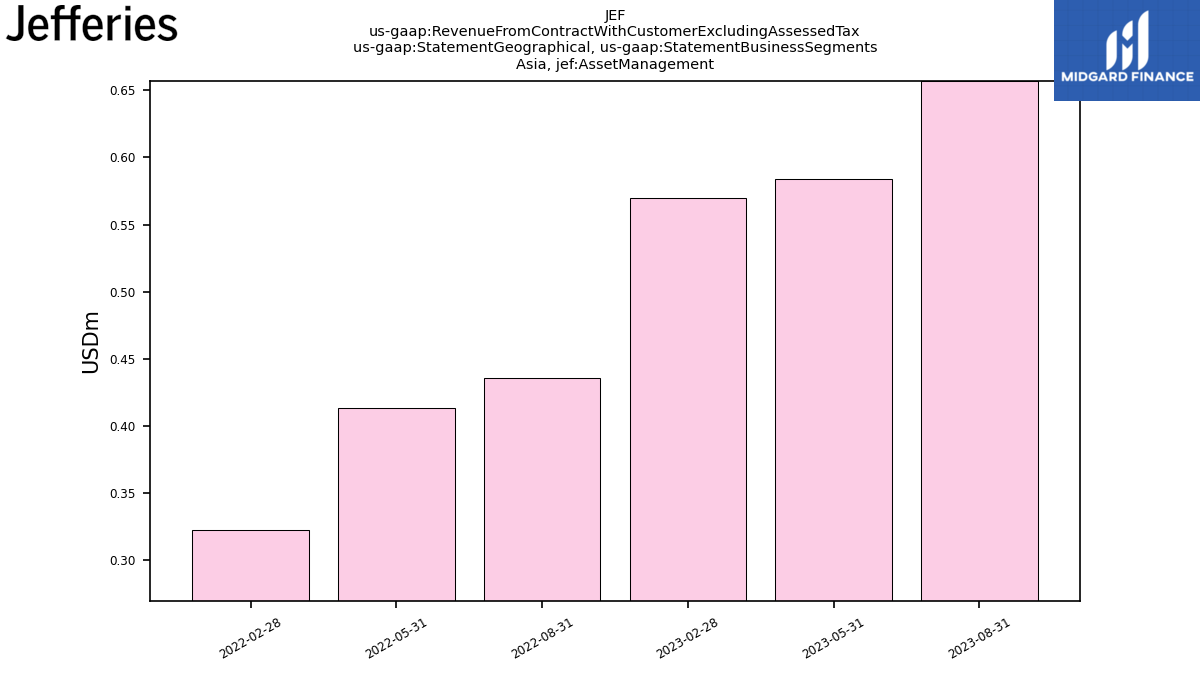
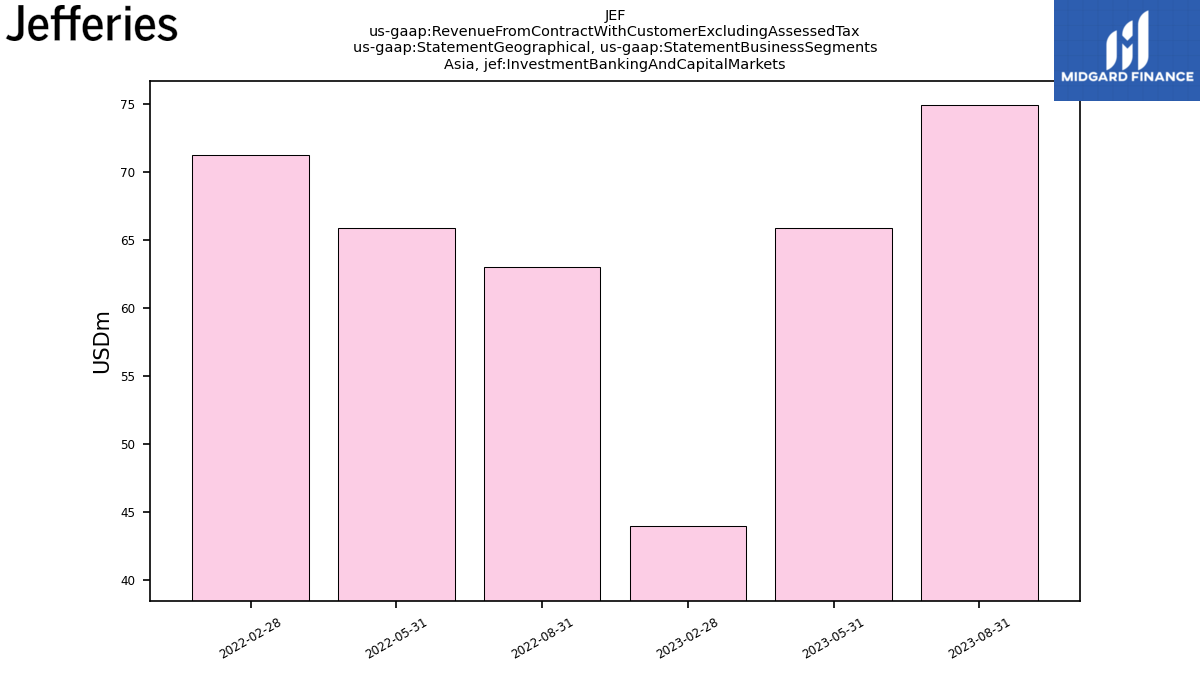
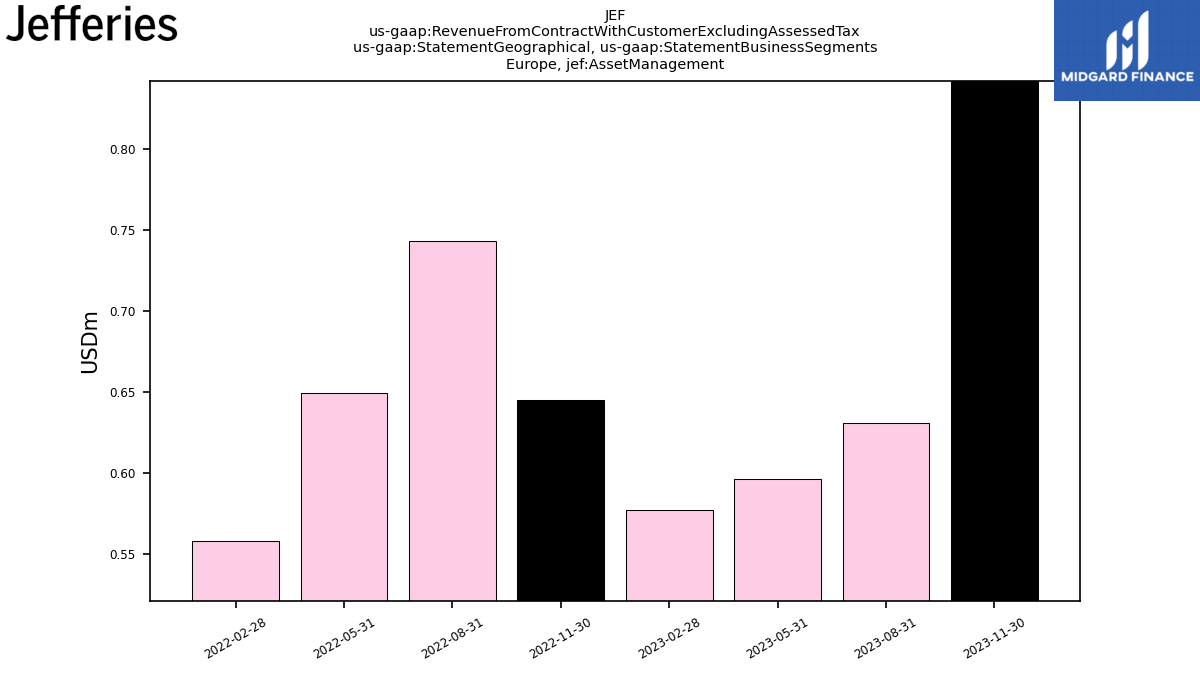
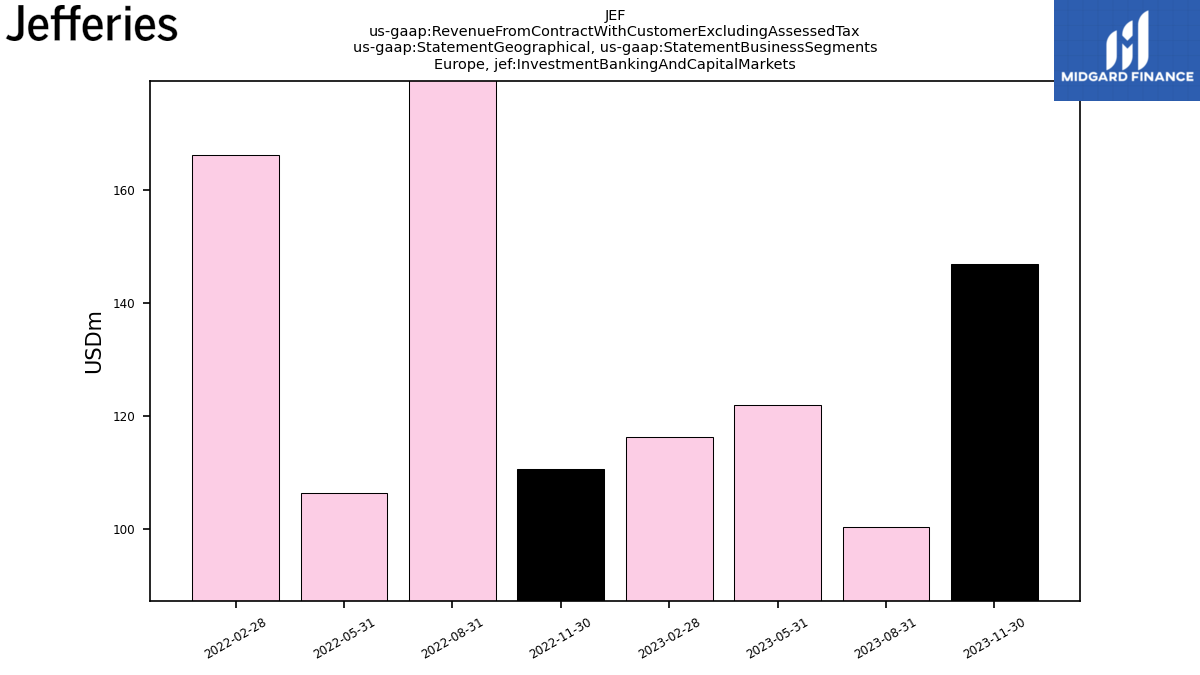
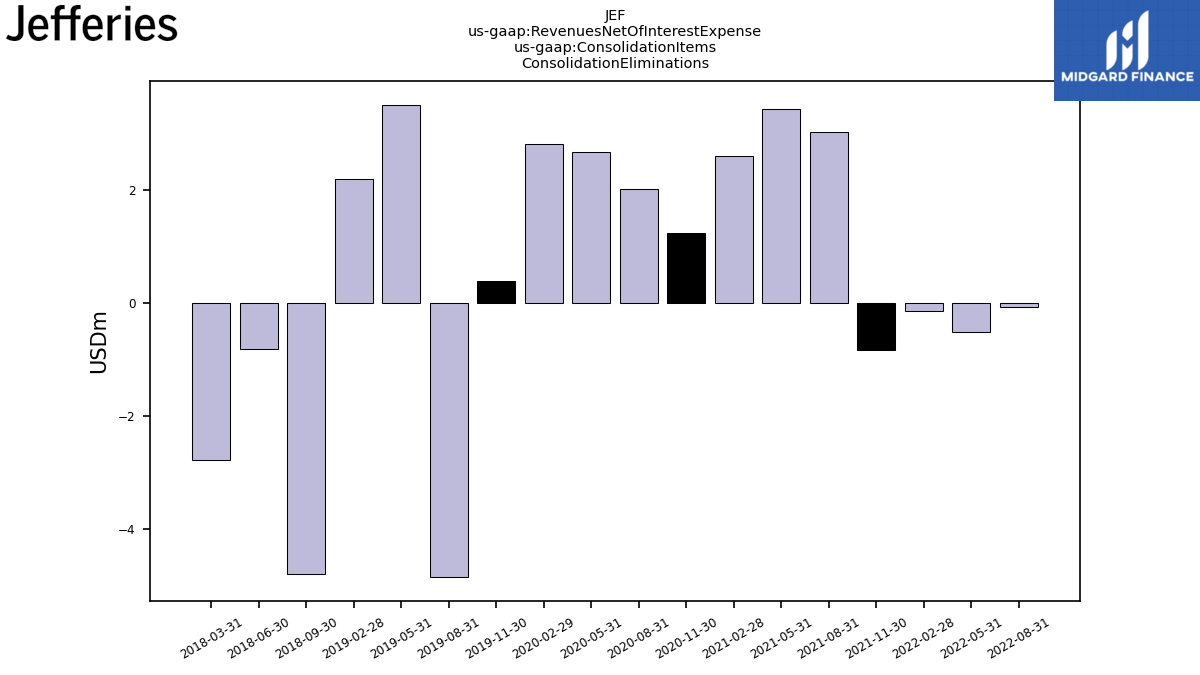
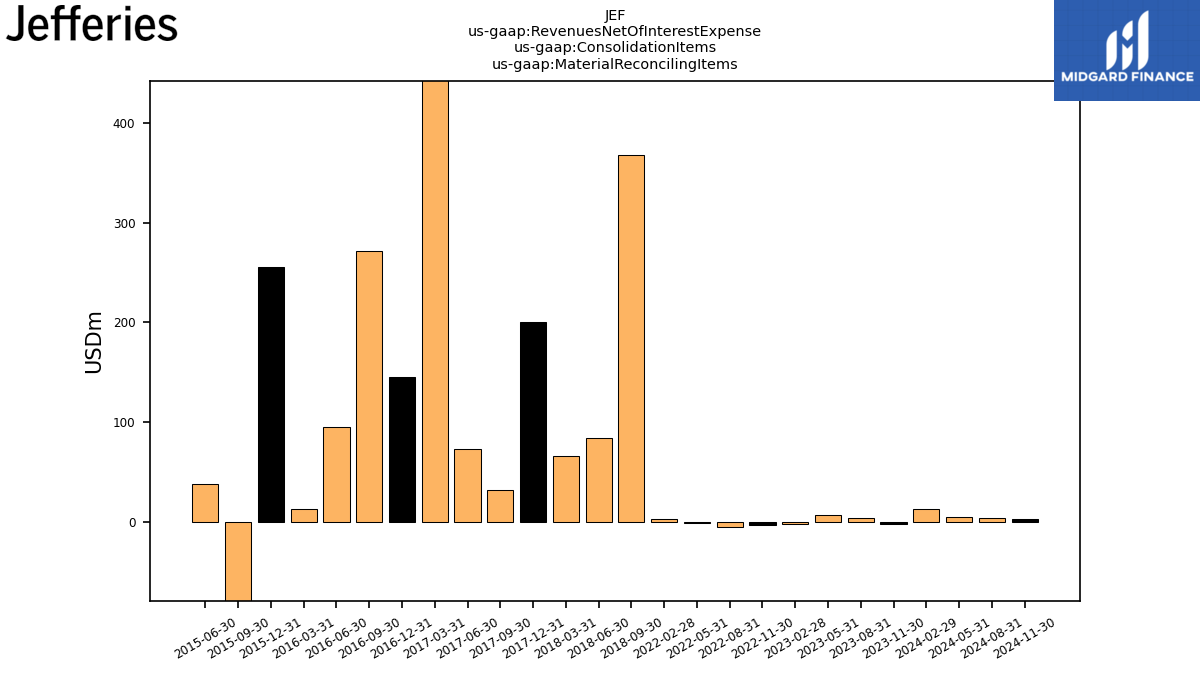
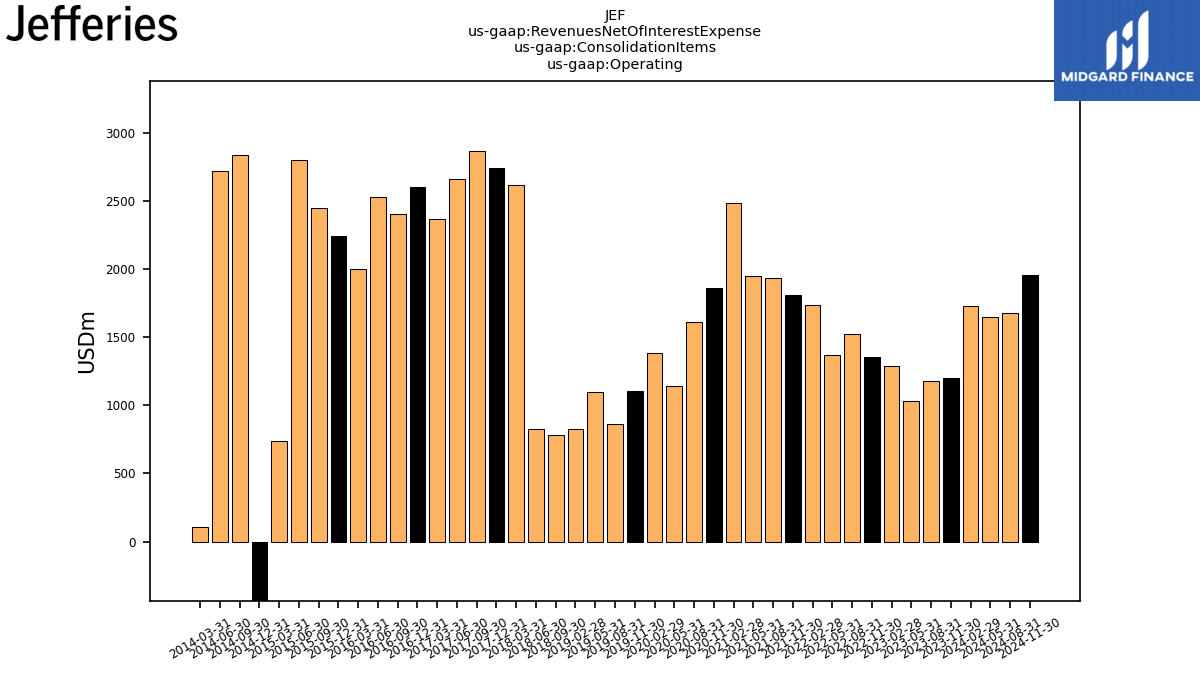
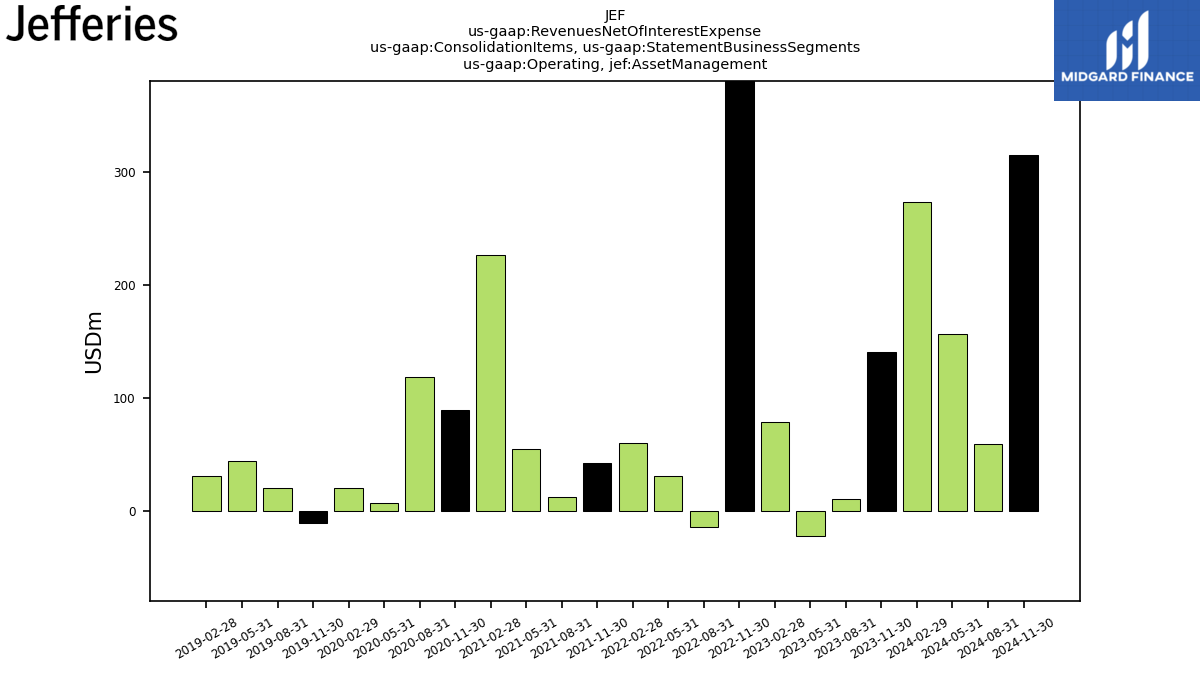
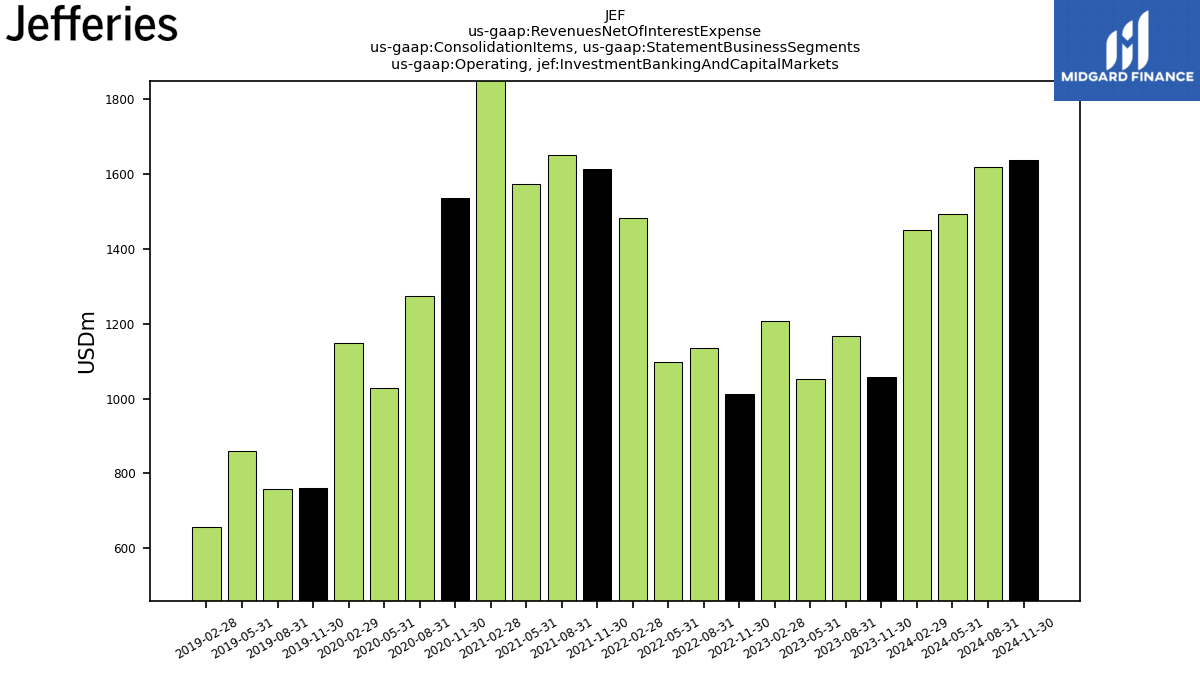
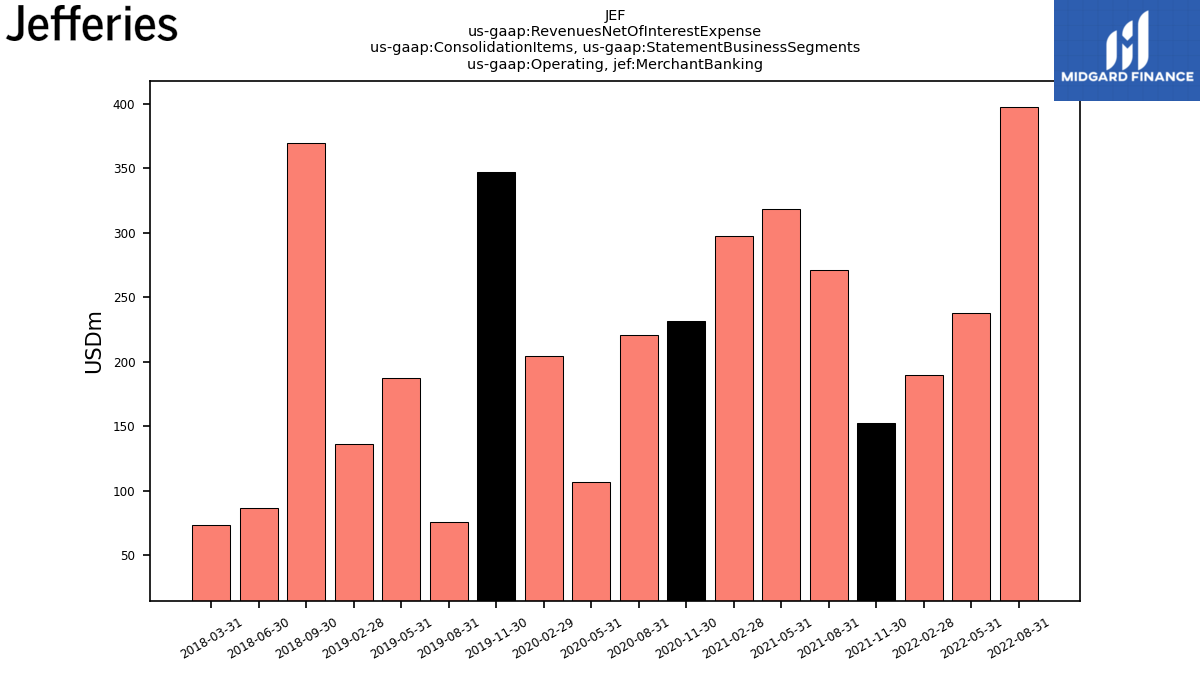
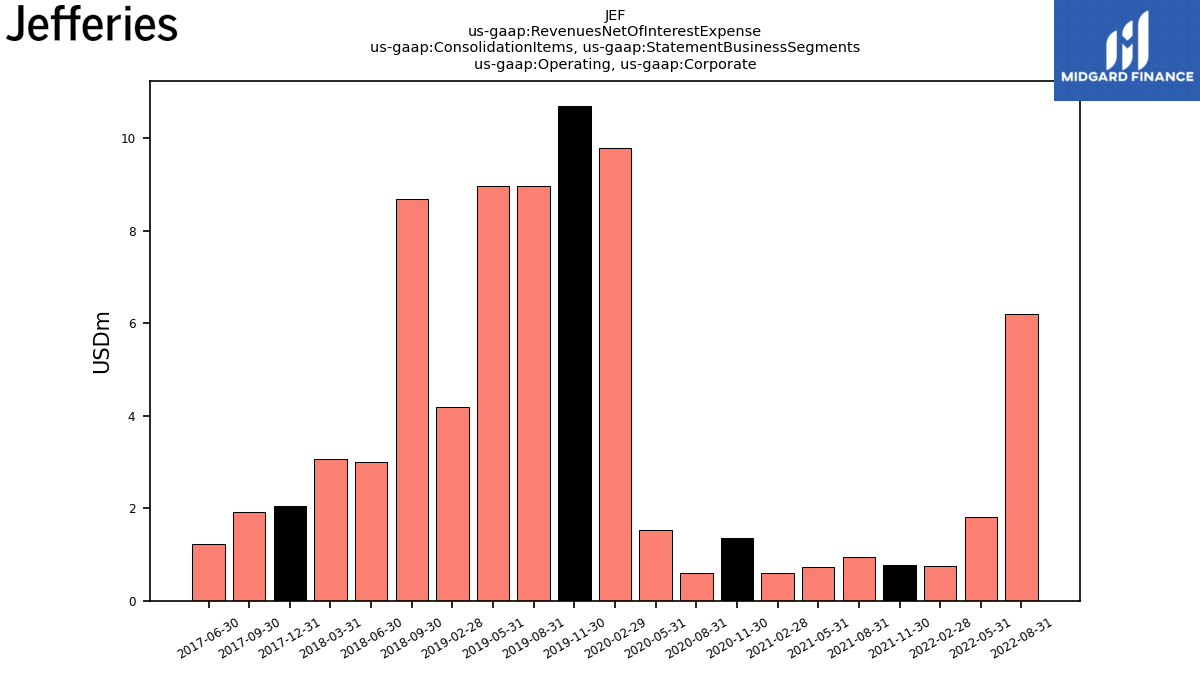
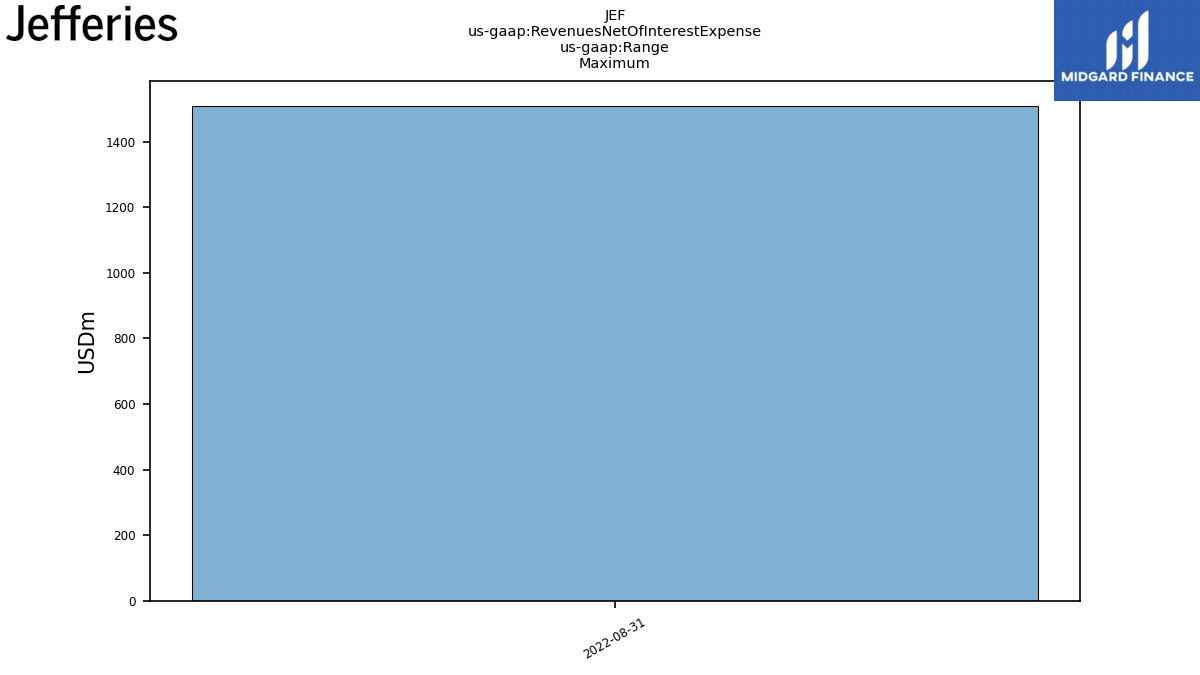
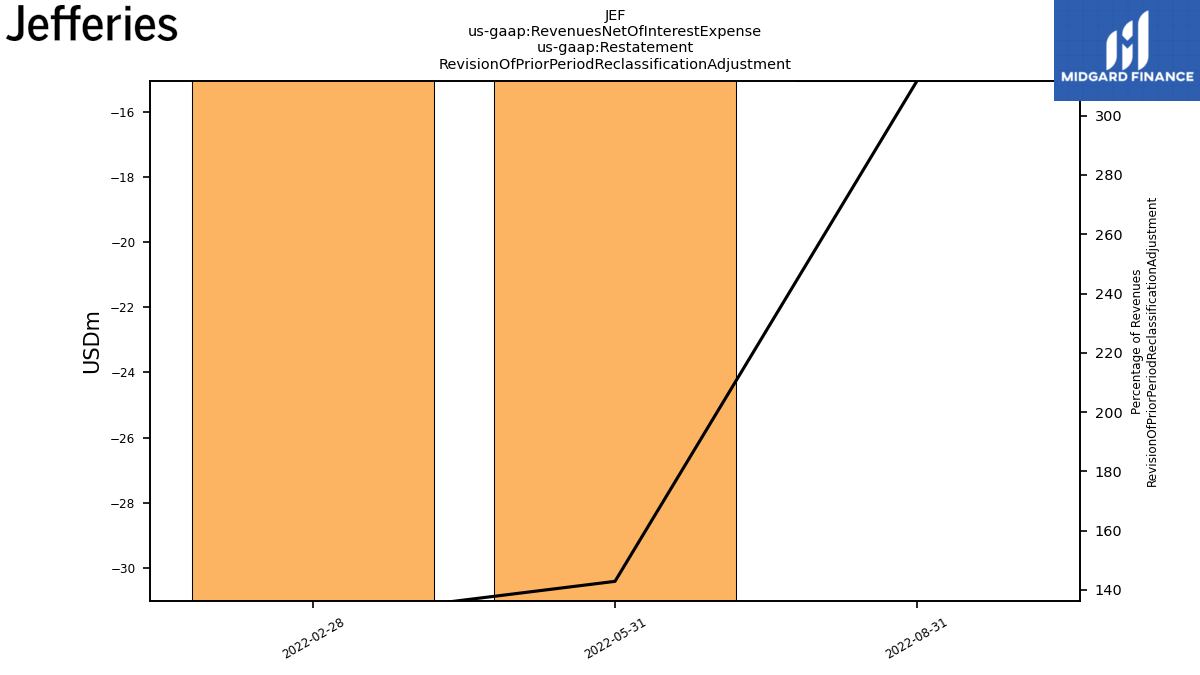
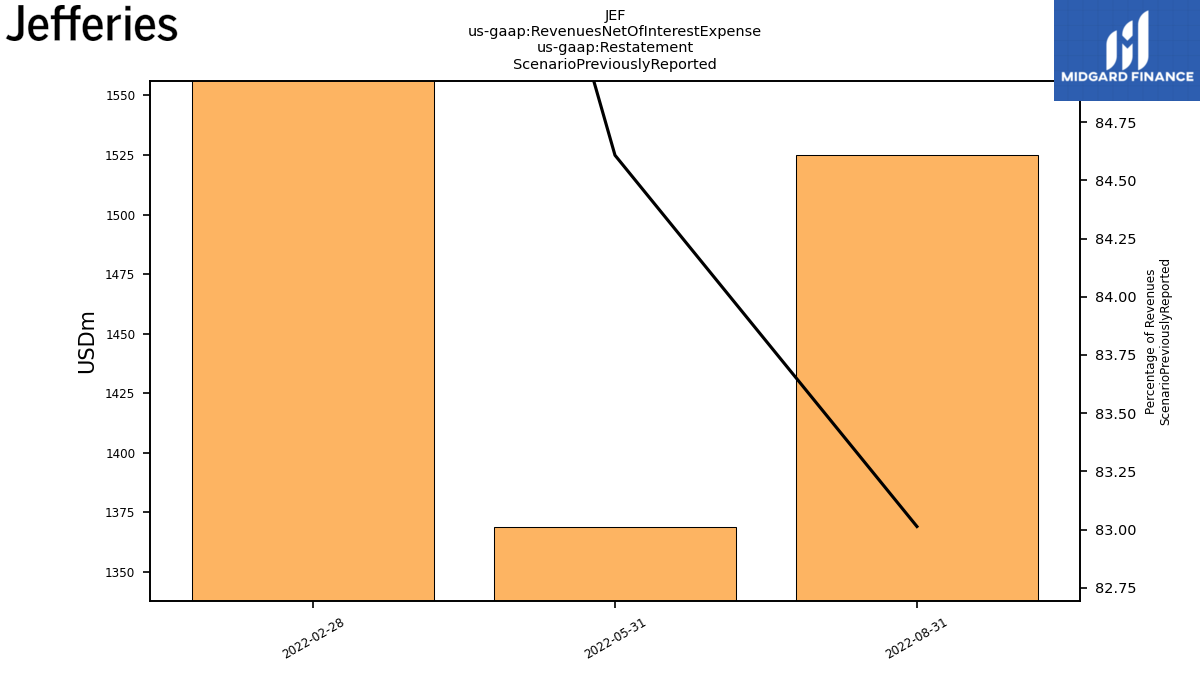
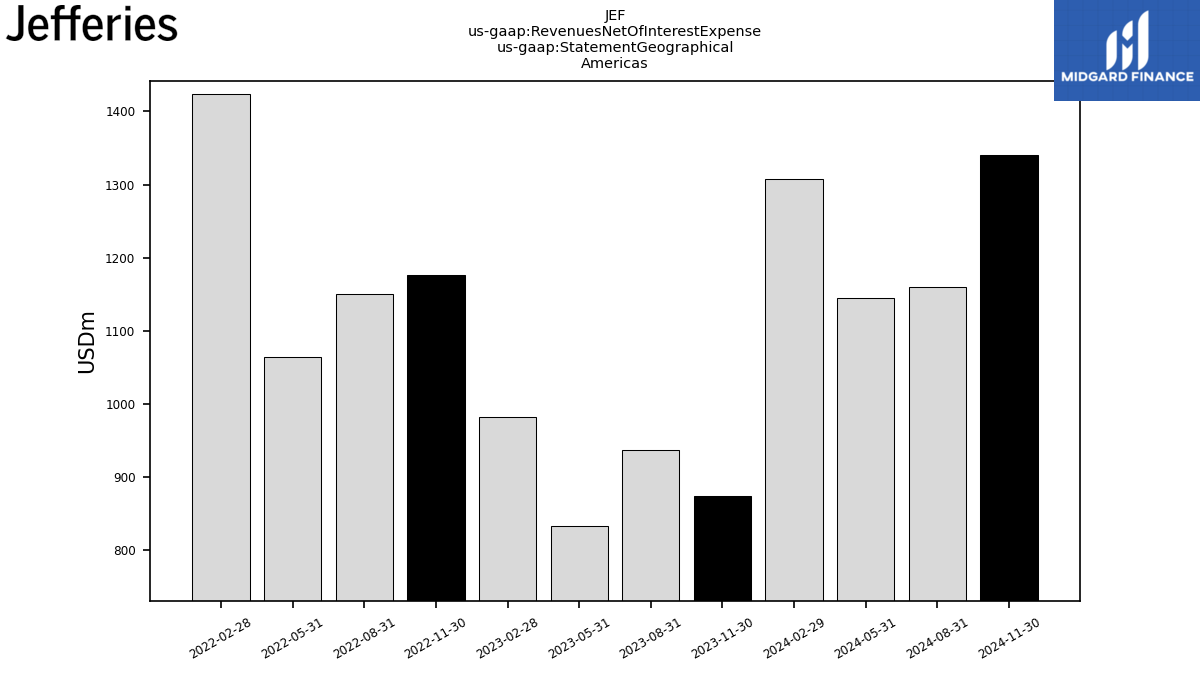
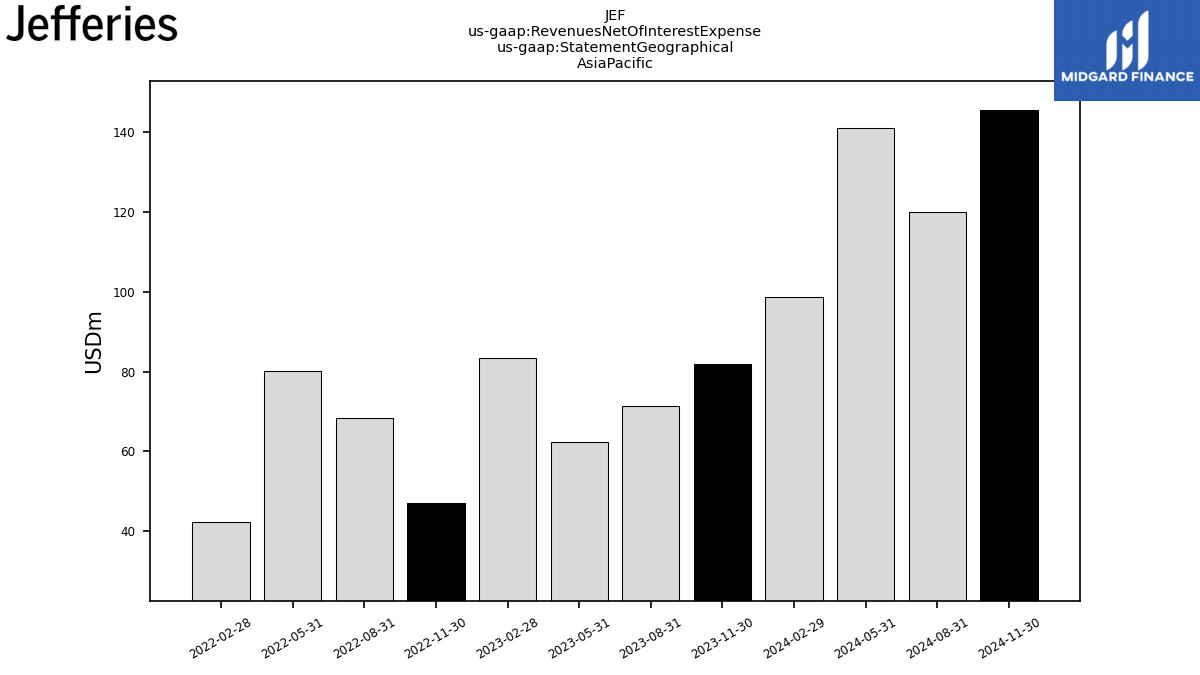
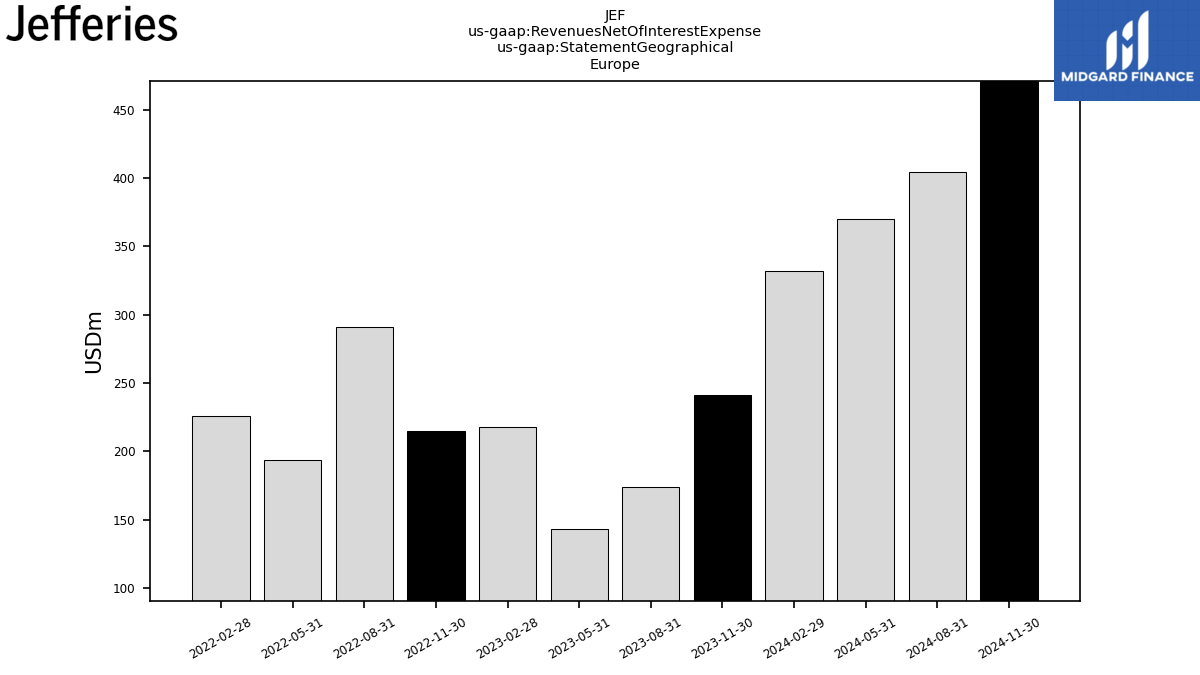