
| 2023-12-31 | 2023-09-30 | 2023-07-01 | 2023-04-01 | 2022-12-31 | 2022-09-24 | 2022-06-25 | 2022-03-26 | 2021-12-31 | 2021-09-25 | 2021-06-26 | 2021-03-27 | 2020-12-31 | 2020-09-26 | 2020-06-27 | 2020-03-28 | 2019-12-31 | 2019-09-28 | 2019-06-29 | 2019-03-30 | 2018-12-31 | 2018-09-29 | 2018-06-30 | 2018-03-31 | 2017-12-31 | 2017-09-30 | 2017-07-01 | 2017-04-01 | 2016-12-31 | 2016-09-24 | 2016-06-25 | 2016-03-26 | ||
|---|---|---|---|---|---|---|---|---|---|---|---|---|---|---|---|---|---|---|---|---|---|---|---|---|---|---|---|---|---|---|---|---|---|
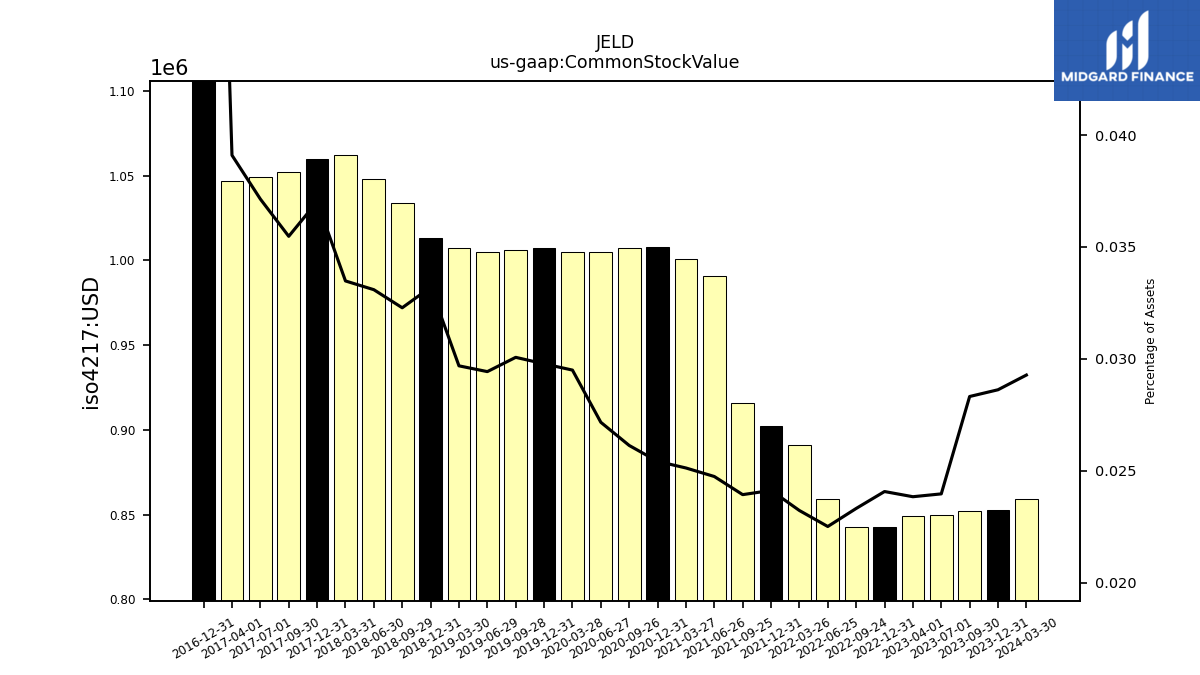
| Common Stock Value | 0.85 | 0.85 | 0.85 | 0.85 | 0.84 | 0.84 | 0.86 | 0.89 | 0.90 | 0.92 | 0.99 | 1.00 | 1.01 | 1.01 | 1.00 | 1.00 | 1.01 | 1.01 | 1.00 | 1.01 | 1.01 | 1.03 | 1.05 | 1.06 | 1.06 | 1.05 | 1.05 | 1.05 | 1.98 | NA | NA | NA | |
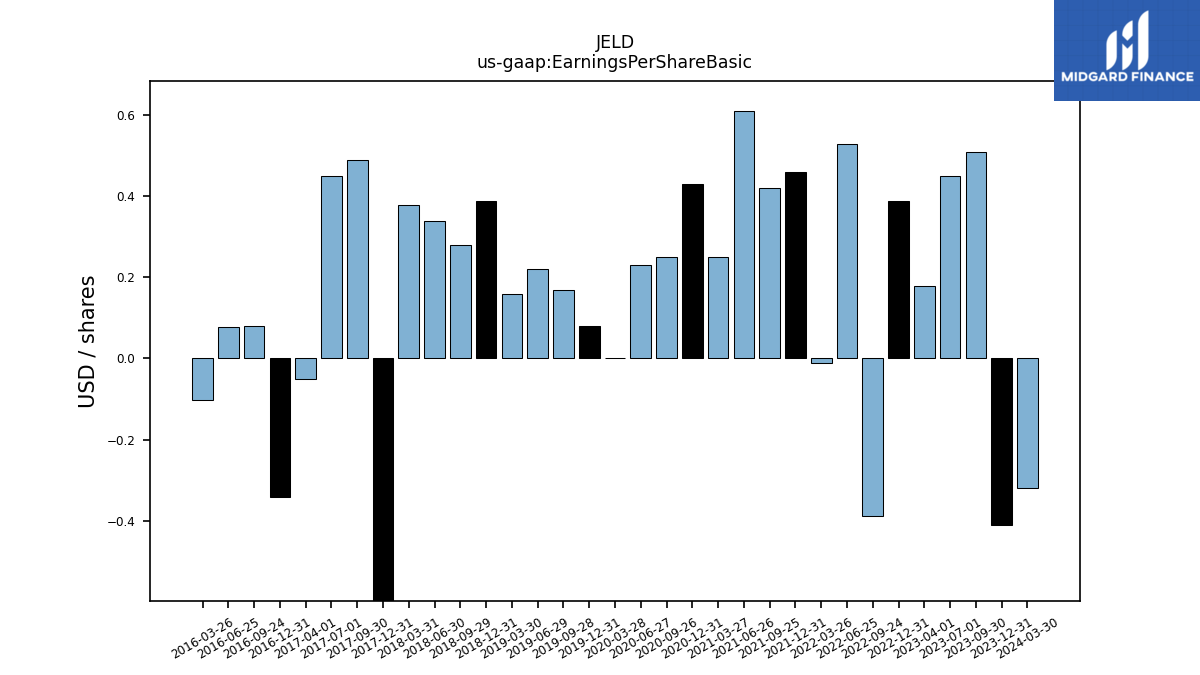
| Earnings Per Share Basic | -0.41 | 0.51 | 0.45 | 0.18 | 0.39 | -0.39 | 0.53 | -0.01 | 0.46 | 0.42 | 0.61 | 0.25 | 0.43 | 0.25 | 0.23 | 0.00 | 0.08 | 0.17 | 0.22 | 0.16 | 0.39 | 0.28 | 0.34 | 0.38 | -0.89 | 0.49 | 0.45 | -0.05 | -0.34 | 0.08 | 0.08 | -0.10 | |
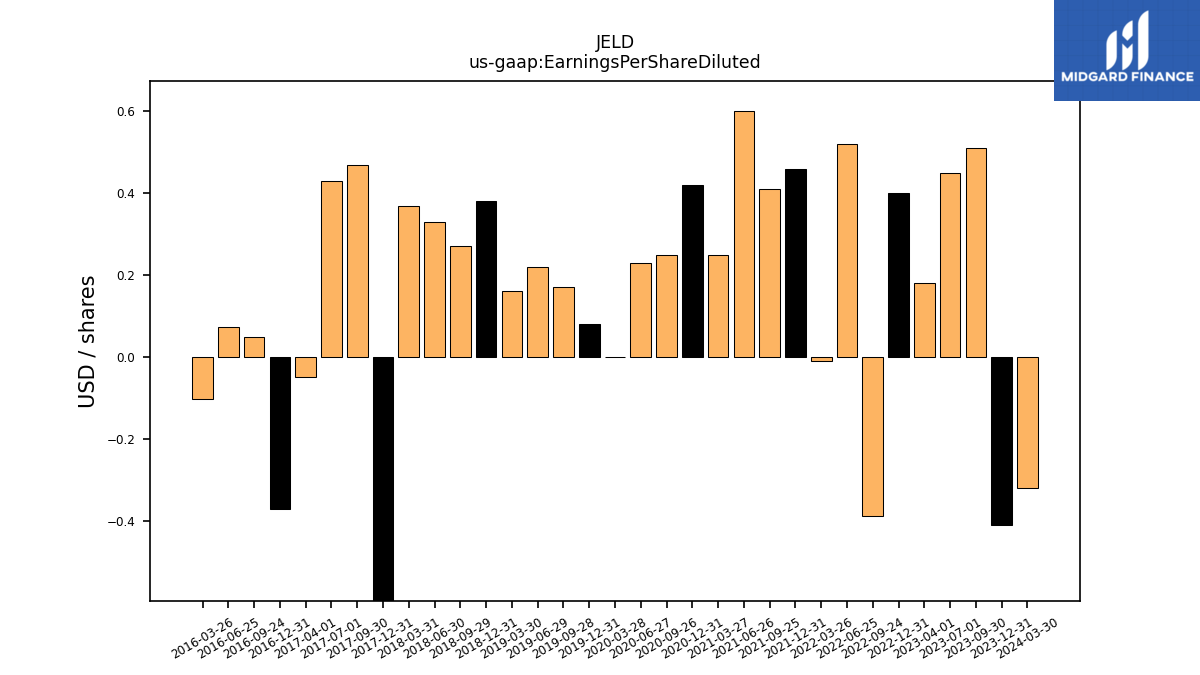
| Earnings Per Share Diluted | -0.41 | 0.51 | 0.45 | 0.18 | 0.40 | -0.39 | 0.52 | -0.01 | 0.46 | 0.41 | 0.60 | 0.25 | 0.42 | 0.25 | 0.23 | 0.00 | 0.08 | 0.17 | 0.22 | 0.16 | 0.38 | 0.27 | 0.33 | 0.37 | -0.89 | 0.47 | 0.43 | -0.05 | -0.37 | 0.05 | 0.07 | -0.10 | |
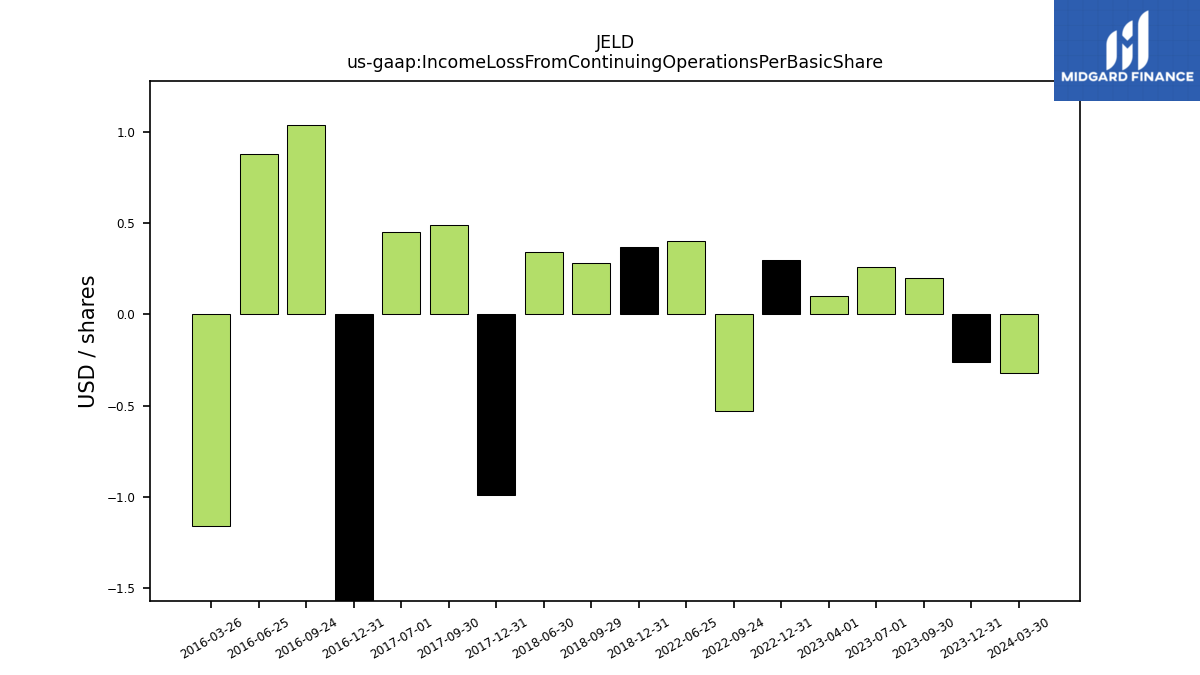
| Income Loss From Continuing Operations Per Basic Share | -0.00 | 0.00 | 0.00 | NA | 0.00 | -0.00 | 0.00 | NA | NA | NA | NA | NA | NA | NA | NA | NA | NA | NA | NA | NA | 0.00 | 0.00 | 0.00 | NA | -0.00 | 0.00 | 0.00 | NA | -0.00 | 0.00 | 0.00 | -0.00 | |
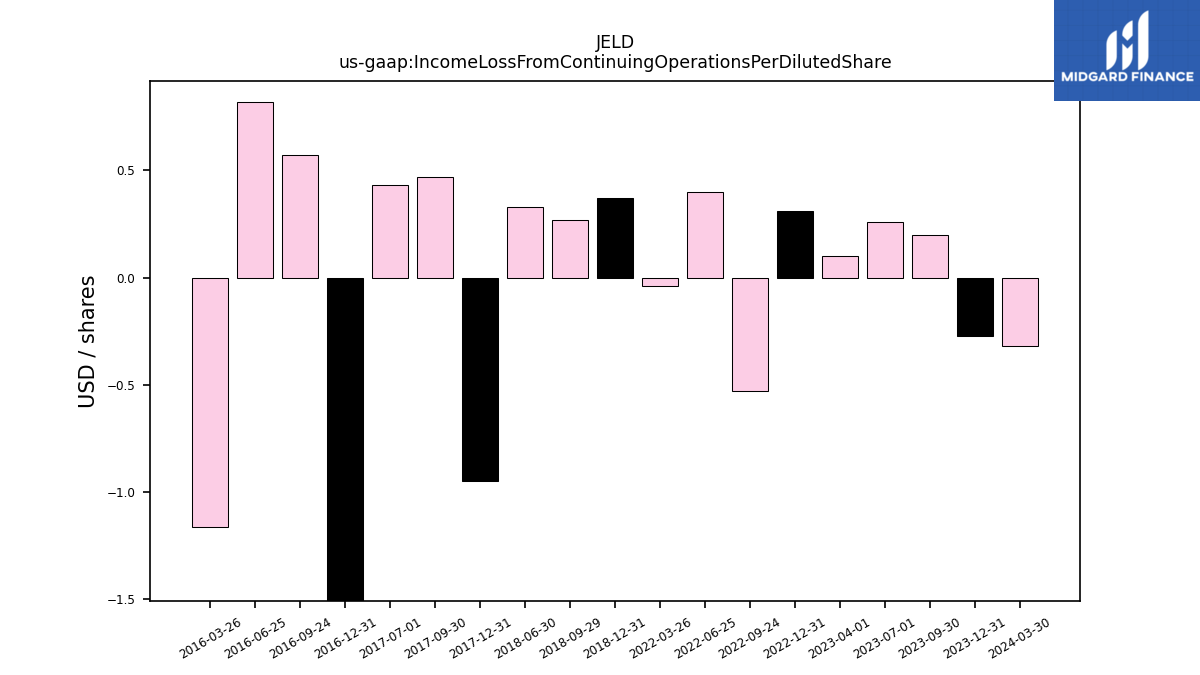
| Income Loss From Continuing Operations Per Diluted Share | -0.00 | 0.00 | 0.00 | 0.00 | 0.00 | -0.00 | 0.00 | -0.00 | NA | NA | NA | NA | NA | NA | NA | NA | NA | NA | NA | NA | 0.00 | 0.00 | 0.00 | NA | -0.00 | 0.00 | 0.00 | NA | -0.00 | 0.00 | 0.00 | -0.00 |
| 2023-12-31 | 2023-09-30 | 2023-07-01 | 2023-04-01 | 2022-12-31 | 2022-09-24 | 2022-06-25 | 2022-03-26 | 2021-12-31 | 2021-09-25 | 2021-06-26 | 2021-03-27 | 2020-12-31 | 2020-09-26 | 2020-06-27 | 2020-03-28 | 2019-12-31 | 2019-09-28 | 2019-06-29 | 2019-03-30 | 2018-12-31 | 2018-09-29 | 2018-06-30 | 2018-03-31 | 2017-12-31 | 2017-09-30 | 2017-07-01 | 2017-04-01 | 2016-12-31 | 2016-09-24 | 2016-06-25 | 2016-03-26 | ||
|---|---|---|---|---|---|---|---|---|---|---|---|---|---|---|---|---|---|---|---|---|---|---|---|---|---|---|---|---|---|---|---|---|---|
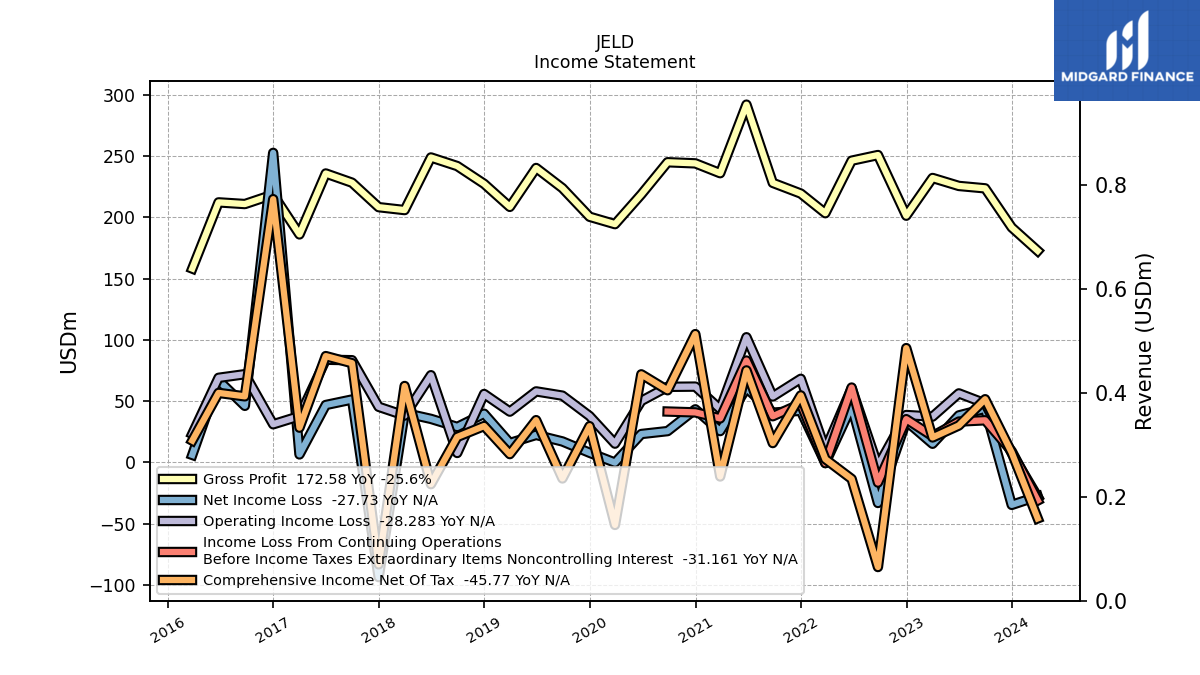
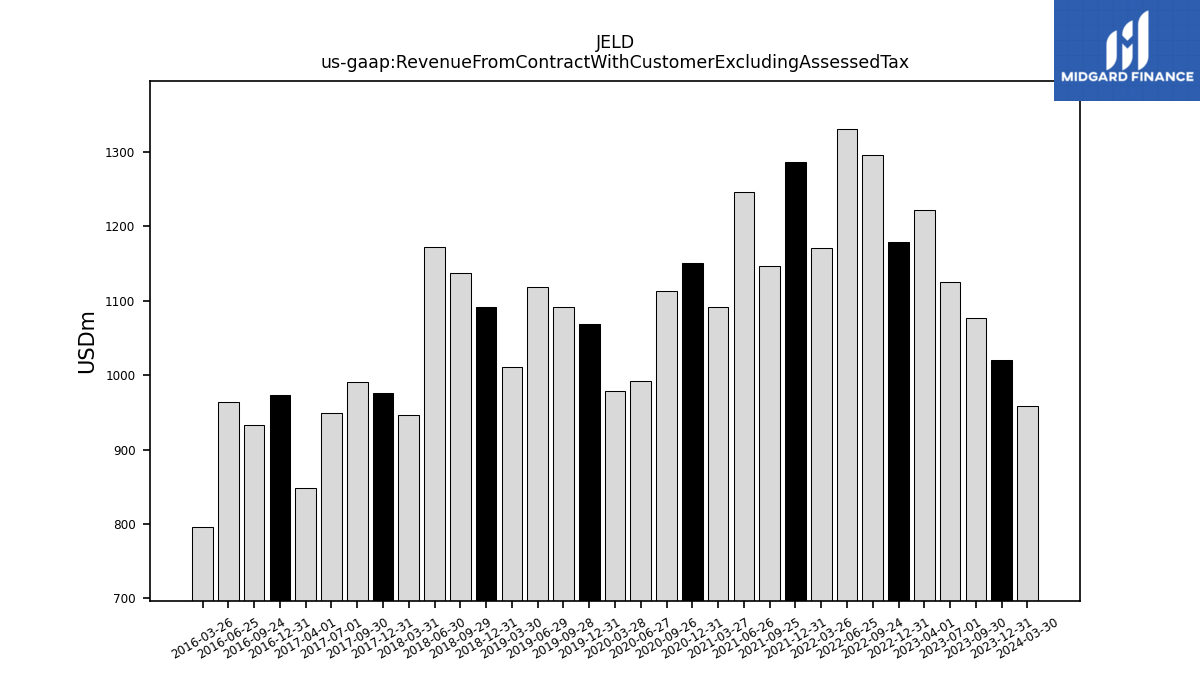
| Revenue From Contract With Customer Excluding Assessed Tax | 1021.07 | 1076.98 | 1125.77 | 1222.62 | 1179.01 | 1295.81 | 1330.97 | 1171.02 | 1286.94 | 1146.59 | 1245.82 | 1092.38 | 1151.28 | 1112.87 | 992.35 | 979.19 | 1068.56 | 1091.95 | 1118.99 | 1010.91 | 1091.08 | 1136.95 | 1172.50 | 946.18 | 975.78 | 991.33 | 948.79 | 847.85 | 973.17 | 932.48 | 964.61 | 796.55 | |
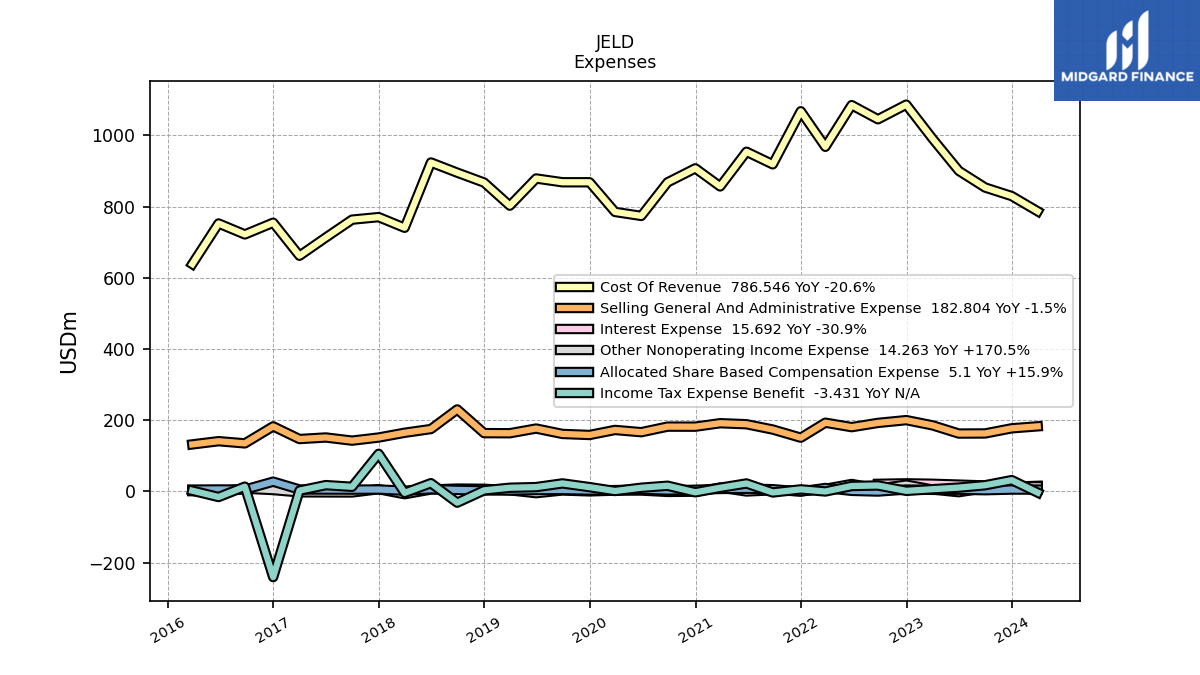
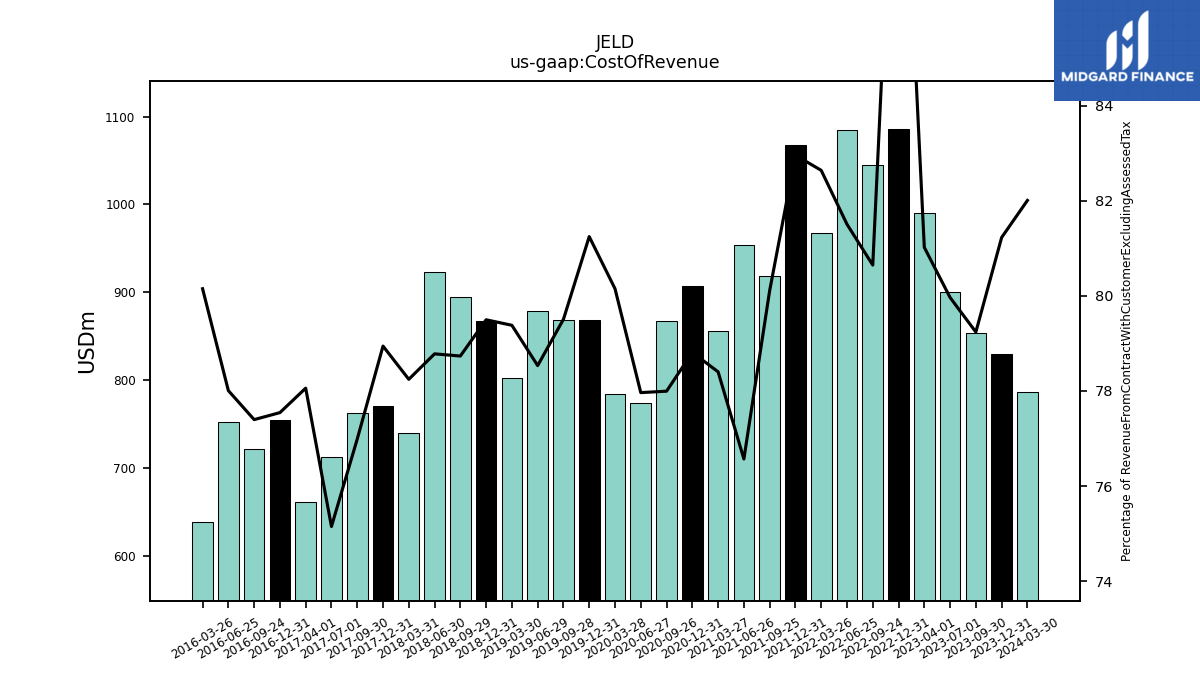
| Cost Of Revenue | 829.38 | 853.38 | 900.21 | 990.55 | 1086.19 | 1045.03 | 1084.80 | 967.72 | 1067.60 | 918.51 | 953.90 | 856.44 | 907.30 | 867.97 | 773.67 | 784.82 | 868.15 | 868.17 | 878.77 | 802.46 | 867.37 | 895.16 | 923.69 | 740.33 | 770.31 | 763.20 | 713.00 | 661.82 | 754.63 | 721.70 | 752.46 | 638.42 | |
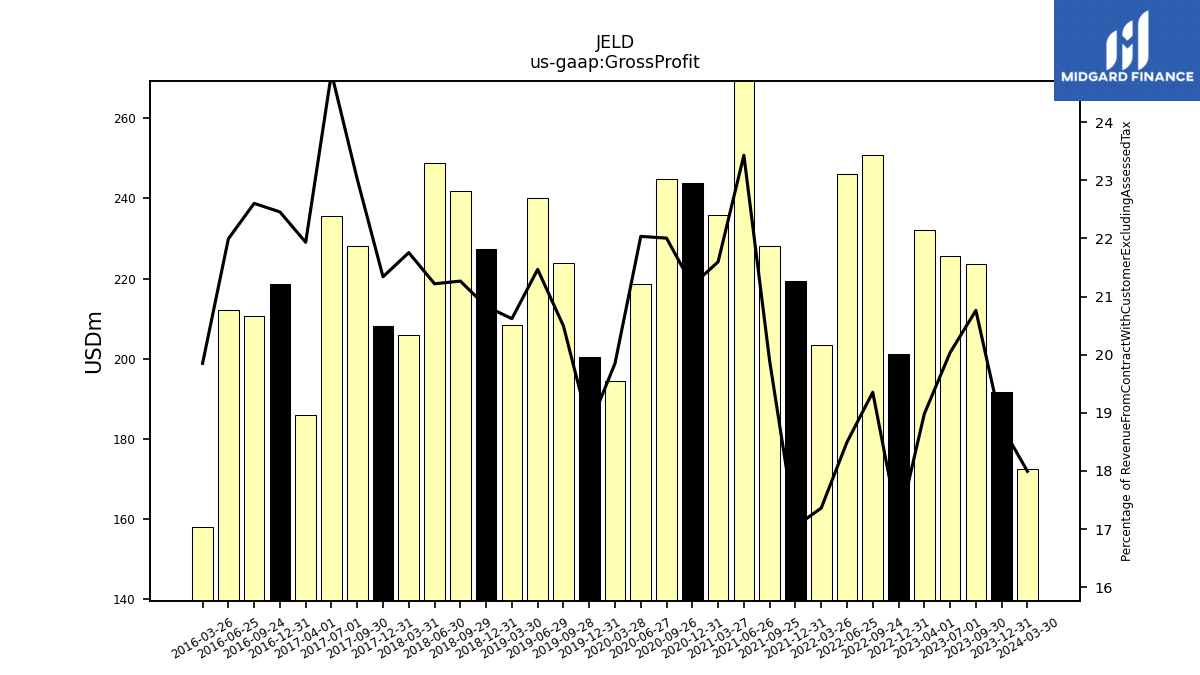
| Gross Profit | 191.68 | 223.60 | 225.56 | 232.07 | 201.25 | 250.78 | 246.16 | 203.30 | 219.34 | 228.07 | 291.92 | 235.94 | 243.97 | 244.89 | 218.67 | 194.37 | 200.41 | 223.78 | 240.22 | 208.45 | 227.28 | 241.79 | 248.81 | 205.85 | 208.24 | 228.21 | 235.74 | 185.97 | 218.54 | 210.77 | 212.15 | 158.12 | |
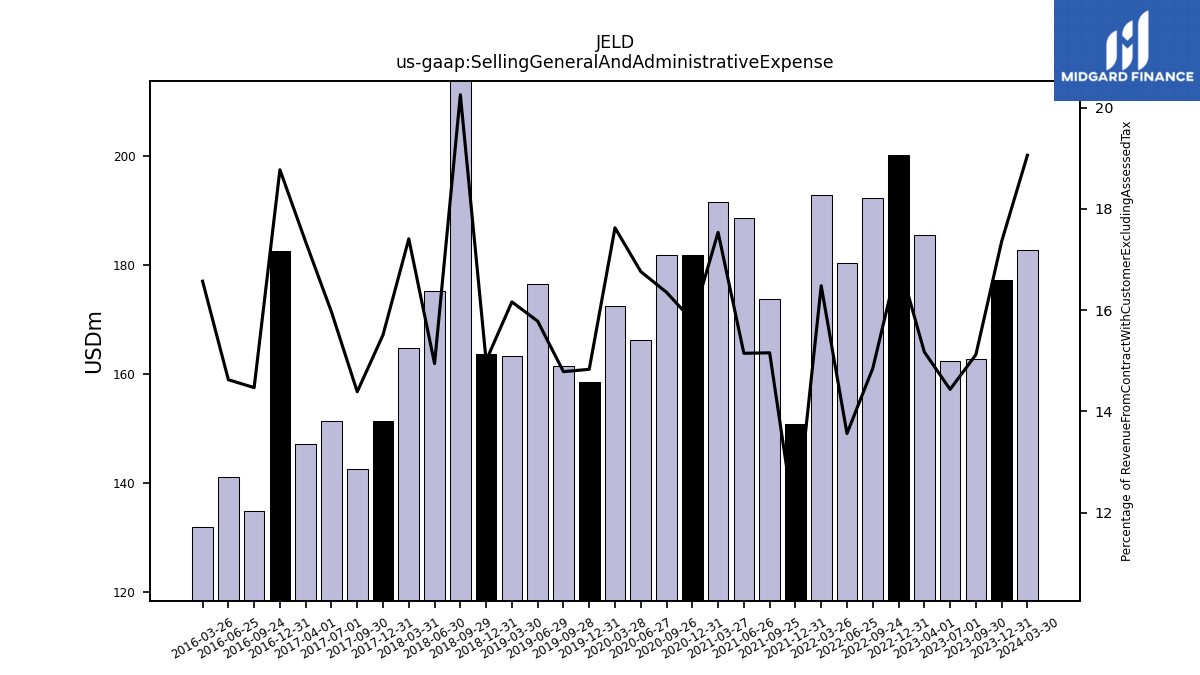
| Selling General And Administrative Expense | 177.22 | 162.82 | 162.48 | 185.51 | 200.22 | 192.39 | 180.49 | 193.00 | 150.87 | 173.77 | 188.69 | 191.55 | 181.84 | 181.96 | 166.33 | 172.58 | 158.47 | 161.42 | 176.59 | 163.38 | 163.67 | 230.28 | 175.20 | 164.71 | 151.33 | 142.62 | 151.46 | 147.08 | 182.69 | 134.91 | 141.06 | 131.99 | |
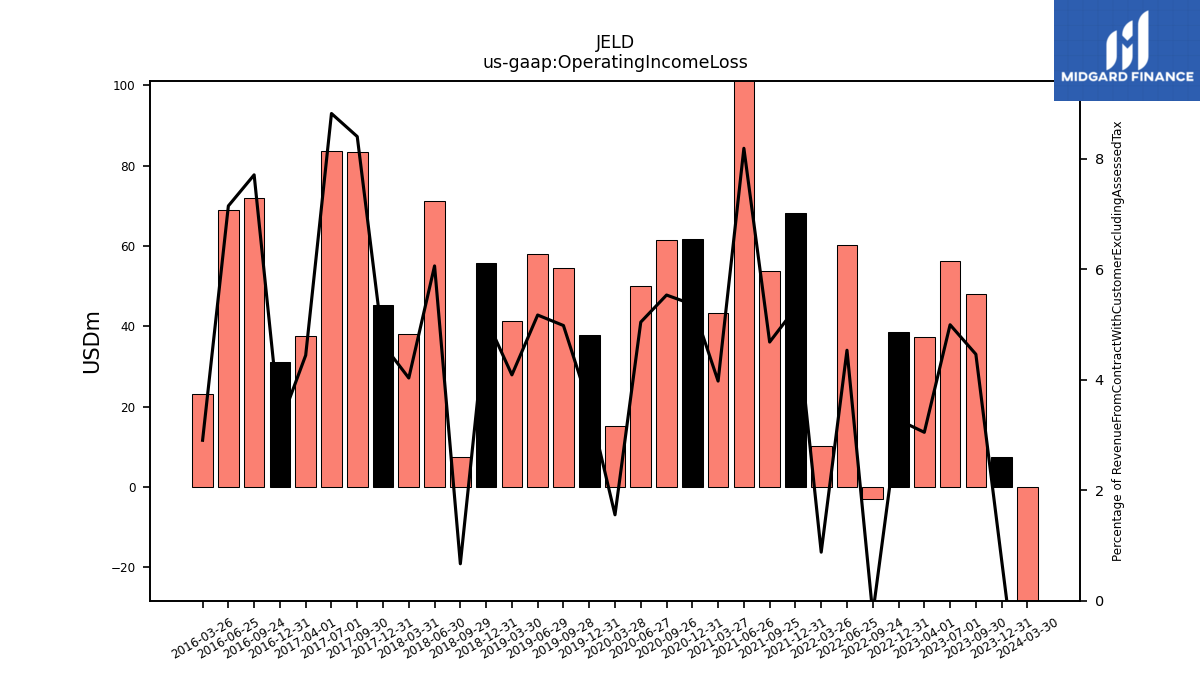
| Operating Income Loss | 7.50 | 48.08 | 56.27 | 37.30 | 38.61 | -3.08 | 60.38 | 10.30 | 68.16 | 53.72 | 102.08 | 43.46 | 61.79 | 61.61 | 50.08 | 15.24 | 37.78 | 54.43 | 57.90 | 41.35 | 55.78 | 7.61 | 71.10 | 38.16 | 45.32 | 83.33 | 83.72 | 37.69 | 31.05 | 71.92 | 68.97 | 23.15 | |
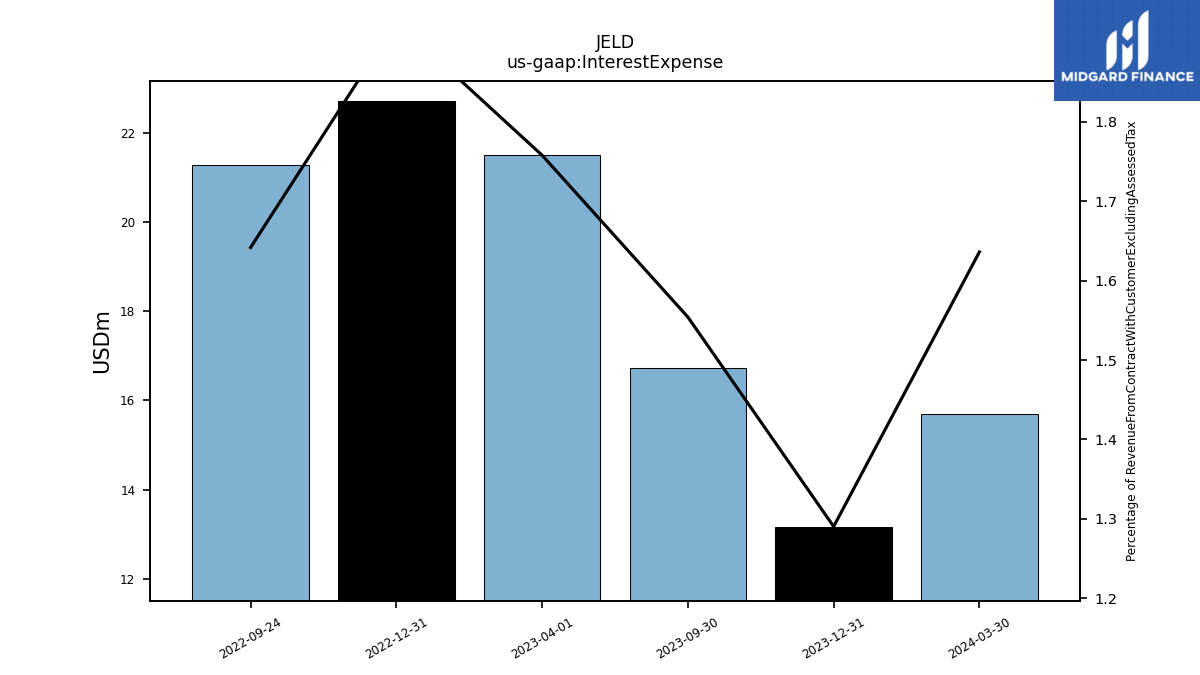
| Interest Expense | 13.18 | 16.74 | NA | NA | 22.71 | 21.27 | NA | NA | NA | NA | NA | NA | NA | NA | NA | NA | NA | NA | NA | NA | NA | NA | NA | NA | NA | NA | NA | NA | NA | NA | NA | NA | |
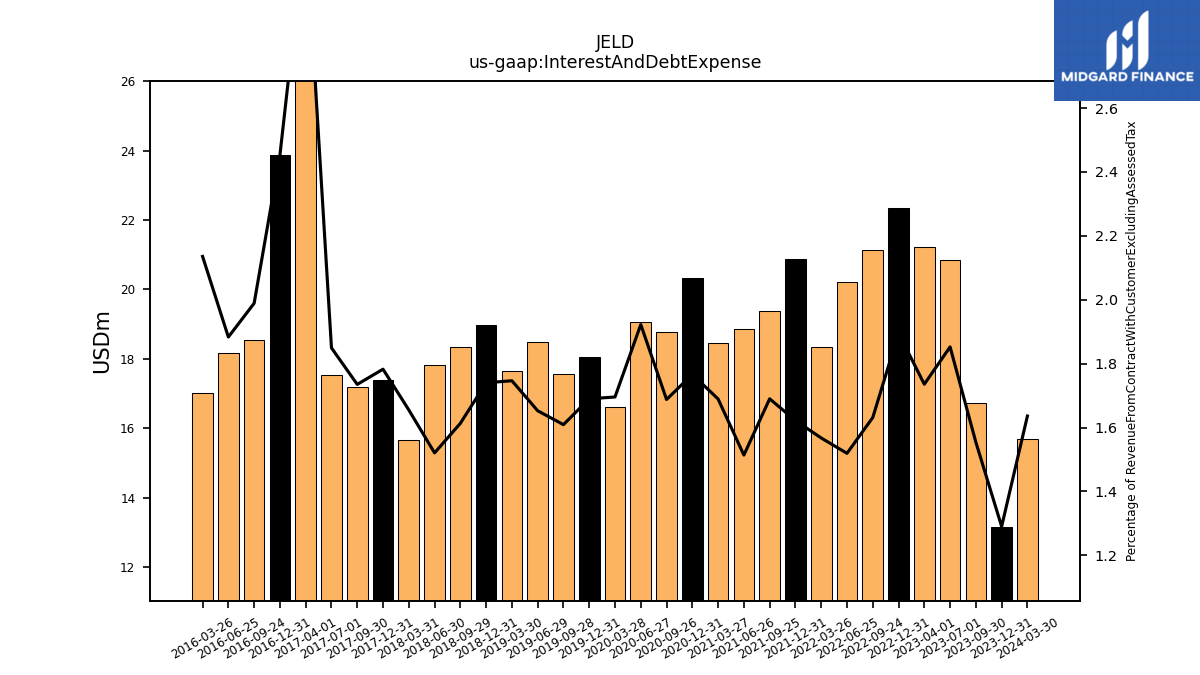
| Interest And Debt Expense | 13.18 | 16.74 | 20.85 | 21.22 | 22.35 | 21.14 | 20.22 | 18.35 | 20.87 | 19.38 | 18.86 | 18.45 | 20.34 | 18.78 | 19.08 | 16.60 | 18.06 | 17.57 | 18.49 | 17.66 | 18.99 | 18.34 | 17.83 | 15.66 | 17.39 | 17.20 | 17.55 | 26.89 | 23.86 | 18.55 | 18.17 | 17.01 | |
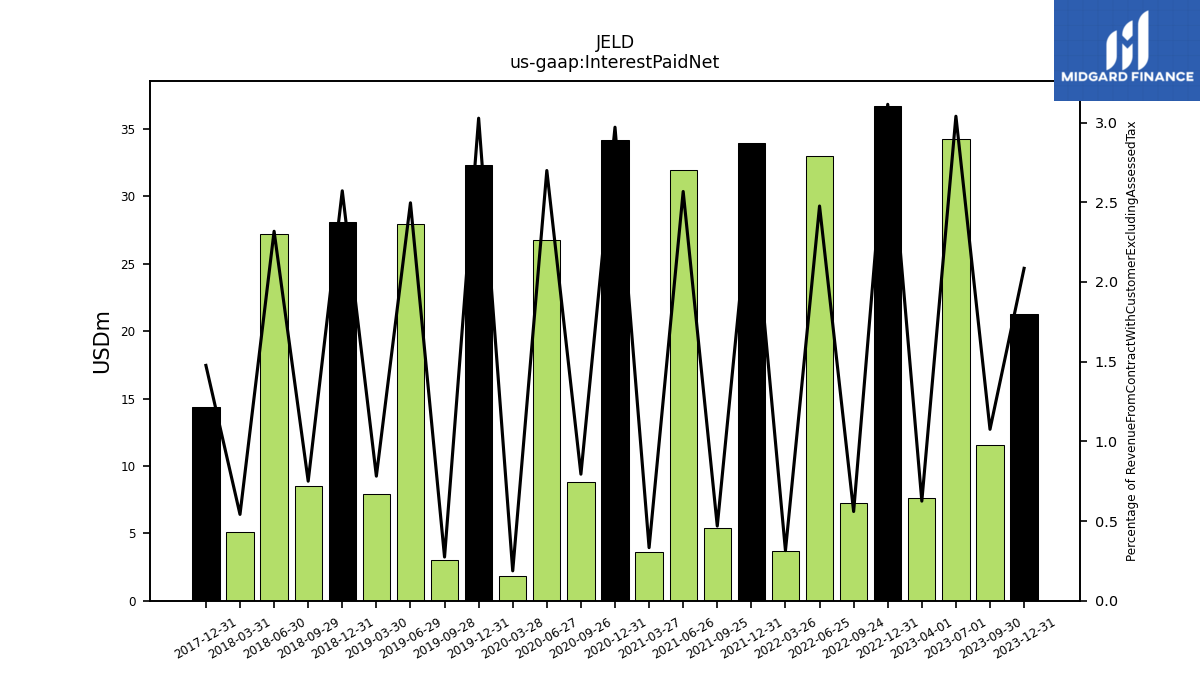
| Interest Paid Net | 21.29 | 11.58 | 34.22 | 7.64 | 36.72 | 7.25 | 32.96 | 3.68 | 33.96 | 5.37 | 31.98 | 3.64 | 34.20 | 8.84 | 26.78 | 1.84 | 32.35 | 3.00 | 27.93 | 7.90 | 28.06 | 8.53 | 27.18 | 5.13 | 14.41 | NA | NA | NA | NA | NA | NA | NA | |
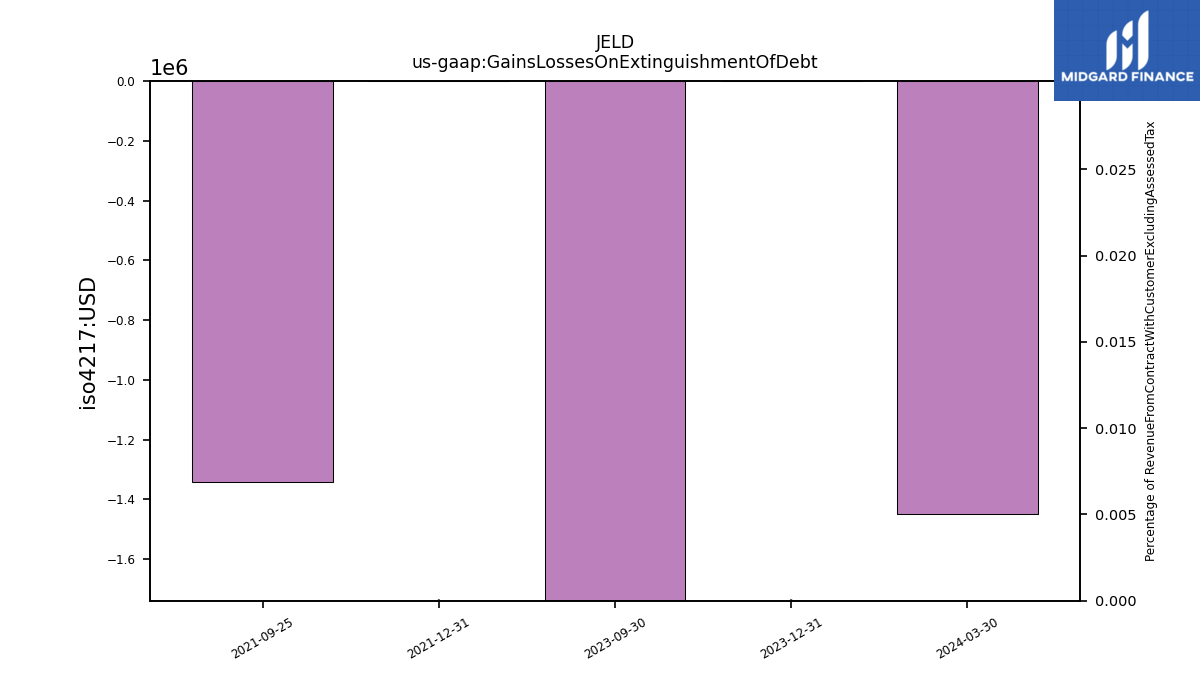
| Gains Losses On Extinguishment Of Debt | 0.00 | -6.49 | NA | NA | NA | NA | NA | NA | 0.00 | -1.34 | NA | NA | NA | NA | NA | NA | NA | NA | NA | NA | NA | NA | NA | NA | NA | NA | NA | NA | NA | NA | NA | NA | |
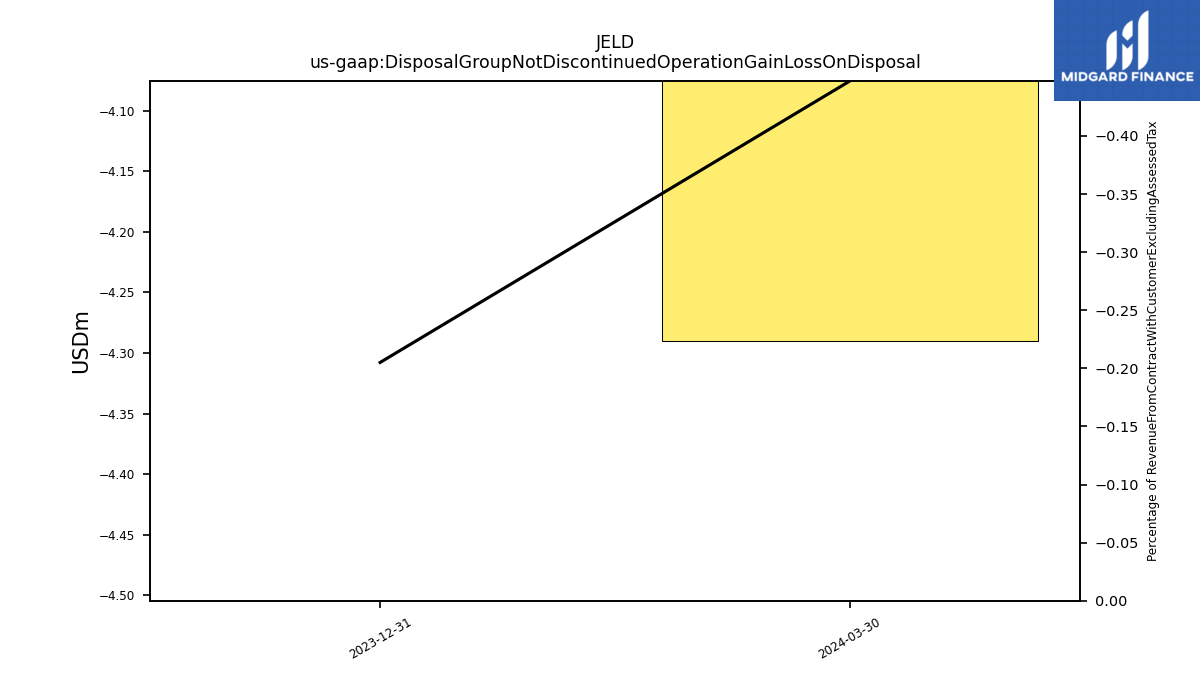
| Disposal Group Not Discontinued Operation Gain Loss On Disposal | -2.09 | NA | NA | NA | NA | NA | NA | NA | NA | NA | NA | NA | NA | NA | NA | NA | NA | NA | NA | NA | NA | NA | NA | NA | NA | NA | NA | NA | NA | NA | NA | NA | |
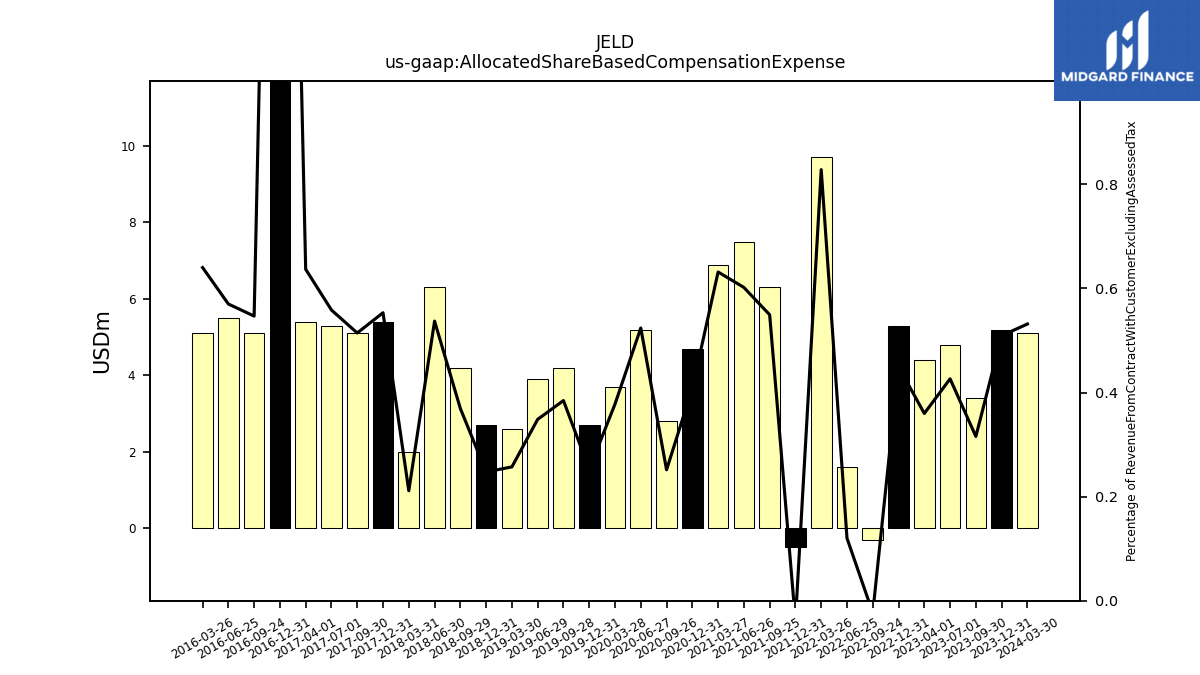
| Allocated Share Based Compensation Expense | 5.20 | 3.40 | 4.80 | 4.40 | 5.30 | -0.30 | 1.60 | 9.70 | -0.50 | 6.30 | 7.50 | 6.90 | 4.70 | 2.80 | 5.20 | 3.70 | 2.70 | 4.20 | 3.90 | 2.60 | 2.70 | 4.20 | 6.30 | 2.00 | 5.40 | 5.10 | 5.30 | 5.40 | 27.40 | 5.10 | 5.50 | 5.10 | |
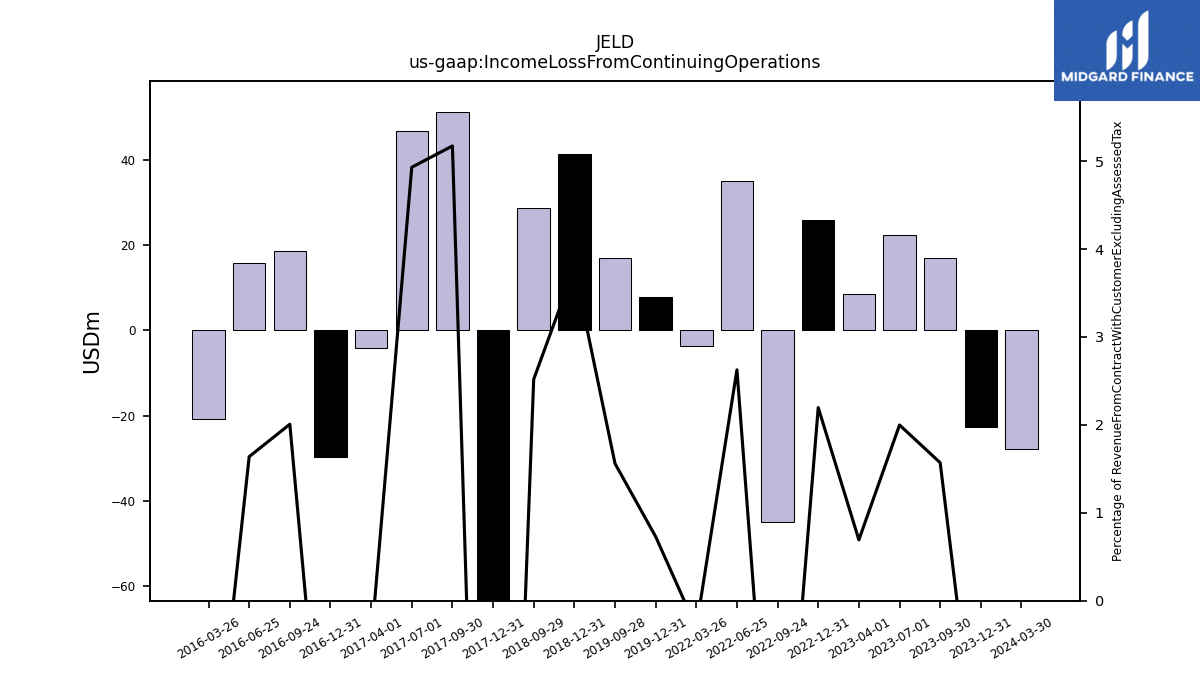
| Income Loss From Continuing Operations | -22.64 | 16.91 | 22.50 | 8.46 | 25.90 | -45.06 | 34.96 | -3.58 | NA | NA | NA | NA | NA | NA | NA | NA | 7.80 | 17.04 | NA | NA | 41.28 | 28.64 | NA | NA | -93.69 | 51.27 | 46.78 | -4.03 | -29.79 | 18.72 | 15.81 | -20.88 | |
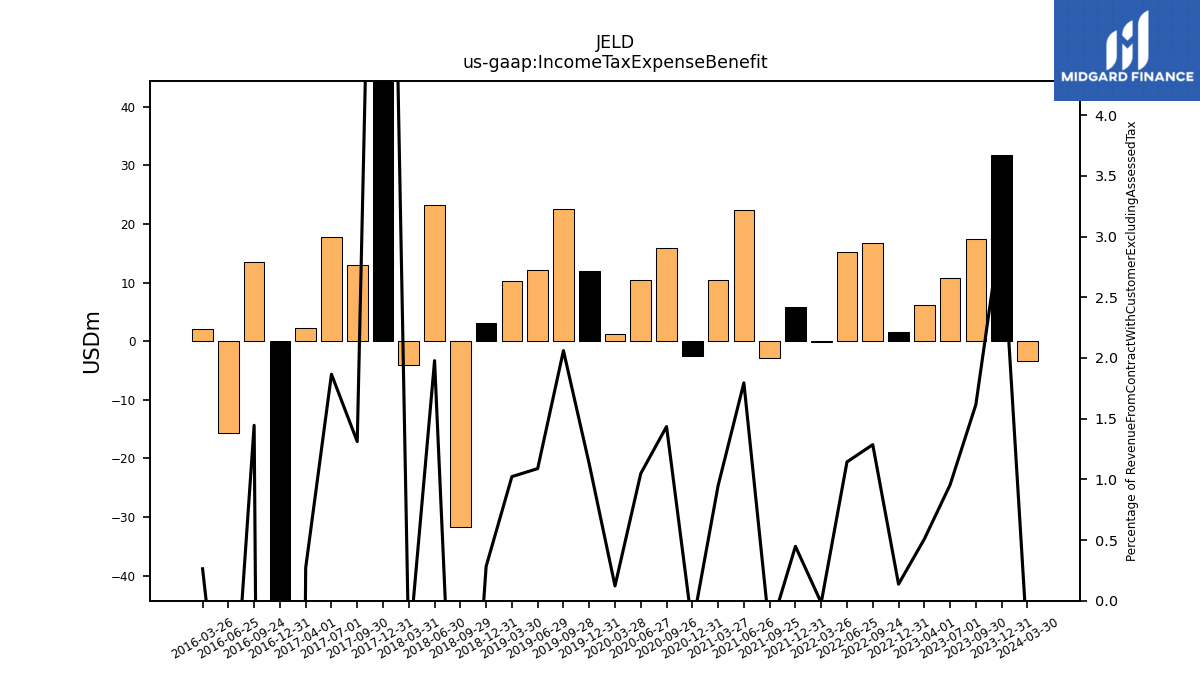
| Income Tax Expense Benefit | 31.70 | 17.40 | 10.75 | 6.21 | 1.61 | 16.66 | 15.22 | -0.19 | 5.77 | -2.95 | 22.36 | 10.36 | -2.48 | 15.97 | 10.40 | 1.20 | 12.04 | 22.50 | 12.18 | 10.34 | 3.08 | -31.61 | 23.19 | -4.03 | 105.61 | 13.00 | 17.70 | 2.30 | -240.66 | 13.48 | -15.71 | 2.10 | |
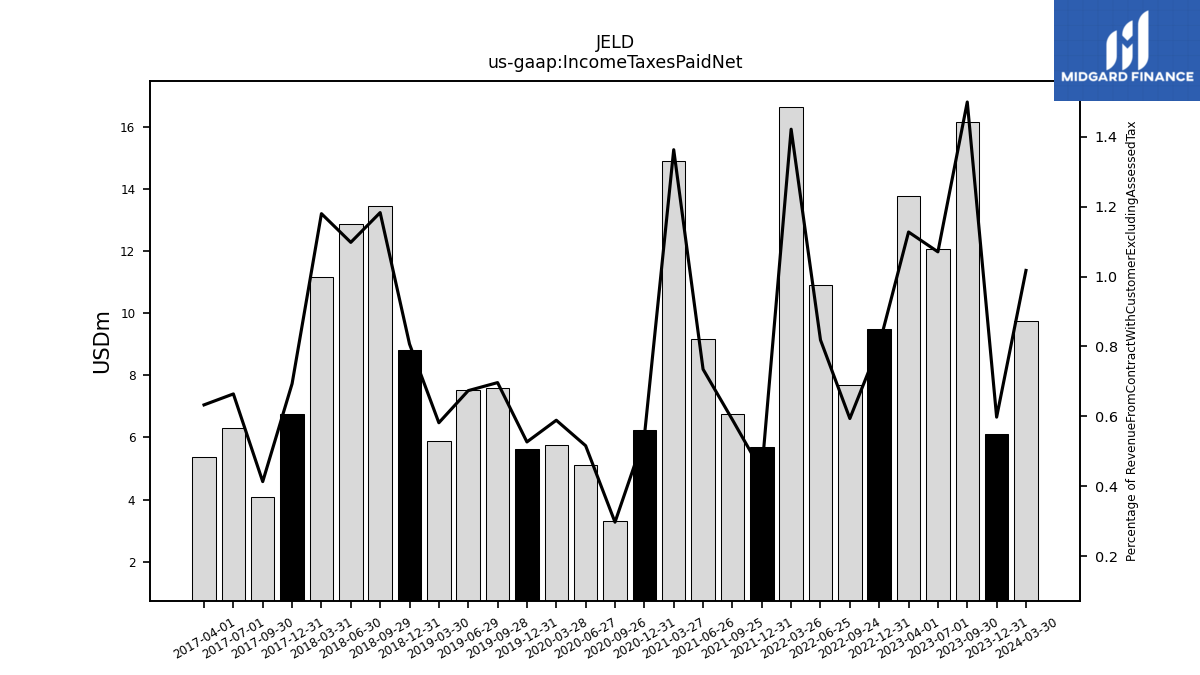
| Income Taxes Paid Net | 6.10 | 16.15 | 12.05 | 13.79 | 9.48 | 7.70 | 10.90 | 16.65 | 5.70 | 6.77 | 9.15 | 14.89 | 6.25 | 3.31 | 5.12 | 5.77 | 5.63 | 7.61 | 7.54 | 5.88 | 8.81 | 13.45 | 12.87 | 11.16 | 6.77 | 4.10 | 6.30 | 5.37 | NA | NA | NA | NA | |
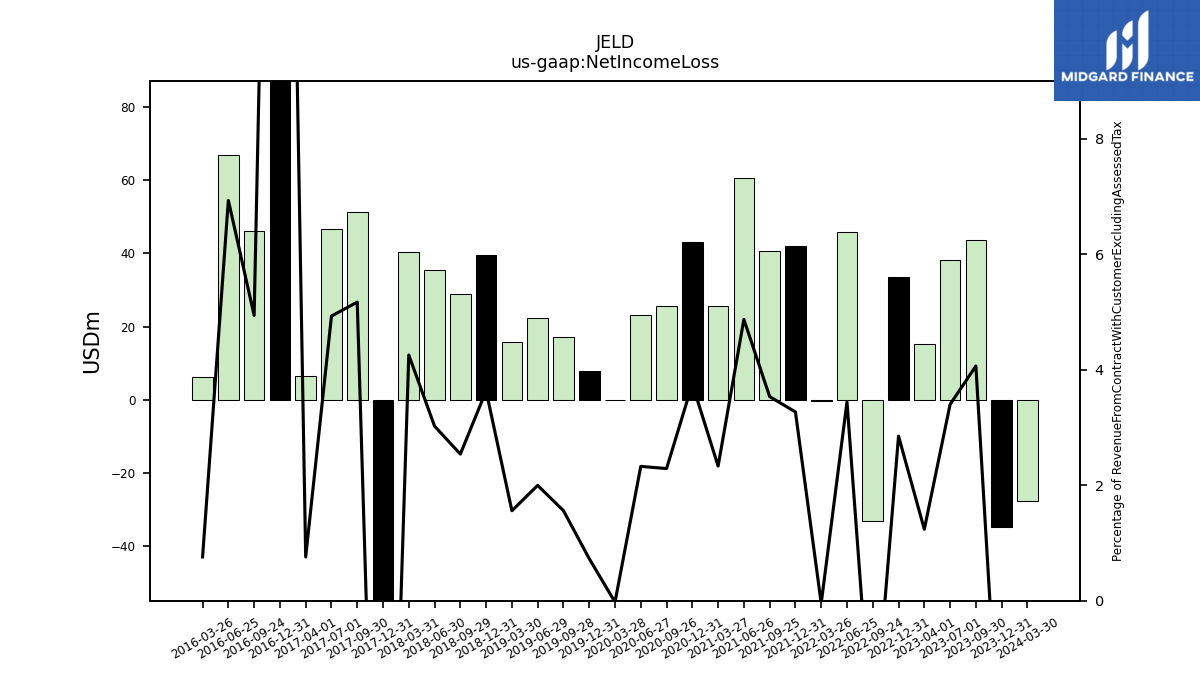
| Net Income Loss | -34.76 | 43.78 | 38.28 | 15.13 | 33.62 | -33.19 | 45.83 | -0.53 | 42.09 | 40.54 | 60.71 | 25.48 | 43.24 | 25.48 | 23.10 | -0.23 | 7.80 | 17.04 | 22.36 | 15.76 | 39.66 | 28.89 | 35.45 | 40.27 | -93.69 | 51.27 | 46.78 | 6.43 | 252.57 | 46.08 | 66.89 | 6.04 | |
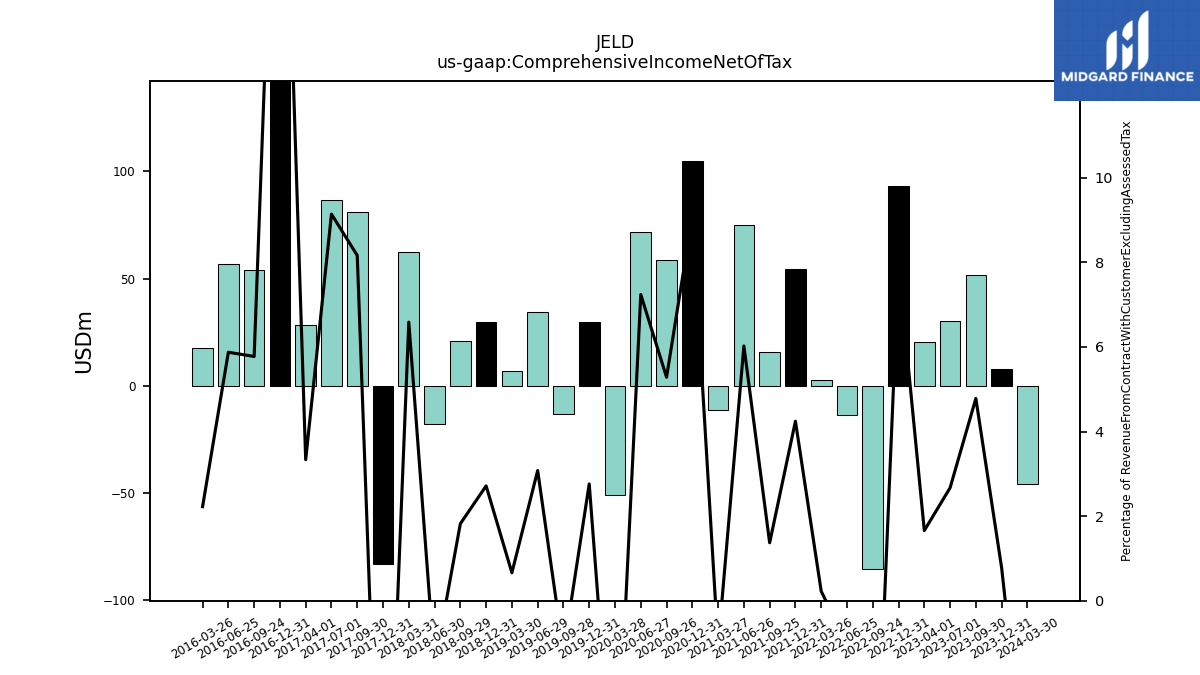
| Comprehensive Income Net Of Tax | 7.93 | 51.50 | 30.06 | 20.28 | 93.23 | -85.46 | -13.55 | 2.63 | 54.60 | 15.71 | 75.03 | -11.57 | 104.66 | 58.80 | 71.82 | -51.11 | 29.51 | -13.17 | 34.43 | 6.70 | 29.62 | 20.70 | -17.83 | 62.31 | -83.26 | 80.91 | 86.70 | 28.27 | 214.77 | 53.84 | 56.66 | 17.72 |
| 2023-12-31 | 2023-09-30 | 2023-07-01 | 2023-04-01 | 2022-12-31 | 2022-09-24 | 2022-06-25 | 2022-03-26 | 2021-12-31 | 2021-09-25 | 2021-06-26 | 2021-03-27 | 2020-12-31 | 2020-09-26 | 2020-06-27 | 2020-03-28 | 2019-12-31 | 2019-09-28 | 2019-06-29 | 2019-03-30 | 2018-12-31 | 2018-09-29 | 2018-06-30 | 2018-03-31 | 2017-12-31 | 2017-09-30 | 2017-07-01 | 2017-04-01 | 2016-12-31 | 2016-09-24 | 2016-06-25 | 2016-03-26 | ||
|---|---|---|---|---|---|---|---|---|---|---|---|---|---|---|---|---|---|---|---|---|---|---|---|---|---|---|---|---|---|---|---|---|---|
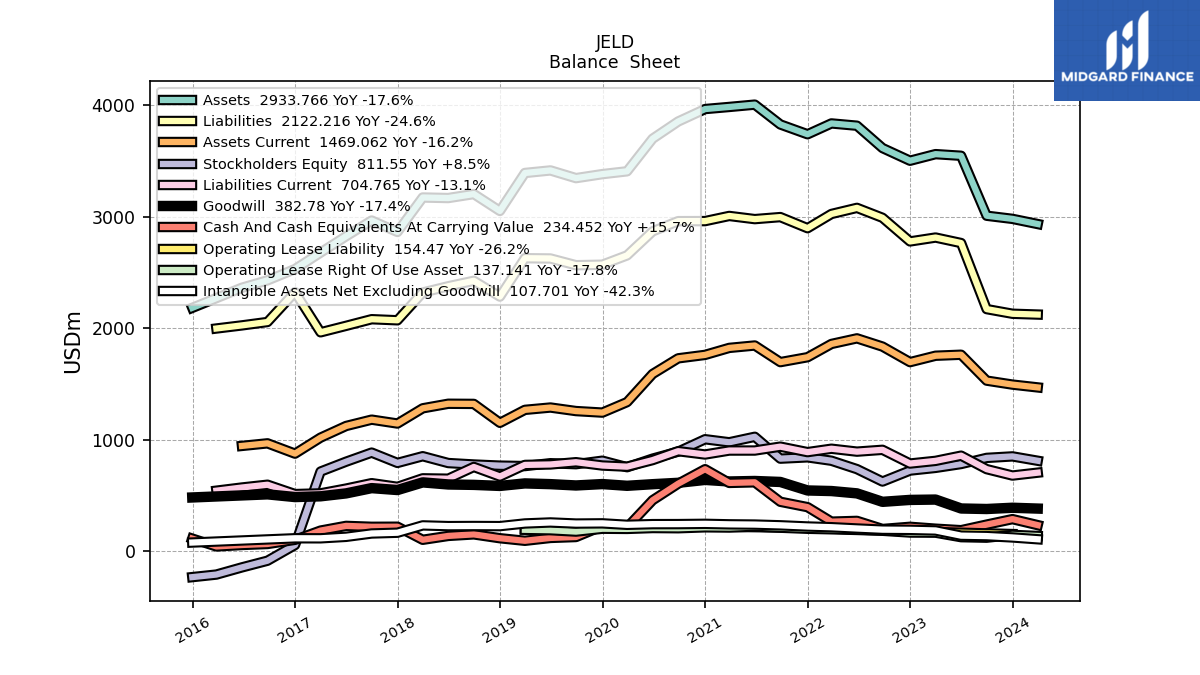
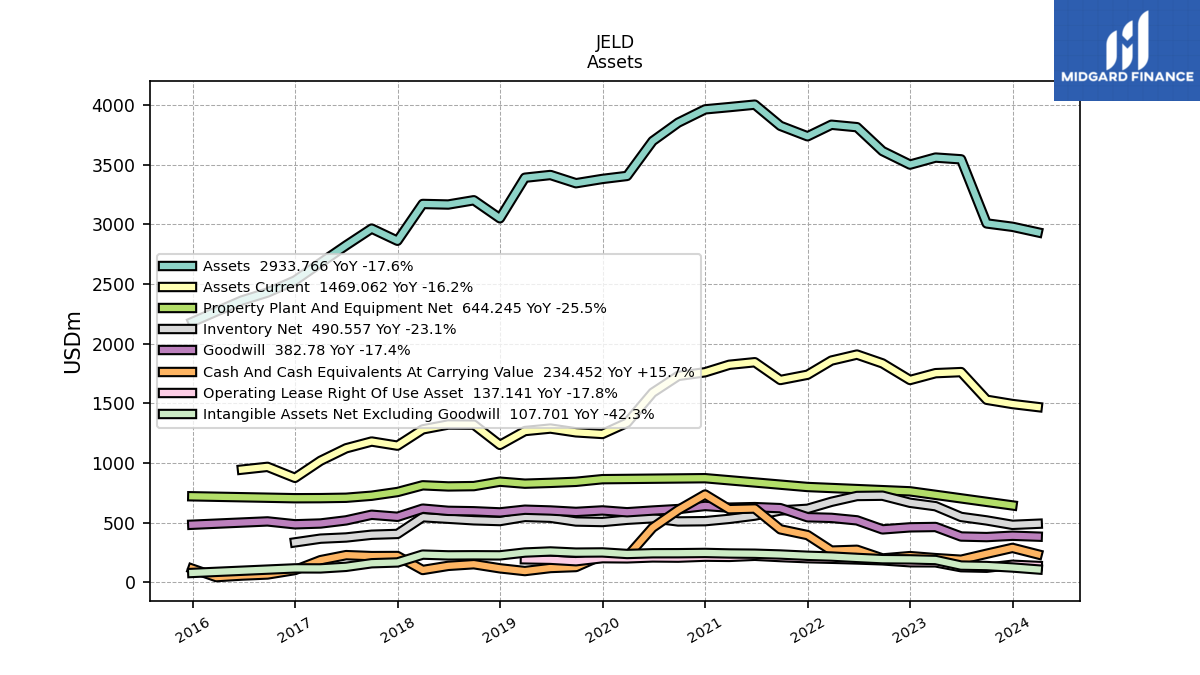
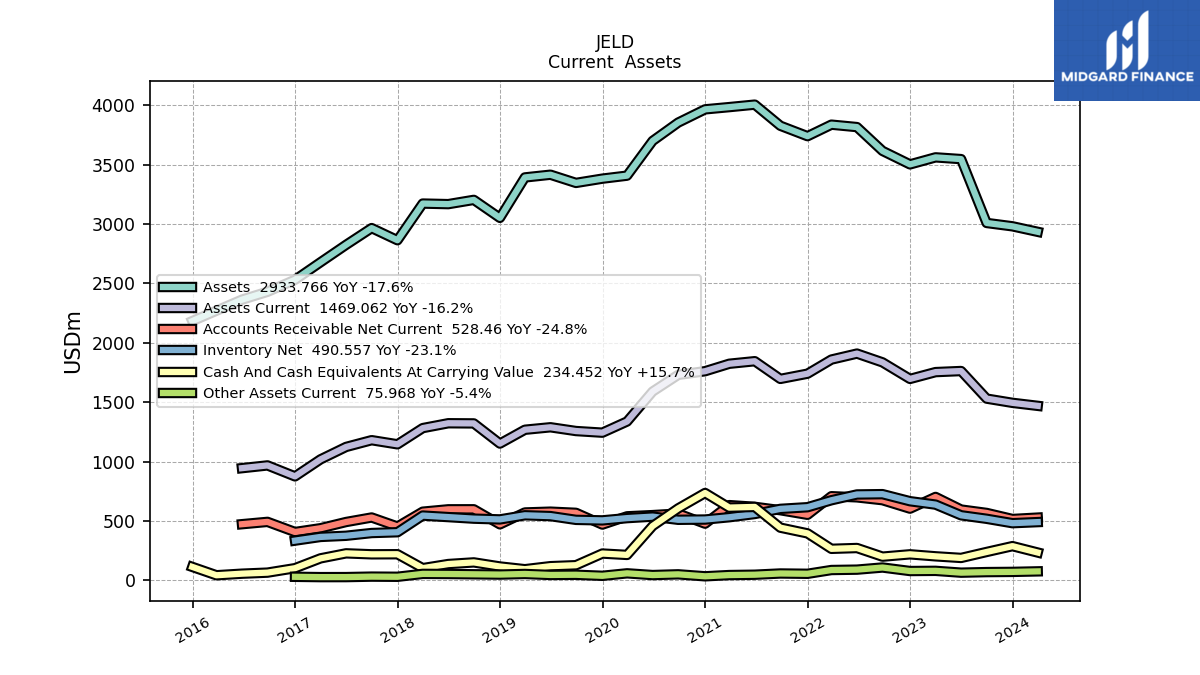
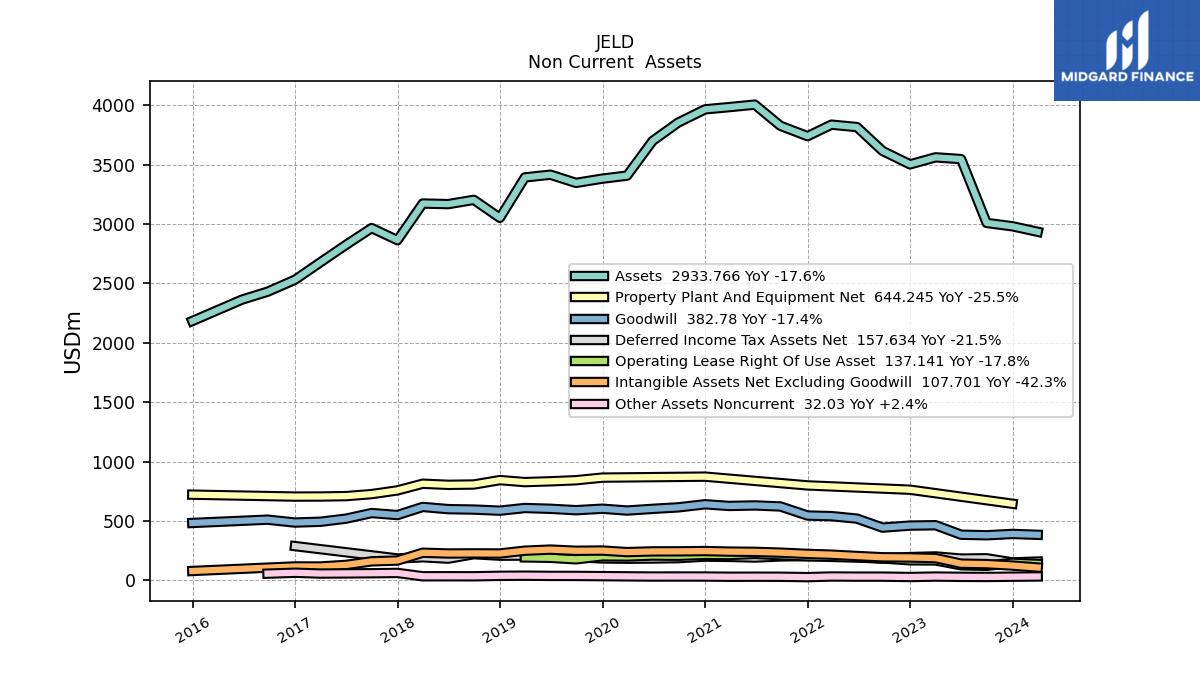
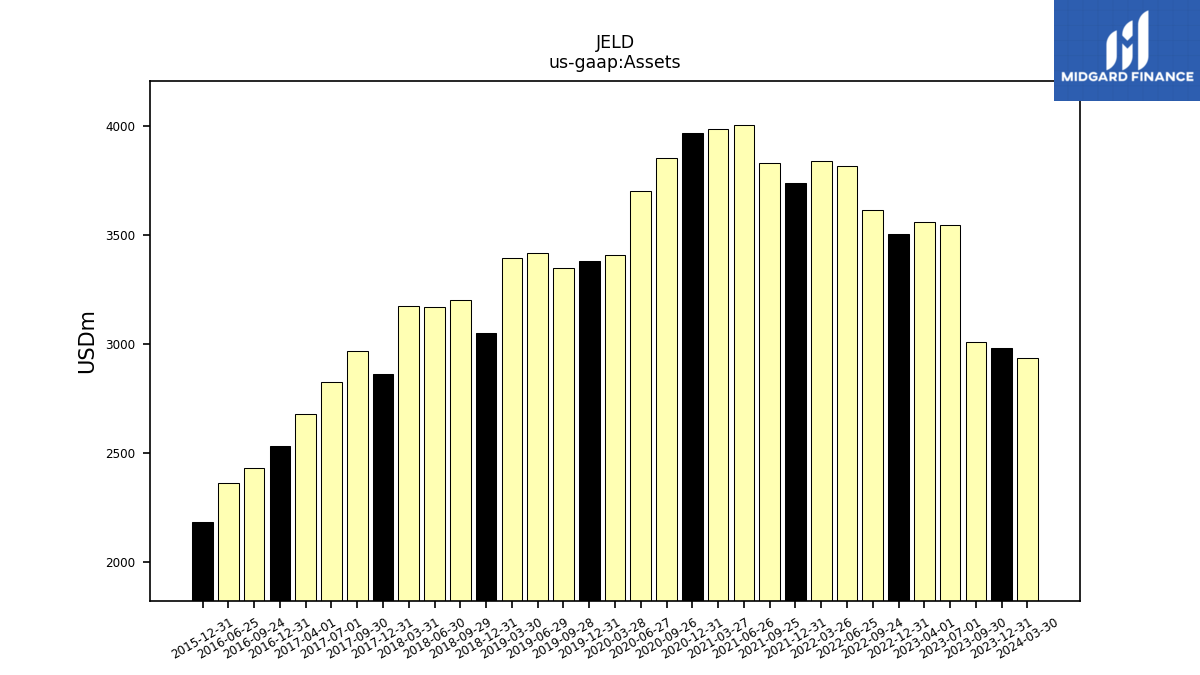
| Assets | 2980.12 | 3008.32 | 3545.85 | 3560.52 | 3501.36 | 3614.92 | 3815.31 | 3835.79 | 3738.67 | 3826.55 | 4004.39 | 3983.47 | 3964.68 | 3853.07 | 3698.88 | 3406.58 | 3381.33 | 3345.40 | 3414.47 | 3391.54 | 3051.05 | 3202.74 | 3166.84 | 3171.70 | 2862.94 | 2965.28 | 2824.37 | 2677.85 | 2530.08 | 2429.12 | 2362.71 | NA | |
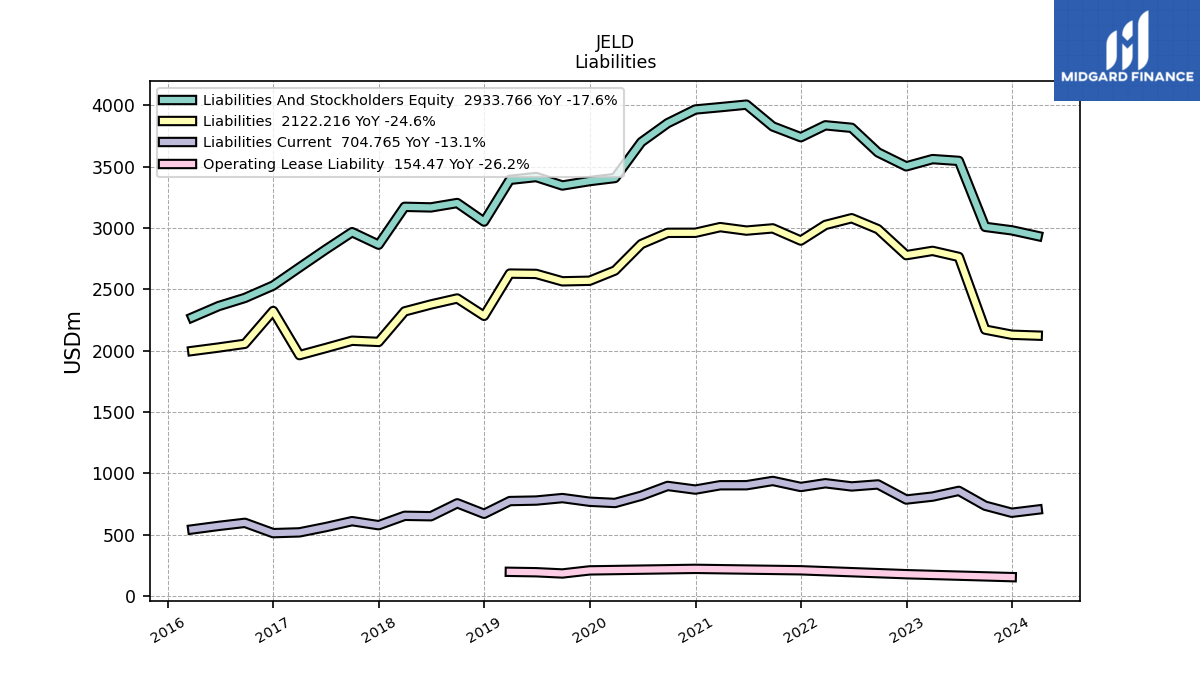
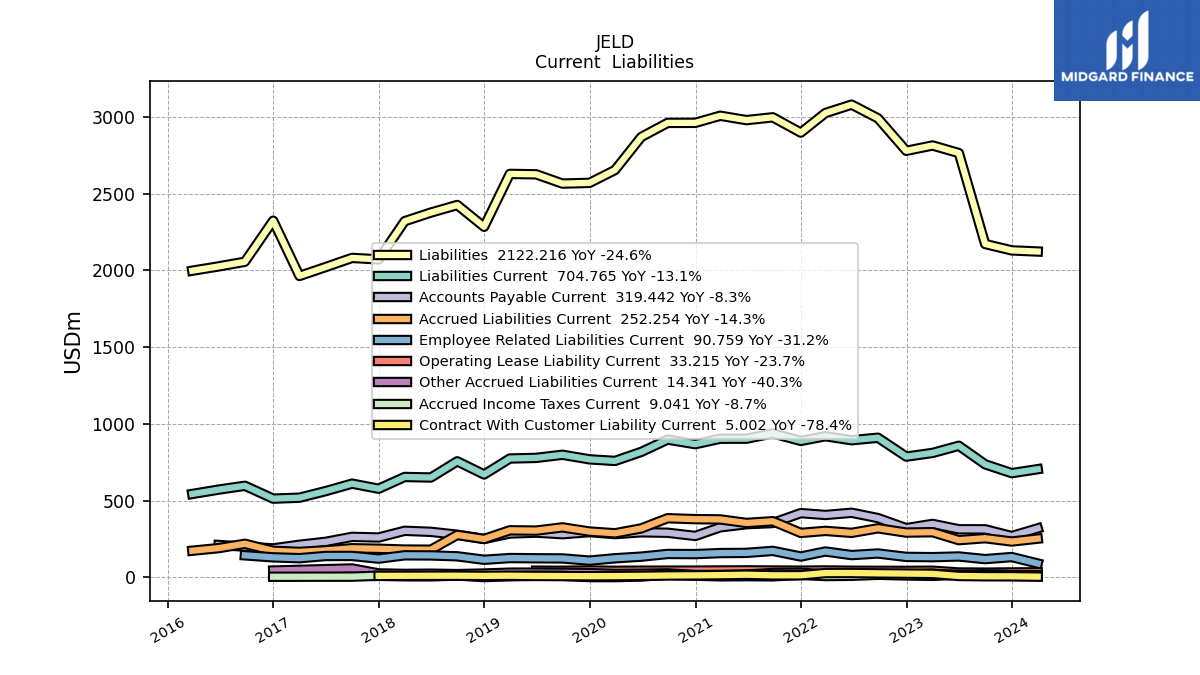
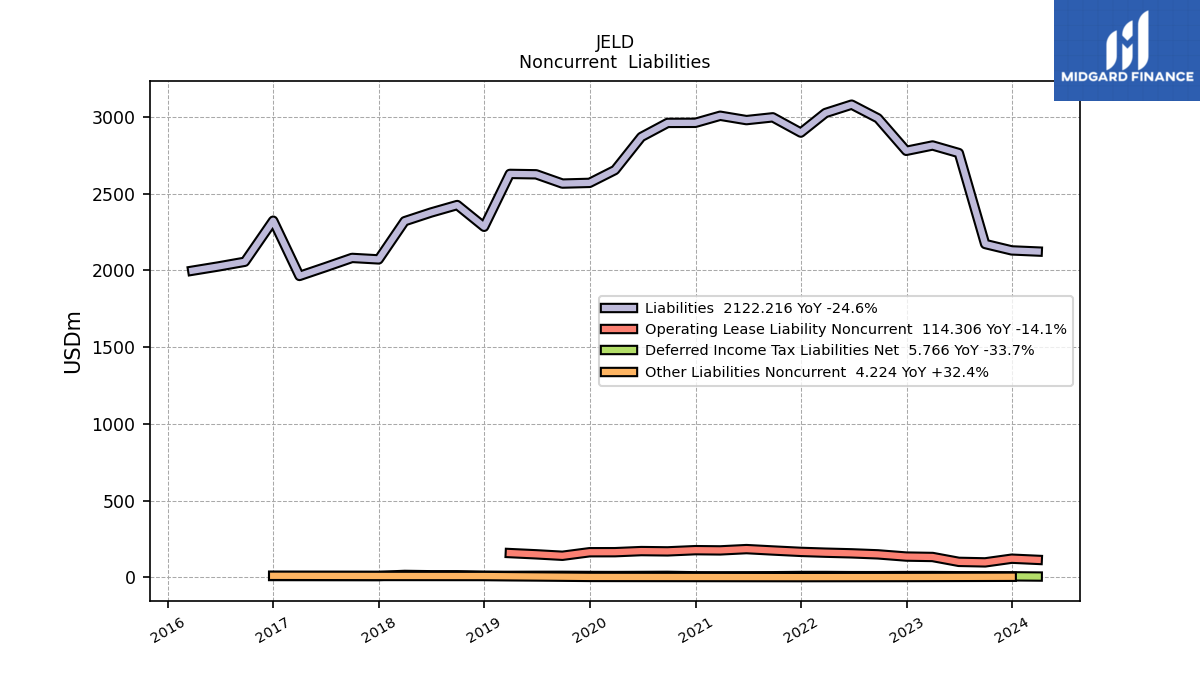
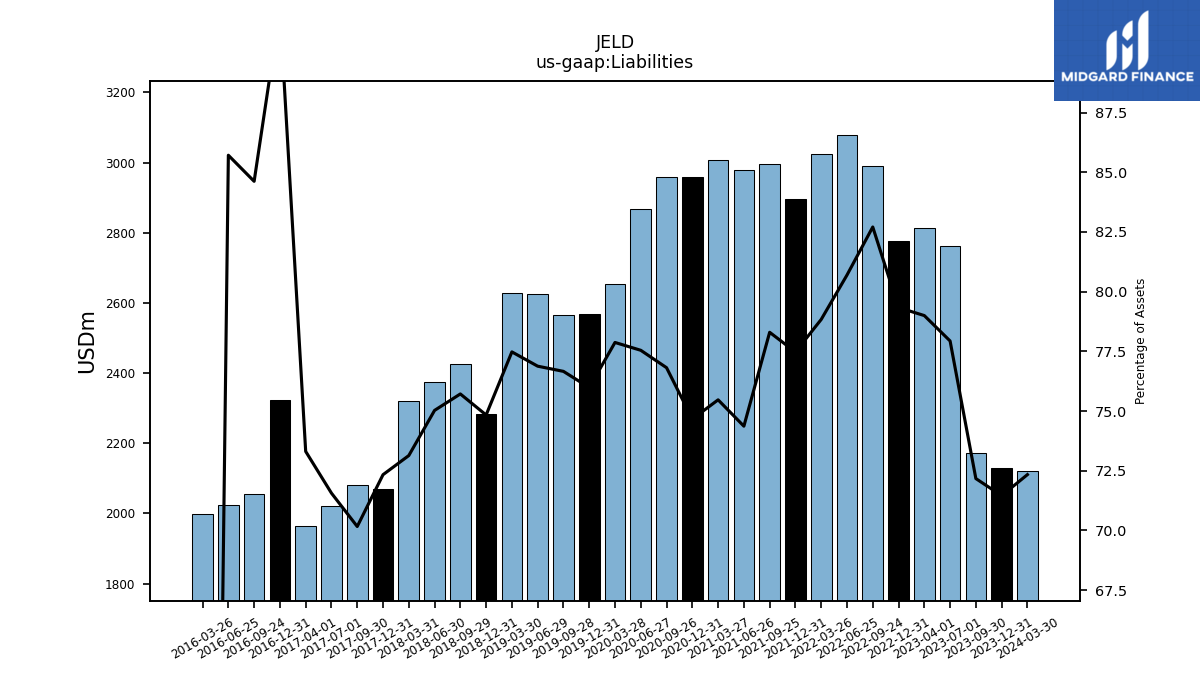
| Liabilities | 2129.48 | 2171.16 | 2763.47 | 2812.76 | 2777.81 | 2989.83 | 3078.80 | 3024.01 | 2896.45 | 2996.12 | 2977.94 | 3006.31 | 2960.22 | 2959.76 | 2868.28 | 2652.81 | 2569.24 | 2564.65 | 2625.03 | 2627.68 | 2283.25 | 2424.99 | 2376.00 | 2319.66 | 2070.90 | 2080.58 | 2021.17 | 1963.11 | 2323.12 | 2055.57 | 2025.16 | 1997.25 | |
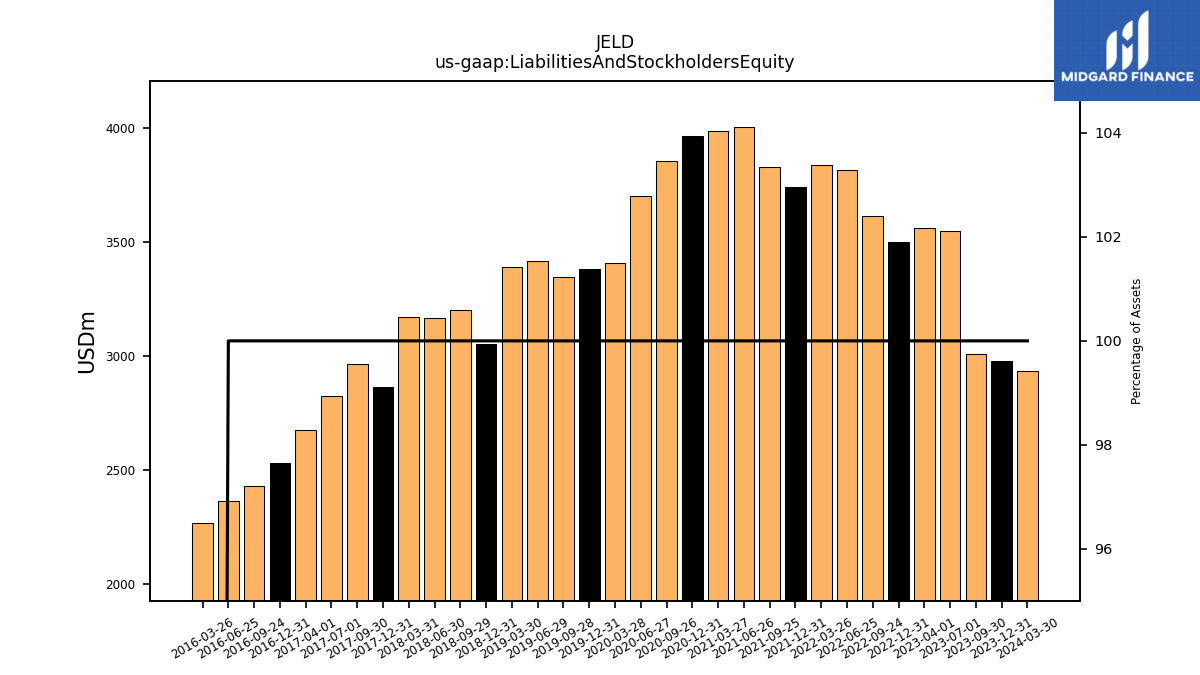
| Liabilities And Stockholders Equity | 2980.12 | 3008.32 | 3545.85 | 3560.52 | 3501.36 | 3614.92 | 3815.31 | 3835.79 | 3738.67 | 3826.55 | 4004.39 | 3983.47 | 3964.68 | 3853.07 | 3698.88 | 3406.58 | 3381.33 | 3345.40 | 3414.47 | 3391.54 | 3051.05 | 3202.74 | 3166.84 | 3171.70 | 2862.94 | 2965.28 | 2824.37 | 2677.85 | 2530.08 | 2429.12 | 2362.71 | 2270.46 | |
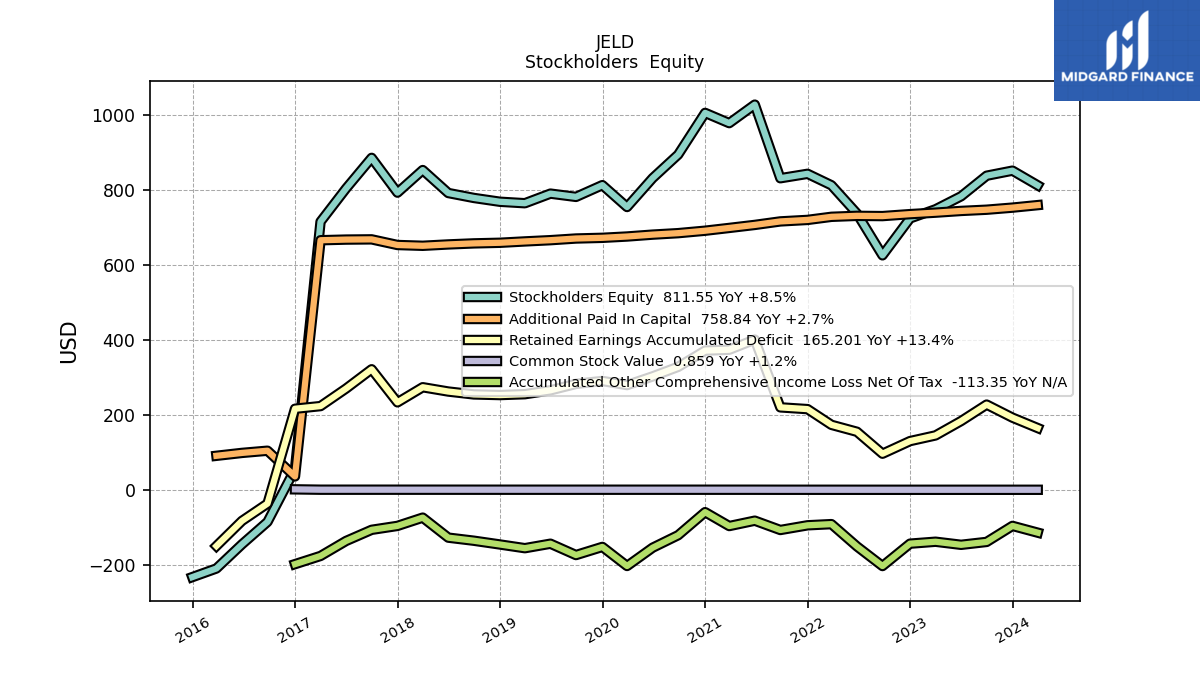
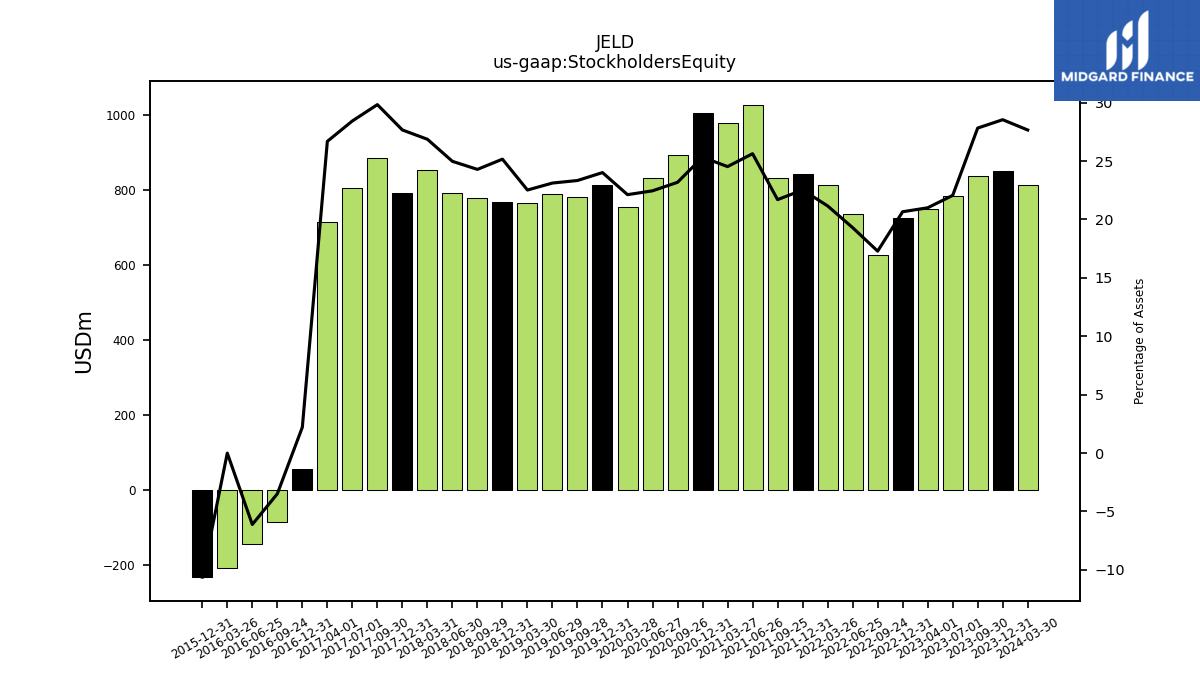
| Stockholders Equity | 850.64 | 837.16 | 782.38 | 747.76 | 723.55 | 625.10 | 736.51 | 811.77 | 842.22 | 830.42 | 1026.45 | 977.15 | 1004.46 | 893.31 | 830.60 | 753.77 | 812.09 | 780.75 | 789.47 | 763.89 | 767.82 | 777.96 | 791.07 | 852.23 | 792.04 | 884.70 | 803.20 | 714.74 | 56.00 | -84.68 | -144.39 | -208.73 |
| 2023-12-31 | 2023-09-30 | 2023-07-01 | 2023-04-01 | 2022-12-31 | 2022-09-24 | 2022-06-25 | 2022-03-26 | 2021-12-31 | 2021-09-25 | 2021-06-26 | 2021-03-27 | 2020-12-31 | 2020-09-26 | 2020-06-27 | 2020-03-28 | 2019-12-31 | 2019-09-28 | 2019-06-29 | 2019-03-30 | 2018-12-31 | 2018-09-29 | 2018-06-30 | 2018-03-31 | 2017-12-31 | 2017-09-30 | 2017-07-01 | 2017-04-01 | 2016-12-31 | 2016-09-24 | 2016-06-25 | 2016-03-26 | ||
|---|---|---|---|---|---|---|---|---|---|---|---|---|---|---|---|---|---|---|---|---|---|---|---|---|---|---|---|---|---|---|---|---|---|
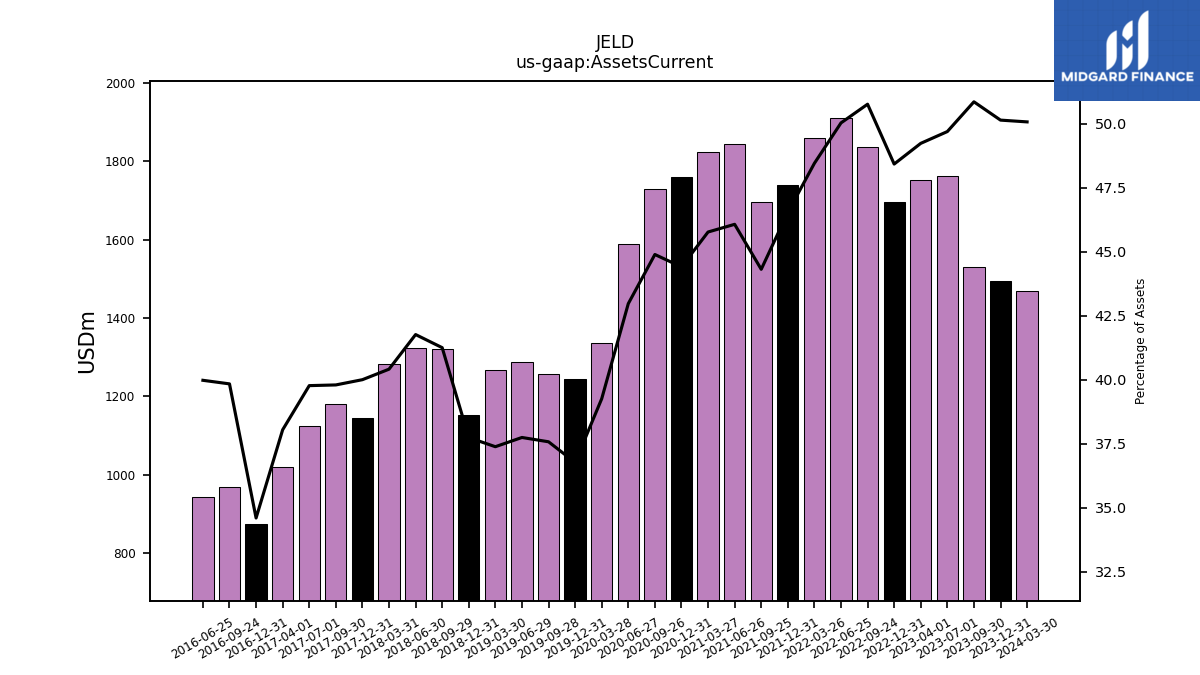
| Assets Current | 1494.34 | 1530.00 | 1762.16 | 1753.05 | 1695.61 | 1835.13 | 1908.96 | 1858.68 | 1739.86 | 1695.72 | 1844.92 | 1823.29 | 1760.65 | 1729.77 | 1589.51 | 1337.32 | 1243.28 | 1257.06 | 1288.76 | 1267.88 | 1151.48 | 1321.23 | 1322.63 | 1281.76 | 1145.24 | 1180.09 | 1123.24 | 1018.79 | 875.36 | 967.72 | 944.56 | NA | |
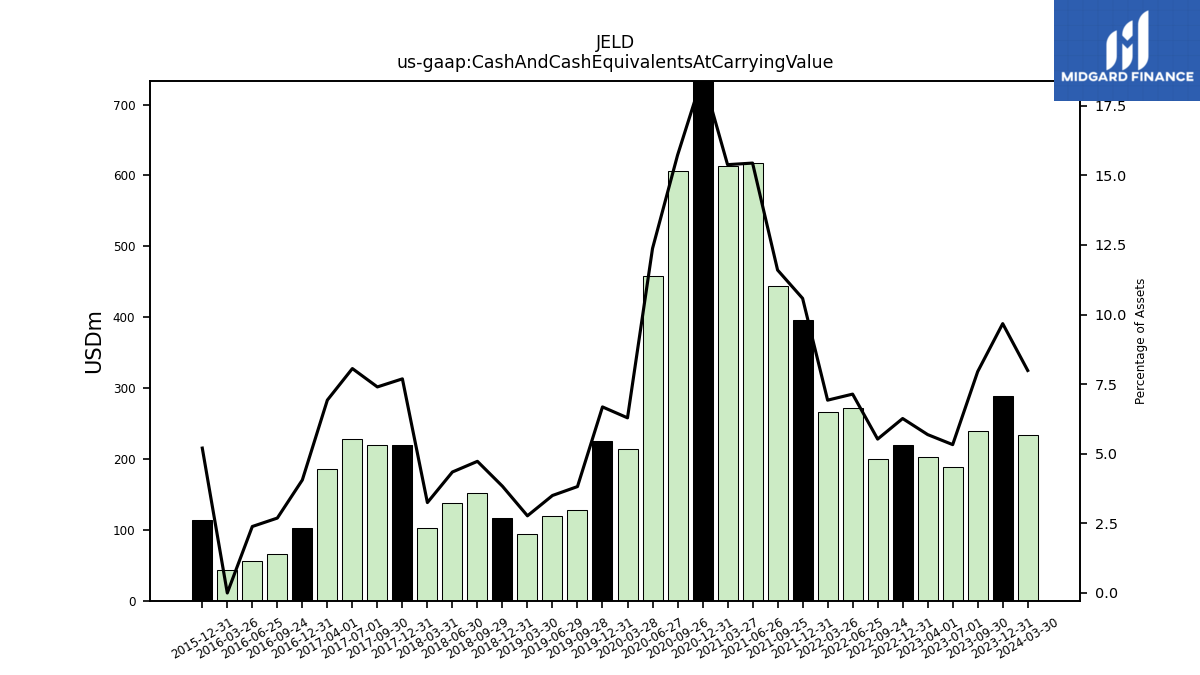
| Cash And Cash Equivalents At Carrying Value | 288.31 | 239.22 | 188.95 | 202.55 | 219.41 | 199.81 | 272.51 | 265.65 | 395.60 | 443.85 | 618.31 | 612.82 | 735.82 | 605.78 | 457.65 | 214.30 | 225.96 | 127.86 | 119.56 | 94.00 | 116.99 | 151.44 | 137.62 | 102.97 | 220.18 | 219.46 | 227.66 | 185.50 | 102.70 | 65.36 | 56.42 | 43.22 | |
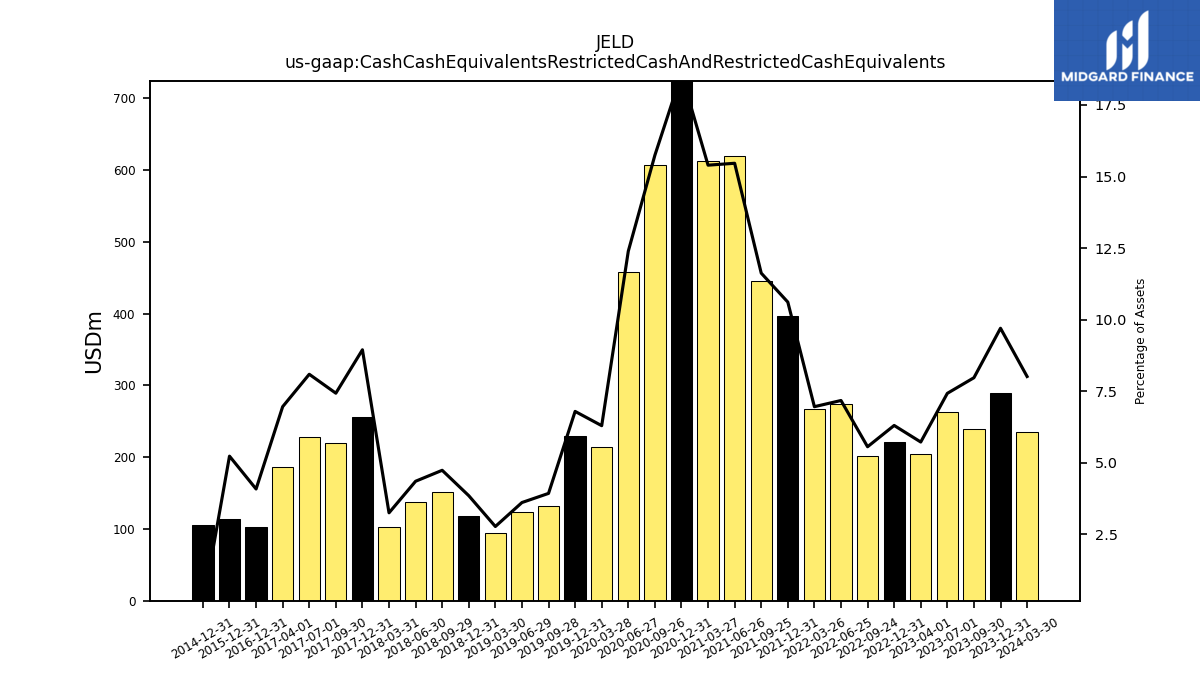
| Cash Cash Equivalents Restricted Cash And Restricted Cash Equivalents | 289.15 | 239.91 | 263.44 | 203.99 | 220.87 | 201.15 | 273.92 | 267.10 | 396.89 | 444.93 | 619.22 | 613.34 | 736.59 | 606.61 | 458.44 | 214.61 | 229.88 | 131.66 | 123.47 | 94.26 | 117.62 | 151.88 | 138.06 | 103.30 | 256.23 | 220.45 | 228.65 | 186.49 | 103.45 | NA | NA | NA | |
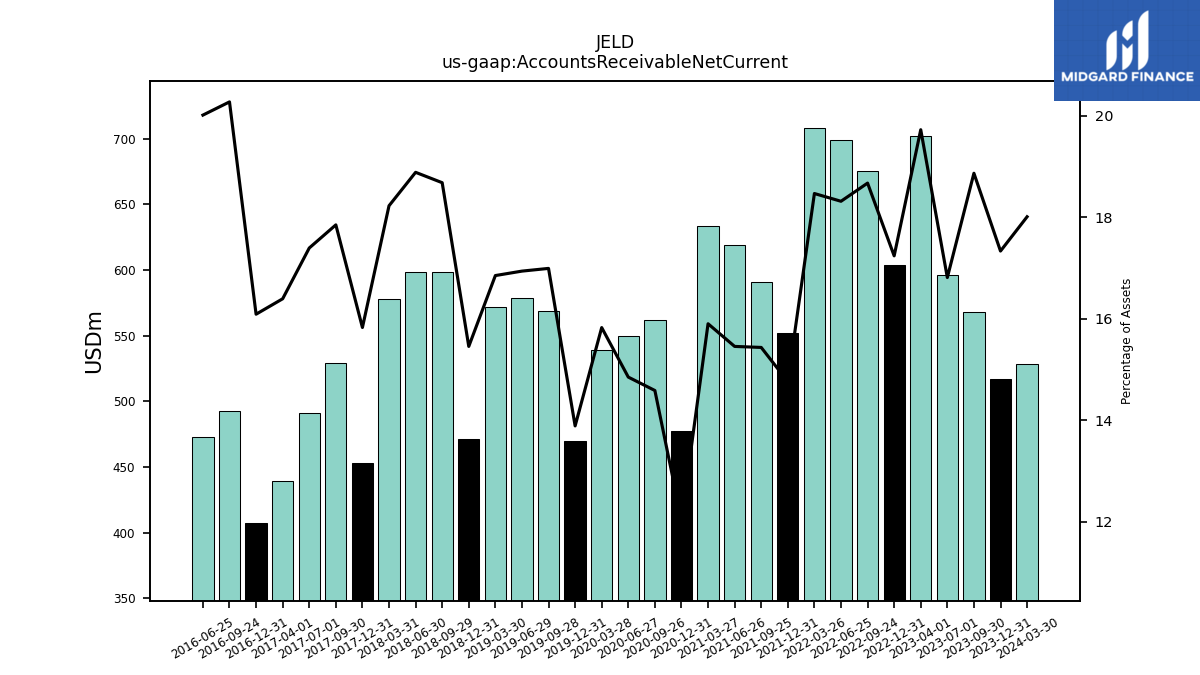
| Accounts Receivable Net Current | 516.67 | 567.67 | 596.25 | 702.41 | 603.75 | 675.12 | 698.89 | 708.50 | 552.04 | 590.77 | 619.03 | 633.58 | 477.47 | 562.17 | 549.45 | 539.25 | 469.76 | 568.57 | 578.49 | 571.63 | 471.65 | 598.40 | 598.17 | 578.18 | 453.25 | 529.40 | 491.37 | 439.10 | 407.17 | 492.52 | 472.91 | NA | |
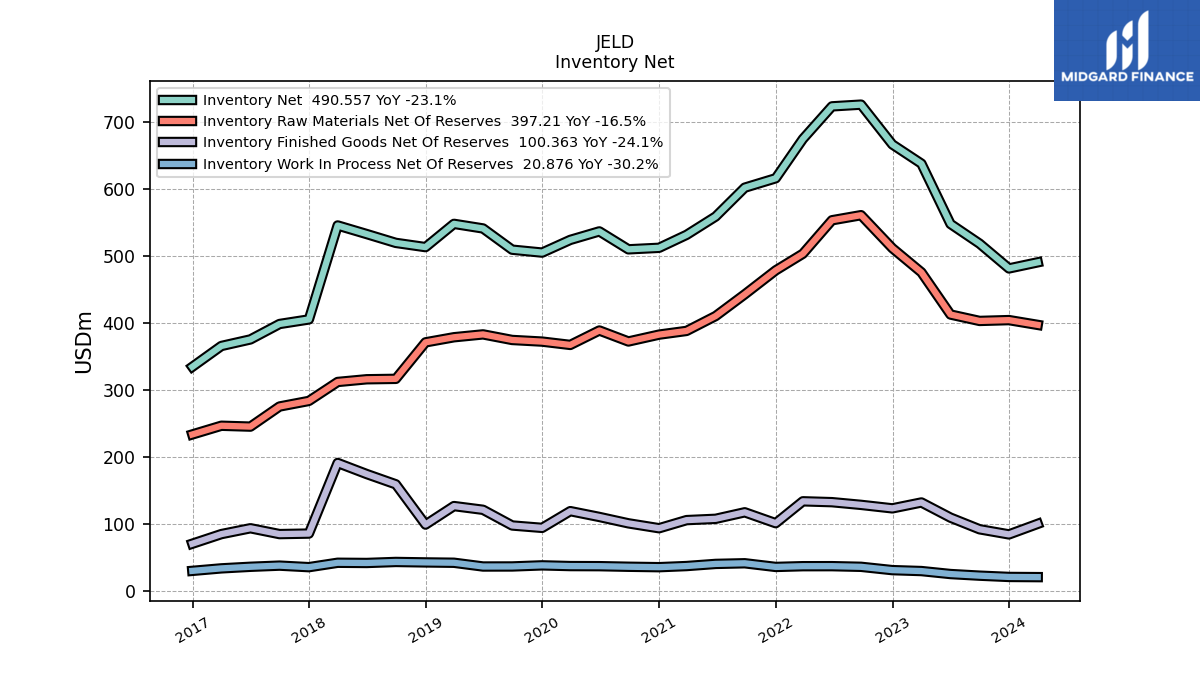
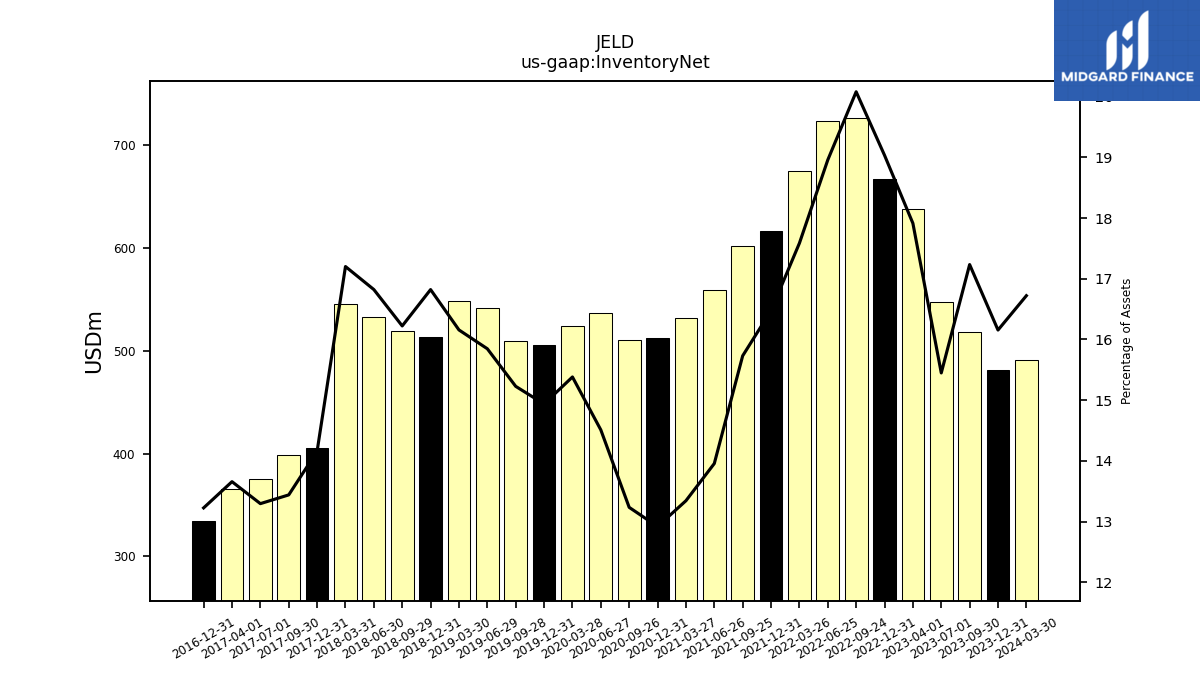
| Inventory Net | 481.45 | 518.44 | 547.80 | 637.80 | 666.46 | 725.86 | 723.26 | 674.55 | 615.97 | 601.94 | 558.88 | 531.55 | 512.23 | 509.95 | 536.74 | 524.02 | 505.08 | 509.44 | 541.10 | 547.98 | 513.24 | 519.58 | 532.73 | 545.58 | 405.35 | 398.54 | 375.54 | 365.74 | 334.63 | NA | NA | NA | |
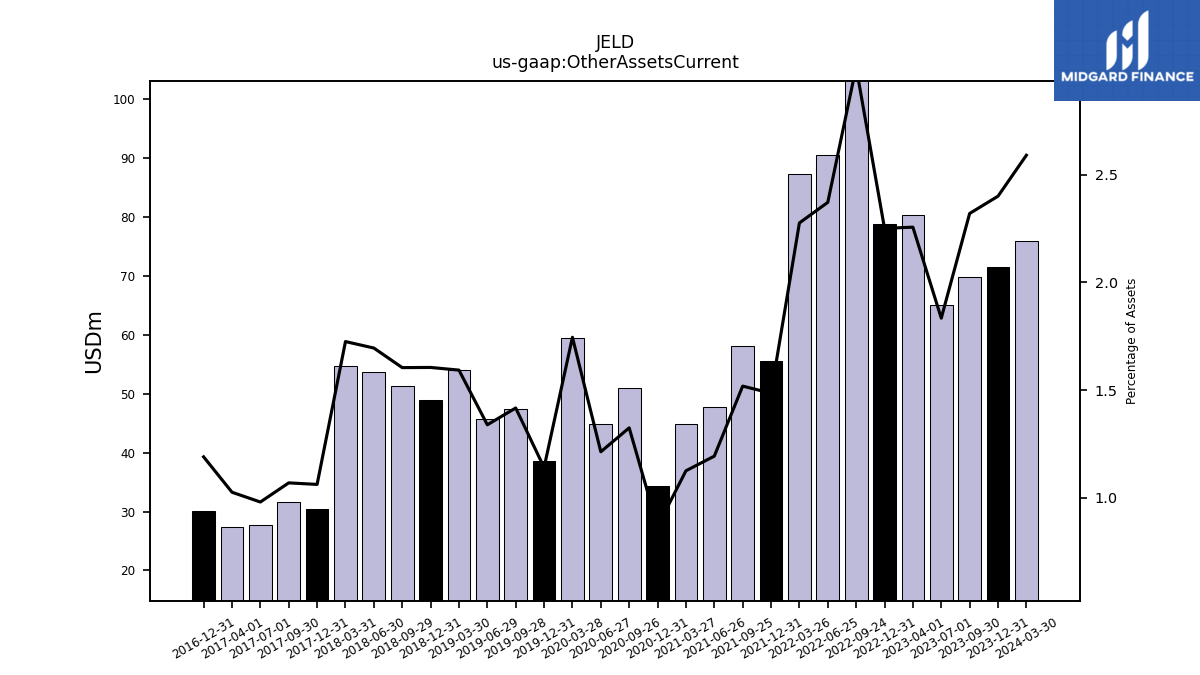
| Other Assets Current | 71.51 | 69.77 | 65.01 | 80.31 | 78.79 | 108.41 | 90.45 | 87.28 | 55.53 | 58.09 | 47.78 | 44.82 | 34.36 | 51.03 | 44.88 | 59.44 | 38.56 | 47.39 | 45.71 | 54.01 | 48.96 | 51.37 | 53.67 | 54.70 | 30.40 | 31.70 | 27.69 | 27.46 | 30.10 | NA | NA | NA | |
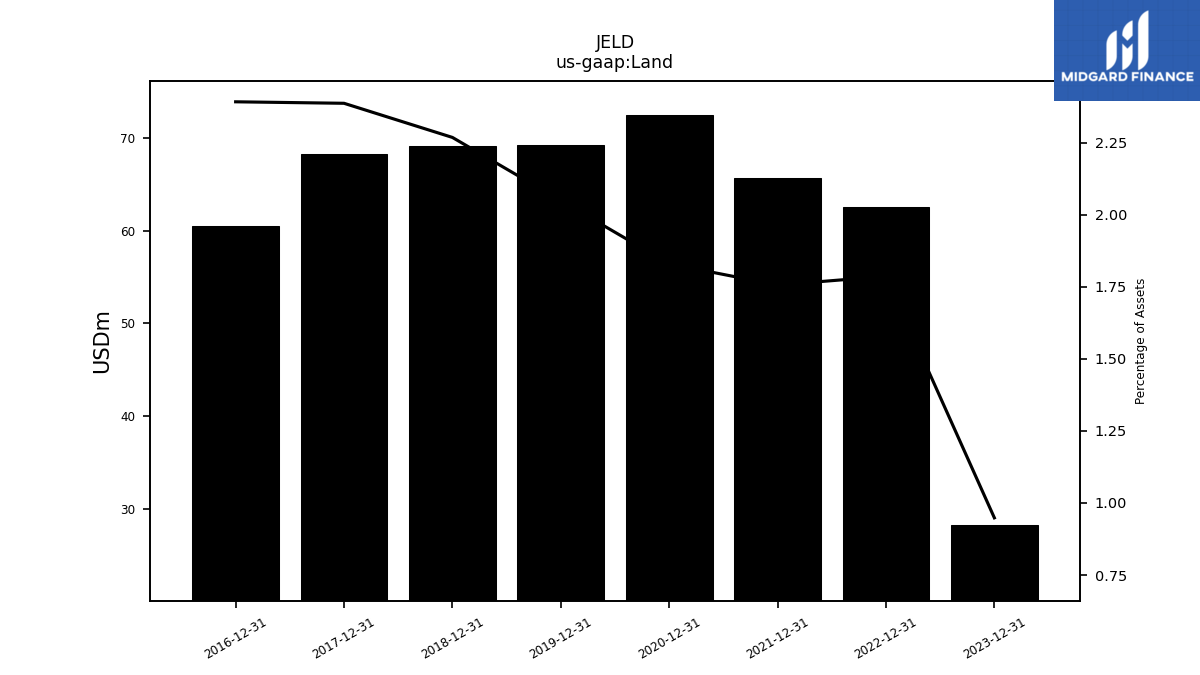
| Land | 28.26 | NA | NA | NA | 62.54 | NA | NA | NA | 65.64 | NA | NA | NA | 72.53 | NA | NA | NA | 69.26 | NA | NA | NA | 69.19 | NA | NA | NA | 68.31 | NA | NA | NA | 60.50 | NA | NA | NA |
| 2023-12-31 | 2023-09-30 | 2023-07-01 | 2023-04-01 | 2022-12-31 | 2022-09-24 | 2022-06-25 | 2022-03-26 | 2021-12-31 | 2021-09-25 | 2021-06-26 | 2021-03-27 | 2020-12-31 | 2020-09-26 | 2020-06-27 | 2020-03-28 | 2019-12-31 | 2019-09-28 | 2019-06-29 | 2019-03-30 | 2018-12-31 | 2018-09-29 | 2018-06-30 | 2018-03-31 | 2017-12-31 | 2017-09-30 | 2017-07-01 | 2017-04-01 | 2016-12-31 | 2016-09-24 | 2016-06-25 | 2016-03-26 | ||
|---|---|---|---|---|---|---|---|---|---|---|---|---|---|---|---|---|---|---|---|---|---|---|---|---|---|---|---|---|---|---|---|---|---|
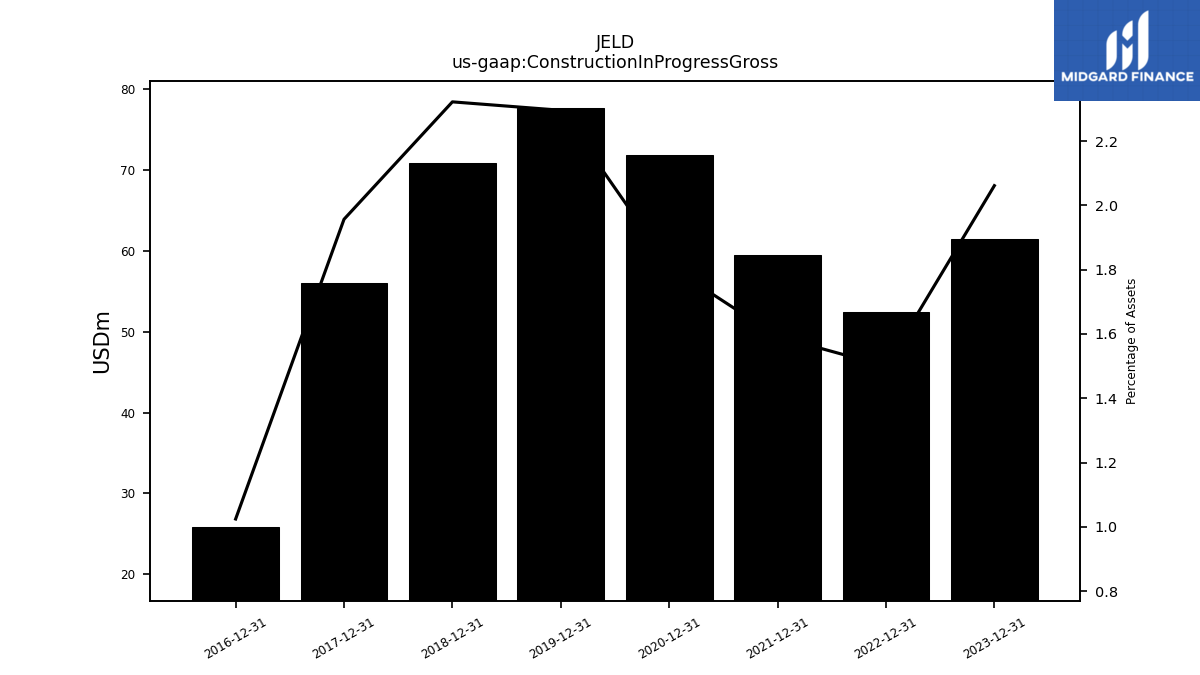
| Construction In Progress Gross | 61.42 | NA | NA | NA | 52.49 | NA | NA | NA | 59.52 | NA | NA | NA | 71.82 | NA | NA | NA | 77.62 | NA | NA | NA | 70.84 | NA | NA | NA | 56.02 | NA | NA | NA | 25.91 | NA | NA | NA | |
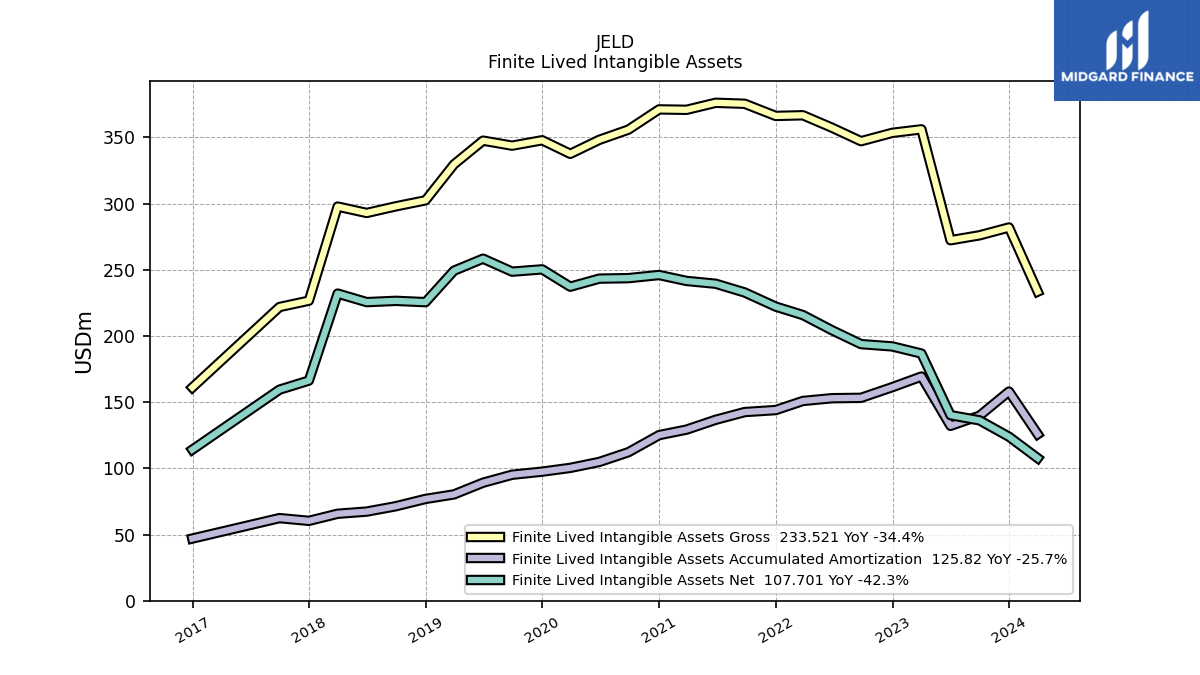
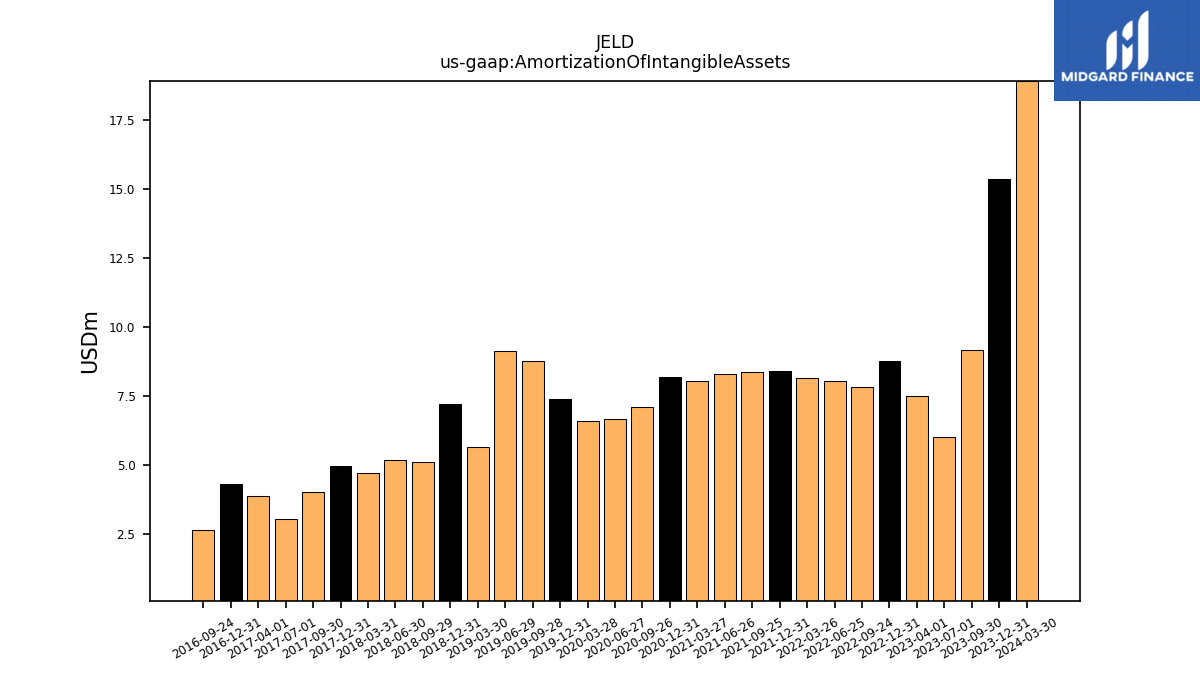
| Amortization Of Intangible Assets | 15.36 | 9.17 | 6.00 | 7.49 | 8.76 | 7.81 | 8.04 | 8.14 | 8.40 | 8.37 | 8.31 | 8.05 | 8.20 | 7.10 | 6.64 | 6.60 | 7.40 | 8.76 | 9.13 | 5.66 | 7.22 | 5.12 | 5.17 | 4.70 | 4.97 | 4.01 | 3.04 | 3.88 | 4.29 | 2.62 | NA | NA | |
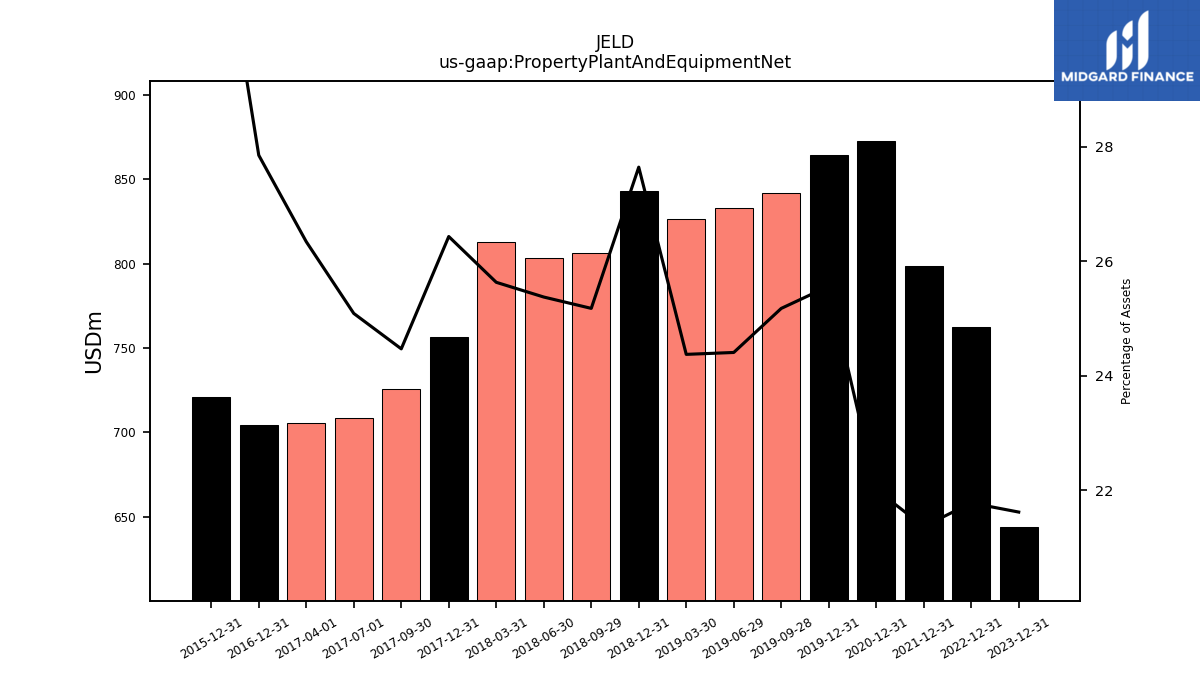
| Property Plant And Equipment Net | 644.25 | NA | NA | NA | 762.49 | NA | NA | NA | 798.80 | NA | NA | NA | 872.59 | NA | NA | NA | 864.38 | 842.22 | 833.34 | 826.61 | 843.40 | 806.33 | 803.56 | 812.96 | 756.71 | 725.58 | 708.58 | 705.36 | 704.65 | NA | NA | NA | |
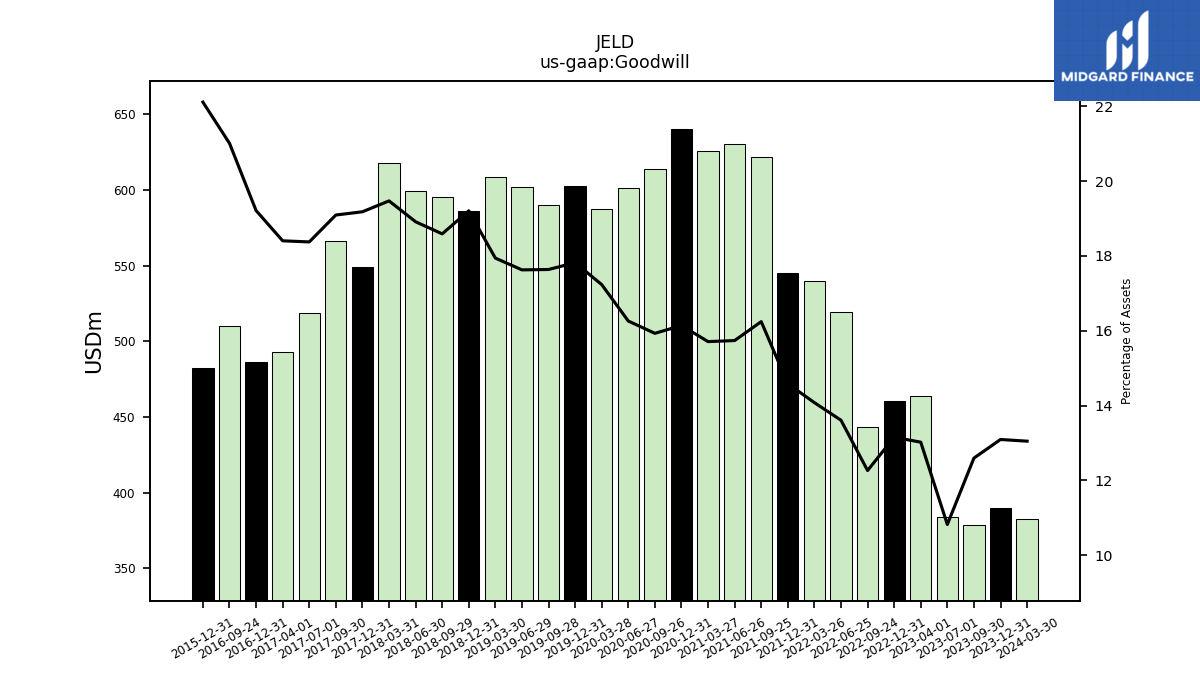
| Goodwill | 390.17 | 378.90 | 383.66 | 463.60 | 460.50 | 443.29 | 519.16 | 539.97 | 545.21 | 621.50 | 630.16 | 625.74 | 639.87 | 613.77 | 601.40 | 587.04 | 602.50 | 589.98 | 601.83 | 608.45 | 585.94 | 595.32 | 598.90 | 617.50 | 549.06 | 566.13 | 518.91 | 492.79 | 486.06 | 510.33 | NA | NA | |
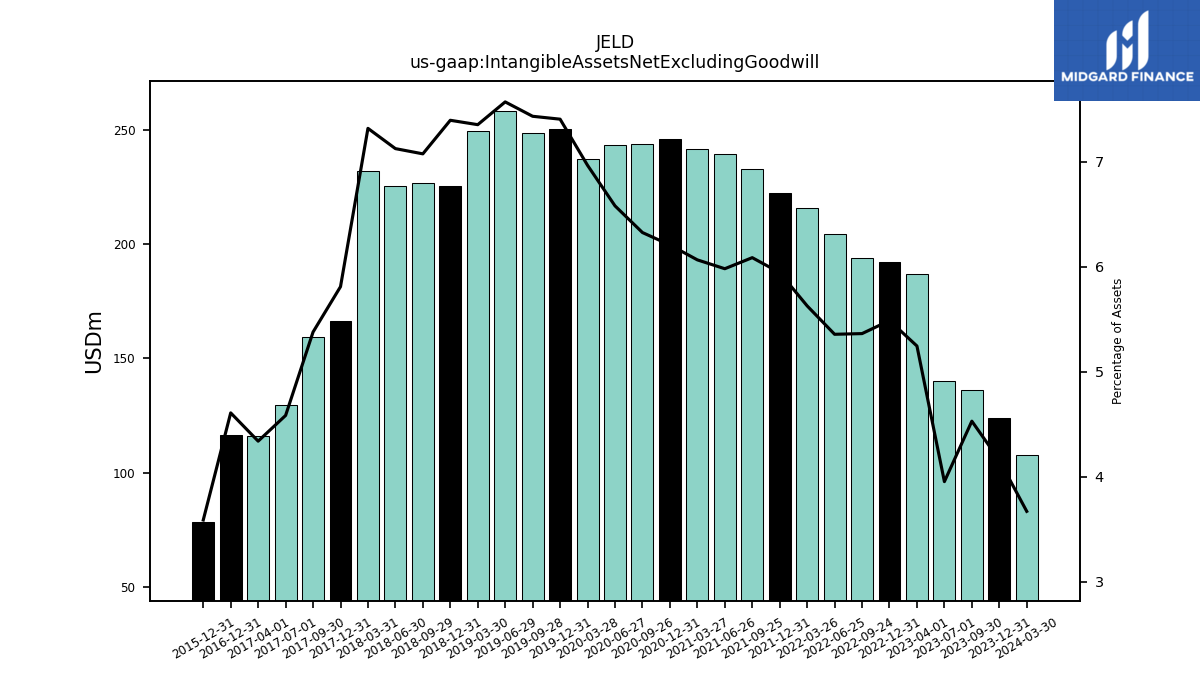
| Intangible Assets Net Excluding Goodwill | 123.91 | 136.25 | 140.20 | 186.73 | 192.10 | 193.85 | 204.35 | 215.82 | 222.18 | 232.86 | 239.46 | 241.57 | 246.06 | 243.68 | 243.32 | 237.23 | 250.33 | 248.59 | 258.39 | 249.31 | 225.55 | 226.54 | 225.57 | 232.04 | 166.31 | 159.46 | 129.46 | 116.19 | 116.59 | NA | NA | NA | |
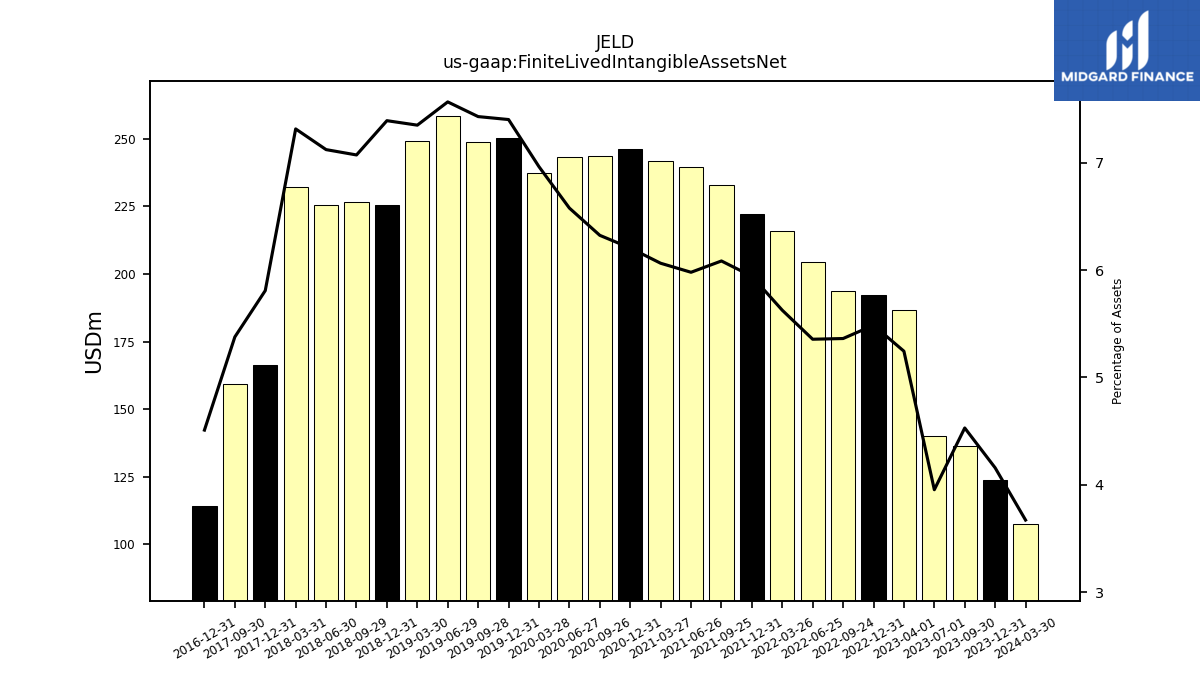
| Finite Lived Intangible Assets Net | 123.91 | 136.25 | 140.20 | 186.73 | 192.10 | 193.85 | 204.35 | 215.82 | 222.18 | 232.86 | 239.46 | 241.57 | 246.06 | 243.68 | 243.32 | 237.23 | 250.33 | 248.59 | 258.39 | 249.31 | 225.55 | 226.54 | 225.57 | 232.04 | 166.31 | 159.46 | NA | NA | 114.09 | NA | NA | NA | |
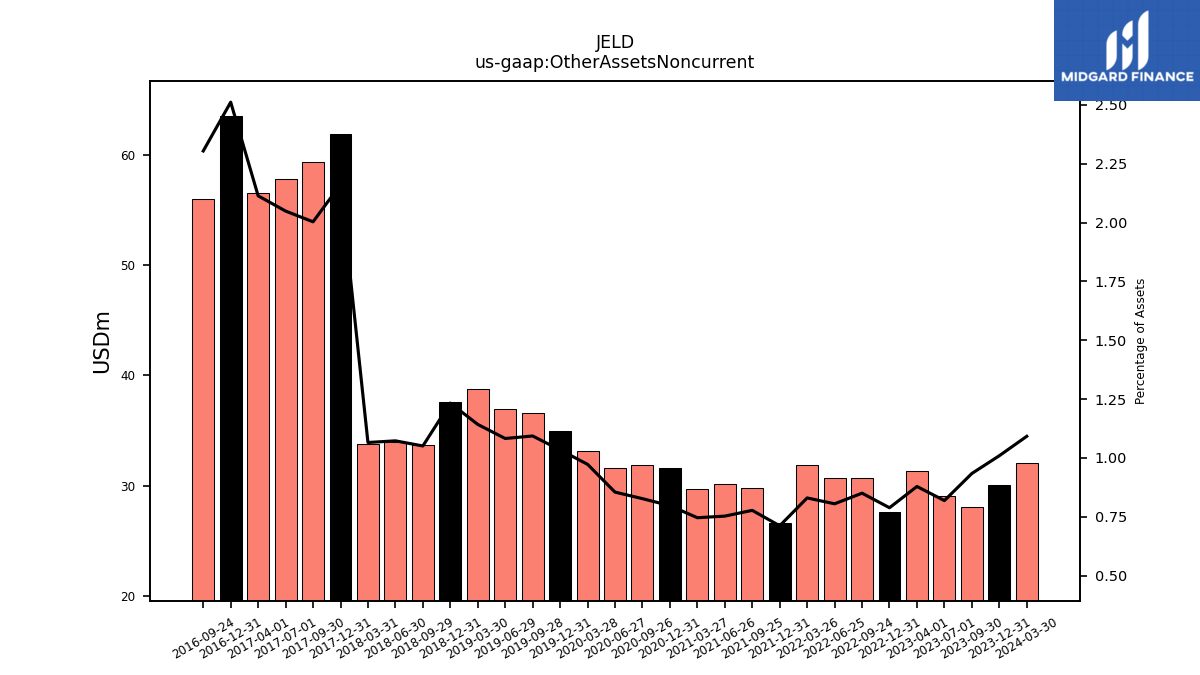
| Other Assets Noncurrent | 30.08 | 28.09 | 29.03 | 31.28 | 27.60 | 30.73 | 30.71 | 31.83 | 26.60 | 29.74 | 30.14 | 29.71 | 31.60 | 31.86 | 31.61 | 33.14 | 34.96 | 36.57 | 36.96 | 38.74 | 37.62 | 33.65 | 33.97 | 33.79 | 61.89 | 59.41 | 57.87 | 56.60 | 63.55 | 55.98 | NA | NA |
| 2023-12-31 | 2023-09-30 | 2023-07-01 | 2023-04-01 | 2022-12-31 | 2022-09-24 | 2022-06-25 | 2022-03-26 | 2021-12-31 | 2021-09-25 | 2021-06-26 | 2021-03-27 | 2020-12-31 | 2020-09-26 | 2020-06-27 | 2020-03-28 | 2019-12-31 | 2019-09-28 | 2019-06-29 | 2019-03-30 | 2018-12-31 | 2018-09-29 | 2018-06-30 | 2018-03-31 | 2017-12-31 | 2017-09-30 | 2017-07-01 | 2017-04-01 | 2016-12-31 | 2016-09-24 | 2016-06-25 | 2016-03-26 | ||
|---|---|---|---|---|---|---|---|---|---|---|---|---|---|---|---|---|---|---|---|---|---|---|---|---|---|---|---|---|---|---|---|---|---|
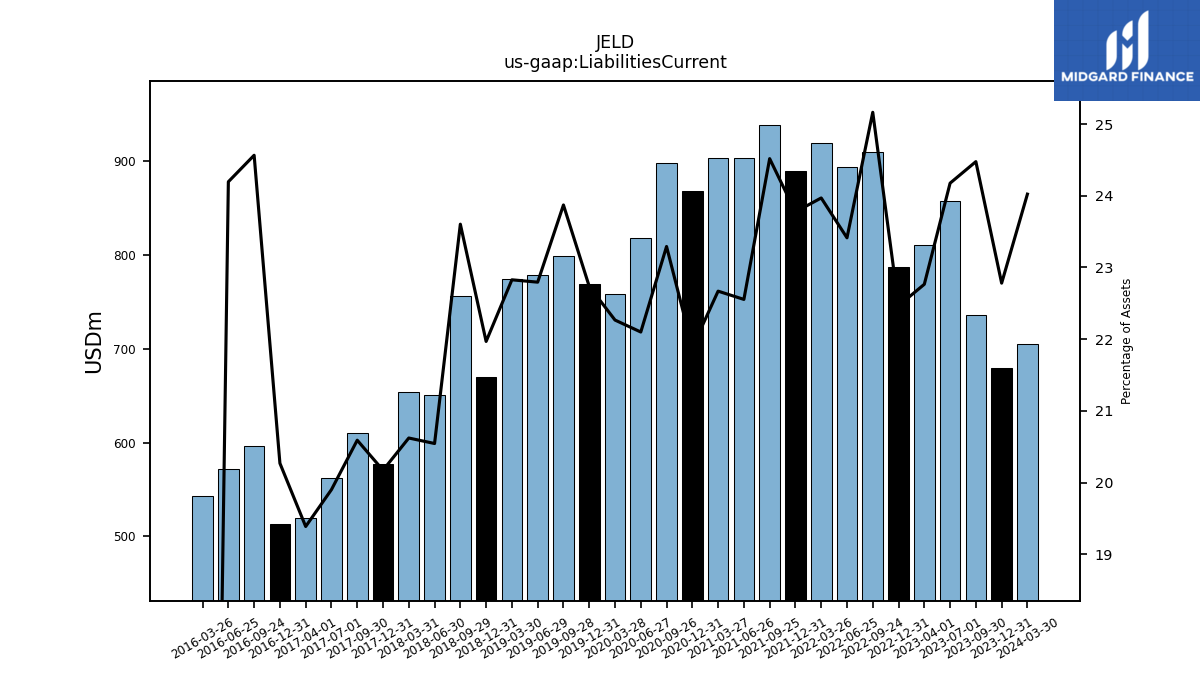
| Liabilities Current | 678.91 | 736.31 | 857.22 | 810.57 | 786.63 | 909.66 | 893.31 | 919.41 | 888.87 | 938.17 | 903.17 | 903.03 | 867.62 | 897.47 | 817.44 | 758.52 | 768.79 | 798.59 | 778.33 | 774.21 | 670.27 | 755.96 | 650.62 | 654.05 | 577.52 | 610.57 | 562.11 | 519.17 | 512.83 | 596.71 | 571.66 | 543.32 | |
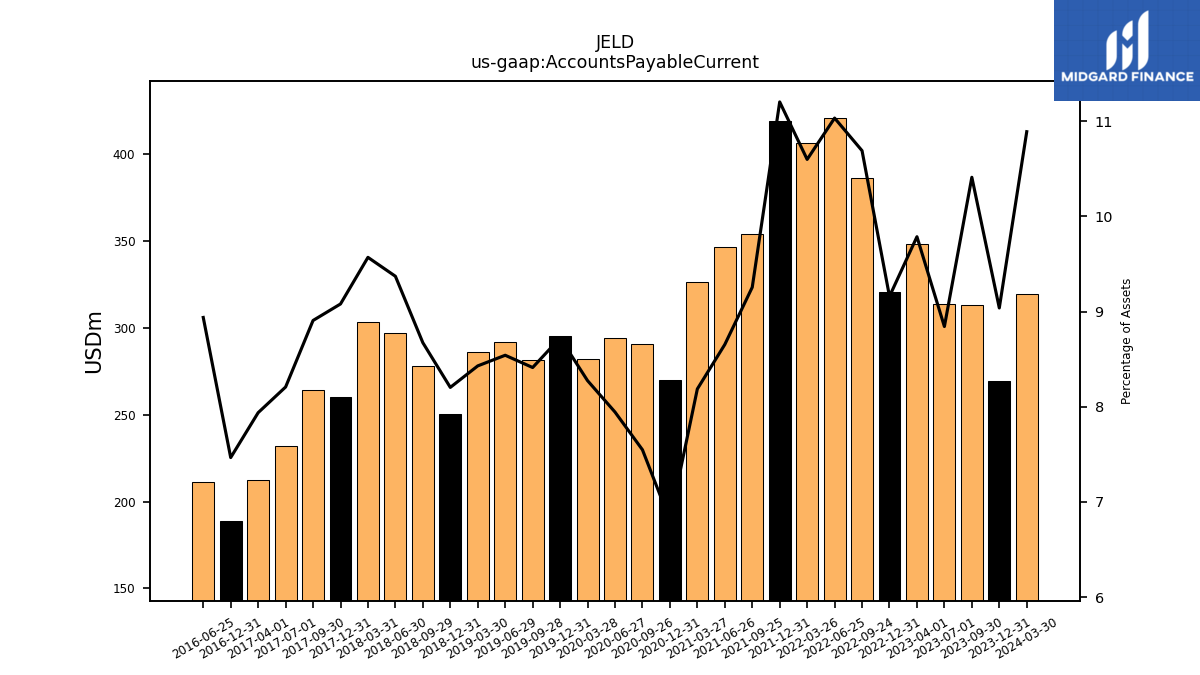
| Accounts Payable Current | 269.32 | 313.16 | 313.54 | 348.41 | 320.68 | 386.39 | 420.88 | 406.49 | 418.77 | 354.13 | 346.52 | 326.12 | 269.89 | 290.83 | 293.85 | 281.86 | 294.95 | 281.41 | 291.62 | 285.87 | 250.28 | 277.76 | 296.74 | 303.49 | 259.93 | 264.08 | 231.81 | 212.56 | 188.91 | NA | 211.17 | NA | |
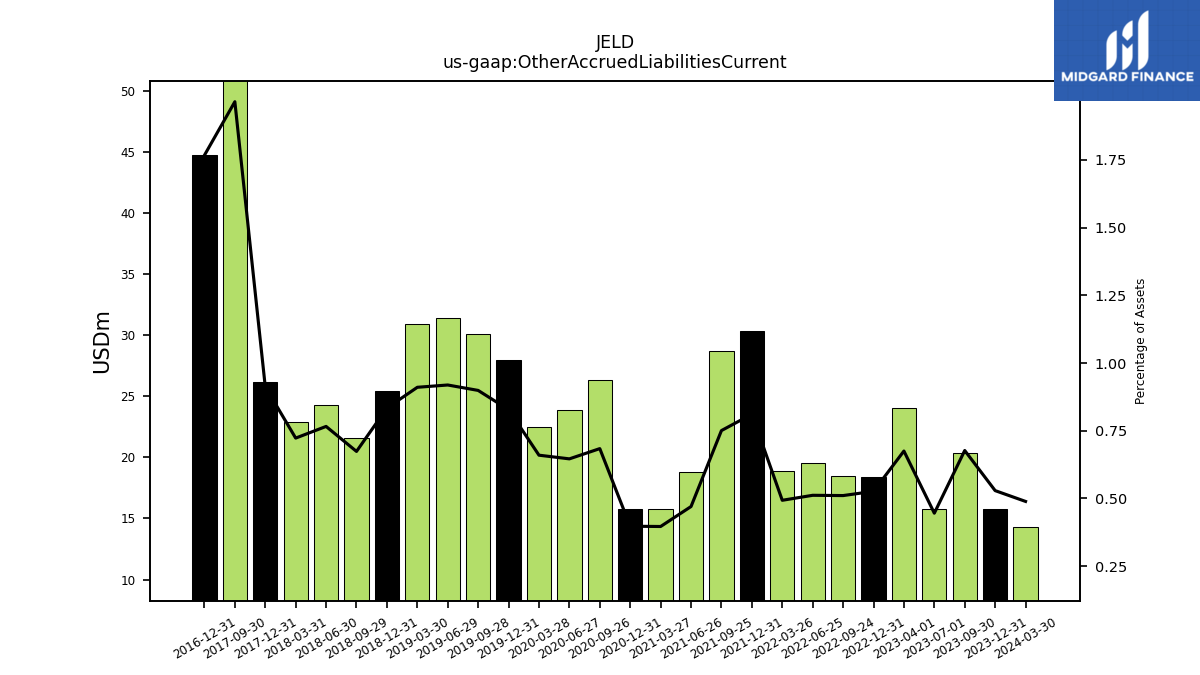
| Other Accrued Liabilities Current | 15.76 | 20.36 | 15.79 | 24.03 | 18.42 | 18.45 | 19.51 | 18.91 | 30.32 | 28.72 | 18.82 | 15.78 | 15.75 | 26.35 | 23.90 | 22.47 | 27.99 | 30.07 | 31.38 | 30.88 | 25.43 | 21.57 | 24.25 | 22.92 | 26.13 | 58.27 | NA | NA | 44.72 | NA | NA | NA | |
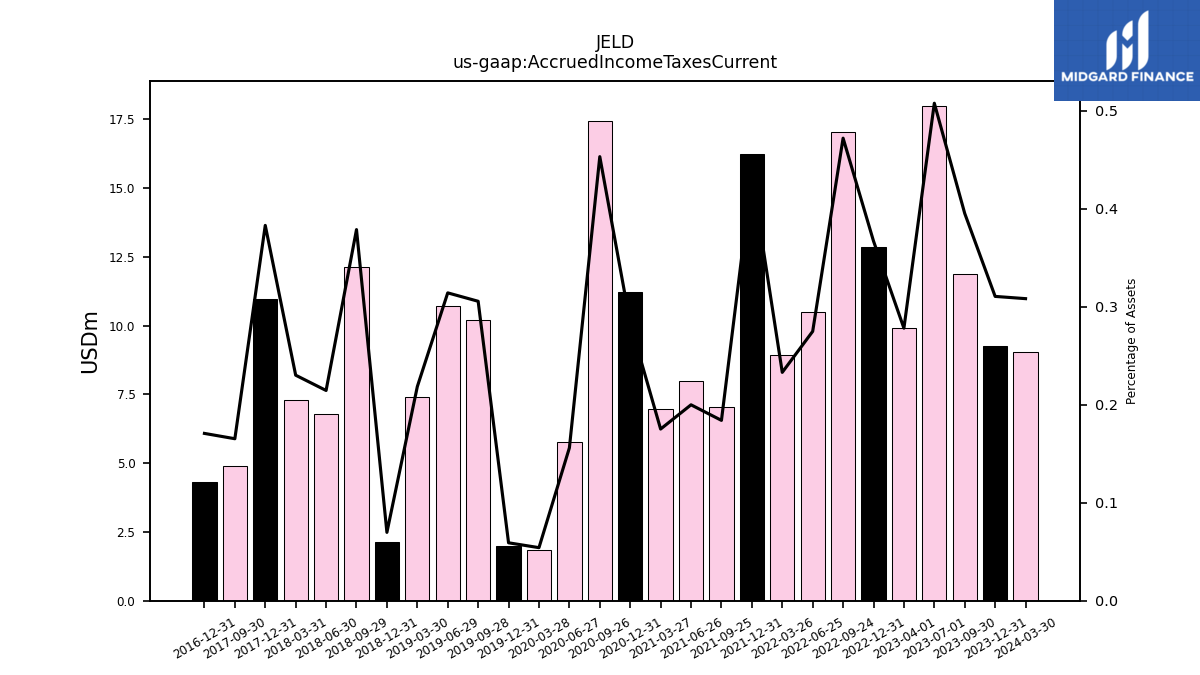
| Accrued Income Taxes Current | 9.25 | 11.88 | 18.00 | 9.90 | 12.85 | 17.06 | 10.48 | 8.94 | 16.24 | 7.04 | 8.00 | 6.98 | 11.22 | 17.45 | 5.77 | 1.84 | 2.00 | 10.22 | 10.72 | 7.41 | 2.13 | 12.13 | 6.79 | 7.30 | 10.96 | 4.90 | NA | NA | 4.32 | NA | NA | NA | |
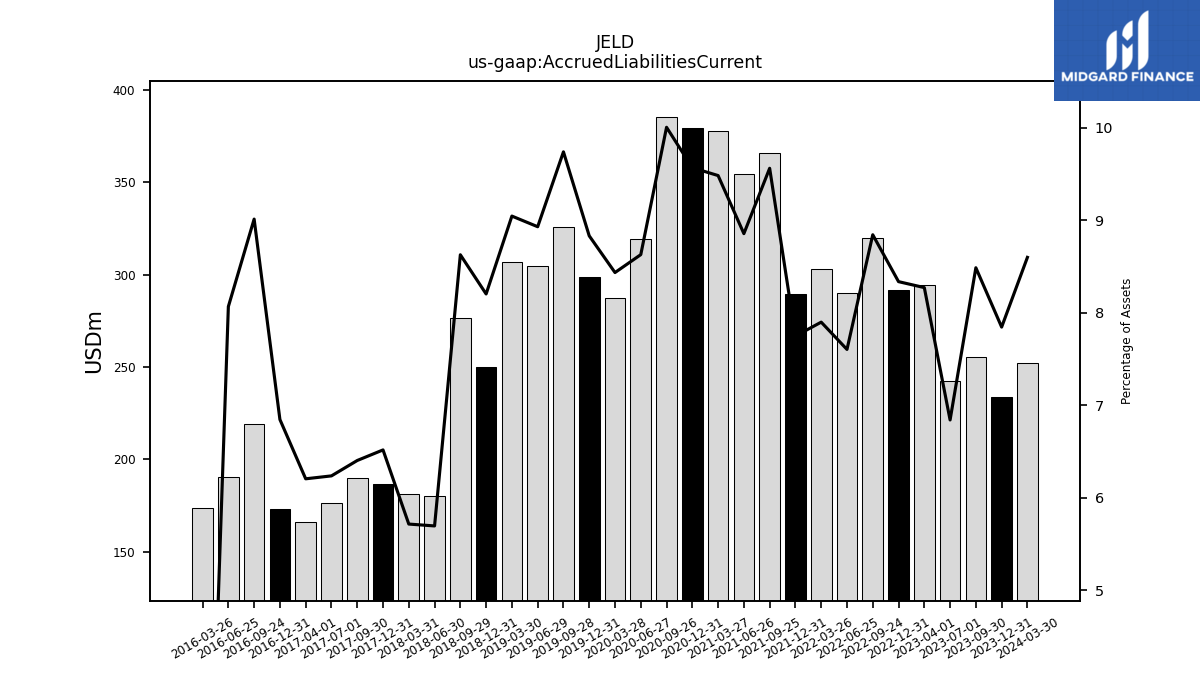
| Accrued Liabilities Current | 233.80 | 255.29 | 242.60 | 294.51 | 291.88 | 319.65 | 290.10 | 302.97 | 289.68 | 365.85 | 354.58 | 377.72 | 379.29 | 385.44 | 319.13 | 287.32 | 298.60 | 325.79 | 304.89 | 306.74 | 250.27 | 276.28 | 180.41 | 181.33 | 186.60 | 189.89 | 176.17 | 166.19 | 173.23 | 218.91 | 190.59 | 173.83 | |
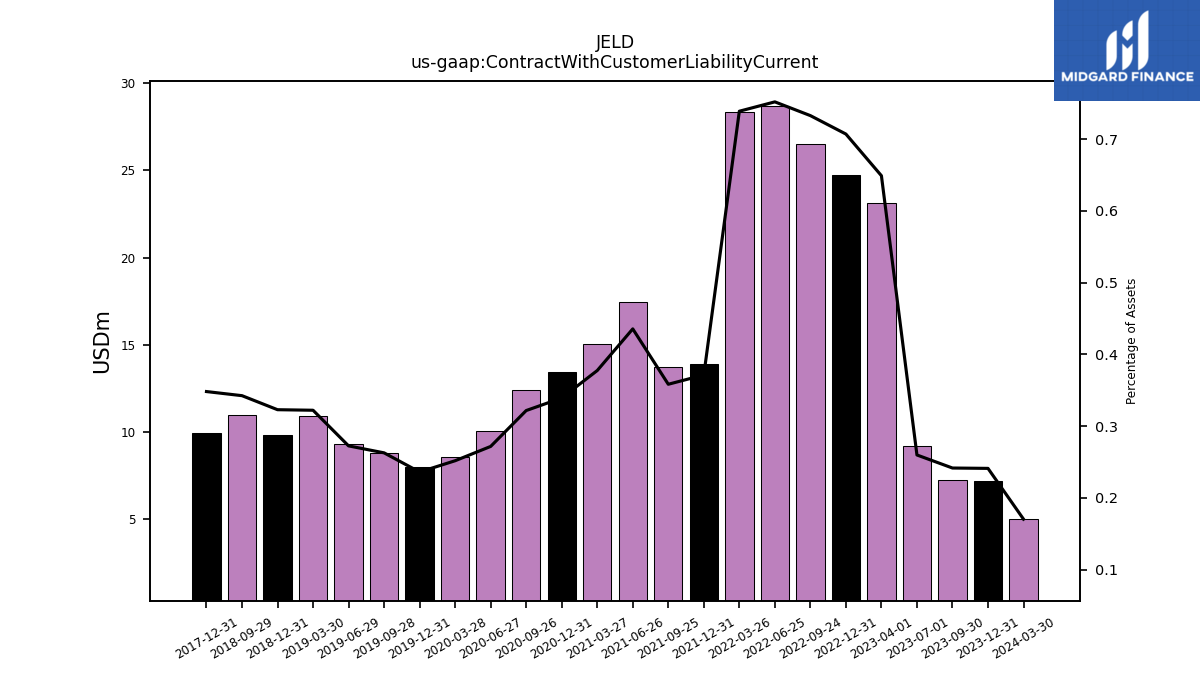
| Contract With Customer Liability Current | 7.19 | 7.27 | 9.22 | 23.10 | 24.75 | 26.48 | 28.68 | 28.34 | 13.88 | 13.71 | 17.44 | 15.04 | 13.45 | 12.40 | 10.05 | 8.58 | 7.99 | 8.79 | 9.31 | 10.93 | 9.85 | 10.97 | NA | NA | 9.97 | NA | NA | NA | NA | NA | NA | NA |
| 2023-12-31 | 2023-09-30 | 2023-07-01 | 2023-04-01 | 2022-12-31 | 2022-09-24 | 2022-06-25 | 2022-03-26 | 2021-12-31 | 2021-09-25 | 2021-06-26 | 2021-03-27 | 2020-12-31 | 2020-09-26 | 2020-06-27 | 2020-03-28 | 2019-12-31 | 2019-09-28 | 2019-06-29 | 2019-03-30 | 2018-12-31 | 2018-09-29 | 2018-06-30 | 2018-03-31 | 2017-12-31 | 2017-09-30 | 2017-07-01 | 2017-04-01 | 2016-12-31 | 2016-09-24 | 2016-06-25 | 2016-03-26 | ||
|---|---|---|---|---|---|---|---|---|---|---|---|---|---|---|---|---|---|---|---|---|---|---|---|---|---|---|---|---|---|---|---|---|---|
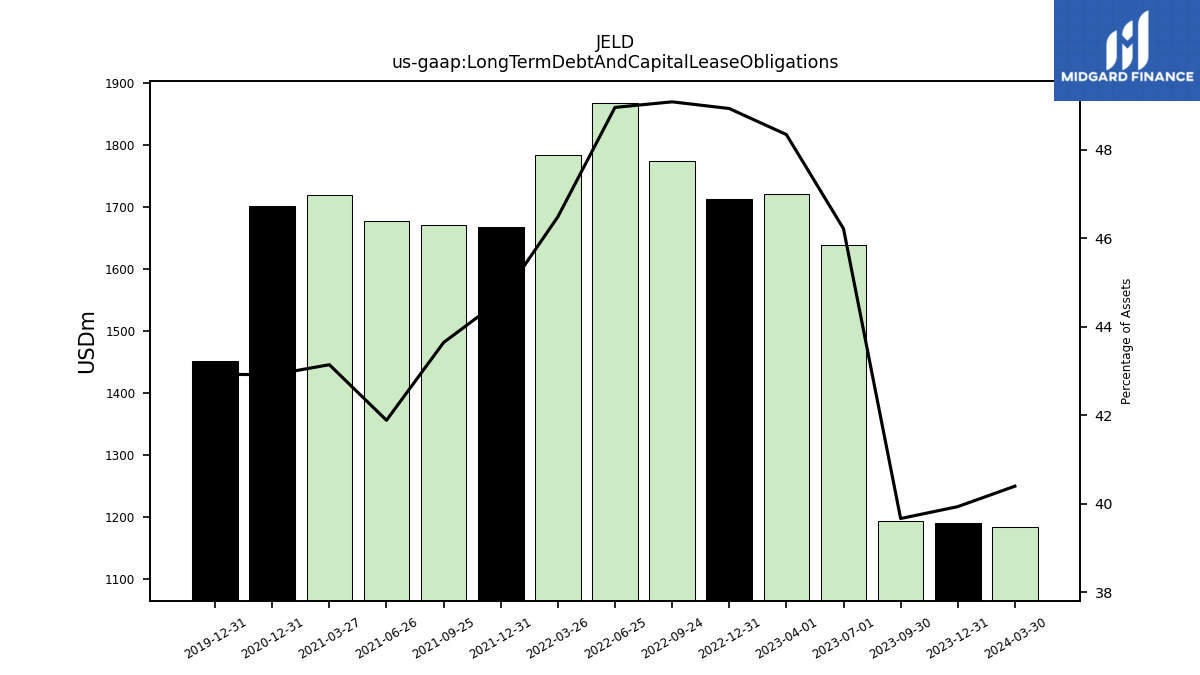
| Long Term Debt And Capital Lease Obligations | 1190.08 | 1193.25 | 1638.72 | 1721.24 | 1713.24 | 1774.27 | 1867.84 | 1783.03 | 1667.70 | 1670.04 | 1677.25 | 1718.51 | 1701.34 | NA | NA | NA | 1451.53 | NA | NA | NA | NA | NA | NA | NA | NA | NA | NA | NA | NA | NA | NA | NA | |
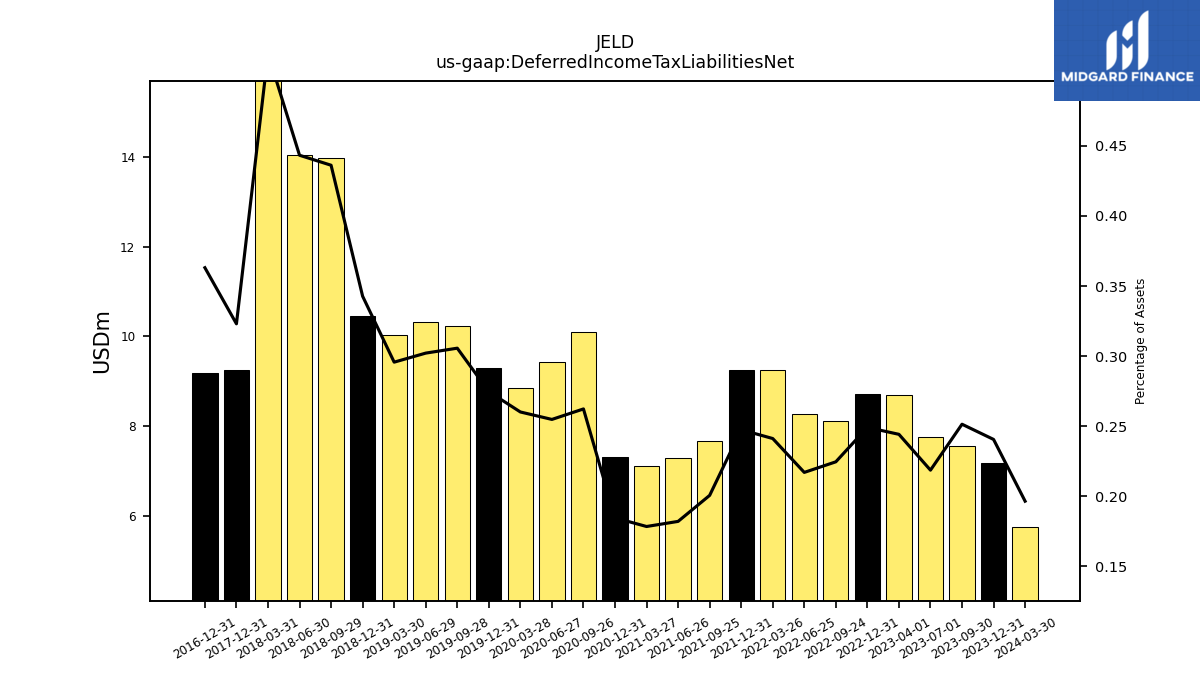
| Deferred Income Tax Liabilities Net | 7.17 | 7.56 | 7.75 | 8.70 | 8.72 | 8.12 | 8.28 | 9.25 | 9.25 | 7.68 | 7.29 | 7.11 | 7.32 | 10.11 | 9.43 | 8.86 | 9.29 | 10.23 | 10.32 | 10.03 | 10.46 | 13.97 | 14.04 | 16.36 | 9.25 | NA | NA | NA | 9.19 | NA | NA | NA | |
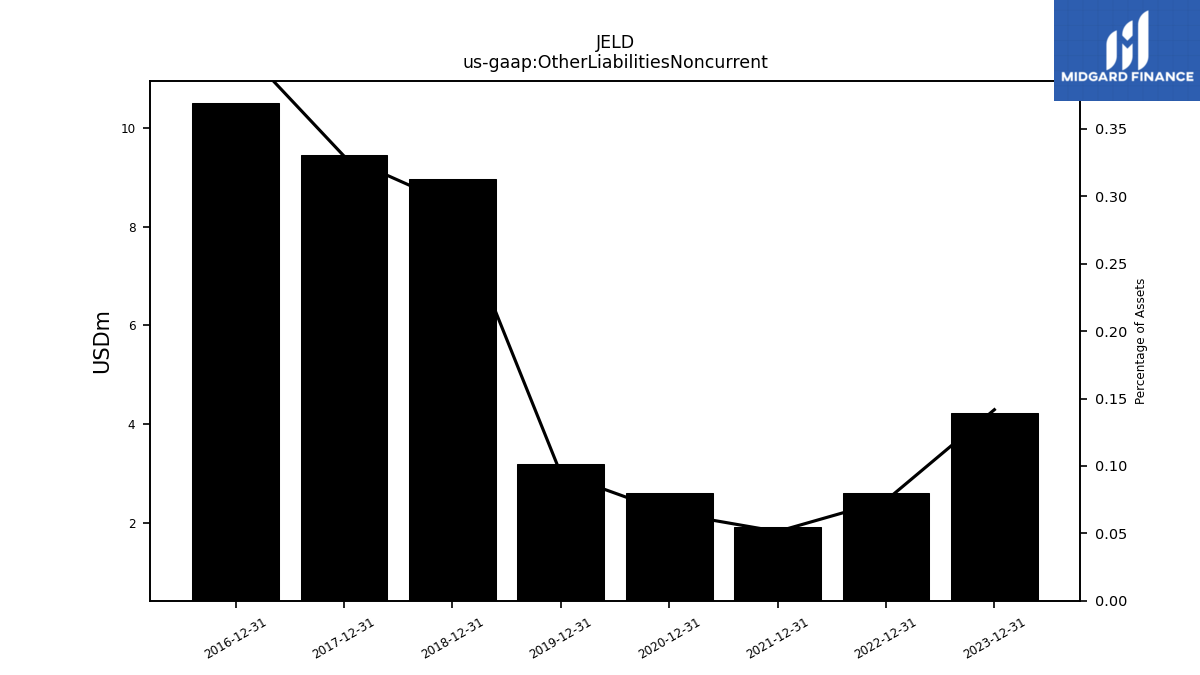
| Other Liabilities Noncurrent | 4.22 | NA | NA | NA | 2.60 | NA | NA | NA | 1.92 | NA | NA | NA | 2.59 | NA | NA | NA | 3.19 | NA | NA | NA | 8.97 | NA | NA | NA | 9.44 | NA | NA | NA | 10.51 | NA | NA | NA | |
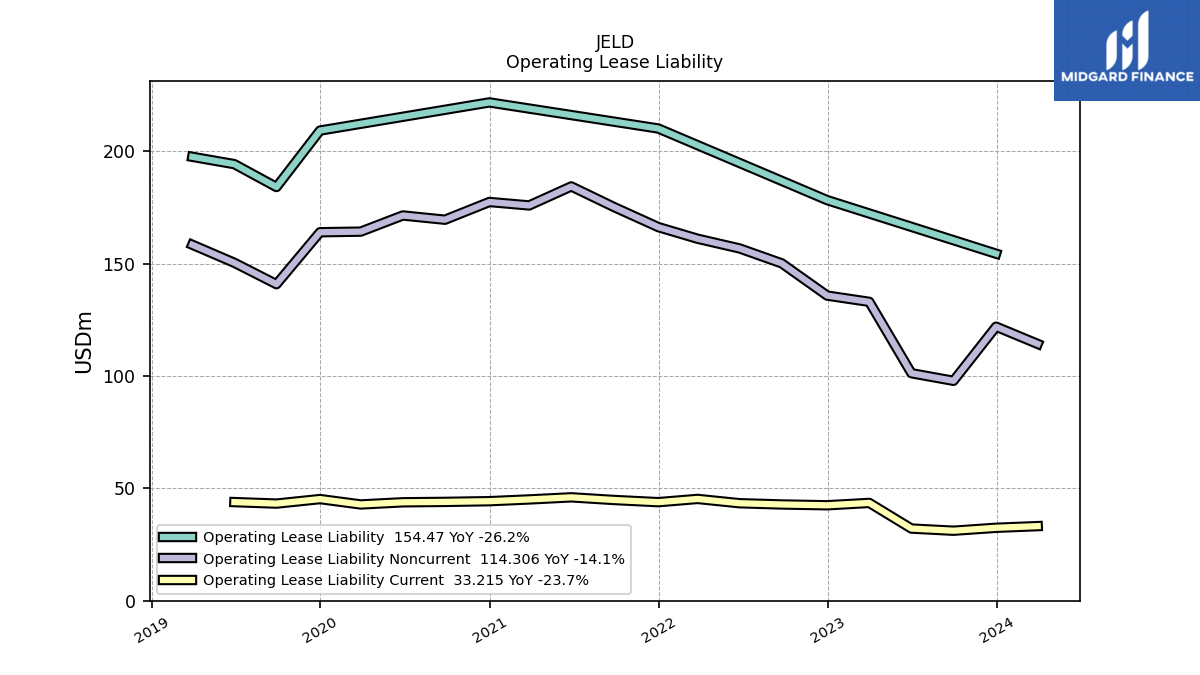
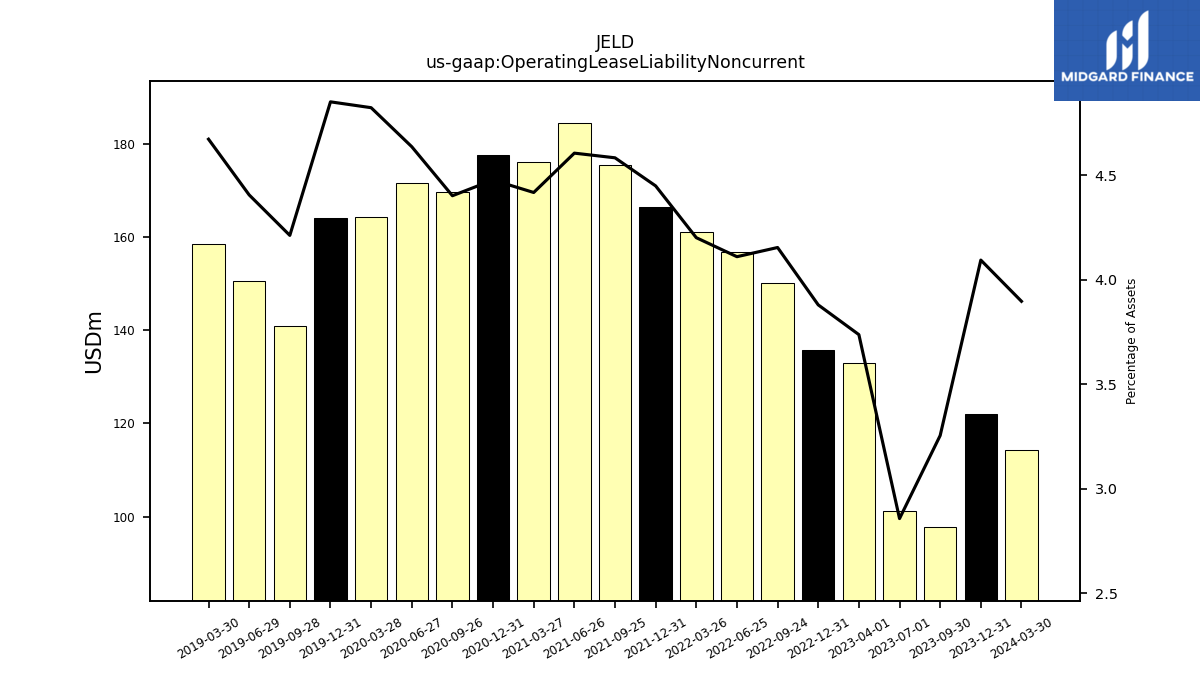
| Operating Lease Liability Noncurrent | 121.99 | 97.89 | 101.28 | 133.05 | 135.82 | 150.16 | 156.80 | 161.13 | 166.32 | 175.37 | 184.42 | 175.95 | 177.49 | 169.59 | 171.49 | 164.30 | 164.03 | 140.90 | 150.42 | 158.46 | NA | NA | NA | NA | NA | NA | NA | NA | NA | NA | NA | NA |
| 2023-12-31 | 2023-09-30 | 2023-07-01 | 2023-04-01 | 2022-12-31 | 2022-09-24 | 2022-06-25 | 2022-03-26 | 2021-12-31 | 2021-09-25 | 2021-06-26 | 2021-03-27 | 2020-12-31 | 2020-09-26 | 2020-06-27 | 2020-03-28 | 2019-12-31 | 2019-09-28 | 2019-06-29 | 2019-03-30 | 2018-12-31 | 2018-09-29 | 2018-06-30 | 2018-03-31 | 2017-12-31 | 2017-09-30 | 2017-07-01 | 2017-04-01 | 2016-12-31 | 2016-09-24 | 2016-06-25 | 2016-03-26 | ||
|---|---|---|---|---|---|---|---|---|---|---|---|---|---|---|---|---|---|---|---|---|---|---|---|---|---|---|---|---|---|---|---|---|---|
| Stockholders Equity | 850.64 | 837.16 | 782.38 | 747.76 | 723.55 | 625.10 | 736.51 | 811.77 | 842.22 | 830.42 | 1026.45 | 977.15 | 1004.46 | 893.31 | 830.60 | 753.77 | 812.09 | 780.75 | 789.47 | 763.89 | 767.82 | 777.96 | 791.07 | 852.23 | 792.04 | 884.70 | 803.20 | 714.74 | 56.00 | -84.68 | -144.39 | -208.73 | |
| Common Stock Value | 0.85 | 0.85 | 0.85 | 0.85 | 0.84 | 0.84 | 0.86 | 0.89 | 0.90 | 0.92 | 0.99 | 1.00 | 1.01 | 1.01 | 1.00 | 1.00 | 1.01 | 1.01 | 1.00 | 1.01 | 1.01 | 1.03 | 1.05 | 1.06 | 1.06 | 1.05 | 1.05 | 1.05 | 1.98 | NA | NA | NA | |
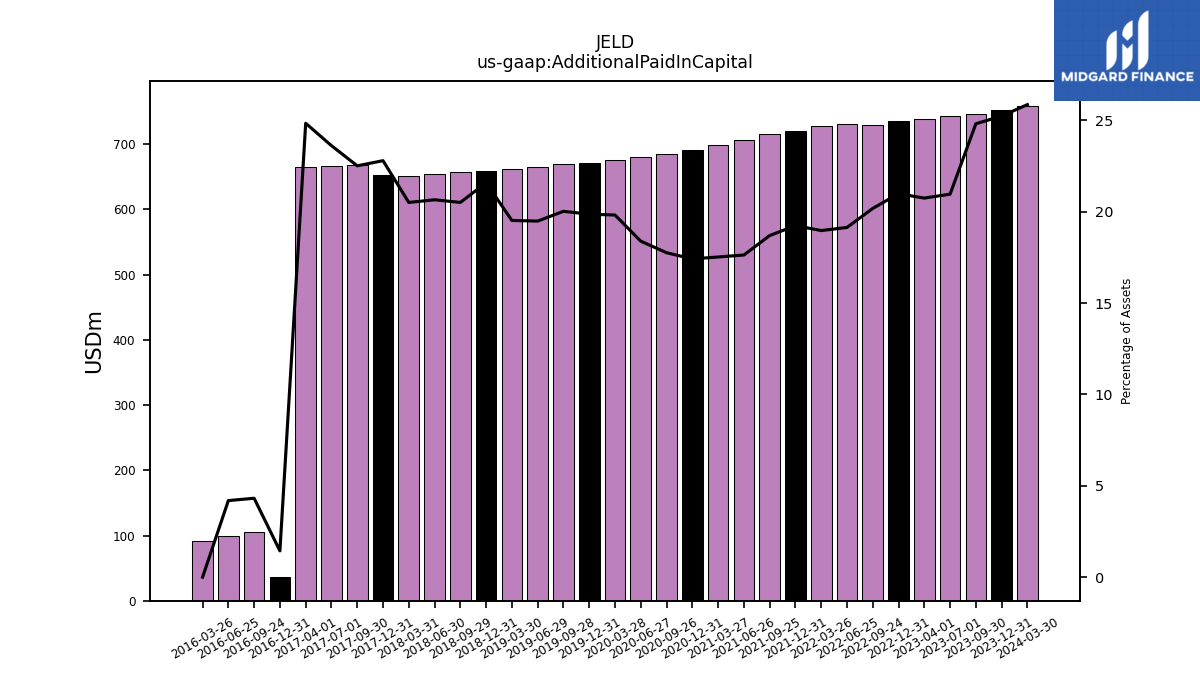
| Additional Paid In Capital | 752.17 | 746.62 | 743.34 | 738.77 | 734.85 | 729.63 | 730.29 | 727.72 | 719.45 | 715.46 | 706.11 | 698.09 | 690.69 | 684.19 | 680.28 | 675.27 | 671.77 | 669.94 | 665.50 | 662.18 | 658.59 | 656.95 | 654.16 | 650.55 | 652.67 | 667.67 | 667.08 | 665.33 | 36.36 | 104.87 | 99.00 | 91.32 | |
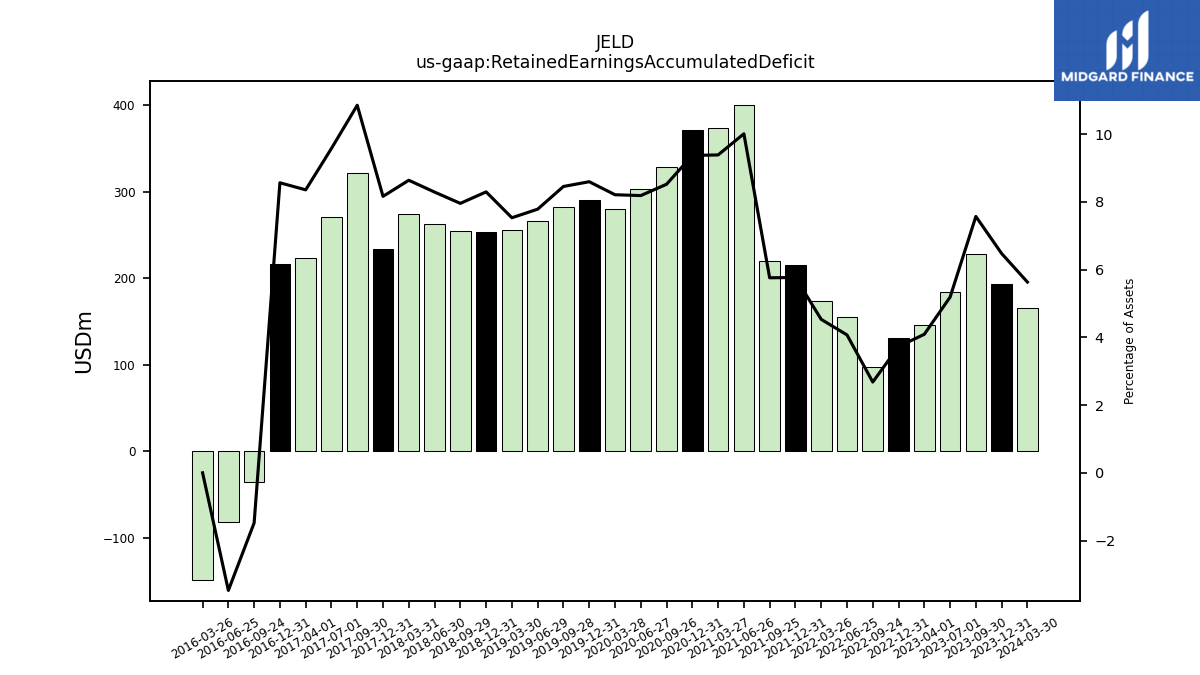
| Retained Earnings Accumulated Deficit | 192.93 | 227.69 | 183.90 | 145.62 | 130.49 | 96.86 | 155.33 | 173.76 | 215.61 | 220.31 | 400.78 | 373.81 | 371.46 | 328.22 | 302.74 | 279.65 | 290.58 | 282.79 | 265.75 | 255.38 | 253.04 | 254.75 | 262.46 | 273.92 | 233.66 | 321.75 | 270.48 | 223.70 | 216.64 | -35.93 | -82.01 | -148.90 | |
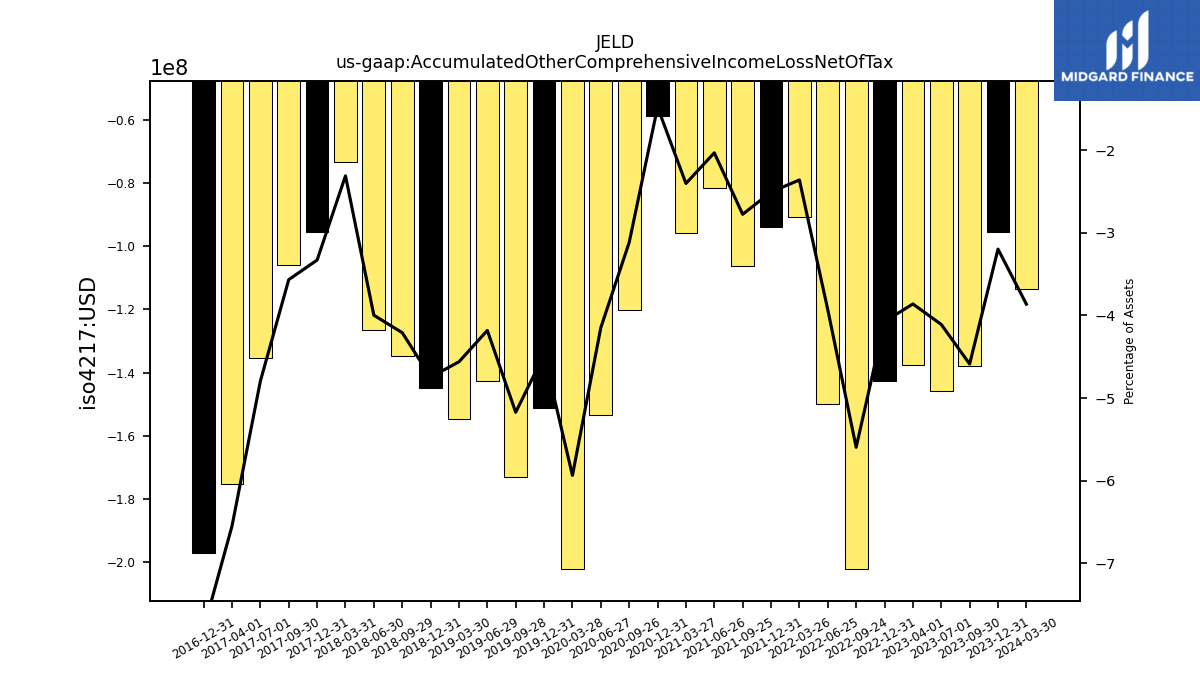
| Accumulated Other Comprehensive Income Loss Net Of Tax | -95.31 | -138.00 | -145.71 | -137.48 | -142.63 | -202.25 | -149.97 | -90.59 | -93.75 | -106.26 | -81.44 | -95.75 | -58.69 | -120.11 | -153.43 | -202.15 | -151.28 | -172.99 | -142.78 | -154.68 | -144.82 | -134.78 | -126.59 | -73.31 | -95.35 | -105.78 | -135.42 | -175.34 | -197.18 | NA | NA | NA |
| 2023-12-31 | 2023-09-30 | 2023-07-01 | 2023-04-01 | 2022-12-31 | 2022-09-24 | 2022-06-25 | 2022-03-26 | 2021-12-31 | 2021-09-25 | 2021-06-26 | 2021-03-27 | 2020-12-31 | 2020-09-26 | 2020-06-27 | 2020-03-28 | 2019-12-31 | 2019-09-28 | 2019-06-29 | 2019-03-30 | 2018-12-31 | 2018-09-29 | 2018-06-30 | 2018-03-31 | 2017-12-31 | 2017-09-30 | 2017-07-01 | 2017-04-01 | 2016-12-31 | 2016-09-24 | 2016-06-25 | 2016-03-26 | ||
|---|---|---|---|---|---|---|---|---|---|---|---|---|---|---|---|---|---|---|---|---|---|---|---|---|---|---|---|---|---|---|---|---|---|
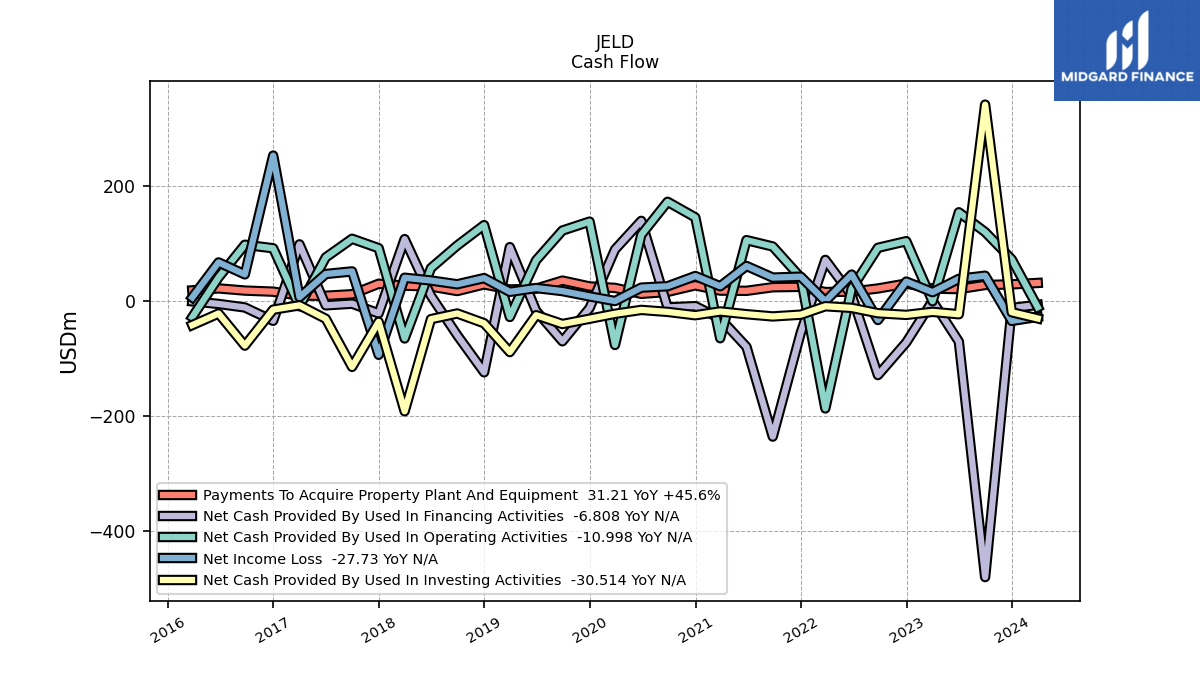
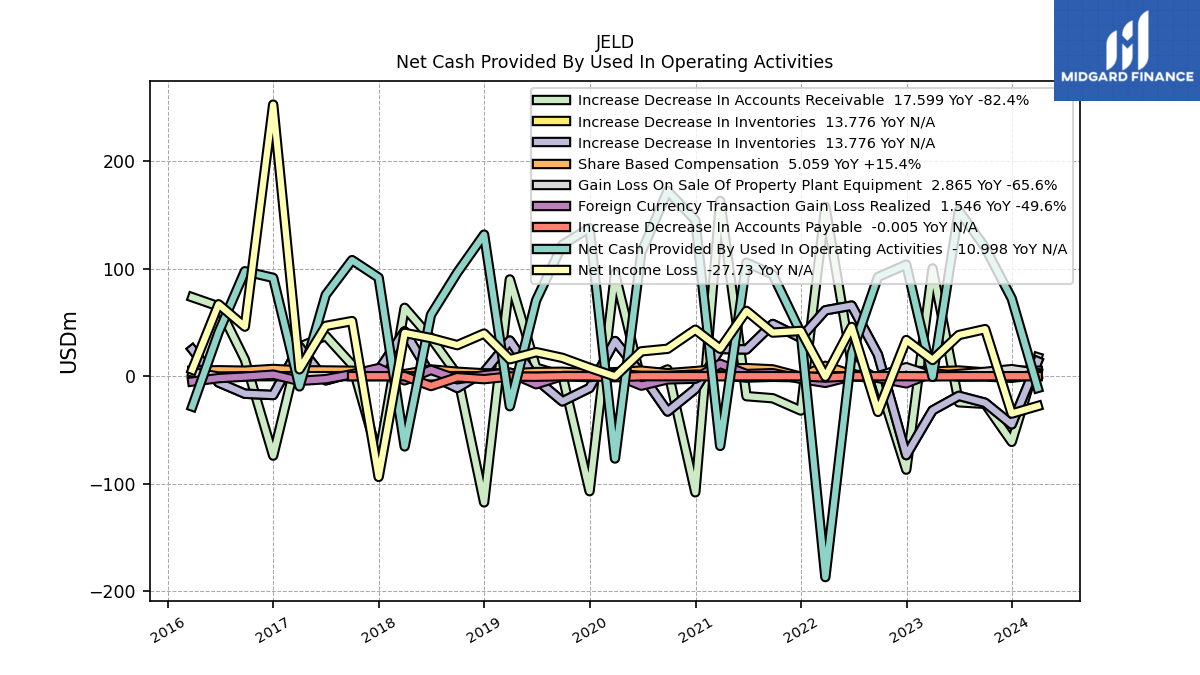
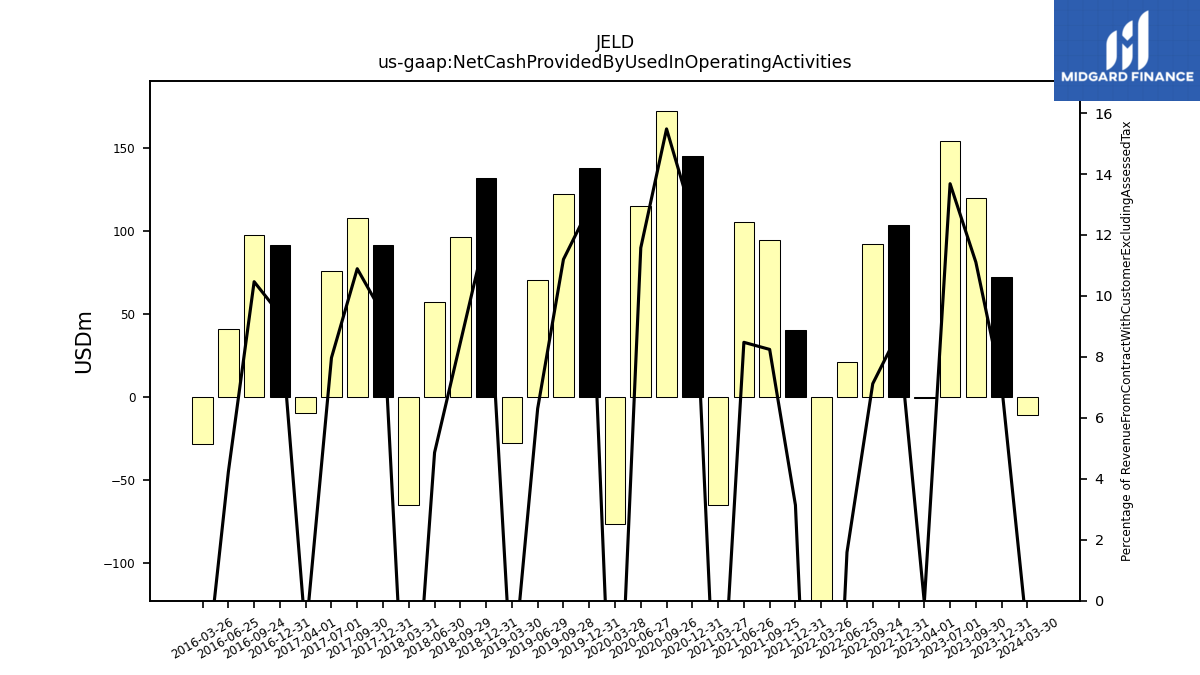
| Net Cash Provided By Used In Operating Activities | 72.20 | 119.61 | 154.03 | -0.66 | 103.76 | 92.28 | 21.16 | -186.87 | 40.38 | 94.54 | 105.62 | -64.88 | 145.07 | 172.27 | 114.89 | -76.58 | 137.82 | 122.29 | 70.56 | -27.96 | 131.68 | 96.28 | 57.00 | -65.31 | 91.67 | 107.98 | 75.64 | -9.48 | 91.47 | 97.60 | 40.79 | -28.20 | |
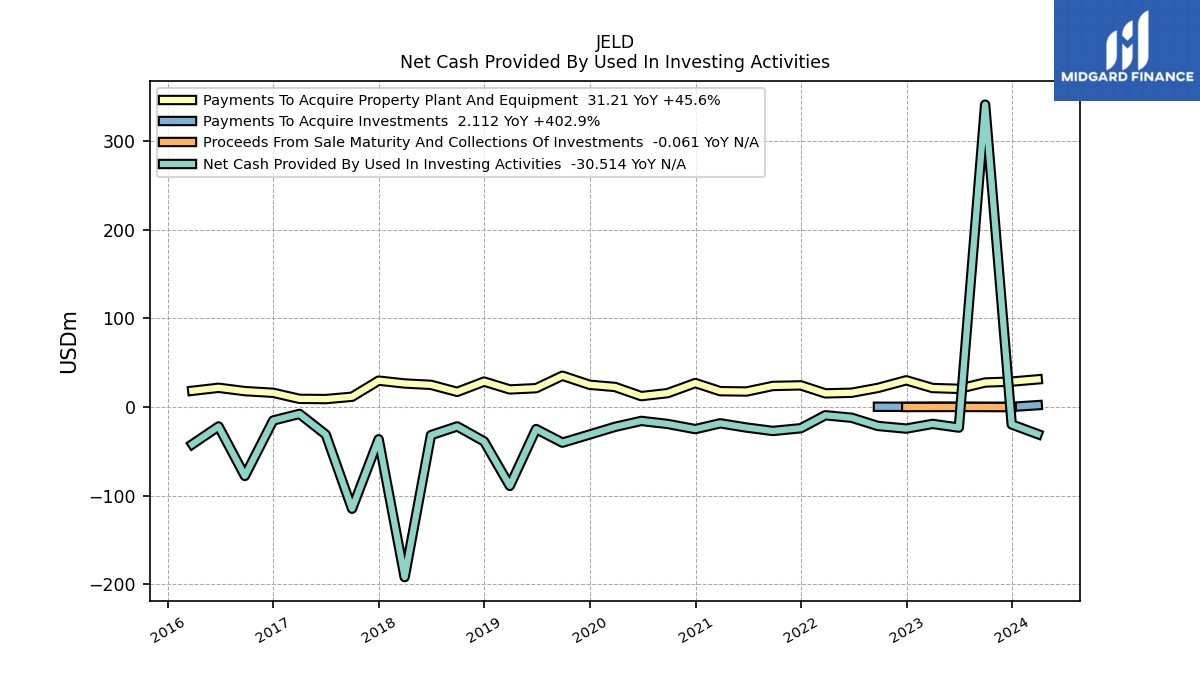
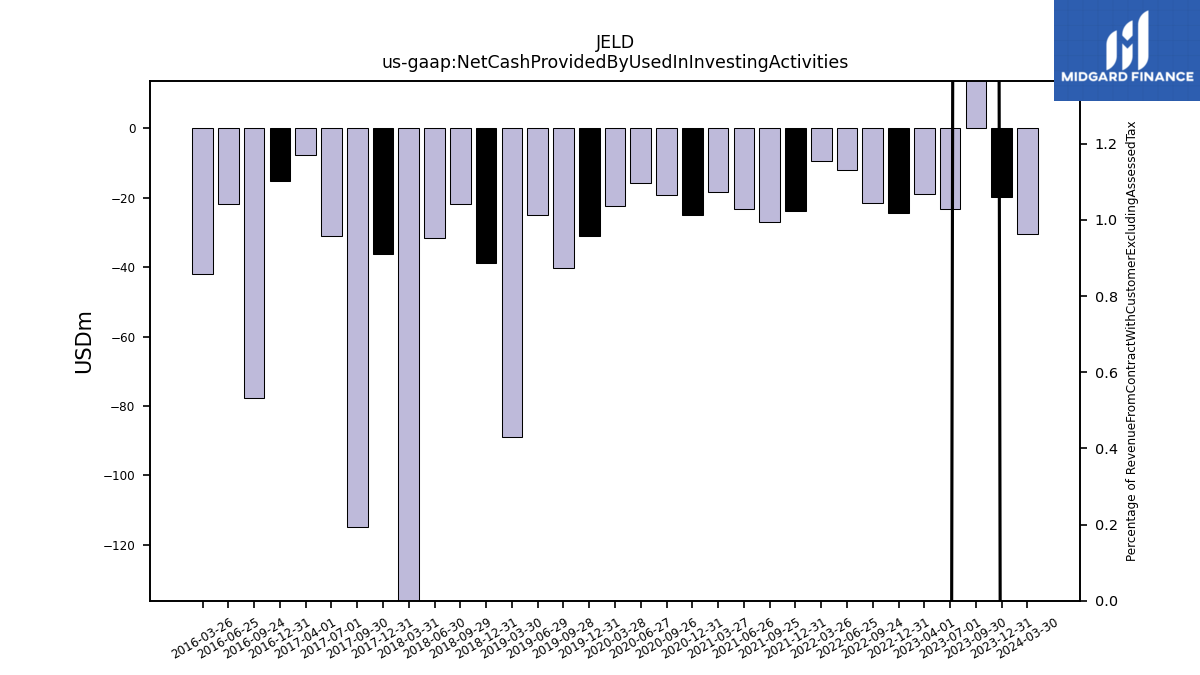
| Net Cash Provided By Used In Investing Activities | -19.67 | 341.07 | -23.19 | -19.03 | -24.30 | -21.36 | -12.10 | -9.27 | -23.90 | -26.98 | -23.13 | -18.35 | -24.89 | -19.10 | -15.65 | -22.37 | -31.01 | -40.18 | -24.82 | -88.94 | -38.79 | -21.85 | -31.67 | -191.83 | -36.33 | -114.71 | -31.02 | -7.74 | -15.17 | -77.73 | -21.88 | -42.00 | |
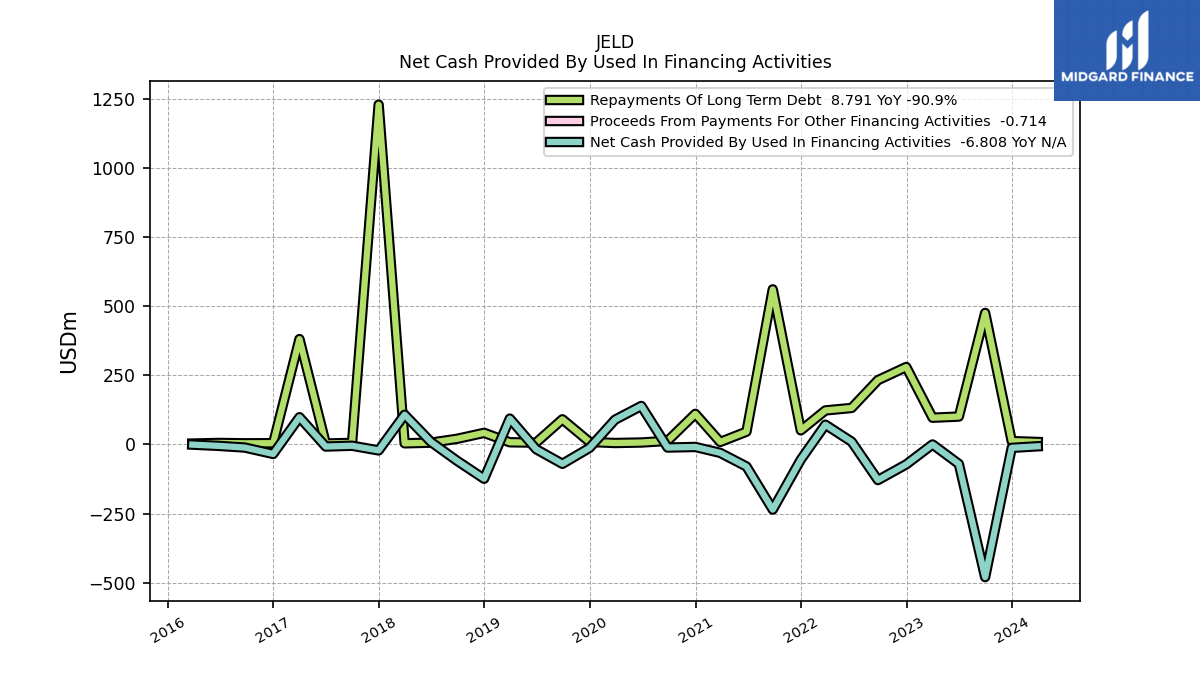
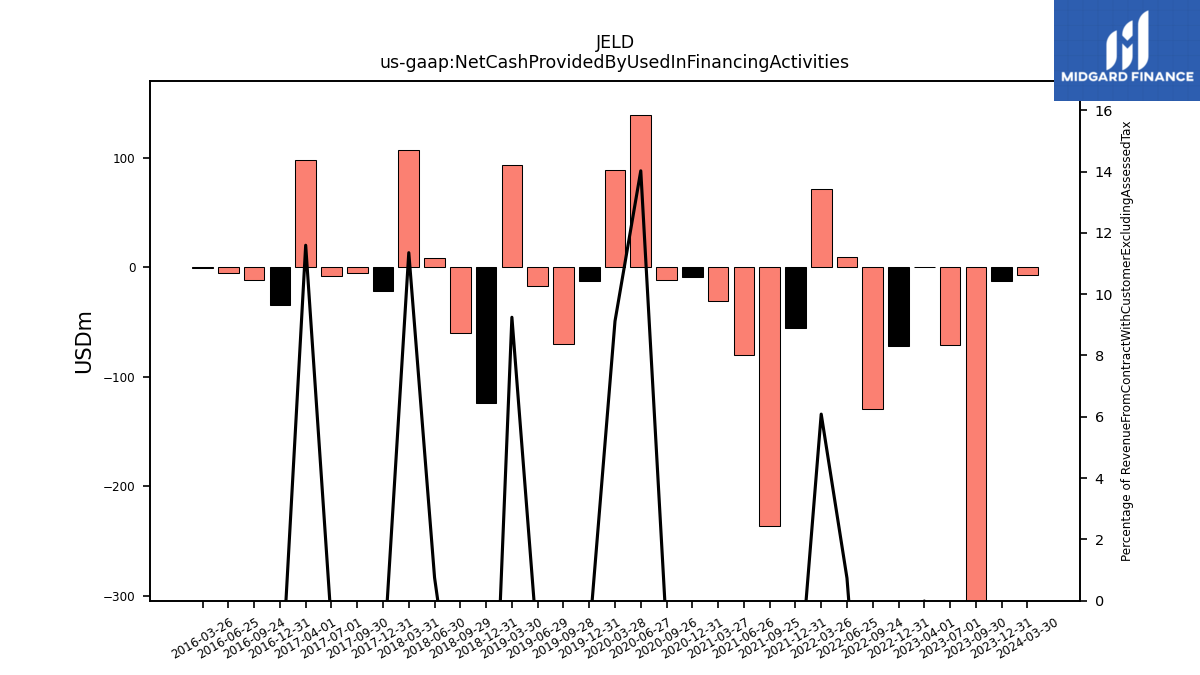
| Net Cash Provided By Used In Financing Activities | -12.40 | -479.97 | -70.69 | -0.10 | -72.16 | -128.94 | 9.80 | 71.28 | -55.05 | -235.83 | -79.81 | -30.52 | -9.20 | -11.34 | 139.15 | 89.29 | -12.47 | -70.20 | -17.20 | 93.47 | -124.14 | -59.58 | 8.82 | 107.41 | -21.71 | -4.81 | -7.70 | 98.31 | -34.58 | -11.38 | -5.27 | -0.78 |
| 2023-12-31 | 2023-09-30 | 2023-07-01 | 2023-04-01 | 2022-12-31 | 2022-09-24 | 2022-06-25 | 2022-03-26 | 2021-12-31 | 2021-09-25 | 2021-06-26 | 2021-03-27 | 2020-12-31 | 2020-09-26 | 2020-06-27 | 2020-03-28 | 2019-12-31 | 2019-09-28 | 2019-06-29 | 2019-03-30 | 2018-12-31 | 2018-09-29 | 2018-06-30 | 2018-03-31 | 2017-12-31 | 2017-09-30 | 2017-07-01 | 2017-04-01 | 2016-12-31 | 2016-09-24 | 2016-06-25 | 2016-03-26 | ||
|---|---|---|---|---|---|---|---|---|---|---|---|---|---|---|---|---|---|---|---|---|---|---|---|---|---|---|---|---|---|---|---|---|---|
| Net Cash Provided By Used In Operating Activities | 72.20 | 119.61 | 154.03 | -0.66 | 103.76 | 92.28 | 21.16 | -186.87 | 40.38 | 94.54 | 105.62 | -64.88 | 145.07 | 172.27 | 114.89 | -76.58 | 137.82 | 122.29 | 70.56 | -27.96 | 131.68 | 96.28 | 57.00 | -65.31 | 91.67 | 107.98 | 75.64 | -9.48 | 91.47 | 97.60 | 40.79 | -28.20 | |
| Net Income Loss | -34.76 | 43.78 | 38.28 | 15.13 | 33.62 | -33.19 | 45.83 | -0.53 | 42.09 | 40.54 | 60.71 | 25.48 | 43.24 | 25.48 | 23.10 | -0.23 | 7.80 | 17.04 | 22.36 | 15.76 | 39.66 | 28.89 | 35.45 | 40.27 | -93.69 | 51.27 | 46.78 | 6.43 | 252.57 | 46.08 | 66.89 | 6.04 | |
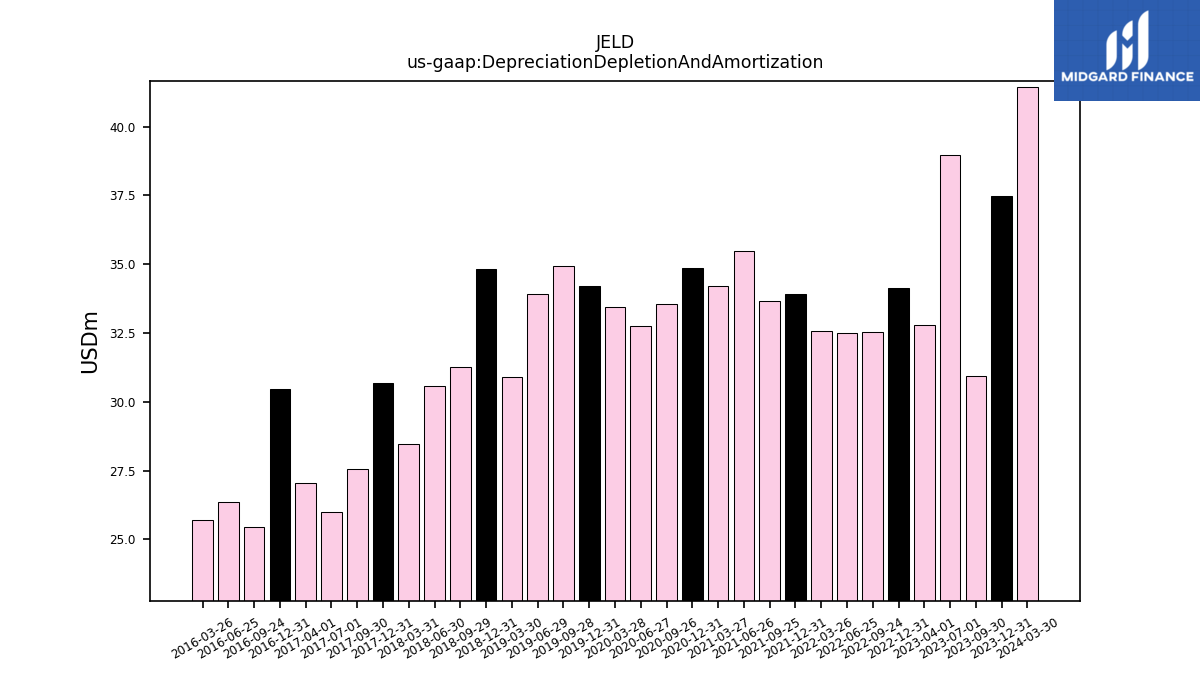
| Depreciation Depletion And Amortization | 37.49 | 30.95 | 38.96 | 32.79 | 34.13 | 32.55 | 32.51 | 32.56 | 33.91 | 33.66 | 35.47 | 34.21 | 34.87 | 33.54 | 32.77 | 33.45 | 34.22 | 34.92 | 33.93 | 30.90 | 34.82 | 31.25 | 30.57 | 28.46 | 30.67 | 27.55 | 25.99 | 27.06 | 30.48 | 25.47 | 26.36 | 25.69 | |
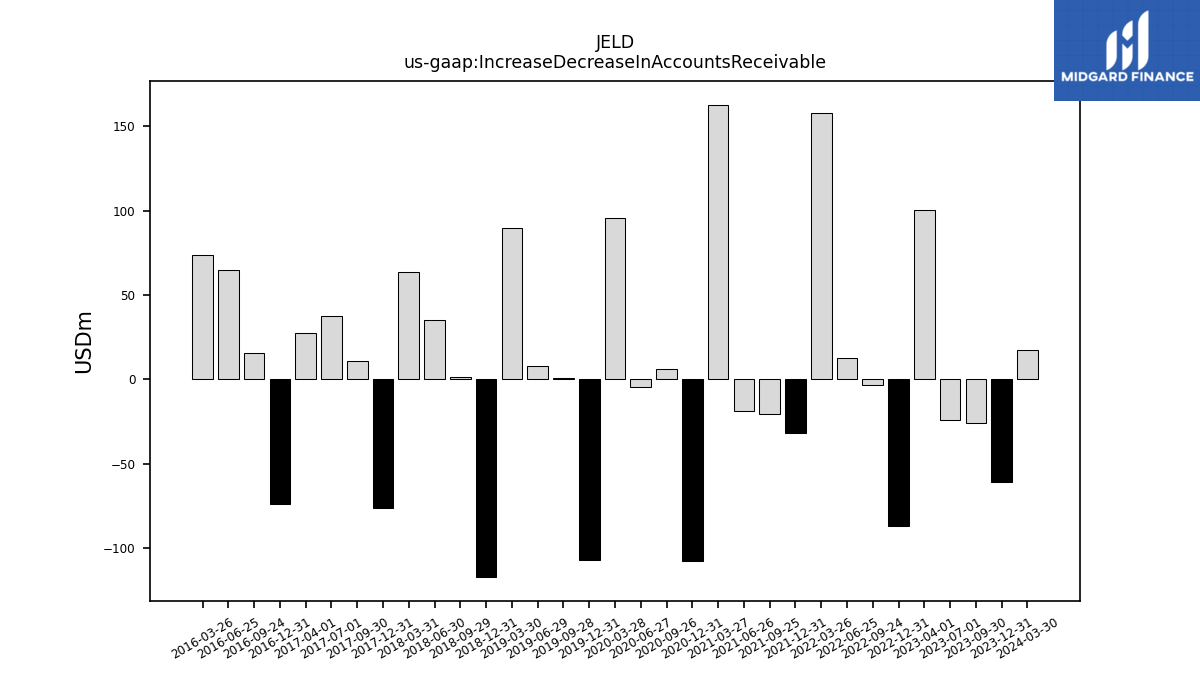
| Increase Decrease In Accounts Receivable | -61.10 | -25.71 | -24.28 | 100.23 | -86.92 | -3.46 | 12.37 | 157.70 | -31.94 | -20.50 | -18.58 | 162.95 | -108.00 | 6.29 | -4.58 | 95.48 | -106.95 | 0.58 | 7.92 | 90.02 | -117.37 | 1.52 | 35.45 | 63.60 | -76.08 | 10.67 | 37.49 | 27.26 | -73.89 | 15.39 | 64.92 | 73.45 | |
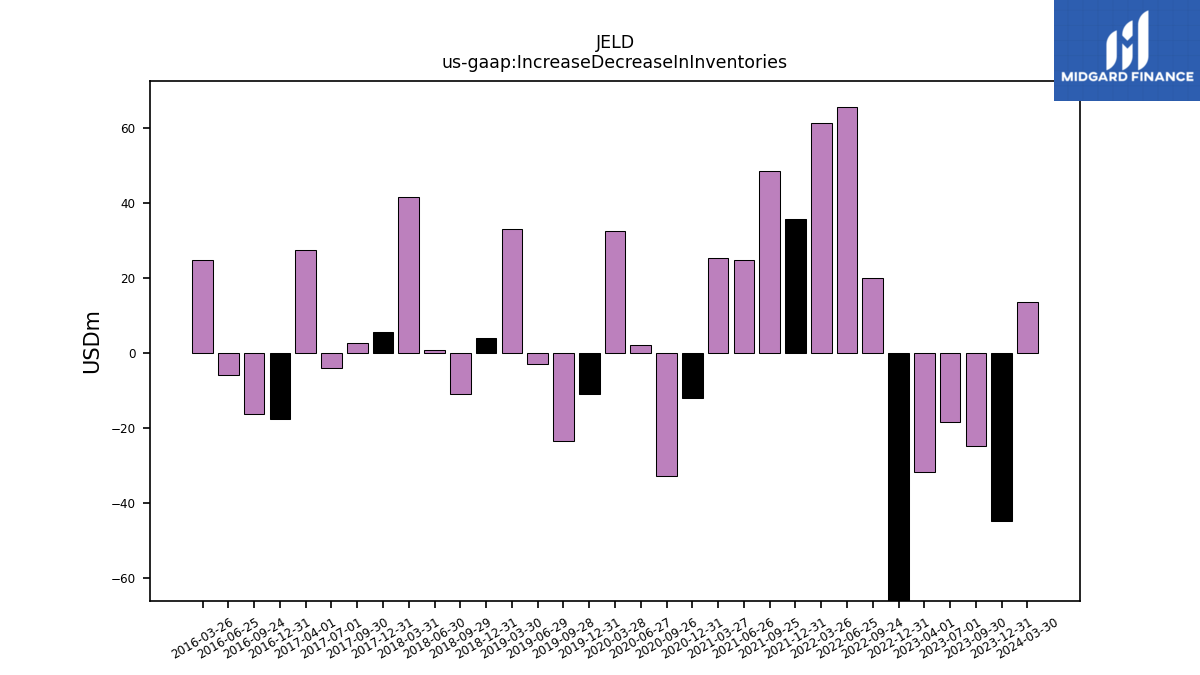
| Increase Decrease In Inventories | -44.79 | -24.70 | -18.29 | -31.78 | -73.42 | 20.06 | 65.65 | 61.28 | 35.69 | 48.55 | 24.88 | 25.37 | -11.89 | -32.84 | 2.20 | 32.69 | -10.99 | -23.41 | -2.90 | 33.10 | 3.95 | -10.91 | 0.79 | 41.70 | 5.64 | 2.83 | -3.85 | 27.41 | -17.51 | -16.30 | -5.84 | 24.91 | |
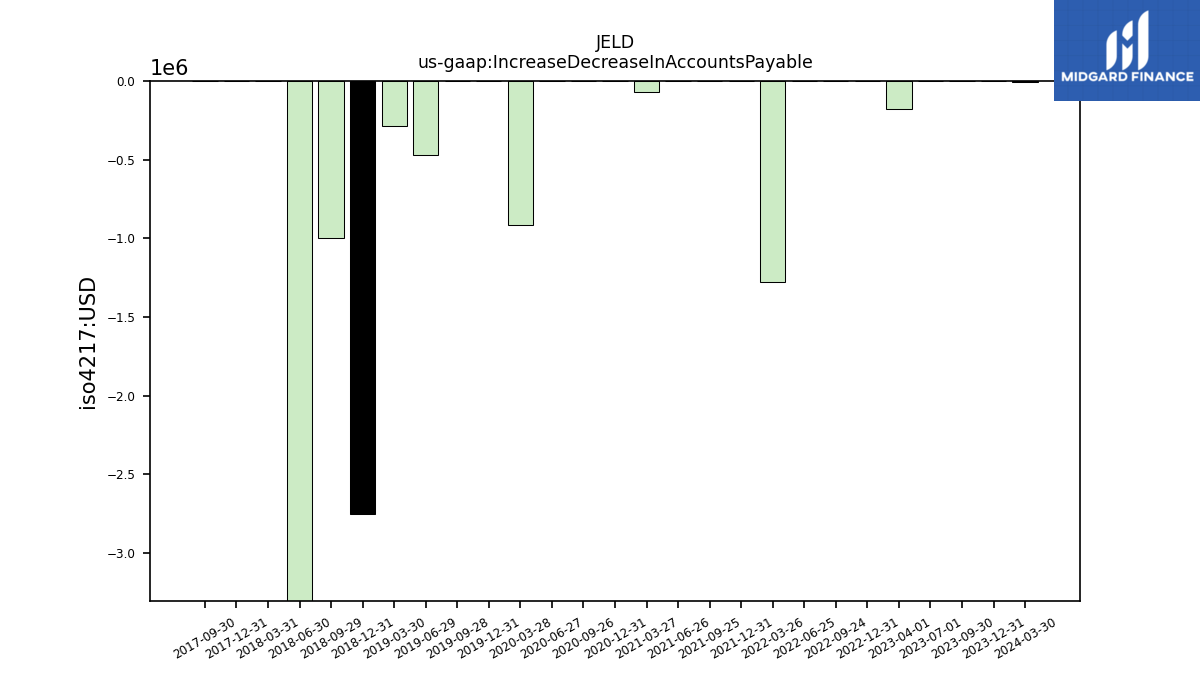
| Increase Decrease In Accounts Payable | 0.00 | 0.00 | 0.00 | -0.18 | 0.00 | 0.00 | 0.00 | -1.28 | 0.00 | 0.00 | 0.00 | -0.07 | 0.00 | 0.00 | 0.00 | -0.91 | 0.00 | 0.00 | -0.47 | -0.29 | -2.75 | -1.00 | -9.14 | 0.00 | 0.00 | 0.00 | NA | NA | NA | NA | NA | NA | |
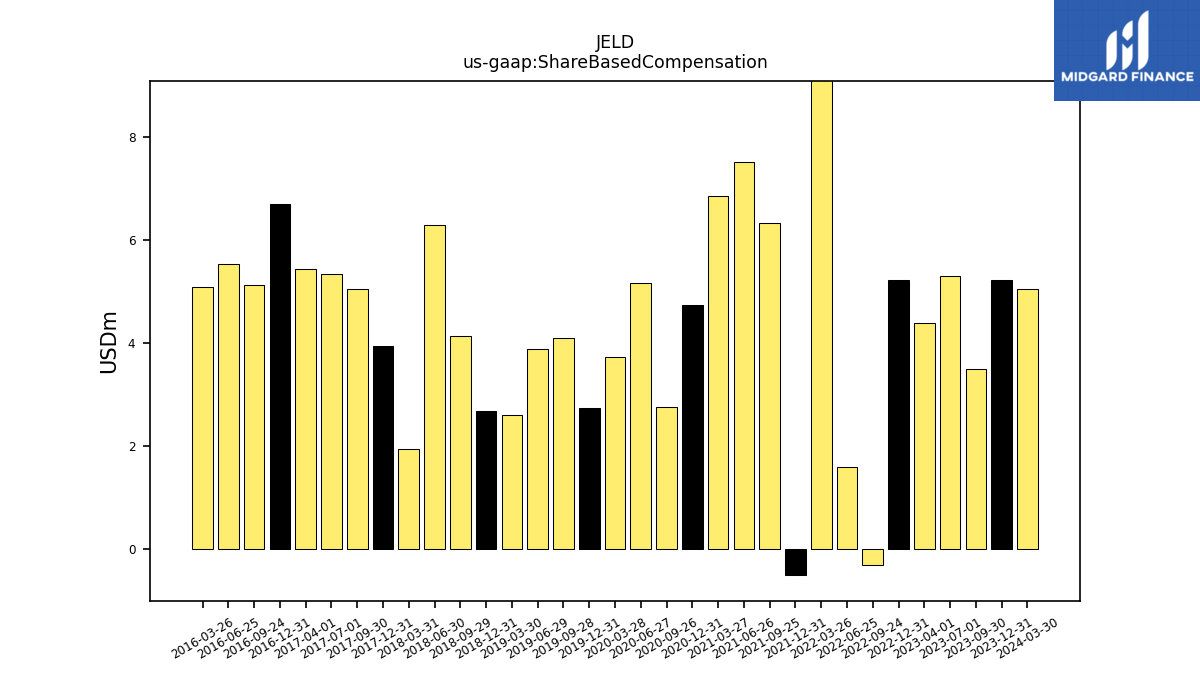
| Share Based Compensation | 5.22 | 3.50 | 5.30 | 4.38 | 5.22 | -0.32 | 1.60 | 9.66 | -0.50 | 6.33 | 7.53 | 6.86 | 4.74 | 2.77 | 5.16 | 3.73 | 2.73 | 4.11 | 3.88 | 2.60 | 2.68 | 4.13 | 6.29 | 1.95 | 3.94 | 5.06 | 5.34 | 5.44 | 6.71 | 5.14 | 5.53 | 5.08 | |
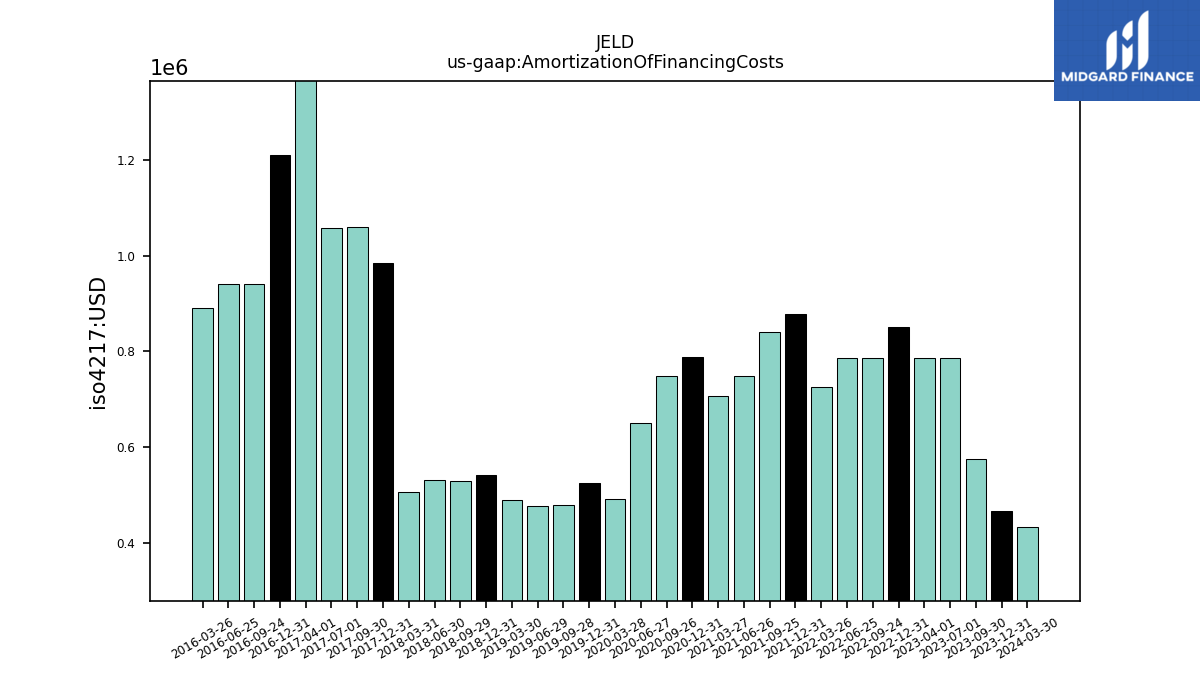
| Amortization Of Financing Costs | 0.47 | 0.58 | 0.79 | 0.79 | 0.85 | 0.79 | 0.79 | 0.73 | 0.88 | 0.84 | 0.75 | 0.71 | 0.79 | 0.75 | 0.65 | 0.49 | 0.53 | 0.48 | 0.48 | 0.49 | 0.54 | 0.53 | 0.53 | 0.51 | 0.98 | 1.06 | 1.06 | 6.32 | 1.21 | 0.94 | 0.94 | 0.89 |
| 2023-12-31 | 2023-09-30 | 2023-07-01 | 2023-04-01 | 2022-12-31 | 2022-09-24 | 2022-06-25 | 2022-03-26 | 2021-12-31 | 2021-09-25 | 2021-06-26 | 2021-03-27 | 2020-12-31 | 2020-09-26 | 2020-06-27 | 2020-03-28 | 2019-12-31 | 2019-09-28 | 2019-06-29 | 2019-03-30 | 2018-12-31 | 2018-09-29 | 2018-06-30 | 2018-03-31 | 2017-12-31 | 2017-09-30 | 2017-07-01 | 2017-04-01 | 2016-12-31 | 2016-09-24 | 2016-06-25 | 2016-03-26 | ||
|---|---|---|---|---|---|---|---|---|---|---|---|---|---|---|---|---|---|---|---|---|---|---|---|---|---|---|---|---|---|---|---|---|---|
| Net Cash Provided By Used In Investing Activities | -19.67 | 341.07 | -23.19 | -19.03 | -24.30 | -21.36 | -12.10 | -9.27 | -23.90 | -26.98 | -23.13 | -18.35 | -24.89 | -19.10 | -15.65 | -22.37 | -31.01 | -40.18 | -24.82 | -88.94 | -38.79 | -21.85 | -31.67 | -191.83 | -36.33 | -114.71 | -31.02 | -7.74 | -15.17 | -77.73 | -21.88 | -42.00 | |
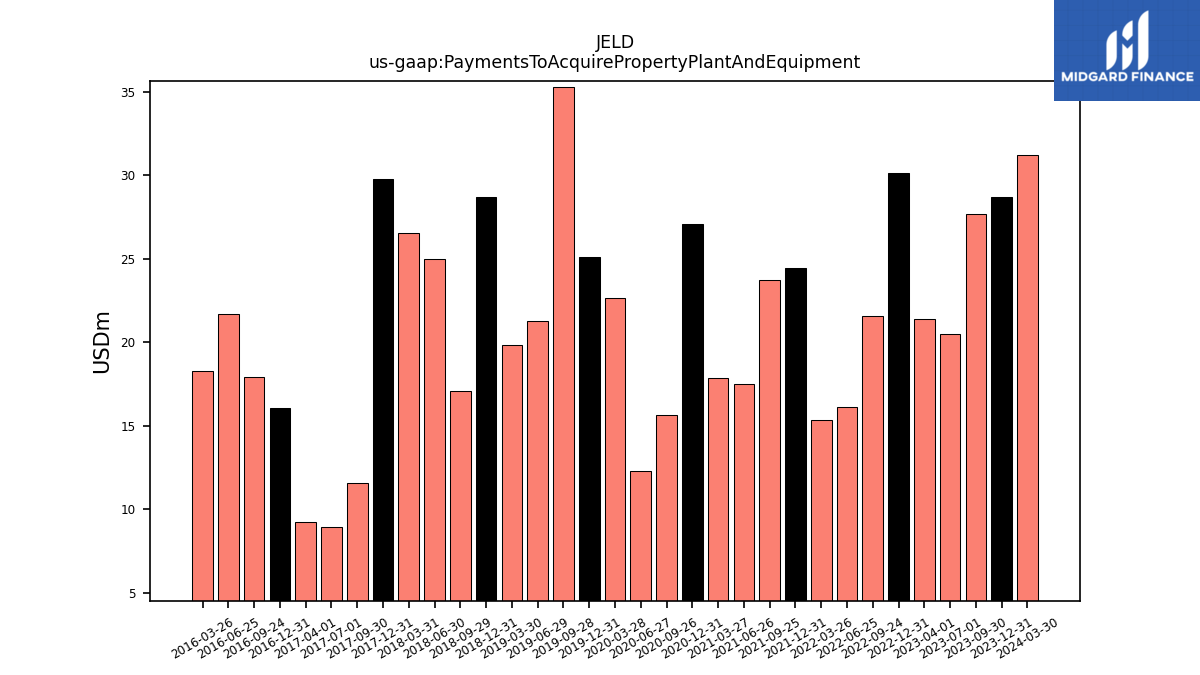
| Payments To Acquire Property Plant And Equipment | 28.70 | 27.68 | 20.52 | 21.43 | 30.15 | 21.57 | 16.12 | 15.38 | 24.45 | 23.76 | 17.50 | 17.89 | 27.06 | 15.68 | 12.32 | 22.64 | 25.11 | 35.29 | 21.27 | 19.84 | 28.70 | 17.11 | 25.02 | 26.57 | 29.79 | 11.60 | 8.97 | 9.24 | 16.06 | 17.95 | 21.72 | 18.31 | |
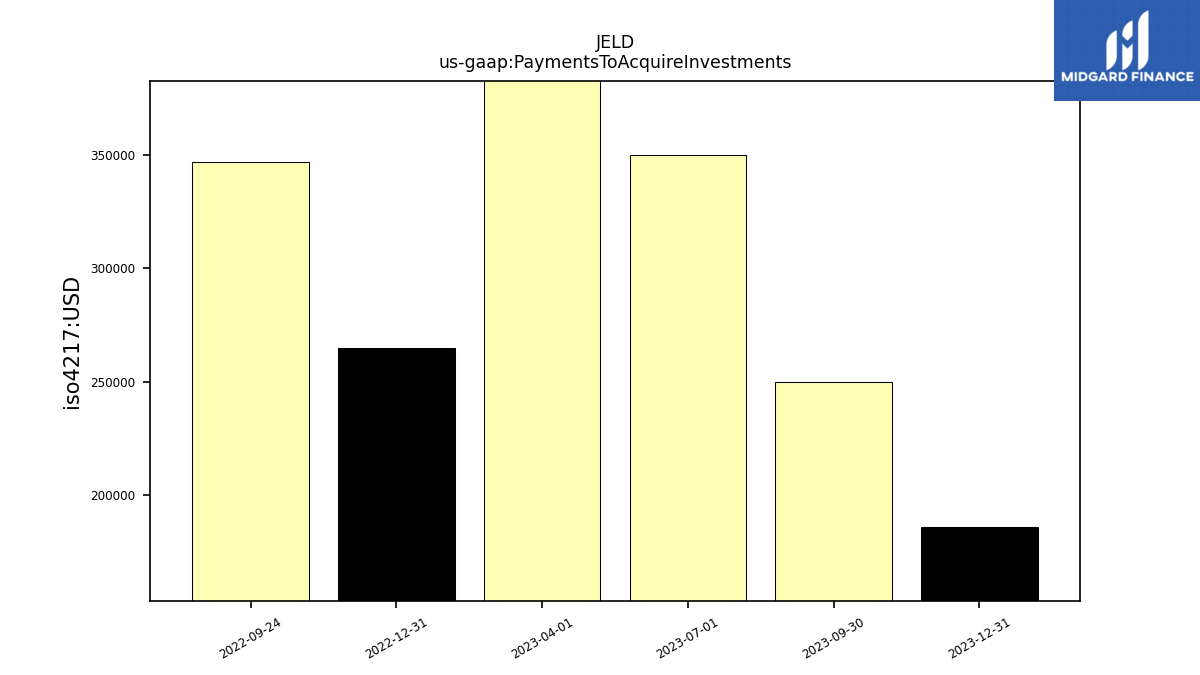
| Payments To Acquire Investments | 0.19 | 0.25 | 0.35 | 0.42 | 0.27 | 0.35 | NA | NA | NA | NA | NA | NA | NA | NA | NA | NA | NA | NA | NA | NA | NA | NA | NA | NA | NA | NA | NA | NA | NA | NA | NA | NA |
| 2023-12-31 | 2023-09-30 | 2023-07-01 | 2023-04-01 | 2022-12-31 | 2022-09-24 | 2022-06-25 | 2022-03-26 | 2021-12-31 | 2021-09-25 | 2021-06-26 | 2021-03-27 | 2020-12-31 | 2020-09-26 | 2020-06-27 | 2020-03-28 | 2019-12-31 | 2019-09-28 | 2019-06-29 | 2019-03-30 | 2018-12-31 | 2018-09-29 | 2018-06-30 | 2018-03-31 | 2017-12-31 | 2017-09-30 | 2017-07-01 | 2017-04-01 | 2016-12-31 | 2016-09-24 | 2016-06-25 | 2016-03-26 | ||
|---|---|---|---|---|---|---|---|---|---|---|---|---|---|---|---|---|---|---|---|---|---|---|---|---|---|---|---|---|---|---|---|---|---|
| Net Cash Provided By Used In Financing Activities | -12.40 | -479.97 | -70.69 | -0.10 | -72.16 | -128.94 | 9.80 | 71.28 | -55.05 | -235.83 | -79.81 | -30.52 | -9.20 | -11.34 | 139.15 | 89.29 | -12.47 | -70.20 | -17.20 | 93.47 | -124.14 | -59.58 | 8.82 | 107.41 | -21.71 | -4.81 | -7.70 | 98.31 | -34.58 | -11.38 | -5.27 | -0.78 |
| 2023-12-31 | 2023-09-30 | 2023-07-01 | 2023-04-01 | 2022-12-31 | 2022-09-24 | 2022-06-25 | 2022-03-26 | 2021-12-31 | 2021-09-25 | 2021-06-26 | 2021-03-27 | 2020-12-31 | 2020-09-26 | 2020-06-27 | 2020-03-28 | 2019-12-31 | 2019-09-28 | 2019-06-29 | 2019-03-30 | 2018-12-31 | 2018-09-29 | 2018-06-30 | 2018-03-31 | 2017-12-31 | 2017-09-30 | 2017-07-01 | 2017-04-01 | 2016-12-31 | 2016-09-24 | 2016-06-25 | 2016-03-26 | ||
|---|---|---|---|---|---|---|---|---|---|---|---|---|---|---|---|---|---|---|---|---|---|---|---|---|---|---|---|---|---|---|---|---|---|
| Revenue From Contract With Customer Excluding Assessed Tax | 1021.07 | 1076.98 | 1125.77 | 1222.62 | 1179.01 | 1295.81 | 1330.97 | 1171.02 | 1286.94 | 1146.59 | 1245.82 | 1092.38 | 1151.28 | 1112.87 | 992.35 | 979.19 | 1068.56 | 1091.95 | 1118.99 | 1010.91 | 1091.08 | 1136.95 | 1172.50 | 946.18 | 975.78 | 991.33 | 948.79 | 847.85 | 973.17 | 932.48 | 964.61 | 796.55 | |
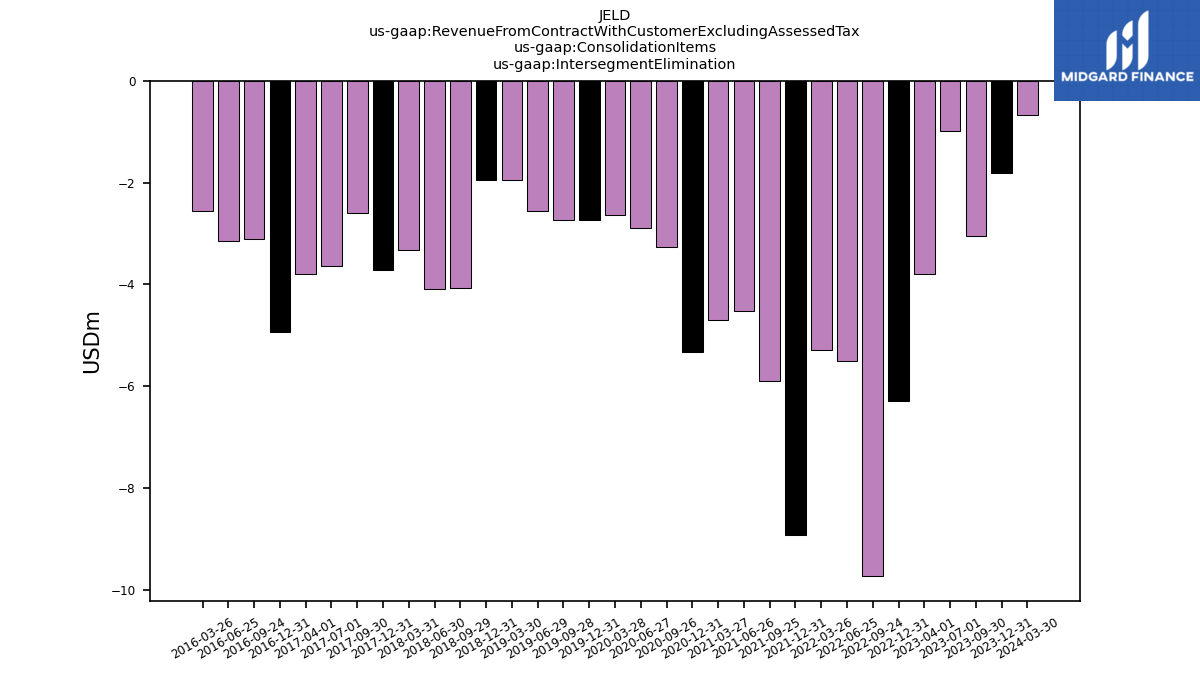
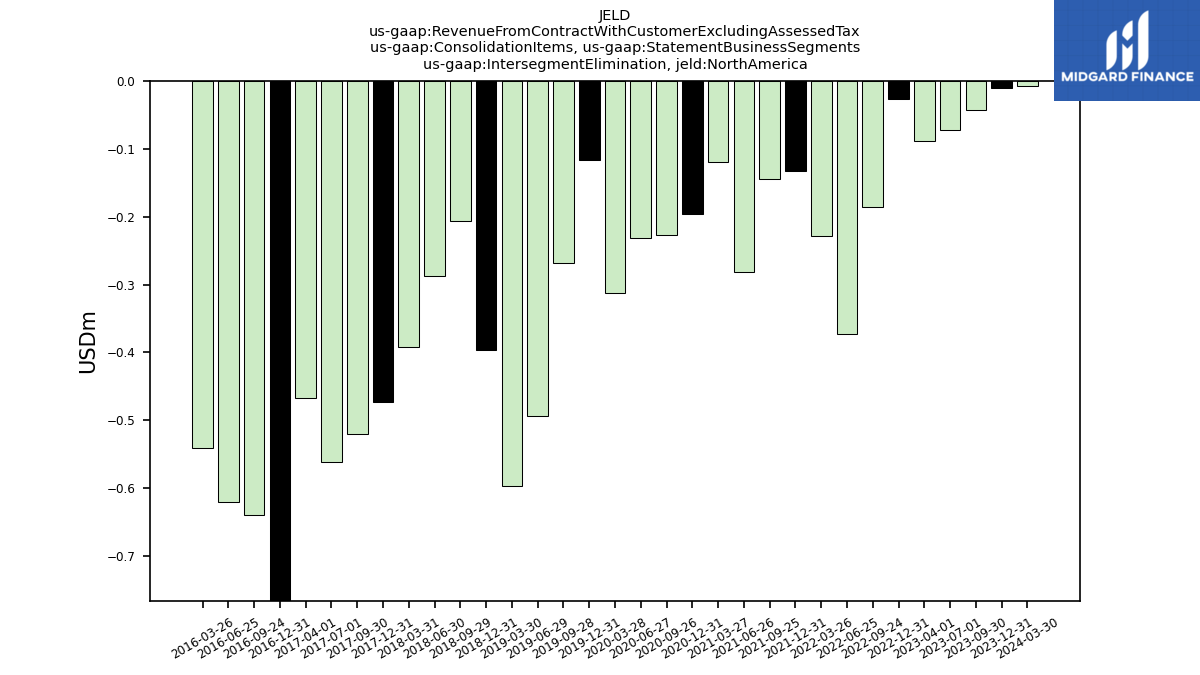
| Intersegment Elimination | -1.81 | -3.04 | -0.98 | -3.80 | -6.30 | -9.73 | -5.51 | -5.29 | -8.92 | -5.90 | -4.52 | -4.71 | -5.34 | -3.27 | -2.89 | -2.64 | -2.73 | -2.74 | -2.56 | -1.95 | -1.95 | -4.07 | -4.09 | -3.32 | -3.73 | -2.59 | -3.63 | -3.79 | -4.94 | -3.10 | -3.14 | -2.56 | |
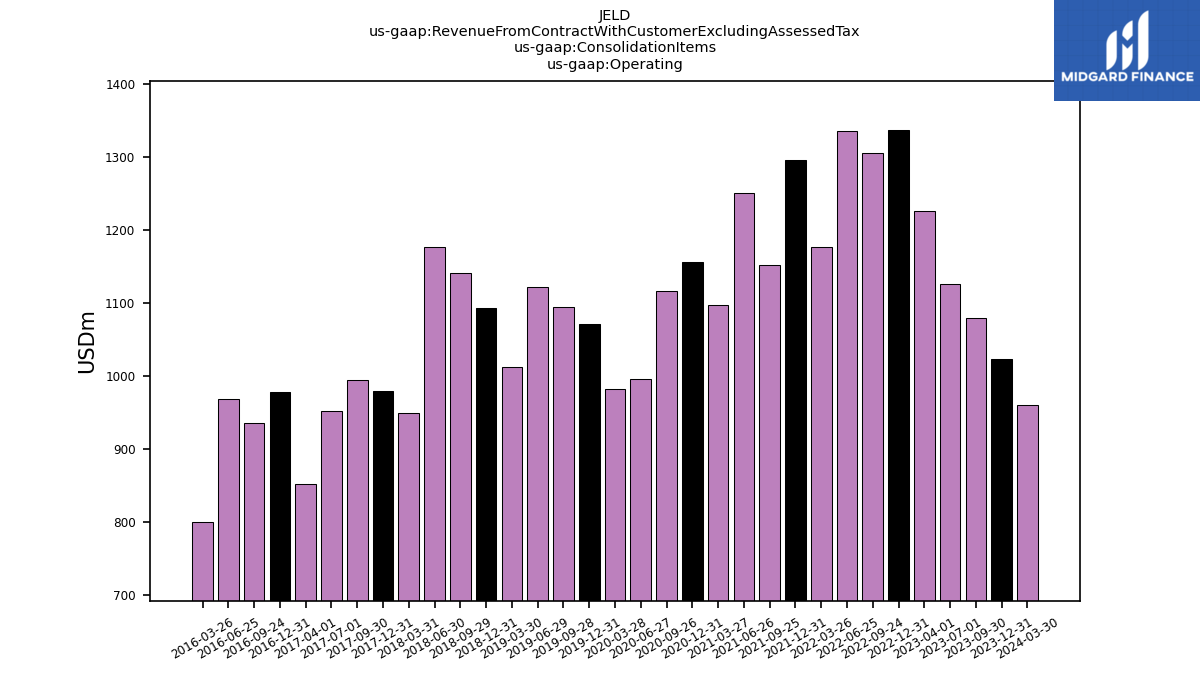
| Operating | 1022.88 | 1080.02 | 1126.75 | 1226.41 | 1337.68 | 1305.54 | 1336.48 | 1176.31 | 1295.86 | 1152.49 | 1250.33 | 1097.09 | 1156.62 | 1116.14 | 995.24 | 981.83 | 1071.29 | 1094.69 | 1121.55 | 1012.86 | 1093.03 | 1141.02 | 1176.55 | 949.50 | 979.51 | 993.91 | 952.37 | 851.57 | 978.25 | 935.58 | 967.75 | 799.11 | |
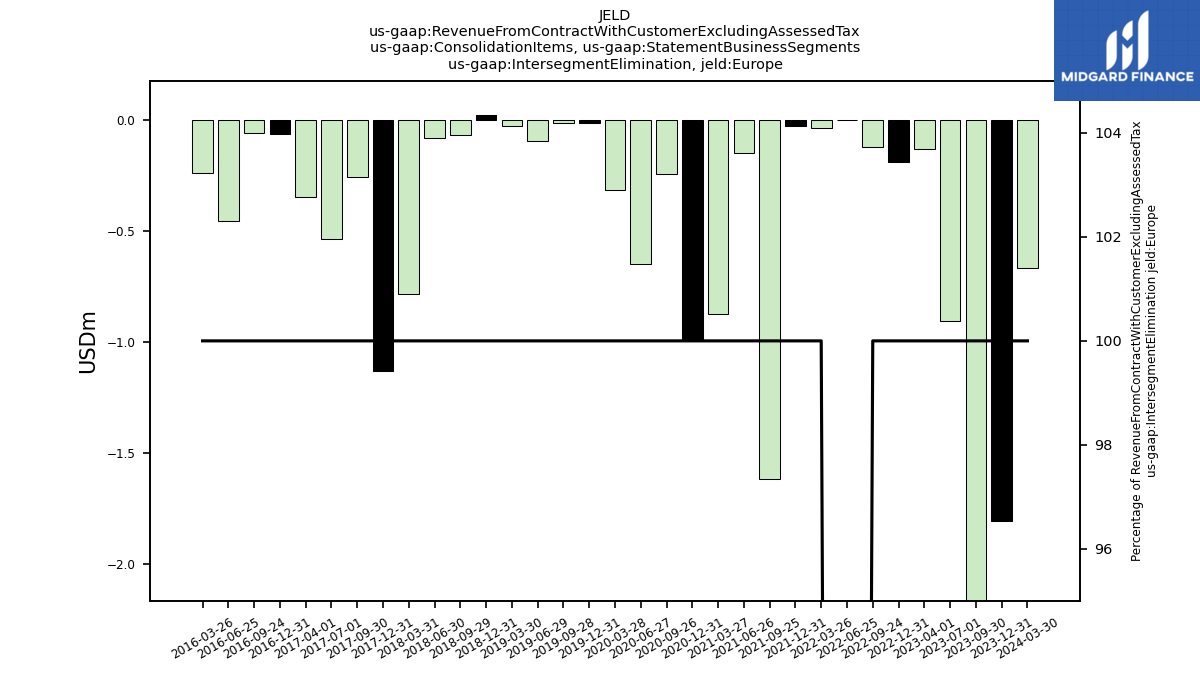
| Intersegment Elimination, Europe | -1.80 | -3.00 | -0.91 | -0.13 | -0.19 | -0.12 | 0.00 | -0.03 | -0.03 | -1.61 | -0.15 | -0.87 | -0.99 | -0.24 | -0.65 | -0.31 | -0.01 | -0.01 | -0.09 | -0.03 | 0.03 | -0.07 | -0.08 | -0.78 | -1.13 | -0.26 | -0.54 | -0.35 | -0.06 | -0.06 | -0.46 | -0.24 | |
| Intersegment Elimination, North America | -0.01 | -0.04 | -0.07 | -0.09 | -0.03 | -0.18 | -0.37 | -0.23 | -0.13 | -0.14 | -0.28 | -0.12 | -0.20 | -0.23 | -0.23 | -0.31 | -0.12 | -0.27 | -0.49 | -0.60 | -0.40 | -0.21 | -0.29 | -0.39 | -0.47 | -0.52 | -0.56 | -0.47 | -2.04 | -0.64 | -0.62 | -0.54 | |
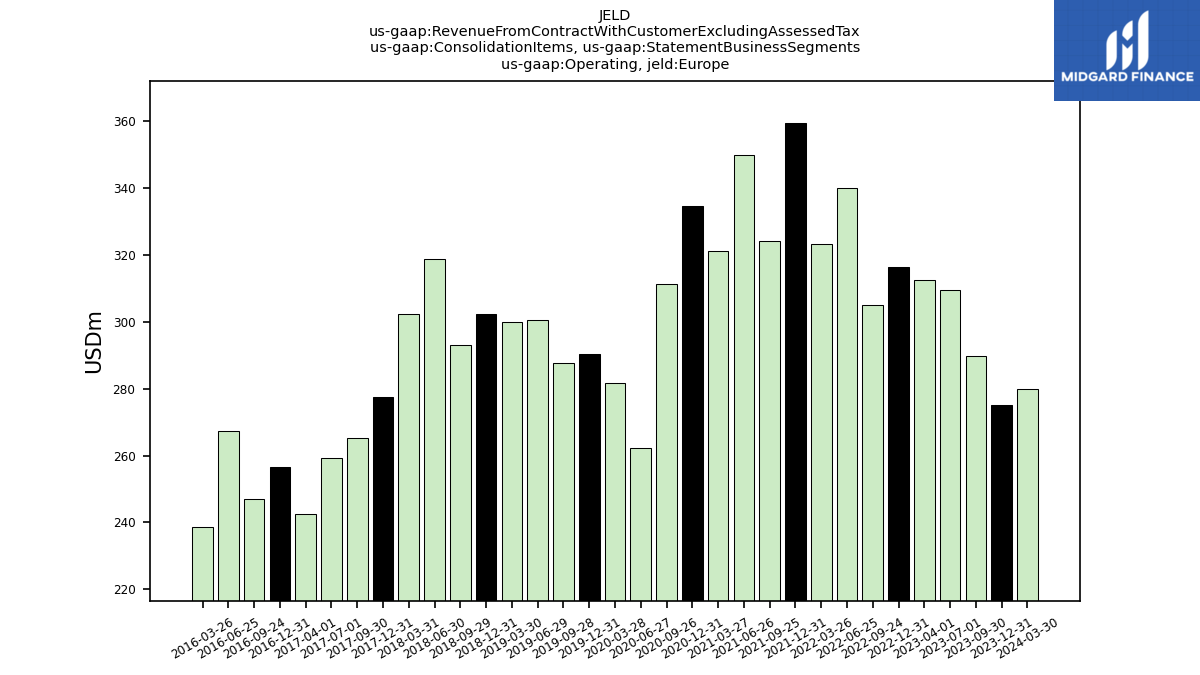
| Operating, Europe | 275.24 | 289.69 | 309.56 | 312.62 | 316.43 | 305.01 | 340.05 | 323.31 | 359.66 | 324.17 | 349.89 | 321.39 | 334.78 | 311.22 | 262.17 | 281.81 | 290.42 | 287.70 | 300.48 | 299.99 | 302.48 | 292.98 | 318.78 | 302.47 | 277.57 | 265.37 | 259.43 | 242.67 | 256.59 | 246.93 | 267.23 | 238.79 | |
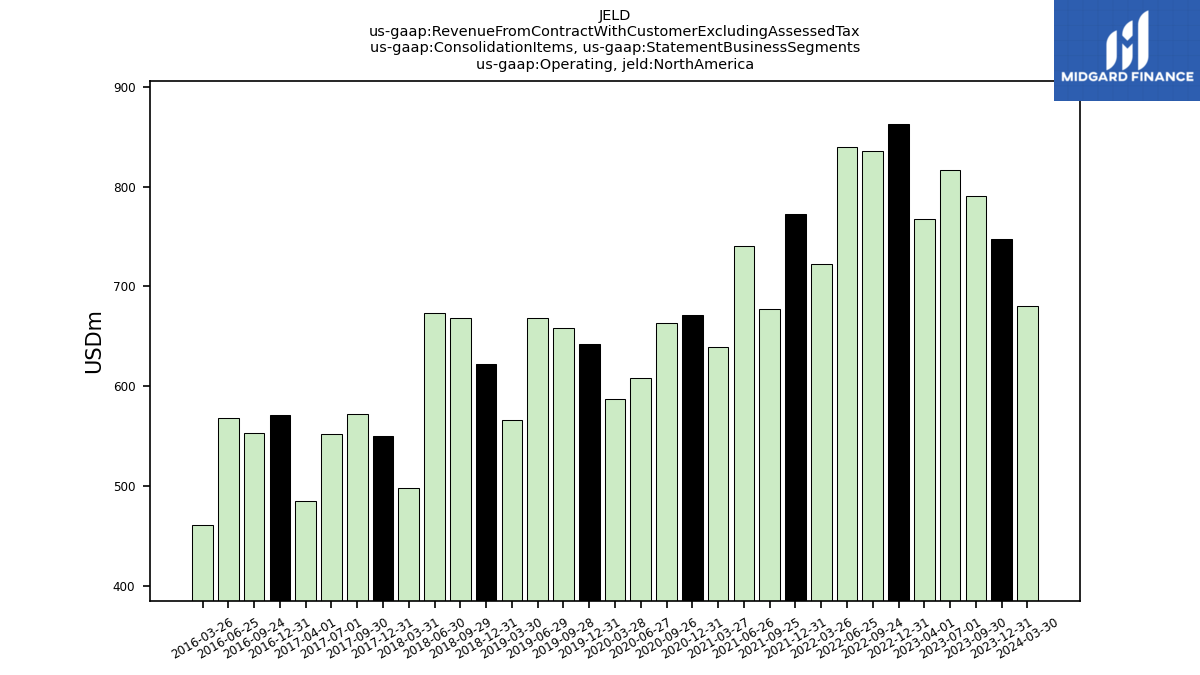
| Operating, North America | 747.64 | 790.33 | 817.18 | 768.12 | 862.80 | 835.32 | 839.48 | 722.57 | 772.84 | 676.94 | 740.41 | 639.74 | 671.65 | 662.92 | 608.35 | 587.05 | 642.54 | 658.71 | 668.87 | 566.35 | 622.04 | 668.39 | 673.48 | 498.33 | 550.59 | 572.40 | 552.25 | 484.56 | 571.47 | 552.87 | 568.06 | 460.77 | |
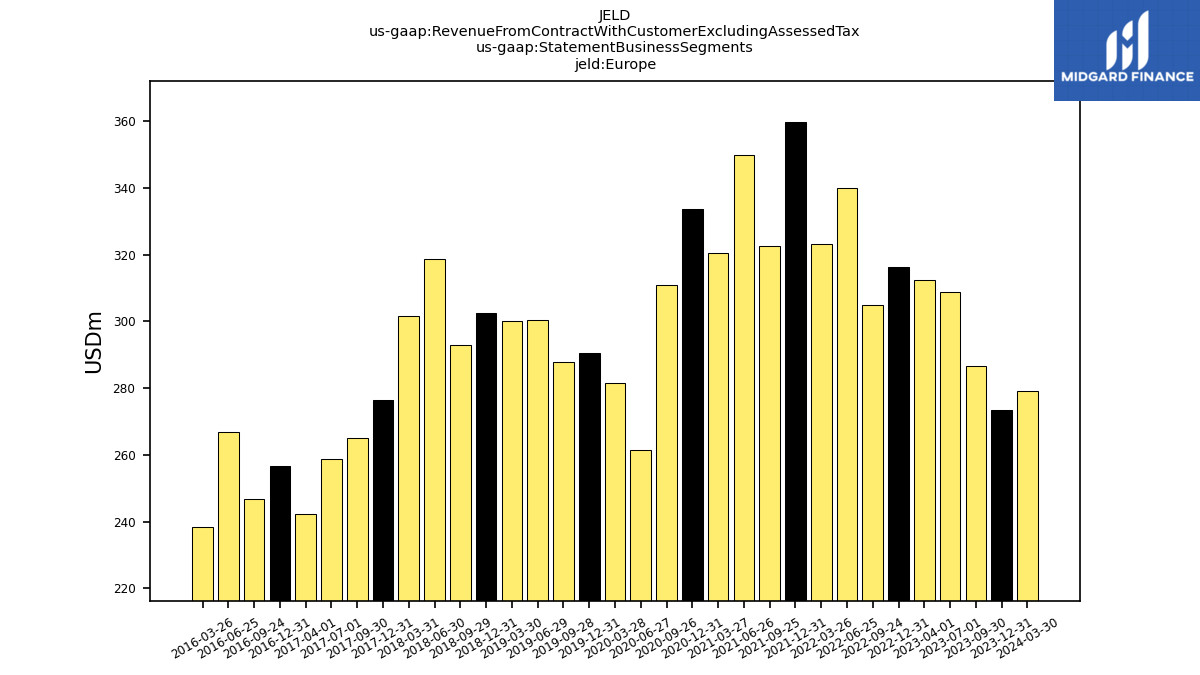
| Europe | 273.44 | 286.69 | 308.65 | 312.49 | 316.25 | 304.89 | 340.05 | 323.27 | 359.63 | 322.55 | 349.75 | 320.51 | 333.79 | 310.97 | 261.52 | 281.49 | 290.40 | 287.69 | 300.39 | 299.97 | 302.51 | 292.91 | 318.70 | 301.69 | 276.44 | 265.12 | 258.89 | 242.32 | 256.53 | 246.88 | 266.77 | 238.55 | |
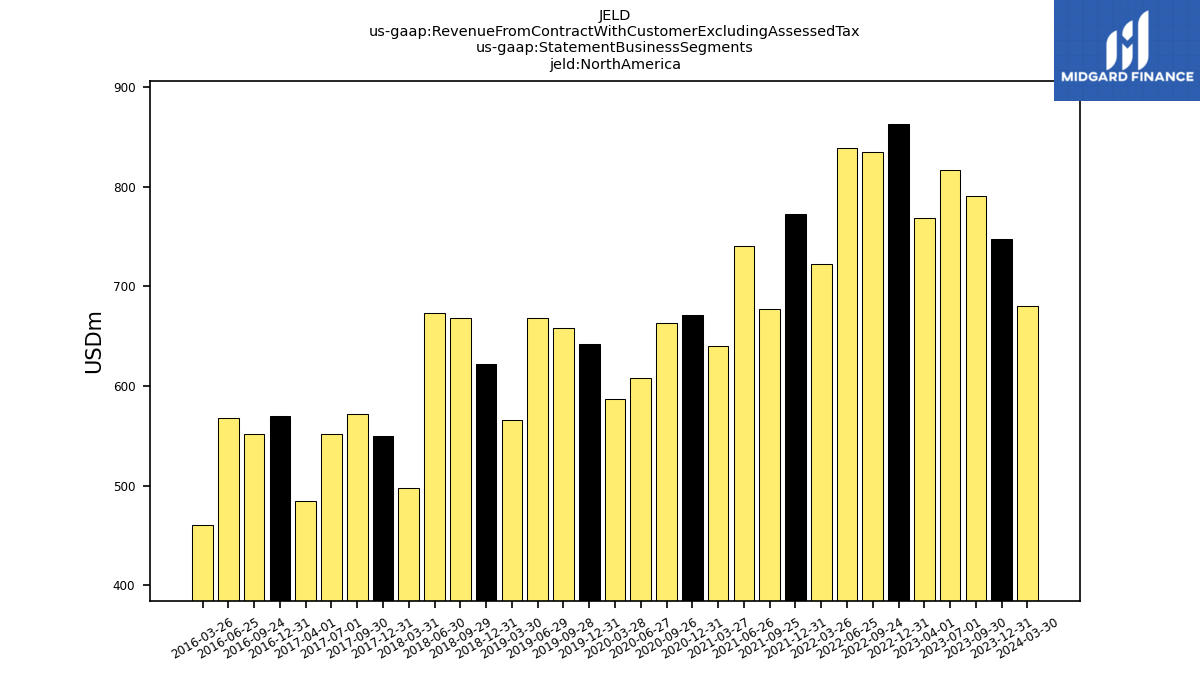
| North America | 747.63 | 790.28 | 817.11 | 768.03 | 862.77 | 835.13 | 839.11 | 722.34 | 772.70 | 676.79 | 740.13 | 639.62 | 671.45 | 662.69 | 608.11 | 586.74 | 642.42 | 658.44 | 668.37 | 565.75 | 621.64 | 668.18 | 673.19 | 497.94 | 550.12 | 571.88 | 551.68 | 484.10 | 569.43 | 552.23 | 567.43 | 460.23 |