
| 2023-12-31 | 2023-09-30 | 2023-06-30 | 2023-03-31 | 2022-12-31 | 2022-09-30 | 2022-06-30 | 2022-03-31 | 2021-12-31 | 2021-09-30 | 2021-06-30 | 2021-03-31 | 2020-12-31 | 2020-09-30 | 2020-06-30 | 2020-03-31 | 2019-12-31 | 2019-09-30 | 2019-06-30 | 2019-03-31 | 2018-12-31 | 2018-09-30 | 2018-06-30 | 2018-03-31 | 2017-12-31 | 2017-09-30 | 2017-06-30 | 2017-03-31 | 2016-12-31 | 2016-09-30 | 2016-06-30 | 2016-03-31 | 2015-12-31 | 2015-09-30 | 2015-06-30 | 2015-03-31 | 2014-12-31 | 2014-09-30 | 2014-06-30 | 2014-03-31 | 2013-12-31 | 2013-09-30 | 2013-06-30 | 2013-03-31 | ||
|---|---|---|---|---|---|---|---|---|---|---|---|---|---|---|---|---|---|---|---|---|---|---|---|---|---|---|---|---|---|---|---|---|---|---|---|---|---|---|---|---|---|---|---|---|---|
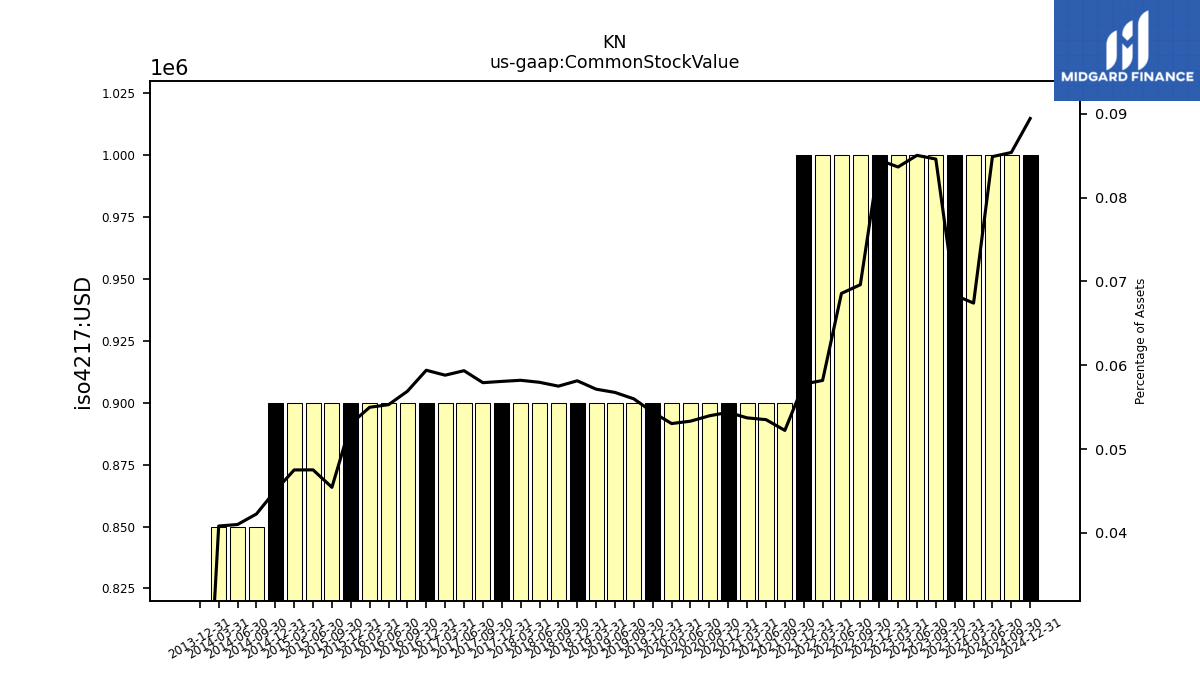
| Common Stock Value | 1.00 | 1.00 | 1.00 | 1.00 | 1.00 | 1.00 | 1.00 | 1.00 | 1.00 | 0.90 | 0.90 | 0.90 | 0.90 | 0.90 | 0.90 | 0.90 | 0.90 | 0.90 | 0.90 | 0.90 | 0.90 | 0.90 | 0.90 | 0.90 | 0.90 | 0.90 | 0.90 | 0.90 | 0.90 | 0.90 | 0.90 | 0.90 | 0.90 | 0.90 | 0.90 | 0.90 | 0.90 | 0.85 | 0.85 | 0.85 | 0.00 | NA | NA | NA | |
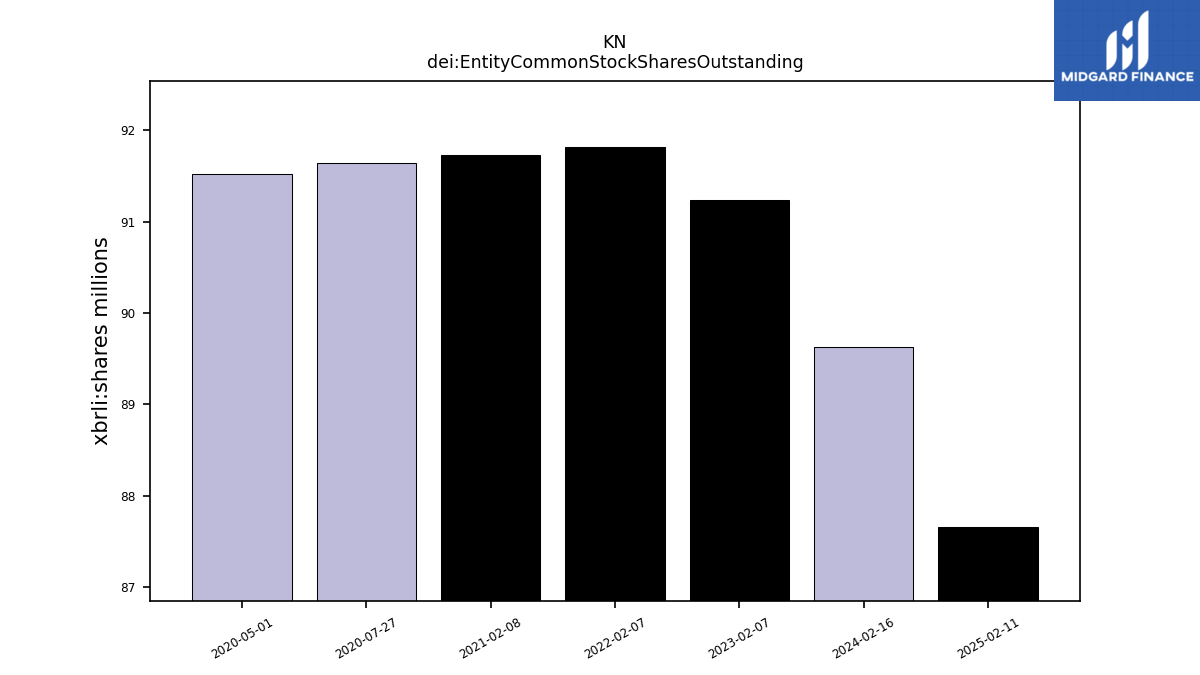
| dei: Entity Common Stock Shares Outstanding | NA | NA | NA | NA | NA | NA | NA | NA | NA | NA | NA | NA | NA | NA | NA | NA | NA | NA | NA | NA | NA | NA | NA | NA | NA | NA | NA | NA | NA | NA | NA | NA | NA | NA | NA | NA | NA | NA | NA | NA | NA | NA | NA | NA | |
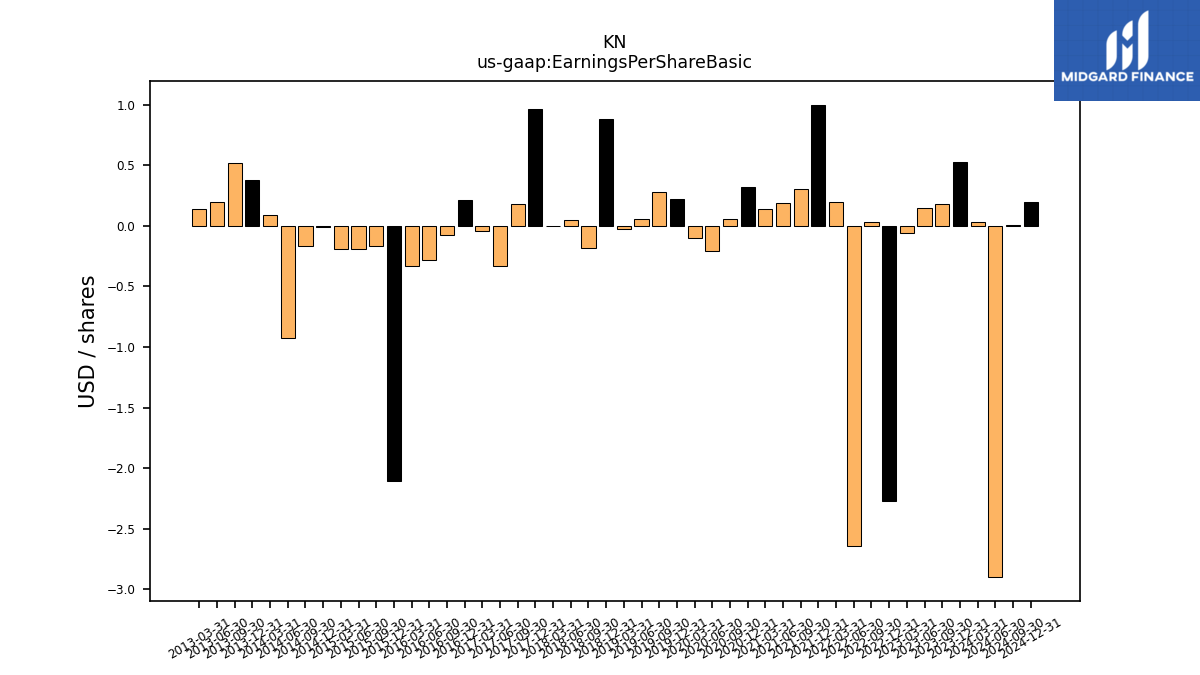
| Earnings Per Share Basic | 0.53 | 0.18 | 0.15 | -0.06 | -2.27 | 0.03 | -2.64 | 0.20 | 1.00 | 0.30 | 0.19 | 0.14 | 0.32 | 0.06 | -0.21 | -0.10 | 0.22 | 0.28 | 0.06 | -0.03 | 0.88 | -0.18 | 0.05 | 0.00 | 0.96 | 0.18 | -0.33 | -0.04 | 0.21 | -0.08 | -0.28 | -0.33 | -2.11 | -0.17 | -0.19 | -0.19 | -0.01 | -0.17 | -0.93 | 0.09 | 0.38 | 0.52 | 0.20 | 0.14 | |
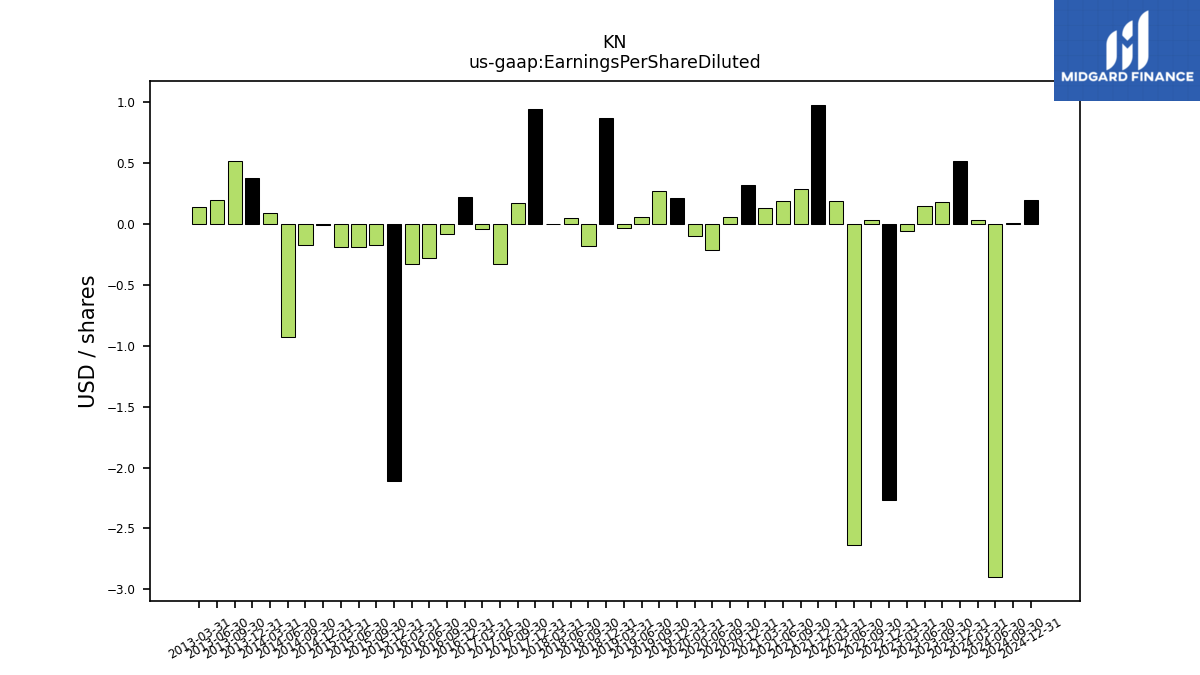
| Earnings Per Share Diluted | 0.52 | 0.18 | 0.15 | -0.06 | -2.27 | 0.03 | -2.64 | 0.19 | 0.98 | 0.29 | 0.19 | 0.13 | 0.32 | 0.06 | -0.21 | -0.10 | 0.21 | 0.27 | 0.06 | -0.03 | 0.87 | -0.18 | 0.05 | 0.00 | 0.94 | 0.17 | -0.33 | -0.04 | 0.22 | -0.08 | -0.28 | -0.33 | -2.11 | -0.17 | -0.19 | -0.19 | -0.01 | -0.17 | -0.93 | 0.09 | 0.38 | 0.52 | 0.20 | 0.14 |
| 2023-12-31 | 2023-09-30 | 2023-06-30 | 2023-03-31 | 2022-12-31 | 2022-09-30 | 2022-06-30 | 2022-03-31 | 2021-12-31 | 2021-09-30 | 2021-06-30 | 2021-03-31 | 2020-12-31 | 2020-09-30 | 2020-06-30 | 2020-03-31 | 2019-12-31 | 2019-09-30 | 2019-06-30 | 2019-03-31 | 2018-12-31 | 2018-09-30 | 2018-06-30 | 2018-03-31 | 2017-12-31 | 2017-09-30 | 2017-06-30 | 2017-03-31 | 2016-12-31 | 2016-09-30 | 2016-06-30 | 2016-03-31 | 2015-12-31 | 2015-09-30 | 2015-06-30 | 2015-03-31 | 2014-12-31 | 2014-09-30 | 2014-06-30 | 2014-03-31 | 2013-12-31 | 2013-09-30 | 2013-06-30 | 2013-03-31 | ||
|---|---|---|---|---|---|---|---|---|---|---|---|---|---|---|---|---|---|---|---|---|---|---|---|---|---|---|---|---|---|---|---|---|---|---|---|---|---|---|---|---|---|---|---|---|---|
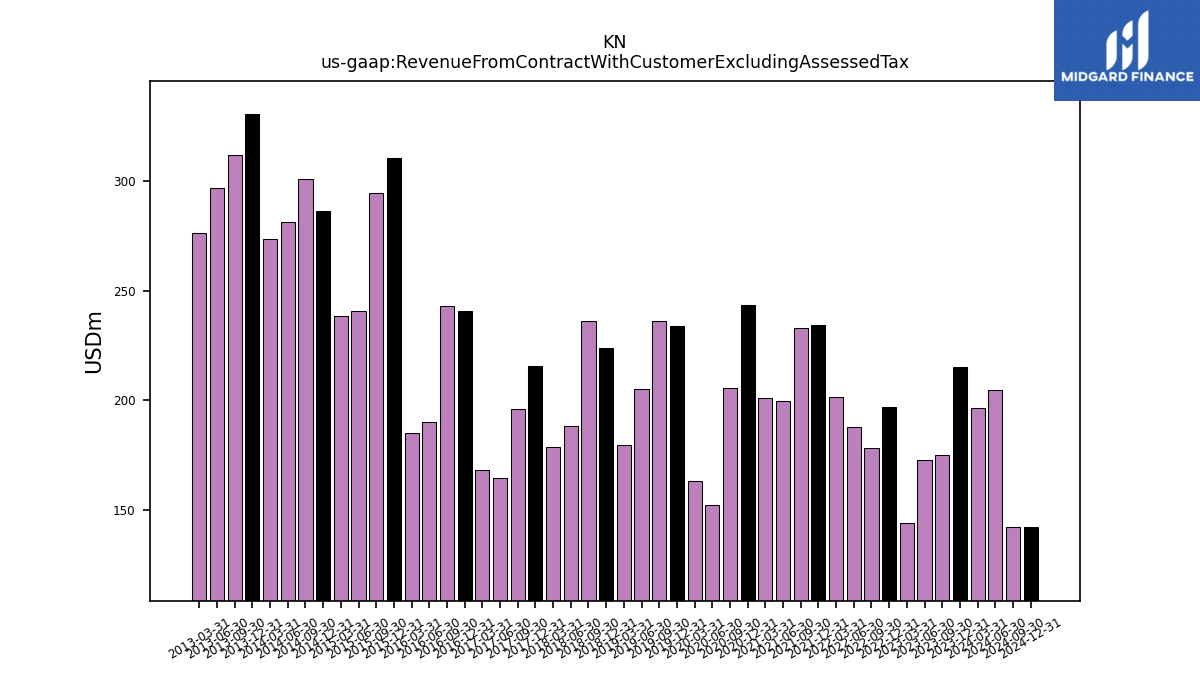
| Revenue From Contract With Customer Excluding Assessed Tax | 215.20 | 175.10 | 173.00 | 144.30 | 197.10 | 178.20 | 188.00 | 201.40 | 234.30 | 233.00 | 199.80 | 201.00 | 243.20 | 205.80 | 152.20 | 163.10 | 233.90 | 235.90 | 205.20 | 179.80 | 223.80 | 236.20 | 188.40 | 178.50 | 215.50 | 196.00 | 164.40 | 168.30 | 240.60 | 243.10 | 190.30 | 185.30 | 310.50 | 294.60 | 240.90 | 238.60 | 286.10 | 300.84 | 281.03 | 273.38 | 330.40 | 311.64 | 296.71 | 276.12 | |
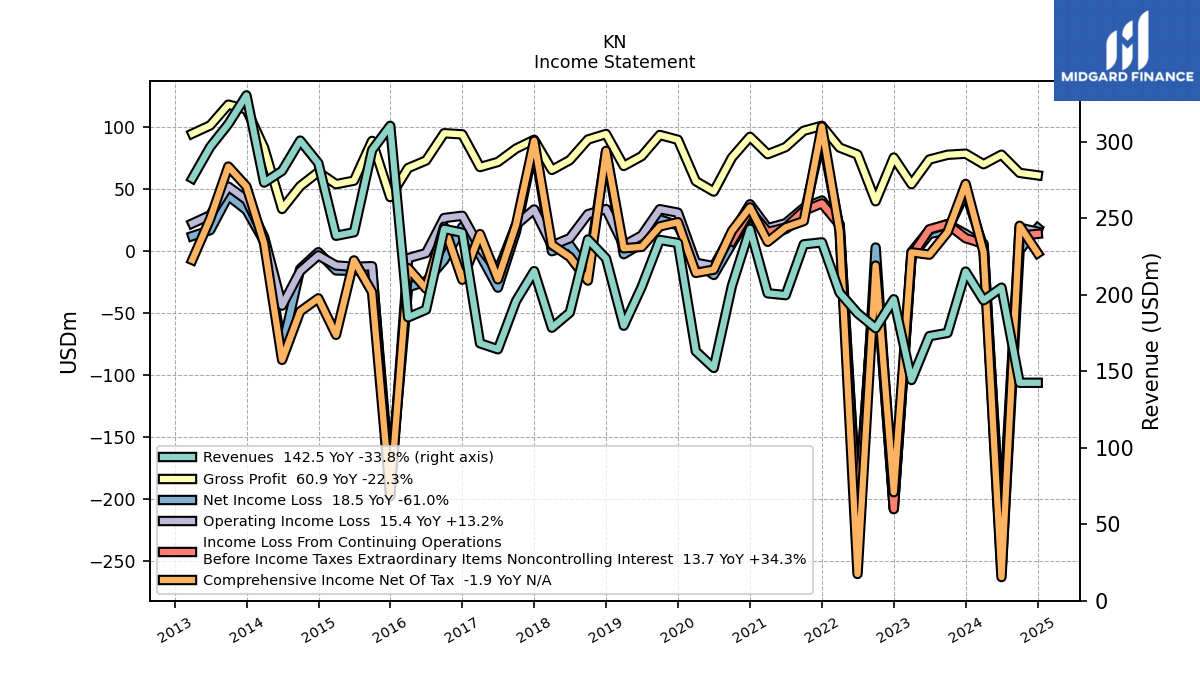
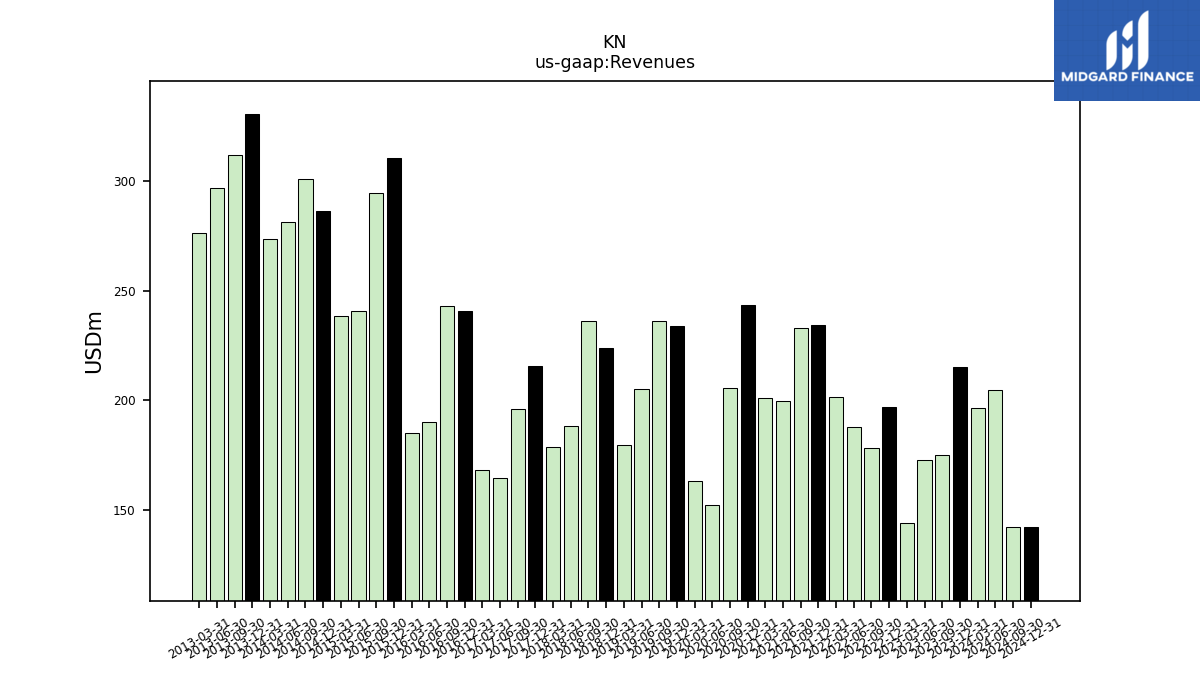
| Revenues | 215.20 | 175.10 | 173.00 | 144.30 | 197.10 | 178.20 | 188.00 | 201.40 | 234.30 | 233.00 | 199.80 | 201.00 | 243.20 | 205.80 | 152.20 | 163.10 | 233.90 | 235.90 | 205.20 | 179.80 | 223.80 | 236.20 | 188.40 | 178.50 | 215.50 | 196.00 | 164.40 | 168.30 | 240.60 | 243.10 | 190.30 | 185.30 | 310.50 | 294.60 | 240.90 | 238.60 | 286.10 | 300.84 | 281.03 | 273.38 | 330.40 | 311.64 | 296.71 | 276.12 | |
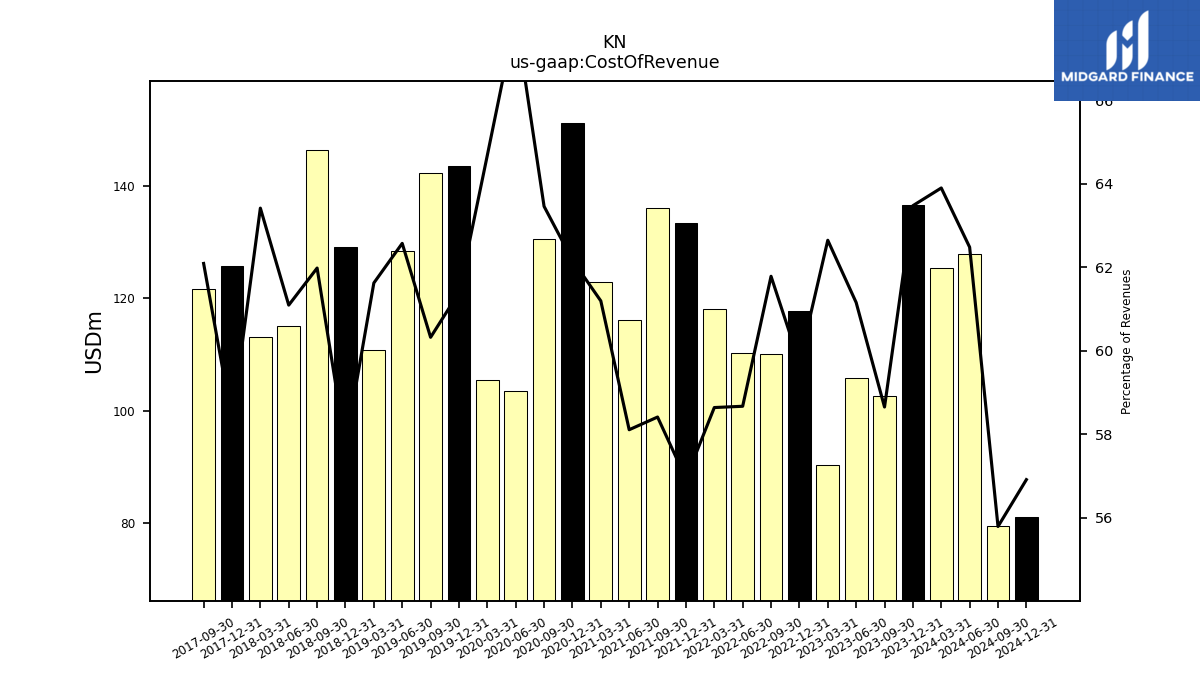
| Cost Of Revenue | 136.60 | 102.70 | 105.80 | 90.40 | 117.70 | 110.10 | 110.30 | 118.10 | 133.40 | 136.10 | 116.10 | 123.00 | 151.20 | 130.60 | 103.50 | 105.50 | 143.60 | 142.30 | 128.40 | 110.80 | 129.20 | 146.40 | 115.10 | 113.20 | 125.70 | 121.70 | NA | NA | NA | NA | NA | NA | NA | NA | NA | NA | NA | NA | NA | NA | NA | NA | NA | NA | |
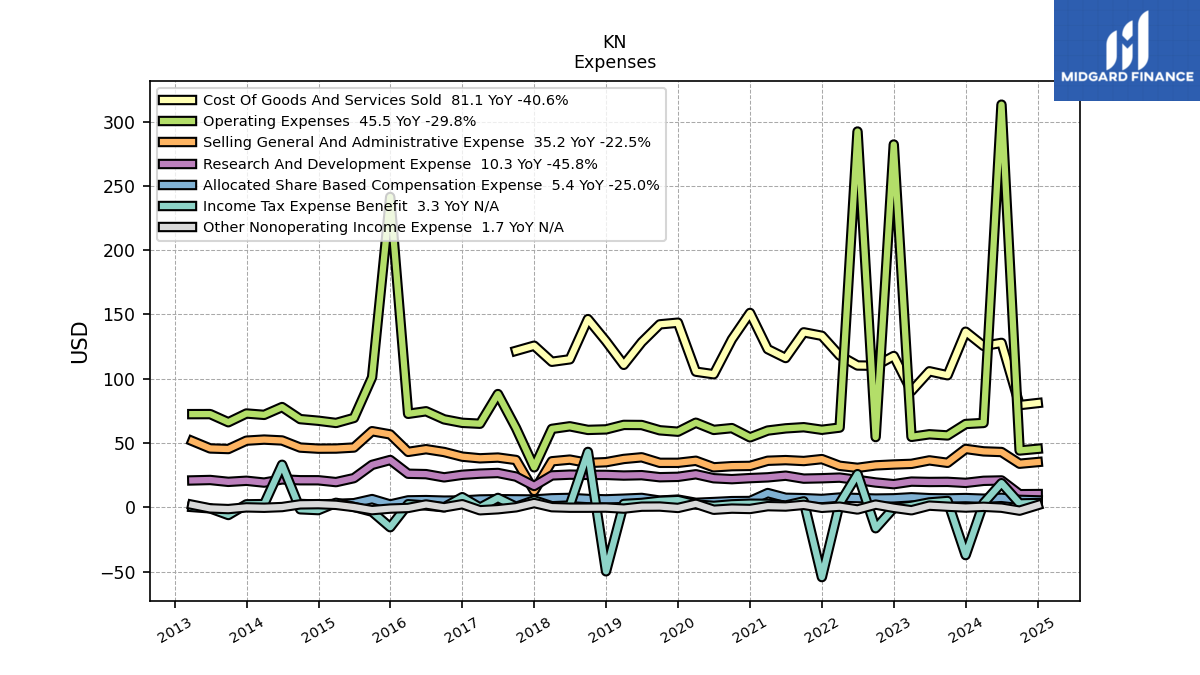
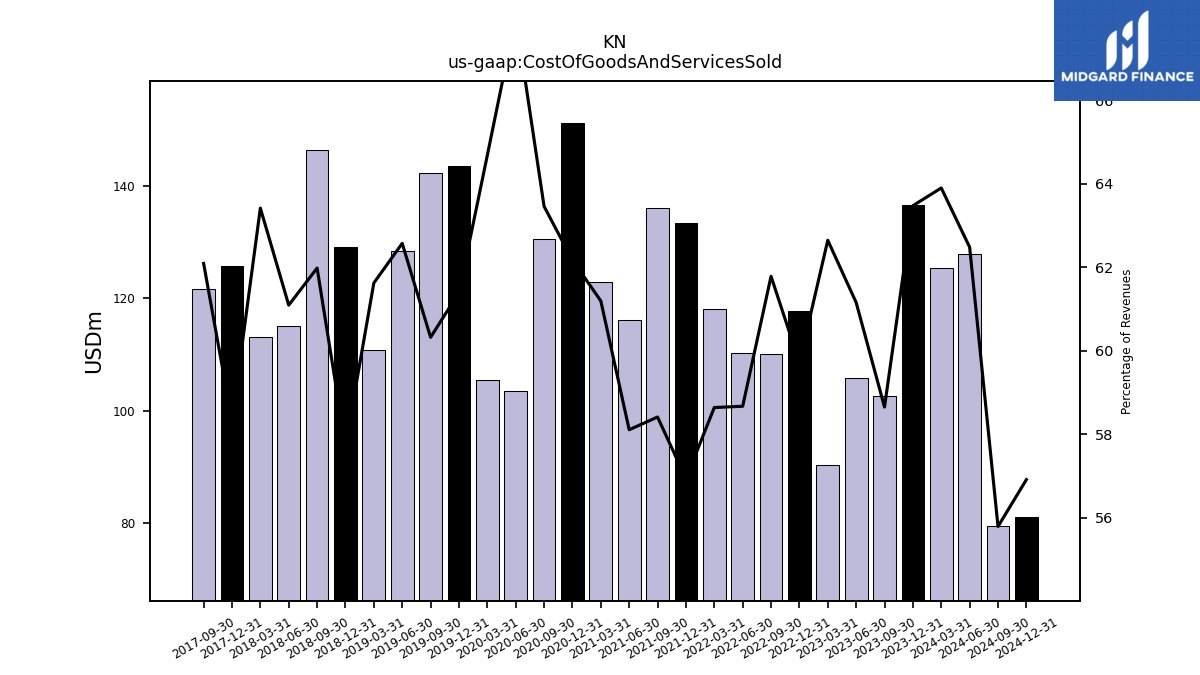
| Cost Of Goods And Services Sold | 136.60 | 102.70 | 105.80 | 90.40 | 117.70 | 110.10 | 110.30 | 118.10 | 133.40 | 136.10 | 116.10 | 123.00 | 151.20 | 130.60 | 103.50 | 105.50 | 143.60 | 142.30 | 128.40 | 110.80 | 129.20 | 146.40 | 115.10 | 113.20 | 125.70 | 121.70 | NA | NA | NA | NA | NA | NA | NA | NA | NA | NA | NA | NA | NA | NA | NA | NA | NA | NA | |
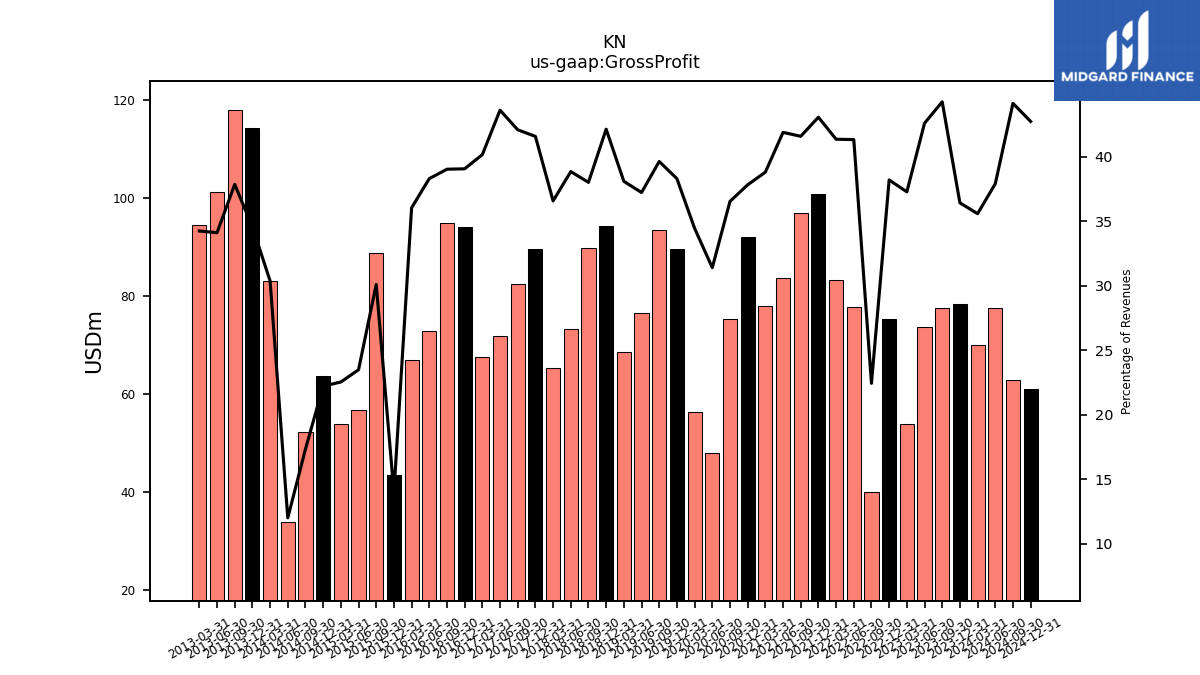
| Gross Profit | 78.40 | 77.50 | 73.70 | 53.80 | 75.30 | 40.00 | 77.70 | 83.30 | 100.90 | 96.90 | 83.70 | 78.00 | 92.00 | 75.20 | 47.80 | 56.20 | 89.60 | 93.50 | 76.40 | 68.50 | 94.30 | 89.80 | 73.20 | 65.30 | 89.60 | 82.50 | 71.70 | 67.60 | 94.00 | 94.90 | 72.90 | 66.80 | 43.40 | 88.70 | 56.60 | 53.80 | 63.60 | 52.19 | 33.78 | 83.06 | 114.20 | 117.99 | 101.23 | 94.56 | |
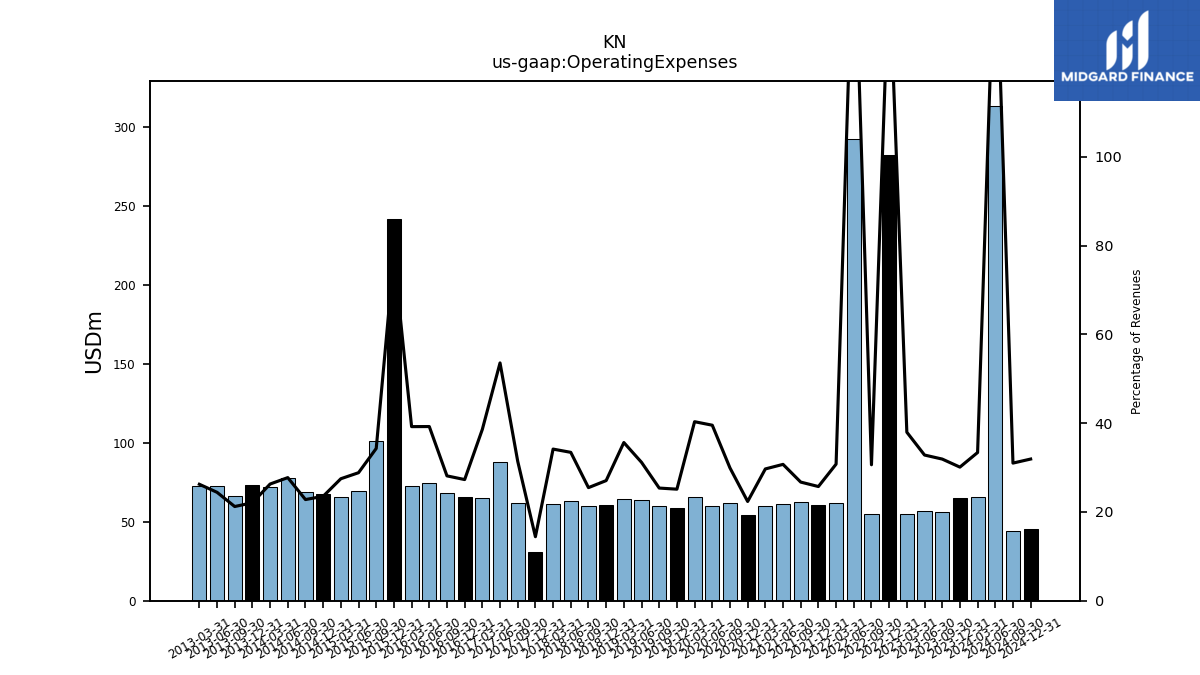
| Operating Expenses | 64.80 | 55.90 | 56.80 | 54.80 | 282.20 | 54.60 | 292.30 | 62.00 | 60.30 | 62.30 | 61.40 | 59.70 | 54.40 | 61.60 | 60.20 | 65.80 | 58.80 | 59.90 | 64.00 | 64.10 | 60.60 | 60.20 | 63.00 | 61.00 | 31.10 | 61.60 | 88.10 | 65.00 | 65.70 | 68.40 | 74.70 | 72.70 | 241.40 | 101.10 | 69.50 | 65.60 | 67.33 | 68.60 | 77.97 | 71.89 | 72.97 | 66.17 | 72.50 | 72.47 | |
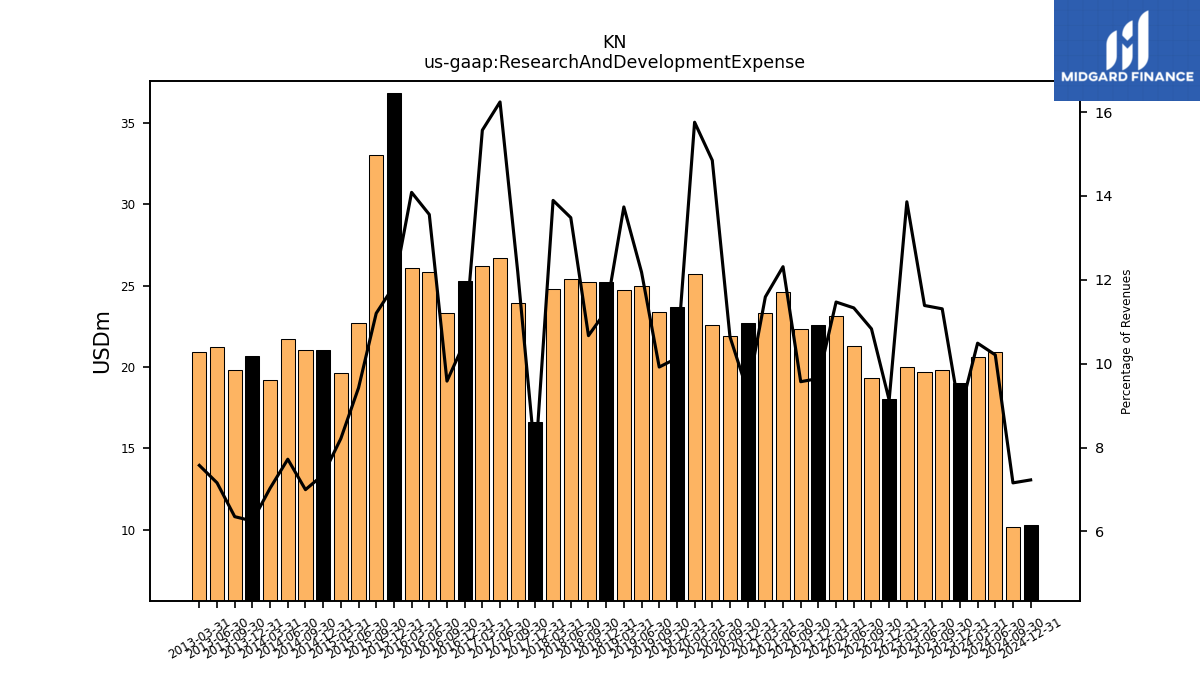
| Research And Development Expense | 19.00 | 19.80 | 19.70 | 20.00 | 18.00 | 19.30 | 21.30 | 23.10 | 22.60 | 22.30 | 24.60 | 23.30 | 22.70 | 21.90 | 22.60 | 25.70 | 23.70 | 23.40 | 25.00 | 24.70 | 25.20 | 25.20 | 25.40 | 24.80 | 16.60 | 23.90 | 26.70 | 26.20 | 25.30 | 23.30 | 25.80 | 26.10 | 36.80 | 33.00 | 22.70 | 19.60 | 21.03 | 21.05 | 21.70 | 19.22 | 20.64 | 19.80 | 21.24 | 20.92 | |
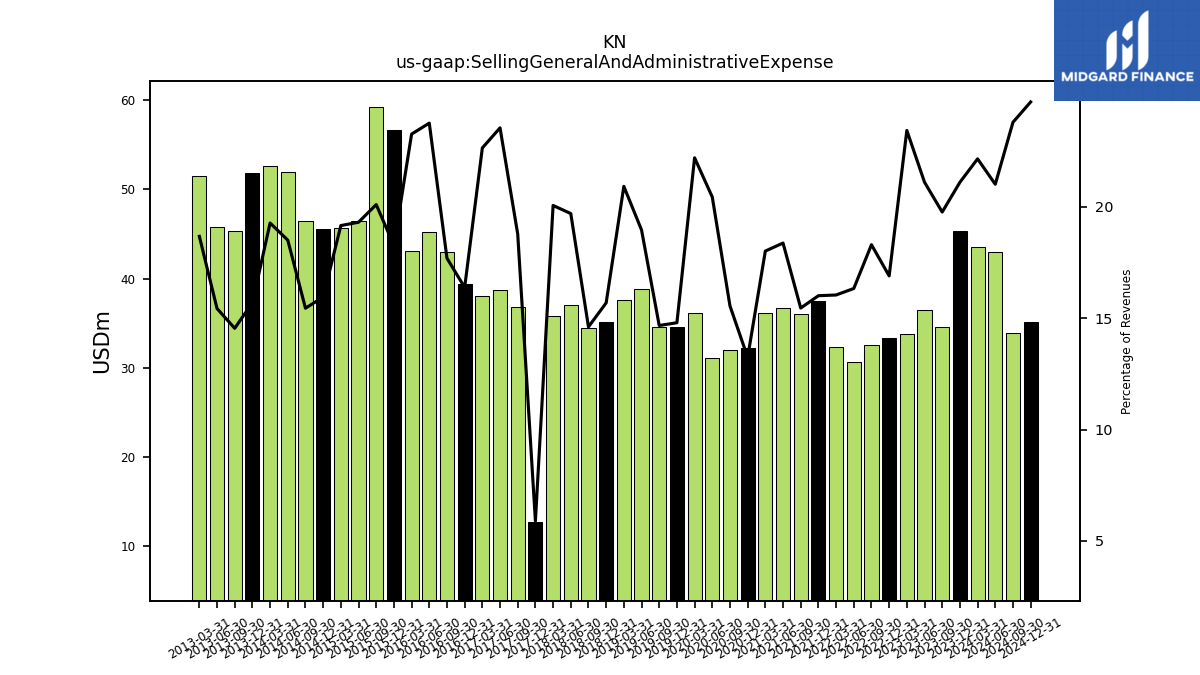
| Selling General And Administrative Expense | 45.40 | 34.60 | 36.50 | 33.80 | 33.30 | 32.60 | 30.70 | 32.30 | 37.50 | 36.00 | 36.70 | 36.20 | 32.20 | 32.00 | 31.10 | 36.20 | 34.60 | 34.60 | 38.90 | 37.60 | 35.10 | 34.50 | 37.10 | 35.80 | 12.70 | 36.80 | 38.70 | 38.10 | 39.40 | 43.00 | 45.20 | 43.10 | 56.70 | 59.20 | 46.50 | 45.70 | 45.62 | 46.46 | 51.99 | 52.67 | 51.84 | 45.32 | 45.78 | 51.55 | |
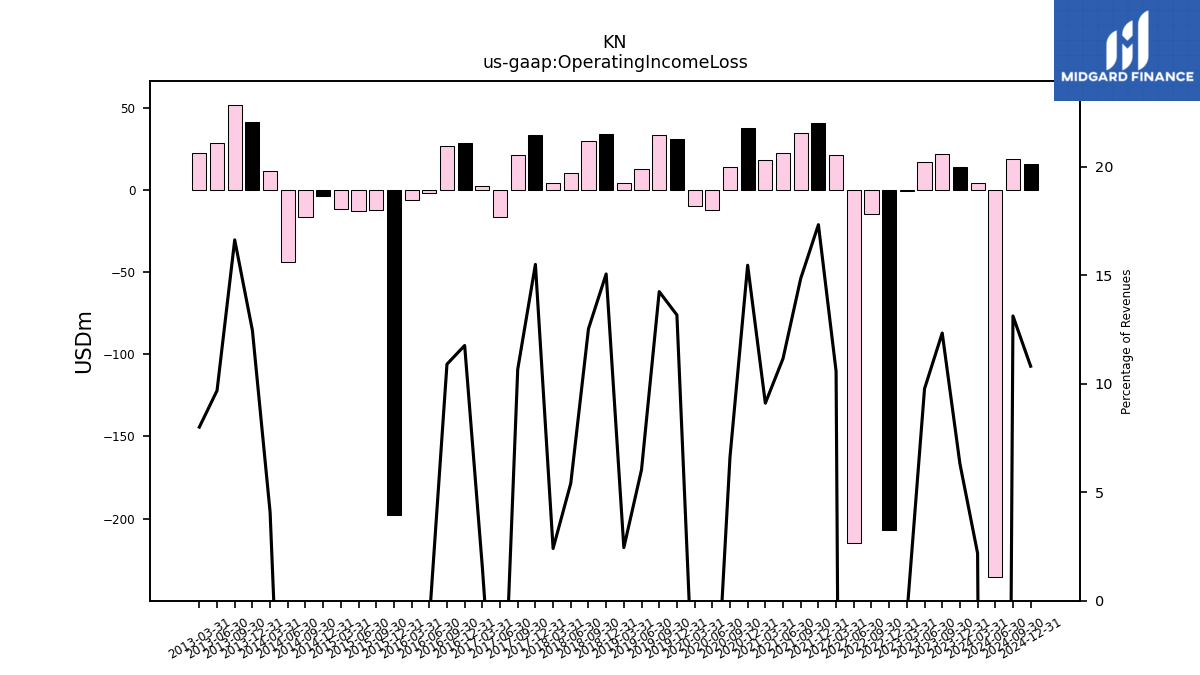
| Operating Income Loss | 13.60 | 21.60 | 16.90 | -1.00 | -206.90 | -14.60 | -214.60 | 21.30 | 40.60 | 34.60 | 22.30 | 18.30 | 37.60 | 13.60 | -12.40 | -9.60 | 30.80 | 33.60 | 12.40 | 4.40 | 33.70 | 29.60 | 10.20 | 4.30 | 33.40 | 20.90 | -16.40 | 2.60 | 28.30 | 26.50 | -1.80 | -5.90 | -198.00 | -12.40 | -12.90 | -11.80 | -3.67 | -16.41 | -44.19 | 11.16 | 41.16 | 51.82 | 28.73 | 22.09 | |
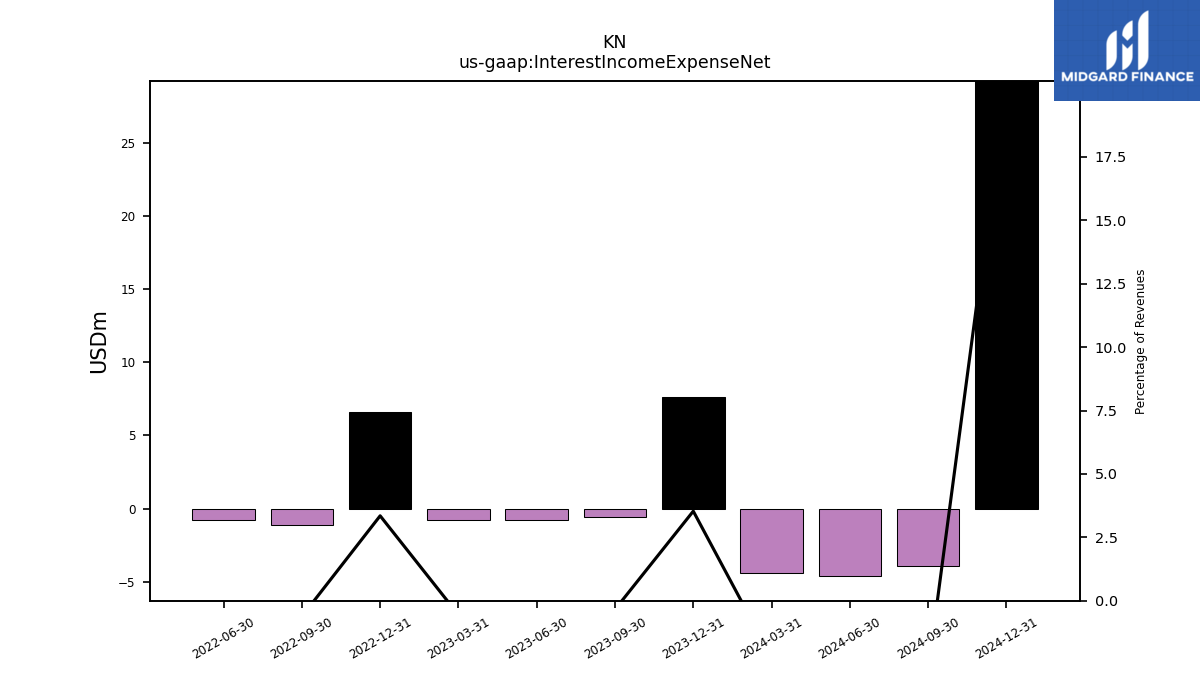
| Interest Income Expense Net | 7.60 | -0.60 | -0.80 | NA | 6.60 | -1.10 | -0.80 | NA | NA | NA | NA | NA | NA | NA | NA | NA | NA | NA | NA | NA | NA | NA | NA | NA | NA | NA | NA | NA | NA | NA | NA | NA | NA | NA | NA | NA | NA | NA | NA | NA | NA | NA | NA | NA | |
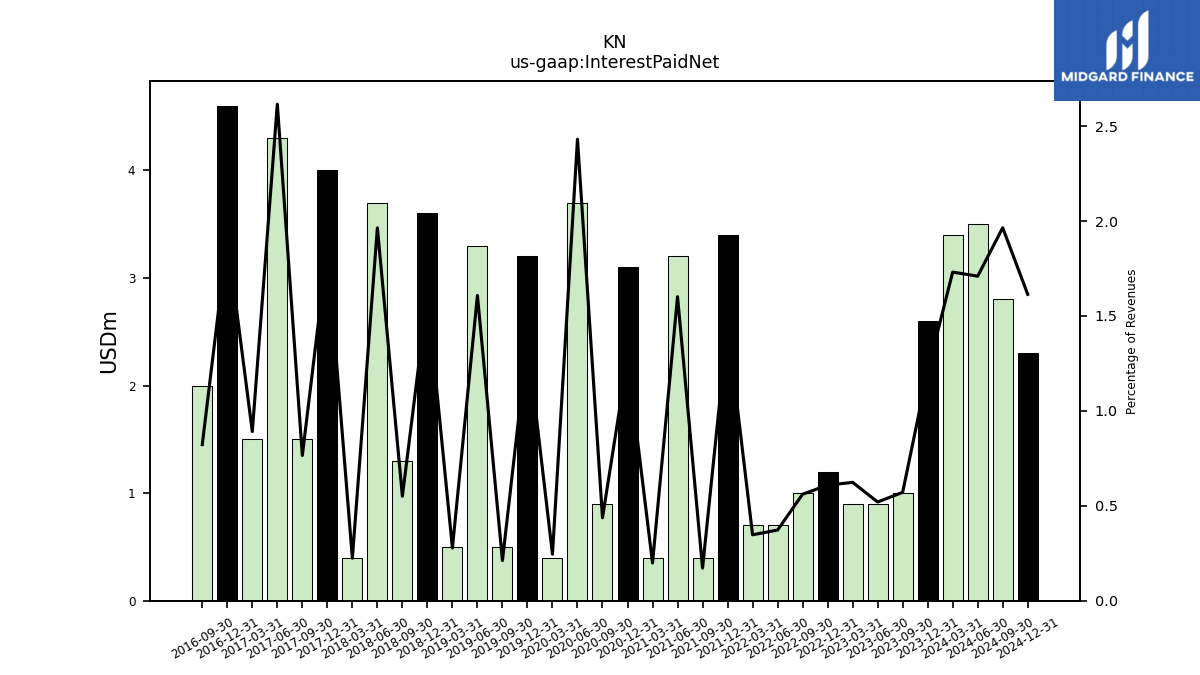
| Interest Paid Net | 2.60 | 1.00 | 0.90 | 0.90 | 1.20 | 1.00 | 0.70 | 0.70 | 3.40 | 0.40 | 3.20 | 0.40 | 3.10 | 0.90 | 3.70 | 0.40 | 3.20 | 0.50 | 3.30 | 0.50 | 3.60 | 1.30 | 3.70 | 0.40 | 4.00 | 1.50 | 4.30 | 1.50 | 4.60 | 2.00 | NA | NA | NA | NA | NA | NA | NA | NA | NA | NA | NA | NA | NA | NA | |
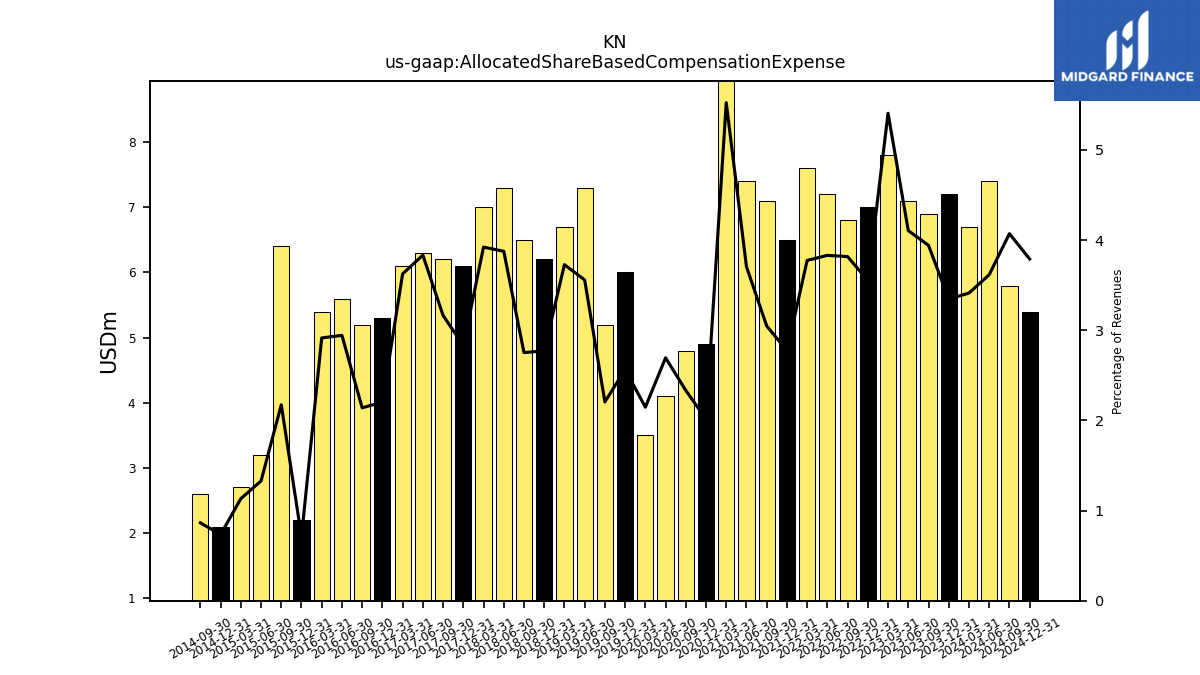
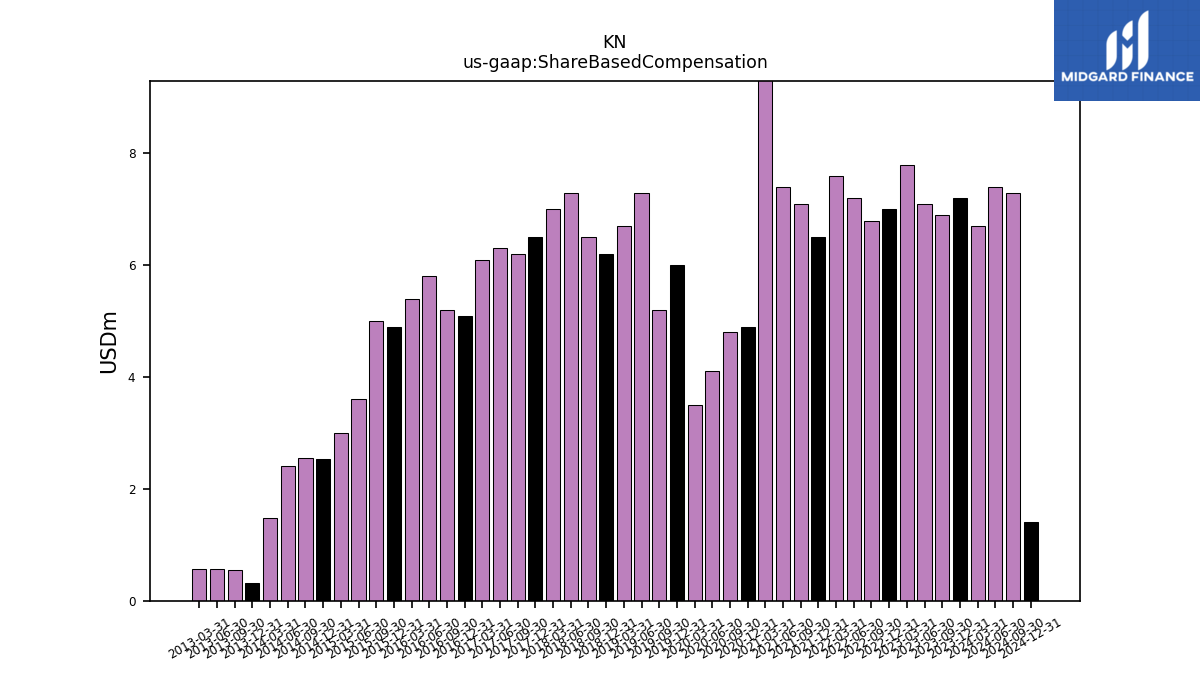
| Allocated Share Based Compensation Expense | 7.20 | 6.90 | 7.10 | 7.80 | 7.00 | 6.80 | 7.20 | 7.60 | 6.50 | 7.10 | 7.40 | 11.10 | 4.90 | 4.80 | 4.10 | 3.50 | 6.00 | 5.20 | 7.30 | 6.70 | 6.20 | 6.50 | 7.30 | 7.00 | 6.10 | 6.20 | 6.30 | 6.10 | 5.30 | 5.20 | 5.60 | 5.40 | 2.20 | 6.40 | 3.20 | 2.70 | 2.10 | 2.60 | NA | NA | NA | NA | NA | NA | |
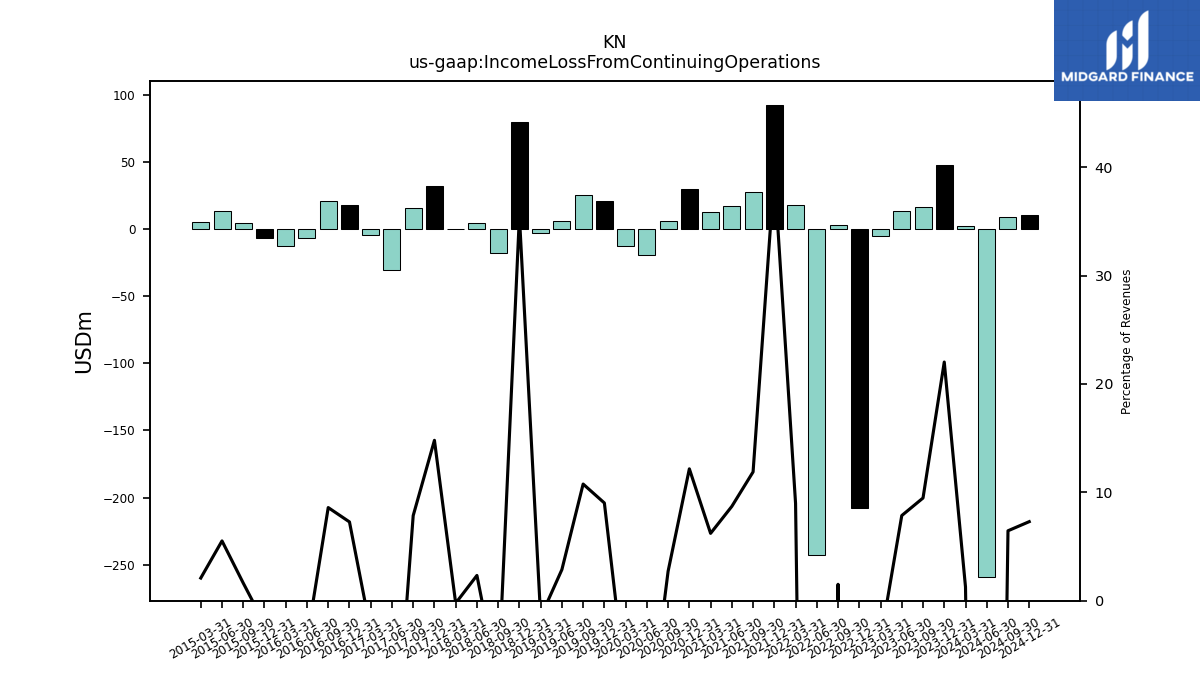
| Income Loss From Continuing Operations | 47.40 | 16.60 | 13.60 | -5.20 | -208.00 | 2.70 | -242.90 | 18.10 | 92.60 | 27.70 | 17.40 | 12.50 | 29.60 | 5.60 | -19.50 | -12.80 | 21.10 | 25.40 | 5.90 | -2.70 | 79.40 | -17.80 | 4.40 | -0.40 | 31.90 | 15.40 | -30.30 | -4.70 | 17.50 | 20.90 | -6.80 | -12.50 | -6.60 | 4.80 | 13.30 | 5.00 | NA | NA | NA | NA | NA | NA | NA | NA | |
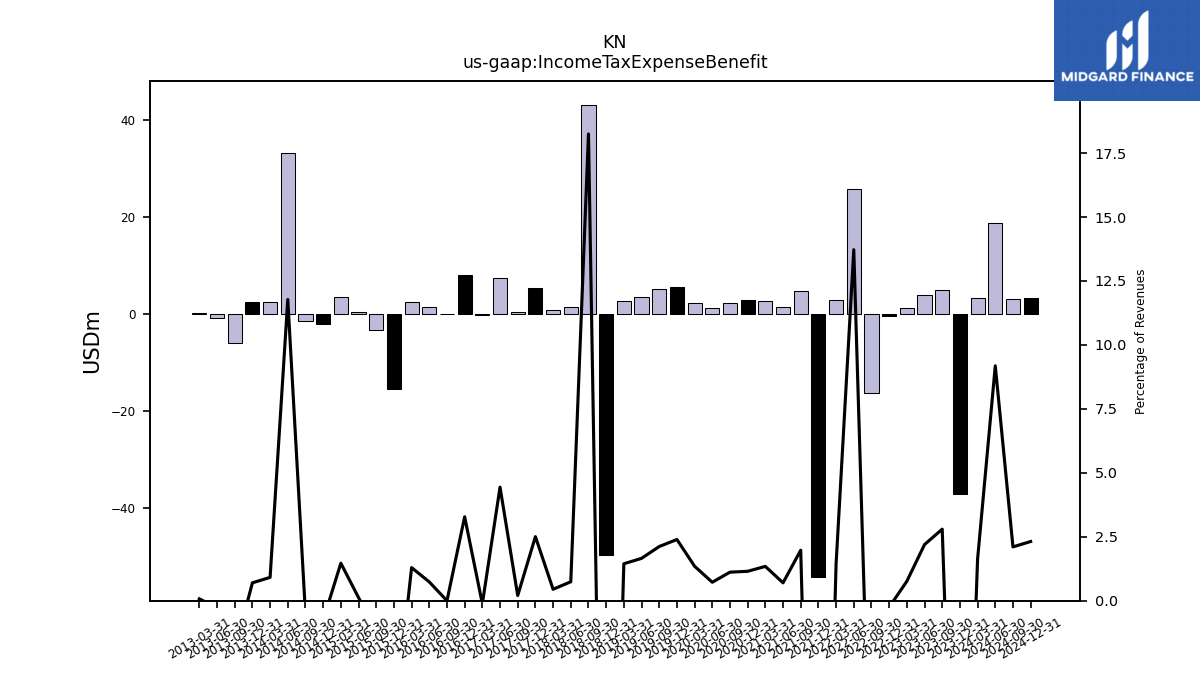
| Income Tax Expense Benefit | -37.20 | 4.90 | 3.80 | 1.10 | -0.50 | -16.30 | 25.80 | 2.90 | -54.30 | 4.60 | 1.40 | 2.70 | 2.80 | 2.30 | 1.10 | 2.20 | 5.60 | 5.00 | 3.40 | 2.60 | -49.80 | 43.10 | 1.40 | 0.80 | 5.40 | 0.40 | 7.30 | -0.20 | 7.90 | 0.00 | 1.40 | 2.40 | -15.50 | -3.40 | 0.30 | 3.50 | -2.17 | -1.53 | 33.10 | 2.50 | 2.31 | -5.99 | -0.83 | 0.21 | |
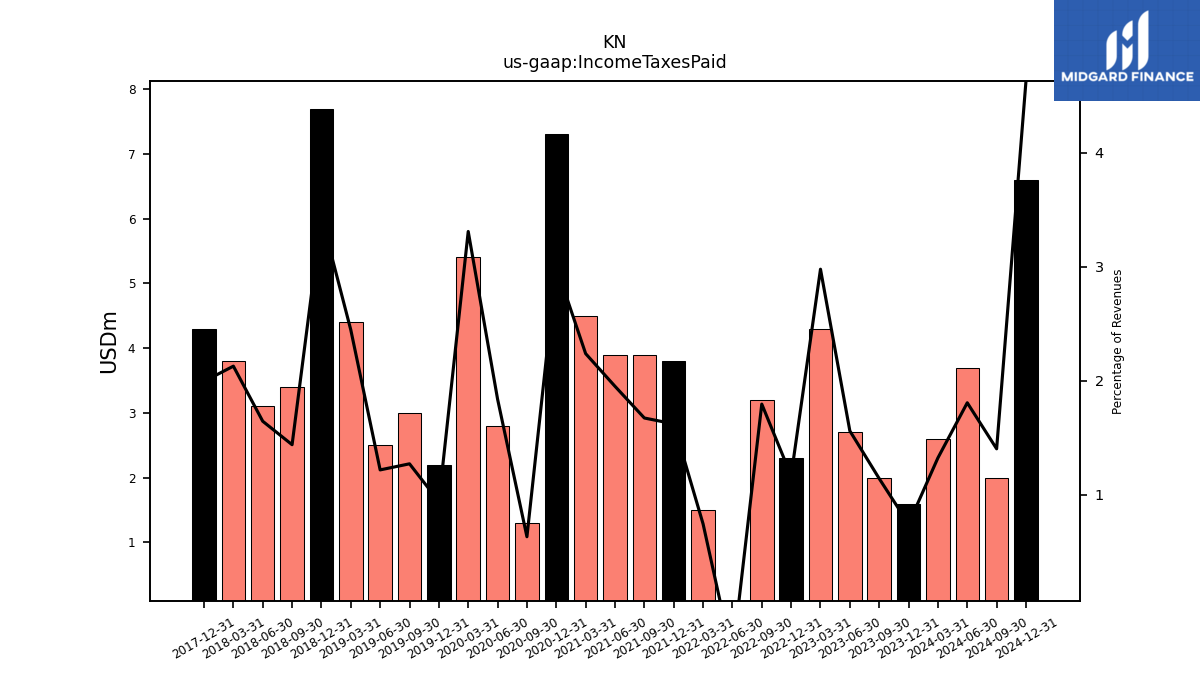
| Income Taxes Paid | 1.60 | 2.00 | 2.70 | 4.30 | 2.30 | 3.20 | -0.80 | 1.50 | 3.80 | 3.90 | 3.90 | 4.50 | 7.30 | 1.30 | 2.80 | 5.40 | 2.20 | 3.00 | 2.50 | 4.40 | 7.70 | 3.40 | 3.10 | 3.80 | 4.30 | NA | NA | NA | NA | NA | NA | NA | NA | NA | NA | NA | NA | NA | NA | NA | NA | NA | NA | NA | |
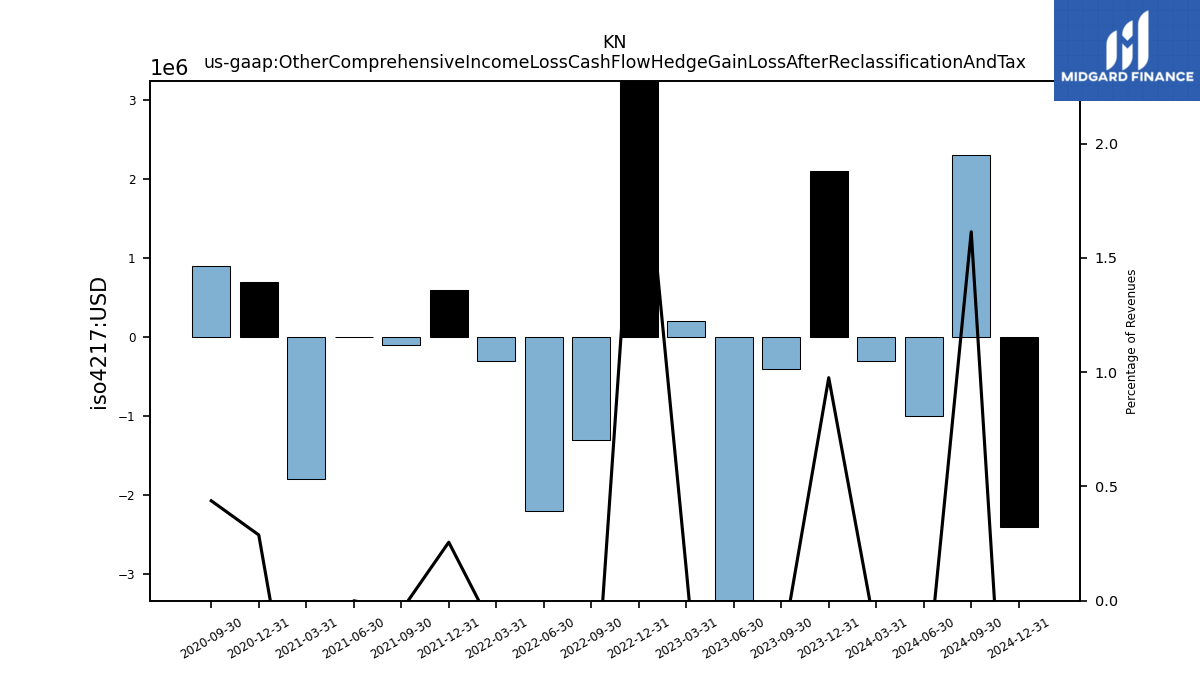
| Other Comprehensive Income Loss Cash Flow Hedge Gain Loss After Reclassification And Tax | 2.10 | -0.40 | -3.60 | 0.20 | 4.50 | -1.30 | -2.20 | -0.30 | 0.60 | -0.10 | 0.00 | -1.80 | 0.70 | 0.90 | NA | NA | NA | NA | NA | NA | NA | NA | NA | NA | NA | NA | NA | NA | NA | NA | NA | NA | NA | NA | NA | NA | NA | NA | NA | NA | NA | NA | NA | NA | |
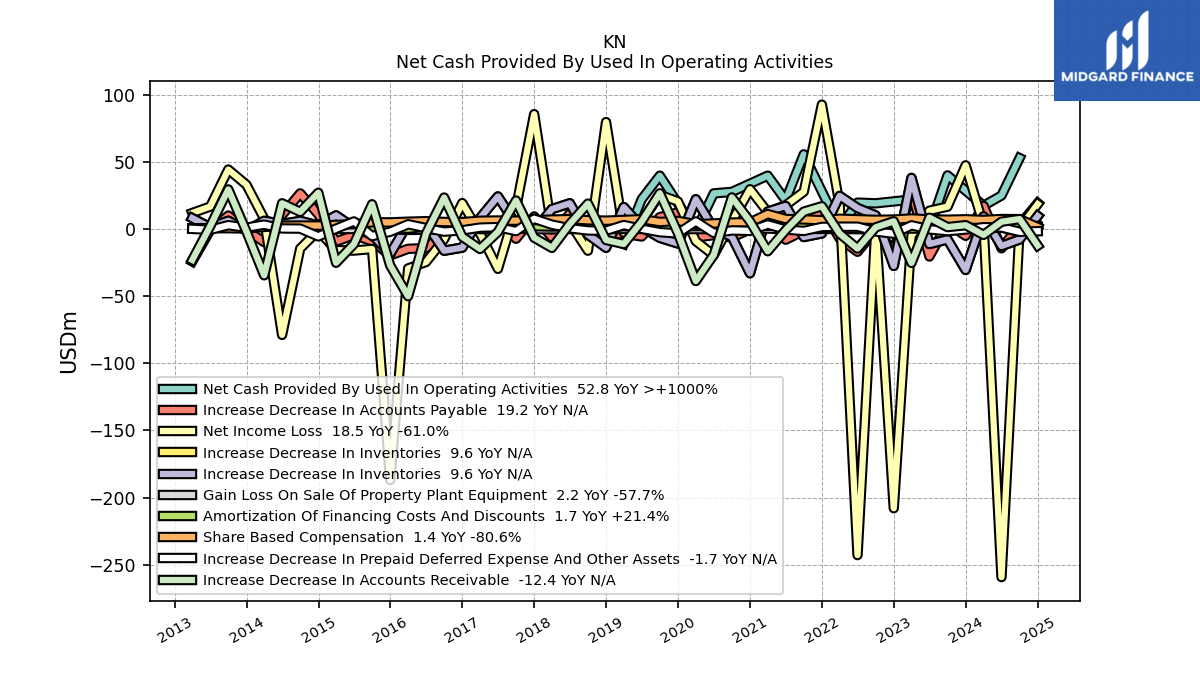
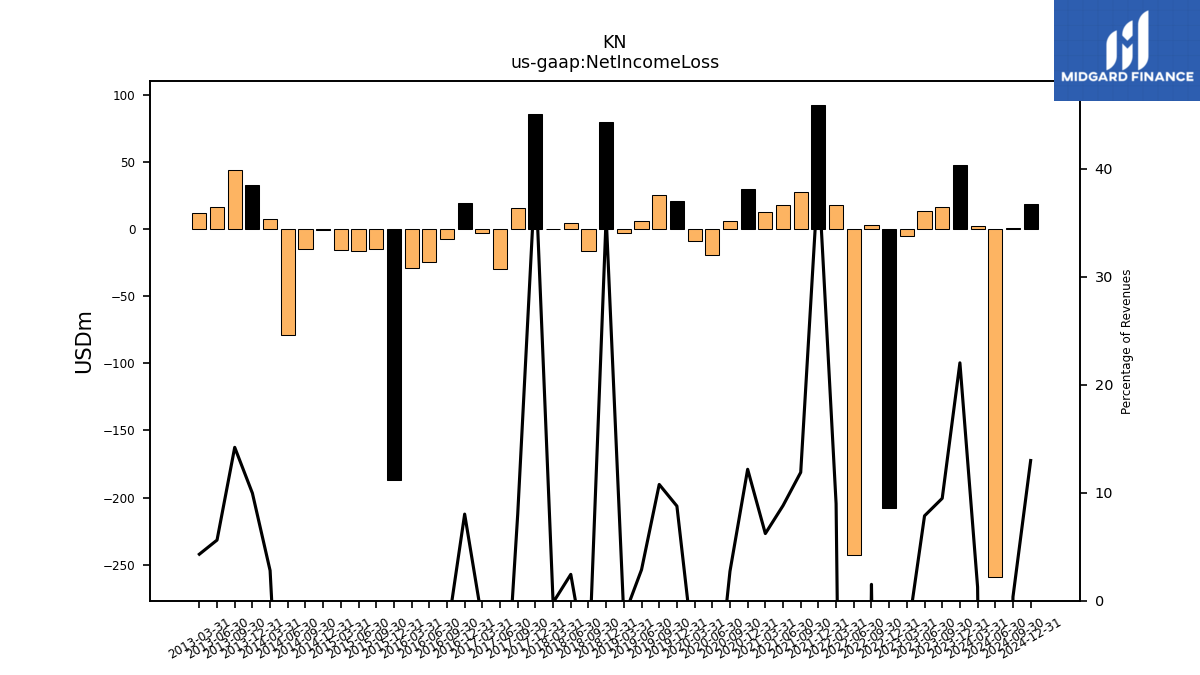
| Net Income Loss | 47.40 | 16.60 | 13.60 | -5.20 | -208.00 | 2.70 | -242.90 | 18.10 | 92.60 | 27.70 | 17.60 | 12.50 | 29.60 | 5.60 | -19.50 | -9.10 | 20.50 | 25.40 | 5.90 | -2.70 | 79.60 | -16.20 | 4.60 | -0.30 | 85.50 | 15.70 | -29.70 | -3.20 | 19.30 | -7.60 | -24.60 | -29.40 | -187.00 | -14.90 | -16.10 | -15.80 | -1.10 | -14.61 | -78.90 | 7.64 | 32.90 | 44.26 | 16.67 | 11.89 | |
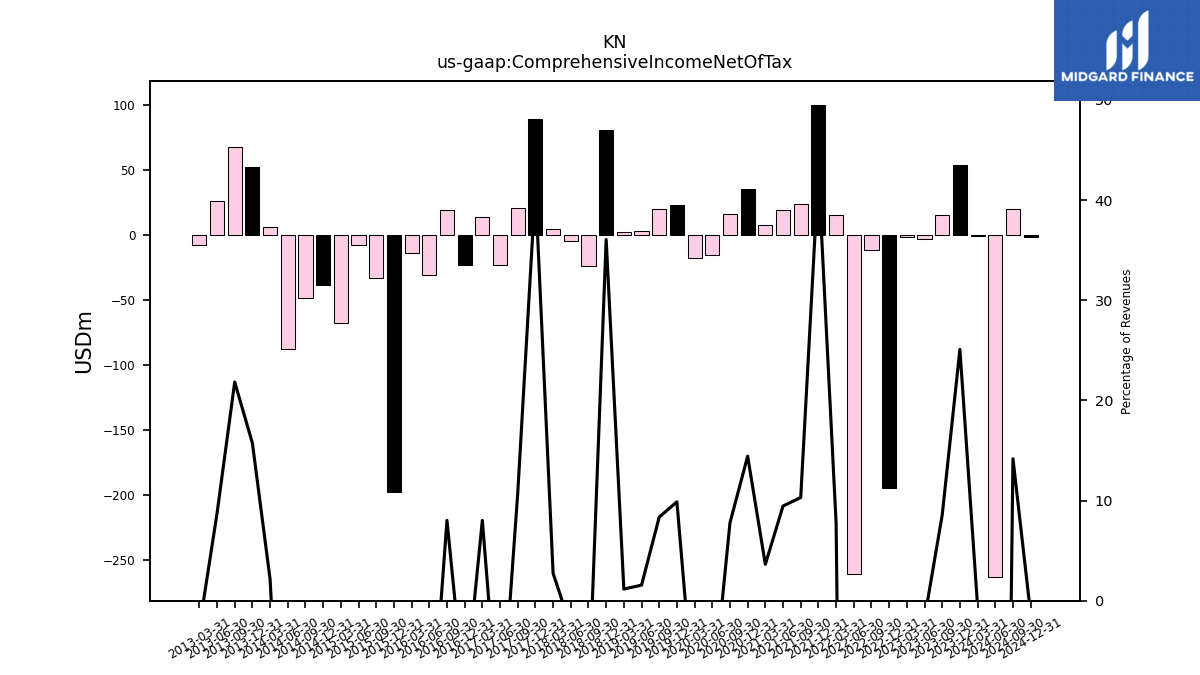
| Comprehensive Income Net Of Tax | 54.00 | 15.00 | -3.10 | -1.20 | -194.80 | -11.90 | -260.80 | 15.70 | 100.30 | 24.00 | 18.90 | 7.30 | 35.10 | 16.00 | -15.20 | -17.80 | 23.10 | 19.70 | 3.20 | 2.10 | 80.70 | -24.00 | -4.90 | 4.90 | 88.90 | 21.00 | -23.00 | 13.50 | -23.30 | 19.50 | -30.50 | -13.90 | -197.90 | -33.30 | -7.70 | -67.80 | -38.33 | -48.85 | -88.00 | 5.88 | 51.98 | 68.05 | 25.86 | -7.39 |
| 2023-12-31 | 2023-09-30 | 2023-06-30 | 2023-03-31 | 2022-12-31 | 2022-09-30 | 2022-06-30 | 2022-03-31 | 2021-12-31 | 2021-09-30 | 2021-06-30 | 2021-03-31 | 2020-12-31 | 2020-09-30 | 2020-06-30 | 2020-03-31 | 2019-12-31 | 2019-09-30 | 2019-06-30 | 2019-03-31 | 2018-12-31 | 2018-09-30 | 2018-06-30 | 2018-03-31 | 2017-12-31 | 2017-09-30 | 2017-06-30 | 2017-03-31 | 2016-12-31 | 2016-09-30 | 2016-06-30 | 2016-03-31 | 2015-12-31 | 2015-09-30 | 2015-06-30 | 2015-03-31 | 2014-12-31 | 2014-09-30 | 2014-06-30 | 2014-03-31 | 2013-12-31 | 2013-09-30 | 2013-06-30 | 2013-03-31 | ||
|---|---|---|---|---|---|---|---|---|---|---|---|---|---|---|---|---|---|---|---|---|---|---|---|---|---|---|---|---|---|---|---|---|---|---|---|---|---|---|---|---|---|---|---|---|---|
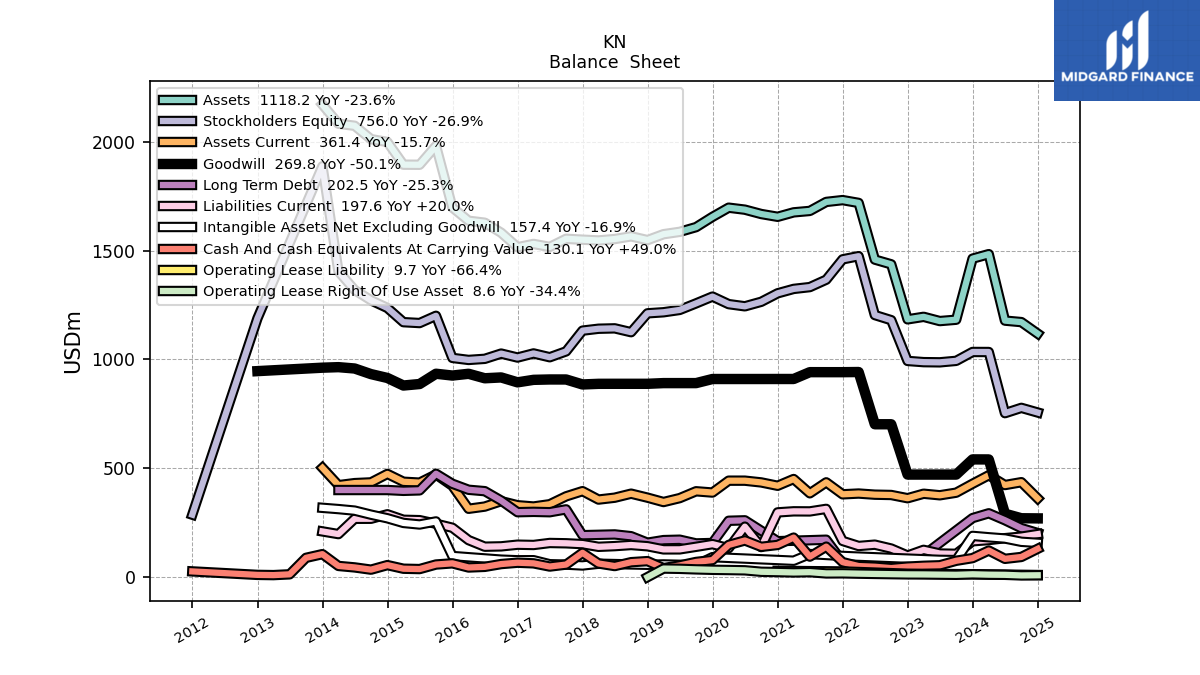
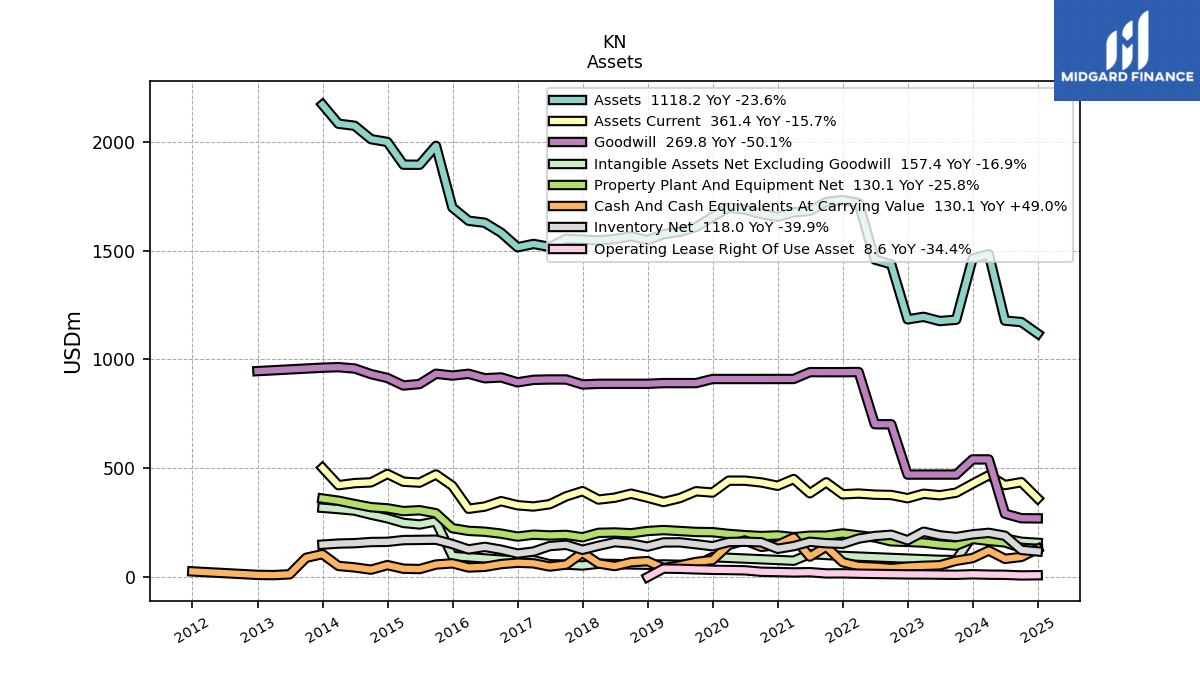
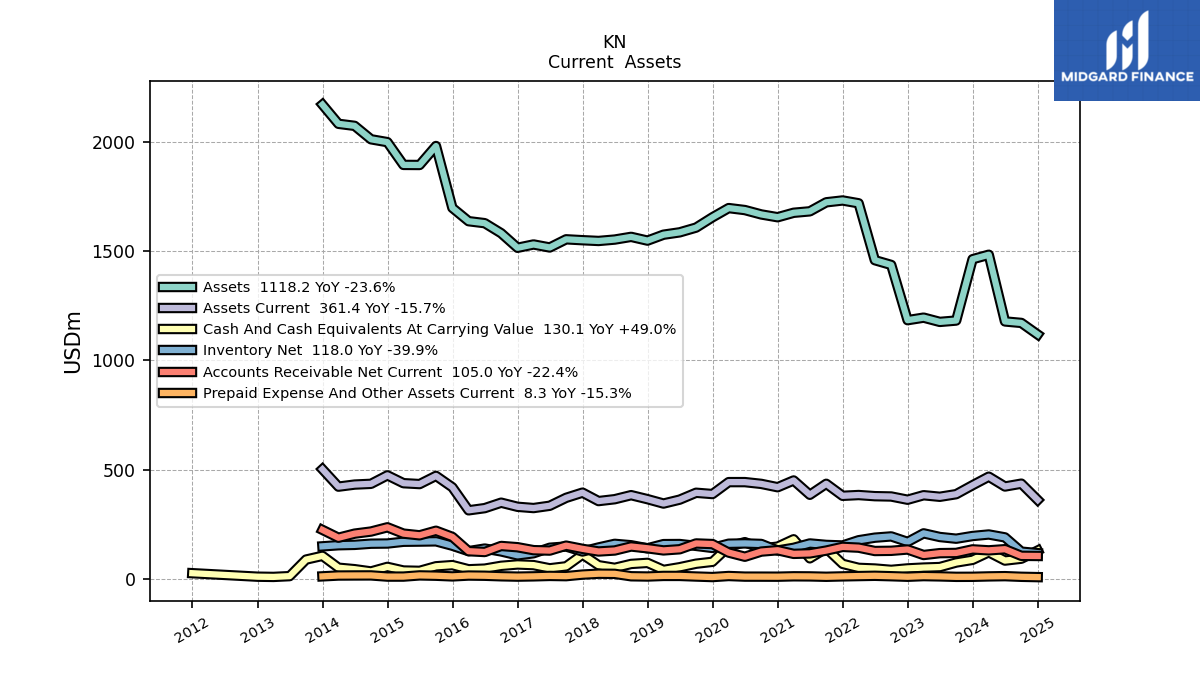
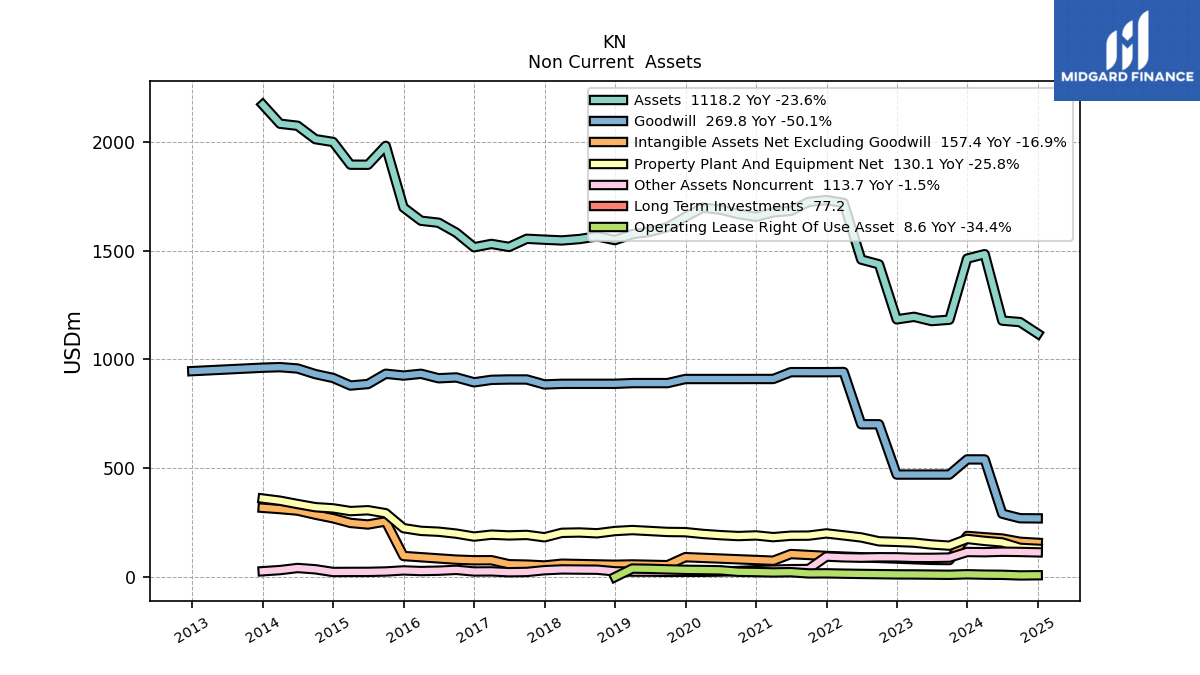
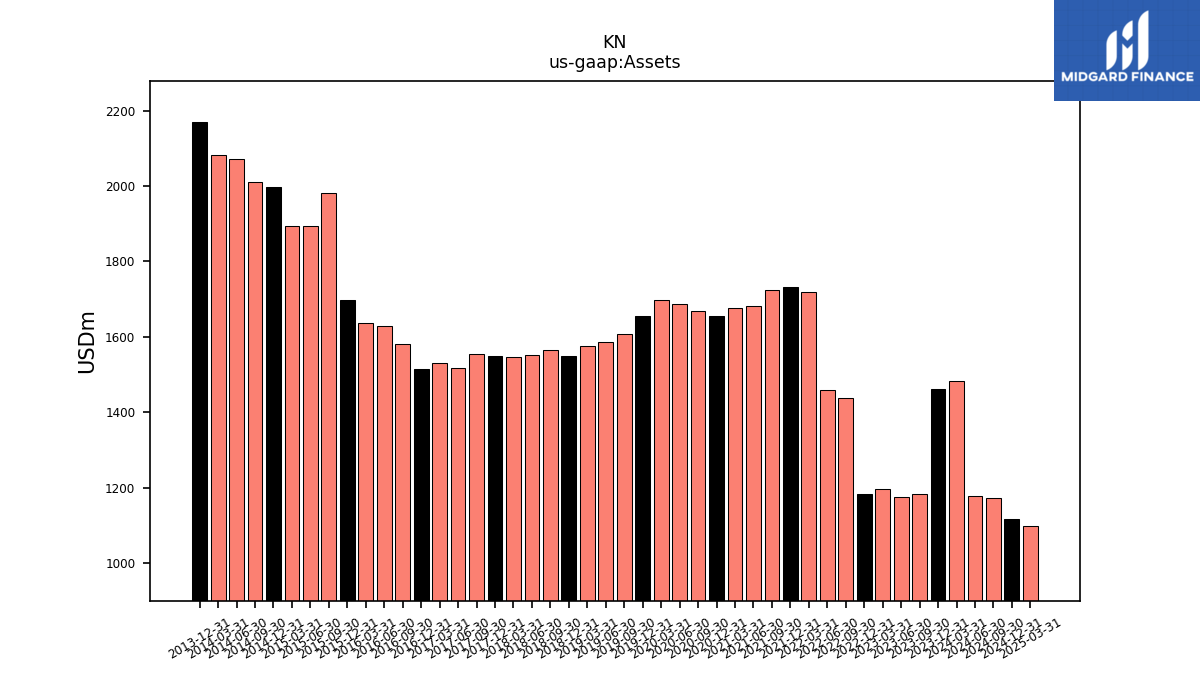
| Assets | 1462.80 | 1182.20 | 1176.00 | 1195.50 | 1183.90 | 1436.70 | 1458.40 | 1718.70 | 1731.60 | 1723.20 | 1681.90 | 1675.30 | 1654.90 | 1667.70 | 1687.70 | 1696.80 | 1654.60 | 1607.50 | 1585.80 | 1575.00 | 1547.90 | 1565.10 | 1552.70 | 1546.30 | 1549.80 | 1553.90 | 1516.50 | 1530.30 | 1515.10 | 1581.80 | 1627.70 | 1636.80 | 1697.70 | 1980.80 | 1893.90 | 1894.30 | 1998.50 | 2011.53 | 2072.99 | 2082.34 | 2170.12 | NA | NA | NA | |
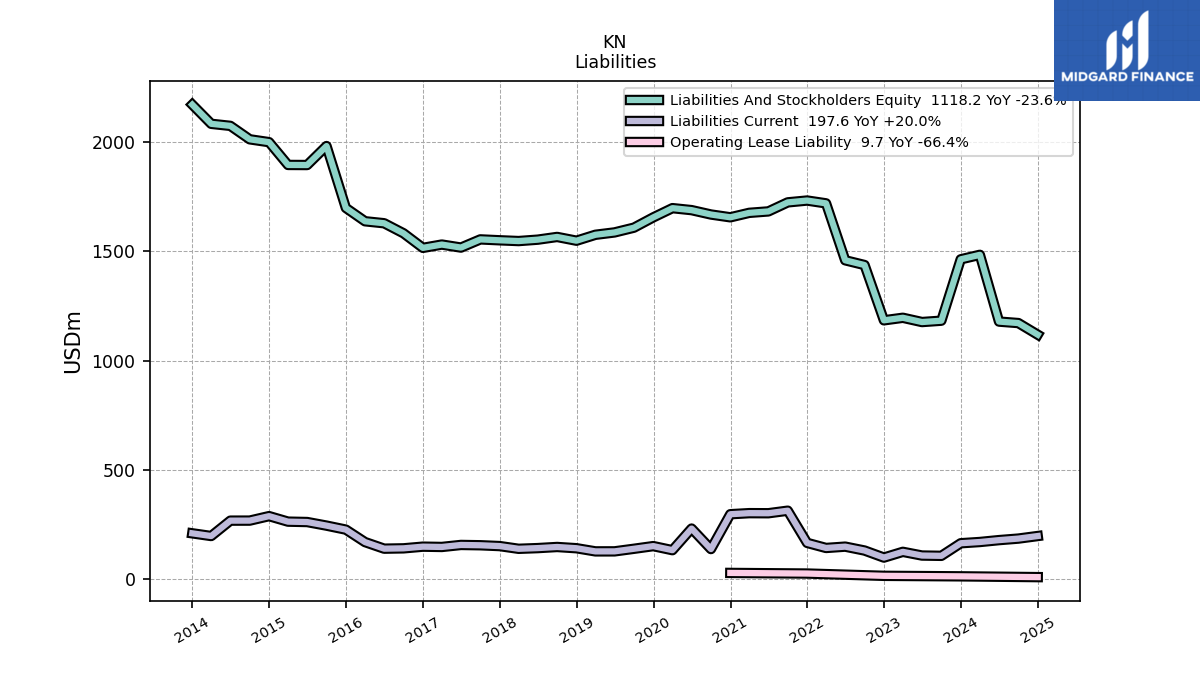
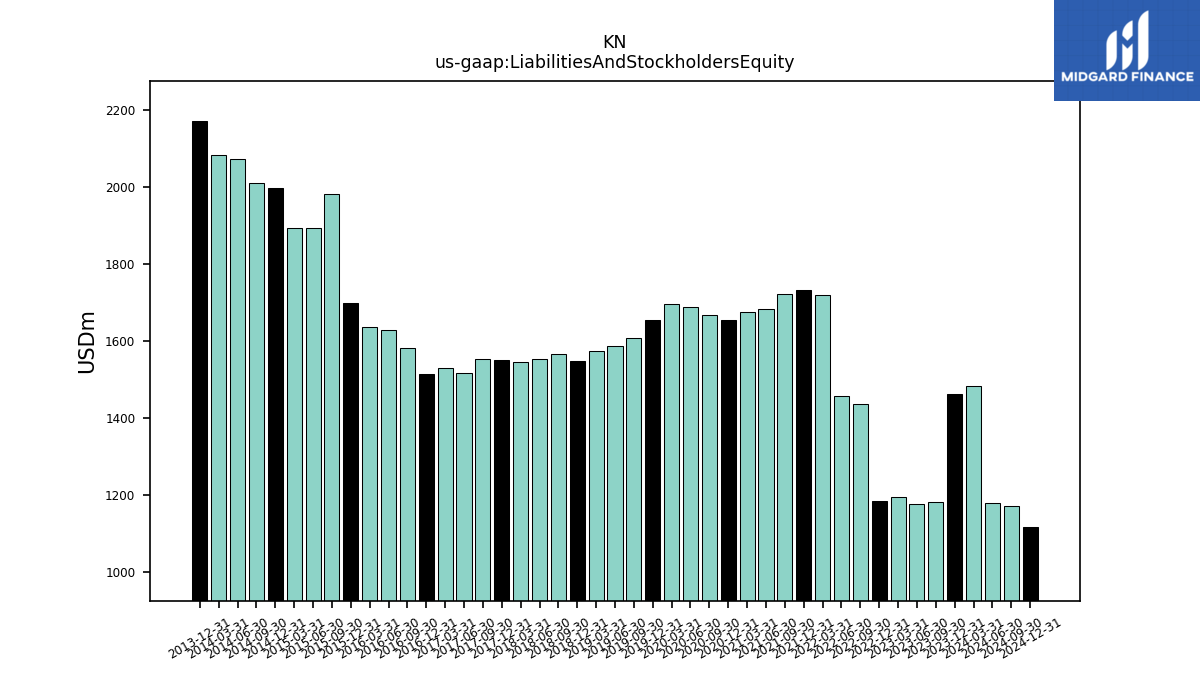
| Liabilities And Stockholders Equity | 1462.80 | 1182.20 | 1176.00 | 1195.50 | 1183.90 | 1436.70 | 1458.40 | 1718.70 | 1731.60 | 1723.20 | 1681.90 | 1675.30 | 1654.90 | 1667.70 | 1687.70 | 1696.80 | 1654.60 | 1607.50 | 1585.80 | 1575.00 | 1547.90 | 1565.10 | 1552.70 | 1546.30 | 1549.80 | 1553.90 | 1516.50 | 1530.30 | 1515.10 | 1581.80 | 1627.70 | 1636.80 | 1697.70 | 1980.80 | 1893.90 | 1894.30 | 1998.50 | 2011.53 | 2072.99 | 2082.34 | 2170.12 | NA | NA | NA | |
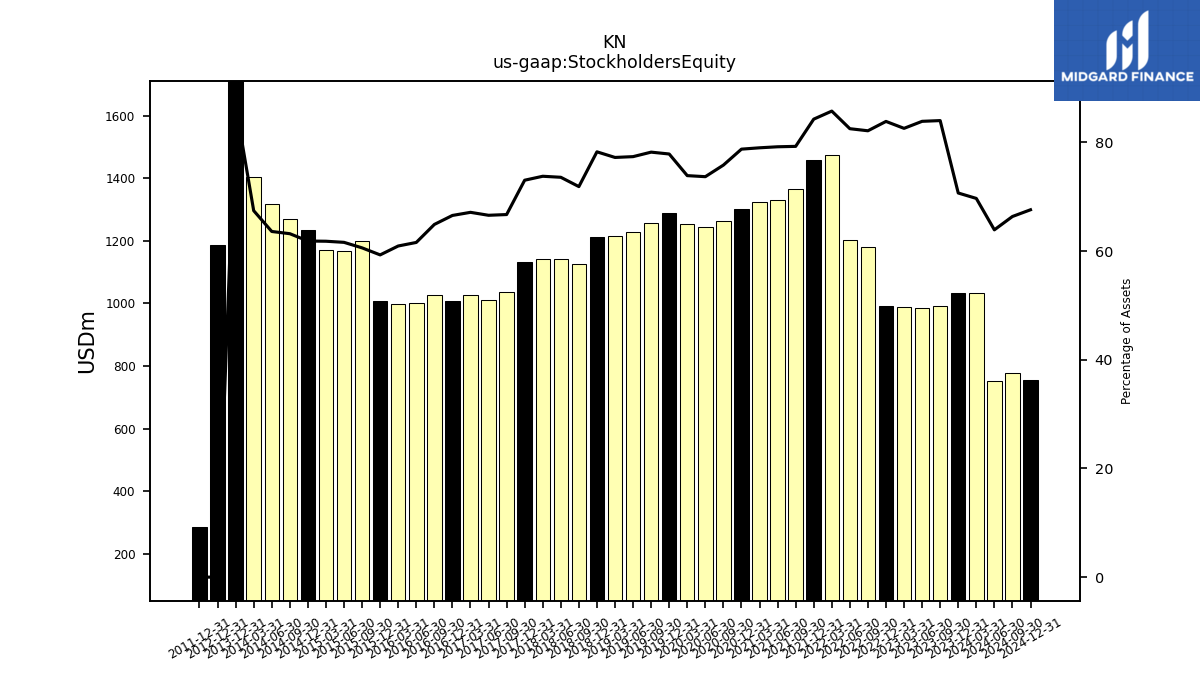
| Stockholders Equity | 1034.10 | 993.30 | 986.50 | 987.40 | 992.90 | 1180.20 | 1203.60 | 1474.10 | 1459.50 | 1366.10 | 1332.10 | 1323.70 | 1303.50 | 1264.60 | 1243.80 | 1253.80 | 1288.50 | 1257.30 | 1227.20 | 1216.50 | 1211.60 | 1124.90 | 1142.60 | 1140.80 | 1132.10 | 1036.90 | 1009.90 | 1027.40 | 1008.50 | 1026.70 | 1002.60 | 997.50 | 1006.80 | 1200.30 | 1166.90 | 1171.00 | 1236.20 | 1271.38 | 1318.71 | 1404.38 | 1887.13 | NA | NA | NA |
| 2023-12-31 | 2023-09-30 | 2023-06-30 | 2023-03-31 | 2022-12-31 | 2022-09-30 | 2022-06-30 | 2022-03-31 | 2021-12-31 | 2021-09-30 | 2021-06-30 | 2021-03-31 | 2020-12-31 | 2020-09-30 | 2020-06-30 | 2020-03-31 | 2019-12-31 | 2019-09-30 | 2019-06-30 | 2019-03-31 | 2018-12-31 | 2018-09-30 | 2018-06-30 | 2018-03-31 | 2017-12-31 | 2017-09-30 | 2017-06-30 | 2017-03-31 | 2016-12-31 | 2016-09-30 | 2016-06-30 | 2016-03-31 | 2015-12-31 | 2015-09-30 | 2015-06-30 | 2015-03-31 | 2014-12-31 | 2014-09-30 | 2014-06-30 | 2014-03-31 | 2013-12-31 | 2013-09-30 | 2013-06-30 | 2013-03-31 | ||
|---|---|---|---|---|---|---|---|---|---|---|---|---|---|---|---|---|---|---|---|---|---|---|---|---|---|---|---|---|---|---|---|---|---|---|---|---|---|---|---|---|---|---|---|---|---|
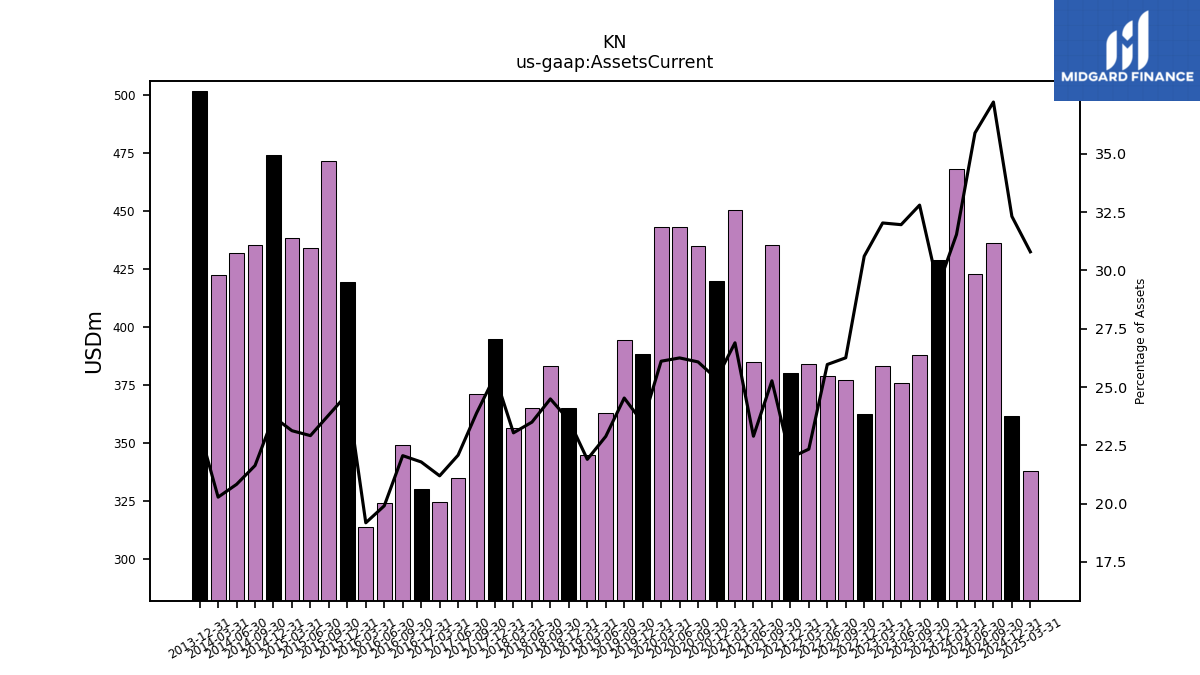
| Assets Current | 428.80 | 387.80 | 375.90 | 383.00 | 362.40 | 377.20 | 378.70 | 383.90 | 380.30 | 435.40 | 385.00 | 450.60 | 419.60 | 434.90 | 443.00 | 443.00 | 388.40 | 394.30 | 362.90 | 344.90 | 365.00 | 383.30 | 364.80 | 356.20 | 394.90 | 371.10 | 334.80 | 324.30 | 330.10 | 348.90 | 324.00 | 313.90 | 419.30 | 471.60 | 434.00 | 438.10 | 474.00 | 435.16 | 431.74 | 422.24 | 501.82 | NA | NA | NA | |
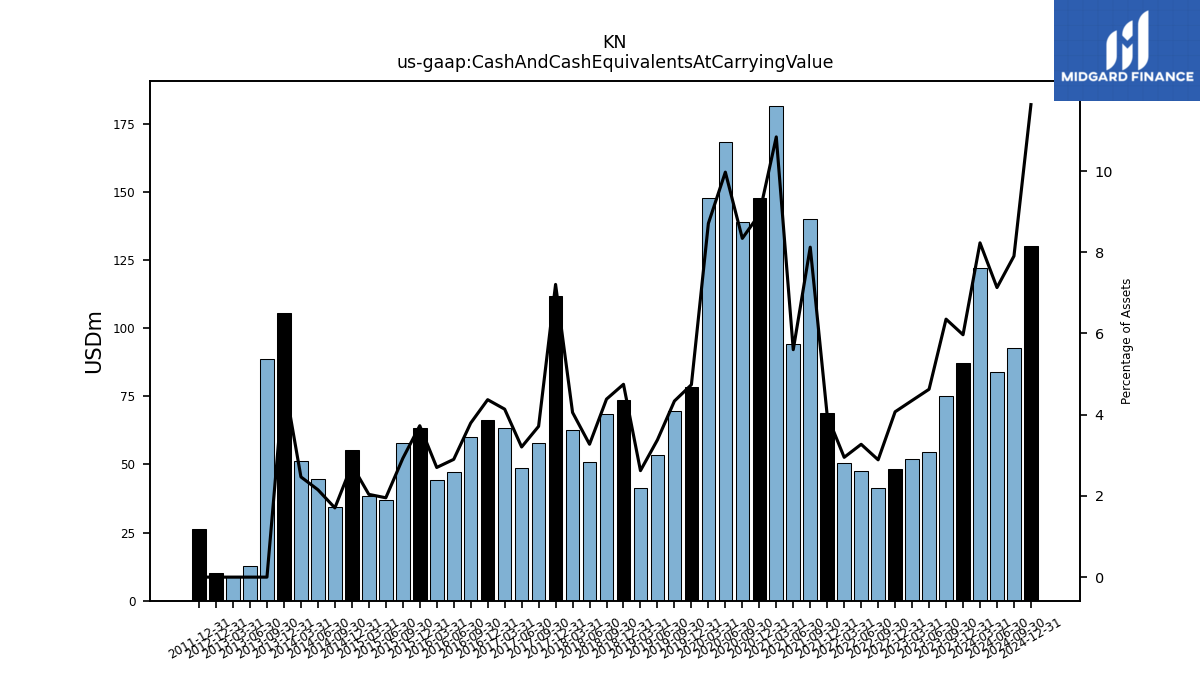
| Cash And Cash Equivalents At Carrying Value | 87.30 | 75.10 | 54.40 | 52.00 | 48.20 | 41.50 | 47.70 | 50.70 | 68.90 | 140.00 | 94.20 | 181.60 | 147.80 | 139.10 | 168.30 | 147.80 | 78.40 | 69.70 | 53.60 | 41.30 | 73.50 | 68.60 | 50.80 | 62.70 | 111.70 | 57.70 | 48.60 | 63.30 | 66.20 | 60.00 | 47.20 | 44.20 | 63.30 | 57.90 | 37.00 | 38.60 | 55.20 | 34.30 | 44.61 | 51.38 | 105.59 | 88.59 | 12.82 | 9.25 | |
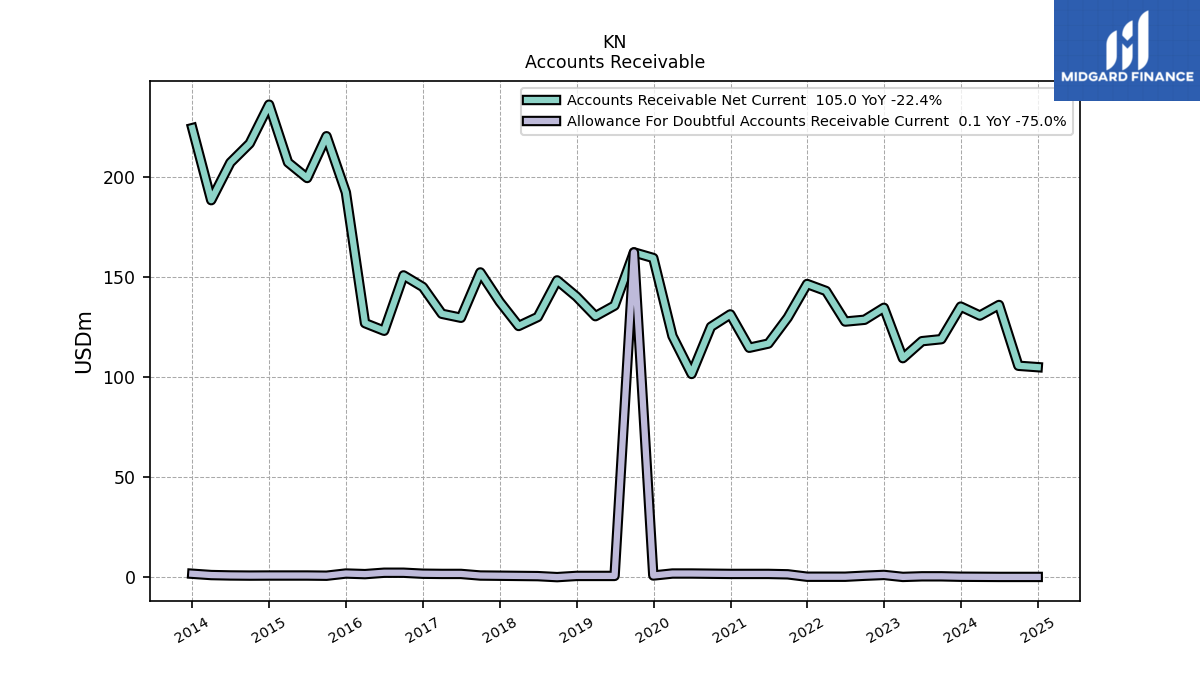
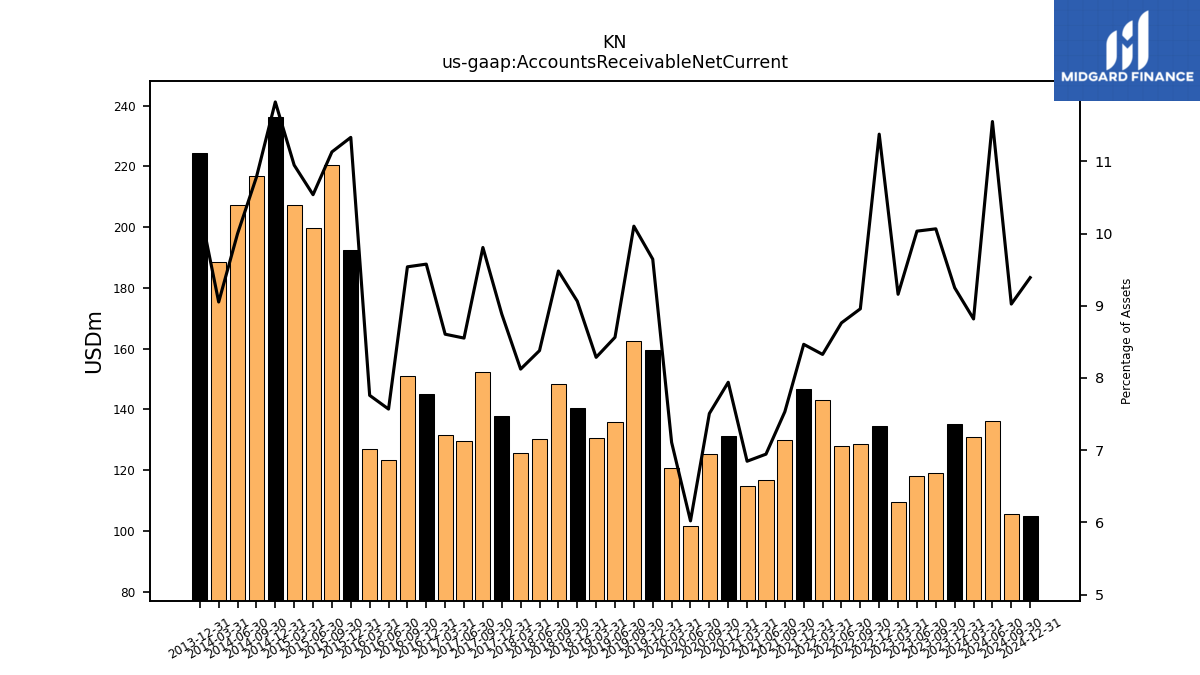
| Accounts Receivable Net Current | 135.30 | 119.00 | 118.00 | 109.50 | 134.70 | 128.70 | 127.80 | 143.10 | 146.60 | 129.80 | 116.80 | 114.70 | 131.40 | 125.20 | 101.60 | 120.60 | 159.60 | 162.40 | 135.80 | 130.50 | 140.30 | 148.40 | 130.10 | 125.60 | 137.70 | 152.40 | 129.70 | 131.70 | 145.10 | 150.90 | 123.20 | 127.00 | 192.40 | 220.50 | 199.60 | 207.40 | 236.30 | 216.89 | 207.29 | 188.50 | 224.56 | NA | NA | NA | |
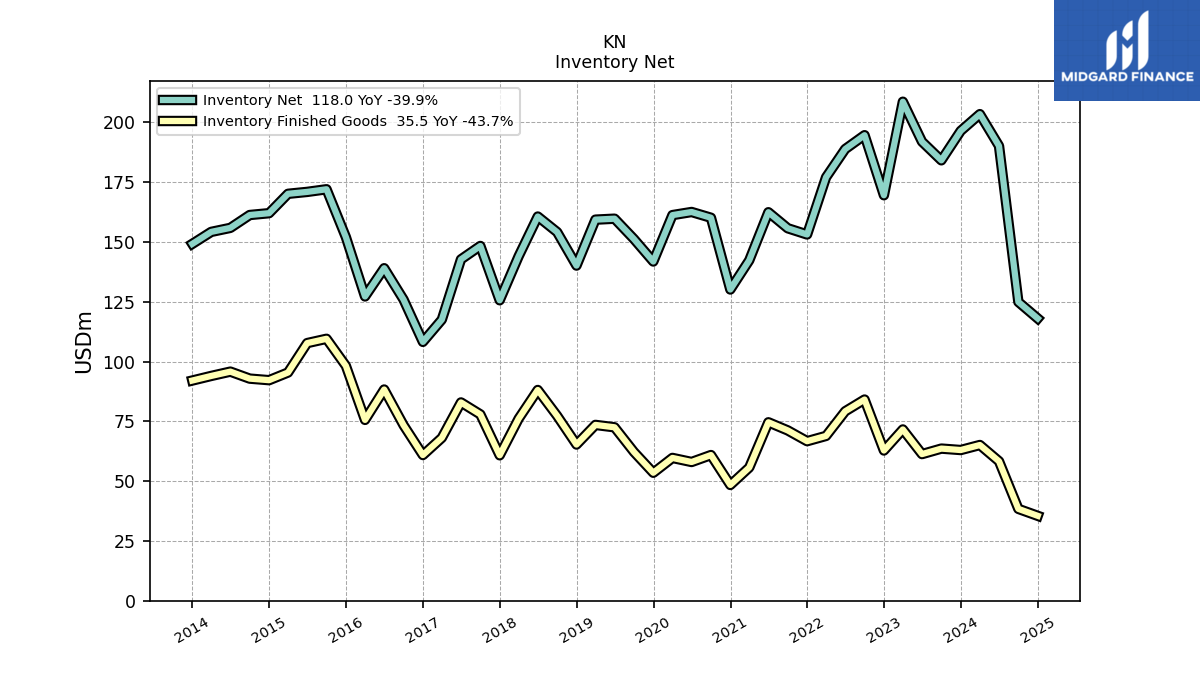
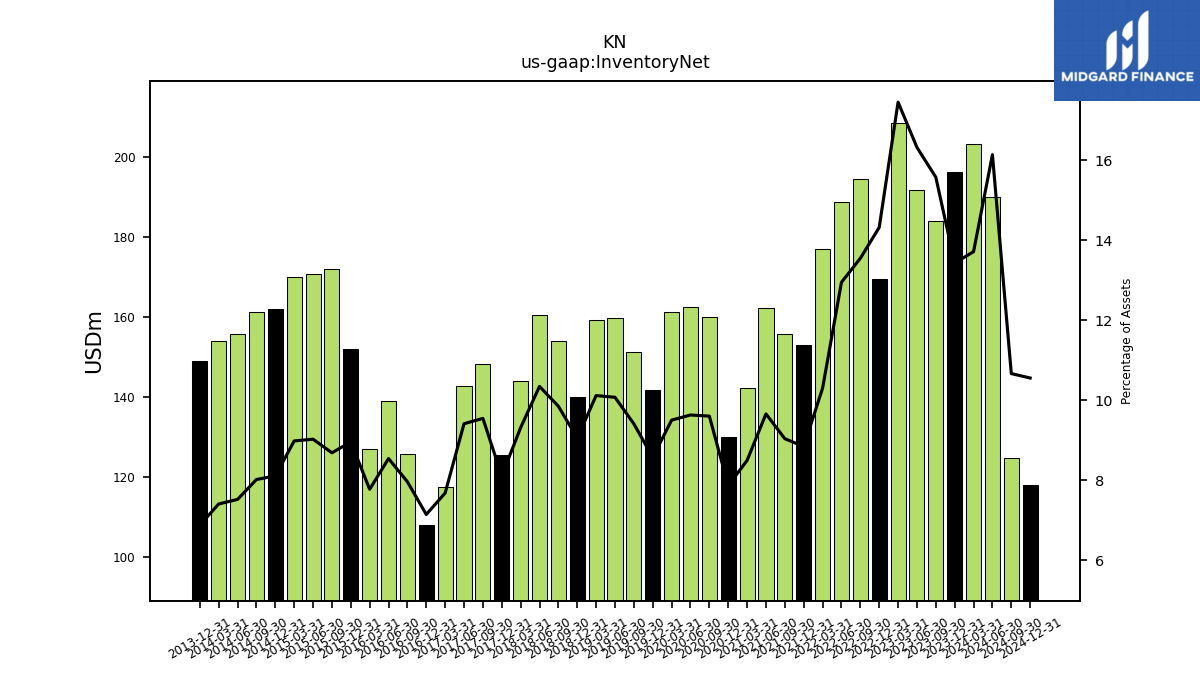
| Inventory Net | 196.40 | 184.10 | 191.90 | 208.60 | 169.50 | 194.60 | 188.80 | 177.00 | 153.10 | 155.70 | 162.40 | 142.30 | 130.10 | 160.10 | 162.50 | 161.20 | 141.80 | 151.20 | 159.70 | 159.30 | 140.10 | 154.10 | 160.60 | 144.00 | 125.60 | 148.30 | 142.70 | 117.50 | 108.20 | 125.90 | 139.00 | 127.20 | 152.00 | 172.00 | 170.90 | 170.10 | 162.00 | 161.24 | 155.86 | 154.19 | 149.17 | NA | NA | NA | |
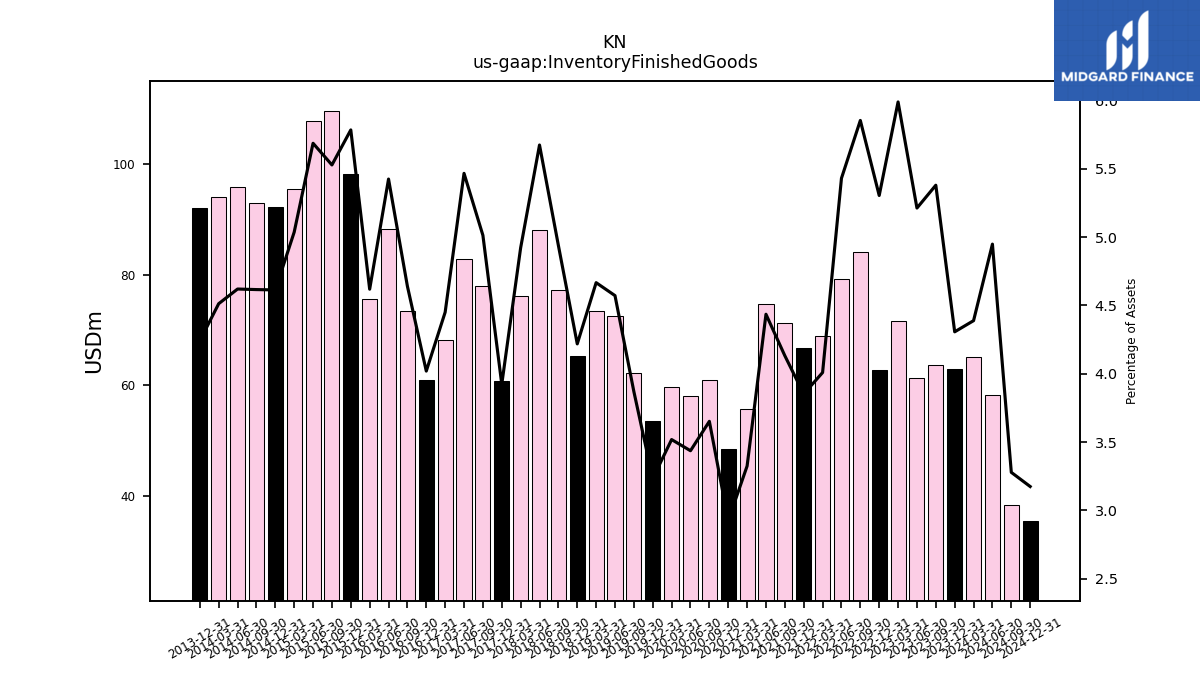
| Inventory Finished Goods | 63.00 | 63.60 | 61.30 | 71.60 | 62.80 | 84.10 | 79.20 | 68.90 | 66.70 | 71.20 | 74.60 | 55.70 | 48.40 | 60.90 | 58.00 | 59.70 | 53.50 | 62.20 | 72.50 | 73.50 | 65.30 | 77.30 | 88.10 | 76.10 | 60.80 | 77.90 | 82.90 | 68.10 | 60.90 | 73.40 | 88.30 | 75.60 | 98.20 | 109.50 | 107.70 | 95.40 | 92.20 | 92.85 | 95.77 | 93.97 | 92.05 | NA | NA | NA | |
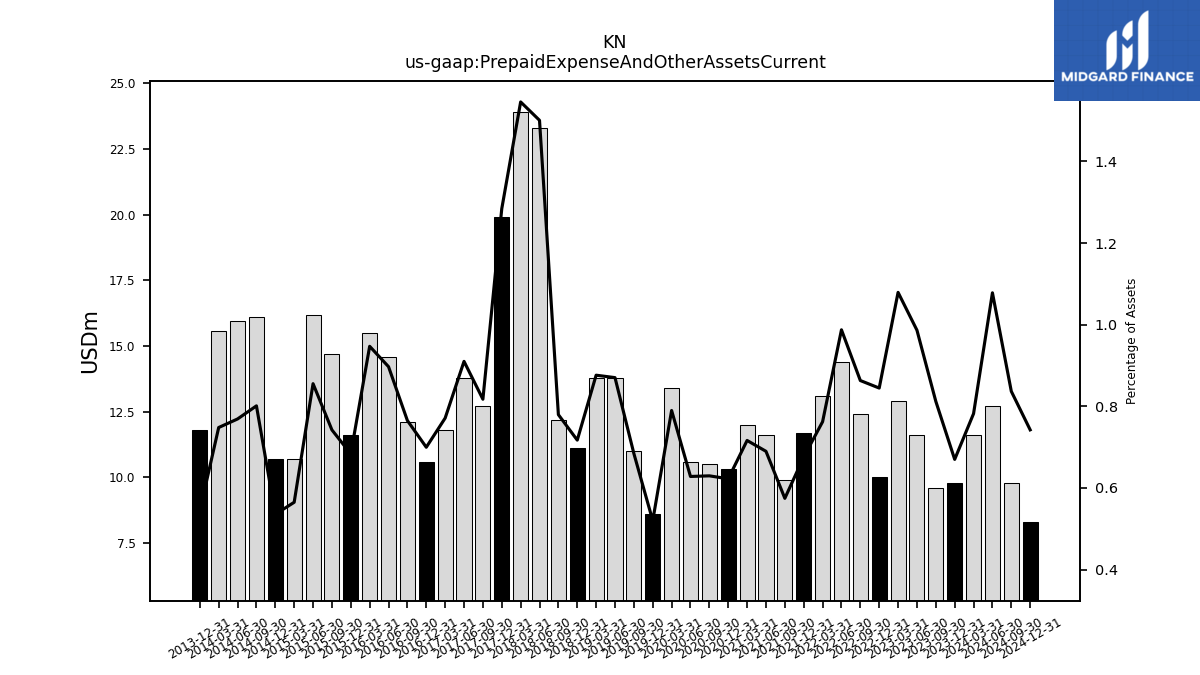
| Prepaid Expense And Other Assets Current | 9.80 | 9.60 | 11.60 | 12.90 | 10.00 | 12.40 | 14.40 | 13.10 | 11.70 | 9.90 | 11.60 | 12.00 | 10.30 | 10.50 | 10.60 | 13.40 | 8.60 | 11.00 | 13.80 | 13.80 | 11.10 | 12.20 | 23.30 | 23.90 | 19.90 | 12.70 | 13.80 | 11.80 | 10.60 | 12.10 | 14.60 | 15.50 | 11.60 | 14.70 | 16.20 | 10.70 | 10.70 | 16.11 | 15.94 | 15.58 | 11.80 | NA | NA | NA |
| 2023-12-31 | 2023-09-30 | 2023-06-30 | 2023-03-31 | 2022-12-31 | 2022-09-30 | 2022-06-30 | 2022-03-31 | 2021-12-31 | 2021-09-30 | 2021-06-30 | 2021-03-31 | 2020-12-31 | 2020-09-30 | 2020-06-30 | 2020-03-31 | 2019-12-31 | 2019-09-30 | 2019-06-30 | 2019-03-31 | 2018-12-31 | 2018-09-30 | 2018-06-30 | 2018-03-31 | 2017-12-31 | 2017-09-30 | 2017-06-30 | 2017-03-31 | 2016-12-31 | 2016-09-30 | 2016-06-30 | 2016-03-31 | 2015-12-31 | 2015-09-30 | 2015-06-30 | 2015-03-31 | 2014-12-31 | 2014-09-30 | 2014-06-30 | 2014-03-31 | 2013-12-31 | 2013-09-30 | 2013-06-30 | 2013-03-31 | ||
|---|---|---|---|---|---|---|---|---|---|---|---|---|---|---|---|---|---|---|---|---|---|---|---|---|---|---|---|---|---|---|---|---|---|---|---|---|---|---|---|---|---|---|---|---|---|
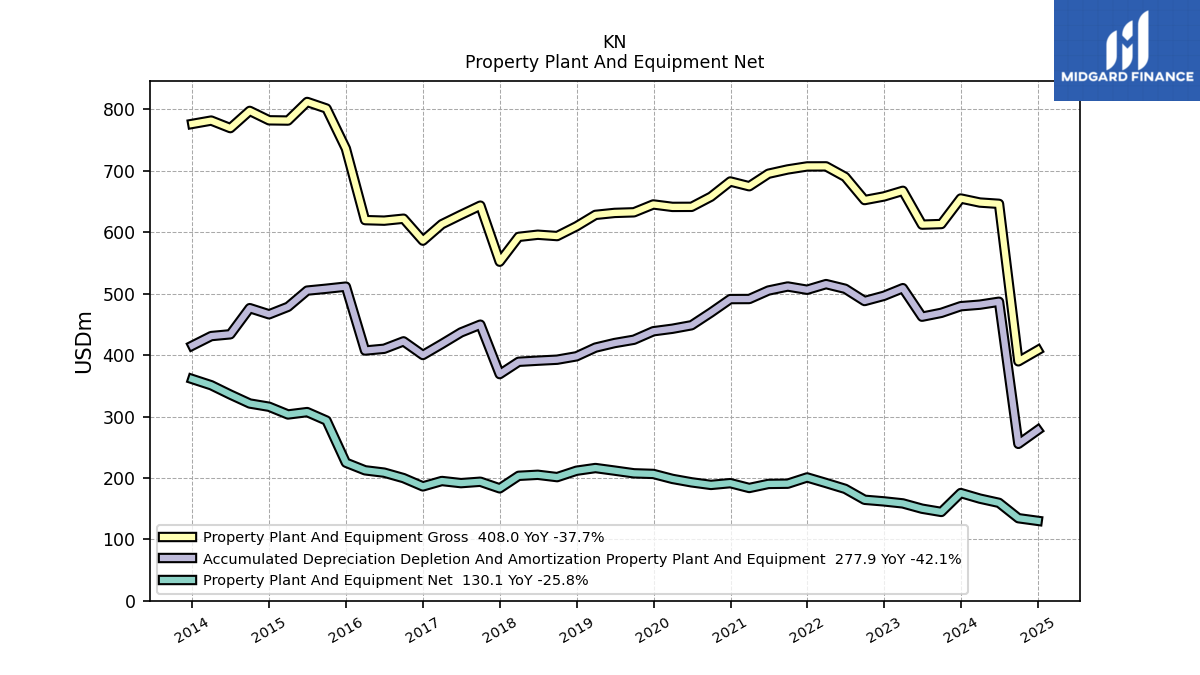
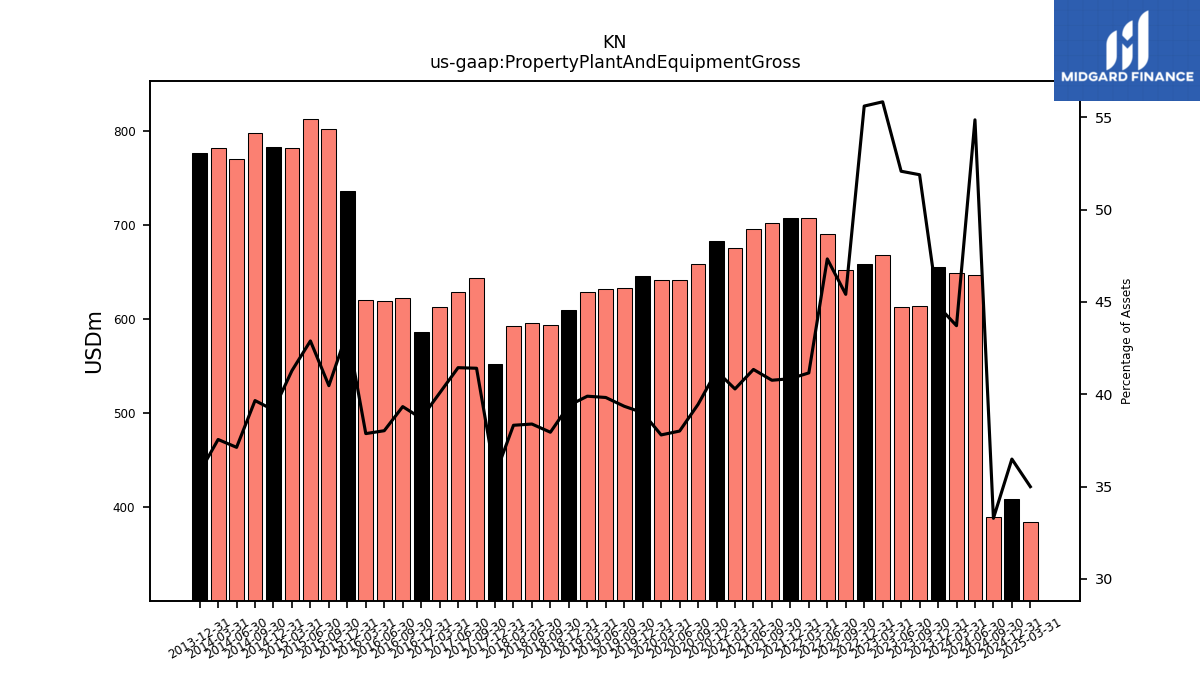
| Property Plant And Equipment Gross | 655.00 | 613.40 | 612.40 | 667.50 | 658.30 | 652.40 | 690.20 | 707.30 | 707.20 | 702.30 | 695.30 | 674.90 | 682.70 | 657.90 | 641.40 | 641.30 | 645.30 | 632.50 | 631.50 | 628.30 | 609.70 | 593.80 | 596.00 | 592.50 | 552.00 | 643.40 | 628.40 | 613.10 | 586.30 | 622.10 | 618.90 | 619.80 | 736.30 | 801.50 | 812.20 | 781.90 | 782.30 | 797.66 | 769.54 | 781.87 | 776.44 | NA | NA | NA | |
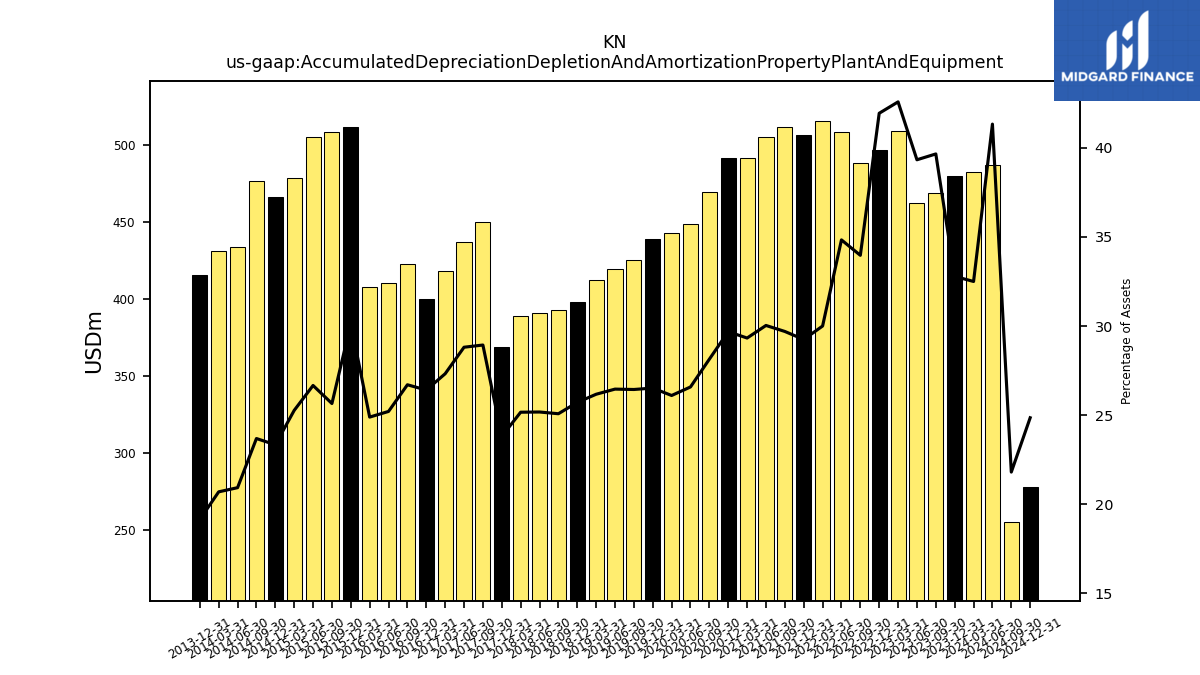
| Accumulated Depreciation Depletion And Amortization Property Plant And Equipment | 479.60 | 468.80 | 462.50 | 509.00 | 496.50 | 488.00 | 508.00 | 515.60 | 506.40 | 511.70 | 505.10 | 491.30 | 491.20 | 469.30 | 448.60 | 442.90 | 438.80 | 425.00 | 419.60 | 412.20 | 398.00 | 392.50 | 390.90 | 389.10 | 369.00 | 449.60 | 436.90 | 418.10 | 400.10 | 422.40 | 410.30 | 407.40 | 511.50 | 508.10 | 505.00 | 478.60 | 466.40 | 476.48 | 433.87 | 430.96 | 415.44 | NA | NA | NA | |
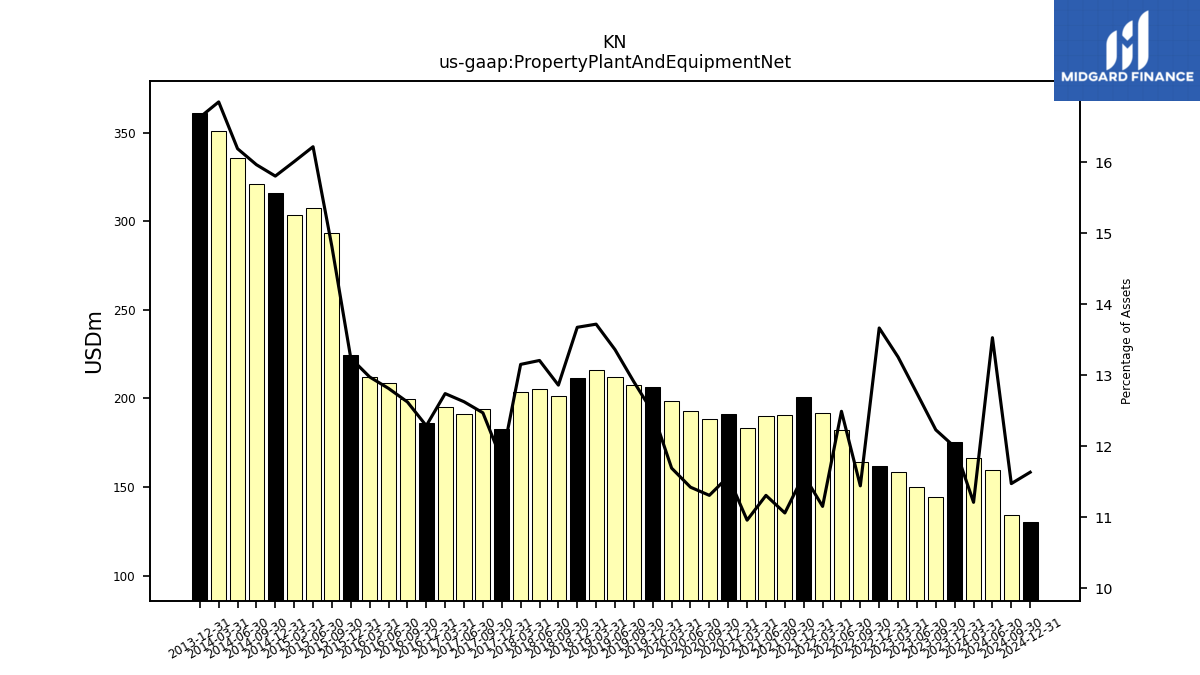
| Property Plant And Equipment Net | 175.40 | 144.60 | 149.90 | 158.50 | 161.80 | 164.40 | 182.20 | 191.70 | 200.80 | 190.60 | 190.20 | 183.60 | 191.50 | 188.60 | 192.80 | 198.40 | 206.50 | 207.50 | 211.90 | 216.10 | 211.70 | 201.30 | 205.10 | 203.40 | 183.00 | 193.80 | 191.50 | 195.00 | 186.20 | 199.70 | 208.60 | 212.40 | 224.80 | 293.40 | 307.20 | 303.30 | 315.90 | 321.18 | 335.67 | 350.91 | 361.00 | NA | NA | NA | |
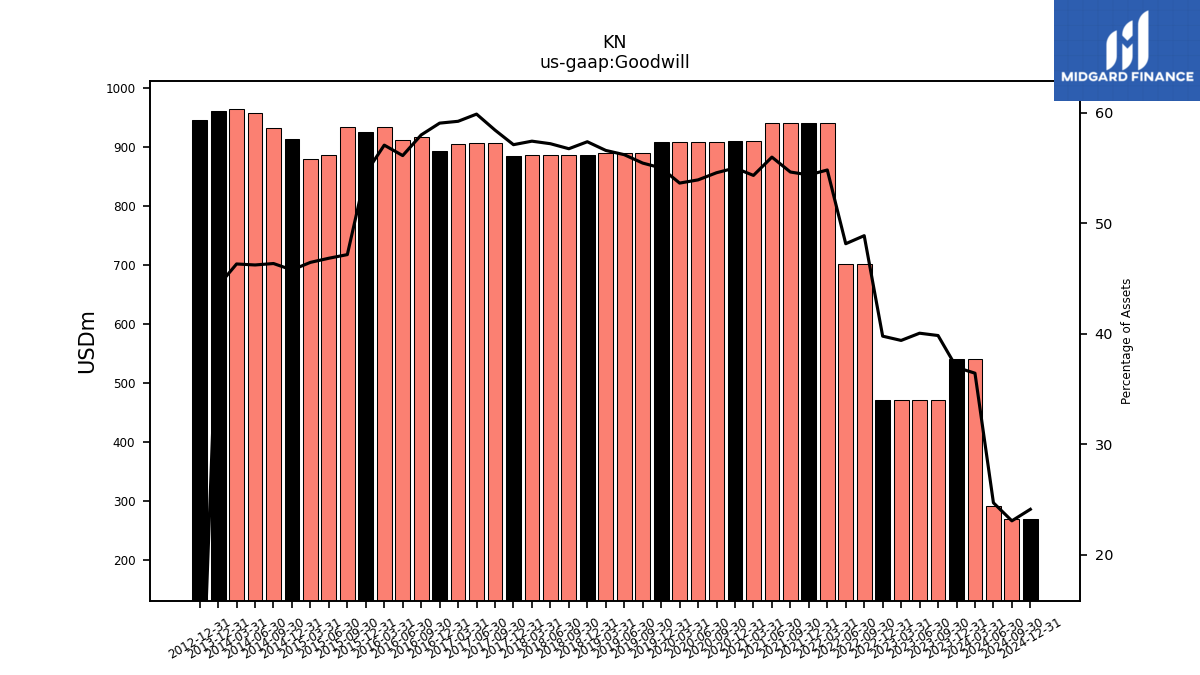
| Goodwill | 540.70 | 471.00 | 471.00 | 471.00 | 471.00 | 702.10 | 702.10 | 942.00 | 941.30 | 941.30 | 941.40 | 910.00 | 910.00 | 909.90 | 909.90 | 909.90 | 909.90 | 891.10 | 891.10 | 891.10 | 887.90 | 887.90 | 887.90 | 887.80 | 884.90 | 907.70 | 907.80 | 906.10 | 894.60 | 917.10 | 913.30 | 933.90 | 925.80 | 934.10 | 886.90 | 880.00 | 914.70 | 932.38 | 958.15 | 964.35 | 961.92 | NA | NA | NA | |
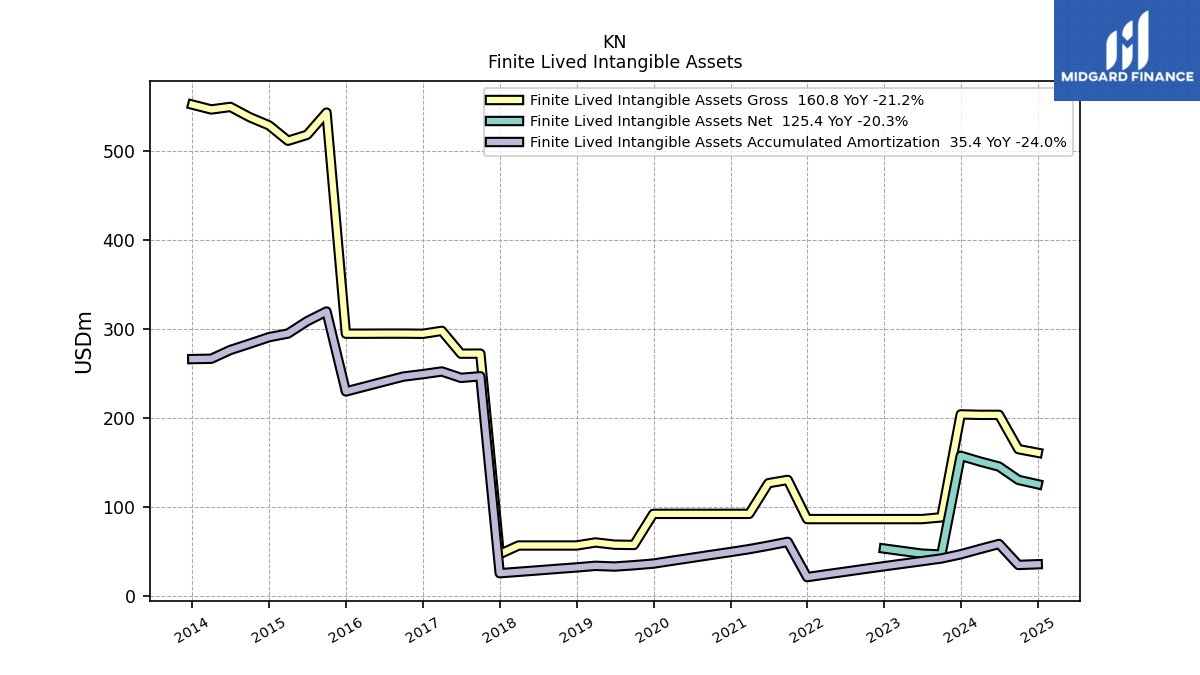
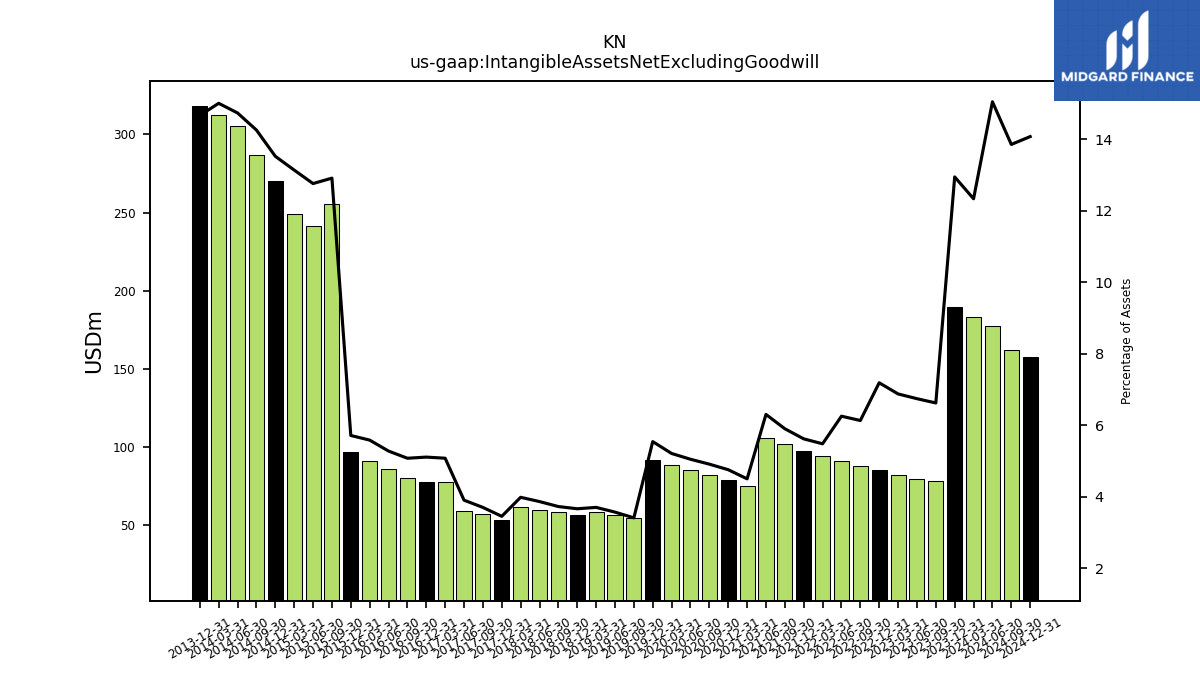
| Intangible Assets Net Excluding Goodwill | 189.40 | 78.30 | 79.30 | 82.20 | 85.10 | 88.10 | 91.20 | 94.20 | 97.30 | 101.70 | 106.00 | 75.40 | 78.70 | 81.90 | 85.20 | 88.40 | 91.70 | 54.80 | 56.60 | 58.30 | 56.70 | 58.30 | 60.00 | 61.60 | 53.50 | 57.50 | 59.20 | 77.70 | 77.40 | 80.30 | 85.90 | 91.40 | 97.00 | 255.80 | 241.70 | 248.90 | 270.30 | 286.83 | 305.50 | 312.51 | 318.31 | NA | NA | NA | |
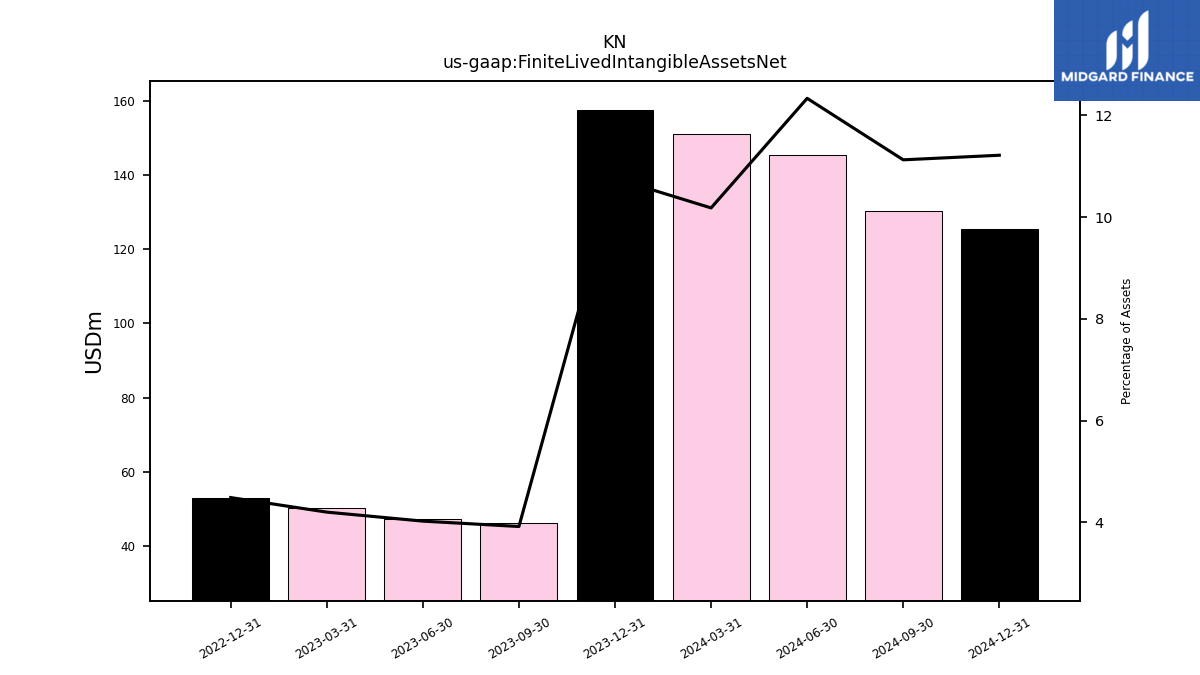
| Finite Lived Intangible Assets Net | 157.40 | 46.30 | 47.30 | 50.20 | 53.10 | NA | NA | NA | NA | NA | NA | NA | NA | NA | NA | NA | NA | NA | NA | NA | NA | NA | NA | NA | NA | NA | NA | NA | NA | NA | NA | NA | NA | NA | NA | NA | NA | NA | NA | NA | NA | NA | NA | NA | |
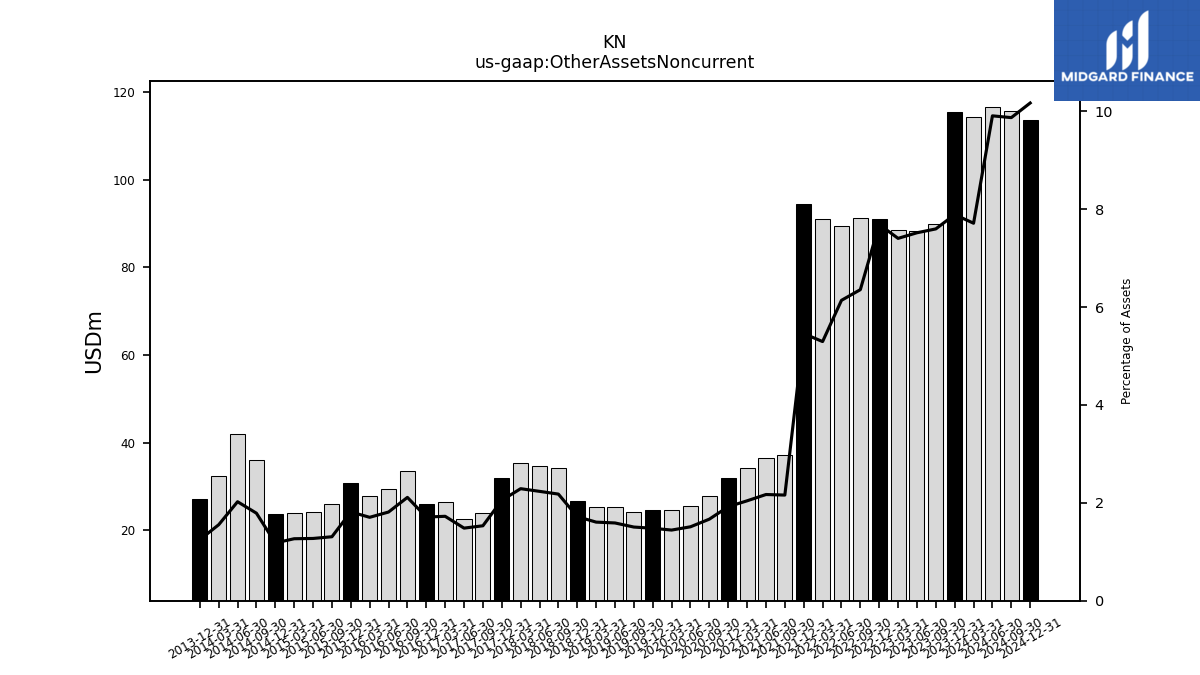
| Other Assets Noncurrent | 115.40 | 89.80 | 88.40 | 88.50 | 91.00 | 91.30 | 89.50 | 91.00 | 94.50 | 37.20 | 36.50 | 34.20 | 31.80 | 27.80 | 25.50 | 24.50 | 24.50 | 24.20 | 25.20 | 25.30 | 26.60 | 34.10 | 34.70 | 35.40 | 31.80 | 23.80 | 22.50 | 26.40 | 25.90 | 33.40 | 29.50 | 27.90 | 30.80 | 25.90 | 24.10 | 24.00 | 23.60 | 35.98 | 41.93 | 32.33 | 27.07 | NA | NA | NA |
| 2023-12-31 | 2023-09-30 | 2023-06-30 | 2023-03-31 | 2022-12-31 | 2022-09-30 | 2022-06-30 | 2022-03-31 | 2021-12-31 | 2021-09-30 | 2021-06-30 | 2021-03-31 | 2020-12-31 | 2020-09-30 | 2020-06-30 | 2020-03-31 | 2019-12-31 | 2019-09-30 | 2019-06-30 | 2019-03-31 | 2018-12-31 | 2018-09-30 | 2018-06-30 | 2018-03-31 | 2017-12-31 | 2017-09-30 | 2017-06-30 | 2017-03-31 | 2016-12-31 | 2016-09-30 | 2016-06-30 | 2016-03-31 | 2015-12-31 | 2015-09-30 | 2015-06-30 | 2015-03-31 | 2014-12-31 | 2014-09-30 | 2014-06-30 | 2014-03-31 | 2013-12-31 | 2013-09-30 | 2013-06-30 | 2013-03-31 | ||
|---|---|---|---|---|---|---|---|---|---|---|---|---|---|---|---|---|---|---|---|---|---|---|---|---|---|---|---|---|---|---|---|---|---|---|---|---|---|---|---|---|---|---|---|---|---|
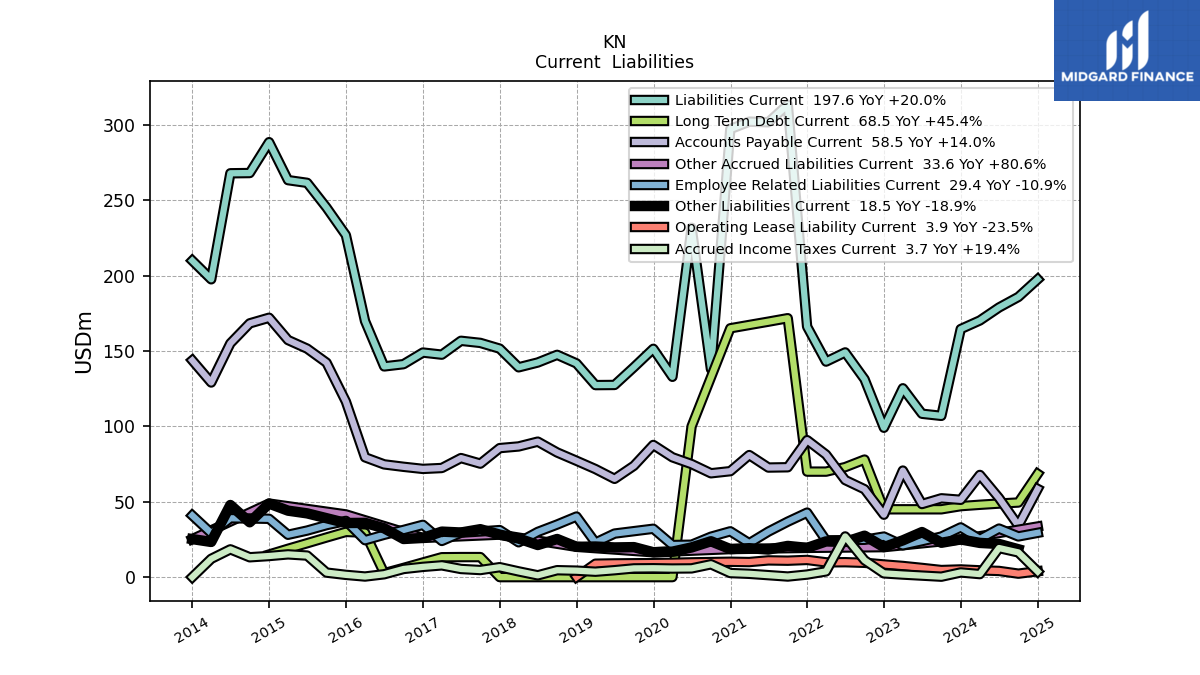
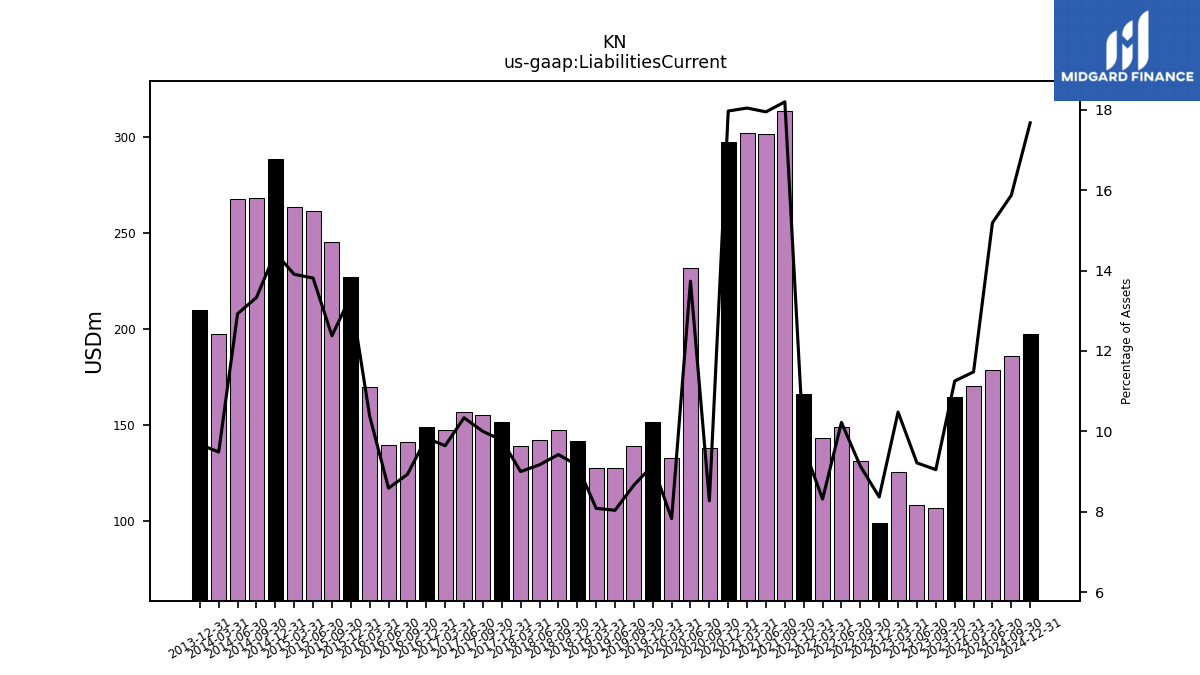
| Liabilities Current | 164.60 | 107.00 | 108.40 | 125.30 | 99.10 | 131.30 | 149.10 | 143.00 | 166.20 | 313.50 | 301.80 | 302.20 | 297.30 | 138.00 | 231.80 | 132.90 | 151.50 | 139.30 | 127.50 | 127.40 | 141.80 | 147.50 | 142.40 | 139.20 | 151.60 | 155.40 | 156.80 | 147.60 | 149.00 | 141.30 | 139.80 | 169.90 | 226.90 | 245.20 | 261.60 | 263.40 | 288.60 | 268.10 | 267.95 | 197.59 | 209.97 | NA | NA | NA | |
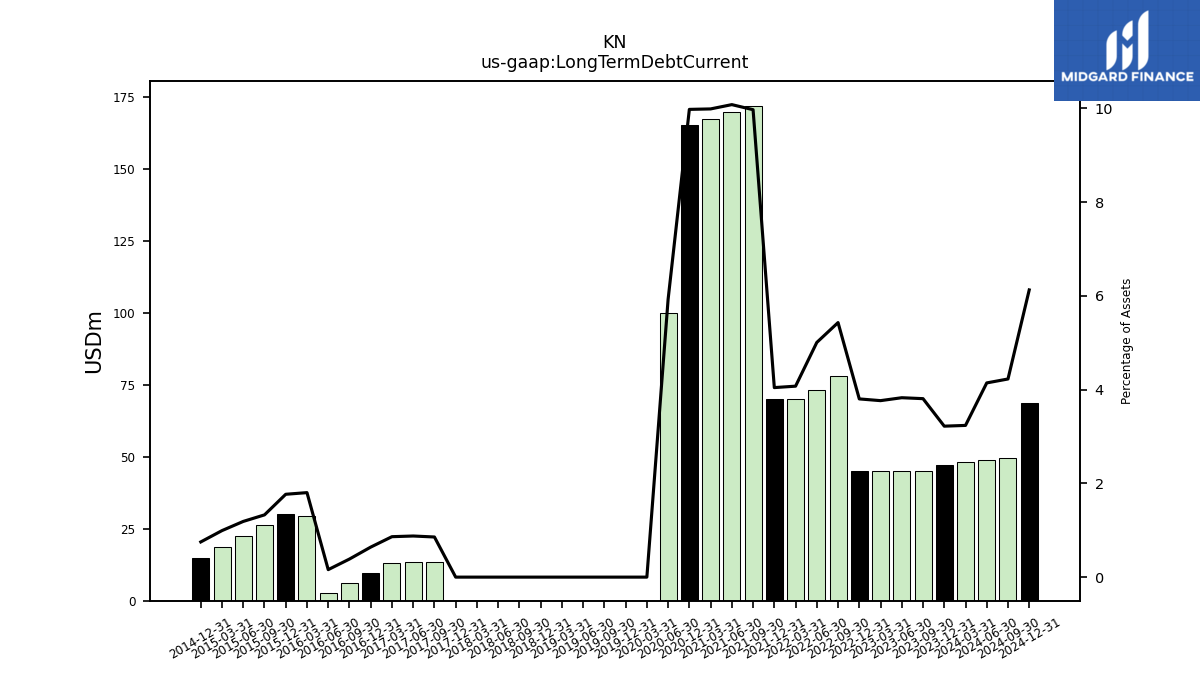
| Long Term Debt Current | 47.10 | 45.00 | 45.00 | 45.00 | 45.00 | 78.00 | 73.00 | 70.00 | 70.00 | 171.80 | 169.50 | 167.30 | 165.10 | NA | 100.00 | 0.00 | 0.00 | 0.00 | 0.00 | 0.00 | 0.00 | 0.00 | 0.00 | 0.00 | 0.00 | 13.30 | 13.30 | 13.20 | 9.70 | 6.10 | 2.60 | 29.50 | 30.00 | 26.30 | 22.50 | 18.80 | 15.00 | NA | NA | NA | NA | NA | NA | NA | |
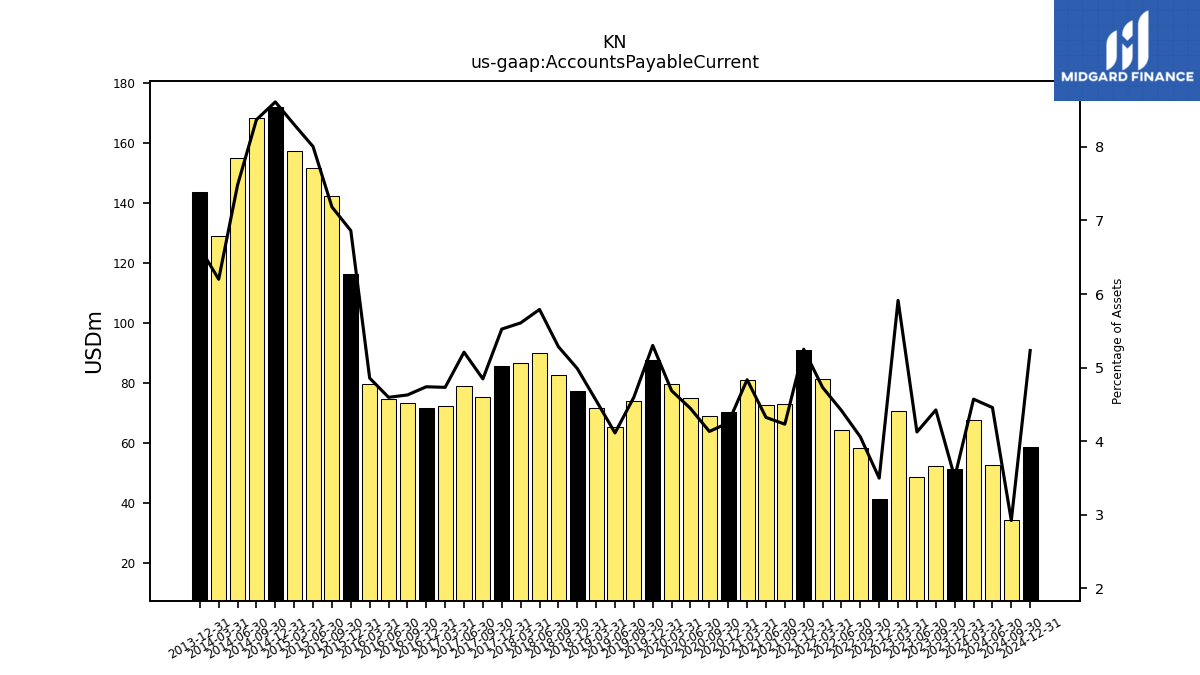
| Accounts Payable Current | 51.30 | 52.30 | 48.50 | 70.70 | 41.40 | 58.30 | 64.40 | 81.30 | 90.90 | 72.90 | 72.70 | 81.00 | 70.30 | 68.90 | 75.00 | 79.50 | 87.70 | 73.90 | 65.20 | 71.70 | 77.20 | 82.70 | 89.90 | 86.70 | 85.60 | 75.30 | 79.00 | 72.40 | 71.80 | 73.20 | 74.80 | 79.50 | 116.50 | 142.30 | 151.60 | 157.30 | 172.10 | 168.37 | 155.10 | 129.13 | 143.81 | NA | NA | NA | |
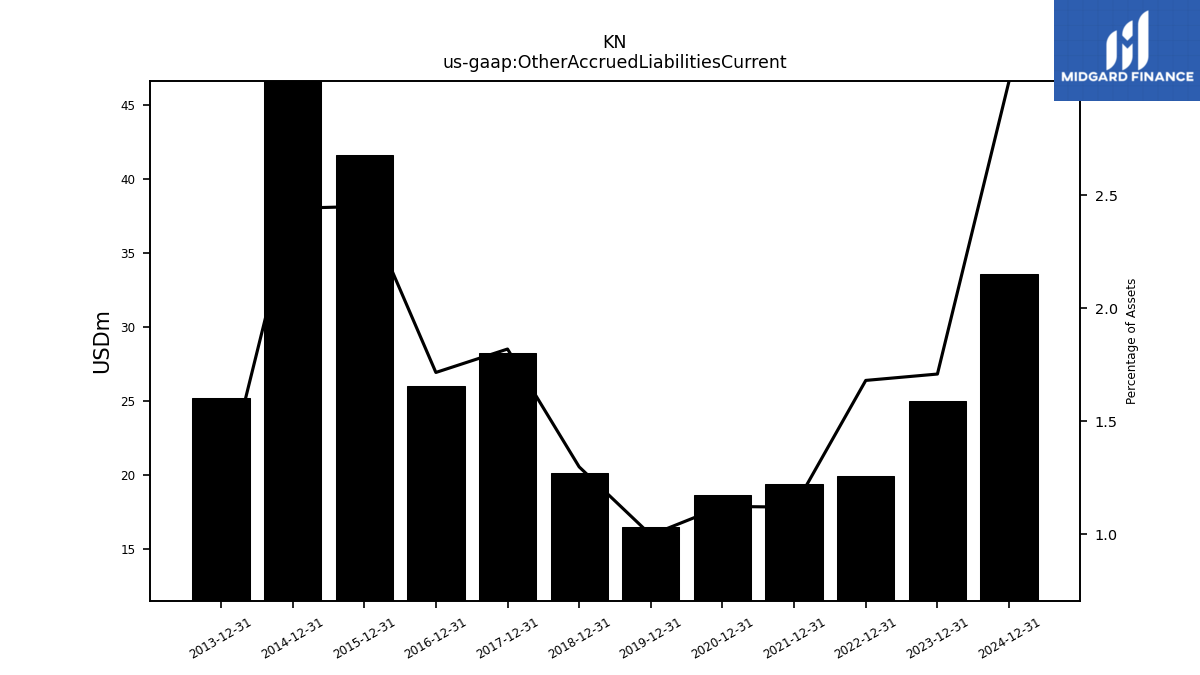
| Other Accrued Liabilities Current | 25.00 | NA | NA | NA | 19.90 | NA | NA | NA | 19.40 | NA | NA | NA | 18.60 | NA | NA | NA | 16.50 | NA | NA | NA | 20.10 | NA | NA | NA | 28.20 | NA | NA | NA | 26.00 | NA | NA | NA | 41.60 | NA | NA | NA | 48.80 | NA | NA | NA | 25.20 | NA | NA | NA | |
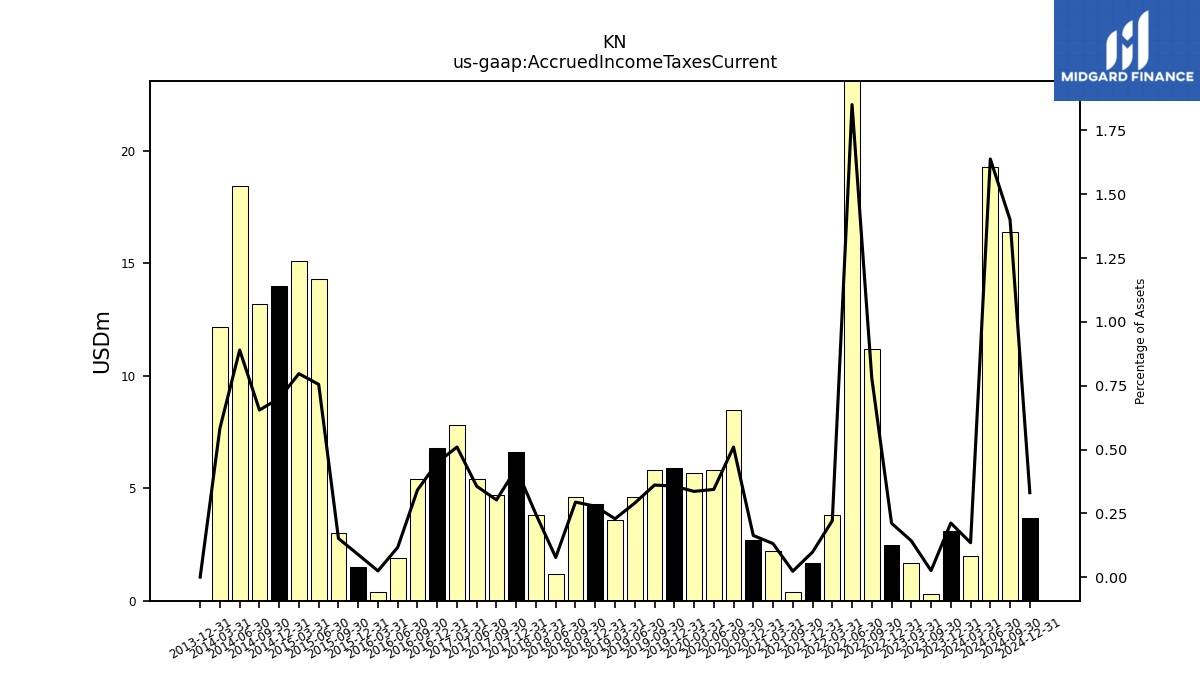
| Accrued Income Taxes Current | 3.10 | 0.30 | NA | 1.70 | 2.50 | 11.20 | 27.00 | 3.80 | 1.70 | 0.40 | NA | 2.20 | 2.70 | 8.50 | 5.80 | 5.70 | 5.90 | 5.80 | 4.60 | 3.60 | 4.30 | 4.60 | 1.20 | 3.80 | 6.60 | 4.70 | 5.40 | 7.80 | 6.80 | 5.40 | 1.90 | 0.40 | 1.50 | 3.00 | 14.30 | 15.10 | 14.00 | 13.17 | 18.45 | 12.15 | 0.00 | NA | NA | NA |
| 2023-12-31 | 2023-09-30 | 2023-06-30 | 2023-03-31 | 2022-12-31 | 2022-09-30 | 2022-06-30 | 2022-03-31 | 2021-12-31 | 2021-09-30 | 2021-06-30 | 2021-03-31 | 2020-12-31 | 2020-09-30 | 2020-06-30 | 2020-03-31 | 2019-12-31 | 2019-09-30 | 2019-06-30 | 2019-03-31 | 2018-12-31 | 2018-09-30 | 2018-06-30 | 2018-03-31 | 2017-12-31 | 2017-09-30 | 2017-06-30 | 2017-03-31 | 2016-12-31 | 2016-09-30 | 2016-06-30 | 2016-03-31 | 2015-12-31 | 2015-09-30 | 2015-06-30 | 2015-03-31 | 2014-12-31 | 2014-09-30 | 2014-06-30 | 2014-03-31 | 2013-12-31 | 2013-09-30 | 2013-06-30 | 2013-03-31 | ||
|---|---|---|---|---|---|---|---|---|---|---|---|---|---|---|---|---|---|---|---|---|---|---|---|---|---|---|---|---|---|---|---|---|---|---|---|---|---|---|---|---|---|---|---|---|---|
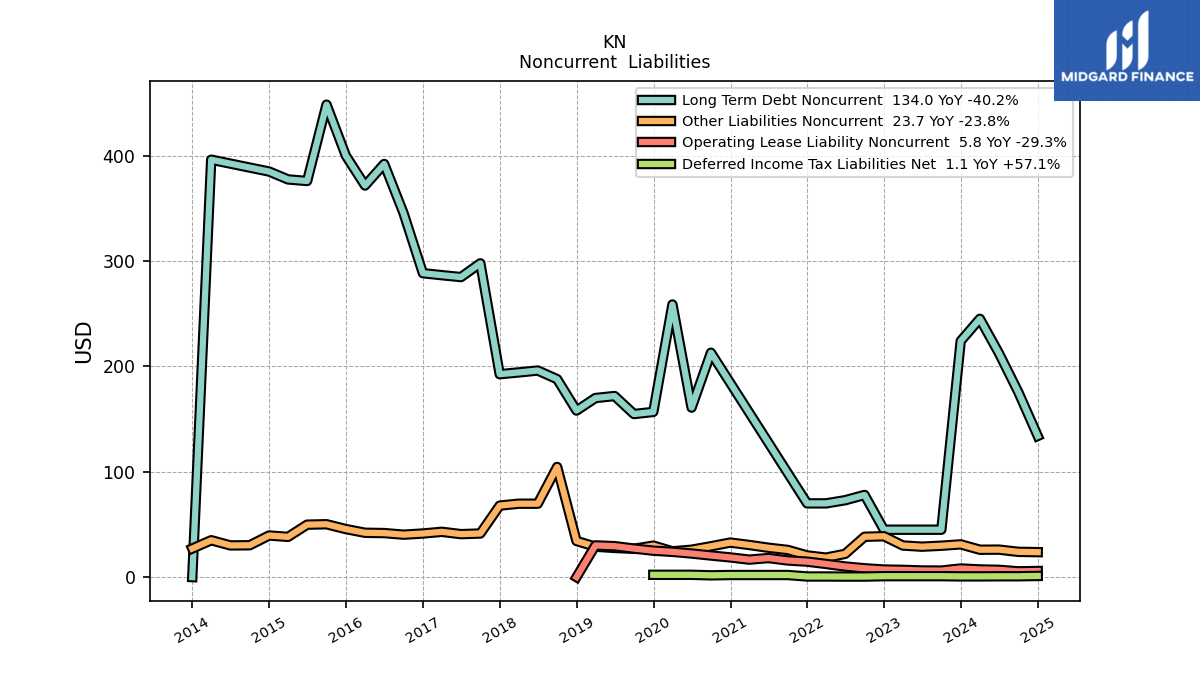
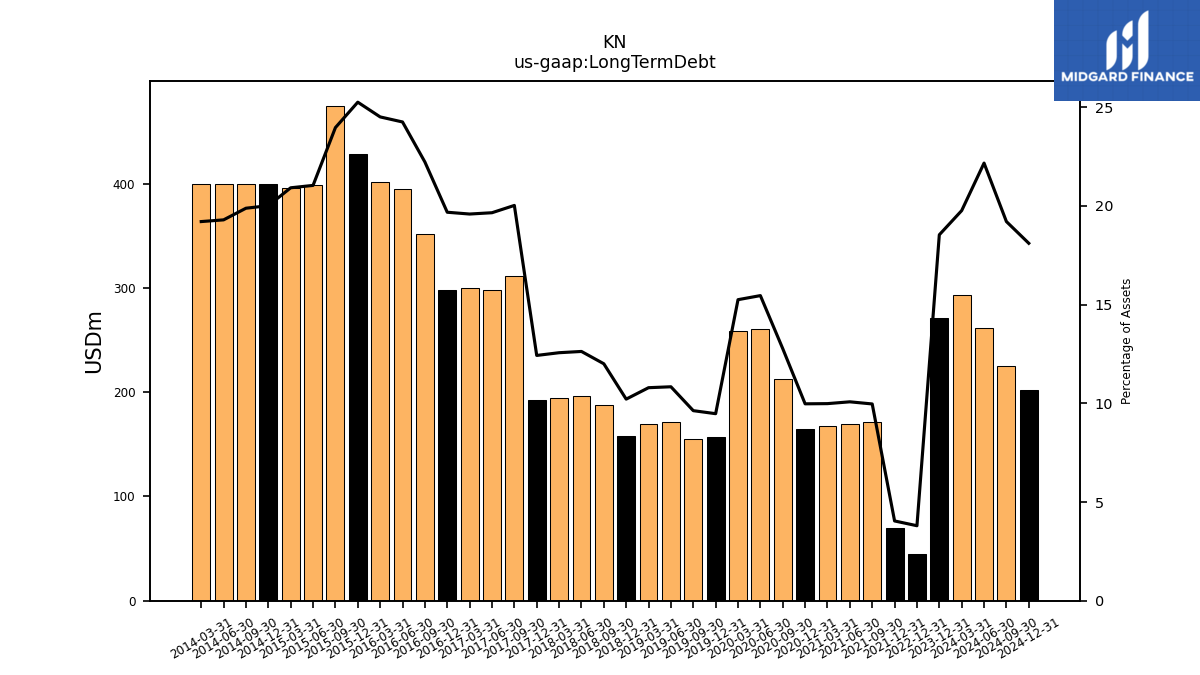
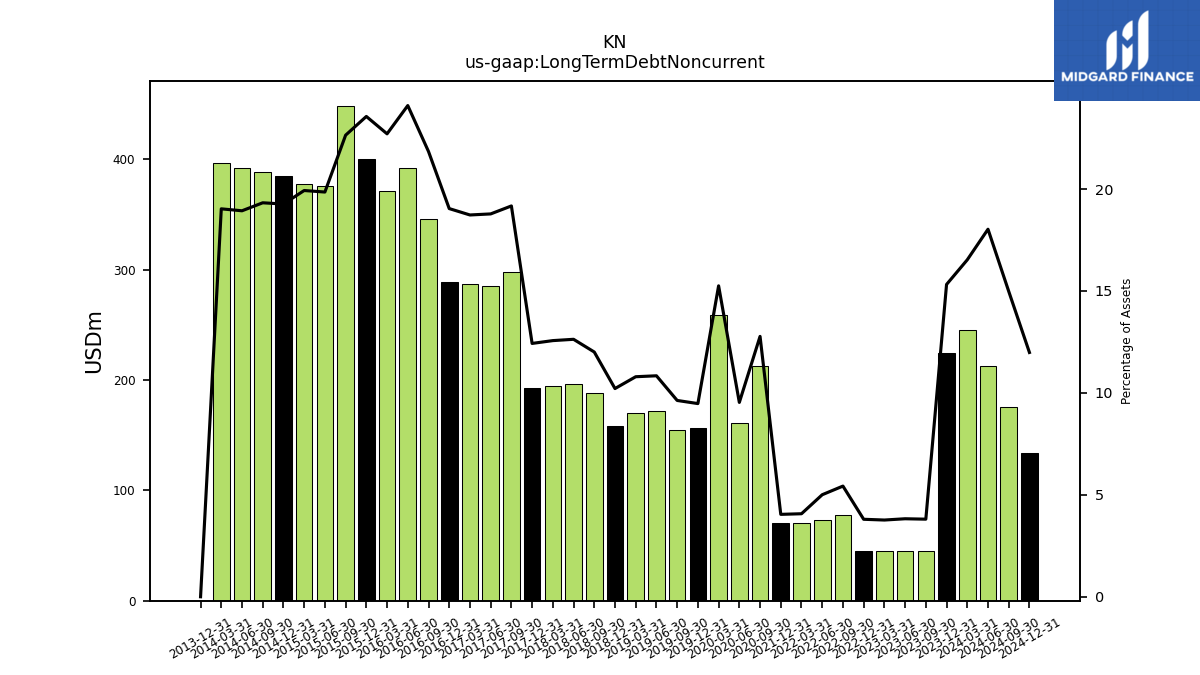
| Long Term Debt | 271.20 | NA | NA | NA | 45.00 | NA | NA | NA | 70.00 | 171.80 | 169.50 | 167.30 | 165.10 | 213.00 | 260.90 | 258.80 | 156.80 | 154.80 | 171.90 | 170.00 | 158.10 | 187.90 | 196.10 | 194.30 | 192.60 | 311.20 | 298.10 | 299.80 | 298.20 | 351.60 | 394.80 | 401.20 | 428.80 | 474.80 | 398.50 | 396.30 | 400.00 | 400.00 | 400.00 | 400.00 | NA | NA | NA | NA | |
| Long Term Debt Noncurrent | 224.10 | 45.00 | 45.00 | 45.00 | 45.00 | 78.00 | 73.00 | 70.00 | 70.00 | NA | NA | NA | NA | 213.00 | 160.90 | 258.80 | 156.80 | 154.80 | 171.90 | 170.00 | 158.10 | 187.90 | 196.10 | 194.30 | 192.60 | 297.90 | 284.80 | 286.60 | 288.50 | 345.50 | 392.20 | 371.70 | 400.00 | 448.50 | 376.00 | 377.50 | 385.00 | 388.75 | 392.50 | 396.25 | 0.00 | NA | NA | NA | |
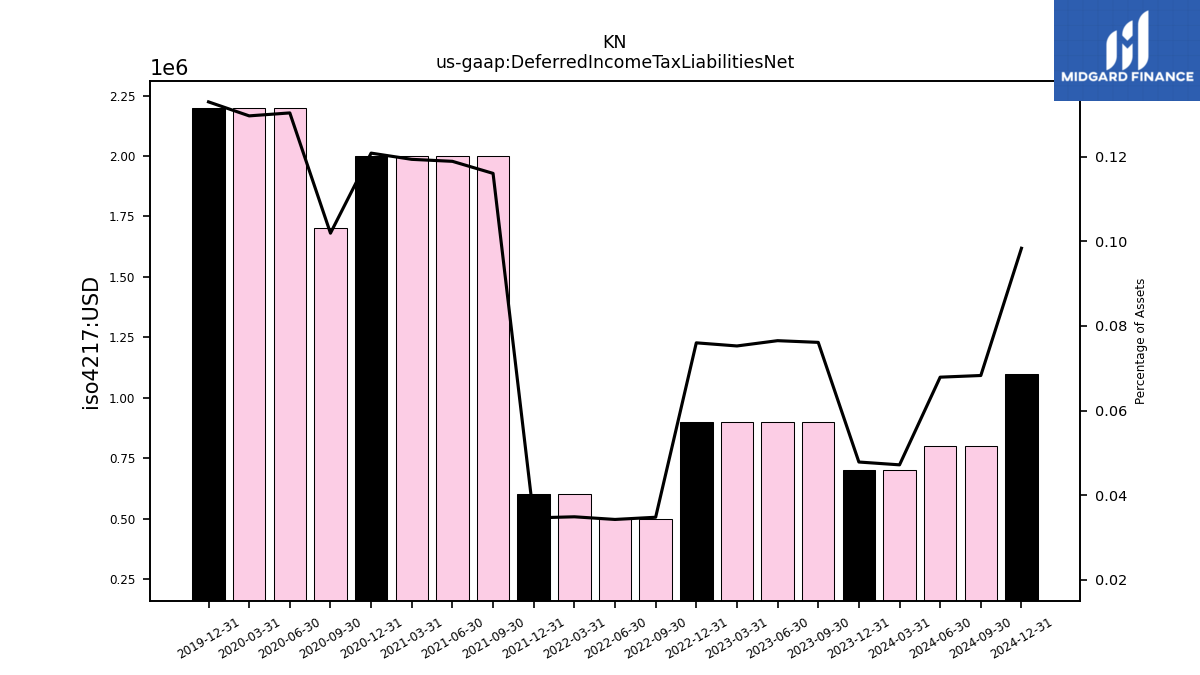
| Deferred Income Tax Liabilities Net | 0.70 | 0.90 | 0.90 | 0.90 | 0.90 | 0.50 | 0.50 | 0.60 | 0.60 | 2.00 | 2.00 | 2.00 | 2.00 | 1.70 | 2.20 | 2.20 | 2.20 | NA | NA | NA | NA | NA | NA | NA | NA | NA | NA | NA | NA | NA | NA | NA | NA | NA | NA | NA | NA | NA | NA | NA | NA | NA | NA | NA | |
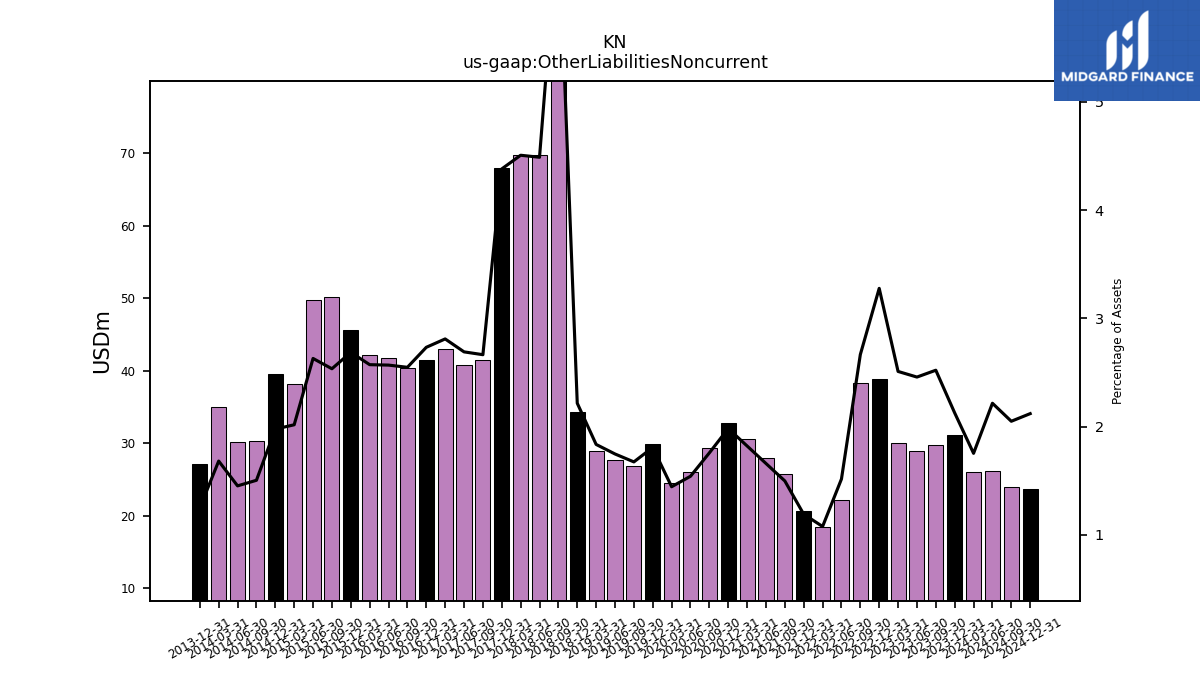
| Other Liabilities Noncurrent | 31.10 | 29.80 | 28.90 | 30.00 | 38.80 | 38.30 | 22.10 | 18.50 | 20.60 | 25.80 | 27.90 | 30.50 | 32.80 | 29.30 | 26.00 | 24.50 | 29.90 | 26.90 | 27.70 | 28.90 | 34.30 | 104.60 | 69.70 | 69.70 | 67.90 | 41.40 | 40.80 | 43.00 | 41.40 | 40.30 | 41.80 | 42.10 | 45.60 | 50.20 | 49.80 | 38.20 | 39.50 | 30.24 | 30.10 | 35.01 | 27.12 | NA | NA | NA | |
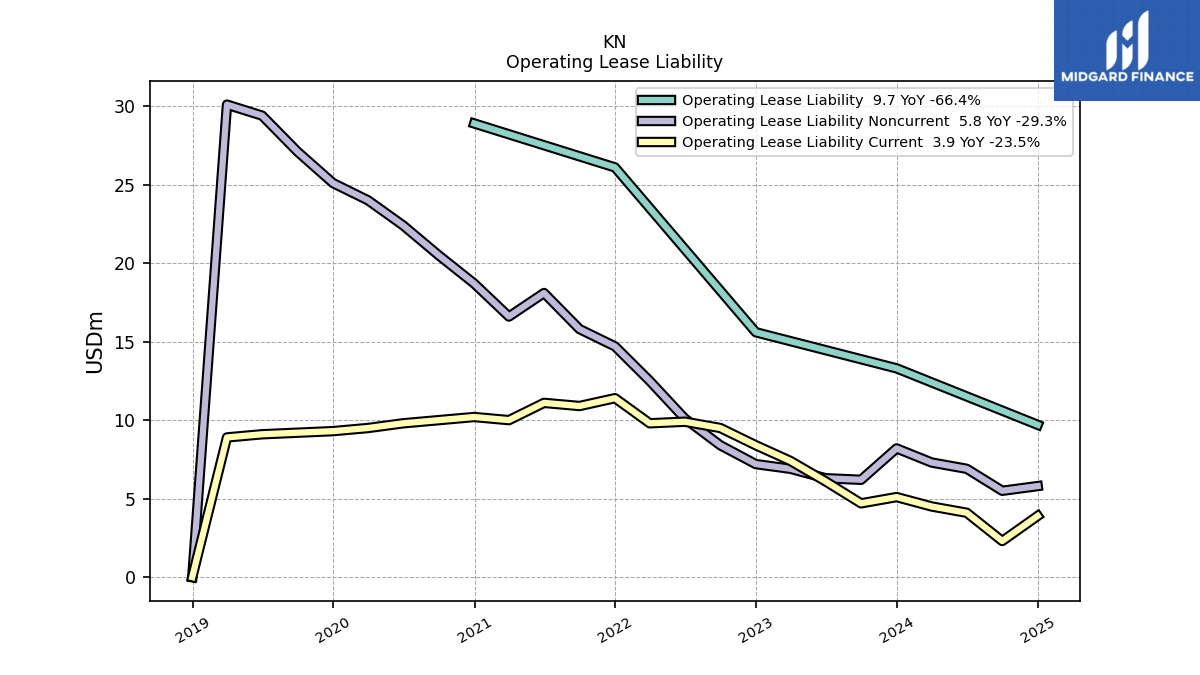
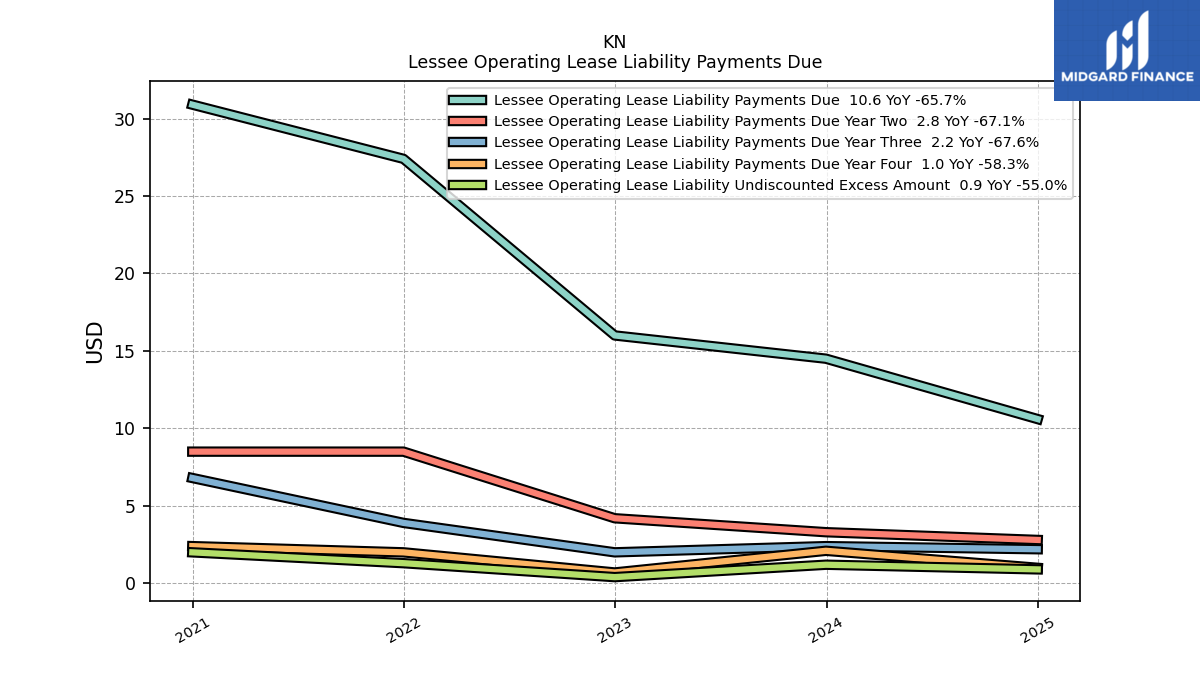
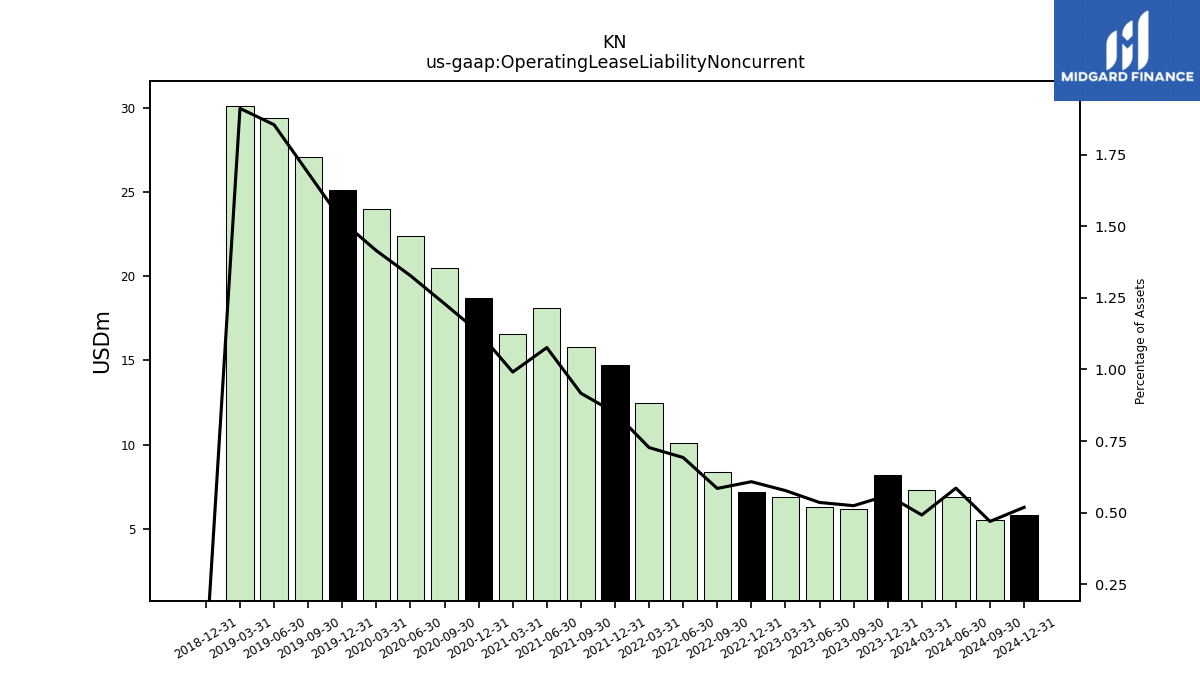
| Operating Lease Liability Noncurrent | 8.20 | 6.20 | 6.30 | 6.90 | 7.20 | 8.40 | 10.10 | 12.50 | 14.70 | 15.80 | 18.10 | 16.60 | 18.70 | 20.50 | 22.40 | 24.00 | 25.10 | 27.10 | 29.40 | 30.10 | 0.00 | NA | NA | NA | NA | NA | NA | NA | NA | NA | NA | NA | NA | NA | NA | NA | NA | NA | NA | NA | NA | NA | NA | NA |
| 2023-12-31 | 2023-09-30 | 2023-06-30 | 2023-03-31 | 2022-12-31 | 2022-09-30 | 2022-06-30 | 2022-03-31 | 2021-12-31 | 2021-09-30 | 2021-06-30 | 2021-03-31 | 2020-12-31 | 2020-09-30 | 2020-06-30 | 2020-03-31 | 2019-12-31 | 2019-09-30 | 2019-06-30 | 2019-03-31 | 2018-12-31 | 2018-09-30 | 2018-06-30 | 2018-03-31 | 2017-12-31 | 2017-09-30 | 2017-06-30 | 2017-03-31 | 2016-12-31 | 2016-09-30 | 2016-06-30 | 2016-03-31 | 2015-12-31 | 2015-09-30 | 2015-06-30 | 2015-03-31 | 2014-12-31 | 2014-09-30 | 2014-06-30 | 2014-03-31 | 2013-12-31 | 2013-09-30 | 2013-06-30 | 2013-03-31 | ||
|---|---|---|---|---|---|---|---|---|---|---|---|---|---|---|---|---|---|---|---|---|---|---|---|---|---|---|---|---|---|---|---|---|---|---|---|---|---|---|---|---|---|---|---|---|---|
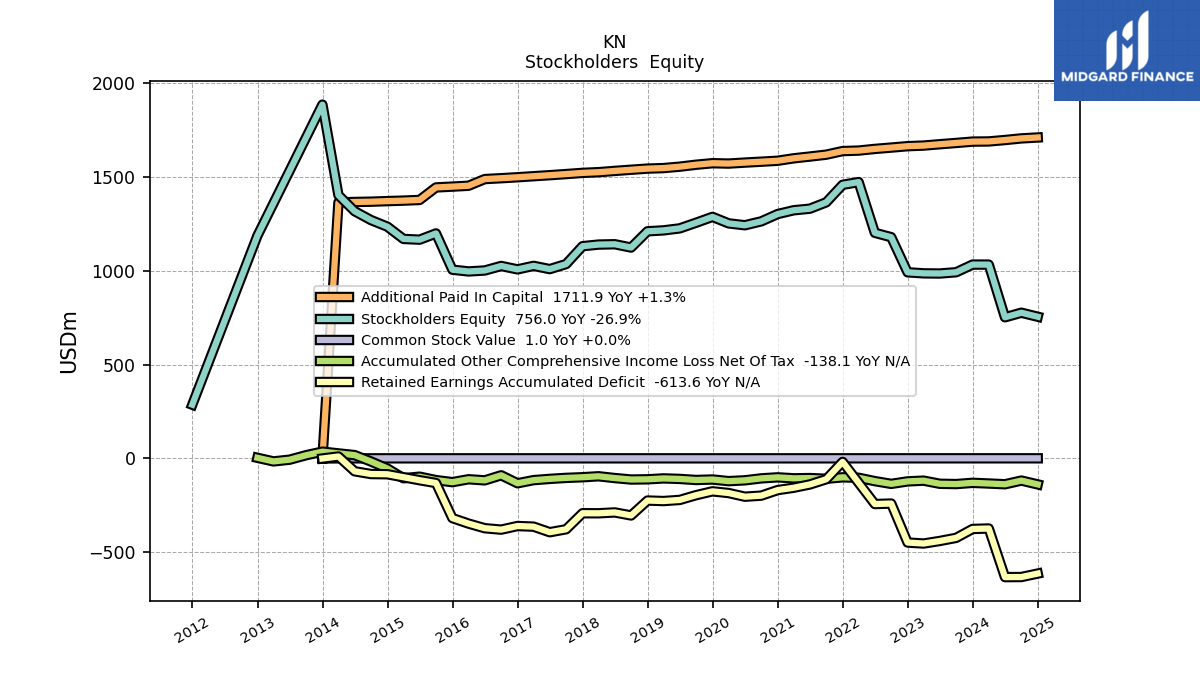
| Stockholders Equity | 1034.10 | 993.30 | 986.50 | 987.40 | 992.90 | 1180.20 | 1203.60 | 1474.10 | 1459.50 | 1366.10 | 1332.10 | 1323.70 | 1303.50 | 1264.60 | 1243.80 | 1253.80 | 1288.50 | 1257.30 | 1227.20 | 1216.50 | 1211.60 | 1124.90 | 1142.60 | 1140.80 | 1132.10 | 1036.90 | 1009.90 | 1027.40 | 1008.50 | 1026.70 | 1002.60 | 997.50 | 1006.80 | 1200.30 | 1166.90 | 1171.00 | 1236.20 | 1271.38 | 1318.71 | 1404.38 | 1887.13 | NA | NA | NA | |
| Common Stock Value | 1.00 | 1.00 | 1.00 | 1.00 | 1.00 | 1.00 | 1.00 | 1.00 | 1.00 | 0.90 | 0.90 | 0.90 | 0.90 | 0.90 | 0.90 | 0.90 | 0.90 | 0.90 | 0.90 | 0.90 | 0.90 | 0.90 | 0.90 | 0.90 | 0.90 | 0.90 | 0.90 | 0.90 | 0.90 | 0.90 | 0.90 | 0.90 | 0.90 | 0.90 | 0.90 | 0.90 | 0.90 | 0.85 | 0.85 | 0.85 | 0.00 | NA | NA | NA | |
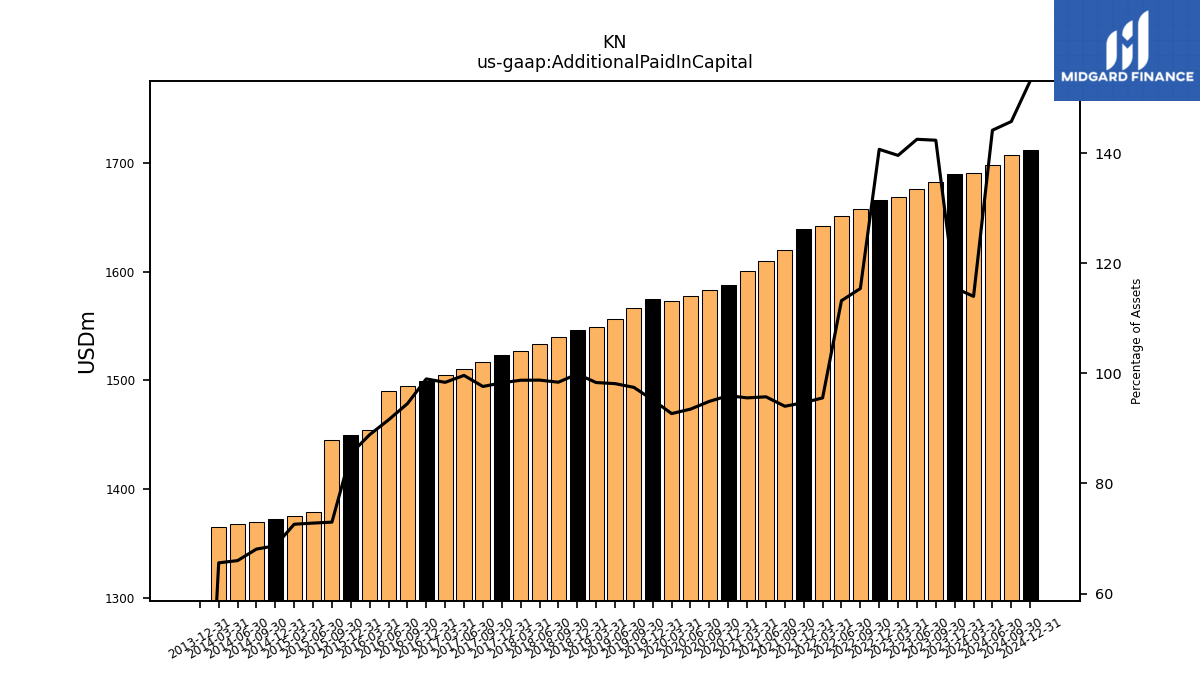
| Additional Paid In Capital | 1689.90 | 1682.70 | 1675.90 | 1668.70 | 1665.50 | 1658.00 | 1650.90 | 1642.00 | 1639.40 | 1620.20 | 1610.20 | 1600.70 | 1587.80 | 1582.80 | 1578.00 | 1572.80 | 1574.70 | 1566.60 | 1556.20 | 1548.70 | 1545.90 | 1539.90 | 1533.60 | 1526.90 | 1523.10 | 1516.80 | 1510.80 | 1505.30 | 1499.80 | 1494.70 | 1490.10 | 1454.50 | 1449.90 | 1445.50 | 1378.80 | 1375.20 | 1372.60 | 1369.52 | 1367.99 | 1365.66 | 0.00 | NA | NA | NA | |
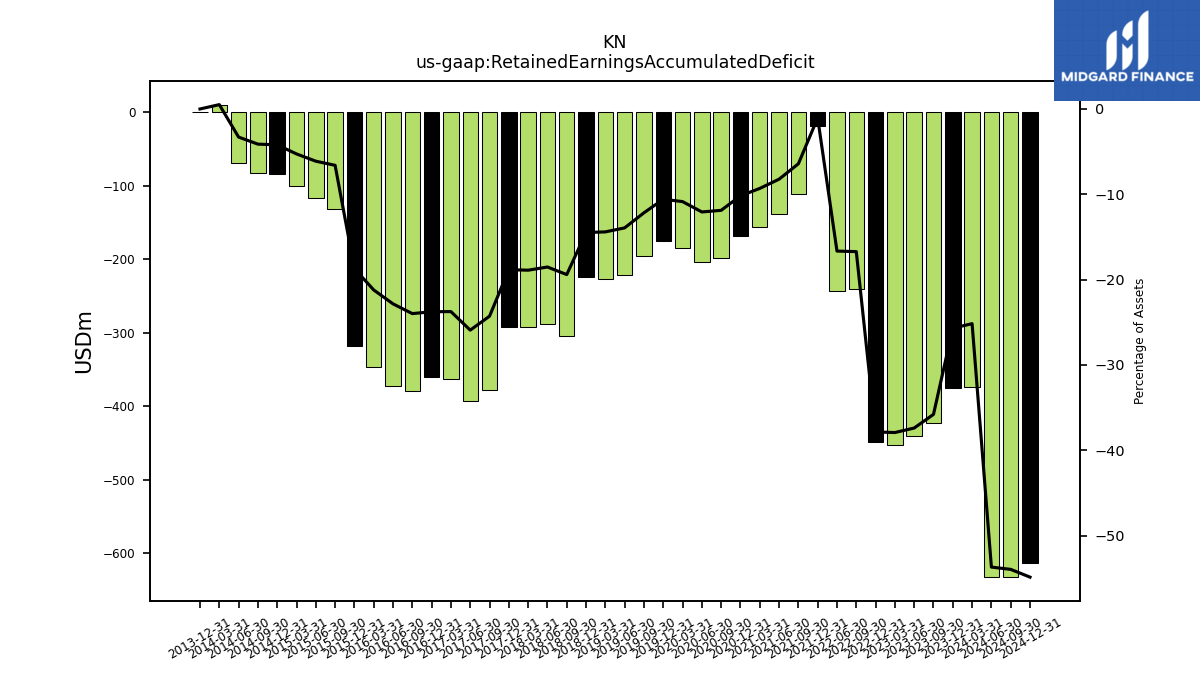
| Retained Earnings Accumulated Deficit | -375.80 | -423.20 | -439.80 | -453.40 | -448.20 | -240.20 | -242.90 | NA | -18.10 | -110.70 | -138.40 | -156.00 | -168.50 | -198.10 | -203.70 | -184.20 | -175.10 | -195.60 | -221.00 | -226.90 | -224.20 | -303.80 | -287.60 | -292.20 | -291.90 | -377.40 | -393.10 | -363.40 | -360.10 | -379.40 | -371.80 | -347.20 | -317.80 | -130.80 | -115.90 | -99.80 | -84.00 | -82.86 | -68.25 | 10.65 | 0.00 | NA | NA | NA | |
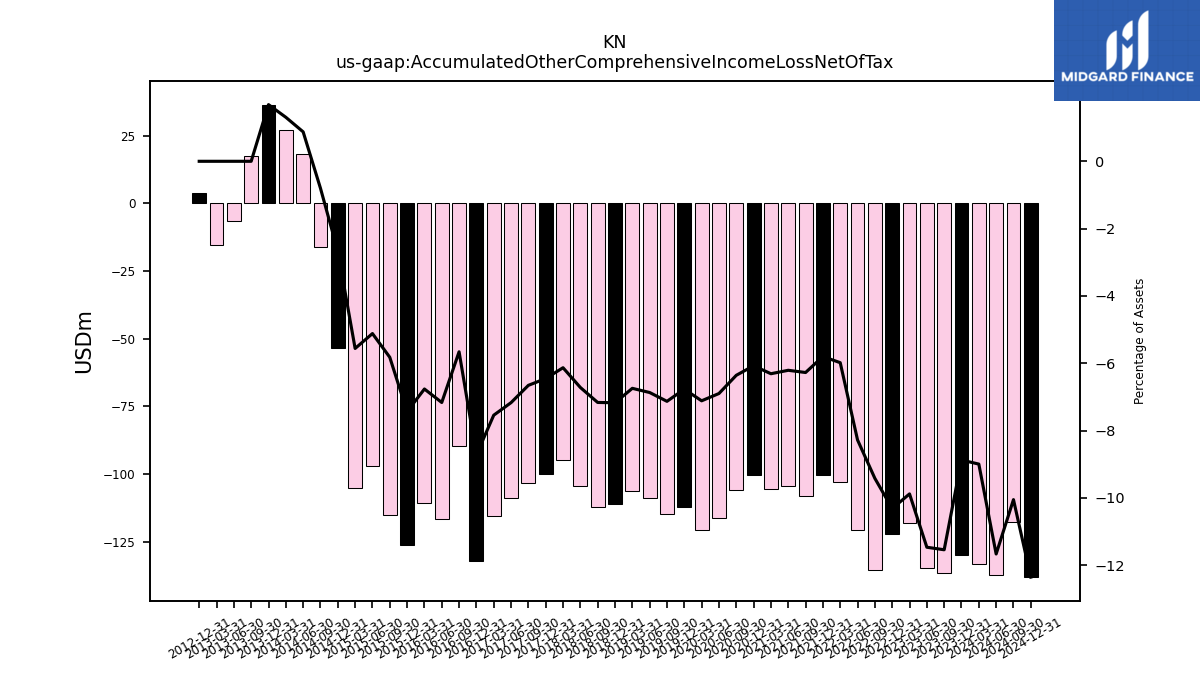
| Accumulated Other Comprehensive Income Loss Net Of Tax | -129.80 | -136.40 | -134.80 | -118.10 | -122.10 | -135.30 | -120.70 | -102.80 | -100.40 | -108.10 | -104.40 | -105.70 | -100.50 | -106.00 | -116.40 | -120.70 | -112.00 | -114.60 | -108.90 | -106.20 | -111.00 | -112.10 | -104.30 | -94.80 | -100.00 | -103.40 | -108.70 | -115.40 | -132.10 | -89.50 | -116.60 | -110.70 | -126.20 | -115.30 | -96.90 | -105.30 | -53.30 | -16.12 | 18.12 | 27.22 | 36.52 | 17.46 | -6.32 | -15.52 | |
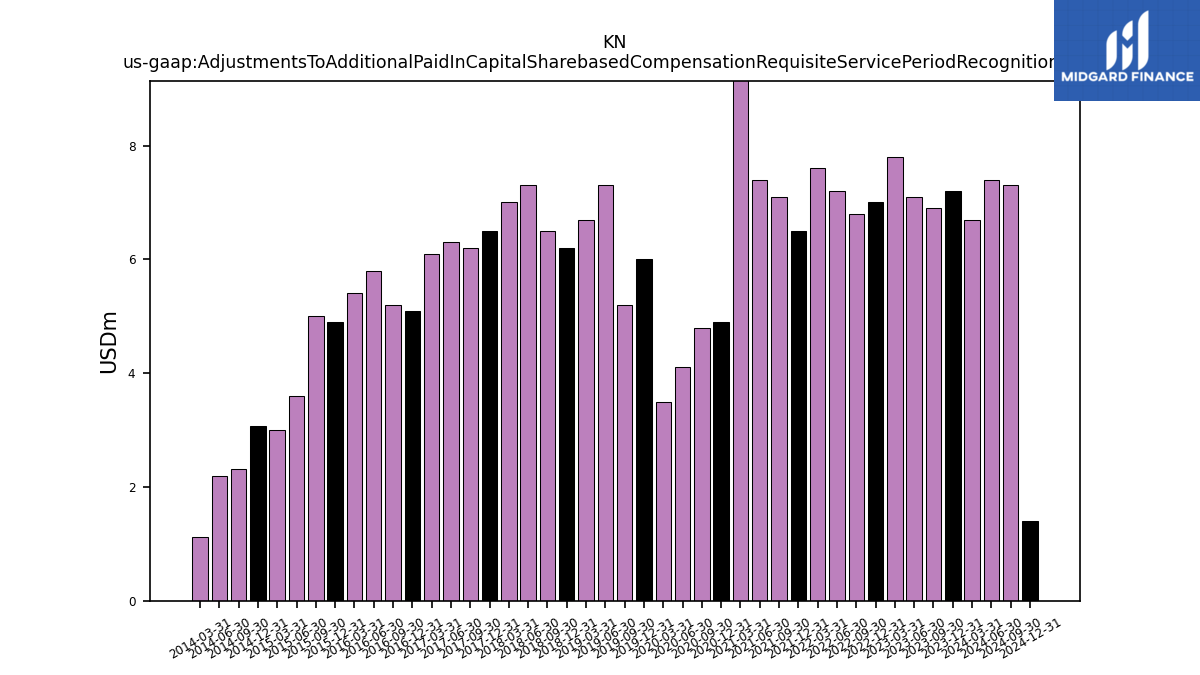
| Adjustments To Additional Paid In Capital Sharebased Compensation Requisite Service Period Recognition Value | 7.20 | 6.90 | 7.10 | 7.80 | 7.00 | 6.80 | 7.20 | 7.60 | 6.50 | 7.10 | 7.40 | 11.10 | 4.90 | 4.80 | 4.10 | 3.50 | 6.00 | 5.20 | 7.30 | 6.70 | 6.20 | 6.50 | 7.30 | 7.00 | 6.50 | 6.20 | 6.30 | 6.10 | 5.10 | 5.20 | 5.80 | 5.40 | 4.90 | 5.00 | 3.60 | 3.00 | 3.07 | 2.32 | 2.19 | 1.13 | NA | NA | NA | NA |
| 2023-12-31 | 2023-09-30 | 2023-06-30 | 2023-03-31 | 2022-12-31 | 2022-09-30 | 2022-06-30 | 2022-03-31 | 2021-12-31 | 2021-09-30 | 2021-06-30 | 2021-03-31 | 2020-12-31 | 2020-09-30 | 2020-06-30 | 2020-03-31 | 2019-12-31 | 2019-09-30 | 2019-06-30 | 2019-03-31 | 2018-12-31 | 2018-09-30 | 2018-06-30 | 2018-03-31 | 2017-12-31 | 2017-09-30 | 2017-06-30 | 2017-03-31 | 2016-12-31 | 2016-09-30 | 2016-06-30 | 2016-03-31 | 2015-12-31 | 2015-09-30 | 2015-06-30 | 2015-03-31 | 2014-12-31 | 2014-09-30 | 2014-06-30 | 2014-03-31 | 2013-12-31 | 2013-09-30 | 2013-06-30 | 2013-03-31 | ||
|---|---|---|---|---|---|---|---|---|---|---|---|---|---|---|---|---|---|---|---|---|---|---|---|---|---|---|---|---|---|---|---|---|---|---|---|---|---|---|---|---|---|---|---|---|---|
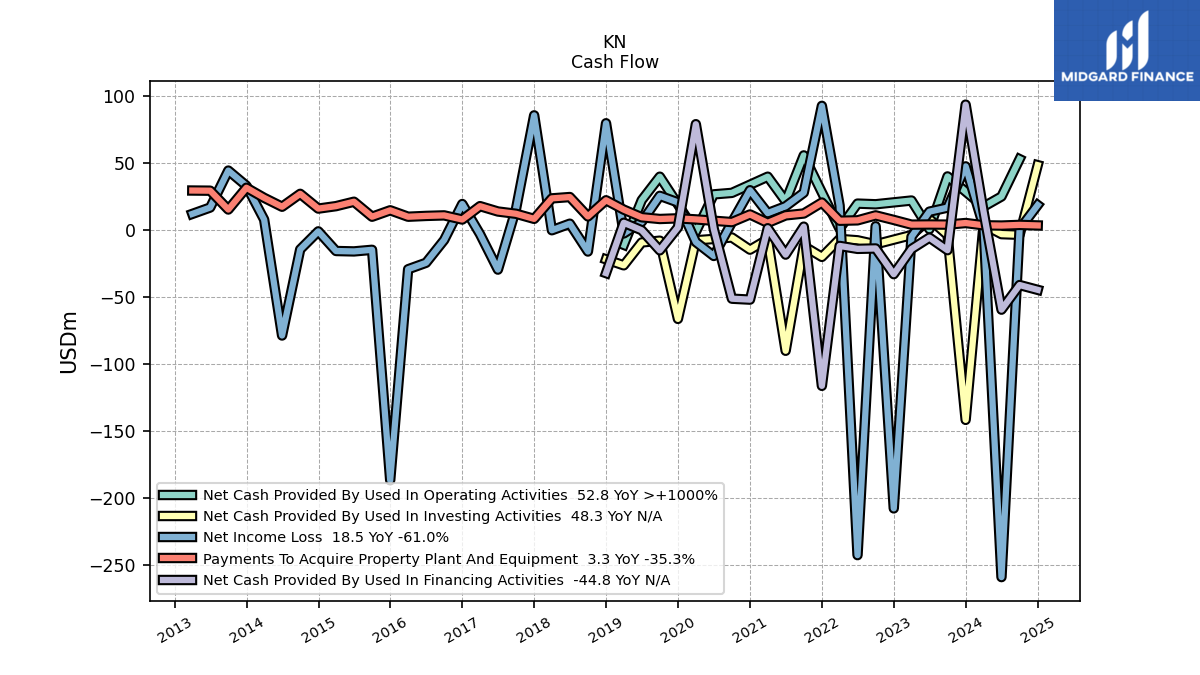
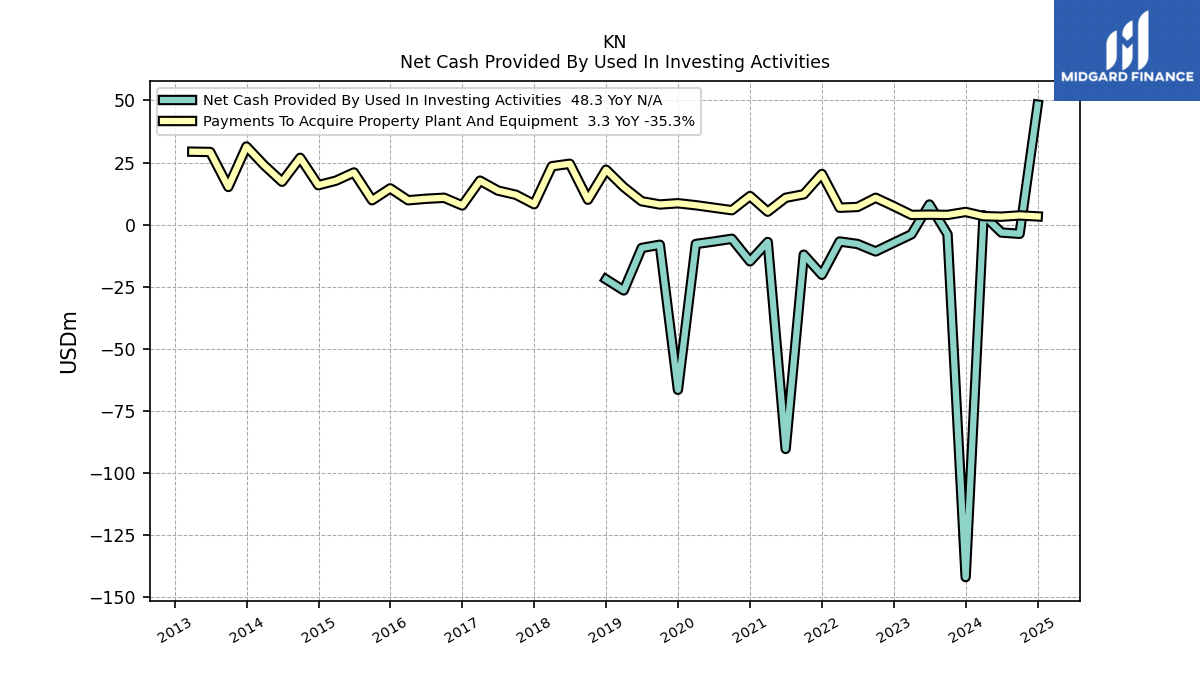
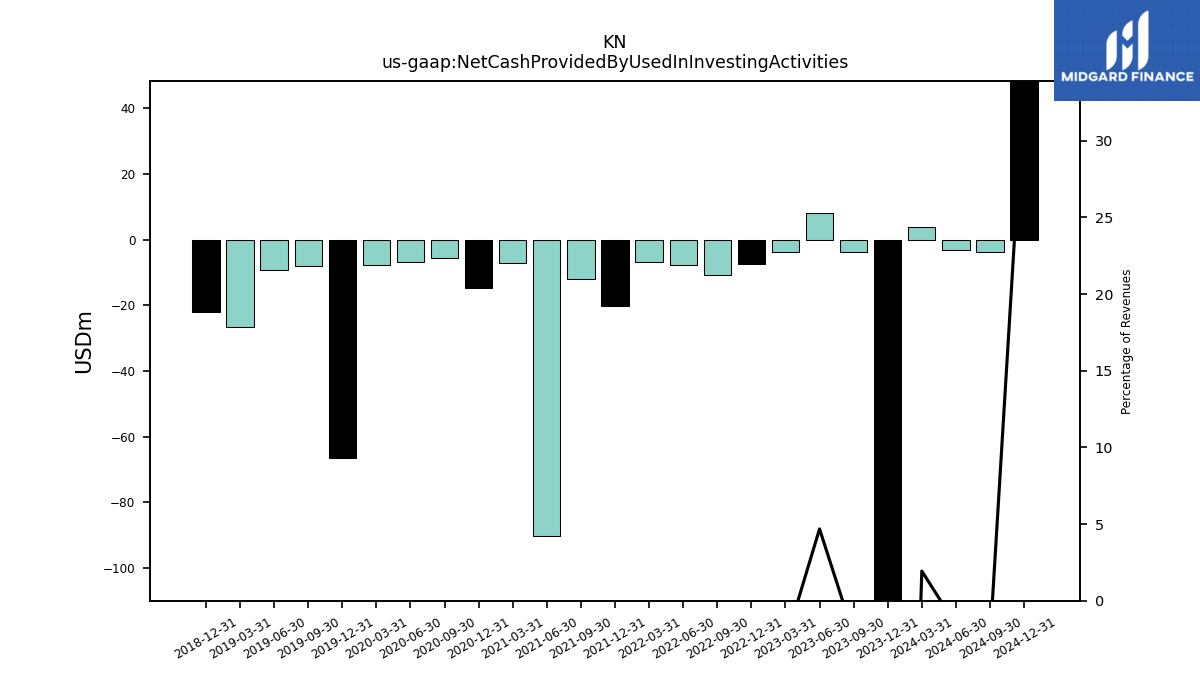
| Net Cash Provided By Used In Investing Activities | -141.90 | -3.90 | 8.10 | -3.90 | -7.30 | -10.80 | -7.80 | -6.80 | -20.20 | -12.10 | -90.30 | -7.00 | -14.80 | -5.70 | -6.80 | -7.80 | -66.50 | -8.10 | -9.40 | -26.50 | -22.00 | NA | NA | NA | NA | NA | NA | NA | NA | NA | NA | NA | NA | NA | NA | NA | NA | NA | NA | NA | NA | NA | NA | NA | |
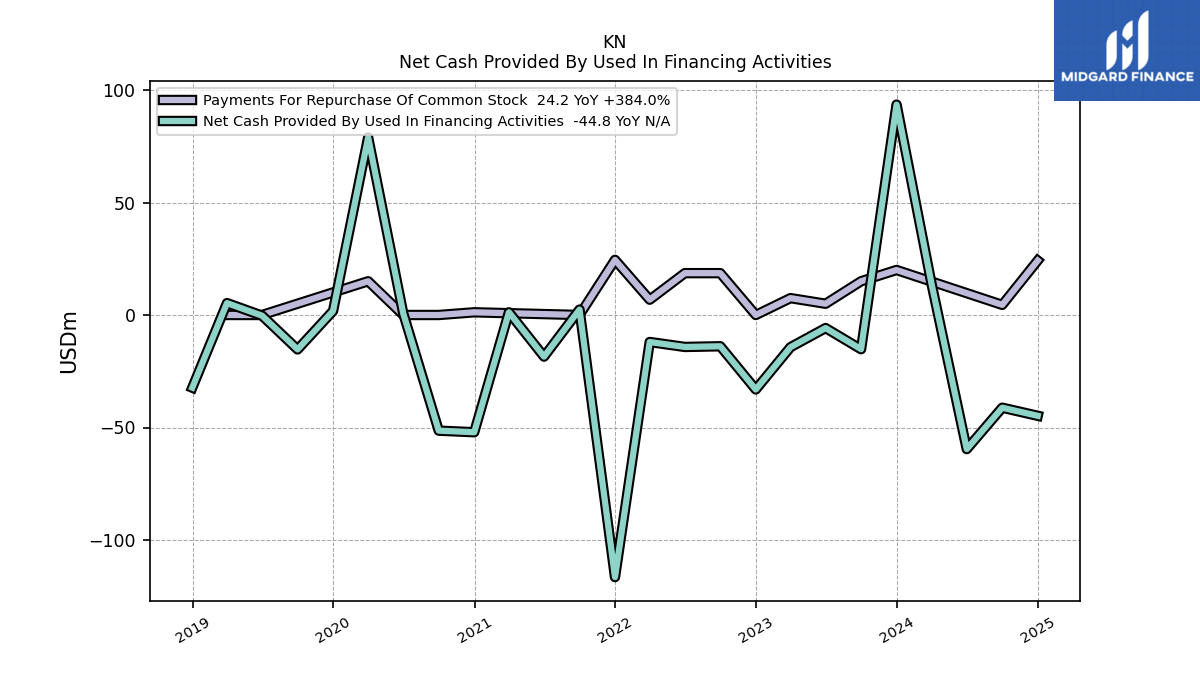
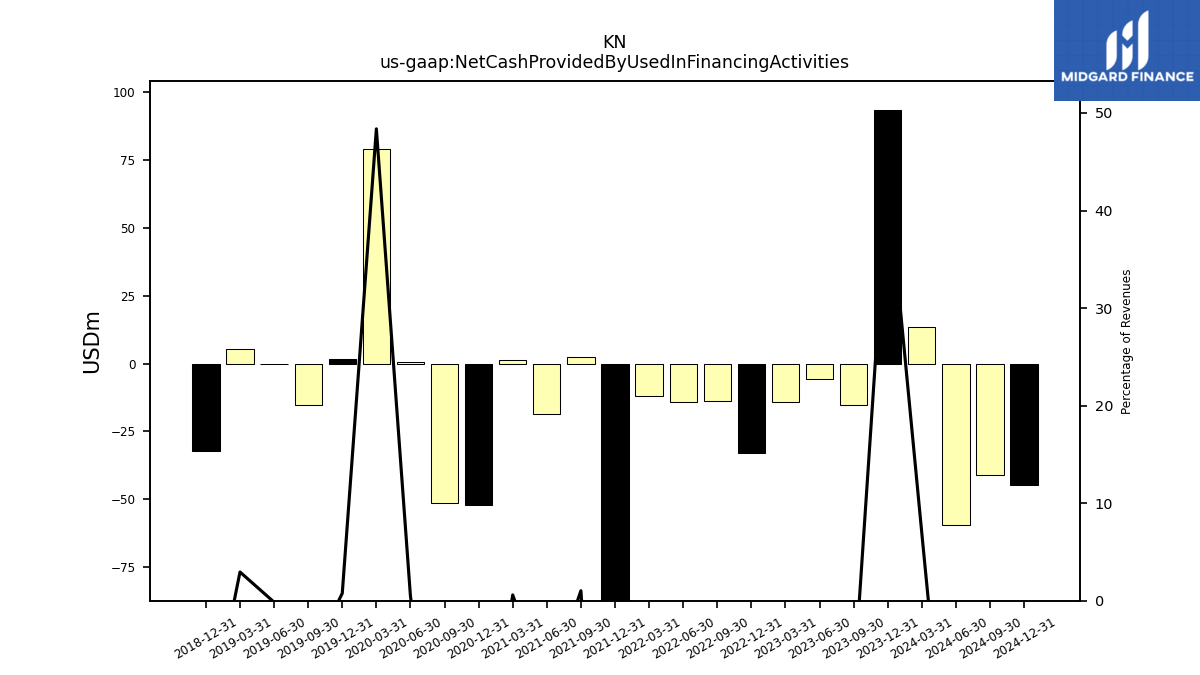
| Net Cash Provided By Used In Financing Activities | 93.50 | -15.20 | -5.80 | -14.30 | -33.10 | -13.90 | -14.20 | -12.00 | -116.50 | 2.40 | -18.50 | 1.20 | -52.10 | -51.40 | 0.70 | 78.90 | 1.80 | -15.30 | -0.30 | 5.30 | -32.30 | NA | NA | NA | NA | NA | NA | NA | NA | NA | NA | NA | NA | NA | NA | NA | NA | NA | NA | NA | NA | NA | NA | NA |
| 2023-12-31 | 2023-09-30 | 2023-06-30 | 2023-03-31 | 2022-12-31 | 2022-09-30 | 2022-06-30 | 2022-03-31 | 2021-12-31 | 2021-09-30 | 2021-06-30 | 2021-03-31 | 2020-12-31 | 2020-09-30 | 2020-06-30 | 2020-03-31 | 2019-12-31 | 2019-09-30 | 2019-06-30 | 2019-03-31 | 2018-12-31 | 2018-09-30 | 2018-06-30 | 2018-03-31 | 2017-12-31 | 2017-09-30 | 2017-06-30 | 2017-03-31 | 2016-12-31 | 2016-09-30 | 2016-06-30 | 2016-03-31 | 2015-12-31 | 2015-09-30 | 2015-06-30 | 2015-03-31 | 2014-12-31 | 2014-09-30 | 2014-06-30 | 2014-03-31 | 2013-12-31 | 2013-09-30 | 2013-06-30 | 2013-03-31 | ||
|---|---|---|---|---|---|---|---|---|---|---|---|---|---|---|---|---|---|---|---|---|---|---|---|---|---|---|---|---|---|---|---|---|---|---|---|---|---|---|---|---|---|---|---|---|---|
| Net Income Loss | 47.40 | 16.60 | 13.60 | -5.20 | -208.00 | 2.70 | -242.90 | 18.10 | 92.60 | 27.70 | 17.60 | 12.50 | 29.60 | 5.60 | -19.50 | -9.10 | 20.50 | 25.40 | 5.90 | -2.70 | 79.60 | -16.20 | 4.60 | -0.30 | 85.50 | 15.70 | -29.70 | -3.20 | 19.30 | -7.60 | -24.60 | -29.40 | -187.00 | -14.90 | -16.10 | -15.80 | -1.10 | -14.61 | -78.90 | 7.64 | 32.90 | 44.26 | 16.67 | 11.89 | |
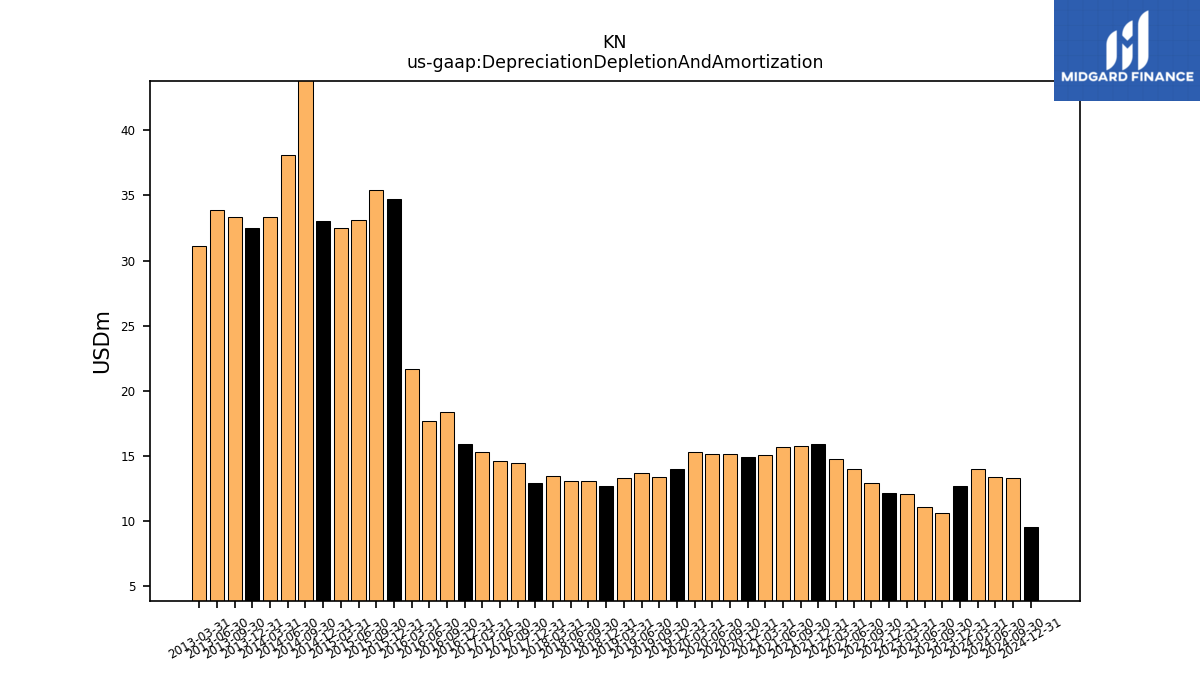
| Depreciation Depletion And Amortization | 12.70 | 10.60 | 11.10 | 12.10 | 12.20 | 12.90 | 14.00 | 14.80 | 15.90 | 15.80 | 15.70 | 15.10 | 14.90 | 15.20 | 15.20 | 15.30 | 14.00 | 13.40 | 13.70 | 13.30 | 12.70 | 13.10 | 13.10 | 13.50 | 12.90 | 14.50 | 14.60 | 15.30 | 15.90 | 18.40 | 17.70 | 21.70 | 34.70 | 35.40 | 33.10 | 32.50 | 33.07 | 47.07 | 38.08 | 33.38 | 32.53 | 33.36 | 33.88 | 31.14 | |
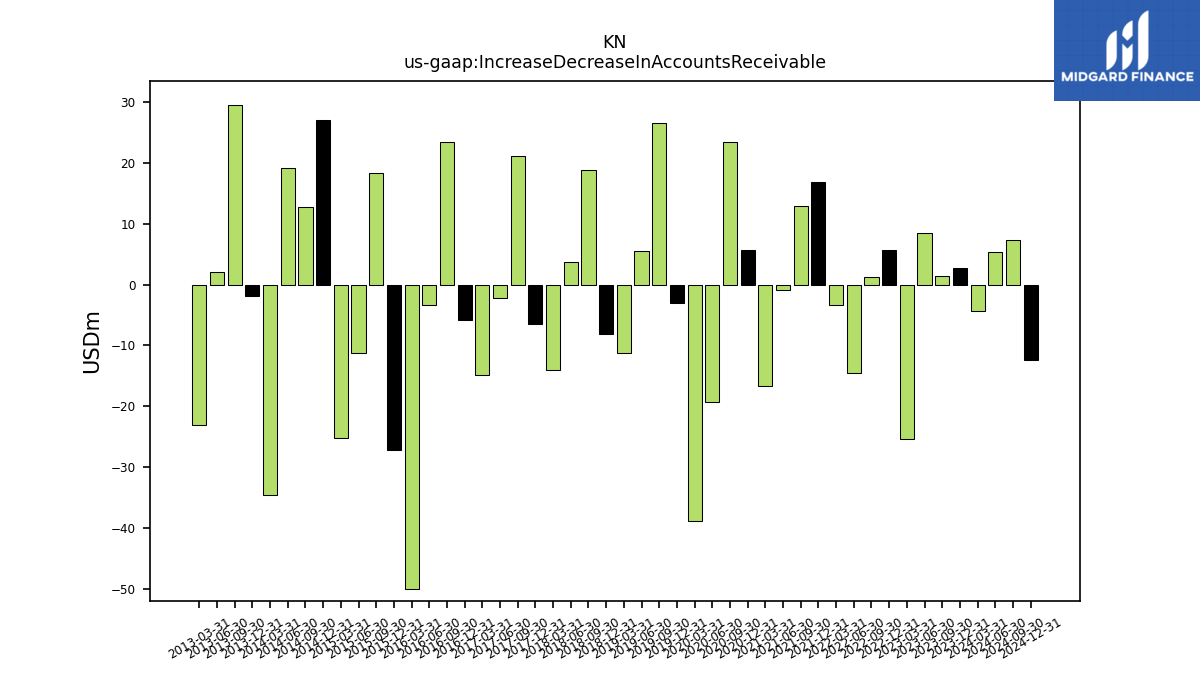
| Increase Decrease In Accounts Receivable | 2.80 | 1.40 | 8.40 | -25.30 | 5.70 | 1.20 | -14.60 | -3.40 | 16.90 | 12.90 | -0.90 | -16.60 | 5.60 | 23.50 | -19.30 | -38.80 | -3.10 | 26.60 | 5.50 | -11.20 | -8.20 | 18.90 | 3.70 | -14.10 | -6.50 | 21.20 | -2.20 | -14.90 | -5.80 | 23.40 | -3.40 | -50.10 | -27.20 | 18.40 | -11.20 | -25.20 | 27.00 | 12.71 | 19.12 | -34.53 | -1.89 | 29.47 | 2.01 | -23.09 | |
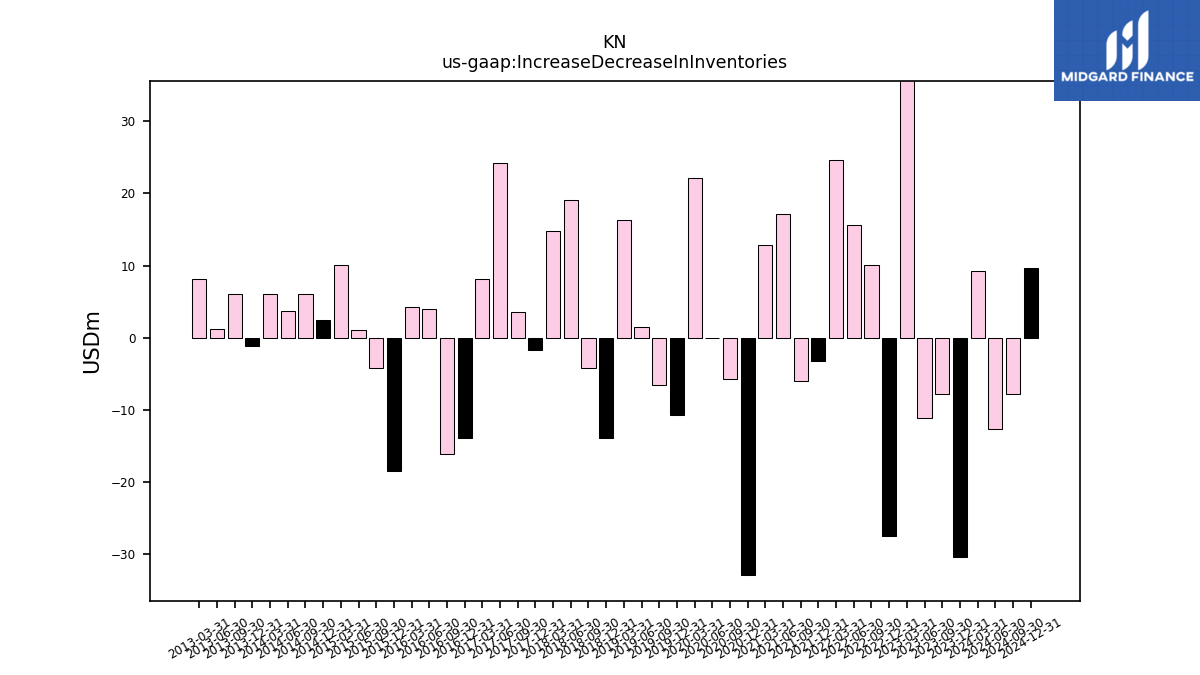
| Increase Decrease In Inventories | -30.50 | -7.80 | -11.20 | 38.00 | -27.50 | 10.10 | 15.60 | 24.60 | -3.30 | -6.00 | 17.10 | 12.90 | -33.00 | -5.80 | 0.00 | 22.10 | -10.80 | -6.60 | 1.40 | 16.30 | -14.00 | -4.20 | 19.10 | 14.80 | -1.80 | 3.50 | 24.20 | 8.10 | -13.90 | -16.20 | 3.90 | 4.30 | -18.60 | -4.20 | 1.00 | 10.10 | 2.50 | 5.99 | 3.67 | 6.04 | -1.24 | 6.10 | 1.16 | 8.07 | |
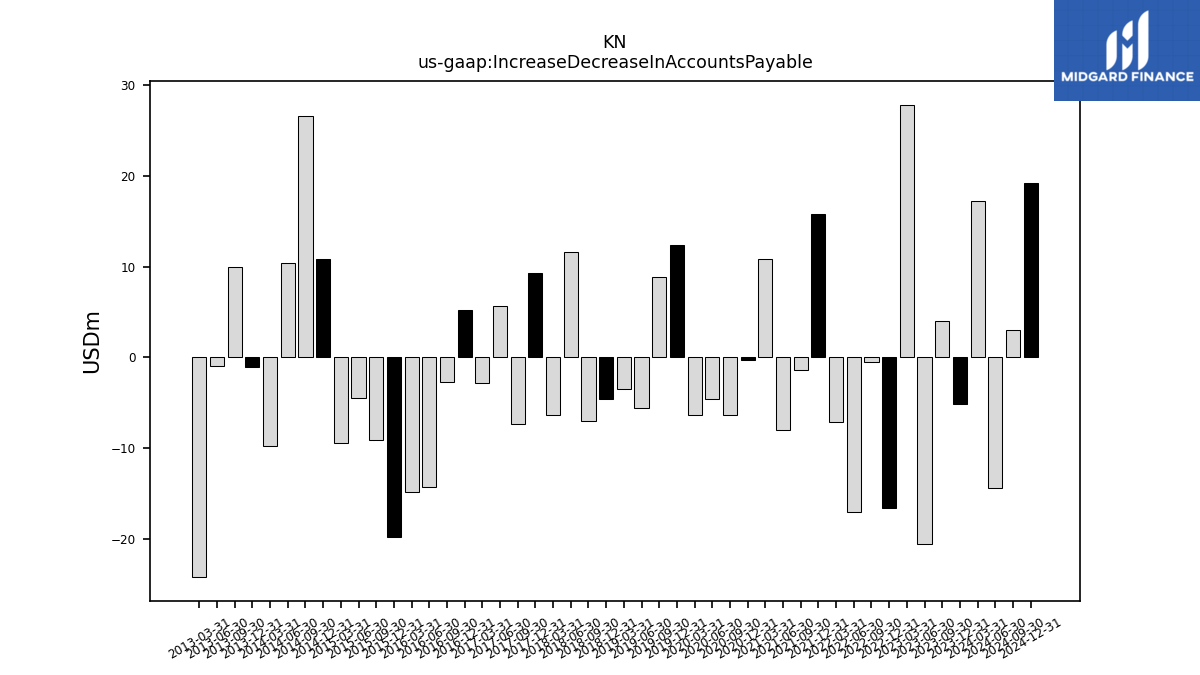
| Increase Decrease In Accounts Payable | -5.10 | 4.00 | -20.50 | 27.80 | -16.60 | -0.50 | -17.00 | -7.10 | 15.80 | -1.40 | -8.00 | 10.80 | -0.30 | -6.30 | -4.60 | -6.30 | 12.40 | 8.80 | -5.60 | -3.50 | -4.60 | -7.00 | 11.60 | -6.30 | 9.30 | -7.30 | 5.70 | -2.80 | 5.20 | -2.70 | -14.30 | -14.80 | -19.70 | -9.10 | -4.50 | -9.40 | 10.84 | 26.52 | 10.39 | -9.76 | -1.02 | 9.99 | -0.91 | -24.16 | |
| Share Based Compensation | 7.20 | 6.90 | 7.10 | 7.80 | 7.00 | 6.80 | 7.20 | 7.60 | 6.50 | 7.10 | 7.40 | 11.10 | 4.90 | 4.80 | 4.10 | 3.50 | 6.00 | 5.20 | 7.30 | 6.70 | 6.20 | 6.50 | 7.30 | 7.00 | 6.50 | 6.20 | 6.30 | 6.10 | 5.10 | 5.20 | 5.80 | 5.40 | 4.90 | 5.00 | 3.60 | 3.00 | 2.54 | 2.56 | 2.42 | 1.49 | 0.32 | 0.55 | 0.56 | 0.56 |
| 2023-12-31 | 2023-09-30 | 2023-06-30 | 2023-03-31 | 2022-12-31 | 2022-09-30 | 2022-06-30 | 2022-03-31 | 2021-12-31 | 2021-09-30 | 2021-06-30 | 2021-03-31 | 2020-12-31 | 2020-09-30 | 2020-06-30 | 2020-03-31 | 2019-12-31 | 2019-09-30 | 2019-06-30 | 2019-03-31 | 2018-12-31 | 2018-09-30 | 2018-06-30 | 2018-03-31 | 2017-12-31 | 2017-09-30 | 2017-06-30 | 2017-03-31 | 2016-12-31 | 2016-09-30 | 2016-06-30 | 2016-03-31 | 2015-12-31 | 2015-09-30 | 2015-06-30 | 2015-03-31 | 2014-12-31 | 2014-09-30 | 2014-06-30 | 2014-03-31 | 2013-12-31 | 2013-09-30 | 2013-06-30 | 2013-03-31 | ||
|---|---|---|---|---|---|---|---|---|---|---|---|---|---|---|---|---|---|---|---|---|---|---|---|---|---|---|---|---|---|---|---|---|---|---|---|---|---|---|---|---|---|---|---|---|---|
| Net Cash Provided By Used In Investing Activities | -141.90 | -3.90 | 8.10 | -3.90 | -7.30 | -10.80 | -7.80 | -6.80 | -20.20 | -12.10 | -90.30 | -7.00 | -14.80 | -5.70 | -6.80 | -7.80 | -66.50 | -8.10 | -9.40 | -26.50 | -22.00 | NA | NA | NA | NA | NA | NA | NA | NA | NA | NA | NA | NA | NA | NA | NA | NA | NA | NA | NA | NA | NA | NA | NA | |
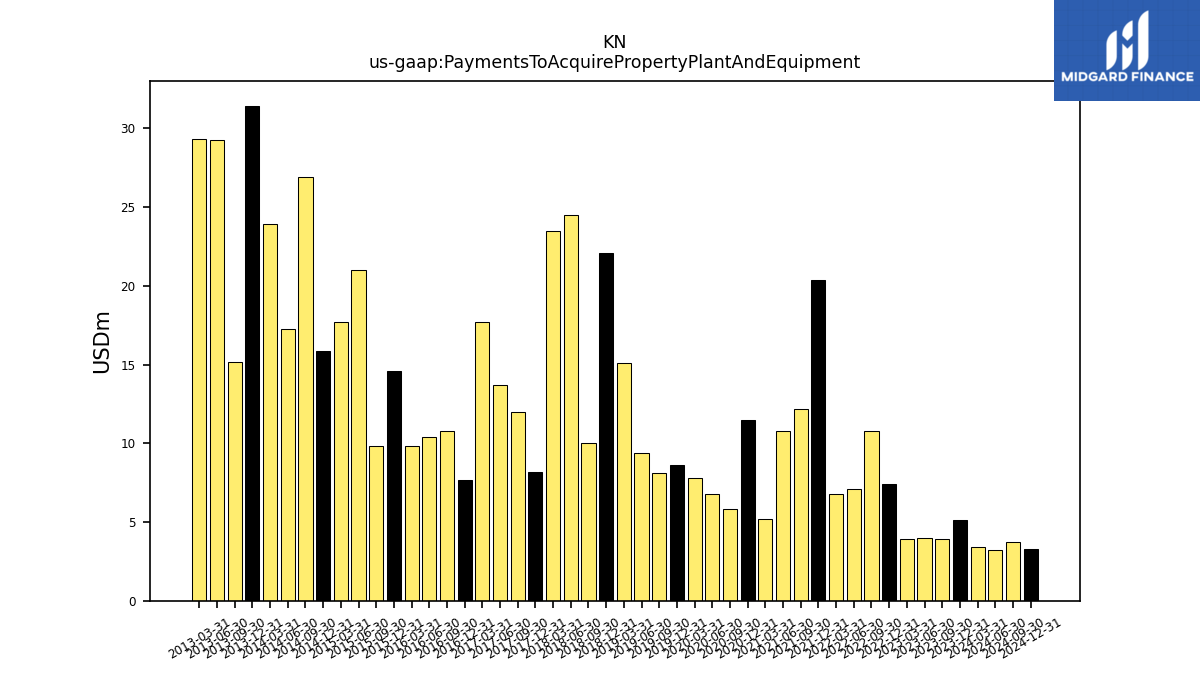
| Payments To Acquire Property Plant And Equipment | 5.10 | 3.90 | 4.00 | 3.90 | 7.40 | 10.80 | 7.10 | 6.80 | 20.40 | 12.20 | 10.80 | 5.20 | 11.50 | 5.80 | 6.80 | 7.80 | 8.60 | 8.10 | 9.40 | 15.10 | 22.10 | 10.00 | 24.50 | 23.50 | 8.20 | 12.00 | 13.70 | 17.70 | 7.70 | 10.80 | 10.40 | 9.80 | 14.60 | 9.80 | 21.00 | 17.70 | 15.86 | 26.89 | 17.25 | 23.90 | 31.44 | 15.16 | 29.24 | 29.36 |
| 2023-12-31 | 2023-09-30 | 2023-06-30 | 2023-03-31 | 2022-12-31 | 2022-09-30 | 2022-06-30 | 2022-03-31 | 2021-12-31 | 2021-09-30 | 2021-06-30 | 2021-03-31 | 2020-12-31 | 2020-09-30 | 2020-06-30 | 2020-03-31 | 2019-12-31 | 2019-09-30 | 2019-06-30 | 2019-03-31 | 2018-12-31 | 2018-09-30 | 2018-06-30 | 2018-03-31 | 2017-12-31 | 2017-09-30 | 2017-06-30 | 2017-03-31 | 2016-12-31 | 2016-09-30 | 2016-06-30 | 2016-03-31 | 2015-12-31 | 2015-09-30 | 2015-06-30 | 2015-03-31 | 2014-12-31 | 2014-09-30 | 2014-06-30 | 2014-03-31 | 2013-12-31 | 2013-09-30 | 2013-06-30 | 2013-03-31 | ||
|---|---|---|---|---|---|---|---|---|---|---|---|---|---|---|---|---|---|---|---|---|---|---|---|---|---|---|---|---|---|---|---|---|---|---|---|---|---|---|---|---|---|---|---|---|---|
| Net Cash Provided By Used In Financing Activities | 93.50 | -15.20 | -5.80 | -14.30 | -33.10 | -13.90 | -14.20 | -12.00 | -116.50 | 2.40 | -18.50 | 1.20 | -52.10 | -51.40 | 0.70 | 78.90 | 1.80 | -15.30 | -0.30 | 5.30 | -32.30 | NA | NA | NA | NA | NA | NA | NA | NA | NA | NA | NA | NA | NA | NA | NA | NA | NA | NA | NA | NA | NA | NA | NA | |
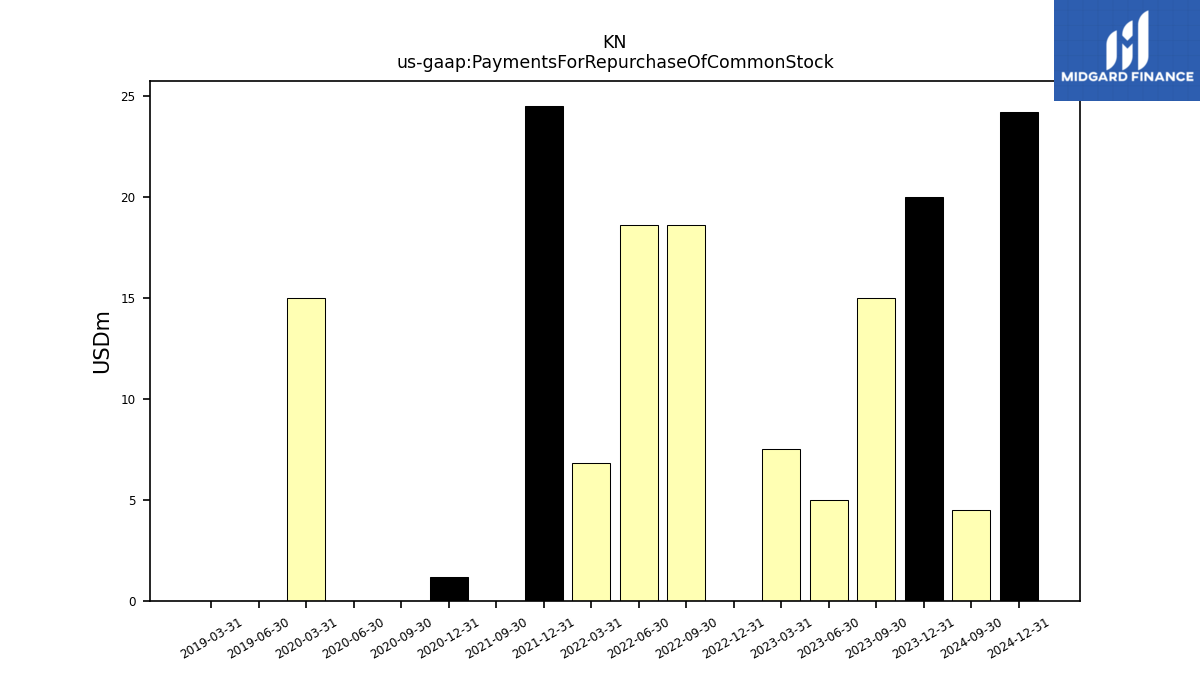
| Payments For Repurchase Of Common Stock | 20.00 | 15.00 | 5.00 | 7.50 | 0.00 | 18.60 | 18.60 | 6.80 | 24.50 | 0.00 | NA | NA | 1.20 | 0.00 | 0.00 | 15.00 | NA | NA | 0.00 | 0.00 | NA | NA | NA | NA | NA | NA | NA | NA | NA | NA | NA | NA | NA | NA | NA | NA | NA | NA | NA | NA | NA | NA | NA | NA |
| 2023-12-31 | 2023-09-30 | 2023-06-30 | 2023-03-31 | 2022-12-31 | 2022-09-30 | 2022-06-30 | 2022-03-31 | 2021-12-31 | 2021-09-30 | 2021-06-30 | 2021-03-31 | 2020-12-31 | 2020-09-30 | 2020-06-30 | 2020-03-31 | 2019-12-31 | 2019-09-30 | 2019-06-30 | 2019-03-31 | 2018-12-31 | 2018-09-30 | 2018-06-30 | 2018-03-31 | 2017-12-31 | 2017-09-30 | 2017-06-30 | 2017-03-31 | 2016-12-31 | 2016-09-30 | 2016-06-30 | 2016-03-31 | 2015-12-31 | 2015-09-30 | 2015-06-30 | 2015-03-31 | 2014-12-31 | 2014-09-30 | 2014-06-30 | 2014-03-31 | 2013-12-31 | 2013-09-30 | 2013-06-30 | 2013-03-31 | ||
|---|---|---|---|---|---|---|---|---|---|---|---|---|---|---|---|---|---|---|---|---|---|---|---|---|---|---|---|---|---|---|---|---|---|---|---|---|---|---|---|---|---|---|---|---|---|
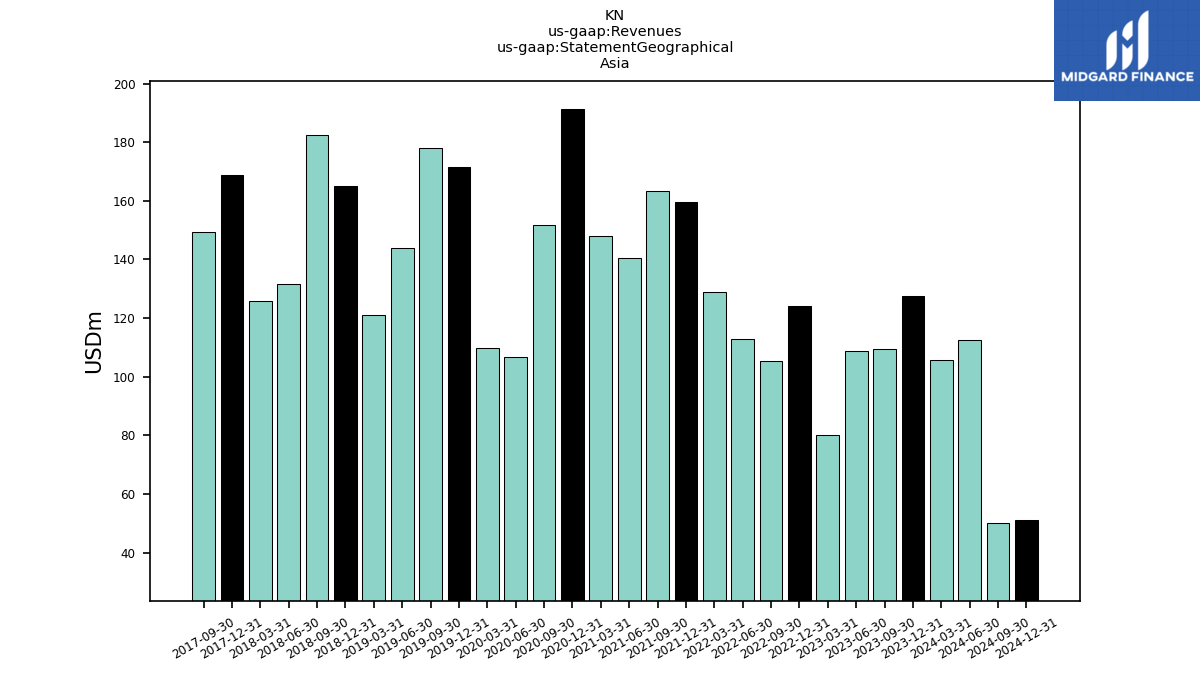
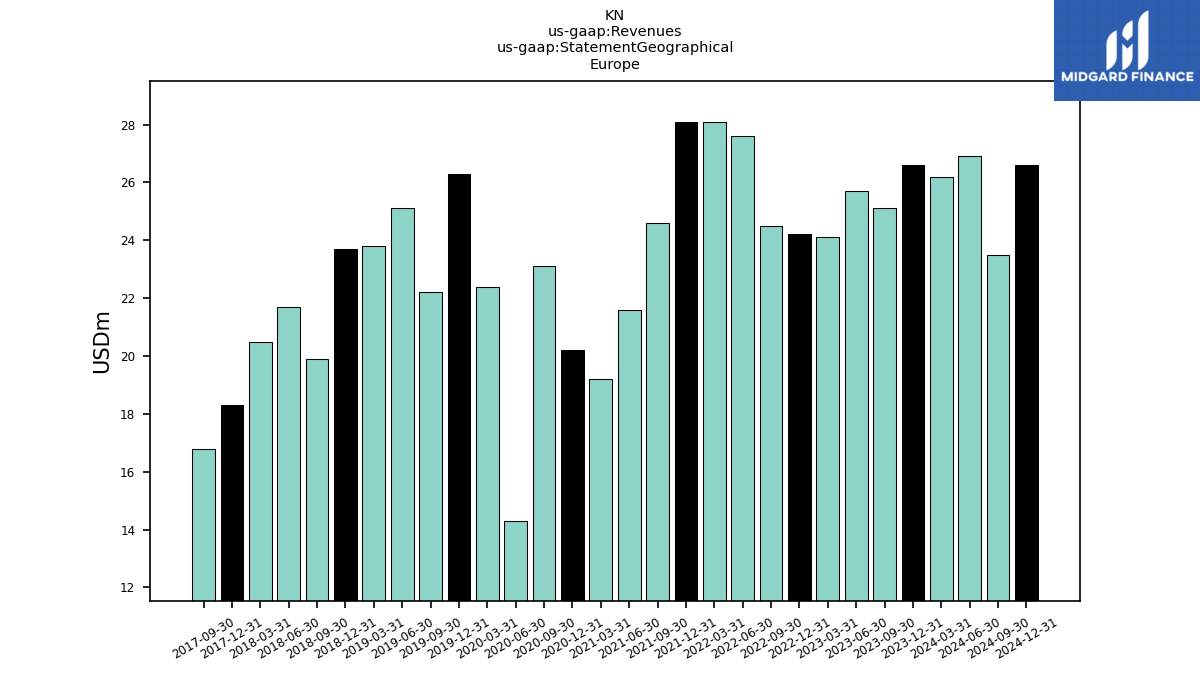
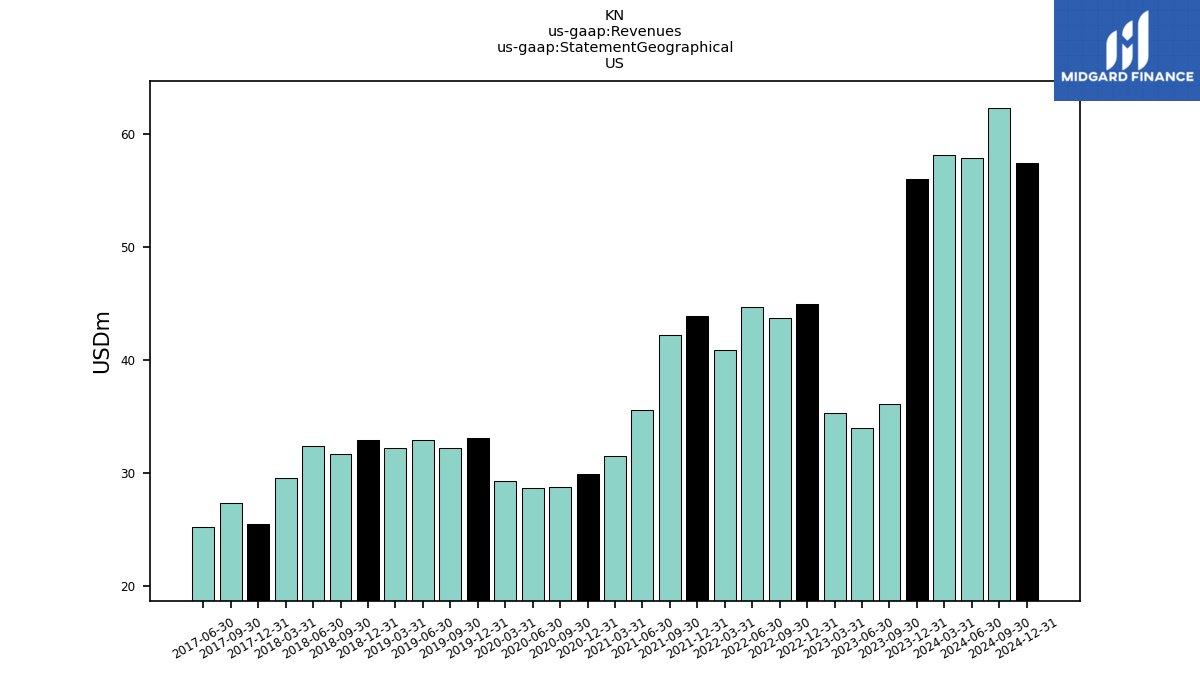
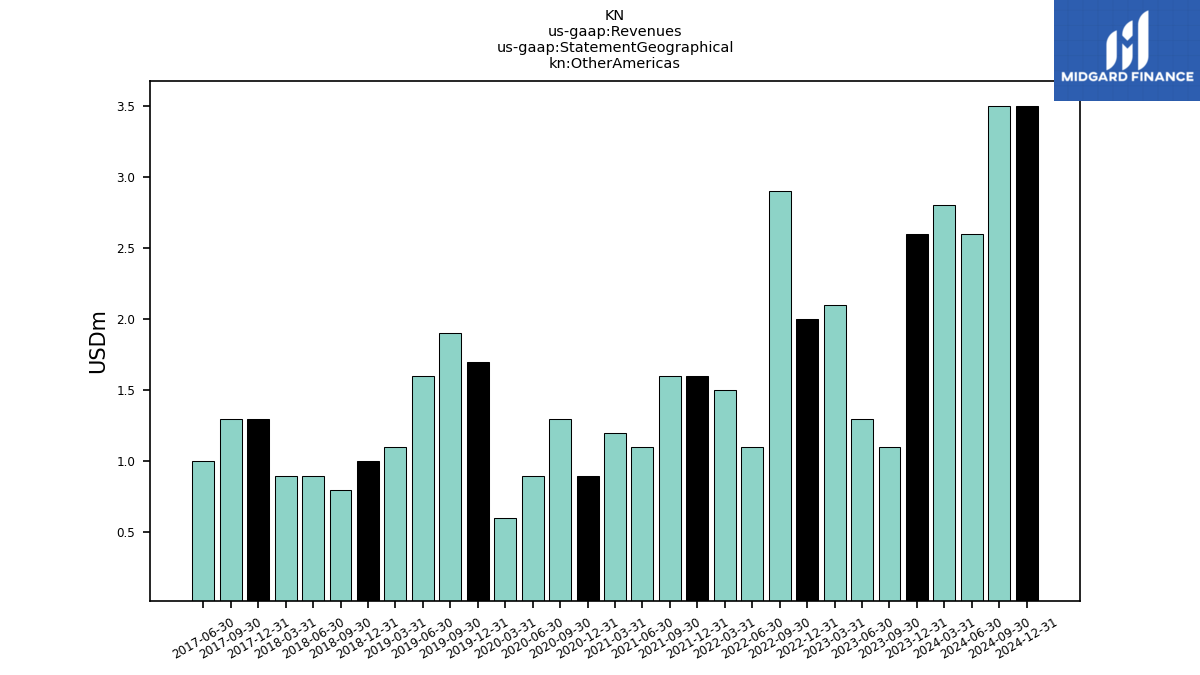
| Revenues | 215.20 | 175.10 | 173.00 | 144.30 | 197.10 | 178.20 | 188.00 | 201.40 | 234.30 | 233.00 | 199.80 | 201.00 | 243.20 | 205.80 | 152.20 | 163.10 | 233.90 | 235.90 | 205.20 | 179.80 | 223.80 | 236.20 | 188.40 | 178.50 | 215.50 | 196.00 | 164.40 | 168.30 | 240.60 | 243.10 | 190.30 | 185.30 | 310.50 | 294.60 | 240.90 | 238.60 | 286.10 | 300.84 | 281.03 | 273.38 | 330.40 | 311.64 | 296.71 | 276.12 | |
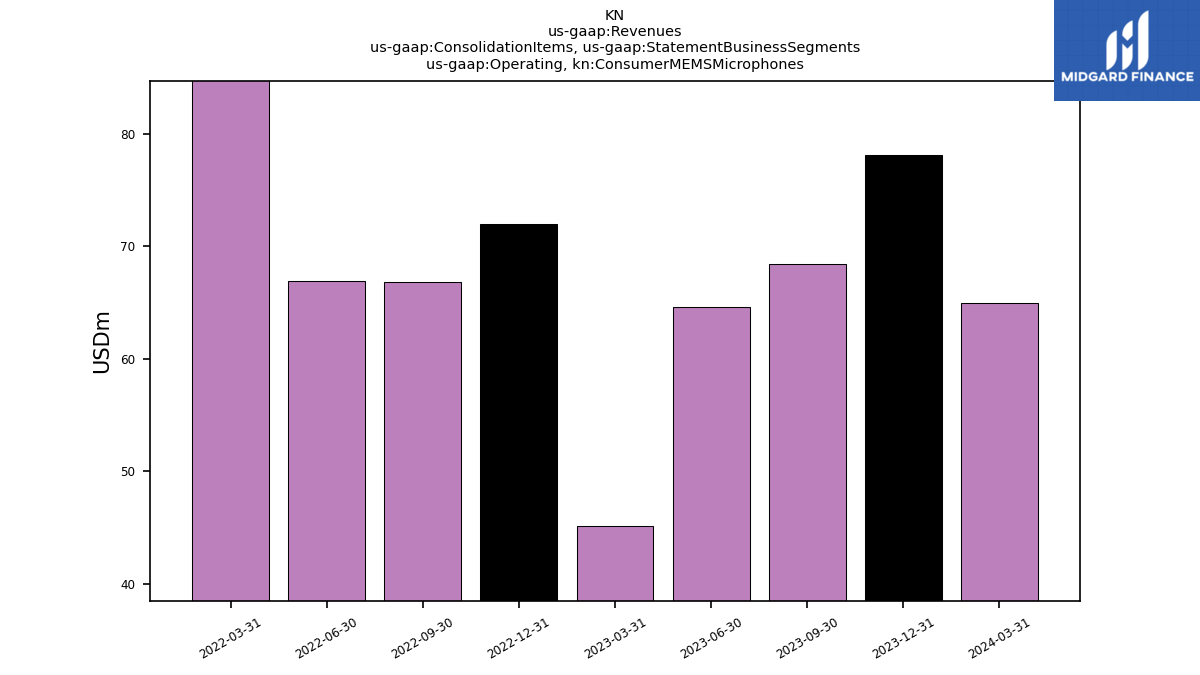
| Operating, Consumer M E M S Microphones | 78.10 | 68.40 | 64.60 | 45.10 | 72.00 | 66.80 | 66.90 | 86.20 | NA | NA | NA | NA | NA | NA | NA | NA | NA | NA | NA | NA | NA | NA | NA | NA | NA | NA | NA | NA | NA | NA | NA | NA | NA | NA | NA | NA | NA | NA | NA | NA | NA | NA | NA | NA | |
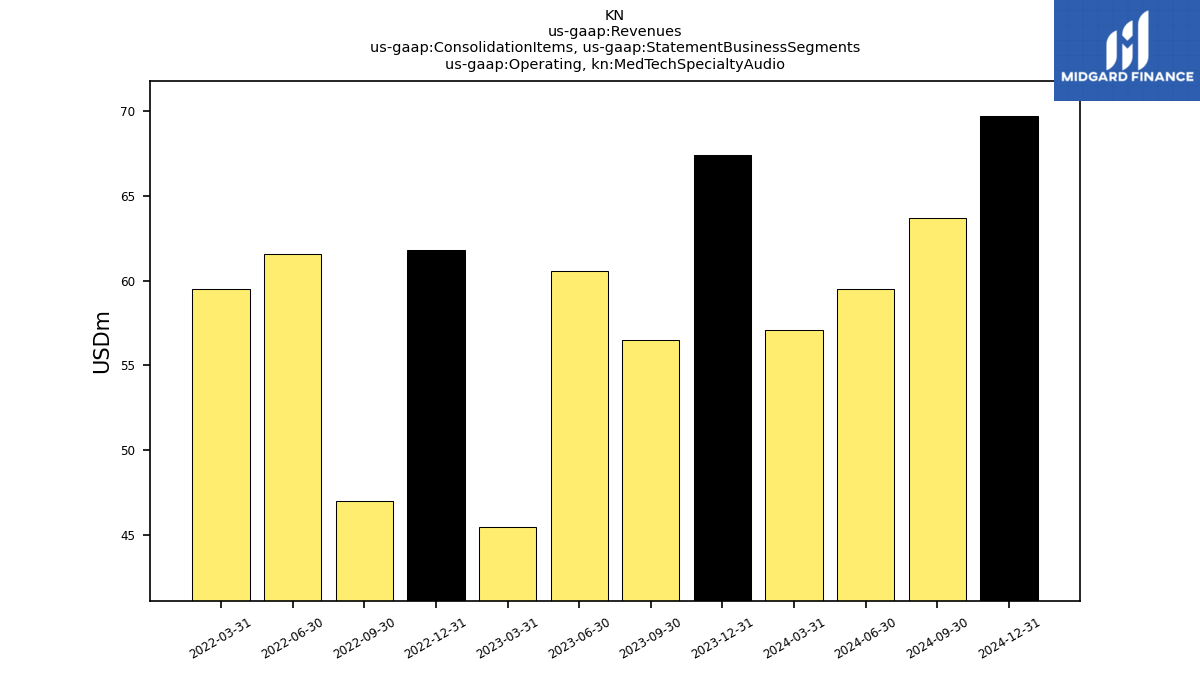
| Operating, Med Tech Specialty Audio | 67.40 | 56.50 | 60.60 | 45.50 | 61.80 | 47.00 | 61.60 | 59.50 | NA | NA | NA | NA | NA | NA | NA | NA | NA | NA | NA | NA | NA | NA | NA | NA | NA | NA | NA | NA | NA | NA | NA | NA | NA | NA | NA | NA | NA | NA | NA | NA | NA | NA | NA | NA | |
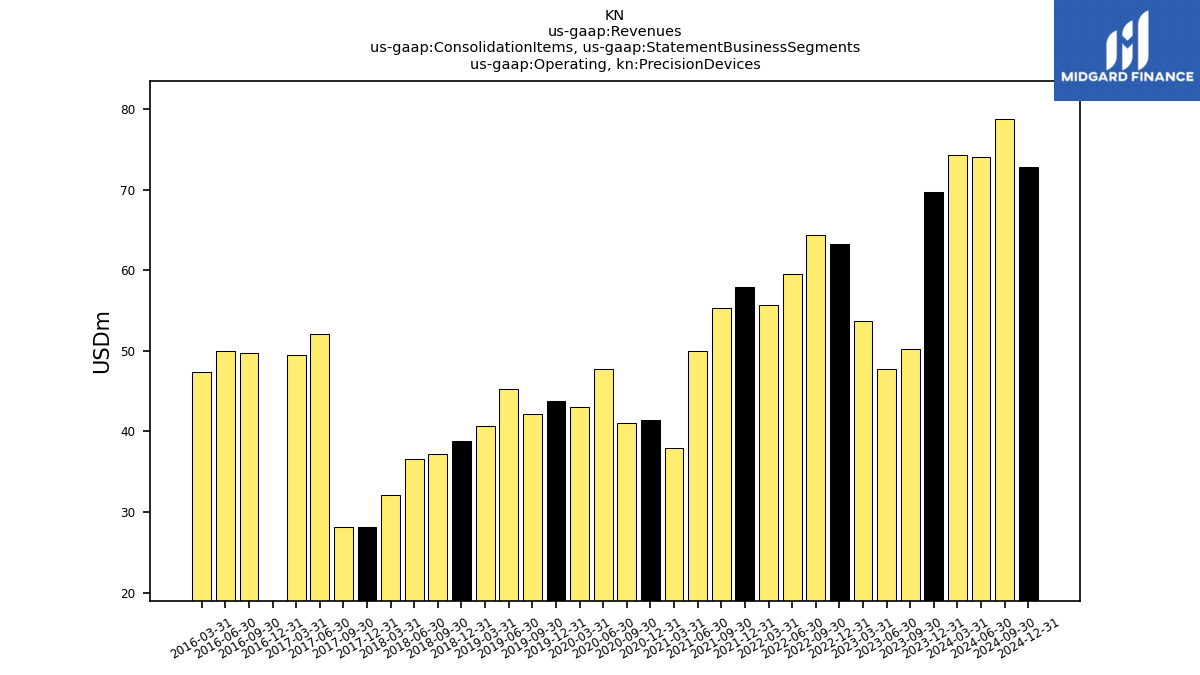
| Operating, Precision Devices | 69.70 | 50.20 | 47.80 | 53.70 | 63.30 | 64.40 | 59.50 | 55.70 | 57.90 | 55.30 | 50.00 | 37.90 | 41.40 | 41.00 | 47.70 | 43.00 | 43.80 | 42.20 | 45.30 | 40.70 | 38.80 | 37.20 | 36.60 | 32.10 | 28.20 | 28.20 | 52.10 | 49.50 | -53.30 | 49.70 | 50.00 | 47.40 | NA | NA | NA | NA | NA | NA | NA | NA | NA | NA | NA | NA | |
| 127.60 | 109.60 | 108.90 | 80.00 | 124.10 | 105.30 | 113.00 | 128.90 | 159.50 | 163.40 | 140.50 | 148.10 | 191.30 | 151.70 | 106.90 | 109.70 | 171.60 | 178.00 | 144.00 | 121.10 | 165.10 | 182.50 | 131.80 | 126.00 | 168.70 | 149.30 | NA | NA | NA | NA | NA | NA | NA | NA | NA | NA | NA | NA | NA | NA | NA | NA | NA | NA | ||
| 26.60 | 25.10 | 25.70 | 24.10 | 24.20 | 24.50 | 27.60 | 28.10 | 28.10 | 24.60 | 21.60 | 19.20 | 20.20 | 23.10 | 14.30 | 22.40 | 26.30 | 22.20 | 25.10 | 23.80 | 23.70 | 19.90 | 21.70 | 20.50 | 18.30 | 16.80 | NA | NA | NA | NA | NA | NA | NA | NA | NA | NA | NA | NA | NA | NA | NA | NA | NA | NA | ||
| US | 56.00 | 36.10 | 34.00 | 35.30 | 45.00 | 43.70 | 44.70 | 40.90 | 43.90 | 42.20 | 35.60 | 31.50 | 29.90 | 28.80 | 28.70 | 29.30 | 33.10 | 32.20 | 32.90 | 32.20 | 32.90 | 31.70 | 32.40 | 29.60 | 25.50 | 27.40 | 25.30 | NA | NA | NA | NA | NA | NA | NA | NA | NA | NA | NA | NA | NA | NA | NA | NA | NA | |
| Other Americas | 2.60 | 1.10 | 1.30 | 2.10 | 2.00 | 2.90 | 1.10 | 1.50 | 1.60 | 1.60 | 1.10 | 1.20 | 0.90 | 1.30 | 0.90 | 0.60 | 1.70 | 1.90 | 1.60 | 1.10 | 1.00 | 0.80 | 0.90 | 0.90 | 1.30 | 1.30 | 1.00 | NA | NA | NA | NA | NA | NA | NA | NA | NA | NA | NA | NA | NA | NA | NA | NA | NA | |
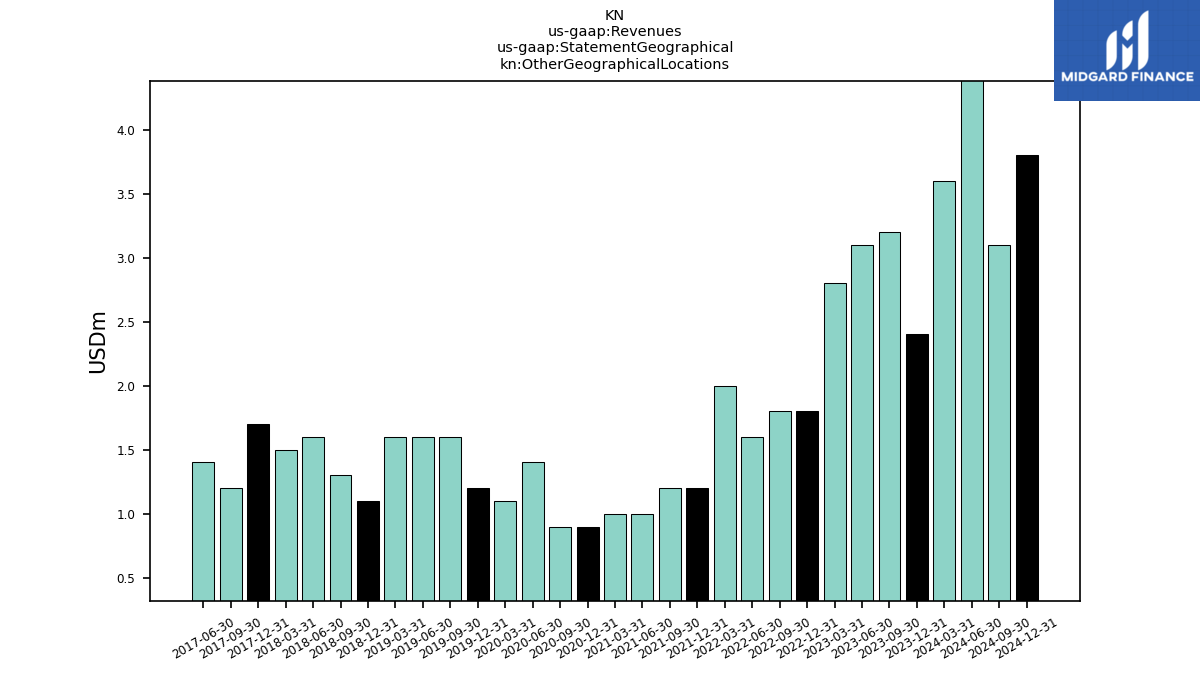
| Other Geographical Locations | 2.40 | 3.20 | 3.10 | 2.80 | 1.80 | 1.80 | 1.60 | 2.00 | 1.20 | 1.20 | 1.00 | 1.00 | 0.90 | 0.90 | 1.40 | 1.10 | 1.20 | 1.60 | 1.60 | 1.60 | 1.10 | 1.30 | 1.60 | 1.50 | 1.70 | 1.20 | 1.40 | NA | NA | NA | NA | NA | NA | NA | NA | NA | NA | NA | NA | NA | NA | NA | NA | NA | |
| Revenue From Contract With Customer Excluding Assessed Tax | 215.20 | 175.10 | 173.00 | 144.30 | 197.10 | 178.20 | 188.00 | 201.40 | 234.30 | 233.00 | 199.80 | 201.00 | 243.20 | 205.80 | 152.20 | 163.10 | 233.90 | 235.90 | 205.20 | 179.80 | 223.80 | 236.20 | 188.40 | 178.50 | 215.50 | 196.00 | 164.40 | 168.30 | 240.60 | 243.10 | 190.30 | 185.30 | 310.50 | 294.60 | 240.90 | 238.60 | 286.10 | 300.84 | 281.03 | 273.38 | 330.40 | 311.64 | 296.71 | 276.12 |