
| 2024-03-31 | 2023-12-31 | 2023-09-30 | 2023-06-30 | 2023-03-31 | 2022-12-31 | 2022-09-30 | 2022-06-30 | 2022-03-31 | 2021-12-31 | 2021-09-30 | 2021-06-30 | 2021-03-31 | 2020-12-31 | 2020-09-30 | 2020-06-30 | 2020-03-31 | 2019-12-31 | 2019-09-30 | 2019-06-30 | 2019-03-31 | 2018-12-31 | 2018-09-30 | 2018-06-30 | 2018-03-31 | 2017-12-31 | 2017-09-30 | 2017-06-30 | 2017-03-31 | 2016-12-31 | 2016-09-30 | 2016-06-30 | 2016-03-31 | 2015-12-31 | 2015-09-30 | 2015-06-30 | 2015-03-31 | 2014-12-31 | 2014-09-30 | 2014-06-30 | 2014-03-31 | 2013-12-31 | 2013-09-30 | 2013-06-30 | 2013-03-31 | 2012-12-31 | 2012-09-30 | 2012-06-30 | 2012-03-31 | 2011-12-31 | 2011-09-30 | 2011-06-30 | 2011-03-31 | 2010-12-31 | 2010-09-30 | 2010-06-30 | ||
|---|---|---|---|---|---|---|---|---|---|---|---|---|---|---|---|---|---|---|---|---|---|---|---|---|---|---|---|---|---|---|---|---|---|---|---|---|---|---|---|---|---|---|---|---|---|---|---|---|---|---|---|---|---|---|---|---|---|
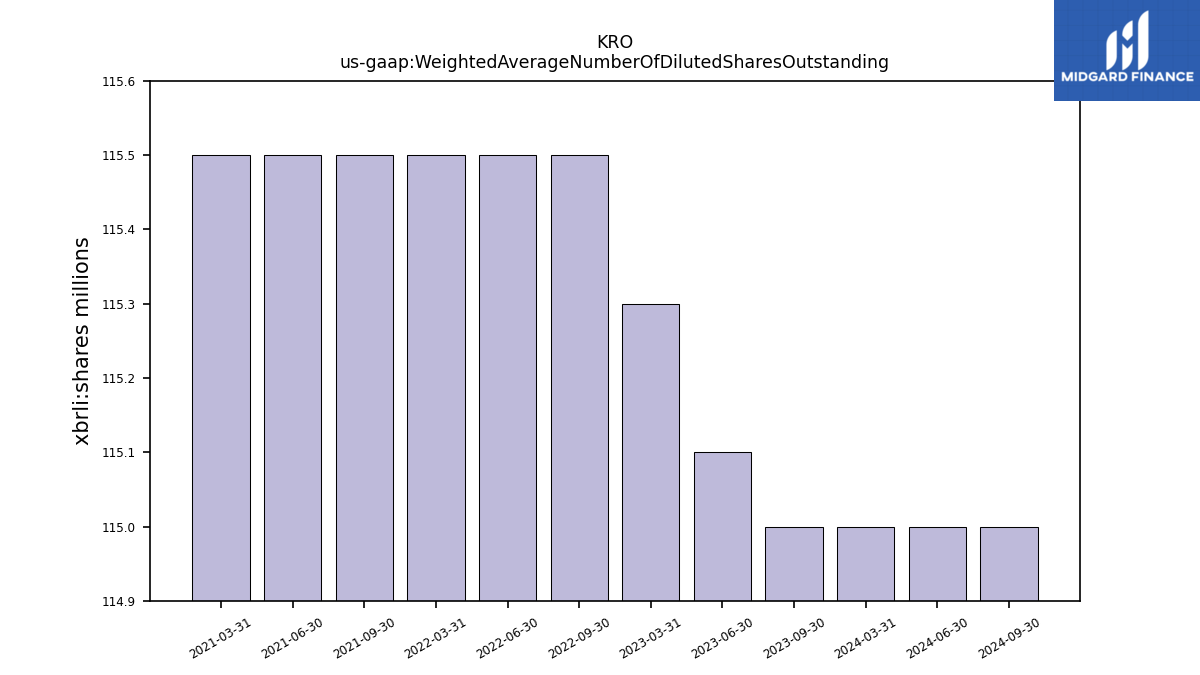
| Weighted Average Number Of Diluted Shares Outstanding | 115.00 | NA | 115.00 | 115.10 | 115.30 | NA | 115.50 | 115.50 | 115.50 | NA | 115.50 | 115.50 | 115.50 | NA | NA | NA | NA | NA | NA | NA | NA | NA | NA | NA | NA | NA | NA | NA | NA | NA | NA | NA | NA | NA | NA | NA | NA | NA | NA | NA | NA | NA | NA | NA | NA | NA | NA | NA | NA | NA | NA | NA | NA | NA | NA | NA | |
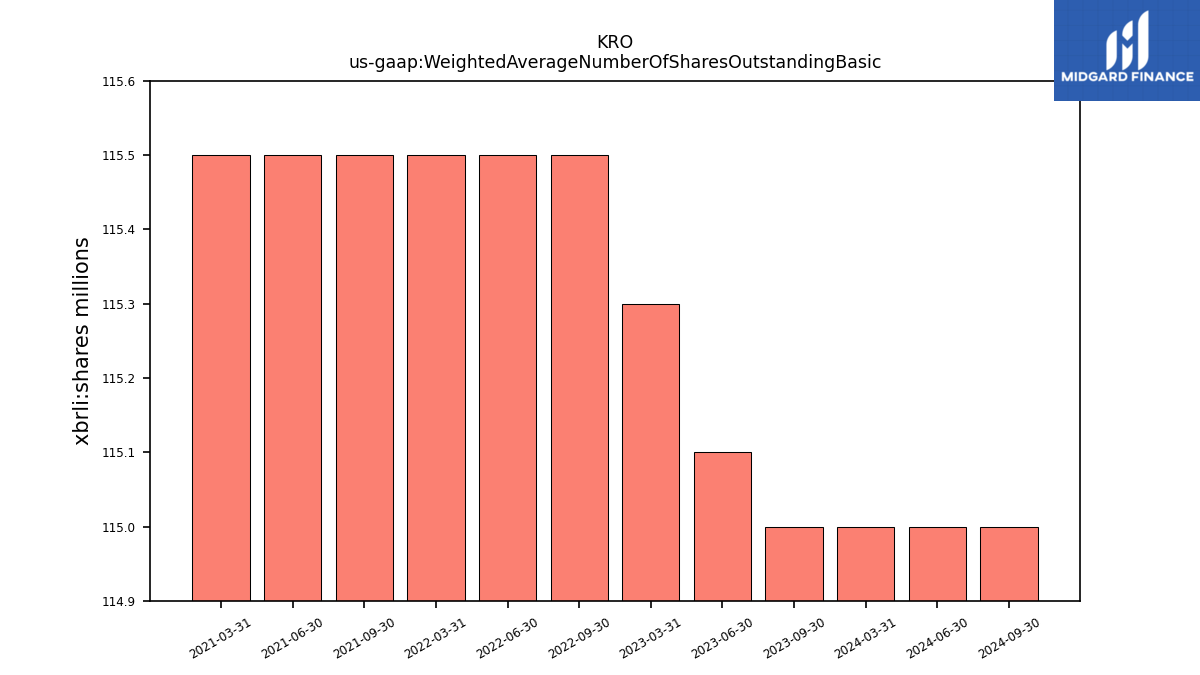
| Weighted Average Number Of Shares Outstanding Basic | 115.00 | NA | 115.00 | 115.10 | 115.30 | NA | 115.50 | 115.50 | 115.50 | NA | 115.50 | 115.50 | 115.50 | NA | NA | NA | NA | NA | NA | NA | NA | NA | NA | NA | NA | NA | NA | NA | NA | NA | NA | NA | NA | NA | NA | NA | NA | NA | NA | NA | NA | NA | NA | NA | NA | NA | NA | NA | NA | NA | NA | NA | NA | NA | NA | NA | |
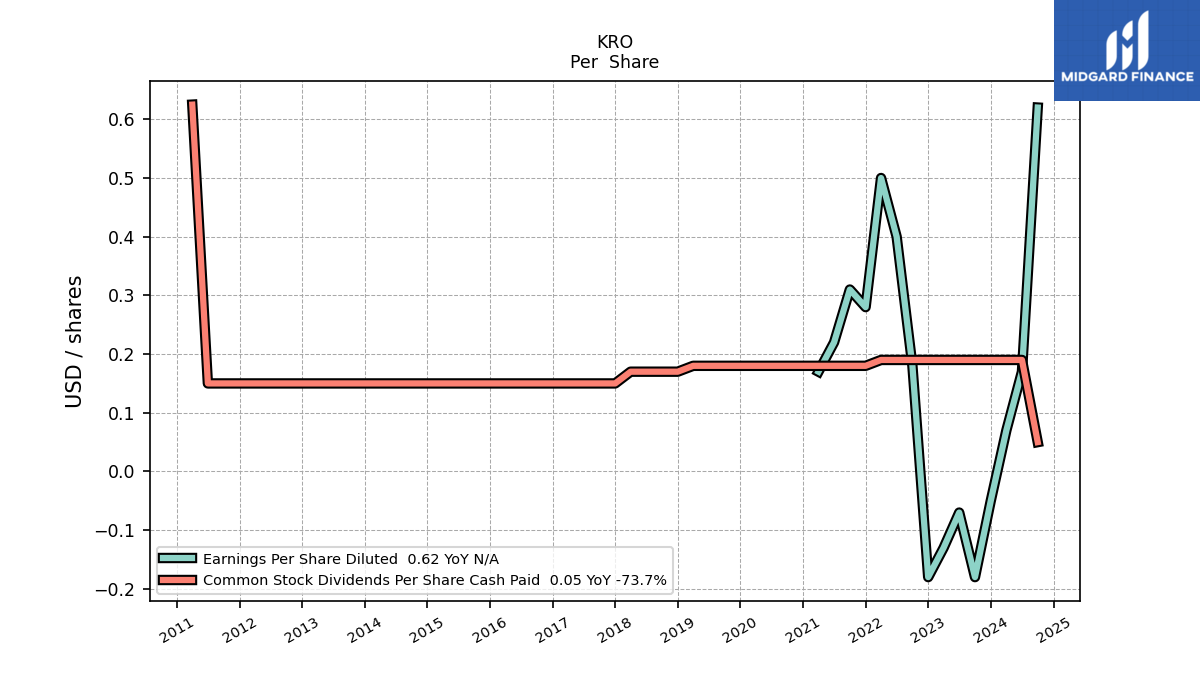
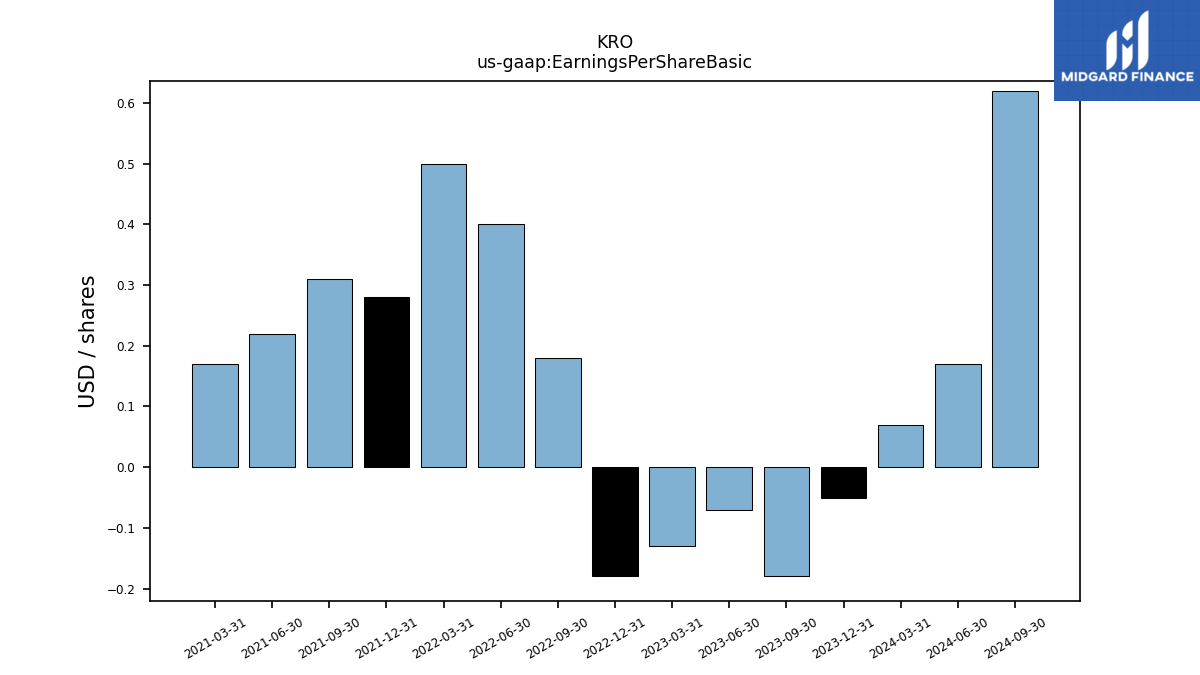
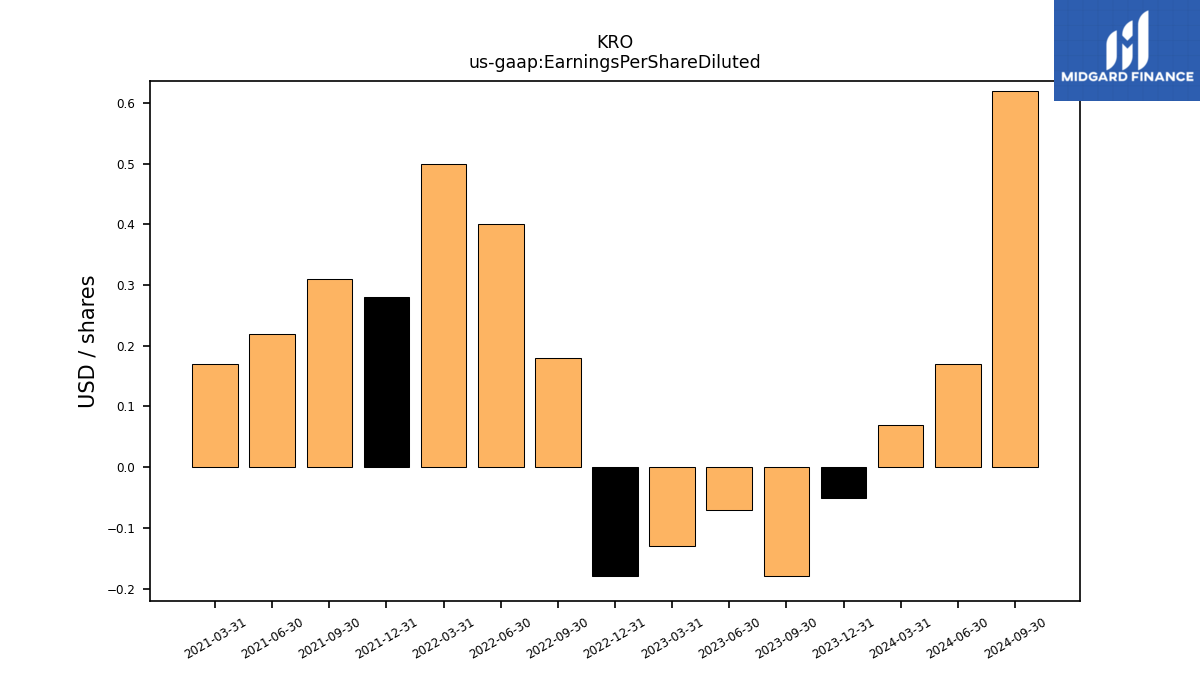
| Earnings Per Share Basic | 0.07 | -0.05 | -0.18 | -0.07 | -0.13 | -0.18 | 0.18 | 0.40 | 0.50 | 0.28 | 0.31 | 0.22 | 0.17 | NA | NA | NA | NA | NA | NA | NA | NA | NA | NA | NA | NA | NA | NA | NA | NA | NA | NA | NA | NA | NA | NA | NA | NA | NA | NA | NA | NA | NA | NA | NA | NA | NA | NA | NA | NA | NA | NA | NA | NA | NA | NA | NA | |
| Earnings Per Share Diluted | 0.07 | -0.05 | -0.18 | -0.07 | -0.13 | -0.18 | 0.18 | 0.40 | 0.50 | 0.28 | 0.31 | 0.22 | 0.17 | NA | NA | NA | NA | NA | NA | NA | NA | NA | NA | NA | NA | NA | NA | NA | NA | NA | NA | NA | NA | NA | NA | NA | NA | NA | NA | NA | NA | NA | NA | NA | NA | NA | NA | NA | NA | NA | NA | NA | NA | NA | NA | NA |
| 2024-03-31 | 2023-12-31 | 2023-09-30 | 2023-06-30 | 2023-03-31 | 2022-12-31 | 2022-09-30 | 2022-06-30 | 2022-03-31 | 2021-12-31 | 2021-09-30 | 2021-06-30 | 2021-03-31 | 2020-12-31 | 2020-09-30 | 2020-06-30 | 2020-03-31 | 2019-12-31 | 2019-09-30 | 2019-06-30 | 2019-03-31 | 2018-12-31 | 2018-09-30 | 2018-06-30 | 2018-03-31 | 2017-12-31 | 2017-09-30 | 2017-06-30 | 2017-03-31 | 2016-12-31 | 2016-09-30 | 2016-06-30 | 2016-03-31 | 2015-12-31 | 2015-09-30 | 2015-06-30 | 2015-03-31 | 2014-12-31 | 2014-09-30 | 2014-06-30 | 2014-03-31 | 2013-12-31 | 2013-09-30 | 2013-06-30 | 2013-03-31 | 2012-12-31 | 2012-09-30 | 2012-06-30 | 2012-03-31 | 2011-12-31 | 2011-09-30 | 2011-06-30 | 2011-03-31 | 2010-12-31 | 2010-09-30 | 2010-06-30 | ||
|---|---|---|---|---|---|---|---|---|---|---|---|---|---|---|---|---|---|---|---|---|---|---|---|---|---|---|---|---|---|---|---|---|---|---|---|---|---|---|---|---|---|---|---|---|---|---|---|---|---|---|---|---|---|---|---|---|---|
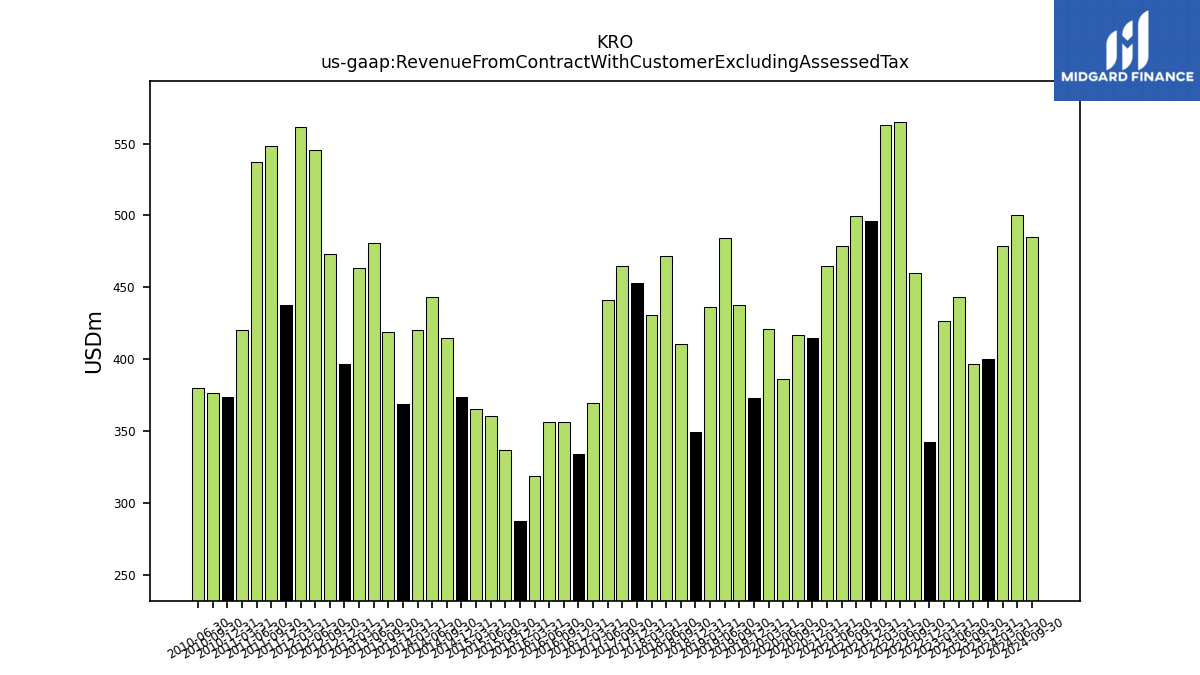
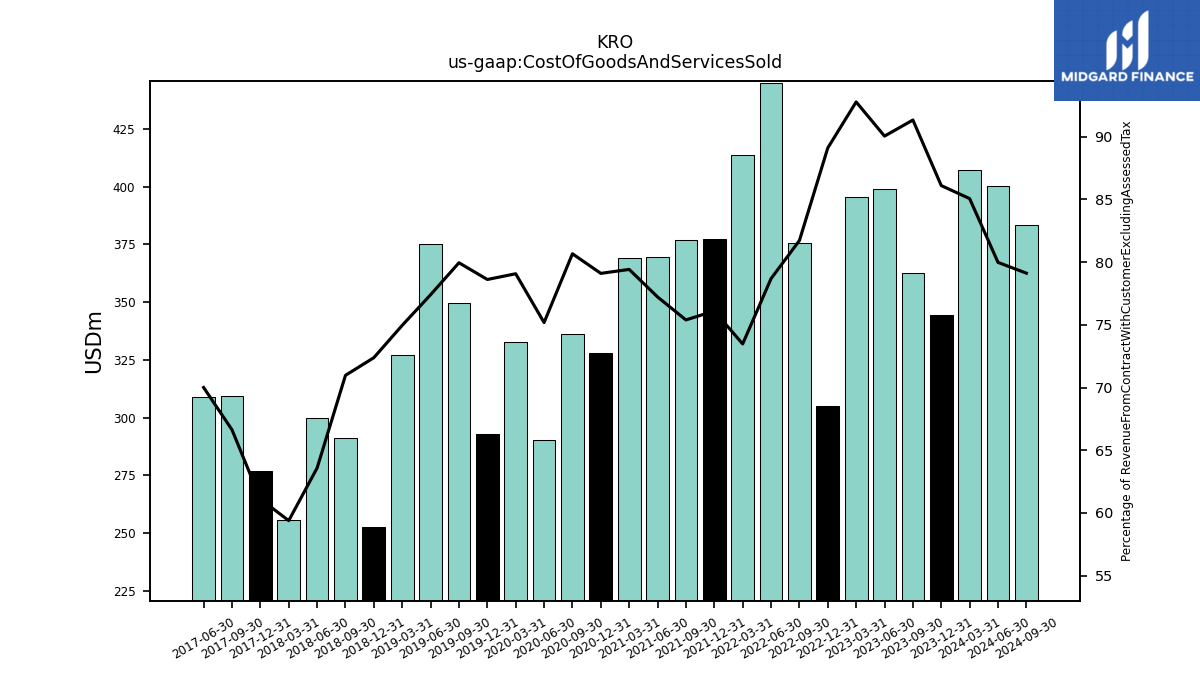
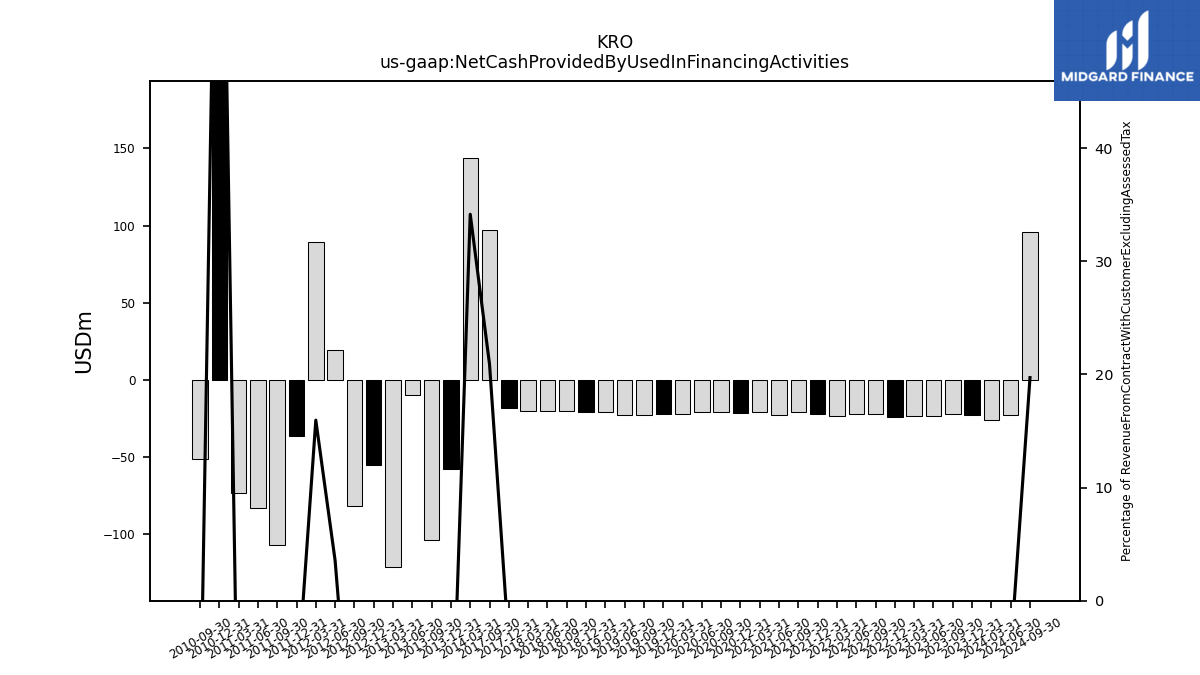
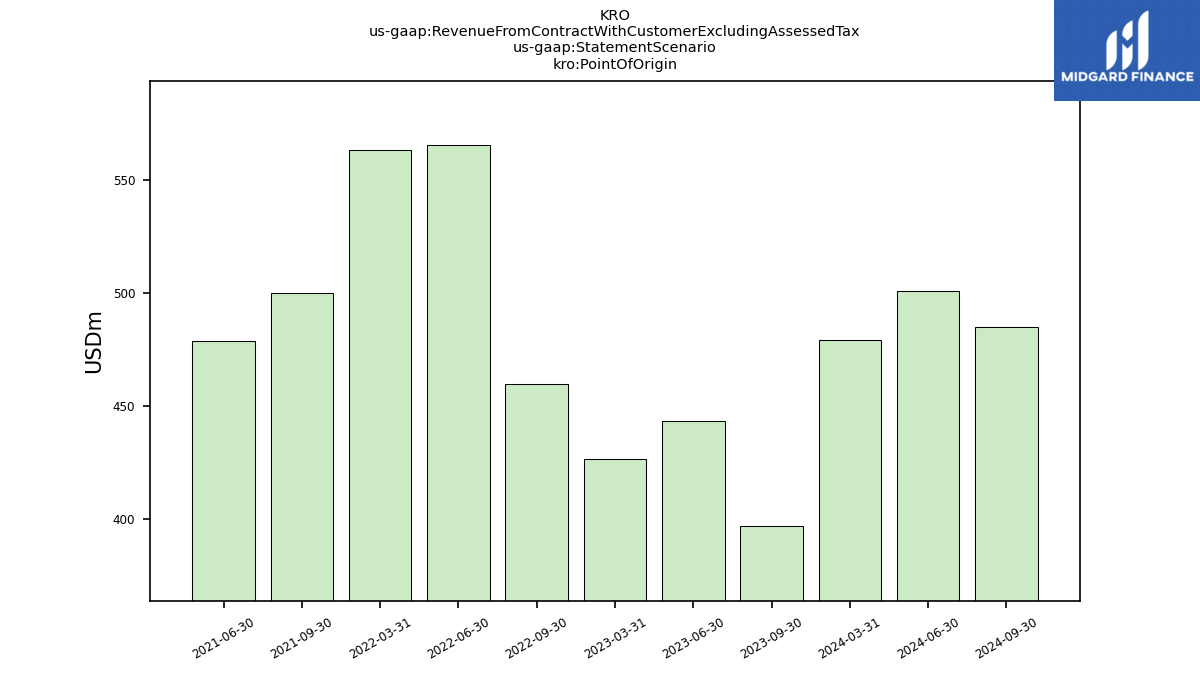
| Revenue From Contract With Customer Excluding Assessed Tax | 478.80 | 400.10 | 396.90 | 443.20 | 426.30 | 342.40 | 459.60 | 565.30 | 562.90 | 496.00 | 499.80 | 478.60 | 465.00 | 414.90 | 416.90 | 386.00 | 421.00 | 372.70 | 437.40 | 484.50 | 436.50 | 349.40 | 410.30 | 471.80 | 430.40 | 453.30 | 464.50 | 441.40 | 369.80 | 333.70 | 356.10 | 356.10 | 318.40 | 287.00 | 336.50 | 360.20 | 365.10 | 373.50 | 414.80 | 443.50 | 420.10 | 368.60 | 419.10 | 481.10 | 463.60 | 396.80 | 472.90 | 545.30 | 561.30 | 437.40 | 548.00 | 537.50 | 420.40 | 373.30 | 376.60 | 380.10 | |
| Cost Of Goods And Services Sold | 407.30 | 344.50 | 362.50 | 399.10 | 395.50 | 305.10 | 375.60 | 444.80 | 413.60 | 377.50 | 376.80 | 369.60 | 369.30 | 328.20 | 336.30 | 290.20 | 332.90 | 293.00 | 349.70 | 375.00 | 327.20 | 252.90 | 291.20 | 300.00 | 255.60 | 277.00 | 309.50 | 309.00 | NA | NA | NA | NA | NA | NA | NA | NA | NA | NA | NA | NA | NA | NA | NA | NA | NA | NA | NA | NA | NA | NA | NA | NA | NA | NA | NA | NA | |
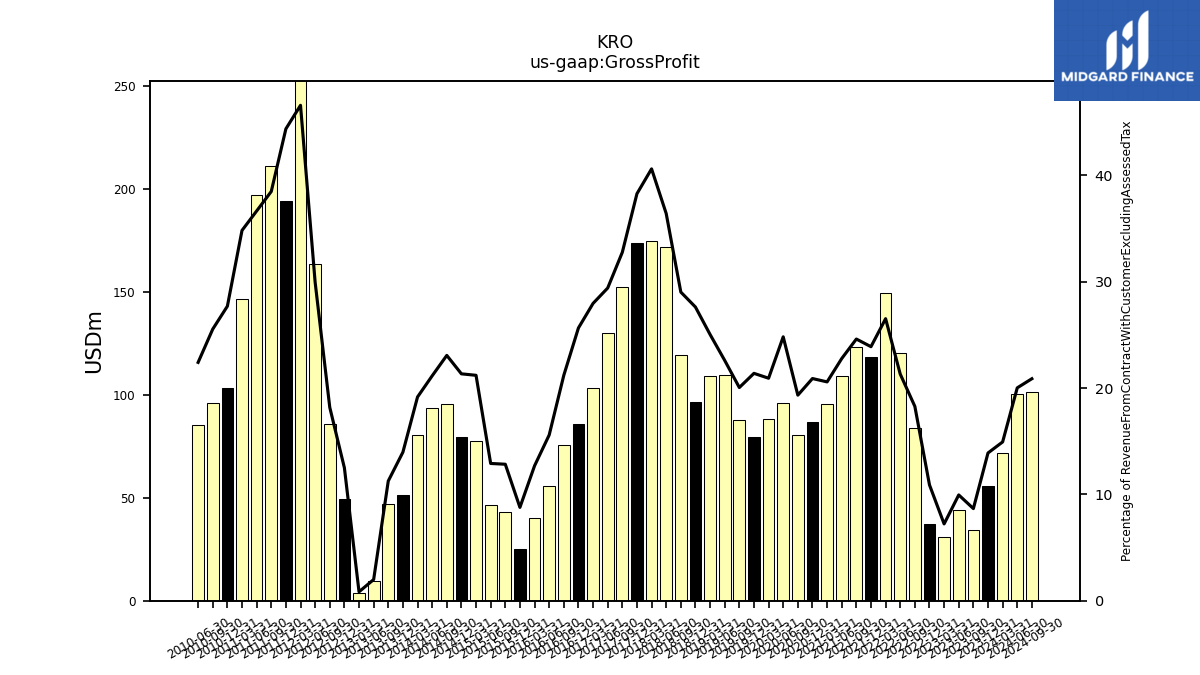
| Gross Profit | 71.50 | 55.60 | 34.40 | 44.10 | 30.80 | 37.30 | 84.00 | 120.50 | 149.30 | 118.50 | 123.00 | 109.00 | 95.70 | 86.70 | 80.60 | 95.80 | 88.10 | 79.70 | 87.70 | 109.50 | 109.30 | 96.50 | 119.10 | 171.80 | 174.80 | 173.50 | 152.20 | 129.80 | 103.40 | 85.60 | 75.50 | 55.50 | 40.40 | 25.20 | 43.20 | 46.50 | 77.40 | 79.70 | 95.70 | 93.80 | 80.50 | 51.50 | 47.20 | 9.60 | 3.90 | 49.60 | 86.00 | 163.30 | 261.50 | 194.10 | 210.90 | 197.00 | 146.40 | 103.40 | 96.20 | 85.20 | |
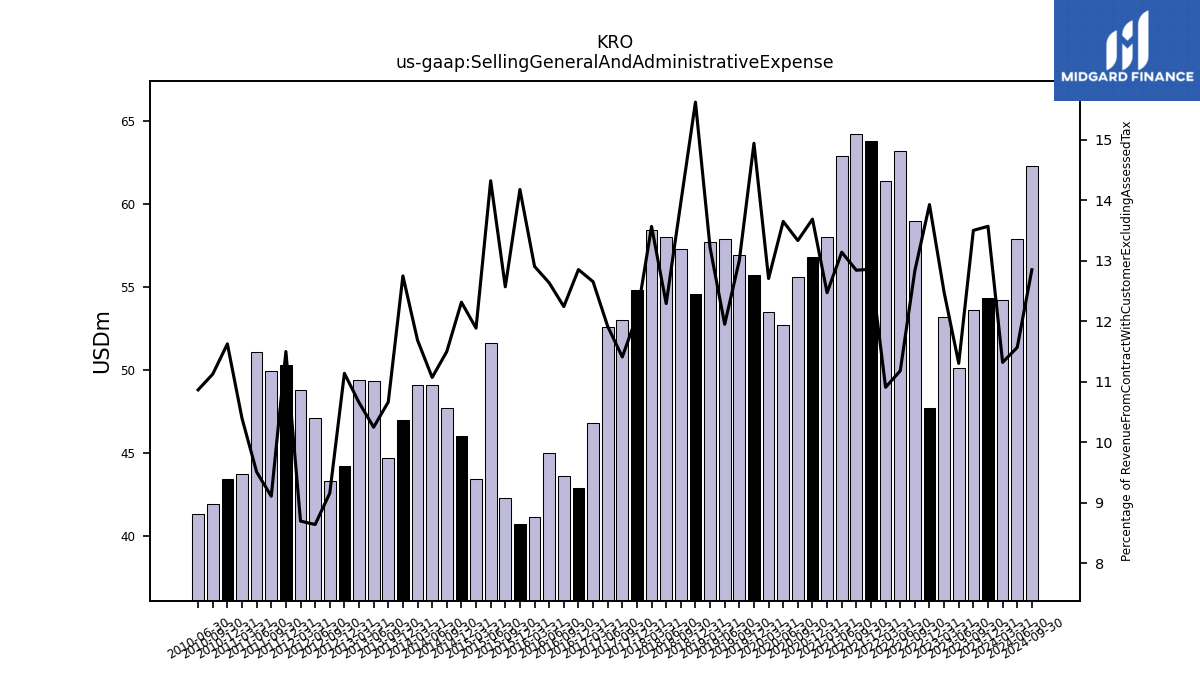
| Selling General And Administrative Expense | 54.20 | 54.30 | 53.60 | 50.10 | 53.20 | 47.70 | 59.00 | 63.20 | 61.40 | 63.80 | 64.20 | 62.90 | 58.00 | 56.80 | 55.60 | 52.70 | 53.50 | 55.70 | 56.90 | 57.90 | 57.70 | 54.60 | 57.30 | 58.00 | 58.40 | 54.80 | 53.00 | 52.60 | 46.80 | 42.90 | 43.60 | 45.00 | 41.10 | 40.70 | 42.30 | 51.60 | 43.40 | 46.00 | 47.70 | 49.10 | 49.10 | 47.00 | 44.70 | 49.30 | 49.40 | 44.20 | 43.30 | 47.10 | 48.80 | 50.30 | 49.90 | 51.10 | 43.70 | 43.40 | 41.90 | 41.30 | |
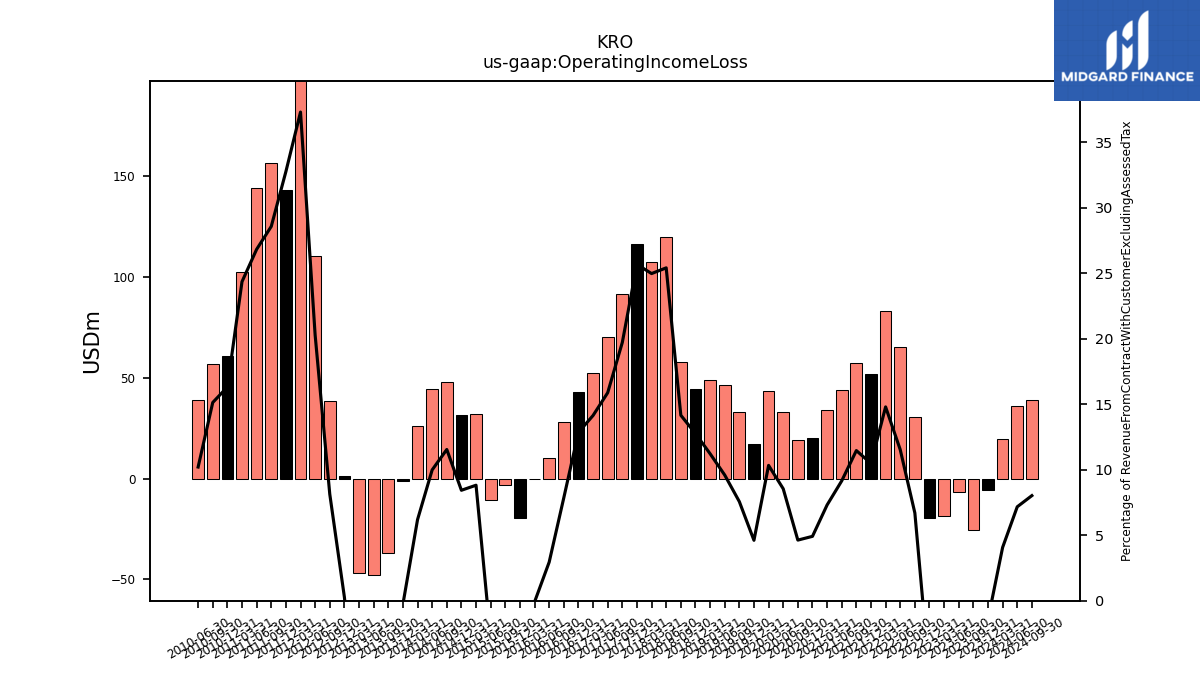
| Operating Income Loss | 19.50 | -5.70 | -25.30 | -6.70 | -18.30 | -19.70 | 30.80 | 65.20 | 83.30 | 52.00 | 57.30 | 43.80 | 34.00 | 20.40 | 19.30 | 33.00 | 43.50 | 17.20 | 33.10 | 46.50 | 49.00 | 44.60 | 58.10 | 119.90 | 107.50 | 116.40 | 91.60 | 70.10 | 52.30 | 42.90 | 28.00 | 10.50 | -0.30 | -19.70 | -3.20 | -10.40 | 32.20 | 31.50 | 47.90 | 44.30 | 26.00 | -1.00 | -37.00 | -47.70 | -46.90 | 1.10 | 38.50 | 110.60 | 209.40 | 143.30 | 156.60 | 144.20 | 102.40 | 60.90 | 57.00 | 38.80 | |
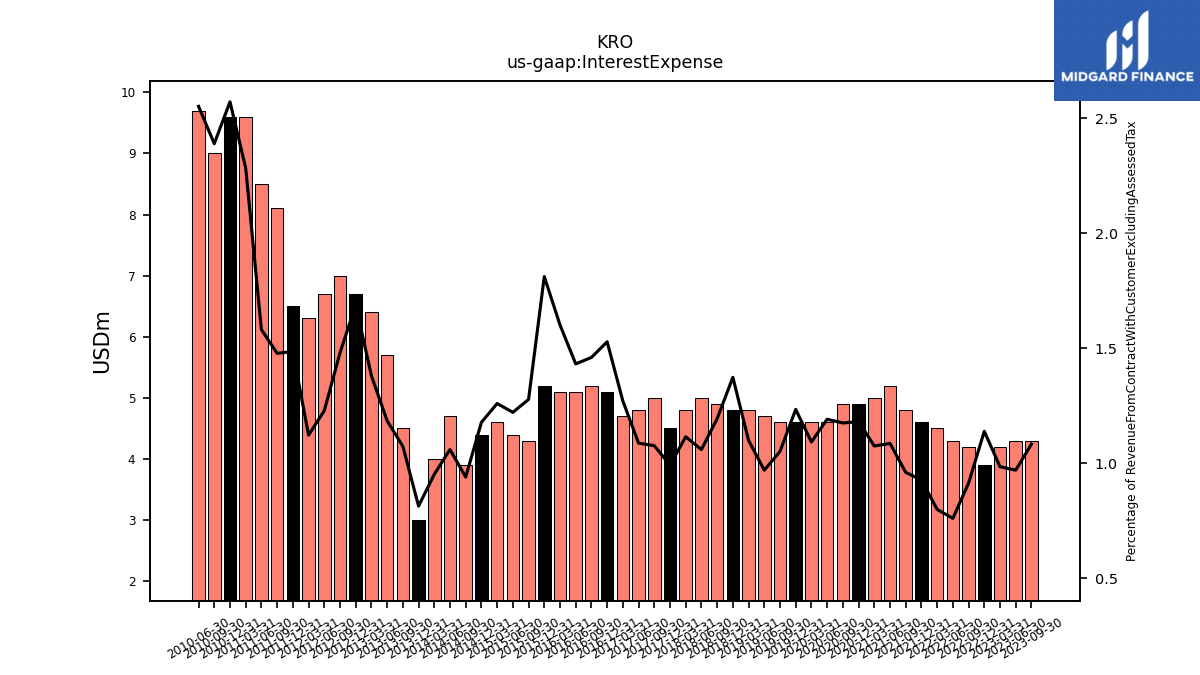
| Interest Expense | 9.20 | 4.30 | 4.30 | 4.30 | 4.20 | 3.90 | 4.20 | 4.30 | 4.50 | 4.60 | 4.80 | 5.20 | 5.00 | 4.90 | 4.90 | 4.60 | 4.60 | 4.60 | 4.60 | 4.70 | 4.80 | 4.80 | 4.90 | 5.00 | 4.80 | 4.50 | 5.00 | 4.80 | 4.70 | 5.10 | 5.20 | 5.10 | 5.10 | 5.20 | 4.30 | 4.40 | 4.60 | 4.40 | 3.90 | 4.70 | 4.00 | 3.00 | 4.50 | 5.70 | 6.40 | 6.70 | 7.00 | 6.70 | 6.30 | 6.50 | 8.10 | 8.50 | 9.60 | 9.60 | 9.00 | 9.70 | |
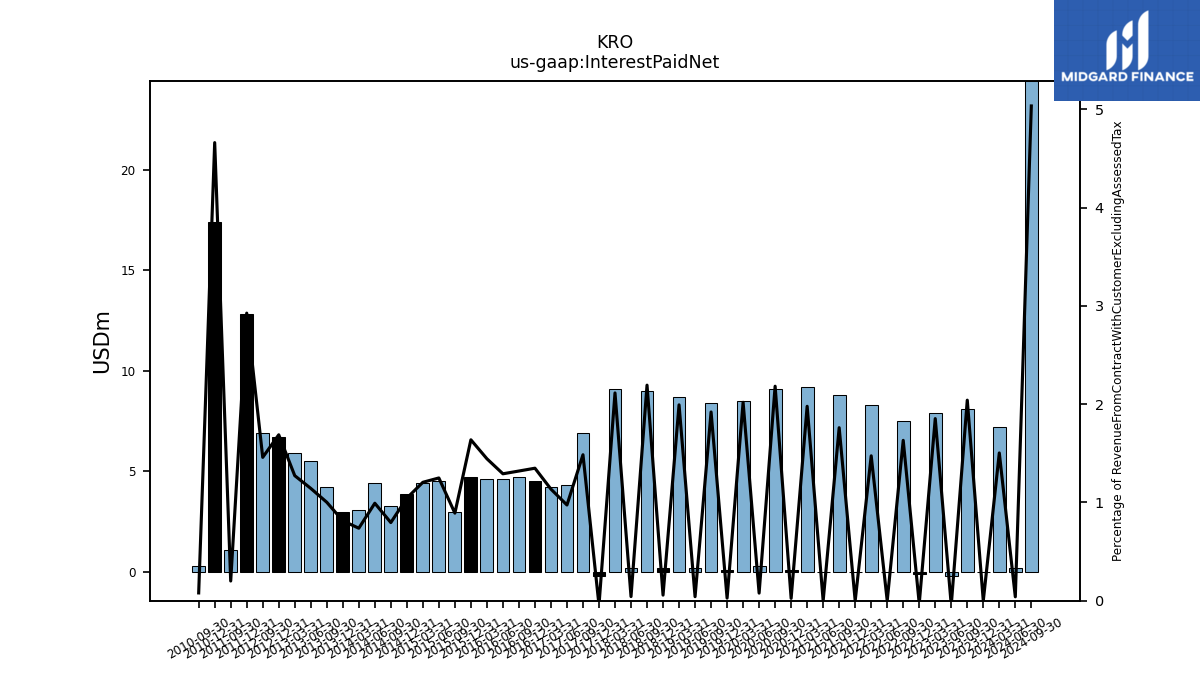
| Interest Paid Net | 7.20 | 0.00 | 8.10 | -0.20 | 7.90 | -0.10 | 7.50 | 0.00 | 8.30 | 0.00 | 8.80 | 0.00 | 9.20 | 0.10 | 9.10 | 0.30 | 8.50 | 0.10 | 8.40 | 0.20 | 8.70 | 0.20 | 9.00 | 0.20 | 9.10 | -0.20 | 6.90 | 4.30 | 4.20 | 4.50 | 4.70 | 4.60 | 4.60 | 4.70 | 3.00 | 4.50 | 4.40 | 3.90 | 3.30 | 4.40 | 3.10 | 3.00 | 4.20 | 5.50 | 5.90 | 6.70 | 6.90 | NA | NA | 12.80 | 1.10 | NA | NA | 17.40 | 0.30 | NA | |
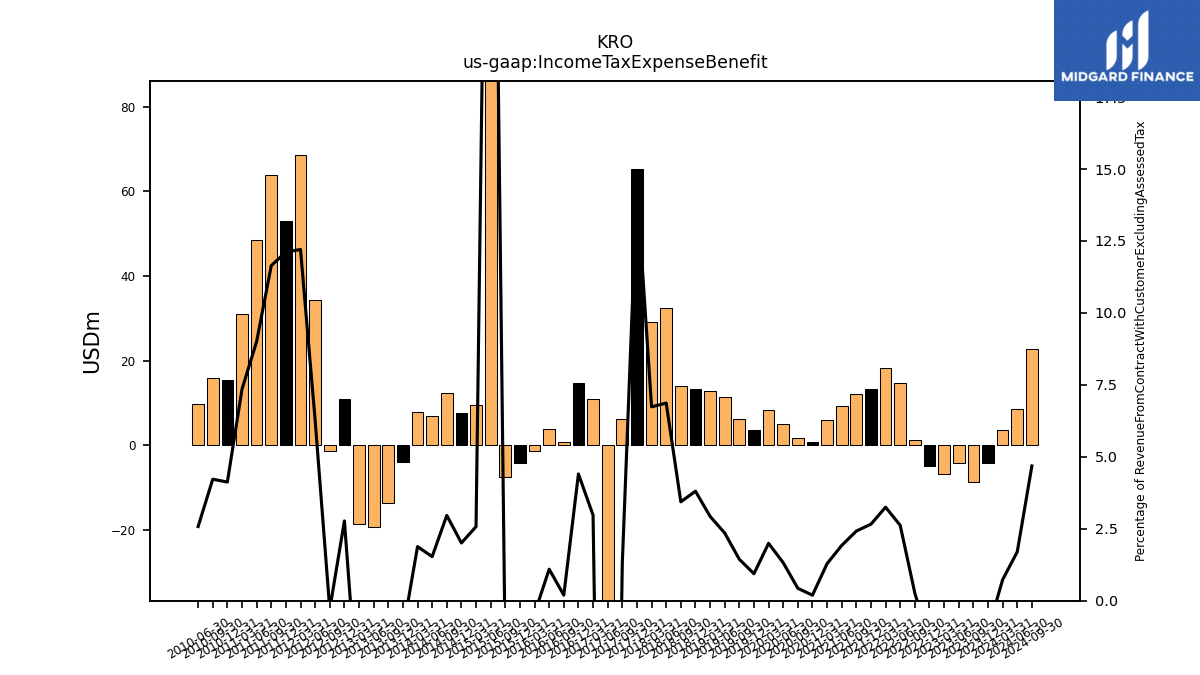
| Income Tax Expense Benefit | 3.50 | -4.10 | -8.70 | -4.10 | -6.90 | -4.90 | 1.20 | 14.80 | 18.30 | 13.20 | 12.10 | 9.20 | 6.00 | 0.80 | 1.80 | 5.10 | 8.40 | 3.50 | 6.30 | 11.40 | 12.80 | 13.30 | 14.10 | 32.40 | 29.00 | 65.20 | 6.10 | -131.10 | 11.00 | 14.70 | 0.70 | 3.90 | -1.40 | -4.30 | -7.40 | 145.10 | 9.40 | 7.50 | 12.30 | 6.80 | 7.90 | -3.90 | -13.60 | -19.20 | -18.50 | 11.00 | -1.40 | 34.20 | 68.50 | 53.00 | 63.80 | 48.40 | 30.90 | 15.40 | 15.90 | 9.80 | |
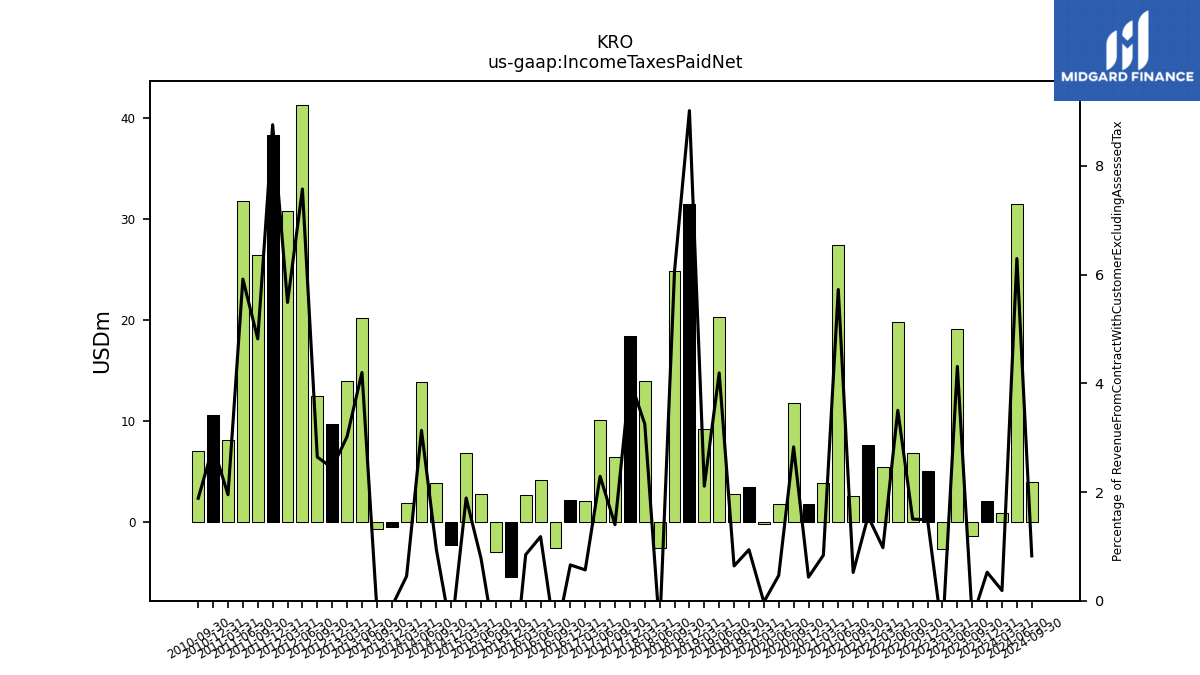
| Income Taxes Paid Net | 0.90 | 2.10 | -1.30 | 19.10 | -2.60 | 5.10 | 6.90 | 19.80 | 5.50 | 7.70 | 2.60 | 27.40 | 3.90 | 1.80 | 11.80 | 1.80 | -0.10 | 3.50 | 2.80 | 20.30 | 9.20 | 31.50 | 24.90 | -2.50 | 14.00 | 18.40 | 6.50 | 10.10 | 2.10 | 2.20 | -2.50 | 4.20 | 2.70 | -5.40 | -2.90 | 2.80 | 6.90 | -2.20 | 3.90 | 13.90 | 1.90 | -0.40 | -0.60 | 20.20 | 14.00 | 9.70 | 12.50 | 41.30 | 30.80 | 38.30 | 26.40 | 31.80 | 8.20 | 10.60 | 7.10 | NA | |
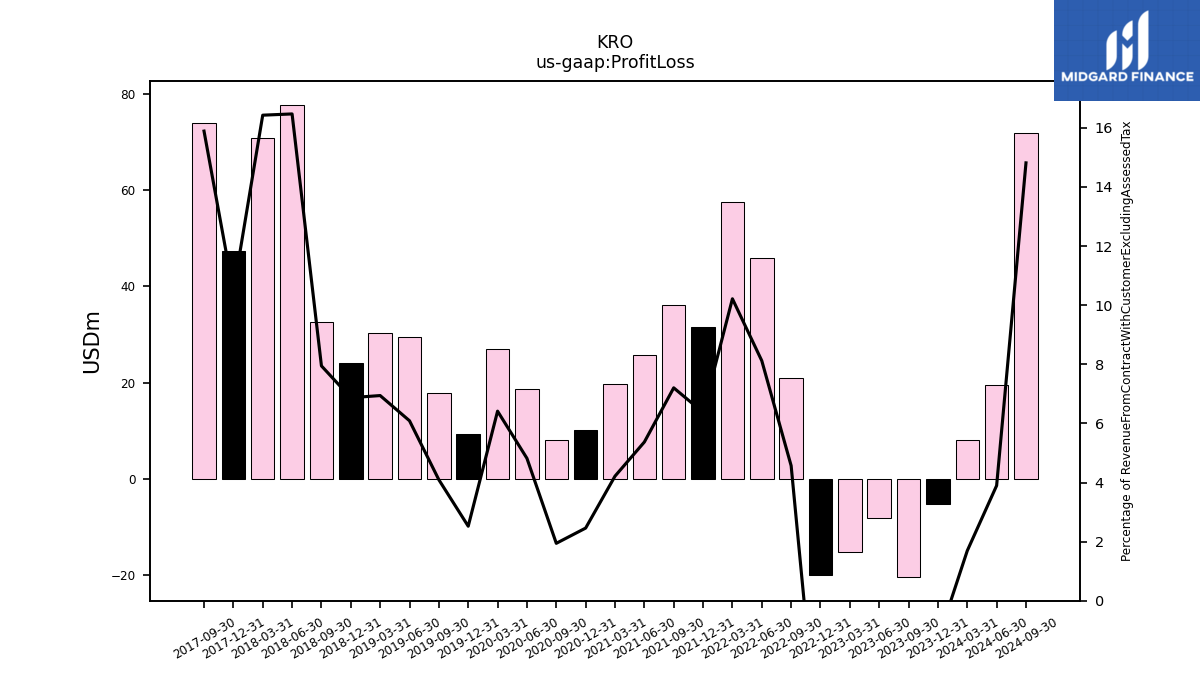
| Profit Loss | 8.10 | -5.30 | -20.40 | -8.20 | -15.20 | -19.90 | 21.00 | 45.90 | 57.50 | 31.60 | 36.00 | 25.70 | 19.60 | 10.20 | 8.10 | 18.60 | 27.00 | 9.40 | 17.90 | 29.50 | 30.30 | 24.00 | 32.60 | 77.70 | 70.70 | 47.40 | 73.80 | NA | NA | NA | NA | NA | NA | NA | NA | NA | NA | NA | NA | NA | NA | NA | NA | NA | NA | NA | NA | NA | NA | NA | NA | NA | NA | NA | NA | NA | |
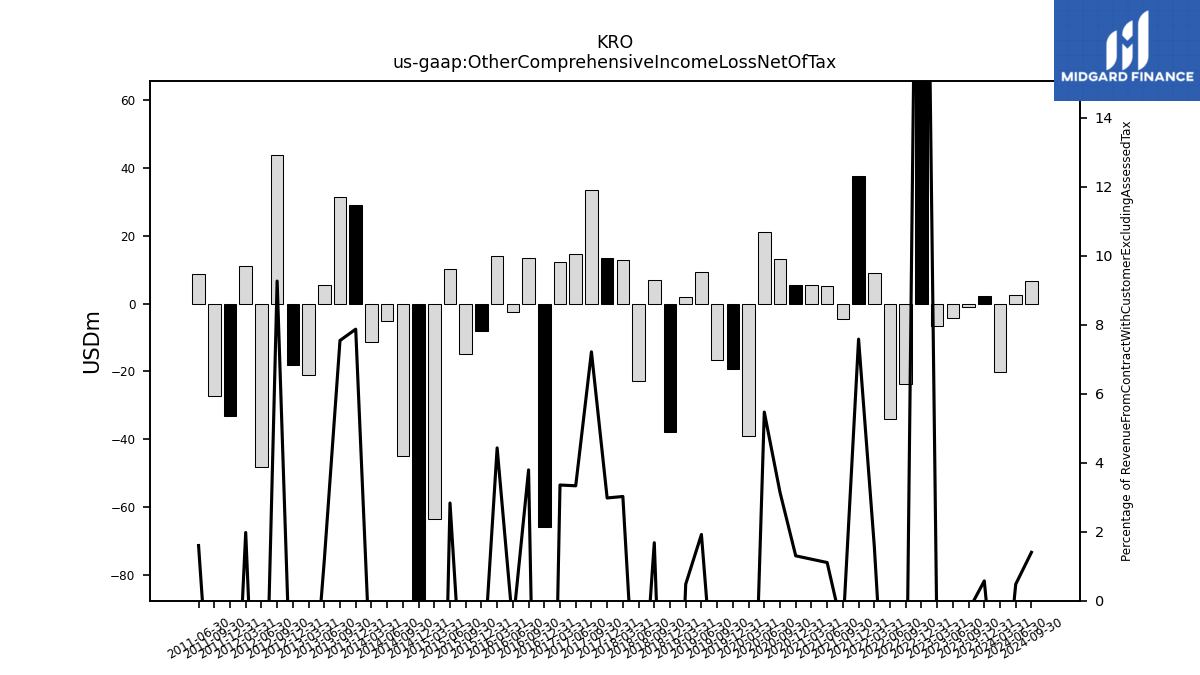
| Other Comprehensive Income Loss Net Of Tax | -20.10 | 2.30 | -1.10 | -4.20 | -6.60 | 121.50 | -23.80 | -34.00 | 8.90 | 37.60 | -4.40 | 5.30 | 5.60 | 5.40 | 13.10 | 21.10 | -39.00 | -19.30 | -16.60 | 9.30 | 2.10 | -37.90 | 6.90 | -22.80 | 13.00 | 13.50 | 33.50 | 14.70 | 12.40 | -65.80 | 13.50 | -2.60 | 14.10 | -8.00 | -14.80 | 10.20 | -63.60 | -122.30 | -45.00 | -5.10 | -11.40 | 29.00 | 31.60 | 5.60 | -21.10 | -18.10 | 43.80 | -48.10 | 11.10 | -33.10 | -27.20 | 8.60 | NA | NA | NA | NA | |
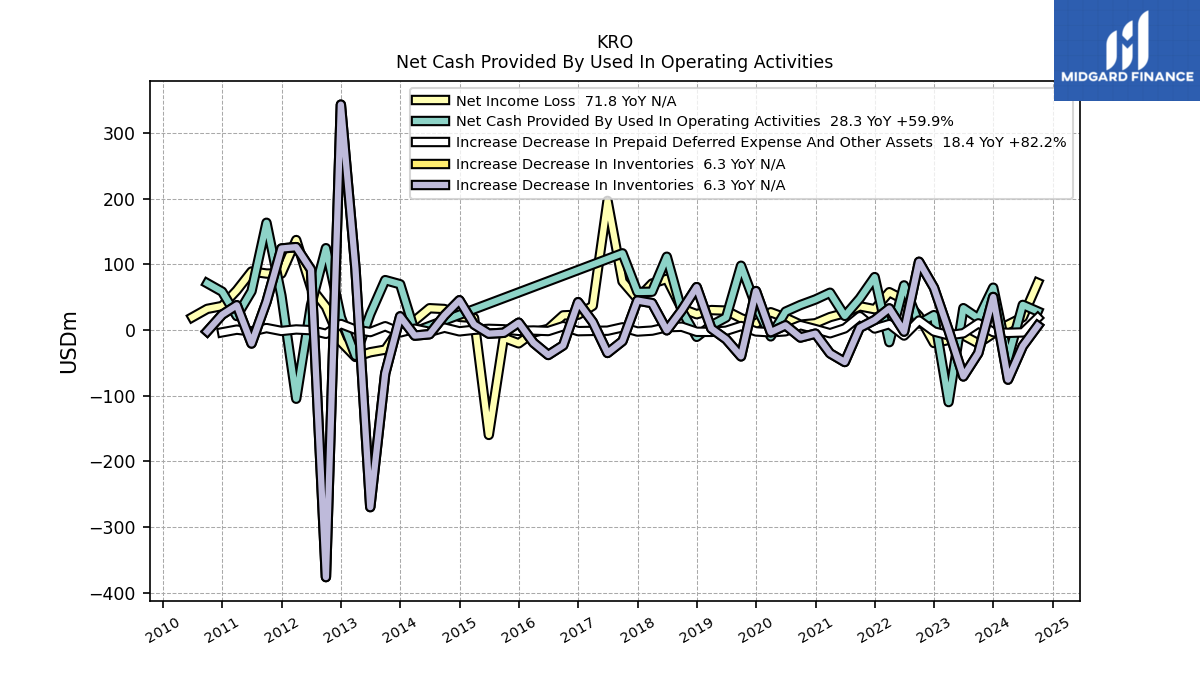
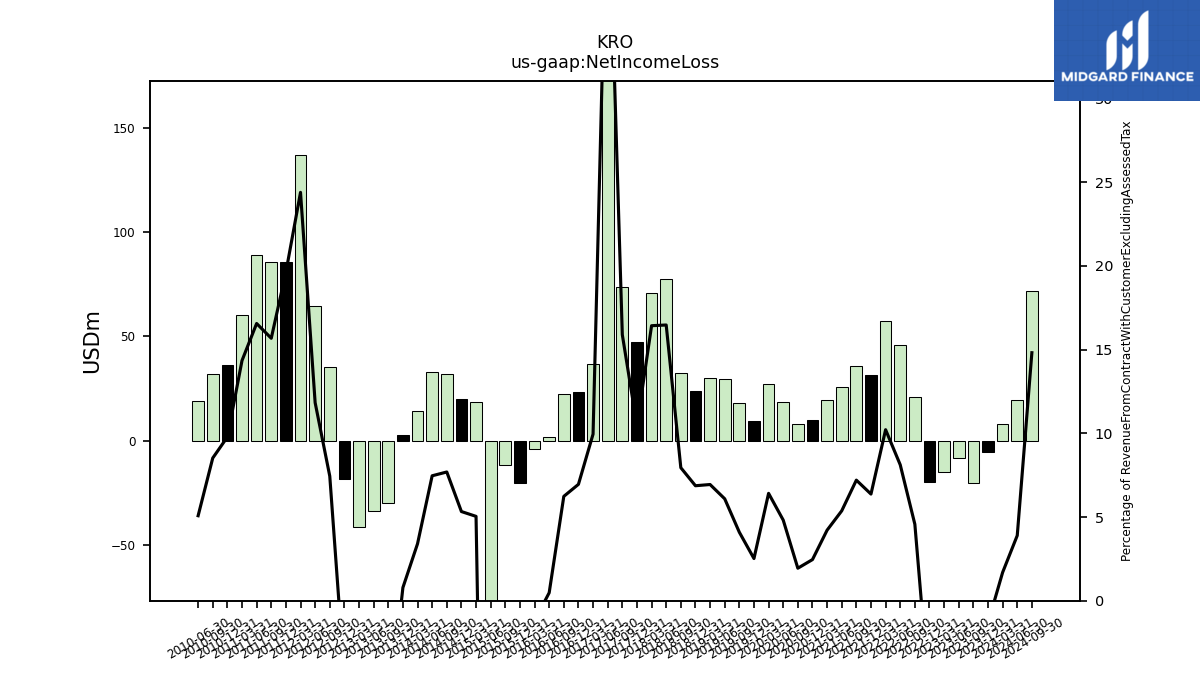
| Net Income Loss | 8.10 | -5.30 | -20.40 | -8.20 | -15.20 | -19.90 | 21.00 | 45.90 | 57.50 | 31.60 | 36.00 | 25.70 | 19.60 | 10.20 | 8.10 | 18.60 | 27.00 | 9.40 | 17.90 | 29.50 | 30.30 | 24.00 | 32.60 | 77.70 | 70.70 | 47.40 | 73.80 | 196.50 | 36.80 | 23.20 | 22.20 | 1.70 | -3.80 | -20.40 | -11.80 | -159.80 | 18.40 | 19.90 | 31.90 | 33.10 | 14.30 | 2.90 | -29.90 | -33.90 | -41.10 | -18.10 | 35.20 | 64.50 | 136.90 | 85.80 | 85.90 | 89.00 | 60.30 | 36.50 | 32.10 | 19.30 | |
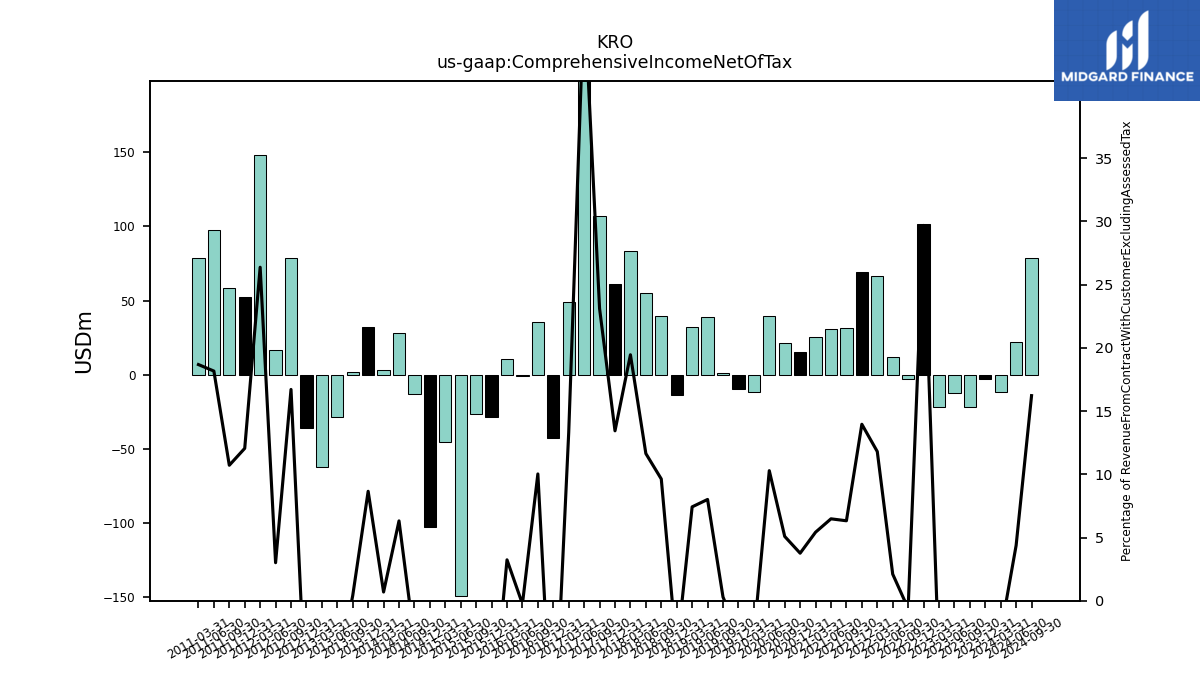
| Comprehensive Income Net Of Tax | -12.00 | -3.00 | -21.50 | -12.40 | -21.80 | 101.60 | -2.80 | 11.90 | 66.40 | 69.20 | 31.60 | 31.00 | 25.20 | 15.60 | 21.20 | 39.70 | -12.00 | -9.90 | 1.30 | 38.80 | 32.40 | -13.90 | 39.50 | 54.90 | 83.70 | 60.90 | 107.30 | 211.20 | 49.20 | -42.60 | 35.70 | -0.90 | 10.30 | -28.40 | -26.60 | -149.60 | -45.20 | -102.40 | -13.10 | 28.00 | 2.90 | 31.90 | 1.70 | -28.30 | -62.20 | -36.20 | 79.00 | 16.40 | 148.00 | 52.70 | 58.70 | 97.60 | 78.50 | NA | NA | NA |
| 2024-03-31 | 2023-12-31 | 2023-09-30 | 2023-06-30 | 2023-03-31 | 2022-12-31 | 2022-09-30 | 2022-06-30 | 2022-03-31 | 2021-12-31 | 2021-09-30 | 2021-06-30 | 2021-03-31 | 2020-12-31 | 2020-09-30 | 2020-06-30 | 2020-03-31 | 2019-12-31 | 2019-09-30 | 2019-06-30 | 2019-03-31 | 2018-12-31 | 2018-09-30 | 2018-06-30 | 2018-03-31 | 2017-12-31 | 2017-09-30 | 2017-06-30 | 2017-03-31 | 2016-12-31 | 2016-09-30 | 2016-06-30 | 2016-03-31 | 2015-12-31 | 2015-09-30 | 2015-06-30 | 2015-03-31 | 2014-12-31 | 2014-09-30 | 2014-06-30 | 2014-03-31 | 2013-12-31 | 2013-09-30 | 2013-06-30 | 2013-03-31 | 2012-12-31 | 2012-09-30 | 2012-06-30 | 2012-03-31 | 2011-12-31 | 2011-09-30 | 2011-06-30 | 2011-03-31 | 2010-12-31 | 2010-09-30 | 2010-06-30 | ||
|---|---|---|---|---|---|---|---|---|---|---|---|---|---|---|---|---|---|---|---|---|---|---|---|---|---|---|---|---|---|---|---|---|---|---|---|---|---|---|---|---|---|---|---|---|---|---|---|---|---|---|---|---|---|---|---|---|---|
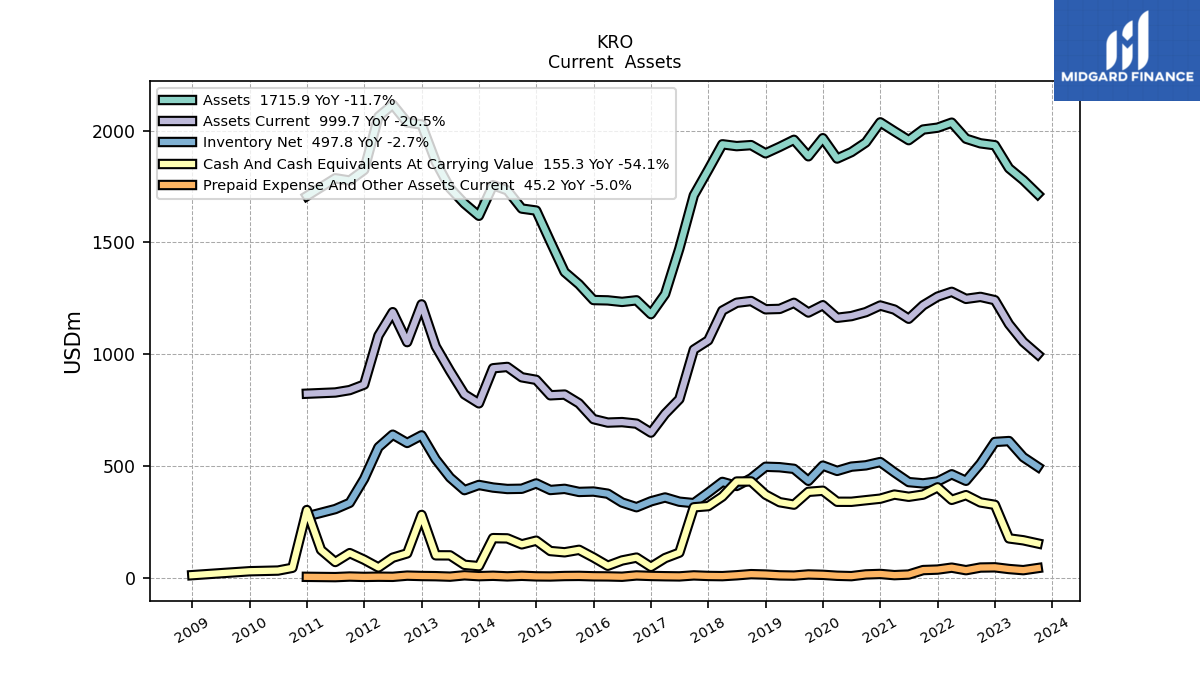
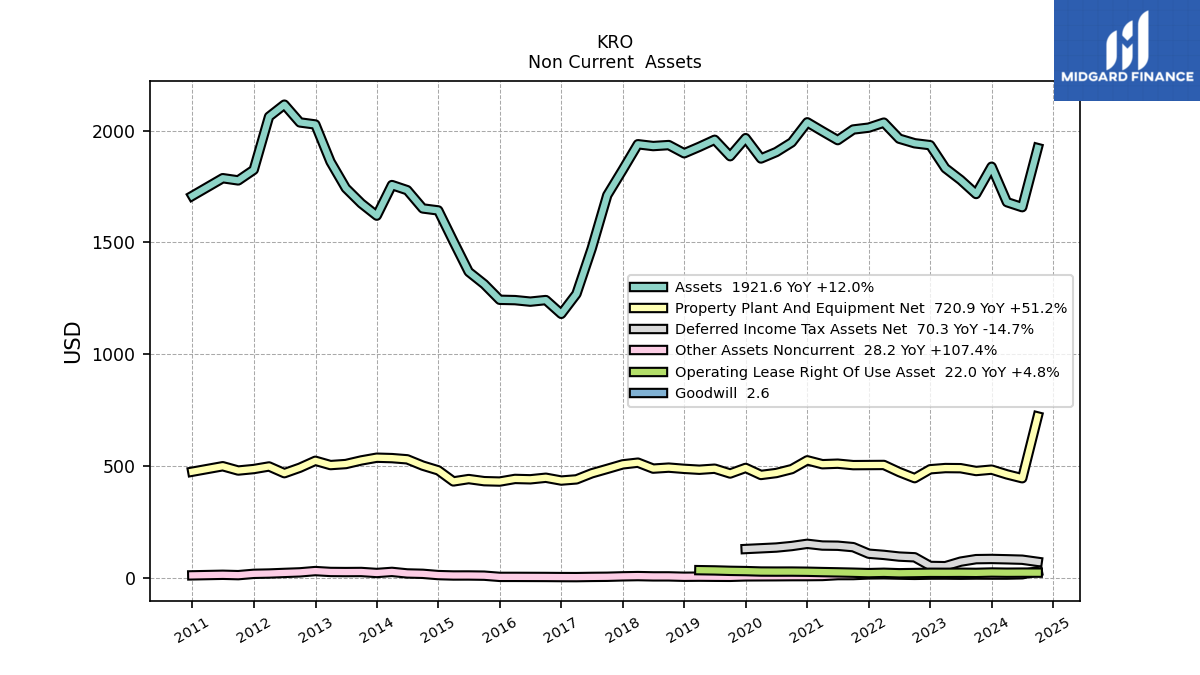
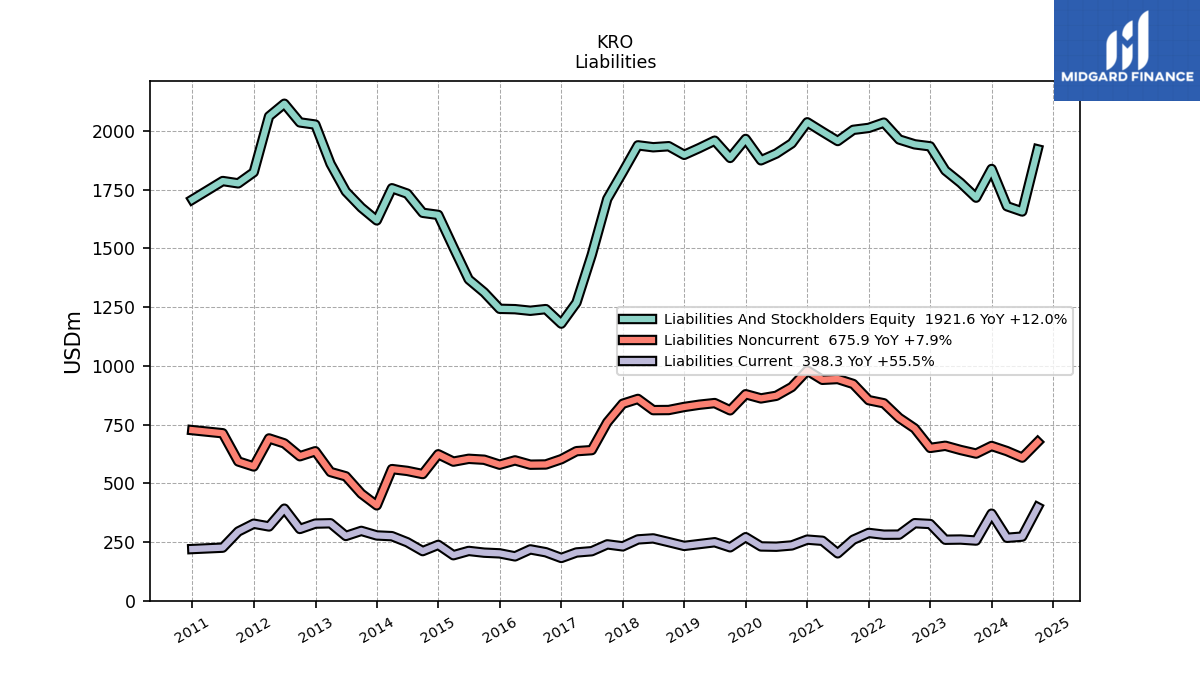
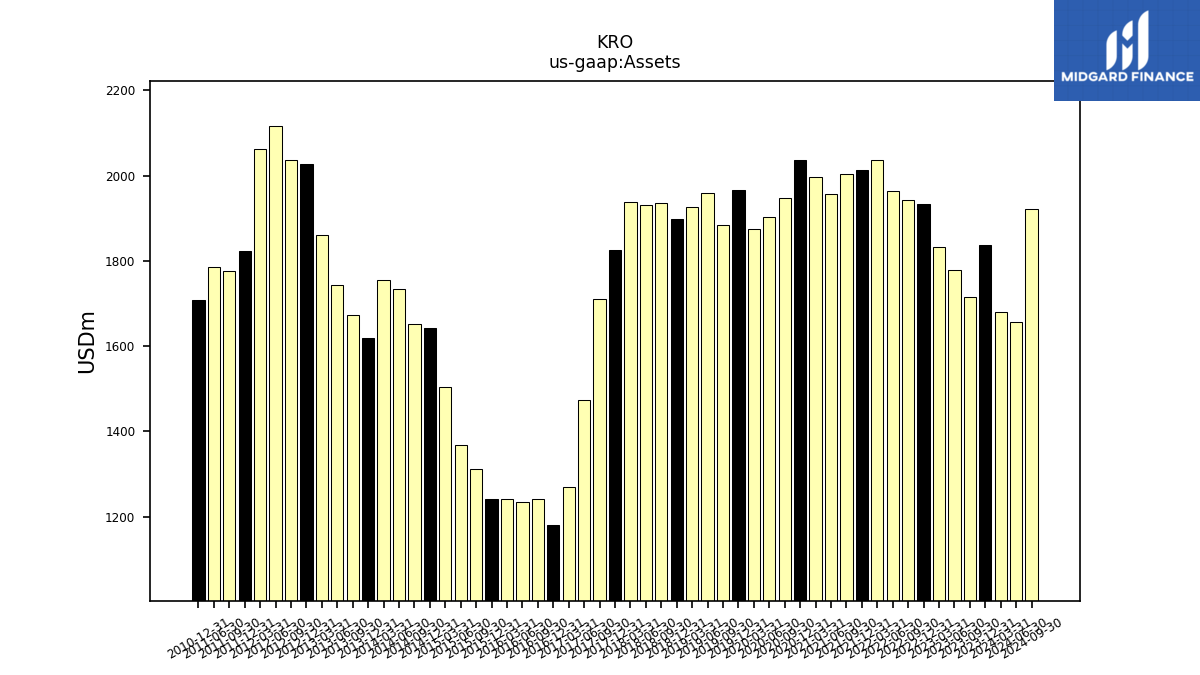
| Assets | 1679.40 | 1838.00 | 1715.90 | 1778.80 | 1831.50 | 1934.40 | 1942.90 | 1963.50 | 2035.30 | 2012.80 | 2004.50 | 1956.90 | 1996.60 | 2036.70 | 1946.90 | 1903.70 | 1874.80 | 1965.80 | 1884.90 | 1958.60 | 1927.10 | 1898.10 | 1934.90 | 1930.40 | 1938.60 | 1824.40 | 1710.40 | 1472.90 | 1269.00 | 1179.60 | 1241.50 | 1234.40 | 1241.20 | 1242.70 | 1312.70 | 1367.90 | 1504.50 | 1642.50 | 1651.40 | 1733.00 | 1756.00 | 1619.10 | 1673.80 | 1742.30 | 1860.30 | 2027.00 | 2036.20 | 2115.80 | 2062.10 | 1823.90 | 1776.70 | 1786.70 | NA | 1707.60 | NA | NA | |
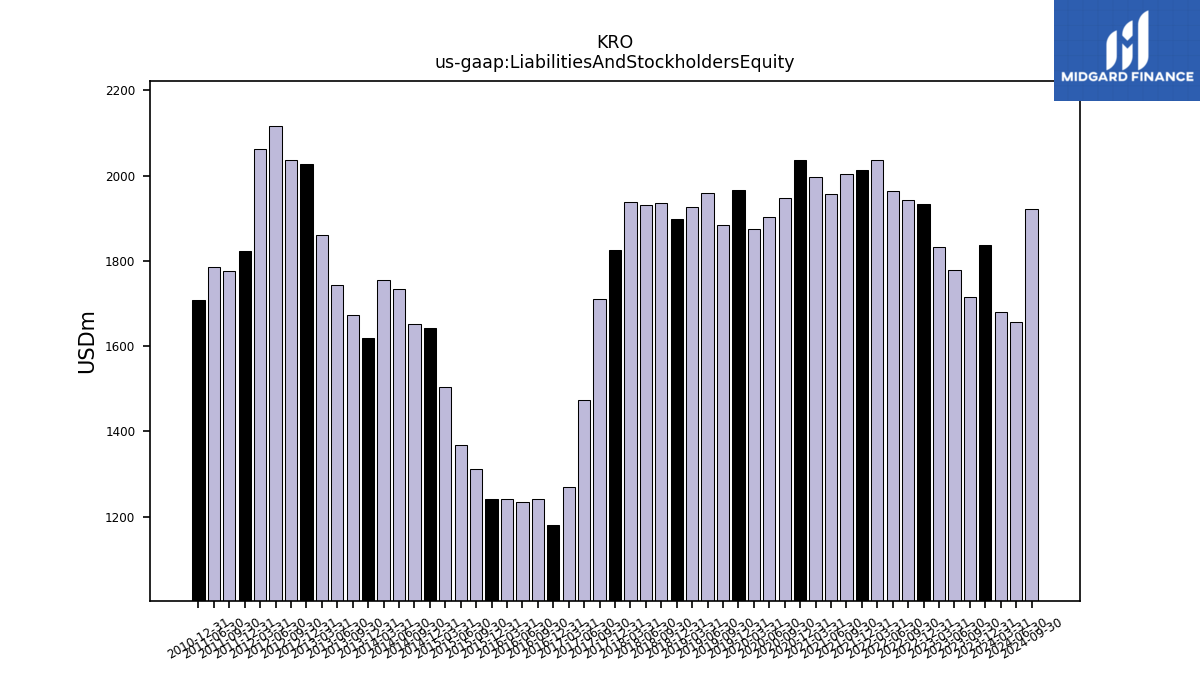
| Liabilities And Stockholders Equity | 1679.40 | 1838.00 | 1715.90 | 1778.80 | 1831.50 | 1934.40 | 1942.90 | 1963.50 | 2035.30 | 2012.80 | 2004.50 | 1956.90 | 1996.60 | 2036.70 | 1946.90 | 1903.70 | 1874.80 | 1965.80 | 1884.90 | 1958.60 | 1927.10 | 1898.10 | 1934.90 | 1930.40 | 1938.60 | 1824.40 | 1710.40 | 1472.90 | 1269.00 | 1179.60 | 1241.50 | 1234.40 | 1241.20 | 1242.70 | 1312.70 | 1367.90 | 1504.50 | 1642.50 | 1651.40 | 1733.00 | 1756.00 | 1619.10 | 1673.80 | 1742.30 | 1860.30 | 2027.00 | 2036.20 | 2115.80 | 2062.10 | 1823.90 | 1776.70 | 1786.70 | NA | 1707.60 | NA | NA | |
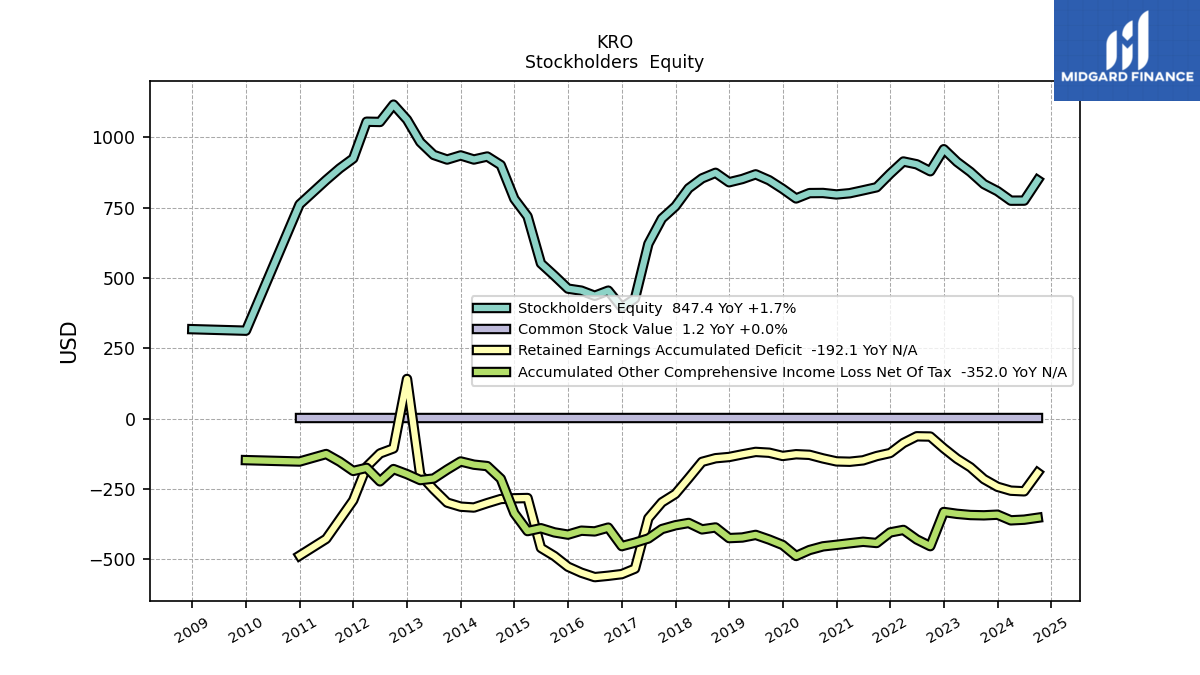
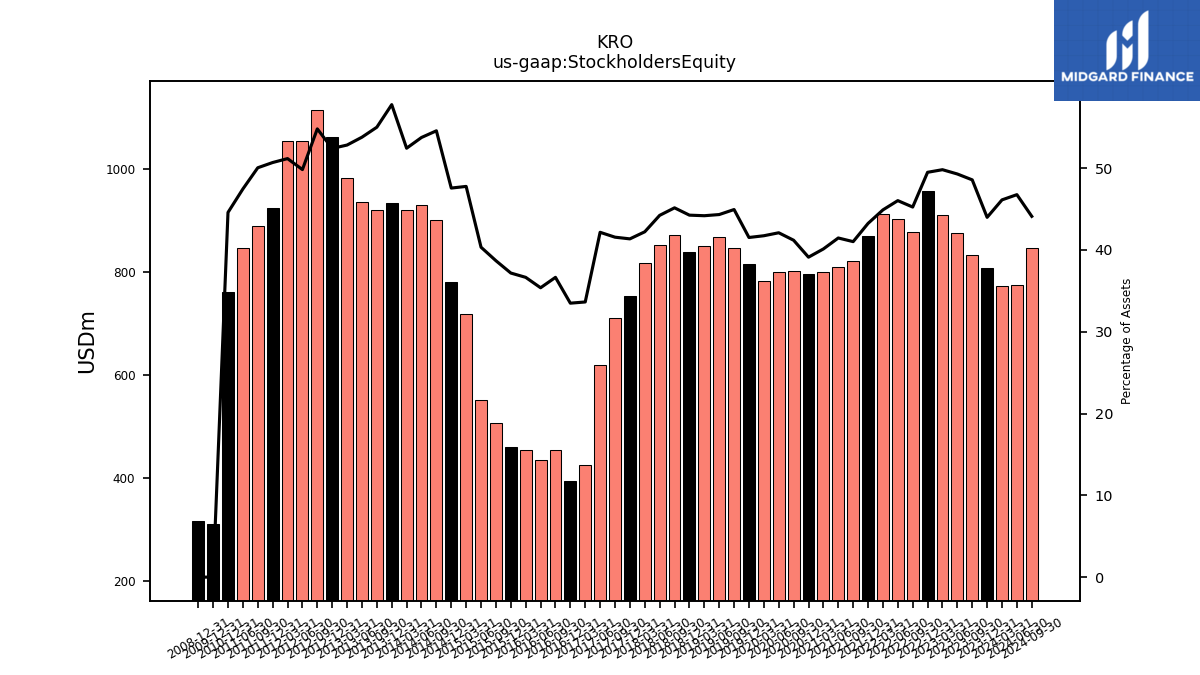
| Stockholders Equity | 774.40 | 808.30 | 833.20 | 876.50 | 912.10 | 957.20 | 878.90 | 903.60 | 913.60 | 870.20 | 822.00 | 811.20 | 800.90 | 796.50 | 801.70 | 801.30 | 782.30 | 816.10 | 846.90 | 868.00 | 851.30 | 839.80 | 873.40 | 853.60 | 818.30 | 754.30 | 710.70 | 620.80 | 426.80 | 395.00 | 454.90 | 436.60 | 454.80 | 461.90 | 507.70 | 551.60 | 718.50 | 781.10 | 900.90 | 931.30 | 920.60 | 935.10 | 920.50 | 936.90 | 982.50 | 1062.10 | 1115.60 | 1054.00 | 1054.90 | 924.30 | 889.00 | 847.70 | NA | 761.20 | NA | NA |
| 2024-03-31 | 2023-12-31 | 2023-09-30 | 2023-06-30 | 2023-03-31 | 2022-12-31 | 2022-09-30 | 2022-06-30 | 2022-03-31 | 2021-12-31 | 2021-09-30 | 2021-06-30 | 2021-03-31 | 2020-12-31 | 2020-09-30 | 2020-06-30 | 2020-03-31 | 2019-12-31 | 2019-09-30 | 2019-06-30 | 2019-03-31 | 2018-12-31 | 2018-09-30 | 2018-06-30 | 2018-03-31 | 2017-12-31 | 2017-09-30 | 2017-06-30 | 2017-03-31 | 2016-12-31 | 2016-09-30 | 2016-06-30 | 2016-03-31 | 2015-12-31 | 2015-09-30 | 2015-06-30 | 2015-03-31 | 2014-12-31 | 2014-09-30 | 2014-06-30 | 2014-03-31 | 2013-12-31 | 2013-09-30 | 2013-06-30 | 2013-03-31 | 2012-12-31 | 2012-09-30 | 2012-06-30 | 2012-03-31 | 2011-12-31 | 2011-09-30 | 2011-06-30 | 2011-03-31 | 2010-12-31 | 2010-09-30 | 2010-06-30 | ||
|---|---|---|---|---|---|---|---|---|---|---|---|---|---|---|---|---|---|---|---|---|---|---|---|---|---|---|---|---|---|---|---|---|---|---|---|---|---|---|---|---|---|---|---|---|---|---|---|---|---|---|---|---|---|---|---|---|---|
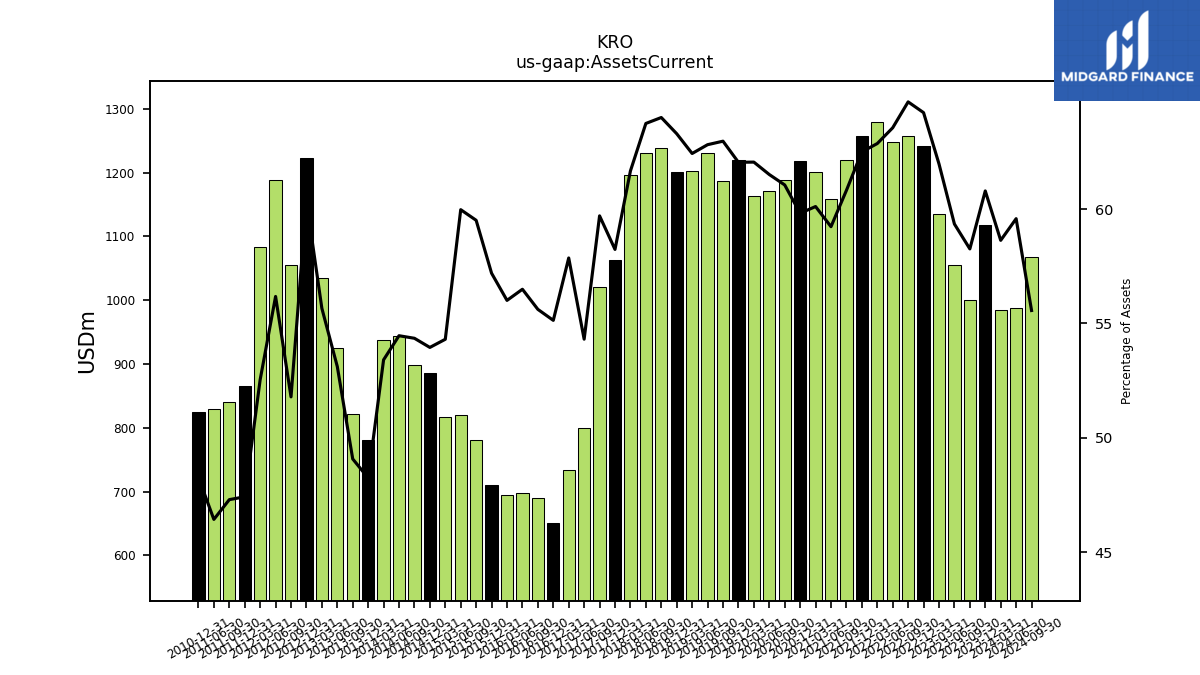
| Assets Current | 984.70 | 1117.40 | 999.70 | 1055.70 | 1135.10 | 1242.20 | 1256.80 | 1247.90 | 1279.50 | 1258.00 | 1219.10 | 1159.10 | 1200.20 | 1218.30 | 1188.70 | 1171.00 | 1163.40 | 1219.70 | 1186.90 | 1230.30 | 1203.10 | 1201.40 | 1238.40 | 1230.50 | 1195.50 | 1062.50 | 1021.20 | 800.00 | 734.30 | 650.40 | 690.50 | 697.40 | 695.20 | 710.80 | 781.20 | 820.40 | 817.10 | 886.20 | 897.60 | 943.90 | 937.90 | 781.20 | 821.50 | 925.50 | 1035.50 | 1223.40 | 1054.60 | 1188.70 | 1083.50 | 865.00 | 840.40 | 829.70 | NA | 824.30 | NA | NA | |
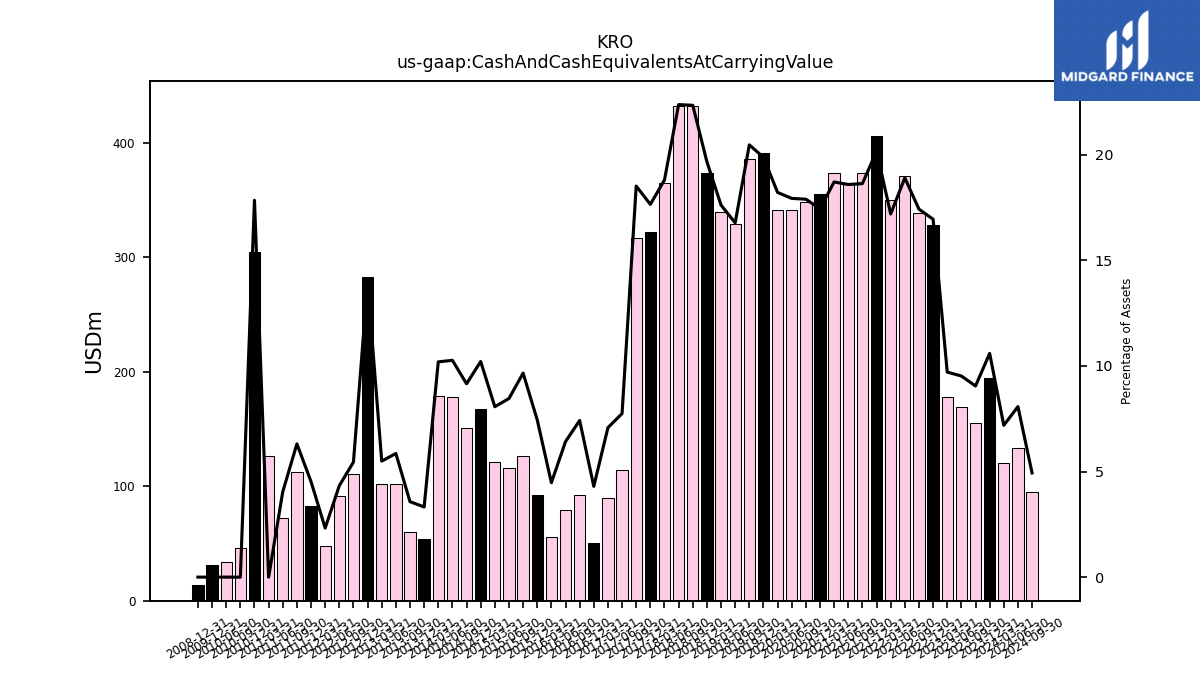
| Cash And Cash Equivalents At Carrying Value | 120.70 | 194.70 | 155.30 | 169.40 | 177.80 | 327.80 | 338.50 | 371.20 | 350.00 | 406.00 | 373.50 | 363.80 | 373.60 | 355.30 | 348.40 | 341.40 | 341.50 | 390.80 | 385.80 | 328.60 | 339.50 | 373.30 | 432.30 | 431.90 | 364.60 | 322.00 | 316.70 | 114.10 | 89.80 | 50.70 | 92.10 | 79.20 | 55.50 | 92.50 | 126.80 | 115.70 | 121.40 | 167.70 | 151.20 | 177.90 | 179.00 | 53.80 | 59.80 | 102.00 | 102.20 | 282.70 | 110.90 | 91.60 | 47.90 | 82.50 | 112.10 | 72.20 | 126.40 | 304.70 | 46.40 | 34.10 | |
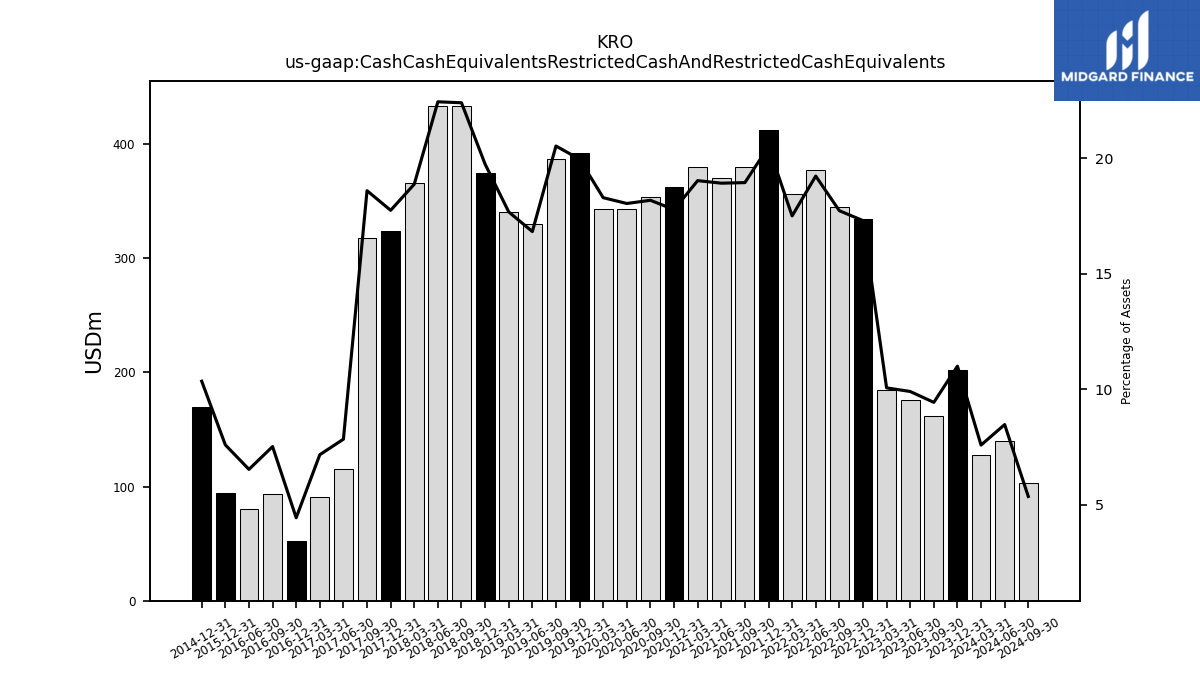
| Cash Cash Equivalents Restricted Cash And Restricted Cash Equivalents | 127.30 | 202.10 | 161.80 | 176.10 | 184.20 | 334.60 | 344.40 | 377.50 | 356.20 | 412.60 | 379.70 | 370.20 | 379.90 | 362.00 | 353.90 | 343.40 | 342.90 | 392.30 | 386.90 | 329.50 | 340.60 | 374.70 | 433.40 | 433.20 | 365.90 | 323.70 | 318.00 | 115.40 | 90.90 | 52.30 | 93.30 | 80.60 | NA | 94.30 | NA | NA | NA | 169.90 | NA | NA | NA | NA | NA | NA | NA | NA | NA | NA | NA | NA | NA | NA | NA | NA | NA | NA | |
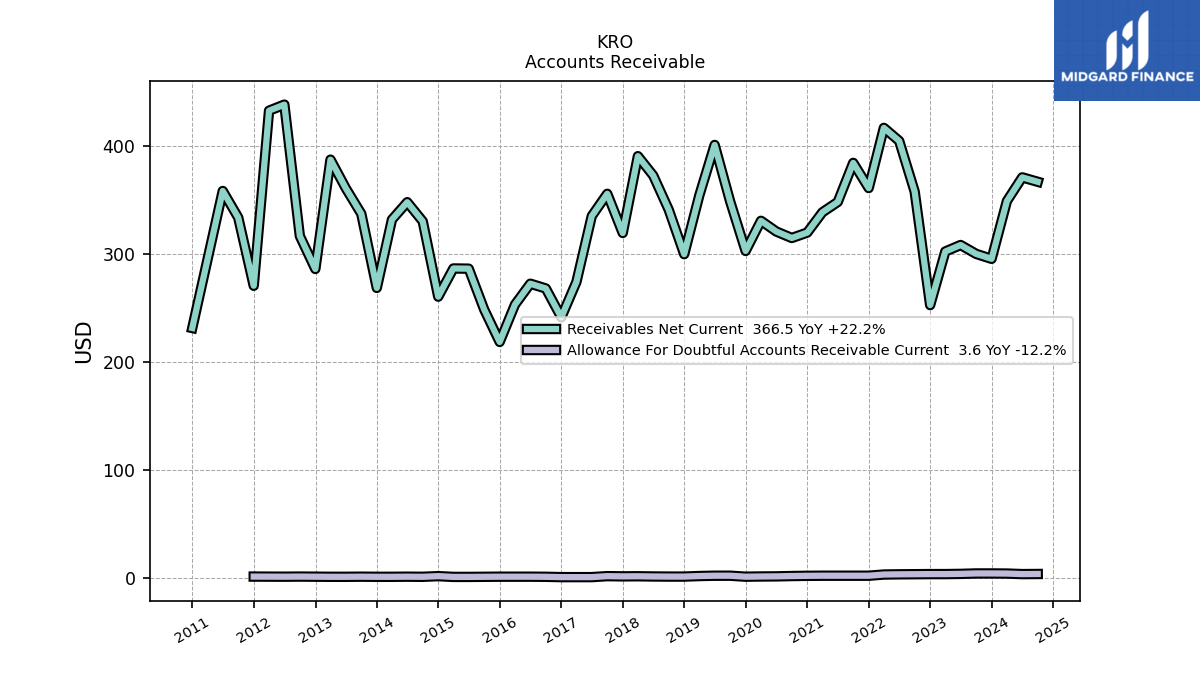
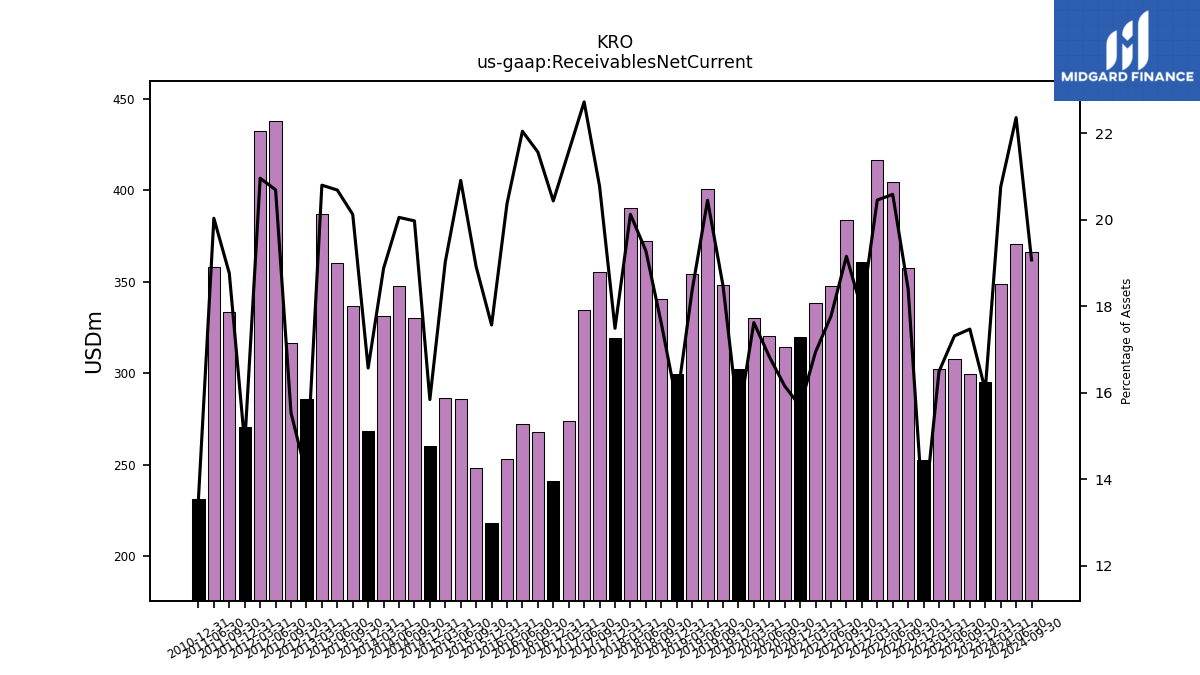
| Receivables Net Current | 348.70 | 295.20 | 299.80 | 308.00 | 302.00 | 252.40 | 357.50 | 404.30 | 416.40 | 360.70 | 384.00 | 347.80 | 338.30 | 319.50 | 314.50 | 320.50 | 330.40 | 302.50 | 348.30 | 400.60 | 354.00 | 299.50 | 340.70 | 372.30 | 390.20 | 319.10 | 355.40 | 334.80 | 273.90 | 241.10 | 267.80 | 272.20 | 252.90 | 218.30 | 248.30 | 286.10 | 286.30 | 260.20 | 329.90 | 347.60 | 331.50 | 268.30 | 336.90 | 360.50 | 387.00 | 285.80 | 316.30 | 437.90 | 432.30 | 270.30 | 333.40 | 358.00 | NA | 231.20 | NA | NA | |
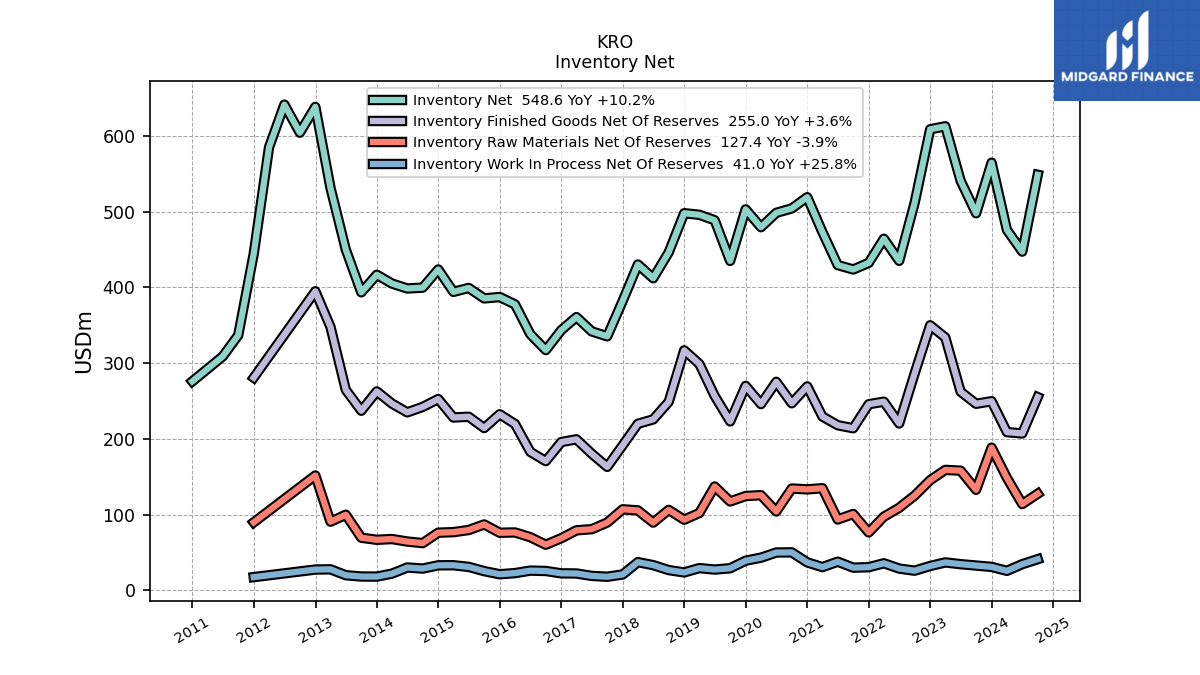
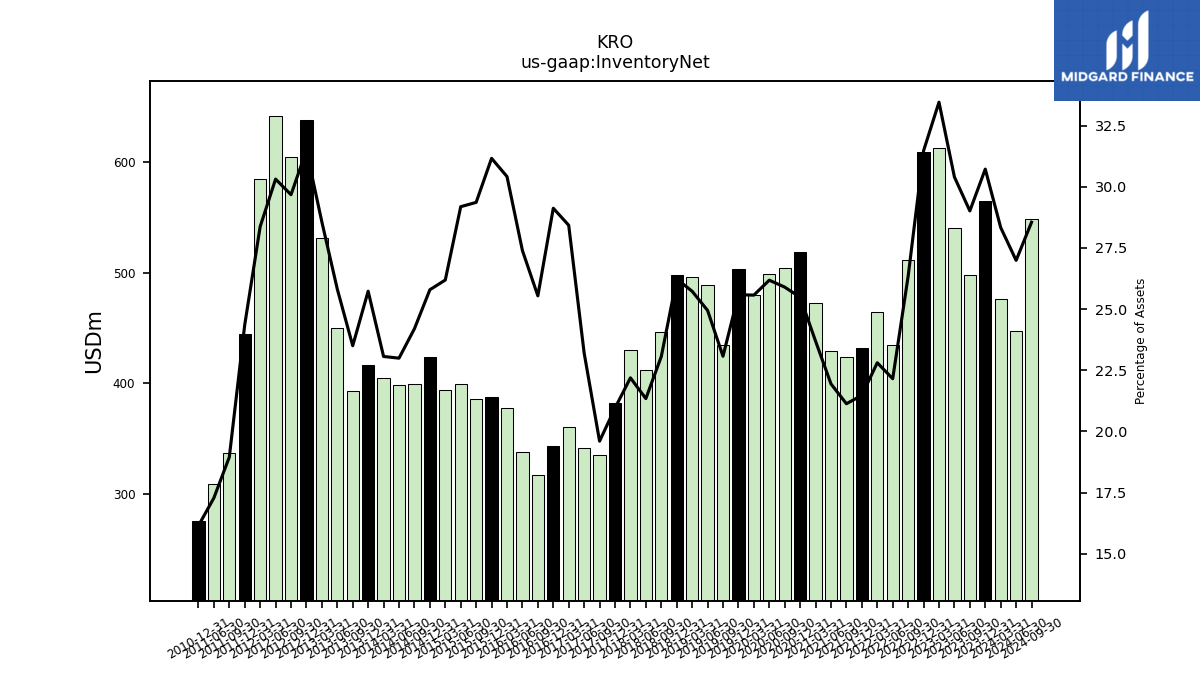
| Inventory Net | 475.80 | 564.60 | 497.80 | 540.70 | 612.70 | 608.70 | 511.70 | 435.00 | 464.20 | 432.30 | 423.60 | 429.40 | 473.00 | 519.00 | 504.20 | 498.40 | 479.40 | 503.00 | 434.90 | 488.60 | 495.80 | 497.90 | 446.20 | 412.00 | 430.20 | 382.30 | 335.30 | 341.80 | 360.70 | 343.50 | 317.10 | 338.10 | 377.50 | 387.20 | 385.40 | 399.20 | 394.00 | 423.60 | 399.60 | 398.50 | 405.00 | 416.60 | 393.40 | 449.80 | 531.30 | 638.30 | 604.20 | 641.30 | 585.00 | 444.20 | 336.70 | 308.80 | NA | 275.80 | NA | NA | |
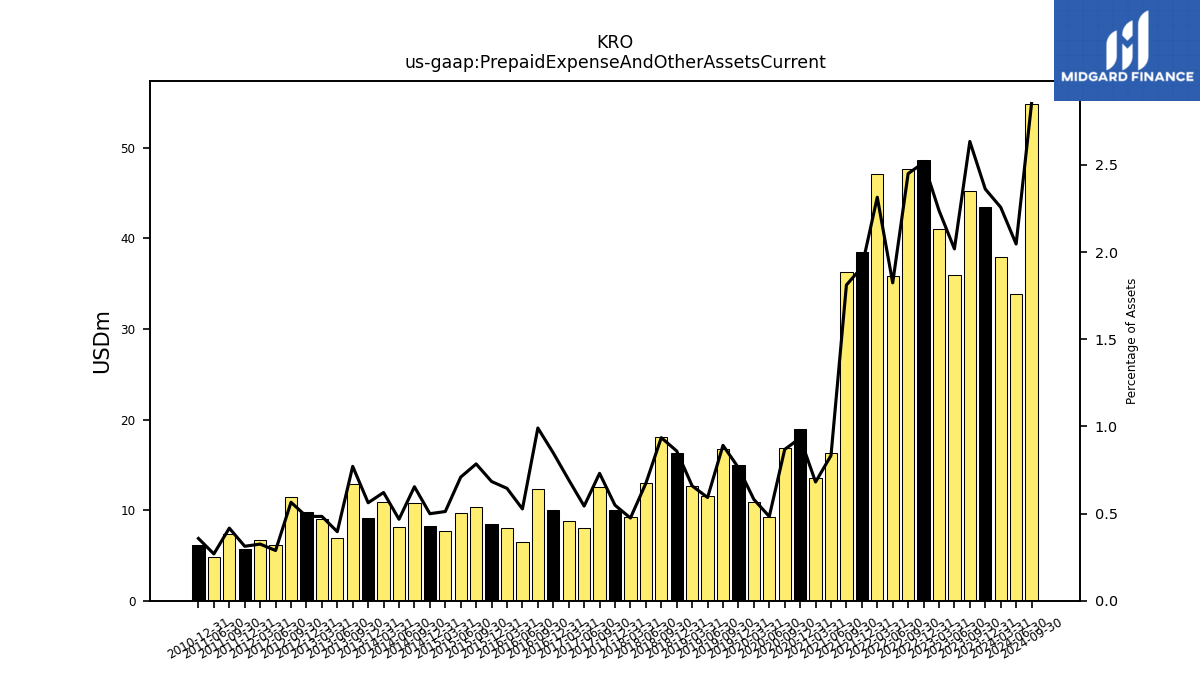
| Prepaid Expense And Other Assets Current | 37.90 | 43.40 | 45.20 | 35.90 | 41.00 | 48.60 | 47.60 | 35.80 | 47.10 | 38.50 | 36.30 | 16.30 | 13.60 | 19.00 | 16.90 | 9.20 | 10.90 | 15.00 | 16.80 | 11.60 | 12.70 | 16.30 | 18.10 | 13.00 | 9.20 | 10.00 | 12.50 | 8.00 | 8.80 | 10.00 | 12.30 | 6.50 | 8.00 | 8.50 | 10.30 | 9.70 | 7.70 | 8.20 | 10.80 | 8.10 | 10.90 | 9.10 | 12.90 | 6.90 | 9.00 | 9.80 | 11.50 | 6.10 | 6.70 | 5.70 | 7.40 | 4.80 | NA | 6.10 | NA | NA | |
| Land | 43.30 | 44.70 | 42.40 | 41.90 | 42.20 | 41.90 | 38.80 | 41.00 | 43.80 | 43.90 | 44.10 | 43.20 | 42.70 | 44.10 | 41.80 | 40.20 | 39.10 | 40.40 | 39.30 | 40.90 | 40.40 | 41.00 | 41.40 | 41.10 | 43.20 | 42.00 | 41.40 | 40.00 | 37.90 | 37.30 | 39.10 | 38.50 | 38.70 | 37.80 | 38.70 | 39.60 | 38.30 | 42.60 | 45.10 | 47.90 | 48.30 | 46.30 | 45.40 | 44.20 | 43.60 | 45.20 | 43.90 | 41.90 | 44.60 | 43.20 | 45.20 | 47.20 | NA | 44.30 | NA | NA | |
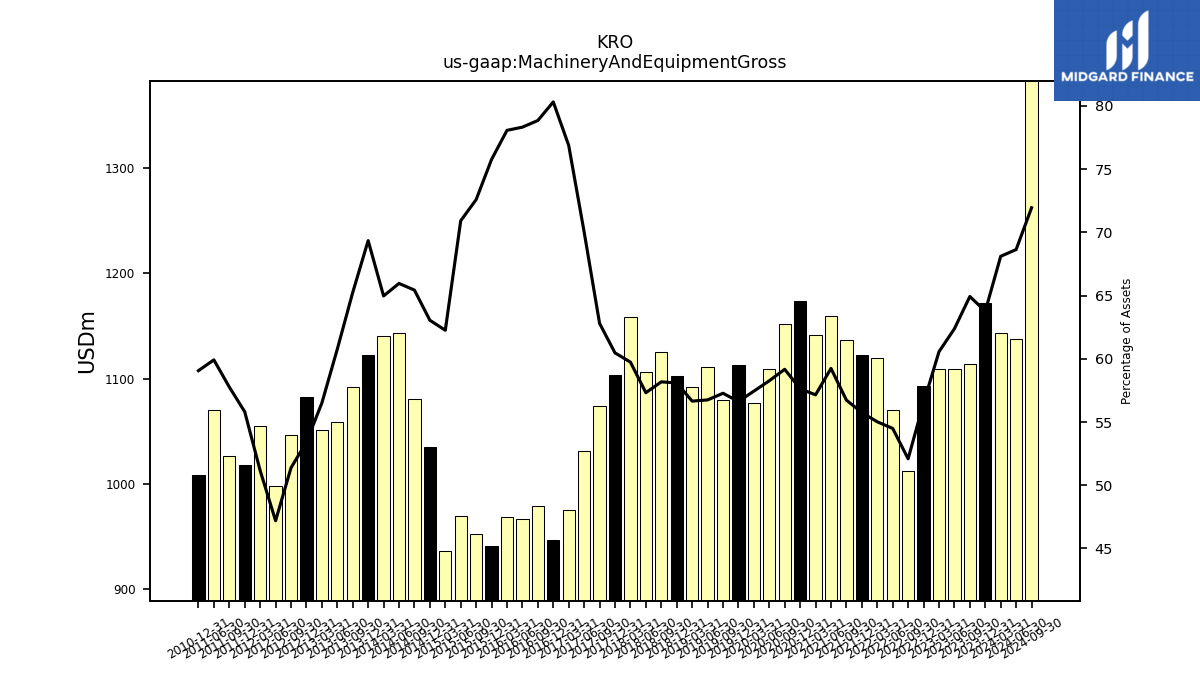
| Machinery And Equipment Gross | 1143.80 | 1172.00 | 1114.10 | 1109.60 | 1109.20 | 1093.20 | 1012.10 | 1070.00 | 1119.80 | 1122.10 | 1137.20 | 1159.30 | 1141.10 | 1173.70 | 1152.00 | 1109.20 | 1076.90 | 1113.10 | 1079.60 | 1111.50 | 1091.80 | 1102.60 | 1125.70 | 1106.50 | 1158.10 | 1103.20 | 1074.20 | 1031.50 | 975.50 | 947.40 | 978.90 | 966.80 | 969.00 | 941.60 | 952.90 | 970.10 | 936.70 | 1035.60 | 1080.60 | 1143.10 | 1140.90 | 1122.80 | 1092.10 | 1058.70 | 1051.20 | 1082.90 | 1046.20 | 998.60 | 1055.00 | 1018.00 | 1026.40 | 1070.50 | NA | 1008.60 | NA | NA |
| 2024-03-31 | 2023-12-31 | 2023-09-30 | 2023-06-30 | 2023-03-31 | 2022-12-31 | 2022-09-30 | 2022-06-30 | 2022-03-31 | 2021-12-31 | 2021-09-30 | 2021-06-30 | 2021-03-31 | 2020-12-31 | 2020-09-30 | 2020-06-30 | 2020-03-31 | 2019-12-31 | 2019-09-30 | 2019-06-30 | 2019-03-31 | 2018-12-31 | 2018-09-30 | 2018-06-30 | 2018-03-31 | 2017-12-31 | 2017-09-30 | 2017-06-30 | 2017-03-31 | 2016-12-31 | 2016-09-30 | 2016-06-30 | 2016-03-31 | 2015-12-31 | 2015-09-30 | 2015-06-30 | 2015-03-31 | 2014-12-31 | 2014-09-30 | 2014-06-30 | 2014-03-31 | 2013-12-31 | 2013-09-30 | 2013-06-30 | 2013-03-31 | 2012-12-31 | 2012-09-30 | 2012-06-30 | 2012-03-31 | 2011-12-31 | 2011-09-30 | 2011-06-30 | 2011-03-31 | 2010-12-31 | 2010-09-30 | 2010-06-30 | ||
|---|---|---|---|---|---|---|---|---|---|---|---|---|---|---|---|---|---|---|---|---|---|---|---|---|---|---|---|---|---|---|---|---|---|---|---|---|---|---|---|---|---|---|---|---|---|---|---|---|---|---|---|---|---|---|---|---|---|
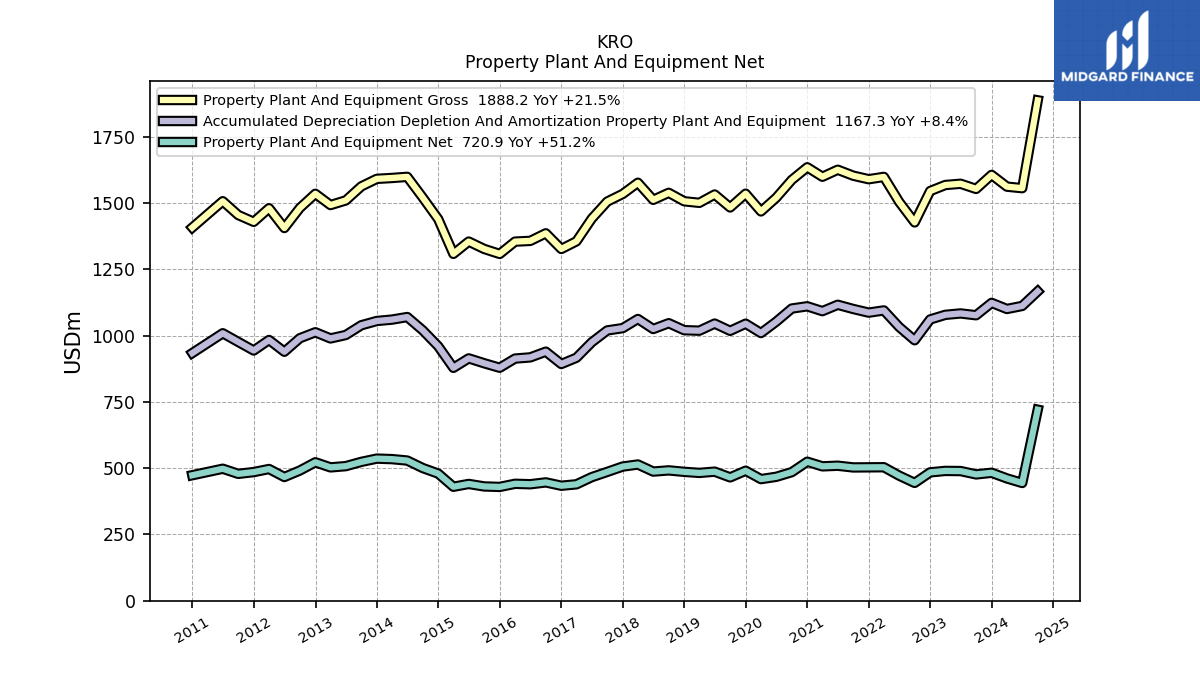
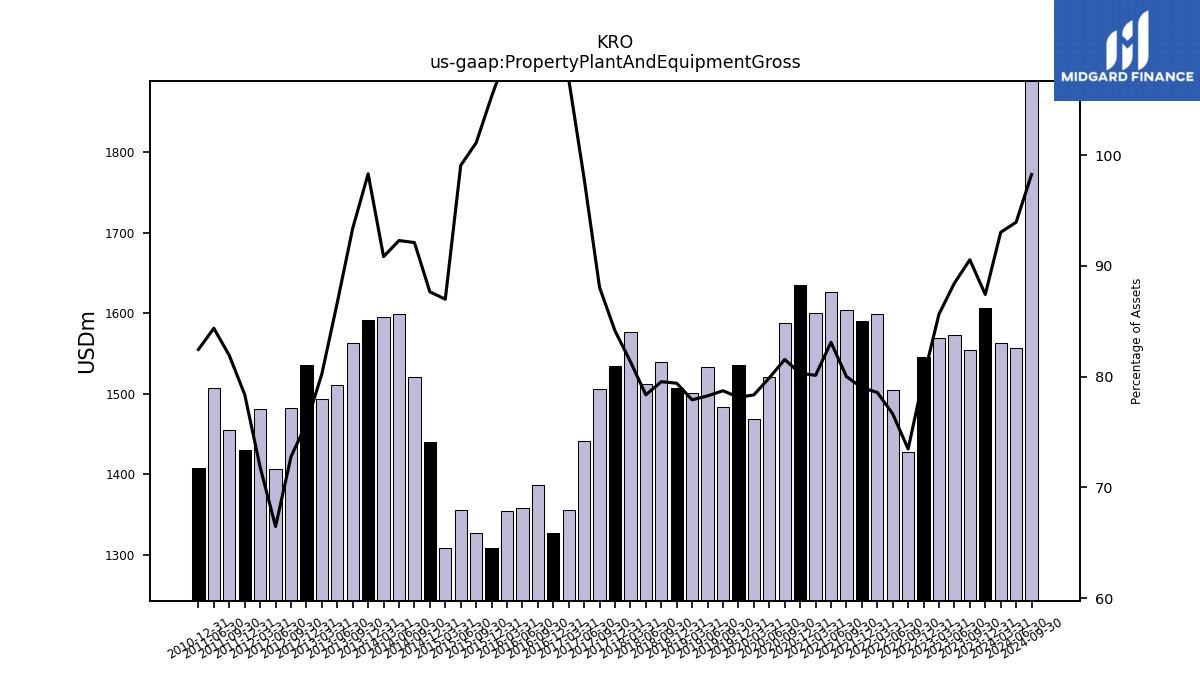
| Property Plant And Equipment Gross | 1562.50 | 1606.90 | 1553.90 | 1573.40 | 1568.70 | 1545.90 | 1427.50 | 1505.00 | 1599.30 | 1590.50 | 1603.90 | 1626.30 | 1599.80 | 1635.60 | 1587.80 | 1520.90 | 1469.00 | 1536.00 | 1484.00 | 1532.90 | 1501.40 | 1507.30 | 1539.20 | 1512.70 | 1577.30 | 1535.10 | 1506.20 | 1441.80 | 1356.20 | 1327.30 | 1386.50 | 1357.90 | 1355.10 | 1308.60 | 1327.40 | 1355.30 | 1308.90 | 1439.90 | 1521.20 | 1599.50 | 1595.20 | 1591.90 | 1563.50 | 1510.60 | 1493.00 | 1535.60 | 1482.00 | 1406.40 | 1481.10 | 1429.70 | 1455.40 | 1507.50 | NA | 1408.10 | NA | NA | |
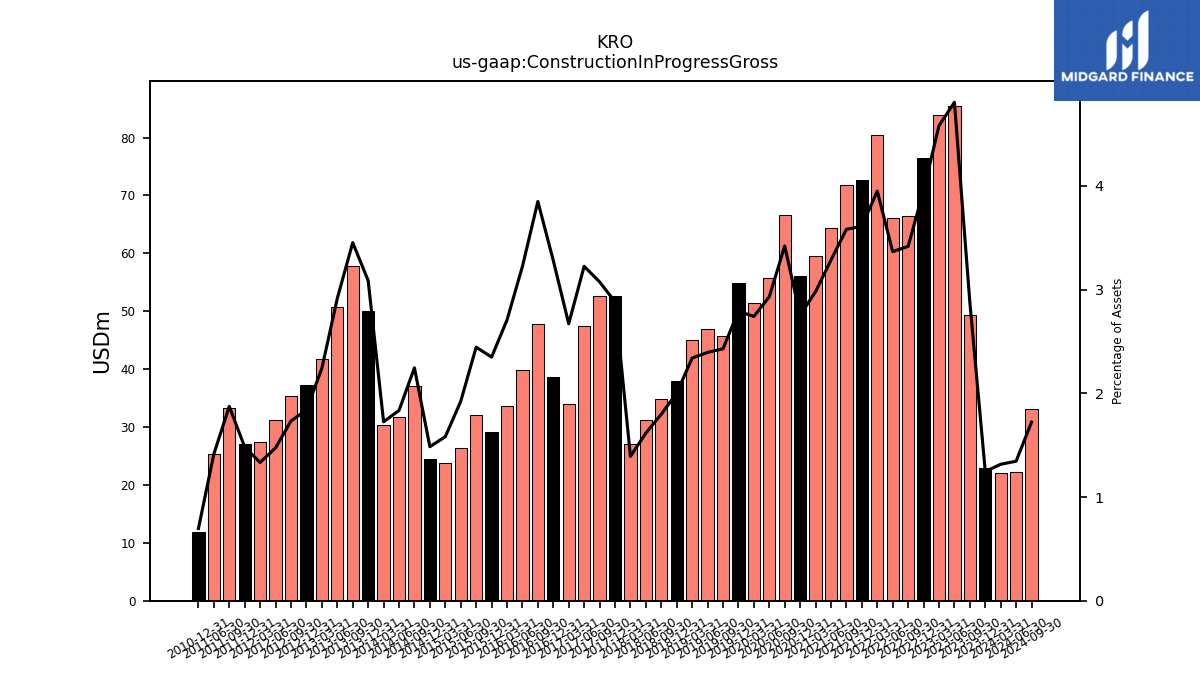
| Construction In Progress Gross | 22.10 | 22.90 | 49.40 | 85.50 | 83.90 | 76.50 | 66.40 | 66.10 | 80.40 | 72.70 | 71.80 | 64.30 | 59.50 | 56.10 | 66.60 | 55.80 | 51.40 | 54.90 | 45.80 | 46.90 | 45.10 | 38.00 | 34.80 | 31.20 | 27.00 | 52.60 | 52.60 | 47.50 | 33.90 | 38.70 | 47.80 | 39.80 | 33.60 | 29.20 | 32.10 | 26.30 | 23.80 | 24.40 | 37.10 | 31.80 | 30.30 | 50.00 | 57.80 | 50.80 | 41.70 | 37.30 | 35.30 | 31.20 | 27.50 | 27.00 | 33.30 | 25.30 | NA | 11.90 | NA | NA | |
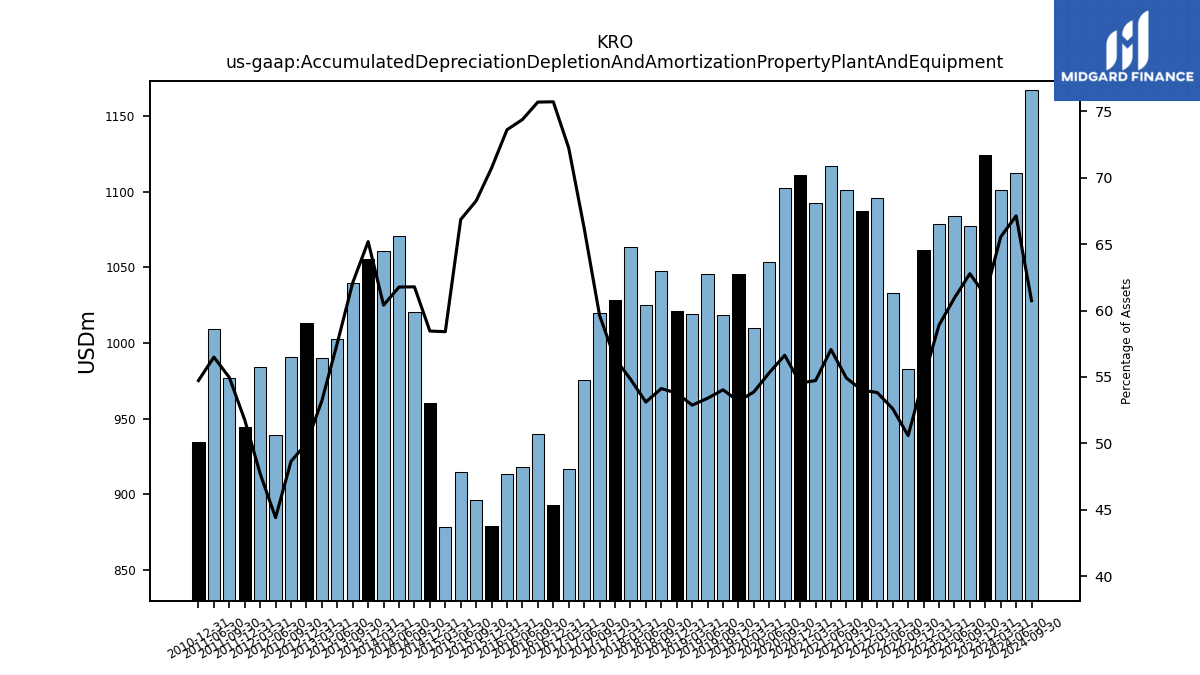
| Accumulated Depreciation Depletion And Amortization Property Plant And Equipment | 1100.90 | 1124.00 | 1077.20 | 1084.10 | 1078.80 | 1061.40 | 982.80 | 1033.00 | 1095.50 | 1087.10 | 1100.90 | 1116.80 | 1092.70 | 1111.00 | 1102.60 | 1053.20 | 1010.00 | 1045.40 | 1018.50 | 1045.80 | 1019.00 | 1020.90 | 1047.30 | 1025.30 | 1063.20 | 1028.70 | 1020.00 | 975.40 | 916.90 | 893.30 | 939.90 | 918.30 | 913.80 | 879.10 | 896.10 | 914.60 | 878.80 | 960.20 | 1020.40 | 1070.50 | 1060.80 | 1055.60 | 1039.50 | 1002.70 | 989.80 | 1013.10 | 990.60 | 939.50 | 984.00 | 944.20 | 976.60 | 1009.40 | NA | 934.50 | NA | NA | |
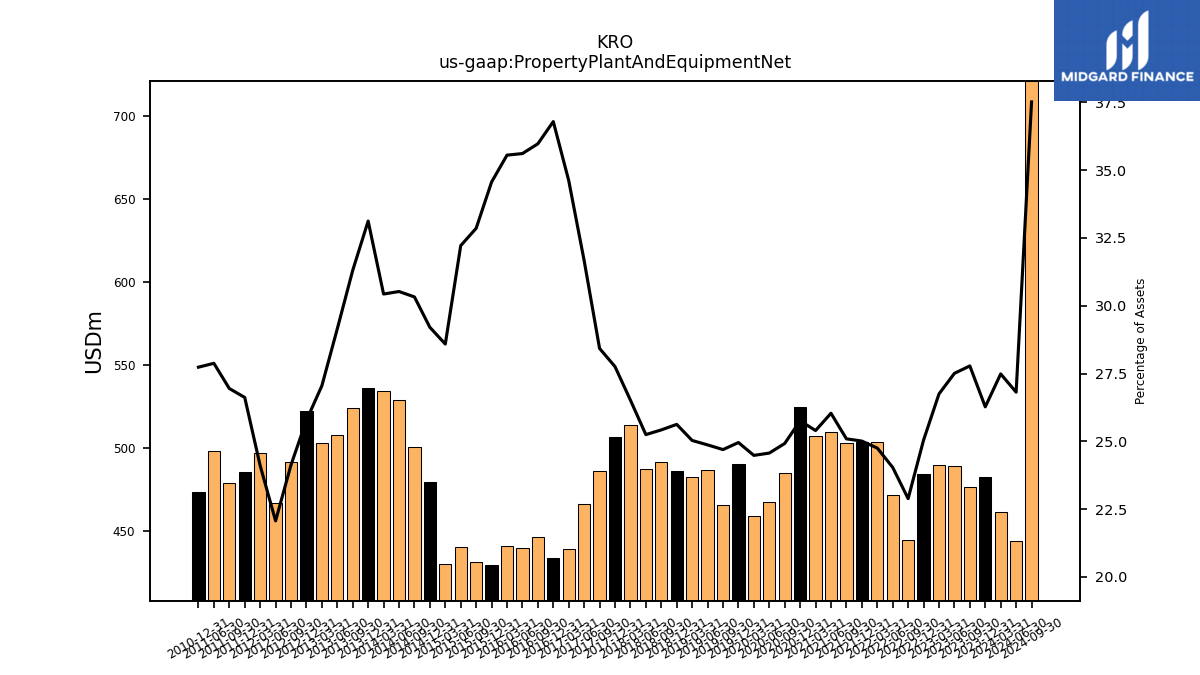
| Property Plant And Equipment Net | 461.60 | 482.90 | 476.70 | 489.30 | 489.90 | 484.50 | 444.70 | 472.00 | 503.80 | 503.40 | 503.00 | 509.50 | 507.10 | 524.60 | 485.20 | 467.70 | 459.00 | 490.60 | 465.50 | 487.10 | 482.40 | 486.40 | 491.90 | 487.40 | 514.10 | 506.40 | 486.20 | 466.40 | 439.30 | 434.00 | 446.60 | 439.60 | 441.30 | 429.50 | 431.30 | 440.70 | 430.10 | 479.70 | 500.80 | 529.00 | 534.40 | 536.30 | 524.00 | 507.90 | 503.20 | 522.50 | 491.40 | 466.90 | 497.10 | 485.50 | 478.80 | 498.10 | NA | 473.60 | NA | NA | |
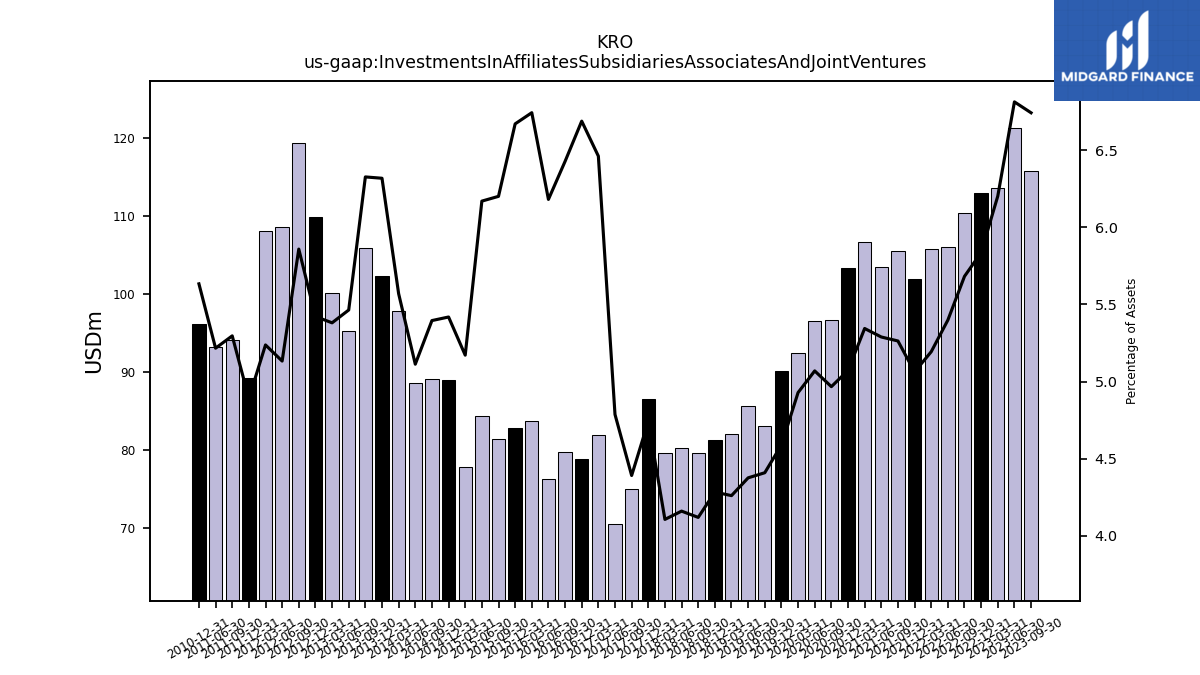
| Investments In Affiliates Subsidiaries Associates And Joint Ventures | 108.70 | 111.00 | 115.70 | 121.20 | 113.60 | 112.90 | 110.40 | 106.00 | 105.70 | 101.90 | 105.50 | 103.50 | 106.70 | 103.30 | 96.70 | 96.50 | 92.40 | 90.20 | 83.10 | 85.70 | 82.10 | 81.30 | 79.70 | 80.30 | 79.60 | 86.50 | 75.10 | 70.50 | 82.00 | 78.90 | 79.80 | 76.30 | 83.70 | 82.90 | 81.40 | 84.40 | 77.80 | 89.00 | 89.10 | 88.60 | 97.80 | 102.30 | 105.90 | 95.20 | 100.10 | 109.90 | 119.30 | 108.60 | 108.00 | 89.20 | 94.10 | 93.20 | NA | 96.20 | NA | NA | |
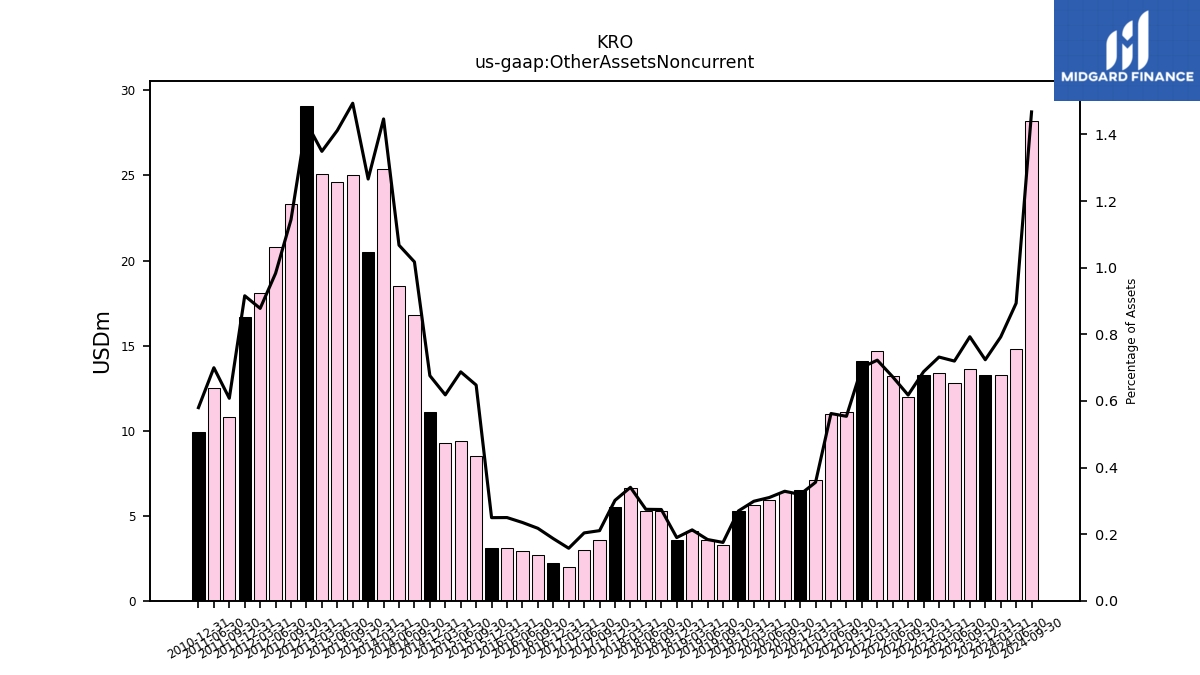
| Other Assets Noncurrent | 13.30 | 13.30 | 13.60 | 12.80 | 13.40 | 13.30 | 12.00 | 13.20 | 14.70 | 14.10 | 11.10 | 11.00 | 7.10 | 6.50 | 6.40 | 5.90 | 5.60 | 5.30 | 3.30 | 3.60 | 4.10 | 3.60 | 5.30 | 5.30 | 6.60 | 5.50 | 3.60 | 3.00 | 2.00 | 2.20 | 2.70 | 2.90 | 3.10 | 3.10 | 8.50 | 9.40 | 9.30 | 11.10 | 16.80 | 18.50 | 25.40 | 20.50 | 25.00 | 24.60 | 25.10 | 29.10 | 23.30 | 20.80 | 18.10 | 16.70 | 10.80 | 12.50 | NA | 9.90 | NA | NA |
| 2024-03-31 | 2023-12-31 | 2023-09-30 | 2023-06-30 | 2023-03-31 | 2022-12-31 | 2022-09-30 | 2022-06-30 | 2022-03-31 | 2021-12-31 | 2021-09-30 | 2021-06-30 | 2021-03-31 | 2020-12-31 | 2020-09-30 | 2020-06-30 | 2020-03-31 | 2019-12-31 | 2019-09-30 | 2019-06-30 | 2019-03-31 | 2018-12-31 | 2018-09-30 | 2018-06-30 | 2018-03-31 | 2017-12-31 | 2017-09-30 | 2017-06-30 | 2017-03-31 | 2016-12-31 | 2016-09-30 | 2016-06-30 | 2016-03-31 | 2015-12-31 | 2015-09-30 | 2015-06-30 | 2015-03-31 | 2014-12-31 | 2014-09-30 | 2014-06-30 | 2014-03-31 | 2013-12-31 | 2013-09-30 | 2013-06-30 | 2013-03-31 | 2012-12-31 | 2012-09-30 | 2012-06-30 | 2012-03-31 | 2011-12-31 | 2011-09-30 | 2011-06-30 | 2011-03-31 | 2010-12-31 | 2010-09-30 | 2010-06-30 | ||
|---|---|---|---|---|---|---|---|---|---|---|---|---|---|---|---|---|---|---|---|---|---|---|---|---|---|---|---|---|---|---|---|---|---|---|---|---|---|---|---|---|---|---|---|---|---|---|---|---|---|---|---|---|---|---|---|---|---|
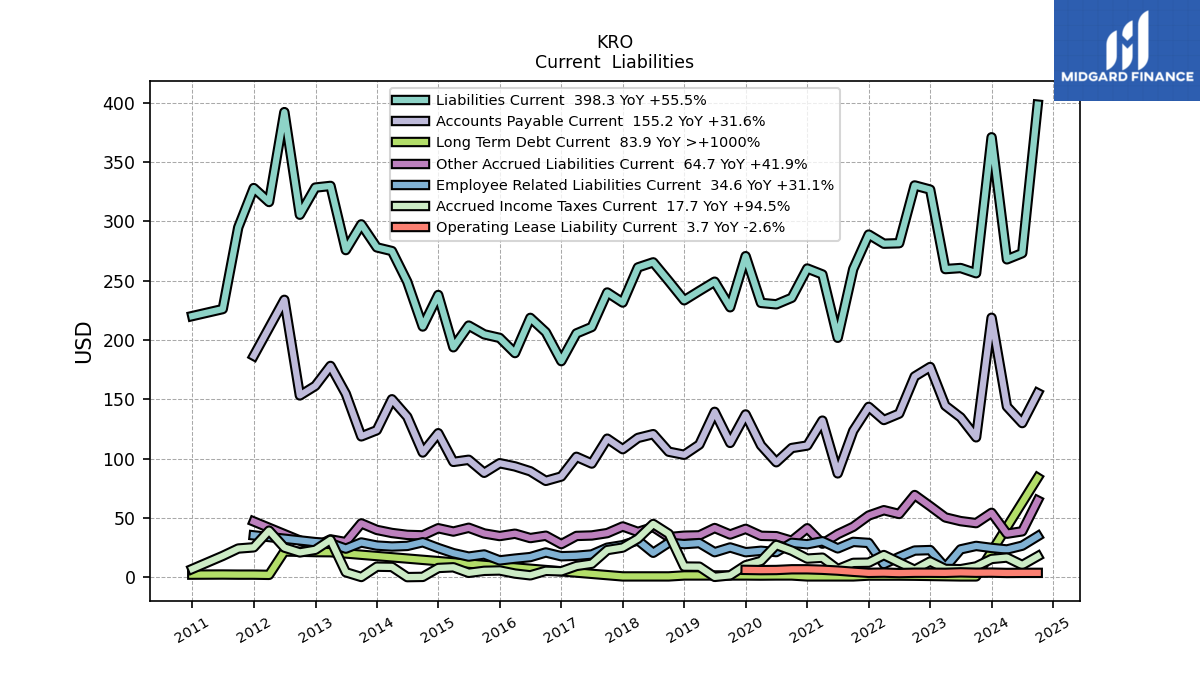
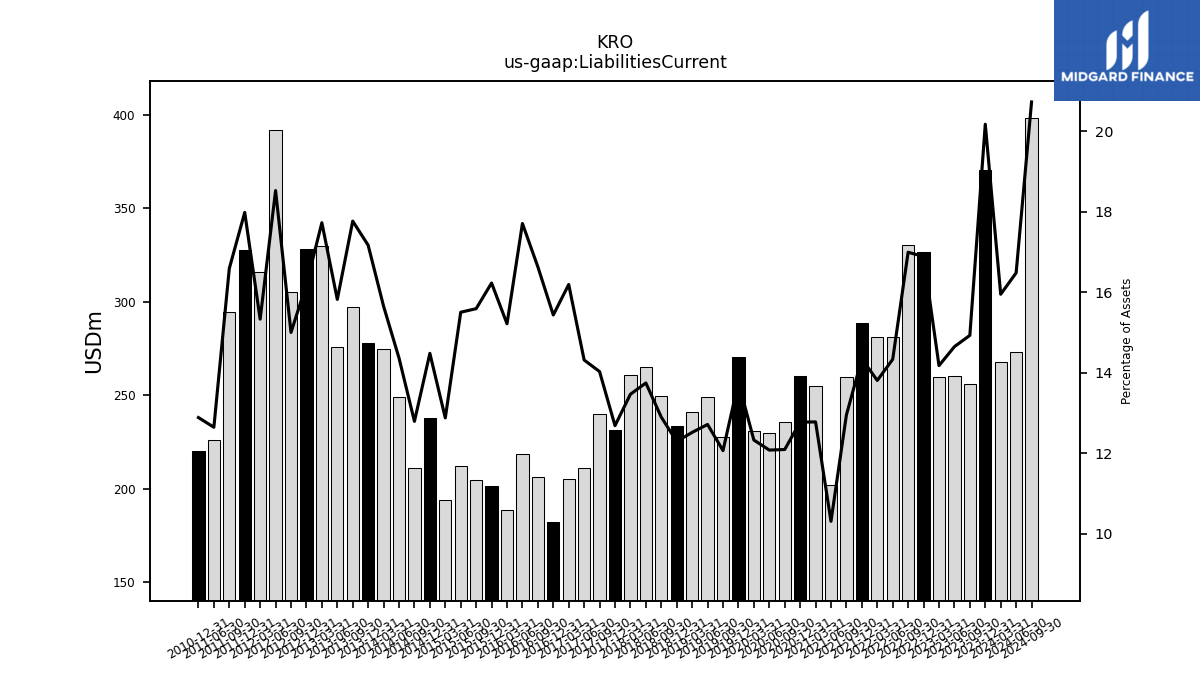
| Liabilities Current | 267.90 | 370.80 | 256.20 | 260.60 | 259.70 | 326.70 | 330.20 | 281.50 | 281.10 | 288.80 | 259.70 | 201.80 | 255.20 | 260.20 | 235.50 | 230.00 | 231.20 | 270.60 | 227.50 | 249.10 | 241.30 | 233.40 | 249.60 | 265.40 | 261.10 | 231.50 | 240.00 | 210.90 | 205.50 | 182.10 | 206.50 | 218.60 | 188.90 | 201.70 | 204.70 | 212.10 | 193.80 | 237.90 | 211.30 | 249.00 | 274.90 | 278.00 | 297.40 | 275.70 | 329.80 | 328.40 | 305.50 | 392.00 | 316.20 | 328.00 | 294.80 | 226.00 | NA | 220.10 | NA | NA | |
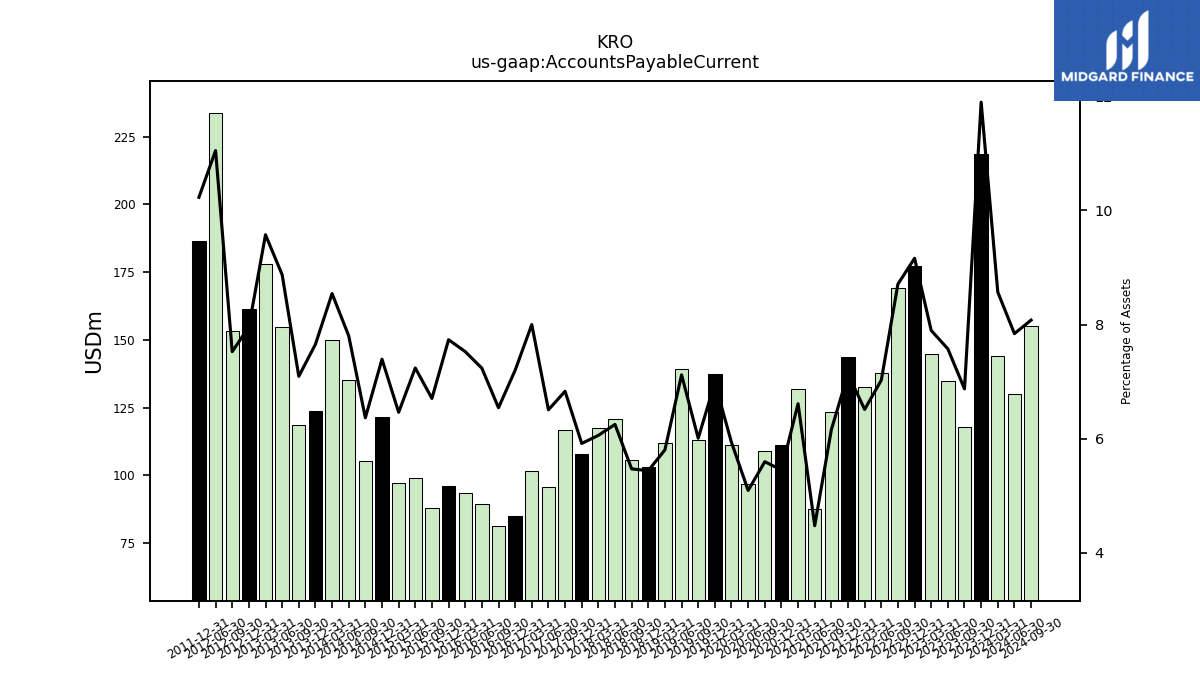
| Accounts Payable Current | 143.90 | 218.70 | 117.90 | 134.70 | 144.60 | 177.20 | 169.20 | 137.90 | 132.50 | 143.60 | 123.40 | 87.50 | 132.00 | 111.00 | 108.90 | 96.90 | 111.20 | 137.20 | 113.20 | 139.40 | 111.80 | 103.20 | 105.80 | 120.60 | 117.40 | 107.90 | 116.80 | 95.80 | 101.50 | 84.90 | 81.20 | 89.30 | 93.40 | 96.10 | 88.00 | 99.00 | 97.20 | 121.40 | 105.10 | 135.20 | 150.00 | 123.90 | 118.70 | 154.60 | 178.10 | 161.30 | 153.20 | 233.80 | NA | 186.60 | NA | NA | NA | NA | NA | NA | |
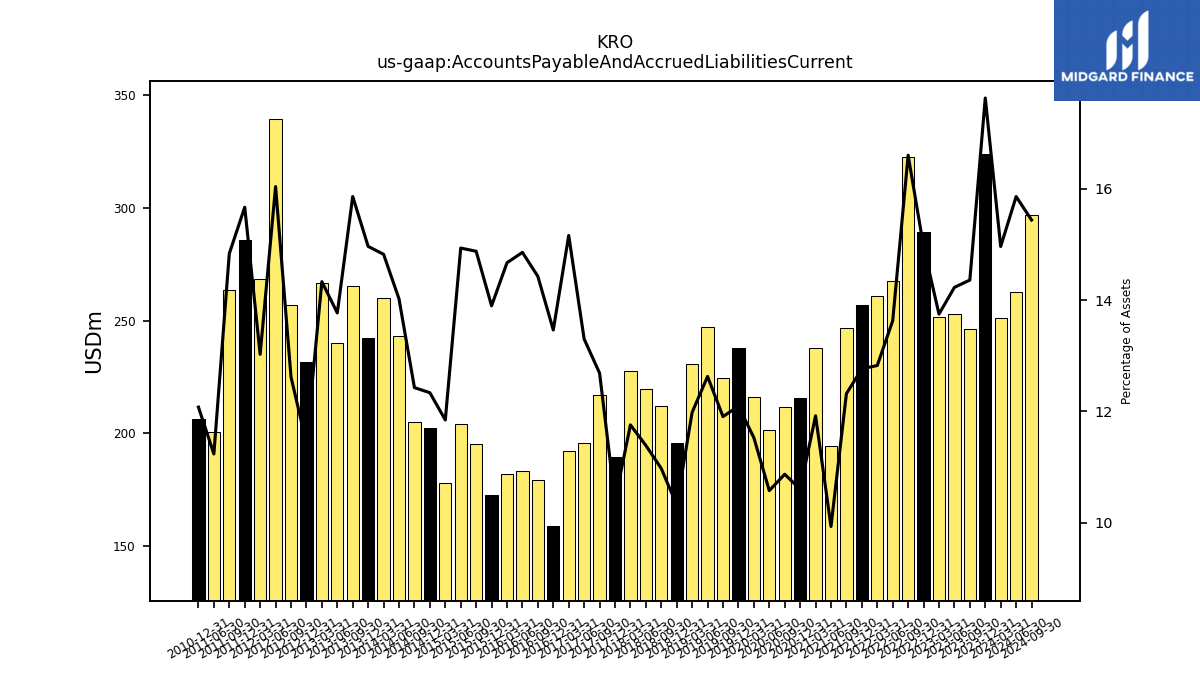
| Accounts Payable And Accrued Liabilities Current | 251.30 | 324.10 | 246.40 | 253.10 | 251.80 | 289.40 | 322.60 | 267.60 | 261.00 | 256.90 | 246.90 | 194.30 | 238.00 | 215.90 | 211.60 | 201.30 | 216.10 | 237.70 | 224.40 | 247.30 | 230.90 | 195.80 | 212.30 | 219.80 | 227.90 | 189.60 | 217.00 | 195.90 | 192.40 | 158.80 | 179.10 | 183.40 | 182.10 | 172.70 | 195.30 | 204.30 | 178.20 | 202.60 | 205.20 | 243.00 | 260.30 | 242.30 | 265.50 | 239.90 | 266.60 | 231.60 | 256.90 | 339.40 | 268.60 | 285.80 | 263.60 | 200.70 | NA | 206.20 | NA | NA | |
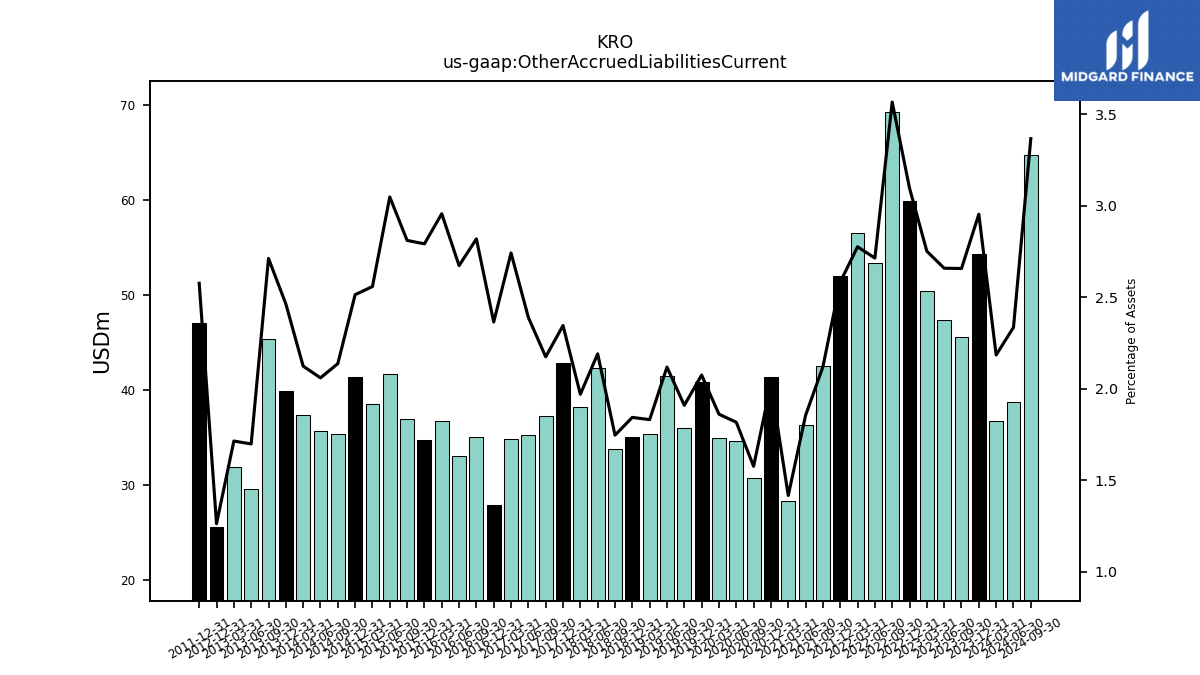
| Other Accrued Liabilities Current | 36.70 | 54.30 | 45.60 | 47.30 | 50.40 | 59.90 | 69.30 | 53.30 | 56.50 | 52.00 | 42.50 | 36.30 | 28.30 | 41.30 | 30.70 | 34.60 | 34.90 | 40.80 | 36.00 | 41.50 | 35.30 | 35.00 | 33.80 | 42.30 | 38.20 | 42.80 | 37.20 | 35.20 | 34.80 | 27.90 | 35.00 | 33.00 | 36.70 | 34.70 | 36.90 | 41.70 | 38.50 | 41.30 | 35.30 | 35.70 | 37.30 | 39.90 | 45.40 | 29.60 | 31.90 | 25.60 | NA | NA | NA | 47.00 | NA | NA | NA | NA | NA | NA | |
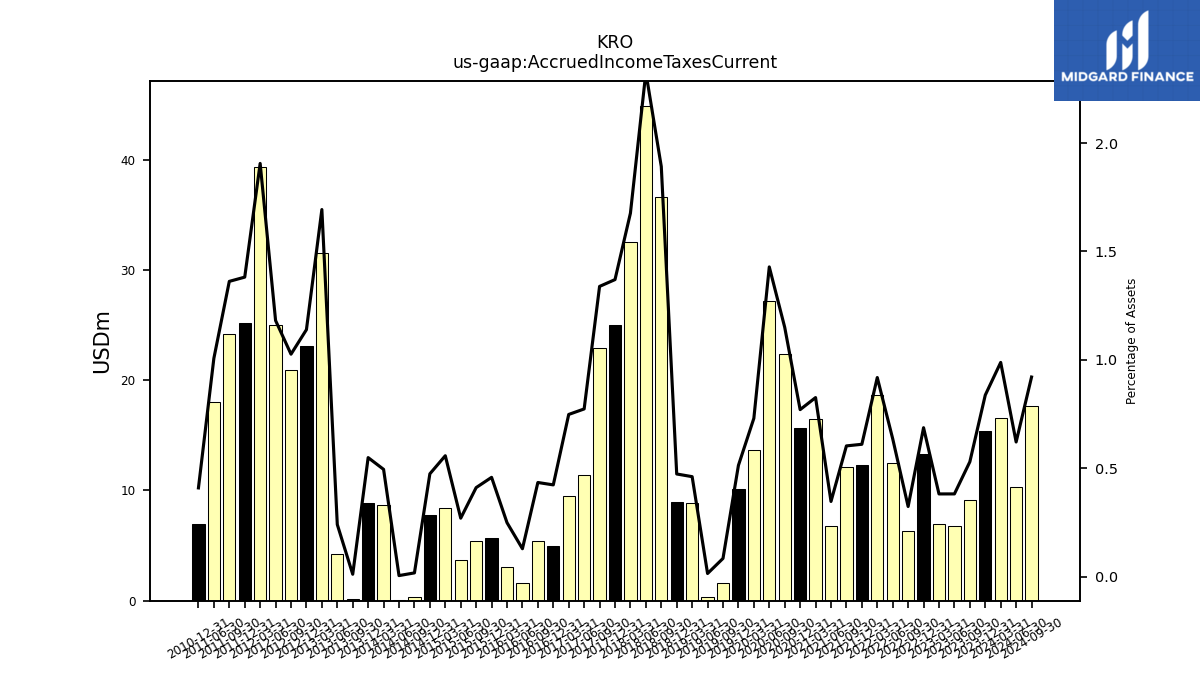
| Accrued Income Taxes Current | 16.60 | 15.40 | 9.10 | 6.80 | 7.00 | 13.30 | 6.30 | 12.50 | 18.70 | 12.30 | 12.10 | 6.80 | 16.50 | 15.70 | 22.40 | 27.20 | 13.70 | 10.10 | 1.60 | 0.30 | 8.90 | 9.00 | 36.60 | 44.90 | 32.50 | 25.00 | 22.90 | 11.40 | 9.50 | 5.00 | 5.40 | 1.60 | 3.10 | 5.70 | 5.40 | 3.70 | 8.40 | 7.80 | 0.30 | 0.10 | 8.70 | 8.90 | 0.20 | 4.20 | 31.50 | 23.10 | 20.90 | 25.00 | 39.30 | 25.20 | 24.20 | 18.00 | NA | 7.00 | NA | NA | |
| Other Liabilities Current | NA | 31.30 | NA | NA | NA | 22.90 | NA | NA | NA | NA | NA | NA | NA | NA | NA | NA | NA | NA | NA | NA | NA | NA | NA | NA | NA | NA | NA | NA | NA | NA | NA | NA | NA | NA | NA | NA | NA | NA | NA | NA | NA | NA | NA | NA | NA | NA | NA | NA | NA | NA | NA | NA | NA | NA | NA | NA |
| 2024-03-31 | 2023-12-31 | 2023-09-30 | 2023-06-30 | 2023-03-31 | 2022-12-31 | 2022-09-30 | 2022-06-30 | 2022-03-31 | 2021-12-31 | 2021-09-30 | 2021-06-30 | 2021-03-31 | 2020-12-31 | 2020-09-30 | 2020-06-30 | 2020-03-31 | 2019-12-31 | 2019-09-30 | 2019-06-30 | 2019-03-31 | 2018-12-31 | 2018-09-30 | 2018-06-30 | 2018-03-31 | 2017-12-31 | 2017-09-30 | 2017-06-30 | 2017-03-31 | 2016-12-31 | 2016-09-30 | 2016-06-30 | 2016-03-31 | 2015-12-31 | 2015-09-30 | 2015-06-30 | 2015-03-31 | 2014-12-31 | 2014-09-30 | 2014-06-30 | 2014-03-31 | 2013-12-31 | 2013-09-30 | 2013-06-30 | 2013-03-31 | 2012-12-31 | 2012-09-30 | 2012-06-30 | 2012-03-31 | 2011-12-31 | 2011-09-30 | 2011-06-30 | 2011-03-31 | 2010-12-31 | 2010-09-30 | 2010-06-30 | ||
|---|---|---|---|---|---|---|---|---|---|---|---|---|---|---|---|---|---|---|---|---|---|---|---|---|---|---|---|---|---|---|---|---|---|---|---|---|---|---|---|---|---|---|---|---|---|---|---|---|---|---|---|---|---|---|---|---|---|
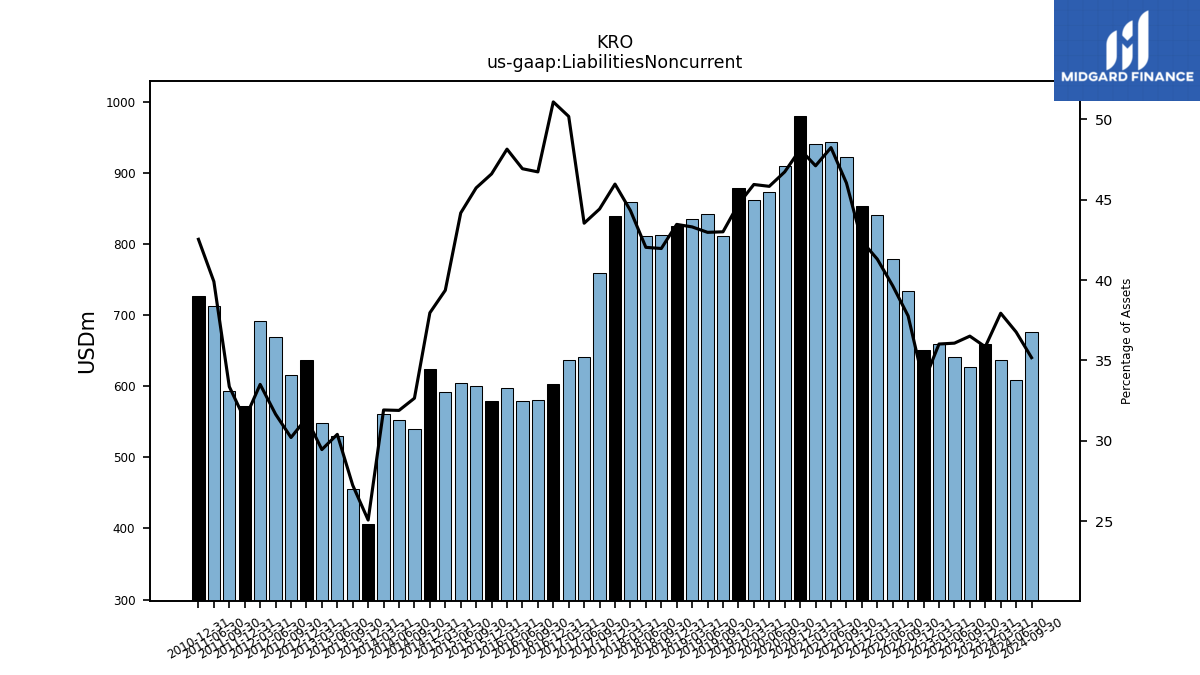
| Liabilities Noncurrent | 637.10 | 658.90 | 626.50 | 641.70 | 659.70 | 650.50 | 733.80 | 778.40 | 840.60 | 853.80 | 922.80 | 943.90 | 940.50 | 980.00 | 909.70 | 872.40 | 861.30 | 879.10 | 810.50 | 841.50 | 834.50 | 824.90 | 811.90 | 811.40 | 859.20 | 838.60 | 759.70 | 641.20 | 636.70 | 602.50 | 580.10 | 579.20 | 597.50 | 579.10 | 600.30 | 604.20 | 592.20 | 623.50 | 539.20 | 552.70 | 560.50 | 406.00 | 455.90 | 529.70 | 548.00 | 636.50 | 615.10 | 669.80 | 691.00 | 571.60 | 592.90 | 713.00 | NA | 726.30 | NA | NA | |
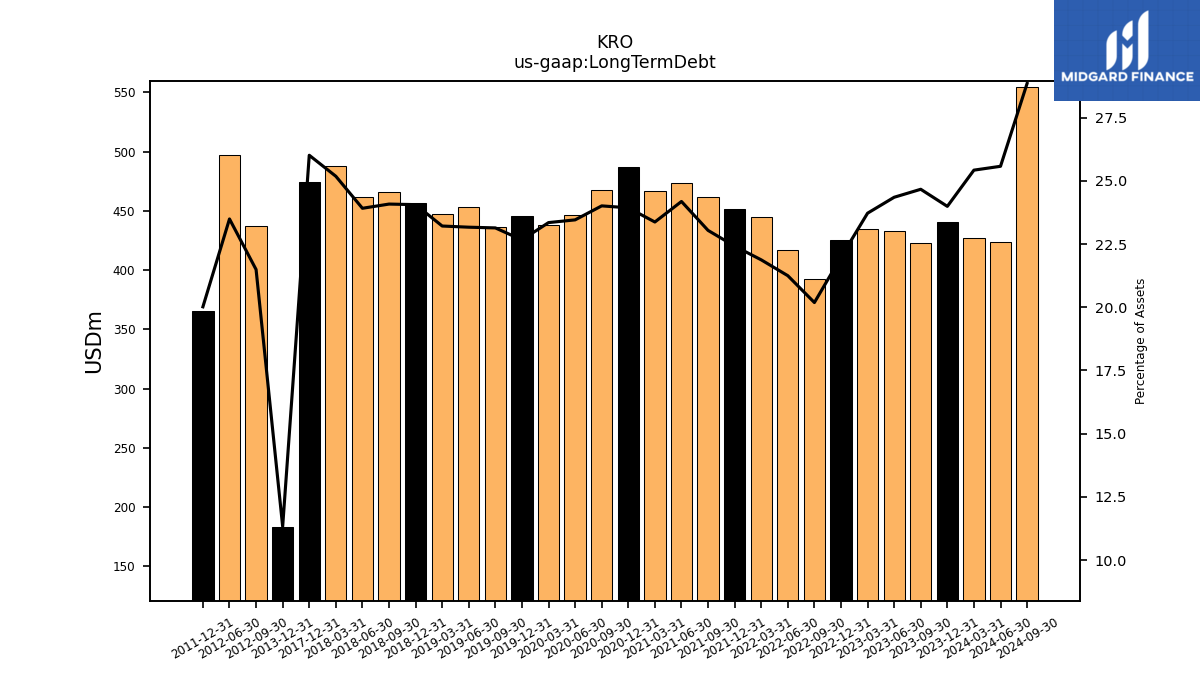
| Long Term Debt | 426.90 | 440.90 | 423.20 | 433.10 | 434.40 | 425.20 | 392.20 | 417.20 | 445.20 | 451.20 | 461.80 | 473.20 | 466.60 | 487.40 | 467.40 | 446.50 | 437.70 | 445.50 | 436.10 | 453.70 | 447.30 | 456.60 | 465.90 | 461.60 | 488.10 | 474.50 | NA | NA | NA | NA | NA | NA | NA | NA | NA | NA | NA | NA | NA | NA | NA | 183.50 | NA | NA | NA | NA | 437.60 | 497.00 | NA | 365.10 | NA | NA | NA | NA | NA | NA | |
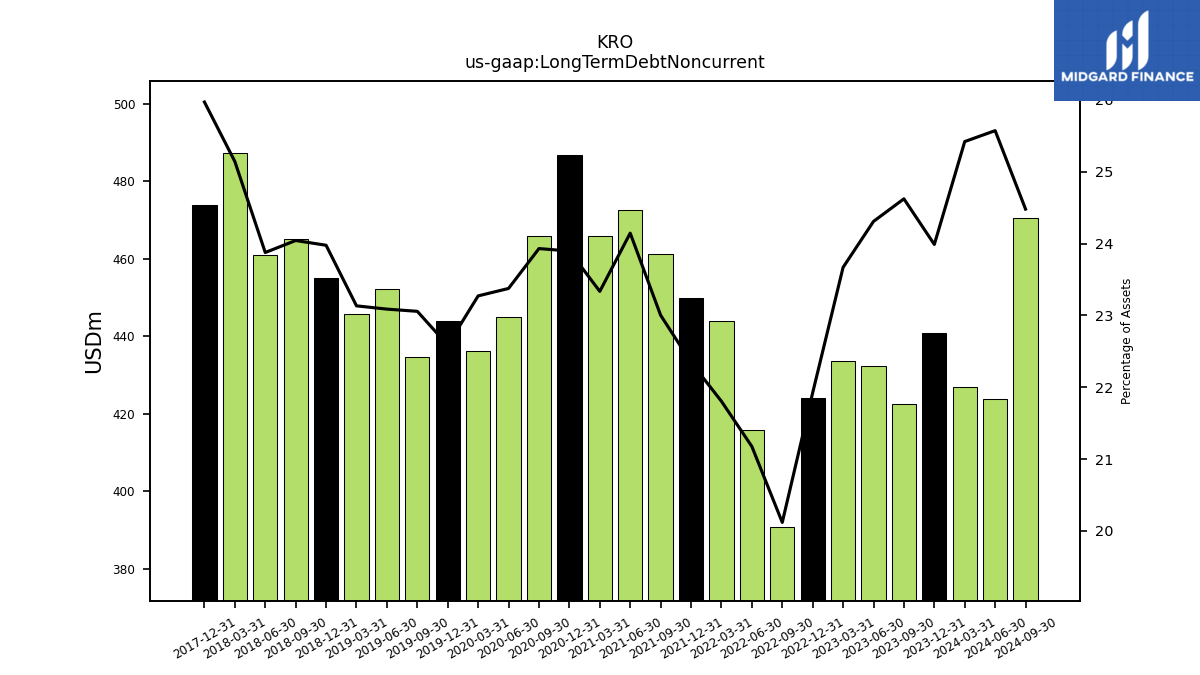
| Long Term Debt Noncurrent | 426.90 | 440.90 | 422.50 | 432.40 | 433.50 | 424.10 | 390.90 | 415.80 | 443.80 | 449.80 | 461.10 | 472.50 | 465.90 | 486.70 | 465.90 | 445.00 | 436.30 | 444.00 | 434.60 | 452.20 | 445.80 | 455.10 | 465.20 | 460.90 | 487.40 | 473.80 | NA | NA | NA | NA | NA | NA | NA | NA | NA | NA | NA | NA | NA | NA | NA | NA | NA | NA | NA | NA | NA | NA | NA | NA | NA | NA | NA | NA | NA | NA | |
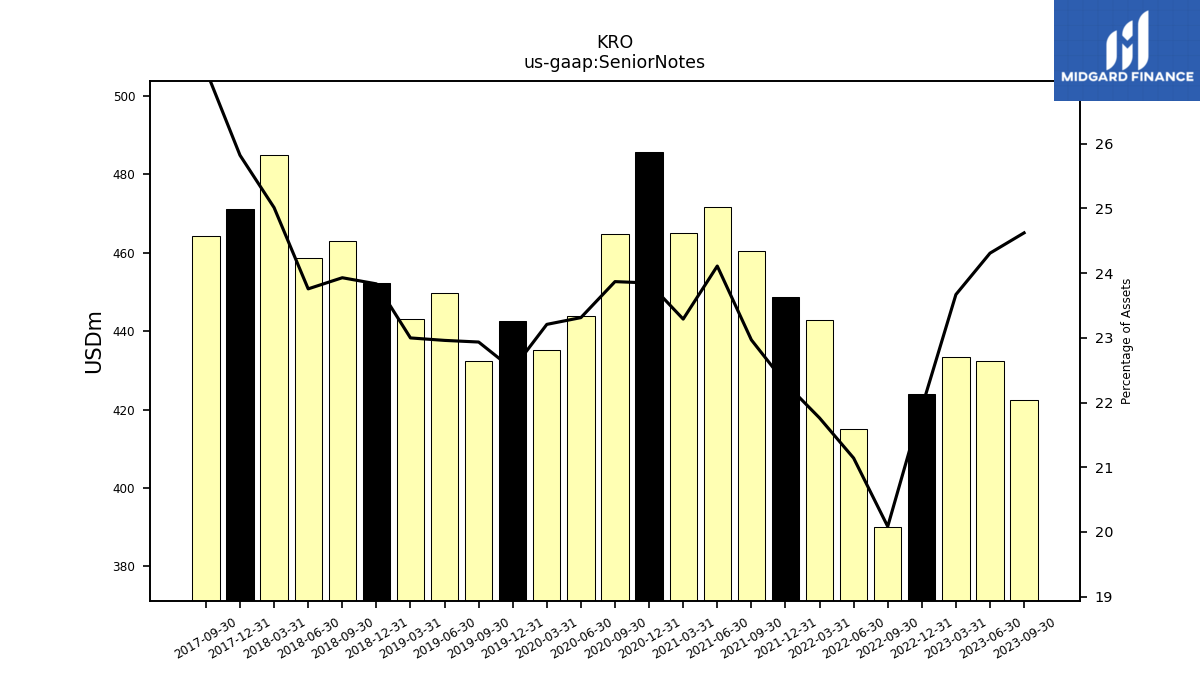
| Senior Notes | NA | 440.90 | 422.50 | 432.40 | 433.50 | 424.10 | 390.20 | 415.10 | 442.90 | 448.80 | 460.40 | 471.80 | 465.00 | 485.70 | 464.70 | 443.80 | 435.10 | 442.60 | 432.30 | 449.70 | 443.20 | 452.40 | 463.00 | 458.60 | 484.90 | 471.10 | 464.20 | NA | NA | NA | NA | NA | NA | NA | NA | NA | NA | NA | NA | NA | NA | NA | NA | NA | NA | NA | NA | NA | NA | NA | NA | NA | NA | NA | NA | NA | |
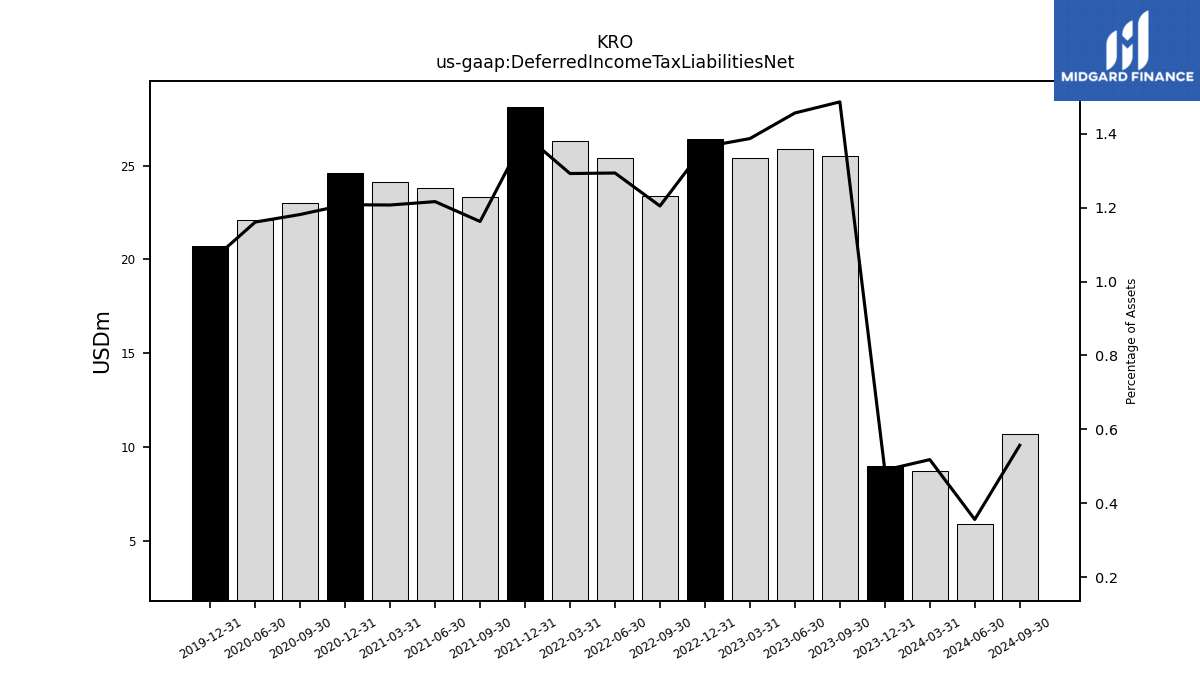
| Deferred Income Tax Liabilities Net | 8.70 | 9.00 | 25.50 | 25.90 | 25.40 | 26.40 | 23.40 | 25.40 | 26.30 | 28.10 | 23.30 | 23.80 | 24.10 | 24.60 | 23.00 | 22.10 | NA | 20.70 | NA | NA | NA | NA | NA | NA | NA | NA | NA | NA | NA | NA | NA | NA | NA | NA | NA | NA | NA | NA | NA | NA | NA | NA | NA | NA | NA | NA | NA | NA | NA | NA | NA | NA | NA | NA | NA | NA | |
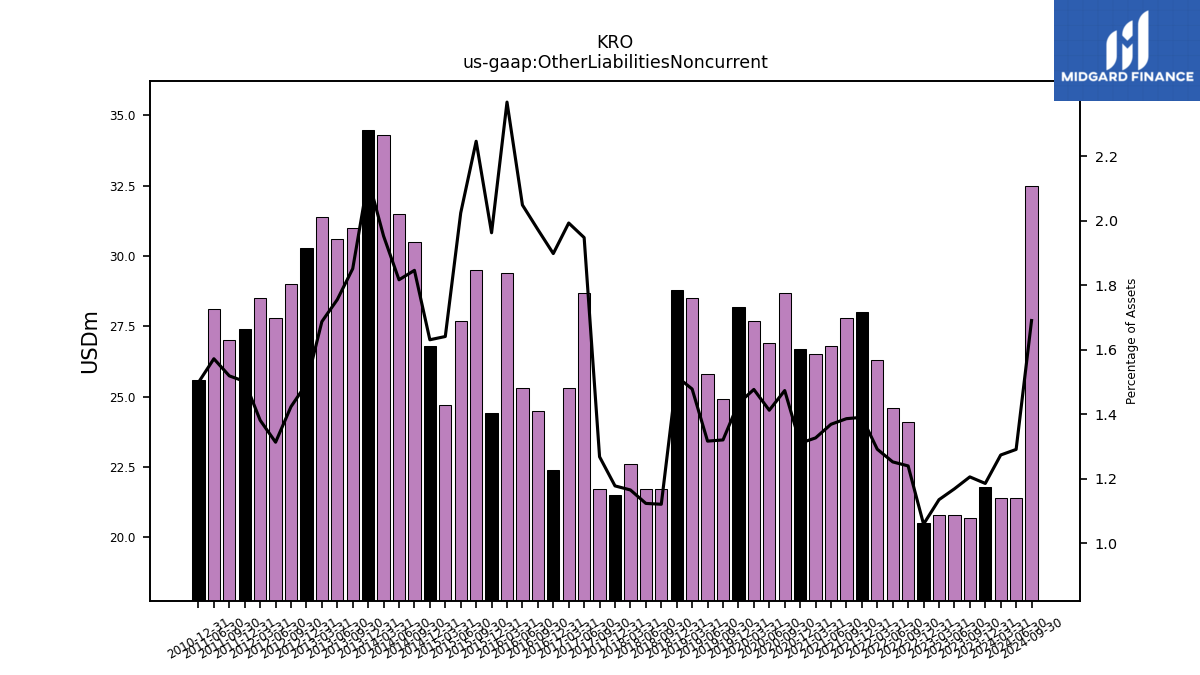
| Other Liabilities Noncurrent | 21.40 | 21.80 | 20.70 | 20.80 | 20.80 | 20.50 | 24.10 | 24.60 | 26.30 | 28.00 | 27.80 | 26.80 | 26.50 | 26.70 | 28.70 | 26.90 | 27.70 | 28.20 | 24.90 | 25.80 | 28.50 | 28.80 | 21.70 | 21.70 | 22.60 | 21.50 | 21.70 | 28.70 | 25.30 | 22.40 | 24.50 | 25.30 | 29.40 | 24.40 | 29.50 | 27.70 | 24.70 | 26.80 | 30.50 | 31.50 | 34.30 | 34.50 | 31.00 | 30.60 | 31.40 | 30.30 | 29.00 | 27.80 | 28.50 | 27.40 | 27.00 | 28.10 | NA | 25.60 | NA | NA | |
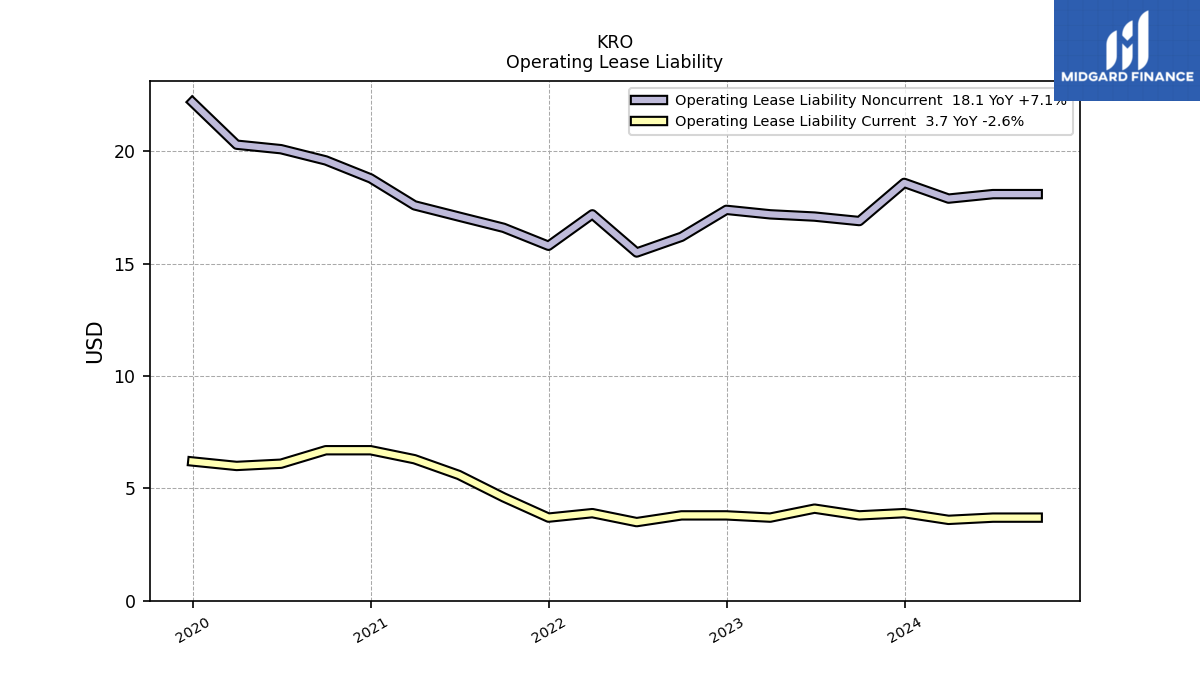
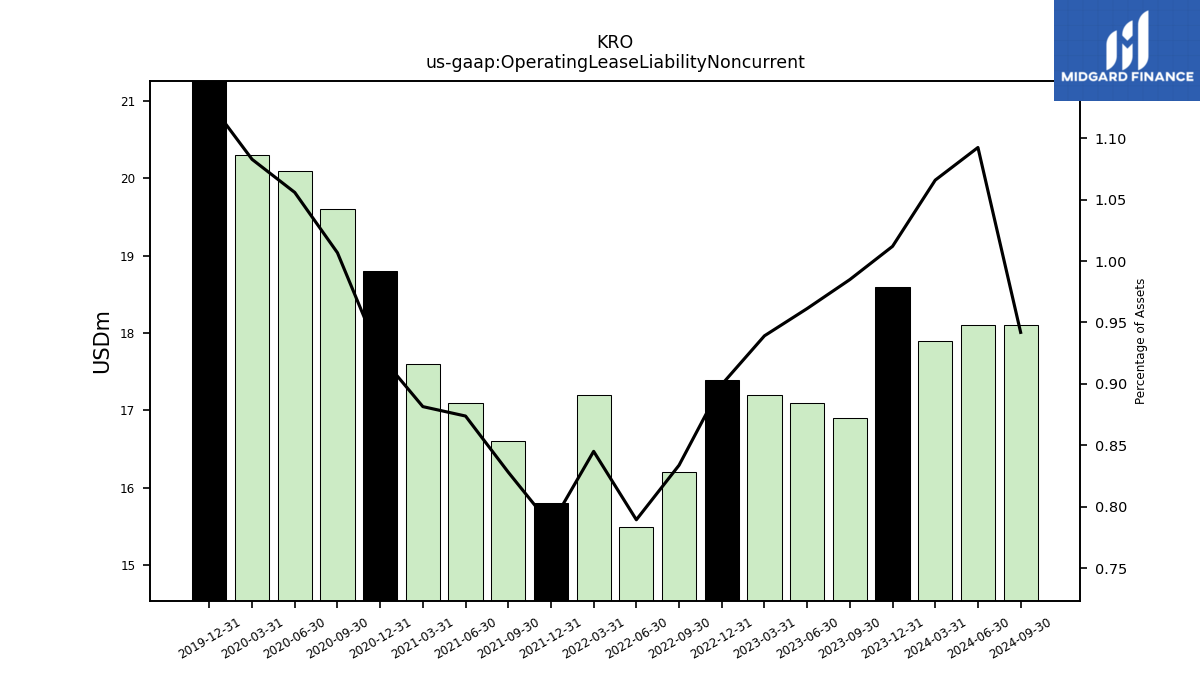
| Operating Lease Liability Noncurrent | 17.90 | 18.60 | 16.90 | 17.10 | 17.20 | 17.40 | 16.20 | 15.50 | 17.20 | 15.80 | 16.60 | 17.10 | 17.60 | 18.80 | 19.60 | 20.10 | 20.30 | 22.20 | NA | NA | NA | NA | NA | NA | NA | NA | NA | NA | NA | NA | NA | NA | NA | NA | NA | NA | NA | NA | NA | NA | NA | NA | NA | NA | NA | NA | NA | NA | NA | NA | NA | NA | NA | NA | NA | NA |
| 2024-03-31 | 2023-12-31 | 2023-09-30 | 2023-06-30 | 2023-03-31 | 2022-12-31 | 2022-09-30 | 2022-06-30 | 2022-03-31 | 2021-12-31 | 2021-09-30 | 2021-06-30 | 2021-03-31 | 2020-12-31 | 2020-09-30 | 2020-06-30 | 2020-03-31 | 2019-12-31 | 2019-09-30 | 2019-06-30 | 2019-03-31 | 2018-12-31 | 2018-09-30 | 2018-06-30 | 2018-03-31 | 2017-12-31 | 2017-09-30 | 2017-06-30 | 2017-03-31 | 2016-12-31 | 2016-09-30 | 2016-06-30 | 2016-03-31 | 2015-12-31 | 2015-09-30 | 2015-06-30 | 2015-03-31 | 2014-12-31 | 2014-09-30 | 2014-06-30 | 2014-03-31 | 2013-12-31 | 2013-09-30 | 2013-06-30 | 2013-03-31 | 2012-12-31 | 2012-09-30 | 2012-06-30 | 2012-03-31 | 2011-12-31 | 2011-09-30 | 2011-06-30 | 2011-03-31 | 2010-12-31 | 2010-09-30 | 2010-06-30 | ||
|---|---|---|---|---|---|---|---|---|---|---|---|---|---|---|---|---|---|---|---|---|---|---|---|---|---|---|---|---|---|---|---|---|---|---|---|---|---|---|---|---|---|---|---|---|---|---|---|---|---|---|---|---|---|---|---|---|---|
| Stockholders Equity | 774.40 | 808.30 | 833.20 | 876.50 | 912.10 | 957.20 | 878.90 | 903.60 | 913.60 | 870.20 | 822.00 | 811.20 | 800.90 | 796.50 | 801.70 | 801.30 | 782.30 | 816.10 | 846.90 | 868.00 | 851.30 | 839.80 | 873.40 | 853.60 | 818.30 | 754.30 | 710.70 | 620.80 | 426.80 | 395.00 | 454.90 | 436.60 | 454.80 | 461.90 | 507.70 | 551.60 | 718.50 | 781.10 | 900.90 | 931.30 | 920.60 | 935.10 | 920.50 | 936.90 | 982.50 | 1062.10 | 1115.60 | 1054.00 | 1054.90 | 924.30 | 889.00 | 847.70 | NA | 761.20 | NA | NA | |
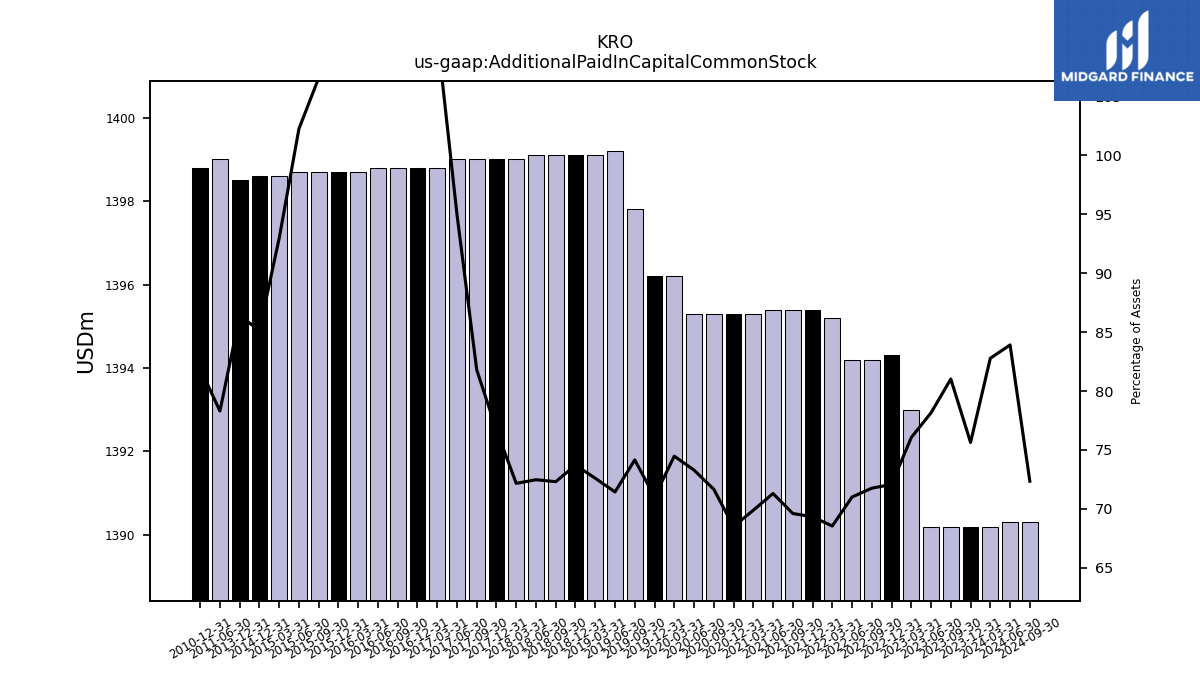
| Additional Paid In Capital Common Stock | 1390.20 | 1390.20 | 1390.20 | 1390.20 | 1393.00 | 1394.30 | 1394.20 | 1394.20 | 1395.20 | 1395.40 | 1395.40 | 1395.40 | 1395.30 | 1395.30 | 1395.30 | 1395.30 | 1396.20 | 1396.20 | 1397.80 | 1399.20 | 1399.10 | 1399.10 | 1399.10 | 1399.10 | 1399.00 | 1399.00 | 1399.00 | 1399.00 | 1398.80 | 1398.80 | 1398.80 | 1398.80 | 1398.70 | 1398.70 | 1398.70 | 1398.70 | 1398.60 | 1398.60 | NA | NA | NA | 1398.50 | NA | NA | NA | NA | NA | NA | NA | NA | NA | 1399.00 | NA | 1398.80 | NA | NA | |
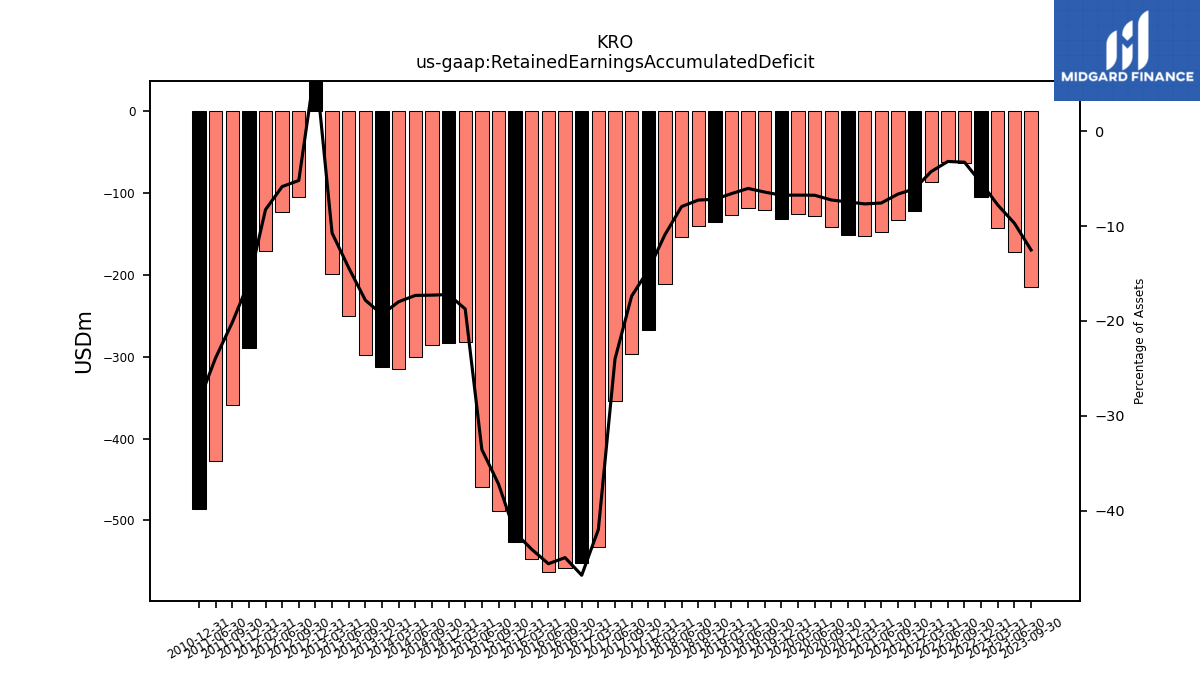
| Retained Earnings Accumulated Deficit | -255.80 | -242.00 | -214.80 | -172.60 | -142.50 | -105.40 | -63.50 | -62.60 | -86.50 | -122.10 | -132.90 | -148.10 | -153.00 | -151.80 | -141.20 | -128.50 | -126.30 | -132.50 | -121.00 | -118.10 | -126.80 | -136.20 | -140.50 | -153.40 | -211.40 | -267.20 | -297.30 | -353.70 | -532.80 | -552.20 | -558.10 | -562.90 | -547.20 | -526.00 | -488.20 | -459.10 | -281.90 | -282.90 | -285.40 | -300.00 | -315.70 | -312.60 | -298.20 | -250.90 | -199.60 | 141.10 | -105.70 | -123.50 | -170.60 | -290.10 | -358.50 | -427.00 | NA | -486.50 | NA | NA | |
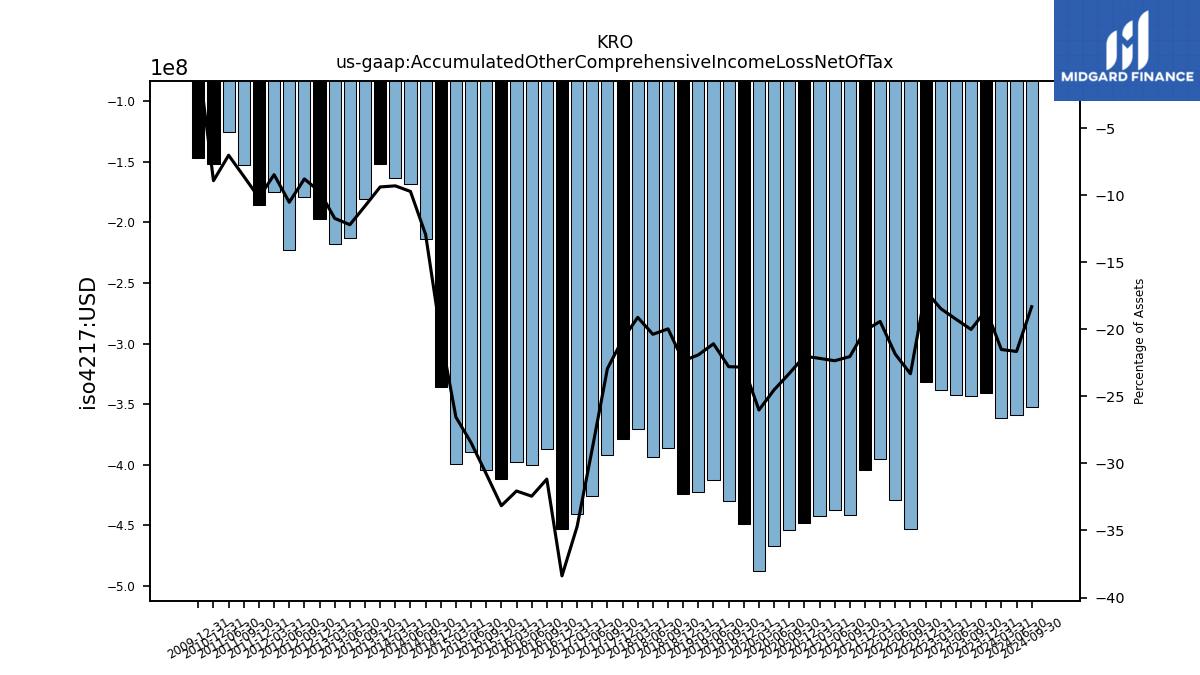
| Accumulated Other Comprehensive Income Loss Net Of Tax | -361.20 | -341.10 | -343.40 | -342.30 | -338.10 | -331.50 | -453.00 | -429.20 | -395.20 | -404.10 | -441.70 | -437.30 | -442.60 | -448.20 | -453.60 | -466.70 | -487.80 | -448.80 | -429.50 | -412.90 | -422.20 | -424.30 | -386.40 | -393.30 | -370.50 | -378.70 | -392.20 | -425.70 | -440.40 | -452.80 | -387.00 | -400.50 | -397.90 | -412.00 | -404.00 | -389.20 | -399.40 | -335.80 | -213.50 | -168.50 | -163.40 | -152.00 | -181.00 | -212.60 | -218.20 | -197.10 | -179.00 | -222.80 | -174.70 | -185.80 | -152.70 | -125.50 | NA | -152.30 | NA | NA | |
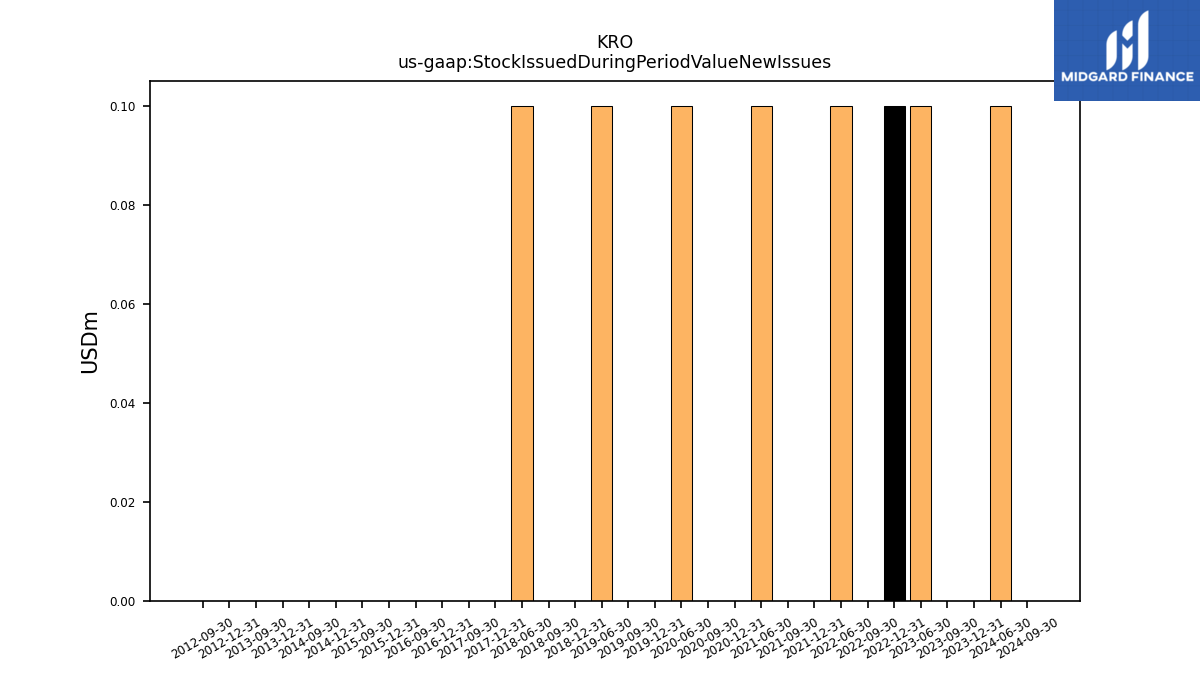
| Stock Issued During Period Value New Issues | NA | 0.00 | 0.00 | 0.10 | NA | 0.10 | 0.00 | 0.10 | NA | 0.00 | 0.00 | 0.10 | NA | 0.00 | 0.00 | 0.10 | NA | 0.00 | 0.00 | 0.10 | NA | 0.00 | 0.00 | 0.10 | NA | 0.00 | 0.00 | NA | NA | 0.00 | 0.00 | NA | NA | 0.00 | 0.00 | NA | NA | 0.00 | 0.00 | NA | NA | 0.00 | 0.00 | NA | NA | 0.00 | 0.00 | NA | NA | NA | NA | NA | NA | NA | NA | NA |
| 2024-03-31 | 2023-12-31 | 2023-09-30 | 2023-06-30 | 2023-03-31 | 2022-12-31 | 2022-09-30 | 2022-06-30 | 2022-03-31 | 2021-12-31 | 2021-09-30 | 2021-06-30 | 2021-03-31 | 2020-12-31 | 2020-09-30 | 2020-06-30 | 2020-03-31 | 2019-12-31 | 2019-09-30 | 2019-06-30 | 2019-03-31 | 2018-12-31 | 2018-09-30 | 2018-06-30 | 2018-03-31 | 2017-12-31 | 2017-09-30 | 2017-06-30 | 2017-03-31 | 2016-12-31 | 2016-09-30 | 2016-06-30 | 2016-03-31 | 2015-12-31 | 2015-09-30 | 2015-06-30 | 2015-03-31 | 2014-12-31 | 2014-09-30 | 2014-06-30 | 2014-03-31 | 2013-12-31 | 2013-09-30 | 2013-06-30 | 2013-03-31 | 2012-12-31 | 2012-09-30 | 2012-06-30 | 2012-03-31 | 2011-12-31 | 2011-09-30 | 2011-06-30 | 2011-03-31 | 2010-12-31 | 2010-09-30 | 2010-06-30 | ||
|---|---|---|---|---|---|---|---|---|---|---|---|---|---|---|---|---|---|---|---|---|---|---|---|---|---|---|---|---|---|---|---|---|---|---|---|---|---|---|---|---|---|---|---|---|---|---|---|---|---|---|---|---|---|---|---|---|---|
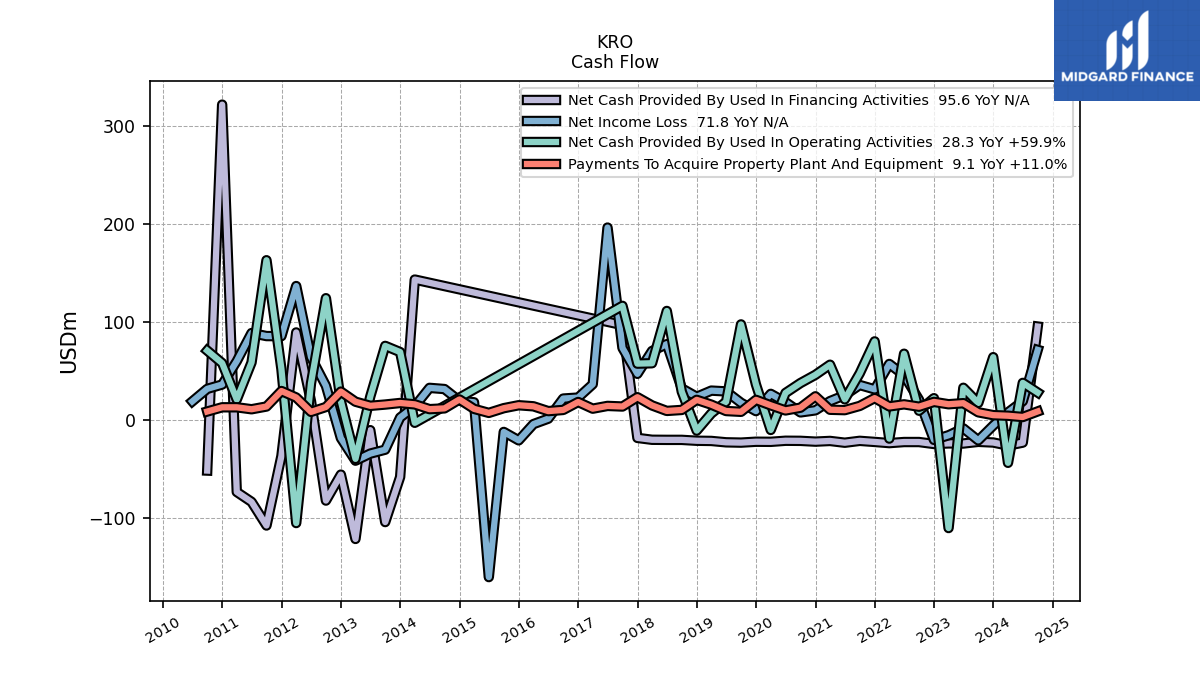
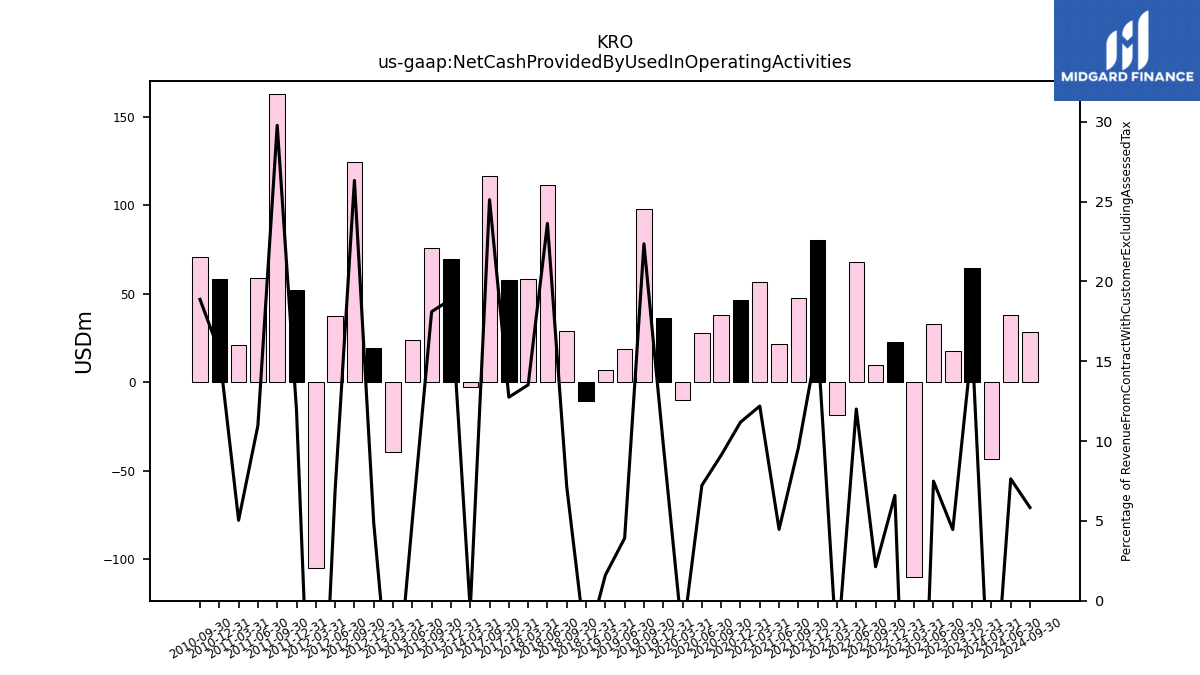
| Net Cash Provided By Used In Operating Activities | -43.30 | 64.40 | 17.70 | 33.20 | -109.80 | 22.60 | 9.80 | 67.90 | -18.60 | 80.50 | 47.90 | 21.40 | 56.70 | 46.40 | 38.00 | 27.90 | -9.80 | 36.50 | 97.80 | 19.00 | 7.00 | -10.50 | 29.30 | 111.50 | 58.20 | 57.80 | 116.70 | NA | NA | NA | NA | NA | NA | NA | NA | NA | NA | NA | NA | NA | -2.50 | 69.60 | 75.90 | 24.20 | -39.30 | 19.40 | 124.50 | 37.70 | -104.70 | 52.20 | 163.20 | 59.00 | 21.20 | 58.30 | 71.10 | NA | |
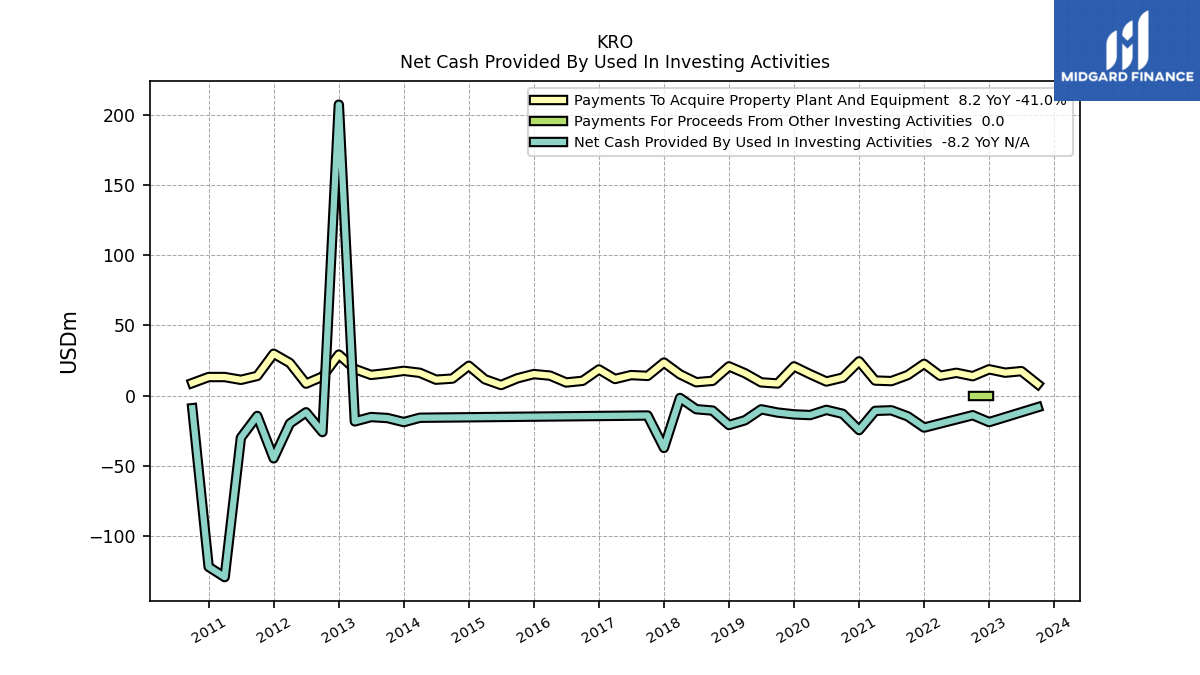
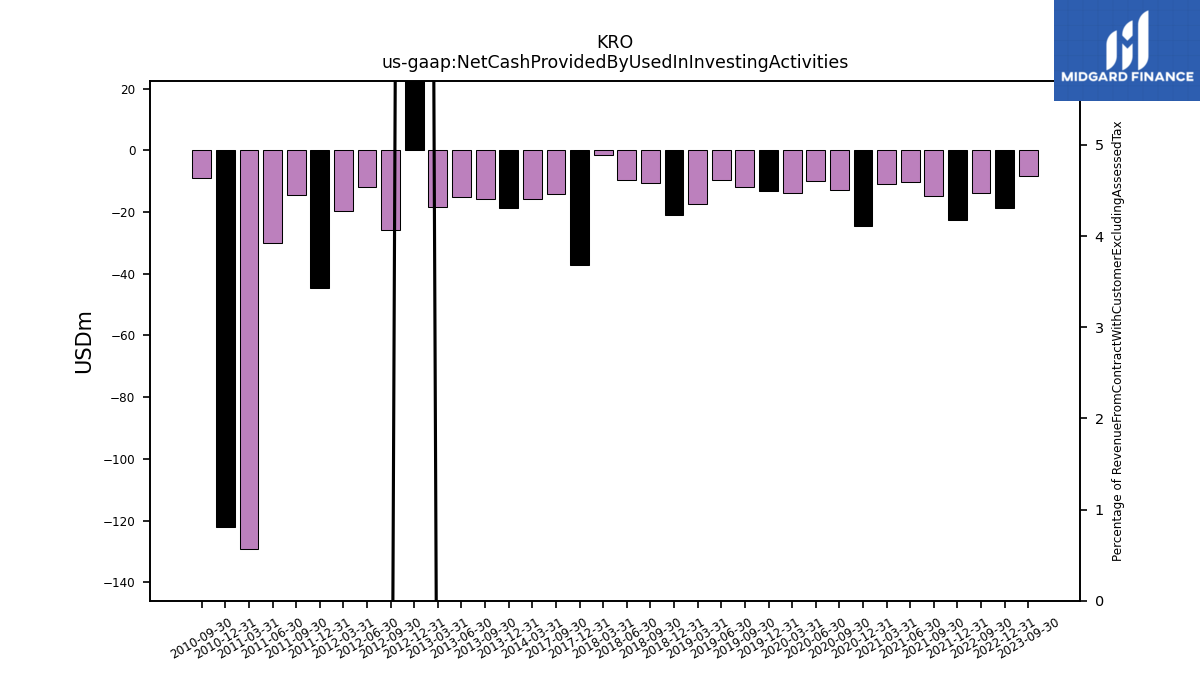
| Net Cash Provided By Used In Investing Activities | NA | -5.30 | -8.20 | NA | NA | -18.80 | -13.90 | NA | NA | -22.70 | -14.70 | -10.40 | -10.80 | -24.50 | -12.90 | -10.10 | -13.80 | -13.30 | -12.00 | -9.70 | -17.50 | -20.90 | -10.60 | -9.60 | -1.60 | -37.20 | -14.10 | NA | NA | NA | NA | NA | NA | NA | NA | NA | NA | NA | NA | NA | -15.70 | -18.80 | -15.90 | -15.20 | -18.30 | 207.30 | -25.90 | -11.80 | -19.80 | -44.60 | -14.40 | -29.90 | -129.20 | -121.90 | -8.90 | NA | |
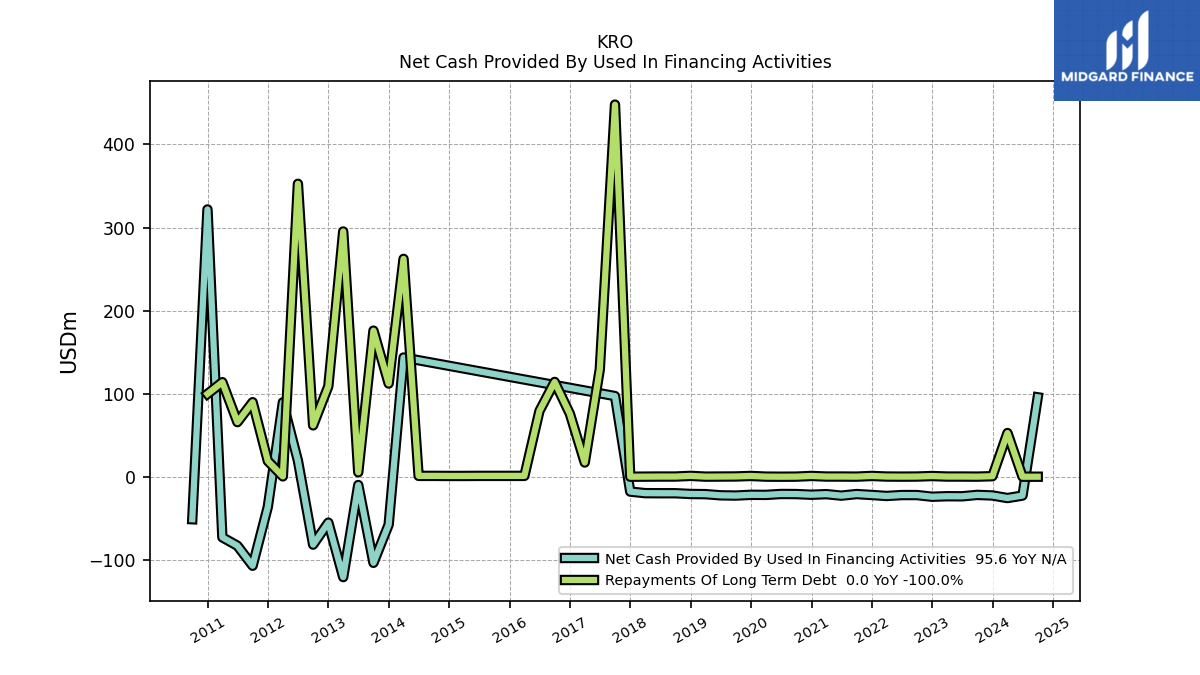
| Net Cash Provided By Used In Financing Activities | -25.70 | -22.60 | -21.90 | -23.60 | -23.50 | -24.10 | -22.10 | -22.10 | -23.20 | -22.00 | -20.90 | -22.80 | -21.00 | -21.70 | -20.90 | -20.80 | -21.90 | -21.80 | -22.70 | -22.40 | -21.00 | -20.80 | -19.90 | -19.90 | -19.80 | -17.90 | 97.10 | NA | NA | NA | NA | NA | NA | NA | NA | NA | NA | NA | NA | NA | 143.50 | -57.70 | -103.70 | -10.00 | -120.90 | -55.30 | -81.80 | 19.40 | 89.60 | -36.30 | -107.20 | -83.10 | -73.00 | 321.80 | -51.20 | NA |
| 2024-03-31 | 2023-12-31 | 2023-09-30 | 2023-06-30 | 2023-03-31 | 2022-12-31 | 2022-09-30 | 2022-06-30 | 2022-03-31 | 2021-12-31 | 2021-09-30 | 2021-06-30 | 2021-03-31 | 2020-12-31 | 2020-09-30 | 2020-06-30 | 2020-03-31 | 2019-12-31 | 2019-09-30 | 2019-06-30 | 2019-03-31 | 2018-12-31 | 2018-09-30 | 2018-06-30 | 2018-03-31 | 2017-12-31 | 2017-09-30 | 2017-06-30 | 2017-03-31 | 2016-12-31 | 2016-09-30 | 2016-06-30 | 2016-03-31 | 2015-12-31 | 2015-09-30 | 2015-06-30 | 2015-03-31 | 2014-12-31 | 2014-09-30 | 2014-06-30 | 2014-03-31 | 2013-12-31 | 2013-09-30 | 2013-06-30 | 2013-03-31 | 2012-12-31 | 2012-09-30 | 2012-06-30 | 2012-03-31 | 2011-12-31 | 2011-09-30 | 2011-06-30 | 2011-03-31 | 2010-12-31 | 2010-09-30 | 2010-06-30 | ||
|---|---|---|---|---|---|---|---|---|---|---|---|---|---|---|---|---|---|---|---|---|---|---|---|---|---|---|---|---|---|---|---|---|---|---|---|---|---|---|---|---|---|---|---|---|---|---|---|---|---|---|---|---|---|---|---|---|---|
| Net Cash Provided By Used In Operating Activities | -43.30 | 64.40 | 17.70 | 33.20 | -109.80 | 22.60 | 9.80 | 67.90 | -18.60 | 80.50 | 47.90 | 21.40 | 56.70 | 46.40 | 38.00 | 27.90 | -9.80 | 36.50 | 97.80 | 19.00 | 7.00 | -10.50 | 29.30 | 111.50 | 58.20 | 57.80 | 116.70 | NA | NA | NA | NA | NA | NA | NA | NA | NA | NA | NA | NA | NA | -2.50 | 69.60 | 75.90 | 24.20 | -39.30 | 19.40 | 124.50 | 37.70 | -104.70 | 52.20 | 163.20 | 59.00 | 21.20 | 58.30 | 71.10 | NA | |
| Net Income Loss | 8.10 | -5.30 | -20.40 | -8.20 | -15.20 | -19.90 | 21.00 | 45.90 | 57.50 | 31.60 | 36.00 | 25.70 | 19.60 | 10.20 | 8.10 | 18.60 | 27.00 | 9.40 | 17.90 | 29.50 | 30.30 | 24.00 | 32.60 | 77.70 | 70.70 | 47.40 | 73.80 | 196.50 | 36.80 | 23.20 | 22.20 | 1.70 | -3.80 | -20.40 | -11.80 | -159.80 | 18.40 | 19.90 | 31.90 | 33.10 | 14.30 | 2.90 | -29.90 | -33.90 | -41.10 | -18.10 | 35.20 | 64.50 | 136.90 | 85.80 | 85.90 | 89.00 | 60.30 | 36.50 | 32.10 | 19.30 | |
| Profit Loss | 8.10 | -5.30 | -20.40 | -8.20 | -15.20 | -19.90 | 21.00 | 45.90 | 57.50 | 31.60 | 36.00 | 25.70 | 19.60 | 10.20 | 8.10 | 18.60 | 27.00 | 9.40 | 17.90 | 29.50 | 30.30 | 24.00 | 32.60 | 77.70 | 70.70 | 47.40 | 73.80 | NA | NA | NA | NA | NA | NA | NA | NA | NA | NA | NA | NA | NA | NA | NA | NA | NA | NA | NA | NA | NA | NA | NA | NA | NA | NA | NA | NA | NA | |
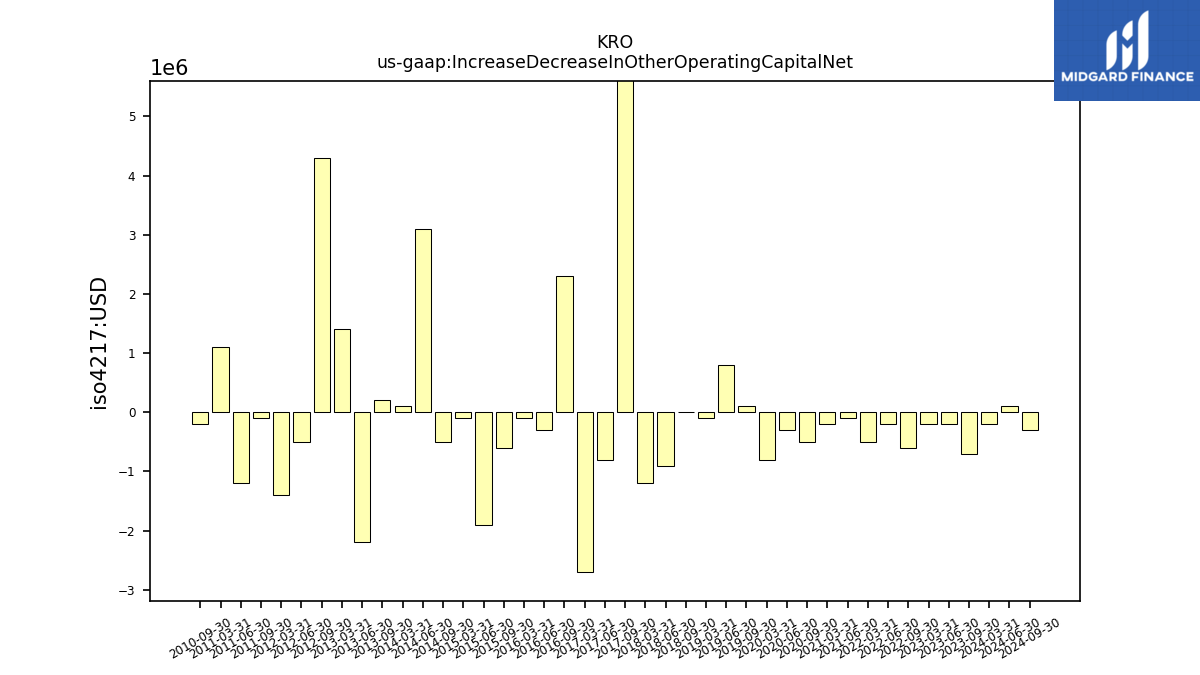
| Increase Decrease In Other Operating Capital Net | -0.20 | NA | -0.70 | -0.20 | -0.20 | NA | -0.60 | -0.20 | -0.50 | NA | NA | -0.10 | -0.20 | NA | -0.50 | -0.30 | -0.80 | NA | 0.10 | 0.80 | -0.10 | NA | 0.00 | -0.90 | -1.20 | NA | 7.00 | -0.80 | -2.70 | NA | 2.30 | -0.30 | -0.10 | NA | -0.60 | -1.90 | -0.10 | NA | -0.50 | 3.10 | 0.10 | NA | 0.20 | -2.20 | 1.40 | NA | 4.30 | -0.50 | -1.40 | NA | -0.10 | -1.20 | 1.10 | NA | -0.20 | NA | |
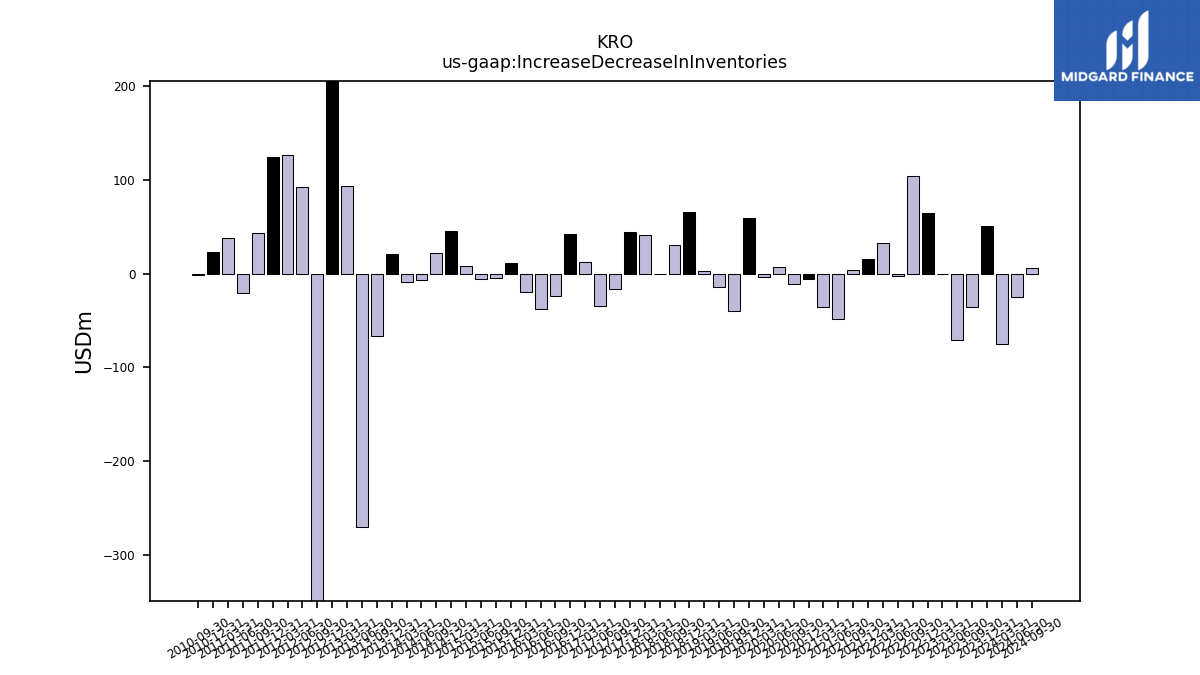
| Increase Decrease In Inventories | -75.60 | 50.20 | -35.30 | -70.70 | -0.50 | 64.30 | 103.80 | -2.50 | 32.80 | 15.20 | 3.40 | -48.80 | -35.60 | -5.60 | -11.50 | 7.10 | -3.30 | 59.20 | -40.20 | -14.10 | 2.20 | 65.20 | 29.90 | -0.50 | 40.90 | 44.80 | -17.00 | -35.00 | 12.10 | 42.30 | -23.50 | -38.10 | -19.50 | 11.10 | -4.30 | -5.60 | 8.30 | 45.20 | 22.20 | -6.50 | -8.60 | 20.70 | -66.30 | -269.70 | 93.10 | 343.00 | -376.20 | 91.90 | 126.10 | 124.00 | 42.80 | -20.60 | 37.60 | 23.30 | -2.10 | NA | |
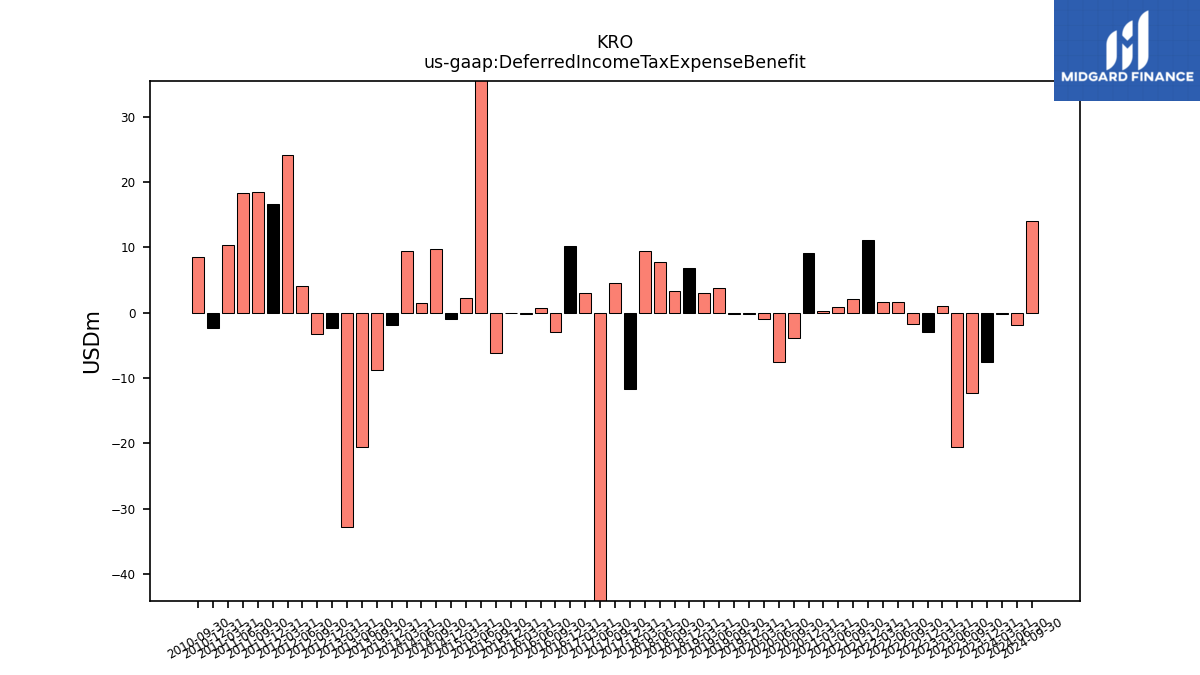
| Deferred Income Tax Expense Benefit | -0.20 | -7.60 | -12.20 | -20.60 | 1.10 | -3.00 | -1.70 | 1.60 | 1.70 | 11.10 | 2.10 | 0.90 | 0.20 | 9.10 | -3.80 | -7.60 | -0.90 | -0.20 | -0.20 | 3.80 | 3.10 | 6.80 | 3.30 | 7.80 | 9.40 | -11.70 | 4.50 | -147.40 | 3.00 | 10.20 | -3.00 | 0.70 | -0.20 | -0.10 | -6.20 | 142.50 | 2.30 | -1.00 | 9.70 | 1.50 | 9.40 | -1.90 | -8.80 | -20.60 | -32.70 | -2.40 | -3.20 | 4.10 | 24.10 | 16.60 | 18.50 | 18.40 | 10.30 | -2.40 | 8.60 | NA |
| 2024-03-31 | 2023-12-31 | 2023-09-30 | 2023-06-30 | 2023-03-31 | 2022-12-31 | 2022-09-30 | 2022-06-30 | 2022-03-31 | 2021-12-31 | 2021-09-30 | 2021-06-30 | 2021-03-31 | 2020-12-31 | 2020-09-30 | 2020-06-30 | 2020-03-31 | 2019-12-31 | 2019-09-30 | 2019-06-30 | 2019-03-31 | 2018-12-31 | 2018-09-30 | 2018-06-30 | 2018-03-31 | 2017-12-31 | 2017-09-30 | 2017-06-30 | 2017-03-31 | 2016-12-31 | 2016-09-30 | 2016-06-30 | 2016-03-31 | 2015-12-31 | 2015-09-30 | 2015-06-30 | 2015-03-31 | 2014-12-31 | 2014-09-30 | 2014-06-30 | 2014-03-31 | 2013-12-31 | 2013-09-30 | 2013-06-30 | 2013-03-31 | 2012-12-31 | 2012-09-30 | 2012-06-30 | 2012-03-31 | 2011-12-31 | 2011-09-30 | 2011-06-30 | 2011-03-31 | 2010-12-31 | 2010-09-30 | 2010-06-30 | ||
|---|---|---|---|---|---|---|---|---|---|---|---|---|---|---|---|---|---|---|---|---|---|---|---|---|---|---|---|---|---|---|---|---|---|---|---|---|---|---|---|---|---|---|---|---|---|---|---|---|---|---|---|---|---|---|---|---|---|
| Net Cash Provided By Used In Investing Activities | NA | -5.30 | -8.20 | NA | NA | -18.80 | -13.90 | NA | NA | -22.70 | -14.70 | -10.40 | -10.80 | -24.50 | -12.90 | -10.10 | -13.80 | -13.30 | -12.00 | -9.70 | -17.50 | -20.90 | -10.60 | -9.60 | -1.60 | -37.20 | -14.10 | NA | NA | NA | NA | NA | NA | NA | NA | NA | NA | NA | NA | NA | -15.70 | -18.80 | -15.90 | -15.20 | -18.30 | 207.30 | -25.90 | -11.80 | -19.80 | -44.60 | -14.40 | -29.90 | -129.20 | -121.90 | -8.90 | NA | |
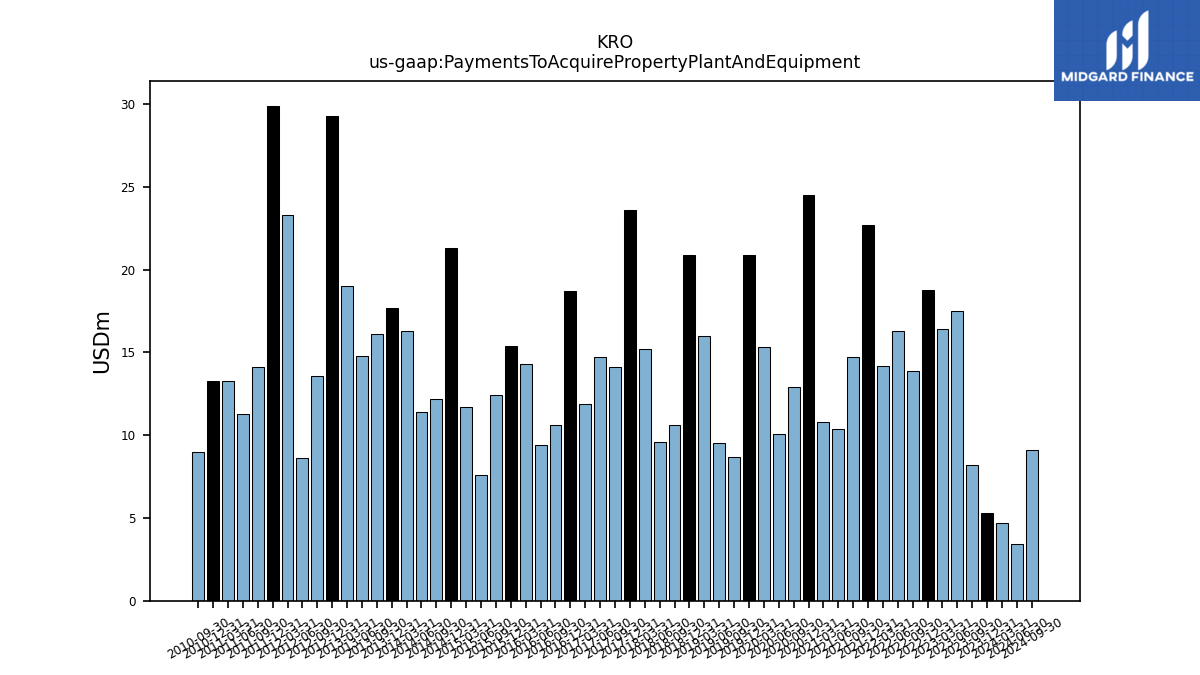
| Payments To Acquire Property Plant And Equipment | 4.70 | 5.30 | 8.20 | 17.50 | 16.40 | 18.80 | 13.90 | 16.30 | 14.20 | 22.70 | 14.70 | 10.40 | 10.80 | 24.50 | 12.90 | 10.10 | 15.30 | 20.90 | 8.70 | 9.50 | 16.00 | 20.90 | 10.60 | 9.60 | 15.20 | 23.60 | 14.10 | 14.70 | 11.90 | 18.70 | 10.60 | 9.40 | 14.30 | 15.40 | 12.40 | 7.60 | 11.70 | 21.30 | 12.20 | 11.40 | 16.30 | 17.70 | 16.10 | 14.80 | 19.00 | 29.30 | 13.60 | 8.60 | 23.30 | 29.90 | 14.10 | 11.30 | 13.30 | 13.30 | 9.00 | NA |
| 2024-03-31 | 2023-12-31 | 2023-09-30 | 2023-06-30 | 2023-03-31 | 2022-12-31 | 2022-09-30 | 2022-06-30 | 2022-03-31 | 2021-12-31 | 2021-09-30 | 2021-06-30 | 2021-03-31 | 2020-12-31 | 2020-09-30 | 2020-06-30 | 2020-03-31 | 2019-12-31 | 2019-09-30 | 2019-06-30 | 2019-03-31 | 2018-12-31 | 2018-09-30 | 2018-06-30 | 2018-03-31 | 2017-12-31 | 2017-09-30 | 2017-06-30 | 2017-03-31 | 2016-12-31 | 2016-09-30 | 2016-06-30 | 2016-03-31 | 2015-12-31 | 2015-09-30 | 2015-06-30 | 2015-03-31 | 2014-12-31 | 2014-09-30 | 2014-06-30 | 2014-03-31 | 2013-12-31 | 2013-09-30 | 2013-06-30 | 2013-03-31 | 2012-12-31 | 2012-09-30 | 2012-06-30 | 2012-03-31 | 2011-12-31 | 2011-09-30 | 2011-06-30 | 2011-03-31 | 2010-12-31 | 2010-09-30 | 2010-06-30 | ||
|---|---|---|---|---|---|---|---|---|---|---|---|---|---|---|---|---|---|---|---|---|---|---|---|---|---|---|---|---|---|---|---|---|---|---|---|---|---|---|---|---|---|---|---|---|---|---|---|---|---|---|---|---|---|---|---|---|---|
| Net Cash Provided By Used In Financing Activities | -25.70 | -22.60 | -21.90 | -23.60 | -23.50 | -24.10 | -22.10 | -22.10 | -23.20 | -22.00 | -20.90 | -22.80 | -21.00 | -21.70 | -20.90 | -20.80 | -21.90 | -21.80 | -22.70 | -22.40 | -21.00 | -20.80 | -19.90 | -19.90 | -19.80 | -17.90 | 97.10 | NA | NA | NA | NA | NA | NA | NA | NA | NA | NA | NA | NA | NA | 143.50 | -57.70 | -103.70 | -10.00 | -120.90 | -55.30 | -81.80 | 19.40 | 89.60 | -36.30 | -107.20 | -83.10 | -73.00 | 321.80 | -51.20 | NA | |
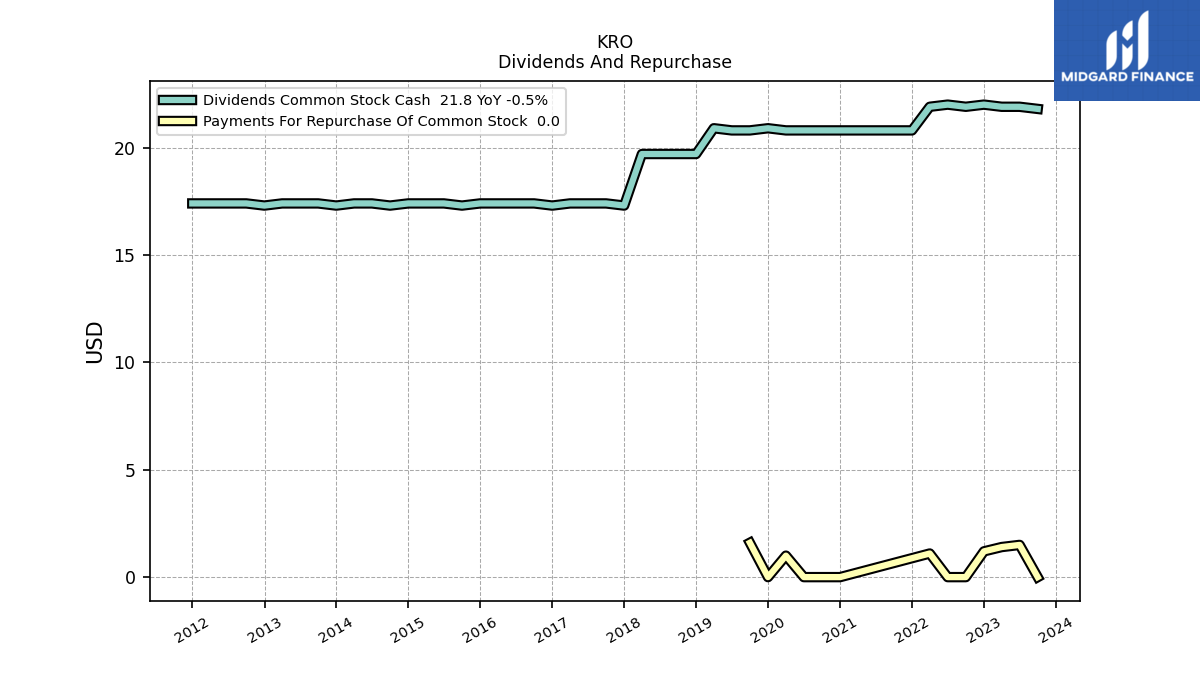
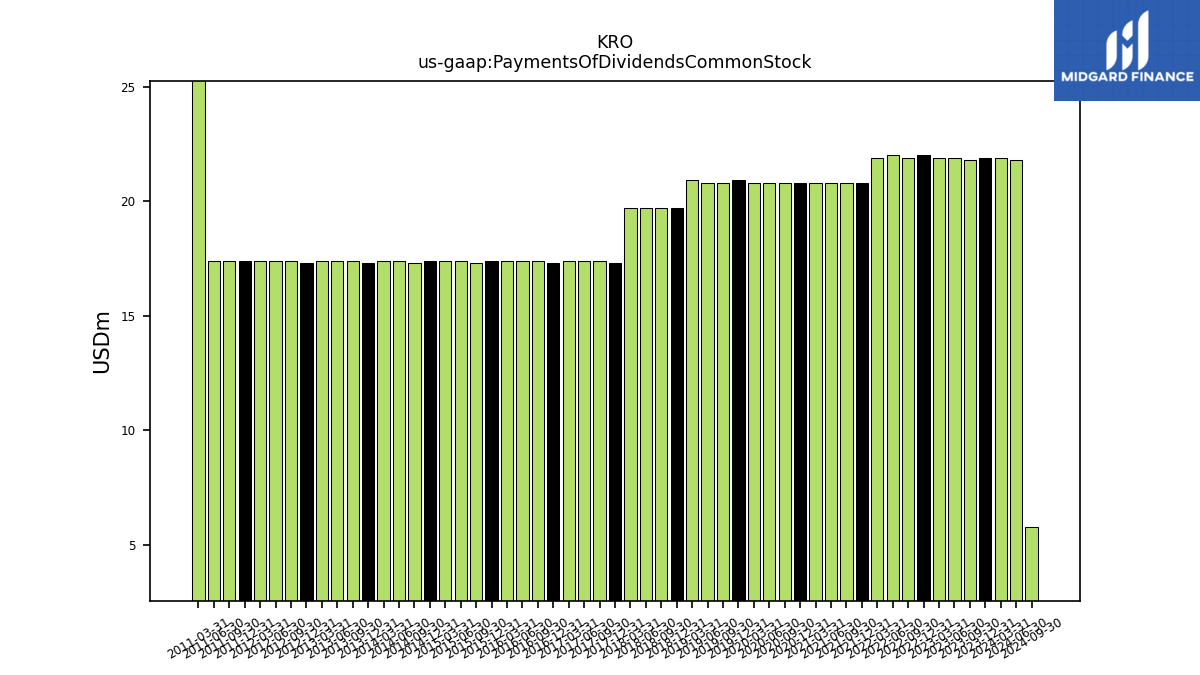
| Payments Of Dividends Common Stock | 21.90 | 21.90 | 21.80 | 21.90 | 21.90 | 22.00 | 21.90 | 22.00 | 21.90 | 20.80 | 20.80 | 20.80 | 20.80 | 20.80 | 20.80 | 20.80 | 20.80 | 20.90 | 20.80 | 20.80 | 20.90 | 19.70 | 19.70 | 19.70 | 19.70 | 17.30 | 17.40 | 17.40 | 17.40 | 17.30 | 17.40 | 17.40 | 17.40 | 17.40 | 17.30 | 17.40 | 17.40 | 17.40 | 17.30 | 17.40 | 17.40 | 17.30 | 17.40 | 17.40 | 17.40 | 17.30 | 17.40 | 17.40 | 17.40 | 17.40 | 17.40 | 17.40 | 72.40 | NA | NA | NA | |
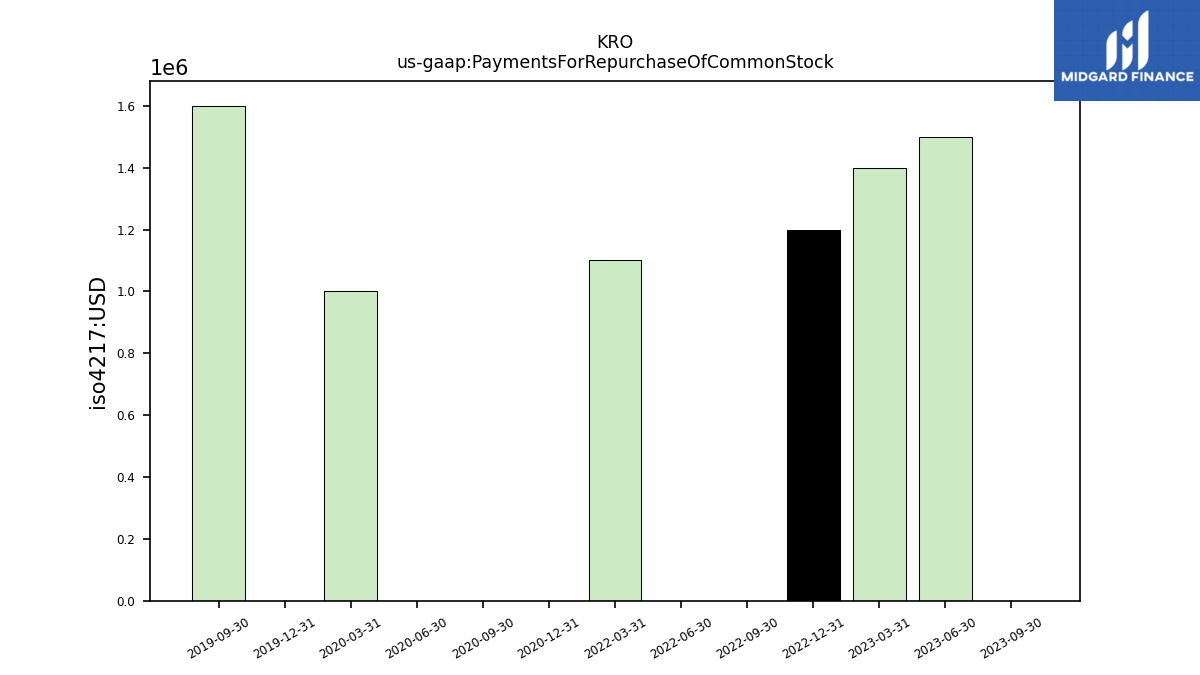
| Payments For Repurchase Of Common Stock | NA | 0.00 | 0.00 | 1.50 | 1.40 | 1.20 | 0.00 | 0.00 | 1.10 | NA | NA | NA | NA | 0.00 | 0.00 | 0.00 | 1.00 | 0.00 | 1.60 | NA | NA | NA | NA | NA | NA | NA | NA | NA | NA | NA | NA | NA | NA | NA | NA | NA | NA | NA | NA | NA | NA | NA | NA | NA | NA | NA | NA | NA | NA | NA | NA | NA | NA | NA | NA | NA |
| 2024-03-31 | 2023-12-31 | 2023-09-30 | 2023-06-30 | 2023-03-31 | 2022-12-31 | 2022-09-30 | 2022-06-30 | 2022-03-31 | 2021-12-31 | 2021-09-30 | 2021-06-30 | 2021-03-31 | 2020-12-31 | 2020-09-30 | 2020-06-30 | 2020-03-31 | 2019-12-31 | 2019-09-30 | 2019-06-30 | 2019-03-31 | 2018-12-31 | 2018-09-30 | 2018-06-30 | 2018-03-31 | 2017-12-31 | 2017-09-30 | 2017-06-30 | 2017-03-31 | 2016-12-31 | 2016-09-30 | 2016-06-30 | 2016-03-31 | 2015-12-31 | 2015-09-30 | 2015-06-30 | 2015-03-31 | 2014-12-31 | 2014-09-30 | 2014-06-30 | 2014-03-31 | 2013-12-31 | 2013-09-30 | 2013-06-30 | 2013-03-31 | 2012-12-31 | 2012-09-30 | 2012-06-30 | 2012-03-31 | 2011-12-31 | 2011-09-30 | 2011-06-30 | 2011-03-31 | 2010-12-31 | 2010-09-30 | 2010-06-30 | ||
|---|---|---|---|---|---|---|---|---|---|---|---|---|---|---|---|---|---|---|---|---|---|---|---|---|---|---|---|---|---|---|---|---|---|---|---|---|---|---|---|---|---|---|---|---|---|---|---|---|---|---|---|---|---|---|---|---|---|
| Revenue From Contract With Customer Excluding Assessed Tax | 478.80 | 400.10 | 396.90 | 443.20 | 426.30 | 342.40 | 459.60 | 565.30 | 562.90 | 496.00 | 499.80 | 478.60 | 465.00 | 414.90 | 416.90 | 386.00 | 421.00 | 372.70 | 437.40 | 484.50 | 436.50 | 349.40 | 410.30 | 471.80 | 430.40 | 453.30 | 464.50 | 441.40 | 369.80 | 333.70 | 356.10 | 356.10 | 318.40 | 287.00 | 336.50 | 360.20 | 365.10 | 373.50 | 414.80 | 443.50 | 420.10 | 368.60 | 419.10 | 481.10 | 463.60 | 396.80 | 472.90 | 545.30 | 561.30 | 437.40 | 548.00 | 537.50 | 420.40 | 373.30 | 376.60 | 380.10 | |
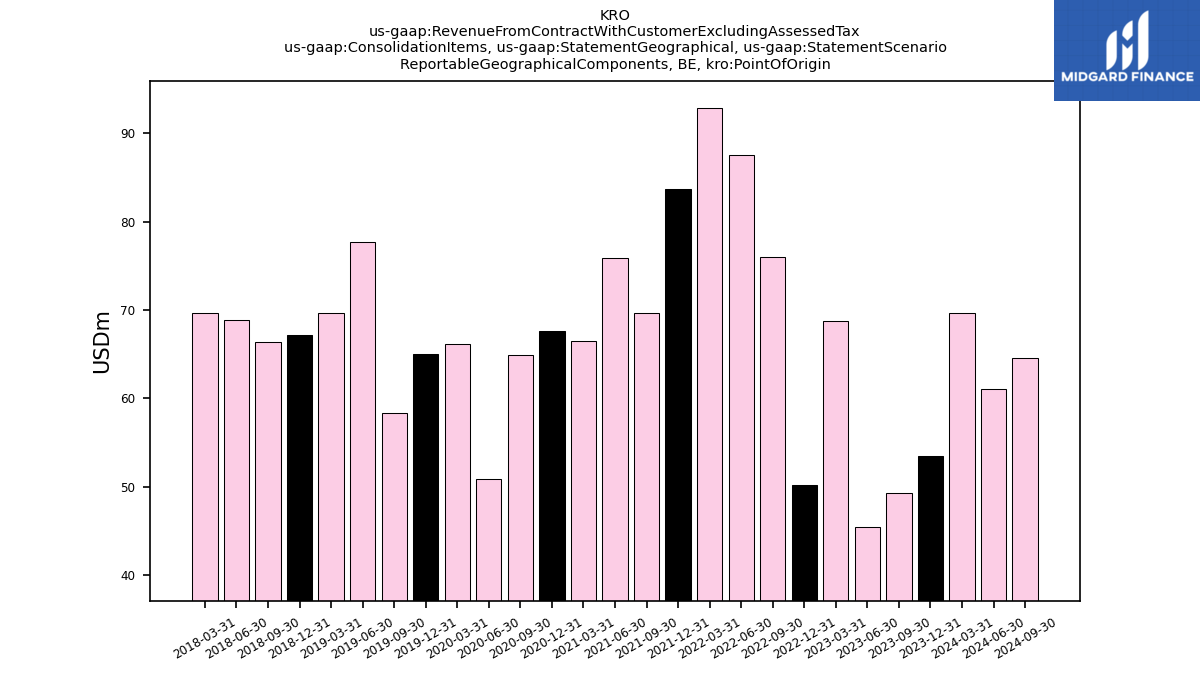
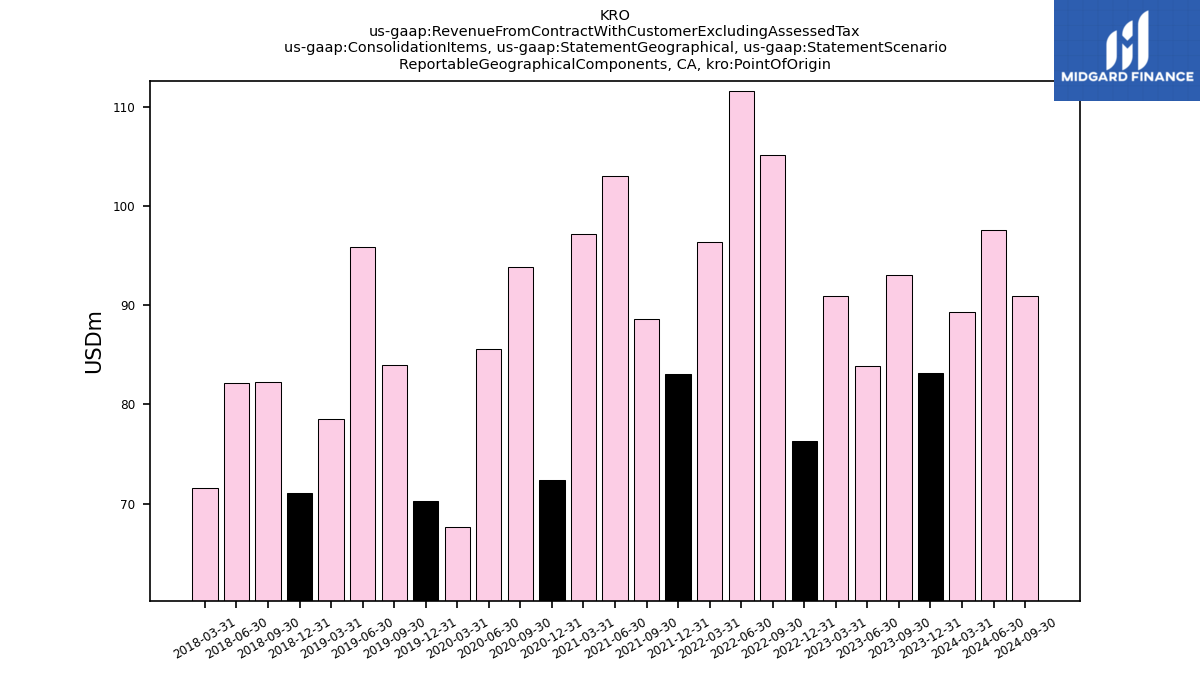
| ,, Point Of Origin | 69.60 | 53.50 | 49.30 | 45.50 | 68.80 | 50.20 | 76.00 | 87.50 | 92.80 | 83.70 | 69.60 | 75.90 | 66.50 | 67.60 | 64.90 | 50.90 | 66.10 | 65.00 | 58.30 | 77.70 | 69.70 | 67.20 | 66.40 | 68.90 | 69.70 | NA | NA | NA | NA | NA | NA | NA | NA | NA | NA | NA | NA | NA | NA | NA | NA | NA | NA | NA | NA | NA | NA | NA | NA | NA | NA | NA | NA | NA | NA | NA | |
| ,, Point Of Origin | 89.30 | 83.20 | 93.00 | 83.90 | 90.90 | 76.30 | 105.10 | 111.60 | 96.40 | 83.10 | 88.60 | 103.00 | 97.20 | 72.40 | 93.80 | 85.60 | 67.70 | 70.30 | 84.00 | 95.90 | 78.50 | 71.10 | 82.30 | 82.20 | 71.60 | NA | NA | NA | NA | NA | NA | NA | NA | NA | NA | NA | NA | NA | NA | NA | NA | NA | NA | NA | NA | NA | NA | NA | NA | NA | NA | NA | NA | NA | NA | NA | |
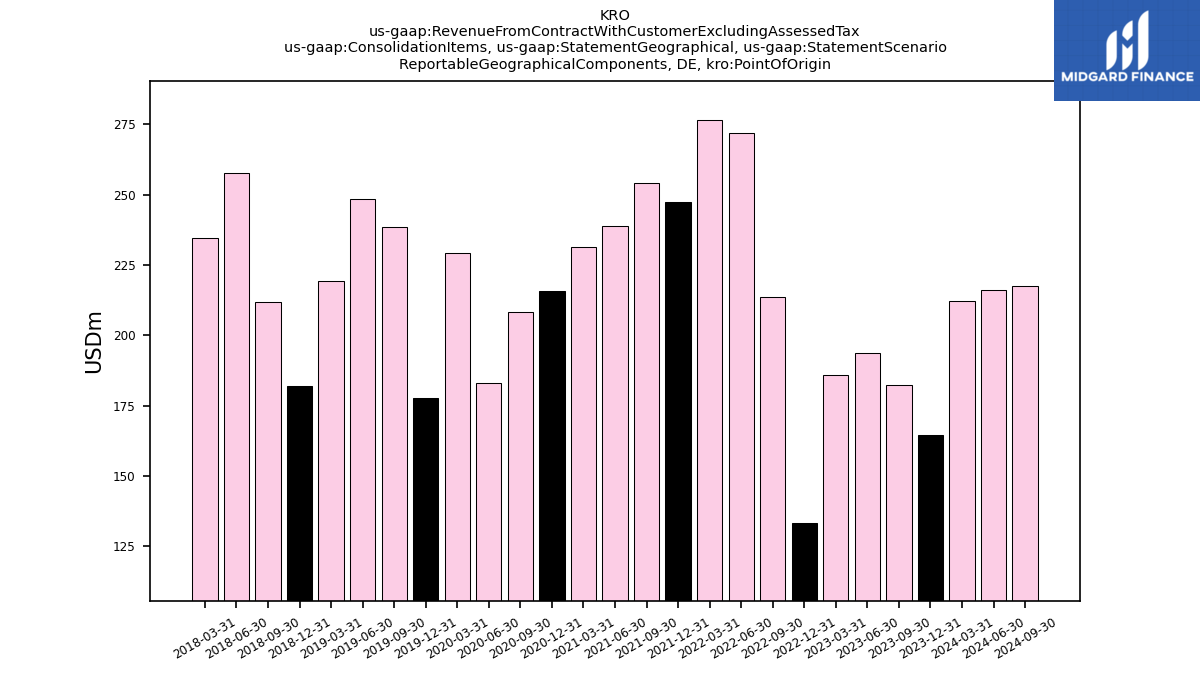
| ,, Point Of Origin | 212.20 | 164.50 | 182.30 | 193.60 | 186.00 | 133.40 | 213.50 | 272.00 | 276.50 | 247.50 | 254.20 | 238.80 | 231.20 | 215.70 | 208.10 | 183.10 | 229.10 | 177.60 | 238.30 | 248.50 | 219.20 | 182.00 | 211.90 | 257.70 | 234.50 | NA | NA | NA | NA | NA | NA | NA | NA | NA | NA | NA | NA | NA | NA | NA | NA | NA | NA | NA | NA | NA | NA | NA | NA | NA | NA | NA | NA | NA | NA | NA | |
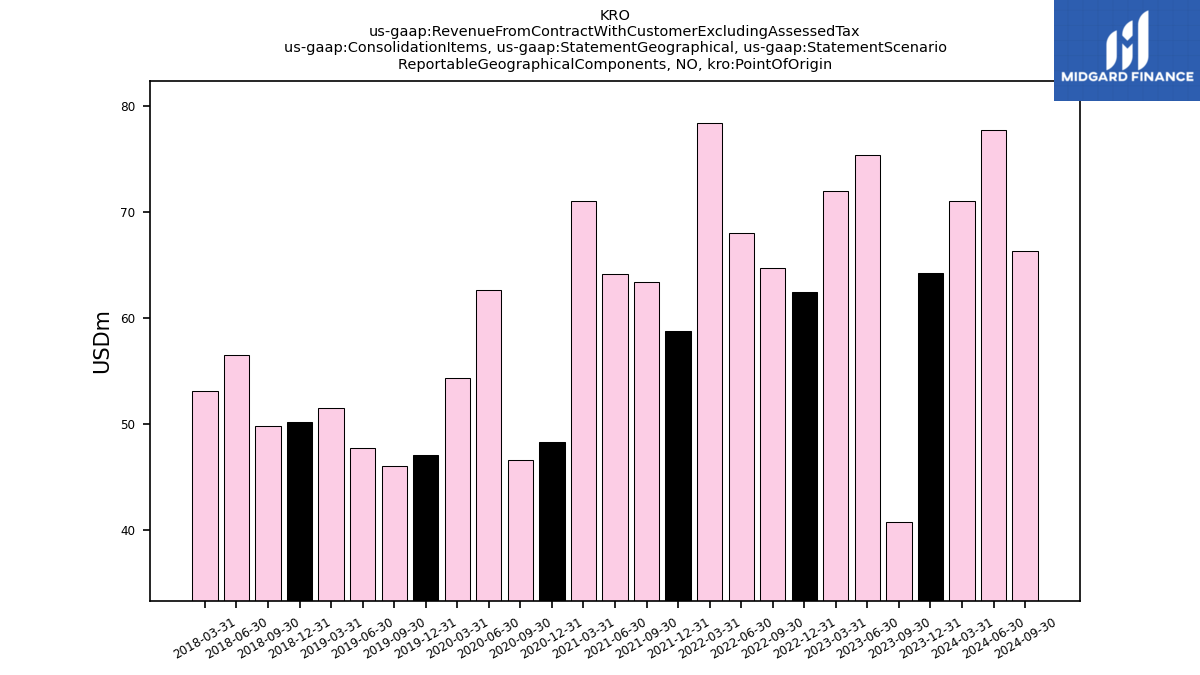
| ,, Point Of Origin | 71.00 | 64.20 | 40.70 | 75.30 | 71.90 | 62.40 | 64.70 | 68.00 | 78.40 | 58.70 | 63.40 | 64.10 | 71.00 | 48.30 | 46.60 | 62.60 | 54.30 | 47.00 | 46.00 | 47.70 | 51.50 | 50.20 | 49.80 | 56.50 | 53.10 | NA | NA | NA | NA | NA | NA | NA | NA | NA | NA | NA | NA | NA | NA | NA | NA | NA | NA | NA | NA | NA | NA | NA | NA | NA | NA | NA | NA | NA | NA | NA | |
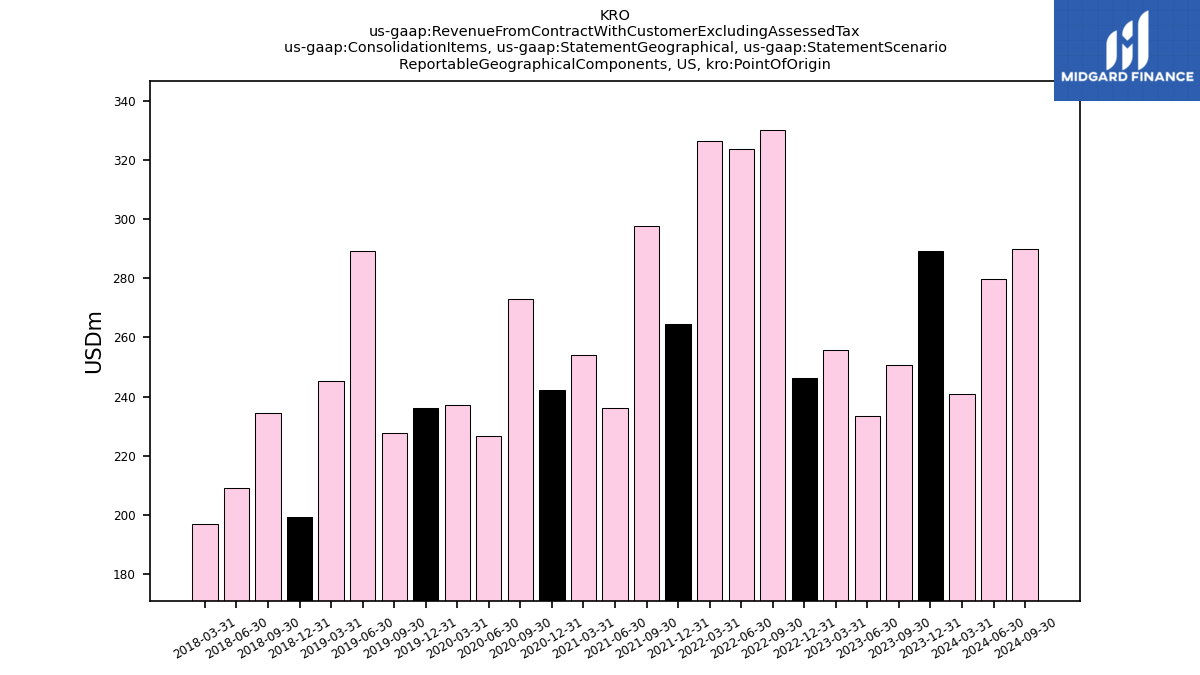
| ,US, Point Of Origin | 240.90 | 289.40 | 250.60 | 233.40 | 255.80 | 246.20 | 330.30 | 323.70 | 326.40 | 264.60 | 297.60 | 236.00 | 253.90 | 242.30 | 272.90 | 226.60 | 237.00 | 236.20 | 227.70 | 289.30 | 245.30 | 199.20 | 234.50 | 208.90 | 196.80 | NA | NA | NA | NA | NA | NA | NA | NA | NA | NA | NA | NA | NA | NA | NA | NA | NA | NA | NA | NA | NA | NA | NA | NA | NA | NA | NA | NA | NA | NA | NA | |
| , Point Of Origin | -204.20 | -254.70 | -219.00 | -188.50 | -247.10 | -226.10 | -330.00 | -297.50 | -307.60 | -241.60 | -273.60 | -239.20 | -254.80 | -231.40 | -269.40 | -222.80 | -233.20 | -223.40 | -216.90 | -274.60 | -227.70 | -220.30 | -234.60 | -202.40 | -195.30 | NA | NA | NA | NA | NA | NA | NA | NA | NA | NA | NA | NA | NA | NA | NA | NA | NA | NA | NA | NA | NA | NA | NA | NA | NA | NA | NA | NA | NA | NA | NA | |
| , Point Of Destination | 214.90 | 157.80 | 179.90 | 199.00 | 201.10 | 146.70 | 197.50 | 264.60 | 269.50 | 232.90 | 248.00 | 236.80 | 227.30 | 204.60 | 194.30 | 169.80 | 214.50 | 177.30 | 201.60 | 229.40 | 215.20 | 153.00 | 191.80 | 238.50 | 233.90 | NA | NA | NA | NA | NA | NA | NA | NA | NA | NA | NA | NA | NA | NA | NA | NA | NA | NA | NA | NA | NA | NA | NA | NA | NA | NA | NA | NA | NA | NA | NA | |
| , Point Of Destination | 166.00 | 151.40 | 165.10 | 153.00 | 148.60 | 137.30 | 182.50 | 196.00 | 179.90 | 168.80 | 174.30 | 157.30 | 145.30 | 134.90 | 153.20 | 148.90 | 132.30 | 119.50 | 147.80 | 161.50 | 146.80 | 129.40 | 142.00 | 143.60 | 127.00 | NA | NA | NA | NA | NA | NA | NA | NA | NA | NA | NA | NA | NA | NA | NA | NA | NA | NA | NA | NA | NA | NA | NA | NA | NA | NA | NA | NA | NA | NA | NA | |
| Other Geographical Area, Point Of Destination | 97.90 | 90.90 | 51.90 | 91.20 | 76.60 | 58.40 | 79.60 | 104.70 | 113.50 | 94.30 | 77.50 | 84.50 | 92.40 | 75.40 | 69.40 | 67.30 | 74.20 | 75.90 | 88.00 | 93.60 | 74.50 | 67.00 | 76.50 | 89.70 | 69.50 | NA | NA | NA | NA | NA | NA | NA | NA | NA | NA | NA | NA | NA | NA | NA | NA | NA | NA | NA | NA | NA | NA | NA | NA | NA | NA | NA | NA | NA | NA | NA | |
| Point Of Destination | 478.80 | NA | 396.90 | 443.20 | 426.30 | NA | 459.60 | 565.30 | 562.90 | NA | 499.80 | 478.60 | NA | NA | NA | NA | NA | NA | NA | NA | NA | NA | NA | NA | NA | NA | NA | NA | NA | NA | NA | NA | NA | NA | NA | NA | NA | NA | NA | NA | NA | NA | NA | NA | NA | NA | NA | NA | NA | NA | NA | NA | NA | NA | NA | NA | |
| Point Of Origin | 478.80 | NA | 396.90 | 443.20 | 426.30 | NA | 459.60 | 565.30 | 562.90 | NA | 499.80 | 478.60 | NA | NA | NA | NA | NA | NA | NA | NA | NA | NA | NA | NA | NA | NA | NA | NA | NA | NA | NA | NA | NA | NA | NA | NA | NA | NA | NA | NA | NA | NA | NA | NA | NA | NA | NA | NA | NA | NA | NA | NA | NA | NA | NA | NA |
