
| 2024-03-31 | 2023-12-31 | 2023-09-30 | 2023-06-30 | 2023-03-31 | 2022-12-31 | 2022-09-30 | 2022-06-30 | 2022-03-31 | 2021-12-31 | 2021-09-30 | 2021-06-30 | 2021-03-31 | 2020-12-31 | 2020-09-30 | 2020-06-30 | 2020-03-31 | 2019-12-31 | 2019-09-30 | 2019-06-30 | 2019-03-31 | 2018-12-31 | 2018-09-30 | 2018-06-30 | 2018-03-31 | 2017-12-31 | 2017-09-30 | 2017-06-30 | 2017-03-31 | 2016-12-31 | 2016-09-30 | 2016-06-30 | 2016-03-31 | 2015-12-31 | 2015-09-30 | 2015-06-30 | 2015-03-31 | 2014-12-31 | 2014-09-30 | 2014-06-30 | 2014-03-31 | 2013-12-31 | 2013-09-30 | 2013-06-30 | 2013-03-31 | 2012-12-31 | 2012-09-30 | 2012-06-30 | 2012-03-31 | 2011-12-31 | 2011-09-30 | 2011-06-30 | 2011-03-31 | 2010-12-31 | ||
|---|---|---|---|---|---|---|---|---|---|---|---|---|---|---|---|---|---|---|---|---|---|---|---|---|---|---|---|---|---|---|---|---|---|---|---|---|---|---|---|---|---|---|---|---|---|---|---|---|---|---|---|---|---|---|---|
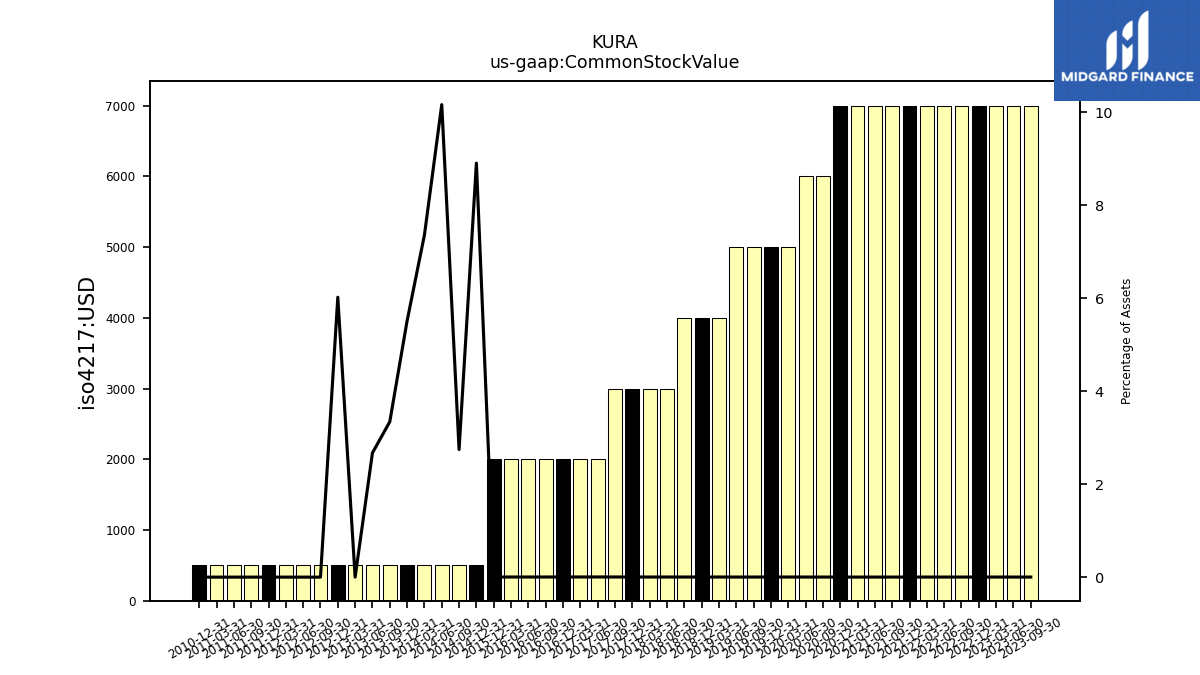
| Common Stock Value | 0.01 | 0.01 | 0.01 | 0.01 | 0.01 | 0.01 | 0.01 | 0.01 | 0.01 | 0.01 | 0.01 | 0.01 | 0.01 | 0.01 | 0.01 | 0.01 | 0.01 | 0.01 | 0.01 | 0.01 | 0.00 | 0.00 | 0.00 | 0.00 | 0.00 | 0.00 | 0.00 | 0.00 | 0.00 | 0.00 | 0.00 | 0.00 | 0.00 | 0.00 | NA | NA | NA | 0.00 | 0.00 | 0.00 | 0.00 | 0.00 | 0.00 | 0.00 | 0.00 | 0.00 | 0.00 | 0.00 | 0.00 | 0.00 | 0.00 | 0.00 | 0.00 | 0.00 | |
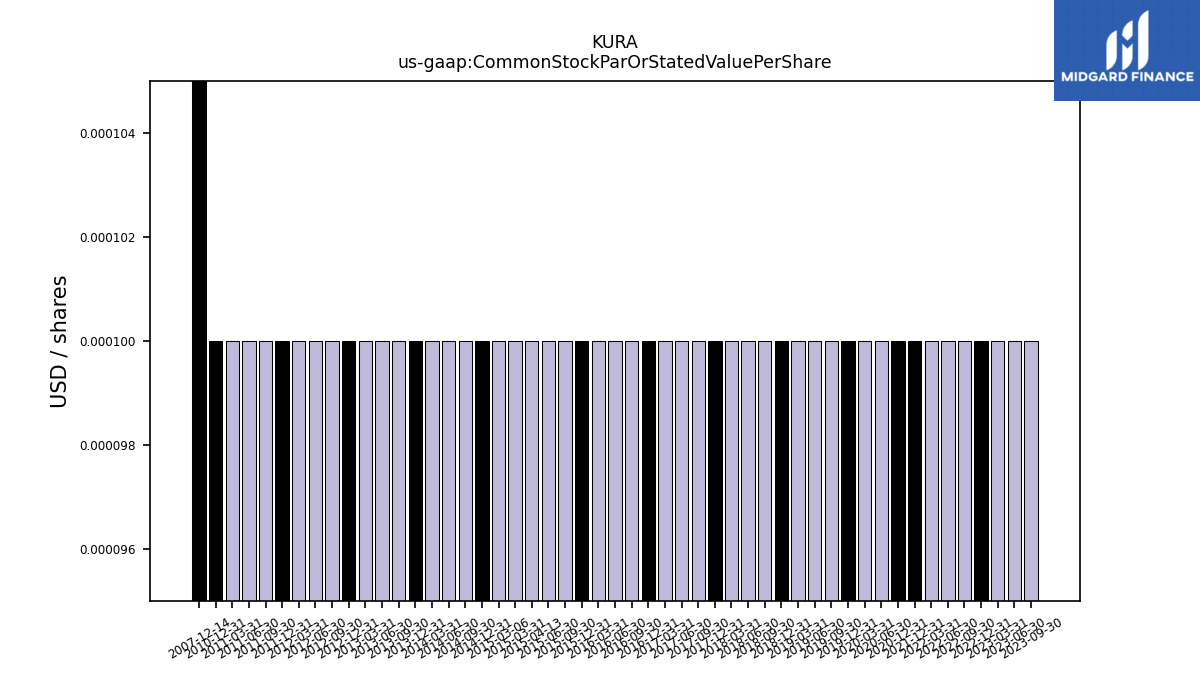
| Common Stock Par Or Stated Value Per Share | 0.00 | 0.00 | 0.00 | 0.00 | 0.00 | 0.00 | 0.00 | 0.00 | 0.00 | 0.00 | NA | NA | NA | 0.00 | NA | 0.00 | 0.00 | 0.00 | 0.00 | 0.00 | 0.00 | 0.00 | 0.00 | 0.00 | 0.00 | 0.00 | 0.00 | 0.00 | 0.00 | 0.00 | 0.00 | 0.00 | 0.00 | 0.00 | 0.00 | 0.00 | 0.00 | 0.00 | 0.00 | 0.00 | 0.00 | 0.00 | 0.00 | 0.00 | 0.00 | 0.00 | 0.00 | 0.00 | 0.00 | 0.00 | 0.00 | 0.00 | 0.00 | 0.00 | |
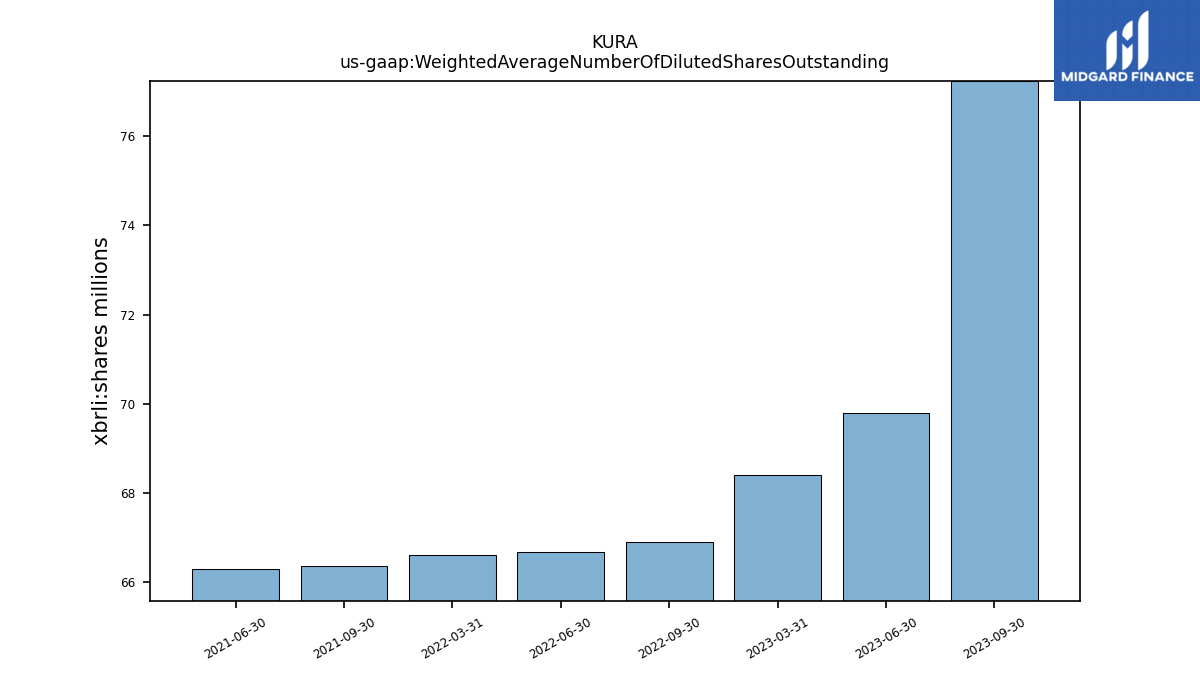
| Weighted Average Number Of Diluted Shares Outstanding | 83.91 | NA | 77.24 | 69.80 | 68.40 | NA | 66.89 | 66.67 | 66.61 | NA | 66.35 | 66.28 | NA | NA | NA | NA | NA | NA | NA | NA | NA | NA | NA | NA | NA | NA | NA | NA | NA | NA | NA | NA | NA | NA | NA | NA | NA | NA | NA | NA | NA | NA | NA | NA | NA | NA | NA | NA | NA | NA | NA | NA | NA | NA | |
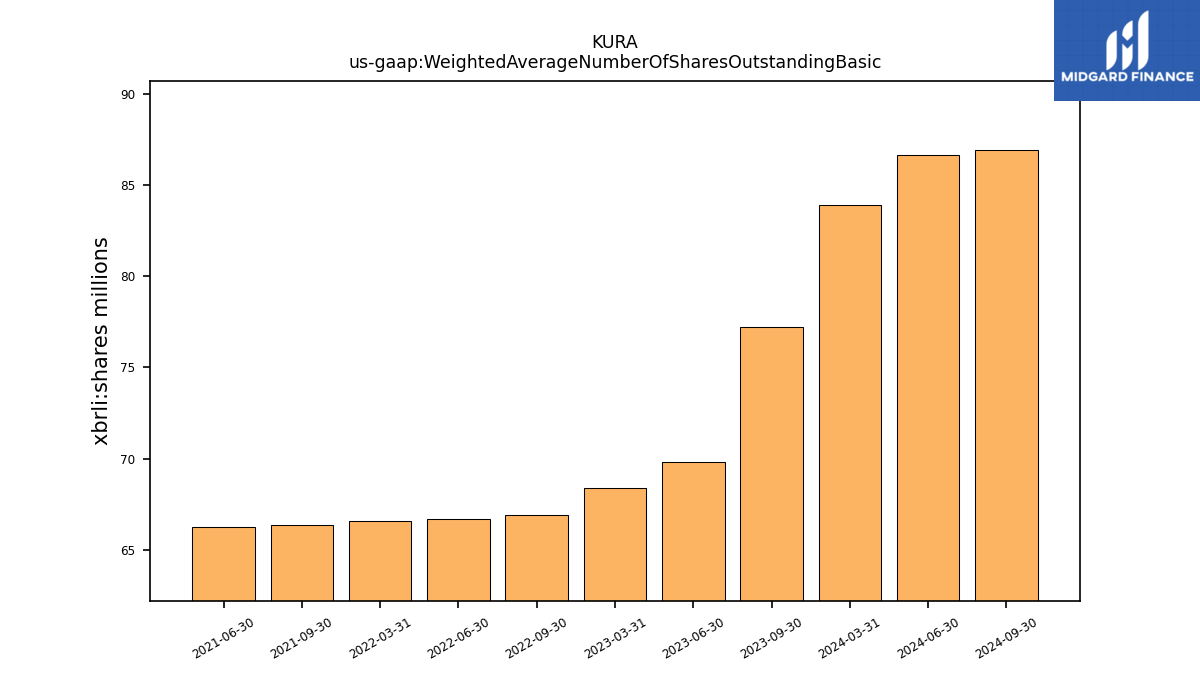
| Weighted Average Number Of Shares Outstanding Basic | 83.91 | NA | 77.24 | 69.80 | 68.40 | NA | 66.89 | 66.67 | 66.61 | NA | 66.35 | 66.28 | NA | NA | NA | NA | NA | NA | NA | NA | NA | NA | NA | NA | NA | NA | NA | NA | NA | NA | NA | NA | NA | NA | NA | NA | NA | NA | NA | NA | NA | NA | NA | NA | NA | NA | NA | NA | NA | NA | NA | NA | NA | NA | |
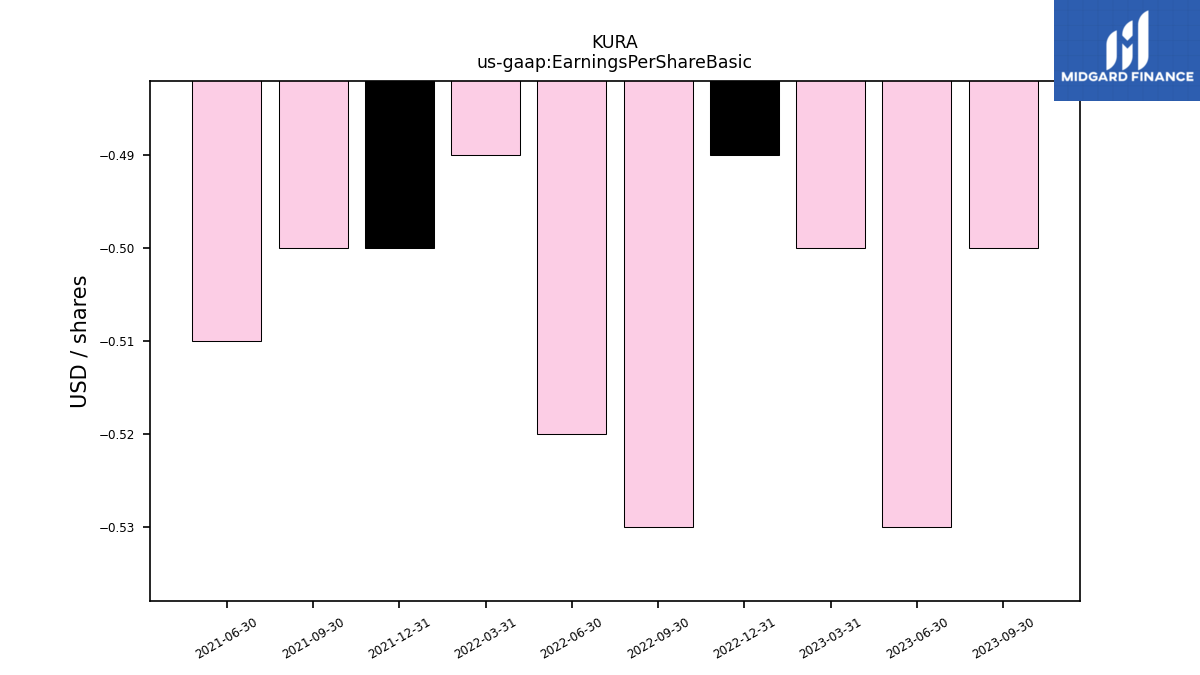
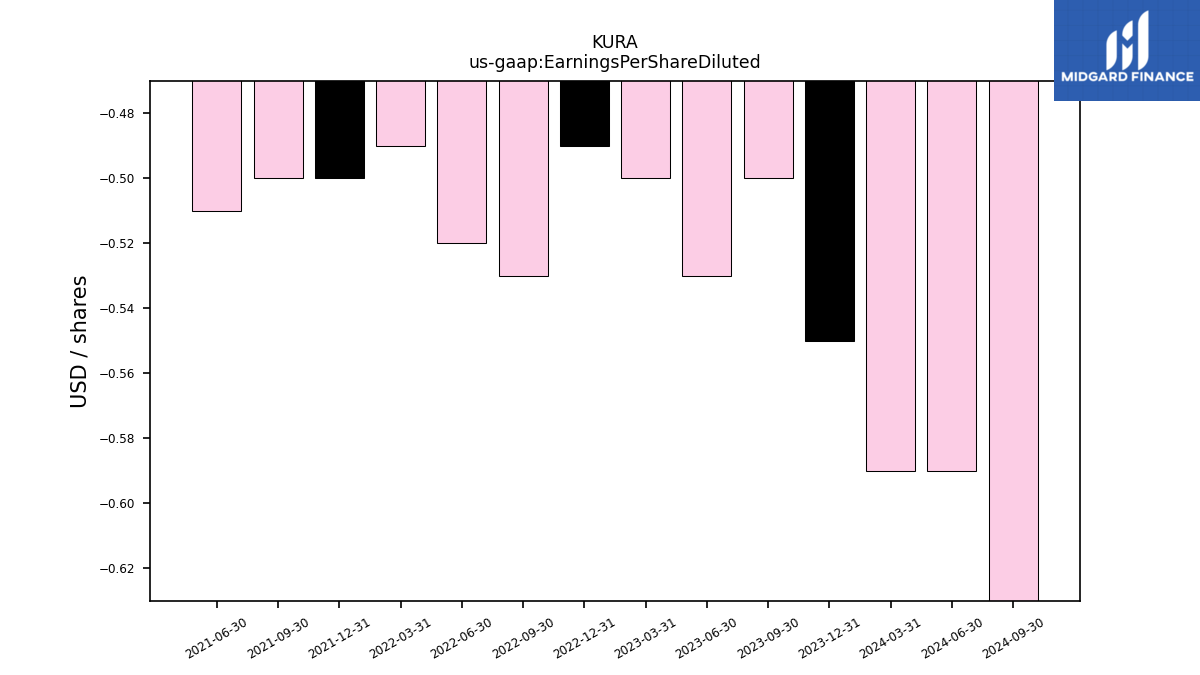
| Earnings Per Share Basic | -0.59 | -0.55 | -0.50 | -0.53 | -0.50 | -0.49 | -0.53 | -0.52 | -0.49 | -0.50 | -0.50 | -0.51 | NA | NA | NA | NA | NA | NA | NA | NA | NA | NA | NA | NA | NA | NA | NA | NA | NA | NA | NA | NA | NA | NA | NA | NA | NA | NA | NA | NA | NA | NA | NA | NA | NA | NA | NA | NA | NA | NA | NA | NA | NA | NA | |
| Earnings Per Share Diluted | -0.59 | -0.55 | -0.50 | -0.53 | -0.50 | -0.49 | -0.53 | -0.52 | -0.49 | -0.50 | -0.50 | -0.51 | NA | NA | NA | NA | NA | NA | NA | NA | NA | NA | NA | NA | NA | NA | NA | NA | NA | NA | NA | NA | NA | NA | NA | NA | NA | NA | NA | NA | NA | NA | NA | NA | NA | NA | NA | NA | NA | NA | NA | NA | NA | NA |
| 2024-03-31 | 2023-12-31 | 2023-09-30 | 2023-06-30 | 2023-03-31 | 2022-12-31 | 2022-09-30 | 2022-06-30 | 2022-03-31 | 2021-12-31 | 2021-09-30 | 2021-06-30 | 2021-03-31 | 2020-12-31 | 2020-09-30 | 2020-06-30 | 2020-03-31 | 2019-12-31 | 2019-09-30 | 2019-06-30 | 2019-03-31 | 2018-12-31 | 2018-09-30 | 2018-06-30 | 2018-03-31 | 2017-12-31 | 2017-09-30 | 2017-06-30 | 2017-03-31 | 2016-12-31 | 2016-09-30 | 2016-06-30 | 2016-03-31 | 2015-12-31 | 2015-09-30 | 2015-06-30 | 2015-03-31 | 2014-12-31 | 2014-09-30 | 2014-06-30 | 2014-03-31 | 2013-12-31 | 2013-09-30 | 2013-06-30 | 2013-03-31 | 2012-12-31 | 2012-09-30 | 2012-06-30 | 2012-03-31 | 2011-12-31 | 2011-09-30 | 2011-06-30 | 2011-03-31 | 2010-12-31 | ||
|---|---|---|---|---|---|---|---|---|---|---|---|---|---|---|---|---|---|---|---|---|---|---|---|---|---|---|---|---|---|---|---|---|---|---|---|---|---|---|---|---|---|---|---|---|---|---|---|---|---|---|---|---|---|---|---|
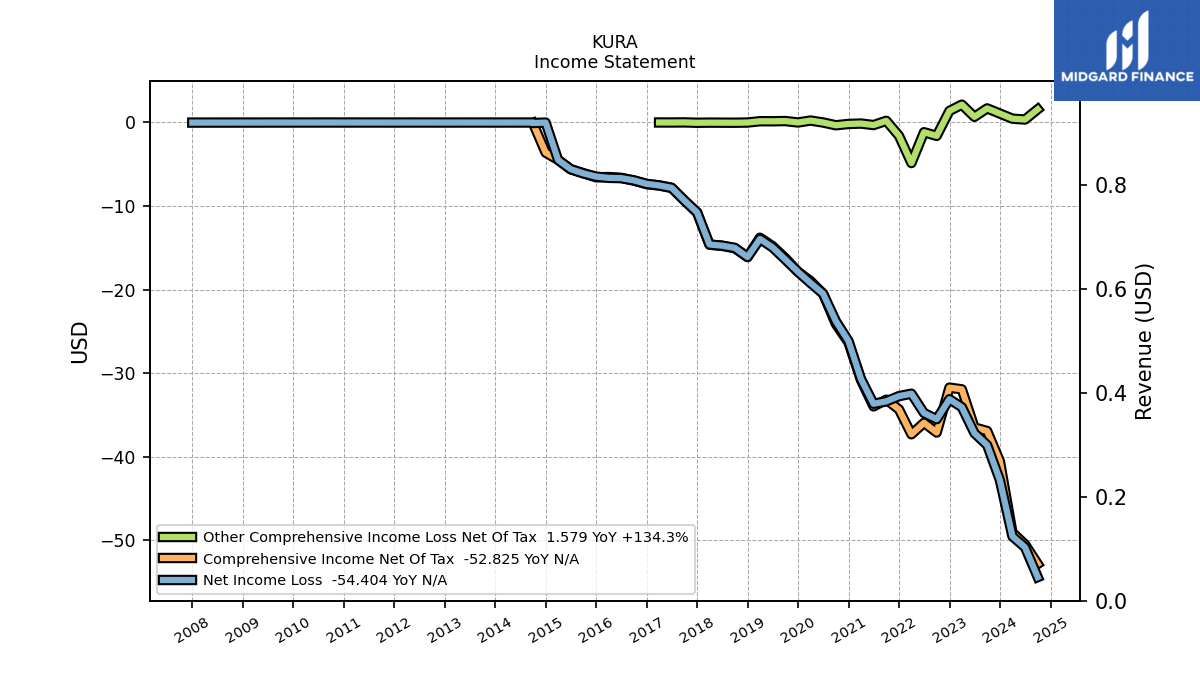
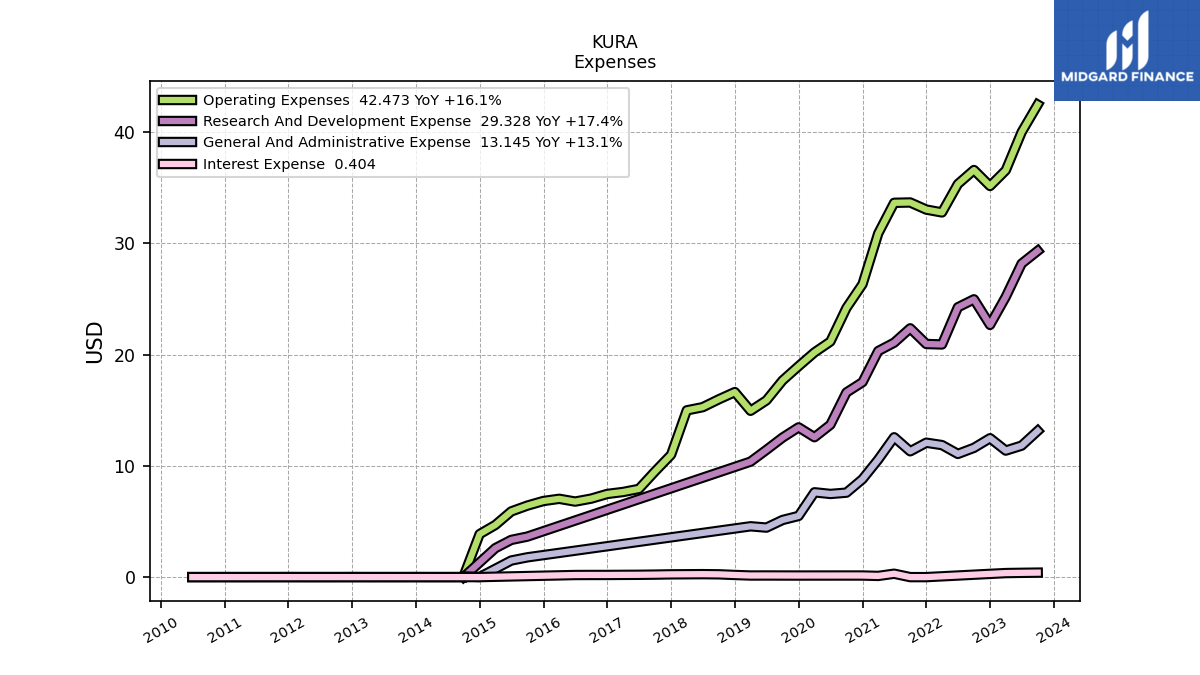
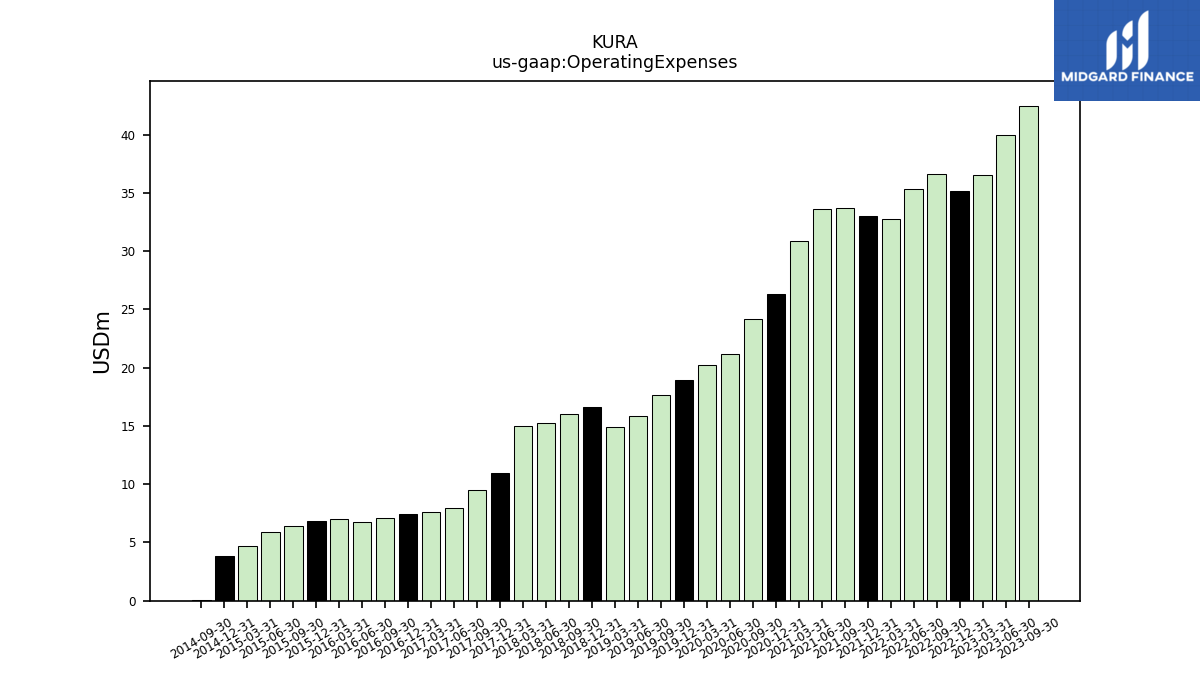
| Operating Expenses | 54.45 | 46.76 | 42.47 | 40.00 | 36.57 | 35.16 | 36.59 | 35.33 | 32.78 | 33.04 | 33.68 | 33.65 | 30.90 | 26.33 | 24.19 | 21.17 | 20.20 | 18.96 | 17.67 | 15.89 | 14.95 | 16.63 | 15.98 | 15.28 | 14.99 | 10.99 | 9.50 | 7.93 | 7.65 | 7.48 | 7.06 | 6.79 | 7.04 | 6.84 | 6.43 | 5.91 | 4.69 | 3.87 | 0.07 | NA | NA | NA | NA | NA | NA | NA | NA | NA | NA | NA | NA | NA | NA | NA | |
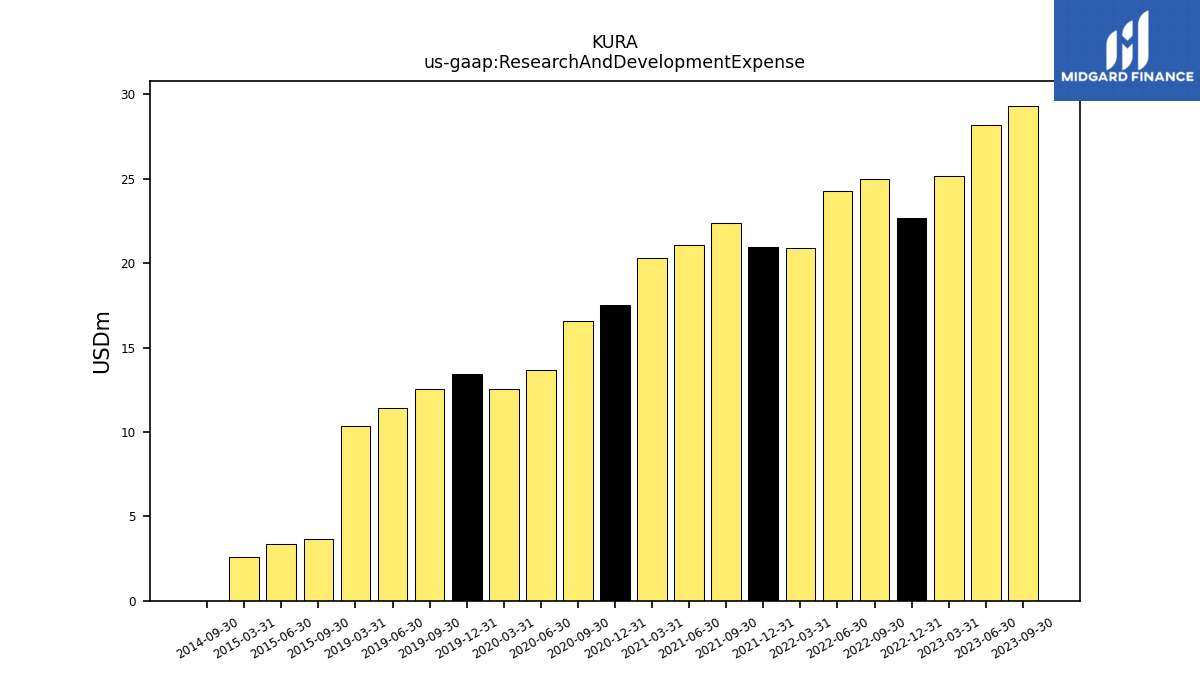
| Research And Development Expense | 36.27 | 32.53 | 29.33 | 28.18 | 25.19 | 22.67 | 24.97 | 24.26 | 20.91 | 20.96 | 22.37 | 21.07 | 20.32 | 17.52 | 16.60 | 13.70 | 12.57 | 13.46 | 12.54 | 11.44 | 10.38 | NA | NA | NA | NA | NA | NA | NA | NA | NA | NA | NA | NA | NA | 3.64 | 3.35 | 2.60 | NA | 0.00 | NA | NA | NA | NA | NA | NA | NA | NA | NA | NA | NA | NA | NA | NA | NA | |
| General And Administrative Expense | 18.18 | 14.23 | 13.14 | 11.82 | 11.37 | 12.49 | 11.62 | 11.07 | 11.87 | 12.08 | 11.31 | 12.57 | 10.57 | 8.81 | 7.59 | 7.48 | 7.62 | 5.50 | 5.13 | 4.45 | 4.57 | NA | NA | NA | NA | NA | NA | NA | NA | NA | NA | NA | NA | NA | 1.78 | 1.49 | NA | 0.01 | 0.00 | 0.01 | 0.00 | 0.01 | 0.00 | 0.01 | 0.00 | 0.01 | 0.00 | 0.00 | 0.00 | 0.01 | 0.01 | 0.01 | 0.00 | 0.01 | |
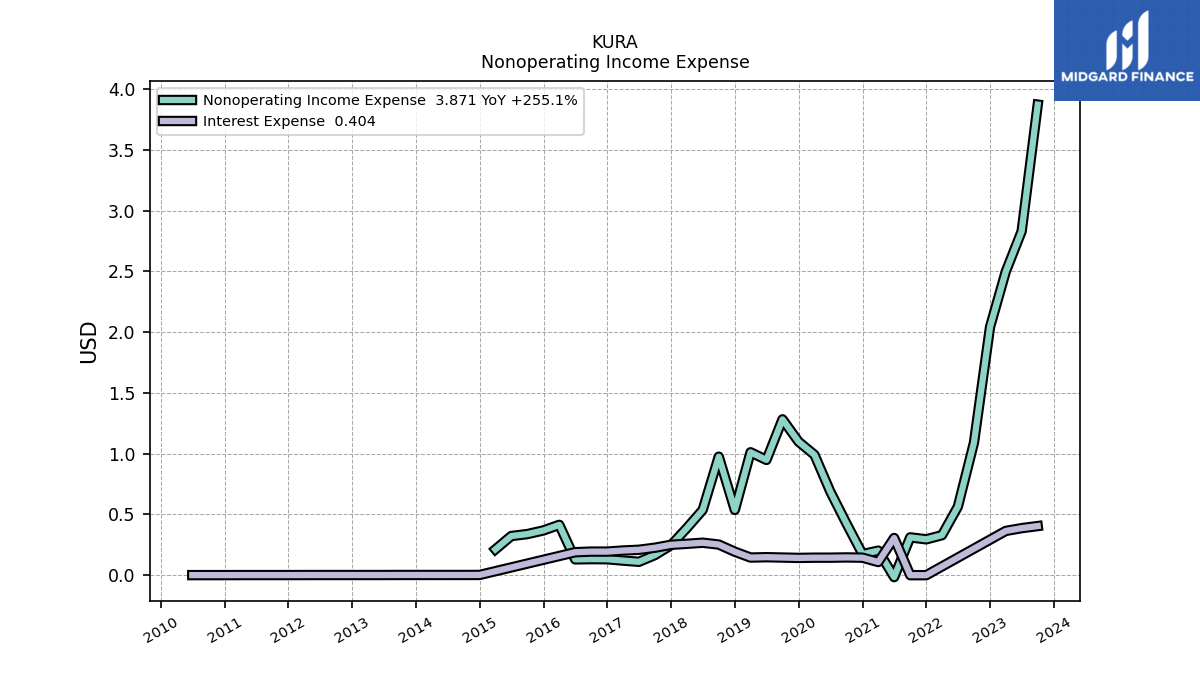
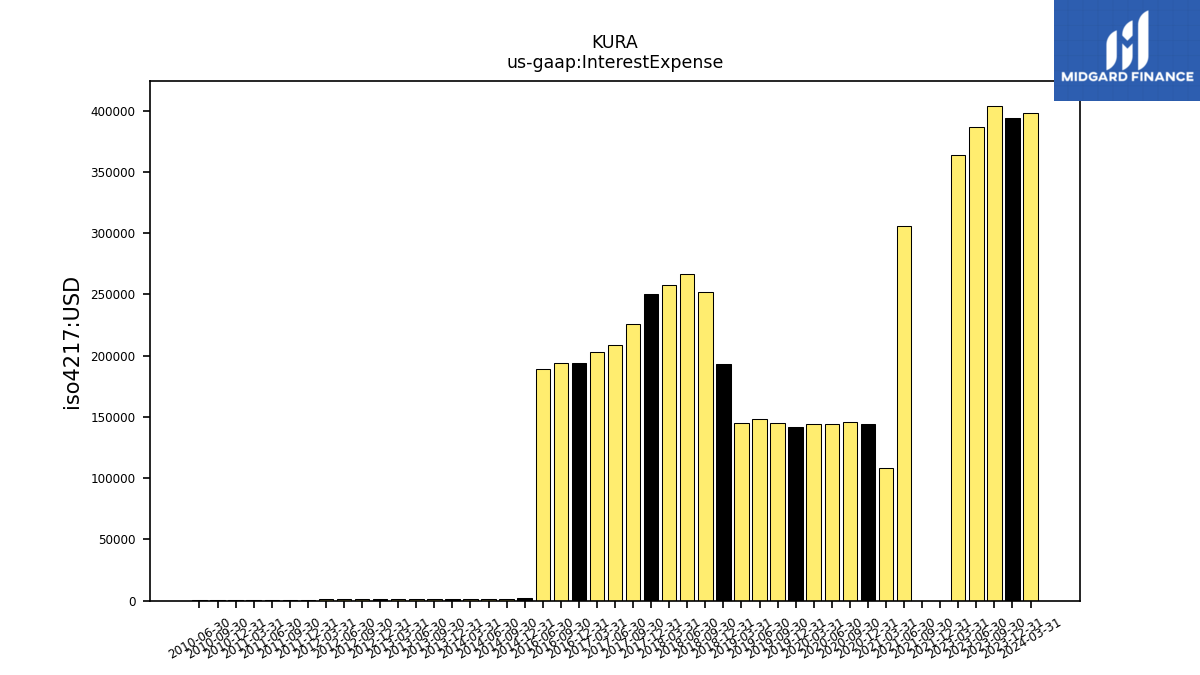
| Interest Expense | 0.40 | 0.39 | 0.40 | 0.39 | 0.36 | NA | NA | NA | NA | 0.00 | 0.00 | 0.31 | 0.11 | 0.14 | 0.15 | 0.14 | 0.14 | 0.14 | 0.14 | 0.15 | 0.14 | 0.19 | 0.25 | 0.27 | 0.26 | 0.25 | 0.23 | 0.21 | 0.20 | 0.19 | 0.19 | 0.19 | NA | NA | NA | NA | NA | 0.00 | 0.00 | 0.00 | 0.00 | 0.00 | 0.00 | 0.00 | 0.00 | 0.00 | 0.00 | 0.00 | 0.00 | 0.00 | 0.00 | 0.00 | 0.00 | 0.00 | |
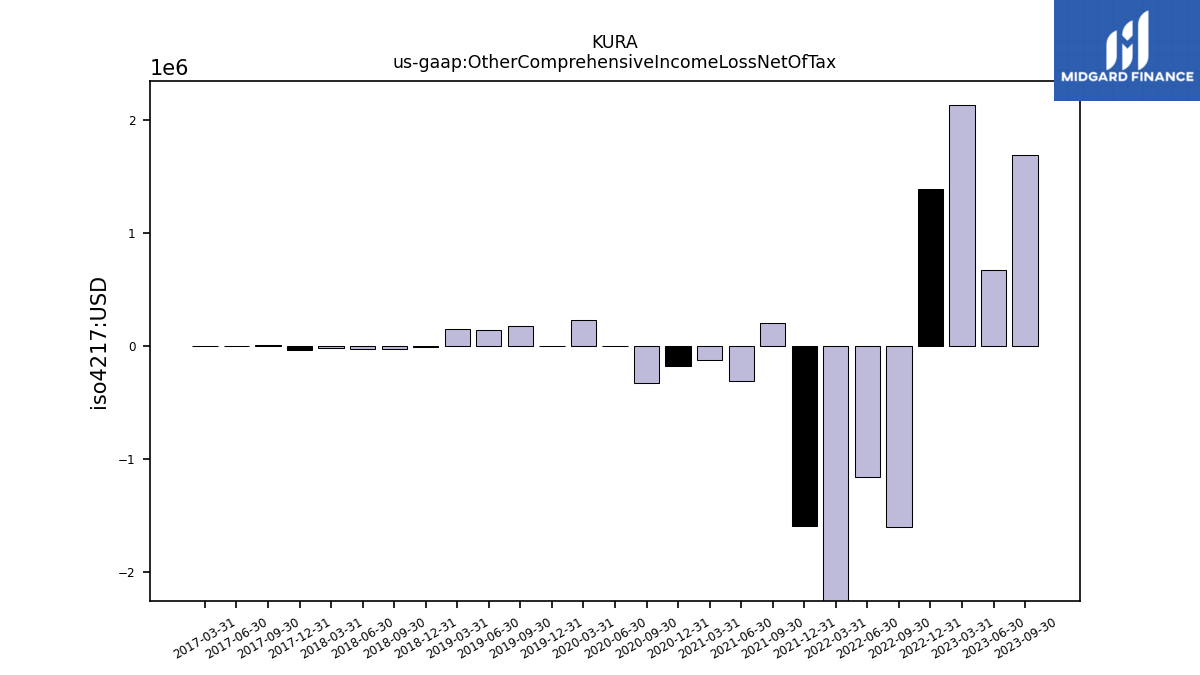
| Other Comprehensive Income Loss Net Of Tax | 0.46 | NA | 1.69 | 0.67 | 2.14 | 1.38 | -1.60 | -1.17 | -4.86 | -1.59 | 0.20 | -0.31 | -0.13 | -0.18 | -0.33 | -0.00 | 0.23 | -0.00 | 0.17 | 0.14 | 0.15 | -0.01 | -0.03 | -0.03 | -0.02 | -0.04 | 0.01 | -0.00 | -0.00 | NA | NA | NA | NA | NA | NA | NA | NA | NA | NA | NA | NA | NA | NA | NA | NA | NA | NA | NA | NA | NA | NA | NA | NA | NA | |
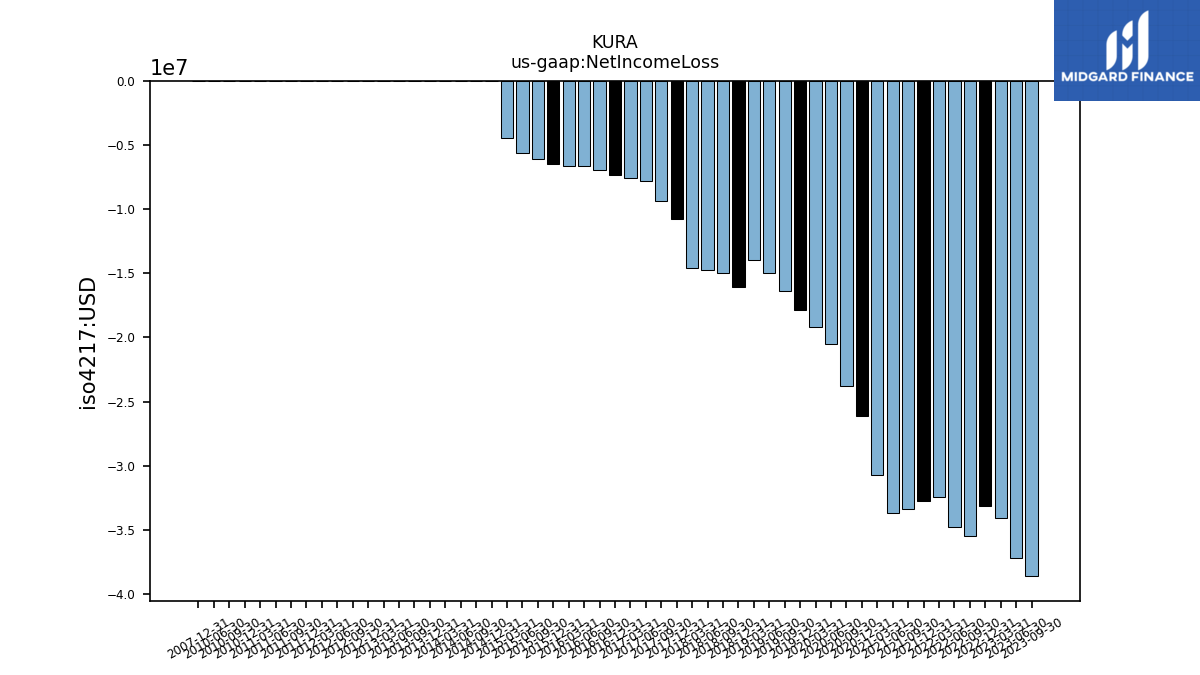
| Net Income Loss | -49.52 | -42.79 | -38.60 | -37.17 | -34.07 | -33.11 | -35.50 | -34.77 | -32.45 | -32.74 | -33.37 | -33.66 | -30.69 | -26.16 | -23.77 | -20.49 | -19.21 | -17.86 | -16.39 | -14.94 | -13.94 | -16.10 | -15.01 | -14.74 | -14.60 | -10.75 | -9.33 | -7.82 | -7.53 | -7.35 | -6.93 | -6.66 | -6.63 | -6.47 | -6.09 | -5.58 | -4.48 | -0.01 | -0.01 | -0.01 | -0.01 | -0.01 | -0.01 | -0.01 | -0.01 | -0.01 | -0.01 | -0.01 | -0.01 | -0.01 | -0.01 | -0.01 | -0.01 | -0.01 | |
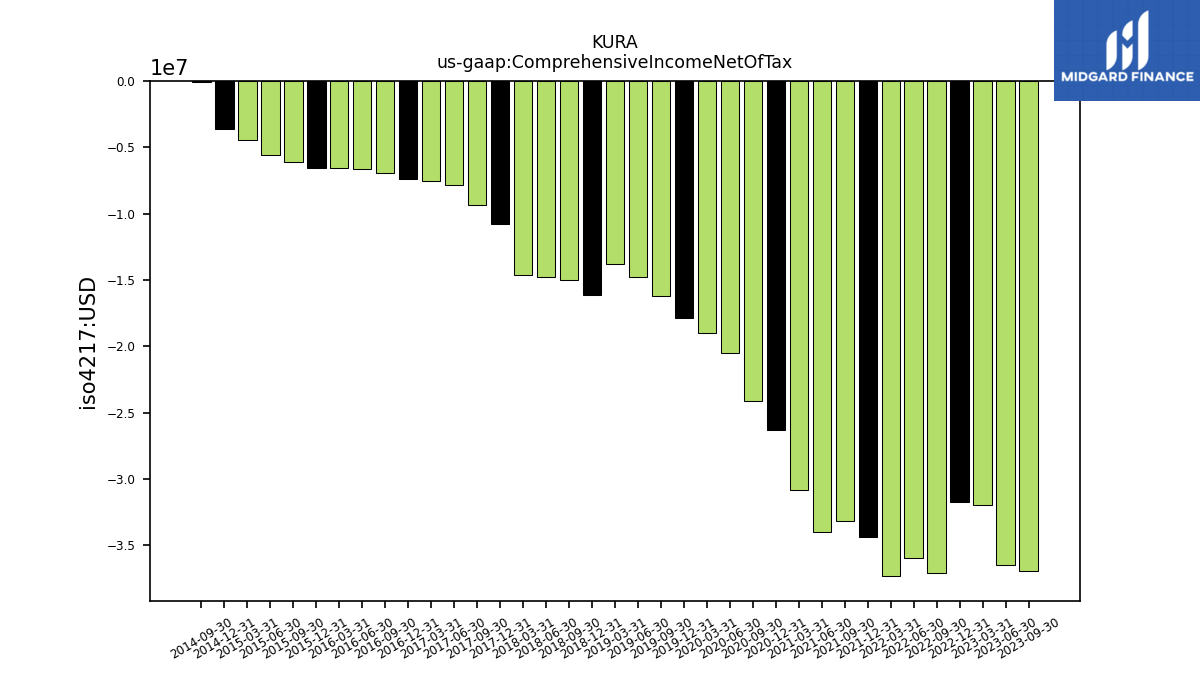
| Comprehensive Income Net Of Tax | -49.07 | -40.52 | -36.91 | -36.50 | -31.93 | -31.73 | -37.10 | -35.94 | -37.31 | -34.34 | -33.17 | -33.97 | -30.82 | -26.34 | -24.10 | -20.49 | -18.98 | -17.87 | -16.22 | -14.80 | -13.79 | -16.11 | -15.04 | -14.76 | -14.62 | -10.78 | -9.32 | -7.82 | -7.53 | -7.38 | -6.96 | -6.63 | -6.53 | -6.56 | -6.08 | -5.60 | -4.48 | -3.60 | -0.07 | NA | NA | NA | NA | NA | NA | NA | NA | NA | NA | NA | NA | NA | NA | NA |
| 2024-03-31 | 2023-12-31 | 2023-09-30 | 2023-06-30 | 2023-03-31 | 2022-12-31 | 2022-09-30 | 2022-06-30 | 2022-03-31 | 2021-12-31 | 2021-09-30 | 2021-06-30 | 2021-03-31 | 2020-12-31 | 2020-09-30 | 2020-06-30 | 2020-03-31 | 2019-12-31 | 2019-09-30 | 2019-06-30 | 2019-03-31 | 2018-12-31 | 2018-09-30 | 2018-06-30 | 2018-03-31 | 2017-12-31 | 2017-09-30 | 2017-06-30 | 2017-03-31 | 2016-12-31 | 2016-09-30 | 2016-06-30 | 2016-03-31 | 2015-12-31 | 2015-09-30 | 2015-06-30 | 2015-03-31 | 2014-12-31 | 2014-09-30 | 2014-06-30 | 2014-03-31 | 2013-12-31 | 2013-09-30 | 2013-06-30 | 2013-03-31 | 2012-12-31 | 2012-09-30 | 2012-06-30 | 2012-03-31 | 2011-12-31 | 2011-09-30 | 2011-06-30 | 2011-03-31 | 2010-12-31 | ||
|---|---|---|---|---|---|---|---|---|---|---|---|---|---|---|---|---|---|---|---|---|---|---|---|---|---|---|---|---|---|---|---|---|---|---|---|---|---|---|---|---|---|---|---|---|---|---|---|---|---|---|---|---|---|---|---|
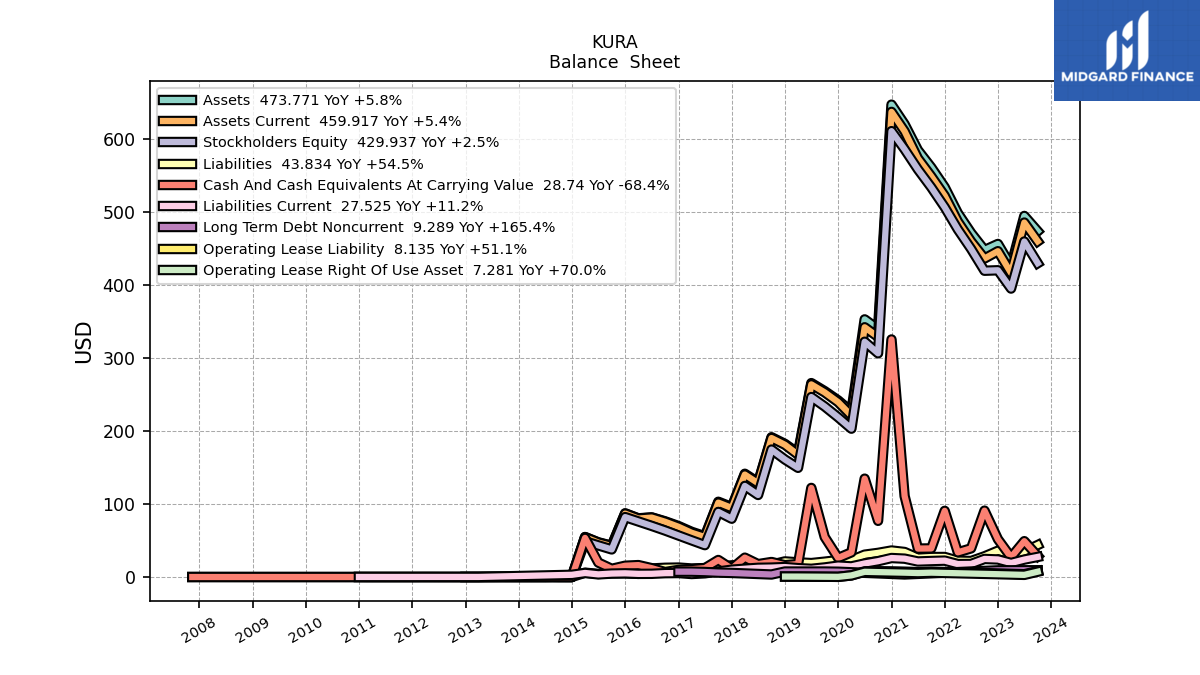
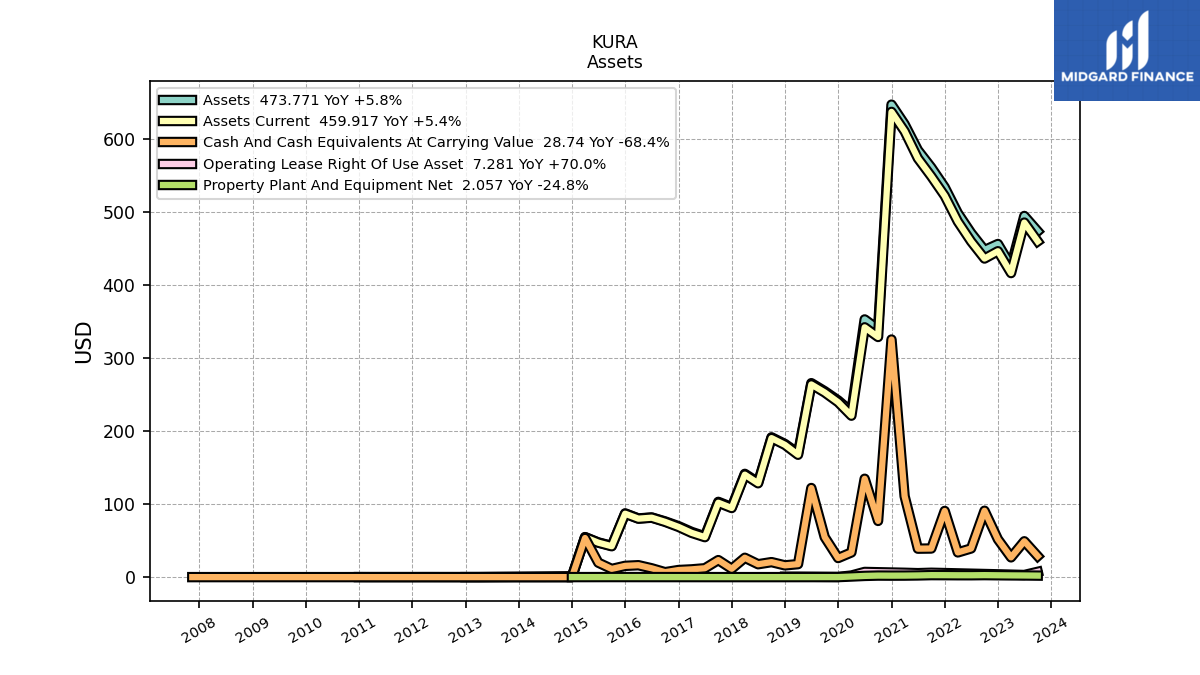
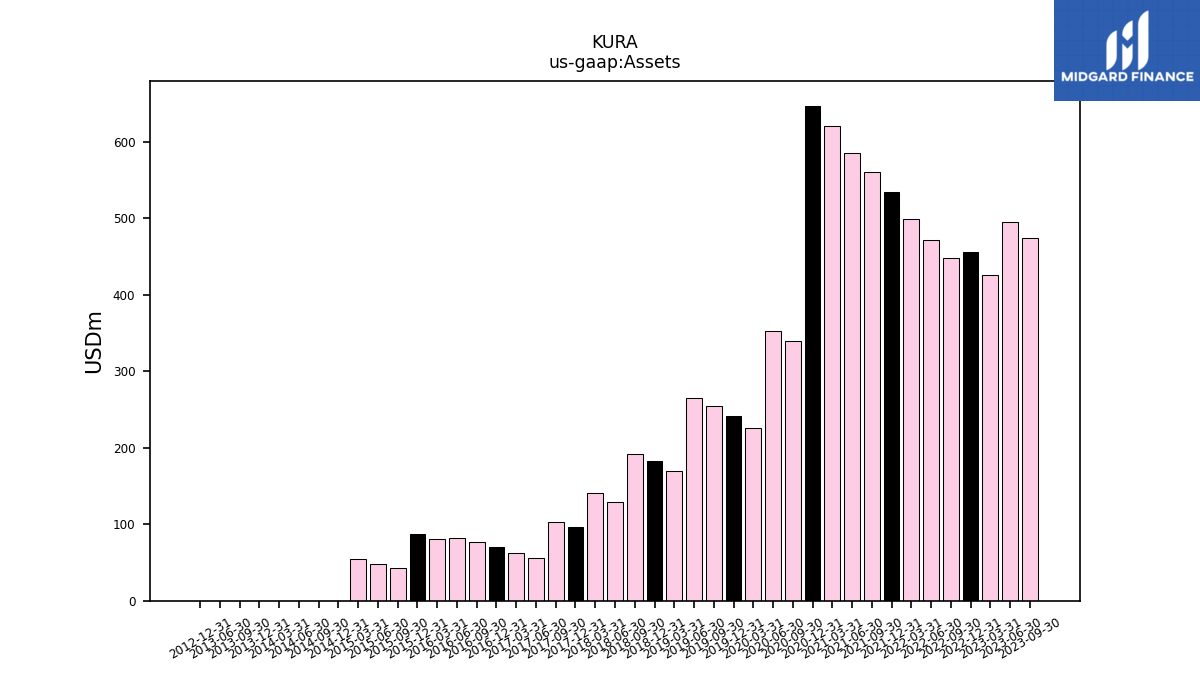
| Assets | 553.91 | 448.94 | 473.77 | 494.74 | 425.98 | 456.31 | 447.99 | 471.43 | 498.58 | 534.05 | 561.14 | 584.89 | 620.26 | 647.21 | 339.57 | 353.00 | 226.46 | 241.97 | 254.60 | 265.69 | 169.62 | 182.38 | 191.50 | 129.63 | 141.46 | 95.85 | 103.11 | 55.85 | 61.92 | 69.82 | 76.30 | 81.74 | 80.38 | 87.26 | 42.83 | 47.53 | 54.82 | 0.01 | 0.02 | 0.00 | 0.01 | 0.01 | 0.01 | 0.02 | NA | 0.01 | NA | NA | NA | NA | NA | NA | NA | NA | |
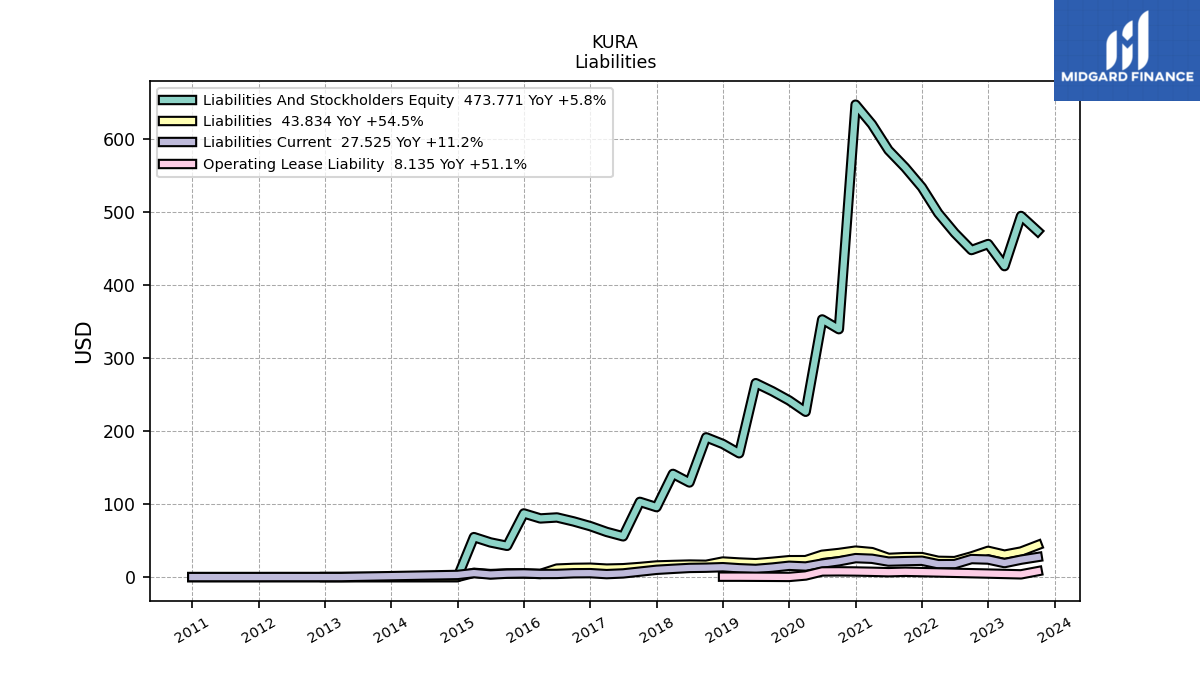
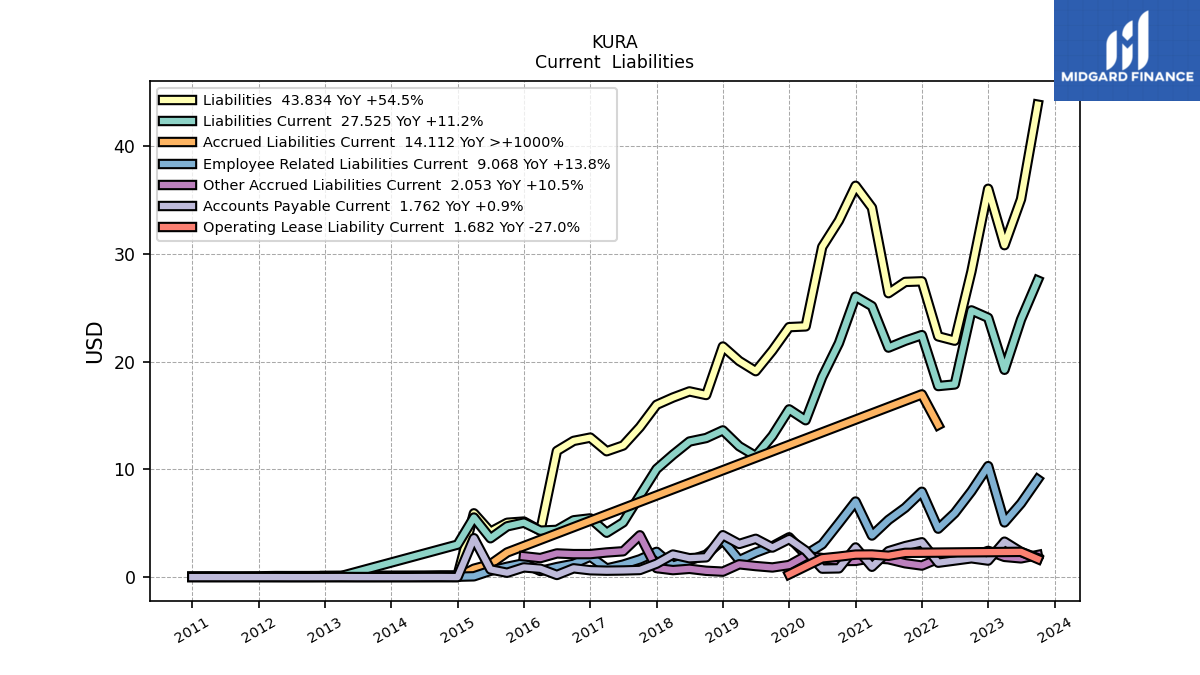
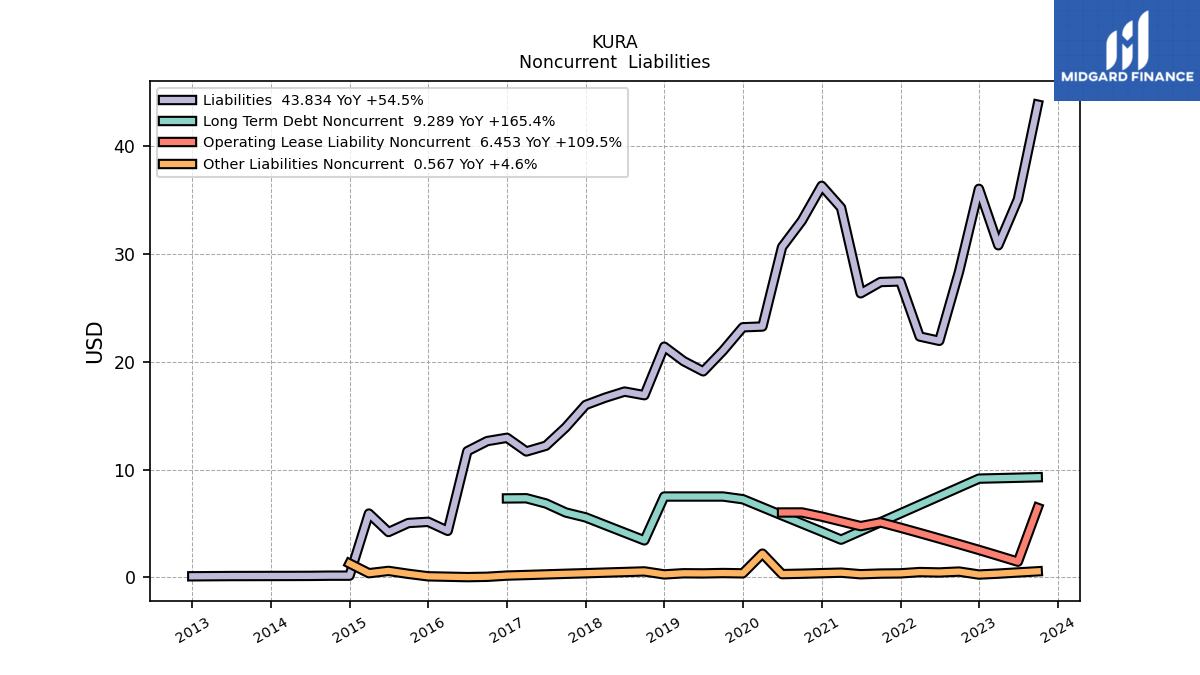
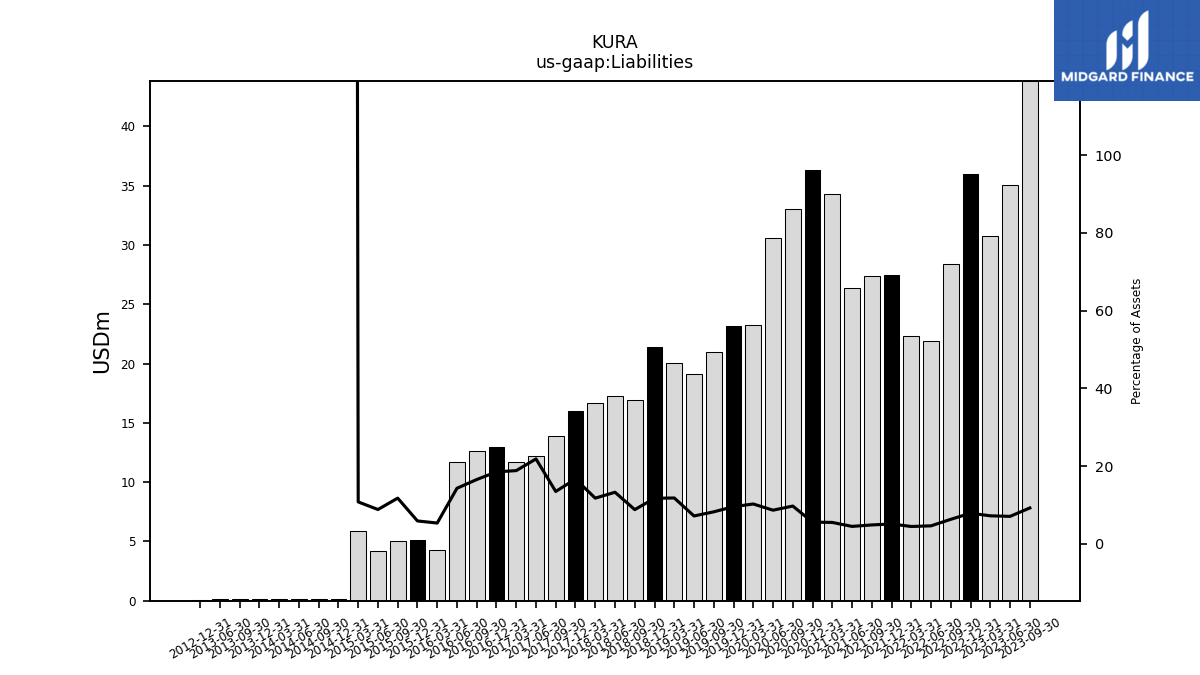
| Liabilities | 48.82 | 51.66 | 43.83 | 35.06 | 30.79 | 36.03 | 28.37 | 21.93 | 22.34 | 27.44 | 27.39 | 26.34 | 34.28 | 36.31 | 33.07 | 30.63 | 23.26 | 23.19 | 21.02 | 19.10 | 20.05 | 21.39 | 16.89 | 17.23 | 16.66 | 15.99 | 13.92 | 12.21 | 11.68 | 12.95 | 12.64 | 11.70 | 4.32 | 5.16 | 5.04 | 4.21 | 5.92 | 0.16 | 0.16 | 0.14 | 0.14 | 0.13 | 0.13 | 0.13 | NA | 0.10 | NA | NA | NA | NA | NA | NA | NA | NA | |
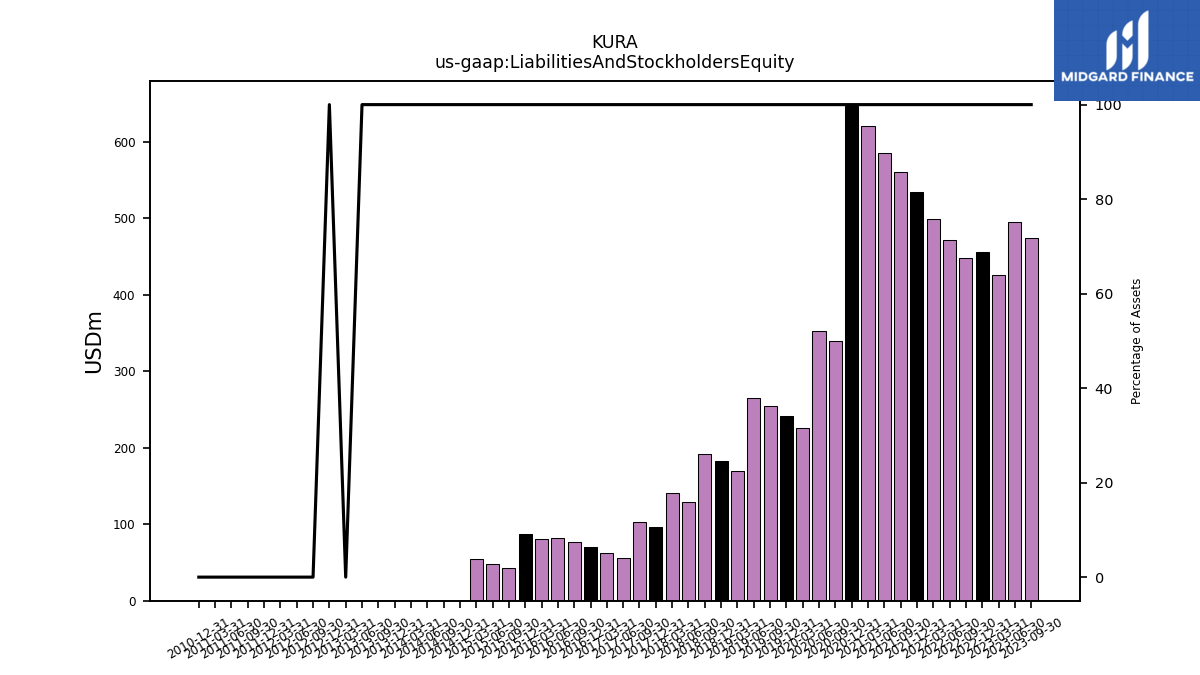
| Liabilities And Stockholders Equity | 553.91 | 448.94 | 473.77 | 494.74 | 425.98 | 456.31 | 447.99 | 471.43 | 498.58 | 534.05 | 561.14 | 584.89 | 620.26 | 647.21 | 339.57 | 353.00 | 226.46 | 241.97 | 254.60 | 265.69 | 169.62 | 182.38 | 191.50 | 129.63 | 141.46 | 95.85 | 103.11 | 55.85 | 61.92 | 69.82 | 76.30 | 81.74 | 80.38 | 87.26 | 42.83 | 47.53 | 54.82 | 0.01 | 0.02 | 0.00 | 0.01 | 0.01 | 0.01 | 0.02 | 0.00 | 0.01 | 0.01 | 0.02 | 0.02 | 0.01 | 0.01 | 0.02 | 0.01 | 0.03 | |
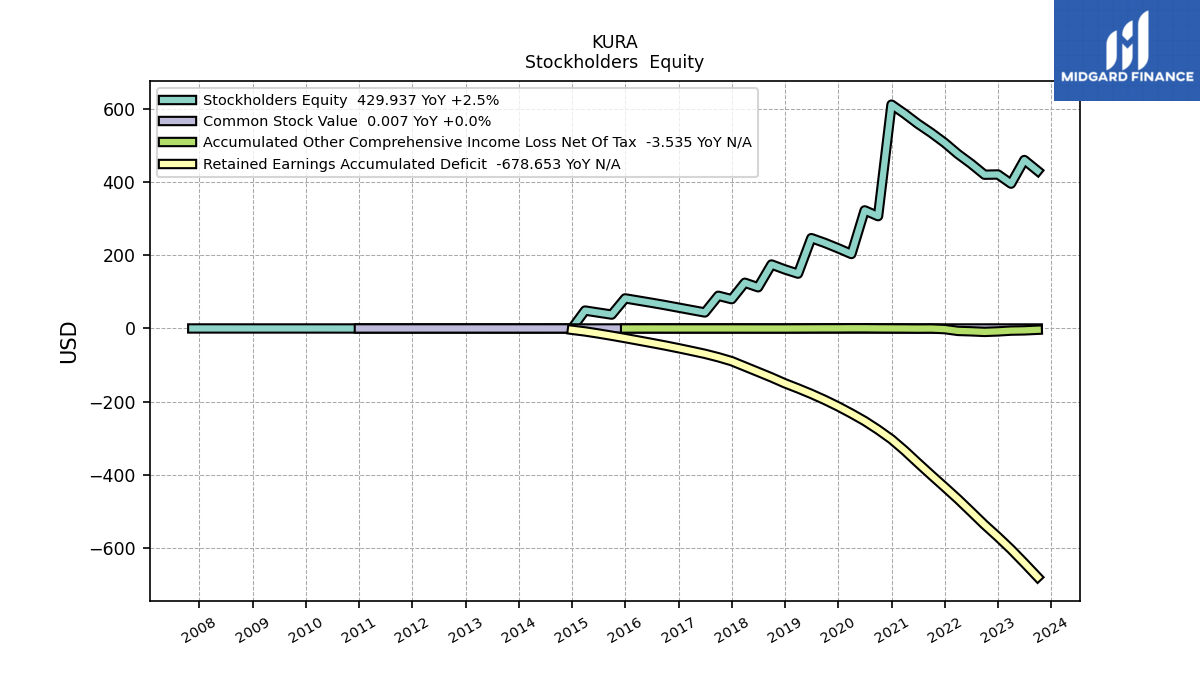
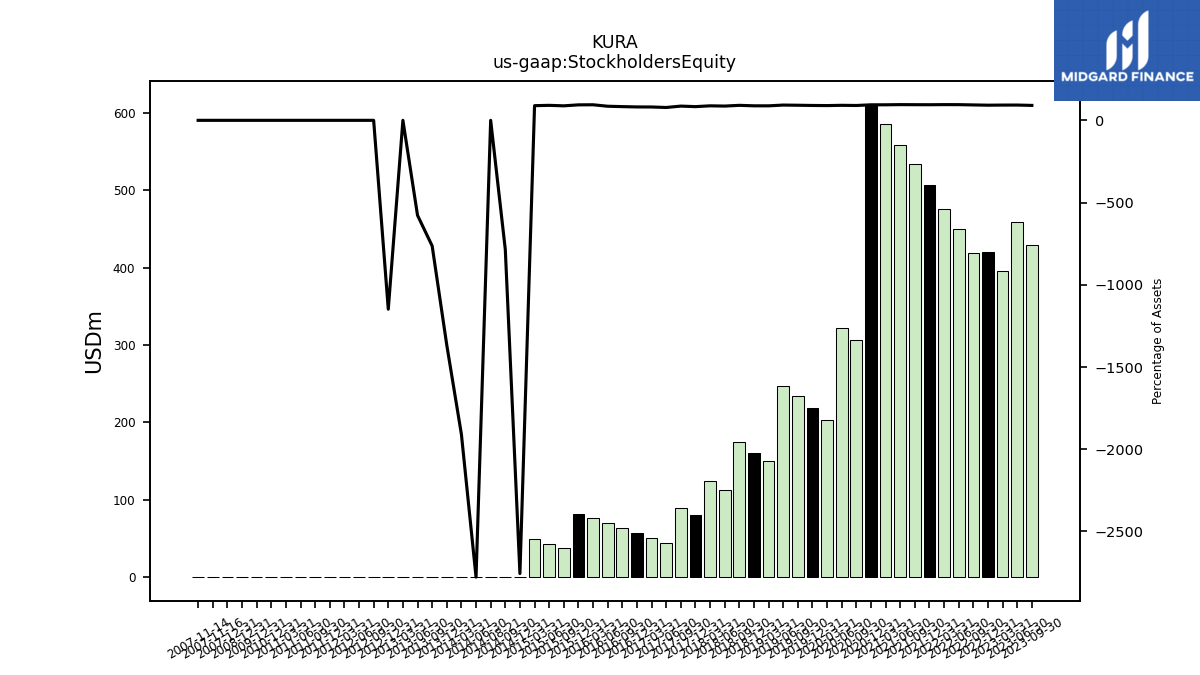
| Stockholders Equity | 505.08 | 397.27 | 429.94 | 459.68 | 395.18 | 420.28 | 419.62 | 449.49 | 476.25 | 506.61 | 533.76 | 558.55 | 585.99 | 610.90 | 306.50 | 322.37 | 203.20 | 218.78 | 233.58 | 246.58 | 149.56 | 160.99 | 174.61 | 112.40 | 124.80 | 79.86 | 89.20 | 43.64 | 50.24 | 56.88 | 63.67 | 70.04 | 76.07 | 82.10 | 37.78 | 43.32 | 48.89 | -0.15 | -0.14 | -0.14 | -0.13 | -0.12 | -0.11 | -0.11 | -0.10 | -0.10 | -0.09 | -0.08 | -0.07 | -0.07 | -0.06 | -0.05 | -0.07 | -0.04 |
| 2024-03-31 | 2023-12-31 | 2023-09-30 | 2023-06-30 | 2023-03-31 | 2022-12-31 | 2022-09-30 | 2022-06-30 | 2022-03-31 | 2021-12-31 | 2021-09-30 | 2021-06-30 | 2021-03-31 | 2020-12-31 | 2020-09-30 | 2020-06-30 | 2020-03-31 | 2019-12-31 | 2019-09-30 | 2019-06-30 | 2019-03-31 | 2018-12-31 | 2018-09-30 | 2018-06-30 | 2018-03-31 | 2017-12-31 | 2017-09-30 | 2017-06-30 | 2017-03-31 | 2016-12-31 | 2016-09-30 | 2016-06-30 | 2016-03-31 | 2015-12-31 | 2015-09-30 | 2015-06-30 | 2015-03-31 | 2014-12-31 | 2014-09-30 | 2014-06-30 | 2014-03-31 | 2013-12-31 | 2013-09-30 | 2013-06-30 | 2013-03-31 | 2012-12-31 | 2012-09-30 | 2012-06-30 | 2012-03-31 | 2011-12-31 | 2011-09-30 | 2011-06-30 | 2011-03-31 | 2010-12-31 | ||
|---|---|---|---|---|---|---|---|---|---|---|---|---|---|---|---|---|---|---|---|---|---|---|---|---|---|---|---|---|---|---|---|---|---|---|---|---|---|---|---|---|---|---|---|---|---|---|---|---|---|---|---|---|---|---|---|
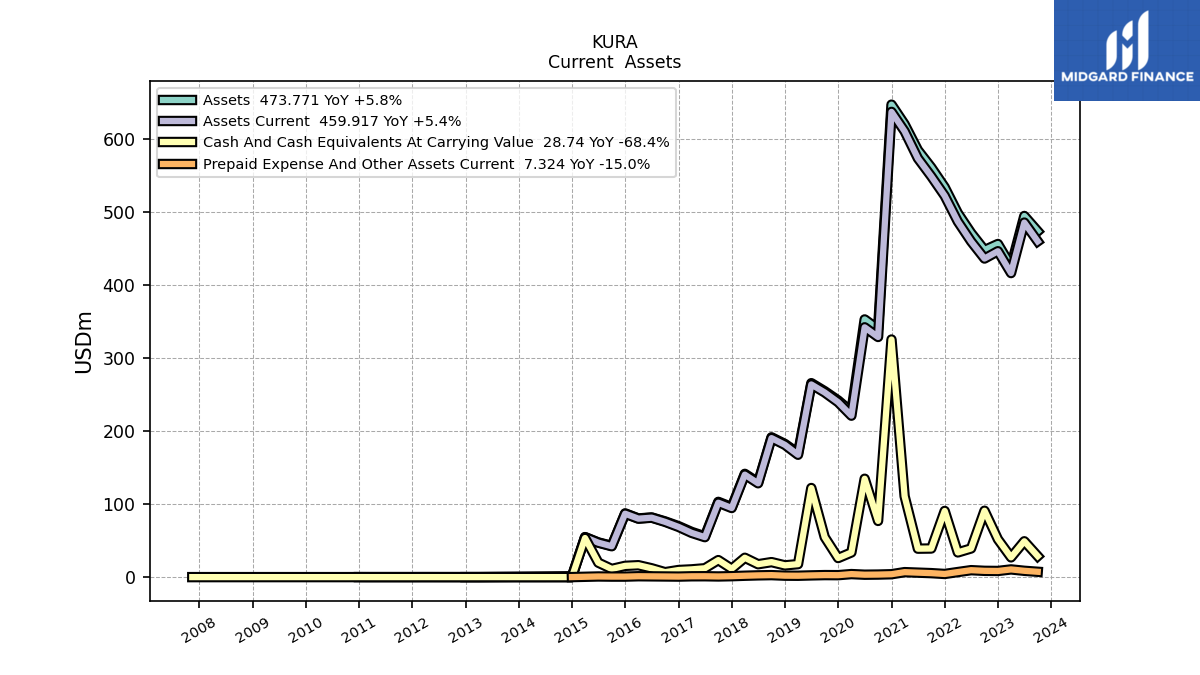
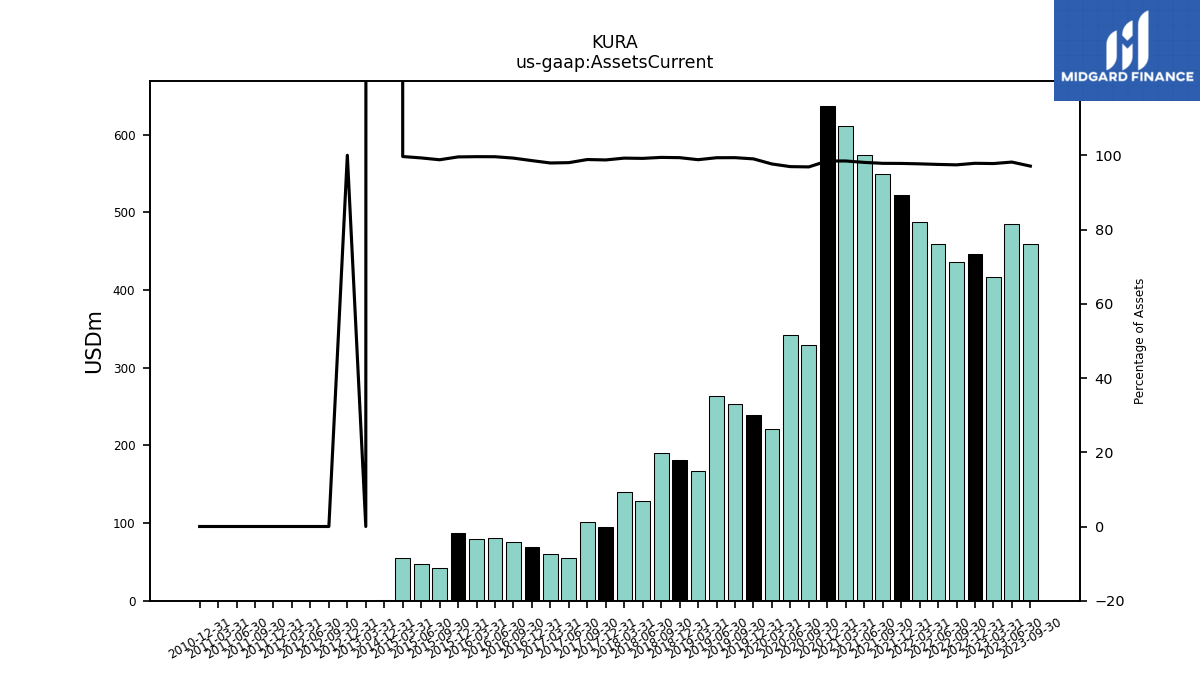
| Assets Current | 537.84 | 432.48 | 459.92 | 485.65 | 416.45 | 446.43 | 436.39 | 459.79 | 487.03 | 522.29 | 548.90 | 573.63 | 610.71 | 637.29 | 328.91 | 342.19 | 221.13 | 239.60 | 252.95 | 263.90 | 167.59 | 181.20 | 190.39 | 128.53 | 140.36 | 94.64 | 101.92 | 54.73 | 60.63 | 68.81 | 75.72 | 81.42 | 80.08 | 86.87 | 42.31 | 47.19 | 54.63 | 1.20 | NA | NA | NA | NA | NA | NA | 0.00 | 0.01 | 0.01 | 0.02 | 0.02 | 0.01 | 0.01 | 0.02 | 0.01 | 0.03 | |
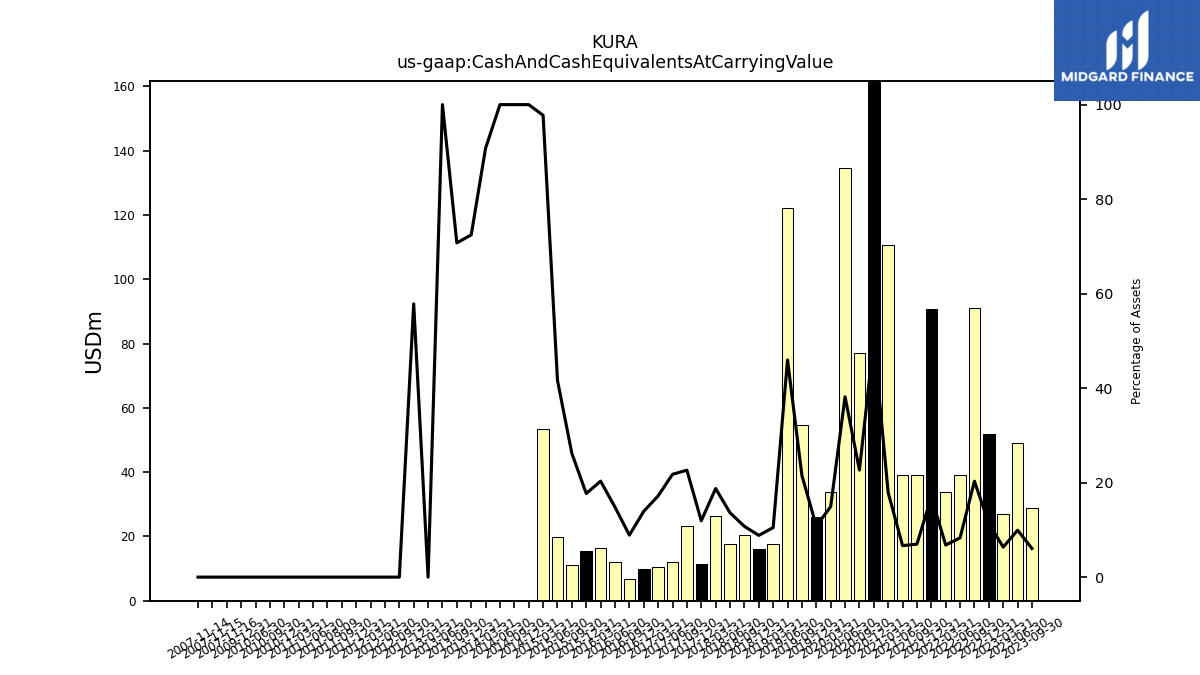
| Cash And Cash Equivalents At Carrying Value | 41.51 | 37.32 | 28.74 | 49.12 | 27.06 | 51.80 | 90.94 | 39.26 | 33.83 | 90.67 | 39.18 | 38.97 | 110.83 | 325.49 | 76.95 | 134.76 | 33.81 | 26.14 | 54.74 | 122.08 | 17.78 | 16.12 | 20.57 | 17.66 | 26.52 | 11.43 | 23.34 | 12.15 | 10.64 | 9.72 | 6.78 | 12.11 | 16.33 | 15.44 | 11.21 | 19.79 | 53.57 | 0.01 | 0.02 | 0.00 | 0.01 | 0.01 | 0.01 | 0.02 | 0.00 | 0.00 | 0.01 | 0.01 | 0.02 | 0.00 | 0.01 | 0.01 | 0.00 | 0.03 | |
| Cash Cash Equivalents Restricted Cash And Restricted Cash Equivalents | 41.51 | 37.32 | 28.74 | 49.33 | 27.27 | 52.01 | 91.15 | 39.47 | 34.04 | 90.88 | 39.39 | 39.18 | 111.05 | 325.70 | 77.17 | 134.97 | 34.02 | 26.14 | 54.74 | 122.08 | 17.78 | 16.12 | 20.57 | NA | NA | 11.43 | NA | NA | NA | 9.72 | NA | NA | NA | NA | NA | NA | NA | NA | NA | NA | NA | NA | NA | NA | NA | NA | NA | NA | NA | NA | NA | NA | NA | NA | |
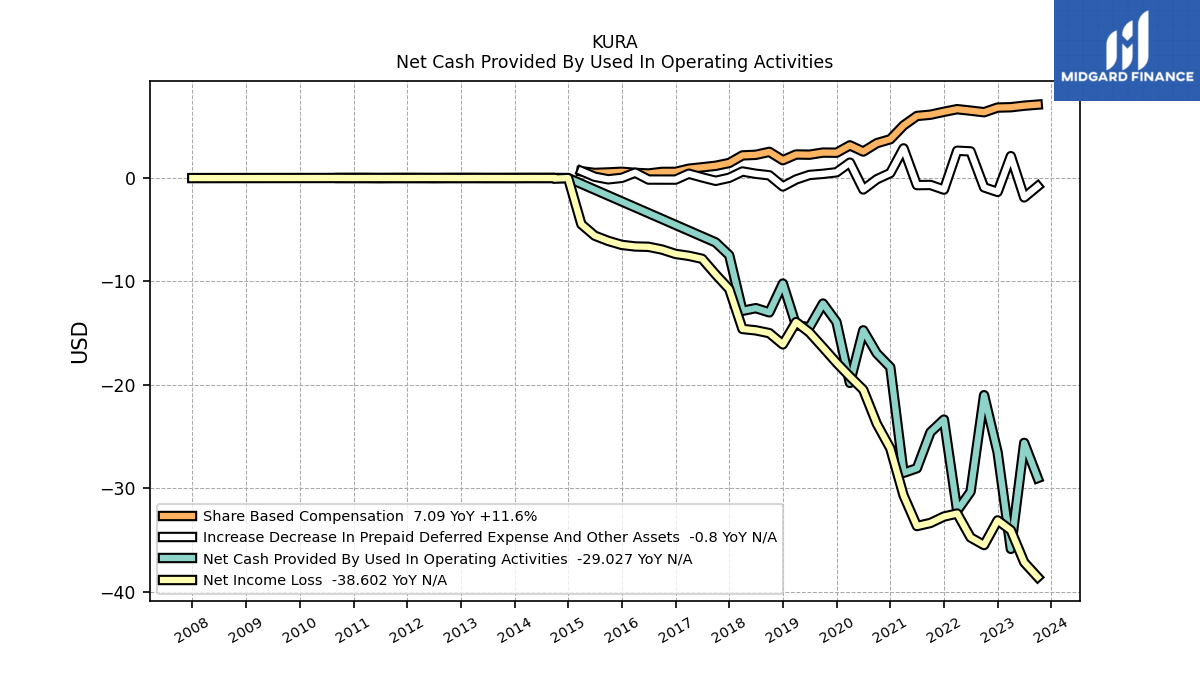
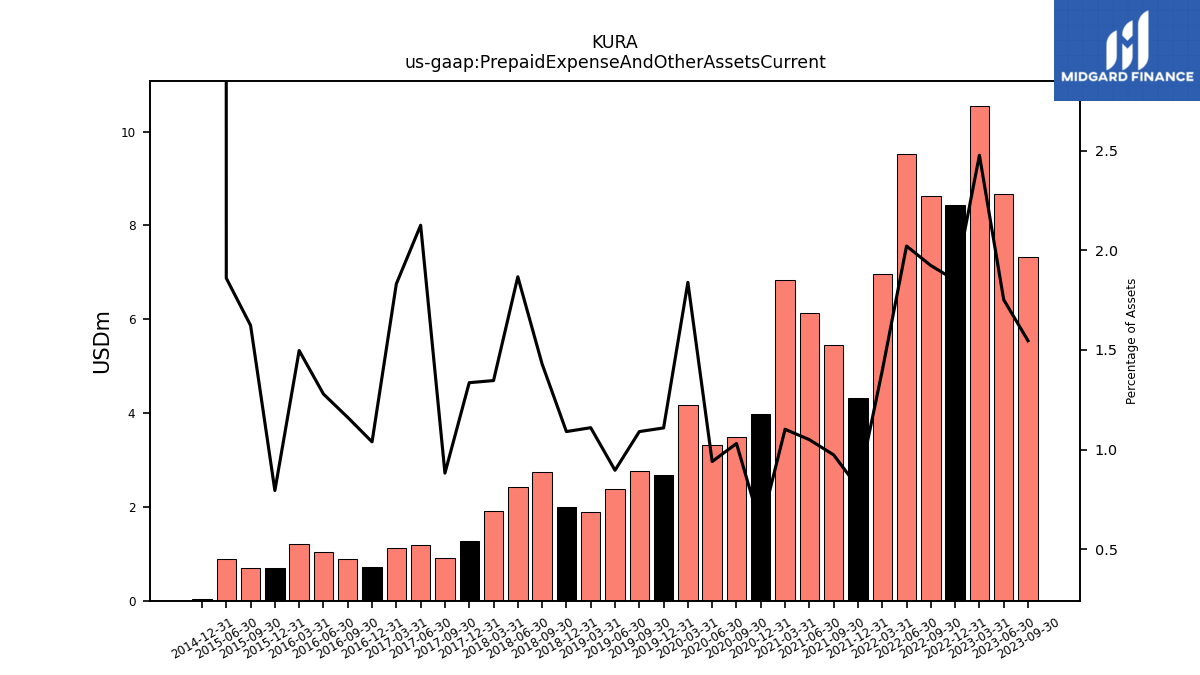
| Prepaid Expense And Other Assets Current | 10.71 | 8.52 | 7.32 | 8.67 | 10.55 | 8.44 | 8.62 | 9.53 | 6.96 | 4.33 | 5.46 | 6.14 | 6.83 | 3.97 | 3.50 | 3.32 | 4.16 | 2.68 | 2.77 | 2.38 | 1.88 | 1.99 | 2.74 | 2.42 | 1.90 | 1.28 | 0.91 | 1.19 | 1.13 | 0.72 | 0.89 | 1.04 | 1.20 | 0.69 | 0.69 | 0.88 | NA | 0.04 | NA | NA | NA | NA | NA | NA | NA | NA | NA | NA | NA | NA | NA | NA | NA | NA |
| 2024-03-31 | 2023-12-31 | 2023-09-30 | 2023-06-30 | 2023-03-31 | 2022-12-31 | 2022-09-30 | 2022-06-30 | 2022-03-31 | 2021-12-31 | 2021-09-30 | 2021-06-30 | 2021-03-31 | 2020-12-31 | 2020-09-30 | 2020-06-30 | 2020-03-31 | 2019-12-31 | 2019-09-30 | 2019-06-30 | 2019-03-31 | 2018-12-31 | 2018-09-30 | 2018-06-30 | 2018-03-31 | 2017-12-31 | 2017-09-30 | 2017-06-30 | 2017-03-31 | 2016-12-31 | 2016-09-30 | 2016-06-30 | 2016-03-31 | 2015-12-31 | 2015-09-30 | 2015-06-30 | 2015-03-31 | 2014-12-31 | 2014-09-30 | 2014-06-30 | 2014-03-31 | 2013-12-31 | 2013-09-30 | 2013-06-30 | 2013-03-31 | 2012-12-31 | 2012-09-30 | 2012-06-30 | 2012-03-31 | 2011-12-31 | 2011-09-30 | 2011-06-30 | 2011-03-31 | 2010-12-31 | ||
|---|---|---|---|---|---|---|---|---|---|---|---|---|---|---|---|---|---|---|---|---|---|---|---|---|---|---|---|---|---|---|---|---|---|---|---|---|---|---|---|---|---|---|---|---|---|---|---|---|---|---|---|---|---|---|---|
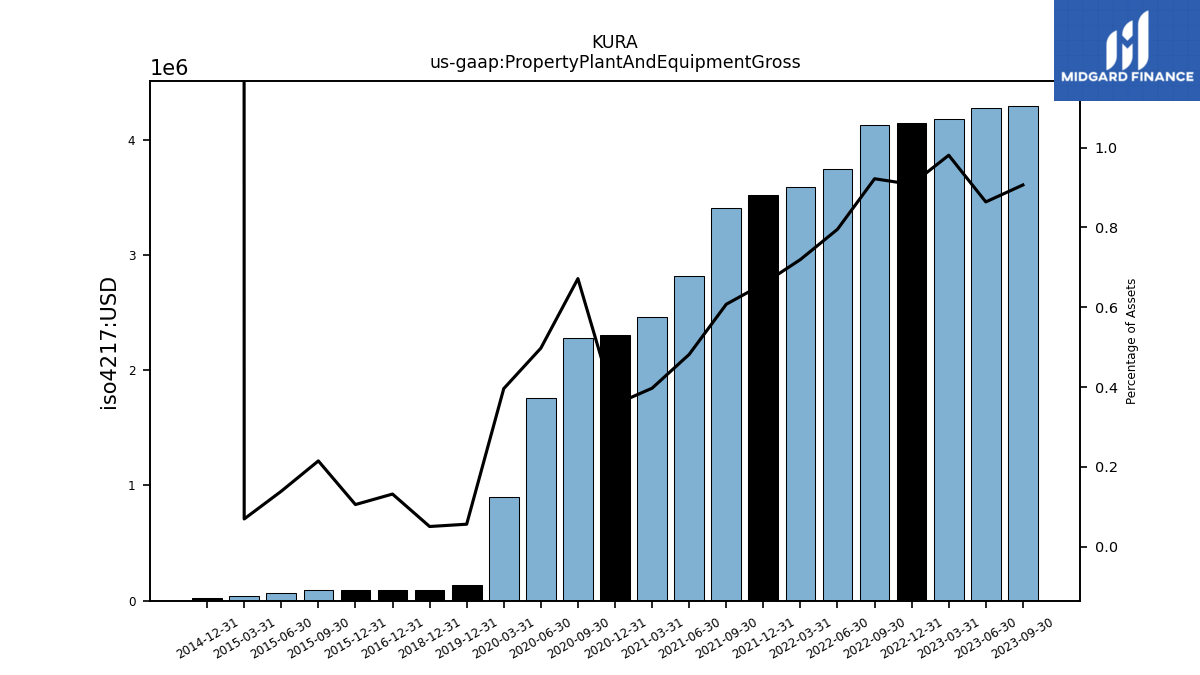
| Property Plant And Equipment Gross | 4.37 | 4.31 | 4.29 | 4.28 | 4.18 | 4.14 | 4.13 | 3.75 | 3.59 | 3.52 | 3.41 | 2.82 | 2.46 | 2.31 | 2.28 | 1.76 | 0.90 | 0.14 | NA | NA | NA | 0.09 | NA | NA | NA | NA | NA | NA | NA | 0.09 | NA | NA | NA | 0.09 | 0.09 | 0.07 | 0.04 | 0.03 | NA | NA | NA | NA | NA | NA | NA | NA | NA | NA | NA | NA | NA | NA | NA | NA | |
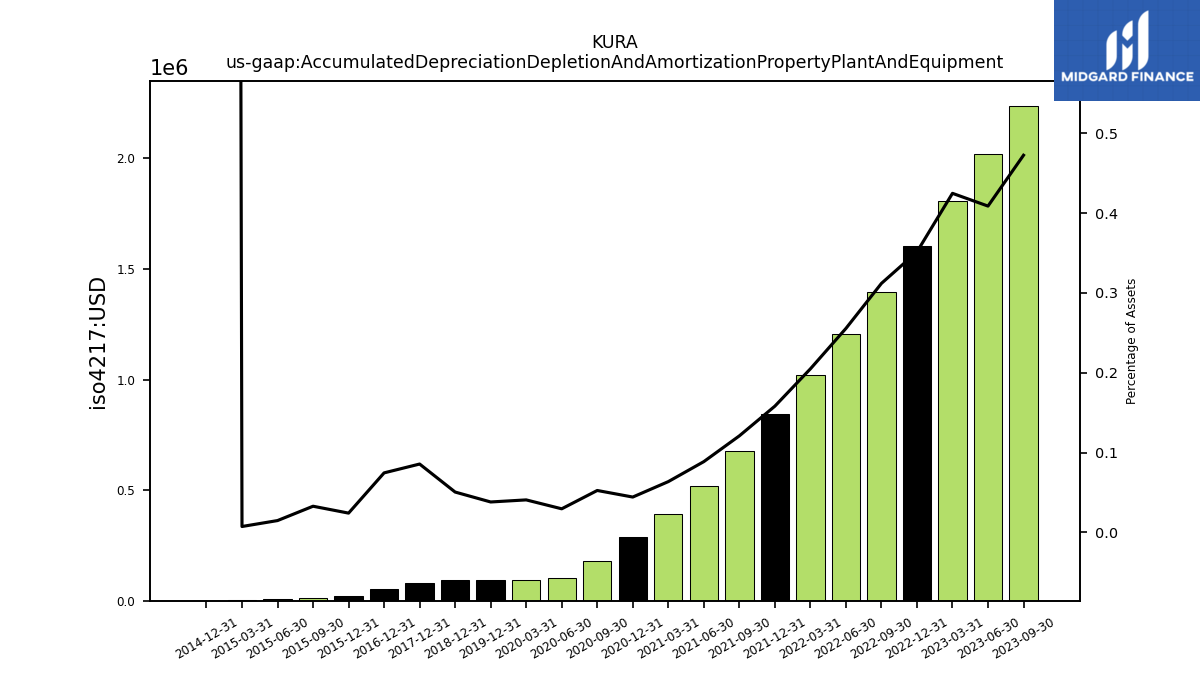
| Accumulated Depreciation Depletion And Amortization Property Plant And Equipment | 2.66 | 2.45 | 2.24 | 2.02 | 1.81 | 1.60 | 1.40 | 1.20 | 1.02 | 0.84 | 0.68 | 0.52 | 0.39 | 0.29 | 0.18 | 0.10 | 0.09 | 0.09 | NA | NA | NA | 0.09 | NA | NA | NA | 0.08 | NA | NA | NA | 0.05 | NA | NA | NA | 0.02 | 0.01 | 0.01 | 0.00 | 0.00 | NA | NA | NA | NA | NA | NA | NA | NA | NA | NA | NA | NA | NA | NA | NA | NA | |
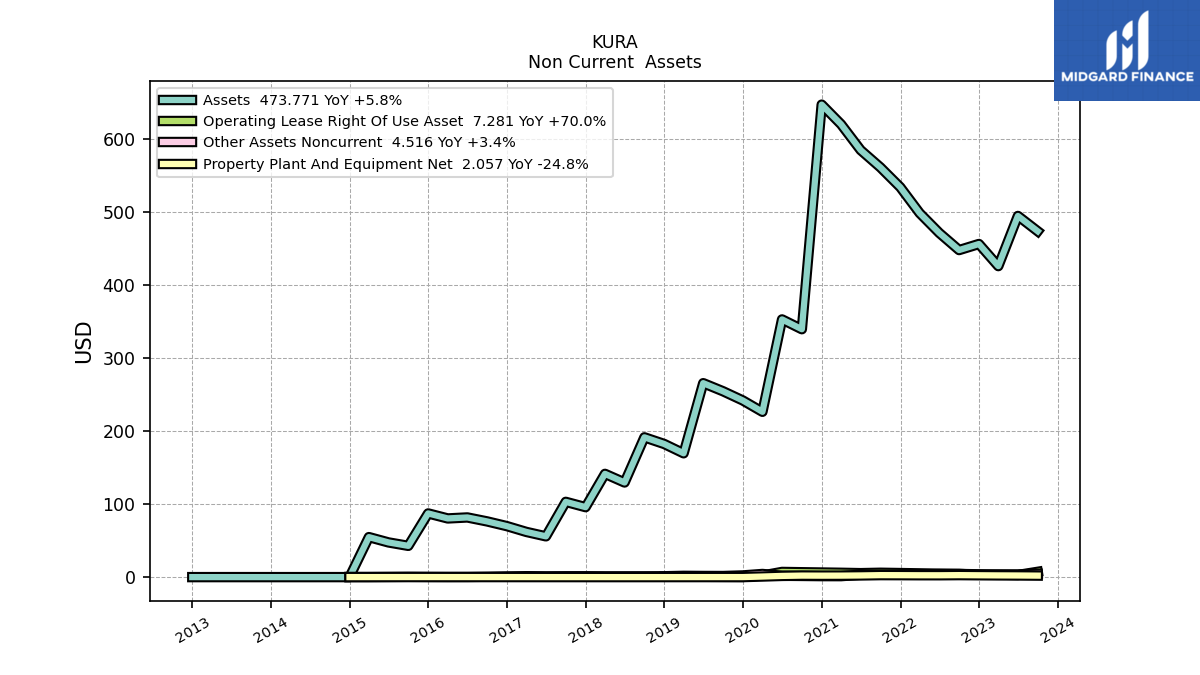
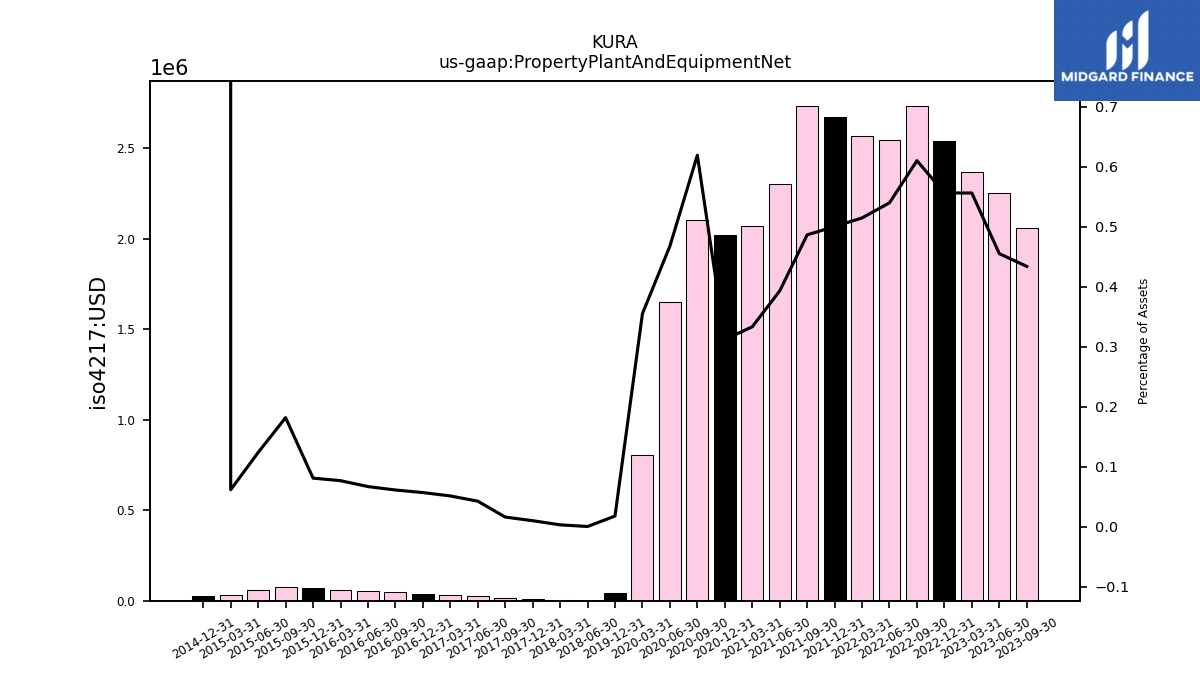
| Property Plant And Equipment Net | 1.71 | 1.86 | 2.06 | 2.25 | 2.37 | 2.54 | 2.73 | 2.55 | 2.57 | 2.67 | 2.73 | 2.30 | 2.07 | 2.02 | 2.10 | 1.65 | 0.81 | 0.04 | NA | NA | NA | NA | NA | 0.00 | 0.01 | 0.01 | 0.02 | 0.02 | 0.03 | 0.04 | 0.05 | 0.06 | 0.06 | 0.07 | 0.08 | 0.06 | 0.03 | 0.03 | NA | NA | NA | NA | NA | NA | NA | NA | NA | NA | NA | NA | NA | NA | NA | NA | |
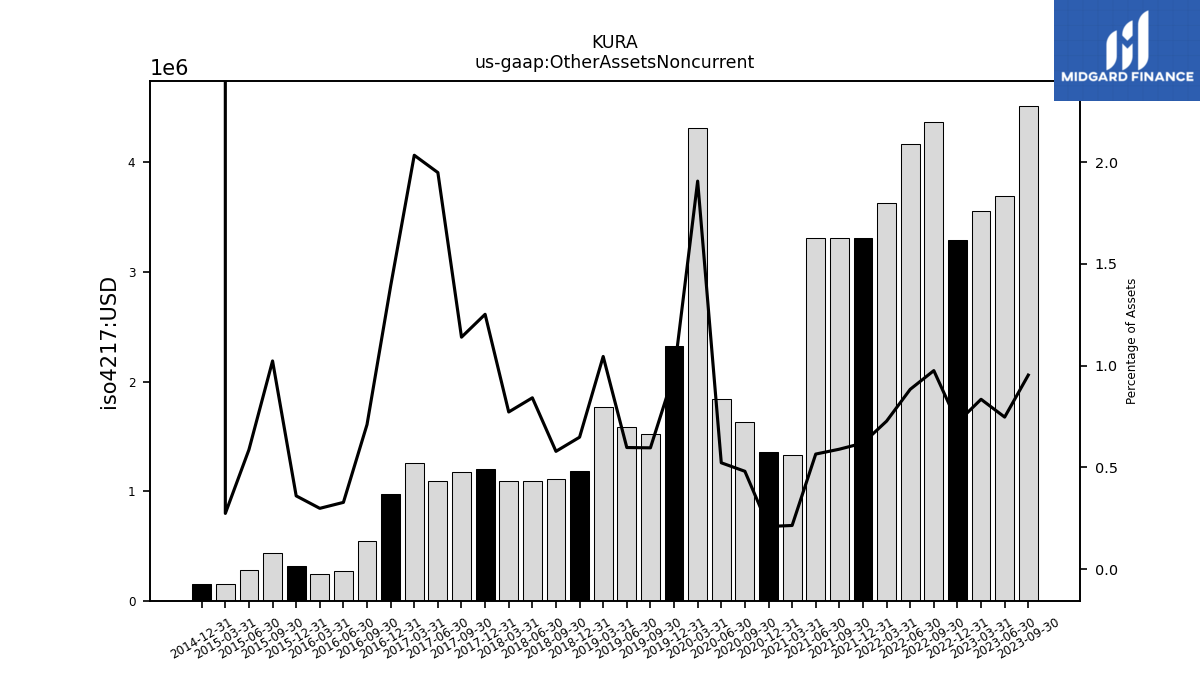
| Other Assets Noncurrent | 7.67 | 7.60 | 4.52 | 3.69 | 3.55 | 3.29 | 4.37 | 4.16 | 3.62 | 3.31 | 3.31 | 3.31 | 1.33 | 1.35 | 1.63 | 1.84 | 4.32 | 2.33 | 1.52 | 1.59 | 1.77 | 1.18 | 1.11 | 1.09 | 1.09 | 1.20 | 1.18 | 1.09 | 1.26 | 0.97 | 0.54 | 0.27 | 0.24 | 0.31 | 0.44 | 0.28 | 0.15 | 0.15 | NA | NA | NA | NA | NA | NA | NA | NA | NA | NA | NA | NA | NA | NA | NA | NA |
| 2024-03-31 | 2023-12-31 | 2023-09-30 | 2023-06-30 | 2023-03-31 | 2022-12-31 | 2022-09-30 | 2022-06-30 | 2022-03-31 | 2021-12-31 | 2021-09-30 | 2021-06-30 | 2021-03-31 | 2020-12-31 | 2020-09-30 | 2020-06-30 | 2020-03-31 | 2019-12-31 | 2019-09-30 | 2019-06-30 | 2019-03-31 | 2018-12-31 | 2018-09-30 | 2018-06-30 | 2018-03-31 | 2017-12-31 | 2017-09-30 | 2017-06-30 | 2017-03-31 | 2016-12-31 | 2016-09-30 | 2016-06-30 | 2016-03-31 | 2015-12-31 | 2015-09-30 | 2015-06-30 | 2015-03-31 | 2014-12-31 | 2014-09-30 | 2014-06-30 | 2014-03-31 | 2013-12-31 | 2013-09-30 | 2013-06-30 | 2013-03-31 | 2012-12-31 | 2012-09-30 | 2012-06-30 | 2012-03-31 | 2011-12-31 | 2011-09-30 | 2011-06-30 | 2011-03-31 | 2010-12-31 | ||
|---|---|---|---|---|---|---|---|---|---|---|---|---|---|---|---|---|---|---|---|---|---|---|---|---|---|---|---|---|---|---|---|---|---|---|---|---|---|---|---|---|---|---|---|---|---|---|---|---|---|---|---|---|---|---|---|
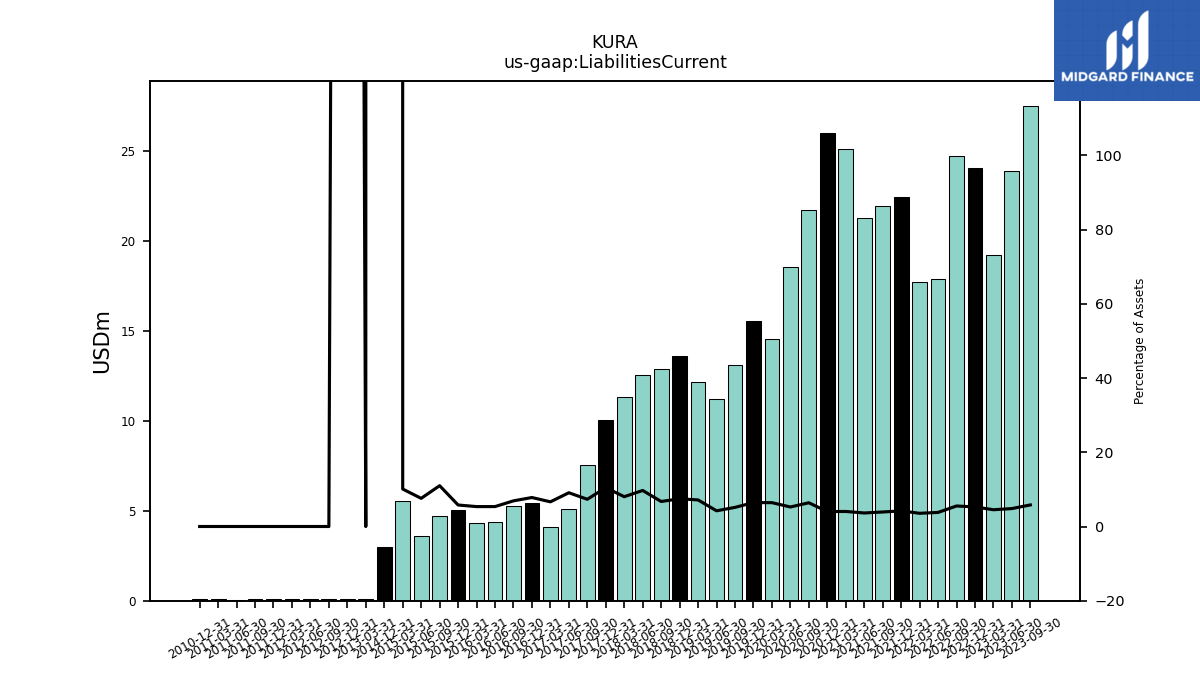
| Liabilities Current | 32.27 | 35.26 | 27.52 | 23.90 | 19.23 | 24.06 | 24.75 | 17.87 | 17.73 | 22.45 | 21.93 | 21.29 | 25.14 | 26.02 | 21.70 | 18.55 | 14.55 | 15.56 | 13.11 | 11.23 | 12.14 | 13.62 | 12.90 | 12.58 | 11.35 | 10.03 | 7.56 | 5.08 | 4.12 | 5.45 | 5.27 | 4.38 | 4.31 | 5.05 | 4.71 | 3.60 | 5.53 | 3.02 | NA | NA | NA | NA | NA | NA | 0.11 | 0.10 | 0.10 | 0.10 | 0.10 | 0.07 | 0.07 | 0.07 | 0.07 | 0.07 | |
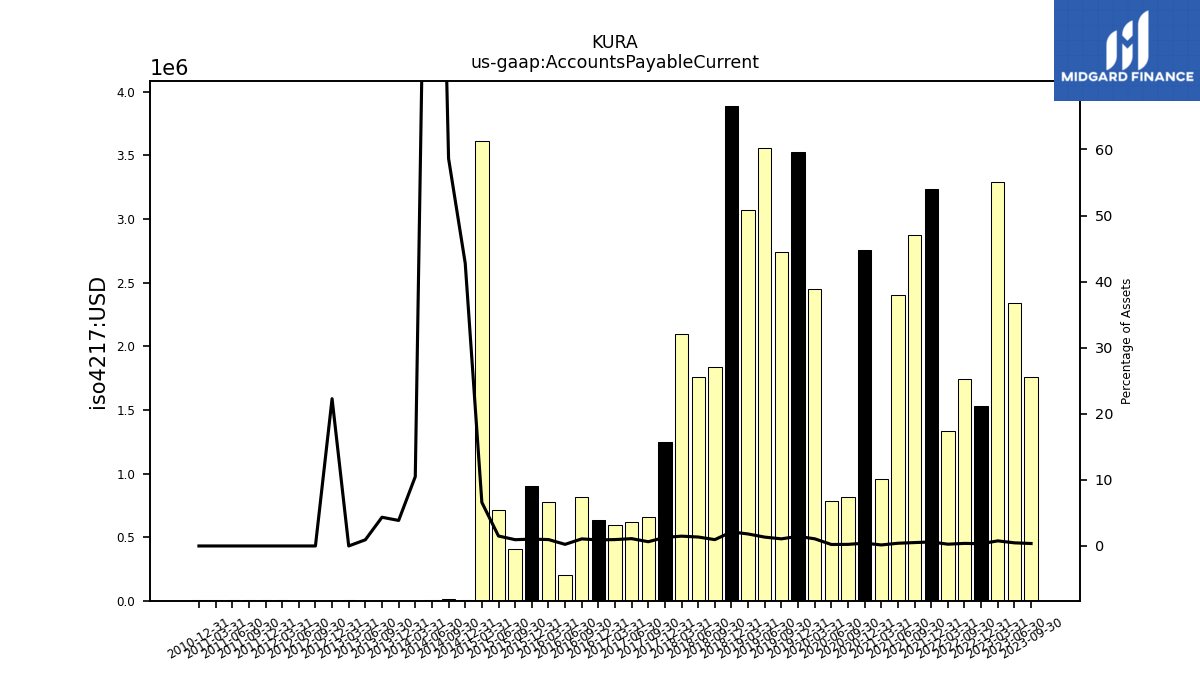
| Accounts Payable Current | 7.53 | 2.30 | 1.76 | 2.34 | 3.29 | 1.53 | 1.75 | NA | 1.34 | 3.24 | 2.88 | 2.40 | 0.96 | 2.75 | 0.81 | 0.79 | 2.45 | 3.53 | 2.74 | 3.56 | 3.07 | 3.89 | 1.84 | 1.75 | 2.10 | 1.25 | 0.66 | 0.62 | 0.60 | 0.64 | 0.82 | 0.20 | 0.78 | 0.90 | 0.41 | 0.71 | 3.61 | 0.00 | 0.01 | 0.01 | 0.00 | 0.00 | 0.00 | 0.00 | 0.01 | 0.00 | 0.00 | 0.00 | 0.00 | 0.00 | 0.00 | 0.00 | 0.00 | 0.00 | |
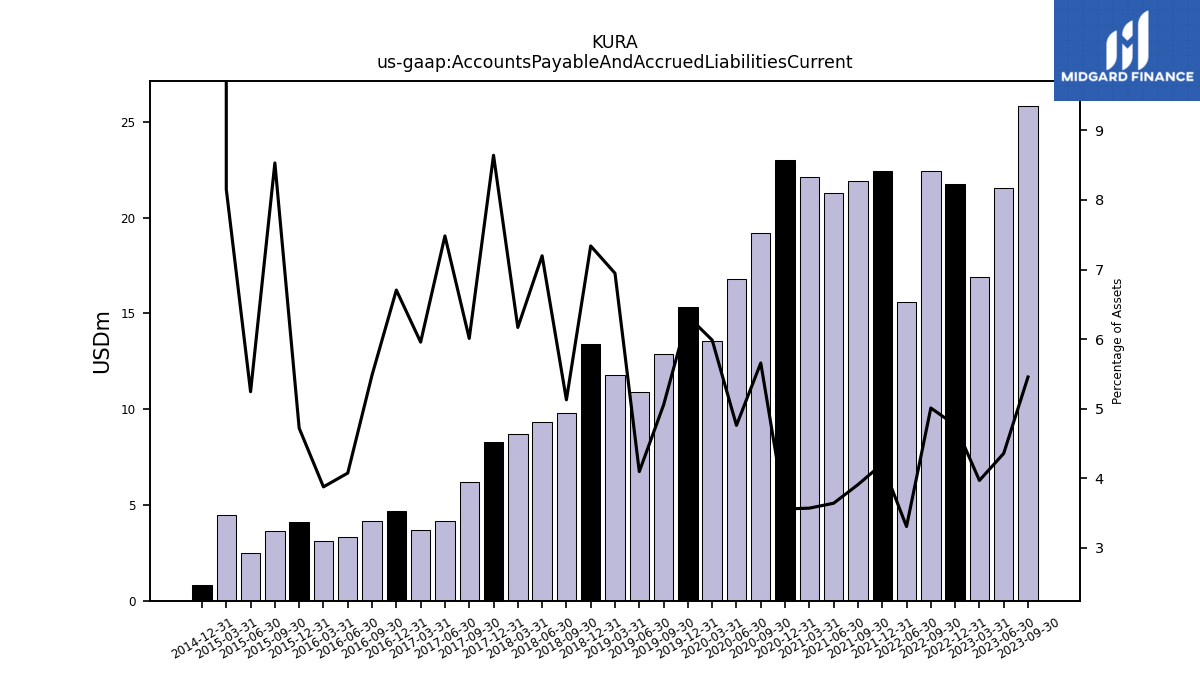
| Accounts Payable And Accrued Liabilities Current | 30.90 | 33.76 | 25.84 | 21.55 | 16.90 | 21.74 | 22.44 | 15.58 | NA | 22.45 | 21.93 | 21.29 | 22.14 | 23.02 | 19.20 | 16.80 | 13.55 | 15.31 | 12.87 | 10.88 | 11.78 | 13.38 | 9.82 | 9.33 | 8.72 | 8.28 | 6.20 | 4.18 | 3.69 | 4.68 | 4.18 | 3.33 | 3.12 | 4.12 | 3.65 | 2.49 | 4.47 | 0.85 | NA | NA | NA | NA | NA | NA | NA | NA | NA | NA | NA | NA | NA | NA | NA | NA | |
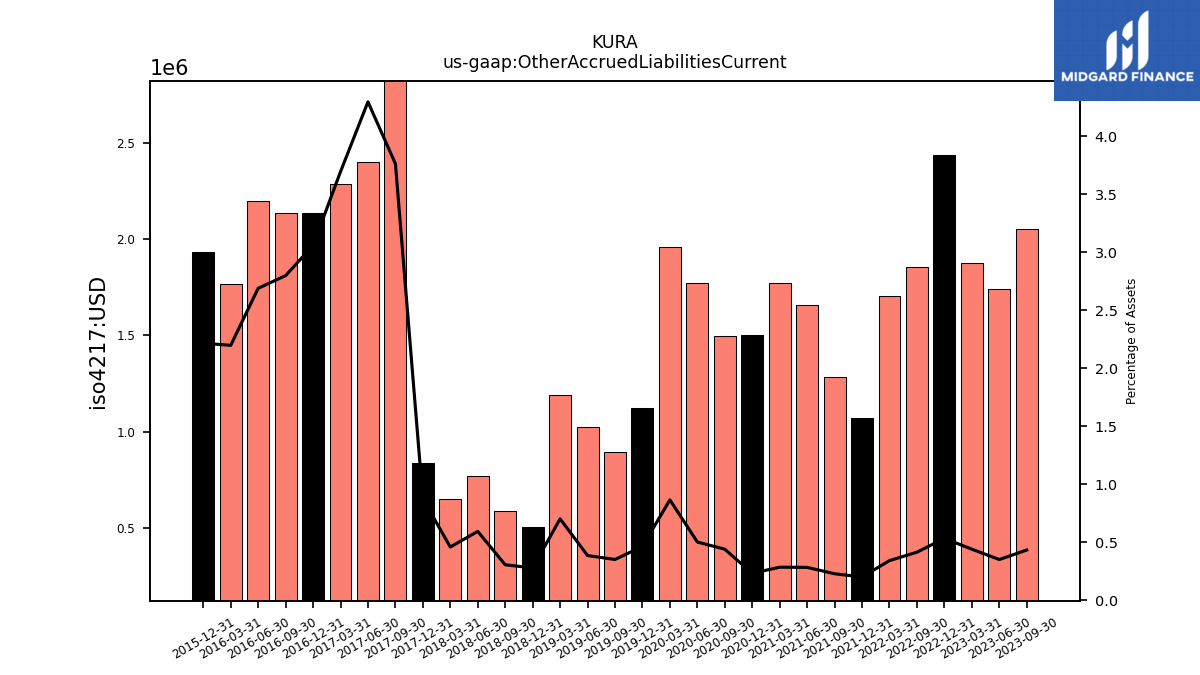
| Other Accrued Liabilities Current | 3.67 | 1.30 | 2.05 | 1.74 | 1.88 | 2.44 | 1.86 | NA | 1.71 | 1.07 | 1.28 | 1.66 | 1.77 | 1.50 | 1.50 | 1.77 | 1.96 | 1.12 | 0.90 | 1.02 | 1.19 | 0.51 | 0.59 | 0.77 | 0.65 | 0.84 | 3.88 | 2.40 | 2.29 | 2.14 | 2.14 | 2.20 | 1.77 | 1.93 | NA | NA | NA | NA | NA | NA | NA | NA | NA | NA | NA | NA | NA | NA | NA | NA | NA | NA | NA | NA |
| 2024-03-31 | 2023-12-31 | 2023-09-30 | 2023-06-30 | 2023-03-31 | 2022-12-31 | 2022-09-30 | 2022-06-30 | 2022-03-31 | 2021-12-31 | 2021-09-30 | 2021-06-30 | 2021-03-31 | 2020-12-31 | 2020-09-30 | 2020-06-30 | 2020-03-31 | 2019-12-31 | 2019-09-30 | 2019-06-30 | 2019-03-31 | 2018-12-31 | 2018-09-30 | 2018-06-30 | 2018-03-31 | 2017-12-31 | 2017-09-30 | 2017-06-30 | 2017-03-31 | 2016-12-31 | 2016-09-30 | 2016-06-30 | 2016-03-31 | 2015-12-31 | 2015-09-30 | 2015-06-30 | 2015-03-31 | 2014-12-31 | 2014-09-30 | 2014-06-30 | 2014-03-31 | 2013-12-31 | 2013-09-30 | 2013-06-30 | 2013-03-31 | 2012-12-31 | 2012-09-30 | 2012-06-30 | 2012-03-31 | 2011-12-31 | 2011-09-30 | 2011-06-30 | 2011-03-31 | 2010-12-31 | ||
|---|---|---|---|---|---|---|---|---|---|---|---|---|---|---|---|---|---|---|---|---|---|---|---|---|---|---|---|---|---|---|---|---|---|---|---|---|---|---|---|---|---|---|---|---|---|---|---|---|---|---|---|---|---|---|---|
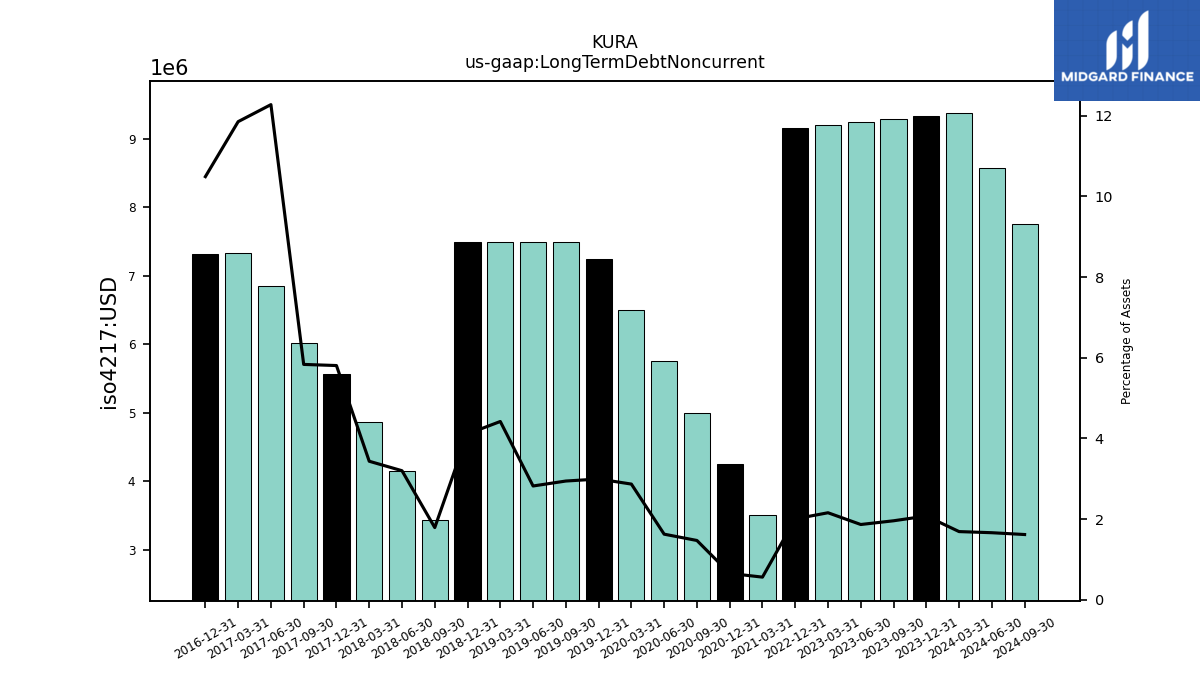
| Long Term Debt Noncurrent | 9.38 | 9.33 | 9.29 | 9.24 | 9.20 | 9.16 | NA | NA | NA | NA | NA | NA | 3.50 | 4.25 | 5.00 | 5.75 | 6.50 | 7.25 | 7.50 | 7.50 | 7.50 | 7.50 | 3.43 | 4.15 | 4.86 | 5.57 | 6.02 | 6.86 | 7.34 | 7.32 | NA | NA | NA | NA | NA | NA | NA | NA | NA | NA | NA | NA | NA | NA | NA | NA | NA | NA | NA | NA | NA | NA | NA | NA | |
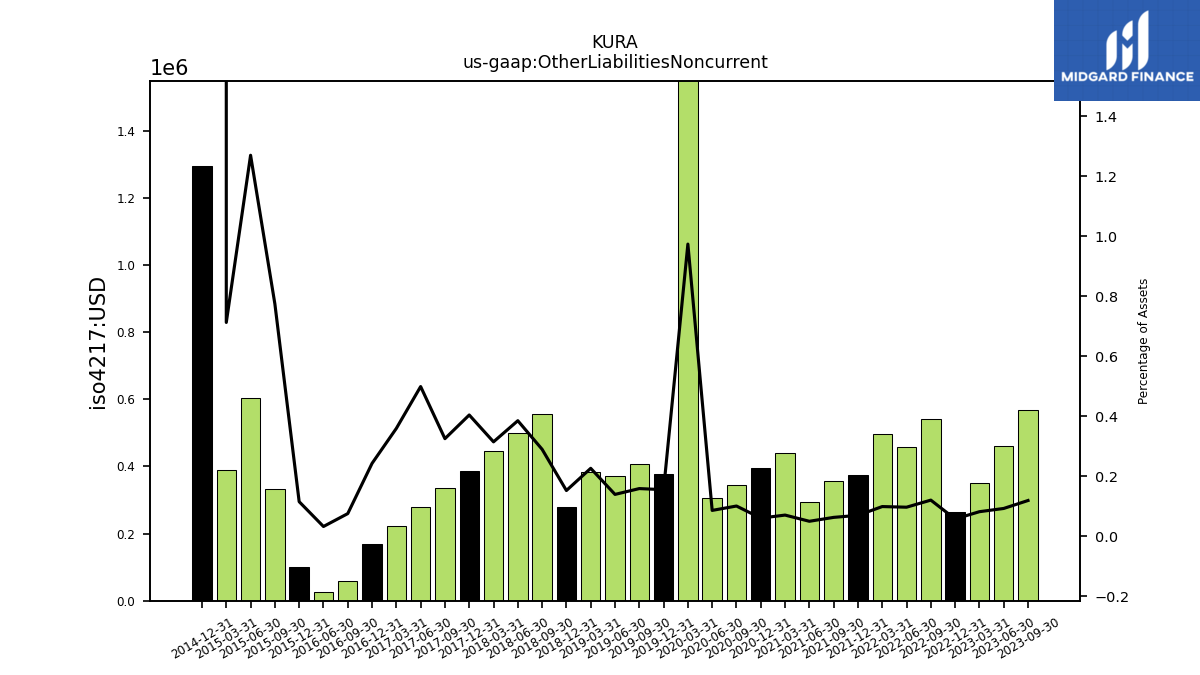
| Other Liabilities Noncurrent | 0.95 | 0.70 | 0.57 | 0.46 | 0.35 | 0.27 | 0.54 | 0.46 | 0.50 | 0.38 | 0.36 | 0.29 | 0.44 | 0.40 | 0.34 | 0.31 | 2.21 | 0.38 | 0.41 | 0.37 | 0.39 | 0.28 | 0.56 | 0.50 | 0.45 | 0.39 | 0.34 | 0.28 | 0.22 | 0.17 | 0.06 | 0.03 | NA | 0.10 | 0.33 | 0.60 | 0.39 | 1.29 | NA | NA | NA | NA | NA | NA | NA | NA | NA | NA | NA | NA | NA | NA | NA | NA | |
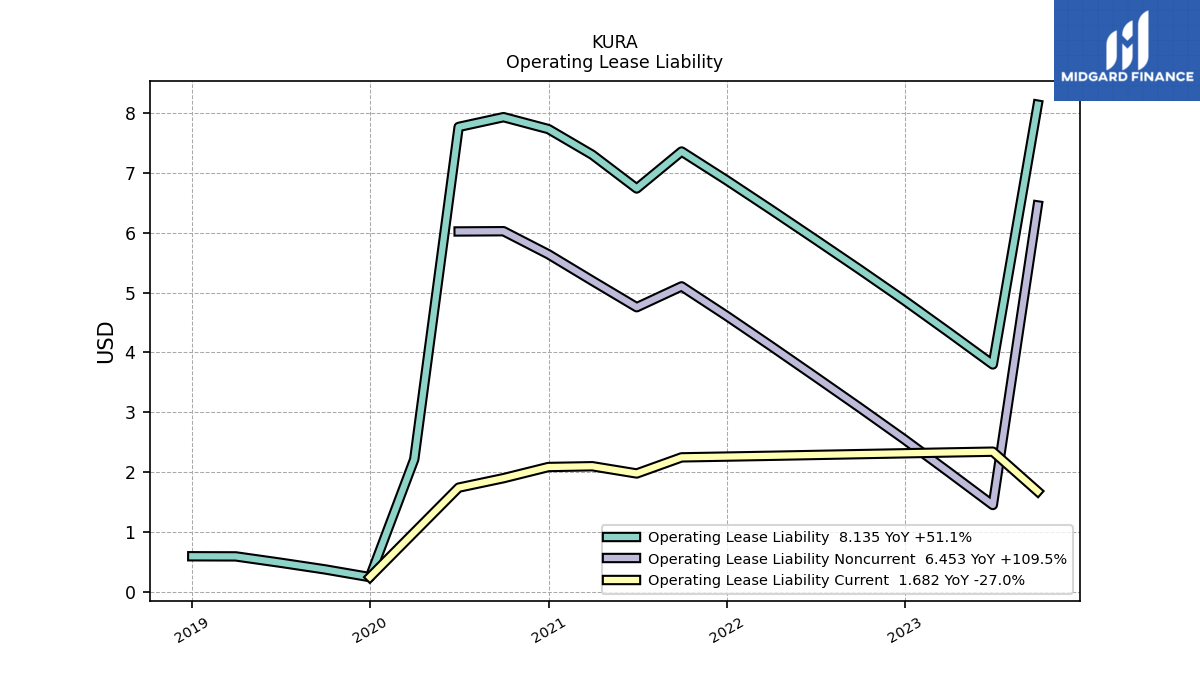
| Operating Lease Liability Noncurrent | 6.23 | 6.36 | 6.45 | 1.46 | 2.01 | 2.55 | 3.08 | 3.60 | 4.11 | 4.61 | 5.10 | 4.75 | 5.20 | 5.64 | 6.02 | 6.02 | NA | NA | NA | NA | NA | NA | NA | NA | NA | NA | NA | NA | NA | NA | NA | NA | NA | NA | NA | NA | NA | NA | NA | NA | NA | NA | NA | NA | NA | NA | NA | NA | NA | NA | NA | NA | NA | NA |
| 2024-03-31 | 2023-12-31 | 2023-09-30 | 2023-06-30 | 2023-03-31 | 2022-12-31 | 2022-09-30 | 2022-06-30 | 2022-03-31 | 2021-12-31 | 2021-09-30 | 2021-06-30 | 2021-03-31 | 2020-12-31 | 2020-09-30 | 2020-06-30 | 2020-03-31 | 2019-12-31 | 2019-09-30 | 2019-06-30 | 2019-03-31 | 2018-12-31 | 2018-09-30 | 2018-06-30 | 2018-03-31 | 2017-12-31 | 2017-09-30 | 2017-06-30 | 2017-03-31 | 2016-12-31 | 2016-09-30 | 2016-06-30 | 2016-03-31 | 2015-12-31 | 2015-09-30 | 2015-06-30 | 2015-03-31 | 2014-12-31 | 2014-09-30 | 2014-06-30 | 2014-03-31 | 2013-12-31 | 2013-09-30 | 2013-06-30 | 2013-03-31 | 2012-12-31 | 2012-09-30 | 2012-06-30 | 2012-03-31 | 2011-12-31 | 2011-09-30 | 2011-06-30 | 2011-03-31 | 2010-12-31 | ||
|---|---|---|---|---|---|---|---|---|---|---|---|---|---|---|---|---|---|---|---|---|---|---|---|---|---|---|---|---|---|---|---|---|---|---|---|---|---|---|---|---|---|---|---|---|---|---|---|---|---|---|---|---|---|---|---|
| Stockholders Equity | 505.08 | 397.27 | 429.94 | 459.68 | 395.18 | 420.28 | 419.62 | 449.49 | 476.25 | 506.61 | 533.76 | 558.55 | 585.99 | 610.90 | 306.50 | 322.37 | 203.20 | 218.78 | 233.58 | 246.58 | 149.56 | 160.99 | 174.61 | 112.40 | 124.80 | 79.86 | 89.20 | 43.64 | 50.24 | 56.88 | 63.67 | 70.04 | 76.07 | 82.10 | 37.78 | 43.32 | 48.89 | -0.15 | -0.14 | -0.14 | -0.13 | -0.12 | -0.11 | -0.11 | -0.10 | -0.10 | -0.09 | -0.08 | -0.07 | -0.07 | -0.06 | -0.05 | -0.07 | -0.04 | |
| Common Stock Value | 0.01 | 0.01 | 0.01 | 0.01 | 0.01 | 0.01 | 0.01 | 0.01 | 0.01 | 0.01 | 0.01 | 0.01 | 0.01 | 0.01 | 0.01 | 0.01 | 0.01 | 0.01 | 0.01 | 0.01 | 0.00 | 0.00 | 0.00 | 0.00 | 0.00 | 0.00 | 0.00 | 0.00 | 0.00 | 0.00 | 0.00 | 0.00 | 0.00 | 0.00 | NA | NA | NA | 0.00 | 0.00 | 0.00 | 0.00 | 0.00 | 0.00 | 0.00 | 0.00 | 0.00 | 0.00 | 0.00 | 0.00 | 0.00 | 0.00 | 0.00 | 0.00 | 0.00 | |
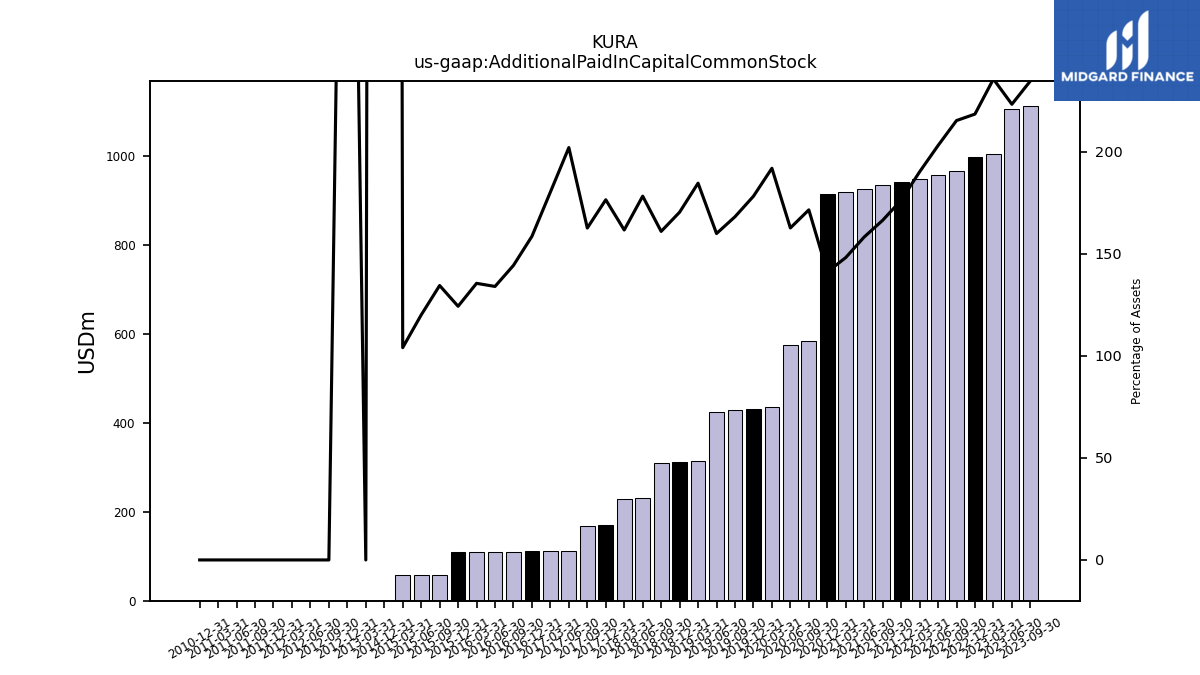
| Additional Paid In Capital Common Stock | 1276.86 | 1119.98 | 1112.12 | 1104.94 | 1003.95 | 997.11 | 964.72 | 957.49 | 948.31 | 941.36 | 934.17 | 925.80 | 919.26 | 913.35 | 582.61 | 574.38 | 434.72 | 431.32 | 428.26 | 425.04 | 313.22 | 310.85 | 308.37 | 231.12 | 228.76 | 169.20 | 167.75 | 112.87 | 111.65 | 110.75 | 110.16 | 109.58 | 108.97 | 108.48 | 57.60 | 57.07 | 57.04 | 0.24 | NA | NA | NA | NA | NA | NA | 0.05 | 0.05 | 0.05 | 0.05 | 0.05 | 0.05 | 0.05 | 0.05 | 0.05 | 0.05 | |
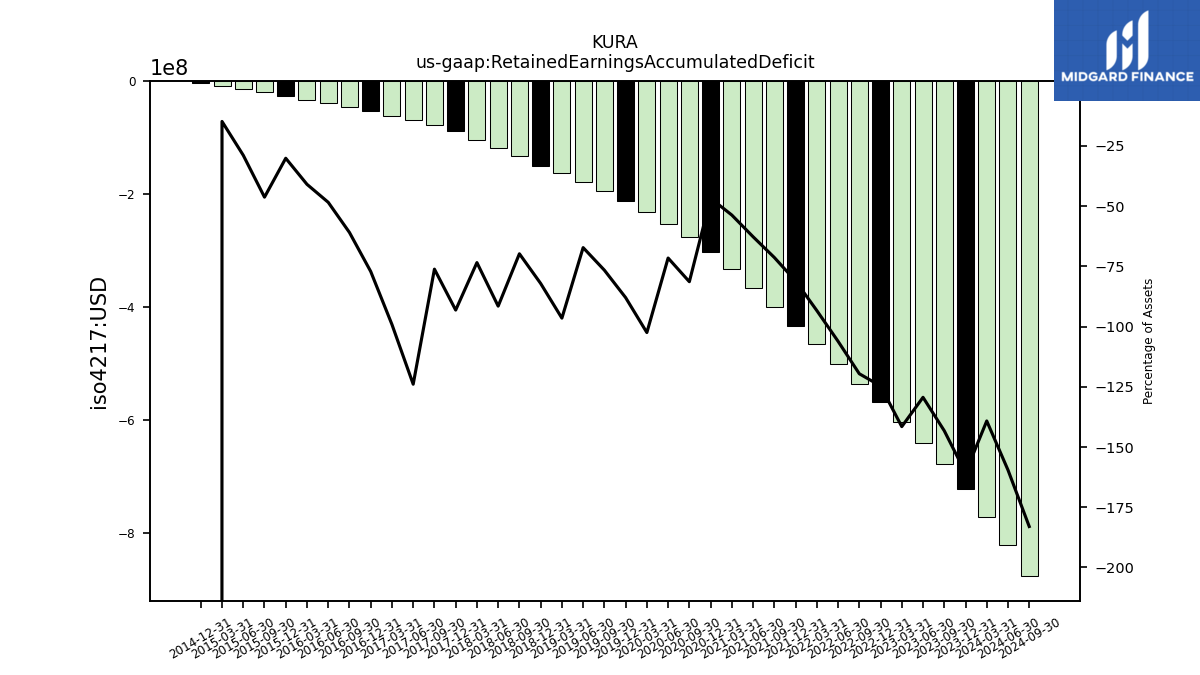
| Retained Earnings Accumulated Deficit | -770.96 | -721.44 | -678.65 | -640.05 | -602.88 | -568.81 | -535.69 | -500.19 | -465.42 | -432.97 | -400.23 | -366.86 | -333.20 | -302.50 | -276.34 | -252.57 | -232.09 | -212.88 | -195.01 | -178.62 | -163.68 | -149.74 | -133.64 | -118.63 | -103.89 | -89.29 | -78.54 | -69.21 | -61.39 | -53.86 | -46.51 | -39.58 | -32.92 | -26.30 | -19.82 | -13.73 | -8.15 | -3.67 | NA | NA | NA | NA | NA | NA | NA | NA | NA | NA | NA | NA | NA | NA | NA | NA | |
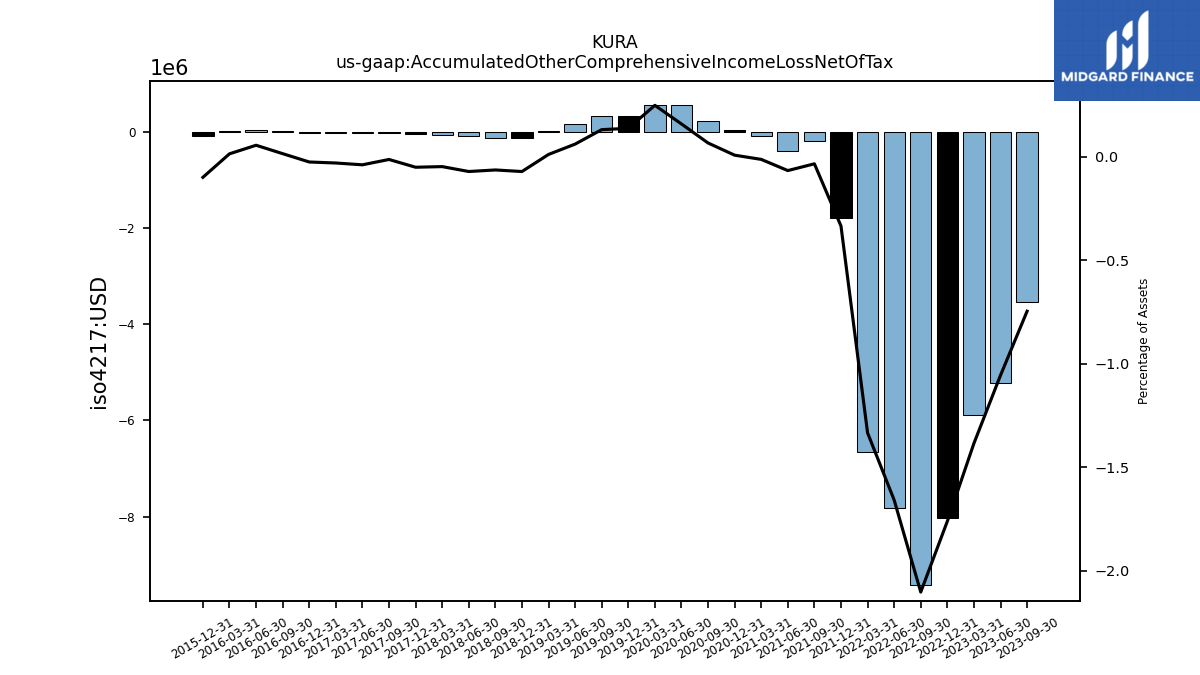
| Accumulated Other Comprehensive Income Loss Net Of Tax | -0.82 | -1.27 | -3.54 | -5.22 | -5.90 | -8.03 | -9.42 | -7.82 | -6.65 | -1.79 | -0.19 | -0.39 | -0.08 | 0.05 | 0.22 | 0.56 | 0.56 | 0.33 | 0.33 | 0.16 | 0.02 | -0.13 | -0.12 | -0.09 | -0.07 | -0.05 | -0.01 | -0.02 | -0.02 | -0.02 | 0.01 | 0.04 | 0.01 | -0.09 | NA | NA | NA | NA | NA | NA | NA | NA | NA | NA | NA | NA | NA | NA | NA | NA | NA | NA | NA | NA | |
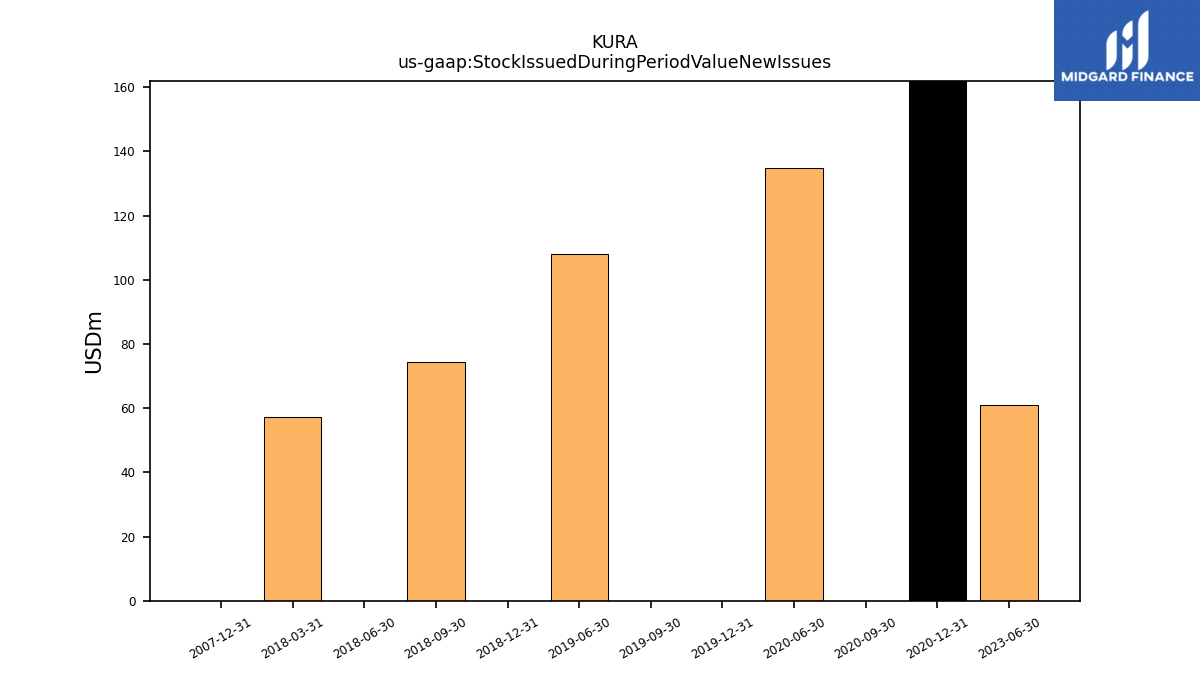
| Stock Issued During Period Value New Issues | 23.09 | NA | NA | 60.92 | NA | NA | NA | NA | NA | NA | NA | NA | NA | 324.05 | 0.00 | 134.92 | NA | 0.02 | 0.00 | 108.11 | NA | 0.00 | 74.52 | 0.00 | 57.38 | NA | NA | NA | NA | NA | NA | NA | NA | NA | NA | NA | NA | NA | NA | NA | NA | NA | NA | NA | NA | NA | NA | NA | NA | NA | NA | NA | NA | NA | |
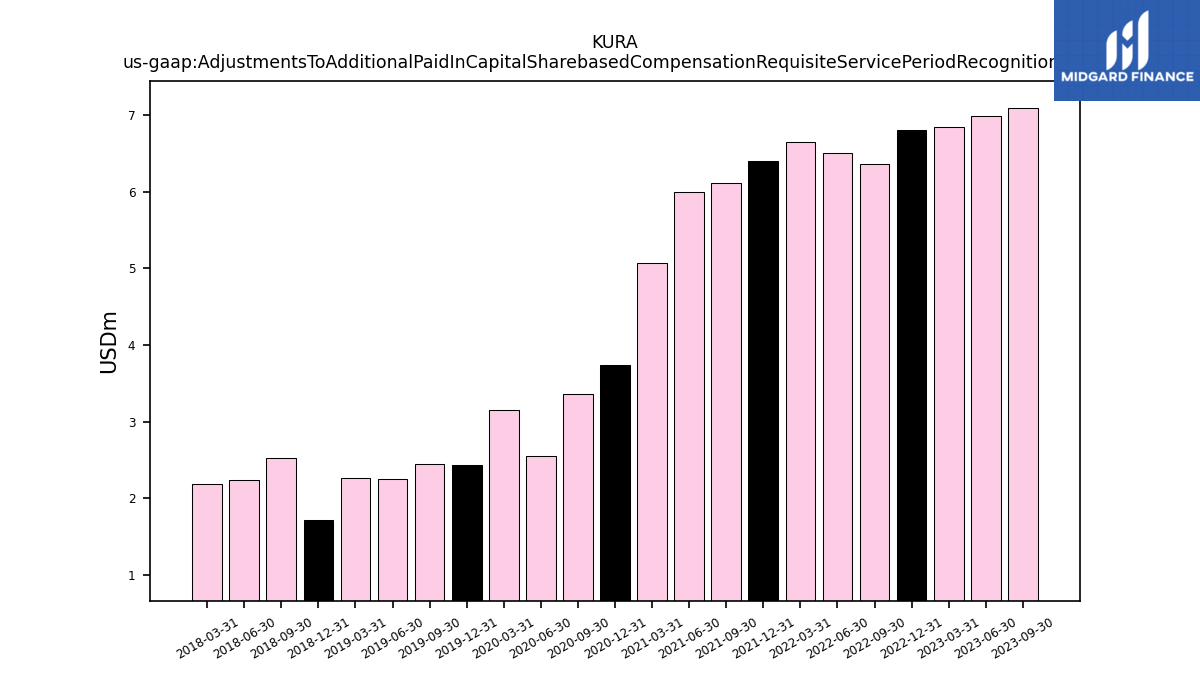
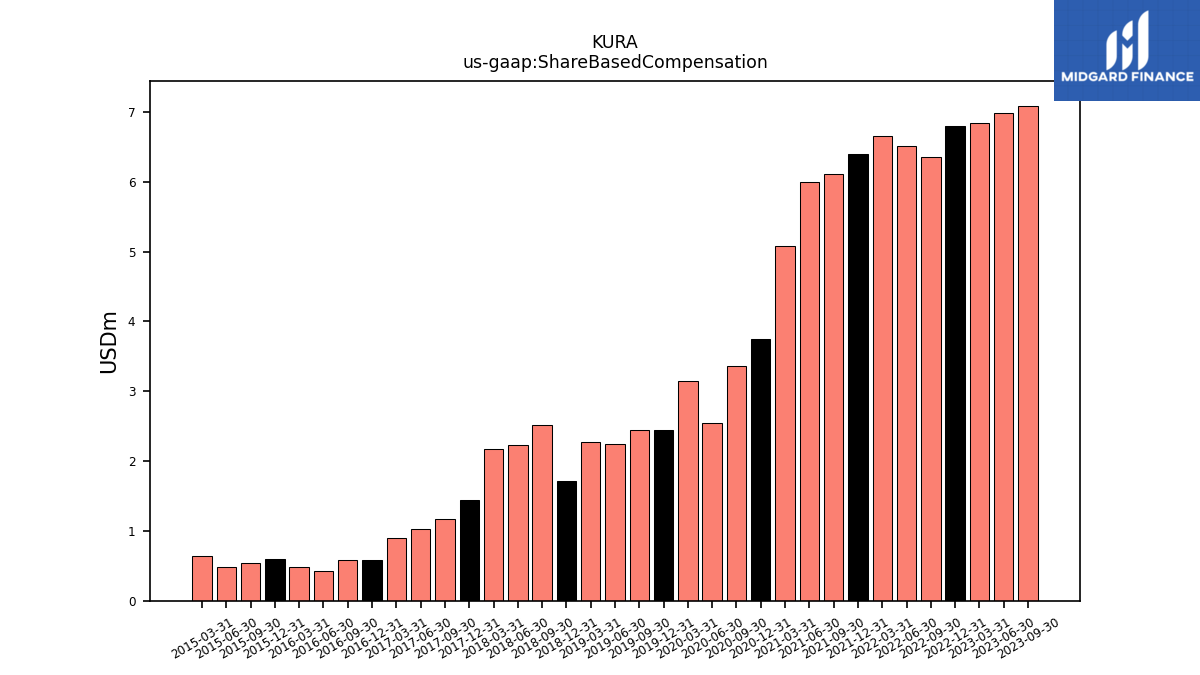
| Adjustments To Additional Paid In Capital Sharebased Compensation Requisite Service Period Recognition Value | 8.51 | NA | 7.09 | 6.99 | 6.84 | 6.80 | 6.36 | 6.51 | 6.65 | 6.40 | 6.11 | 5.99 | 5.08 | 3.74 | 3.36 | 2.55 | 3.15 | 2.44 | 2.45 | 2.25 | 2.27 | 1.72 | 2.52 | 2.24 | 2.18 | NA | NA | NA | NA | NA | NA | NA | NA | NA | NA | NA | NA | NA | NA | NA | NA | NA | NA | NA | NA | NA | NA | NA | NA | NA | NA | NA | NA | NA |
| 2024-03-31 | 2023-12-31 | 2023-09-30 | 2023-06-30 | 2023-03-31 | 2022-12-31 | 2022-09-30 | 2022-06-30 | 2022-03-31 | 2021-12-31 | 2021-09-30 | 2021-06-30 | 2021-03-31 | 2020-12-31 | 2020-09-30 | 2020-06-30 | 2020-03-31 | 2019-12-31 | 2019-09-30 | 2019-06-30 | 2019-03-31 | 2018-12-31 | 2018-09-30 | 2018-06-30 | 2018-03-31 | 2017-12-31 | 2017-09-30 | 2017-06-30 | 2017-03-31 | 2016-12-31 | 2016-09-30 | 2016-06-30 | 2016-03-31 | 2015-12-31 | 2015-09-30 | 2015-06-30 | 2015-03-31 | 2014-12-31 | 2014-09-30 | 2014-06-30 | 2014-03-31 | 2013-12-31 | 2013-09-30 | 2013-06-30 | 2013-03-31 | 2012-12-31 | 2012-09-30 | 2012-06-30 | 2012-03-31 | 2011-12-31 | 2011-09-30 | 2011-06-30 | 2011-03-31 | 2010-12-31 | ||
|---|---|---|---|---|---|---|---|---|---|---|---|---|---|---|---|---|---|---|---|---|---|---|---|---|---|---|---|---|---|---|---|---|---|---|---|---|---|---|---|---|---|---|---|---|---|---|---|---|---|---|---|---|---|---|---|
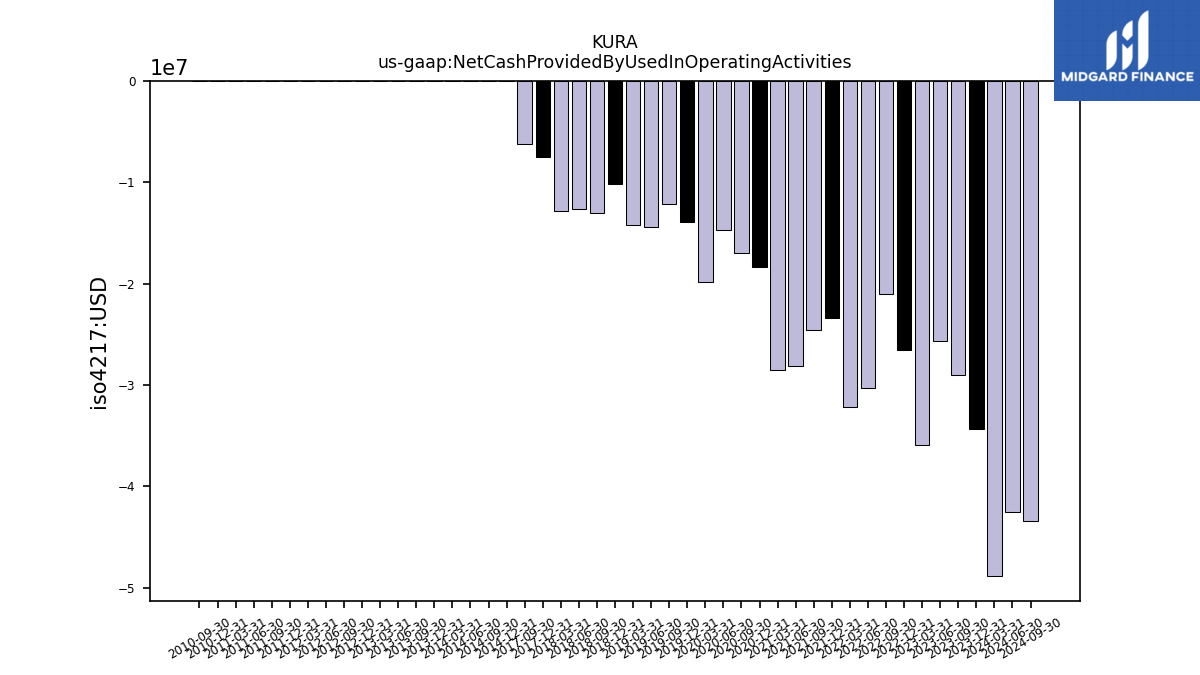
| Net Cash Provided By Used In Operating Activities | -48.84 | -34.31 | -29.03 | -25.62 | -35.87 | -26.53 | -21.01 | -30.34 | -32.18 | -23.37 | -24.59 | -28.07 | -28.52 | -18.31 | -16.97 | -14.73 | -19.82 | -13.93 | -12.14 | -14.43 | -14.25 | -10.21 | -13.00 | -12.59 | -12.85 | -7.47 | -6.24 | NA | NA | NA | NA | NA | NA | NA | NA | NA | NA | -0.01 | -0.00 | -0.00 | -0.00 | -0.00 | -0.01 | -0.01 | -0.00 | -0.00 | -0.00 | -0.01 | -0.01 | -0.00 | -0.00 | -0.02 | -0.00 | -0.00 | |
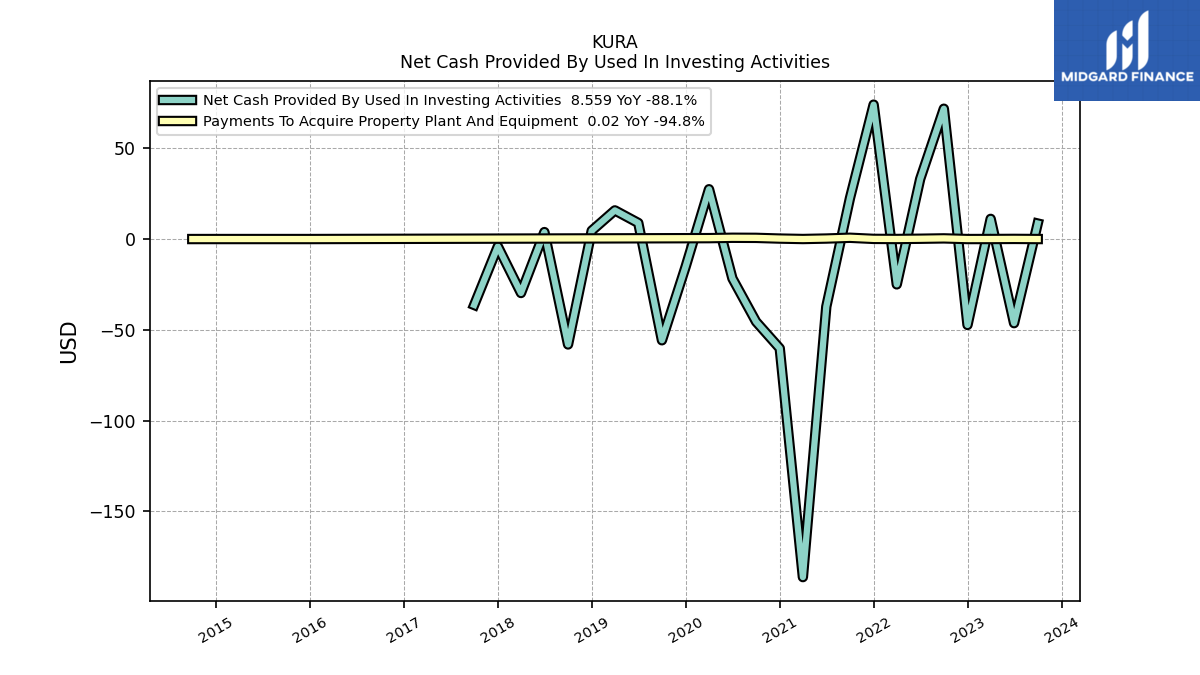
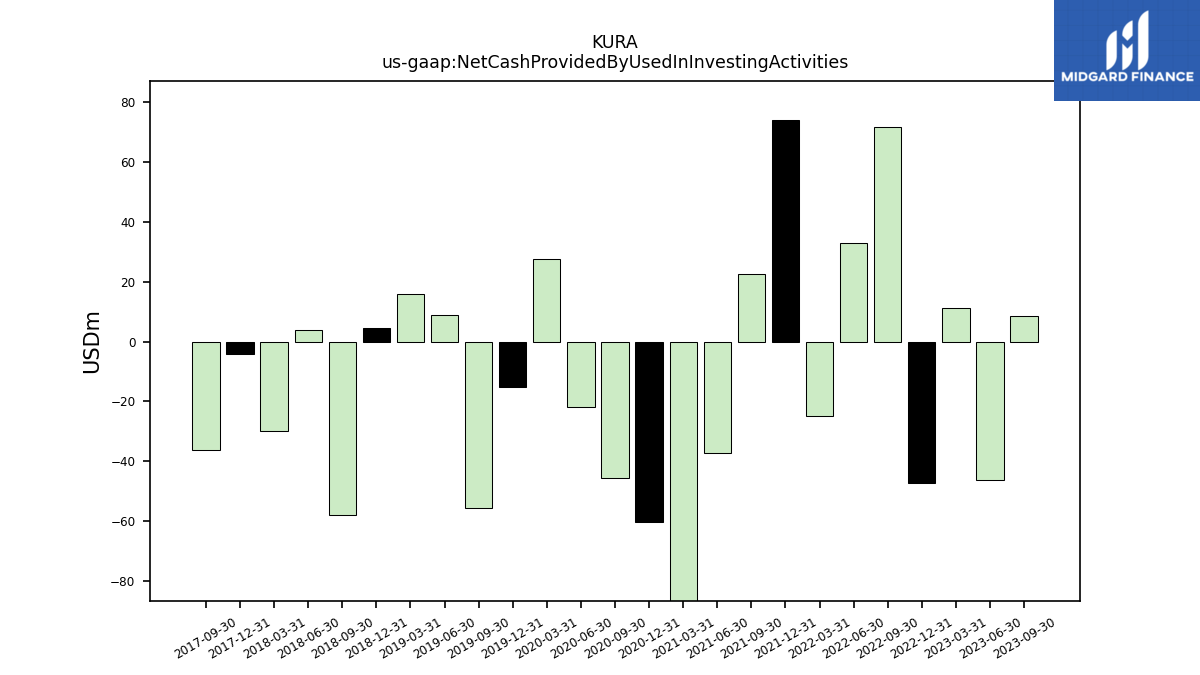
| Net Cash Provided By Used In Investing Activities | -95.34 | 42.20 | 8.56 | -46.33 | 11.13 | -47.32 | 71.81 | 33.10 | -24.96 | 74.06 | 22.55 | -37.22 | -186.22 | -60.19 | -45.52 | -21.69 | 27.46 | -15.26 | -55.75 | 8.88 | 15.81 | 4.62 | -58.06 | 3.86 | -29.71 | -4.09 | -36.29 | NA | NA | NA | NA | NA | NA | NA | NA | NA | NA | NA | NA | NA | NA | NA | NA | NA | NA | NA | NA | NA | NA | NA | NA | NA | NA | NA | |
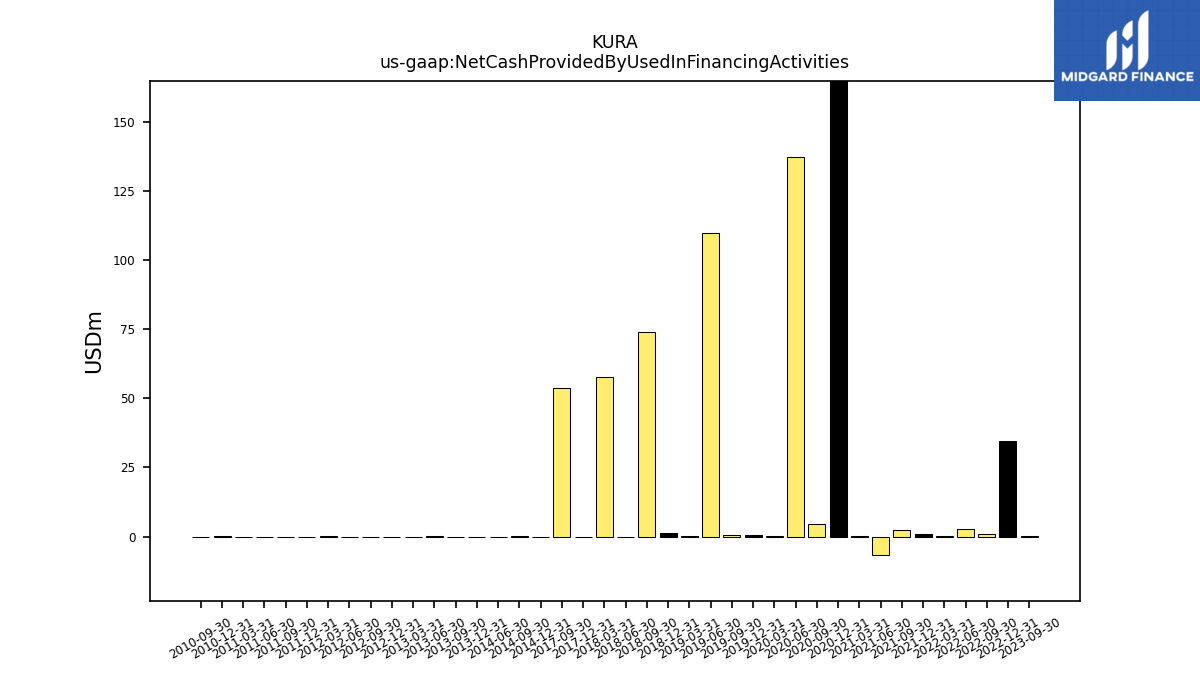
| Net Cash Provided By Used In Financing Activities | 148.37 | 0.69 | 0.08 | NA | NA | 34.71 | 0.88 | 2.67 | 0.30 | 0.79 | 2.26 | -6.57 | 0.08 | 327.04 | 4.68 | 137.37 | 0.25 | 0.58 | 0.56 | 109.86 | 0.10 | 1.14 | 73.97 | -0.12 | 57.65 | -0.34 | 53.71 | NA | NA | NA | NA | NA | NA | NA | NA | NA | NA | 0.00 | 0.01 | 0.00 | NA | 0.00 | 0.00 | 0.03 | 0.00 | 0.00 | 0.00 | 0.00 | 0.03 | 0.00 | 0.00 | 0.00 | 0.00 | 0.03 |
| 2024-03-31 | 2023-12-31 | 2023-09-30 | 2023-06-30 | 2023-03-31 | 2022-12-31 | 2022-09-30 | 2022-06-30 | 2022-03-31 | 2021-12-31 | 2021-09-30 | 2021-06-30 | 2021-03-31 | 2020-12-31 | 2020-09-30 | 2020-06-30 | 2020-03-31 | 2019-12-31 | 2019-09-30 | 2019-06-30 | 2019-03-31 | 2018-12-31 | 2018-09-30 | 2018-06-30 | 2018-03-31 | 2017-12-31 | 2017-09-30 | 2017-06-30 | 2017-03-31 | 2016-12-31 | 2016-09-30 | 2016-06-30 | 2016-03-31 | 2015-12-31 | 2015-09-30 | 2015-06-30 | 2015-03-31 | 2014-12-31 | 2014-09-30 | 2014-06-30 | 2014-03-31 | 2013-12-31 | 2013-09-30 | 2013-06-30 | 2013-03-31 | 2012-12-31 | 2012-09-30 | 2012-06-30 | 2012-03-31 | 2011-12-31 | 2011-09-30 | 2011-06-30 | 2011-03-31 | 2010-12-31 | ||
|---|---|---|---|---|---|---|---|---|---|---|---|---|---|---|---|---|---|---|---|---|---|---|---|---|---|---|---|---|---|---|---|---|---|---|---|---|---|---|---|---|---|---|---|---|---|---|---|---|---|---|---|---|---|---|---|
| Net Cash Provided By Used In Operating Activities | -48.84 | -34.31 | -29.03 | -25.62 | -35.87 | -26.53 | -21.01 | -30.34 | -32.18 | -23.37 | -24.59 | -28.07 | -28.52 | -18.31 | -16.97 | -14.73 | -19.82 | -13.93 | -12.14 | -14.43 | -14.25 | -10.21 | -13.00 | -12.59 | -12.85 | -7.47 | -6.24 | NA | NA | NA | NA | NA | NA | NA | NA | NA | NA | -0.01 | -0.00 | -0.00 | -0.00 | -0.00 | -0.01 | -0.01 | -0.00 | -0.00 | -0.00 | -0.01 | -0.01 | -0.00 | -0.00 | -0.02 | -0.00 | -0.00 | |
| Net Income Loss | -49.52 | -42.79 | -38.60 | -37.17 | -34.07 | -33.11 | -35.50 | -34.77 | -32.45 | -32.74 | -33.37 | -33.66 | -30.69 | -26.16 | -23.77 | -20.49 | -19.21 | -17.86 | -16.39 | -14.94 | -13.94 | -16.10 | -15.01 | -14.74 | -14.60 | -10.75 | -9.33 | -7.82 | -7.53 | -7.35 | -6.93 | -6.66 | -6.63 | -6.47 | -6.09 | -5.58 | -4.48 | -0.01 | -0.01 | -0.01 | -0.01 | -0.01 | -0.01 | -0.01 | -0.01 | -0.01 | -0.01 | -0.01 | -0.01 | -0.01 | -0.01 | -0.01 | -0.01 | -0.01 | |
| Share Based Compensation | 8.51 | 7.17 | 7.09 | 6.99 | 6.84 | 6.80 | 6.36 | 6.51 | 6.65 | 6.40 | 6.11 | 5.99 | 5.08 | 3.74 | 3.36 | 2.55 | 3.15 | 2.44 | 2.45 | 2.25 | 2.27 | 1.72 | 2.52 | 2.24 | 2.18 | 1.45 | 1.18 | 1.03 | 0.89 | 0.59 | 0.58 | 0.43 | 0.49 | 0.60 | 0.53 | 0.48 | 0.64 | NA | NA | NA | NA | NA | NA | NA | NA | NA | NA | NA | NA | NA | NA | NA | NA | NA | |
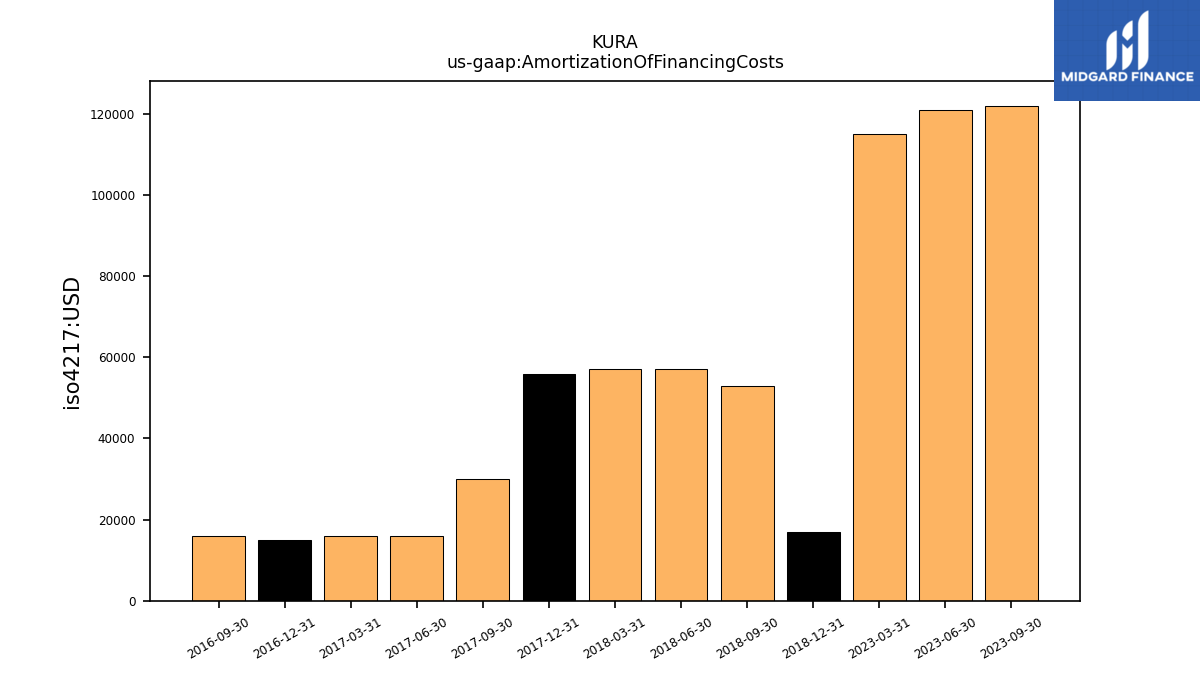
| Amortization Of Financing Costs | 0.12 | 0.12 | 0.12 | 0.12 | 0.12 | NA | NA | NA | NA | NA | NA | NA | NA | NA | NA | NA | NA | NA | NA | NA | NA | 0.02 | 0.05 | 0.06 | 0.06 | 0.06 | 0.03 | 0.02 | 0.02 | 0.01 | 0.02 | NA | NA | NA | NA | NA | NA | NA | NA | NA | NA | NA | NA | NA | NA | NA | NA | NA | NA | NA | NA | NA | NA | NA |
| 2024-03-31 | 2023-12-31 | 2023-09-30 | 2023-06-30 | 2023-03-31 | 2022-12-31 | 2022-09-30 | 2022-06-30 | 2022-03-31 | 2021-12-31 | 2021-09-30 | 2021-06-30 | 2021-03-31 | 2020-12-31 | 2020-09-30 | 2020-06-30 | 2020-03-31 | 2019-12-31 | 2019-09-30 | 2019-06-30 | 2019-03-31 | 2018-12-31 | 2018-09-30 | 2018-06-30 | 2018-03-31 | 2017-12-31 | 2017-09-30 | 2017-06-30 | 2017-03-31 | 2016-12-31 | 2016-09-30 | 2016-06-30 | 2016-03-31 | 2015-12-31 | 2015-09-30 | 2015-06-30 | 2015-03-31 | 2014-12-31 | 2014-09-30 | 2014-06-30 | 2014-03-31 | 2013-12-31 | 2013-09-30 | 2013-06-30 | 2013-03-31 | 2012-12-31 | 2012-09-30 | 2012-06-30 | 2012-03-31 | 2011-12-31 | 2011-09-30 | 2011-06-30 | 2011-03-31 | 2010-12-31 | ||
|---|---|---|---|---|---|---|---|---|---|---|---|---|---|---|---|---|---|---|---|---|---|---|---|---|---|---|---|---|---|---|---|---|---|---|---|---|---|---|---|---|---|---|---|---|---|---|---|---|---|---|---|---|---|---|---|
| Net Cash Provided By Used In Investing Activities | -95.34 | 42.20 | 8.56 | -46.33 | 11.13 | -47.32 | 71.81 | 33.10 | -24.96 | 74.06 | 22.55 | -37.22 | -186.22 | -60.19 | -45.52 | -21.69 | 27.46 | -15.26 | -55.75 | 8.88 | 15.81 | 4.62 | -58.06 | 3.86 | -29.71 | -4.09 | -36.29 | NA | NA | NA | NA | NA | NA | NA | NA | NA | NA | NA | NA | NA | NA | NA | NA | NA | NA | NA | NA | NA | NA | NA | NA | NA | NA | NA | |
| Payments To Acquire Property Plant And Equipment | 0.08 | 0.02 | 0.02 | 0.10 | 0.04 | 0.01 | 0.38 | 0.18 | 0.05 | 0.10 | 0.72 | 0.29 | 0.03 | 0.28 | 0.67 | 0.72 | 0.51 | NA | NA | NA | NA | NA | NA | NA | NA | NA | NA | NA | NA | NA | NA | NA | NA | 0.01 | NA | NA | NA | 0.02 | 0.01 | NA | NA | NA | NA | NA | NA | NA | NA | NA | NA | NA | NA | NA | NA | NA |
| 2024-03-31 | 2023-12-31 | 2023-09-30 | 2023-06-30 | 2023-03-31 | 2022-12-31 | 2022-09-30 | 2022-06-30 | 2022-03-31 | 2021-12-31 | 2021-09-30 | 2021-06-30 | 2021-03-31 | 2020-12-31 | 2020-09-30 | 2020-06-30 | 2020-03-31 | 2019-12-31 | 2019-09-30 | 2019-06-30 | 2019-03-31 | 2018-12-31 | 2018-09-30 | 2018-06-30 | 2018-03-31 | 2017-12-31 | 2017-09-30 | 2017-06-30 | 2017-03-31 | 2016-12-31 | 2016-09-30 | 2016-06-30 | 2016-03-31 | 2015-12-31 | 2015-09-30 | 2015-06-30 | 2015-03-31 | 2014-12-31 | 2014-09-30 | 2014-06-30 | 2014-03-31 | 2013-12-31 | 2013-09-30 | 2013-06-30 | 2013-03-31 | 2012-12-31 | 2012-09-30 | 2012-06-30 | 2012-03-31 | 2011-12-31 | 2011-09-30 | 2011-06-30 | 2011-03-31 | 2010-12-31 | ||
|---|---|---|---|---|---|---|---|---|---|---|---|---|---|---|---|---|---|---|---|---|---|---|---|---|---|---|---|---|---|---|---|---|---|---|---|---|---|---|---|---|---|---|---|---|---|---|---|---|---|---|---|---|---|---|---|
| Net Cash Provided By Used In Financing Activities | 148.37 | 0.69 | 0.08 | NA | NA | 34.71 | 0.88 | 2.67 | 0.30 | 0.79 | 2.26 | -6.57 | 0.08 | 327.04 | 4.68 | 137.37 | 0.25 | 0.58 | 0.56 | 109.86 | 0.10 | 1.14 | 73.97 | -0.12 | 57.65 | -0.34 | 53.71 | NA | NA | NA | NA | NA | NA | NA | NA | NA | NA | 0.00 | 0.01 | 0.00 | NA | 0.00 | 0.00 | 0.03 | 0.00 | 0.00 | 0.00 | 0.00 | 0.03 | 0.00 | 0.00 | 0.00 | 0.00 | 0.03 |


