
| 2024-03-31 | 2023-12-31 | 2023-09-30 | 2023-06-30 | 2023-03-31 | 2022-12-31 | 2022-09-30 | 2022-06-30 | 2022-03-31 | 2021-12-31 | 2021-09-30 | 2021-06-30 | 2021-03-31 | 2020-12-31 | 2020-09-30 | 2020-06-30 | 2020-03-31 | 2019-12-31 | 2019-09-30 | 2019-06-30 | 2019-03-31 | 2018-12-31 | 2018-09-30 | 2018-06-30 | 2018-03-31 | 2017-12-31 | 2017-09-30 | 2017-06-30 | 2017-03-31 | 2016-12-31 | 2016-09-30 | 2016-06-30 | 2016-03-31 | 2015-12-31 | 2015-09-30 | 2015-06-30 | 2015-03-31 | 2014-12-31 | 2014-09-30 | 2014-06-30 | 2014-03-31 | 2013-12-31 | 2013-09-30 | 2013-06-30 | 2013-03-31 | 2012-12-31 | 2012-09-30 | 2012-06-30 | 2012-03-31 | 2011-12-31 | 2011-09-30 | 2011-06-30 | 2011-03-31 | 2010-12-31 | 2010-09-30 | 2010-06-30 | ||
|---|---|---|---|---|---|---|---|---|---|---|---|---|---|---|---|---|---|---|---|---|---|---|---|---|---|---|---|---|---|---|---|---|---|---|---|---|---|---|---|---|---|---|---|---|---|---|---|---|---|---|---|---|---|---|---|---|---|
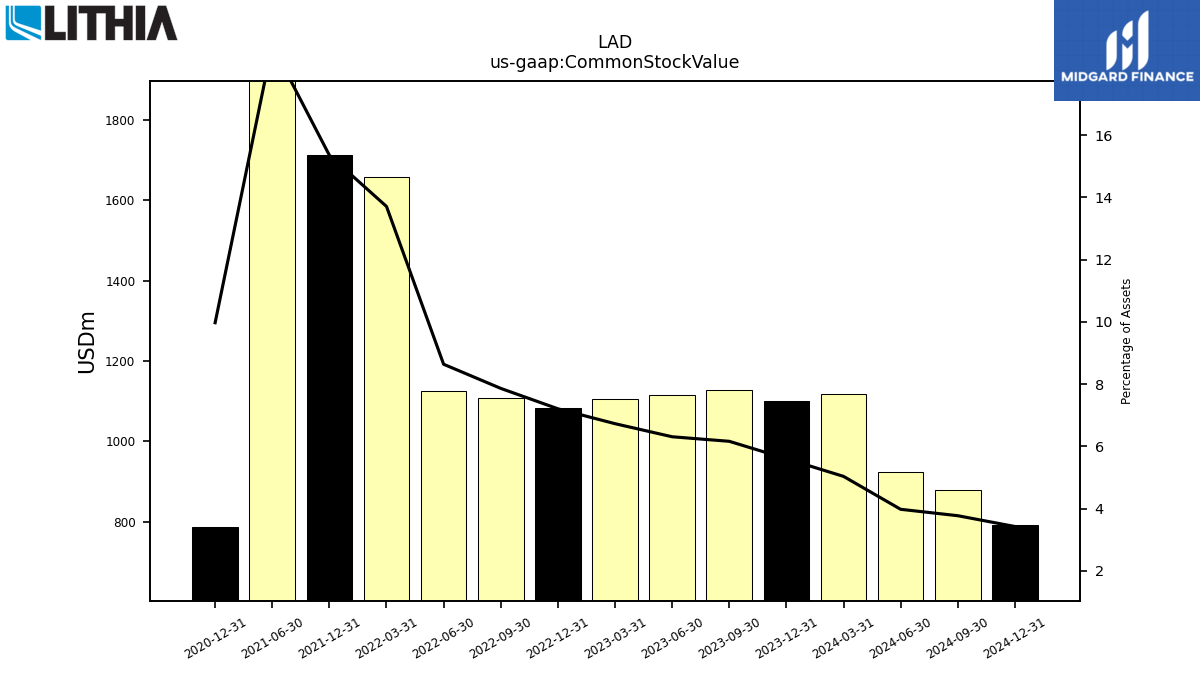
| Common Stock Value | 1117.80 | 1100.60 | 1126.50 | 1116.10 | 1105.50 | 1082.10 | 1107.10 | 1124.00 | 1656.30 | 1711.60 | NA | 1906.90 | NA | 788.20 | NA | NA | NA | NA | NA | NA | NA | NA | NA | NA | NA | NA | NA | NA | NA | NA | NA | NA | NA | NA | NA | NA | NA | NA | NA | NA | NA | NA | NA | NA | NA | NA | NA | NA | NA | NA | NA | NA | NA | NA | NA | NA | |
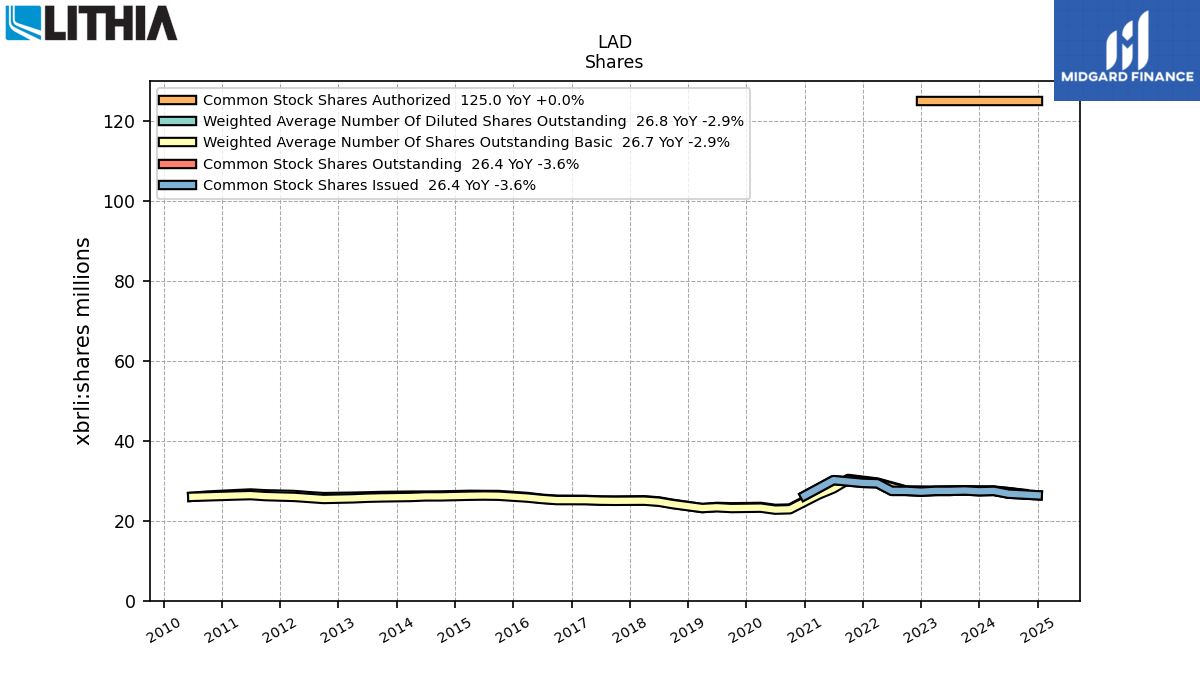
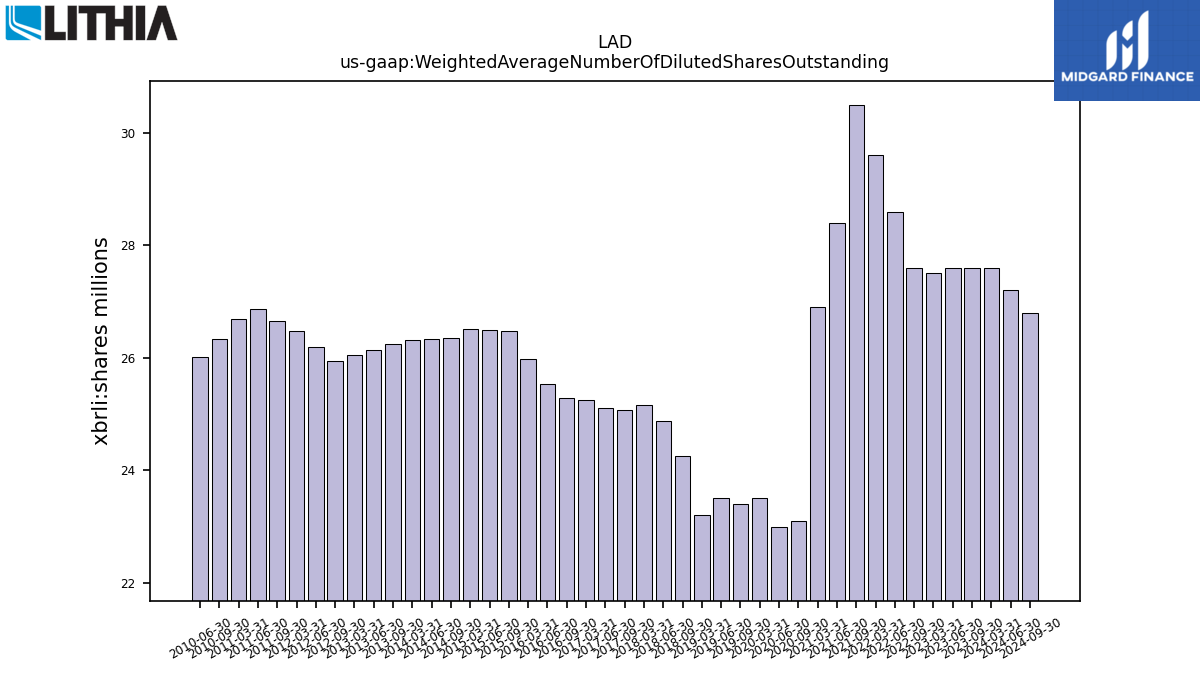
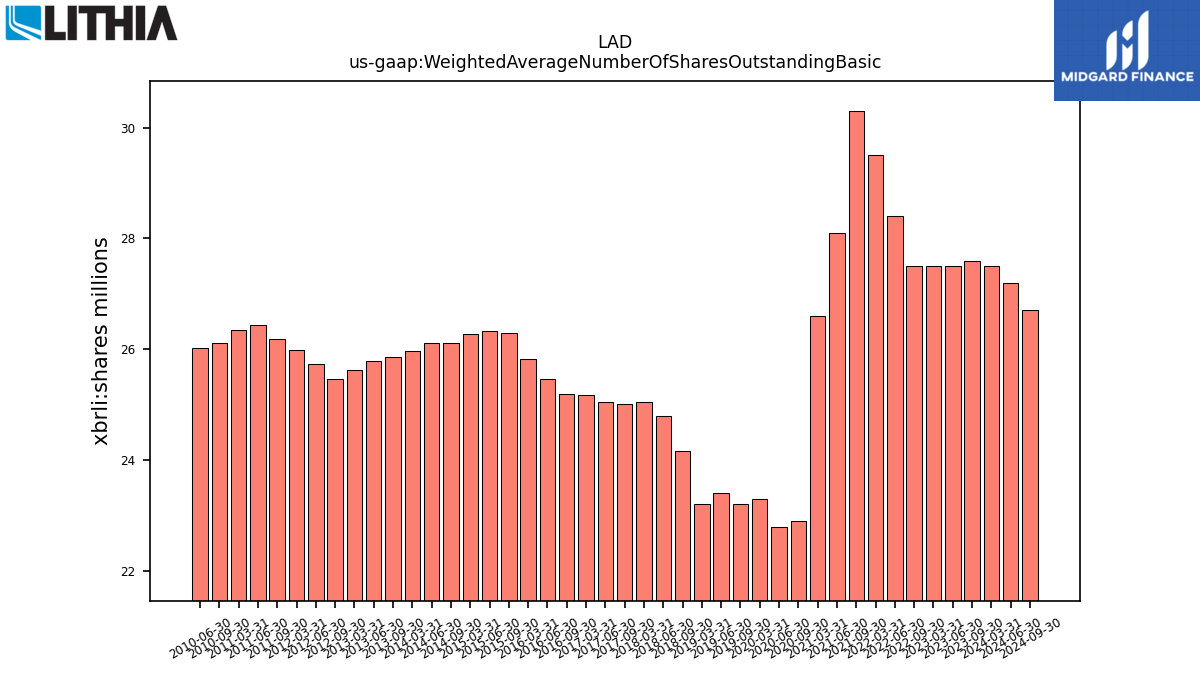
| Weighted Average Number Of Diluted Shares Outstanding | 27.60 | NA | 27.60 | 27.60 | 27.50 | NA | 27.60 | 28.60 | 29.60 | NA | 30.50 | 28.40 | 26.90 | NA | 23.10 | 23.00 | 23.50 | NA | 23.40 | 23.50 | 23.20 | NA | 24.26 | 24.88 | 25.16 | NA | 25.08 | 25.11 | 25.25 | NA | 25.29 | 25.53 | 25.97 | NA | 26.48 | 26.50 | 26.52 | NA | 26.36 | 26.33 | 26.32 | NA | 26.24 | 26.13 | 26.05 | NA | 25.95 | 26.18 | 26.48 | NA | 26.65 | 26.86 | 26.69 | NA | 26.33 | 26.01 | |
| Weighted Average Number Of Shares Outstanding Basic | 27.50 | NA | 27.60 | 27.50 | 27.50 | NA | 27.50 | 28.40 | 29.50 | NA | 30.30 | 28.10 | 26.60 | NA | 22.90 | 22.80 | 23.30 | NA | 23.20 | 23.40 | 23.20 | NA | 24.16 | 24.79 | 25.05 | NA | 25.01 | 25.05 | 25.18 | NA | 25.19 | 25.46 | 25.82 | NA | 26.29 | 26.33 | 26.28 | NA | 26.12 | 26.12 | 25.97 | NA | 25.87 | 25.78 | 25.63 | NA | 25.47 | 25.73 | 25.99 | NA | 26.19 | 26.44 | 26.34 | NA | 26.12 | 26.01 | |
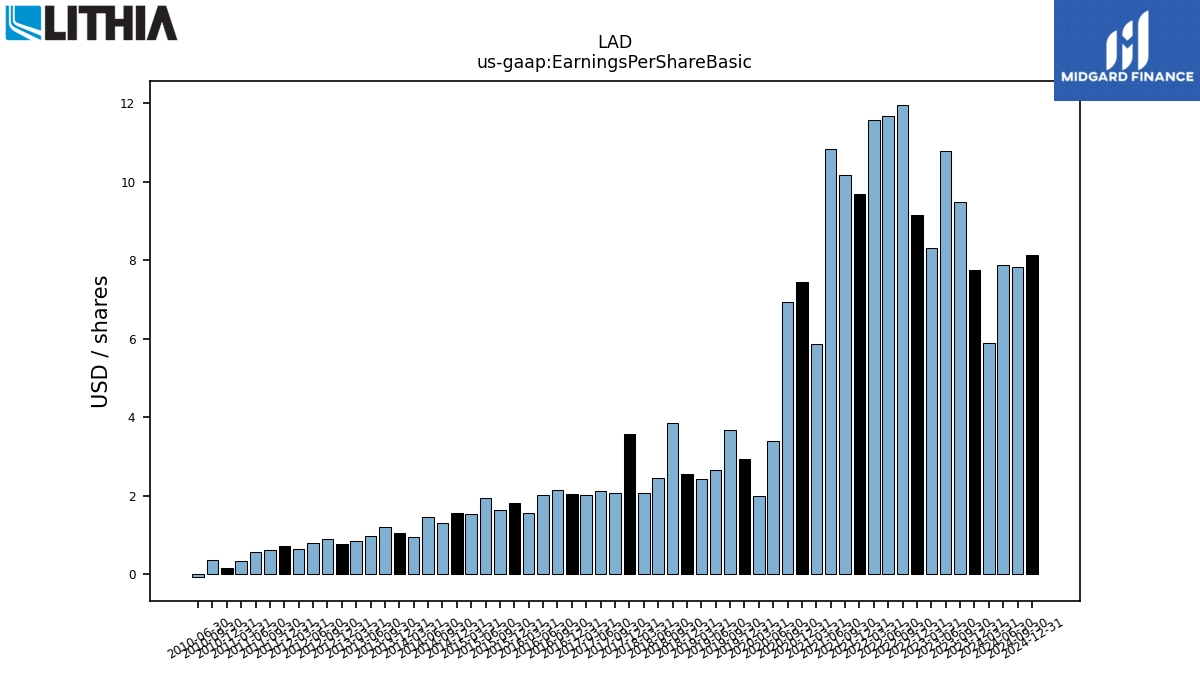
| Earnings Per Share Basic | 5.90 | 7.76 | 9.49 | 10.79 | 8.32 | 9.15 | 11.97 | 11.67 | 11.59 | 9.69 | 10.18 | 10.83 | 5.86 | 7.44 | 6.95 | 3.40 | 1.99 | 2.93 | 3.67 | 2.65 | 2.43 | 2.57 | 3.85 | 2.45 | 2.08 | 3.57 | 2.07 | 2.12 | 2.01 | 2.04 | 2.15 | 2.02 | 1.56 | 1.82 | 1.65 | 1.95 | 1.55 | 1.57 | 1.32 | 1.47 | 0.95 | 1.06 | 1.20 | 0.99 | 0.86 | 0.78 | 0.91 | 0.80 | 0.65 | 0.72 | 0.63 | 0.56 | 0.33 | 0.17 | 0.37 | -0.07 | |
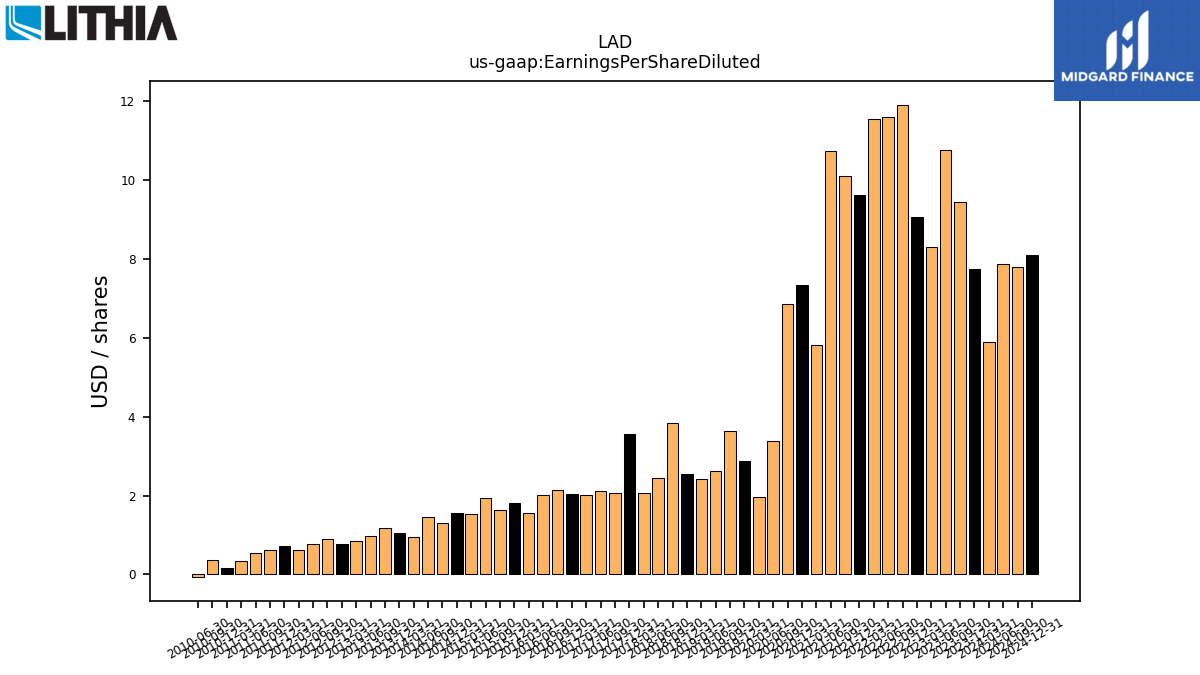
| Earnings Per Share Diluted | 5.89 | 7.75 | 9.46 | 10.78 | 8.30 | 9.07 | 11.92 | 11.60 | 11.55 | 9.63 | 10.11 | 10.75 | 5.81 | 7.35 | 6.86 | 3.38 | 1.97 | 2.88 | 3.64 | 2.63 | 2.42 | 2.55 | 3.84 | 2.44 | 2.07 | 3.56 | 2.07 | 2.12 | 2.01 | 2.03 | 2.14 | 2.01 | 1.55 | 1.81 | 1.64 | 1.93 | 1.53 | 1.55 | 1.31 | 1.45 | 0.94 | 1.04 | 1.18 | 0.98 | 0.85 | 0.76 | 0.90 | 0.78 | 0.63 | 0.71 | 0.62 | 0.55 | 0.33 | 0.16 | 0.37 | -0.07 |
| 2024-03-31 | 2023-12-31 | 2023-09-30 | 2023-06-30 | 2023-03-31 | 2022-12-31 | 2022-09-30 | 2022-06-30 | 2022-03-31 | 2021-12-31 | 2021-09-30 | 2021-06-30 | 2021-03-31 | 2020-12-31 | 2020-09-30 | 2020-06-30 | 2020-03-31 | 2019-12-31 | 2019-09-30 | 2019-06-30 | 2019-03-31 | 2018-12-31 | 2018-09-30 | 2018-06-30 | 2018-03-31 | 2017-12-31 | 2017-09-30 | 2017-06-30 | 2017-03-31 | 2016-12-31 | 2016-09-30 | 2016-06-30 | 2016-03-31 | 2015-12-31 | 2015-09-30 | 2015-06-30 | 2015-03-31 | 2014-12-31 | 2014-09-30 | 2014-06-30 | 2014-03-31 | 2013-12-31 | 2013-09-30 | 2013-06-30 | 2013-03-31 | 2012-12-31 | 2012-09-30 | 2012-06-30 | 2012-03-31 | 2011-12-31 | 2011-09-30 | 2011-06-30 | 2011-03-31 | 2010-12-31 | 2010-09-30 | 2010-06-30 | ||
|---|---|---|---|---|---|---|---|---|---|---|---|---|---|---|---|---|---|---|---|---|---|---|---|---|---|---|---|---|---|---|---|---|---|---|---|---|---|---|---|---|---|---|---|---|---|---|---|---|---|---|---|---|---|---|---|---|---|
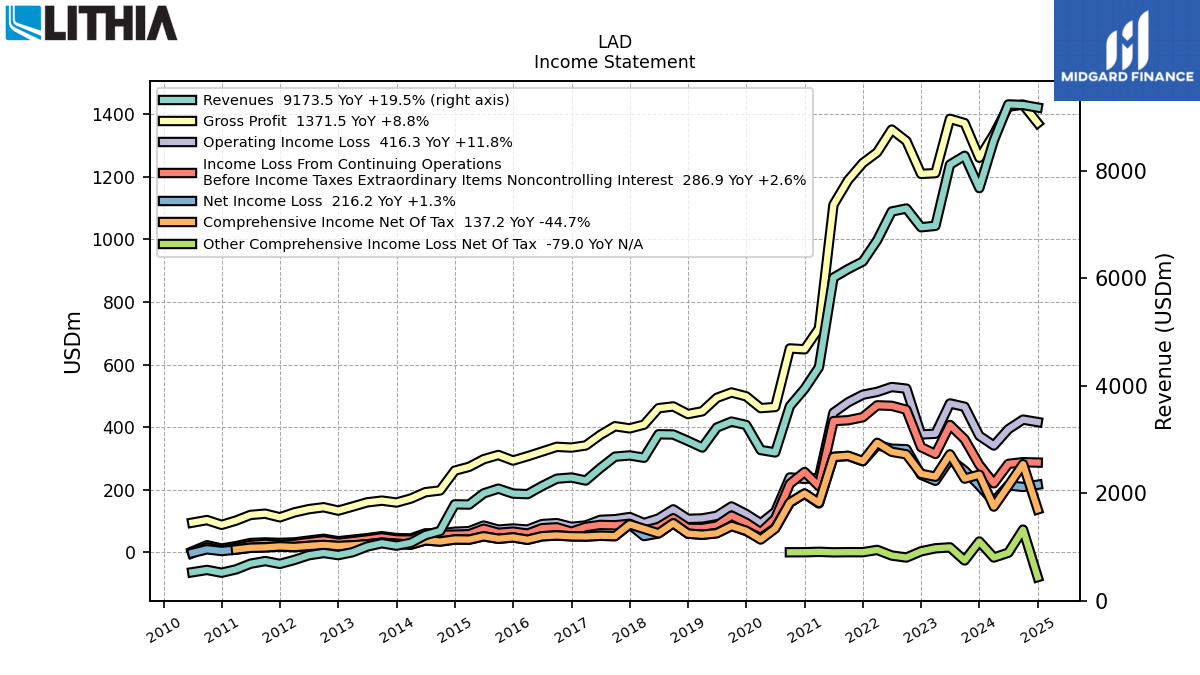
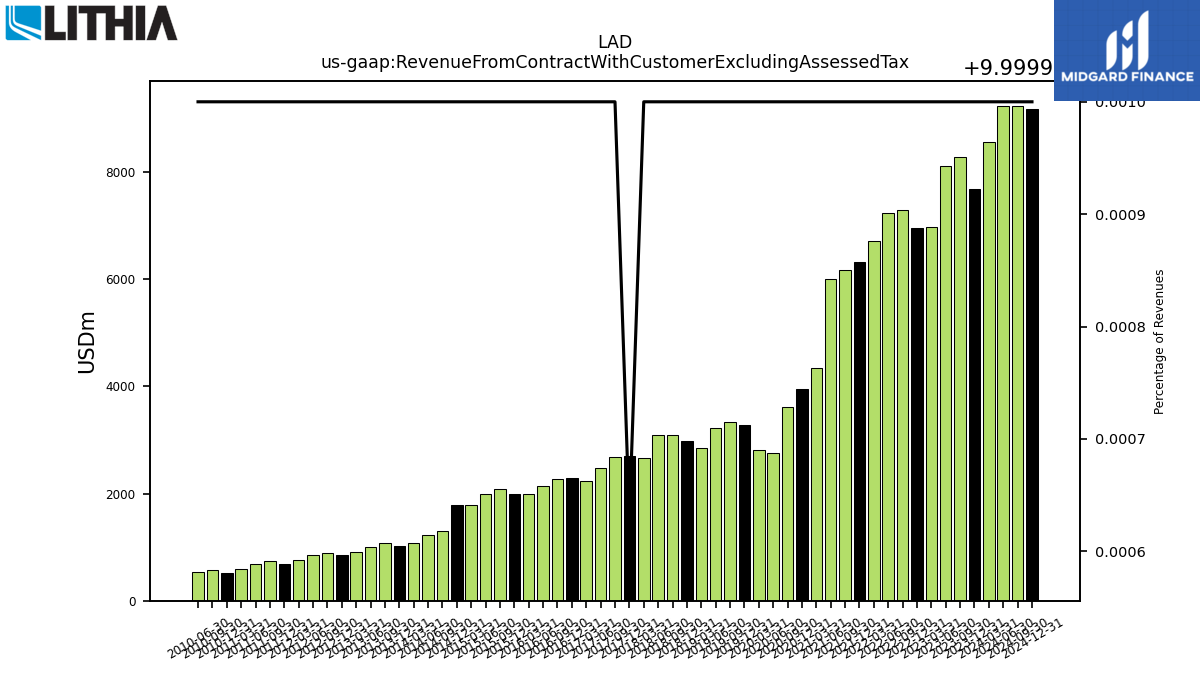
| Revenue From Contract With Customer Excluding Assessed Tax | 8561.80 | 7674.30 | 8277.00 | 8111.50 | 6973.80 | 6946.50 | 7295.70 | 7240.10 | 6705.30 | 6309.50 | 6169.80 | 6009.40 | 4343.00 | 3941.80 | 3620.20 | 2758.60 | 2803.80 | 3268.90 | 3332.40 | 3221.70 | 2849.70 | 2973.23 | 3091.95 | 3096.54 | 2659.68 | 2703.02 | 2680.34 | 2467.04 | 2236.10 | 2291.99 | 2269.97 | 2133.34 | 1982.86 | 1993.28 | 2084.84 | 1996.95 | 1789.18 | 1793.31 | 1297.11 | 1221.80 | 1078.11 | 1024.87 | 1069.29 | 1008.50 | 903.08 | 849.00 | 888.37 | 847.12 | 758.89 | 685.88 | 737.90 | 689.07 | 582.86 | 521.26 | 573.00 | 530.15 | |
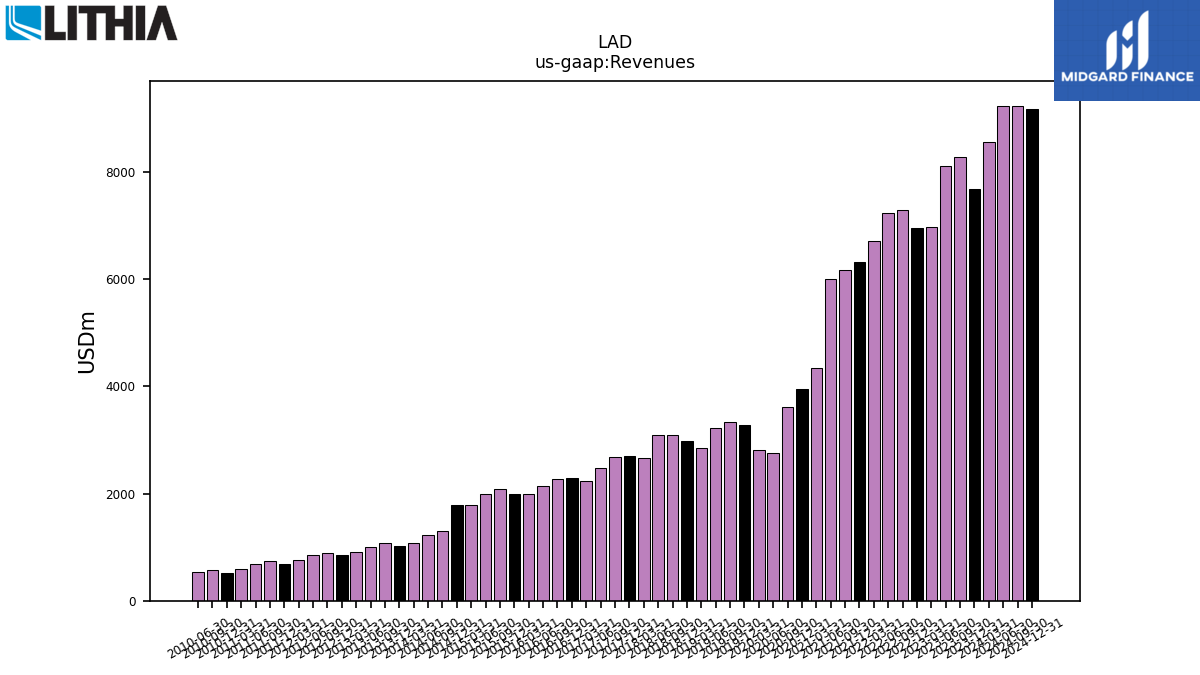
| Revenues | 8561.80 | 7674.30 | 8277.00 | 8111.50 | 6973.80 | 6946.50 | 7295.70 | 7240.10 | 6705.30 | 6309.50 | 6169.80 | 6009.40 | 4343.00 | 3941.80 | 3620.20 | 2758.60 | 2803.80 | 3268.90 | 3332.40 | 3221.70 | 2849.70 | 2973.23 | 3091.95 | 3096.54 | 2659.68 | 2703.03 | 2680.34 | 2467.04 | 2236.10 | 2291.99 | 2269.97 | 2133.34 | 1982.86 | 1993.28 | 2084.84 | 1996.95 | 1789.18 | 1793.31 | 1297.11 | 1221.80 | 1078.11 | 1024.87 | 1069.29 | 1008.50 | 903.08 | 849.00 | 888.37 | 847.12 | 758.89 | 685.88 | 737.90 | 689.07 | 582.86 | 521.26 | 573.00 | 530.15 | |
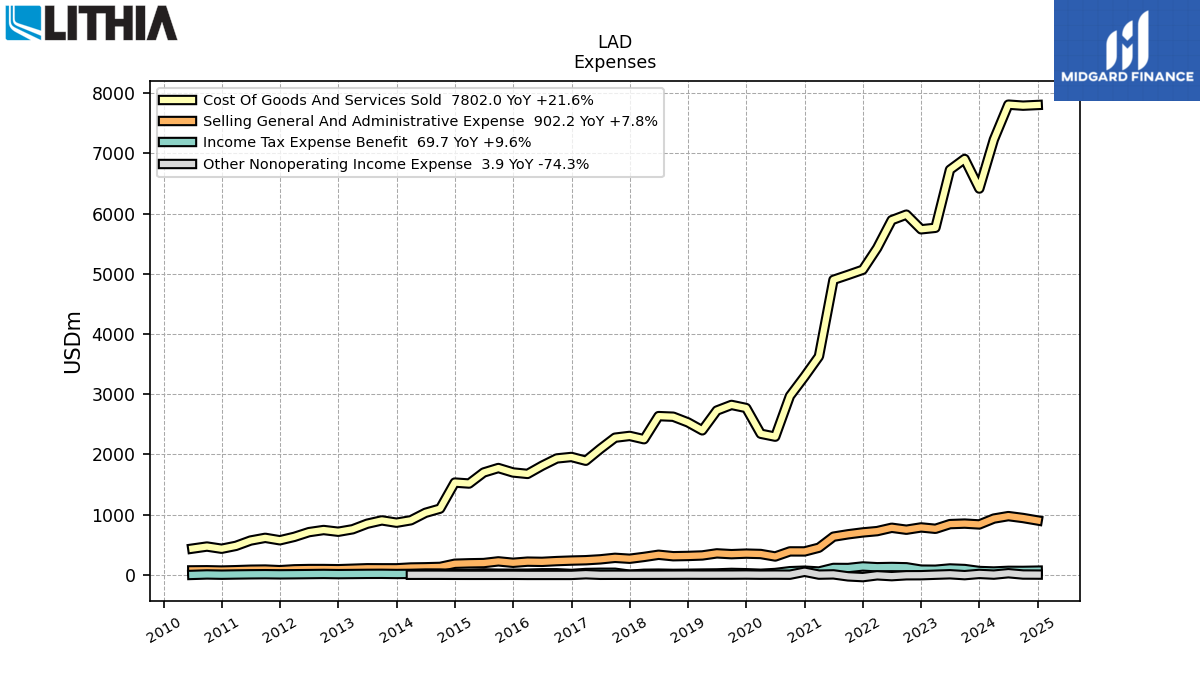
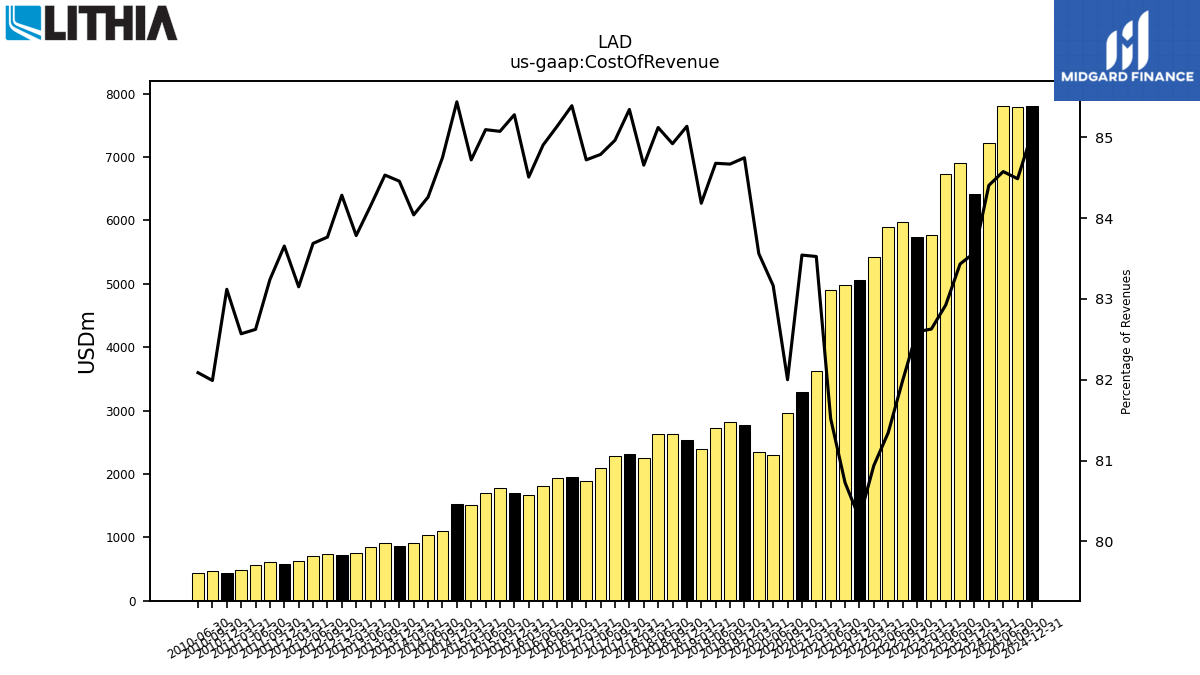
| Cost Of Revenue | 7226.60 | 6413.60 | 6905.70 | 6726.40 | 5762.30 | 5737.40 | 5981.50 | 5889.40 | 5427.20 | 5065.70 | 4980.70 | 4898.80 | 3627.50 | 3293.10 | 2968.60 | 2294.20 | 2342.90 | 2770.30 | 2821.50 | 2728.10 | 2399.00 | 2531.31 | 2625.71 | 2635.81 | 2251.57 | 2306.89 | 2277.32 | 2091.76 | 1894.45 | 1957.15 | 1932.71 | 1811.30 | 1675.68 | 1699.86 | 1773.66 | 1699.30 | 1515.80 | 1532.19 | 1099.27 | 1029.50 | 906.04 | 865.58 | 903.90 | 848.67 | 756.64 | 715.57 | 744.15 | 708.93 | 631.02 | 573.77 | 614.23 | 569.33 | 481.26 | 433.26 | 469.81 | 435.19 | |
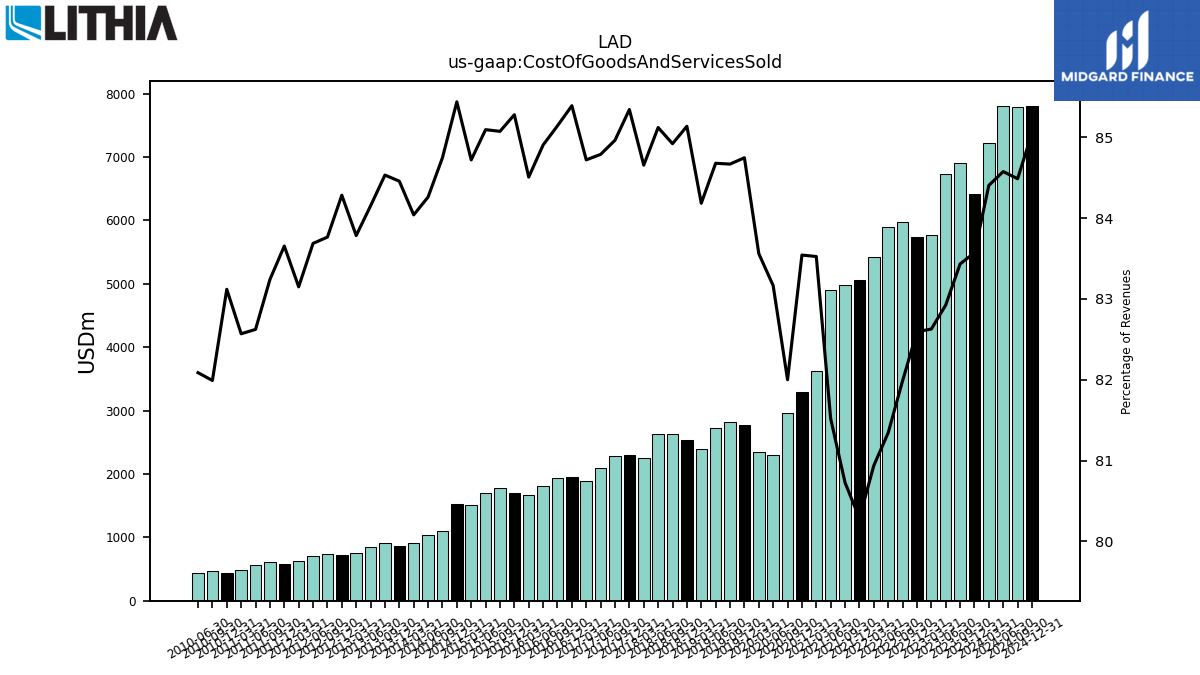
| Cost Of Goods And Services Sold | 7226.60 | 6413.60 | 6905.70 | 6726.40 | 5762.30 | 5737.40 | 5981.50 | 5889.40 | 5427.20 | 5065.70 | 4980.70 | 4898.80 | 3627.50 | 3293.10 | 2968.60 | 2294.20 | 2342.90 | 2770.30 | 2821.50 | 2728.10 | 2399.00 | 2531.31 | 2625.71 | 2635.81 | 2251.57 | 2306.86 | 2277.32 | 2091.76 | 1894.45 | 1957.15 | 1932.71 | 1811.30 | 1675.68 | 1699.86 | 1773.66 | 1699.30 | 1515.80 | 1532.19 | 1099.27 | 1029.50 | 906.04 | 865.58 | 903.90 | 848.67 | 756.64 | 715.57 | 744.15 | 708.93 | 631.02 | 573.77 | 614.23 | 569.33 | 481.26 | 433.26 | 469.81 | 435.19 | |
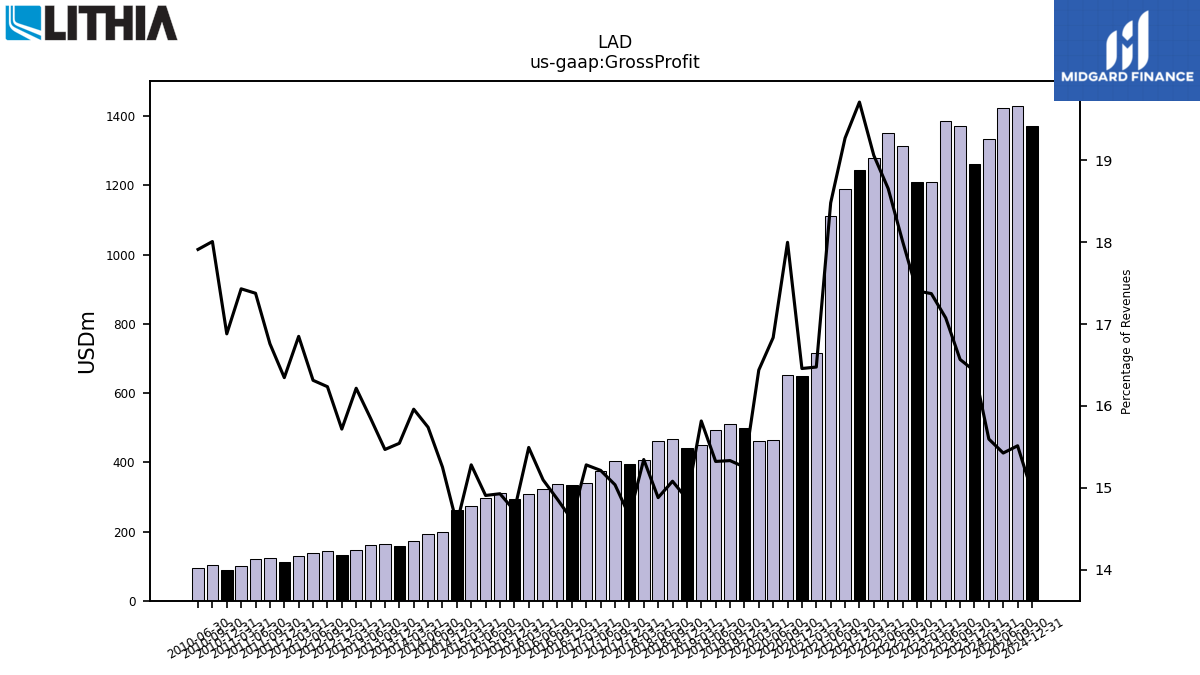
| Gross Profit | 1335.20 | 1260.70 | 1371.30 | 1385.10 | 1211.50 | 1209.10 | 1314.20 | 1350.70 | 1278.10 | 1243.80 | 1189.10 | 1110.60 | 715.50 | 648.70 | 651.60 | 464.40 | 460.90 | 498.60 | 510.90 | 493.60 | 450.70 | 441.92 | 466.24 | 460.73 | 408.11 | 396.14 | 403.02 | 375.27 | 341.65 | 334.84 | 337.26 | 322.04 | 307.18 | 293.42 | 311.19 | 297.65 | 273.38 | 261.12 | 197.84 | 192.30 | 172.06 | 159.29 | 165.39 | 159.83 | 146.44 | 133.43 | 144.22 | 138.19 | 127.87 | 112.11 | 123.67 | 119.74 | 101.60 | 87.99 | 103.19 | 94.96 | |
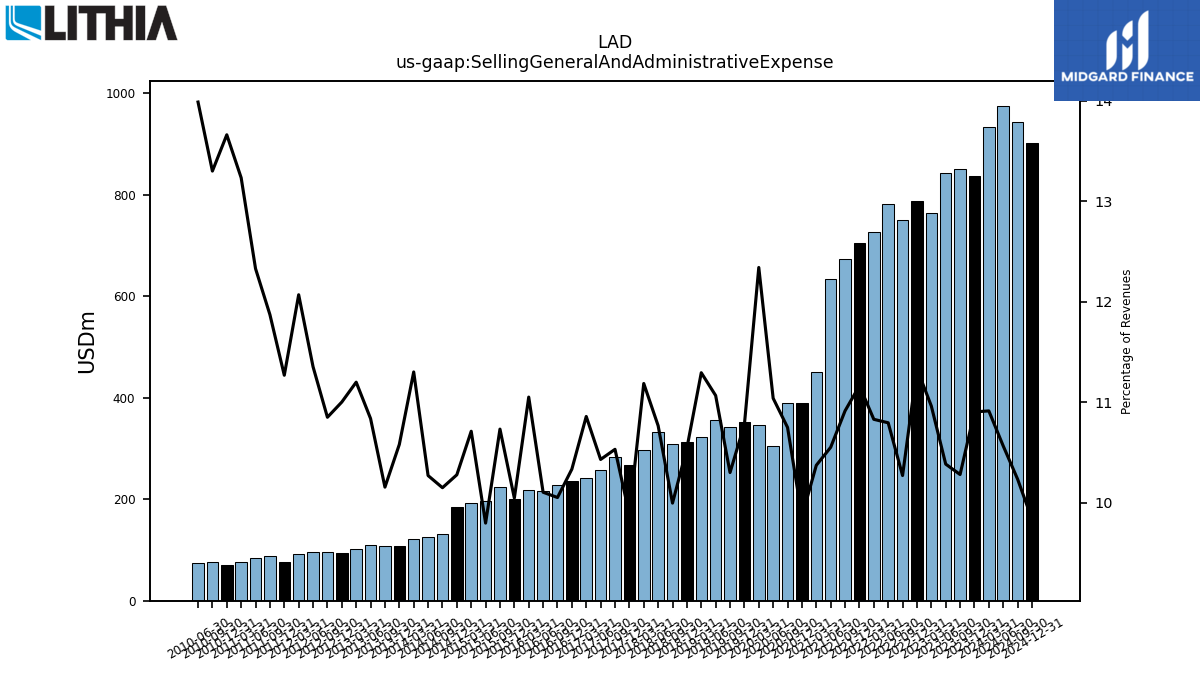
| Selling General And Administrative Expense | 934.30 | 836.70 | 850.80 | 842.20 | 764.40 | 787.30 | 749.20 | 781.50 | 726.10 | 704.30 | 673.30 | 634.00 | 450.40 | 388.70 | 389.10 | 304.50 | 346.00 | 352.30 | 343.20 | 356.50 | 321.80 | 313.43 | 309.02 | 333.35 | 297.49 | 267.07 | 282.24 | 257.29 | 242.77 | 236.82 | 228.13 | 215.53 | 219.11 | 200.22 | 223.73 | 195.61 | 191.62 | 184.29 | 131.63 | 125.46 | 121.83 | 108.42 | 108.57 | 109.28 | 101.13 | 93.40 | 96.38 | 96.17 | 91.59 | 77.28 | 87.59 | 84.95 | 77.13 | 71.21 | 76.21 | 74.16 | |
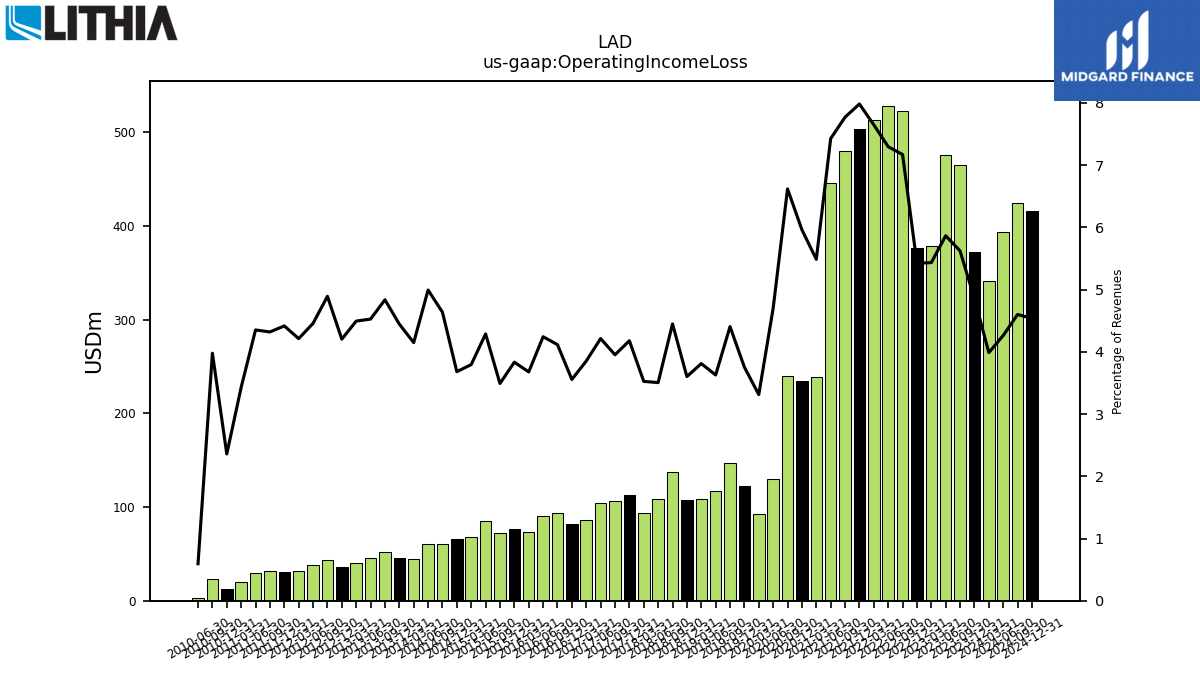
| Operating Income Loss | 341.40 | 372.50 | 465.30 | 475.80 | 379.00 | 376.70 | 523.10 | 528.30 | 512.80 | 503.70 | 479.50 | 446.30 | 238.30 | 235.00 | 239.60 | 129.70 | 92.90 | 122.70 | 146.80 | 116.90 | 108.60 | 107.11 | 137.57 | 108.56 | 93.76 | 112.94 | 105.95 | 103.95 | 86.14 | 81.52 | 93.42 | 90.51 | 72.92 | 76.42 | 72.80 | 85.62 | 67.90 | 66.02 | 60.15 | 61.01 | 44.73 | 45.56 | 51.72 | 45.65 | 40.59 | 35.69 | 43.46 | 37.76 | 31.97 | 30.29 | 31.88 | 29.99 | 19.99 | 12.30 | 22.80 | 3.15 | |
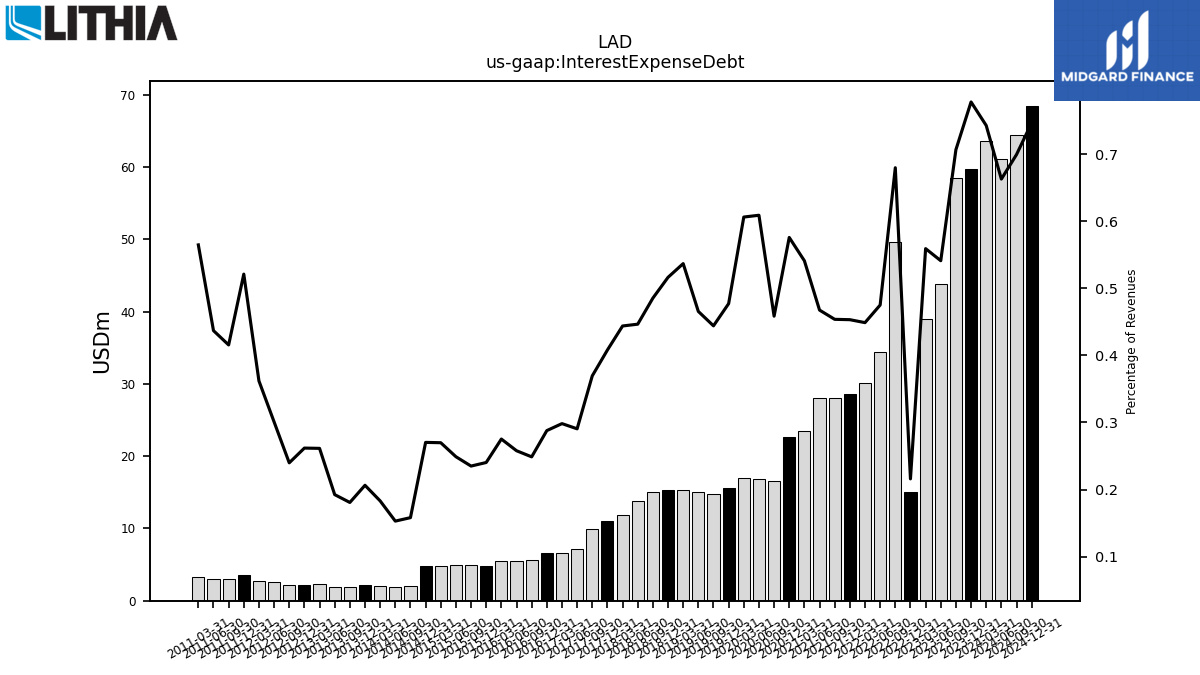
| Interest Expense Debt | 63.60 | 59.70 | 58.50 | 43.90 | 39.00 | 15.00 | 49.60 | 34.40 | 30.10 | 28.60 | 28.00 | 28.10 | 23.50 | 22.70 | 16.60 | 16.80 | 17.00 | 15.60 | 14.80 | 15.00 | 15.30 | 15.36 | 15.01 | 13.83 | 11.81 | 11.03 | 9.90 | 7.17 | 6.67 | 6.60 | 5.65 | 5.50 | 5.46 | 4.79 | 4.90 | 4.97 | 4.83 | 4.85 | 2.05 | 1.87 | 1.97 | 2.12 | 1.93 | 1.94 | 2.36 | 2.22 | 2.13 | 2.55 | 2.75 | 3.58 | 3.07 | 3.01 | 3.29 | NA | NA | NA | |
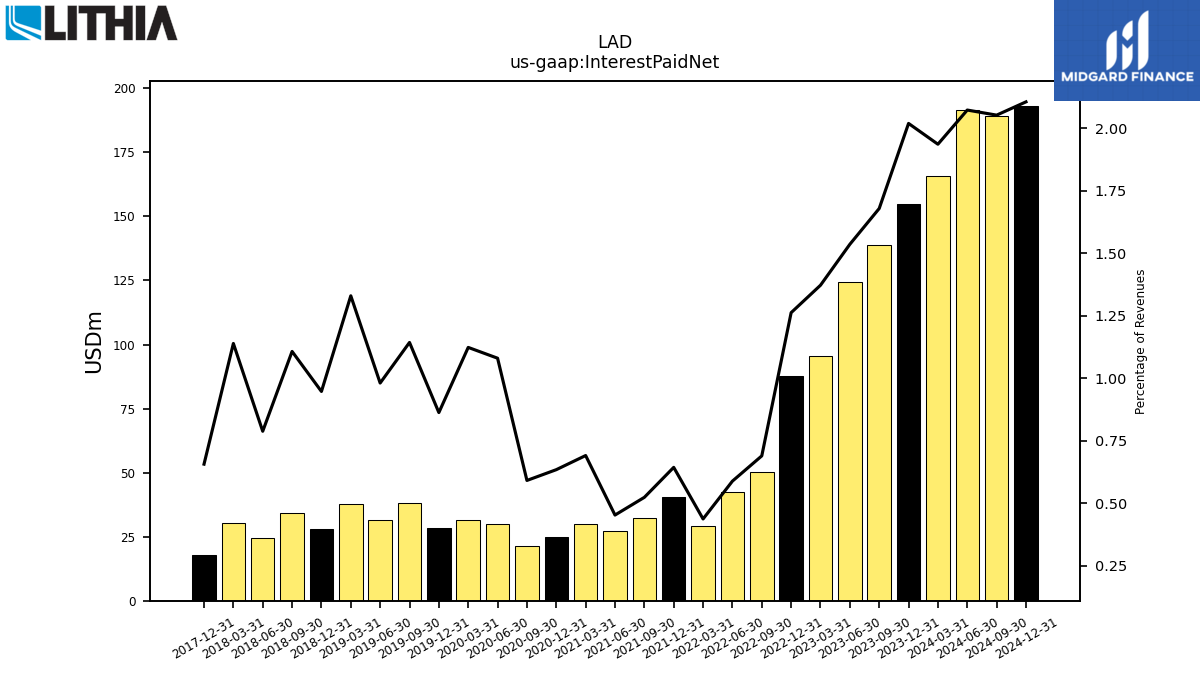
| Interest Paid Net | 165.80 | 155.00 | 139.00 | 124.60 | 95.70 | 87.70 | 50.30 | 42.60 | 29.30 | 40.60 | 32.30 | 27.20 | 30.00 | 25.00 | 21.40 | 29.80 | 31.50 | 28.20 | 38.10 | 31.60 | 37.90 | 28.16 | 34.24 | 24.40 | 30.30 | 17.74 | NA | NA | NA | NA | NA | NA | NA | NA | NA | NA | NA | NA | NA | NA | NA | NA | NA | NA | NA | NA | NA | NA | NA | NA | NA | NA | NA | NA | NA | NA | |
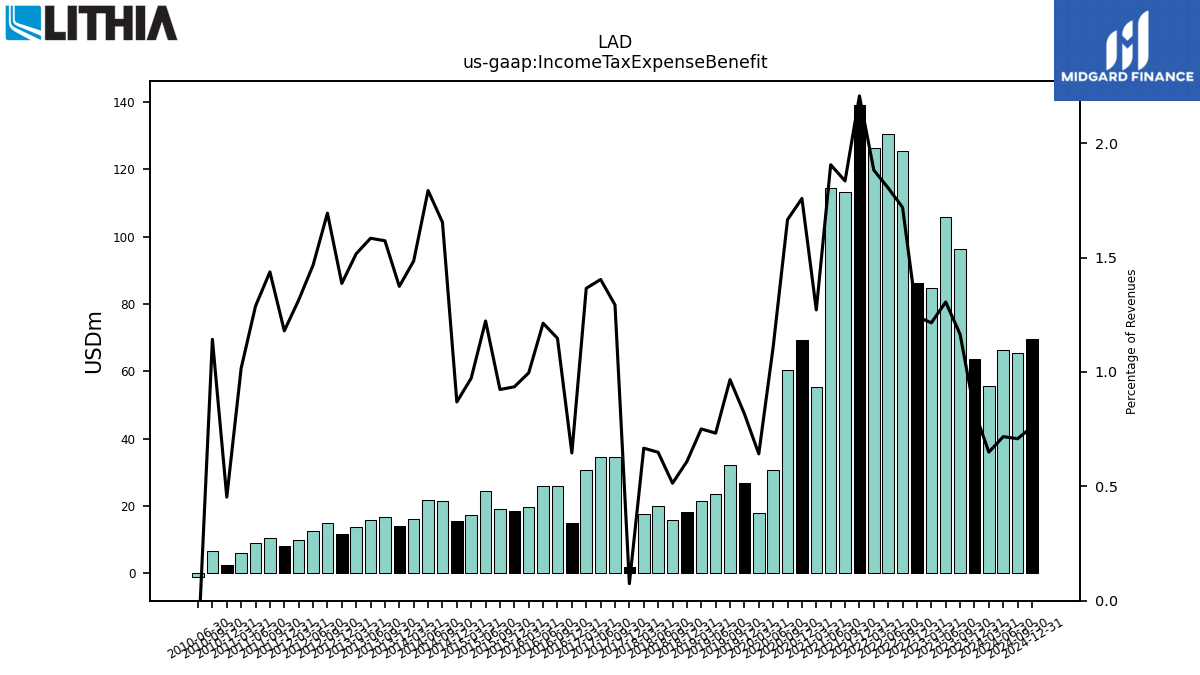
| Income Tax Expense Benefit | 55.60 | 63.60 | 96.40 | 105.90 | 84.70 | 86.30 | 125.40 | 130.60 | 126.20 | 139.20 | 113.20 | 114.50 | 55.20 | 69.30 | 60.30 | 30.60 | 18.00 | 26.70 | 32.20 | 23.60 | 21.40 | 18.09 | 15.88 | 20.09 | 17.74 | 2.02 | 34.66 | 34.64 | 30.54 | 14.80 | 26.04 | 25.88 | 19.75 | 18.64 | 19.25 | 24.42 | 17.40 | 15.58 | 21.46 | 21.90 | 16.01 | 14.08 | 16.82 | 15.98 | 13.70 | 11.78 | 15.05 | 12.42 | 9.97 | 8.09 | 10.60 | 8.88 | 5.92 | 2.36 | 6.54 | -1.13 | |
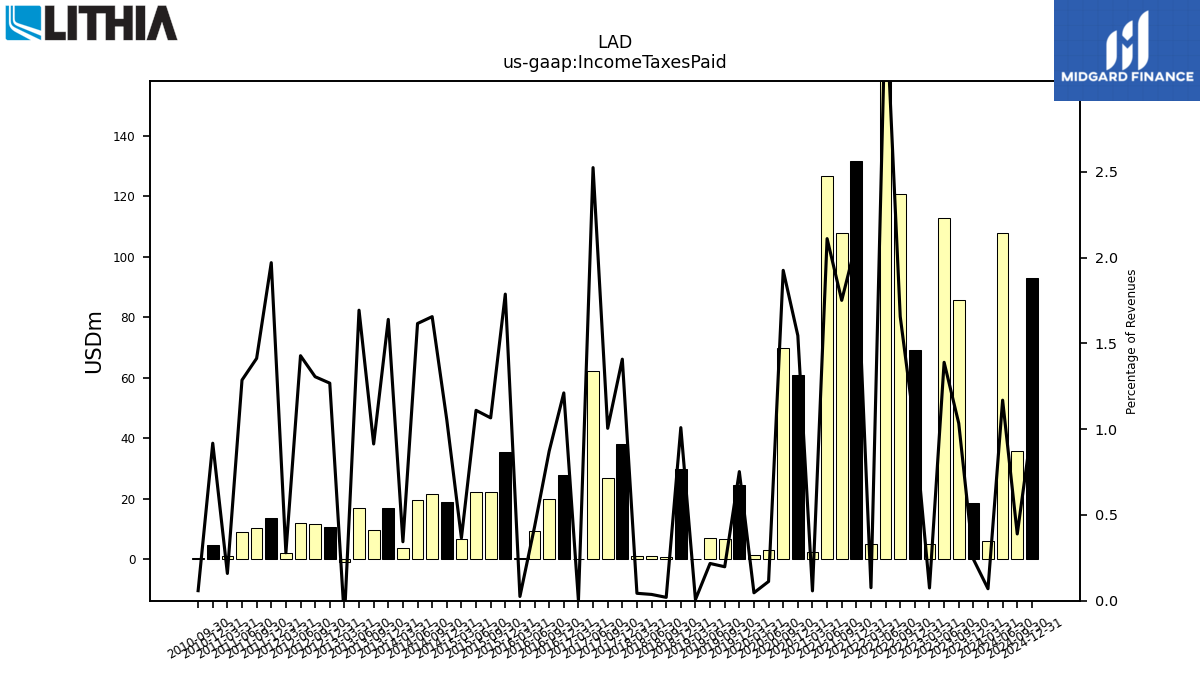
| Income Taxes Paid | 6.00 | 18.60 | 85.60 | 112.70 | 5.20 | 69.30 | 120.80 | 254.10 | 5.10 | 131.80 | 108.00 | 126.80 | 2.50 | 60.90 | 69.70 | 3.10 | 1.30 | 24.60 | 6.60 | 7.00 | 0.20 | 29.99 | 0.61 | 1.14 | 1.16 | 38.05 | 26.93 | 62.27 | 0.01 | 27.76 | 19.79 | 9.19 | 0.50 | 35.62 | 22.22 | 22.16 | 6.54 | 18.91 | 21.47 | 19.74 | 3.71 | 16.80 | 9.77 | 17.07 | -0.96 | 10.77 | 11.60 | 12.10 | 2.12 | 13.51 | 10.42 | 8.86 | 0.93 | 4.79 | 0.34 | NA | |
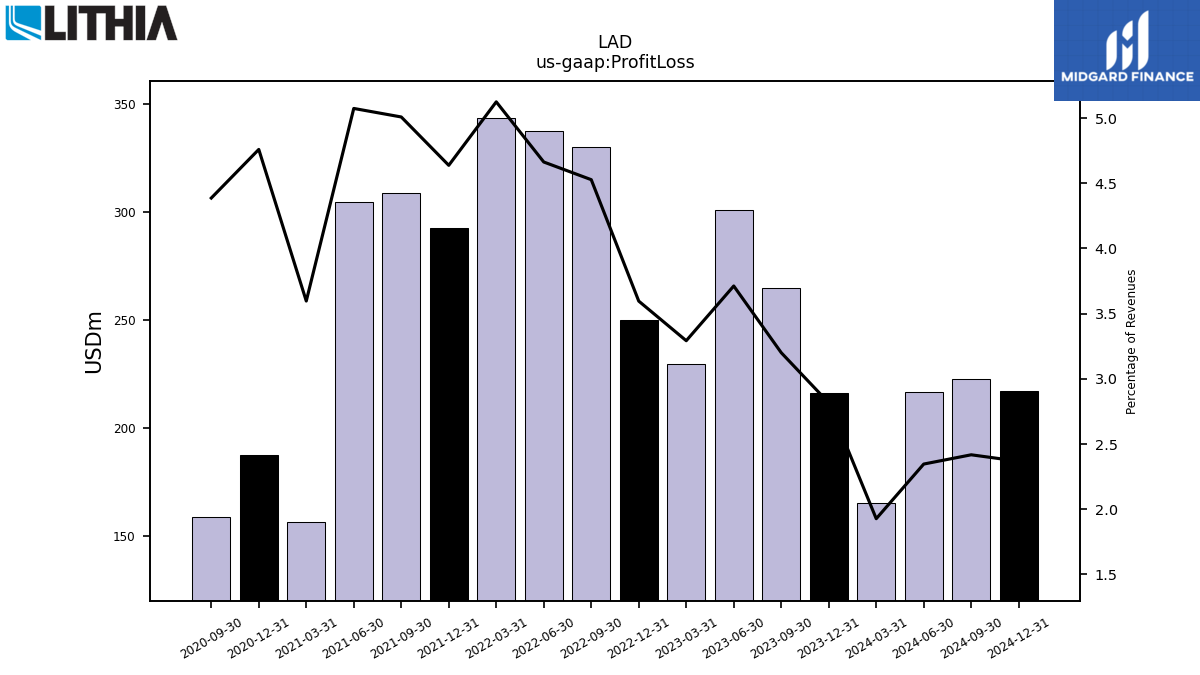
| Profit Loss | 165.00 | 216.10 | 264.90 | 301.10 | 229.60 | 249.80 | 330.30 | 337.60 | 343.60 | 292.60 | 309.00 | 304.90 | 156.20 | 187.60 | 158.80 | NA | NA | NA | NA | NA | NA | NA | NA | NA | NA | NA | NA | NA | NA | NA | NA | NA | NA | NA | NA | NA | NA | NA | NA | NA | NA | NA | NA | NA | NA | NA | NA | NA | NA | NA | NA | NA | NA | NA | NA | NA | |
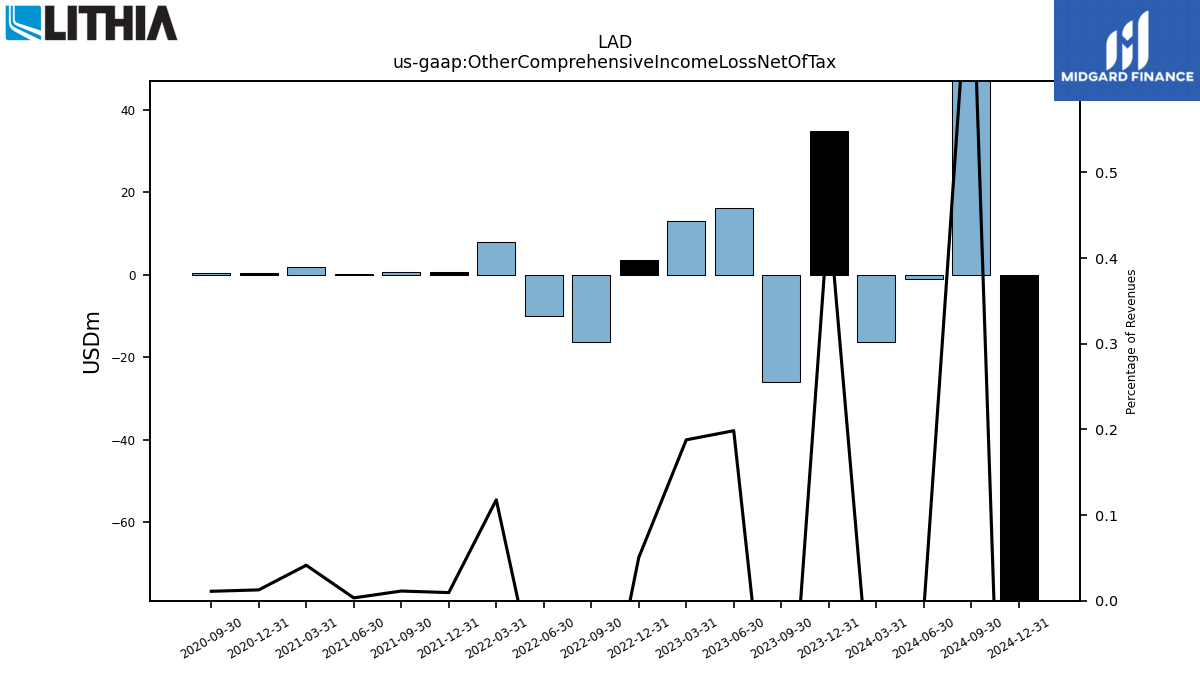
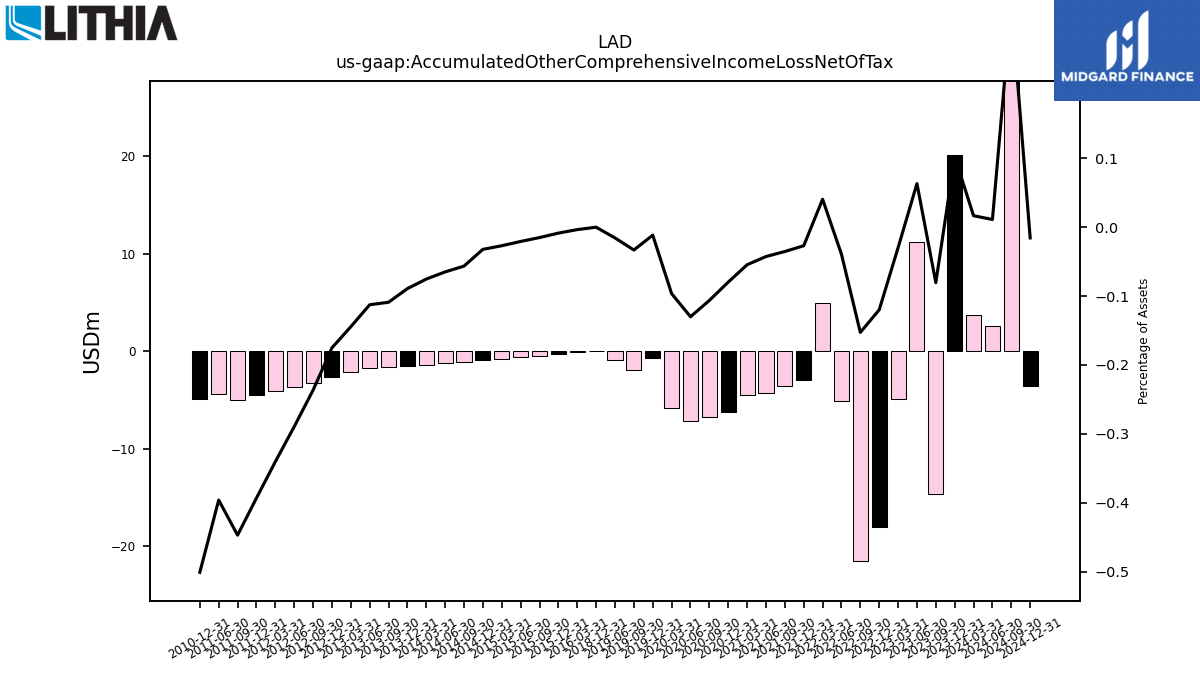
| Other Comprehensive Income Loss Net Of Tax | -16.40 | 34.80 | -25.90 | 16.10 | 13.10 | 3.50 | -16.40 | -10.00 | 7.90 | 0.60 | 0.70 | 0.20 | 1.80 | 0.50 | 0.40 | NA | NA | NA | NA | NA | NA | NA | NA | NA | NA | NA | NA | NA | NA | NA | NA | NA | NA | NA | NA | NA | NA | NA | NA | NA | NA | NA | NA | NA | NA | NA | NA | NA | NA | NA | NA | NA | NA | NA | NA | NA | |
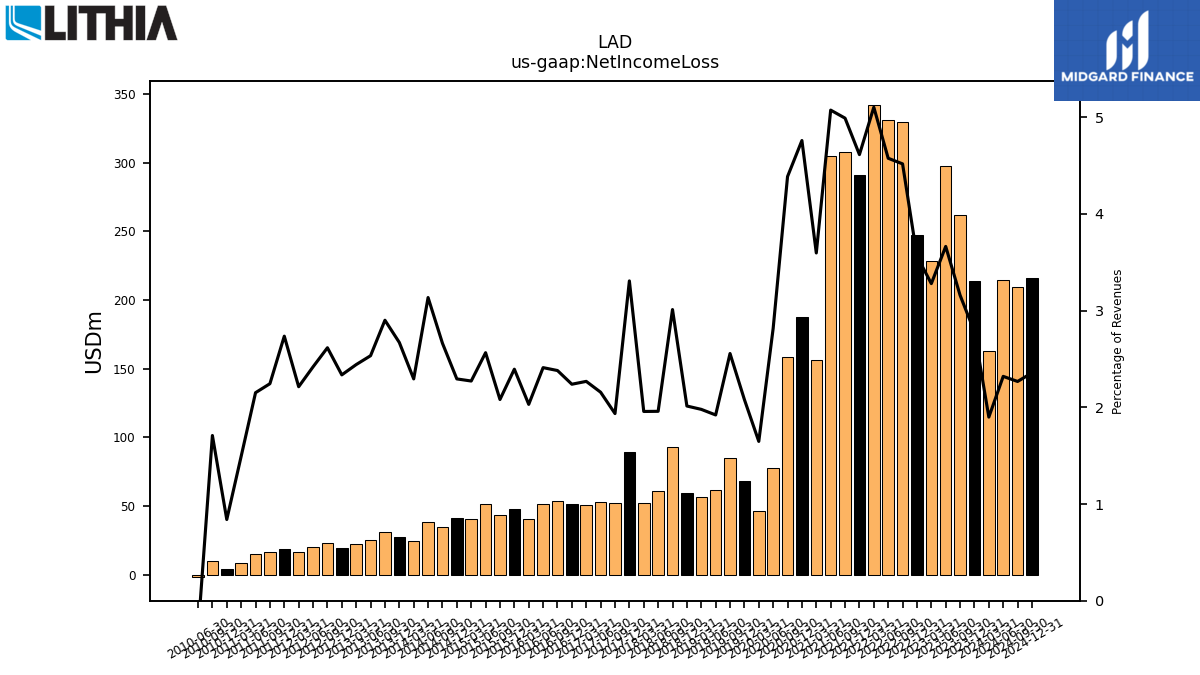
| Net Income Loss | 162.60 | 213.50 | 261.50 | 297.20 | 228.70 | 247.60 | 329.60 | 331.30 | 342.20 | 291.10 | 307.90 | 304.90 | 156.20 | 187.60 | 158.80 | 77.70 | 46.20 | 68.00 | 85.20 | 61.90 | 56.40 | 59.87 | 93.11 | 60.66 | 52.06 | 89.40 | 51.89 | 53.20 | 50.73 | 51.32 | 54.04 | 51.43 | 40.27 | 47.73 | 43.39 | 51.22 | 40.65 | 41.14 | 34.54 | 38.31 | 24.73 | 27.37 | 31.02 | 25.55 | 22.05 | 19.83 | 23.24 | 20.49 | 16.80 | 18.77 | 16.56 | 14.83 | 8.71 | 4.38 | 9.79 | -1.72 | |
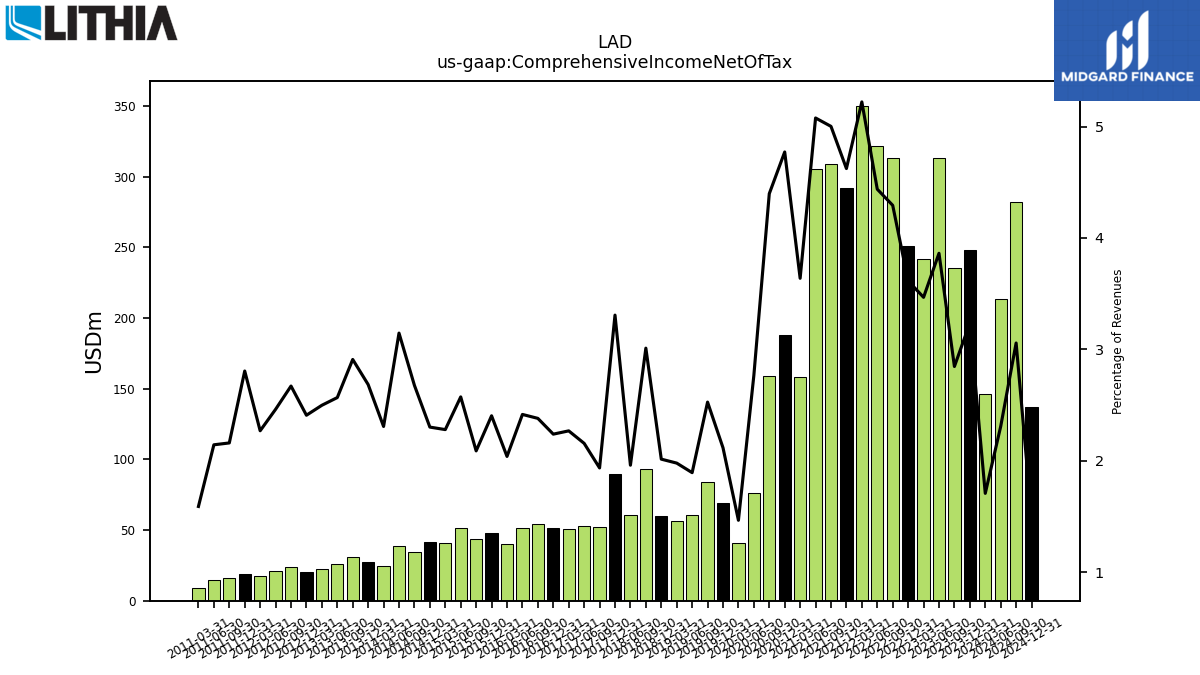
| Comprehensive Income Net Of Tax | 146.20 | 248.30 | 235.60 | 313.30 | 241.80 | 251.10 | 313.20 | 321.30 | 350.10 | 291.70 | 308.60 | 305.10 | 158.00 | 188.10 | 159.20 | 76.30 | 41.10 | 69.20 | 84.20 | 61.00 | 56.40 | 59.90 | 93.10 | 60.70 | NA | 89.40 | 51.89 | 53.20 | 50.73 | 51.32 | 54.04 | 51.54 | 40.43 | 47.92 | 43.55 | 51.39 | 40.79 | 41.29 | 34.72 | 38.44 | 24.88 | 27.51 | 31.11 | 25.89 | 22.56 | 20.45 | 23.73 | 20.86 | 17.22 | 19.24 | 15.94 | 14.77 | 9.27 | NA | NA | NA |
| 2024-03-31 | 2023-12-31 | 2023-09-30 | 2023-06-30 | 2023-03-31 | 2022-12-31 | 2022-09-30 | 2022-06-30 | 2022-03-31 | 2021-12-31 | 2021-09-30 | 2021-06-30 | 2021-03-31 | 2020-12-31 | 2020-09-30 | 2020-06-30 | 2020-03-31 | 2019-12-31 | 2019-09-30 | 2019-06-30 | 2019-03-31 | 2018-12-31 | 2018-09-30 | 2018-06-30 | 2018-03-31 | 2017-12-31 | 2017-09-30 | 2017-06-30 | 2017-03-31 | 2016-12-31 | 2016-09-30 | 2016-06-30 | 2016-03-31 | 2015-12-31 | 2015-09-30 | 2015-06-30 | 2015-03-31 | 2014-12-31 | 2014-09-30 | 2014-06-30 | 2014-03-31 | 2013-12-31 | 2013-09-30 | 2013-06-30 | 2013-03-31 | 2012-12-31 | 2012-09-30 | 2012-06-30 | 2012-03-31 | 2011-12-31 | 2011-09-30 | 2011-06-30 | 2011-03-31 | 2010-12-31 | 2010-09-30 | 2010-06-30 | ||
|---|---|---|---|---|---|---|---|---|---|---|---|---|---|---|---|---|---|---|---|---|---|---|---|---|---|---|---|---|---|---|---|---|---|---|---|---|---|---|---|---|---|---|---|---|---|---|---|---|---|---|---|---|---|---|---|---|---|
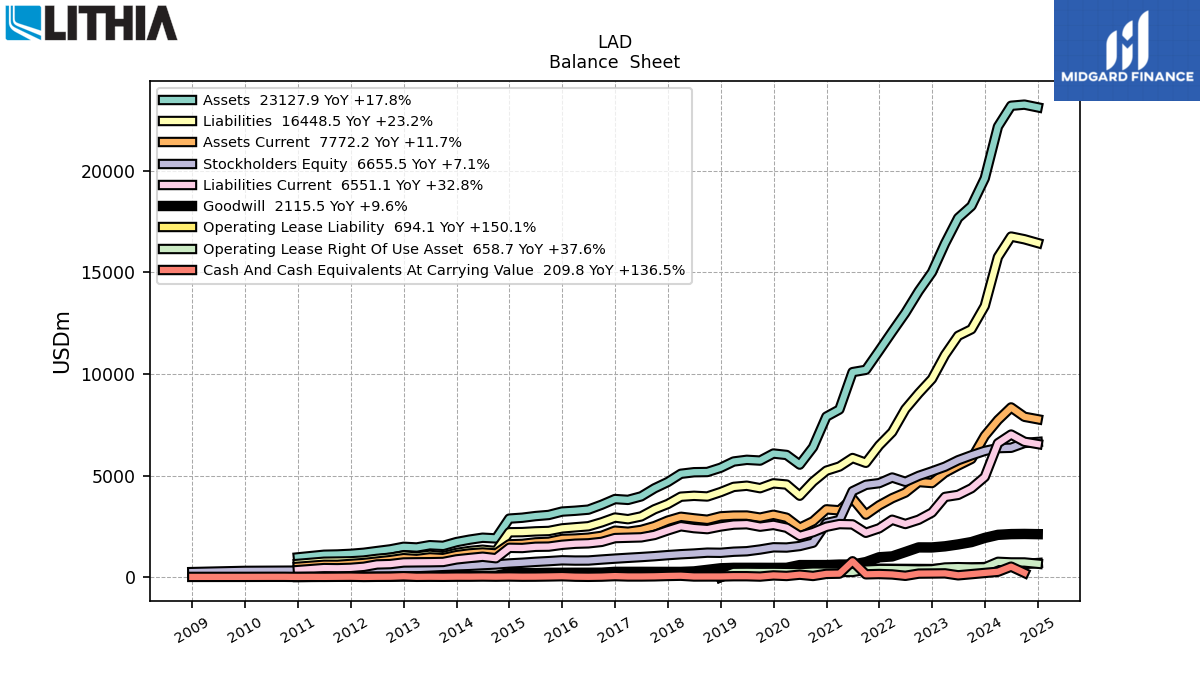
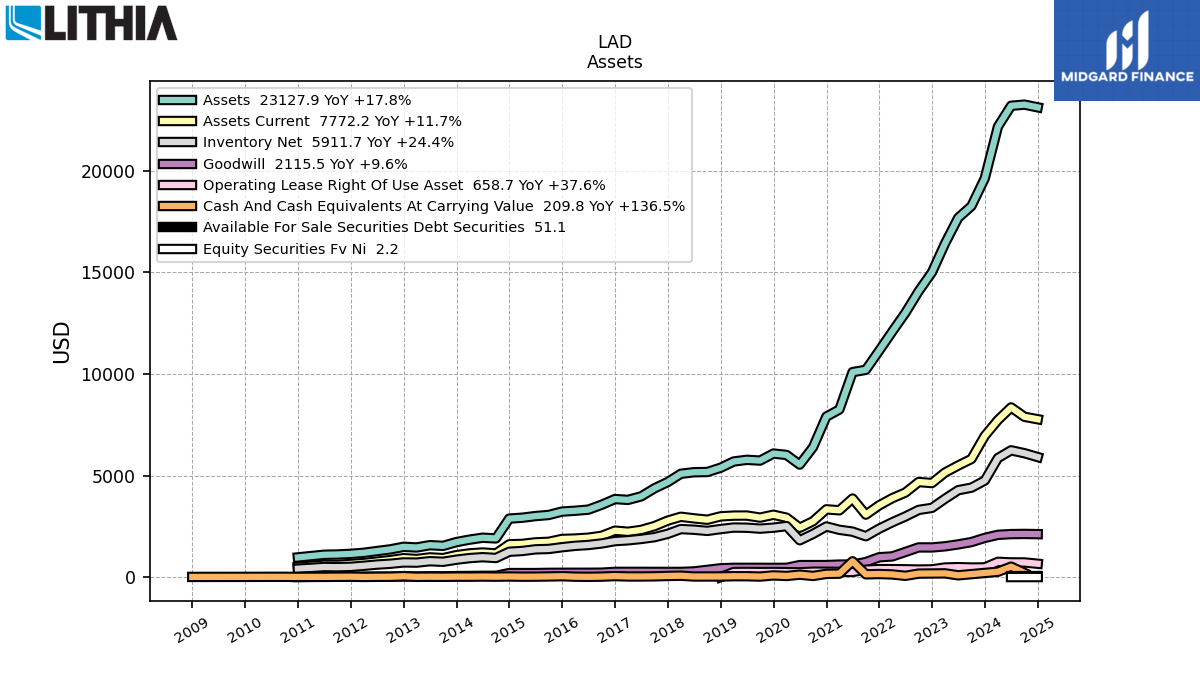
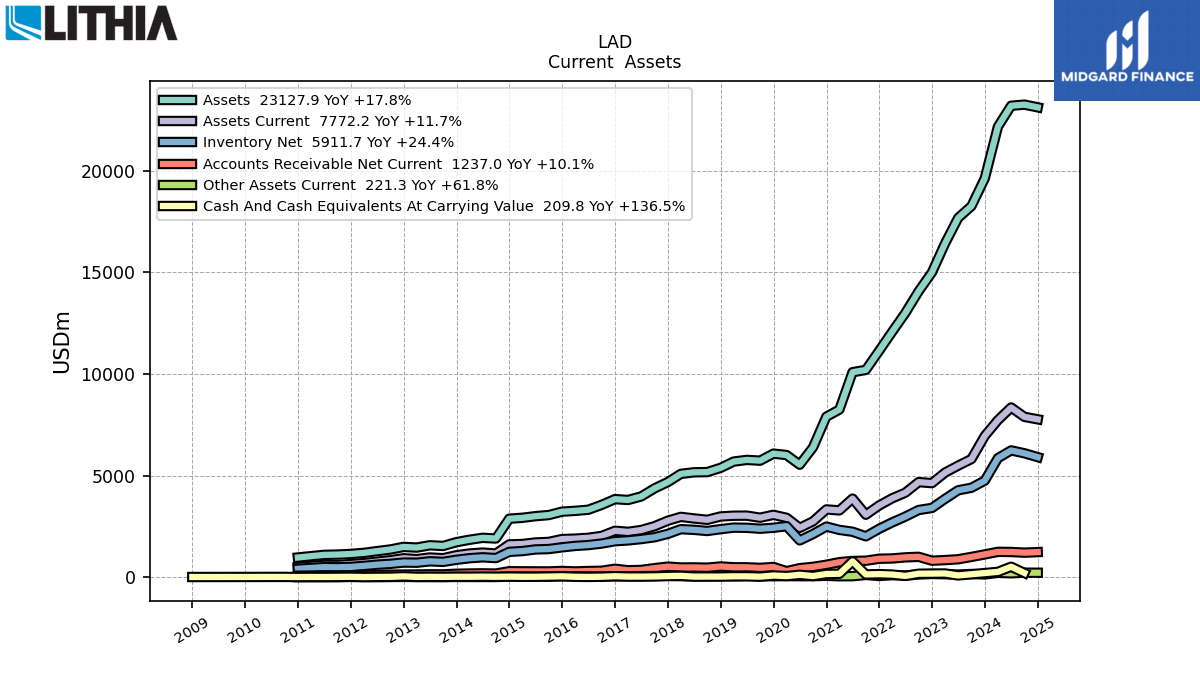
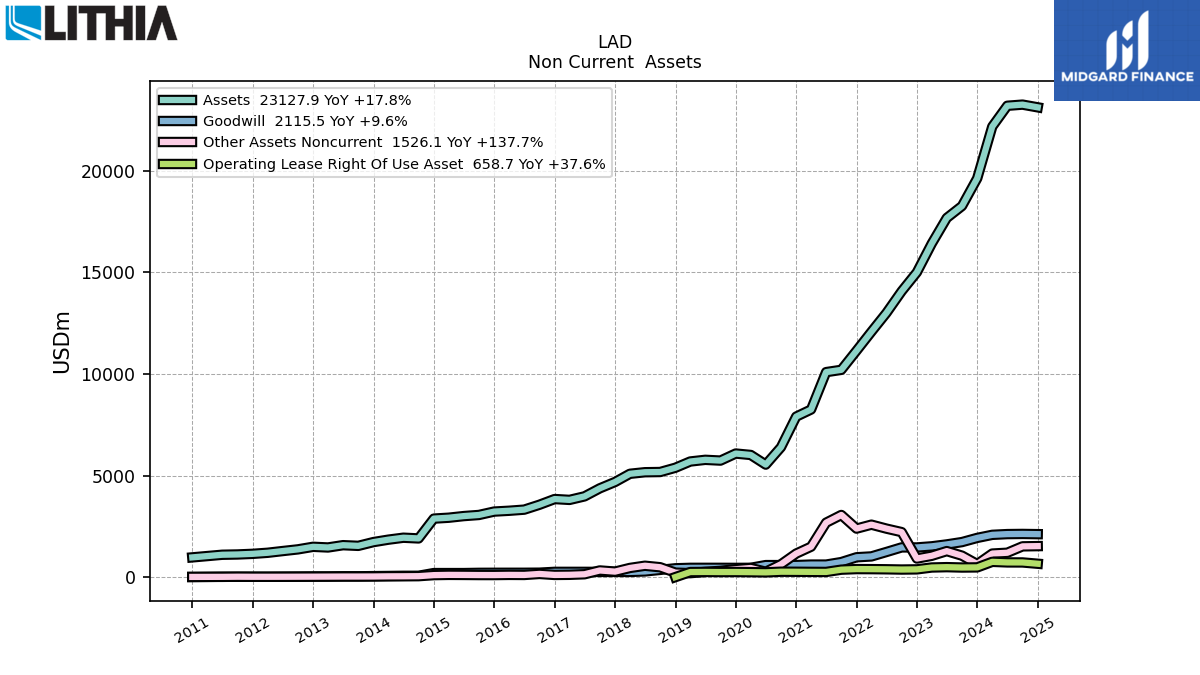
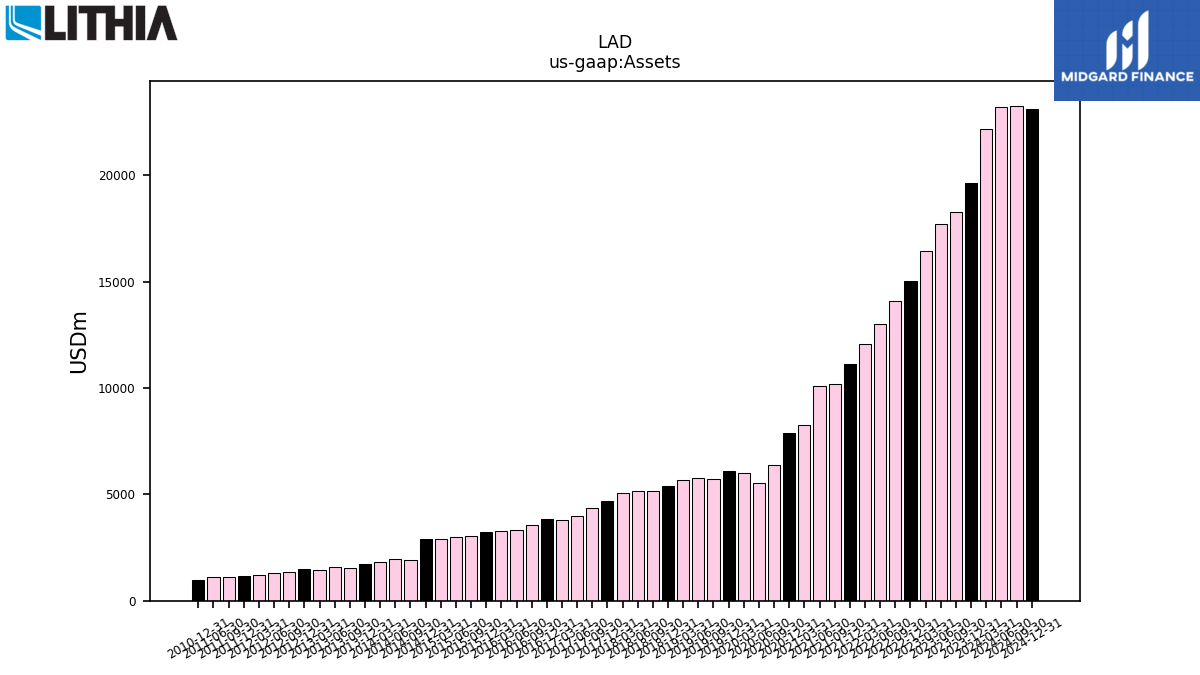
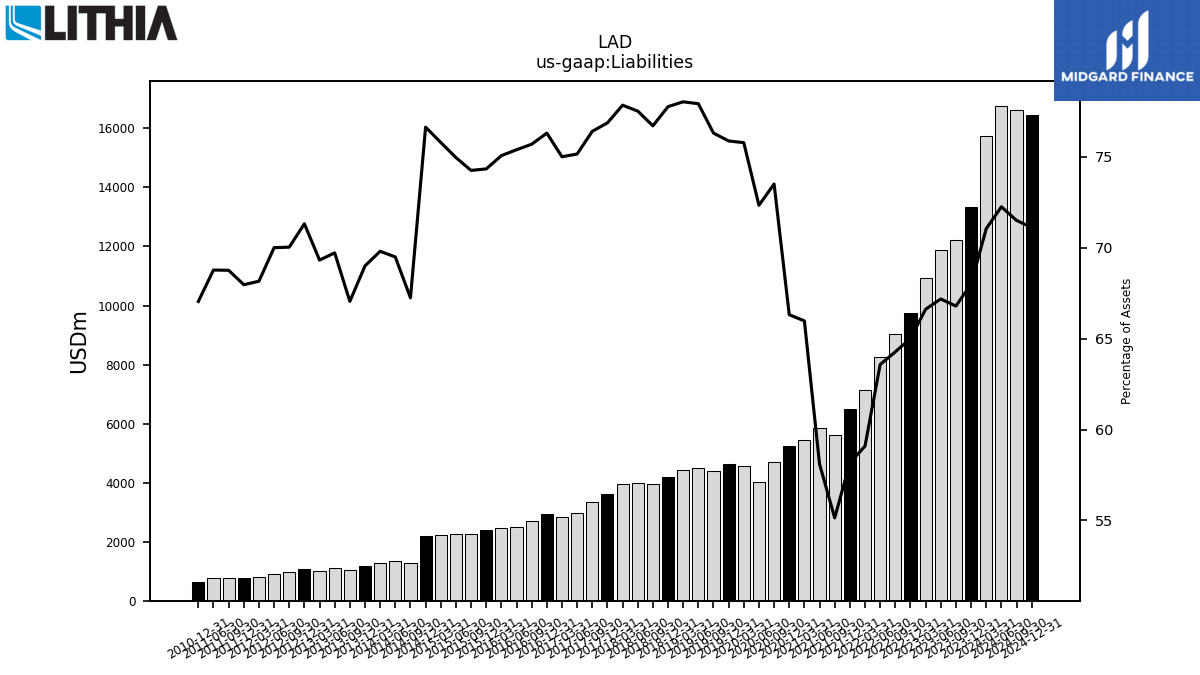
| Assets | 22180.00 | 19632.50 | 18269.80 | 17682.70 | 16421.40 | 15006.60 | 14074.50 | 13007.70 | 12080.80 | 11146.90 | 10204.60 | 10092.50 | 8251.60 | 7902.10 | 6395.70 | 5539.00 | 6014.10 | 6083.90 | 5737.50 | 5774.60 | 5692.00 | 5384.00 | 5174.57 | 5164.16 | 5086.98 | 4683.07 | 4371.59 | 3976.49 | 3801.96 | 3844.15 | 3563.61 | 3322.07 | 3267.62 | 3227.30 | 3059.83 | 3004.86 | 2924.39 | 2880.93 | 1904.90 | 1940.13 | 1844.28 | 1725.12 | 1539.18 | 1572.52 | 1459.70 | 1492.70 | 1366.54 | 1283.58 | 1198.73 | 1146.13 | 1115.21 | 1101.20 | NA | 971.68 | NA | NA | |
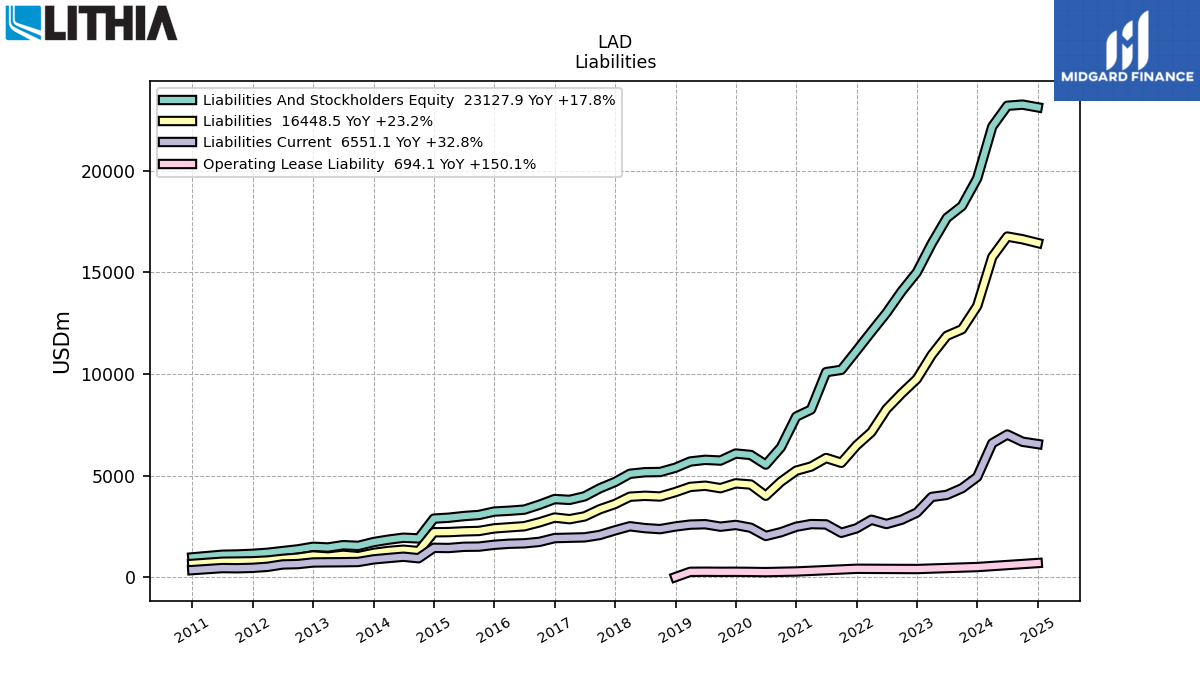
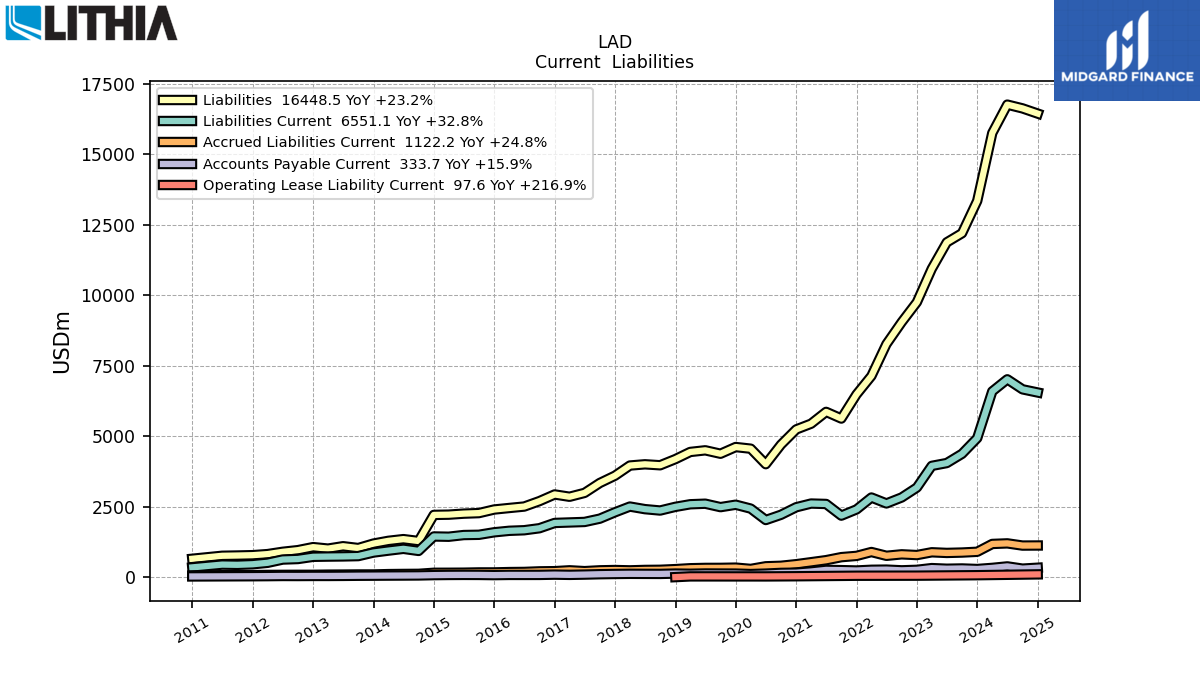
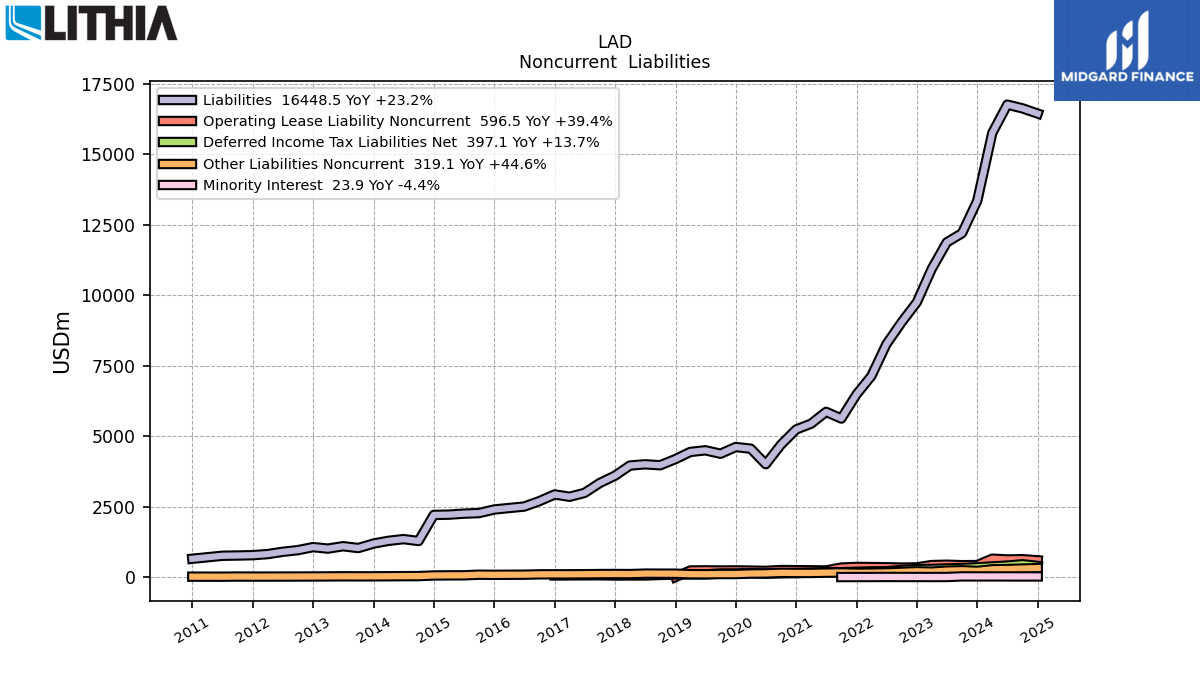
| Liabilities | 15758.40 | 13349.60 | 12203.00 | 11880.00 | 10939.60 | 9755.50 | 9046.30 | 8269.90 | 7138.20 | 6483.70 | 5626.70 | 5864.10 | 5444.00 | 5240.60 | 4701.30 | 4006.80 | 4557.60 | 4616.20 | 4378.30 | 4499.90 | 4441.50 | 4186.80 | 3969.43 | 4003.29 | 3959.88 | 3599.85 | 3340.22 | 2988.67 | 2851.80 | 2933.37 | 2697.52 | 2504.61 | 2452.94 | 2399.14 | 2272.12 | 2252.55 | 2216.55 | 2207.83 | 1280.99 | 1348.28 | 1287.44 | 1190.40 | 1032.05 | 1096.37 | 1011.90 | 1064.60 | 957.05 | 898.58 | 817.05 | 779.01 | 766.83 | 757.37 | NA | 651.46 | NA | NA | |
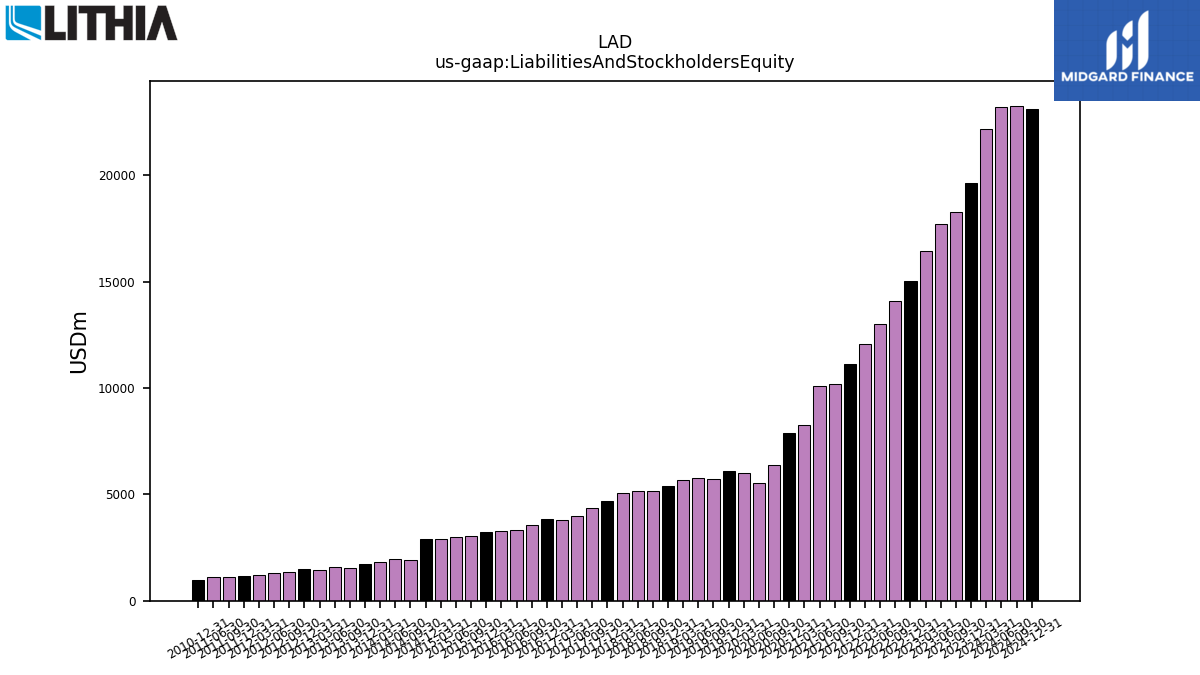
| Liabilities And Stockholders Equity | 22180.00 | 19632.50 | 18269.80 | 17682.70 | 16421.40 | 15006.60 | 14074.50 | 13007.70 | 12080.80 | 11146.90 | 10204.60 | 10092.50 | 8251.60 | 7902.10 | 6395.70 | 5539.00 | 6014.10 | 6083.90 | 5737.50 | 5774.60 | 5692.00 | 5384.00 | 5174.57 | 5164.16 | 5086.98 | 4683.07 | 4371.59 | 3976.49 | 3801.96 | 3844.15 | 3563.61 | 3322.07 | 3267.62 | 3227.30 | 3059.83 | 3004.86 | 2924.39 | 2880.93 | 1904.90 | 1940.13 | 1844.28 | 1725.12 | 1539.18 | 1572.52 | 1459.70 | 1492.70 | 1366.54 | 1283.58 | 1198.73 | 1146.13 | 1115.21 | 1101.20 | NA | 971.68 | NA | NA | |
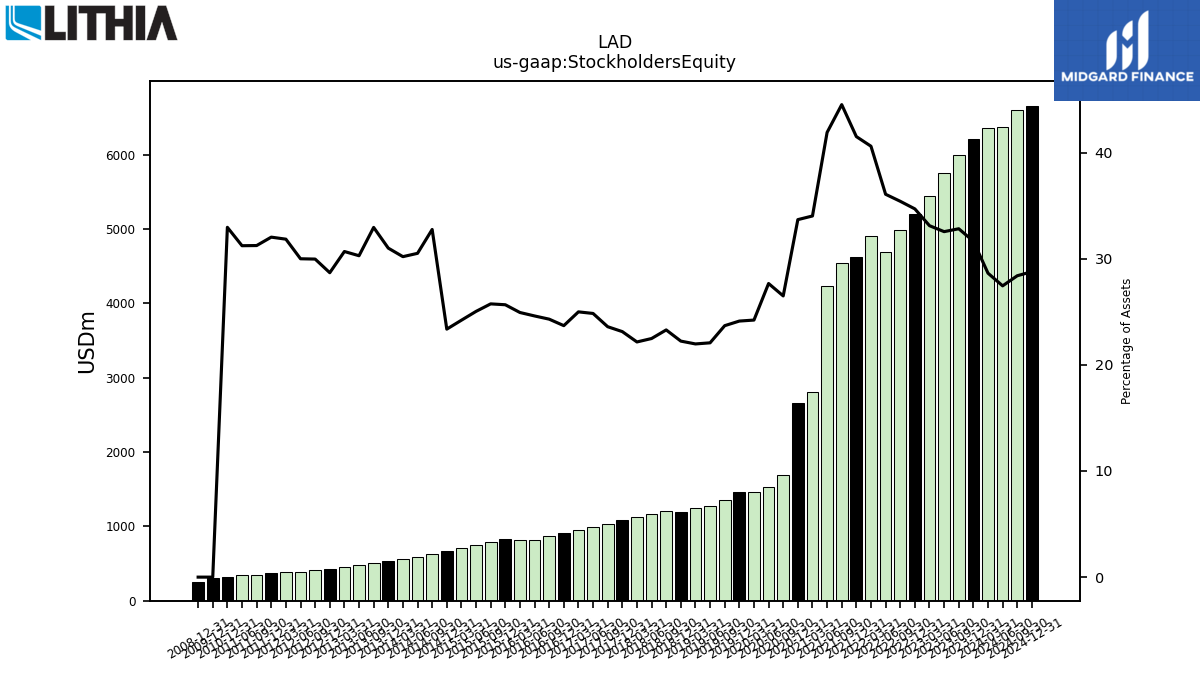
| Stockholders Equity | 6351.40 | 6213.90 | 5996.40 | 5755.60 | 5437.30 | 5206.20 | 4983.70 | 4691.90 | 4904.40 | 4626.40 | 4542.70 | 4228.40 | 2807.60 | 2661.50 | 1694.40 | 1532.20 | 1456.50 | 1467.70 | 1359.20 | 1274.70 | 1250.50 | 1197.20 | 1205.14 | 1160.87 | 1127.11 | 1083.22 | 1031.38 | 987.83 | 950.17 | 910.78 | 866.09 | 817.46 | 814.68 | 828.16 | 787.71 | 752.30 | 707.84 | 673.11 | 623.91 | 591.85 | 556.84 | 534.72 | 507.13 | 476.15 | 447.80 | 428.10 | 409.48 | 384.99 | 381.68 | 367.12 | 348.38 | 343.84 | NA | 320.22 | NA | NA |
| 2024-03-31 | 2023-12-31 | 2023-09-30 | 2023-06-30 | 2023-03-31 | 2022-12-31 | 2022-09-30 | 2022-06-30 | 2022-03-31 | 2021-12-31 | 2021-09-30 | 2021-06-30 | 2021-03-31 | 2020-12-31 | 2020-09-30 | 2020-06-30 | 2020-03-31 | 2019-12-31 | 2019-09-30 | 2019-06-30 | 2019-03-31 | 2018-12-31 | 2018-09-30 | 2018-06-30 | 2018-03-31 | 2017-12-31 | 2017-09-30 | 2017-06-30 | 2017-03-31 | 2016-12-31 | 2016-09-30 | 2016-06-30 | 2016-03-31 | 2015-12-31 | 2015-09-30 | 2015-06-30 | 2015-03-31 | 2014-12-31 | 2014-09-30 | 2014-06-30 | 2014-03-31 | 2013-12-31 | 2013-09-30 | 2013-06-30 | 2013-03-31 | 2012-12-31 | 2012-09-30 | 2012-06-30 | 2012-03-31 | 2011-12-31 | 2011-09-30 | 2011-06-30 | 2011-03-31 | 2010-12-31 | 2010-09-30 | 2010-06-30 | ||
|---|---|---|---|---|---|---|---|---|---|---|---|---|---|---|---|---|---|---|---|---|---|---|---|---|---|---|---|---|---|---|---|---|---|---|---|---|---|---|---|---|---|---|---|---|---|---|---|---|---|---|---|---|---|---|---|---|---|
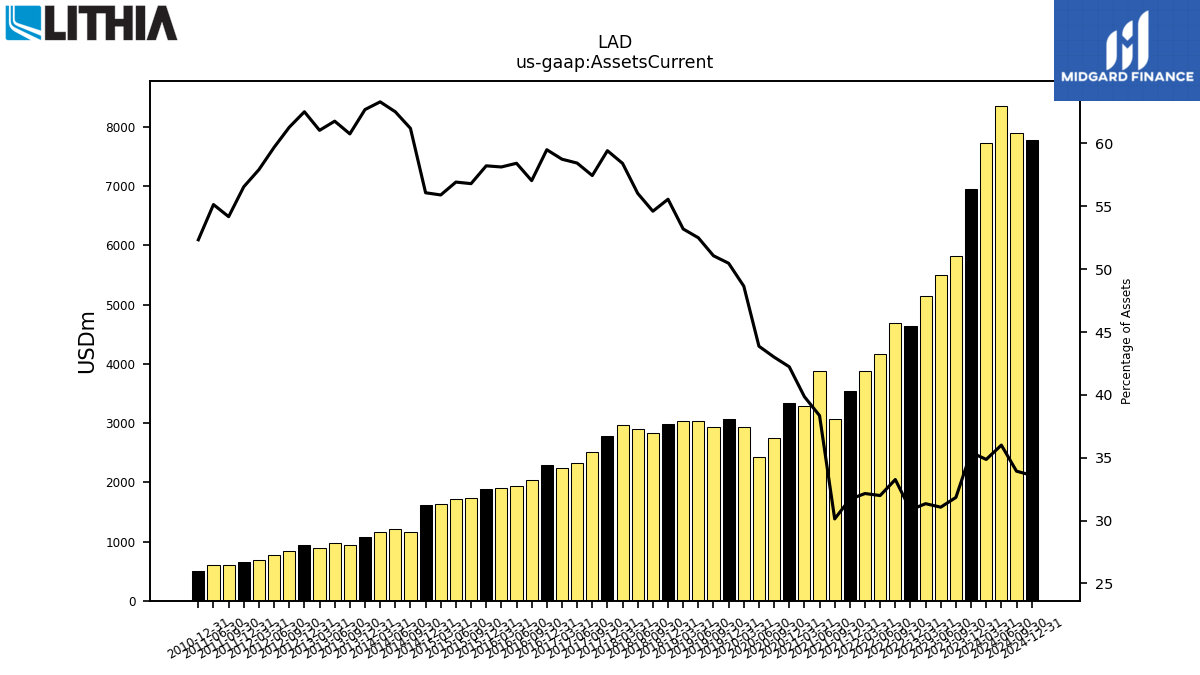
| Assets Current | 7733.20 | 6955.20 | 5818.20 | 5494.00 | 5147.70 | 4630.90 | 4682.30 | 4161.80 | 3884.60 | 3533.30 | 3075.50 | 3870.80 | 3288.90 | 3337.60 | 2750.40 | 2430.10 | 2925.80 | 3070.50 | 2929.90 | 3031.50 | 3027.90 | 2991.40 | 2825.73 | 2893.33 | 2971.44 | 2782.78 | 2511.27 | 2323.77 | 2233.50 | 2287.19 | 2032.70 | 1940.80 | 1899.41 | 1878.87 | 1738.04 | 1710.55 | 1634.80 | 1615.51 | 1165.79 | 1212.90 | 1167.55 | 1081.55 | 935.20 | 971.34 | 891.04 | 933.21 | 837.50 | 766.13 | 694.27 | 648.19 | 604.16 | 607.17 | NA | 508.54 | NA | NA | |
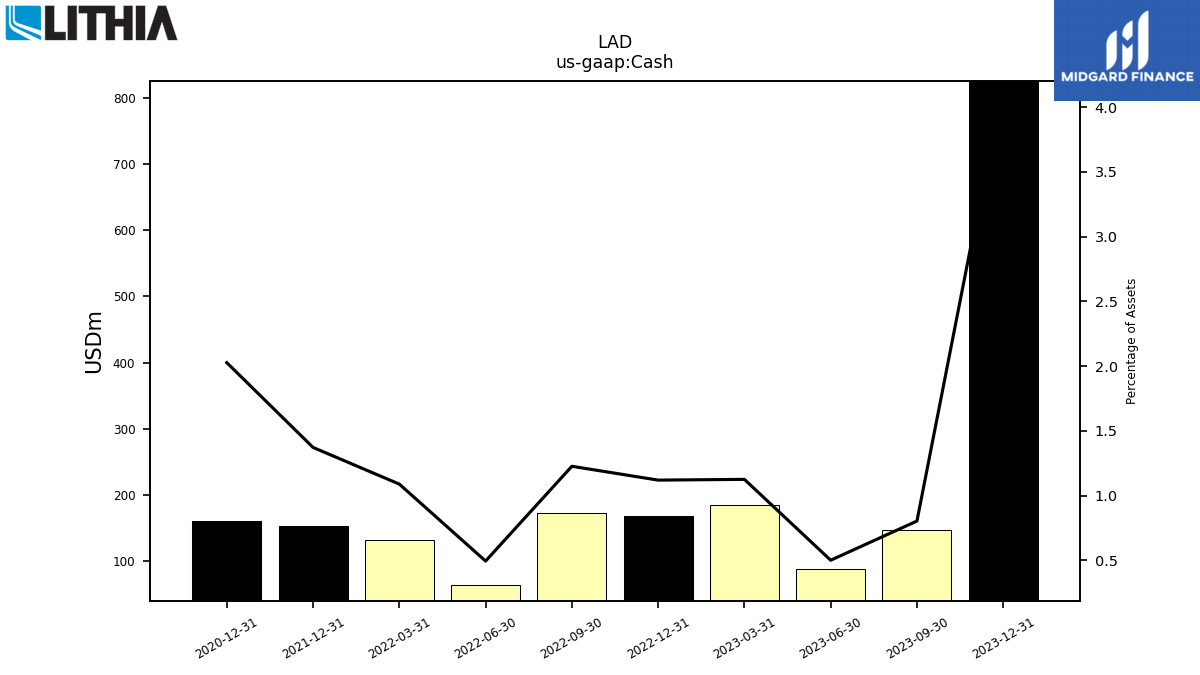
| Cash | NA | 825.00 | 146.90 | 88.70 | 184.90 | 168.10 | 172.70 | 64.40 | 131.60 | 153.00 | NA | NA | NA | 160.20 | NA | NA | NA | NA | NA | NA | NA | NA | NA | NA | NA | NA | NA | NA | NA | NA | NA | NA | NA | NA | NA | NA | NA | NA | NA | NA | NA | NA | NA | NA | NA | NA | NA | NA | NA | NA | NA | NA | NA | NA | NA | NA | |
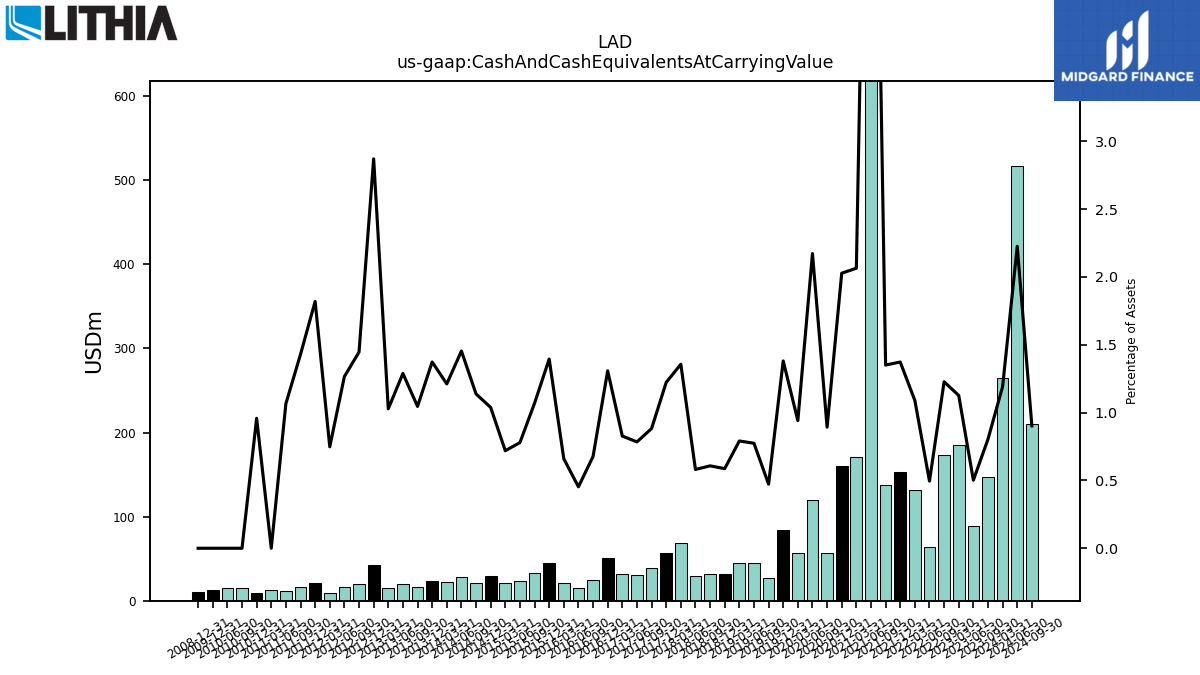
| Cash And Cash Equivalents At Carrying Value | 264.40 | NA | NA | NA | 184.90 | NA | 172.70 | 64.40 | 131.60 | 153.00 | 137.80 | 780.90 | 170.30 | 160.20 | 57.10 | 120.30 | 56.60 | 84.00 | 27.10 | 44.70 | 45.00 | 31.60 | 31.43 | 29.99 | 68.98 | 57.25 | 38.58 | 31.18 | 31.44 | 50.28 | 24.12 | 15.04 | 21.56 | 45.01 | 32.71 | 23.39 | 21.02 | 29.90 | 21.67 | 28.20 | 22.34 | 23.69 | 16.09 | 20.26 | 15.01 | 42.84 | 19.76 | 16.25 | 8.96 | 20.85 | 15.94 | 11.74 | 13.12 | 9.31 | 15.30 | 15.38 | |
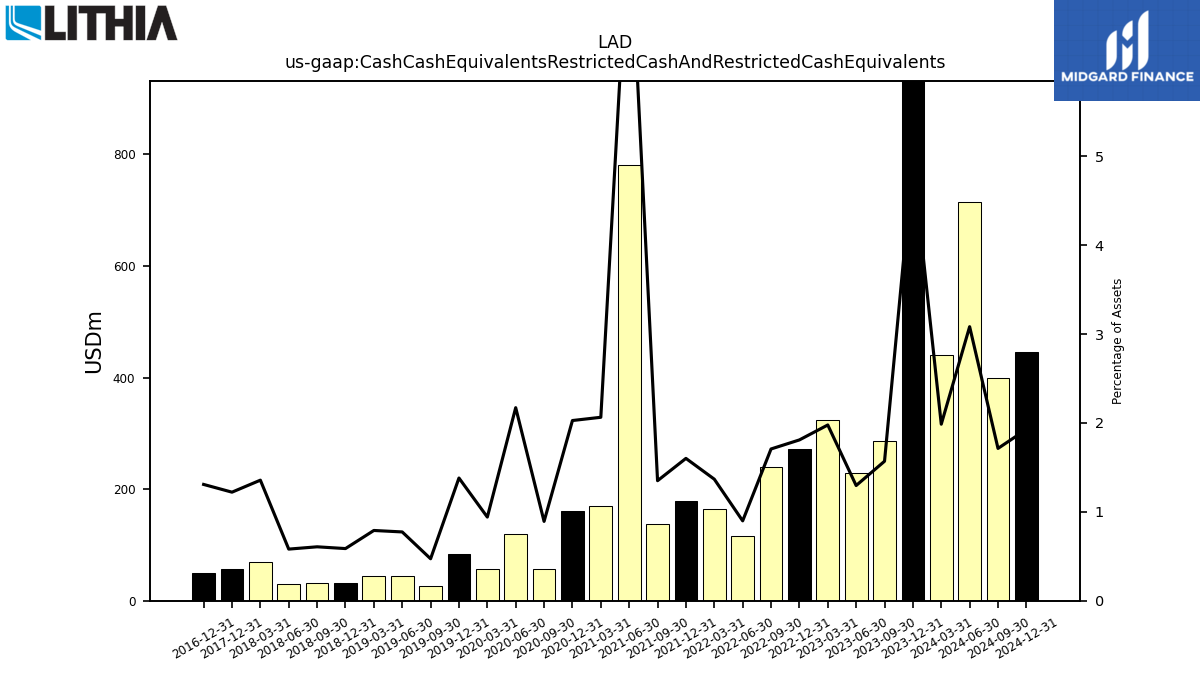
| Cash Cash Equivalents Restricted Cash And Restricted Cash Equivalents | 440.50 | 972.00 | 286.70 | 229.20 | 324.70 | 271.50 | 240.30 | 116.90 | 165.20 | 178.50 | 137.80 | 780.90 | 170.30 | 160.20 | 57.10 | 120.30 | 56.60 | 84.00 | 27.10 | 44.70 | 45.00 | 31.60 | 31.40 | 30.00 | 69.00 | 57.20 | NA | NA | NA | 50.30 | NA | NA | NA | NA | NA | NA | NA | NA | NA | NA | NA | NA | NA | NA | NA | NA | NA | NA | NA | NA | NA | NA | NA | NA | NA | NA | |
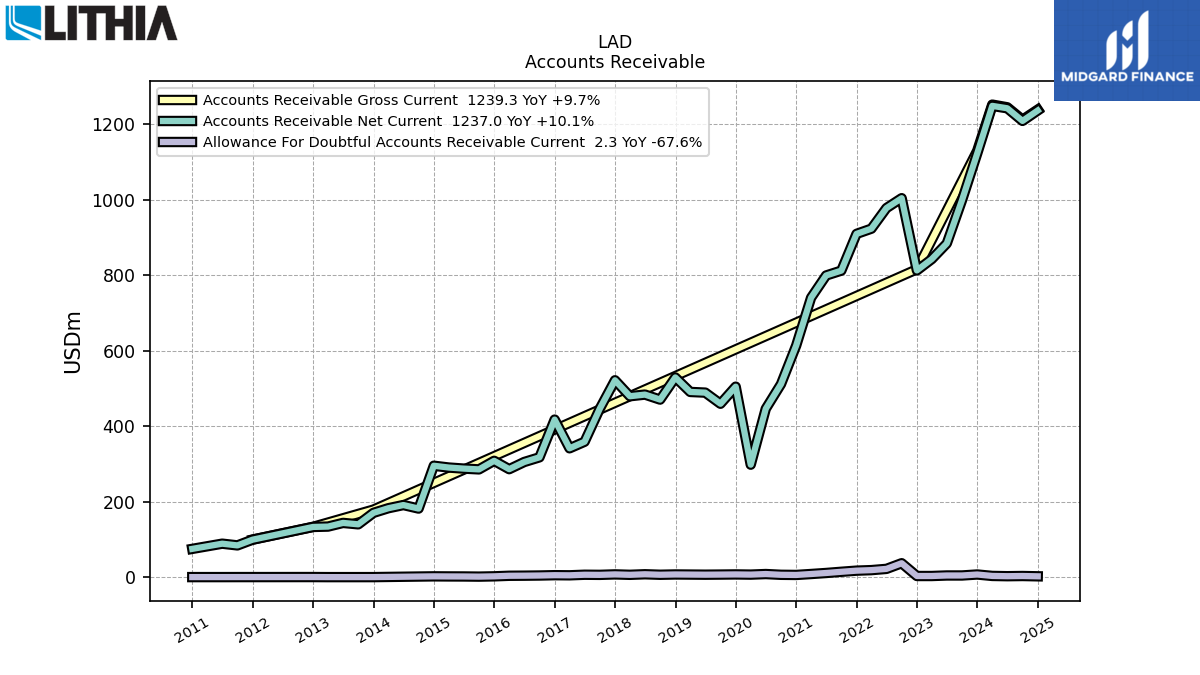
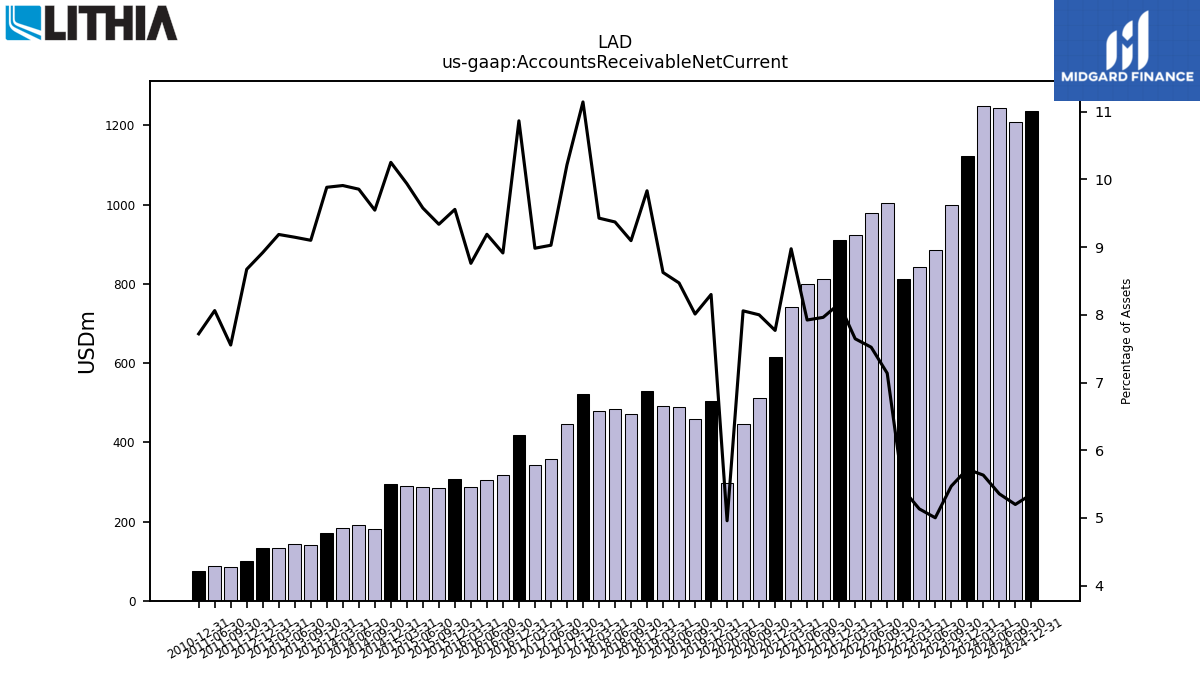
| Accounts Receivable Net Current | 1249.30 | 1123.10 | 999.30 | 884.60 | 843.10 | 813.10 | 1004.60 | 978.40 | 923.80 | 910.00 | 812.60 | 799.70 | 740.70 | 614.00 | 511.70 | 446.40 | 298.20 | 505.00 | 459.70 | 489.20 | 491.00 | 529.40 | 470.69 | 484.00 | 479.64 | 521.94 | 446.61 | 359.01 | 341.59 | 417.71 | 317.66 | 305.29 | 286.29 | 308.46 | 285.73 | 287.81 | 290.64 | 295.38 | 181.85 | 191.23 | 182.78 | 170.52 | 140.09 | 143.83 | 134.11 | 133.15 | NA | NA | NA | 99.41 | 84.25 | 88.79 | NA | 75.01 | NA | NA | |
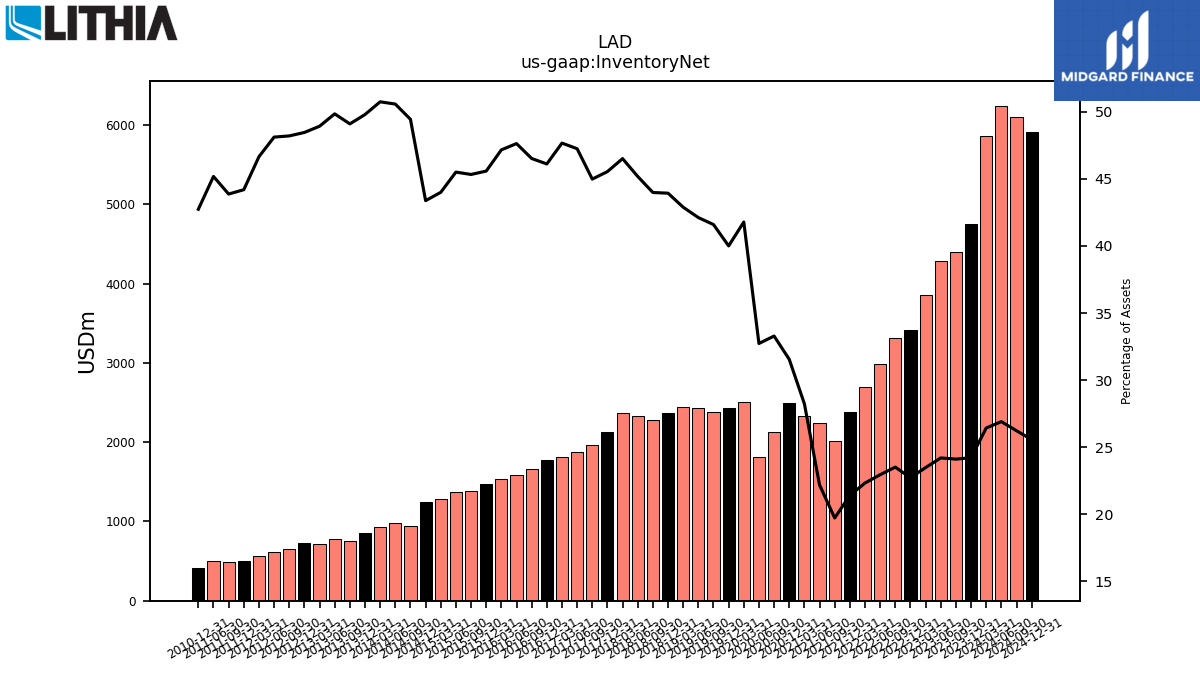
| Inventory Net | 5861.90 | 4753.90 | 4404.50 | 4278.90 | 3855.60 | 3409.40 | 3309.30 | 2985.00 | 2697.30 | 2385.50 | 2012.60 | 2238.80 | 2329.70 | 2492.90 | 2128.70 | 1812.80 | 2512.80 | 2433.70 | 2386.40 | 2431.90 | 2441.00 | 2365.30 | 2275.97 | 2333.11 | 2365.92 | 2132.74 | 1966.46 | 1878.78 | 1812.22 | 1772.59 | 1657.69 | 1582.27 | 1541.09 | 1470.99 | 1386.96 | 1367.32 | 1286.61 | 1249.66 | 941.76 | 981.22 | 935.85 | 859.02 | 755.70 | 783.84 | 714.12 | 723.33 | 658.69 | 617.57 | 559.22 | 506.48 | 489.22 | 497.53 | NA | 415.23 | NA | NA | |
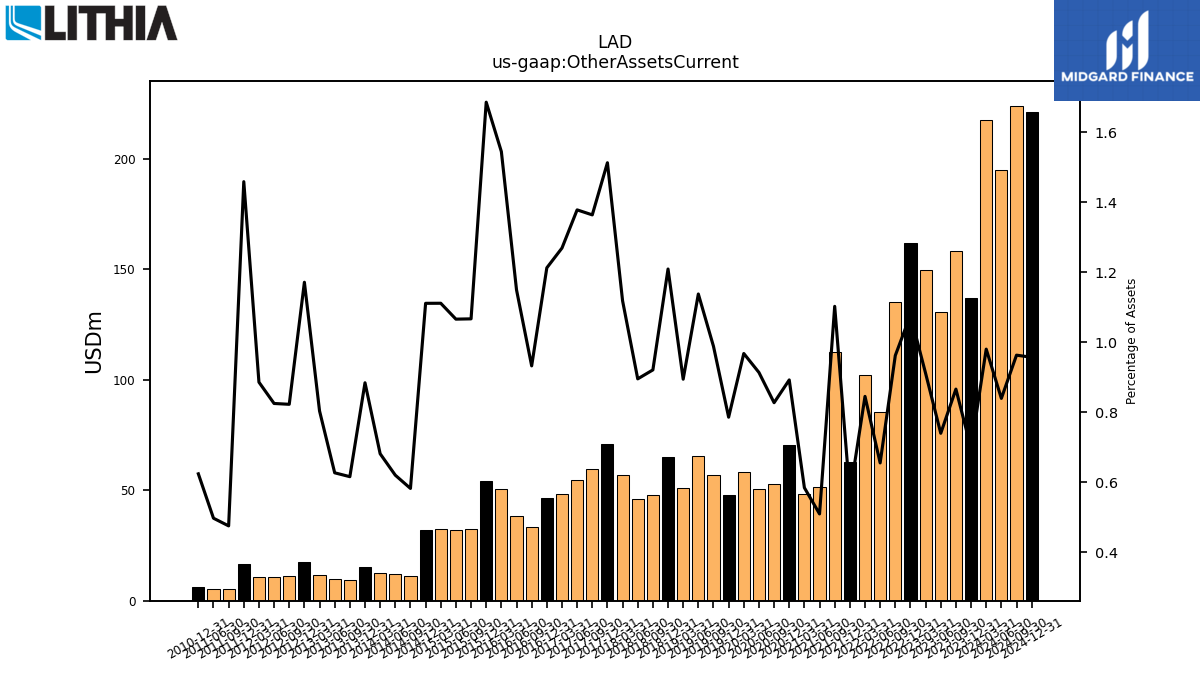
| Other Assets Current | 217.40 | 136.80 | 158.20 | 130.80 | 149.60 | 161.70 | 135.40 | 85.20 | 102.10 | 63.00 | 112.50 | 51.40 | 48.20 | 70.50 | 52.90 | 50.60 | 58.20 | 47.80 | 56.70 | 65.70 | 50.90 | 65.10 | 47.65 | 46.23 | 56.89 | 70.85 | 59.62 | 54.80 | 48.25 | 46.61 | 33.23 | 38.19 | 50.47 | 54.41 | 32.64 | 32.03 | 32.50 | 32.01 | 11.09 | 12.03 | 12.56 | 15.25 | 9.48 | 9.86 | 11.73 | 17.48 | 11.24 | 10.59 | 10.62 | 16.72 | 5.30 | 5.47 | NA | 6.06 | NA | NA |
| 2024-03-31 | 2023-12-31 | 2023-09-30 | 2023-06-30 | 2023-03-31 | 2022-12-31 | 2022-09-30 | 2022-06-30 | 2022-03-31 | 2021-12-31 | 2021-09-30 | 2021-06-30 | 2021-03-31 | 2020-12-31 | 2020-09-30 | 2020-06-30 | 2020-03-31 | 2019-12-31 | 2019-09-30 | 2019-06-30 | 2019-03-31 | 2018-12-31 | 2018-09-30 | 2018-06-30 | 2018-03-31 | 2017-12-31 | 2017-09-30 | 2017-06-30 | 2017-03-31 | 2016-12-31 | 2016-09-30 | 2016-06-30 | 2016-03-31 | 2015-12-31 | 2015-09-30 | 2015-06-30 | 2015-03-31 | 2014-12-31 | 2014-09-30 | 2014-06-30 | 2014-03-31 | 2013-12-31 | 2013-09-30 | 2013-06-30 | 2013-03-31 | 2012-12-31 | 2012-09-30 | 2012-06-30 | 2012-03-31 | 2011-12-31 | 2011-09-30 | 2011-06-30 | 2011-03-31 | 2010-12-31 | 2010-09-30 | 2010-06-30 | ||
|---|---|---|---|---|---|---|---|---|---|---|---|---|---|---|---|---|---|---|---|---|---|---|---|---|---|---|---|---|---|---|---|---|---|---|---|---|---|---|---|---|---|---|---|---|---|---|---|---|---|---|---|---|---|---|---|---|---|
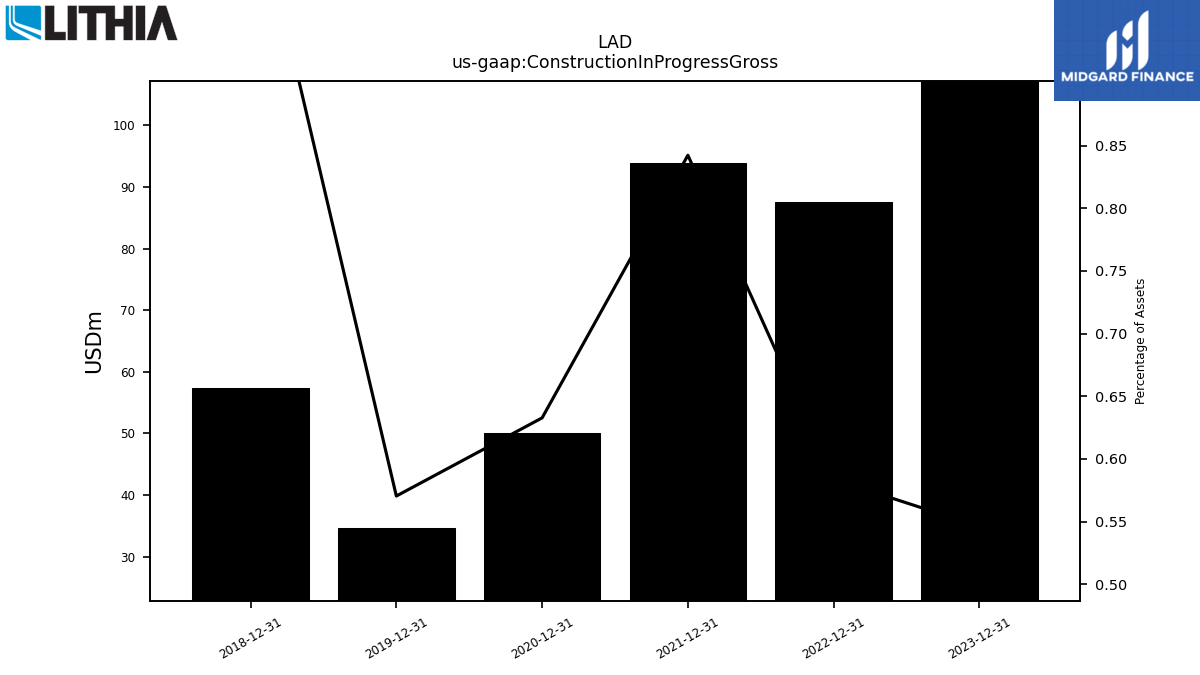
| Construction In Progress Gross | NA | 107.20 | NA | NA | NA | 87.60 | NA | NA | NA | 93.90 | NA | NA | NA | 50.00 | NA | NA | NA | 34.70 | NA | NA | NA | 57.40 | NA | NA | NA | NA | NA | NA | NA | NA | NA | NA | NA | NA | NA | NA | NA | NA | NA | NA | NA | NA | NA | NA | NA | NA | NA | NA | NA | NA | NA | NA | NA | NA | NA | NA | |
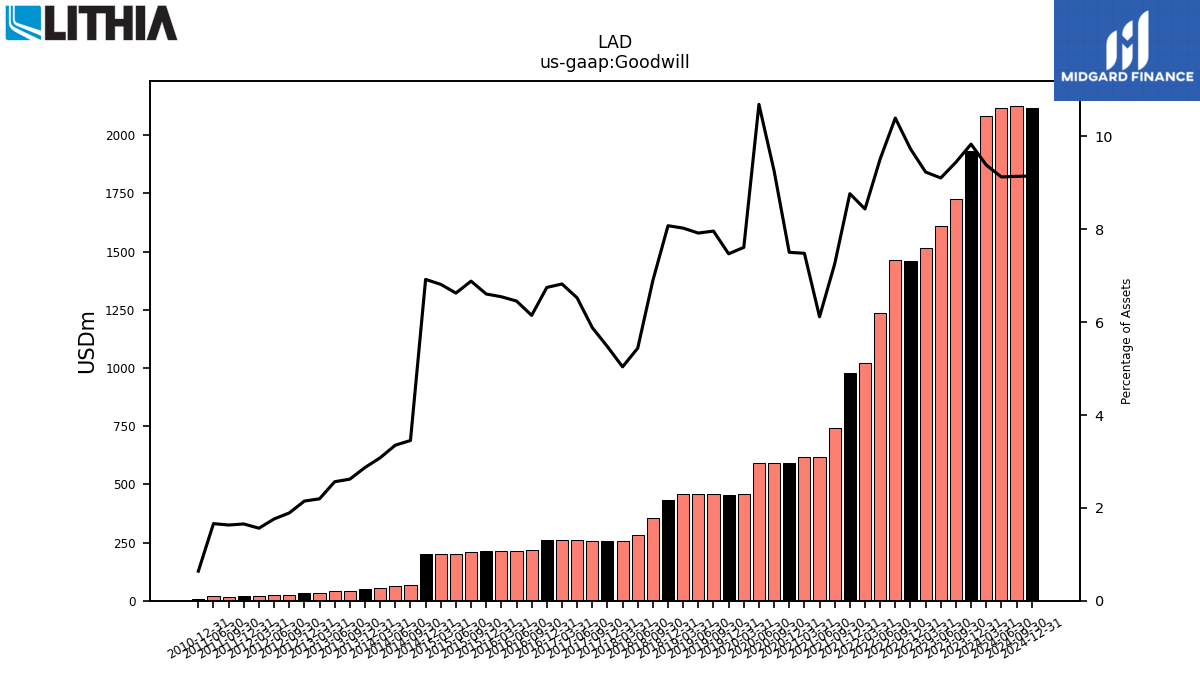
| Goodwill | 2081.70 | 1930.60 | 1725.60 | 1610.20 | 1516.20 | 1460.70 | 1463.10 | 1237.60 | 1019.30 | 977.30 | 740.30 | 617.30 | 617.50 | 593.00 | 592.20 | 592.20 | 457.70 | 454.60 | 456.80 | 457.30 | 456.80 | 434.90 | 356.97 | 280.95 | 256.28 | 256.32 | 257.19 | 259.40 | 259.40 | 259.40 | 219.02 | 214.44 | 213.93 | 213.22 | 210.63 | 199.13 | 199.29 | 199.38 | 65.75 | 65.00 | 56.79 | 49.51 | 40.31 | 40.31 | 32.05 | 32.05 | 25.84 | 22.61 | 18.73 | 18.96 | 18.19 | 18.29 | NA | 6.19 | NA | NA | |
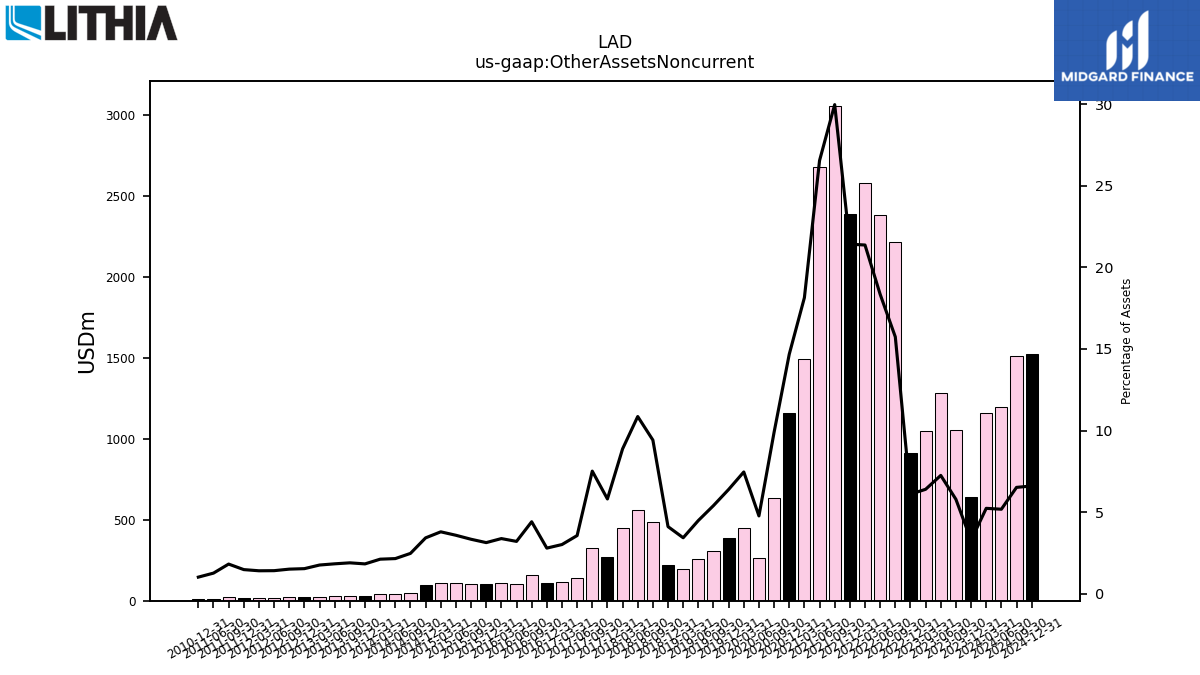
| Other Assets Noncurrent | 1159.40 | 642.00 | 1056.10 | 1281.40 | 1050.10 | 914.70 | 2216.10 | 2387.70 | 2582.60 | 2388.70 | 3060.20 | 2680.30 | 1497.50 | 1159.80 | 632.80 | 263.80 | 448.50 | 388.50 | 309.60 | 258.70 | 194.80 | 221.00 | 487.17 | 560.71 | 451.40 | 271.82 | 328.24 | 141.46 | 114.31 | 107.16 | 156.95 | 106.29 | 110.20 | 100.86 | 101.90 | 107.43 | 110.74 | 98.41 | 46.92 | 41.61 | 38.89 | 31.39 | 29.01 | 28.69 | 25.55 | 22.81 | 20.47 | 18.02 | 16.75 | 16.84 | 20.17 | 13.81 | NA | 9.80 | NA | NA | |
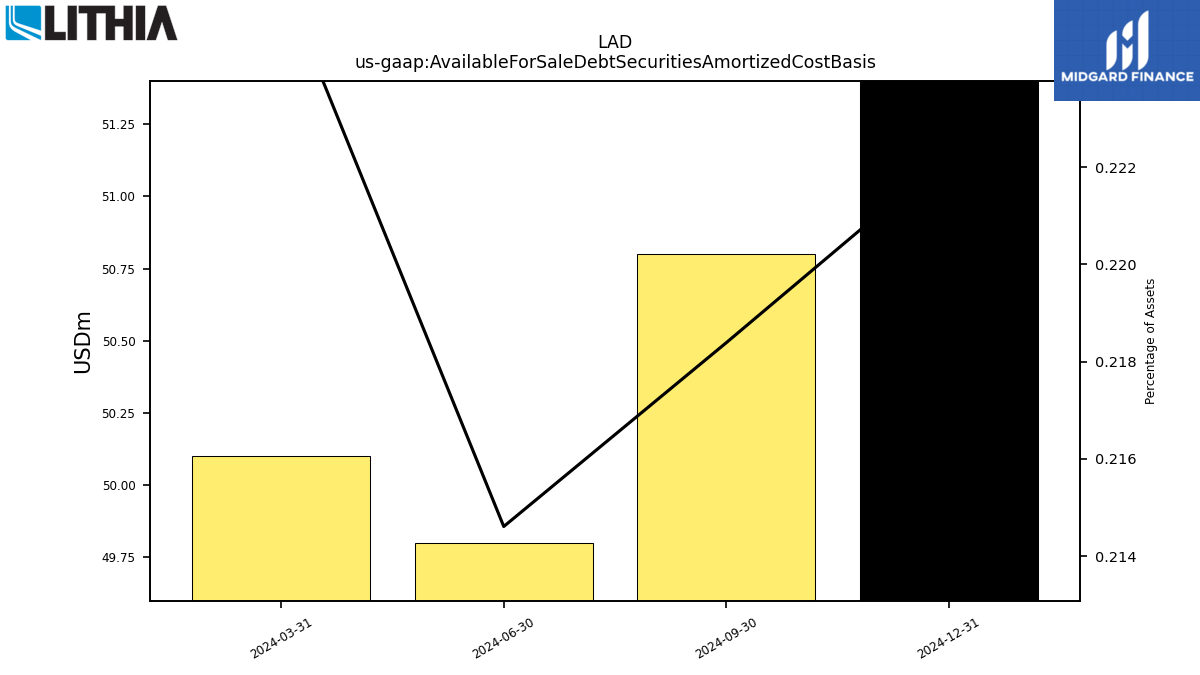
| Available For Sale Debt Securities Amortized Cost Basis | 50.10 | NA | NA | NA | NA | NA | NA | NA | NA | NA | NA | NA | NA | NA | NA | NA | NA | NA | NA | NA | NA | NA | NA | NA | NA | NA | NA | NA | NA | NA | NA | NA | NA | NA | NA | NA | NA | NA | NA | NA | NA | NA | NA | NA | NA | NA | NA | NA | NA | NA | NA | NA | NA | NA | NA | NA |
| 2024-03-31 | 2023-12-31 | 2023-09-30 | 2023-06-30 | 2023-03-31 | 2022-12-31 | 2022-09-30 | 2022-06-30 | 2022-03-31 | 2021-12-31 | 2021-09-30 | 2021-06-30 | 2021-03-31 | 2020-12-31 | 2020-09-30 | 2020-06-30 | 2020-03-31 | 2019-12-31 | 2019-09-30 | 2019-06-30 | 2019-03-31 | 2018-12-31 | 2018-09-30 | 2018-06-30 | 2018-03-31 | 2017-12-31 | 2017-09-30 | 2017-06-30 | 2017-03-31 | 2016-12-31 | 2016-09-30 | 2016-06-30 | 2016-03-31 | 2015-12-31 | 2015-09-30 | 2015-06-30 | 2015-03-31 | 2014-12-31 | 2014-09-30 | 2014-06-30 | 2014-03-31 | 2013-12-31 | 2013-09-30 | 2013-06-30 | 2013-03-31 | 2012-12-31 | 2012-09-30 | 2012-06-30 | 2012-03-31 | 2011-12-31 | 2011-09-30 | 2011-06-30 | 2011-03-31 | 2010-12-31 | 2010-09-30 | 2010-06-30 | ||
|---|---|---|---|---|---|---|---|---|---|---|---|---|---|---|---|---|---|---|---|---|---|---|---|---|---|---|---|---|---|---|---|---|---|---|---|---|---|---|---|---|---|---|---|---|---|---|---|---|---|---|---|---|---|---|---|---|---|
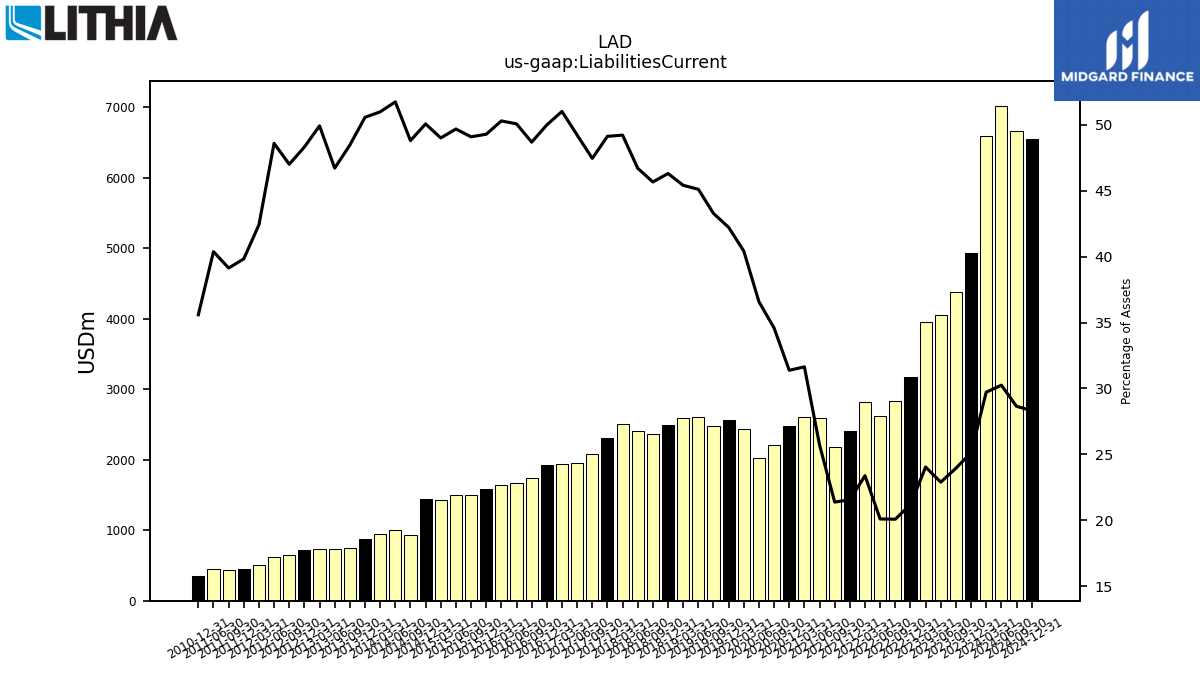
| Liabilities Current | 6591.50 | 4932.20 | 4375.30 | 4048.20 | 3948.00 | 3178.20 | 2826.60 | 2614.40 | 2825.10 | 2402.80 | 2181.80 | 2595.80 | 2610.90 | 2479.70 | 2212.40 | 2026.40 | 2431.50 | 2569.10 | 2483.40 | 2605.30 | 2585.20 | 2493.50 | 2363.21 | 2412.21 | 2503.93 | 2300.98 | 2074.76 | 1957.65 | 1939.87 | 1921.99 | 1735.18 | 1663.71 | 1643.70 | 1590.83 | 1502.27 | 1493.10 | 1433.24 | 1442.60 | 929.77 | 1003.99 | 940.43 | 872.51 | 746.04 | 734.68 | 728.80 | 721.30 | 642.49 | 623.80 | 508.51 | 456.58 | 436.48 | 444.71 | NA | 345.87 | NA | NA | |
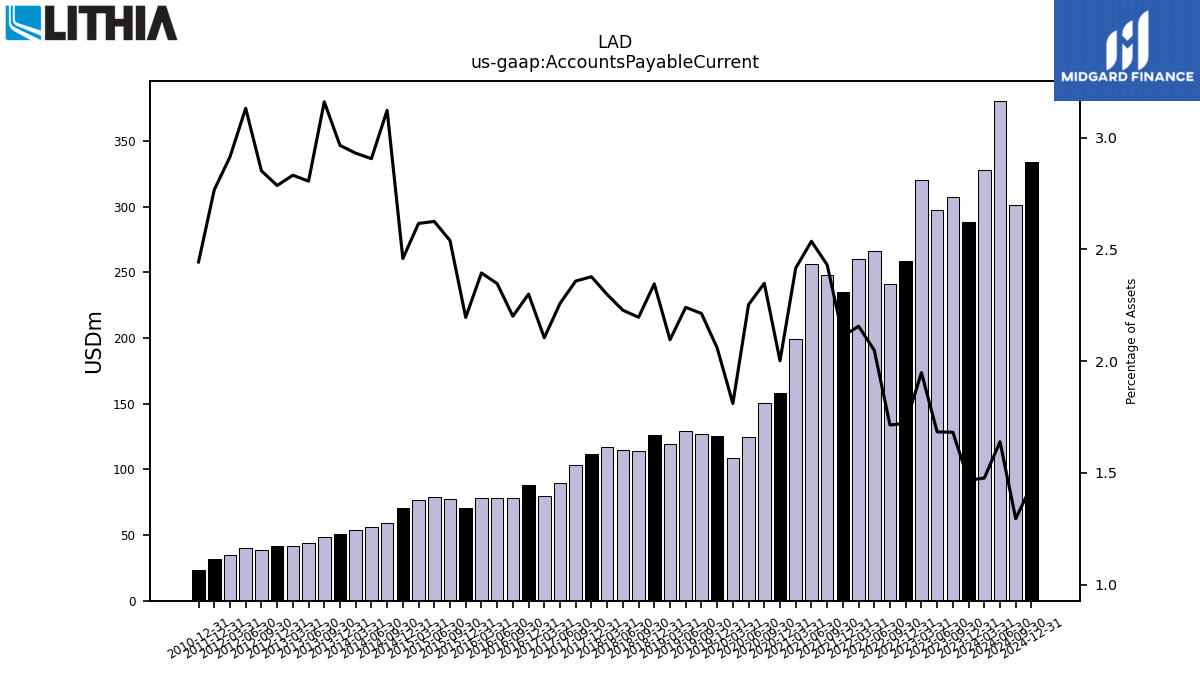
| Accounts Payable Current | 327.60 | 288.00 | 307.30 | 297.70 | 320.00 | 258.40 | 241.30 | 266.50 | 260.50 | 235.40 | 248.10 | 256.00 | 199.40 | 158.20 | 150.20 | 124.80 | 108.90 | 125.30 | 127.00 | 129.40 | 119.30 | 126.30 | 113.66 | 115.06 | 116.93 | 111.36 | 103.11 | 89.80 | 80.02 | 88.42 | 78.44 | 77.98 | 78.25 | 70.87 | 77.72 | 78.89 | 76.52 | 70.85 | 59.48 | 56.38 | 54.05 | 51.16 | 48.65 | 44.12 | 41.34 | 41.59 | 38.97 | 40.20 | 34.93 | 31.71 | NA | NA | NA | 23.75 | NA | NA | |
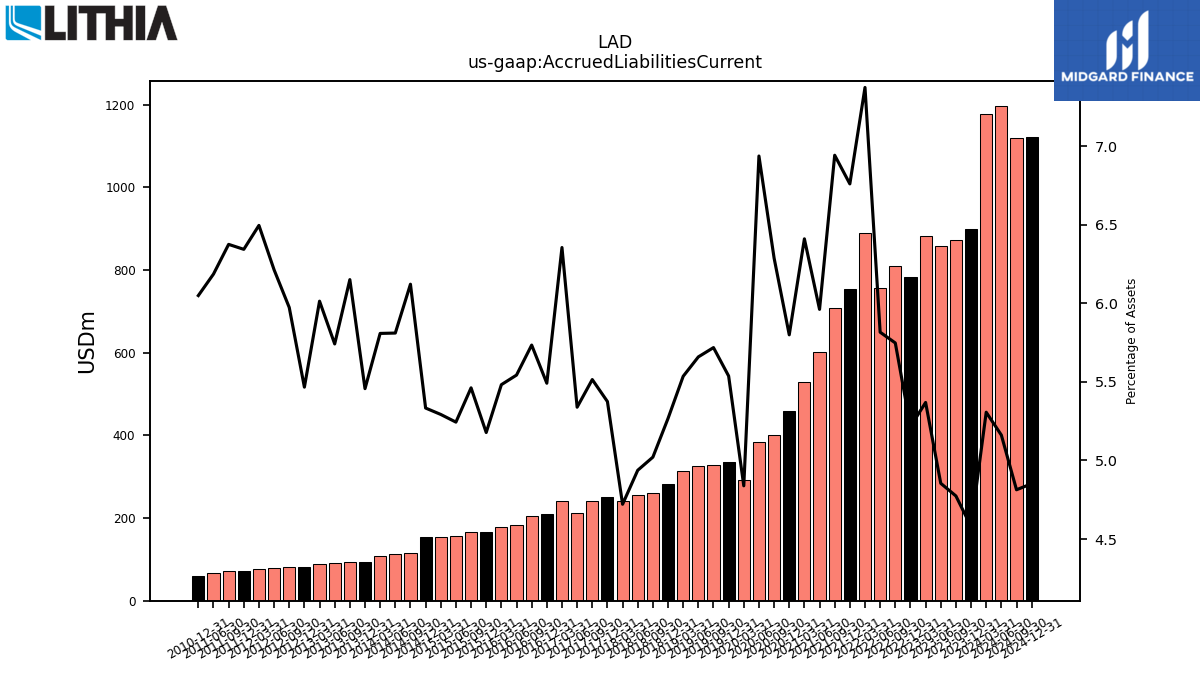
| Accrued Liabilities Current | 1177.10 | 899.10 | 872.20 | 858.40 | 881.70 | 782.70 | 809.00 | 756.60 | 890.90 | 753.60 | 708.50 | 601.70 | 529.00 | 458.30 | 402.20 | 384.30 | 291.00 | 336.90 | 328.10 | 326.80 | 315.10 | 283.60 | 259.82 | 254.98 | 240.17 | 251.72 | 241.09 | 212.31 | 241.64 | 211.11 | 204.36 | 184.16 | 179.15 | 167.11 | 167.13 | 157.58 | 154.79 | 153.66 | 116.62 | 112.74 | 107.13 | 94.14 | 94.68 | 90.29 | 87.79 | 81.60 | 81.64 | 79.76 | 77.87 | 72.71 | 71.10 | 68.13 | NA | 58.78 | NA | NA |
| 2024-03-31 | 2023-12-31 | 2023-09-30 | 2023-06-30 | 2023-03-31 | 2022-12-31 | 2022-09-30 | 2022-06-30 | 2022-03-31 | 2021-12-31 | 2021-09-30 | 2021-06-30 | 2021-03-31 | 2020-12-31 | 2020-09-30 | 2020-06-30 | 2020-03-31 | 2019-12-31 | 2019-09-30 | 2019-06-30 | 2019-03-31 | 2018-12-31 | 2018-09-30 | 2018-06-30 | 2018-03-31 | 2017-12-31 | 2017-09-30 | 2017-06-30 | 2017-03-31 | 2016-12-31 | 2016-09-30 | 2016-06-30 | 2016-03-31 | 2015-12-31 | 2015-09-30 | 2015-06-30 | 2015-03-31 | 2014-12-31 | 2014-09-30 | 2014-06-30 | 2014-03-31 | 2013-12-31 | 2013-09-30 | 2013-06-30 | 2013-03-31 | 2012-12-31 | 2012-09-30 | 2012-06-30 | 2012-03-31 | 2011-12-31 | 2011-09-30 | 2011-06-30 | 2011-03-31 | 2010-12-31 | 2010-09-30 | 2010-06-30 | ||
|---|---|---|---|---|---|---|---|---|---|---|---|---|---|---|---|---|---|---|---|---|---|---|---|---|---|---|---|---|---|---|---|---|---|---|---|---|---|---|---|---|---|---|---|---|---|---|---|---|---|---|---|---|---|---|---|---|---|
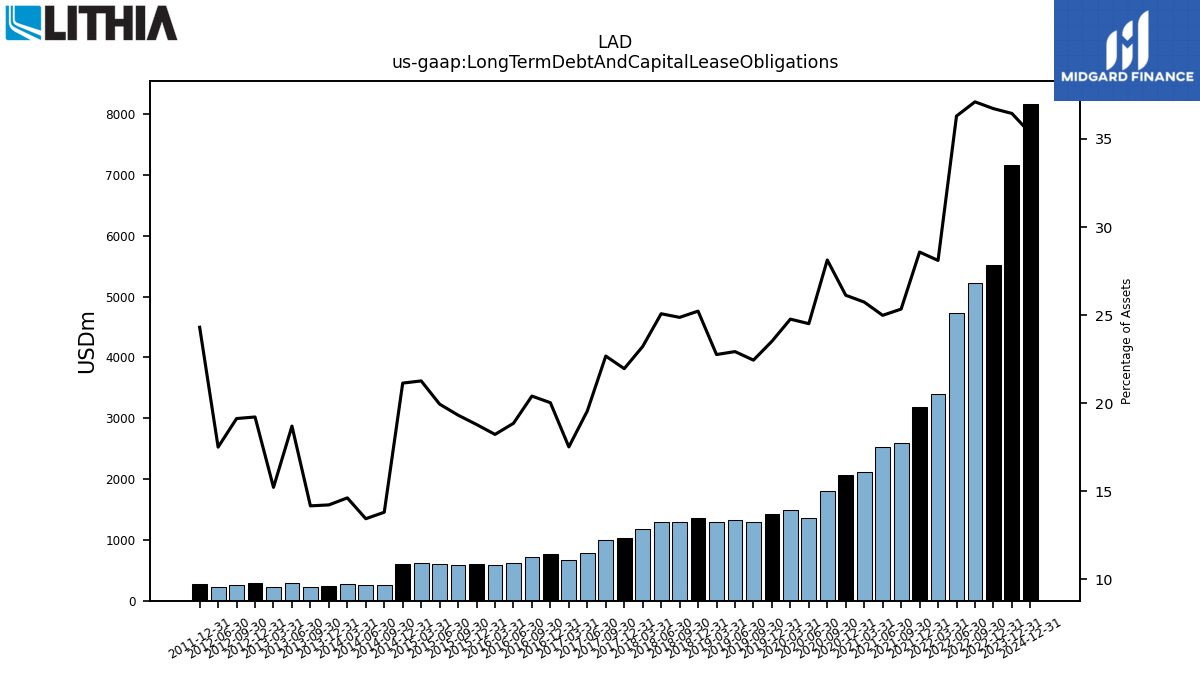
| Long Term Debt And Capital Lease Obligations | NA | 7155.40 | NA | NA | NA | 5510.50 | 5222.30 | 4721.70 | 3395.20 | 3185.70 | 2586.10 | 2521.90 | 2124.00 | 2064.70 | 1799.00 | 1357.90 | 1489.80 | 1430.60 | 1287.80 | 1324.10 | 1295.70 | 1358.20 | 1287.05 | 1295.08 | 1181.23 | 1028.48 | 991.33 | 777.81 | 666.13 | 769.92 | 727.19 | 626.54 | 595.66 | 606.46 | 591.23 | 599.40 | 621.89 | 609.07 | 263.12 | 260.83 | 269.76 | 245.47 | 218.17 | 294.07 | 222.25 | 286.88 | 261.42 | 224.75 | NA | 278.65 | NA | NA | NA | NA | NA | NA | |
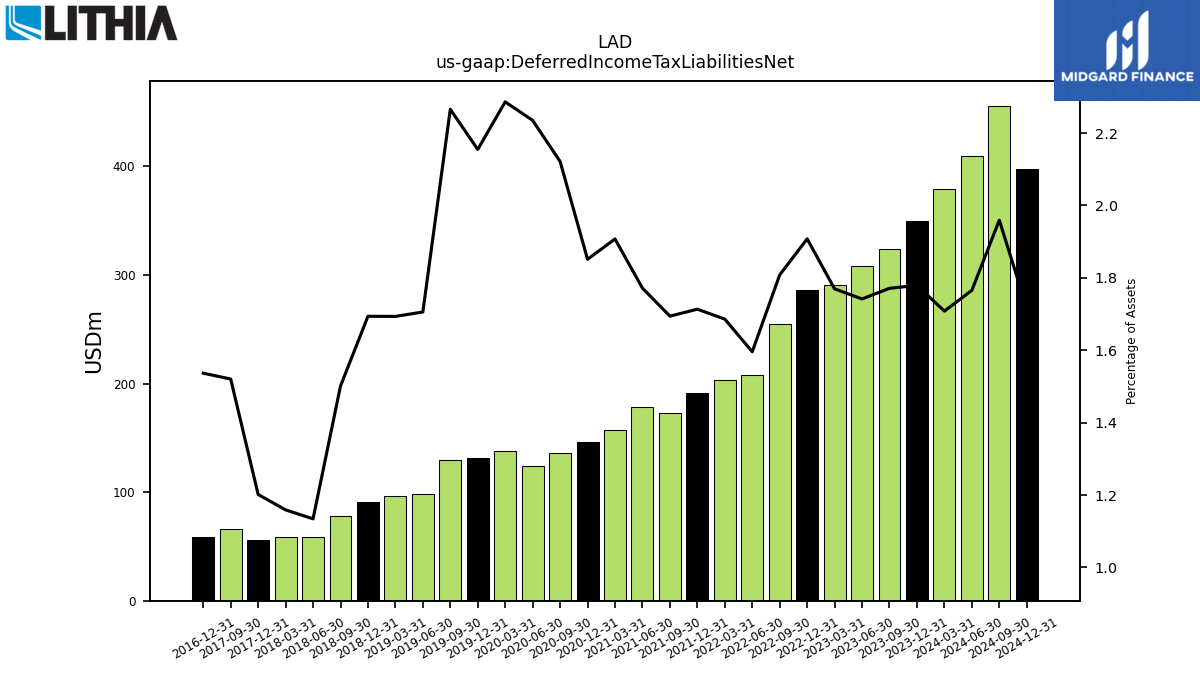
| Deferred Income Tax Liabilities Net | 378.90 | 349.30 | 323.60 | 308.00 | 290.60 | 286.30 | 254.50 | 207.60 | 203.70 | 191.00 | 172.90 | 178.80 | 157.40 | 146.30 | 135.70 | 123.80 | 137.50 | 131.10 | 130.00 | 98.50 | 96.40 | 91.20 | 77.68 | 58.58 | 58.97 | 56.28 | 66.47 | NA | NA | 59.08 | NA | NA | NA | NA | NA | NA | NA | NA | NA | NA | NA | NA | NA | NA | NA | NA | NA | NA | NA | NA | NA | NA | NA | NA | NA | NA | |
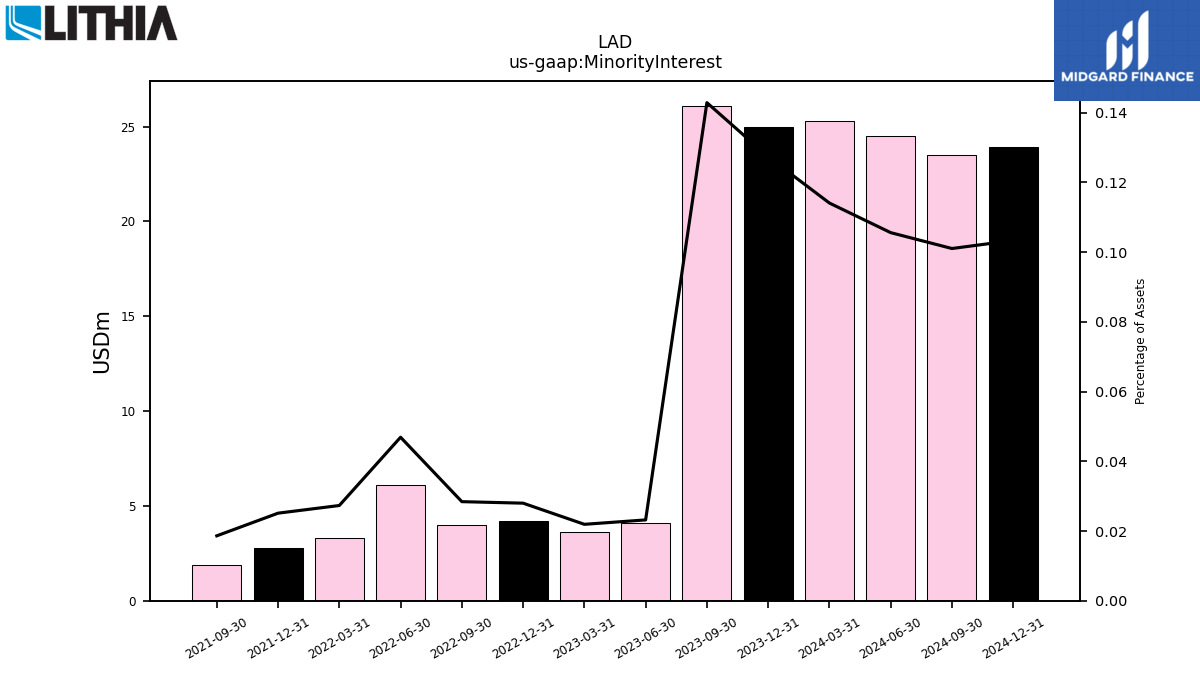
| Minority Interest | 25.30 | 25.00 | 26.10 | 4.10 | 3.60 | 4.20 | 4.00 | 6.10 | 3.30 | 2.80 | 1.90 | NA | NA | NA | NA | NA | NA | NA | NA | NA | NA | NA | NA | NA | NA | NA | NA | NA | NA | NA | NA | NA | NA | NA | NA | NA | NA | NA | NA | NA | NA | NA | NA | NA | NA | NA | NA | NA | NA | NA | NA | NA | NA | NA | NA | NA | |
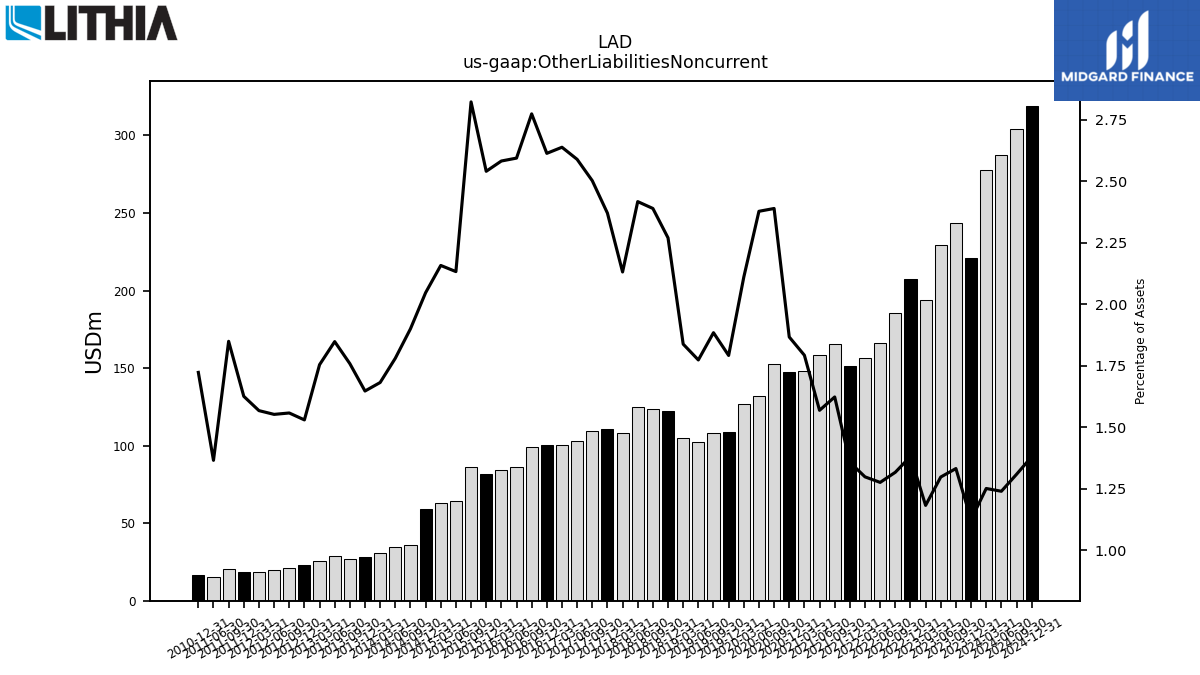
| Other Liabilities Noncurrent | 277.40 | 220.70 | 243.30 | 229.40 | 194.10 | 207.20 | 185.30 | 165.90 | 156.80 | 151.30 | 165.60 | 158.30 | 147.90 | 147.50 | 152.80 | 131.70 | 126.90 | 109.00 | 108.10 | 102.40 | 104.60 | 122.20 | 123.63 | 124.82 | 108.40 | 111.00 | 109.38 | 102.95 | 100.30 | 100.46 | 98.85 | 86.17 | 84.38 | 81.98 | 86.36 | 64.08 | 63.09 | 58.96 | 36.19 | 34.54 | 31.01 | 28.41 | 27.06 | 29.06 | 25.60 | 22.83 | 21.29 | 19.92 | 18.79 | 18.63 | 20.62 | 15.03 | NA | 16.74 | NA | NA | |
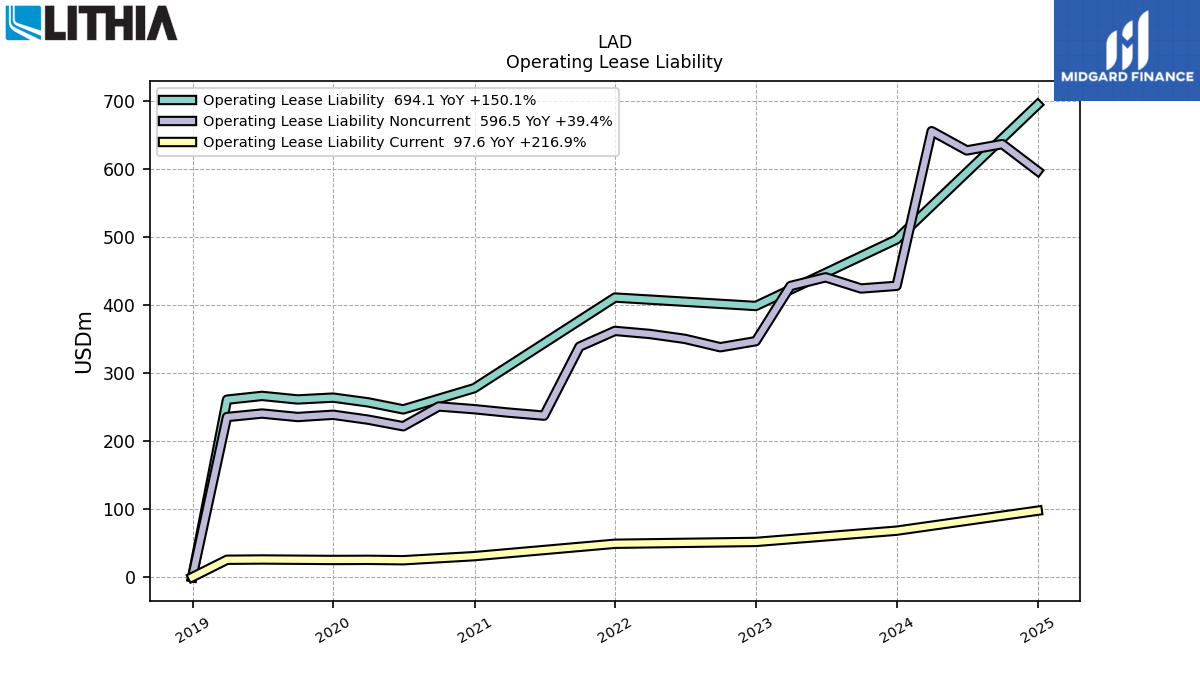
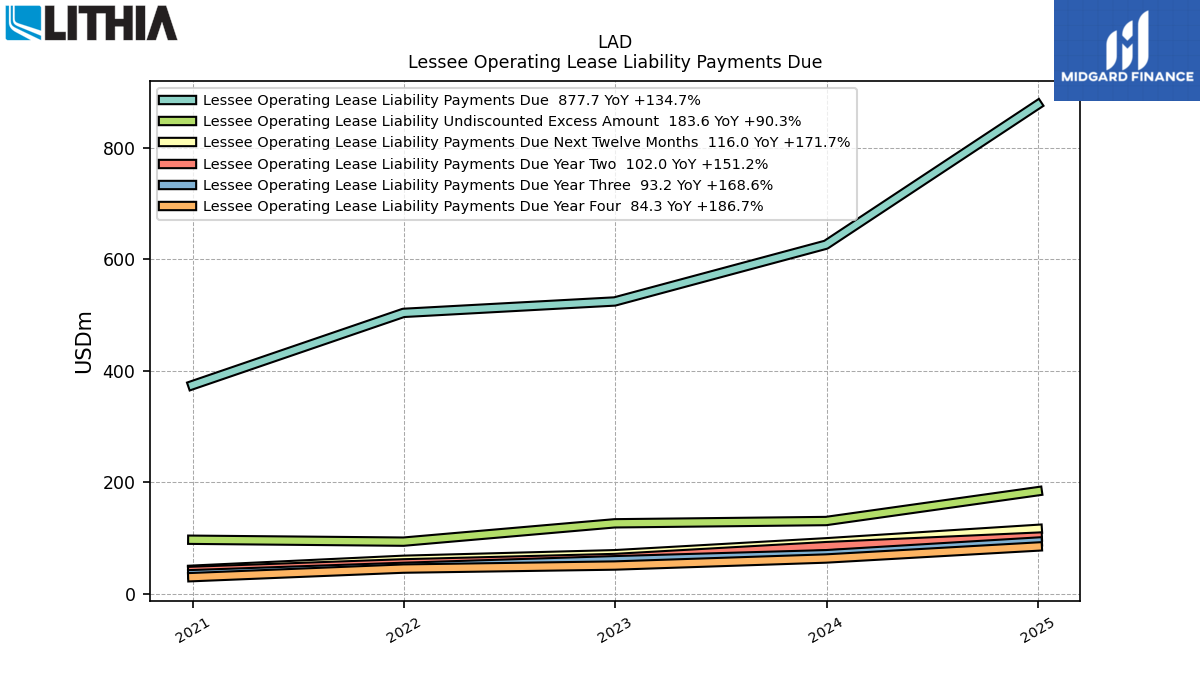
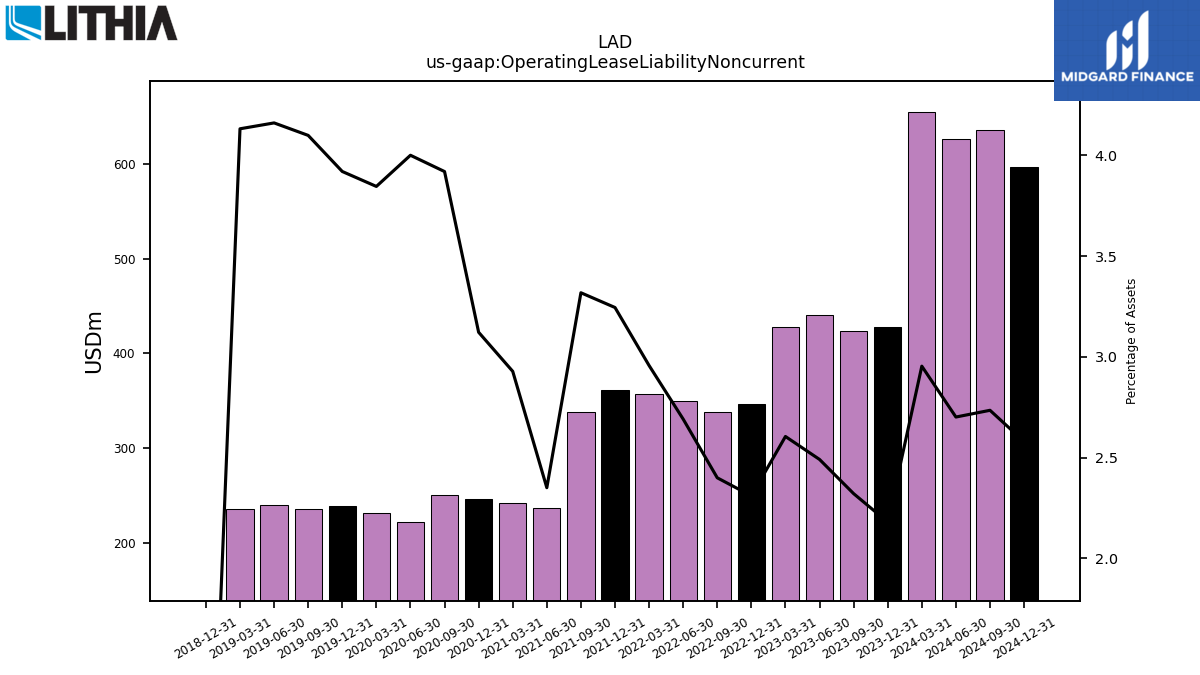
| Operating Lease Liability Noncurrent | 655.10 | 427.90 | 424.00 | 440.40 | 427.70 | 346.60 | 337.70 | 350.00 | 357.20 | 361.70 | 338.60 | 237.20 | 241.60 | 246.70 | 250.70 | 221.60 | 231.30 | 238.50 | 235.20 | 240.30 | 235.20 | 0.00 | NA | NA | NA | NA | NA | NA | NA | NA | NA | NA | NA | NA | NA | NA | NA | NA | NA | NA | NA | NA | NA | NA | NA | NA | NA | NA | NA | NA | NA | NA | NA | NA | NA | NA |
| 2024-03-31 | 2023-12-31 | 2023-09-30 | 2023-06-30 | 2023-03-31 | 2022-12-31 | 2022-09-30 | 2022-06-30 | 2022-03-31 | 2021-12-31 | 2021-09-30 | 2021-06-30 | 2021-03-31 | 2020-12-31 | 2020-09-30 | 2020-06-30 | 2020-03-31 | 2019-12-31 | 2019-09-30 | 2019-06-30 | 2019-03-31 | 2018-12-31 | 2018-09-30 | 2018-06-30 | 2018-03-31 | 2017-12-31 | 2017-09-30 | 2017-06-30 | 2017-03-31 | 2016-12-31 | 2016-09-30 | 2016-06-30 | 2016-03-31 | 2015-12-31 | 2015-09-30 | 2015-06-30 | 2015-03-31 | 2014-12-31 | 2014-09-30 | 2014-06-30 | 2014-03-31 | 2013-12-31 | 2013-09-30 | 2013-06-30 | 2013-03-31 | 2012-12-31 | 2012-09-30 | 2012-06-30 | 2012-03-31 | 2011-12-31 | 2011-09-30 | 2011-06-30 | 2011-03-31 | 2010-12-31 | 2010-09-30 | 2010-06-30 | ||
|---|---|---|---|---|---|---|---|---|---|---|---|---|---|---|---|---|---|---|---|---|---|---|---|---|---|---|---|---|---|---|---|---|---|---|---|---|---|---|---|---|---|---|---|---|---|---|---|---|---|---|---|---|---|---|---|---|---|
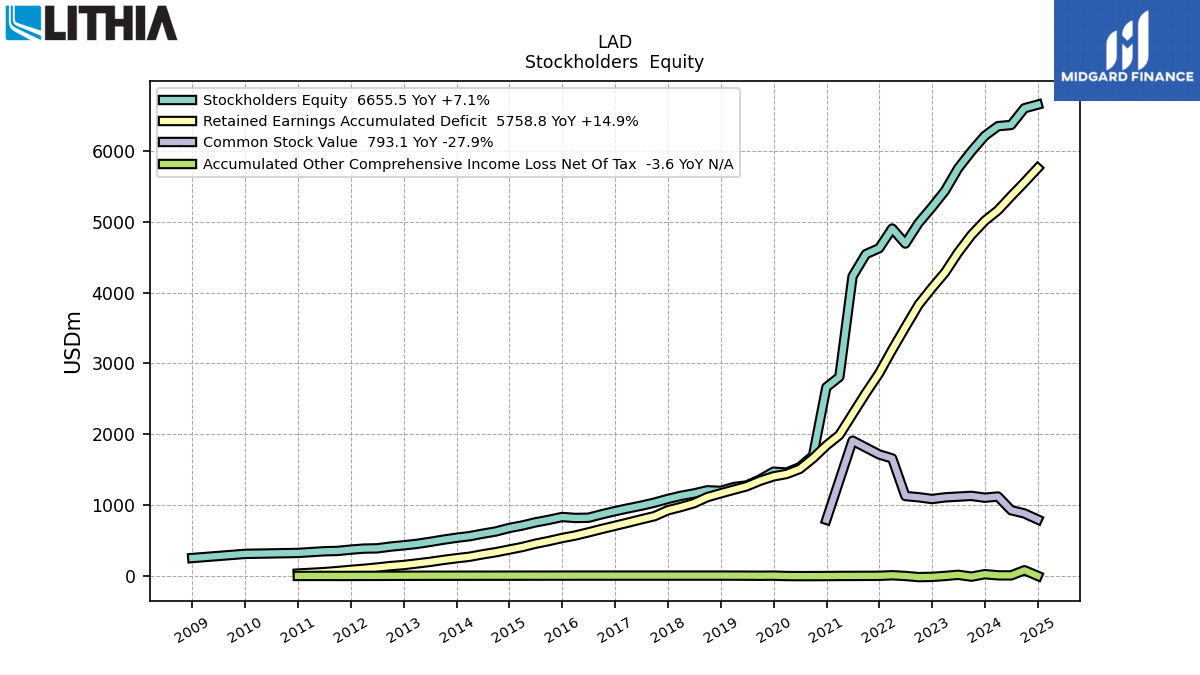
| Stockholders Equity | 6351.40 | 6213.90 | 5996.40 | 5755.60 | 5437.30 | 5206.20 | 4983.70 | 4691.90 | 4904.40 | 4626.40 | 4542.70 | 4228.40 | 2807.60 | 2661.50 | 1694.40 | 1532.20 | 1456.50 | 1467.70 | 1359.20 | 1274.70 | 1250.50 | 1197.20 | 1205.14 | 1160.87 | 1127.11 | 1083.22 | 1031.38 | 987.83 | 950.17 | 910.78 | 866.09 | 817.46 | 814.68 | 828.16 | 787.71 | 752.30 | 707.84 | 673.11 | 623.91 | 591.85 | 556.84 | 534.72 | 507.13 | 476.15 | 447.80 | 428.10 | 409.48 | 384.99 | 381.68 | 367.12 | 348.38 | 343.84 | NA | 320.22 | NA | NA | |
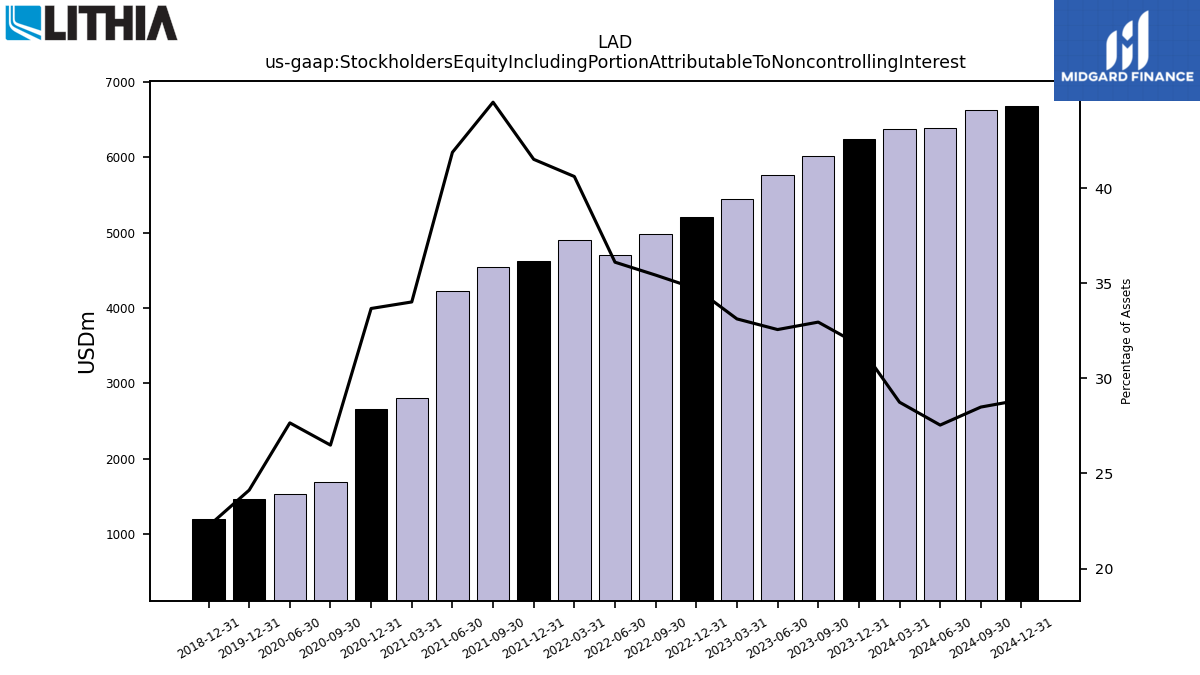
| Stockholders Equity Including Portion Attributable To Noncontrolling Interest | 6376.70 | 6238.90 | 6022.50 | 5759.70 | 5440.90 | 5210.40 | 4987.70 | 4698.00 | 4907.70 | 4629.20 | 4544.60 | 4228.40 | 2807.60 | 2661.50 | 1694.40 | 1532.20 | NA | 1467.70 | NA | NA | NA | 1197.20 | NA | NA | NA | NA | NA | NA | NA | NA | NA | NA | NA | NA | NA | NA | NA | NA | NA | NA | NA | NA | NA | NA | NA | NA | NA | NA | NA | NA | NA | NA | NA | NA | NA | NA | |
| Common Stock Value | 1117.80 | 1100.60 | 1126.50 | 1116.10 | 1105.50 | 1082.10 | 1107.10 | 1124.00 | 1656.30 | 1711.60 | NA | 1906.90 | NA | 788.20 | NA | NA | NA | NA | NA | NA | NA | NA | NA | NA | NA | NA | NA | NA | NA | NA | NA | NA | NA | NA | NA | NA | NA | NA | NA | NA | NA | NA | NA | NA | NA | NA | NA | NA | NA | NA | NA | NA | NA | NA | NA | NA | |
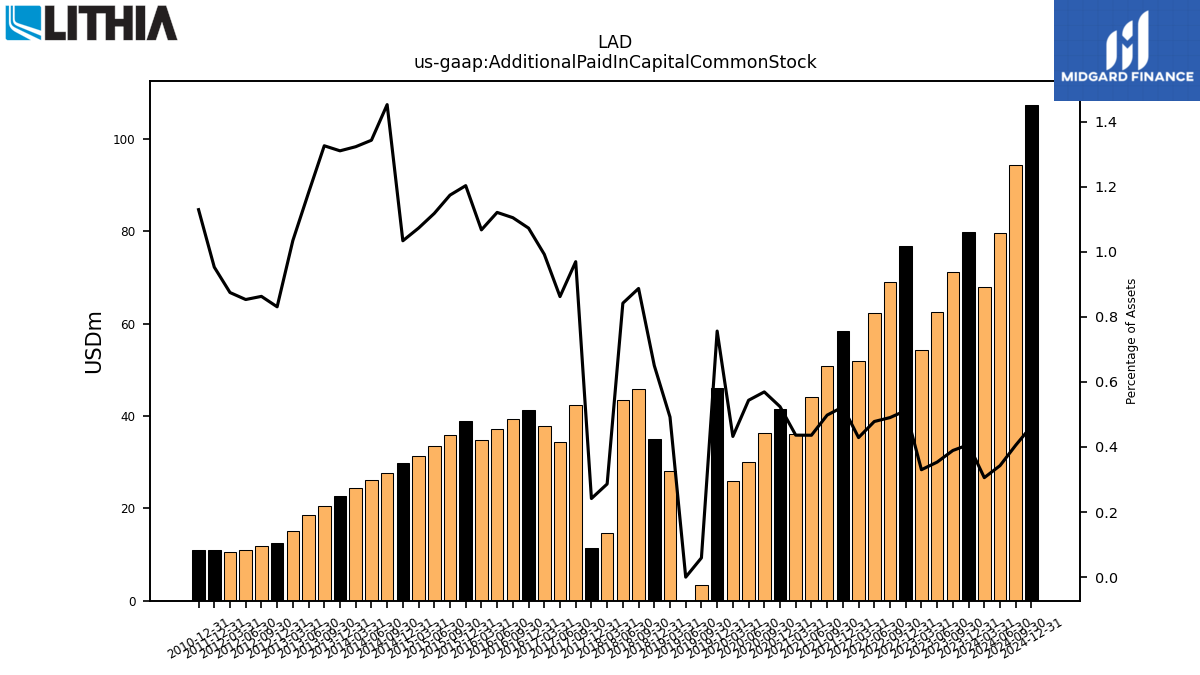
| Additional Paid In Capital Common Stock | 67.80 | 79.90 | 71.10 | 62.50 | 54.20 | 76.80 | 69.00 | 62.20 | 51.80 | 58.30 | 50.80 | 44.00 | 36.00 | 41.40 | 36.40 | 30.10 | 26.00 | 46.00 | 3.40 | 0.00 | 28.00 | 35.00 | 45.90 | 43.47 | 14.56 | 11.31 | 42.37 | 34.28 | 37.71 | 41.23 | 39.36 | 37.23 | 34.87 | 38.82 | 35.92 | 33.58 | 31.36 | 29.77 | 27.66 | 26.05 | 24.39 | 22.60 | 20.40 | 18.58 | 15.10 | 12.40 | 11.79 | 10.95 | 10.48 | 10.92 | NA | NA | NA | 10.97 | NA | NA | |
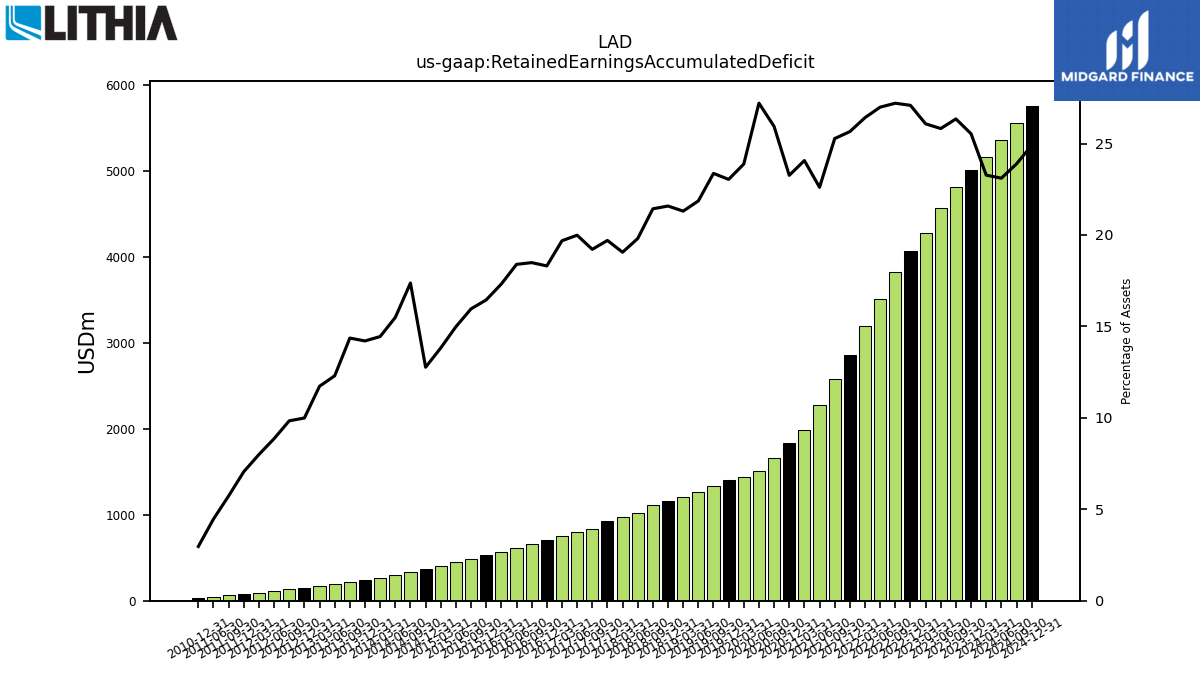
| Retained Earnings Accumulated Deficit | 5162.10 | 5013.30 | 4813.50 | 4565.80 | 4282.50 | 4065.30 | 3829.10 | 3510.80 | 3191.40 | 2859.50 | 2579.10 | 2281.80 | 1986.20 | 1838.20 | 1658.80 | 1507.10 | 1436.20 | 1401.80 | 1340.70 | 1262.50 | 1212.70 | 1162.10 | 1109.02 | 1022.89 | 969.41 | 922.66 | 840.00 | 794.86 | 748.42 | 703.82 | 658.92 | 611.06 | 566.01 | 530.89 | 488.41 | 450.27 | 404.32 | 367.88 | 330.94 | 300.57 | 266.44 | 245.09 | 221.08 | 193.43 | 171.23 | 149.17 | 134.46 | 113.77 | 95.86 | 80.88 | 63.93 | 49.20 | NA | 28.84 | NA | NA | |
| Accumulated Other Comprehensive Income Loss Net Of Tax | 3.70 | 20.10 | -14.70 | 11.20 | -4.90 | -18.00 | -21.50 | -5.10 | 4.90 | -3.00 | -3.60 | -4.30 | -4.50 | -6.30 | -6.80 | -7.20 | -5.80 | -0.70 | -1.90 | -0.90 | NA | 0.00 | NA | NA | NA | NA | NA | NA | NA | NA | NA | NA | -0.11 | -0.28 | -0.46 | -0.62 | -0.79 | -0.93 | -1.07 | -1.26 | -1.39 | -1.54 | -1.68 | -1.77 | -2.11 | -2.62 | -3.23 | -3.72 | -4.08 | -4.51 | -4.99 | -4.36 | NA | -4.87 | NA | NA | |
| Minority Interest | 25.30 | 25.00 | 26.10 | 4.10 | 3.60 | 4.20 | 4.00 | 6.10 | 3.30 | 2.80 | 1.90 | NA | NA | NA | NA | NA | NA | NA | NA | NA | NA | NA | NA | NA | NA | NA | NA | NA | NA | NA | NA | NA | NA | NA | NA | NA | NA | NA | NA | NA | NA | NA | NA | NA | NA | NA | NA | NA | NA | NA | NA | NA | NA | NA | NA | NA |
| 2024-03-31 | 2023-12-31 | 2023-09-30 | 2023-06-30 | 2023-03-31 | 2022-12-31 | 2022-09-30 | 2022-06-30 | 2022-03-31 | 2021-12-31 | 2021-09-30 | 2021-06-30 | 2021-03-31 | 2020-12-31 | 2020-09-30 | 2020-06-30 | 2020-03-31 | 2019-12-31 | 2019-09-30 | 2019-06-30 | 2019-03-31 | 2018-12-31 | 2018-09-30 | 2018-06-30 | 2018-03-31 | 2017-12-31 | 2017-09-30 | 2017-06-30 | 2017-03-31 | 2016-12-31 | 2016-09-30 | 2016-06-30 | 2016-03-31 | 2015-12-31 | 2015-09-30 | 2015-06-30 | 2015-03-31 | 2014-12-31 | 2014-09-30 | 2014-06-30 | 2014-03-31 | 2013-12-31 | 2013-09-30 | 2013-06-30 | 2013-03-31 | 2012-12-31 | 2012-09-30 | 2012-06-30 | 2012-03-31 | 2011-12-31 | 2011-09-30 | 2011-06-30 | 2011-03-31 | 2010-12-31 | 2010-09-30 | 2010-06-30 | ||
|---|---|---|---|---|---|---|---|---|---|---|---|---|---|---|---|---|---|---|---|---|---|---|---|---|---|---|---|---|---|---|---|---|---|---|---|---|---|---|---|---|---|---|---|---|---|---|---|---|---|---|---|---|---|---|---|---|---|
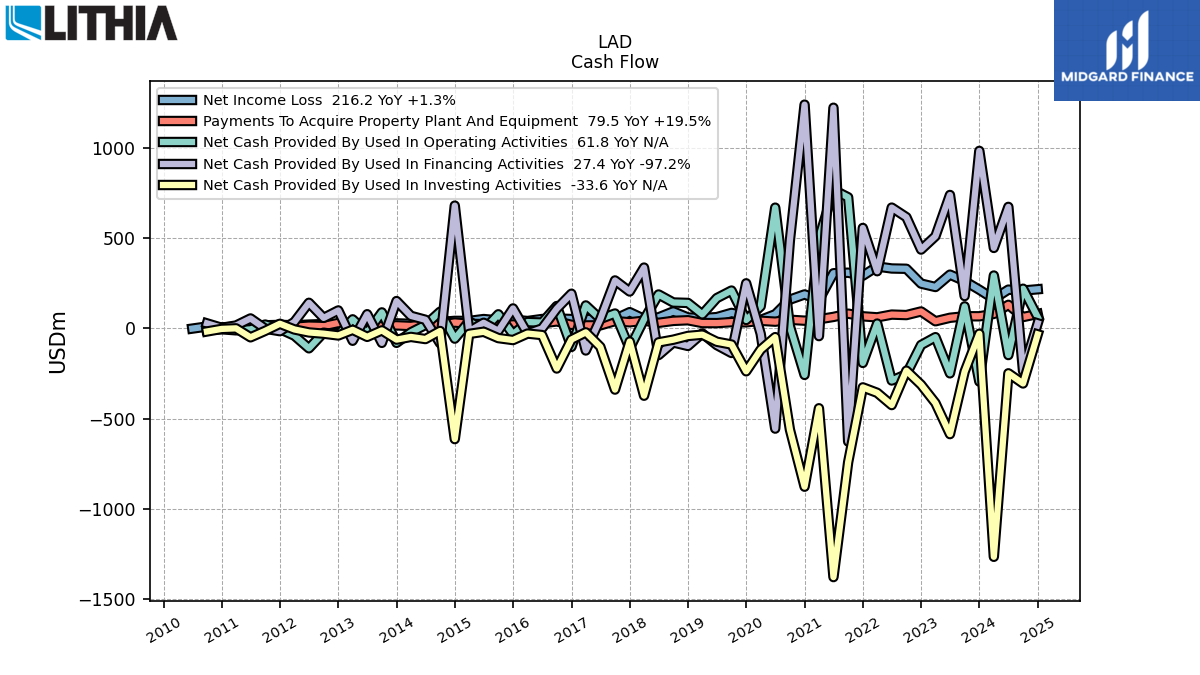
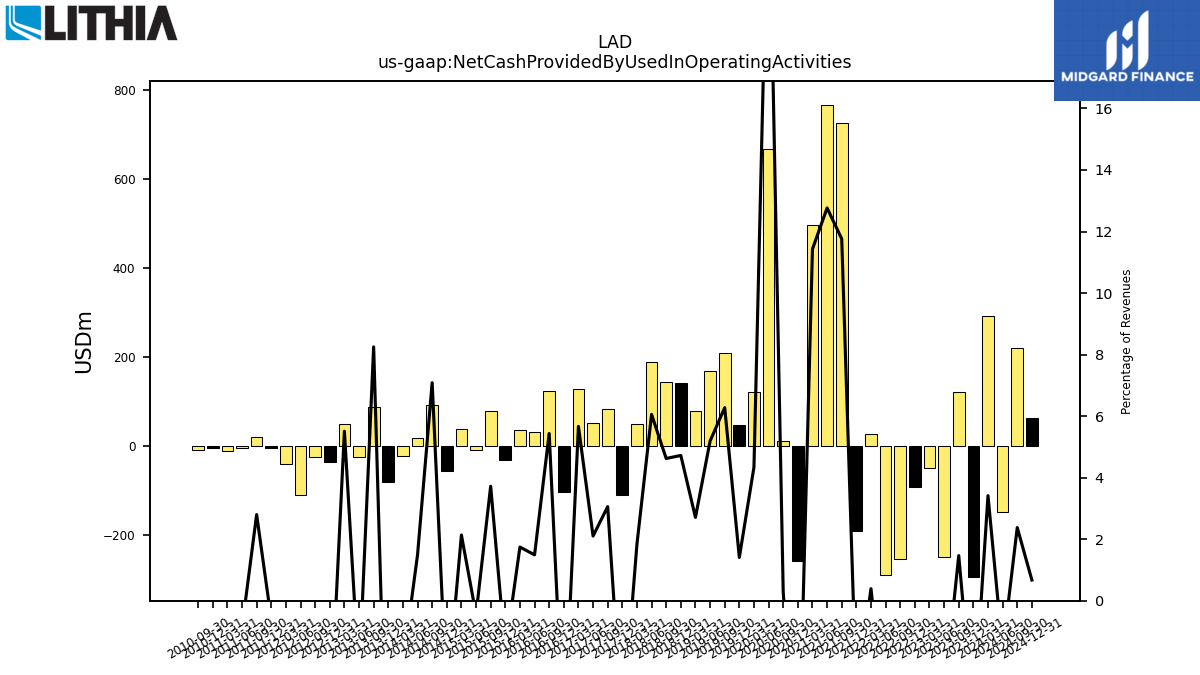
| Net Cash Provided By Used In Operating Activities | 292.40 | -295.20 | 121.50 | -249.70 | -49.00 | -92.60 | -254.40 | -289.40 | 26.30 | -192.00 | 725.70 | 767.10 | 496.40 | -258.40 | 10.60 | 668.30 | 121.70 | 46.00 | 209.10 | 167.20 | 77.20 | 140.41 | 142.96 | 187.46 | 48.87 | -111.68 | 81.98 | 51.88 | 126.67 | -103.28 | 123.38 | 31.82 | 34.59 | -32.71 | 77.59 | -8.90 | 38.23 | -57.38 | 91.90 | 18.19 | -22.39 | -80.61 | 88.22 | -25.31 | 49.76 | -36.14 | -24.29 | -111.06 | -40.99 | -4.19 | 20.66 | -6.00 | -11.24 | -5.34 | -9.71 | NA | |
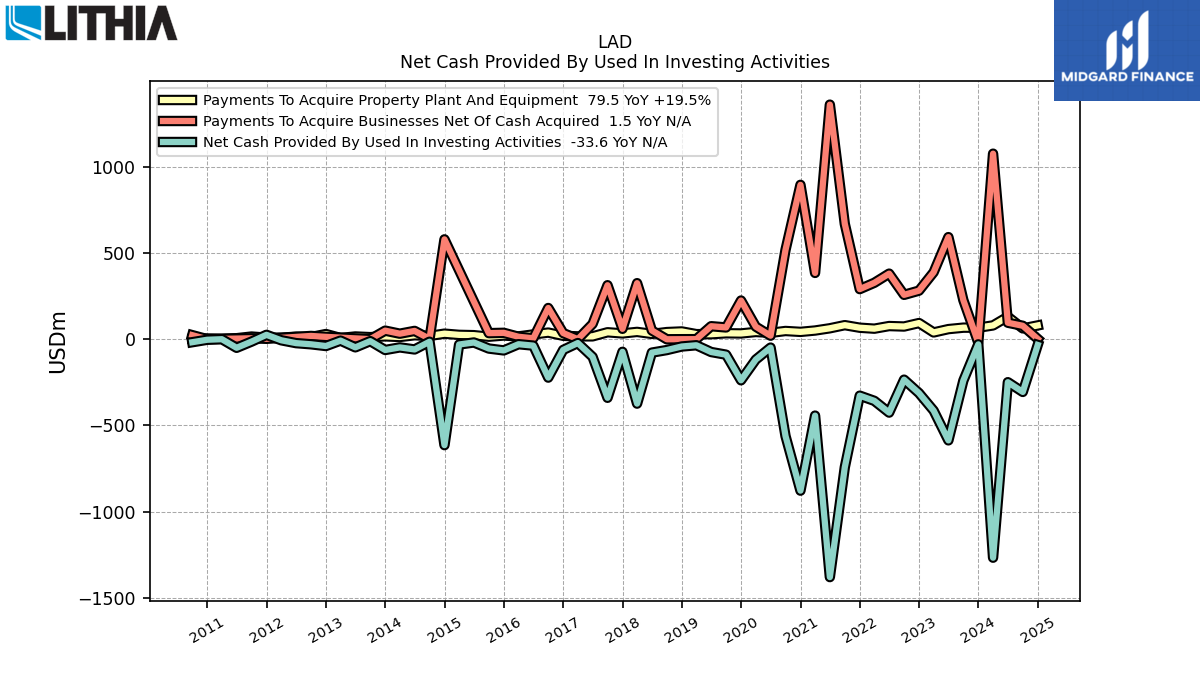
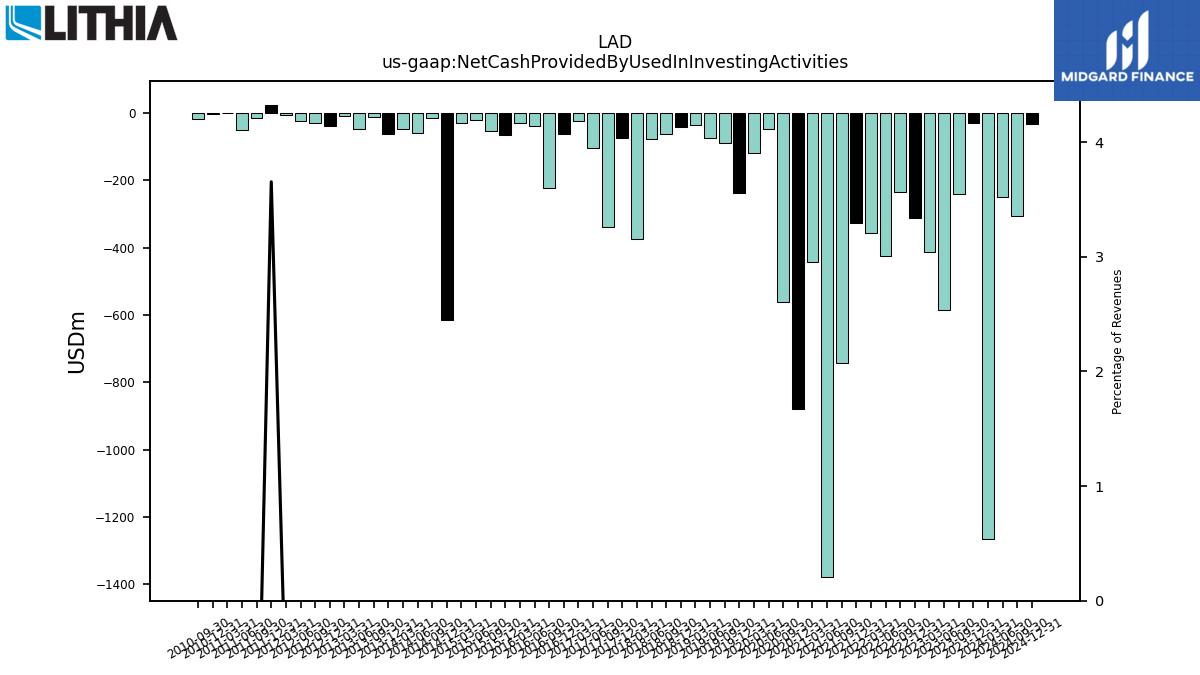
| Net Cash Provided By Used In Investing Activities | -1265.90 | -30.00 | -240.10 | -586.30 | -413.90 | -312.50 | -234.60 | -425.40 | -357.30 | -327.30 | -742.00 | -1378.30 | -442.80 | -877.50 | -561.20 | -48.80 | -118.30 | -238.30 | -89.90 | -74.50 | -35.30 | -42.50 | -63.14 | -77.96 | -373.50 | -73.28 | -339.70 | -102.72 | -22.50 | -62.21 | -222.77 | -37.48 | -29.23 | -65.16 | -54.37 | -19.27 | -30.94 | -613.98 | -14.90 | -59.62 | -47.82 | -62.79 | -11.56 | -47.51 | -8.47 | -39.75 | -29.73 | -23.03 | -6.49 | 25.06 | -14.17 | -50.05 | -0.26 | -3.47 | -17.67 | NA | |
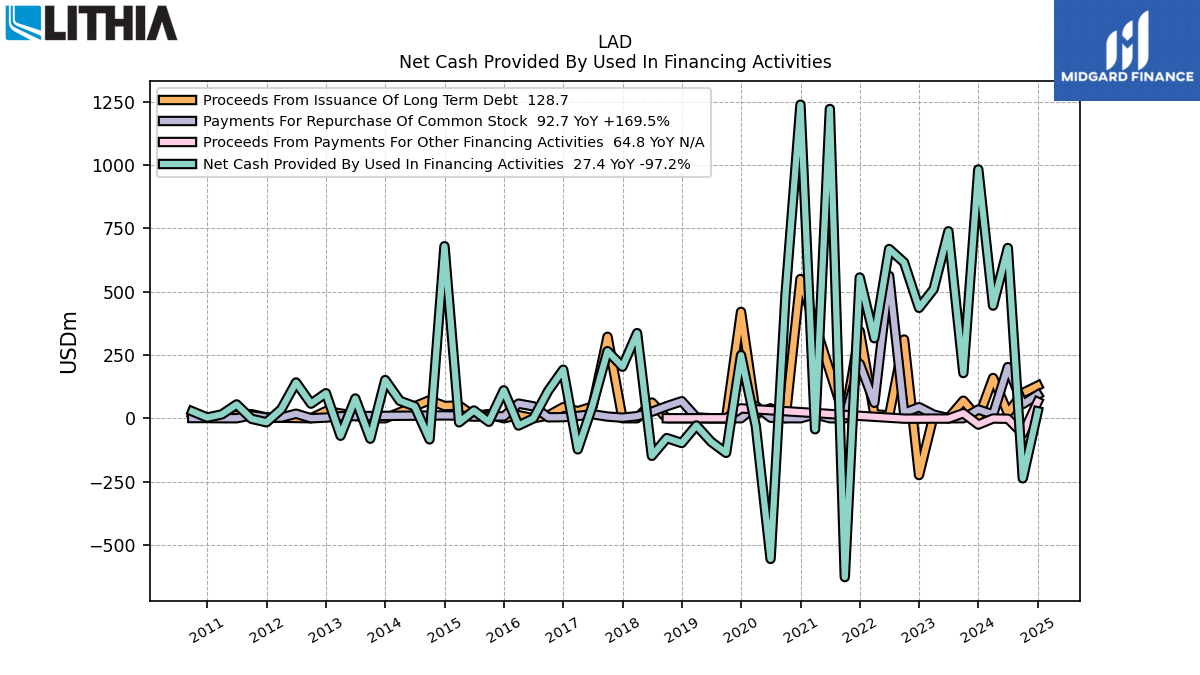
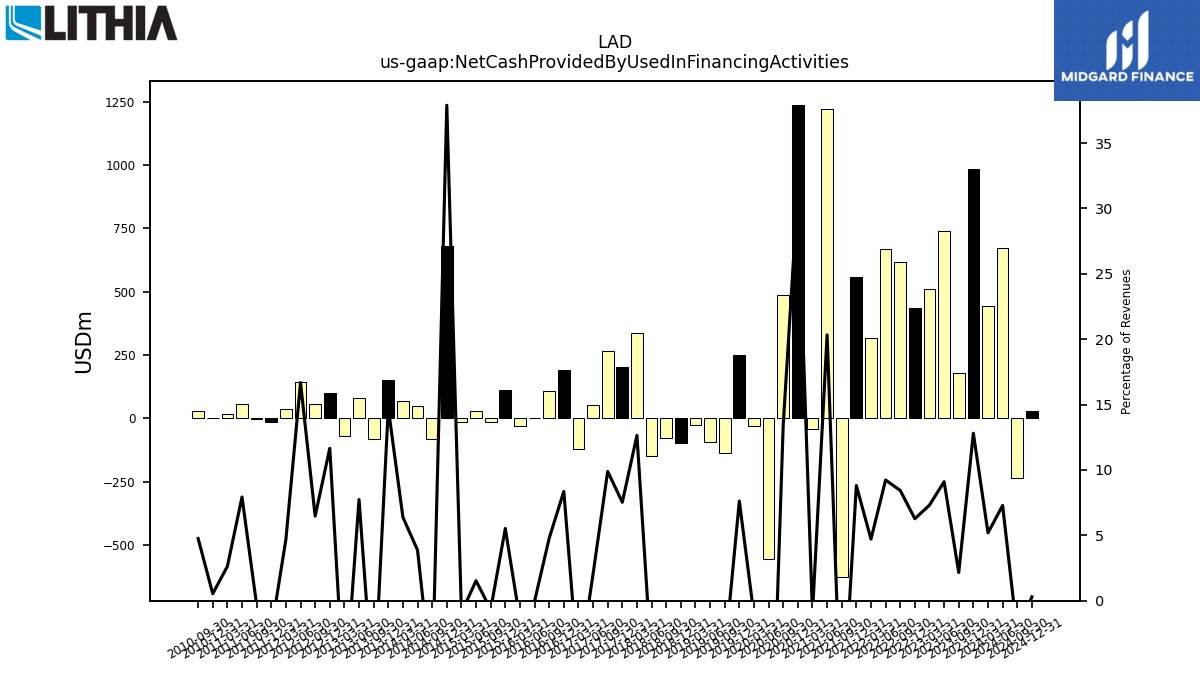
| Net Cash Provided By Used In Financing Activities | 445.00 | 982.80 | 178.50 | 738.60 | 509.90 | 435.90 | 615.40 | 668.60 | 316.00 | 556.00 | -627.60 | 1221.80 | -43.50 | 1238.90 | 487.40 | -555.80 | -30.80 | 249.20 | -136.80 | -93.00 | -28.50 | -97.79 | -78.37 | -148.49 | 336.36 | 203.64 | 265.12 | 50.57 | -123.01 | 191.65 | 108.47 | -0.86 | -28.81 | 110.17 | -13.91 | 30.54 | -16.17 | 679.60 | -83.53 | 47.29 | 68.86 | 151.00 | -80.83 | 78.07 | -69.12 | 98.97 | 57.53 | 141.36 | 35.59 | -15.96 | -2.30 | 54.67 | 15.31 | 2.82 | 27.30 | NA |
| 2024-03-31 | 2023-12-31 | 2023-09-30 | 2023-06-30 | 2023-03-31 | 2022-12-31 | 2022-09-30 | 2022-06-30 | 2022-03-31 | 2021-12-31 | 2021-09-30 | 2021-06-30 | 2021-03-31 | 2020-12-31 | 2020-09-30 | 2020-06-30 | 2020-03-31 | 2019-12-31 | 2019-09-30 | 2019-06-30 | 2019-03-31 | 2018-12-31 | 2018-09-30 | 2018-06-30 | 2018-03-31 | 2017-12-31 | 2017-09-30 | 2017-06-30 | 2017-03-31 | 2016-12-31 | 2016-09-30 | 2016-06-30 | 2016-03-31 | 2015-12-31 | 2015-09-30 | 2015-06-30 | 2015-03-31 | 2014-12-31 | 2014-09-30 | 2014-06-30 | 2014-03-31 | 2013-12-31 | 2013-09-30 | 2013-06-30 | 2013-03-31 | 2012-12-31 | 2012-09-30 | 2012-06-30 | 2012-03-31 | 2011-12-31 | 2011-09-30 | 2011-06-30 | 2011-03-31 | 2010-12-31 | 2010-09-30 | 2010-06-30 | ||
|---|---|---|---|---|---|---|---|---|---|---|---|---|---|---|---|---|---|---|---|---|---|---|---|---|---|---|---|---|---|---|---|---|---|---|---|---|---|---|---|---|---|---|---|---|---|---|---|---|---|---|---|---|---|---|---|---|---|
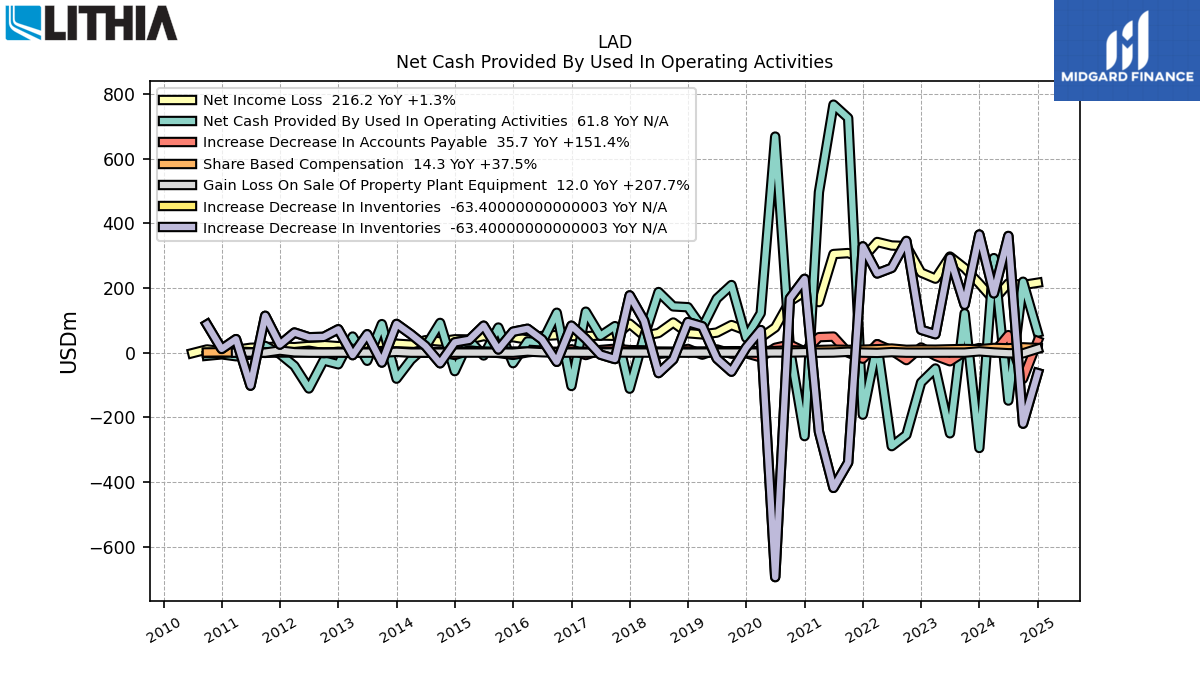
| Net Cash Provided By Used In Operating Activities | 292.40 | -295.20 | 121.50 | -249.70 | -49.00 | -92.60 | -254.40 | -289.40 | 26.30 | -192.00 | 725.70 | 767.10 | 496.40 | -258.40 | 10.60 | 668.30 | 121.70 | 46.00 | 209.10 | 167.20 | 77.20 | 140.41 | 142.96 | 187.46 | 48.87 | -111.68 | 81.98 | 51.88 | 126.67 | -103.28 | 123.38 | 31.82 | 34.59 | -32.71 | 77.59 | -8.90 | 38.23 | -57.38 | 91.90 | 18.19 | -22.39 | -80.61 | 88.22 | -25.31 | 49.76 | -36.14 | -24.29 | -111.06 | -40.99 | -4.19 | 20.66 | -6.00 | -11.24 | -5.34 | -9.71 | NA | |
| Net Income Loss | 162.60 | 213.50 | 261.50 | 297.20 | 228.70 | 247.60 | 329.60 | 331.30 | 342.20 | 291.10 | 307.90 | 304.90 | 156.20 | 187.60 | 158.80 | 77.70 | 46.20 | 68.00 | 85.20 | 61.90 | 56.40 | 59.87 | 93.11 | 60.66 | 52.06 | 89.40 | 51.89 | 53.20 | 50.73 | 51.32 | 54.04 | 51.43 | 40.27 | 47.73 | 43.39 | 51.22 | 40.65 | 41.14 | 34.54 | 38.31 | 24.73 | 27.37 | 31.02 | 25.55 | 22.05 | 19.83 | 23.24 | 20.49 | 16.80 | 18.77 | 16.56 | 14.83 | 8.71 | 4.38 | 9.79 | -1.72 | |
| Profit Loss | 165.00 | 216.10 | 264.90 | 301.10 | 229.60 | 249.80 | 330.30 | 337.60 | 343.60 | 292.60 | 309.00 | 304.90 | 156.20 | 187.60 | 158.80 | NA | NA | NA | NA | NA | NA | NA | NA | NA | NA | NA | NA | NA | NA | NA | NA | NA | NA | NA | NA | NA | NA | NA | NA | NA | NA | NA | NA | NA | NA | NA | NA | NA | NA | NA | NA | NA | NA | NA | NA | NA | |
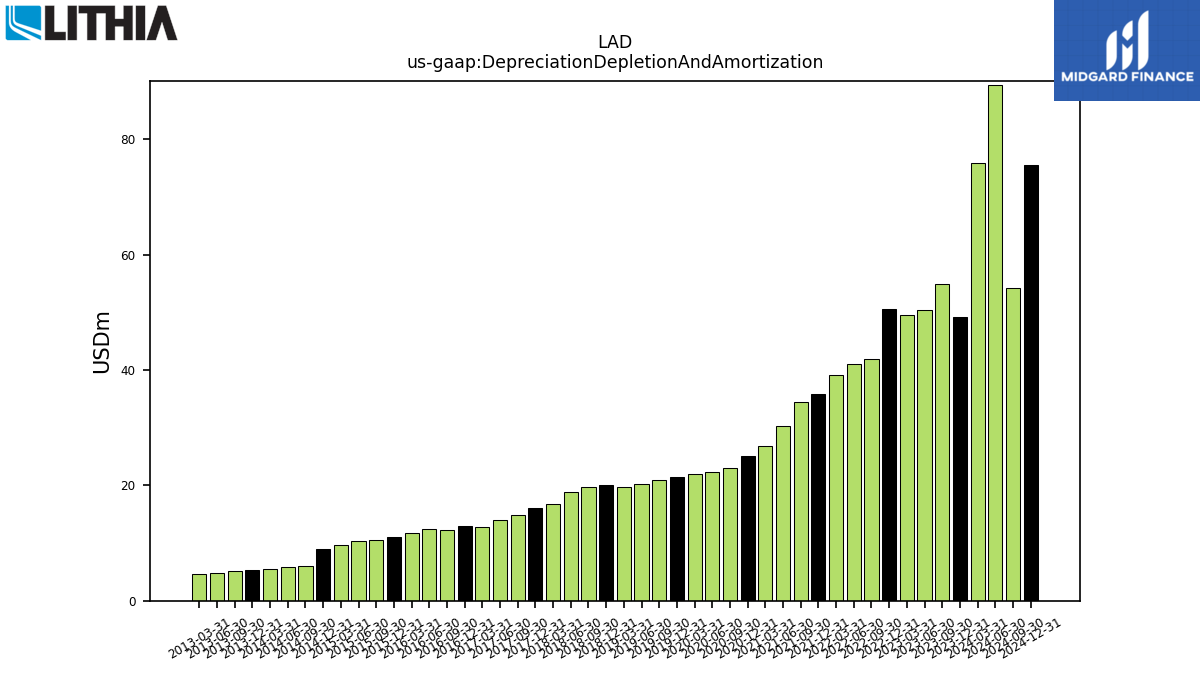
| Depreciation Depletion And Amortization | 75.90 | 49.20 | 54.90 | 50.40 | 49.60 | 50.60 | 41.90 | 41.00 | 39.20 | 35.80 | 34.40 | 30.30 | 26.80 | 25.10 | 23.00 | 22.30 | 22.00 | 21.50 | 20.90 | 20.20 | 19.80 | 20.08 | 19.65 | 18.82 | 16.85 | 16.12 | 14.83 | 14.03 | 12.74 | 13.00 | 12.21 | 12.50 | 11.66 | 11.06 | 10.53 | 10.29 | 9.73 | 8.96 | 6.07 | 5.83 | 5.51 | 5.32 | 5.10 | 4.90 | 4.72 | NA | NA | NA | NA | NA | NA | NA | NA | NA | NA | NA | |
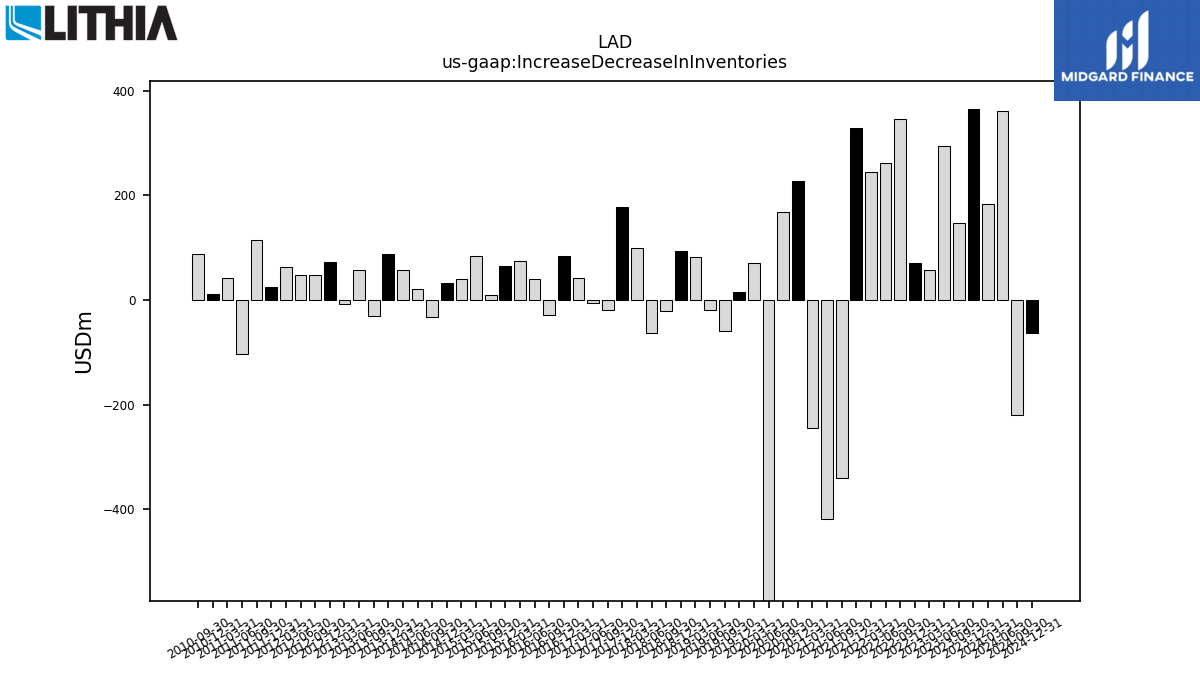
| Increase Decrease In Inventories | 183.30 | 365.30 | 148.00 | 293.30 | 56.90 | 70.60 | 345.40 | 262.10 | 244.90 | 328.60 | -340.10 | -418.50 | -244.60 | 228.20 | 167.70 | -694.50 | 69.80 | 15.60 | -58.90 | -18.40 | 81.40 | 94.43 | -21.06 | -63.33 | 98.86 | 177.00 | -19.98 | -6.22 | 42.30 | 83.28 | -28.49 | 40.31 | 73.74 | 64.67 | 9.75 | 83.20 | 39.46 | 31.65 | -32.95 | 20.55 | 56.75 | 88.71 | -30.71 | 56.79 | -7.89 | 72.26 | 48.59 | 47.48 | 62.11 | 24.81 | 113.89 | -102.27 | 41.77 | 11.27 | 87.14 | NA | |
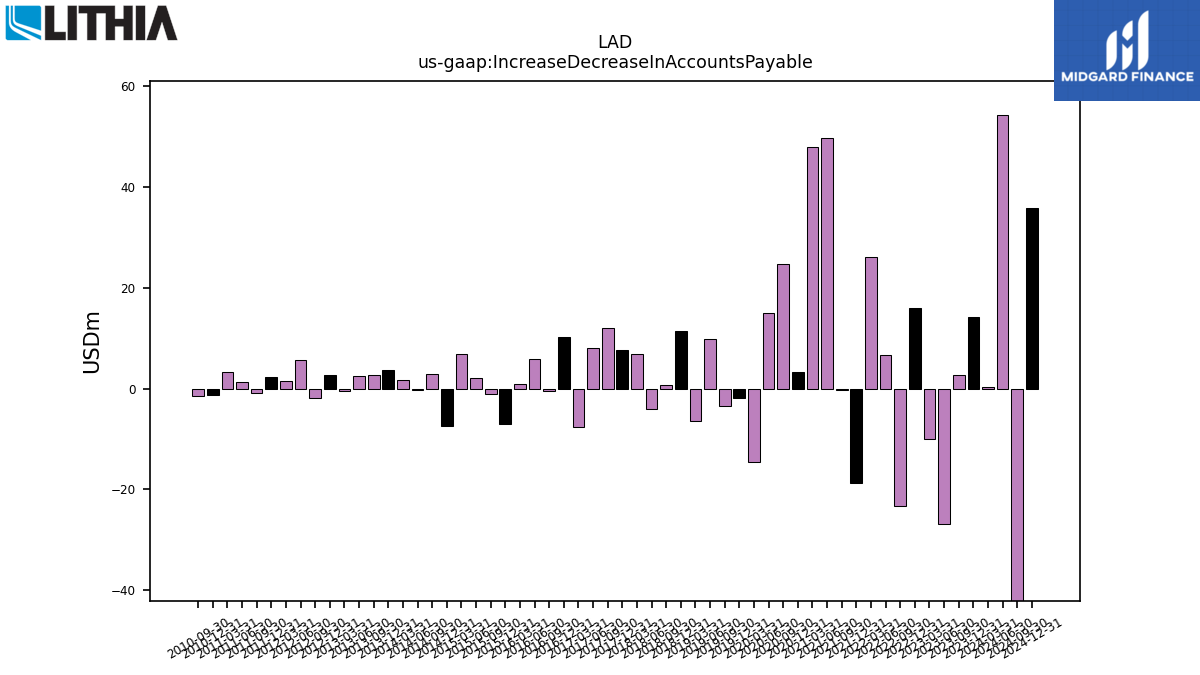
| Increase Decrease In Accounts Payable | 0.20 | 14.20 | 2.70 | -26.80 | -10.00 | 16.00 | -23.30 | 6.60 | 26.00 | -18.80 | -0.20 | 49.60 | 47.80 | 3.20 | 24.70 | 14.90 | -14.60 | -1.90 | -3.40 | 9.90 | -6.40 | 11.46 | 0.72 | -4.00 | 6.93 | 7.61 | 11.98 | 8.03 | -7.62 | 10.30 | -0.53 | 5.76 | 0.92 | -7.09 | -1.09 | 2.06 | 6.80 | -7.35 | 2.83 | -0.36 | 1.77 | 3.63 | 2.77 | 2.49 | -0.41 | 2.62 | -1.91 | 5.74 | 1.55 | 2.24 | -0.92 | 1.38 | 3.30 | -1.21 | -1.49 | NA | |
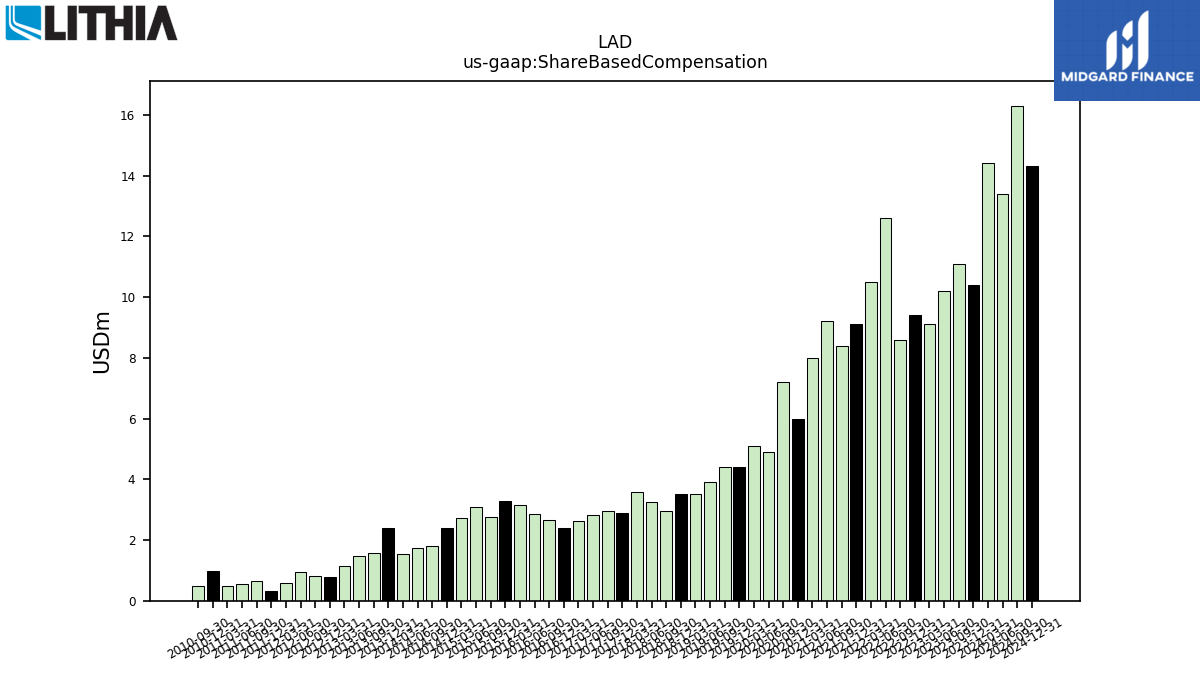
| Share Based Compensation | 14.40 | 10.40 | 11.10 | 10.20 | 9.10 | 9.40 | 8.60 | 12.60 | 10.50 | 9.10 | 8.40 | 9.20 | 8.00 | 6.00 | 7.20 | 4.90 | 5.10 | 4.40 | 4.40 | 3.90 | 3.50 | 3.52 | 2.94 | 3.26 | 3.57 | 2.88 | 2.96 | 2.81 | 2.62 | 2.38 | 2.65 | 2.87 | 3.15 | 3.29 | 2.76 | 3.10 | 2.73 | 2.38 | 1.79 | 1.72 | 1.54 | 2.40 | 1.56 | 1.46 | 1.14 | 0.79 | 0.82 | 0.94 | 0.58 | 0.32 | 0.65 | 0.54 | 0.49 | 0.97 | 0.50 | NA |
| 2024-03-31 | 2023-12-31 | 2023-09-30 | 2023-06-30 | 2023-03-31 | 2022-12-31 | 2022-09-30 | 2022-06-30 | 2022-03-31 | 2021-12-31 | 2021-09-30 | 2021-06-30 | 2021-03-31 | 2020-12-31 | 2020-09-30 | 2020-06-30 | 2020-03-31 | 2019-12-31 | 2019-09-30 | 2019-06-30 | 2019-03-31 | 2018-12-31 | 2018-09-30 | 2018-06-30 | 2018-03-31 | 2017-12-31 | 2017-09-30 | 2017-06-30 | 2017-03-31 | 2016-12-31 | 2016-09-30 | 2016-06-30 | 2016-03-31 | 2015-12-31 | 2015-09-30 | 2015-06-30 | 2015-03-31 | 2014-12-31 | 2014-09-30 | 2014-06-30 | 2014-03-31 | 2013-12-31 | 2013-09-30 | 2013-06-30 | 2013-03-31 | 2012-12-31 | 2012-09-30 | 2012-06-30 | 2012-03-31 | 2011-12-31 | 2011-09-30 | 2011-06-30 | 2011-03-31 | 2010-12-31 | 2010-09-30 | 2010-06-30 | ||
|---|---|---|---|---|---|---|---|---|---|---|---|---|---|---|---|---|---|---|---|---|---|---|---|---|---|---|---|---|---|---|---|---|---|---|---|---|---|---|---|---|---|---|---|---|---|---|---|---|---|---|---|---|---|---|---|---|---|
| Net Cash Provided By Used In Investing Activities | -1265.90 | -30.00 | -240.10 | -586.30 | -413.90 | -312.50 | -234.60 | -425.40 | -357.30 | -327.30 | -742.00 | -1378.30 | -442.80 | -877.50 | -561.20 | -48.80 | -118.30 | -238.30 | -89.90 | -74.50 | -35.30 | -42.50 | -63.14 | -77.96 | -373.50 | -73.28 | -339.70 | -102.72 | -22.50 | -62.21 | -222.77 | -37.48 | -29.23 | -65.16 | -54.37 | -19.27 | -30.94 | -613.98 | -14.90 | -59.62 | -47.82 | -62.79 | -11.56 | -47.51 | -8.47 | -39.75 | -29.73 | -23.03 | -6.49 | 25.06 | -14.17 | -50.05 | -0.26 | -3.47 | -17.67 | NA | |
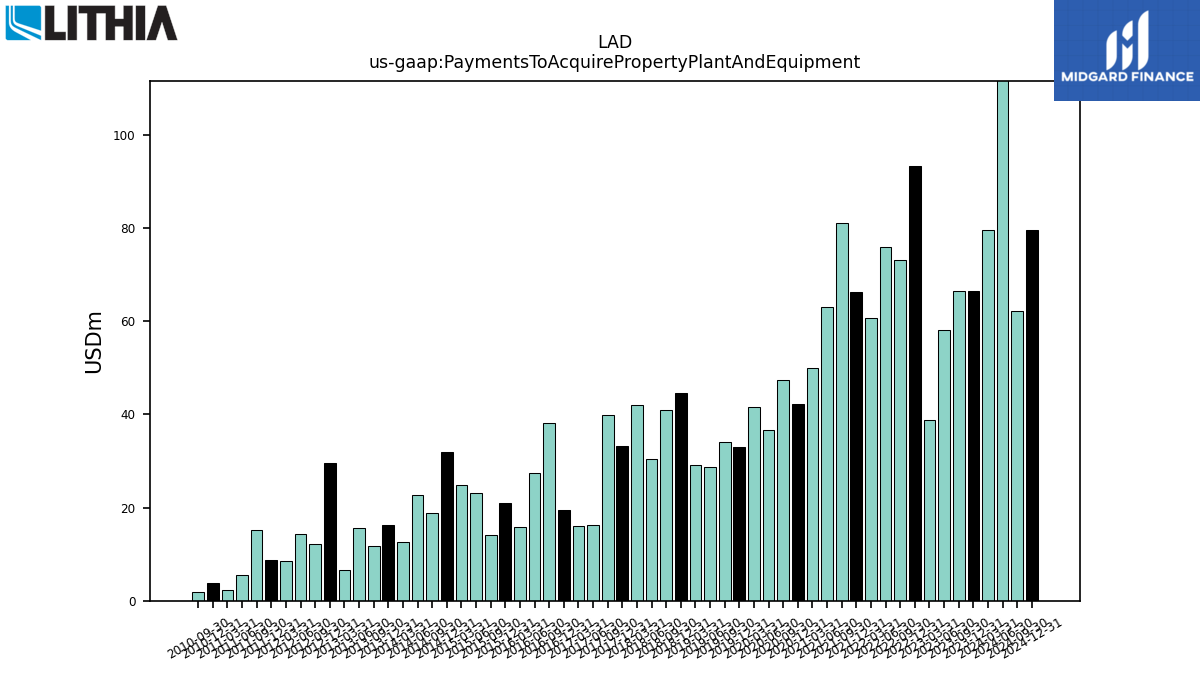
| Payments To Acquire Property Plant And Equipment | 79.60 | 66.50 | 66.60 | 58.20 | 38.90 | 93.30 | 73.20 | 75.90 | 60.70 | 66.30 | 81.10 | 63.00 | 50.00 | 42.20 | 47.30 | 36.70 | 41.60 | 33.00 | 34.10 | 28.70 | 29.10 | 44.61 | 41.01 | 30.37 | 42.00 | 33.20 | 39.91 | 16.23 | 16.04 | 19.40 | 38.12 | 27.35 | 15.90 | 21.09 | 14.15 | 23.09 | 24.92 | 31.83 | 18.92 | 22.60 | 12.63 | 16.22 | 11.70 | 15.52 | 6.58 | 29.62 | 12.27 | 14.23 | 8.46 | 8.68 | 15.14 | 5.52 | 2.33 | 3.90 | 1.81 | NA |
| 2024-03-31 | 2023-12-31 | 2023-09-30 | 2023-06-30 | 2023-03-31 | 2022-12-31 | 2022-09-30 | 2022-06-30 | 2022-03-31 | 2021-12-31 | 2021-09-30 | 2021-06-30 | 2021-03-31 | 2020-12-31 | 2020-09-30 | 2020-06-30 | 2020-03-31 | 2019-12-31 | 2019-09-30 | 2019-06-30 | 2019-03-31 | 2018-12-31 | 2018-09-30 | 2018-06-30 | 2018-03-31 | 2017-12-31 | 2017-09-30 | 2017-06-30 | 2017-03-31 | 2016-12-31 | 2016-09-30 | 2016-06-30 | 2016-03-31 | 2015-12-31 | 2015-09-30 | 2015-06-30 | 2015-03-31 | 2014-12-31 | 2014-09-30 | 2014-06-30 | 2014-03-31 | 2013-12-31 | 2013-09-30 | 2013-06-30 | 2013-03-31 | 2012-12-31 | 2012-09-30 | 2012-06-30 | 2012-03-31 | 2011-12-31 | 2011-09-30 | 2011-06-30 | 2011-03-31 | 2010-12-31 | 2010-09-30 | 2010-06-30 | ||
|---|---|---|---|---|---|---|---|---|---|---|---|---|---|---|---|---|---|---|---|---|---|---|---|---|---|---|---|---|---|---|---|---|---|---|---|---|---|---|---|---|---|---|---|---|---|---|---|---|---|---|---|---|---|---|---|---|---|
| Net Cash Provided By Used In Financing Activities | 445.00 | 982.80 | 178.50 | 738.60 | 509.90 | 435.90 | 615.40 | 668.60 | 316.00 | 556.00 | -627.60 | 1221.80 | -43.50 | 1238.90 | 487.40 | -555.80 | -30.80 | 249.20 | -136.80 | -93.00 | -28.50 | -97.79 | -78.37 | -148.49 | 336.36 | 203.64 | 265.12 | 50.57 | -123.01 | 191.65 | 108.47 | -0.86 | -28.81 | 110.17 | -13.91 | 30.54 | -16.17 | 679.60 | -83.53 | 47.29 | 68.86 | 151.00 | -80.83 | 78.07 | -69.12 | 98.97 | 57.53 | 141.36 | 35.59 | -15.96 | -2.30 | 54.67 | 15.31 | 2.82 | 27.30 | NA | |
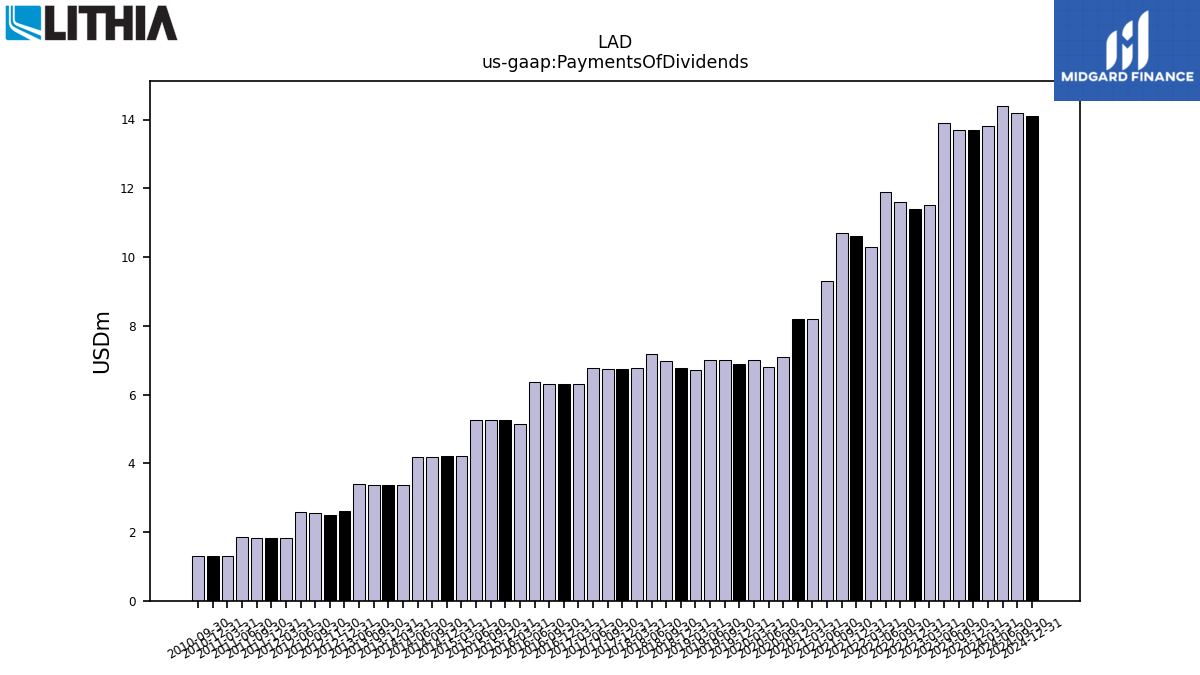
| Payments Of Dividends | 13.80 | 13.70 | 13.70 | 13.90 | 11.50 | 11.40 | 11.60 | 11.90 | 10.30 | 10.60 | 10.70 | 9.30 | 8.20 | 8.20 | 7.10 | 6.80 | 7.00 | 6.90 | 7.00 | 7.00 | 6.70 | 6.79 | 6.98 | 7.18 | 6.76 | 6.74 | 6.75 | 6.76 | 6.29 | 6.31 | 6.30 | 6.37 | 5.15 | 5.25 | 5.26 | 5.27 | 4.22 | 4.20 | 4.17 | 4.18 | 3.38 | 3.37 | 3.36 | 3.40 | NA | 2.60 | 2.54 | 2.58 | 1.81 | 1.82 | 1.84 | 1.85 | 1.32 | 1.31 | 1.31 | NA | |
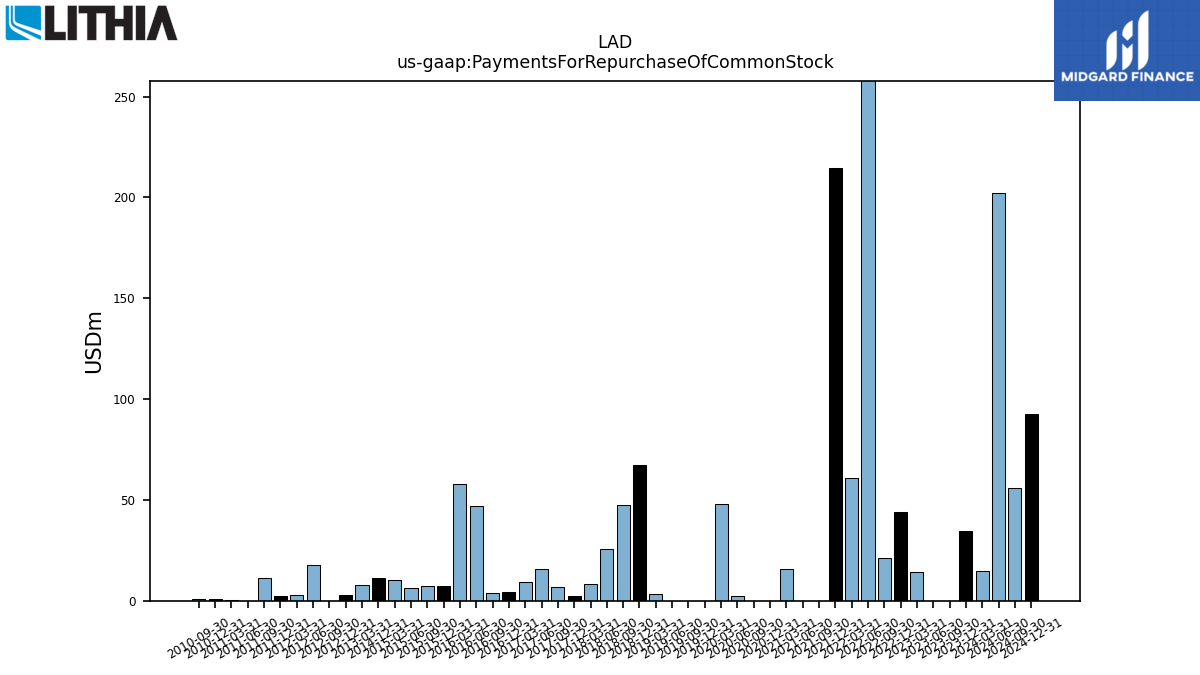
| Payments For Repurchase Of Common Stock | 15.00 | 34.40 | 0.00 | 0.10 | 14.40 | 43.90 | 21.00 | 562.50 | 60.90 | 214.80 | 0.00 | 0.00 | 15.90 | 0.00 | 0.10 | 2.30 | 48.20 | 0.10 | 0.00 | 0.00 | 3.10 | 67.28 | 47.70 | 25.65 | 8.27 | 2.23 | 6.61 | 15.72 | 9.19 | 4.34 | 3.74 | 47.12 | 57.74 | 7.35 | 7.42 | 6.43 | 10.34 | 11.22 | NA | NA | NA | NA | NA | NA | 7.90 | 2.67 | -0.00 | 17.95 | 2.65 | 2.13 | 11.29 | 0.00 | 0.14 | 0.81 | 0.80 | NA |
| 2024-03-31 | 2023-12-31 | 2023-09-30 | 2023-06-30 | 2023-03-31 | 2022-12-31 | 2022-09-30 | 2022-06-30 | 2022-03-31 | 2021-12-31 | 2021-09-30 | 2021-06-30 | 2021-03-31 | 2020-12-31 | 2020-09-30 | 2020-06-30 | 2020-03-31 | 2019-12-31 | 2019-09-30 | 2019-06-30 | 2019-03-31 | 2018-12-31 | 2018-09-30 | 2018-06-30 | 2018-03-31 | 2017-12-31 | 2017-09-30 | 2017-06-30 | 2017-03-31 | 2016-12-31 | 2016-09-30 | 2016-06-30 | 2016-03-31 | 2015-12-31 | 2015-09-30 | 2015-06-30 | 2015-03-31 | 2014-12-31 | 2014-09-30 | 2014-06-30 | 2014-03-31 | 2013-12-31 | 2013-09-30 | 2013-06-30 | 2013-03-31 | 2012-12-31 | 2012-09-30 | 2012-06-30 | 2012-03-31 | 2011-12-31 | 2011-09-30 | 2011-06-30 | 2011-03-31 | 2010-12-31 | 2010-09-30 | 2010-06-30 | ||
|---|---|---|---|---|---|---|---|---|---|---|---|---|---|---|---|---|---|---|---|---|---|---|---|---|---|---|---|---|---|---|---|---|---|---|---|---|---|---|---|---|---|---|---|---|---|---|---|---|---|---|---|---|---|---|---|---|---|
| Revenues | 8561.80 | 7674.30 | 8277.00 | 8111.50 | 6973.80 | 6946.50 | 7295.70 | 7240.10 | 6705.30 | 6309.50 | 6169.80 | 6009.40 | 4343.00 | 3941.80 | 3620.20 | 2758.60 | 2803.80 | 3268.90 | 3332.40 | 3221.70 | 2849.70 | 2973.23 | 3091.95 | 3096.54 | 2659.68 | 2703.03 | 2680.34 | 2467.04 | 2236.10 | 2291.99 | 2269.97 | 2133.34 | 1982.86 | 1993.28 | 2084.84 | 1996.95 | 1789.18 | 1793.31 | 1297.11 | 1221.80 | 1078.11 | 1024.87 | 1069.29 | 1008.50 | 903.08 | 849.00 | 888.37 | 847.12 | 758.89 | 685.88 | 737.90 | 689.07 | 582.86 | 521.26 | 573.00 | 530.15 | |
| Revenue From Contract With Customer Excluding Assessed Tax | 8561.80 | 7674.30 | 8277.00 | 8111.50 | 6973.80 | 6946.50 | 7295.70 | 7240.10 | 6705.30 | 6309.50 | 6169.80 | 6009.40 | 4343.00 | 3941.80 | 3620.20 | 2758.60 | 2803.80 | 3268.90 | 3332.40 | 3221.70 | 2849.70 | 2973.23 | 3091.95 | 3096.54 | 2659.68 | 2703.02 | 2680.34 | 2467.04 | 2236.10 | 2291.99 | 2269.97 | 2133.34 | 1982.86 | 1993.28 | 2084.84 | 1996.95 | 1789.18 | 1793.31 | 1297.11 | 1221.80 | 1078.11 | 1024.87 | 1069.29 | 1008.50 | 903.08 | 849.00 | 888.37 | 847.12 | 758.89 | 685.88 | 737.90 | 689.07 | 582.86 | 521.26 | 573.00 | 530.15 | |
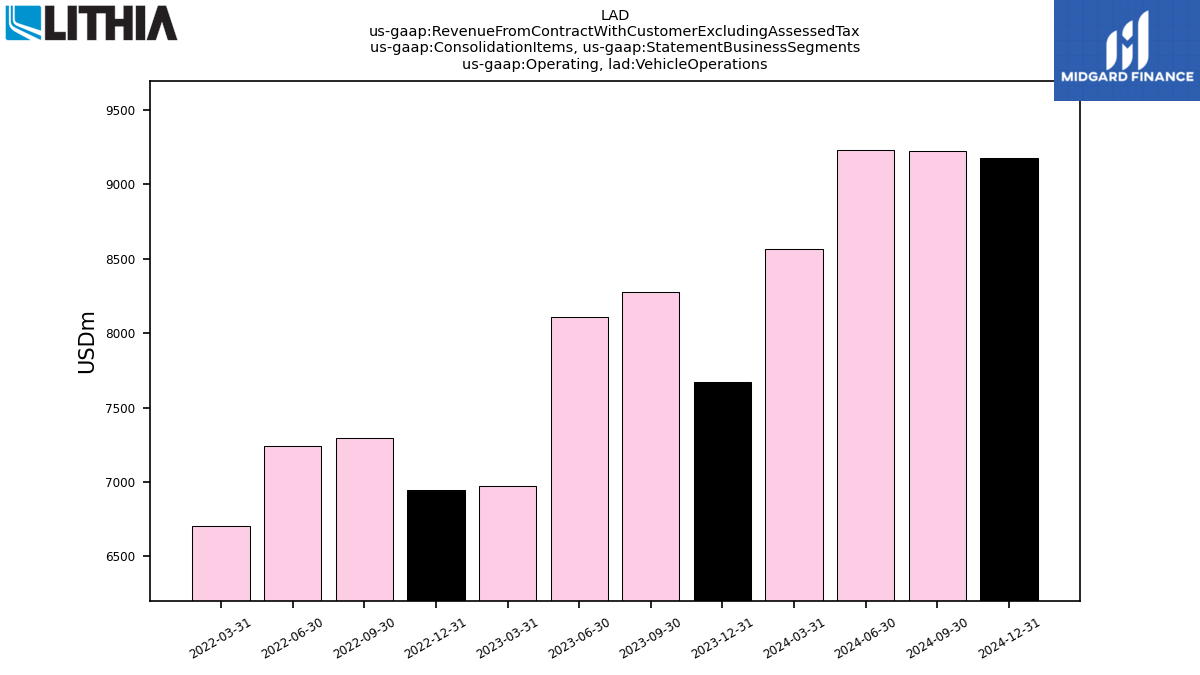
| Operating, Vehicle Operations | 8561.80 | 7674.30 | 8277.00 | 8111.50 | 6973.80 | 6946.50 | 7295.70 | 7240.10 | 6705.30 | NA | NA | NA | NA | NA | NA | NA | NA | NA | NA | NA | NA | NA | NA | NA | NA | NA | NA | NA | NA | NA | NA | NA | NA | NA | NA | NA | NA | NA | NA | NA | NA | NA | NA | NA | NA | NA | NA | NA | NA | NA | NA | NA | NA | NA | NA | NA | |
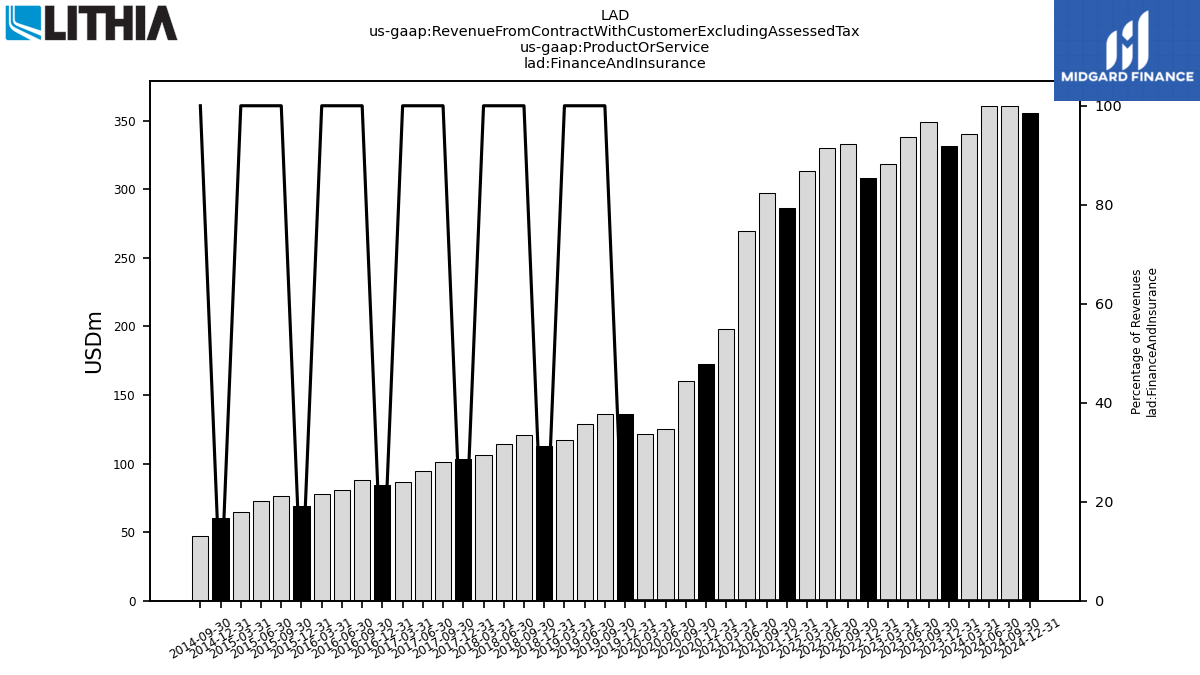
| Finance And Insurance | 340.60 | 331.40 | 349.40 | 337.90 | 318.30 | 308.40 | 333.30 | 330.40 | 313.20 | 286.30 | 297.00 | 269.60 | 198.40 | 172.60 | 160.50 | 124.90 | 121.90 | 135.90 | 136.30 | 129.00 | 117.50 | 112.74 | 121.06 | 114.49 | 106.50 | 103.23 | 101.04 | 94.85 | 86.78 | 84.53 | 87.71 | 81.04 | 77.64 | 69.32 | 76.63 | 72.46 | 64.60 | 60.06 | 46.85 | NA | NA | NA | NA | NA | NA | NA | NA | NA | NA | NA | NA | NA | NA | NA | NA | NA | |
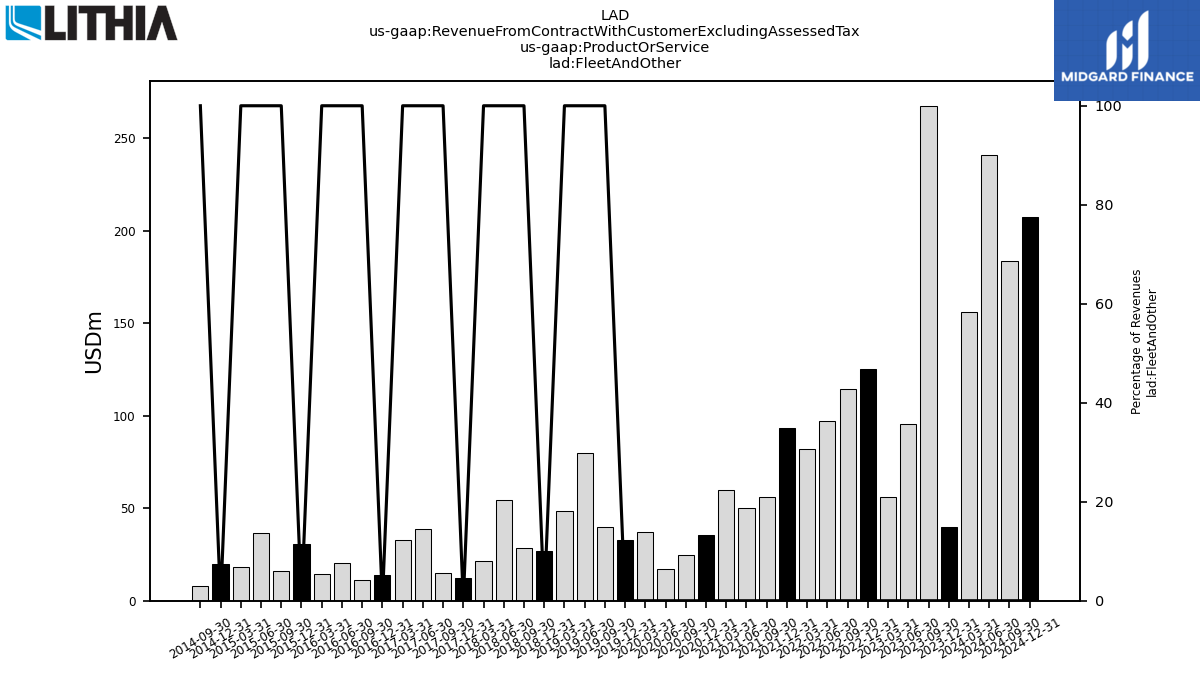
| Fleet And Other | 155.80 | 39.60 | 267.50 | 95.50 | 56.10 | 125.10 | 114.30 | 97.30 | 82.20 | 93.40 | 55.90 | 50.30 | 60.00 | 35.50 | 24.90 | 16.90 | 37.40 | 32.90 | 40.10 | 79.80 | 48.40 | 26.85 | 28.73 | 54.40 | 21.22 | 12.12 | 15.19 | 38.98 | 32.72 | 14.03 | 11.44 | 20.63 | 14.62 | 30.59 | 15.98 | 36.68 | 18.14 | 19.85 | 7.99 | NA | NA | NA | NA | NA | NA | NA | NA | NA | NA | NA | NA | NA | NA | NA | NA | NA | |
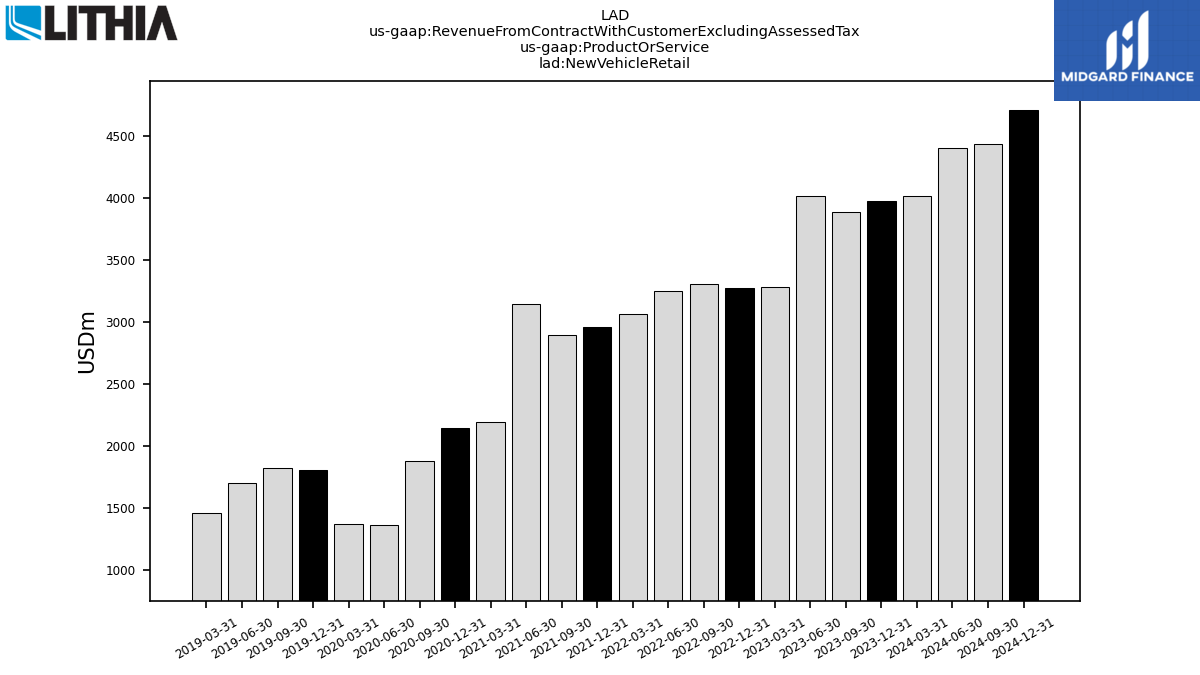
| New Vehicle Retail | 4014.10 | 3974.70 | 3885.80 | 4014.70 | 3278.90 | 3275.10 | 3306.90 | 3250.70 | 3061.80 | 2960.00 | 2898.20 | 3146.20 | 2193.20 | 2149.30 | 1883.30 | 1367.80 | 1373.50 | 1805.80 | 1824.80 | 1707.40 | 1461.10 | NA | NA | NA | NA | NA | NA | NA | NA | NA | NA | NA | NA | NA | NA | NA | NA | NA | NA | NA | NA | NA | NA | NA | NA | NA | NA | NA | NA | NA | NA | NA | NA | NA | NA | NA | |
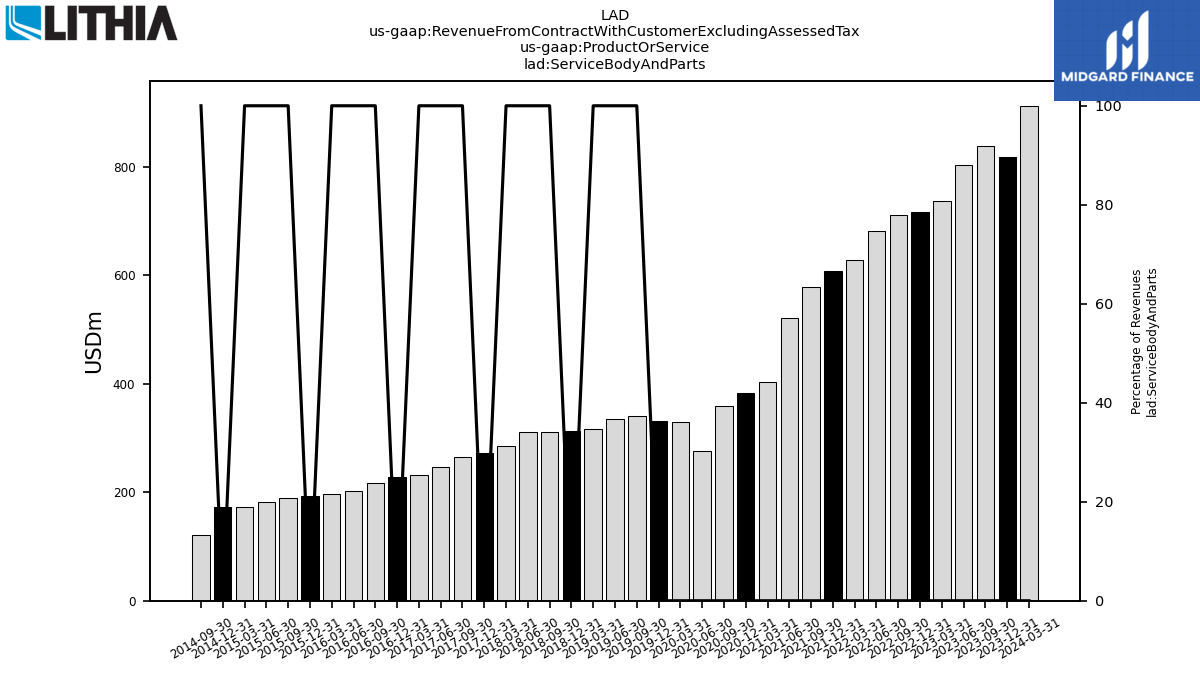
| Service Body And Parts | 912.80 | 818.30 | 838.00 | 804.40 | 736.30 | 716.20 | 712.20 | 682.60 | 627.80 | 607.50 | 578.30 | 521.00 | 404.00 | 383.80 | 359.50 | 275.50 | 329.90 | 331.80 | 340.50 | 335.50 | 317.40 | 313.87 | 311.33 | 311.41 | 285.70 | 271.54 | 265.68 | 246.00 | 232.57 | 228.42 | 217.15 | 202.26 | 196.68 | 193.02 | 189.80 | 182.69 | 173.47 | 172.40 | 120.77 | NA | NA | NA | NA | NA | NA | NA | NA | NA | NA | NA | NA | NA | NA | NA | NA | NA | |
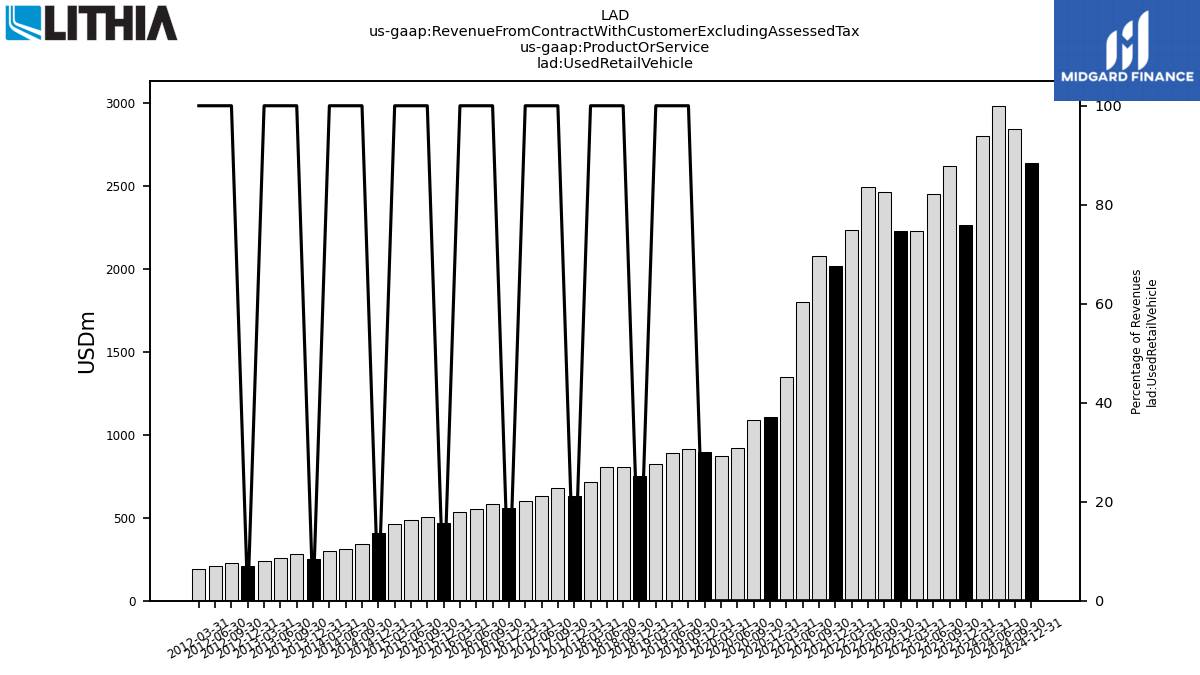
| Used Retail Vehicle | 2800.80 | 2267.40 | 2620.20 | 2455.10 | 2227.50 | 2228.00 | 2465.80 | 2496.70 | 2234.50 | 2018.70 | 2079.50 | 1804.90 | 1352.20 | 1108.70 | 1093.20 | 922.20 | 874.40 | 894.80 | 916.30 | 888.30 | 827.90 | 753.40 | 805.93 | 804.10 | 715.57 | 629.36 | 679.18 | 633.63 | 602.22 | 559.69 | 580.88 | 553.65 | 532.73 | 469.40 | 505.88 | 488.80 | 462.93 | 409.59 | 340.52 | 310.48 | 301.89 | 253.80 | 280.73 | 258.46 | 239.23 | 208.37 | 227.16 | 207.34 | 190.62 | NA | NA | NA | NA | NA | NA | NA | |
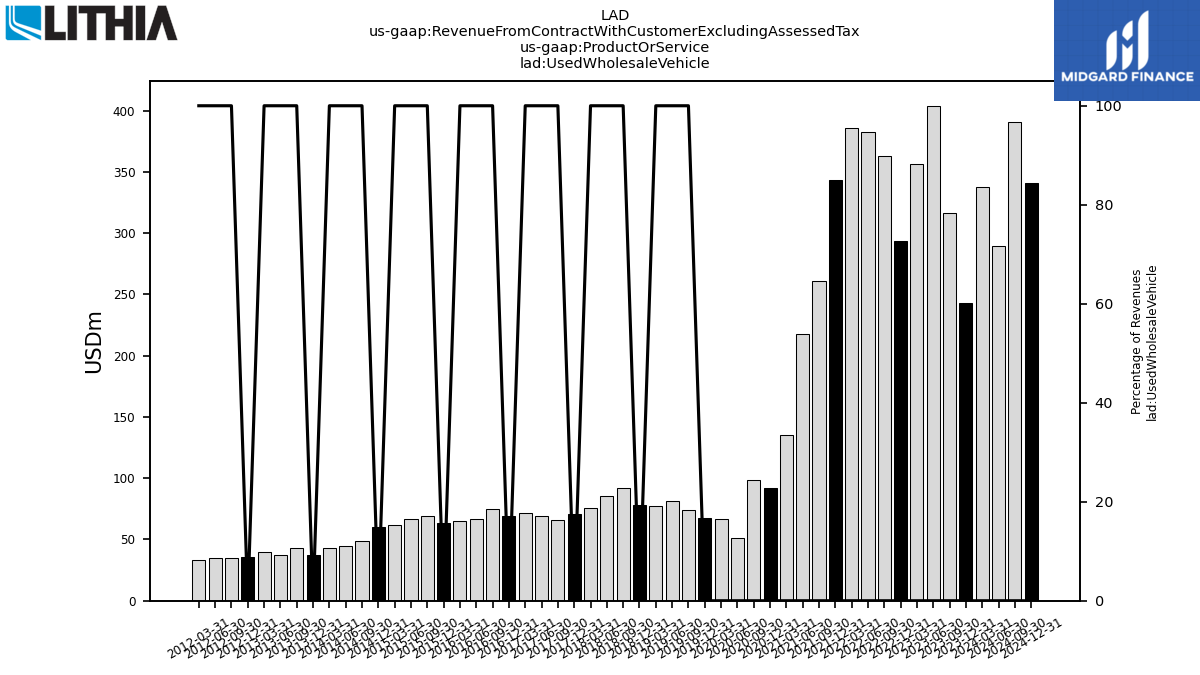
| Used Wholesale Vehicle | 337.70 | 242.90 | 316.10 | 403.90 | 356.70 | 293.70 | 363.20 | 382.40 | 385.80 | 343.60 | 260.90 | 217.40 | 135.20 | 91.90 | 98.80 | 51.30 | 66.70 | 67.70 | 74.40 | 81.70 | 77.40 | 78.05 | 91.96 | 85.33 | 75.95 | 71.05 | 65.74 | 69.51 | 71.50 | 69.48 | 75.27 | 66.71 | 65.15 | 63.05 | 69.47 | 66.80 | 62.21 | 59.87 | 48.85 | 44.29 | 42.69 | 37.64 | 43.40 | 37.69 | 39.51 | 35.77 | 35.01 | 35.11 | 33.36 | NA | NA | NA | NA | NA | NA | NA |