
| 2024-03-31 | 2023-12-31 | 2023-09-30 | 2023-06-30 | 2023-03-31 | 2022-12-31 | 2022-09-30 | 2022-06-30 | 2022-03-31 | 2021-12-31 | 2021-09-30 | 2021-06-30 | 2021-03-31 | 2020-12-31 | 2020-09-30 | 2020-06-30 | 2020-03-31 | 2019-12-31 | 2019-09-30 | 2019-06-30 | 2019-03-31 | 2018-12-31 | 2018-09-30 | 2018-06-30 | 2018-03-31 | 2017-12-31 | 2017-09-30 | 2017-06-30 | 2017-03-31 | ||
|---|---|---|---|---|---|---|---|---|---|---|---|---|---|---|---|---|---|---|---|---|---|---|---|---|---|---|---|---|---|---|
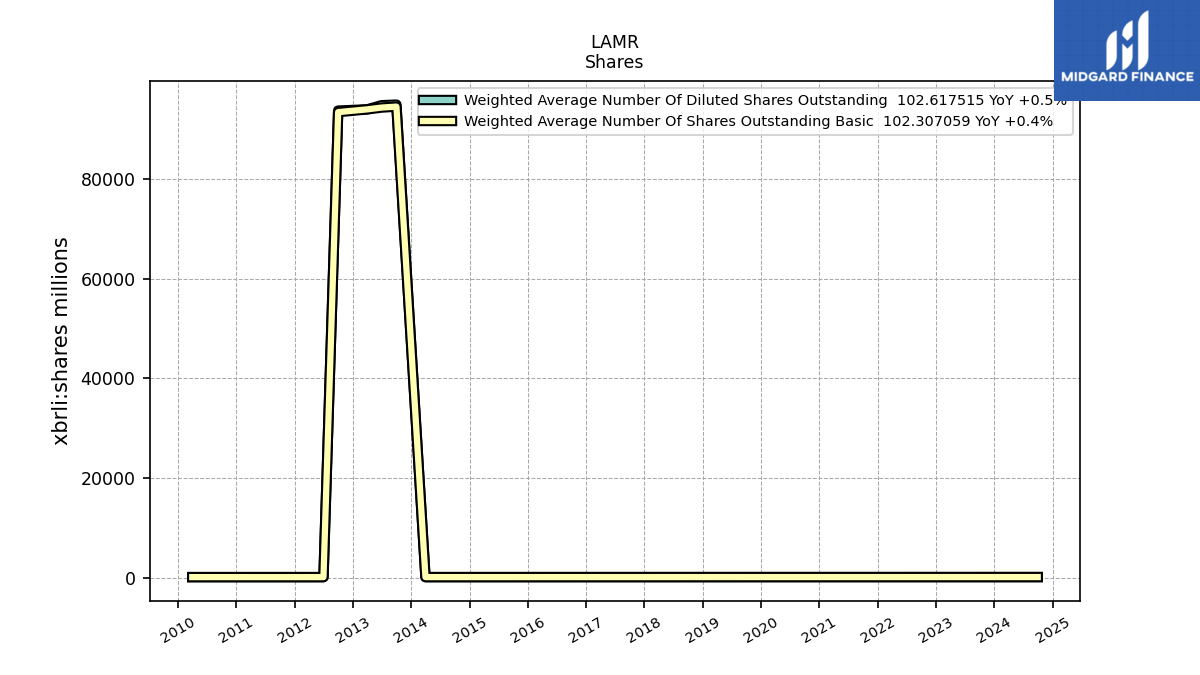
| Weighted Average Number Of Diluted Shares Outstanding | 102.45 | NA | 102.13 | 102.10 | 101.96 | NA | 101.69 | 101.66 | 101.54 | NA | 101.40 | 101.33 | 101.14 | NA | 100.92 | 100.86 | 100.88 | NA | 100.52 | 100.22 | 99.92 | NA | 99.25 | 98.83 | 98.73 | NA | 98.49 | 98.44 | 98.15 | |
| Weighted Average Number Of Shares Outstanding Basic | 102.12 | NA | 101.96 | 101.92 | 101.79 | NA | 101.58 | 101.49 | 101.34 | NA | 101.20 | 101.13 | 100.97 | NA | 100.81 | 100.77 | 100.59 | NA | 100.33 | 100.01 | 99.71 | NA | 98.94 | 98.53 | 98.30 | NA | 98.04 | 97.94 | 97.58 | |
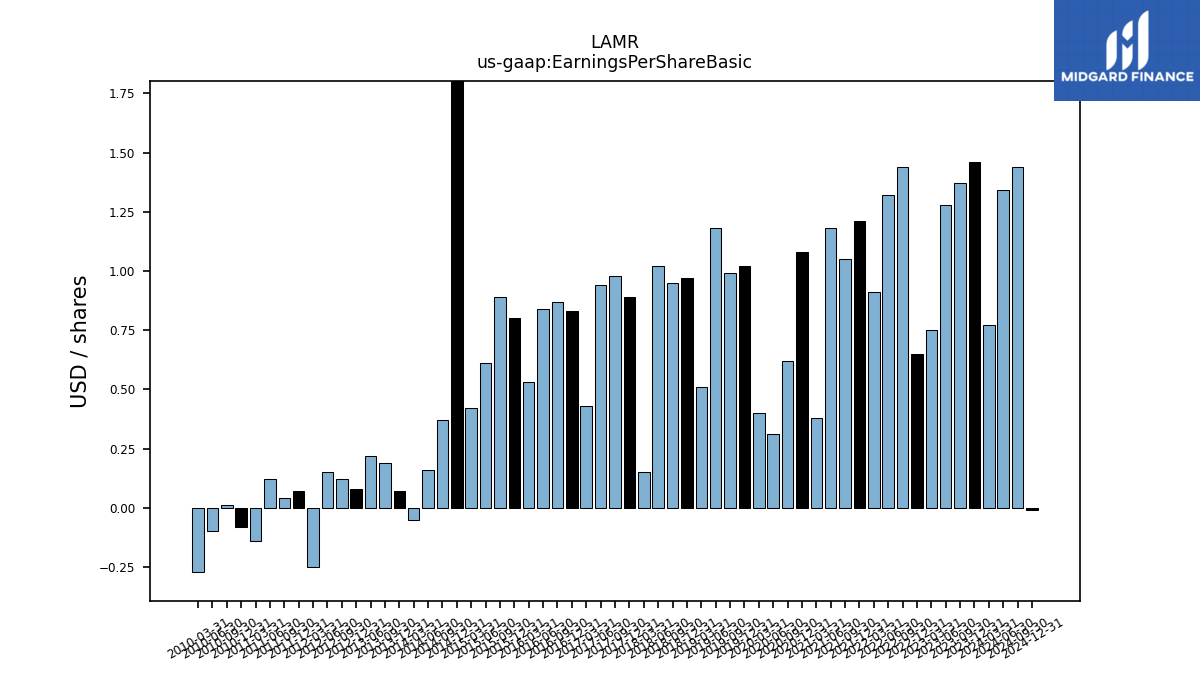
| Earnings Per Share Basic | 0.77 | 1.46 | 1.37 | 1.28 | 0.75 | 0.65 | 1.44 | 1.32 | 0.91 | 1.21 | 1.05 | 1.18 | 0.38 | 1.08 | 0.62 | 0.31 | 0.40 | 1.02 | 0.99 | 1.18 | 0.51 | 0.97 | 0.95 | 1.02 | 0.15 | 0.89 | 0.98 | 0.94 | 0.43 | |
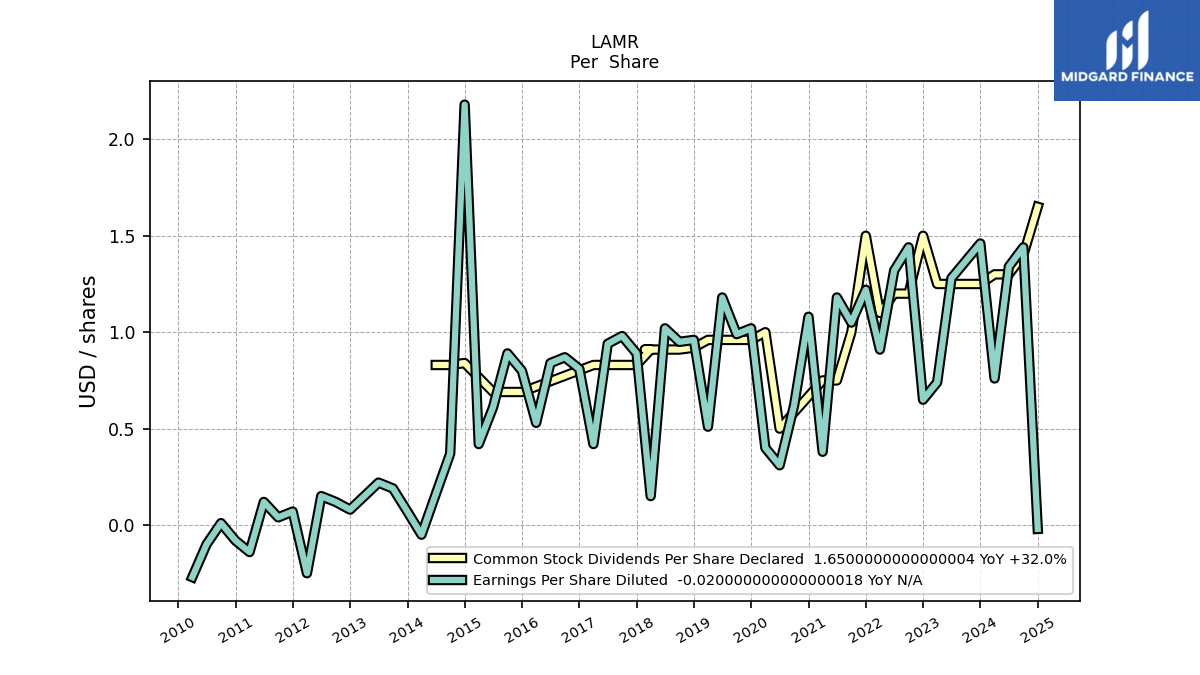
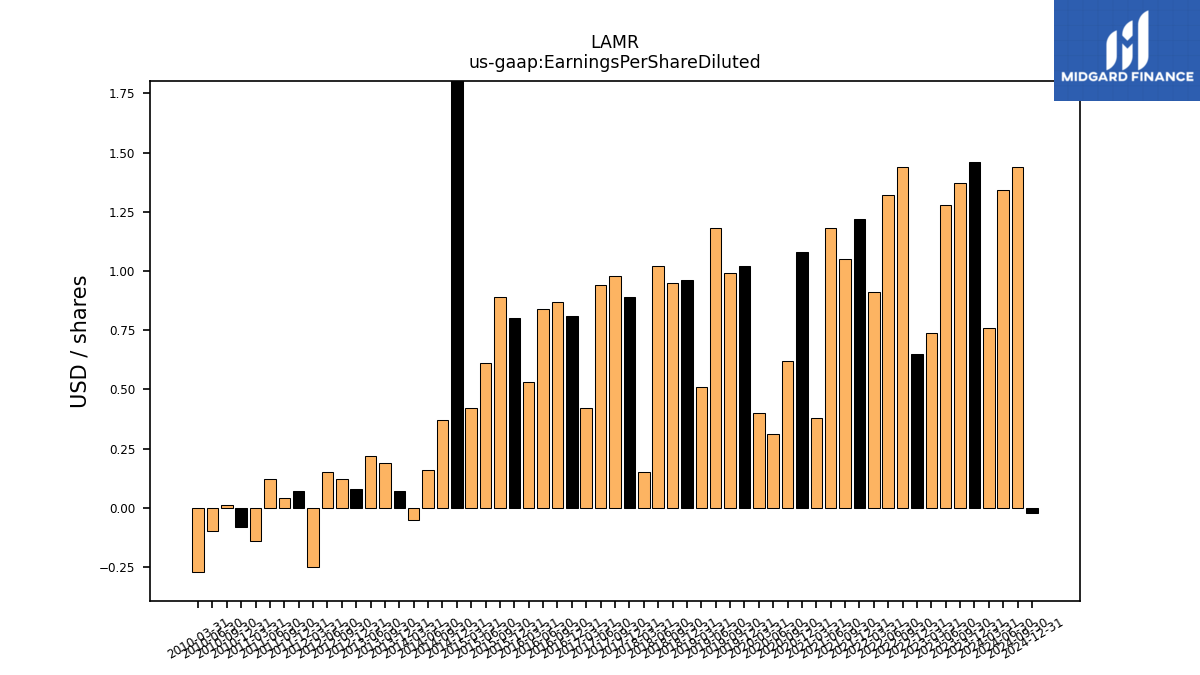
| Earnings Per Share Diluted | 0.76 | 1.46 | 1.37 | 1.28 | 0.74 | 0.65 | 1.44 | 1.32 | 0.91 | 1.22 | 1.05 | 1.18 | 0.38 | 1.08 | 0.62 | 0.31 | 0.40 | 1.02 | 0.99 | 1.18 | 0.51 | 0.96 | 0.95 | 1.02 | 0.15 | 0.89 | 0.98 | 0.94 | 0.42 |
| 2024-03-31 | 2023-12-31 | 2023-09-30 | 2023-06-30 | 2023-03-31 | 2022-12-31 | 2022-09-30 | 2022-06-30 | 2022-03-31 | 2021-12-31 | 2021-09-30 | 2021-06-30 | 2021-03-31 | 2020-12-31 | 2020-09-30 | 2020-06-30 | 2020-03-31 | 2019-12-31 | 2019-09-30 | 2019-06-30 | 2019-03-31 | 2018-12-31 | 2018-09-30 | 2018-06-30 | 2018-03-31 | 2017-12-31 | 2017-09-30 | 2017-06-30 | 2017-03-31 | ||
|---|---|---|---|---|---|---|---|---|---|---|---|---|---|---|---|---|---|---|---|---|---|---|---|---|---|---|---|---|---|---|
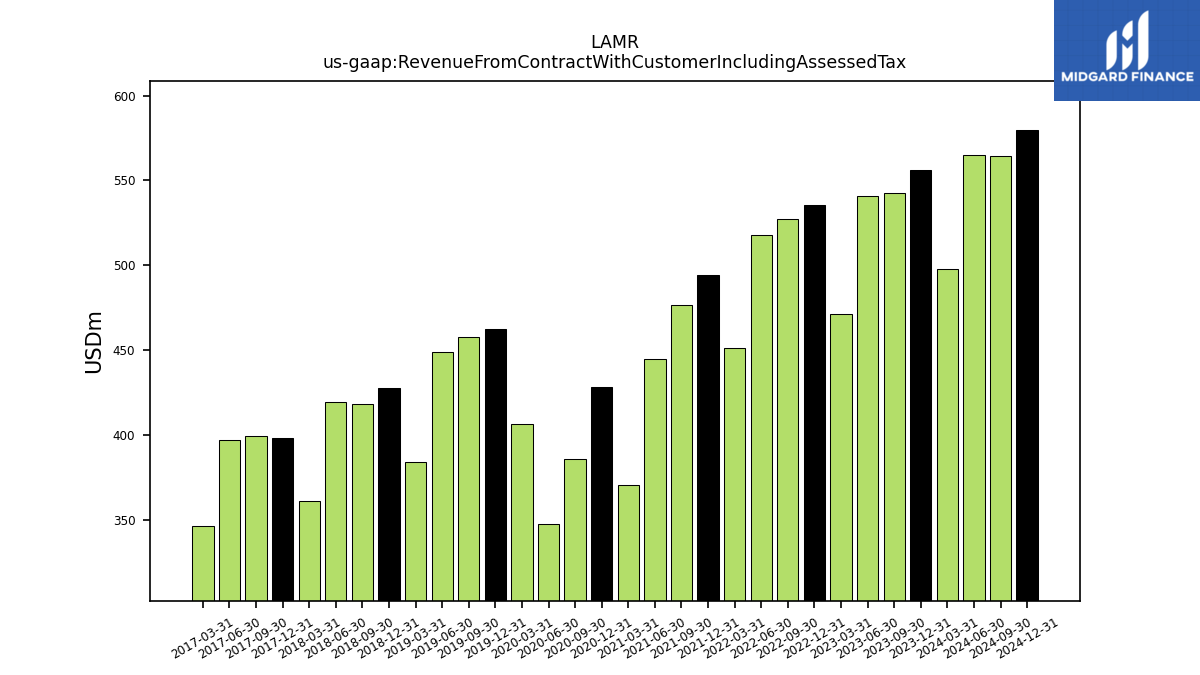
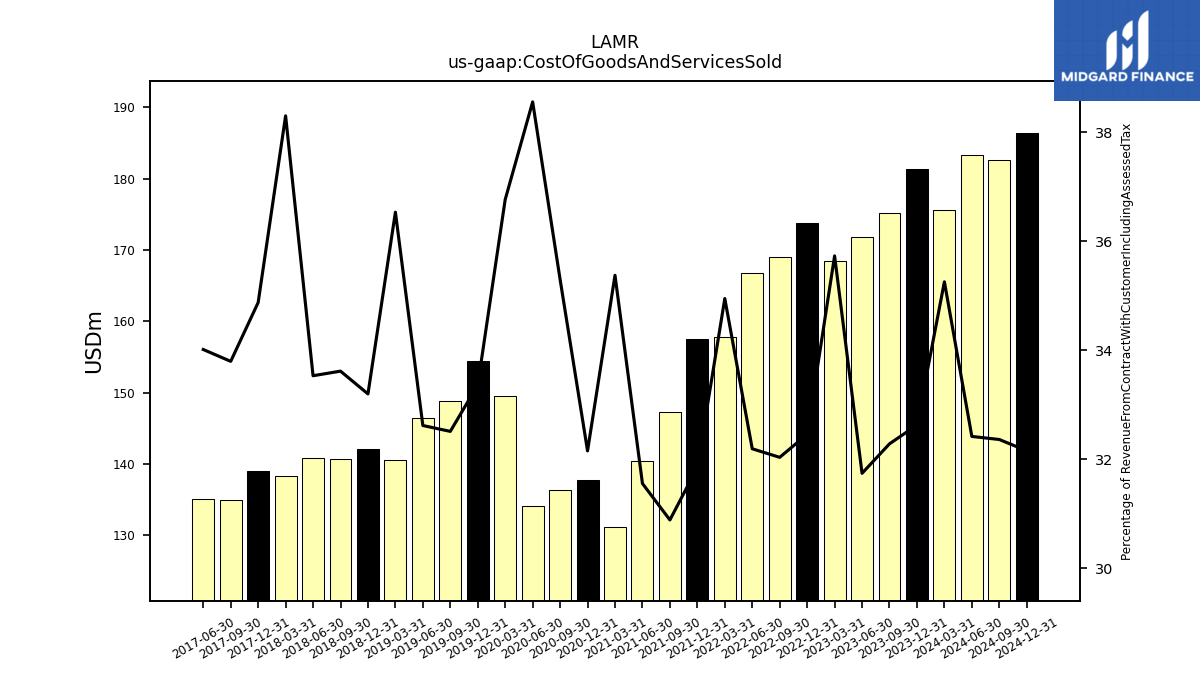
| Revenue From Contract With Customer Including Assessed Tax | 498.15 | 555.91 | 542.61 | 541.14 | 471.33 | 535.51 | 527.39 | 517.85 | 451.39 | 494.57 | 476.89 | 445.05 | 370.88 | 428.52 | 386.11 | 347.65 | 406.57 | 462.66 | 457.79 | 448.74 | 384.46 | 427.90 | 418.50 | 419.80 | 361.03 | 398.48 | 399.35 | 397.08 | 346.36 | |
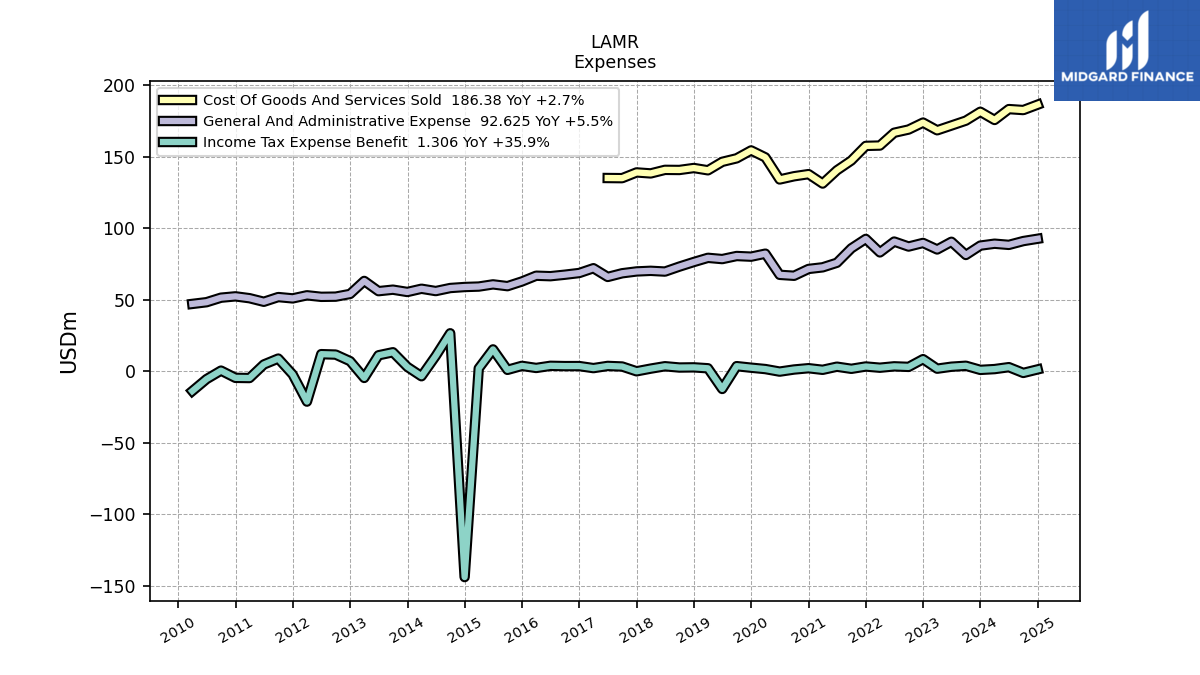
| Cost Of Goods And Services Sold | 175.65 | 181.40 | 175.19 | 171.78 | 168.43 | 173.82 | 168.97 | 166.72 | 157.77 | 157.53 | 147.31 | 140.45 | 131.22 | 137.80 | 136.31 | 134.06 | 149.49 | 154.37 | 148.85 | 146.39 | 140.47 | 142.07 | 140.70 | 140.78 | 138.29 | 138.98 | 134.98 | 135.07 | NA | |
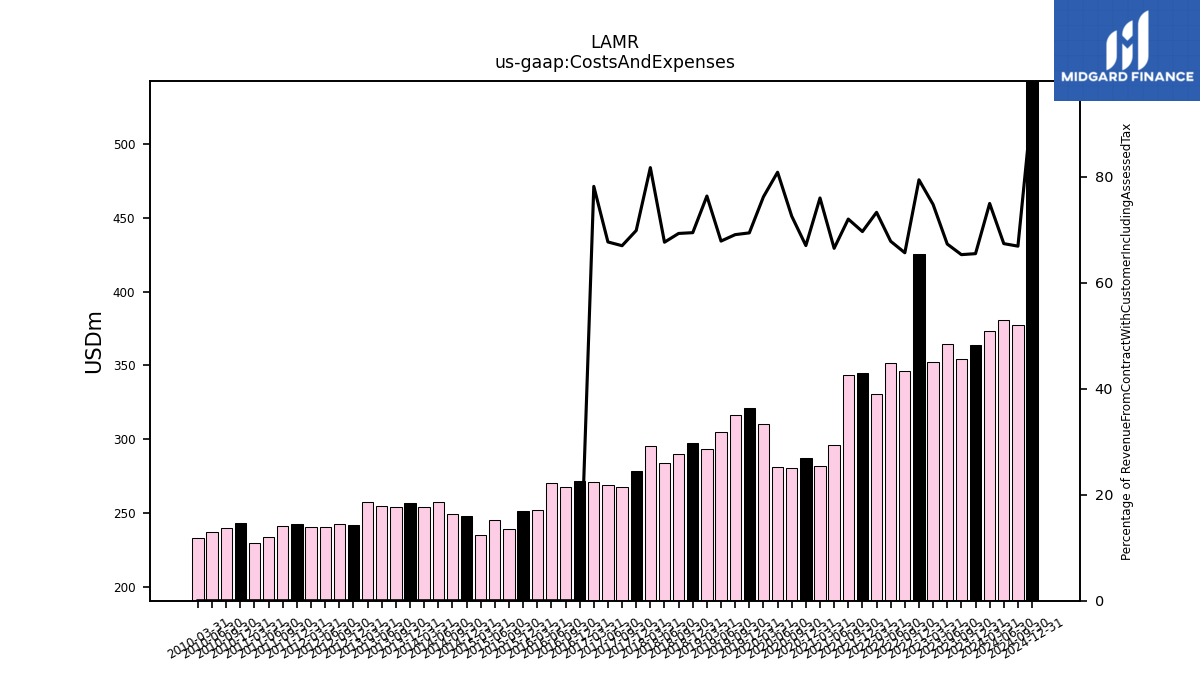
| Costs And Expenses | 373.55 | 364.20 | 354.48 | 364.35 | 352.53 | 425.46 | 346.40 | 351.35 | 330.93 | 344.63 | 343.56 | 296.07 | 281.96 | 287.29 | 280.26 | 281.20 | 310.00 | 321.25 | 316.34 | 304.64 | 293.67 | 297.29 | 290.14 | 284.10 | 295.15 | 278.47 | 267.63 | 268.90 | 270.90 | |
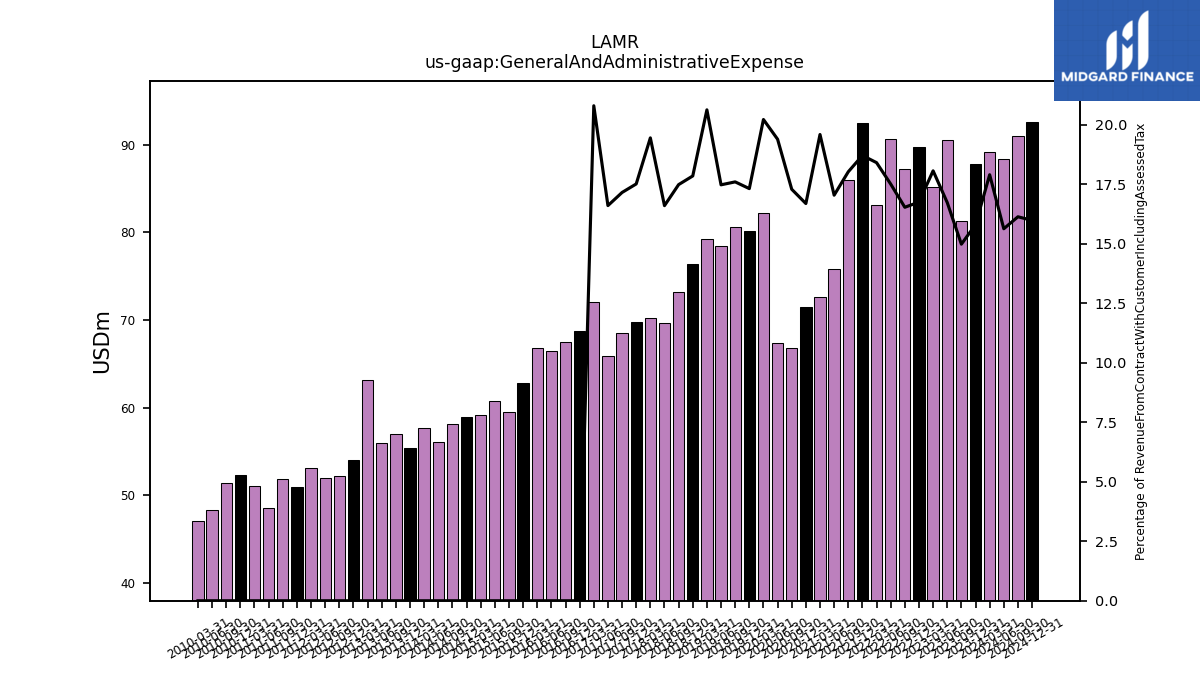
| General And Administrative Expense | 89.16 | 87.84 | 81.28 | 90.53 | 85.14 | 89.70 | 87.18 | 90.66 | 83.08 | 92.52 | 85.95 | 75.83 | 72.65 | 71.51 | 66.75 | 67.41 | 82.20 | 80.11 | 80.56 | 78.42 | 79.29 | 76.37 | 73.17 | 69.69 | 70.21 | 69.78 | 68.50 | 65.92 | 72.03 | |
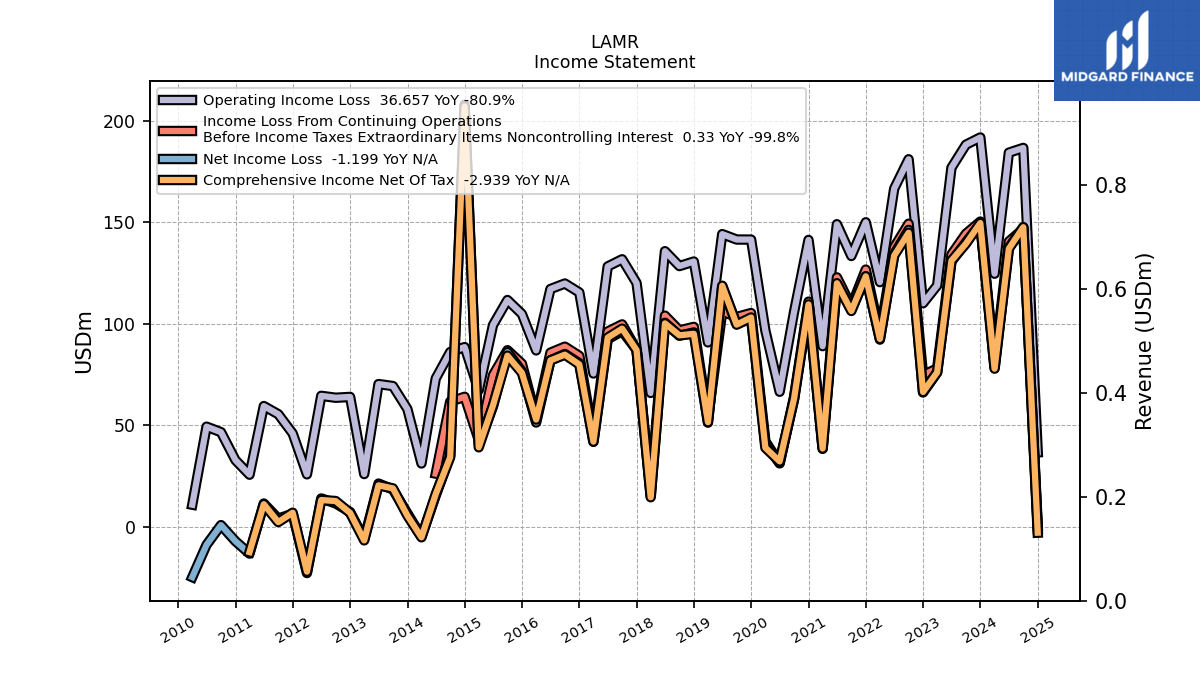
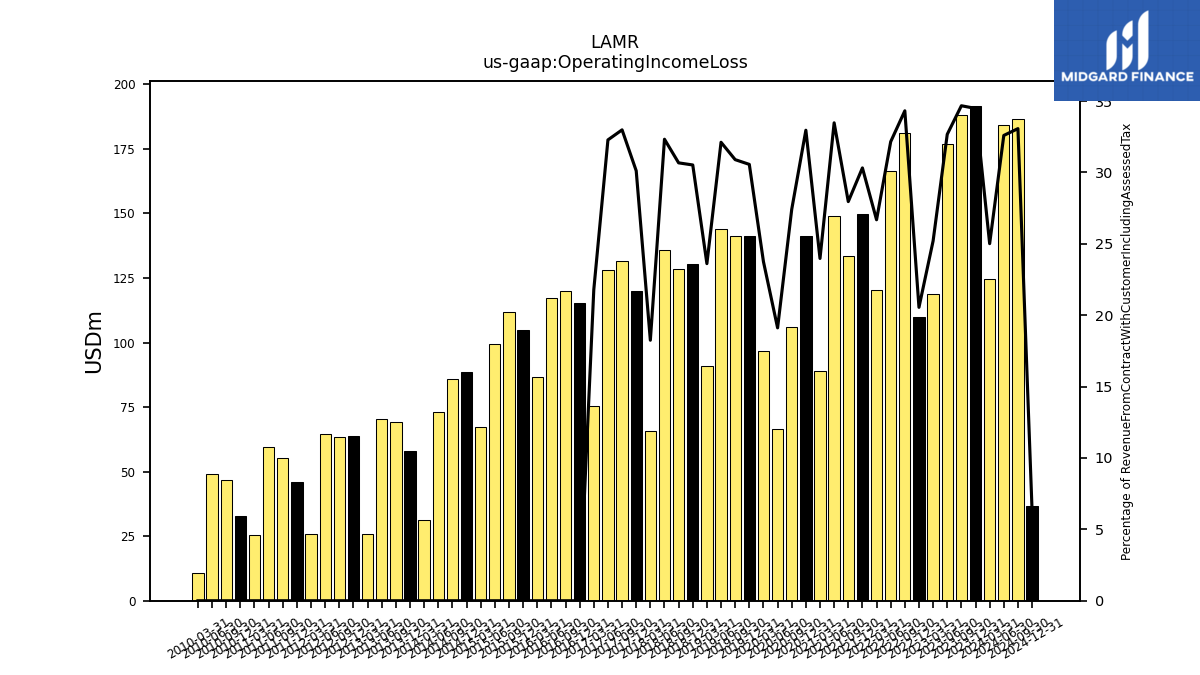
| Operating Income Loss | 124.60 | 191.71 | 188.13 | 176.79 | 118.80 | 110.05 | 180.99 | 166.50 | 120.46 | 149.94 | 133.34 | 148.99 | 88.92 | 141.23 | 105.85 | 66.45 | 96.57 | 141.41 | 141.44 | 144.11 | 90.78 | 130.61 | 128.36 | 135.70 | 65.88 | 120.01 | 131.72 | 128.18 | 75.47 | |
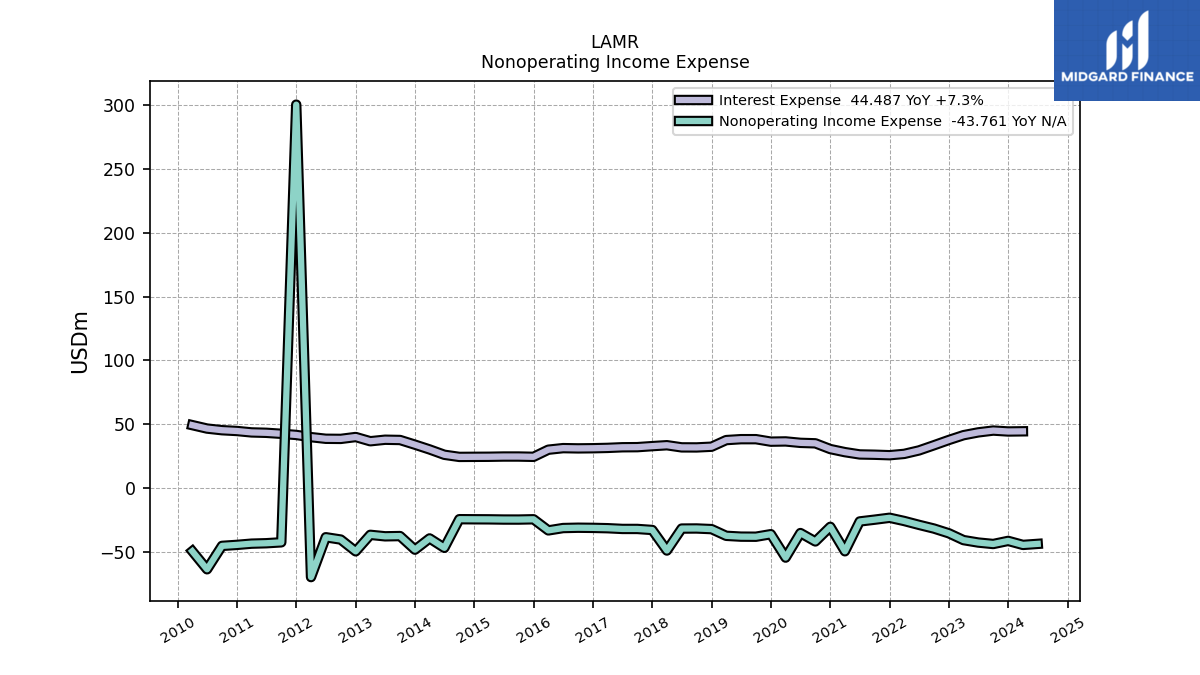
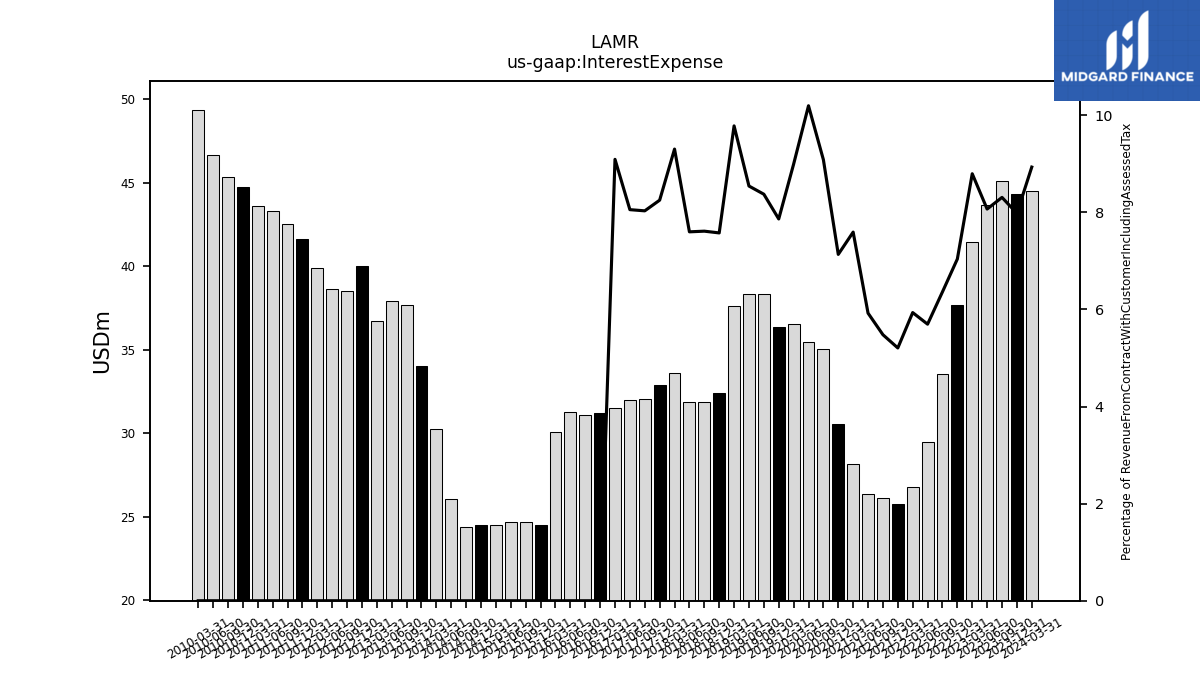
| Interest Expense | 44.49 | 44.35 | 45.07 | 43.65 | 41.44 | 37.69 | 33.55 | 29.49 | 26.79 | 25.75 | 26.12 | 26.36 | 28.15 | 30.57 | 35.07 | 35.44 | 36.55 | 36.38 | 38.32 | 38.32 | 37.59 | 32.41 | 31.85 | 31.89 | 33.58 | 32.87 | 32.06 | 31.98 | 31.48 | |
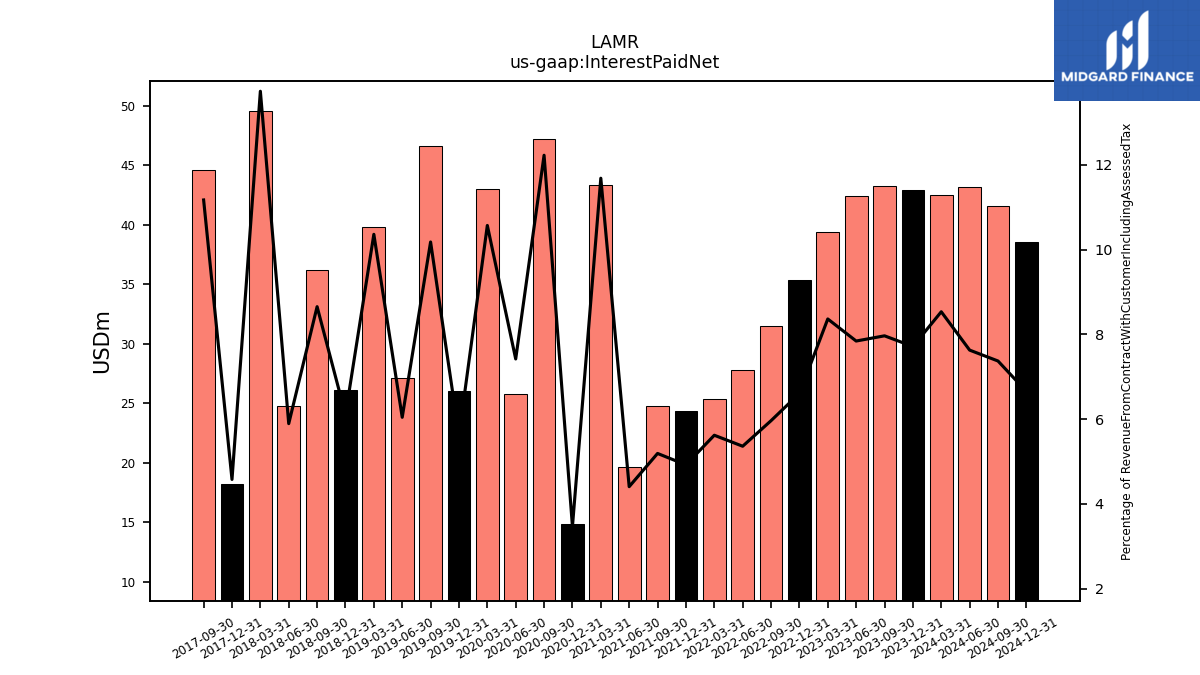
| Interest Paid Net | 42.52 | 42.89 | 43.23 | 42.45 | 39.43 | 35.39 | 31.46 | 27.77 | 25.38 | 24.35 | 24.76 | 19.62 | 43.34 | 14.87 | 47.22 | 25.80 | 42.98 | 26.00 | 46.61 | 27.13 | 39.84 | 26.14 | 36.22 | 24.75 | 49.60 | 18.25 | 44.62 | NA | NA | |
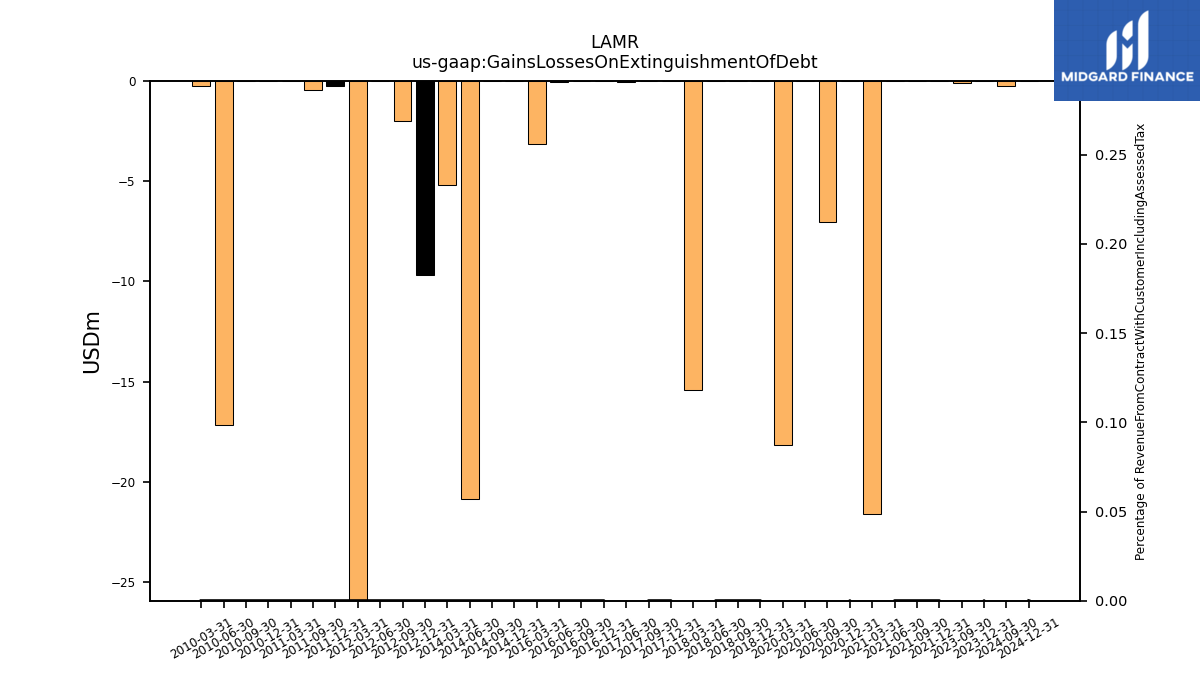
| Gains Losses On Extinguishment Of Debt | NA | 0.00 | -0.12 | NA | NA | NA | NA | NA | NA | 0.00 | 0.00 | 0.00 | -21.60 | 0.00 | -7.05 | -0.01 | -18.18 | NA | NA | NA | NA | 0.00 | 0.00 | 0.00 | -15.43 | 0.00 | 0.00 | -0.07 | NA | |
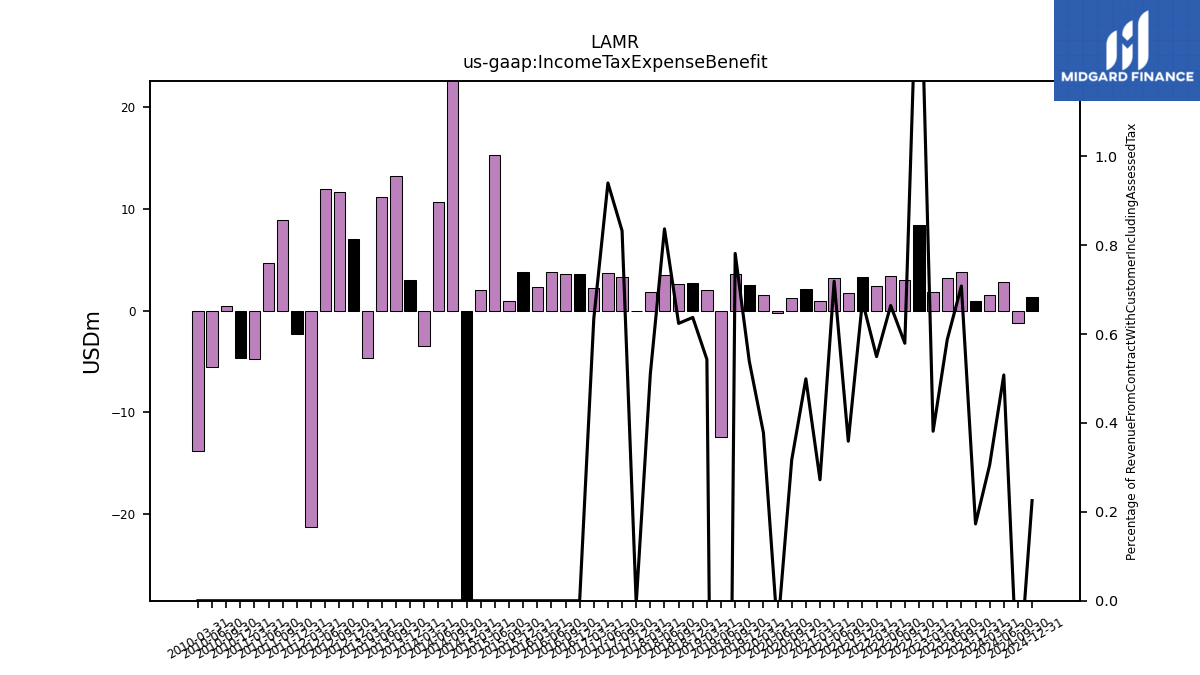
| Income Tax Expense Benefit | 1.52 | 0.96 | 3.84 | 3.18 | 1.80 | 8.48 | 3.06 | 3.44 | 2.48 | 3.33 | 1.71 | 3.20 | 1.01 | 2.14 | 1.22 | -0.24 | 1.54 | 2.49 | 3.58 | -12.38 | 2.09 | 2.73 | 2.61 | 3.51 | 1.84 | -0.03 | 3.33 | 3.73 | 2.20 | |
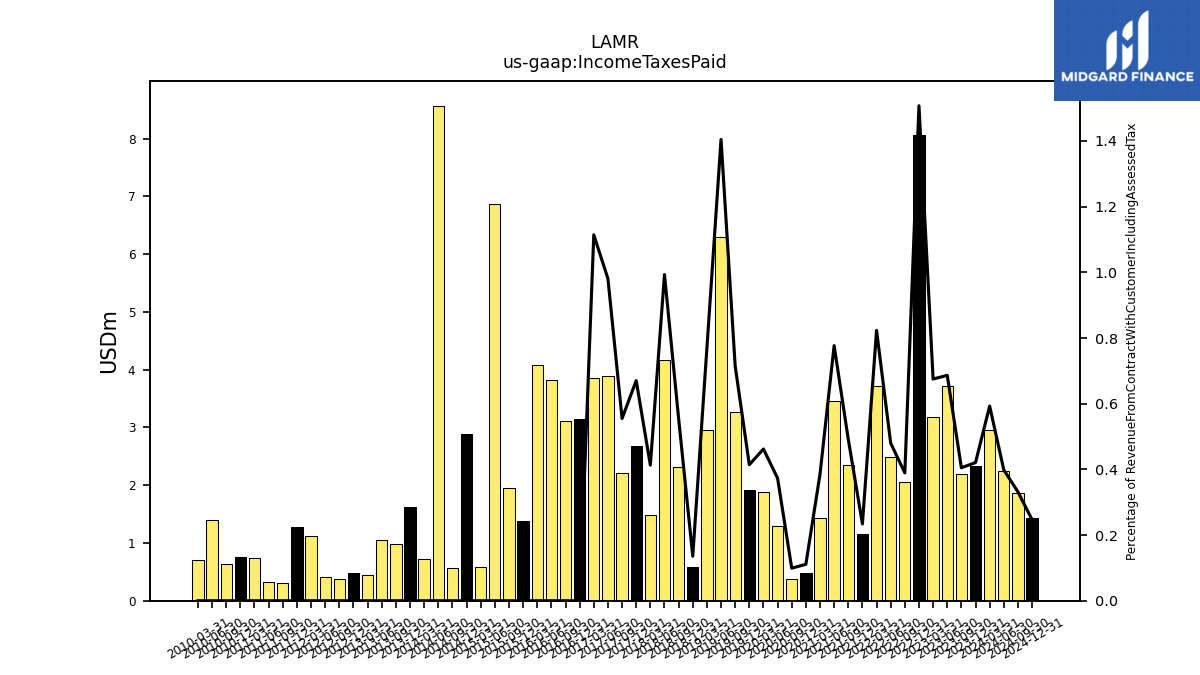
| Income Taxes Paid | 2.95 | 2.34 | 2.20 | 3.71 | 3.18 | 8.07 | 2.05 | 2.48 | 3.72 | 1.16 | 2.35 | 3.46 | 1.43 | 0.47 | 0.38 | 1.30 | 1.88 | 1.92 | 3.27 | 6.30 | 2.96 | 0.58 | 2.32 | 4.17 | 1.49 | 2.67 | 2.22 | 3.89 | 3.86 | |
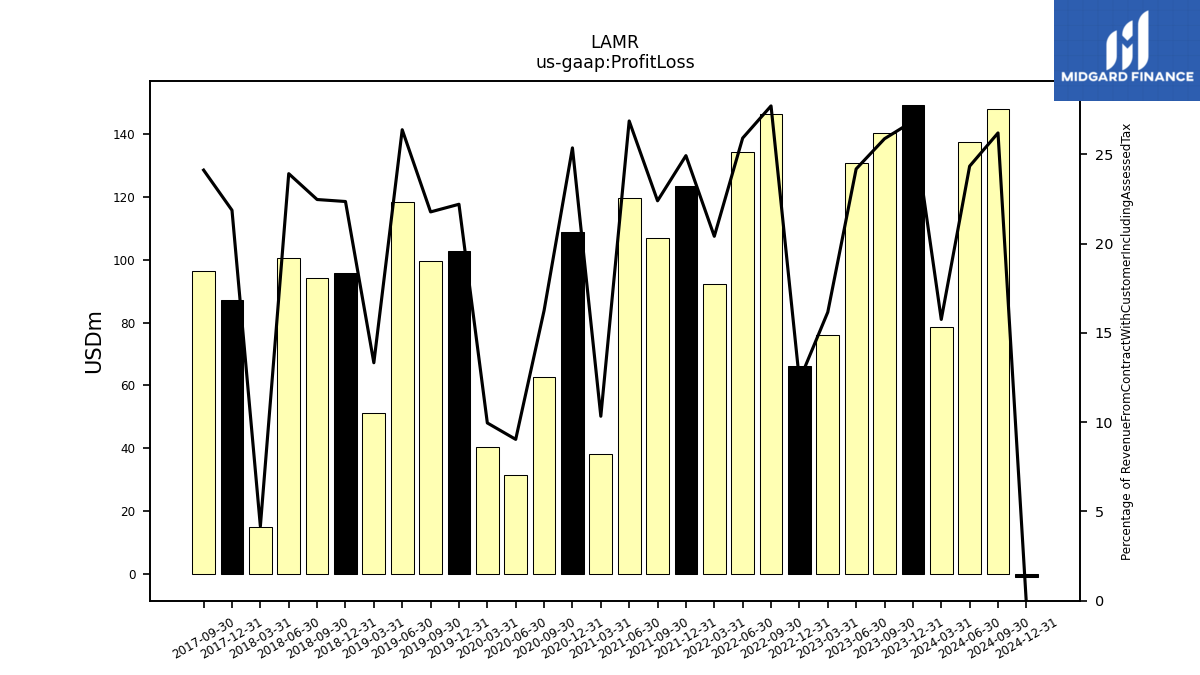
| Profit Loss | 78.50 | 149.32 | 140.43 | 130.89 | 76.20 | 66.10 | 146.19 | 134.21 | 92.15 | 123.31 | 106.84 | 119.61 | 38.33 | 108.71 | 62.76 | 31.43 | 40.49 | 102.75 | 99.71 | 118.40 | 51.25 | 95.69 | 94.06 | 100.43 | 15.05 | 87.16 | 96.33 | NA | NA | |
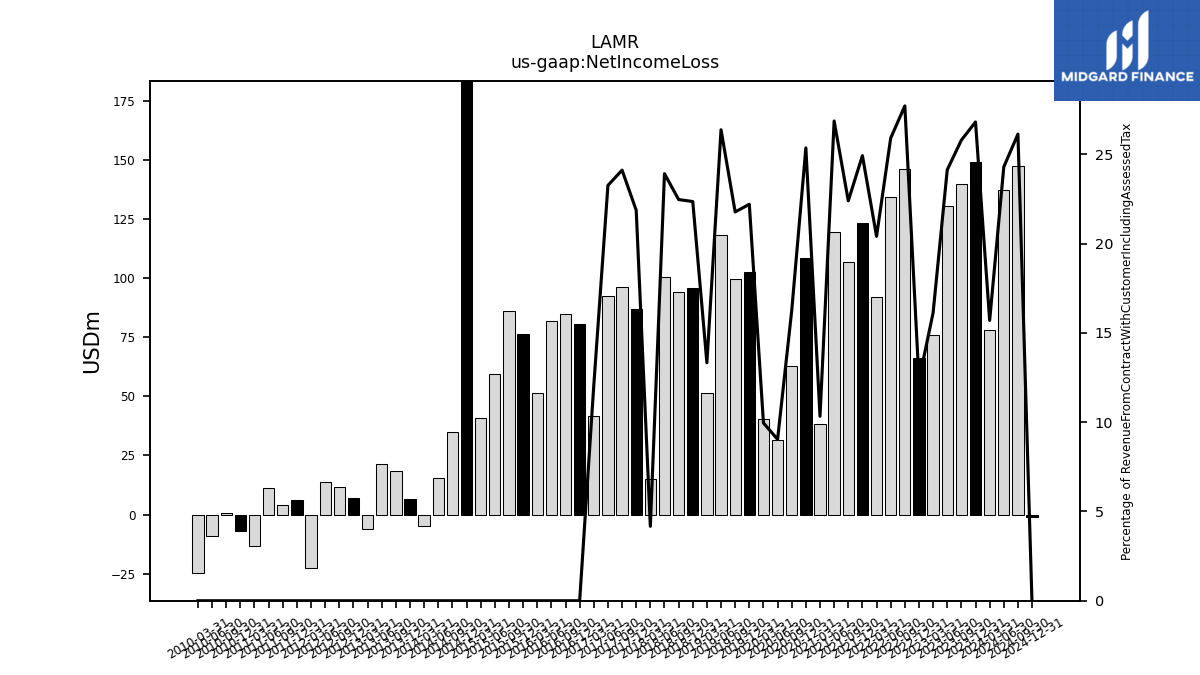
| Net Income Loss | 78.22 | 149.09 | 140.02 | 130.62 | 76.04 | 66.10 | 146.19 | 134.21 | 92.15 | 123.31 | 106.84 | 119.61 | 38.33 | 108.71 | 62.76 | 31.43 | 40.49 | 102.75 | 99.71 | 118.40 | 51.25 | 95.69 | 94.06 | 100.43 | 15.05 | 87.16 | 96.33 | 92.39 | 41.79 | |
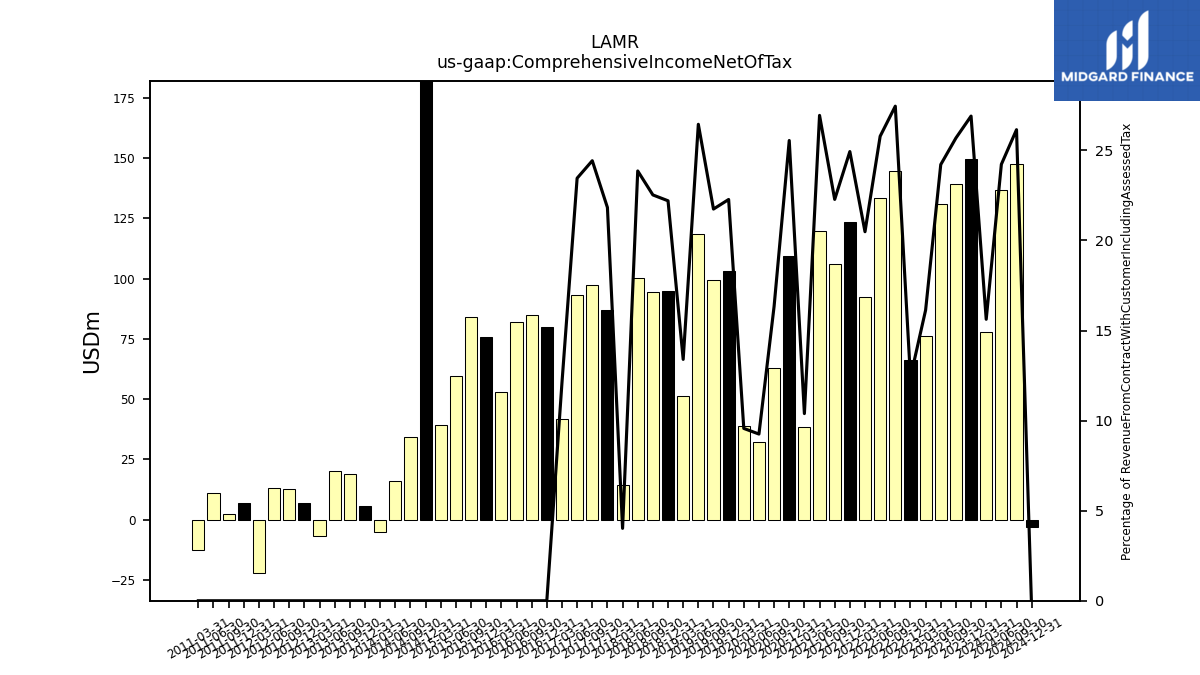
| Comprehensive Income Net Of Tax | 77.83 | 149.56 | 139.37 | 131.02 | 76.04 | 66.36 | 144.79 | 133.52 | 92.47 | 123.32 | 106.25 | 119.91 | 38.53 | 109.48 | 63.09 | 32.17 | 38.90 | 103.05 | 99.53 | 118.68 | 51.51 | 95.00 | 94.28 | 100.15 | 14.51 | 86.99 | 97.55 | 93.14 | 41.93 | |
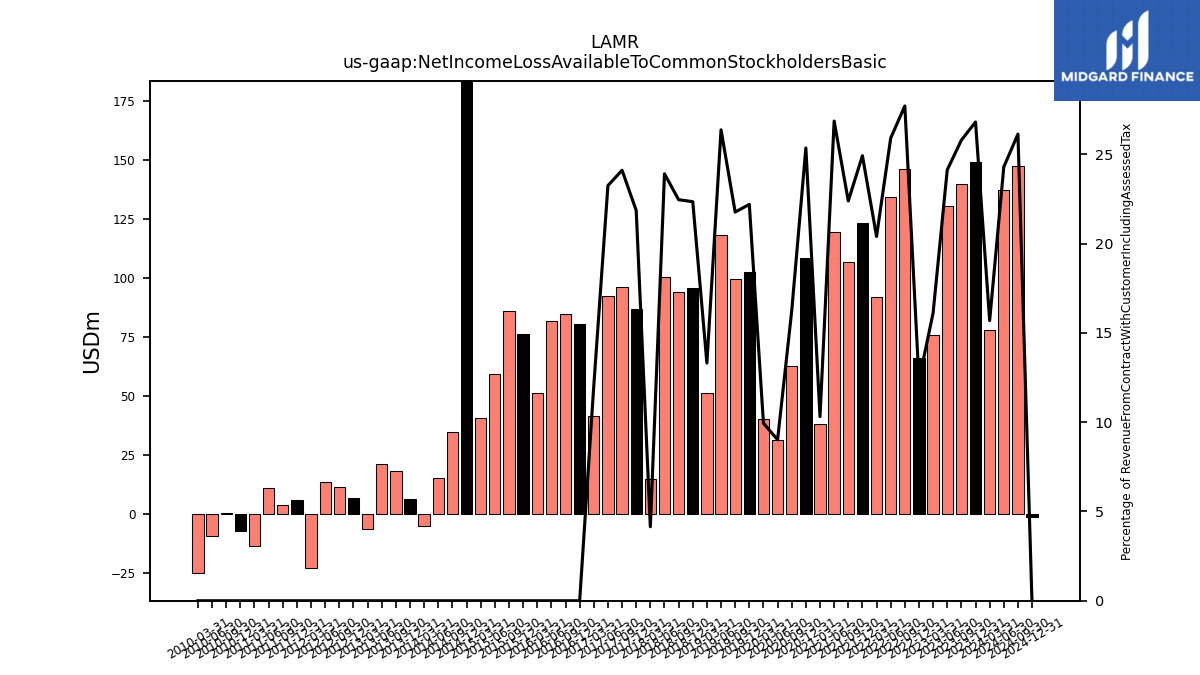
| Net Income Loss Available To Common Stockholders Basic | 78.13 | 148.99 | 139.93 | 130.53 | 75.95 | 66.01 | 146.10 | 134.11 | 92.06 | 123.22 | 106.75 | 119.52 | 38.24 | 108.61 | 62.67 | 31.34 | 40.40 | 102.66 | 99.62 | 118.31 | 51.16 | 95.60 | 93.97 | 100.34 | 14.96 | 87.07 | 96.24 | 92.30 | 41.70 |
| 2024-03-31 | 2023-12-31 | 2023-09-30 | 2023-06-30 | 2023-03-31 | 2022-12-31 | 2022-09-30 | 2022-06-30 | 2022-03-31 | 2021-12-31 | 2021-09-30 | 2021-06-30 | 2021-03-31 | 2020-12-31 | 2020-09-30 | 2020-06-30 | 2020-03-31 | 2019-12-31 | 2019-09-30 | 2019-06-30 | 2019-03-31 | 2018-12-31 | 2018-09-30 | 2018-06-30 | 2018-03-31 | 2017-12-31 | 2017-09-30 | 2017-06-30 | 2017-03-31 | ||
|---|---|---|---|---|---|---|---|---|---|---|---|---|---|---|---|---|---|---|---|---|---|---|---|---|---|---|---|---|---|---|
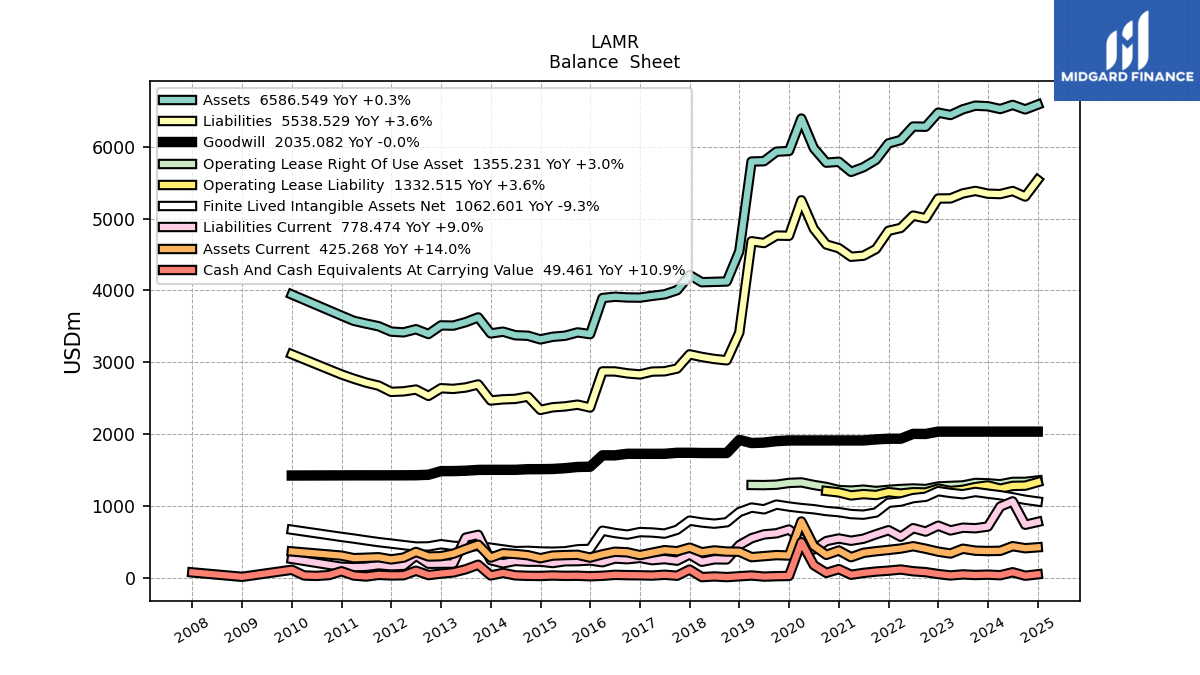
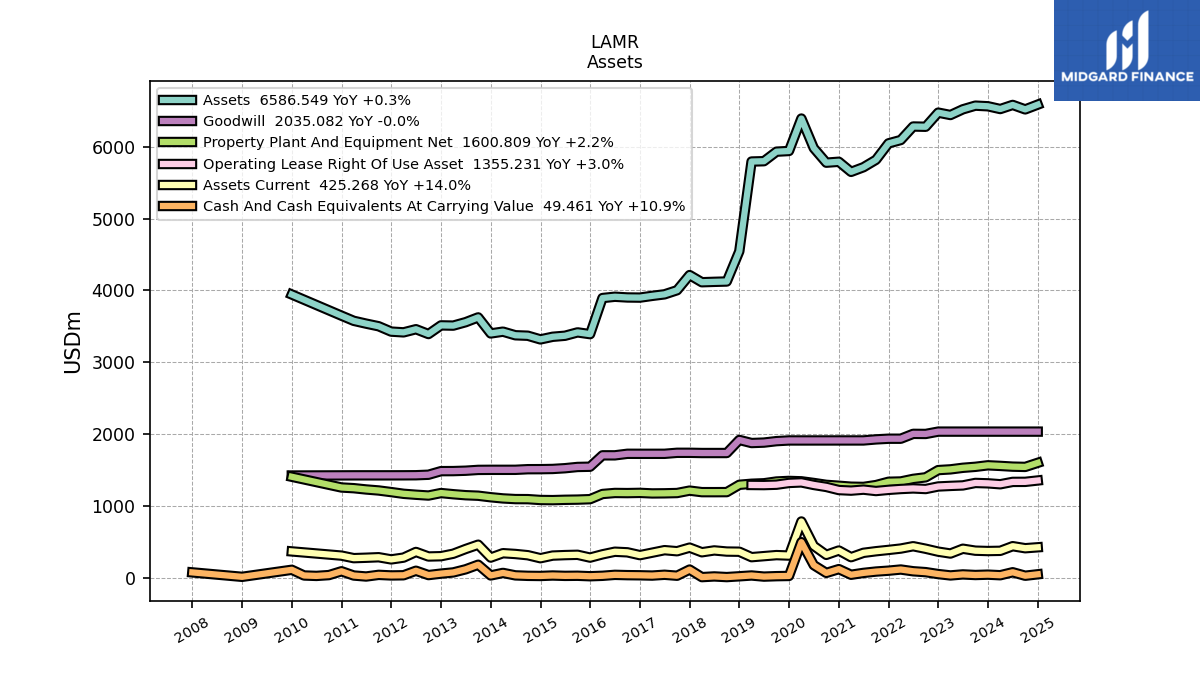
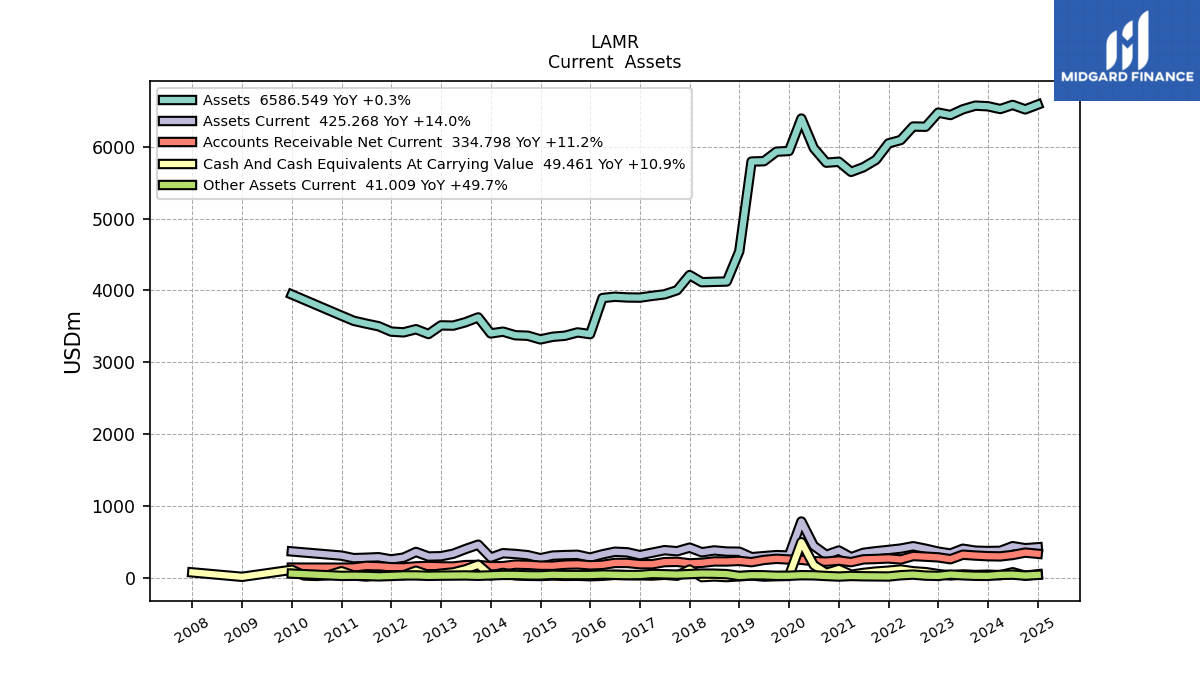
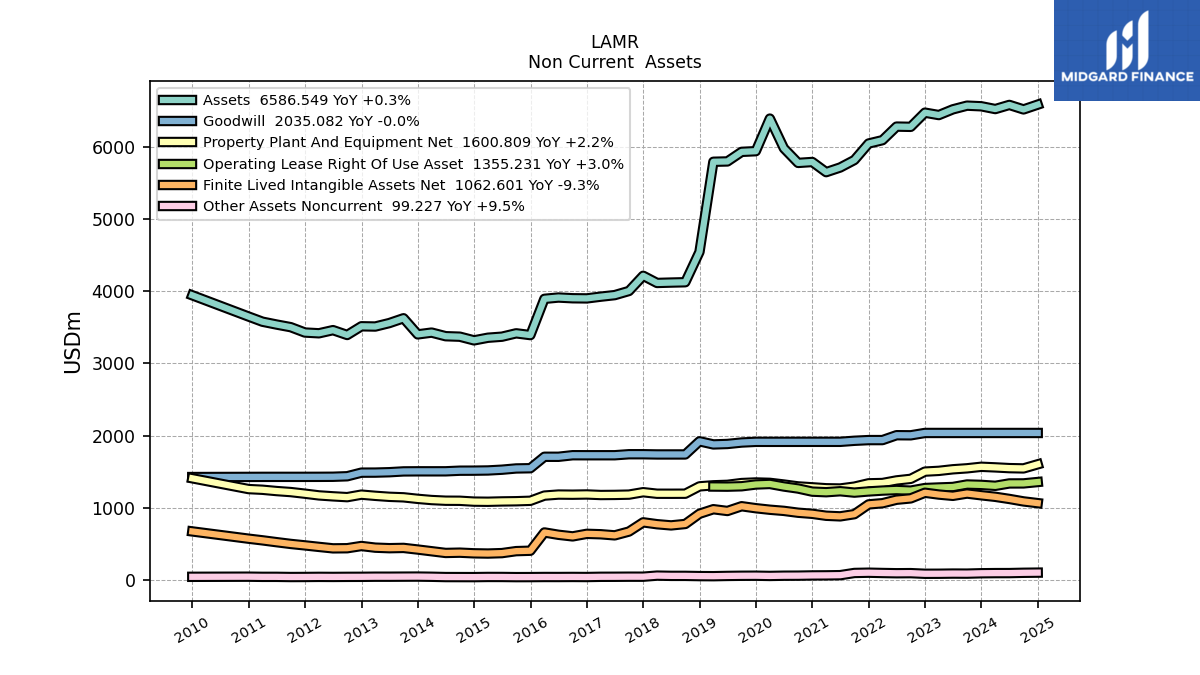
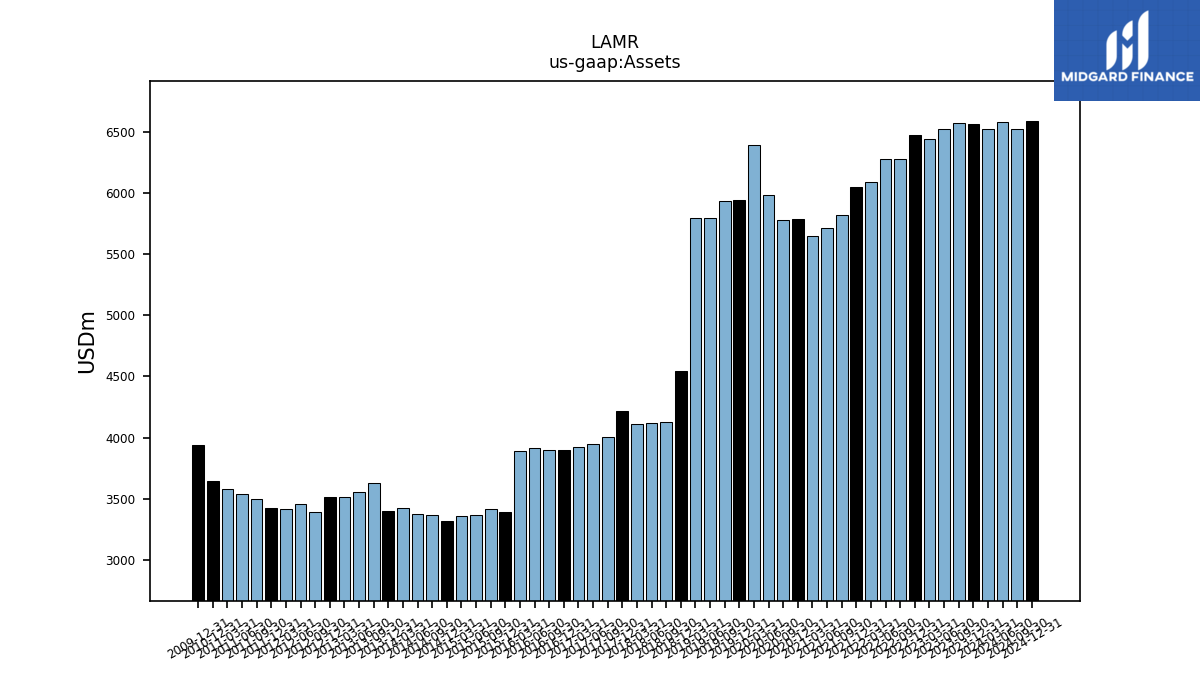
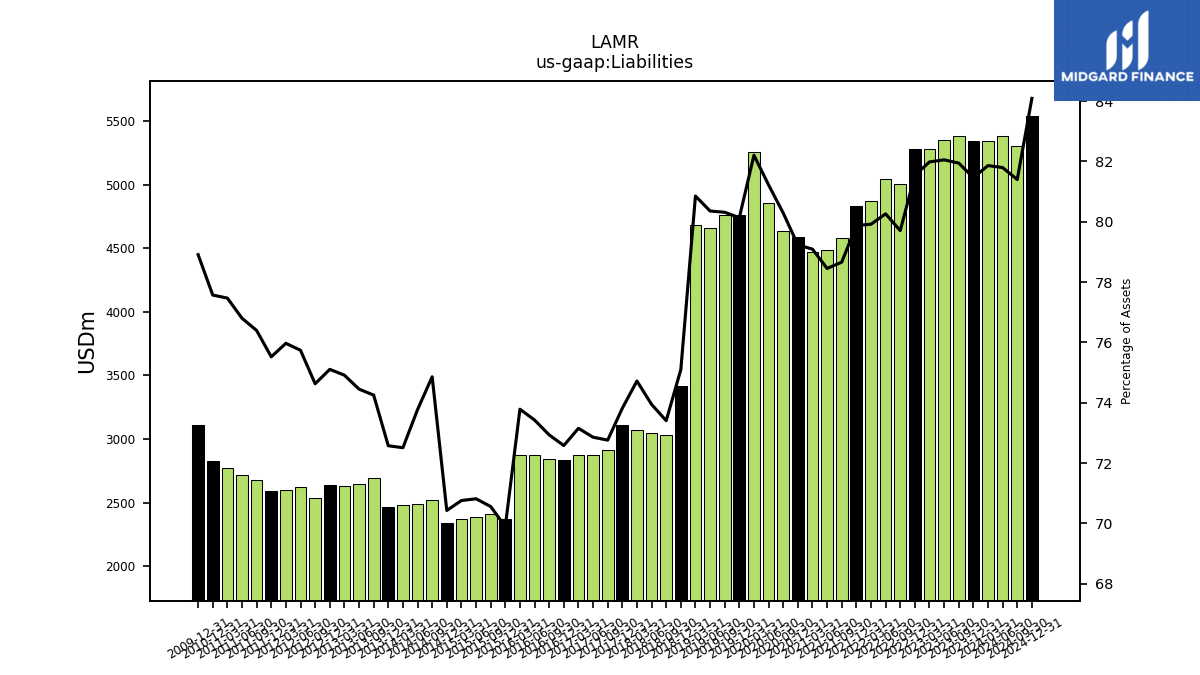
| Assets | 6525.07 | 6563.62 | 6572.32 | 6521.04 | 6441.78 | 6475.21 | 6278.52 | 6282.04 | 6093.86 | 6047.49 | 5818.69 | 5715.30 | 5650.50 | 5791.44 | 5778.40 | 5981.58 | 6393.00 | 5941.15 | 5931.74 | 5799.16 | 5794.54 | 4544.64 | 4124.62 | 4119.97 | 4114.53 | 4214.35 | 4003.23 | 3946.08 | 3924.59 | |
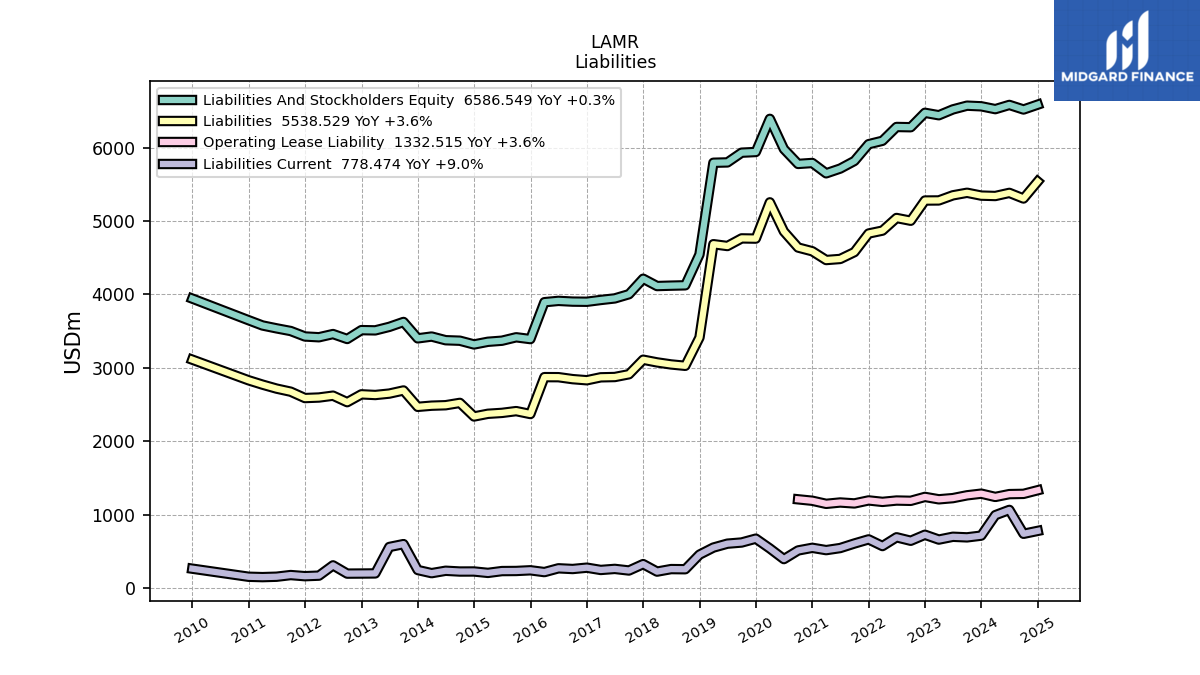
| Liabilities | 5341.43 | 5346.83 | 5385.48 | 5350.55 | 5281.10 | 5279.84 | 5004.23 | 5041.97 | 4870.00 | 4830.40 | 4576.89 | 4483.69 | 4468.99 | 4588.67 | 4639.35 | 4858.21 | 5255.22 | 4760.85 | 4763.91 | 4659.87 | 4684.97 | 3412.86 | 3027.66 | 3046.45 | 3074.33 | 3110.85 | 2912.70 | 2874.97 | 2870.87 | |
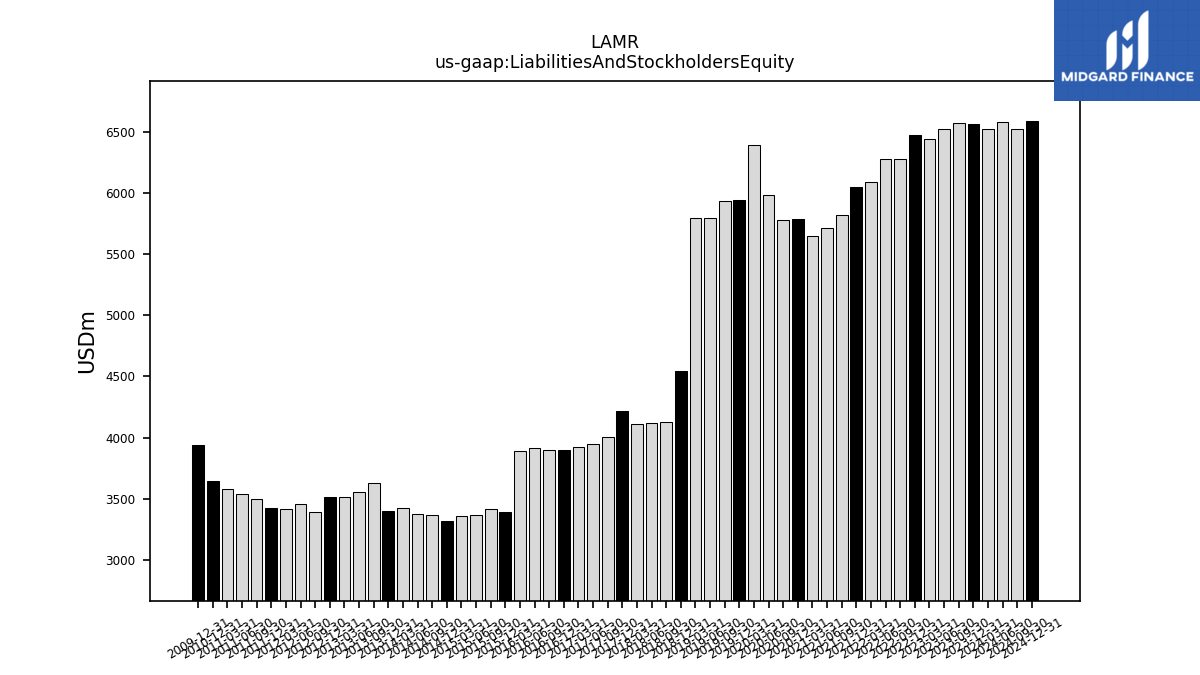
| Liabilities And Stockholders Equity | 6525.07 | 6563.62 | 6572.32 | 6521.04 | 6441.78 | 6475.21 | 6278.52 | 6282.04 | 6093.86 | 6047.49 | 5818.69 | 5715.30 | 5650.50 | 5791.44 | 5778.40 | 5981.58 | 6393.00 | 5941.15 | 5931.74 | 5799.16 | 5794.54 | 4544.64 | 4124.62 | 4119.97 | 4114.53 | 4214.35 | 4003.23 | 3946.08 | 3924.59 |
| 2024-03-31 | 2023-12-31 | 2023-09-30 | 2023-06-30 | 2023-03-31 | 2022-12-31 | 2022-09-30 | 2022-06-30 | 2022-03-31 | 2021-12-31 | 2021-09-30 | 2021-06-30 | 2021-03-31 | 2020-12-31 | 2020-09-30 | 2020-06-30 | 2020-03-31 | 2019-12-31 | 2019-09-30 | 2019-06-30 | 2019-03-31 | 2018-12-31 | 2018-09-30 | 2018-06-30 | 2018-03-31 | 2017-12-31 | 2017-09-30 | 2017-06-30 | 2017-03-31 | ||
|---|---|---|---|---|---|---|---|---|---|---|---|---|---|---|---|---|---|---|---|---|---|---|---|---|---|---|---|---|---|---|
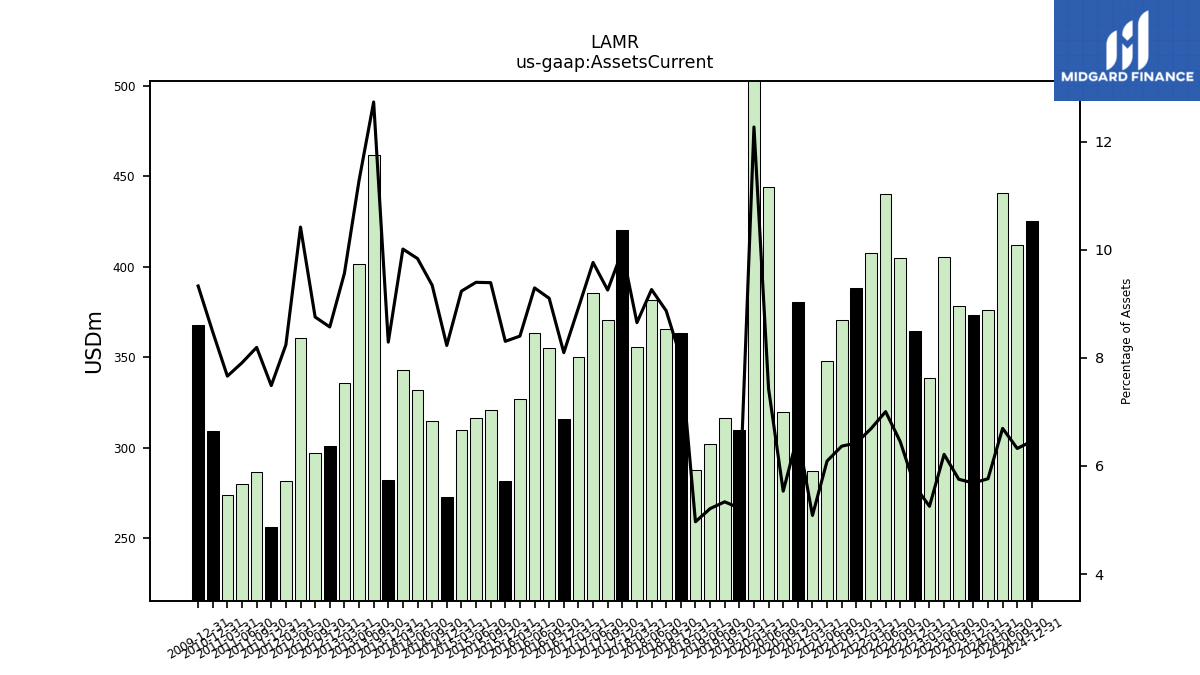
| Assets Current | 376.08 | 373.19 | 378.17 | 405.28 | 338.44 | 364.55 | 405.02 | 440.09 | 407.65 | 388.61 | 370.43 | 348.19 | 287.35 | 380.57 | 319.78 | 444.24 | 784.59 | 310.17 | 316.55 | 302.16 | 287.84 | 363.67 | 365.90 | 381.69 | 356.00 | 420.52 | 370.51 | 385.34 | 350.34 | |
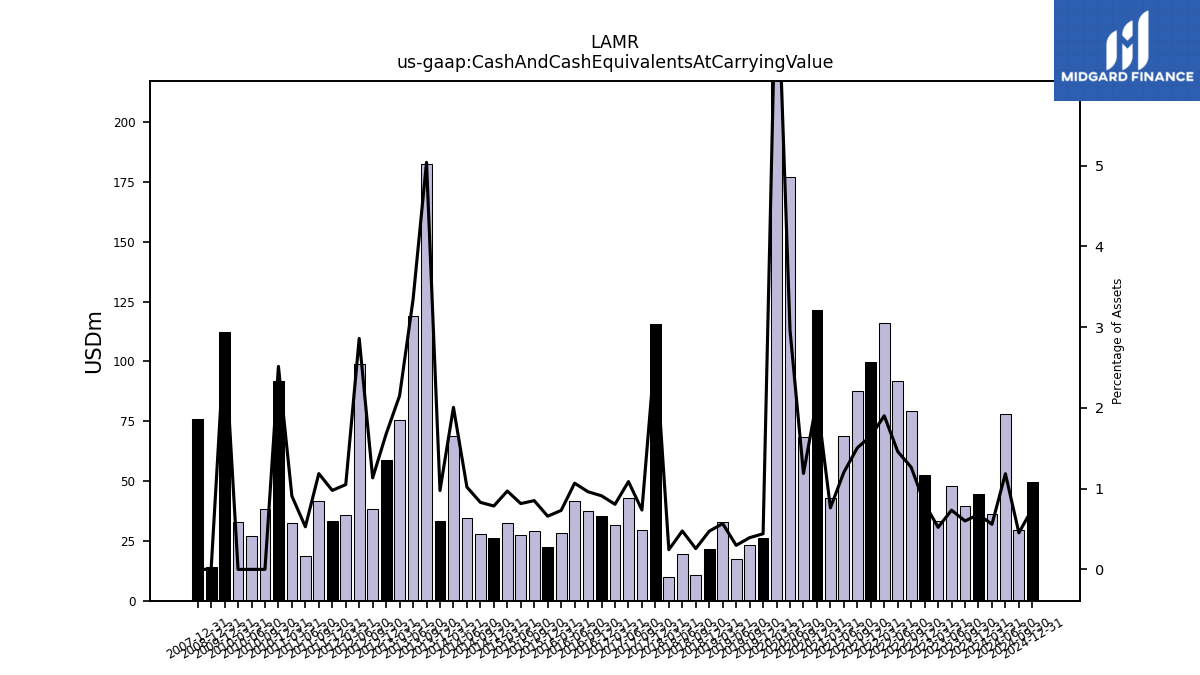
| Cash And Cash Equivalents At Carrying Value | 36.41 | 44.60 | 39.40 | 47.78 | 33.52 | 52.62 | 79.36 | 91.69 | 115.88 | 99.79 | 87.57 | 68.73 | 43.05 | 121.57 | 68.63 | 177.09 | 496.64 | 26.19 | 23.29 | 17.25 | 32.83 | 21.49 | 10.61 | 19.59 | 10.05 | 115.47 | 29.42 | 42.88 | 31.62 | |
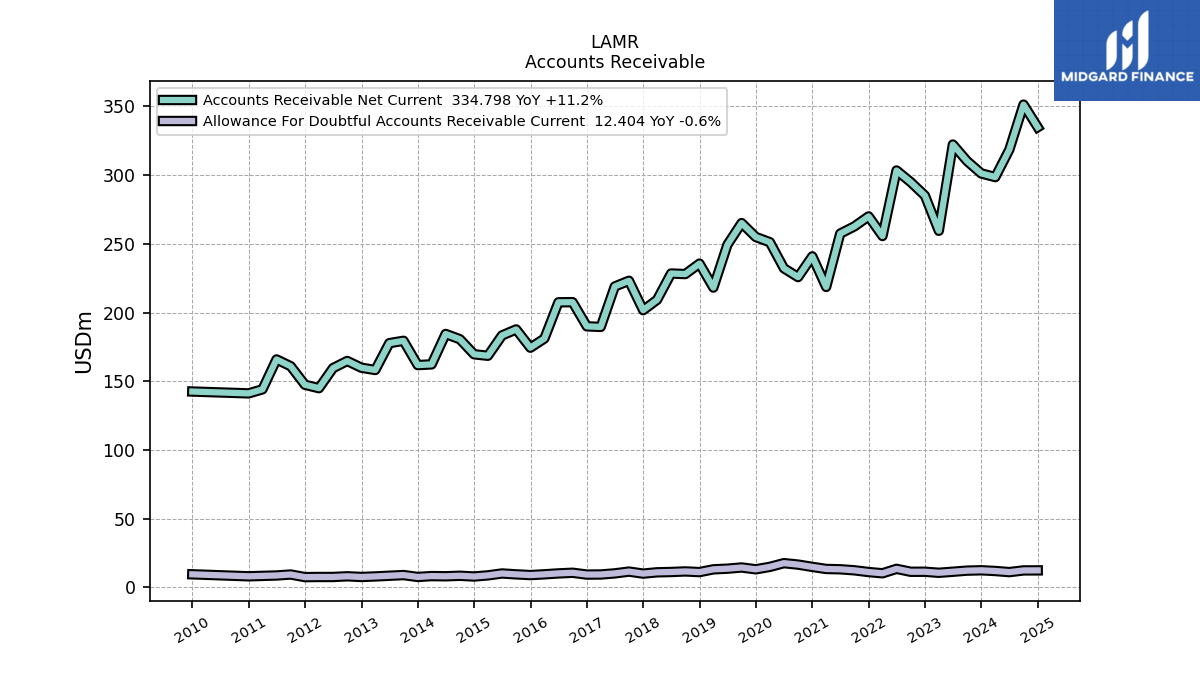
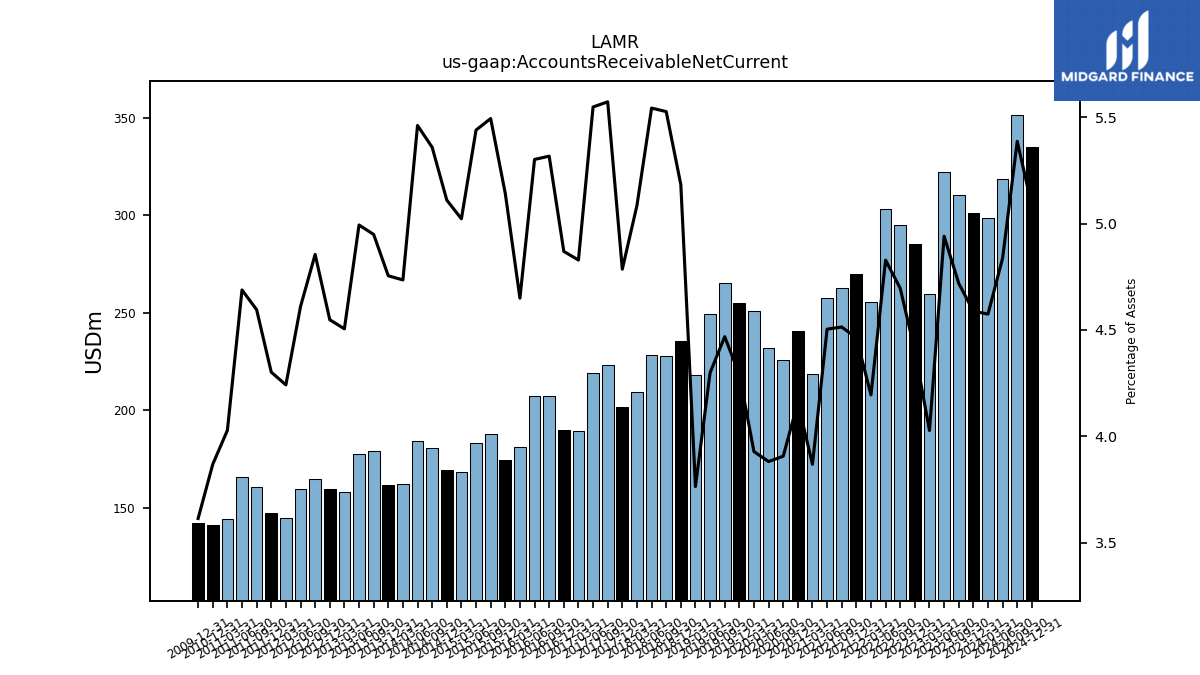
| Accounts Receivable Net Current | 298.51 | 301.19 | 310.17 | 322.19 | 259.44 | 285.04 | 294.84 | 303.32 | 255.64 | 269.92 | 262.66 | 257.41 | 218.60 | 240.85 | 225.75 | 232.18 | 251.15 | 254.93 | 265.06 | 249.28 | 218.11 | 235.58 | 227.96 | 228.38 | 209.23 | 201.70 | 223.09 | 218.94 | 189.51 | |
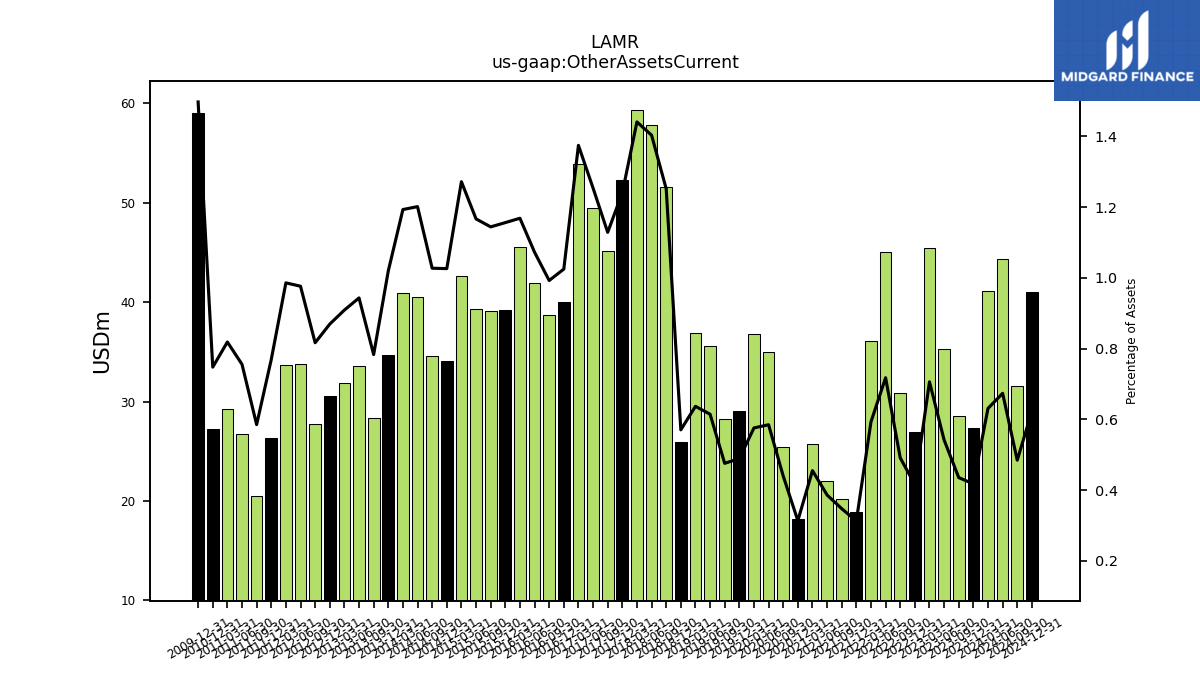
| Other Assets Current | 41.16 | 27.39 | 28.60 | 35.31 | 45.48 | 26.89 | 30.83 | 45.08 | 36.13 | 18.90 | 20.20 | 22.05 | 25.70 | 18.15 | 25.41 | 34.97 | 36.80 | 29.05 | 28.20 | 35.62 | 36.89 | 25.91 | 51.64 | 57.82 | 59.29 | 52.27 | 45.19 | 49.48 | 53.95 |
| 2024-03-31 | 2023-12-31 | 2023-09-30 | 2023-06-30 | 2023-03-31 | 2022-12-31 | 2022-09-30 | 2022-06-30 | 2022-03-31 | 2021-12-31 | 2021-09-30 | 2021-06-30 | 2021-03-31 | 2020-12-31 | 2020-09-30 | 2020-06-30 | 2020-03-31 | 2019-12-31 | 2019-09-30 | 2019-06-30 | 2019-03-31 | 2018-12-31 | 2018-09-30 | 2018-06-30 | 2018-03-31 | 2017-12-31 | 2017-09-30 | 2017-06-30 | 2017-03-31 | ||
|---|---|---|---|---|---|---|---|---|---|---|---|---|---|---|---|---|---|---|---|---|---|---|---|---|---|---|---|---|---|---|
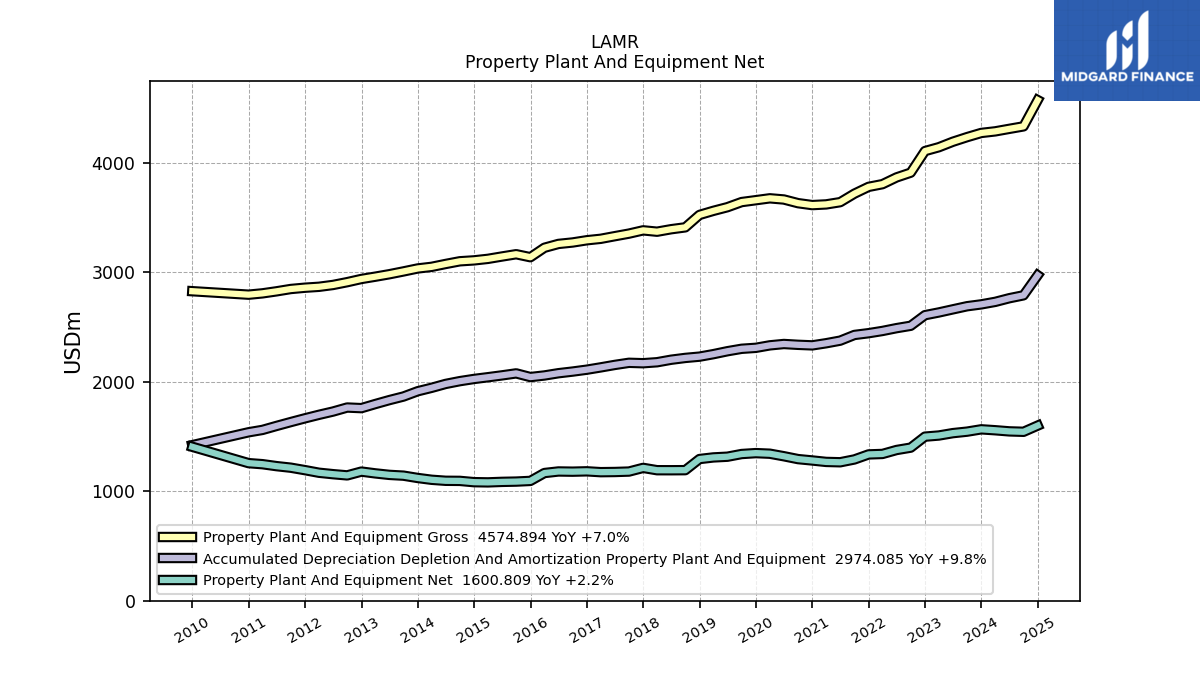
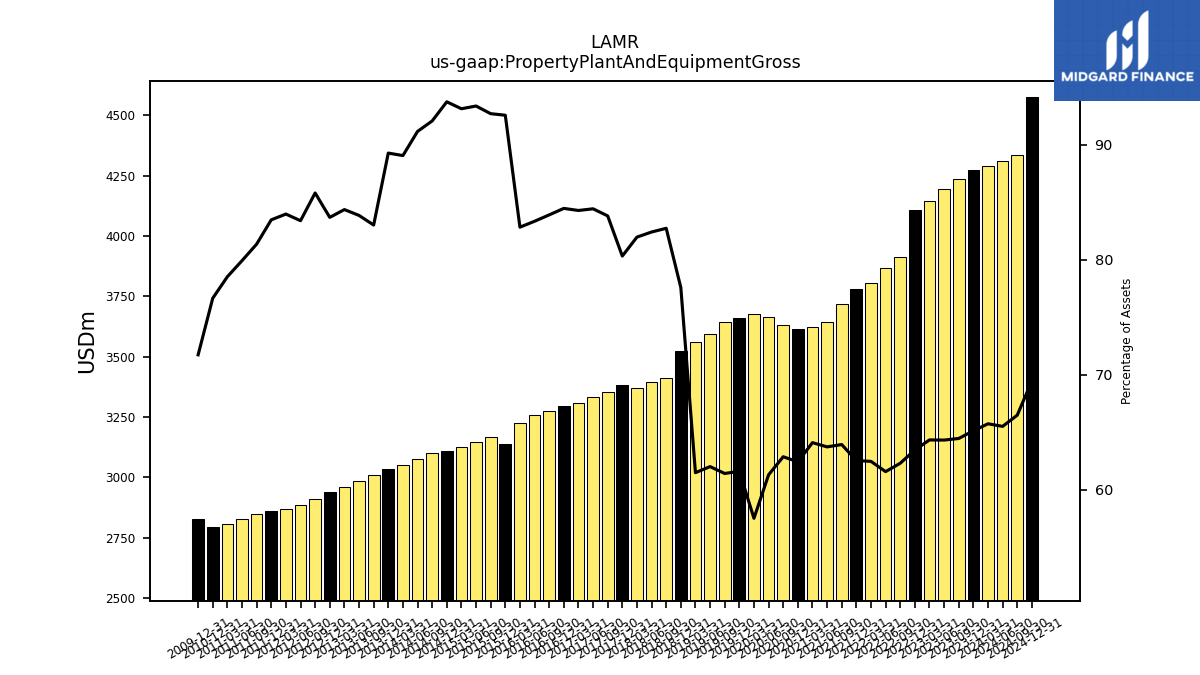
| Property Plant And Equipment Gross | 4289.44 | 4274.83 | 4236.57 | 4194.47 | 4144.29 | 4109.15 | 3912.02 | 3868.51 | 3806.91 | 3782.29 | 3720.04 | 3642.40 | 3621.87 | 3615.51 | 3633.11 | 3666.75 | 3677.51 | 3660.31 | 3643.16 | 3596.39 | 3563.03 | 3525.72 | 3412.22 | 3395.02 | 3372.41 | 3384.72 | 3354.96 | 3331.39 | 3307.51 | |
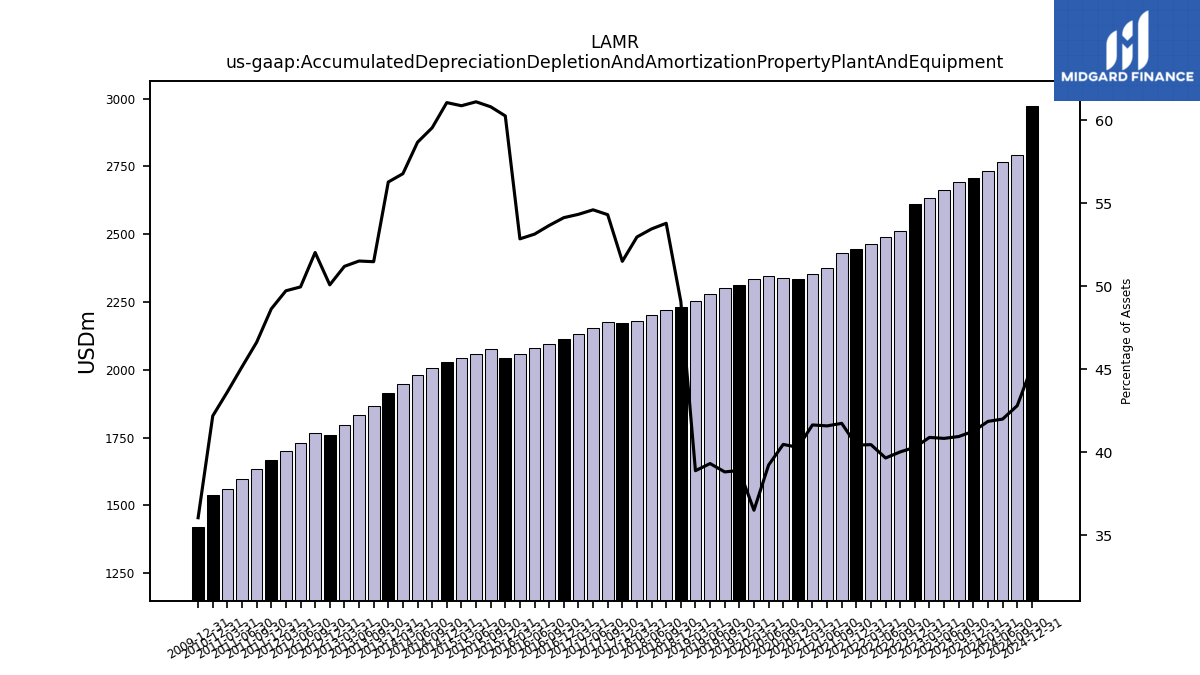
| Accumulated Depreciation Depletion And Amortization Property Plant And Equipment | 2731.41 | 2708.36 | 2691.27 | 2662.82 | 2634.37 | 2609.45 | 2512.79 | 2491.06 | 2465.44 | 2445.01 | 2428.80 | 2376.90 | 2353.19 | 2333.66 | 2338.73 | 2346.27 | 2333.84 | 2311.20 | 2302.40 | 2280.13 | 2253.38 | 2230.68 | 2218.91 | 2202.41 | 2179.51 | 2170.59 | 2174.39 | 2154.87 | 2132.47 | |
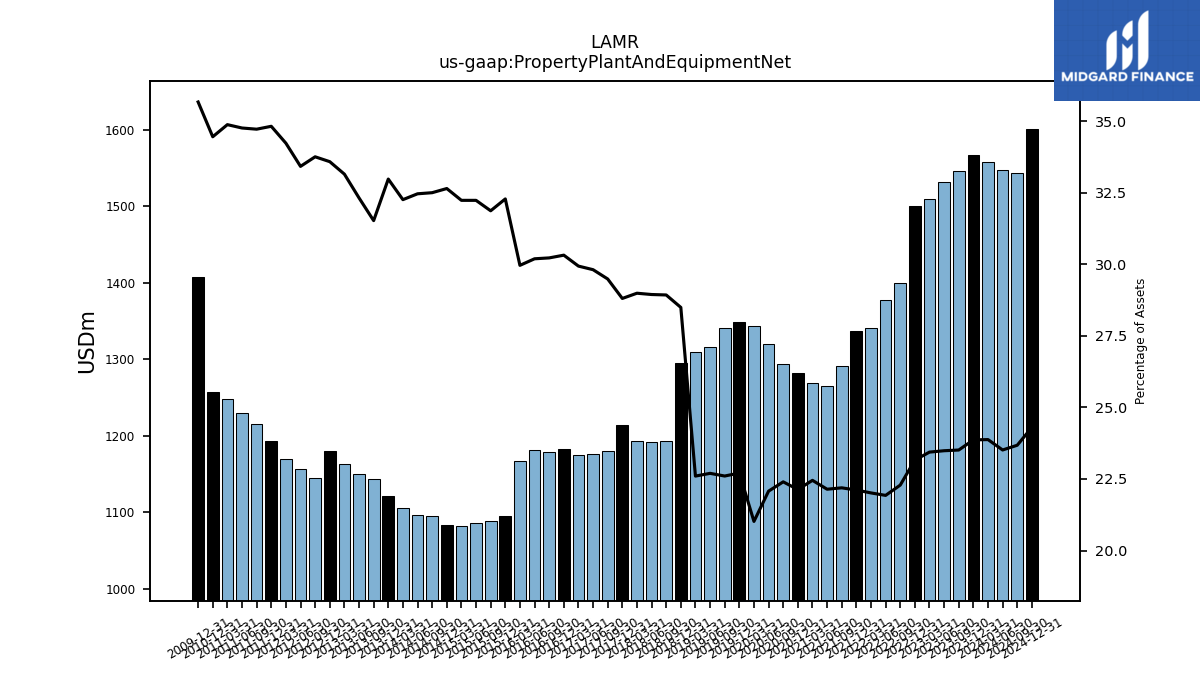
| Property Plant And Equipment Net | 1558.03 | 1566.47 | 1545.30 | 1531.65 | 1509.92 | 1499.70 | 1399.23 | 1377.45 | 1341.47 | 1337.27 | 1291.24 | 1265.49 | 1268.68 | 1281.85 | 1294.38 | 1320.47 | 1343.67 | 1349.12 | 1340.77 | 1316.26 | 1309.65 | 1295.05 | 1193.31 | 1192.62 | 1192.90 | 1214.14 | 1180.57 | 1176.52 | 1175.04 | |
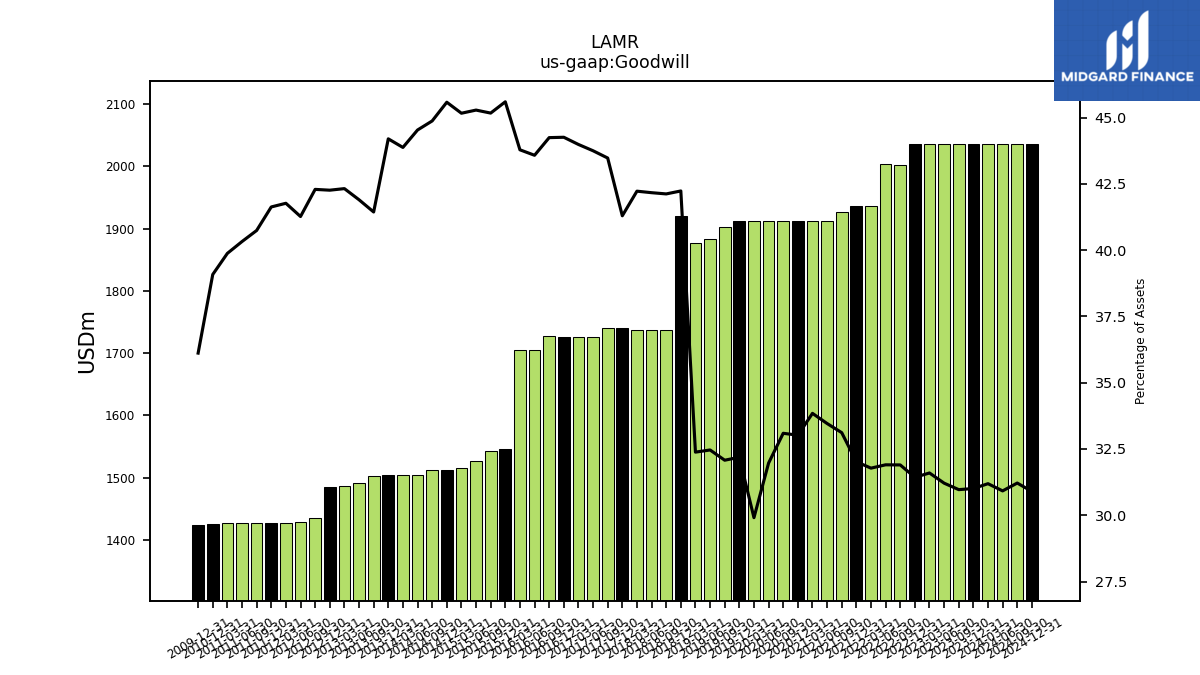
| Goodwill | 2035.22 | 2035.27 | 2035.21 | 2035.27 | 2035.27 | 2035.27 | 2002.75 | 2004.14 | 1936.46 | 1936.43 | 1926.92 | 1912.40 | 1912.36 | 1912.33 | 1912.21 | 1912.16 | 1912.07 | 1912.27 | 1902.68 | 1882.55 | 1876.36 | 1919.39 | 1737.40 | 1737.36 | 1737.40 | 1740.45 | 1740.47 | 1726.44 | 1726.38 | |
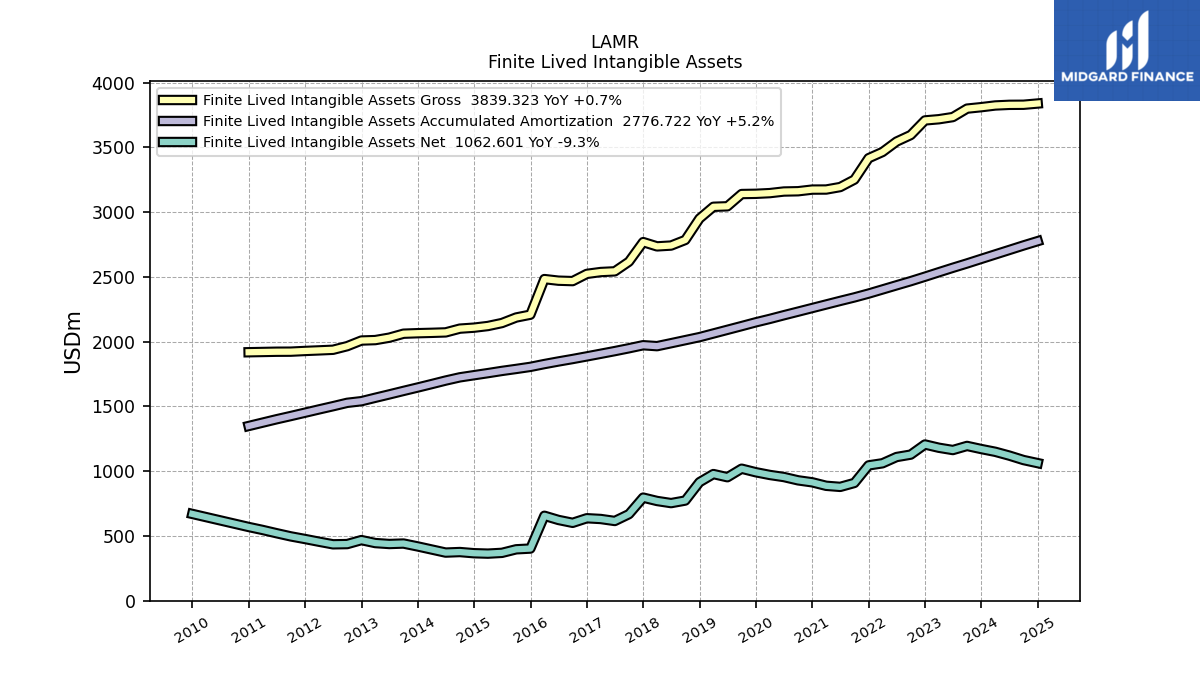
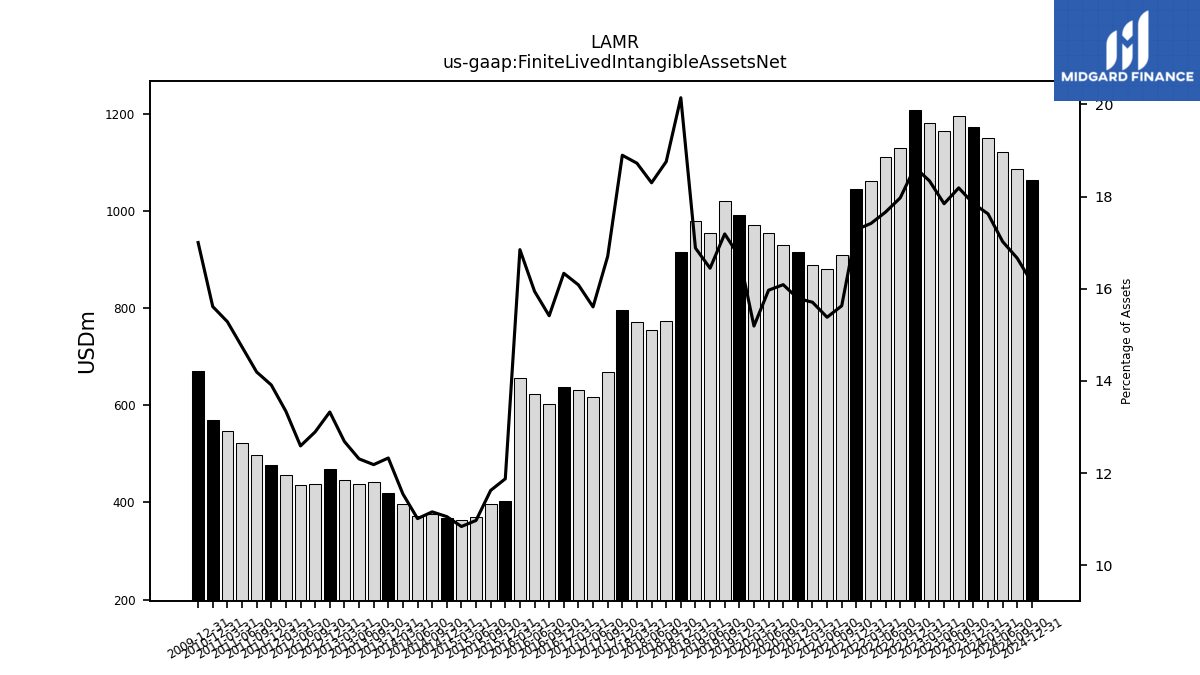
| Finite Lived Intangible Assets Net | 1150.08 | 1171.43 | 1195.37 | 1163.67 | 1181.41 | 1206.62 | 1128.36 | 1109.69 | 1061.39 | 1045.18 | 909.51 | 879.14 | 887.59 | 914.45 | 929.68 | 955.20 | 971.19 | 992.24 | 1019.65 | 953.71 | 978.31 | 915.45 | 773.66 | 753.92 | 770.37 | 796.35 | 668.67 | 615.86 | 631.23 | |
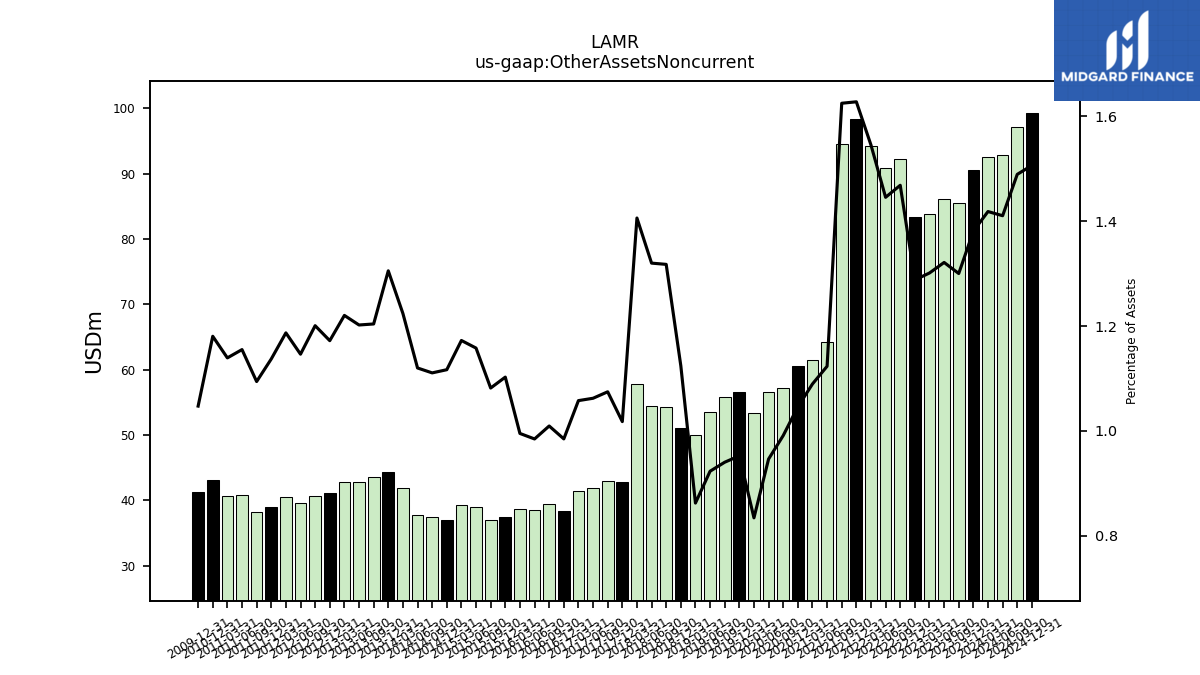
| Other Assets Noncurrent | 92.56 | 90.64 | 85.45 | 86.17 | 83.82 | 83.40 | 92.21 | 90.82 | 94.18 | 98.45 | 94.56 | 64.20 | 61.56 | 60.56 | 57.26 | 56.59 | 53.32 | 56.57 | 55.76 | 53.52 | 49.96 | 51.09 | 54.35 | 54.39 | 57.86 | 42.89 | 43.02 | 41.91 | 41.51 |
| 2024-03-31 | 2023-12-31 | 2023-09-30 | 2023-06-30 | 2023-03-31 | 2022-12-31 | 2022-09-30 | 2022-06-30 | 2022-03-31 | 2021-12-31 | 2021-09-30 | 2021-06-30 | 2021-03-31 | 2020-12-31 | 2020-09-30 | 2020-06-30 | 2020-03-31 | 2019-12-31 | 2019-09-30 | 2019-06-30 | 2019-03-31 | 2018-12-31 | 2018-09-30 | 2018-06-30 | 2018-03-31 | 2017-12-31 | 2017-09-30 | 2017-06-30 | 2017-03-31 | ||
|---|---|---|---|---|---|---|---|---|---|---|---|---|---|---|---|---|---|---|---|---|---|---|---|---|---|---|---|---|---|---|
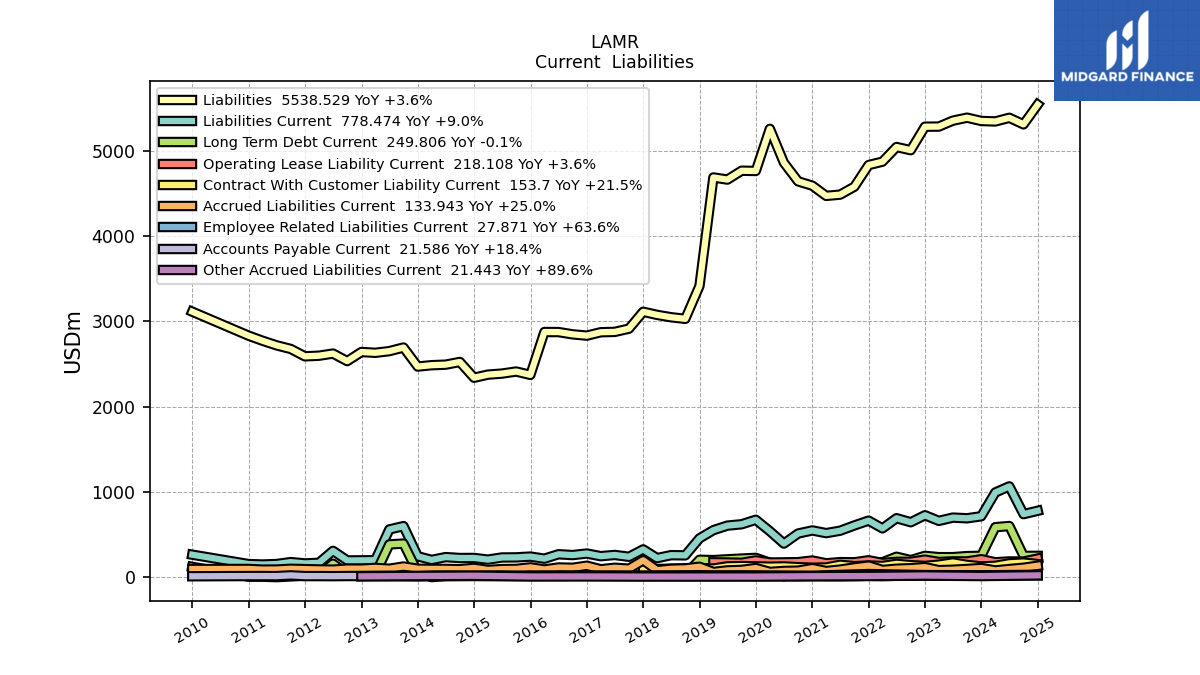
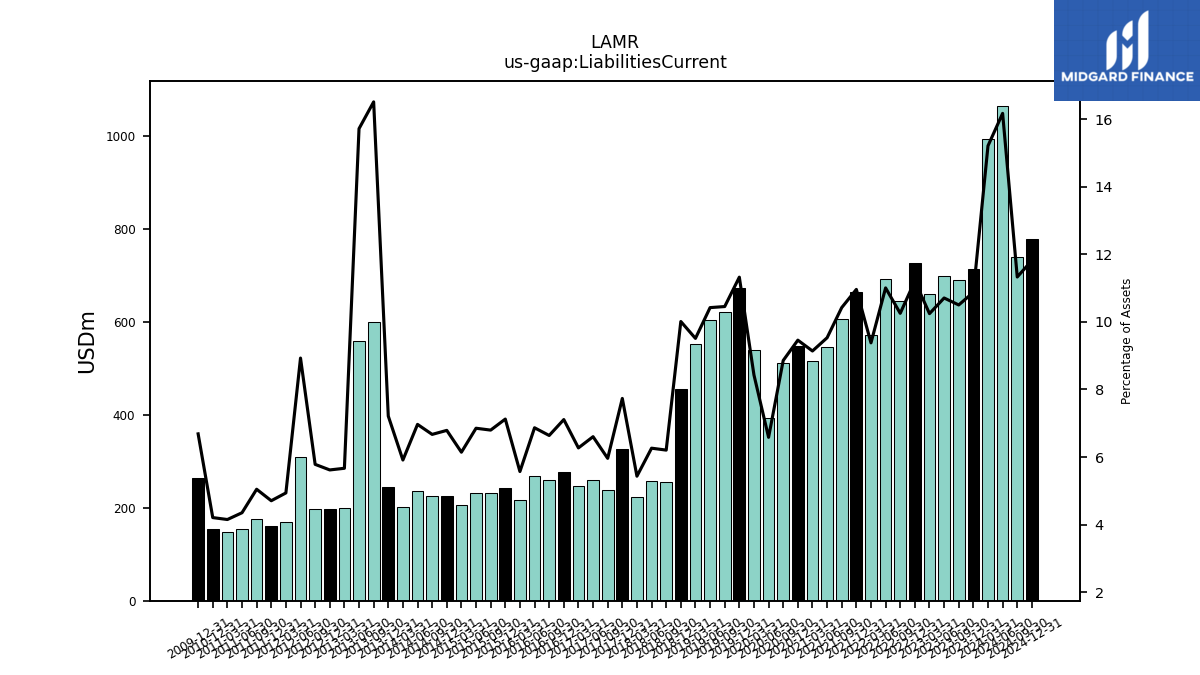
| Liabilities Current | 992.61 | 713.90 | 690.24 | 698.30 | 659.98 | 726.04 | 643.83 | 691.41 | 571.67 | 662.97 | 606.55 | 544.78 | 516.43 | 547.87 | 511.90 | 393.86 | 538.93 | 672.81 | 620.17 | 604.48 | 551.22 | 455.04 | 255.98 | 258.04 | 223.59 | 325.99 | 238.69 | 260.57 | 246.12 | |
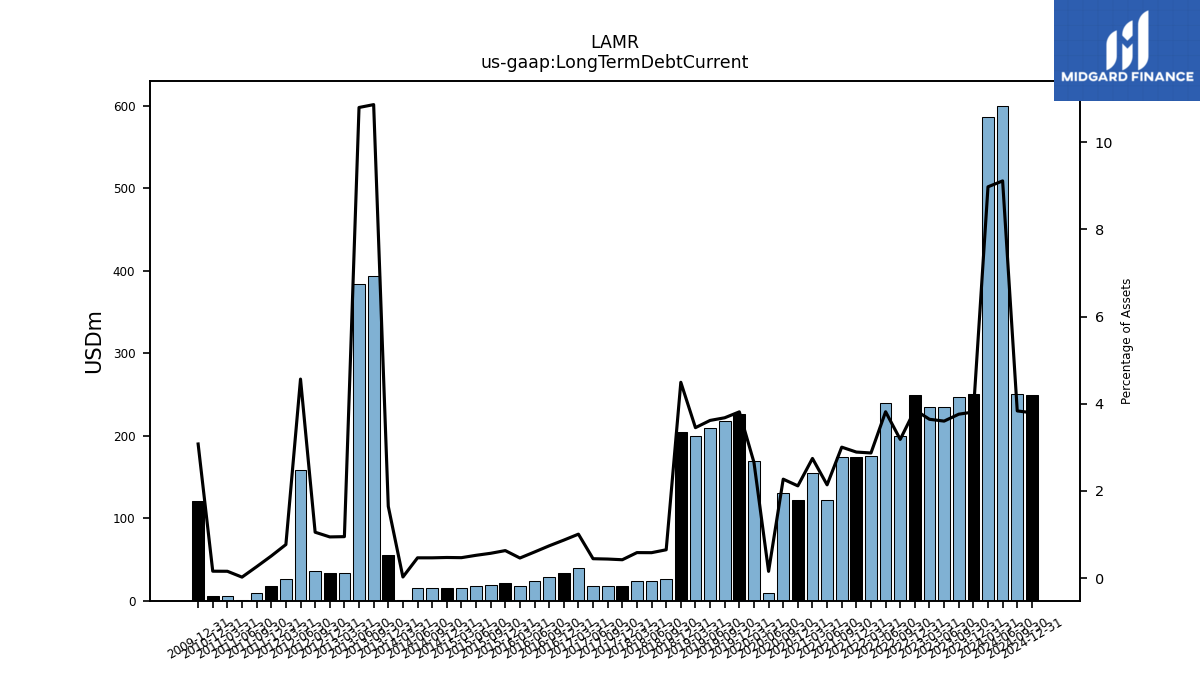
| Long Term Debt Current | 585.76 | 250.02 | 247.05 | 234.79 | 234.62 | 249.78 | 199.72 | 239.70 | 174.84 | 174.78 | 174.72 | 122.19 | 155.04 | 122.43 | 131.07 | 9.12 | 169.62 | 226.51 | 218.10 | 209.70 | 199.93 | 204.12 | 26.73 | 23.95 | 23.98 | 17.66 | 17.41 | 17.47 | 39.49 | |
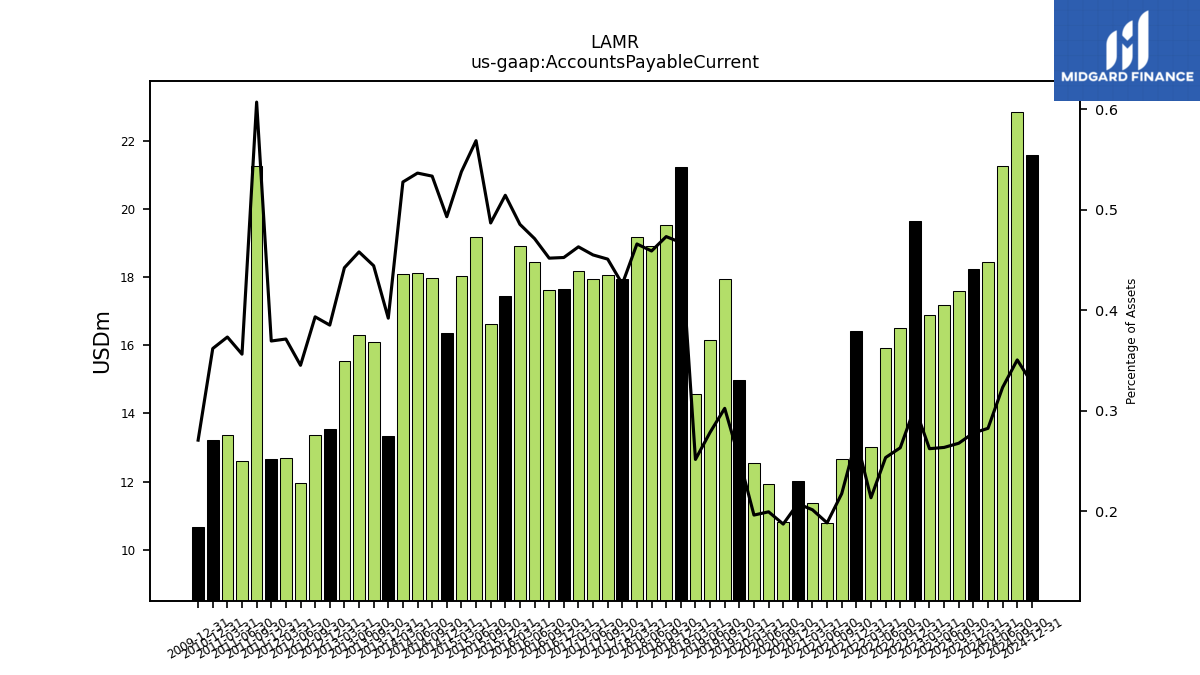
| Accounts Payable Current | 18.43 | 18.24 | 17.59 | 17.18 | 16.89 | 19.64 | 16.52 | 15.92 | 13.01 | 16.43 | 12.65 | 10.77 | 11.38 | 12.02 | 10.82 | 11.93 | 12.54 | 14.97 | 17.94 | 16.15 | 14.58 | 21.25 | 19.53 | 18.91 | 19.18 | 17.96 | 18.05 | 17.96 | 18.18 | |
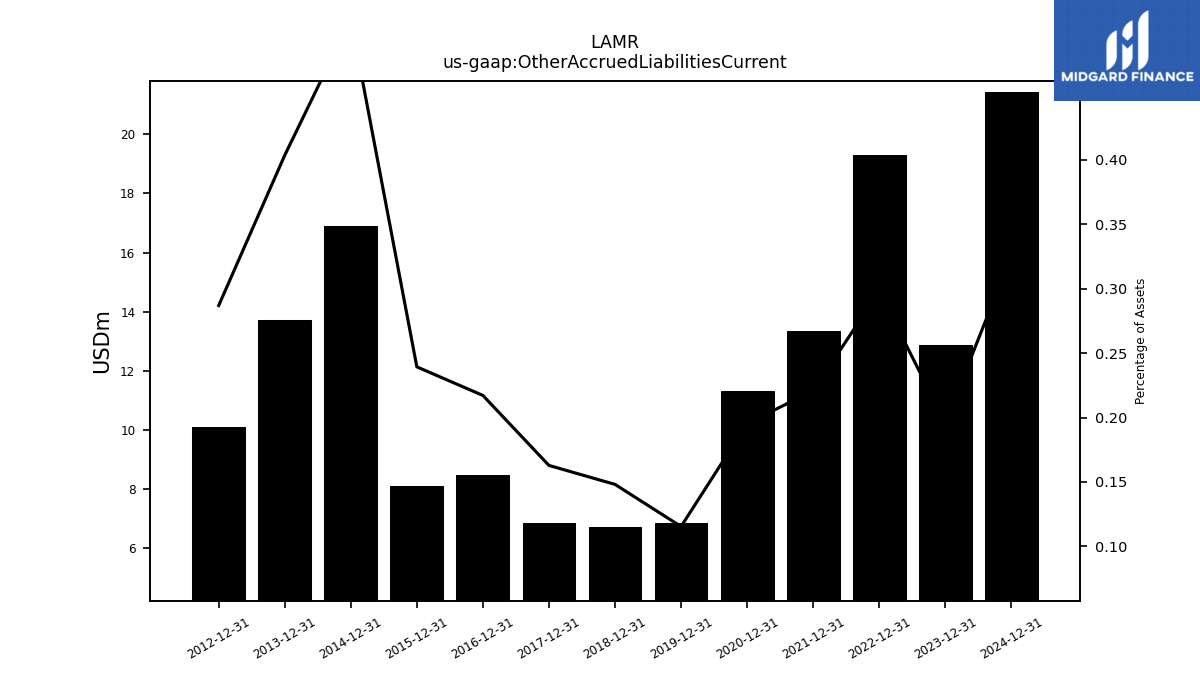
| Other Accrued Liabilities Current | NA | 12.86 | NA | NA | NA | 19.29 | NA | NA | NA | 13.36 | NA | NA | NA | 11.31 | NA | NA | NA | 6.86 | NA | NA | NA | 6.73 | NA | NA | NA | 6.86 | NA | NA | NA | |
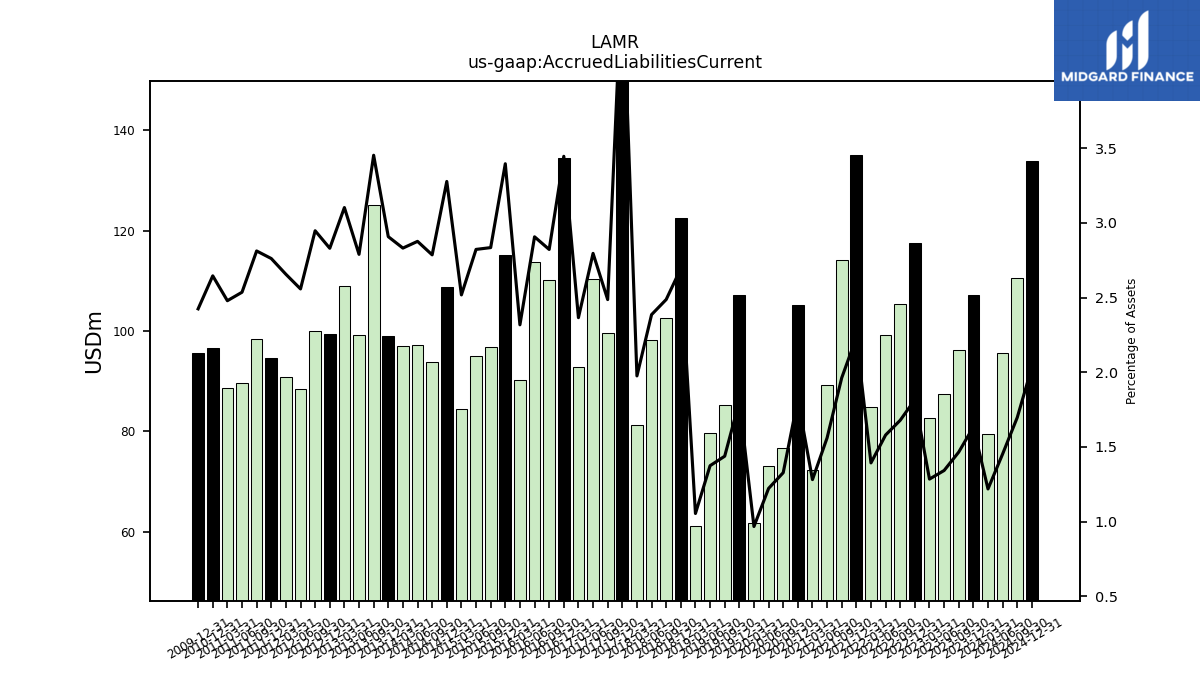
| Accrued Liabilities Current | 79.48 | 107.19 | 96.29 | 87.50 | 82.72 | 117.59 | 105.37 | 99.22 | 84.87 | 135.04 | 114.19 | 89.17 | 72.37 | 105.29 | 76.69 | 73.07 | 61.79 | 107.22 | 85.27 | 79.67 | 61.05 | 122.47 | 102.59 | 98.30 | 81.28 | 197.68 | 99.55 | 110.34 | 92.84 | |
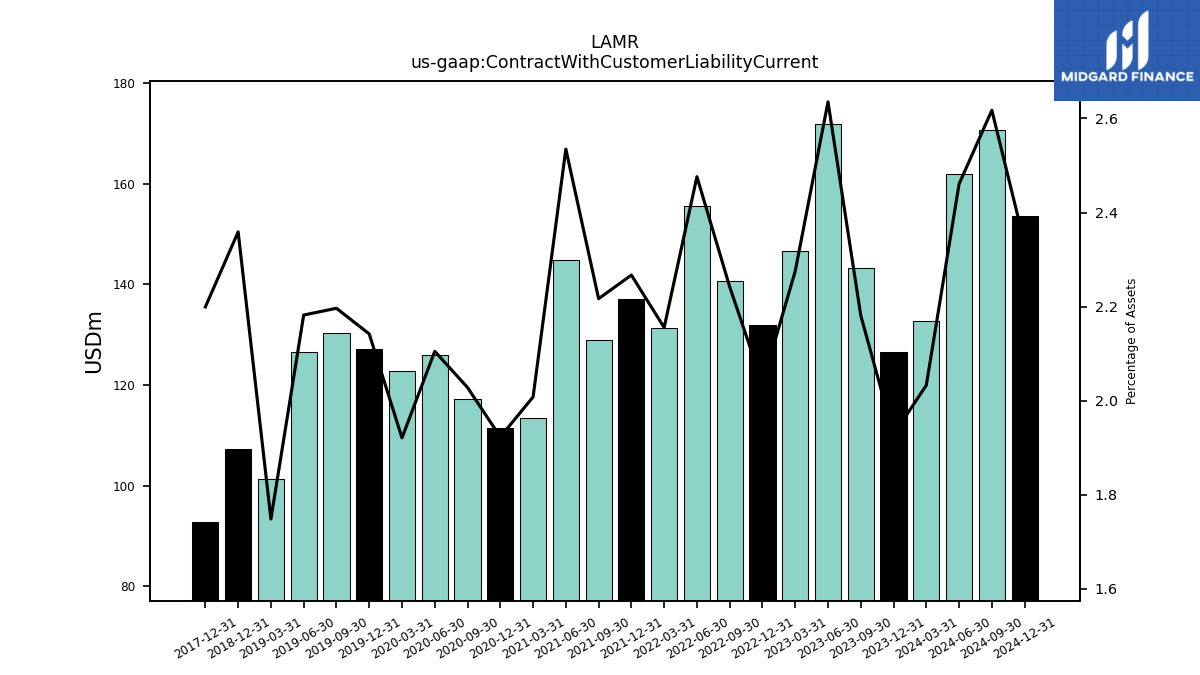
| Contract With Customer Liability Current | 132.64 | 126.55 | 143.35 | 171.85 | 146.58 | 131.85 | 140.77 | 155.55 | 131.35 | 137.10 | 128.99 | 144.88 | 113.45 | 111.36 | 117.18 | 125.91 | 122.81 | 127.25 | 130.29 | 126.55 | 101.31 | 107.20 | NA | NA | NA | 92.69 | NA | NA | NA |
| 2024-03-31 | 2023-12-31 | 2023-09-30 | 2023-06-30 | 2023-03-31 | 2022-12-31 | 2022-09-30 | 2022-06-30 | 2022-03-31 | 2021-12-31 | 2021-09-30 | 2021-06-30 | 2021-03-31 | 2020-12-31 | 2020-09-30 | 2020-06-30 | 2020-03-31 | 2019-12-31 | 2019-09-30 | 2019-06-30 | 2019-03-31 | 2018-12-31 | 2018-09-30 | 2018-06-30 | 2018-03-31 | 2017-12-31 | 2017-09-30 | 2017-06-30 | 2017-03-31 | ||
|---|---|---|---|---|---|---|---|---|---|---|---|---|---|---|---|---|---|---|---|---|---|---|---|---|---|---|---|---|---|---|
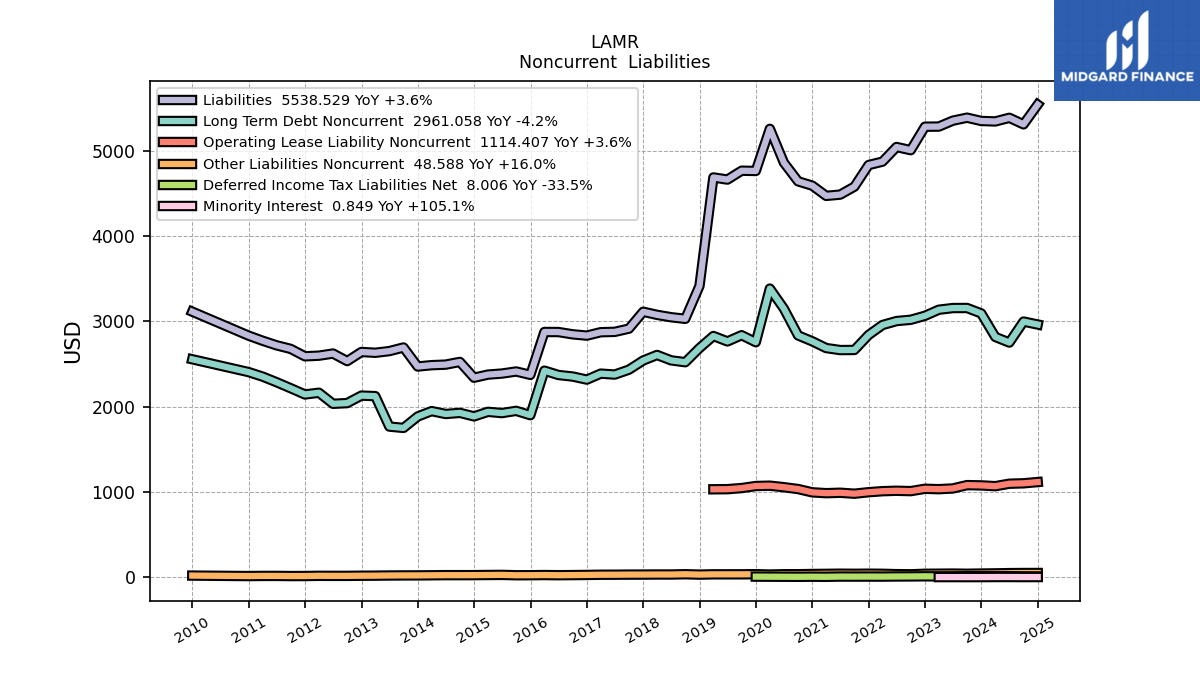
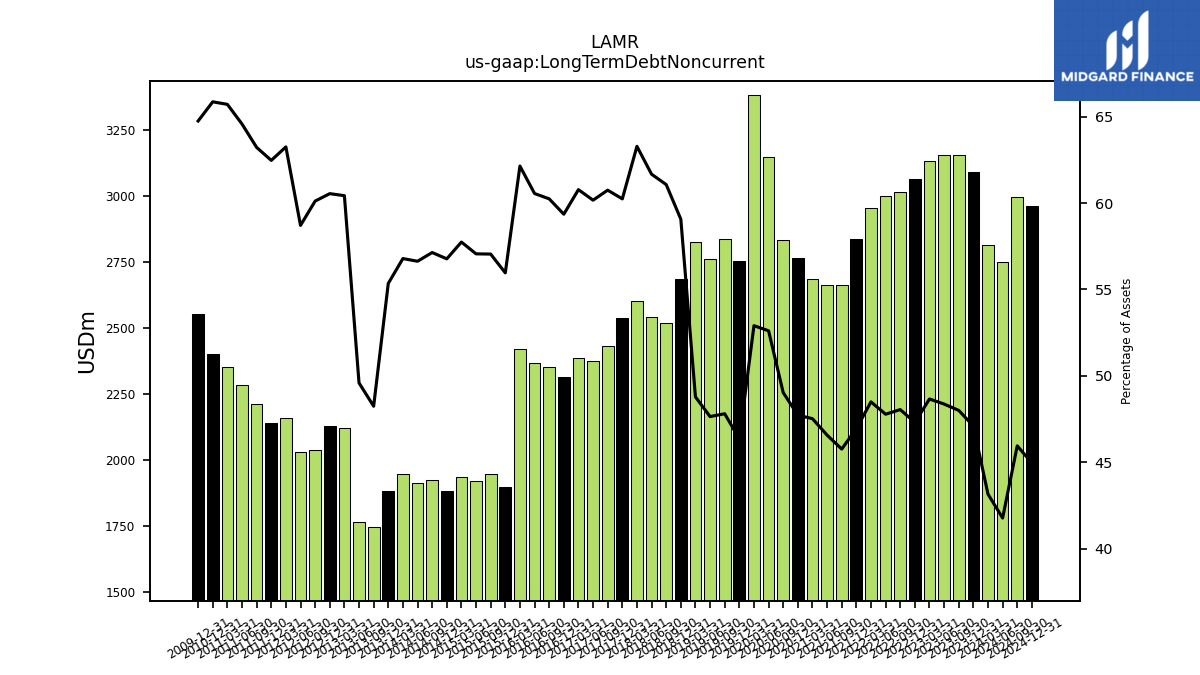
| Long Term Debt Noncurrent | 2815.57 | 3091.11 | 3154.65 | 3154.00 | 3134.51 | 3063.02 | 3016.56 | 3001.47 | 2955.14 | 2838.82 | 2662.66 | 2661.49 | 2685.09 | 2764.08 | 2833.12 | 3146.78 | 3382.19 | 2753.60 | 2835.70 | 2762.81 | 2826.62 | 2684.57 | 2519.15 | 2540.95 | 2603.98 | 2539.03 | 2432.01 | 2374.38 | 2385.41 | |
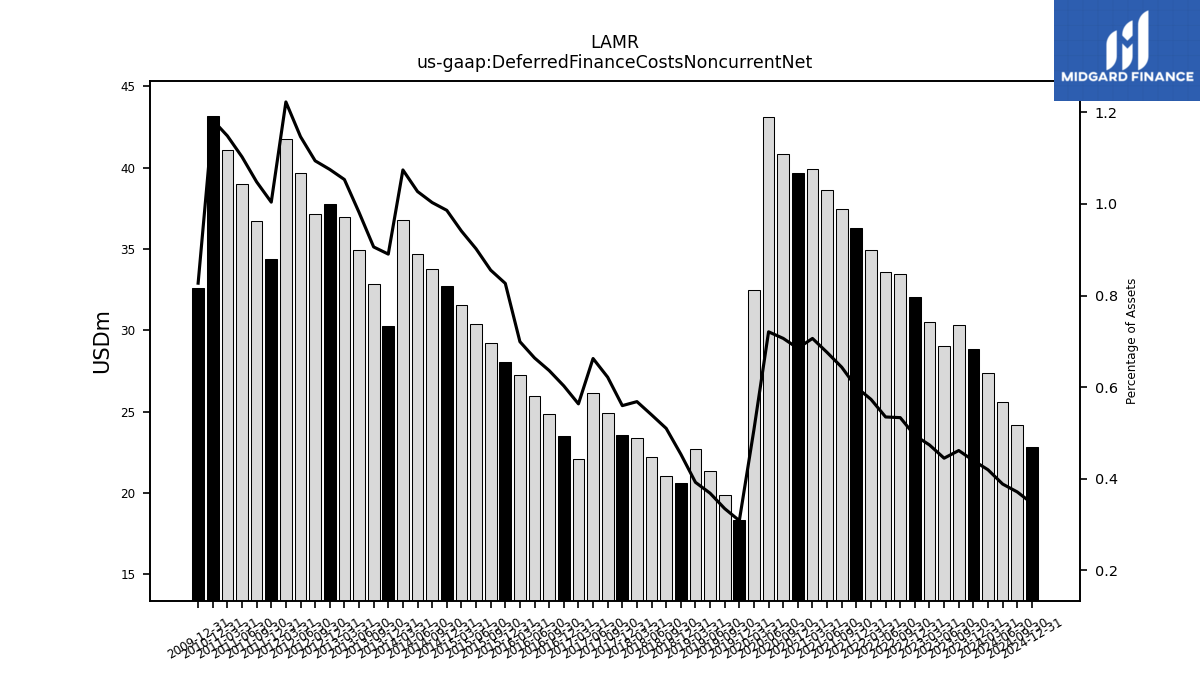
| Deferred Finance Costs Noncurrent Net | 27.38 | 28.86 | 30.34 | 29.01 | 30.52 | 32.02 | 33.49 | 33.60 | 34.94 | 36.27 | 37.45 | 38.62 | 39.91 | 39.67 | 40.82 | 43.12 | 32.45 | 18.33 | 19.86 | 21.37 | 22.73 | 20.62 | 21.03 | 22.23 | 23.39 | 23.59 | 24.89 | 26.14 | 22.12 | |
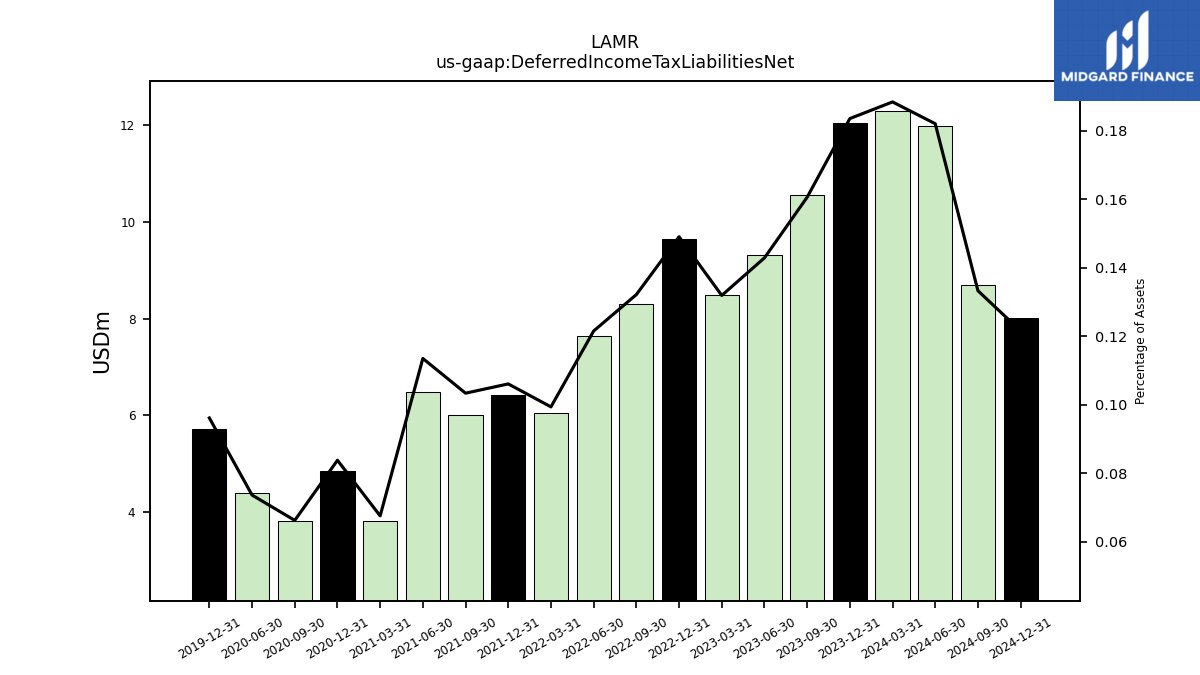
| Deferred Income Tax Liabilities Net | 12.29 | 12.05 | 10.55 | 9.32 | 8.50 | 9.65 | 8.30 | 7.63 | 6.06 | 6.42 | 6.02 | 6.49 | 3.82 | 4.85 | 3.83 | 4.41 | NA | 5.71 | NA | NA | NA | NA | NA | NA | NA | NA | NA | NA | NA | |
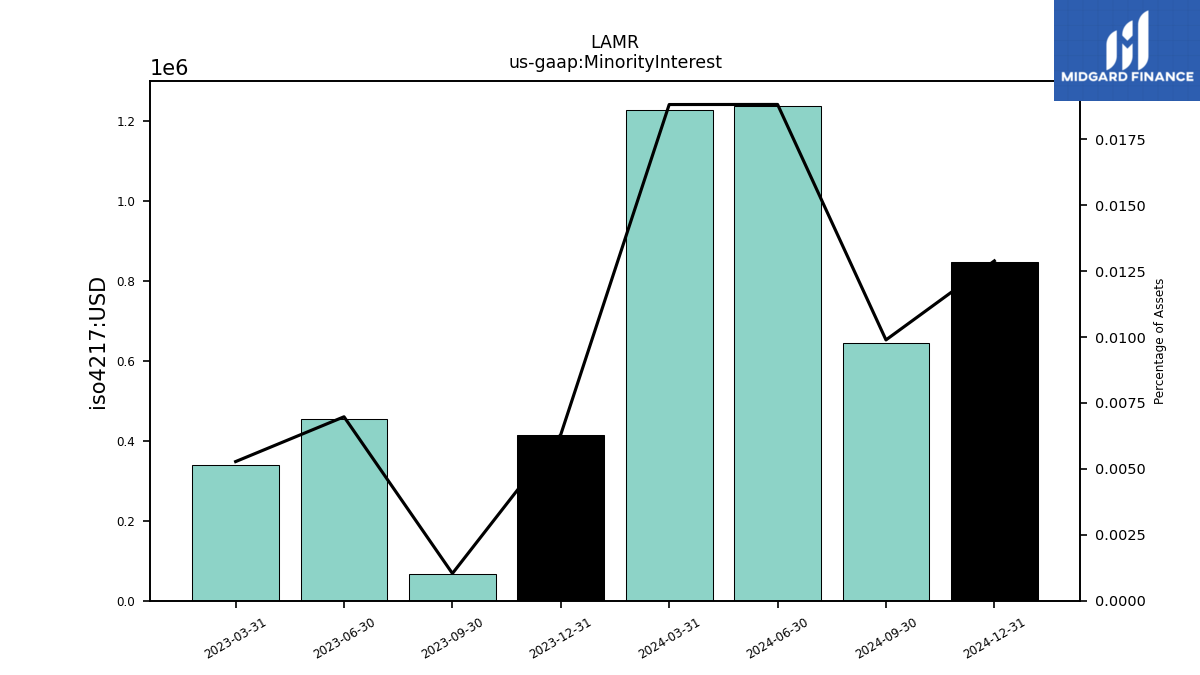
| Minority Interest | 1.23 | 0.41 | 0.07 | 0.46 | 0.34 | NA | NA | NA | NA | NA | NA | NA | NA | NA | NA | NA | NA | NA | NA | NA | NA | NA | NA | NA | NA | NA | NA | NA | NA | |
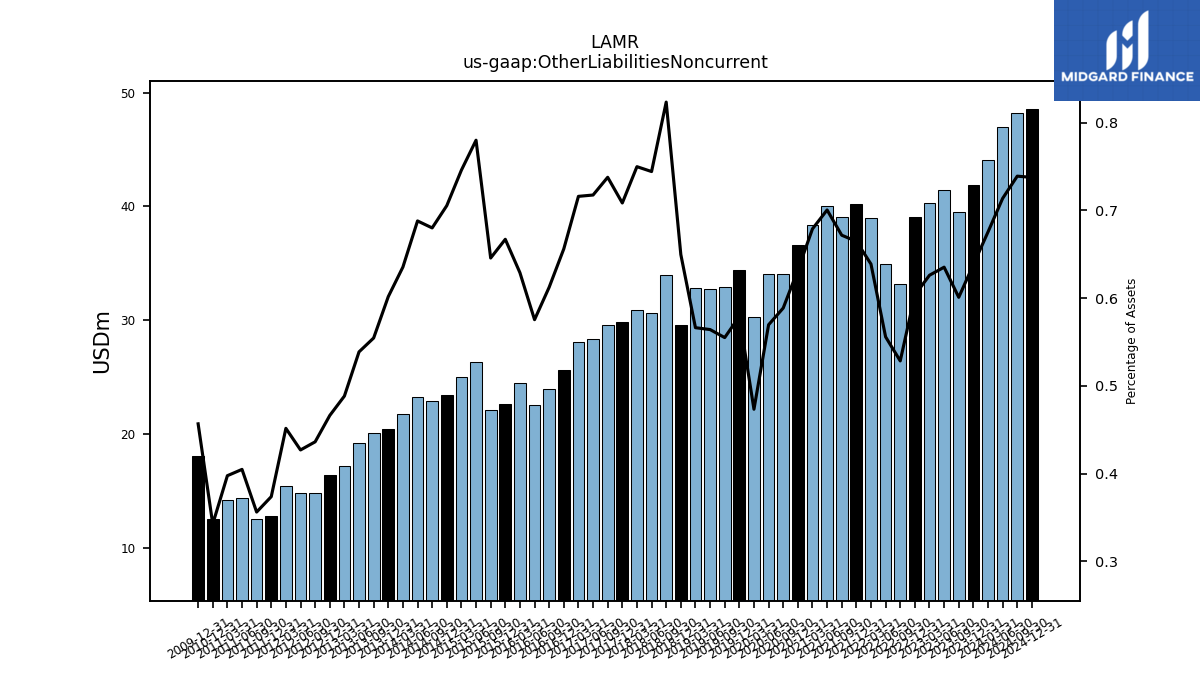
| Other Liabilities Noncurrent | 44.07 | 41.89 | 39.50 | 41.43 | 40.34 | 39.09 | 33.19 | 34.93 | 38.94 | 40.21 | 39.09 | 40.04 | 38.37 | 36.60 | 34.02 | 34.08 | 30.27 | 34.41 | 32.93 | 32.72 | 32.82 | 29.53 | 33.97 | 30.67 | 30.86 | 29.86 | 29.54 | 28.32 | 28.10 | |
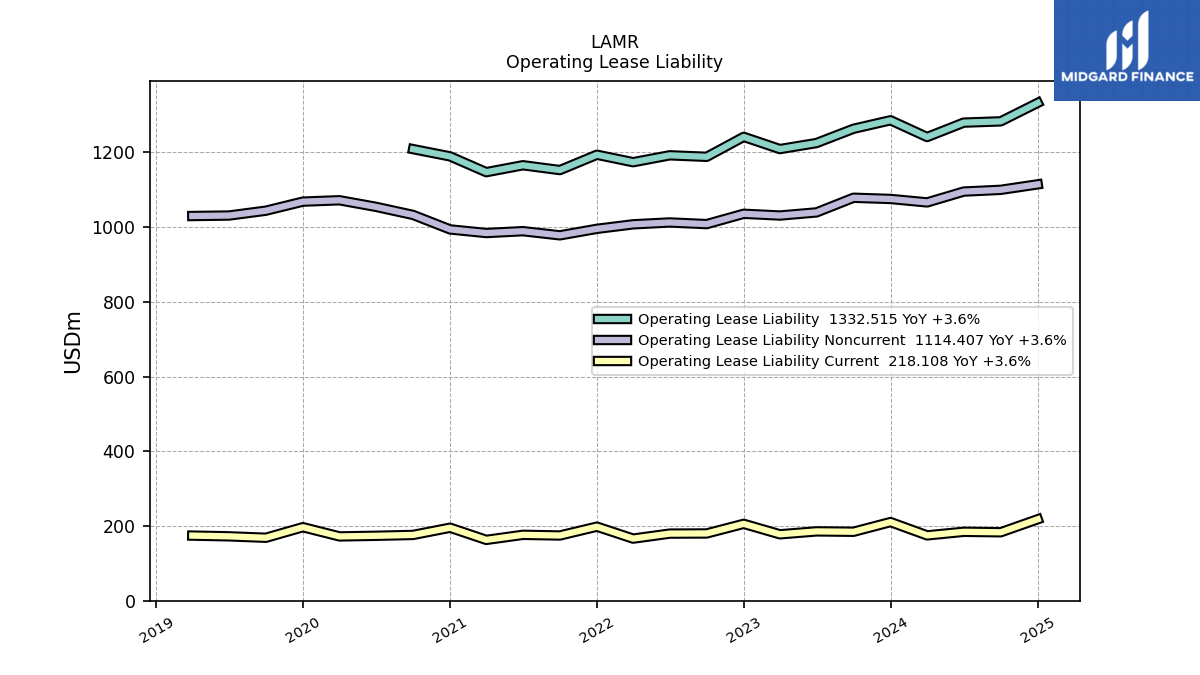
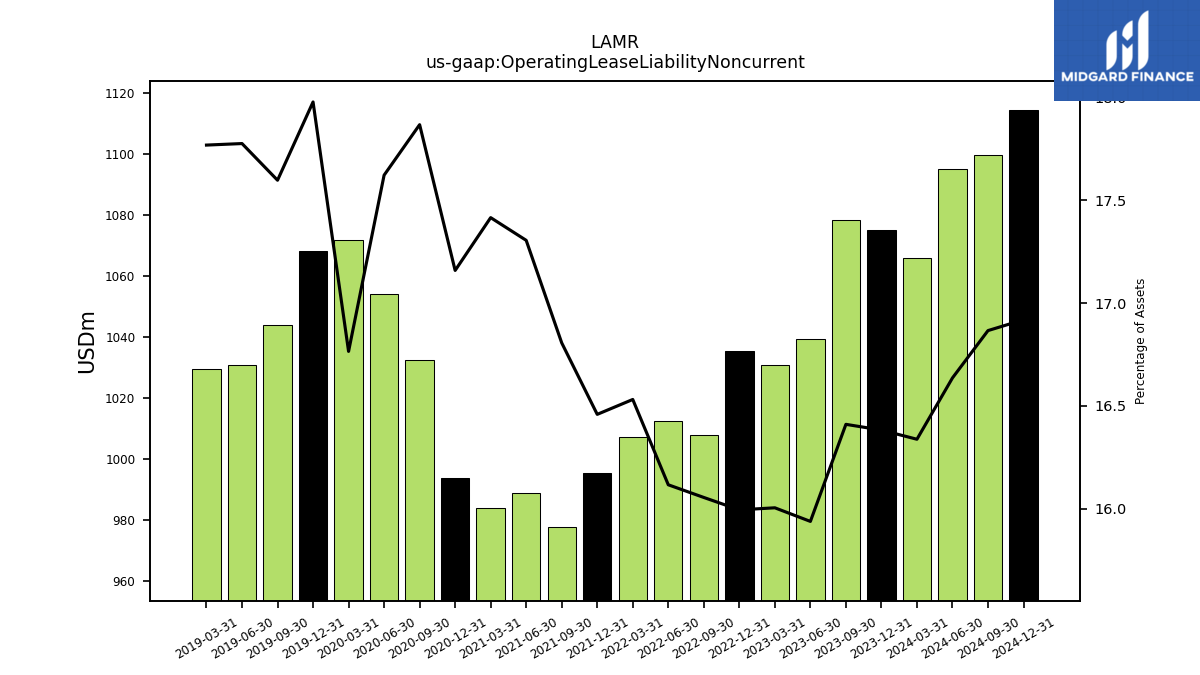
| Operating Lease Liability Noncurrent | 1066.06 | 1075.29 | 1078.55 | 1039.33 | 1030.96 | 1035.65 | 1007.99 | 1012.43 | 1007.40 | 995.36 | 977.94 | 989.09 | 984.12 | 993.78 | 1032.54 | 1054.14 | 1071.81 | 1068.18 | 1043.89 | 1030.91 | 1029.66 | NA | NA | NA | NA | NA | NA | NA | NA |
| 2024-03-31 | 2023-12-31 | 2023-09-30 | 2023-06-30 | 2023-03-31 | 2022-12-31 | 2022-09-30 | 2022-06-30 | 2022-03-31 | 2021-12-31 | 2021-09-30 | 2021-06-30 | 2021-03-31 | 2020-12-31 | 2020-09-30 | 2020-06-30 | 2020-03-31 | 2019-12-31 | 2019-09-30 | 2019-06-30 | 2019-03-31 | 2018-12-31 | 2018-09-30 | 2018-06-30 | 2018-03-31 | 2017-12-31 | 2017-09-30 | 2017-06-30 | 2017-03-31 | ||
|---|---|---|---|---|---|---|---|---|---|---|---|---|---|---|---|---|---|---|---|---|---|---|---|---|---|---|---|---|---|---|
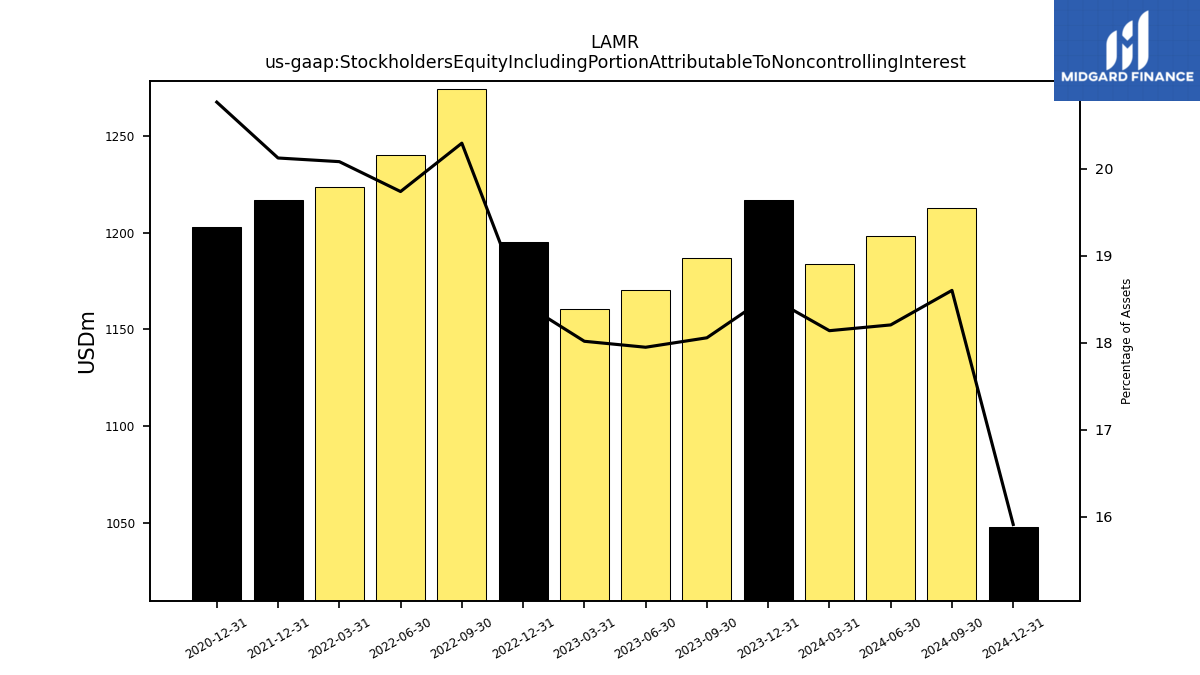
| Stockholders Equity Including Portion Attributable To Noncontrolling Interest | 1183.64 | 1216.79 | 1186.84 | 1170.49 | 1160.69 | 1195.37 | 1274.29 | 1240.07 | 1223.86 | 1217.09 | NA | NA | NA | 1202.77 | NA | NA | NA | NA | NA | NA | NA | NA | NA | NA | NA | NA | NA | NA | NA | |
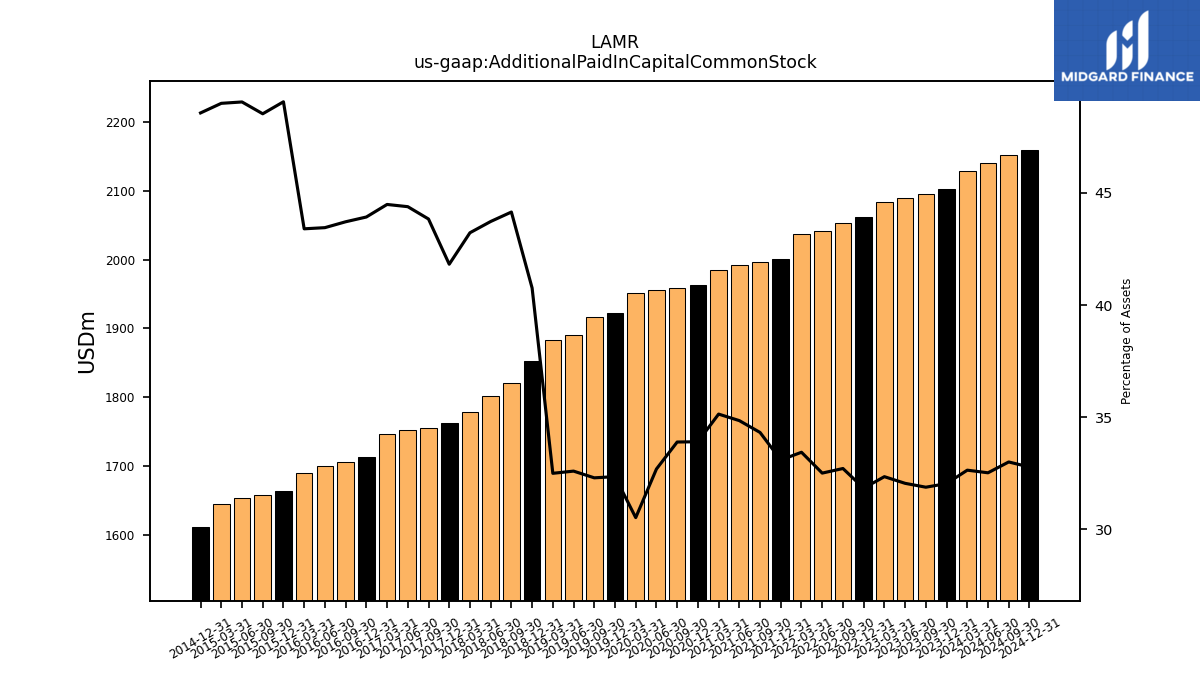
| Additional Paid In Capital Common Stock | 2129.94 | 2103.28 | 2095.48 | 2090.40 | 2084.10 | 2061.67 | 2054.11 | 2042.43 | 2037.85 | 2001.40 | 1997.16 | 1991.84 | 1985.68 | 1963.85 | 1958.71 | 1955.61 | 1951.65 | 1922.22 | 1916.03 | 1890.56 | 1883.39 | 1852.42 | 1820.91 | 1801.48 | 1778.44 | 1762.50 | 1754.89 | 1751.52 | 1745.86 | |
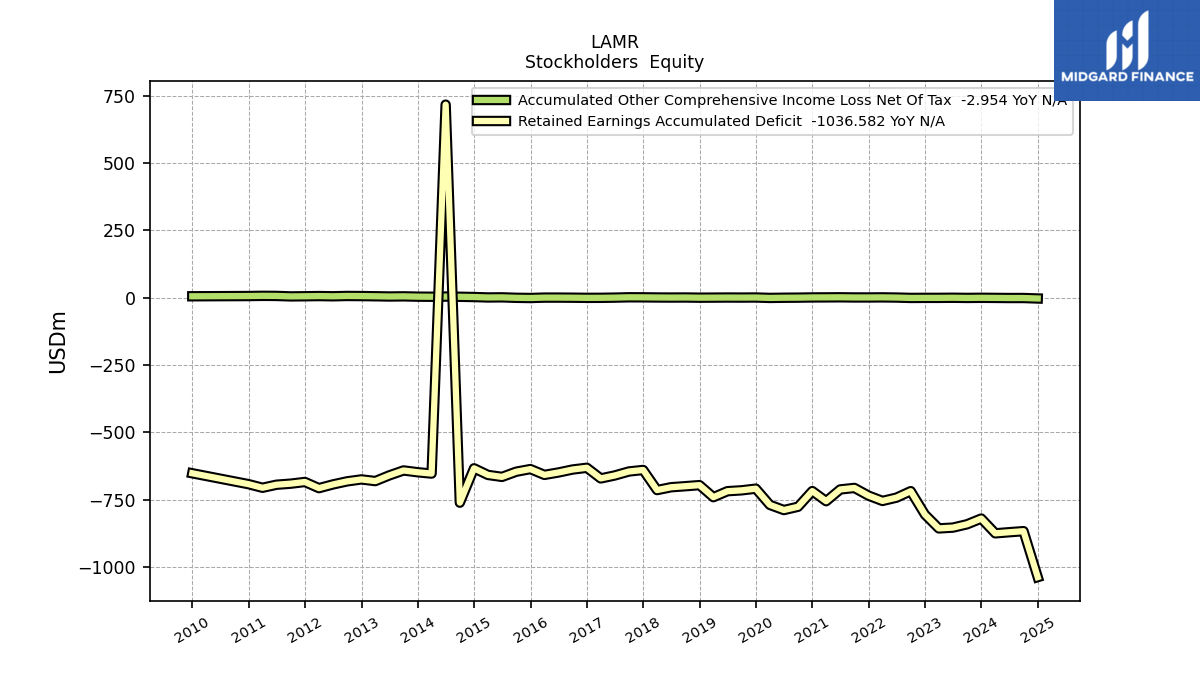
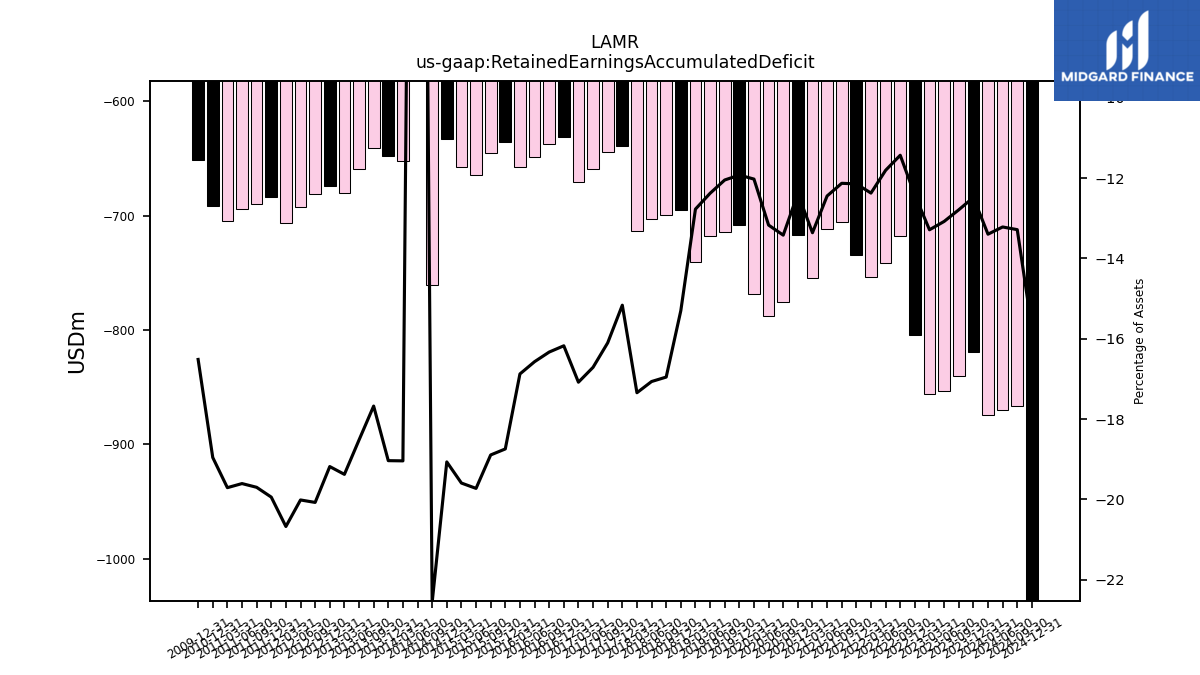
| Retained Earnings Accumulated Deficit | -874.13 | -819.24 | -840.56 | -852.90 | -855.89 | -804.38 | -717.65 | -741.65 | -753.96 | -734.41 | -705.75 | -711.27 | -754.91 | -717.33 | -775.50 | -787.75 | -768.69 | -708.41 | -714.60 | -717.82 | -740.09 | -695.34 | -699.34 | -703.13 | -713.69 | -639.11 | -644.64 | -659.48 | -670.45 | |
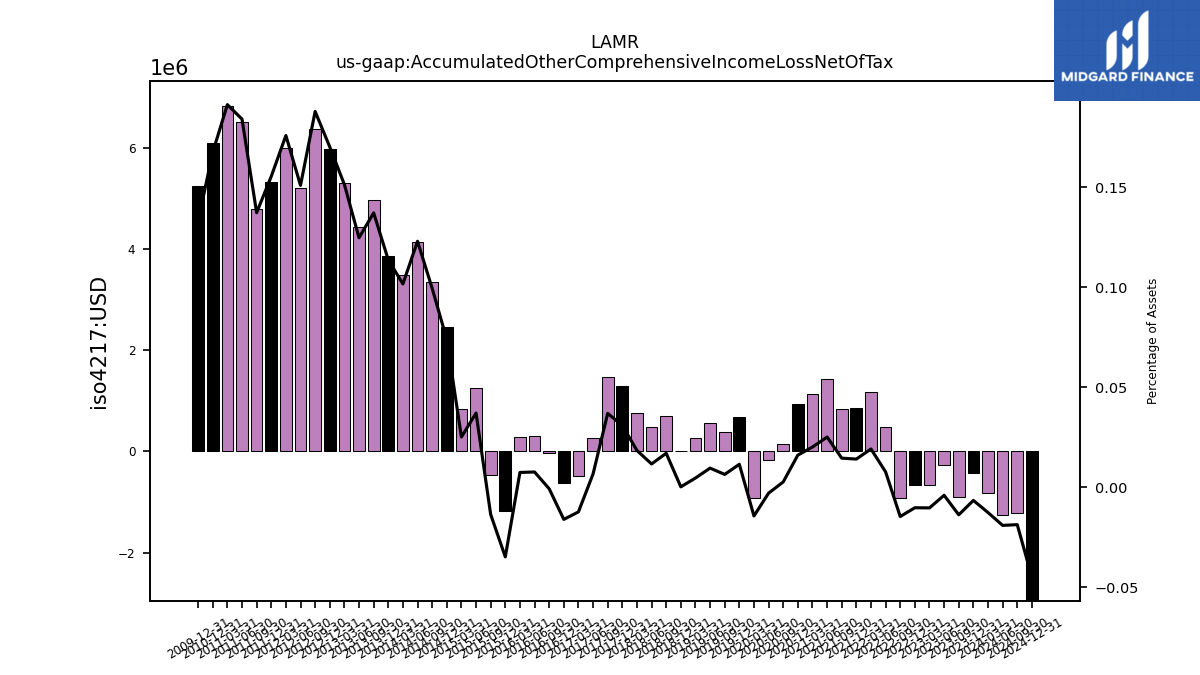
| Accumulated Other Comprehensive Income Loss Net Of Tax | -0.82 | -0.43 | -0.90 | -0.26 | -0.66 | -0.66 | -0.92 | 0.49 | 1.17 | 0.85 | 0.85 | 1.44 | 1.14 | 0.93 | 0.16 | -0.17 | -0.91 | 0.69 | 0.38 | 0.56 | 0.27 | 0.01 | 0.70 | 0.48 | 0.76 | 1.30 | 1.48 | 0.26 | -0.48 | |
| Minority Interest | 1.23 | 0.41 | 0.07 | 0.46 | 0.34 | NA | NA | NA | NA | NA | NA | NA | NA | NA | NA | NA | NA | NA | NA | NA | NA | NA | NA | NA | NA | NA | NA | NA | NA | |
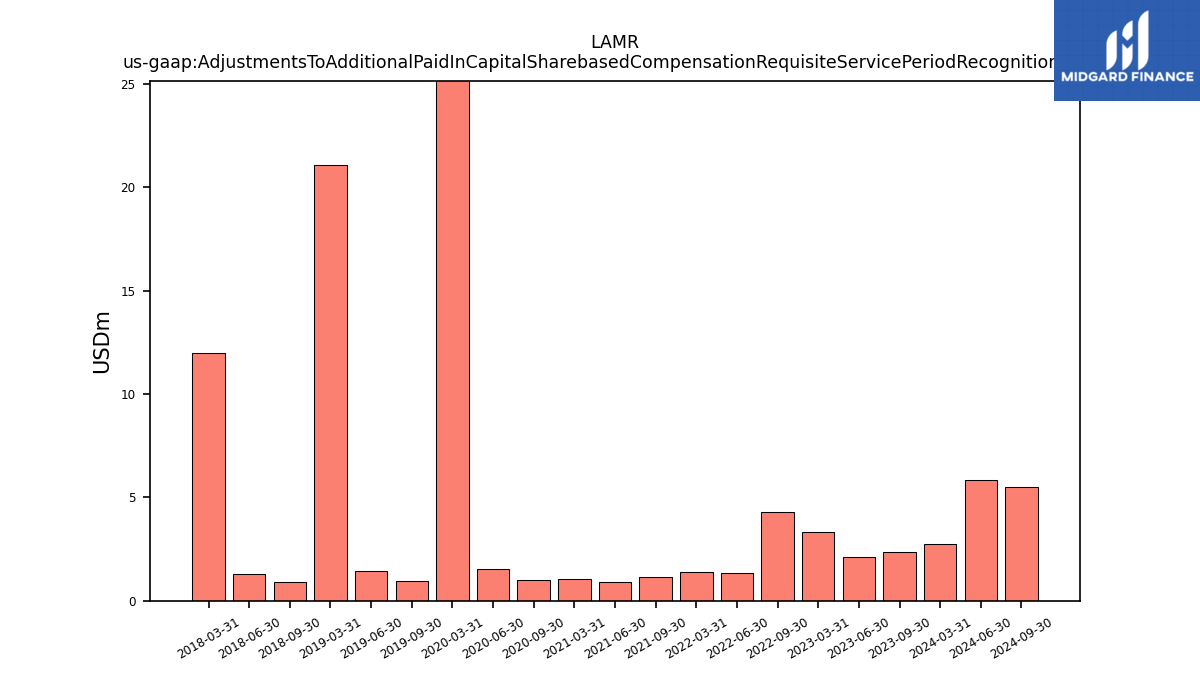
| Adjustments To Additional Paid In Capital Sharebased Compensation Requisite Service Period Recognition Value | 2.75 | NA | 2.37 | 2.13 | 3.31 | NA | 4.28 | 1.36 | 1.41 | NA | 1.13 | 0.92 | 1.06 | NA | 1.01 | 1.52 | 26.22 | NA | 0.97 | 1.43 | 21.10 | NA | 0.89 | 1.30 | 11.97 | NA | NA | NA | NA |
| 2024-03-31 | 2023-12-31 | 2023-09-30 | 2023-06-30 | 2023-03-31 | 2022-12-31 | 2022-09-30 | 2022-06-30 | 2022-03-31 | 2021-12-31 | 2021-09-30 | 2021-06-30 | 2021-03-31 | 2020-12-31 | 2020-09-30 | 2020-06-30 | 2020-03-31 | 2019-12-31 | 2019-09-30 | 2019-06-30 | 2019-03-31 | 2018-12-31 | 2018-09-30 | 2018-06-30 | 2018-03-31 | 2017-12-31 | 2017-09-30 | 2017-06-30 | 2017-03-31 | ||
|---|---|---|---|---|---|---|---|---|---|---|---|---|---|---|---|---|---|---|---|---|---|---|---|---|---|---|---|---|---|---|
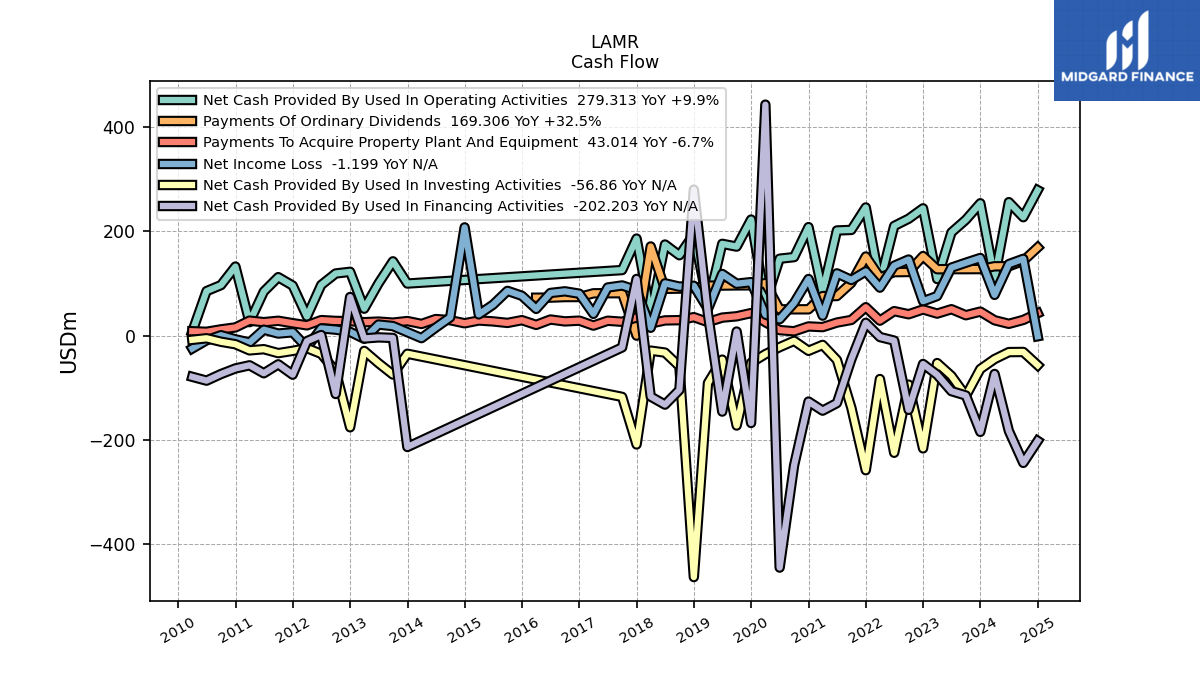
| Net Cash Provided By Used In Operating Activities | 110.56 | 254.19 | 222.55 | 198.16 | 108.71 | 244.51 | 224.47 | 210.59 | 102.04 | 246.18 | 202.98 | 201.94 | 83.32 | 208.42 | 150.78 | 147.75 | 62.93 | 222.90 | 170.92 | 176.32 | 60.73 | 194.76 | 154.31 | 175.01 | 40.77 | 186.38 | 125.89 | NA | NA | |
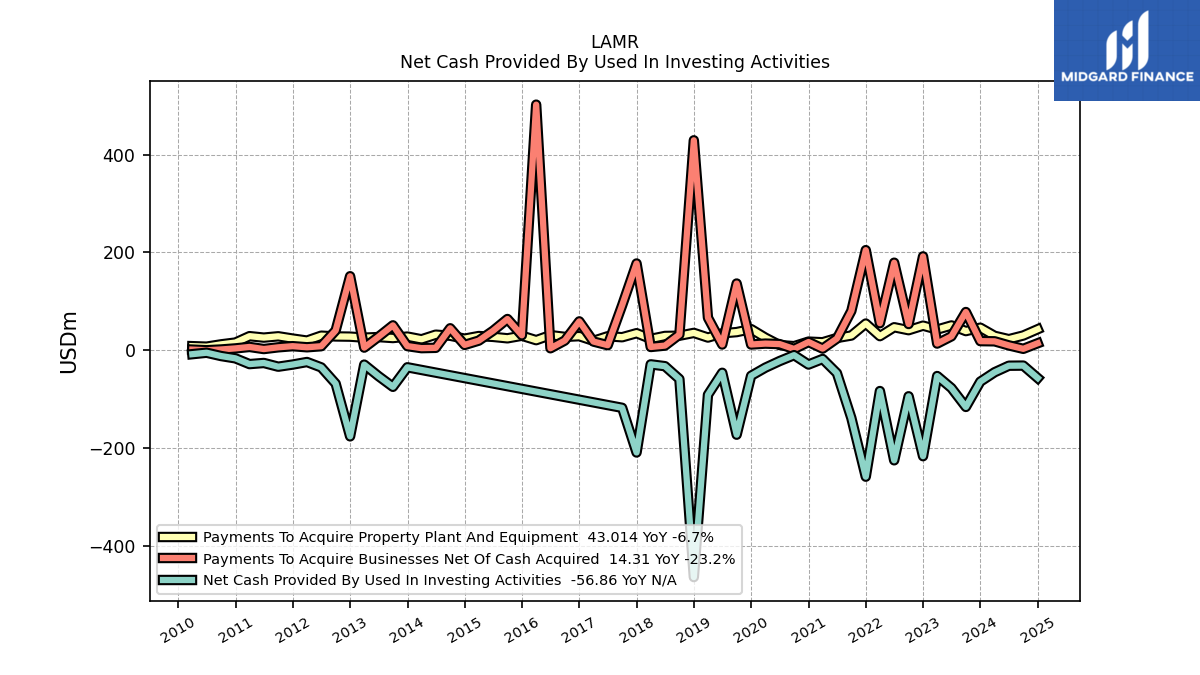
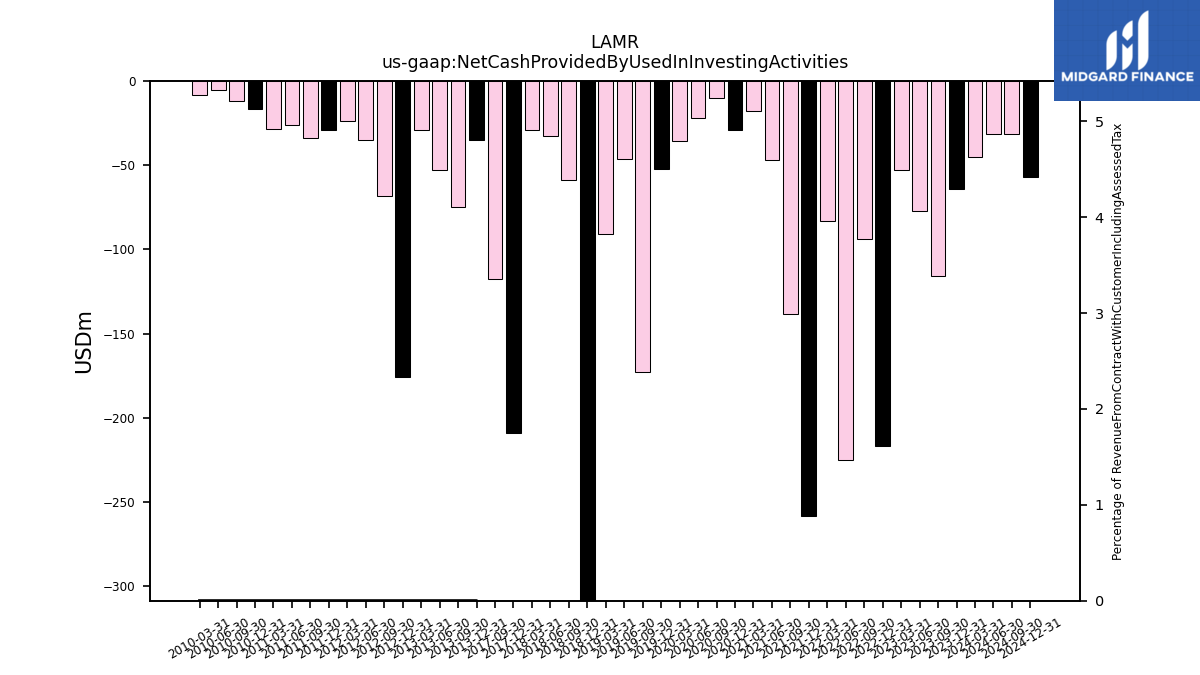
| Net Cash Provided By Used In Investing Activities | -45.02 | -64.19 | -115.92 | -77.34 | -52.66 | -216.61 | -94.09 | -225.04 | -83.34 | -258.52 | -138.57 | -46.85 | -17.82 | -29.21 | -10.00 | -22.09 | -35.59 | -52.22 | -172.67 | -46.07 | -91.08 | -463.82 | -58.90 | -32.57 | -28.85 | -209.04 | -117.67 | NA | NA | |
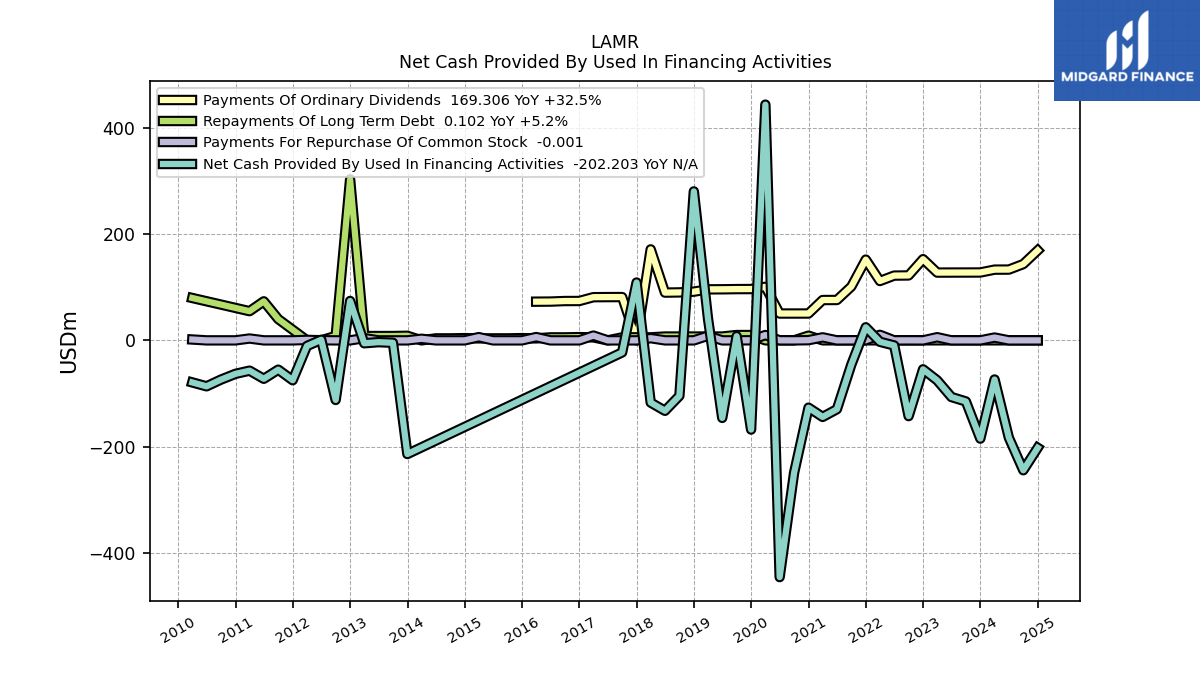
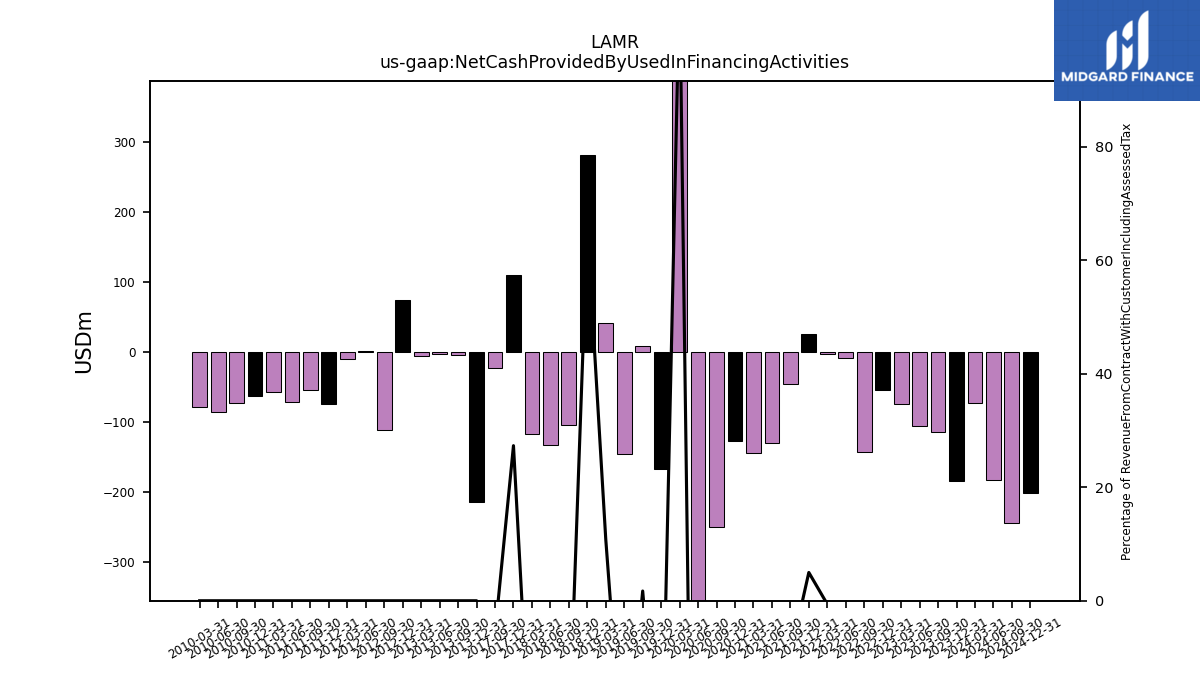
| Net Cash Provided By Used In Financing Activities | -73.63 | -184.90 | -114.96 | -106.62 | -75.16 | -54.48 | -142.56 | -9.57 | -2.71 | 24.62 | -45.50 | -129.56 | -144.09 | -126.65 | -249.36 | -445.54 | 443.64 | -167.85 | 7.84 | -145.93 | 41.58 | 280.38 | -104.38 | -132.51 | -117.05 | 108.85 | -22.65 | NA | NA |
| 2024-03-31 | 2023-12-31 | 2023-09-30 | 2023-06-30 | 2023-03-31 | 2022-12-31 | 2022-09-30 | 2022-06-30 | 2022-03-31 | 2021-12-31 | 2021-09-30 | 2021-06-30 | 2021-03-31 | 2020-12-31 | 2020-09-30 | 2020-06-30 | 2020-03-31 | 2019-12-31 | 2019-09-30 | 2019-06-30 | 2019-03-31 | 2018-12-31 | 2018-09-30 | 2018-06-30 | 2018-03-31 | 2017-12-31 | 2017-09-30 | 2017-06-30 | 2017-03-31 | ||
|---|---|---|---|---|---|---|---|---|---|---|---|---|---|---|---|---|---|---|---|---|---|---|---|---|---|---|---|---|---|---|
| Net Cash Provided By Used In Operating Activities | 110.56 | 254.19 | 222.55 | 198.16 | 108.71 | 244.51 | 224.47 | 210.59 | 102.04 | 246.18 | 202.98 | 201.94 | 83.32 | 208.42 | 150.78 | 147.75 | 62.93 | 222.90 | 170.92 | 176.32 | 60.73 | 194.76 | 154.31 | 175.01 | 40.77 | 186.38 | 125.89 | NA | NA | |
| Net Income Loss | 78.22 | 149.09 | 140.02 | 130.62 | 76.04 | 66.10 | 146.19 | 134.21 | 92.15 | 123.31 | 106.84 | 119.61 | 38.33 | 108.71 | 62.76 | 31.43 | 40.49 | 102.75 | 99.71 | 118.40 | 51.25 | 95.69 | 94.06 | 100.43 | 15.05 | 87.16 | 96.33 | 92.39 | 41.79 | |
| Profit Loss | 78.50 | 149.32 | 140.43 | 130.89 | 76.20 | 66.10 | 146.19 | 134.21 | 92.15 | 123.31 | 106.84 | 119.61 | 38.33 | 108.71 | 62.76 | 31.43 | 40.49 | 102.75 | 99.71 | 118.40 | 51.25 | 95.69 | 94.06 | 100.43 | 15.05 | 87.16 | 96.33 | NA | NA | |
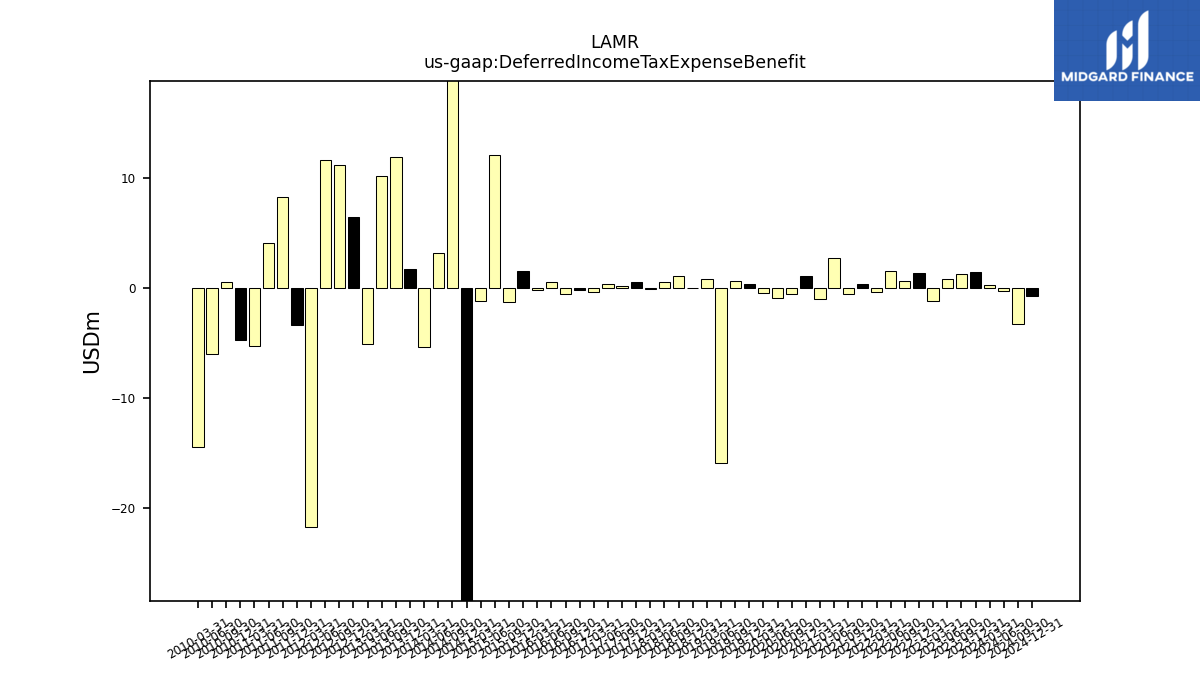
| Deferred Income Tax Expense Benefit | 0.25 | 1.47 | 1.25 | 0.81 | -1.15 | 1.36 | 0.64 | 1.55 | -0.34 | 0.40 | -0.56 | 2.76 | -1.02 | 1.07 | -0.56 | -0.89 | -0.42 | 0.33 | 0.66 | -15.91 | 0.79 | -0.04 | 1.14 | 0.52 | -0.09 | 0.55 | 0.23 | 0.39 | -0.35 | |
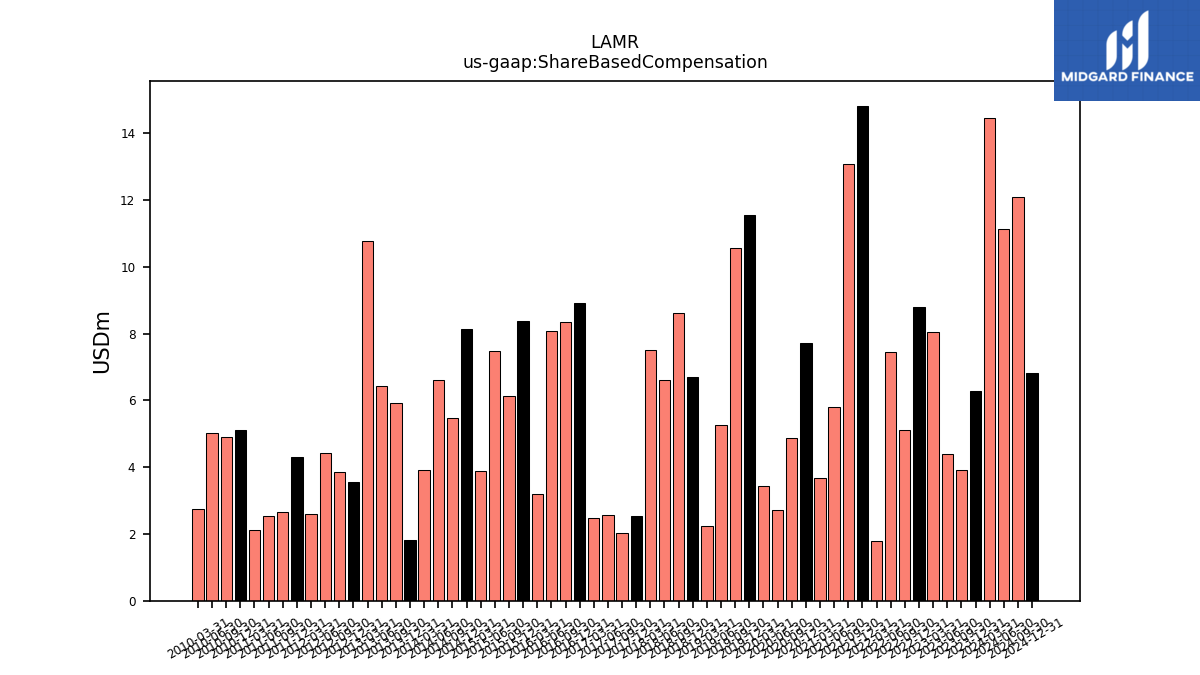
| Share Based Compensation | 14.47 | 6.29 | 3.92 | 4.41 | 8.04 | 8.80 | 5.11 | 7.44 | 1.78 | 14.83 | 13.08 | 5.79 | 3.67 | 7.73 | 4.88 | 2.73 | 3.44 | 11.57 | 10.57 | 5.27 | 2.23 | 6.70 | 8.62 | 6.61 | 7.51 | 2.54 | 2.02 | 2.56 | 2.48 | |
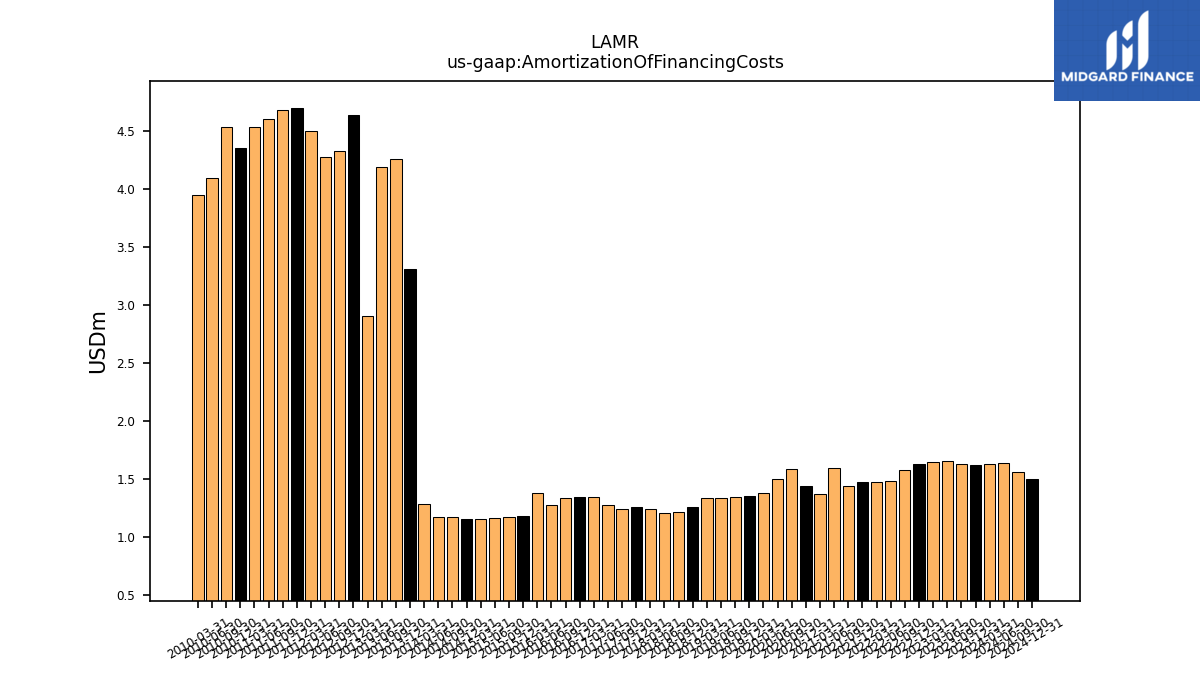
| Amortization Of Financing Costs | 1.63 | 1.62 | 1.63 | 1.65 | 1.64 | 1.63 | 1.58 | 1.48 | 1.47 | 1.47 | 1.44 | 1.59 | 1.37 | 1.44 | 1.59 | 1.50 | 1.38 | 1.35 | 1.34 | 1.34 | 1.33 | 1.26 | 1.21 | 1.21 | 1.24 | 1.25 | 1.24 | 1.27 | 1.35 |
| 2024-03-31 | 2023-12-31 | 2023-09-30 | 2023-06-30 | 2023-03-31 | 2022-12-31 | 2022-09-30 | 2022-06-30 | 2022-03-31 | 2021-12-31 | 2021-09-30 | 2021-06-30 | 2021-03-31 | 2020-12-31 | 2020-09-30 | 2020-06-30 | 2020-03-31 | 2019-12-31 | 2019-09-30 | 2019-06-30 | 2019-03-31 | 2018-12-31 | 2018-09-30 | 2018-06-30 | 2018-03-31 | 2017-12-31 | 2017-09-30 | 2017-06-30 | 2017-03-31 | ||
|---|---|---|---|---|---|---|---|---|---|---|---|---|---|---|---|---|---|---|---|---|---|---|---|---|---|---|---|---|---|---|
| Net Cash Provided By Used In Investing Activities | -45.02 | -64.19 | -115.92 | -77.34 | -52.66 | -216.61 | -94.09 | -225.04 | -83.34 | -258.52 | -138.57 | -46.85 | -17.82 | -29.21 | -10.00 | -22.09 | -35.59 | -52.22 | -172.67 | -46.07 | -91.08 | -463.82 | -58.90 | -32.57 | -28.85 | -209.04 | -117.67 | NA | NA | |
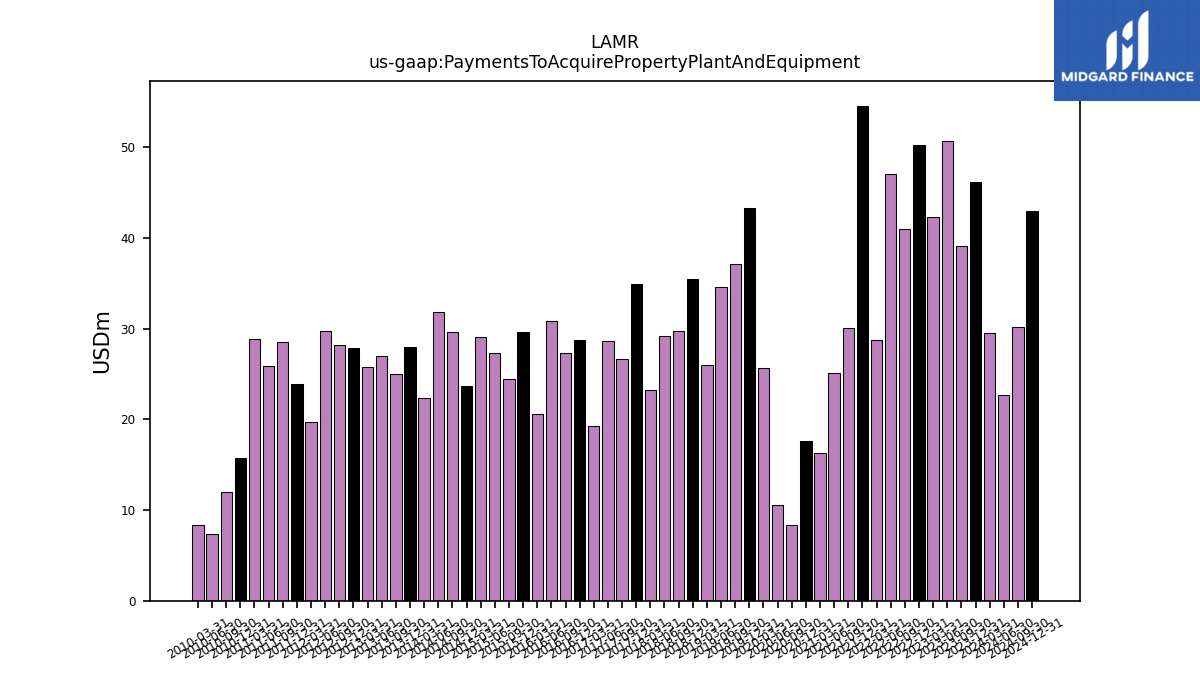
| Payments To Acquire Property Plant And Equipment | 29.48 | 46.12 | 39.15 | 50.72 | 42.28 | 50.27 | 41.01 | 47.04 | 28.76 | 54.58 | 30.10 | 25.08 | 16.33 | 17.64 | 8.36 | 10.56 | 25.71 | 43.28 | 37.12 | 34.61 | 25.95 | 35.46 | 29.70 | 29.22 | 23.25 | 34.88 | 26.61 | 28.60 | 19.24 |
| 2024-03-31 | 2023-12-31 | 2023-09-30 | 2023-06-30 | 2023-03-31 | 2022-12-31 | 2022-09-30 | 2022-06-30 | 2022-03-31 | 2021-12-31 | 2021-09-30 | 2021-06-30 | 2021-03-31 | 2020-12-31 | 2020-09-30 | 2020-06-30 | 2020-03-31 | 2019-12-31 | 2019-09-30 | 2019-06-30 | 2019-03-31 | 2018-12-31 | 2018-09-30 | 2018-06-30 | 2018-03-31 | 2017-12-31 | 2017-09-30 | 2017-06-30 | 2017-03-31 | ||
|---|---|---|---|---|---|---|---|---|---|---|---|---|---|---|---|---|---|---|---|---|---|---|---|---|---|---|---|---|---|---|
| Net Cash Provided By Used In Financing Activities | -73.63 | -184.90 | -114.96 | -106.62 | -75.16 | -54.48 | -142.56 | -9.57 | -2.71 | 24.62 | -45.50 | -129.56 | -144.09 | -126.65 | -249.36 | -445.54 | 443.64 | -167.85 | 7.84 | -145.93 | 41.58 | 280.38 | -104.38 | -132.51 | -117.05 | 108.85 | -22.65 | NA | NA | |
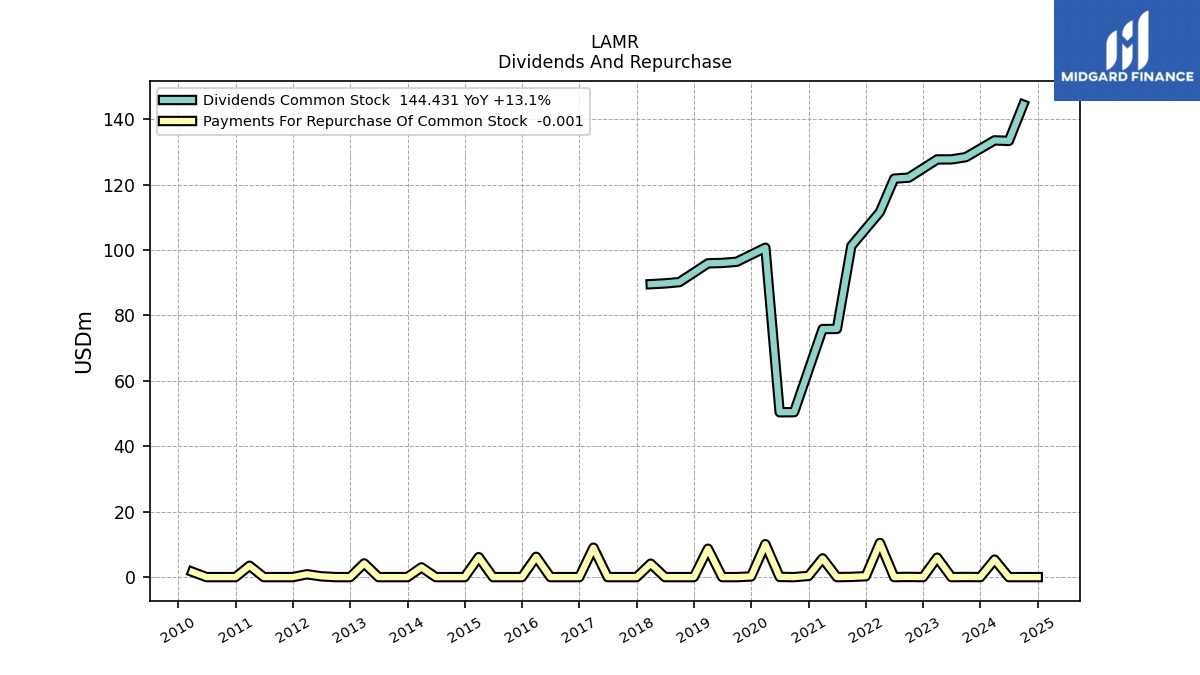
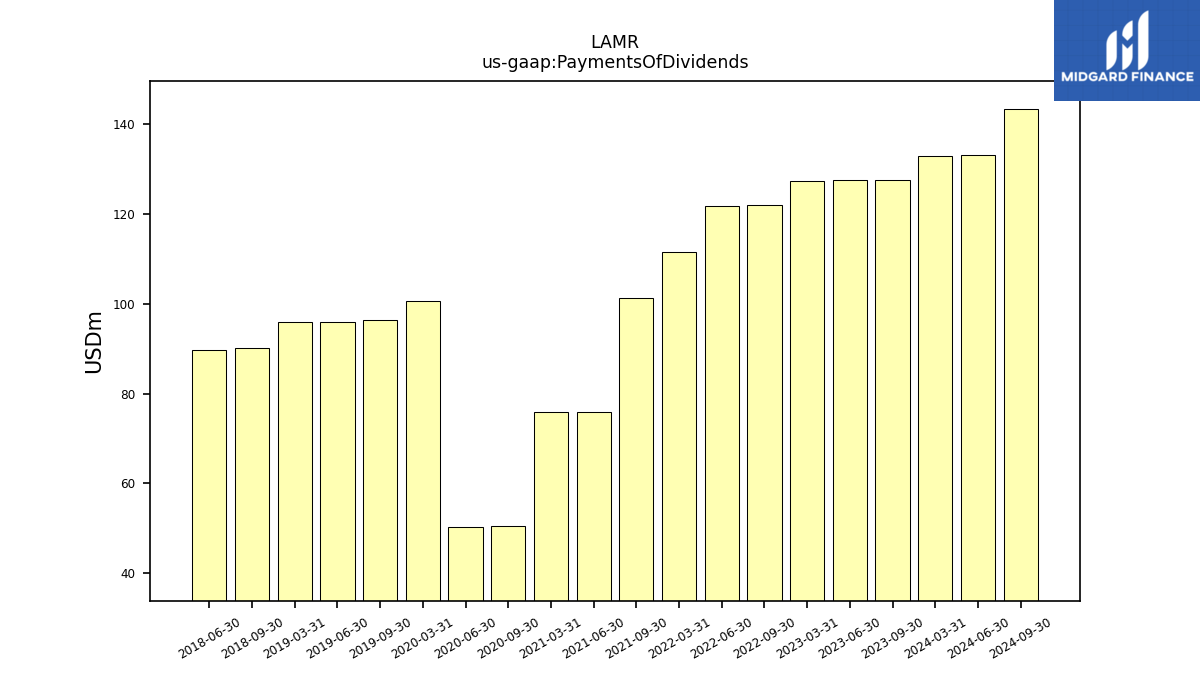
| Payments Of Dividends | 133.03 | NA | 127.58 | 127.54 | 127.46 | NA | 122.10 | 121.81 | 111.60 | NA | 101.22 | 75.87 | 75.82 | NA | 50.42 | 50.40 | 100.69 | NA | 96.39 | 96.04 | 95.92 | NA | 90.18 | 89.78 | NA | NA | NA | NA | NA | |
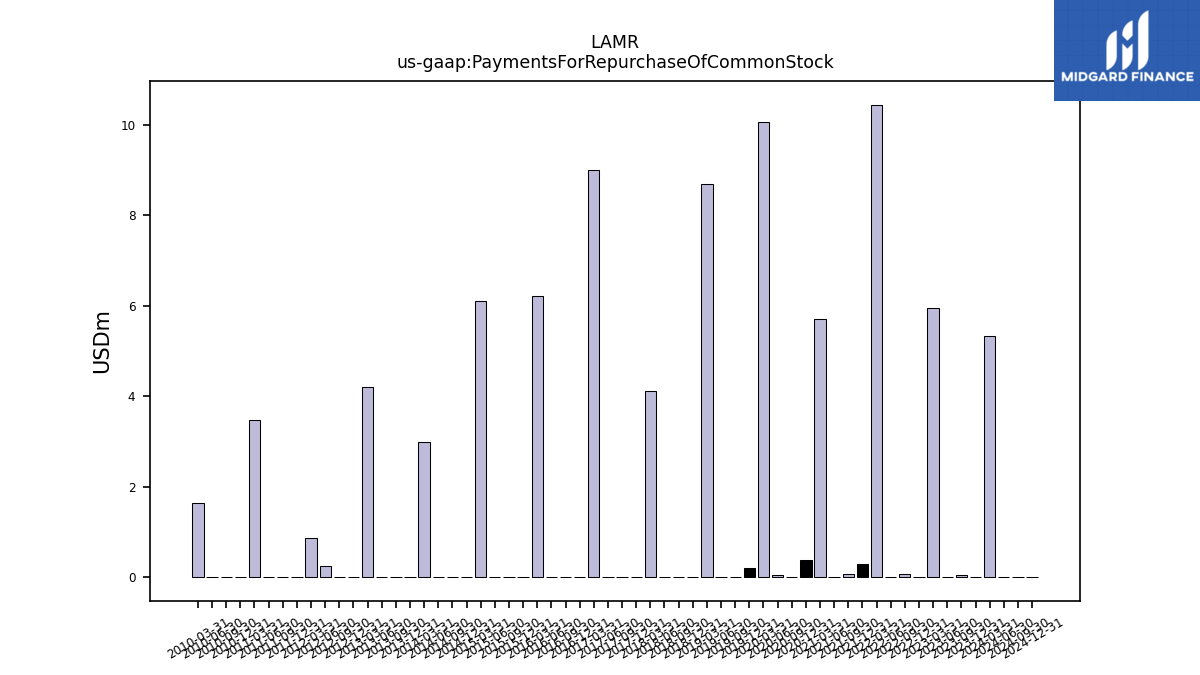
| Payments For Repurchase Of Common Stock | 5.34 | 0.00 | 0.04 | -0.00 | 5.95 | 0.00 | 0.06 | 0.00 | 10.45 | 0.28 | 0.07 | 0.00 | 5.72 | 0.37 | 0.00 | 0.06 | 10.07 | 0.20 | 0.00 | 0.00 | 8.68 | 0.00 | 0.00 | 0.00 | 4.11 | 0.00 | 0.00 | 0.00 | 9.00 |
| 2024-03-31 | 2023-12-31 | 2023-09-30 | 2023-06-30 | 2023-03-31 | 2022-12-31 | 2022-09-30 | 2022-06-30 | 2022-03-31 | 2021-12-31 | 2021-09-30 | 2021-06-30 | 2021-03-31 | 2020-12-31 | 2020-09-30 | 2020-06-30 | 2020-03-31 | 2019-12-31 | 2019-09-30 | 2019-06-30 | 2019-03-31 | 2018-12-31 | 2018-09-30 | 2018-06-30 | 2018-03-31 | 2017-12-31 | 2017-09-30 | 2017-06-30 | 2017-03-31 | ||
|---|---|---|---|---|---|---|---|---|---|---|---|---|---|---|---|---|---|---|---|---|---|---|---|---|---|---|---|---|---|---|
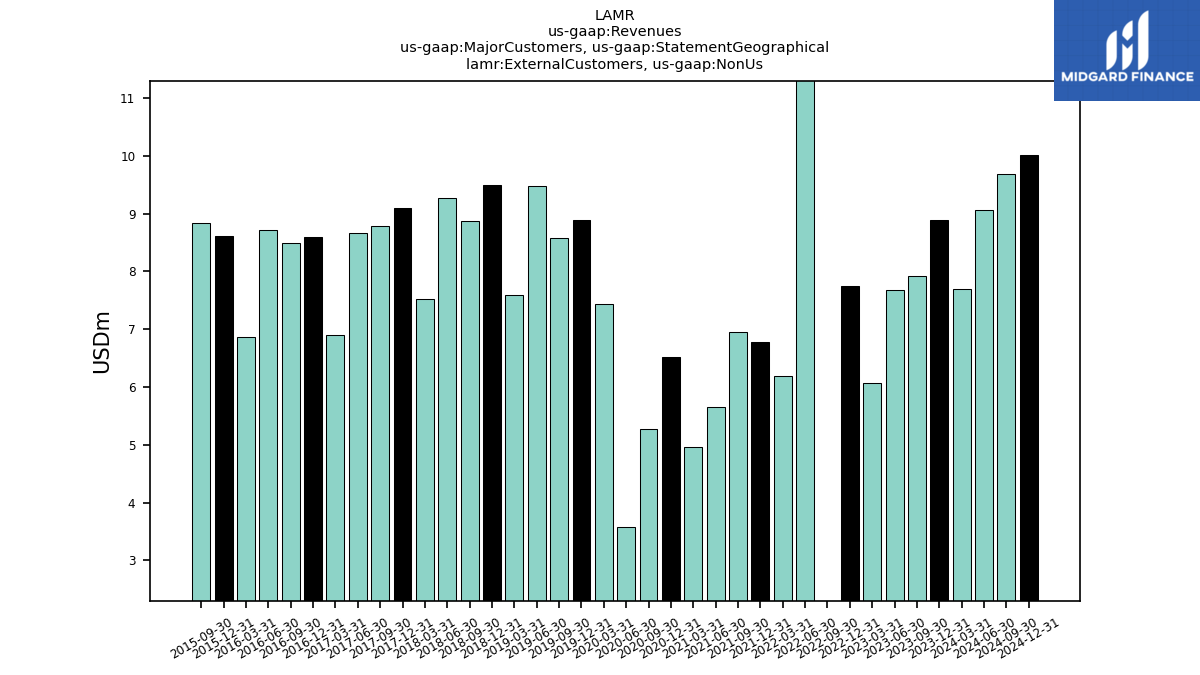
| External Customers, Non Us | 7.70 | 8.88 | 7.92 | 7.69 | 6.08 | 7.74 | -0.23 | 15.75 | 6.20 | 6.79 | 6.95 | 5.65 | 4.96 | 6.52 | 5.27 | 3.59 | 7.44 | 8.88 | 8.58 | 9.47 | 7.59 | 9.49 | 8.87 | 9.27 | 7.53 | 9.09 | 8.78 | 8.66 | 6.89 | |
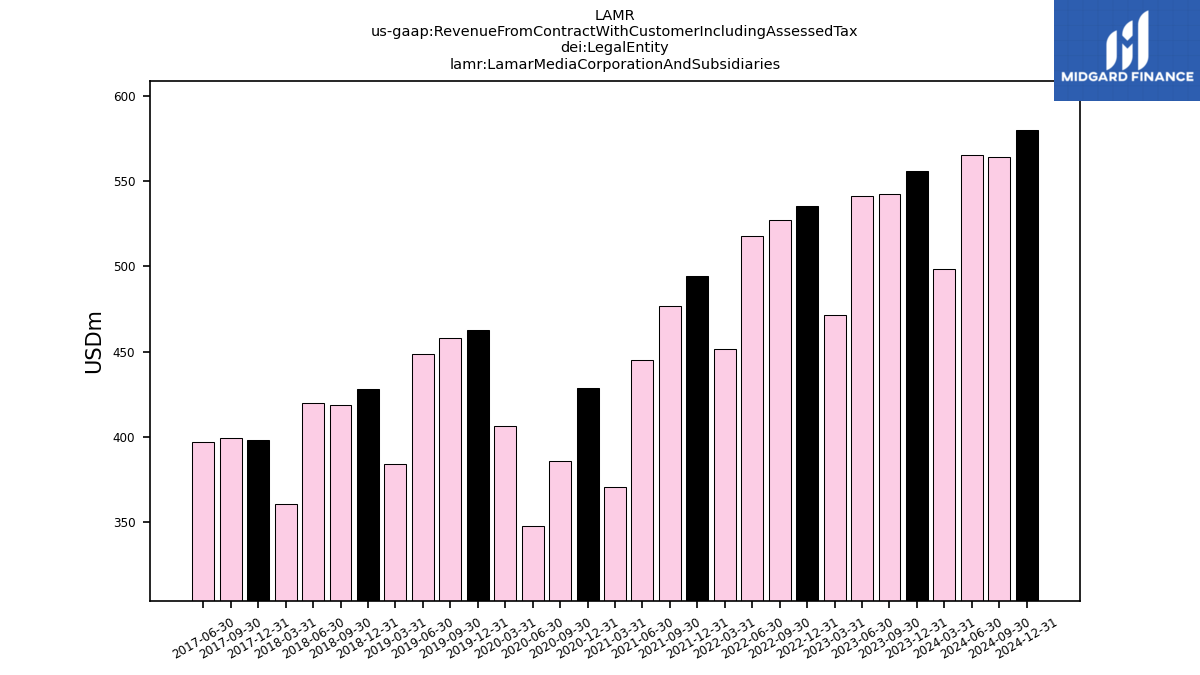
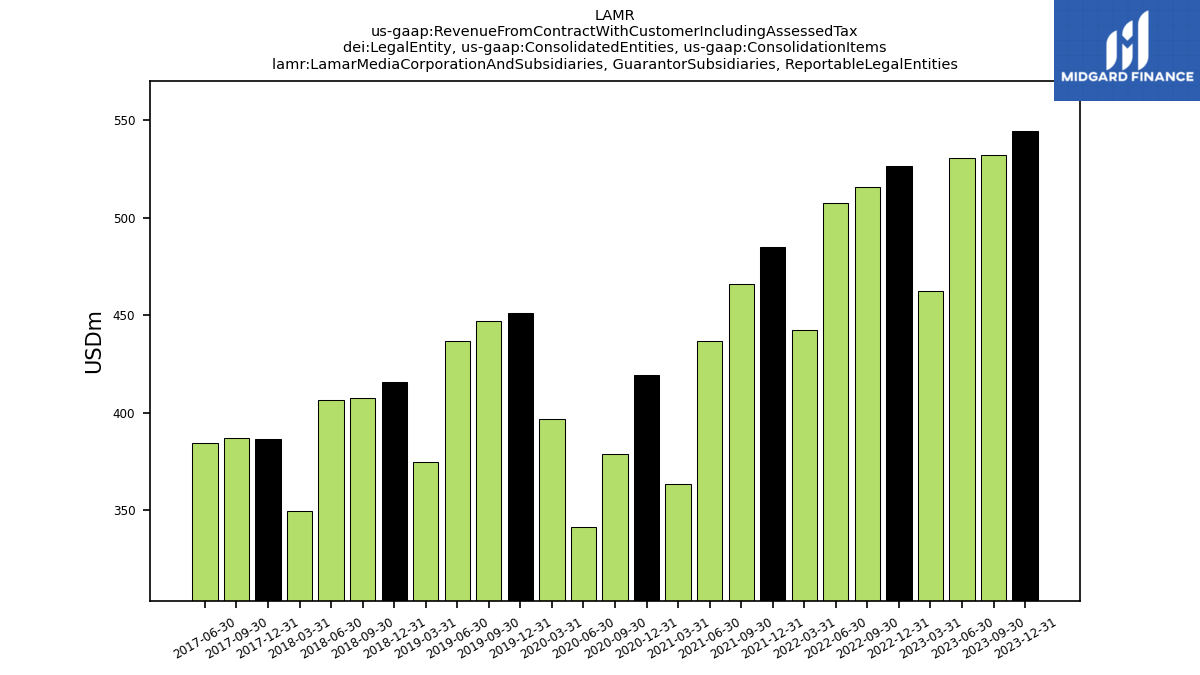
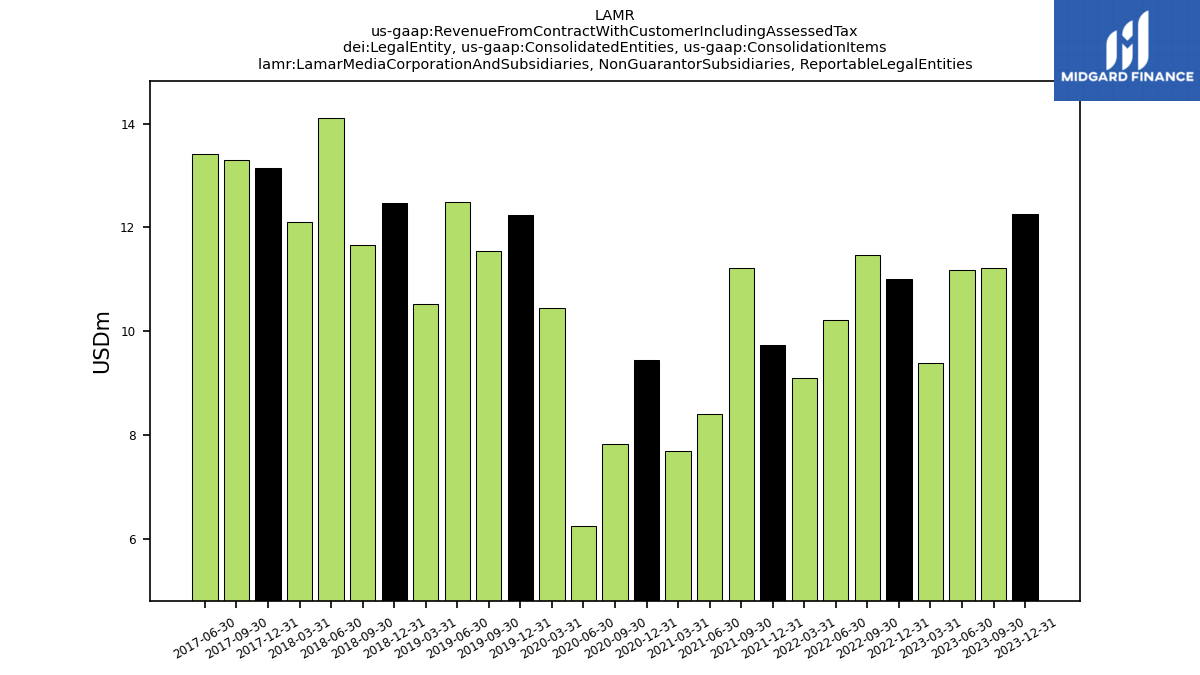
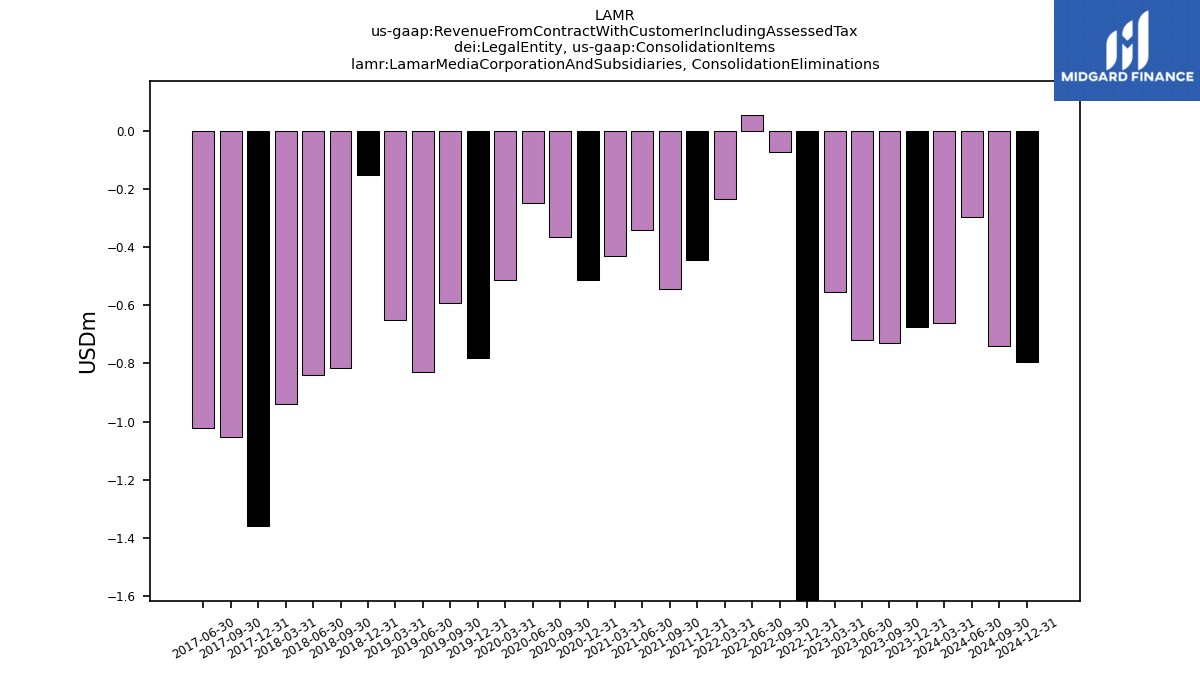
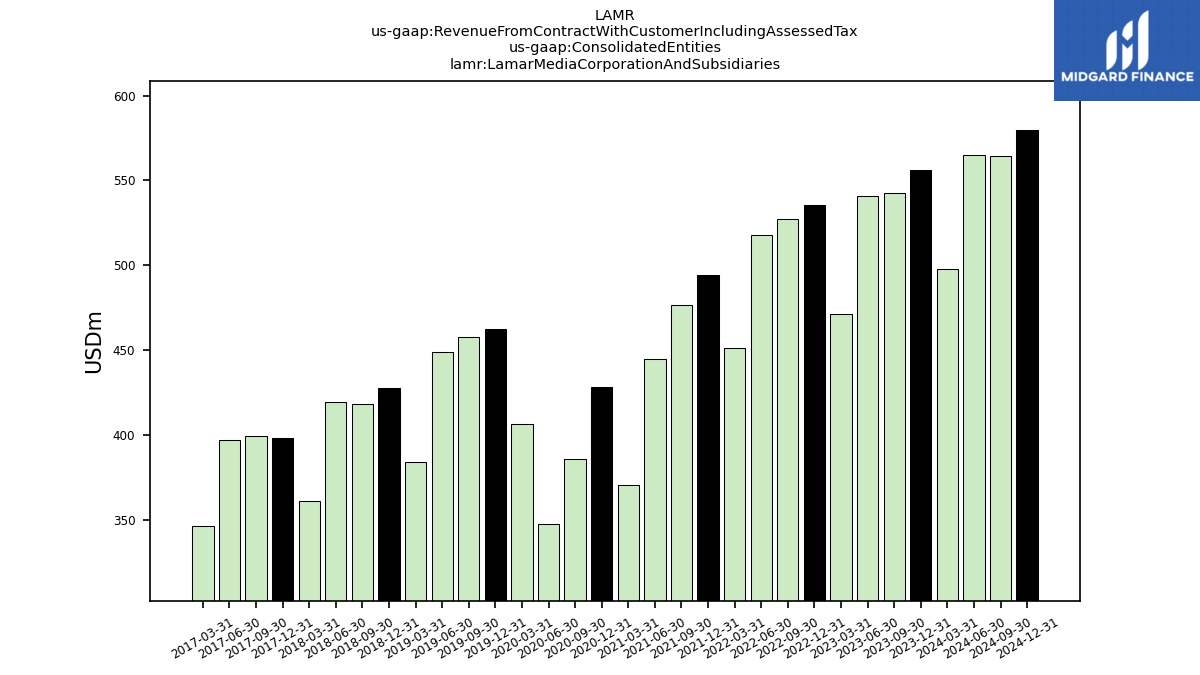
| Revenue From Contract With Customer Including Assessed Tax | 498.15 | 555.91 | 542.61 | 541.14 | 471.33 | 535.51 | 527.39 | 517.85 | 451.39 | 494.57 | 476.89 | 445.05 | 370.88 | 428.52 | 386.11 | 347.65 | 406.57 | 462.66 | 457.79 | 448.74 | 384.46 | 427.90 | 418.50 | 419.80 | 361.03 | 398.48 | 399.35 | 397.08 | 346.36 | |
| Lamar Media Corporation And Subsidiaries | 498.15 | 555.91 | 542.61 | 541.14 | 471.33 | 535.51 | 527.39 | 517.85 | 451.39 | 494.57 | 476.89 | 445.05 | 370.88 | 428.52 | 386.11 | 347.65 | 406.57 | 462.66 | 457.79 | 448.74 | 384.46 | 427.90 | 418.50 | 419.80 | 361.03 | 398.48 | 399.35 | 397.08 | NA | |
| Lamar Media Corporation And Subsidiaries,, | 487.79 | 544.33 | 532.11 | 530.67 | 462.49 | 526.79 | 515.99 | 507.59 | 442.53 | 485.29 | 466.22 | 436.98 | 363.61 | 419.59 | 378.65 | 341.66 | 396.63 | 451.20 | 446.84 | 437.07 | 374.58 | 415.58 | 407.66 | 406.52 | 349.86 | 386.69 | 387.10 | 384.69 | NA | |
| Lamar Media Corporation And Subsidiaries,, | 11.02 | 12.26 | 11.23 | 11.19 | 9.39 | 11.01 | 11.47 | 10.21 | 9.10 | 9.73 | 11.22 | 8.41 | 7.70 | 9.45 | 7.83 | 6.24 | 10.45 | 12.24 | 11.54 | 12.50 | 10.53 | 12.47 | 11.66 | 14.12 | 12.10 | 13.14 | 13.30 | 13.41 | NA | |
| Lamar Media Corporation And Subsidiaries, | -0.66 | -0.67 | -0.73 | -0.72 | -0.56 | -2.29 | -0.07 | 0.05 | -0.23 | -0.44 | -0.54 | -0.34 | -0.43 | -0.51 | -0.37 | -0.25 | -0.51 | -0.78 | -0.59 | -0.83 | -0.65 | -0.15 | -0.82 | -0.84 | -0.94 | -1.36 | -1.05 | -1.02 | NA | |
| Lamar Media Corporation And Subsidiaries | 498.15 | 555.91 | 542.61 | 541.14 | 471.33 | 535.51 | 527.39 | 517.85 | 451.39 | 494.57 | 476.89 | 445.05 | 370.88 | 428.52 | 386.11 | 347.65 | 406.57 | 462.66 | 457.79 | 448.74 | 384.46 | 427.90 | 418.50 | 419.80 | 361.03 | 398.48 | 399.35 | 397.08 | 346.36 | |
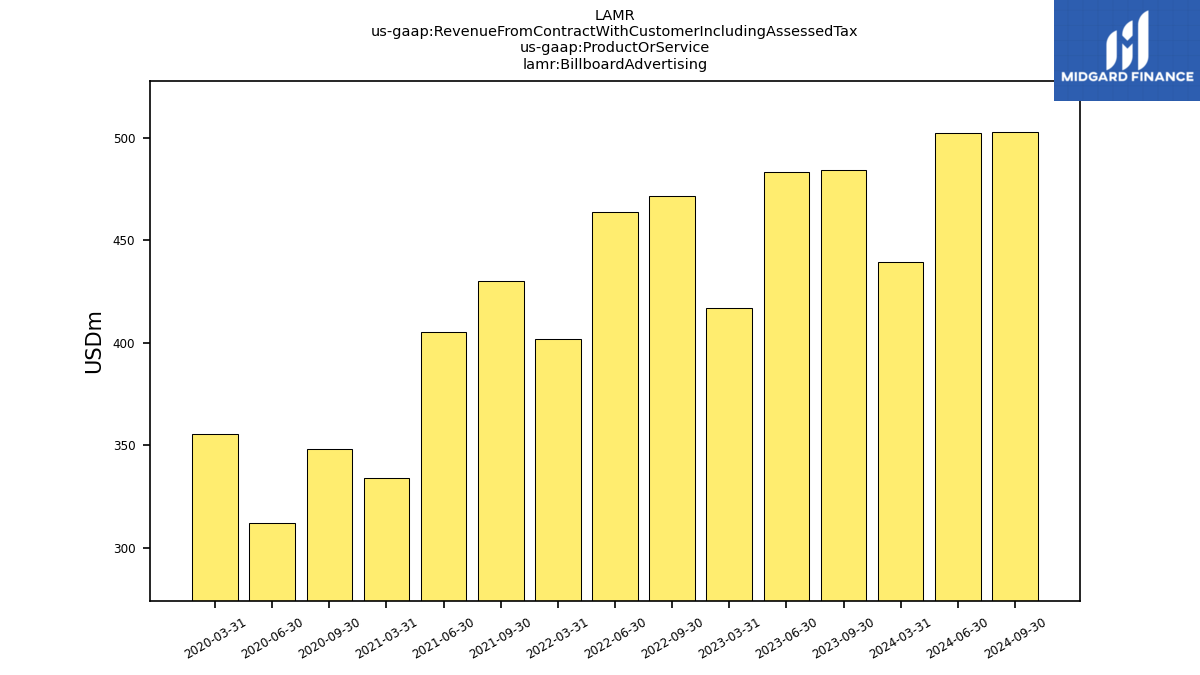
| Billboard Advertising | 439.38 | NA | 484.27 | 483.28 | 417.18 | NA | 471.45 | 463.83 | 401.74 | NA | 430.10 | 405.28 | 334.04 | NA | 348.36 | 312.10 | 355.31 | NA | NA | NA | NA | NA | NA | NA | NA | NA | NA | NA | NA | |
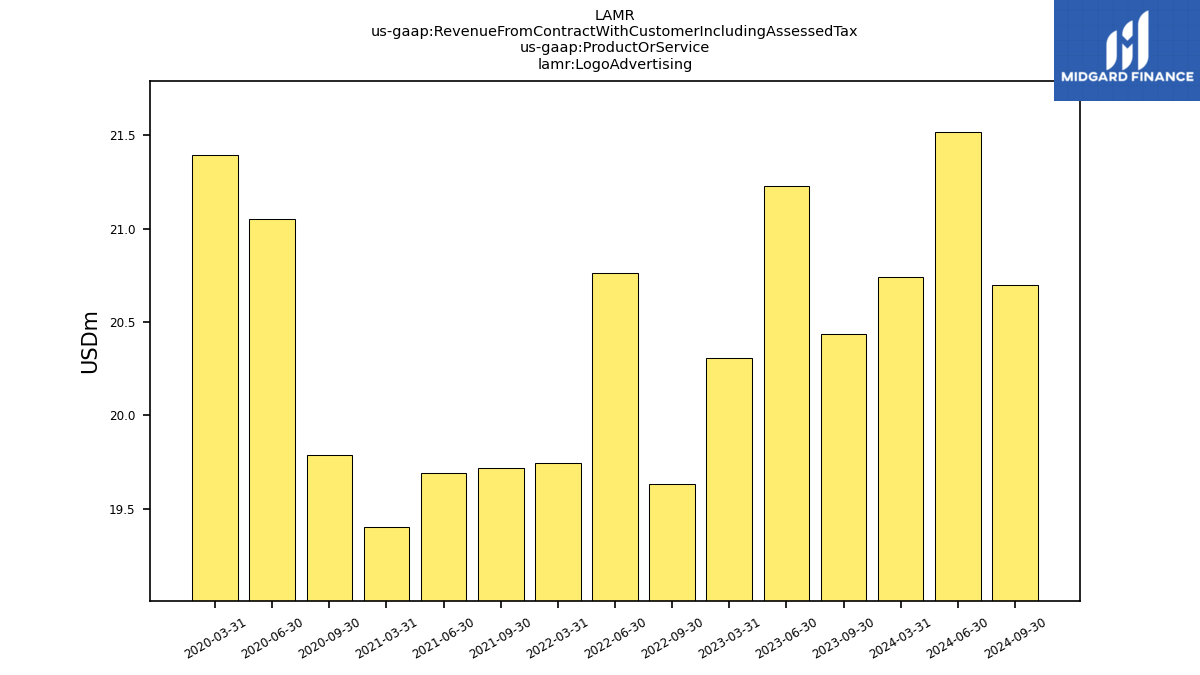
| Logo Advertising | 20.74 | NA | 20.44 | 21.23 | 20.31 | NA | 19.63 | 20.76 | 19.75 | NA | 19.72 | 19.69 | 19.41 | NA | 19.79 | 21.05 | 21.39 | NA | NA | NA | NA | NA | NA | NA | NA | NA | NA | NA | NA | |
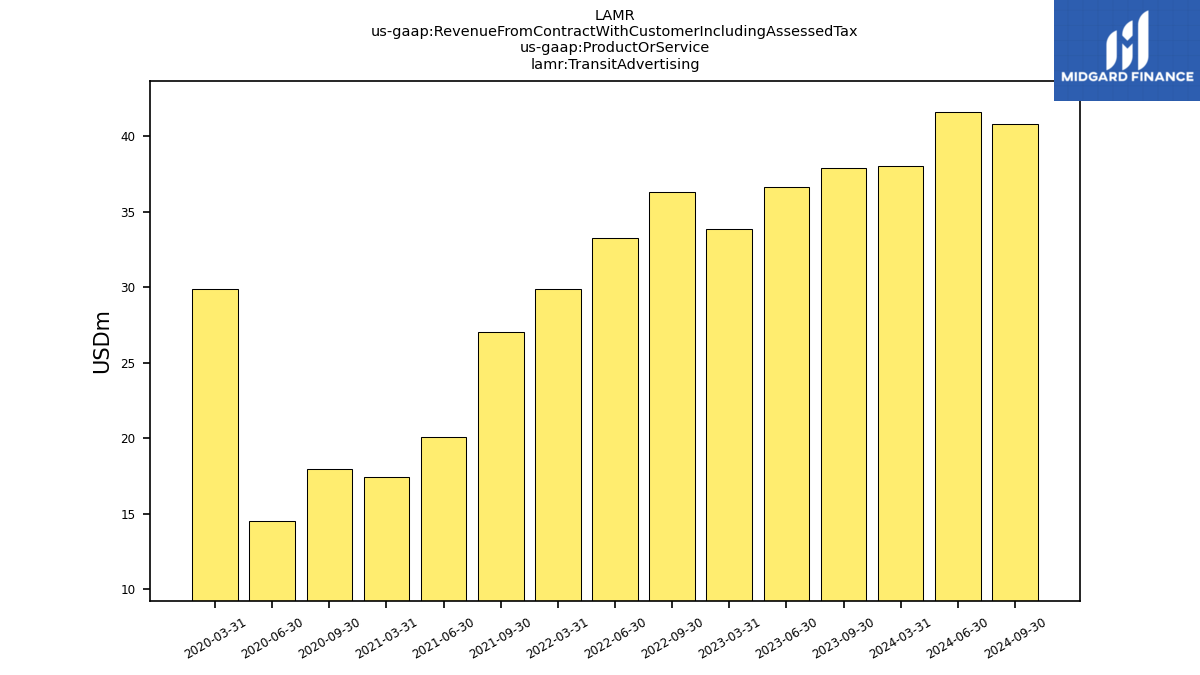
| Transit Advertising | 38.02 | NA | 37.90 | 36.63 | 33.85 | NA | 36.31 | 33.27 | 29.90 | NA | 27.07 | 20.07 | 17.44 | NA | 17.96 | 14.50 | 29.87 | NA | NA | NA | NA | NA | NA | NA | NA | NA | NA | NA | NA |
