
| 2023-08-27 | 2023-05-28 | 2023-02-26 | 2022-11-27 | 2022-08-28 | 2022-05-29 | 2022-02-27 | 2021-11-28 | 2021-08-29 | 2021-05-30 | 2021-02-28 | 2020-11-29 | 2020-08-23 | 2020-05-24 | 2020-02-23 | 2019-11-24 | 2019-08-25 | 2019-05-26 | 2019-02-24 | 2018-11-25 | 2018-08-26 | 2018-05-27 | 2018-02-25 | 2017-11-26 | 2017-08-27 | 2017-05-28 | 2017-02-26 | 2016-11-27 | 2016-08-28 | 2016-05-29 | 2016-02-28 | 2015-11-29 | 2015-08-30 | 2015-05-31 | 2015-03-01 | 2014-11-30 | 2014-08-24 | 2014-05-25 | 2014-02-23 | 2013-11-24 | 2013-08-25 | 2013-05-26 | 2013-02-24 | 2012-11-25 | 2012-08-26 | 2012-05-27 | 2012-02-26 | 2011-11-27 | 2011-08-28 | 2011-05-29 | 2011-02-27 | 2010-11-28 | 2010-08-29 | ||
|---|---|---|---|---|---|---|---|---|---|---|---|---|---|---|---|---|---|---|---|---|---|---|---|---|---|---|---|---|---|---|---|---|---|---|---|---|---|---|---|---|---|---|---|---|---|---|---|---|---|---|---|---|---|---|
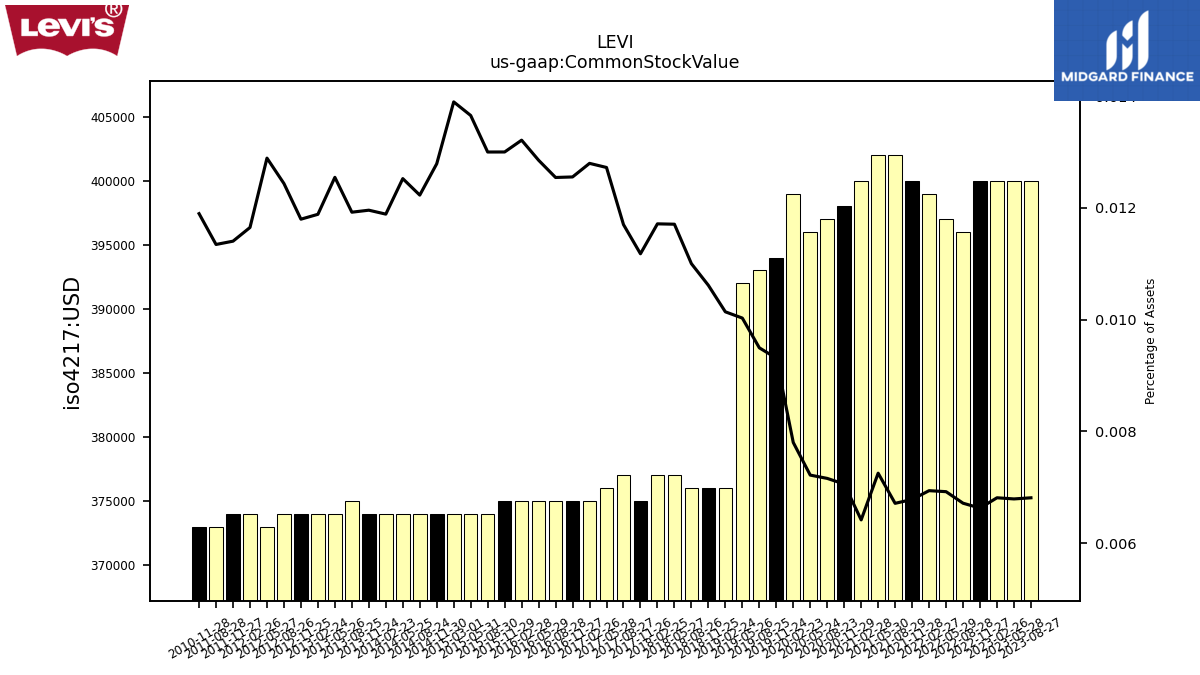
| Common Stock Value | 0.40 | 0.40 | 0.40 | 0.40 | 0.40 | 0.40 | 0.40 | 0.40 | 0.40 | 0.40 | 0.40 | 0.40 | 0.40 | 0.40 | 0.40 | 0.39 | 0.39 | 0.39 | 0.38 | 0.38 | 0.38 | 0.38 | 0.38 | 0.38 | 0.38 | 0.38 | 0.38 | 0.38 | 0.38 | 0.38 | 0.38 | 0.38 | 0.37 | 0.37 | 0.37 | 0.37 | 0.37 | 0.37 | 0.37 | 0.37 | 0.38 | 0.37 | 0.37 | 0.37 | 0.37 | 0.37 | 0.37 | 0.37 | 0.37 | NA | NA | 0.37 | NA | |
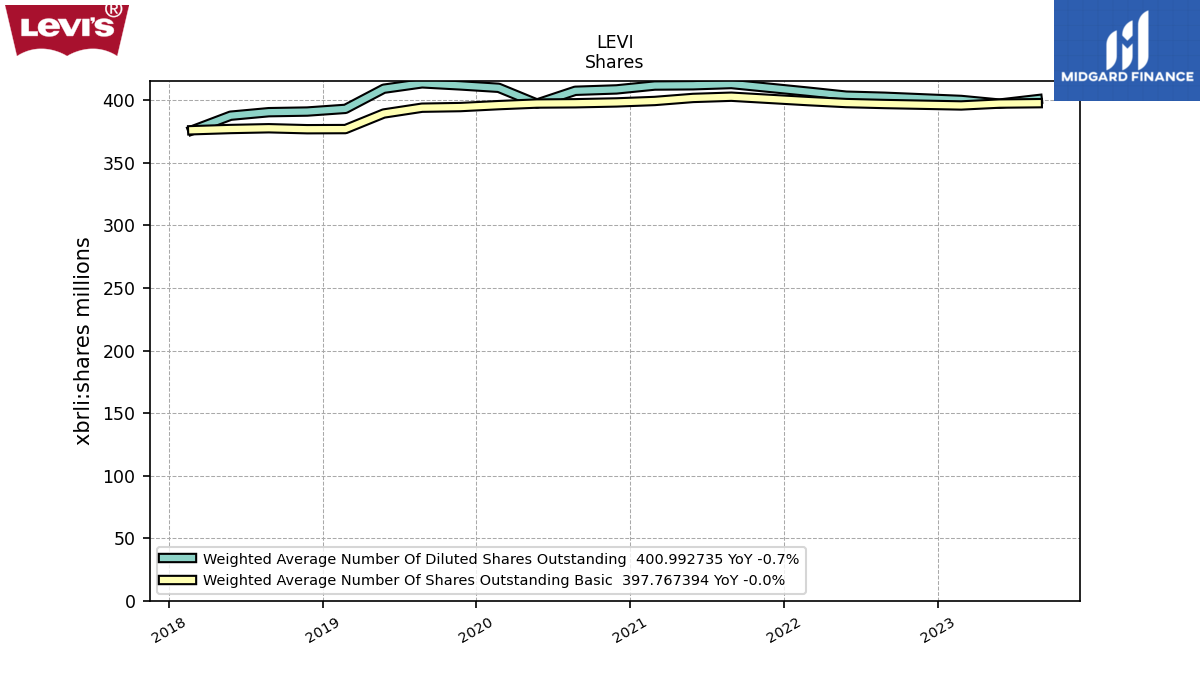
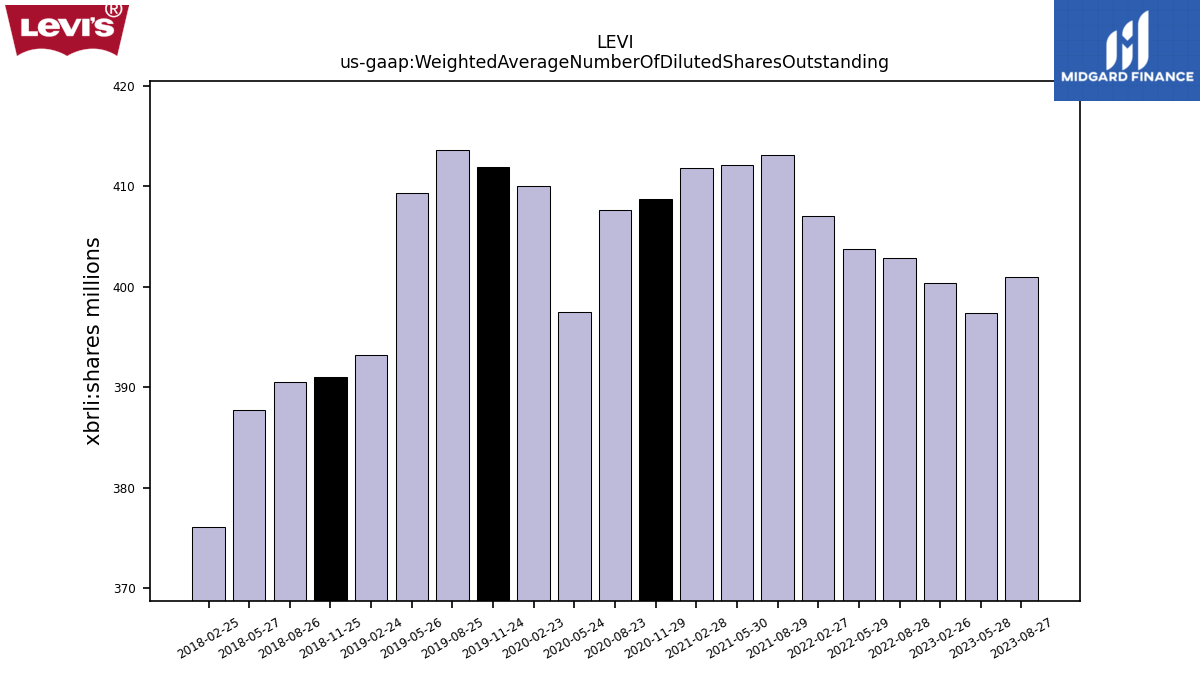
| Weighted Average Number Of Diluted Shares Outstanding | 400.99 | 397.46 | 400.36 | NA | 402.92 | 403.78 | 407.02 | NA | 413.11 | 412.10 | 411.87 | 408.78 | 407.68 | 397.48 | 410.07 | 411.98 | 413.64 | 409.33 | 393.23 | 391.09 | 390.59 | 387.76 | 376.17 | NA | NA | NA | NA | NA | NA | NA | NA | NA | NA | NA | NA | NA | NA | NA | NA | NA | NA | NA | NA | NA | NA | NA | NA | NA | NA | NA | NA | NA | NA | |
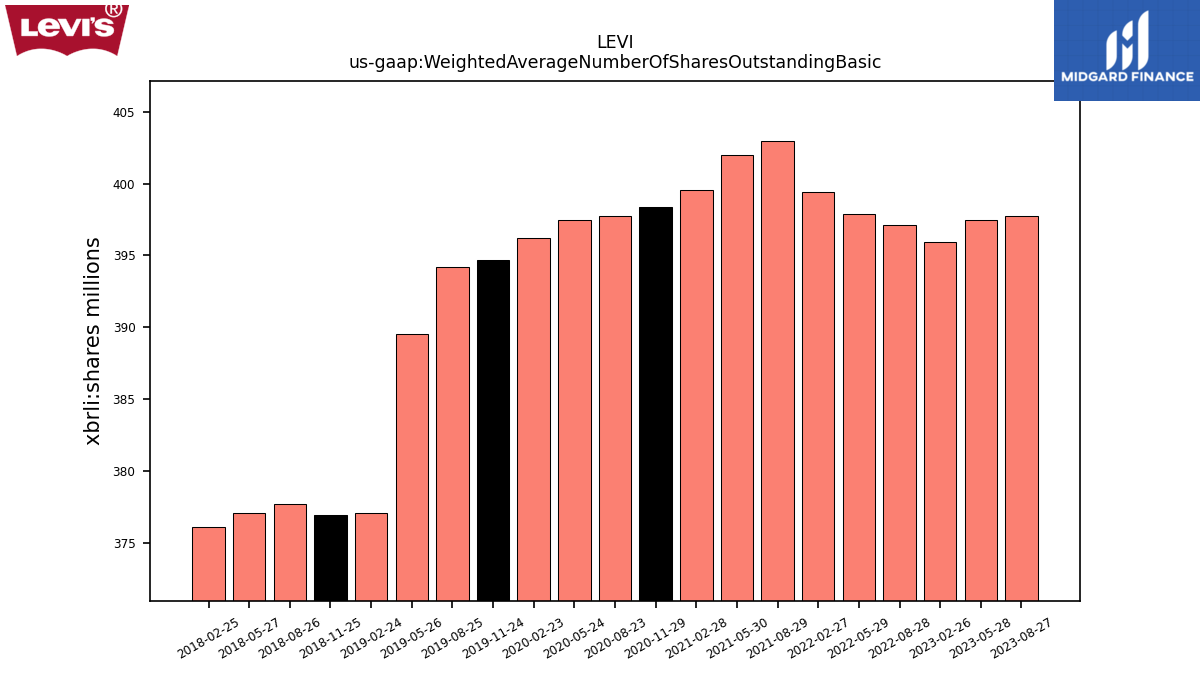
| Weighted Average Number Of Shares Outstanding Basic | 397.77 | 397.46 | 395.96 | NA | 397.11 | 397.88 | 399.45 | NA | 402.96 | 401.96 | 399.54 | 398.38 | 397.71 | 397.48 | 396.22 | 394.67 | 394.17 | 389.52 | 377.08 | 376.97 | 377.74 | 377.13 | 376.17 | NA | NA | NA | NA | NA | NA | NA | NA | NA | NA | NA | NA | NA | NA | NA | NA | NA | NA | NA | NA | NA | NA | NA | NA | NA | NA | NA | NA | NA | NA | |
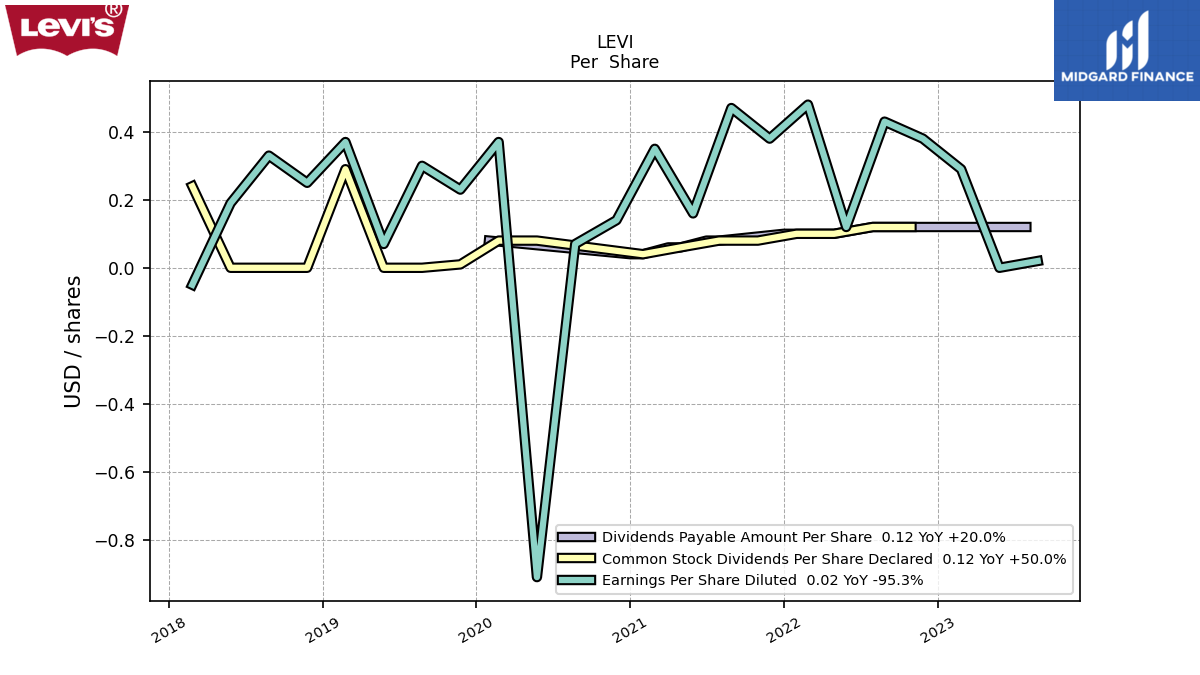
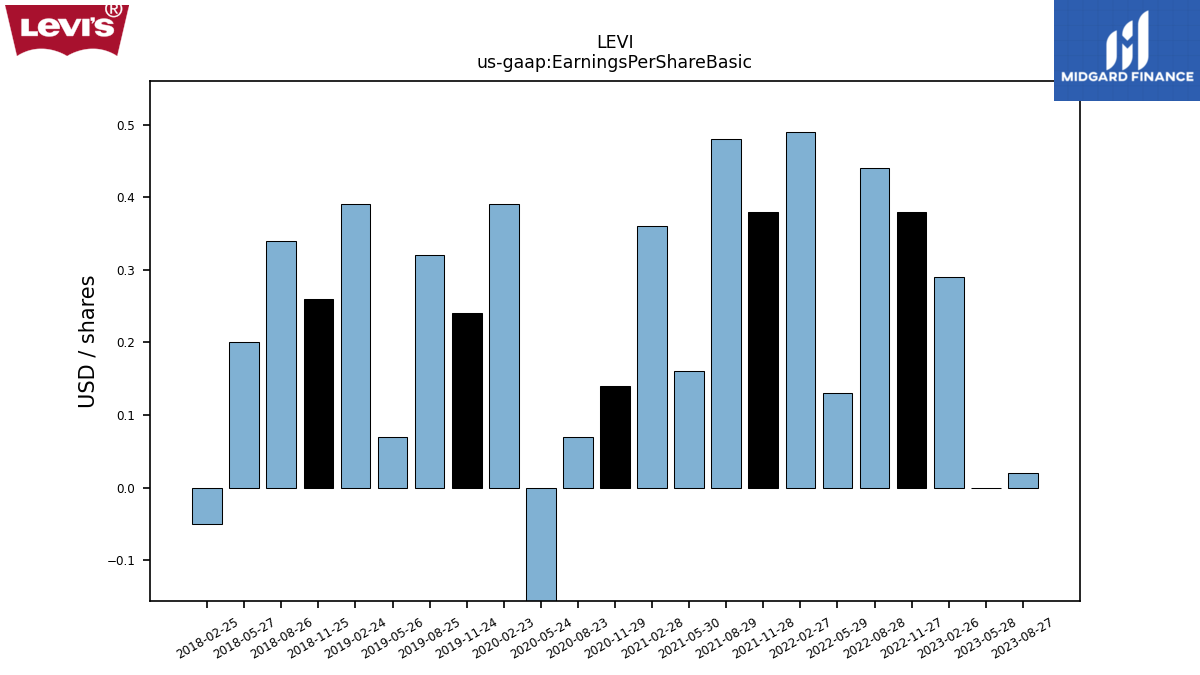
| Earnings Per Share Basic | 0.02 | 0.00 | 0.29 | 0.38 | 0.44 | 0.13 | 0.49 | 0.38 | 0.48 | 0.16 | 0.36 | 0.14 | 0.07 | -0.91 | 0.39 | 0.24 | 0.32 | 0.07 | 0.39 | 0.26 | 0.34 | 0.20 | -0.05 | NA | NA | NA | NA | NA | NA | NA | NA | NA | NA | NA | NA | NA | NA | NA | NA | NA | NA | NA | NA | NA | NA | NA | NA | NA | NA | NA | NA | NA | NA | |
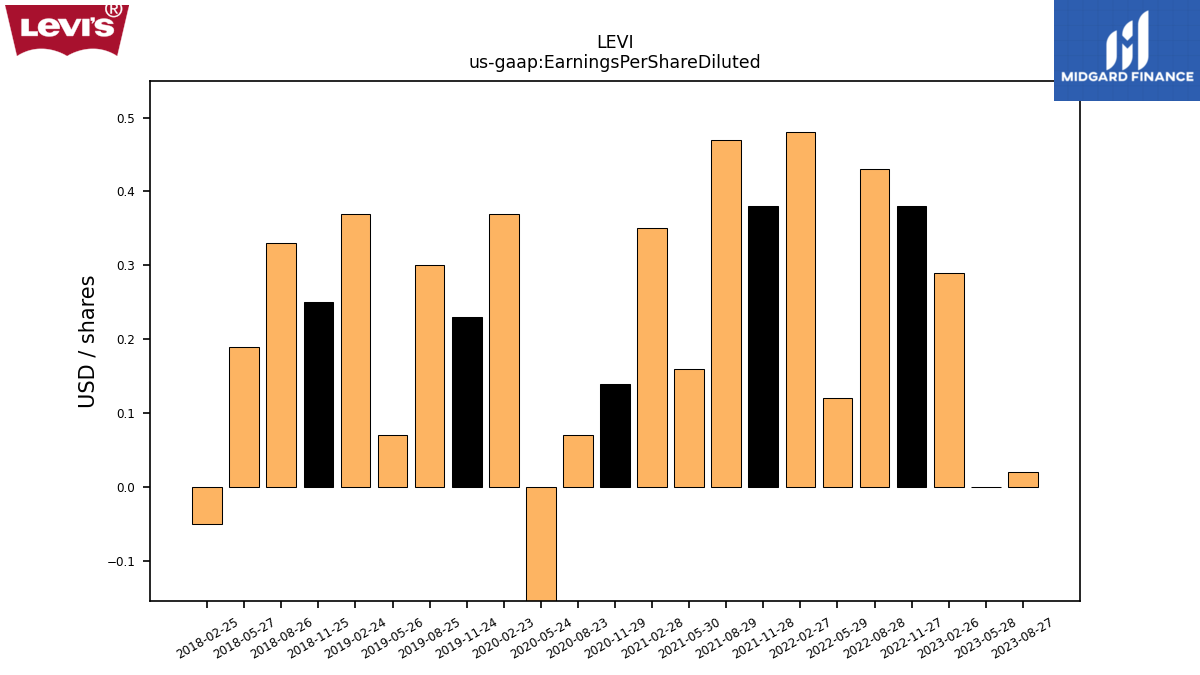
| Earnings Per Share Diluted | 0.02 | -0.00 | 0.29 | 0.38 | 0.43 | 0.12 | 0.48 | 0.38 | 0.47 | 0.16 | 0.35 | 0.14 | 0.07 | -0.91 | 0.37 | 0.23 | 0.30 | 0.07 | 0.37 | 0.25 | 0.33 | 0.19 | -0.05 | NA | NA | NA | NA | NA | NA | NA | NA | NA | NA | NA | NA | NA | NA | NA | NA | NA | NA | NA | NA | NA | NA | NA | NA | NA | NA | NA | NA | NA | NA |
| 2023-08-27 | 2023-05-28 | 2023-02-26 | 2022-11-27 | 2022-08-28 | 2022-05-29 | 2022-02-27 | 2021-11-28 | 2021-08-29 | 2021-05-30 | 2021-02-28 | 2020-11-29 | 2020-08-23 | 2020-05-24 | 2020-02-23 | 2019-11-24 | 2019-08-25 | 2019-05-26 | 2019-02-24 | 2018-11-25 | 2018-08-26 | 2018-05-27 | 2018-02-25 | 2017-11-26 | 2017-08-27 | 2017-05-28 | 2017-02-26 | 2016-11-27 | 2016-08-28 | 2016-05-29 | 2016-02-28 | 2015-11-29 | 2015-08-30 | 2015-05-31 | 2015-03-01 | 2014-11-30 | 2014-08-24 | 2014-05-25 | 2014-02-23 | 2013-11-24 | 2013-08-25 | 2013-05-26 | 2013-02-24 | 2012-11-25 | 2012-08-26 | 2012-05-27 | 2012-02-26 | 2011-11-27 | 2011-08-28 | 2011-05-29 | 2011-02-27 | 2010-11-28 | 2010-08-29 | ||
|---|---|---|---|---|---|---|---|---|---|---|---|---|---|---|---|---|---|---|---|---|---|---|---|---|---|---|---|---|---|---|---|---|---|---|---|---|---|---|---|---|---|---|---|---|---|---|---|---|---|---|---|---|---|---|
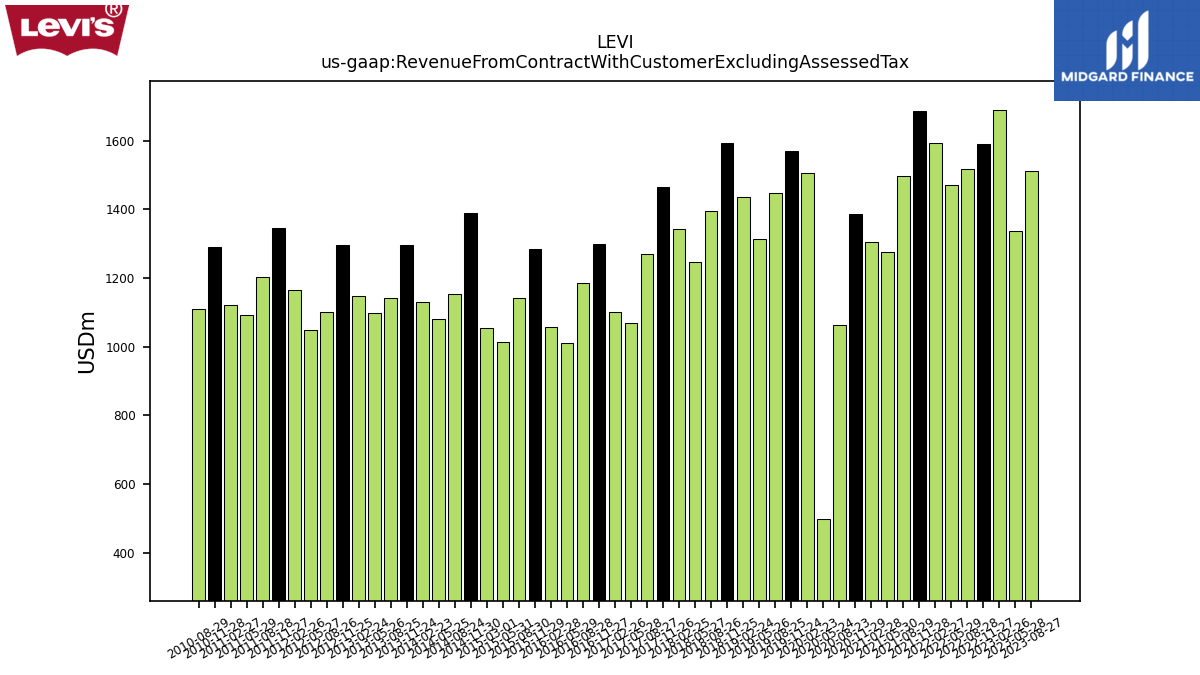
| Revenue From Contract With Customer Excluding Assessed Tax | 1511.00 | 1336.80 | 1688.90 | 1588.74 | 1517.15 | 1471.15 | 1591.56 | 1684.78 | 1497.58 | 1275.97 | 1305.60 | 1385.86 | 1063.09 | 497.54 | 1506.13 | 1568.61 | 1447.08 | 1312.94 | 1434.46 | 1591.86 | 1394.15 | 1245.74 | 1343.68 | 1465.79 | 1268.39 | 1067.86 | 1101.99 | 1299.54 | 1185.11 | 1011.59 | 1056.50 | 1285.23 | 1142.01 | 1012.18 | 1055.08 | 1388.03 | 1154.13 | 1081.85 | 1129.99 | 1294.83 | 1141.28 | 1098.90 | 1146.68 | 1297.22 | 1100.86 | 1047.16 | 1164.96 | 1343.93 | 1204.02 | 1092.92 | 1120.69 | 1289.91 | 1109.01 | |
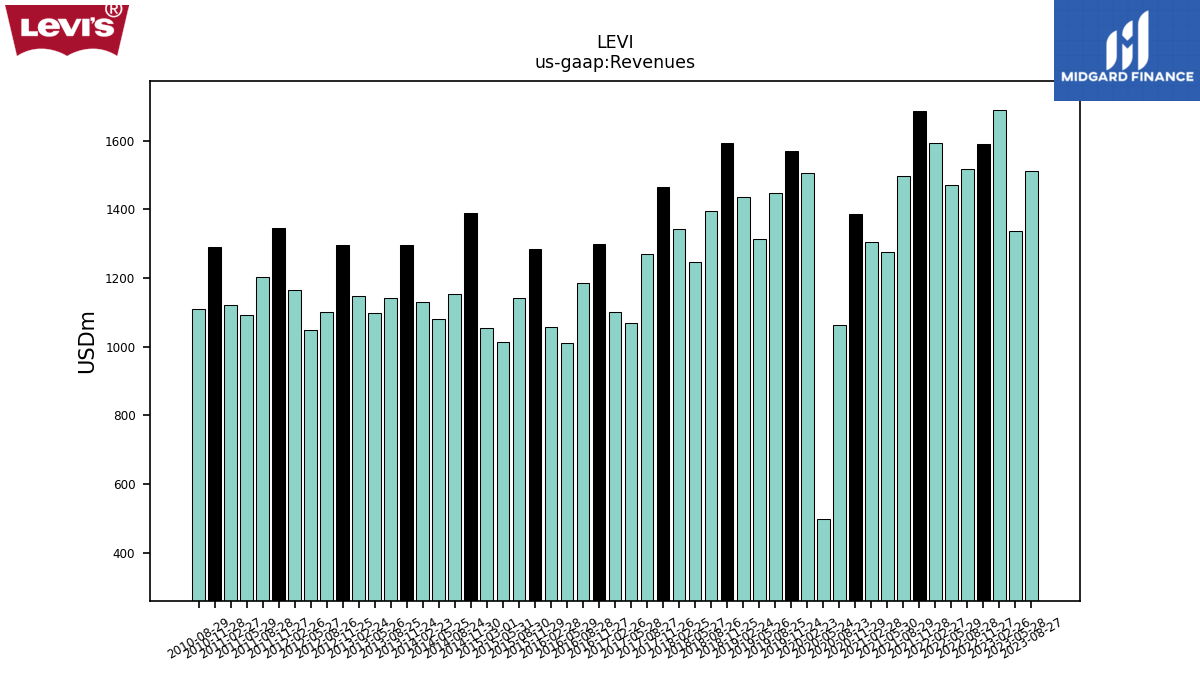
| Revenues | 1511.00 | 1336.80 | 1688.90 | 1588.74 | 1517.15 | 1471.15 | 1591.56 | 1684.78 | 1497.58 | 1275.97 | 1305.60 | 1385.86 | 1063.09 | 497.54 | 1506.13 | 1568.61 | 1447.08 | 1312.94 | 1434.46 | 1591.86 | 1394.15 | 1245.74 | 1343.68 | 1465.79 | 1268.39 | 1067.86 | 1101.99 | 1299.54 | 1185.11 | 1011.59 | 1056.50 | 1285.23 | 1142.01 | 1012.18 | 1055.08 | 1388.03 | 1154.13 | 1081.85 | 1129.99 | 1294.83 | 1141.28 | 1098.90 | 1146.68 | 1297.22 | 1100.86 | 1047.16 | 1164.96 | 1343.93 | 1204.02 | 1092.92 | 1120.69 | 1289.91 | 1109.01 | |
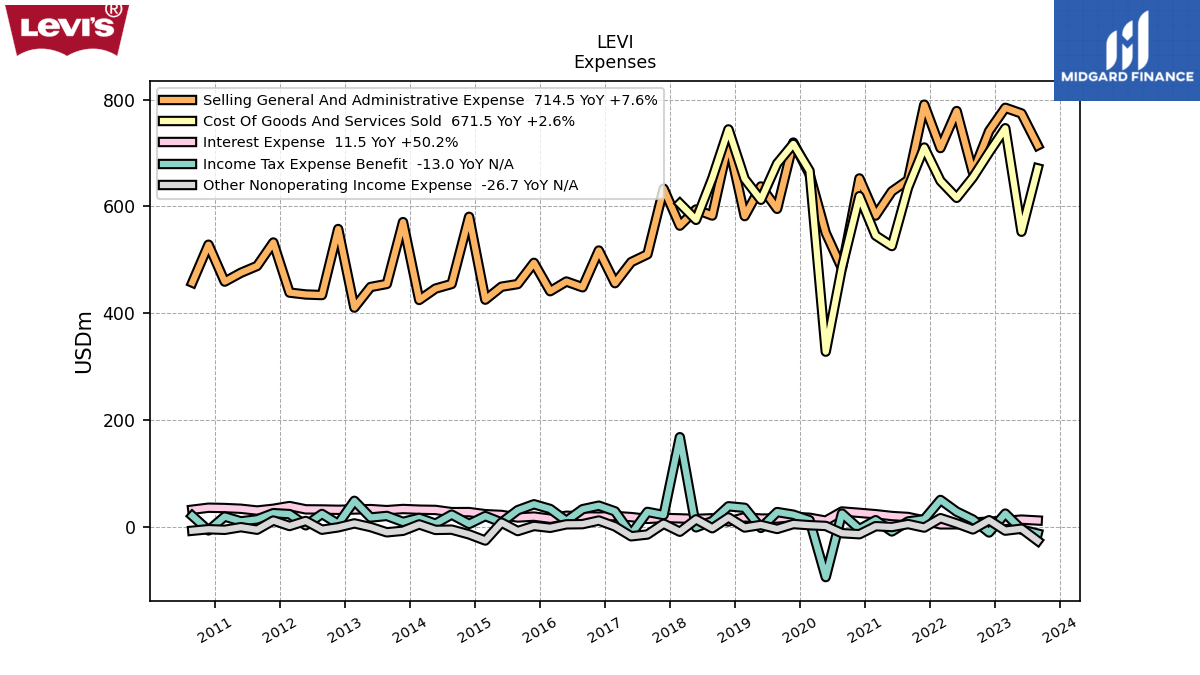
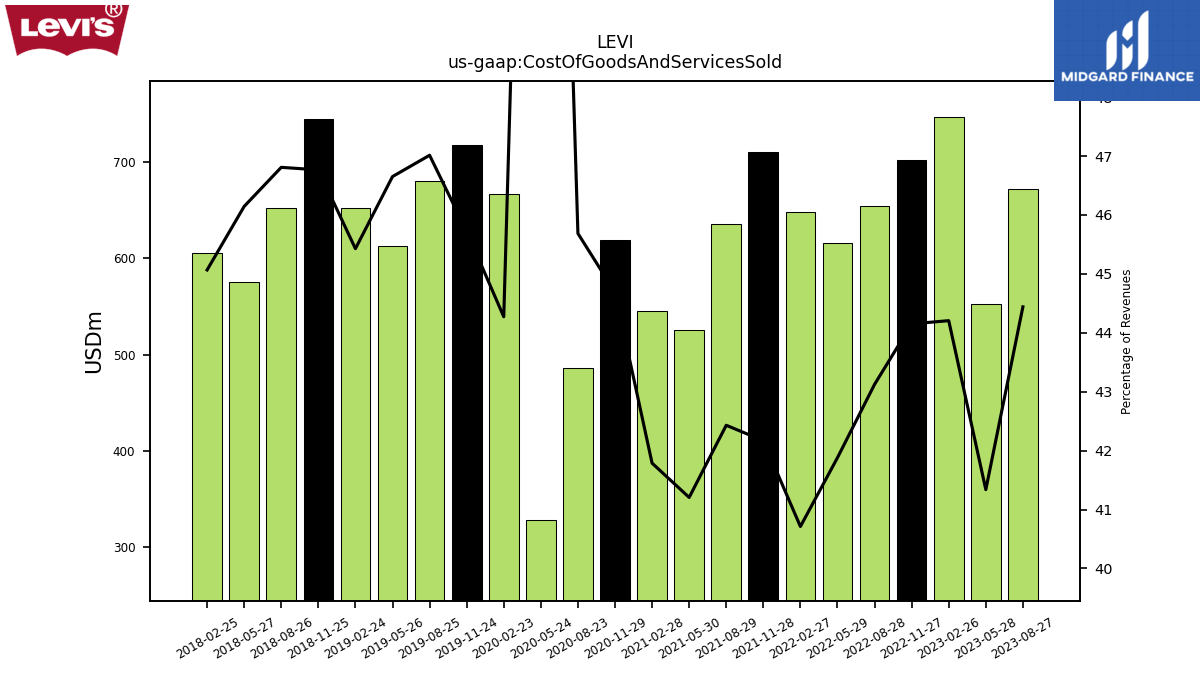
| Cost Of Goods And Services Sold | 671.50 | 552.60 | 746.60 | 701.45 | 654.27 | 616.13 | 647.95 | 710.46 | 635.43 | 525.77 | 545.57 | 619.31 | 485.69 | 327.89 | 666.80 | 717.21 | 680.34 | 612.52 | 651.65 | 744.45 | 652.59 | 574.87 | 605.56 | NA | NA | NA | NA | NA | NA | NA | NA | NA | NA | NA | NA | NA | NA | NA | NA | NA | NA | NA | NA | NA | NA | NA | NA | NA | NA | NA | NA | NA | NA | |
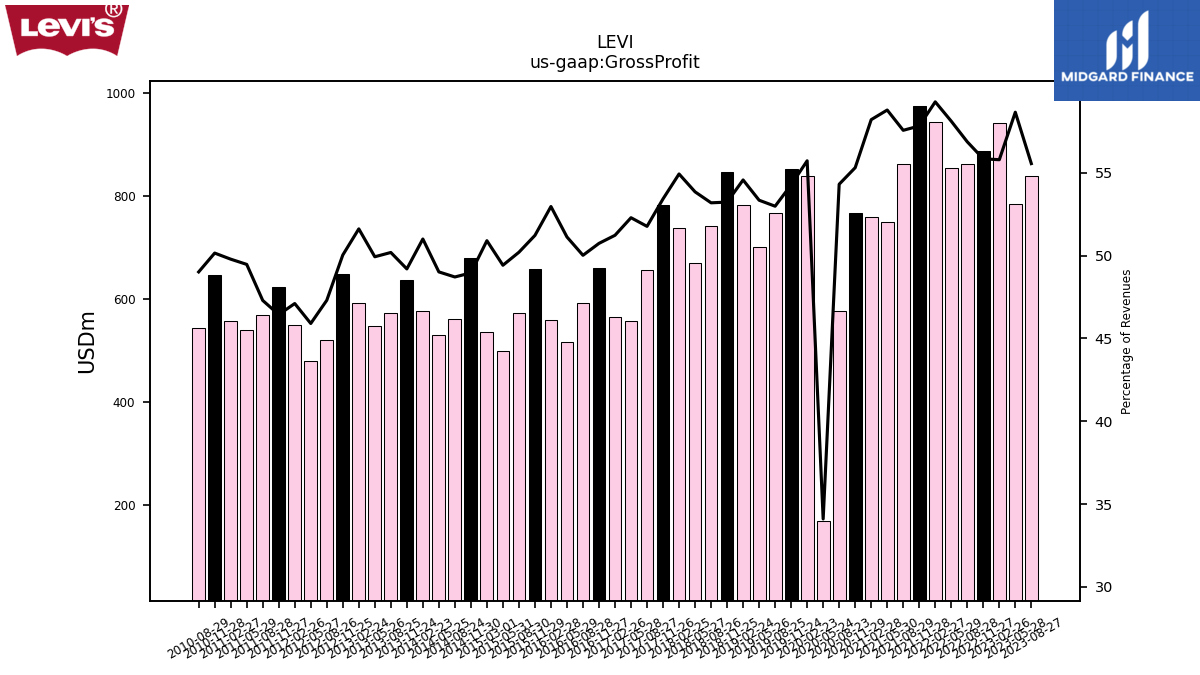
| Gross Profit | 839.50 | 784.20 | 942.30 | 887.29 | 862.88 | 855.02 | 943.61 | 974.33 | 862.15 | 750.20 | 760.03 | 766.55 | 577.40 | 169.65 | 839.33 | 851.40 | 766.75 | 700.42 | 782.81 | 847.41 | 741.56 | 670.88 | 738.12 | 783.15 | 656.63 | 558.39 | 564.55 | 659.41 | 592.81 | 517.20 | 559.60 | 658.33 | 573.36 | 500.23 | 537.07 | 679.58 | 562.20 | 530.30 | 576.35 | 637.05 | 572.84 | 548.71 | 591.88 | 649.10 | 520.75 | 480.69 | 548.79 | 624.13 | 569.44 | 540.70 | 557.97 | 646.96 | 543.61 | |
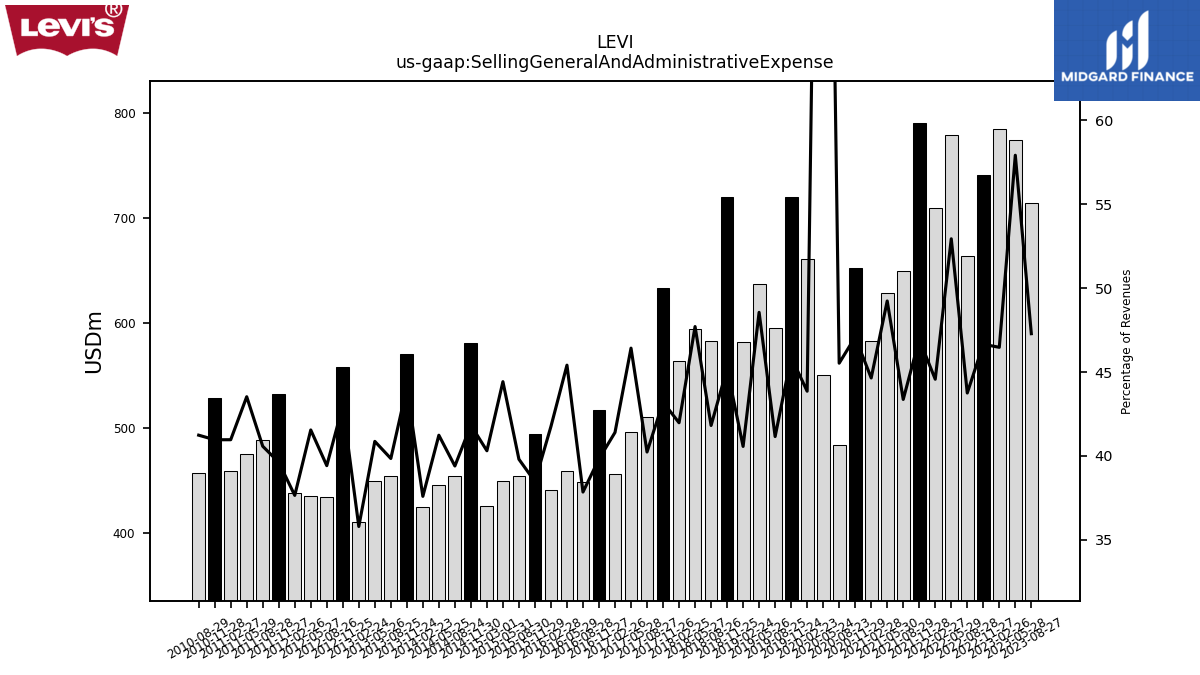
| Selling General And Administrative Expense | 714.50 | 774.30 | 784.90 | 741.21 | 663.75 | 778.86 | 709.38 | 790.84 | 649.46 | 628.23 | 582.91 | 652.56 | 484.00 | 550.52 | 660.54 | 719.75 | 595.53 | 637.52 | 581.90 | 719.58 | 582.95 | 594.35 | 564.02 | 633.30 | 510.31 | 495.74 | 456.21 | 517.45 | 448.52 | 459.35 | 441.16 | 494.39 | 454.53 | 449.66 | 425.28 | 580.62 | 454.71 | 446.07 | 424.76 | 570.72 | 454.75 | 449.07 | 410.42 | 557.75 | 433.96 | 435.06 | 438.58 | 532.49 | 488.55 | 475.72 | 459.09 | 528.38 | 457.31 | |
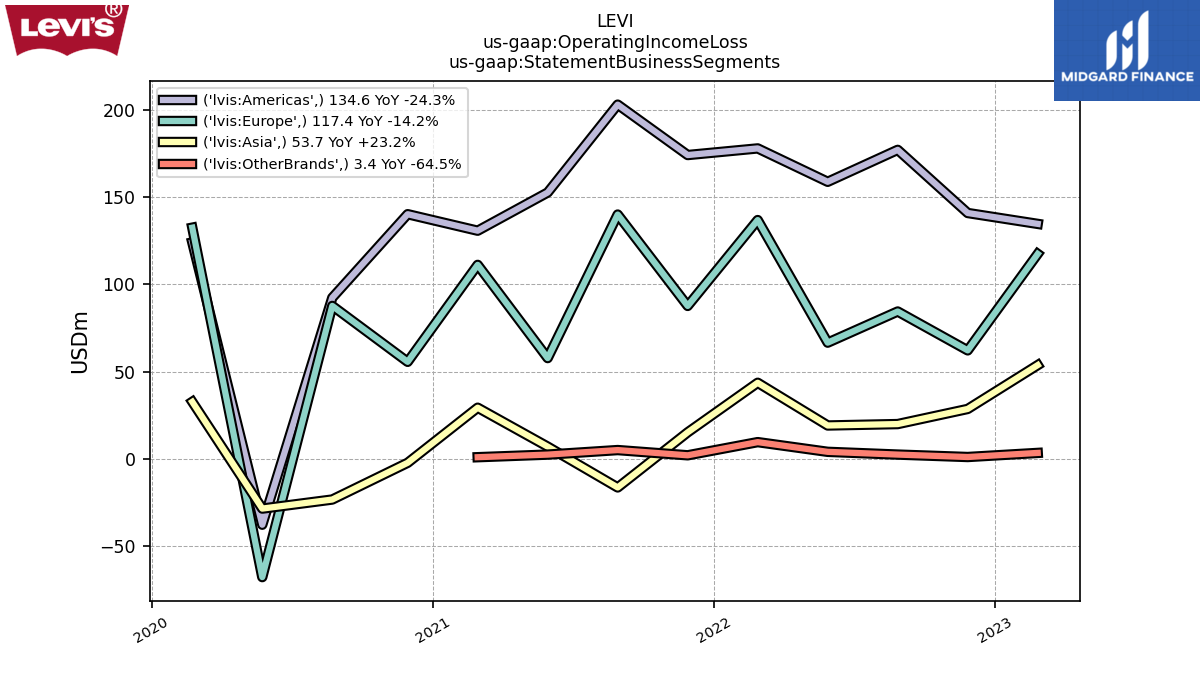
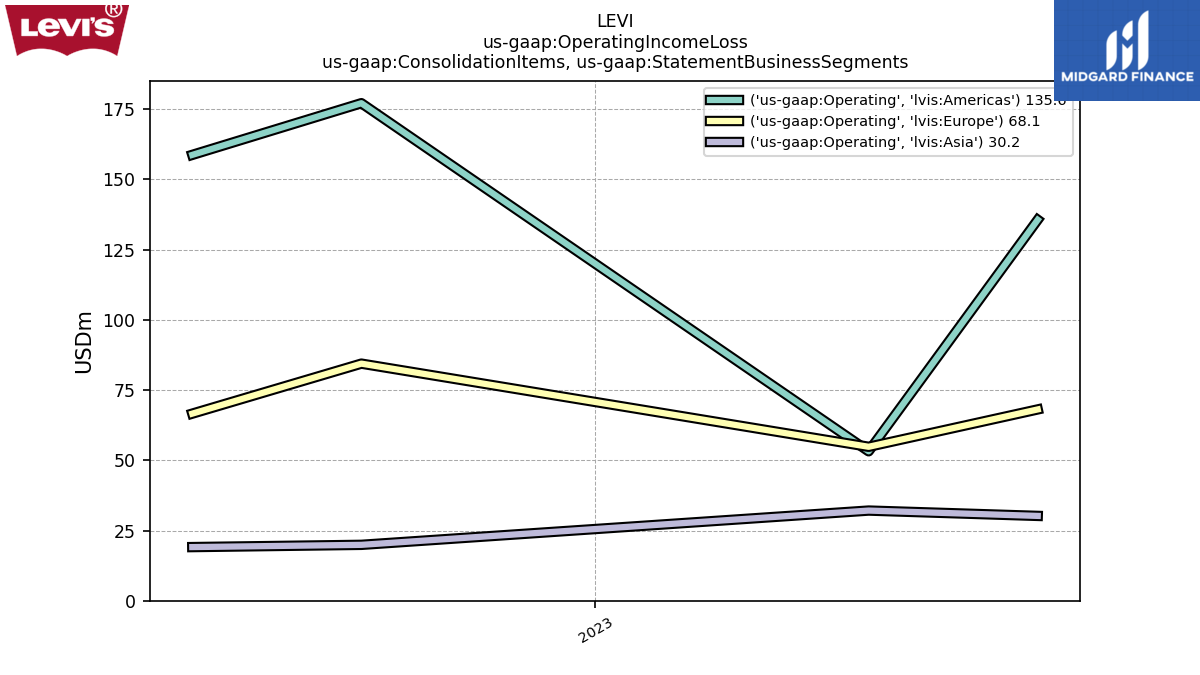
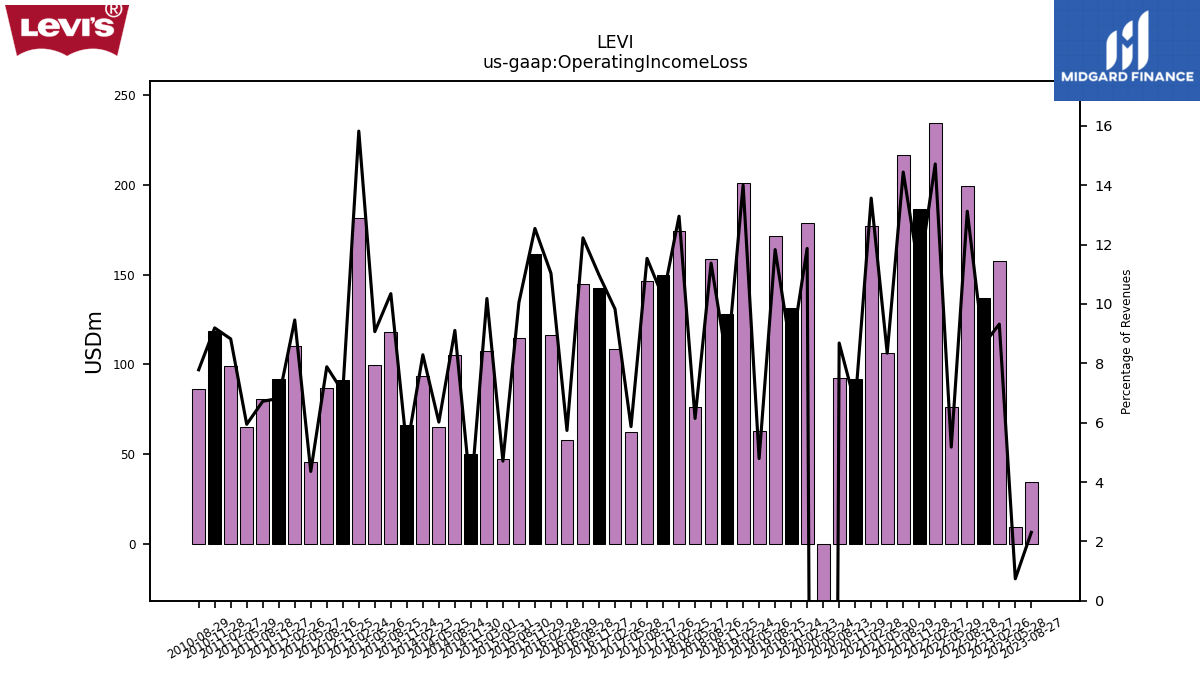
| Operating Income Loss | 34.80 | 9.90 | 157.40 | 136.97 | 199.13 | 76.17 | 234.23 | 186.32 | 216.31 | 106.45 | 177.12 | 92.02 | 92.33 | -448.20 | 178.78 | 131.65 | 171.22 | 62.90 | 200.91 | 127.83 | 158.61 | 76.52 | 174.10 | 149.86 | 146.32 | 62.65 | 108.34 | 142.67 | 144.91 | 58.04 | 116.59 | 161.21 | 114.77 | 47.62 | 107.44 | 49.95 | 105.12 | 65.13 | 93.66 | 66.33 | 118.09 | 99.64 | 181.46 | 91.35 | 86.79 | 45.63 | 110.21 | 91.64 | 80.90 | 64.98 | 98.87 | 118.58 | 86.30 | |
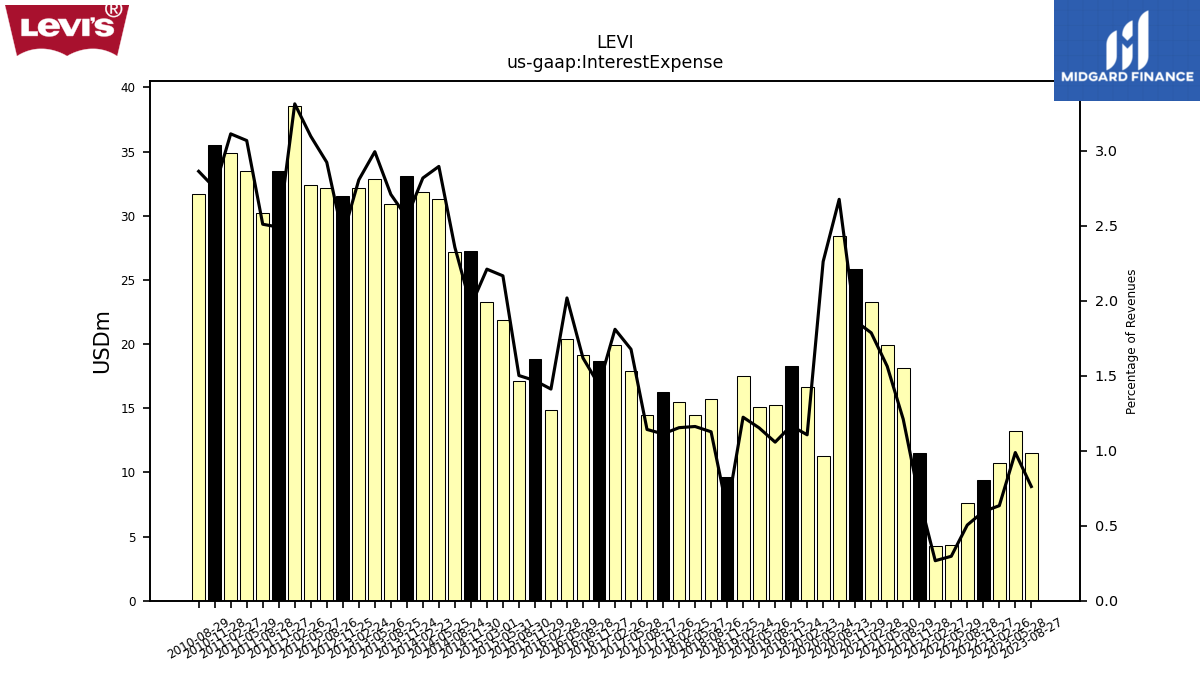
| Interest Expense | 11.50 | 13.20 | 10.70 | 9.44 | 7.65 | 4.36 | 4.25 | 11.54 | 18.12 | 19.93 | 23.31 | 25.85 | 28.44 | 11.25 | 16.65 | 18.29 | 15.29 | 15.13 | 17.54 | 9.64 | 15.70 | 14.46 | 15.50 | 16.30 | 14.48 | 17.89 | 19.93 | 18.69 | 19.17 | 20.41 | 14.90 | 18.85 | 17.14 | 21.91 | 23.31 | 27.28 | 27.18 | 31.31 | 31.83 | 33.08 | 30.90 | 32.88 | 32.16 | 31.55 | 32.16 | 32.41 | 38.57 | 33.45 | 30.21 | 33.52 | 34.87 | 35.48 | 31.73 | |
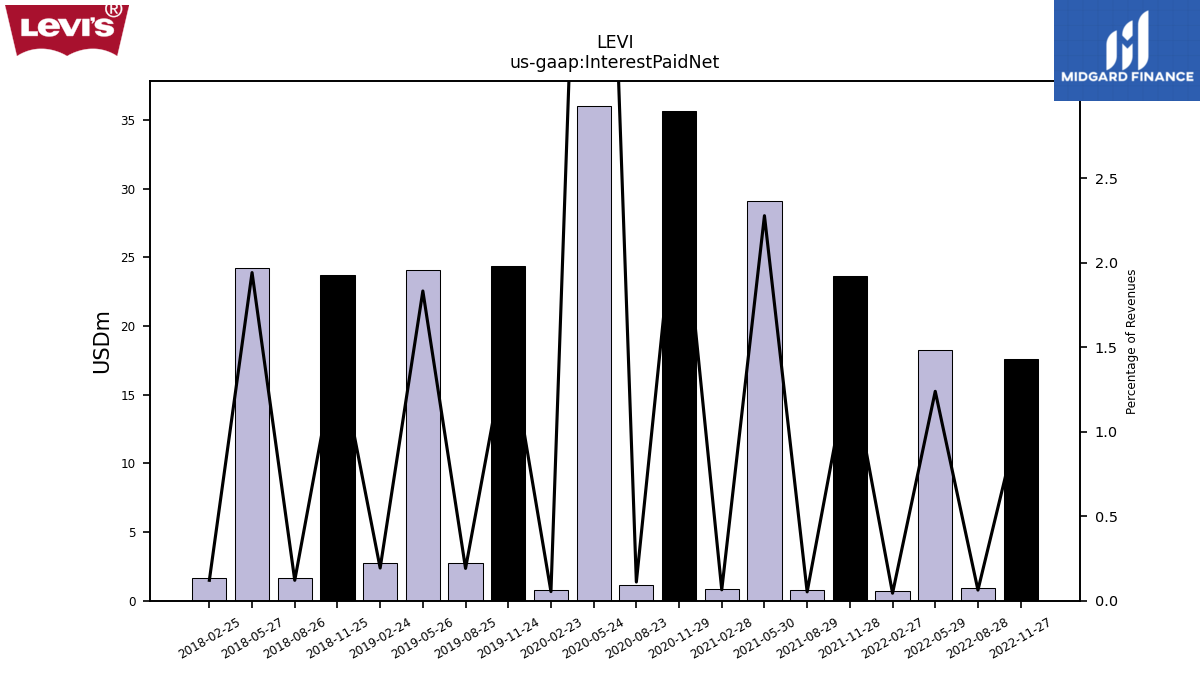
| Interest Paid Net | NA | NA | NA | 17.59 | 0.96 | 18.23 | 0.71 | 23.64 | 0.79 | 29.08 | 0.85 | 35.63 | 1.18 | 36.04 | 0.82 | 24.38 | 2.77 | 24.07 | 2.78 | 23.69 | 1.69 | 24.20 | 1.63 | NA | NA | NA | NA | NA | NA | NA | NA | NA | NA | NA | NA | NA | NA | NA | NA | NA | NA | NA | NA | NA | NA | NA | NA | NA | NA | NA | NA | NA | NA | |
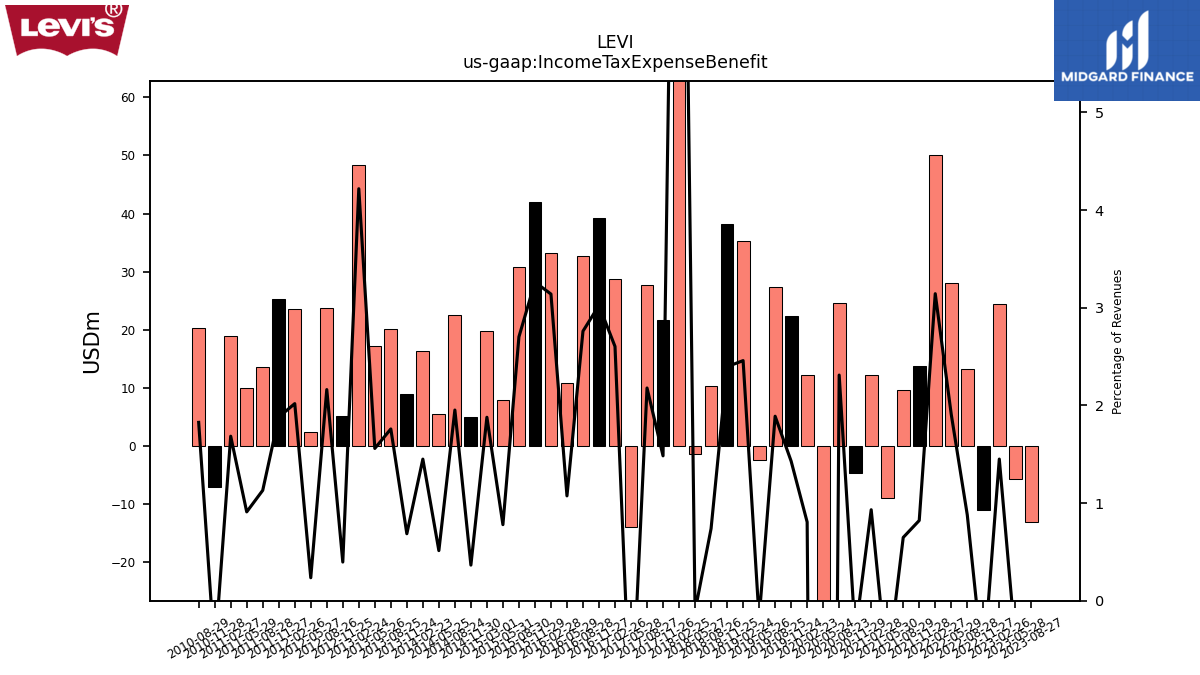
| Income Tax Expense Benefit | -13.00 | -5.60 | 24.50 | -10.95 | 13.34 | 28.07 | 50.04 | 13.85 | 9.71 | -9.02 | 12.17 | -4.71 | 24.57 | -94.60 | 12.14 | 22.42 | 27.34 | -2.43 | 35.27 | 38.15 | 10.30 | -1.32 | 167.65 | 21.75 | 27.63 | -13.85 | 28.69 | 39.30 | 32.71 | 10.86 | 33.17 | 41.94 | 30.86 | 7.89 | 19.82 | 5.07 | 22.54 | 5.56 | 16.39 | 8.88 | 20.08 | 17.14 | 48.38 | 5.14 | 23.80 | 2.47 | 23.51 | 25.28 | 13.61 | 9.94 | 18.88 | -7.05 | 20.25 | |
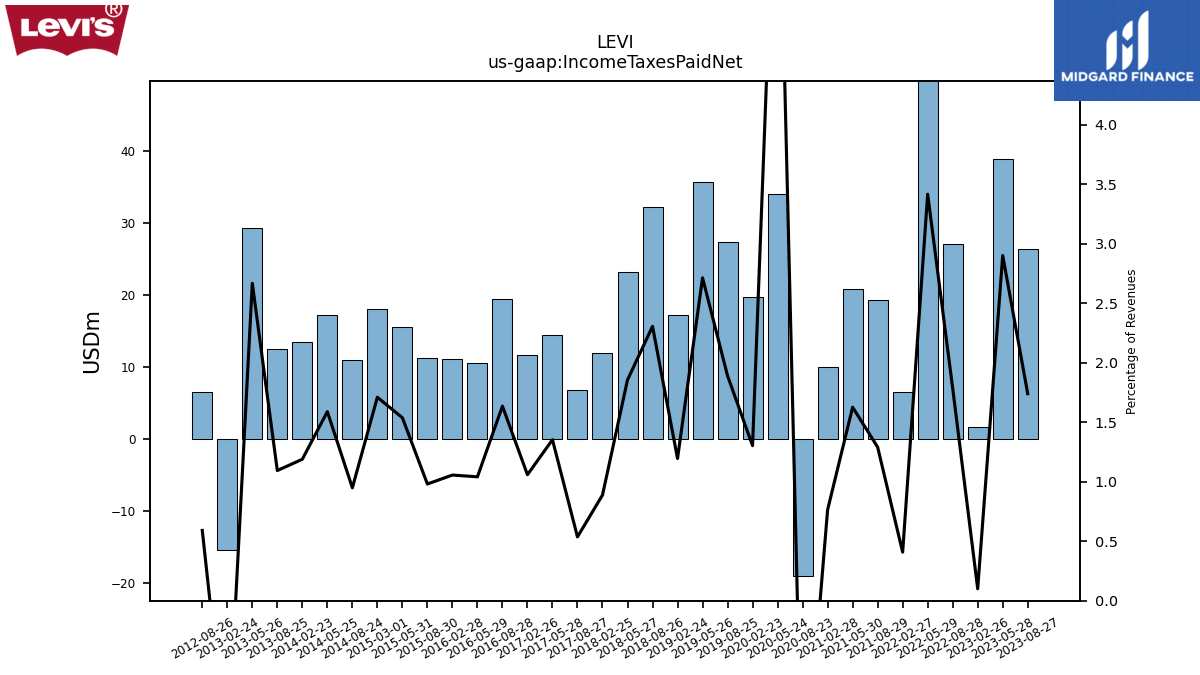
| Income Taxes Paid Net | 26.30 | 38.80 | 1.70 | NA | 27.11 | 50.28 | 6.50 | NA | 19.34 | 20.76 | 9.99 | NA | -18.94 | 33.96 | 19.64 | NA | 27.36 | 35.64 | 17.16 | NA | 32.16 | 23.13 | 11.94 | NA | 6.81 | 14.46 | 11.68 | NA | 19.39 | 10.54 | 11.16 | NA | 11.21 | 15.57 | 18.05 | NA | 10.96 | 17.20 | 13.44 | NA | 12.49 | 29.32 | -15.38 | NA | 6.51 | NA | NA | NA | NA | NA | NA | NA | NA | |
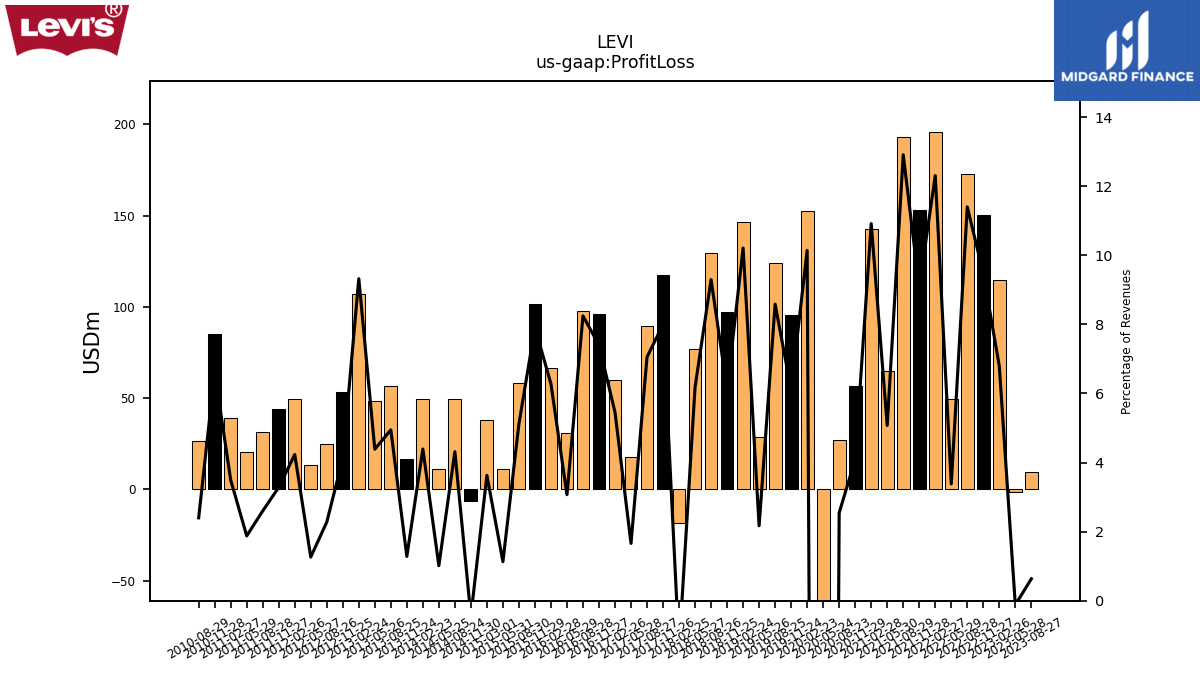
| Profit Loss | 9.60 | -1.60 | 114.70 | 150.56 | 172.96 | 49.74 | 195.84 | 152.99 | 193.33 | 64.72 | 142.50 | 56.67 | 27.05 | -363.55 | 152.69 | 95.81 | 124.22 | 28.51 | 146.45 | 97.26 | 129.58 | 77.03 | -18.63 | 117.23 | 89.48 | 17.72 | 60.12 | 96.15 | 97.70 | 31.06 | 66.29 | 101.69 | 58.46 | 11.45 | 38.28 | -6.10 | 49.80 | 10.99 | 49.62 | 16.61 | 56.45 | 48.21 | 106.88 | 53.34 | 25.08 | 13.24 | 49.30 | 44.13 | 31.30 | 20.51 | 39.17 | 85.34 | 26.62 | |
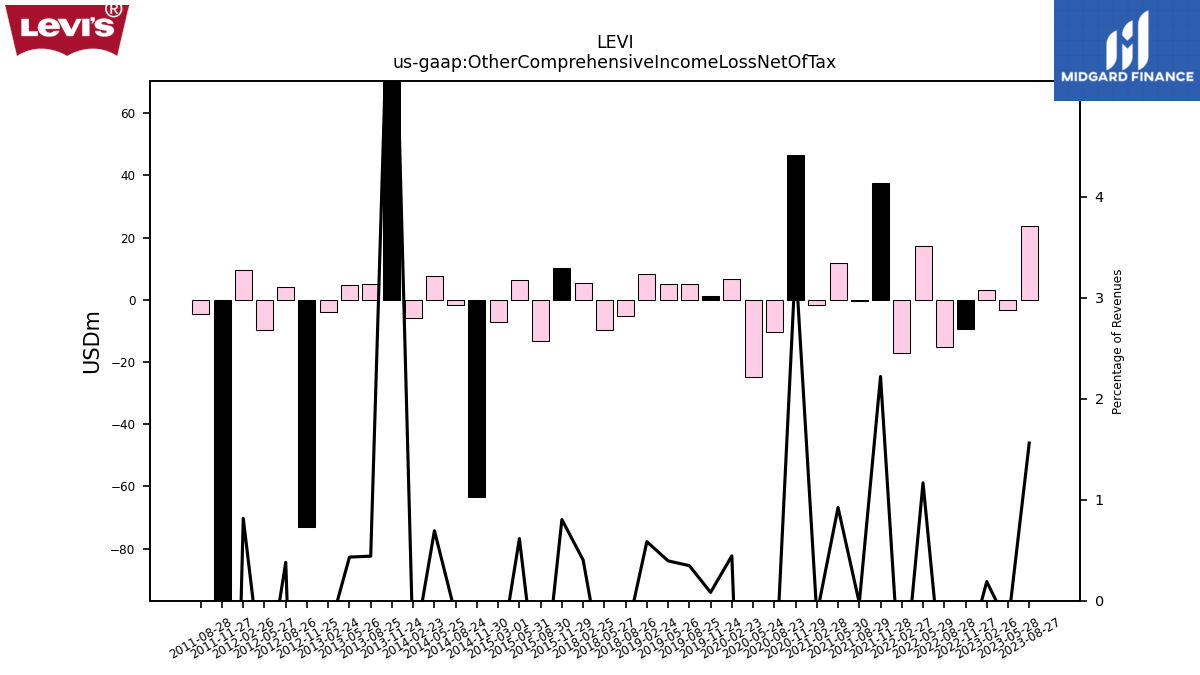
| Other Comprehensive Income Loss Net Of Tax | 23.60 | -3.20 | 3.20 | -9.49 | -15.11 | 17.19 | -16.99 | 37.43 | -0.33 | 11.79 | -1.83 | 46.48 | -10.23 | -24.96 | 6.70 | 1.30 | 5.03 | 5.18 | 8.39 | NA | -5.26 | -9.57 | 5.43 | NA | NA | NA | NA | NA | NA | NA | NA | 10.34 | -13.15 | 6.23 | -7.22 | -63.50 | -1.64 | 7.50 | -6.00 | 95.55 | 5.04 | 4.75 | -3.79 | -72.91 | 4.18 | -9.88 | 9.51 | -98.41 | -4.58 | NA | NA | NA | NA | |
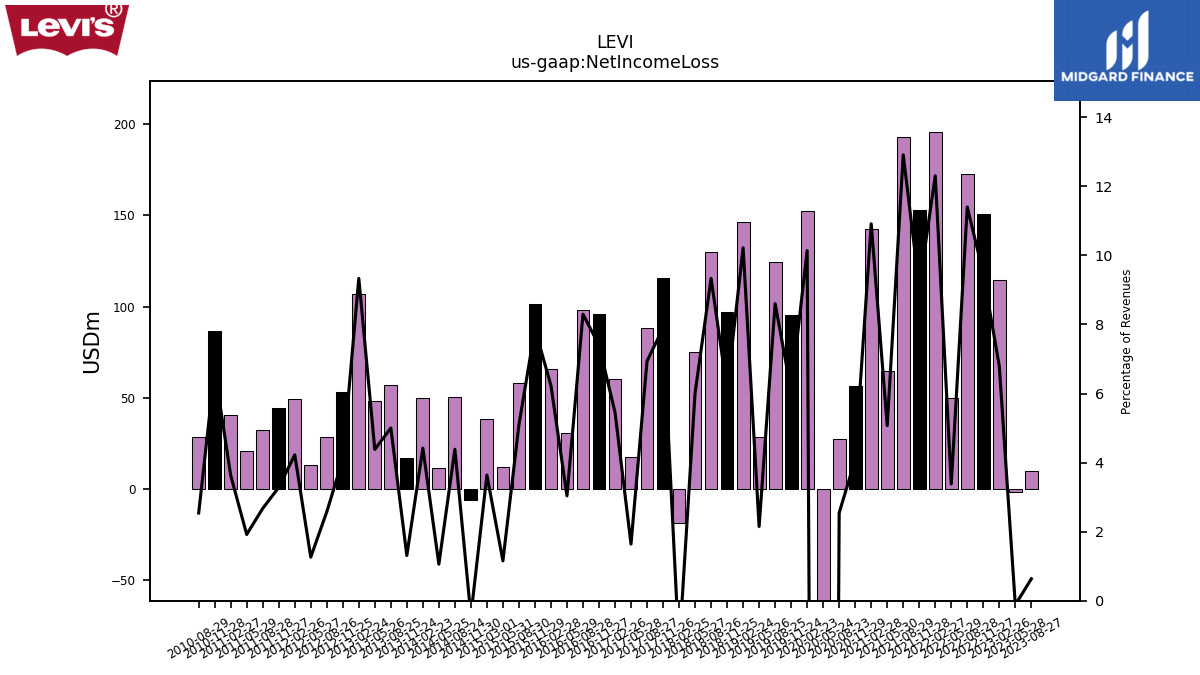
| Net Income Loss | 9.60 | -1.60 | 114.70 | 150.56 | 172.96 | 49.74 | 195.84 | 152.99 | 193.33 | 64.72 | 142.50 | 56.67 | 27.05 | -363.55 | 152.69 | 95.30 | 124.51 | 28.23 | 146.58 | 97.10 | 130.12 | 74.93 | -19.01 | 115.75 | 87.99 | 17.52 | 60.14 | 96.17 | 98.32 | 30.73 | 65.84 | 101.18 | 58.17 | 11.69 | 38.39 | -5.97 | 50.62 | 11.46 | 49.97 | 16.95 | 57.08 | 48.15 | 107.02 | 53.05 | 28.35 | 13.23 | 49.22 | 44.11 | 32.19 | 20.97 | 40.67 | 86.35 | 28.18 | |
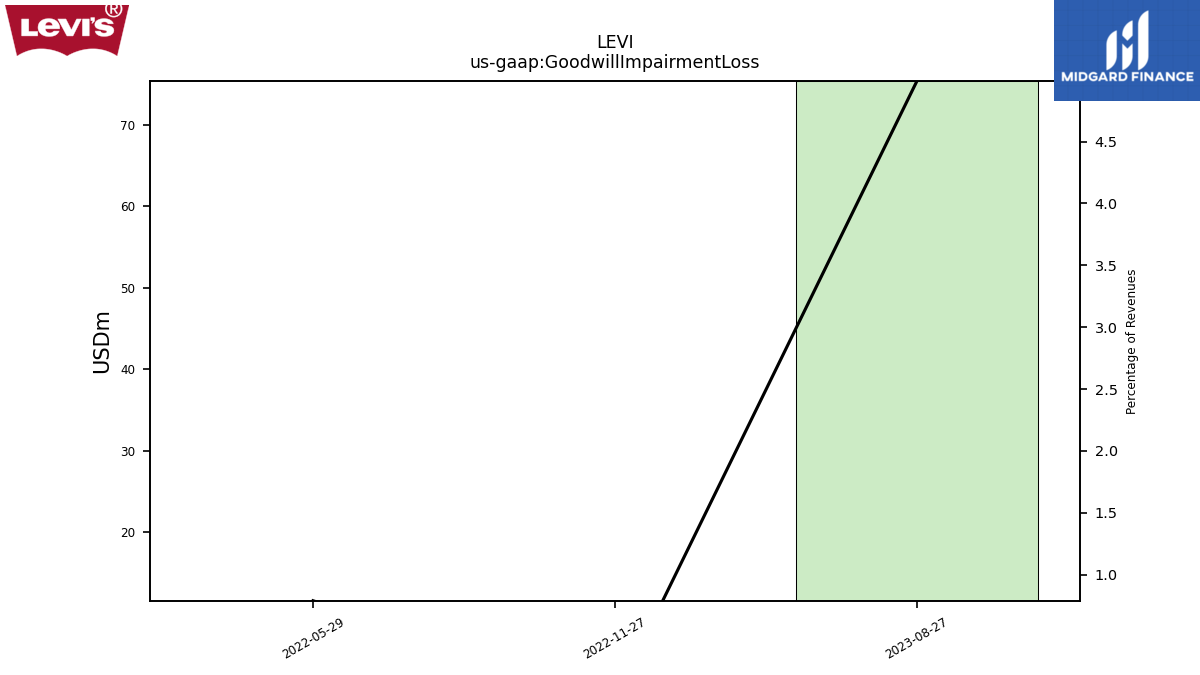
| Goodwill Impairment Loss | 75.40 | NA | NA | 0.00 | NA | 11.60 | NA | NA | NA | NA | NA | NA | NA | NA | NA | NA | NA | NA | NA | NA | NA | NA | NA | NA | NA | NA | NA | NA | NA | NA | NA | NA | NA | NA | NA | NA | NA | NA | NA | NA | NA | NA | NA | NA | NA | NA | NA | NA | NA | NA | NA | NA | NA |
| 2023-08-27 | 2023-05-28 | 2023-02-26 | 2022-11-27 | 2022-08-28 | 2022-05-29 | 2022-02-27 | 2021-11-28 | 2021-08-29 | 2021-05-30 | 2021-02-28 | 2020-11-29 | 2020-08-23 | 2020-05-24 | 2020-02-23 | 2019-11-24 | 2019-08-25 | 2019-05-26 | 2019-02-24 | 2018-11-25 | 2018-08-26 | 2018-05-27 | 2018-02-25 | 2017-11-26 | 2017-08-27 | 2017-05-28 | 2017-02-26 | 2016-11-27 | 2016-08-28 | 2016-05-29 | 2016-02-28 | 2015-11-29 | 2015-08-30 | 2015-05-31 | 2015-03-01 | 2014-11-30 | 2014-08-24 | 2014-05-25 | 2014-02-23 | 2013-11-24 | 2013-08-25 | 2013-05-26 | 2013-02-24 | 2012-11-25 | 2012-08-26 | 2012-05-27 | 2012-02-26 | 2011-11-27 | 2011-08-28 | 2011-05-29 | 2011-02-27 | 2010-11-28 | 2010-08-29 | ||
|---|---|---|---|---|---|---|---|---|---|---|---|---|---|---|---|---|---|---|---|---|---|---|---|---|---|---|---|---|---|---|---|---|---|---|---|---|---|---|---|---|---|---|---|---|---|---|---|---|---|---|---|---|---|---|
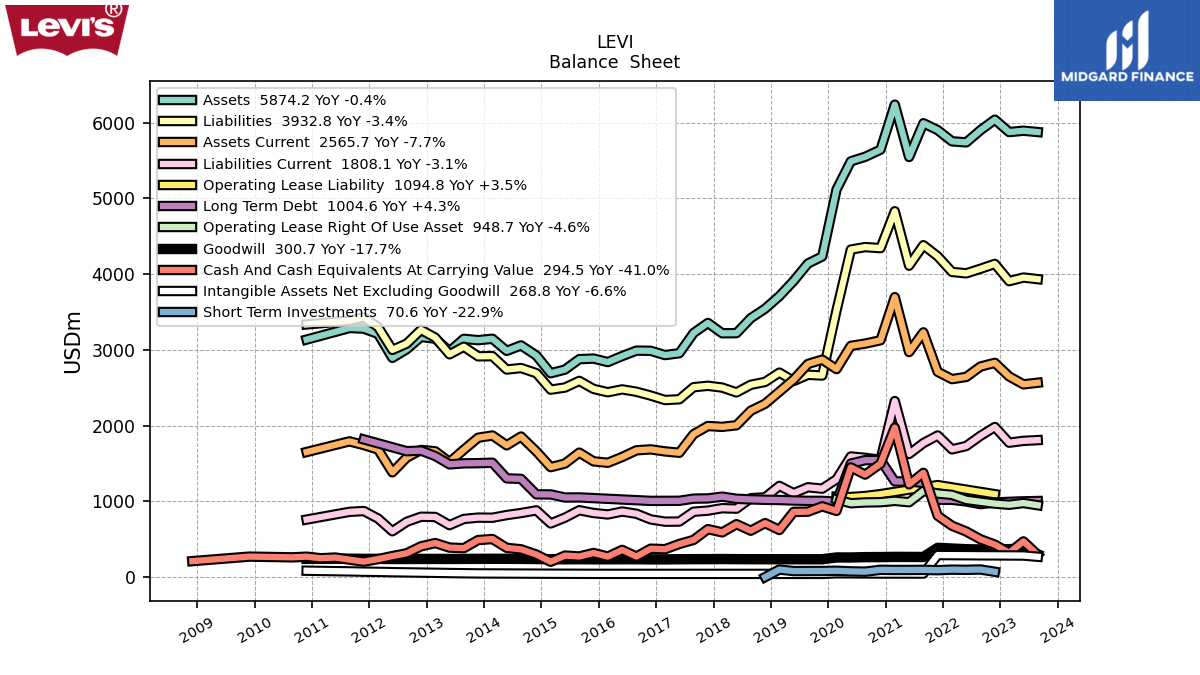
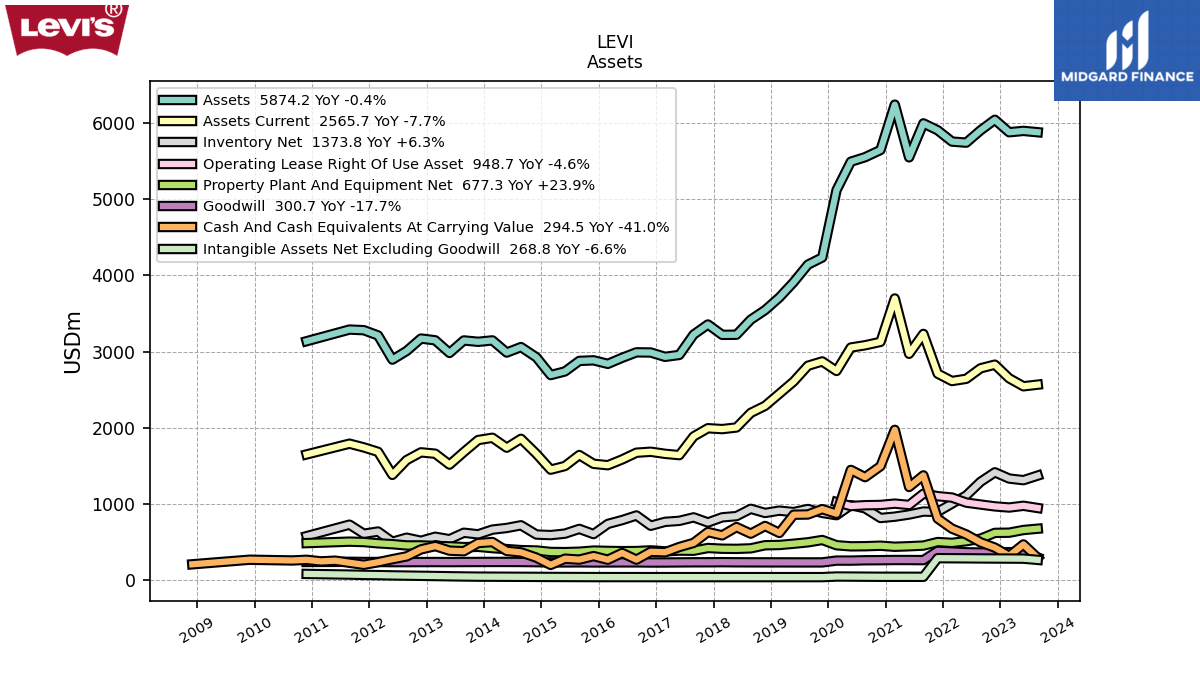
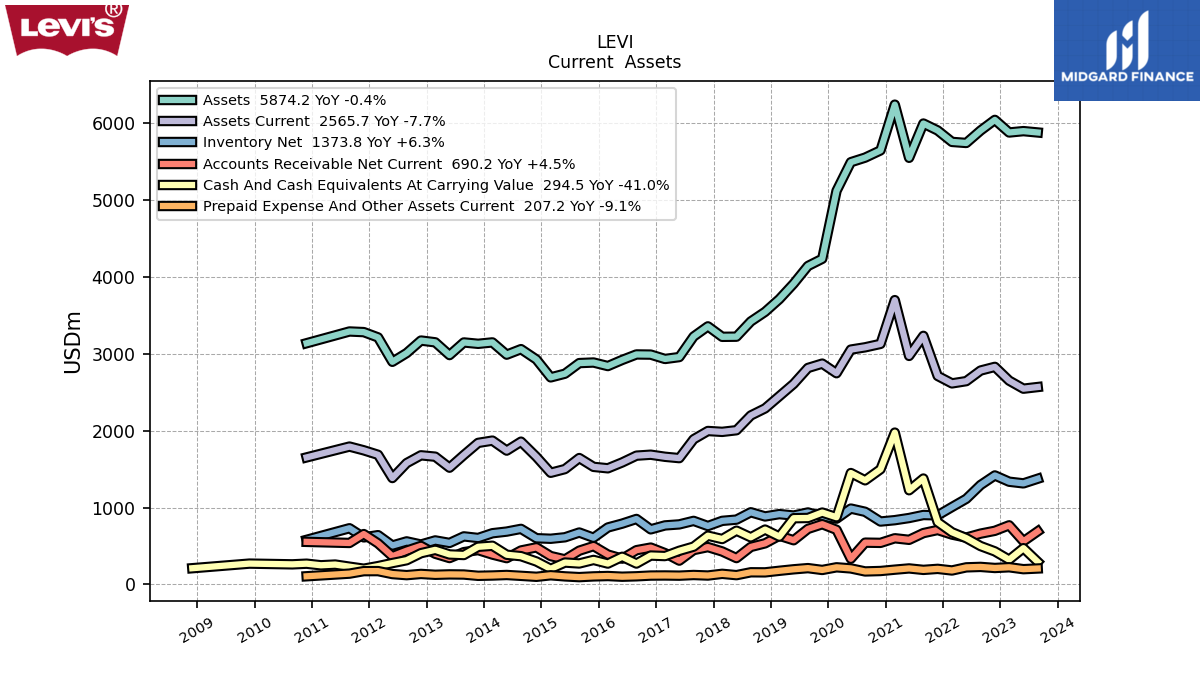
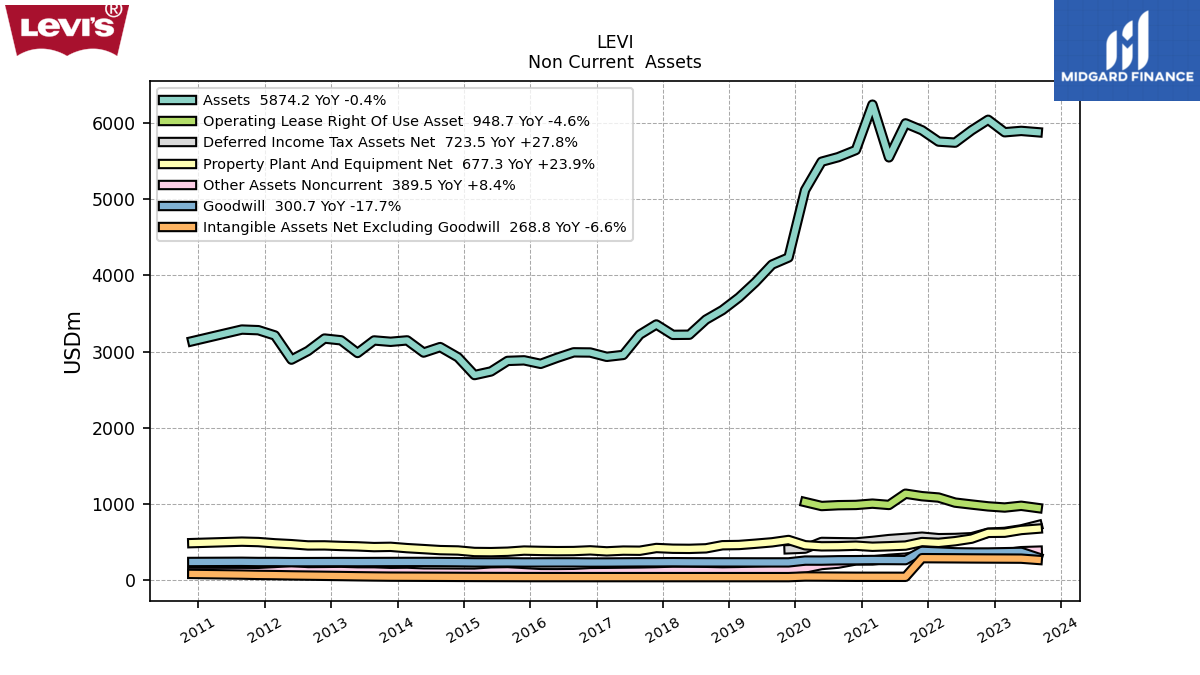
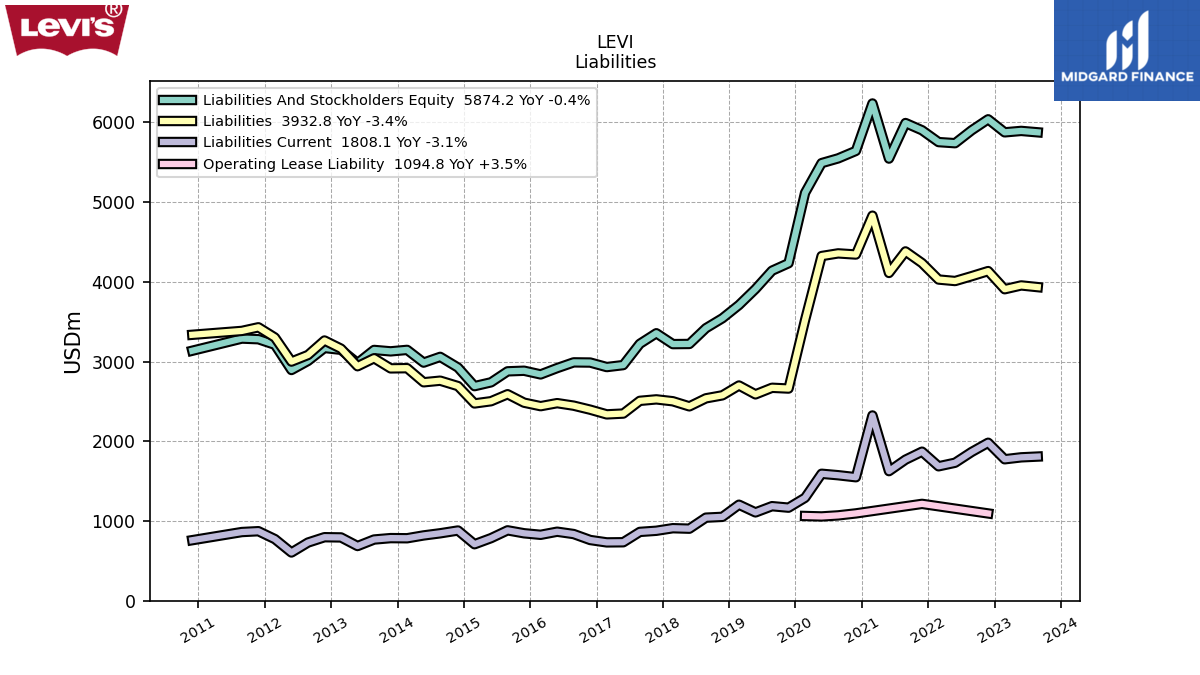
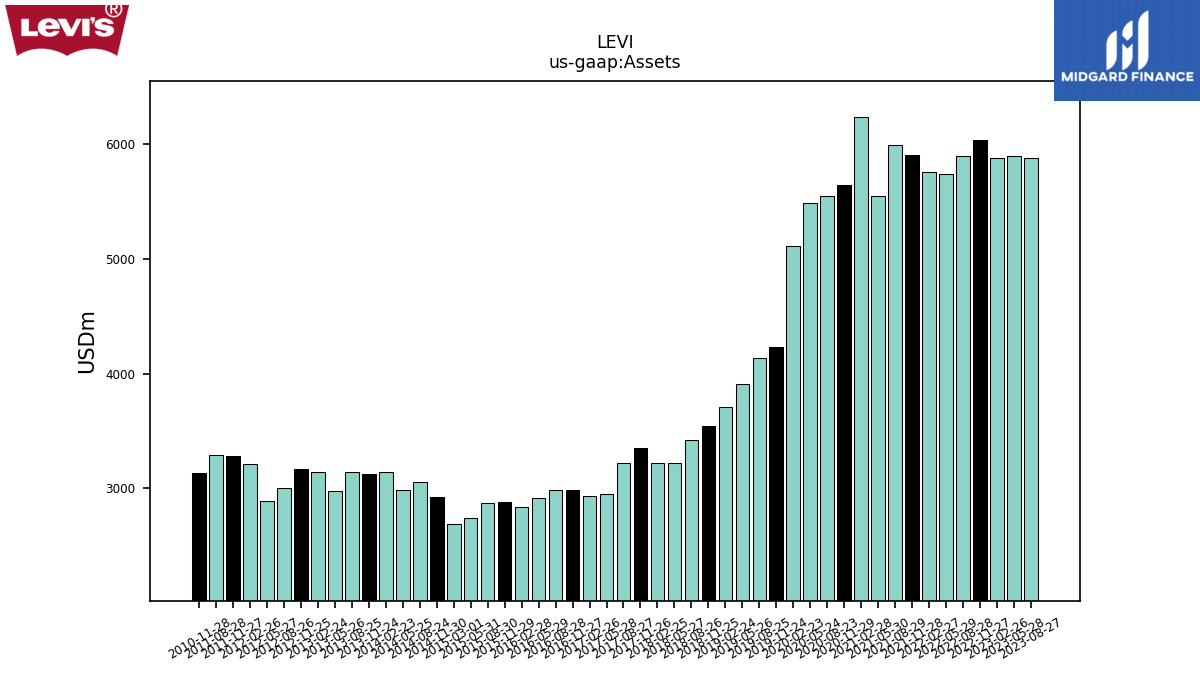
| Assets | 5874.20 | 5891.80 | 5873.90 | 6037.80 | 5899.20 | 5737.76 | 5751.75 | 5900.07 | 5990.77 | 5544.66 | 6236.19 | 5641.24 | 5547.27 | 5487.97 | 5115.24 | 4232.42 | 4139.00 | 3909.39 | 3708.37 | 3542.66 | 3417.68 | 3220.08 | 3218.31 | 3354.69 | 3221.95 | 2955.16 | 2930.32 | 2987.10 | 2989.37 | 2917.57 | 2838.23 | 2884.39 | 2876.85 | 2739.03 | 2691.10 | 2924.07 | 3058.36 | 2986.27 | 3145.95 | 3127.42 | 3145.21 | 2980.77 | 3146.83 | 3170.08 | 3007.44 | 2893.47 | 3210.52 | 3279.55 | 3287.76 | NA | NA | 3135.25 | NA | |
| Liabilities | 3932.80 | 3954.10 | 3906.40 | 4134.10 | 4070.20 | 4009.43 | 4028.16 | 4234.41 | 4380.89 | 4110.64 | 4829.21 | 4341.77 | 4356.00 | 4322.77 | 3520.41 | 2660.86 | 2670.65 | 2588.14 | 2699.34 | 2576.06 | 2538.41 | 2437.59 | 2501.67 | 2525.27 | 2506.86 | 2347.34 | 2337.15 | 2395.97 | 2446.39 | 2478.06 | 2440.06 | 2483.75 | 2589.83 | 2502.16 | 2474.24 | 2691.95 | 2759.68 | 2739.67 | 2916.52 | 2913.92 | 3041.00 | 2940.60 | 3161.01 | 3263.70 | 3081.53 | 2999.10 | 3300.80 | 3429.38 | 3383.77 | NA | NA | 3335.08 | NA | |
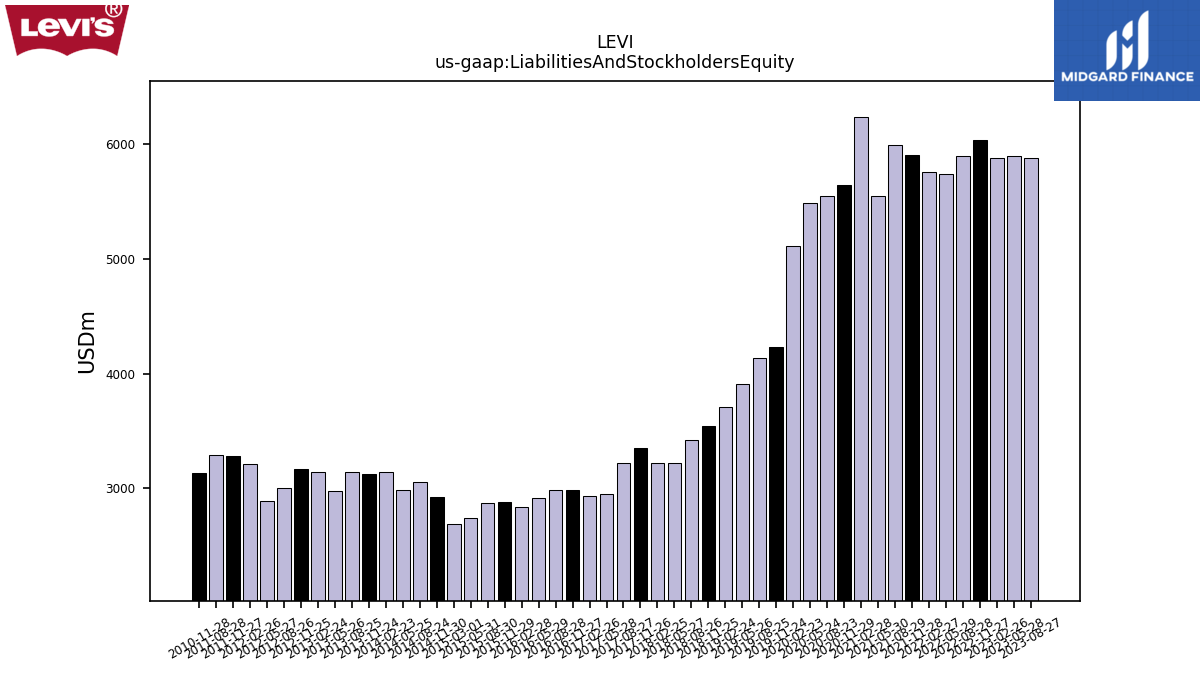
| Liabilities And Stockholders Equity | 5874.20 | 5891.80 | 5873.90 | 6037.80 | 5899.20 | 5737.76 | 5751.75 | 5900.07 | 5990.77 | 5544.66 | 6236.19 | 5641.24 | 5547.27 | 5487.97 | 5115.24 | 4232.42 | 4139.00 | 3909.39 | 3708.37 | 3542.66 | 3417.68 | 3220.08 | 3218.31 | 3354.69 | 3221.95 | 2955.16 | 2930.32 | 2987.10 | 2989.37 | 2917.57 | 2838.23 | 2884.39 | 2876.85 | 2739.03 | 2691.10 | 2924.07 | 3058.36 | 2986.27 | 3145.95 | 3127.42 | 3145.21 | 2980.77 | 3146.83 | 3170.08 | 3007.44 | 2893.47 | 3210.52 | 3279.55 | 3287.76 | NA | NA | 3135.25 | NA |
| 2023-08-27 | 2023-05-28 | 2023-02-26 | 2022-11-27 | 2022-08-28 | 2022-05-29 | 2022-02-27 | 2021-11-28 | 2021-08-29 | 2021-05-30 | 2021-02-28 | 2020-11-29 | 2020-08-23 | 2020-05-24 | 2020-02-23 | 2019-11-24 | 2019-08-25 | 2019-05-26 | 2019-02-24 | 2018-11-25 | 2018-08-26 | 2018-05-27 | 2018-02-25 | 2017-11-26 | 2017-08-27 | 2017-05-28 | 2017-02-26 | 2016-11-27 | 2016-08-28 | 2016-05-29 | 2016-02-28 | 2015-11-29 | 2015-08-30 | 2015-05-31 | 2015-03-01 | 2014-11-30 | 2014-08-24 | 2014-05-25 | 2014-02-23 | 2013-11-24 | 2013-08-25 | 2013-05-26 | 2013-02-24 | 2012-11-25 | 2012-08-26 | 2012-05-27 | 2012-02-26 | 2011-11-27 | 2011-08-28 | 2011-05-29 | 2011-02-27 | 2010-11-28 | 2010-08-29 | ||
|---|---|---|---|---|---|---|---|---|---|---|---|---|---|---|---|---|---|---|---|---|---|---|---|---|---|---|---|---|---|---|---|---|---|---|---|---|---|---|---|---|---|---|---|---|---|---|---|---|---|---|---|---|---|---|
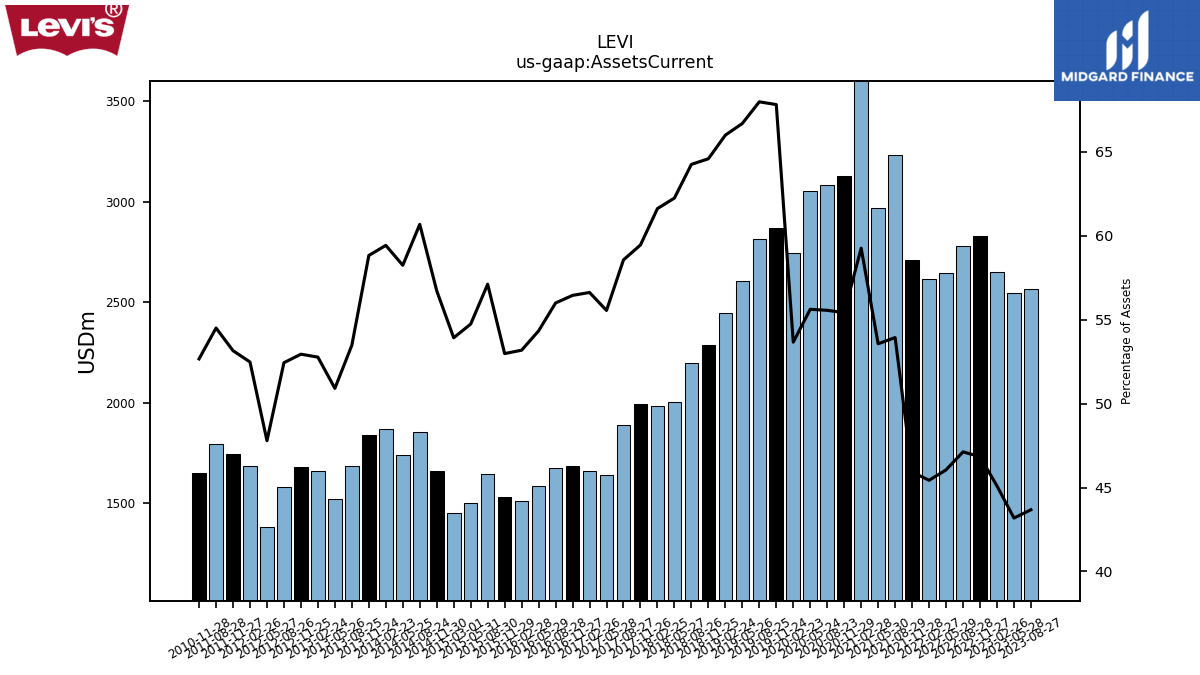
| Assets Current | 2565.70 | 2544.20 | 2648.90 | 2827.90 | 2780.03 | 2642.36 | 2613.03 | 2709.90 | 3231.03 | 2970.03 | 3695.59 | 3126.24 | 3081.92 | 3052.35 | 2745.00 | 2870.19 | 2813.67 | 2607.15 | 2447.30 | 2288.06 | 2195.98 | 2004.35 | 1983.06 | 1994.39 | 1886.88 | 1641.60 | 1659.18 | 1686.15 | 1673.86 | 1585.20 | 1509.42 | 1528.15 | 1643.09 | 1499.32 | 1451.09 | 1658.51 | 1855.73 | 1739.27 | 1869.53 | 1839.71 | 1681.97 | 1517.51 | 1660.53 | 1678.37 | 1577.02 | 1382.82 | 1684.84 | 1743.22 | 1791.96 | NA | NA | 1651.13 | NA | |
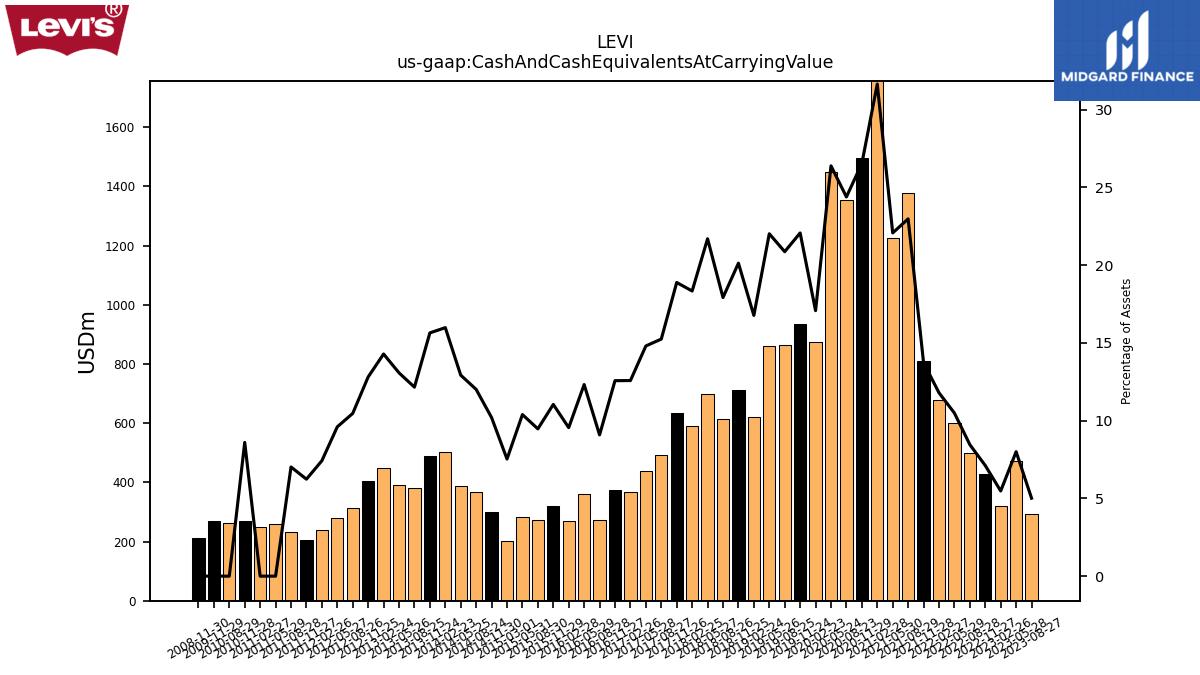
| Cash And Cash Equivalents At Carrying Value | 294.50 | 471.60 | 321.80 | 429.60 | 498.89 | 601.87 | 678.31 | 810.27 | 1376.62 | 1224.08 | 1973.60 | 1497.15 | 1353.04 | 1448.23 | 873.56 | 934.24 | 863.77 | 860.93 | 621.93 | 713.12 | 612.51 | 698.72 | 590.23 | 633.62 | 491.29 | 437.52 | 368.62 | 375.56 | 271.64 | 359.54 | 271.10 | 318.57 | 272.56 | 284.63 | 202.73 | 298.25 | 367.36 | 386.07 | 502.83 | 489.26 | 382.33 | 389.79 | 449.60 | 406.13 | 314.77 | 277.89 | 238.32 | 204.54 | 230.84 | 258.49 | 249.11 | 269.73 | 261.20 | |
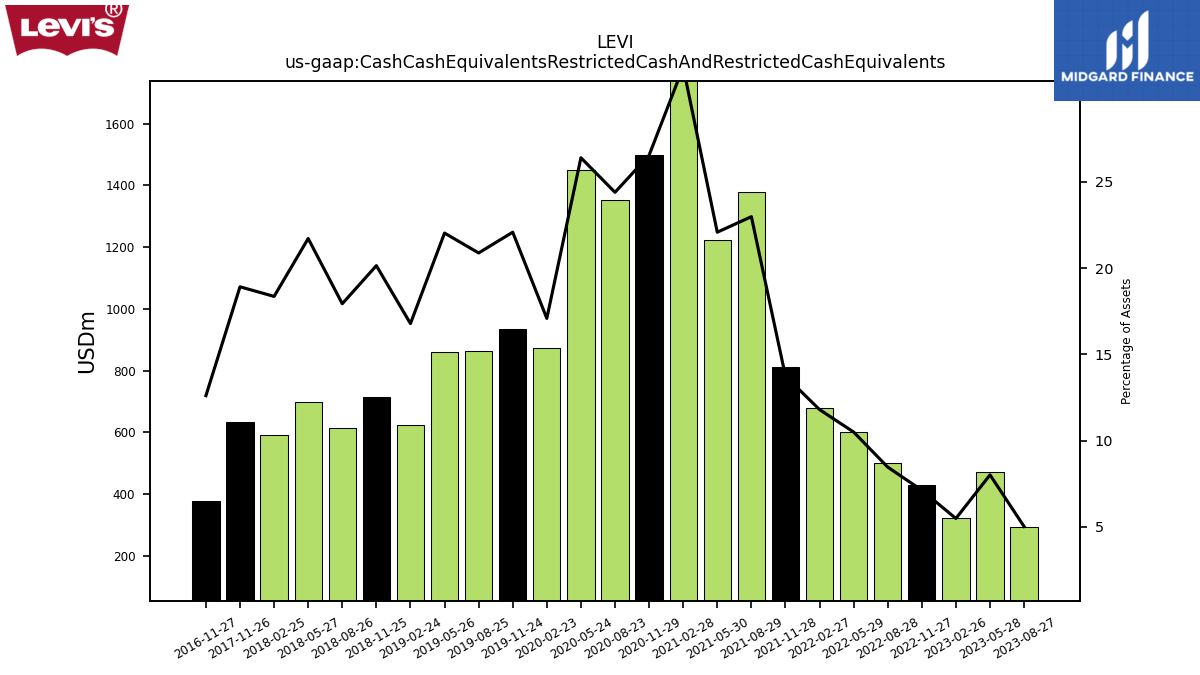
| Cash Cash Equivalents Restricted Cash And Restricted Cash Equivalents | 294.80 | 472.00 | 322.20 | 430.00 | 499.20 | 602.22 | 678.64 | 810.58 | 1377.03 | 1224.58 | 1974.09 | 1497.65 | 1353.50 | 1449.04 | 874.07 | 934.75 | 864.30 | 861.46 | 622.51 | 713.70 | 613.06 | 699.33 | 590.96 | 634.69 | NA | NA | NA | 376.55 | NA | NA | NA | NA | NA | NA | NA | NA | NA | NA | NA | NA | NA | NA | NA | NA | NA | NA | NA | NA | NA | NA | NA | NA | NA | |
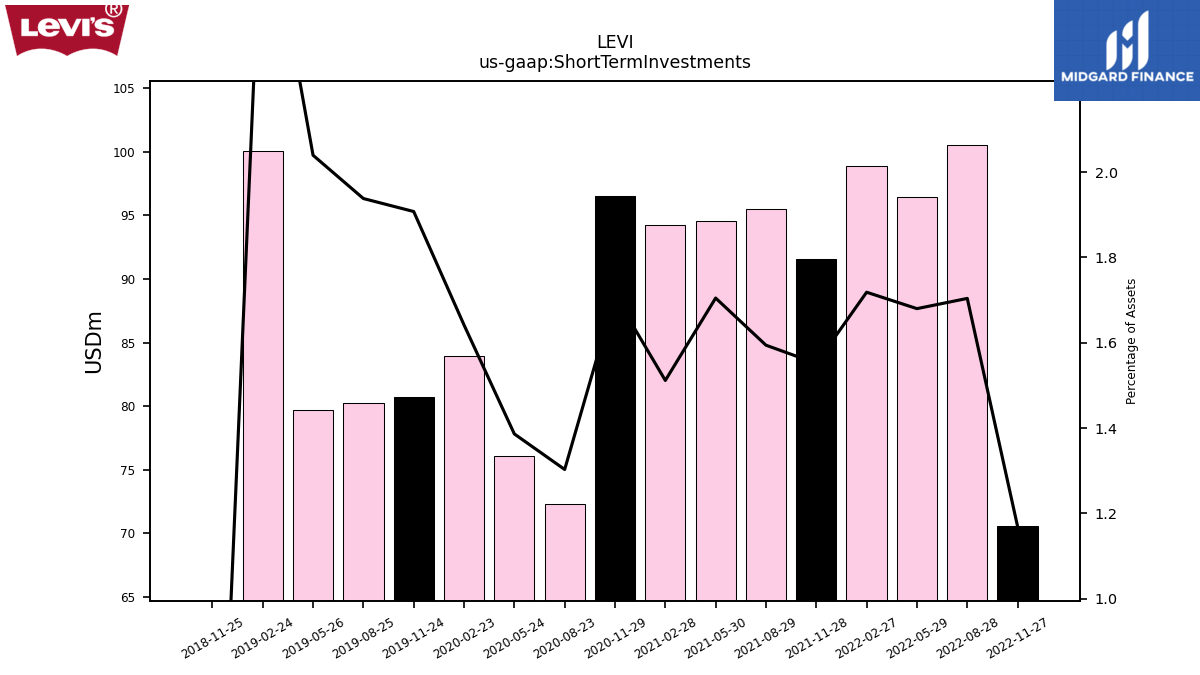
| Short Term Investments | NA | NA | NA | 70.60 | 100.52 | 96.40 | 98.84 | 91.55 | 95.51 | 94.53 | 94.27 | 96.53 | 72.28 | 76.08 | 83.98 | 80.74 | 80.22 | 79.74 | 100.02 | 0.00 | NA | NA | NA | NA | NA | NA | NA | NA | NA | NA | NA | NA | NA | NA | NA | NA | NA | NA | NA | NA | NA | NA | NA | NA | NA | NA | NA | NA | NA | NA | NA | NA | NA | |
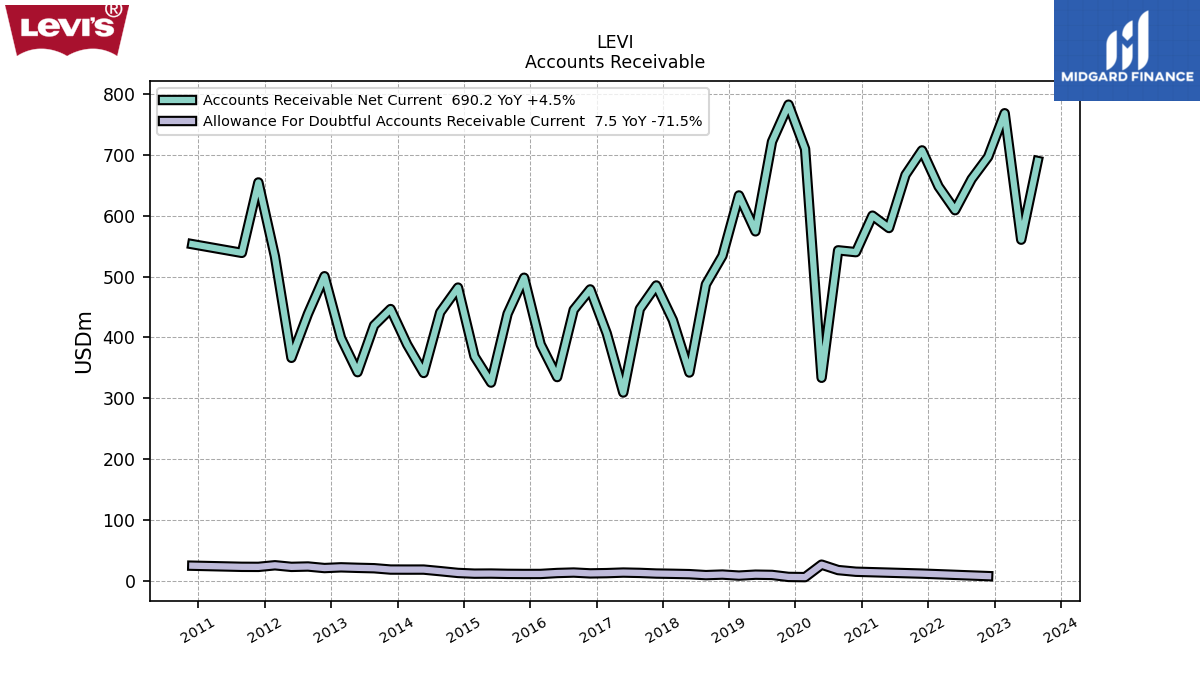
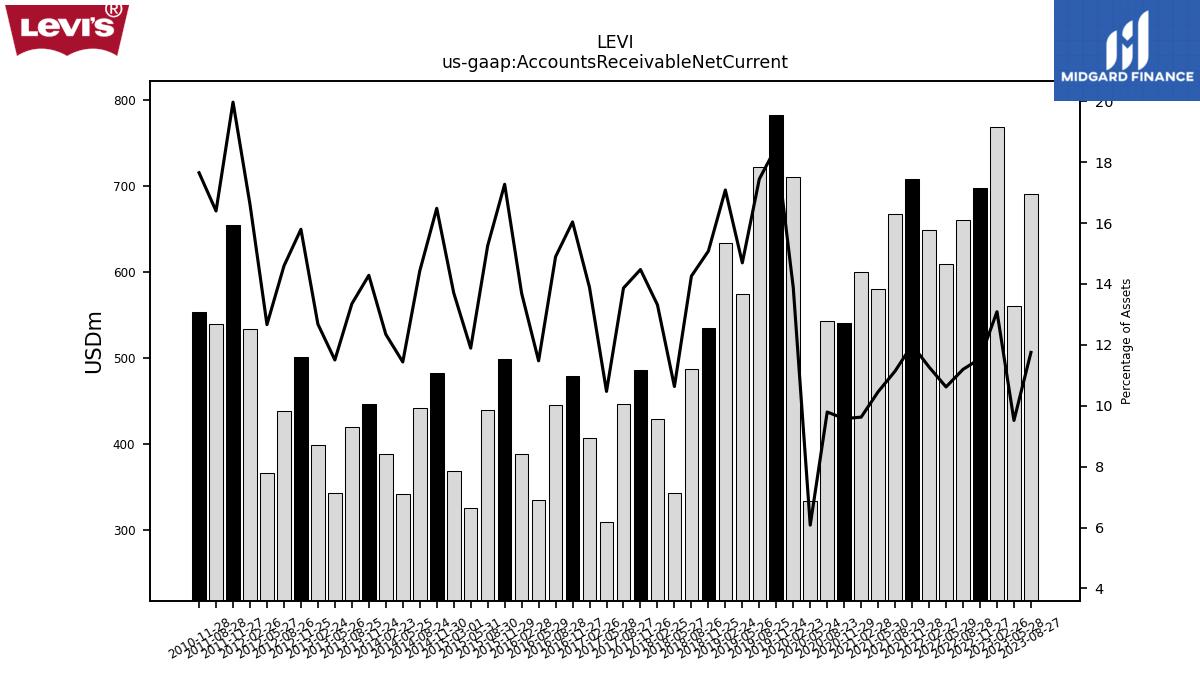
| Accounts Receivable Net Current | 690.20 | 560.70 | 768.70 | 697.00 | 660.38 | 609.18 | 648.23 | 707.62 | 667.29 | 579.90 | 600.27 | 540.23 | 543.26 | 333.60 | 709.99 | 782.85 | 722.00 | 574.39 | 633.53 | 534.16 | 487.24 | 342.32 | 428.47 | 485.49 | 446.70 | 309.39 | 406.69 | 479.02 | 445.24 | 334.80 | 388.62 | 498.20 | 438.85 | 325.71 | 368.81 | 481.98 | 441.16 | 341.54 | 388.31 | 446.67 | 419.79 | 342.86 | 398.99 | 500.67 | 438.78 | 366.43 | 533.36 | 654.90 | 539.04 | NA | NA | 553.38 | NA | |
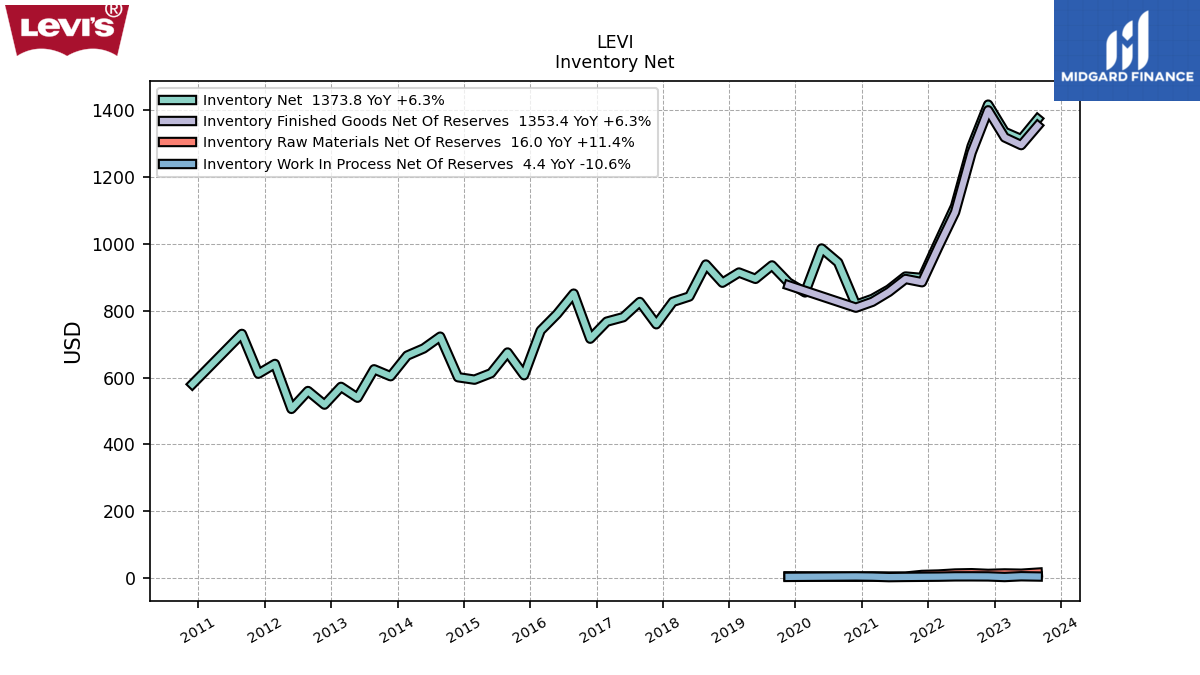
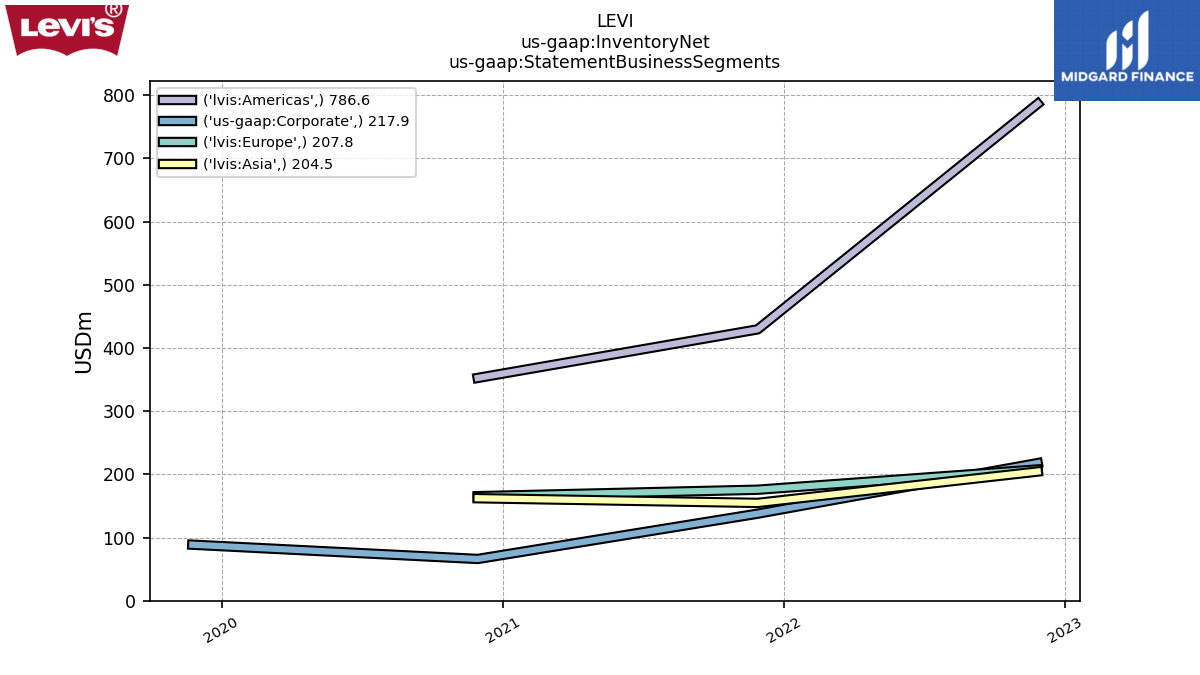
| Inventory Net | 1373.80 | 1313.50 | 1335.20 | 1416.80 | 1292.30 | 1112.84 | 1006.18 | 897.95 | 902.35 | 863.36 | 835.36 | 817.69 | 944.33 | 986.22 | 854.70 | 884.19 | 935.56 | 895.32 | 914.28 | 883.77 | 938.25 | 842.57 | 826.44 | 759.40 | 826.13 | 780.58 | 767.23 | 716.18 | 851.17 | 790.37 | 740.29 | 606.86 | 674.89 | 612.90 | 593.61 | 600.92 | 722.34 | 686.97 | 665.61 | 603.87 | 624.63 | 539.49 | 572.05 | 518.86 | 559.64 | 506.10 | 640.68 | 611.40 | 730.63 | NA | NA | 579.90 | NA | |
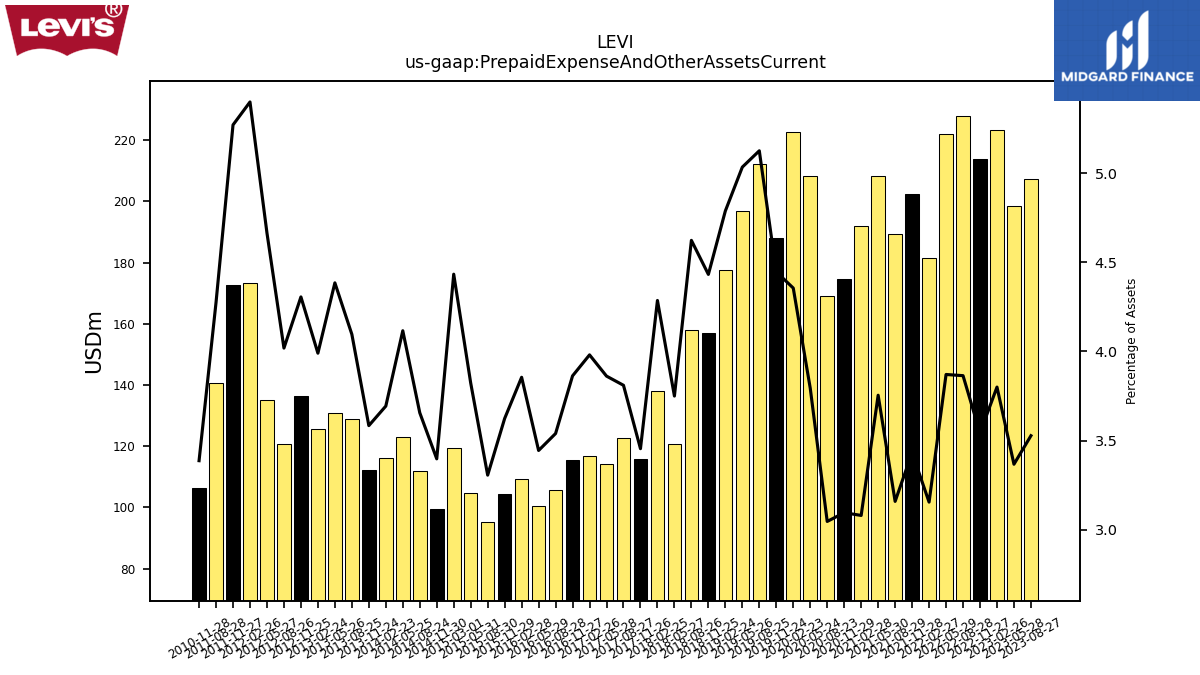
| Prepaid Expense And Other Assets Current | 207.20 | 198.40 | 223.20 | 213.90 | 227.94 | 222.08 | 181.47 | 202.51 | 189.25 | 208.16 | 192.09 | 174.64 | 169.00 | 208.22 | 222.77 | 188.17 | 212.12 | 196.77 | 177.54 | 157.00 | 157.98 | 120.74 | 137.92 | 115.89 | 122.75 | 114.11 | 116.64 | 115.39 | 105.81 | 100.50 | 109.41 | 104.52 | 95.11 | 104.71 | 119.29 | 99.35 | 111.81 | 122.91 | 116.19 | 112.08 | 128.82 | 130.69 | 125.56 | 136.48 | 120.86 | 134.94 | 173.32 | 172.83 | 140.55 | NA | NA | 106.20 | NA |
| 2023-08-27 | 2023-05-28 | 2023-02-26 | 2022-11-27 | 2022-08-28 | 2022-05-29 | 2022-02-27 | 2021-11-28 | 2021-08-29 | 2021-05-30 | 2021-02-28 | 2020-11-29 | 2020-08-23 | 2020-05-24 | 2020-02-23 | 2019-11-24 | 2019-08-25 | 2019-05-26 | 2019-02-24 | 2018-11-25 | 2018-08-26 | 2018-05-27 | 2018-02-25 | 2017-11-26 | 2017-08-27 | 2017-05-28 | 2017-02-26 | 2016-11-27 | 2016-08-28 | 2016-05-29 | 2016-02-28 | 2015-11-29 | 2015-08-30 | 2015-05-31 | 2015-03-01 | 2014-11-30 | 2014-08-24 | 2014-05-25 | 2014-02-23 | 2013-11-24 | 2013-08-25 | 2013-05-26 | 2013-02-24 | 2012-11-25 | 2012-08-26 | 2012-05-27 | 2012-02-26 | 2011-11-27 | 2011-08-28 | 2011-05-29 | 2011-02-27 | 2010-11-28 | 2010-08-29 | ||
|---|---|---|---|---|---|---|---|---|---|---|---|---|---|---|---|---|---|---|---|---|---|---|---|---|---|---|---|---|---|---|---|---|---|---|---|---|---|---|---|---|---|---|---|---|---|---|---|---|---|---|---|---|---|---|
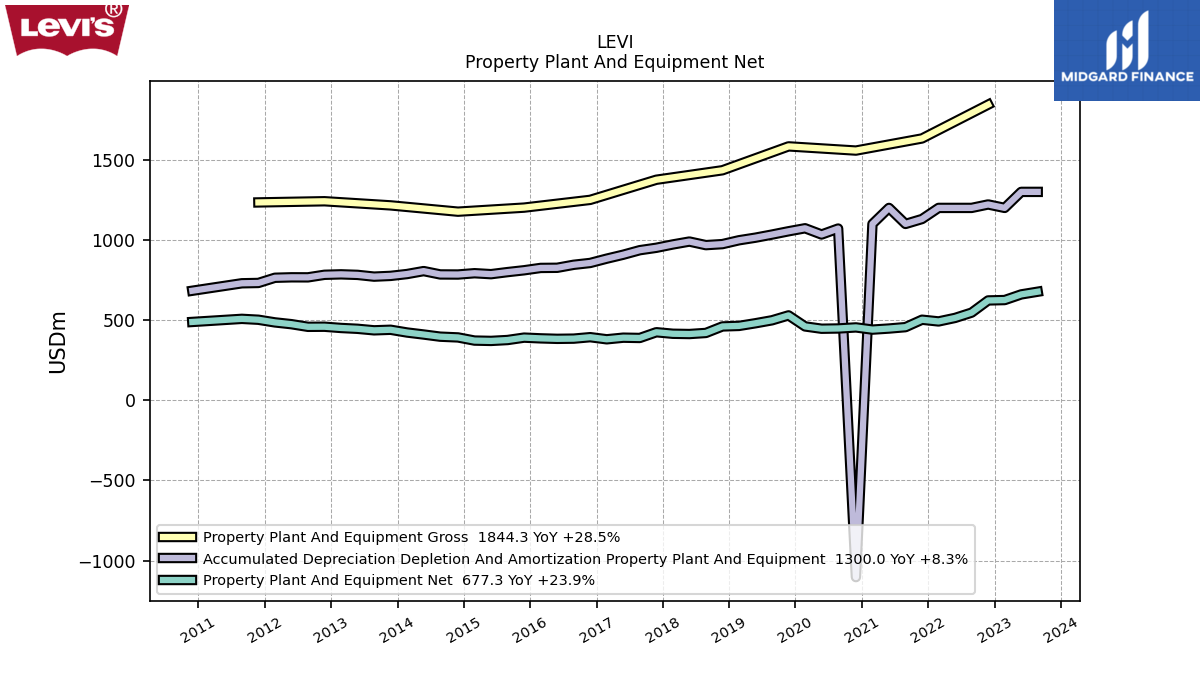
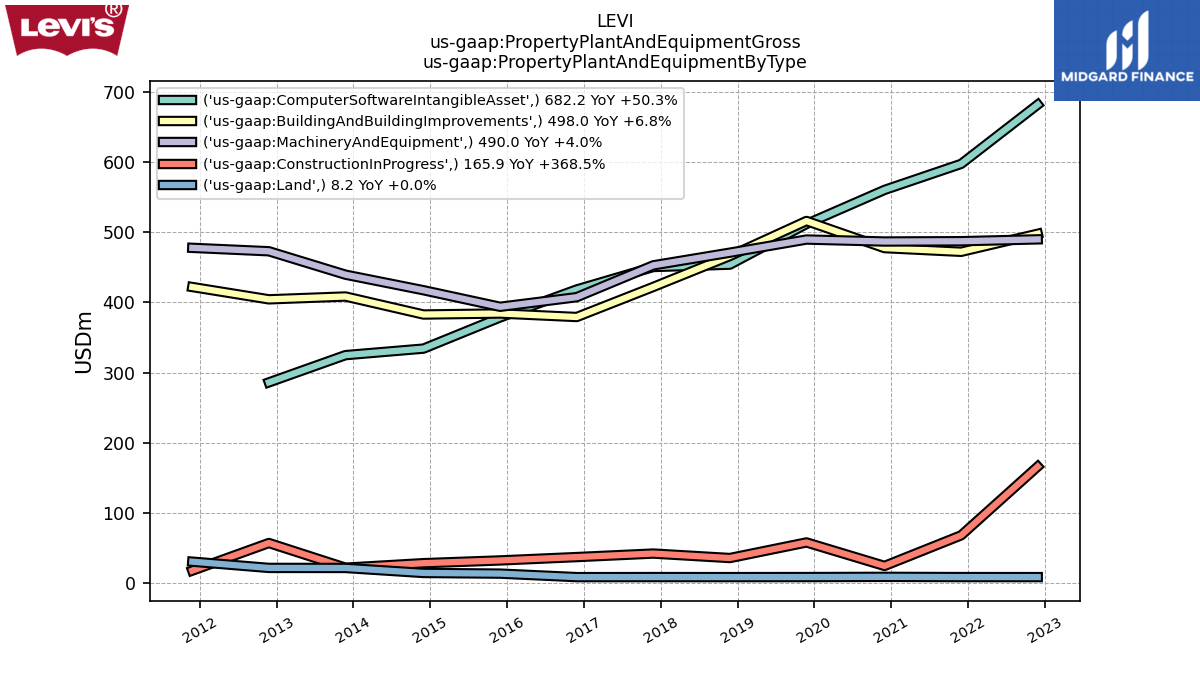
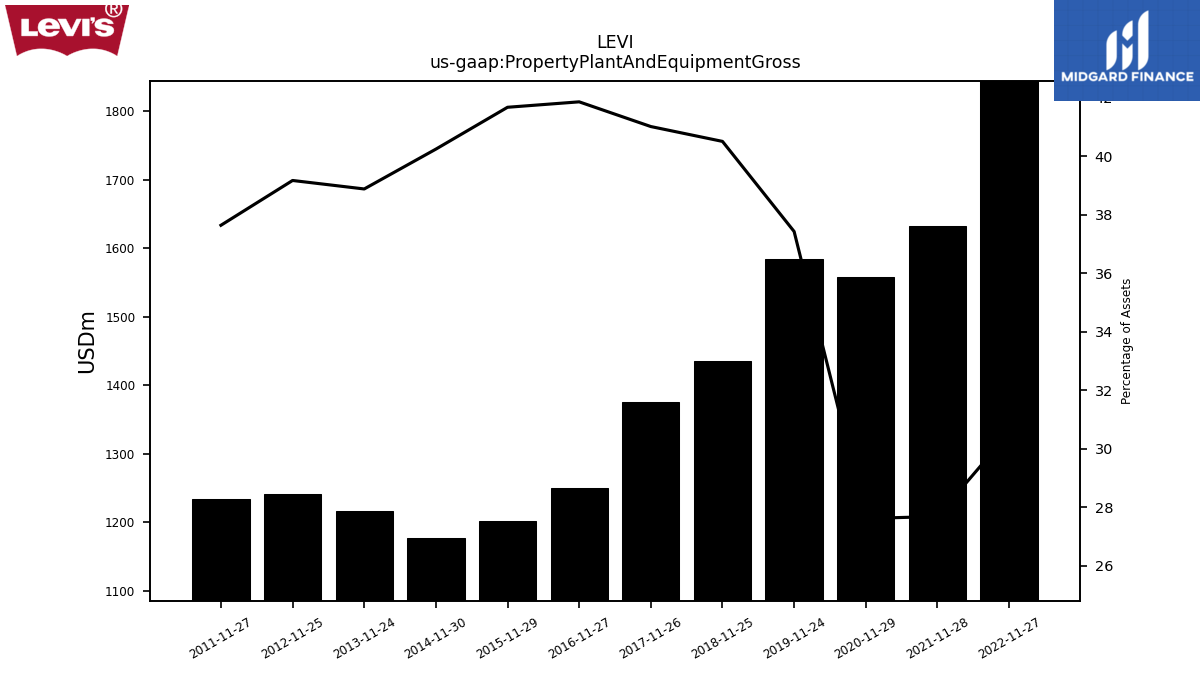
| Property Plant And Equipment Gross | NA | NA | NA | 1844.30 | NA | NA | NA | 1633.26 | NA | NA | NA | 1557.70 | NA | NA | NA | 1583.83 | NA | NA | NA | 1434.82 | NA | NA | NA | 1375.71 | NA | NA | NA | 1250.19 | NA | NA | NA | 1201.84 | NA | NA | NA | 1176.56 | NA | NA | NA | 1215.79 | NA | NA | NA | 1241.57 | NA | NA | NA | 1234.25 | NA | NA | NA | NA | NA | |
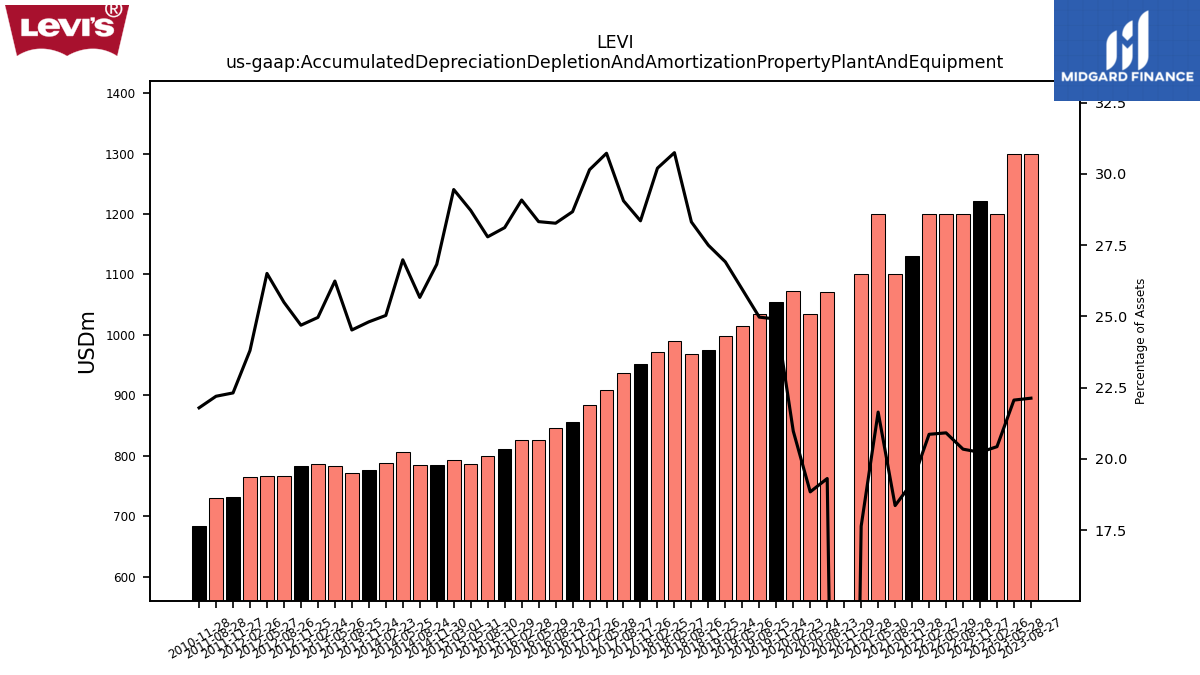
| Accumulated Depreciation Depletion And Amortization Property Plant And Equipment | 1300.00 | 1300.00 | 1200.00 | 1221.50 | 1200.00 | 1200.00 | 1200.00 | 1130.70 | 1100.00 | 1200.00 | 1100.00 | -1103.17 | 1071.26 | 1034.09 | 1073.02 | 1054.27 | 1033.73 | 1014.37 | 998.13 | 974.21 | 967.76 | 990.12 | 972.03 | 951.25 | 936.26 | 908.04 | 883.47 | 856.59 | 845.16 | 826.48 | 825.54 | 811.01 | 799.59 | 786.71 | 792.64 | 784.49 | 785.02 | 805.92 | 787.59 | 775.93 | 771.34 | 782.20 | 785.63 | 782.77 | 766.79 | 767.03 | 764.23 | 731.86 | 729.84 | NA | NA | 683.26 | NA | |
| Amortization Of Intangible Assets | 1.10 | NA | NA | 1.00 | 1.00 | NA | NA | NA | NA | NA | NA | NA | NA | NA | NA | NA | NA | NA | NA | NA | NA | NA | NA | NA | NA | NA | NA | NA | NA | NA | NA | NA | NA | NA | NA | NA | NA | NA | NA | NA | NA | NA | NA | NA | NA | NA | NA | NA | NA | NA | NA | NA | NA | |
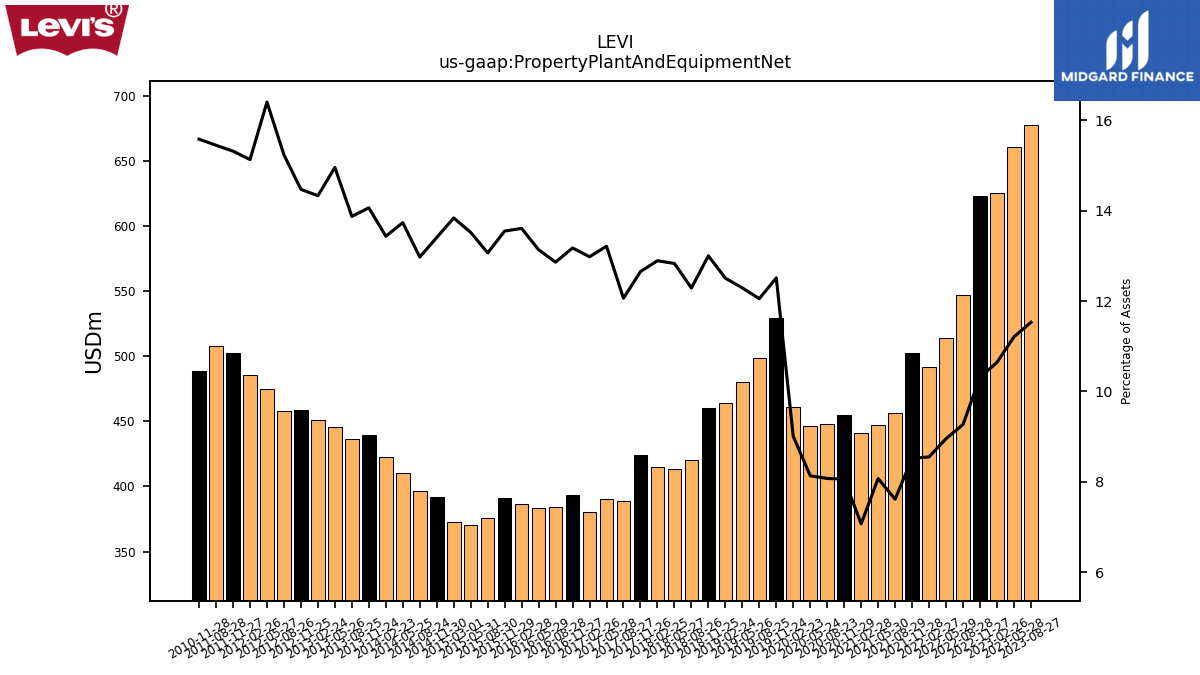
| Property Plant And Equipment Net | 677.30 | 660.40 | 625.20 | 622.80 | 546.76 | 513.78 | 491.83 | 502.56 | 456.26 | 447.52 | 440.86 | 454.53 | 447.87 | 446.29 | 460.68 | 529.56 | 498.94 | 480.51 | 463.84 | 460.61 | 420.01 | 413.24 | 414.95 | 424.46 | 388.65 | 390.50 | 380.39 | 393.61 | 384.50 | 383.26 | 386.27 | 390.83 | 375.90 | 370.33 | 372.45 | 392.06 | 396.81 | 410.20 | 422.67 | 439.86 | 436.39 | 445.89 | 451.03 | 458.81 | 458.23 | 474.68 | 485.85 | 502.39 | 507.93 | NA | NA | 488.60 | NA | |
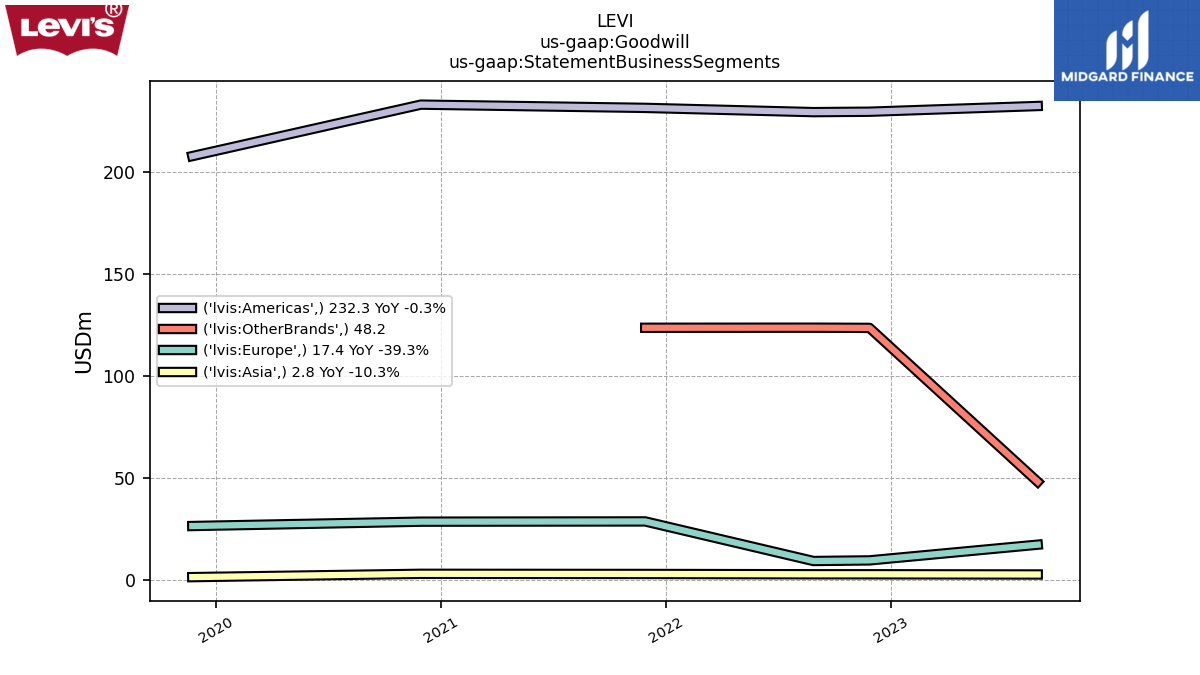
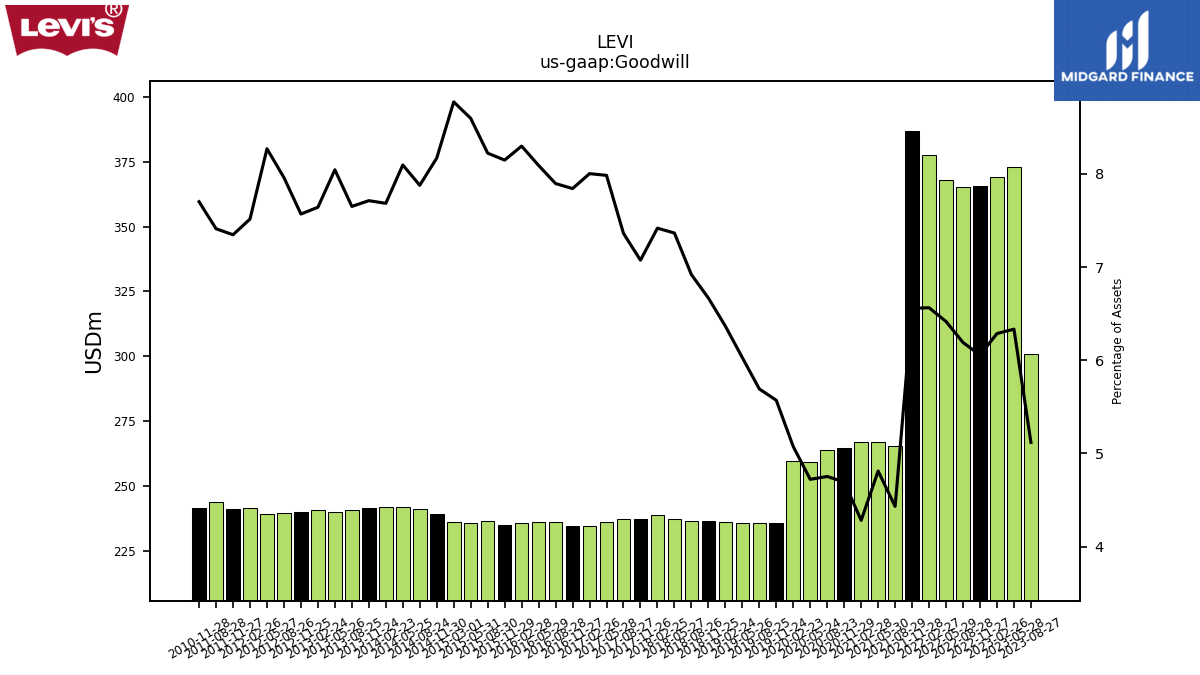
| Goodwill | 300.70 | 373.20 | 369.30 | 365.70 | 365.23 | 368.16 | 377.58 | 386.88 | 265.53 | 266.77 | 267.07 | 264.77 | 263.69 | 259.19 | 259.53 | 235.79 | 235.63 | 235.69 | 236.13 | 236.25 | 236.49 | 237.19 | 238.73 | 237.33 | 237.20 | 235.97 | 234.52 | 234.28 | 236.07 | 236.06 | 235.54 | 235.04 | 236.57 | 235.47 | 236.09 | 238.92 | 240.94 | 241.78 | 241.76 | 241.23 | 240.66 | 239.80 | 240.50 | 239.97 | 239.42 | 239.29 | 241.30 | 240.97 | 243.68 | NA | NA | 241.47 | NA | |
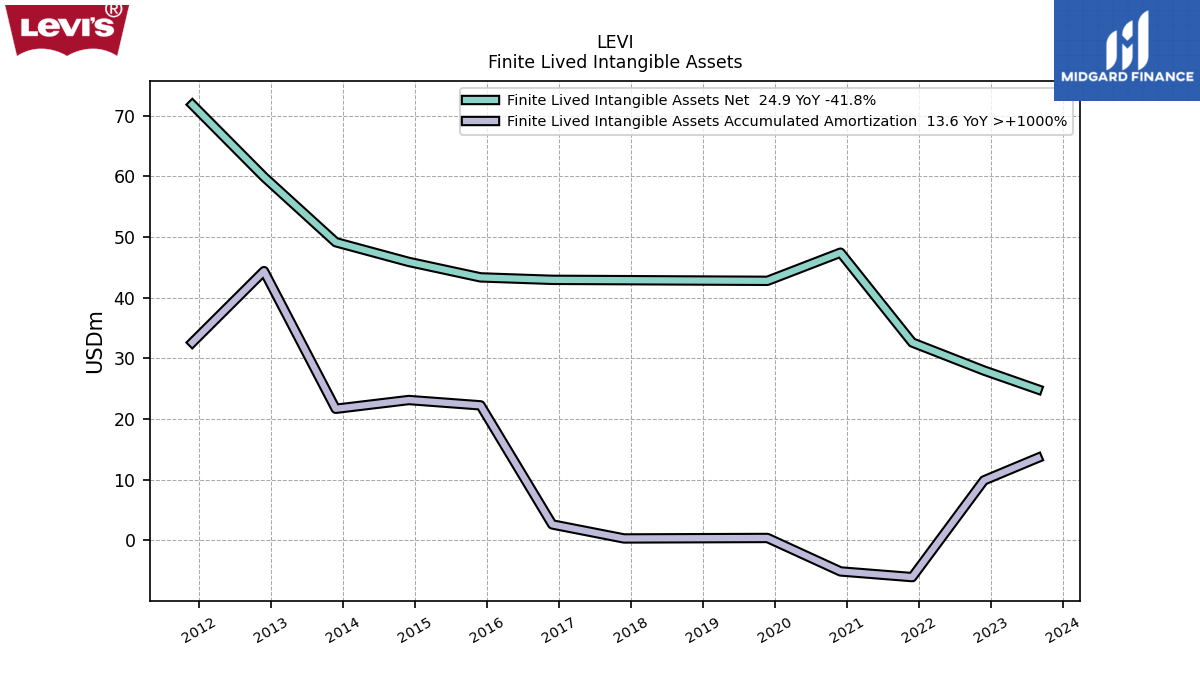
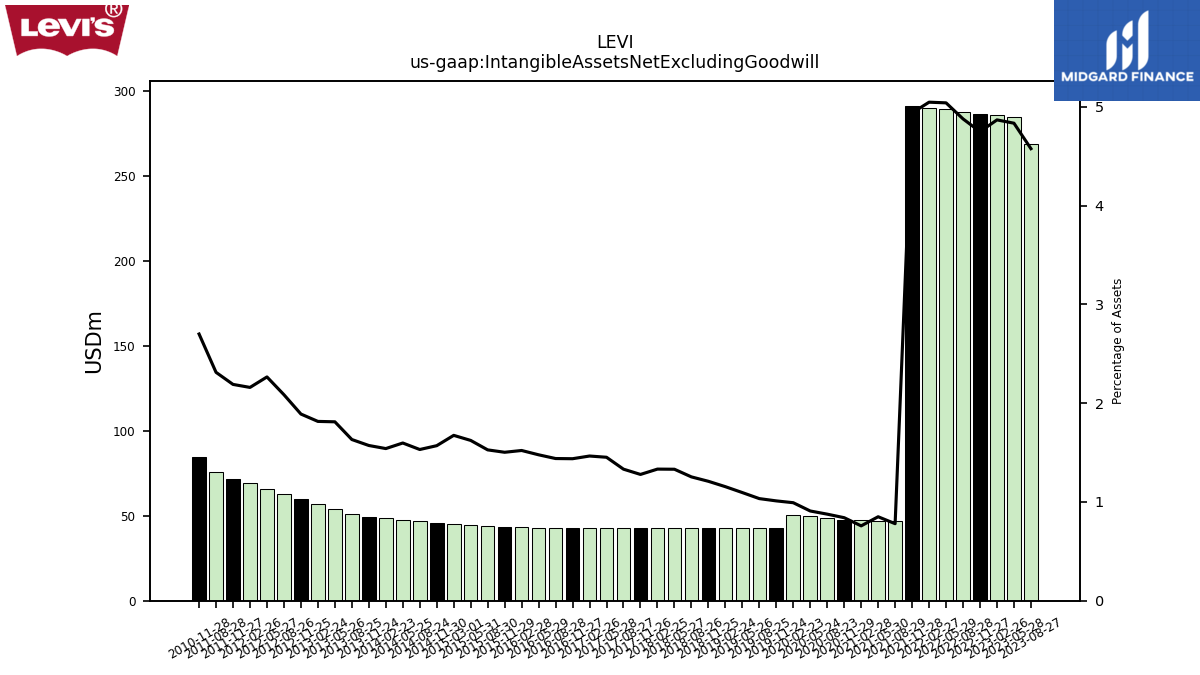
| Intangible Assets Net Excluding Goodwill | 268.80 | 284.80 | 285.90 | 286.70 | 287.73 | 289.18 | 290.27 | 291.33 | 46.73 | 47.14 | 47.27 | 47.43 | 48.62 | 49.86 | 50.76 | 42.78 | 42.79 | 42.81 | 42.82 | 42.84 | 42.85 | 42.87 | 42.88 | 42.89 | 42.91 | 42.92 | 42.93 | 42.95 | 43.03 | 43.10 | 43.17 | 43.35 | 43.93 | 44.45 | 45.05 | 45.90 | 46.82 | 47.68 | 48.46 | 49.15 | 51.33 | 53.99 | 57.13 | 59.91 | 62.72 | 65.55 | 69.33 | 71.82 | 76.02 | NA | NA | 84.65 | NA | |
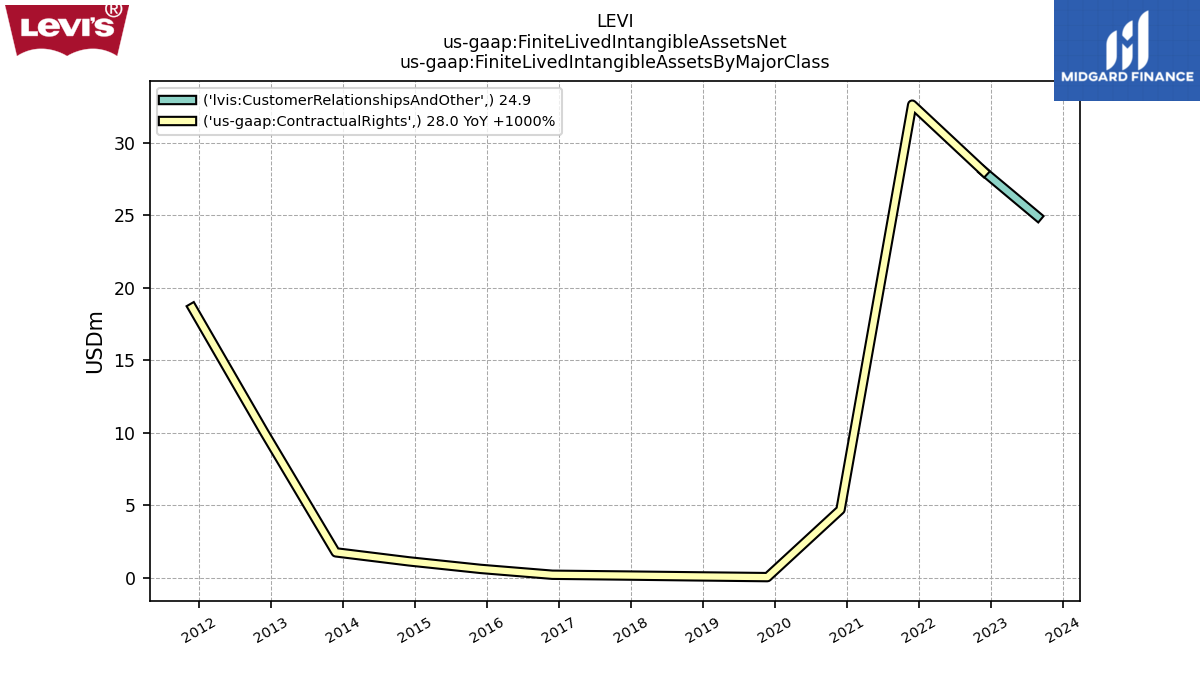
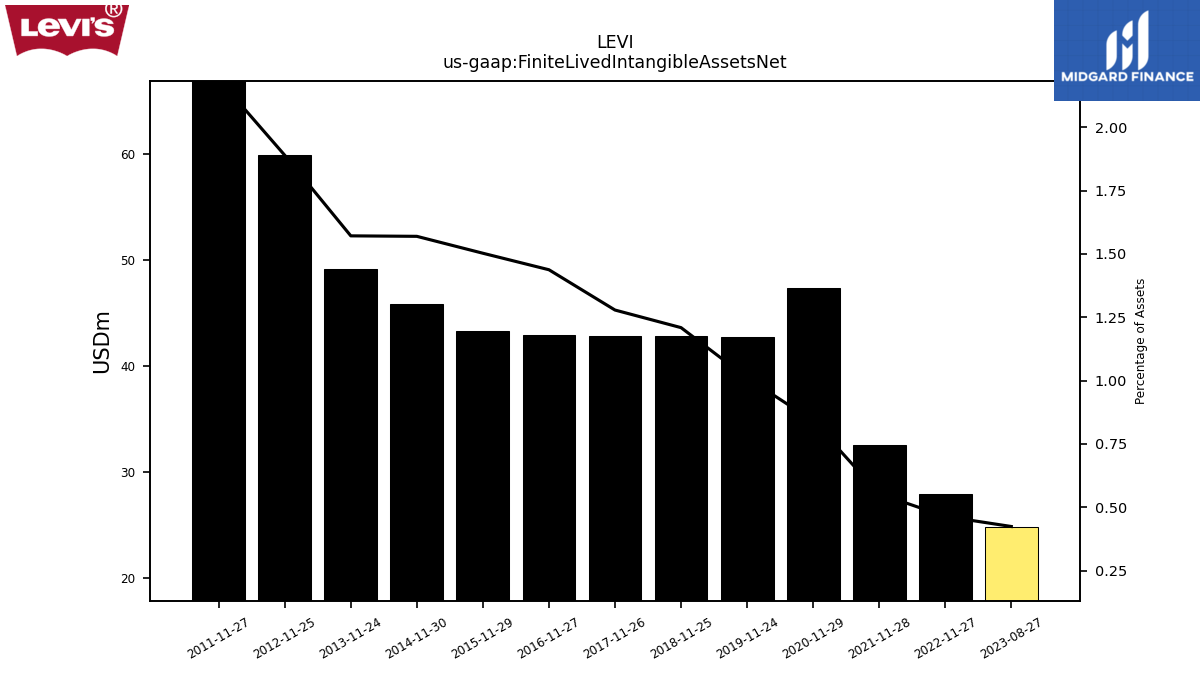
| Finite Lived Intangible Assets Net | 24.90 | NA | NA | 28.00 | NA | NA | NA | 32.62 | NA | NA | NA | 47.43 | NA | NA | NA | 42.78 | NA | NA | NA | 42.84 | NA | NA | NA | 42.89 | NA | NA | NA | 42.95 | NA | NA | NA | 43.35 | NA | NA | NA | 45.90 | NA | NA | NA | 49.15 | NA | NA | NA | 59.91 | NA | NA | NA | 71.82 | NA | NA | NA | NA | NA | |
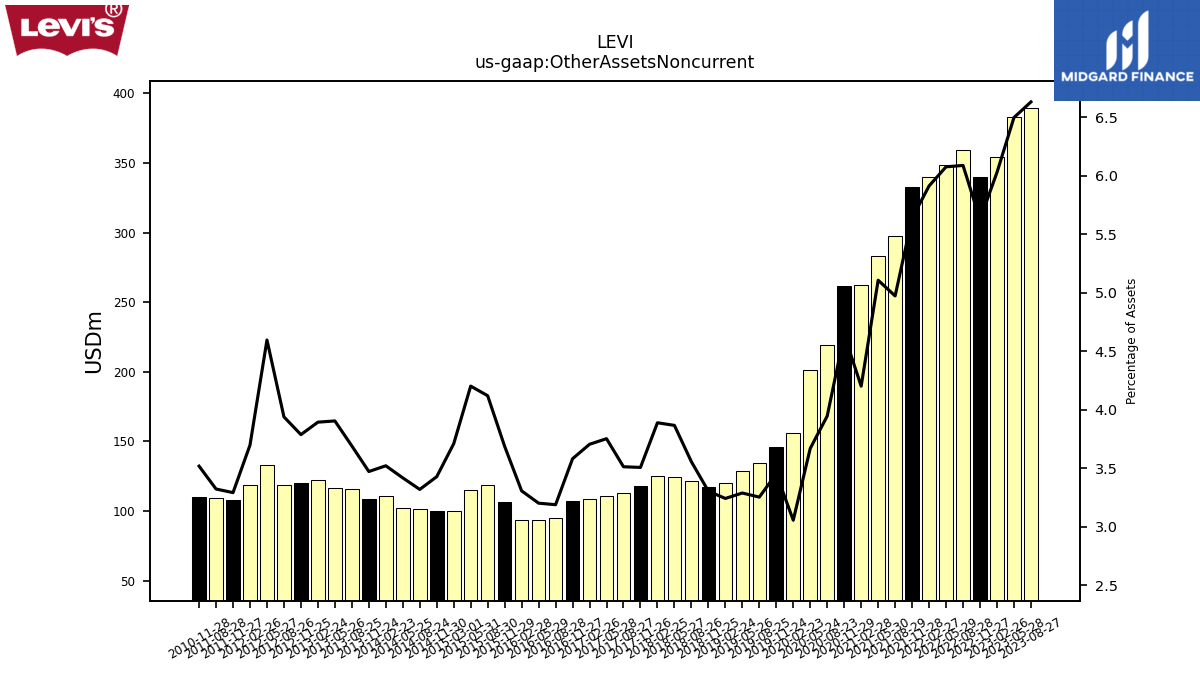
| Other Assets Noncurrent | 389.50 | 382.80 | 354.10 | 339.70 | 359.15 | 348.64 | 340.10 | 332.57 | 297.94 | 283.19 | 262.09 | 261.92 | 218.97 | 201.45 | 156.39 | 146.20 | 134.71 | 128.62 | 120.27 | 117.12 | 121.57 | 124.54 | 125.19 | 117.69 | 113.22 | 110.93 | 108.60 | 107.02 | 95.36 | 93.45 | 93.89 | 106.39 | 118.55 | 115.12 | 99.86 | 100.28 | 101.55 | 102.10 | 110.81 | 108.63 | 116.11 | 116.42 | 122.57 | 120.10 | 118.50 | 133.01 | 118.76 | 108.00 | 109.28 | NA | NA | 110.34 | NA |
| 2023-08-27 | 2023-05-28 | 2023-02-26 | 2022-11-27 | 2022-08-28 | 2022-05-29 | 2022-02-27 | 2021-11-28 | 2021-08-29 | 2021-05-30 | 2021-02-28 | 2020-11-29 | 2020-08-23 | 2020-05-24 | 2020-02-23 | 2019-11-24 | 2019-08-25 | 2019-05-26 | 2019-02-24 | 2018-11-25 | 2018-08-26 | 2018-05-27 | 2018-02-25 | 2017-11-26 | 2017-08-27 | 2017-05-28 | 2017-02-26 | 2016-11-27 | 2016-08-28 | 2016-05-29 | 2016-02-28 | 2015-11-29 | 2015-08-30 | 2015-05-31 | 2015-03-01 | 2014-11-30 | 2014-08-24 | 2014-05-25 | 2014-02-23 | 2013-11-24 | 2013-08-25 | 2013-05-26 | 2013-02-24 | 2012-11-25 | 2012-08-26 | 2012-05-27 | 2012-02-26 | 2011-11-27 | 2011-08-28 | 2011-05-29 | 2011-02-27 | 2010-11-28 | 2010-08-29 | ||
|---|---|---|---|---|---|---|---|---|---|---|---|---|---|---|---|---|---|---|---|---|---|---|---|---|---|---|---|---|---|---|---|---|---|---|---|---|---|---|---|---|---|---|---|---|---|---|---|---|---|---|---|---|---|---|
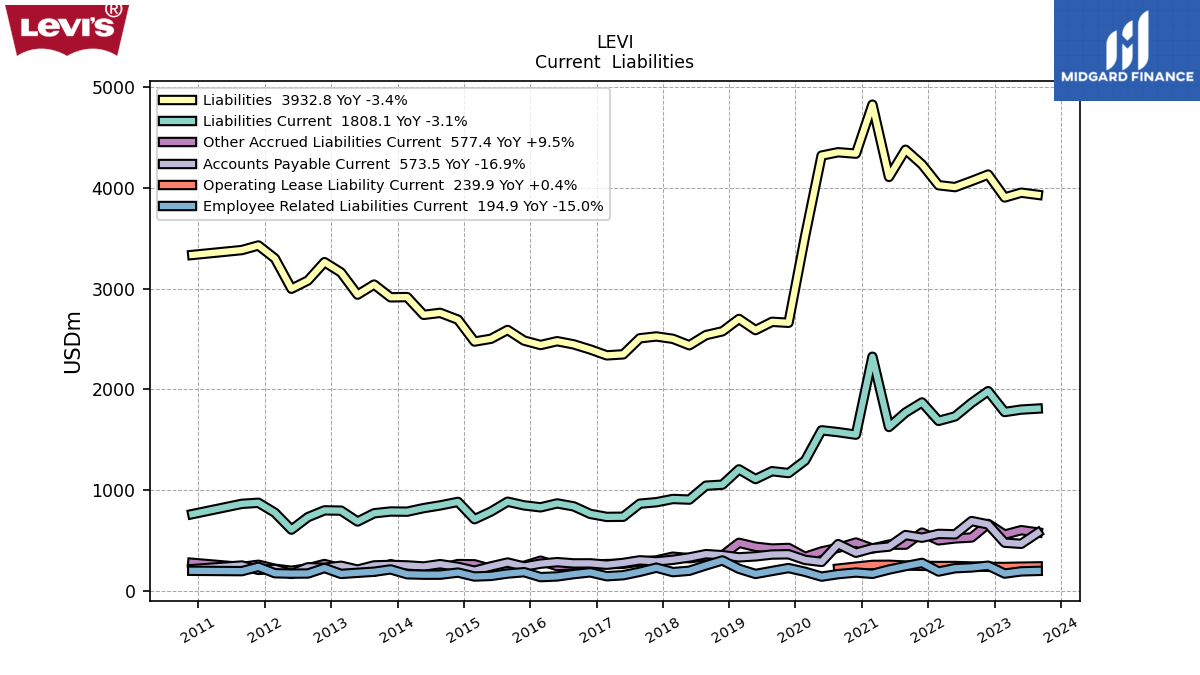
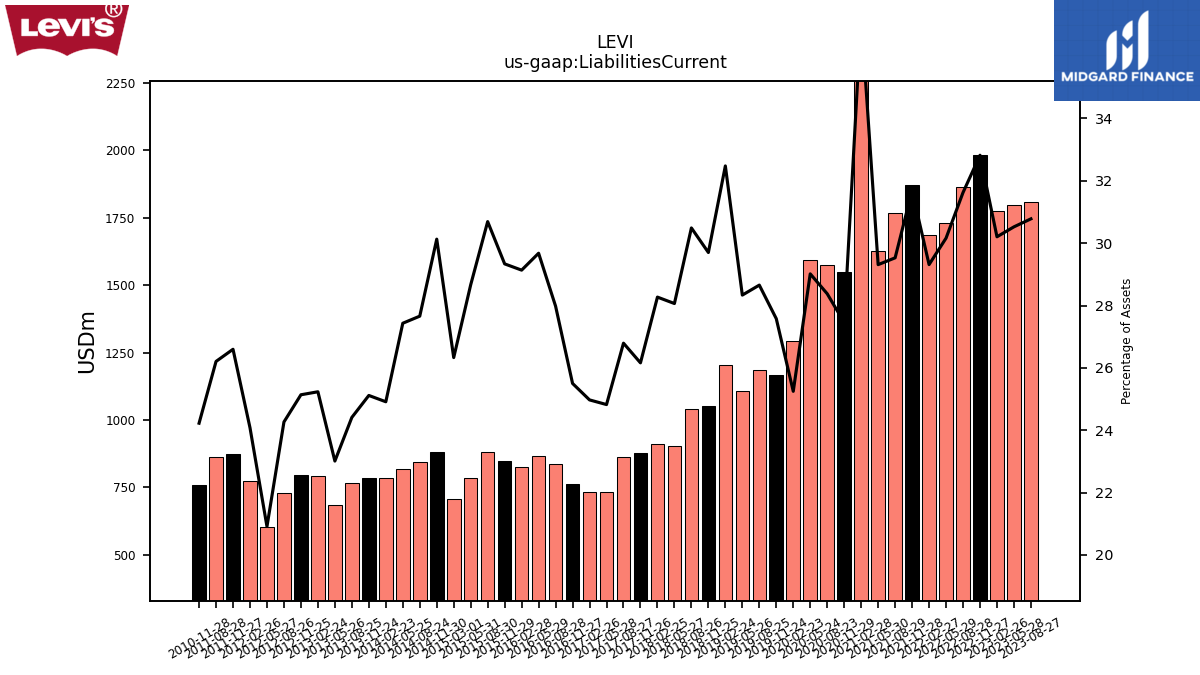
| Liabilities Current | 1808.10 | 1798.40 | 1774.20 | 1981.60 | 1865.59 | 1730.61 | 1686.04 | 1869.62 | 1769.05 | 1625.23 | 2323.73 | 1548.88 | 1574.18 | 1592.41 | 1291.51 | 1167.20 | 1186.02 | 1107.71 | 1204.39 | 1052.20 | 1042.02 | 903.70 | 909.82 | 877.63 | 863.25 | 733.58 | 731.78 | 761.74 | 836.44 | 865.87 | 826.92 | 846.17 | 882.96 | 785.14 | 708.58 | 881.00 | 845.91 | 819.19 | 783.77 | 785.48 | 767.81 | 685.92 | 794.07 | 796.88 | 729.77 | 605.10 | 773.10 | 872.26 | 861.63 | NA | NA | 759.52 | NA | |
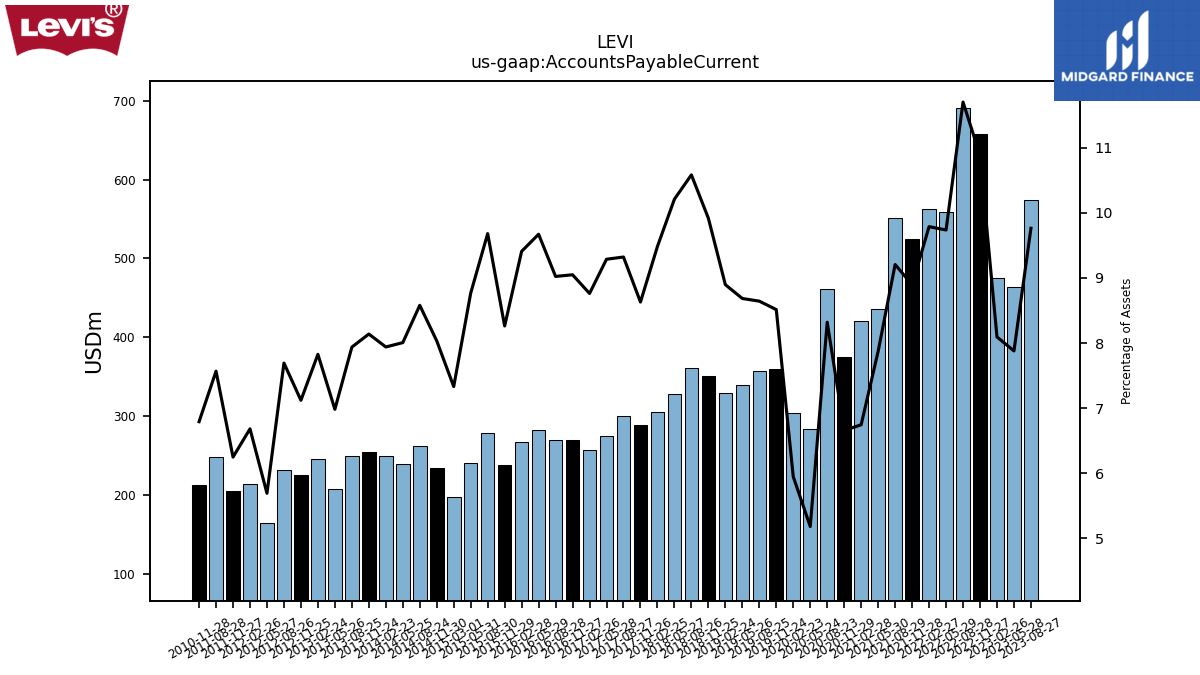
| Accounts Payable Current | 573.50 | 464.20 | 475.40 | 657.20 | 690.32 | 558.66 | 562.97 | 524.84 | 551.53 | 436.49 | 420.62 | 375.45 | 461.50 | 284.35 | 304.21 | 360.32 | 357.75 | 339.50 | 329.91 | 351.33 | 361.70 | 328.79 | 305.22 | 289.50 | 300.33 | 274.45 | 256.74 | 270.29 | 269.74 | 282.17 | 267.03 | 238.31 | 278.51 | 240.11 | 197.29 | 234.89 | 262.38 | 239.09 | 249.77 | 254.52 | 249.64 | 208.12 | 246.28 | 225.73 | 231.33 | 164.68 | 214.52 | 204.90 | 248.81 | NA | NA | 212.94 | NA | |
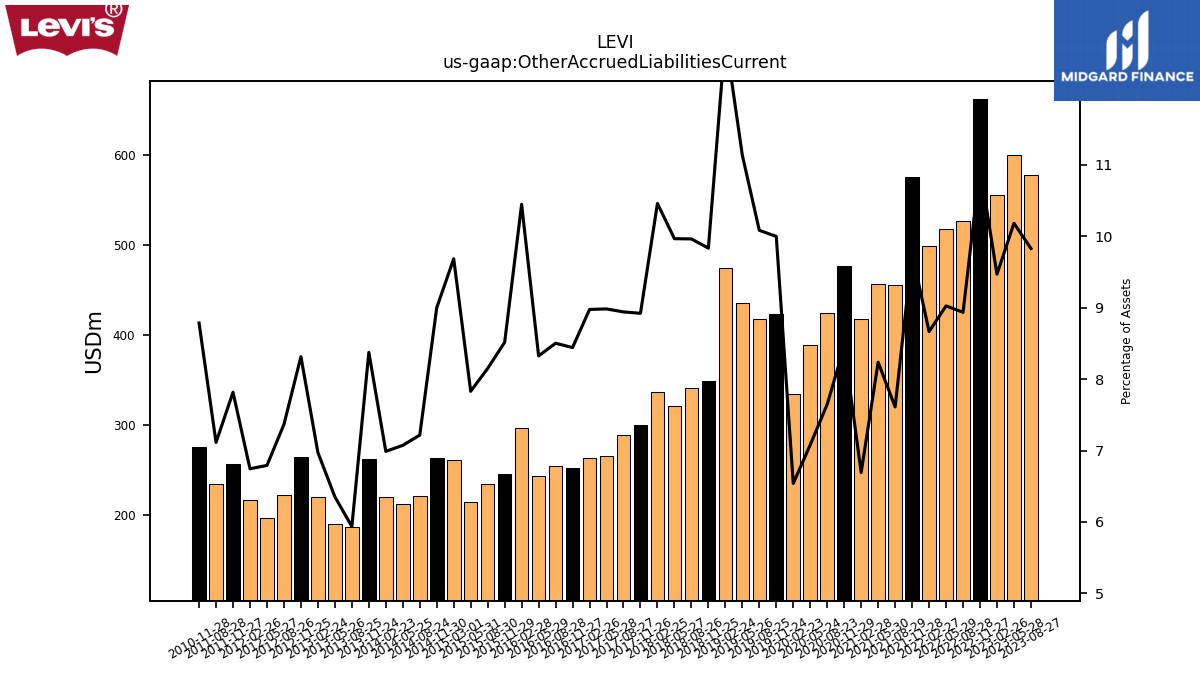
| Other Accrued Liabilities Current | 577.40 | 599.90 | 556.20 | 662.00 | 527.12 | 517.83 | 498.45 | 575.90 | 455.93 | 456.70 | 417.32 | 477.00 | 424.27 | 388.53 | 334.49 | 423.17 | 417.34 | 435.30 | 474.26 | 348.39 | 340.50 | 320.93 | 336.61 | 299.29 | 288.07 | 265.46 | 263.00 | 252.16 | 254.16 | 242.89 | 296.52 | 245.61 | 234.47 | 214.45 | 260.62 | 263.18 | 220.69 | 211.20 | 219.85 | 261.90 | 186.70 | 189.33 | 219.40 | 263.57 | 221.51 | 196.52 | 216.53 | 256.32 | 233.87 | NA | NA | 275.44 | NA |
| 2023-08-27 | 2023-05-28 | 2023-02-26 | 2022-11-27 | 2022-08-28 | 2022-05-29 | 2022-02-27 | 2021-11-28 | 2021-08-29 | 2021-05-30 | 2021-02-28 | 2020-11-29 | 2020-08-23 | 2020-05-24 | 2020-02-23 | 2019-11-24 | 2019-08-25 | 2019-05-26 | 2019-02-24 | 2018-11-25 | 2018-08-26 | 2018-05-27 | 2018-02-25 | 2017-11-26 | 2017-08-27 | 2017-05-28 | 2017-02-26 | 2016-11-27 | 2016-08-28 | 2016-05-29 | 2016-02-28 | 2015-11-29 | 2015-08-30 | 2015-05-31 | 2015-03-01 | 2014-11-30 | 2014-08-24 | 2014-05-25 | 2014-02-23 | 2013-11-24 | 2013-08-25 | 2013-05-26 | 2013-02-24 | 2012-11-25 | 2012-08-26 | 2012-05-27 | 2012-02-26 | 2011-11-27 | 2011-08-28 | 2011-05-29 | 2011-02-27 | 2010-11-28 | 2010-08-29 | ||
|---|---|---|---|---|---|---|---|---|---|---|---|---|---|---|---|---|---|---|---|---|---|---|---|---|---|---|---|---|---|---|---|---|---|---|---|---|---|---|---|---|---|---|---|---|---|---|---|---|---|---|---|---|---|---|
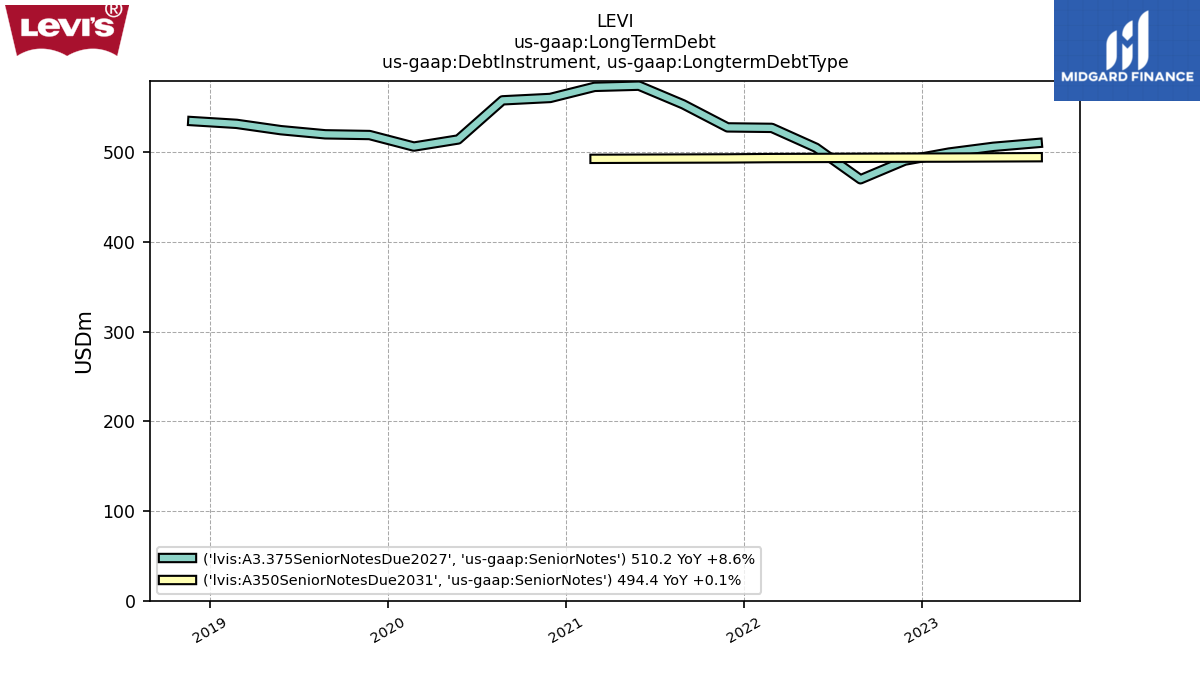
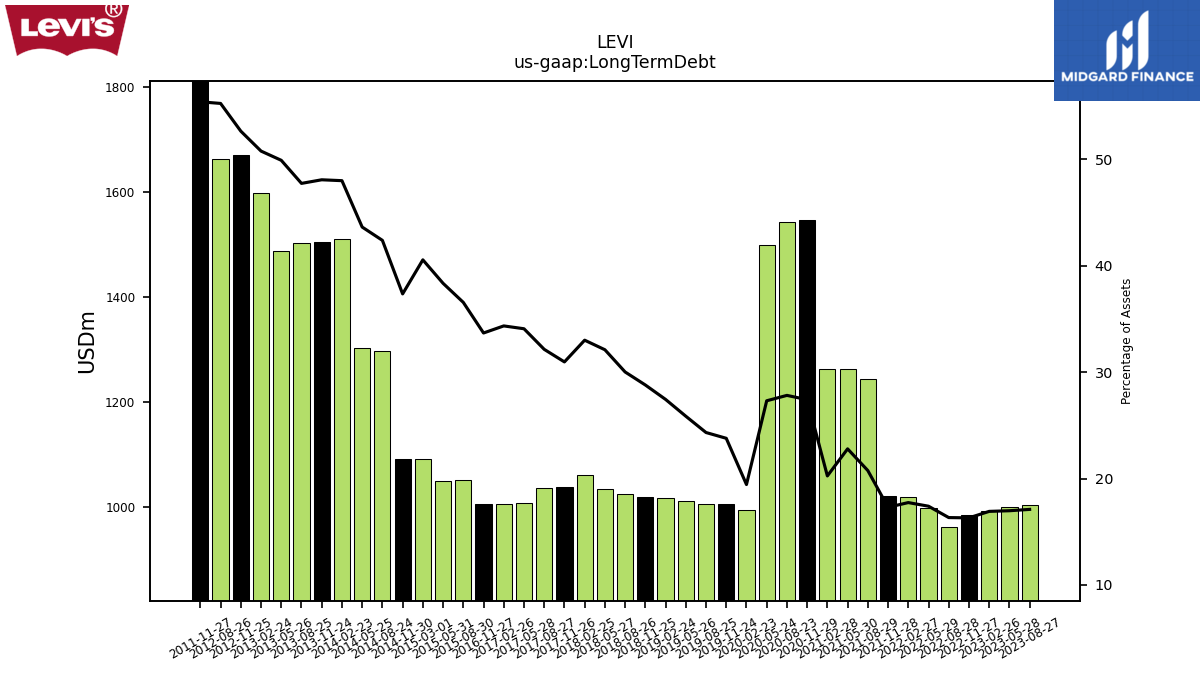
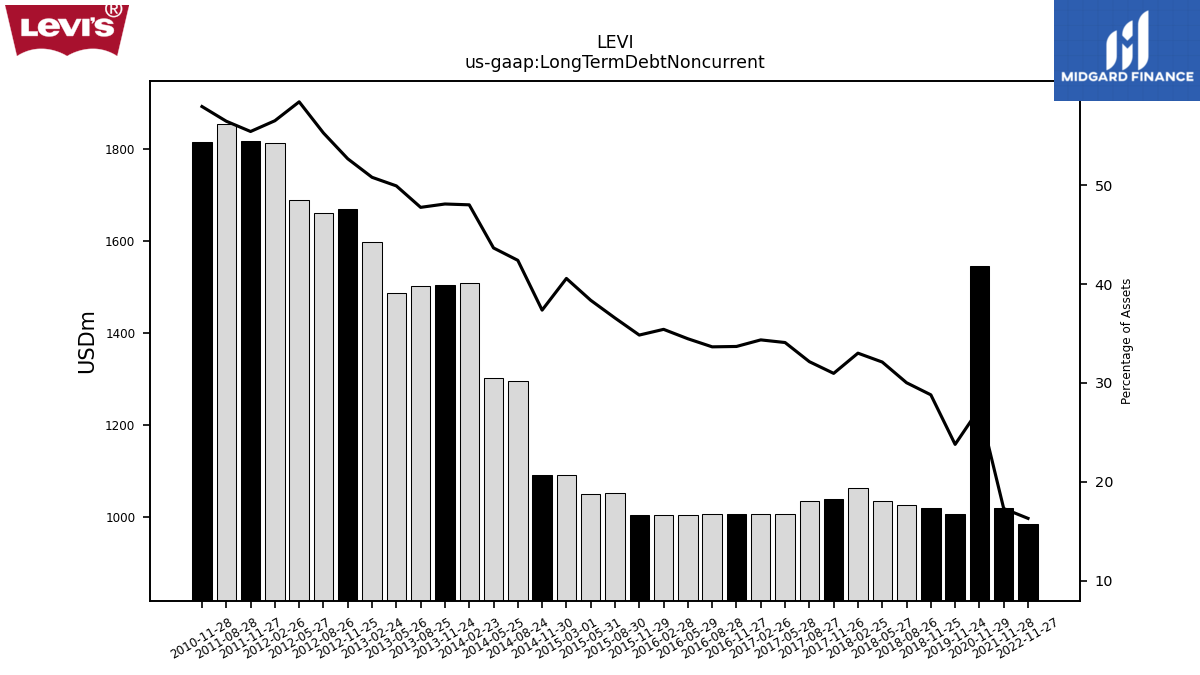
| Long Term Debt | 1004.60 | 1000.20 | 993.60 | 984.50 | 963.50 | 998.48 | 1020.50 | 1020.70 | 1243.31 | 1263.83 | 1262.70 | 1546.70 | 1543.30 | 1498.98 | 994.39 | 1006.75 | 1007.01 | 1011.12 | 1017.66 | 1020.22 | 1026.06 | 1034.04 | 1062.36 | 1038.86 | 1035.85 | 1007.28 | 1006.62 | 1006.26 | NA | NA | NA | NA | 1051.89 | 1050.62 | 1091.62 | 1092.48 | 1296.61 | 1303.41 | 1510.30 | 1504.02 | 1501.91 | 1488.06 | 1598.27 | 1669.45 | 1662.20 | NA | NA | 1817.62 | NA | NA | NA | NA | NA | |
| Long Term Debt Noncurrent | NA | NA | NA | 984.50 | NA | NA | NA | 1020.70 | NA | NA | NA | 1546.70 | NA | NA | NA | 1006.75 | NA | NA | NA | 1020.22 | 1026.06 | 1034.04 | 1062.36 | 1038.86 | 1035.85 | 1007.28 | 1006.62 | 1006.26 | 1005.90 | 1005.57 | 1005.24 | 1004.94 | 1051.89 | 1050.62 | 1091.62 | 1092.48 | 1296.61 | 1303.41 | 1510.30 | 1504.02 | 1501.91 | 1488.06 | 1598.27 | 1669.45 | 1662.20 | 1690.40 | 1814.26 | 1817.62 | 1856.24 | NA | NA | 1816.73 | NA | |
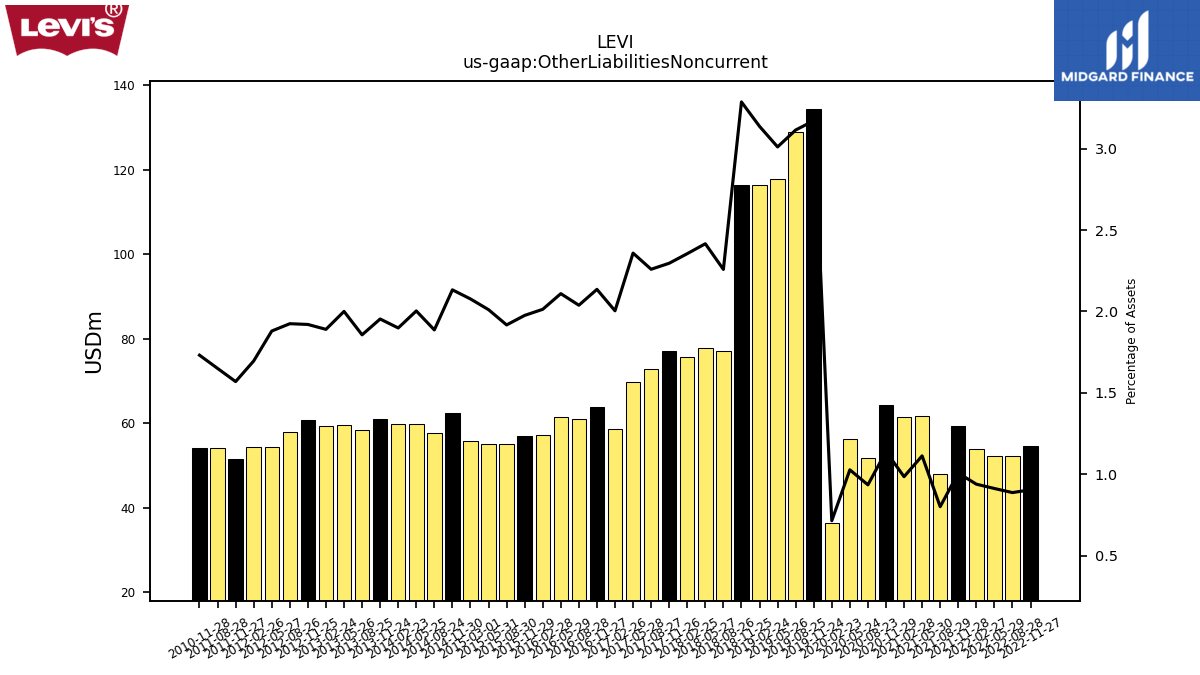
| Other Liabilities Noncurrent | NA | NA | NA | 54.60 | 52.32 | 52.34 | 53.99 | 59.41 | 47.95 | 61.69 | 61.41 | 64.27 | 51.84 | 56.35 | 36.52 | 134.25 | 128.92 | 117.72 | 116.35 | 116.46 | 77.18 | 77.80 | 75.80 | 77.03 | 72.79 | 69.70 | 58.72 | 63.80 | 60.93 | 61.54 | 57.14 | 56.99 | 55.16 | 55.08 | 55.89 | 62.36 | 57.70 | 59.82 | 59.73 | 61.10 | 58.39 | 59.62 | 59.48 | 60.87 | 57.89 | 54.39 | 54.44 | 51.46 | 54.25 | NA | NA | 54.28 | NA | |
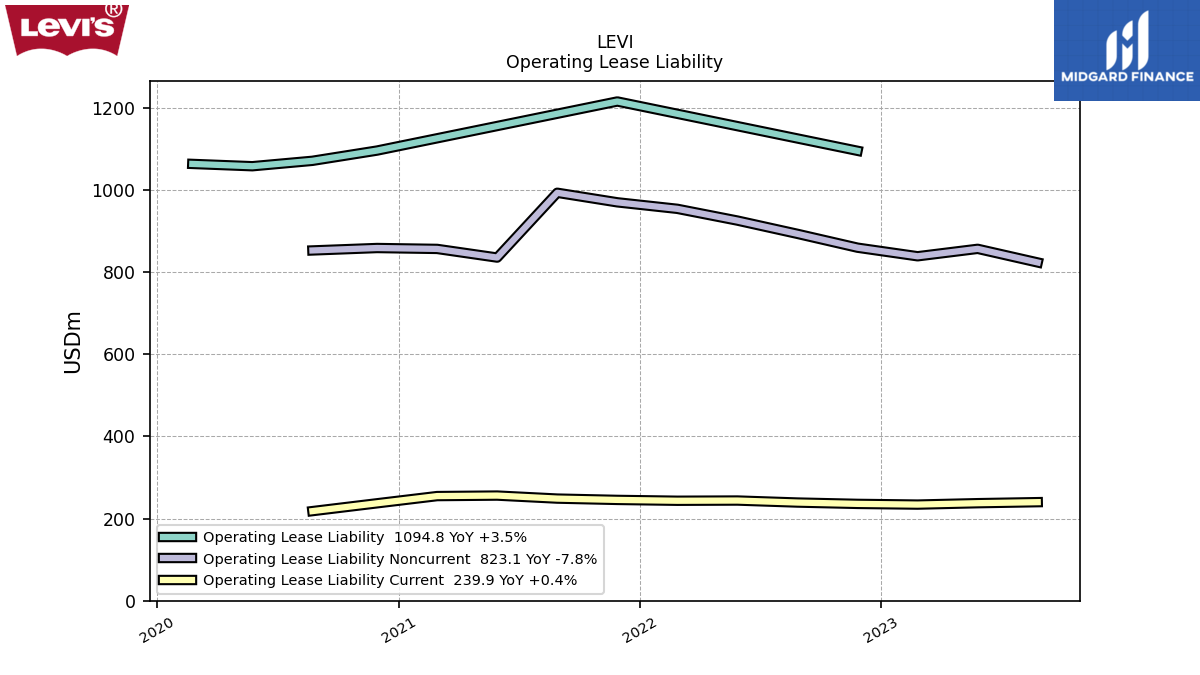
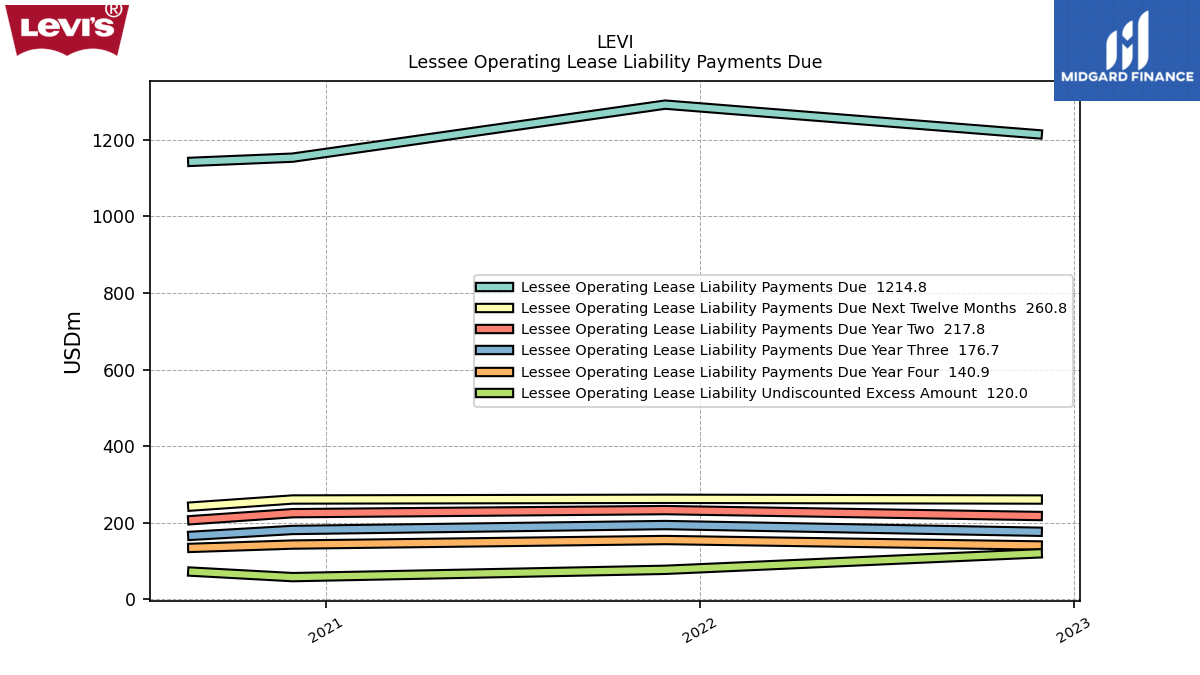
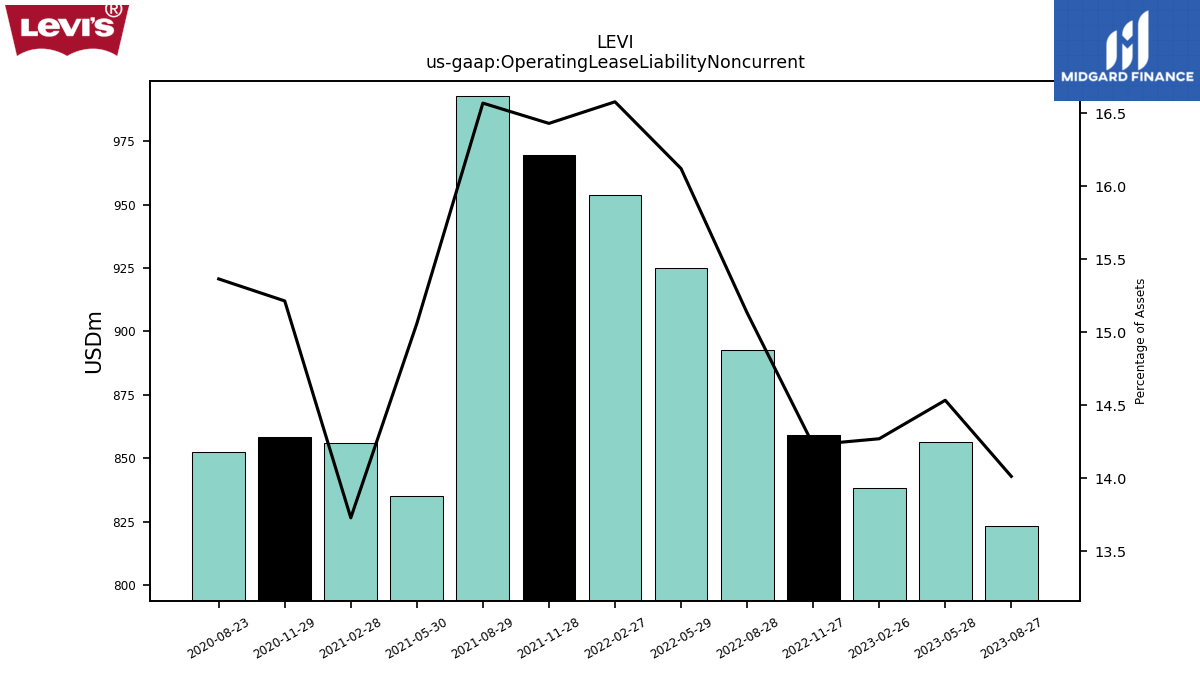
| Operating Lease Liability Noncurrent | 823.10 | 856.30 | 838.20 | 859.10 | 892.74 | 925.05 | 953.63 | 969.48 | 992.72 | 835.02 | 856.10 | 858.29 | 852.37 | NA | NA | NA | NA | NA | NA | NA | NA | NA | NA | NA | NA | NA | NA | NA | NA | NA | NA | NA | NA | NA | NA | NA | NA | NA | NA | NA | NA | NA | NA | NA | NA | NA | NA | NA | NA | NA | NA | NA | NA |
| 2023-08-27 | 2023-05-28 | 2023-02-26 | 2022-11-27 | 2022-08-28 | 2022-05-29 | 2022-02-27 | 2021-11-28 | 2021-08-29 | 2021-05-30 | 2021-02-28 | 2020-11-29 | 2020-08-23 | 2020-05-24 | 2020-02-23 | 2019-11-24 | 2019-08-25 | 2019-05-26 | 2019-02-24 | 2018-11-25 | 2018-08-26 | 2018-05-27 | 2018-02-25 | 2017-11-26 | 2017-08-27 | 2017-05-28 | 2017-02-26 | 2016-11-27 | 2016-08-28 | 2016-05-29 | 2016-02-28 | 2015-11-29 | 2015-08-30 | 2015-05-31 | 2015-03-01 | 2014-11-30 | 2014-08-24 | 2014-05-25 | 2014-02-23 | 2013-11-24 | 2013-08-25 | 2013-05-26 | 2013-02-24 | 2012-11-25 | 2012-08-26 | 2012-05-27 | 2012-02-26 | 2011-11-27 | 2011-08-28 | 2011-05-29 | 2011-02-27 | 2010-11-28 | 2010-08-29 | ||
|---|---|---|---|---|---|---|---|---|---|---|---|---|---|---|---|---|---|---|---|---|---|---|---|---|---|---|---|---|---|---|---|---|---|---|---|---|---|---|---|---|---|---|---|---|---|---|---|---|---|---|---|---|---|---|
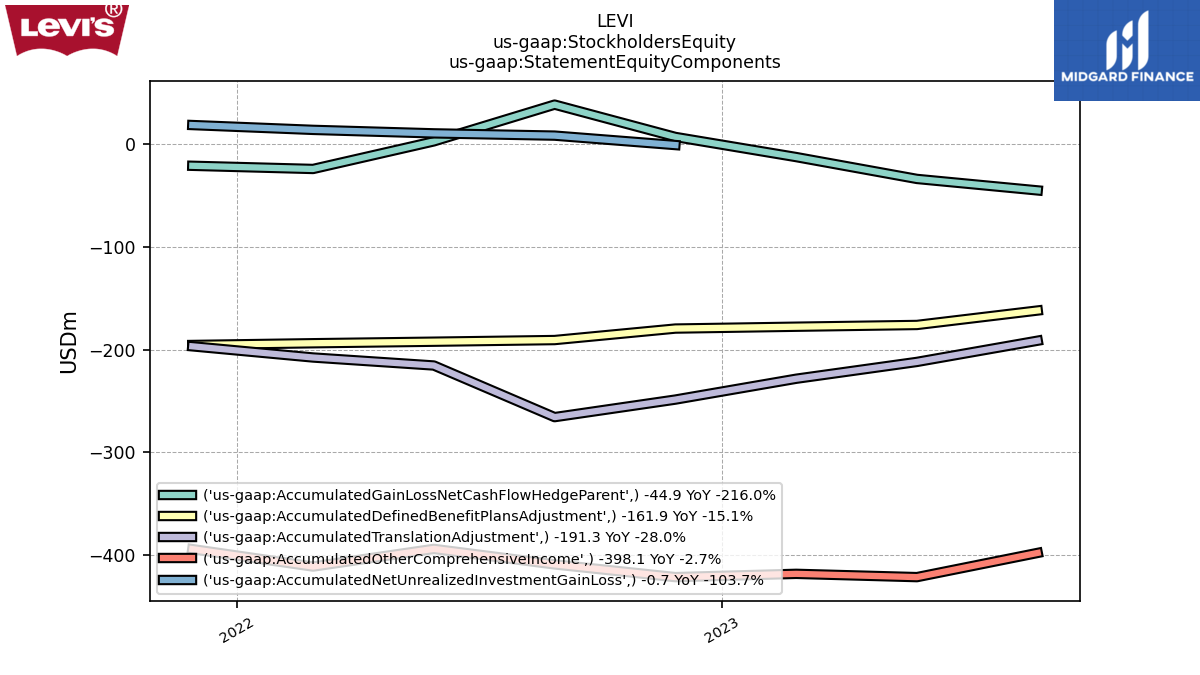
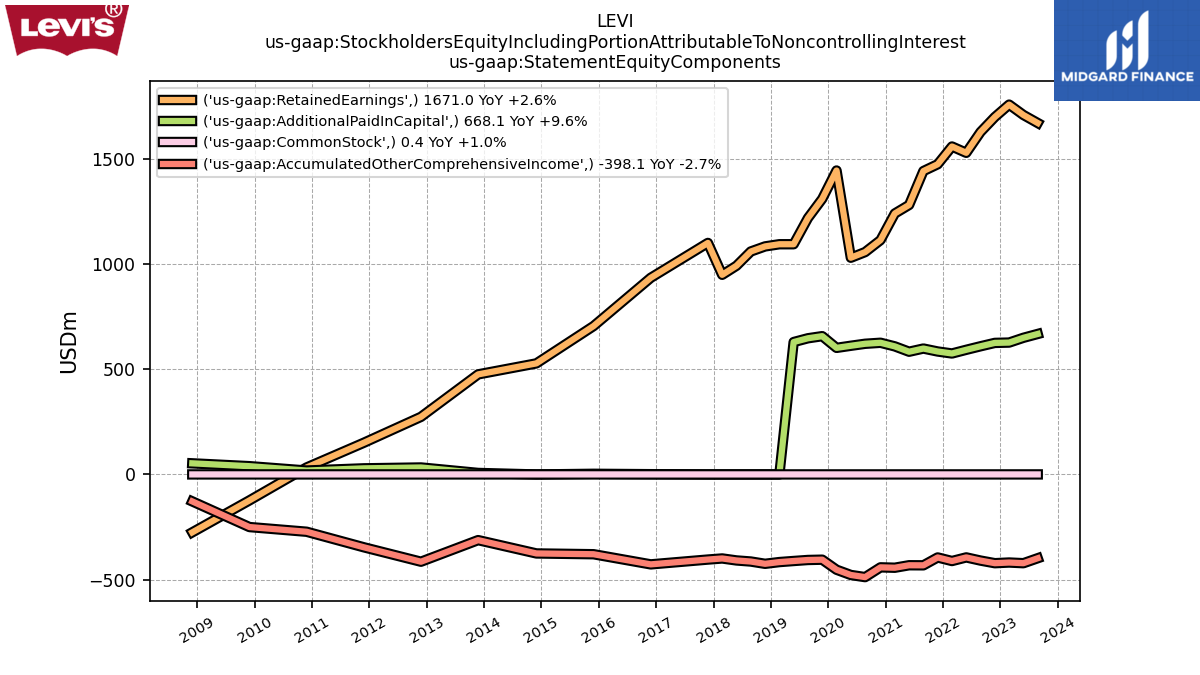
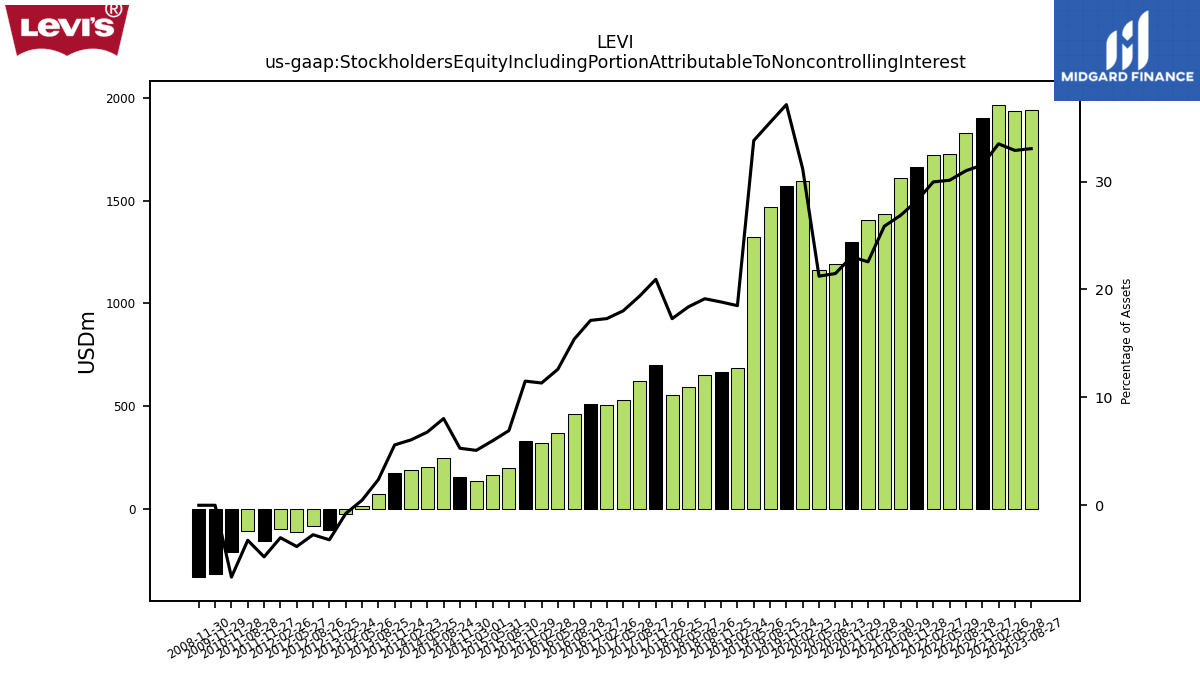
| Stockholders Equity Including Portion Attributable To Noncontrolling Interest | 1941.40 | 1937.70 | 1967.50 | 1903.70 | 1829.00 | 1728.33 | 1723.59 | 1665.66 | 1609.89 | 1434.02 | 1406.98 | 1299.47 | 1191.27 | 1165.21 | 1594.83 | 1571.56 | 1468.35 | 1321.25 | 686.04 | 667.46 | 654.17 | 592.22 | 556.60 | 702.39 | 624.25 | 532.50 | 506.97 | 511.77 | 460.15 | 367.78 | 321.63 | 331.86 | 199.10 | 163.71 | 136.94 | 154.46 | 245.81 | 202.54 | 190.64 | 174.98 | 74.78 | 13.91 | -24.28 | -101.51 | -82.09 | -110.65 | -96.49 | -156.83 | -106.73 | NA | NA | -208.80 | NA | |
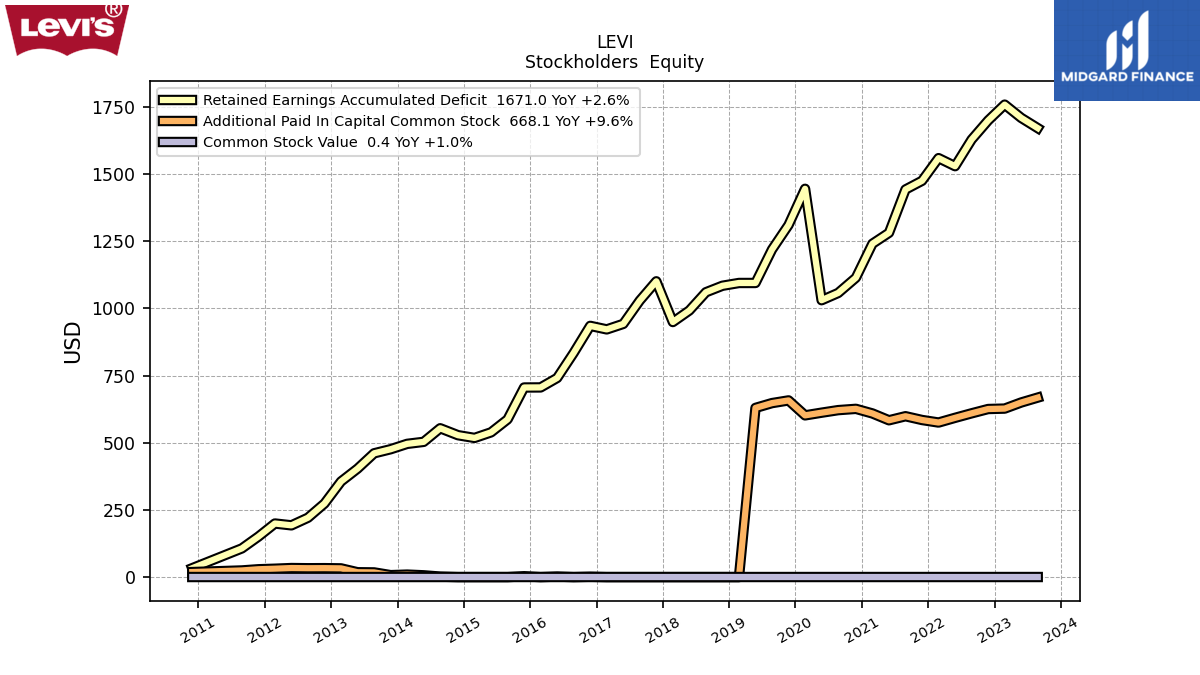
| Common Stock Value | 0.40 | 0.40 | 0.40 | 0.40 | 0.40 | 0.40 | 0.40 | 0.40 | 0.40 | 0.40 | 0.40 | 0.40 | 0.40 | 0.40 | 0.40 | 0.39 | 0.39 | 0.39 | 0.38 | 0.38 | 0.38 | 0.38 | 0.38 | 0.38 | 0.38 | 0.38 | 0.38 | 0.38 | 0.38 | 0.38 | 0.38 | 0.38 | 0.37 | 0.37 | 0.37 | 0.37 | 0.37 | 0.37 | 0.37 | 0.37 | 0.38 | 0.37 | 0.37 | 0.37 | 0.37 | 0.37 | 0.37 | 0.37 | 0.37 | NA | NA | 0.37 | NA | |
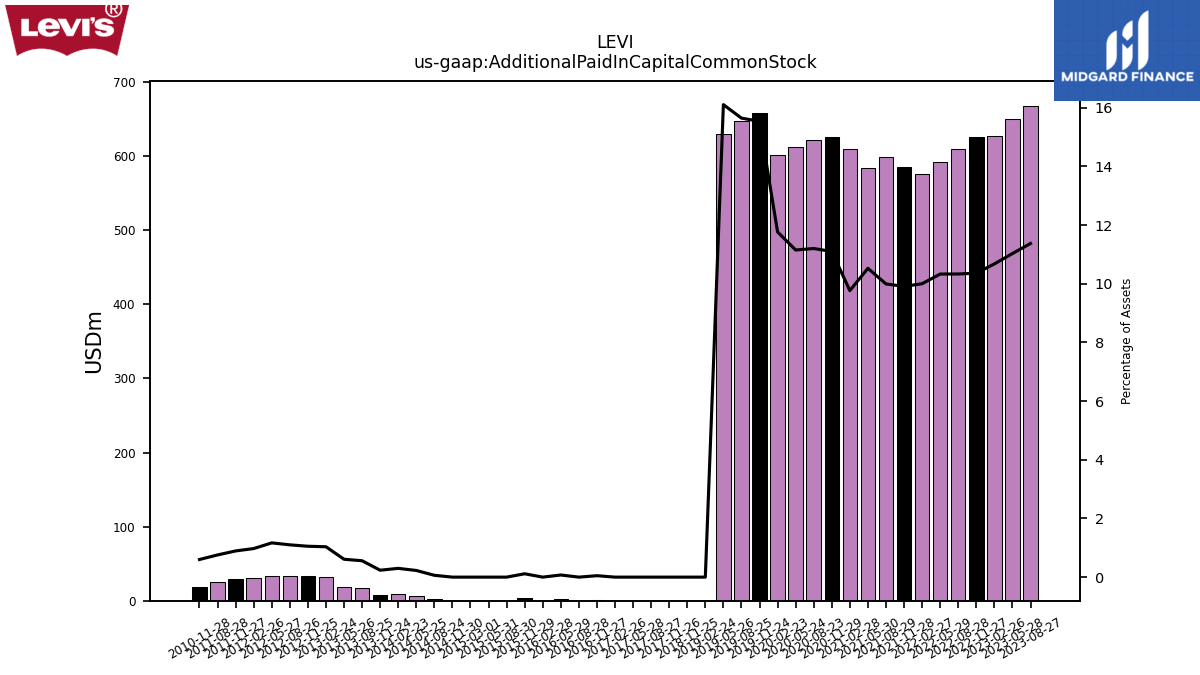
| Additional Paid In Capital Common Stock | 668.10 | 649.90 | 627.20 | 625.60 | 609.62 | 592.83 | 575.31 | 584.77 | 598.76 | 583.70 | 609.07 | 626.24 | 621.43 | 611.99 | 601.98 | 657.66 | 647.63 | 629.70 | 0.00 | 0.00 | NA | NA | NA | 0.00 | 0.00 | 0.00 | 0.00 | 1.45 | 0.00 | 2.12 | 0.00 | 3.29 | 0.00 | 0.00 | 0.00 | 0.00 | 1.91 | 6.78 | 9.40 | 7.36 | 17.57 | 18.17 | 32.58 | 33.37 | 33.10 | 33.78 | 31.26 | 29.27 | 24.86 | NA | NA | 18.84 | NA | |
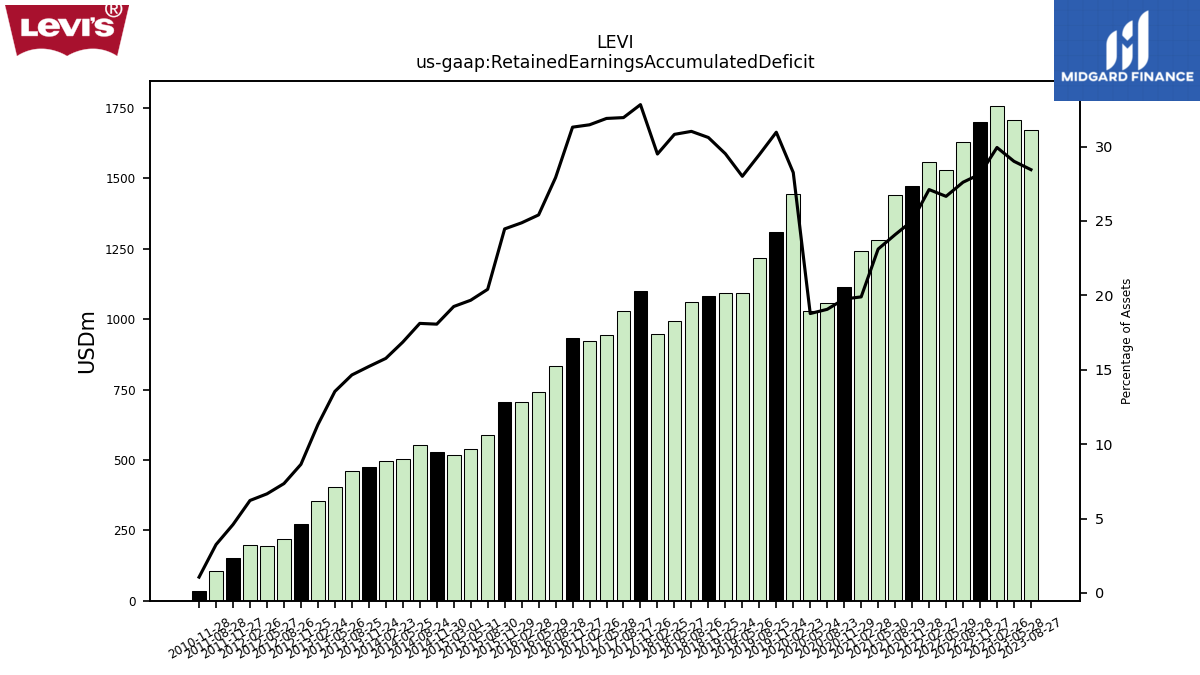
| Retained Earnings Accumulated Deficit | 1671.00 | 1709.10 | 1758.40 | 1699.40 | 1628.28 | 1529.29 | 1559.25 | 1474.87 | 1442.55 | 1281.41 | 1240.79 | 1114.28 | 1057.37 | 1030.51 | 1445.19 | 1310.46 | 1219.09 | 1094.67 | 1094.64 | 1084.32 | 1060.16 | 992.40 | 949.32 | 1100.92 | 1029.26 | 942.37 | 921.94 | 935.05 | 834.49 | 741.22 | 705.99 | 705.67 | 587.05 | 538.80 | 518.02 | 528.21 | 554.02 | 503.42 | 495.93 | 475.96 | 460.76 | 403.71 | 355.92 | 273.98 | 221.05 | 192.72 | 199.52 | 150.77 | 106.89 | NA | NA | 33.35 | NA | |
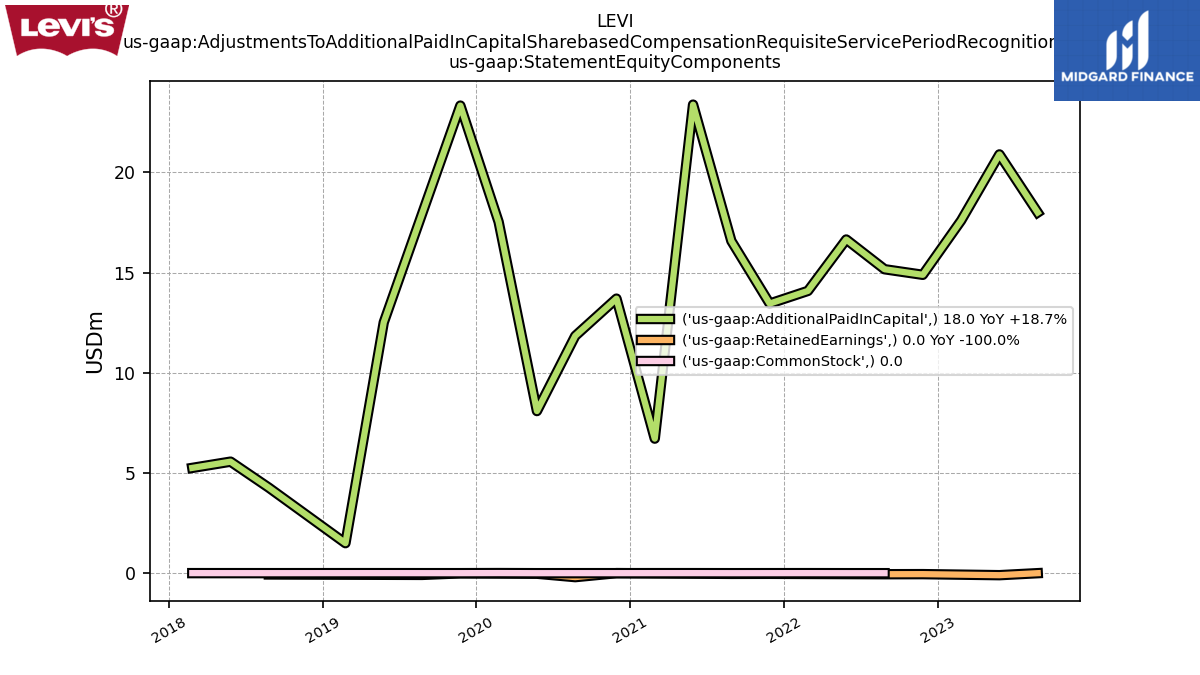
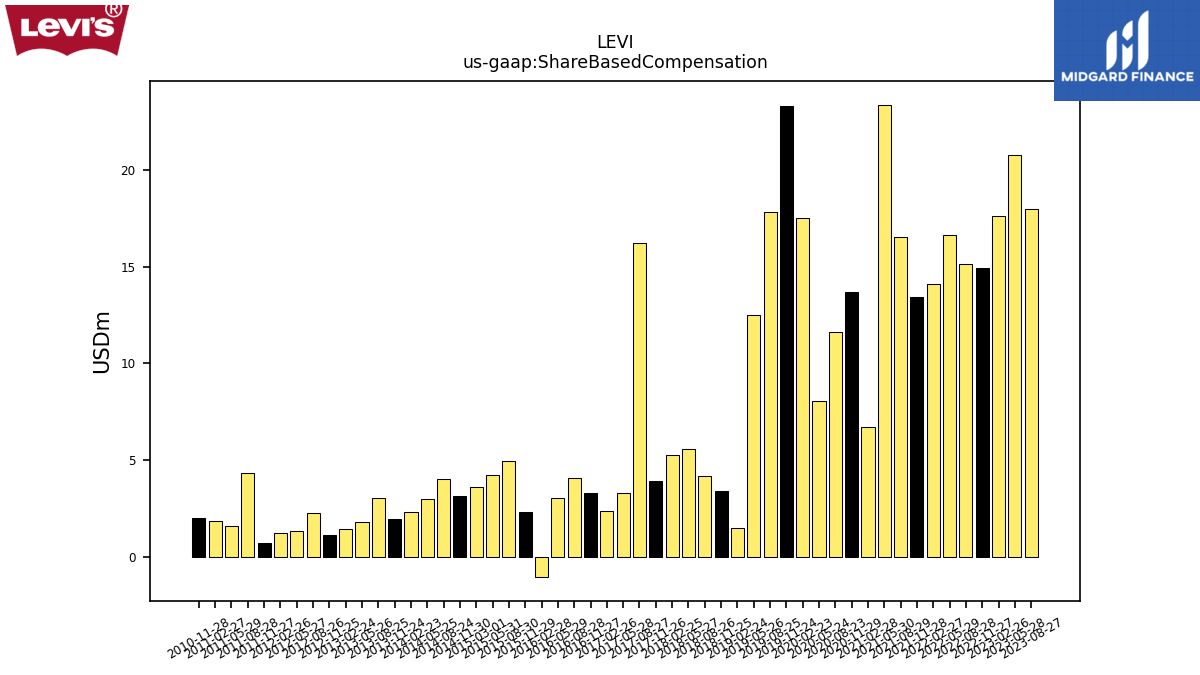
| Adjustments To Additional Paid In Capital Sharebased Compensation Requisite Service Period Recognition Value | 18.00 | 20.80 | 17.60 | 14.84 | 15.12 | 16.65 | 14.09 | 13.42 | 16.54 | 23.39 | 6.72 | 13.71 | 11.64 | 8.06 | 17.54 | 23.33 | 17.84 | 12.52 | 1.50 | NA | 4.20 | 5.57 | 5.26 | NA | NA | NA | NA | NA | NA | NA | NA | NA | NA | NA | NA | NA | NA | NA | NA | NA | NA | NA | NA | NA | NA | NA | NA | NA | NA | NA | NA | NA | NA |
| 2023-08-27 | 2023-05-28 | 2023-02-26 | 2022-11-27 | 2022-08-28 | 2022-05-29 | 2022-02-27 | 2021-11-28 | 2021-08-29 | 2021-05-30 | 2021-02-28 | 2020-11-29 | 2020-08-23 | 2020-05-24 | 2020-02-23 | 2019-11-24 | 2019-08-25 | 2019-05-26 | 2019-02-24 | 2018-11-25 | 2018-08-26 | 2018-05-27 | 2018-02-25 | 2017-11-26 | 2017-08-27 | 2017-05-28 | 2017-02-26 | 2016-11-27 | 2016-08-28 | 2016-05-29 | 2016-02-28 | 2015-11-29 | 2015-08-30 | 2015-05-31 | 2015-03-01 | 2014-11-30 | 2014-08-24 | 2014-05-25 | 2014-02-23 | 2013-11-24 | 2013-08-25 | 2013-05-26 | 2013-02-24 | 2012-11-25 | 2012-08-26 | 2012-05-27 | 2012-02-26 | 2011-11-27 | 2011-08-28 | 2011-05-29 | 2011-02-27 | 2010-11-28 | 2010-08-29 | ||
|---|---|---|---|---|---|---|---|---|---|---|---|---|---|---|---|---|---|---|---|---|---|---|---|---|---|---|---|---|---|---|---|---|---|---|---|---|---|---|---|---|---|---|---|---|---|---|---|---|---|---|---|---|---|---|
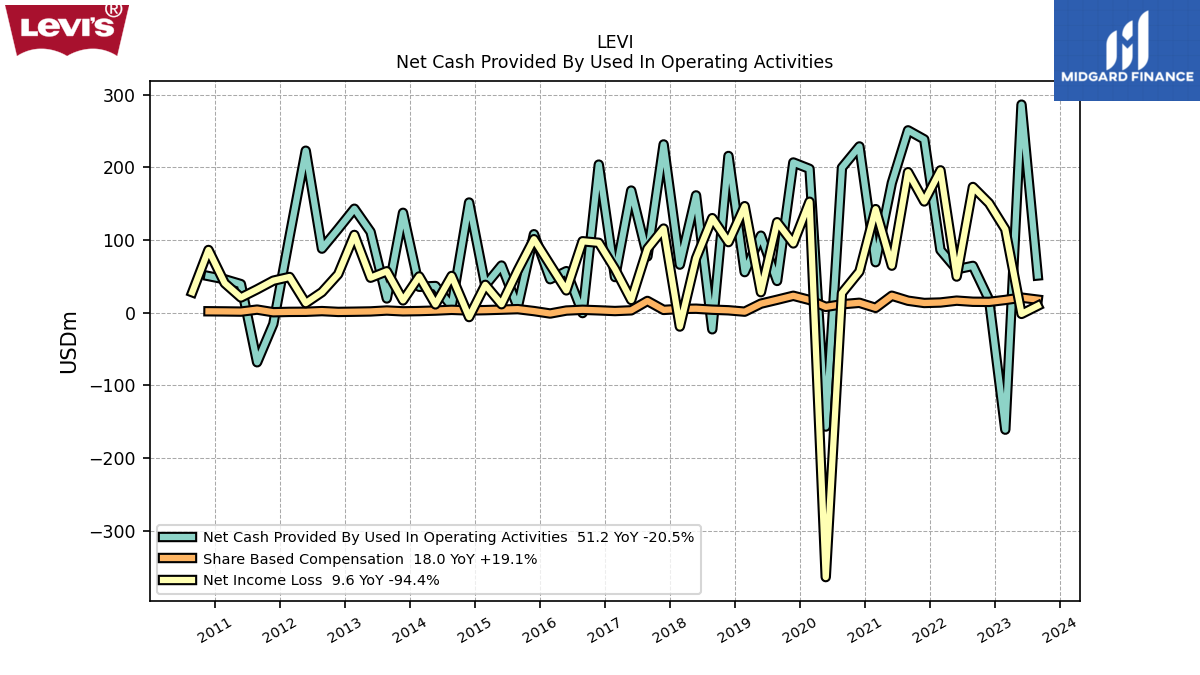
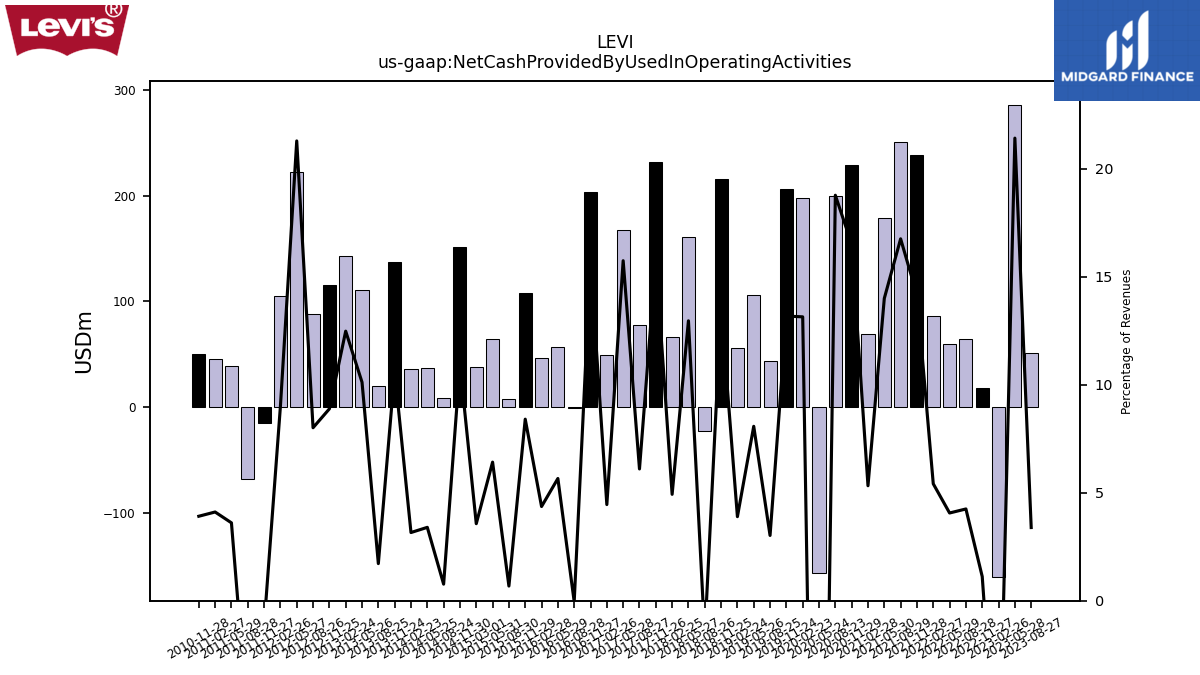
| Net Cash Provided By Used In Operating Activities | 51.20 | 286.20 | -160.80 | 17.78 | 64.44 | 59.75 | 86.14 | 238.41 | 250.83 | 178.54 | 69.48 | 228.72 | 199.50 | -156.52 | 197.88 | 206.65 | 43.72 | 105.99 | 55.82 | 215.61 | -22.80 | 161.39 | 66.17 | 231.49 | 77.36 | 168.04 | 49.05 | 203.73 | -0.48 | 57.23 | 46.08 | 108.00 | 7.77 | 64.94 | 37.63 | 151.62 | 8.87 | 36.75 | 35.67 | 137.45 | 19.62 | 111.14 | 143.05 | 115.20 | 88.15 | 222.83 | 104.79 | -15.44 | -68.14 | 39.40 | 46.03 | 50.45 | NA | |
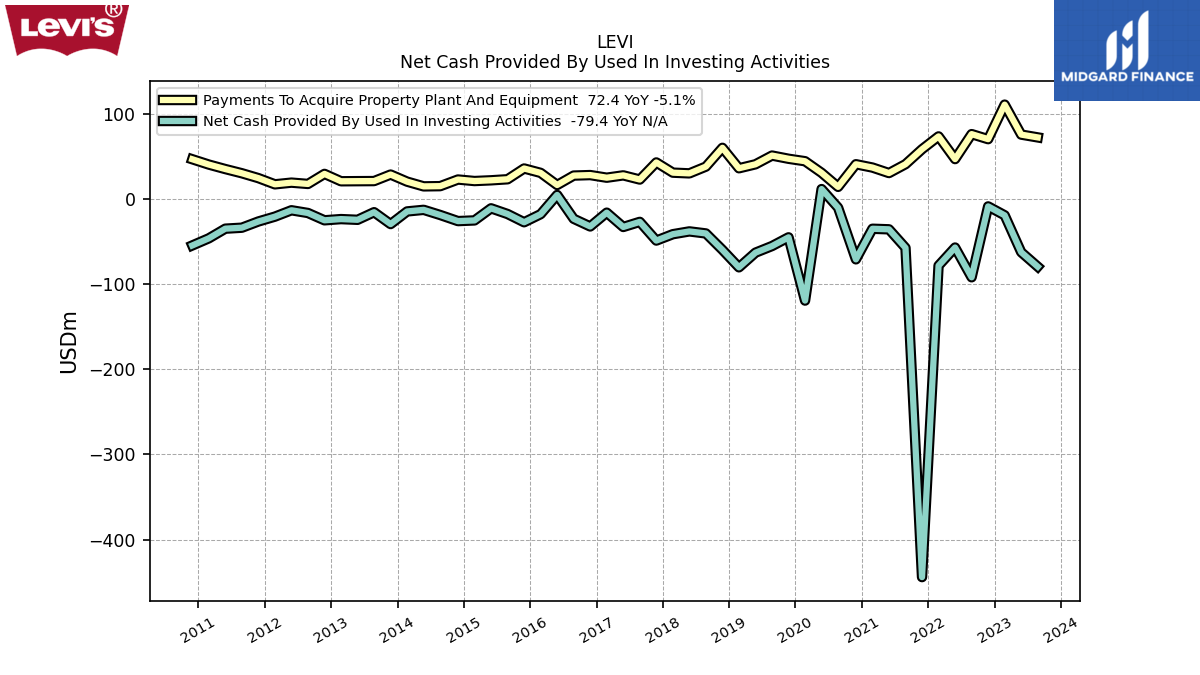
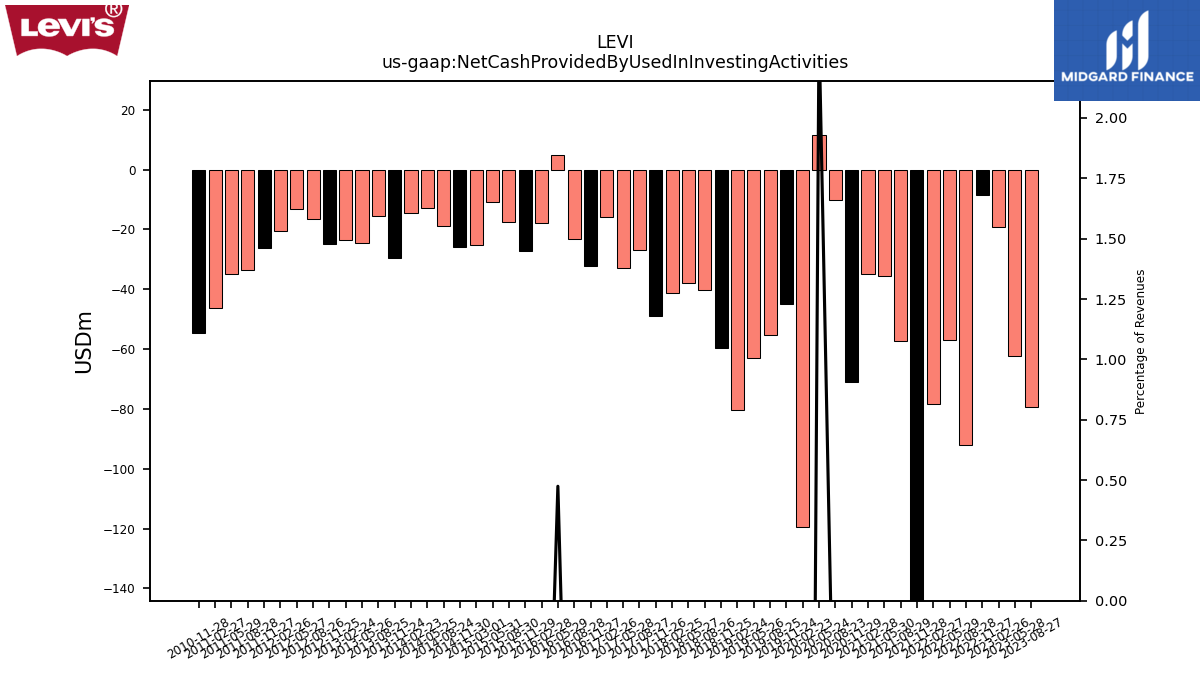
| Net Cash Provided By Used In Investing Activities | -79.40 | -62.40 | -19.10 | -8.64 | -91.91 | -56.95 | -78.20 | -444.07 | -57.30 | -35.55 | -34.89 | -70.83 | -10.17 | 11.72 | -119.28 | -44.97 | -55.19 | -62.97 | -80.21 | -59.68 | -40.41 | -38.00 | -41.30 | -48.78 | -26.80 | -32.81 | -16.00 | -32.20 | -23.19 | 4.80 | -17.76 | -27.24 | -17.59 | -10.90 | -25.10 | -25.90 | -18.73 | -12.68 | -14.55 | -29.42 | -15.44 | -24.39 | -23.55 | -24.97 | -16.39 | -13.18 | -20.66 | -26.35 | -33.66 | -34.80 | -46.15 | -54.51 | NA | |
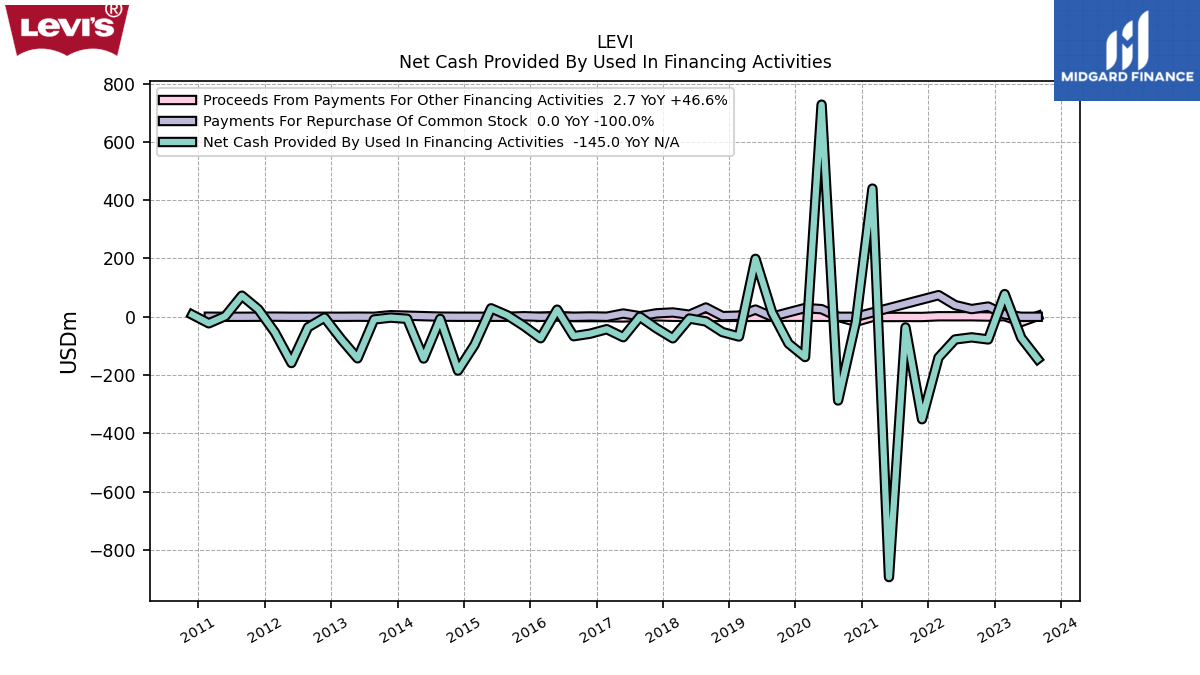
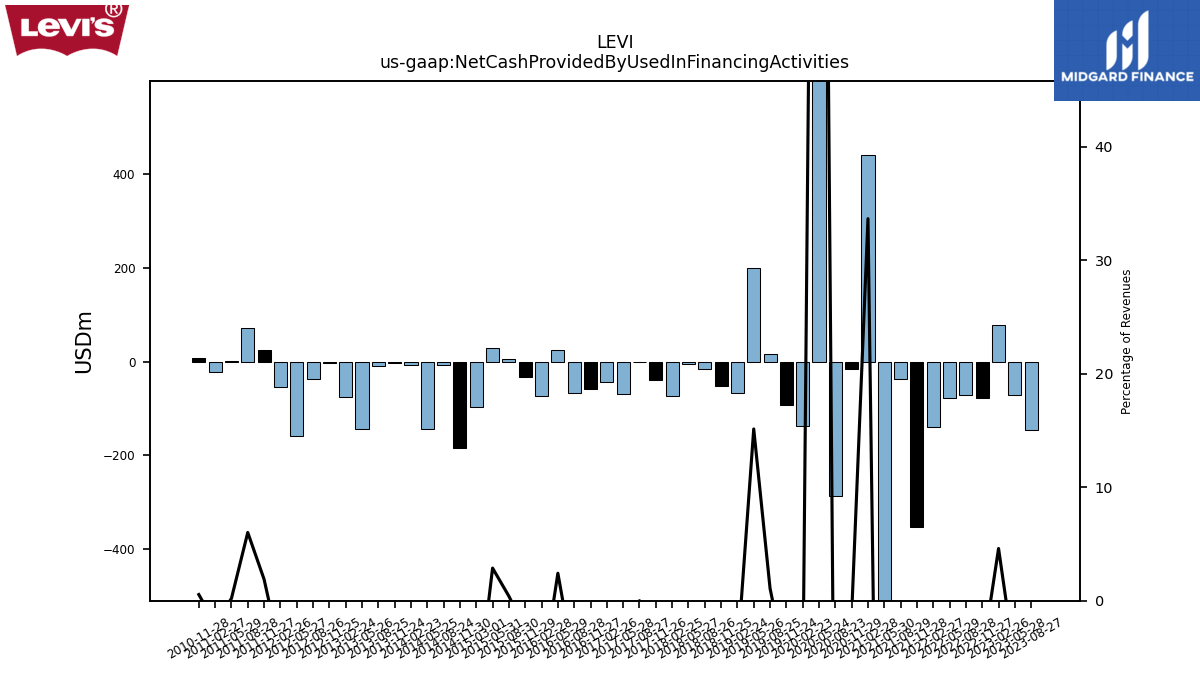
| Net Cash Provided By Used In Financing Activities | -145.00 | -71.90 | 77.80 | -77.67 | -70.58 | -77.72 | -139.43 | -351.28 | -36.47 | -892.81 | 439.67 | -16.53 | -287.07 | 727.61 | -138.02 | -91.78 | 15.75 | 198.79 | -67.75 | -52.46 | -15.97 | -5.93 | -73.86 | -39.33 | 0.07 | -69.98 | -42.50 | -57.89 | -66.61 | 24.52 | -73.57 | -32.03 | 4.54 | 29.13 | -96.53 | -184.48 | -7.15 | -143.09 | -6.95 | -2.79 | -9.21 | -142.51 | -76.00 | -2.71 | -36.08 | -158.62 | -53.54 | 25.39 | 72.44 | 2.24 | -22.37 | 7.05 | NA |
| 2023-08-27 | 2023-05-28 | 2023-02-26 | 2022-11-27 | 2022-08-28 | 2022-05-29 | 2022-02-27 | 2021-11-28 | 2021-08-29 | 2021-05-30 | 2021-02-28 | 2020-11-29 | 2020-08-23 | 2020-05-24 | 2020-02-23 | 2019-11-24 | 2019-08-25 | 2019-05-26 | 2019-02-24 | 2018-11-25 | 2018-08-26 | 2018-05-27 | 2018-02-25 | 2017-11-26 | 2017-08-27 | 2017-05-28 | 2017-02-26 | 2016-11-27 | 2016-08-28 | 2016-05-29 | 2016-02-28 | 2015-11-29 | 2015-08-30 | 2015-05-31 | 2015-03-01 | 2014-11-30 | 2014-08-24 | 2014-05-25 | 2014-02-23 | 2013-11-24 | 2013-08-25 | 2013-05-26 | 2013-02-24 | 2012-11-25 | 2012-08-26 | 2012-05-27 | 2012-02-26 | 2011-11-27 | 2011-08-28 | 2011-05-29 | 2011-02-27 | 2010-11-28 | 2010-08-29 | ||
|---|---|---|---|---|---|---|---|---|---|---|---|---|---|---|---|---|---|---|---|---|---|---|---|---|---|---|---|---|---|---|---|---|---|---|---|---|---|---|---|---|---|---|---|---|---|---|---|---|---|---|---|---|---|---|
| Net Cash Provided By Used In Operating Activities | 51.20 | 286.20 | -160.80 | 17.78 | 64.44 | 59.75 | 86.14 | 238.41 | 250.83 | 178.54 | 69.48 | 228.72 | 199.50 | -156.52 | 197.88 | 206.65 | 43.72 | 105.99 | 55.82 | 215.61 | -22.80 | 161.39 | 66.17 | 231.49 | 77.36 | 168.04 | 49.05 | 203.73 | -0.48 | 57.23 | 46.08 | 108.00 | 7.77 | 64.94 | 37.63 | 151.62 | 8.87 | 36.75 | 35.67 | 137.45 | 19.62 | 111.14 | 143.05 | 115.20 | 88.15 | 222.83 | 104.79 | -15.44 | -68.14 | 39.40 | 46.03 | 50.45 | NA | |
| Net Income Loss | 9.60 | -1.60 | 114.70 | 150.56 | 172.96 | 49.74 | 195.84 | 152.99 | 193.33 | 64.72 | 142.50 | 56.67 | 27.05 | -363.55 | 152.69 | 95.30 | 124.51 | 28.23 | 146.58 | 97.10 | 130.12 | 74.93 | -19.01 | 115.75 | 87.99 | 17.52 | 60.14 | 96.17 | 98.32 | 30.73 | 65.84 | 101.18 | 58.17 | 11.69 | 38.39 | -5.97 | 50.62 | 11.46 | 49.97 | 16.95 | 57.08 | 48.15 | 107.02 | 53.05 | 28.35 | 13.23 | 49.22 | 44.11 | 32.19 | 20.97 | 40.67 | 86.35 | 28.18 | |
| Profit Loss | 9.60 | -1.60 | 114.70 | 150.56 | 172.96 | 49.74 | 195.84 | 152.99 | 193.33 | 64.72 | 142.50 | 56.67 | 27.05 | -363.55 | 152.69 | 95.81 | 124.22 | 28.51 | 146.45 | 97.26 | 129.58 | 77.03 | -18.63 | 117.23 | 89.48 | 17.72 | 60.12 | 96.15 | 97.70 | 31.06 | 66.29 | 101.69 | 58.46 | 11.45 | 38.28 | -6.10 | 49.80 | 10.99 | 49.62 | 16.61 | 56.45 | 48.21 | 106.88 | 53.34 | 25.08 | 13.24 | 49.30 | 44.13 | 31.30 | 20.51 | 39.17 | 85.34 | 26.62 | |
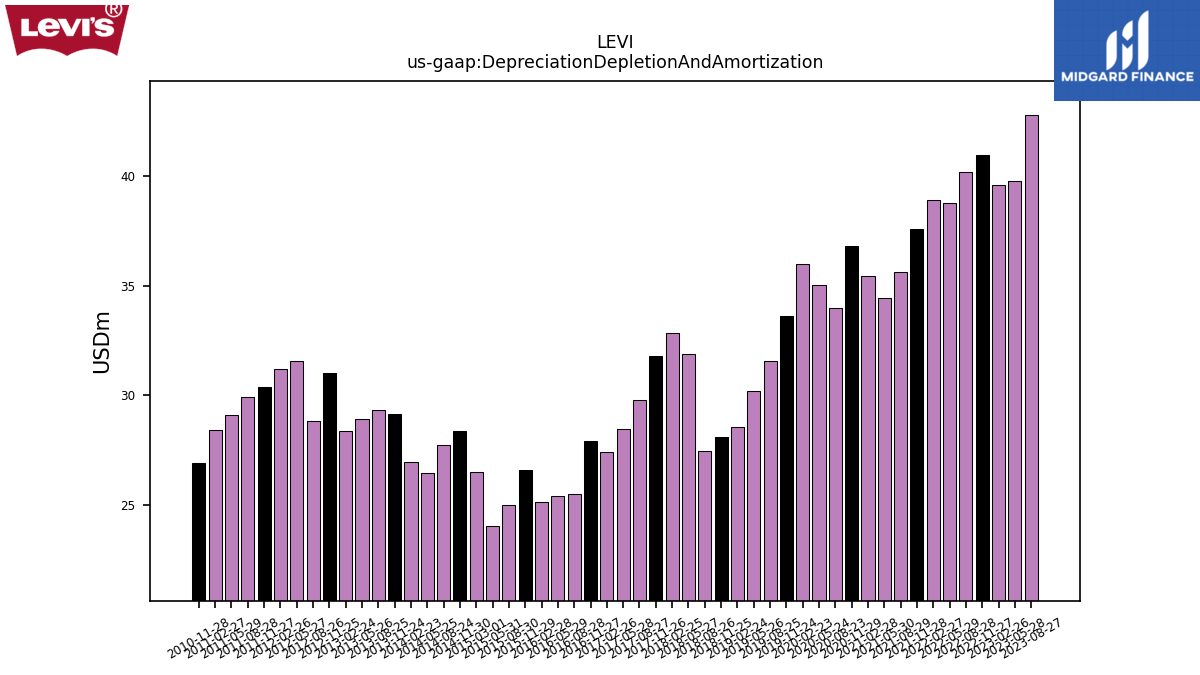
| Depreciation Depletion And Amortization | 42.80 | 39.80 | 39.60 | 40.97 | 40.19 | 38.81 | 38.93 | 37.59 | 35.65 | 34.46 | 35.47 | 36.80 | 33.99 | 35.03 | 35.97 | 33.64 | 31.56 | 30.19 | 28.56 | 28.07 | 27.43 | 31.87 | 32.82 | 31.77 | 29.79 | 28.44 | 27.39 | 27.91 | 25.47 | 25.39 | 25.11 | 26.60 | 24.98 | 24.00 | 26.48 | 28.36 | 27.72 | 26.45 | 26.95 | 29.12 | 29.34 | 28.89 | 28.37 | 31.03 | 28.80 | 31.56 | 31.22 | 30.37 | 29.93 | 29.11 | 28.39 | 26.91 | NA | |
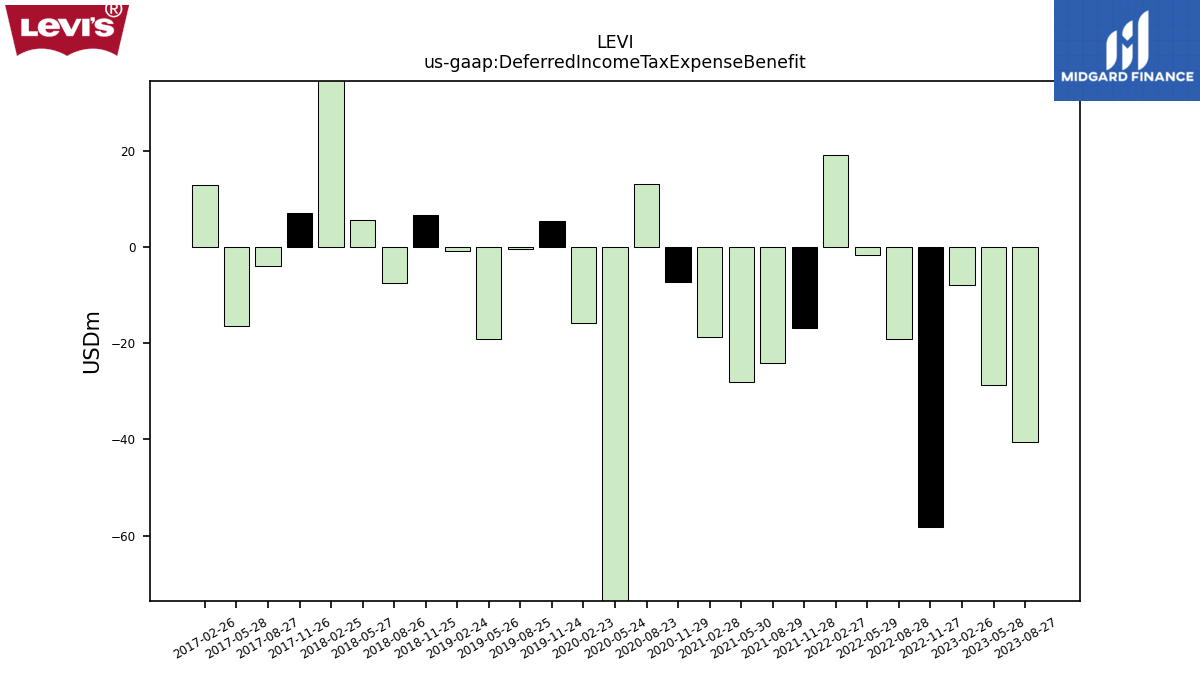
| Deferred Income Tax Expense Benefit | -40.50 | -28.60 | -7.90 | -58.09 | -19.14 | -1.60 | 19.03 | -16.90 | -24.19 | -28.07 | -18.79 | -7.37 | 13.11 | -85.16 | -15.82 | 5.39 | -0.41 | -19.14 | -0.80 | 6.63 | -7.54 | 5.63 | 129.54 | 6.96 | -3.92 | -16.48 | 12.95 | NA | NA | NA | NA | NA | NA | NA | NA | NA | NA | NA | NA | NA | NA | NA | NA | NA | NA | NA | NA | NA | NA | NA | NA | NA | NA | |
| Share Based Compensation | 18.00 | 20.80 | 17.60 | 14.94 | 15.12 | 16.65 | 14.09 | 13.42 | 16.54 | 23.39 | 6.72 | 13.71 | 11.64 | 8.06 | 17.54 | 23.33 | 17.84 | 12.52 | 1.50 | 3.38 | 4.20 | 5.57 | 5.26 | 3.90 | 16.25 | 3.31 | 2.35 | 3.29 | 4.07 | 3.03 | -1.05 | 2.31 | 4.98 | 4.25 | 3.60 | 3.14 | 4.00 | 2.99 | 2.31 | 1.95 | 3.06 | 1.81 | 1.44 | 1.15 | 2.27 | 1.33 | 1.21 | 0.70 | 4.33 | 1.57 | 1.84 | 2.02 | NA |
| 2023-08-27 | 2023-05-28 | 2023-02-26 | 2022-11-27 | 2022-08-28 | 2022-05-29 | 2022-02-27 | 2021-11-28 | 2021-08-29 | 2021-05-30 | 2021-02-28 | 2020-11-29 | 2020-08-23 | 2020-05-24 | 2020-02-23 | 2019-11-24 | 2019-08-25 | 2019-05-26 | 2019-02-24 | 2018-11-25 | 2018-08-26 | 2018-05-27 | 2018-02-25 | 2017-11-26 | 2017-08-27 | 2017-05-28 | 2017-02-26 | 2016-11-27 | 2016-08-28 | 2016-05-29 | 2016-02-28 | 2015-11-29 | 2015-08-30 | 2015-05-31 | 2015-03-01 | 2014-11-30 | 2014-08-24 | 2014-05-25 | 2014-02-23 | 2013-11-24 | 2013-08-25 | 2013-05-26 | 2013-02-24 | 2012-11-25 | 2012-08-26 | 2012-05-27 | 2012-02-26 | 2011-11-27 | 2011-08-28 | 2011-05-29 | 2011-02-27 | 2010-11-28 | 2010-08-29 | ||
|---|---|---|---|---|---|---|---|---|---|---|---|---|---|---|---|---|---|---|---|---|---|---|---|---|---|---|---|---|---|---|---|---|---|---|---|---|---|---|---|---|---|---|---|---|---|---|---|---|---|---|---|---|---|---|
| Net Cash Provided By Used In Investing Activities | -79.40 | -62.40 | -19.10 | -8.64 | -91.91 | -56.95 | -78.20 | -444.07 | -57.30 | -35.55 | -34.89 | -70.83 | -10.17 | 11.72 | -119.28 | -44.97 | -55.19 | -62.97 | -80.21 | -59.68 | -40.41 | -38.00 | -41.30 | -48.78 | -26.80 | -32.81 | -16.00 | -32.20 | -23.19 | 4.80 | -17.76 | -27.24 | -17.59 | -10.90 | -25.10 | -25.90 | -18.73 | -12.68 | -14.55 | -29.42 | -15.44 | -24.39 | -23.55 | -24.97 | -16.39 | -13.18 | -20.66 | -26.35 | -33.66 | -34.80 | -46.15 | -54.51 | NA | |
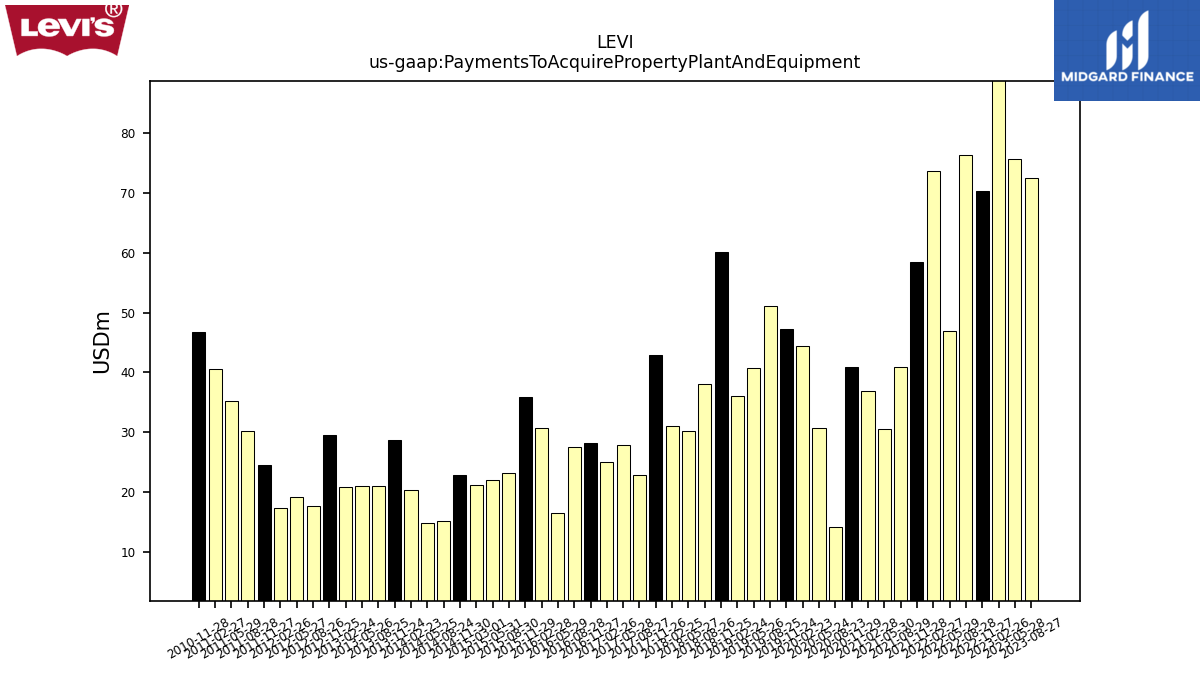
| Payments To Acquire Property Plant And Equipment | 72.40 | 75.70 | 110.90 | 70.32 | 76.27 | 46.92 | 73.59 | 58.51 | 40.93 | 30.52 | 36.99 | 40.90 | 14.28 | 30.79 | 44.42 | 47.31 | 51.08 | 40.81 | 36.15 | 60.15 | 38.11 | 30.16 | 31.00 | 42.98 | 22.90 | 27.82 | 25.07 | 28.15 | 27.57 | 16.48 | 30.75 | 35.90 | 23.24 | 22.01 | 21.15 | 22.93 | 15.14 | 14.89 | 20.43 | 28.77 | 21.11 | 21.01 | 20.88 | 29.55 | 17.74 | 19.28 | 17.29 | 24.57 | 30.30 | 35.22 | 40.50 | 46.76 | NA |
| 2023-08-27 | 2023-05-28 | 2023-02-26 | 2022-11-27 | 2022-08-28 | 2022-05-29 | 2022-02-27 | 2021-11-28 | 2021-08-29 | 2021-05-30 | 2021-02-28 | 2020-11-29 | 2020-08-23 | 2020-05-24 | 2020-02-23 | 2019-11-24 | 2019-08-25 | 2019-05-26 | 2019-02-24 | 2018-11-25 | 2018-08-26 | 2018-05-27 | 2018-02-25 | 2017-11-26 | 2017-08-27 | 2017-05-28 | 2017-02-26 | 2016-11-27 | 2016-08-28 | 2016-05-29 | 2016-02-28 | 2015-11-29 | 2015-08-30 | 2015-05-31 | 2015-03-01 | 2014-11-30 | 2014-08-24 | 2014-05-25 | 2014-02-23 | 2013-11-24 | 2013-08-25 | 2013-05-26 | 2013-02-24 | 2012-11-25 | 2012-08-26 | 2012-05-27 | 2012-02-26 | 2011-11-27 | 2011-08-28 | 2011-05-29 | 2011-02-27 | 2010-11-28 | 2010-08-29 | ||
|---|---|---|---|---|---|---|---|---|---|---|---|---|---|---|---|---|---|---|---|---|---|---|---|---|---|---|---|---|---|---|---|---|---|---|---|---|---|---|---|---|---|---|---|---|---|---|---|---|---|---|---|---|---|---|
| Net Cash Provided By Used In Financing Activities | -145.00 | -71.90 | 77.80 | -77.67 | -70.58 | -77.72 | -139.43 | -351.28 | -36.47 | -892.81 | 439.67 | -16.53 | -287.07 | 727.61 | -138.02 | -91.78 | 15.75 | 198.79 | -67.75 | -52.46 | -15.97 | -5.93 | -73.86 | -39.33 | 0.07 | -69.98 | -42.50 | -57.89 | -66.61 | 24.52 | -73.57 | -32.03 | 4.54 | 29.13 | -96.53 | -184.48 | -7.15 | -143.09 | -6.95 | -2.79 | -9.21 | -142.51 | -76.00 | -2.71 | -36.08 | -158.62 | -53.54 | 25.39 | 72.44 | 2.24 | -22.37 | 7.05 | NA | |
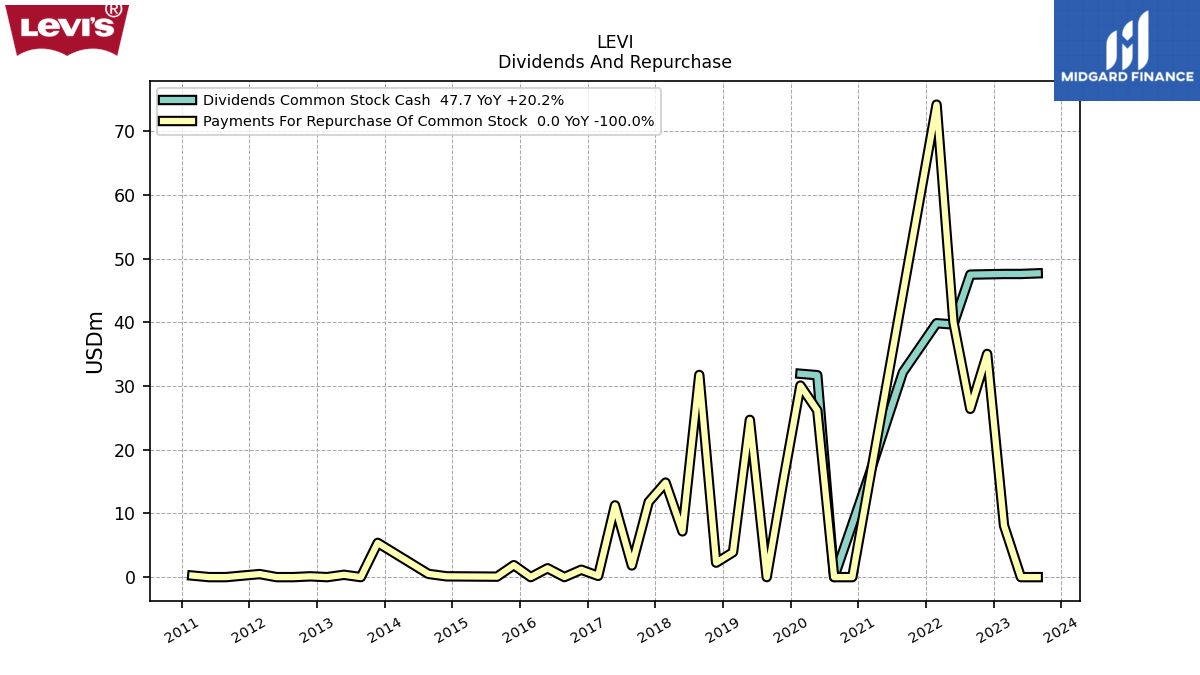
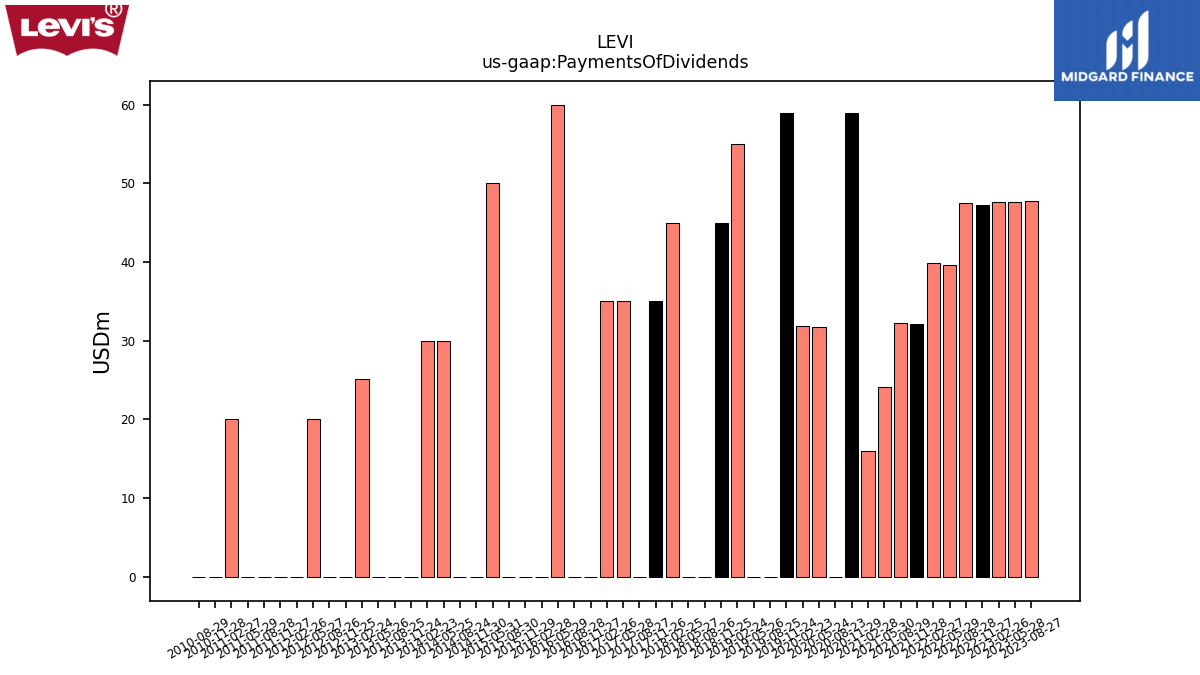
| Payments Of Dividends | 47.70 | 47.60 | 47.60 | 47.27 | 47.50 | 39.60 | 39.86 | 32.17 | 32.20 | 24.10 | 15.99 | 58.90 | 0.00 | 31.71 | 31.93 | 58.90 | 0.00 | 0.00 | 55.00 | 45.00 | 0.00 | 0.00 | 45.00 | 35.00 | 0.00 | 35.00 | 35.00 | 0.00 | 0.00 | 60.00 | 0.00 | 0.00 | 0.00 | 50.00 | NA | 0.00 | 0.00 | 30.00 | 30.00 | 0.00 | 0.00 | -0.02 | 25.10 | 0.00 | 0.00 | 20.00 | 0.00 | 0.00 | 0.00 | 0.00 | 20.02 | 0.00 | 0.01 | |
| Payments For Repurchase Of Common Stock | 0.00 | 0.00 | 8.10 | 35.05 | 26.42 | 40.04 | 74.19 | NA | NA | NA | NA | 0.00 | 0.00 | 26.17 | 30.07 | 15.37 | 0.00 | 24.70 | 3.91 | 2.27 | 31.75 | 7.18 | 14.84 | 11.81 | 1.83 | 11.27 | 0.19 | 1.16 | 0.01 | 1.39 | 0.00 | 1.88 | 0.07 | NA | NA | 0.13 | 0.51 | NA | NA | 5.38 | 0.00 | 0.36 | 0.00 | 0.12 | 0.00 | 0.00 | 0.48 | 0.24 | 0.00 | 0.00 | 0.24 | NA | NA |
| 2023-08-27 | 2023-05-28 | 2023-02-26 | 2022-11-27 | 2022-08-28 | 2022-05-29 | 2022-02-27 | 2021-11-28 | 2021-08-29 | 2021-05-30 | 2021-02-28 | 2020-11-29 | 2020-08-23 | 2020-05-24 | 2020-02-23 | 2019-11-24 | 2019-08-25 | 2019-05-26 | 2019-02-24 | 2018-11-25 | 2018-08-26 | 2018-05-27 | 2018-02-25 | 2017-11-26 | 2017-08-27 | 2017-05-28 | 2017-02-26 | 2016-11-27 | 2016-08-28 | 2016-05-29 | 2016-02-28 | 2015-11-29 | 2015-08-30 | 2015-05-31 | 2015-03-01 | 2014-11-30 | 2014-08-24 | 2014-05-25 | 2014-02-23 | 2013-11-24 | 2013-08-25 | 2013-05-26 | 2013-02-24 | 2012-11-25 | 2012-08-26 | 2012-05-27 | 2012-02-26 | 2011-11-27 | 2011-08-28 | 2011-05-29 | 2011-02-27 | 2010-11-28 | 2010-08-29 | ||
|---|---|---|---|---|---|---|---|---|---|---|---|---|---|---|---|---|---|---|---|---|---|---|---|---|---|---|---|---|---|---|---|---|---|---|---|---|---|---|---|---|---|---|---|---|---|---|---|---|---|---|---|---|---|---|
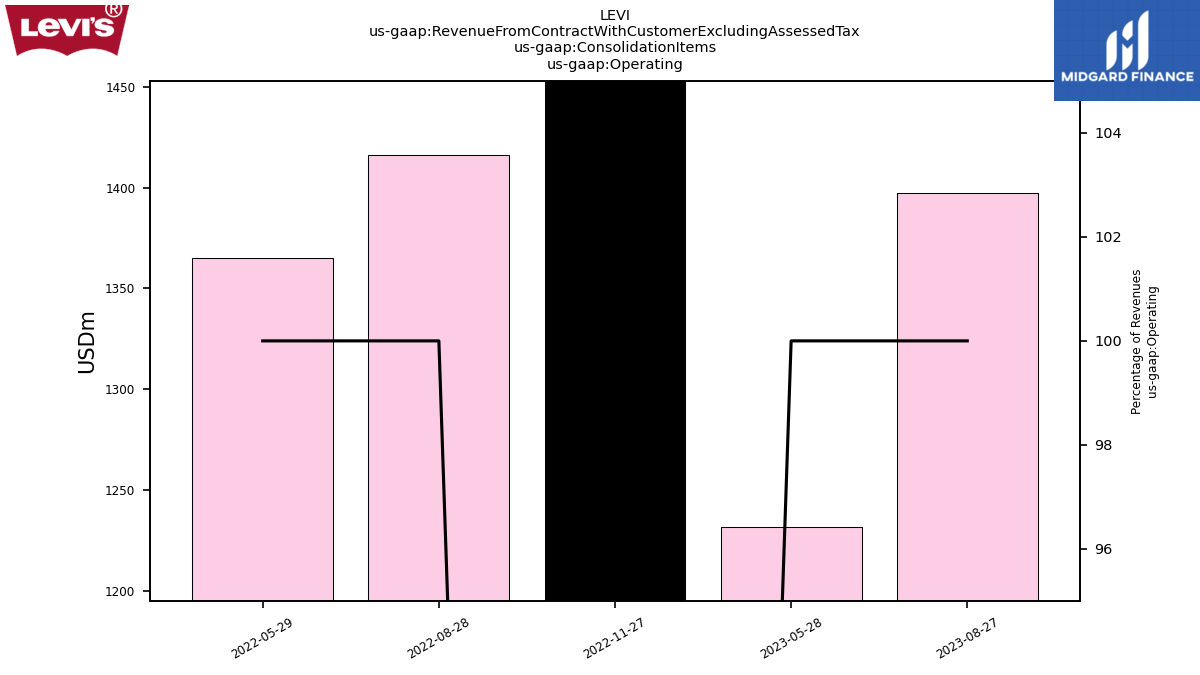
| Revenues | 1511.00 | 1336.80 | 1688.90 | 1588.74 | 1517.15 | 1471.15 | 1591.56 | 1684.78 | 1497.58 | 1275.97 | 1305.60 | 1385.86 | 1063.09 | 497.54 | 1506.13 | 1568.61 | 1447.08 | 1312.94 | 1434.46 | 1591.86 | 1394.15 | 1245.74 | 1343.68 | 1465.79 | 1268.39 | 1067.86 | 1101.99 | 1299.54 | 1185.11 | 1011.59 | 1056.50 | 1285.23 | 1142.01 | 1012.18 | 1055.08 | 1388.03 | 1154.13 | 1081.85 | 1129.99 | 1294.83 | 1141.28 | 1098.90 | 1146.68 | 1297.22 | 1100.86 | 1047.16 | 1164.96 | 1343.93 | 1204.02 | 1092.92 | 1120.69 | 1289.91 | 1109.01 | |
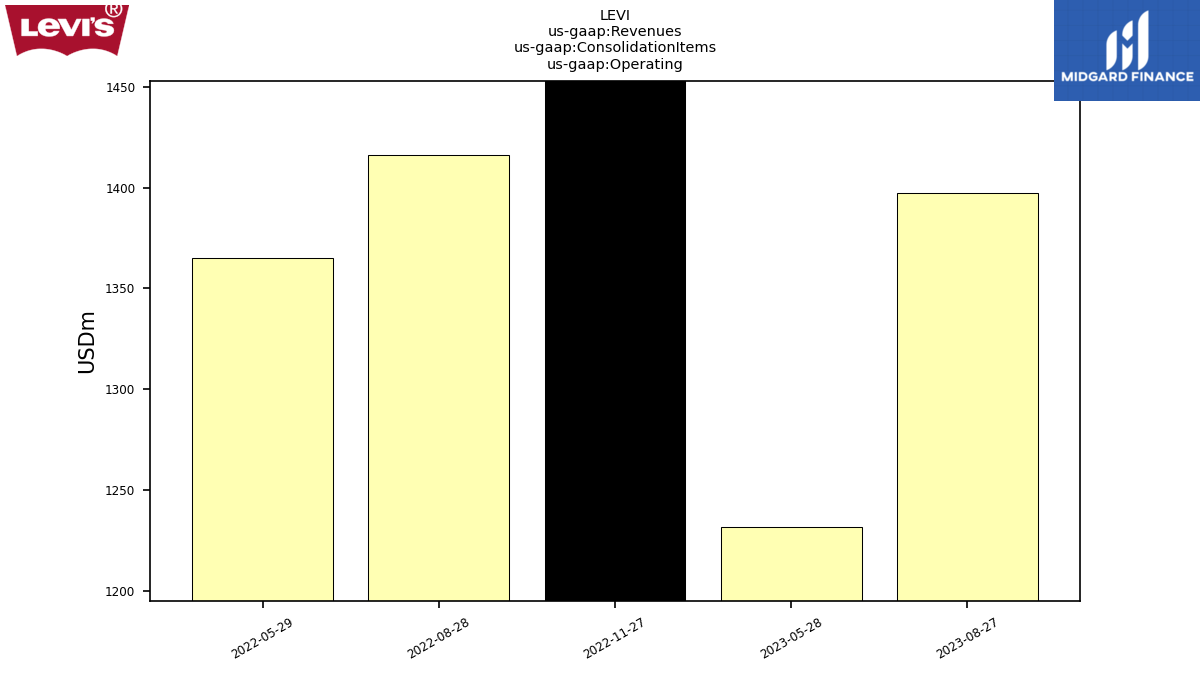
| Operating | 1397.30 | 1231.90 | NA | 1893.90 | 1416.00 | 1365.00 | NA | NA | NA | NA | NA | NA | NA | NA | NA | NA | NA | NA | NA | NA | NA | NA | NA | NA | NA | NA | NA | NA | NA | NA | NA | NA | NA | NA | NA | NA | NA | NA | NA | NA | NA | NA | NA | NA | NA | NA | NA | NA | NA | NA | NA | NA | NA | |
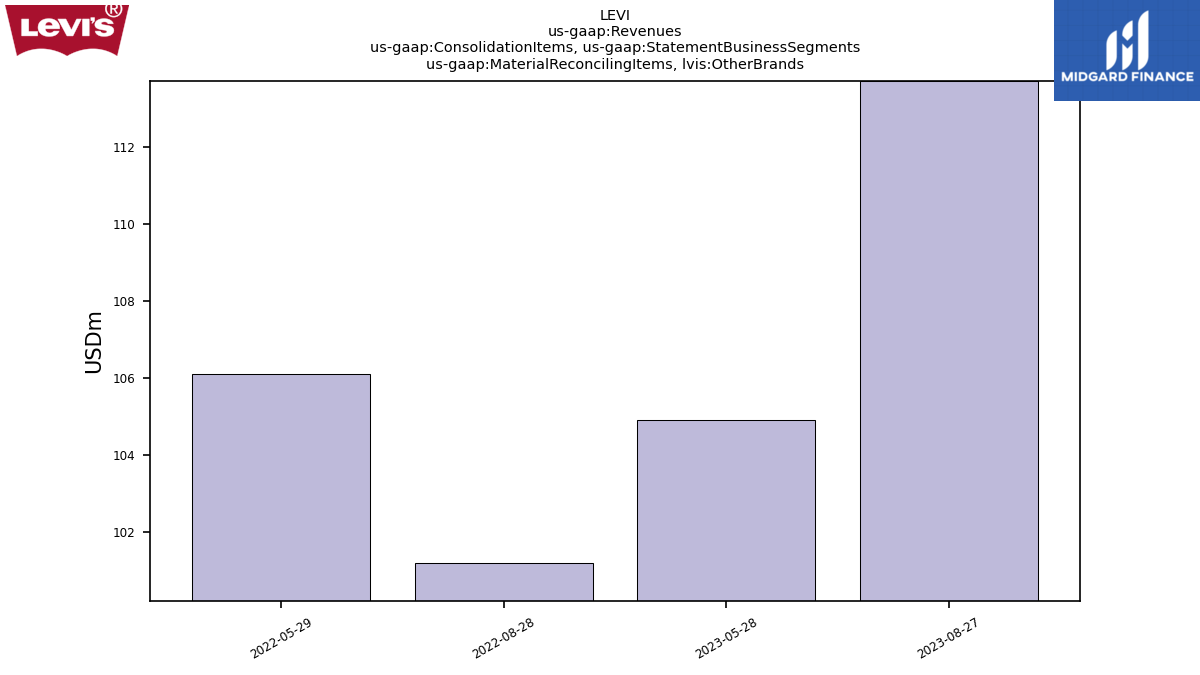
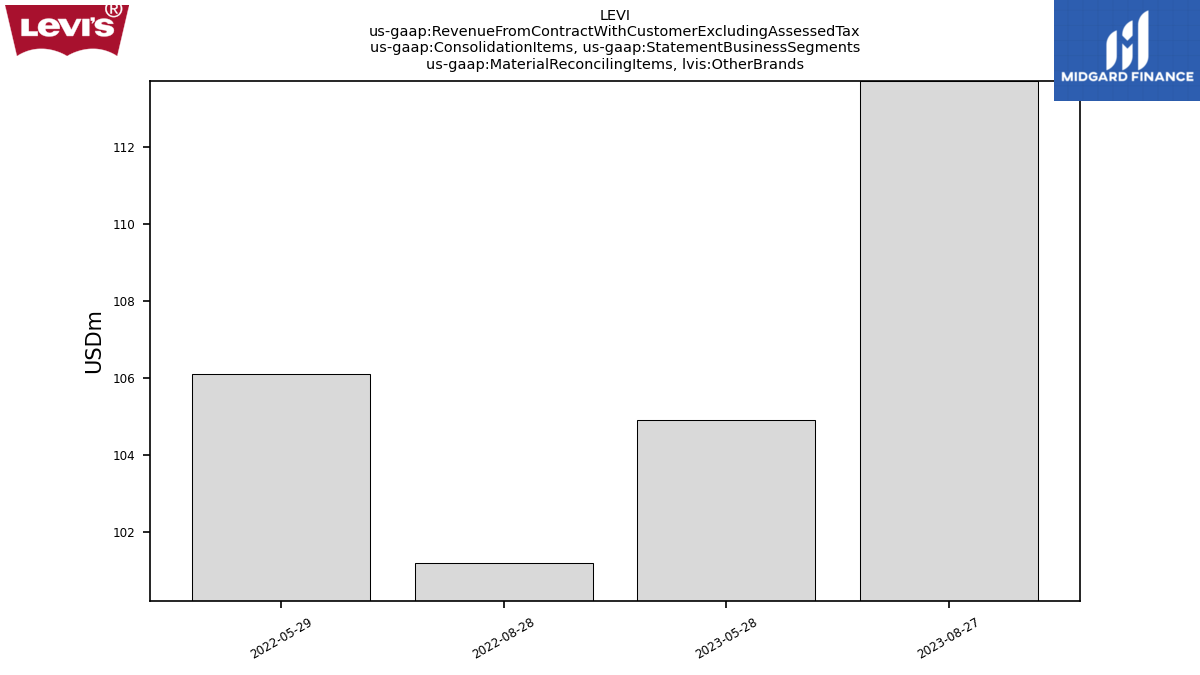
| Material Reconciling Items, Other Brands | 113.70 | 104.90 | NA | NA | 101.20 | 106.10 | NA | NA | NA | NA | NA | NA | NA | NA | NA | NA | NA | NA | NA | NA | NA | NA | NA | NA | NA | NA | NA | NA | NA | NA | NA | NA | NA | NA | NA | NA | NA | NA | NA | NA | NA | NA | NA | NA | NA | NA | NA | NA | NA | NA | NA | NA | NA | |
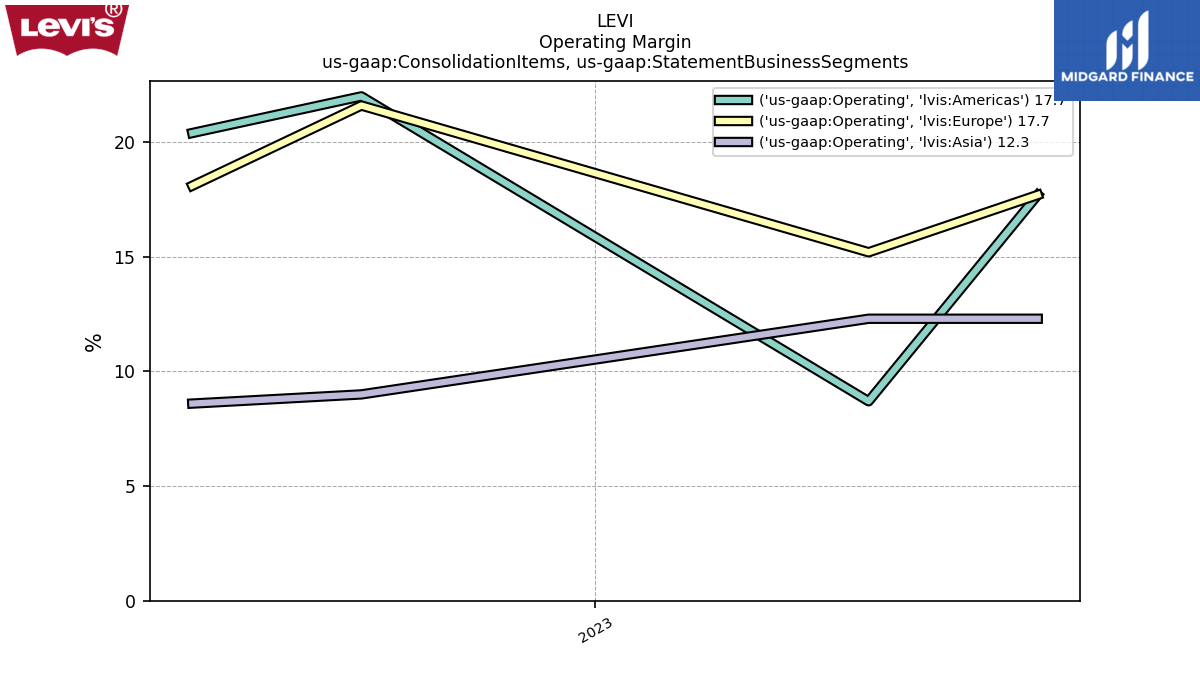
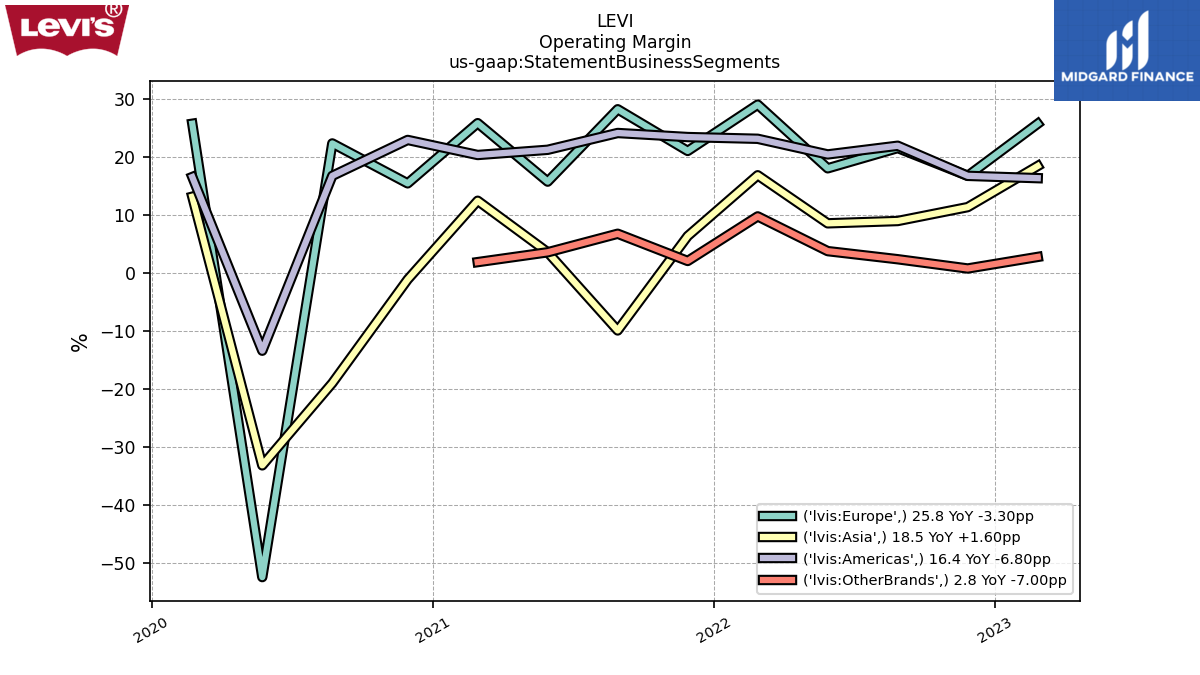
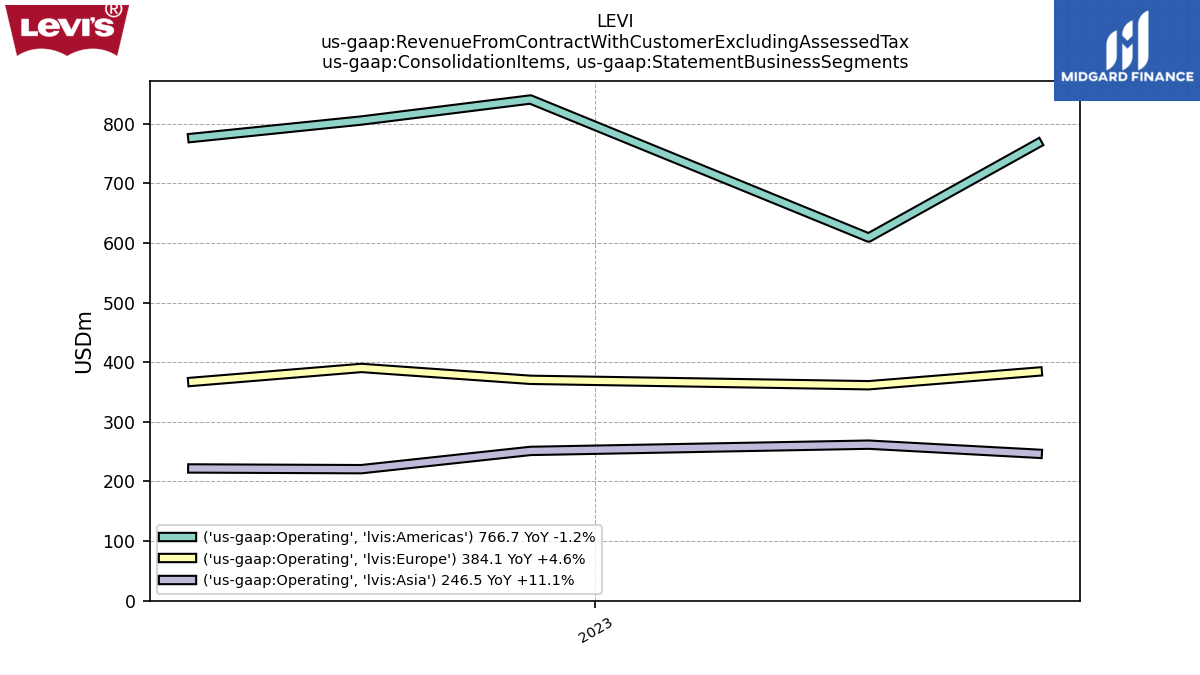
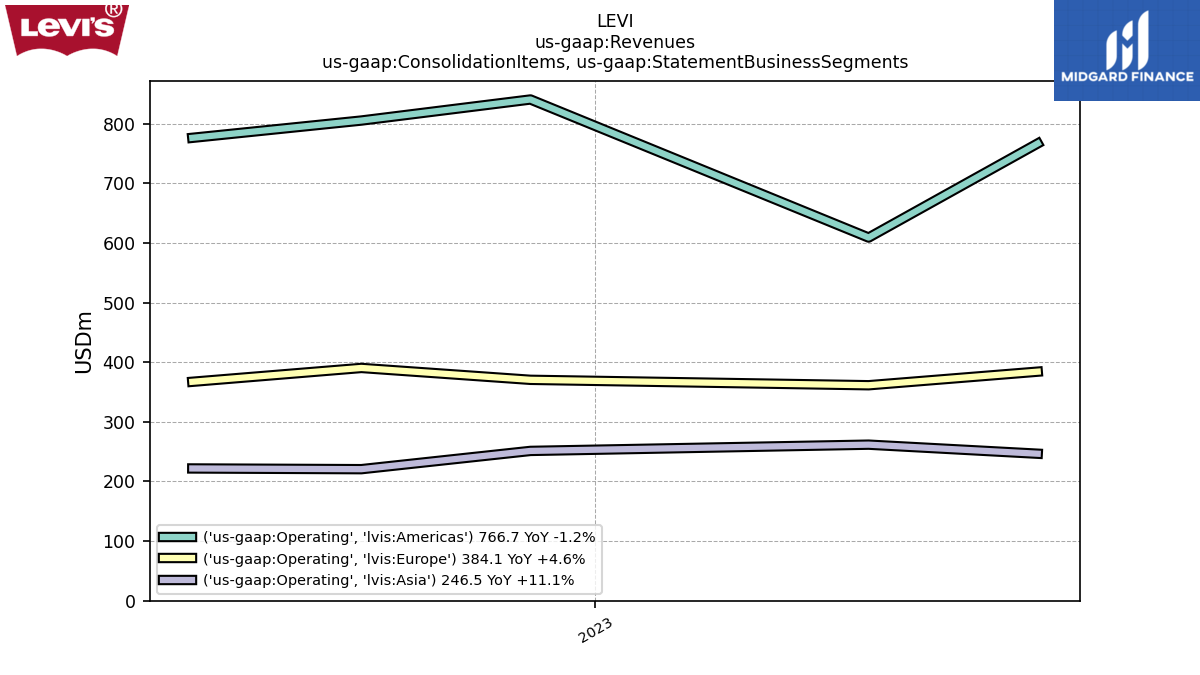
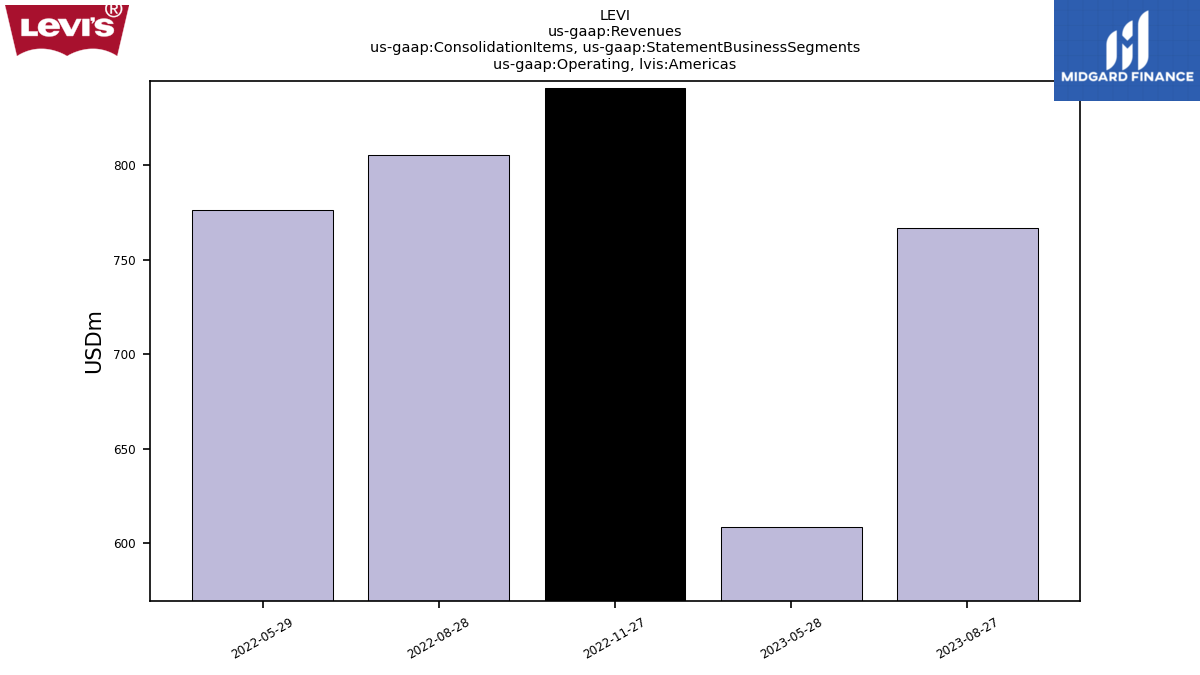
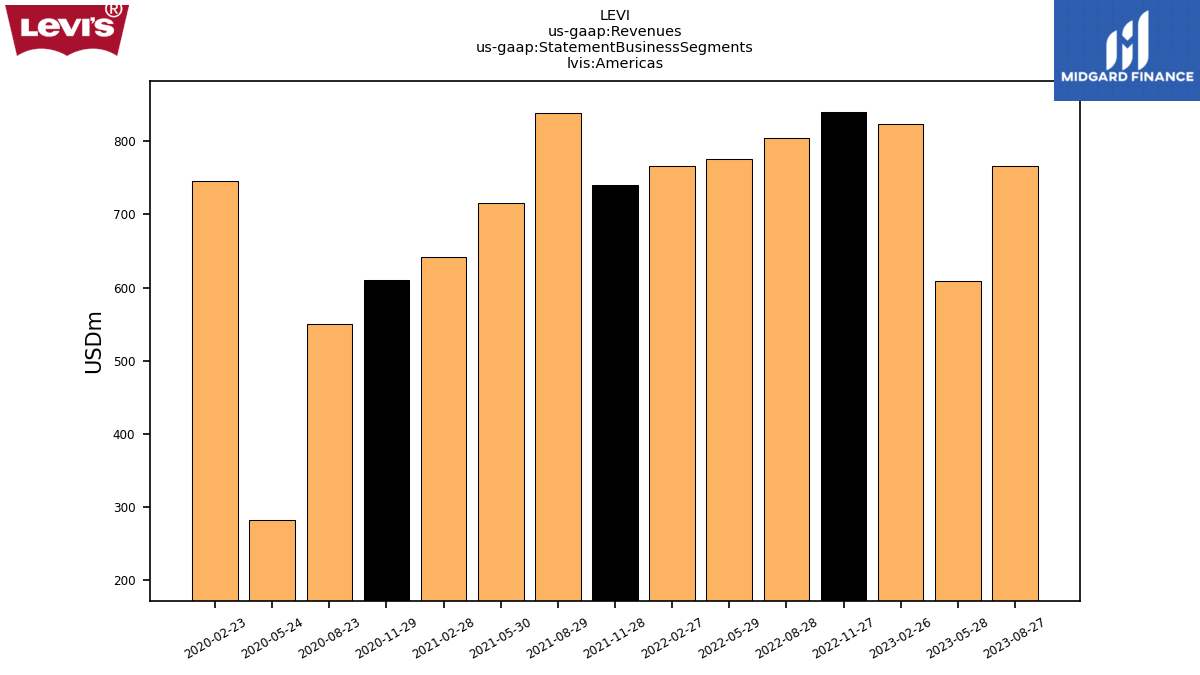
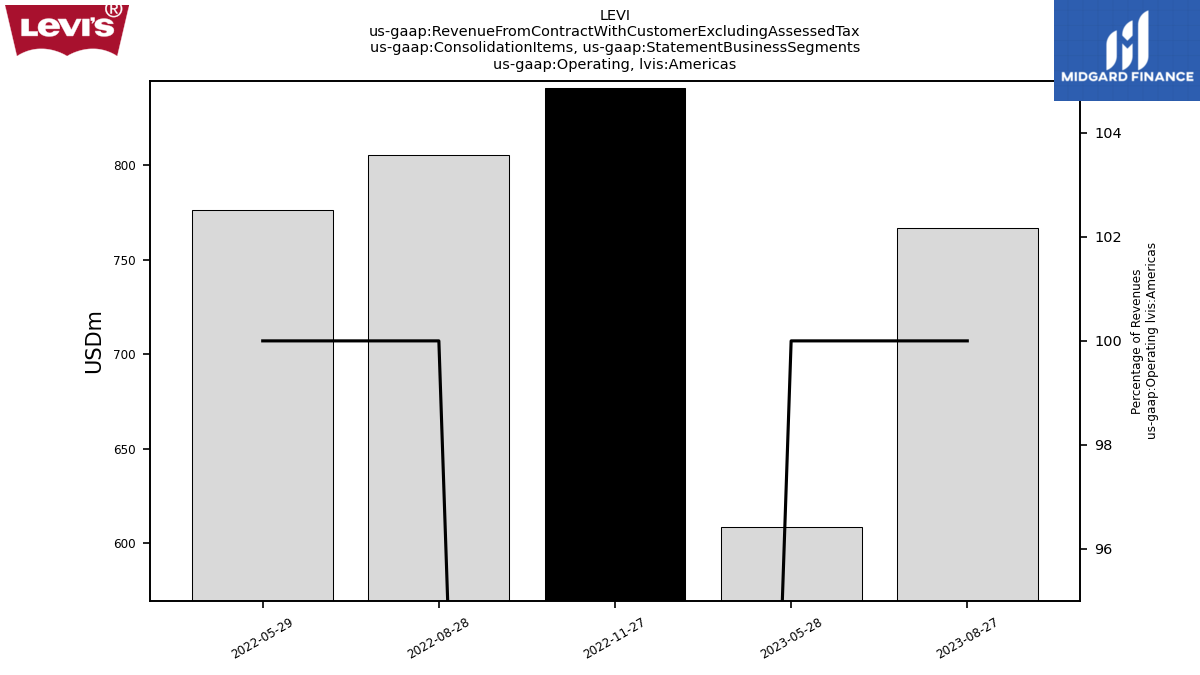
| Operating, Americas | 766.70 | 608.90 | NA | 840.40 | 805.10 | 776.10 | NA | NA | NA | NA | NA | NA | NA | NA | NA | NA | NA | NA | NA | NA | NA | NA | NA | NA | NA | NA | NA | NA | NA | NA | NA | NA | NA | NA | NA | NA | NA | NA | NA | NA | NA | NA | NA | NA | NA | NA | NA | NA | NA | NA | NA | NA | NA | |
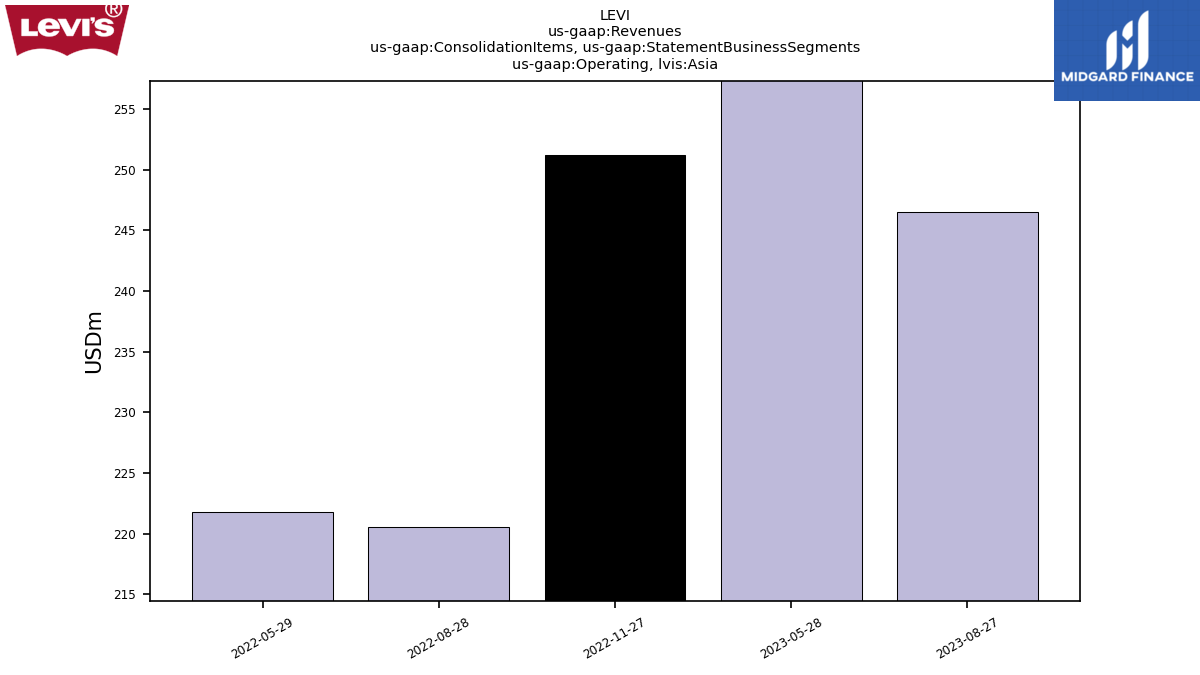
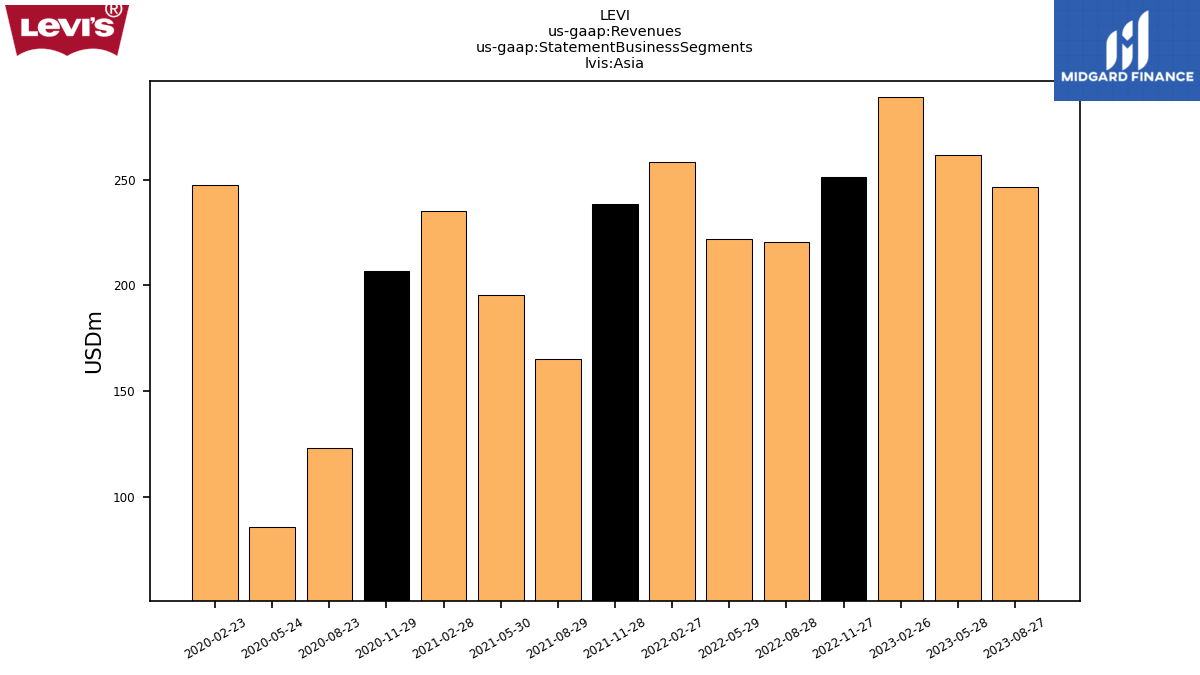
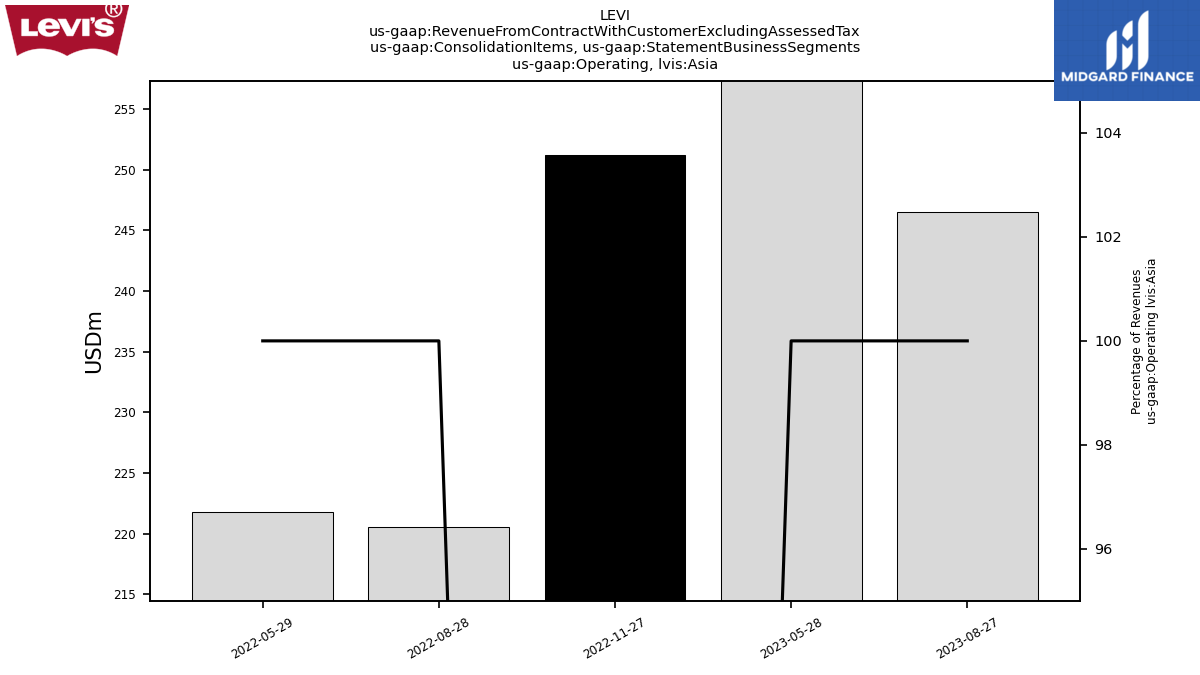
| Operating, Asia | 246.50 | 261.70 | NA | 251.20 | 220.60 | 221.80 | NA | NA | NA | NA | NA | NA | NA | NA | NA | NA | NA | NA | NA | NA | NA | NA | NA | NA | NA | NA | NA | NA | NA | NA | NA | NA | NA | NA | NA | NA | NA | NA | NA | NA | NA | NA | NA | NA | NA | NA | NA | NA | NA | NA | NA | NA | NA | |
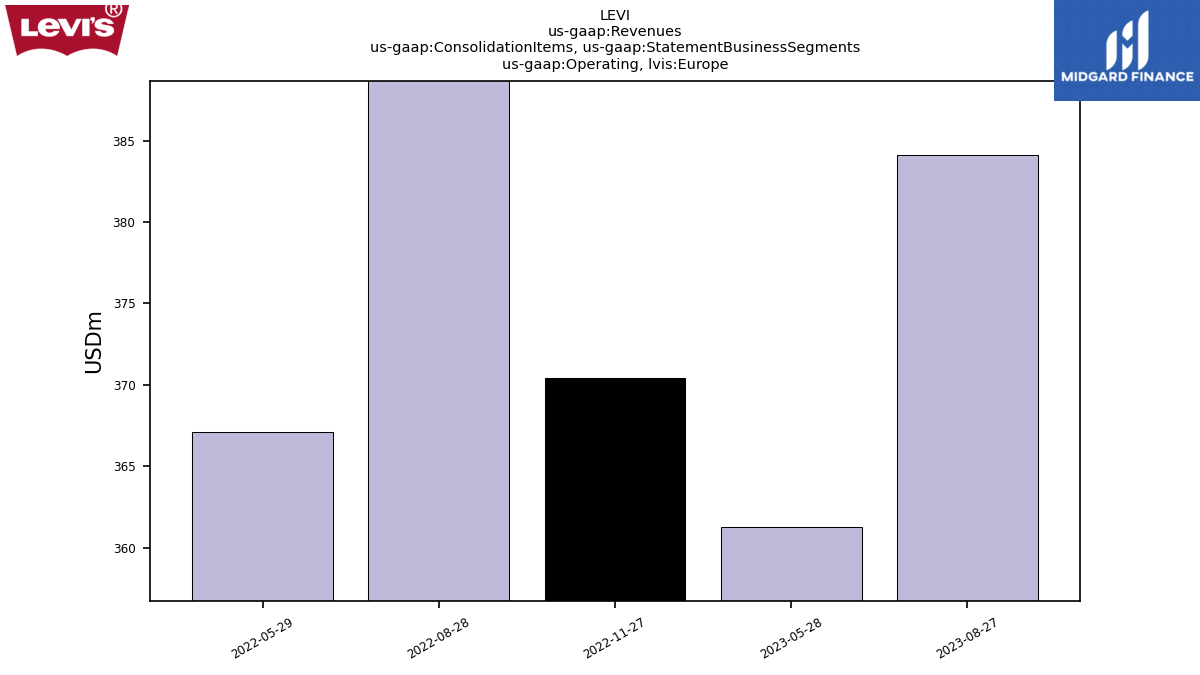
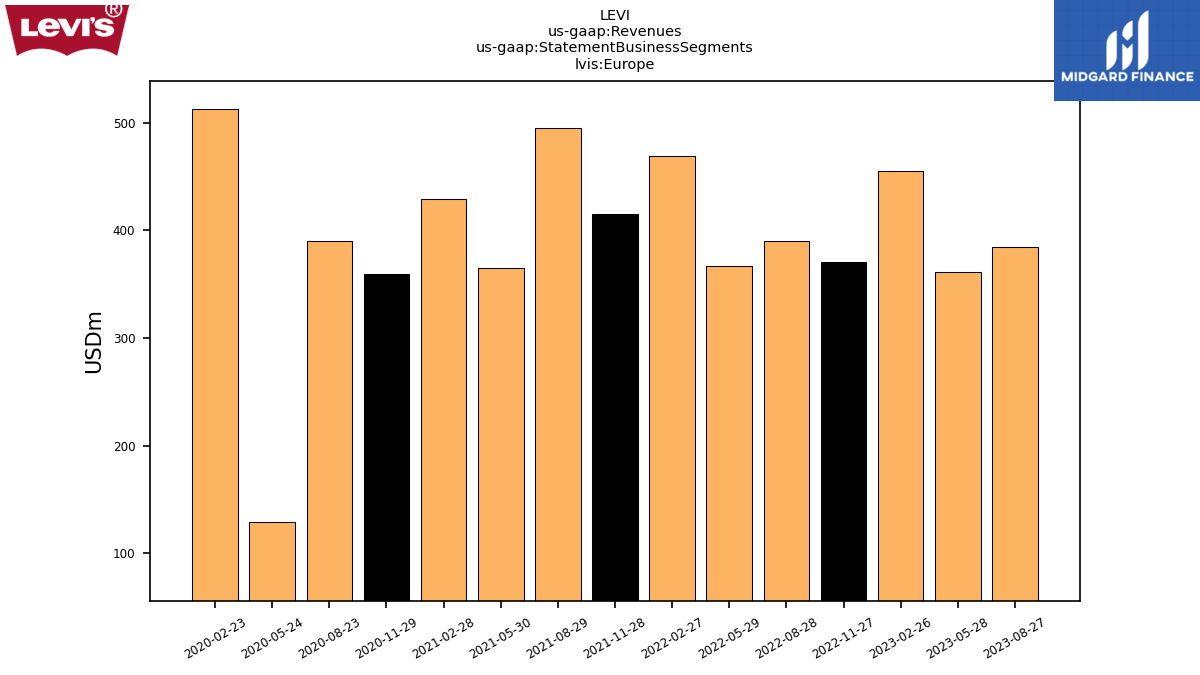
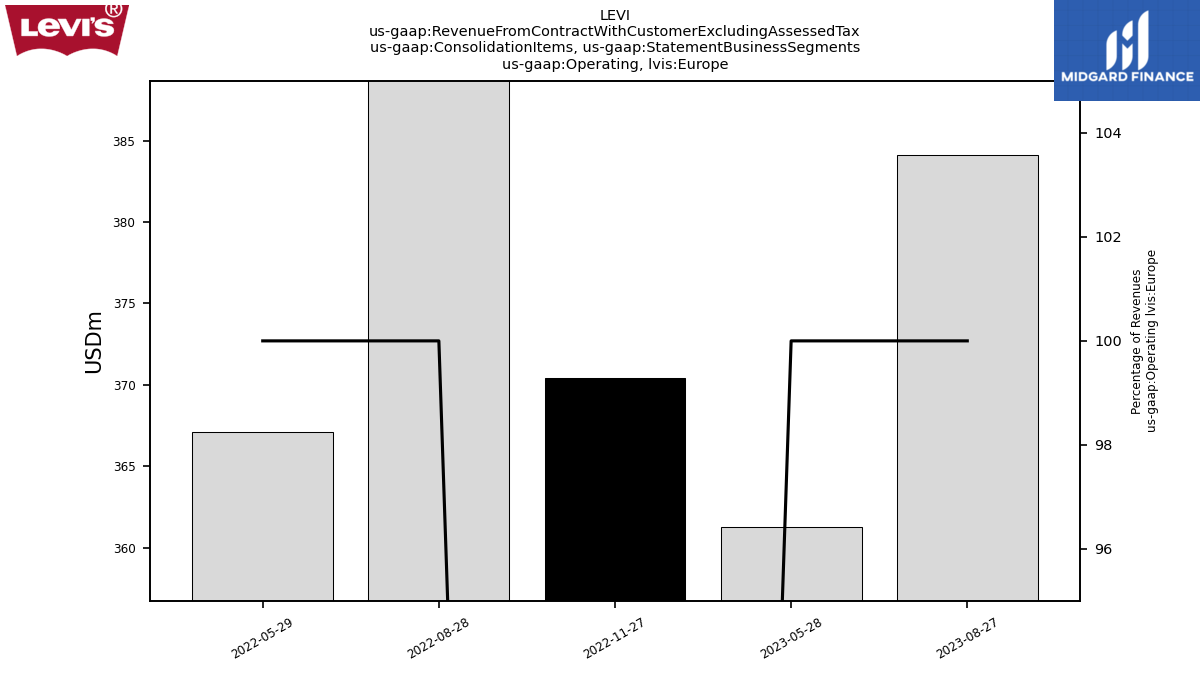
| Operating, Europe | 384.10 | 361.30 | NA | 370.40 | 390.30 | 367.10 | NA | NA | NA | NA | NA | NA | NA | NA | NA | NA | NA | NA | NA | NA | NA | NA | NA | NA | NA | NA | NA | NA | NA | NA | NA | NA | NA | NA | NA | NA | NA | NA | NA | NA | NA | NA | NA | NA | NA | NA | NA | NA | NA | NA | NA | NA | NA | |
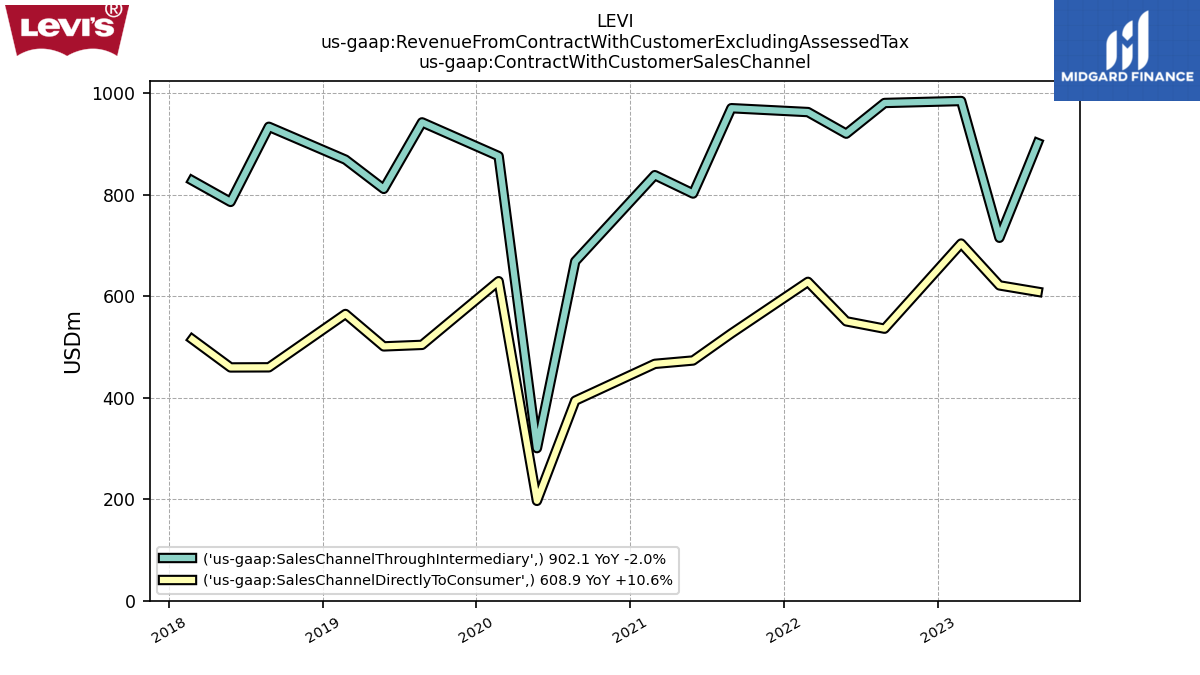
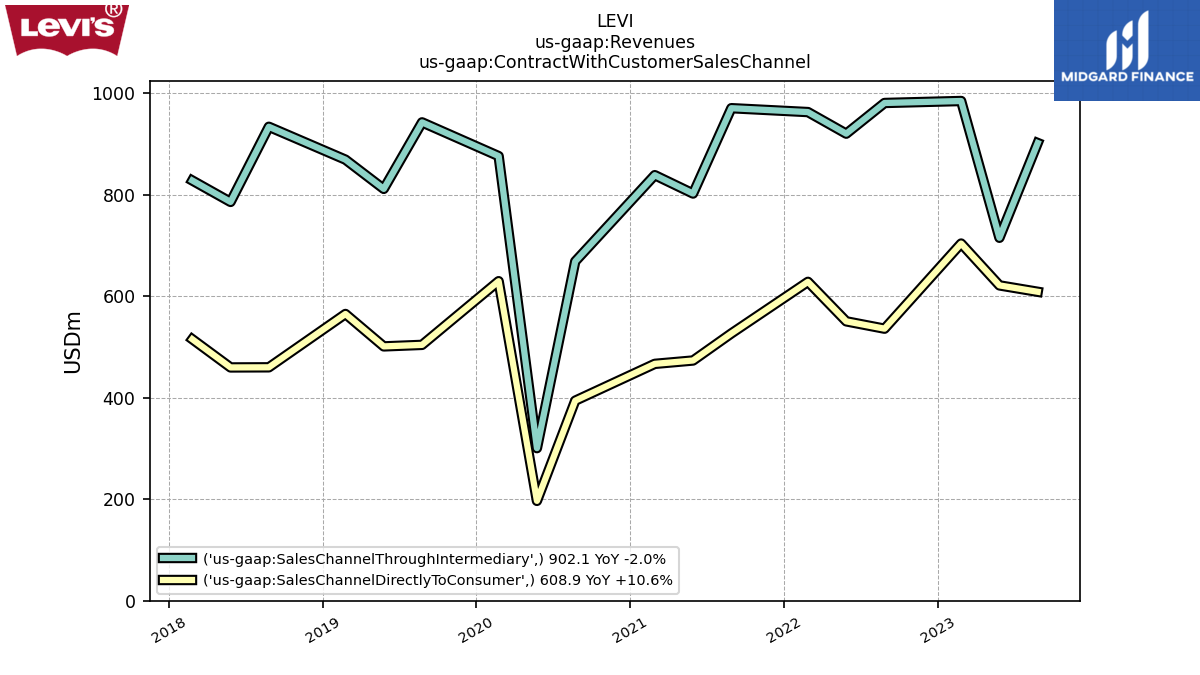
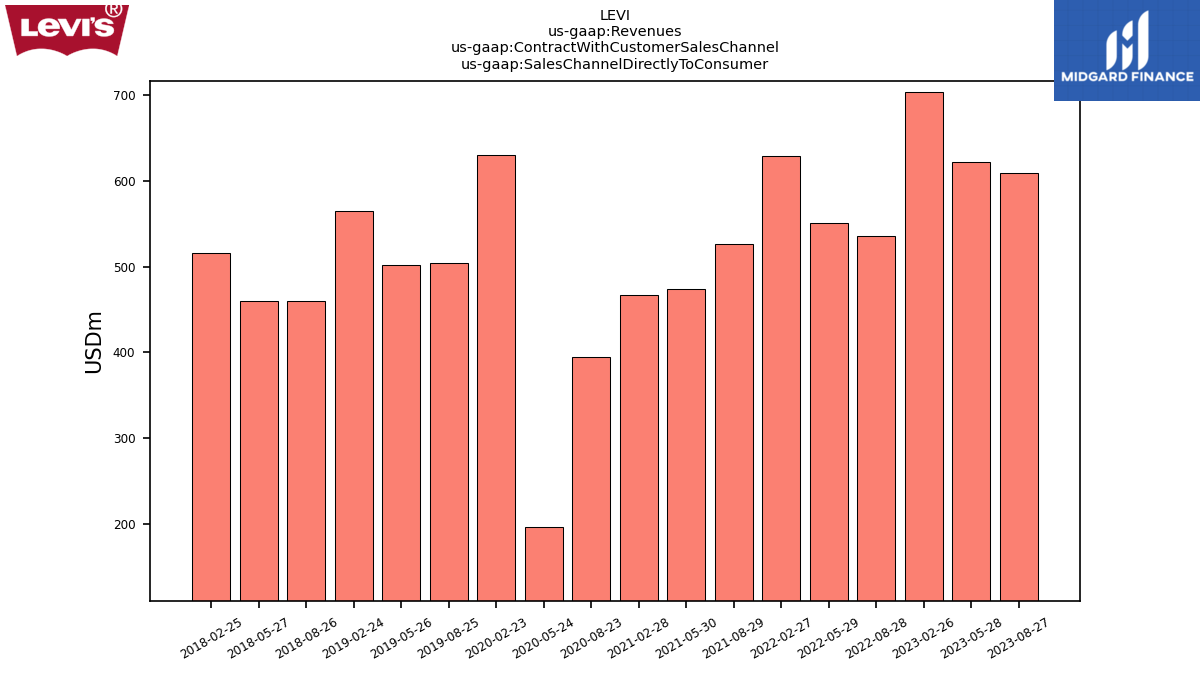
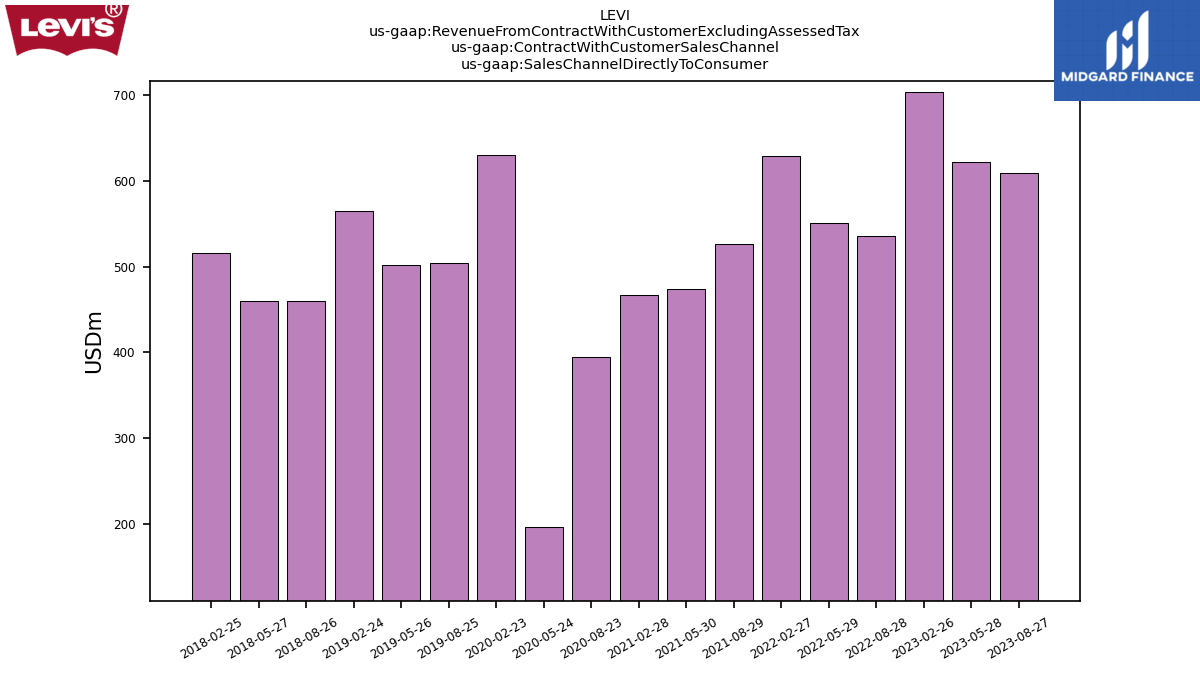
| Sales Channel Directly To Consumer | 608.90 | 621.50 | 704.00 | NA | 536.18 | 550.66 | 628.49 | NA | 526.87 | 473.49 | 466.84 | NA | 394.30 | 196.82 | 629.80 | NA | 504.27 | 501.27 | 565.15 | NA | 460.04 | 459.79 | 515.45 | NA | NA | NA | NA | NA | NA | NA | NA | NA | NA | NA | NA | NA | NA | NA | NA | NA | NA | NA | NA | NA | NA | NA | NA | NA | NA | NA | NA | NA | NA | |
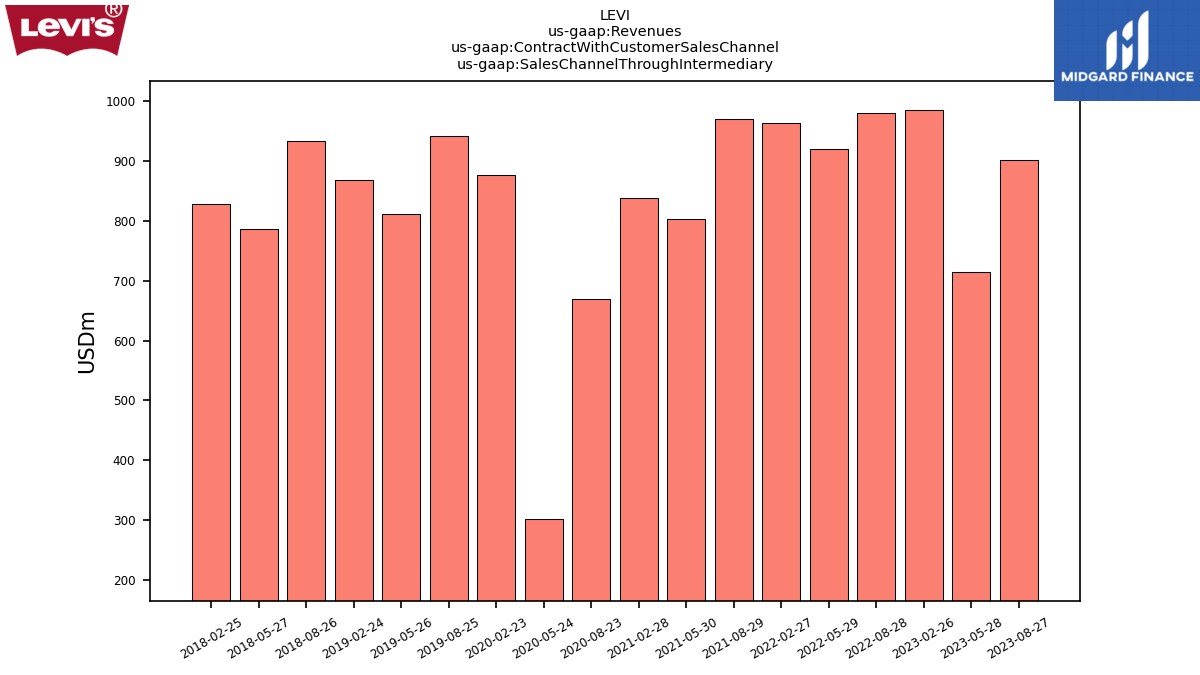
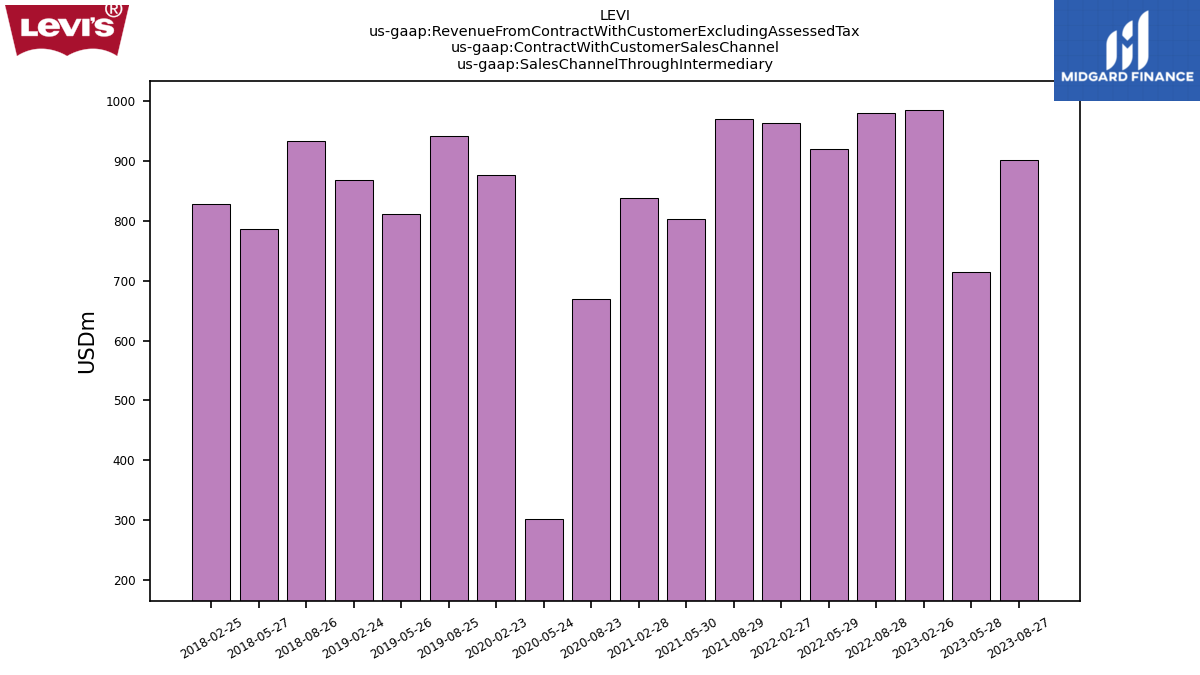
| Sales Channel Through Intermediary | 902.10 | 715.30 | 984.90 | NA | 980.97 | 920.49 | 963.07 | NA | 970.72 | 802.48 | 838.76 | NA | 668.79 | 300.73 | 876.32 | NA | 942.81 | 811.67 | 869.31 | NA | 934.11 | 785.95 | 828.24 | NA | NA | NA | NA | NA | NA | NA | NA | NA | NA | NA | NA | NA | NA | NA | NA | NA | NA | NA | NA | NA | NA | NA | NA | NA | NA | NA | NA | NA | NA | |
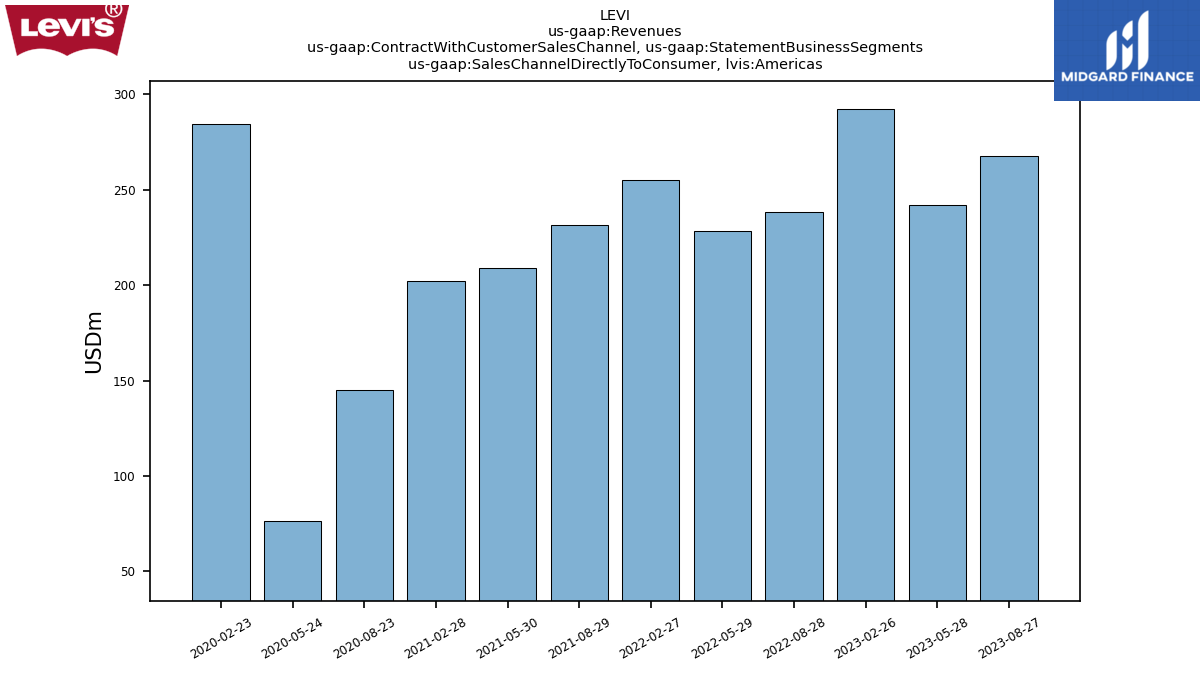
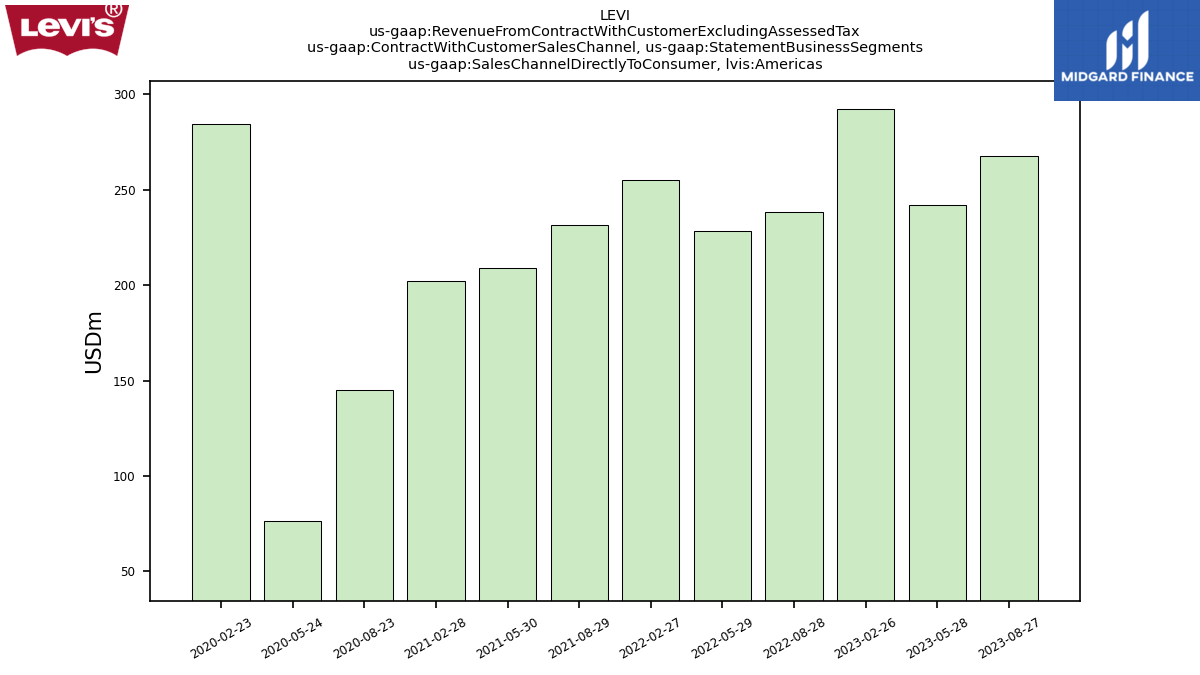
| Sales Channel Directly To Consumer, Americas | 267.60 | 242.20 | 292.40 | NA | 238.24 | 228.38 | 255.12 | NA | 231.68 | 208.88 | 201.98 | NA | 145.27 | 76.29 | 284.71 | NA | NA | NA | NA | NA | NA | NA | NA | NA | NA | NA | NA | NA | NA | NA | NA | NA | NA | NA | NA | NA | NA | NA | NA | NA | NA | NA | NA | NA | NA | NA | NA | NA | NA | NA | NA | NA | NA | |
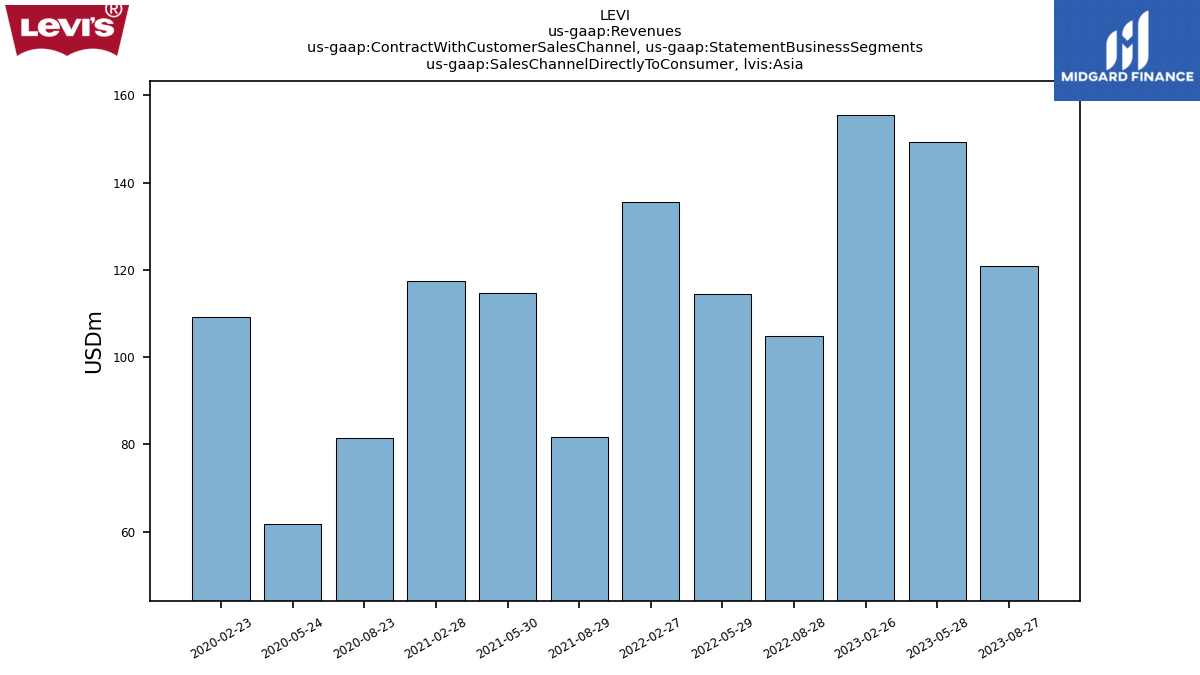
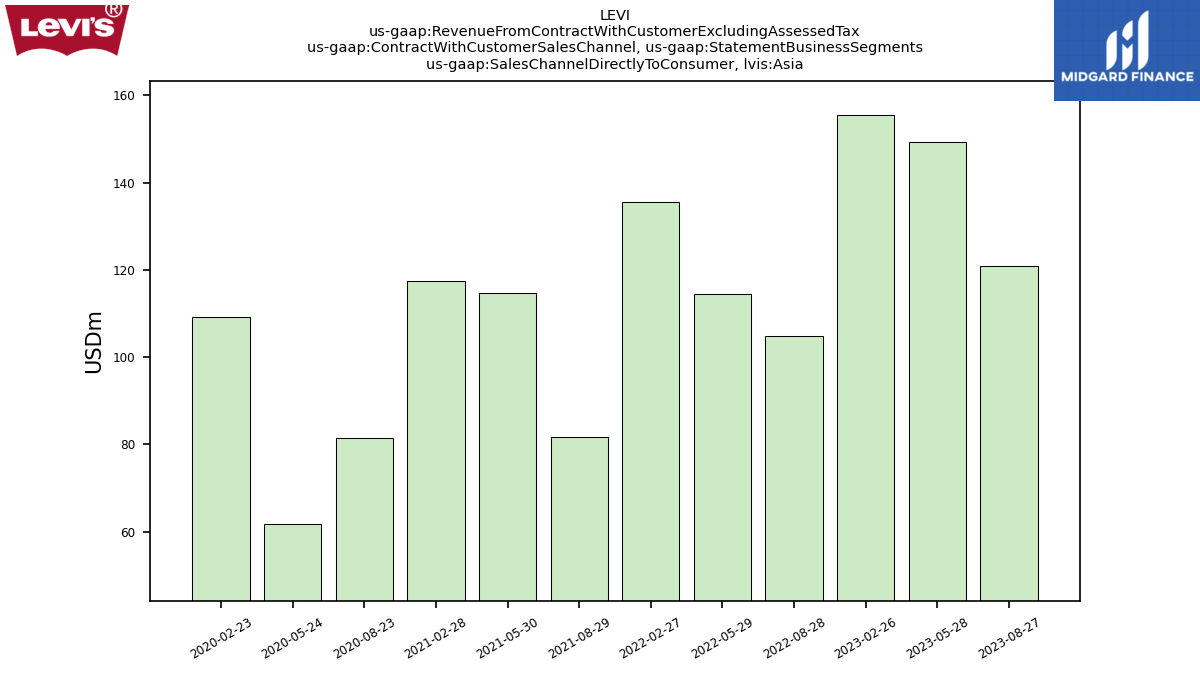
| Sales Channel Directly To Consumer, Asia | 120.90 | 149.40 | 155.50 | NA | 104.75 | 114.56 | 135.64 | NA | 81.60 | 114.73 | 117.47 | NA | 81.43 | 61.69 | 109.10 | NA | NA | NA | NA | NA | NA | NA | NA | NA | NA | NA | NA | NA | NA | NA | NA | NA | NA | NA | NA | NA | NA | NA | NA | NA | NA | NA | NA | NA | NA | NA | NA | NA | NA | NA | NA | NA | NA | |
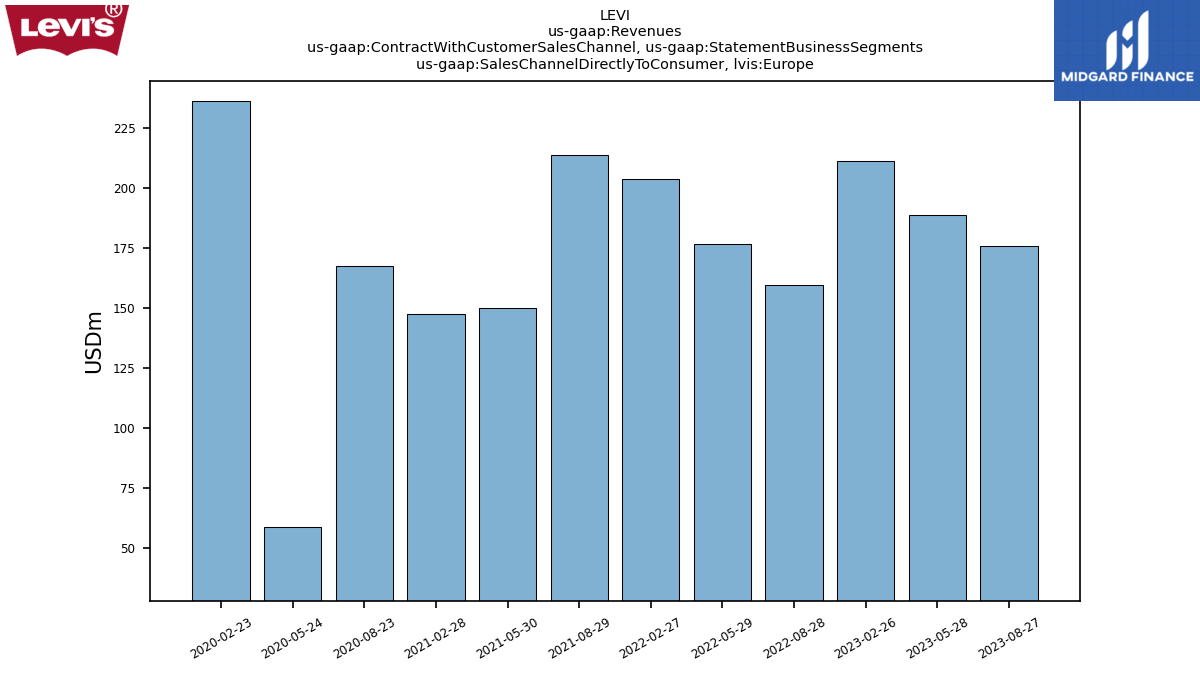
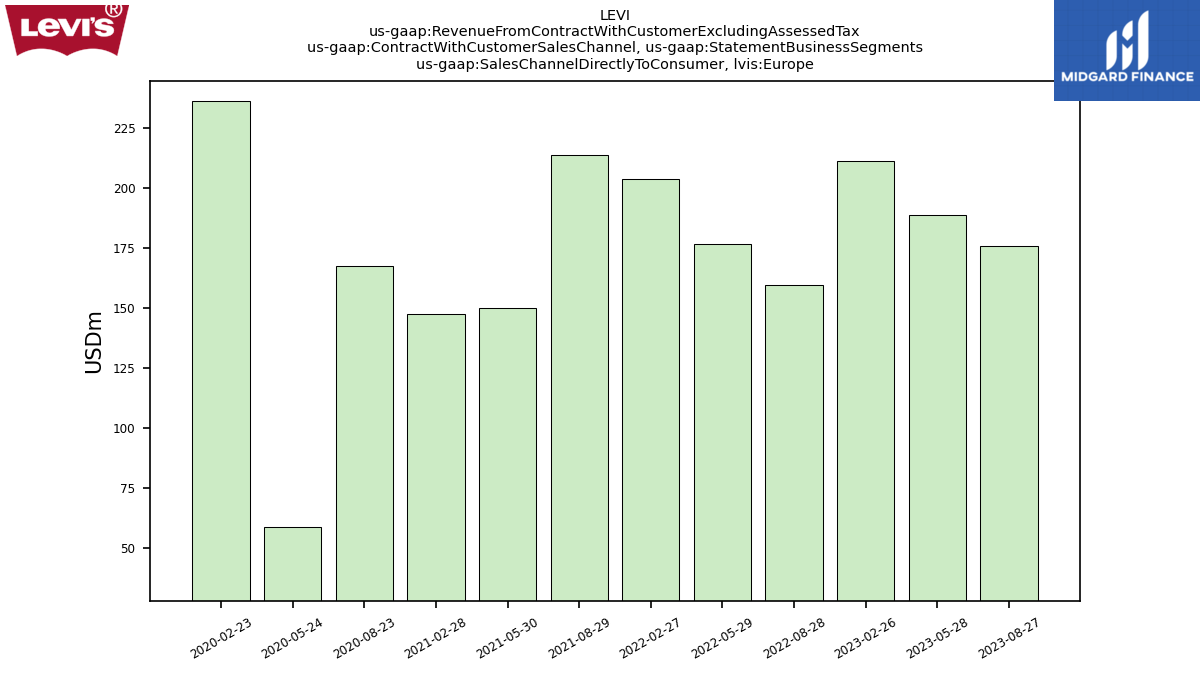
| Sales Channel Directly To Consumer, Europe | 175.80 | 188.80 | 211.00 | NA | 159.45 | 176.52 | 203.64 | NA | 213.58 | 149.87 | 147.40 | NA | 167.60 | 58.84 | 235.99 | NA | NA | NA | NA | NA | NA | NA | NA | NA | NA | NA | NA | NA | NA | NA | NA | NA | NA | NA | NA | NA | NA | NA | NA | NA | NA | NA | NA | NA | NA | NA | NA | NA | NA | NA | NA | NA | NA | |
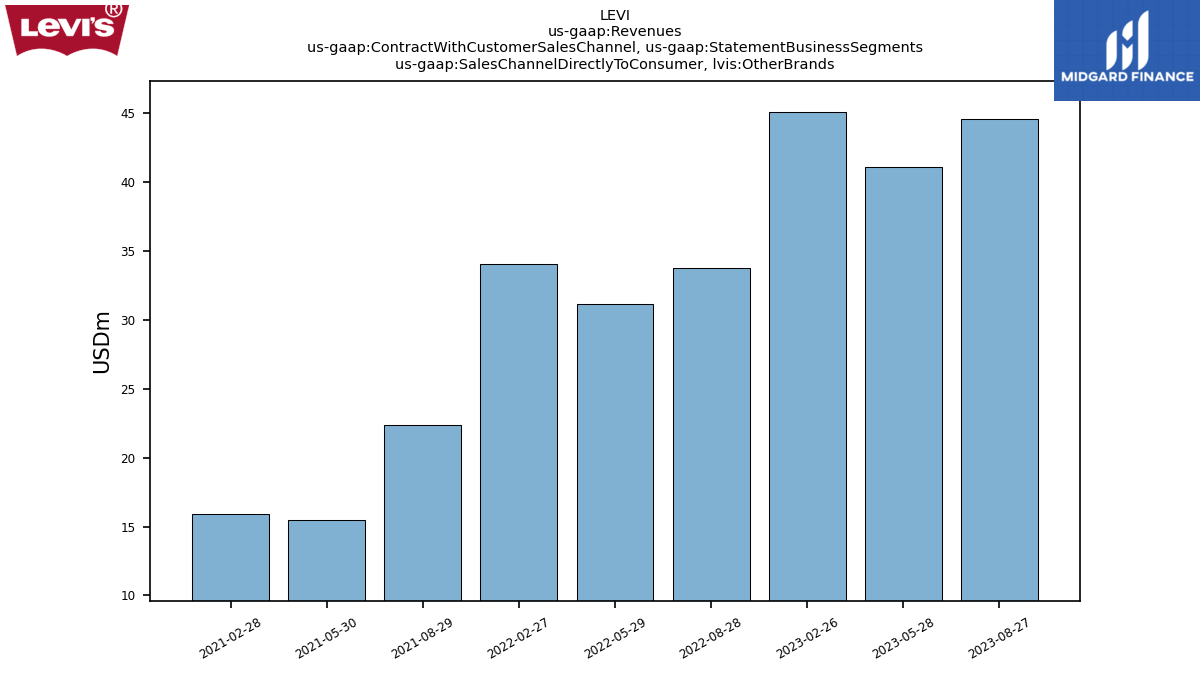
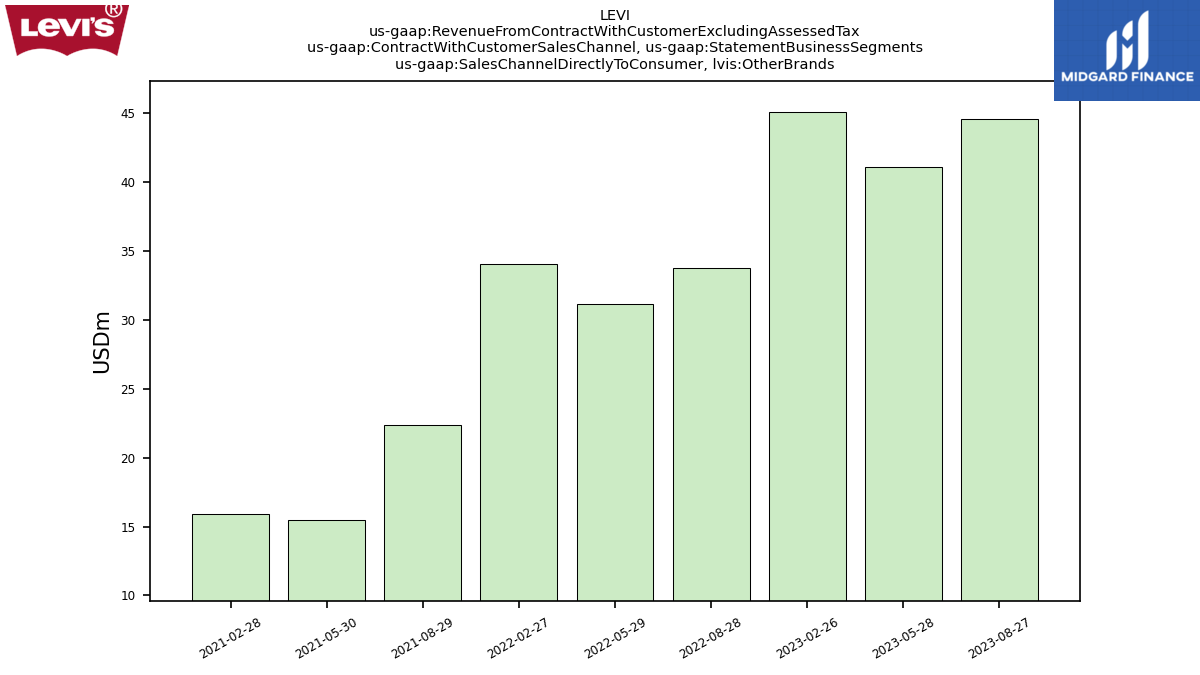
| Sales Channel Directly To Consumer, Other Brands | 44.60 | 41.10 | 45.10 | NA | 33.74 | 31.20 | 34.09 | NA | 22.41 | 15.45 | 15.89 | NA | NA | NA | NA | NA | NA | NA | NA | NA | NA | NA | NA | NA | NA | NA | NA | NA | NA | NA | NA | NA | NA | NA | NA | NA | NA | NA | NA | NA | NA | NA | NA | NA | NA | NA | NA | NA | NA | NA | NA | NA | NA | |
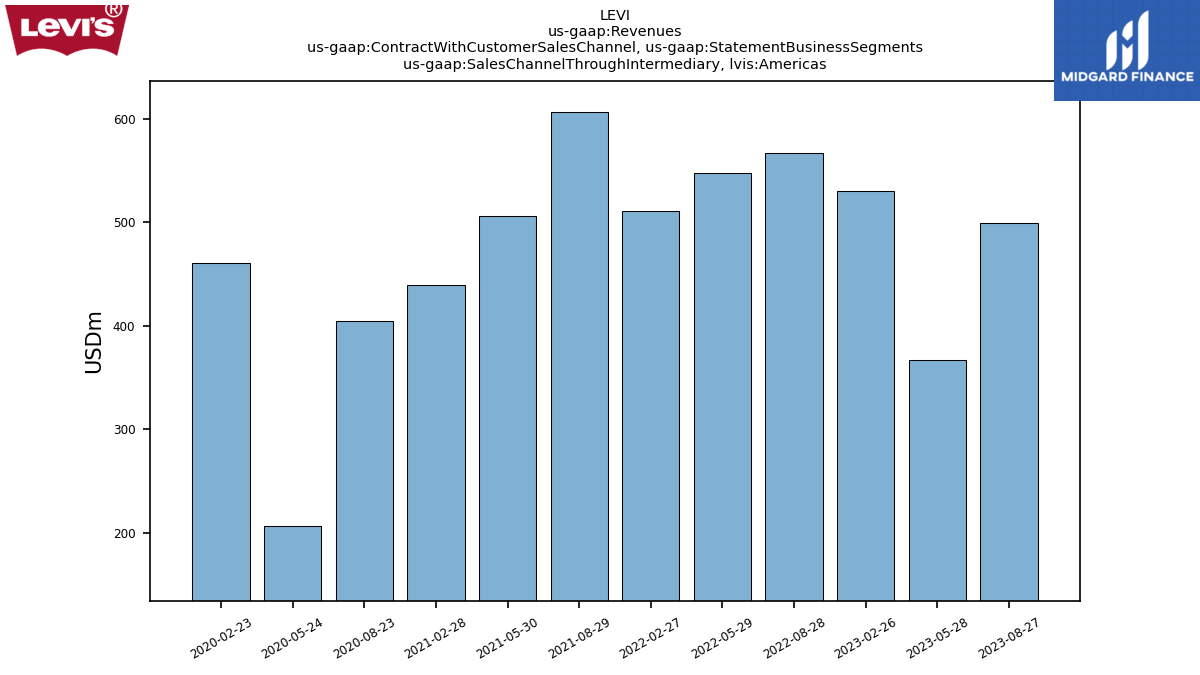
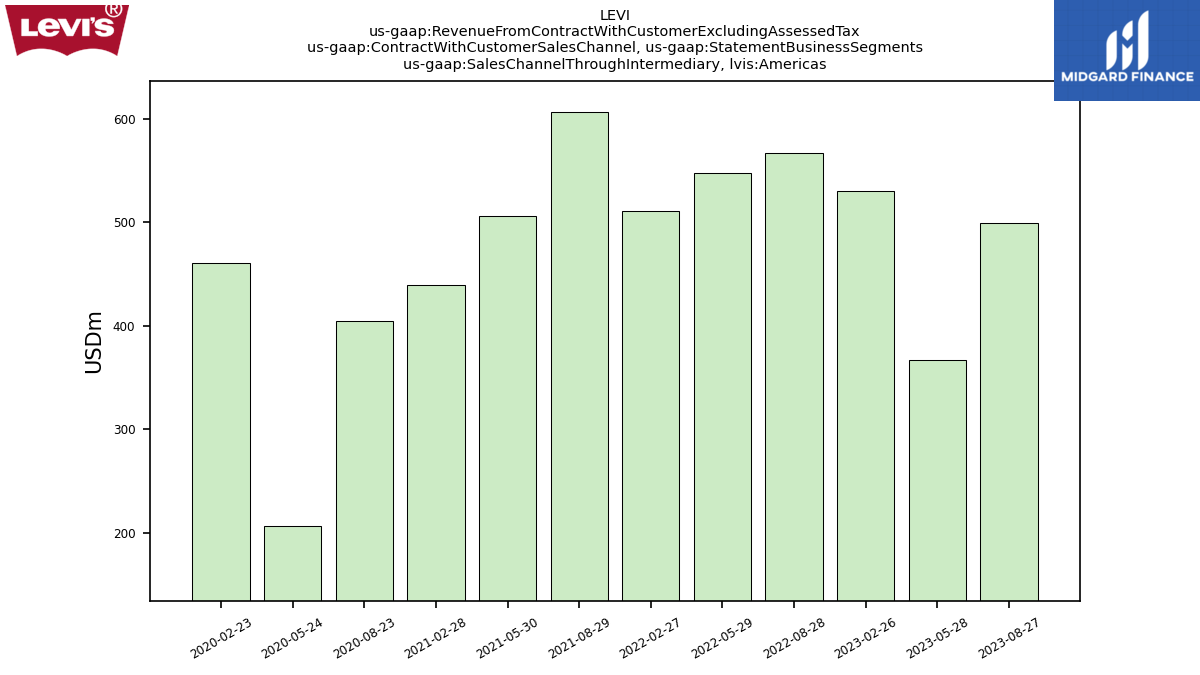
| Sales Channel Through Intermediary, Americas | 499.10 | 366.70 | 530.60 | NA | 566.84 | 547.72 | 510.74 | NA | 606.29 | 506.20 | 439.29 | NA | 404.53 | 206.44 | 460.87 | NA | NA | NA | NA | NA | NA | NA | NA | NA | NA | NA | NA | NA | NA | NA | NA | NA | NA | NA | NA | NA | NA | NA | NA | NA | NA | NA | NA | NA | NA | NA | NA | NA | NA | NA | NA | NA | NA | |
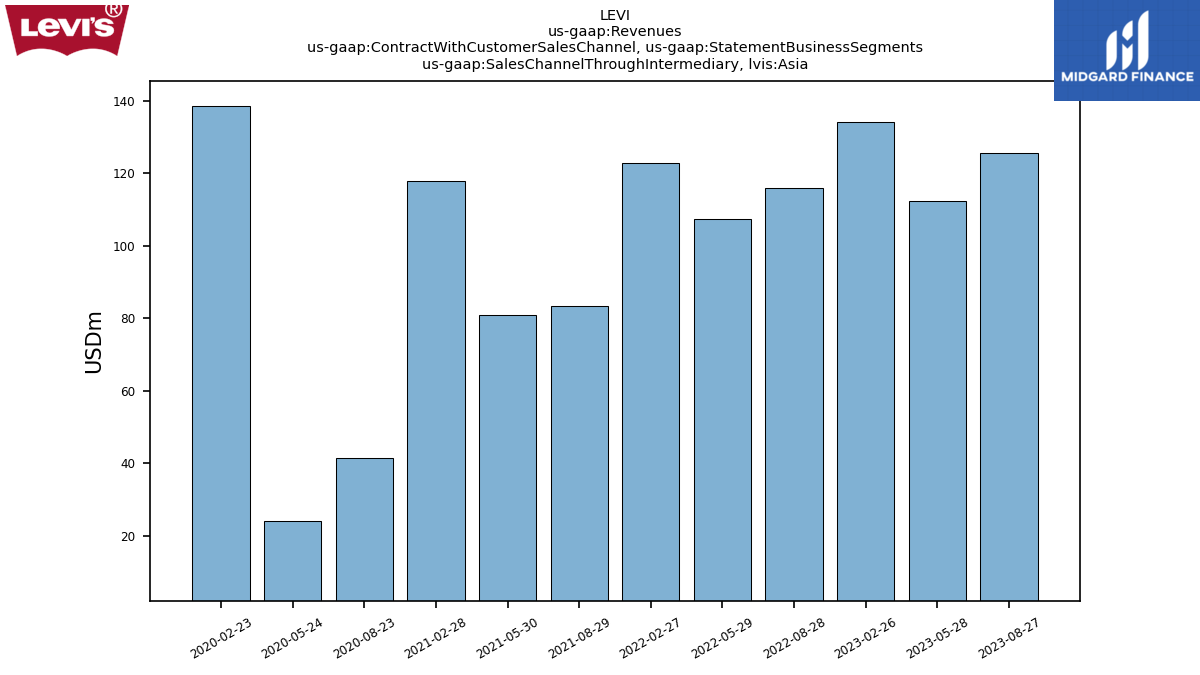
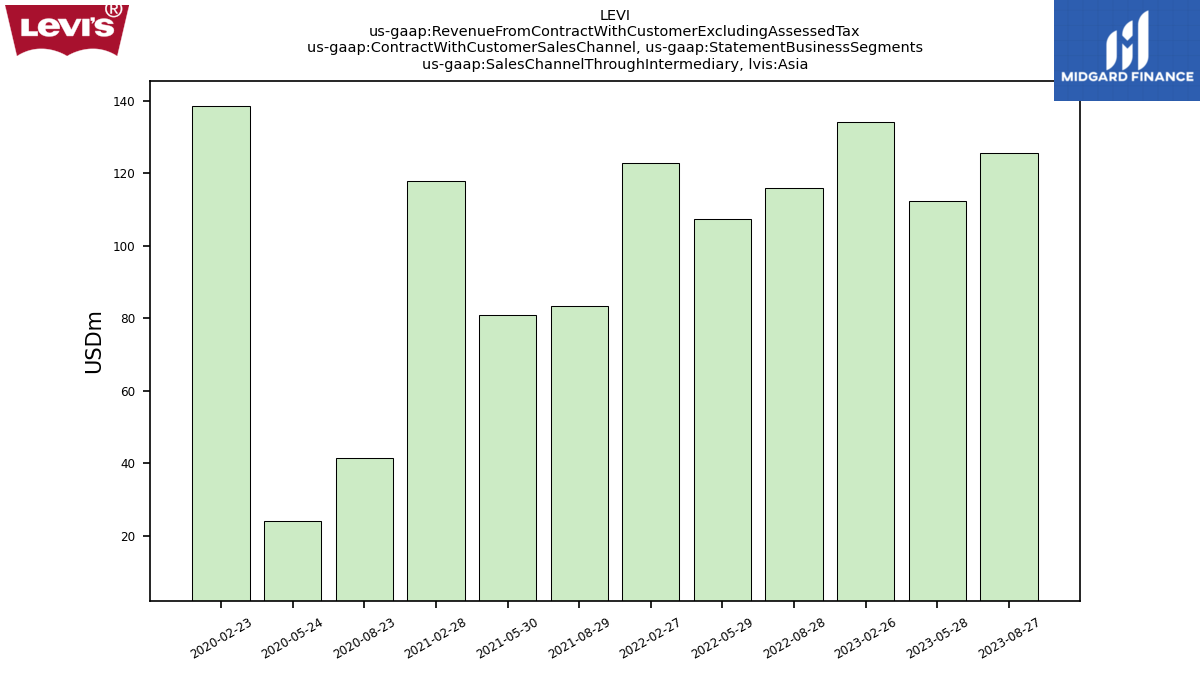
| Sales Channel Through Intermediary, Asia | 125.60 | 112.30 | 134.00 | NA | 115.90 | 107.28 | 122.76 | NA | 83.52 | 80.80 | 117.84 | NA | 41.48 | 24.10 | 138.50 | NA | NA | NA | NA | NA | NA | NA | NA | NA | NA | NA | NA | NA | NA | NA | NA | NA | NA | NA | NA | NA | NA | NA | NA | NA | NA | NA | NA | NA | NA | NA | NA | NA | NA | NA | NA | NA | NA | |
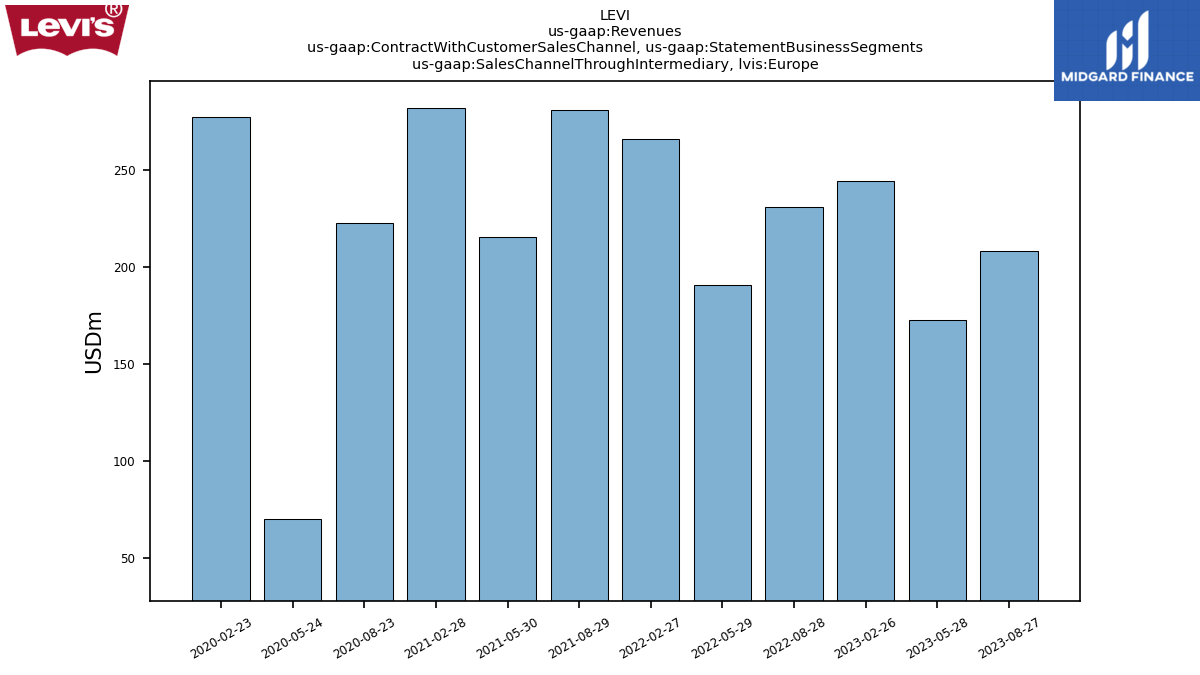
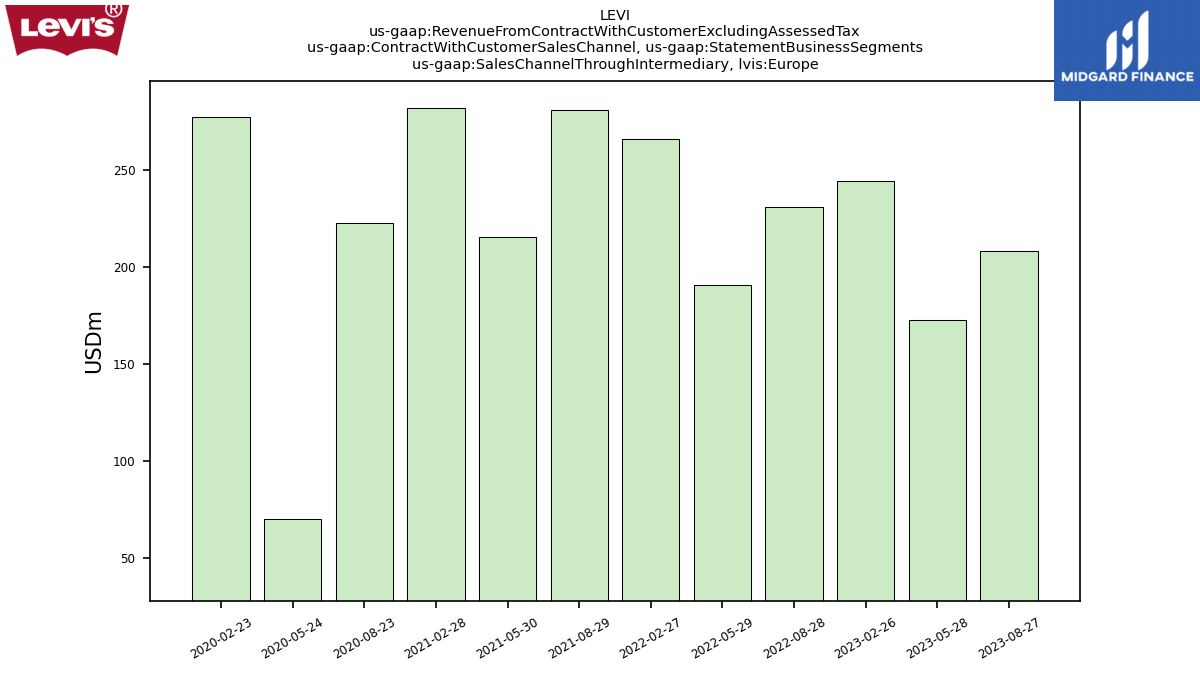
| Sales Channel Through Intermediary, Europe | 208.30 | 172.50 | 244.10 | NA | 230.85 | 190.62 | 265.72 | NA | 280.90 | 215.48 | 281.63 | NA | 222.78 | 70.19 | 276.95 | NA | NA | NA | NA | NA | NA | NA | NA | NA | NA | NA | NA | NA | NA | NA | NA | NA | NA | NA | NA | NA | NA | NA | NA | NA | NA | NA | NA | NA | NA | NA | NA | NA | NA | NA | NA | NA | NA | |
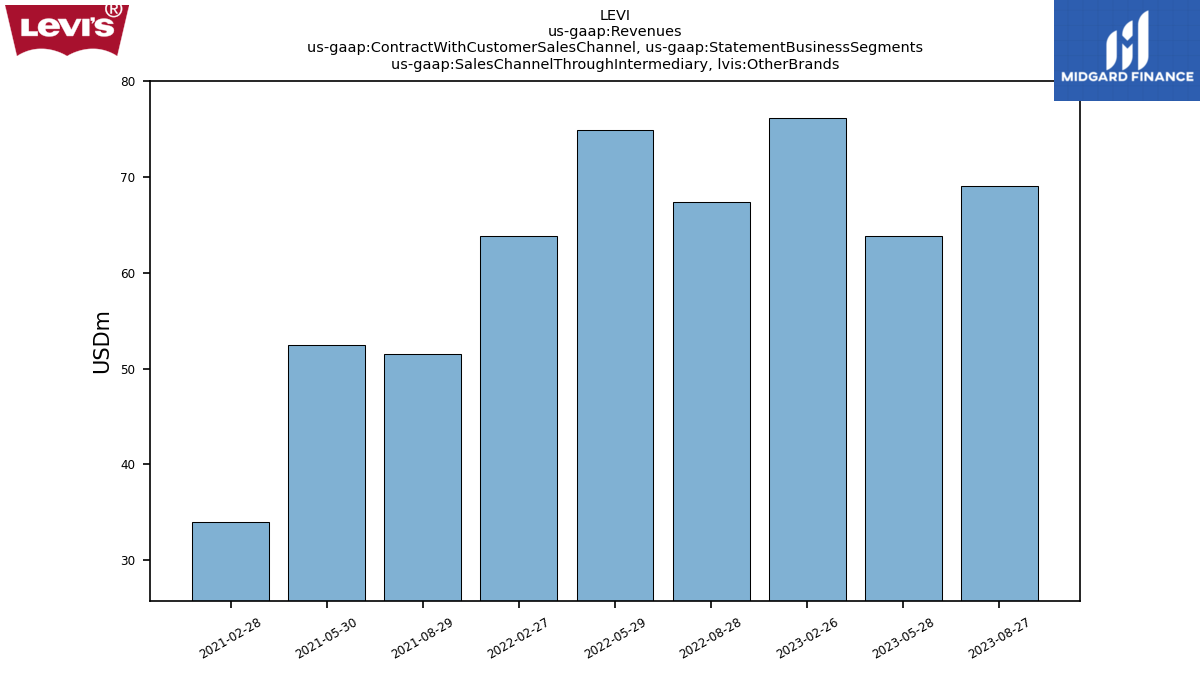
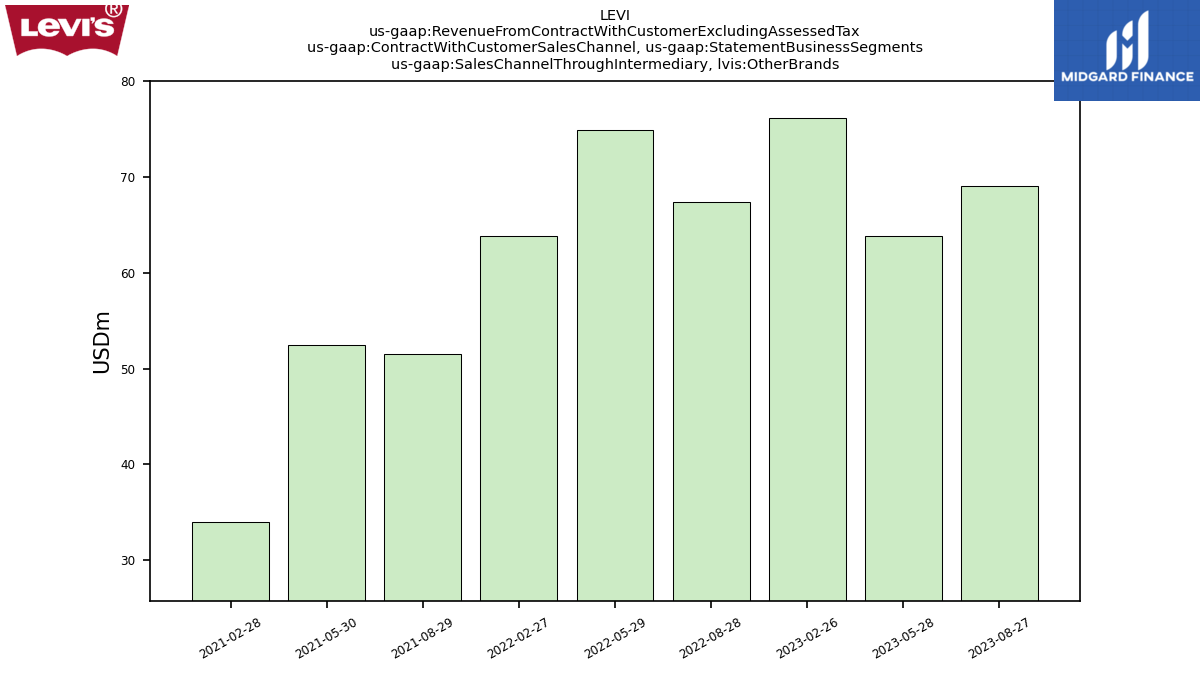
| Sales Channel Through Intermediary, Other Brands | 69.10 | 63.80 | 76.20 | NA | 67.38 | 74.87 | 63.85 | NA | 51.55 | 52.41 | 33.96 | NA | NA | NA | NA | NA | NA | NA | NA | NA | NA | NA | NA | NA | NA | NA | NA | NA | NA | NA | NA | NA | NA | NA | NA | NA | NA | NA | NA | NA | NA | NA | NA | NA | NA | NA | NA | NA | NA | NA | NA | NA | NA | |
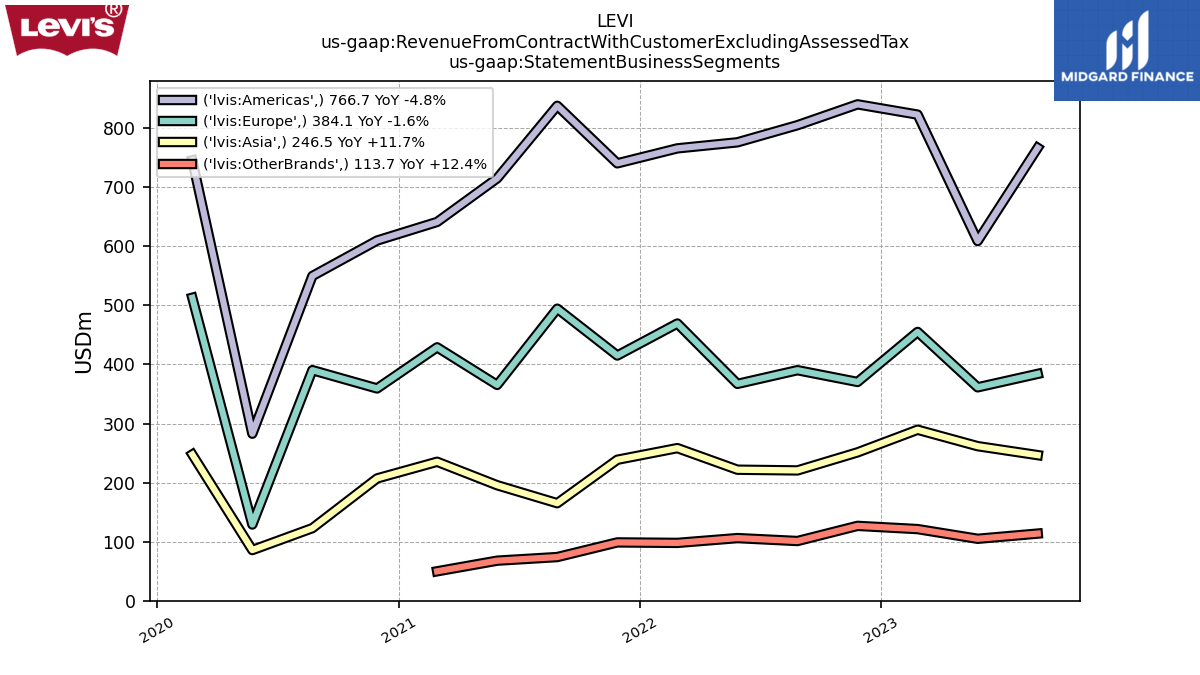
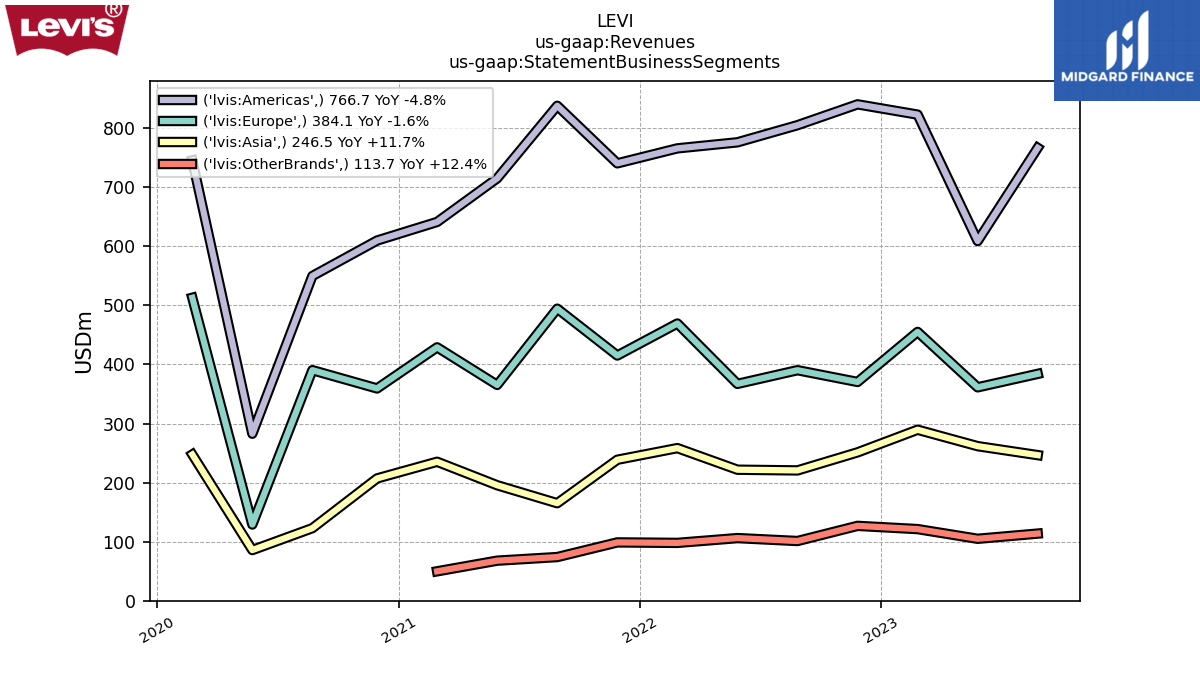
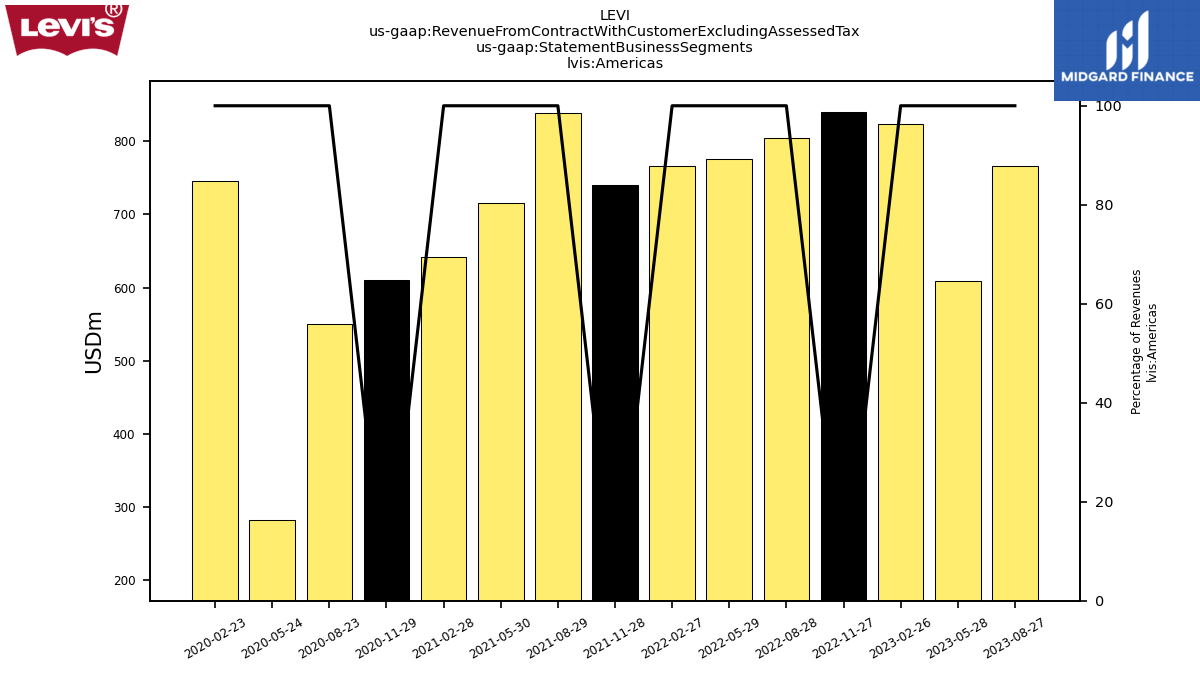
| Americas | 766.70 | 608.90 | 823.00 | 840.37 | 805.08 | 776.09 | 765.85 | 740.49 | 837.98 | 715.09 | 641.27 | 609.79 | 549.80 | 282.73 | 745.58 | NA | NA | NA | NA | NA | NA | NA | NA | NA | NA | NA | NA | NA | NA | NA | NA | NA | NA | NA | NA | NA | NA | NA | NA | NA | NA | NA | NA | NA | NA | NA | NA | NA | NA | NA | NA | NA | NA | |
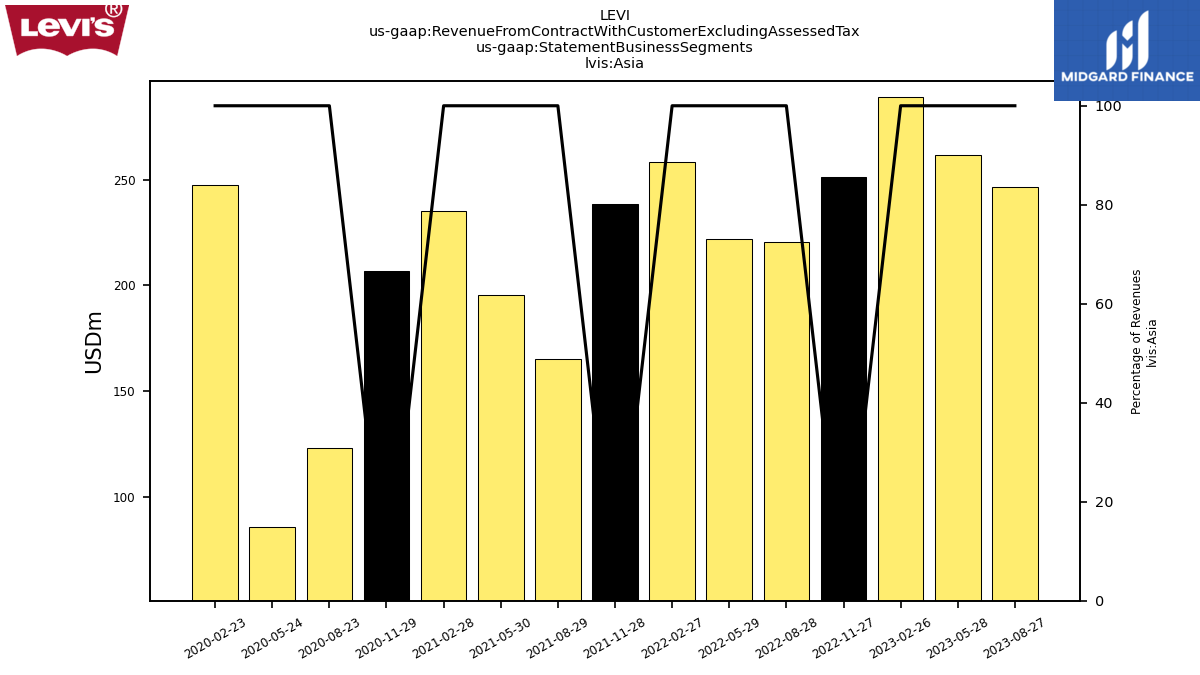
| Asia | 246.50 | 261.70 | 289.50 | 251.20 | 220.65 | 221.85 | 258.40 | 238.69 | 165.12 | 195.53 | 235.30 | 207.08 | 122.91 | 85.79 | 247.60 | NA | NA | NA | NA | NA | NA | NA | NA | NA | NA | NA | NA | NA | NA | NA | NA | NA | NA | NA | NA | NA | NA | NA | NA | NA | NA | NA | NA | NA | NA | NA | NA | NA | NA | NA | NA | NA | NA | |
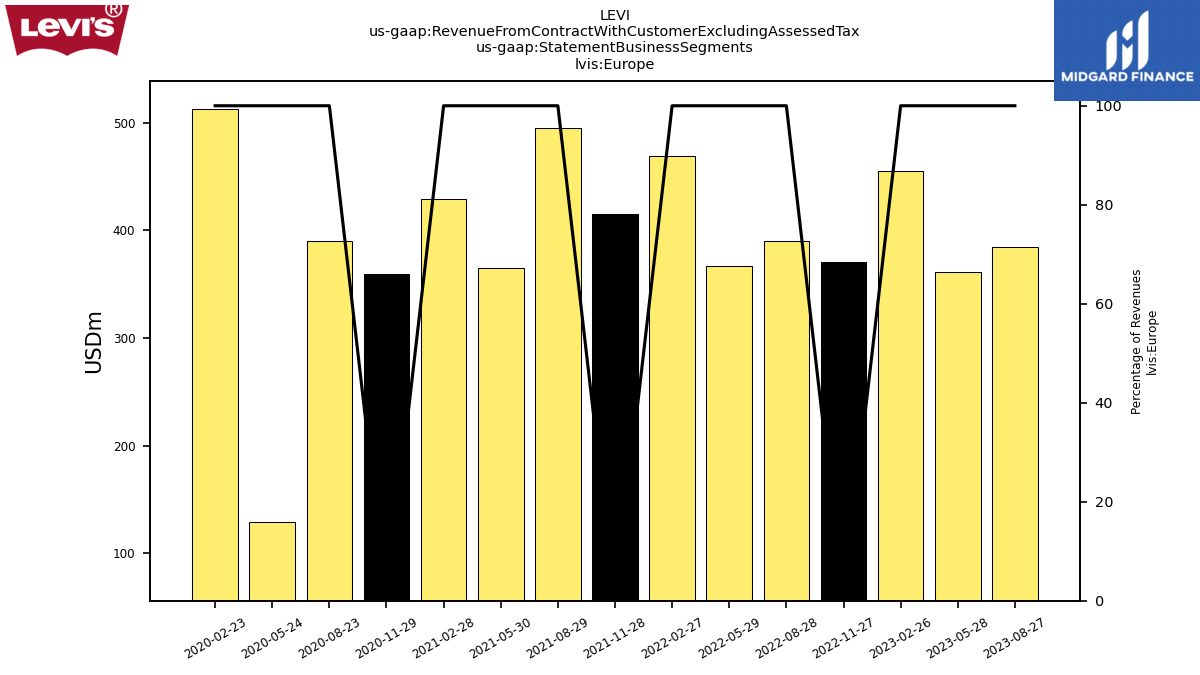
| Europe | 384.10 | 361.30 | 455.10 | 370.40 | 390.30 | 367.14 | 469.36 | 415.16 | 494.48 | 365.35 | 429.03 | 359.43 | 390.37 | 129.02 | 512.94 | NA | NA | NA | NA | NA | NA | NA | NA | NA | NA | NA | NA | NA | NA | NA | NA | NA | NA | NA | NA | NA | NA | NA | NA | NA | NA | NA | NA | NA | NA | NA | NA | NA | NA | NA | NA | NA | NA | |
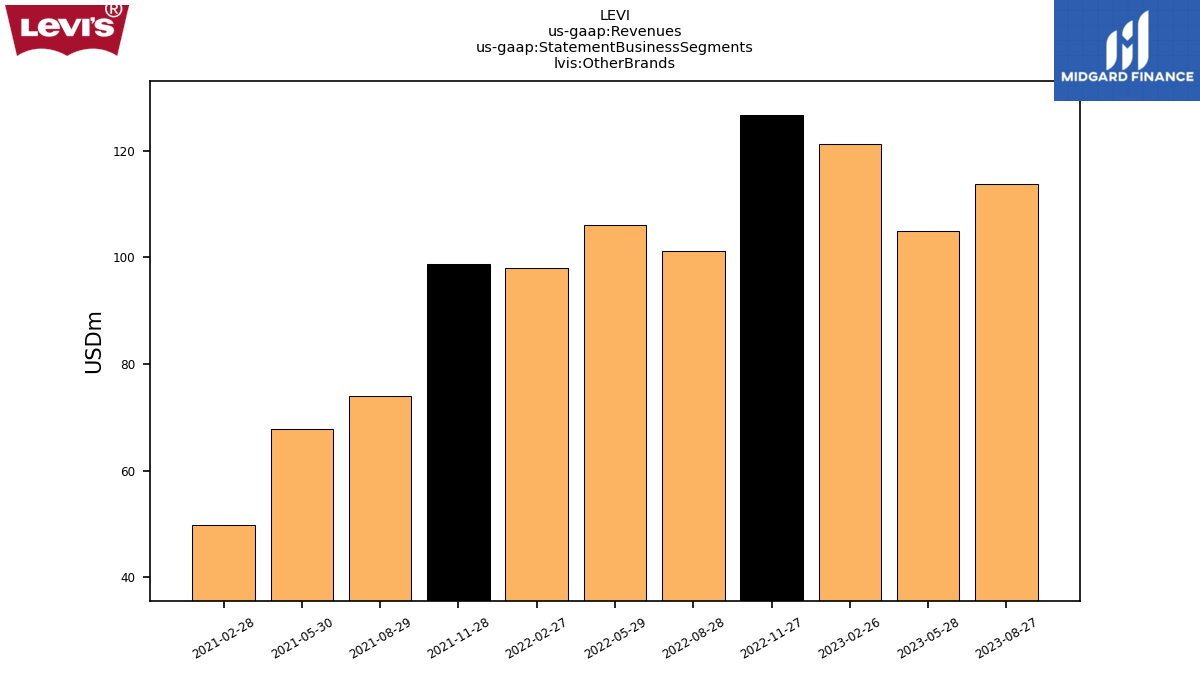
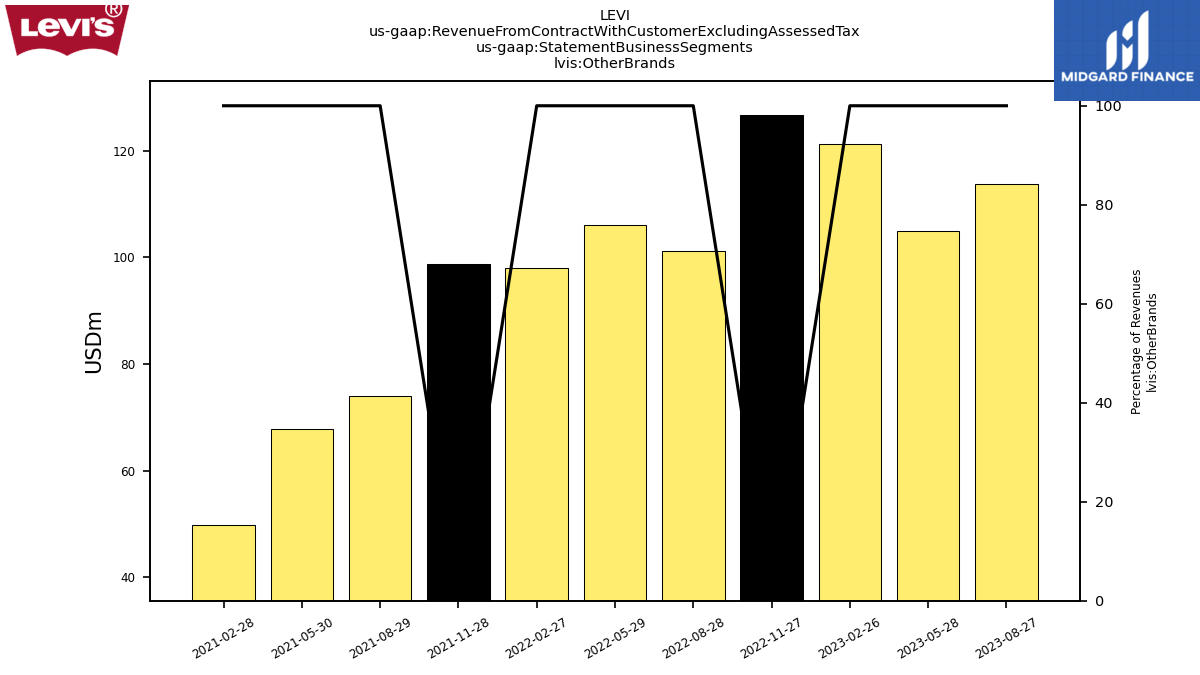
| Other Brands | 113.70 | 104.90 | 121.30 | 126.76 | 101.12 | 106.07 | 97.95 | 98.78 | 73.96 | 67.86 | 49.85 | NA | NA | NA | NA | NA | NA | NA | NA | NA | NA | NA | NA | NA | NA | NA | NA | NA | NA | NA | NA | NA | NA | NA | NA | NA | NA | NA | NA | NA | NA | NA | NA | NA | NA | NA | NA | NA | NA | NA | NA | NA | NA | |
| Revenue From Contract With Customer Excluding Assessed Tax | 1511.00 | 1336.80 | 1688.90 | 1588.74 | 1517.15 | 1471.15 | 1591.56 | 1684.78 | 1497.58 | 1275.97 | 1305.60 | 1385.86 | 1063.09 | 497.54 | 1506.13 | 1568.61 | 1447.08 | 1312.94 | 1434.46 | 1591.86 | 1394.15 | 1245.74 | 1343.68 | 1465.79 | 1268.39 | 1067.86 | 1101.99 | 1299.54 | 1185.11 | 1011.59 | 1056.50 | 1285.23 | 1142.01 | 1012.18 | 1055.08 | 1388.03 | 1154.13 | 1081.85 | 1129.99 | 1294.83 | 1141.28 | 1098.90 | 1146.68 | 1297.22 | 1100.86 | 1047.16 | 1164.96 | 1343.93 | 1204.02 | 1092.92 | 1120.69 | 1289.91 | 1109.01 | |
| Operating | 1397.30 | 1231.90 | NA | 1893.90 | 1416.00 | 1365.00 | NA | NA | NA | NA | NA | NA | NA | NA | NA | NA | NA | NA | NA | NA | NA | NA | NA | NA | NA | NA | NA | NA | NA | NA | NA | NA | NA | NA | NA | NA | NA | NA | NA | NA | NA | NA | NA | NA | NA | NA | NA | NA | NA | NA | NA | NA | NA | |
| Material Reconciling Items, Other Brands | 113.70 | 104.90 | NA | NA | 101.20 | 106.10 | NA | NA | NA | NA | NA | NA | NA | NA | NA | NA | NA | NA | NA | NA | NA | NA | NA | NA | NA | NA | NA | NA | NA | NA | NA | NA | NA | NA | NA | NA | NA | NA | NA | NA | NA | NA | NA | NA | NA | NA | NA | NA | NA | NA | NA | NA | NA | |
| Operating, Americas | 766.70 | 608.90 | NA | 840.40 | 805.10 | 776.10 | NA | NA | NA | NA | NA | NA | NA | NA | NA | NA | NA | NA | NA | NA | NA | NA | NA | NA | NA | NA | NA | NA | NA | NA | NA | NA | NA | NA | NA | NA | NA | NA | NA | NA | NA | NA | NA | NA | NA | NA | NA | NA | NA | NA | NA | NA | NA | |
| Operating, Asia | 246.50 | 261.70 | NA | 251.20 | 220.60 | 221.80 | NA | NA | NA | NA | NA | NA | NA | NA | NA | NA | NA | NA | NA | NA | NA | NA | NA | NA | NA | NA | NA | NA | NA | NA | NA | NA | NA | NA | NA | NA | NA | NA | NA | NA | NA | NA | NA | NA | NA | NA | NA | NA | NA | NA | NA | NA | NA | |
| Operating, Europe | 384.10 | 361.30 | NA | 370.40 | 390.30 | 367.10 | NA | NA | NA | NA | NA | NA | NA | NA | NA | NA | NA | NA | NA | NA | NA | NA | NA | NA | NA | NA | NA | NA | NA | NA | NA | NA | NA | NA | NA | NA | NA | NA | NA | NA | NA | NA | NA | NA | NA | NA | NA | NA | NA | NA | NA | NA | NA | |
| Sales Channel Directly To Consumer | 608.90 | 621.50 | 704.00 | NA | 536.18 | 550.66 | 628.49 | NA | 526.87 | 473.49 | 466.84 | NA | 394.30 | 196.82 | 629.80 | NA | 504.27 | 501.27 | 565.15 | NA | 460.04 | 459.79 | 515.45 | NA | NA | NA | NA | NA | NA | NA | NA | NA | NA | NA | NA | NA | NA | NA | NA | NA | NA | NA | NA | NA | NA | NA | NA | NA | NA | NA | NA | NA | NA | |
| Sales Channel Through Intermediary | 902.10 | 715.30 | 984.90 | NA | 980.97 | 920.49 | 963.07 | NA | 970.72 | 802.48 | 838.76 | NA | 668.79 | 300.73 | 876.32 | NA | 942.81 | 811.67 | 869.31 | NA | 934.11 | 785.95 | 828.24 | NA | NA | NA | NA | NA | NA | NA | NA | NA | NA | NA | NA | NA | NA | NA | NA | NA | NA | NA | NA | NA | NA | NA | NA | NA | NA | NA | NA | NA | NA | |
| Sales Channel Directly To Consumer, Americas | 267.60 | 242.20 | 292.40 | NA | 238.24 | 228.38 | 255.12 | NA | 231.68 | 208.88 | 201.98 | NA | 145.27 | 76.29 | 284.71 | NA | NA | NA | NA | NA | NA | NA | NA | NA | NA | NA | NA | NA | NA | NA | NA | NA | NA | NA | NA | NA | NA | NA | NA | NA | NA | NA | NA | NA | NA | NA | NA | NA | NA | NA | NA | NA | NA | |
| Sales Channel Directly To Consumer, Asia | 120.90 | 149.40 | 155.50 | NA | 104.75 | 114.56 | 135.64 | NA | 81.60 | 114.73 | 117.47 | NA | 81.43 | 61.69 | 109.10 | NA | NA | NA | NA | NA | NA | NA | NA | NA | NA | NA | NA | NA | NA | NA | NA | NA | NA | NA | NA | NA | NA | NA | NA | NA | NA | NA | NA | NA | NA | NA | NA | NA | NA | NA | NA | NA | NA | |
| Sales Channel Directly To Consumer, Europe | 175.80 | 188.80 | 211.00 | NA | 159.45 | 176.52 | 203.64 | NA | 213.58 | 149.87 | 147.40 | NA | 167.60 | 58.84 | 235.99 | NA | NA | NA | NA | NA | NA | NA | NA | NA | NA | NA | NA | NA | NA | NA | NA | NA | NA | NA | NA | NA | NA | NA | NA | NA | NA | NA | NA | NA | NA | NA | NA | NA | NA | NA | NA | NA | NA | |
| Sales Channel Directly To Consumer, Other Brands | 44.60 | 41.10 | 45.10 | NA | 33.74 | 31.20 | 34.09 | NA | 22.41 | 15.45 | 15.89 | NA | NA | NA | NA | NA | NA | NA | NA | NA | NA | NA | NA | NA | NA | NA | NA | NA | NA | NA | NA | NA | NA | NA | NA | NA | NA | NA | NA | NA | NA | NA | NA | NA | NA | NA | NA | NA | NA | NA | NA | NA | NA | |
| Sales Channel Through Intermediary, Americas | 499.10 | 366.70 | 530.60 | NA | 566.84 | 547.72 | 510.74 | NA | 606.29 | 506.20 | 439.29 | NA | 404.53 | 206.44 | 460.87 | NA | NA | NA | NA | NA | NA | NA | NA | NA | NA | NA | NA | NA | NA | NA | NA | NA | NA | NA | NA | NA | NA | NA | NA | NA | NA | NA | NA | NA | NA | NA | NA | NA | NA | NA | NA | NA | NA | |
| Sales Channel Through Intermediary, Asia | 125.60 | 112.30 | 134.00 | NA | 115.90 | 107.28 | 122.76 | NA | 83.52 | 80.80 | 117.84 | NA | 41.48 | 24.10 | 138.50 | NA | NA | NA | NA | NA | NA | NA | NA | NA | NA | NA | NA | NA | NA | NA | NA | NA | NA | NA | NA | NA | NA | NA | NA | NA | NA | NA | NA | NA | NA | NA | NA | NA | NA | NA | NA | NA | NA | |
| Sales Channel Through Intermediary, Europe | 208.30 | 172.50 | 244.10 | NA | 230.85 | 190.62 | 265.72 | NA | 280.90 | 215.48 | 281.63 | NA | 222.78 | 70.19 | 276.95 | NA | NA | NA | NA | NA | NA | NA | NA | NA | NA | NA | NA | NA | NA | NA | NA | NA | NA | NA | NA | NA | NA | NA | NA | NA | NA | NA | NA | NA | NA | NA | NA | NA | NA | NA | NA | NA | NA | |
| Sales Channel Through Intermediary, Other Brands | 69.10 | 63.80 | 76.20 | NA | 67.38 | 74.87 | 63.85 | NA | 51.55 | 52.41 | 33.96 | NA | NA | NA | NA | NA | NA | NA | NA | NA | NA | NA | NA | NA | NA | NA | NA | NA | NA | NA | NA | NA | NA | NA | NA | NA | NA | NA | NA | NA | NA | NA | NA | NA | NA | NA | NA | NA | NA | NA | NA | NA | NA | |
| Americas | 766.70 | 608.90 | 823.00 | 840.37 | 805.08 | 776.09 | 765.85 | 740.49 | 837.98 | 715.09 | 641.27 | 609.79 | 549.80 | 282.73 | 745.58 | NA | NA | NA | NA | NA | NA | NA | NA | NA | NA | NA | NA | NA | NA | NA | NA | NA | NA | NA | NA | NA | NA | NA | NA | NA | NA | NA | NA | NA | NA | NA | NA | NA | NA | NA | NA | NA | NA | |
| Asia | 246.50 | 261.70 | 289.50 | 251.20 | 220.65 | 221.85 | 258.40 | 238.69 | 165.12 | 195.53 | 235.30 | 207.08 | 122.91 | 85.79 | 247.60 | NA | NA | NA | NA | NA | NA | NA | NA | NA | NA | NA | NA | NA | NA | NA | NA | NA | NA | NA | NA | NA | NA | NA | NA | NA | NA | NA | NA | NA | NA | NA | NA | NA | NA | NA | NA | NA | NA | |
| Europe | 384.10 | 361.30 | 455.10 | 370.40 | 390.30 | 367.14 | 469.36 | 415.16 | 494.48 | 365.35 | 429.03 | 359.43 | 390.37 | 129.02 | 512.94 | NA | NA | NA | NA | NA | NA | NA | NA | NA | NA | NA | NA | NA | NA | NA | NA | NA | NA | NA | NA | NA | NA | NA | NA | NA | NA | NA | NA | NA | NA | NA | NA | NA | NA | NA | NA | NA | NA | |
| Other Brands | 113.70 | 104.90 | 121.30 | 126.76 | 101.12 | 106.07 | 97.95 | 98.78 | 73.96 | 67.86 | 49.85 | NA | NA | NA | NA | NA | NA | NA | NA | NA | NA | NA | NA | NA | NA | NA | NA | NA | NA | NA | NA | NA | NA | NA | NA | NA | NA | NA | NA | NA | NA | NA | NA | NA | NA | NA | NA | NA | NA | NA | NA | NA | NA |


