
| 2024-03-31 | 2023-12-31 | 2023-09-30 | 2023-06-30 | 2023-03-31 | 2022-12-31 | 2022-09-30 | 2022-06-30 | 2022-03-31 | 2021-12-31 | 2021-09-30 | 2021-06-30 | 2021-03-31 | 2020-12-31 | 2020-09-30 | 2020-06-30 | 2020-05-14 | ||
|---|---|---|---|---|---|---|---|---|---|---|---|---|---|---|---|---|---|---|
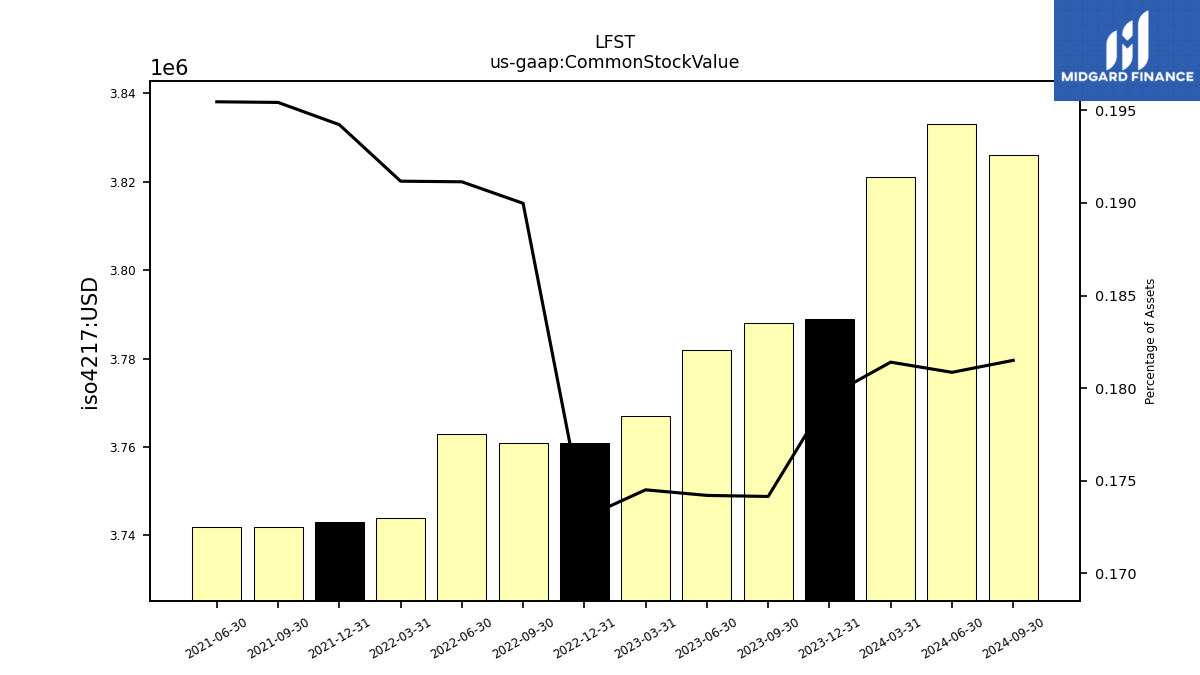
| Common Stock Value | 3.82 | 3.79 | 3.79 | 3.78 | 3.77 | 3.76 | 3.76 | 3.76 | 3.74 | 3.74 | 3.74 | 3.74 | NA | NA | NA | NA | NA | |
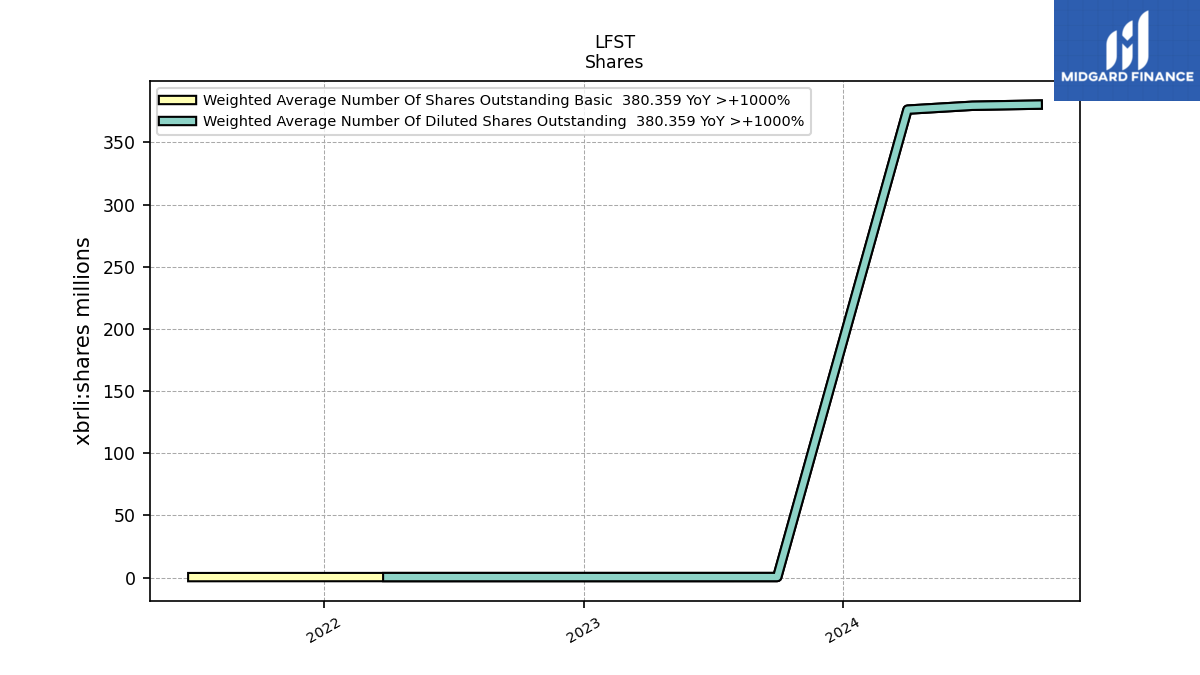
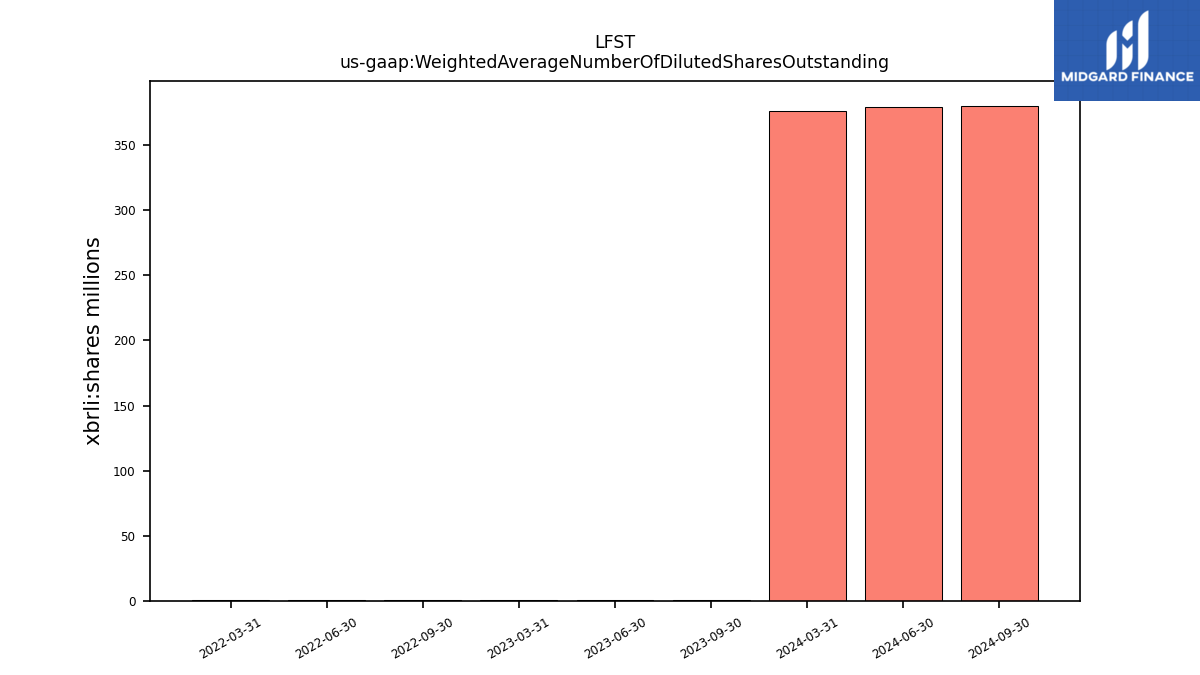
| Weighted Average Number Of Diluted Shares Outstanding | 376.33 | NA | 0.37 | 0.36 | 0.36 | NA | 0.36 | 0.35 | 0.35 | NA | NA | NA | NA | NA | NA | NA | NA | |
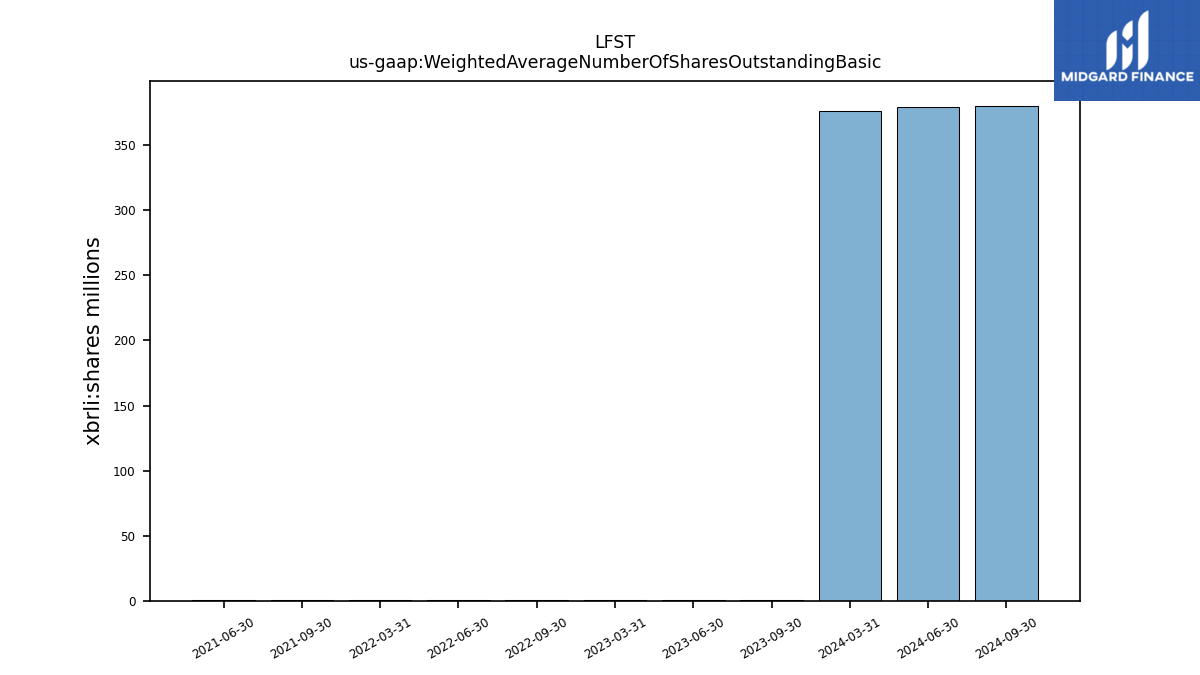
| Weighted Average Number Of Shares Outstanding Basic | 376.33 | NA | 0.37 | 0.36 | 0.36 | NA | 0.36 | 0.35 | 0.35 | NA | 0.34 | 0.31 | NA | NA | NA | NA | NA | |
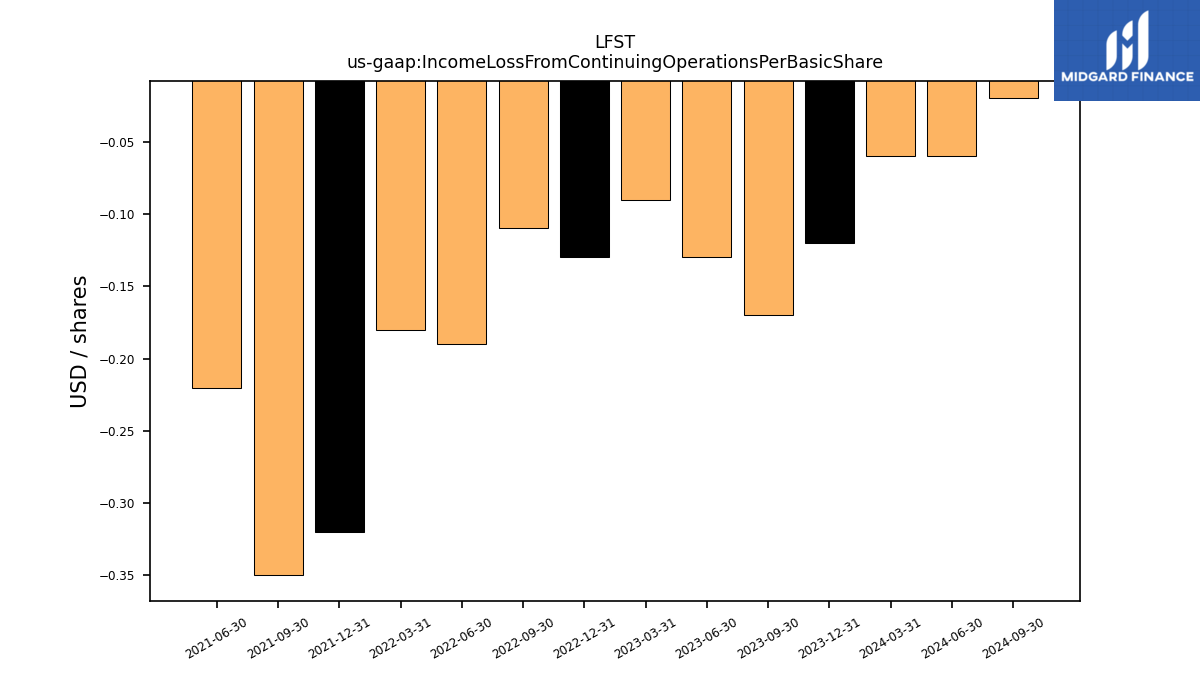
| Income Loss From Continuing Operations Per Basic Share | -0.00 | -0.00 | -0.00 | -0.00 | -0.00 | -0.00 | -0.00 | -0.00 | -0.00 | -0.00 | -0.00 | -0.00 | NA | NA | NA | NA | NA | |
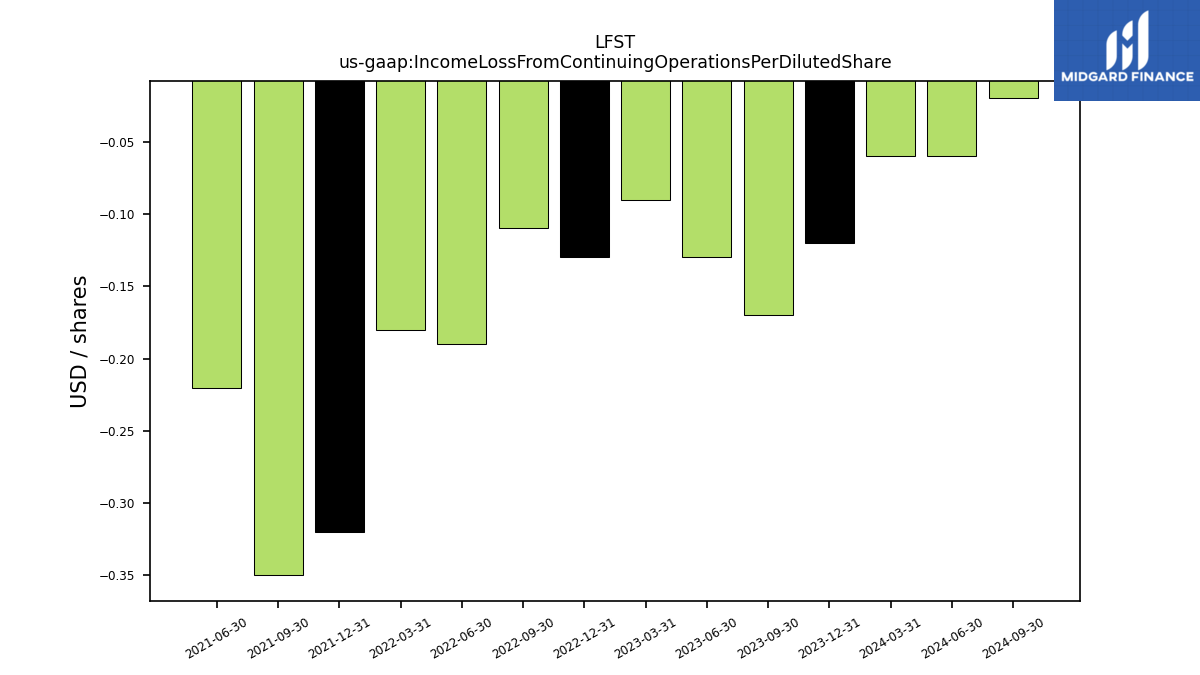
| Income Loss From Continuing Operations Per Diluted Share | -0.00 | -0.00 | -0.00 | -0.00 | -0.00 | -0.00 | -0.00 | -0.00 | -0.00 | -0.00 | -0.00 | -0.00 | NA | NA | NA | NA | NA |
| 2024-03-31 | 2023-12-31 | 2023-09-30 | 2023-06-30 | 2023-03-31 | 2022-12-31 | 2022-09-30 | 2022-06-30 | 2022-03-31 | 2021-12-31 | 2021-09-30 | 2021-06-30 | 2021-03-31 | 2020-12-31 | 2020-09-30 | 2020-06-30 | 2020-05-14 | ||
|---|---|---|---|---|---|---|---|---|---|---|---|---|---|---|---|---|---|---|
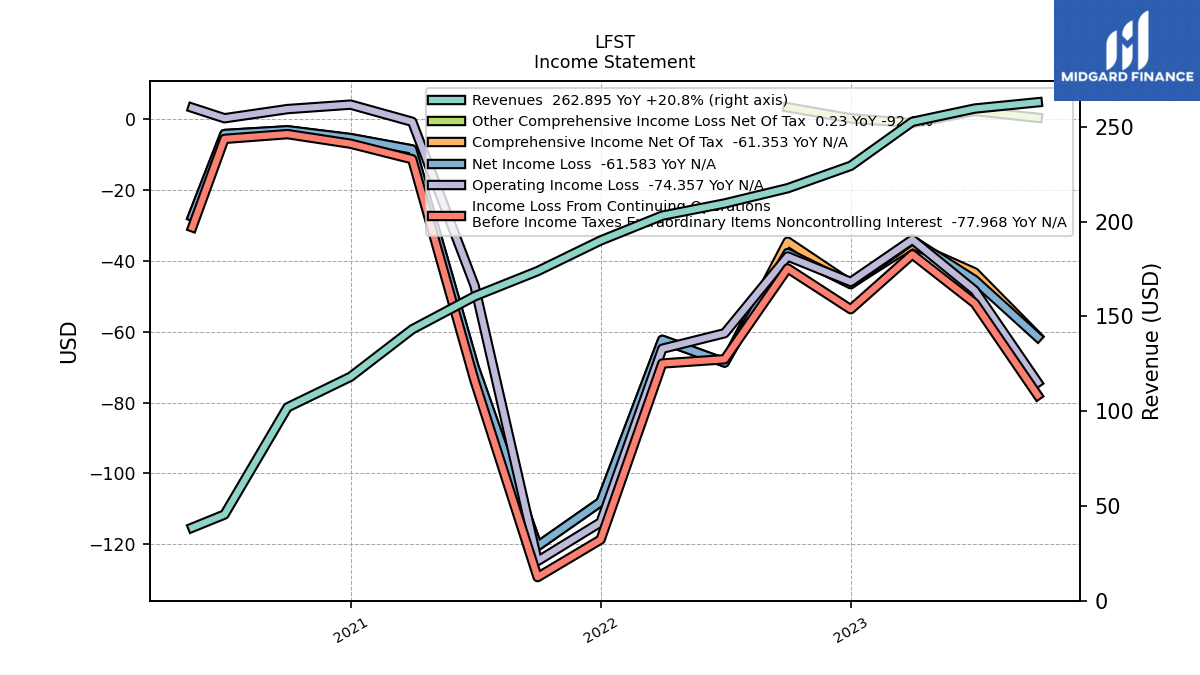
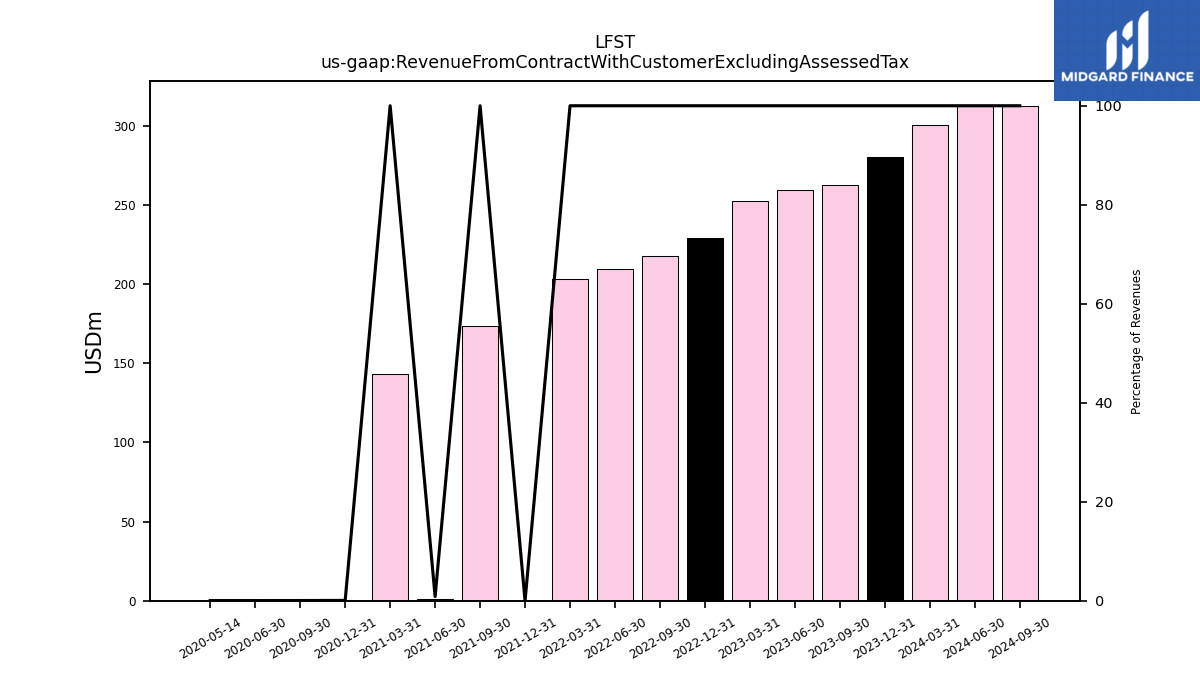
| Revenue From Contract With Customer Excluding Assessed Tax | 300.44 | 280.60 | 262.89 | 259.58 | 252.59 | 229.36 | 217.56 | 209.53 | 203.09 | 0.00 | 173.84 | 1.36 | 143.13 | 0.08 | 0.04 | 0.02 | 0.01 | |
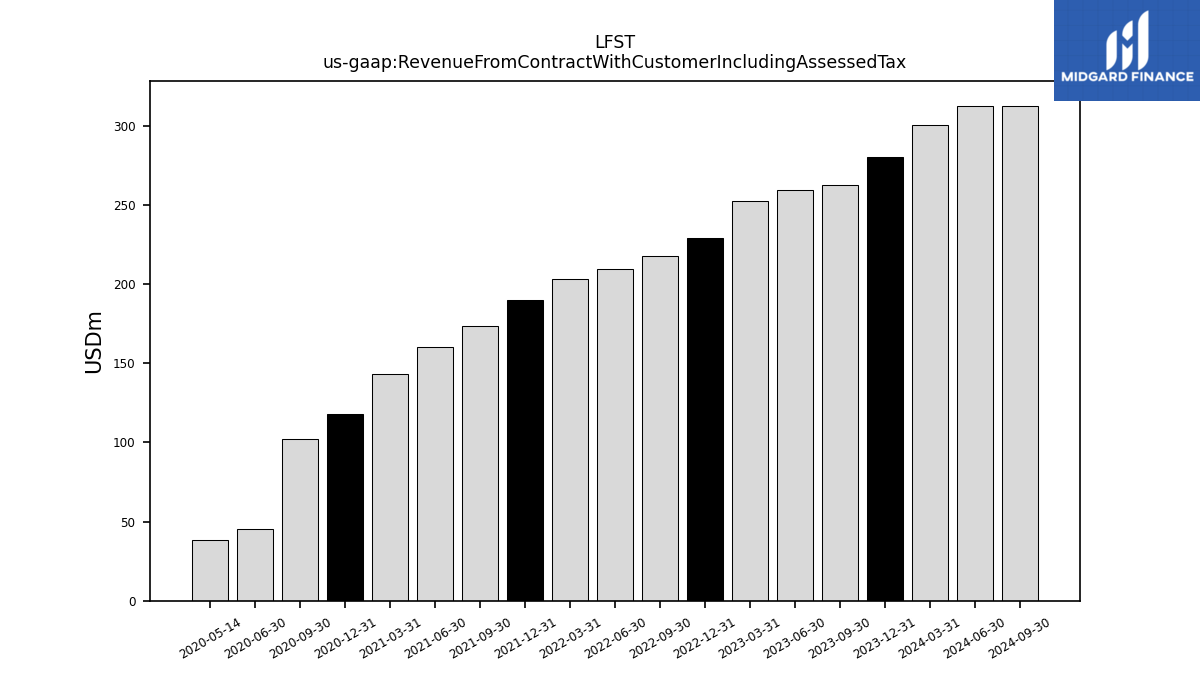
| Revenue From Contract With Customer Including Assessed Tax | 300.44 | 280.60 | 262.89 | 259.58 | 252.59 | 229.36 | 217.56 | 209.53 | 203.09 | 190.00 | 173.84 | 160.55 | 143.13 | 118.12 | 101.98 | 45.45 | 38.55 | |
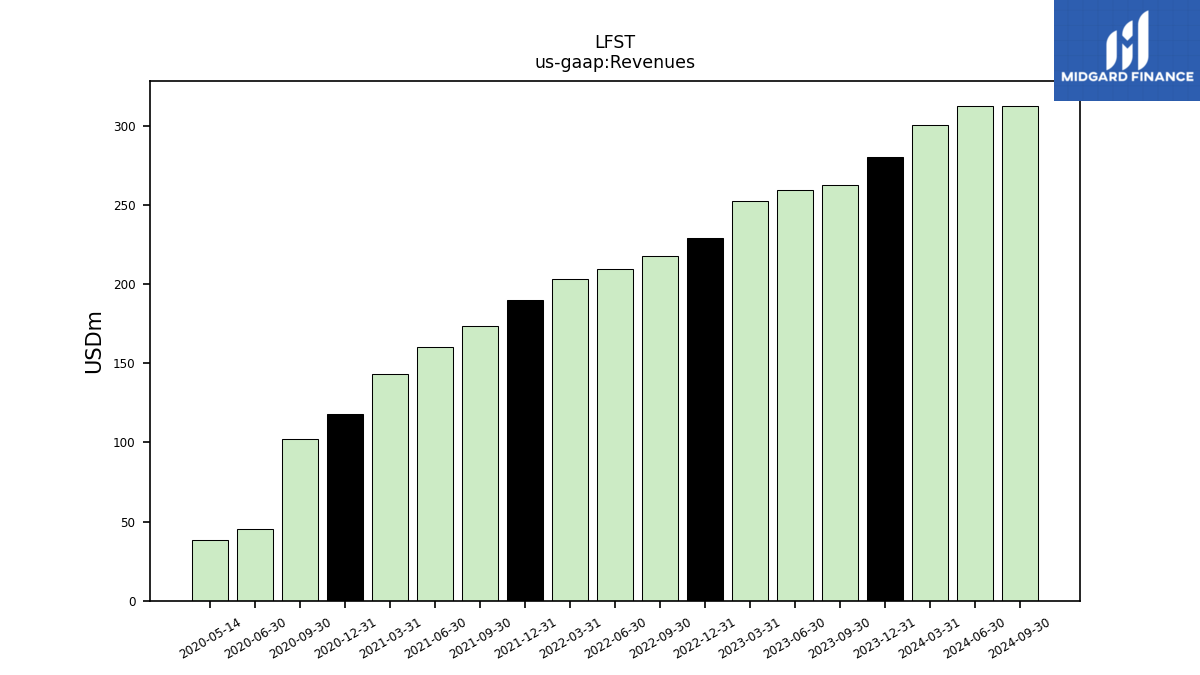
| Revenues | 300.44 | 280.60 | 262.89 | 259.58 | 252.59 | 229.36 | 217.56 | 209.53 | 203.09 | 190.00 | 173.84 | 160.55 | 143.13 | 118.12 | 101.98 | 45.45 | 38.55 | |
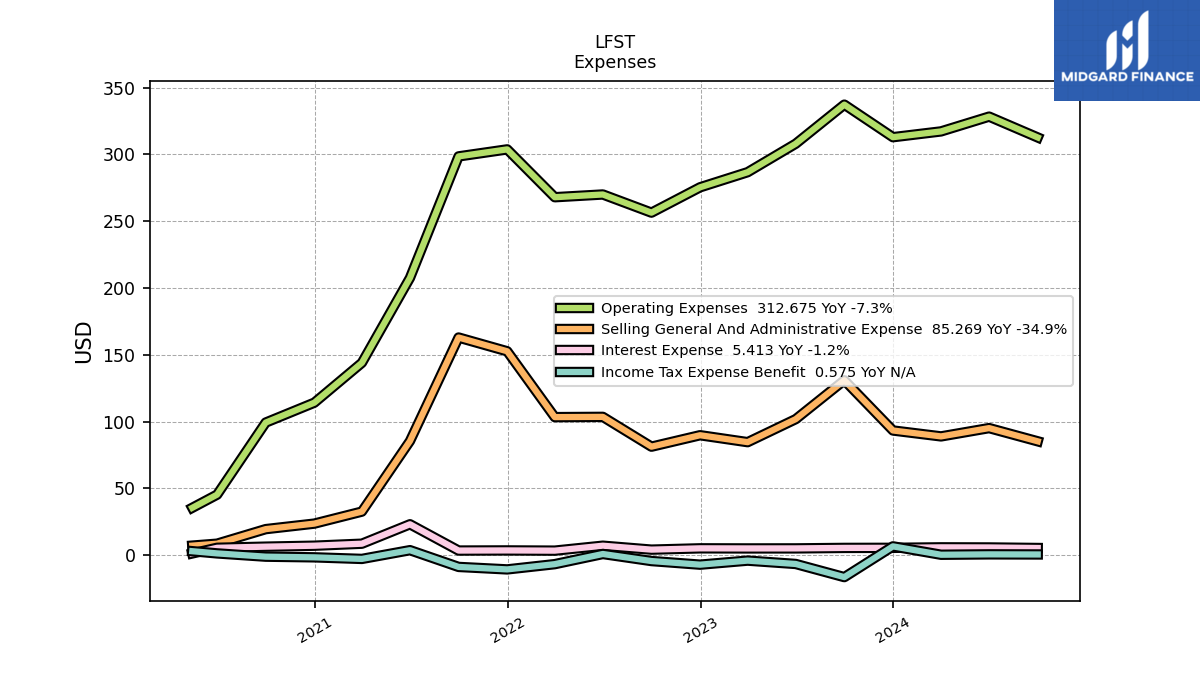
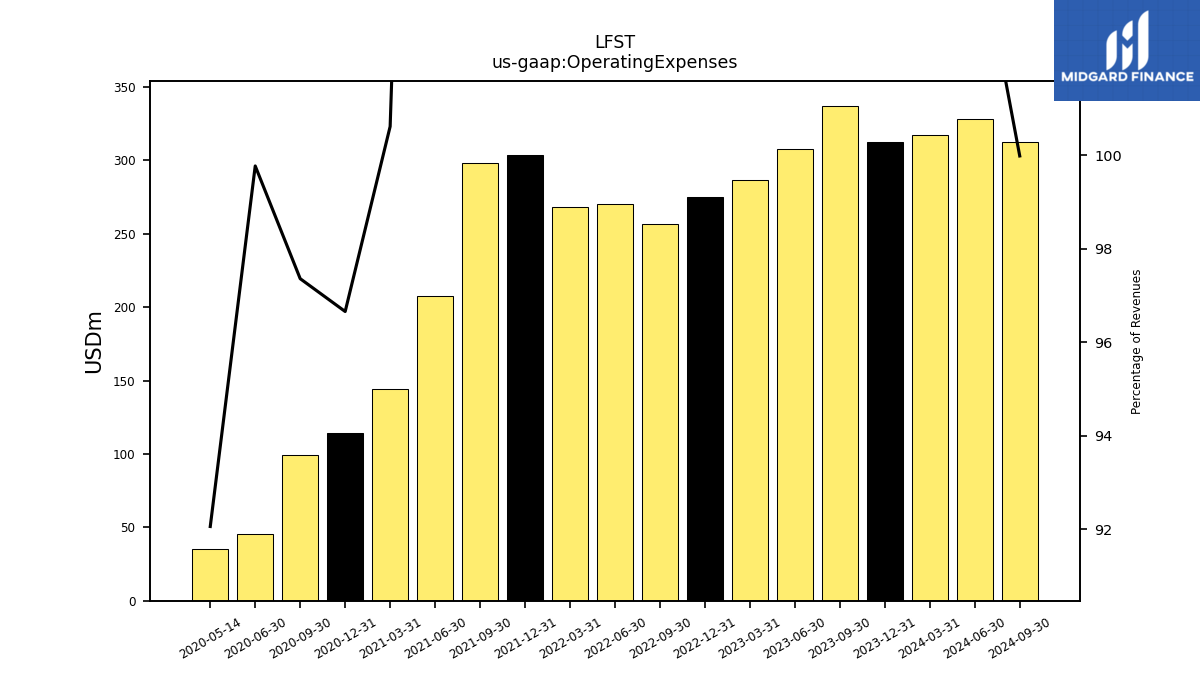
| Operating Expenses | 317.21 | 312.87 | 337.25 | 307.99 | 286.68 | 275.37 | 256.40 | 270.00 | 267.95 | 303.75 | 298.50 | 207.59 | 144.01 | 114.17 | 99.29 | 45.35 | 35.49 | |
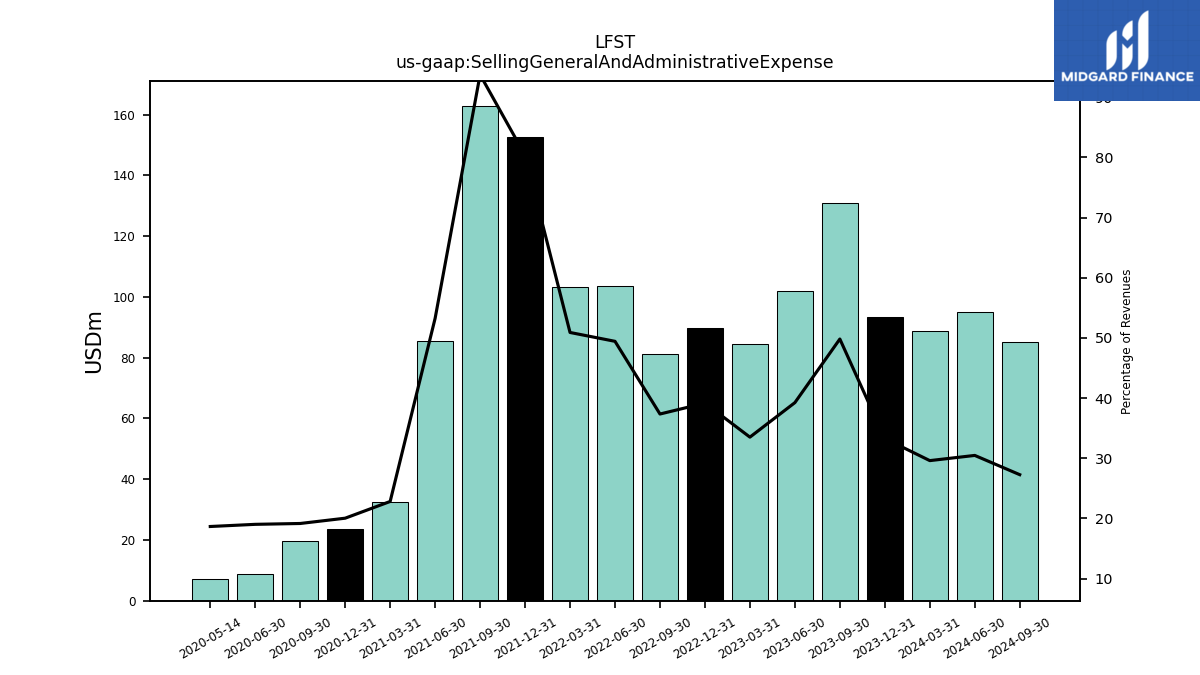
| Selling General And Administrative Expense | 88.93 | 93.37 | 130.94 | 101.85 | 84.63 | 89.82 | 81.25 | 103.56 | 103.37 | 152.65 | 162.94 | 85.48 | 32.65 | 23.66 | 19.53 | 8.64 | 7.19 | |
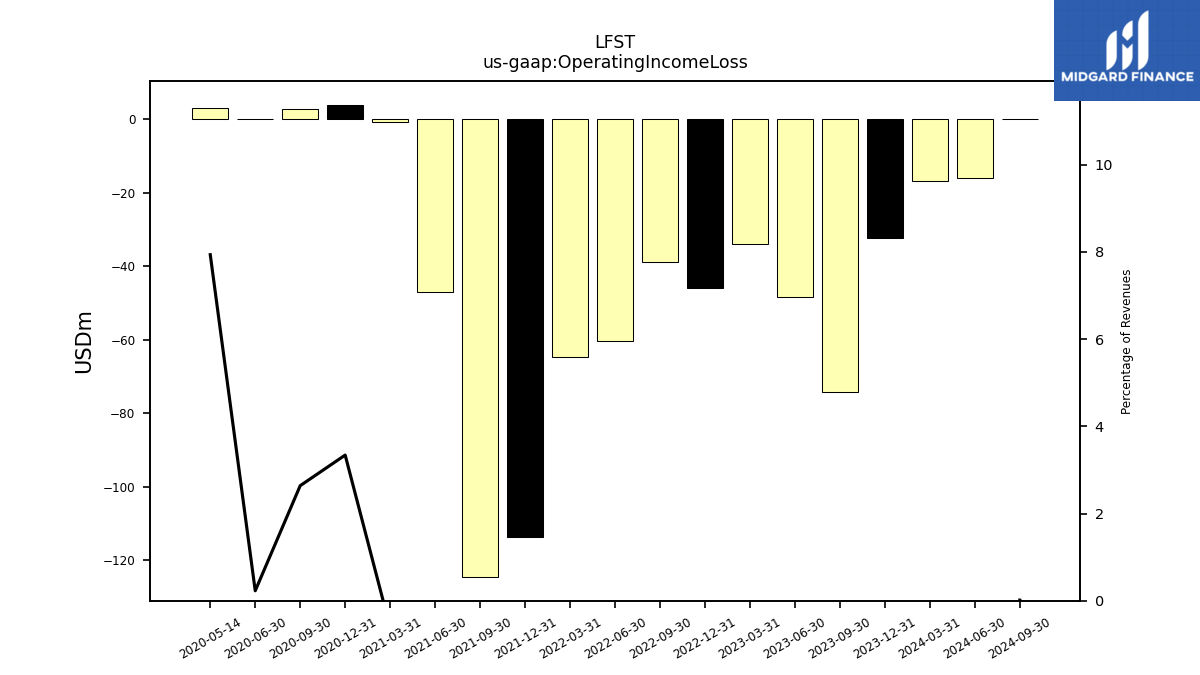
| Operating Income Loss | -16.77 | -32.27 | -74.36 | -48.41 | -34.09 | -46.01 | -38.84 | -60.47 | -64.85 | -113.76 | -124.67 | -47.05 | -0.88 | 3.95 | 2.69 | 0.10 | 3.06 | |
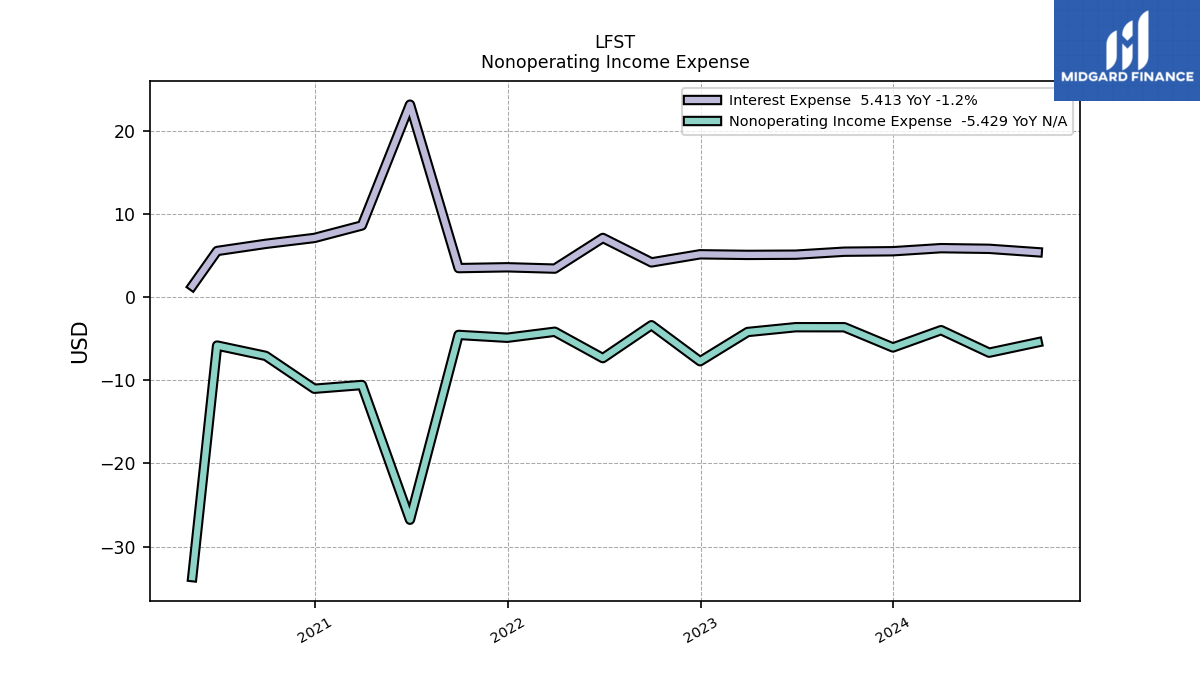
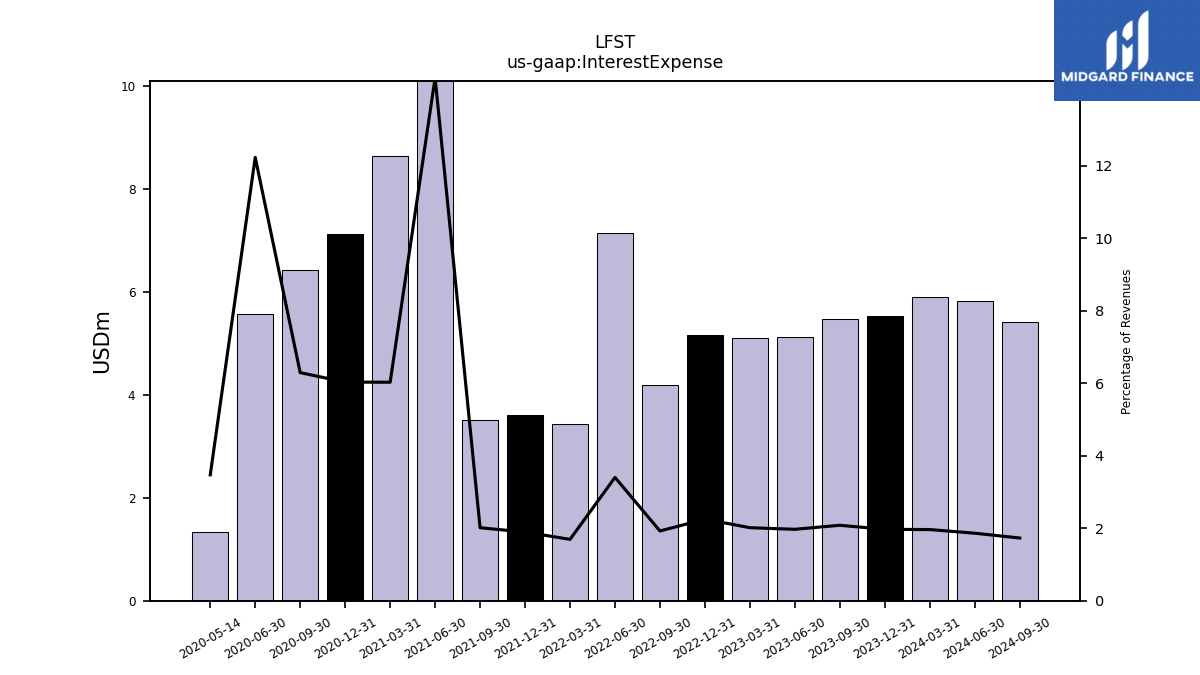
| Interest Expense | 5.90 | 5.53 | 5.48 | 5.12 | 5.09 | 5.17 | 4.19 | 7.13 | 3.44 | 3.60 | 3.50 | 23.17 | 8.63 | 7.13 | 6.42 | 5.56 | 1.34 | |
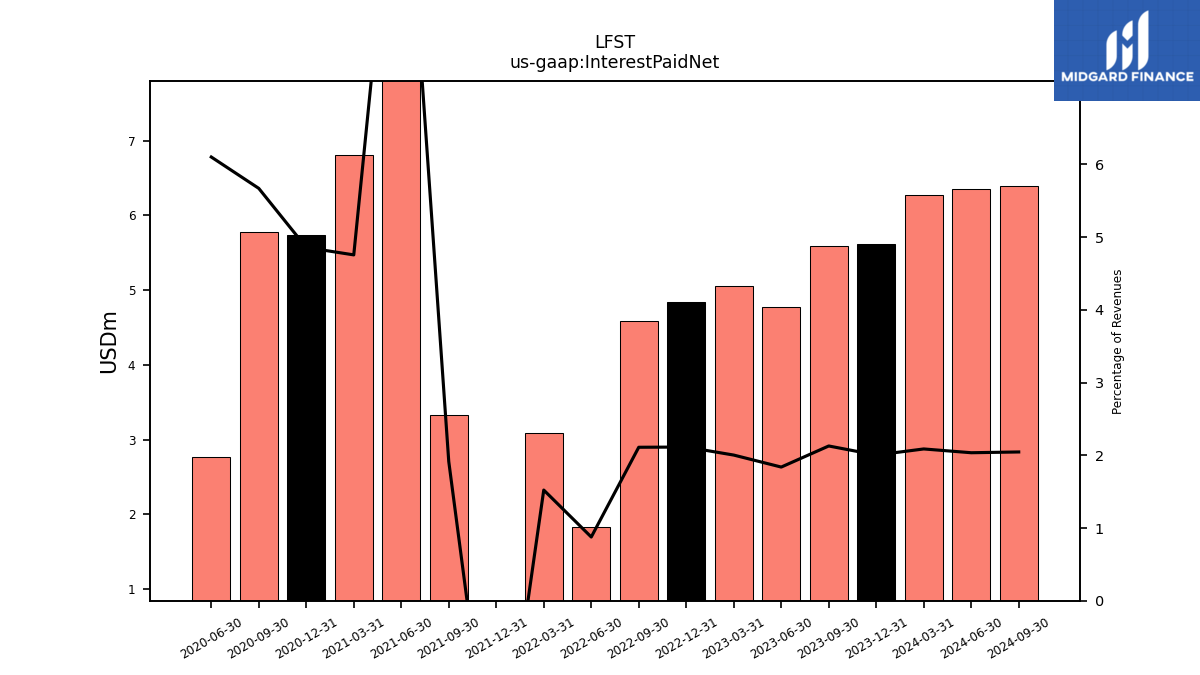
| Interest Paid Net | 6.27 | 5.62 | 5.59 | 4.77 | 5.06 | 4.85 | 4.59 | 1.84 | 3.09 | -5.80 | 3.33 | 18.08 | 6.81 | 5.74 | 5.78 | 2.77 | NA | |
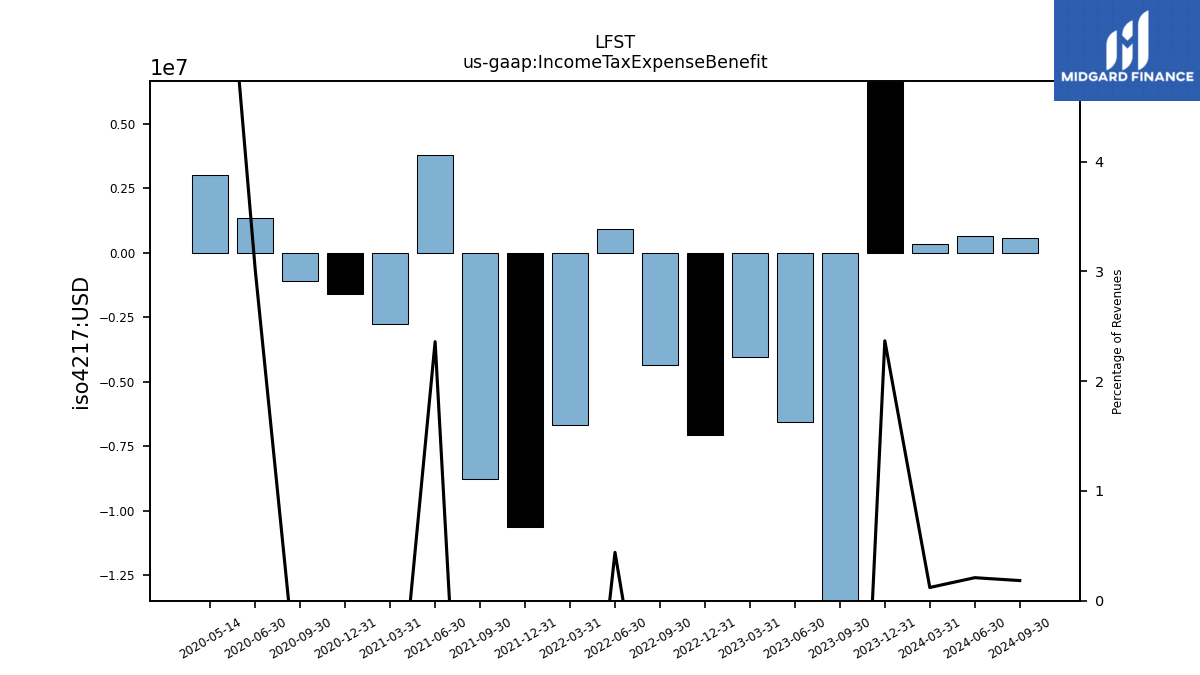
| Income Tax Expense Benefit | 0.36 | 6.64 | -16.39 | -6.54 | -4.04 | -7.06 | -4.35 | 0.92 | -6.68 | -10.61 | -8.75 | 3.79 | -2.76 | -1.58 | -1.07 | 1.37 | 3.02 | |
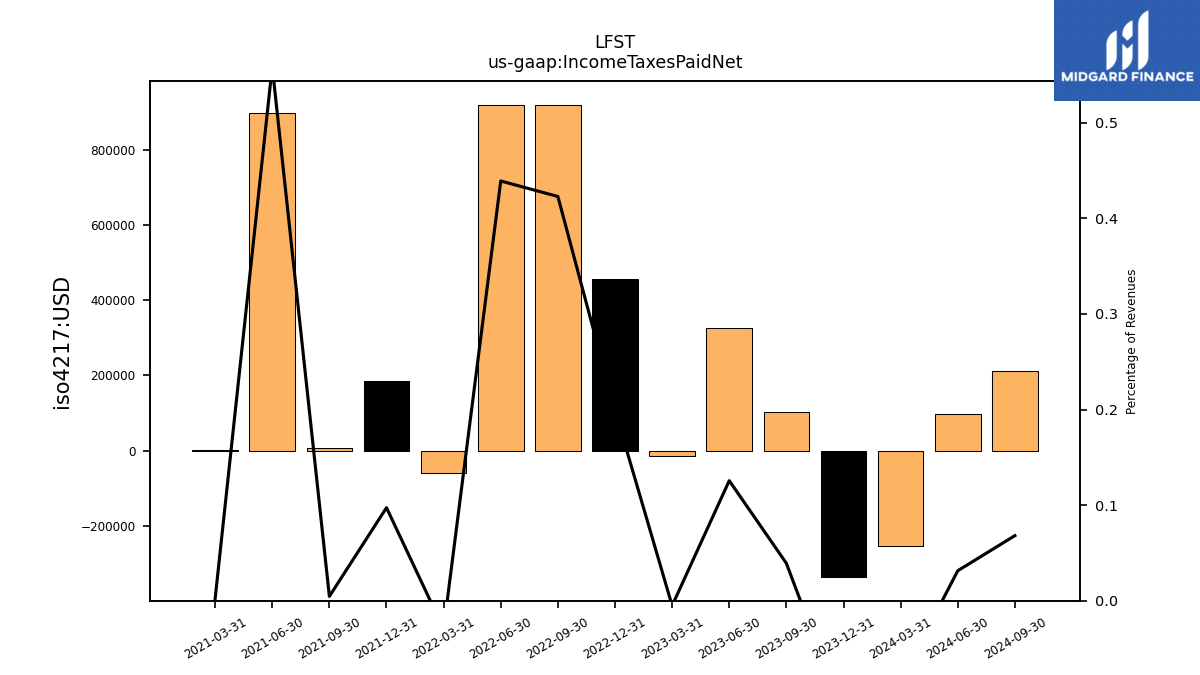
| Income Taxes Paid Net | -0.25 | -0.34 | 0.10 | 0.33 | -0.01 | 0.46 | 0.92 | 0.92 | -0.06 | 0.18 | 0.01 | 0.90 | 0.00 | NA | NA | NA | NA | |
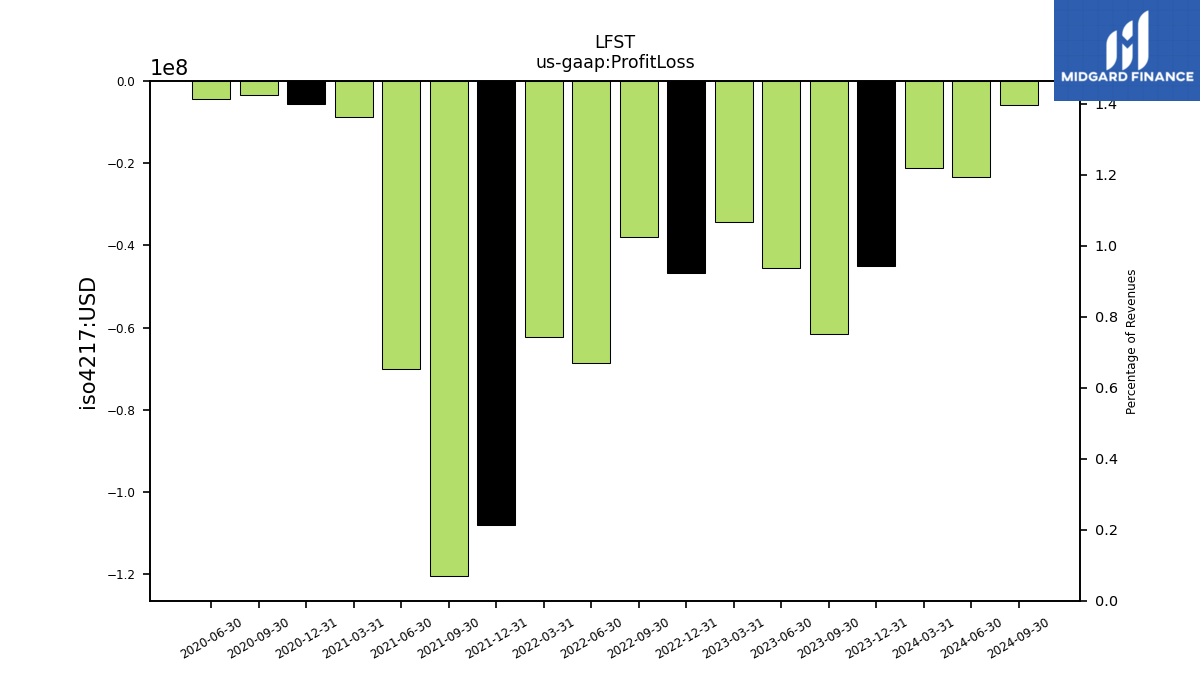
| Profit Loss | -21.10 | -44.96 | -61.58 | -45.48 | -34.24 | -46.66 | -37.85 | -68.73 | -62.33 | -108.03 | -120.45 | -70.03 | -8.68 | -5.49 | -3.29 | -4.34 | NA | |
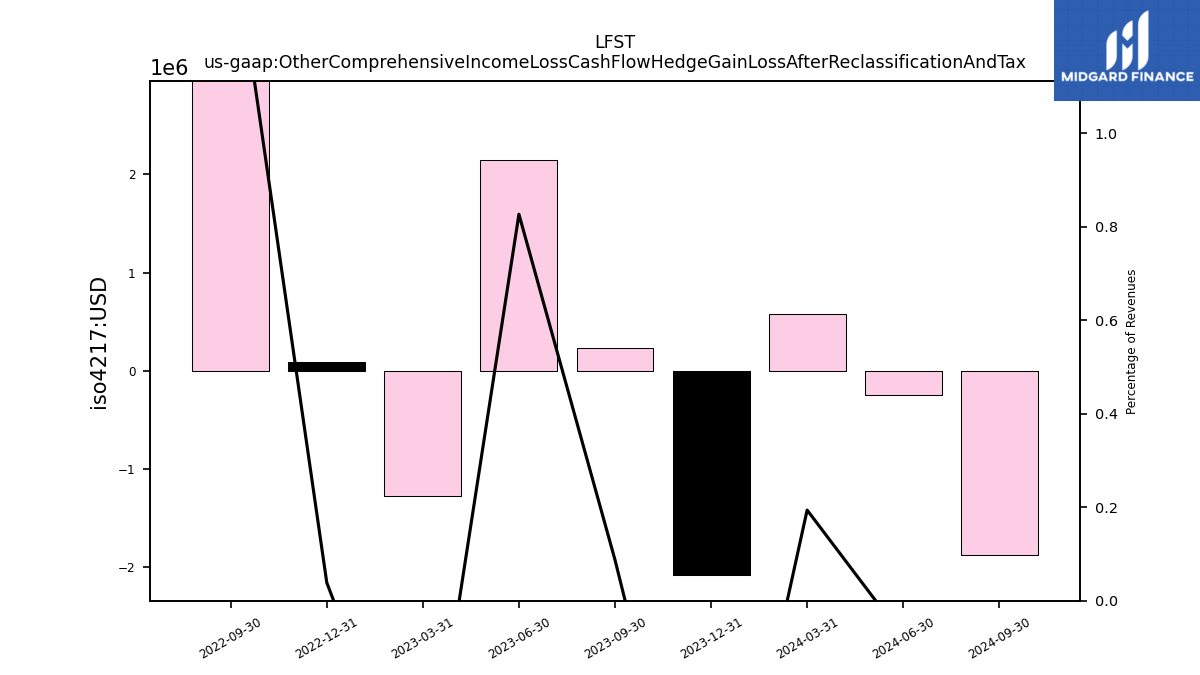
| Other Comprehensive Income Loss Cash Flow Hedge Gain Loss After Reclassification And Tax | 0.58 | -2.08 | 0.23 | 2.15 | -1.27 | 0.09 | 3.19 | NA | NA | NA | NA | NA | NA | NA | NA | NA | NA | |
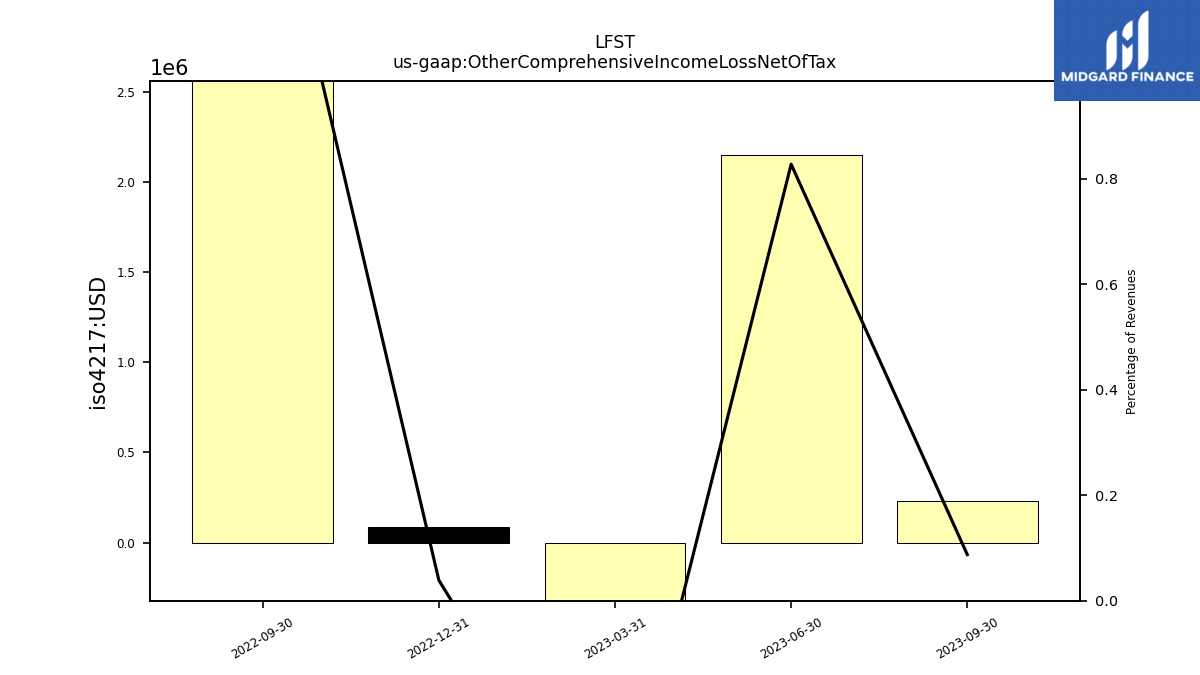
| Other Comprehensive Income Loss Net Of Tax | 0.58 | -2.08 | 0.23 | 2.15 | -1.27 | 0.09 | 3.19 | NA | NA | NA | NA | NA | NA | NA | NA | NA | NA | |
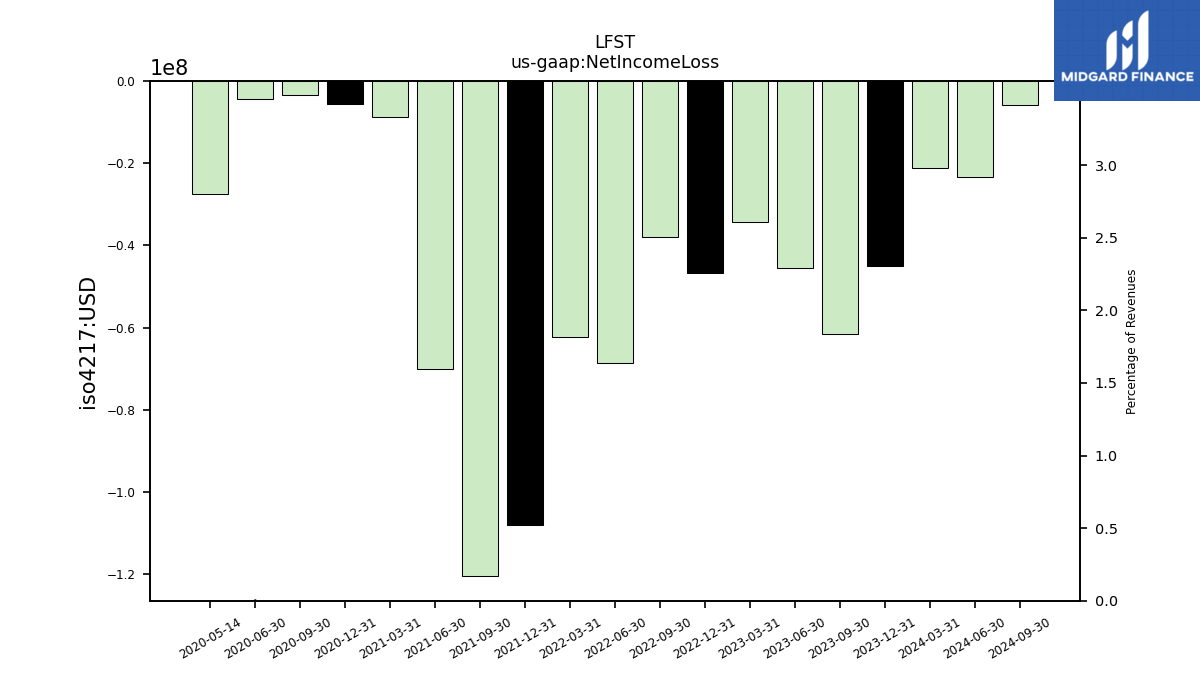
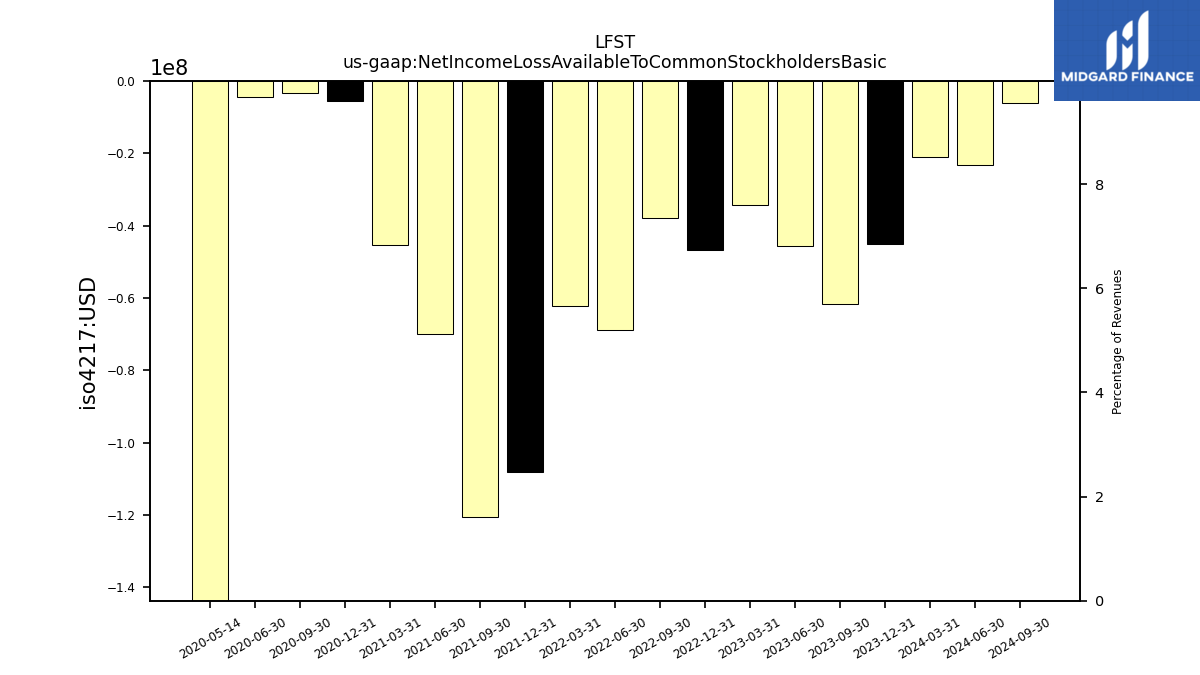
| Net Income Loss | -21.10 | -44.96 | -61.58 | -45.48 | -34.24 | -46.66 | -37.85 | -68.73 | -62.33 | -108.03 | -120.45 | -70.03 | -8.68 | -5.49 | -3.29 | -4.34 | -27.60 | |
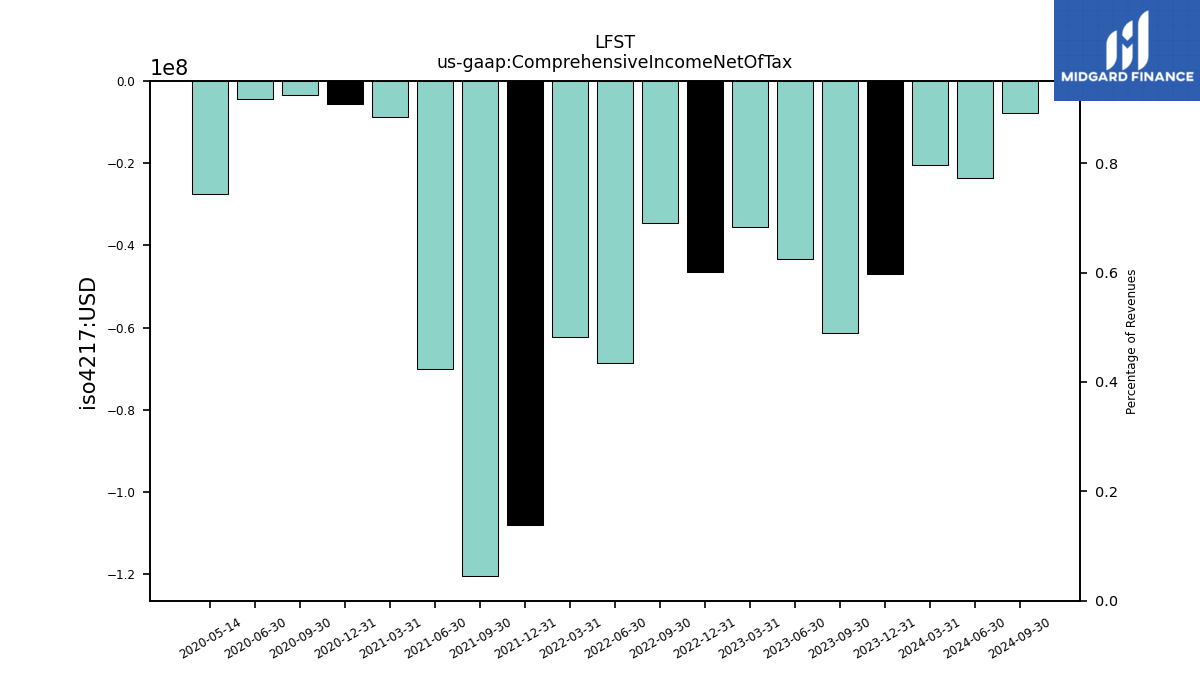
| Comprehensive Income Net Of Tax | -20.51 | -47.04 | -61.35 | -43.33 | -35.51 | -46.57 | -34.67 | -68.73 | -62.33 | -108.03 | -120.45 | -70.03 | -8.68 | -5.49 | -3.29 | -4.34 | -27.60 | |
| Net Income Loss Available To Common Stockholders Basic | -21.10 | -44.96 | -61.58 | -45.48 | -34.24 | -46.66 | -37.85 | -68.73 | -62.33 | -108.03 | -120.45 | -70.03 | -45.43 | -5.49 | -3.29 | -4.34 | -300.40 |
| 2024-03-31 | 2023-12-31 | 2023-09-30 | 2023-06-30 | 2023-03-31 | 2022-12-31 | 2022-09-30 | 2022-06-30 | 2022-03-31 | 2021-12-31 | 2021-09-30 | 2021-06-30 | 2021-03-31 | 2020-12-31 | 2020-09-30 | 2020-06-30 | 2020-05-14 | ||
|---|---|---|---|---|---|---|---|---|---|---|---|---|---|---|---|---|---|---|
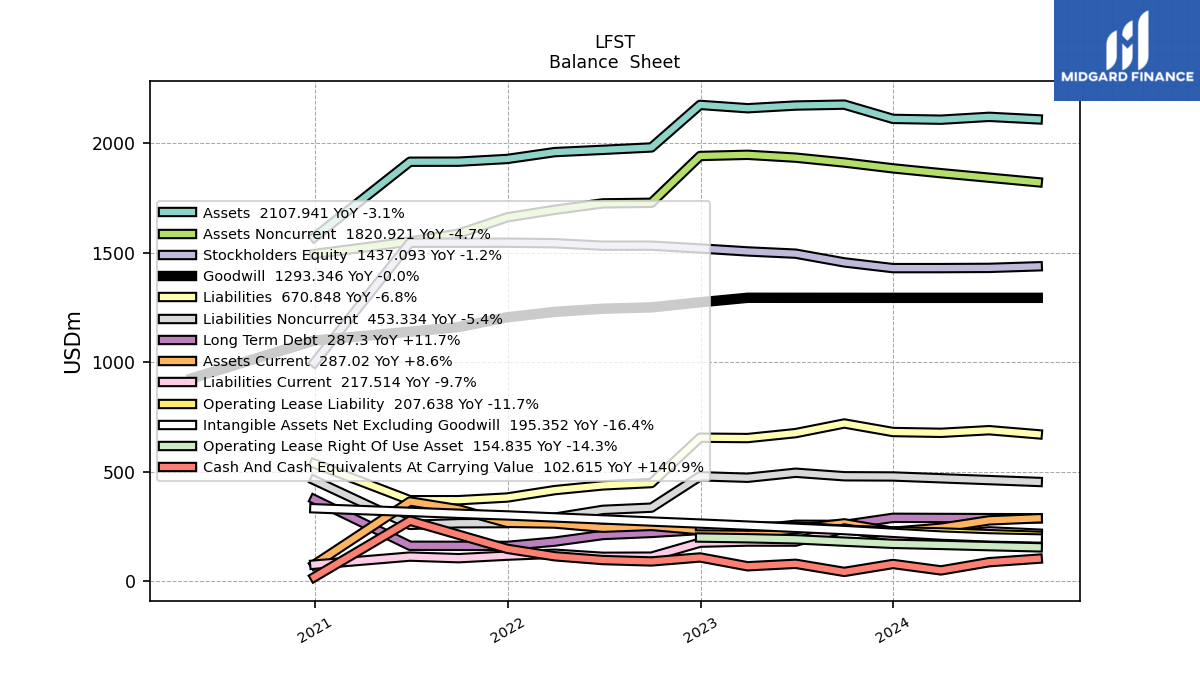
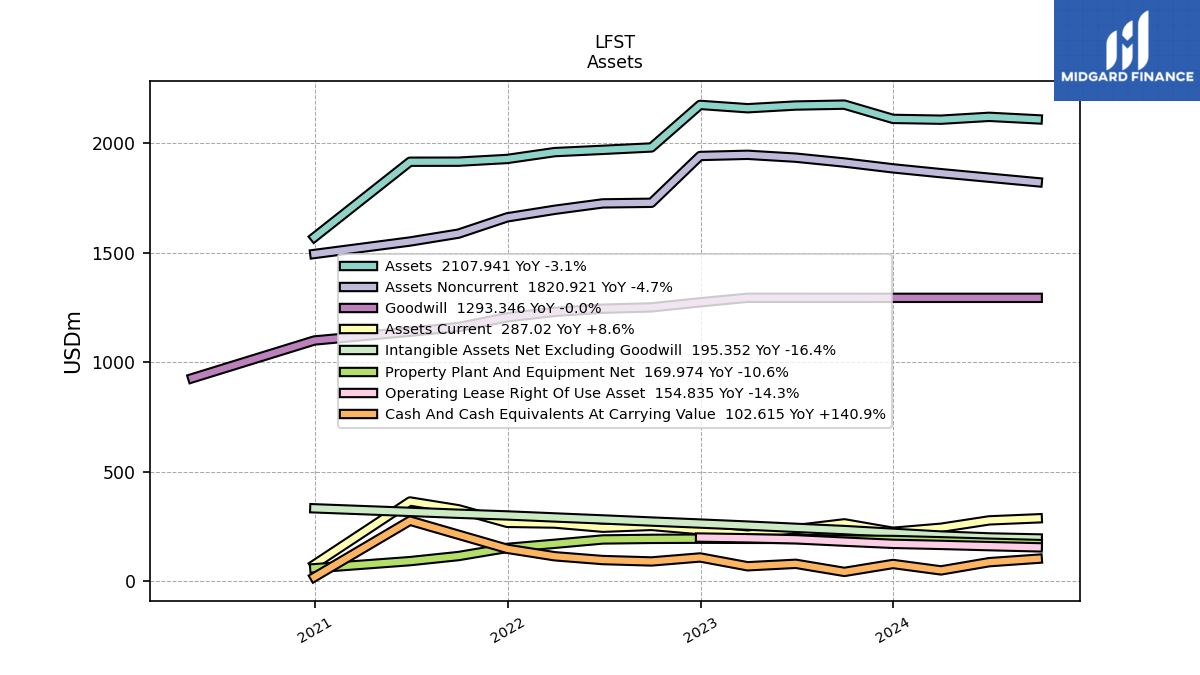
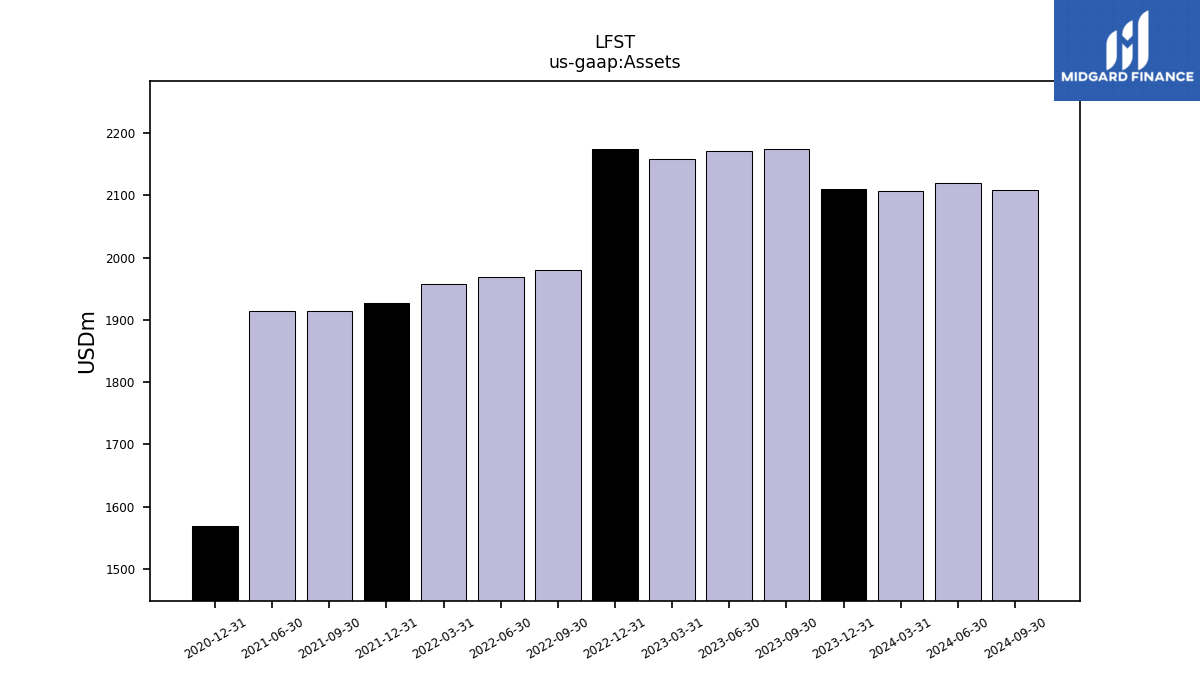
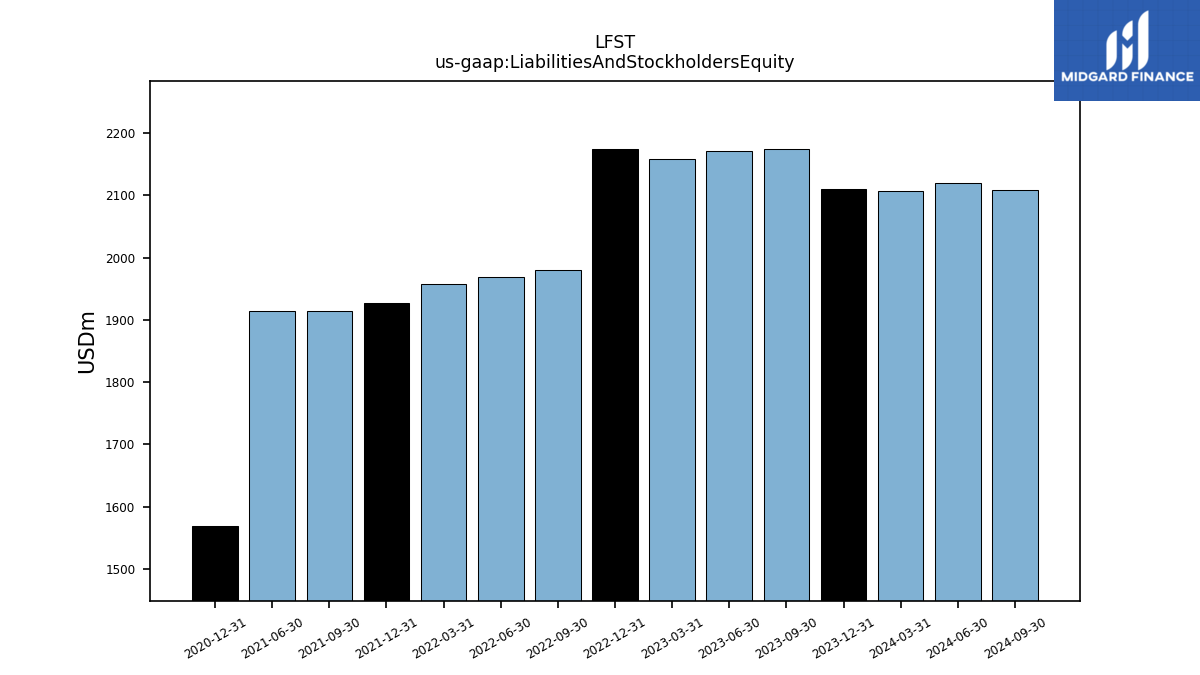
| Assets | 2106.32 | 2109.97 | 2175.07 | 2170.92 | 2158.56 | 2173.87 | 1979.66 | 1968.68 | 1958.39 | 1927.11 | 1914.76 | 1914.43 | NA | 1569.73 | NA | NA | NA | |
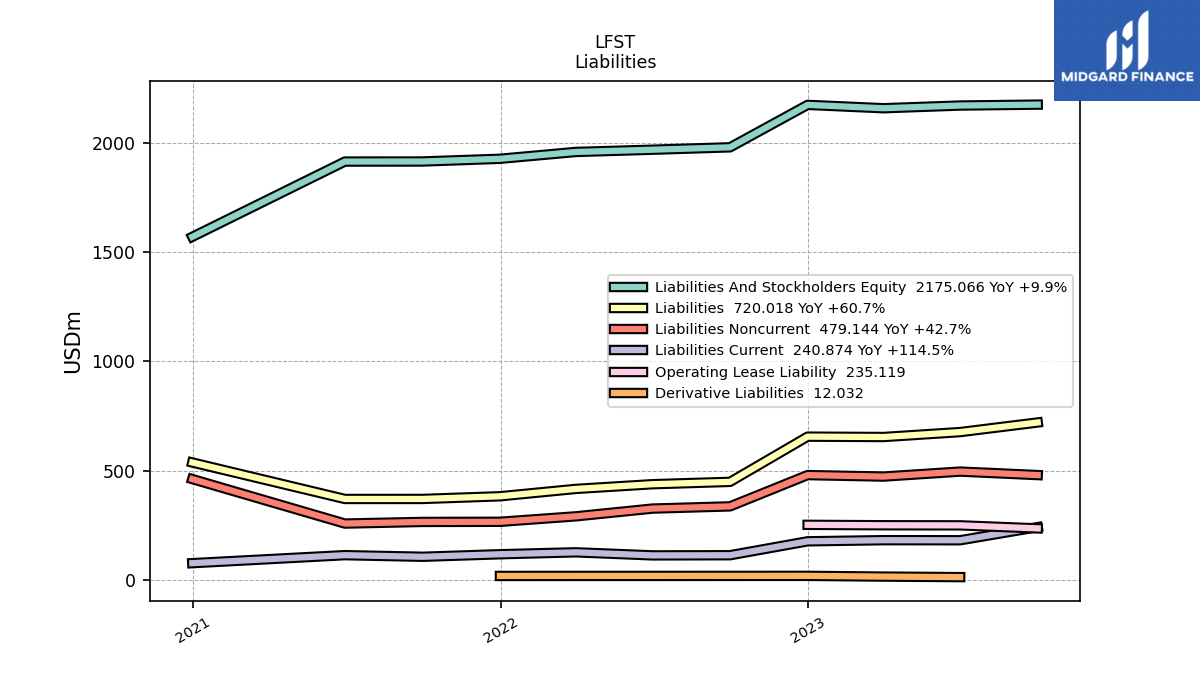
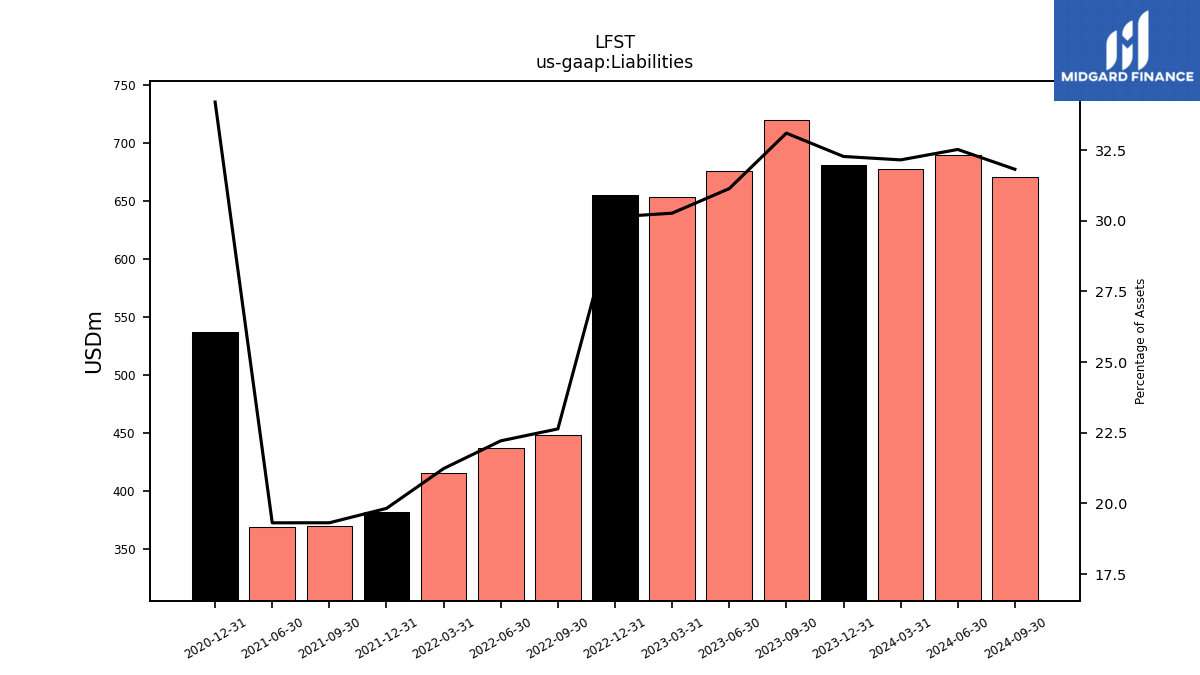
| Liabilities | 677.32 | 681.04 | 720.02 | 676.04 | 653.43 | 655.15 | 448.16 | 437.38 | 415.87 | 382.08 | 369.89 | 369.80 | NA | 536.89 | NA | NA | NA | |
| Liabilities And Stockholders Equity | 2106.32 | 2109.97 | 2175.07 | 2170.92 | 2158.56 | 2173.87 | 1979.66 | 1968.68 | 1958.39 | 1927.11 | 1914.76 | 1914.43 | NA | 1569.73 | NA | NA | NA | |
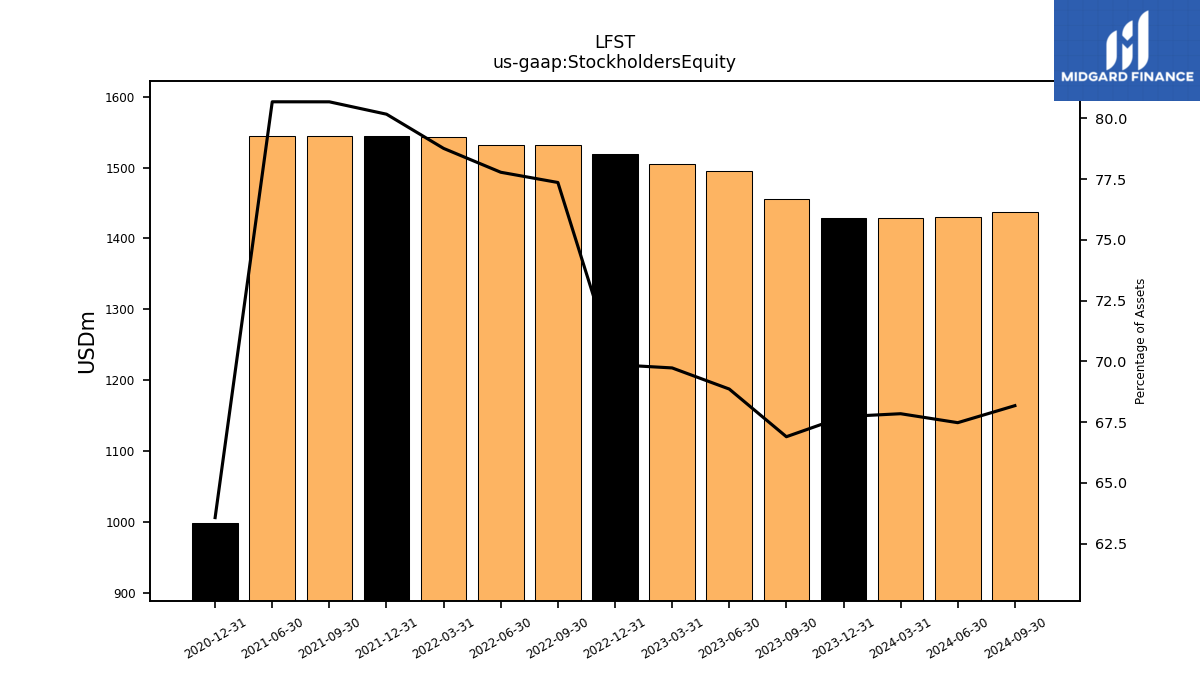
| Stockholders Equity | 1429.00 | 1428.93 | 1455.05 | 1494.88 | 1505.13 | 1518.72 | 1531.50 | 1531.30 | 1542.52 | 1545.03 | 1544.87 | 1544.63 | NA | 997.84 | NA | NA | NA |
| 2024-03-31 | 2023-12-31 | 2023-09-30 | 2023-06-30 | 2023-03-31 | 2022-12-31 | 2022-09-30 | 2022-06-30 | 2022-03-31 | 2021-12-31 | 2021-09-30 | 2021-06-30 | 2021-03-31 | 2020-12-31 | 2020-09-30 | 2020-06-30 | 2020-05-14 | ||
|---|---|---|---|---|---|---|---|---|---|---|---|---|---|---|---|---|---|---|
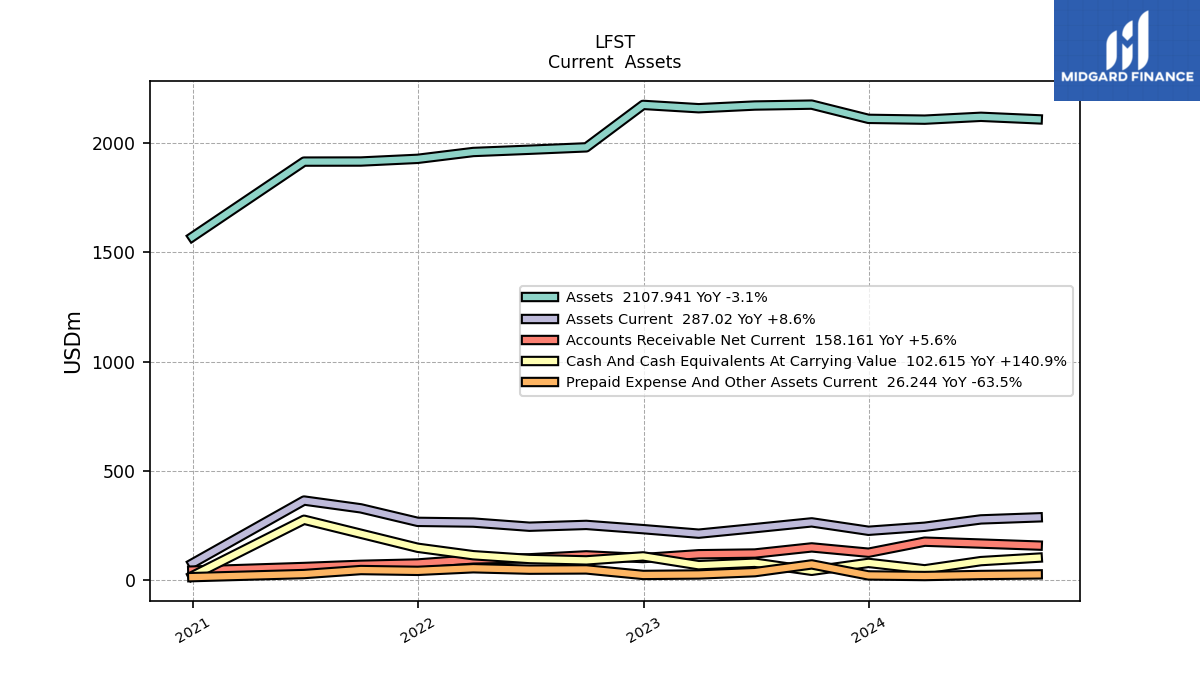
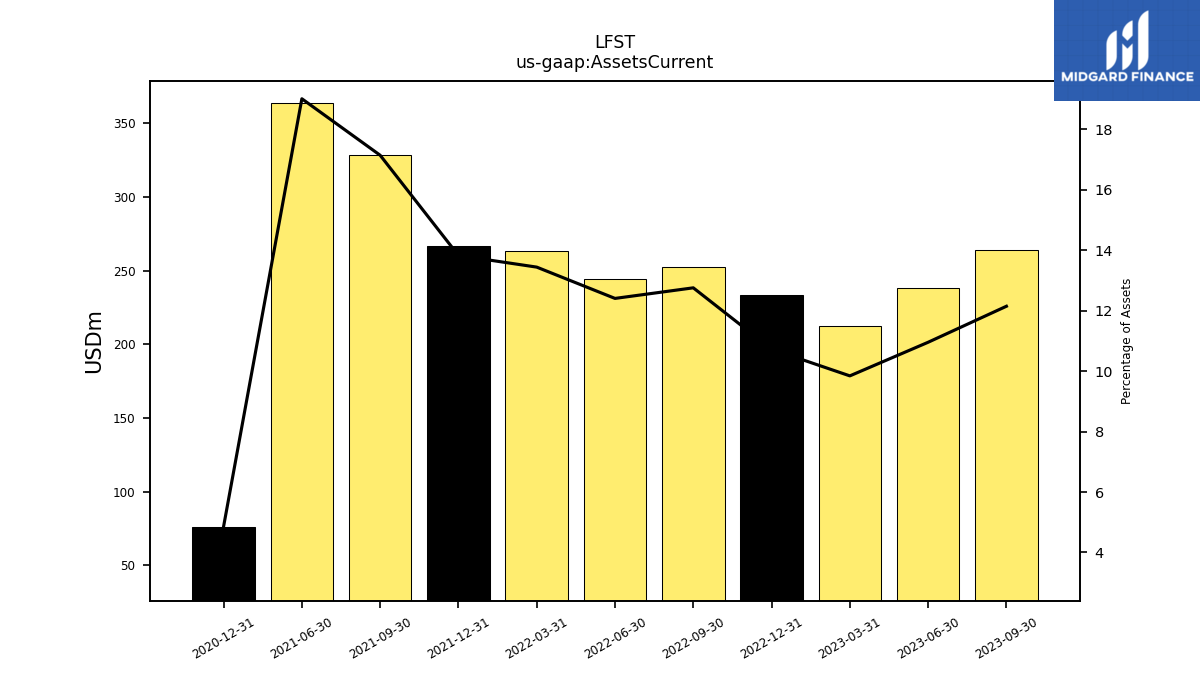
| Assets Current | 244.12 | 225.73 | 264.25 | 237.88 | 212.51 | 233.22 | 252.59 | 244.29 | 263.30 | 266.52 | 328.33 | 364.06 | NA | 76.28 | NA | NA | NA | |
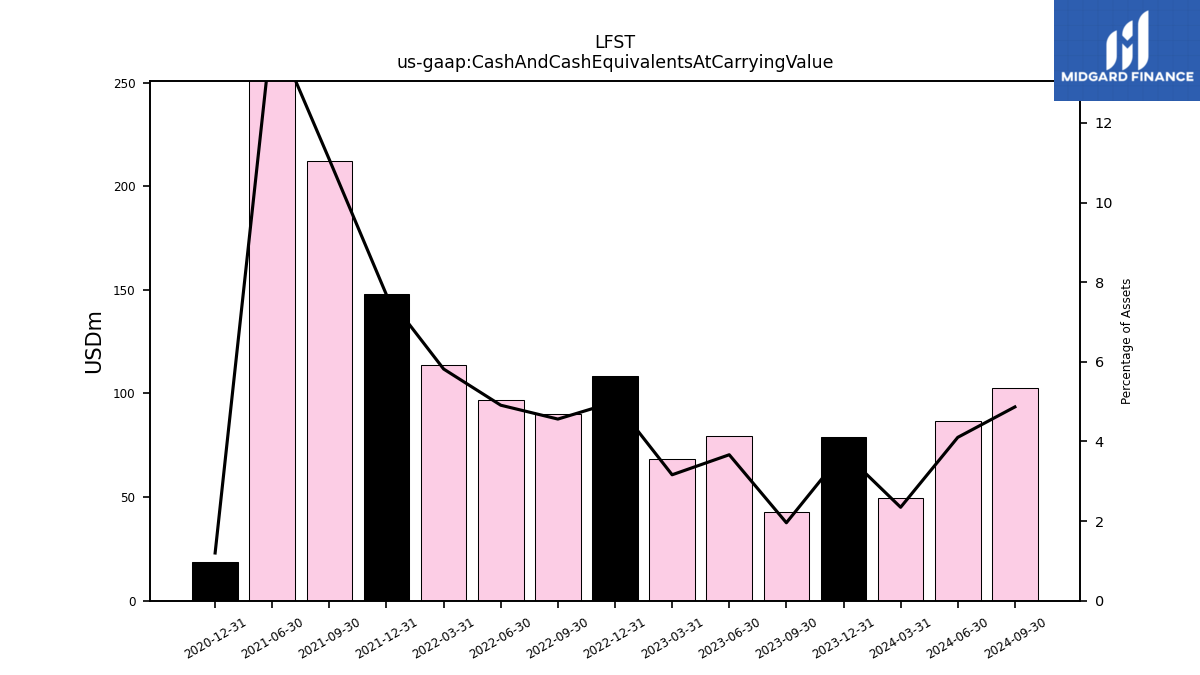
| Cash And Cash Equivalents At Carrying Value | 49.45 | 78.82 | 42.60 | 79.61 | 68.29 | 108.62 | 90.34 | 96.69 | 113.99 | 148.03 | 212.12 | 276.19 | NA | 18.83 | NA | NA | NA | |
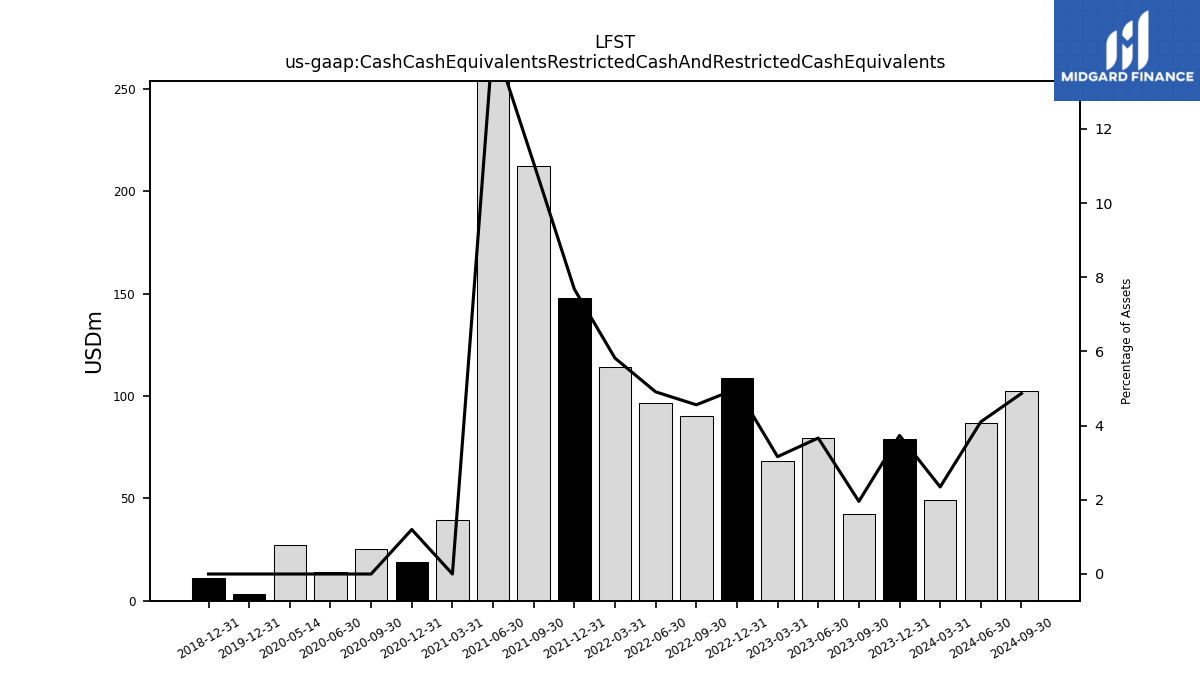
| Cash Cash Equivalents Restricted Cash And Restricted Cash Equivalents | 49.45 | 78.82 | 42.60 | 79.61 | 68.29 | 108.62 | 90.34 | 96.69 | 113.99 | 148.03 | 212.12 | 276.19 | 39.49 | 18.83 | 25.07 | 13.80 | 27.22 | |
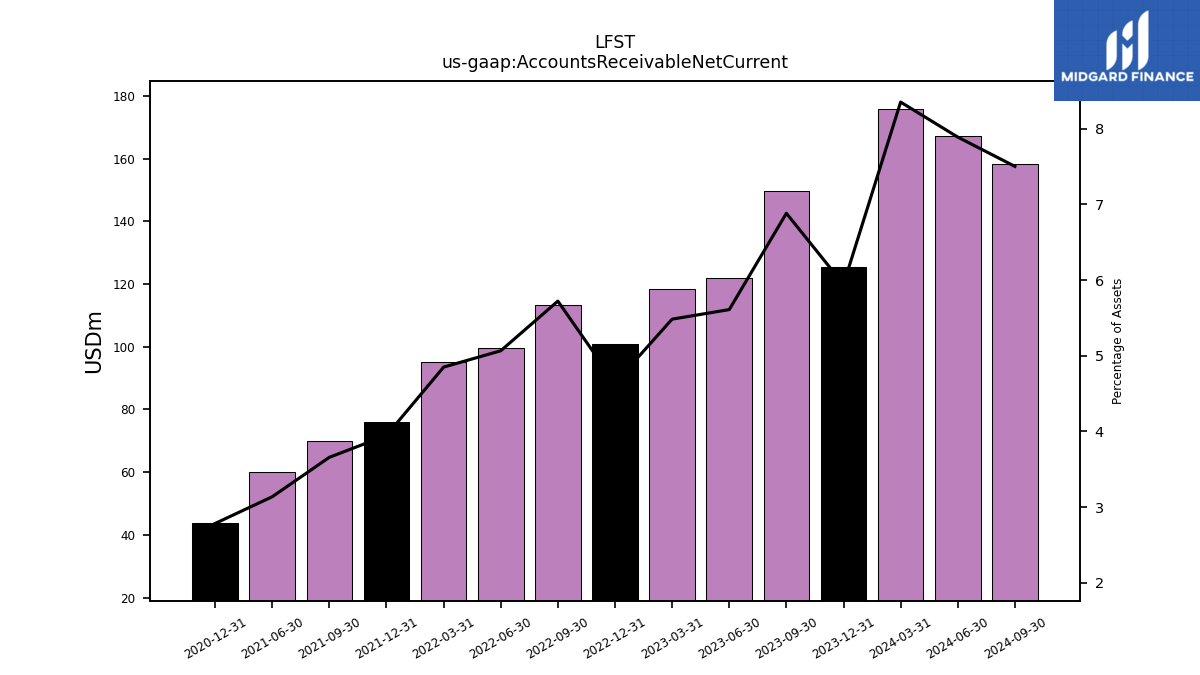
| Accounts Receivable Net Current | 175.94 | 125.41 | 149.72 | 121.80 | 118.38 | 100.87 | 113.28 | 99.74 | 94.99 | 76.08 | 70.06 | 60.07 | NA | 43.71 | NA | NA | NA | |
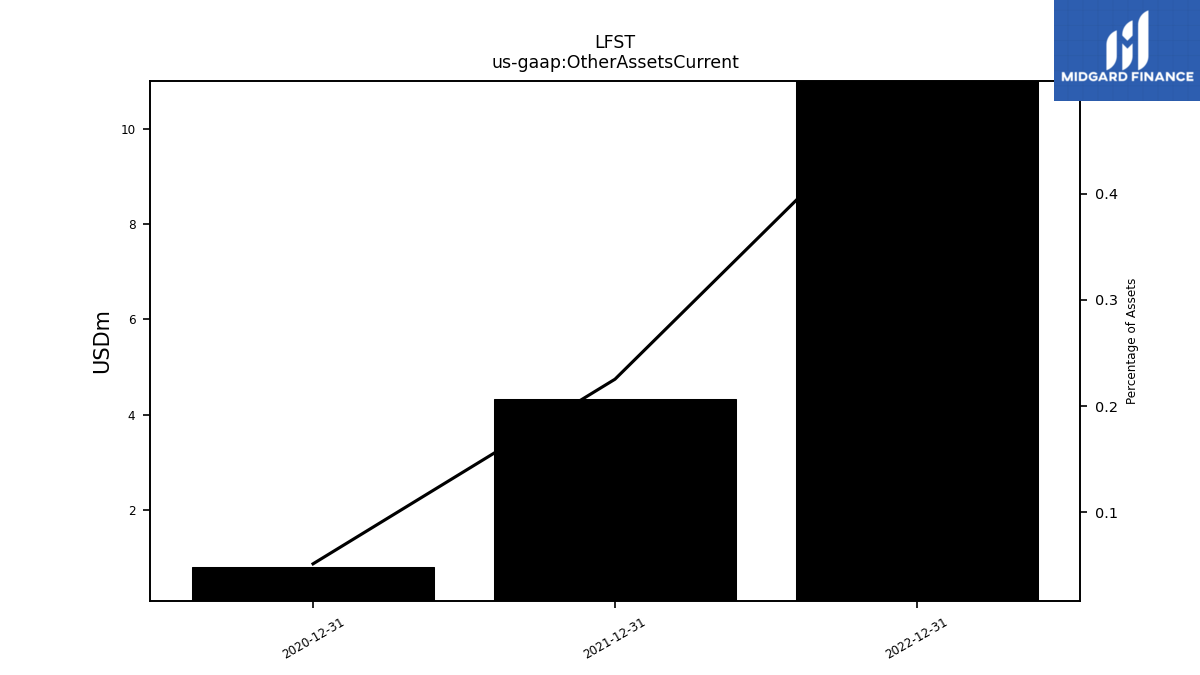
| Other Assets Current | NA | 10.73 | NA | NA | NA | 11.00 | NA | NA | NA | 4.34 | NA | NA | NA | 0.81 | NA | NA | NA | |
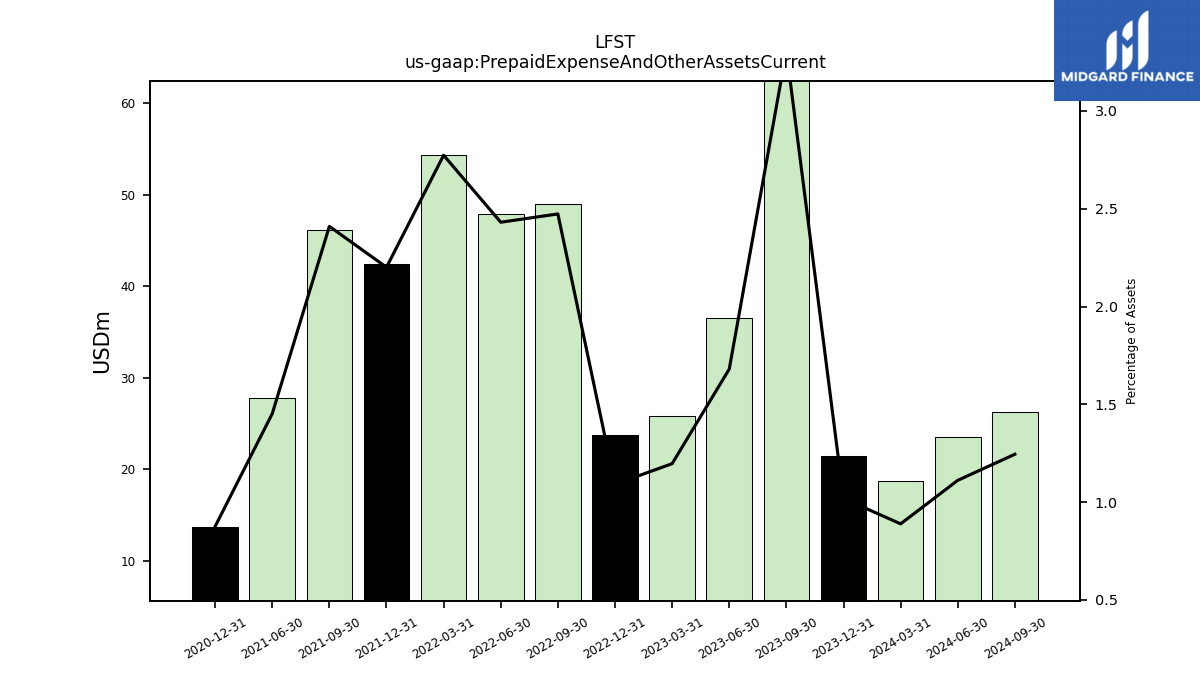
| Prepaid Expense And Other Assets Current | 18.73 | 21.50 | 71.93 | 36.48 | 25.83 | 23.73 | 48.97 | 47.86 | 54.32 | 42.41 | 46.14 | 27.80 | NA | 13.74 | NA | NA | NA |
| 2024-03-31 | 2023-12-31 | 2023-09-30 | 2023-06-30 | 2023-03-31 | 2022-12-31 | 2022-09-30 | 2022-06-30 | 2022-03-31 | 2021-12-31 | 2021-09-30 | 2021-06-30 | 2021-03-31 | 2020-12-31 | 2020-09-30 | 2020-06-30 | 2020-05-14 | ||
|---|---|---|---|---|---|---|---|---|---|---|---|---|---|---|---|---|---|---|
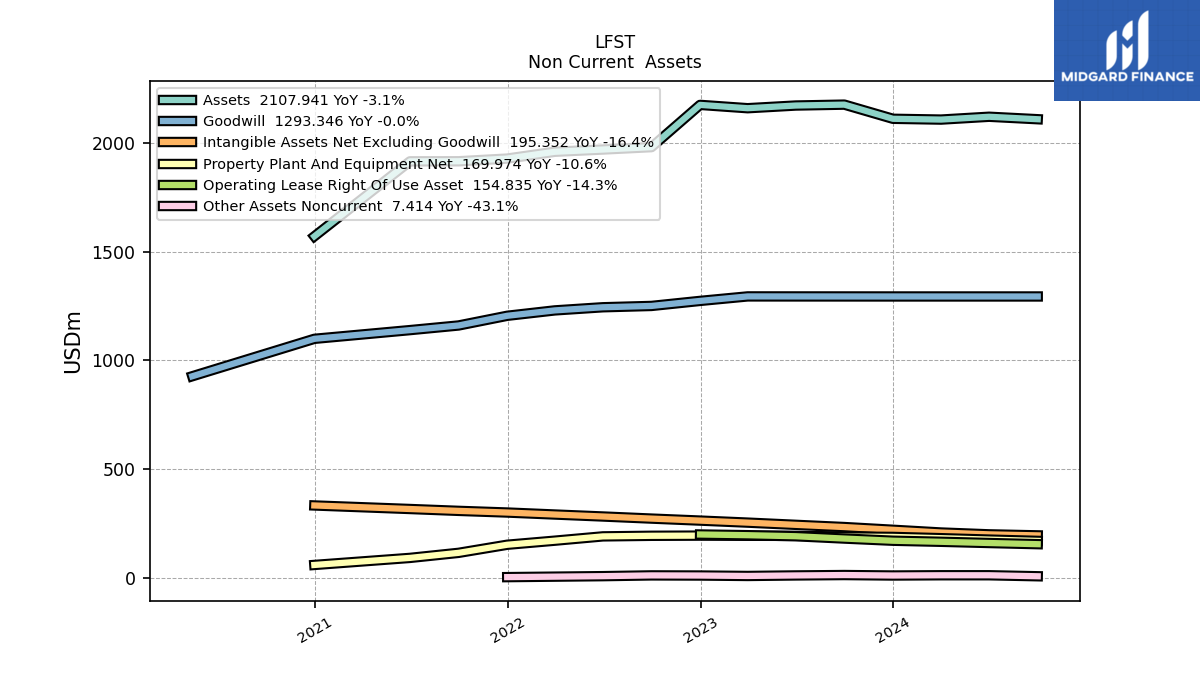
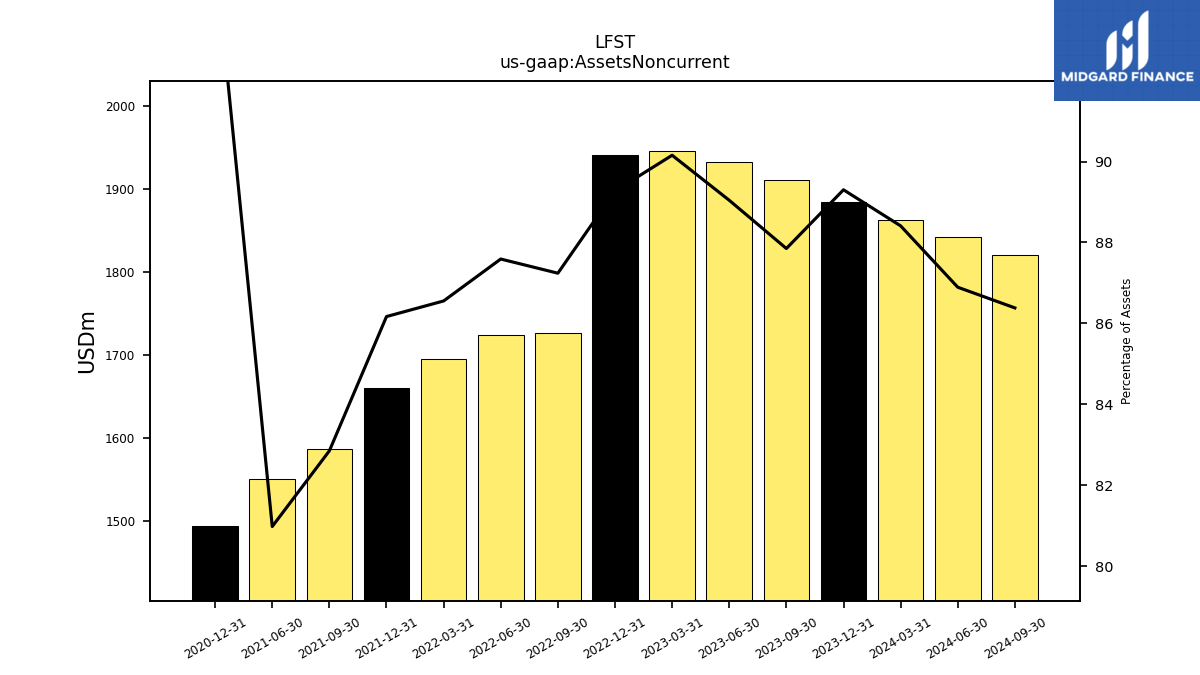
| Assets Noncurrent | 1862.20 | 1884.24 | 1910.82 | 1933.04 | 1946.05 | 1940.65 | 1727.08 | 1724.39 | 1695.09 | 1660.59 | 1586.43 | 1550.37 | NA | 1493.45 | NA | NA | NA | |
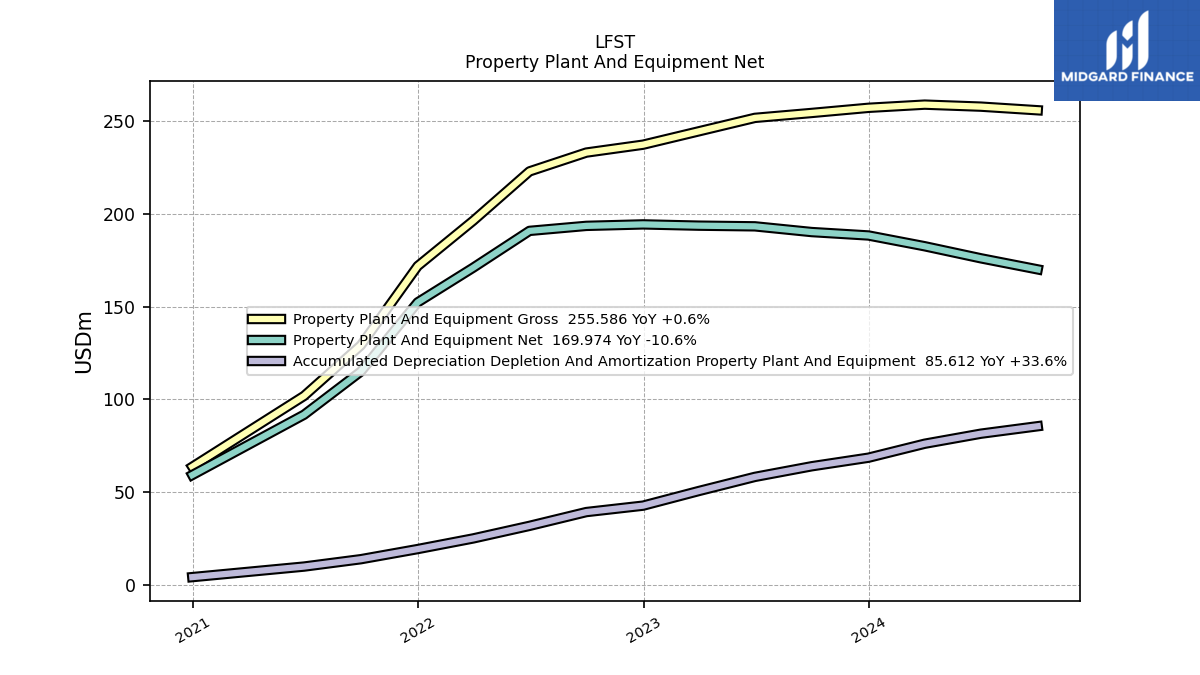
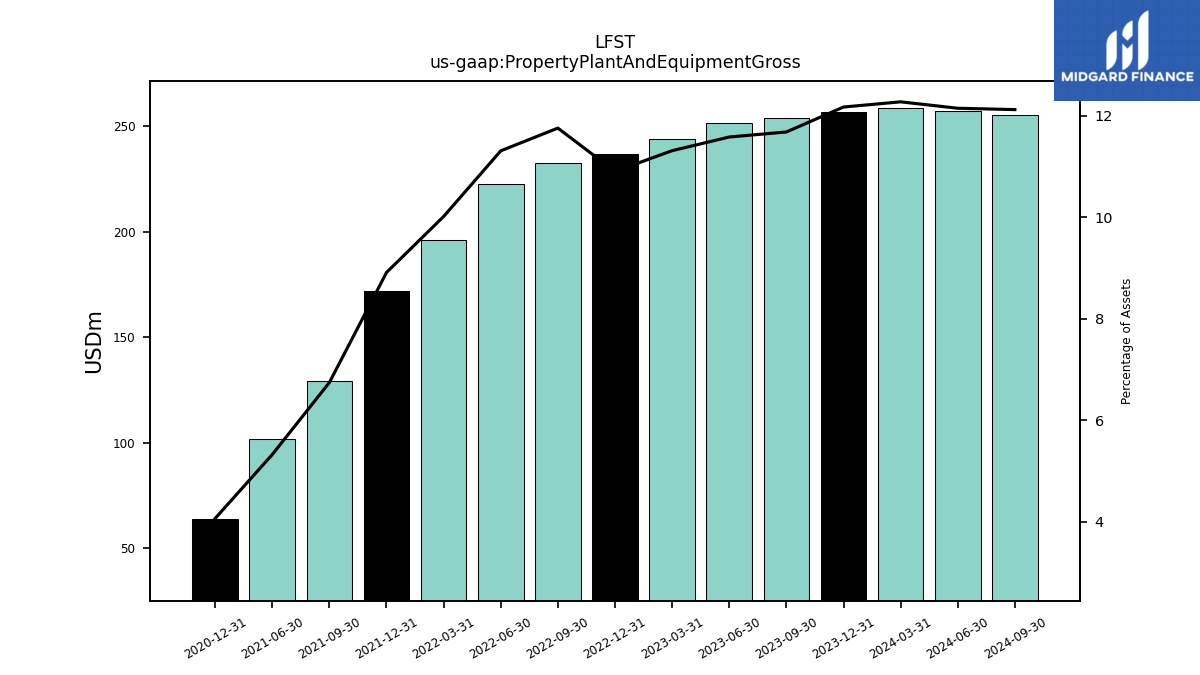
| Property Plant And Equipment Gross | 258.62 | 256.91 | 254.14 | 251.49 | 244.24 | 237.07 | 232.82 | 222.70 | 196.18 | 171.77 | 129.12 | 101.91 | NA | 63.78 | NA | NA | NA | |
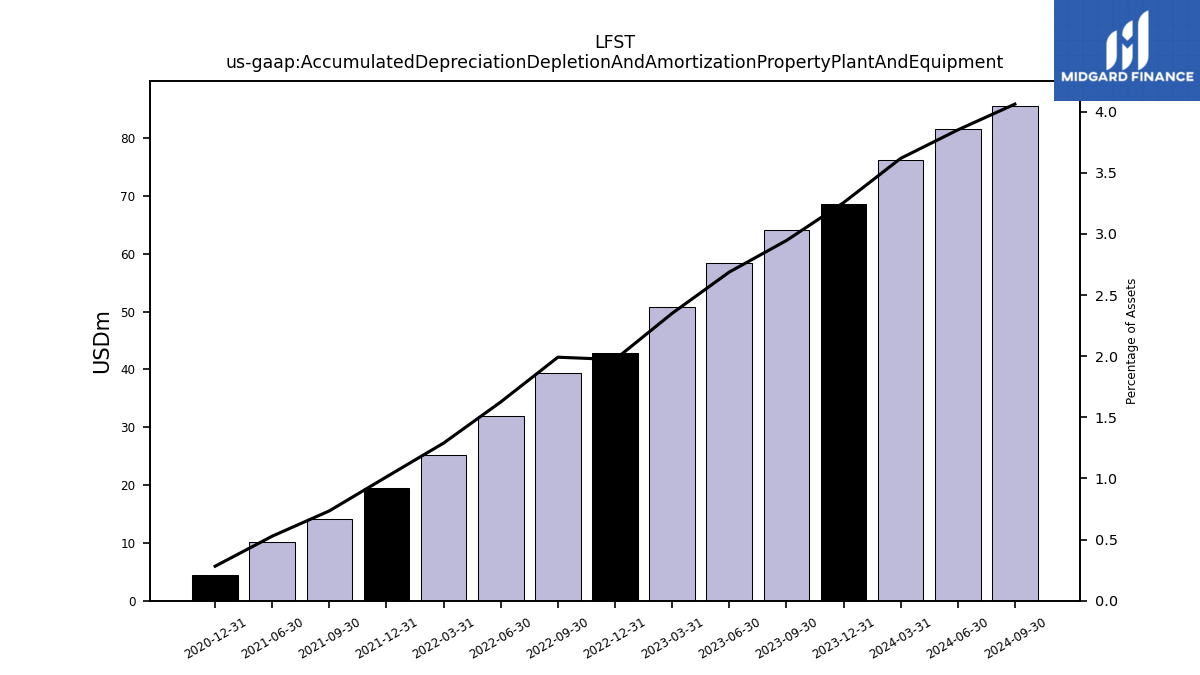
| Accumulated Depreciation Depletion And Amortization Property Plant And Equipment | 76.19 | 68.68 | 64.07 | 58.35 | 50.73 | 42.88 | 39.43 | 32.00 | 25.25 | 19.53 | 14.08 | 10.11 | NA | 4.43 | NA | NA | NA | |
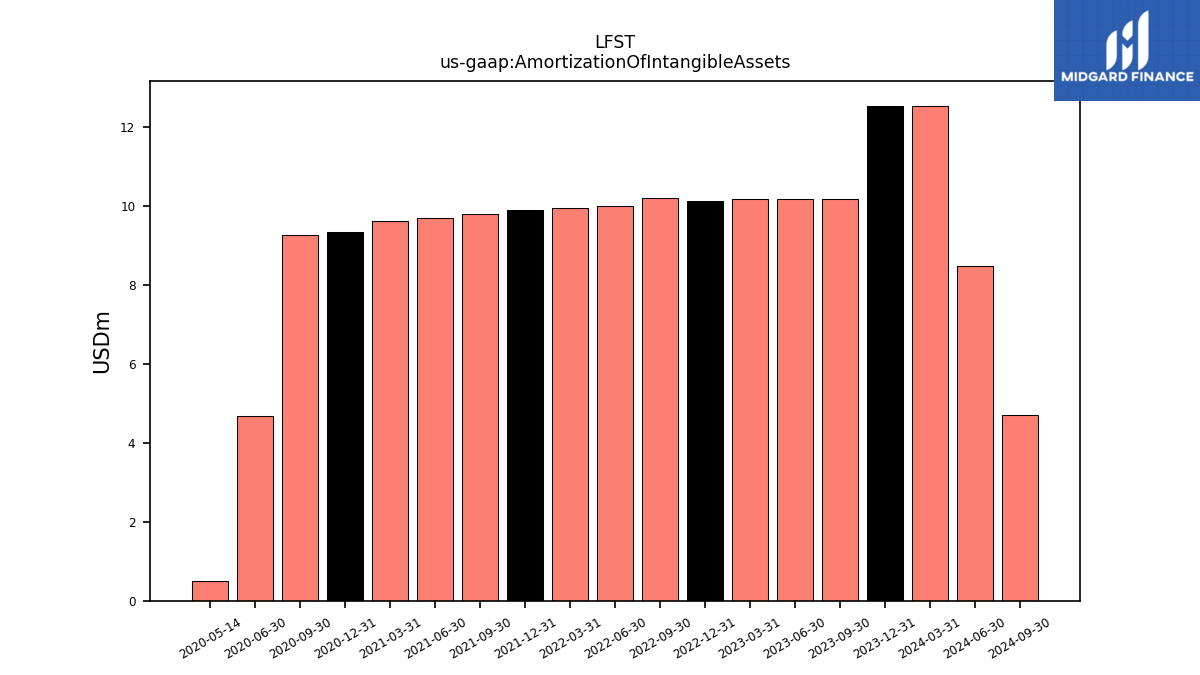
| Amortization Of Intangible Assets | 12.54 | 12.54 | 10.17 | 10.18 | 10.17 | 10.13 | 10.20 | 9.99 | 9.96 | 9.91 | 9.81 | 9.70 | 9.62 | 9.34 | 9.26 | 4.67 | 0.50 | |
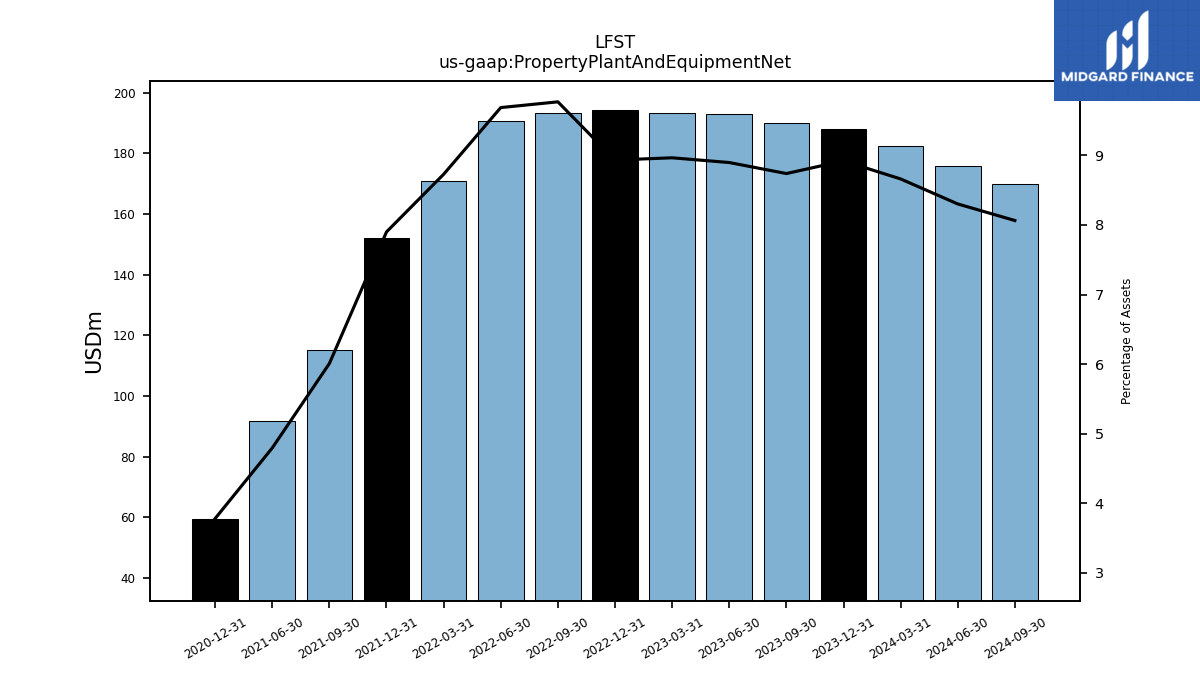
| Property Plant And Equipment Net | 182.43 | 188.22 | 190.07 | 193.14 | 193.51 | 194.19 | 193.39 | 190.69 | 170.93 | 152.24 | 115.05 | 91.80 | NA | 59.35 | NA | NA | NA | |
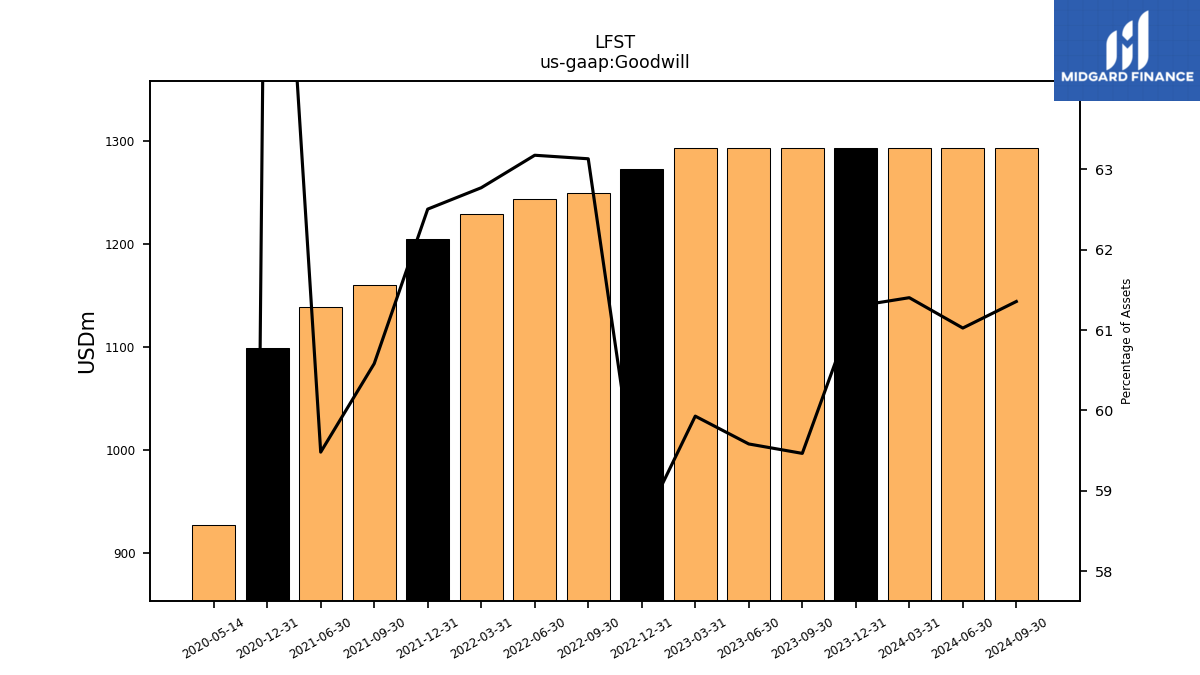
| Goodwill | 1293.35 | 1293.35 | 1293.43 | 1293.50 | 1293.61 | 1272.94 | 1249.79 | 1243.72 | 1229.30 | 1204.54 | 1160.01 | 1138.73 | NA | 1098.66 | NA | NA | 926.66 | |
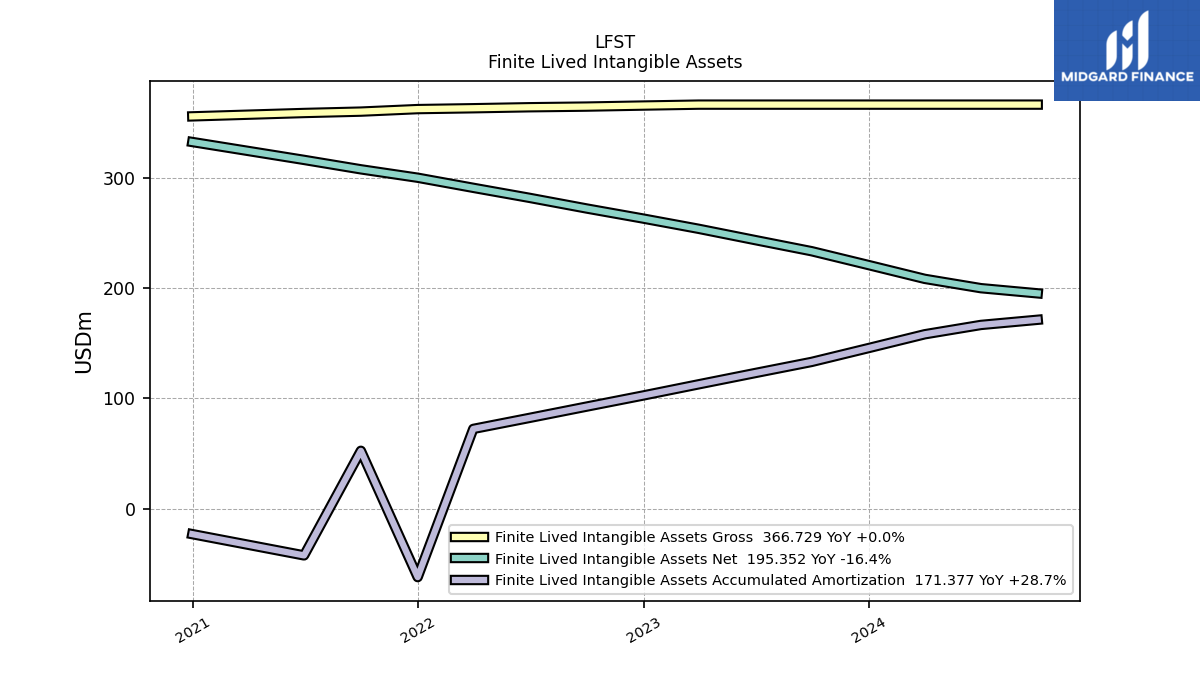
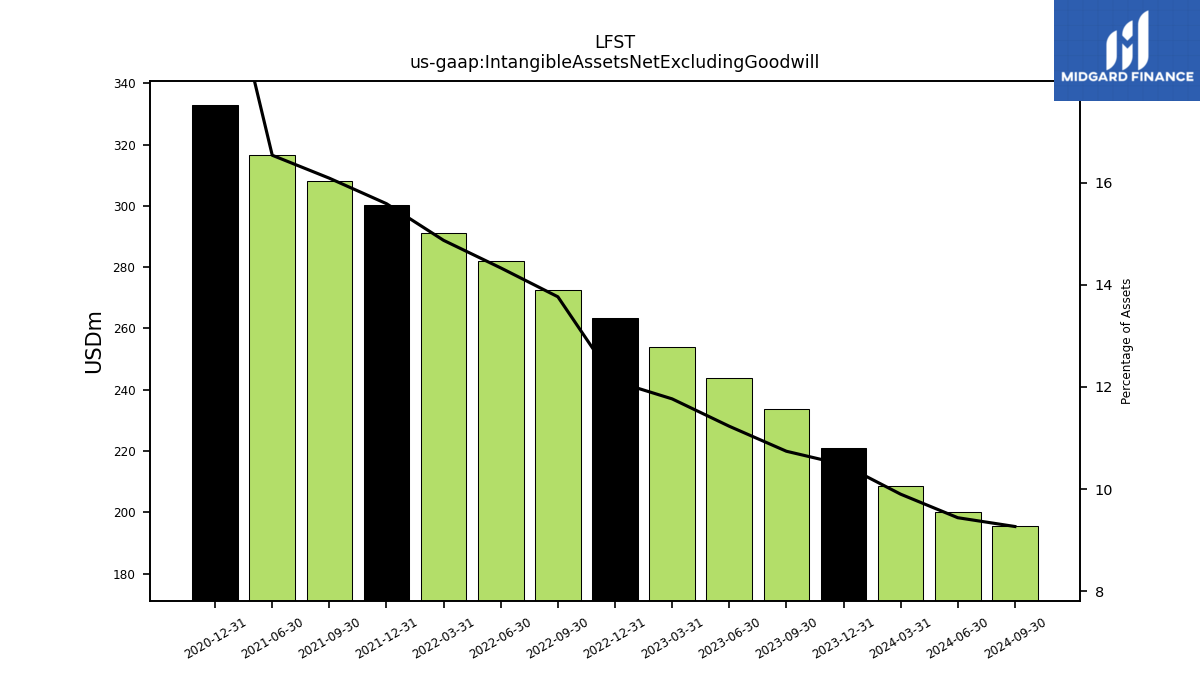
| Intangible Assets Net Excluding Goodwill | 208.53 | 221.07 | 233.62 | 243.79 | 253.96 | 263.29 | 272.47 | 282.09 | 291.18 | 300.36 | 307.98 | 316.53 | NA | 332.80 | NA | NA | NA | |
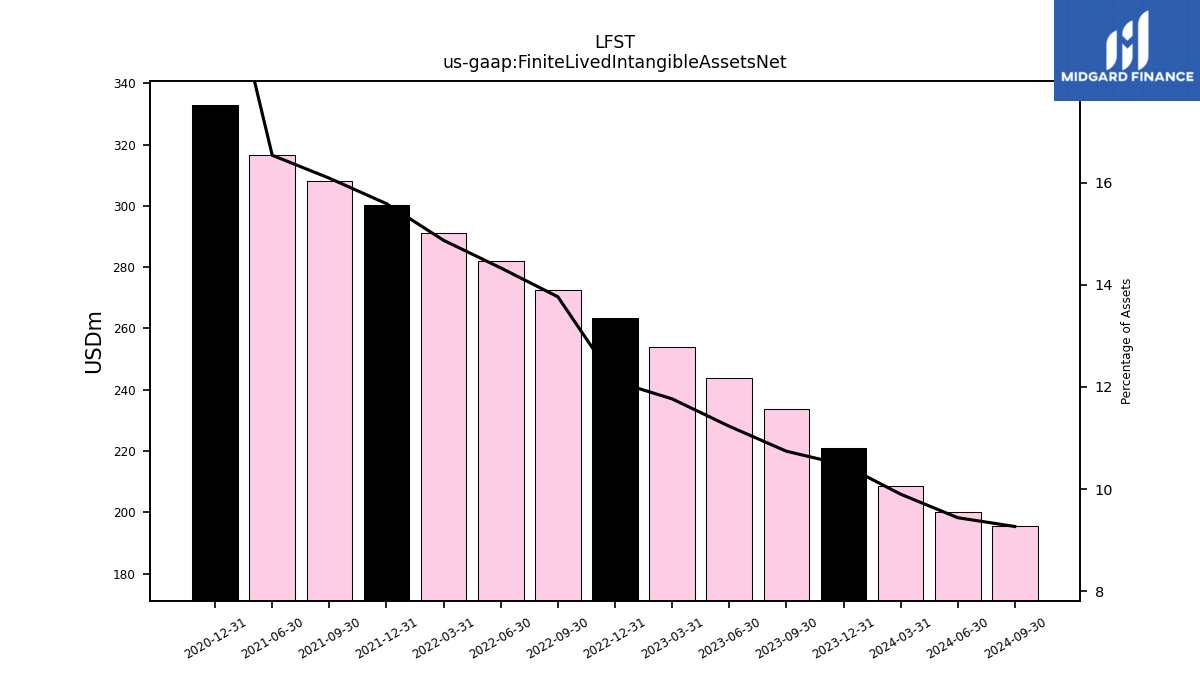
| Finite Lived Intangible Assets Net | 208.53 | 221.07 | 233.62 | 243.79 | 253.96 | 263.29 | 272.47 | 282.09 | 291.18 | 300.36 | 307.98 | 316.53 | NA | 332.80 | NA | NA | NA | |
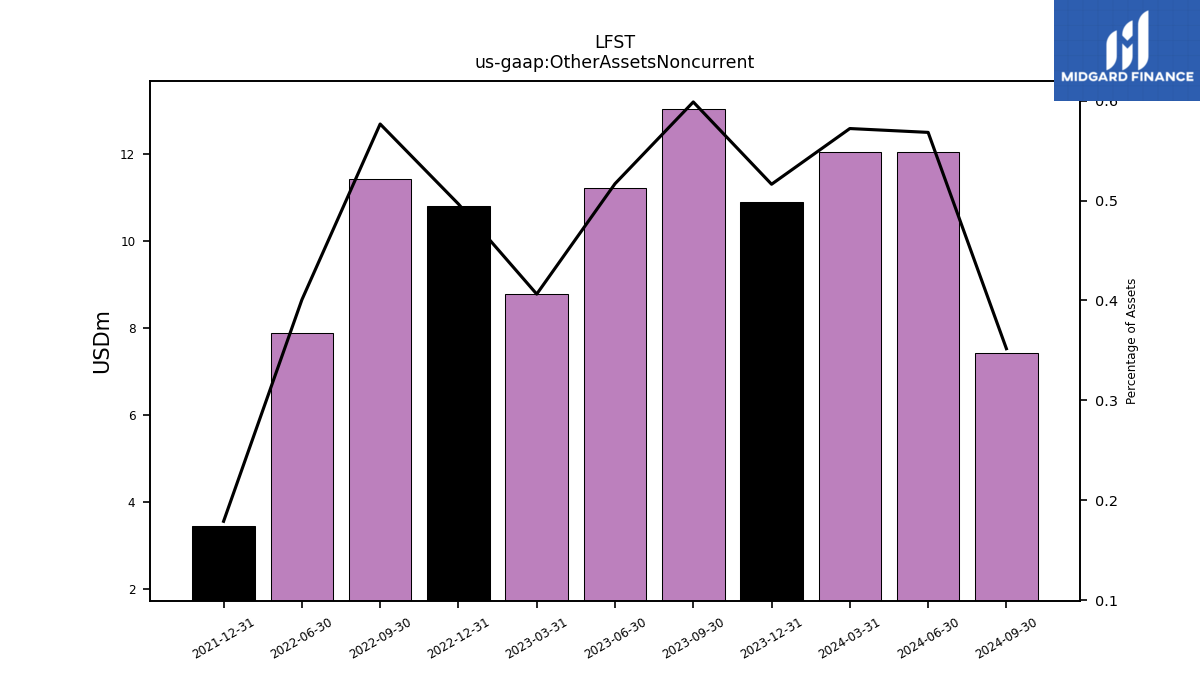
| Other Assets Noncurrent | 12.05 | 10.89 | 13.02 | 11.22 | 8.77 | 10.79 | 11.42 | 7.89 | NA | 3.45 | NA | NA | NA | NA | NA | NA | NA |
| 2024-03-31 | 2023-12-31 | 2023-09-30 | 2023-06-30 | 2023-03-31 | 2022-12-31 | 2022-09-30 | 2022-06-30 | 2022-03-31 | 2021-12-31 | 2021-09-30 | 2021-06-30 | 2021-03-31 | 2020-12-31 | 2020-09-30 | 2020-06-30 | 2020-05-14 | ||
|---|---|---|---|---|---|---|---|---|---|---|---|---|---|---|---|---|---|---|
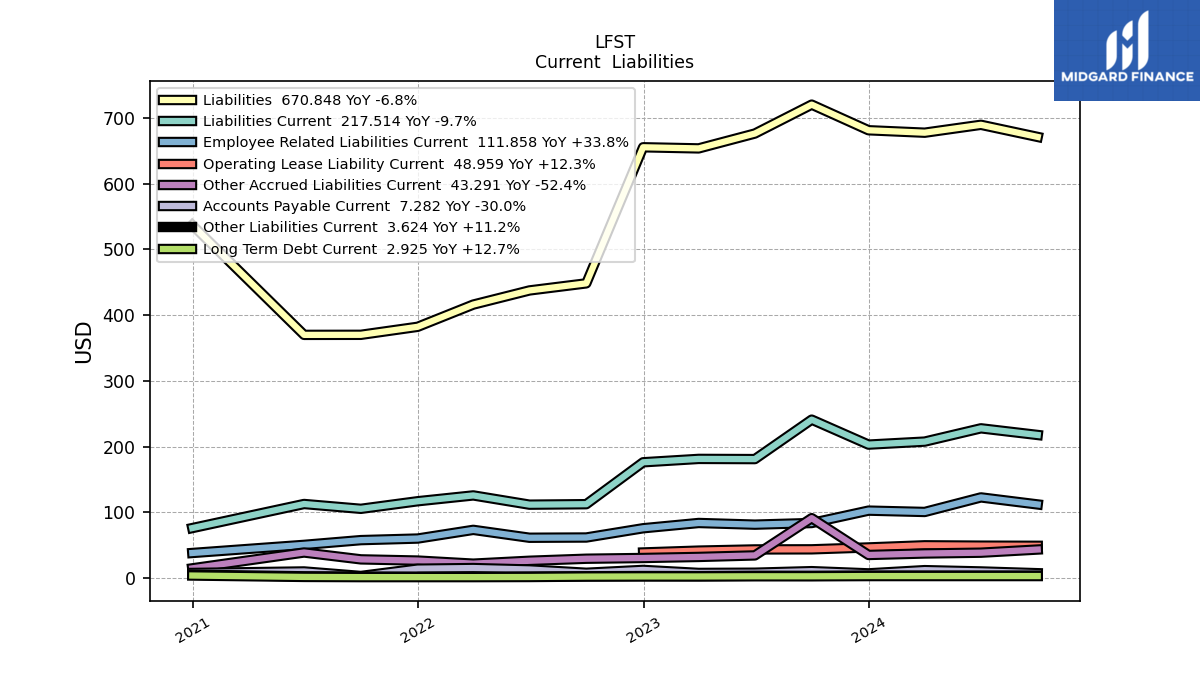
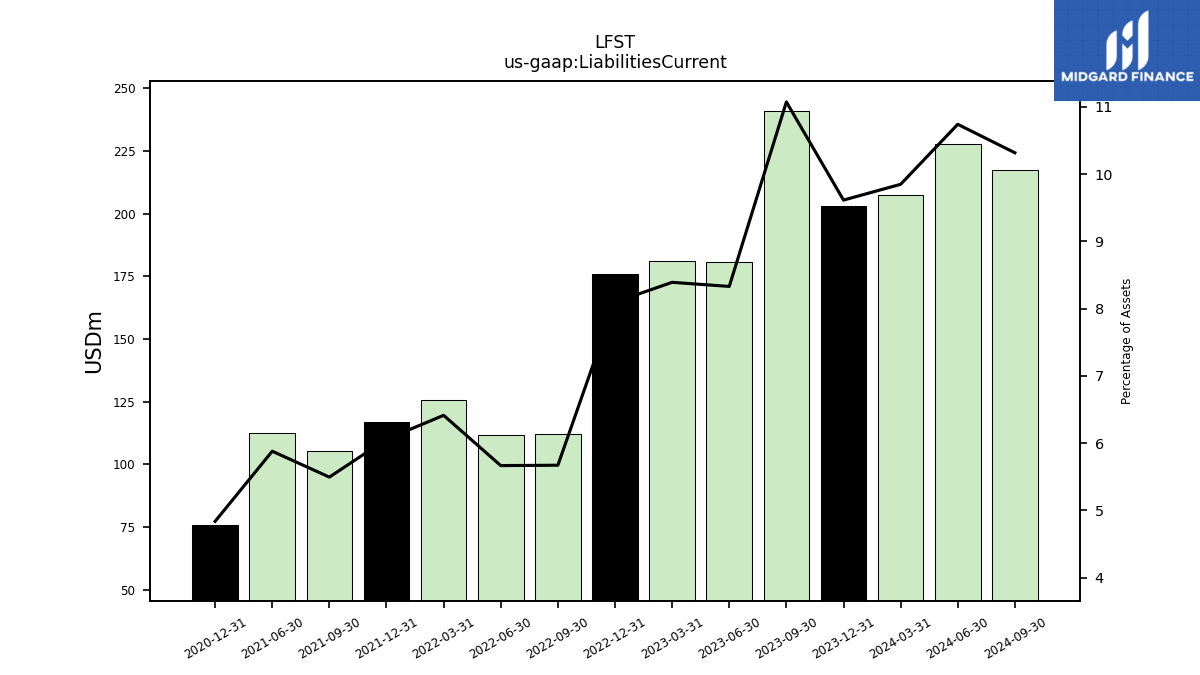
| Liabilities Current | 207.46 | 202.87 | 240.87 | 180.85 | 181.14 | 176.00 | 112.27 | 111.54 | 125.60 | 116.75 | 105.20 | 112.56 | NA | 75.92 | NA | NA | NA | |
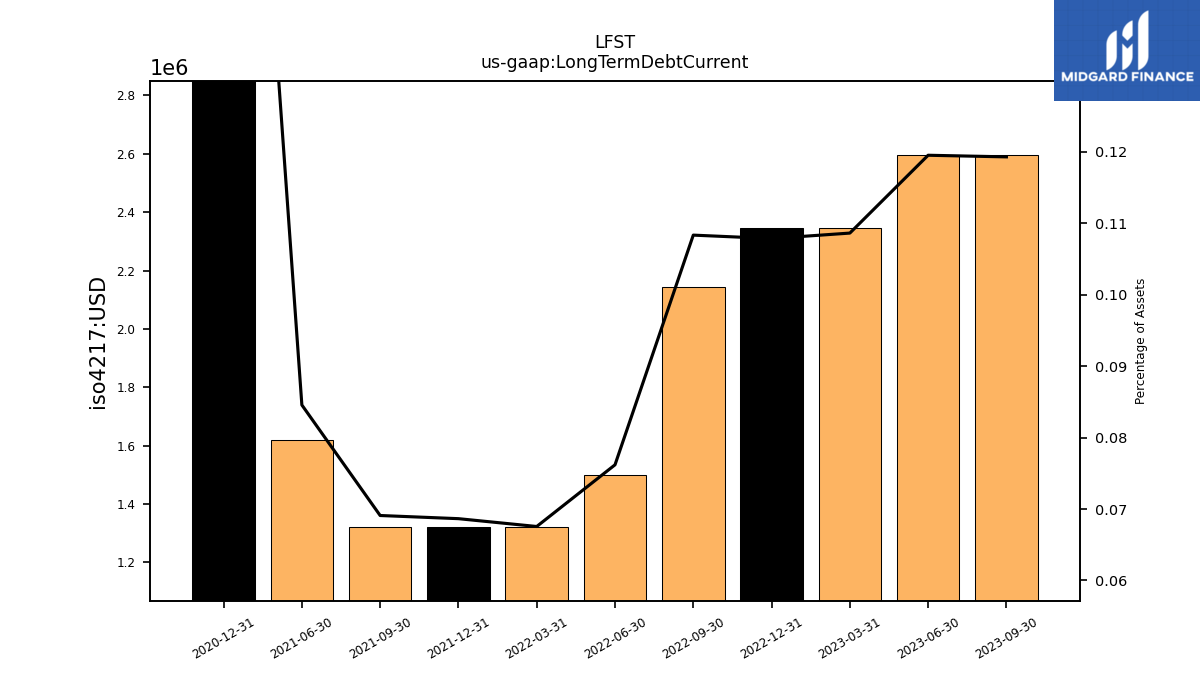
| Long Term Debt Current | 2.92 | 2.92 | 2.60 | 2.60 | 2.35 | 2.35 | 2.15 | 1.50 | 1.32 | 1.32 | 1.32 | 1.62 | NA | 3.74 | NA | NA | NA | |
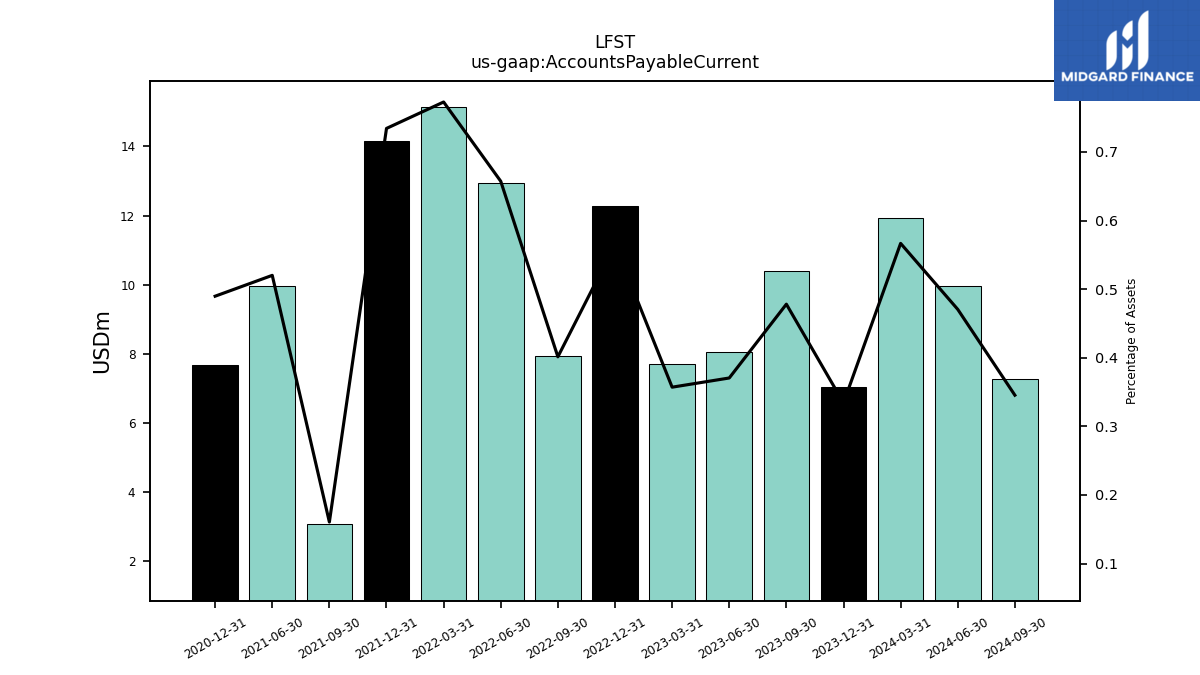
| Accounts Payable Current | 11.94 | 7.05 | 10.40 | 8.04 | 7.71 | 12.29 | 7.95 | 12.94 | 15.14 | 14.15 | 3.07 | 9.96 | NA | 7.69 | NA | NA | NA | |
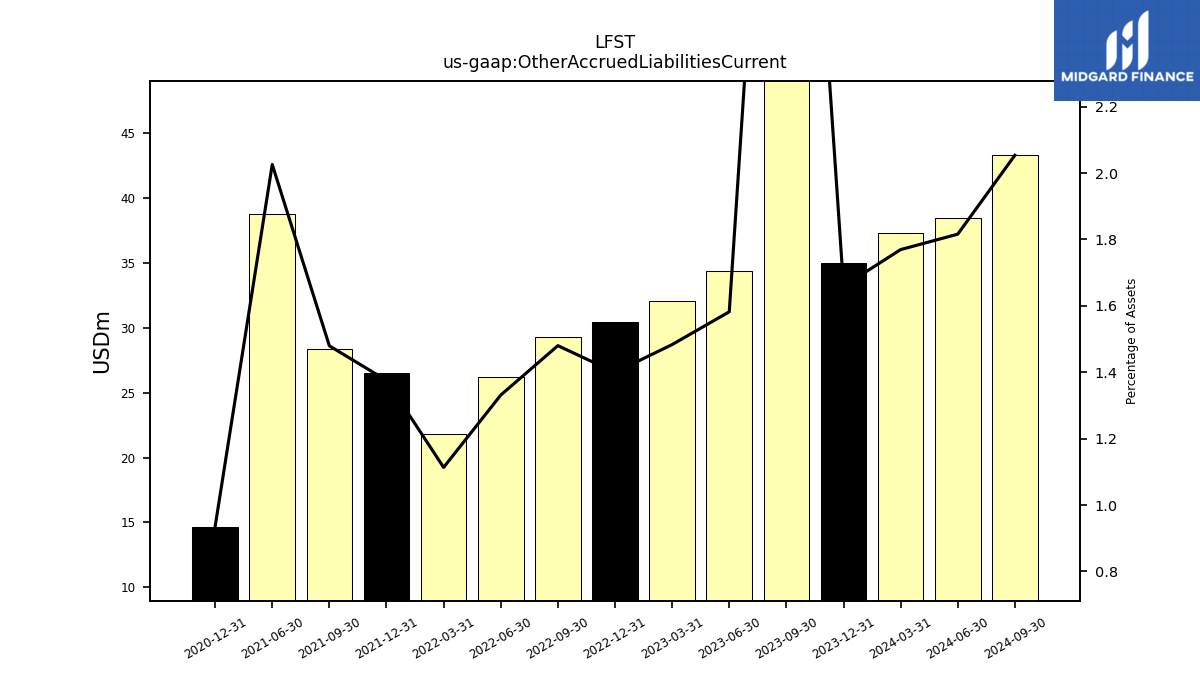
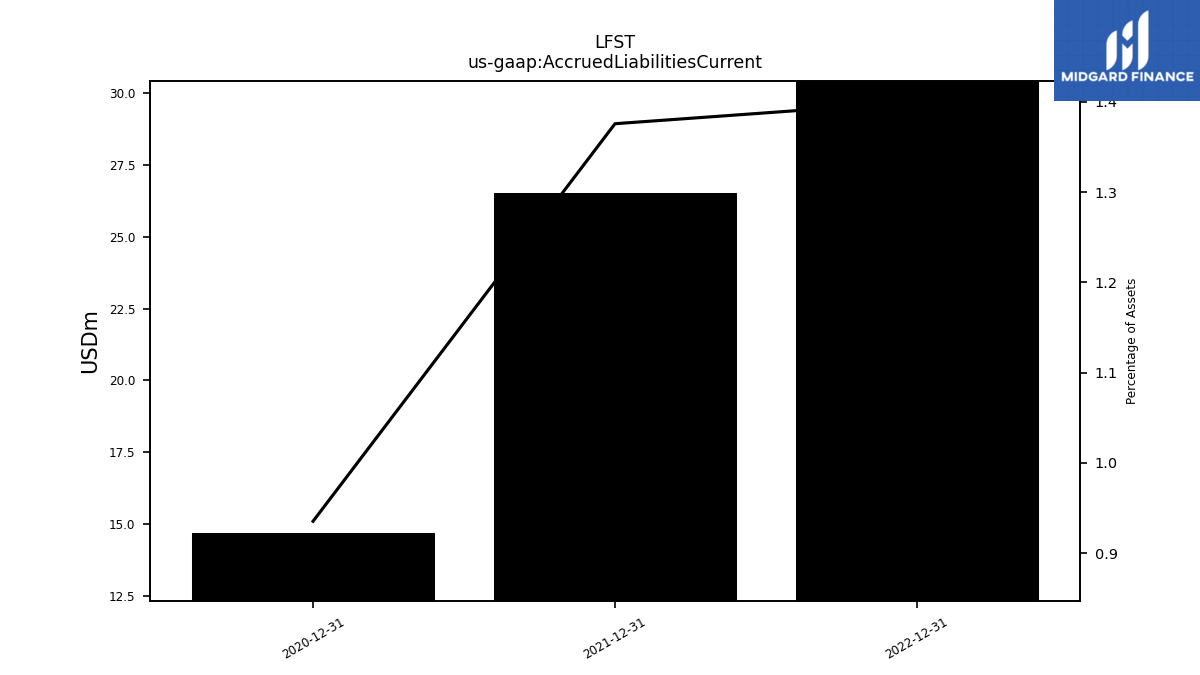
| Other Accrued Liabilities Current | 37.27 | 35.01 | 91.03 | 34.35 | 32.02 | 30.43 | 29.30 | 26.21 | 21.81 | 26.51 | 28.33 | 38.78 | NA | 14.69 | NA | NA | NA | |
| Accrued Liabilities Current | NA | 35.01 | NA | NA | NA | 30.43 | NA | NA | NA | 26.51 | NA | NA | NA | 14.69 | NA | NA | NA | |
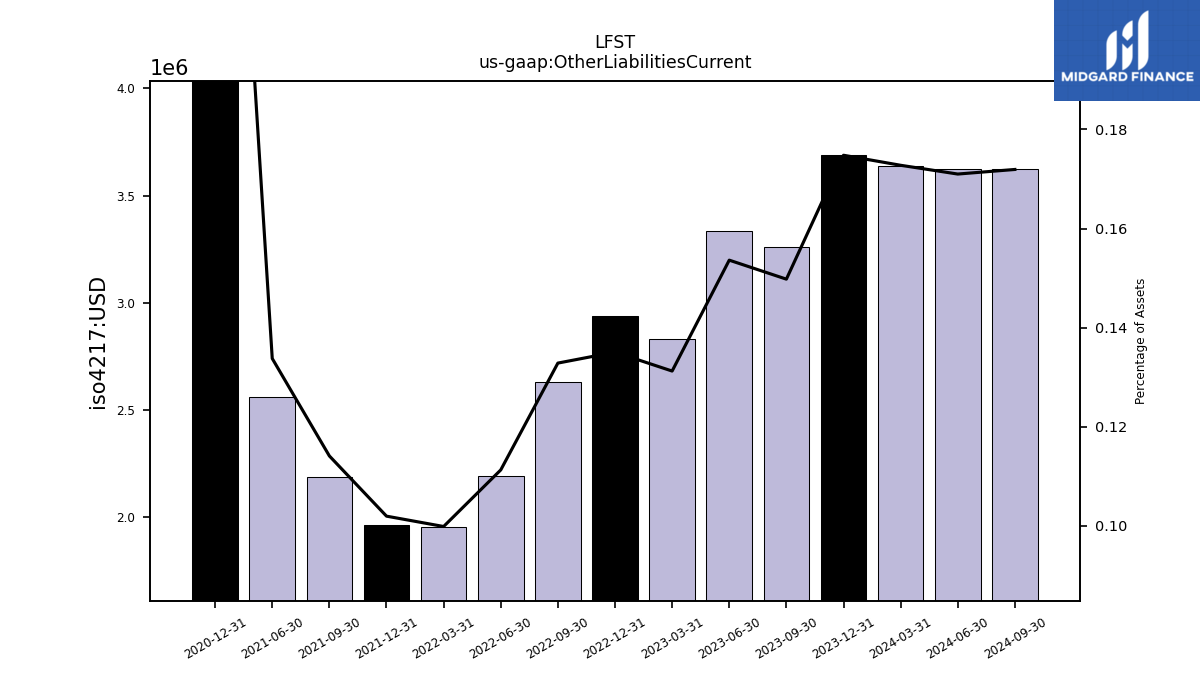
| Other Liabilities Current | 3.64 | 3.69 | 3.26 | 3.33 | 2.83 | 2.94 | 2.63 | 2.19 | 1.96 | 1.97 | 2.19 | 2.56 | NA | 4.96 | NA | NA | NA |
| 2024-03-31 | 2023-12-31 | 2023-09-30 | 2023-06-30 | 2023-03-31 | 2022-12-31 | 2022-09-30 | 2022-06-30 | 2022-03-31 | 2021-12-31 | 2021-09-30 | 2021-06-30 | 2021-03-31 | 2020-12-31 | 2020-09-30 | 2020-06-30 | 2020-05-14 | ||
|---|---|---|---|---|---|---|---|---|---|---|---|---|---|---|---|---|---|---|
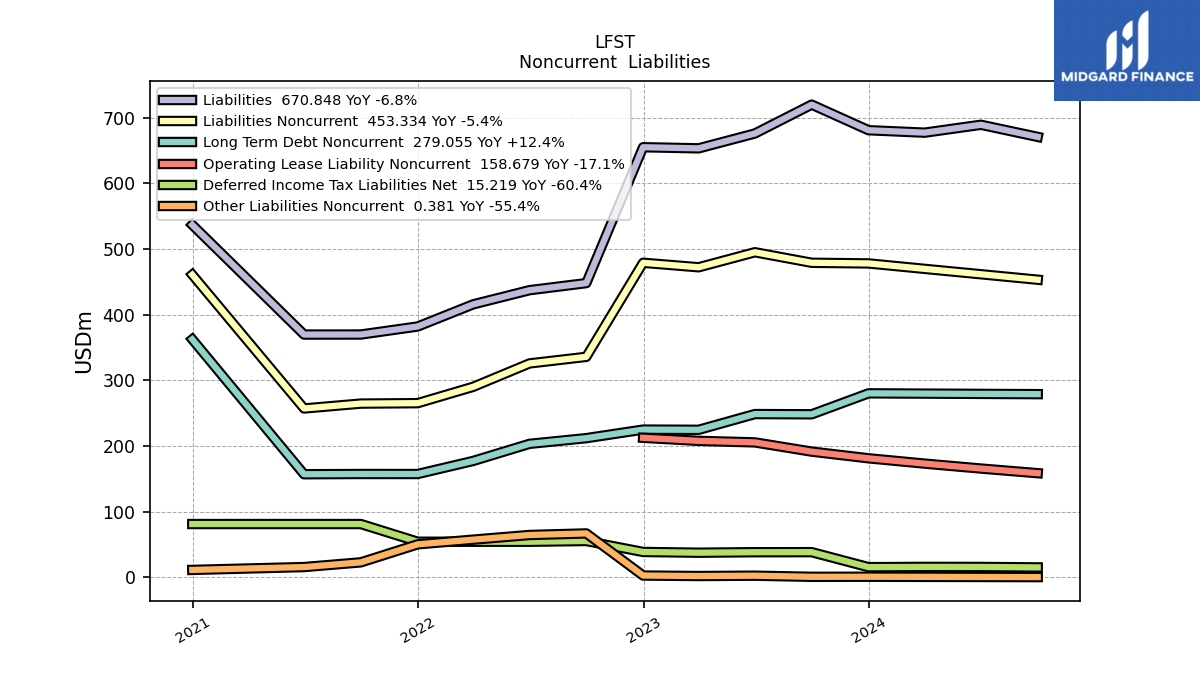
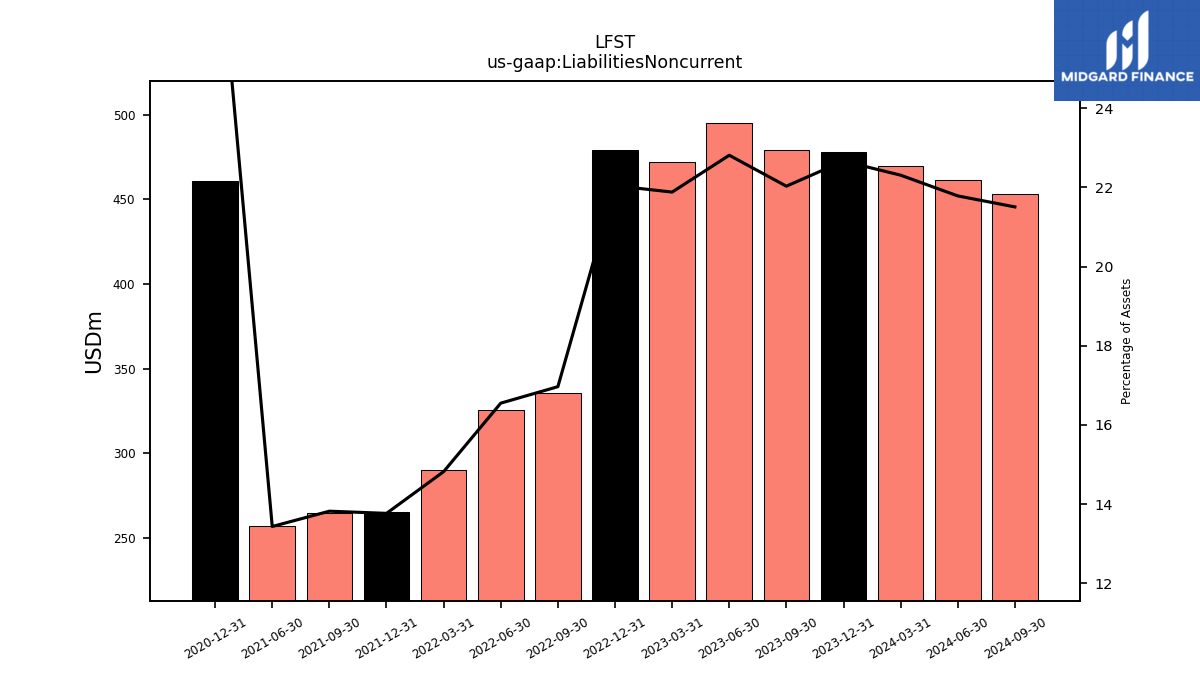
| Liabilities Noncurrent | 469.86 | 478.17 | 479.14 | 495.19 | 472.29 | 479.15 | 335.89 | 325.84 | 290.27 | 265.33 | 264.68 | 257.24 | NA | 460.97 | NA | NA | NA | |
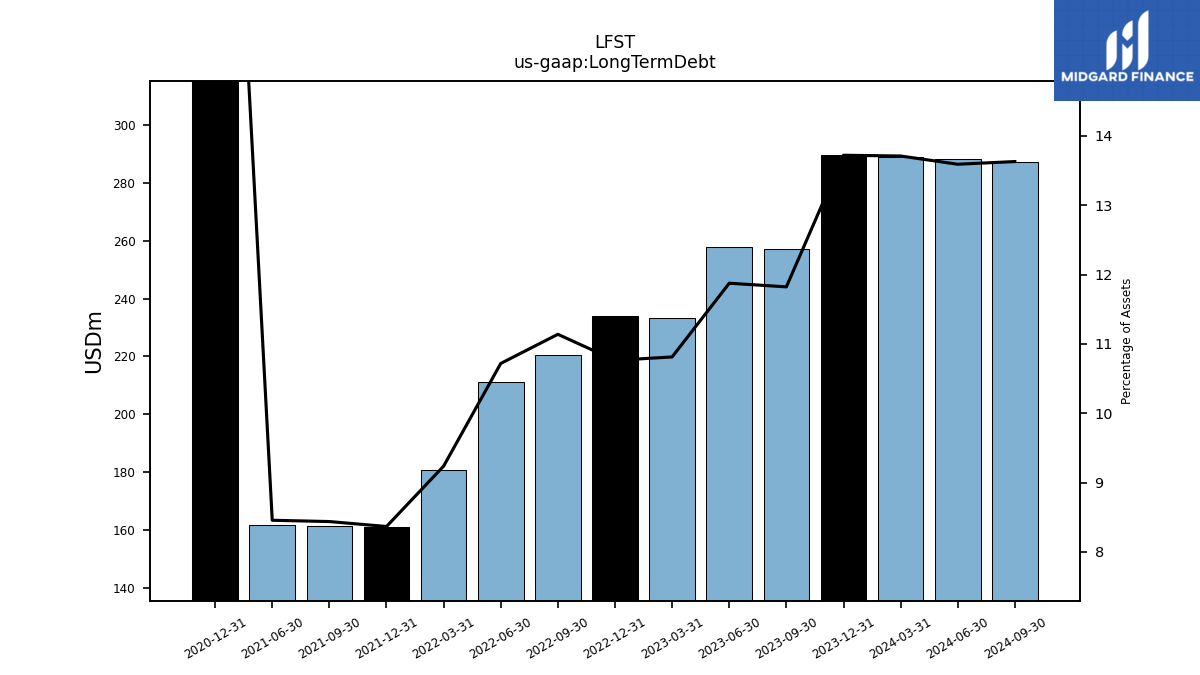
| Long Term Debt | 288.76 | 289.49 | 257.14 | 257.79 | 233.38 | 233.96 | 220.50 | 211.00 | 180.90 | 161.23 | 161.56 | 161.89 | NA | 373.82 | NA | NA | NA | |
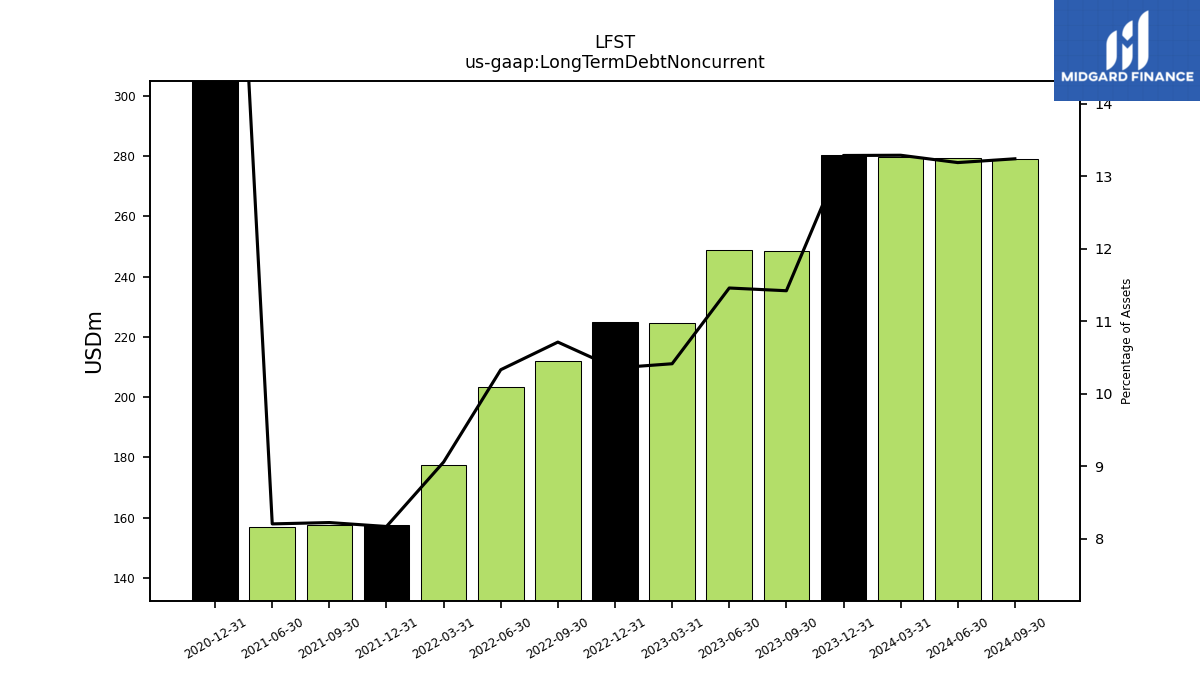
| Long Term Debt Noncurrent | 279.87 | 280.29 | 248.37 | 248.72 | 224.76 | 225.08 | 212.04 | 203.36 | 177.38 | 157.42 | 157.45 | 157.07 | NA | 362.53 | NA | NA | NA | |
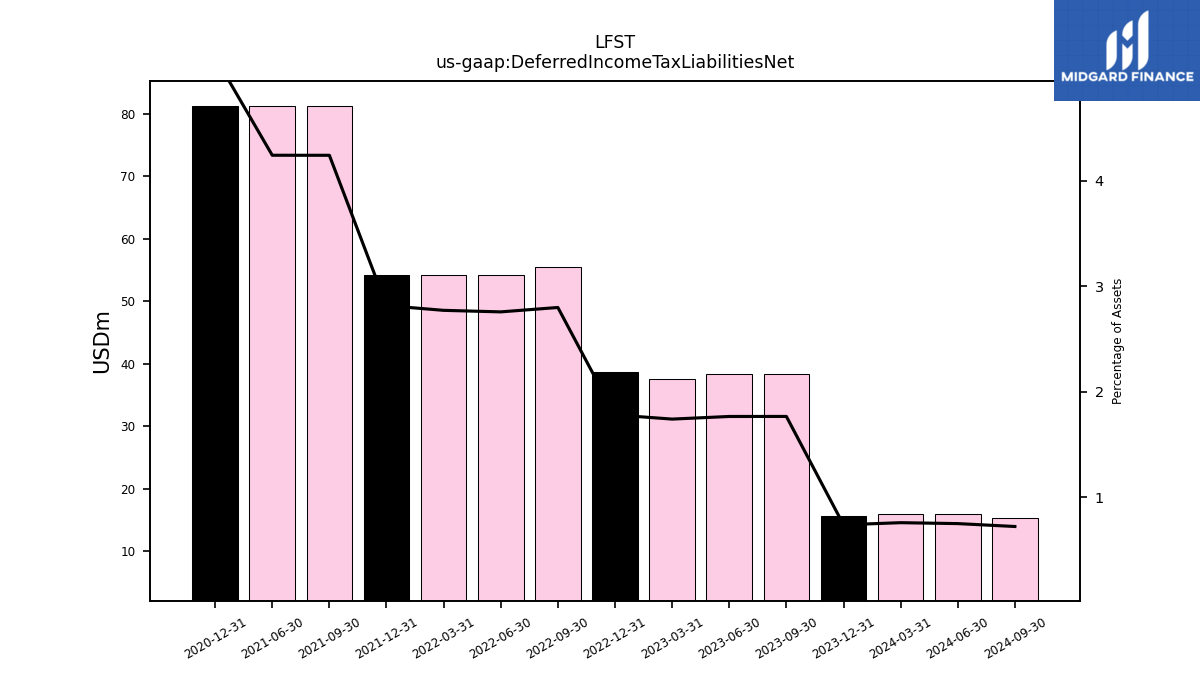
| Deferred Income Tax Liabilities Net | 15.97 | 15.57 | 38.40 | 38.32 | 37.57 | 38.70 | 55.41 | 54.28 | 54.28 | 54.28 | 81.23 | 81.22 | NA | 81.23 | NA | NA | NA | |
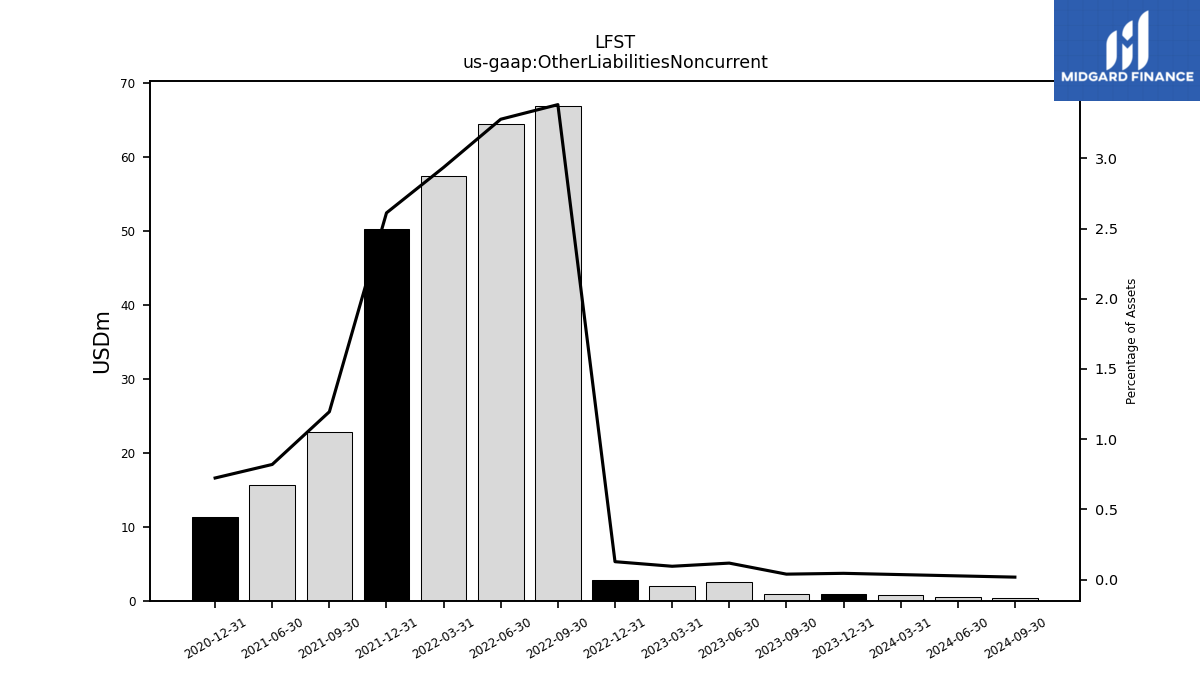
| Other Liabilities Noncurrent | 0.76 | 0.95 | 0.85 | 2.56 | 2.06 | 2.78 | 66.96 | 64.54 | 57.49 | 50.33 | 22.89 | 15.70 | NA | 11.36 | NA | NA | NA | |
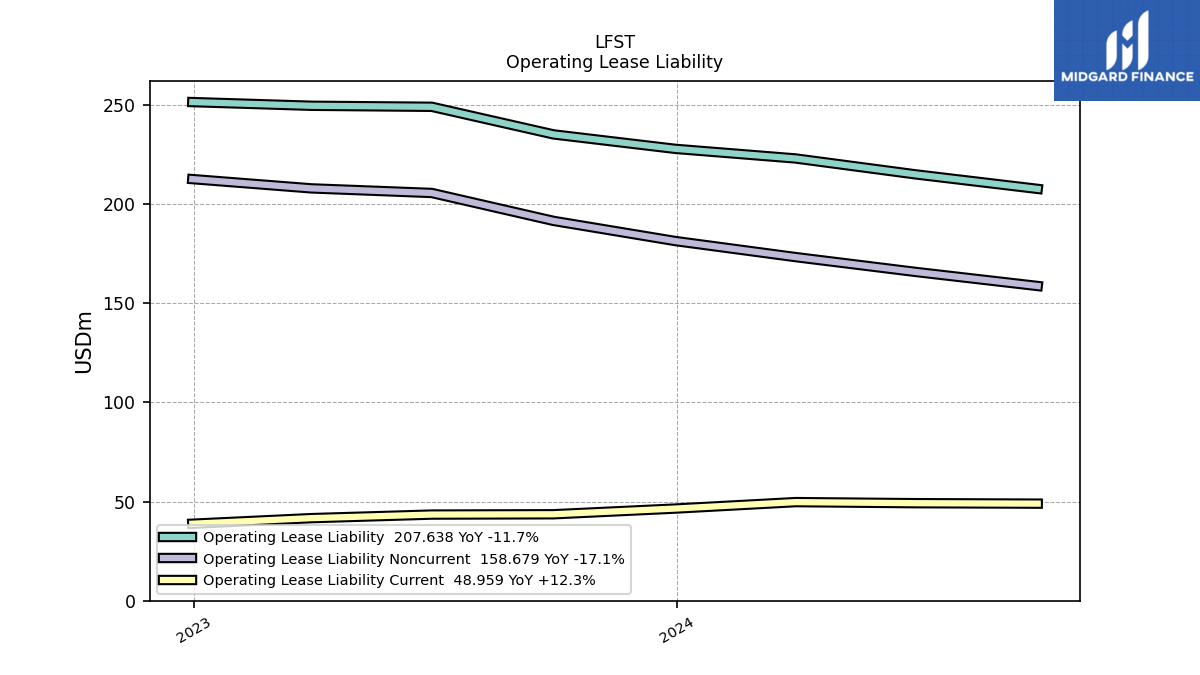
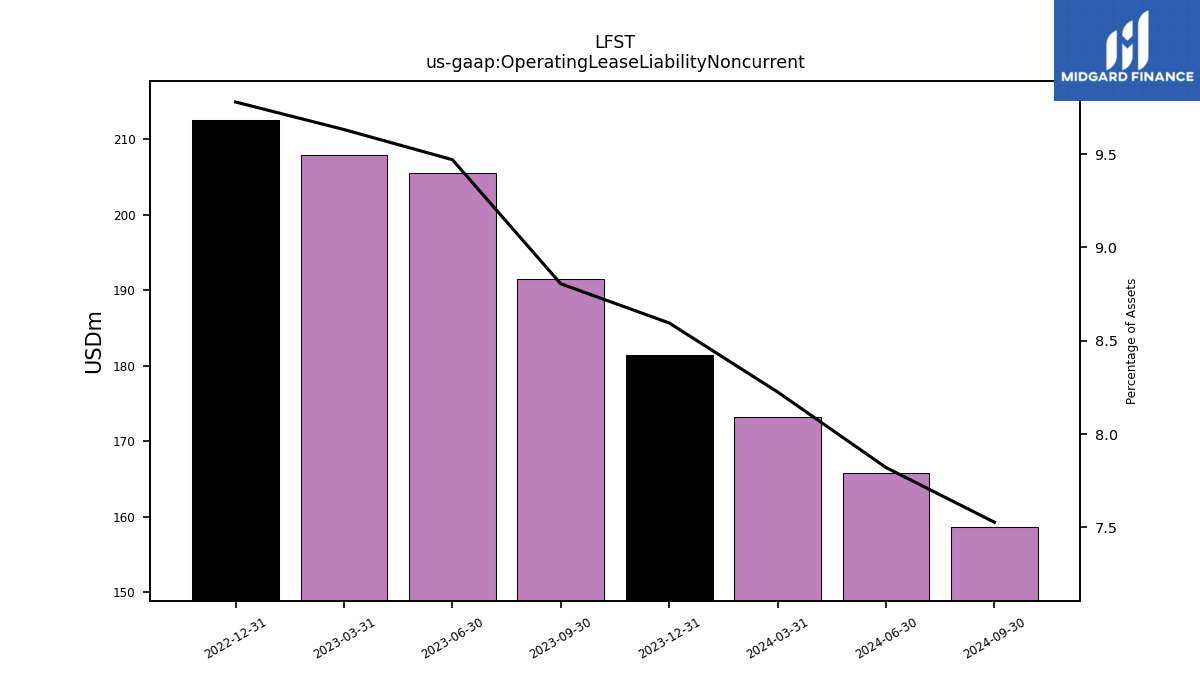
| Operating Lease Liability Noncurrent | 173.25 | 181.36 | 191.51 | 205.59 | 207.90 | 212.59 | NA | NA | NA | NA | NA | NA | NA | NA | NA | NA | NA |
| 2024-03-31 | 2023-12-31 | 2023-09-30 | 2023-06-30 | 2023-03-31 | 2022-12-31 | 2022-09-30 | 2022-06-30 | 2022-03-31 | 2021-12-31 | 2021-09-30 | 2021-06-30 | 2021-03-31 | 2020-12-31 | 2020-09-30 | 2020-06-30 | 2020-05-14 | ||
|---|---|---|---|---|---|---|---|---|---|---|---|---|---|---|---|---|---|---|
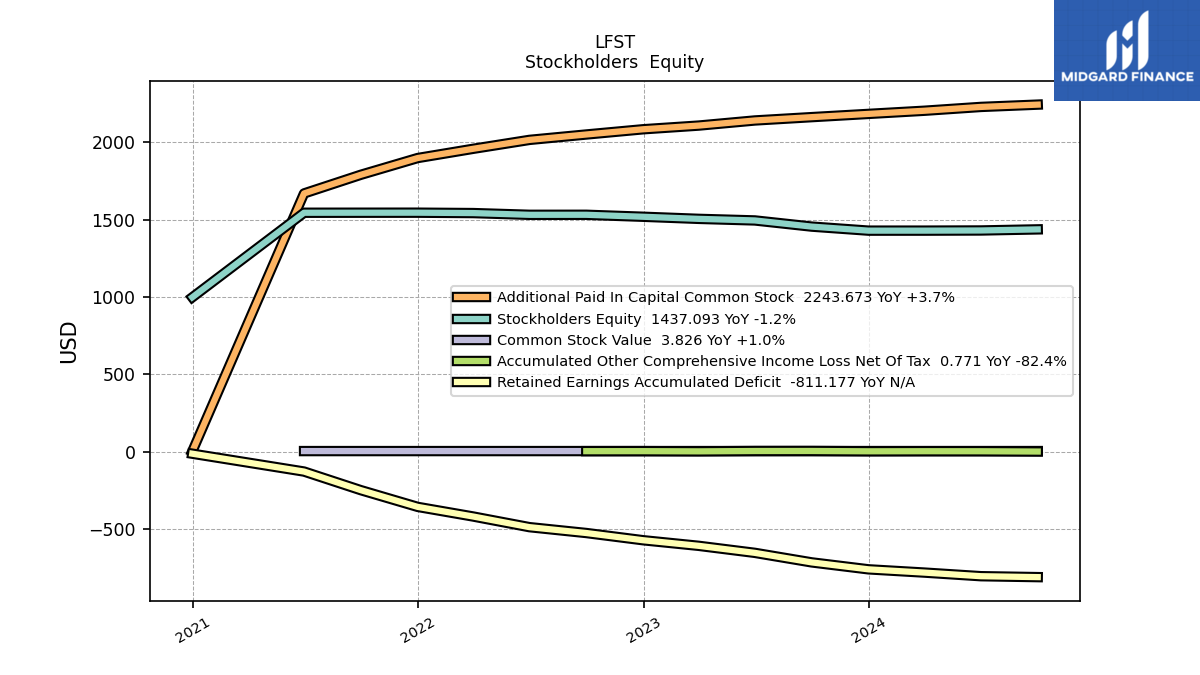
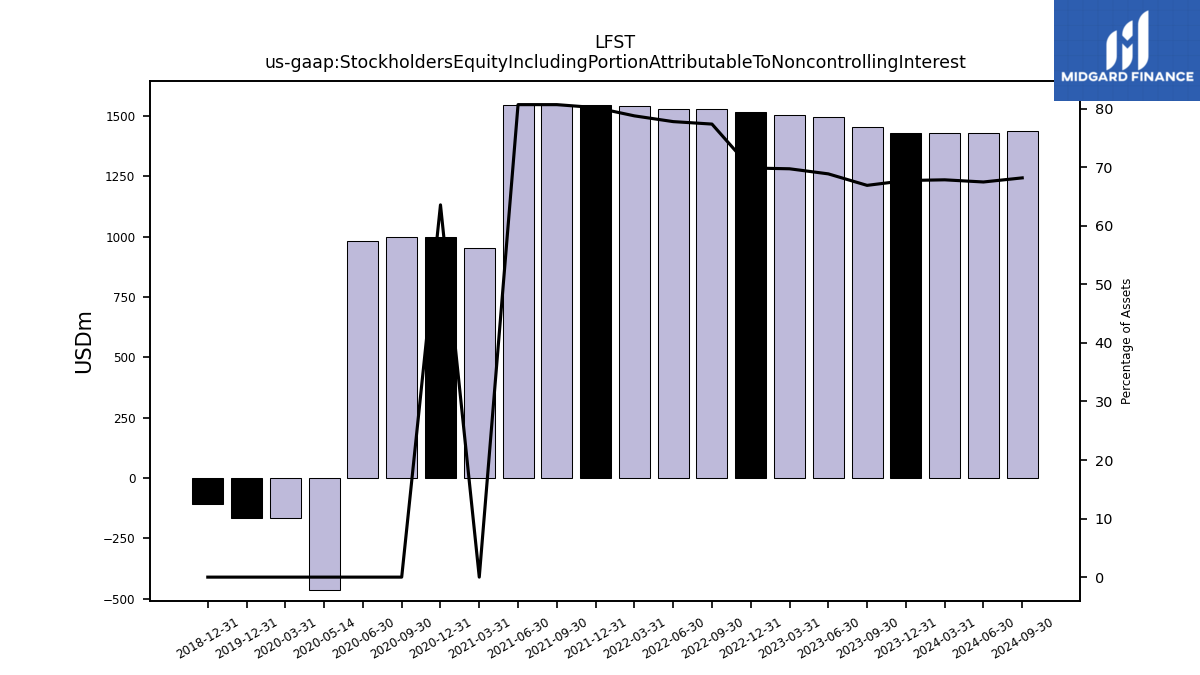
| Stockholders Equity | 1429.00 | 1428.93 | 1455.05 | 1494.88 | 1505.13 | 1518.72 | 1531.50 | 1531.30 | 1542.52 | 1545.03 | 1544.87 | 1544.63 | NA | 997.84 | NA | NA | NA | |
| Stockholders Equity Including Portion Attributable To Noncontrolling Interest | 1429.00 | 1428.93 | 1455.05 | 1494.88 | 1505.13 | 1518.72 | 1531.50 | 1531.30 | 1542.52 | 1545.03 | 1544.87 | 1544.63 | 954.01 | 997.84 | 999.65 | 981.37 | -464.38 | |
| Common Stock Value | 3.82 | 3.79 | 3.79 | 3.78 | 3.77 | 3.76 | 3.76 | 3.76 | 3.74 | 3.74 | 3.74 | 3.74 | NA | NA | NA | NA | NA | |
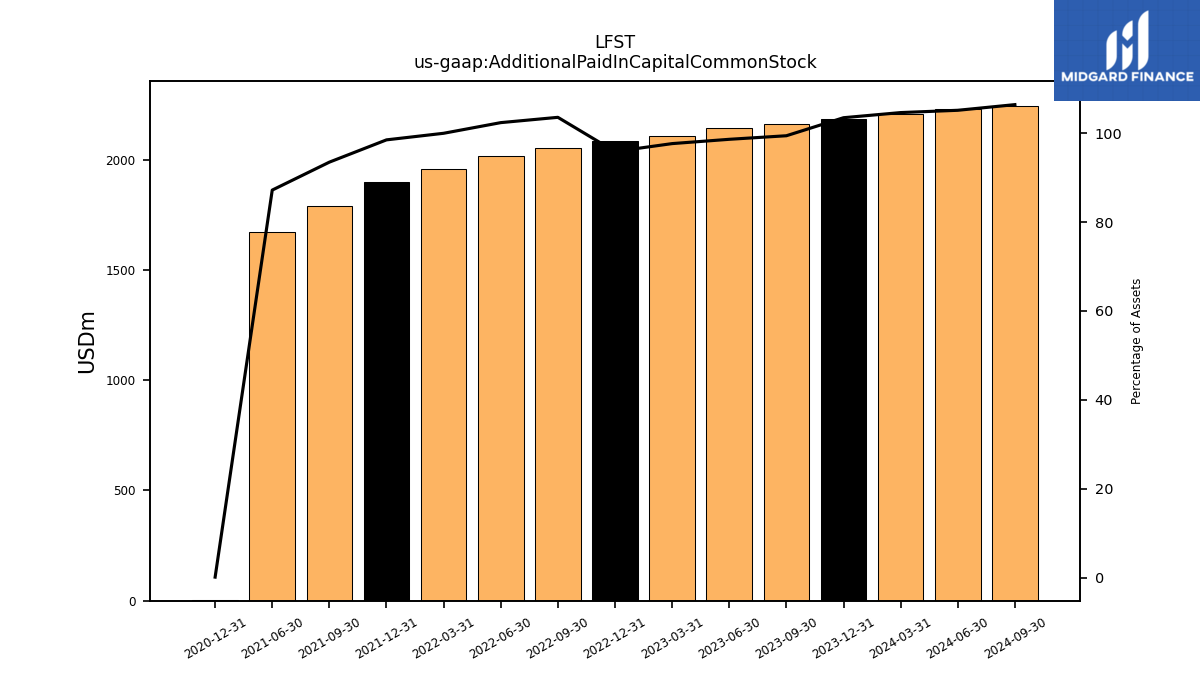
| Additional Paid In Capital Common Stock | 2204.23 | 2183.68 | 2162.77 | 2141.25 | 2108.18 | 2084.32 | 2050.54 | 2015.66 | 1958.17 | 1898.36 | 1790.17 | 1669.48 | NA | 1.45 | NA | NA | NA | |
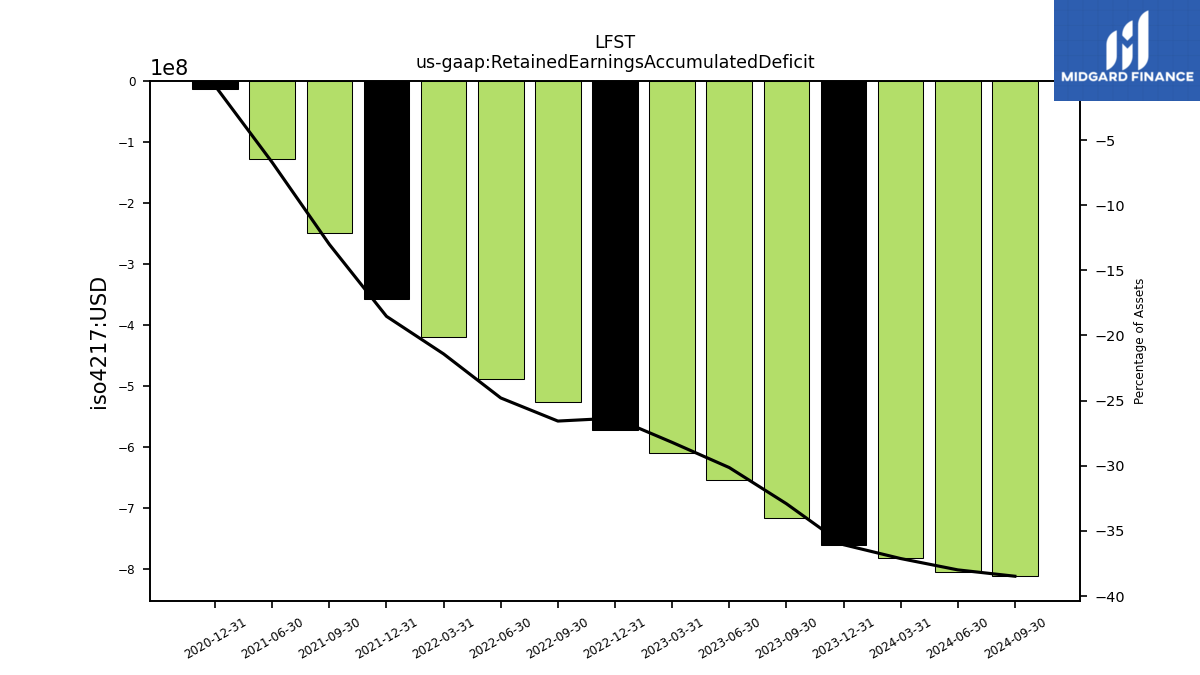
| Retained Earnings Accumulated Deficit | -781.94 | -760.85 | -715.89 | -654.30 | -608.83 | -572.64 | -525.98 | -488.13 | -419.40 | -357.07 | -249.04 | -128.59 | NA | -13.12 | NA | NA | NA | |
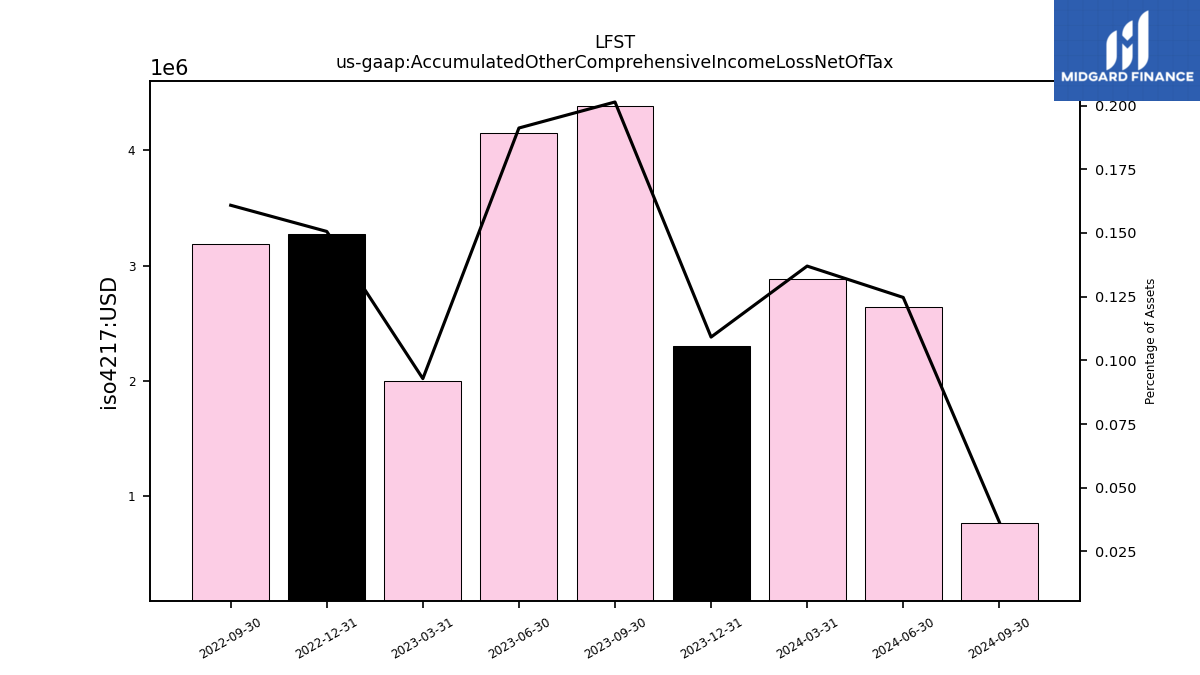
| Accumulated Other Comprehensive Income Loss Net Of Tax | 2.89 | 2.30 | 4.38 | 4.15 | 2.00 | 3.27 | 3.19 | NA | NA | NA | NA | NA | NA | NA | NA | NA | NA | |
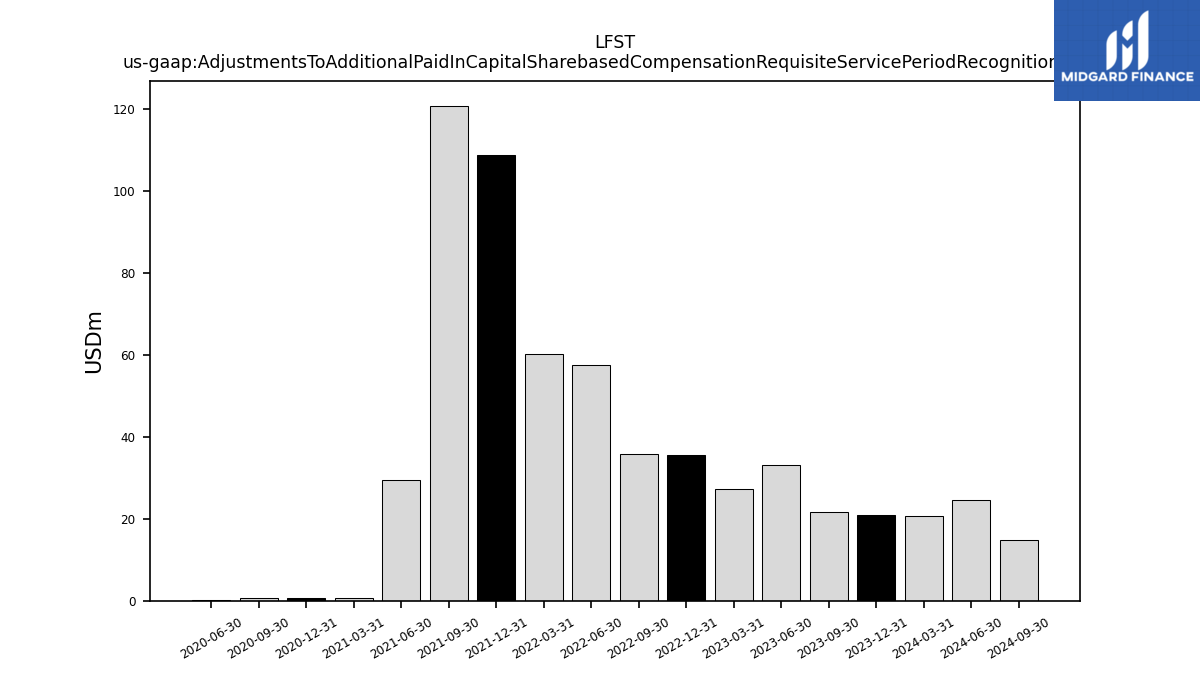
| Adjustments To Additional Paid In Capital Sharebased Compensation Requisite Service Period Recognition Value | 20.58 | 20.92 | 21.52 | 33.11 | 27.23 | 35.51 | 35.73 | 57.51 | 60.04 | 108.63 | 120.69 | 29.52 | 0.60 | 0.59 | 0.57 | 0.29 | NA |
| 2024-03-31 | 2023-12-31 | 2023-09-30 | 2023-06-30 | 2023-03-31 | 2022-12-31 | 2022-09-30 | 2022-06-30 | 2022-03-31 | 2021-12-31 | 2021-09-30 | 2021-06-30 | 2021-03-31 | 2020-12-31 | 2020-09-30 | 2020-06-30 | 2020-05-14 | ||
|---|---|---|---|---|---|---|---|---|---|---|---|---|---|---|---|---|---|---|
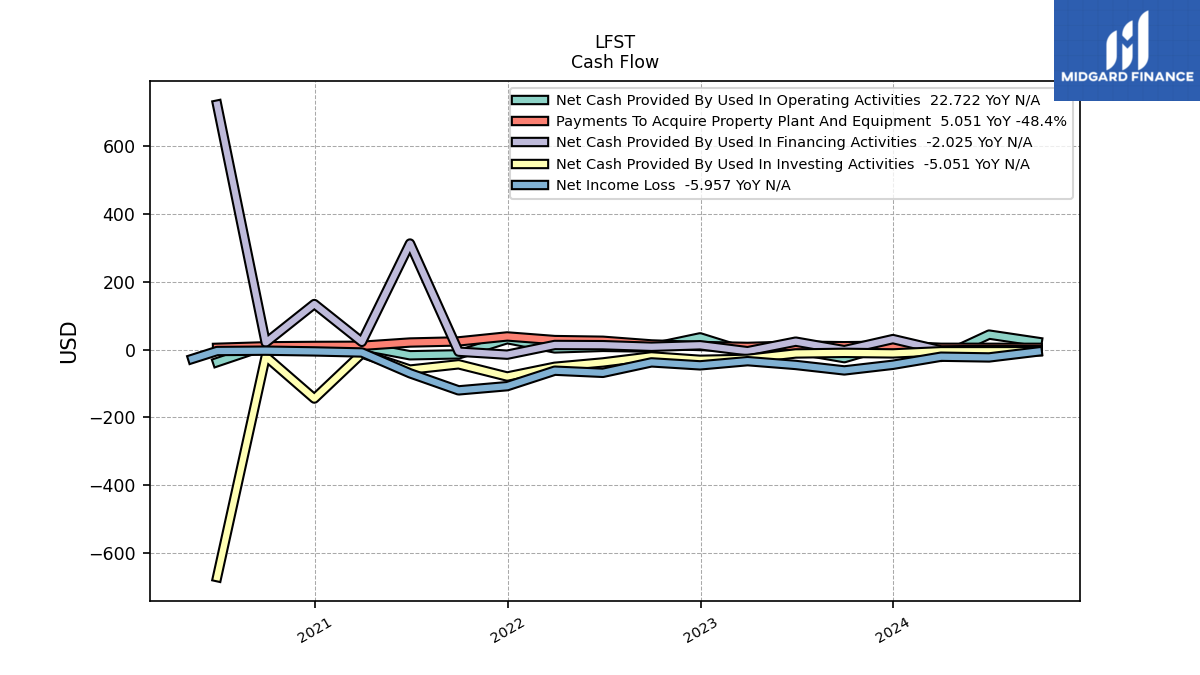
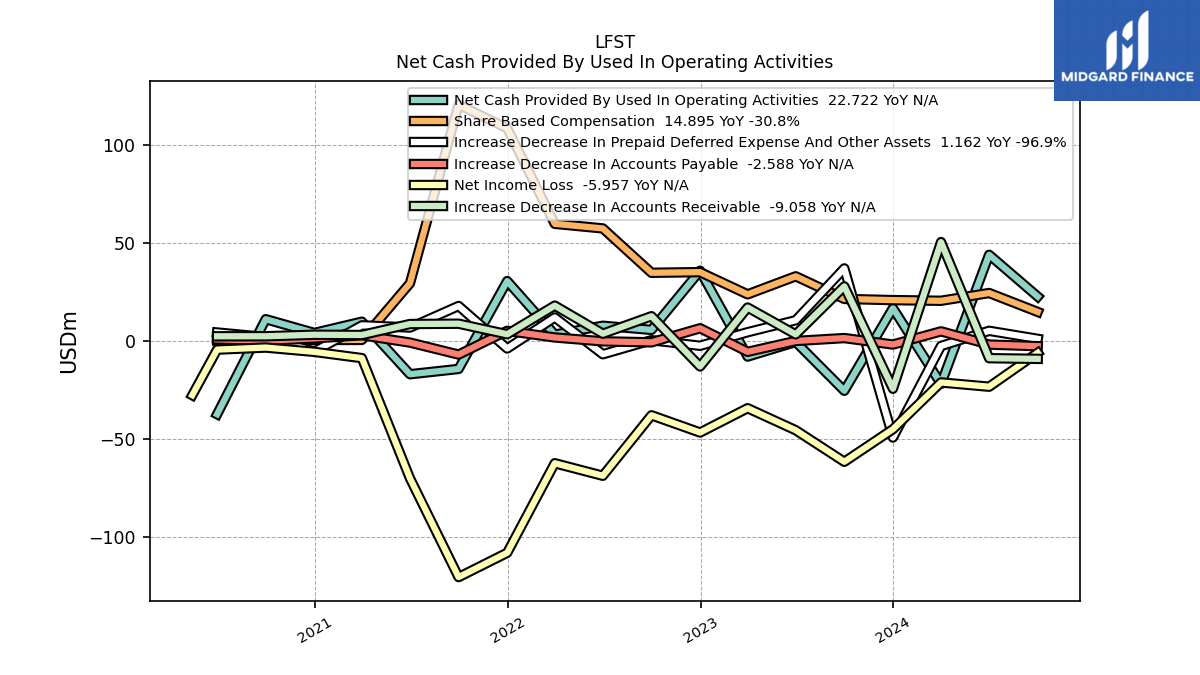
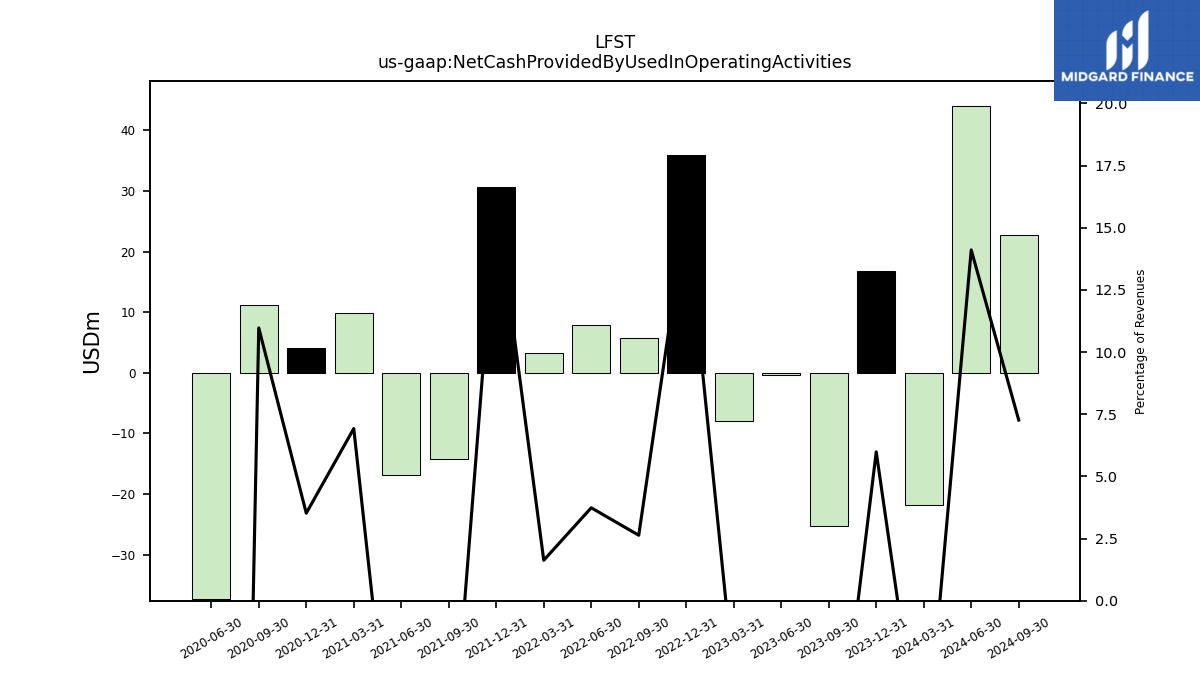
| Net Cash Provided By Used In Operating Activities | -21.84 | 16.80 | -25.36 | -0.43 | -7.89 | 35.92 | 5.73 | 7.83 | 3.31 | 30.64 | -14.21 | -16.91 | 9.91 | 4.16 | 11.19 | -37.32 | NA | |
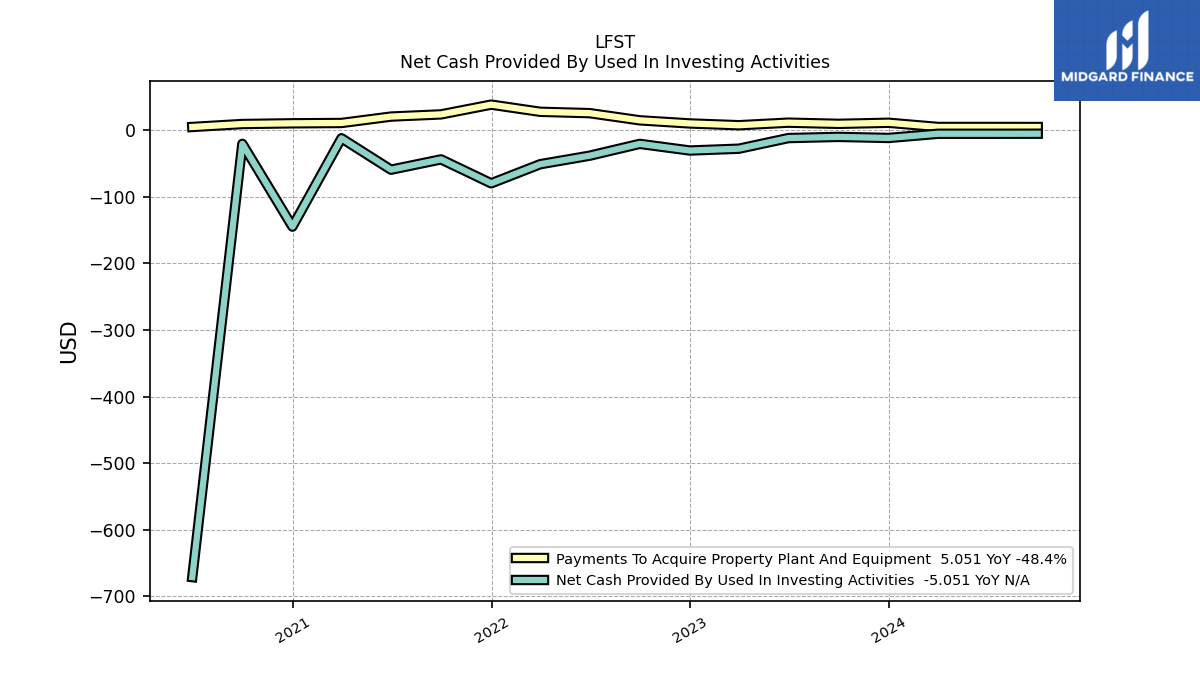
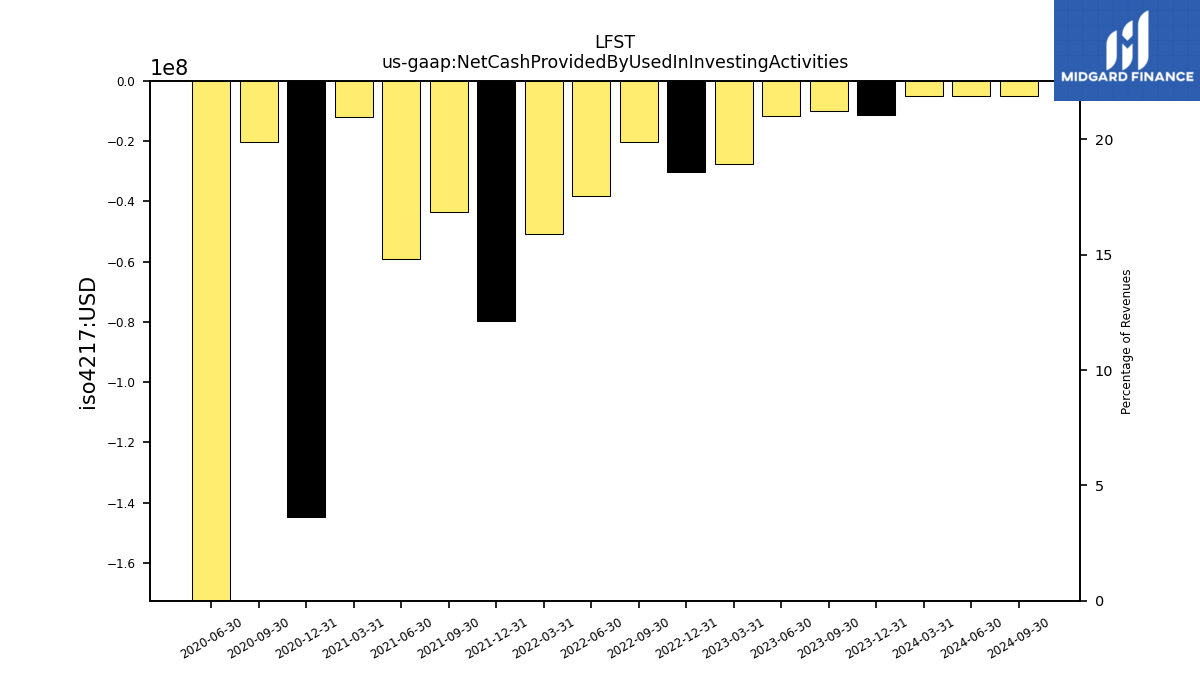
| Net Cash Provided By Used In Investing Activities | -5.10 | -11.41 | -9.80 | -11.58 | -27.55 | -30.30 | -20.27 | -38.04 | -50.85 | -79.56 | -43.59 | -59.09 | -11.84 | -144.64 | -20.23 | -671.21 | NA | |
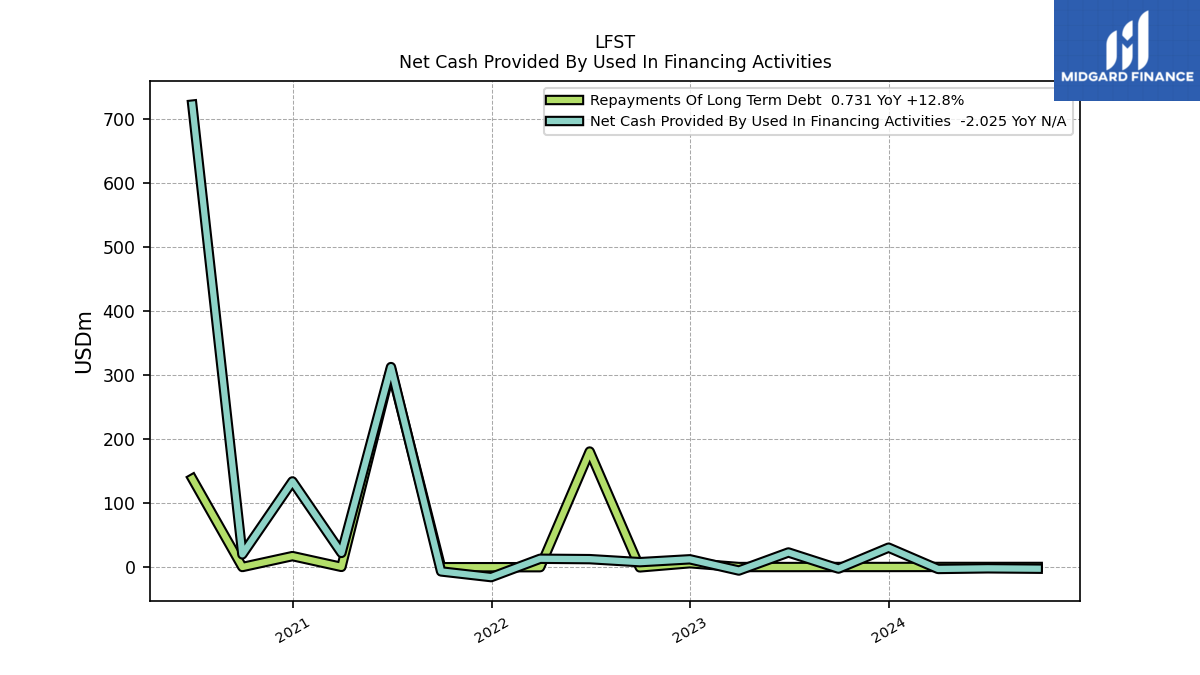
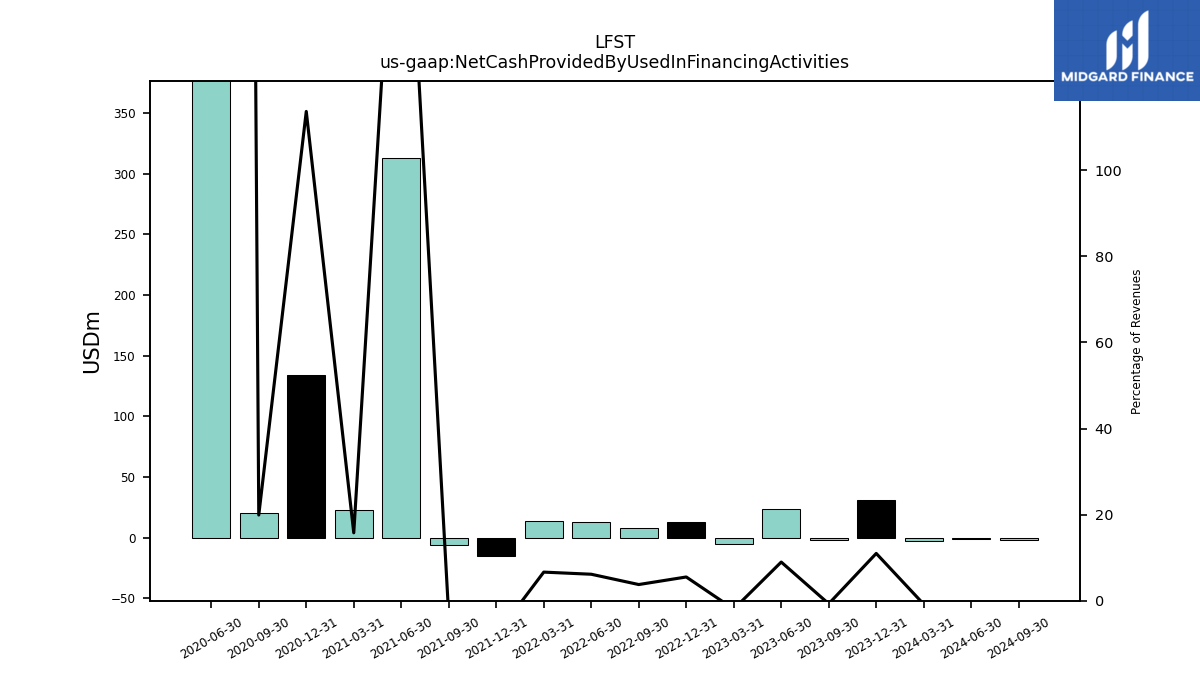
| Net Cash Provided By Used In Financing Activities | -2.43 | 30.84 | -1.85 | 23.33 | -4.89 | 12.66 | 8.19 | 12.90 | 13.51 | -15.17 | -6.27 | 312.70 | 22.59 | 134.25 | 20.31 | 722.33 | NA |
| 2024-03-31 | 2023-12-31 | 2023-09-30 | 2023-06-30 | 2023-03-31 | 2022-12-31 | 2022-09-30 | 2022-06-30 | 2022-03-31 | 2021-12-31 | 2021-09-30 | 2021-06-30 | 2021-03-31 | 2020-12-31 | 2020-09-30 | 2020-06-30 | 2020-05-14 | ||
|---|---|---|---|---|---|---|---|---|---|---|---|---|---|---|---|---|---|---|
| Net Cash Provided By Used In Operating Activities | -21.84 | 16.80 | -25.36 | -0.43 | -7.89 | 35.92 | 5.73 | 7.83 | 3.31 | 30.64 | -14.21 | -16.91 | 9.91 | 4.16 | 11.19 | -37.32 | NA | |
| Net Income Loss | -21.10 | -44.96 | -61.58 | -45.48 | -34.24 | -46.66 | -37.85 | -68.73 | -62.33 | -108.03 | -120.45 | -70.03 | -8.68 | -5.49 | -3.29 | -4.34 | -27.60 | |
| Profit Loss | -21.10 | -44.96 | -61.58 | -45.48 | -34.24 | -46.66 | -37.85 | -68.73 | -62.33 | -108.03 | -120.45 | -70.03 | -8.68 | -5.49 | -3.29 | -4.34 | NA | |
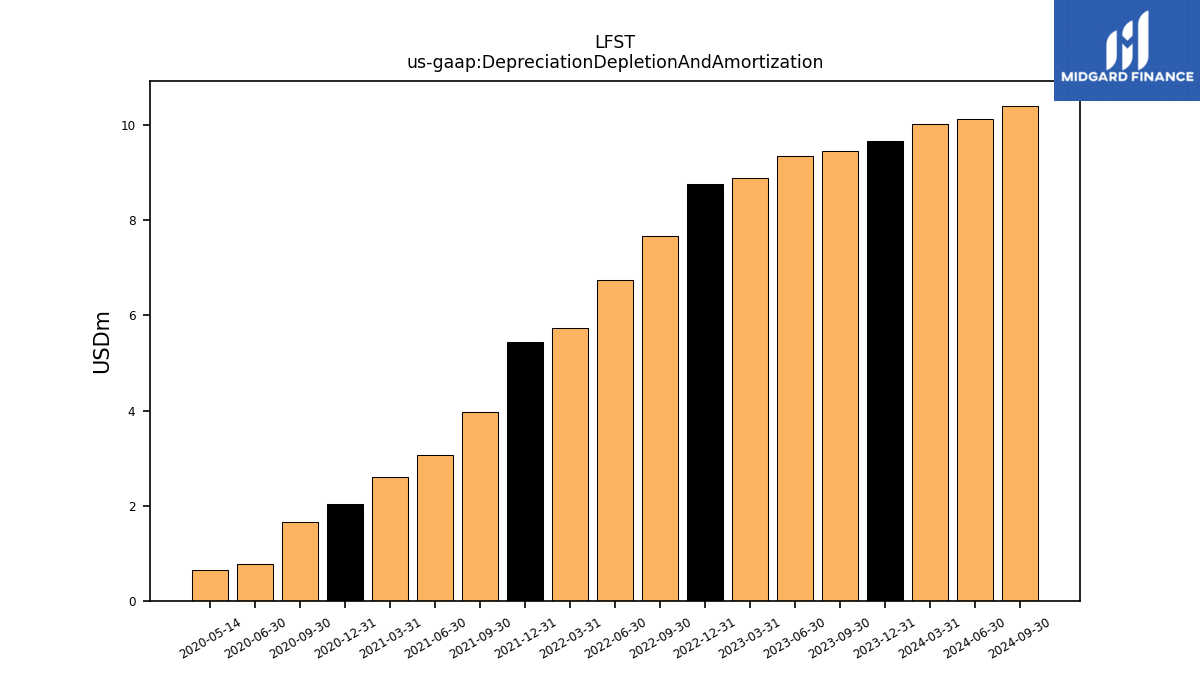
| Depreciation Depletion And Amortization | 10.02 | 9.67 | 9.45 | 9.35 | 8.90 | 8.76 | 7.68 | 6.75 | 5.73 | 5.45 | 3.96 | 3.07 | 2.61 | 2.03 | 1.65 | 0.76 | 0.66 | |
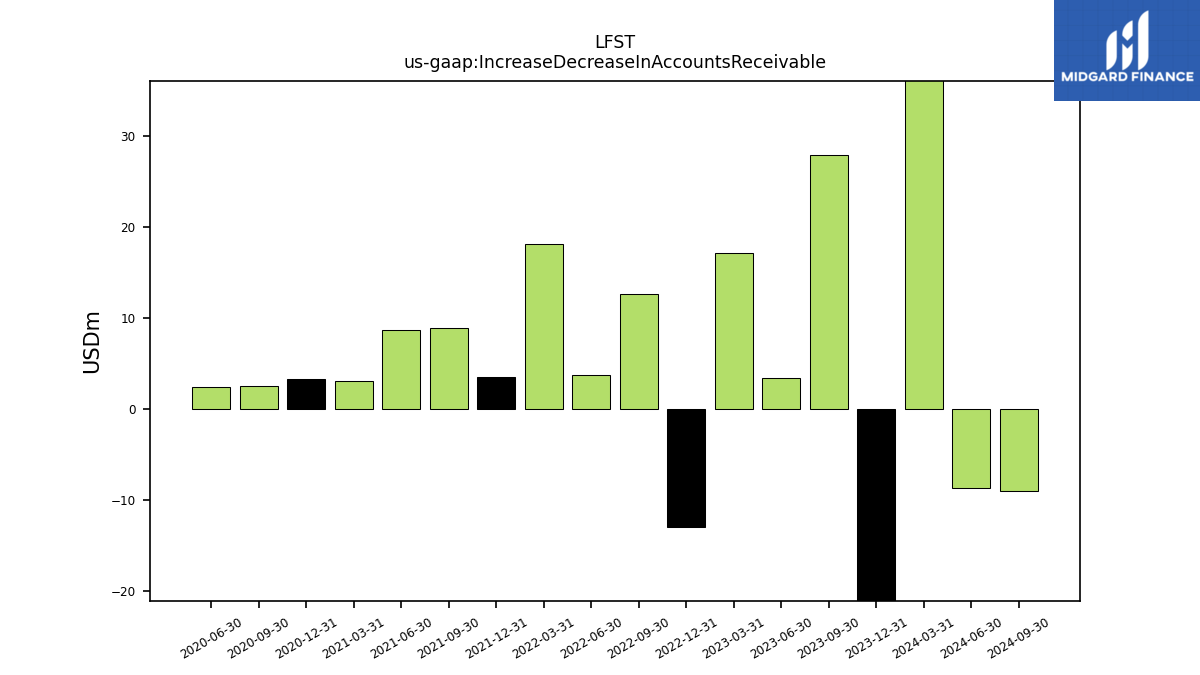
| Increase Decrease In Accounts Receivable | 50.53 | -24.31 | 27.93 | 3.42 | 17.14 | -12.94 | 12.71 | 3.78 | 18.12 | 3.50 | 8.88 | 8.71 | 3.12 | 3.24 | 2.48 | 2.46 | NA | |
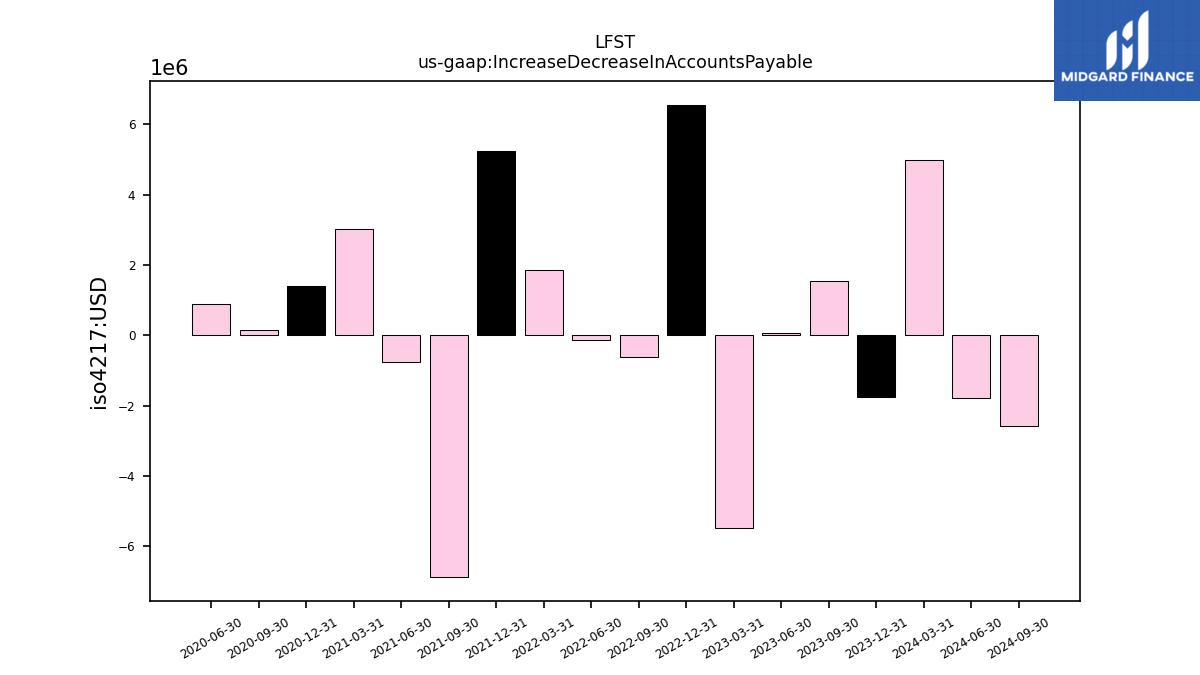
| Increase Decrease In Accounts Payable | 4.98 | -1.76 | 1.55 | 0.07 | -5.47 | 6.56 | -0.62 | -0.12 | 1.85 | 5.24 | -6.87 | -0.75 | 3.01 | 1.41 | 0.17 | 0.89 | NA | |
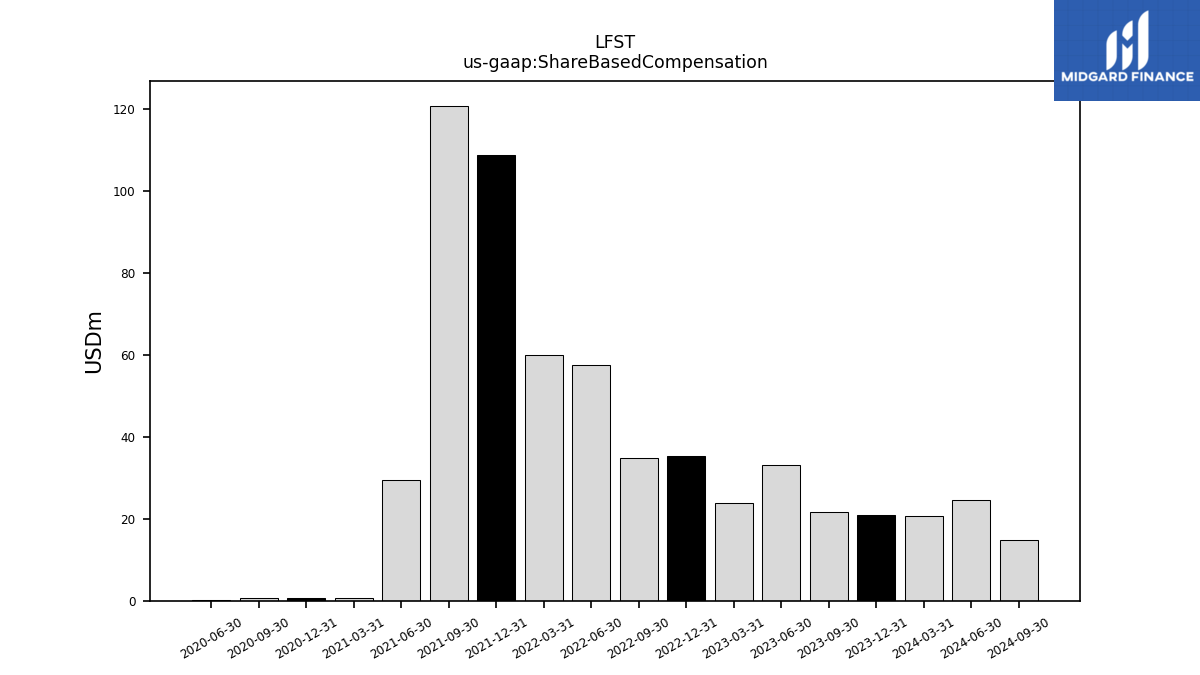
| Share Based Compensation | 20.58 | 20.92 | 21.52 | 33.08 | 23.87 | 35.20 | 34.87 | 57.51 | 59.85 | 108.63 | 120.69 | 29.52 | 0.60 | 0.59 | 0.57 | 0.29 | NA | |
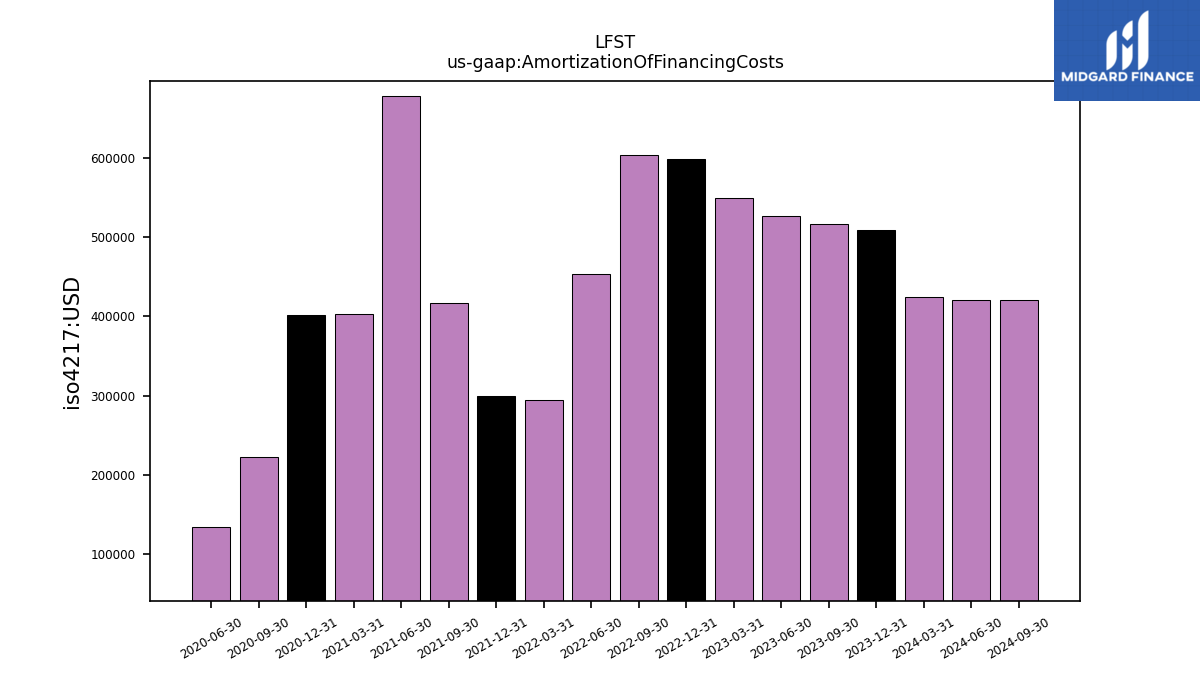
| Amortization Of Financing Costs | 0.42 | 0.51 | 0.52 | 0.53 | 0.55 | 0.60 | 0.60 | 0.45 | 0.29 | 0.30 | 0.42 | 0.68 | 0.40 | 0.40 | 0.22 | 0.14 | NA |
| 2024-03-31 | 2023-12-31 | 2023-09-30 | 2023-06-30 | 2023-03-31 | 2022-12-31 | 2022-09-30 | 2022-06-30 | 2022-03-31 | 2021-12-31 | 2021-09-30 | 2021-06-30 | 2021-03-31 | 2020-12-31 | 2020-09-30 | 2020-06-30 | 2020-05-14 | ||
|---|---|---|---|---|---|---|---|---|---|---|---|---|---|---|---|---|---|---|
| Net Cash Provided By Used In Investing Activities | -5.10 | -11.41 | -9.80 | -11.58 | -27.55 | -30.30 | -20.27 | -38.04 | -50.85 | -79.56 | -43.59 | -59.09 | -11.84 | -144.64 | -20.23 | -671.21 | NA | |
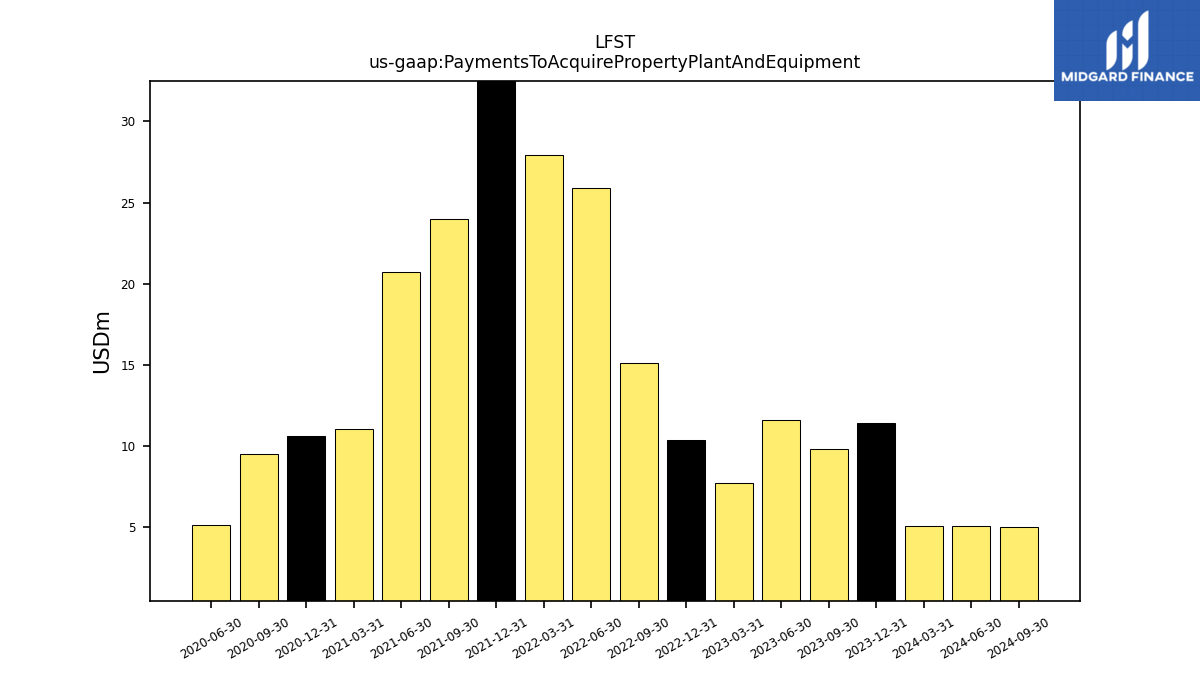
| Payments To Acquire Property Plant And Equipment | 5.10 | 11.41 | 9.80 | 11.58 | 7.73 | 10.38 | 15.10 | 25.86 | 27.91 | 38.68 | 24.01 | 20.72 | 11.08 | 10.61 | 9.53 | 5.12 | NA |
| 2024-03-31 | 2023-12-31 | 2023-09-30 | 2023-06-30 | 2023-03-31 | 2022-12-31 | 2022-09-30 | 2022-06-30 | 2022-03-31 | 2021-12-31 | 2021-09-30 | 2021-06-30 | 2021-03-31 | 2020-12-31 | 2020-09-30 | 2020-06-30 | 2020-05-14 | ||
|---|---|---|---|---|---|---|---|---|---|---|---|---|---|---|---|---|---|---|
| Net Cash Provided By Used In Financing Activities | -2.43 | 30.84 | -1.85 | 23.33 | -4.89 | 12.66 | 8.19 | 12.90 | 13.51 | -15.17 | -6.27 | 312.70 | 22.59 | 134.25 | 20.31 | 722.33 | NA |
| 2024-03-31 | 2023-12-31 | 2023-09-30 | 2023-06-30 | 2023-03-31 | 2022-12-31 | 2022-09-30 | 2022-06-30 | 2022-03-31 | 2021-12-31 | 2021-09-30 | 2021-06-30 | 2021-03-31 | 2020-12-31 | 2020-09-30 | 2020-06-30 | 2020-05-14 | ||
|---|---|---|---|---|---|---|---|---|---|---|---|---|---|---|---|---|---|---|
| Revenues | 300.44 | 280.60 | 262.89 | 259.58 | 252.59 | 229.36 | 217.56 | 209.53 | 203.09 | 190.00 | 173.84 | 160.55 | 143.13 | 118.12 | 101.98 | 45.45 | 38.55 | |
| Revenue From Contract With Customer Excluding Assessed Tax | 300.44 | 280.60 | 262.89 | 259.58 | 252.59 | 229.36 | 217.56 | 209.53 | 203.09 | 0.00 | 173.84 | 1.36 | 143.13 | 0.08 | 0.04 | 0.02 | 0.01 | |
| Revenue From Contract With Customer Including Assessed Tax | 300.44 | 280.60 | 262.89 | 259.58 | 252.59 | 229.36 | 217.56 | 209.53 | 203.09 | 190.00 | 173.84 | 160.55 | 143.13 | 118.12 | 101.98 | 45.45 | 38.55 | |
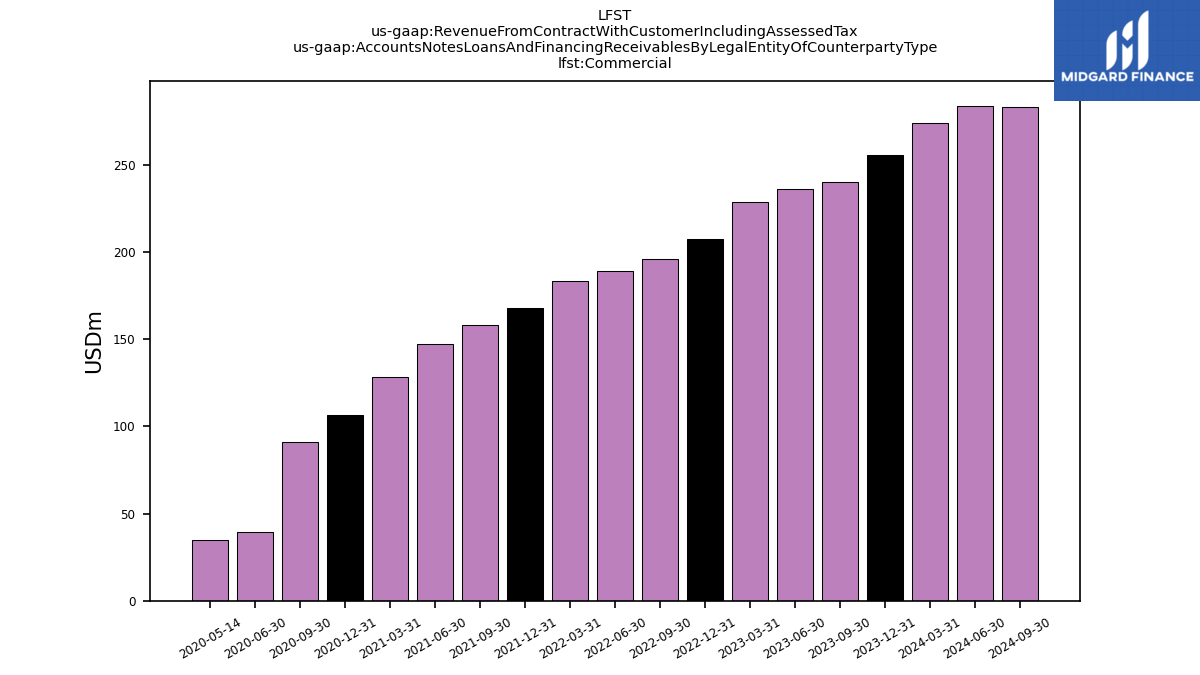
| Commercial | 273.77 | 255.41 | 239.90 | 235.90 | 228.92 | 207.66 | 196.01 | 189.06 | 183.61 | 168.17 | 158.03 | 147.39 | 128.26 | 106.67 | 90.81 | 39.17 | 35.04 | |
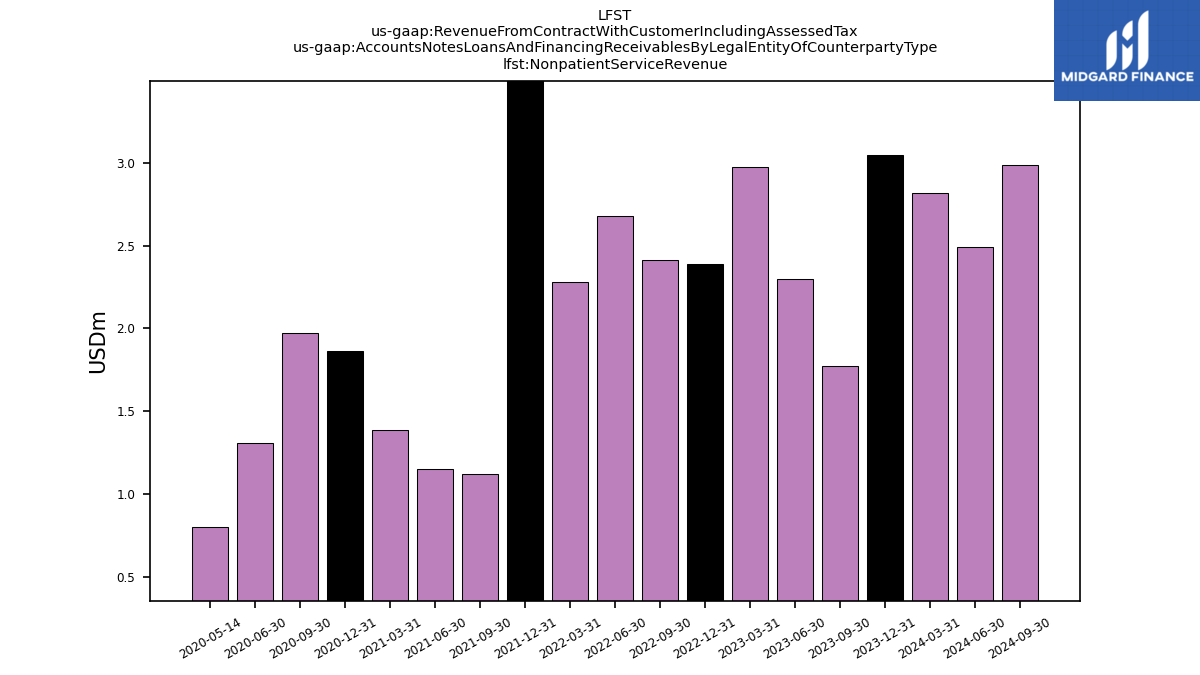
| Nonpatient Service Revenue | 2.82 | 3.04 | 1.77 | 2.30 | 2.97 | 2.39 | 2.41 | 2.68 | 2.28 | 3.65 | 1.12 | 1.15 | 1.39 | 1.86 | 1.97 | 1.31 | 0.80 | |
| Total Patient Service Revenue | 297.62 | 277.56 | 261.12 | 257.28 | 249.62 | 226.97 | 215.15 | 206.85 | 200.82 | 186.34 | 172.71 | 159.40 | 141.75 | 116.26 | 100.01 | 44.15 | 37.75 | |
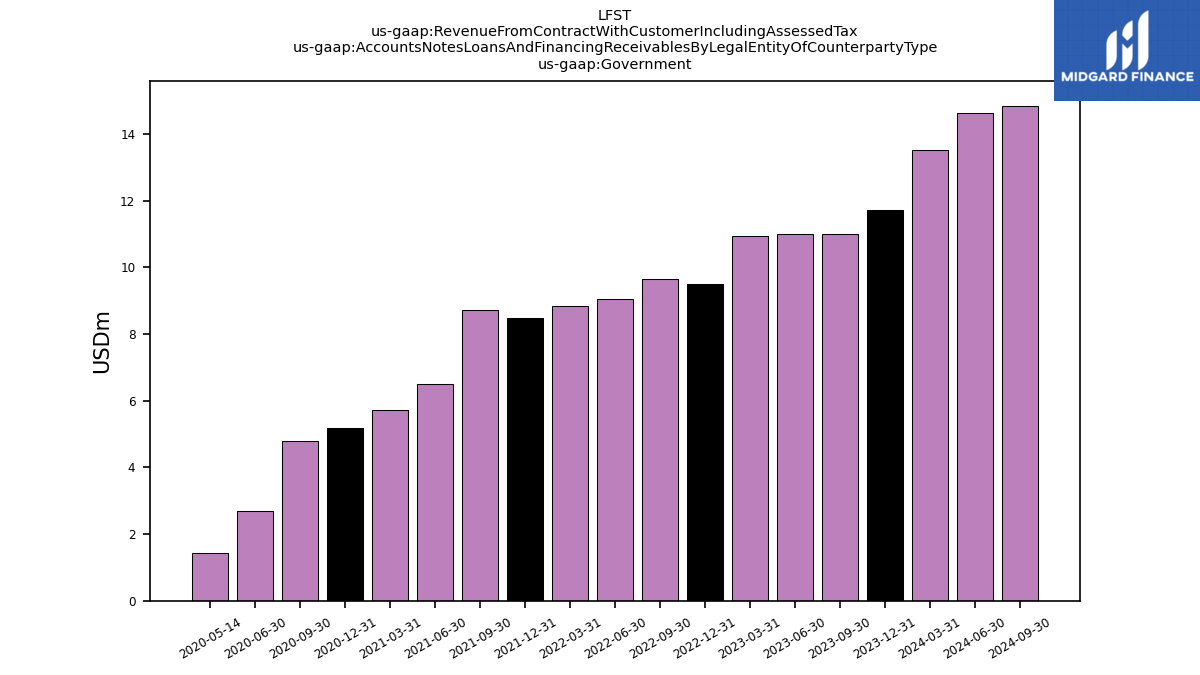
| Government | 13.53 | 11.71 | 10.99 | 11.00 | 10.95 | 9.51 | 9.65 | 9.06 | 8.83 | 8.49 | 8.73 | 6.49 | 5.72 | 5.19 | 4.78 | 2.69 | 1.43 | |
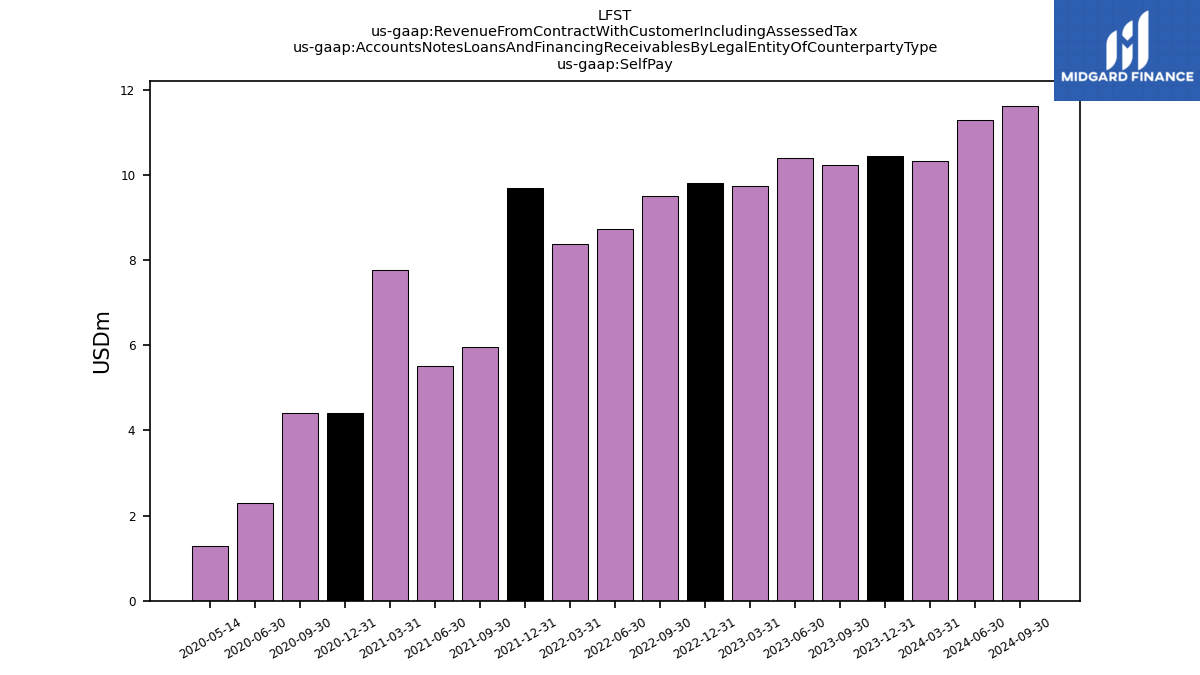
| Self Pay | 10.32 | 10.44 | 10.23 | 10.38 | 9.75 | 9.79 | 9.49 | 8.72 | 8.38 | 9.69 | 5.95 | 5.52 | 7.76 | 4.40 | 4.42 | 2.29 | 1.28 |