
| 2023-12-30 | 2023-09-30 | 2023-07-01 | 2023-04-01 | 2022-12-31 | 2022-10-01 | 2022-07-02 | 2022-04-02 | 2022-01-01 | 2021-09-25 | 2021-06-26 | 2021-03-27 | 2020-12-26 | 2020-09-26 | 2020-06-27 | 2020-03-28 | 2019-12-28 | 2019-09-28 | 2019-06-29 | 2019-03-30 | 2018-12-29 | 2018-09-29 | 2018-06-30 | 2018-03-31 | 2017-12-30 | 2017-09-30 | 2017-07-01 | 2017-04-01 | 2016-12-31 | 2016-10-01 | 2016-07-02 | 2016-04-02 | 2016-01-02 | 2015-09-26 | 2015-06-27 | 2015-03-28 | 2014-12-27 | 2014-09-27 | 2014-06-28 | 2014-03-29 | 2013-12-28 | 2013-09-28 | 2013-06-29 | 2013-03-30 | 2012-12-31 | 2012-12-29 | 2012-09-29 | 2012-06-30 | 2012-03-31 | 2011-12-31 | 2011-10-01 | 2011-07-02 | 2011-04-02 | 2011-01-01 | 2010-10-02 | 2010-07-03 | ||
|---|---|---|---|---|---|---|---|---|---|---|---|---|---|---|---|---|---|---|---|---|---|---|---|---|---|---|---|---|---|---|---|---|---|---|---|---|---|---|---|---|---|---|---|---|---|---|---|---|---|---|---|---|---|---|---|---|---|
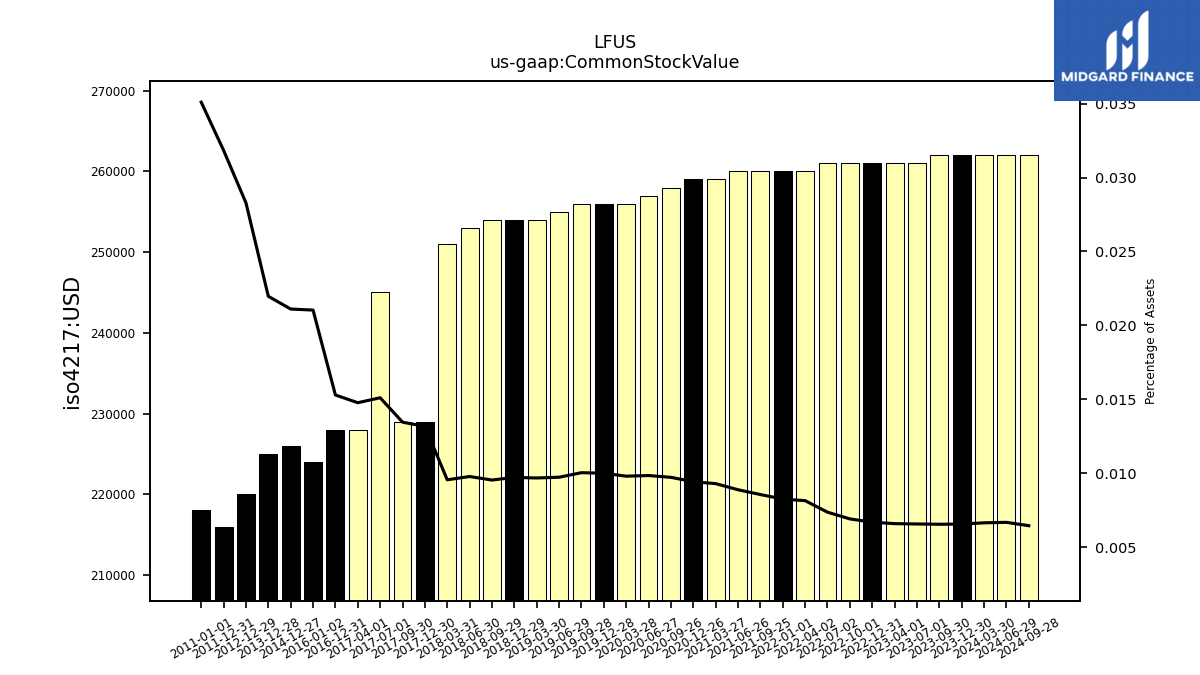
| Common Stock Value | 0.26 | 0.26 | 0.26 | 0.26 | 0.26 | 0.26 | 0.26 | 0.26 | 0.26 | 0.26 | 0.26 | 0.26 | 0.26 | 0.26 | 0.26 | 0.26 | 0.26 | 0.26 | 0.26 | 0.25 | 0.25 | 0.25 | 0.25 | 0.25 | 0.23 | 0.23 | 0.24 | 0.23 | 0.23 | NA | NA | NA | 0.22 | NA | NA | NA | 0.23 | NA | NA | NA | 0.23 | NA | NA | NA | NA | 0.22 | NA | NA | NA | 0.22 | NA | NA | NA | 0.22 | NA | NA | |
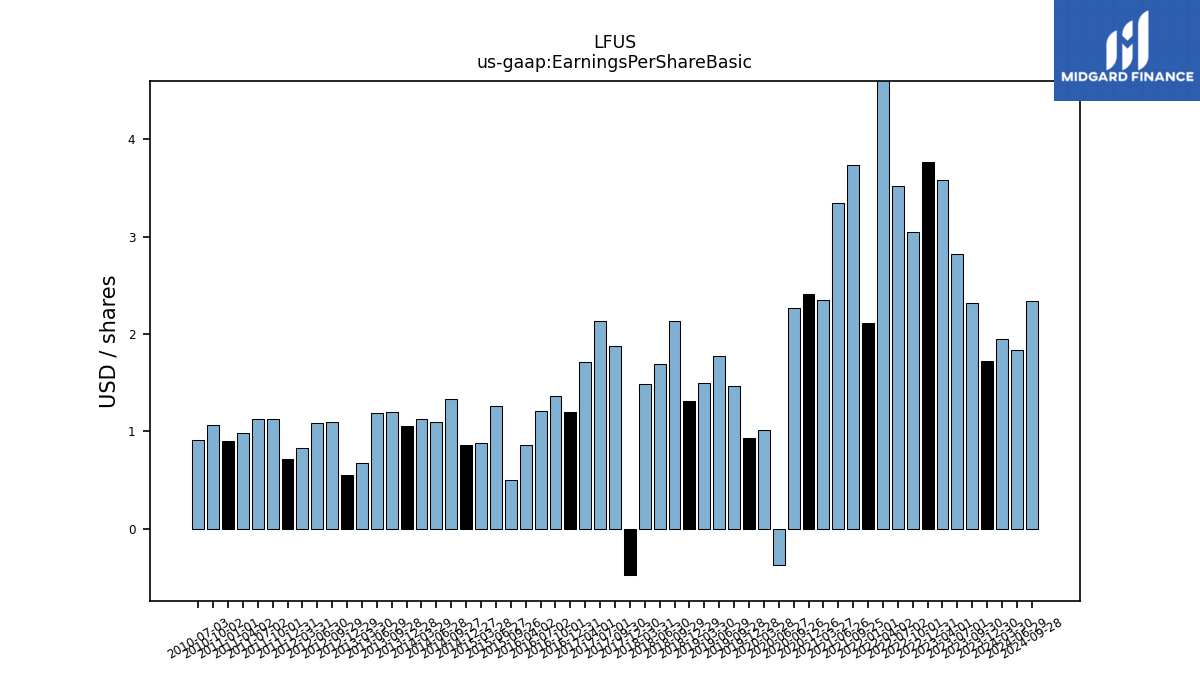
| Earnings Per Share Basic | 1.72 | 2.32 | 2.82 | 3.58 | 3.77 | 3.05 | 3.52 | 4.76 | 2.11 | 3.74 | 3.34 | 2.35 | 2.41 | 2.27 | -0.37 | 1.01 | 0.93 | 1.46 | 1.77 | 1.50 | 1.31 | 2.13 | 1.69 | 1.48 | -0.48 | 1.88 | 2.13 | 1.71 | 1.20 | 1.36 | 1.21 | 0.86 | NA | 0.50 | 1.26 | 0.88 | 0.86 | 1.33 | 1.09 | 1.13 | 1.05 | 1.20 | 1.19 | 0.67 | NA | 0.55 | 1.09 | 1.08 | 0.83 | 0.71 | 1.13 | 1.13 | 0.98 | 0.90 | 1.06 | 0.91 | |
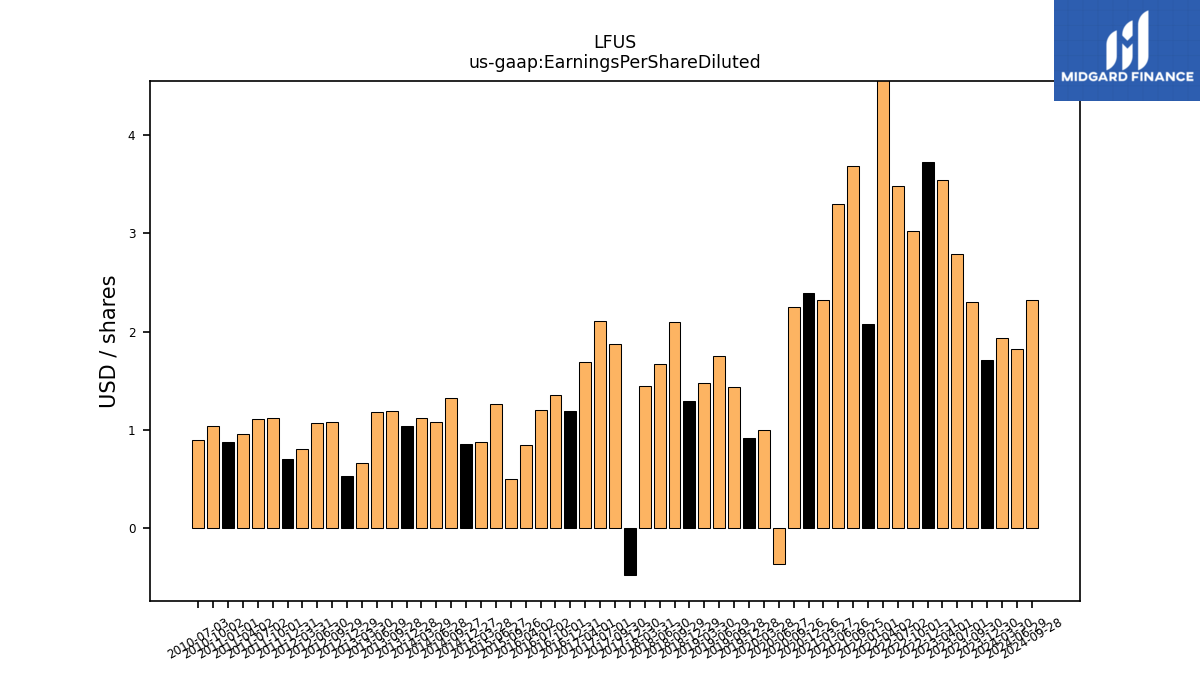
| Earnings Per Share Diluted | 1.71 | 2.30 | 2.79 | 3.54 | 3.73 | 3.02 | 3.48 | 4.70 | 2.08 | 3.69 | 3.30 | 2.32 | 2.39 | 2.25 | -0.37 | 1.00 | 0.92 | 1.44 | 1.75 | 1.48 | 1.29 | 2.10 | 1.67 | 1.45 | -0.48 | 1.87 | 2.11 | 1.69 | 1.19 | 1.35 | 1.20 | 0.85 | NA | 0.50 | 1.26 | 0.88 | 0.86 | 1.32 | 1.08 | 1.12 | 1.04 | 1.19 | 1.18 | 0.66 | NA | 0.53 | 1.08 | 1.07 | 0.81 | 0.70 | 1.12 | 1.11 | 0.96 | 0.88 | 1.04 | 0.90 |
| 2023-12-30 | 2023-09-30 | 2023-07-01 | 2023-04-01 | 2022-12-31 | 2022-10-01 | 2022-07-02 | 2022-04-02 | 2022-01-01 | 2021-09-25 | 2021-06-26 | 2021-03-27 | 2020-12-26 | 2020-09-26 | 2020-06-27 | 2020-03-28 | 2019-12-28 | 2019-09-28 | 2019-06-29 | 2019-03-30 | 2018-12-29 | 2018-09-29 | 2018-06-30 | 2018-03-31 | 2017-12-30 | 2017-09-30 | 2017-07-01 | 2017-04-01 | 2016-12-31 | 2016-10-01 | 2016-07-02 | 2016-04-02 | 2016-01-02 | 2015-09-26 | 2015-06-27 | 2015-03-28 | 2014-12-27 | 2014-09-27 | 2014-06-28 | 2014-03-29 | 2013-12-28 | 2013-09-28 | 2013-06-29 | 2013-03-30 | 2012-12-31 | 2012-12-29 | 2012-09-29 | 2012-06-30 | 2012-03-31 | 2011-12-31 | 2011-10-01 | 2011-07-02 | 2011-04-02 | 2011-01-01 | 2010-10-02 | 2010-07-03 | ||
|---|---|---|---|---|---|---|---|---|---|---|---|---|---|---|---|---|---|---|---|---|---|---|---|---|---|---|---|---|---|---|---|---|---|---|---|---|---|---|---|---|---|---|---|---|---|---|---|---|---|---|---|---|---|---|---|---|---|
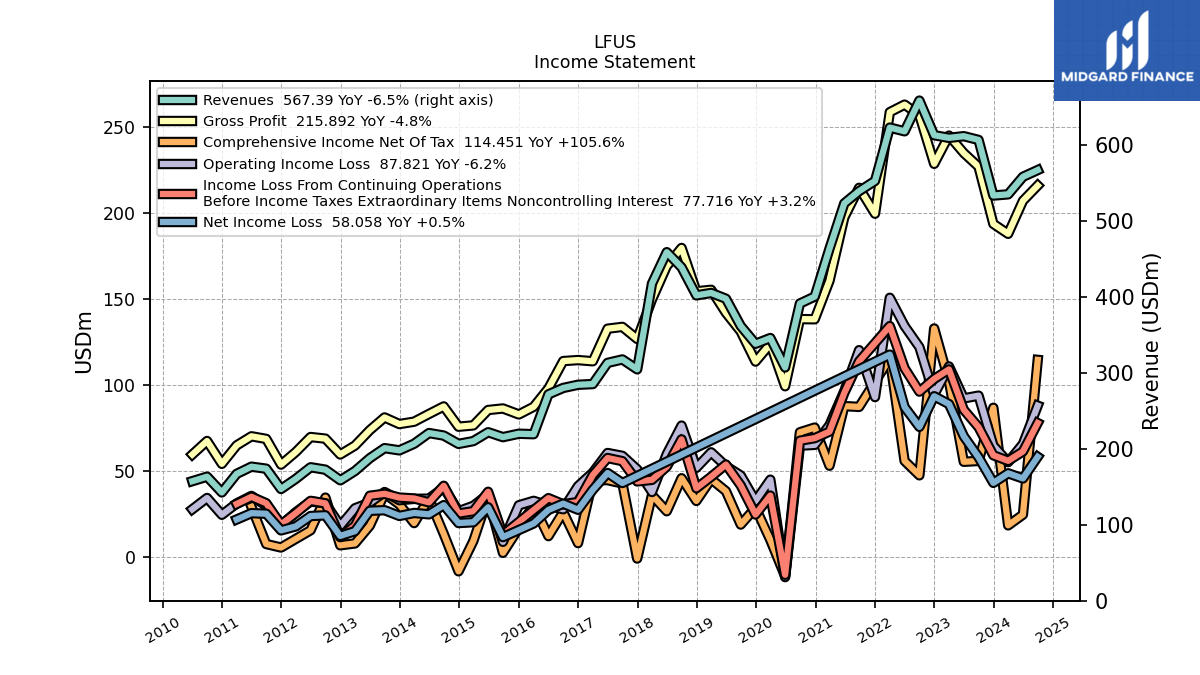
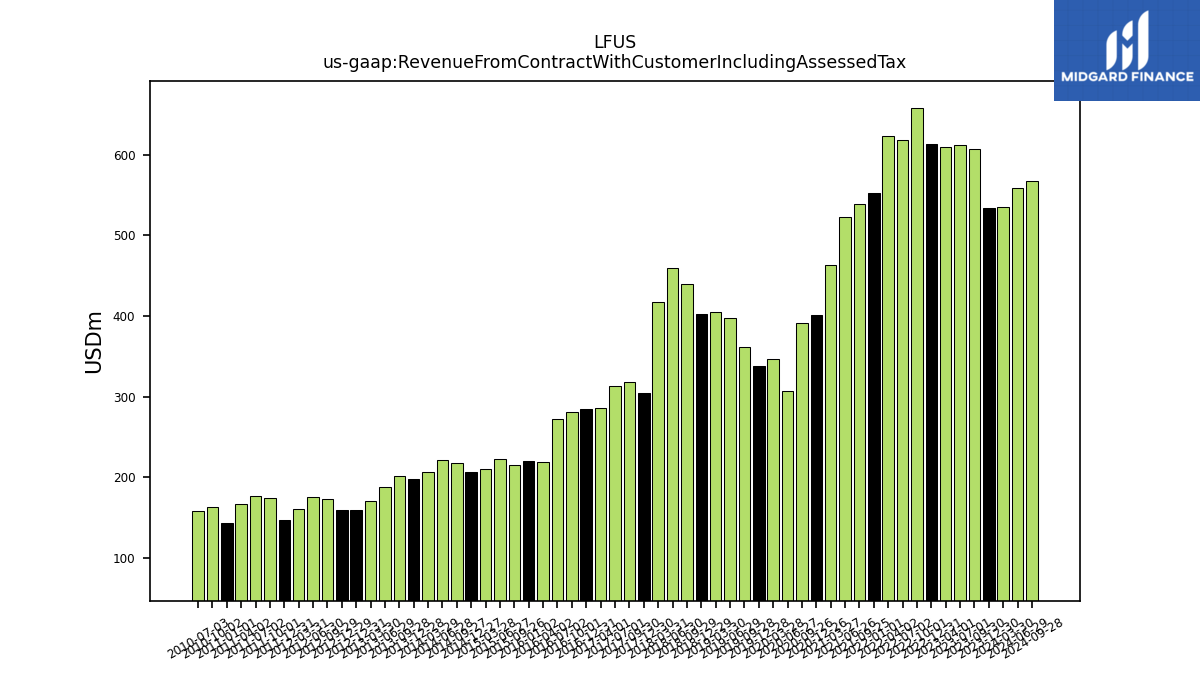
| Revenue From Contract With Customer Including Assessed Tax | 533.81 | 607.07 | 612.00 | 609.78 | 613.25 | 658.88 | 618.44 | 623.33 | 553.07 | 539.58 | 523.49 | 463.79 | 400.70 | 391.57 | 307.34 | 346.10 | 338.52 | 361.97 | 397.88 | 405.50 | 402.28 | 439.19 | 459.18 | 417.81 | 304.85 | 317.89 | 313.36 | 285.44 | 284.52 | 280.33 | 271.91 | 219.40 | 220.02 | 215.51 | 222.02 | 210.31 | 206.62 | 217.61 | 220.91 | 206.86 | 198.13 | 201.04 | 187.77 | 170.92 | 158.79 | 158.79 | 172.69 | 175.85 | 160.58 | 147.19 | 173.99 | 176.62 | 167.16 | 142.65 | 163.47 | 157.51 | |
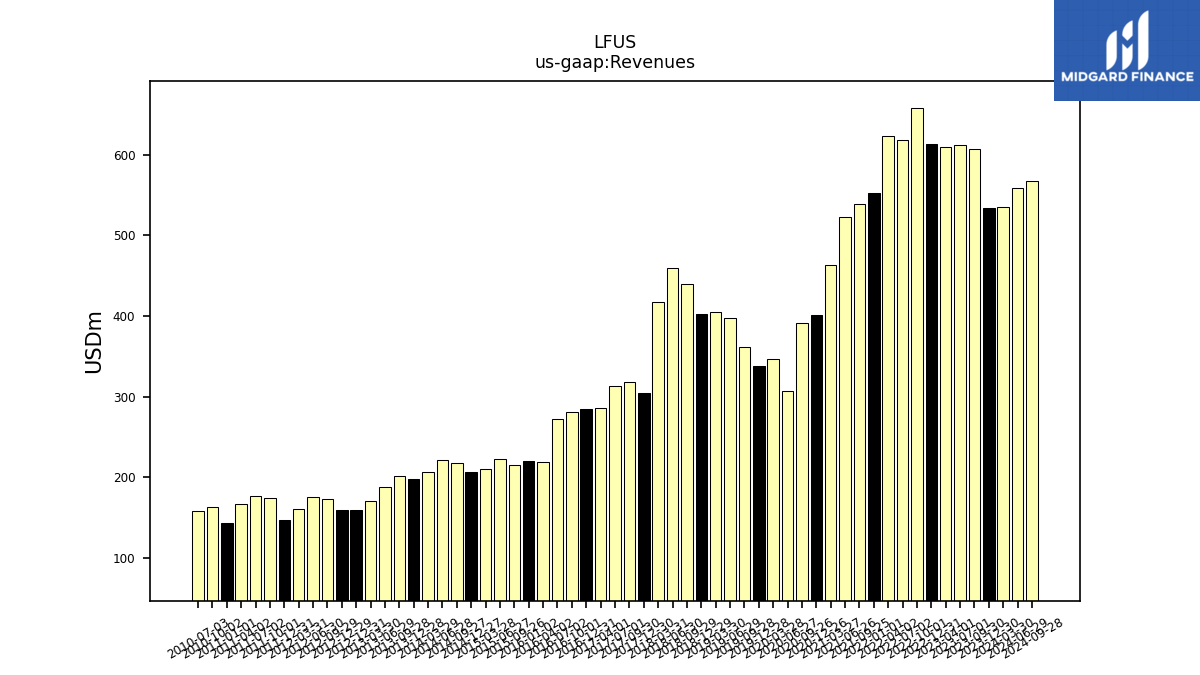
| Revenues | 533.81 | 607.07 | 612.00 | 609.78 | 613.25 | 658.88 | 618.44 | 623.33 | 553.07 | 539.58 | 523.49 | 463.79 | 400.70 | 391.57 | 307.34 | 346.10 | 338.52 | 361.97 | 397.88 | 405.50 | 402.28 | 439.19 | 459.18 | 417.81 | 304.85 | 317.89 | 313.36 | 285.44 | 284.52 | 280.33 | 271.91 | 219.40 | 220.02 | 215.51 | 222.02 | 210.31 | 206.62 | 217.61 | 220.91 | 206.86 | 198.13 | 201.04 | 187.77 | 170.92 | 158.79 | 158.79 | 172.69 | 175.85 | 160.58 | 147.19 | 173.99 | 176.62 | 167.16 | 142.65 | 163.47 | 157.51 | |
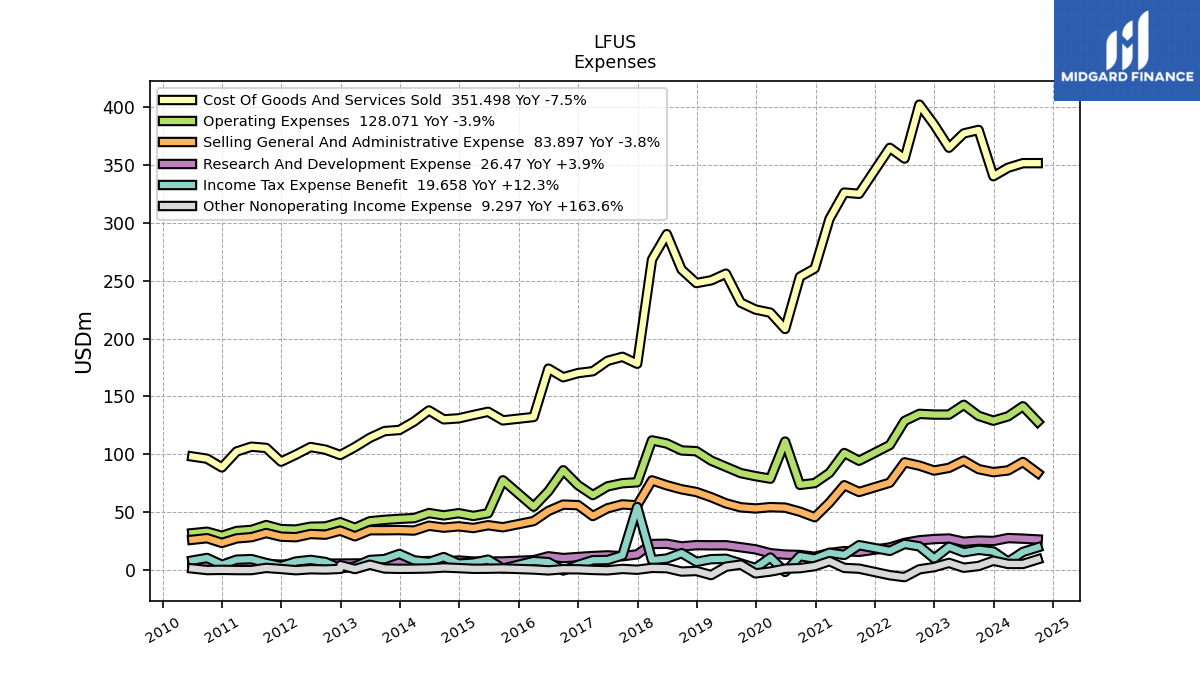
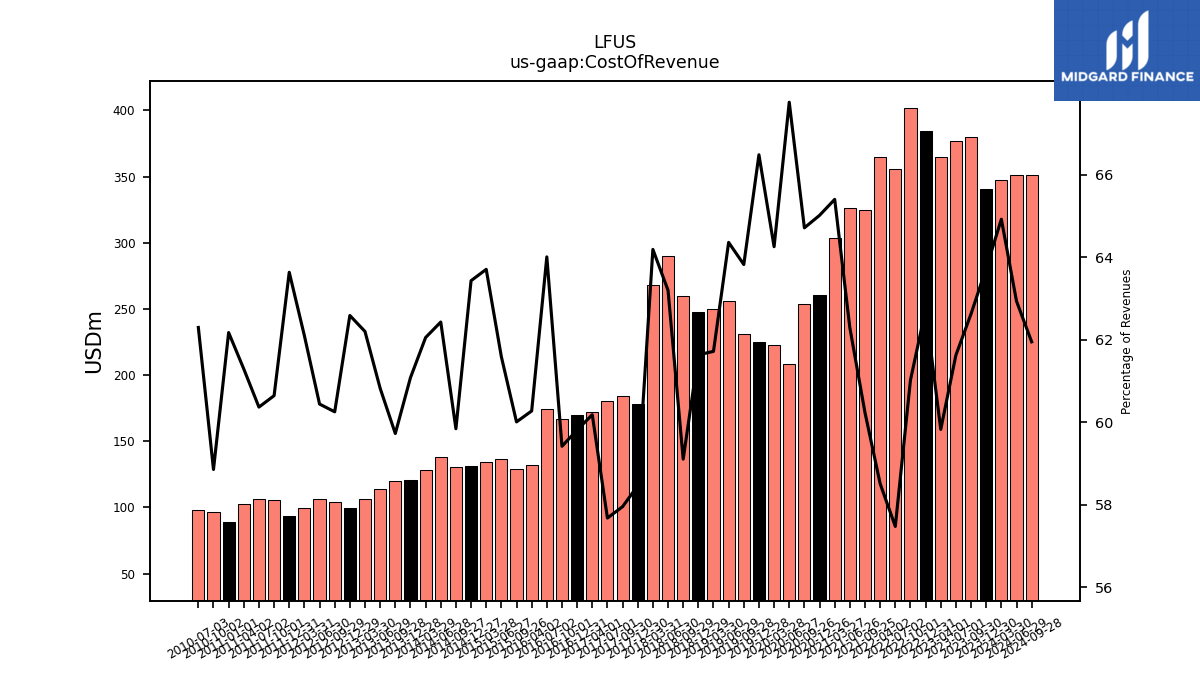
| Cost Of Revenue | 340.23 | 380.20 | 377.17 | 364.82 | 384.73 | 402.06 | 355.46 | 364.73 | NA | 325.01 | 326.09 | 303.33 | 260.51 | 253.39 | 208.24 | 222.38 | 225.06 | 231.03 | 256.07 | 250.27 | 247.94 | 259.60 | 290.20 | 268.19 | 178.22 | 184.24 | 180.75 | 171.79 | 170.18 | 166.57 | 174.05 | 132.24 | NA | 129.33 | 136.74 | 133.98 | 131.06 | 130.23 | 137.91 | 128.37 | 121.02 | 120.08 | 114.21 | 106.31 | NA | 99.39 | 104.05 | 106.29 | 99.72 | 93.67 | 105.52 | 106.62 | 102.46 | 88.69 | 96.21 | 98.12 | |
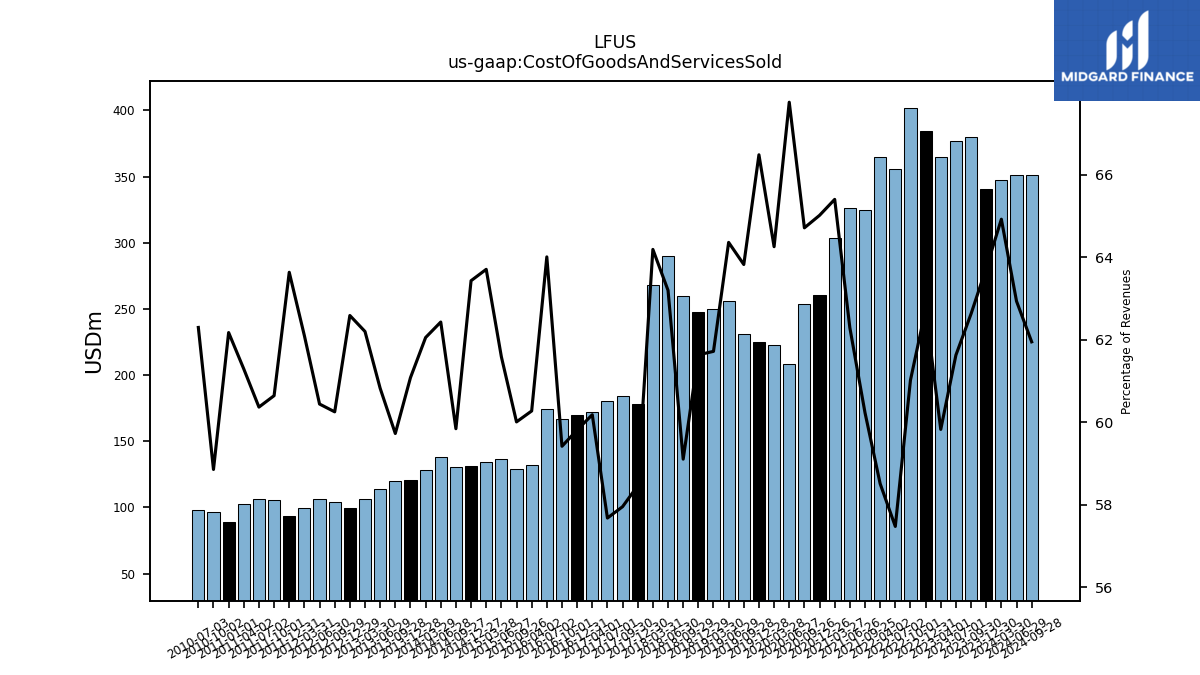
| Cost Of Goods And Services Sold | 340.23 | 380.20 | 377.17 | 364.82 | 384.73 | 402.06 | 355.46 | 364.73 | NA | 325.01 | 326.09 | 303.33 | 260.51 | 253.39 | 208.24 | 222.38 | 225.06 | 231.03 | 256.07 | 250.27 | 247.94 | 259.60 | 290.20 | 268.19 | 178.22 | 184.24 | 180.75 | 171.79 | 170.18 | 166.57 | 174.05 | 132.24 | NA | 129.33 | 136.74 | 133.98 | 131.06 | 130.23 | 137.91 | 128.37 | 121.02 | 120.08 | 114.21 | 106.31 | NA | 99.39 | 104.05 | 106.29 | 99.72 | 93.67 | 105.52 | 106.62 | 102.46 | 88.69 | 96.21 | 98.12 | |
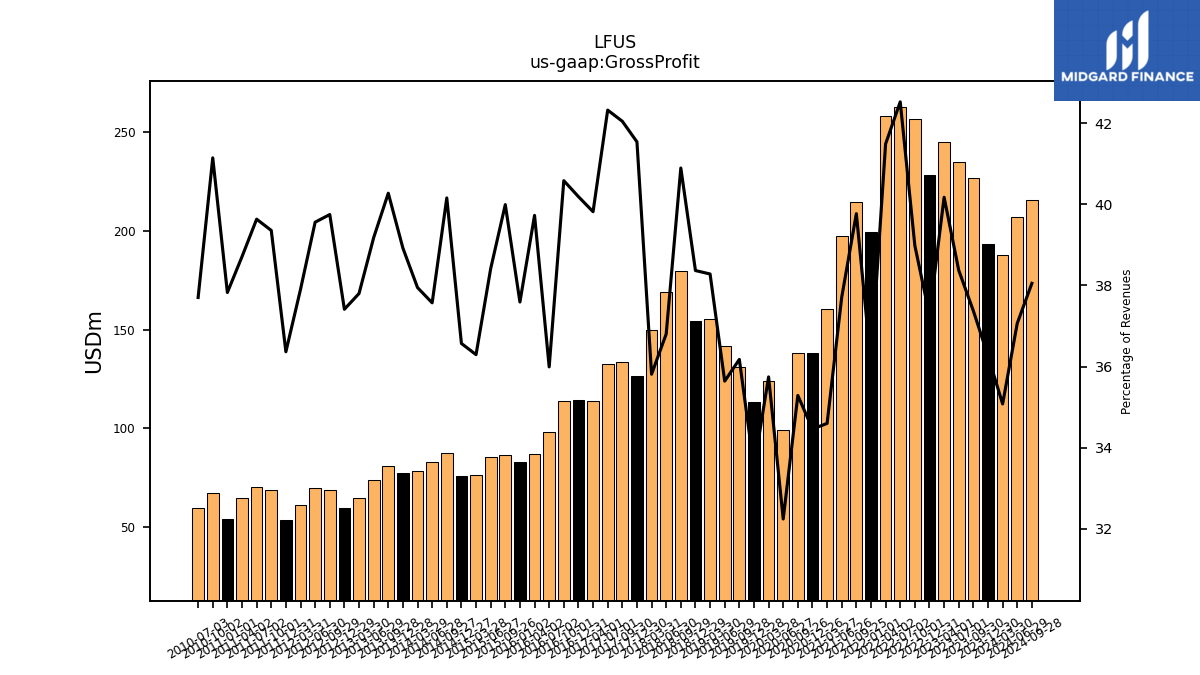
| Gross Profit | 193.58 | 226.87 | 234.83 | 244.96 | 228.53 | 256.82 | 262.97 | 258.60 | 199.49 | 214.57 | 197.40 | 160.47 | 138.08 | 138.18 | 99.10 | 123.71 | 113.47 | 130.95 | 141.81 | 155.23 | 154.34 | 179.59 | 168.99 | 149.62 | 126.62 | 133.65 | 132.61 | 113.65 | 114.34 | 113.76 | 97.87 | 87.16 | 82.71 | 86.18 | 85.28 | 76.33 | 75.56 | 87.38 | 83.00 | 78.49 | 77.11 | 80.96 | 73.56 | 64.61 | NA | 59.41 | 68.64 | 69.56 | 60.86 | 53.53 | 68.47 | 69.99 | 64.70 | 53.96 | 67.25 | 59.38 | |
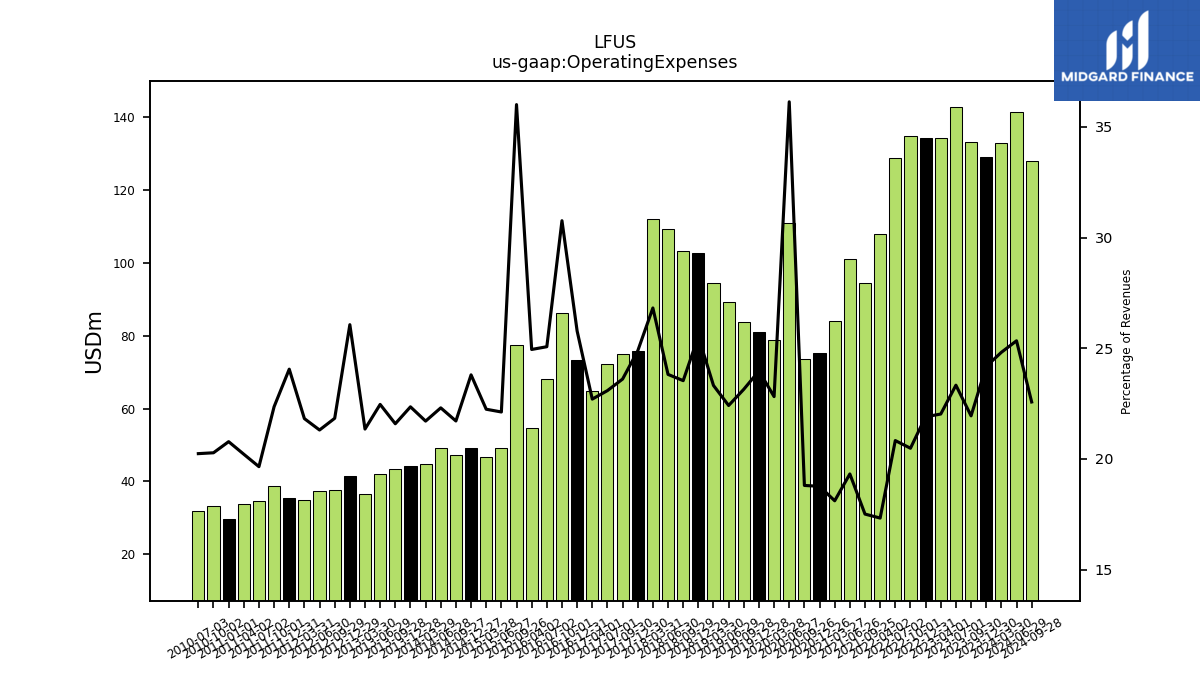
| Operating Expenses | 129.06 | 133.23 | 142.78 | 134.32 | 134.32 | 134.95 | 128.81 | 108.01 | NA | 94.47 | 101.14 | 83.98 | 75.17 | 73.62 | 111.05 | 78.96 | 81.15 | 83.78 | 89.17 | 94.56 | 102.71 | 103.37 | 109.36 | 112.05 | 75.84 | 75.04 | 72.34 | 64.80 | 73.35 | 86.23 | 68.16 | 54.73 | NA | 77.60 | 49.11 | 46.78 | 49.17 | 47.25 | 49.28 | 44.90 | 44.29 | 43.40 | 42.17 | 36.49 | NA | 41.39 | 37.70 | 37.47 | 35.04 | 35.41 | 38.90 | 34.70 | 33.78 | 29.64 | 33.15 | 31.88 | |
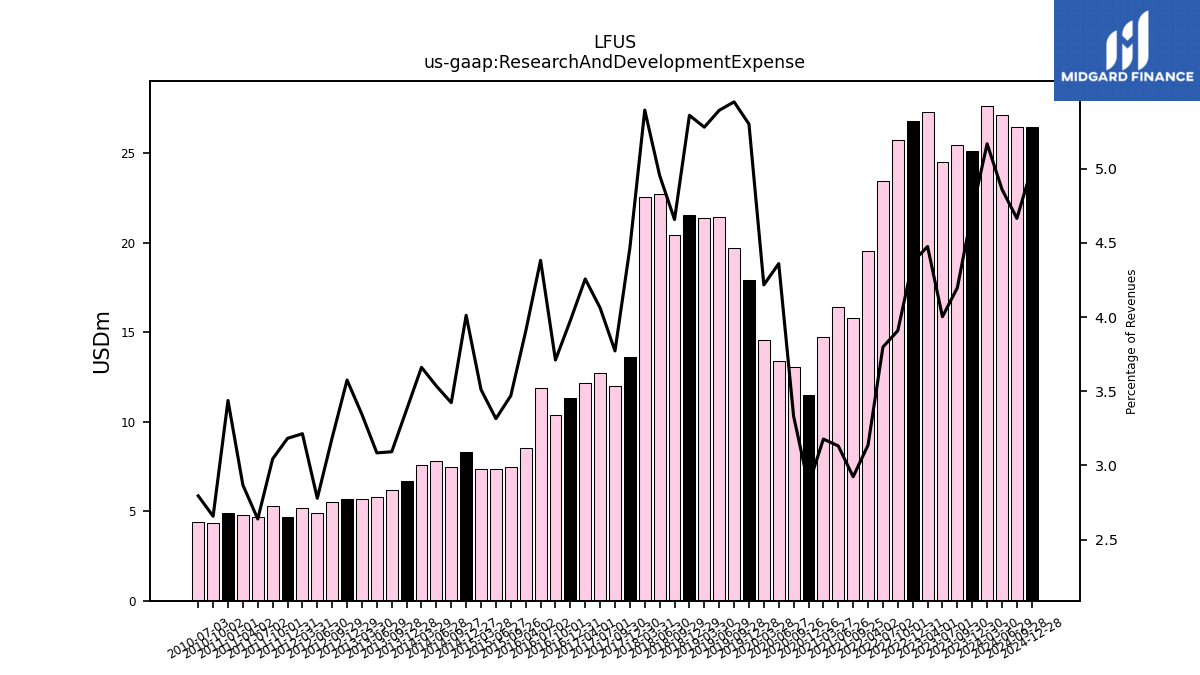
| Research And Development Expense | 25.16 | 25.48 | 24.50 | 27.29 | 26.81 | 25.75 | 23.49 | 19.56 | NA | 15.78 | 16.39 | 14.74 | 11.49 | 13.05 | 13.40 | 14.60 | 17.94 | 19.73 | 21.46 | 21.41 | 21.56 | 20.45 | 22.75 | 22.54 | 13.62 | 11.99 | 12.73 | 12.15 | 11.31 | 10.40 | 11.92 | 8.56 | NA | 7.48 | 7.36 | 7.38 | 8.29 | 7.45 | 7.81 | 7.57 | 6.69 | 6.22 | 5.79 | 5.71 | NA | 5.68 | 5.50 | 4.89 | 5.16 | 4.68 | 5.30 | 4.66 | 4.79 | 4.90 | 4.34 | 4.40 | |
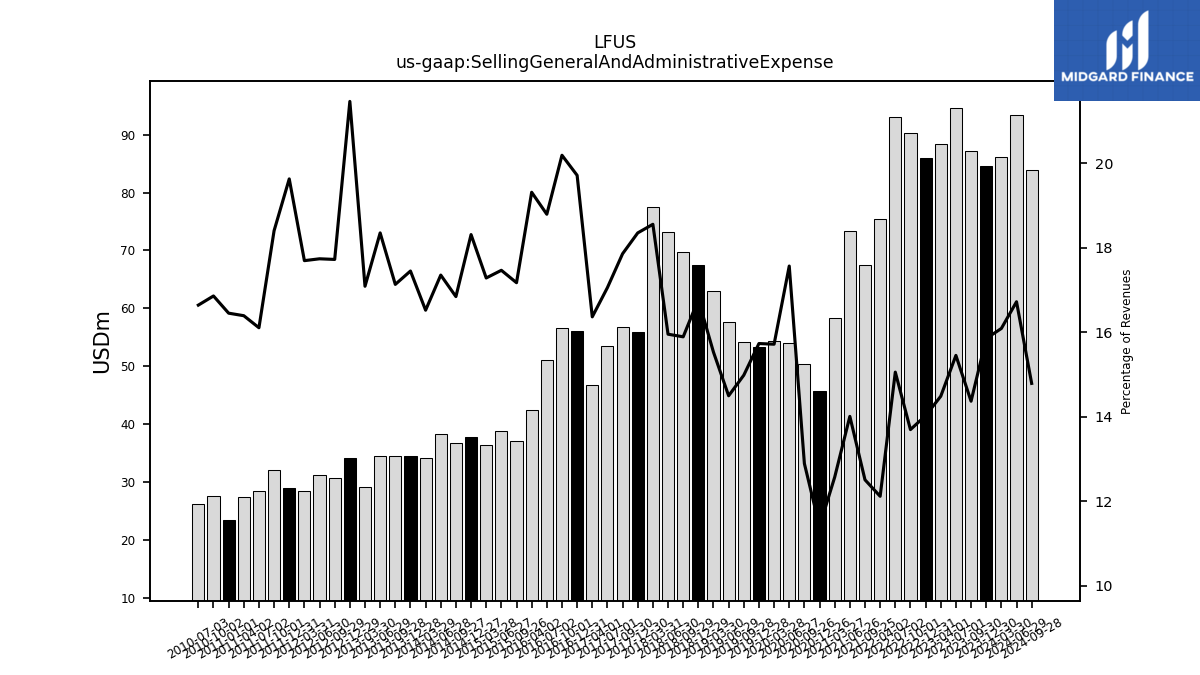
| Selling General And Administrative Expense | 84.60 | 87.20 | 94.54 | 88.31 | 85.99 | 90.22 | 93.09 | 75.51 | NA | 67.47 | 73.31 | 58.29 | 45.67 | 50.47 | 53.98 | 54.39 | 53.25 | 54.22 | 57.67 | 62.95 | 67.46 | 69.78 | 73.24 | 77.51 | 55.93 | 56.76 | 53.44 | 46.70 | 56.08 | 56.59 | 51.09 | 42.37 | NA | 37.00 | 38.77 | 36.34 | 37.83 | 36.65 | 38.33 | 34.17 | 34.57 | 34.44 | 34.45 | 29.20 | NA | 34.08 | 30.60 | 31.19 | 28.41 | 28.89 | 32.02 | 28.44 | 27.39 | 23.46 | 27.55 | 26.21 | |
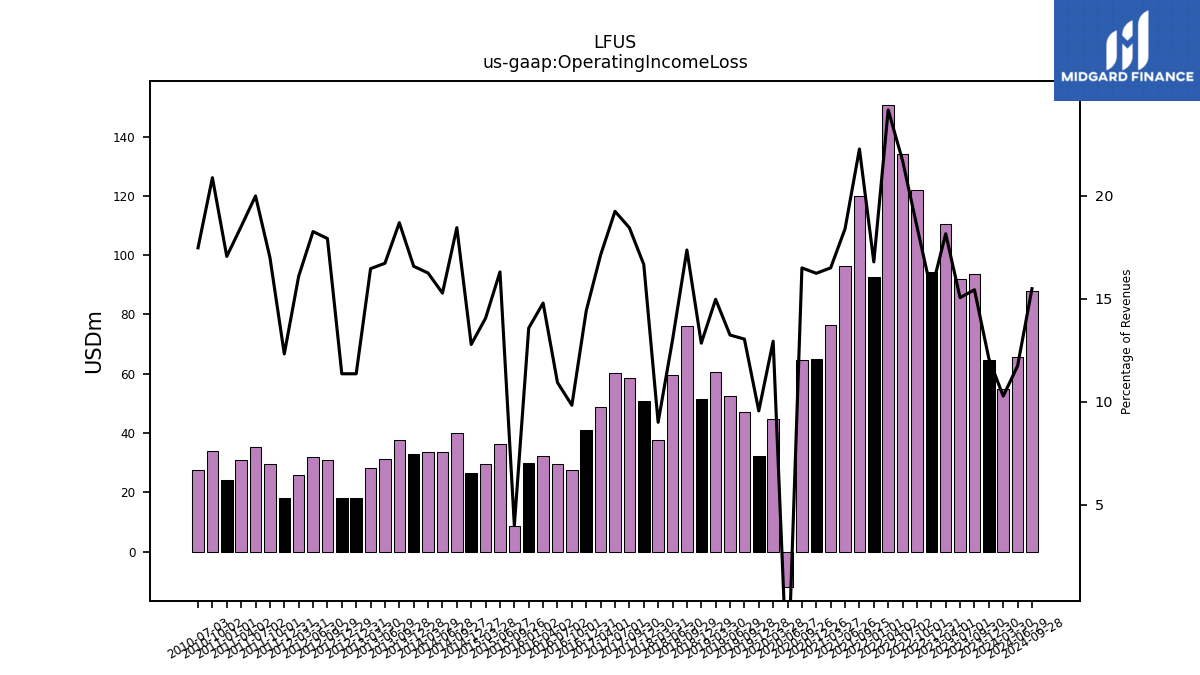
| Operating Income Loss | 64.52 | 93.64 | 92.05 | 110.64 | 94.20 | 121.87 | 134.16 | 150.59 | 92.80 | 120.11 | 96.26 | 76.48 | 65.01 | 64.56 | -11.95 | 44.75 | 32.32 | 47.17 | 52.63 | 60.67 | 51.63 | 76.23 | 59.62 | 37.57 | 50.78 | 58.61 | 60.27 | 48.85 | 40.99 | 27.53 | 29.70 | 32.43 | 29.85 | 8.58 | 36.17 | 29.55 | 26.39 | 40.13 | 33.72 | 33.59 | 32.82 | 37.56 | 31.38 | 28.12 | 18.02 | 18.02 | 30.93 | 32.10 | 25.82 | 18.12 | 29.57 | 35.29 | 30.92 | 24.32 | 34.11 | 27.51 | |
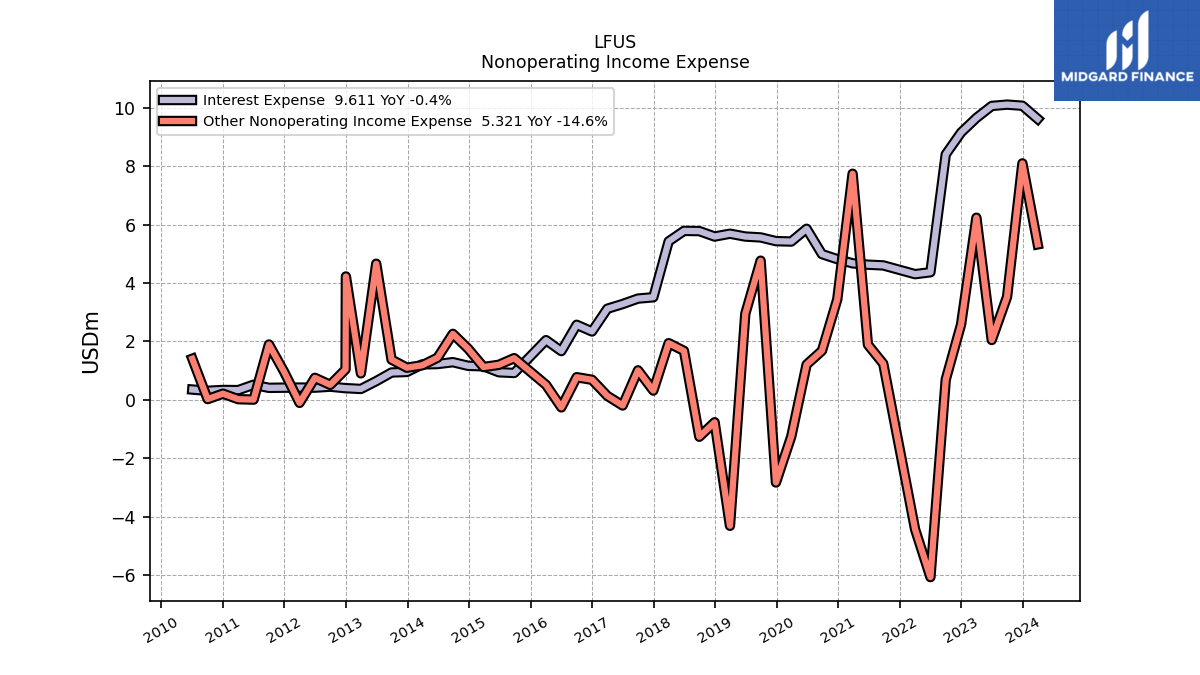
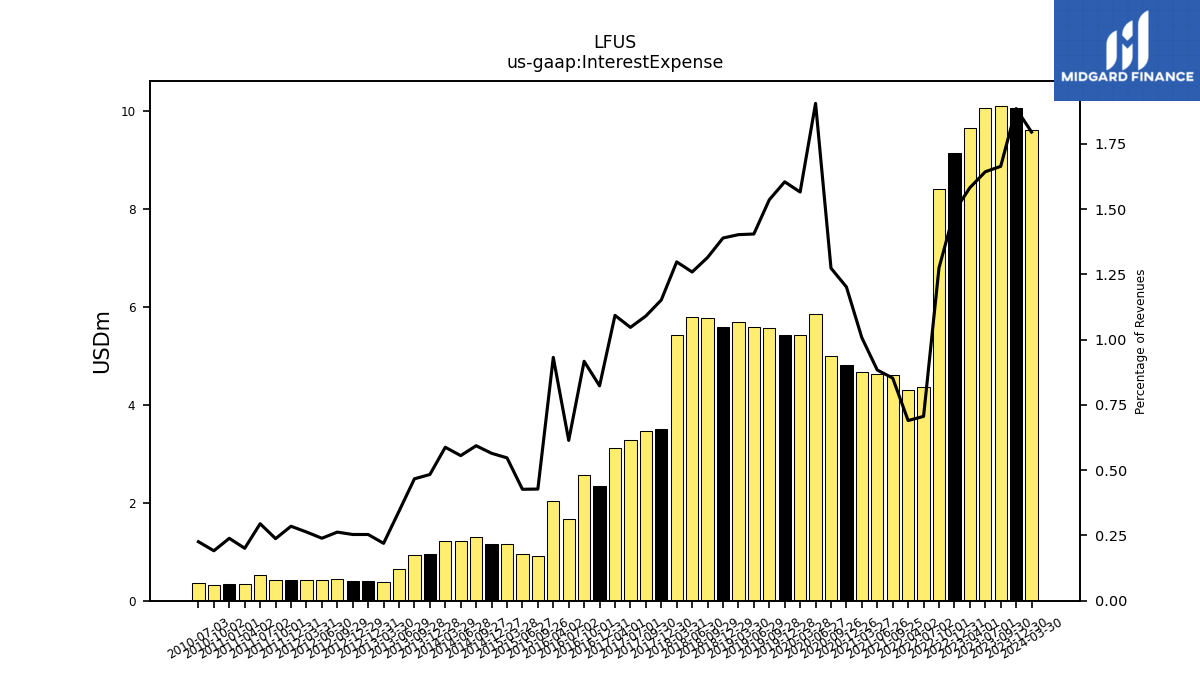
| Interest Expense | 10.06 | 10.10 | 10.06 | 9.65 | 9.15 | 8.40 | 4.37 | 4.30 | NA | 4.60 | 4.63 | 4.67 | 4.82 | 4.99 | 5.86 | 5.42 | 5.43 | 5.56 | 5.59 | 5.69 | 5.59 | 5.78 | 5.78 | 5.42 | 3.51 | 3.47 | 3.28 | 3.12 | 2.34 | 2.57 | 1.67 | 2.04 | NA | 0.92 | 0.95 | 1.15 | 1.17 | 1.29 | 1.23 | 1.22 | 0.96 | 0.94 | 0.64 | 0.38 | 0.40 | 0.40 | 0.45 | 0.42 | 0.42 | 0.42 | 0.41 | 0.52 | 0.34 | 0.34 | 0.31 | 0.36 | |
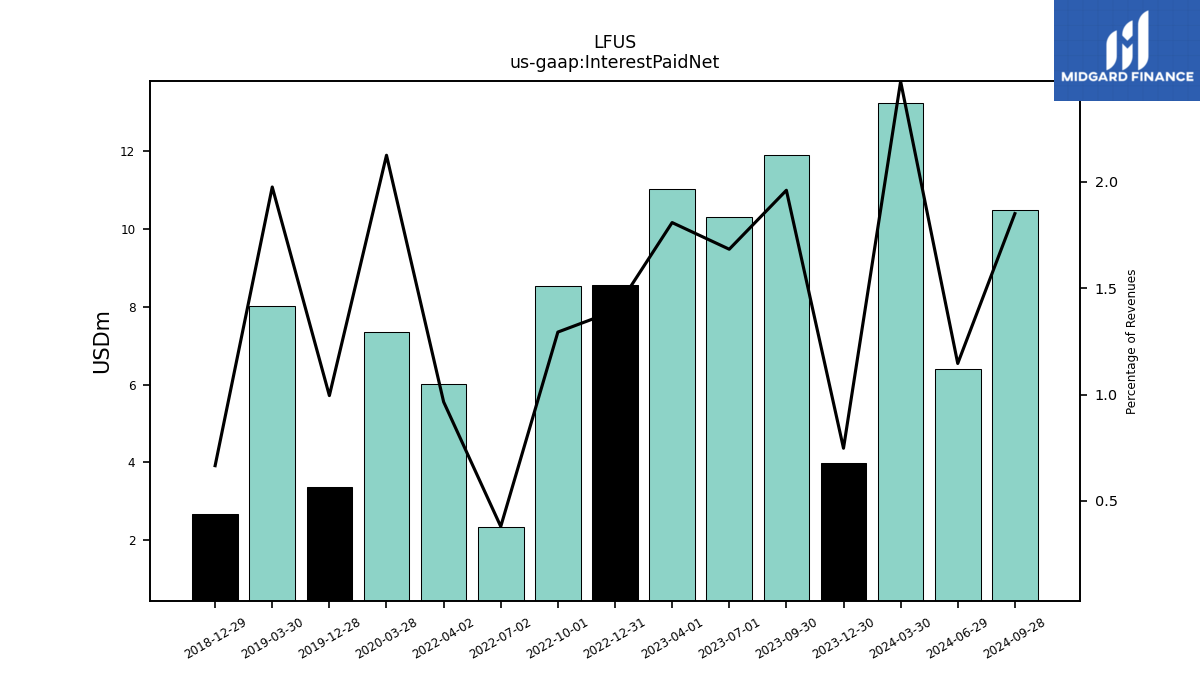
| Interest Paid Net | 3.99 | 11.87 | 10.28 | 11.03 | 8.55 | 8.52 | 2.35 | 6.02 | NA | NA | NA | NA | NA | NA | NA | 7.35 | 3.37 | NA | NA | 8.01 | 2.68 | NA | NA | NA | NA | NA | NA | NA | NA | NA | NA | NA | NA | NA | NA | NA | NA | NA | NA | NA | NA | NA | NA | NA | NA | NA | NA | NA | NA | NA | NA | NA | NA | NA | NA | NA | |
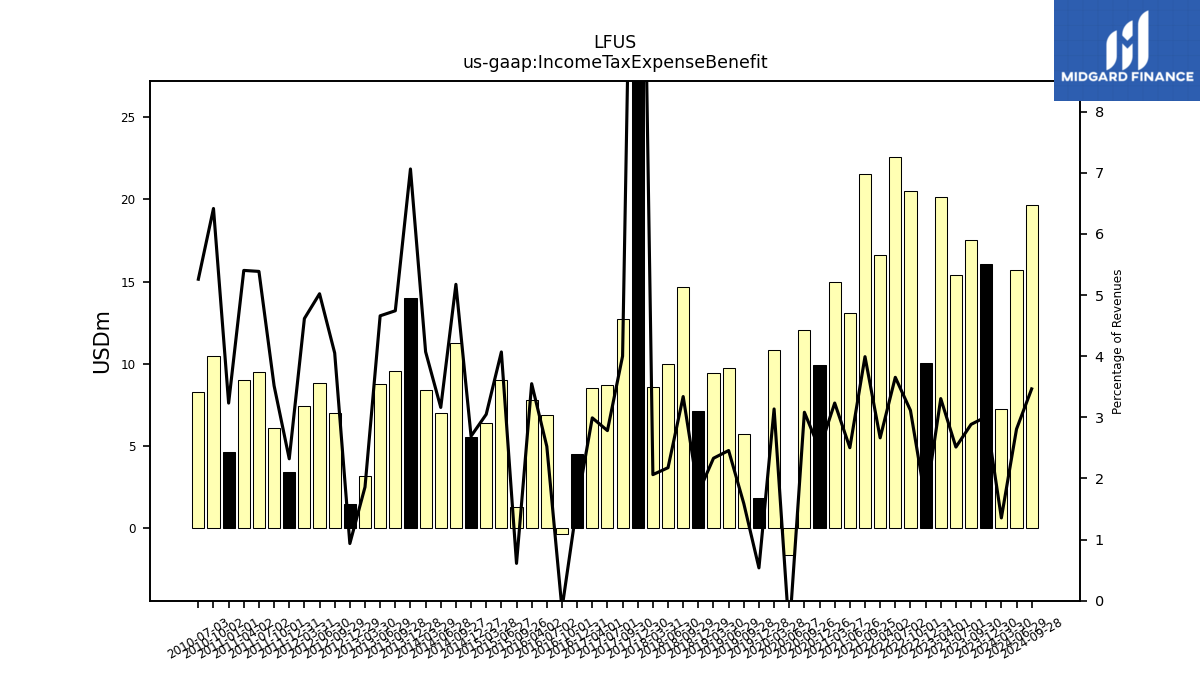
| Income Tax Expense Benefit | 16.07 | 17.51 | 15.38 | 20.16 | 10.03 | 20.51 | 22.60 | 16.61 | NA | 21.54 | 13.10 | 14.99 | 9.94 | 12.07 | -1.59 | 10.86 | 1.82 | 5.76 | 9.78 | 9.45 | 7.10 | 14.67 | 9.99 | 8.62 | 54.55 | 12.71 | 8.72 | 8.54 | 4.50 | -0.37 | 6.86 | 7.79 | NA | 1.32 | 9.03 | 6.41 | 5.56 | 11.26 | 6.98 | 8.42 | 13.99 | 9.53 | 8.75 | 3.18 | NA | 1.49 | 7.00 | 8.83 | 7.41 | 3.42 | 6.12 | 9.51 | 9.03 | 4.61 | 10.49 | 8.28 | |
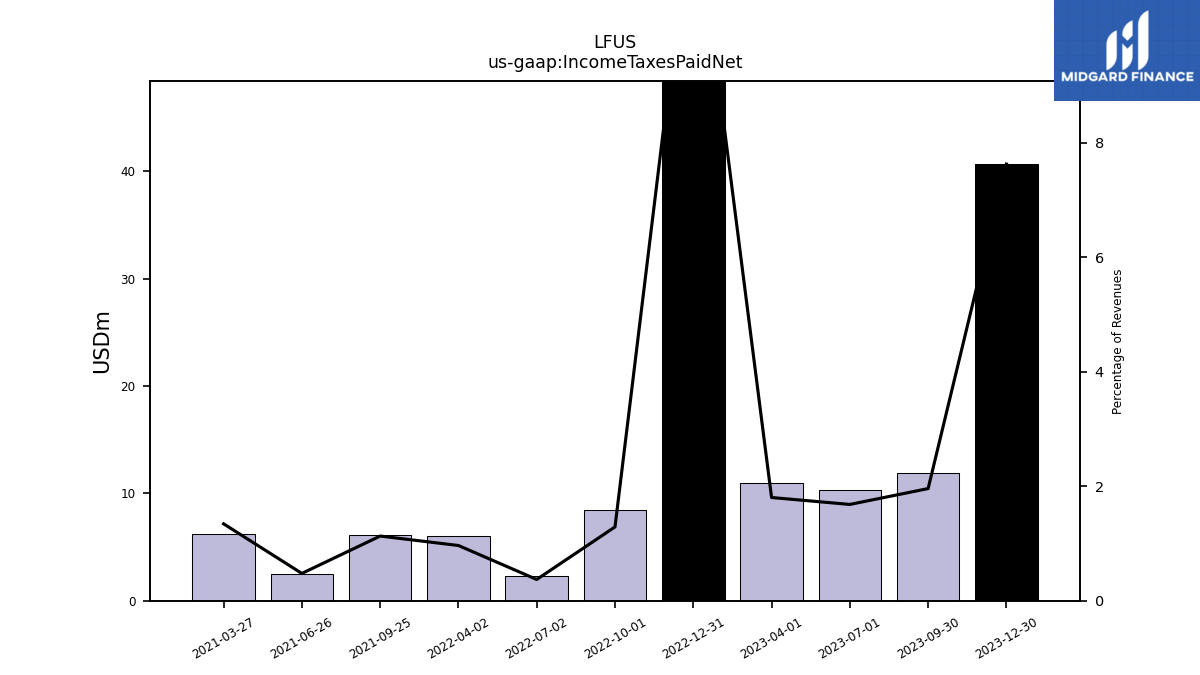
| Income Taxes Paid Net | 40.73 | 11.90 | 10.30 | 11.00 | 76.73 | 8.50 | 2.30 | 6.02 | NA | 6.10 | 2.50 | 6.24 | NA | NA | NA | NA | NA | NA | NA | NA | NA | NA | NA | NA | NA | NA | NA | NA | NA | NA | NA | NA | NA | NA | NA | NA | NA | NA | NA | NA | NA | NA | NA | NA | NA | NA | NA | NA | NA | NA | NA | NA | NA | NA | NA | NA | |
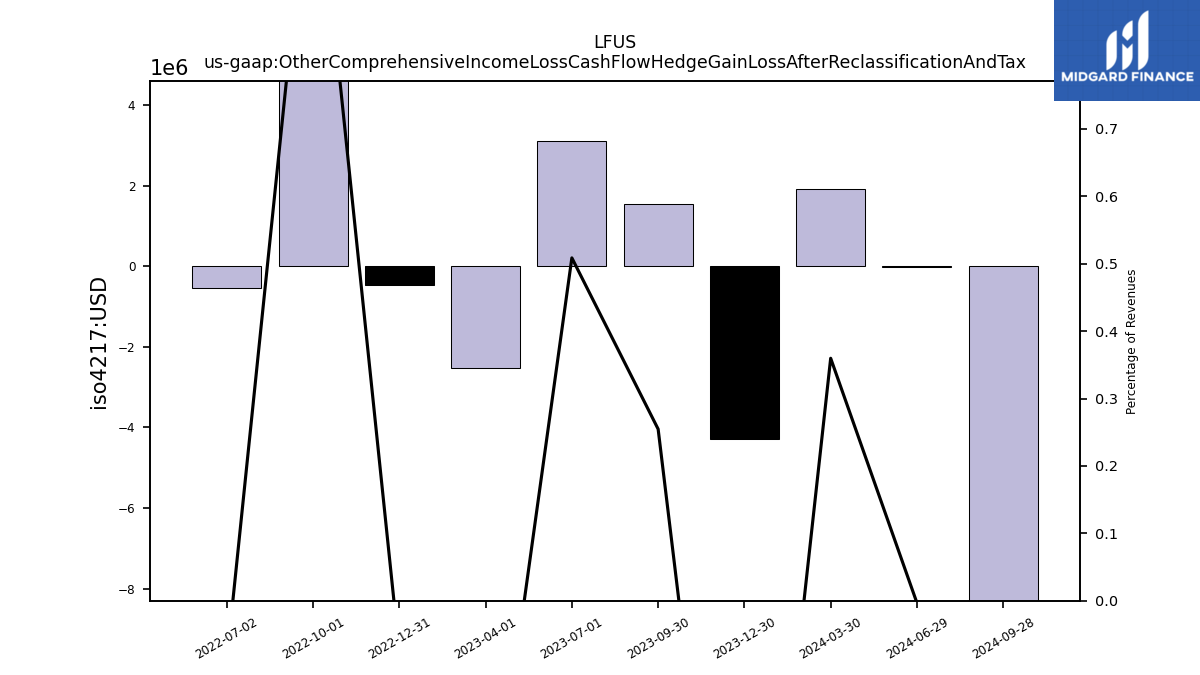
| Other Comprehensive Income Loss Cash Flow Hedge Gain Loss After Reclassification And Tax | -4.29 | 1.55 | 3.11 | -2.52 | -0.47 | 7.61 | -0.54 | NA | NA | NA | NA | NA | NA | NA | NA | NA | NA | NA | NA | NA | NA | NA | NA | NA | NA | NA | NA | NA | NA | NA | NA | NA | NA | NA | NA | NA | NA | NA | NA | NA | NA | NA | NA | NA | NA | NA | NA | NA | NA | NA | NA | NA | NA | NA | NA | NA | |
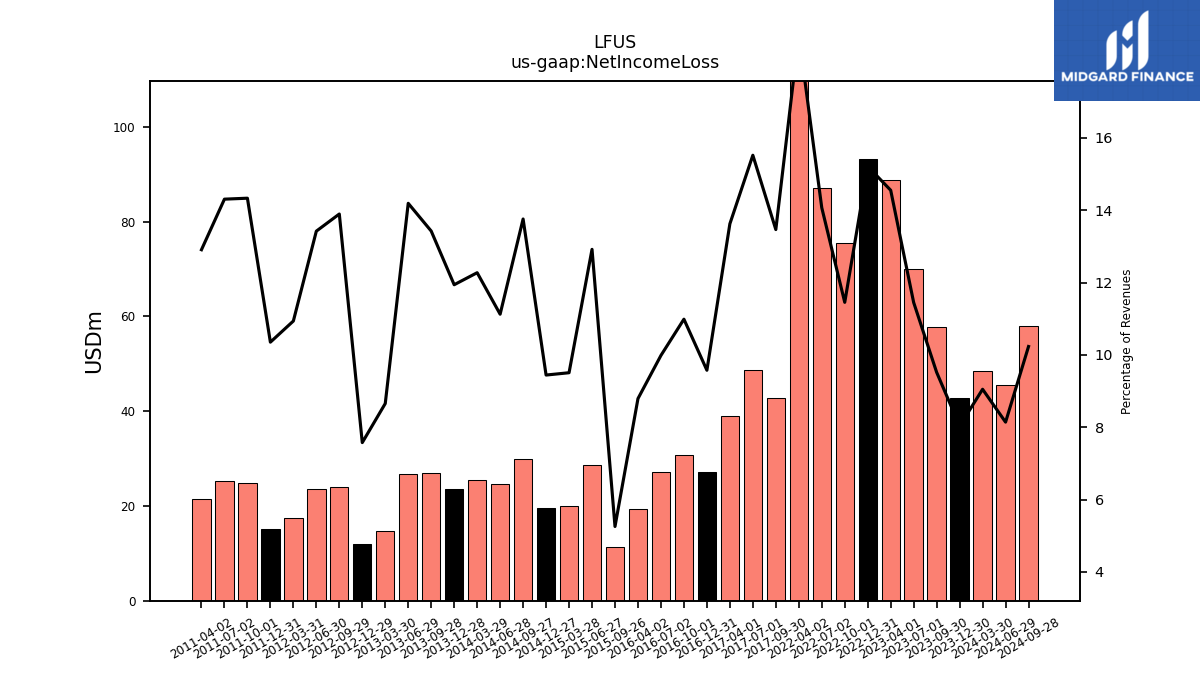
| Net Income Loss | 42.88 | 57.79 | 70.07 | 88.75 | 93.30 | 75.47 | 87.02 | 117.52 | NA | NA | NA | NA | NA | NA | NA | NA | NA | NA | NA | NA | NA | NA | NA | NA | NA | 42.81 | 48.64 | 38.89 | 27.25 | 30.80 | 27.15 | 19.29 | NA | 11.32 | 28.68 | 20.00 | 19.51 | 29.94 | 24.58 | 25.39 | 23.66 | 26.99 | 26.65 | 14.79 | NA | 12.03 | 24.00 | 23.60 | 17.56 | 15.24 | 24.94 | 25.27 | 21.58 | NA | NA | NA | |
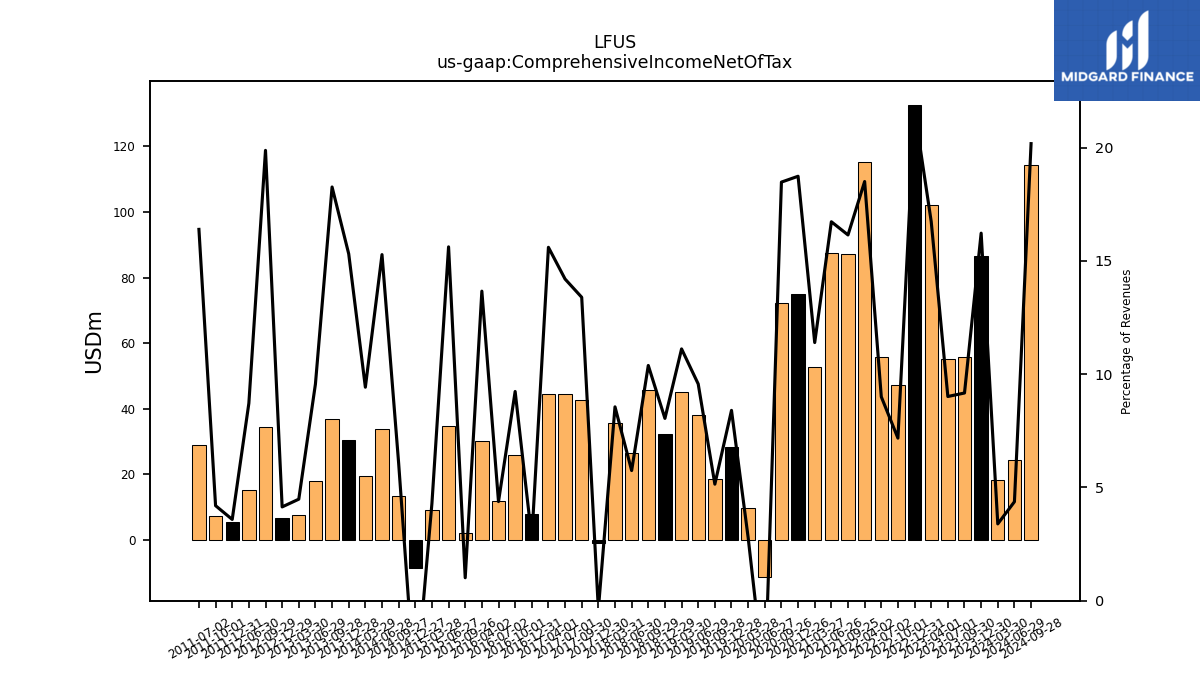
| Comprehensive Income Net Of Tax | 86.59 | 55.65 | 55.16 | 102.03 | 132.74 | 47.28 | 55.67 | 115.31 | NA | 87.10 | 87.55 | 52.84 | 75.06 | 72.34 | -11.41 | 9.66 | 28.44 | 18.62 | 38.06 | 45.06 | 32.37 | 45.60 | 26.38 | 35.75 | -1.14 | 42.57 | 44.48 | 44.52 | 7.82 | 25.89 | 11.90 | 29.98 | NA | 2.19 | 34.67 | 9.04 | -8.57 | 13.21 | 33.74 | 19.49 | 30.33 | 36.71 | 17.96 | 7.66 | NA | 6.58 | 34.32 | 15.32 | NA | 5.28 | 7.30 | 28.94 | NA | NA | NA | NA |
| 2023-12-30 | 2023-09-30 | 2023-07-01 | 2023-04-01 | 2022-12-31 | 2022-10-01 | 2022-07-02 | 2022-04-02 | 2022-01-01 | 2021-09-25 | 2021-06-26 | 2021-03-27 | 2020-12-26 | 2020-09-26 | 2020-06-27 | 2020-03-28 | 2019-12-28 | 2019-09-28 | 2019-06-29 | 2019-03-30 | 2018-12-29 | 2018-09-29 | 2018-06-30 | 2018-03-31 | 2017-12-30 | 2017-09-30 | 2017-07-01 | 2017-04-01 | 2016-12-31 | 2016-10-01 | 2016-07-02 | 2016-04-02 | 2016-01-02 | 2015-09-26 | 2015-06-27 | 2015-03-28 | 2014-12-27 | 2014-09-27 | 2014-06-28 | 2014-03-29 | 2013-12-28 | 2013-09-28 | 2013-06-29 | 2013-03-30 | 2012-12-31 | 2012-12-29 | 2012-09-29 | 2012-06-30 | 2012-03-31 | 2011-12-31 | 2011-10-01 | 2011-07-02 | 2011-04-02 | 2011-01-01 | 2010-10-02 | 2010-07-03 | ||
|---|---|---|---|---|---|---|---|---|---|---|---|---|---|---|---|---|---|---|---|---|---|---|---|---|---|---|---|---|---|---|---|---|---|---|---|---|---|---|---|---|---|---|---|---|---|---|---|---|---|---|---|---|---|---|---|---|---|
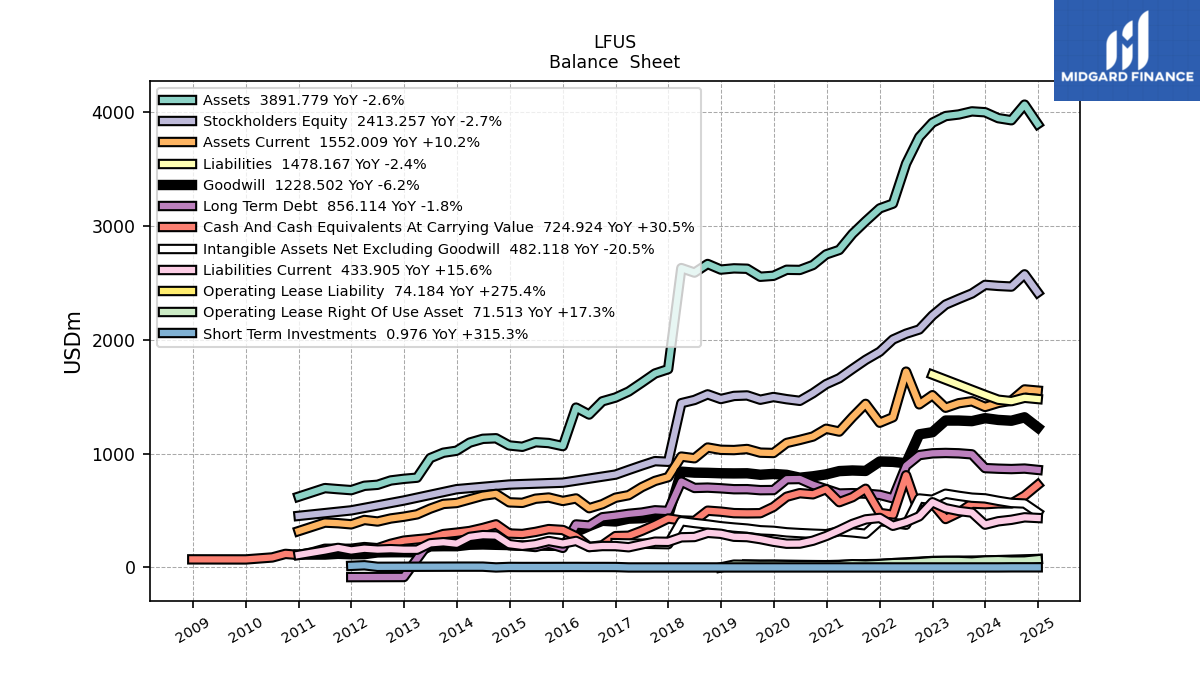
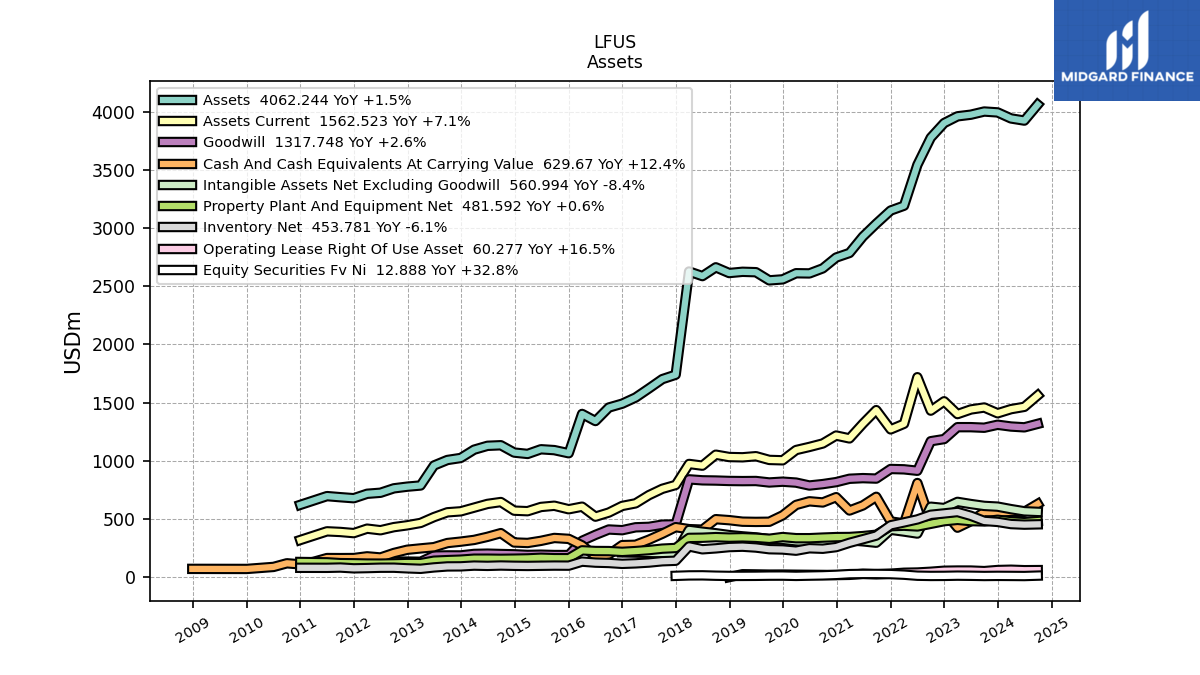
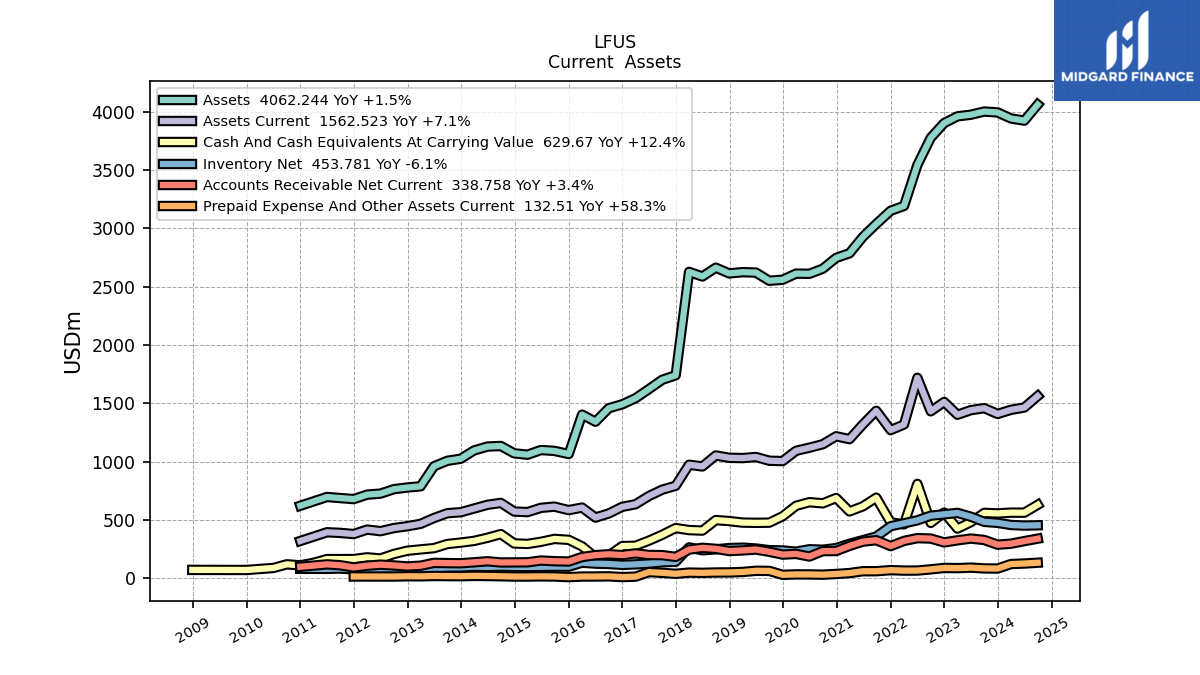
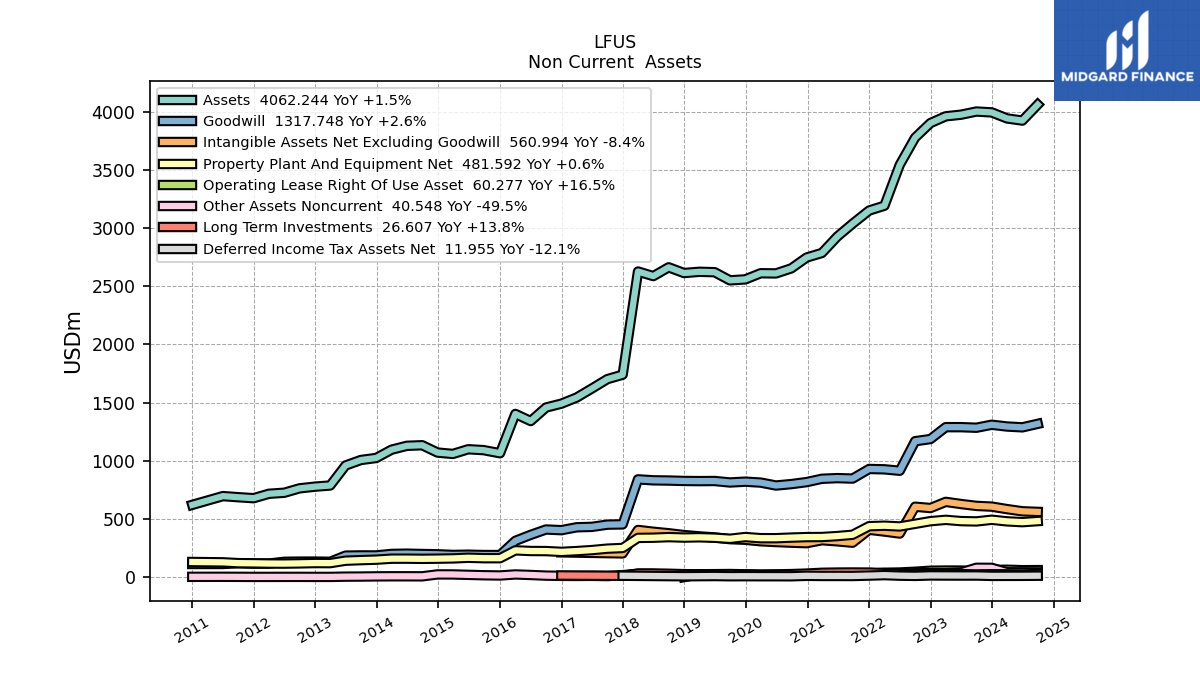
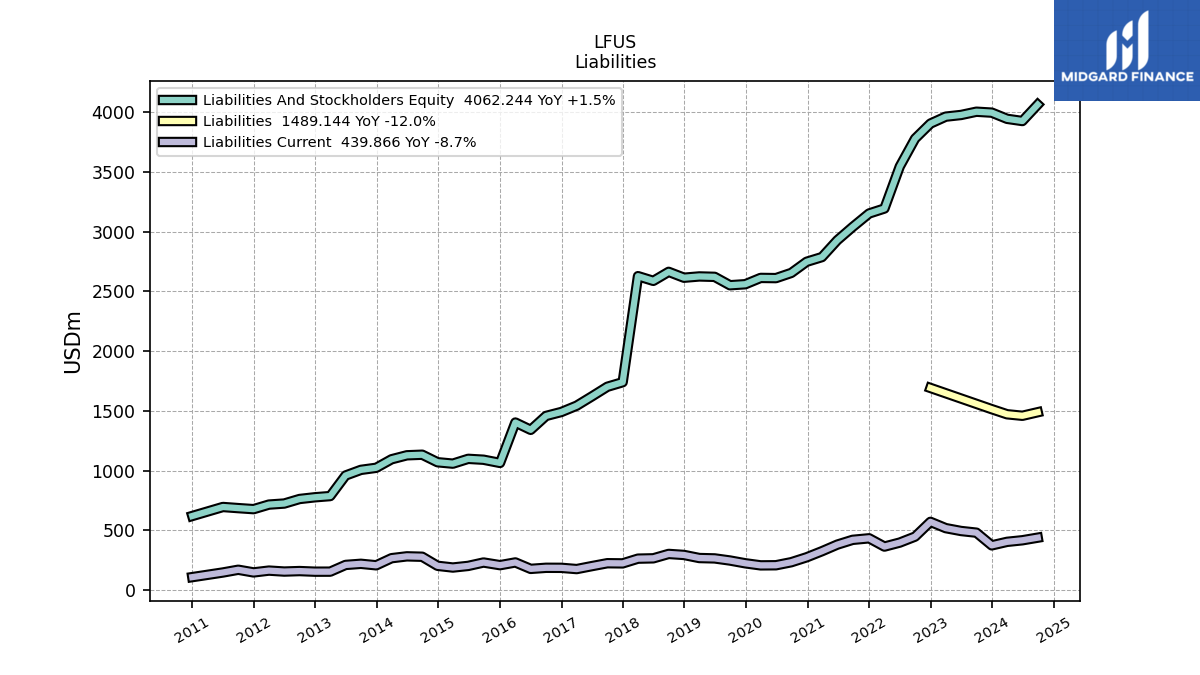
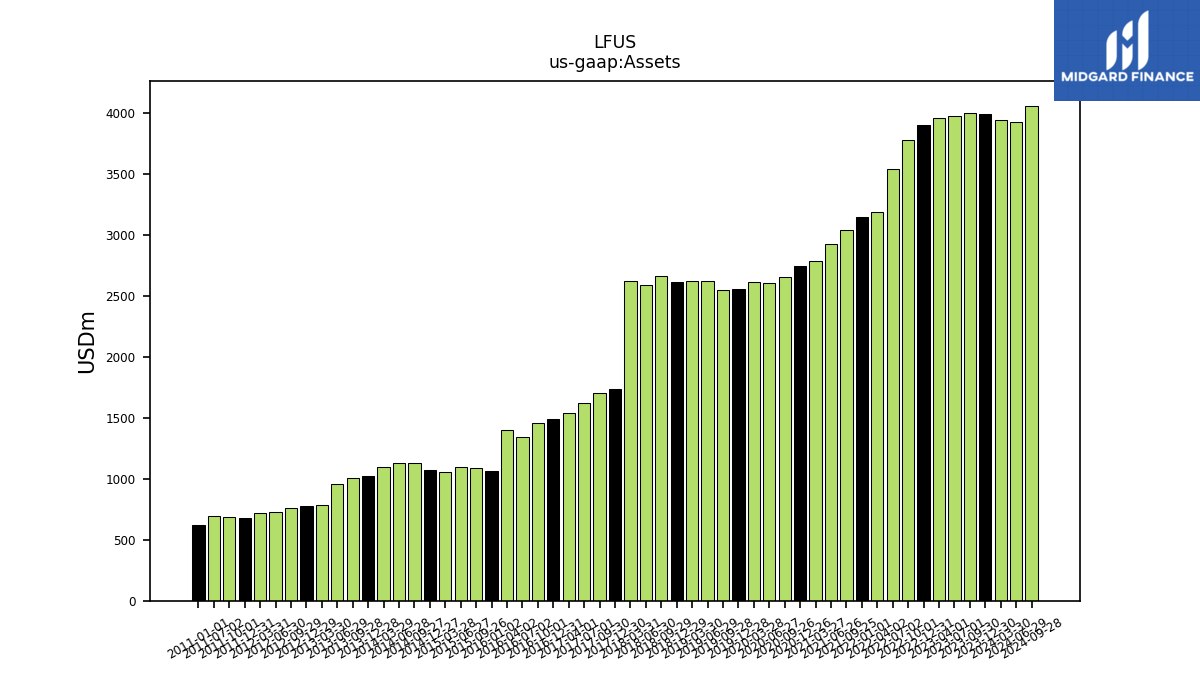
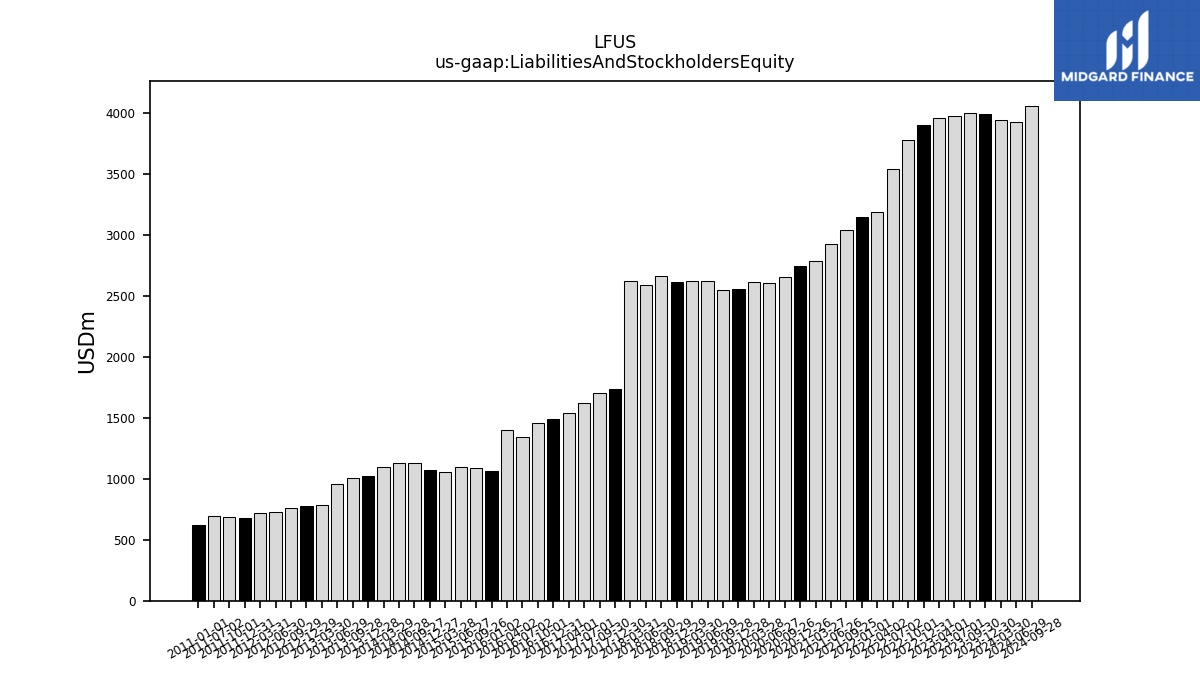
| Assets | 3995.28 | 4002.93 | 3975.71 | 3961.74 | 3903.73 | 3777.93 | 3544.47 | 3193.17 | 3151.70 | 3038.52 | 2927.50 | 2786.87 | 2747.59 | 2654.37 | 2611.06 | 2612.63 | 2559.90 | 2551.36 | 2621.59 | 2625.02 | 2614.31 | 2663.49 | 2587.99 | 2627.51 | 1740.10 | 1702.19 | 1622.19 | 1544.05 | 1491.19 | 1458.10 | 1341.80 | 1403.11 | 1064.98 | 1091.88 | 1099.29 | 1059.02 | 1070.83 | 1133.82 | 1128.90 | 1095.67 | 1024.37 | 1006.93 | 959.82 | 787.81 | NA | 777.73 | 763.35 | 725.37 | 716.58 | 678.42 | 687.06 | 696.49 | NA | 621.13 | NA | NA | |
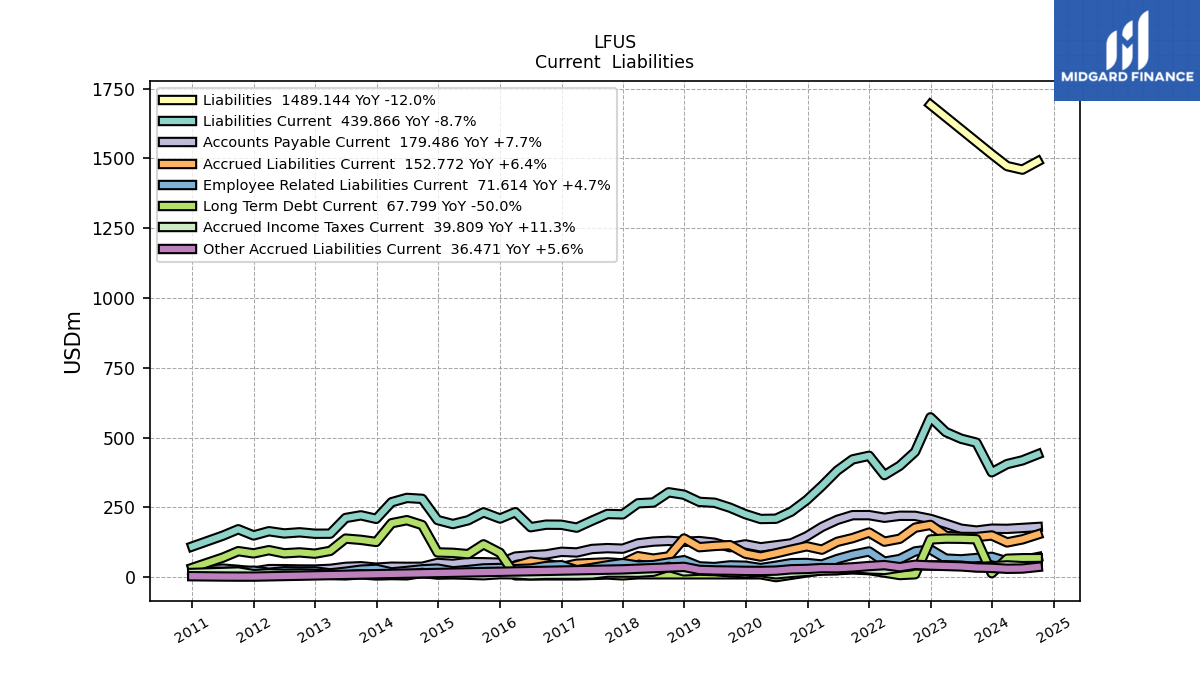
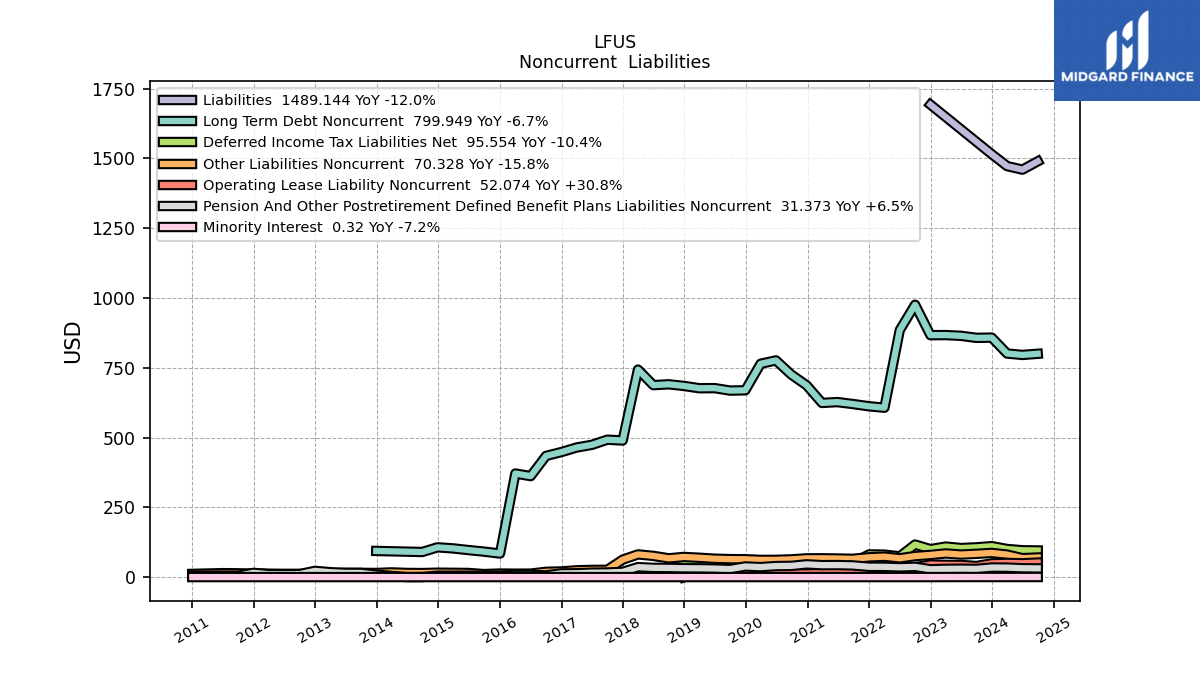
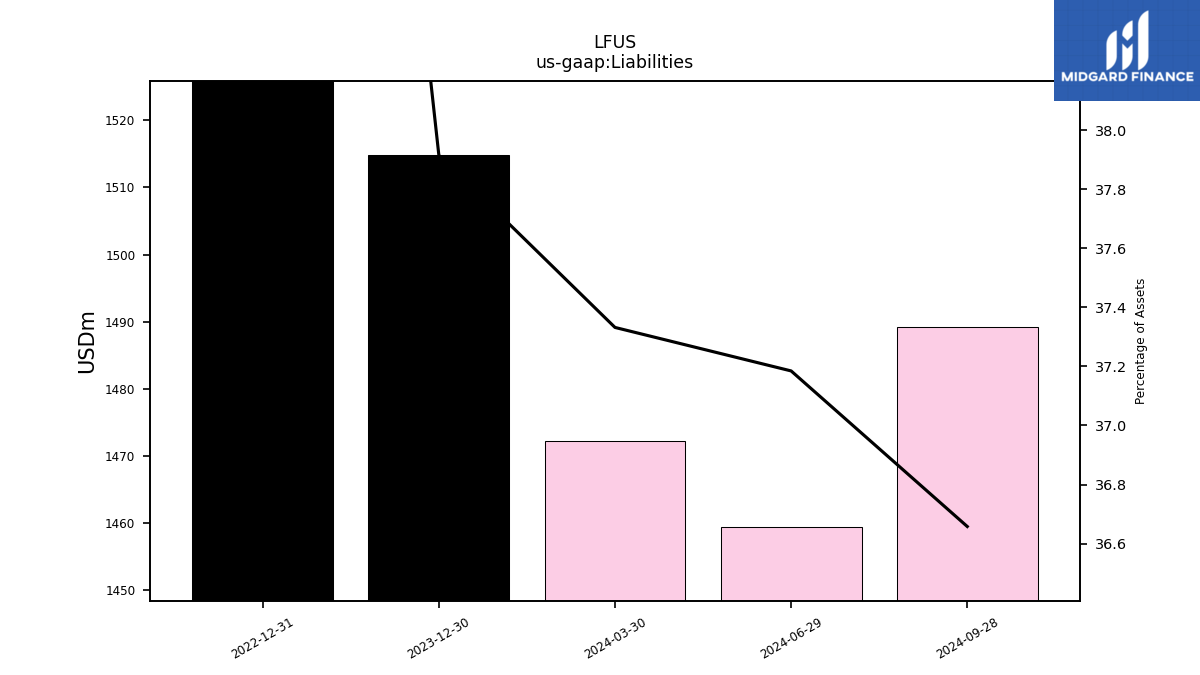
| Liabilities | 1514.79 | NA | NA | NA | 1692.36 | NA | NA | NA | NA | NA | NA | NA | NA | NA | NA | NA | NA | NA | NA | NA | NA | NA | NA | NA | NA | NA | NA | NA | NA | NA | NA | NA | NA | NA | NA | NA | NA | NA | NA | NA | NA | NA | NA | NA | NA | NA | NA | NA | NA | NA | NA | NA | NA | NA | NA | NA | |
| Liabilities And Stockholders Equity | 3995.28 | 4002.93 | 3975.71 | 3961.74 | 3903.73 | 3777.93 | 3544.47 | 3193.17 | 3151.70 | 3038.52 | 2927.50 | 2786.87 | 2747.59 | 2654.37 | 2611.06 | 2612.63 | 2559.90 | 2551.36 | 2621.59 | 2625.02 | 2614.31 | 2663.49 | 2587.99 | 2627.51 | 1740.10 | 1702.19 | 1622.19 | 1544.05 | 1491.19 | 1458.10 | 1341.80 | 1403.11 | 1064.98 | 1091.88 | 1099.29 | 1059.02 | 1070.83 | 1133.82 | 1128.90 | 1095.67 | 1024.37 | 1006.93 | 959.82 | 787.81 | NA | 777.73 | 763.35 | 725.37 | 716.58 | 678.42 | 687.06 | 696.49 | NA | 621.13 | NA | NA | |
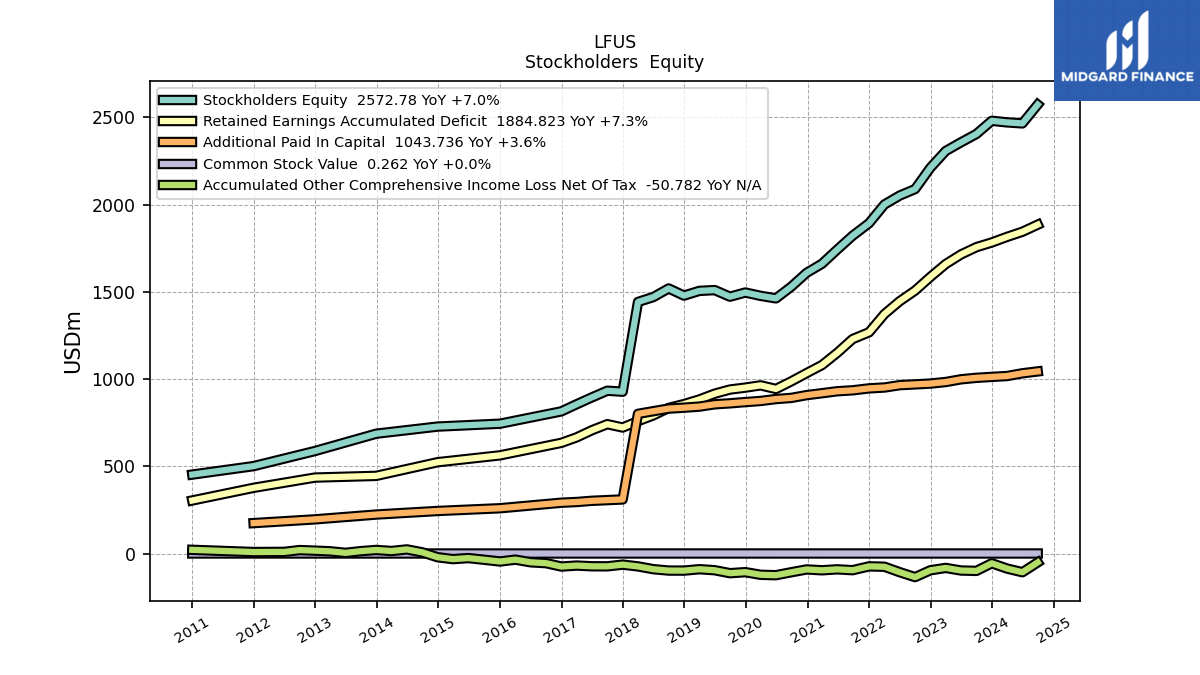
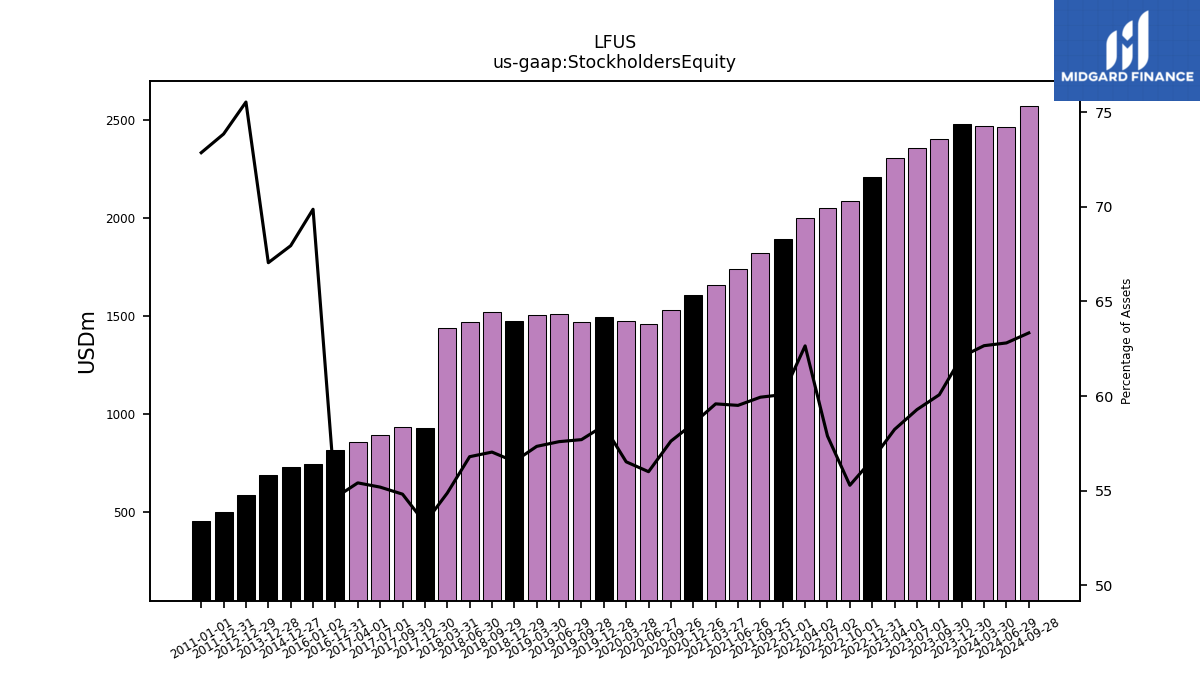
| Stockholders Equity | 2480.17 | 2404.51 | 2356.96 | 2307.23 | 2211.19 | 2088.72 | 2051.81 | 2000.52 | 1893.39 | 1821.27 | 1742.09 | 1660.61 | 1608.64 | 1529.43 | 1462.30 | 1476.82 | 1495.88 | 1472.08 | 1509.81 | 1505.26 | 1478.21 | 1519.27 | 1469.89 | 1441.84 | 927.42 | 933.11 | 895.29 | 855.62 | 814.79 | NA | NA | NA | 744.05 | NA | NA | NA | 727.52 | NA | NA | NA | 686.77 | NA | NA | NA | NA | 587.41 | NA | NA | NA | 500.96 | NA | NA | NA | 452.52 | NA | NA |
| 2023-12-30 | 2023-09-30 | 2023-07-01 | 2023-04-01 | 2022-12-31 | 2022-10-01 | 2022-07-02 | 2022-04-02 | 2022-01-01 | 2021-09-25 | 2021-06-26 | 2021-03-27 | 2020-12-26 | 2020-09-26 | 2020-06-27 | 2020-03-28 | 2019-12-28 | 2019-09-28 | 2019-06-29 | 2019-03-30 | 2018-12-29 | 2018-09-29 | 2018-06-30 | 2018-03-31 | 2017-12-30 | 2017-09-30 | 2017-07-01 | 2017-04-01 | 2016-12-31 | 2016-10-01 | 2016-07-02 | 2016-04-02 | 2016-01-02 | 2015-09-26 | 2015-06-27 | 2015-03-28 | 2014-12-27 | 2014-09-27 | 2014-06-28 | 2014-03-29 | 2013-12-28 | 2013-09-28 | 2013-06-29 | 2013-03-30 | 2012-12-31 | 2012-12-29 | 2012-09-29 | 2012-06-30 | 2012-03-31 | 2011-12-31 | 2011-10-01 | 2011-07-02 | 2011-04-02 | 2011-01-01 | 2010-10-02 | 2010-07-03 | ||
|---|---|---|---|---|---|---|---|---|---|---|---|---|---|---|---|---|---|---|---|---|---|---|---|---|---|---|---|---|---|---|---|---|---|---|---|---|---|---|---|---|---|---|---|---|---|---|---|---|---|---|---|---|---|---|---|---|---|
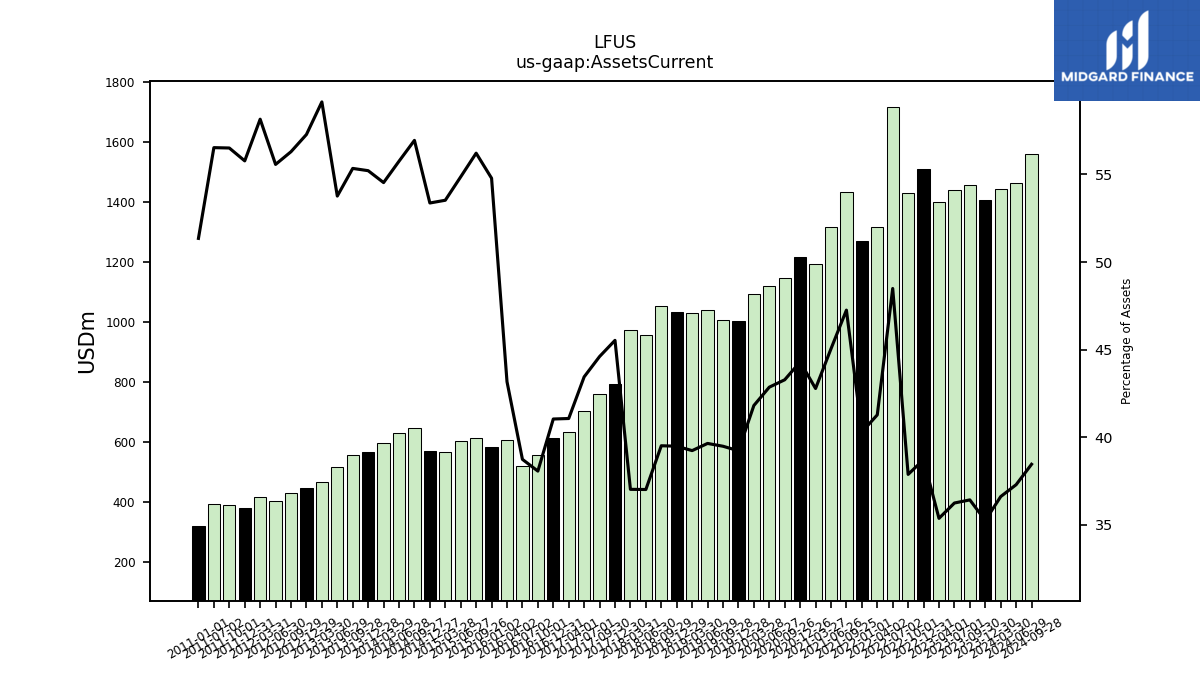
| Assets Current | 1408.60 | 1458.32 | 1441.35 | 1401.60 | 1511.80 | 1431.31 | 1718.83 | 1318.21 | 1270.21 | 1435.94 | 1318.92 | 1192.41 | 1217.31 | 1148.93 | 1119.16 | 1092.48 | 1004.39 | 1007.59 | 1039.55 | 1030.14 | 1032.52 | 1052.63 | 958.20 | 973.06 | 792.34 | 759.36 | 704.85 | 634.23 | 612.08 | 555.17 | 519.88 | 605.79 | 583.43 | 613.77 | 603.12 | 566.86 | 571.50 | 645.63 | 629.40 | 597.52 | 565.60 | 557.27 | 516.06 | 465.89 | NA | 445.46 | 429.74 | 403.10 | 416.70 | 378.38 | 388.24 | 393.71 | NA | 318.96 | NA | NA | |
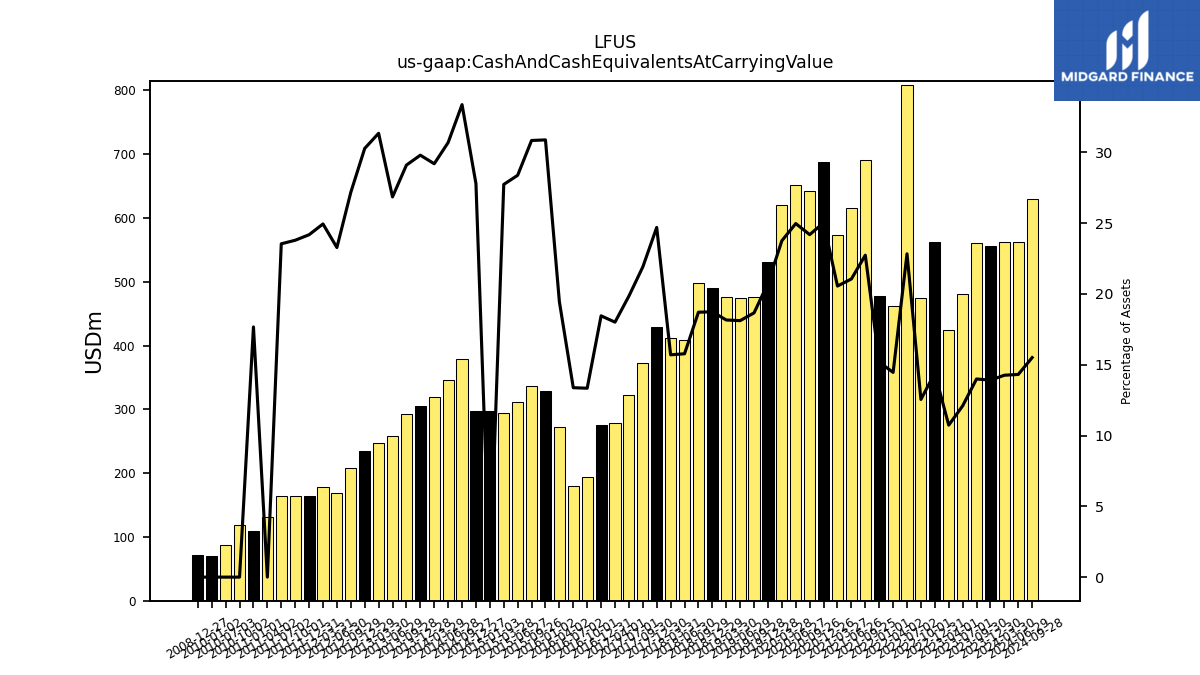
| Cash And Cash Equivalents At Carrying Value | 555.51 | 560.06 | 480.74 | 425.13 | 562.59 | 474.00 | 809.12 | 461.62 | 478.47 | 690.68 | 616.33 | 572.77 | 687.52 | 641.89 | 651.87 | 620.58 | 531.14 | 476.06 | 474.78 | 476.61 | 489.73 | 498.21 | 408.15 | 412.46 | 429.68 | 372.83 | 321.89 | 277.98 | 275.12 | 194.49 | 179.46 | 272.86 | 328.79 | 336.64 | 311.92 | 293.63 | 297.57 | 378.28 | 346.41 | 319.81 | 305.19 | 292.94 | 257.67 | 246.90 | NA | 235.40 | 207.40 | 168.82 | 178.69 | 164.02 | 163.42 | 163.92 | 131.53 | 109.72 | 118.93 | 87.68 | |
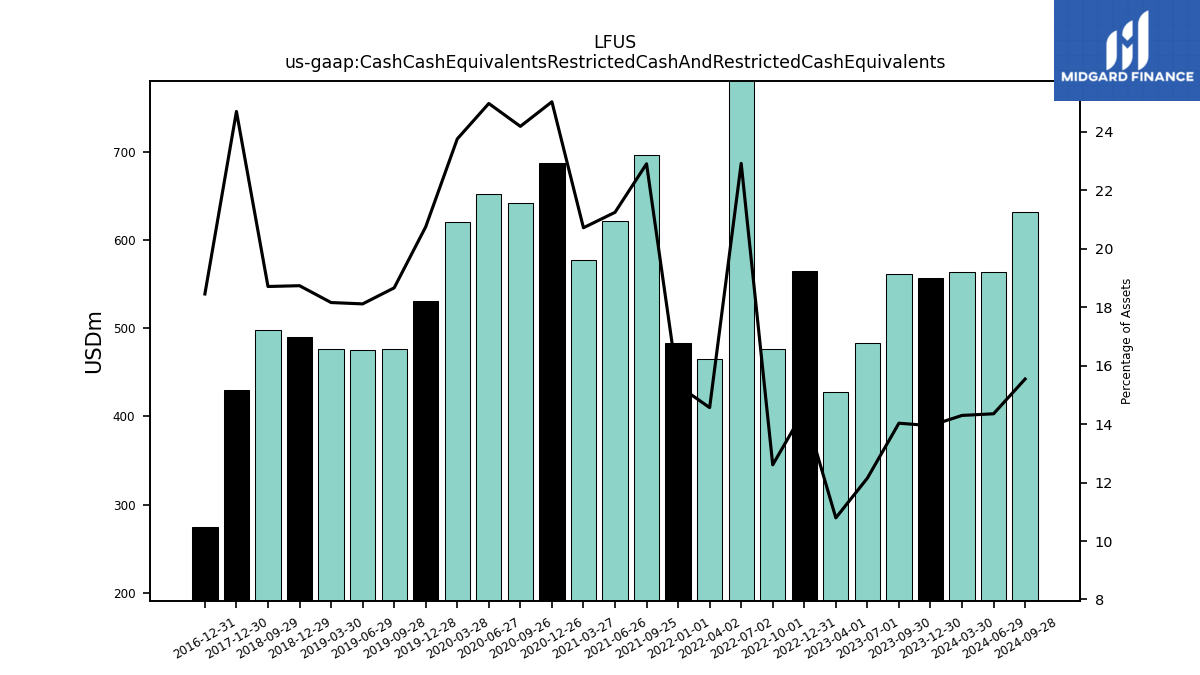
| Cash Cash Equivalents Restricted Cash And Restricted Cash Equivalents | 557.12 | 561.59 | 483.09 | 427.52 | 564.94 | 476.25 | 812.30 | 464.97 | 482.84 | 695.87 | 621.85 | 577.30 | 687.52 | 641.89 | 651.87 | 620.58 | 531.14 | 476.06 | 474.78 | 476.61 | 489.73 | 498.21 | NA | NA | 429.68 | NA | NA | NA | 275.12 | NA | NA | NA | NA | NA | NA | NA | NA | NA | NA | NA | NA | NA | NA | NA | NA | NA | NA | NA | NA | NA | NA | NA | NA | NA | NA | NA | |
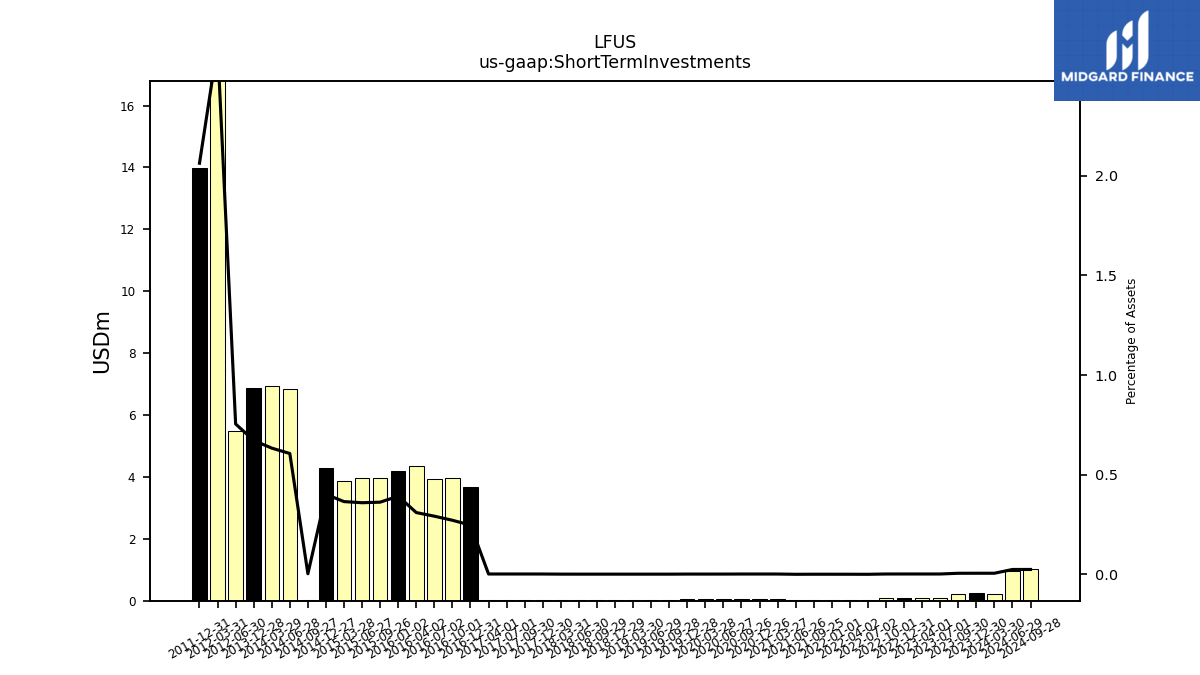
| Short Term Investments | 0.23 | 0.23 | 0.08 | 0.09 | 0.08 | 0.08 | 0.02 | 0.03 | 0.03 | 0.03 | 0.02 | 0.05 | 0.05 | 0.05 | 0.04 | 0.04 | 0.04 | 0.03 | 0.03 | 0.03 | 0.03 | 0.04 | 0.03 | 0.04 | 0.04 | 0.04 | 0.03 | 0.03 | 3.69 | 3.96 | 3.92 | 4.35 | 4.18 | 3.96 | 3.95 | 3.87 | 4.30 | 0.04 | 6.85 | 6.94 | 6.89 | NA | NA | NA | NA | NA | NA | 5.47 | 19.02 | 14.00 | NA | NA | NA | NA | NA | NA | |
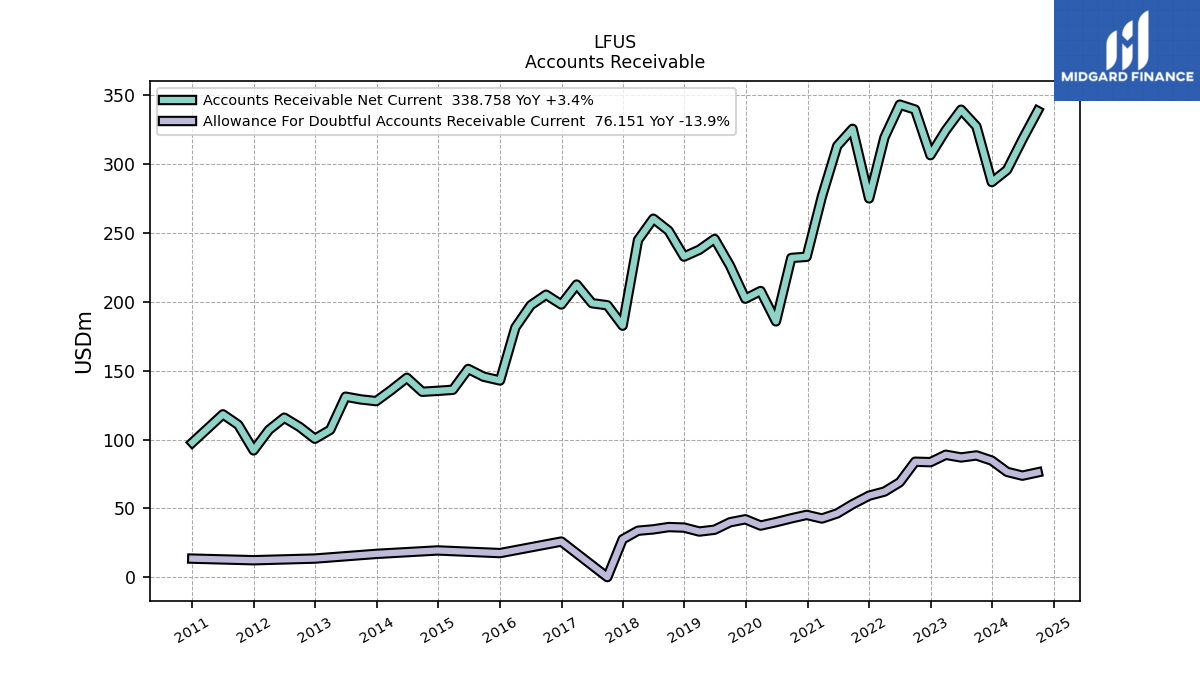
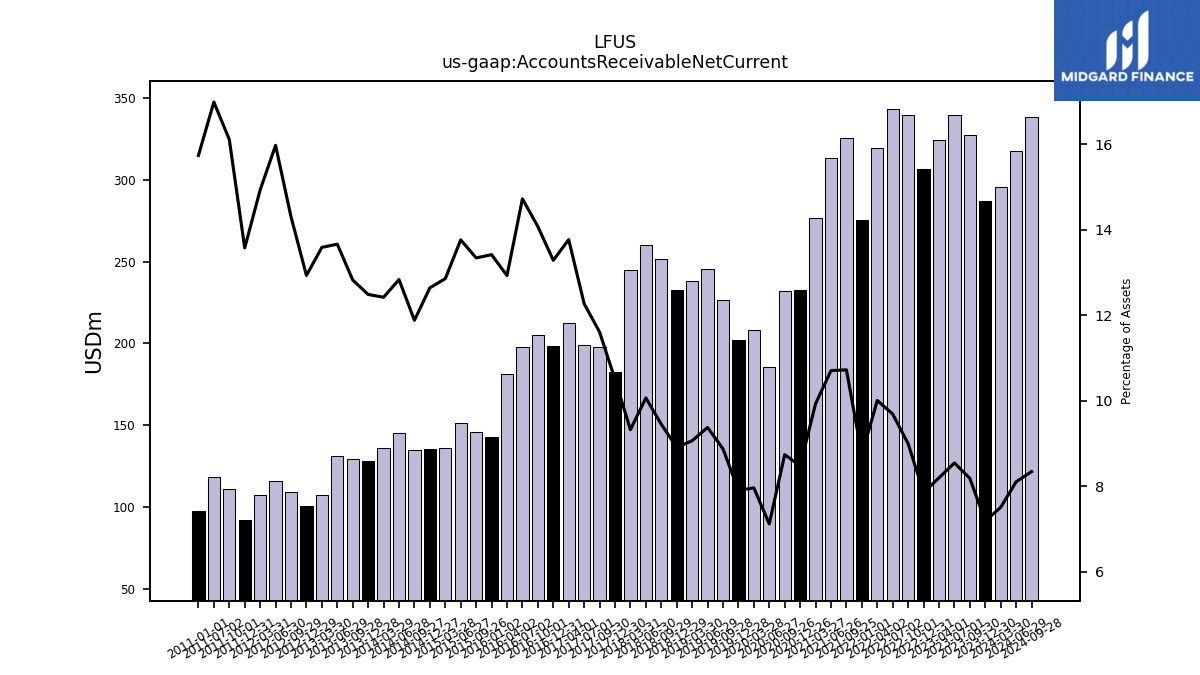
| Accounts Receivable Net Current | 287.02 | 327.50 | 339.64 | 324.58 | 306.58 | 339.73 | 343.32 | 319.46 | 275.19 | 325.74 | 313.33 | 276.69 | 232.76 | 231.93 | 185.81 | 207.91 | 202.31 | 226.35 | 245.72 | 237.88 | 232.89 | 251.64 | 260.44 | 244.91 | 182.70 | 197.54 | 199.03 | 212.59 | 198.09 | 205.21 | 197.54 | 181.38 | 142.88 | 145.66 | 151.28 | 136.13 | 135.36 | 134.71 | 144.87 | 136.08 | 127.89 | 129.12 | 131.12 | 107.04 | NA | 100.56 | 109.18 | 115.87 | 106.98 | 92.09 | 110.69 | 118.31 | NA | 97.75 | NA | NA | |
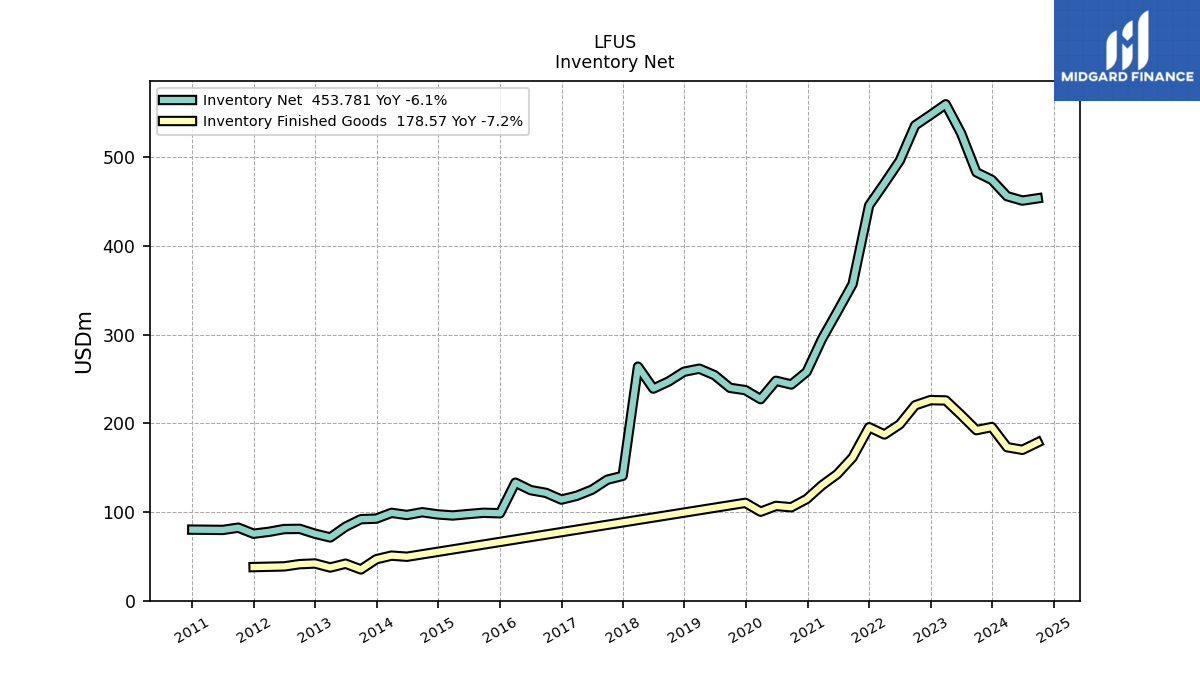
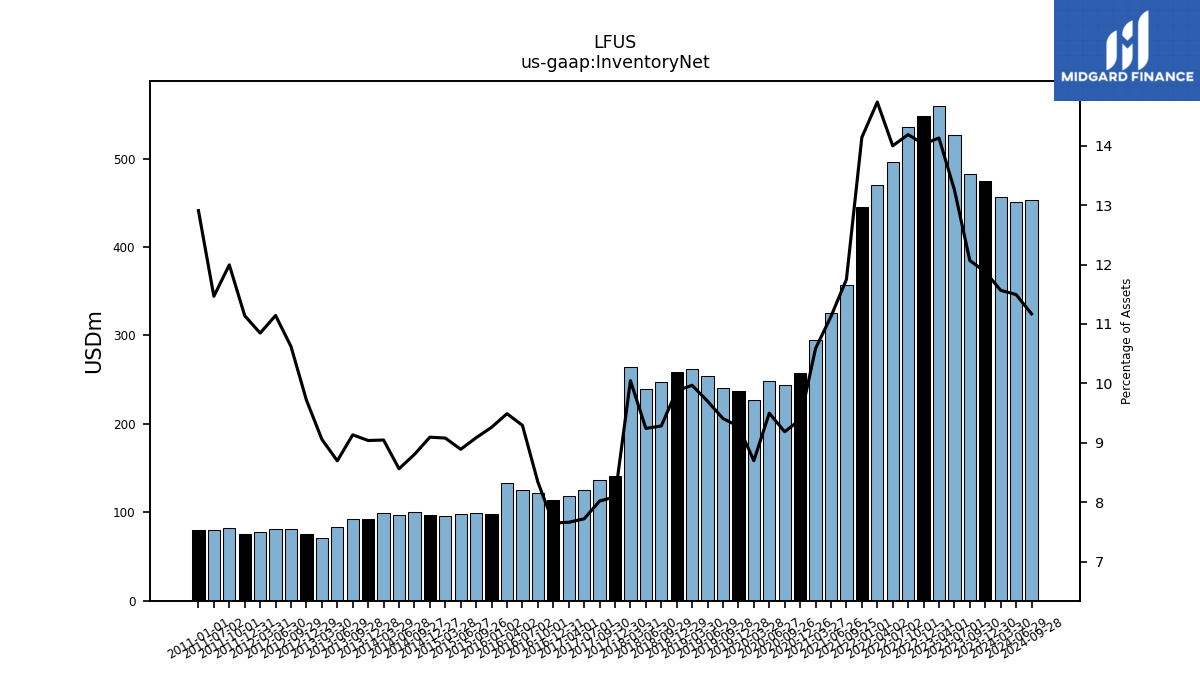
| Inventory Net | 474.61 | 483.07 | 527.15 | 559.83 | 547.69 | 536.03 | 496.21 | 470.55 | 445.67 | 357.02 | 325.77 | 295.06 | 258.00 | 243.83 | 248.02 | 227.28 | 237.51 | 240.06 | 254.31 | 261.66 | 258.23 | 247.25 | 239.20 | 263.97 | 140.79 | 136.50 | 125.24 | 118.31 | 114.06 | 121.62 | 124.70 | 133.16 | 98.63 | 99.20 | 97.73 | 96.16 | 97.39 | 99.82 | 96.67 | 99.12 | 92.59 | 91.98 | 83.47 | 71.37 | NA | 75.58 | 81.07 | 80.83 | 77.73 | 75.58 | 82.41 | 79.86 | NA | 80.18 | NA | NA | |
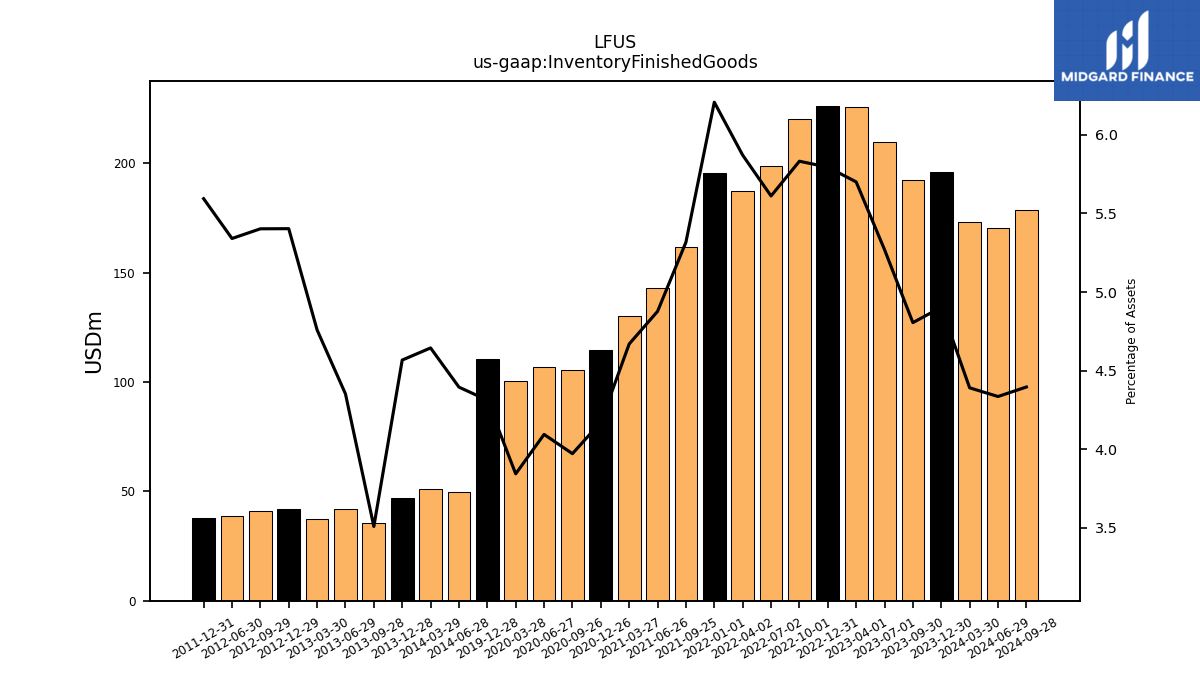
| Inventory Finished Goods | 195.89 | 192.37 | 209.52 | 225.86 | 226.22 | 220.34 | 198.89 | 187.48 | 195.66 | 161.57 | 142.78 | 130.14 | 114.64 | 105.42 | 106.90 | 100.42 | 110.39 | NA | NA | NA | NA | NA | NA | NA | NA | NA | NA | NA | NA | NA | NA | NA | NA | NA | NA | NA | NA | NA | 49.62 | 50.89 | 46.79 | 35.33 | 41.77 | 37.49 | NA | 42.02 | 41.24 | 38.74 | NA | 37.95 | NA | NA | NA | NA | NA | NA | |
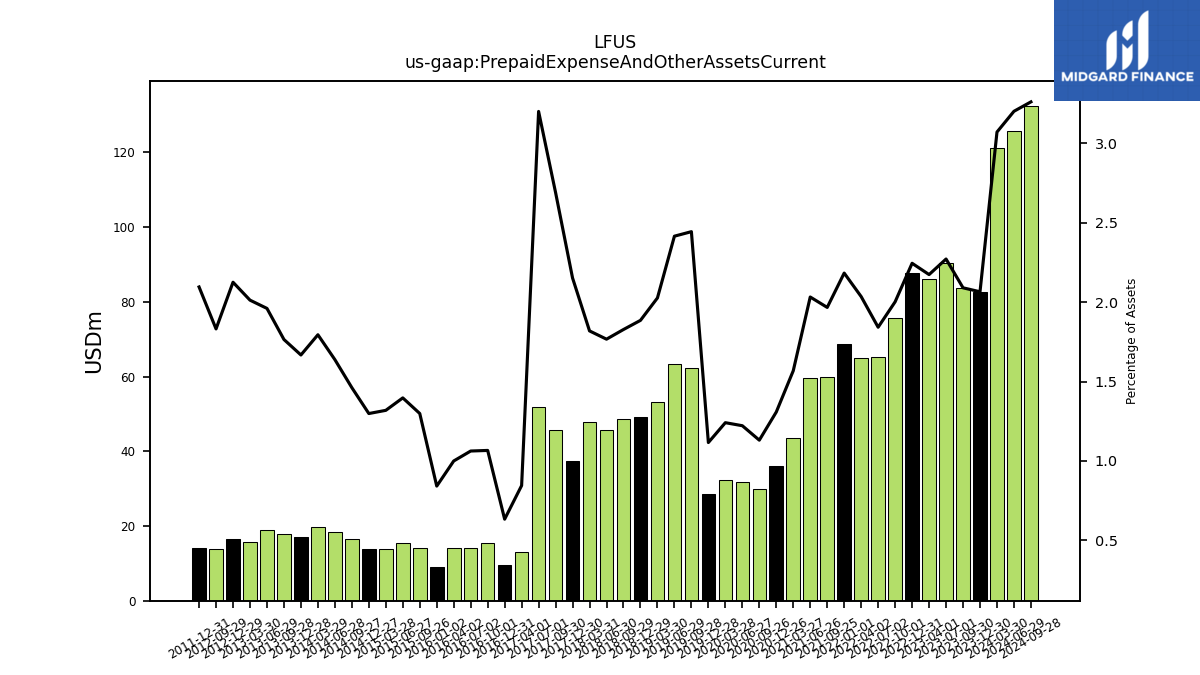
| Prepaid Expense And Other Assets Current | 82.53 | 83.68 | 90.32 | 86.12 | 87.64 | 75.64 | 65.29 | 64.99 | 68.81 | 59.77 | 59.50 | 43.70 | 35.94 | 30.01 | 31.90 | 32.42 | 28.56 | 62.36 | 63.33 | 53.20 | 49.29 | 48.68 | 45.73 | 47.79 | 37.45 | 45.80 | 51.94 | 13.04 | 9.44 | 15.54 | 14.25 | 14.02 | 8.96 | 14.18 | 15.36 | 13.96 | 13.90 | 16.57 | 18.49 | 19.66 | 17.08 | 17.77 | 18.82 | 15.86 | NA | 16.53 | 13.98 | NA | NA | 14.22 | NA | NA | NA | NA | NA | NA | |
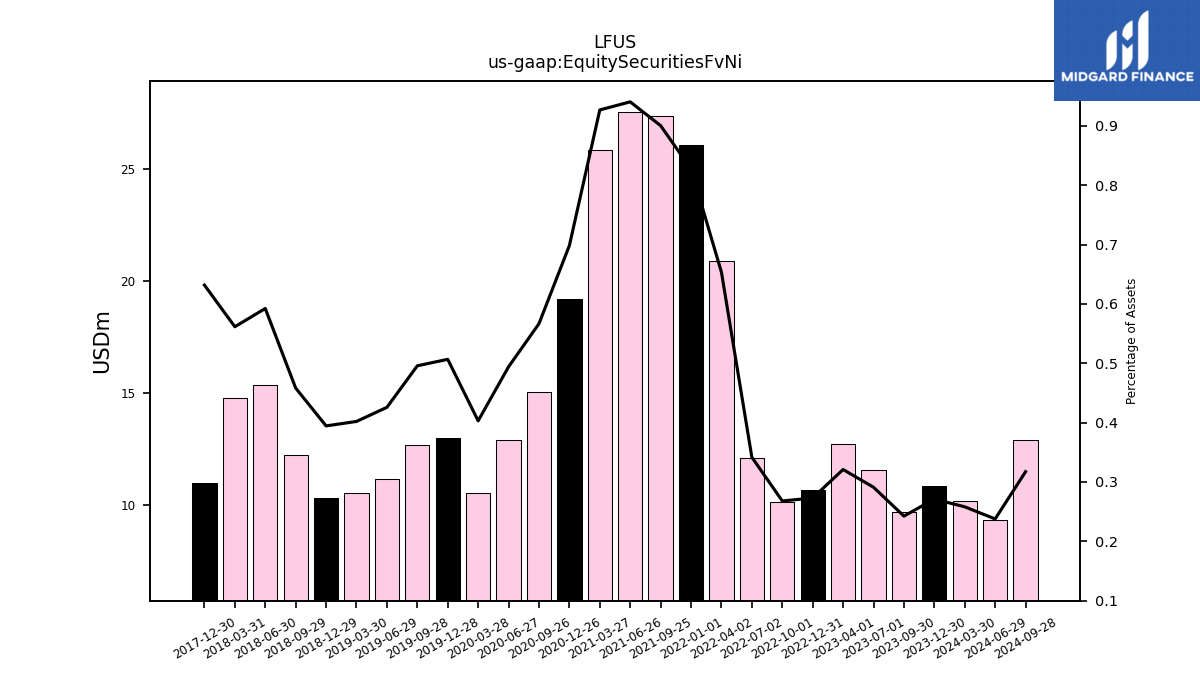
| Equity Securities Fv Ni | 10.83 | 9.70 | 11.57 | 12.71 | 10.65 | 10.12 | 12.11 | 20.86 | 26.07 | 27.36 | 27.53 | 25.83 | 19.19 | 15.04 | 12.90 | 10.53 | 12.97 | 12.65 | 11.16 | 10.55 | 10.31 | 12.20 | 15.33 | 14.75 | 10.99 | NA | NA | NA | NA | NA | NA | NA | NA | NA | NA | NA | NA | NA | NA | NA | NA | NA | NA | NA | NA | NA | NA | NA | NA | NA | NA | NA | NA | NA | NA | NA |
| 2023-12-30 | 2023-09-30 | 2023-07-01 | 2023-04-01 | 2022-12-31 | 2022-10-01 | 2022-07-02 | 2022-04-02 | 2022-01-01 | 2021-09-25 | 2021-06-26 | 2021-03-27 | 2020-12-26 | 2020-09-26 | 2020-06-27 | 2020-03-28 | 2019-12-28 | 2019-09-28 | 2019-06-29 | 2019-03-30 | 2018-12-29 | 2018-09-29 | 2018-06-30 | 2018-03-31 | 2017-12-30 | 2017-09-30 | 2017-07-01 | 2017-04-01 | 2016-12-31 | 2016-10-01 | 2016-07-02 | 2016-04-02 | 2016-01-02 | 2015-09-26 | 2015-06-27 | 2015-03-28 | 2014-12-27 | 2014-09-27 | 2014-06-28 | 2014-03-29 | 2013-12-28 | 2013-09-28 | 2013-06-29 | 2013-03-30 | 2012-12-31 | 2012-12-29 | 2012-09-29 | 2012-06-30 | 2012-03-31 | 2011-12-31 | 2011-10-01 | 2011-07-02 | 2011-04-02 | 2011-01-01 | 2010-10-02 | 2010-07-03 | ||
|---|---|---|---|---|---|---|---|---|---|---|---|---|---|---|---|---|---|---|---|---|---|---|---|---|---|---|---|---|---|---|---|---|---|---|---|---|---|---|---|---|---|---|---|---|---|---|---|---|---|---|---|---|---|---|---|---|---|
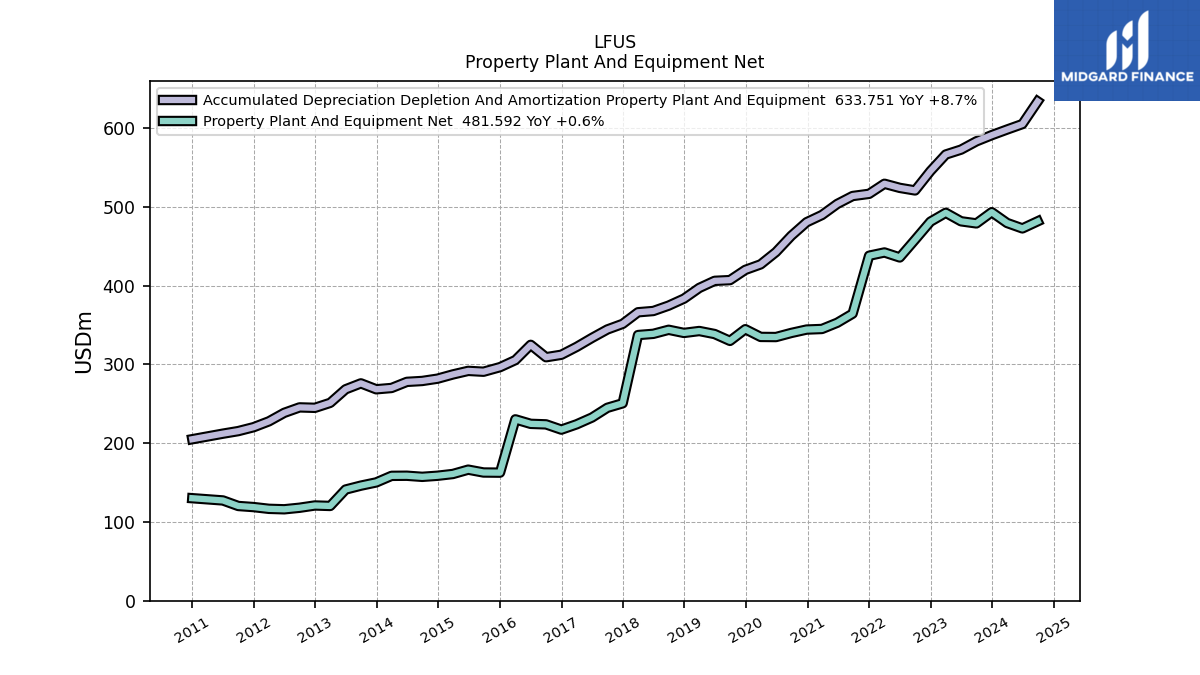
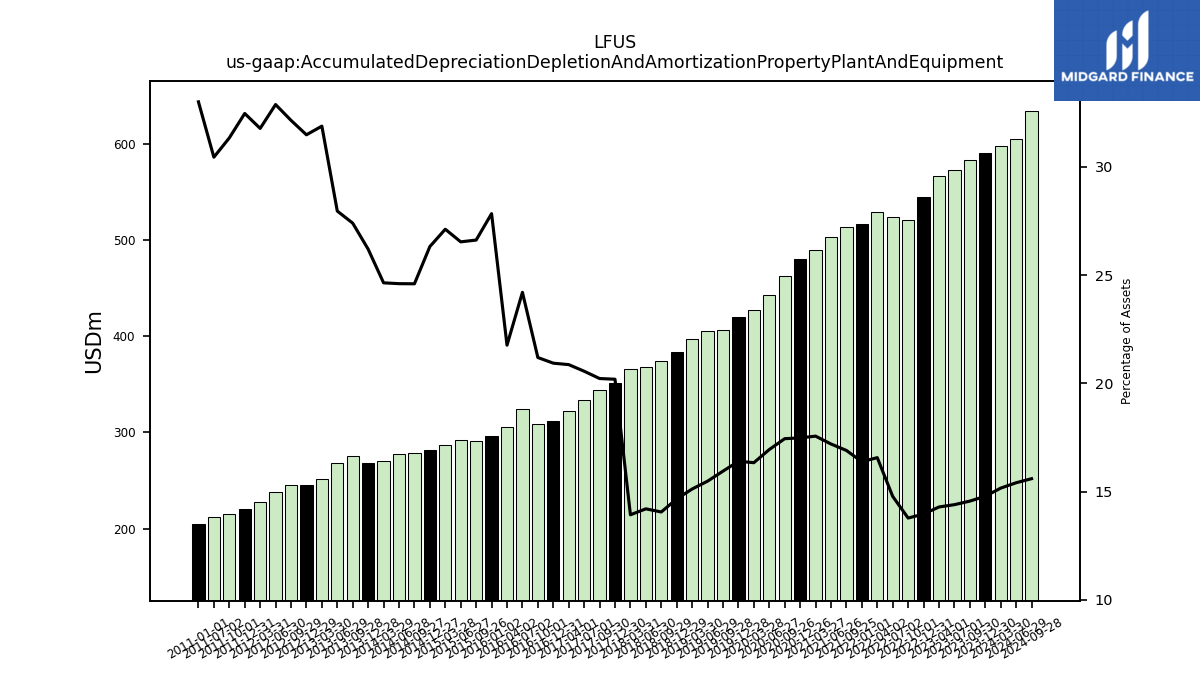
| Accumulated Depreciation Depletion And Amortization Property Plant And Equipment | 590.88 | 583.06 | 572.57 | 566.33 | 545.25 | 520.73 | 523.99 | 529.23 | 516.44 | 513.66 | 503.61 | 489.55 | 480.39 | 463.16 | 442.49 | 426.92 | 419.92 | 406.93 | 406.00 | 397.03 | 383.42 | 374.57 | 367.73 | 366.12 | 351.41 | 344.29 | 333.59 | 322.21 | 312.19 | 309.06 | 324.80 | 305.41 | 296.48 | 290.66 | 291.74 | 287.21 | 281.85 | 278.93 | 277.79 | 270.03 | 268.38 | 275.91 | 268.36 | 251.16 | NA | 244.84 | 245.41 | 238.49 | 227.70 | 220.25 | 215.31 | 212.06 | NA | 205.00 | NA | NA | |
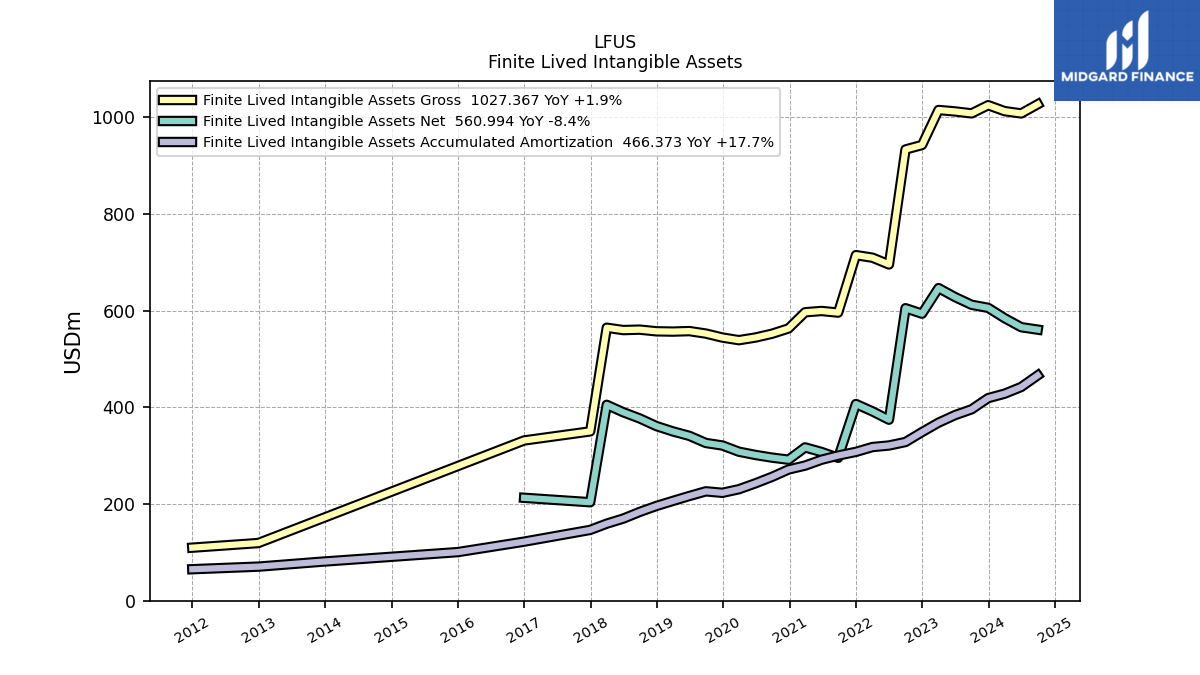
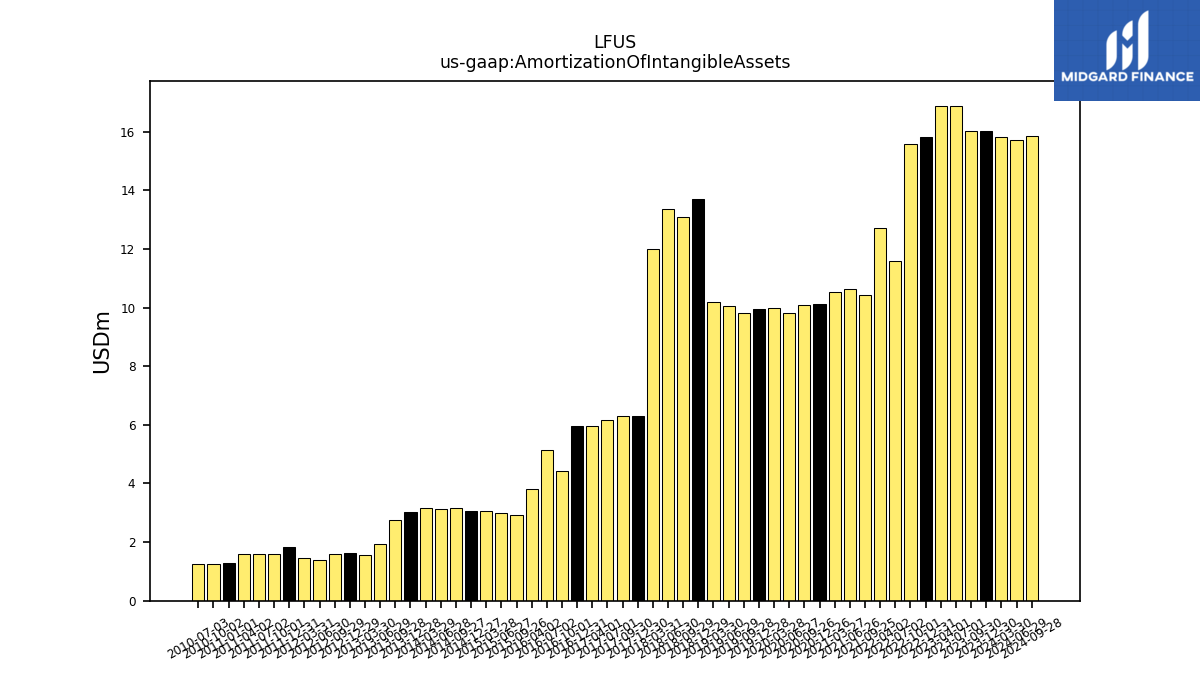
| Amortization Of Intangible Assets | 16.02 | 16.02 | 16.89 | 16.87 | 15.81 | 15.57 | 11.59 | 12.72 | NA | 10.45 | 10.64 | 10.52 | 10.13 | 10.10 | 9.83 | 9.98 | 9.96 | 9.83 | 10.05 | 10.20 | 13.70 | 13.10 | 13.37 | 12.00 | 6.29 | 6.29 | 6.17 | 5.94 | 5.95 | 4.43 | 5.16 | 3.80 | NA | 2.92 | 2.98 | 3.05 | 3.05 | 3.15 | 3.14 | 3.16 | 3.03 | 2.75 | 1.93 | 1.57 | NA | 1.63 | 1.60 | 1.39 | 1.47 | 1.83 | 1.58 | 1.60 | 1.59 | 1.27 | 1.25 | 1.26 | |
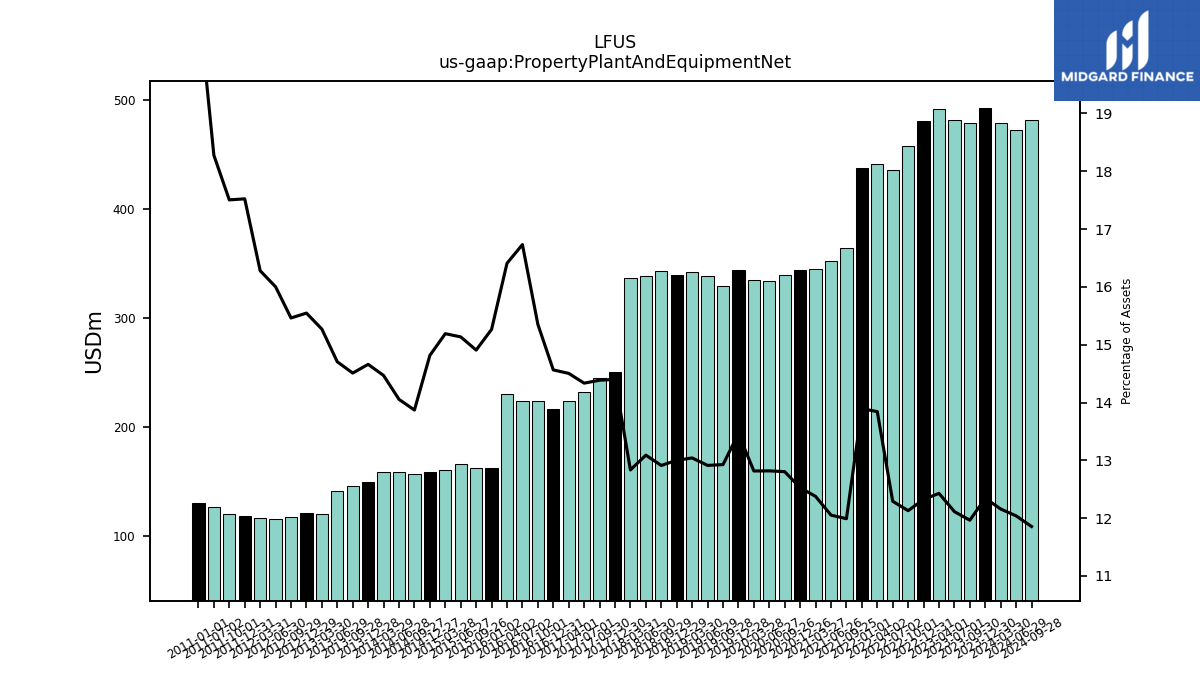
| Property Plant And Equipment Net | 493.15 | 478.91 | 481.57 | 492.37 | 481.11 | 458.23 | 435.68 | 442.02 | 437.89 | 364.33 | 352.83 | 344.91 | 344.18 | 339.87 | 334.68 | 334.83 | 344.62 | 329.79 | 338.50 | 342.33 | 339.89 | 343.88 | 338.75 | 337.20 | 250.58 | 244.87 | 232.54 | 223.94 | 217.18 | 223.85 | 224.51 | 230.23 | 162.57 | 162.76 | 166.38 | 160.87 | 158.64 | 157.26 | 158.66 | 158.52 | 150.17 | 146.10 | 141.13 | 120.30 | NA | 120.91 | 118.03 | 116.07 | 116.66 | 118.88 | 120.27 | 127.30 | NA | 130.15 | NA | NA | |
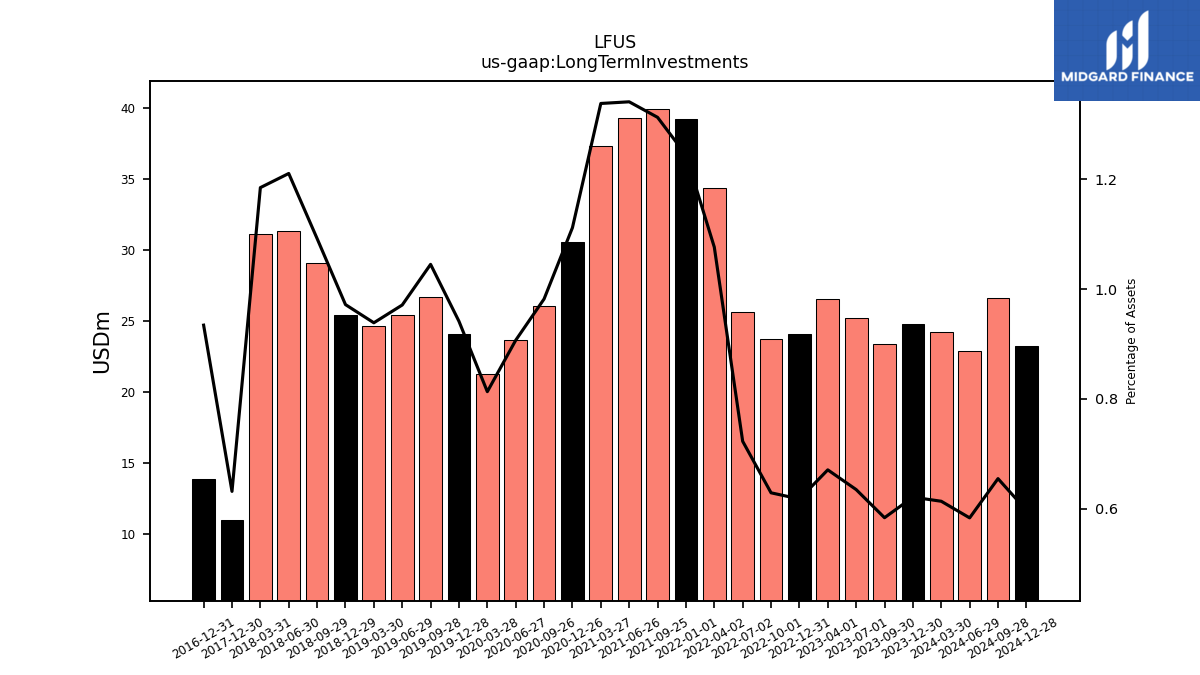
| Long Term Investments | 24.82 | 23.37 | 25.25 | 26.58 | 24.12 | 23.77 | 25.63 | 34.37 | 39.21 | 39.88 | 39.26 | 37.28 | 30.55 | 26.07 | 23.68 | 21.25 | 24.10 | 26.66 | 25.46 | 24.64 | 25.41 | 29.08 | 31.33 | 31.13 | 10.99 | NA | NA | NA | 13.93 | NA | NA | NA | NA | NA | NA | NA | NA | NA | NA | NA | NA | NA | NA | NA | NA | NA | NA | NA | NA | NA | NA | NA | NA | NA | NA | NA | |
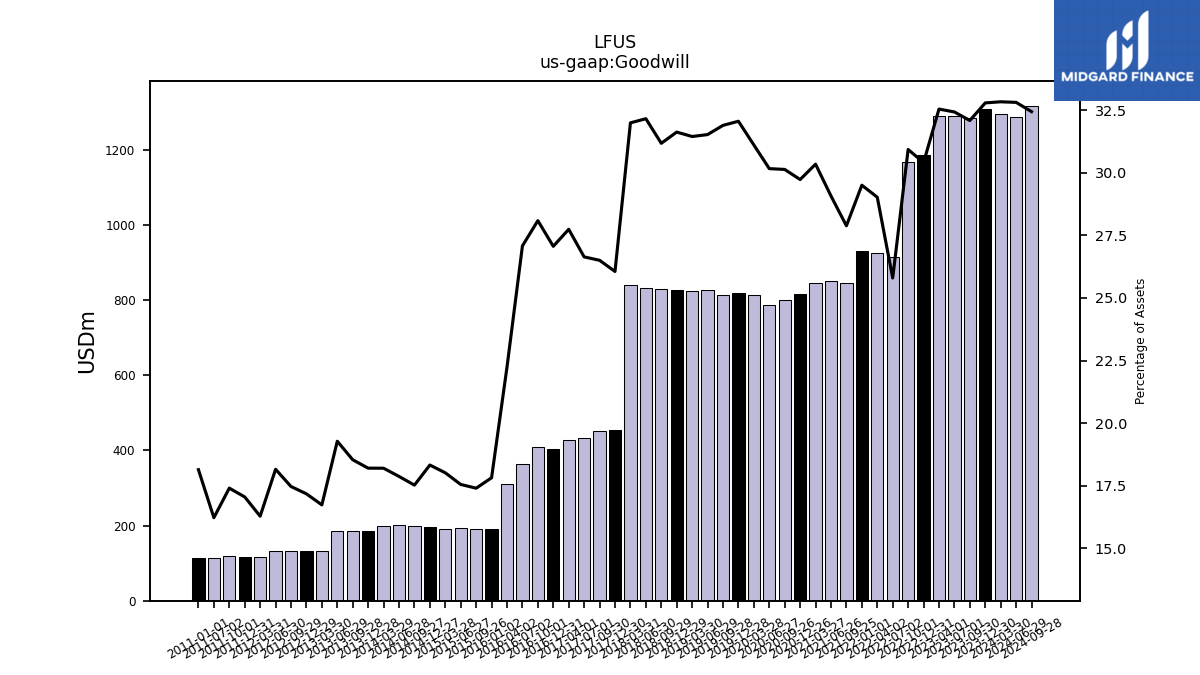
| Goodwill | 1310.00 | 1284.34 | 1289.19 | 1289.23 | 1186.92 | 1168.46 | 914.36 | 926.73 | 929.79 | 847.21 | 851.07 | 845.59 | 816.81 | 799.79 | 787.60 | 812.76 | 820.59 | 813.65 | 826.41 | 825.47 | 826.72 | 830.35 | 832.23 | 840.57 | 453.41 | 451.13 | 432.13 | 428.34 | 403.54 | 409.53 | 363.34 | 312.06 | 189.77 | 190.02 | 192.95 | 190.80 | 196.26 | 198.70 | 201.77 | 199.41 | 186.46 | 186.67 | 185.03 | 131.85 | NA | 133.59 | 133.36 | 131.71 | 116.69 | 115.70 | 119.58 | 113.00 | NA | 112.69 | NA | NA | |
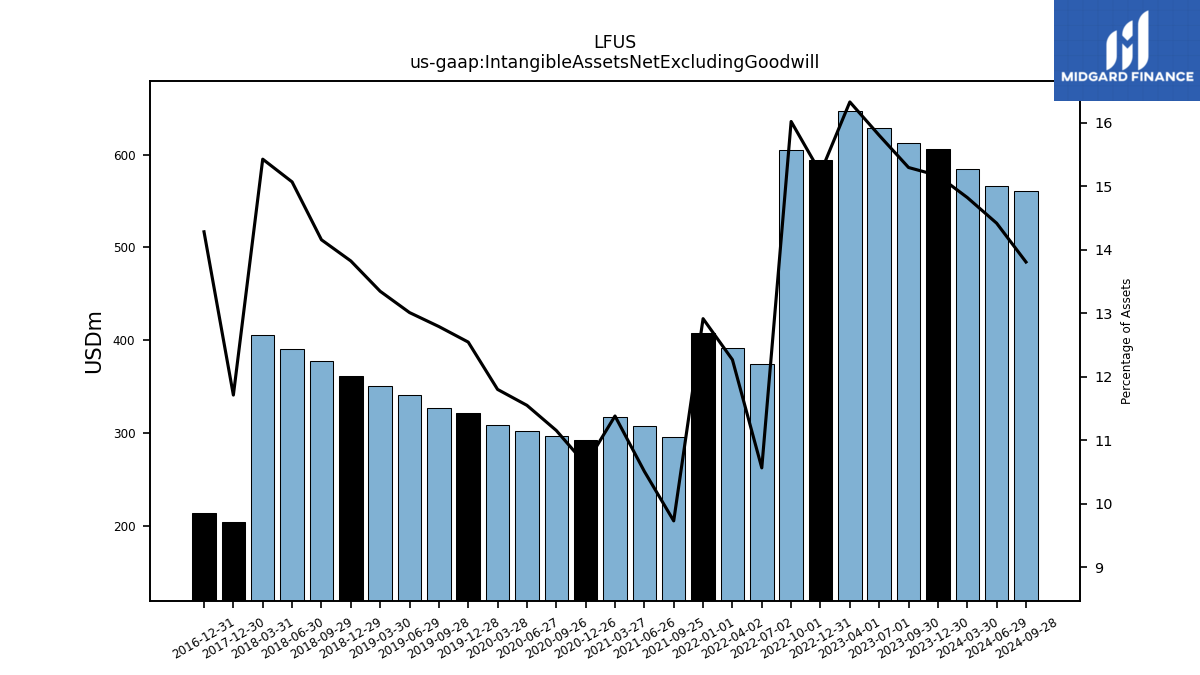
| Intangible Assets Net Excluding Goodwill | 606.14 | 612.37 | 628.33 | 646.96 | 593.97 | 605.31 | 374.59 | 391.86 | 407.13 | 295.77 | 307.77 | 317.29 | 291.89 | 296.16 | 301.66 | 308.39 | 321.25 | 326.42 | 341.17 | 350.42 | 361.47 | 377.15 | 390.05 | 405.41 | 203.85 | NA | NA | NA | 213.03 | NA | NA | NA | NA | NA | NA | NA | NA | NA | NA | NA | NA | NA | NA | NA | NA | NA | NA | NA | NA | NA | NA | NA | NA | NA | NA | NA | |
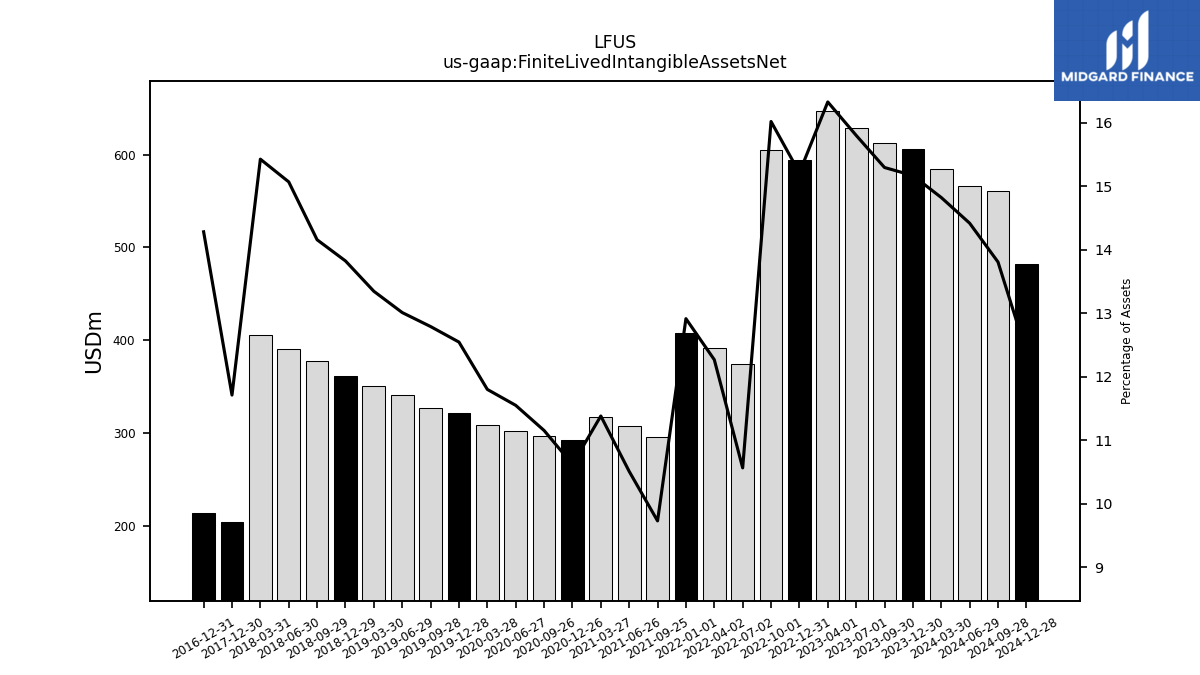
| Finite Lived Intangible Assets Net | 606.14 | 612.37 | 628.33 | 646.96 | 593.97 | 605.31 | 374.59 | 391.86 | 407.13 | 295.77 | 307.77 | 317.29 | 291.89 | 296.16 | 301.66 | 308.39 | 321.25 | 326.42 | 341.17 | 350.42 | 361.47 | 377.15 | 390.05 | 405.41 | 203.85 | NA | NA | NA | 213.03 | NA | NA | NA | NA | NA | NA | NA | NA | NA | NA | NA | NA | NA | NA | NA | NA | NA | NA | NA | NA | NA | NA | NA | NA | NA | NA | NA | |
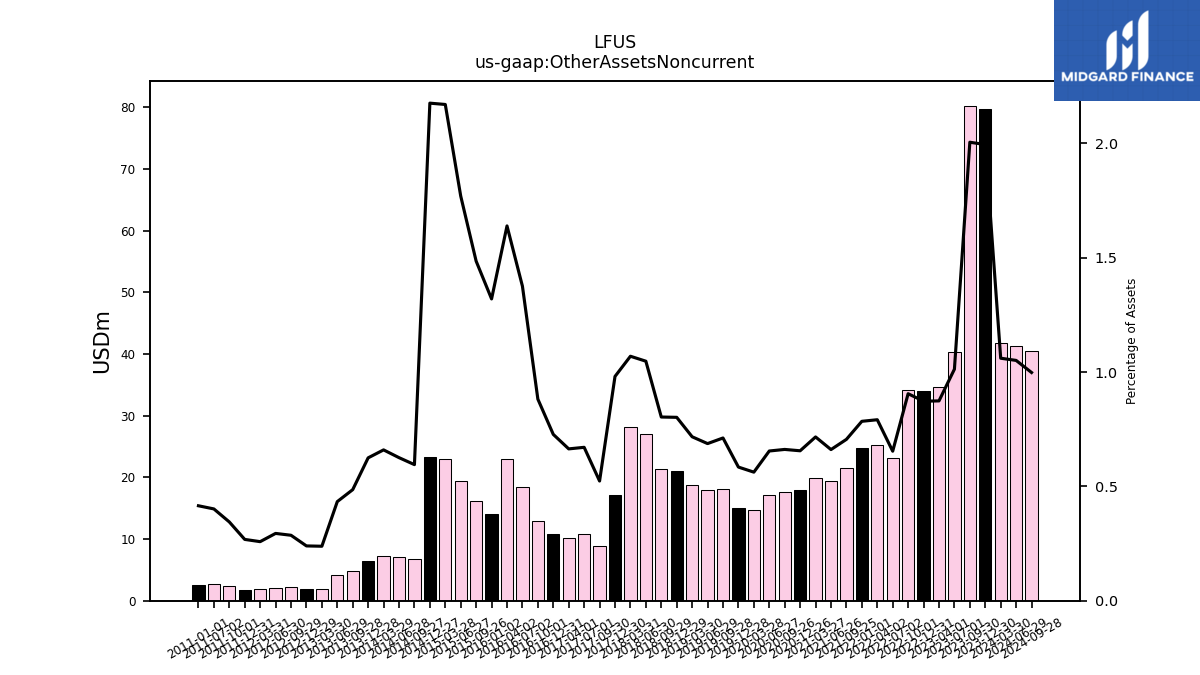
| Other Assets Noncurrent | 79.71 | 80.27 | 40.26 | 34.63 | 34.07 | 34.21 | 23.18 | 25.28 | 24.73 | 21.45 | 19.36 | 19.96 | 18.02 | 17.57 | 17.10 | 14.69 | 14.96 | 18.16 | 18.02 | 18.82 | 20.97 | 21.40 | 27.11 | 28.10 | 17.07 | 8.91 | 10.88 | 10.26 | 10.85 | 12.86 | 18.46 | 23.00 | 14.06 | 16.22 | 19.46 | 22.98 | 23.30 | 6.75 | 7.07 | 7.23 | 6.40 | 4.89 | 4.16 | 1.88 | NA | 1.86 | 2.19 | 2.14 | 1.85 | 1.82 | 2.37 | 2.80 | NA | 2.58 | NA | NA | |
| Equity Securities Fv Ni | 10.83 | 9.70 | 11.57 | 12.71 | 10.65 | 10.12 | 12.11 | 20.86 | 26.07 | 27.36 | 27.53 | 25.83 | 19.19 | 15.04 | 12.90 | 10.53 | 12.97 | 12.65 | 11.16 | 10.55 | 10.31 | 12.20 | 15.33 | 14.75 | 10.99 | NA | NA | NA | NA | NA | NA | NA | NA | NA | NA | NA | NA | NA | NA | NA | NA | NA | NA | NA | NA | NA | NA | NA | NA | NA | NA | NA | NA | NA | NA | NA |
| 2023-12-30 | 2023-09-30 | 2023-07-01 | 2023-04-01 | 2022-12-31 | 2022-10-01 | 2022-07-02 | 2022-04-02 | 2022-01-01 | 2021-09-25 | 2021-06-26 | 2021-03-27 | 2020-12-26 | 2020-09-26 | 2020-06-27 | 2020-03-28 | 2019-12-28 | 2019-09-28 | 2019-06-29 | 2019-03-30 | 2018-12-29 | 2018-09-29 | 2018-06-30 | 2018-03-31 | 2017-12-30 | 2017-09-30 | 2017-07-01 | 2017-04-01 | 2016-12-31 | 2016-10-01 | 2016-07-02 | 2016-04-02 | 2016-01-02 | 2015-09-26 | 2015-06-27 | 2015-03-28 | 2014-12-27 | 2014-09-27 | 2014-06-28 | 2014-03-29 | 2013-12-28 | 2013-09-28 | 2013-06-29 | 2013-03-30 | 2012-12-31 | 2012-12-29 | 2012-09-29 | 2012-06-30 | 2012-03-31 | 2011-12-31 | 2011-10-01 | 2011-07-02 | 2011-04-02 | 2011-01-01 | 2010-10-02 | 2010-07-03 | ||
|---|---|---|---|---|---|---|---|---|---|---|---|---|---|---|---|---|---|---|---|---|---|---|---|---|---|---|---|---|---|---|---|---|---|---|---|---|---|---|---|---|---|---|---|---|---|---|---|---|---|---|---|---|---|---|---|---|---|
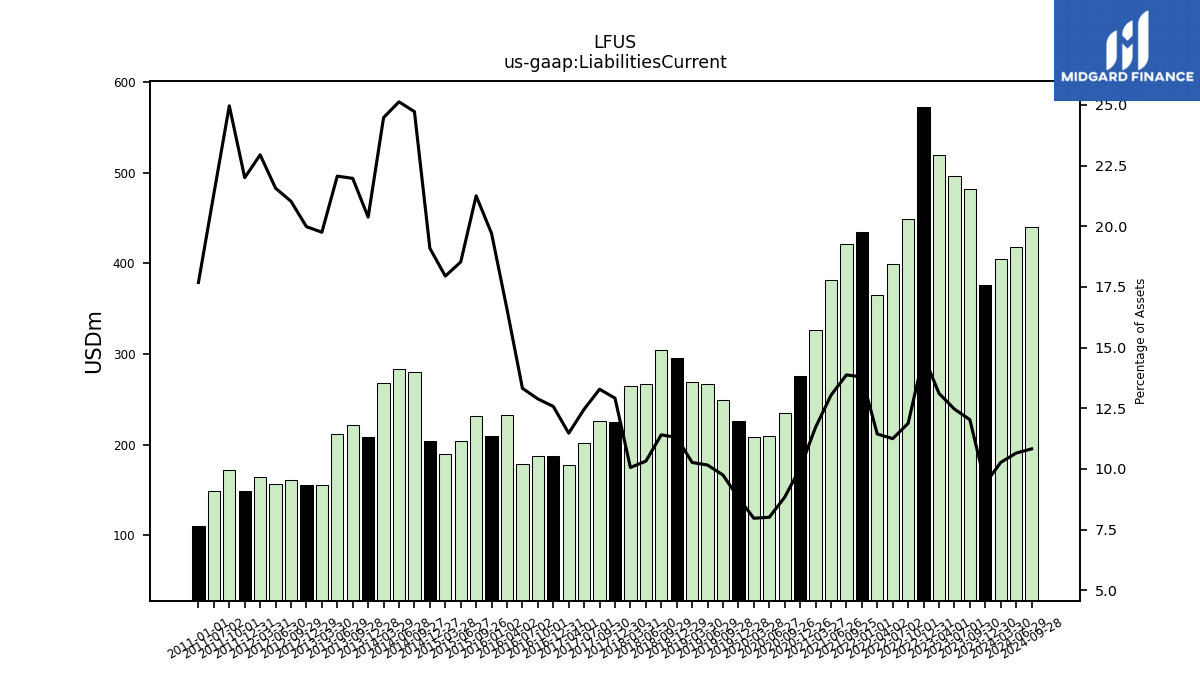
| Liabilities Current | 375.49 | 481.65 | 495.68 | 519.64 | 572.29 | 448.81 | 398.77 | 365.34 | 434.63 | 421.64 | 381.69 | 326.55 | 275.65 | 234.61 | 209.16 | 208.22 | 225.56 | 248.75 | 266.41 | 269.55 | 295.27 | 303.89 | 267.16 | 264.38 | 224.79 | 226.16 | 202.19 | 177.17 | 187.54 | 187.90 | 178.79 | 232.68 | 209.83 | 232.09 | 203.69 | 190.07 | 204.47 | 280.31 | 283.67 | 268.20 | 208.74 | 221.26 | 211.80 | 155.63 | NA | 155.42 | 160.52 | 156.45 | 164.41 | 149.28 | 171.51 | 148.63 | NA | 109.85 | NA | NA | |
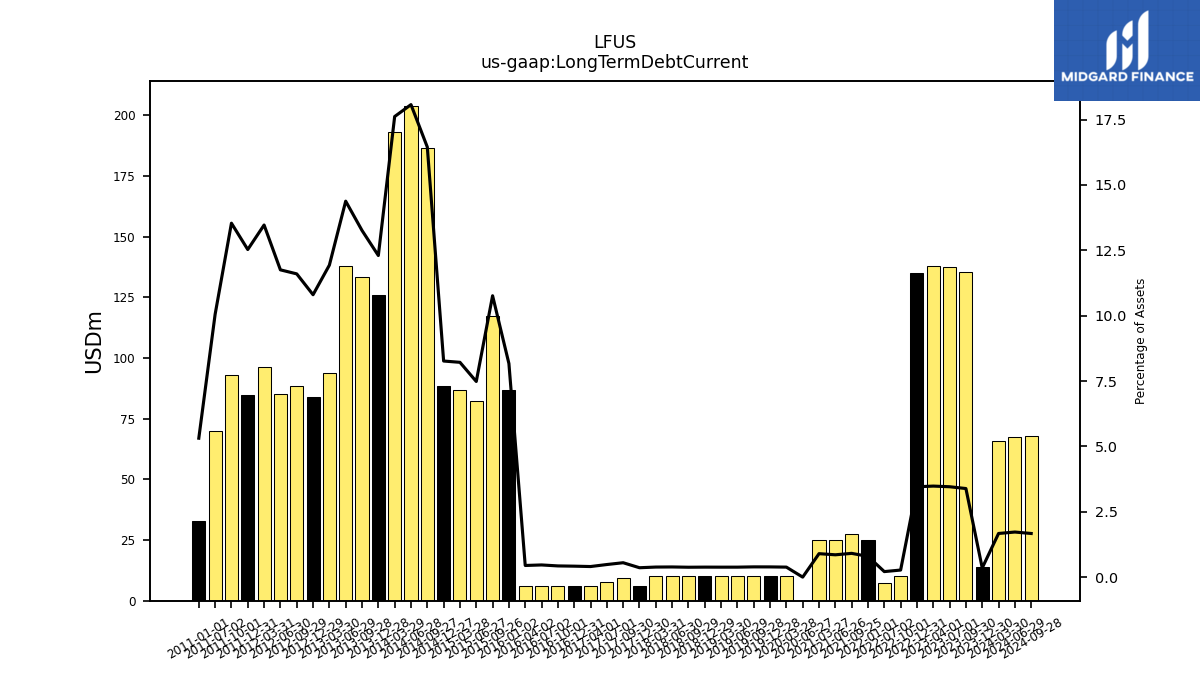
| Long Term Debt Current | 14.02 | 135.62 | 137.44 | 137.93 | 134.87 | 10.22 | 7.50 | NA | 25.00 | 27.62 | 25.00 | 25.00 | NA | NA | 0.00 | 10.00 | 10.00 | 10.00 | 10.00 | 10.00 | 10.00 | 10.08 | 10.06 | 10.11 | 6.25 | 9.38 | 7.81 | 6.25 | 6.25 | 6.25 | 6.25 | 6.25 | 87.00 | 117.50 | 82.25 | 87.00 | 88.50 | 186.50 | 204.00 | 193.00 | 126.00 | 133.50 | 138.00 | 94.00 | NA | 84.00 | 88.53 | 85.24 | 96.50 | 85.00 | 93.00 | 70.00 | NA | 33.00 | NA | NA | |
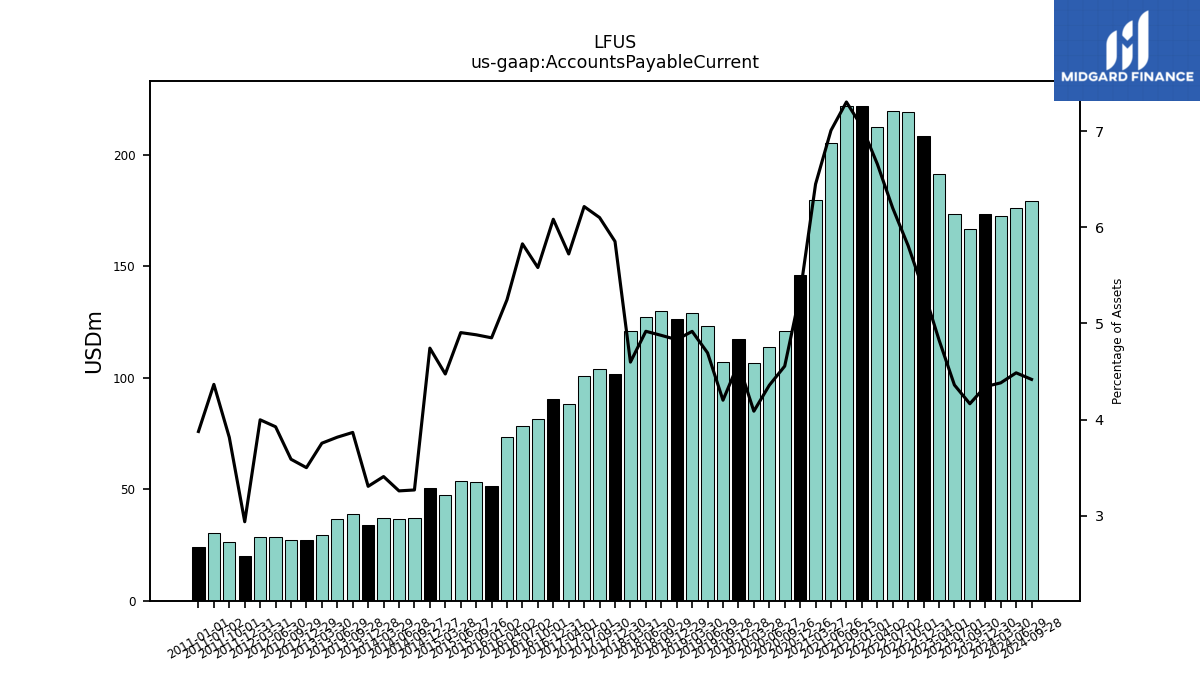
| Accounts Payable Current | 173.53 | 166.72 | 173.35 | 191.35 | 208.57 | 219.45 | 219.76 | 212.64 | 222.04 | 221.89 | 205.14 | 179.72 | 145.98 | 120.94 | 113.77 | 106.80 | 117.32 | 107.21 | 123.06 | 129.09 | 126.32 | 129.87 | 127.29 | 120.82 | 101.84 | 103.85 | 100.83 | 88.36 | 90.71 | 81.38 | 78.20 | 73.62 | 51.66 | 53.31 | 53.92 | 47.38 | 50.79 | 37.06 | 36.79 | 37.34 | 33.87 | 38.94 | 36.64 | 29.58 | NA | 27.23 | 27.39 | 28.48 | 28.65 | 19.93 | 26.21 | 30.41 | NA | 24.08 | NA | NA | |
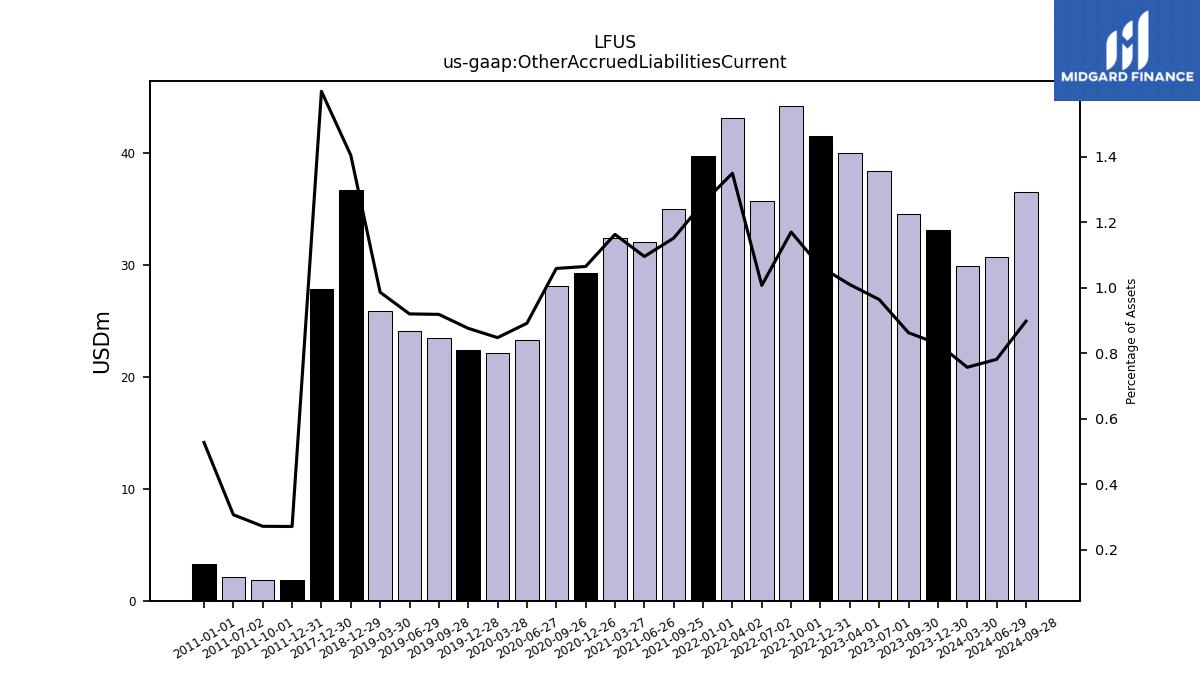
| Other Accrued Liabilities Current | 33.13 | 34.53 | 38.32 | 39.99 | 41.52 | 44.19 | 35.69 | 43.07 | 39.67 | 34.98 | 32.06 | 32.40 | 29.25 | 28.10 | 23.28 | 22.15 | 22.42 | 23.44 | 24.12 | 25.88 | 36.70 | NA | NA | NA | 27.82 | NA | NA | NA | NA | NA | NA | NA | NA | NA | NA | NA | NA | NA | NA | NA | NA | NA | NA | NA | NA | NA | NA | NA | NA | 1.84 | 1.87 | 2.14 | NA | 3.28 | NA | NA | |
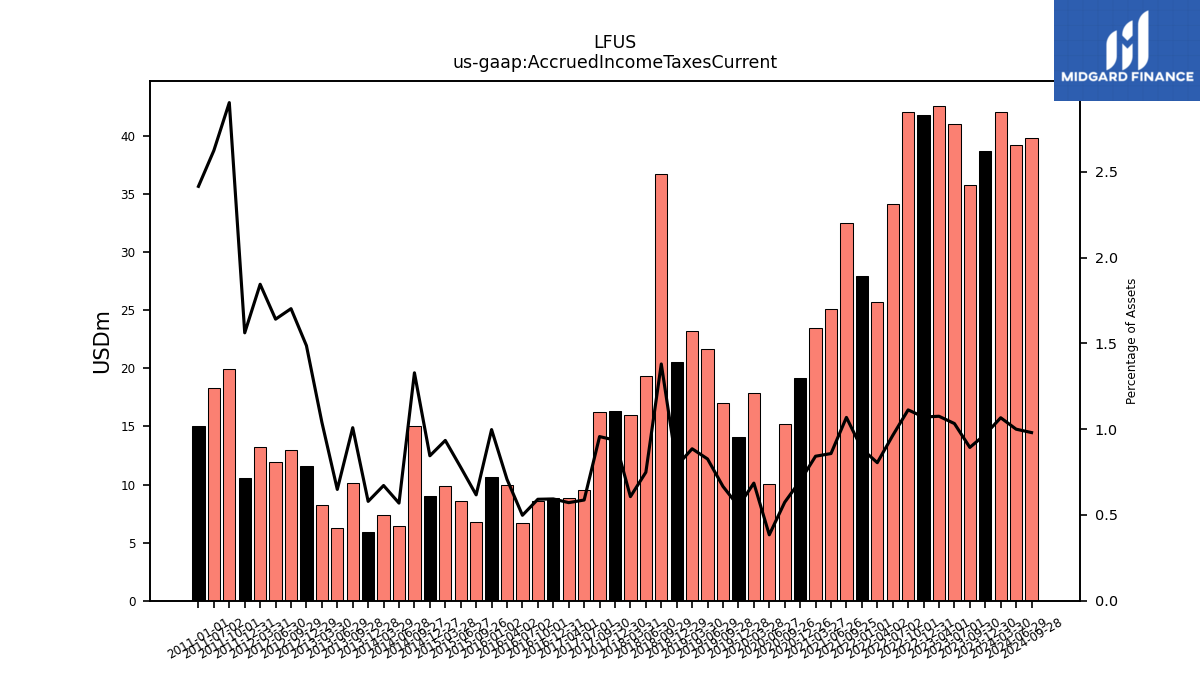
| Accrued Income Taxes Current | 38.73 | 35.76 | 41.05 | 42.59 | 41.79 | 42.02 | 34.13 | 25.69 | 27.91 | 32.46 | 25.11 | 23.47 | 19.19 | 15.23 | 10.03 | 17.91 | 14.12 | 16.99 | 21.66 | 23.24 | 20.55 | 36.75 | 19.38 | 15.94 | 16.29 | 16.28 | 9.52 | 8.83 | 8.85 | 8.62 | 6.68 | 9.93 | 10.62 | 6.74 | 8.55 | 9.89 | 9.04 | 15.06 | 6.42 | 7.36 | 5.93 | 10.15 | 6.23 | 8.20 | NA | 11.56 | 12.99 | 11.90 | 13.21 | 10.59 | 19.94 | 18.27 | NA | 15.00 | NA | NA | |
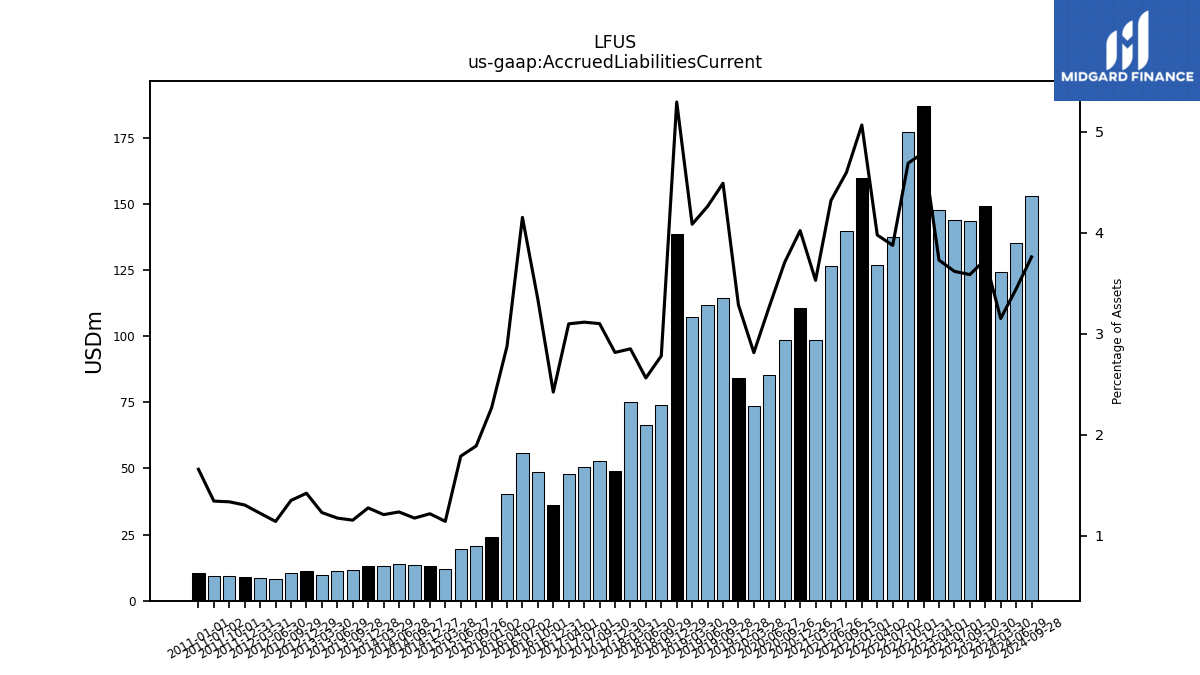
| Accrued Liabilities Current | 149.21 | 143.54 | 143.84 | 147.78 | 187.06 | 177.13 | 137.38 | 127.01 | 159.69 | 139.67 | 126.44 | 98.35 | 110.48 | 98.44 | 85.36 | 73.51 | 84.12 | 114.55 | 111.70 | 107.21 | 138.41 | 74.08 | 66.34 | 74.92 | 48.99 | 52.79 | 50.54 | 47.85 | 36.14 | 48.71 | 55.72 | 40.35 | 24.14 | 20.64 | 19.67 | 12.12 | 13.06 | 13.34 | 13.97 | 13.27 | 13.09 | 11.64 | 11.29 | 9.70 | NA | 11.06 | 10.32 | 8.29 | 8.77 | 8.86 | 9.19 | 9.37 | NA | 10.31 | NA | NA |
| 2023-12-30 | 2023-09-30 | 2023-07-01 | 2023-04-01 | 2022-12-31 | 2022-10-01 | 2022-07-02 | 2022-04-02 | 2022-01-01 | 2021-09-25 | 2021-06-26 | 2021-03-27 | 2020-12-26 | 2020-09-26 | 2020-06-27 | 2020-03-28 | 2019-12-28 | 2019-09-28 | 2019-06-29 | 2019-03-30 | 2018-12-29 | 2018-09-29 | 2018-06-30 | 2018-03-31 | 2017-12-30 | 2017-09-30 | 2017-07-01 | 2017-04-01 | 2016-12-31 | 2016-10-01 | 2016-07-02 | 2016-04-02 | 2016-01-02 | 2015-09-26 | 2015-06-27 | 2015-03-28 | 2014-12-27 | 2014-09-27 | 2014-06-28 | 2014-03-29 | 2013-12-28 | 2013-09-28 | 2013-06-29 | 2013-03-30 | 2012-12-31 | 2012-12-29 | 2012-09-29 | 2012-06-30 | 2012-03-31 | 2011-12-31 | 2011-10-01 | 2011-07-02 | 2011-04-02 | 2011-01-01 | 2010-10-02 | 2010-07-03 | ||
|---|---|---|---|---|---|---|---|---|---|---|---|---|---|---|---|---|---|---|---|---|---|---|---|---|---|---|---|---|---|---|---|---|---|---|---|---|---|---|---|---|---|---|---|---|---|---|---|---|---|---|---|---|---|---|---|---|---|
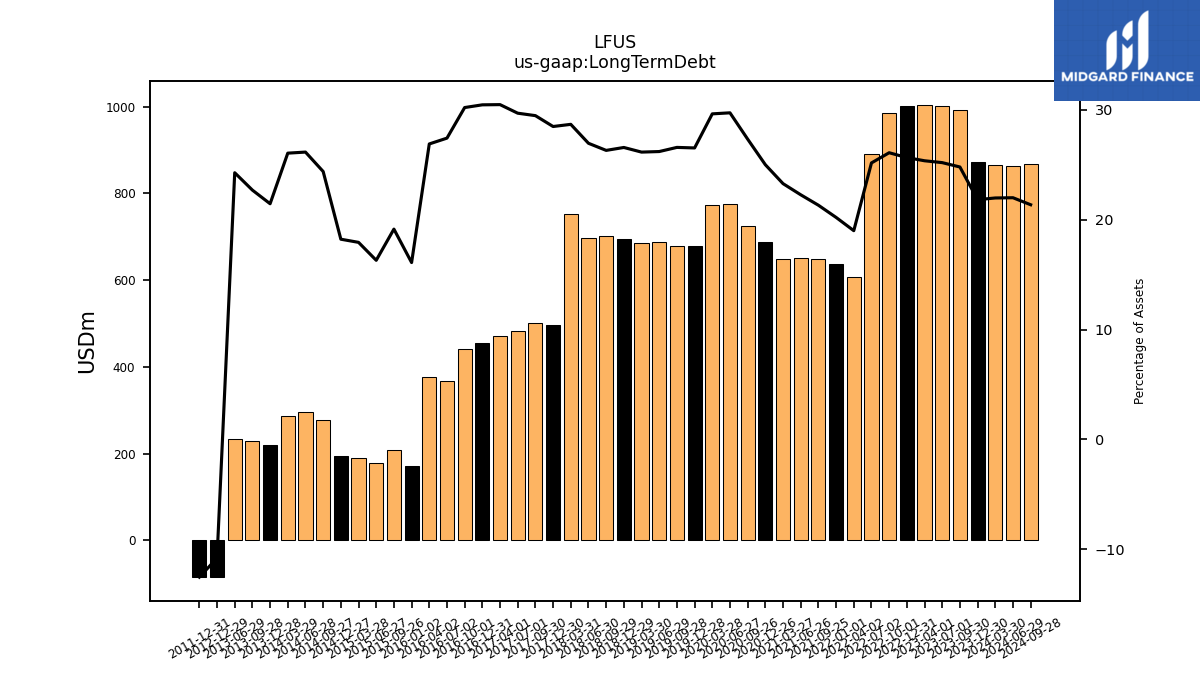
| Long Term Debt | 871.93 | 992.62 | 1001.66 | 1004.85 | 1001.50 | 985.83 | 892.07 | 606.74 | 636.90 | 647.73 | 651.92 | 648.87 | 687.03 | 725.51 | 776.21 | 774.20 | 679.16 | 678.16 | 686.94 | 686.51 | 694.73 | 700.71 | 697.60 | 753.55 | 495.61 | 501.65 | 481.69 | 470.52 | 454.14 | 440.46 | 367.98 | 377.36 | 171.47 | 209.02 | 179.24 | 189.97 | 195.16 | 276.50 | 295.25 | 285.50 | 219.75 | 228.50 | 233.00 | NA | NA | -84.00 | NA | NA | NA | -85.00 | NA | NA | NA | NA | NA | NA | |
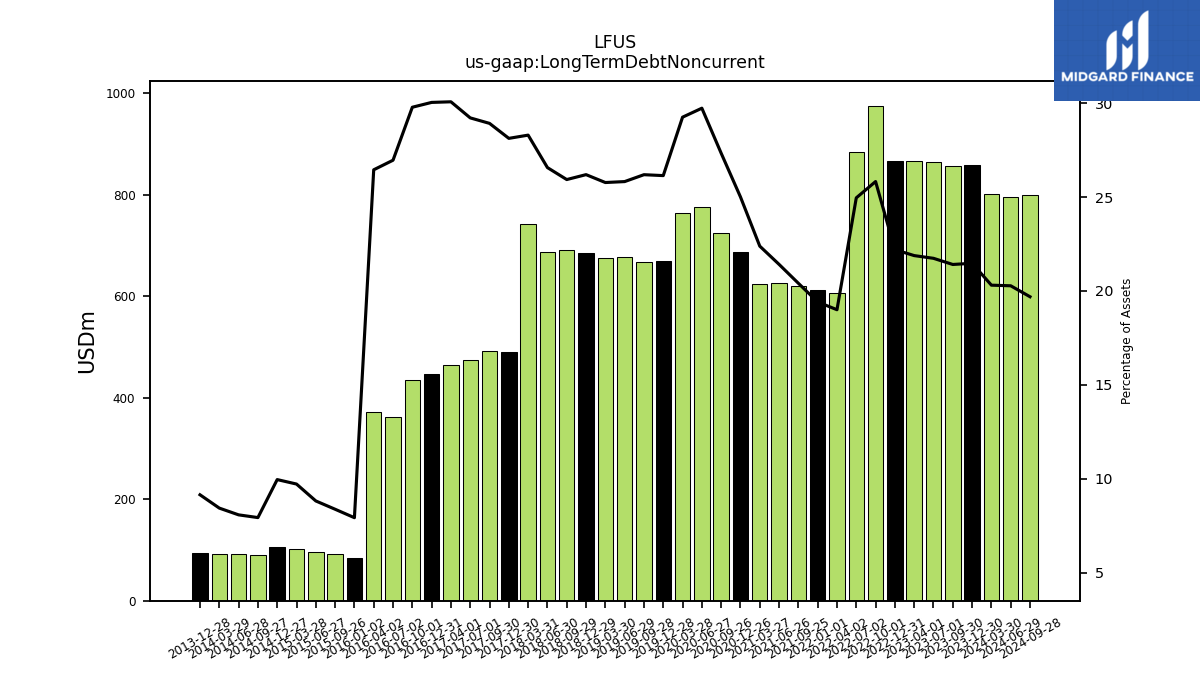
| Long Term Debt Noncurrent | 857.91 | 857.01 | 864.22 | 866.92 | 866.62 | 975.61 | 884.57 | 606.74 | 611.90 | 620.11 | 626.92 | 623.87 | 687.03 | 725.51 | 776.21 | 764.20 | 669.16 | 668.16 | 676.94 | 676.51 | 684.73 | 690.64 | 687.54 | 743.44 | 489.36 | 492.27 | 473.88 | 464.27 | 447.89 | 434.21 | 361.73 | 371.11 | 84.47 | 91.52 | 96.99 | 102.97 | 106.66 | 90.00 | 91.25 | 92.50 | 93.75 | NA | NA | NA | NA | NA | NA | NA | NA | NA | NA | NA | NA | NA | NA | NA | |
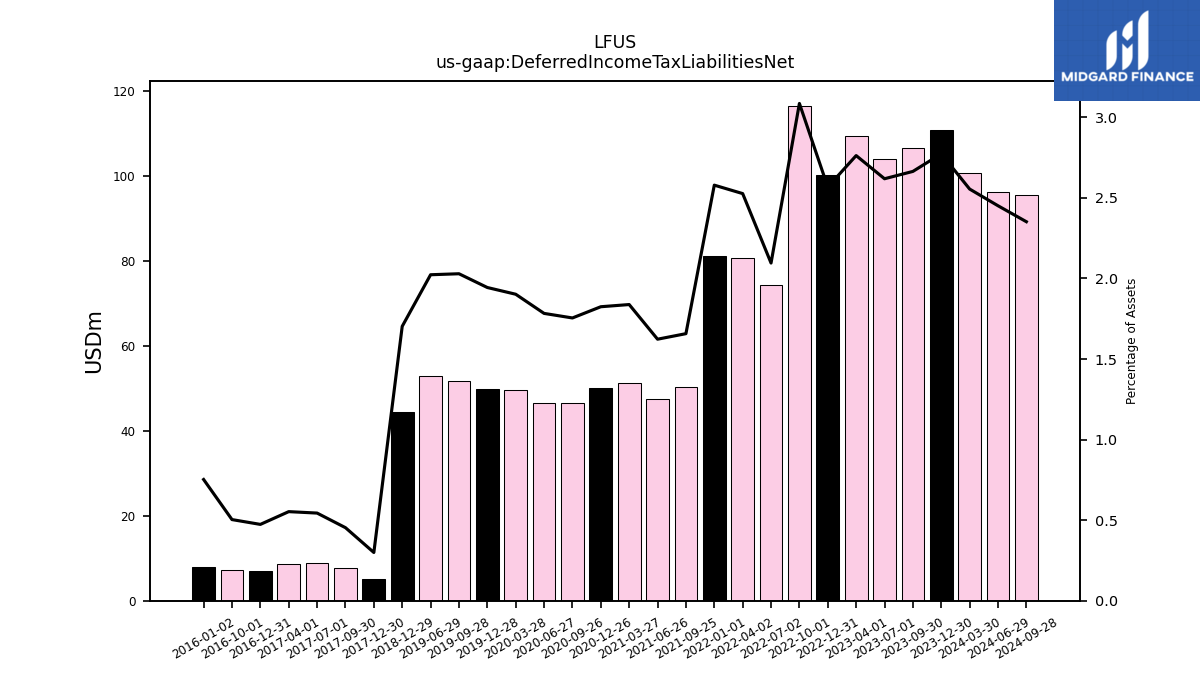
| Deferred Income Tax Liabilities Net | 110.82 | 106.66 | 104.12 | 109.45 | 100.23 | 116.59 | 74.29 | 80.69 | 81.29 | 50.37 | 47.52 | 51.23 | 50.13 | 46.58 | 46.56 | 49.70 | 49.76 | 51.78 | 53.04 | NA | 44.52 | NA | NA | NA | 5.21 | 7.72 | 8.83 | 8.54 | 7.07 | 7.34 | NA | NA | 8.01 | NA | NA | NA | NA | NA | NA | NA | NA | NA | NA | NA | NA | NA | NA | NA | NA | NA | NA | NA | NA | NA | NA | NA | |
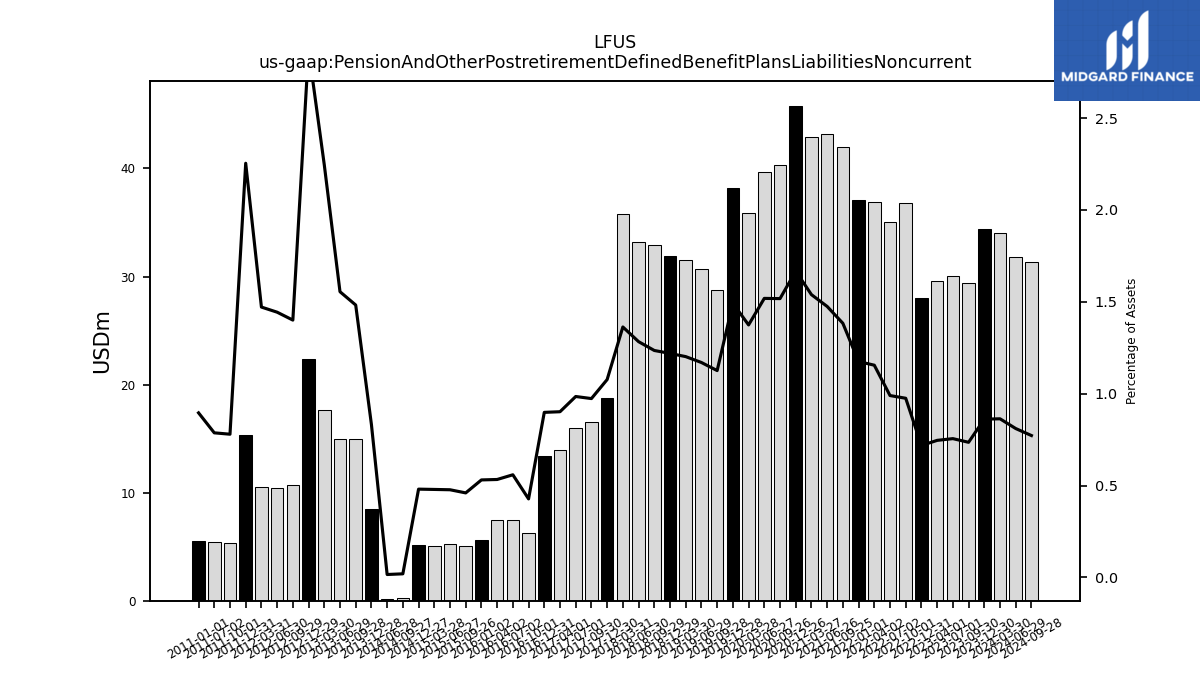
| Pension And Other Postretirement Defined Benefit Plans Liabilities Noncurrent | 34.42 | 29.45 | 30.04 | 29.56 | 28.04 | 36.84 | 35.09 | 36.88 | 37.04 | 42.03 | 43.18 | 42.89 | 45.80 | 40.28 | 39.65 | 35.90 | 38.20 | 28.73 | 30.67 | 31.55 | 31.87 | 32.90 | 33.21 | 35.82 | 18.74 | 16.57 | 15.97 | 13.93 | 13.40 | 6.24 | 7.50 | 7.48 | 5.65 | 5.03 | 5.25 | 5.07 | 5.15 | 0.23 | 0.18 | NA | 8.53 | 14.93 | 14.93 | 17.69 | NA | 22.34 | 10.69 | 10.47 | 10.54 | 15.29 | 5.36 | 5.48 | NA | 5.56 | NA | NA | |
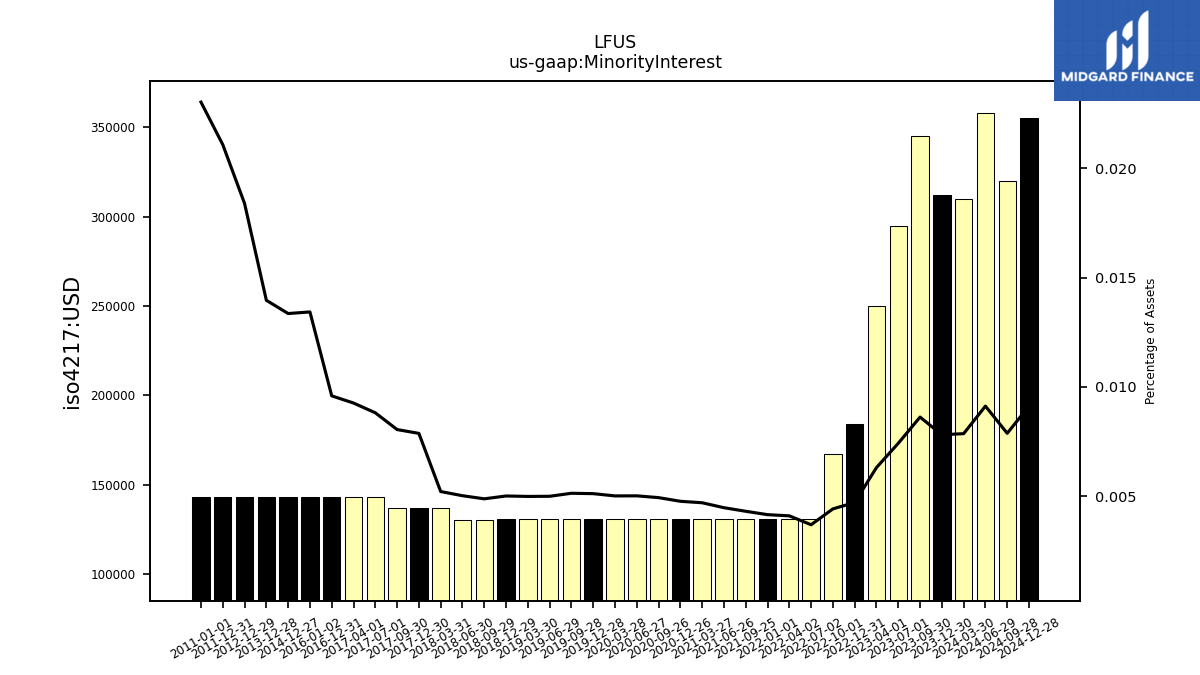
| Minority Interest | 0.31 | 0.34 | 0.29 | 0.25 | 0.18 | 0.17 | 0.13 | 0.13 | 0.13 | 0.13 | 0.13 | 0.13 | 0.13 | 0.13 | 0.13 | 0.13 | 0.13 | 0.13 | 0.13 | 0.13 | 0.13 | 0.13 | 0.13 | 0.14 | 0.14 | 0.14 | 0.14 | 0.14 | 0.14 | NA | NA | NA | 0.14 | NA | NA | NA | 0.14 | NA | NA | NA | 0.14 | NA | NA | NA | NA | 0.14 | NA | NA | NA | 0.14 | NA | NA | NA | 0.14 | NA | NA | |
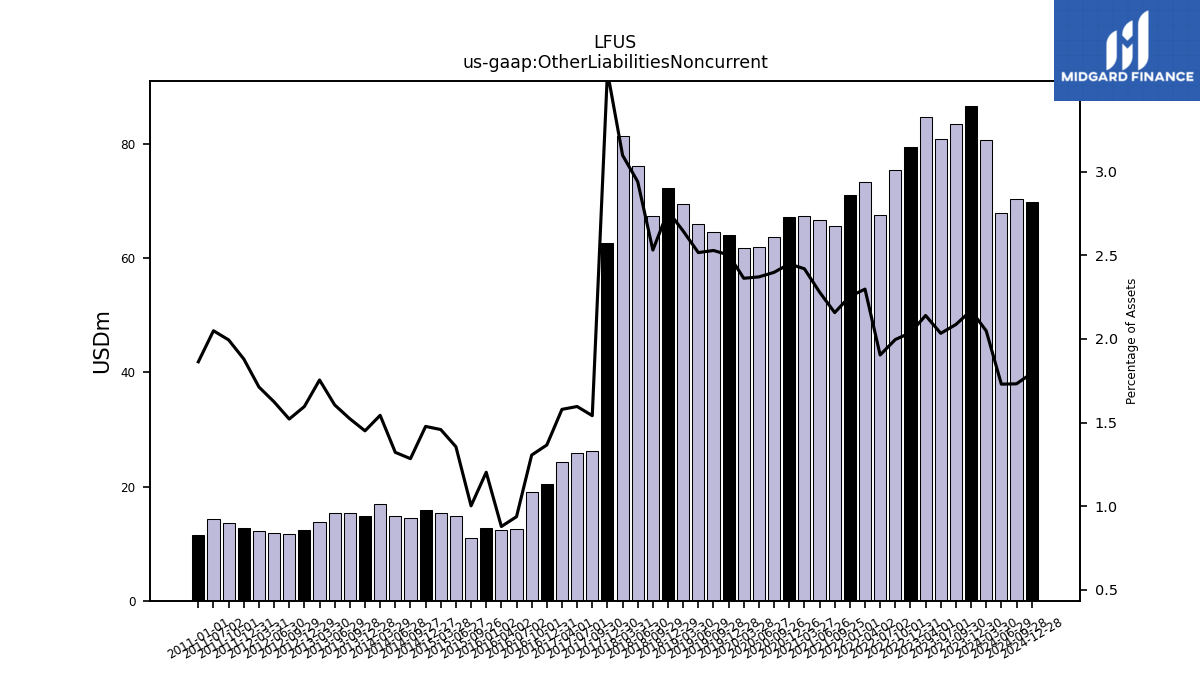
| Other Liabilities Noncurrent | 86.67 | 83.50 | 80.83 | 84.77 | 79.51 | 75.40 | 67.48 | 73.35 | 71.02 | 65.54 | 66.73 | 67.41 | 67.25 | 63.64 | 61.89 | 61.71 | 64.04 | 64.50 | 65.94 | 69.41 | 72.23 | 67.40 | 76.07 | 81.38 | 62.58 | 26.23 | 25.89 | 24.38 | 20.37 | 19.04 | 12.58 | 12.33 | 12.81 | 10.94 | 14.90 | 15.44 | 15.81 | 14.56 | 14.92 | 16.91 | 14.86 | 15.33 | 15.41 | 13.82 | NA | 12.41 | 11.61 | 11.78 | 12.27 | 12.75 | 13.70 | 14.27 | NA | 11.57 | NA | NA | |
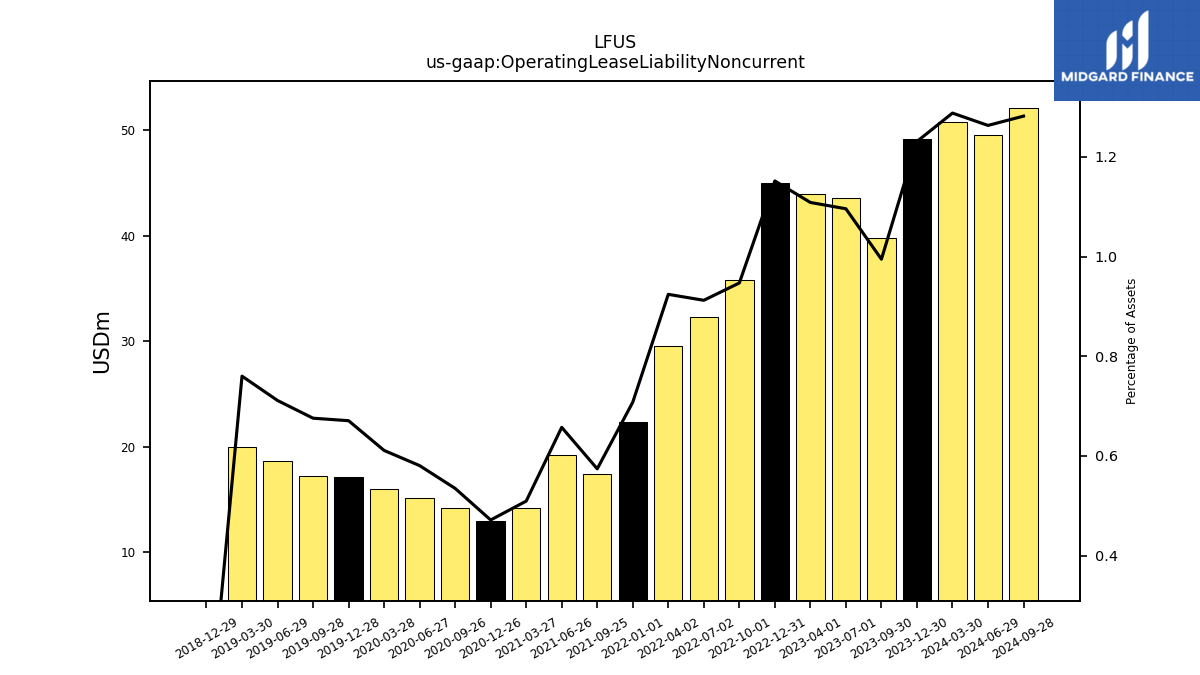
| Operating Lease Liability Noncurrent | 49.18 | 39.82 | 43.57 | 43.92 | 44.96 | 35.78 | 32.33 | 29.51 | 22.30 | 17.44 | 19.24 | 14.19 | 12.95 | 14.19 | 15.15 | 15.96 | 17.17 | 17.24 | 18.64 | 19.95 | 0.00 | NA | NA | NA | NA | NA | NA | NA | NA | NA | NA | NA | NA | NA | NA | NA | NA | NA | NA | NA | NA | NA | NA | NA | NA | NA | NA | NA | NA | NA | NA | NA | NA | NA | NA | NA |
| 2023-12-30 | 2023-09-30 | 2023-07-01 | 2023-04-01 | 2022-12-31 | 2022-10-01 | 2022-07-02 | 2022-04-02 | 2022-01-01 | 2021-09-25 | 2021-06-26 | 2021-03-27 | 2020-12-26 | 2020-09-26 | 2020-06-27 | 2020-03-28 | 2019-12-28 | 2019-09-28 | 2019-06-29 | 2019-03-30 | 2018-12-29 | 2018-09-29 | 2018-06-30 | 2018-03-31 | 2017-12-30 | 2017-09-30 | 2017-07-01 | 2017-04-01 | 2016-12-31 | 2016-10-01 | 2016-07-02 | 2016-04-02 | 2016-01-02 | 2015-09-26 | 2015-06-27 | 2015-03-28 | 2014-12-27 | 2014-09-27 | 2014-06-28 | 2014-03-29 | 2013-12-28 | 2013-09-28 | 2013-06-29 | 2013-03-30 | 2012-12-31 | 2012-12-29 | 2012-09-29 | 2012-06-30 | 2012-03-31 | 2011-12-31 | 2011-10-01 | 2011-07-02 | 2011-04-02 | 2011-01-01 | 2010-10-02 | 2010-07-03 | ||
|---|---|---|---|---|---|---|---|---|---|---|---|---|---|---|---|---|---|---|---|---|---|---|---|---|---|---|---|---|---|---|---|---|---|---|---|---|---|---|---|---|---|---|---|---|---|---|---|---|---|---|---|---|---|---|---|---|---|
| Stockholders Equity | 2480.17 | 2404.51 | 2356.96 | 2307.23 | 2211.19 | 2088.72 | 2051.81 | 2000.52 | 1893.39 | 1821.27 | 1742.09 | 1660.61 | 1608.64 | 1529.43 | 1462.30 | 1476.82 | 1495.88 | 1472.08 | 1509.81 | 1505.26 | 1478.21 | 1519.27 | 1469.89 | 1441.84 | 927.42 | 933.11 | 895.29 | 855.62 | 814.79 | NA | NA | NA | 744.05 | NA | NA | NA | 727.52 | NA | NA | NA | 686.77 | NA | NA | NA | NA | 587.41 | NA | NA | NA | 500.96 | NA | NA | NA | 452.52 | NA | NA | |
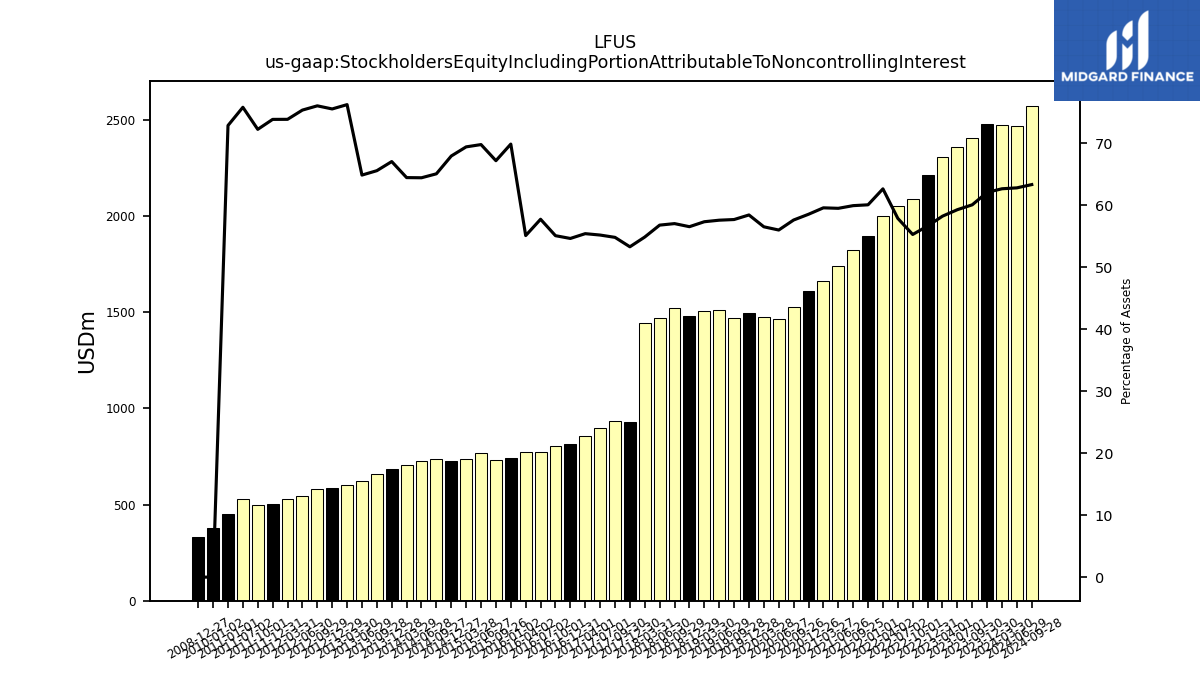
| Stockholders Equity Including Portion Attributable To Noncontrolling Interest | 2480.48 | 2404.86 | 2357.25 | 2307.48 | 2211.38 | 2088.89 | 2051.94 | 2000.65 | 1893.52 | 1821.40 | 1742.22 | 1660.74 | 1608.77 | 1529.56 | 1462.43 | 1476.95 | 1496.01 | 1472.21 | 1509.94 | 1505.39 | 1478.34 | 1519.40 | 1470.02 | 1441.97 | 927.56 | 933.24 | 895.43 | 855.76 | 814.93 | 803.38 | 774.86 | 773.31 | 744.20 | 733.74 | 767.29 | 735.26 | 727.66 | 737.90 | 727.49 | 706.37 | 686.92 | 660.41 | 622.69 | 600.67 | NA | 587.56 | 580.53 | 546.67 | 529.36 | 501.10 | 496.45 | 528.06 | NA | 452.66 | NA | NA | |
| Common Stock Value | 0.26 | 0.26 | 0.26 | 0.26 | 0.26 | 0.26 | 0.26 | 0.26 | 0.26 | 0.26 | 0.26 | 0.26 | 0.26 | 0.26 | 0.26 | 0.26 | 0.26 | 0.26 | 0.26 | 0.25 | 0.25 | 0.25 | 0.25 | 0.25 | 0.23 | 0.23 | 0.24 | 0.23 | 0.23 | NA | NA | NA | 0.22 | NA | NA | NA | 0.23 | NA | NA | NA | 0.23 | NA | NA | NA | NA | 0.22 | NA | NA | NA | 0.22 | NA | NA | NA | 0.22 | NA | NA | |
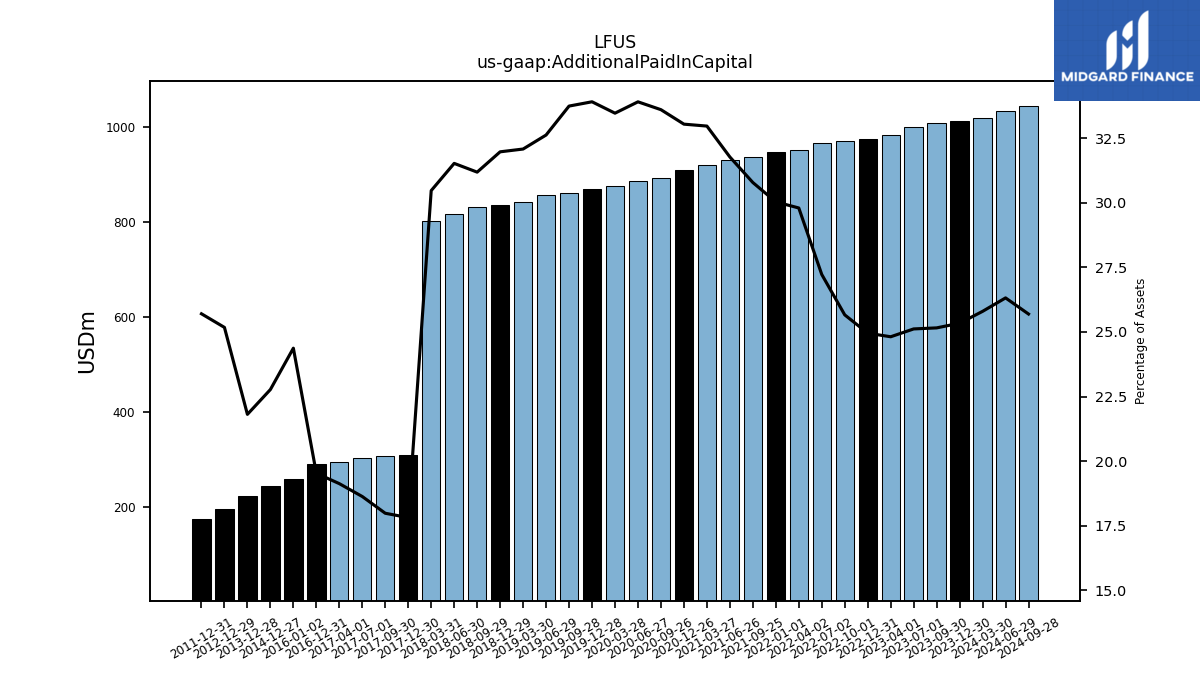
| Additional Paid In Capital | 1012.33 | 1007.03 | 998.59 | 983.07 | 974.10 | 969.46 | 964.94 | 951.50 | 946.59 | 935.35 | 930.11 | 918.76 | 907.86 | 891.92 | 885.31 | 874.36 | 868.00 | 860.87 | 855.19 | 842.09 | 835.83 | 830.61 | 815.83 | 800.61 | 310.01 | 306.12 | 302.24 | 295.37 | 291.26 | NA | NA | NA | 259.55 | NA | NA | NA | 243.84 | NA | NA | NA | 223.43 | NA | NA | NA | NA | 195.80 | NA | NA | NA | 174.38 | NA | NA | NA | NA | NA | NA | |
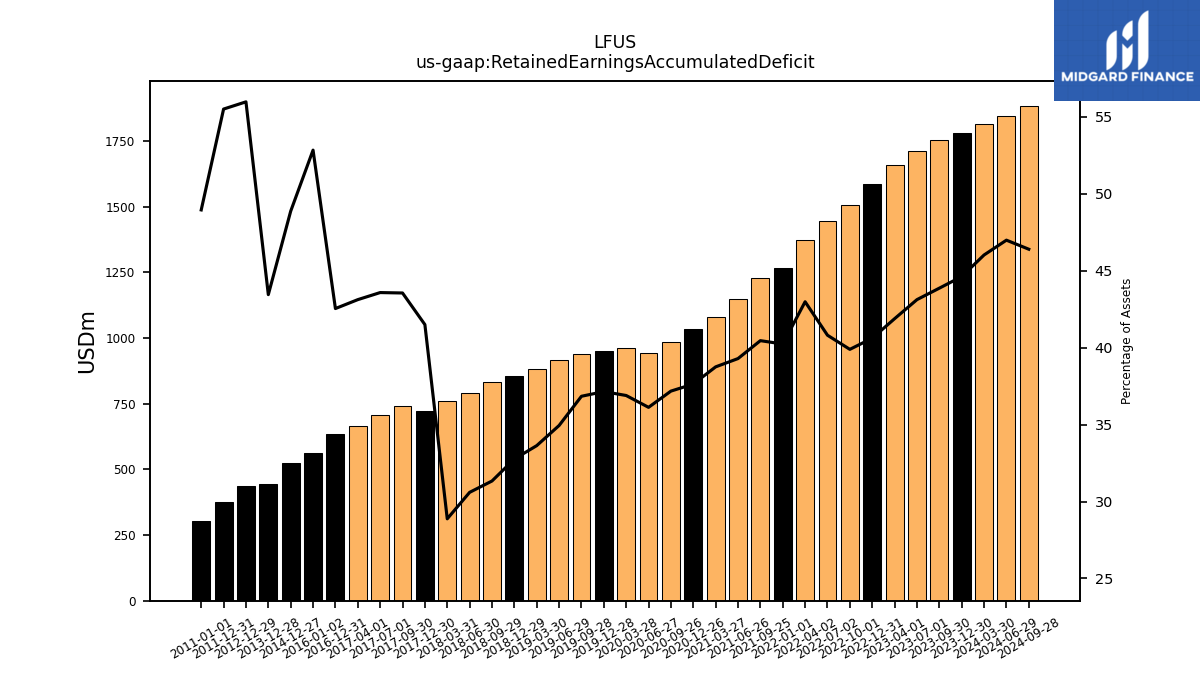
| Retained Earnings Accumulated Deficit | 1782.66 | 1755.94 | 1714.38 | 1659.27 | 1585.47 | 1507.04 | 1446.46 | 1372.56 | 1268.12 | 1229.26 | 1150.26 | 1079.98 | 1034.05 | 986.81 | 943.15 | 963.82 | 950.90 | 939.95 | 916.01 | 882.87 | 856.51 | 834.58 | 791.83 | 758.77 | 722.14 | 741.36 | 706.96 | 665.81 | 634.39 | NA | NA | NA | 562.72 | NA | NA | NA | 523.30 | NA | NA | NA | 445.06 | NA | NA | NA | NA | 435.34 | NA | NA | NA | 376.57 | NA | NA | NA | 304.06 | NA | NA | |
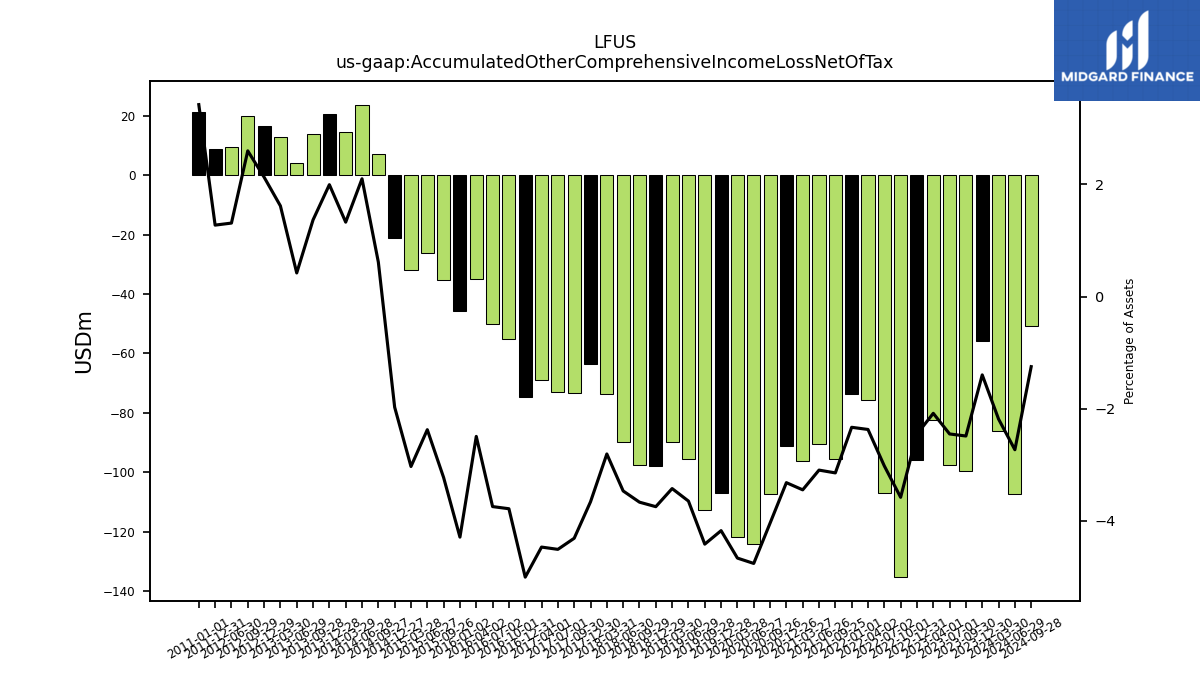
| Accumulated Other Comprehensive Income Loss Net Of Tax | -55.82 | -99.53 | -97.39 | -82.48 | -95.76 | -135.20 | -107.02 | -75.67 | -73.46 | -95.53 | -90.57 | -96.03 | -91.16 | -107.24 | -124.22 | -121.80 | -106.82 | -112.61 | -95.58 | -89.85 | -97.92 | -97.63 | -89.68 | -73.74 | -63.67 | -73.34 | -73.10 | -68.95 | -74.58 | -55.15 | -50.24 | -34.98 | -45.67 | -35.23 | -26.10 | -32.08 | -21.13 | 6.95 | 23.68 | 14.52 | 20.42 | 13.75 | 4.03 | 12.72 | NA | 16.55 | 19.81 | 9.49 | NA | 8.63 | NA | NA | NA | 21.24 | NA | NA | |
| Minority Interest | 0.31 | 0.34 | 0.29 | 0.25 | 0.18 | 0.17 | 0.13 | 0.13 | 0.13 | 0.13 | 0.13 | 0.13 | 0.13 | 0.13 | 0.13 | 0.13 | 0.13 | 0.13 | 0.13 | 0.13 | 0.13 | 0.13 | 0.13 | 0.14 | 0.14 | 0.14 | 0.14 | 0.14 | 0.14 | NA | NA | NA | 0.14 | NA | NA | NA | 0.14 | NA | NA | NA | 0.14 | NA | NA | NA | NA | 0.14 | NA | NA | NA | 0.14 | NA | NA | NA | 0.14 | NA | NA |
| 2023-12-30 | 2023-09-30 | 2023-07-01 | 2023-04-01 | 2022-12-31 | 2022-10-01 | 2022-07-02 | 2022-04-02 | 2022-01-01 | 2021-09-25 | 2021-06-26 | 2021-03-27 | 2020-12-26 | 2020-09-26 | 2020-06-27 | 2020-03-28 | 2019-12-28 | 2019-09-28 | 2019-06-29 | 2019-03-30 | 2018-12-29 | 2018-09-29 | 2018-06-30 | 2018-03-31 | 2017-12-30 | 2017-09-30 | 2017-07-01 | 2017-04-01 | 2016-12-31 | 2016-10-01 | 2016-07-02 | 2016-04-02 | 2016-01-02 | 2015-09-26 | 2015-06-27 | 2015-03-28 | 2014-12-27 | 2014-09-27 | 2014-06-28 | 2014-03-29 | 2013-12-28 | 2013-09-28 | 2013-06-29 | 2013-03-30 | 2012-12-31 | 2012-12-29 | 2012-09-29 | 2012-06-30 | 2012-03-31 | 2011-12-31 | 2011-10-01 | 2011-07-02 | 2011-04-02 | 2011-01-01 | 2010-10-02 | 2010-07-03 | ||
|---|---|---|---|---|---|---|---|---|---|---|---|---|---|---|---|---|---|---|---|---|---|---|---|---|---|---|---|---|---|---|---|---|---|---|---|---|---|---|---|---|---|---|---|---|---|---|---|---|---|---|---|---|---|---|---|---|---|
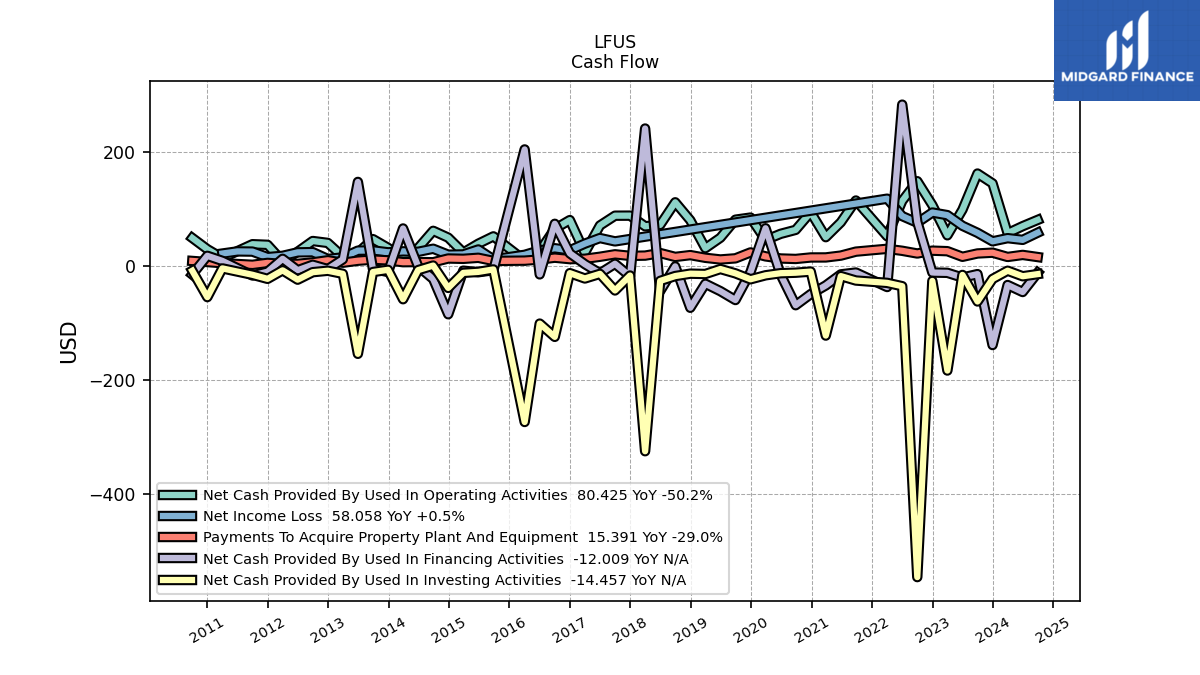
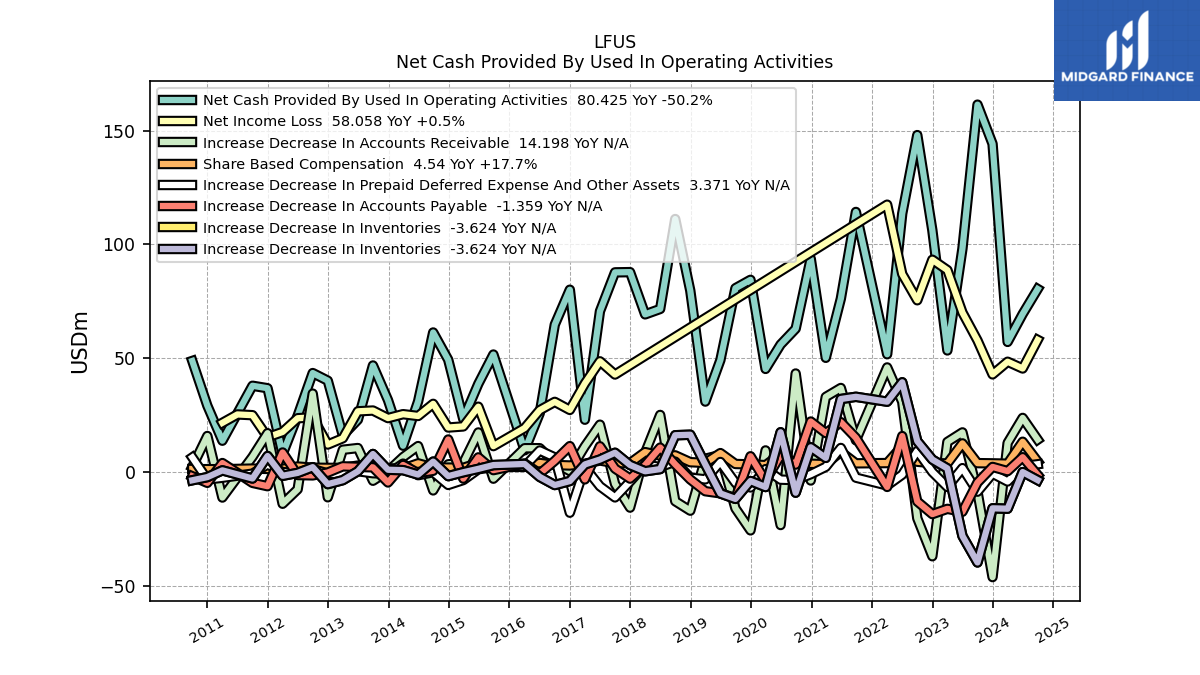
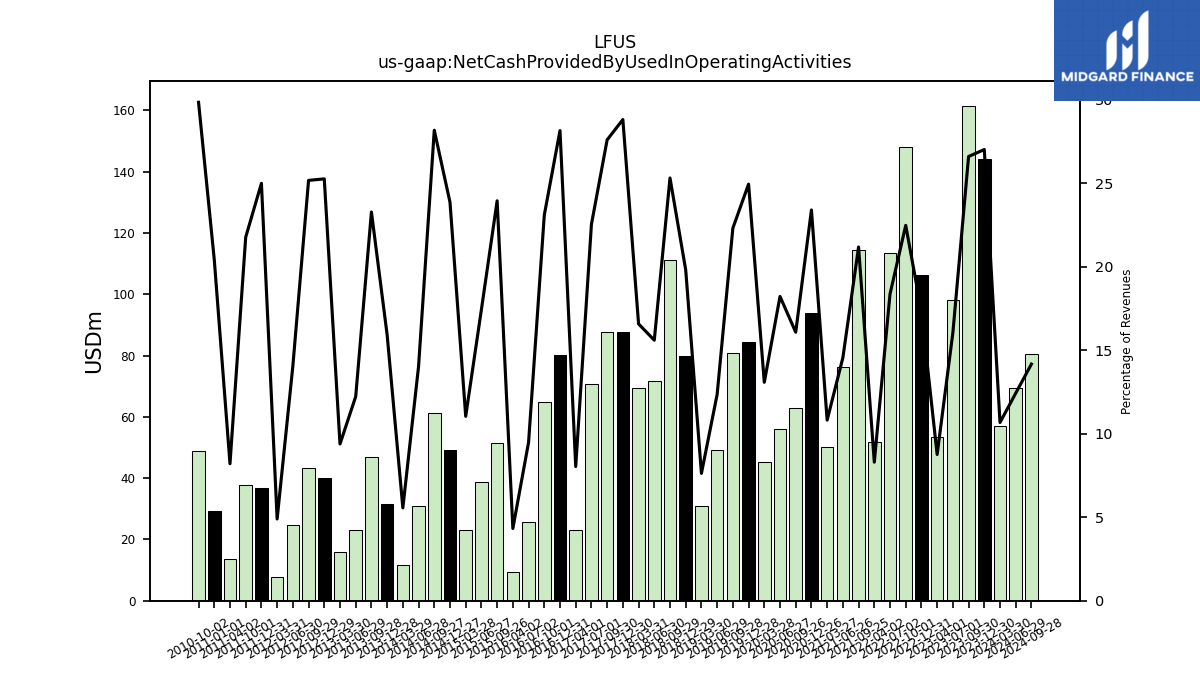
| Net Cash Provided By Used In Operating Activities | 144.25 | 161.51 | 98.23 | 53.41 | 106.28 | 148.12 | 113.59 | 51.73 | NA | 114.32 | 76.18 | 50.17 | 93.78 | 62.97 | 56.01 | 45.28 | 84.47 | 80.77 | 49.17 | 30.92 | 79.71 | 111.20 | 71.65 | 69.27 | 87.85 | 87.75 | 70.63 | 22.94 | 80.12 | 64.74 | 25.78 | 9.49 | NA | 51.62 | 38.73 | 23.23 | 49.31 | 61.32 | 31.00 | 11.51 | 31.56 | 46.81 | 22.96 | 16.05 | NA | 40.12 | 43.47 | 24.71 | 7.86 | 36.80 | 37.88 | NA | 13.72 | 29.14 | 48.80 | NA | |
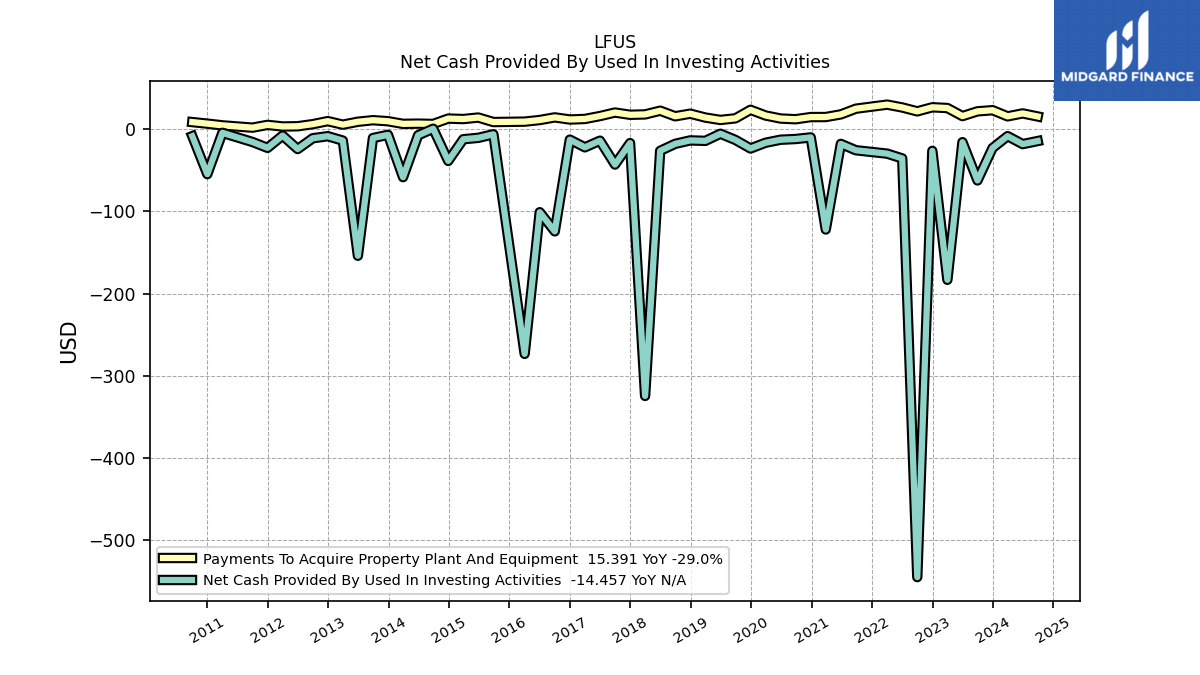
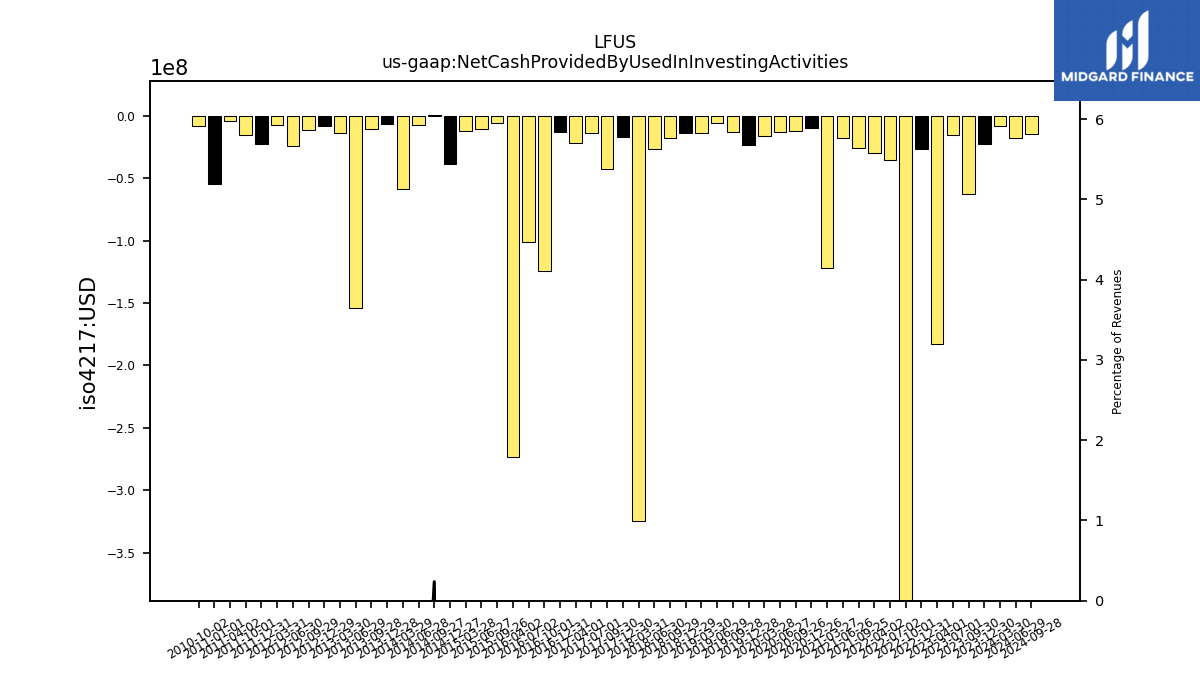
| Net Cash Provided By Used In Investing Activities | -22.94 | -62.36 | -15.83 | -183.19 | -26.42 | -544.61 | -35.58 | -29.79 | NA | -25.67 | -17.92 | -122.02 | -10.04 | -12.00 | -12.85 | -16.54 | -23.50 | -13.15 | -5.57 | -14.24 | -13.69 | -17.83 | -26.36 | -324.38 | -16.94 | -43.08 | -14.02 | -22.10 | -12.76 | -124.28 | -100.98 | -273.22 | NA | -6.23 | -10.55 | -12.27 | -38.65 | 0.52 | -7.46 | -58.41 | -6.95 | -10.78 | -153.94 | -13.92 | NA | -8.56 | -11.09 | -24.20 | -7.84 | -22.76 | -15.63 | NA | -4.45 | -54.74 | -8.55 | NA | |
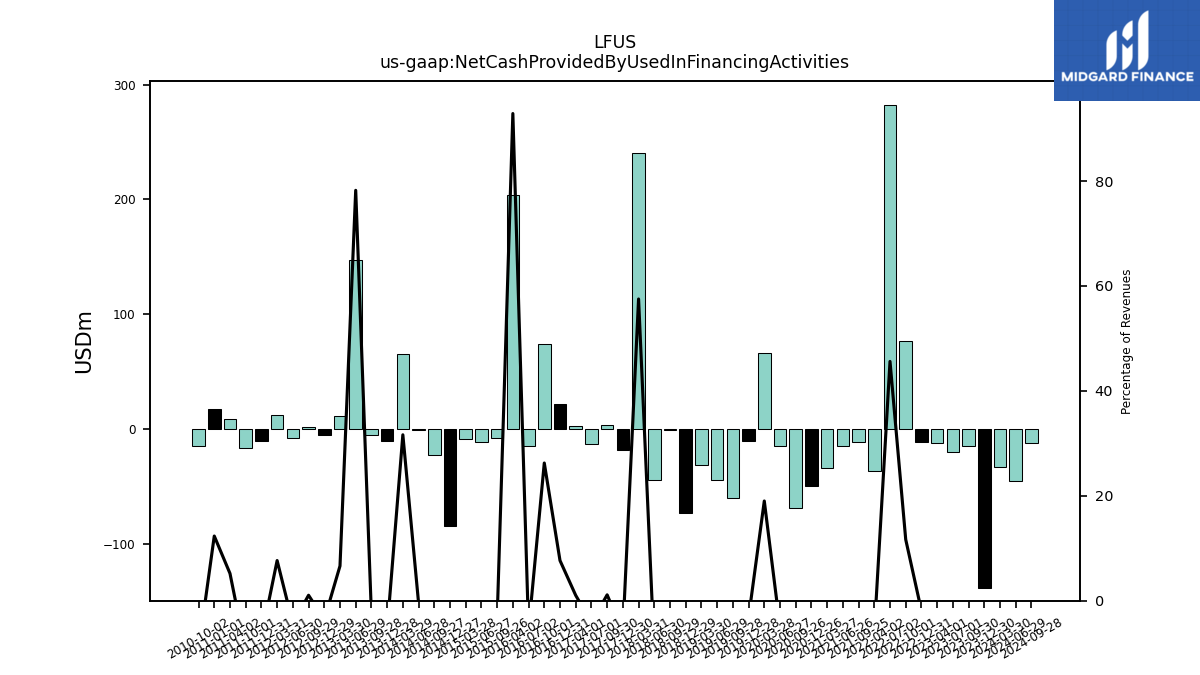
| Net Cash Provided By Used In Financing Activities | -138.58 | -14.46 | -20.48 | -12.20 | -11.72 | 76.91 | 282.09 | -37.07 | NA | -11.69 | -14.91 | -34.27 | -49.43 | -68.90 | -15.28 | 65.80 | -10.81 | -59.84 | -44.29 | -31.33 | -73.36 | -0.95 | -44.10 | 240.31 | -18.19 | 3.59 | -13.02 | 2.94 | 21.82 | 73.59 | -14.95 | 203.73 | NA | -7.54 | -11.16 | -8.45 | -84.72 | -23.06 | -0.91 | 65.43 | -10.77 | -5.22 | 146.88 | 11.34 | NA | -5.70 | 1.81 | -7.67 | 12.30 | -10.23 | -16.86 | NA | 8.69 | 17.59 | -15.19 | NA |
| 2023-12-30 | 2023-09-30 | 2023-07-01 | 2023-04-01 | 2022-12-31 | 2022-10-01 | 2022-07-02 | 2022-04-02 | 2022-01-01 | 2021-09-25 | 2021-06-26 | 2021-03-27 | 2020-12-26 | 2020-09-26 | 2020-06-27 | 2020-03-28 | 2019-12-28 | 2019-09-28 | 2019-06-29 | 2019-03-30 | 2018-12-29 | 2018-09-29 | 2018-06-30 | 2018-03-31 | 2017-12-30 | 2017-09-30 | 2017-07-01 | 2017-04-01 | 2016-12-31 | 2016-10-01 | 2016-07-02 | 2016-04-02 | 2016-01-02 | 2015-09-26 | 2015-06-27 | 2015-03-28 | 2014-12-27 | 2014-09-27 | 2014-06-28 | 2014-03-29 | 2013-12-28 | 2013-09-28 | 2013-06-29 | 2013-03-30 | 2012-12-31 | 2012-12-29 | 2012-09-29 | 2012-06-30 | 2012-03-31 | 2011-12-31 | 2011-10-01 | 2011-07-02 | 2011-04-02 | 2011-01-01 | 2010-10-02 | 2010-07-03 | ||
|---|---|---|---|---|---|---|---|---|---|---|---|---|---|---|---|---|---|---|---|---|---|---|---|---|---|---|---|---|---|---|---|---|---|---|---|---|---|---|---|---|---|---|---|---|---|---|---|---|---|---|---|---|---|---|---|---|---|
| Net Cash Provided By Used In Operating Activities | 144.25 | 161.51 | 98.23 | 53.41 | 106.28 | 148.12 | 113.59 | 51.73 | NA | 114.32 | 76.18 | 50.17 | 93.78 | 62.97 | 56.01 | 45.28 | 84.47 | 80.77 | 49.17 | 30.92 | 79.71 | 111.20 | 71.65 | 69.27 | 87.85 | 87.75 | 70.63 | 22.94 | 80.12 | 64.74 | 25.78 | 9.49 | NA | 51.62 | 38.73 | 23.23 | 49.31 | 61.32 | 31.00 | 11.51 | 31.56 | 46.81 | 22.96 | 16.05 | NA | 40.12 | 43.47 | 24.71 | 7.86 | 36.80 | 37.88 | NA | 13.72 | 29.14 | 48.80 | NA | |
| Net Income Loss | 42.88 | 57.79 | 70.07 | 88.75 | 93.30 | 75.47 | 87.02 | 117.52 | NA | NA | NA | NA | NA | NA | NA | NA | NA | NA | NA | NA | NA | NA | NA | NA | NA | 42.81 | 48.64 | 38.89 | 27.25 | 30.80 | 27.15 | 19.29 | NA | 11.32 | 28.68 | 20.00 | 19.51 | 29.94 | 24.58 | 25.39 | 23.66 | 26.99 | 26.65 | 14.79 | NA | 12.03 | 24.00 | 23.60 | 17.56 | 15.24 | 24.94 | 25.27 | 21.58 | NA | NA | NA | |
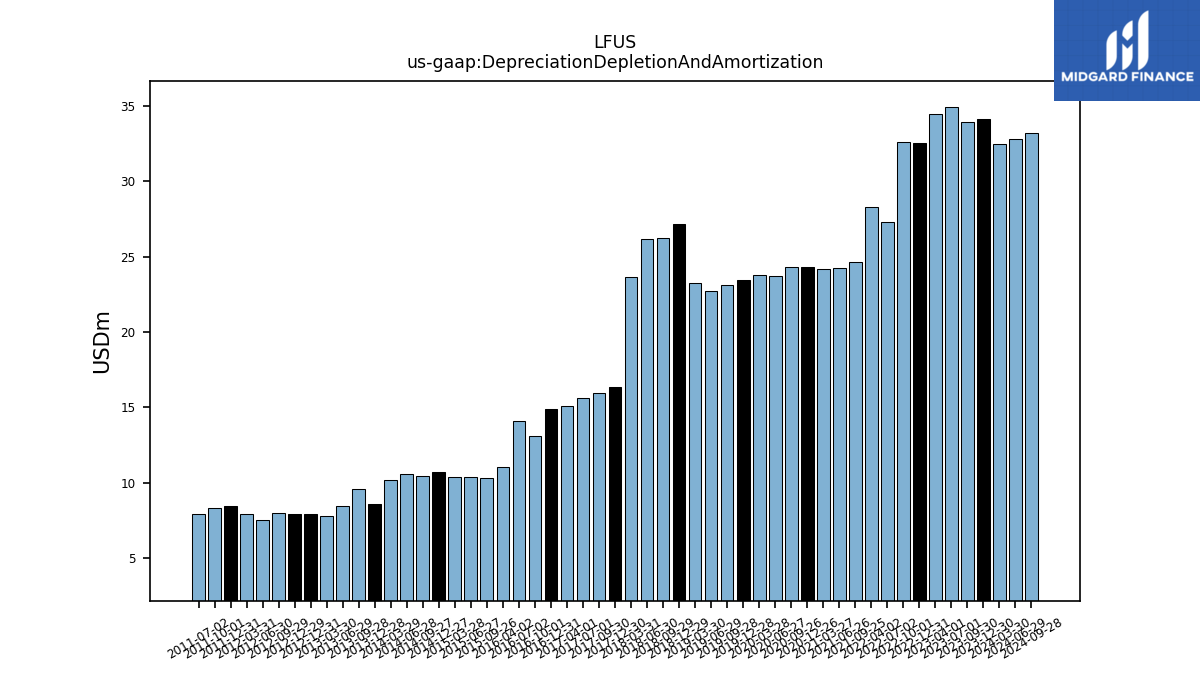
| Depreciation Depletion And Amortization | 34.15 | 33.91 | 34.89 | 34.48 | 32.50 | 32.59 | 27.32 | 28.30 | NA | 24.64 | 24.21 | 24.20 | 24.31 | 24.33 | 23.73 | 23.80 | 23.45 | 23.09 | 22.69 | 23.28 | 27.13 | 26.26 | 26.19 | 23.61 | 16.38 | 15.95 | 15.62 | 15.07 | 14.91 | 13.12 | 14.08 | 11.03 | NA | 10.31 | 10.37 | 10.42 | 10.69 | 10.43 | 10.59 | 10.17 | 8.63 | 9.60 | 8.45 | 7.80 | 7.95 | 7.95 | 7.97 | 7.57 | 7.95 | 8.44 | 8.30 | 7.92 | NA | NA | NA | NA | |
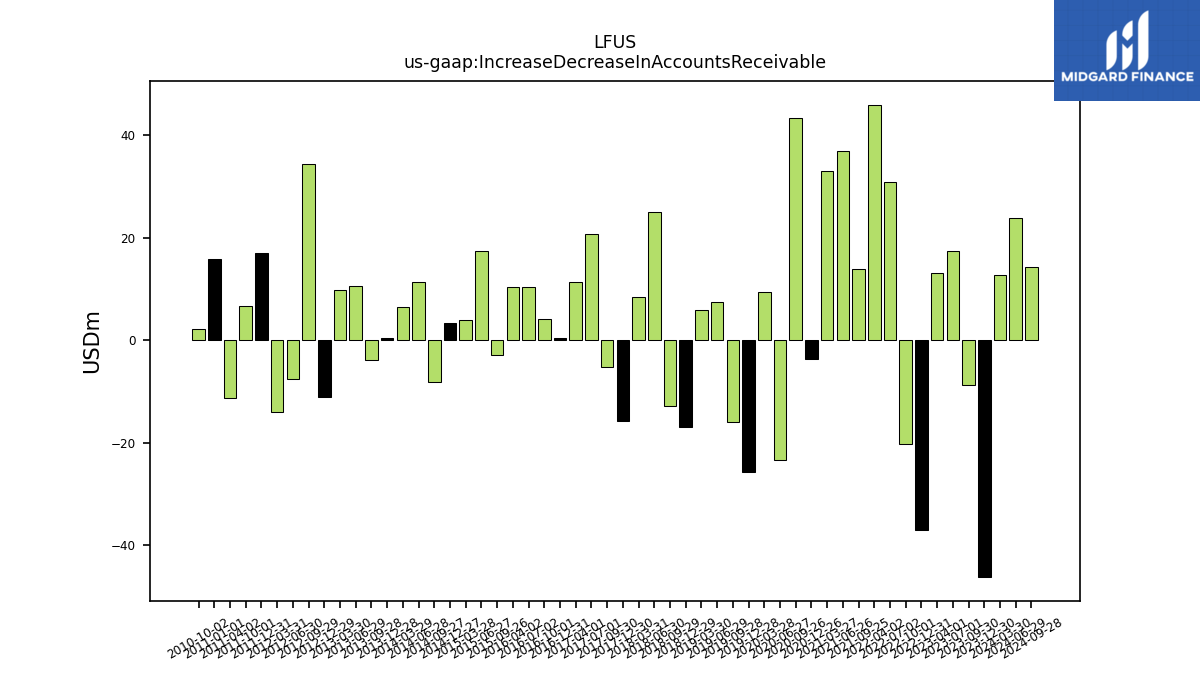
| Increase Decrease In Accounts Receivable | -46.27 | -8.81 | 17.39 | 13.18 | -37.10 | -20.38 | 30.86 | 45.95 | NA | 13.91 | 36.91 | 32.97 | -3.77 | 43.28 | -23.37 | 9.46 | -25.72 | -16.02 | 7.44 | 5.80 | -17.05 | -12.89 | 25.06 | 8.42 | -15.71 | -5.25 | 20.77 | 11.27 | 0.37 | 4.02 | 10.43 | 10.41 | NA | -2.99 | 17.36 | 3.91 | 3.33 | -8.14 | 11.37 | 6.50 | 0.34 | -3.90 | 10.50 | 9.74 | NA | -11.17 | 34.44 | -7.66 | -14.02 | 17.03 | 6.62 | NA | -11.28 | 15.80 | 2.18 | NA | |
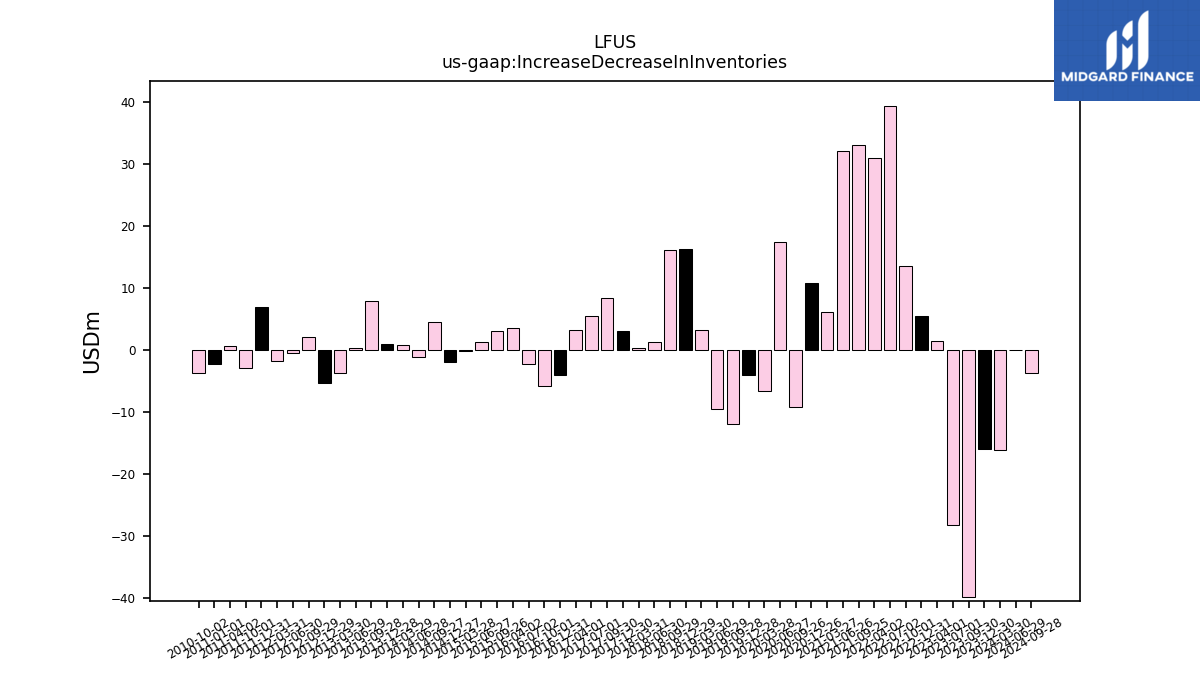
| Increase Decrease In Inventories | -16.02 | -39.82 | -28.17 | 1.53 | 5.43 | 13.52 | 39.41 | 30.88 | NA | 33.03 | 32.05 | 6.15 | 10.81 | -9.15 | 17.43 | -6.67 | -3.99 | -11.87 | -9.48 | 3.25 | 16.35 | 16.12 | 1.23 | 0.27 | 3.02 | 8.42 | 5.44 | 3.30 | -4.03 | -5.79 | -2.20 | 3.48 | NA | 3.00 | 1.35 | -0.15 | -1.86 | 4.53 | -1.18 | 0.77 | 0.95 | 7.89 | 0.28 | -3.63 | NA | -5.38 | 2.09 | -0.44 | -1.71 | 6.98 | -2.90 | NA | 0.68 | -2.29 | -3.68 | NA | |
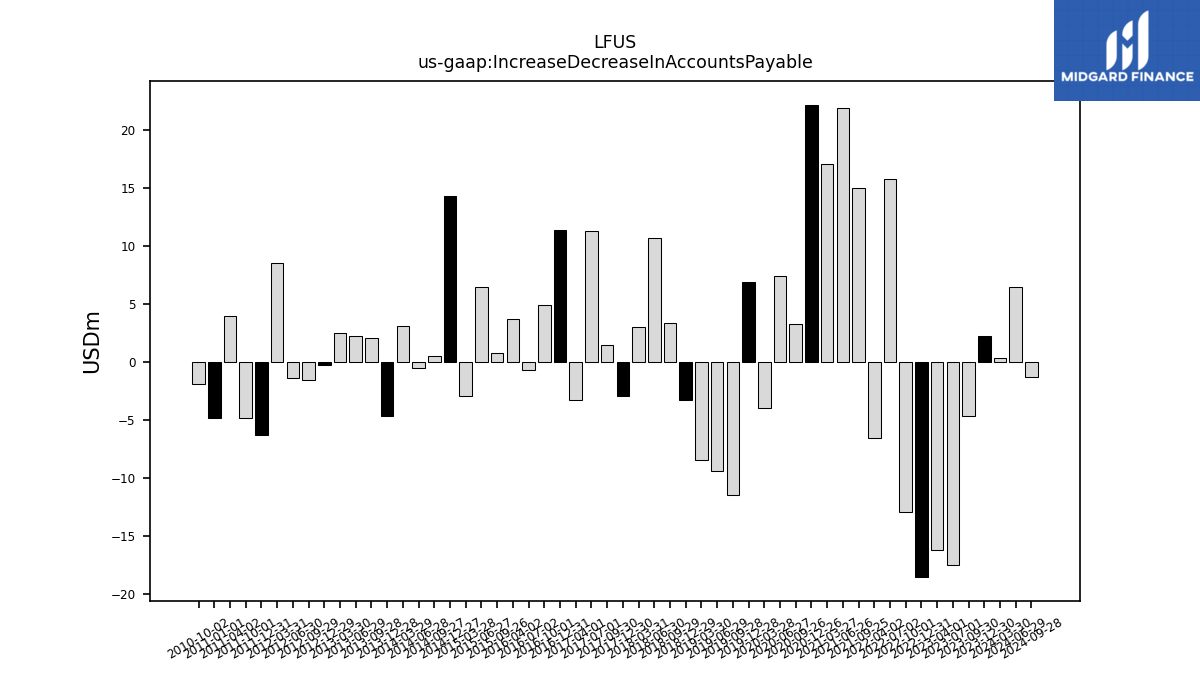
| Increase Decrease In Accounts Payable | 2.20 | -4.68 | -17.55 | -16.25 | -18.57 | -12.99 | 15.76 | -6.61 | NA | 14.99 | 21.89 | 17.07 | 22.16 | 3.22 | 7.40 | -3.96 | 6.88 | -11.53 | -9.43 | -8.50 | -3.33 | 3.35 | 10.69 | 2.99 | -2.95 | 1.46 | 11.28 | -3.29 | 11.35 | 4.87 | -0.74 | 3.72 | NA | 0.78 | 6.40 | -2.96 | 14.26 | 0.49 | -0.52 | 3.06 | -4.66 | 2.00 | 2.20 | 2.45 | NA | -0.29 | -1.53 | -1.38 | 8.55 | -6.29 | -4.83 | NA | 3.90 | -4.82 | -1.92 | NA | |
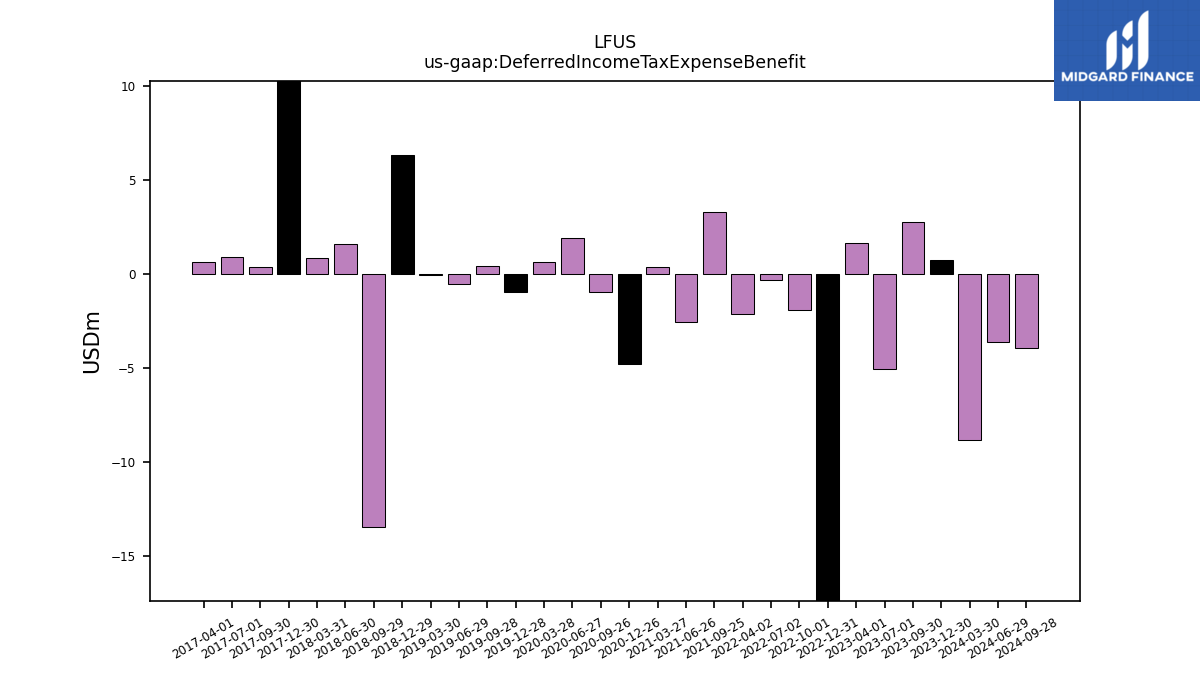
| Deferred Income Tax Expense Benefit | 0.73 | 2.74 | -5.05 | 1.62 | -18.10 | -1.90 | -0.31 | -2.11 | NA | 3.29 | -2.55 | 0.38 | -4.78 | -0.94 | 1.90 | 0.62 | -0.94 | 0.43 | -0.56 | -0.07 | 6.30 | -13.41 | 1.59 | 0.84 | 15.20 | 0.35 | 0.90 | 0.62 | NA | NA | NA | NA | NA | NA | NA | NA | NA | NA | NA | NA | NA | NA | NA | NA | NA | NA | NA | NA | NA | NA | NA | NA | NA | NA | NA | NA | |
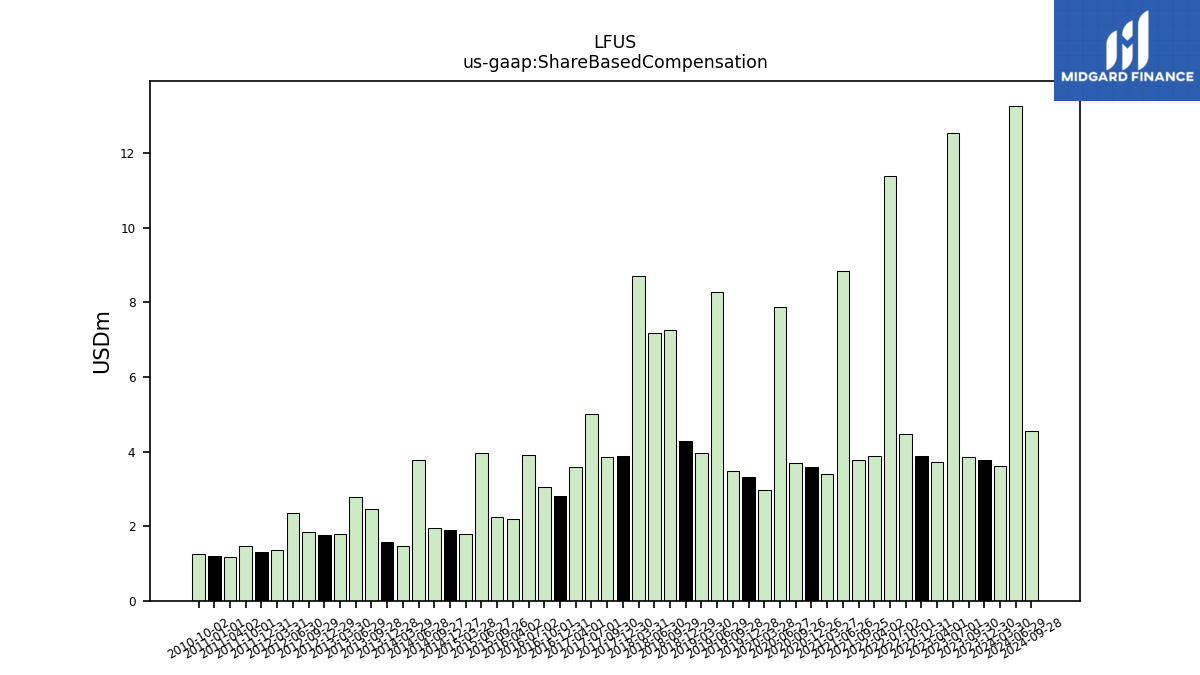
| Share Based Compensation | 3.77 | 3.86 | 12.54 | 3.73 | 3.89 | 4.46 | 11.38 | 3.89 | NA | 3.77 | 8.84 | 3.40 | 3.58 | 3.69 | 7.89 | 2.96 | 3.31 | 3.49 | 8.28 | 3.97 | 4.28 | 7.27 | 7.17 | 8.71 | 3.88 | 3.85 | 5.01 | 3.58 | 2.82 | 3.04 | 3.92 | 2.20 | NA | 2.23 | 3.96 | 1.80 | 1.90 | 1.94 | 3.76 | 1.47 | 1.58 | 2.47 | 2.78 | 1.78 | NA | 1.77 | 1.85 | 2.36 | 1.36 | 1.30 | 1.46 | NA | 1.18 | 1.20 | 1.26 | NA |
| 2023-12-30 | 2023-09-30 | 2023-07-01 | 2023-04-01 | 2022-12-31 | 2022-10-01 | 2022-07-02 | 2022-04-02 | 2022-01-01 | 2021-09-25 | 2021-06-26 | 2021-03-27 | 2020-12-26 | 2020-09-26 | 2020-06-27 | 2020-03-28 | 2019-12-28 | 2019-09-28 | 2019-06-29 | 2019-03-30 | 2018-12-29 | 2018-09-29 | 2018-06-30 | 2018-03-31 | 2017-12-30 | 2017-09-30 | 2017-07-01 | 2017-04-01 | 2016-12-31 | 2016-10-01 | 2016-07-02 | 2016-04-02 | 2016-01-02 | 2015-09-26 | 2015-06-27 | 2015-03-28 | 2014-12-27 | 2014-09-27 | 2014-06-28 | 2014-03-29 | 2013-12-28 | 2013-09-28 | 2013-06-29 | 2013-03-30 | 2012-12-31 | 2012-12-29 | 2012-09-29 | 2012-06-30 | 2012-03-31 | 2011-12-31 | 2011-10-01 | 2011-07-02 | 2011-04-02 | 2011-01-01 | 2010-10-02 | 2010-07-03 | ||
|---|---|---|---|---|---|---|---|---|---|---|---|---|---|---|---|---|---|---|---|---|---|---|---|---|---|---|---|---|---|---|---|---|---|---|---|---|---|---|---|---|---|---|---|---|---|---|---|---|---|---|---|---|---|---|---|---|---|
| Net Cash Provided By Used In Investing Activities | -22.94 | -62.36 | -15.83 | -183.19 | -26.42 | -544.61 | -35.58 | -29.79 | NA | -25.67 | -17.92 | -122.02 | -10.04 | -12.00 | -12.85 | -16.54 | -23.50 | -13.15 | -5.57 | -14.24 | -13.69 | -17.83 | -26.36 | -324.38 | -16.94 | -43.08 | -14.02 | -22.10 | -12.76 | -124.28 | -100.98 | -273.22 | NA | -6.23 | -10.55 | -12.27 | -38.65 | 0.52 | -7.46 | -58.41 | -6.95 | -10.78 | -153.94 | -13.92 | NA | -8.56 | -11.09 | -24.20 | -7.84 | -22.76 | -15.63 | NA | -4.45 | -54.74 | -8.55 | NA | |
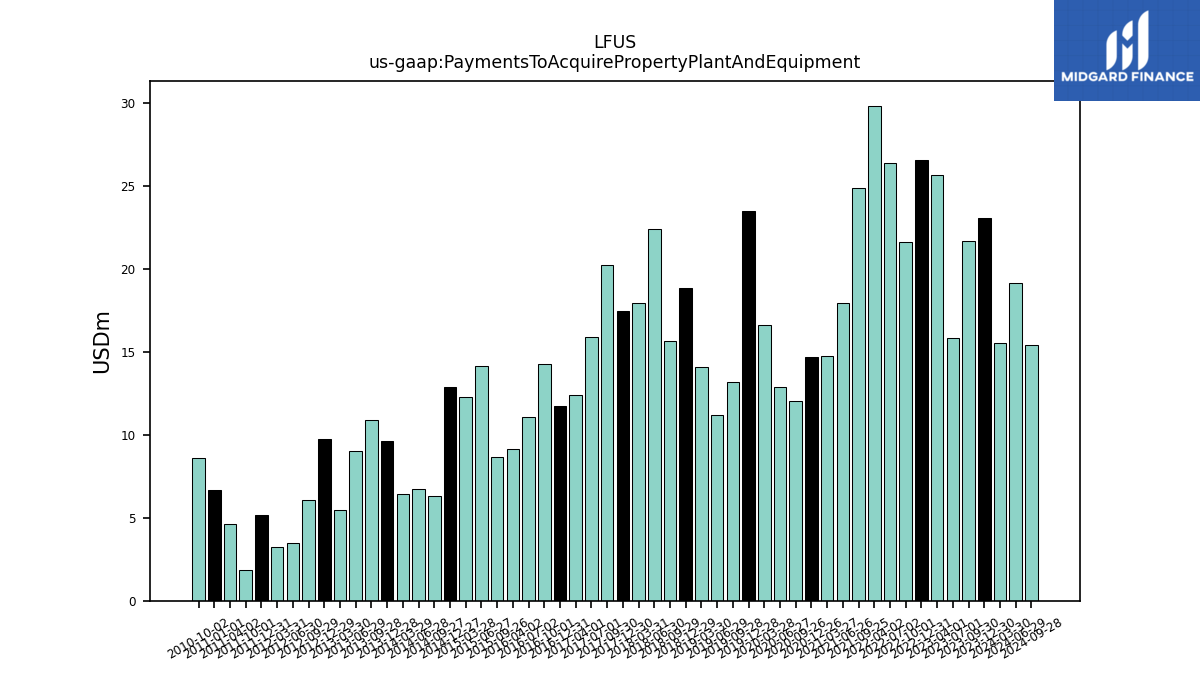
| Payments To Acquire Property Plant And Equipment | 23.02 | 21.66 | 15.84 | 25.66 | 26.57 | 21.62 | 26.34 | 29.81 | NA | 24.87 | 17.94 | 14.72 | 14.65 | 12.06 | 12.89 | 16.59 | 23.50 | 13.15 | 11.17 | 14.08 | 18.81 | 15.63 | 22.41 | 17.91 | 17.45 | 20.19 | 15.90 | 12.38 | 11.73 | 14.28 | 11.08 | 9.14 | NA | 8.63 | 14.11 | 12.28 | 12.86 | 6.29 | 6.71 | 6.42 | 9.62 | 10.88 | 8.99 | 5.45 | NA | 9.73 | 6.05 | 3.50 | 3.24 | 5.17 | 1.82 | NA | 4.61 | 6.69 | 8.59 | NA |
| 2023-12-30 | 2023-09-30 | 2023-07-01 | 2023-04-01 | 2022-12-31 | 2022-10-01 | 2022-07-02 | 2022-04-02 | 2022-01-01 | 2021-09-25 | 2021-06-26 | 2021-03-27 | 2020-12-26 | 2020-09-26 | 2020-06-27 | 2020-03-28 | 2019-12-28 | 2019-09-28 | 2019-06-29 | 2019-03-30 | 2018-12-29 | 2018-09-29 | 2018-06-30 | 2018-03-31 | 2017-12-30 | 2017-09-30 | 2017-07-01 | 2017-04-01 | 2016-12-31 | 2016-10-01 | 2016-07-02 | 2016-04-02 | 2016-01-02 | 2015-09-26 | 2015-06-27 | 2015-03-28 | 2014-12-27 | 2014-09-27 | 2014-06-28 | 2014-03-29 | 2013-12-28 | 2013-09-28 | 2013-06-29 | 2013-03-30 | 2012-12-31 | 2012-12-29 | 2012-09-29 | 2012-06-30 | 2012-03-31 | 2011-12-31 | 2011-10-01 | 2011-07-02 | 2011-04-02 | 2011-01-01 | 2010-10-02 | 2010-07-03 | ||
|---|---|---|---|---|---|---|---|---|---|---|---|---|---|---|---|---|---|---|---|---|---|---|---|---|---|---|---|---|---|---|---|---|---|---|---|---|---|---|---|---|---|---|---|---|---|---|---|---|---|---|---|---|---|---|---|---|---|
| Net Cash Provided By Used In Financing Activities | -138.58 | -14.46 | -20.48 | -12.20 | -11.72 | 76.91 | 282.09 | -37.07 | NA | -11.69 | -14.91 | -34.27 | -49.43 | -68.90 | -15.28 | 65.80 | -10.81 | -59.84 | -44.29 | -31.33 | -73.36 | -0.95 | -44.10 | 240.31 | -18.19 | 3.59 | -13.02 | 2.94 | 21.82 | 73.59 | -14.95 | 203.73 | NA | -7.54 | -11.16 | -8.45 | -84.72 | -23.06 | -0.91 | 65.43 | -10.77 | -5.22 | 146.88 | 11.34 | NA | -5.70 | 1.81 | -7.67 | 12.30 | -10.23 | -16.86 | NA | 8.69 | 17.59 | -15.19 | NA | |
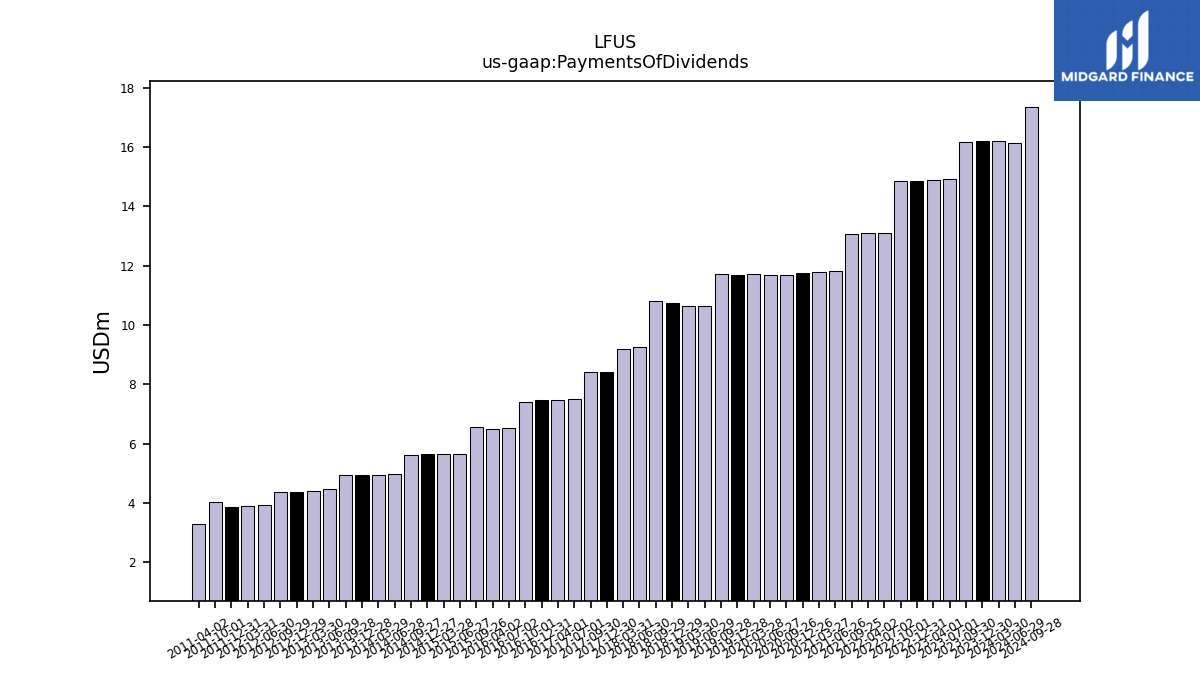
| Payments Of Dividends | 16.19 | 16.18 | 14.91 | 14.88 | 14.86 | 14.85 | 13.12 | 13.09 | NA | 13.05 | 11.81 | 11.78 | 11.74 | 11.70 | 11.68 | 11.72 | 11.70 | 11.72 | 10.65 | 10.62 | 10.73 | 10.80 | 9.26 | 9.20 | 8.40 | 8.40 | 7.49 | 7.47 | 7.46 | 7.41 | 6.51 | 6.48 | NA | 6.57 | 5.66 | 5.63 | 5.63 | 5.62 | 4.98 | 4.94 | 4.93 | 4.92 | 4.46 | 4.41 | NA | 4.38 | 4.38 | 3.92 | 3.89 | 3.88 | 4.02 | NA | 3.28 | NA | NA | NA |
| 2023-12-30 | 2023-09-30 | 2023-07-01 | 2023-04-01 | 2022-12-31 | 2022-10-01 | 2022-07-02 | 2022-04-02 | 2022-01-01 | 2021-09-25 | 2021-06-26 | 2021-03-27 | 2020-12-26 | 2020-09-26 | 2020-06-27 | 2020-03-28 | 2019-12-28 | 2019-09-28 | 2019-06-29 | 2019-03-30 | 2018-12-29 | 2018-09-29 | 2018-06-30 | 2018-03-31 | 2017-12-30 | 2017-09-30 | 2017-07-01 | 2017-04-01 | 2016-12-31 | 2016-10-01 | 2016-07-02 | 2016-04-02 | 2016-01-02 | 2015-09-26 | 2015-06-27 | 2015-03-28 | 2014-12-27 | 2014-09-27 | 2014-06-28 | 2014-03-29 | 2013-12-28 | 2013-09-28 | 2013-06-29 | 2013-03-30 | 2012-12-31 | 2012-12-29 | 2012-09-29 | 2012-06-30 | 2012-03-31 | 2011-12-31 | 2011-10-01 | 2011-07-02 | 2011-04-02 | 2011-01-01 | 2010-10-02 | 2010-07-03 | ||
|---|---|---|---|---|---|---|---|---|---|---|---|---|---|---|---|---|---|---|---|---|---|---|---|---|---|---|---|---|---|---|---|---|---|---|---|---|---|---|---|---|---|---|---|---|---|---|---|---|---|---|---|---|---|---|---|---|---|
| Revenues | 533.81 | 607.07 | 612.00 | 609.78 | 613.25 | 658.88 | 618.44 | 623.33 | 553.07 | 539.58 | 523.49 | 463.79 | 400.70 | 391.57 | 307.34 | 346.10 | 338.52 | 361.97 | 397.88 | 405.50 | 402.28 | 439.19 | 459.18 | 417.81 | 304.85 | 317.89 | 313.36 | 285.44 | 284.52 | 280.33 | 271.91 | 219.40 | 220.02 | 215.51 | 222.02 | 210.31 | 206.62 | 217.61 | 220.91 | 206.86 | 198.13 | 201.04 | 187.77 | 170.92 | 158.79 | 158.79 | 172.69 | 175.85 | 160.58 | 147.19 | 173.99 | 176.62 | 167.16 | 142.65 | 163.47 | 157.51 | |
| Revenue From Contract With Customer Including Assessed Tax | 533.81 | 607.07 | 612.00 | 609.78 | 613.25 | 658.88 | 618.44 | 623.33 | 553.07 | 539.58 | 523.49 | 463.79 | 400.70 | 391.57 | 307.34 | 346.10 | 338.52 | 361.97 | 397.88 | 405.50 | 402.28 | 439.19 | 459.18 | 417.81 | 304.85 | 317.89 | 313.36 | 285.44 | 284.52 | 280.33 | 271.91 | 219.40 | 220.02 | 215.51 | 222.02 | 210.31 | 206.62 | 217.61 | 220.91 | 206.86 | 198.13 | 201.04 | 187.77 | 170.92 | 158.79 | 158.79 | 172.69 | 175.85 | 160.58 | 147.19 | 173.99 | 176.62 | 167.16 | 142.65 | 163.47 | 157.51 | |
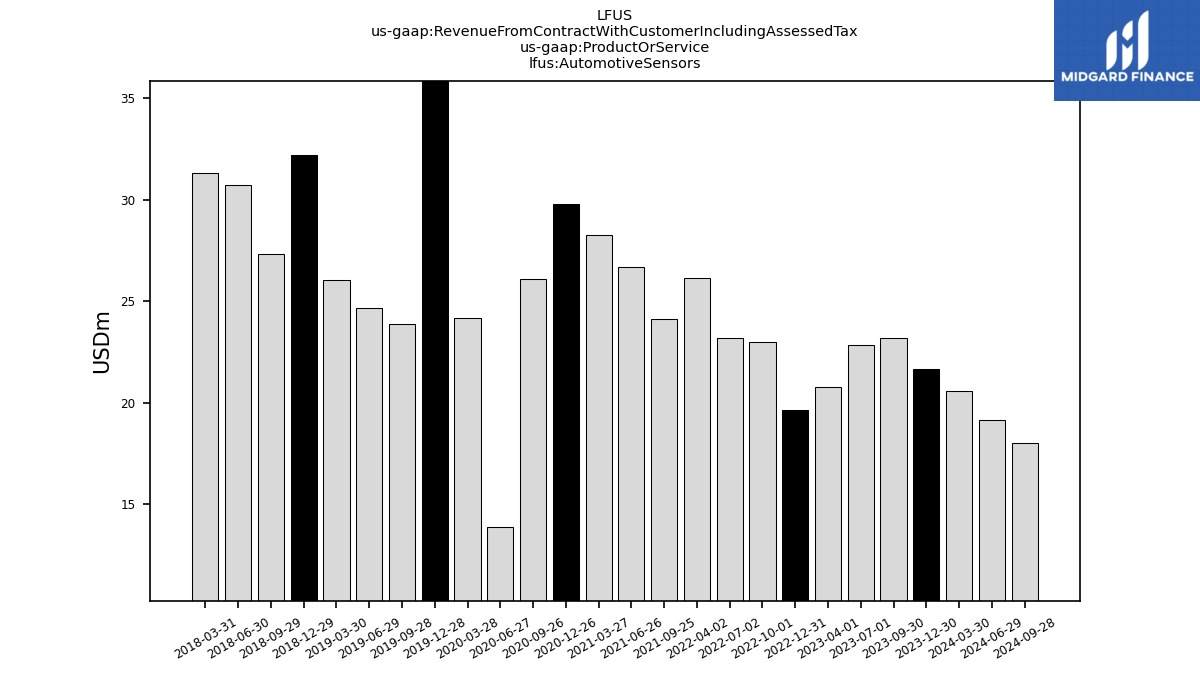
| Automotive Sensors | 21.68 | 23.20 | 22.84 | 20.80 | 19.63 | 23.00 | 23.20 | 26.14 | NA | 24.11 | 26.68 | 28.28 | 29.82 | 26.09 | 13.90 | 24.17 | 37.36 | 23.88 | 24.68 | 26.06 | 32.20 | 27.31 | 30.73 | 31.32 | NA | NA | NA | NA | NA | NA | NA | NA | NA | NA | NA | NA | NA | NA | NA | NA | NA | NA | NA | NA | NA | NA | NA | NA | NA | NA | NA | NA | NA | NA | NA | NA | |
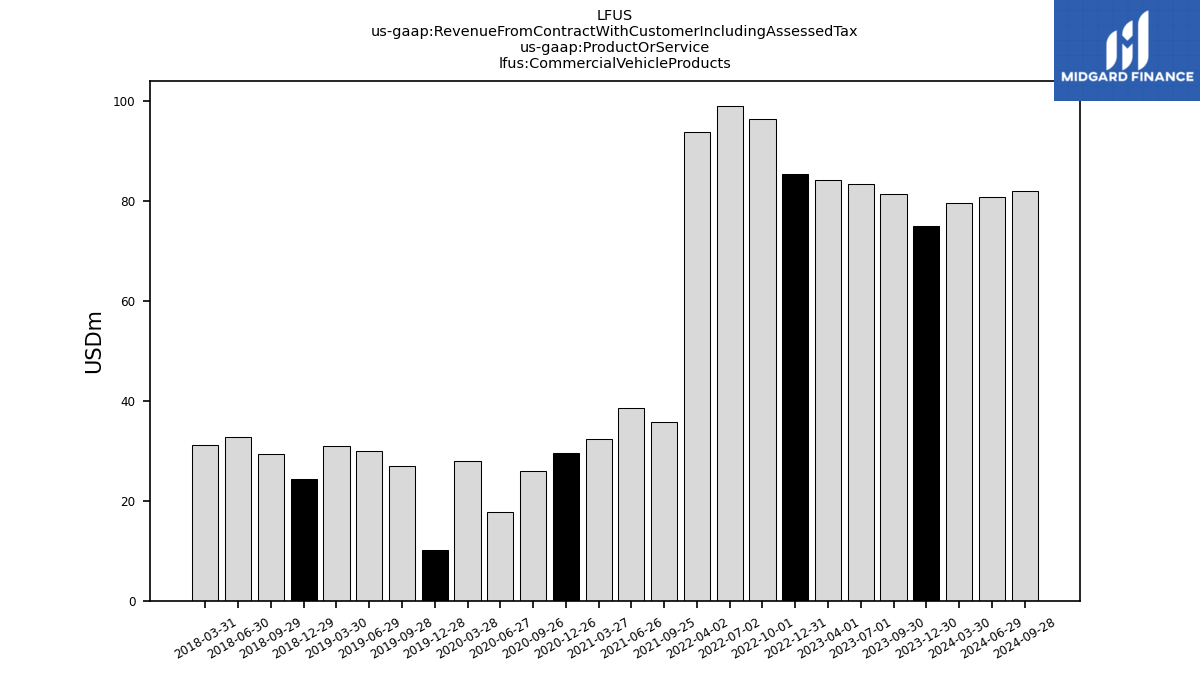
| Commercial Vehicle Products | 74.99 | 81.29 | 83.33 | 84.15 | 85.33 | 96.46 | 99.05 | 93.87 | NA | 35.67 | 38.59 | 32.34 | 29.64 | 25.94 | 17.79 | 27.95 | 10.15 | 26.91 | 30.05 | 30.88 | 24.29 | 29.34 | 32.86 | 31.23 | NA | NA | NA | NA | NA | NA | NA | NA | NA | NA | NA | NA | NA | NA | NA | NA | NA | NA | NA | NA | NA | NA | NA | NA | NA | NA | NA | NA | NA | NA | NA | NA | |
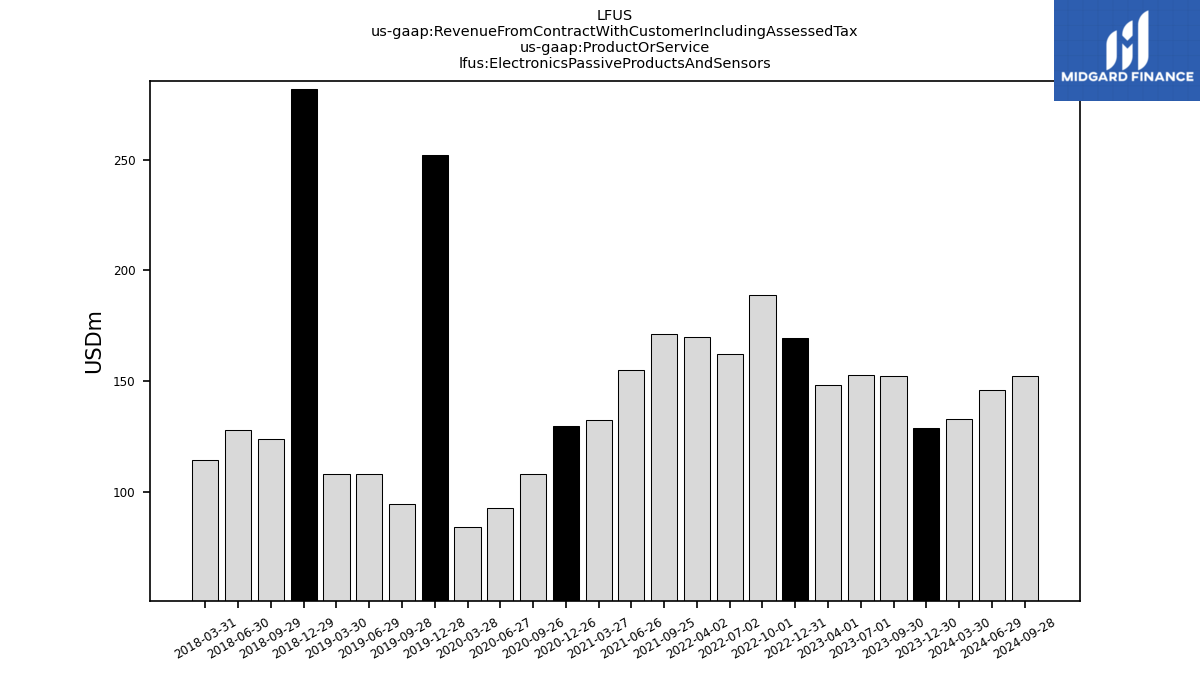
| Electronics Passive Products And Sensors | 129.17 | 152.41 | 152.85 | 148.60 | 169.37 | 188.92 | 162.31 | 169.94 | NA | 171.30 | 155.28 | 132.44 | 129.71 | 108.25 | 92.85 | 84.60 | 251.95 | 94.77 | 108.48 | 108.38 | 281.98 | 124.17 | 128.32 | 114.50 | NA | NA | NA | NA | NA | NA | NA | NA | NA | NA | NA | NA | NA | NA | NA | NA | NA | NA | NA | NA | NA | NA | NA | NA | NA | NA | NA | NA | NA | NA | NA | NA | |
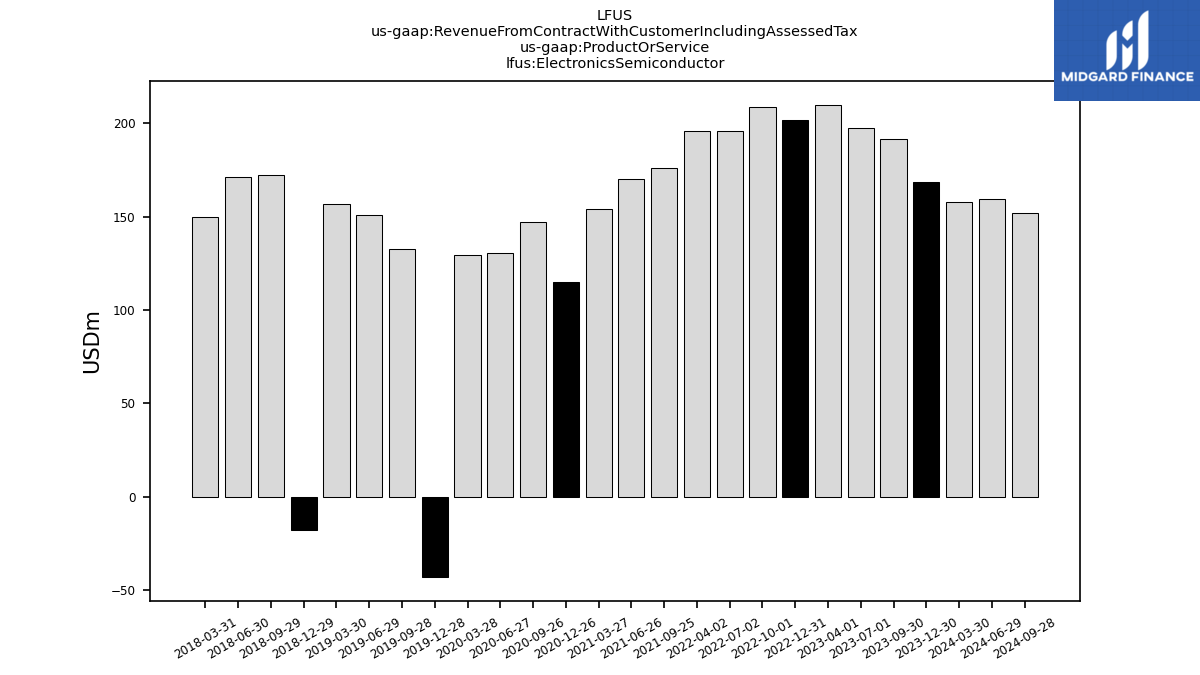
| Electronics Semiconductor | 168.58 | 191.52 | 197.29 | 210.00 | 201.83 | 208.71 | 195.86 | 195.88 | NA | 175.94 | 170.07 | 154.10 | 115.24 | 147.10 | 130.43 | 129.59 | -43.07 | 132.49 | 151.07 | 157.02 | -17.92 | 172.30 | 171.04 | 149.92 | NA | NA | NA | NA | NA | NA | NA | NA | NA | NA | NA | NA | NA | NA | NA | NA | NA | NA | NA | NA | NA | NA | NA | NA | NA | NA | NA | NA | NA | NA | NA | NA | |
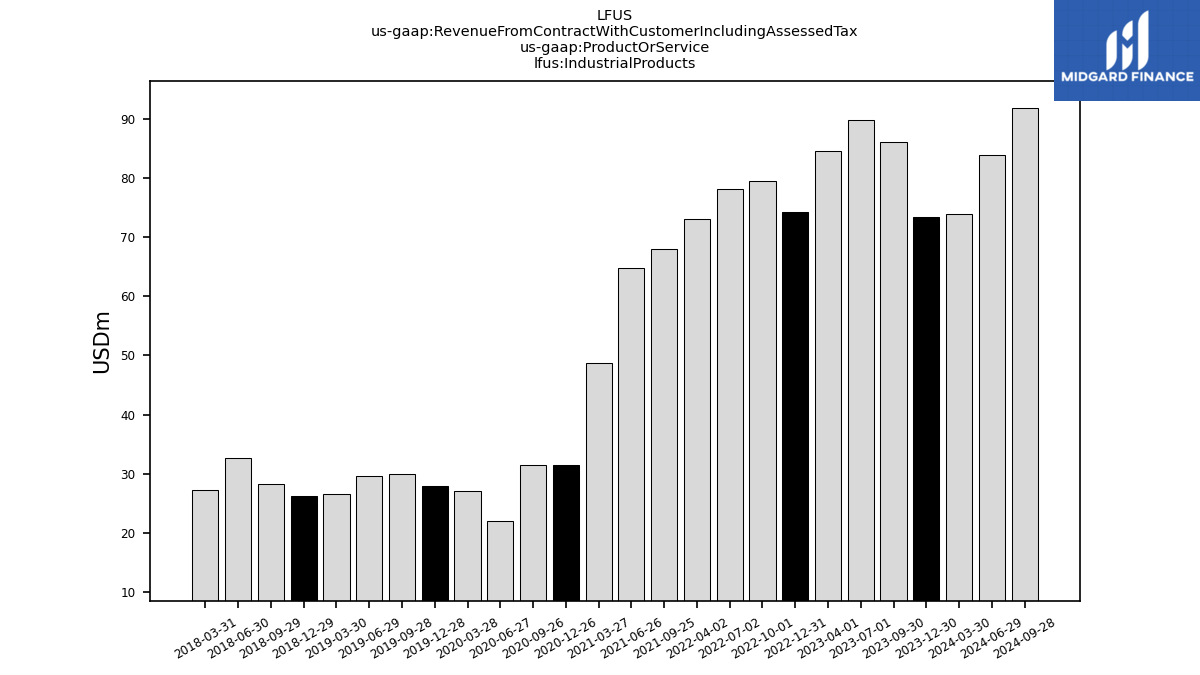
| Industrial Products | 73.48 | 86.12 | 89.80 | 84.55 | 74.18 | 79.52 | 78.23 | 73.00 | NA | 67.93 | 64.82 | 48.73 | 31.47 | 31.49 | 22.07 | 27.14 | 27.92 | 30.04 | 29.68 | 26.62 | 26.15 | 28.30 | 32.65 | 27.27 | NA | NA | NA | NA | NA | NA | NA | NA | NA | NA | NA | NA | NA | NA | NA | NA | NA | NA | NA | NA | NA | NA | NA | NA | NA | NA | NA | NA | NA | NA | NA | NA | |
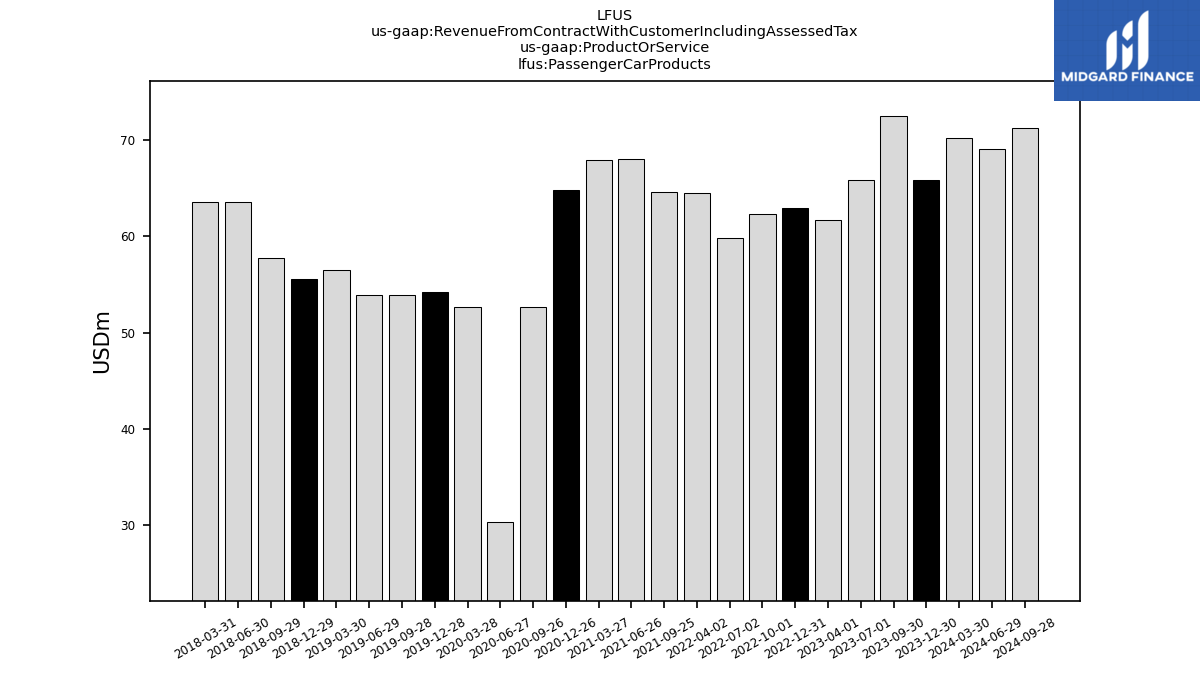
| Passenger Car Products | 65.90 | 72.52 | 65.88 | 61.70 | 62.92 | 62.28 | 59.78 | 64.49 | NA | 64.63 | 68.05 | 67.90 | 64.81 | 52.69 | 30.31 | 52.65 | 54.21 | 53.89 | 53.92 | 56.54 | 55.58 | 57.76 | 63.58 | 63.58 | NA | NA | NA | NA | NA | NA | NA | NA | NA | NA | NA | NA | NA | NA | NA | NA | NA | NA | NA | NA | NA | NA | NA | NA | NA | NA | NA | NA | NA | NA | NA | NA | |
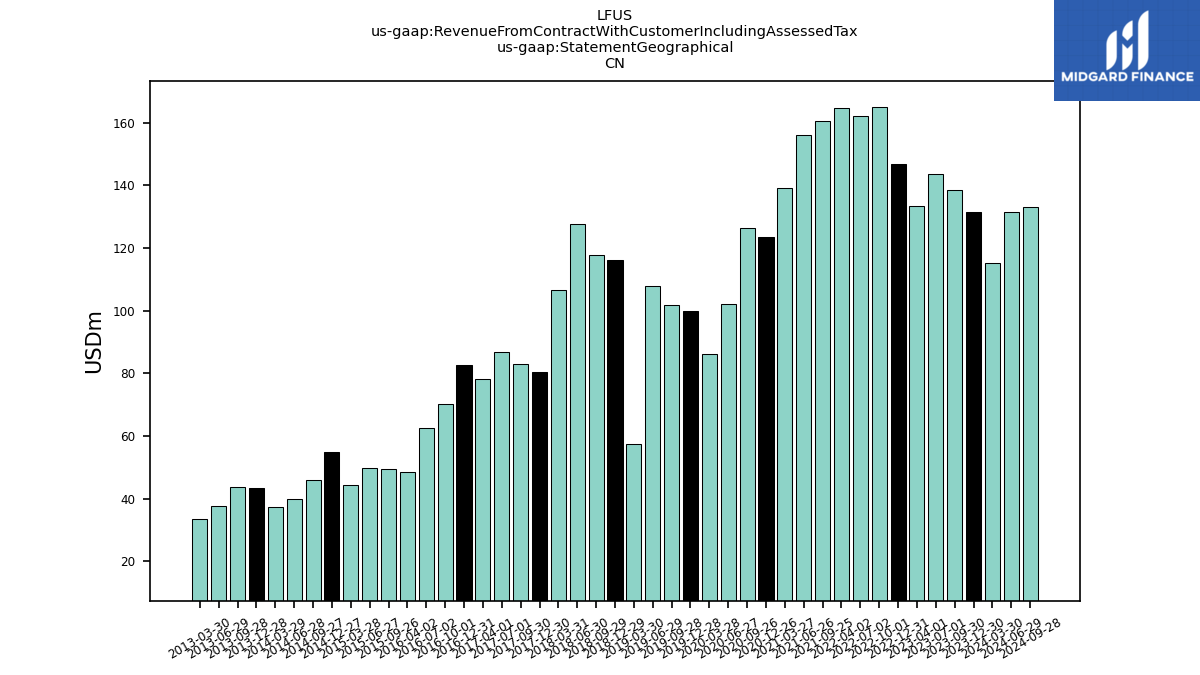
| 131.36 | 138.39 | 143.57 | 133.47 | 146.78 | 165.09 | 162.32 | 164.78 | NA | 160.63 | 156.09 | 139.16 | 123.45 | 126.51 | 102.03 | 86.02 | 99.83 | 101.96 | 107.73 | 57.33 | 116.08 | 117.81 | 127.78 | 106.51 | 80.38 | 82.99 | 86.89 | 78.22 | 82.57 | 70.22 | 62.41 | 48.51 | NA | 49.34 | 49.92 | 44.43 | 55.02 | 45.91 | 39.99 | 37.21 | 43.54 | 43.64 | 37.69 | 33.61 | NA | NA | NA | NA | NA | NA | NA | NA | NA | NA | NA | NA | ||
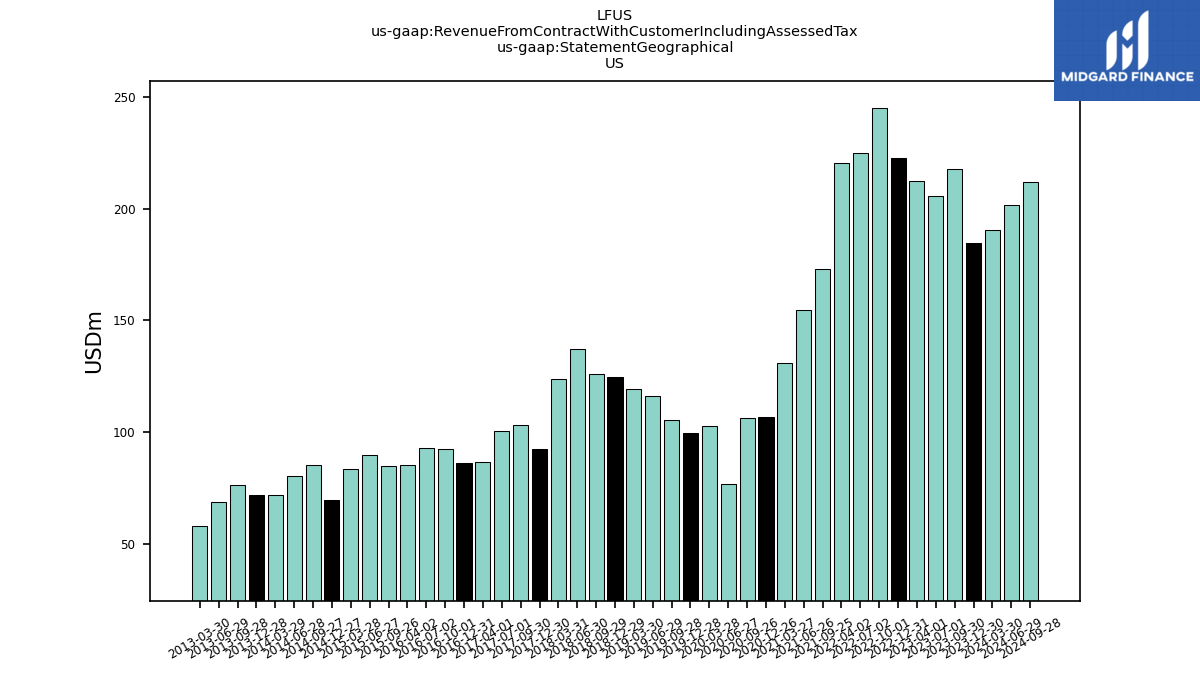
| US | 184.84 | 217.90 | 205.79 | 212.19 | 222.61 | 244.91 | 224.74 | 220.24 | NA | 173.00 | 154.80 | 130.93 | 106.64 | 106.12 | 76.87 | 102.91 | 99.65 | 105.29 | 115.99 | 119.53 | 124.56 | 125.87 | 137.24 | 123.88 | 92.49 | 103.23 | 100.65 | 86.66 | 86.02 | 92.47 | 93.04 | 85.15 | NA | 85.05 | 89.61 | 83.37 | 69.78 | 85.33 | 80.49 | 71.87 | 71.94 | 76.18 | 68.63 | 57.91 | NA | NA | NA | NA | NA | NA | NA | NA | NA | NA | NA | NA | |
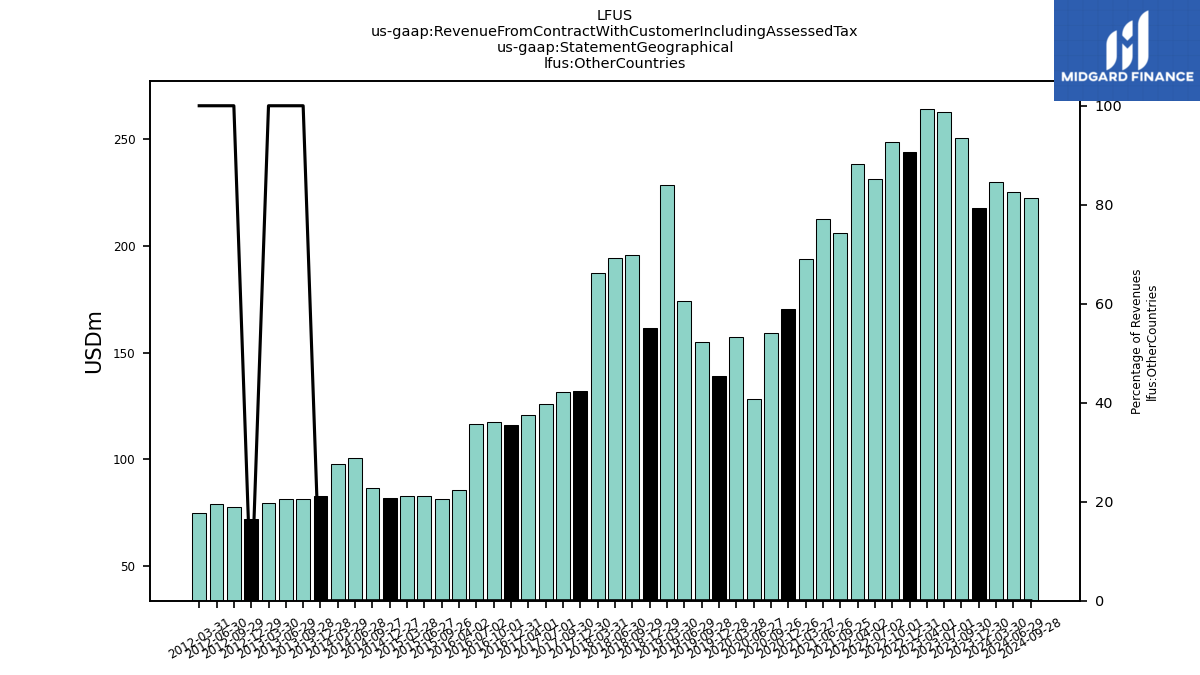
| Other Countries | 217.61 | 250.77 | 262.63 | 264.12 | 243.86 | 248.88 | 231.37 | 238.31 | NA | 205.96 | 212.60 | 193.71 | 170.60 | 158.94 | 128.44 | 157.17 | 139.04 | 154.72 | 174.16 | 228.64 | 161.64 | 195.51 | 194.17 | 187.43 | 131.98 | 131.67 | 125.82 | 120.56 | 115.94 | 117.64 | 116.47 | 85.74 | NA | 81.12 | 82.49 | 82.51 | 81.81 | 86.38 | 100.43 | 97.77 | 82.65 | 81.21 | 81.44 | 79.39 | NA | 71.77 | 77.36 | 78.81 | 74.88 | NA | NA | NA | NA | NA | NA | NA |
