
| 2023-09-30 | 2023-06-30 | 2023-03-31 | 2022-12-31 | 2022-09-30 | 2022-06-30 | 2022-03-31 | 2021-12-31 | 2021-09-30 | 2021-06-30 | 2021-03-31 | 2020-12-31 | 2020-09-30 | 2020-06-30 | 2020-03-31 | 2019-12-31 | 2019-09-30 | 2019-06-30 | 2019-03-31 | 2018-12-31 | 2018-09-30 | 2018-06-30 | 2018-03-31 | 2017-12-31 | 2017-09-30 | 2017-06-30 | 2017-03-31 | 2016-12-31 | 2016-09-30 | 2016-06-30 | 2016-03-31 | 2015-12-31 | 2015-09-30 | 2015-06-30 | 2015-03-31 | 2014-12-31 | 2014-09-30 | 2014-06-30 | 2014-03-31 | 2013-12-31 | 2013-09-30 | 2013-06-30 | 2013-03-31 | 2012-12-31 | 2012-09-30 | 2012-06-30 | 2012-03-31 | 2011-12-31 | 2011-09-30 | 2011-06-30 | 2011-03-31 | 2010-12-31 | 2010-09-30 | 2010-06-30 | ||
|---|---|---|---|---|---|---|---|---|---|---|---|---|---|---|---|---|---|---|---|---|---|---|---|---|---|---|---|---|---|---|---|---|---|---|---|---|---|---|---|---|---|---|---|---|---|---|---|---|---|---|---|---|---|---|---|
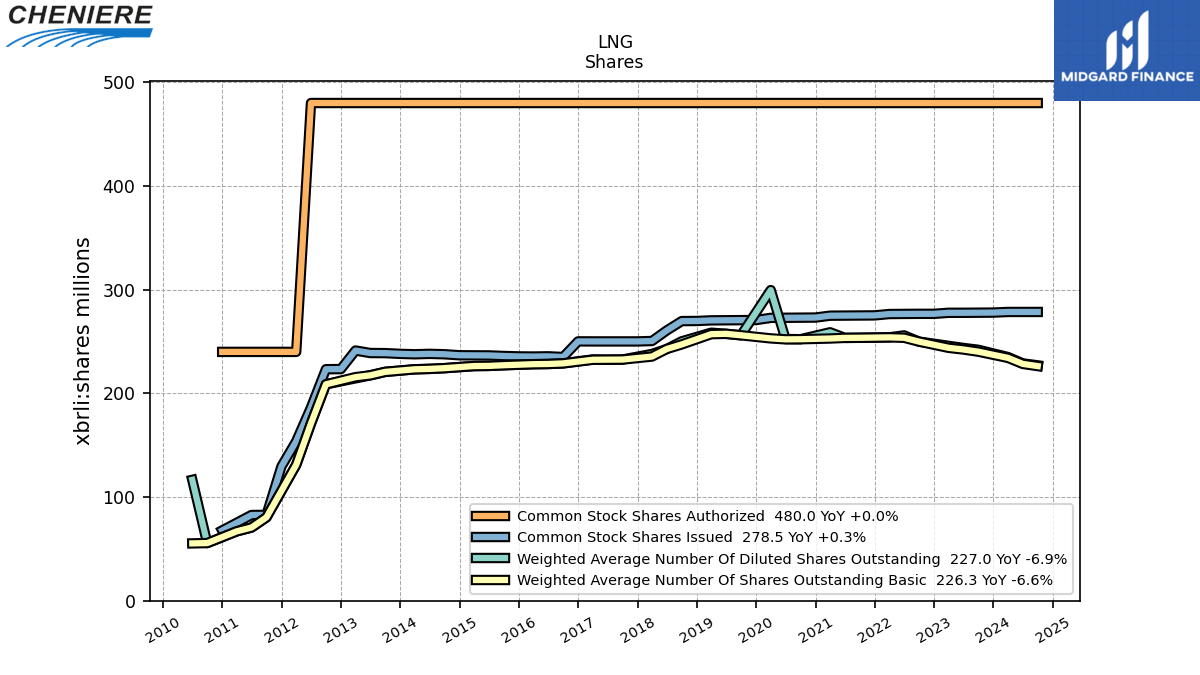
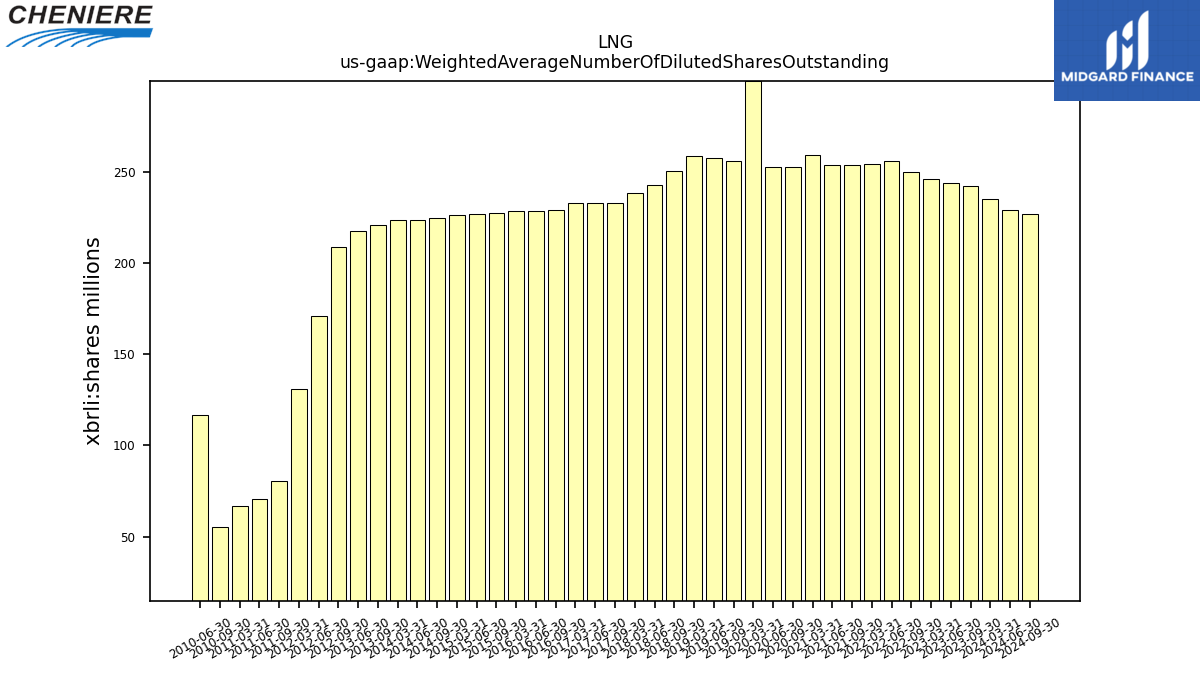
| Weighted Average Number Of Diluted Shares Outstanding | 242.00 | 243.80 | 245.80 | NA | 249.90 | 255.90 | 254.00 | NA | 253.60 | 253.50 | 258.90 | NA | 252.20 | 252.40 | 299.60 | NA | 256.00 | 257.40 | 258.50 | NA | 250.20 | 242.80 | 238.00 | NA | 232.60 | 232.50 | 232.70 | NA | 228.92 | 228.32 | 228.14 | NA | 227.13 | 226.48 | 226.33 | NA | 224.31 | 223.60 | 223.21 | NA | 220.73 | 217.40 | NA | NA | 208.71 | 171.00 | 131.11 | NA | 80.47 | 70.63 | 66.95 | NA | 55.61 | 116.60 | |
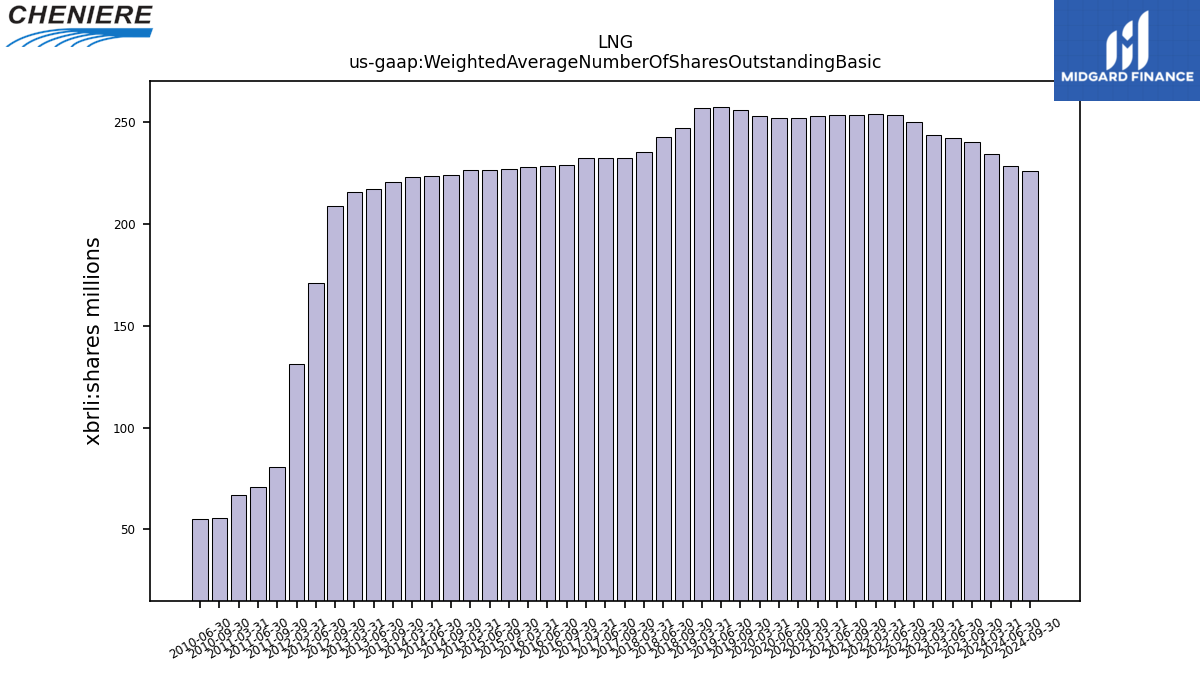
| Weighted Average Number Of Shares Outstanding Basic | 240.20 | 242.30 | 243.90 | NA | 249.90 | 253.60 | 254.00 | NA | 253.60 | 253.50 | 252.90 | NA | 252.20 | 252.10 | 253.00 | NA | 256.00 | 257.40 | 257.10 | NA | 247.20 | 242.80 | 235.50 | NA | 232.60 | 232.50 | 232.40 | NA | 228.92 | 228.32 | 228.14 | NA | 227.13 | 226.48 | 226.33 | NA | 224.31 | 223.60 | 223.21 | NA | 220.73 | 217.40 | 215.63 | NA | 208.71 | 171.00 | 131.11 | NA | 80.47 | 70.63 | 66.95 | NA | 55.61 | 55.32 | |
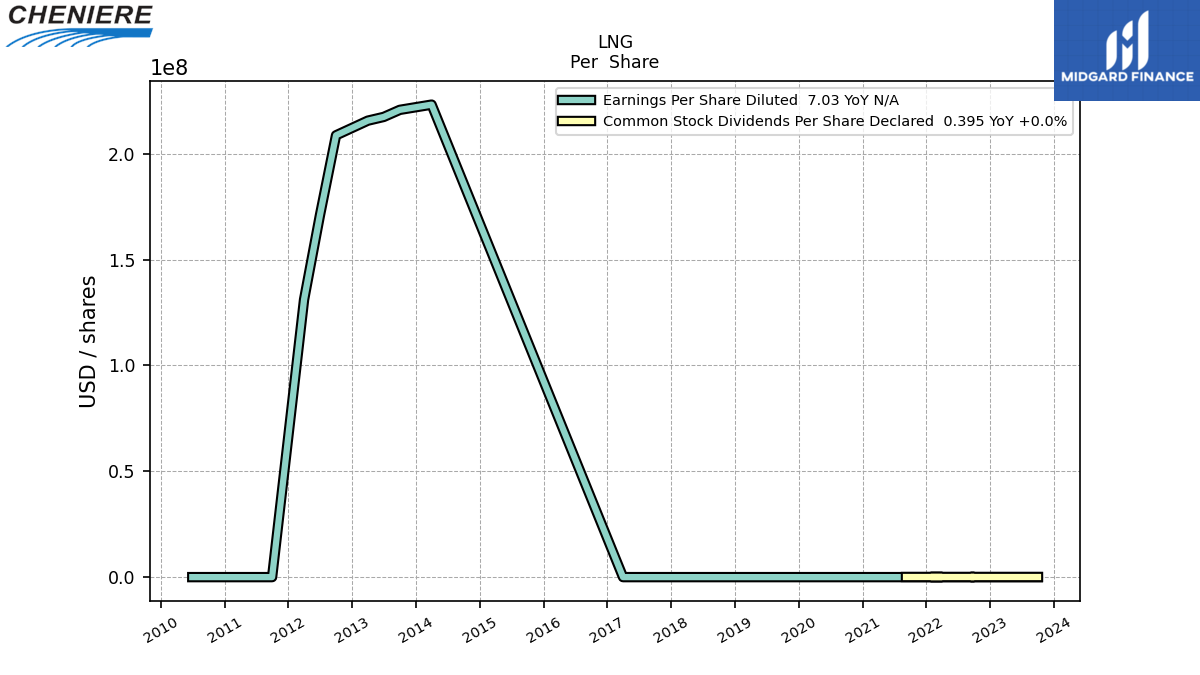
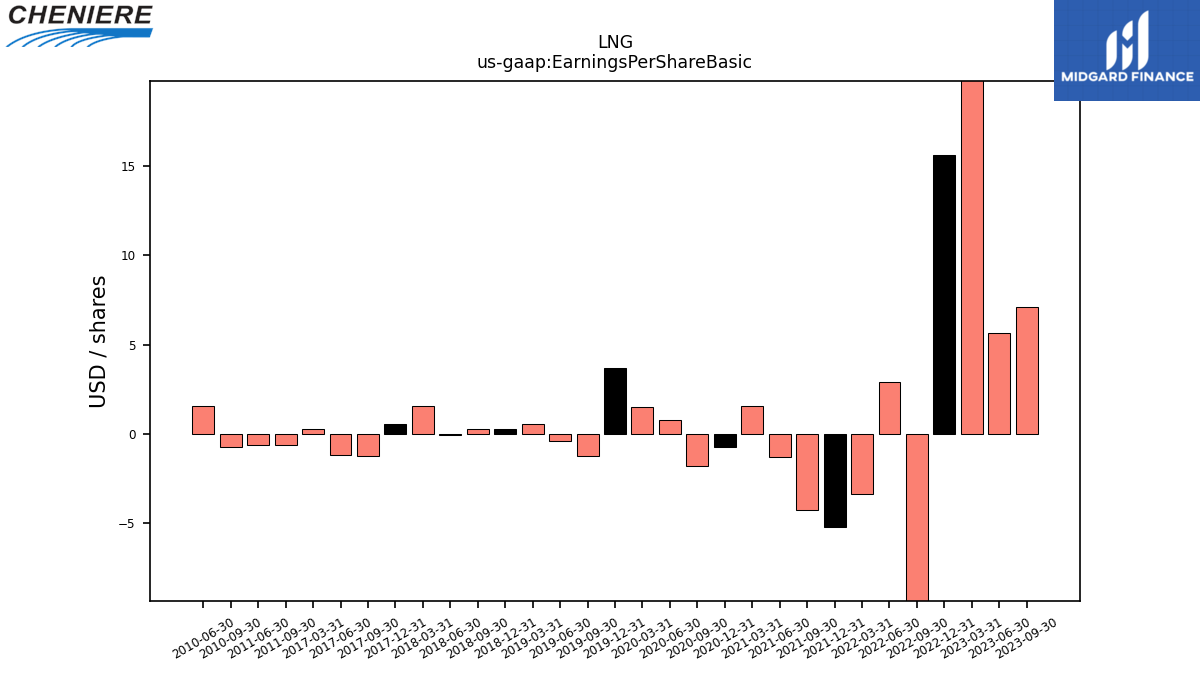
| Earnings Per Share Basic | 7.08 | 5.65 | 22.28 | 15.63 | -9.54 | 2.92 | -3.41 | -5.22 | -4.27 | -1.30 | 1.56 | -0.77 | -1.84 | 0.78 | 1.48 | 3.70 | -1.25 | -0.44 | 0.55 | 0.26 | 0.26 | -0.07 | 1.52 | 0.56 | -1.24 | -1.23 | 0.23 | NA | NA | NA | NA | NA | NA | NA | NA | NA | NA | NA | NA | NA | NA | NA | NA | NA | NA | NA | NA | NA | -0.67 | -0.67 | NA | NA | -0.73 | 1.55 | |
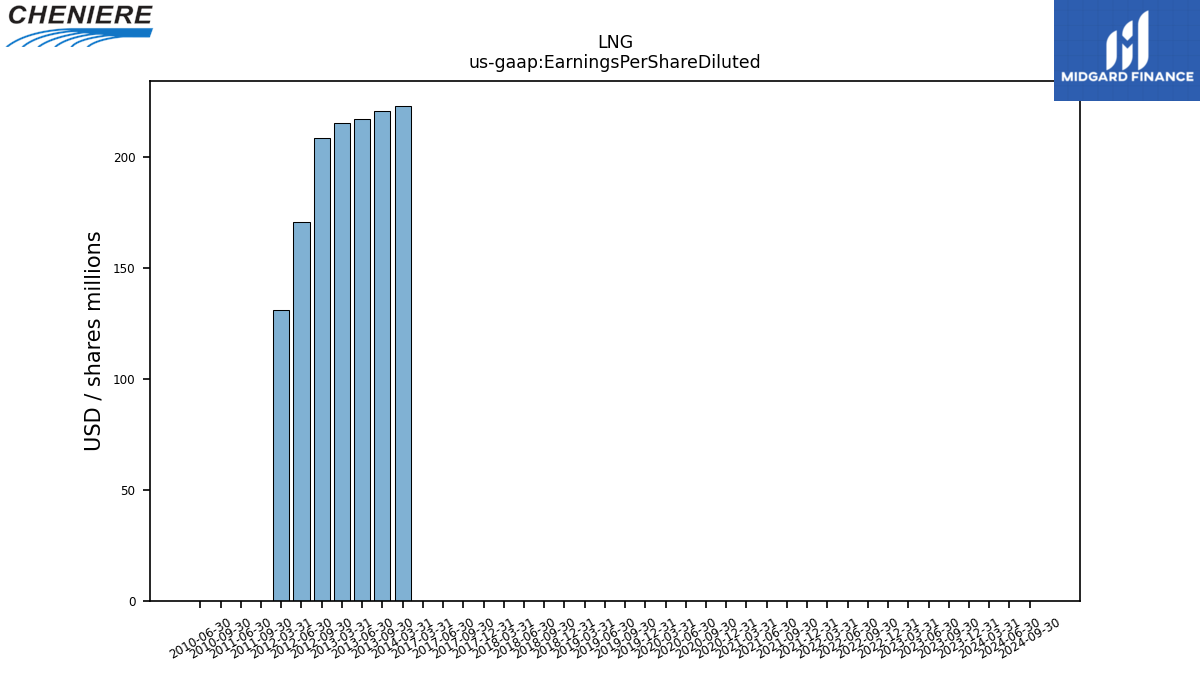
| Earnings Per Share Diluted | 7.03 | 5.61 | 22.10 | 15.58 | -9.54 | 2.90 | -3.41 | -5.22 | -4.27 | -1.30 | 1.54 | -0.77 | -1.84 | 0.78 | 1.43 | 3.34 | -1.25 | -0.44 | 0.54 | 0.26 | 0.26 | -0.07 | 1.50 | 0.56 | -1.24 | -1.23 | 0.23 | NA | NA | NA | NA | NA | NA | NA | NA | NA | NA | NA | 223207000.00 | NA | 220734000.00 | 217397000.00 | 215634000.00 | NA | 208712000.00 | 171001000.00 | 131107000.00 | NA | -0.67 | -0.67 | NA | NA | -0.73 | 0.86 |
| 2023-09-30 | 2023-06-30 | 2023-03-31 | 2022-12-31 | 2022-09-30 | 2022-06-30 | 2022-03-31 | 2021-12-31 | 2021-09-30 | 2021-06-30 | 2021-03-31 | 2020-12-31 | 2020-09-30 | 2020-06-30 | 2020-03-31 | 2019-12-31 | 2019-09-30 | 2019-06-30 | 2019-03-31 | 2018-12-31 | 2018-09-30 | 2018-06-30 | 2018-03-31 | 2017-12-31 | 2017-09-30 | 2017-06-30 | 2017-03-31 | 2016-12-31 | 2016-09-30 | 2016-06-30 | 2016-03-31 | 2015-12-31 | 2015-09-30 | 2015-06-30 | 2015-03-31 | 2014-12-31 | 2014-09-30 | 2014-06-30 | 2014-03-31 | 2013-12-31 | 2013-09-30 | 2013-06-30 | 2013-03-31 | 2012-12-31 | 2012-09-30 | 2012-06-30 | 2012-03-31 | 2011-12-31 | 2011-09-30 | 2011-06-30 | 2011-03-31 | 2010-12-31 | 2010-09-30 | 2010-06-30 | ||
|---|---|---|---|---|---|---|---|---|---|---|---|---|---|---|---|---|---|---|---|---|---|---|---|---|---|---|---|---|---|---|---|---|---|---|---|---|---|---|---|---|---|---|---|---|---|---|---|---|---|---|---|---|---|---|---|
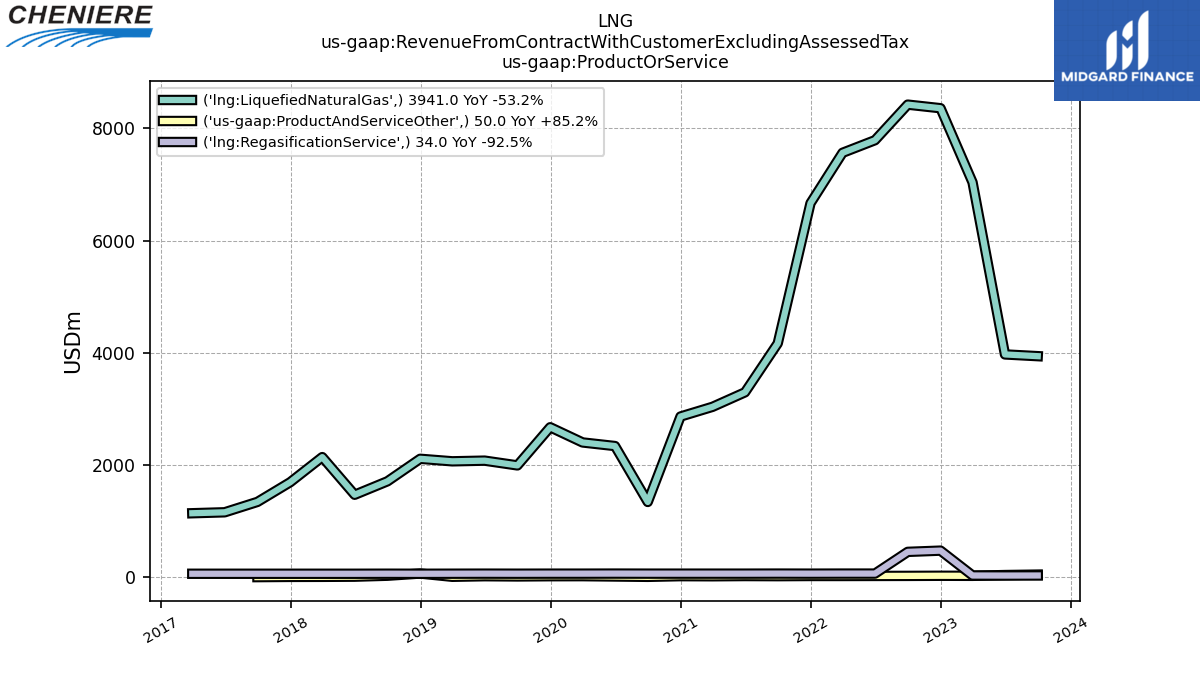
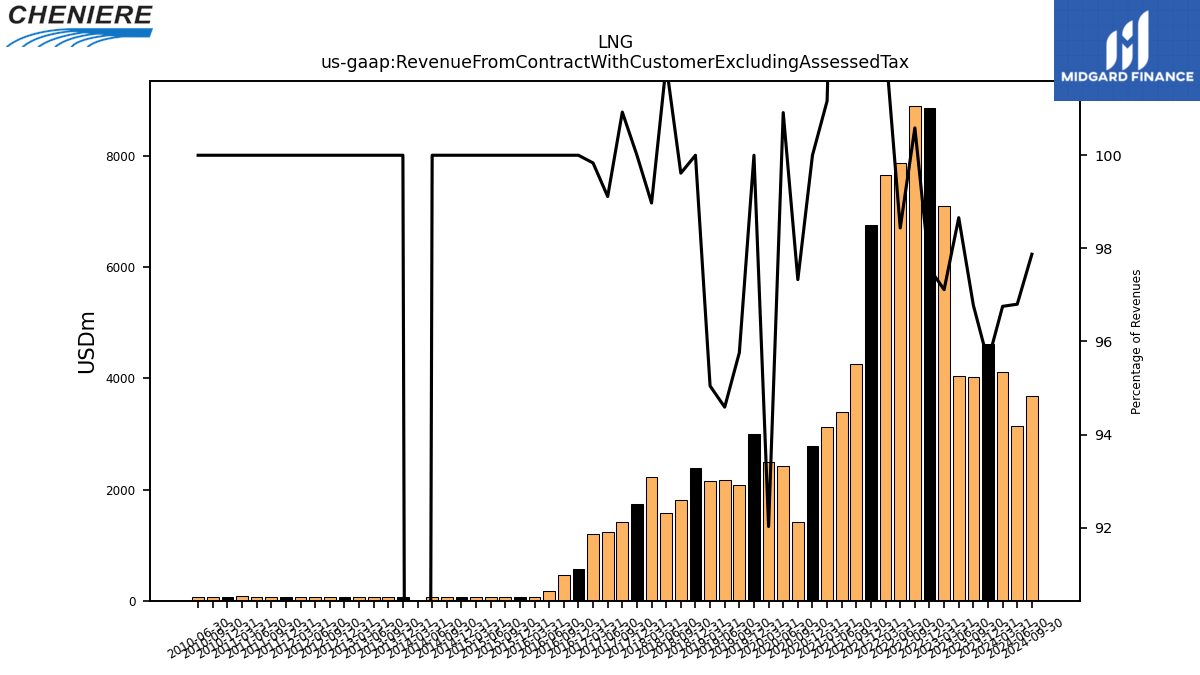
| Revenue From Contract With Customer Excluding Assessed Tax | 4025.00 | 4047.00 | 7099.00 | 8864.00 | 8904.00 | 7882.00 | 7657.00 | 6758.00 | 4259.00 | 3388.00 | 3126.00 | 2787.00 | 1421.00 | 2424.00 | 2493.00 | 3007.00 | 2078.00 | 2168.00 | 2149.00 | 2383.00 | 1812.00 | 1573.00 | 2219.00 | 1746.00 | 1416.00 | 1230.00 | 1209.00 | 571.59 | 465.67 | 176.83 | 69.08 | 68.43 | 66.06 | 68.03 | 68.37 | 65.95 | 66.81 | 67.64 | 0.00 | 66.42 | 67.71 | 67.18 | 65.91 | 67.42 | 66.00 | 62.33 | 70.47 | 72.59 | 65.81 | 72.81 | 79.23 | 75.47 | 68.25 | 68.28 | |
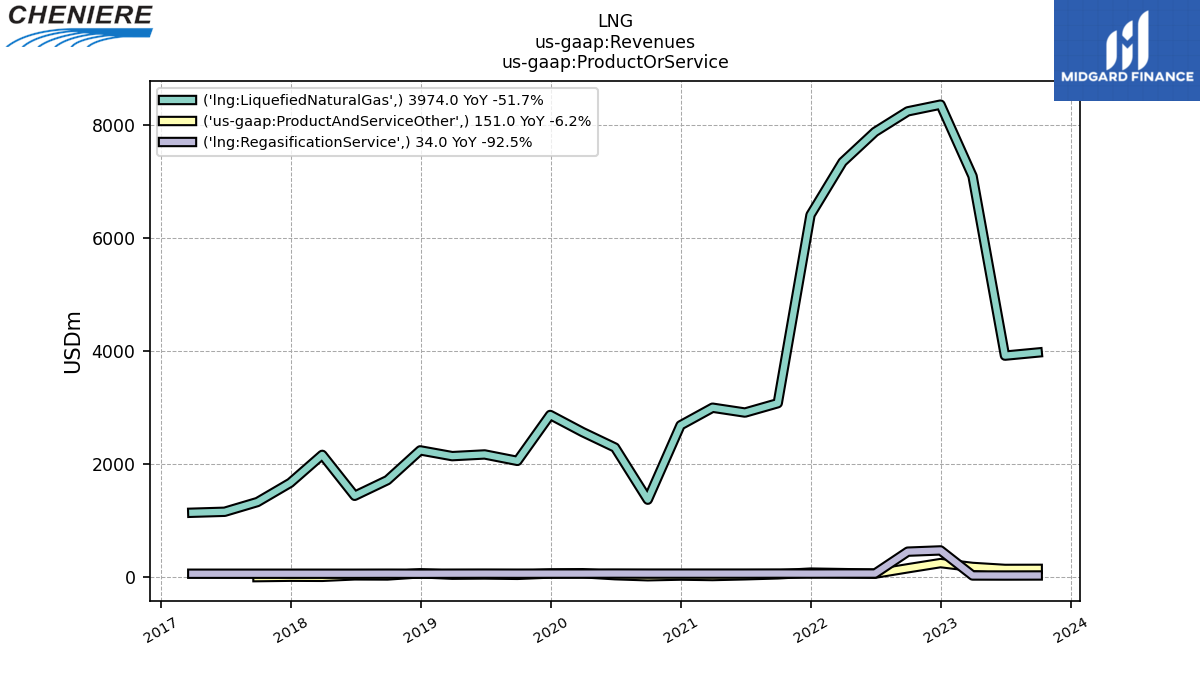
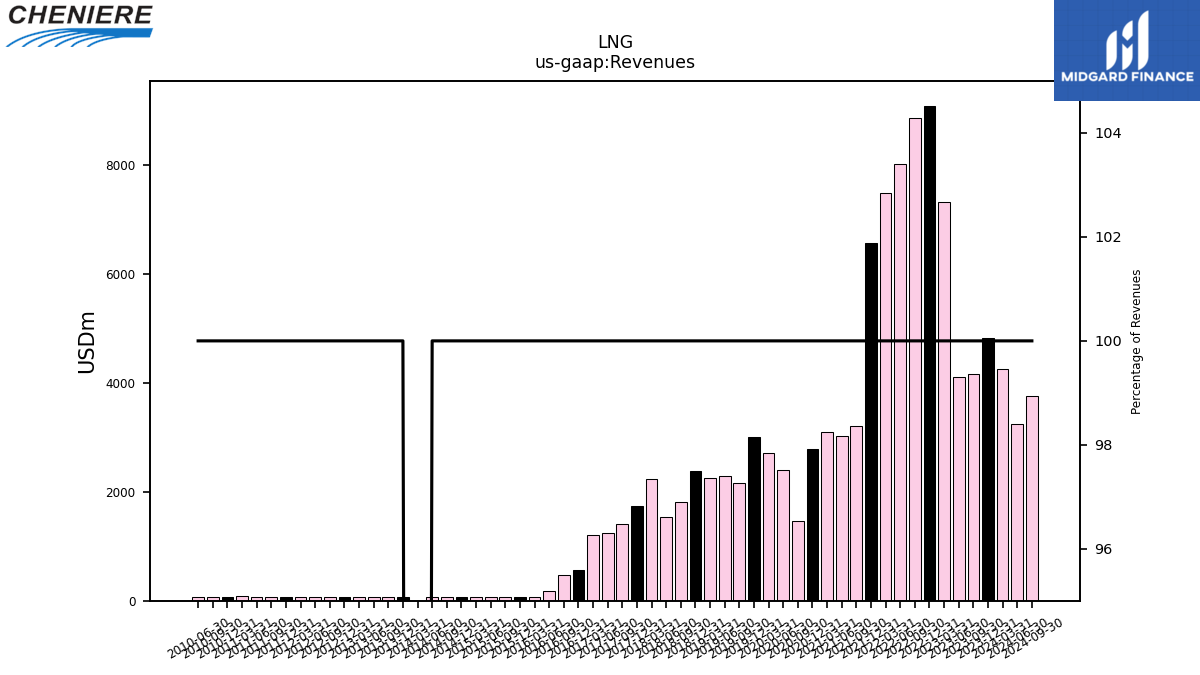
| Revenues | 4159.00 | 4102.00 | 7310.00 | 9085.00 | 8852.00 | 8007.00 | 7484.00 | 6557.00 | 3200.00 | 3017.00 | 3090.00 | 2787.00 | 1460.00 | 2402.00 | 2709.00 | 3007.00 | 2170.00 | 2292.00 | 2261.00 | 2383.00 | 1819.00 | 1543.00 | 2242.00 | 1746.00 | 1403.00 | 1241.00 | 1211.00 | 571.59 | 465.67 | 176.83 | 69.08 | 68.43 | 66.06 | 68.03 | 68.37 | 65.95 | 66.81 | 67.64 | 0.00 | 66.42 | 67.71 | 67.18 | 65.91 | 67.42 | 66.00 | 62.33 | 70.47 | 72.59 | 65.81 | 72.81 | 79.23 | 75.47 | 68.25 | 68.28 | |
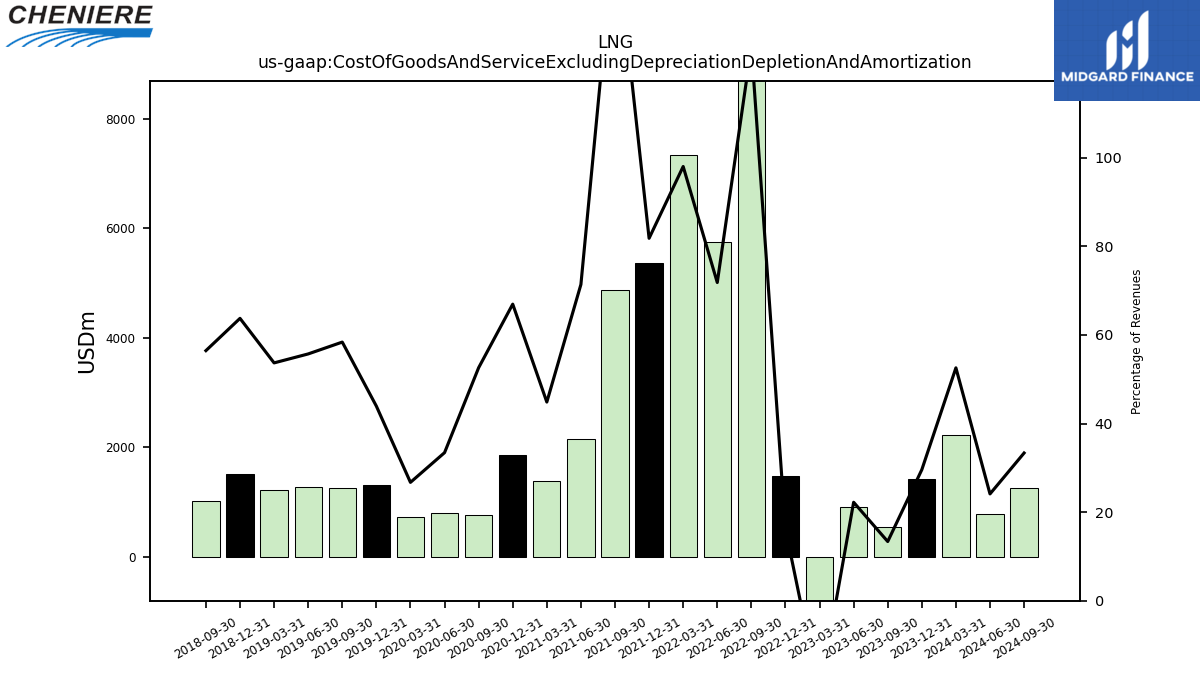
| Cost Of Goods And Service Excluding Depreciation Depletion And Amortization | 556.00 | 912.00 | -1539.00 | 1471.00 | 11073.00 | 5752.00 | 7336.00 | 5365.00 | 4868.00 | 2154.00 | 1386.00 | 1866.00 | 768.00 | 803.00 | 724.00 | 1321.00 | 1267.00 | 1277.00 | 1214.00 | 1519.00 | 1027.00 | NA | NA | NA | NA | NA | NA | NA | NA | NA | NA | NA | NA | NA | NA | NA | NA | NA | NA | NA | NA | NA | NA | NA | NA | NA | NA | NA | NA | NA | NA | NA | NA | NA | |
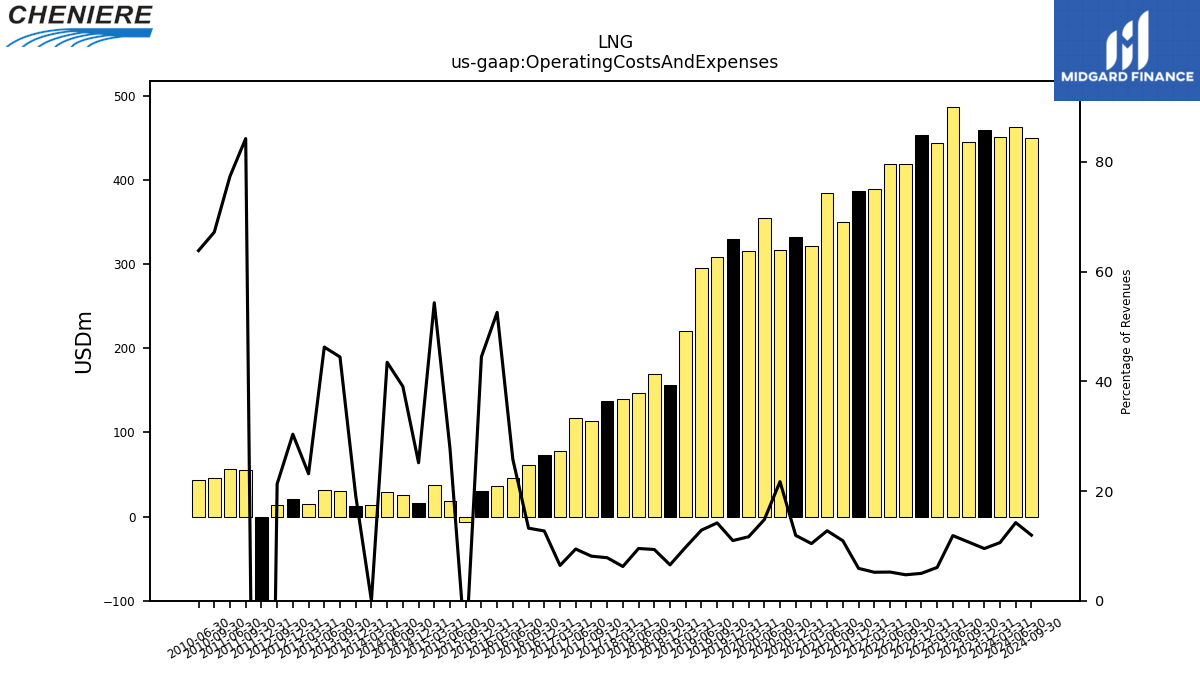
| Operating Costs And Expenses | 445.00 | 487.00 | 444.00 | 454.00 | 419.00 | 419.00 | 389.00 | 387.00 | 350.00 | 385.00 | 322.00 | 332.00 | 317.00 | 355.00 | 316.00 | 330.00 | 308.00 | 295.00 | 221.00 | 156.00 | 170.00 | 147.00 | 140.00 | 137.00 | 114.00 | 117.00 | 78.00 | 72.73 | 61.61 | 45.56 | 36.32 | 30.45 | -6.25 | 18.88 | 37.15 | 16.59 | 26.10 | 29.41 | 13.69 | 12.74 | 30.10 | 31.07 | 15.26 | 20.47 | 14.06 | NA | NA | -128.37 | 55.46 | 56.35 | NA | NA | 45.87 | 43.59 | |
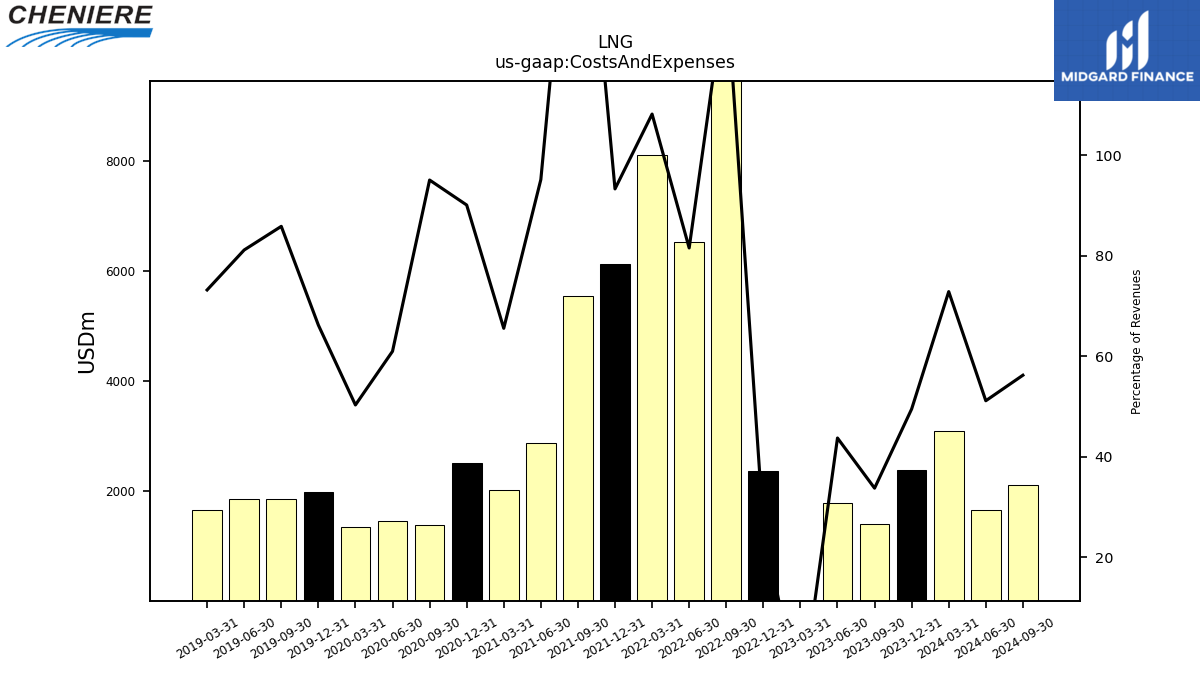
| Costs And Expenses | 1404.00 | 1794.00 | -681.00 | 2374.00 | 11868.00 | 6530.00 | 8097.00 | 6118.00 | 5550.00 | 2871.00 | 2026.00 | 2511.00 | 1388.00 | 1465.00 | 1363.00 | 1991.00 | 1863.00 | 1860.00 | 1655.00 | NA | NA | NA | NA | NA | NA | NA | NA | NA | NA | NA | NA | NA | NA | NA | NA | NA | NA | NA | NA | NA | NA | NA | NA | NA | NA | NA | NA | NA | NA | NA | NA | NA | NA | NA | |
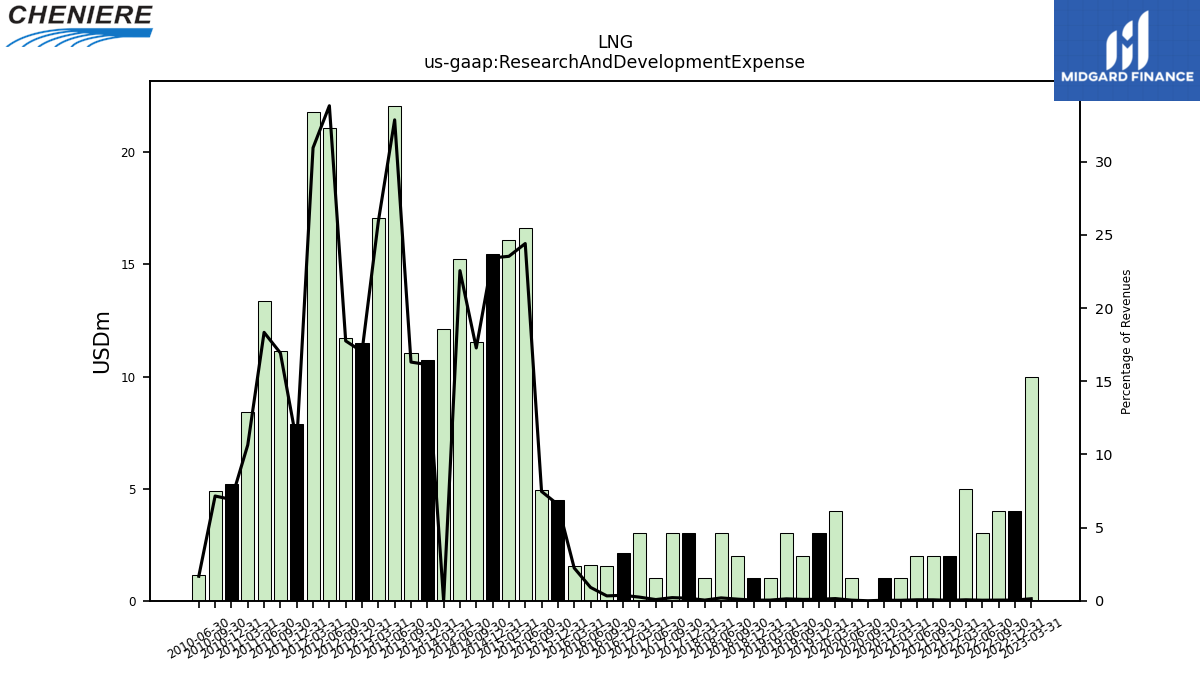
| Research And Development Expense | NA | NA | 10.00 | 4.00 | 4.00 | 3.00 | 5.00 | 2.00 | 2.00 | 2.00 | 1.00 | 1.00 | 0.00 | 1.00 | 4.00 | 3.00 | 2.00 | 3.00 | 1.00 | 1.00 | 2.00 | 3.00 | 1.00 | 3.00 | 3.00 | 1.00 | 3.00 | 2.13 | 1.55 | 1.62 | 1.55 | 4.50 | 4.93 | 16.61 | 16.10 | 15.46 | 11.54 | 15.26 | 12.11 | 10.72 | 11.05 | 22.08 | 17.09 | 11.48 | 11.72 | 21.09 | 21.82 | 7.87 | 11.14 | 13.36 | 8.44 | 5.22 | 4.88 | 1.14 | |
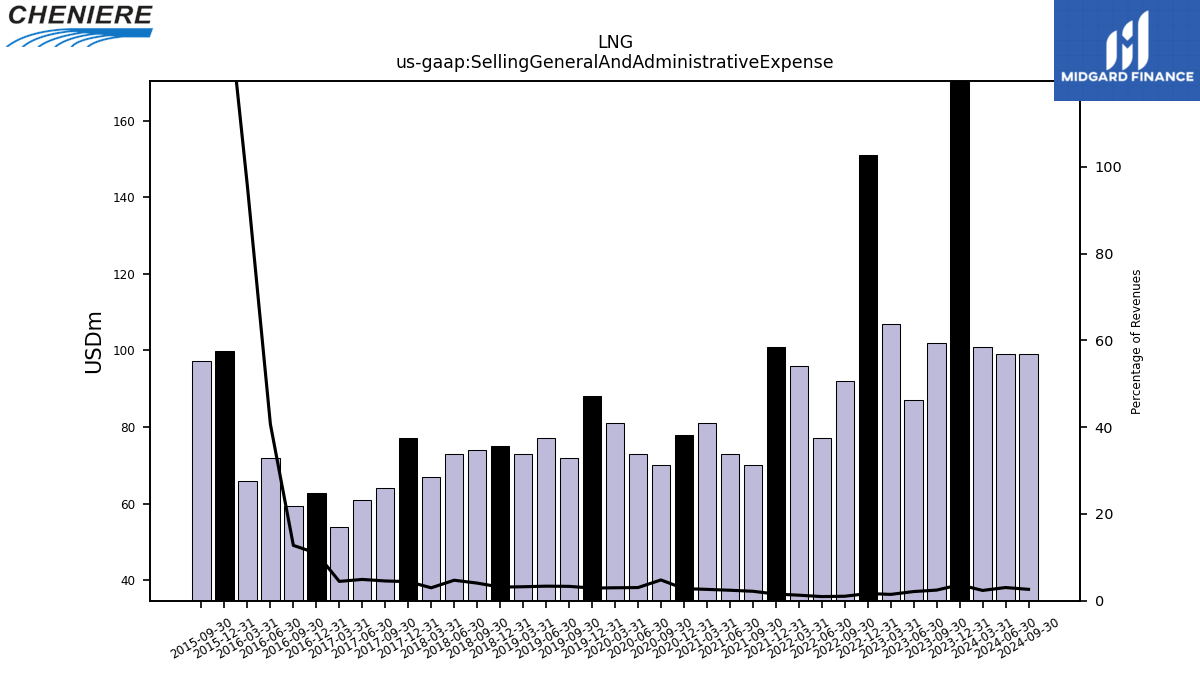
| Selling General And Administrative Expense | 102.00 | 87.00 | 107.00 | 151.00 | 92.00 | 77.00 | 96.00 | 101.00 | 70.00 | 73.00 | 81.00 | 78.00 | 70.00 | 73.00 | 81.00 | 88.00 | 72.00 | 77.00 | 73.00 | 75.00 | 74.00 | 73.00 | 67.00 | 77.00 | 64.00 | 61.00 | 54.00 | 62.69 | 59.42 | 72.00 | 66.00 | 99.89 | 97.33 | NA | NA | NA | NA | NA | NA | NA | NA | NA | NA | NA | NA | NA | NA | NA | NA | NA | NA | NA | NA | NA | |
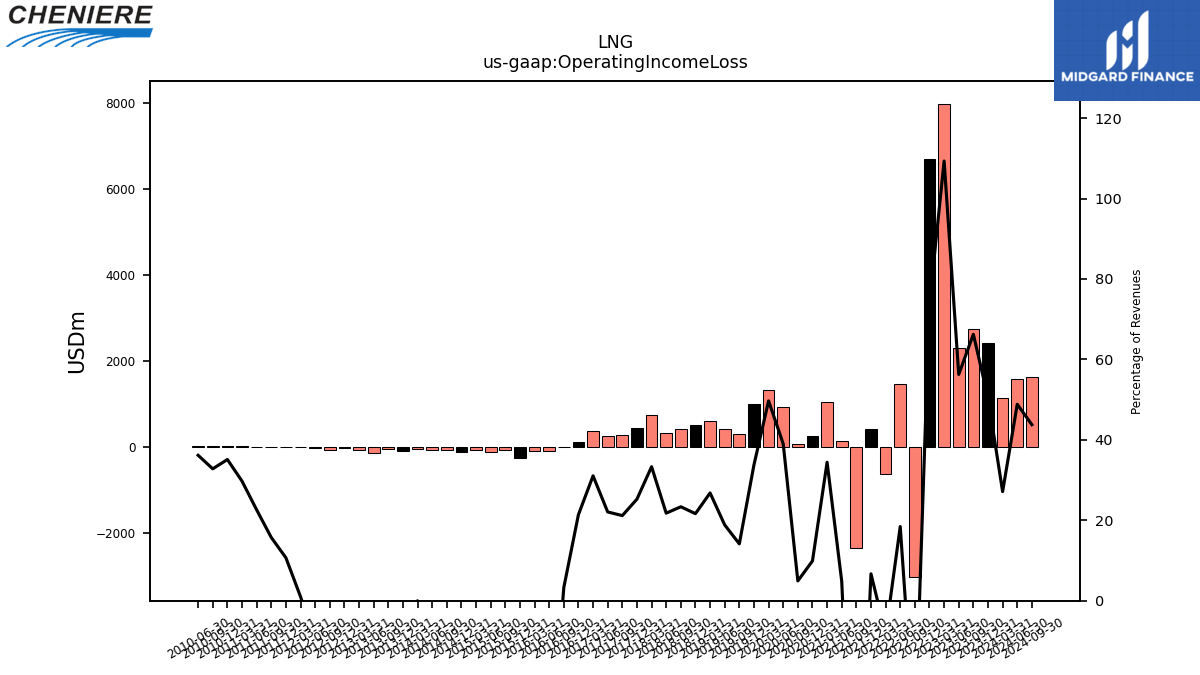
| Operating Income Loss | 2755.00 | 2308.00 | 7991.00 | 6711.00 | -3016.00 | 1477.00 | -613.00 | 439.00 | -2350.00 | 146.00 | 1064.00 | 276.00 | 72.00 | 937.00 | 1346.00 | 1016.00 | 307.00 | 432.00 | 606.00 | 516.00 | 425.00 | 336.00 | 747.00 | 441.00 | 297.00 | 274.00 | 376.00 | 122.37 | 15.28 | -76.45 | -90.56 | -241.12 | -52.07 | -95.58 | -61.00 | -102.46 | -61.36 | -62.13 | -47.61 | -79.38 | -45.88 | -136.28 | -67.45 | -15.91 | -54.52 | -6.12 | 0.72 | 7.76 | 10.36 | 16.46 | 23.57 | 26.50 | 22.38 | 24.69 | |
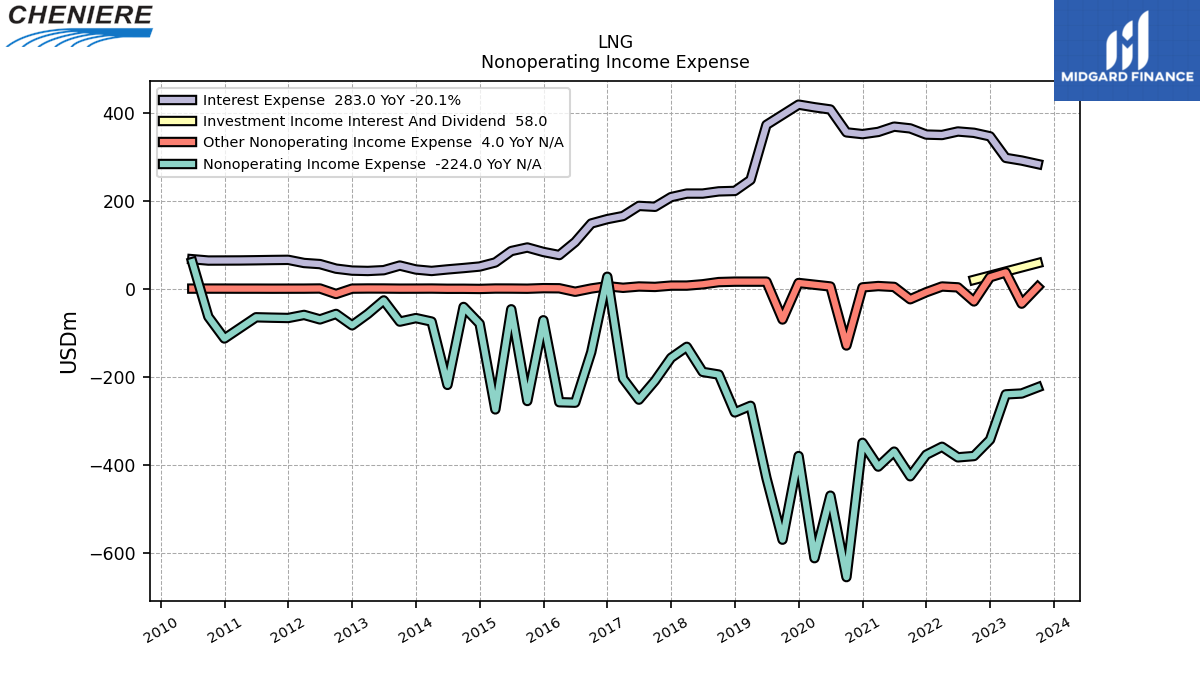
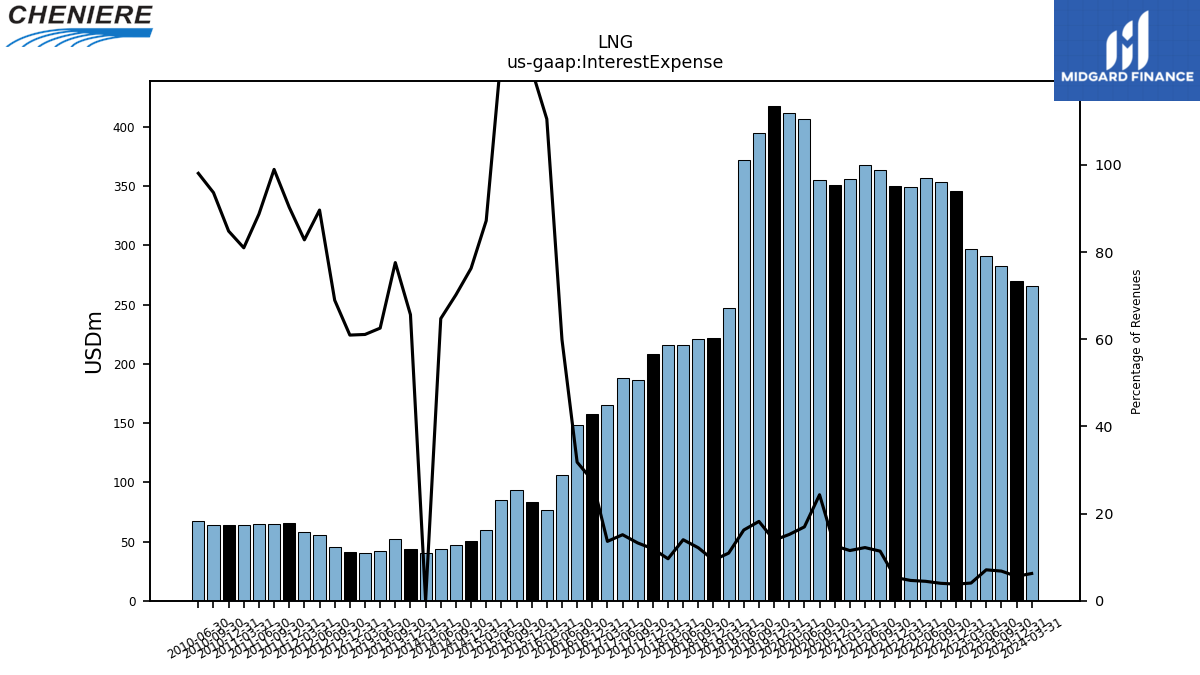
| Interest Expense | 283.00 | 291.00 | 297.00 | 346.00 | 354.00 | 357.00 | 349.00 | 350.00 | 364.00 | 368.00 | 356.00 | 351.00 | 355.00 | 407.00 | 412.00 | 418.00 | 395.00 | 372.00 | 247.00 | 222.00 | 221.00 | 216.00 | 216.00 | 208.00 | 186.00 | 188.00 | 165.00 | 158.03 | 148.05 | 105.97 | 76.34 | 83.42 | 93.57 | 85.49 | 59.61 | 50.29 | 46.88 | 43.79 | 40.27 | 43.59 | 52.53 | 42.02 | 40.26 | 41.09 | 45.50 | 55.86 | 58.35 | 65.53 | 65.12 | 64.59 | 64.15 | 64.00 | 63.90 | 66.95 | |
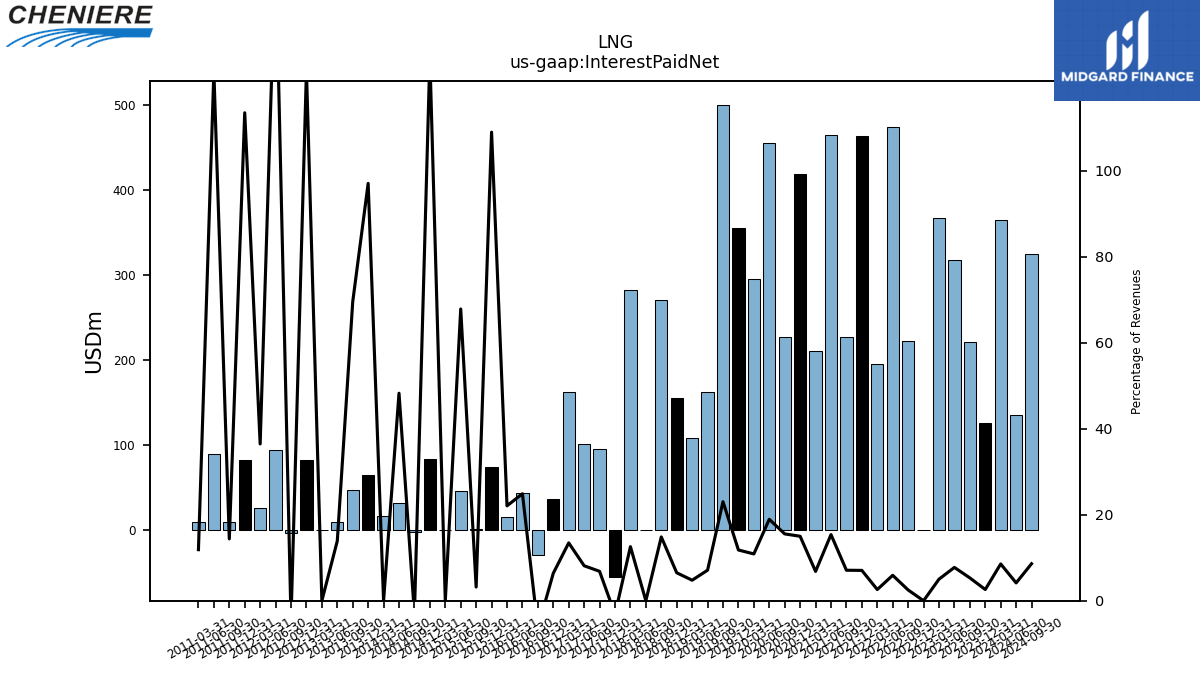
| Interest Paid Net | 221.00 | 318.00 | 367.00 | 0.00 | 222.00 | 474.00 | 195.00 | 463.00 | 227.00 | 464.00 | 211.00 | 418.00 | 227.00 | 455.00 | 295.00 | 355.00 | 500.00 | 163.00 | 108.00 | 155.00 | 270.00 | 0.00 | 282.00 | -55.00 | 96.00 | 101.00 | 163.00 | 36.56 | -29.38 | 44.01 | 15.25 | 74.59 | 2.11 | 46.16 | 0.00 | 83.43 | -2.07 | 32.65 | 16.57 | 64.48 | 47.08 | 9.35 | 0.00 | 83.13 | -2.94 | 94.43 | 25.70 | 82.39 | 9.47 | 89.57 | 9.41 | NA | NA | NA | |
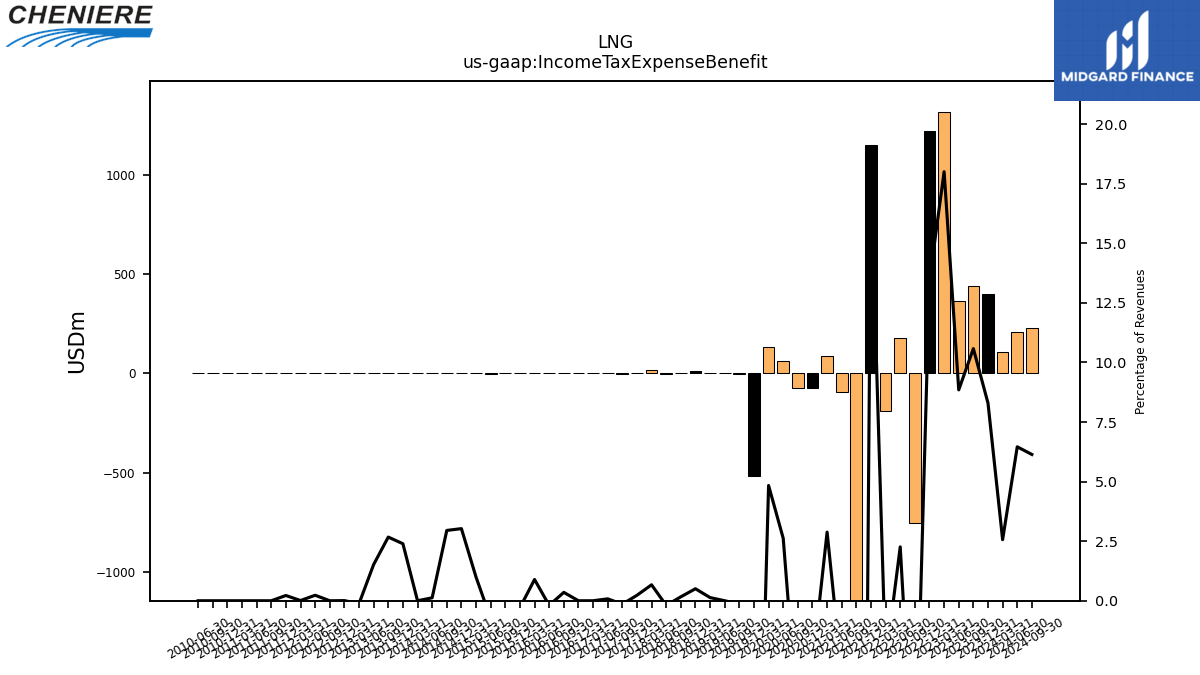
| Income Tax Expense Benefit | 440.00 | 363.00 | 1316.00 | 1221.00 | -752.00 | 181.00 | -191.00 | 1151.00 | -1860.00 | -93.00 | 89.00 | -76.00 | -75.00 | 63.00 | 131.00 | -517.00 | -3.00 | 0.00 | 3.00 | 12.00 | 3.00 | -3.00 | 15.00 | 4.00 | -2.00 | 1.00 | 0.00 | -0.00 | 1.64 | -0.34 | 0.62 | -0.20 | -0.07 | -0.51 | 0.68 | 2.00 | 1.97 | 0.08 | 0.09 | 1.59 | 1.81 | 1.02 | -0.08 | 0.00 | 0.00 | 0.14 | 0.01 | 0.16 | 0.00 | 0.00 | 0.00 | 0.00 | 0.00 | 0.00 | |
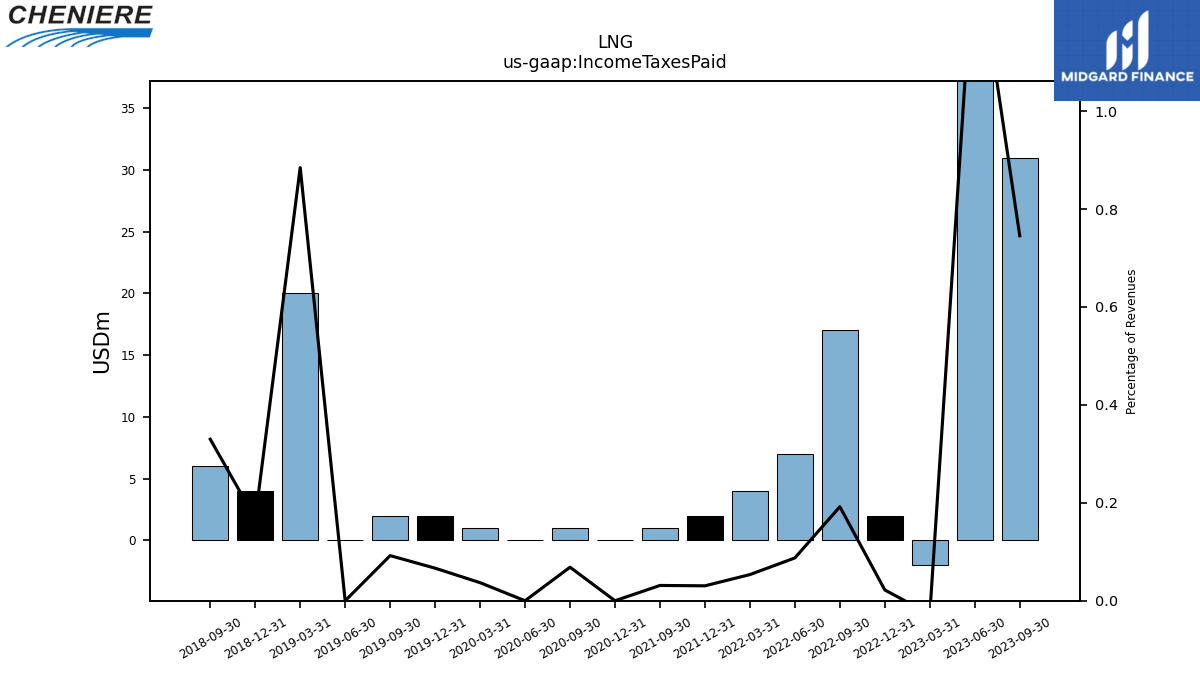
| Income Taxes Paid | 31.00 | 56.00 | -2.00 | 2.00 | 17.00 | 7.00 | 4.00 | 2.00 | 1.00 | NA | NA | 0.00 | 1.00 | 0.00 | 1.00 | 2.00 | 2.00 | 0.00 | 20.00 | 4.00 | 6.00 | NA | NA | NA | NA | NA | NA | NA | NA | NA | NA | NA | NA | NA | NA | NA | NA | NA | NA | NA | NA | NA | NA | NA | NA | NA | NA | NA | NA | NA | NA | NA | NA | NA | |
| Profit Loss | 2091.00 | 1707.00 | 6435.00 | 5147.00 | -2644.00 | 913.00 | -781.00 | -1089.00 | -916.00 | -131.00 | 571.00 | 2.00 | -508.00 | 404.00 | 603.00 | 1153.00 | -260.00 | 2.00 | 337.00 | 223.00 | 227.00 | 150.00 | 600.00 | 280.00 | 90.00 | 21.00 | 172.00 | 149.54 | -130.42 | -334.94 | -348.97 | -312.58 | -307.09 | -141.80 | -335.84 | -184.02 | -104.80 | -280.71 | -122.34 | -147.75 | -122.48 | -163.90 | -124.63 | -98.91 | -111.88 | -76.00 | -58.85 | -58.93 | -55.47 | -48.46 | -40.48 | -86.62 | -41.30 | 85.17 | |
| Net Income Loss | 1701.00 | 1369.00 | 5434.00 | 3937.00 | -2385.00 | 741.00 | -865.00 | -1323.00 | -1084.00 | -329.00 | 393.00 | -194.00 | -463.00 | 197.00 | 375.00 | 939.00 | -318.00 | -114.00 | 141.00 | 67.00 | 65.00 | -18.00 | 357.00 | 127.00 | -289.00 | -285.00 | 54.00 | 109.71 | -100.44 | -298.42 | -320.84 | -291.10 | -297.81 | -118.50 | -267.71 | -158.61 | -89.58 | -201.93 | -97.81 | -135.23 | -100.82 | -154.76 | -117.11 | -94.32 | -109.00 | -73.04 | -56.41 | -57.81 | -53.94 | -47.17 | -39.84 | -86.13 | -40.58 | 85.68 |
| 2023-09-30 | 2023-06-30 | 2023-03-31 | 2022-12-31 | 2022-09-30 | 2022-06-30 | 2022-03-31 | 2021-12-31 | 2021-09-30 | 2021-06-30 | 2021-03-31 | 2020-12-31 | 2020-09-30 | 2020-06-30 | 2020-03-31 | 2019-12-31 | 2019-09-30 | 2019-06-30 | 2019-03-31 | 2018-12-31 | 2018-09-30 | 2018-06-30 | 2018-03-31 | 2017-12-31 | 2017-09-30 | 2017-06-30 | 2017-03-31 | 2016-12-31 | 2016-09-30 | 2016-06-30 | 2016-03-31 | 2015-12-31 | 2015-09-30 | 2015-06-30 | 2015-03-31 | 2014-12-31 | 2014-09-30 | 2014-06-30 | 2014-03-31 | 2013-12-31 | 2013-09-30 | 2013-06-30 | 2013-03-31 | 2012-12-31 | 2012-09-30 | 2012-06-30 | 2012-03-31 | 2011-12-31 | 2011-09-30 | 2011-06-30 | 2011-03-31 | 2010-12-31 | 2010-09-30 | 2010-06-30 | ||
|---|---|---|---|---|---|---|---|---|---|---|---|---|---|---|---|---|---|---|---|---|---|---|---|---|---|---|---|---|---|---|---|---|---|---|---|---|---|---|---|---|---|---|---|---|---|---|---|---|---|---|---|---|---|---|---|
| Assets | 41719.00 | 41803.00 | 40265.00 | 41266.00 | 43642.00 | 41313.00 | 40055.00 | 39258.00 | 40179.00 | 36752.00 | 36395.00 | 35697.00 | 35931.00 | 35846.00 | 35747.00 | 35492.00 | 34705.00 | 34572.00 | 32885.00 | 31987.00 | 30740.00 | 30327.00 | 28341.00 | 27906.00 | 27134.00 | 26600.00 | 26056.00 | 23702.74 | 22689.08 | 21436.85 | 20430.95 | 19019.59 | 18452.26 | 17759.50 | 14923.05 | 12573.68 | 11785.32 | 11859.30 | 9524.62 | 9673.24 | 8125.85 | 8582.23 | 6581.82 | 4639.09 | 4383.73 | 3028.33 | 2934.52 | 2915.32 | 2651.44 | 2619.81 | 2564.43 | 2553.51 | NA | NA | |
| Liabilities And Stockholders Equity | 41719.00 | 41803.00 | 40265.00 | 41266.00 | 43642.00 | 41313.00 | 40055.00 | 39258.00 | 40179.00 | 36752.00 | 36395.00 | 35697.00 | 35931.00 | 35846.00 | 35747.00 | 35492.00 | 34705.00 | 34572.00 | 32885.00 | 31987.00 | 30740.00 | 30327.00 | 28341.00 | 27906.00 | 27134.00 | 26600.00 | 26056.00 | 23702.74 | 22689.08 | 21436.85 | 20430.95 | 19019.59 | 18452.26 | 17759.50 | 14923.05 | 12573.68 | 11785.32 | 11859.30 | 9524.62 | 9673.24 | 8125.85 | 8582.23 | 6581.82 | 4639.09 | 4383.73 | 3028.33 | 2934.52 | 2915.32 | 2651.44 | 2619.81 | NA | 2553.51 | NA | NA | |
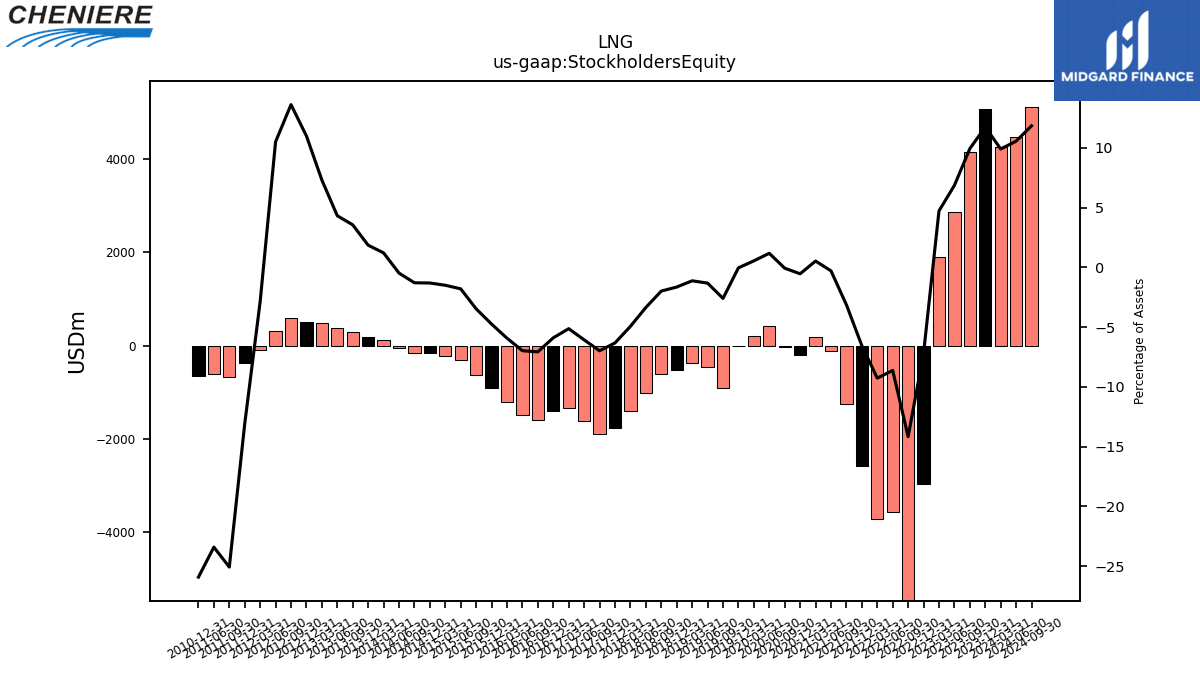
| Stockholders Equity | 4144.00 | 2868.00 | 1902.00 | -2969.00 | -6179.00 | -3562.00 | -3710.00 | -2571.00 | -1257.00 | -106.00 | 193.00 | -191.00 | -24.00 | 422.00 | 196.00 | -14.00 | -900.00 | -454.00 | -369.00 | -526.00 | -609.00 | -1017.00 | -1397.00 | -1764.00 | -1893.00 | -1613.00 | -1336.00 | -1396.42 | -1602.72 | -1494.26 | -1210.33 | -901.85 | -639.88 | -318.77 | -223.14 | -164.18 | -151.81 | -56.46 | 115.56 | 179.68 | 289.21 | 370.76 | 481.03 | 510.00 | 596.89 | 318.27 | -84.07 | -381.57 | -664.67 | -613.09 | NA | -661.63 | NA | NA |
| 2023-09-30 | 2023-06-30 | 2023-03-31 | 2022-12-31 | 2022-09-30 | 2022-06-30 | 2022-03-31 | 2021-12-31 | 2021-09-30 | 2021-06-30 | 2021-03-31 | 2020-12-31 | 2020-09-30 | 2020-06-30 | 2020-03-31 | 2019-12-31 | 2019-09-30 | 2019-06-30 | 2019-03-31 | 2018-12-31 | 2018-09-30 | 2018-06-30 | 2018-03-31 | 2017-12-31 | 2017-09-30 | 2017-06-30 | 2017-03-31 | 2016-12-31 | 2016-09-30 | 2016-06-30 | 2016-03-31 | 2015-12-31 | 2015-09-30 | 2015-06-30 | 2015-03-31 | 2014-12-31 | 2014-09-30 | 2014-06-30 | 2014-03-31 | 2013-12-31 | 2013-09-30 | 2013-06-30 | 2013-03-31 | 2012-12-31 | 2012-09-30 | 2012-06-30 | 2012-03-31 | 2011-12-31 | 2011-09-30 | 2011-06-30 | 2011-03-31 | 2010-12-31 | 2010-09-30 | 2010-06-30 | ||
|---|---|---|---|---|---|---|---|---|---|---|---|---|---|---|---|---|---|---|---|---|---|---|---|---|---|---|---|---|---|---|---|---|---|---|---|---|---|---|---|---|---|---|---|---|---|---|---|---|---|---|---|---|---|---|---|
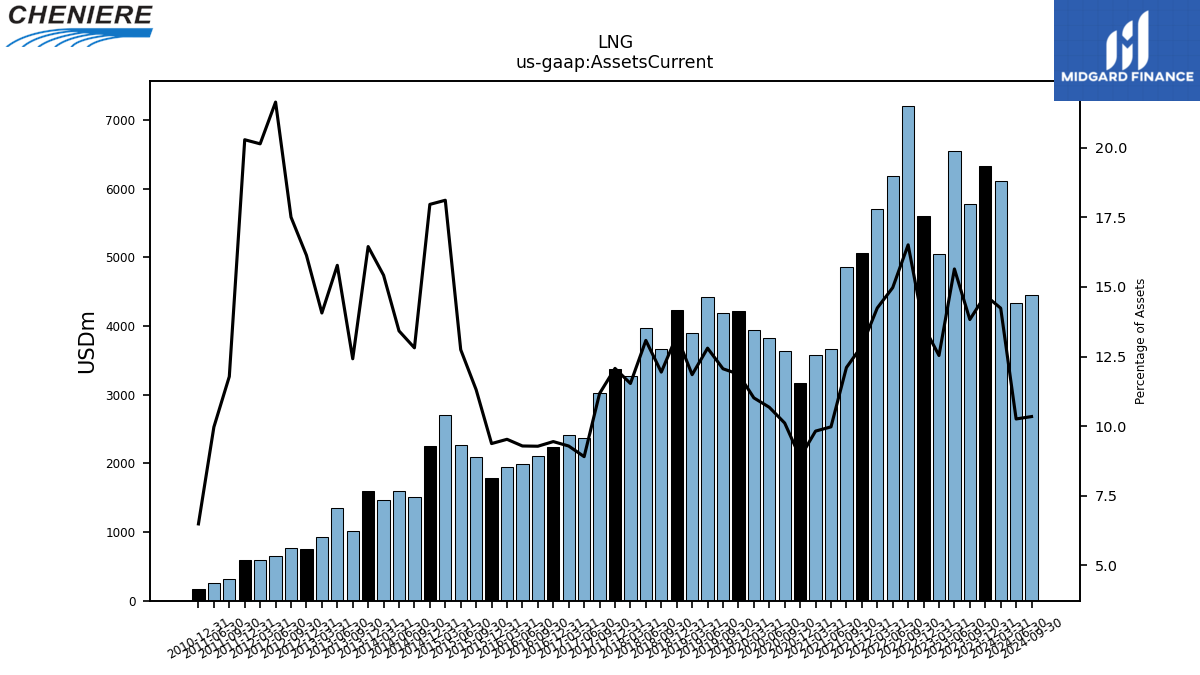
| Assets Current | 5769.00 | 6540.00 | 5048.00 | 5608.00 | 7206.00 | 6186.00 | 5705.00 | 5056.00 | 4863.00 | 3665.00 | 3574.00 | 3169.00 | 3632.00 | 3827.00 | 3937.00 | 4212.00 | 4185.00 | 4425.00 | 3896.00 | 4234.00 | 3670.00 | 3966.00 | 3268.00 | 3369.00 | 3031.00 | 2368.00 | 2419.00 | 2238.32 | 2104.73 | 1990.48 | 1946.12 | 1782.59 | 2086.27 | 2263.36 | 2703.06 | 2258.88 | 1509.86 | 1591.48 | 1468.63 | 1591.18 | 1009.06 | 1353.90 | 925.58 | 748.56 | 767.41 | 655.33 | 591.03 | 591.45 | 312.34 | 261.05 | NA | 165.61 | NA | NA | |
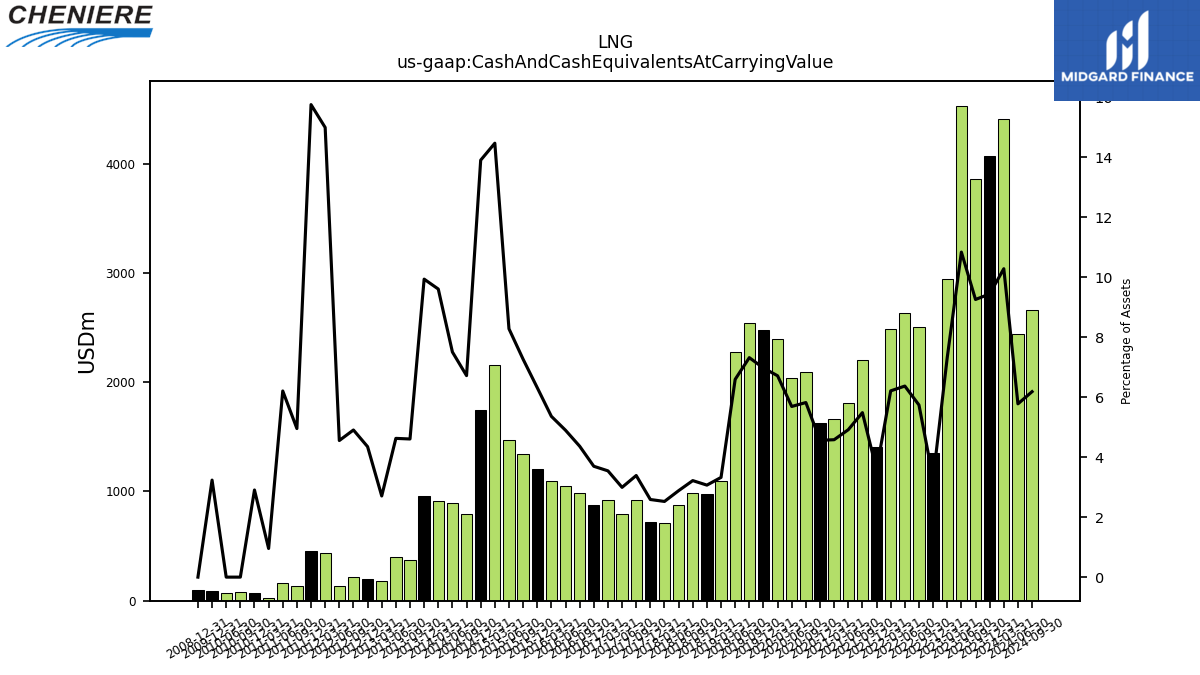
| Cash And Cash Equivalents At Carrying Value | 3861.00 | 4529.00 | 2948.00 | 1353.00 | 2504.00 | 2631.00 | 2487.00 | 1404.00 | 2203.00 | 1806.00 | 1667.00 | 1628.00 | 2091.00 | 2039.00 | 2399.00 | 2474.00 | 2539.00 | 2279.00 | 1093.00 | 981.00 | 989.00 | 874.00 | 715.00 | 722.00 | 919.00 | 796.00 | 923.00 | 875.84 | 990.13 | 1049.48 | 1094.83 | 1201.11 | 1340.26 | 1470.21 | 2158.34 | 1747.58 | 791.66 | 889.89 | 914.60 | 960.84 | 374.16 | 396.92 | 178.04 | 201.71 | 215.00 | 137.88 | 439.83 | 459.16 | 131.31 | 162.56 | 24.47 | 74.16 | 81.52 | 73.94 | |
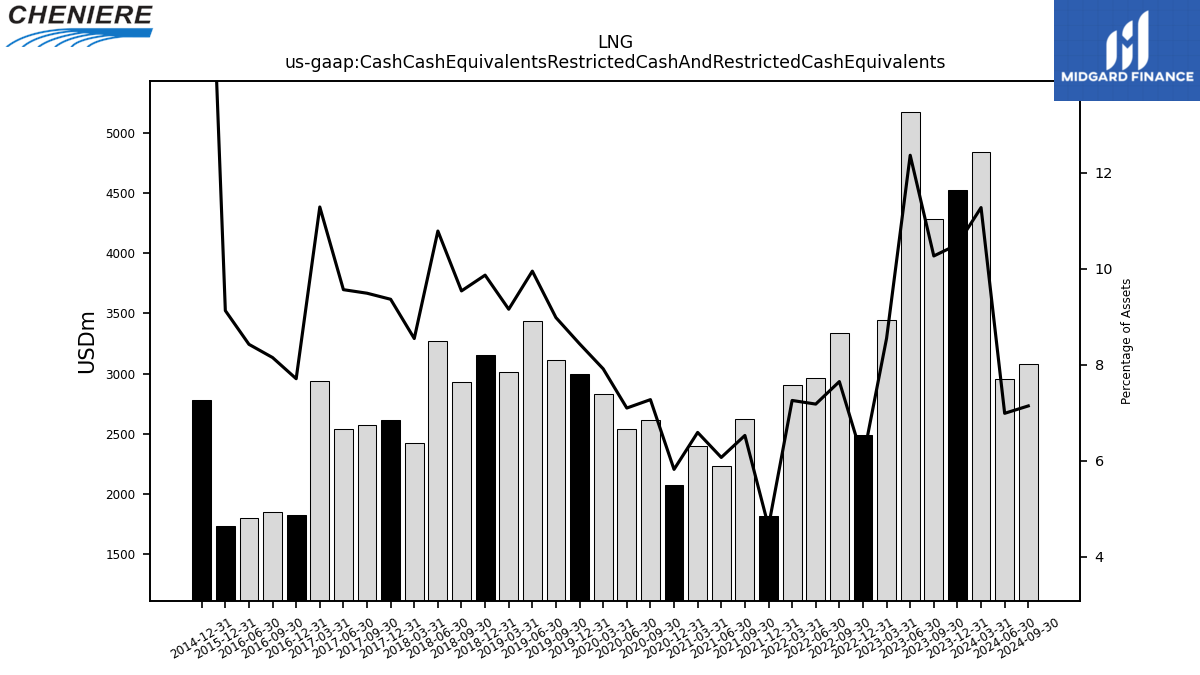
| Cash Cash Equivalents Restricted Cash And Restricted Cash Equivalents | 4283.00 | 5169.00 | 3443.00 | 2487.00 | 3338.00 | 2966.00 | 2906.00 | 1817.00 | 2622.00 | 2230.00 | 2398.00 | 2077.00 | 2613.00 | 2544.00 | 2829.00 | 2994.00 | 3117.00 | 3440.00 | 3011.00 | 3156.00 | 2932.00 | 3271.00 | 2422.00 | 2613.00 | 2575.00 | 2544.00 | 2941.00 | 1827.00 | 1849.00 | 1806.00 | NA | 1736.00 | NA | NA | NA | 2780.00 | NA | NA | NA | NA | NA | NA | NA | NA | NA | NA | NA | NA | NA | NA | NA | NA | NA | NA | |
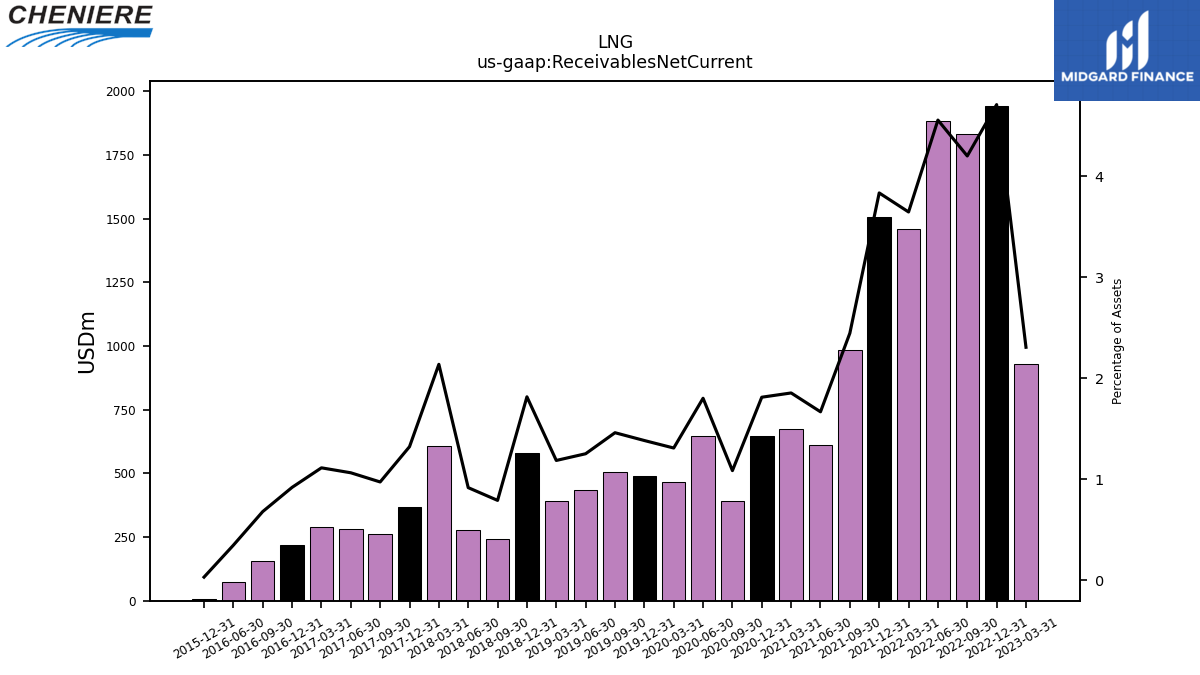
| Receivables Net Current | NA | NA | 929.00 | 1944.00 | 1834.00 | 1883.00 | 1461.00 | 1506.00 | 983.00 | 613.00 | 675.00 | 647.00 | 390.00 | 646.00 | 468.00 | 491.00 | 507.00 | 433.00 | 390.00 | 581.00 | 243.00 | 278.00 | 606.00 | 369.00 | 264.00 | 283.00 | 290.00 | 217.93 | 154.17 | 74.28 | NA | 5.75 | NA | NA | NA | NA | NA | NA | NA | NA | NA | NA | NA | NA | NA | NA | NA | NA | NA | NA | NA | NA | NA | NA | |
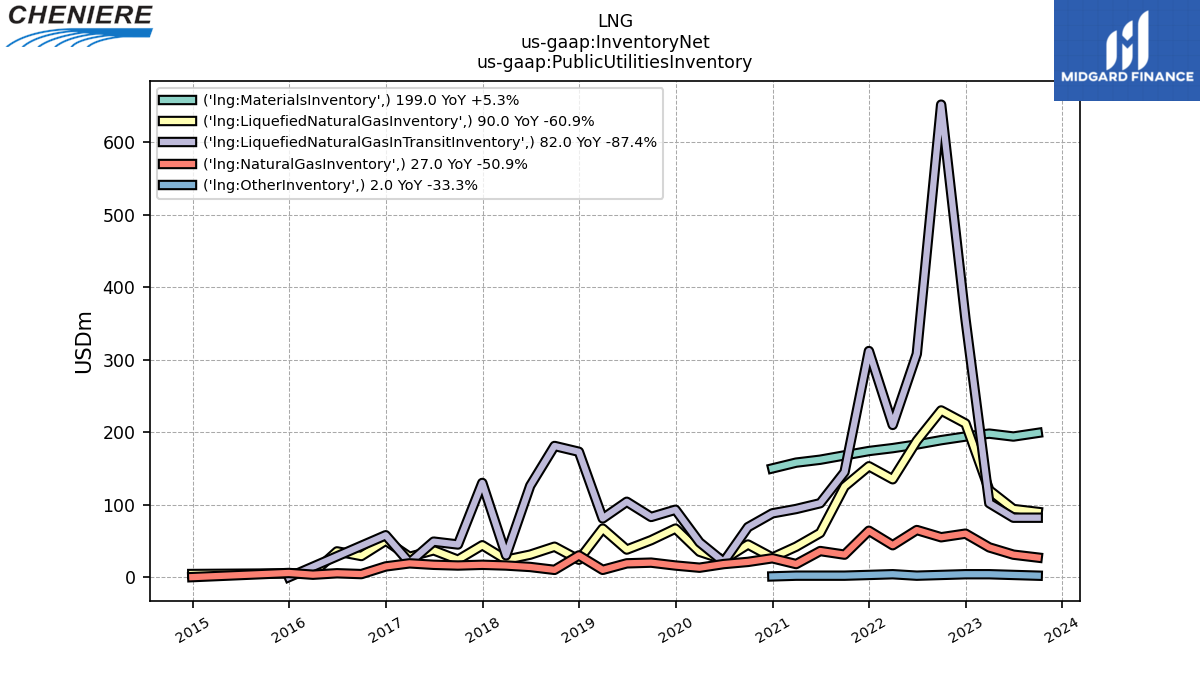
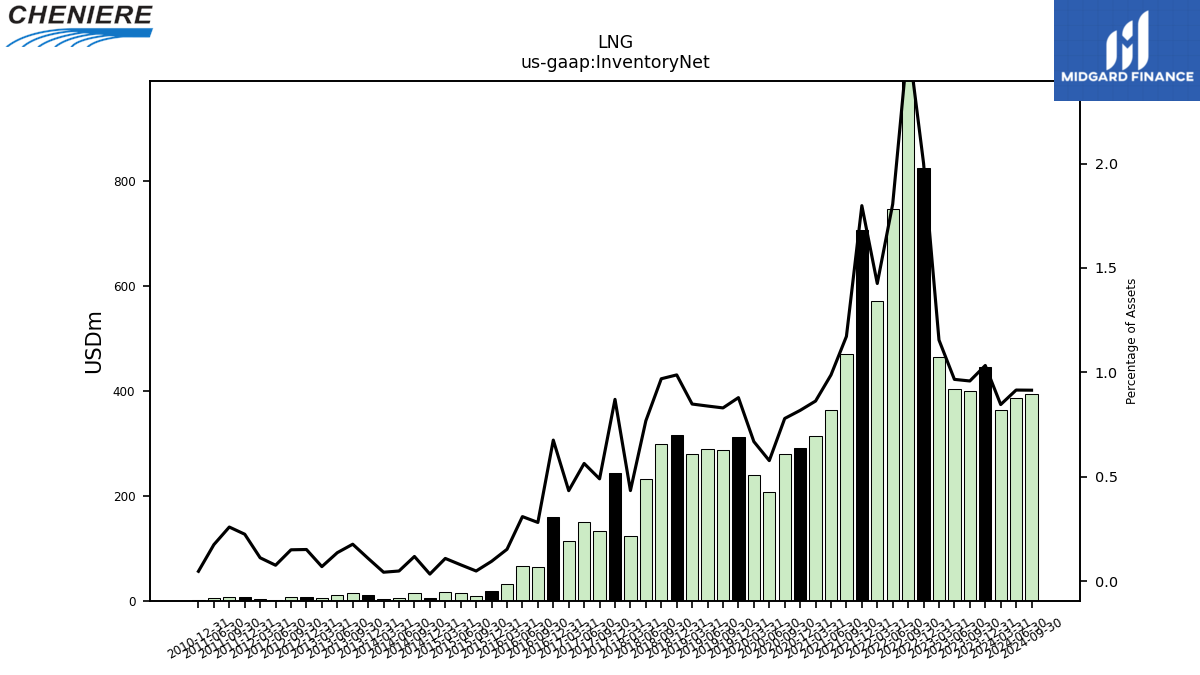
| Inventory Net | 400.00 | 404.00 | 465.00 | 826.00 | 1129.00 | 746.00 | 571.00 | 706.00 | 471.00 | 363.00 | 314.00 | 292.00 | 280.00 | 207.00 | 239.00 | 312.00 | 288.00 | 290.00 | 279.00 | 316.00 | 298.00 | 233.00 | 123.00 | 243.00 | 133.00 | 150.00 | 113.00 | 160.16 | 63.85 | 66.32 | 31.24 | 18.12 | 9.03 | 13.95 | 16.28 | 4.29 | 13.97 | 5.80 | 4.11 | 10.56 | 14.40 | 11.73 | 4.61 | 7.04 | 6.60 | 2.32 | 3.29 | 6.56 | 6.88 | 4.59 | NA | 1.21 | NA | NA | |
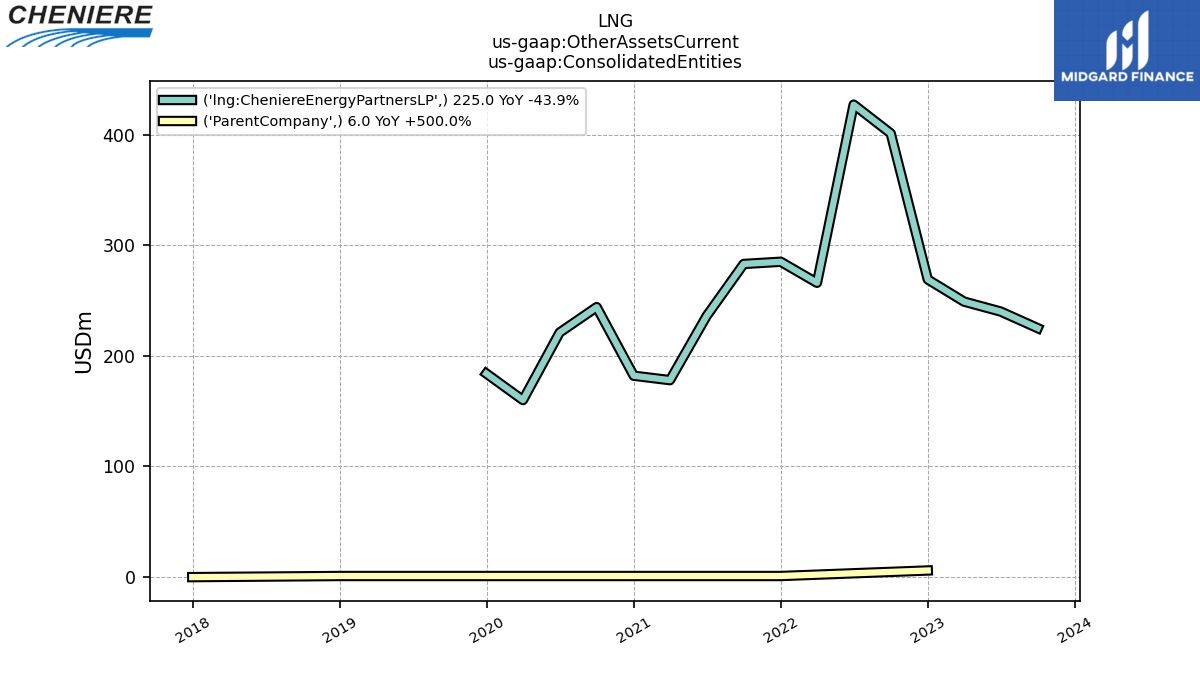
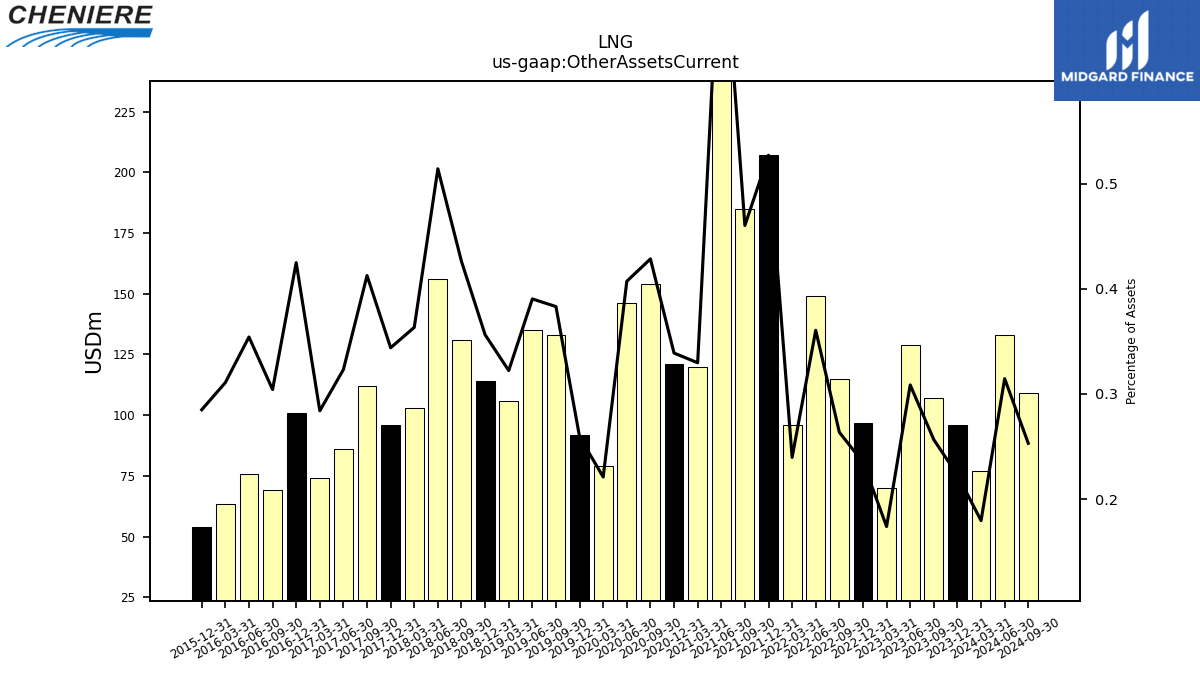
| Other Assets Current | 107.00 | 129.00 | 70.00 | 97.00 | 115.00 | 149.00 | 96.00 | 207.00 | 185.00 | 281.00 | 120.00 | 121.00 | 154.00 | 146.00 | 79.00 | 92.00 | 133.00 | 135.00 | 106.00 | 114.00 | 131.00 | 156.00 | 103.00 | 96.00 | 112.00 | 86.00 | 74.00 | 100.75 | 69.03 | 75.94 | 63.51 | 54.20 | NA | NA | NA | NA | NA | NA | NA | NA | NA | NA | NA | NA | NA | NA | NA | NA | NA | NA | NA | NA | NA | NA |
| 2023-09-30 | 2023-06-30 | 2023-03-31 | 2022-12-31 | 2022-09-30 | 2022-06-30 | 2022-03-31 | 2021-12-31 | 2021-09-30 | 2021-06-30 | 2021-03-31 | 2020-12-31 | 2020-09-30 | 2020-06-30 | 2020-03-31 | 2019-12-31 | 2019-09-30 | 2019-06-30 | 2019-03-31 | 2018-12-31 | 2018-09-30 | 2018-06-30 | 2018-03-31 | 2017-12-31 | 2017-09-30 | 2017-06-30 | 2017-03-31 | 2016-12-31 | 2016-09-30 | 2016-06-30 | 2016-03-31 | 2015-12-31 | 2015-09-30 | 2015-06-30 | 2015-03-31 | 2014-12-31 | 2014-09-30 | 2014-06-30 | 2014-03-31 | 2013-12-31 | 2013-09-30 | 2013-06-30 | 2013-03-31 | 2012-12-31 | 2012-09-30 | 2012-06-30 | 2012-03-31 | 2011-12-31 | 2011-09-30 | 2011-06-30 | 2011-03-31 | 2010-12-31 | 2010-09-30 | 2010-06-30 | ||
|---|---|---|---|---|---|---|---|---|---|---|---|---|---|---|---|---|---|---|---|---|---|---|---|---|---|---|---|---|---|---|---|---|---|---|---|---|---|---|---|---|---|---|---|---|---|---|---|---|---|---|---|---|---|---|---|
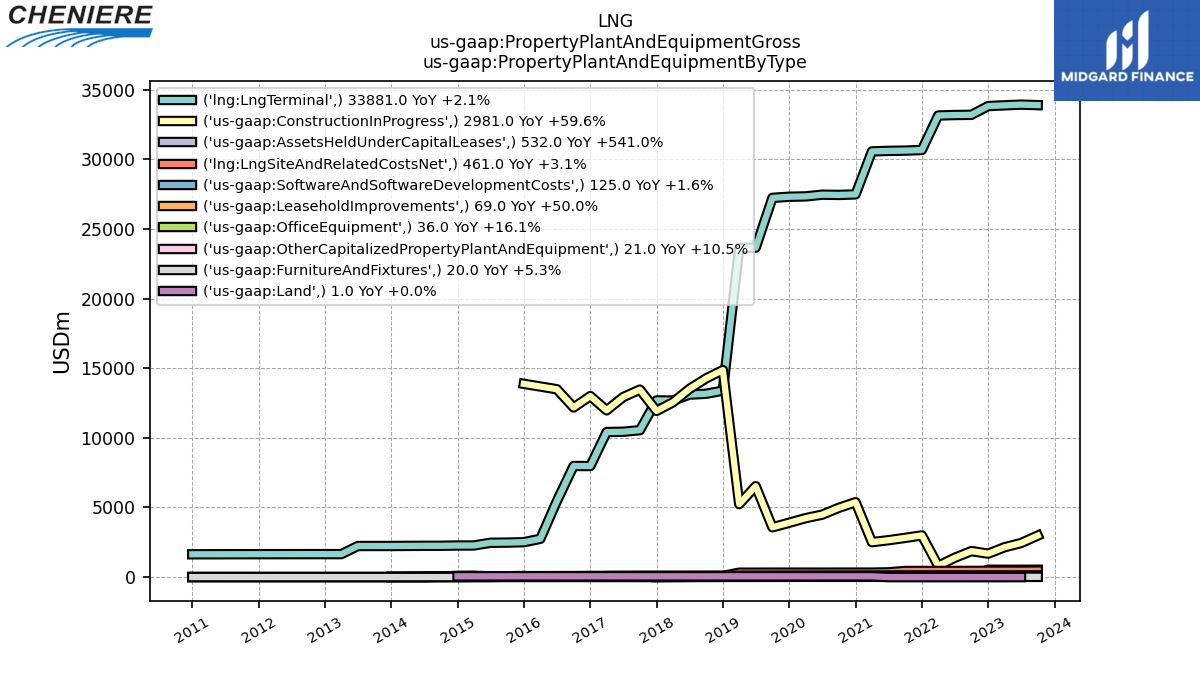
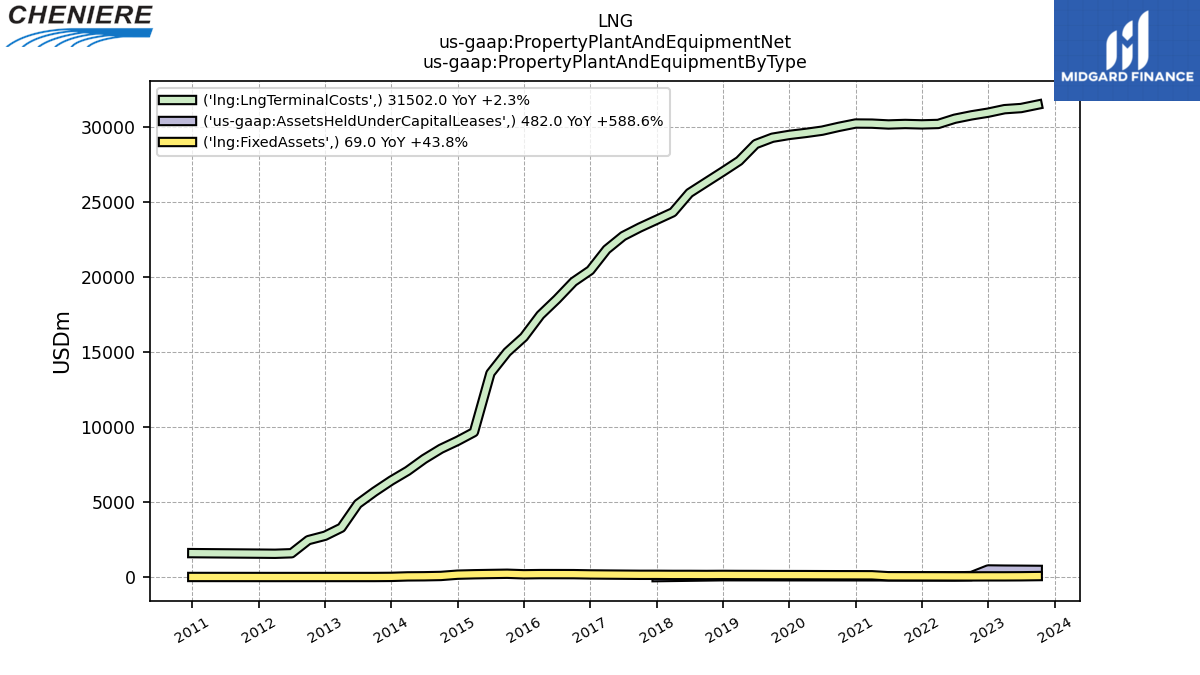
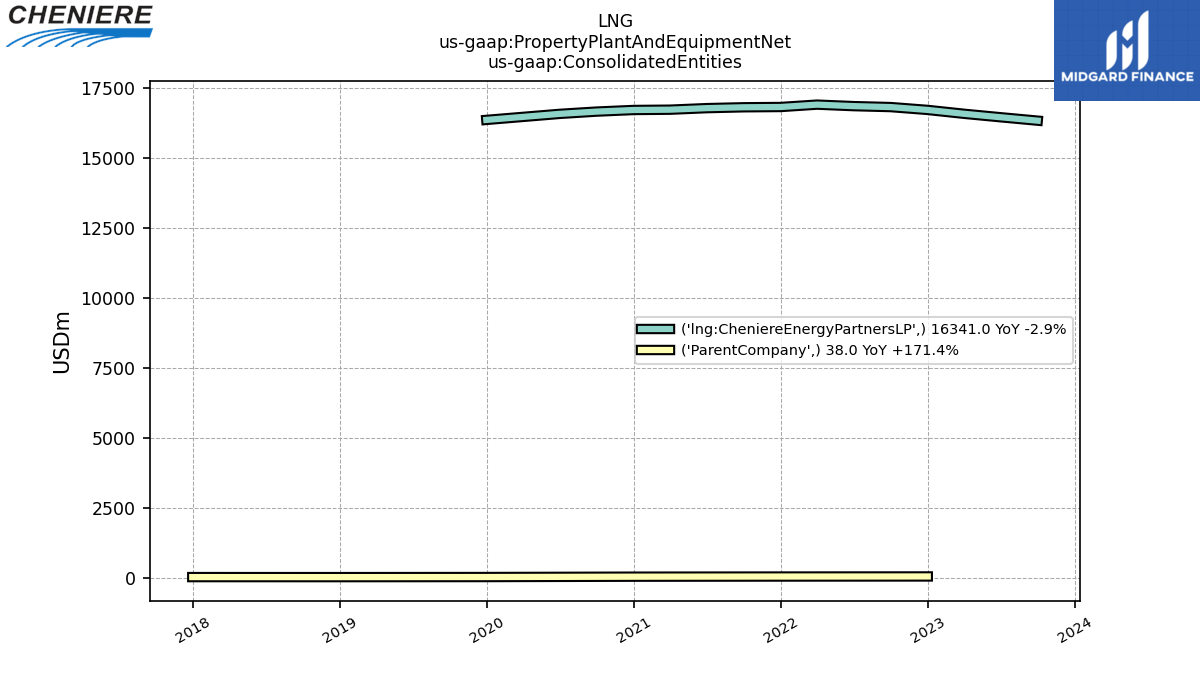
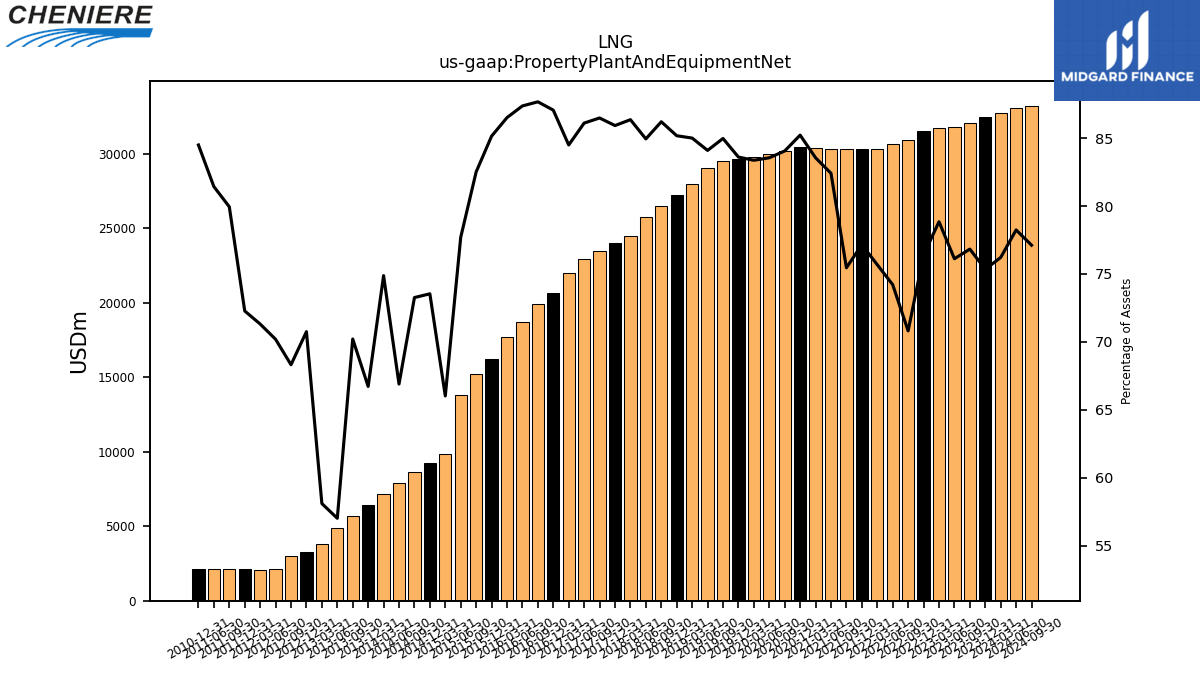
| Property Plant And Equipment Net | 32053.00 | 31821.00 | 31747.00 | 31528.00 | 30904.00 | 30659.00 | 30314.00 | 30288.00 | 30318.00 | 30288.00 | 30409.00 | 30421.00 | 30201.00 | 29950.00 | 29802.00 | 29673.00 | 29490.00 | 29073.00 | 27953.00 | 27245.00 | 26499.00 | 25760.00 | 24474.00 | 23978.00 | 23466.00 | 22904.00 | 22016.00 | 20635.29 | 19891.67 | 18729.18 | 17674.55 | 16193.91 | 15225.25 | 13799.11 | 9852.97 | 9246.75 | 8634.50 | 7933.87 | 7132.04 | 6454.40 | 5705.57 | 4893.60 | 3824.30 | 3282.30 | 2995.05 | 2125.69 | 2092.80 | 2107.13 | 2119.72 | 2133.33 | NA | 2157.60 | NA | NA | |
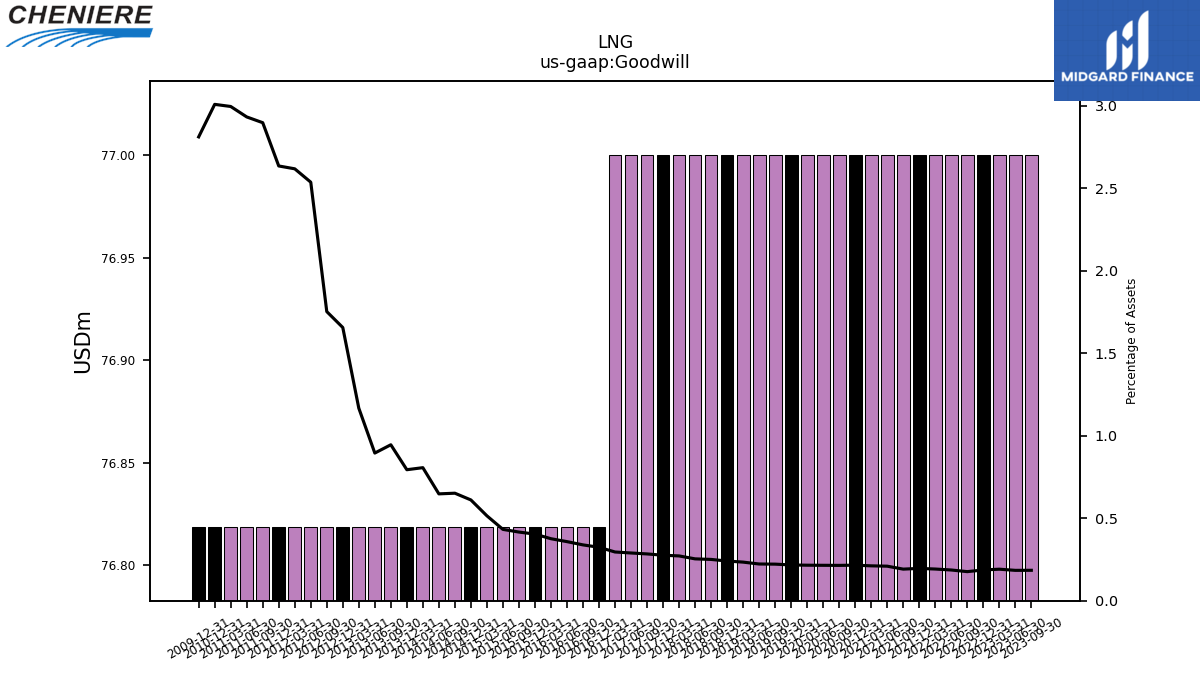
| Goodwill | 77.00 | 77.00 | 77.00 | 77.00 | 77.00 | 77.00 | 77.00 | 77.00 | 77.00 | 77.00 | 77.00 | 77.00 | 77.00 | 77.00 | 77.00 | 77.00 | 77.00 | 77.00 | 77.00 | 77.00 | 77.00 | 77.00 | 77.00 | 77.00 | 77.00 | 77.00 | 77.00 | 76.82 | 76.82 | 76.82 | 76.82 | 76.82 | 76.82 | 76.82 | 76.82 | 76.82 | 76.82 | 76.82 | 76.82 | 76.82 | 76.82 | 76.82 | 76.82 | 76.82 | 76.82 | 76.82 | 76.82 | 76.82 | 76.82 | 76.82 | 76.82 | 76.82 | NA | NA | |
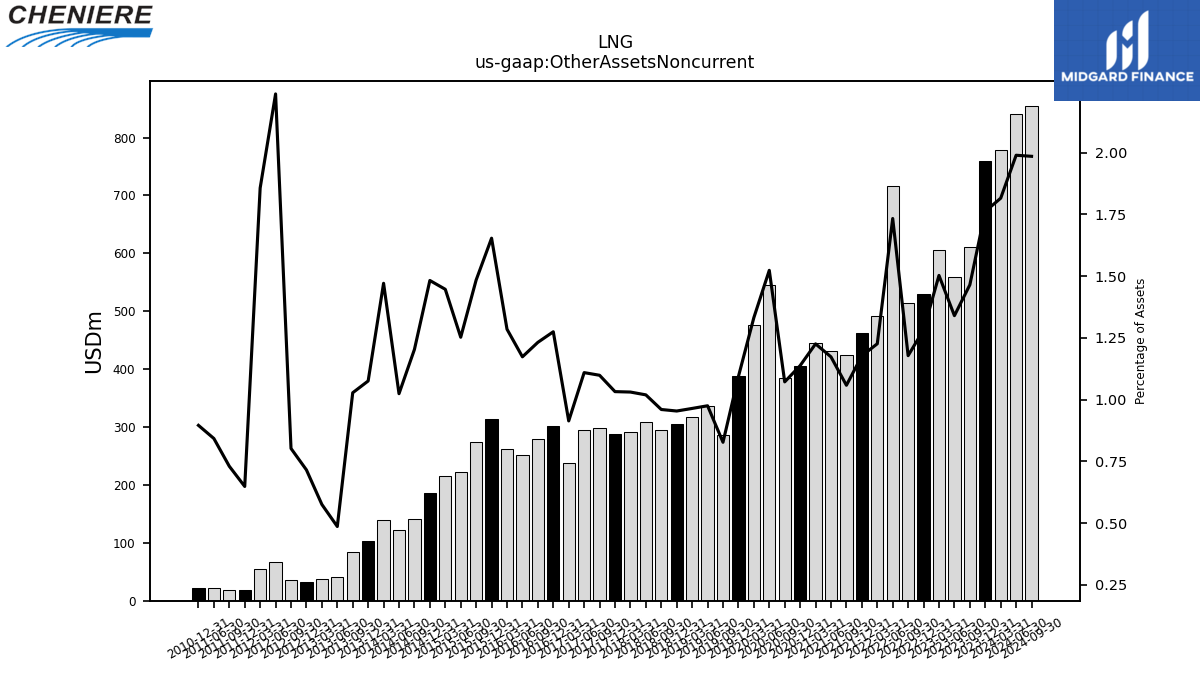
| Other Assets Noncurrent | 611.00 | 560.00 | 605.00 | 529.00 | 514.00 | 716.00 | 491.00 | 462.00 | 425.00 | 431.00 | 446.00 | 406.00 | 385.00 | 546.00 | 476.00 | 388.00 | 287.00 | 337.00 | 317.00 | 305.00 | 295.00 | 309.00 | 292.00 | 288.00 | 298.00 | 295.00 | 238.00 | 302.07 | 279.43 | 251.46 | 262.49 | 314.45 | 273.84 | 222.40 | 215.84 | 186.36 | 141.76 | 121.40 | 140.08 | 104.01 | 83.49 | 41.70 | 37.86 | 33.17 | 35.15 | 67.76 | 54.48 | 18.89 | 19.35 | 22.07 | NA | 22.87 | NA | NA |
| 2023-09-30 | 2023-06-30 | 2023-03-31 | 2022-12-31 | 2022-09-30 | 2022-06-30 | 2022-03-31 | 2021-12-31 | 2021-09-30 | 2021-06-30 | 2021-03-31 | 2020-12-31 | 2020-09-30 | 2020-06-30 | 2020-03-31 | 2019-12-31 | 2019-09-30 | 2019-06-30 | 2019-03-31 | 2018-12-31 | 2018-09-30 | 2018-06-30 | 2018-03-31 | 2017-12-31 | 2017-09-30 | 2017-06-30 | 2017-03-31 | 2016-12-31 | 2016-09-30 | 2016-06-30 | 2016-03-31 | 2015-12-31 | 2015-09-30 | 2015-06-30 | 2015-03-31 | 2014-12-31 | 2014-09-30 | 2014-06-30 | 2014-03-31 | 2013-12-31 | 2013-09-30 | 2013-06-30 | 2013-03-31 | 2012-12-31 | 2012-09-30 | 2012-06-30 | 2012-03-31 | 2011-12-31 | 2011-09-30 | 2011-06-30 | 2011-03-31 | 2010-12-31 | 2010-09-30 | 2010-06-30 | ||
|---|---|---|---|---|---|---|---|---|---|---|---|---|---|---|---|---|---|---|---|---|---|---|---|---|---|---|---|---|---|---|---|---|---|---|---|---|---|---|---|---|---|---|---|---|---|---|---|---|---|---|---|---|---|---|---|
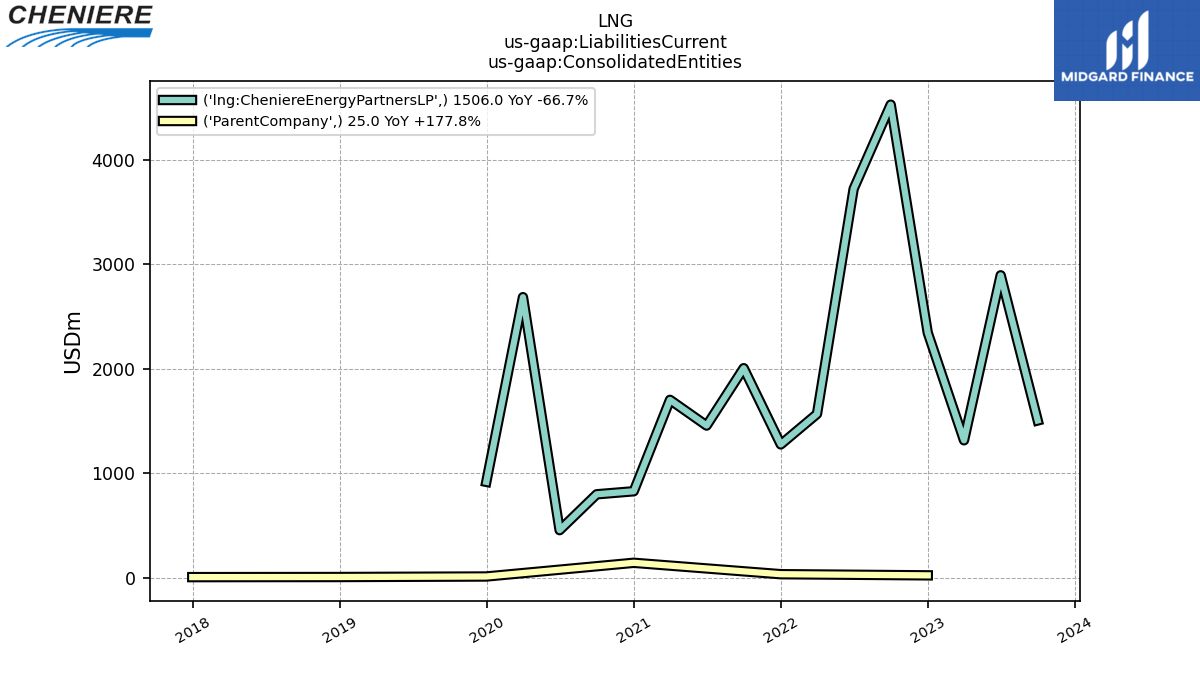
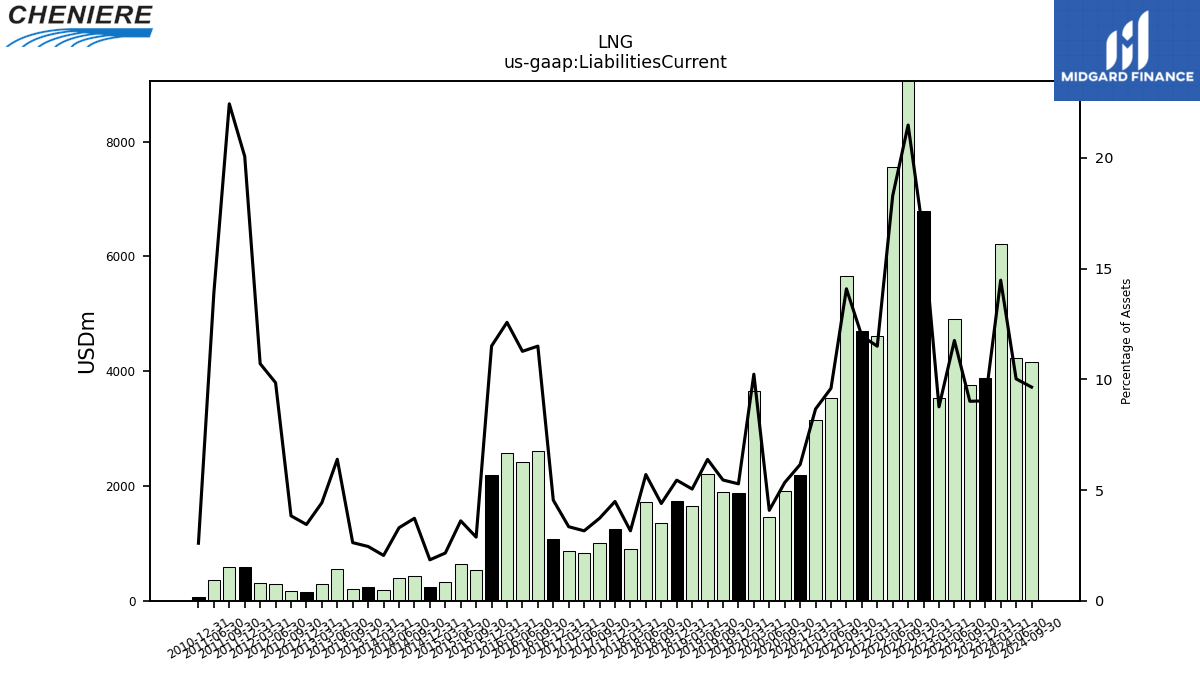
| Liabilities Current | 3758.00 | 4913.00 | 3526.00 | 6795.00 | 9375.00 | 7556.00 | 4605.00 | 4693.00 | 5660.00 | 3526.00 | 3152.00 | 2196.00 | 1917.00 | 1464.00 | 3657.00 | 1874.00 | 1892.00 | 2207.00 | 1659.00 | 1742.00 | 1350.00 | 1728.00 | 895.00 | 1251.00 | 1011.00 | 840.00 | 871.00 | 1076.67 | 2608.88 | 2414.52 | 2568.62 | 2188.09 | 530.22 | 640.84 | 321.47 | 232.47 | 438.79 | 390.88 | 194.87 | 237.01 | 213.24 | 548.29 | 291.37 | 159.76 | 168.12 | 298.14 | 314.17 | 584.96 | 595.02 | 364.20 | NA | 66.33 | NA | NA | |
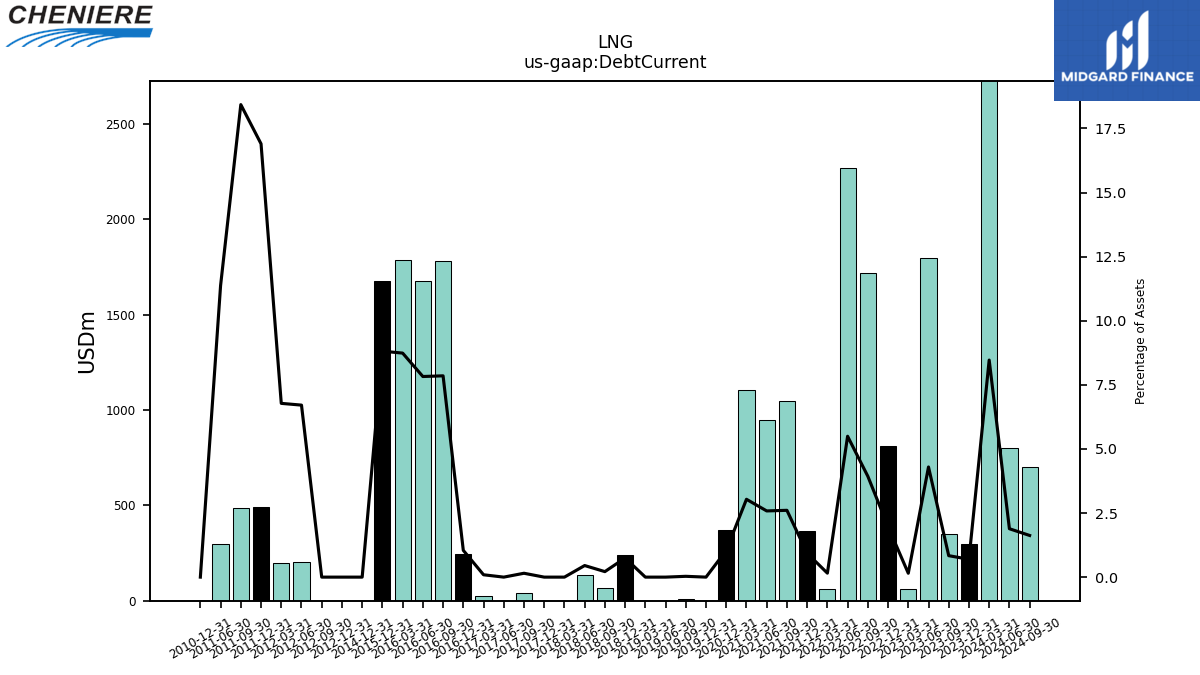
| Debt Current | 349.00 | 1796.00 | 61.00 | 813.00 | 1717.00 | 2270.00 | 62.00 | 366.00 | 1047.00 | 949.00 | 1105.00 | 372.00 | NA | NA | NA | 0.00 | 11.00 | 0.00 | 0.00 | 239.00 | 66.00 | 137.00 | 0.00 | 0.00 | 41.00 | 0.00 | 24.00 | 247.47 | 1781.51 | 1677.48 | 1785.32 | 1676.20 | NA | NA | NA | 0.00 | NA | NA | NA | NA | NA | NA | NA | 0.00 | 0.00 | 203.18 | 198.89 | 492.72 | 488.67 | 298.00 | NA | 0.00 | NA | NA | |
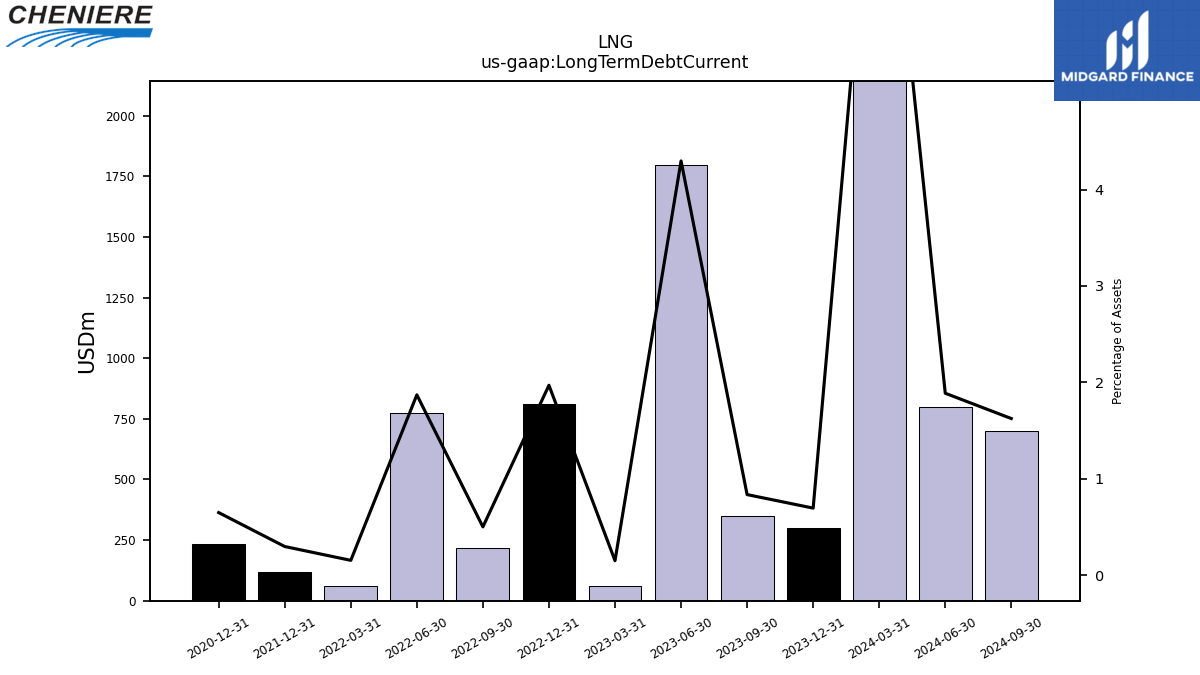
| Long Term Debt Current | 349.00 | 1796.00 | 61.00 | 813.00 | 219.00 | 773.00 | 62.00 | 117.00 | NA | NA | NA | 232.00 | NA | NA | NA | NA | NA | NA | NA | NA | NA | NA | NA | NA | NA | NA | NA | NA | NA | NA | NA | NA | NA | NA | NA | NA | NA | NA | NA | NA | NA | NA | NA | NA | NA | NA | NA | NA | NA | NA | NA | NA | NA | NA | |
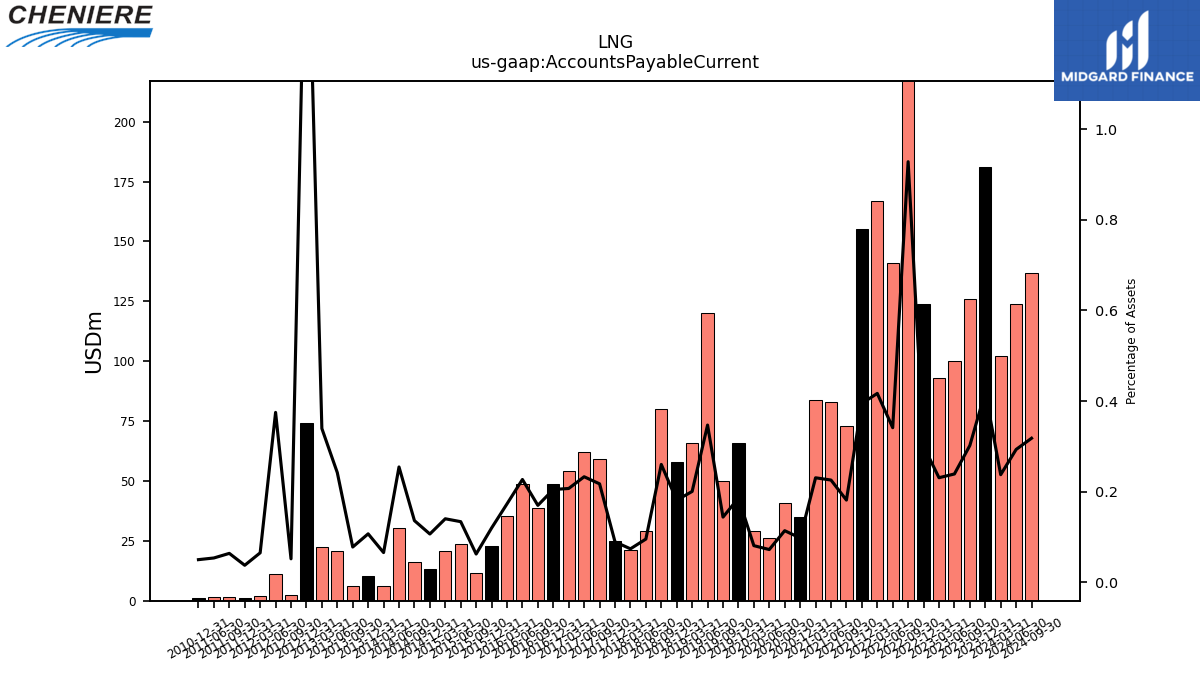
| Accounts Payable Current | 126.00 | 100.00 | 93.00 | 124.00 | 405.00 | 141.00 | 167.00 | 155.00 | 73.00 | 83.00 | 84.00 | 35.00 | 41.00 | 26.00 | 29.00 | 66.00 | 50.00 | 120.00 | 66.00 | 58.00 | 80.00 | 29.00 | 21.00 | 25.00 | 59.00 | 62.00 | 54.00 | 48.58 | 38.57 | 48.68 | 35.40 | 22.82 | 11.56 | 23.80 | 20.95 | 13.43 | 16.06 | 30.20 | 6.27 | 10.37 | 6.34 | 20.79 | 22.34 | 74.36 | 2.28 | 11.36 | 1.92 | 1.10 | 1.70 | 1.41 | NA | 1.28 | NA | NA | |
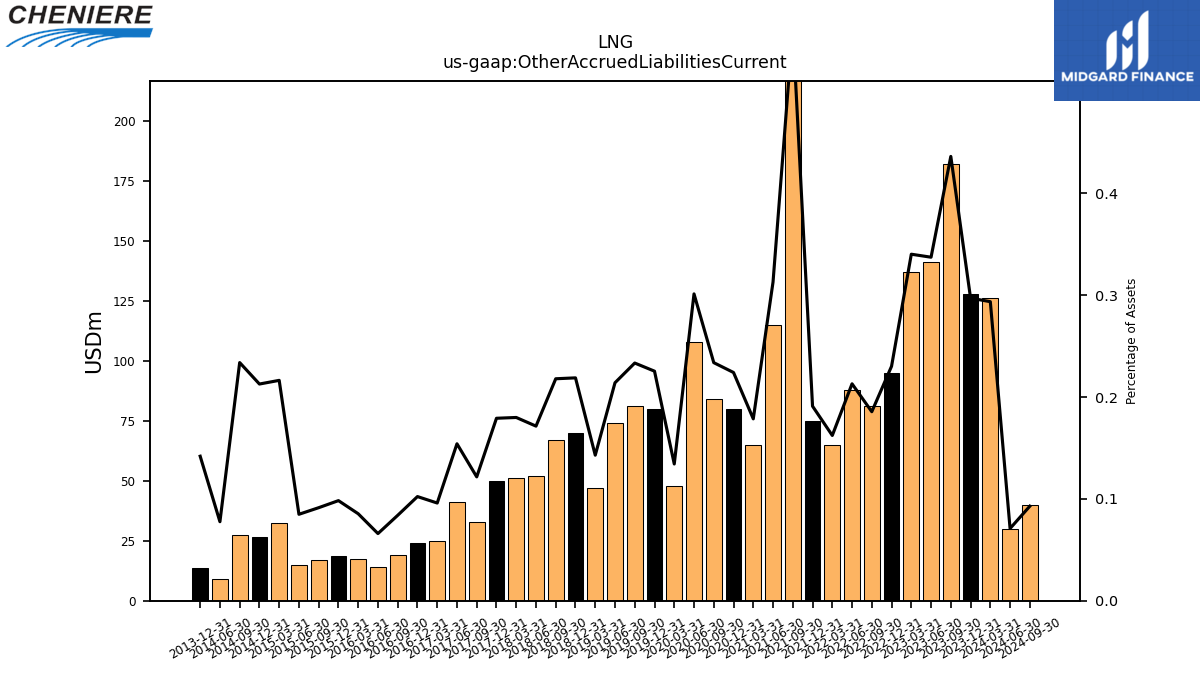
| Other Accrued Liabilities Current | 182.00 | 141.00 | 137.00 | 95.00 | 81.00 | 88.00 | 65.00 | 75.00 | 226.00 | 115.00 | 65.00 | 80.00 | 84.00 | 108.00 | 48.00 | 80.00 | 81.00 | 74.00 | 47.00 | 70.00 | 67.00 | 52.00 | 51.00 | 50.00 | 33.00 | 41.00 | 25.00 | 24.24 | 19.03 | 14.14 | 17.45 | 18.70 | 16.86 | 15.08 | 32.29 | 26.75 | 27.56 | 9.20 | NA | 13.73 | NA | NA | NA | NA | NA | NA | NA | NA | NA | NA | NA | NA | NA | NA | |
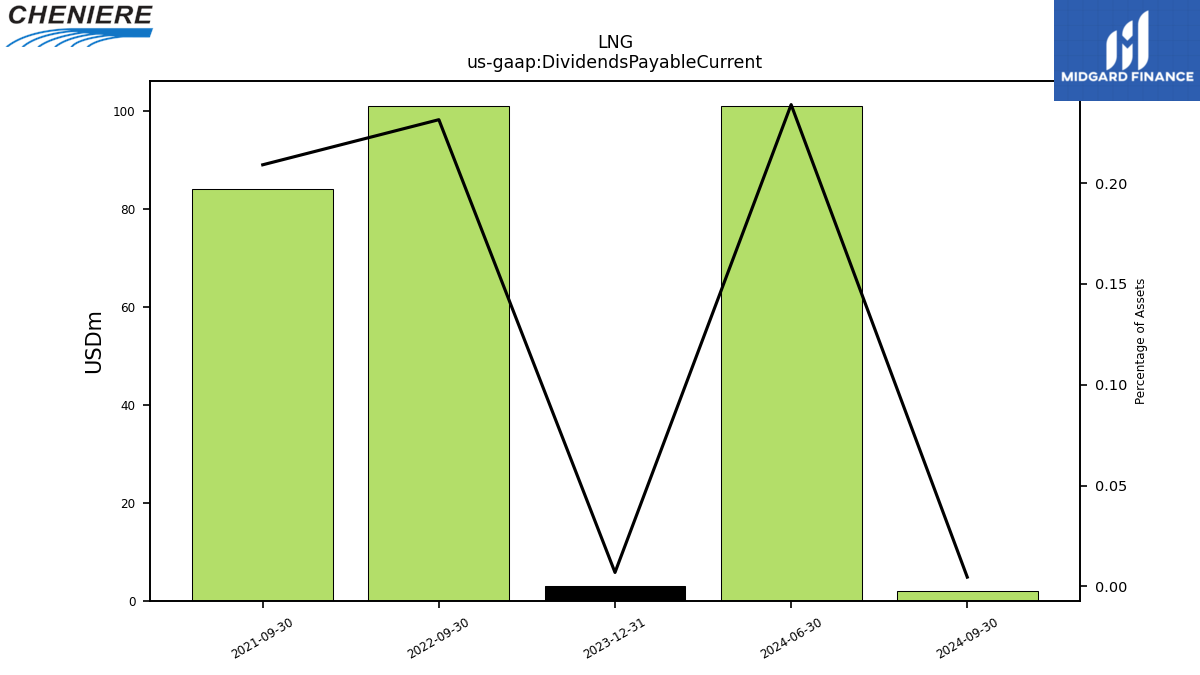
| Dividends Payable Current | NA | NA | NA | NA | 101.00 | NA | NA | NA | 84.00 | NA | NA | NA | NA | NA | NA | NA | NA | NA | NA | NA | NA | NA | NA | NA | NA | NA | NA | NA | NA | NA | NA | NA | NA | NA | NA | NA | NA | NA | NA | NA | NA | NA | NA | NA | NA | NA | NA | NA | NA | NA | NA | NA | NA | NA | |
| Accrued Liabilities Current | 1433.00 | 1037.00 | 1328.00 | 2679.00 | 3108.00 | 2599.00 | 1963.00 | 2299.00 | 1787.00 | 1197.00 | 1263.00 | 1175.00 | 1006.00 | 735.00 | 922.00 | 1281.00 | 1199.00 | 1572.00 | 1101.00 | 1169.00 | 987.00 | 1382.00 | 729.00 | 1078.00 | 722.00 | 674.00 | 683.00 | 637.10 | 700.00 | 589.60 | 670.58 | 427.20 | 457.90 | 565.83 | 255.81 | 169.13 | 378.98 | 320.92 | 142.28 | 186.55 | 172.01 | 491.42 | 242.15 | 58.74 | 138.78 | 57.75 | 85.25 | 63.07 | 77.41 | 38.06 | NA | 38.46 | NA | NA | |
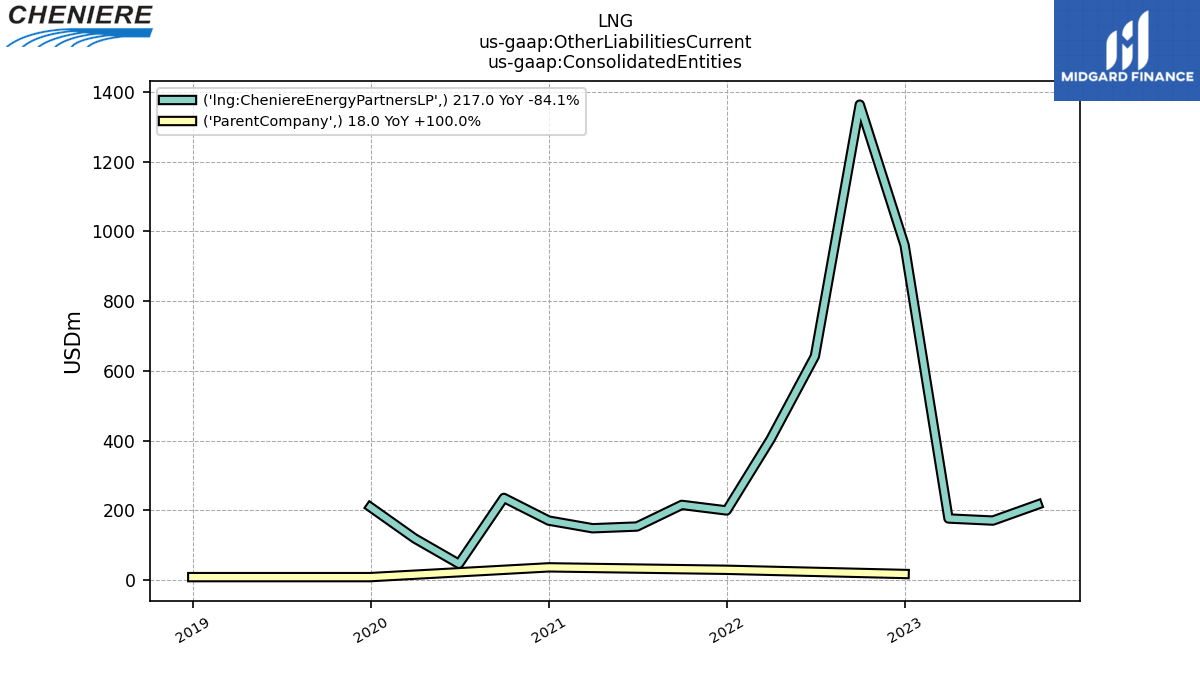
| Other Liabilities Current | 38.00 | 37.00 | 40.00 | 28.00 | 50.00 | 14.00 | 20.00 | 94.00 | 129.00 | 5.00 | 5.00 | 2.00 | 29.00 | 25.00 | 53.00 | 13.00 | 5.00 | 3.00 | 17.00 | 9.00 | 1.00 | NA | NA | 0.00 | NA | NA | NA | 0.22 | 0.26 | 0.05 | 0.09 | 0.00 | 0.27 | 0.60 | NA | 0.02 | 17.10 | 13.12 | 19.56 | 13.50 | 8.29 | 9.50 | 1.54 | 0.13 | 0.54 | 0.71 | 1.59 | 1.43 | 0.78 | 0.36 | NA | 0.00 | NA | NA |
| 2023-09-30 | 2023-06-30 | 2023-03-31 | 2022-12-31 | 2022-09-30 | 2022-06-30 | 2022-03-31 | 2021-12-31 | 2021-09-30 | 2021-06-30 | 2021-03-31 | 2020-12-31 | 2020-09-30 | 2020-06-30 | 2020-03-31 | 2019-12-31 | 2019-09-30 | 2019-06-30 | 2019-03-31 | 2018-12-31 | 2018-09-30 | 2018-06-30 | 2018-03-31 | 2017-12-31 | 2017-09-30 | 2017-06-30 | 2017-03-31 | 2016-12-31 | 2016-09-30 | 2016-06-30 | 2016-03-31 | 2015-12-31 | 2015-09-30 | 2015-06-30 | 2015-03-31 | 2014-12-31 | 2014-09-30 | 2014-06-30 | 2014-03-31 | 2013-12-31 | 2013-09-30 | 2013-06-30 | 2013-03-31 | 2012-12-31 | 2012-09-30 | 2012-06-30 | 2012-03-31 | 2011-12-31 | 2011-09-30 | 2011-06-30 | 2011-03-31 | 2010-12-31 | 2010-09-30 | 2010-06-30 | ||
|---|---|---|---|---|---|---|---|---|---|---|---|---|---|---|---|---|---|---|---|---|---|---|---|---|---|---|---|---|---|---|---|---|---|---|---|---|---|---|---|---|---|---|---|---|---|---|---|---|---|---|---|---|---|---|---|
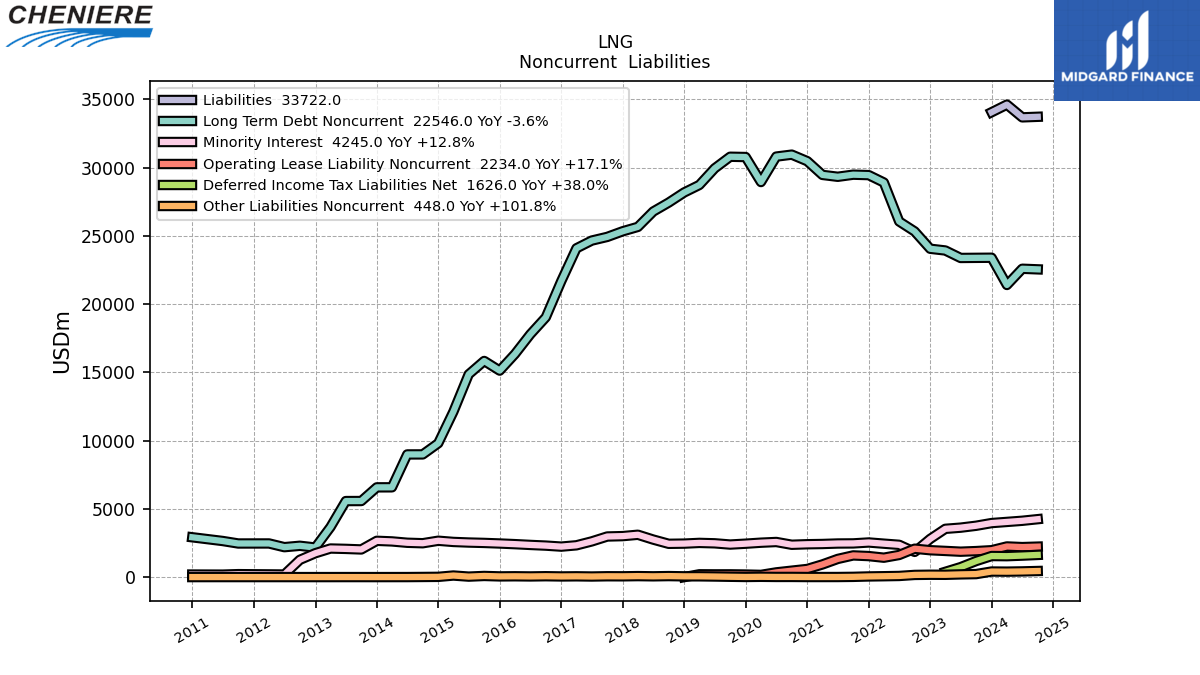
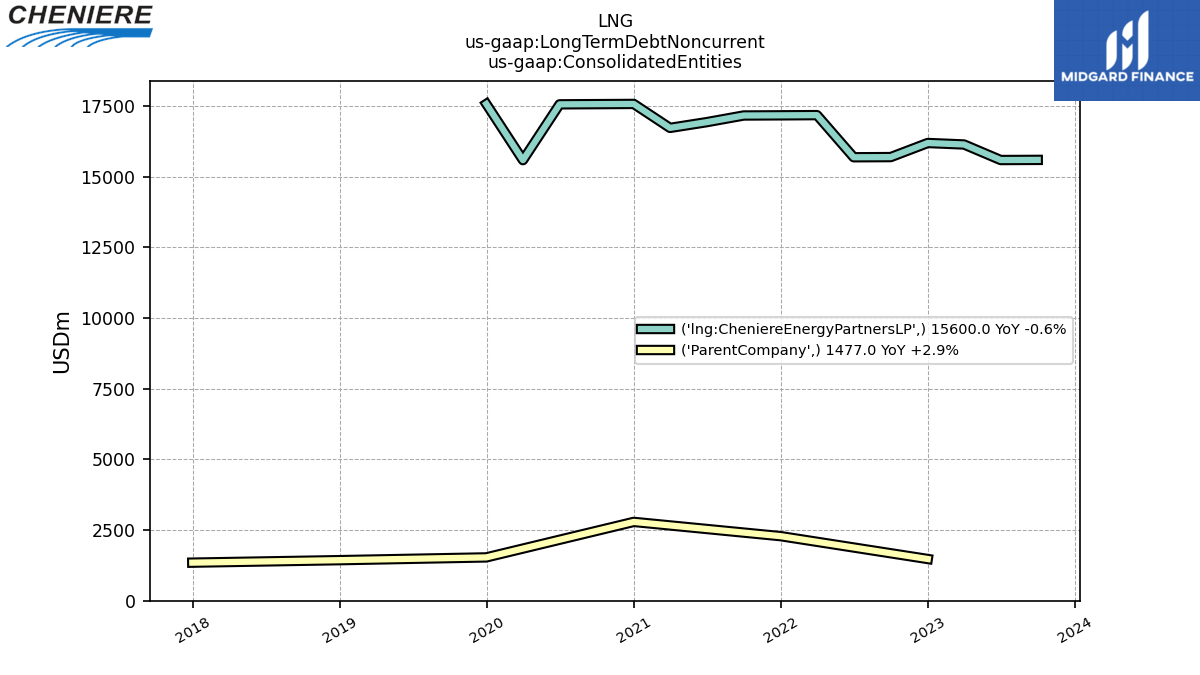
| Long Term Debt | 23389.00 | 23380.00 | 23928.00 | 24055.00 | 25325.00 | 26055.00 | 28907.00 | 29449.00 | 29481.00 | 29327.00 | 29465.00 | 30471.00 | 30949.00 | 30807.00 | 28940.00 | 30774.00 | 30795.00 | 29944.00 | 28726.00 | 28179.00 | 27438.00 | 26782.00 | 25656.00 | 25336.00 | 24923.00 | 24654.00 | 24088.00 | 21687.53 | 19033.51 | 17789.07 | 16348.10 | 15128.15 | 15835.91 | 14854.79 | 12117.88 | 9806.08 | 8989.76 | 8987.85 | 6578.35 | 6576.27 | 5574.19 | NA | NA | 2167.11 | NA | NA | NA | NA | NA | NA | NA | NA | NA | NA | |
| Long Term Debt Noncurrent | 23389.00 | 23380.00 | 23928.00 | 24055.00 | 25325.00 | 26055.00 | 28907.00 | 29449.00 | 29481.00 | 29327.00 | 29465.00 | 30471.00 | 30949.00 | 30807.00 | 28940.00 | 30774.00 | 30795.00 | 29944.00 | 28726.00 | 28179.00 | 27438.00 | 26782.00 | 25656.00 | 25336.00 | 24923.00 | 24654.00 | 24088.00 | 21687.53 | 19033.51 | 17789.07 | 16348.10 | 15128.15 | 15835.91 | 14854.79 | 12117.88 | 9806.08 | 8989.76 | 8987.85 | 6578.35 | 6576.27 | 5574.19 | 5572.01 | 3668.29 | 2167.11 | 2295.94 | 2194.76 | 2466.29 | 2465.11 | 2463.94 | 2645.61 | NA | 2918.58 | NA | NA | |
| Debt And Capital Lease Obligations | NA | NA | NA | 25086.00 | NA | NA | NA | 30406.00 | NA | NA | NA | 31487.00 | NA | NA | NA | 31466.00 | NA | NA | NA | 29193.00 | NA | NA | NA | 26066.00 | NA | NA | NA | NA | NA | NA | NA | NA | NA | NA | NA | NA | NA | NA | NA | NA | NA | NA | NA | NA | NA | NA | NA | NA | NA | NA | NA | NA | NA | NA | |
| Deferred Income Tax Liabilities Net | 1178.00 | 731.00 | 388.00 | NA | NA | NA | NA | NA | NA | NA | NA | NA | NA | NA | NA | NA | NA | NA | NA | NA | NA | NA | NA | NA | NA | NA | NA | NA | NA | NA | NA | NA | NA | NA | NA | NA | NA | NA | NA | NA | NA | NA | NA | NA | NA | NA | NA | NA | NA | NA | NA | NA | NA | NA | |
| Minority Interest | 3763.00 | 3624.00 | 3538.00 | 2798.00 | 1849.00 | 2367.00 | 2451.00 | 2538.00 | 2470.00 | 2463.00 | 2427.00 | 2409.00 | 2371.00 | 2574.00 | 2523.00 | 2449.00 | 2386.00 | 2477.00 | 2507.00 | 2455.00 | 2440.00 | 2751.00 | 3104.00 | 3004.00 | 2976.00 | 2617.00 | 2331.00 | 2234.82 | 2308.46 | 2358.43 | 2415.02 | 2463.25 | 2504.81 | 2534.13 | 2577.51 | 2665.69 | 2482.36 | 2517.41 | 2616.05 | 2660.38 | 2027.14 | 2067.99 | 2095.87 | 1751.60 | 1268.00 | 190.64 | 200.89 | 208.57 | 217.77 | 182.77 | NA | 189.02 | NA | NA | |
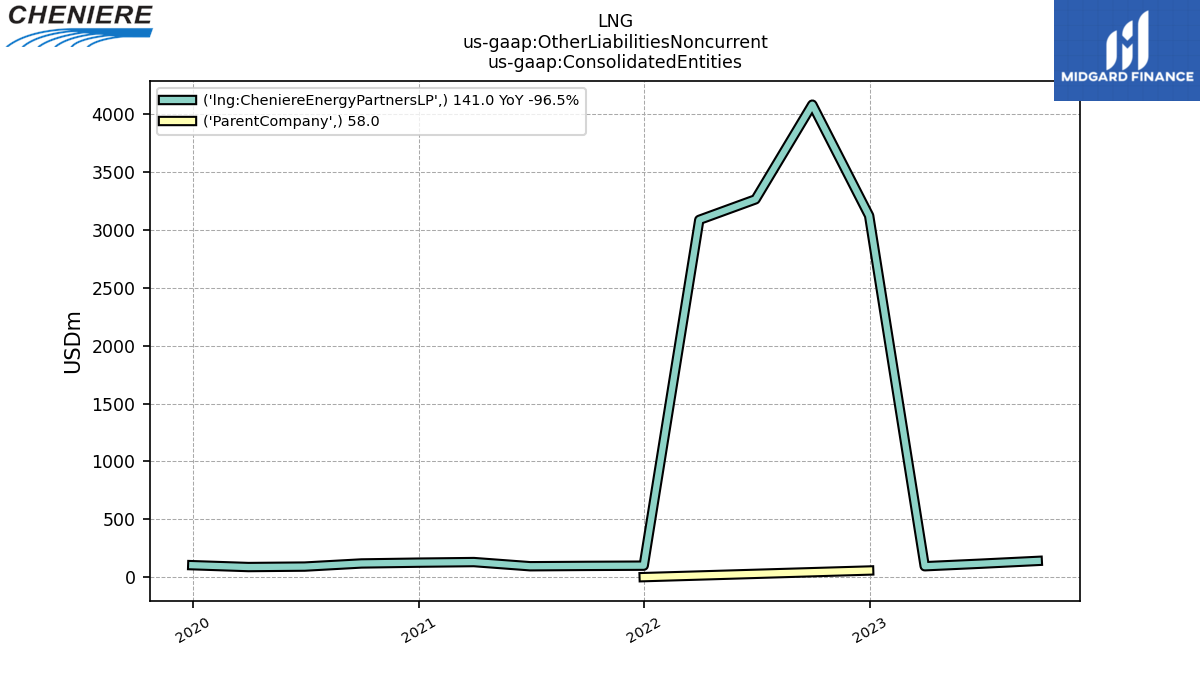
| Other Liabilities Noncurrent | 222.00 | 201.00 | 170.00 | 175.00 | 161.00 | 85.00 | 66.00 | 50.00 | 20.00 | 8.00 | 7.00 | 7.00 | 14.00 | 13.00 | 23.00 | 11.00 | 26.00 | 44.00 | 58.00 | 58.00 | 76.00 | 59.00 | 74.00 | 59.00 | 63.00 | 45.00 | 59.00 | 49.53 | 65.85 | 50.38 | 61.67 | 53.07 | 85.23 | 37.01 | 116.83 | 20.11 | 11.71 | 4.11 | 3.28 | 2.40 | 3.57 | 3.68 | 2.79 | 2.68 | 2.88 | 3.02 | 3.15 | 3.15 | 3.29 | 3.36 | NA | 2.28 | NA | NA | |
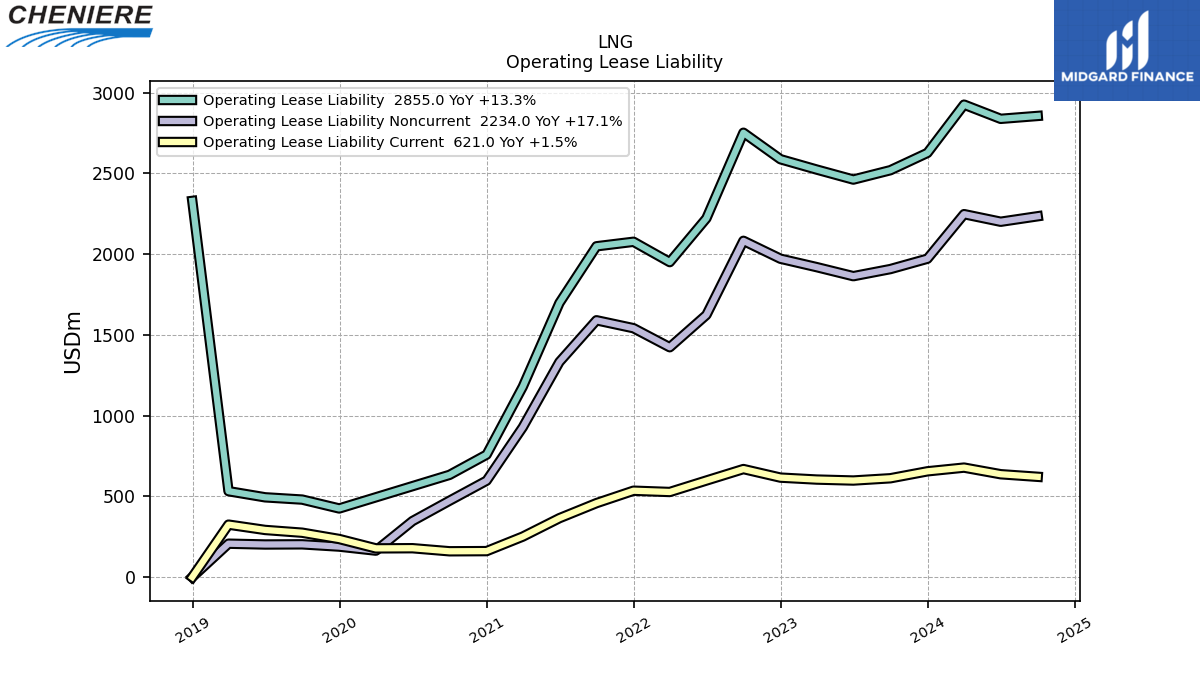
| Operating Lease Liability Noncurrent | 1907.00 | 1863.00 | 1919.00 | 1971.00 | 2082.00 | 1623.00 | 1423.00 | 1541.00 | 1590.00 | 1332.00 | 928.00 | 597.00 | 473.00 | 347.00 | 164.00 | 189.00 | 203.00 | 202.00 | 207.00 | 0.00 | NA | NA | NA | NA | NA | NA | NA | NA | NA | NA | NA | NA | NA | NA | NA | NA | NA | NA | NA | NA | NA | NA | NA | NA | NA | NA | NA | NA | NA | NA | NA | NA | NA | NA |
| 2023-09-30 | 2023-06-30 | 2023-03-31 | 2022-12-31 | 2022-09-30 | 2022-06-30 | 2022-03-31 | 2021-12-31 | 2021-09-30 | 2021-06-30 | 2021-03-31 | 2020-12-31 | 2020-09-30 | 2020-06-30 | 2020-03-31 | 2019-12-31 | 2019-09-30 | 2019-06-30 | 2019-03-31 | 2018-12-31 | 2018-09-30 | 2018-06-30 | 2018-03-31 | 2017-12-31 | 2017-09-30 | 2017-06-30 | 2017-03-31 | 2016-12-31 | 2016-09-30 | 2016-06-30 | 2016-03-31 | 2015-12-31 | 2015-09-30 | 2015-06-30 | 2015-03-31 | 2014-12-31 | 2014-09-30 | 2014-06-30 | 2014-03-31 | 2013-12-31 | 2013-09-30 | 2013-06-30 | 2013-03-31 | 2012-12-31 | 2012-09-30 | 2012-06-30 | 2012-03-31 | 2011-12-31 | 2011-09-30 | 2011-06-30 | 2011-03-31 | 2010-12-31 | 2010-09-30 | 2010-06-30 | ||
|---|---|---|---|---|---|---|---|---|---|---|---|---|---|---|---|---|---|---|---|---|---|---|---|---|---|---|---|---|---|---|---|---|---|---|---|---|---|---|---|---|---|---|---|---|---|---|---|---|---|---|---|---|---|---|---|
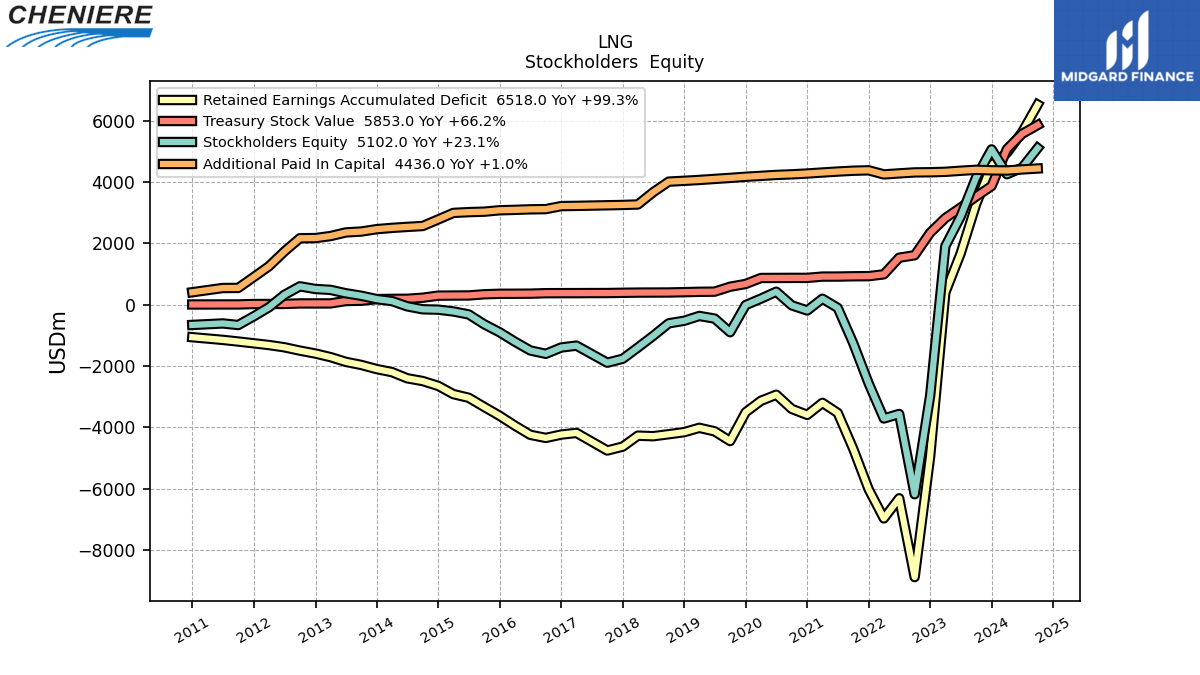
| Stockholders Equity | 4144.00 | 2868.00 | 1902.00 | -2969.00 | -6179.00 | -3562.00 | -3710.00 | -2571.00 | -1257.00 | -106.00 | 193.00 | -191.00 | -24.00 | 422.00 | 196.00 | -14.00 | -900.00 | -454.00 | -369.00 | -526.00 | -609.00 | -1017.00 | -1397.00 | -1764.00 | -1893.00 | -1613.00 | -1336.00 | -1396.42 | -1602.72 | -1494.26 | -1210.33 | -901.85 | -639.88 | -318.77 | -223.14 | -164.18 | -151.81 | -56.46 | 115.56 | 179.68 | 289.21 | 370.76 | 481.03 | 510.00 | 596.89 | 318.27 | -84.07 | -381.57 | -664.67 | -613.09 | NA | -661.63 | NA | NA | |
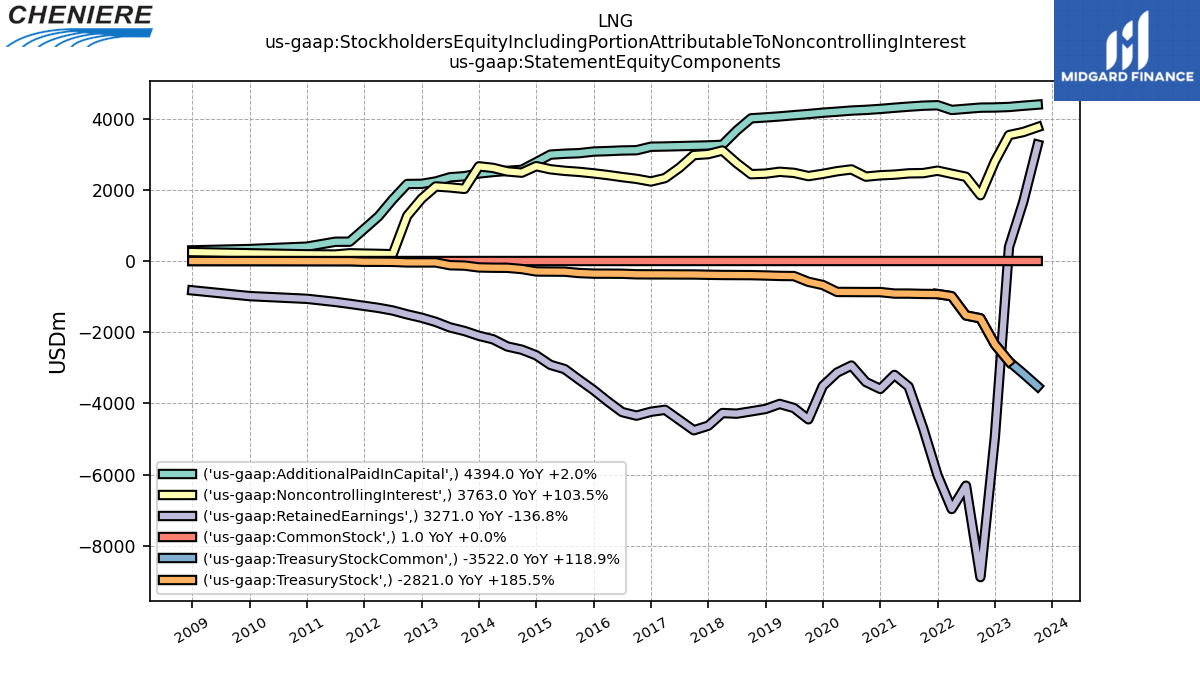
| Stockholders Equity Including Portion Attributable To Noncontrolling Interest | 7907.00 | 6492.00 | 5440.00 | -171.00 | -4330.00 | -1195.00 | -1259.00 | -33.00 | 1213.00 | 2357.00 | 2620.00 | 2218.00 | 2347.00 | 2996.00 | 2719.00 | 2435.00 | 1486.00 | 2023.00 | 2138.00 | 1929.00 | 1831.00 | 1734.00 | 1707.00 | 1240.00 | 1083.00 | 1004.00 | 995.00 | 838.40 | 705.74 | 864.17 | 1204.68 | 1561.40 | 1864.93 | 2215.36 | 2354.37 | 2501.52 | 2330.55 | 2460.96 | 2731.62 | 2840.06 | 2316.35 | 2438.75 | 2576.90 | 2261.61 | 1864.90 | 508.91 | 116.81 | -172.99 | -446.90 | -430.32 | NA | -472.61 | NA | NA | |
| Additional Paid In Capital | 4394.00 | 4363.00 | 4328.00 | 4314.00 | 4309.00 | 4277.00 | 4244.00 | 4377.00 | 4364.00 | 4337.00 | 4306.00 | 4273.00 | 4246.00 | 4227.00 | 4196.00 | 4167.00 | 4130.00 | 4097.00 | 4063.00 | 4035.00 | 4009.00 | 3664.00 | 3264.00 | 3248.00 | 3238.00 | 3228.00 | 3218.00 | 3211.12 | 3112.75 | 3105.73 | 3088.65 | 3075.32 | 3029.32 | 3014.48 | 2989.22 | 2776.70 | 2562.65 | 2533.12 | 2501.13 | 2459.70 | 2382.42 | 2352.74 | 2234.74 | 2168.78 | 2163.80 | 1730.99 | 1252.83 | 898.70 | 543.78 | 541.44 | NA | 404.12 | NA | NA | |
| Retained Earnings Accumulated Deficit | 3271.00 | 1666.00 | 394.00 | -4942.00 | -8880.00 | -6311.00 | -6967.00 | -6021.00 | -4698.00 | -3529.00 | -3200.00 | -3593.00 | -3399.00 | -2936.00 | -3133.00 | -3508.00 | -4447.00 | -4129.00 | -4015.00 | -4156.00 | -4223.00 | -4288.00 | -4270.00 | -4627.00 | -4754.00 | -4465.00 | -4180.00 | -4233.94 | -4343.65 | -4243.20 | -3944.79 | -3623.95 | -3332.85 | -3035.04 | -2916.55 | -2648.84 | -2490.23 | -2400.64 | -2198.72 | -2100.91 | -1965.68 | -1864.85 | -1710.09 | -1592.98 | -1498.66 | -1389.66 | -1316.62 | -1260.20 | -1202.40 | -1148.46 | NA | -1061.45 | NA | NA | |
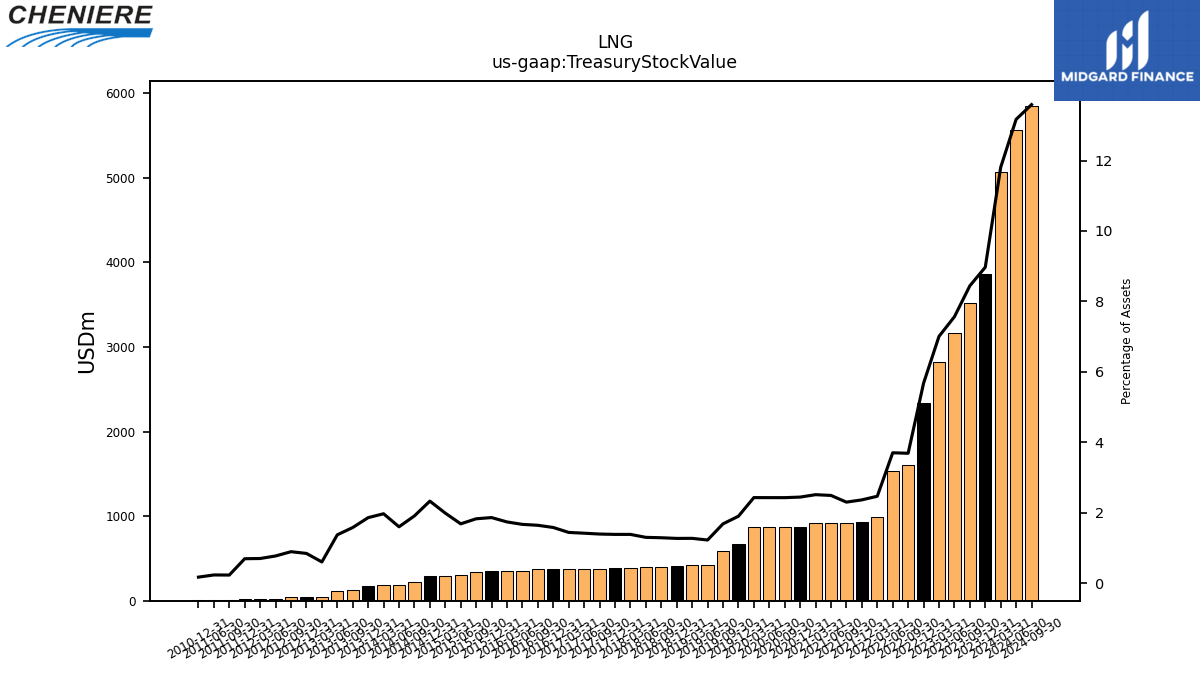
| Treasury Stock Value | 3522.00 | 3162.00 | 2821.00 | 2342.00 | 1609.00 | 1529.00 | 988.00 | 928.00 | 924.00 | 915.00 | 914.00 | 872.00 | 872.00 | 870.00 | 868.00 | 674.00 | 584.00 | 423.00 | 418.00 | 406.00 | 396.00 | 394.00 | 392.00 | 386.00 | 378.00 | 377.00 | 375.00 | 374.32 | 372.53 | 357.49 | 354.90 | 353.93 | 337.06 | 298.93 | 296.52 | 292.75 | 224.94 | 189.65 | 187.57 | 179.83 | 128.25 | 117.71 | 39.58 | 39.12 | 39.12 | 23.34 | 20.50 | 20.20 | 6.07 | 6.07 | NA | 4.34 | NA | NA | |
| Minority Interest | 3763.00 | 3624.00 | 3538.00 | 2798.00 | 1849.00 | 2367.00 | 2451.00 | 2538.00 | 2470.00 | 2463.00 | 2427.00 | 2409.00 | 2371.00 | 2574.00 | 2523.00 | 2449.00 | 2386.00 | 2477.00 | 2507.00 | 2455.00 | 2440.00 | 2751.00 | 3104.00 | 3004.00 | 2976.00 | 2617.00 | 2331.00 | 2234.82 | 2308.46 | 2358.43 | 2415.02 | 2463.25 | 2504.81 | 2534.13 | 2577.51 | 2665.69 | 2482.36 | 2517.41 | 2616.05 | 2660.38 | 2027.14 | 2067.99 | 2095.87 | 1751.60 | 1268.00 | 190.64 | 200.89 | 208.57 | 217.77 | 182.77 | NA | 189.02 | NA | NA | |
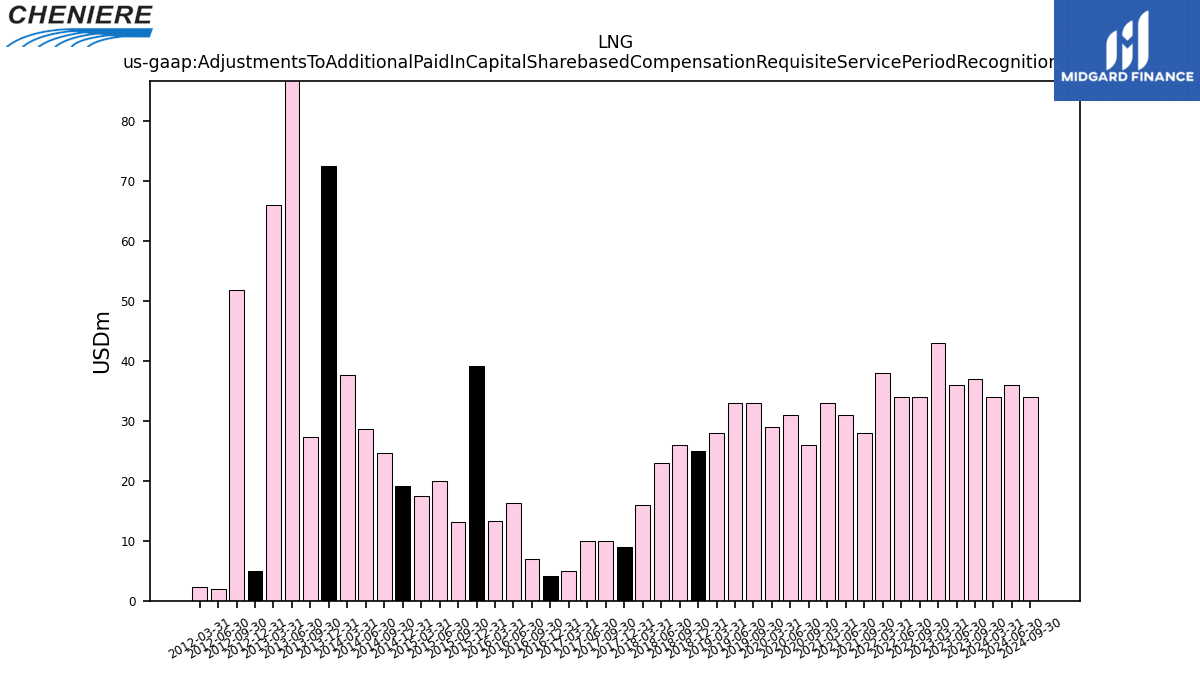
| Adjustments To Additional Paid In Capital Sharebased Compensation Requisite Service Period Recognition Value | 37.00 | 36.00 | 43.00 | NA | 34.00 | 34.00 | 38.00 | NA | 28.00 | 31.00 | 33.00 | NA | 26.00 | 31.00 | 29.00 | NA | 33.00 | 33.00 | 28.00 | 25.00 | 26.00 | 23.00 | 16.00 | 9.00 | 10.00 | 10.00 | 5.00 | 4.17 | 6.96 | 16.24 | 13.33 | 39.05 | 13.17 | 19.95 | 17.46 | 19.07 | 24.66 | 28.62 | 37.70 | 72.53 | 27.34 | 117.99 | 66.01 | 4.93 | 51.87 | 1.96 | 2.29 | NA | NA | NA | NA | NA | NA | NA | |
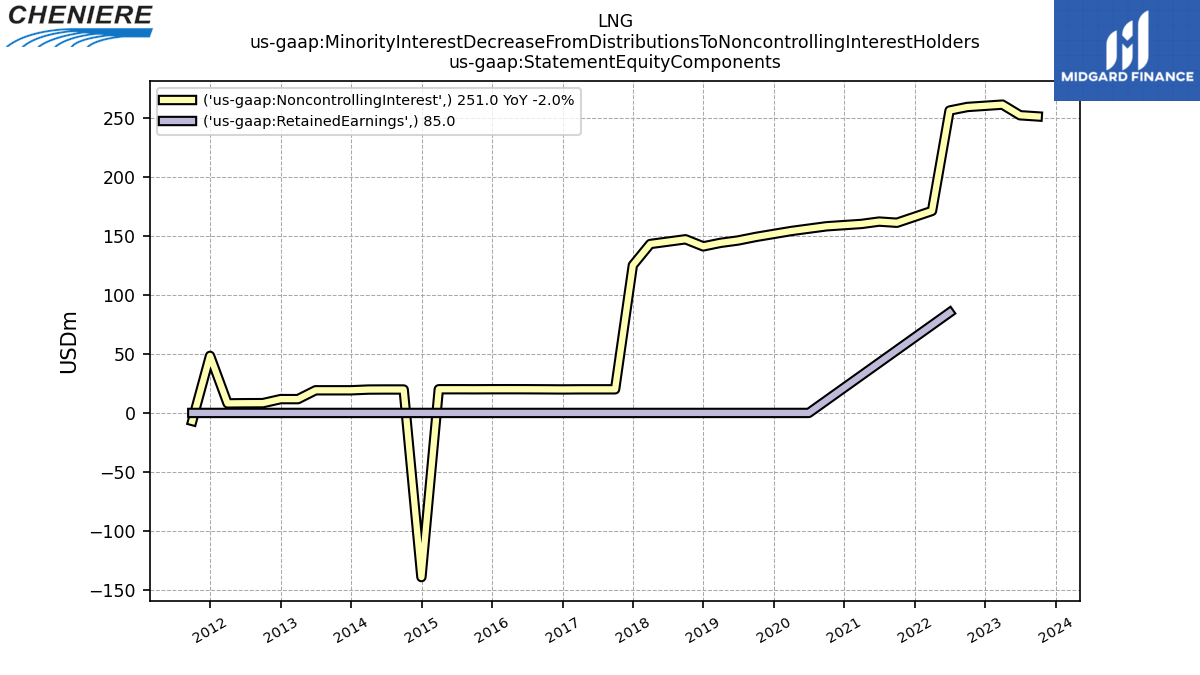
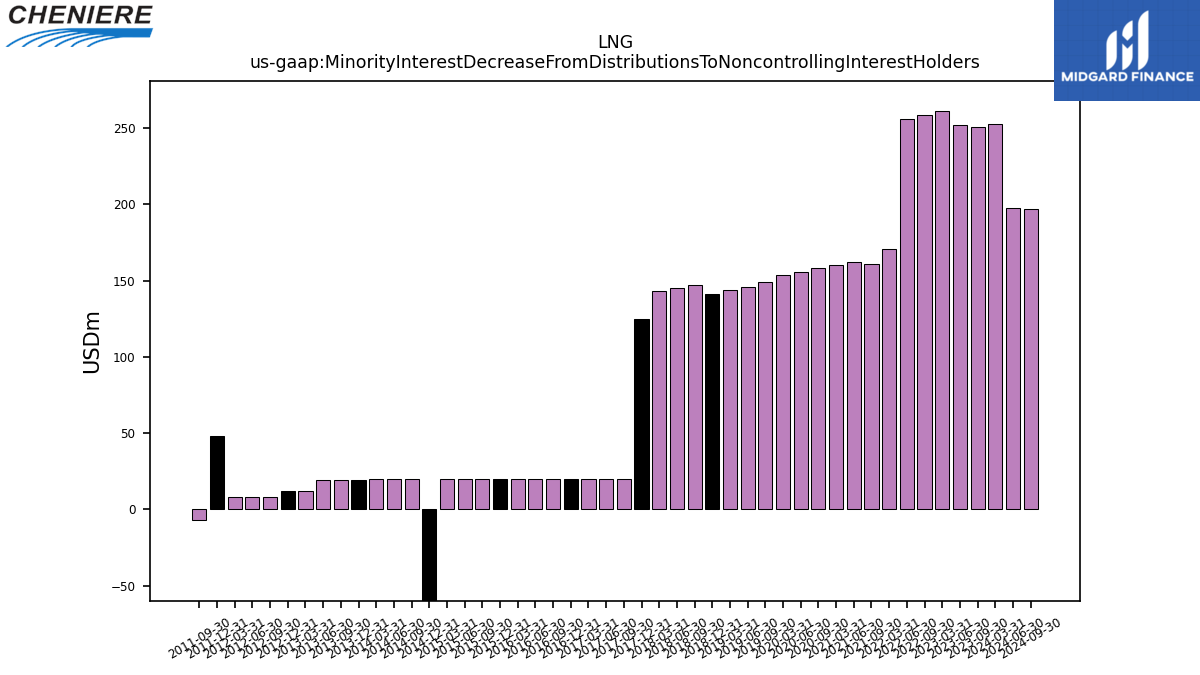
| Minority Interest Decrease From Distributions To Noncontrolling Interest Holders | 251.00 | 252.00 | 261.00 | NA | 259.00 | 256.00 | 171.00 | NA | 161.00 | 162.00 | 160.00 | NA | 158.00 | 156.00 | 154.00 | NA | 149.00 | 146.00 | 144.00 | 141.00 | 147.00 | 145.00 | 143.00 | 125.00 | 20.00 | 20.00 | 20.00 | 19.90 | 20.00 | 20.07 | 20.10 | 20.08 | 20.03 | 20.07 | 20.05 | -139.00 | 19.83 | 19.86 | 19.79 | 19.17 | 19.17 | 19.17 | 11.70 | 11.70 | 8.30 | 8.24 | 8.09 | 48.34 | -6.82 | NA | NA | NA | NA | NA |
| 2023-09-30 | 2023-06-30 | 2023-03-31 | 2022-12-31 | 2022-09-30 | 2022-06-30 | 2022-03-31 | 2021-12-31 | 2021-09-30 | 2021-06-30 | 2021-03-31 | 2020-12-31 | 2020-09-30 | 2020-06-30 | 2020-03-31 | 2019-12-31 | 2019-09-30 | 2019-06-30 | 2019-03-31 | 2018-12-31 | 2018-09-30 | 2018-06-30 | 2018-03-31 | 2017-12-31 | 2017-09-30 | 2017-06-30 | 2017-03-31 | 2016-12-31 | 2016-09-30 | 2016-06-30 | 2016-03-31 | 2015-12-31 | 2015-09-30 | 2015-06-30 | 2015-03-31 | 2014-12-31 | 2014-09-30 | 2014-06-30 | 2014-03-31 | 2013-12-31 | 2013-09-30 | 2013-06-30 | 2013-03-31 | 2012-12-31 | 2012-09-30 | 2012-06-30 | 2012-03-31 | 2011-12-31 | 2011-09-30 | 2011-06-30 | 2011-03-31 | 2010-12-31 | 2010-09-30 | 2010-06-30 | ||
|---|---|---|---|---|---|---|---|---|---|---|---|---|---|---|---|---|---|---|---|---|---|---|---|---|---|---|---|---|---|---|---|---|---|---|---|---|---|---|---|---|---|---|---|---|---|---|---|---|---|---|---|---|---|---|---|
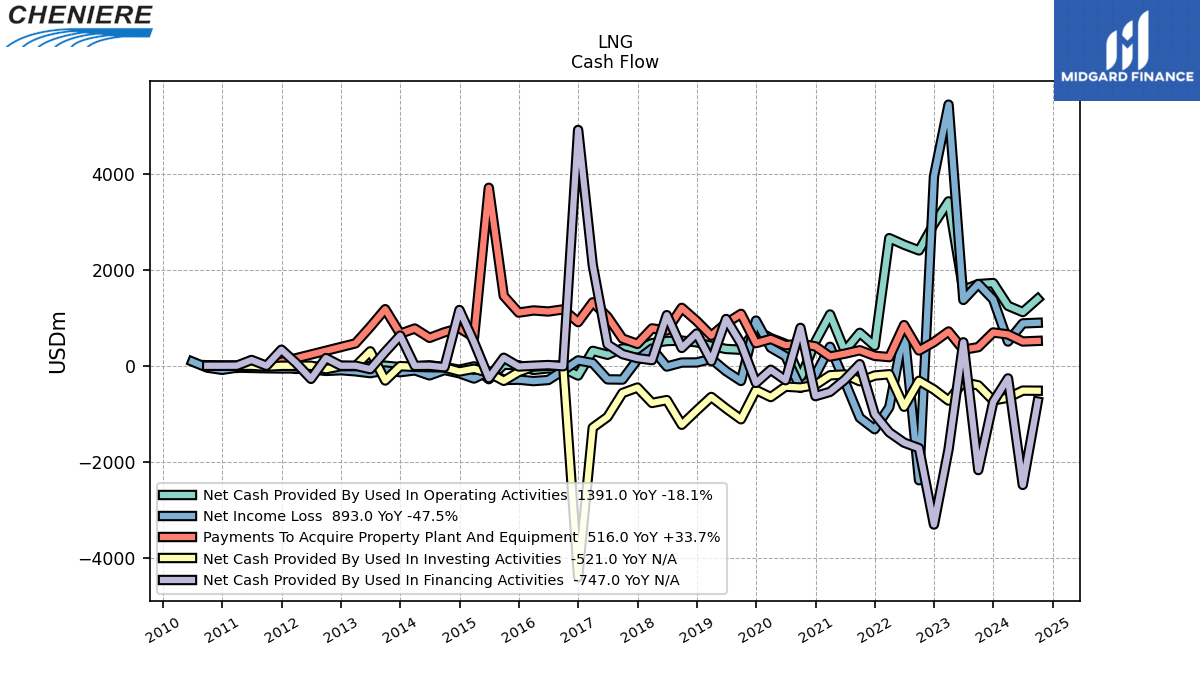
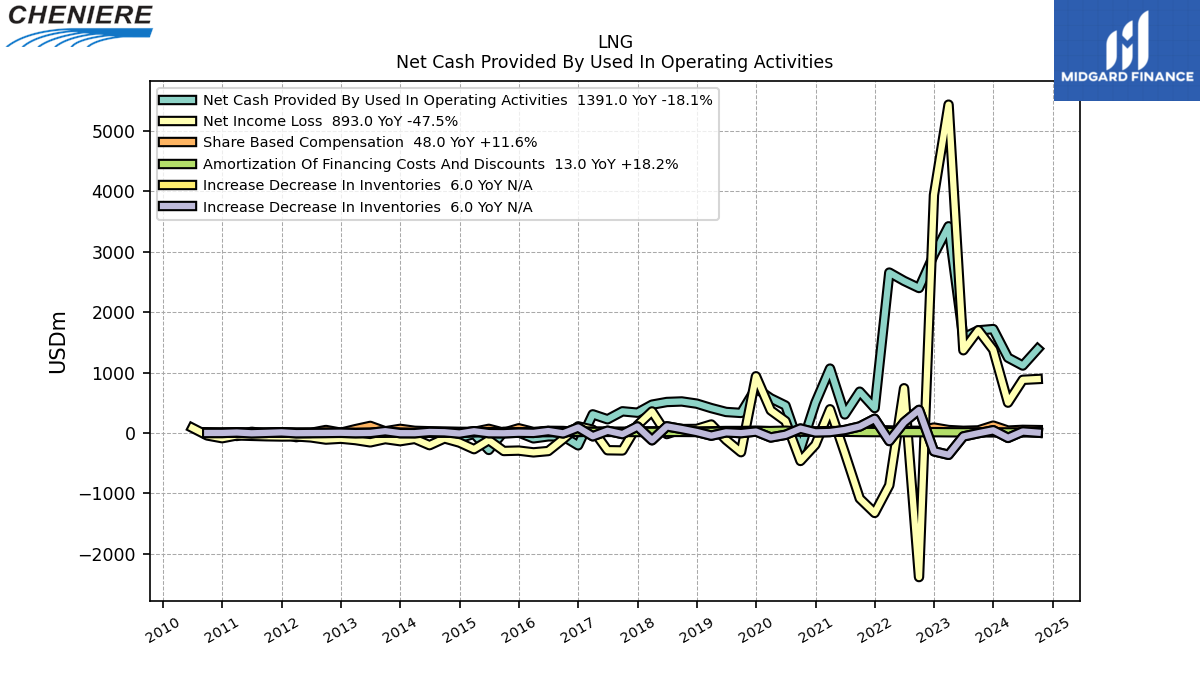
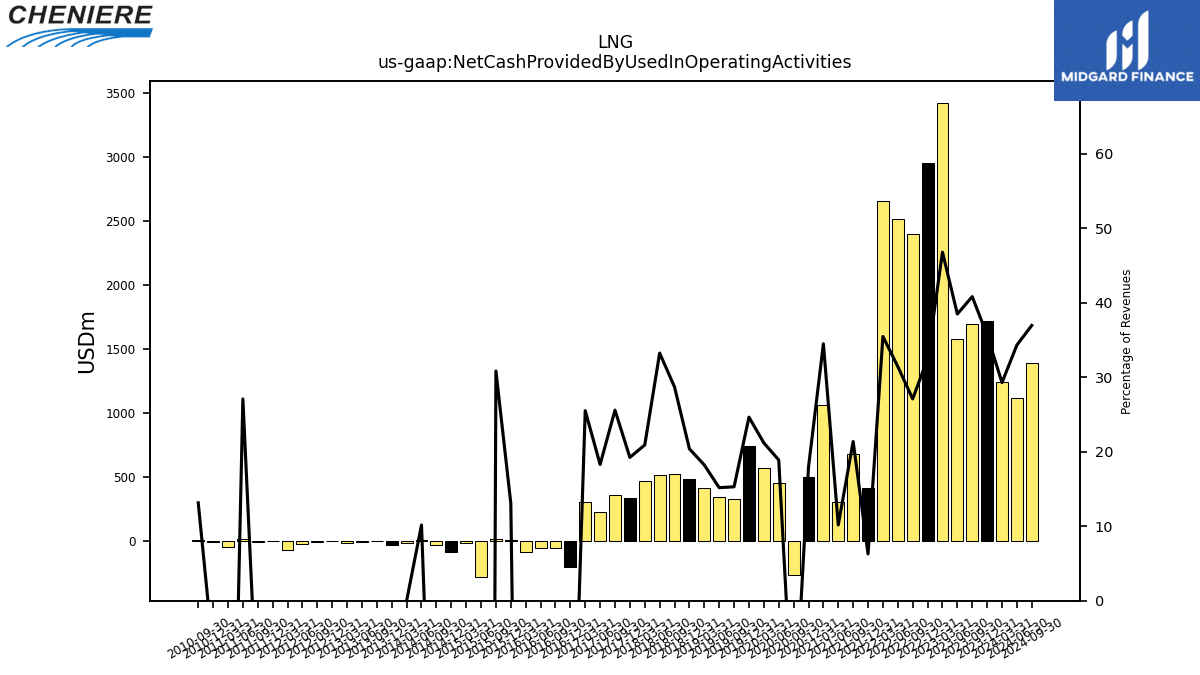
| Net Cash Provided By Used In Operating Activities | 1698.00 | 1579.00 | 3421.00 | 2952.00 | 2399.00 | 2517.00 | 2655.00 | 412.00 | 684.00 | 307.00 | 1066.00 | 500.00 | -263.00 | 454.00 | 574.00 | 741.00 | 332.00 | 348.00 | 412.00 | 486.00 | 522.00 | 513.00 | 469.00 | 336.00 | 359.00 | 227.00 | 309.00 | -204.81 | -54.99 | -55.34 | -88.69 | 8.96 | 20.38 | -280.77 | -14.18 | -83.07 | -29.71 | 6.88 | -18.22 | -30.13 | -0.46 | -8.62 | -13.22 | -2.86 | -10.04 | -26.24 | -68.70 | -2.85 | -10.39 | 19.72 | -49.24 | -5.29 | 8.97 | NA | |
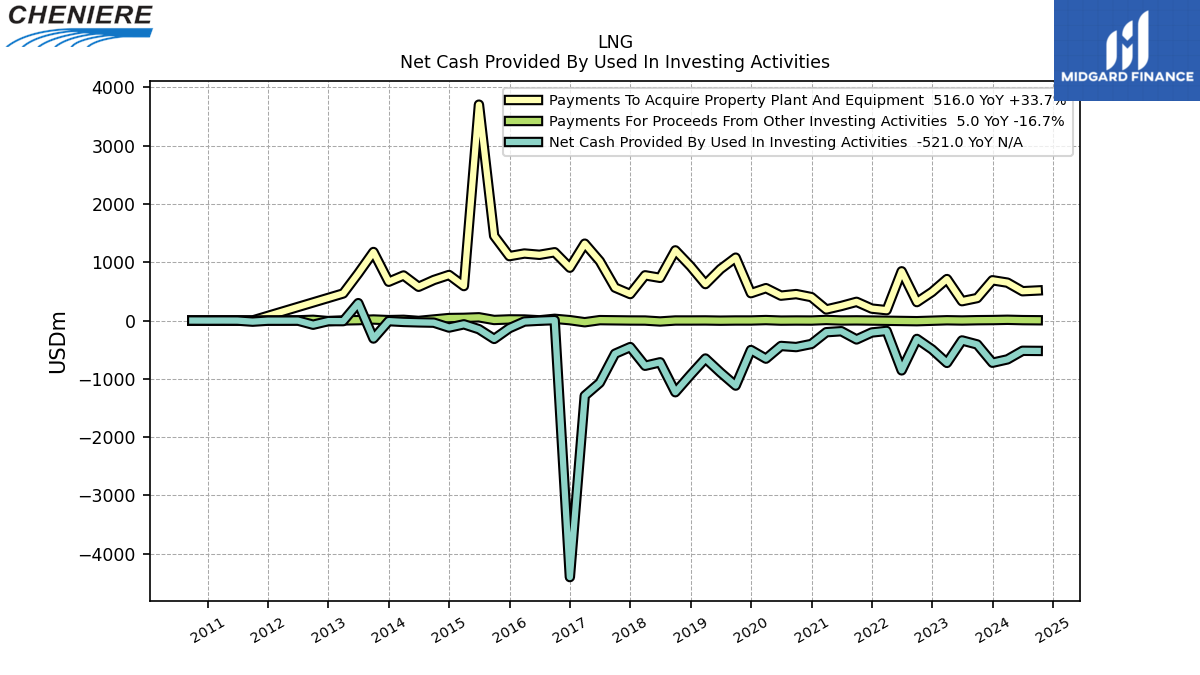
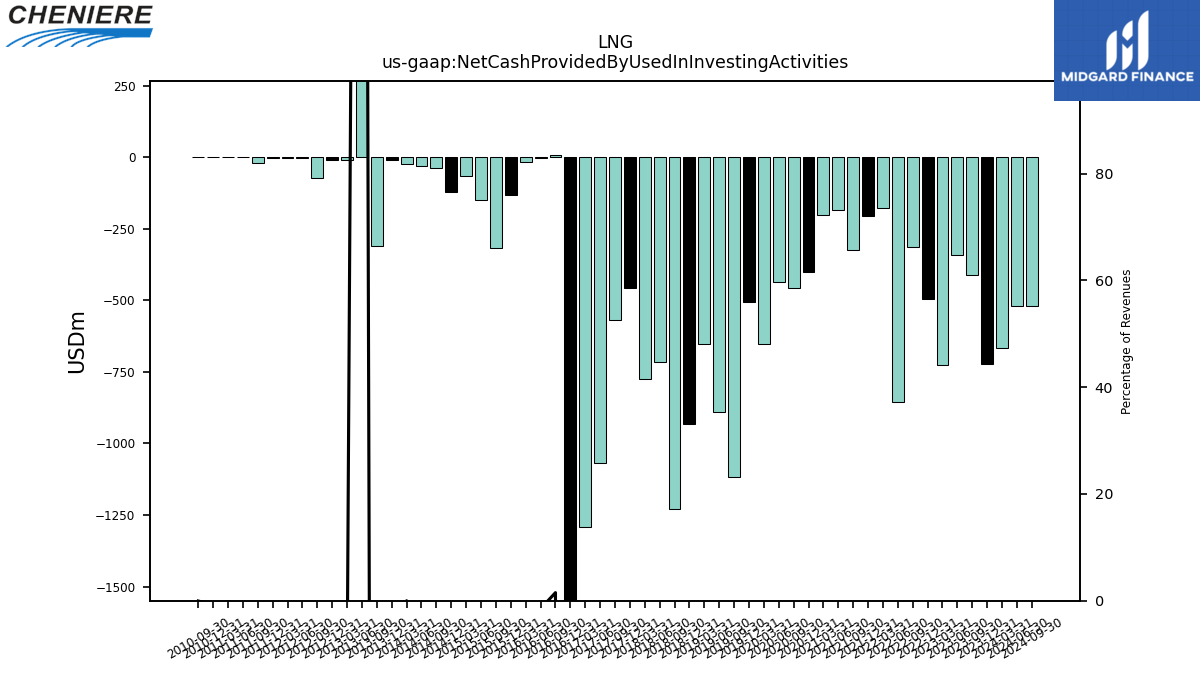
| Net Cash Provided By Used In Investing Activities | -410.00 | -341.00 | -727.00 | -496.00 | -315.00 | -855.00 | -178.00 | -205.00 | -324.00 | -183.00 | -200.00 | -402.00 | -455.00 | -436.00 | -654.00 | -505.00 | -1116.00 | -891.00 | -651.00 | -932.00 | -1230.00 | -716.00 | -776.00 | -455.00 | -569.00 | -1067.00 | -1290.00 | -4401.20 | 7.05 | -2.64 | -16.61 | -130.84 | -315.56 | -148.49 | -64.54 | -120.35 | -36.35 | -31.27 | -24.01 | -9.75 | -308.64 | 298.96 | -9.99 | -9.49 | -71.60 | -1.40 | -2.04 | -2.15 | -19.11 | -0.73 | -0.13 | -0.58 | -0.04 | NA | |
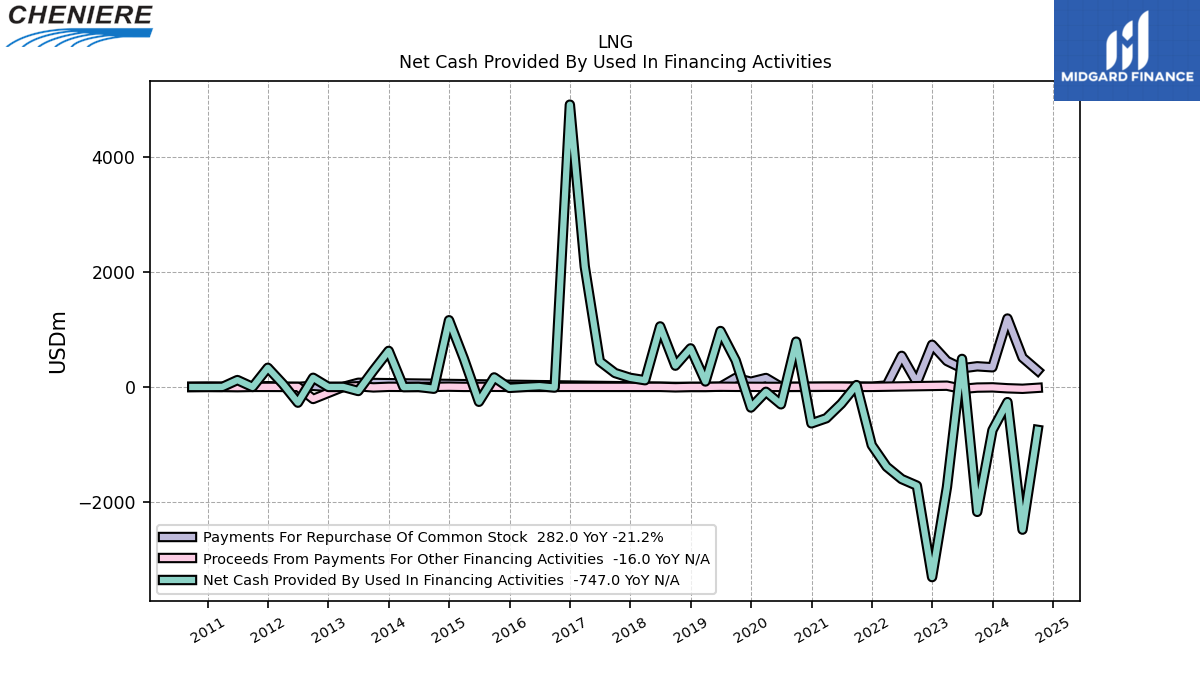
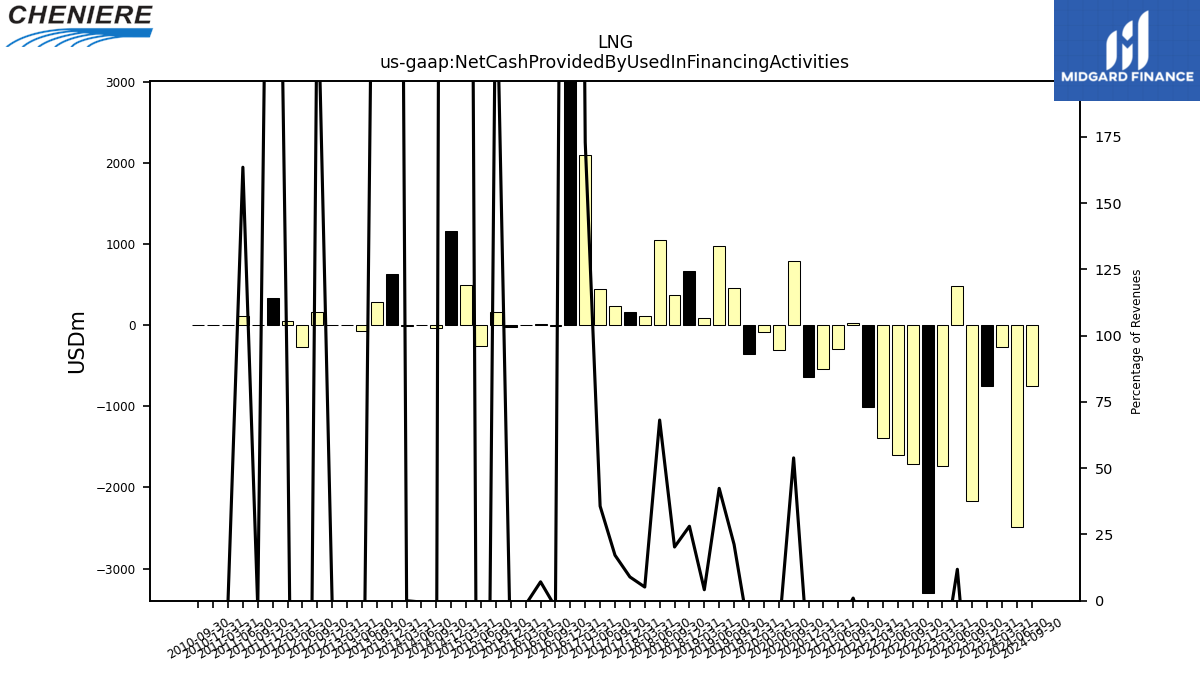
| Net Cash Provided By Used In Financing Activities | -2173.00 | 487.00 | -1740.00 | -3307.00 | -1717.00 | -1602.00 | -1388.00 | -1012.00 | 32.00 | -292.00 | -545.00 | -634.00 | 787.00 | -303.00 | -85.00 | -359.00 | 461.00 | 972.00 | 94.00 | 670.00 | 369.00 | 1052.00 | 116.00 | 157.00 | 241.00 | 443.00 | 2095.00 | 4907.32 | -11.40 | 12.63 | -0.97 | -17.27 | 165.24 | -258.87 | 489.47 | 1159.35 | -32.17 | -0.32 | -4.01 | 626.56 | 286.34 | -71.45 | -0.46 | -0.94 | 158.75 | -274.30 | 51.41 | 332.85 | -1.74 | 119.10 | -0.31 | -1.49 | -1.36 | NA |
| 2023-09-30 | 2023-06-30 | 2023-03-31 | 2022-12-31 | 2022-09-30 | 2022-06-30 | 2022-03-31 | 2021-12-31 | 2021-09-30 | 2021-06-30 | 2021-03-31 | 2020-12-31 | 2020-09-30 | 2020-06-30 | 2020-03-31 | 2019-12-31 | 2019-09-30 | 2019-06-30 | 2019-03-31 | 2018-12-31 | 2018-09-30 | 2018-06-30 | 2018-03-31 | 2017-12-31 | 2017-09-30 | 2017-06-30 | 2017-03-31 | 2016-12-31 | 2016-09-30 | 2016-06-30 | 2016-03-31 | 2015-12-31 | 2015-09-30 | 2015-06-30 | 2015-03-31 | 2014-12-31 | 2014-09-30 | 2014-06-30 | 2014-03-31 | 2013-12-31 | 2013-09-30 | 2013-06-30 | 2013-03-31 | 2012-12-31 | 2012-09-30 | 2012-06-30 | 2012-03-31 | 2011-12-31 | 2011-09-30 | 2011-06-30 | 2011-03-31 | 2010-12-31 | 2010-09-30 | 2010-06-30 | ||
|---|---|---|---|---|---|---|---|---|---|---|---|---|---|---|---|---|---|---|---|---|---|---|---|---|---|---|---|---|---|---|---|---|---|---|---|---|---|---|---|---|---|---|---|---|---|---|---|---|---|---|---|---|---|---|---|
| Net Cash Provided By Used In Operating Activities | 1698.00 | 1579.00 | 3421.00 | 2952.00 | 2399.00 | 2517.00 | 2655.00 | 412.00 | 684.00 | 307.00 | 1066.00 | 500.00 | -263.00 | 454.00 | 574.00 | 741.00 | 332.00 | 348.00 | 412.00 | 486.00 | 522.00 | 513.00 | 469.00 | 336.00 | 359.00 | 227.00 | 309.00 | -204.81 | -54.99 | -55.34 | -88.69 | 8.96 | 20.38 | -280.77 | -14.18 | -83.07 | -29.71 | 6.88 | -18.22 | -30.13 | -0.46 | -8.62 | -13.22 | -2.86 | -10.04 | -26.24 | -68.70 | -2.85 | -10.39 | 19.72 | -49.24 | -5.29 | 8.97 | NA | |
| Net Income Loss | 1701.00 | 1369.00 | 5434.00 | 3937.00 | -2385.00 | 741.00 | -865.00 | -1323.00 | -1084.00 | -329.00 | 393.00 | -194.00 | -463.00 | 197.00 | 375.00 | 939.00 | -318.00 | -114.00 | 141.00 | 67.00 | 65.00 | -18.00 | 357.00 | 127.00 | -289.00 | -285.00 | 54.00 | 109.71 | -100.44 | -298.42 | -320.84 | -291.10 | -297.81 | -118.50 | -267.71 | -158.61 | -89.58 | -201.93 | -97.81 | -135.23 | -100.82 | -154.76 | -117.11 | -94.32 | -109.00 | -73.04 | -56.41 | -57.81 | -53.94 | -47.17 | -39.84 | -86.13 | -40.58 | 85.68 | |
| Profit Loss | 2091.00 | 1707.00 | 6435.00 | 5147.00 | -2644.00 | 913.00 | -781.00 | -1089.00 | -916.00 | -131.00 | 571.00 | 2.00 | -508.00 | 404.00 | 603.00 | 1153.00 | -260.00 | 2.00 | 337.00 | 223.00 | 227.00 | 150.00 | 600.00 | 280.00 | 90.00 | 21.00 | 172.00 | 149.54 | -130.42 | -334.94 | -348.97 | -312.58 | -307.09 | -141.80 | -335.84 | -184.02 | -104.80 | -280.71 | -122.34 | -147.75 | -122.48 | -163.90 | -124.63 | -98.91 | -111.88 | -76.00 | -58.85 | -58.93 | -55.47 | -48.46 | -40.48 | -86.62 | -41.30 | 85.17 | |
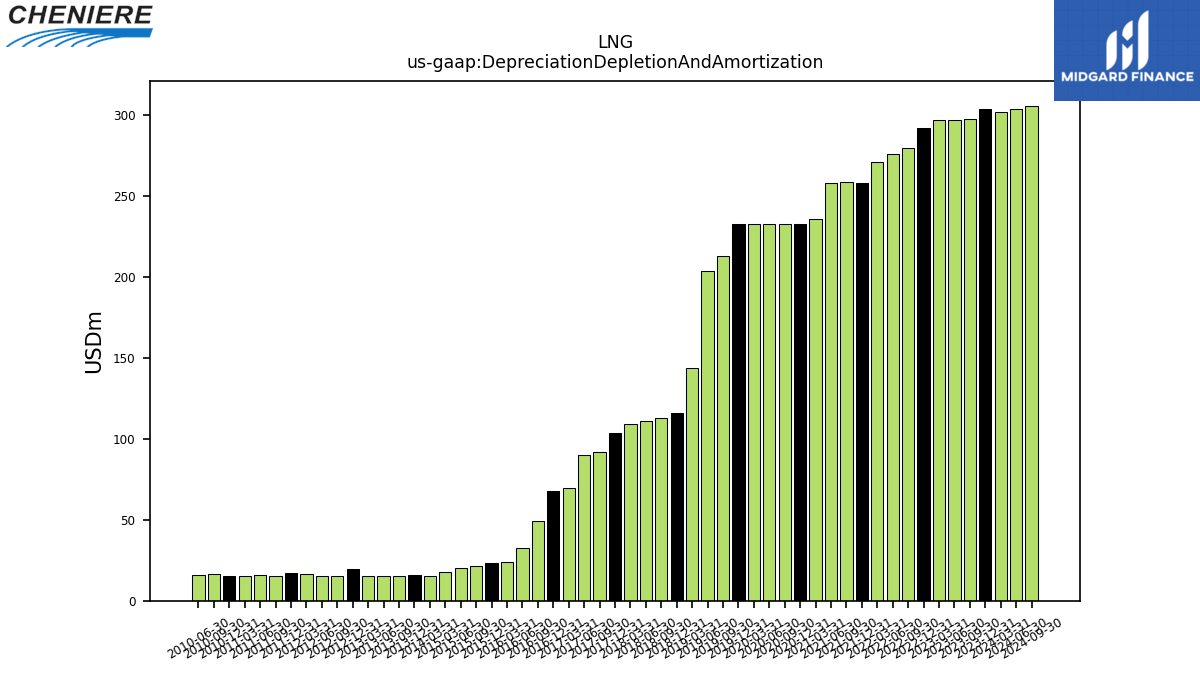
| Depreciation Depletion And Amortization | 298.00 | 297.00 | 297.00 | 292.00 | 280.00 | 276.00 | 271.00 | 258.00 | 259.00 | 258.00 | 236.00 | 233.00 | 233.00 | 233.00 | 233.00 | 233.00 | 213.00 | 204.00 | 144.00 | 116.00 | 113.00 | 111.00 | 109.00 | 104.00 | 92.00 | 90.00 | 70.00 | 67.96 | 49.21 | 32.78 | 24.09 | 23.12 | 21.64 | 20.15 | 17.77 | NA | NA | NA | 15.47 | 15.68 | 15.25 | 15.17 | 15.11 | 19.41 | 15.23 | 15.48 | 16.29 | 17.12 | 15.27 | 15.62 | 15.39 | 15.37 | 16.65 | 15.61 | |
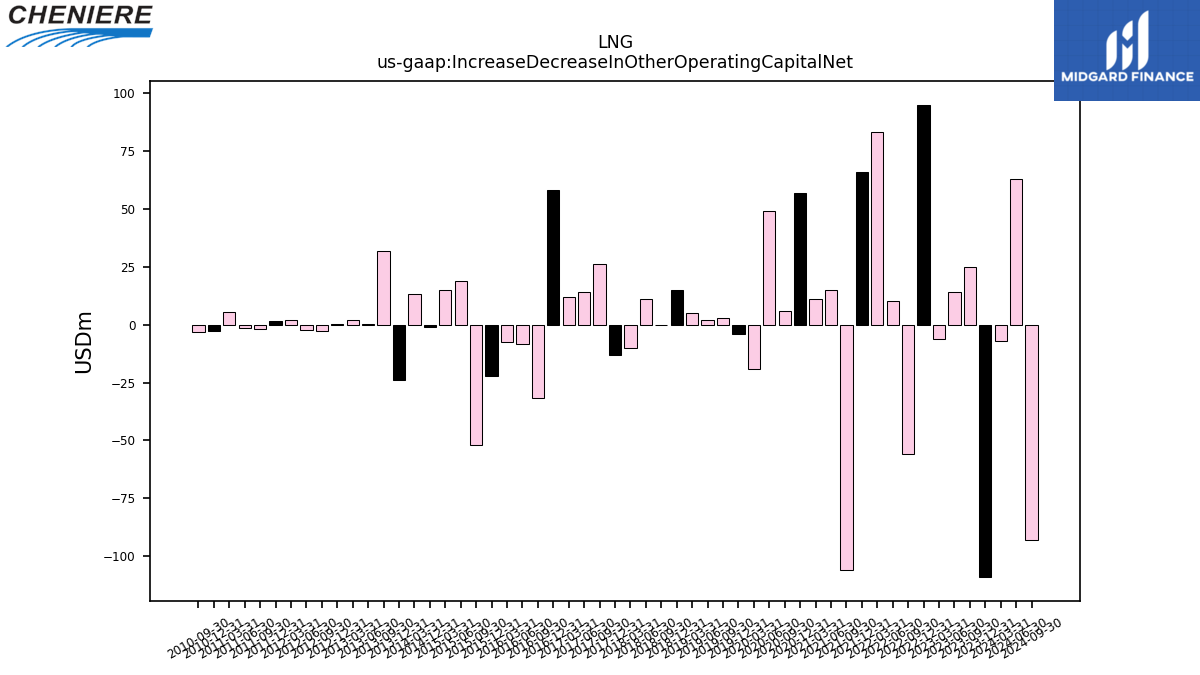
| Increase Decrease In Other Operating Capital Net | 25.00 | 14.00 | -6.00 | 95.00 | -56.00 | 10.00 | 83.00 | 66.00 | -106.00 | 15.00 | 11.00 | 57.00 | 6.00 | 49.00 | -19.00 | -4.00 | 3.00 | 2.00 | 5.00 | 15.00 | 0.00 | 11.00 | -10.00 | -13.00 | 26.00 | 14.00 | 12.00 | 58.13 | -31.77 | -8.24 | -7.62 | -22.13 | -51.79 | 18.89 | 15.05 | -1.16 | NA | NA | 13.19 | -23.91 | 31.70 | 0.46 | 1.86 | 0.11 | -2.59 | -2.22 | 1.82 | 1.64 | -1.67 | -1.54 | 5.62 | -2.91 | -3.17 | NA | |
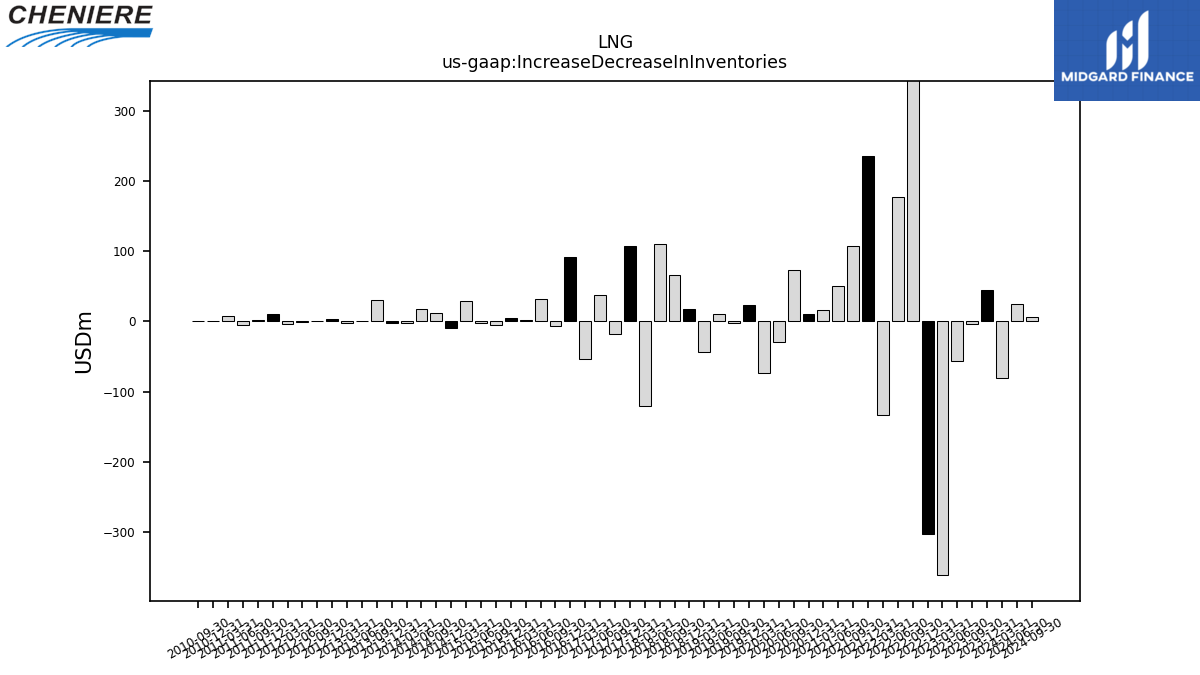
| Increase Decrease In Inventories | -4.00 | -57.00 | -361.00 | -303.00 | 382.00 | 177.00 | -133.00 | 235.00 | 108.00 | 50.00 | 16.00 | 10.00 | 73.00 | -30.00 | -74.00 | 24.00 | -2.00 | 11.00 | -44.00 | 17.00 | 66.00 | 110.00 | -120.00 | 108.00 | -18.00 | 37.00 | -54.00 | 91.25 | -5.95 | 32.47 | 1.53 | 5.31 | -4.46 | -2.46 | 29.49 | -8.72 | 12.53 | 17.38 | -3.00 | -2.50 | 30.36 | 1.15 | -2.44 | 3.94 | 0.79 | -0.97 | -3.27 | 10.68 | 2.29 | -5.01 | 8.39 | 0.58 | 0.40 | NA | |
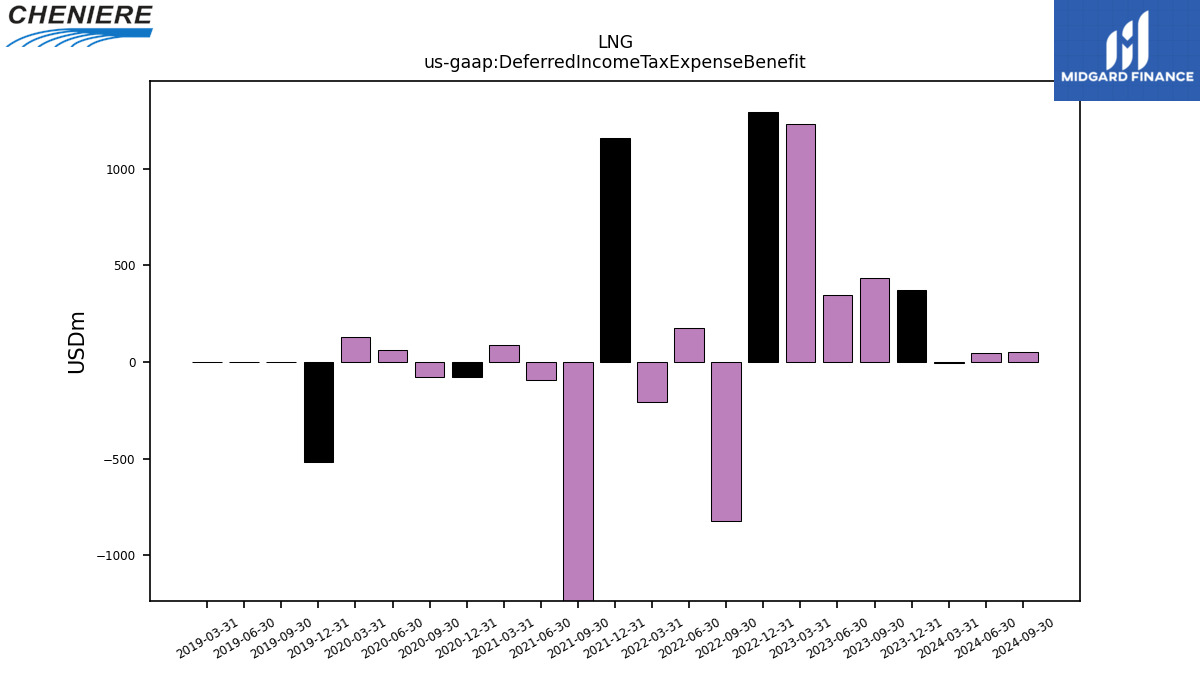
| Deferred Income Tax Expense Benefit | 434.00 | 349.00 | 1232.00 | 1296.00 | -824.00 | 174.00 | -206.00 | 1157.00 | -1865.00 | -94.00 | 87.00 | -75.00 | -77.00 | 63.00 | 129.00 | -519.00 | -2.00 | 0.00 | 0.00 | NA | NA | NA | NA | NA | NA | NA | NA | NA | NA | NA | NA | NA | NA | NA | NA | NA | NA | NA | NA | NA | NA | NA | NA | NA | NA | NA | NA | NA | NA | NA | NA | NA | NA | NA | |
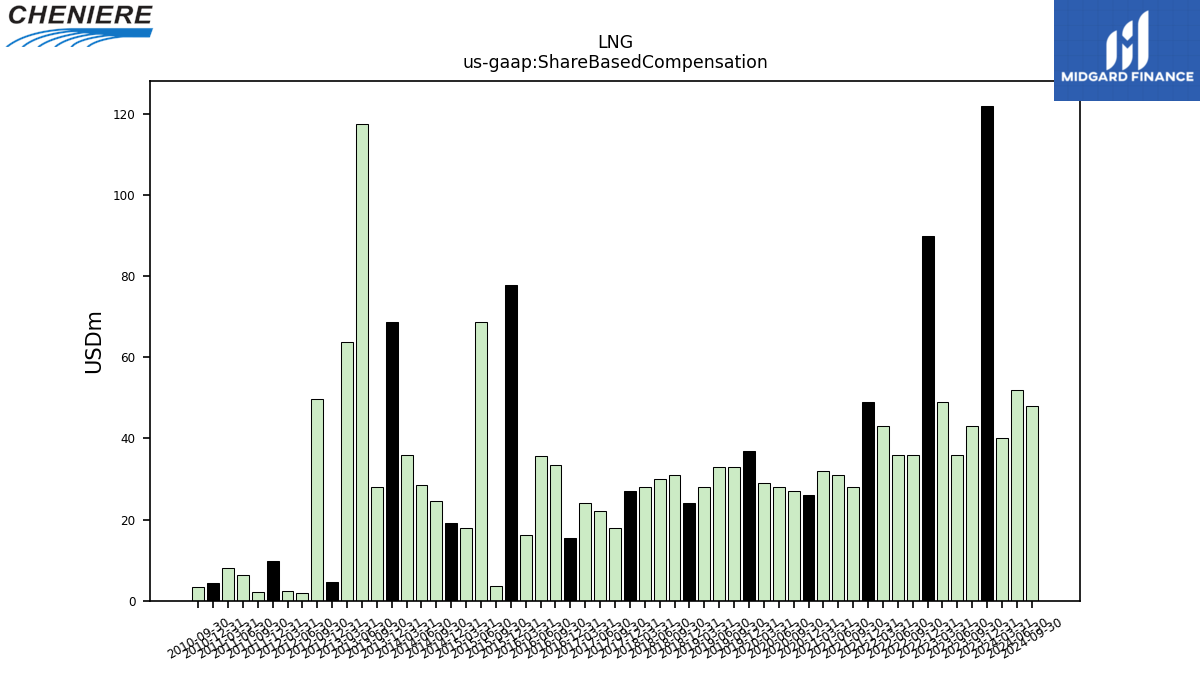
| Share Based Compensation | 43.00 | 36.00 | 49.00 | 90.00 | 36.00 | 36.00 | 43.00 | 49.00 | 28.00 | 31.00 | 32.00 | 26.00 | 27.00 | 28.00 | 29.00 | 37.00 | 33.00 | 33.00 | 28.00 | 24.00 | 31.00 | 30.00 | 28.00 | 27.00 | 18.00 | 22.00 | 24.00 | 15.39 | 33.40 | 35.55 | 16.17 | 77.75 | 3.76 | 68.67 | 17.99 | 19.26 | 24.66 | 28.62 | 35.94 | 68.58 | 27.94 | 117.39 | 63.69 | 4.74 | 49.71 | 1.96 | 2.29 | 9.73 | 2.28 | 6.34 | 8.01 | 4.46 | 3.44 | NA |
| 2023-09-30 | 2023-06-30 | 2023-03-31 | 2022-12-31 | 2022-09-30 | 2022-06-30 | 2022-03-31 | 2021-12-31 | 2021-09-30 | 2021-06-30 | 2021-03-31 | 2020-12-31 | 2020-09-30 | 2020-06-30 | 2020-03-31 | 2019-12-31 | 2019-09-30 | 2019-06-30 | 2019-03-31 | 2018-12-31 | 2018-09-30 | 2018-06-30 | 2018-03-31 | 2017-12-31 | 2017-09-30 | 2017-06-30 | 2017-03-31 | 2016-12-31 | 2016-09-30 | 2016-06-30 | 2016-03-31 | 2015-12-31 | 2015-09-30 | 2015-06-30 | 2015-03-31 | 2014-12-31 | 2014-09-30 | 2014-06-30 | 2014-03-31 | 2013-12-31 | 2013-09-30 | 2013-06-30 | 2013-03-31 | 2012-12-31 | 2012-09-30 | 2012-06-30 | 2012-03-31 | 2011-12-31 | 2011-09-30 | 2011-06-30 | 2011-03-31 | 2010-12-31 | 2010-09-30 | 2010-06-30 | ||
|---|---|---|---|---|---|---|---|---|---|---|---|---|---|---|---|---|---|---|---|---|---|---|---|---|---|---|---|---|---|---|---|---|---|---|---|---|---|---|---|---|---|---|---|---|---|---|---|---|---|---|---|---|---|---|---|
| Net Cash Provided By Used In Investing Activities | -410.00 | -341.00 | -727.00 | -496.00 | -315.00 | -855.00 | -178.00 | -205.00 | -324.00 | -183.00 | -200.00 | -402.00 | -455.00 | -436.00 | -654.00 | -505.00 | -1116.00 | -891.00 | -651.00 | -932.00 | -1230.00 | -716.00 | -776.00 | -455.00 | -569.00 | -1067.00 | -1290.00 | -4401.20 | 7.05 | -2.64 | -16.61 | -130.84 | -315.56 | -148.49 | -64.54 | -120.35 | -36.35 | -31.27 | -24.01 | -9.75 | -308.64 | 298.96 | -9.99 | -9.49 | -71.60 | -1.40 | -2.04 | -2.15 | -19.11 | -0.73 | -0.13 | -0.58 | -0.04 | NA | |
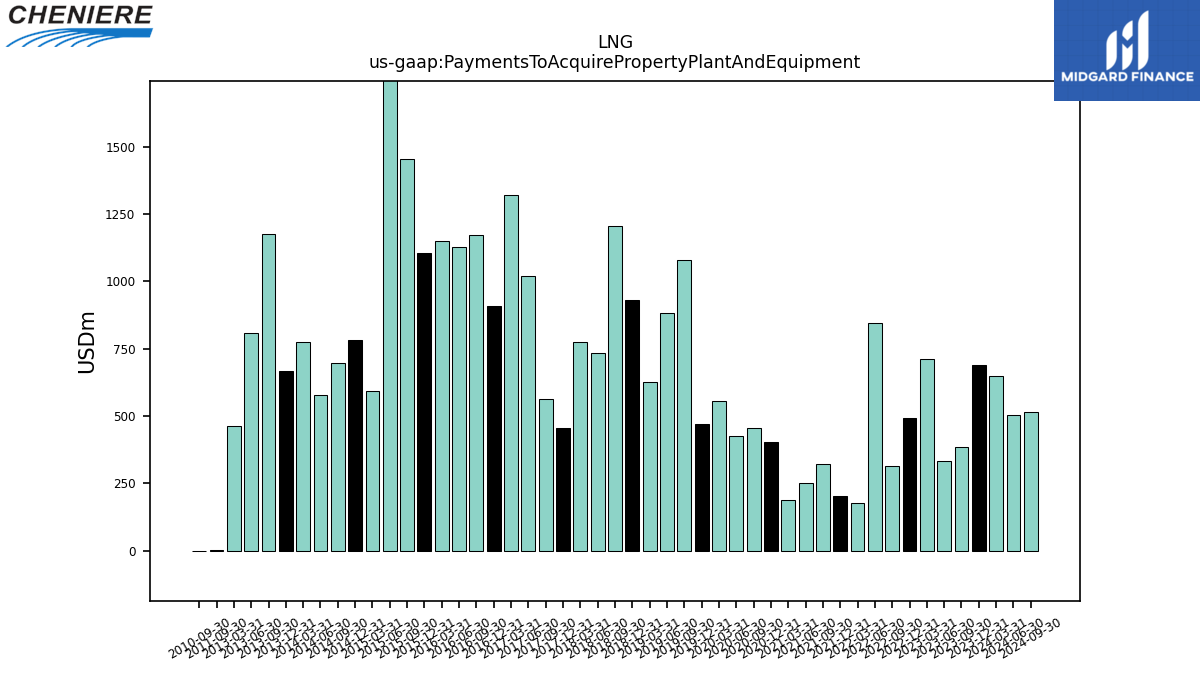
| Payments To Acquire Property Plant And Equipment | 386.00 | 332.00 | 712.00 | 491.00 | 316.00 | 845.00 | 178.00 | 205.00 | 321.00 | 250.00 | 190.00 | 402.00 | 454.00 | 427.00 | 556.00 | 469.00 | 1079.00 | 883.00 | 625.00 | 931.00 | 1204.00 | 732.00 | 776.00 | 454.00 | 565.00 | 1019.00 | 1319.00 | 906.44 | 1171.69 | 1127.64 | 1149.83 | 1104.99 | 1452.78 | 3703.82 | 591.00 | 781.60 | 695.56 | 579.02 | 773.38 | 665.59 | 1176.05 | 808.09 | 464.61 | NA | NA | NA | NA | NA | 1.06 | NA | NA | NA | -0.26 | NA |
| 2023-09-30 | 2023-06-30 | 2023-03-31 | 2022-12-31 | 2022-09-30 | 2022-06-30 | 2022-03-31 | 2021-12-31 | 2021-09-30 | 2021-06-30 | 2021-03-31 | 2020-12-31 | 2020-09-30 | 2020-06-30 | 2020-03-31 | 2019-12-31 | 2019-09-30 | 2019-06-30 | 2019-03-31 | 2018-12-31 | 2018-09-30 | 2018-06-30 | 2018-03-31 | 2017-12-31 | 2017-09-30 | 2017-06-30 | 2017-03-31 | 2016-12-31 | 2016-09-30 | 2016-06-30 | 2016-03-31 | 2015-12-31 | 2015-09-30 | 2015-06-30 | 2015-03-31 | 2014-12-31 | 2014-09-30 | 2014-06-30 | 2014-03-31 | 2013-12-31 | 2013-09-30 | 2013-06-30 | 2013-03-31 | 2012-12-31 | 2012-09-30 | 2012-06-30 | 2012-03-31 | 2011-12-31 | 2011-09-30 | 2011-06-30 | 2011-03-31 | 2010-12-31 | 2010-09-30 | 2010-06-30 | ||
|---|---|---|---|---|---|---|---|---|---|---|---|---|---|---|---|---|---|---|---|---|---|---|---|---|---|---|---|---|---|---|---|---|---|---|---|---|---|---|---|---|---|---|---|---|---|---|---|---|---|---|---|---|---|---|---|
| Net Cash Provided By Used In Financing Activities | -2173.00 | 487.00 | -1740.00 | -3307.00 | -1717.00 | -1602.00 | -1388.00 | -1012.00 | 32.00 | -292.00 | -545.00 | -634.00 | 787.00 | -303.00 | -85.00 | -359.00 | 461.00 | 972.00 | 94.00 | 670.00 | 369.00 | 1052.00 | 116.00 | 157.00 | 241.00 | 443.00 | 2095.00 | 4907.32 | -11.40 | 12.63 | -0.97 | -17.27 | 165.24 | -258.87 | 489.47 | 1159.35 | -32.17 | -0.32 | -4.01 | 626.56 | 286.34 | -71.45 | -0.46 | -0.94 | 158.75 | -274.30 | 51.41 | 332.85 | -1.74 | 119.10 | -0.31 | -1.49 | -1.36 | NA | |
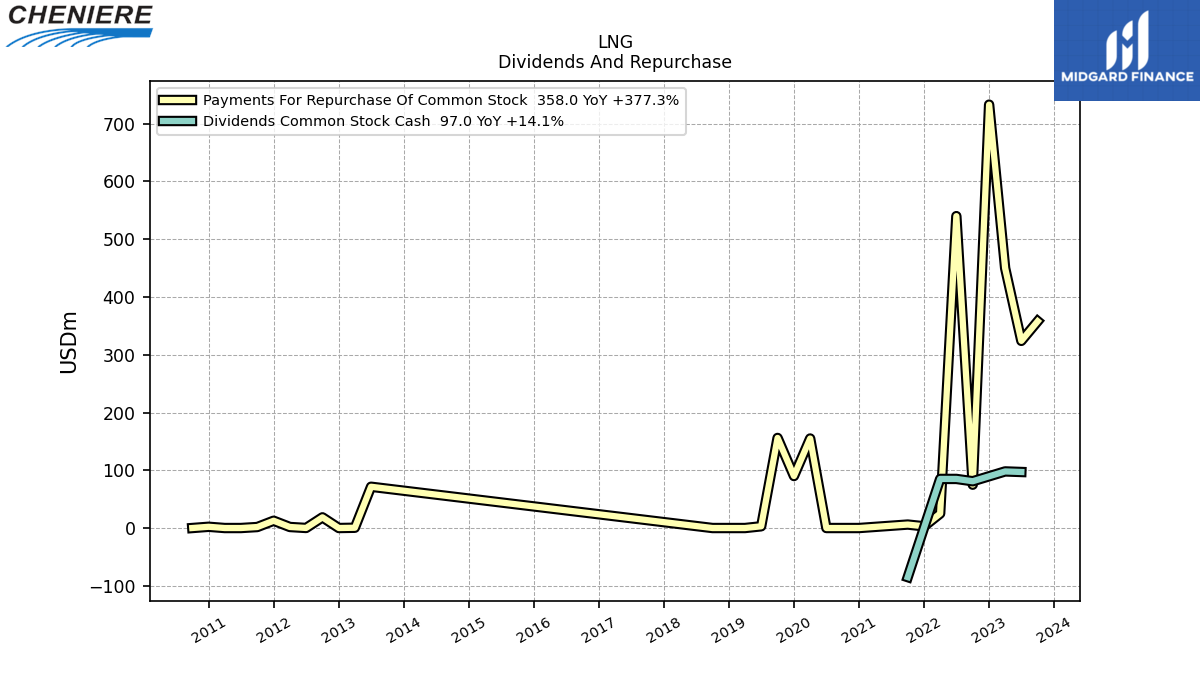
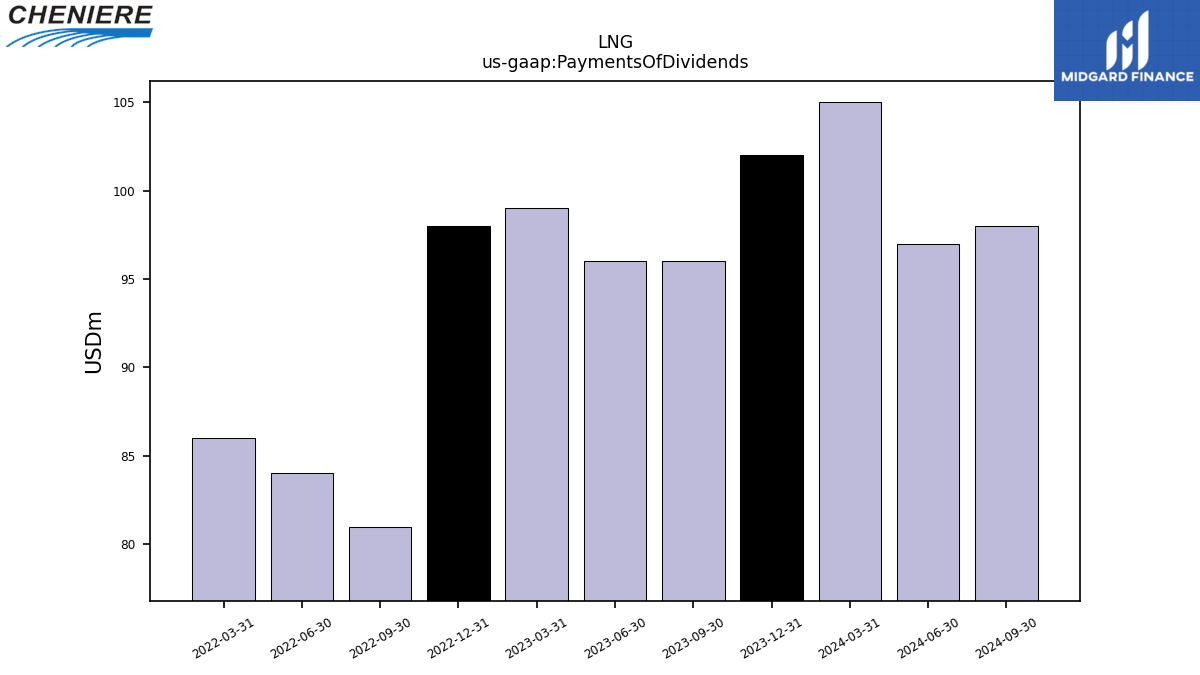
| Payments Of Dividends | 96.00 | 96.00 | 99.00 | 98.00 | 81.00 | 84.00 | 86.00 | NA | NA | NA | NA | NA | NA | NA | NA | NA | NA | NA | NA | NA | NA | NA | NA | NA | NA | NA | NA | NA | NA | NA | NA | NA | NA | NA | NA | NA | NA | NA | NA | NA | NA | NA | NA | NA | NA | NA | NA | NA | NA | NA | NA | NA | NA | NA | |
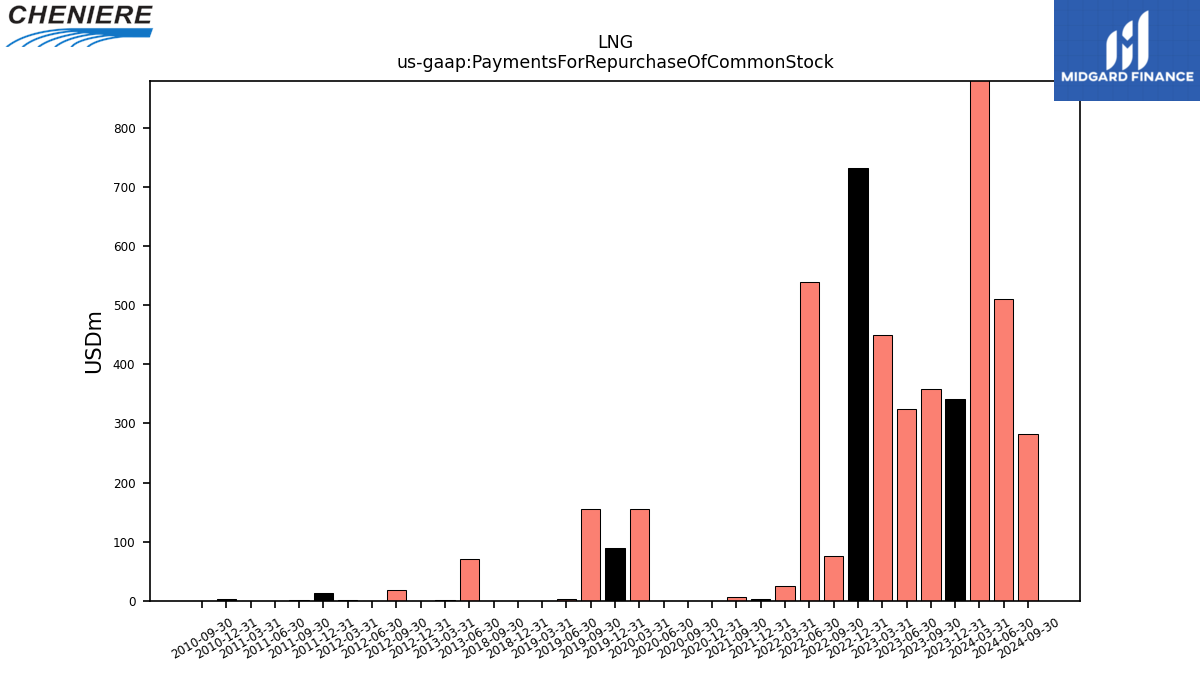
| Payments For Repurchase Of Common Stock | 358.00 | 324.00 | 450.00 | 733.00 | 75.00 | 540.00 | 25.00 | 3.00 | 6.00 | NA | NA | 0.00 | 0.00 | 0.00 | 155.00 | 90.00 | 156.00 | 3.00 | 0.00 | 0.00 | 0.00 | NA | NA | NA | NA | NA | NA | NA | NA | NA | NA | NA | NA | NA | NA | NA | NA | NA | NA | NA | NA | 71.45 | 0.46 | 0.00 | 18.52 | 0.10 | 1.80 | 12.63 | 1.73 | 0.00 | 0.00 | 2.16 | 0.00 | NA |
| 2023-09-30 | 2023-06-30 | 2023-03-31 | 2022-12-31 | 2022-09-30 | 2022-06-30 | 2022-03-31 | 2021-12-31 | 2021-09-30 | 2021-06-30 | 2021-03-31 | 2020-12-31 | 2020-09-30 | 2020-06-30 | 2020-03-31 | 2019-12-31 | 2019-09-30 | 2019-06-30 | 2019-03-31 | 2018-12-31 | 2018-09-30 | 2018-06-30 | 2018-03-31 | 2017-12-31 | 2017-09-30 | 2017-06-30 | 2017-03-31 | 2016-12-31 | 2016-09-30 | 2016-06-30 | 2016-03-31 | 2015-12-31 | 2015-09-30 | 2015-06-30 | 2015-03-31 | 2014-12-31 | 2014-09-30 | 2014-06-30 | 2014-03-31 | 2013-12-31 | 2013-09-30 | 2013-06-30 | 2013-03-31 | 2012-12-31 | 2012-09-30 | 2012-06-30 | 2012-03-31 | 2011-12-31 | 2011-09-30 | 2011-06-30 | 2011-03-31 | 2010-12-31 | 2010-09-30 | 2010-06-30 | ||
|---|---|---|---|---|---|---|---|---|---|---|---|---|---|---|---|---|---|---|---|---|---|---|---|---|---|---|---|---|---|---|---|---|---|---|---|---|---|---|---|---|---|---|---|---|---|---|---|---|---|---|---|---|---|---|---|
| Revenues | 4159.00 | 4102.00 | 7310.00 | 9085.00 | 8852.00 | 8007.00 | 7484.00 | 6557.00 | 3200.00 | 3017.00 | 3090.00 | 2787.00 | 1460.00 | 2402.00 | 2709.00 | 3007.00 | 2170.00 | 2292.00 | 2261.00 | 2383.00 | 1819.00 | 1543.00 | 2242.00 | 1746.00 | 1403.00 | 1241.00 | 1211.00 | 571.59 | 465.67 | 176.83 | 69.08 | 68.43 | 66.06 | 68.03 | 68.37 | 65.95 | 66.81 | 67.64 | 0.00 | 66.42 | 67.71 | 67.18 | 65.91 | 67.42 | 66.00 | 62.33 | 70.47 | 72.59 | 65.81 | 72.81 | 79.23 | 75.47 | 68.25 | 68.28 | |
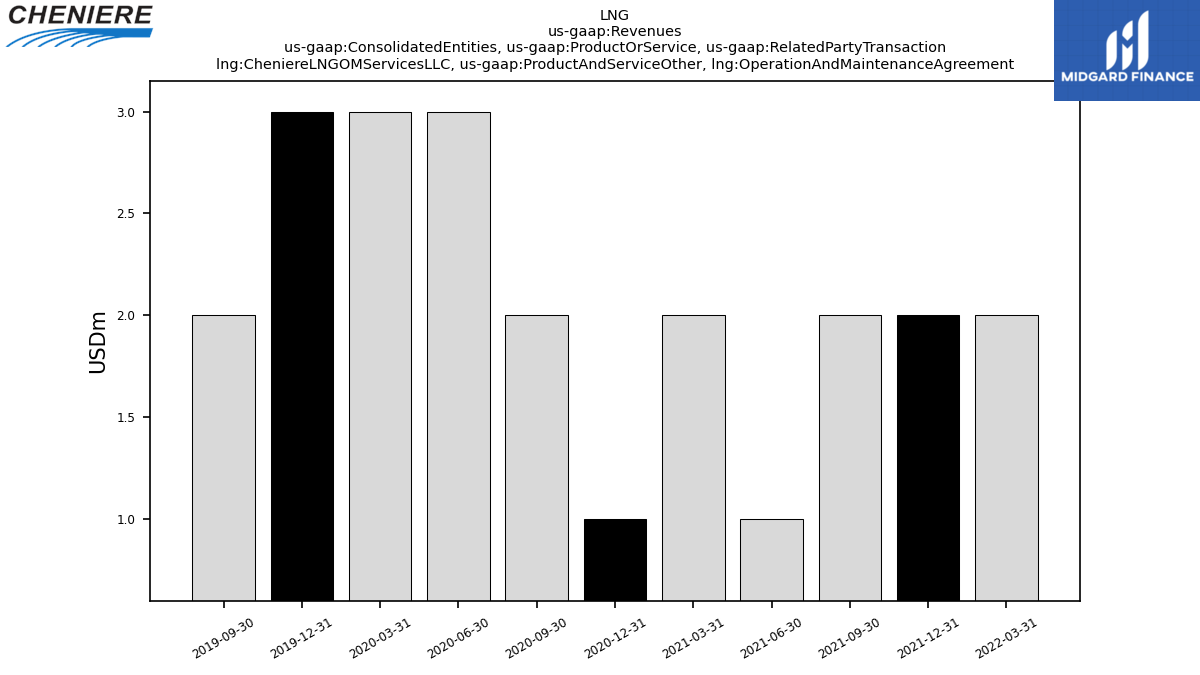
| Cheniere L N G O M Services L L C, Product And Service Other, Operation And Maintenance Agreement | NA | NA | NA | NA | NA | NA | 2.00 | 2.00 | 2.00 | 1.00 | 2.00 | 1.00 | 2.00 | 3.00 | 3.00 | 3.00 | 2.00 | NA | NA | NA | NA | NA | NA | NA | NA | NA | NA | NA | NA | NA | NA | NA | NA | NA | NA | NA | NA | NA | NA | NA | NA | NA | NA | NA | NA | NA | NA | NA | NA | NA | NA | NA | NA | NA | |
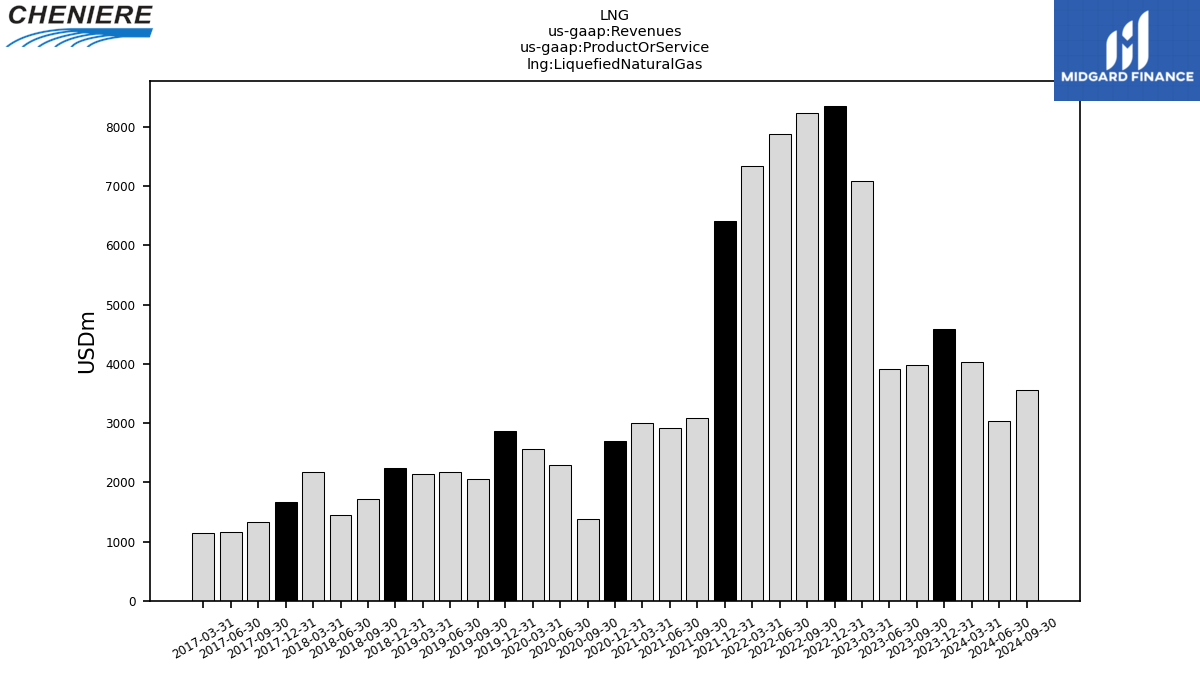
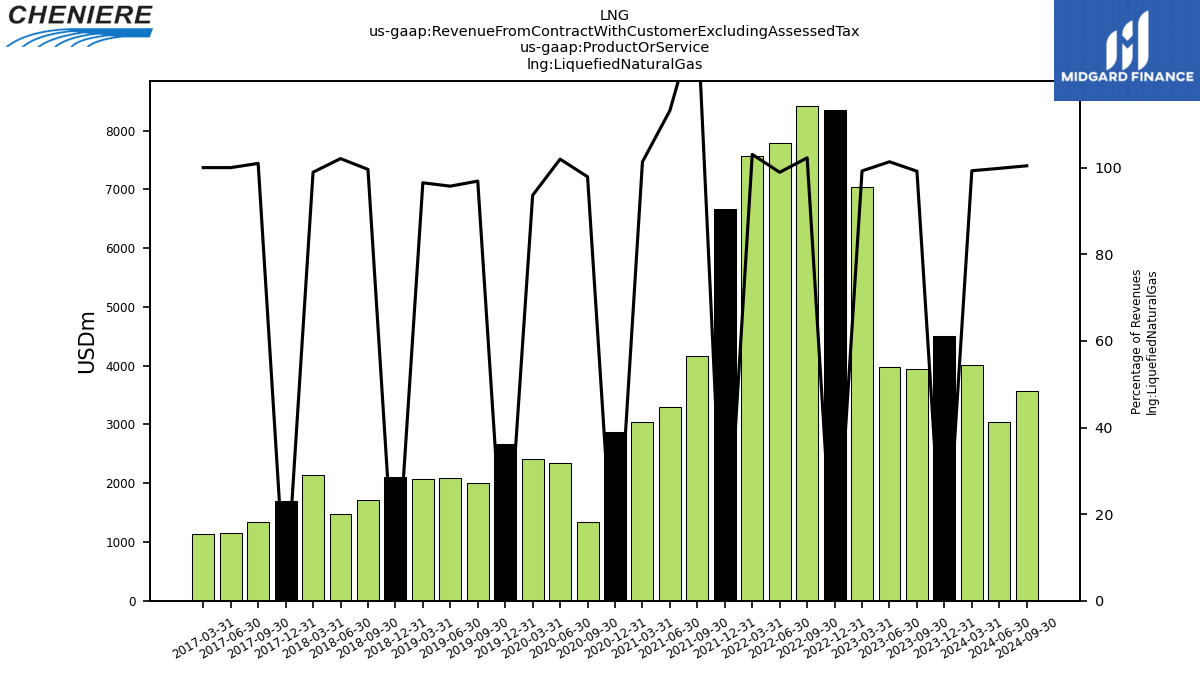
| Liquefied Natural Gas | 3974.00 | 3919.00 | 7091.00 | 8355.00 | 8236.00 | 7873.00 | 7340.00 | 6405.00 | 3078.00 | 2913.00 | 2999.00 | 2688.00 | 1373.00 | 2295.00 | 2568.00 | 2871.00 | 2059.00 | 2173.00 | 2143.00 | 2245.00 | 1719.00 | 1442.00 | 2166.00 | 1671.00 | 1332.00 | 1160.00 | 1143.00 | NA | NA | NA | NA | NA | NA | NA | NA | NA | NA | NA | NA | NA | NA | NA | NA | NA | NA | NA | NA | NA | NA | NA | NA | NA | NA | NA | |
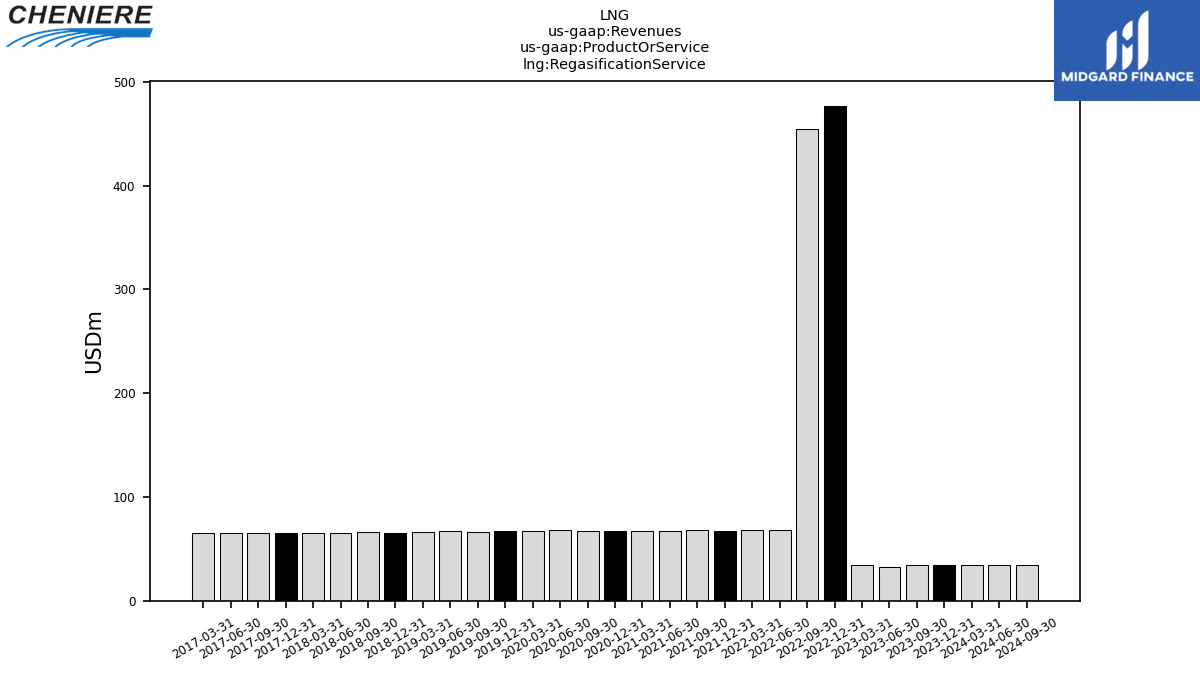
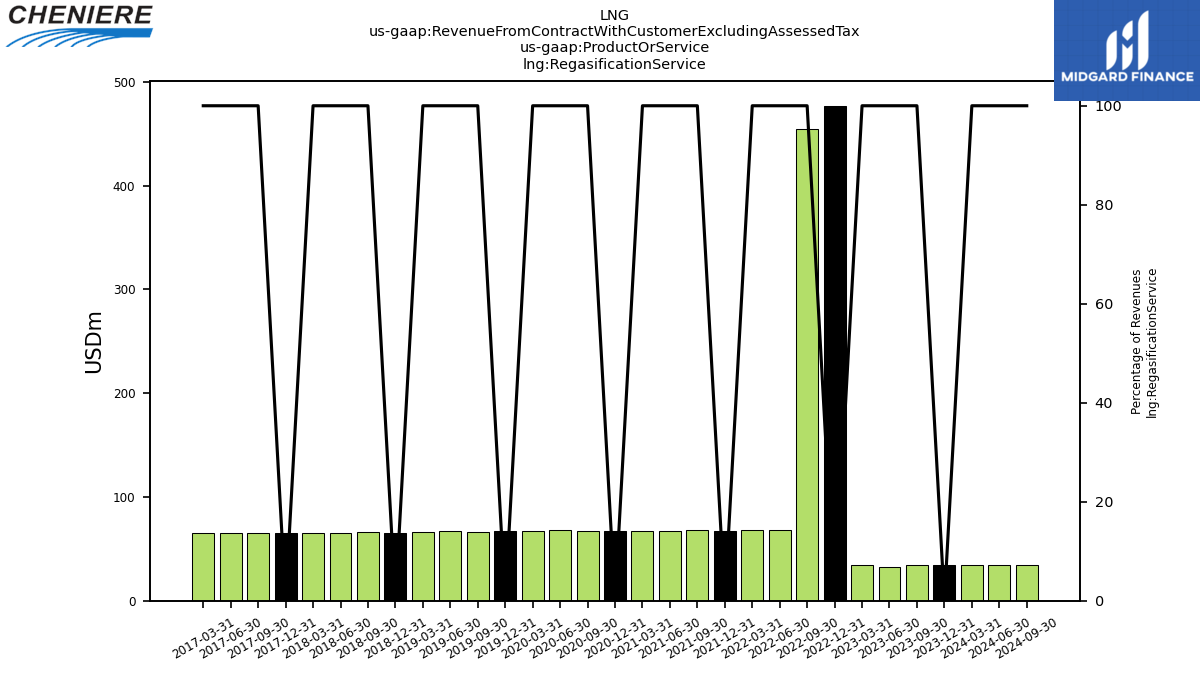
| Regasification Service | 34.00 | 33.00 | 34.00 | 477.00 | 455.00 | 68.00 | 68.00 | 67.00 | 68.00 | 67.00 | 67.00 | 67.00 | 67.00 | 68.00 | 67.00 | 67.00 | 66.00 | 67.00 | 66.00 | 65.00 | 66.00 | 65.00 | 65.00 | 65.00 | 65.00 | 65.00 | 65.00 | NA | NA | NA | NA | NA | NA | NA | NA | NA | NA | NA | NA | NA | NA | NA | NA | NA | NA | NA | NA | NA | NA | NA | NA | NA | NA | NA | |
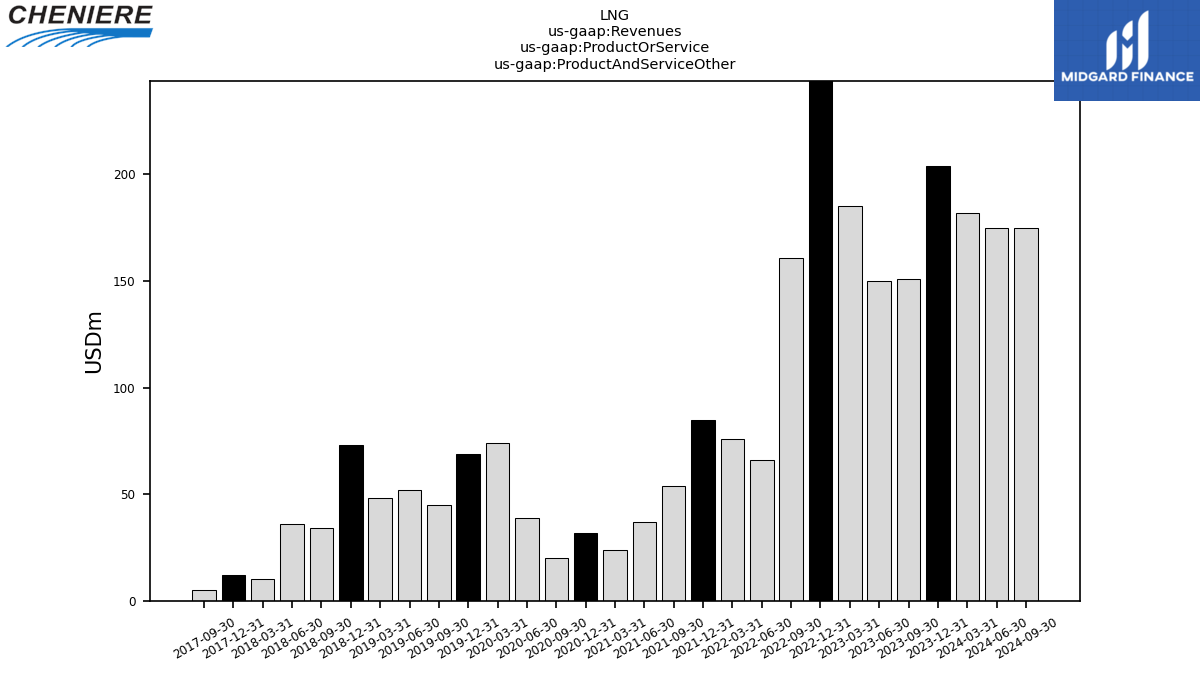
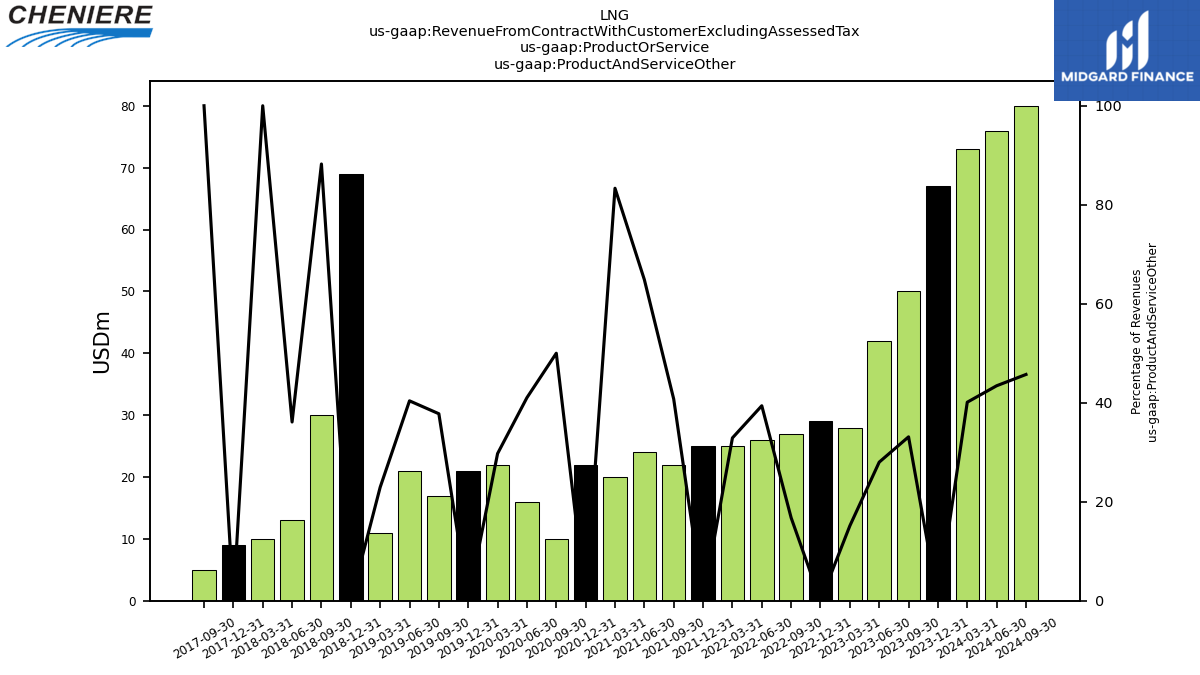
| Product And Service Other | 151.00 | 150.00 | 185.00 | 253.00 | 161.00 | 66.00 | 76.00 | 85.00 | 54.00 | 37.00 | 24.00 | 32.00 | 20.00 | 39.00 | 74.00 | 69.00 | 45.00 | 52.00 | 48.00 | 73.00 | 34.00 | 36.00 | 10.00 | 12.00 | 5.00 | NA | NA | NA | NA | NA | NA | NA | NA | NA | NA | NA | NA | NA | NA | NA | NA | NA | NA | NA | NA | NA | NA | NA | NA | NA | NA | NA | NA | NA | |
| Liquefied Natural Gas, Related Party, Natural Gas Transportation And Storage Agreements, Related Party Through Brookfield Ownership | NA | NA | NA | NA | NA | 4.00 | NA | NA | NA | NA | NA | NA | NA | NA | NA | NA | NA | NA | NA | NA | NA | NA | NA | NA | NA | NA | NA | NA | NA | NA | NA | NA | NA | NA | NA | NA | NA | NA | NA | NA | NA | NA | NA | NA | NA | NA | NA | NA | NA | NA | NA | NA | NA | NA | |
| Liquefied Natural Gas, Natural Gas Transportation And Storage Agreements | NA | NA | NA | NA | 0.00 | 4.00 | NA | NA | NA | NA | NA | NA | NA | NA | NA | NA | NA | NA | NA | NA | NA | NA | NA | NA | NA | NA | NA | NA | NA | NA | NA | NA | NA | NA | NA | NA | NA | NA | NA | NA | NA | NA | NA | NA | NA | NA | NA | NA | NA | NA | NA | NA | NA | NA | |
| Product And Service Other, Operation And Maintenance Agreement | NA | NA | 3.00 | 2.00 | 3.00 | 2.00 | 2.00 | 2.00 | 2.00 | 1.00 | NA | NA | NA | NA | NA | NA | NA | NA | NA | NA | NA | NA | NA | NA | NA | NA | NA | NA | NA | NA | NA | NA | NA | NA | NA | NA | NA | NA | NA | NA | NA | NA | NA | NA | NA | NA | NA | NA | NA | NA | NA | NA | NA | NA | |
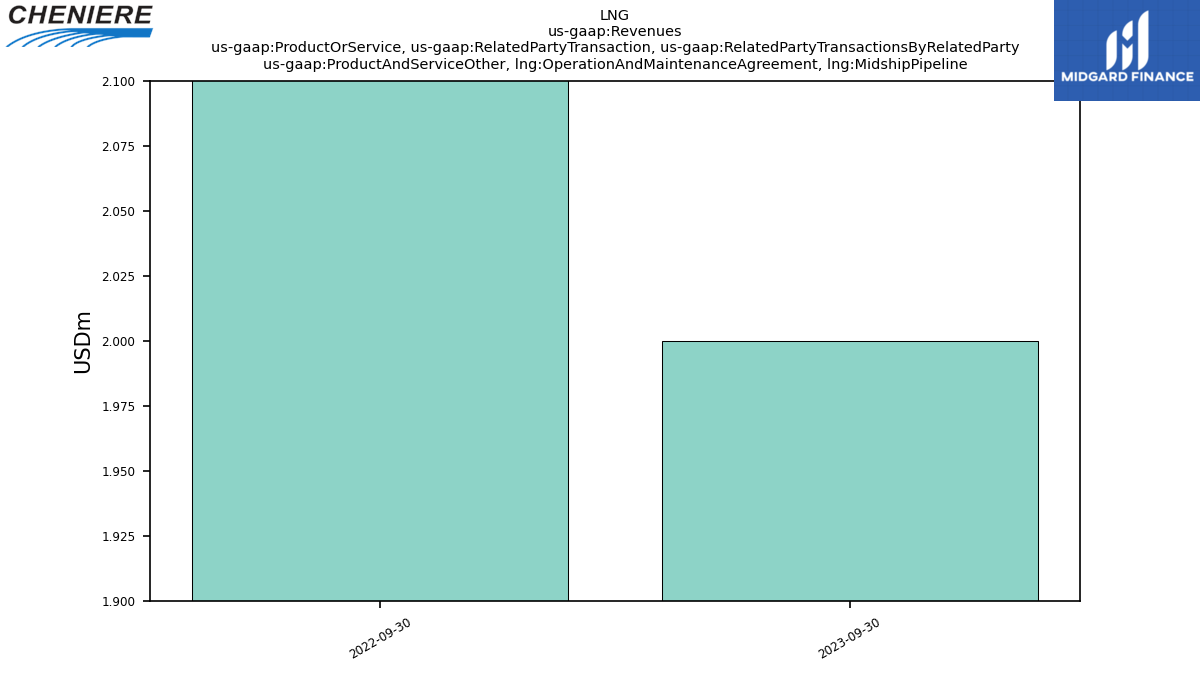
| Product And Service Other, Operation And Maintenance Agreement, Midship Pipeline | 2.00 | NA | NA | NA | 3.00 | NA | NA | NA | NA | NA | NA | NA | NA | NA | NA | NA | NA | NA | NA | NA | NA | NA | NA | NA | NA | NA | NA | NA | NA | NA | NA | NA | NA | NA | NA | NA | NA | NA | NA | NA | NA | NA | NA | NA | NA | NA | NA | NA | NA | NA | NA | NA | NA | NA | |
| Revenue From Contract With Customer Excluding Assessed Tax | 4025.00 | 4047.00 | 7099.00 | 8864.00 | 8904.00 | 7882.00 | 7657.00 | 6758.00 | 4259.00 | 3388.00 | 3126.00 | 2787.00 | 1421.00 | 2424.00 | 2493.00 | 3007.00 | 2078.00 | 2168.00 | 2149.00 | 2383.00 | 1812.00 | 1573.00 | 2219.00 | 1746.00 | 1416.00 | 1230.00 | 1209.00 | 571.59 | 465.67 | 176.83 | 69.08 | 68.43 | 66.06 | 68.03 | 68.37 | 65.95 | 66.81 | 67.64 | 0.00 | 66.42 | 67.71 | 67.18 | 65.91 | 67.42 | 66.00 | 62.33 | 70.47 | 72.59 | 65.81 | 72.81 | 79.23 | 75.47 | 68.25 | 68.28 | |
| Liquefied Natural Gas | 3941.00 | 3972.00 | 7037.00 | 8358.00 | 8422.00 | 7788.00 | 7564.00 | 6666.00 | 4169.00 | 3297.00 | 3039.00 | 2866.00 | 1344.00 | 2340.00 | 2404.00 | 2675.00 | 1995.00 | 2080.00 | 2068.00 | 2113.00 | 1712.00 | 1472.00 | 2143.00 | 1696.00 | 1345.00 | 1160.00 | 1143.00 | NA | NA | NA | NA | NA | NA | NA | NA | NA | NA | NA | NA | NA | NA | NA | NA | NA | NA | NA | NA | NA | NA | NA | NA | NA | NA | NA | |
| Regasification Service | 34.00 | 33.00 | 34.00 | 477.00 | 455.00 | 68.00 | 68.00 | 67.00 | 68.00 | 67.00 | 67.00 | 67.00 | 67.00 | 68.00 | 67.00 | 67.00 | 66.00 | 67.00 | 66.00 | 65.00 | 66.00 | 65.00 | 65.00 | 65.00 | 65.00 | 65.00 | 65.00 | NA | NA | NA | NA | NA | NA | NA | NA | NA | NA | NA | NA | NA | NA | NA | NA | NA | NA | NA | NA | NA | NA | NA | NA | NA | NA | NA | |
| Product And Service Other | 50.00 | 42.00 | 28.00 | 29.00 | 27.00 | 26.00 | 25.00 | 25.00 | 22.00 | 24.00 | 20.00 | 22.00 | 10.00 | 16.00 | 22.00 | 21.00 | 17.00 | 21.00 | 11.00 | 69.00 | 30.00 | 13.00 | 10.00 | 9.00 | 5.00 | NA | NA | NA | NA | NA | NA | NA | NA | NA | NA | NA | NA | NA | NA | NA | NA | NA | NA | NA | NA | NA | NA | NA | NA | NA | NA | NA | NA | NA |