
| 2024-03-31 | 2023-12-31 | 2023-09-30 | 2023-06-30 | 2023-03-31 | 2022-12-31 | 2022-09-30 | 2022-06-30 | 2022-03-31 | 2021-12-31 | 2021-09-30 | 2021-06-30 | 2021-03-31 | 2020-12-31 | 2020-09-30 | 2020-06-30 | 2020-03-31 | 2019-12-31 | 2019-09-30 | 2019-06-30 | 2019-03-31 | 2018-12-31 | 2018-09-30 | 2018-06-30 | 2018-03-31 | 2017-12-31 | 2017-09-30 | 2017-06-30 | 2017-03-31 | 2016-12-31 | 2016-09-30 | 2016-06-30 | 2016-03-31 | 2015-12-31 | 2015-09-30 | 2015-06-30 | 2015-03-31 | 2014-12-31 | 2014-09-30 | 2014-06-30 | 2014-03-31 | 2013-12-31 | 2013-09-30 | 2013-06-30 | 2013-03-31 | 2012-12-31 | 2012-09-30 | 2012-06-30 | 2012-03-31 | 2011-12-31 | 2011-09-30 | 2011-06-30 | 2011-03-31 | 2010-12-31 | 2010-09-30 | 2010-06-30 | 2010-03-31 | ||
|---|---|---|---|---|---|---|---|---|---|---|---|---|---|---|---|---|---|---|---|---|---|---|---|---|---|---|---|---|---|---|---|---|---|---|---|---|---|---|---|---|---|---|---|---|---|---|---|---|---|---|---|---|---|---|---|---|---|---|
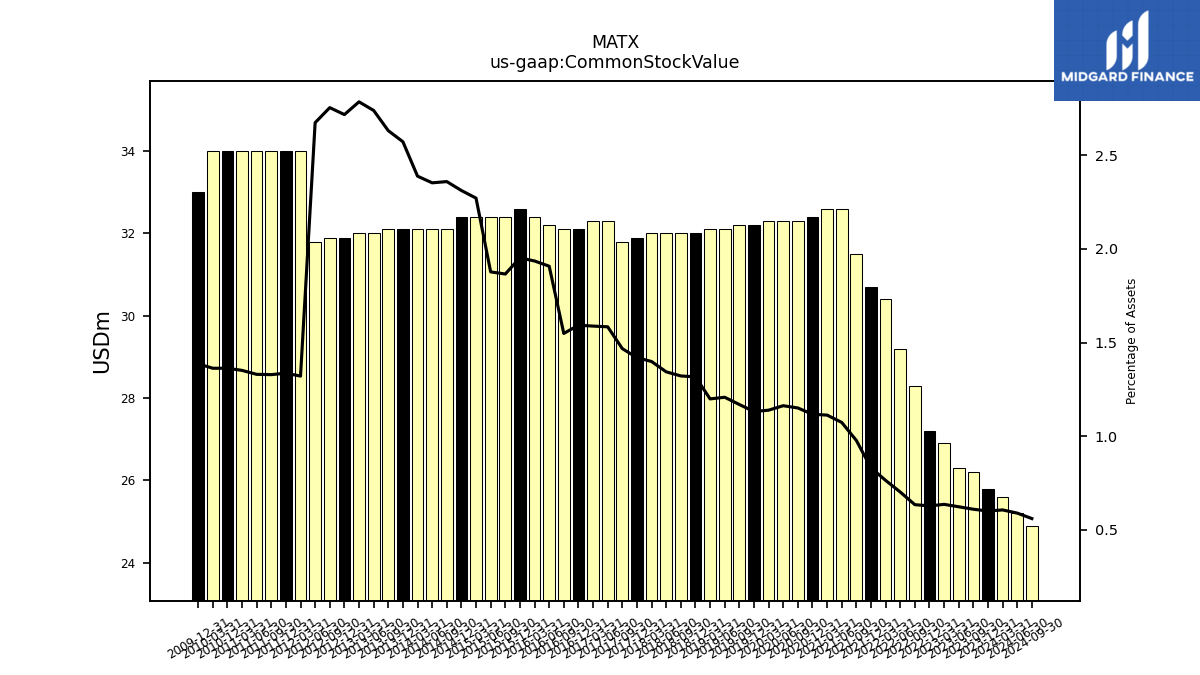
| Common Stock Value | 25.60 | 25.80 | 26.20 | 26.30 | 26.90 | 27.20 | 28.30 | 29.20 | 30.40 | 30.70 | 31.50 | 32.60 | 32.60 | 32.40 | 32.30 | 32.30 | 32.30 | 32.20 | 32.20 | 32.10 | 32.10 | 32.00 | 32.00 | 32.00 | 32.00 | 31.90 | 31.80 | 32.30 | 32.30 | 32.10 | 32.10 | 32.20 | 32.40 | 32.60 | 32.40 | 32.40 | 32.40 | 32.40 | 32.10 | 32.10 | 32.10 | 32.10 | 32.10 | 32.00 | 32.00 | 31.90 | 31.90 | 31.80 | 34.00 | 34.00 | 34.00 | 34.00 | 34.00 | 34.00 | NA | NA | 34.00 | |
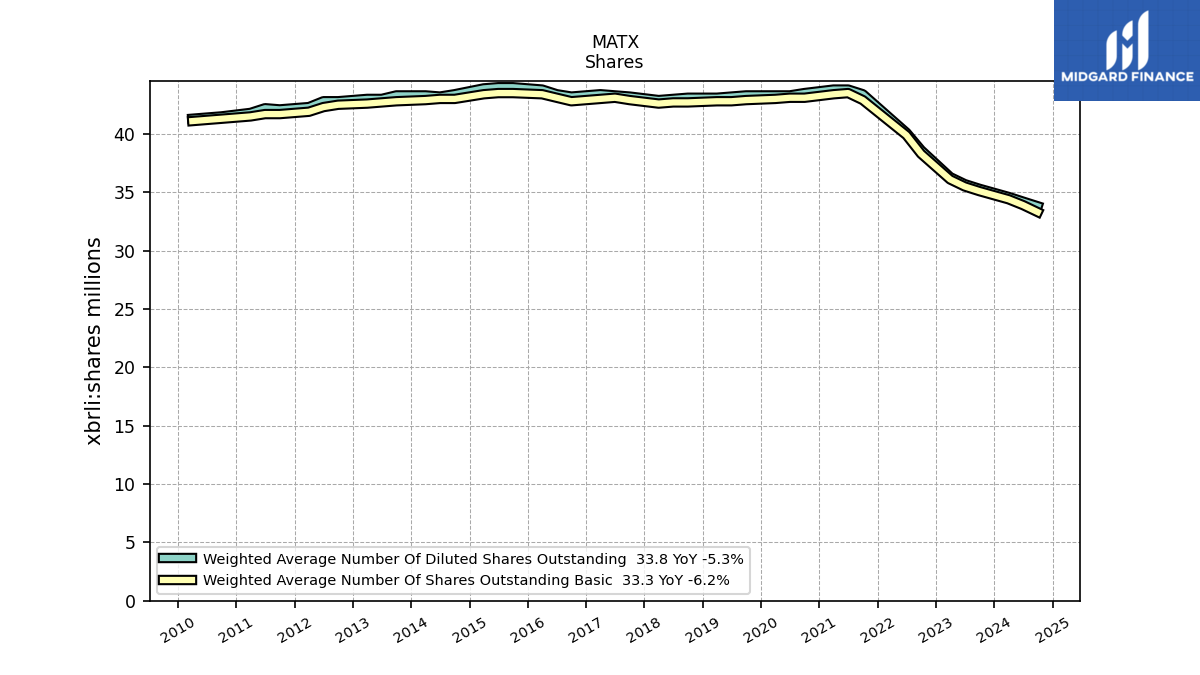
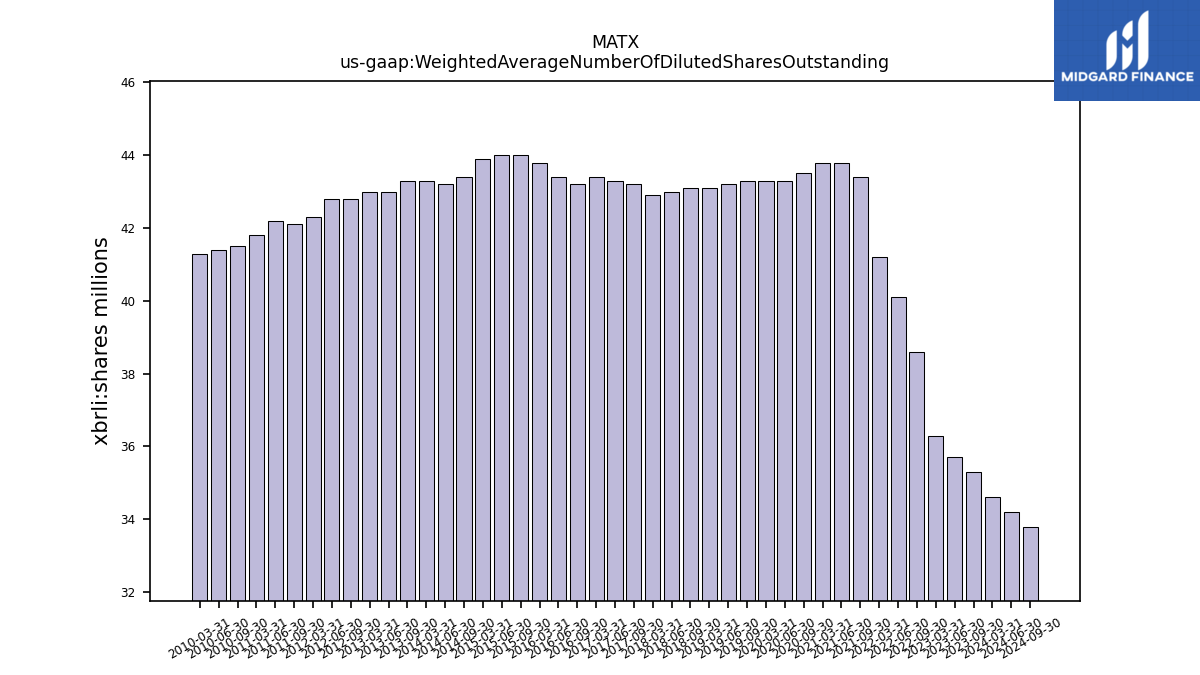
| Weighted Average Number Of Diluted Shares Outstanding | 34.60 | NA | 35.30 | 35.70 | 36.30 | NA | 38.60 | 40.10 | 41.20 | NA | 43.40 | 43.80 | 43.80 | NA | 43.50 | 43.30 | 43.30 | NA | 43.30 | 43.20 | 43.10 | NA | 43.10 | 43.00 | 42.90 | NA | 43.20 | 43.30 | 43.40 | NA | 43.20 | 43.40 | 43.80 | NA | 44.00 | 44.00 | 43.90 | NA | 43.40 | 43.20 | 43.30 | NA | 43.30 | 43.00 | 43.00 | NA | 42.80 | 42.80 | 42.30 | NA | 42.10 | 42.20 | 41.80 | NA | 41.50 | 41.40 | 41.30 | |
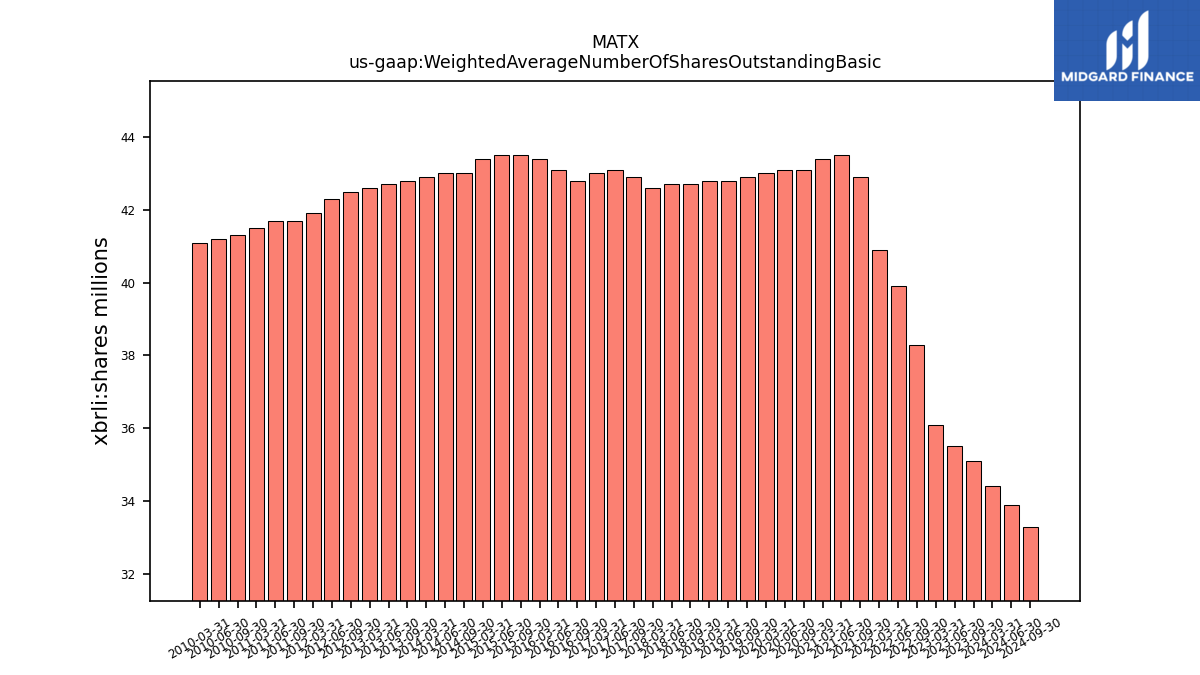
| Weighted Average Number Of Shares Outstanding Basic | 34.40 | NA | 35.10 | 35.50 | 36.10 | NA | 38.30 | 39.90 | 40.90 | NA | 42.90 | 43.50 | 43.40 | NA | 43.10 | 43.10 | 43.00 | NA | 42.90 | 42.80 | 42.80 | NA | 42.70 | 42.70 | 42.60 | NA | 42.90 | 43.10 | 43.00 | NA | 42.80 | 43.10 | 43.40 | NA | 43.50 | 43.50 | 43.40 | NA | 43.00 | 43.00 | 42.90 | NA | 42.80 | 42.70 | 42.60 | NA | 42.50 | 42.30 | 41.90 | NA | 41.70 | 41.70 | 41.50 | NA | 41.30 | 41.20 | 41.10 | |
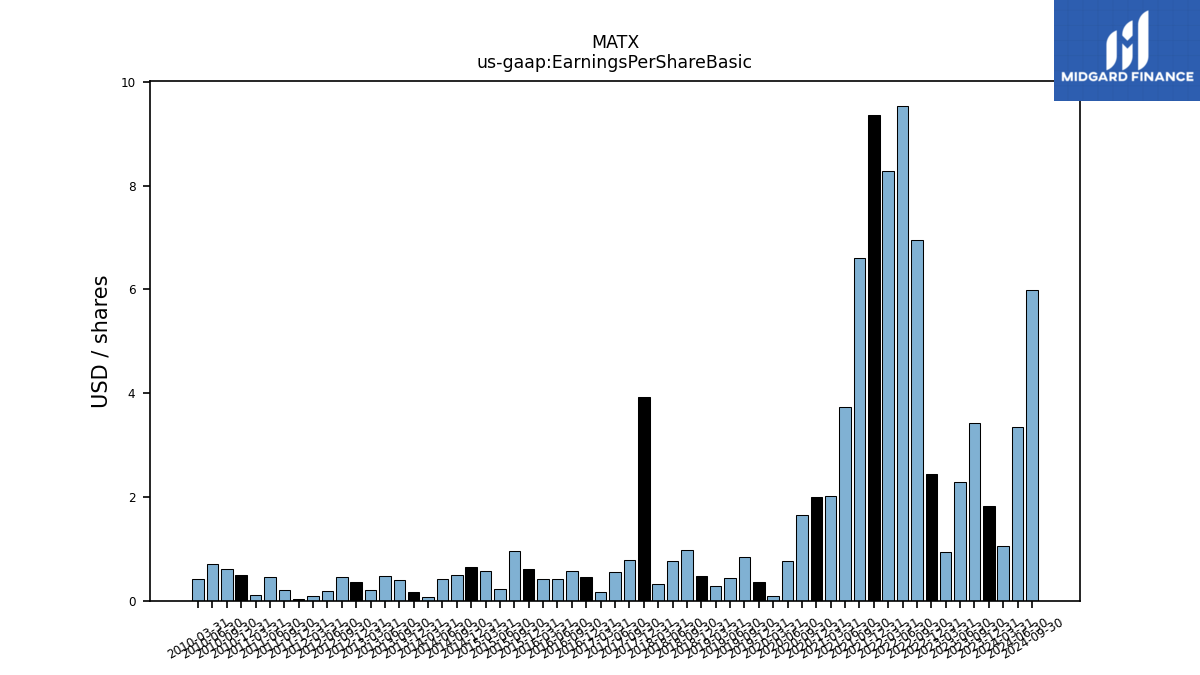
| Earnings Per Share Basic | 1.05 | 1.83 | 3.42 | 2.28 | 0.94 | 2.45 | 6.95 | 9.54 | 8.29 | 9.36 | 6.60 | 3.74 | 2.01 | 1.99 | 1.65 | 0.76 | 0.09 | 0.36 | 0.84 | 0.43 | 0.29 | 0.48 | 0.97 | 0.76 | 0.33 | 3.93 | 0.79 | 0.56 | 0.16 | 0.45 | 0.58 | 0.42 | 0.42 | 0.61 | 0.95 | 0.23 | 0.58 | 0.65 | 0.50 | 0.42 | 0.08 | 0.17 | 0.40 | 0.47 | 0.21 | 0.37 | 0.45 | 0.18 | 0.09 | 0.04 | 0.21 | 0.45 | 0.12 | 0.49 | 0.62 | 0.70 | 0.42 | |
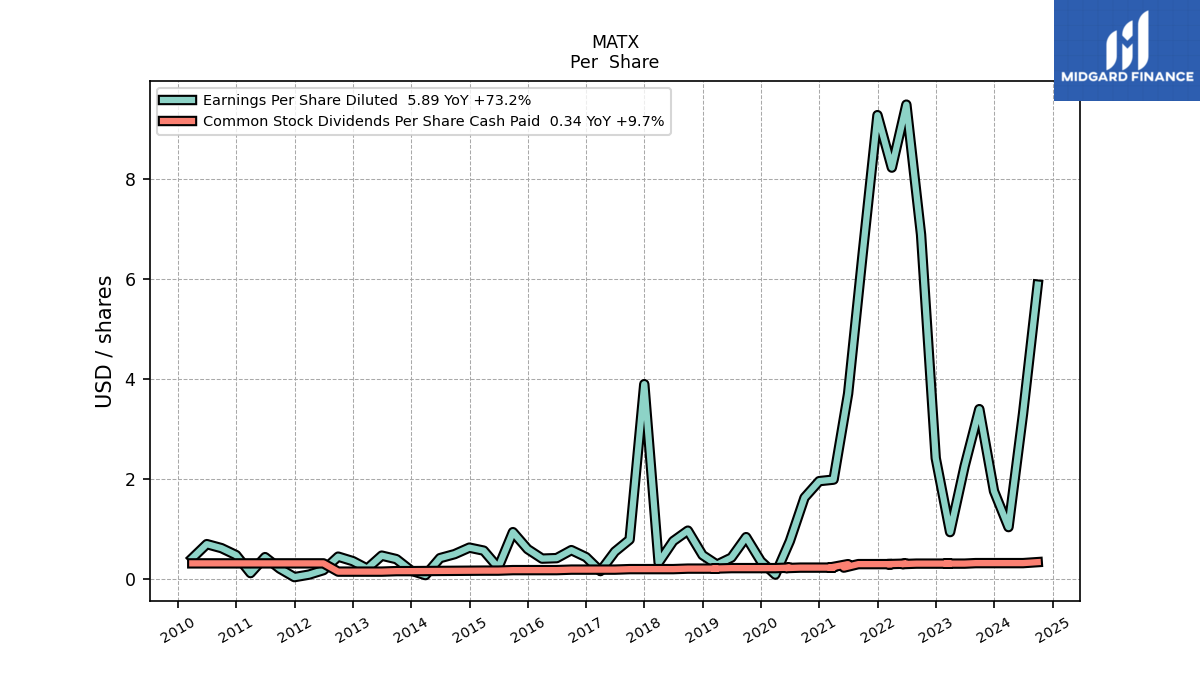
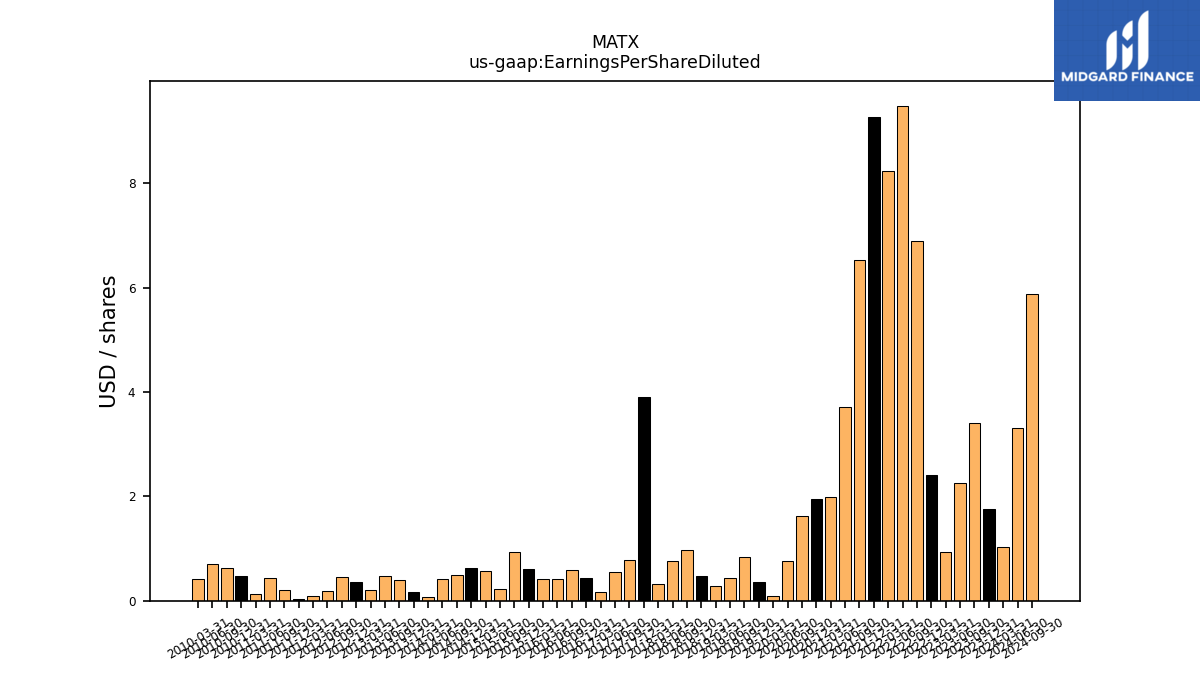
| Earnings Per Share Diluted | 1.04 | 1.76 | 3.40 | 2.26 | 0.94 | 2.42 | 6.89 | 9.49 | 8.23 | 9.28 | 6.53 | 3.71 | 1.99 | 1.96 | 1.63 | 0.76 | 0.09 | 0.36 | 0.84 | 0.43 | 0.29 | 0.48 | 0.97 | 0.76 | 0.33 | 3.90 | 0.79 | 0.55 | 0.16 | 0.44 | 0.58 | 0.42 | 0.41 | 0.60 | 0.94 | 0.23 | 0.57 | 0.63 | 0.50 | 0.42 | 0.08 | 0.17 | 0.40 | 0.47 | 0.21 | 0.36 | 0.45 | 0.18 | 0.09 | 0.04 | 0.21 | 0.44 | 0.12 | 0.48 | 0.62 | 0.70 | 0.42 |
| 2024-03-31 | 2023-12-31 | 2023-09-30 | 2023-06-30 | 2023-03-31 | 2022-12-31 | 2022-09-30 | 2022-06-30 | 2022-03-31 | 2021-12-31 | 2021-09-30 | 2021-06-30 | 2021-03-31 | 2020-12-31 | 2020-09-30 | 2020-06-30 | 2020-03-31 | 2019-12-31 | 2019-09-30 | 2019-06-30 | 2019-03-31 | 2018-12-31 | 2018-09-30 | 2018-06-30 | 2018-03-31 | 2017-12-31 | 2017-09-30 | 2017-06-30 | 2017-03-31 | 2016-12-31 | 2016-09-30 | 2016-06-30 | 2016-03-31 | 2015-12-31 | 2015-09-30 | 2015-06-30 | 2015-03-31 | 2014-12-31 | 2014-09-30 | 2014-06-30 | 2014-03-31 | 2013-12-31 | 2013-09-30 | 2013-06-30 | 2013-03-31 | 2012-12-31 | 2012-09-30 | 2012-06-30 | 2012-03-31 | 2011-12-31 | 2011-09-30 | 2011-06-30 | 2011-03-31 | 2010-12-31 | 2010-09-30 | 2010-06-30 | 2010-03-31 | ||
|---|---|---|---|---|---|---|---|---|---|---|---|---|---|---|---|---|---|---|---|---|---|---|---|---|---|---|---|---|---|---|---|---|---|---|---|---|---|---|---|---|---|---|---|---|---|---|---|---|---|---|---|---|---|---|---|---|---|---|
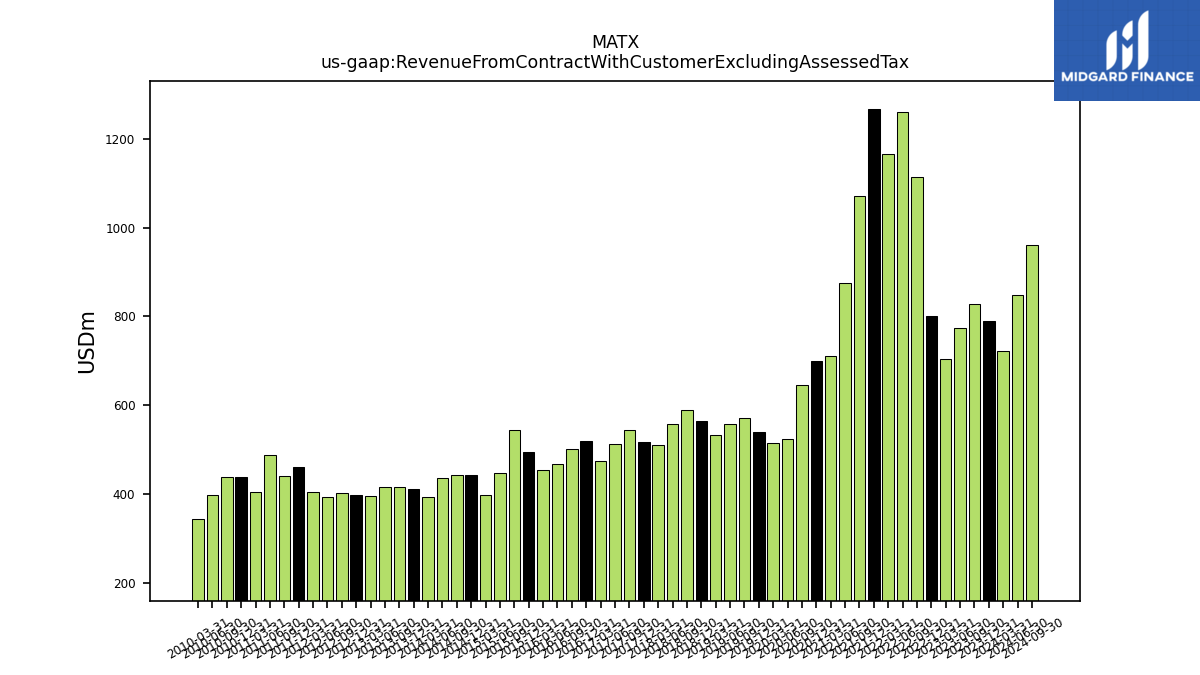
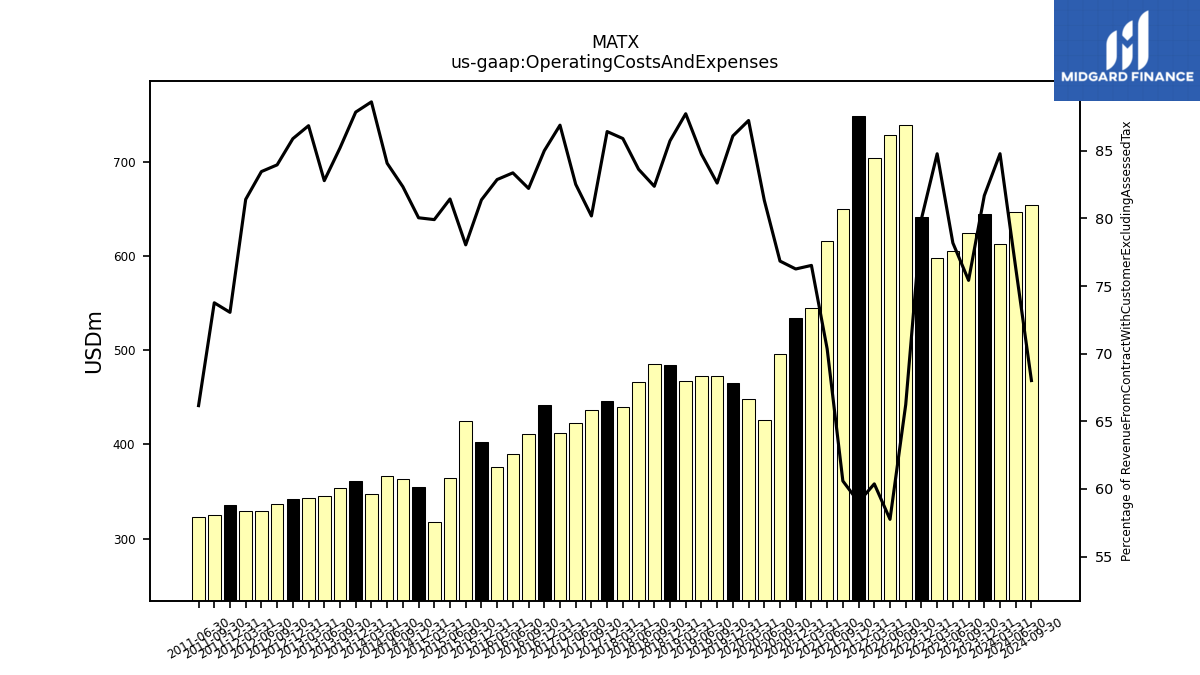
| Revenue From Contract With Customer Excluding Assessed Tax | 722.10 | 788.90 | 827.50 | 773.40 | 704.80 | 801.60 | 1114.80 | 1261.10 | 1165.50 | 1267.00 | 1071.60 | 874.90 | 711.80 | 700.10 | 645.20 | 524.10 | 513.90 | 540.70 | 572.10 | 557.90 | 532.40 | 564.90 | 589.40 | 557.10 | 511.40 | 516.10 | 543.90 | 512.50 | 474.40 | 519.30 | 500.40 | 467.70 | 454.20 | 494.80 | 544.30 | 447.60 | 398.20 | 443.50 | 441.80 | 436.40 | 392.50 | 410.90 | 415.00 | 416.60 | 394.70 | 398.30 | 401.40 | 394.20 | 405.00 | 460.20 | 440.20 | 488.20 | 405.60 | 437.60 | 437.30 | 396.80 | 343.10 | |
| Operating Costs And Expenses | 612.20 | 644.40 | 624.10 | 604.70 | 597.50 | 641.00 | 738.40 | 728.40 | 703.70 | 748.00 | 649.30 | 615.60 | 544.70 | 533.90 | 495.80 | 426.30 | 448.30 | 465.50 | 472.60 | 472.80 | 467.10 | 484.30 | 485.50 | 465.90 | 439.30 | 446.00 | 436.10 | 422.90 | 412.20 | 441.40 | 411.40 | 389.90 | 376.40 | 402.60 | 424.80 | 364.50 | 318.20 | 355.00 | 363.80 | 366.90 | 347.80 | 361.00 | 353.60 | 344.90 | 342.80 | 342.10 | 337.00 | 329.00 | 329.70 | 336.20 | 324.70 | 323.00 | NA | NA | NA | NA | NA | |
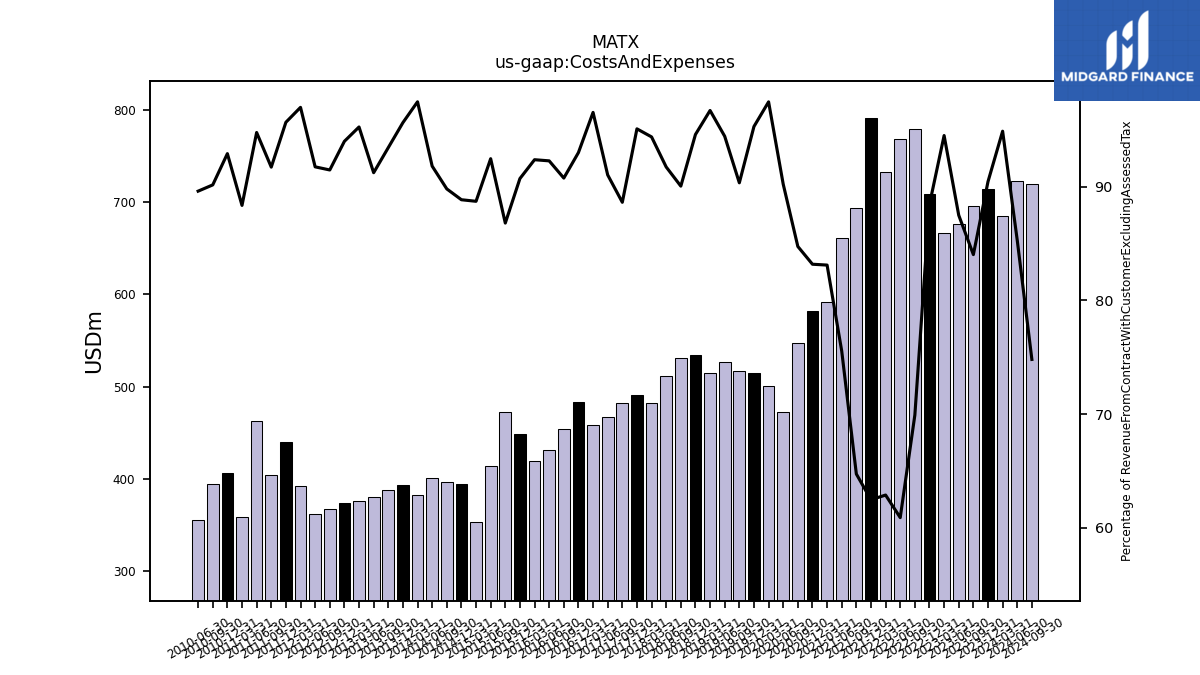
| Costs And Expenses | 685.20 | 713.60 | 695.40 | 676.70 | 666.10 | 709.00 | 779.50 | 768.00 | 732.90 | 791.50 | 693.70 | 661.00 | 591.60 | 582.40 | 546.80 | 472.90 | 500.90 | 515.30 | 516.90 | 526.90 | 514.90 | 534.40 | 530.80 | 511.10 | 482.70 | 490.80 | 482.10 | 466.60 | 458.00 | 483.00 | 454.20 | 431.60 | 419.60 | 448.90 | 472.50 | 413.90 | 353.30 | 394.10 | 396.80 | 400.70 | 382.60 | 393.00 | 387.80 | 380.10 | 376.00 | 374.40 | 367.20 | 361.70 | 392.80 | 440.30 | 403.80 | 462.70 | 358.40 | 406.60 | 394.30 | 355.60 | NA | |
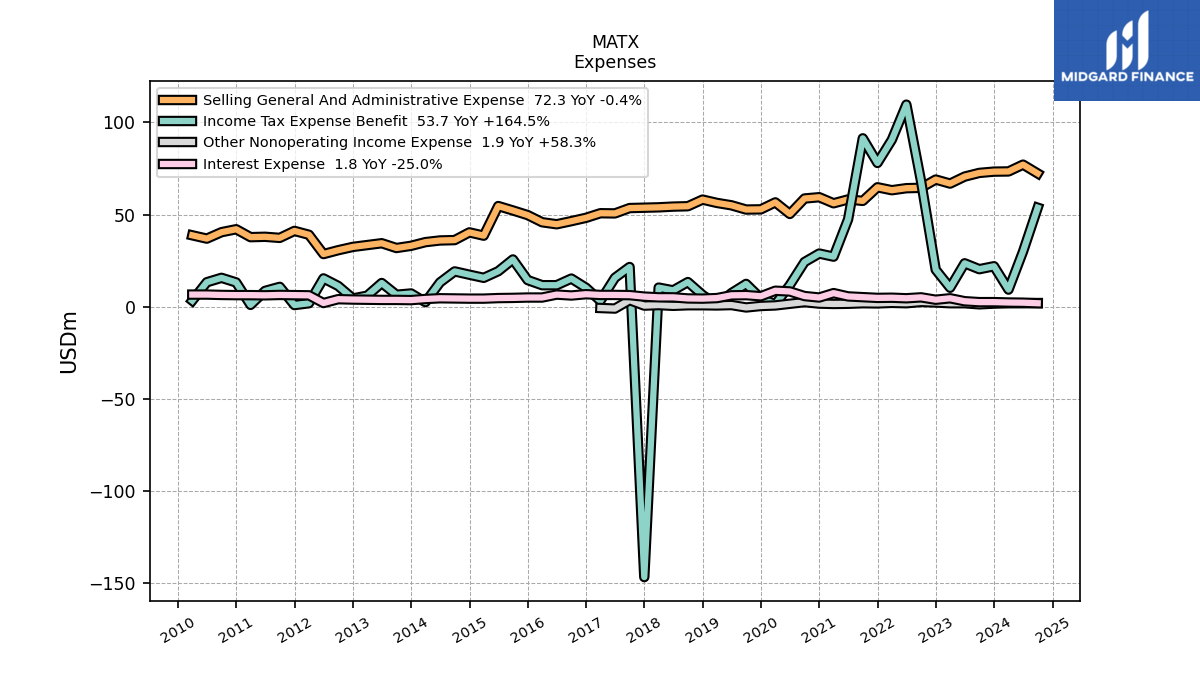
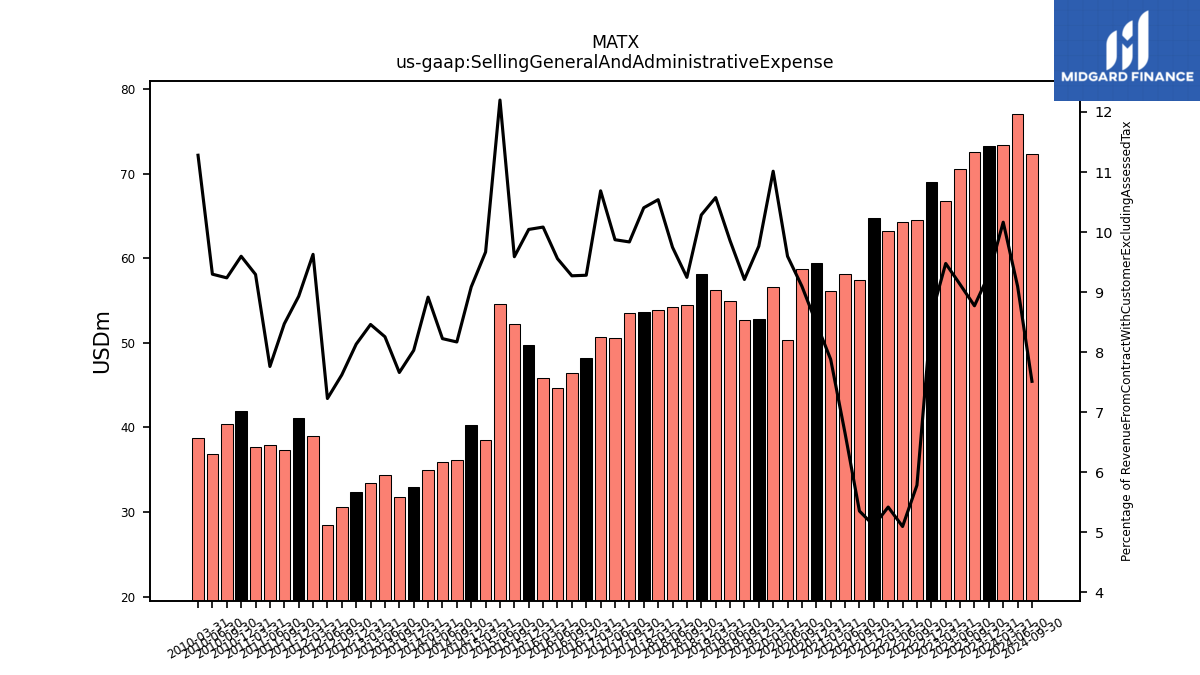
| Selling General And Administrative Expense | 73.40 | 73.30 | 72.60 | 70.60 | 66.80 | 69.00 | 64.50 | 64.30 | 63.20 | 64.80 | 57.40 | 58.20 | 56.10 | 59.40 | 58.70 | 50.30 | 56.60 | 52.80 | 52.70 | 55.00 | 56.30 | 58.10 | 54.50 | 54.30 | 53.90 | 53.70 | 53.50 | 50.60 | 50.70 | 48.20 | 46.40 | 44.70 | 45.80 | 49.70 | 52.20 | 54.60 | 38.50 | 40.30 | 36.10 | 35.90 | 35.00 | 33.00 | 31.80 | 34.40 | 33.40 | 32.40 | 30.60 | 28.50 | 39.00 | 41.10 | 37.30 | 37.90 | 37.70 | 42.00 | 40.40 | 36.90 | 38.70 | |
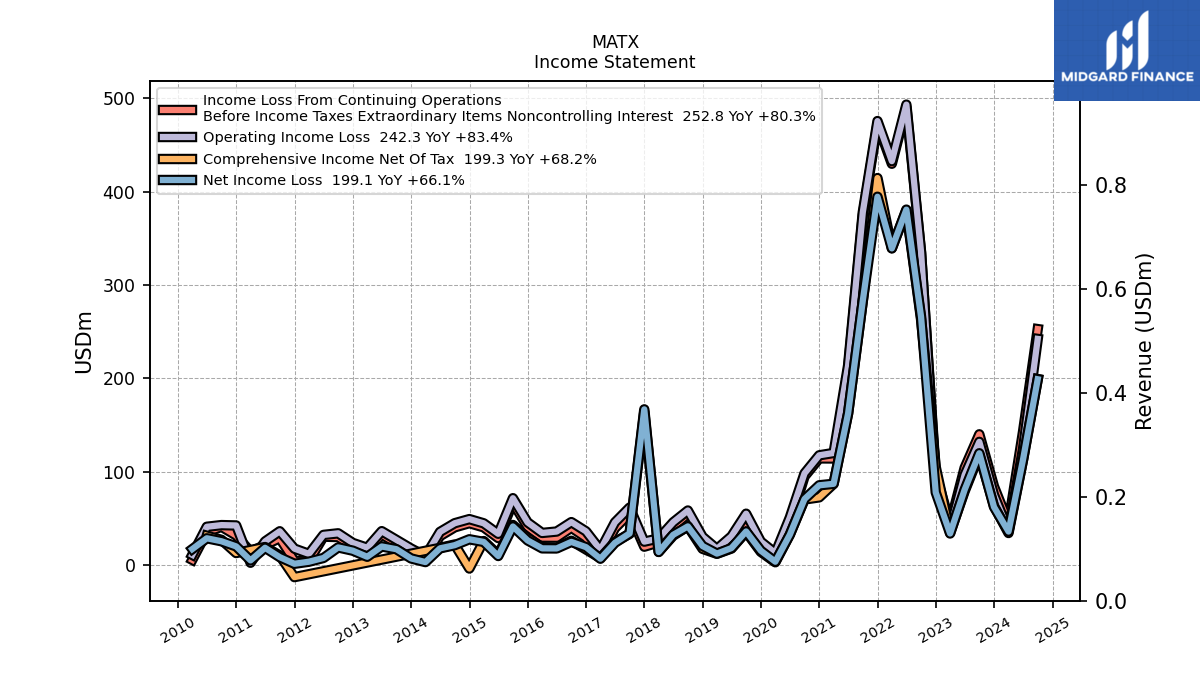
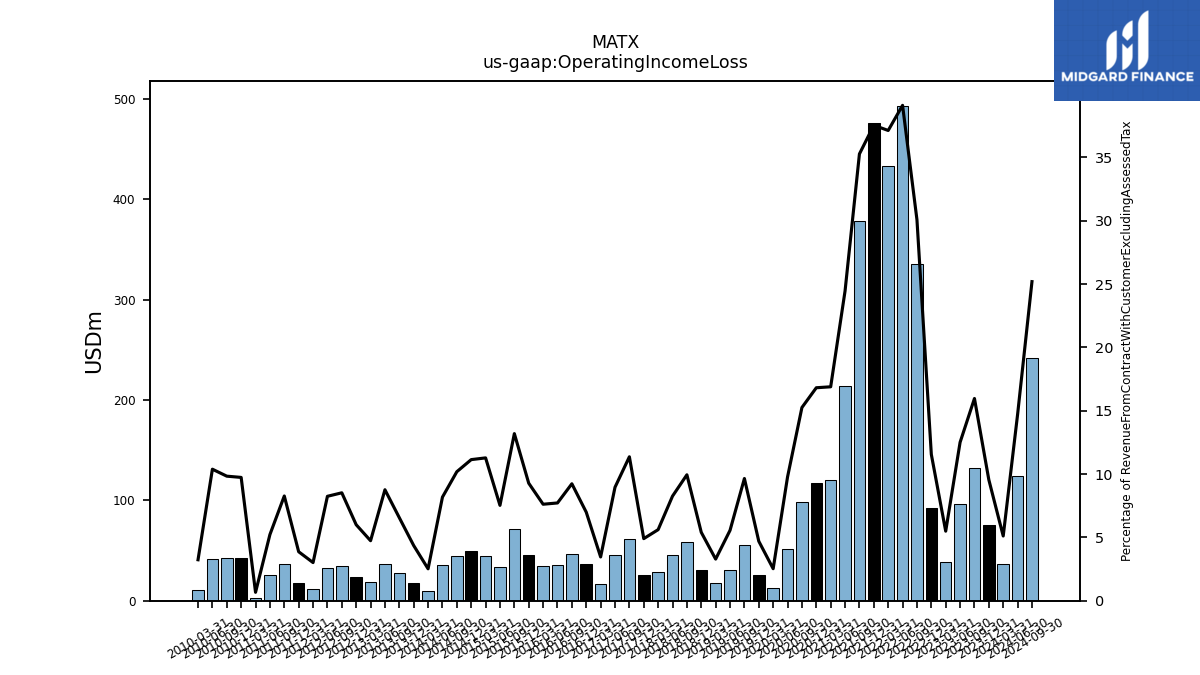
| Operating Income Loss | 36.90 | 75.30 | 132.10 | 96.70 | 38.70 | 92.60 | 335.30 | 493.10 | 432.60 | 475.50 | 377.90 | 213.90 | 120.20 | 117.70 | 98.40 | 51.20 | 13.00 | 25.40 | 55.20 | 31.00 | 17.50 | 30.50 | 58.60 | 46.00 | 28.70 | 25.30 | 61.80 | 45.90 | 16.40 | 36.30 | 46.20 | 36.10 | 34.60 | 45.90 | 71.80 | 33.70 | 44.90 | 49.40 | 45.00 | 35.70 | 9.90 | 17.90 | 27.20 | 36.50 | 18.70 | 23.90 | 34.20 | 32.50 | 12.20 | 17.80 | 36.40 | 25.50 | 2.70 | 42.60 | 43.00 | 41.20 | 11.10 | |
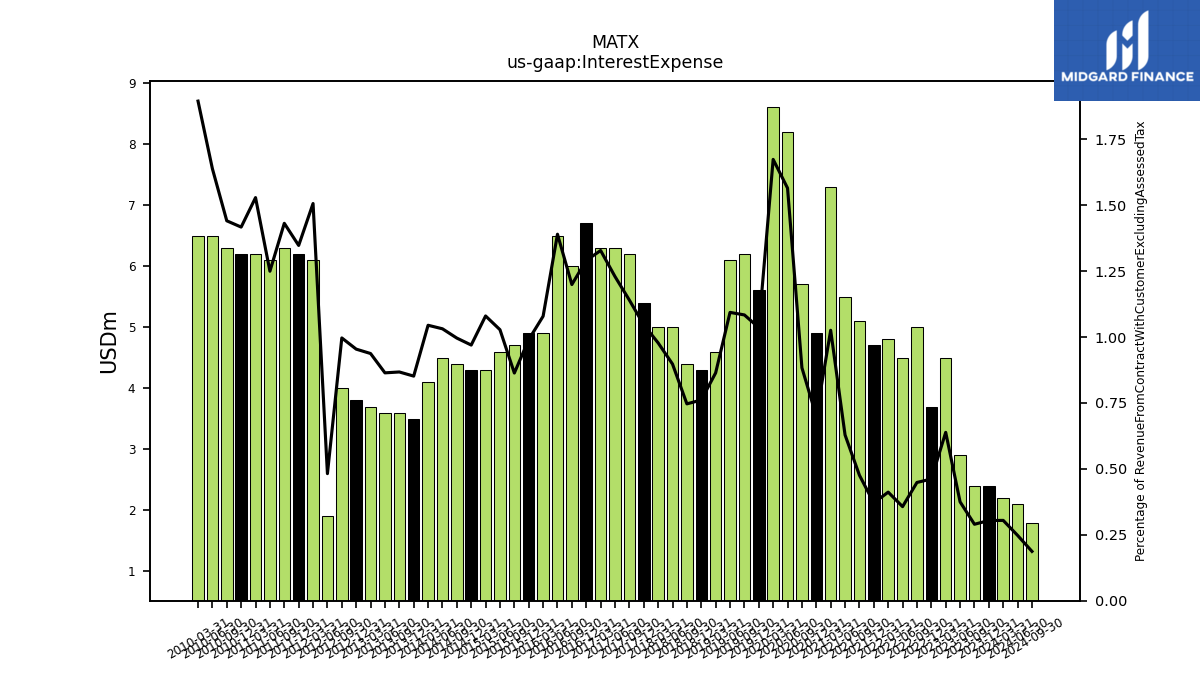
| Interest Expense | 2.20 | 2.40 | 2.40 | 2.90 | 4.50 | 3.70 | 5.00 | 4.50 | 4.80 | 4.70 | 5.10 | 5.50 | 7.30 | 4.90 | 5.70 | 8.20 | 8.60 | 5.60 | 6.20 | 6.10 | 4.60 | 4.30 | 4.40 | 5.00 | 5.00 | 5.40 | 6.20 | 6.30 | 6.30 | 6.70 | 6.00 | 6.50 | 4.90 | 4.90 | 4.70 | 4.60 | 4.30 | 4.30 | 4.40 | 4.50 | 4.10 | 3.50 | 3.60 | 3.60 | 3.70 | 3.80 | 4.00 | 1.90 | 6.10 | 6.20 | 6.30 | 6.10 | 6.20 | 6.20 | 6.30 | 6.50 | 6.50 | |
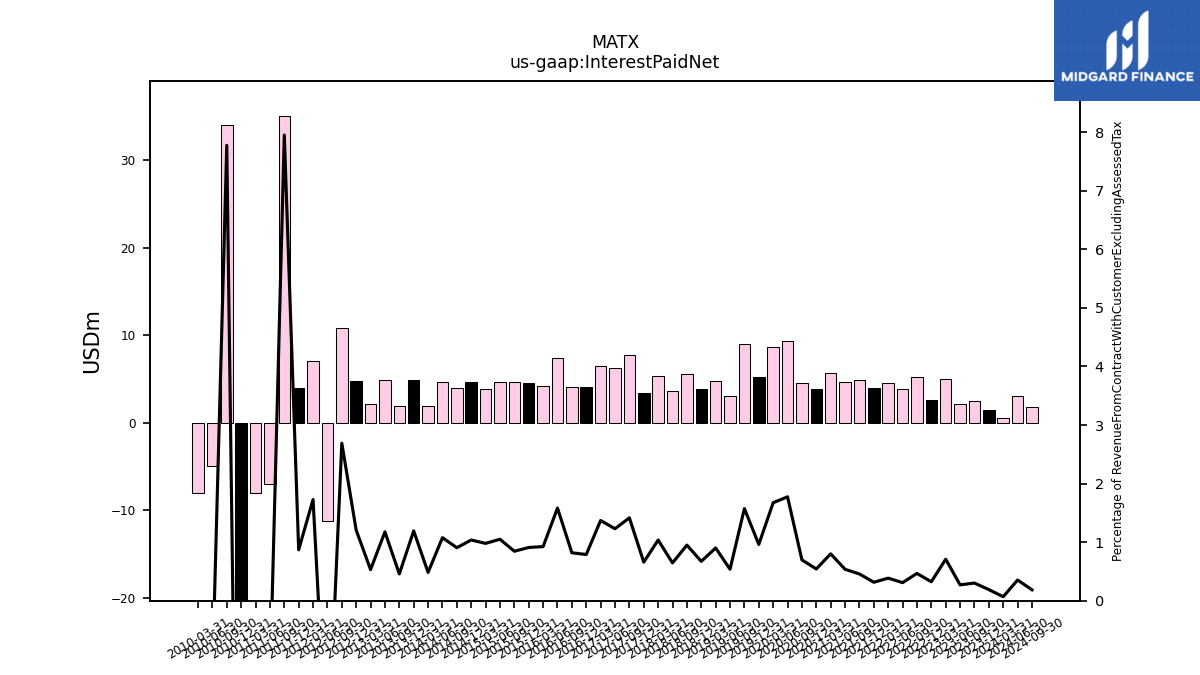
| Interest Paid Net | 0.50 | 1.50 | 2.50 | 2.10 | 5.00 | 2.60 | 5.20 | 3.90 | 4.50 | 4.00 | 4.90 | 4.70 | 5.70 | 3.80 | 4.50 | 9.30 | 8.60 | 5.20 | 9.00 | 3.00 | 4.80 | 3.80 | 5.60 | 3.60 | 5.30 | 3.40 | 7.70 | 6.30 | 6.50 | 4.10 | 4.10 | 7.40 | 4.20 | 4.50 | 4.60 | 4.70 | 3.90 | 4.60 | 4.00 | 4.70 | 1.90 | 4.90 | 1.90 | 4.90 | 2.10 | 4.80 | 10.80 | -11.30 | 7.00 | 4.00 | 35.00 | -7.00 | -8.00 | -46.00 | 34.00 | -5.00 | -8.00 | |
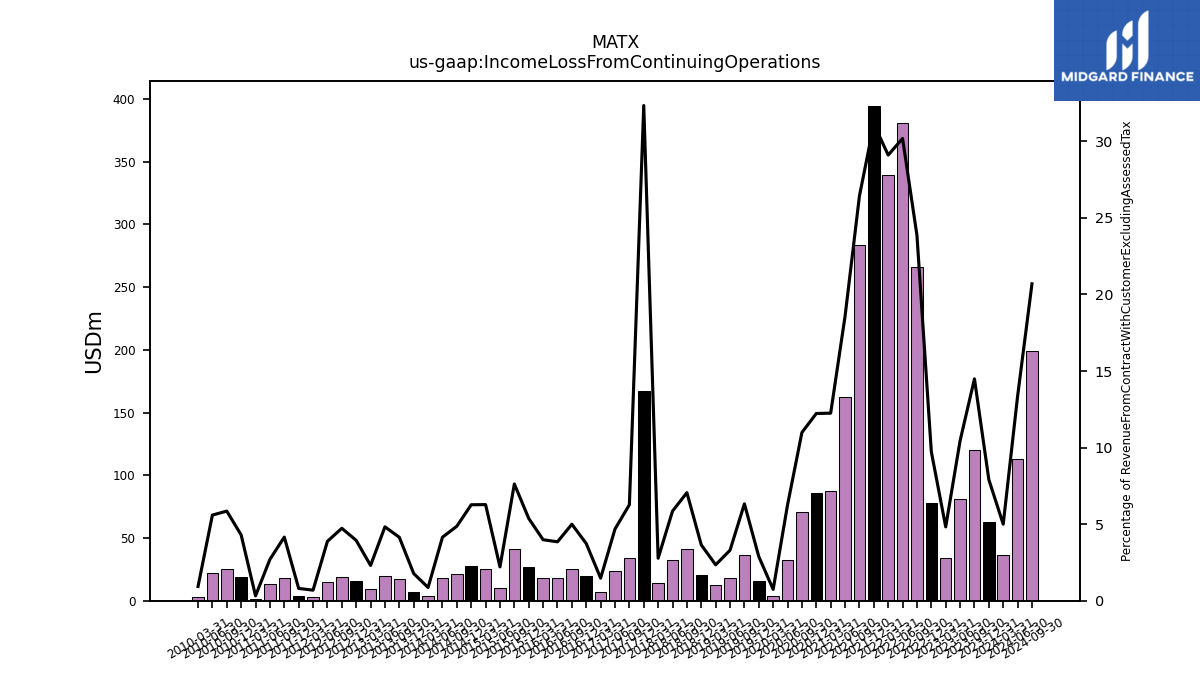
| Income Loss From Continuing Operations | 36.10 | 62.40 | 119.90 | 80.80 | 34.00 | 78.00 | 266.00 | 380.70 | 339.20 | 394.50 | 283.20 | 162.50 | 87.20 | 85.60 | 70.90 | 32.80 | 3.80 | 15.60 | 36.20 | 18.40 | 12.50 | 20.60 | 41.60 | 32.60 | 14.20 | 166.90 | 34.10 | 24.00 | 7.00 | 19.40 | 25.00 | 18.00 | 18.10 | 26.60 | 41.50 | 9.90 | 25.00 | 27.80 | 21.50 | 18.10 | 3.40 | 7.30 | 17.20 | 20.10 | 9.10 | 15.70 | 19.00 | 15.30 | 2.80 | 3.70 | 18.30 | 13.20 | 1.30 | 18.80 | 25.60 | 22.20 | 3.20 | |
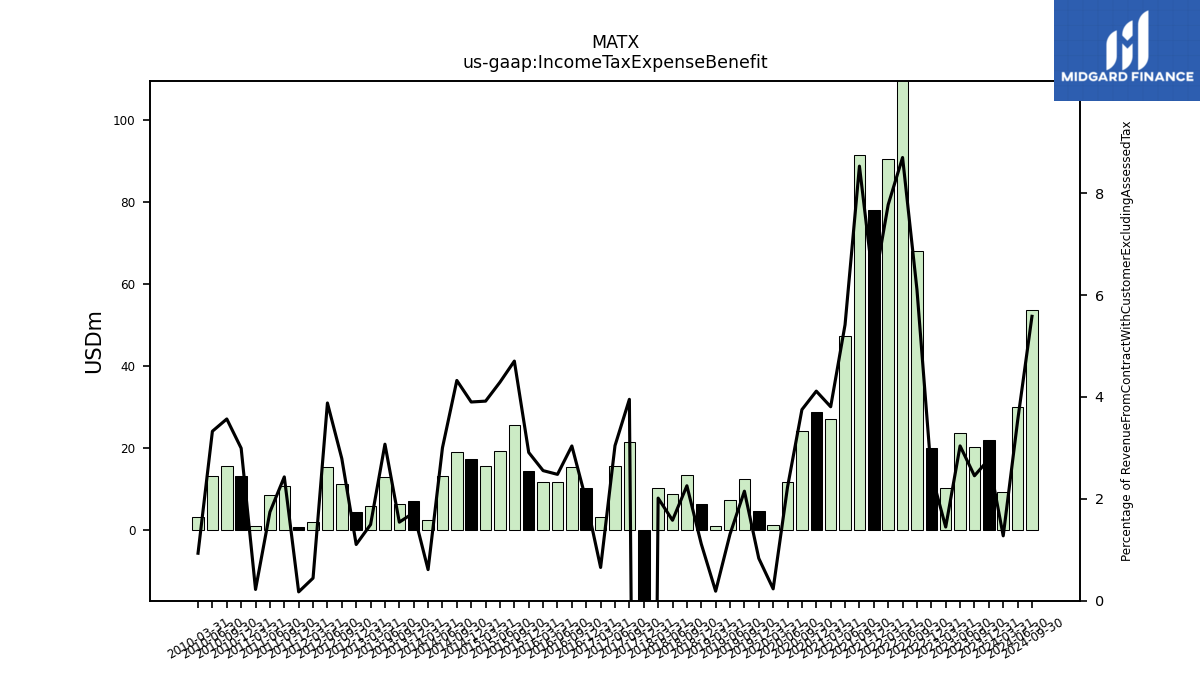
| Income Tax Expense Benefit | 9.20 | 21.90 | 20.30 | 23.50 | 10.20 | 20.00 | 68.10 | 109.70 | 90.60 | 78.00 | 91.40 | 47.40 | 27.10 | 28.80 | 24.20 | 11.70 | 1.20 | 4.50 | 12.30 | 7.30 | 1.00 | 6.30 | 13.30 | 8.80 | 10.30 | -147.00 | 21.50 | 15.60 | 3.10 | 10.20 | 15.20 | 11.60 | 11.60 | 14.40 | 25.60 | 19.20 | 15.60 | 17.30 | 19.10 | 13.10 | 2.40 | 7.10 | 6.40 | 12.80 | 5.90 | 4.40 | 11.20 | 15.30 | 1.80 | 0.80 | 10.70 | 8.50 | 0.90 | 13.10 | 15.60 | 13.20 | 3.20 | |
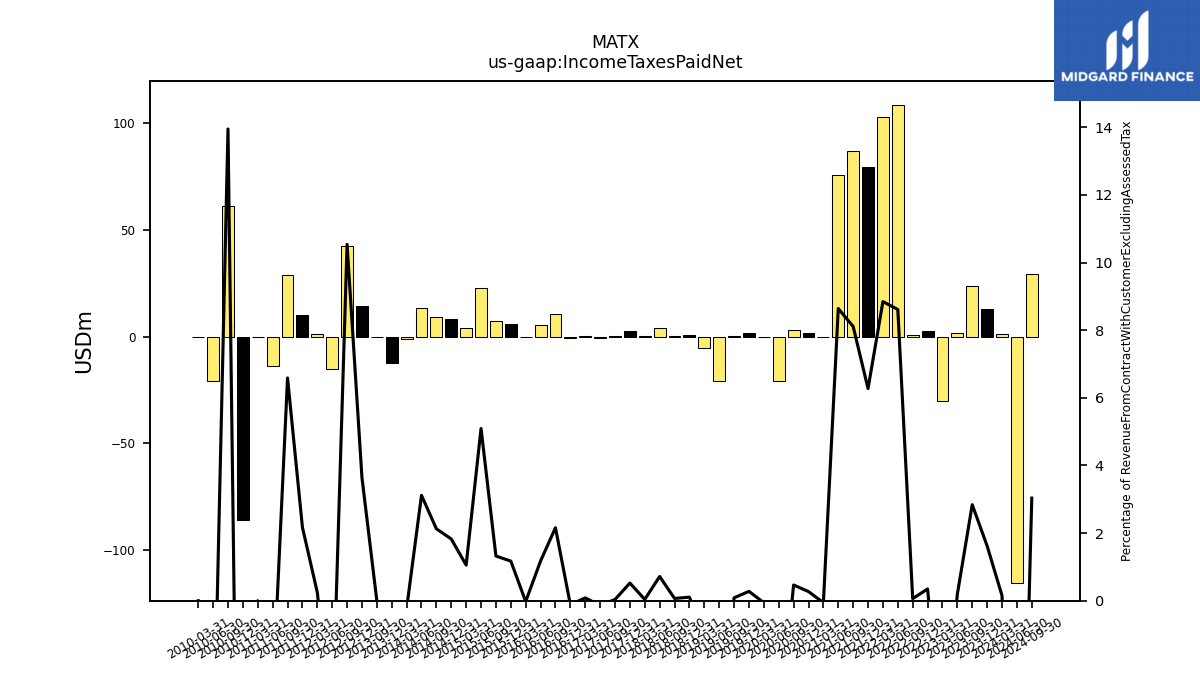
| Income Taxes Paid Net | 1.10 | 12.80 | 23.50 | 1.50 | -30.30 | 2.80 | 0.70 | 108.60 | 103.10 | 79.50 | 86.90 | 75.60 | -0.40 | 1.90 | 3.00 | -20.70 | -0.30 | 1.50 | 0.50 | -20.80 | -5.40 | 0.60 | 0.40 | 4.00 | 0.20 | 2.70 | 0.20 | -0.70 | 0.40 | -0.60 | 10.80 | 5.50 | -0.10 | 5.80 | 7.20 | 22.80 | 4.20 | 8.10 | 9.40 | 13.60 | -0.90 | -12.30 | 0.00 | NA | NA | 14.50 | 42.30 | -15.10 | 1.00 | 10.00 | 29.00 | -14.00 | 0.00 | -86.00 | 61.00 | -21.00 | 0.00 | |
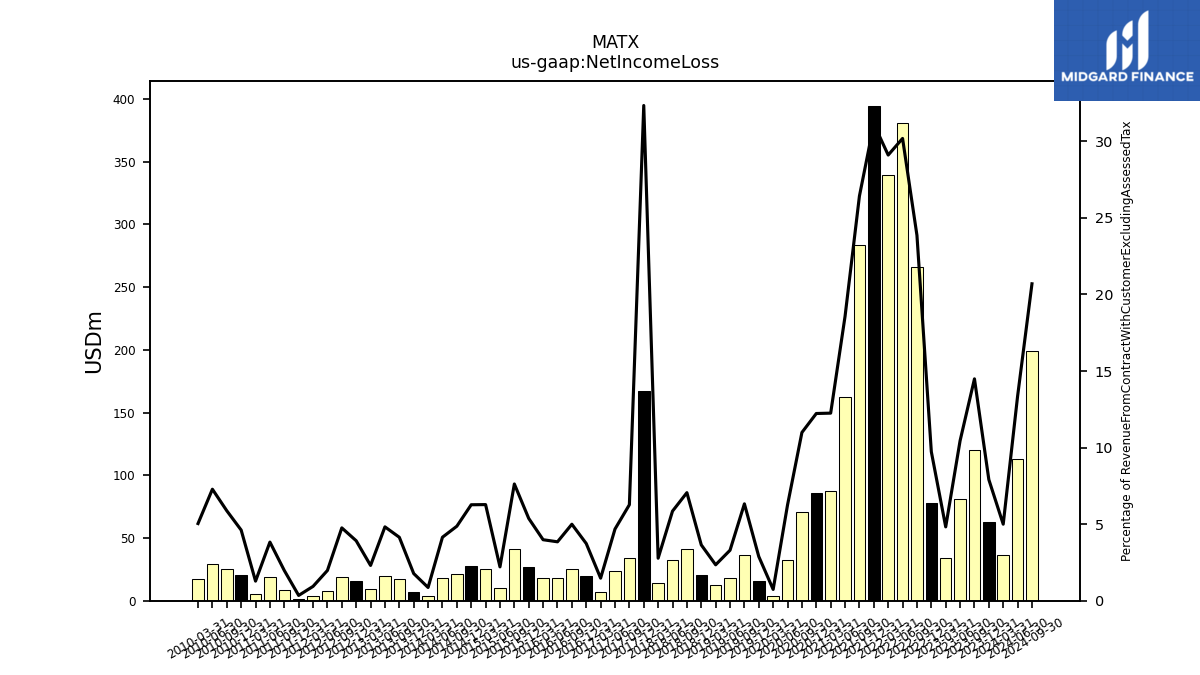
| Net Income Loss | 36.10 | 62.40 | 119.90 | 80.80 | 34.00 | 78.00 | 266.00 | 380.70 | 339.20 | 394.50 | 283.20 | 162.50 | 87.20 | 85.60 | 70.90 | 32.80 | 3.80 | 15.60 | 36.20 | 18.40 | 12.50 | 20.60 | 41.60 | 32.60 | 14.20 | 166.90 | 34.10 | 24.00 | 7.00 | 19.40 | 25.00 | 18.00 | 18.10 | 26.60 | 41.50 | 9.90 | 25.00 | 27.80 | 21.50 | 18.10 | 3.40 | 7.30 | 17.20 | 20.10 | 9.10 | 15.60 | 19.10 | 7.80 | 3.80 | 1.60 | 8.70 | 18.70 | 5.20 | 20.20 | 25.70 | 28.90 | 17.30 | |
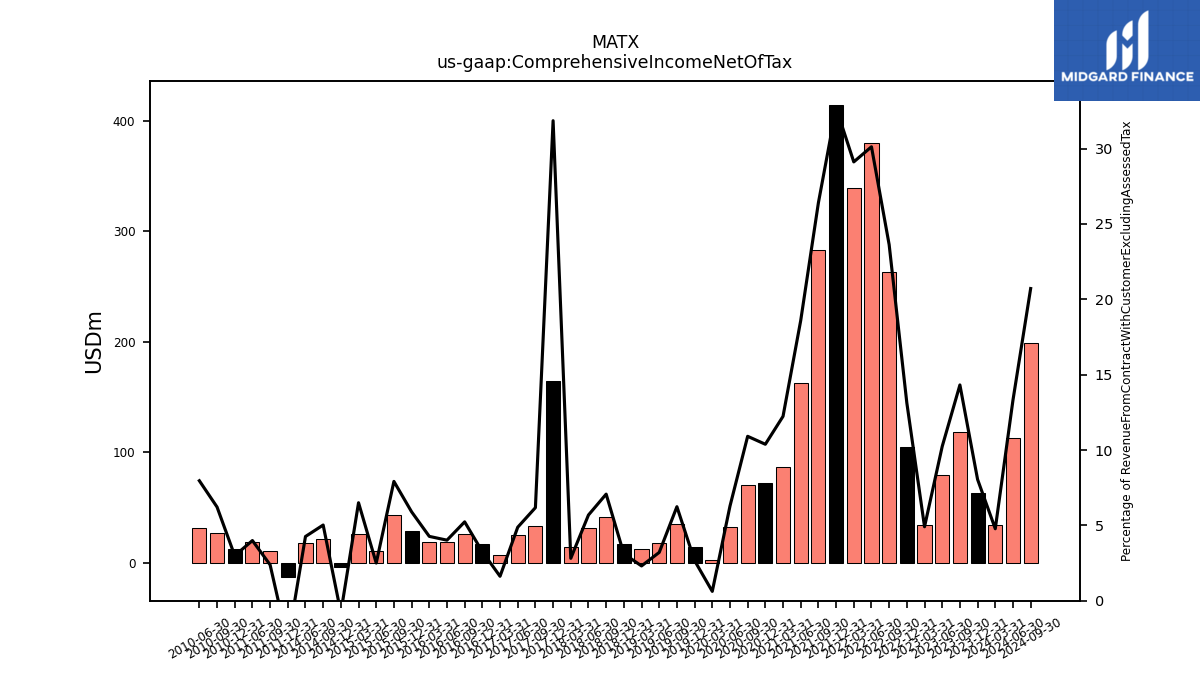
| Comprehensive Income Net Of Tax | 34.50 | 63.50 | 118.50 | 79.20 | 34.60 | 105.20 | 263.40 | 379.90 | 339.40 | 414.50 | 283.00 | 162.70 | 87.10 | 72.70 | 70.40 | 32.90 | 3.20 | 14.40 | 35.70 | 17.90 | 12.30 | 17.60 | 41.70 | 31.70 | 14.40 | 164.40 | 33.60 | 25.00 | 7.70 | 16.90 | 26.20 | 18.80 | 19.40 | 29.20 | 43.10 | 11.20 | 25.90 | -3.50 | 22.20 | 18.60 | NA | NA | NA | NA | NA | NA | NA | NA | NA | -12.70 | 10.50 | 19.50 | NA | 13.10 | 27.20 | 31.60 | NA | |
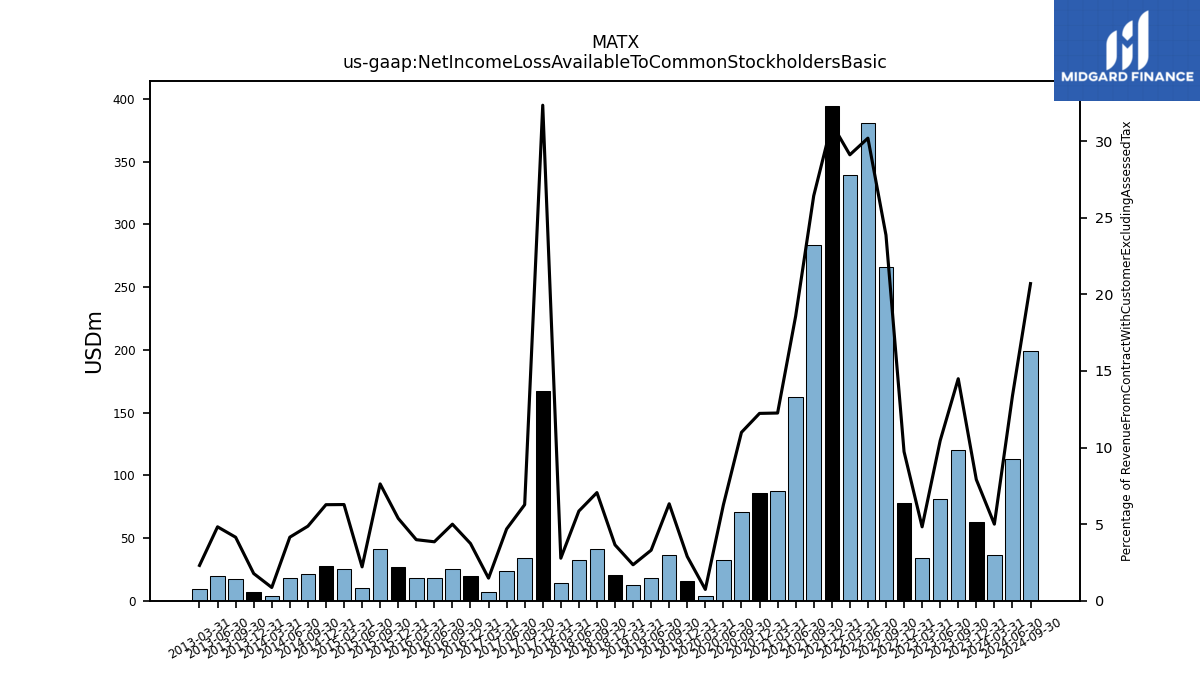
| Net Income Loss Available To Common Stockholders Basic | 36.10 | 62.40 | 119.90 | 80.80 | 34.00 | 78.00 | 266.00 | 380.70 | 339.20 | 394.50 | 283.20 | 162.50 | 87.20 | 85.60 | 70.90 | 32.80 | 3.80 | 15.60 | 36.20 | 18.40 | 12.50 | 20.60 | 41.60 | 32.60 | 14.20 | 166.90 | 34.10 | 24.00 | 7.00 | 19.40 | 25.00 | 18.00 | 18.10 | 26.60 | 41.50 | 9.90 | 25.00 | 27.80 | 21.50 | 18.10 | 3.40 | 7.30 | 17.20 | 20.10 | 9.10 | NA | NA | NA | NA | NA | NA | NA | NA | NA | NA | NA | NA | |
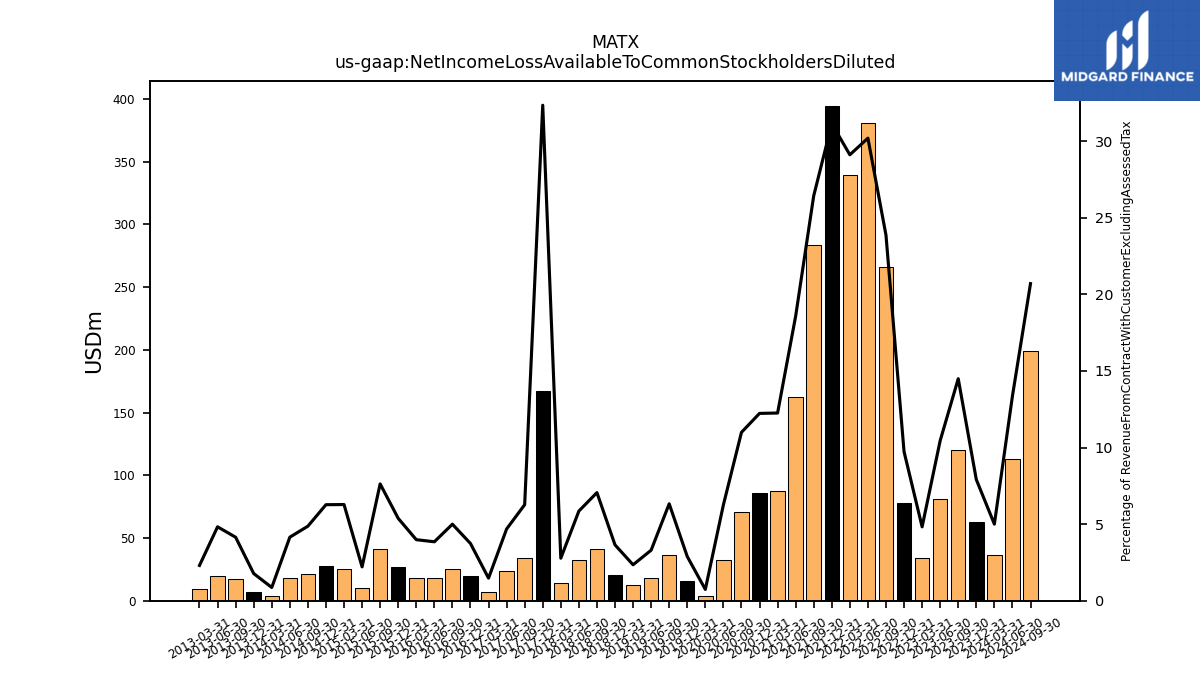
| Net Income Loss Available To Common Stockholders Diluted | 36.10 | 62.40 | 119.90 | 80.80 | 34.00 | 78.00 | 266.00 | 380.70 | 339.20 | 394.50 | 283.20 | 162.50 | 87.20 | 85.60 | 70.90 | 32.80 | 3.80 | 15.60 | 36.20 | 18.40 | 12.50 | 20.60 | 41.60 | 32.60 | 14.20 | 166.90 | 34.10 | 24.00 | 7.00 | 19.40 | 25.00 | 18.00 | 18.10 | 26.60 | 41.50 | 9.90 | 25.00 | 27.80 | 21.50 | 18.10 | 3.40 | 7.30 | 17.20 | 20.10 | 9.10 | NA | NA | NA | NA | NA | NA | NA | NA | NA | NA | NA | NA |
| 2024-03-31 | 2023-12-31 | 2023-09-30 | 2023-06-30 | 2023-03-31 | 2022-12-31 | 2022-09-30 | 2022-06-30 | 2022-03-31 | 2021-12-31 | 2021-09-30 | 2021-06-30 | 2021-03-31 | 2020-12-31 | 2020-09-30 | 2020-06-30 | 2020-03-31 | 2019-12-31 | 2019-09-30 | 2019-06-30 | 2019-03-31 | 2018-12-31 | 2018-09-30 | 2018-06-30 | 2018-03-31 | 2017-12-31 | 2017-09-30 | 2017-06-30 | 2017-03-31 | 2016-12-31 | 2016-09-30 | 2016-06-30 | 2016-03-31 | 2015-12-31 | 2015-09-30 | 2015-06-30 | 2015-03-31 | 2014-12-31 | 2014-09-30 | 2014-06-30 | 2014-03-31 | 2013-12-31 | 2013-09-30 | 2013-06-30 | 2013-03-31 | 2012-12-31 | 2012-09-30 | 2012-06-30 | 2012-03-31 | 2011-12-31 | 2011-09-30 | 2011-06-30 | 2011-03-31 | 2010-12-31 | 2010-09-30 | 2010-06-30 | 2010-03-31 | ||
|---|---|---|---|---|---|---|---|---|---|---|---|---|---|---|---|---|---|---|---|---|---|---|---|---|---|---|---|---|---|---|---|---|---|---|---|---|---|---|---|---|---|---|---|---|---|---|---|---|---|---|---|---|---|---|---|---|---|---|
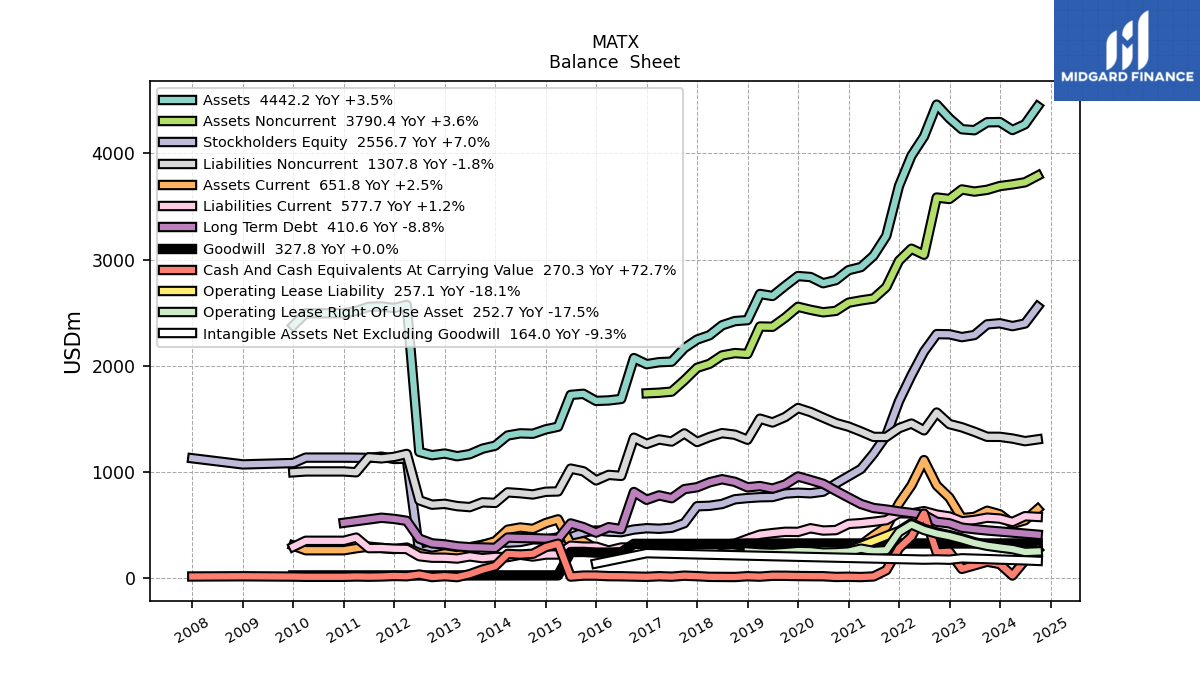
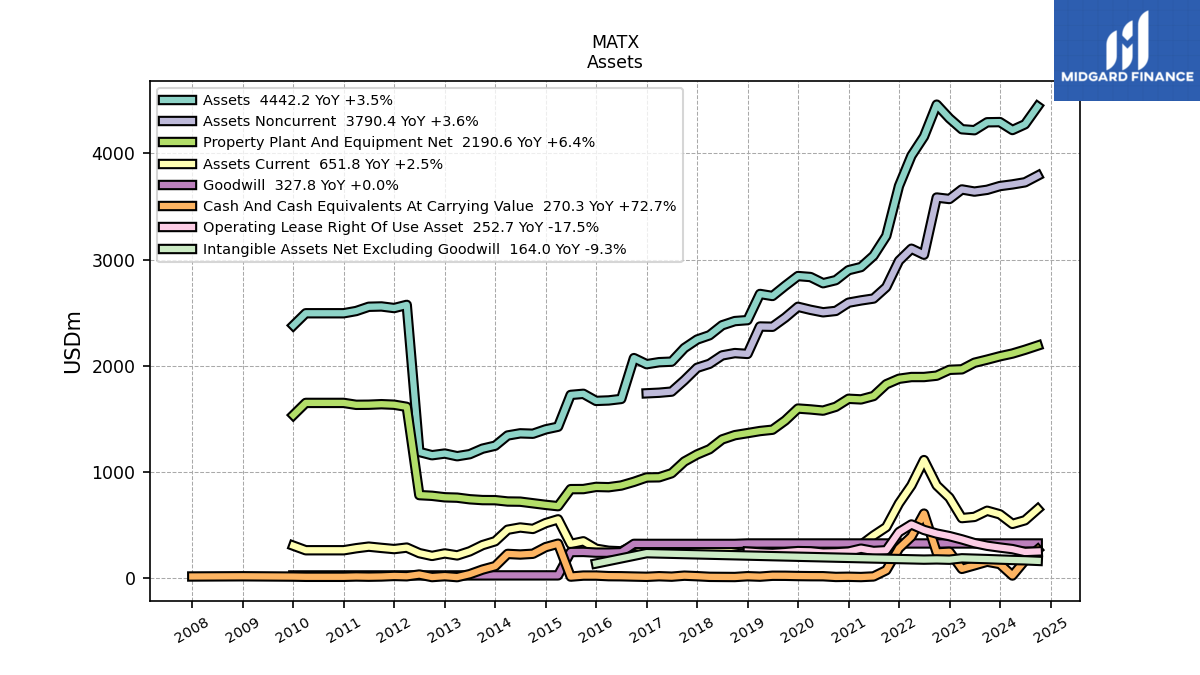
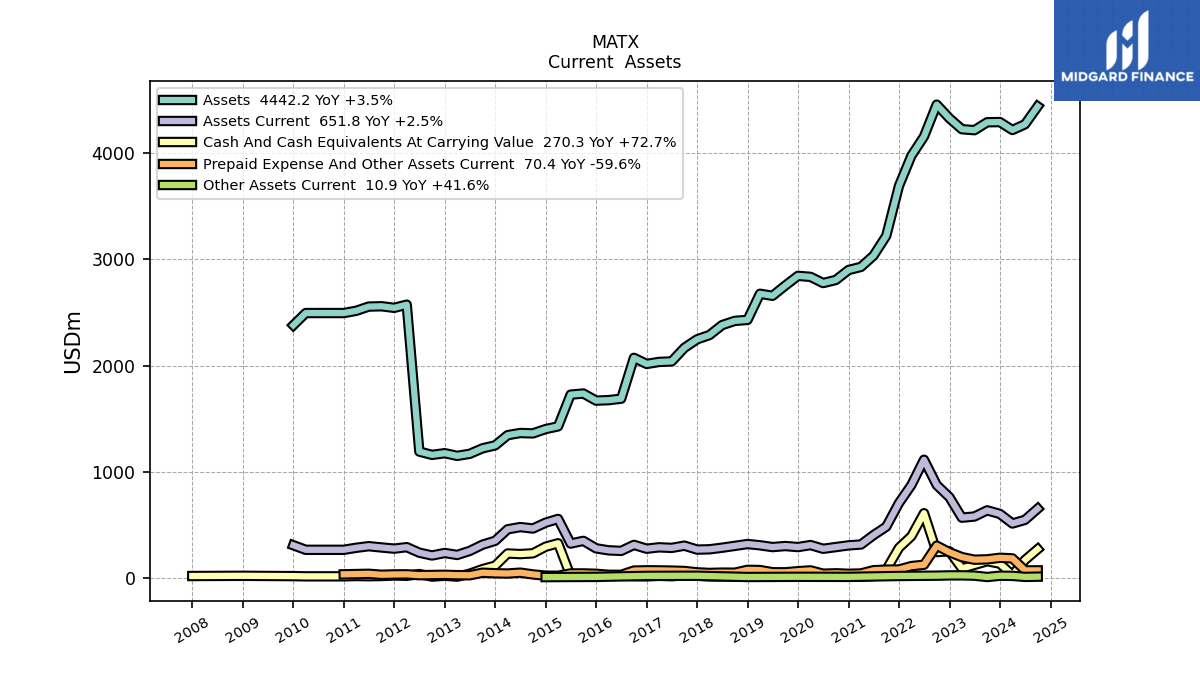
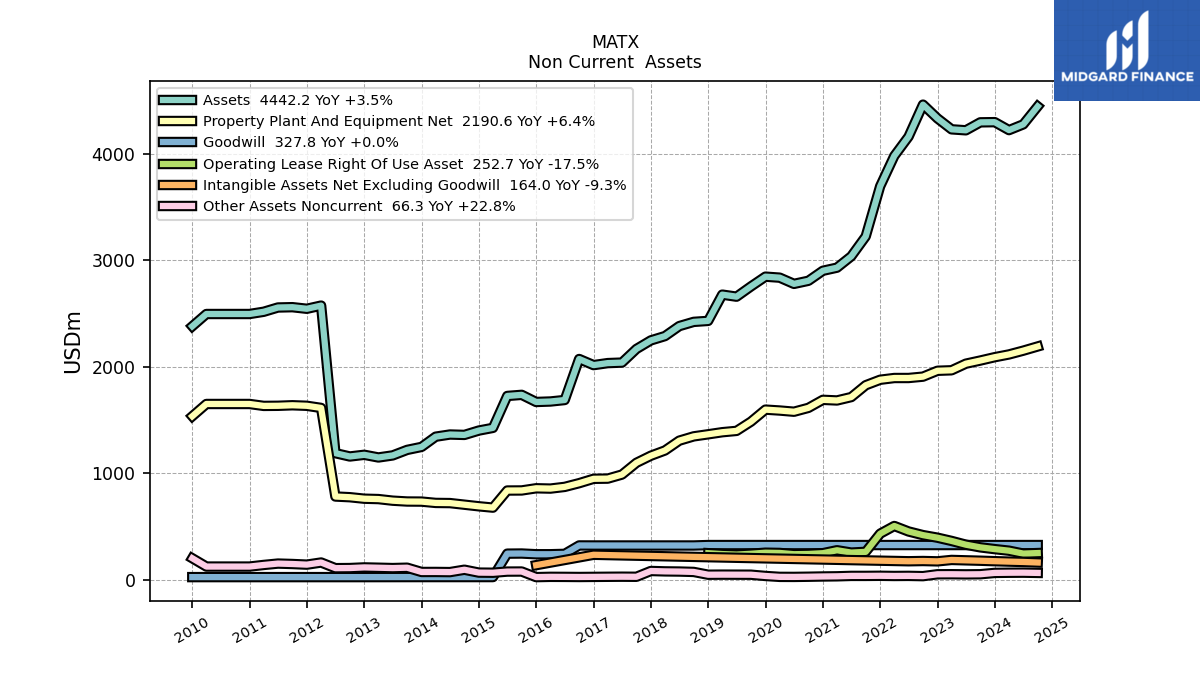
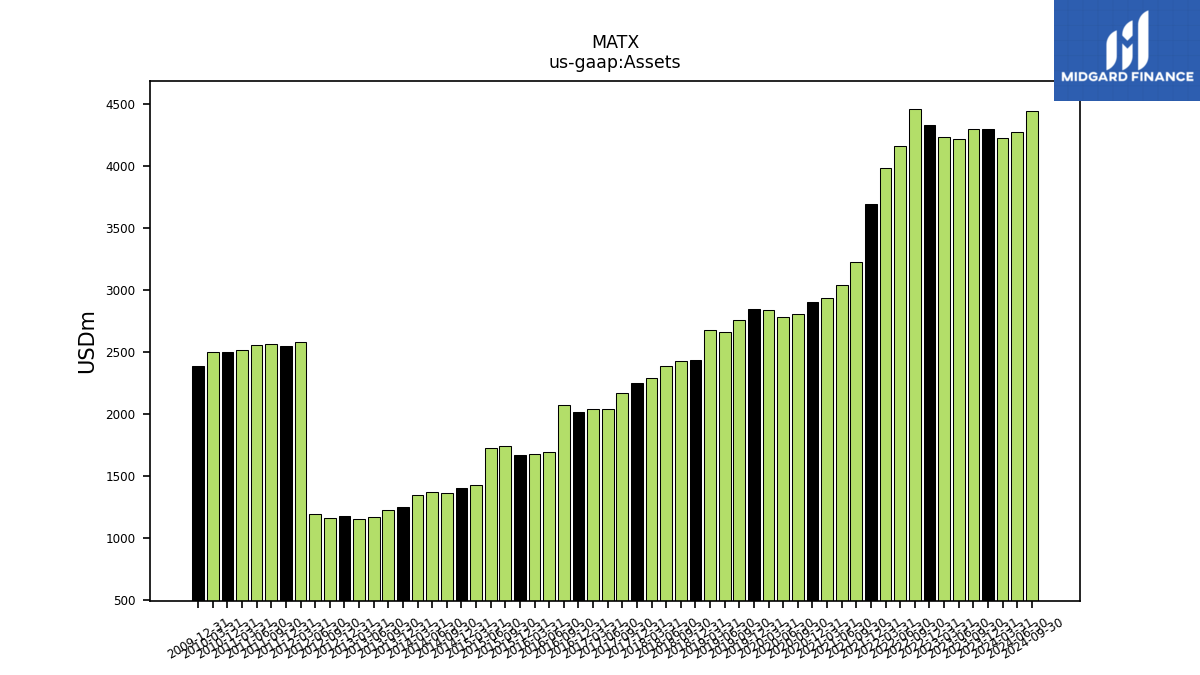
| Assets | 4219.90 | 4294.60 | 4292.80 | 4218.10 | 4227.30 | 4330.00 | 4459.00 | 4158.60 | 3977.50 | 3693.10 | 3222.80 | 3036.20 | 2929.70 | 2900.60 | 2806.70 | 2777.60 | 2835.90 | 2845.40 | 2753.80 | 2657.50 | 2676.80 | 2430.40 | 2421.20 | 2381.60 | 2287.90 | 2247.50 | 2167.00 | 2039.30 | 2034.40 | 2015.50 | 2073.10 | 1688.20 | 1674.30 | 1669.80 | 1736.70 | 1726.20 | 1426.90 | 1401.80 | 1360.80 | 1364.60 | 1344.30 | 1248.30 | 1220.20 | 1168.50 | 1149.20 | 1174.30 | 1158.50 | 1189.50 | 2574.00 | 2544.00 | 2559.00 | 2556.00 | 2516.00 | 2495.00 | NA | NA | 2495.00 | |
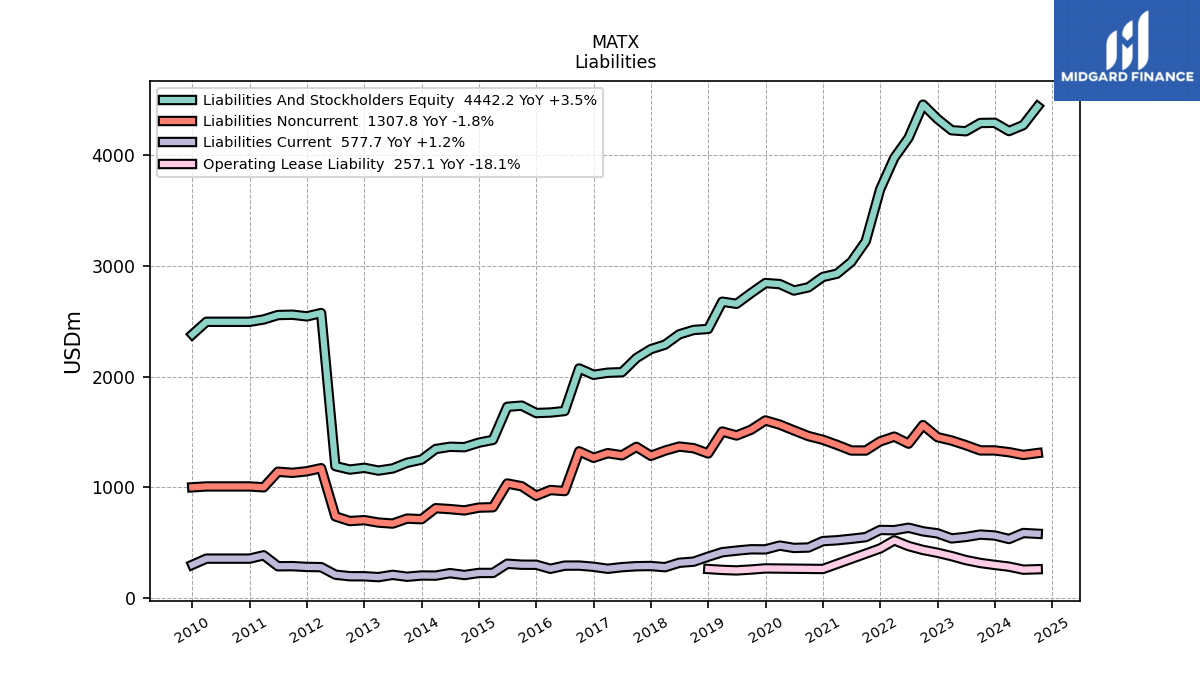
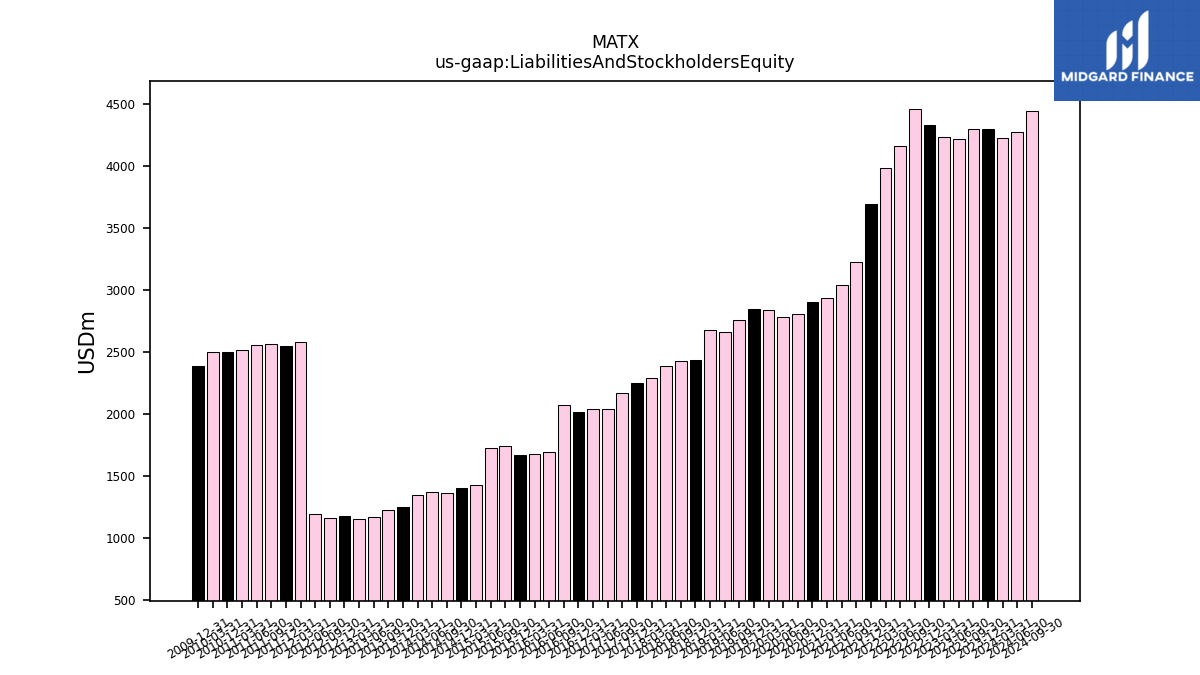
| Liabilities And Stockholders Equity | 4219.90 | 4294.60 | 4292.80 | 4218.10 | 4227.30 | 4330.00 | 4459.00 | 4158.60 | 3977.50 | 3693.10 | 3222.80 | 3036.20 | 2929.70 | 2900.60 | 2806.70 | 2777.60 | 2835.90 | 2845.40 | 2753.80 | 2657.50 | 2676.80 | 2430.40 | 2421.20 | 2381.60 | 2287.90 | 2247.50 | 2167.00 | 2039.30 | 2034.40 | 2015.50 | 2073.10 | 1688.20 | 1674.30 | 1669.80 | 1736.70 | 1726.20 | 1426.90 | 1401.80 | 1360.80 | 1364.60 | 1344.30 | 1248.30 | 1220.20 | 1168.50 | 1149.20 | 1174.30 | 1158.50 | 1189.50 | 2574.00 | 2544.00 | 2559.00 | 2556.00 | 2516.00 | 2495.00 | NA | NA | 2495.00 | |
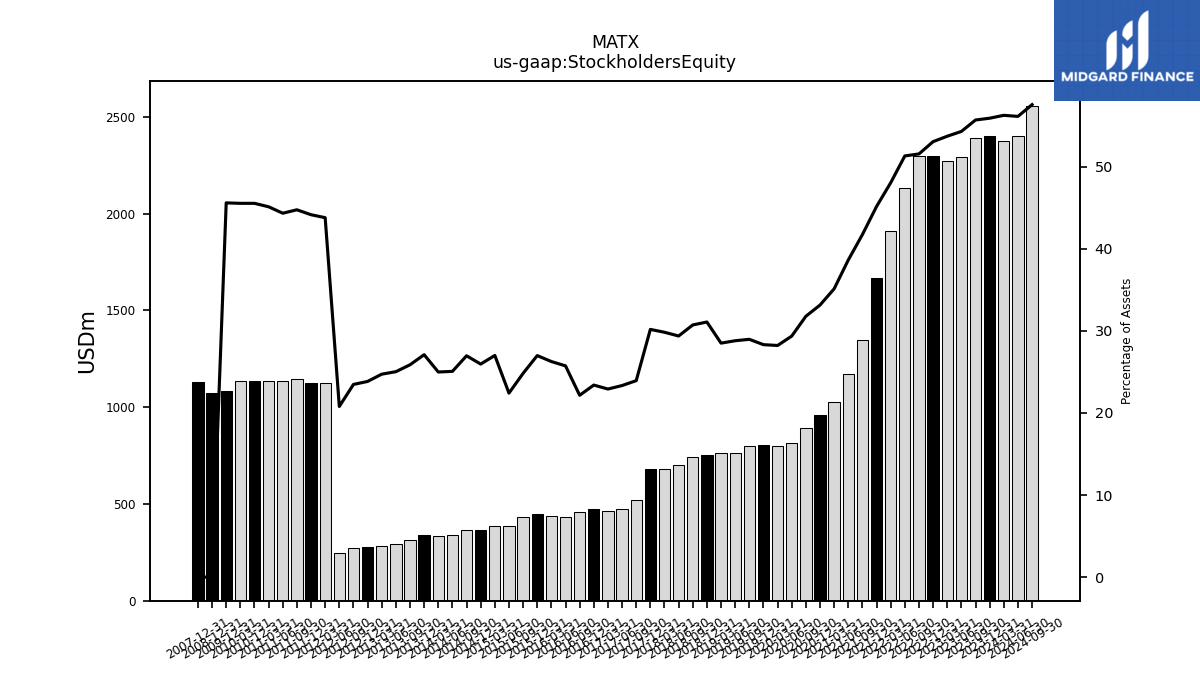
| Stockholders Equity | 2373.80 | 2400.70 | 2390.30 | 2290.00 | 2270.30 | 2296.90 | 2298.60 | 2133.60 | 1910.70 | 1667.40 | 1344.80 | 1172.80 | 1028.90 | 961.20 | 891.80 | 815.50 | 800.20 | 805.70 | 797.70 | 765.20 | 763.00 | 755.30 | 743.70 | 699.50 | 682.40 | 678.20 | 518.60 | 475.90 | 466.10 | 471.50 | 459.20 | 434.40 | 439.70 | 450.60 | 431.10 | 386.90 | 385.30 | 363.80 | 366.90 | 342.00 | 335.90 | 338.20 | 315.60 | 292.40 | 284.10 | 279.90 | 271.90 | 247.30 | 1127.00 | 1123.00 | 1145.00 | 1133.00 | 1135.00 | 1136.00 | NA | NA | 1136.00 |
| 2024-03-31 | 2023-12-31 | 2023-09-30 | 2023-06-30 | 2023-03-31 | 2022-12-31 | 2022-09-30 | 2022-06-30 | 2022-03-31 | 2021-12-31 | 2021-09-30 | 2021-06-30 | 2021-03-31 | 2020-12-31 | 2020-09-30 | 2020-06-30 | 2020-03-31 | 2019-12-31 | 2019-09-30 | 2019-06-30 | 2019-03-31 | 2018-12-31 | 2018-09-30 | 2018-06-30 | 2018-03-31 | 2017-12-31 | 2017-09-30 | 2017-06-30 | 2017-03-31 | 2016-12-31 | 2016-09-30 | 2016-06-30 | 2016-03-31 | 2015-12-31 | 2015-09-30 | 2015-06-30 | 2015-03-31 | 2014-12-31 | 2014-09-30 | 2014-06-30 | 2014-03-31 | 2013-12-31 | 2013-09-30 | 2013-06-30 | 2013-03-31 | 2012-12-31 | 2012-09-30 | 2012-06-30 | 2012-03-31 | 2011-12-31 | 2011-09-30 | 2011-06-30 | 2011-03-31 | 2010-12-31 | 2010-09-30 | 2010-06-30 | 2010-03-31 | ||
|---|---|---|---|---|---|---|---|---|---|---|---|---|---|---|---|---|---|---|---|---|---|---|---|---|---|---|---|---|---|---|---|---|---|---|---|---|---|---|---|---|---|---|---|---|---|---|---|---|---|---|---|---|---|---|---|---|---|---|
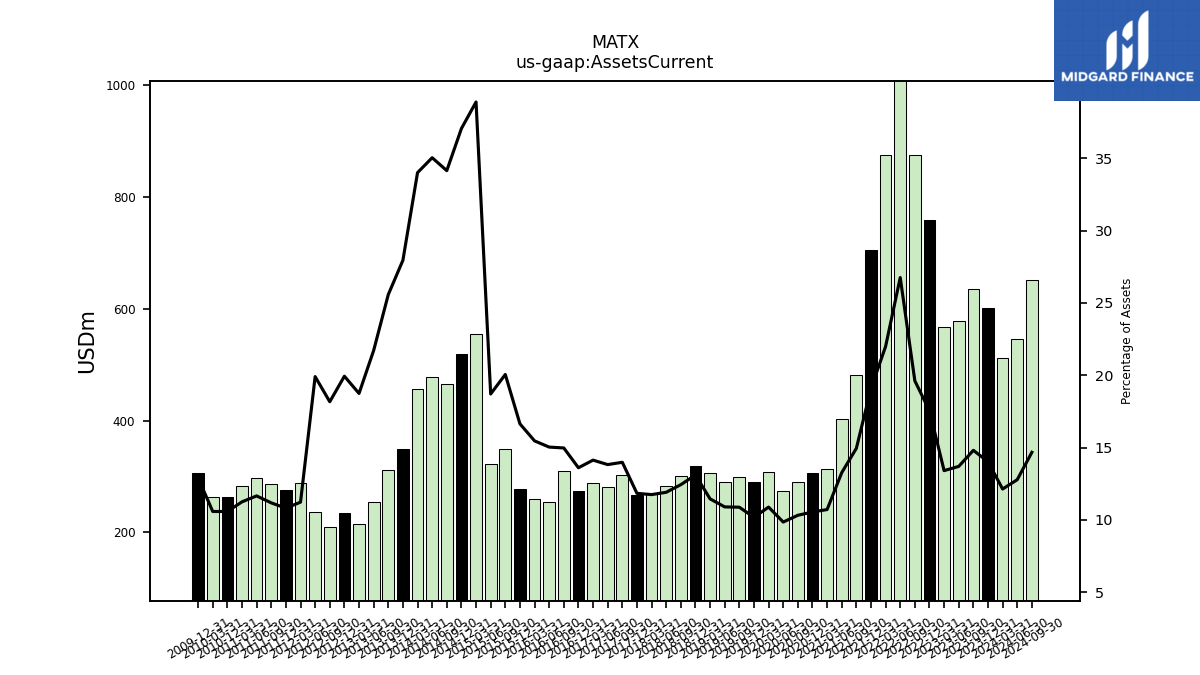
| Assets Current | 512.00 | 602.30 | 635.80 | 577.80 | 566.70 | 759.60 | 874.50 | 1112.70 | 874.80 | 704.50 | 481.70 | 402.70 | 313.90 | 305.90 | 289.60 | 273.60 | 308.70 | 289.60 | 299.50 | 289.60 | 306.60 | 318.40 | 301.10 | 283.60 | 268.80 | 266.00 | 303.00 | 281.90 | 287.50 | 274.20 | 310.40 | 253.80 | 258.90 | 277.90 | 348.30 | 322.90 | 555.00 | 519.50 | 464.70 | 478.20 | 457.20 | 348.90 | 312.10 | 253.70 | 215.40 | 234.10 | 210.50 | 236.80 | 289.00 | 275.00 | 286.00 | 298.00 | 283.00 | 264.00 | NA | NA | 264.00 | |
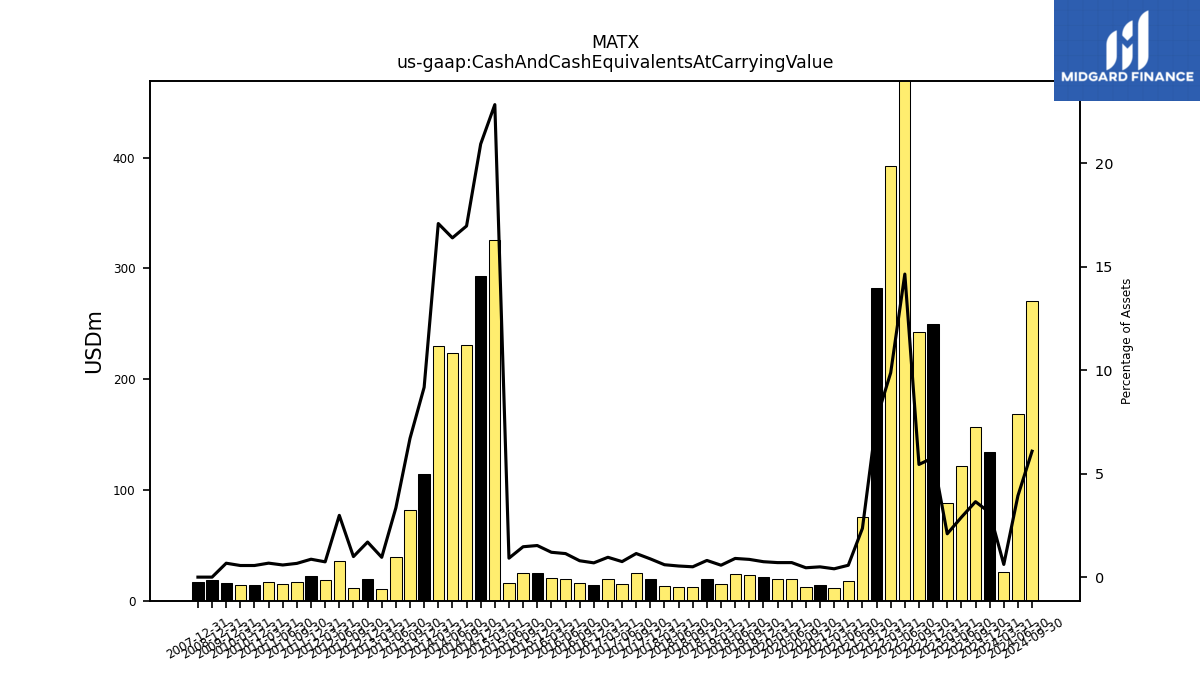
| Cash And Cash Equivalents At Carrying Value | 25.90 | 134.00 | 156.50 | 122.00 | 88.50 | 249.80 | 242.80 | 609.00 | 392.80 | 282.40 | 75.90 | 17.40 | 11.80 | 14.40 | 12.70 | 19.50 | 19.90 | 21.20 | 23.60 | 24.00 | 15.40 | 19.60 | 12.10 | 12.80 | 13.70 | 19.80 | 24.70 | 15.30 | 19.50 | 13.90 | 16.40 | 19.20 | 20.10 | 25.50 | 25.50 | 15.80 | 325.80 | 293.40 | 230.90 | 223.70 | 229.70 | 114.50 | 81.80 | 39.10 | 11.00 | 19.90 | 11.50 | 35.50 | 19.00 | 22.00 | 17.00 | 15.00 | 17.00 | 14.00 | NA | NA | 14.00 | |
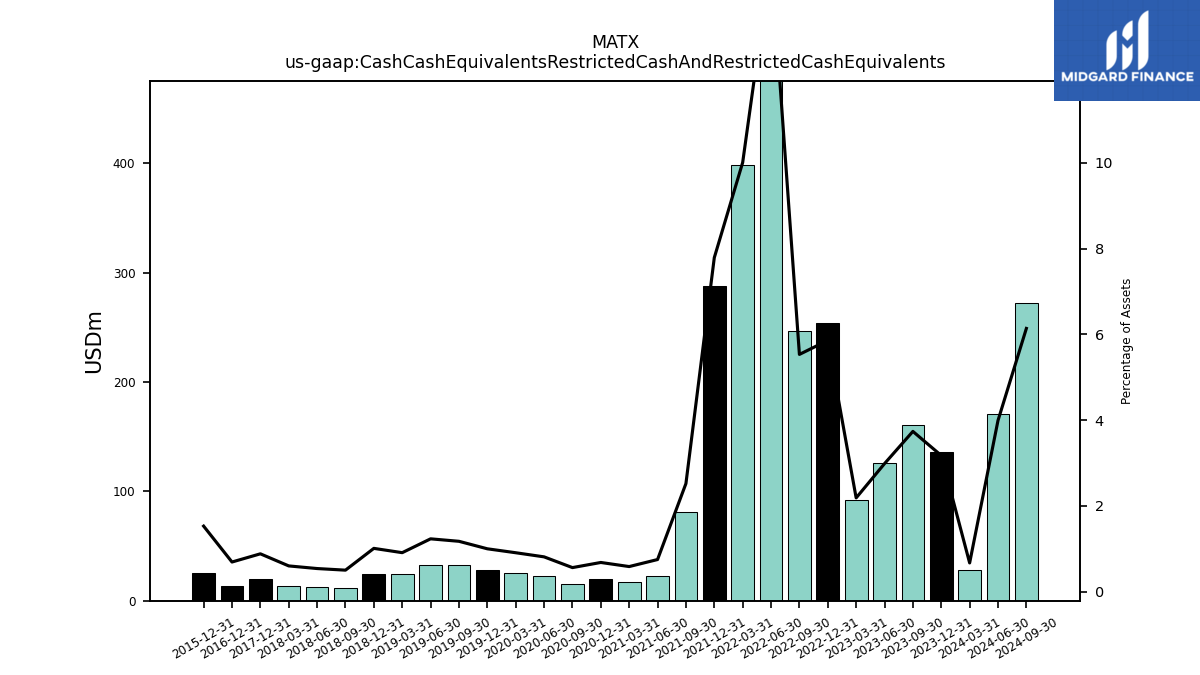
| Cash Cash Equivalents Restricted Cash And Restricted Cash Equivalents | 28.20 | 136.30 | 160.40 | 125.90 | 92.40 | 253.70 | 246.70 | 614.30 | 398.10 | 287.70 | 81.20 | 22.70 | 17.10 | 19.70 | 15.70 | 22.50 | 25.70 | 28.40 | 32.30 | 32.70 | 24.30 | 24.50 | 12.10 | 12.80 | 13.70 | 19.80 | NA | NA | NA | 13.90 | NA | NA | NA | 25.50 | NA | NA | NA | NA | NA | NA | NA | NA | NA | NA | NA | NA | NA | NA | NA | NA | NA | NA | NA | NA | NA | NA | NA | |
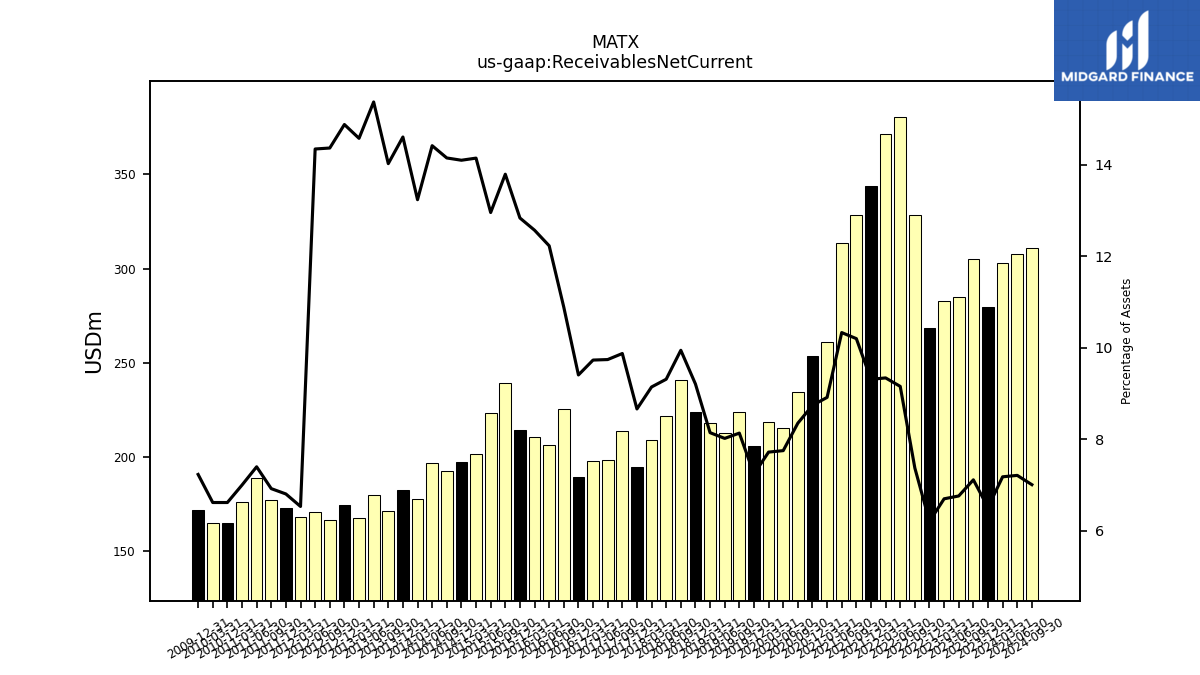
| Receivables Net Current | 302.80 | 279.40 | 305.20 | 285.00 | 283.00 | 268.50 | 328.50 | 380.60 | 371.40 | 343.70 | 328.60 | 313.60 | 261.10 | 253.40 | 234.30 | 215.20 | 218.80 | 205.90 | 223.90 | 213.00 | 217.90 | 223.70 | 240.70 | 221.70 | 209.10 | 194.60 | 213.90 | 198.60 | 197.90 | 189.50 | 225.60 | 206.40 | 210.40 | 214.30 | 239.50 | 223.60 | 201.80 | 197.60 | 192.50 | 196.70 | 177.90 | 182.30 | 171.10 | 179.60 | 167.50 | 174.70 | 166.40 | 170.60 | 168.00 | 173.00 | 177.00 | 189.00 | 176.00 | 165.00 | NA | NA | 165.00 | |
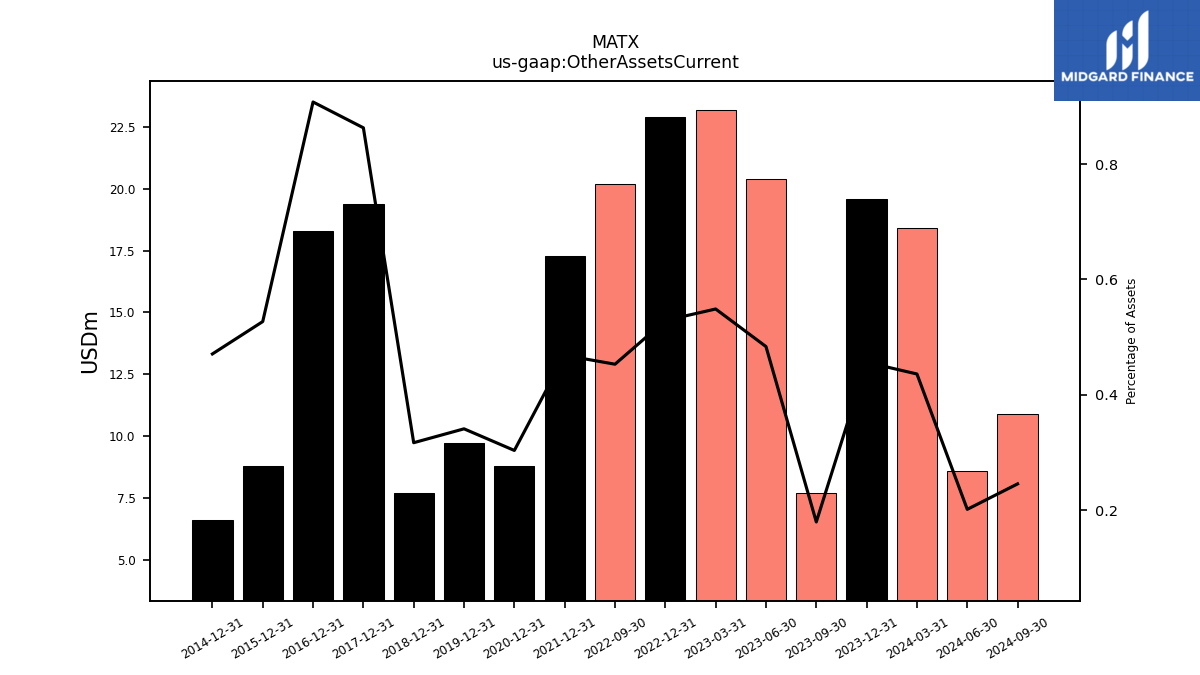
| Other Assets Current | 18.40 | 19.60 | 7.70 | 20.40 | 23.20 | 22.90 | 20.20 | NA | NA | 17.30 | NA | NA | NA | 8.80 | NA | NA | NA | 9.70 | NA | NA | NA | 7.70 | NA | NA | NA | 19.40 | NA | NA | NA | 18.30 | NA | NA | NA | 8.80 | NA | NA | NA | 6.60 | NA | NA | NA | NA | NA | NA | NA | NA | NA | NA | NA | NA | NA | NA | NA | NA | NA | NA | NA | |
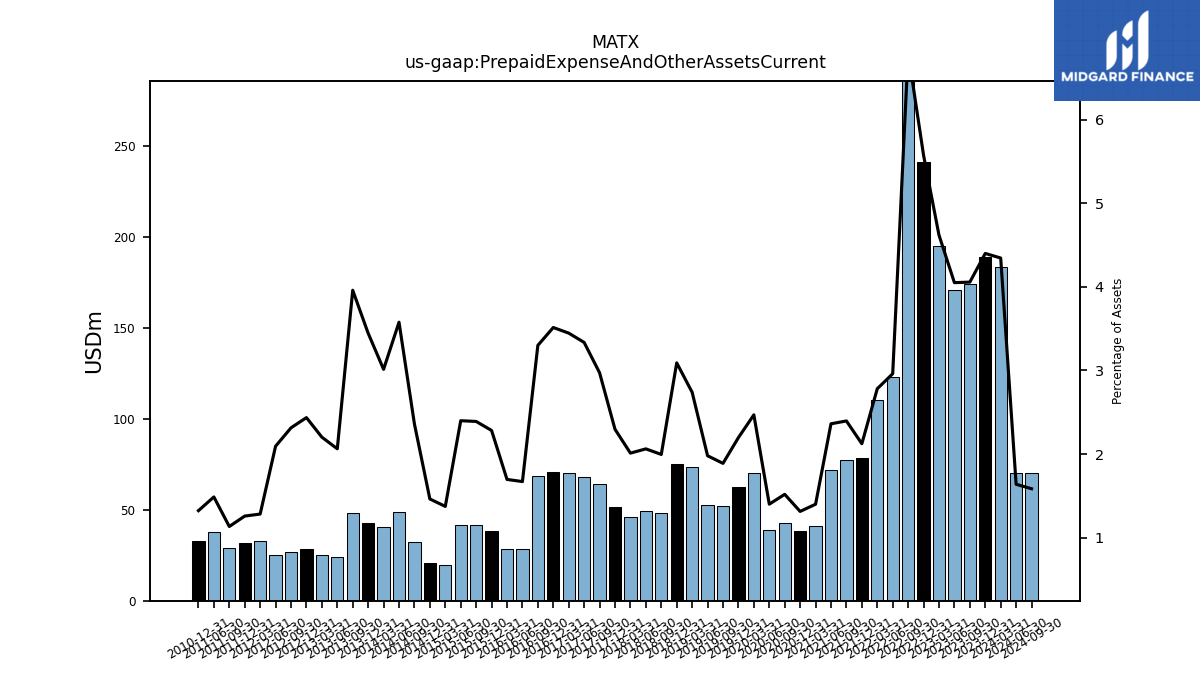
| Prepaid Expense And Other Assets Current | 183.30 | 188.90 | 174.10 | 170.80 | 195.20 | 241.30 | 303.20 | 123.10 | 110.60 | 78.40 | 77.20 | 71.70 | 41.00 | 38.10 | 42.60 | 38.90 | 70.00 | 62.50 | 52.00 | 52.60 | 73.30 | 75.10 | 48.30 | 49.10 | 46.00 | 51.60 | 64.40 | 68.00 | 70.10 | 70.80 | 68.40 | 28.20 | 28.40 | 38.10 | 41.50 | 41.40 | 19.60 | 20.50 | 32.10 | 48.80 | 40.50 | 43.00 | 48.30 | 24.10 | 25.30 | 28.60 | 26.80 | 24.90 | 33.00 | 32.00 | 29.00 | 38.00 | NA | 33.00 | NA | NA | NA |
| 2024-03-31 | 2023-12-31 | 2023-09-30 | 2023-06-30 | 2023-03-31 | 2022-12-31 | 2022-09-30 | 2022-06-30 | 2022-03-31 | 2021-12-31 | 2021-09-30 | 2021-06-30 | 2021-03-31 | 2020-12-31 | 2020-09-30 | 2020-06-30 | 2020-03-31 | 2019-12-31 | 2019-09-30 | 2019-06-30 | 2019-03-31 | 2018-12-31 | 2018-09-30 | 2018-06-30 | 2018-03-31 | 2017-12-31 | 2017-09-30 | 2017-06-30 | 2017-03-31 | 2016-12-31 | 2016-09-30 | 2016-06-30 | 2016-03-31 | 2015-12-31 | 2015-09-30 | 2015-06-30 | 2015-03-31 | 2014-12-31 | 2014-09-30 | 2014-06-30 | 2014-03-31 | 2013-12-31 | 2013-09-30 | 2013-06-30 | 2013-03-31 | 2012-12-31 | 2012-09-30 | 2012-06-30 | 2012-03-31 | 2011-12-31 | 2011-09-30 | 2011-06-30 | 2011-03-31 | 2010-12-31 | 2010-09-30 | 2010-06-30 | 2010-03-31 | ||
|---|---|---|---|---|---|---|---|---|---|---|---|---|---|---|---|---|---|---|---|---|---|---|---|---|---|---|---|---|---|---|---|---|---|---|---|---|---|---|---|---|---|---|---|---|---|---|---|---|---|---|---|---|---|---|---|---|---|---|
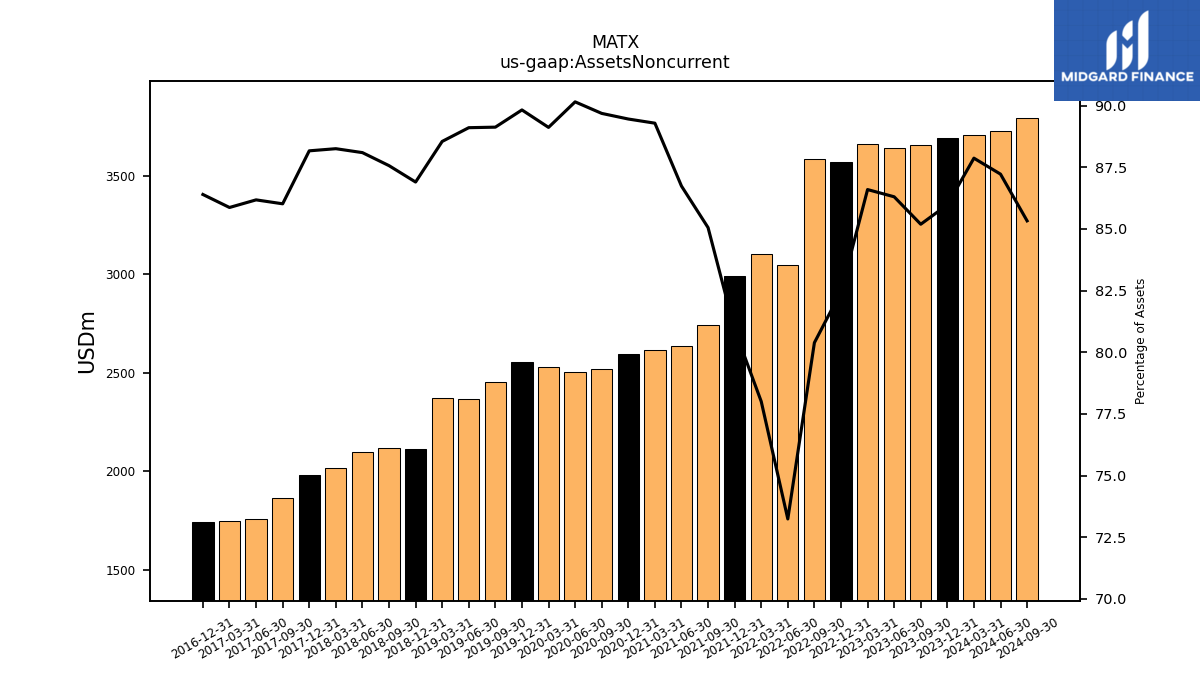
| Assets Noncurrent | 3707.90 | 3692.30 | 3657.00 | 3640.30 | 3660.60 | 3570.40 | 3584.50 | 3045.90 | 3102.70 | 2988.60 | 2741.10 | 2633.50 | 2615.80 | 2594.70 | 2517.10 | 2504.00 | 2527.20 | 2555.80 | 2454.30 | 2367.90 | 2370.20 | 2112.00 | 2120.10 | 2098.00 | 2019.10 | 1981.50 | 1864.00 | 1757.40 | 1746.90 | 1741.30 | NA | NA | NA | NA | NA | NA | NA | NA | NA | NA | NA | NA | NA | NA | NA | NA | NA | NA | NA | NA | NA | NA | NA | NA | NA | NA | NA | |
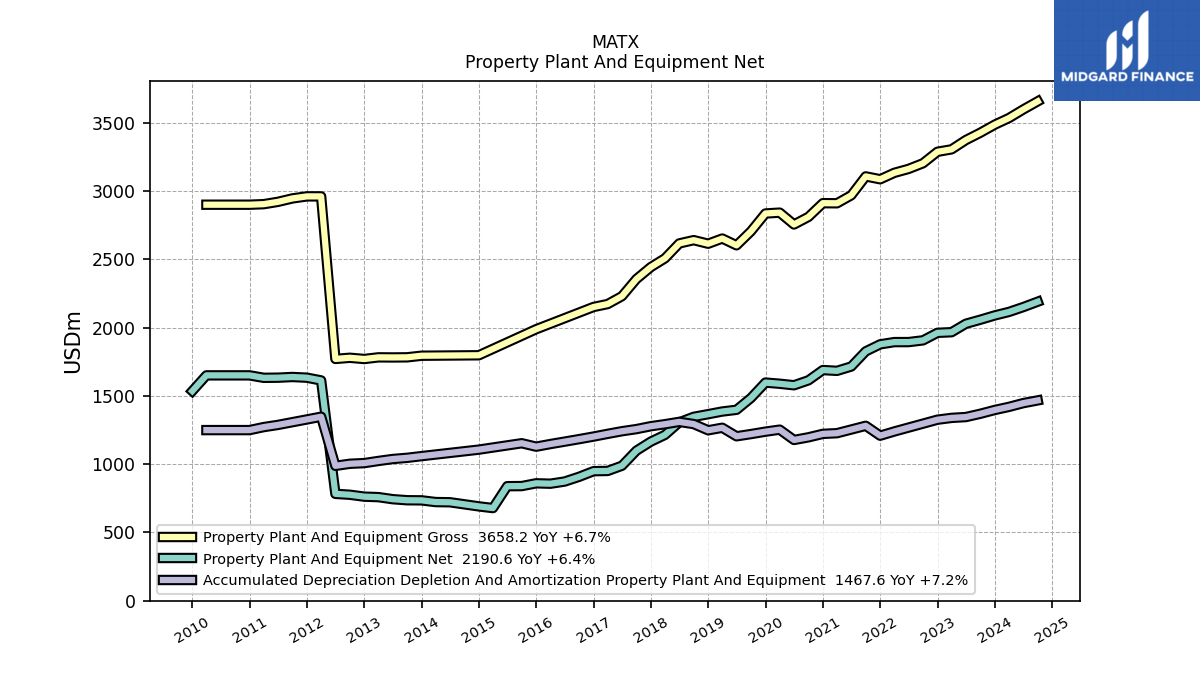
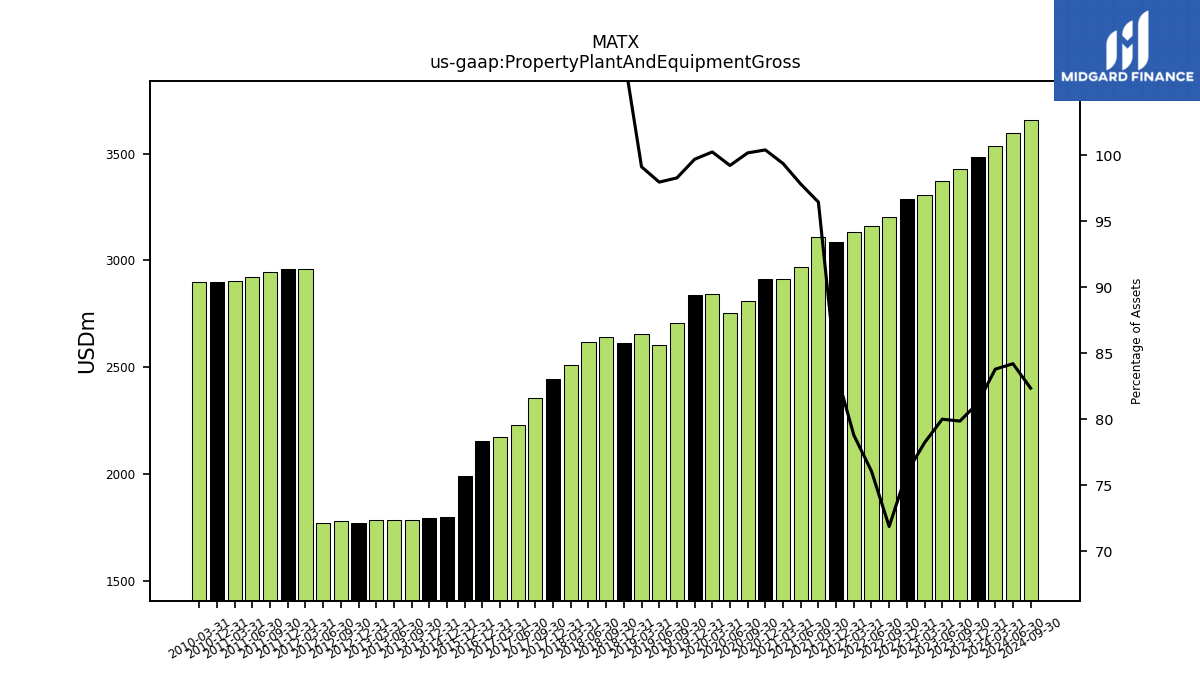
| Property Plant And Equipment Gross | 3535.90 | 3487.20 | 3428.10 | 3374.60 | 3306.50 | 3288.70 | 3204.70 | 3163.20 | 3134.40 | 3087.40 | 3108.40 | 2970.00 | 2911.40 | 2912.30 | 2811.70 | 2756.10 | 2843.00 | 2836.70 | 2706.50 | 2603.40 | 2653.40 | 2615.20 | 2641.40 | 2617.40 | 2508.30 | 2444.20 | 2356.50 | 2230.80 | 2173.40 | 2151.90 | NA | NA | NA | 1988.90 | NA | NA | NA | 1798.20 | NA | NA | NA | 1794.80 | 1783.10 | 1782.20 | 1782.90 | 1770.80 | 1779.80 | 1771.30 | 2962.00 | 2962.00 | 2947.00 | 2922.00 | 2905.00 | 2901.00 | NA | NA | 2901.00 | |
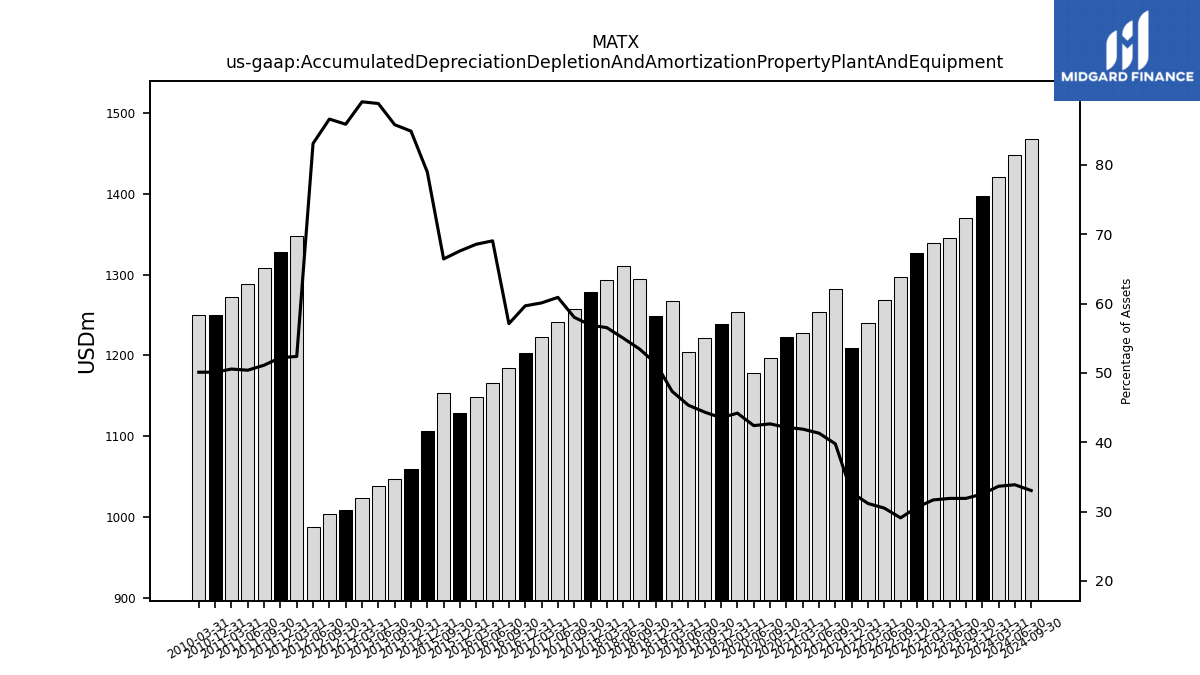
| Accumulated Depreciation Depletion And Amortization Property Plant And Equipment | 1420.20 | 1397.30 | 1369.60 | 1345.60 | 1339.40 | 1326.20 | 1297.30 | 1268.50 | 1239.80 | 1209.10 | 1281.60 | 1254.20 | 1227.40 | 1222.40 | 1197.10 | 1177.70 | 1253.40 | 1238.60 | 1221.00 | 1204.70 | 1267.20 | 1248.60 | 1294.20 | 1310.30 | 1293.30 | 1278.50 | 1257.30 | 1241.80 | 1222.60 | 1202.70 | 1183.80 | 1165.60 | 1147.90 | 1128.60 | 1153.80 | NA | NA | 1107.00 | NA | NA | NA | 1059.40 | 1046.90 | 1038.20 | 1023.90 | 1008.30 | 1003.30 | 988.30 | 1348.00 | 1328.00 | 1308.00 | 1288.00 | 1272.00 | 1250.00 | NA | NA | 1250.00 | |
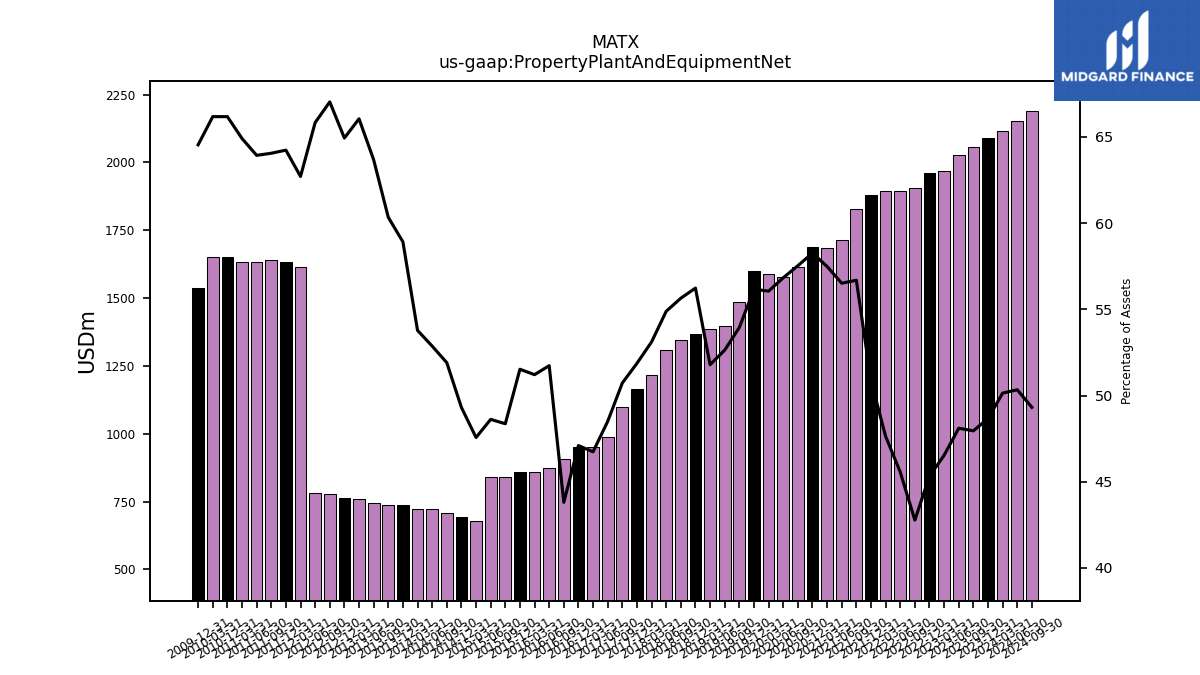
| Property Plant And Equipment Net | 2115.70 | 2089.90 | 2058.50 | 2029.00 | 1967.10 | 1962.50 | 1907.40 | 1894.70 | 1894.60 | 1878.30 | 1826.80 | 1715.80 | 1684.00 | 1689.90 | 1614.60 | 1578.40 | 1589.60 | 1598.10 | 1485.50 | 1398.70 | 1386.20 | 1366.60 | 1347.20 | 1307.10 | 1215.00 | 1165.70 | 1099.20 | 989.00 | 950.80 | 949.20 | 908.10 | 873.30 | 857.40 | 860.30 | 839.90 | 839.20 | 678.70 | 691.20 | 706.30 | 721.40 | 722.90 | 735.40 | 736.20 | 744.00 | 759.00 | 762.50 | 776.50 | 783.00 | 1614.00 | 1634.00 | 1639.00 | 1634.00 | 1633.00 | 1651.00 | NA | NA | 1651.00 | |
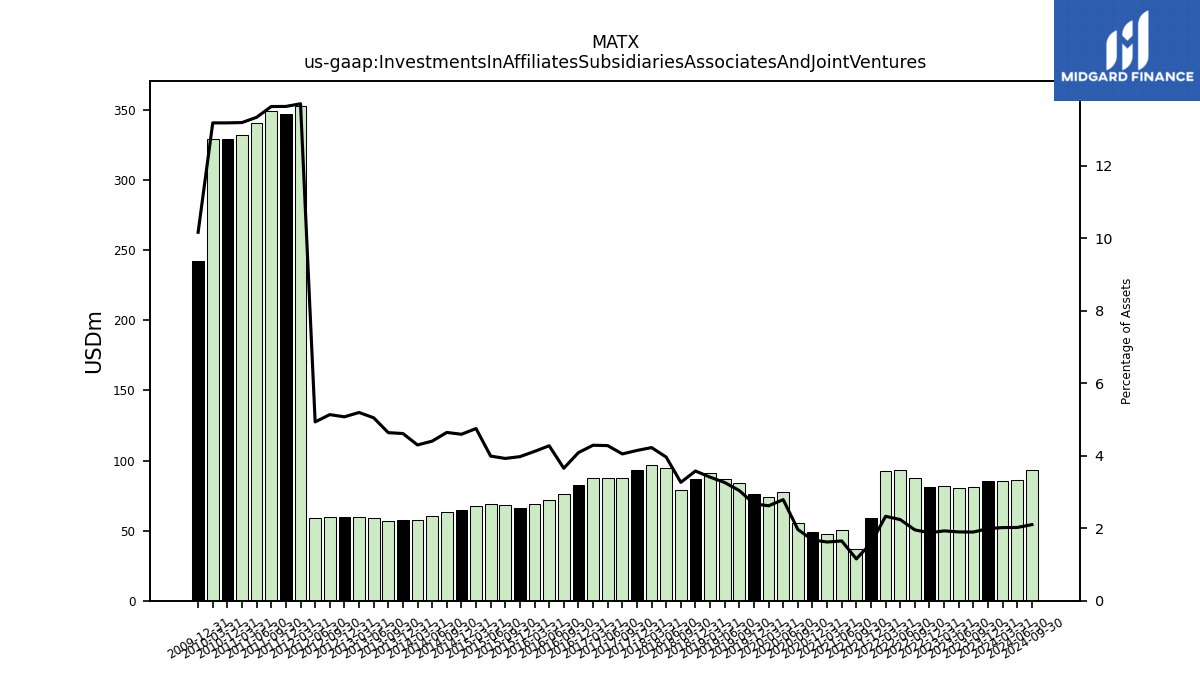
| Investments In Affiliates Subsidiaries Associates And Joint Ventures | 85.20 | 85.50 | 81.40 | 80.10 | 81.50 | 81.20 | 87.20 | 93.10 | 92.70 | 58.70 | 37.20 | 50.10 | 47.50 | 48.70 | 55.20 | 77.50 | 74.30 | 76.20 | 83.70 | 86.70 | 91.30 | 87.00 | 79.10 | 94.40 | 96.70 | 93.20 | 87.80 | 87.30 | 87.30 | 82.40 | 75.80 | 72.20 | 69.00 | 66.40 | 68.20 | 68.90 | 67.80 | 64.40 | 63.20 | 60.10 | 57.80 | 57.60 | 56.60 | 59.00 | 59.70 | 59.60 | 59.50 | 58.70 | 353.00 | 347.00 | 349.00 | 341.00 | 332.00 | 329.00 | NA | NA | 329.00 | |
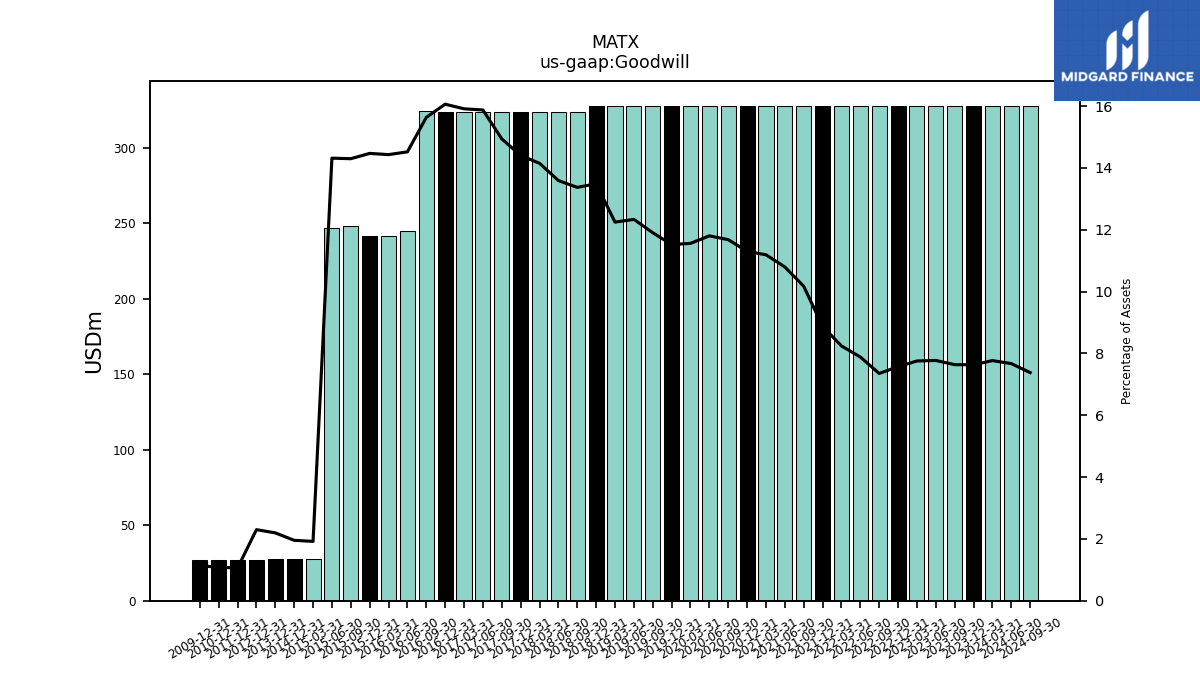
| Goodwill | 327.80 | 327.80 | 327.80 | 327.80 | 327.80 | 327.80 | 327.80 | 327.80 | 327.80 | 327.80 | 327.80 | 327.80 | 327.80 | 327.80 | 327.80 | 327.80 | 327.80 | 327.80 | 327.80 | 327.80 | 327.80 | 327.80 | 323.70 | 323.70 | 323.70 | 323.70 | 323.70 | 323.70 | 323.70 | 323.70 | 324.10 | 245.10 | 241.60 | 241.60 | 248.30 | 247.10 | 27.40 | 27.40 | NA | NA | NA | 27.40 | NA | NA | NA | 27.00 | NA | NA | NA | 27.00 | NA | NA | NA | 27.00 | NA | NA | NA | |
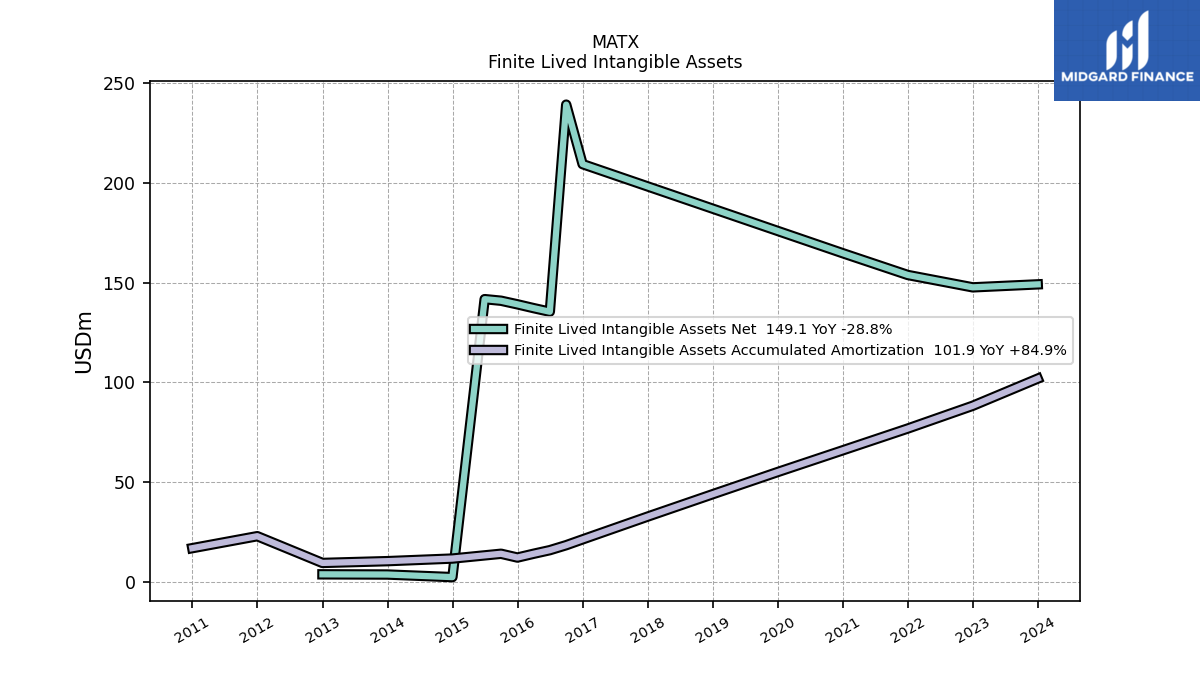
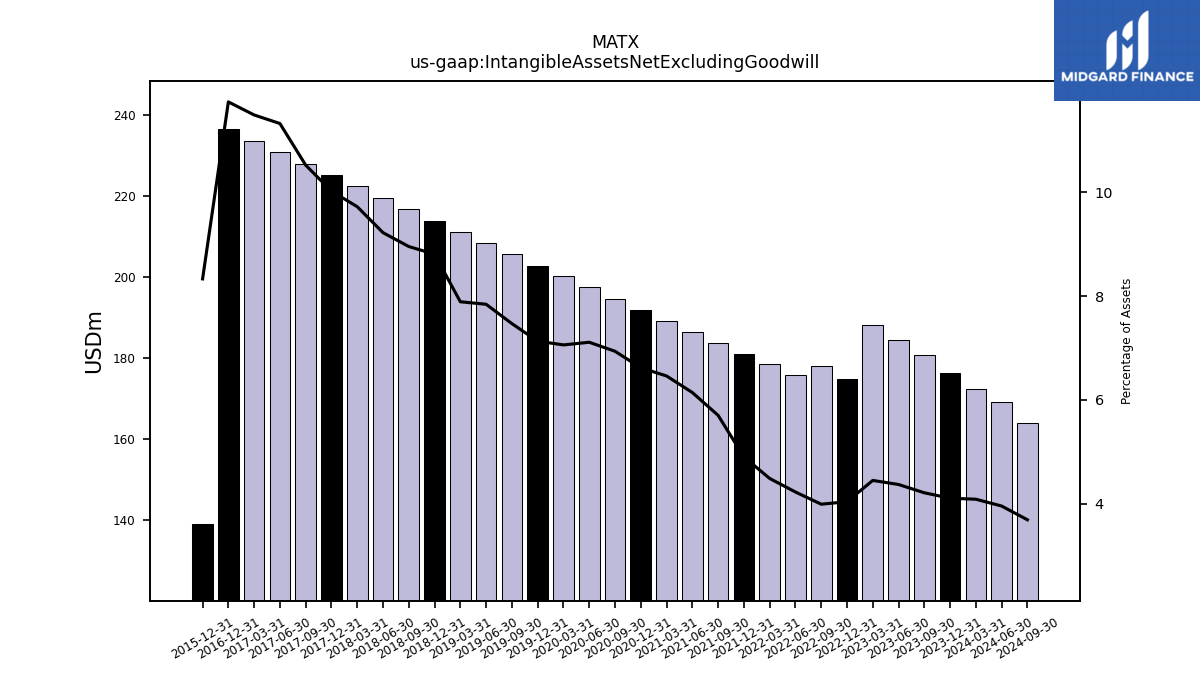
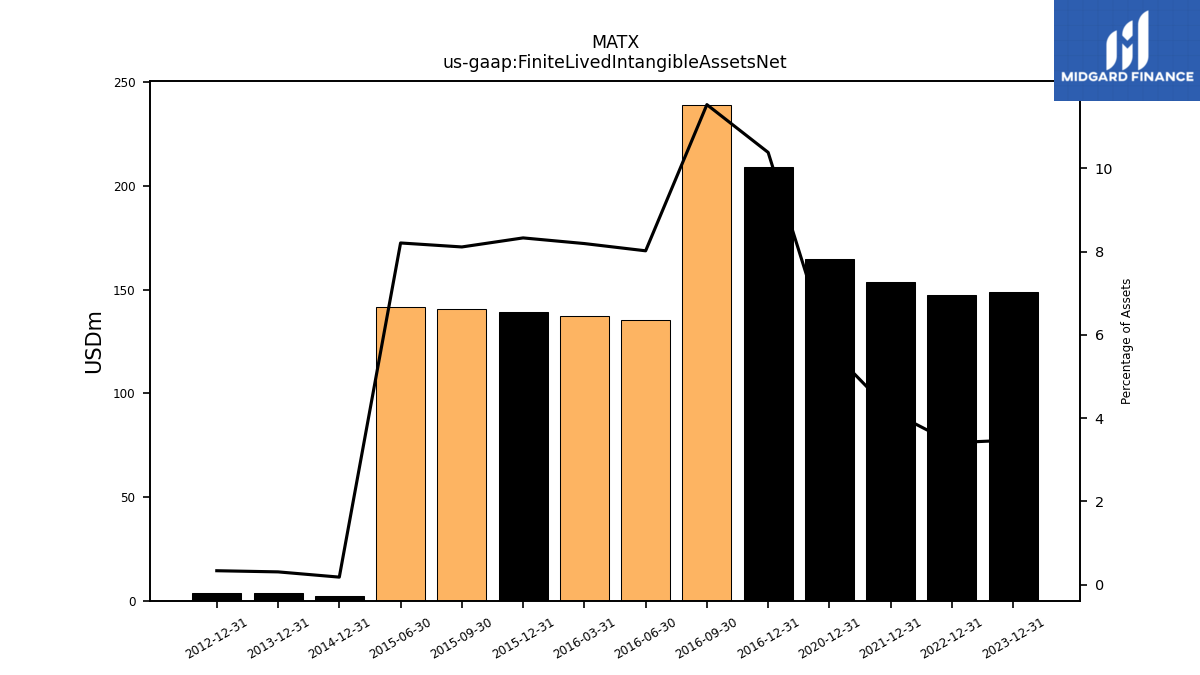
| Intangible Assets Net Excluding Goodwill | 172.50 | 176.40 | 180.80 | 184.40 | 188.10 | 174.90 | 178.00 | 175.80 | 178.50 | 181.10 | 183.80 | 186.50 | 189.30 | 192.00 | 194.70 | 197.50 | 200.20 | 202.90 | 205.70 | 208.40 | 211.20 | 214.00 | 216.80 | 219.60 | 222.40 | 225.20 | 228.00 | 230.90 | 233.70 | 236.60 | NA | NA | NA | 139.10 | NA | NA | NA | NA | NA | NA | NA | NA | NA | NA | NA | NA | NA | NA | NA | NA | NA | NA | NA | NA | NA | NA | NA | |
| Finite Lived Intangible Assets Net | NA | 149.10 | NA | NA | NA | 147.60 | NA | NA | NA | 153.80 | NA | NA | NA | 164.70 | NA | NA | NA | NA | NA | NA | NA | NA | NA | NA | NA | NA | NA | NA | NA | 209.30 | 239.10 | 135.40 | 137.20 | 139.10 | 140.90 | 141.70 | NA | 2.50 | NA | NA | NA | 3.80 | NA | NA | NA | 3.90 | NA | NA | NA | NA | NA | NA | NA | NA | NA | NA | NA | |
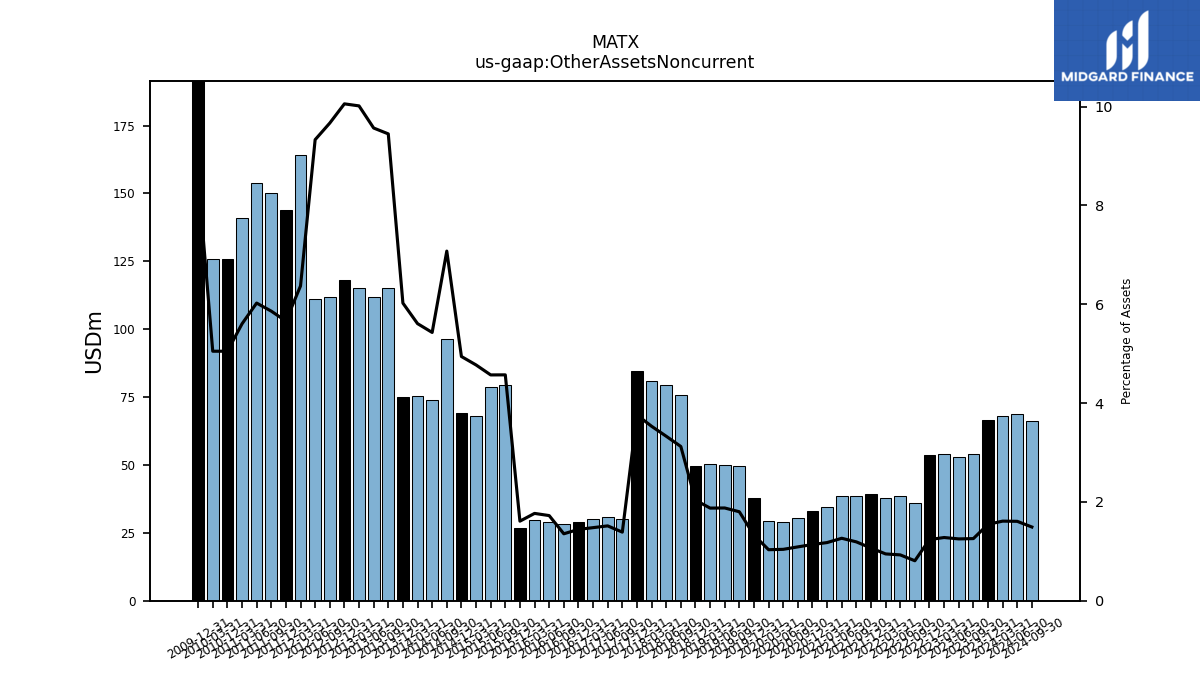
| Other Assets Noncurrent | 68.00 | 66.40 | 54.00 | 52.80 | 54.10 | 53.60 | 36.10 | 38.60 | 37.70 | 39.40 | 38.40 | 38.40 | 34.50 | 33.00 | 30.60 | 28.90 | 29.30 | 37.80 | 49.60 | 49.90 | 50.20 | 49.50 | 75.60 | 79.30 | 80.80 | 84.50 | 30.10 | 30.90 | 30.10 | 29.10 | 28.10 | 29.10 | 29.60 | 26.90 | 79.40 | 78.90 | 68.10 | 69.30 | 96.30 | 74.10 | 75.40 | 75.20 | 115.30 | 111.80 | 115.10 | 118.10 | 112.00 | 111.00 | 164.00 | 144.00 | 150.00 | 154.00 | 141.00 | 126.00 | NA | NA | 126.00 |
| 2024-03-31 | 2023-12-31 | 2023-09-30 | 2023-06-30 | 2023-03-31 | 2022-12-31 | 2022-09-30 | 2022-06-30 | 2022-03-31 | 2021-12-31 | 2021-09-30 | 2021-06-30 | 2021-03-31 | 2020-12-31 | 2020-09-30 | 2020-06-30 | 2020-03-31 | 2019-12-31 | 2019-09-30 | 2019-06-30 | 2019-03-31 | 2018-12-31 | 2018-09-30 | 2018-06-30 | 2018-03-31 | 2017-12-31 | 2017-09-30 | 2017-06-30 | 2017-03-31 | 2016-12-31 | 2016-09-30 | 2016-06-30 | 2016-03-31 | 2015-12-31 | 2015-09-30 | 2015-06-30 | 2015-03-31 | 2014-12-31 | 2014-09-30 | 2014-06-30 | 2014-03-31 | 2013-12-31 | 2013-09-30 | 2013-06-30 | 2013-03-31 | 2012-12-31 | 2012-09-30 | 2012-06-30 | 2012-03-31 | 2011-12-31 | 2011-09-30 | 2011-06-30 | 2011-03-31 | 2010-12-31 | 2010-09-30 | 2010-06-30 | 2010-03-31 | ||
|---|---|---|---|---|---|---|---|---|---|---|---|---|---|---|---|---|---|---|---|---|---|---|---|---|---|---|---|---|---|---|---|---|---|---|---|---|---|---|---|---|---|---|---|---|---|---|---|---|---|---|---|---|---|---|---|---|---|---|
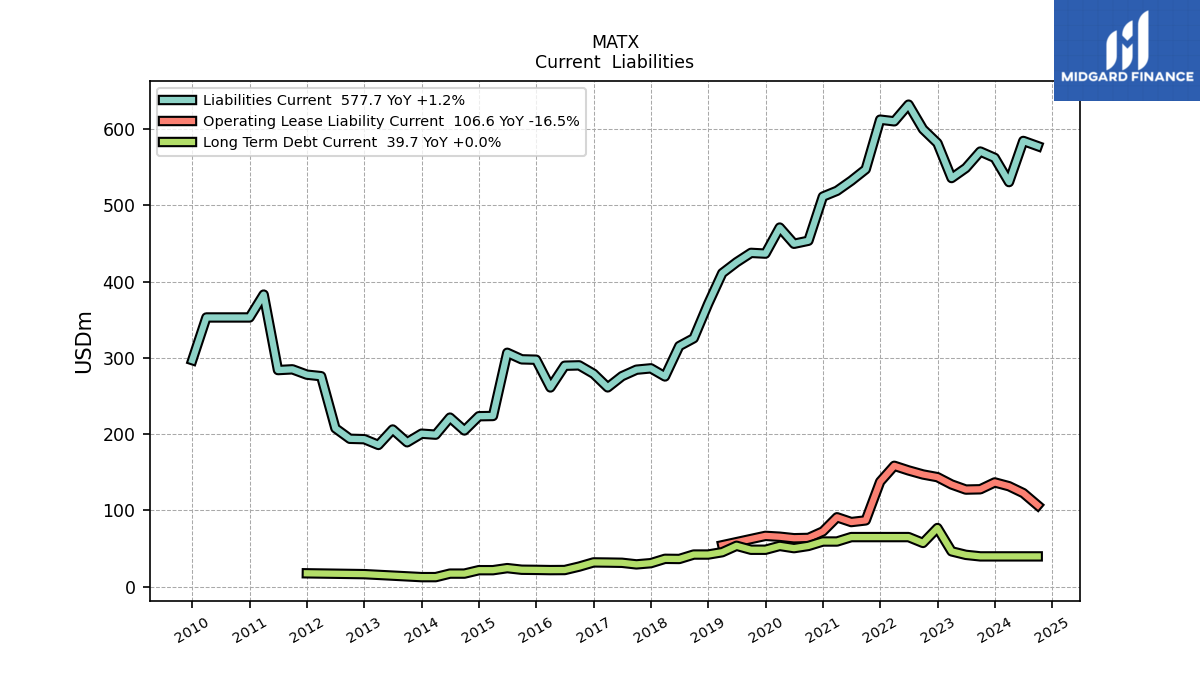
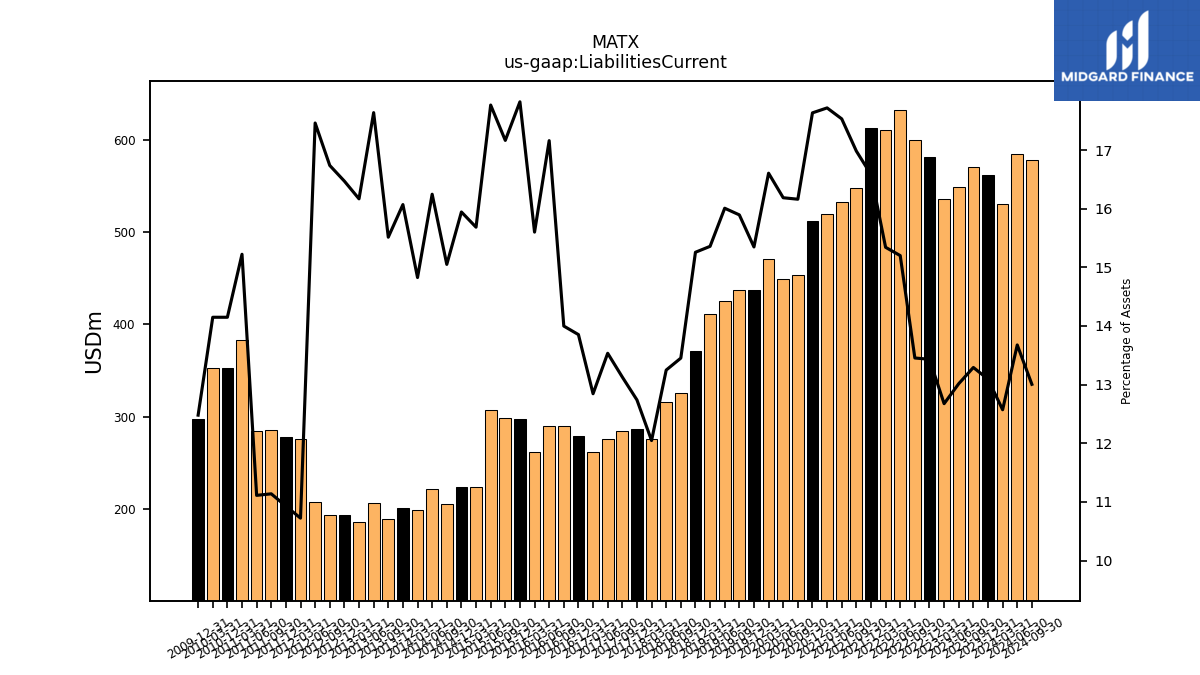
| Liabilities Current | 530.50 | 562.30 | 570.60 | 549.00 | 535.80 | 581.60 | 599.90 | 632.10 | 610.20 | 612.40 | 547.30 | 532.30 | 519.10 | 511.50 | 453.60 | 449.60 | 470.90 | 436.70 | 437.70 | 425.40 | 411.10 | 370.80 | 325.70 | 315.50 | 275.60 | 286.30 | 284.50 | 276.00 | 261.30 | 279.20 | 290.20 | 289.70 | 261.20 | 297.60 | 298.10 | 306.70 | 223.80 | 223.50 | 204.80 | 221.70 | 199.30 | 200.60 | 189.30 | 206.10 | 185.80 | 193.40 | 193.90 | 207.70 | 276.00 | 278.00 | 285.00 | 284.00 | 383.00 | 353.00 | NA | NA | 353.00 | |
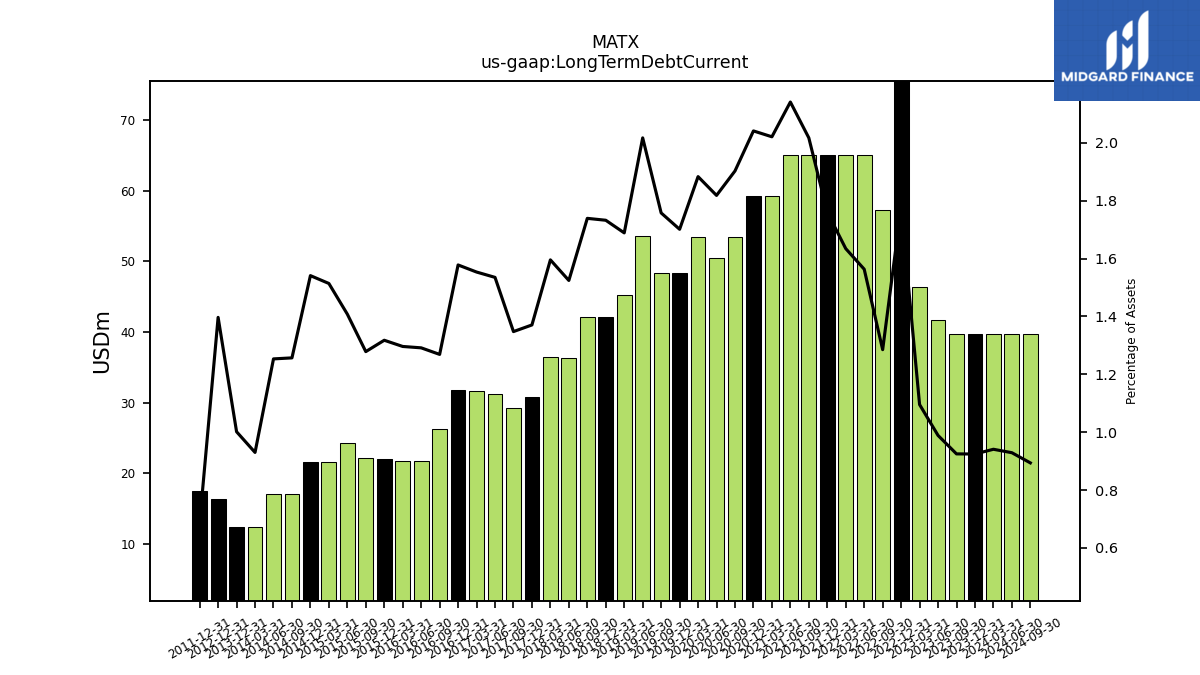
| Long Term Debt Current | 39.70 | 39.70 | 39.70 | 41.70 | 46.30 | 76.90 | 57.30 | 65.00 | 65.00 | 65.00 | 65.00 | 65.00 | 59.20 | 59.20 | 53.40 | 50.50 | 53.40 | 48.40 | 48.40 | 53.60 | 45.20 | 42.10 | 42.10 | 36.30 | 36.50 | 30.80 | 29.20 | 31.30 | 31.60 | 31.80 | 26.30 | 21.80 | 21.70 | 22.00 | 22.20 | 24.30 | 21.60 | 21.60 | 17.10 | 17.10 | 12.50 | 12.50 | NA | NA | NA | 16.40 | NA | NA | NA | 17.50 | NA | NA | NA | NA | NA | NA | NA | |
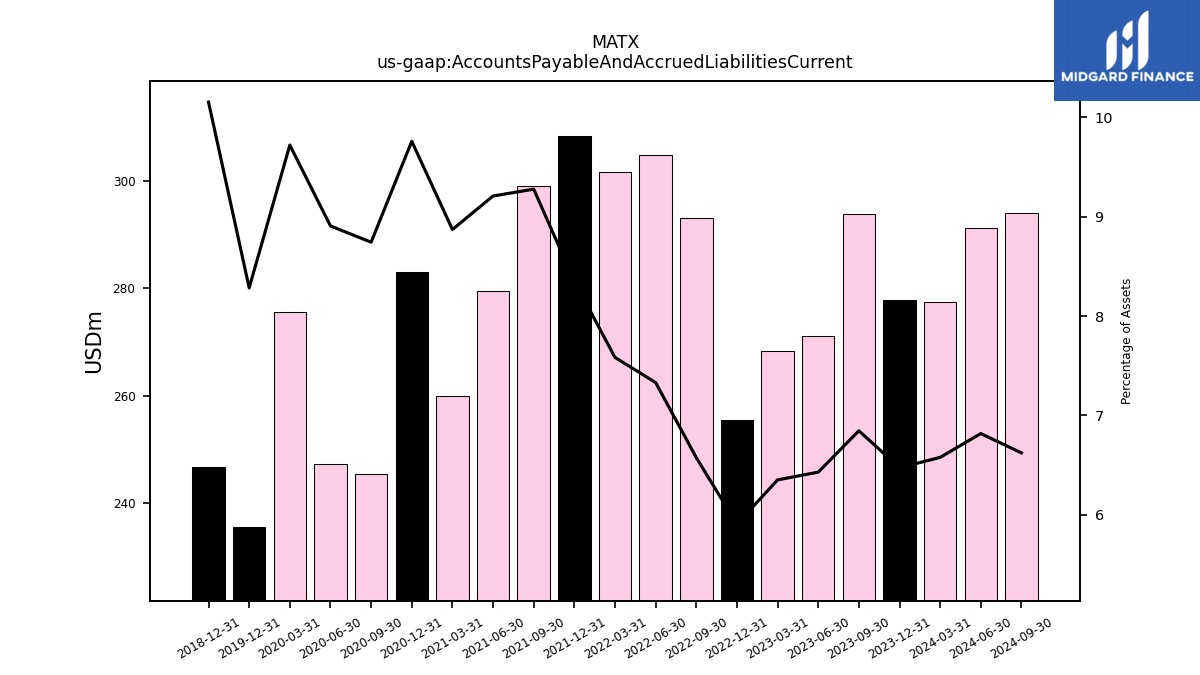
| Accounts Payable And Accrued Liabilities Current | 277.50 | 277.90 | 293.80 | 271.10 | 268.40 | 255.60 | 293.10 | 304.80 | 301.60 | 308.40 | 299.00 | 279.60 | 259.90 | 283.10 | 245.40 | 247.40 | 275.70 | 235.70 | NA | NA | NA | 246.80 | NA | NA | NA | NA | NA | NA | NA | NA | NA | NA | NA | NA | NA | NA | NA | NA | NA | NA | NA | NA | NA | NA | NA | NA | NA | NA | NA | NA | NA | NA | NA | NA | NA | NA | NA | |
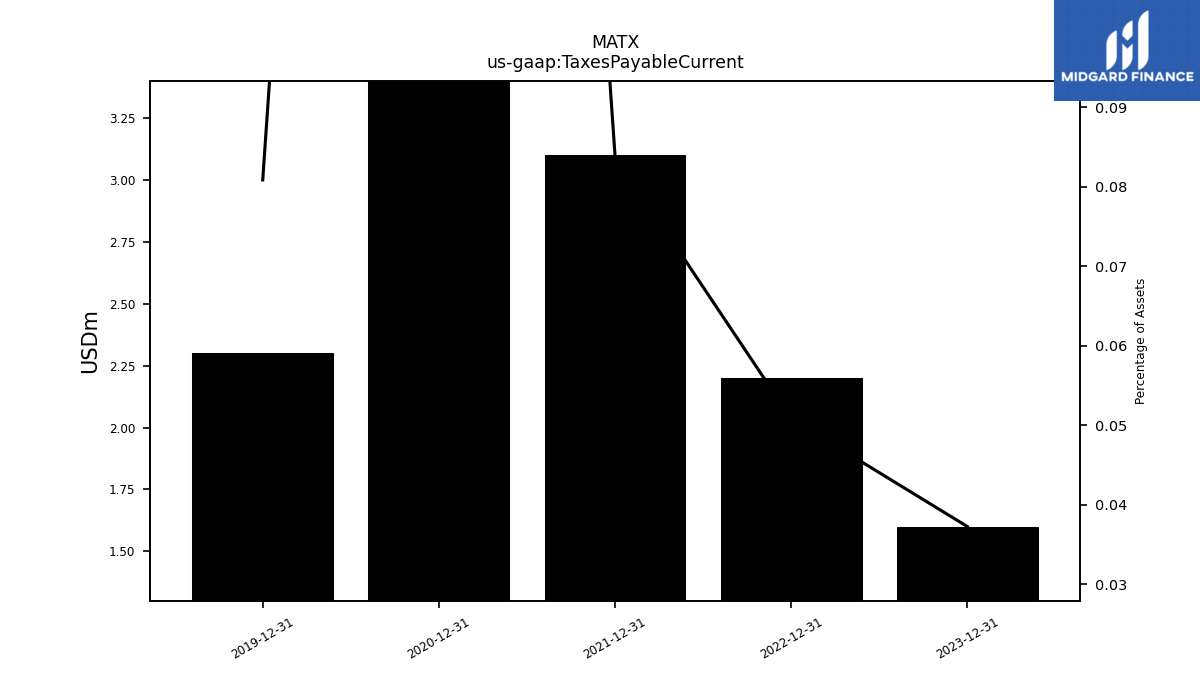
| Taxes Payable Current | NA | 1.60 | NA | NA | NA | 2.20 | NA | NA | NA | 3.10 | NA | NA | NA | 11.70 | NA | NA | NA | 2.30 | NA | NA | NA | NA | NA | NA | NA | NA | NA | NA | NA | NA | NA | NA | NA | NA | NA | NA | NA | NA | NA | NA | NA | NA | NA | NA | NA | NA | NA | NA | NA | NA | NA | NA | NA | NA | NA | NA | NA | |
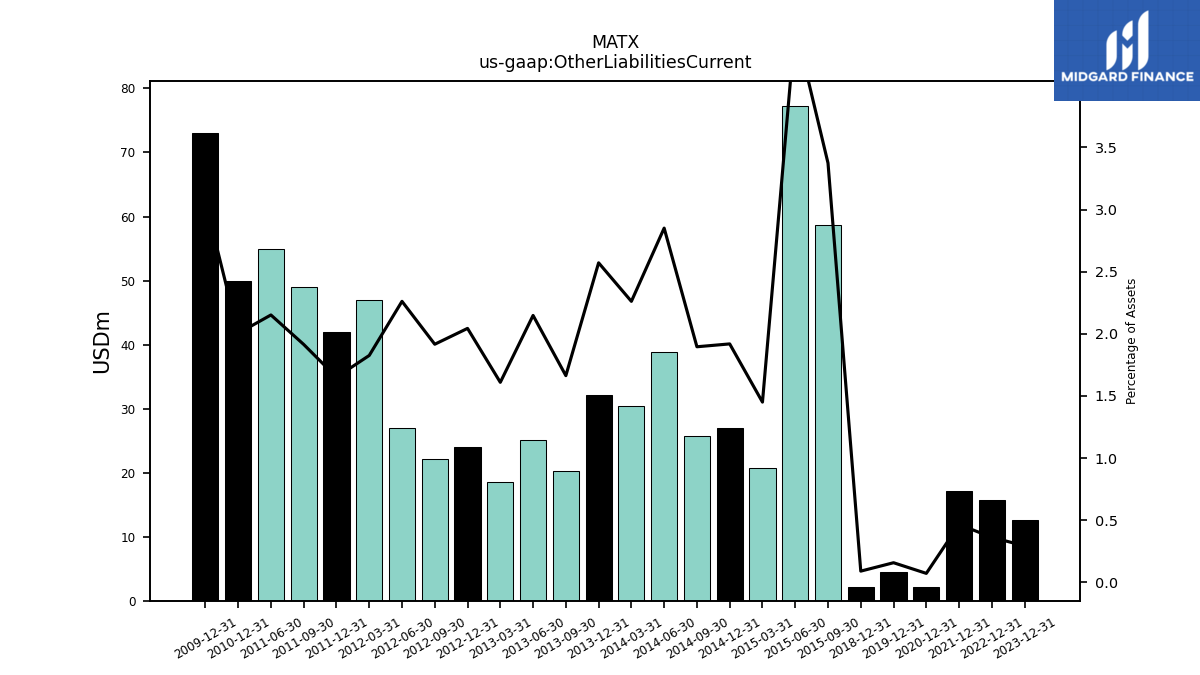
| Other Liabilities Current | NA | 12.60 | NA | NA | NA | 15.70 | NA | NA | NA | 17.20 | NA | NA | NA | 2.10 | NA | NA | NA | 4.50 | NA | NA | NA | 2.20 | NA | NA | NA | NA | NA | NA | NA | NA | NA | NA | NA | NA | 58.60 | 77.30 | 20.70 | 26.90 | 25.80 | 38.90 | 30.40 | 32.10 | 20.30 | 25.10 | 18.50 | 24.00 | 22.20 | 26.90 | 47.00 | 42.00 | 49.00 | 55.00 | NA | 50.00 | NA | NA | NA |
| 2024-03-31 | 2023-12-31 | 2023-09-30 | 2023-06-30 | 2023-03-31 | 2022-12-31 | 2022-09-30 | 2022-06-30 | 2022-03-31 | 2021-12-31 | 2021-09-30 | 2021-06-30 | 2021-03-31 | 2020-12-31 | 2020-09-30 | 2020-06-30 | 2020-03-31 | 2019-12-31 | 2019-09-30 | 2019-06-30 | 2019-03-31 | 2018-12-31 | 2018-09-30 | 2018-06-30 | 2018-03-31 | 2017-12-31 | 2017-09-30 | 2017-06-30 | 2017-03-31 | 2016-12-31 | 2016-09-30 | 2016-06-30 | 2016-03-31 | 2015-12-31 | 2015-09-30 | 2015-06-30 | 2015-03-31 | 2014-12-31 | 2014-09-30 | 2014-06-30 | 2014-03-31 | 2013-12-31 | 2013-09-30 | 2013-06-30 | 2013-03-31 | 2012-12-31 | 2012-09-30 | 2012-06-30 | 2012-03-31 | 2011-12-31 | 2011-09-30 | 2011-06-30 | 2011-03-31 | 2010-12-31 | 2010-09-30 | 2010-06-30 | 2010-03-31 | ||
|---|---|---|---|---|---|---|---|---|---|---|---|---|---|---|---|---|---|---|---|---|---|---|---|---|---|---|---|---|---|---|---|---|---|---|---|---|---|---|---|---|---|---|---|---|---|---|---|---|---|---|---|---|---|---|---|---|---|---|
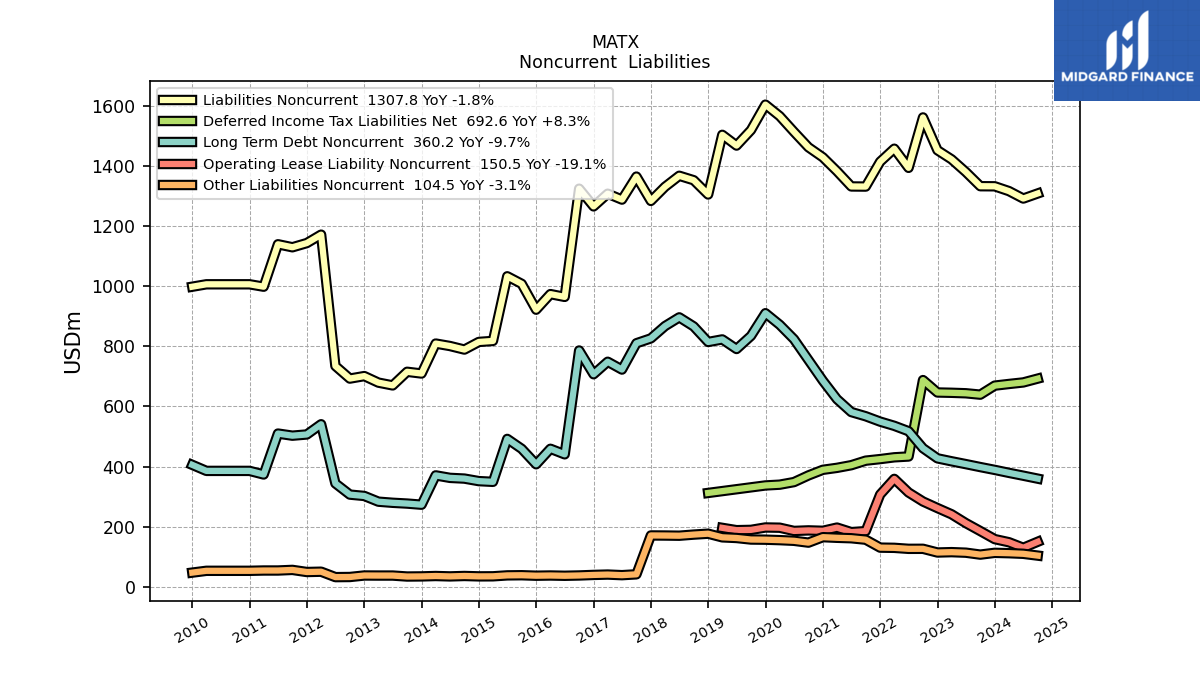
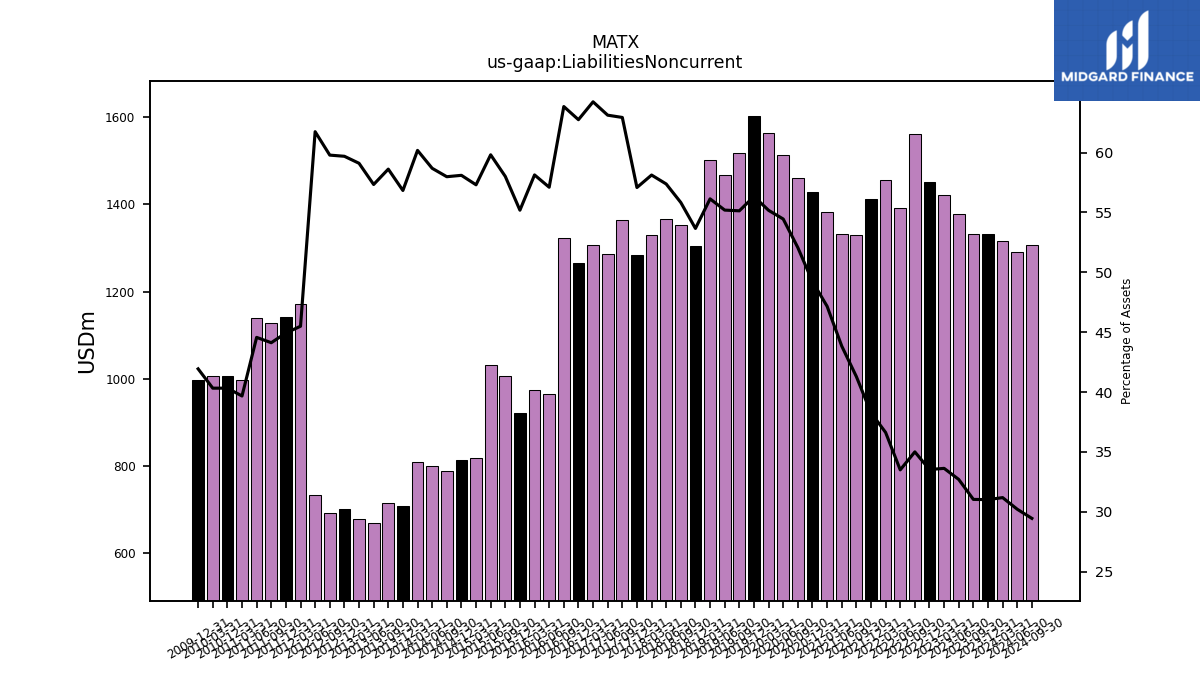
| Liabilities Noncurrent | 1315.60 | 1331.60 | 1331.90 | 1379.10 | 1421.20 | 1451.50 | 1560.50 | 1392.90 | 1456.60 | 1413.30 | 1330.70 | 1331.10 | 1381.70 | 1427.90 | 1461.30 | 1512.50 | 1564.80 | 1603.00 | 1518.40 | 1466.90 | 1502.70 | 1304.30 | 1351.80 | 1366.60 | 1329.90 | 1283.00 | 1363.90 | 1287.40 | 1307.00 | 1264.80 | 1323.70 | 964.10 | 973.40 | 921.60 | 1007.50 | 1032.60 | 817.80 | 814.50 | 789.10 | 800.90 | 809.10 | 709.50 | 715.30 | 670.00 | 679.30 | 701.00 | 692.70 | 734.50 | 1171.00 | 1143.00 | 1129.00 | 1139.00 | 998.00 | 1006.00 | NA | NA | 1006.00 | |
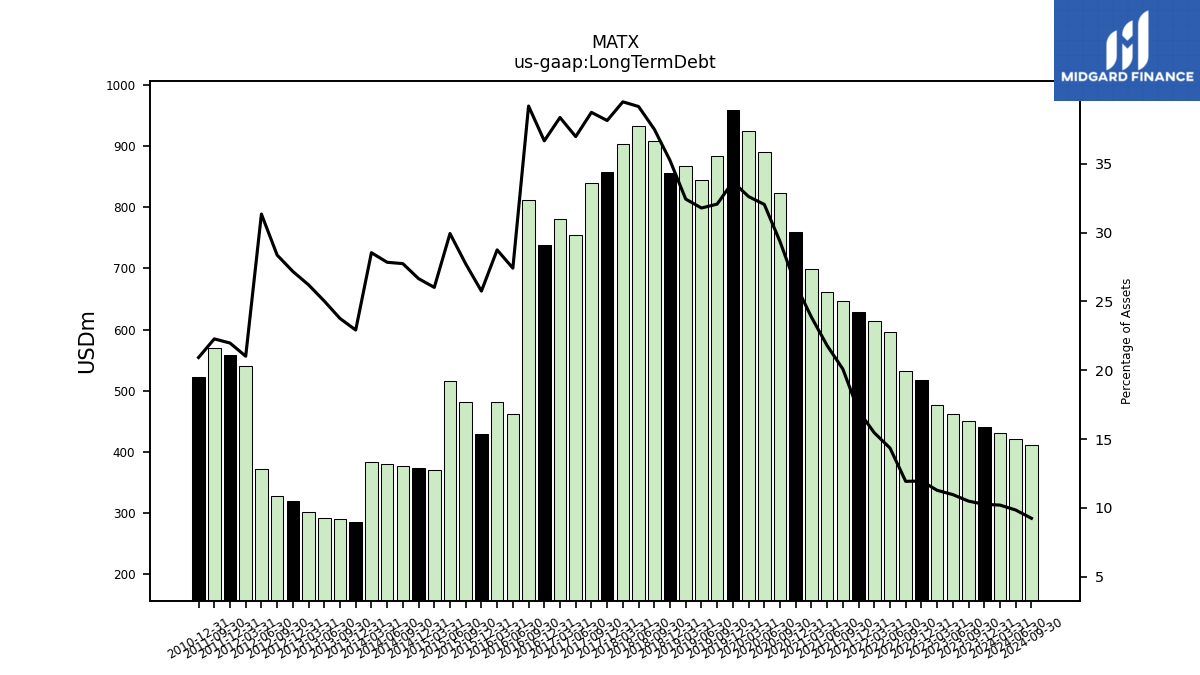
| Long Term Debt | 430.50 | 440.60 | 450.30 | 462.40 | 476.70 | 517.50 | 531.80 | 596.60 | 614.70 | 629.00 | 647.20 | 661.50 | 698.90 | 760.10 | 823.60 | 890.00 | 924.90 | 958.40 | 883.00 | 844.60 | 868.10 | 856.40 | 908.10 | 932.50 | 903.60 | 857.10 | 839.30 | 753.90 | 780.30 | 738.90 | 812.40 | 462.80 | 481.20 | 429.90 | 481.50 | 516.60 | 371.20 | 373.60 | 377.50 | 379.90 | 383.60 | 286.10 | 289.90 | 292.40 | 301.10 | 319.10 | 328.60 | 372.80 | 541.00 | 559.00 | 570.00 | NA | NA | 522.00 | NA | NA | NA | |
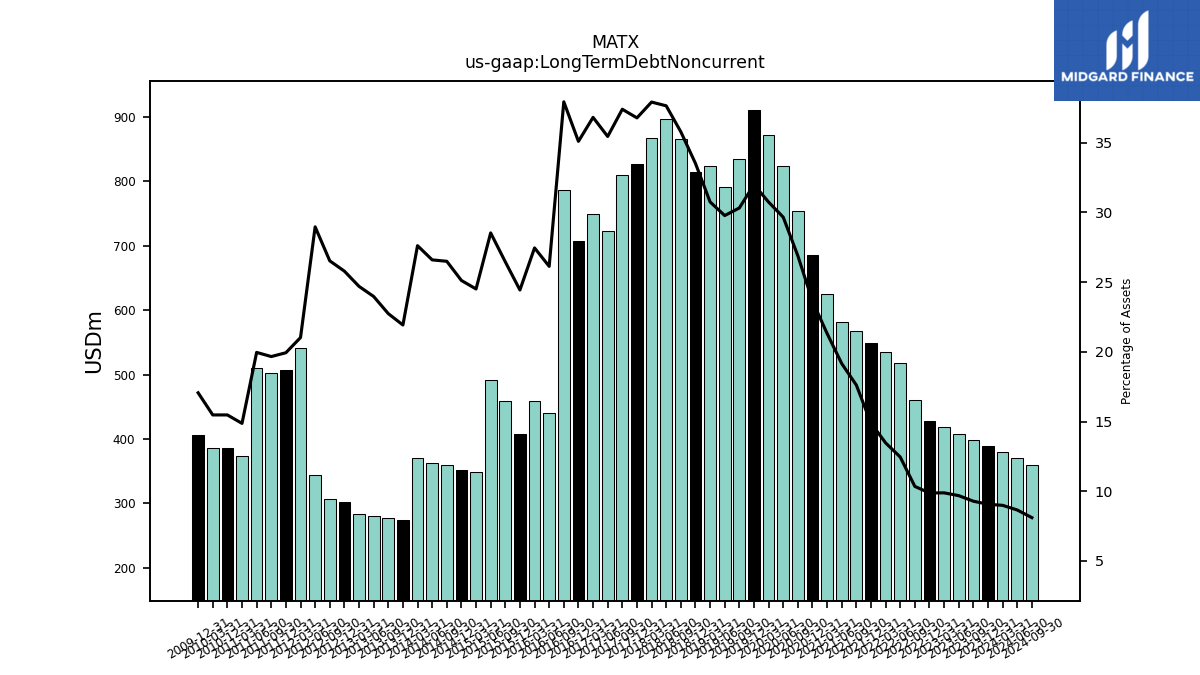
| Long Term Debt Noncurrent | 379.40 | 389.30 | 398.70 | 408.50 | 417.90 | 427.70 | 461.30 | 517.90 | 535.70 | 549.70 | 567.50 | 581.50 | 624.30 | 685.60 | 754.50 | 823.50 | 871.50 | 910.00 | 834.60 | 791.00 | 822.90 | 814.30 | 866.00 | 896.20 | 867.10 | 826.30 | 810.10 | 722.60 | 748.70 | 707.10 | 786.10 | 441.00 | 459.50 | 407.90 | 459.30 | 492.30 | 349.60 | 352.00 | 360.40 | 362.80 | 371.10 | 273.60 | 277.40 | 280.00 | 283.70 | 302.70 | 307.20 | 344.40 | 541.00 | 507.00 | 503.00 | 510.00 | 374.00 | 386.00 | NA | NA | 386.00 | |
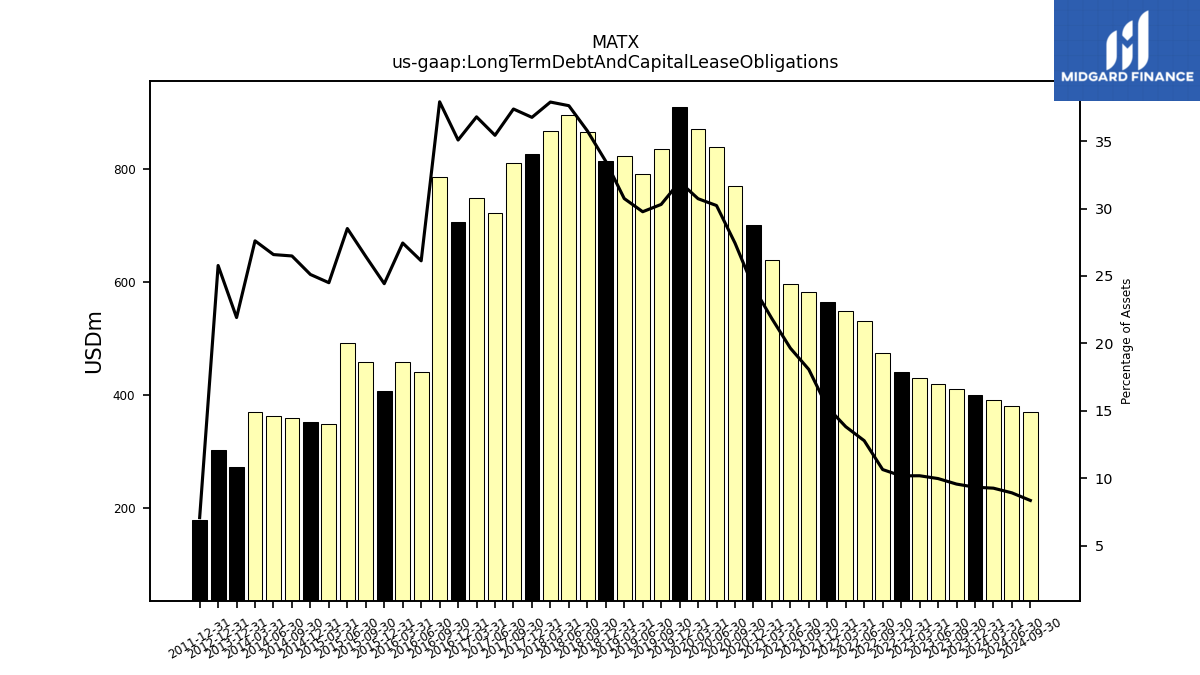
| Long Term Debt And Capital Lease Obligations | 390.80 | 400.90 | 410.60 | 420.70 | 430.40 | 440.60 | 474.50 | 531.60 | 549.70 | 564.00 | 582.20 | 596.50 | 639.70 | 700.90 | 770.20 | 839.50 | 871.50 | 910.00 | 834.60 | 791.00 | 822.90 | 814.30 | 866.00 | 896.20 | 867.10 | 826.30 | 810.10 | 722.60 | 748.70 | 707.10 | 786.10 | 441.00 | 459.50 | 407.90 | 459.30 | 492.30 | 349.60 | 352.00 | 360.40 | 362.80 | 371.10 | 273.60 | NA | NA | NA | 302.70 | NA | NA | NA | 180.00 | NA | NA | NA | NA | NA | NA | NA | |
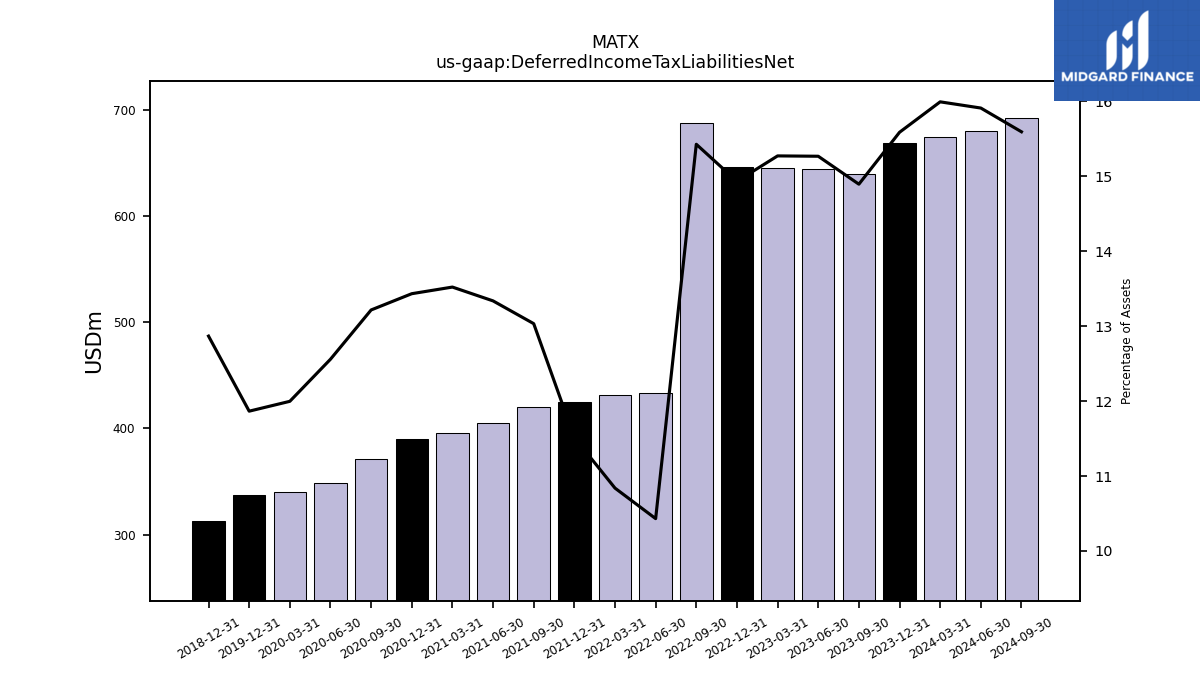
| Deferred Income Tax Liabilities Net | 674.80 | 669.30 | 639.30 | 643.90 | 645.50 | 646.50 | 687.80 | 433.80 | 431.10 | 425.20 | 420.00 | 404.90 | 396.10 | 389.60 | 370.90 | 348.80 | 340.20 | 337.60 | NA | NA | NA | 312.70 | NA | NA | NA | NA | NA | NA | NA | NA | NA | NA | NA | NA | NA | NA | NA | NA | NA | NA | NA | NA | NA | NA | NA | NA | NA | NA | NA | NA | NA | NA | NA | NA | NA | NA | NA | |
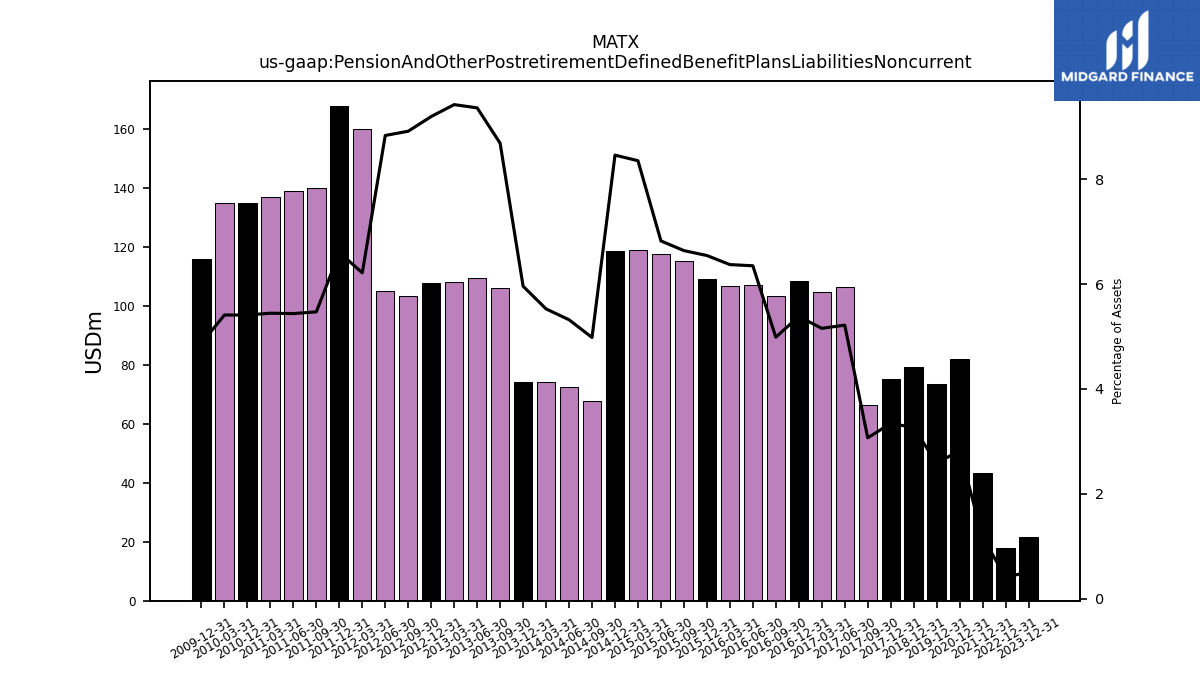
| Pension And Other Postretirement Defined Benefit Plans Liabilities Noncurrent | NA | 21.80 | NA | NA | NA | 17.80 | NA | NA | NA | 43.30 | NA | NA | NA | 82.00 | NA | NA | NA | 73.40 | NA | NA | NA | 79.40 | NA | NA | NA | 75.10 | 66.50 | 106.40 | 104.90 | 108.50 | 103.40 | 107.20 | 106.70 | 109.30 | 115.30 | 117.80 | 119.20 | 118.60 | 67.80 | 72.60 | 74.30 | 74.40 | 106.00 | 109.40 | 108.30 | 108.00 | 103.30 | 105.10 | 160.00 | 168.00 | 140.00 | 139.00 | 137.00 | 135.00 | NA | NA | 135.00 | |
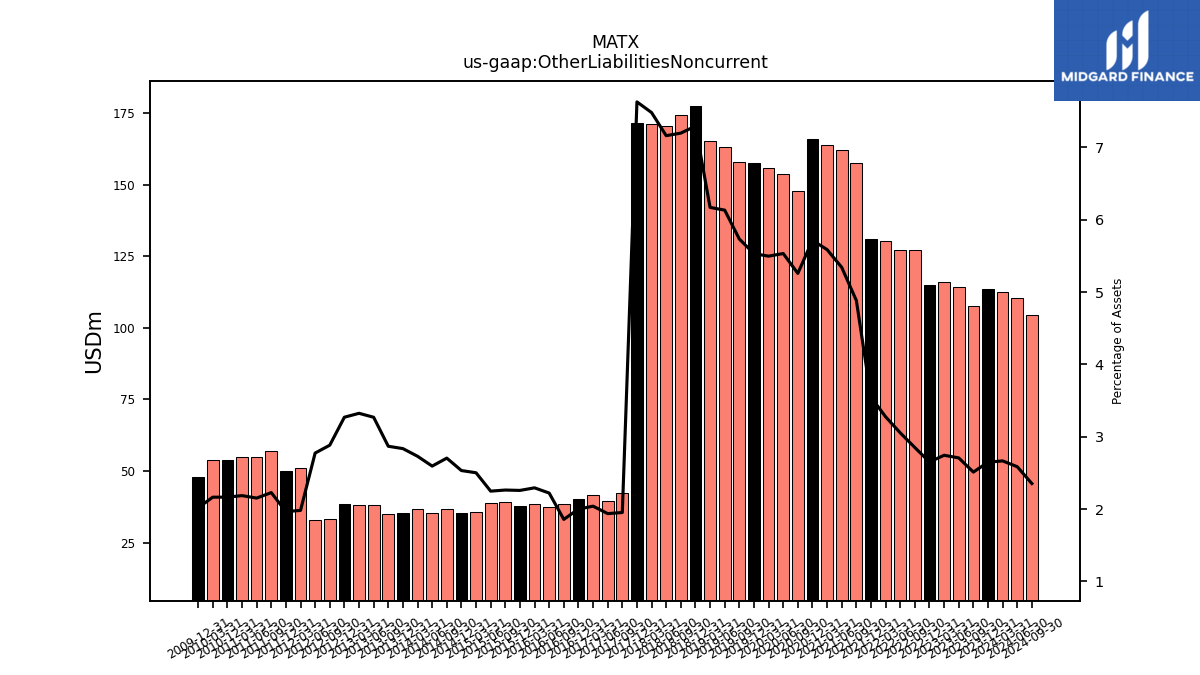
| Other Liabilities Noncurrent | 112.50 | 113.70 | 107.80 | 114.20 | 116.00 | 114.80 | 127.10 | 127.00 | 130.30 | 131.00 | 157.40 | 162.20 | 163.70 | 165.80 | 147.60 | 153.70 | 155.90 | 157.40 | 157.90 | 163.00 | 165.20 | 177.30 | 174.30 | 170.60 | 171.20 | 171.50 | 42.30 | 39.50 | 41.50 | 40.30 | 38.50 | 37.50 | 38.40 | 37.70 | 39.30 | 38.80 | 35.70 | 35.50 | 36.80 | 35.40 | 36.70 | 35.40 | 35.00 | 38.20 | 38.20 | 38.40 | 33.40 | 33.00 | 51.00 | 50.00 | 57.00 | 55.00 | 55.00 | 54.00 | NA | NA | 54.00 | |
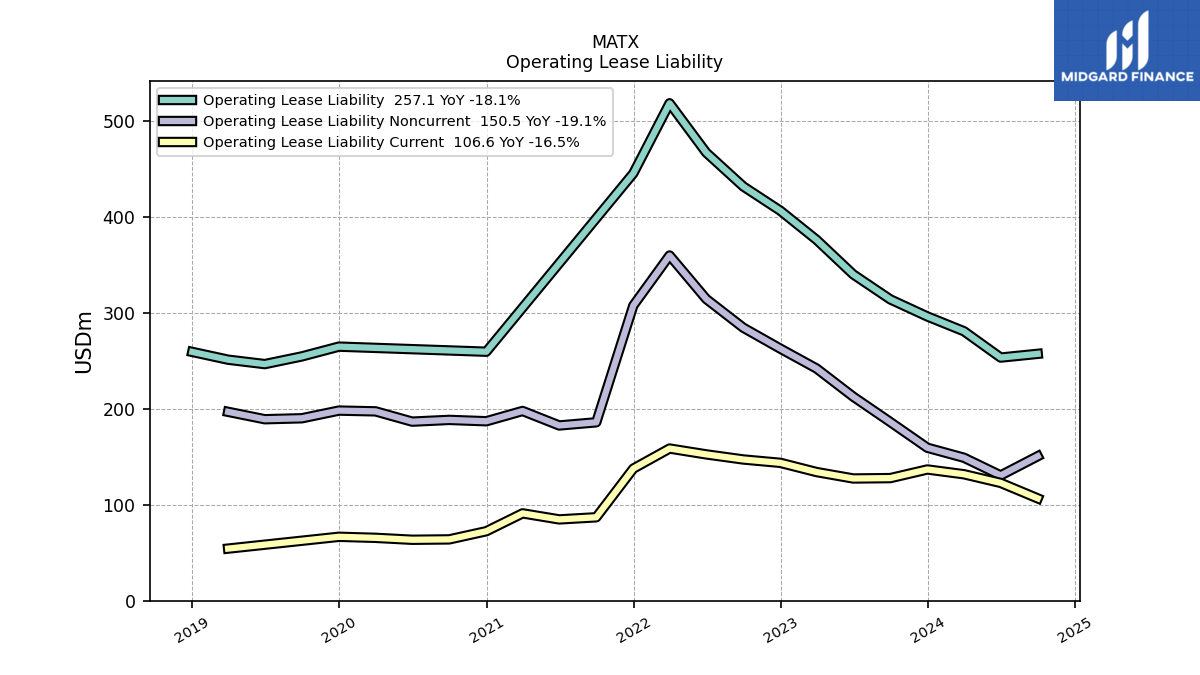
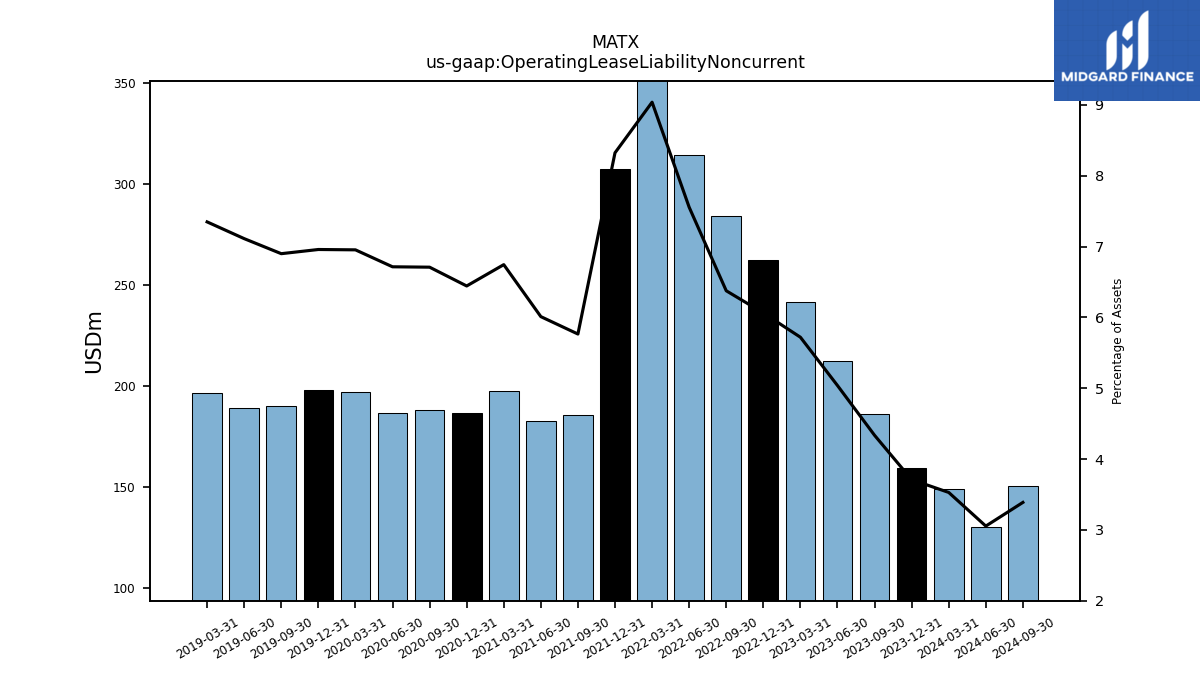
| Operating Lease Liability Noncurrent | 148.90 | 159.30 | 186.10 | 212.50 | 241.80 | 262.50 | 284.30 | 314.20 | 359.50 | 307.40 | 185.80 | 182.50 | 197.60 | 186.90 | 188.30 | 186.50 | 197.20 | 198.00 | 190.00 | 189.00 | 196.70 | NA | NA | NA | NA | NA | NA | NA | NA | NA | NA | NA | NA | NA | NA | NA | NA | NA | NA | NA | NA | NA | NA | NA | NA | NA | NA | NA | NA | NA | NA | NA | NA | NA | NA | NA | NA |
| 2024-03-31 | 2023-12-31 | 2023-09-30 | 2023-06-30 | 2023-03-31 | 2022-12-31 | 2022-09-30 | 2022-06-30 | 2022-03-31 | 2021-12-31 | 2021-09-30 | 2021-06-30 | 2021-03-31 | 2020-12-31 | 2020-09-30 | 2020-06-30 | 2020-03-31 | 2019-12-31 | 2019-09-30 | 2019-06-30 | 2019-03-31 | 2018-12-31 | 2018-09-30 | 2018-06-30 | 2018-03-31 | 2017-12-31 | 2017-09-30 | 2017-06-30 | 2017-03-31 | 2016-12-31 | 2016-09-30 | 2016-06-30 | 2016-03-31 | 2015-12-31 | 2015-09-30 | 2015-06-30 | 2015-03-31 | 2014-12-31 | 2014-09-30 | 2014-06-30 | 2014-03-31 | 2013-12-31 | 2013-09-30 | 2013-06-30 | 2013-03-31 | 2012-12-31 | 2012-09-30 | 2012-06-30 | 2012-03-31 | 2011-12-31 | 2011-09-30 | 2011-06-30 | 2011-03-31 | 2010-12-31 | 2010-09-30 | 2010-06-30 | 2010-03-31 | ||
|---|---|---|---|---|---|---|---|---|---|---|---|---|---|---|---|---|---|---|---|---|---|---|---|---|---|---|---|---|---|---|---|---|---|---|---|---|---|---|---|---|---|---|---|---|---|---|---|---|---|---|---|---|---|---|---|---|---|---|
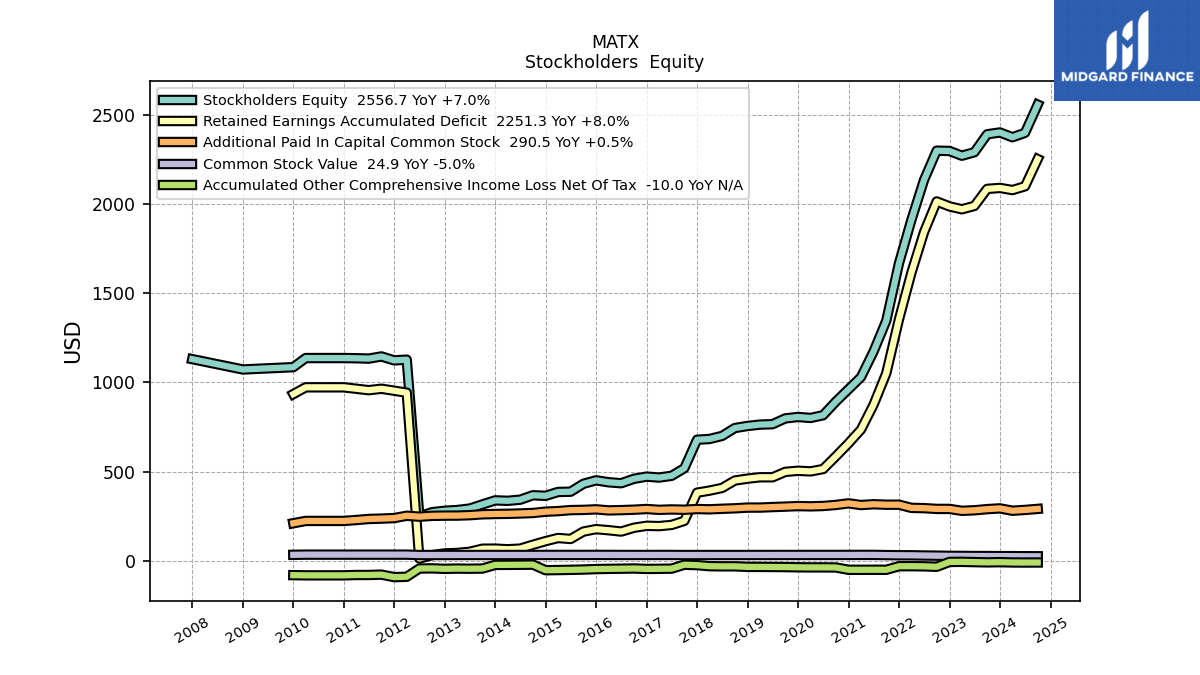
| Stockholders Equity | 2373.80 | 2400.70 | 2390.30 | 2290.00 | 2270.30 | 2296.90 | 2298.60 | 2133.60 | 1910.70 | 1667.40 | 1344.80 | 1172.80 | 1028.90 | 961.20 | 891.80 | 815.50 | 800.20 | 805.70 | 797.70 | 765.20 | 763.00 | 755.30 | 743.70 | 699.50 | 682.40 | 678.20 | 518.60 | 475.90 | 466.10 | 471.50 | 459.20 | 434.40 | 439.70 | 450.60 | 431.10 | 386.90 | 385.30 | 363.80 | 366.90 | 342.00 | 335.90 | 338.20 | 315.60 | 292.40 | 284.10 | 279.90 | 271.90 | 247.30 | 1127.00 | 1123.00 | 1145.00 | 1133.00 | 1135.00 | 1136.00 | NA | NA | 1136.00 | |
| Common Stock Value | 25.60 | 25.80 | 26.20 | 26.30 | 26.90 | 27.20 | 28.30 | 29.20 | 30.40 | 30.70 | 31.50 | 32.60 | 32.60 | 32.40 | 32.30 | 32.30 | 32.30 | 32.20 | 32.20 | 32.10 | 32.10 | 32.00 | 32.00 | 32.00 | 32.00 | 31.90 | 31.80 | 32.30 | 32.30 | 32.10 | 32.10 | 32.20 | 32.40 | 32.60 | 32.40 | 32.40 | 32.40 | 32.40 | 32.10 | 32.10 | 32.10 | 32.10 | 32.10 | 32.00 | 32.00 | 31.90 | 31.90 | 31.80 | 34.00 | 34.00 | 34.00 | 34.00 | 34.00 | 34.00 | NA | NA | 34.00 | |
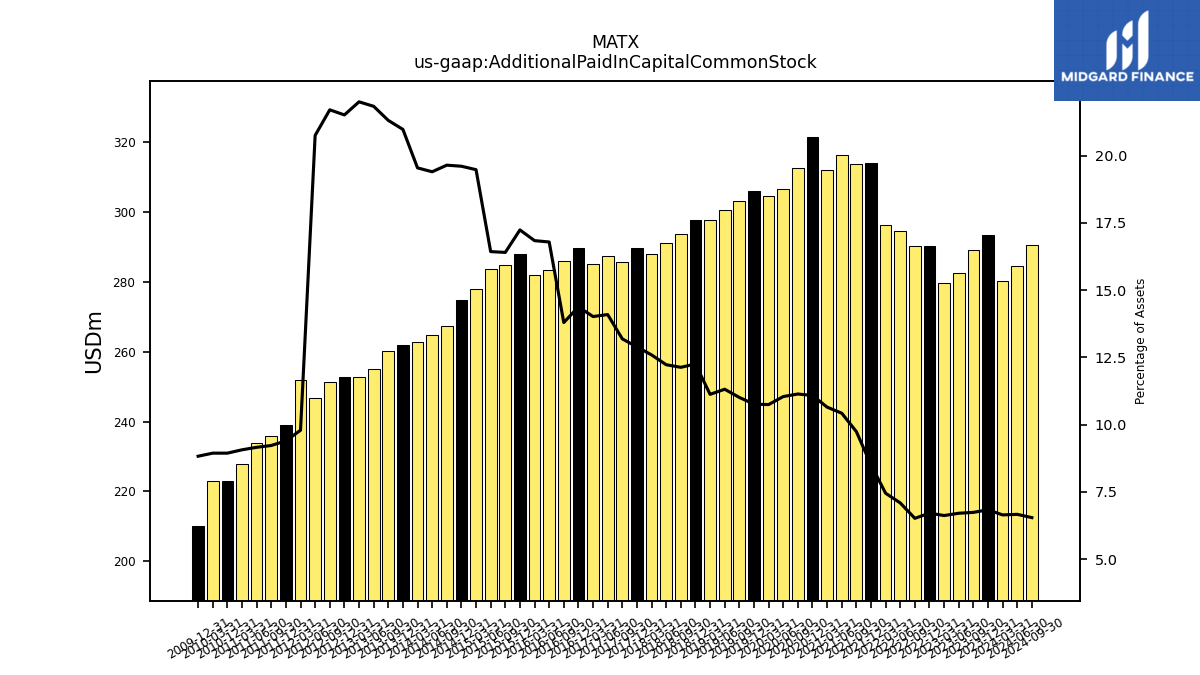
| Additional Paid In Capital Common Stock | 280.20 | 293.40 | 289.10 | 282.70 | 279.70 | 290.40 | 290.40 | 294.70 | 296.20 | 314.10 | 313.90 | 316.50 | 312.00 | 321.50 | 312.60 | 306.70 | 304.70 | 306.20 | 303.20 | 300.70 | 297.80 | 297.80 | 293.70 | 291.20 | 288.10 | 289.70 | 285.80 | 287.40 | 285.20 | 289.80 | 286.00 | 283.50 | 282.00 | 287.90 | 284.90 | 283.70 | 278.00 | 274.90 | 267.40 | 264.80 | 262.80 | 261.90 | 260.10 | 255.20 | 252.90 | 252.70 | 251.50 | 246.90 | 252.00 | 239.00 | 236.00 | 234.00 | 228.00 | 223.00 | NA | NA | 223.00 | |
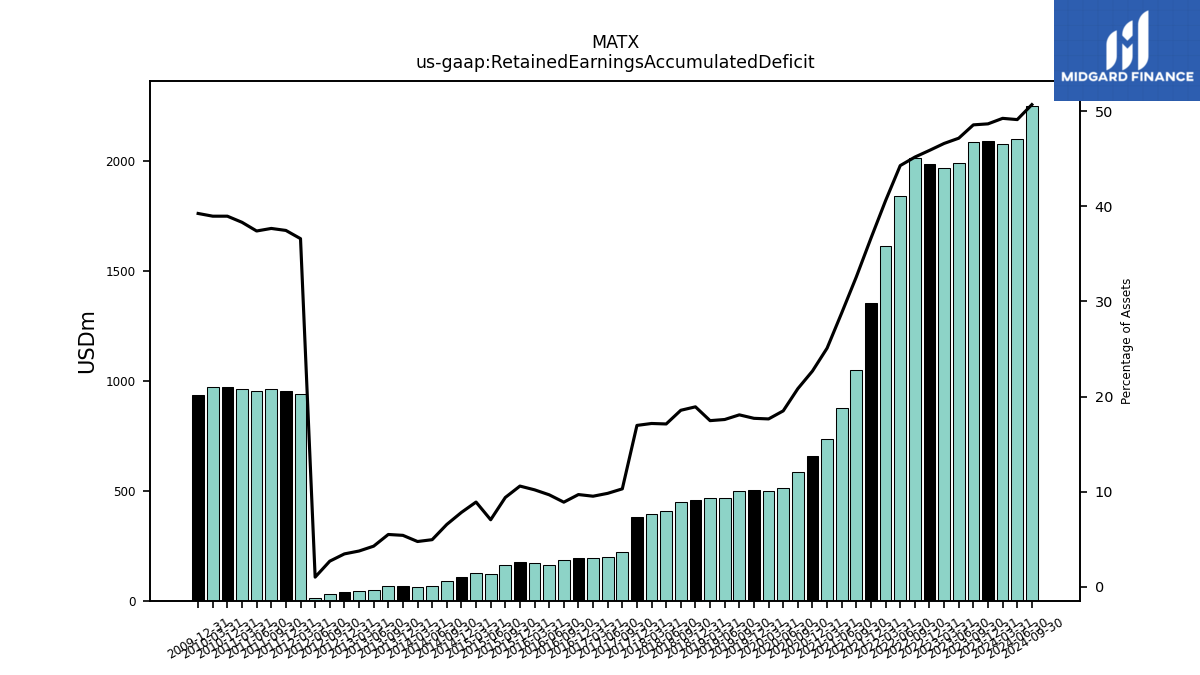
| Retained Earnings Accumulated Deficit | 2077.80 | 2089.70 | 2084.30 | 1988.90 | 1970.00 | 1986.20 | 2014.00 | 1841.20 | 1614.80 | 1353.50 | 1050.30 | 874.40 | 735.20 | 658.10 | 584.80 | 513.90 | 500.70 | 504.20 | 498.00 | 467.60 | 467.80 | 460.00 | 449.50 | 407.90 | 393.00 | 381.50 | 223.40 | 200.60 | 194.00 | 195.70 | 184.70 | 163.50 | 170.90 | 177.00 | 163.30 | 121.90 | 127.30 | 109.80 | 89.40 | 67.80 | 64.20 | 67.70 | 67.30 | 50.10 | 43.40 | 40.80 | 31.40 | 12.30 | 942.00 | 953.00 | 964.00 | 956.00 | 964.00 | 972.00 | NA | NA | 972.00 | |
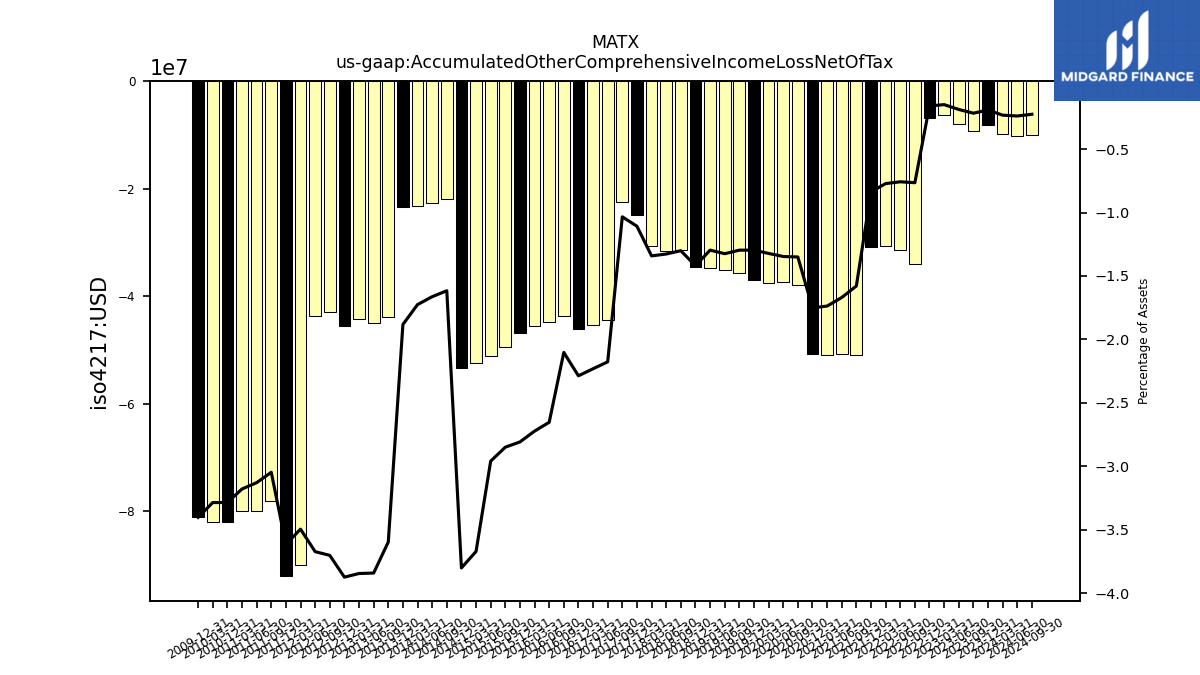
| Accumulated Other Comprehensive Income Loss Net Of Tax | -9.80 | -8.20 | -9.30 | -7.90 | -6.30 | -6.90 | -34.10 | -31.50 | -30.70 | -30.90 | -50.90 | -50.70 | -50.90 | -50.80 | -37.90 | -37.40 | -37.50 | -36.90 | -35.70 | -35.20 | -34.70 | -34.50 | -31.50 | -31.60 | -30.70 | -24.90 | -22.40 | -44.40 | -45.40 | -46.10 | -43.60 | -44.80 | -45.60 | -46.90 | -49.50 | -51.10 | -52.40 | -53.30 | -22.00 | -22.70 | -23.20 | -23.50 | -43.90 | -44.90 | -44.20 | -45.50 | -42.90 | -43.70 | -90.00 | -92.00 | -78.00 | -80.00 | -80.00 | -82.00 | NA | NA | -82.00 | |
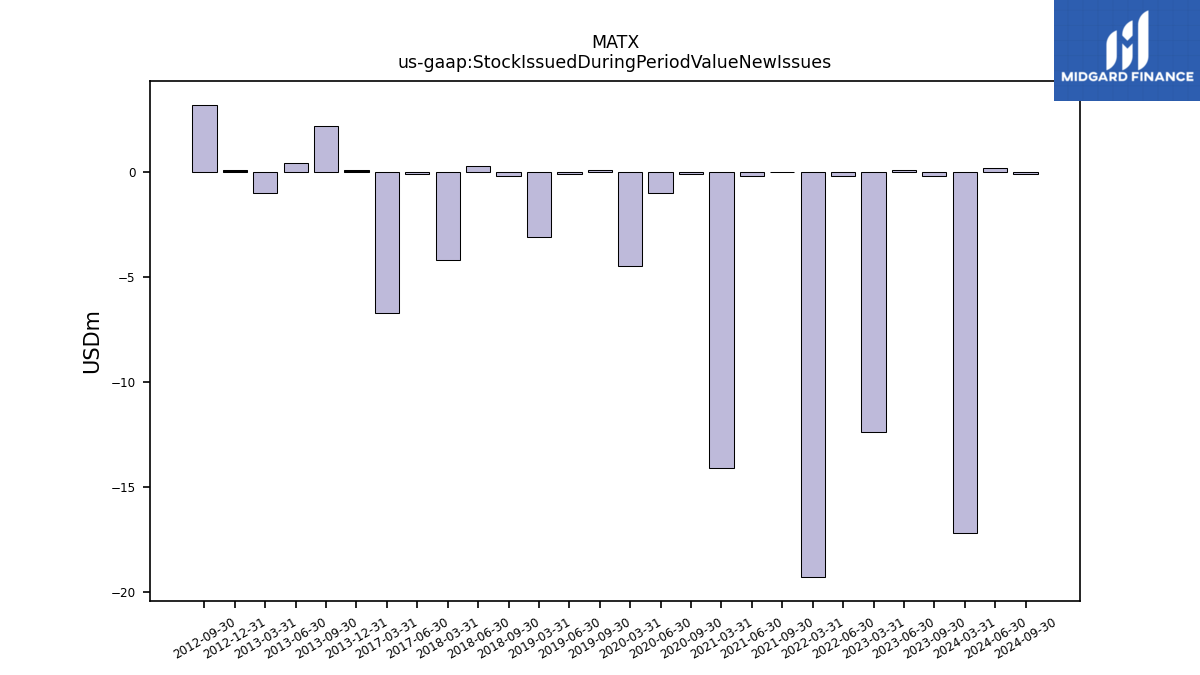
| Stock Issued During Period Value New Issues | -17.20 | NA | NA | 0.10 | -12.40 | NA | NA | -0.20 | -19.30 | NA | 0.00 | -0.20 | -14.10 | NA | -0.10 | -1.00 | -4.50 | NA | 0.10 | -0.10 | -3.10 | NA | -0.20 | 0.30 | -4.20 | NA | NA | -0.10 | -6.70 | NA | NA | NA | NA | NA | NA | NA | NA | NA | NA | NA | NA | 0.10 | 2.20 | 0.40 | -1.00 | 0.10 | 3.20 | NA | NA | NA | NA | NA | NA | NA | NA | NA | NA | |
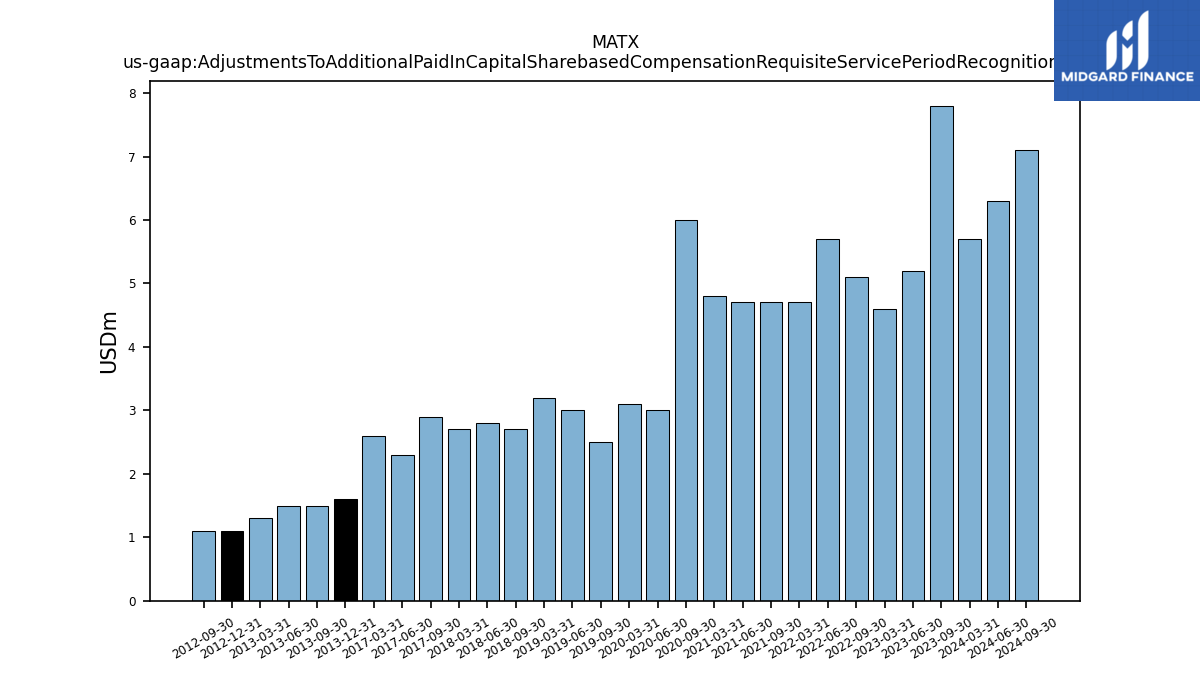
| Adjustments To Additional Paid In Capital Sharebased Compensation Requisite Service Period Recognition Value | 5.70 | NA | 7.80 | 5.20 | 4.60 | NA | 5.10 | 5.70 | 4.70 | NA | 4.70 | 4.70 | 4.80 | NA | 6.00 | 3.00 | 3.10 | NA | 2.50 | 3.00 | 3.20 | NA | 2.70 | 2.80 | 2.70 | NA | 2.90 | 2.30 | 2.60 | NA | NA | NA | NA | NA | NA | NA | NA | NA | NA | NA | NA | 1.60 | 1.50 | 1.50 | 1.30 | 1.10 | 1.10 | NA | NA | NA | NA | NA | NA | NA | NA | NA | NA |
| 2024-03-31 | 2023-12-31 | 2023-09-30 | 2023-06-30 | 2023-03-31 | 2022-12-31 | 2022-09-30 | 2022-06-30 | 2022-03-31 | 2021-12-31 | 2021-09-30 | 2021-06-30 | 2021-03-31 | 2020-12-31 | 2020-09-30 | 2020-06-30 | 2020-03-31 | 2019-12-31 | 2019-09-30 | 2019-06-30 | 2019-03-31 | 2018-12-31 | 2018-09-30 | 2018-06-30 | 2018-03-31 | 2017-12-31 | 2017-09-30 | 2017-06-30 | 2017-03-31 | 2016-12-31 | 2016-09-30 | 2016-06-30 | 2016-03-31 | 2015-12-31 | 2015-09-30 | 2015-06-30 | 2015-03-31 | 2014-12-31 | 2014-09-30 | 2014-06-30 | 2014-03-31 | 2013-12-31 | 2013-09-30 | 2013-06-30 | 2013-03-31 | 2012-12-31 | 2012-09-30 | 2012-06-30 | 2012-03-31 | 2011-12-31 | 2011-09-30 | 2011-06-30 | 2011-03-31 | 2010-12-31 | 2010-09-30 | 2010-06-30 | 2010-03-31 | ||
|---|---|---|---|---|---|---|---|---|---|---|---|---|---|---|---|---|---|---|---|---|---|---|---|---|---|---|---|---|---|---|---|---|---|---|---|---|---|---|---|---|---|---|---|---|---|---|---|---|---|---|---|---|---|---|---|---|---|---|
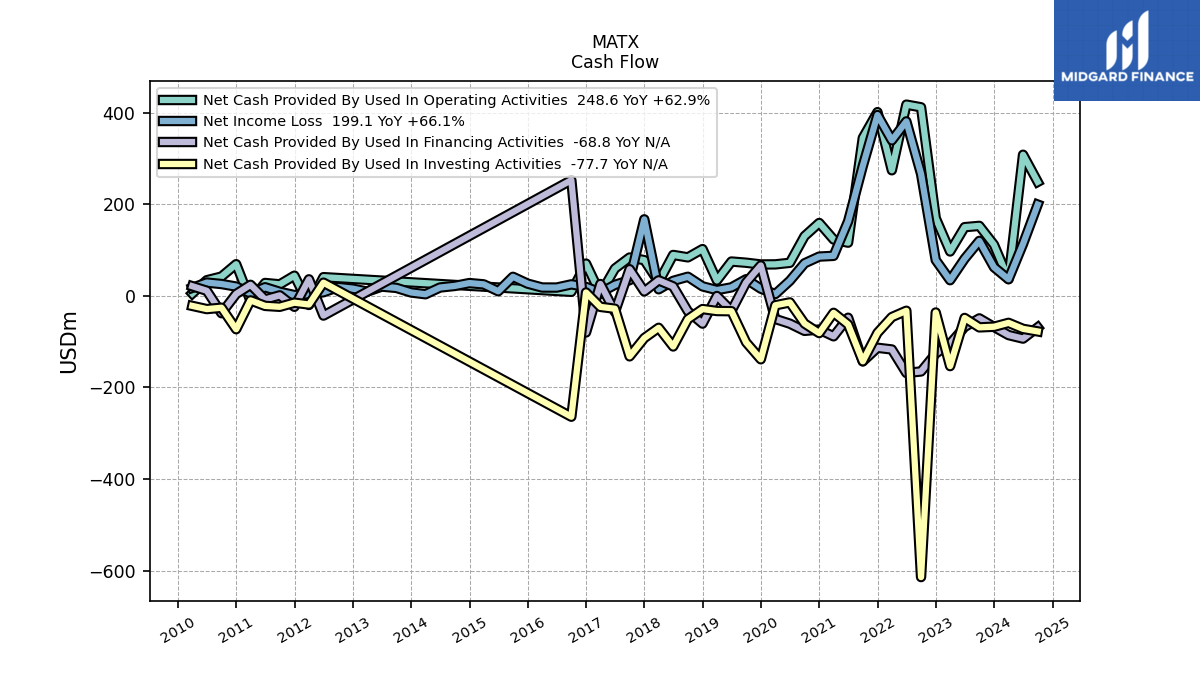
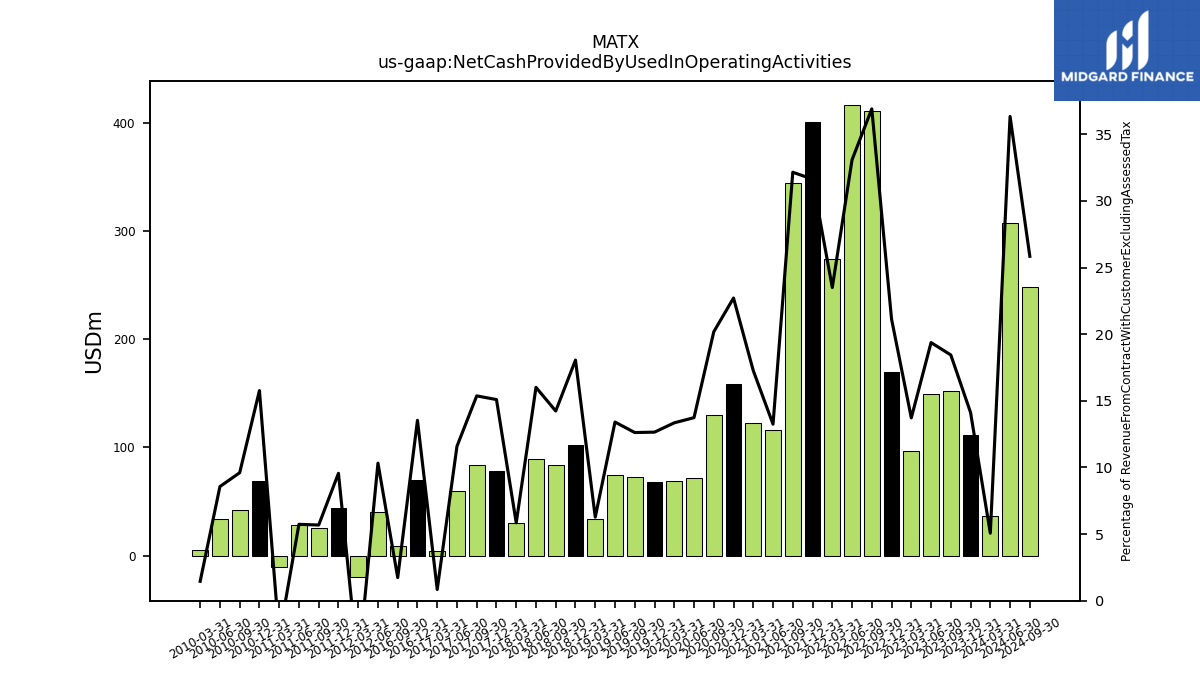
| Net Cash Provided By Used In Operating Activities | 36.60 | 111.40 | 152.60 | 149.80 | 96.70 | 169.40 | 411.40 | 417.20 | 273.90 | 400.80 | 344.50 | 115.90 | 122.90 | 159.00 | 130.20 | 72.00 | 68.60 | 68.40 | 72.20 | 74.80 | 33.40 | 102.00 | 83.90 | 89.20 | 29.90 | 77.90 | 83.60 | 59.40 | 4.00 | 70.30 | 8.70 | NA | NA | NA | NA | NA | NA | NA | NA | NA | NA | NA | NA | NA | NA | NA | NA | 40.70 | -20.00 | 44.00 | 25.00 | 28.00 | -11.00 | 69.00 | 42.00 | 34.00 | 5.00 | |
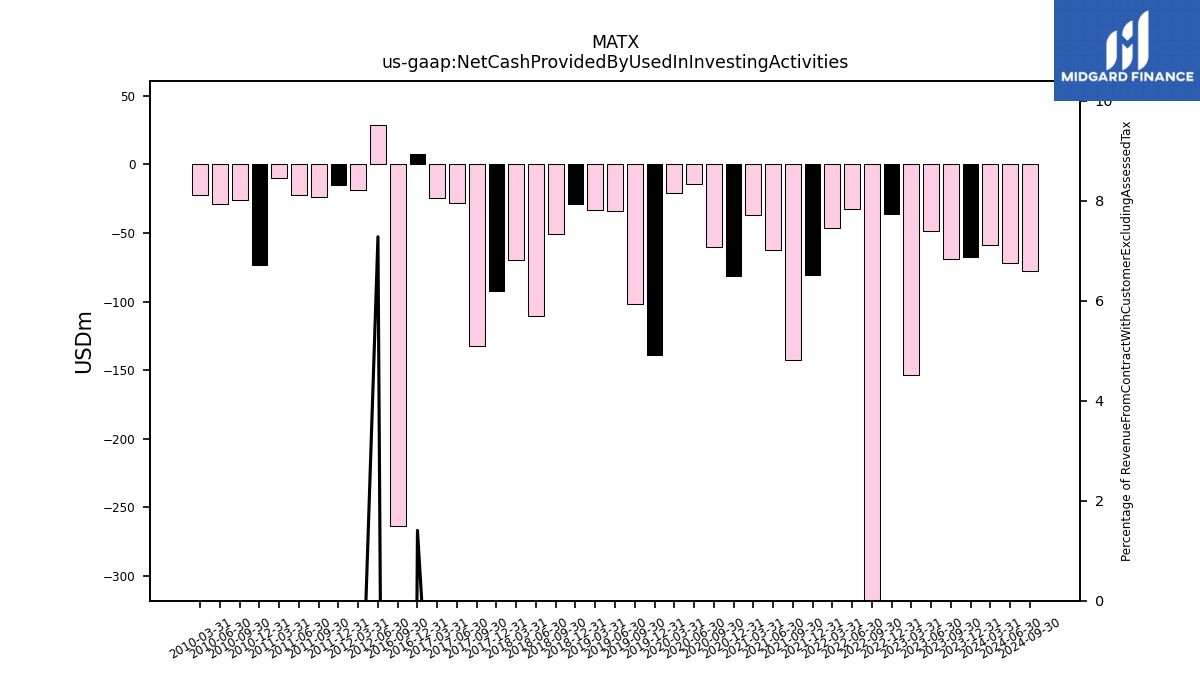
| Net Cash Provided By Used In Investing Activities | -59.00 | -67.50 | -68.90 | -48.30 | -153.50 | -36.40 | -613.90 | -32.60 | -46.40 | -80.90 | -142.90 | -62.50 | -37.10 | -81.40 | -60.50 | -14.40 | -20.70 | -138.60 | -101.50 | -33.60 | -33.20 | -28.90 | -51.00 | -110.60 | -69.80 | -92.30 | -132.20 | -28.20 | -24.20 | 7.30 | -263.90 | NA | NA | NA | NA | NA | NA | NA | NA | NA | NA | NA | NA | NA | NA | NA | NA | 28.70 | -19.00 | -15.00 | -24.00 | -22.00 | -10.00 | -73.00 | -26.00 | -29.00 | -22.00 | |
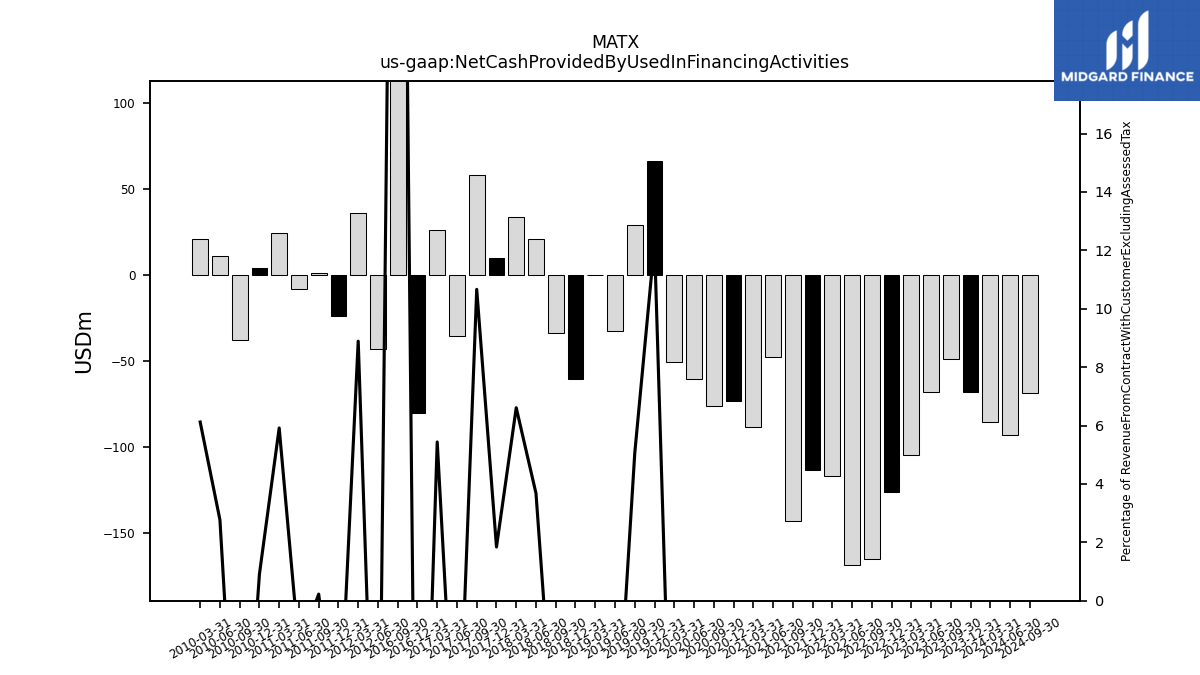
| Net Cash Provided By Used In Financing Activities | -85.70 | -68.00 | -49.20 | -68.00 | -104.50 | -126.00 | -165.10 | -168.40 | -117.10 | -113.40 | -143.10 | -47.80 | -88.40 | -73.60 | -76.50 | -60.80 | -50.60 | 66.30 | 28.90 | -32.80 | -0.40 | -60.70 | -33.60 | 20.50 | 33.80 | 9.50 | 58.00 | -35.40 | 25.80 | -80.10 | 252.40 | NA | NA | NA | NA | NA | NA | NA | NA | NA | NA | NA | NA | NA | NA | NA | NA | -43.20 | 36.00 | -24.00 | 1.00 | -8.00 | 24.00 | 4.00 | -38.00 | 11.00 | 21.00 |
| 2024-03-31 | 2023-12-31 | 2023-09-30 | 2023-06-30 | 2023-03-31 | 2022-12-31 | 2022-09-30 | 2022-06-30 | 2022-03-31 | 2021-12-31 | 2021-09-30 | 2021-06-30 | 2021-03-31 | 2020-12-31 | 2020-09-30 | 2020-06-30 | 2020-03-31 | 2019-12-31 | 2019-09-30 | 2019-06-30 | 2019-03-31 | 2018-12-31 | 2018-09-30 | 2018-06-30 | 2018-03-31 | 2017-12-31 | 2017-09-30 | 2017-06-30 | 2017-03-31 | 2016-12-31 | 2016-09-30 | 2016-06-30 | 2016-03-31 | 2015-12-31 | 2015-09-30 | 2015-06-30 | 2015-03-31 | 2014-12-31 | 2014-09-30 | 2014-06-30 | 2014-03-31 | 2013-12-31 | 2013-09-30 | 2013-06-30 | 2013-03-31 | 2012-12-31 | 2012-09-30 | 2012-06-30 | 2012-03-31 | 2011-12-31 | 2011-09-30 | 2011-06-30 | 2011-03-31 | 2010-12-31 | 2010-09-30 | 2010-06-30 | 2010-03-31 | ||
|---|---|---|---|---|---|---|---|---|---|---|---|---|---|---|---|---|---|---|---|---|---|---|---|---|---|---|---|---|---|---|---|---|---|---|---|---|---|---|---|---|---|---|---|---|---|---|---|---|---|---|---|---|---|---|---|---|---|---|
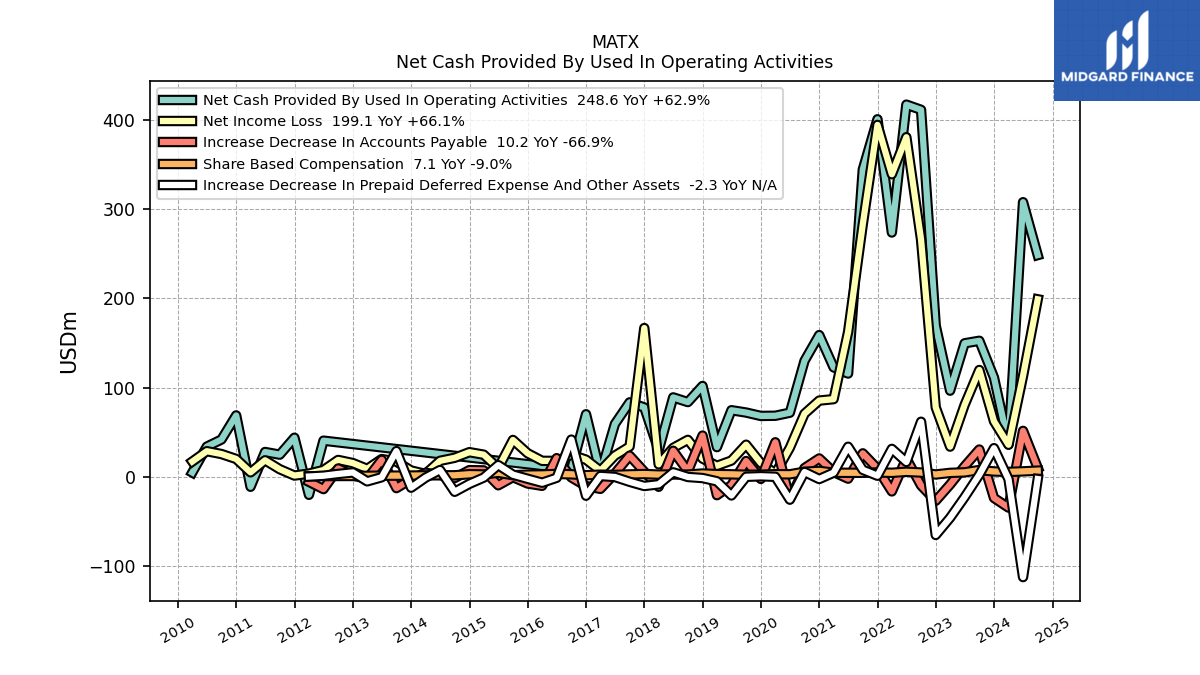
| Net Cash Provided By Used In Operating Activities | 36.60 | 111.40 | 152.60 | 149.80 | 96.70 | 169.40 | 411.40 | 417.20 | 273.90 | 400.80 | 344.50 | 115.90 | 122.90 | 159.00 | 130.20 | 72.00 | 68.60 | 68.40 | 72.20 | 74.80 | 33.40 | 102.00 | 83.90 | 89.20 | 29.90 | 77.90 | 83.60 | 59.40 | 4.00 | 70.30 | 8.70 | NA | NA | NA | NA | NA | NA | NA | NA | NA | NA | NA | NA | NA | NA | NA | NA | 40.70 | -20.00 | 44.00 | 25.00 | 28.00 | -11.00 | 69.00 | 42.00 | 34.00 | 5.00 | |
| Net Income Loss | 36.10 | 62.40 | 119.90 | 80.80 | 34.00 | 78.00 | 266.00 | 380.70 | 339.20 | 394.50 | 283.20 | 162.50 | 87.20 | 85.60 | 70.90 | 32.80 | 3.80 | 15.60 | 36.20 | 18.40 | 12.50 | 20.60 | 41.60 | 32.60 | 14.20 | 166.90 | 34.10 | 24.00 | 7.00 | 19.40 | 25.00 | 18.00 | 18.10 | 26.60 | 41.50 | 9.90 | 25.00 | 27.80 | 21.50 | 18.10 | 3.40 | 7.30 | 17.20 | 20.10 | 9.10 | 15.60 | 19.10 | 7.80 | 3.80 | 1.60 | 8.70 | 18.70 | 5.20 | 20.20 | 25.70 | 28.90 | 17.30 | |
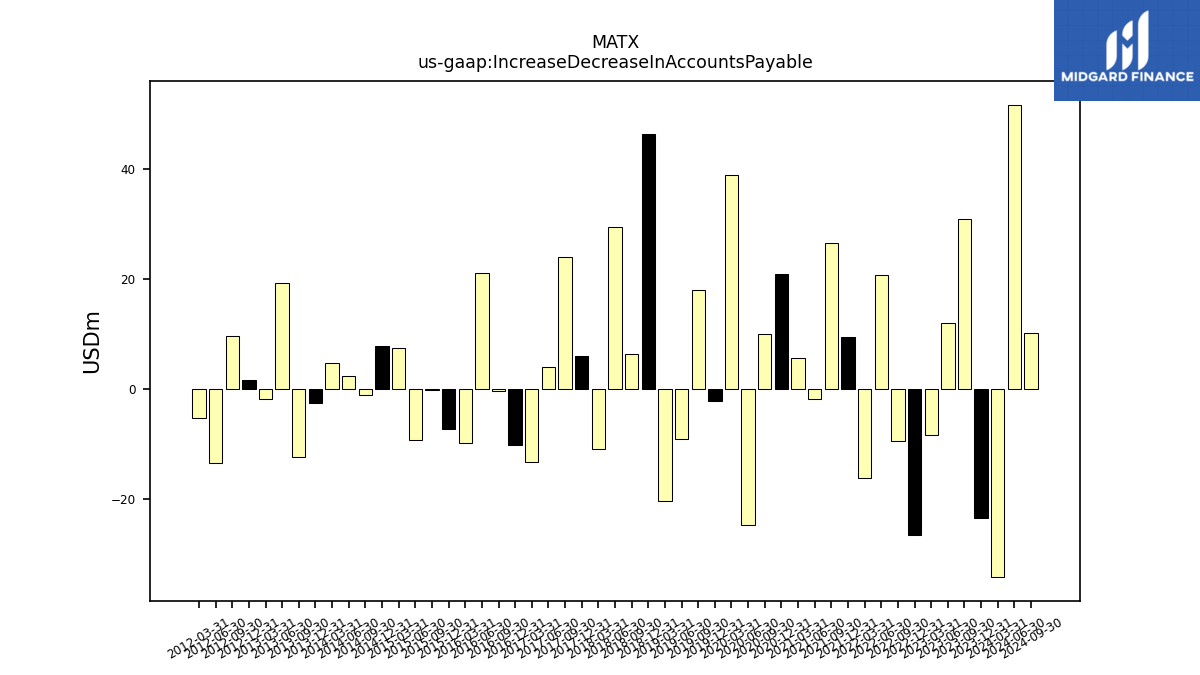
| Increase Decrease In Accounts Payable | -34.30 | -23.50 | 30.80 | 12.00 | -8.40 | -26.70 | -9.50 | 20.70 | -16.20 | 9.40 | 26.50 | -1.90 | 5.60 | 20.80 | 10.00 | -24.90 | 38.90 | -2.20 | 17.90 | -9.20 | -20.40 | 46.40 | 6.40 | 29.40 | -11.00 | 5.90 | 23.90 | 3.90 | -13.30 | -10.20 | -0.50 | 21.10 | -9.90 | -7.30 | -0.20 | -9.30 | 7.40 | 7.70 | -1.20 | 2.30 | 4.70 | -2.60 | -12.50 | 19.20 | -1.90 | 1.60 | 9.50 | -13.60 | -5.40 | NA | NA | NA | NA | NA | NA | NA | NA | |
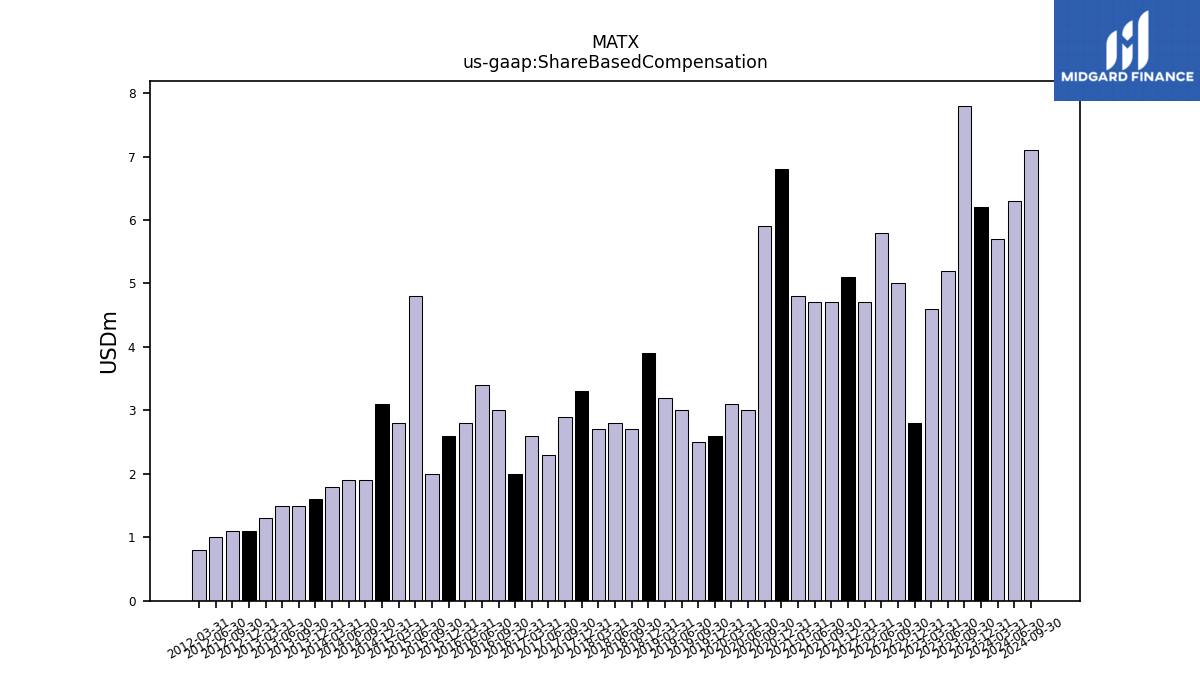
| Share Based Compensation | 5.70 | 6.20 | 7.80 | 5.20 | 4.60 | 2.80 | 5.00 | 5.80 | 4.70 | 5.10 | 4.70 | 4.70 | 4.80 | 6.80 | 5.90 | 3.00 | 3.10 | 2.60 | 2.50 | 3.00 | 3.20 | 3.90 | 2.70 | 2.80 | 2.70 | 3.30 | 2.90 | 2.30 | 2.60 | 2.00 | 3.00 | 3.40 | 2.80 | 2.60 | 2.00 | 4.80 | 2.80 | 3.10 | 1.90 | 1.90 | 1.80 | 1.60 | 1.50 | 1.50 | 1.30 | 1.10 | 1.10 | 1.00 | 0.80 | NA | NA | NA | NA | NA | NA | NA | NA |
| 2024-03-31 | 2023-12-31 | 2023-09-30 | 2023-06-30 | 2023-03-31 | 2022-12-31 | 2022-09-30 | 2022-06-30 | 2022-03-31 | 2021-12-31 | 2021-09-30 | 2021-06-30 | 2021-03-31 | 2020-12-31 | 2020-09-30 | 2020-06-30 | 2020-03-31 | 2019-12-31 | 2019-09-30 | 2019-06-30 | 2019-03-31 | 2018-12-31 | 2018-09-30 | 2018-06-30 | 2018-03-31 | 2017-12-31 | 2017-09-30 | 2017-06-30 | 2017-03-31 | 2016-12-31 | 2016-09-30 | 2016-06-30 | 2016-03-31 | 2015-12-31 | 2015-09-30 | 2015-06-30 | 2015-03-31 | 2014-12-31 | 2014-09-30 | 2014-06-30 | 2014-03-31 | 2013-12-31 | 2013-09-30 | 2013-06-30 | 2013-03-31 | 2012-12-31 | 2012-09-30 | 2012-06-30 | 2012-03-31 | 2011-12-31 | 2011-09-30 | 2011-06-30 | 2011-03-31 | 2010-12-31 | 2010-09-30 | 2010-06-30 | 2010-03-31 | ||
|---|---|---|---|---|---|---|---|---|---|---|---|---|---|---|---|---|---|---|---|---|---|---|---|---|---|---|---|---|---|---|---|---|---|---|---|---|---|---|---|---|---|---|---|---|---|---|---|---|---|---|---|---|---|---|---|---|---|---|
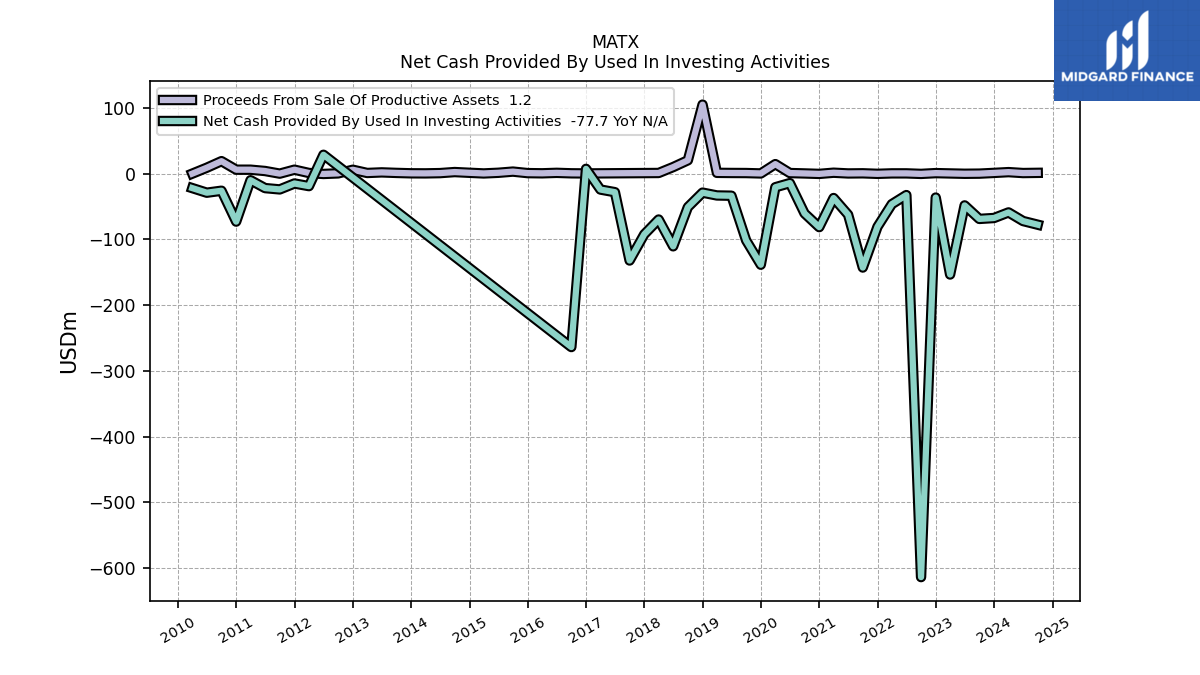
| Net Cash Provided By Used In Investing Activities | -59.00 | -67.50 | -68.90 | -48.30 | -153.50 | -36.40 | -613.90 | -32.60 | -46.40 | -80.90 | -142.90 | -62.50 | -37.10 | -81.40 | -60.50 | -14.40 | -20.70 | -138.60 | -101.50 | -33.60 | -33.20 | -28.90 | -51.00 | -110.60 | -69.80 | -92.30 | -132.20 | -28.20 | -24.20 | 7.30 | -263.90 | NA | NA | NA | NA | NA | NA | NA | NA | NA | NA | NA | NA | NA | NA | NA | NA | 28.70 | -19.00 | -15.00 | -24.00 | -22.00 | -10.00 | -73.00 | -26.00 | -29.00 | -22.00 | |
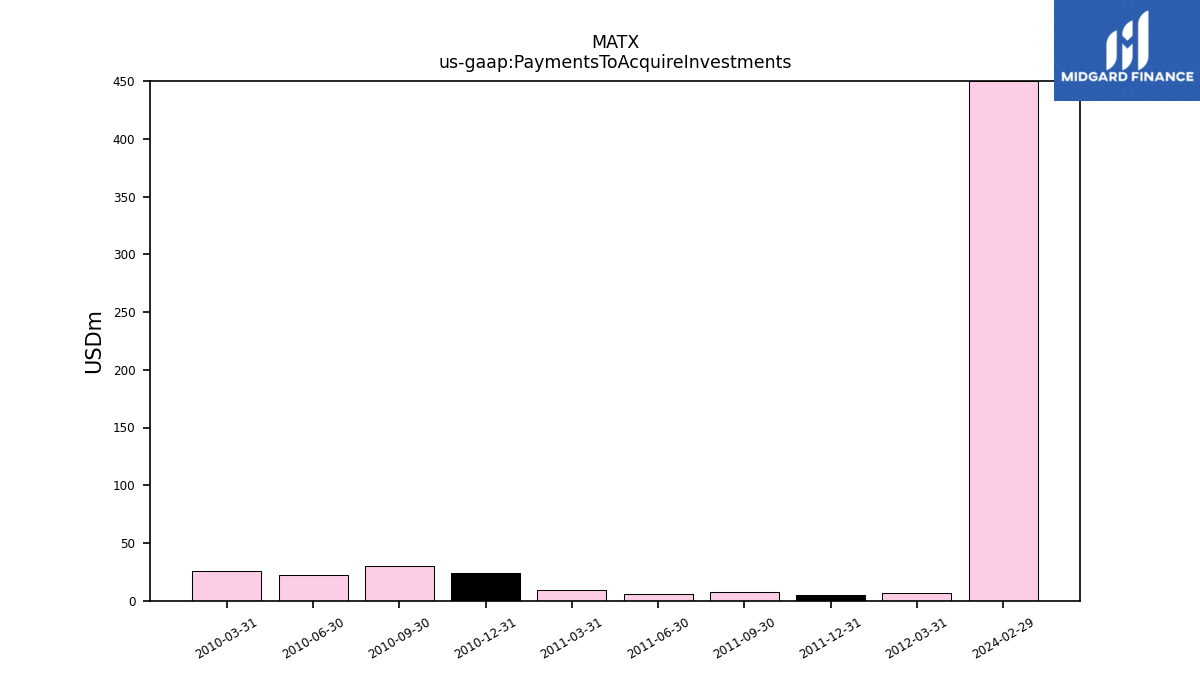
| Payments To Acquire Investments | NA | NA | NA | NA | NA | NA | NA | NA | NA | NA | NA | NA | NA | NA | NA | NA | NA | NA | NA | NA | NA | NA | NA | NA | NA | NA | NA | NA | NA | NA | NA | NA | NA | NA | NA | NA | NA | NA | NA | NA | NA | NA | NA | NA | NA | NA | NA | NA | 7.00 | 5.00 | 8.00 | 6.00 | 9.00 | 24.00 | 30.00 | 22.00 | 26.00 |
| 2024-03-31 | 2023-12-31 | 2023-09-30 | 2023-06-30 | 2023-03-31 | 2022-12-31 | 2022-09-30 | 2022-06-30 | 2022-03-31 | 2021-12-31 | 2021-09-30 | 2021-06-30 | 2021-03-31 | 2020-12-31 | 2020-09-30 | 2020-06-30 | 2020-03-31 | 2019-12-31 | 2019-09-30 | 2019-06-30 | 2019-03-31 | 2018-12-31 | 2018-09-30 | 2018-06-30 | 2018-03-31 | 2017-12-31 | 2017-09-30 | 2017-06-30 | 2017-03-31 | 2016-12-31 | 2016-09-30 | 2016-06-30 | 2016-03-31 | 2015-12-31 | 2015-09-30 | 2015-06-30 | 2015-03-31 | 2014-12-31 | 2014-09-30 | 2014-06-30 | 2014-03-31 | 2013-12-31 | 2013-09-30 | 2013-06-30 | 2013-03-31 | 2012-12-31 | 2012-09-30 | 2012-06-30 | 2012-03-31 | 2011-12-31 | 2011-09-30 | 2011-06-30 | 2011-03-31 | 2010-12-31 | 2010-09-30 | 2010-06-30 | 2010-03-31 | ||
|---|---|---|---|---|---|---|---|---|---|---|---|---|---|---|---|---|---|---|---|---|---|---|---|---|---|---|---|---|---|---|---|---|---|---|---|---|---|---|---|---|---|---|---|---|---|---|---|---|---|---|---|---|---|---|---|---|---|---|
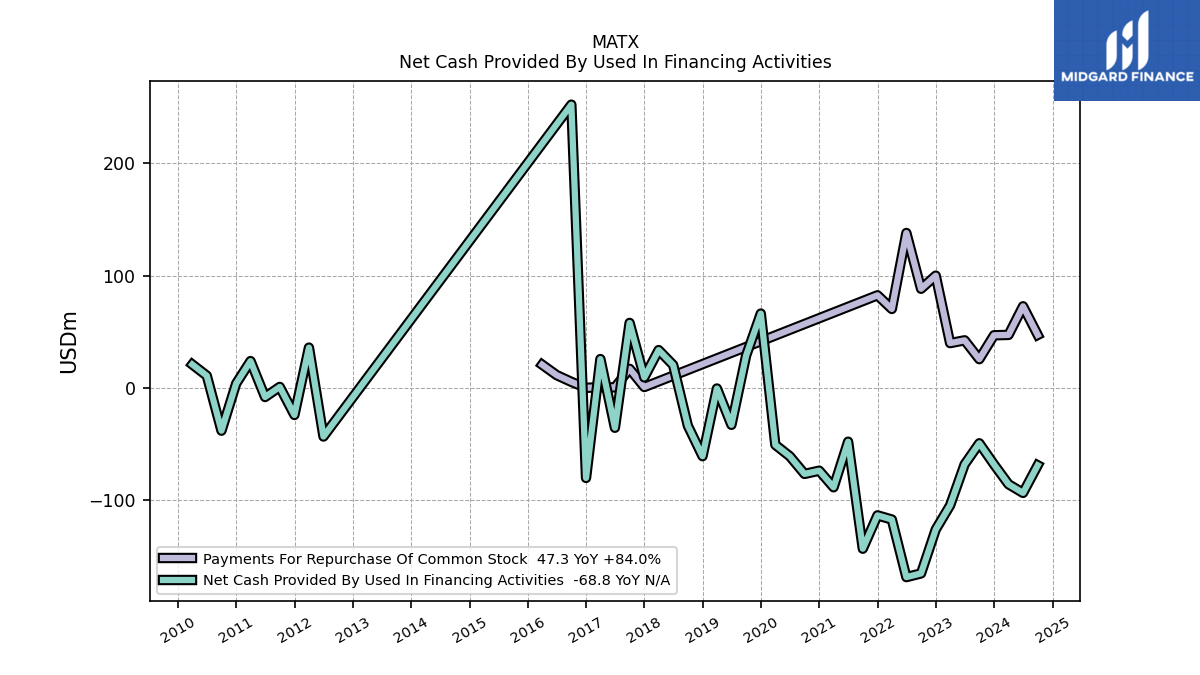
| Net Cash Provided By Used In Financing Activities | -85.70 | -68.00 | -49.20 | -68.00 | -104.50 | -126.00 | -165.10 | -168.40 | -117.10 | -113.40 | -143.10 | -47.80 | -88.40 | -73.60 | -76.50 | -60.80 | -50.60 | 66.30 | 28.90 | -32.80 | -0.40 | -60.70 | -33.60 | 20.50 | 33.80 | 9.50 | 58.00 | -35.40 | 25.80 | -80.10 | 252.40 | NA | NA | NA | NA | NA | NA | NA | NA | NA | NA | NA | NA | NA | NA | NA | NA | -43.20 | 36.00 | -24.00 | 1.00 | -8.00 | 24.00 | 4.00 | -38.00 | 11.00 | 21.00 | |
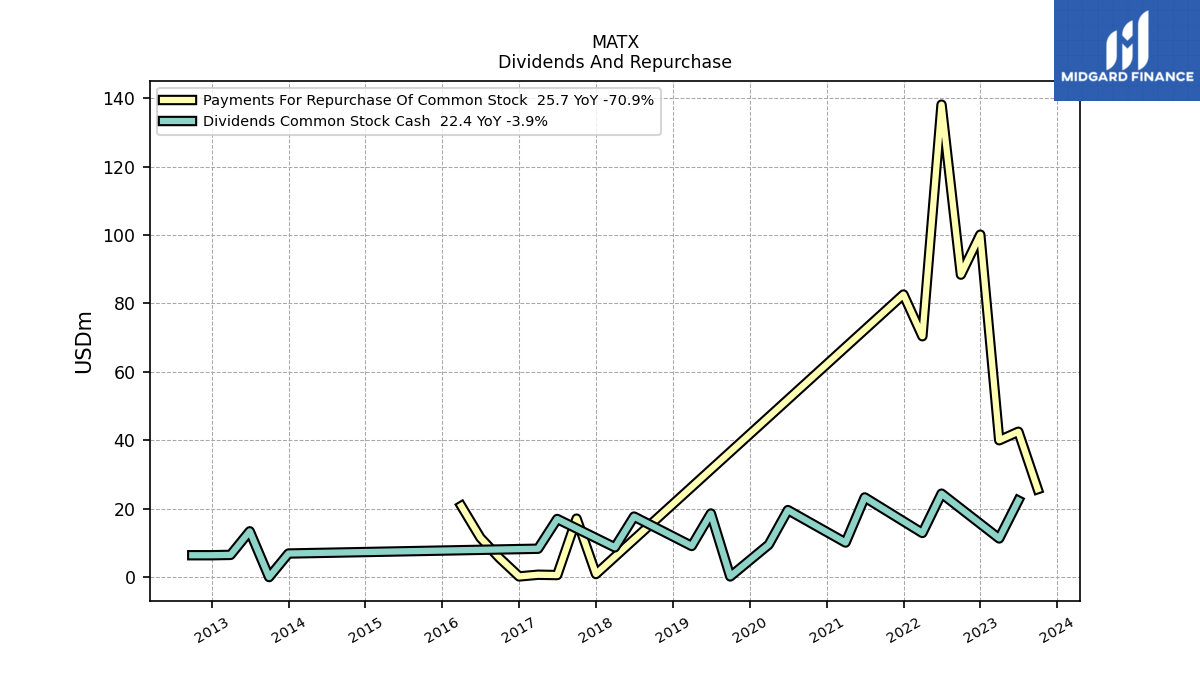
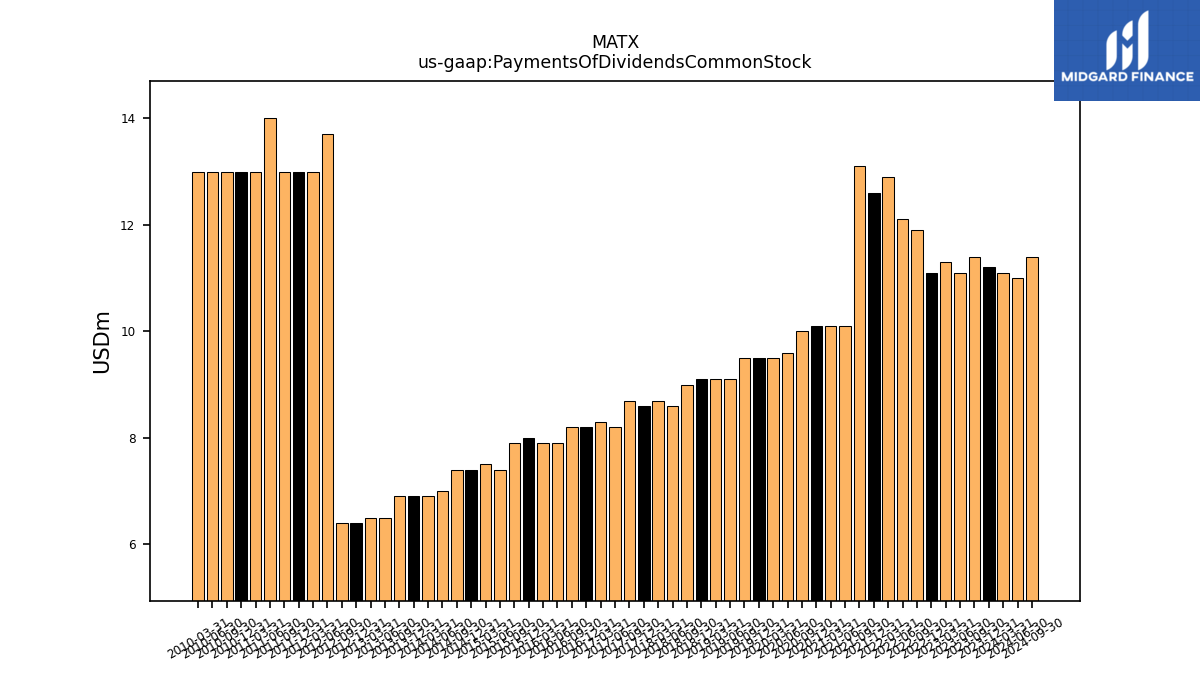
| Payments Of Dividends Common Stock | 11.10 | 11.20 | 11.40 | 11.10 | 11.30 | 11.10 | 11.90 | 12.10 | 12.90 | 12.60 | 13.10 | 10.10 | 10.10 | 10.10 | 10.00 | 9.60 | 9.50 | 9.50 | 9.50 | 9.10 | 9.10 | 9.10 | 9.00 | 8.60 | 8.70 | 8.60 | 8.70 | 8.20 | 8.30 | 8.20 | 8.20 | 7.90 | 7.90 | 8.00 | 7.90 | 7.40 | 7.50 | 7.40 | 7.40 | 7.00 | 6.90 | 6.90 | 6.90 | 6.50 | 6.50 | 6.40 | 6.40 | 13.70 | 13.00 | 13.00 | 13.00 | 14.00 | 13.00 | 13.00 | 13.00 | 13.00 | 13.00 | |
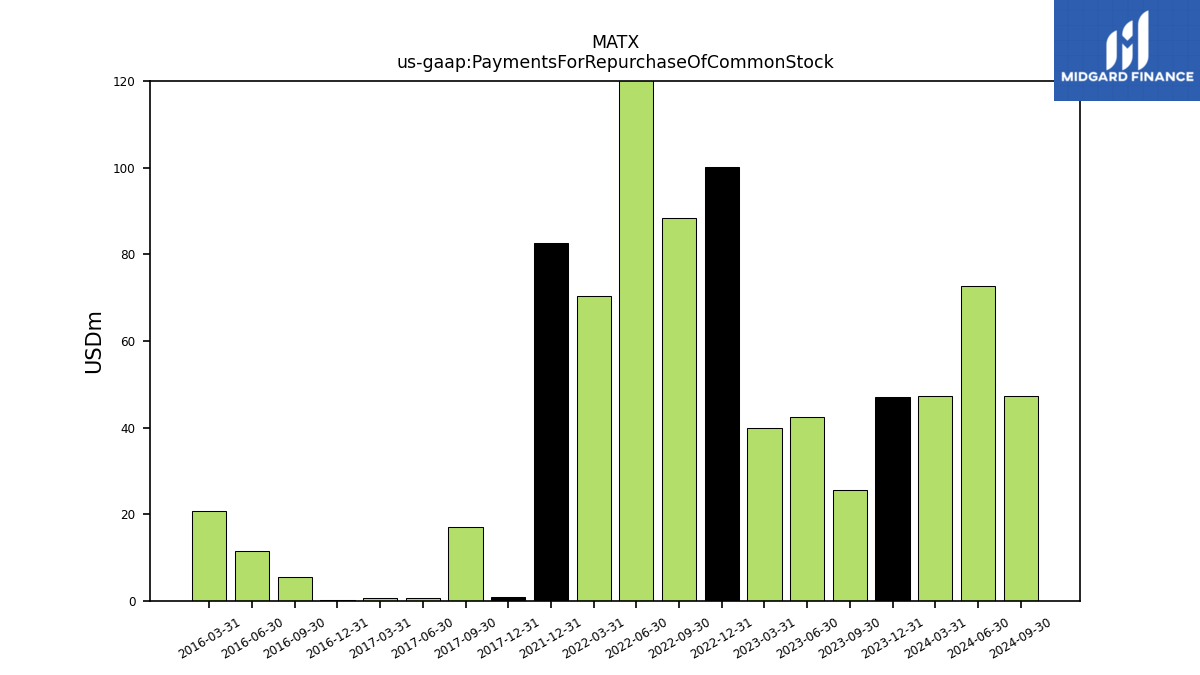
| Payments For Repurchase Of Common Stock | 47.30 | 47.00 | 25.70 | 42.50 | 40.00 | 100.10 | 88.40 | 138.10 | 70.40 | 82.60 | NA | NA | NA | NA | NA | NA | NA | NA | NA | NA | NA | NA | NA | NA | NA | 0.90 | 17.10 | 0.60 | 0.70 | 0.20 | 5.50 | 11.50 | 20.80 | NA | NA | NA | NA | NA | NA | NA | NA | NA | NA | NA | NA | NA | NA | NA | NA | NA | NA | NA | NA | NA | NA | NA | NA |
| 2024-03-31 | 2023-12-31 | 2023-09-30 | 2023-06-30 | 2023-03-31 | 2022-12-31 | 2022-09-30 | 2022-06-30 | 2022-03-31 | 2021-12-31 | 2021-09-30 | 2021-06-30 | 2021-03-31 | 2020-12-31 | 2020-09-30 | 2020-06-30 | 2020-03-31 | 2019-12-31 | 2019-09-30 | 2019-06-30 | 2019-03-31 | 2018-12-31 | 2018-09-30 | 2018-06-30 | 2018-03-31 | 2017-12-31 | 2017-09-30 | 2017-06-30 | 2017-03-31 | 2016-12-31 | 2016-09-30 | 2016-06-30 | 2016-03-31 | 2015-12-31 | 2015-09-30 | 2015-06-30 | 2015-03-31 | 2014-12-31 | 2014-09-30 | 2014-06-30 | 2014-03-31 | 2013-12-31 | 2013-09-30 | 2013-06-30 | 2013-03-31 | 2012-12-31 | 2012-09-30 | 2012-06-30 | 2012-03-31 | 2011-12-31 | 2011-09-30 | 2011-06-30 | 2011-03-31 | 2010-12-31 | 2010-09-30 | 2010-06-30 | 2010-03-31 | ||
|---|---|---|---|---|---|---|---|---|---|---|---|---|---|---|---|---|---|---|---|---|---|---|---|---|---|---|---|---|---|---|---|---|---|---|---|---|---|---|---|---|---|---|---|---|---|---|---|---|---|---|---|---|---|---|---|---|---|---|
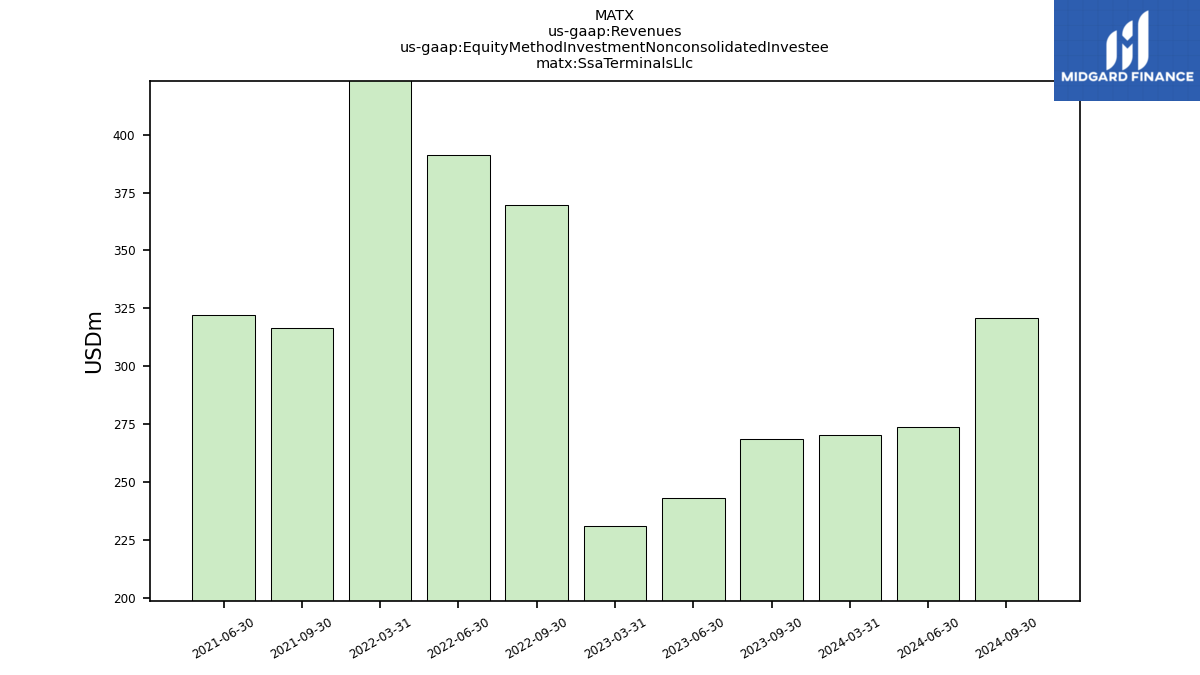
| Ssa Terminals Llc | 270.30 | NA | 268.40 | 242.90 | 230.80 | NA | 369.80 | 391.10 | 430.40 | NA | 316.30 | 322.20 | NA | NA | NA | NA | NA | NA | NA | NA | NA | NA | NA | NA | NA | NA | NA | NA | NA | NA | NA | NA | NA | NA | NA | NA | NA | NA | NA | NA | NA | NA | NA | NA | NA | NA | NA | NA | NA | NA | NA | NA | NA | NA | NA | NA | NA | |
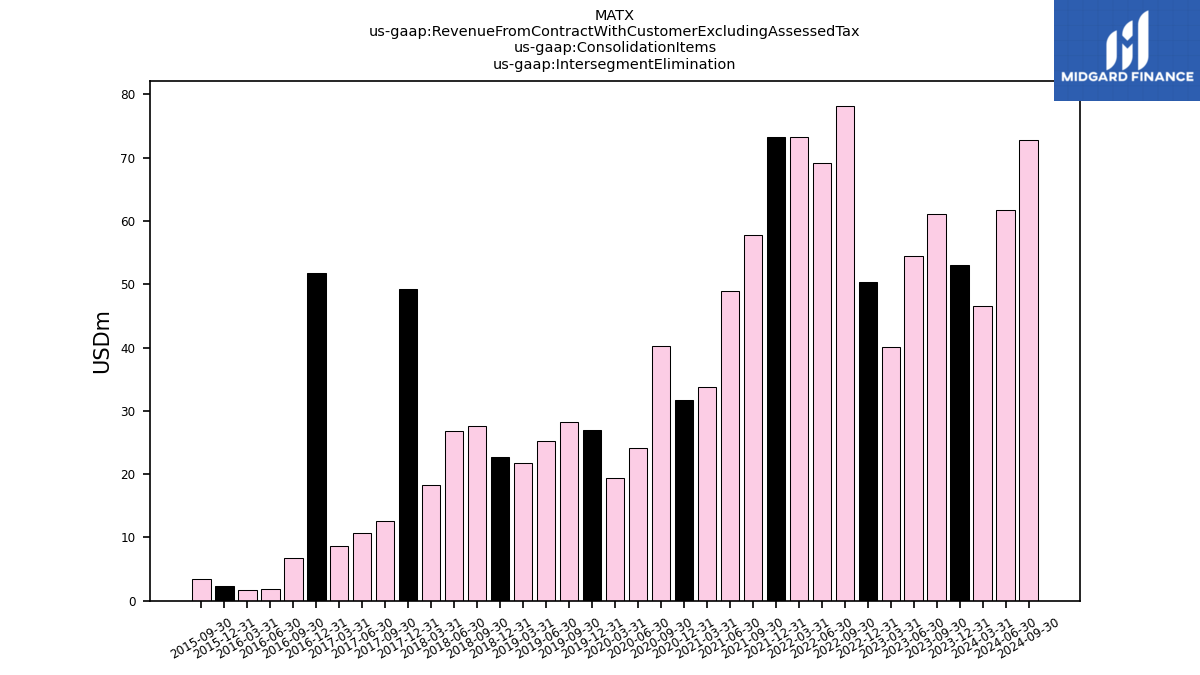
| Revenue From Contract With Customer Excluding Assessed Tax | 722.10 | 788.90 | 827.50 | 773.40 | 704.80 | 801.60 | 1114.80 | 1261.10 | 1165.50 | 1267.00 | 1071.60 | 874.90 | 711.80 | 700.10 | 645.20 | 524.10 | 513.90 | 540.70 | 572.10 | 557.90 | 532.40 | 564.90 | 589.40 | 557.10 | 511.40 | 516.10 | 543.90 | 512.50 | 474.40 | 519.30 | 500.40 | 467.70 | 454.20 | 494.80 | 544.30 | 447.60 | 398.20 | 443.50 | 441.80 | 436.40 | 392.50 | 410.90 | 415.00 | 416.60 | 394.70 | 398.30 | 401.40 | 394.20 | 405.00 | 460.20 | 440.20 | 488.20 | 405.60 | 437.60 | 437.30 | 396.80 | 343.10 | |
| Intersegment Elimination | 46.60 | 53.10 | 61.10 | 54.40 | 40.10 | 50.30 | 78.20 | 69.20 | 73.20 | 73.30 | 57.80 | 49.00 | 33.70 | 31.70 | 40.20 | 24.20 | 19.40 | 27.00 | 28.20 | 25.30 | 21.80 | 22.70 | 27.60 | 26.80 | 18.30 | 49.30 | 12.60 | 10.70 | 8.70 | 51.70 | 6.70 | 1.90 | 1.70 | 2.40 | 3.40 | NA | NA | NA | NA | NA | NA | NA | NA | NA | NA | NA | NA | NA | NA | NA | NA | NA | NA | NA | NA | NA | NA | |
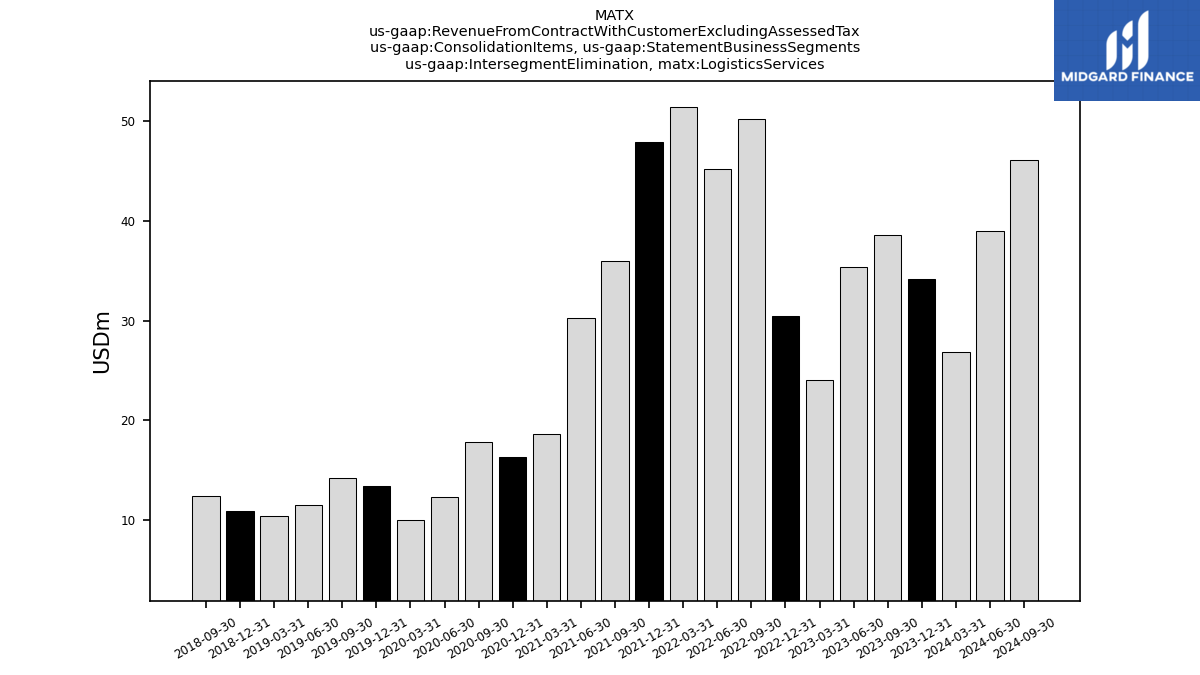
| Intersegment Elimination, Logistics Services | 26.90 | 34.20 | 38.60 | 35.40 | 24.00 | 30.50 | 50.20 | 45.20 | 51.40 | 47.90 | 36.00 | 30.30 | 18.60 | 16.30 | 17.80 | 12.30 | 10.00 | 13.40 | 14.20 | 11.50 | 10.40 | 10.90 | 12.40 | NA | NA | NA | NA | NA | NA | NA | NA | NA | NA | NA | NA | NA | NA | NA | NA | NA | NA | NA | NA | NA | NA | NA | NA | NA | NA | NA | NA | NA | NA | NA | NA | NA | NA | |
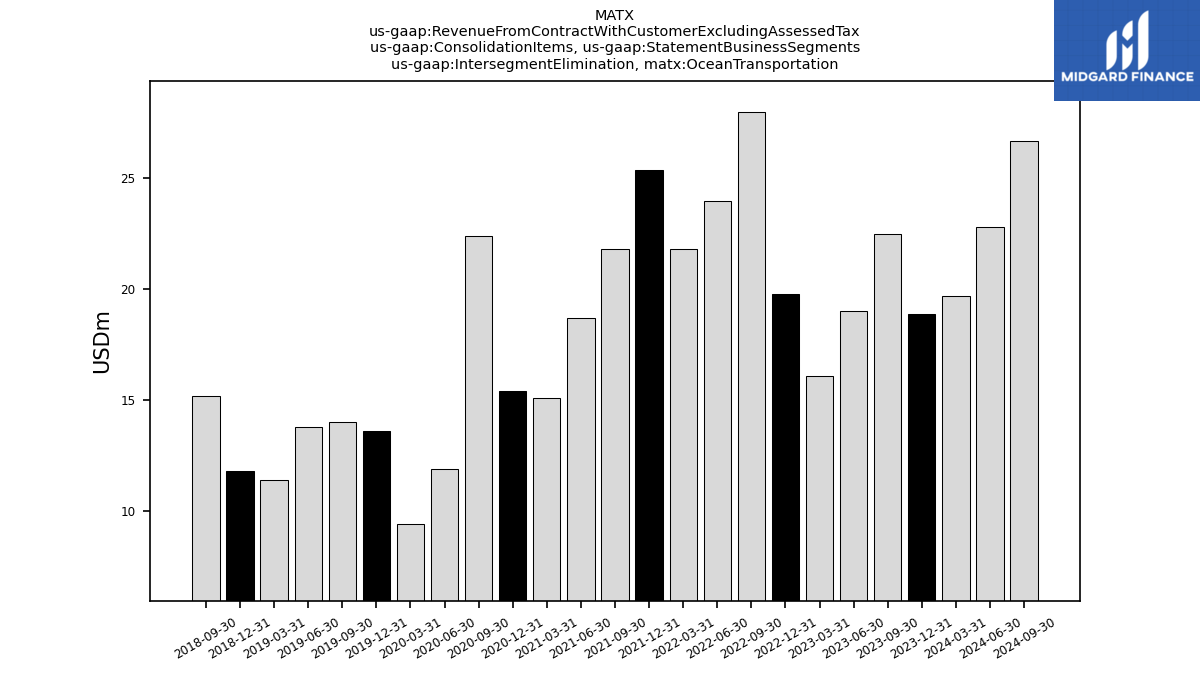
| Intersegment Elimination, Ocean Transportation | 19.70 | 18.90 | 22.50 | 19.00 | 16.10 | 19.80 | 28.00 | 24.00 | 21.80 | 25.40 | 21.80 | 18.70 | 15.10 | 15.40 | 22.40 | 11.90 | 9.40 | 13.60 | 14.00 | 13.80 | 11.40 | 11.80 | 15.20 | NA | NA | NA | NA | NA | NA | NA | NA | NA | NA | NA | NA | NA | NA | NA | NA | NA | NA | NA | NA | NA | NA | NA | NA | NA | NA | NA | NA | NA | NA | NA | NA | NA | NA | |
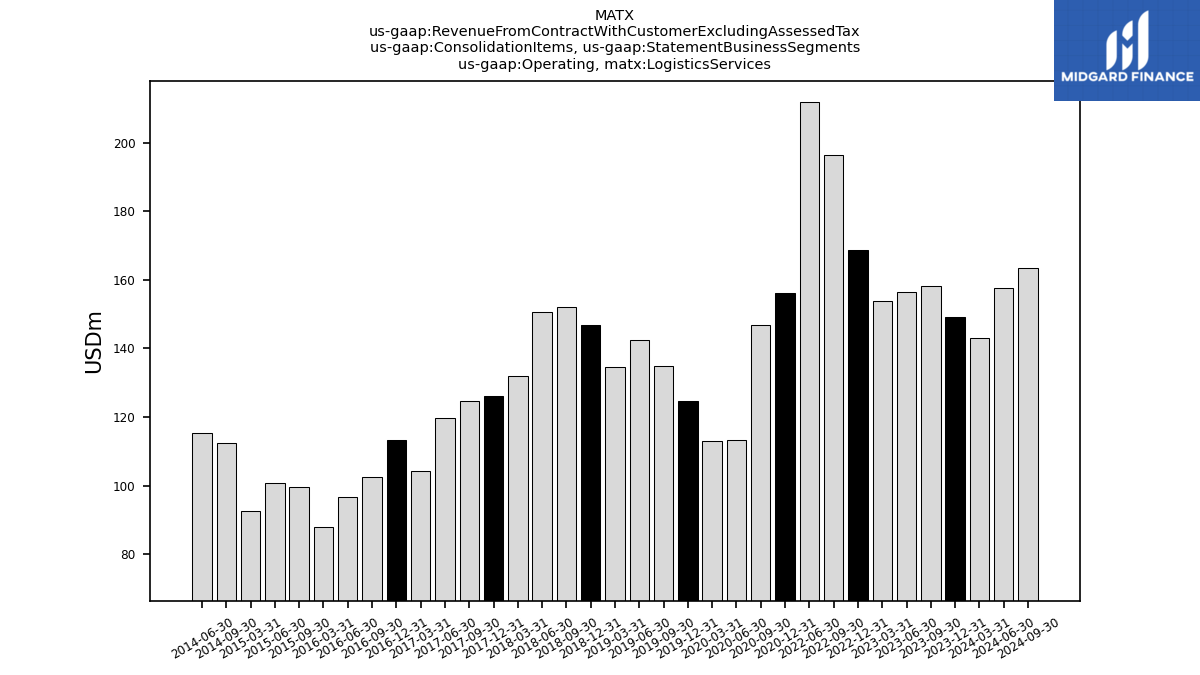
| Operating, Logistics Services | 143.10 | 149.20 | 158.10 | 156.50 | 153.80 | 168.60 | 196.30 | 211.90 | NA | NA | NA | NA | NA | 156.20 | 146.90 | 113.30 | 113.00 | 124.60 | 134.90 | 142.50 | 134.50 | 146.80 | 152.10 | 150.50 | 132.10 | 126.20 | 124.70 | 119.80 | 104.40 | 113.20 | 102.40 | 96.80 | 88.10 | NA | 99.50 | 100.90 | 92.70 | NA | 112.30 | 115.30 | NA | NA | NA | NA | NA | NA | NA | NA | NA | NA | NA | NA | NA | NA | NA | NA | NA | |
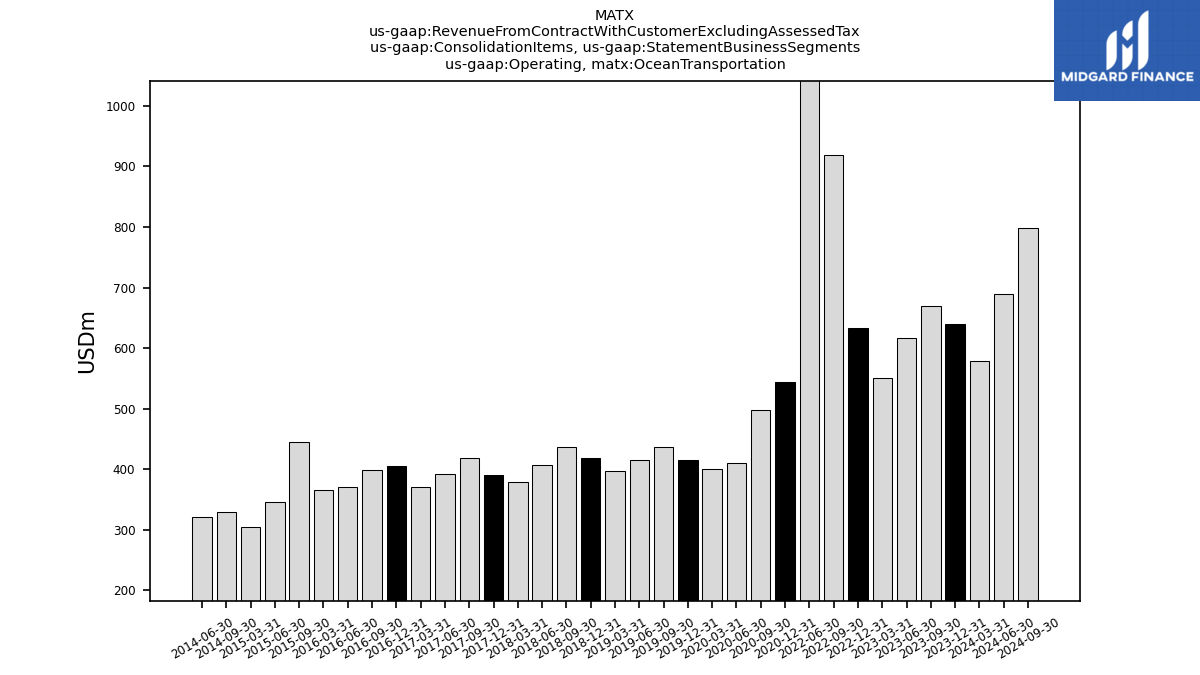
| Operating, Ocean Transportation | 579.00 | 639.70 | 669.40 | 616.90 | 551.00 | 633.00 | 918.50 | 1049.20 | NA | NA | NA | NA | NA | 543.90 | 498.30 | 410.80 | 400.90 | 416.10 | 437.20 | 415.40 | 397.90 | 418.10 | 437.30 | 406.60 | 379.30 | 389.90 | 419.20 | 392.70 | 370.00 | 406.10 | 398.00 | 370.90 | 366.10 | NA | 444.80 | 346.70 | 305.50 | NA | 329.50 | 321.10 | NA | NA | NA | NA | NA | NA | NA | NA | NA | NA | NA | NA | NA | NA | NA | NA | NA | |
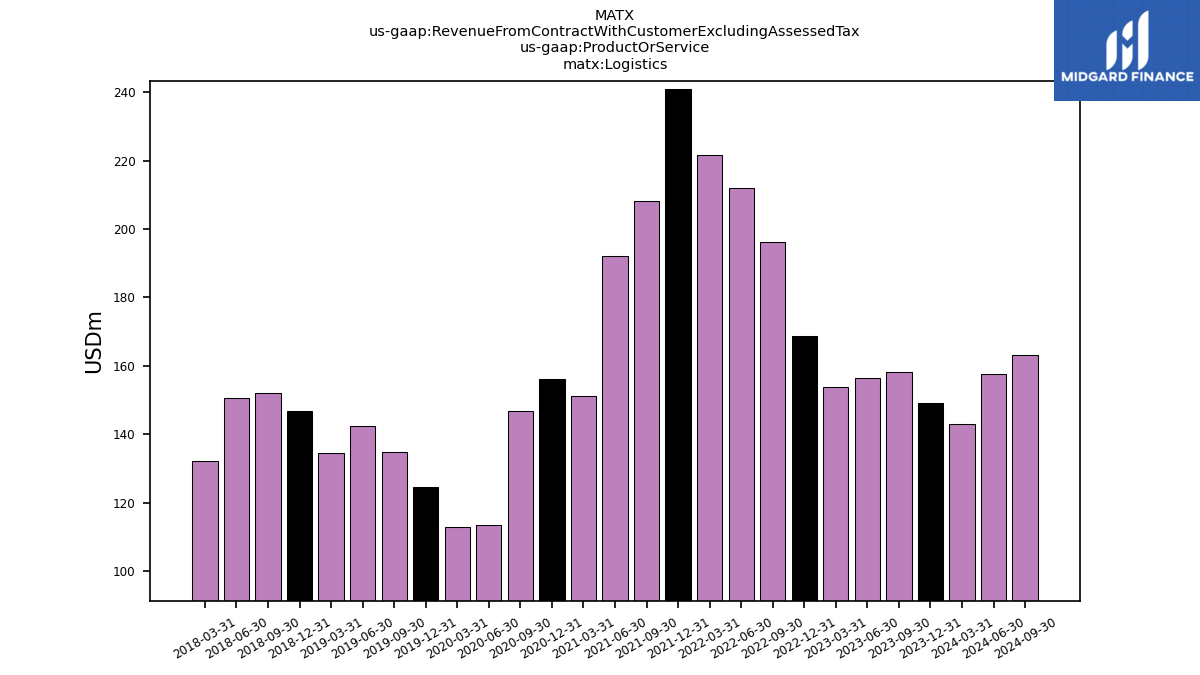
| Logistics | 143.10 | 149.20 | 158.10 | 156.50 | 153.80 | 168.60 | 196.30 | 211.90 | 221.60 | 241.10 | 208.10 | 192.00 | 151.30 | 156.20 | 146.90 | 113.30 | 113.00 | 124.60 | 134.90 | 142.50 | 134.50 | 146.80 | 152.10 | 150.50 | 132.10 | NA | NA | NA | NA | NA | NA | NA | NA | NA | NA | NA | NA | NA | NA | NA | NA | NA | NA | NA | NA | NA | NA | NA | NA | NA | NA | NA | NA | NA | NA | NA | NA | |
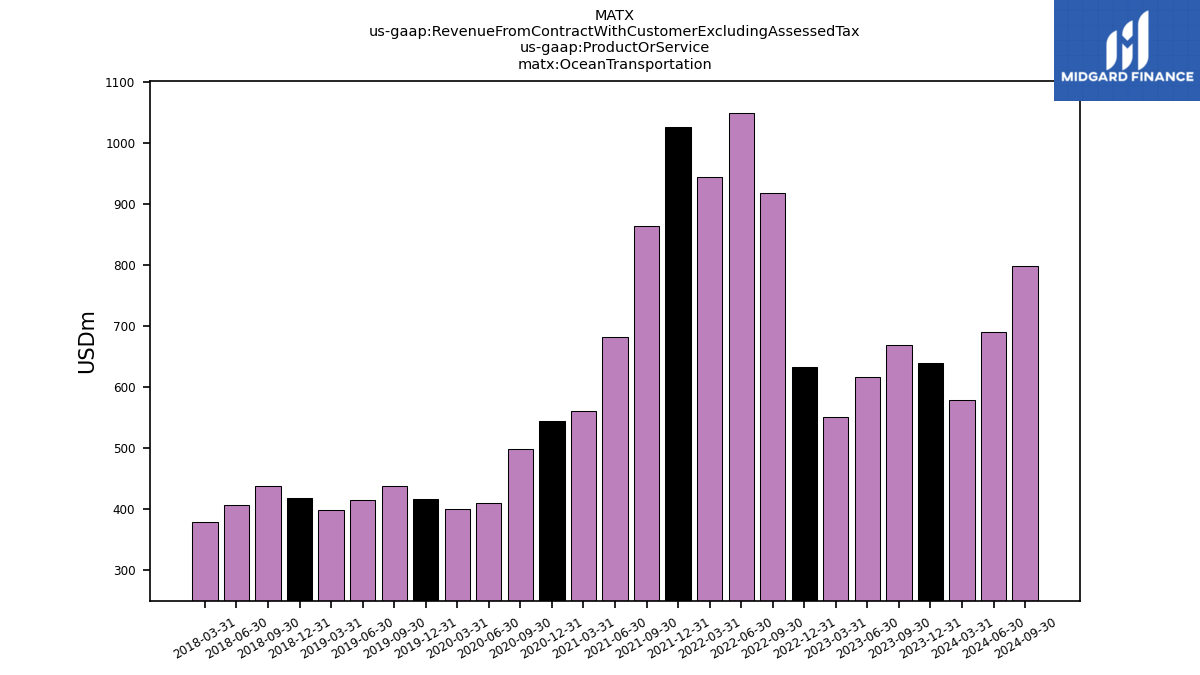
| Ocean Transportation | 579.00 | 639.70 | 669.40 | 616.90 | 551.00 | 633.00 | 918.50 | 1049.20 | 943.90 | 1025.90 | 863.50 | 682.90 | 560.50 | 543.90 | 498.30 | 410.80 | 400.90 | 416.10 | 437.20 | 415.40 | 397.90 | 418.10 | 437.30 | 406.60 | 379.30 | NA | NA | NA | NA | NA | NA | NA | NA | NA | NA | NA | NA | NA | NA | NA | NA | NA | NA | NA | NA | NA | NA | NA | NA | NA | NA | NA | NA | NA | NA | NA | NA |