
| 2023-03-31 | 2022-12-31 | 2022-09-30 | 2022-06-30 | 2022-03-31 | 2021-12-31 | 2021-09-30 | 2021-06-30 | 2021-03-31 | 2020-12-31 | 2020-09-30 | 2020-06-30 | 2020-03-31 | 2019-12-31 | 2019-09-30 | 2019-06-30 | 2019-03-31 | 2018-12-31 | 2018-09-30 | 2018-06-30 | 2018-03-31 | 2017-12-31 | 2017-09-30 | ||
|---|---|---|---|---|---|---|---|---|---|---|---|---|---|---|---|---|---|---|---|---|---|---|---|---|
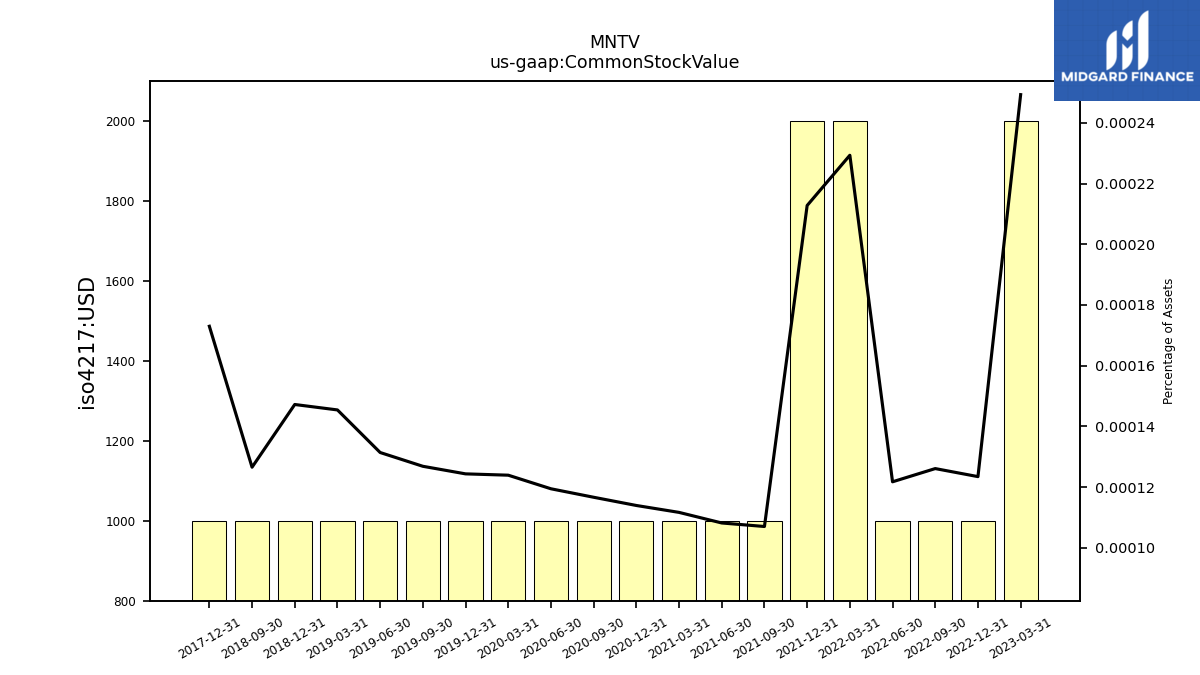
| Common Stock Value | 0.00 | 0.00 | 0.00 | 0.00 | 0.00 | 0.00 | 0.00 | 0.00 | 0.00 | 0.00 | 0.00 | 0.00 | 0.00 | 0.00 | 0.00 | 0.00 | 0.00 | 0.00 | 0.00 | NA | NA | 0.00 | NA | |
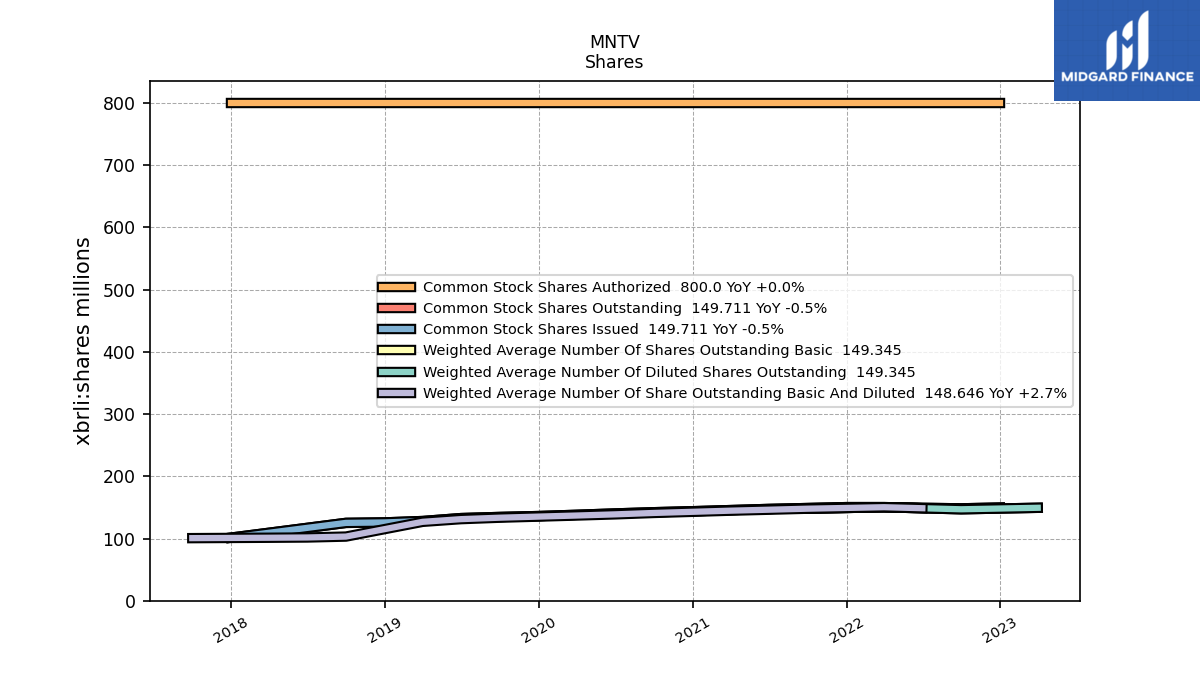
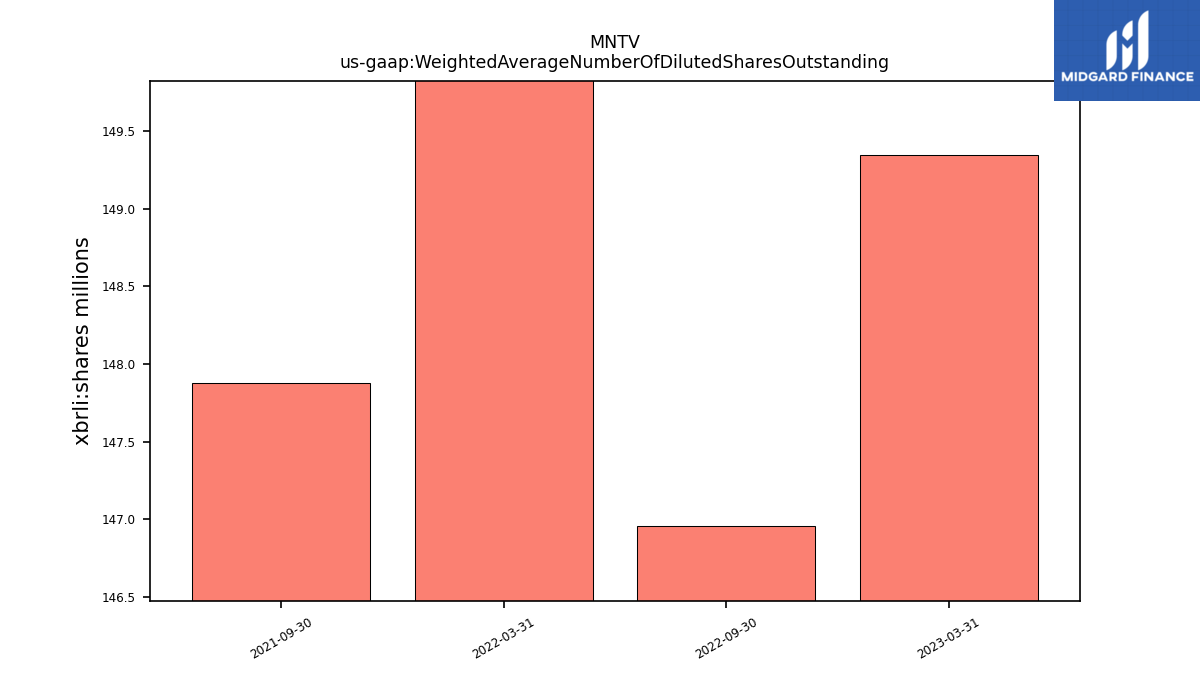
| Weighted Average Number Of Diluted Shares Outstanding | 149.34 | NA | 146.95 | NA | 150.26 | NA | 147.88 | NA | NA | NA | NA | NA | NA | NA | NA | NA | NA | NA | NA | NA | NA | NA | NA | |
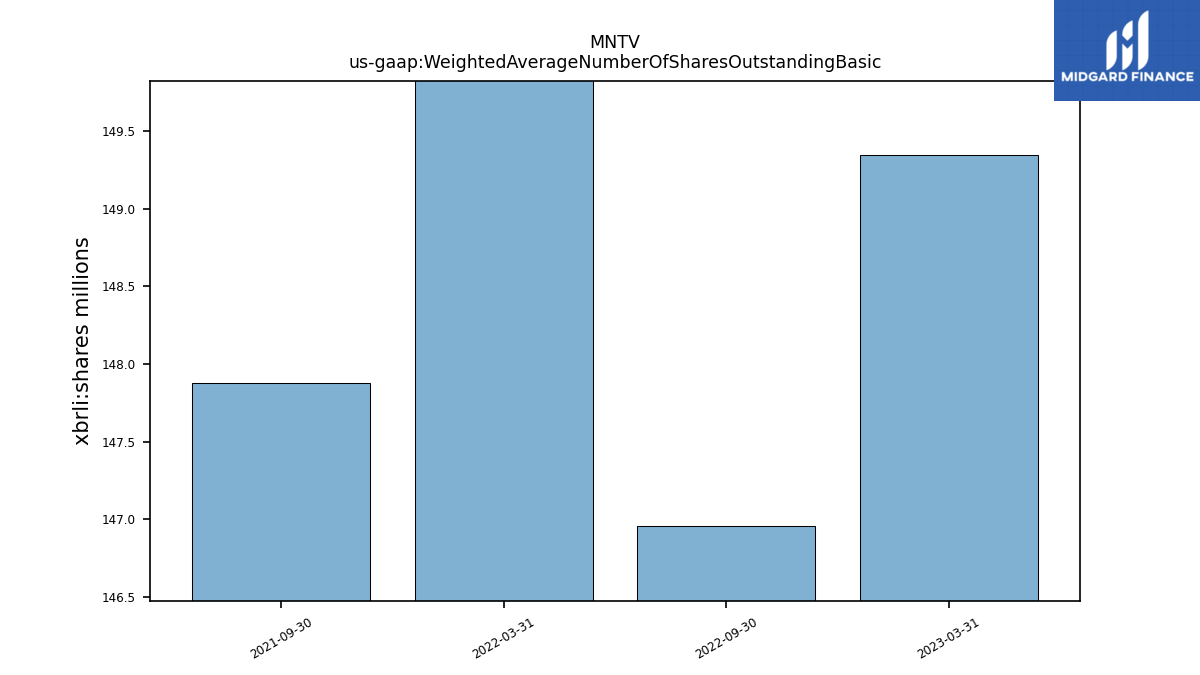
| Weighted Average Number Of Shares Outstanding Basic | 149.34 | NA | 146.95 | NA | 150.26 | NA | 147.88 | NA | NA | NA | NA | NA | NA | NA | NA | NA | NA | NA | NA | NA | NA | NA | NA | |
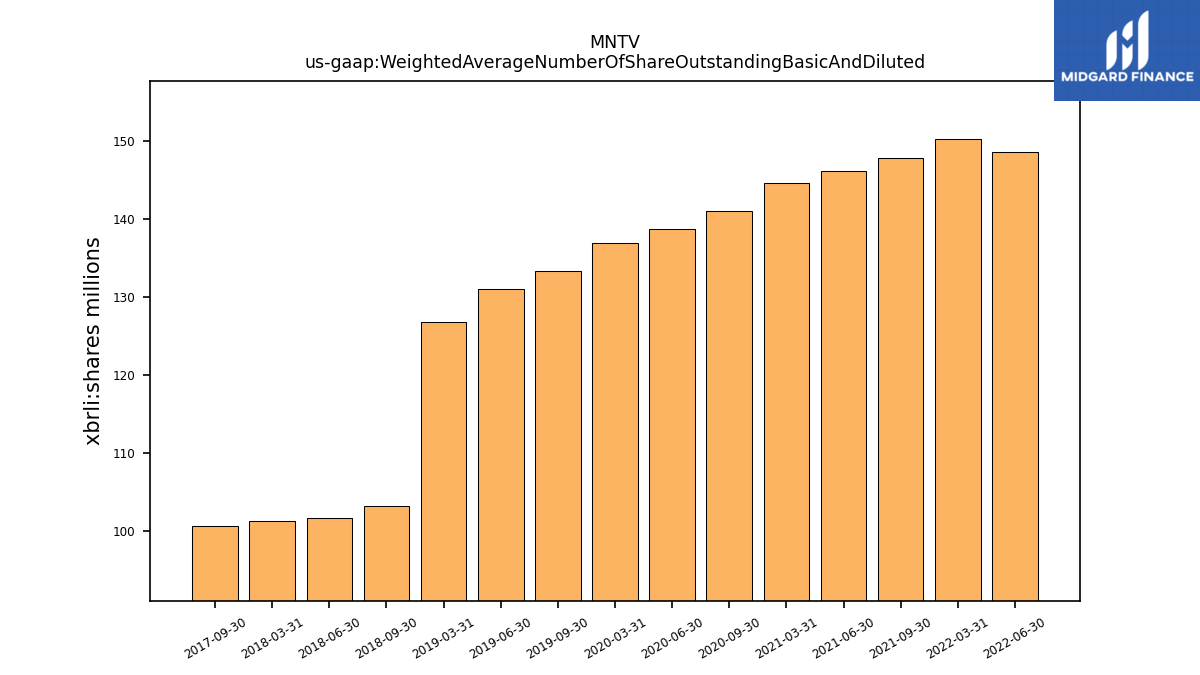
| Weighted Average Number Of Share Outstanding Basic And Diluted | NA | NA | NA | 148.65 | 150.26 | NA | 147.88 | 146.24 | 144.69 | NA | 141.03 | 138.78 | 136.91 | NA | 133.42 | 131.10 | 126.79 | NA | 103.10 | 101.62 | 101.21 | NA | 100.58 | |
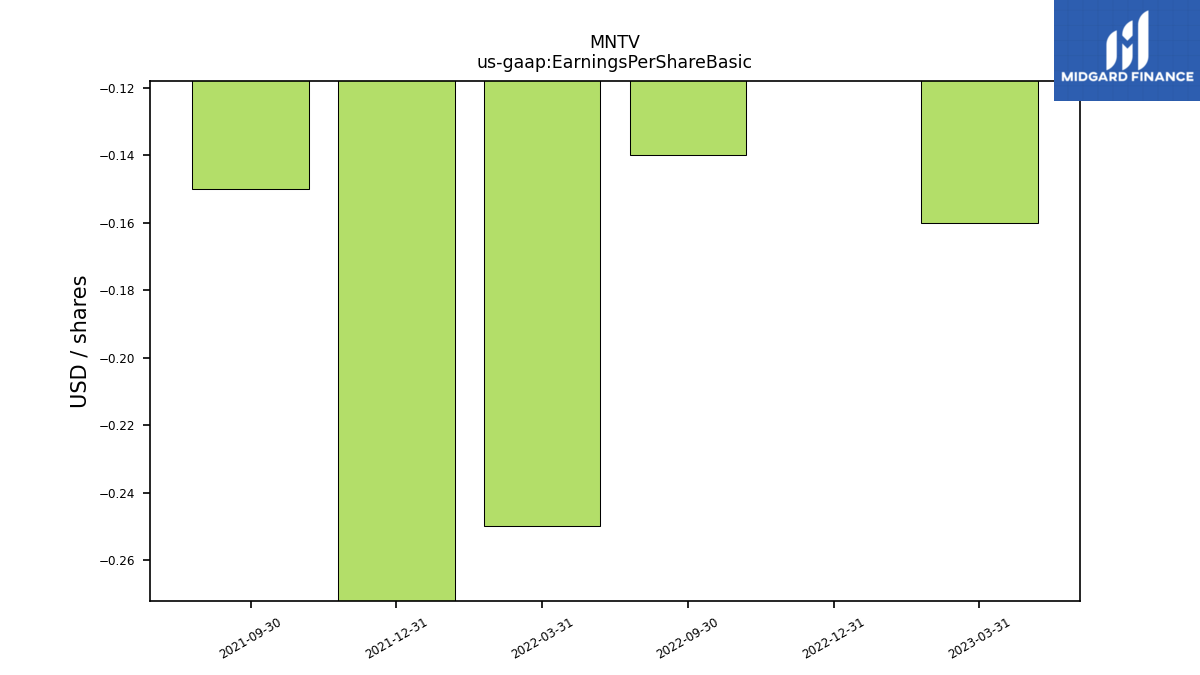
| Earnings Per Share Basic | -0.16 | -0.03 | -0.14 | NA | -0.25 | -0.28 | -0.15 | NA | NA | NA | NA | NA | NA | NA | NA | NA | NA | NA | NA | NA | NA | NA | NA | |
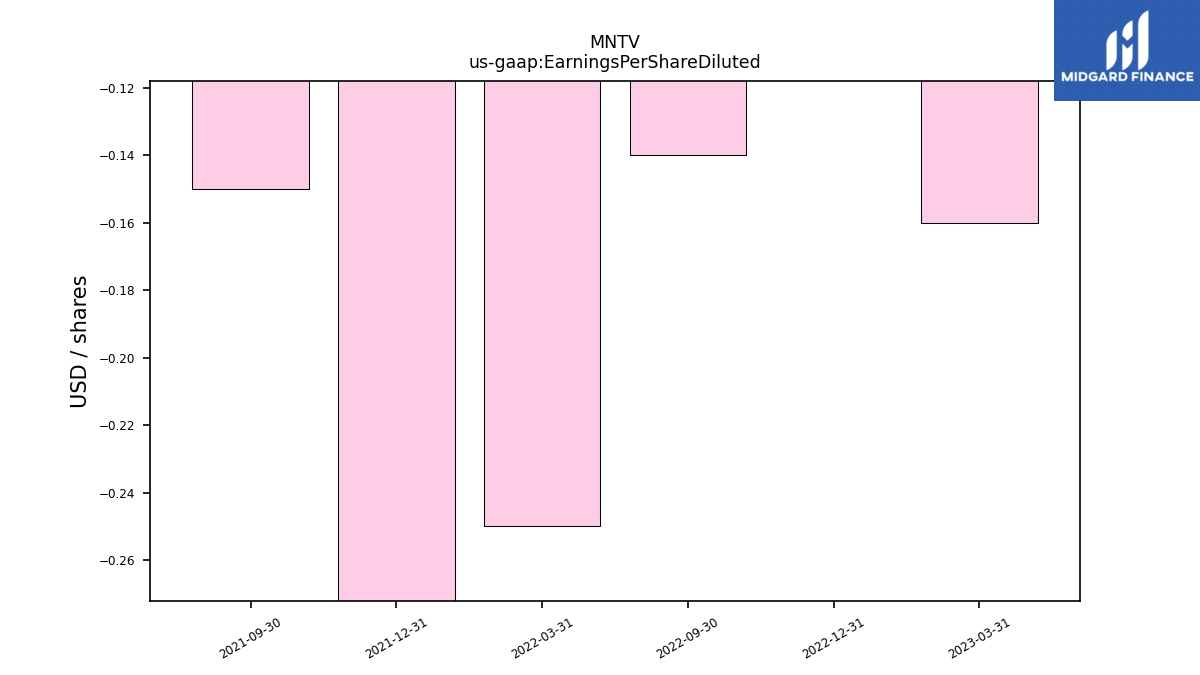
| Earnings Per Share Diluted | -0.16 | -0.03 | -0.14 | NA | -0.25 | -0.28 | -0.15 | NA | NA | NA | NA | NA | NA | NA | NA | NA | NA | NA | NA | NA | NA | NA | NA | |
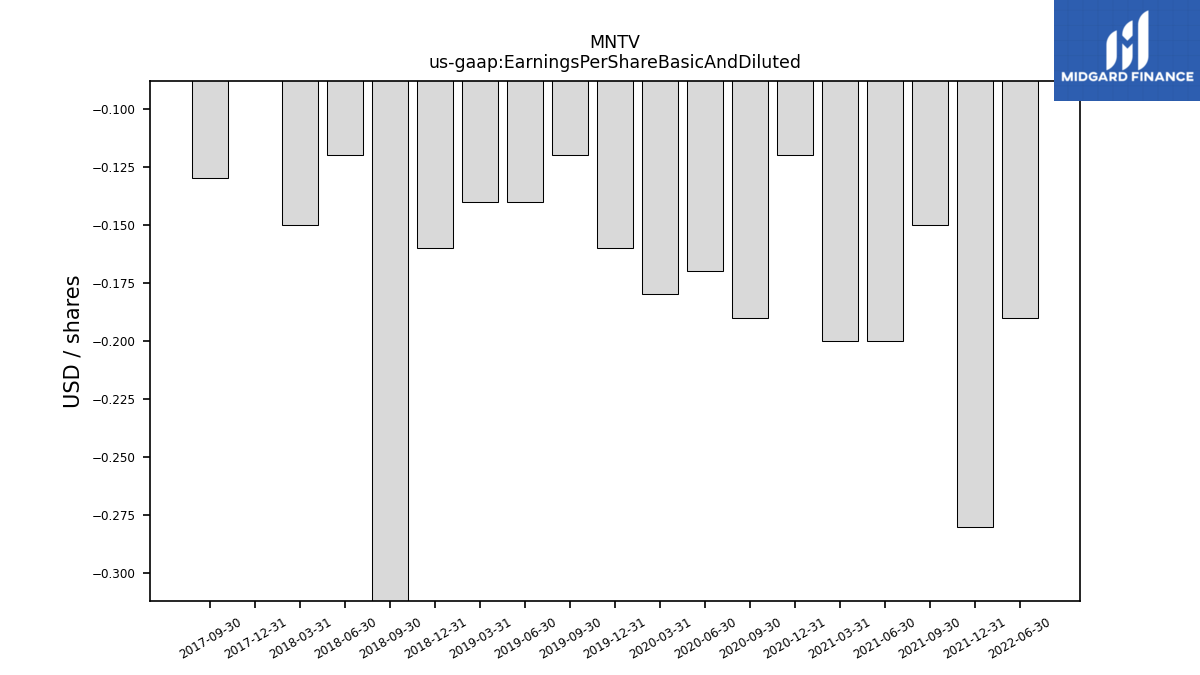
| Earnings Per Share Basic And Diluted | NA | NA | NA | -0.19 | NA | -0.28 | -0.15 | -0.20 | -0.20 | -0.12 | -0.19 | -0.17 | -0.18 | -0.16 | -0.12 | -0.14 | -0.14 | -0.16 | -0.99 | -0.12 | -0.15 | 0.08 | -0.13 |
| 2023-03-31 | 2022-12-31 | 2022-09-30 | 2022-06-30 | 2022-03-31 | 2021-12-31 | 2021-09-30 | 2021-06-30 | 2021-03-31 | 2020-12-31 | 2020-09-30 | 2020-06-30 | 2020-03-31 | 2019-12-31 | 2019-09-30 | 2019-06-30 | 2019-03-31 | 2018-12-31 | 2018-09-30 | 2018-06-30 | 2018-03-31 | 2017-12-31 | 2017-09-30 | ||
|---|---|---|---|---|---|---|---|---|---|---|---|---|---|---|---|---|---|---|---|---|---|---|---|---|
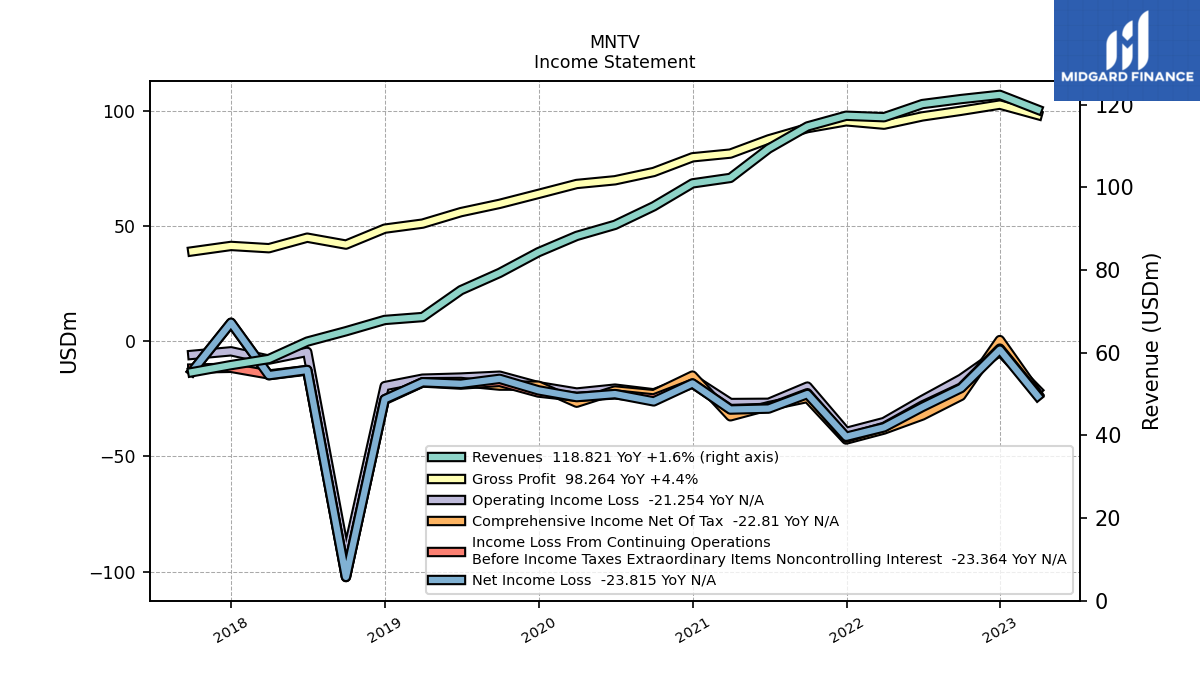
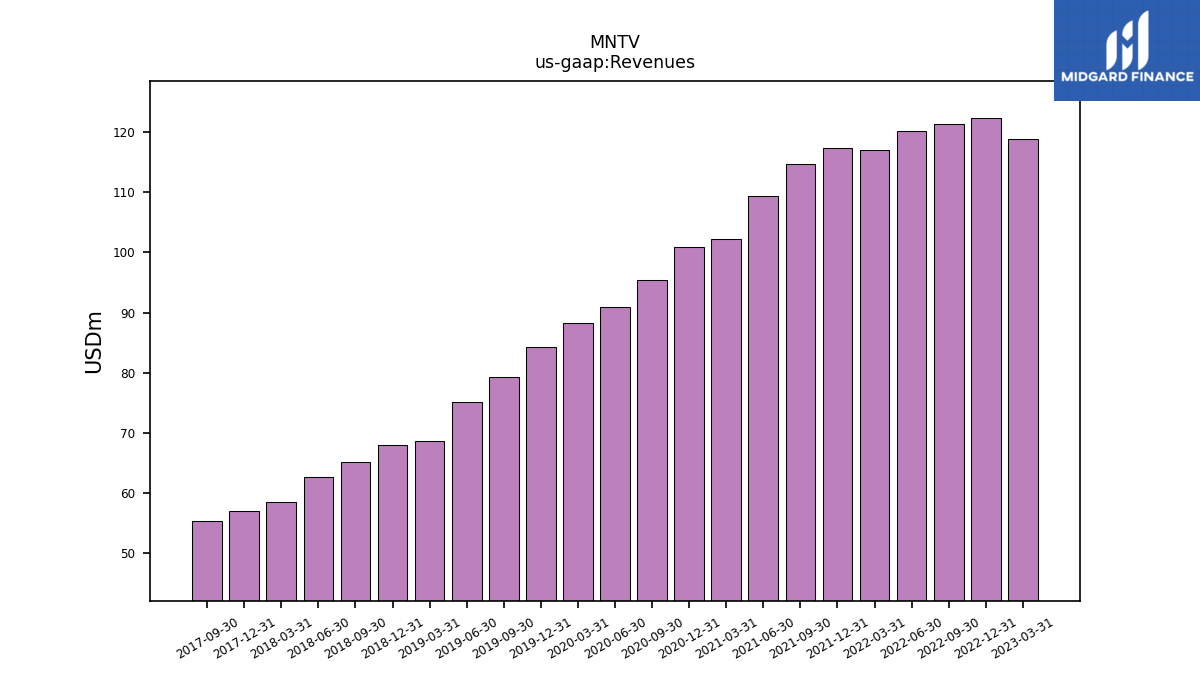
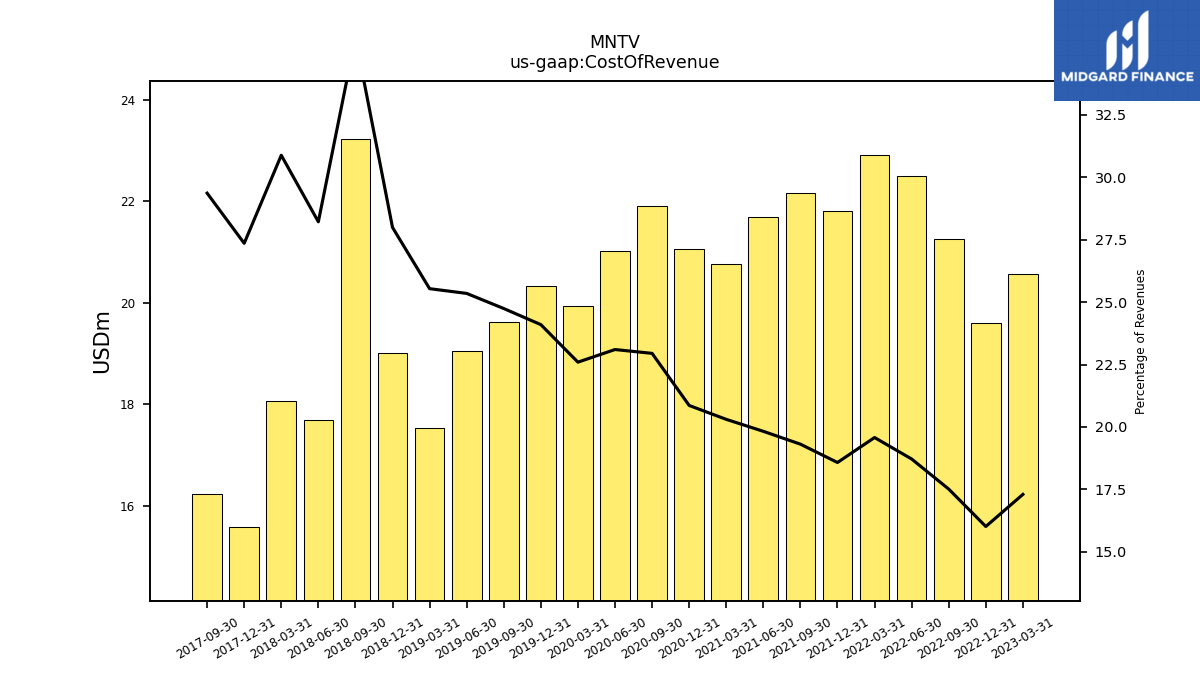
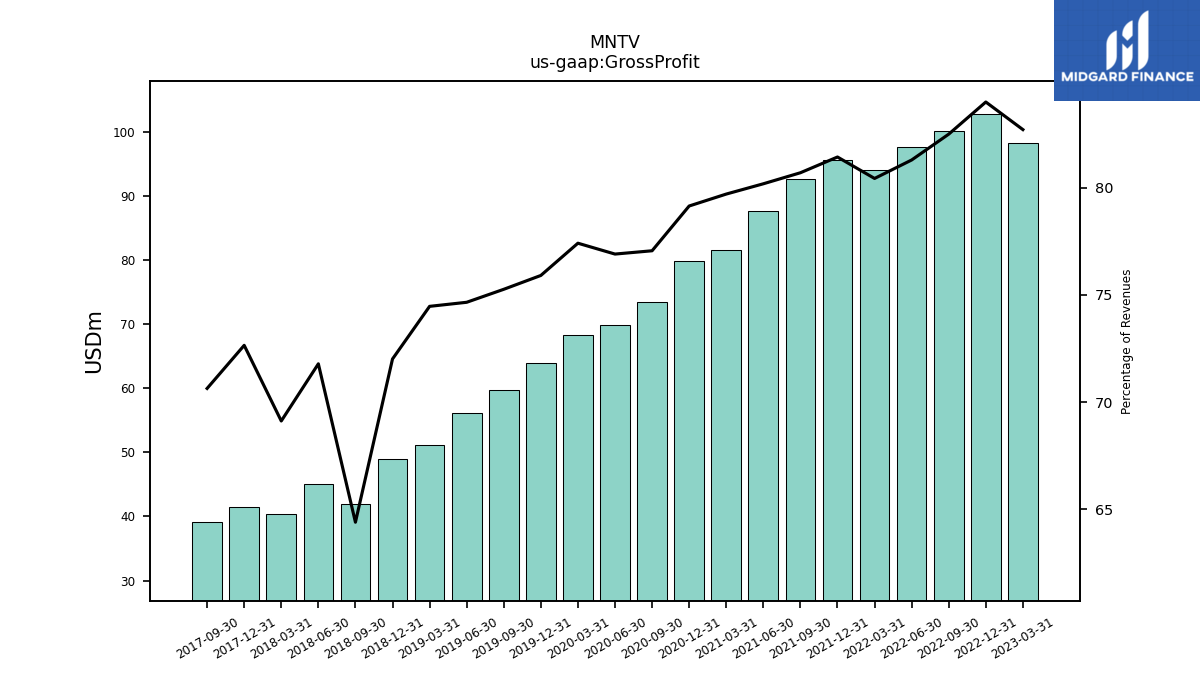
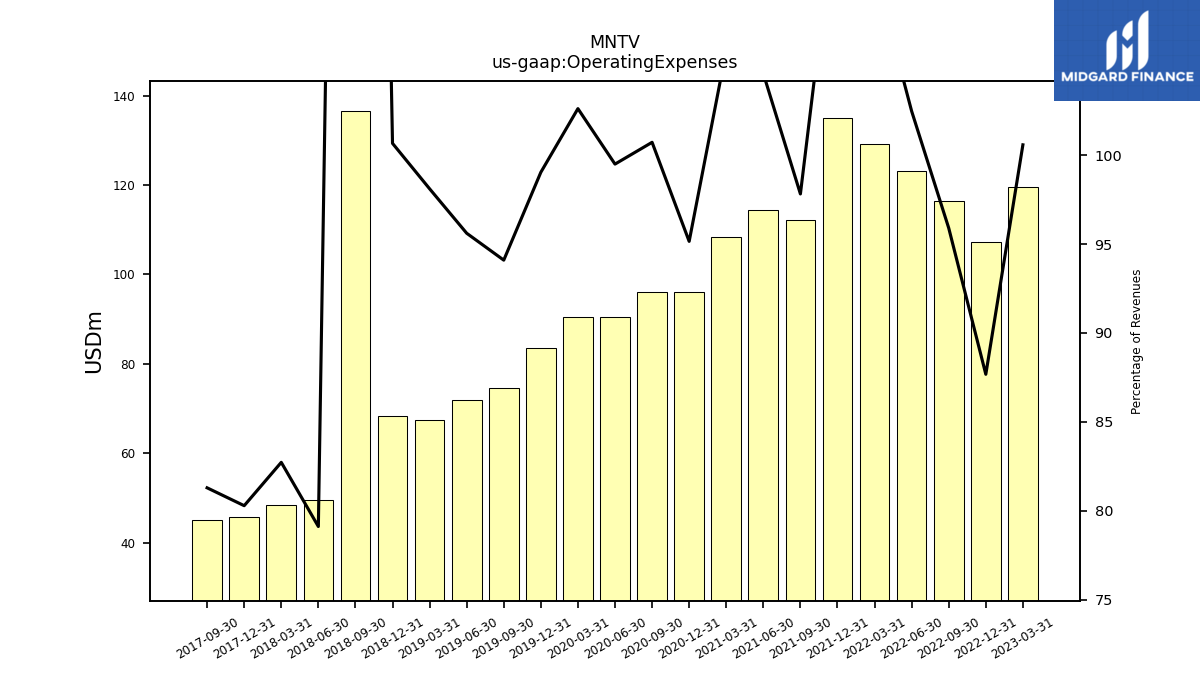
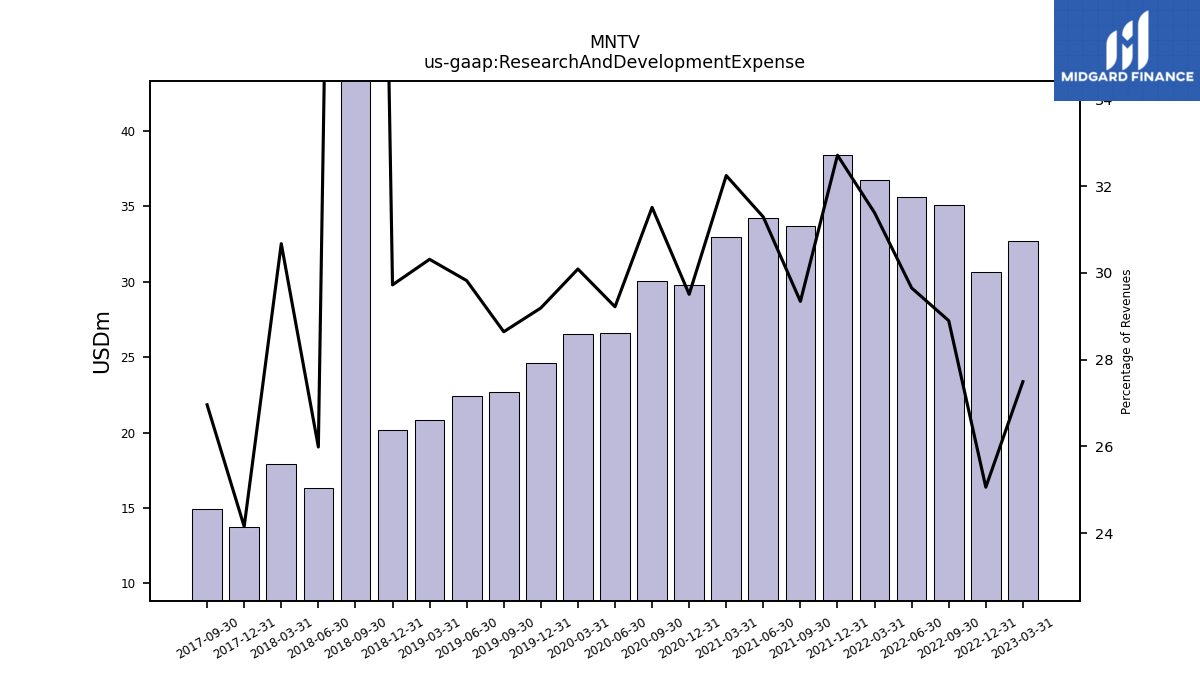
| Revenues | 118.82 | 122.39 | 121.38 | 120.16 | 116.99 | 117.34 | 114.75 | 109.39 | 102.30 | 100.97 | 95.43 | 90.94 | 88.27 | 84.32 | 79.32 | 75.14 | 68.64 | 67.93 | 65.20 | 62.70 | 58.49 | 57.01 | 55.31 | |
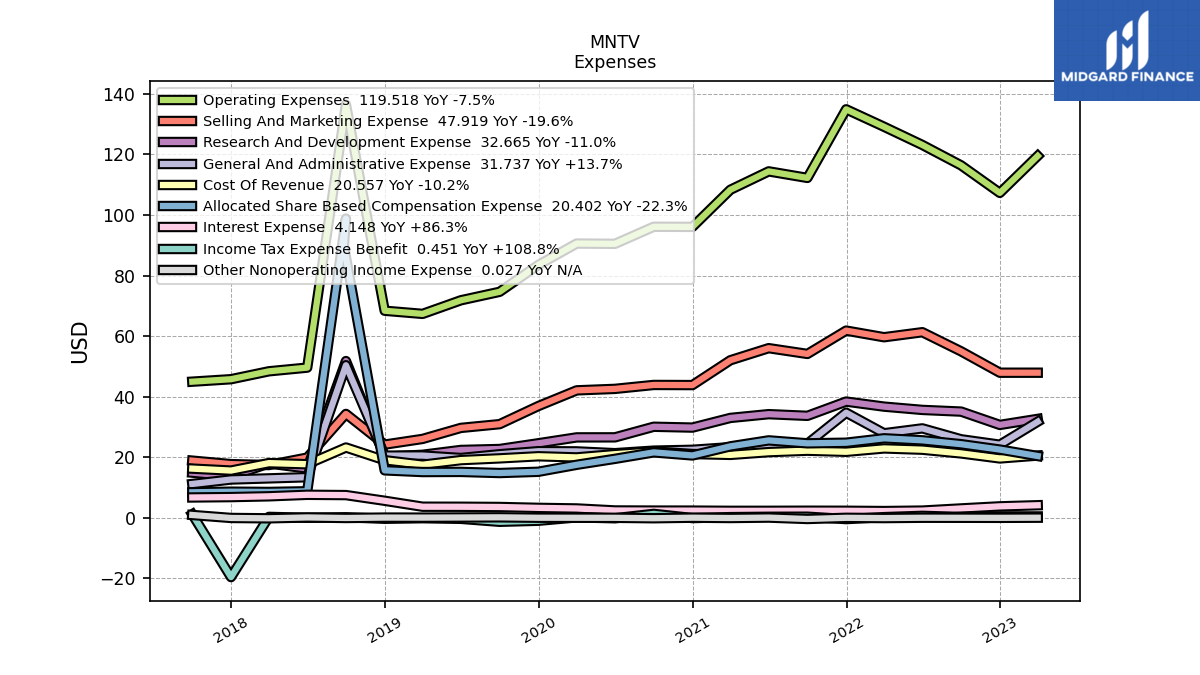
| Cost Of Revenue | 20.56 | 19.60 | 21.26 | 22.49 | 22.90 | 21.80 | 22.16 | 21.69 | 20.77 | 21.07 | 21.90 | 21.01 | 19.94 | 20.32 | 19.63 | 19.05 | 17.53 | 19.02 | 23.21 | 17.69 | 18.06 | 15.60 | 16.24 | |
| Gross Profit | 98.26 | 102.79 | 100.12 | 97.67 | 94.08 | 95.54 | 92.59 | 87.70 | 81.53 | 79.91 | 73.53 | 69.93 | 68.32 | 64.00 | 59.69 | 56.09 | 51.11 | 48.92 | 41.99 | 45.01 | 40.43 | 41.42 | 39.07 | |
| Operating Expenses | 119.52 | 107.31 | 116.40 | 123.14 | 129.15 | 134.92 | 112.25 | 114.42 | 108.34 | 96.08 | 96.12 | 90.49 | 90.58 | 83.52 | 74.64 | 71.84 | 67.35 | 68.39 | 136.47 | 49.60 | 48.38 | 45.77 | 44.96 | |
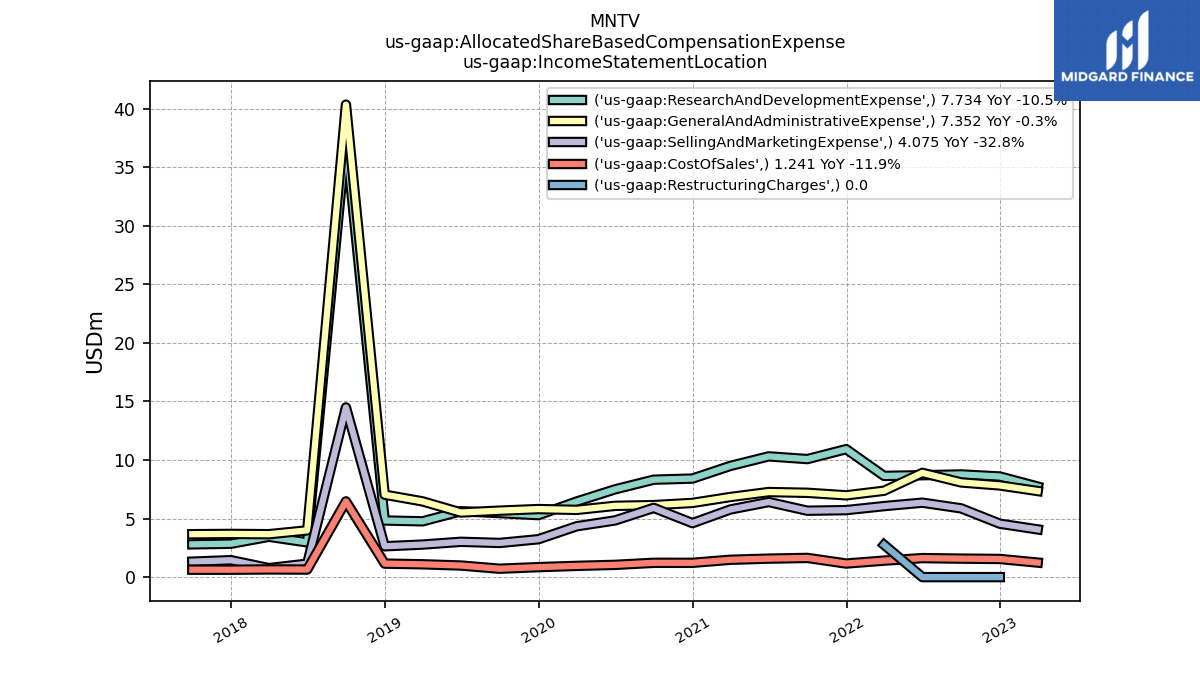
| Research And Development Expense | 32.66 | 30.67 | 35.07 | 35.63 | 36.72 | 38.38 | 33.67 | 34.23 | 32.98 | 29.79 | 30.07 | 26.57 | 26.56 | 24.61 | 22.72 | 22.41 | 20.81 | 20.19 | 51.77 | 16.29 | 17.94 | 13.77 | 14.91 | |
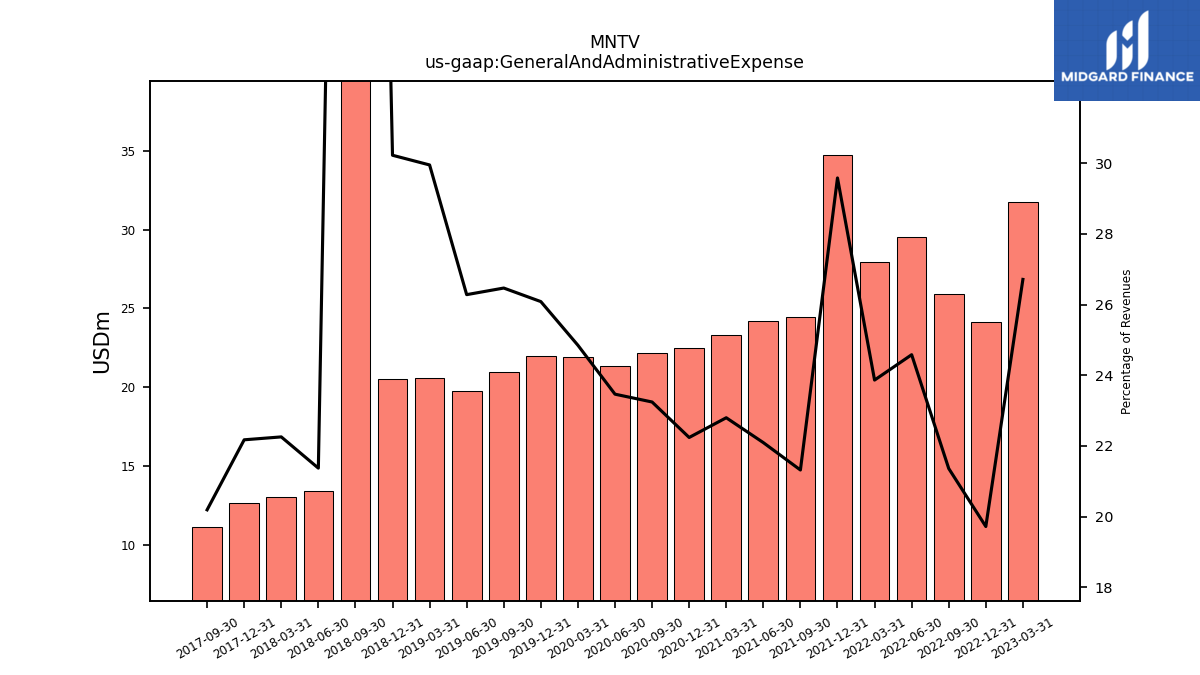
| General And Administrative Expense | 31.74 | 24.14 | 25.93 | 29.54 | 27.92 | 34.71 | 24.47 | 24.17 | 23.32 | 22.46 | 22.18 | 21.34 | 21.93 | 21.99 | 20.99 | 19.75 | 20.56 | 20.53 | 50.39 | 13.40 | 13.02 | 12.64 | 11.17 | |
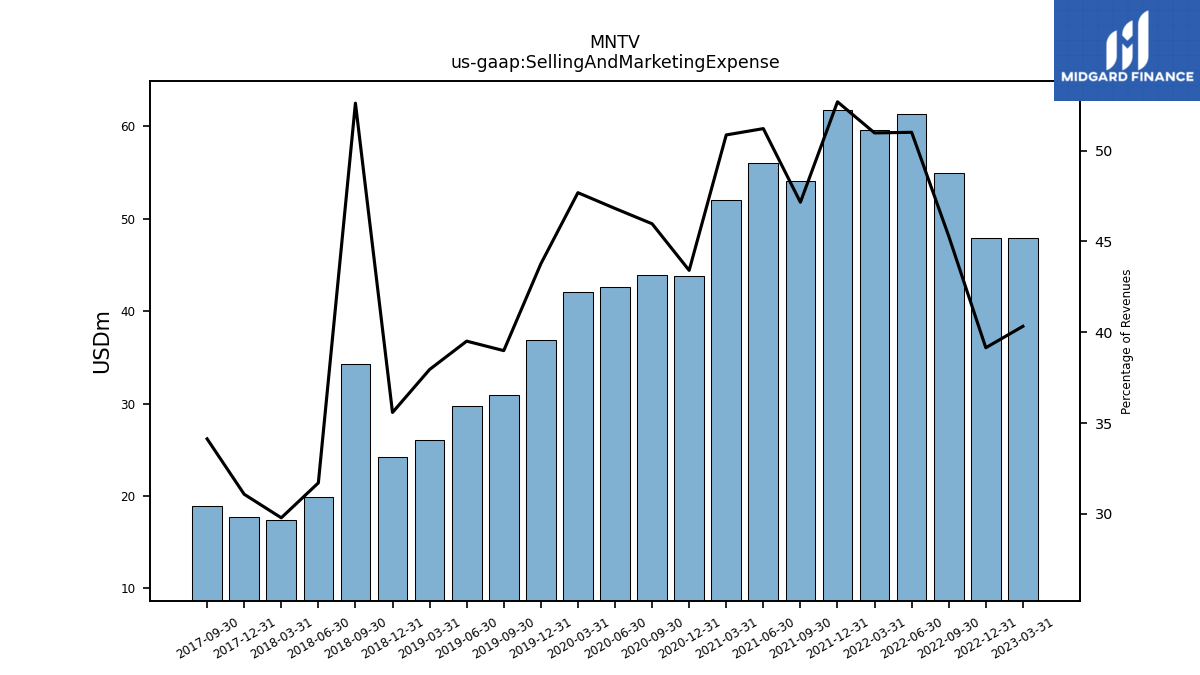
| Selling And Marketing Expense | 47.92 | 47.92 | 54.98 | 61.30 | 59.64 | 61.83 | 54.12 | 56.02 | 52.04 | 43.83 | 43.88 | 42.58 | 42.09 | 36.91 | 30.93 | 29.69 | 26.05 | 24.17 | 34.31 | 19.88 | 17.42 | 17.72 | 18.88 | |
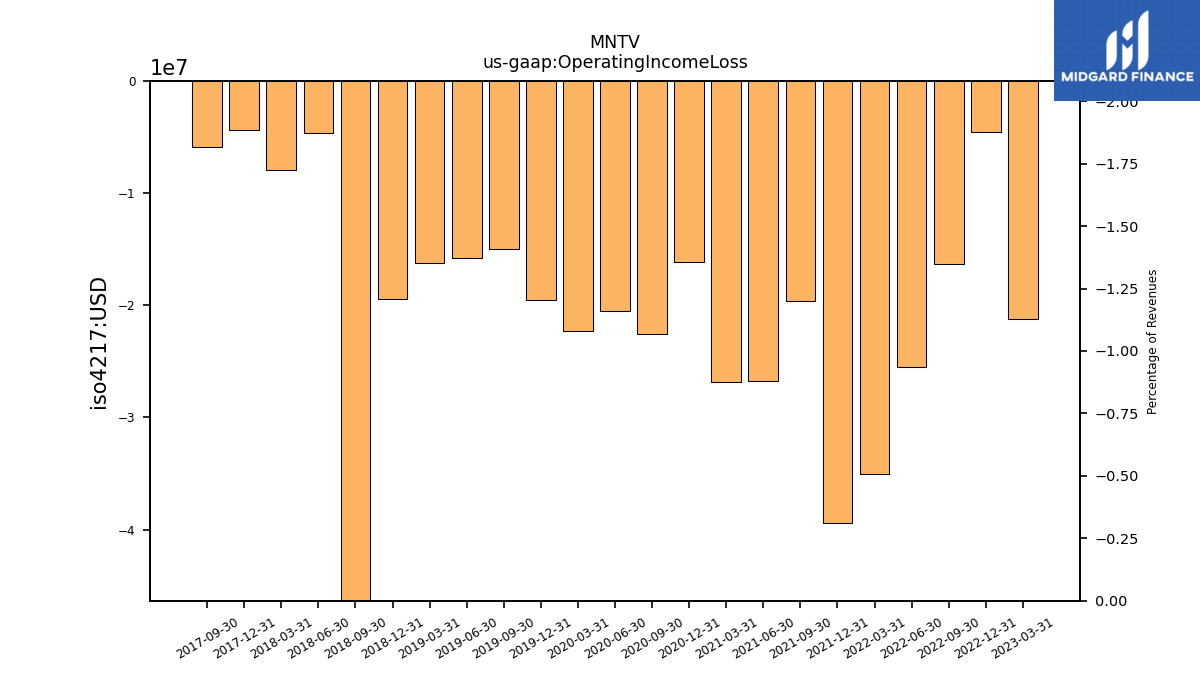
| Operating Income Loss | -21.25 | -4.52 | -16.28 | -25.47 | -35.07 | -39.38 | -19.66 | -26.72 | -26.82 | -16.17 | -22.59 | -20.56 | -22.26 | -19.51 | -14.95 | -15.75 | -16.23 | -19.47 | -94.47 | -4.59 | -7.96 | -4.35 | -5.89 | |
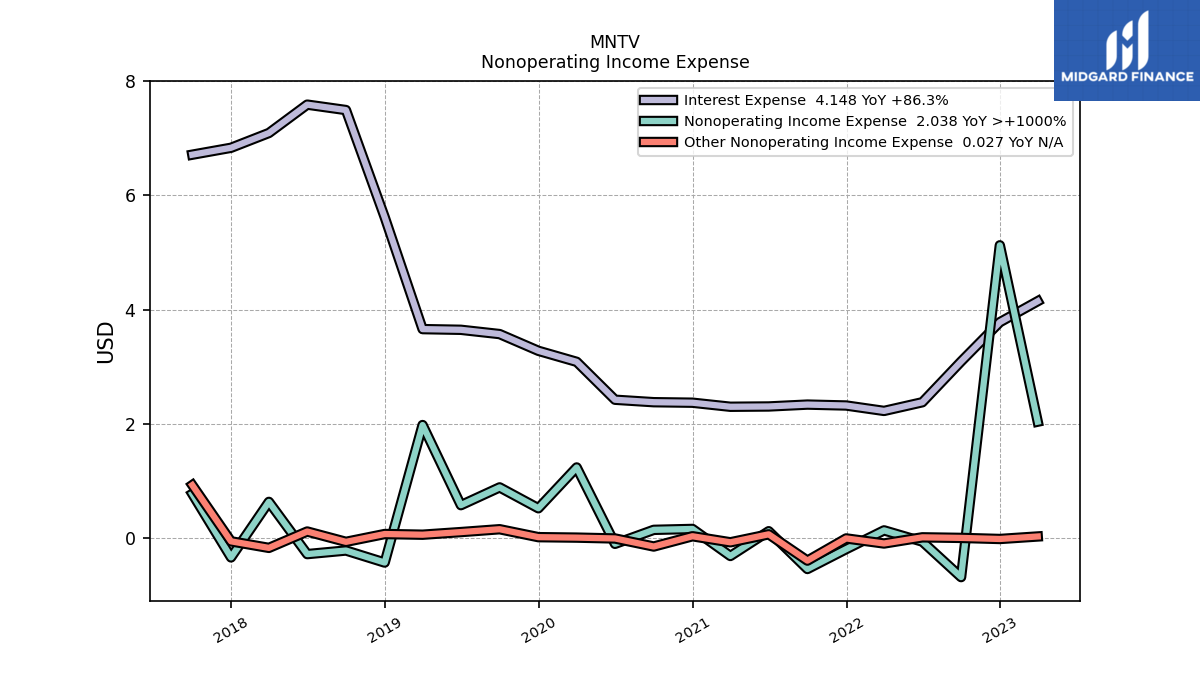
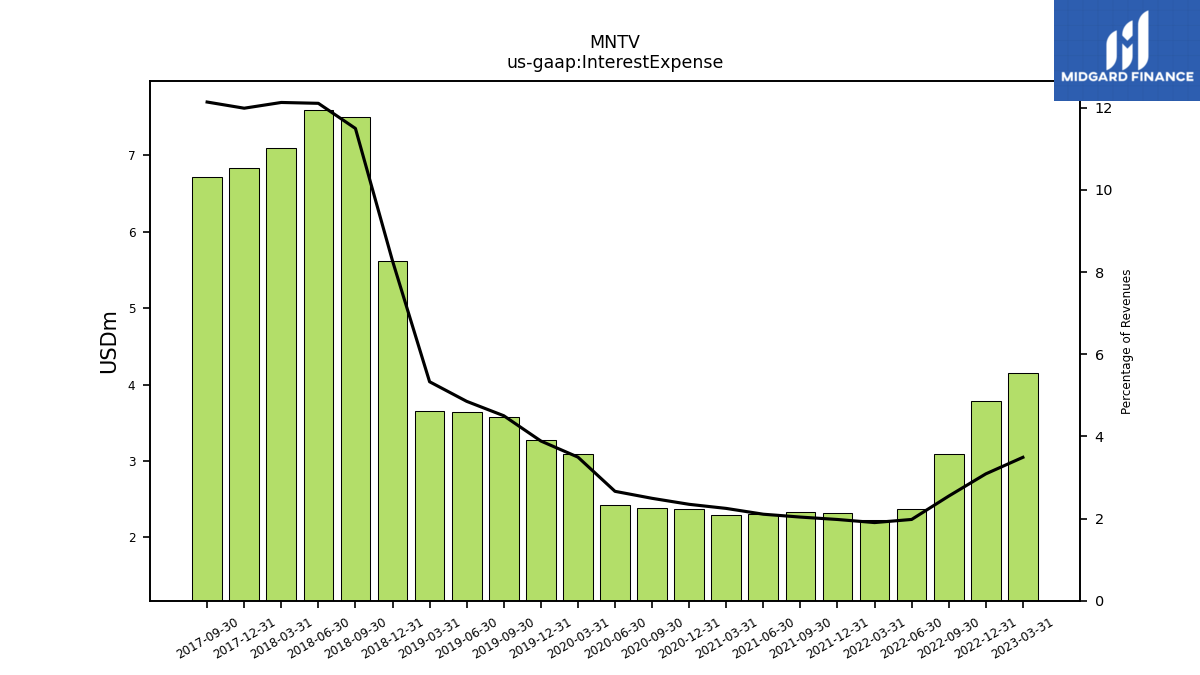
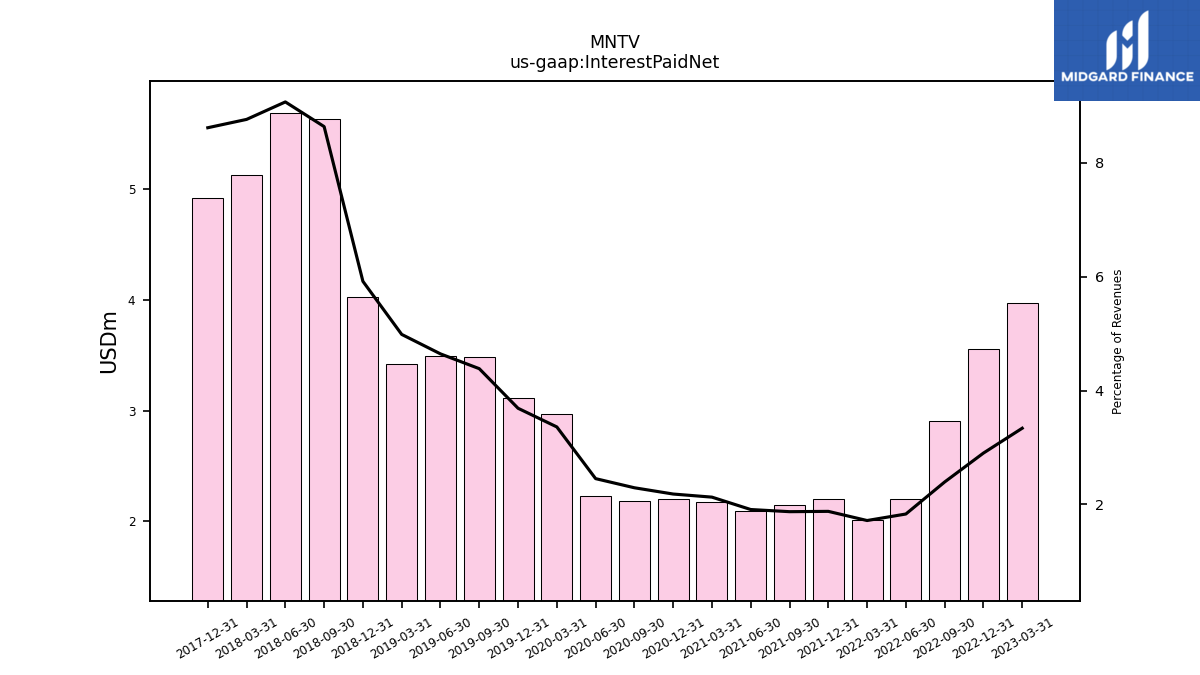
| Interest Expense | 4.15 | 3.78 | 3.09 | 2.38 | 2.23 | 2.32 | 2.34 | 2.30 | 2.30 | 2.37 | 2.38 | 2.42 | 3.09 | 3.28 | 3.57 | 3.65 | 3.66 | 5.62 | 7.50 | 7.59 | 7.09 | 6.83 | 6.71 | |
| Interest Paid Net | 3.97 | 3.55 | 2.91 | 2.20 | 2.01 | 2.20 | 2.15 | 2.09 | 2.18 | 2.20 | 2.19 | 2.23 | 2.97 | 3.11 | 3.48 | 3.49 | 3.42 | 4.02 | 5.63 | 5.69 | 5.13 | 4.91 | NA | |
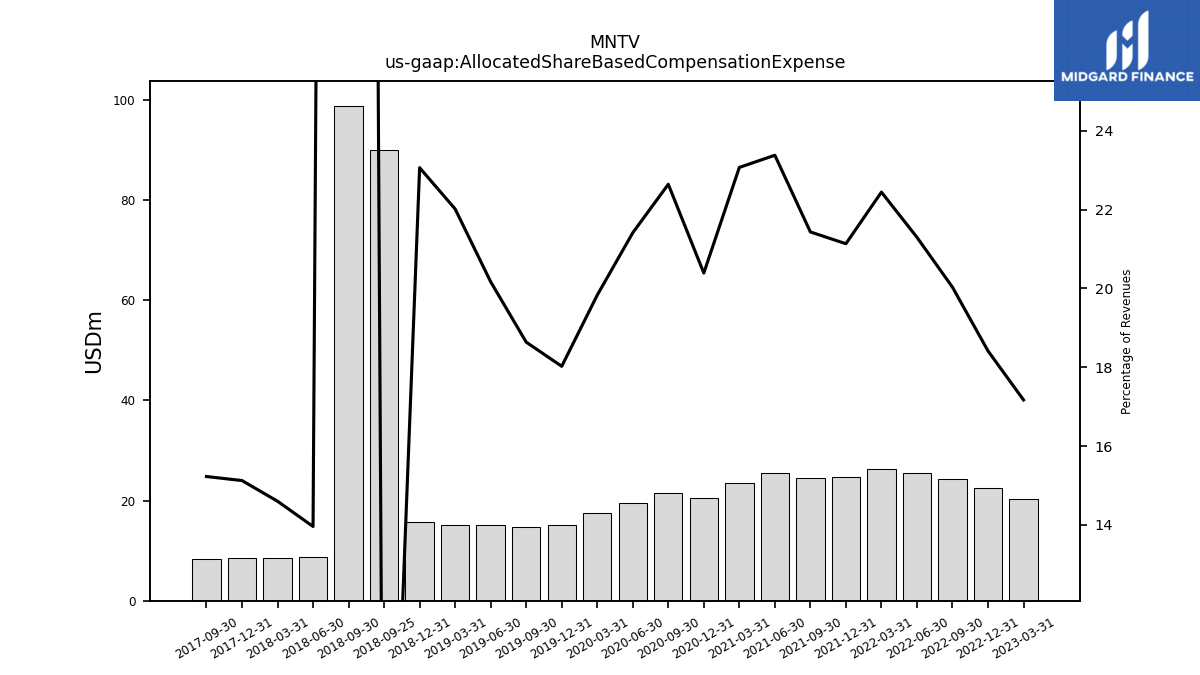
| Allocated Share Based Compensation Expense | 20.40 | 22.54 | 24.31 | 25.59 | 26.25 | 24.80 | 24.59 | 25.57 | 23.60 | 20.59 | 21.61 | 19.47 | 17.50 | 15.20 | 14.78 | 15.15 | 15.11 | 15.67 | 98.81 | 8.75 | 8.54 | 8.62 | 8.42 | |
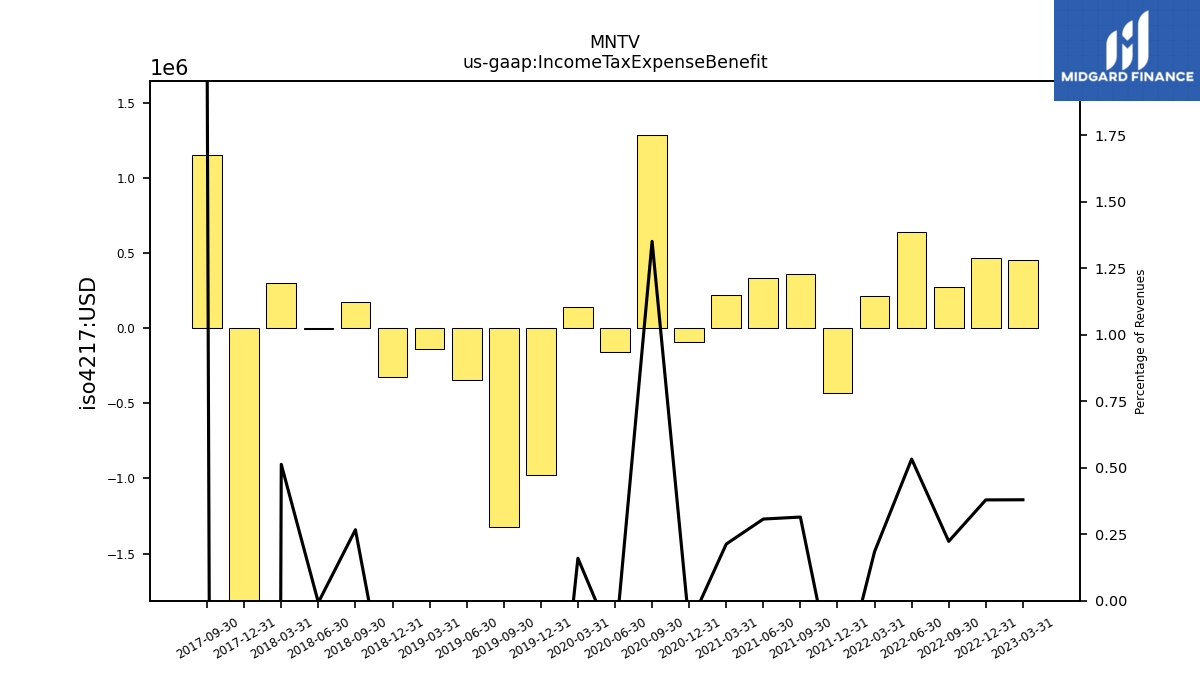
| Income Tax Expense Benefit | 0.45 | 0.46 | 0.27 | 0.64 | 0.22 | -0.43 | 0.36 | 0.34 | 0.22 | -0.10 | 1.29 | -0.16 | 0.14 | -0.98 | -1.32 | -0.34 | -0.14 | -0.32 | 0.17 | -0.00 | 0.30 | -19.60 | 1.15 | |
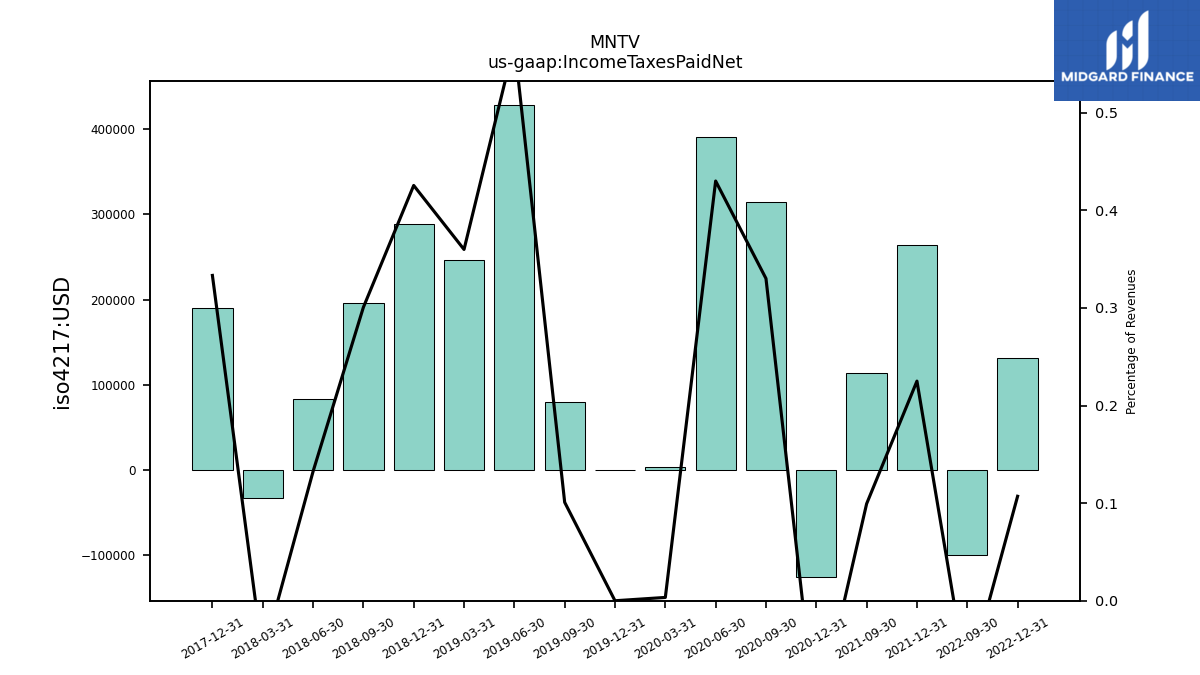
| Income Taxes Paid Net | NA | 0.13 | -0.10 | NA | NA | 0.26 | 0.11 | NA | NA | -0.13 | 0.32 | 0.39 | 0.00 | 0.00 | 0.08 | 0.43 | 0.25 | 0.29 | 0.20 | 0.08 | -0.03 | 0.19 | NA | |
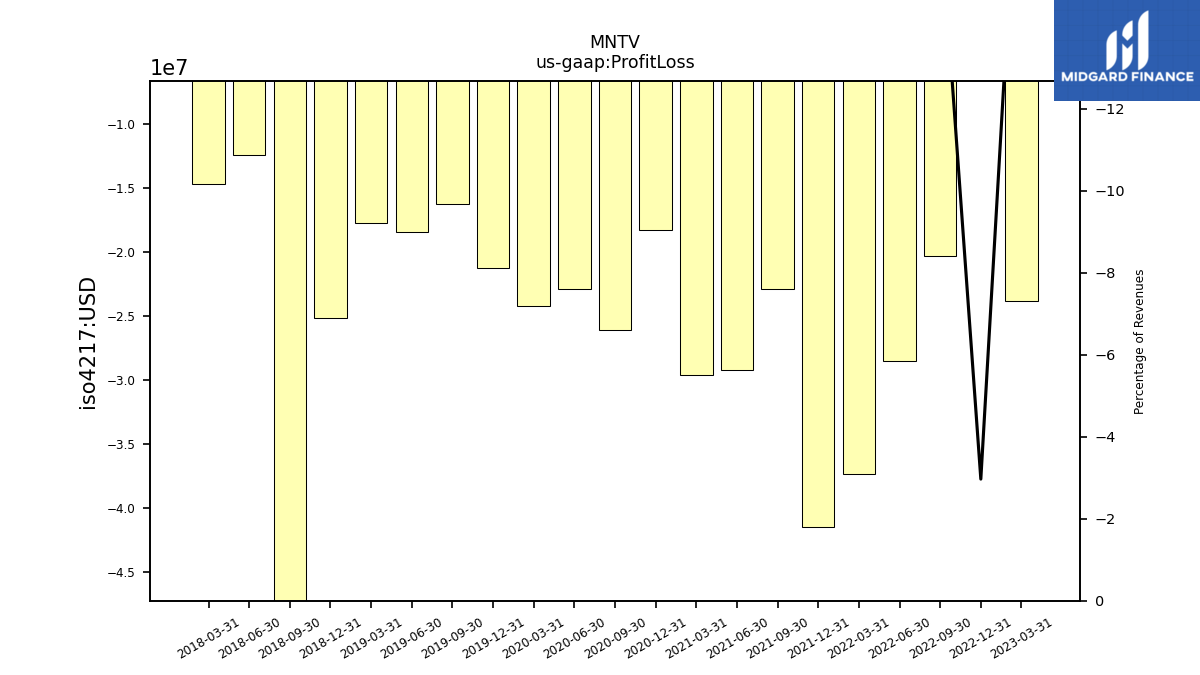
| Profit Loss | -23.82 | -3.63 | -20.33 | -28.55 | -37.38 | -41.46 | -22.90 | -29.24 | -29.65 | -18.29 | -26.12 | -22.92 | -24.25 | -21.29 | -16.31 | -18.48 | -17.78 | -25.20 | -102.36 | -12.46 | -14.72 | NA | NA | |
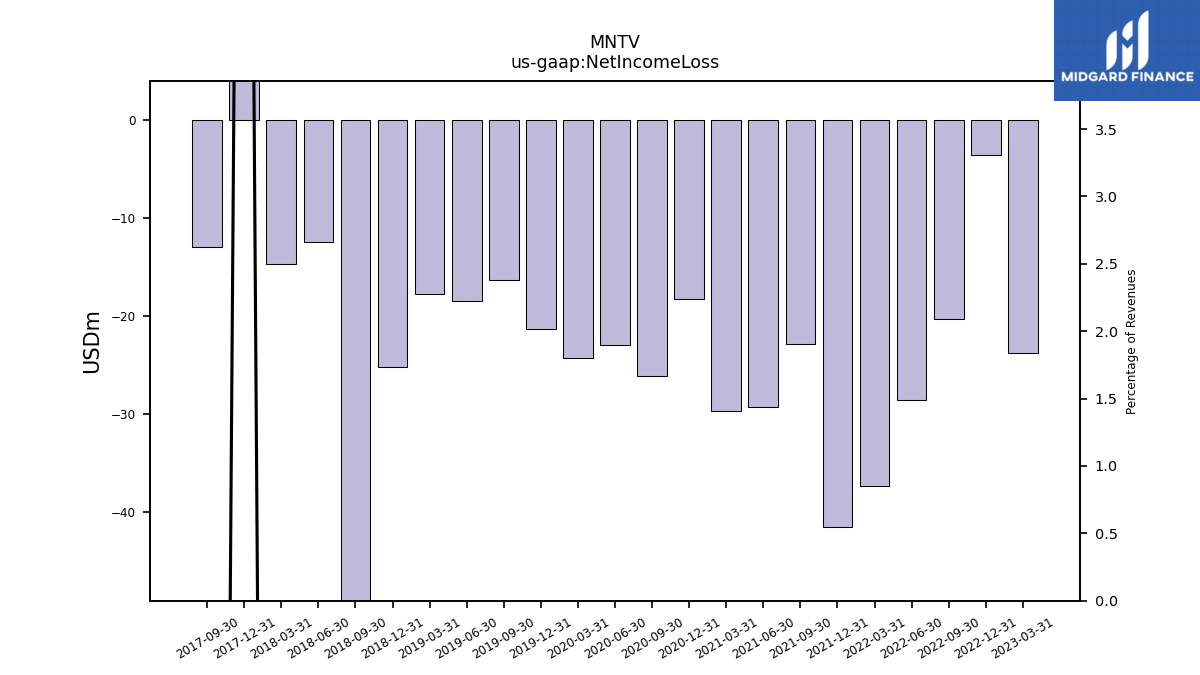
| Net Income Loss | -23.82 | -3.63 | -20.33 | -28.55 | -37.38 | -41.46 | -22.90 | -29.24 | -29.65 | -18.29 | -26.12 | -22.92 | -24.25 | -21.29 | -16.31 | -18.48 | -17.78 | -25.20 | -102.36 | -12.46 | -14.72 | 8.07 | -12.98 | |
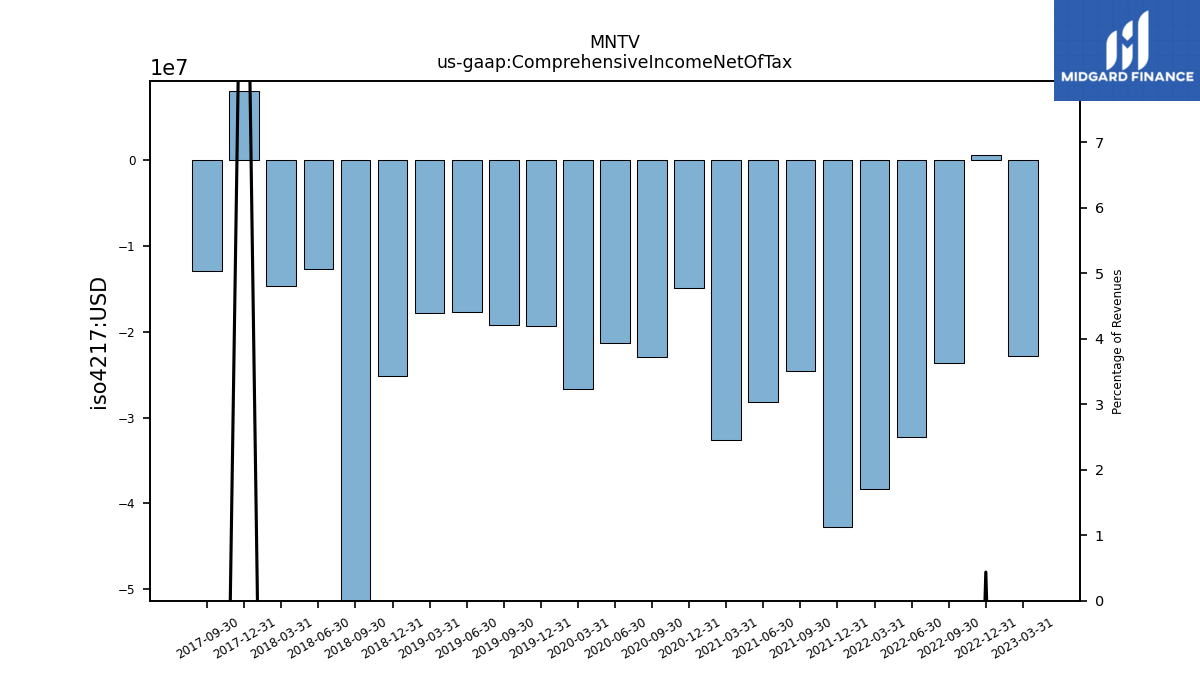
| Comprehensive Income Net Of Tax | -22.81 | 0.54 | -23.70 | -32.25 | -38.32 | -42.69 | -24.61 | -28.15 | -32.60 | -14.89 | -22.98 | -21.38 | -26.69 | -19.29 | -19.26 | -17.67 | -17.80 | -25.17 | -102.43 | -12.72 | -14.72 | 8.00 | -12.95 |
| 2023-03-31 | 2022-12-31 | 2022-09-30 | 2022-06-30 | 2022-03-31 | 2021-12-31 | 2021-09-30 | 2021-06-30 | 2021-03-31 | 2020-12-31 | 2020-09-30 | 2020-06-30 | 2020-03-31 | 2019-12-31 | 2019-09-30 | 2019-06-30 | 2019-03-31 | 2018-12-31 | 2018-09-30 | 2018-06-30 | 2018-03-31 | 2017-12-31 | 2017-09-30 | ||
|---|---|---|---|---|---|---|---|---|---|---|---|---|---|---|---|---|---|---|---|---|---|---|---|---|
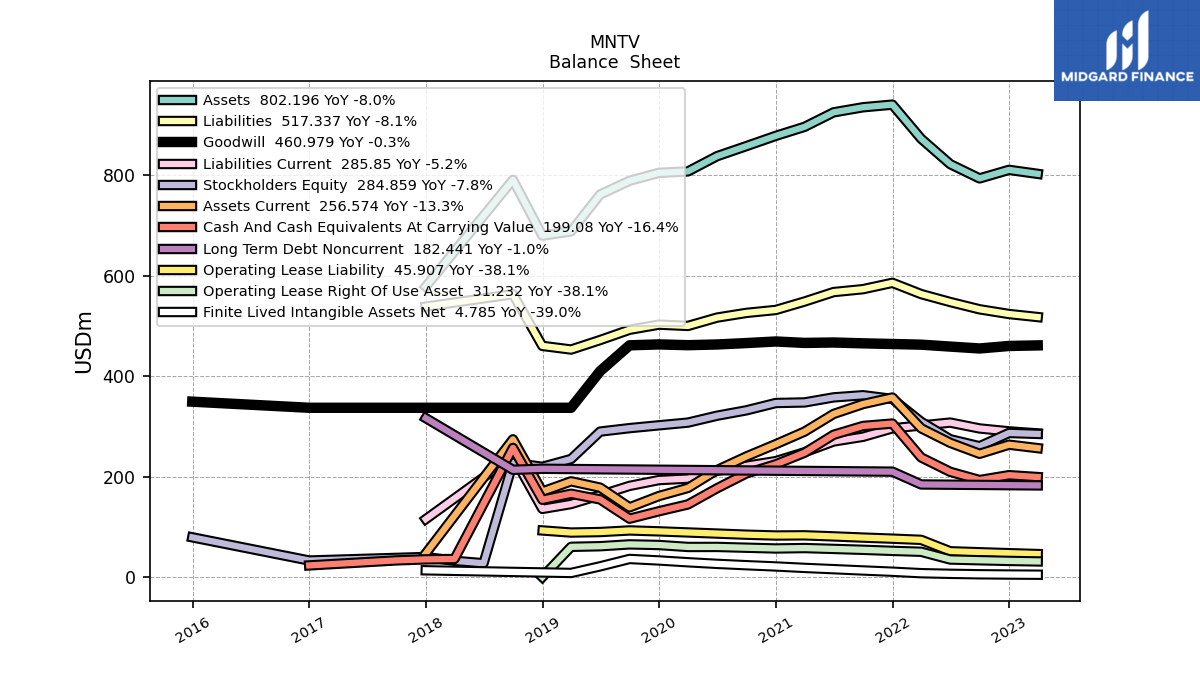
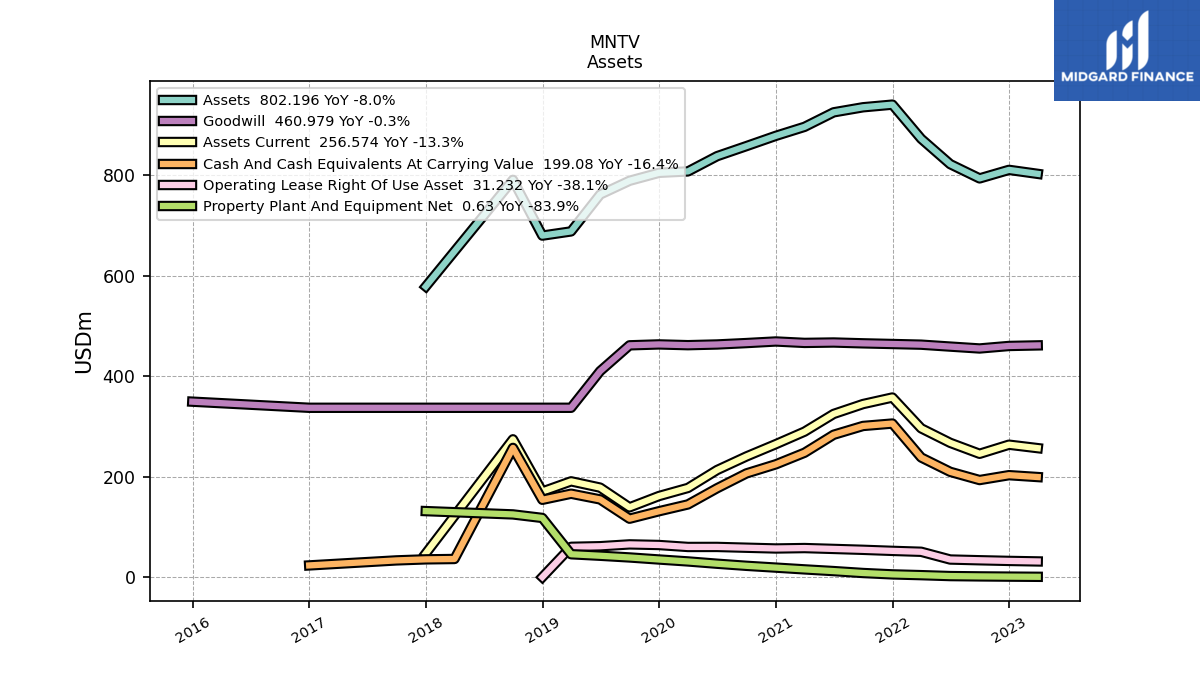
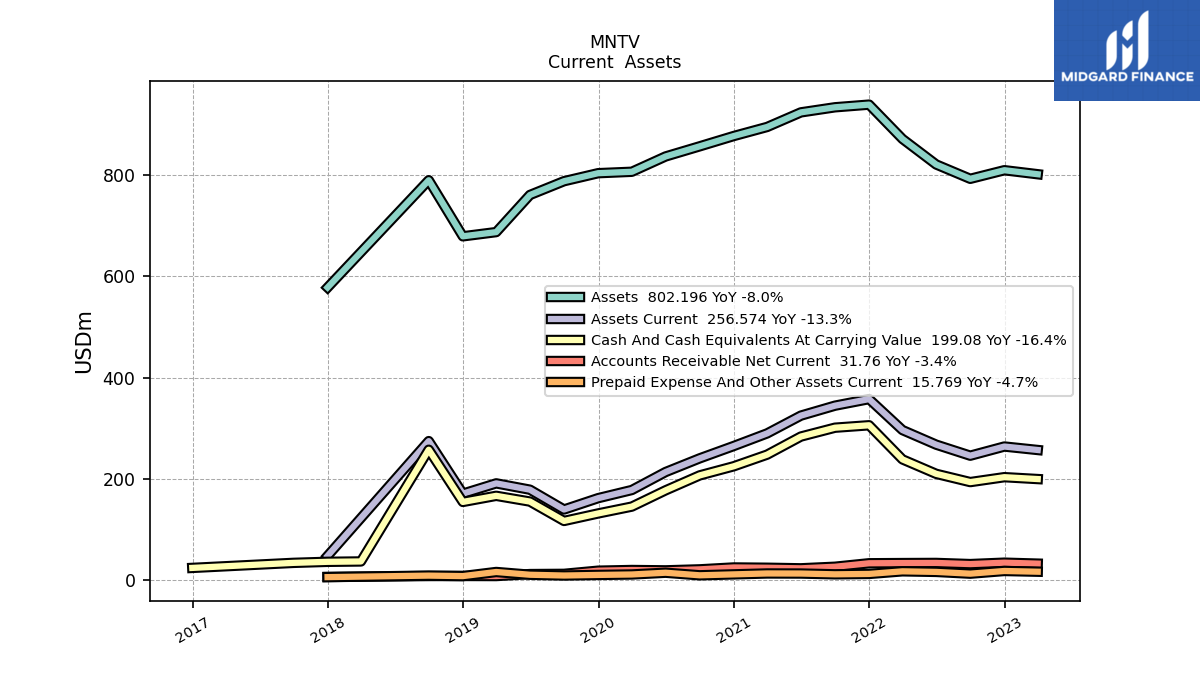
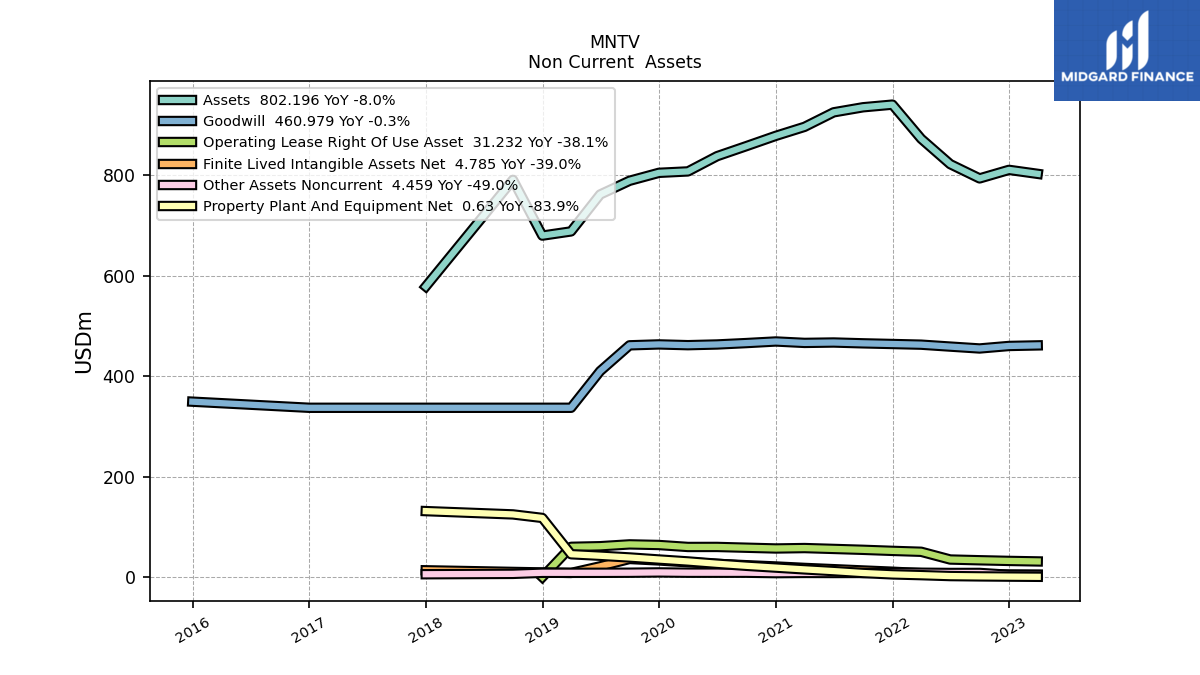
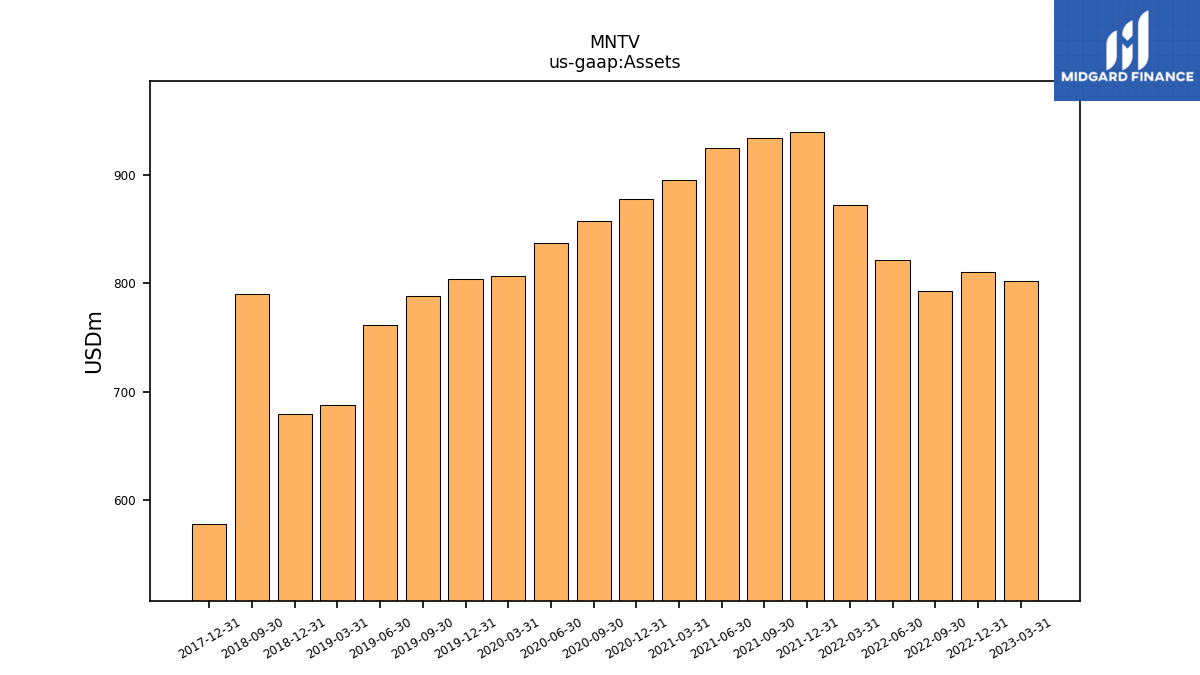
| Assets | 802.20 | 810.15 | 793.14 | 821.52 | 872.07 | 939.92 | 934.65 | 924.60 | 895.72 | 877.82 | 857.42 | 837.35 | 807.08 | 804.26 | 788.42 | 761.16 | 687.72 | 679.35 | 790.31 | NA | NA | 578.09 | NA | |
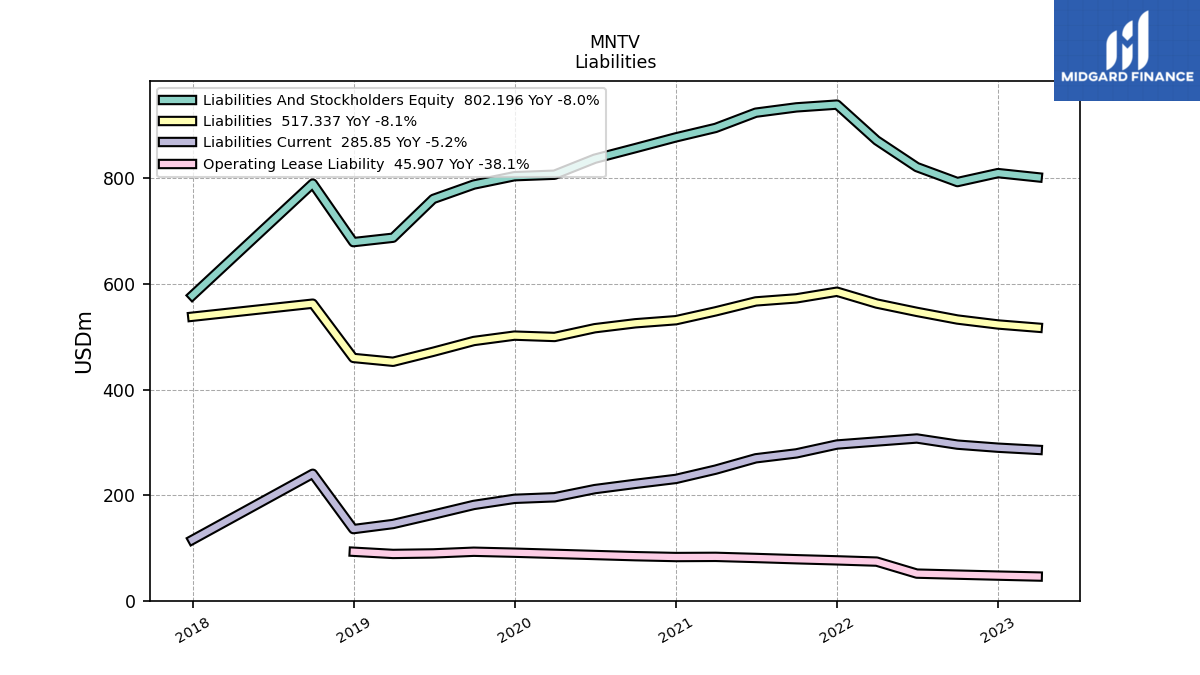
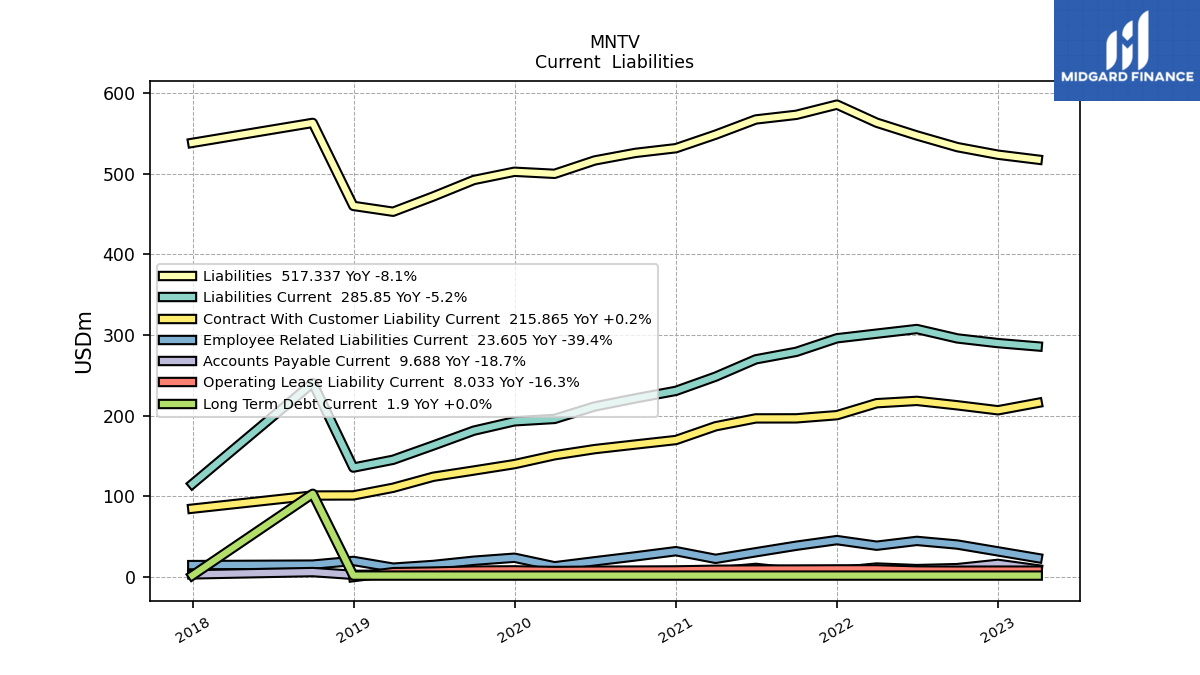
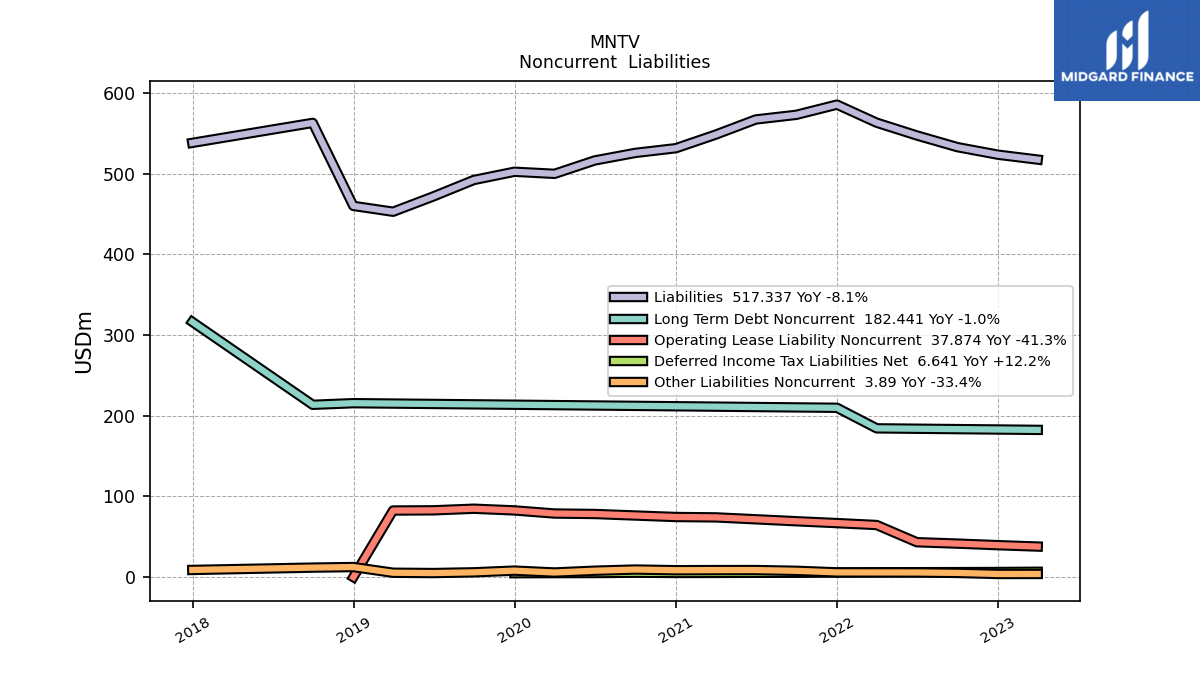
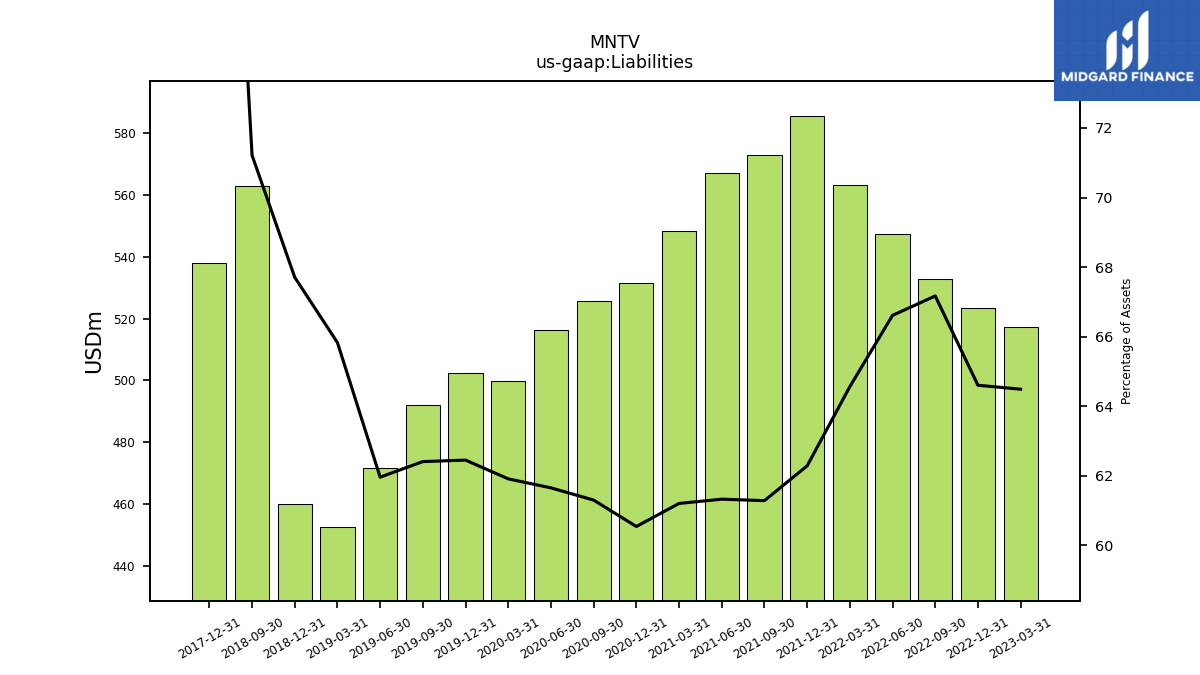
| Liabilities | 517.34 | 523.39 | 532.76 | 547.24 | 563.05 | 585.45 | 572.81 | 567.05 | 548.24 | 531.46 | 525.62 | 516.26 | 499.69 | 502.27 | 492.05 | 471.63 | 452.73 | 459.96 | 562.83 | NA | NA | 538.05 | NA | |
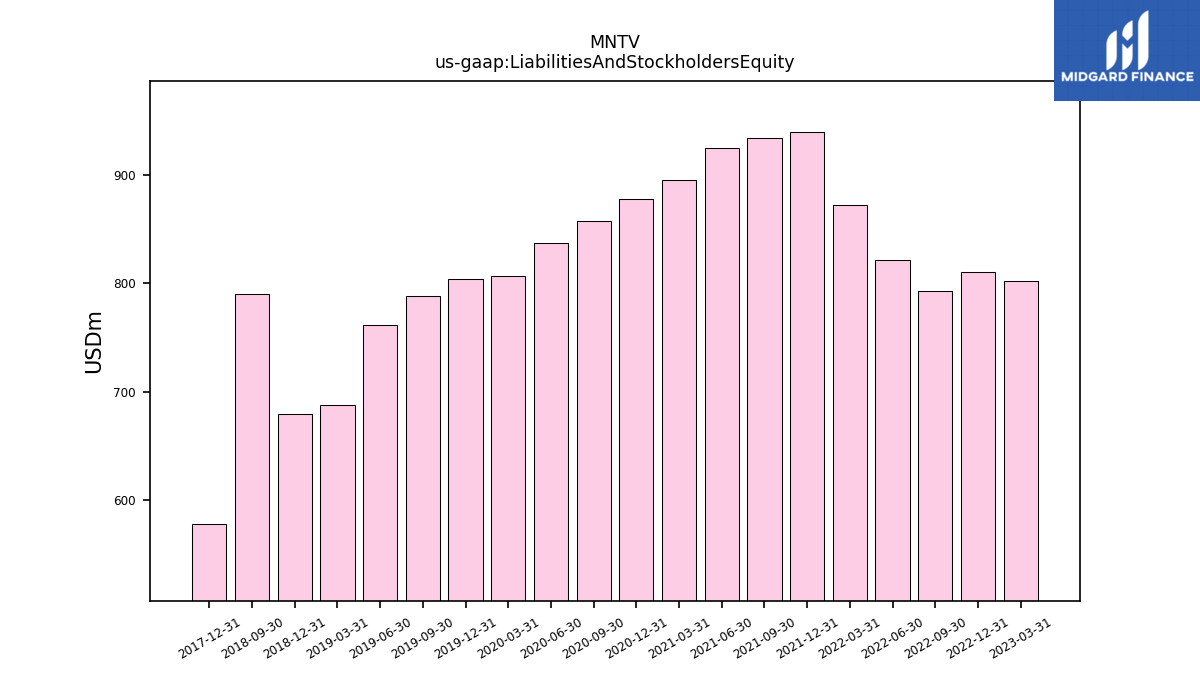
| Liabilities And Stockholders Equity | 802.20 | 810.15 | 793.14 | 821.52 | 872.07 | 939.92 | 934.65 | 924.60 | 895.72 | 877.82 | 857.42 | 837.35 | 807.08 | 804.26 | 788.42 | 761.16 | 687.72 | 679.35 | 790.31 | NA | NA | 578.09 | NA | |
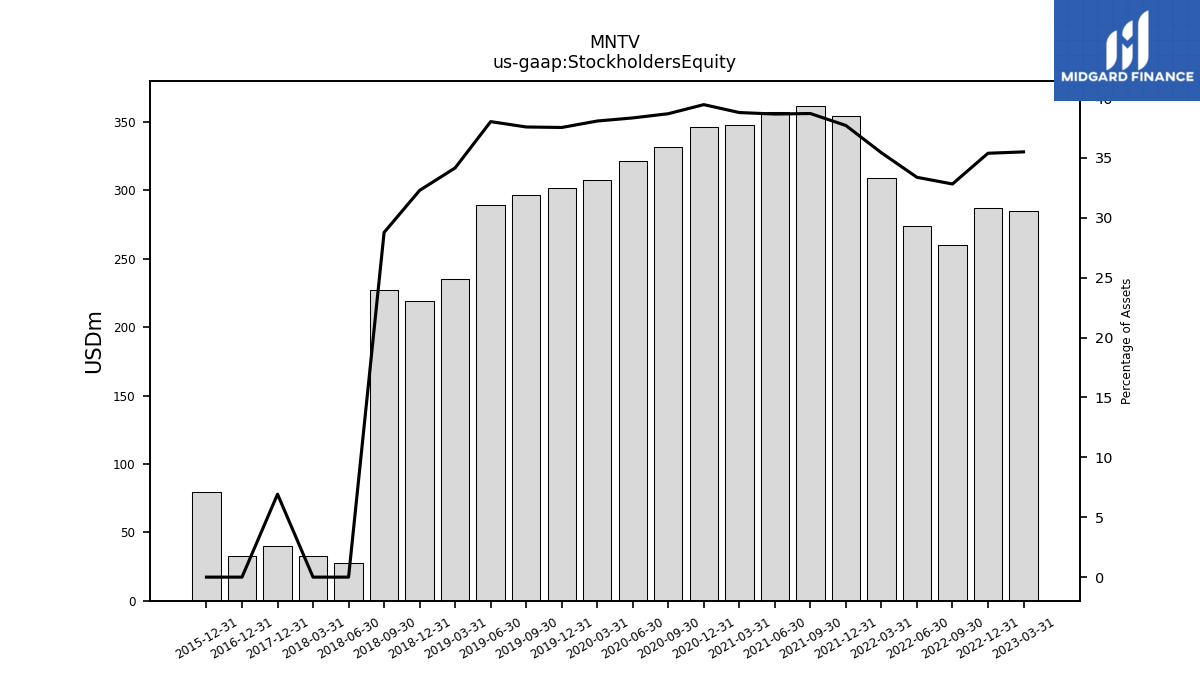
| Stockholders Equity | 284.86 | 286.76 | 260.38 | 274.28 | 309.02 | 354.47 | 361.83 | 357.55 | 347.49 | 346.36 | 331.80 | 321.09 | 307.39 | 301.98 | 296.37 | 289.53 | 235.00 | 219.38 | 227.48 | 27.61 | 32.42 | 40.04 | NA |
| 2023-03-31 | 2022-12-31 | 2022-09-30 | 2022-06-30 | 2022-03-31 | 2021-12-31 | 2021-09-30 | 2021-06-30 | 2021-03-31 | 2020-12-31 | 2020-09-30 | 2020-06-30 | 2020-03-31 | 2019-12-31 | 2019-09-30 | 2019-06-30 | 2019-03-31 | 2018-12-31 | 2018-09-30 | 2018-06-30 | 2018-03-31 | 2017-12-31 | 2017-09-30 | ||
|---|---|---|---|---|---|---|---|---|---|---|---|---|---|---|---|---|---|---|---|---|---|---|---|---|
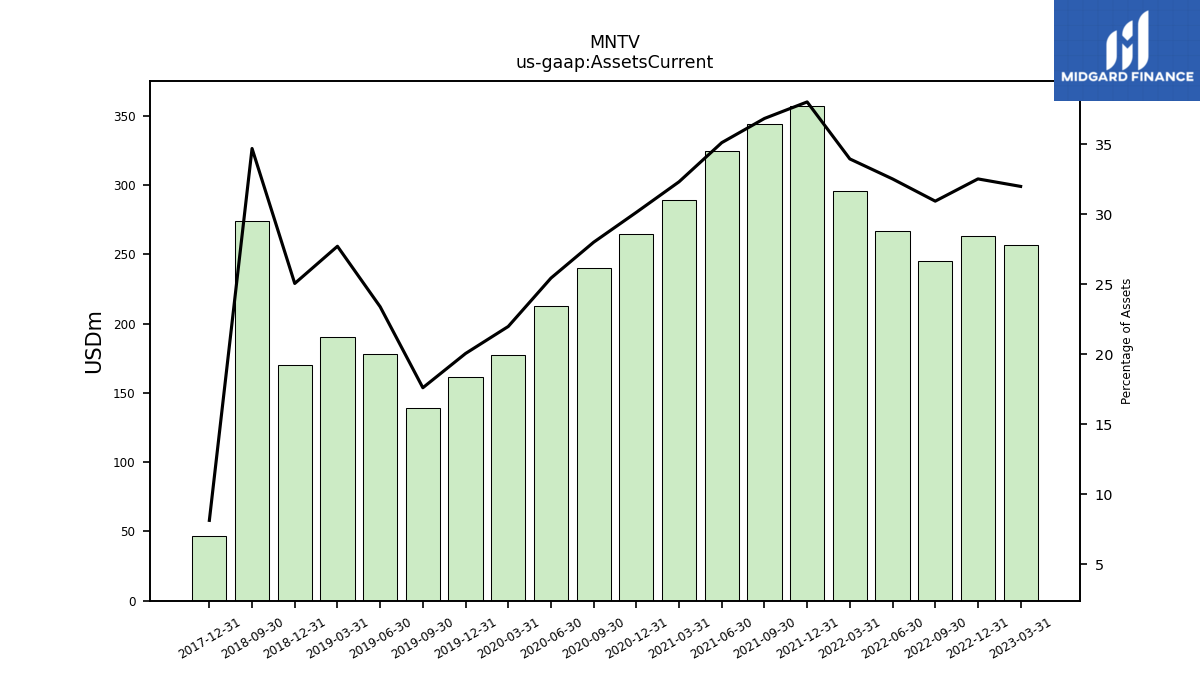
| Assets Current | 256.57 | 263.45 | 245.33 | 267.14 | 296.03 | 357.32 | 344.28 | 324.61 | 289.44 | 264.52 | 240.07 | 213.00 | 177.43 | 161.29 | 138.84 | 178.06 | 190.57 | 170.21 | 274.17 | NA | NA | 47.05 | NA | |
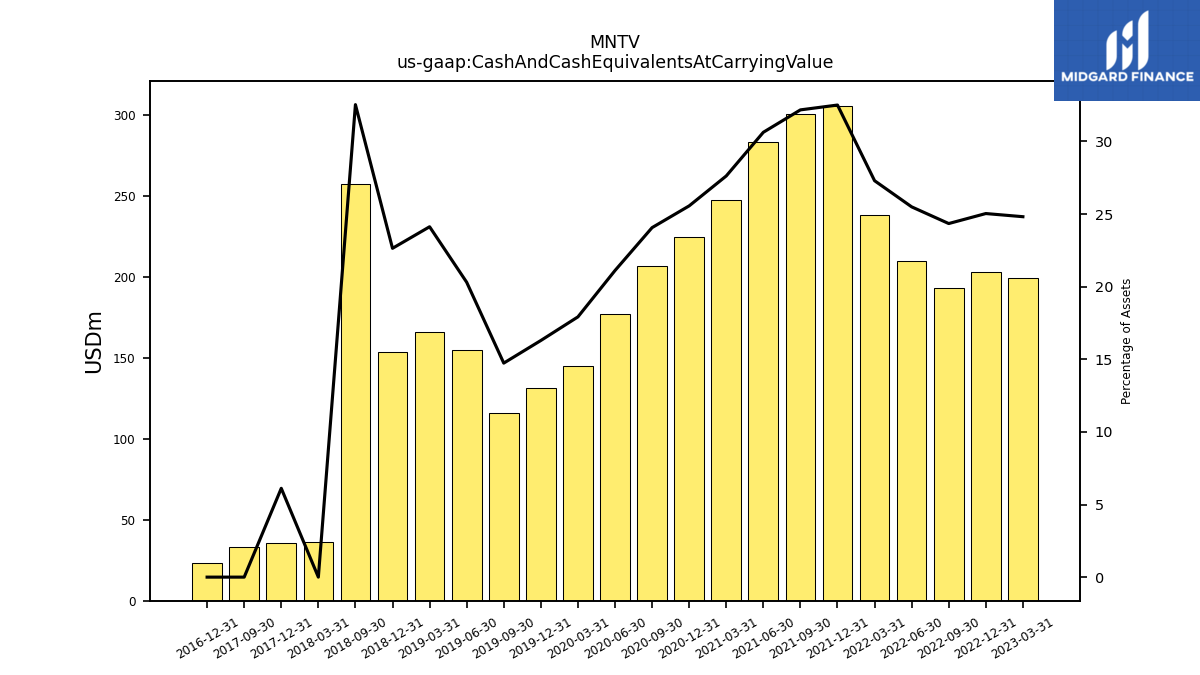
| Cash And Cash Equivalents At Carrying Value | 199.08 | 202.82 | 193.10 | 209.45 | 238.03 | 305.52 | 300.69 | 283.20 | 247.42 | 224.39 | 206.33 | 176.77 | 144.62 | 131.03 | 116.18 | 154.55 | 165.91 | 153.81 | 257.12 | NA | 36.07 | 35.34 | 33.27 | |
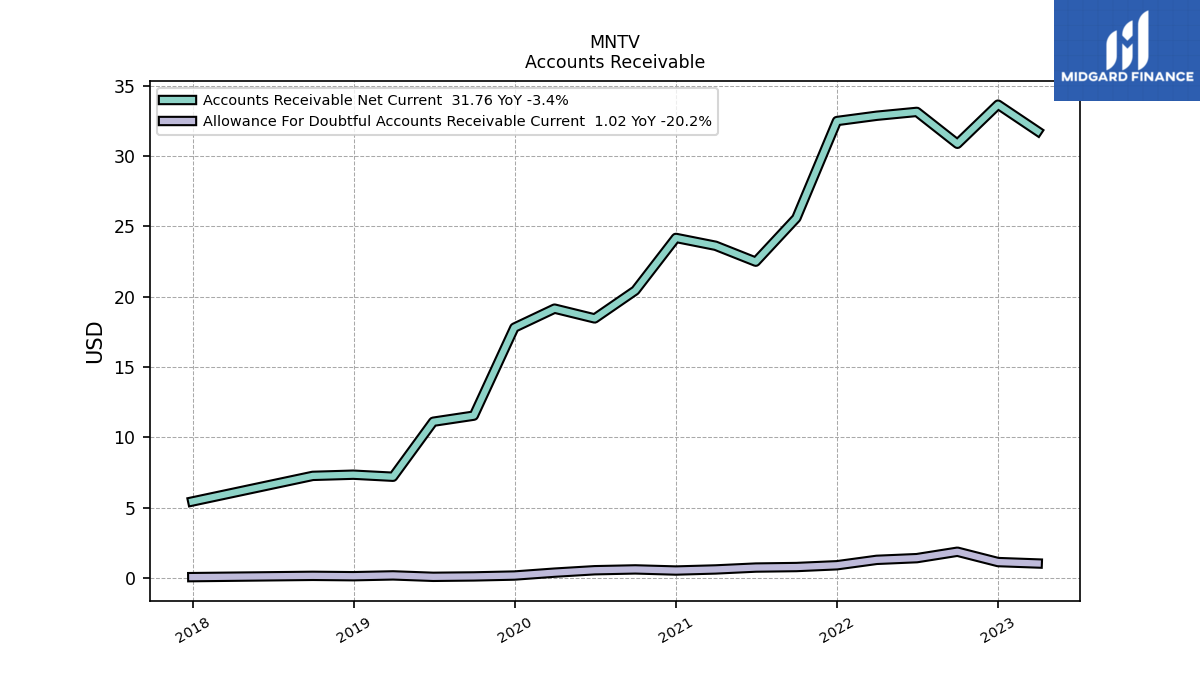
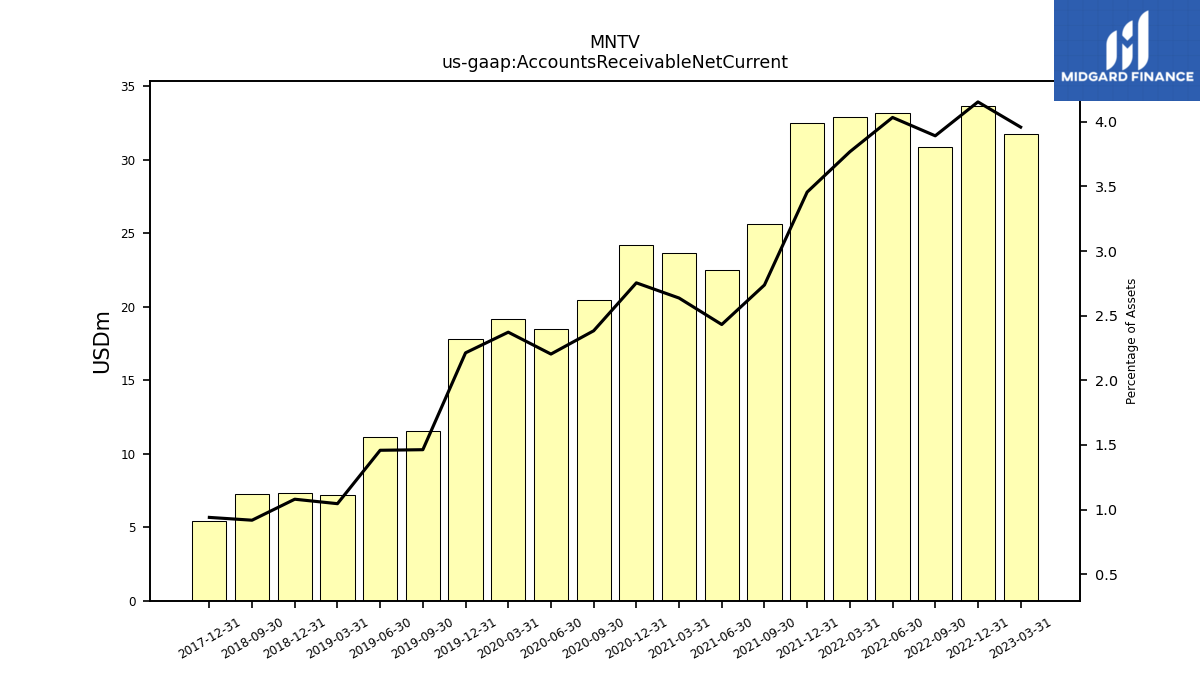
| Accounts Receivable Net Current | 31.76 | 33.66 | 30.87 | 33.14 | 32.86 | 32.49 | 25.59 | 22.48 | 23.62 | 24.18 | 20.43 | 18.45 | 19.15 | 17.80 | 11.54 | 11.10 | 7.19 | 7.34 | 7.25 | NA | NA | 5.43 | NA | |
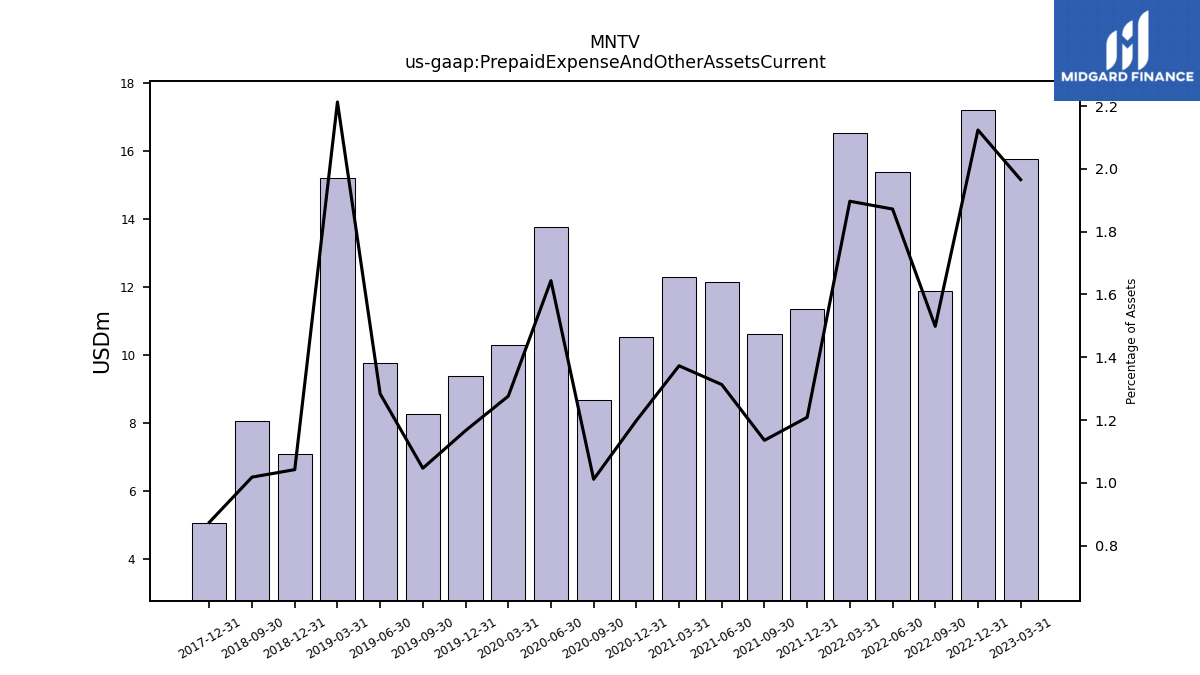
| Prepaid Expense And Other Assets Current | 15.77 | 17.21 | 11.89 | 15.38 | 16.54 | 11.36 | 10.61 | 12.14 | 12.30 | 10.52 | 8.67 | 13.77 | 10.30 | 9.38 | 8.25 | 9.77 | 15.22 | 7.08 | 8.05 | NA | NA | 5.06 | NA |
| 2023-03-31 | 2022-12-31 | 2022-09-30 | 2022-06-30 | 2022-03-31 | 2021-12-31 | 2021-09-30 | 2021-06-30 | 2021-03-31 | 2020-12-31 | 2020-09-30 | 2020-06-30 | 2020-03-31 | 2019-12-31 | 2019-09-30 | 2019-06-30 | 2019-03-31 | 2018-12-31 | 2018-09-30 | 2018-06-30 | 2018-03-31 | 2017-12-31 | 2017-09-30 | ||
|---|---|---|---|---|---|---|---|---|---|---|---|---|---|---|---|---|---|---|---|---|---|---|---|---|
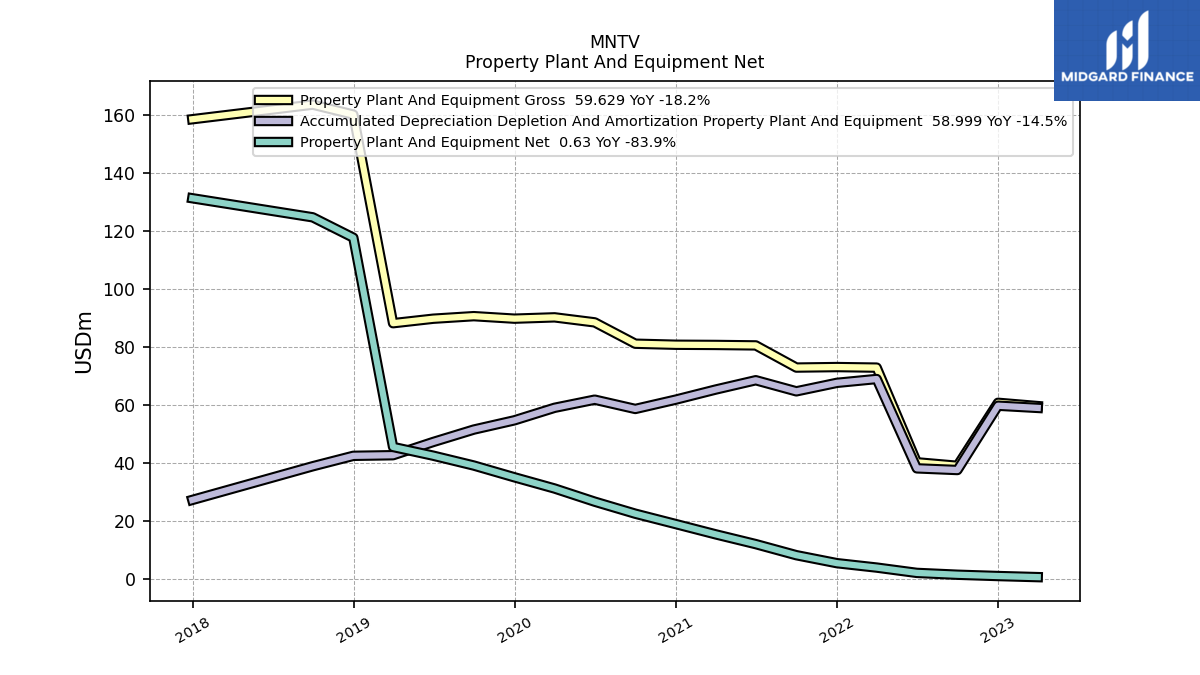
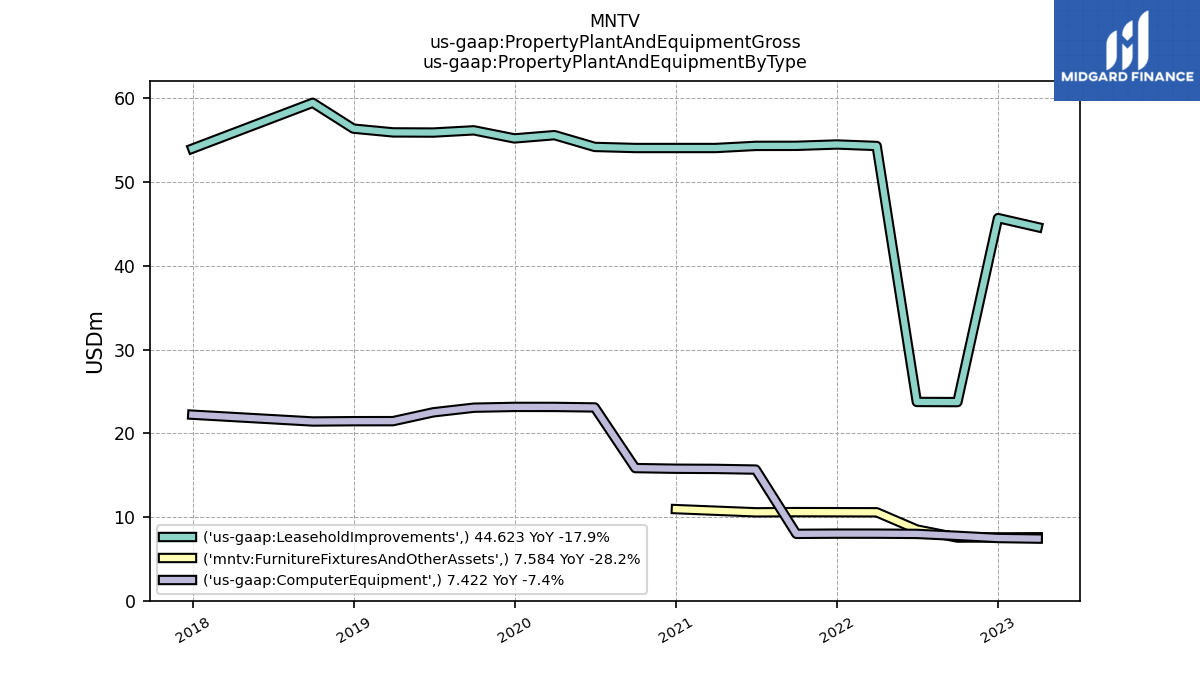
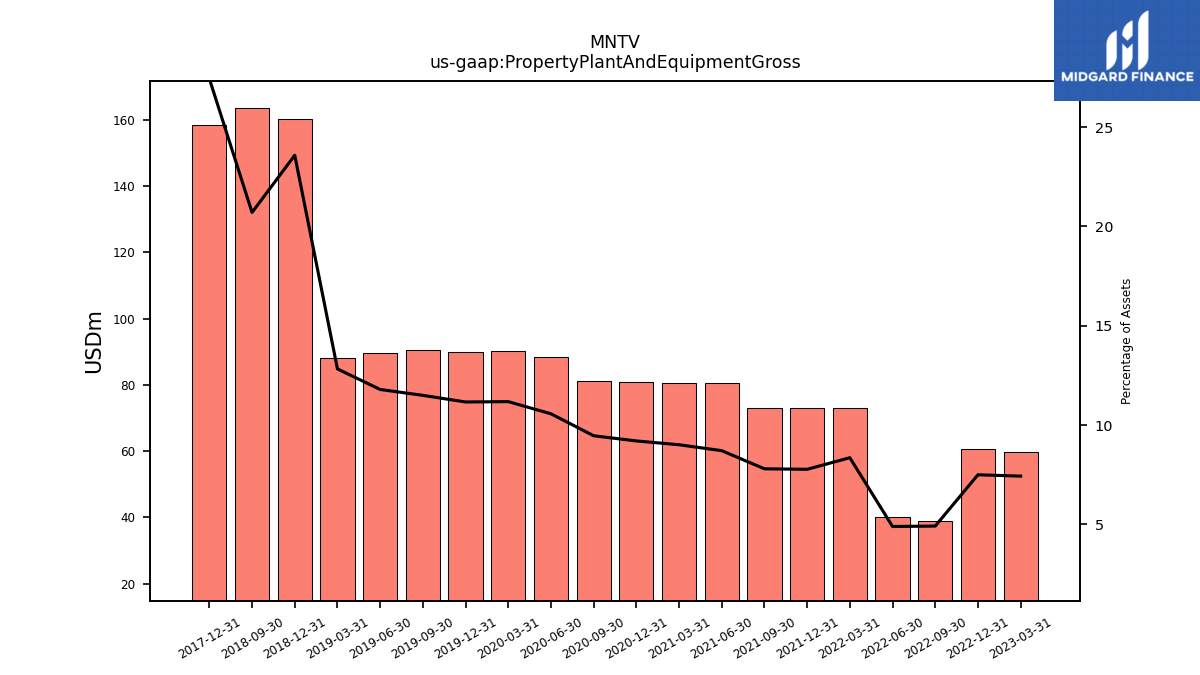
| Property Plant And Equipment Gross | 59.63 | 60.77 | 39.03 | 40.24 | 72.90 | 73.09 | 72.92 | 80.56 | 80.72 | 80.79 | 81.15 | 88.51 | 90.24 | 89.79 | 90.65 | 89.77 | 88.22 | 160.19 | 163.62 | NA | NA | 158.58 | NA | |
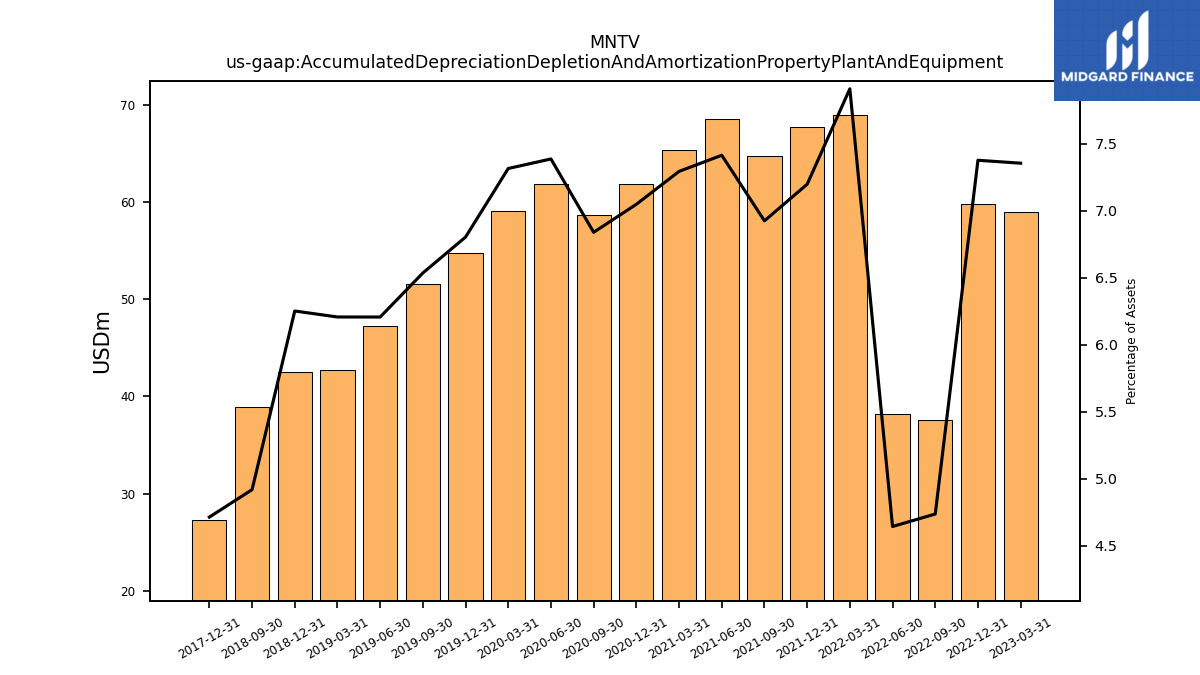
| Accumulated Depreciation Depletion And Amortization Property Plant And Equipment | 59.00 | 59.76 | 37.57 | 38.15 | 68.98 | 67.65 | 64.72 | 68.55 | 65.33 | 61.87 | 58.64 | 61.85 | 59.04 | 54.72 | 51.53 | 47.24 | 42.69 | 42.47 | 38.87 | NA | NA | 27.25 | NA | |
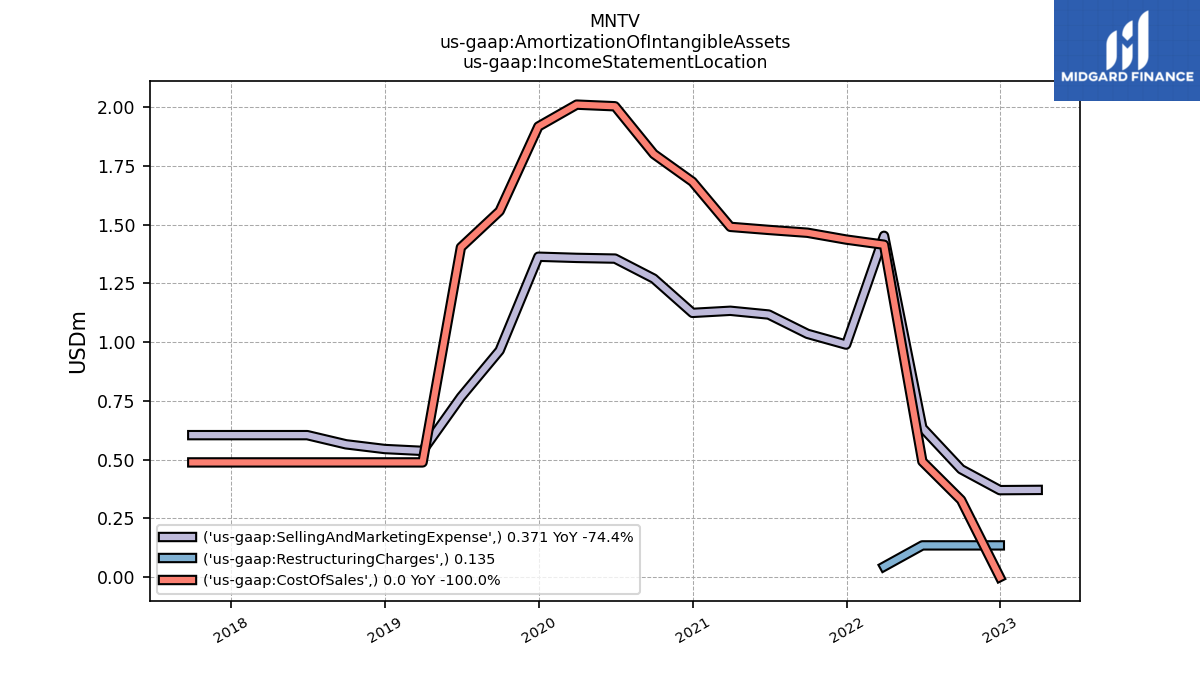
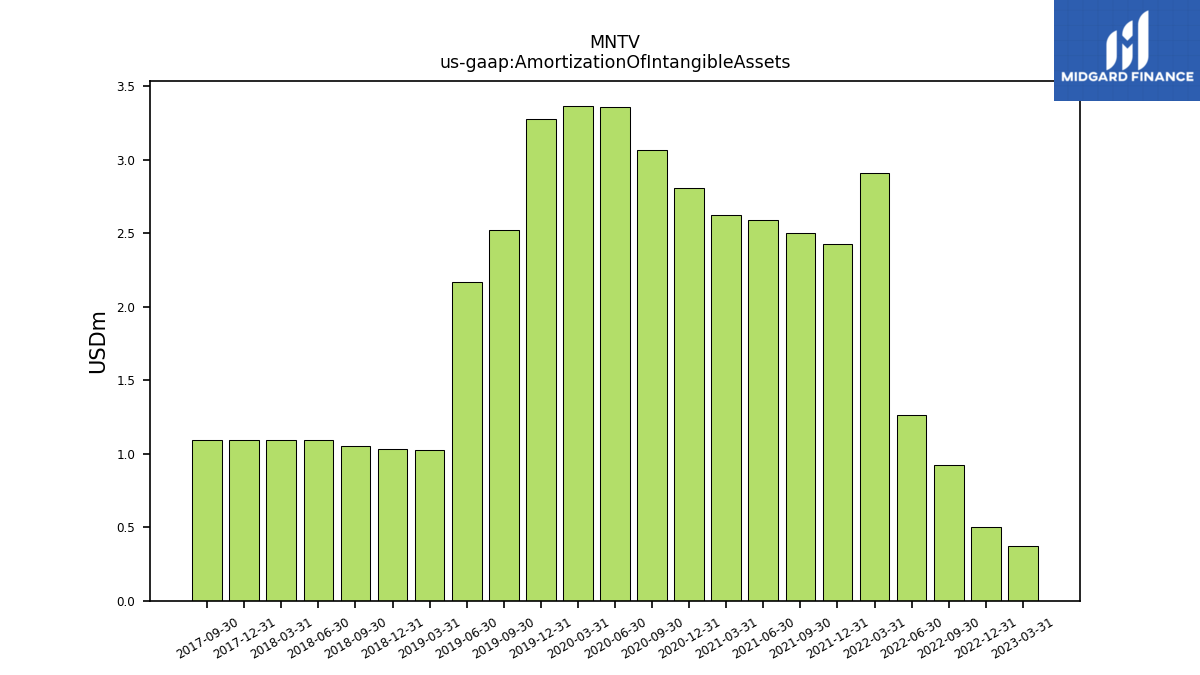
| Amortization Of Intangible Assets | 0.37 | 0.51 | 0.92 | 1.26 | 2.91 | 2.42 | 2.50 | 2.59 | 2.62 | 2.81 | 3.07 | 3.36 | 3.37 | 3.28 | 2.52 | 2.17 | 1.02 | 1.03 | 1.05 | 1.09 | 1.09 | 1.09 | 1.09 | |
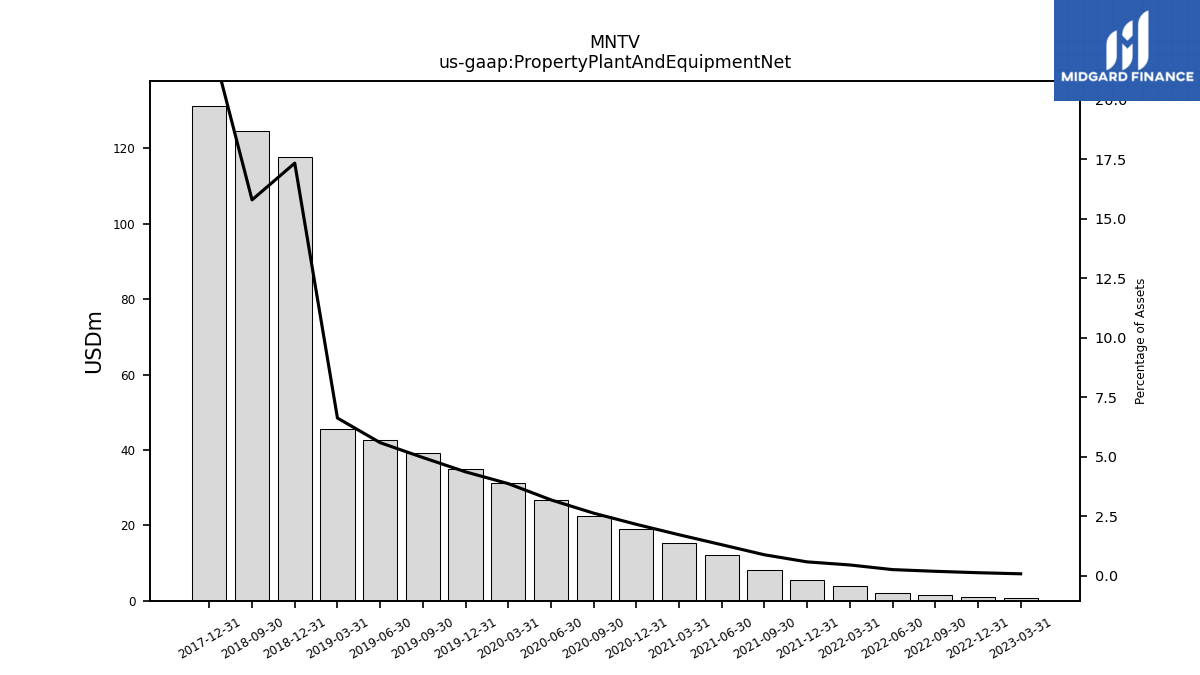
| Property Plant And Equipment Net | 0.63 | 1.01 | 1.46 | 2.09 | 3.92 | 5.44 | 8.20 | 12.02 | 15.39 | 18.92 | 22.51 | 26.66 | 31.20 | 35.07 | 39.12 | 42.53 | 45.53 | 117.72 | 124.75 | NA | NA | 131.33 | NA | |
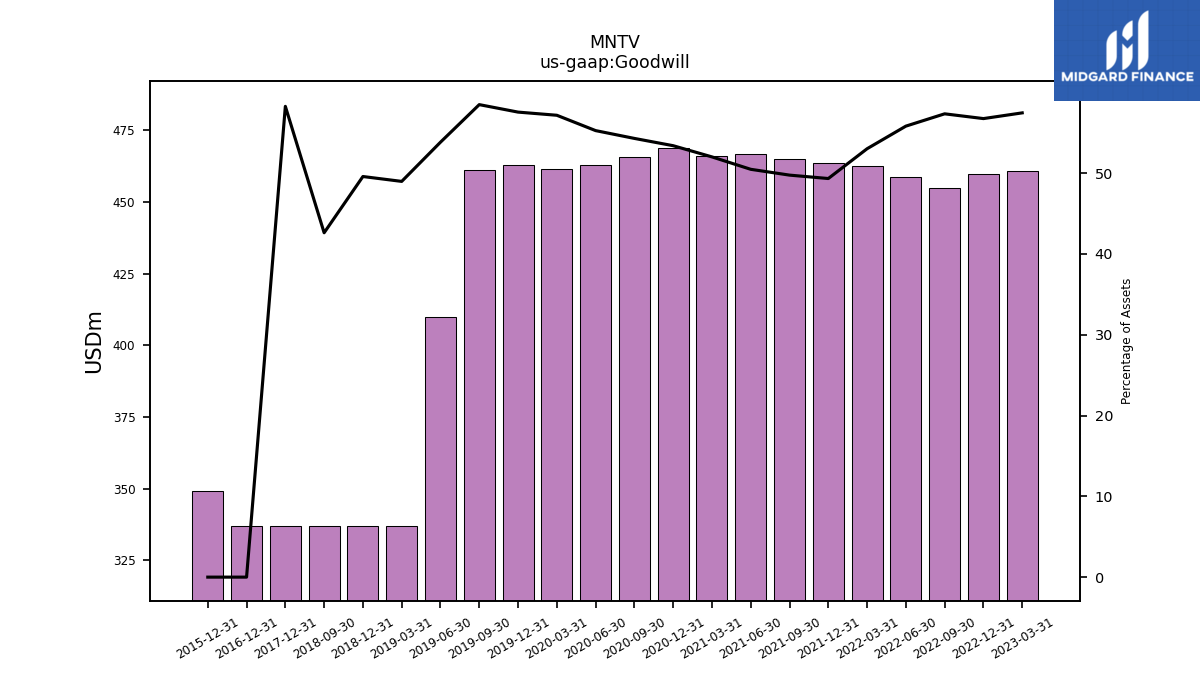
| Goodwill | 460.98 | 459.82 | 454.84 | 458.60 | 462.42 | 463.74 | 465.08 | 466.73 | 465.91 | 468.76 | 465.60 | 462.80 | 461.39 | 462.93 | 461.11 | 409.77 | 336.86 | 336.86 | 336.86 | NA | NA | 336.86 | NA | |
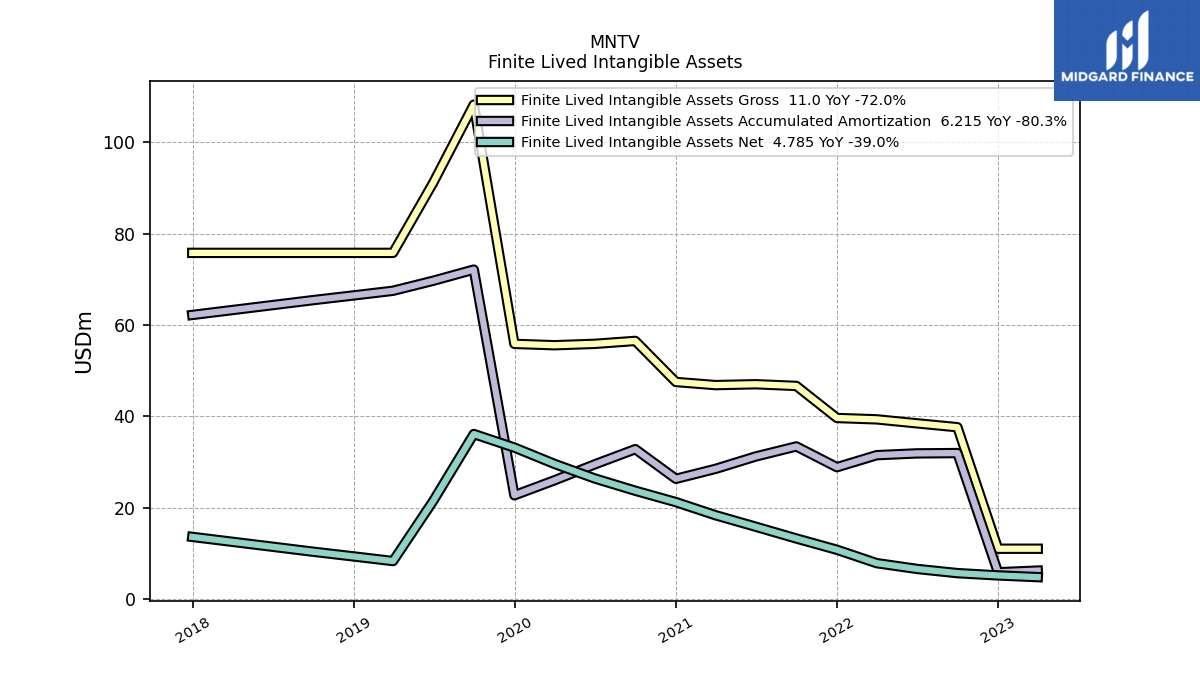
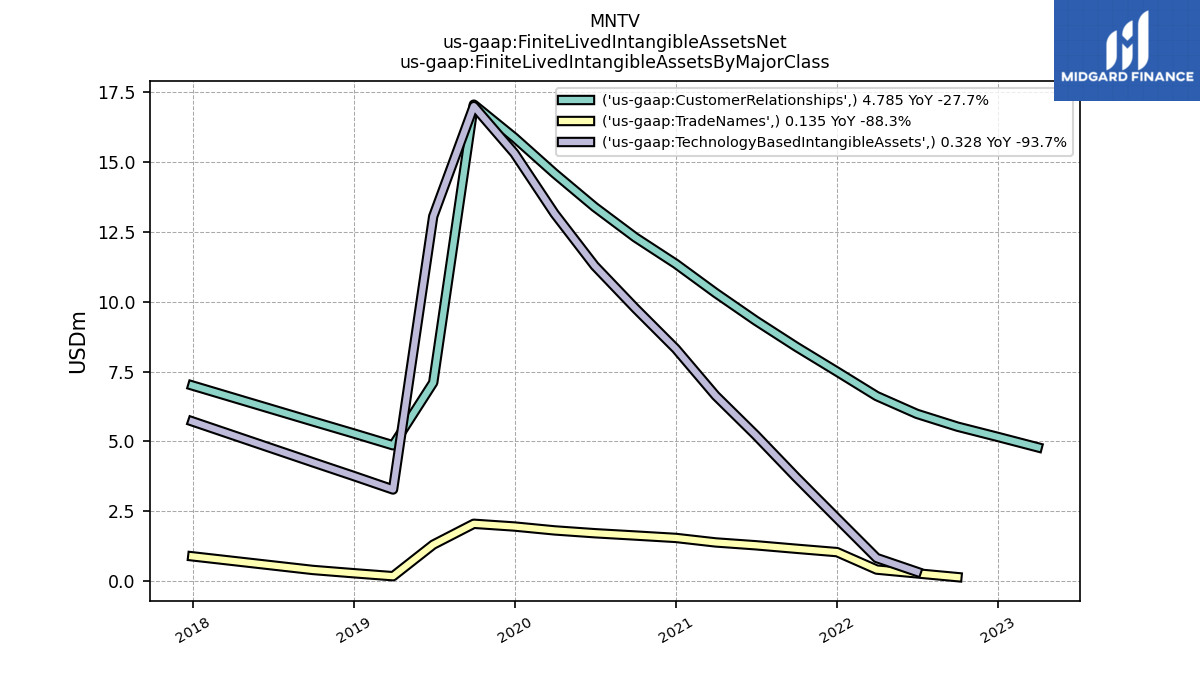
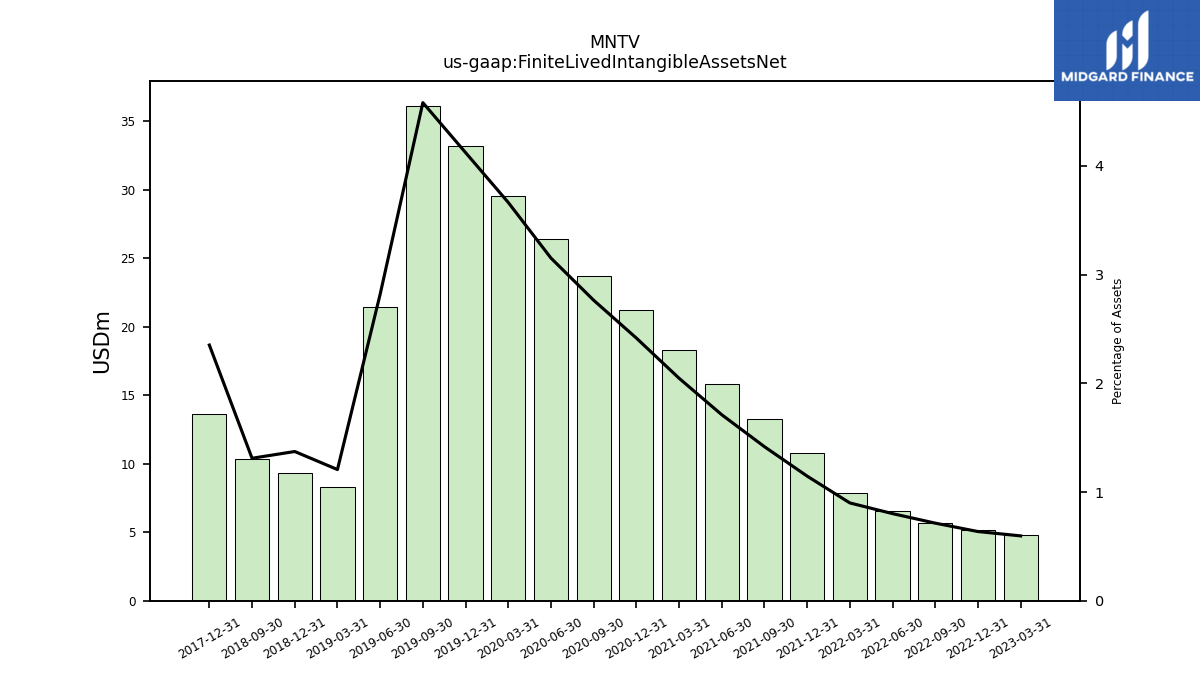
| Finite Lived Intangible Assets Net | 4.79 | 5.16 | 5.66 | 6.58 | 7.84 | 10.77 | 13.24 | 15.82 | 18.33 | 21.21 | 23.70 | 26.39 | 29.57 | 33.15 | 36.12 | 21.46 | 8.30 | 9.32 | 10.36 | NA | NA | 13.59 | NA | |
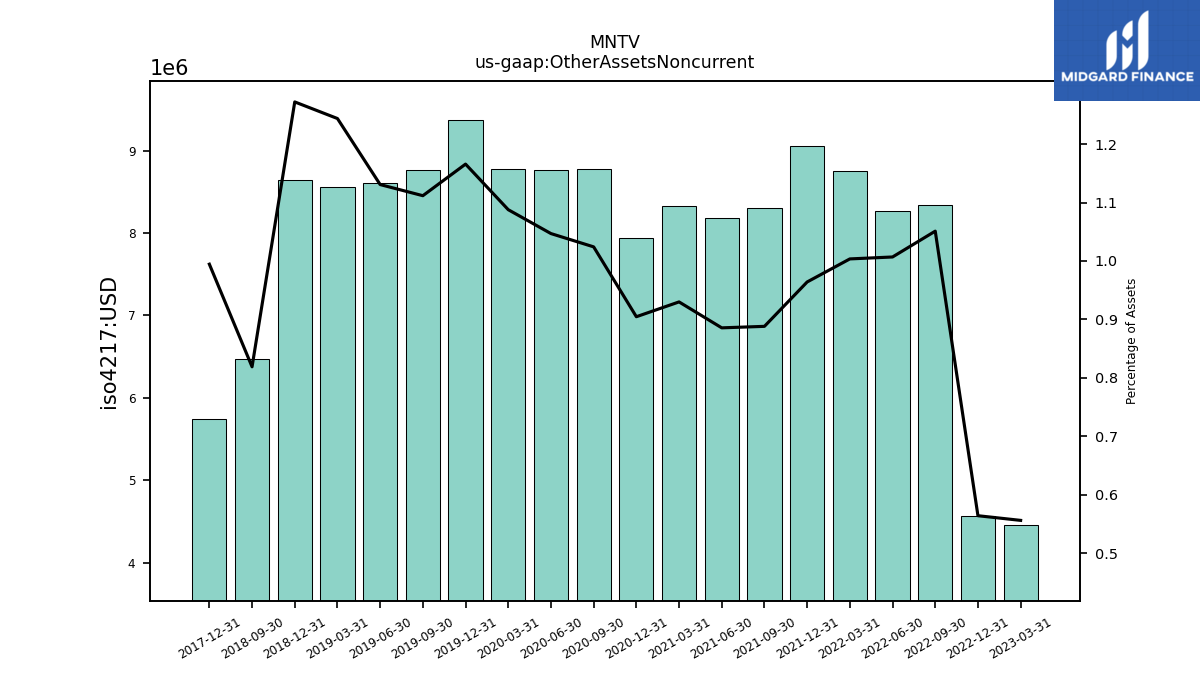
| Other Assets Noncurrent | 4.46 | 4.57 | 8.34 | 8.27 | 8.75 | 9.06 | 8.30 | 8.19 | 8.33 | 7.94 | 8.78 | 8.77 | 8.78 | 9.38 | 8.77 | 8.61 | 8.55 | 8.64 | 6.47 | NA | NA | 5.75 | NA |
| 2023-03-31 | 2022-12-31 | 2022-09-30 | 2022-06-30 | 2022-03-31 | 2021-12-31 | 2021-09-30 | 2021-06-30 | 2021-03-31 | 2020-12-31 | 2020-09-30 | 2020-06-30 | 2020-03-31 | 2019-12-31 | 2019-09-30 | 2019-06-30 | 2019-03-31 | 2018-12-31 | 2018-09-30 | 2018-06-30 | 2018-03-31 | 2017-12-31 | 2017-09-30 | ||
|---|---|---|---|---|---|---|---|---|---|---|---|---|---|---|---|---|---|---|---|---|---|---|---|---|
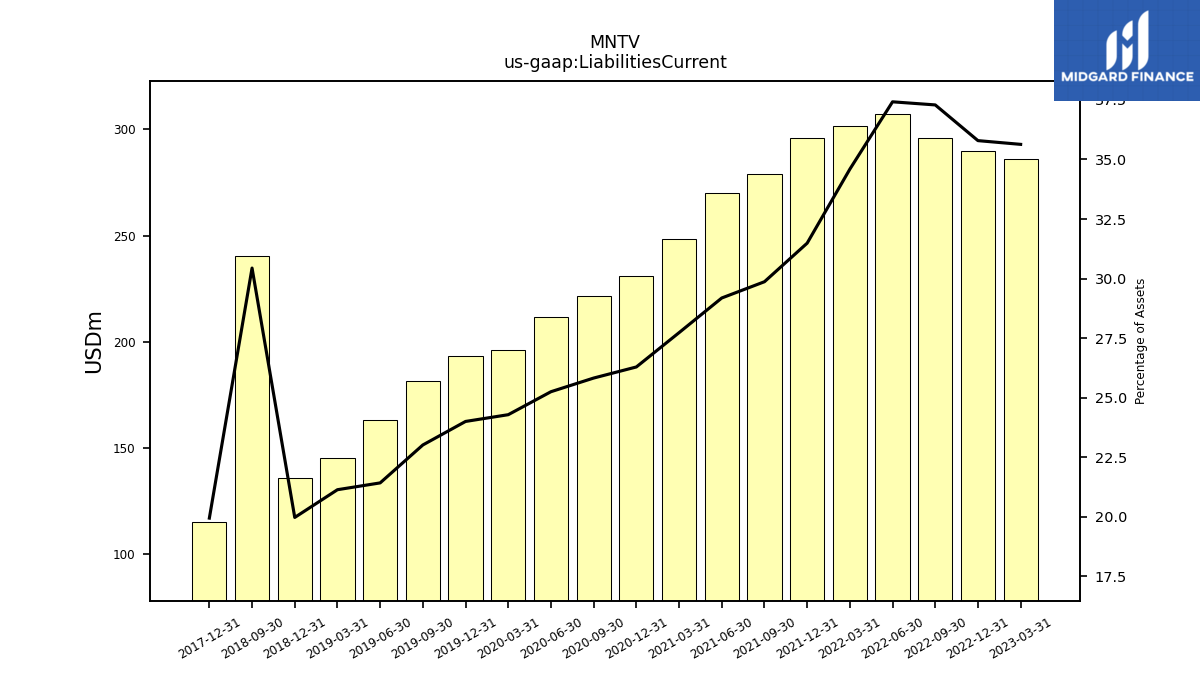
| Liabilities Current | 285.85 | 289.95 | 295.75 | 307.40 | 301.67 | 295.95 | 279.16 | 269.85 | 248.39 | 230.78 | 221.43 | 211.45 | 196.02 | 193.06 | 181.47 | 163.08 | 145.38 | 135.70 | 240.58 | NA | NA | 115.31 | NA | |
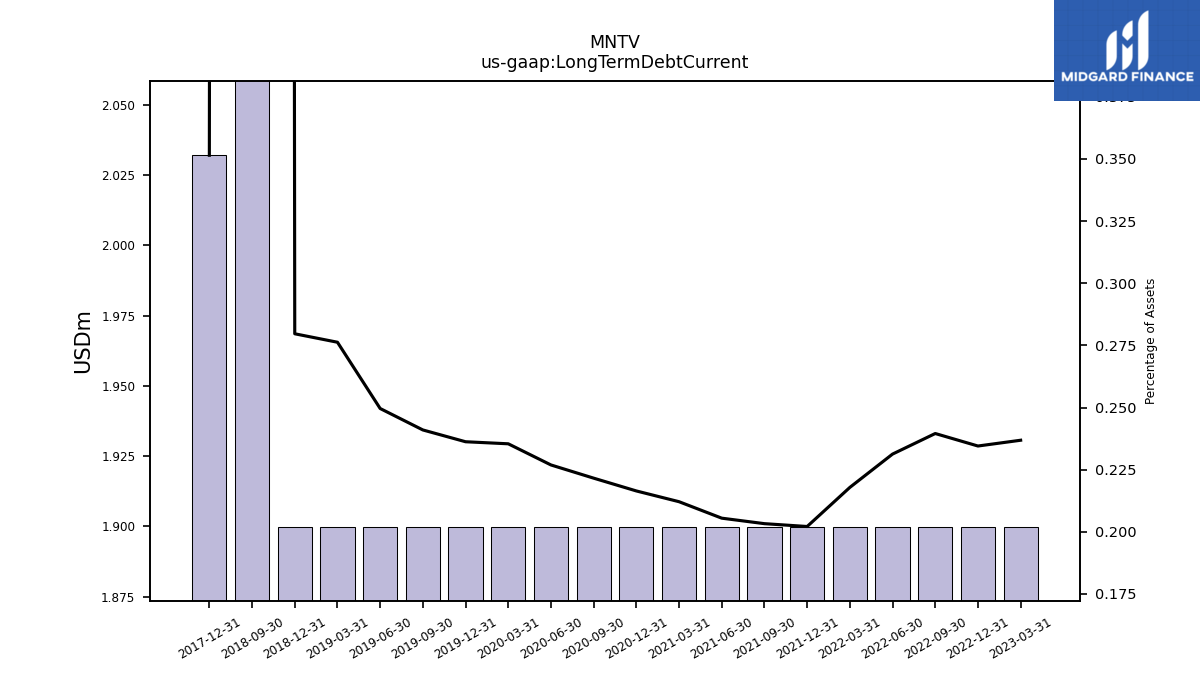
| Long Term Debt Current | 1.90 | 1.90 | 1.90 | 1.90 | 1.90 | 1.90 | 1.90 | 1.90 | 1.90 | 1.90 | 1.90 | 1.90 | 1.90 | 1.90 | 1.90 | 1.90 | 1.90 | 1.90 | 103.28 | NA | NA | 2.03 | NA | |
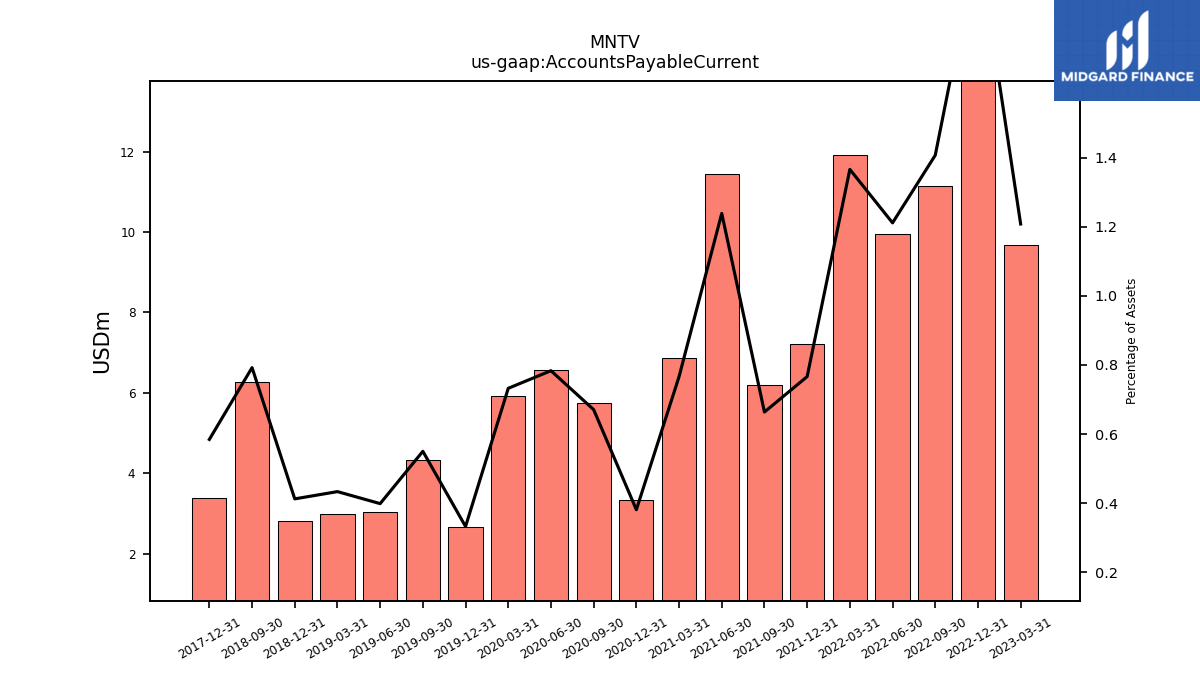
| Accounts Payable Current | 9.69 | 16.42 | 11.16 | 9.95 | 11.91 | 7.20 | 6.21 | 11.45 | 6.86 | 3.35 | 5.75 | 6.56 | 5.91 | 2.68 | 4.34 | 3.04 | 2.98 | 2.80 | 6.26 | NA | NA | 3.38 | NA | |
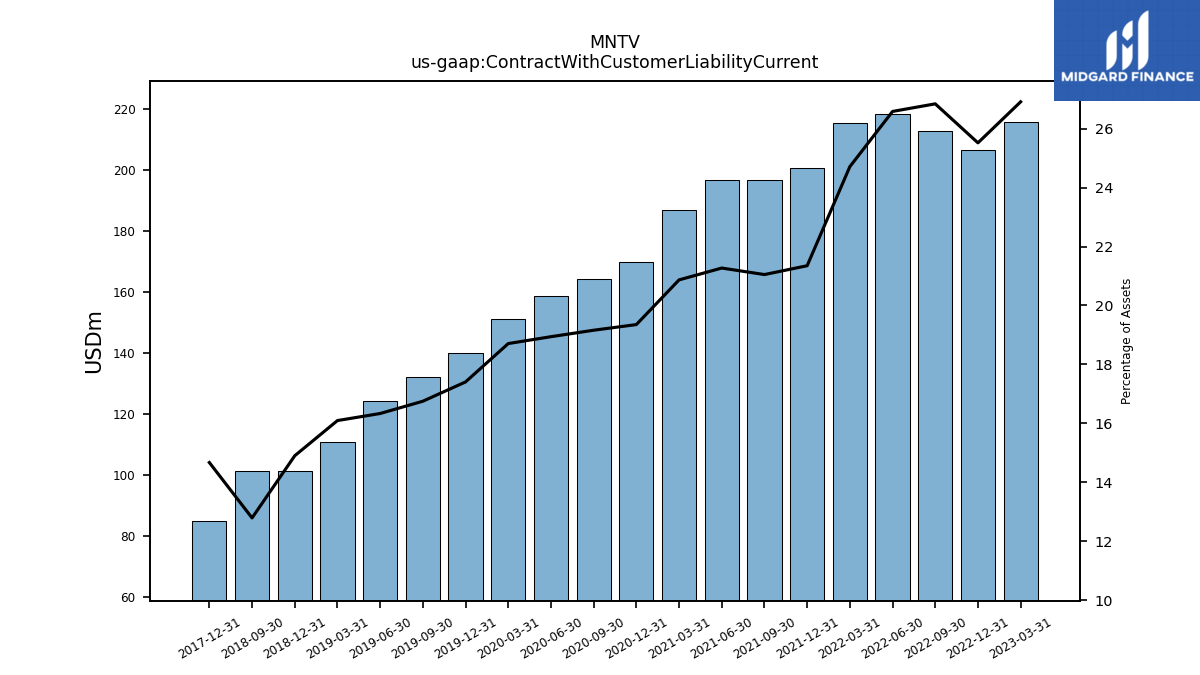
| Contract With Customer Liability Current | 215.87 | 206.73 | 212.88 | 218.38 | 215.48 | 200.66 | 196.73 | 196.66 | 186.92 | 169.87 | 164.28 | 158.60 | 150.99 | 139.99 | 132.07 | 124.33 | 110.69 | 101.24 | 101.10 | NA | NA | 84.82 | NA |
| 2023-03-31 | 2022-12-31 | 2022-09-30 | 2022-06-30 | 2022-03-31 | 2021-12-31 | 2021-09-30 | 2021-06-30 | 2021-03-31 | 2020-12-31 | 2020-09-30 | 2020-06-30 | 2020-03-31 | 2019-12-31 | 2019-09-30 | 2019-06-30 | 2019-03-31 | 2018-12-31 | 2018-09-30 | 2018-06-30 | 2018-03-31 | 2017-12-31 | 2017-09-30 | ||
|---|---|---|---|---|---|---|---|---|---|---|---|---|---|---|---|---|---|---|---|---|---|---|---|---|
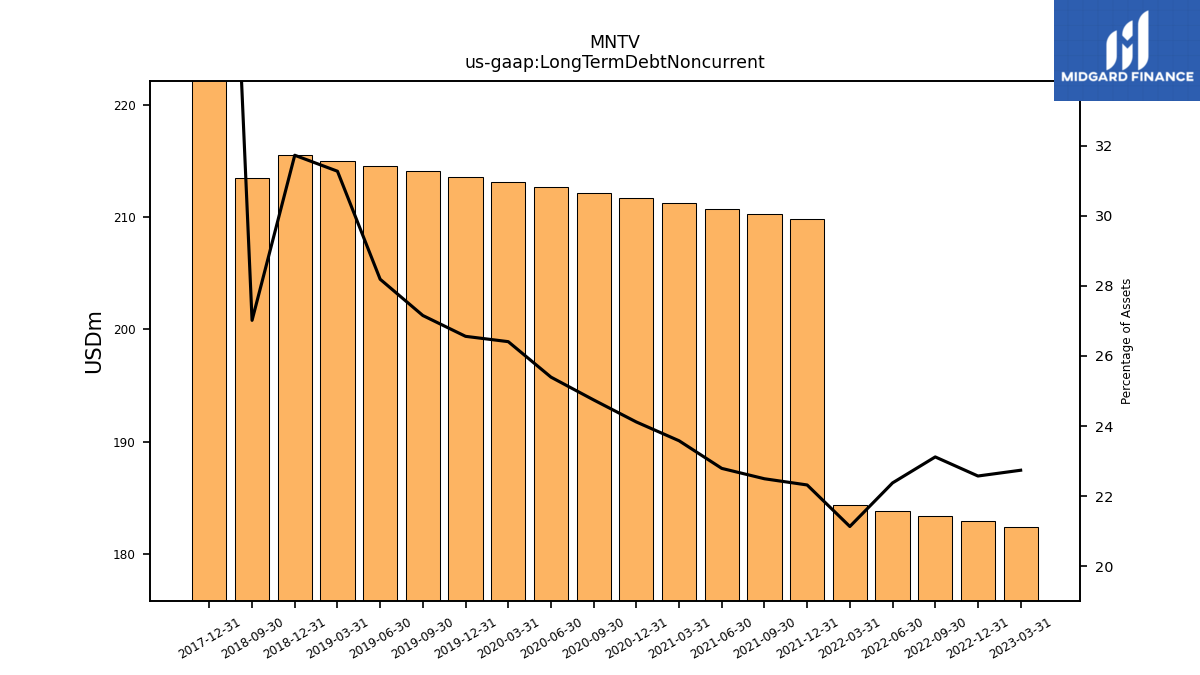
| Long Term Debt Noncurrent | 182.44 | 182.92 | 183.39 | 183.87 | 184.34 | 209.82 | 210.29 | 210.77 | 211.24 | 211.72 | 212.19 | 212.67 | 213.14 | 213.62 | 214.09 | 214.56 | 215.04 | 215.51 | 213.51 | NA | NA | 316.29 | NA | |
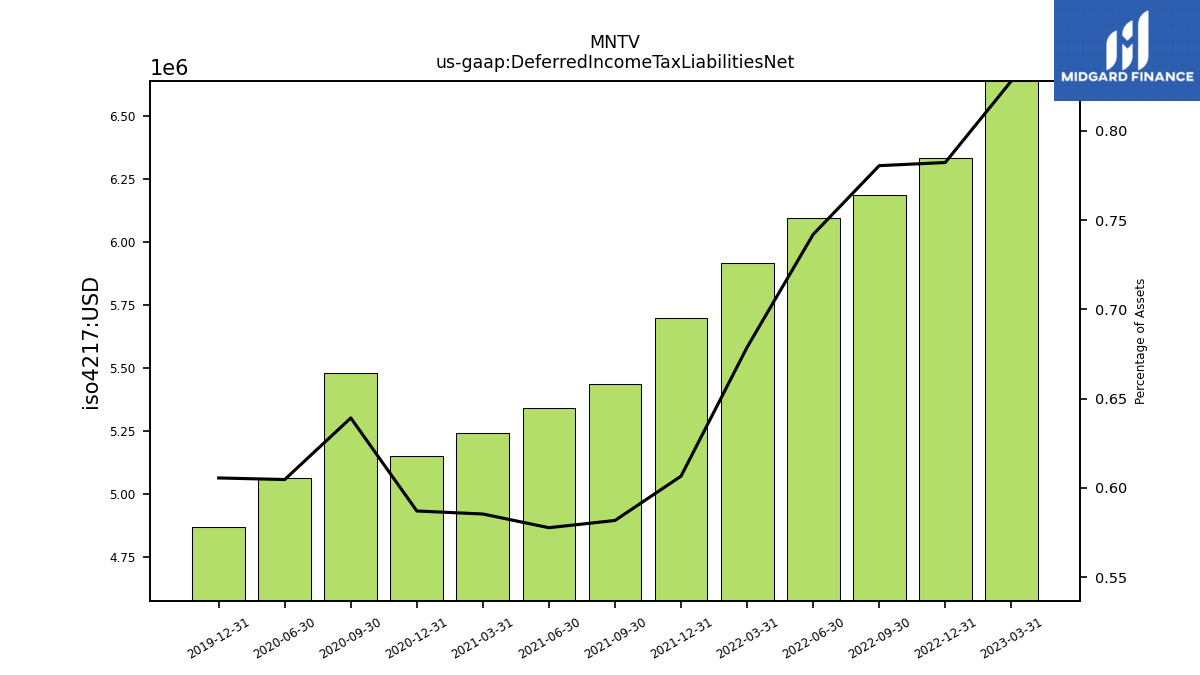
| Deferred Income Tax Liabilities Net | 6.64 | 6.34 | 6.19 | 6.09 | 5.92 | 5.70 | 5.44 | 5.34 | 5.24 | 5.15 | 5.48 | 5.06 | NA | 4.87 | NA | NA | NA | NA | NA | NA | NA | NA | NA | |
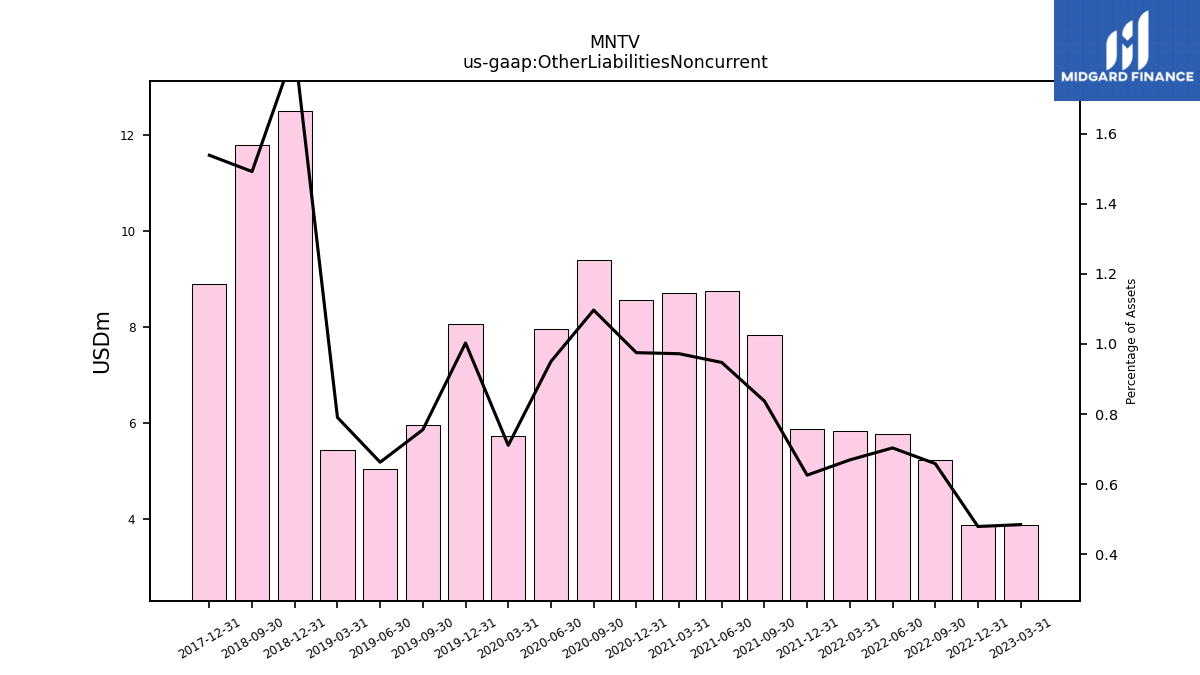
| Other Liabilities Noncurrent | 3.89 | 3.88 | 5.22 | 5.78 | 5.84 | 5.88 | 7.82 | 8.76 | 8.71 | 8.56 | 9.40 | 7.96 | 5.74 | 8.06 | 5.96 | 5.04 | 5.44 | 12.49 | 11.79 | NA | NA | 8.89 | NA | |
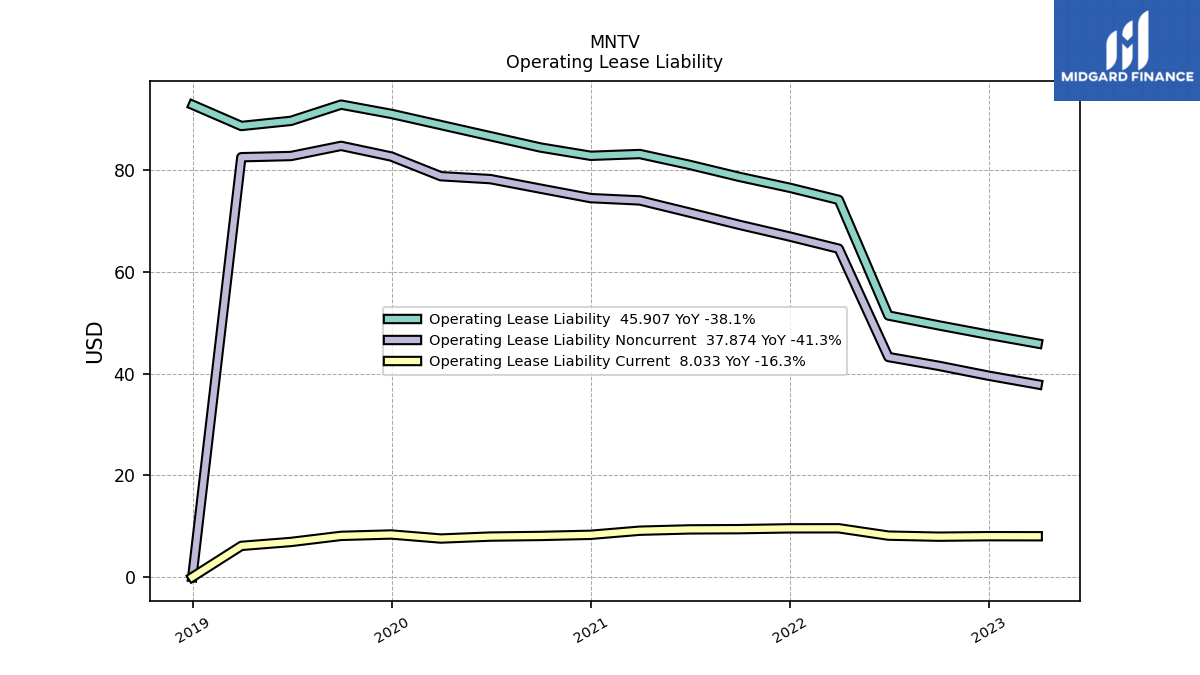
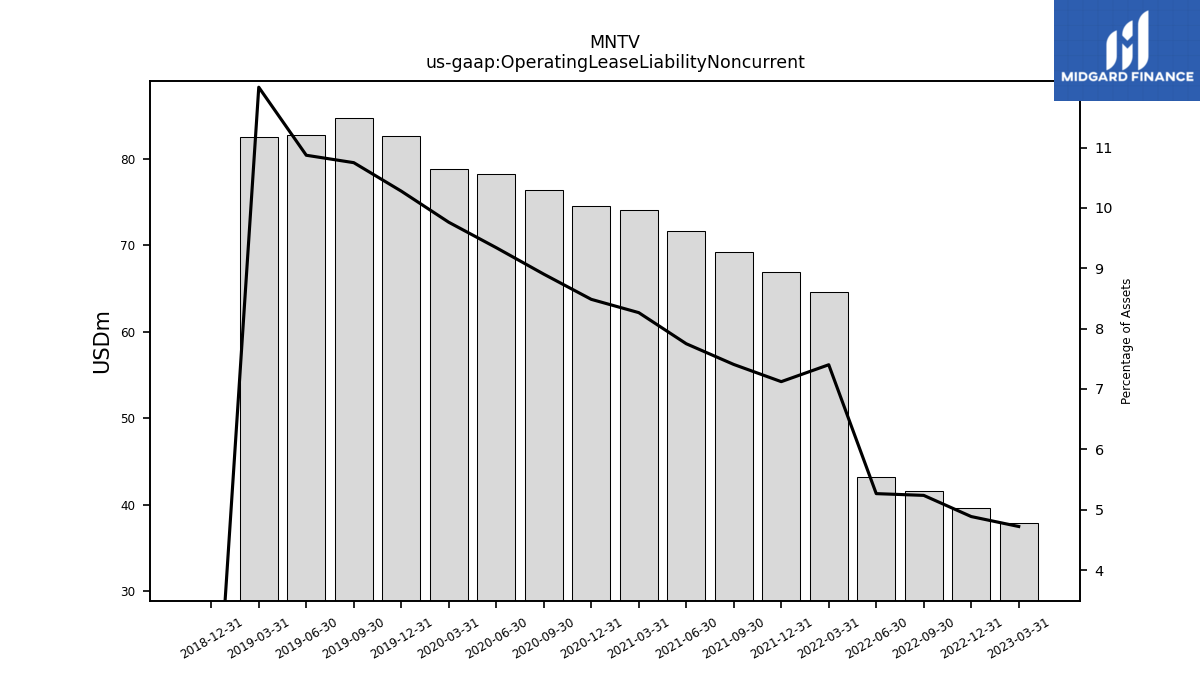
| Operating Lease Liability Noncurrent | 37.87 | 39.58 | 41.54 | 43.26 | 64.55 | 66.94 | 69.23 | 71.65 | 74.03 | 74.49 | 76.34 | 78.22 | 78.80 | 82.67 | 84.76 | 82.76 | 82.53 | 0.00 | NA | NA | NA | NA | NA |
| 2023-03-31 | 2022-12-31 | 2022-09-30 | 2022-06-30 | 2022-03-31 | 2021-12-31 | 2021-09-30 | 2021-06-30 | 2021-03-31 | 2020-12-31 | 2020-09-30 | 2020-06-30 | 2020-03-31 | 2019-12-31 | 2019-09-30 | 2019-06-30 | 2019-03-31 | 2018-12-31 | 2018-09-30 | 2018-06-30 | 2018-03-31 | 2017-12-31 | 2017-09-30 | ||
|---|---|---|---|---|---|---|---|---|---|---|---|---|---|---|---|---|---|---|---|---|---|---|---|---|
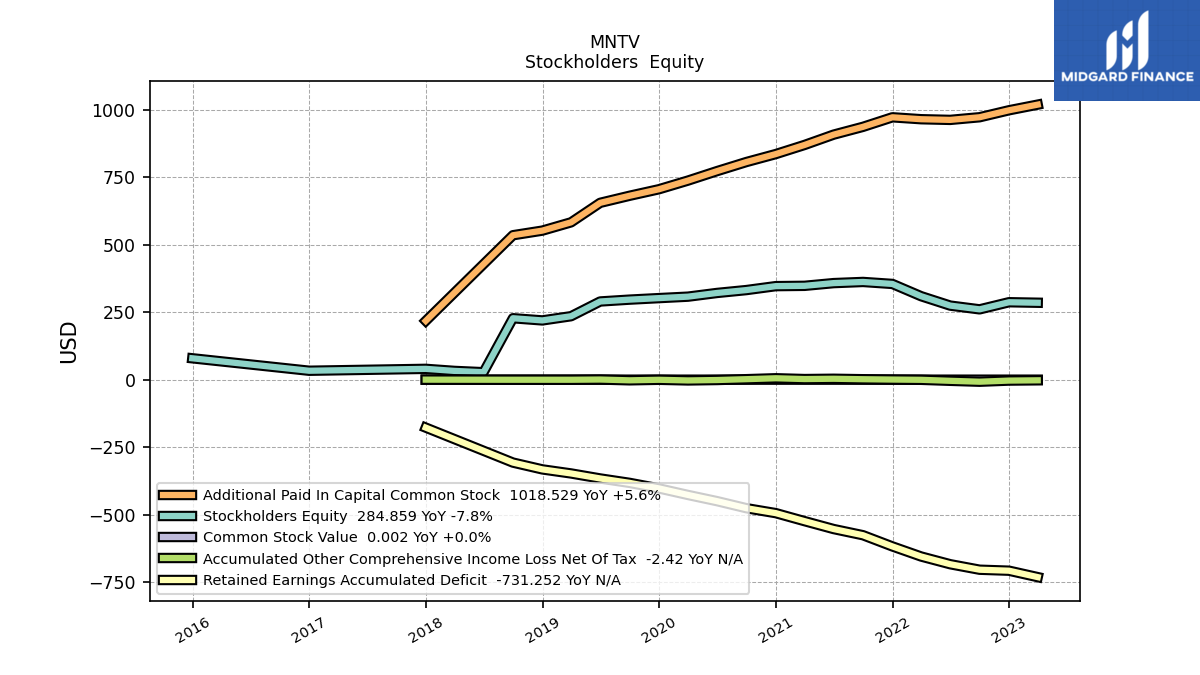
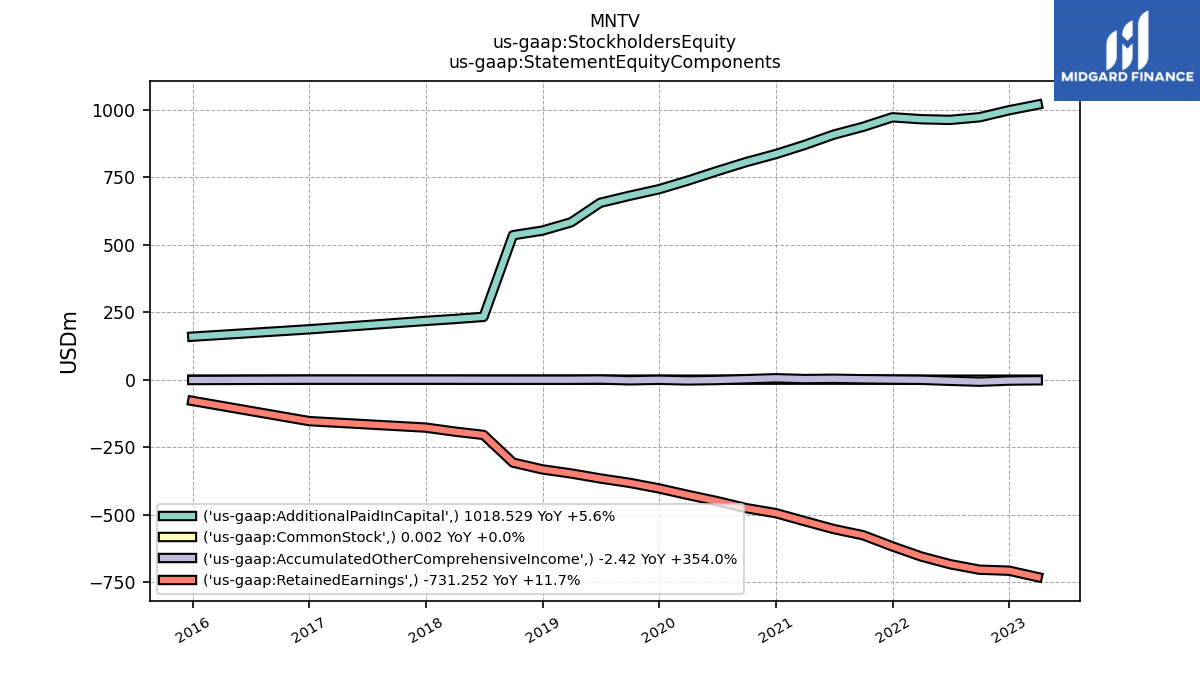
| Stockholders Equity | 284.86 | 286.76 | 260.38 | 274.28 | 309.02 | 354.47 | 361.83 | 357.55 | 347.49 | 346.36 | 331.80 | 321.09 | 307.39 | 301.98 | 296.37 | 289.53 | 235.00 | 219.38 | 227.48 | 27.61 | 32.42 | 40.04 | NA | |
| Common Stock Value | 0.00 | 0.00 | 0.00 | 0.00 | 0.00 | 0.00 | 0.00 | 0.00 | 0.00 | 0.00 | 0.00 | 0.00 | 0.00 | 0.00 | 0.00 | 0.00 | 0.00 | 0.00 | 0.00 | NA | NA | 0.00 | NA | |
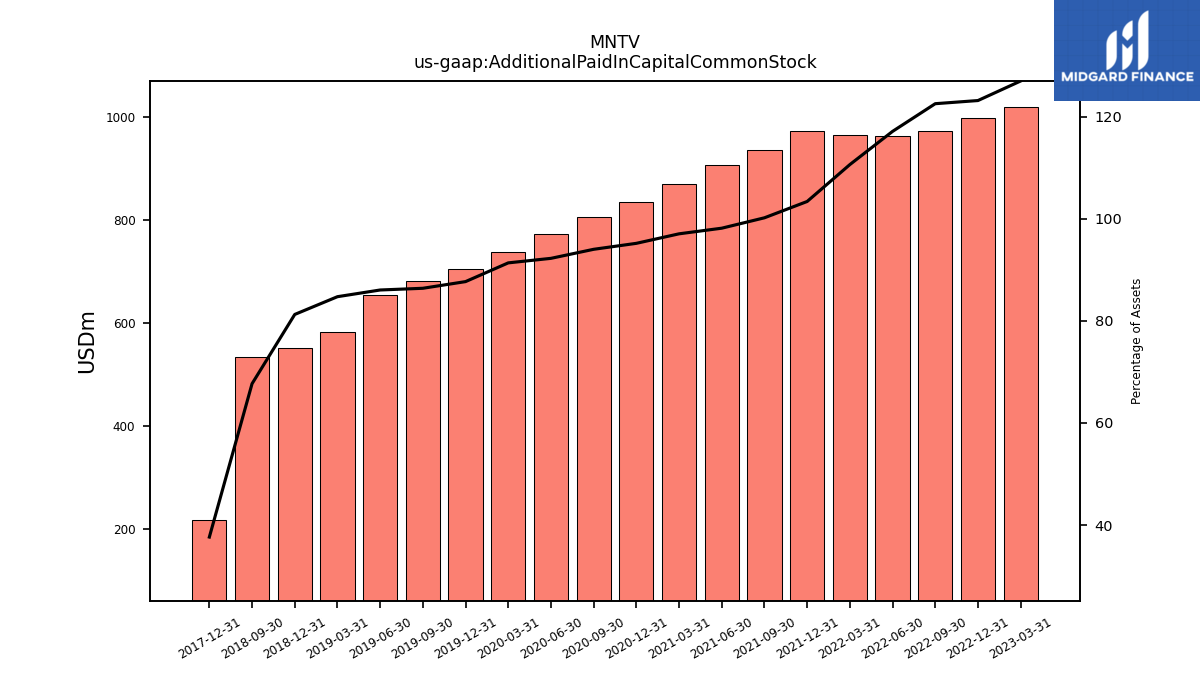
| Additional Paid In Capital Common Stock | 1018.53 | 997.62 | 971.78 | 961.98 | 964.47 | 971.60 | 936.28 | 907.38 | 869.17 | 835.44 | 806.00 | 772.31 | 737.24 | 705.14 | 680.96 | 654.86 | 582.65 | 551.94 | 534.86 | NA | NA | 217.59 | NA | |
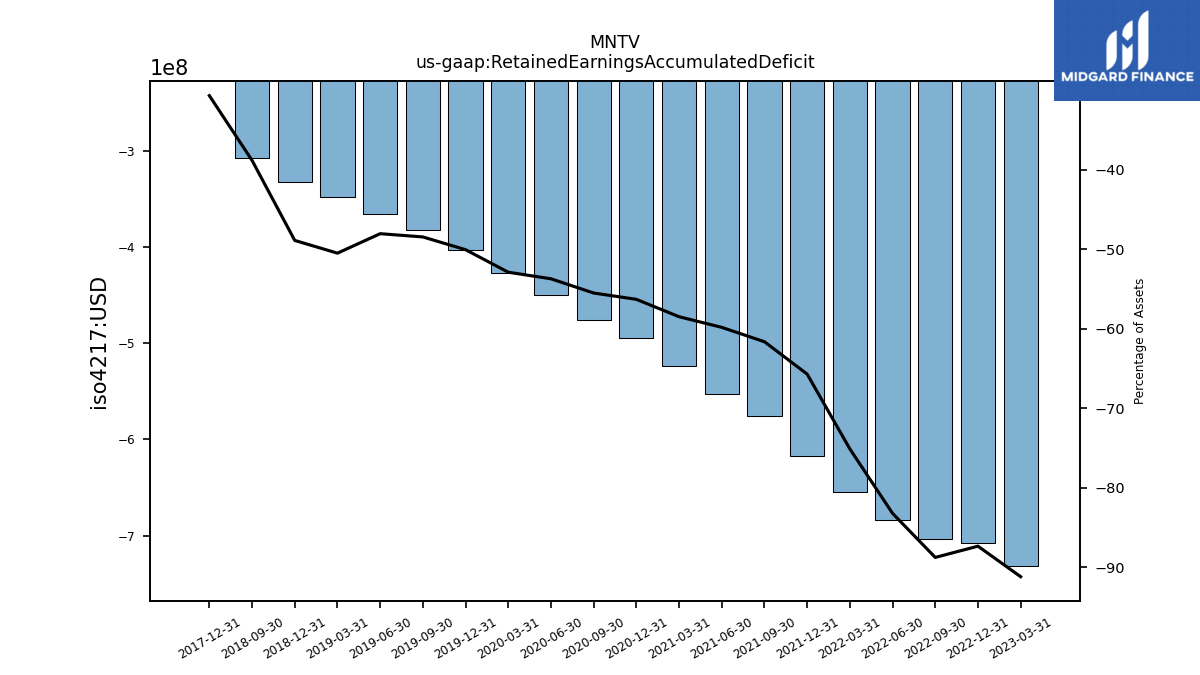
| Retained Earnings Accumulated Deficit | -731.25 | -707.44 | -703.80 | -683.47 | -654.92 | -617.55 | -576.08 | -553.18 | -523.94 | -494.30 | -476.01 | -449.89 | -426.97 | -402.72 | -382.14 | -365.83 | -347.35 | -332.27 | -307.07 | NA | NA | -177.57 | NA | |
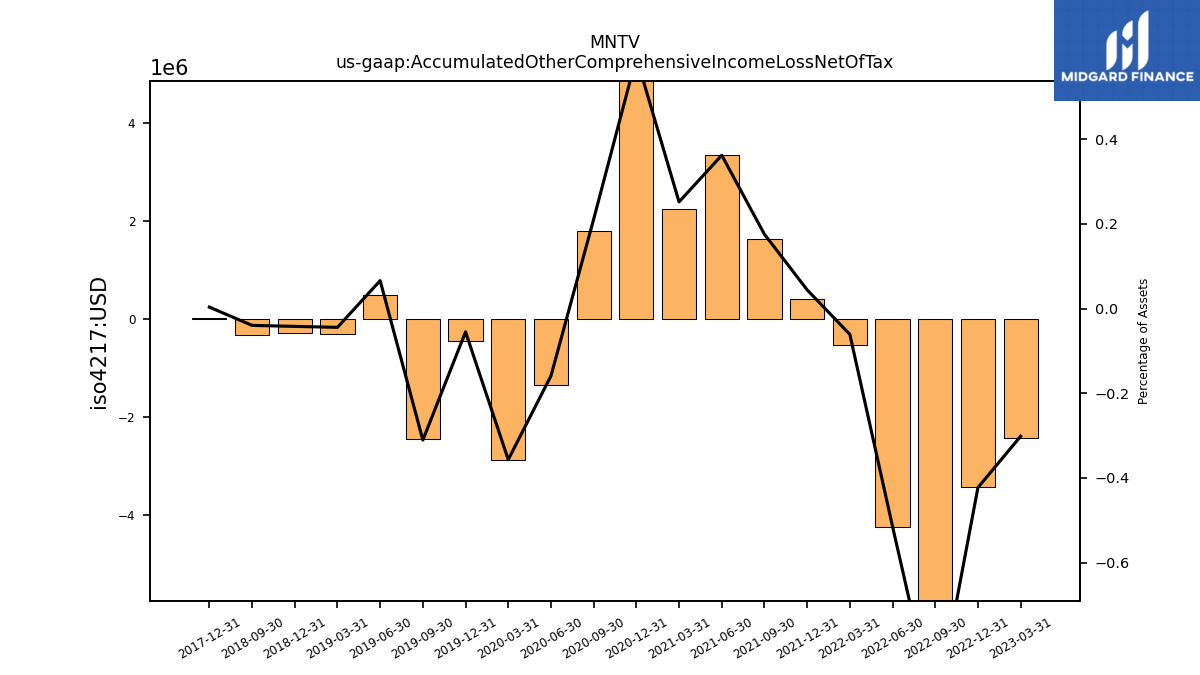
| Accumulated Other Comprehensive Income Loss Net Of Tax | -2.42 | -3.42 | -7.59 | -4.23 | -0.53 | 0.41 | 1.64 | 3.35 | 2.25 | 5.21 | 1.81 | -1.33 | -2.88 | -0.44 | -2.45 | 0.50 | -0.31 | -0.29 | -0.32 | NA | NA | 0.02 | NA | |
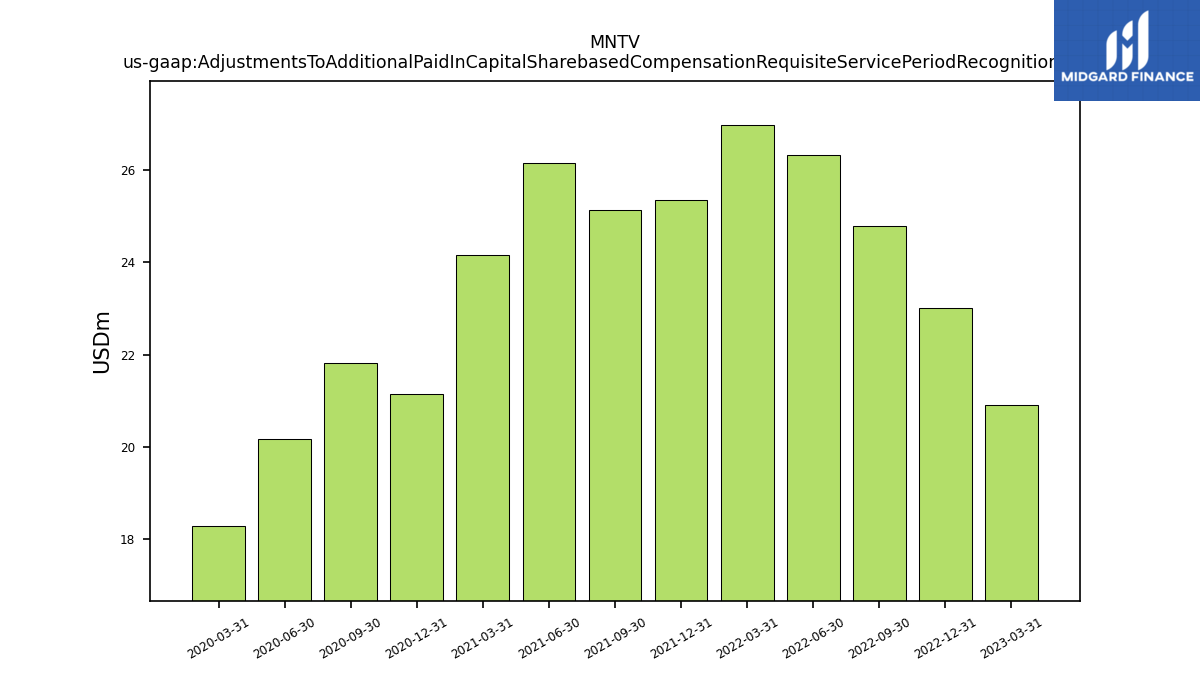
| Adjustments To Additional Paid In Capital Sharebased Compensation Requisite Service Period Recognition Value | 20.91 | 23.00 | 24.79 | 26.32 | 26.97 | 25.34 | 25.12 | 26.15 | 24.16 | 21.14 | 21.81 | 20.18 | 18.28 | NA | NA | NA | NA | NA | NA | NA | NA | NA | NA |
| 2023-03-31 | 2022-12-31 | 2022-09-30 | 2022-06-30 | 2022-03-31 | 2021-12-31 | 2021-09-30 | 2021-06-30 | 2021-03-31 | 2020-12-31 | 2020-09-30 | 2020-06-30 | 2020-03-31 | 2019-12-31 | 2019-09-30 | 2019-06-30 | 2019-03-31 | 2018-12-31 | 2018-09-30 | 2018-06-30 | 2018-03-31 | 2017-12-31 | 2017-09-30 | ||
|---|---|---|---|---|---|---|---|---|---|---|---|---|---|---|---|---|---|---|---|---|---|---|---|---|
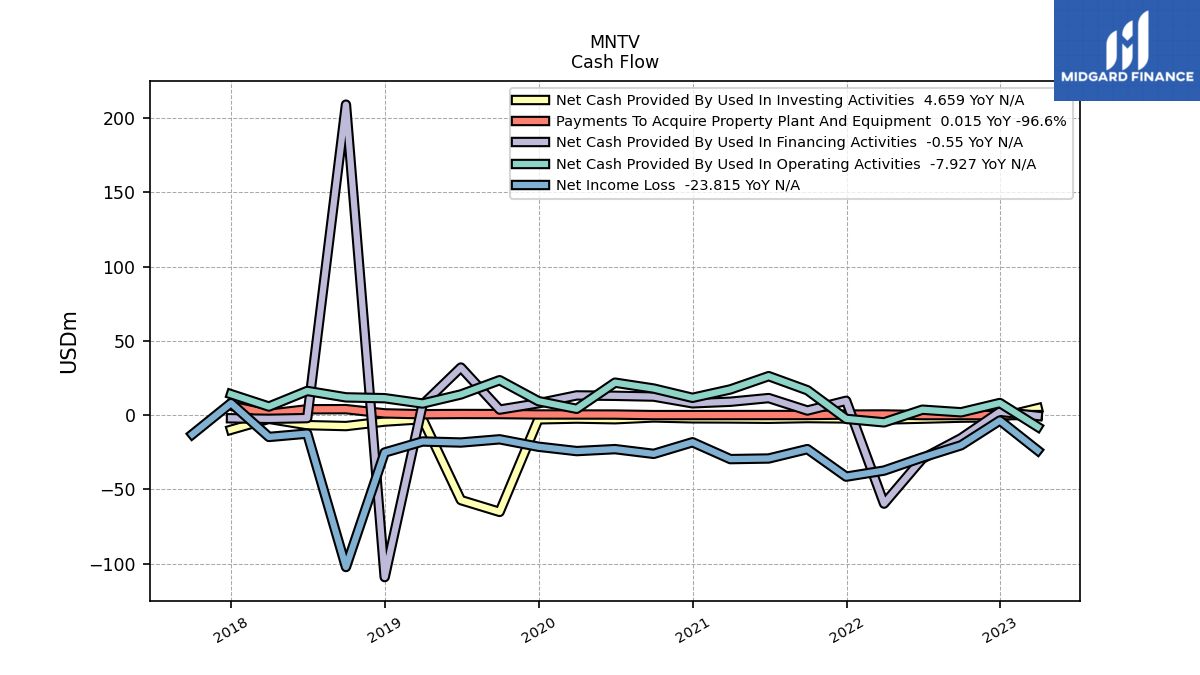
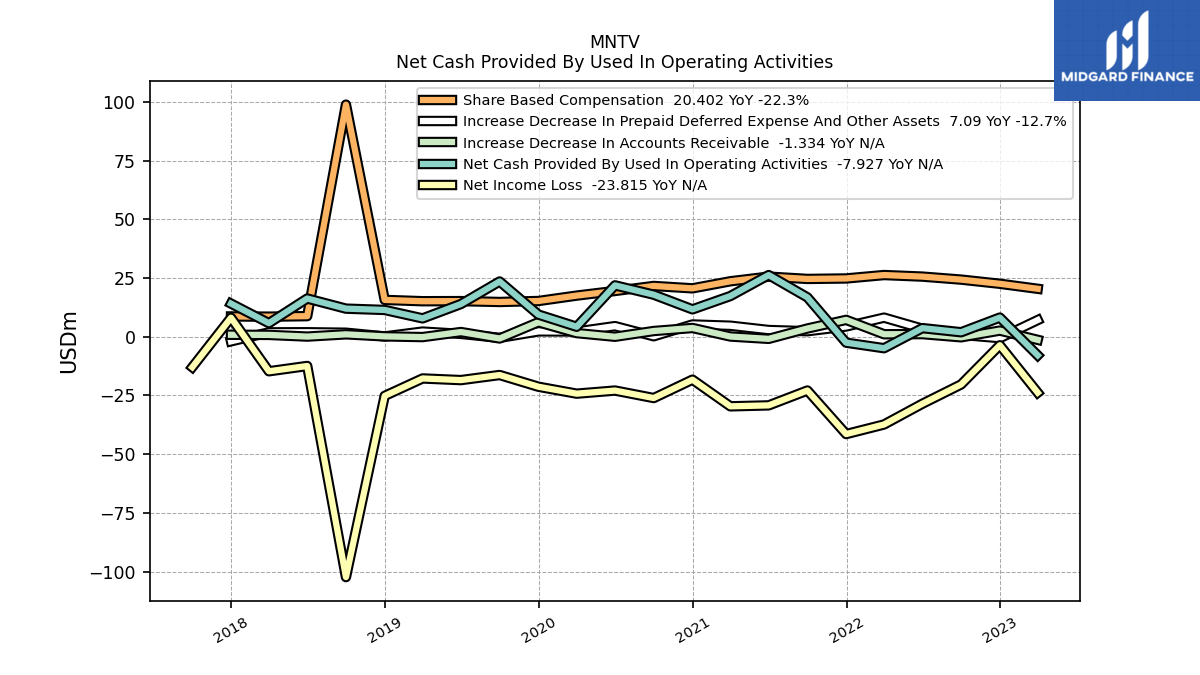
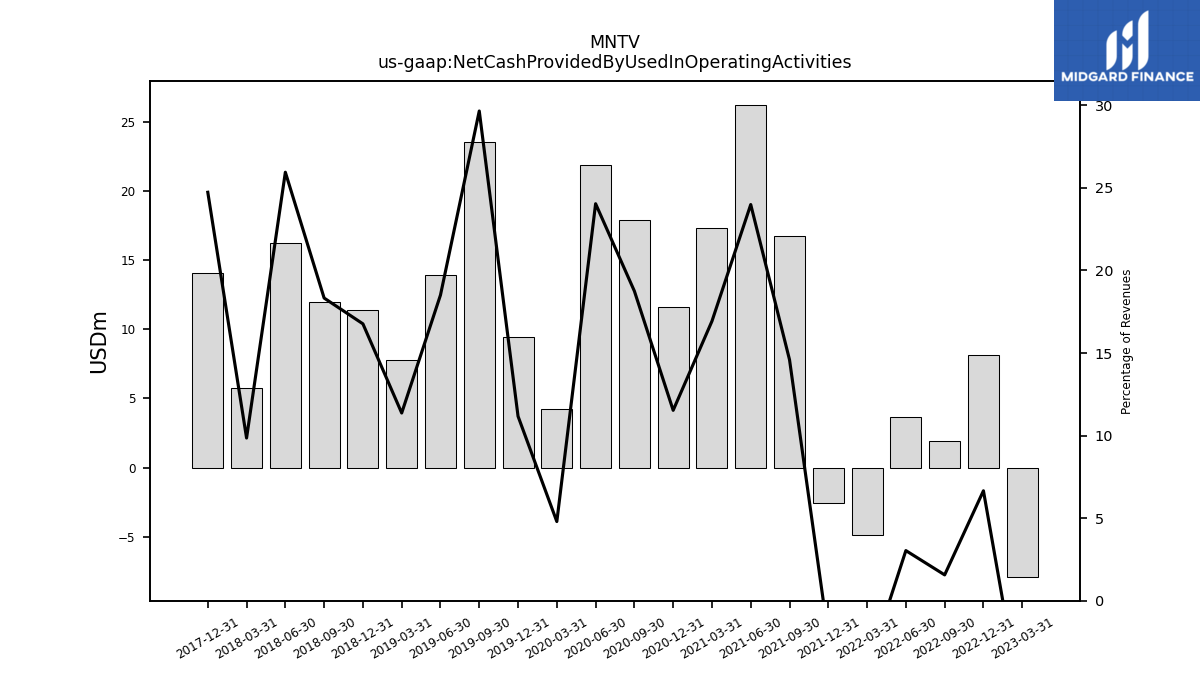
| Net Cash Provided By Used In Operating Activities | -7.93 | 8.15 | 1.90 | 3.65 | -4.90 | -2.54 | 16.75 | 26.24 | 17.32 | 11.64 | 17.89 | 21.86 | 4.23 | 9.42 | 23.52 | 13.91 | 7.80 | 11.39 | 11.95 | 16.27 | 5.76 | 14.10 | NA | |
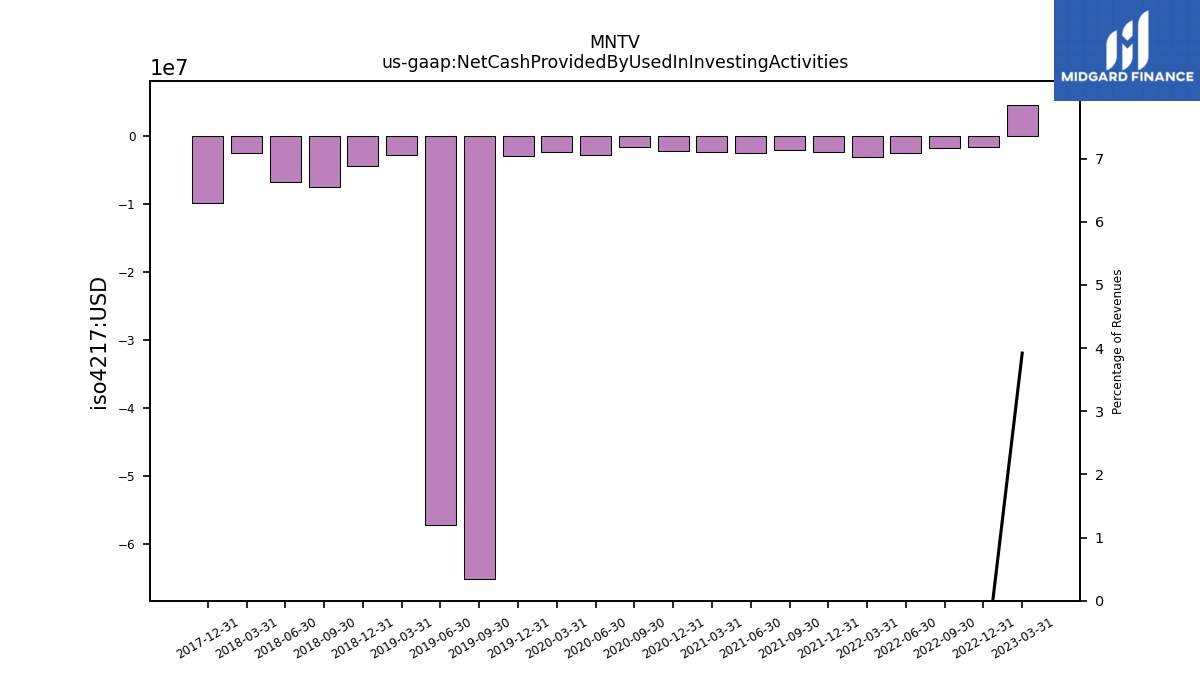
| Net Cash Provided By Used In Investing Activities | 4.66 | -1.53 | -1.72 | -2.40 | -3.01 | -2.26 | -2.01 | -2.47 | -2.27 | -2.18 | -1.58 | -2.79 | -2.35 | -2.87 | -65.22 | -57.27 | -2.73 | -4.37 | -7.39 | -6.76 | -2.52 | -9.88 | NA | |
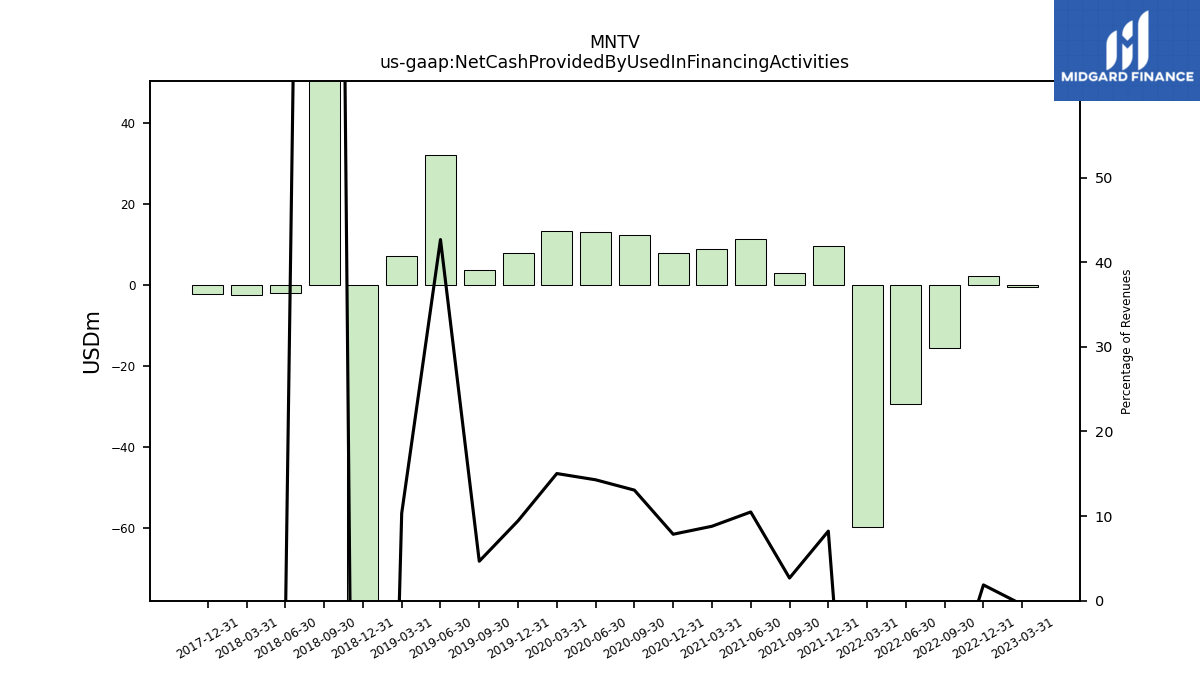
| Net Cash Provided By Used In Financing Activities | -0.55 | 2.29 | -15.54 | -29.37 | -59.65 | 9.65 | 3.08 | 11.47 | 9.00 | 7.94 | 12.47 | 13.00 | 13.27 | 7.96 | 3.70 | 32.06 | 7.09 | -109.16 | 209.17 | -2.03 | -2.51 | -2.15 | NA |
| 2023-03-31 | 2022-12-31 | 2022-09-30 | 2022-06-30 | 2022-03-31 | 2021-12-31 | 2021-09-30 | 2021-06-30 | 2021-03-31 | 2020-12-31 | 2020-09-30 | 2020-06-30 | 2020-03-31 | 2019-12-31 | 2019-09-30 | 2019-06-30 | 2019-03-31 | 2018-12-31 | 2018-09-30 | 2018-06-30 | 2018-03-31 | 2017-12-31 | 2017-09-30 | ||
|---|---|---|---|---|---|---|---|---|---|---|---|---|---|---|---|---|---|---|---|---|---|---|---|---|
| Net Cash Provided By Used In Operating Activities | -7.93 | 8.15 | 1.90 | 3.65 | -4.90 | -2.54 | 16.75 | 26.24 | 17.32 | 11.64 | 17.89 | 21.86 | 4.23 | 9.42 | 23.52 | 13.91 | 7.80 | 11.39 | 11.95 | 16.27 | 5.76 | 14.10 | NA | |
| Net Income Loss | -23.82 | -3.63 | -20.33 | -28.55 | -37.38 | -41.46 | -22.90 | -29.24 | -29.65 | -18.29 | -26.12 | -22.92 | -24.25 | -21.29 | -16.31 | -18.48 | -17.78 | -25.20 | -102.36 | -12.46 | -14.72 | 8.07 | -12.98 | |
| Profit Loss | -23.82 | -3.63 | -20.33 | -28.55 | -37.38 | -41.46 | -22.90 | -29.24 | -29.65 | -18.29 | -26.12 | -22.92 | -24.25 | -21.29 | -16.31 | -18.48 | -17.78 | -25.20 | -102.36 | -12.46 | -14.72 | NA | NA | |
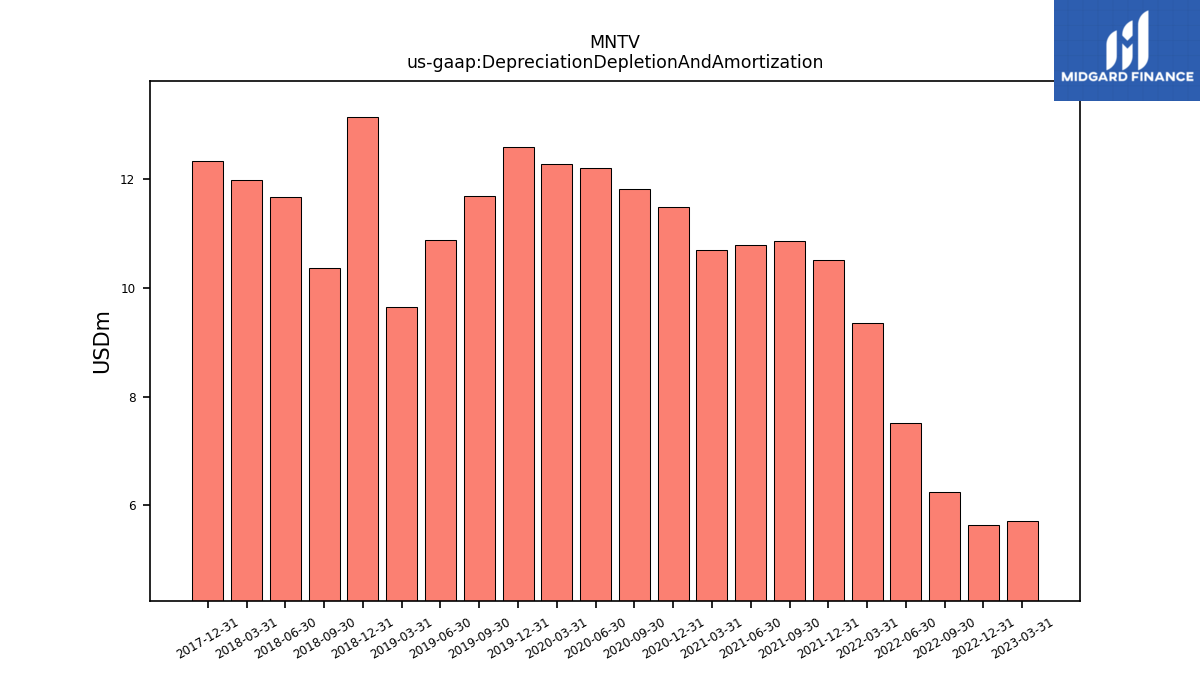
| Depreciation Depletion And Amortization | 5.71 | 5.63 | 6.23 | 7.51 | 9.35 | 10.51 | 10.87 | 10.78 | 10.69 | 11.49 | 11.83 | 12.21 | 12.29 | 12.59 | 11.70 | 10.89 | 9.65 | 13.15 | 10.36 | 11.67 | 11.98 | 12.34 | NA | |
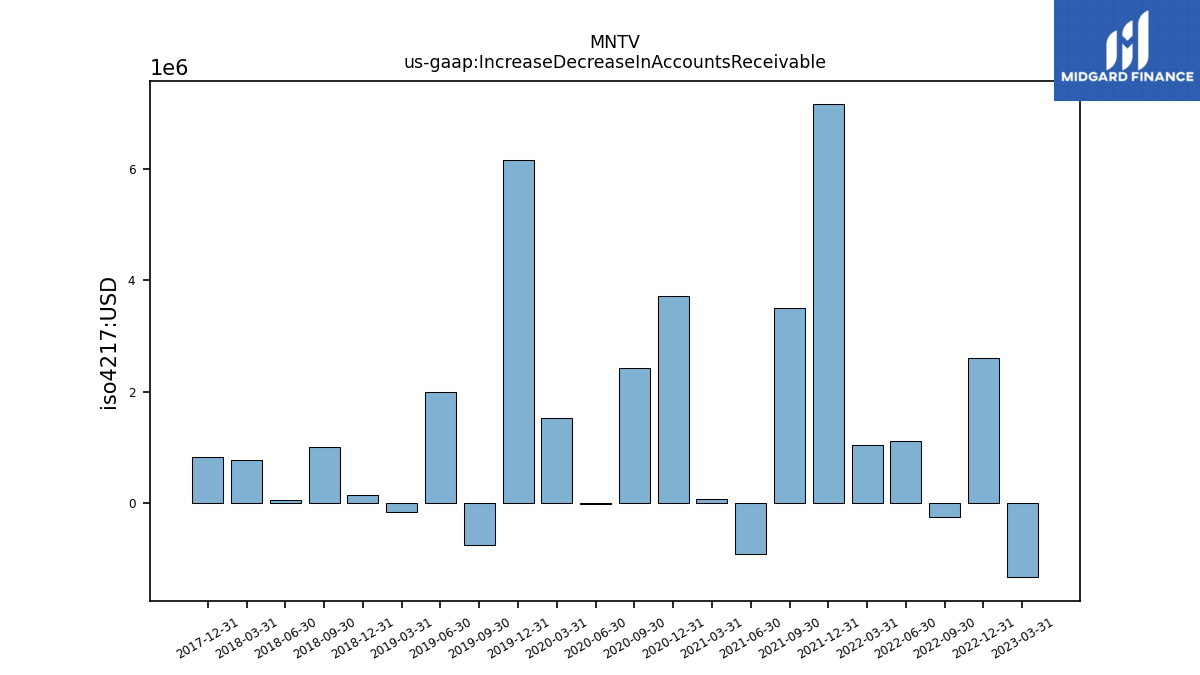
| Increase Decrease In Accounts Receivable | -1.33 | 2.60 | -0.25 | 1.10 | 1.05 | 7.16 | 3.49 | -0.92 | 0.08 | 3.71 | 2.42 | -0.03 | 1.53 | 6.17 | -0.76 | 1.99 | -0.16 | 0.14 | 1.01 | 0.05 | 0.76 | 0.82 | NA | |
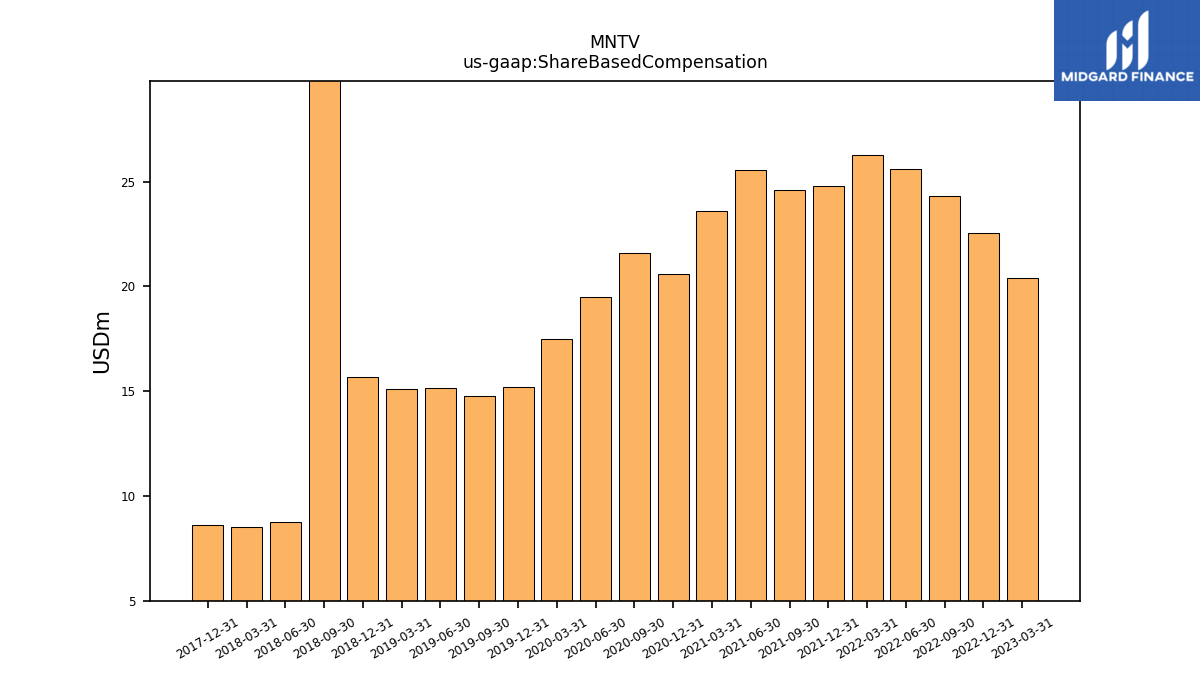
| Share Based Compensation | 20.40 | 22.54 | 24.31 | 25.59 | 26.25 | 24.80 | 24.59 | 25.57 | 23.60 | 20.59 | 21.61 | 19.47 | 17.50 | 15.20 | 14.78 | 15.15 | 15.11 | 15.67 | 98.81 | 8.75 | 8.54 | 8.62 | NA |
| 2023-03-31 | 2022-12-31 | 2022-09-30 | 2022-06-30 | 2022-03-31 | 2021-12-31 | 2021-09-30 | 2021-06-30 | 2021-03-31 | 2020-12-31 | 2020-09-30 | 2020-06-30 | 2020-03-31 | 2019-12-31 | 2019-09-30 | 2019-06-30 | 2019-03-31 | 2018-12-31 | 2018-09-30 | 2018-06-30 | 2018-03-31 | 2017-12-31 | 2017-09-30 | ||
|---|---|---|---|---|---|---|---|---|---|---|---|---|---|---|---|---|---|---|---|---|---|---|---|---|
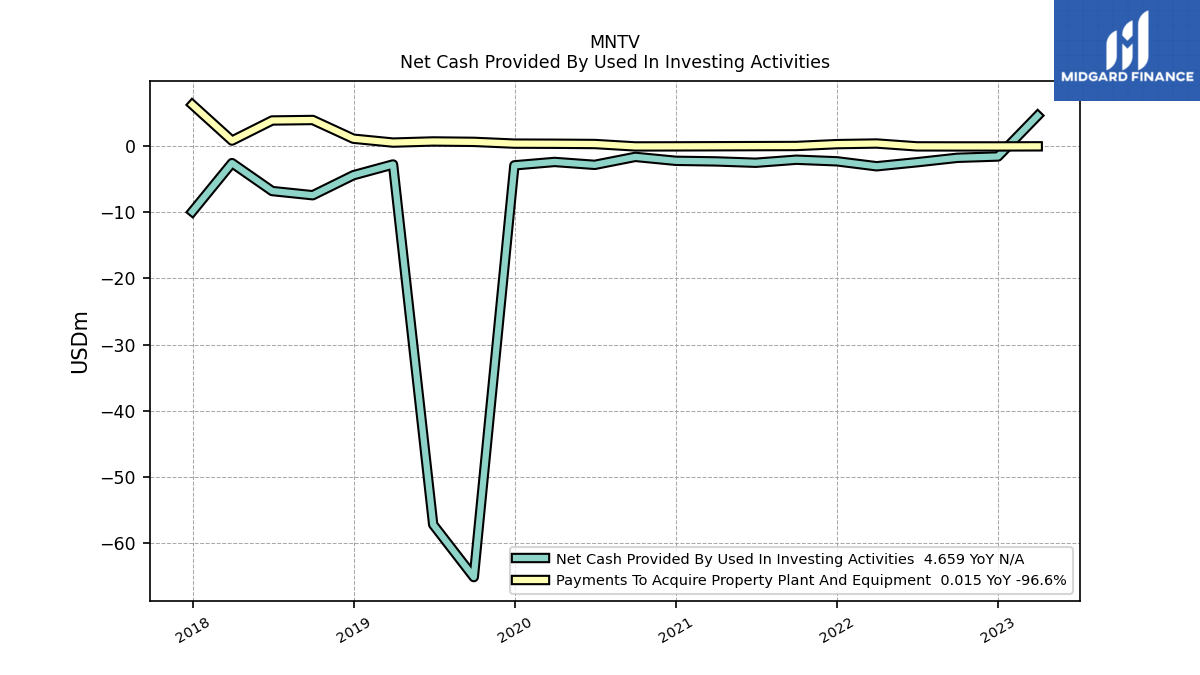
| Net Cash Provided By Used In Investing Activities | 4.66 | -1.53 | -1.72 | -2.40 | -3.01 | -2.26 | -2.01 | -2.47 | -2.27 | -2.18 | -1.58 | -2.79 | -2.35 | -2.87 | -65.22 | -57.27 | -2.73 | -4.37 | -7.39 | -6.76 | -2.52 | -9.88 | NA | |
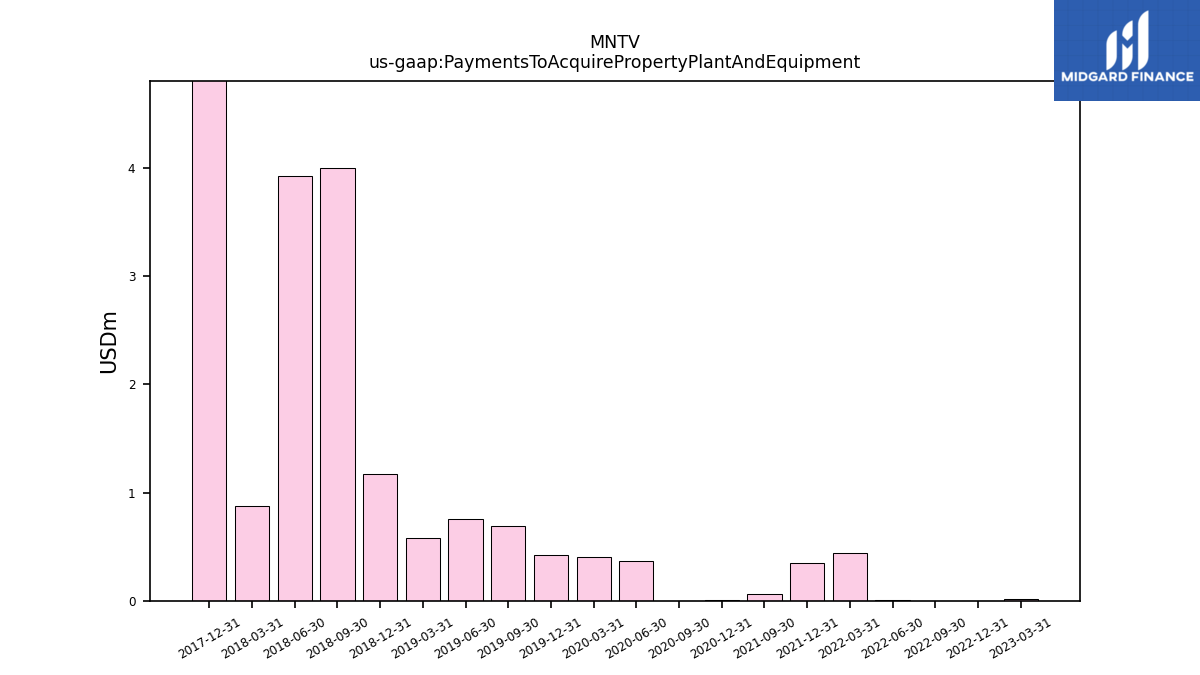
| Payments To Acquire Property Plant And Equipment | 0.01 | 0.00 | 0.00 | 0.01 | 0.44 | 0.35 | 0.07 | NA | NA | 0.01 | 0.00 | 0.37 | 0.41 | 0.42 | 0.69 | 0.75 | 0.58 | 1.17 | 4.00 | 3.93 | 0.88 | 6.33 | NA |
| 2023-03-31 | 2022-12-31 | 2022-09-30 | 2022-06-30 | 2022-03-31 | 2021-12-31 | 2021-09-30 | 2021-06-30 | 2021-03-31 | 2020-12-31 | 2020-09-30 | 2020-06-30 | 2020-03-31 | 2019-12-31 | 2019-09-30 | 2019-06-30 | 2019-03-31 | 2018-12-31 | 2018-09-30 | 2018-06-30 | 2018-03-31 | 2017-12-31 | 2017-09-30 | ||
|---|---|---|---|---|---|---|---|---|---|---|---|---|---|---|---|---|---|---|---|---|---|---|---|---|
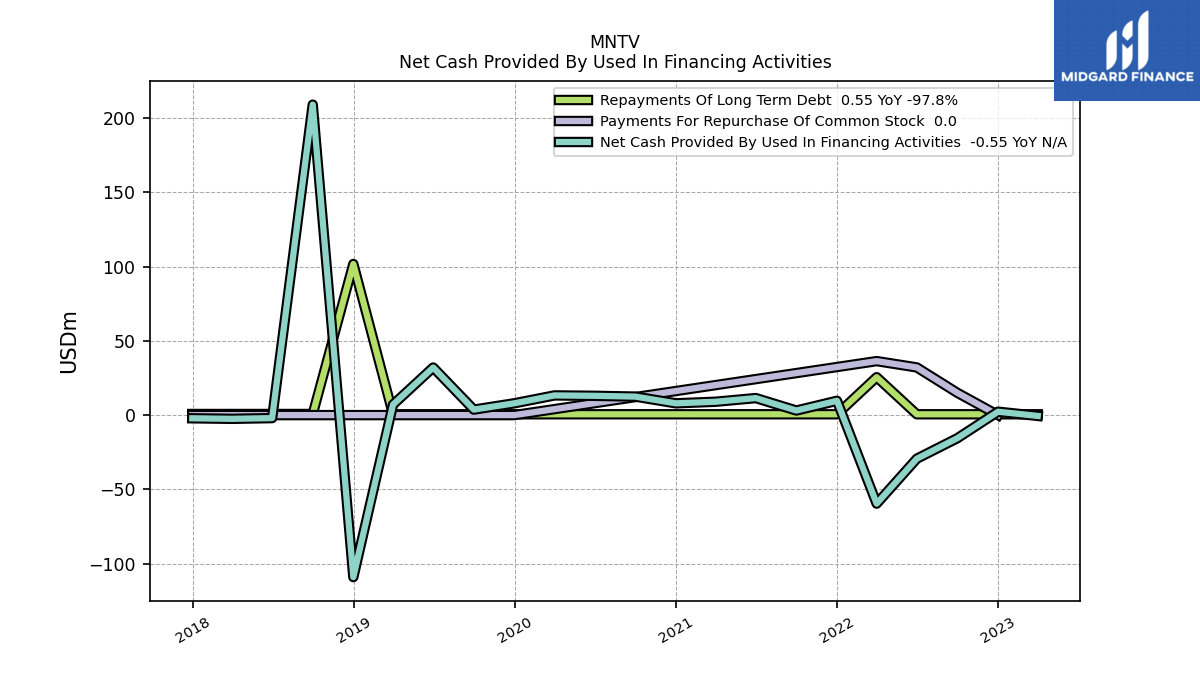
| Net Cash Provided By Used In Financing Activities | -0.55 | 2.29 | -15.54 | -29.37 | -59.65 | 9.65 | 3.08 | 11.47 | 9.00 | 7.94 | 12.47 | 13.00 | 13.27 | 7.96 | 3.70 | 32.06 | 7.09 | -109.16 | 209.17 | -2.03 | -2.51 | -2.15 | NA | |
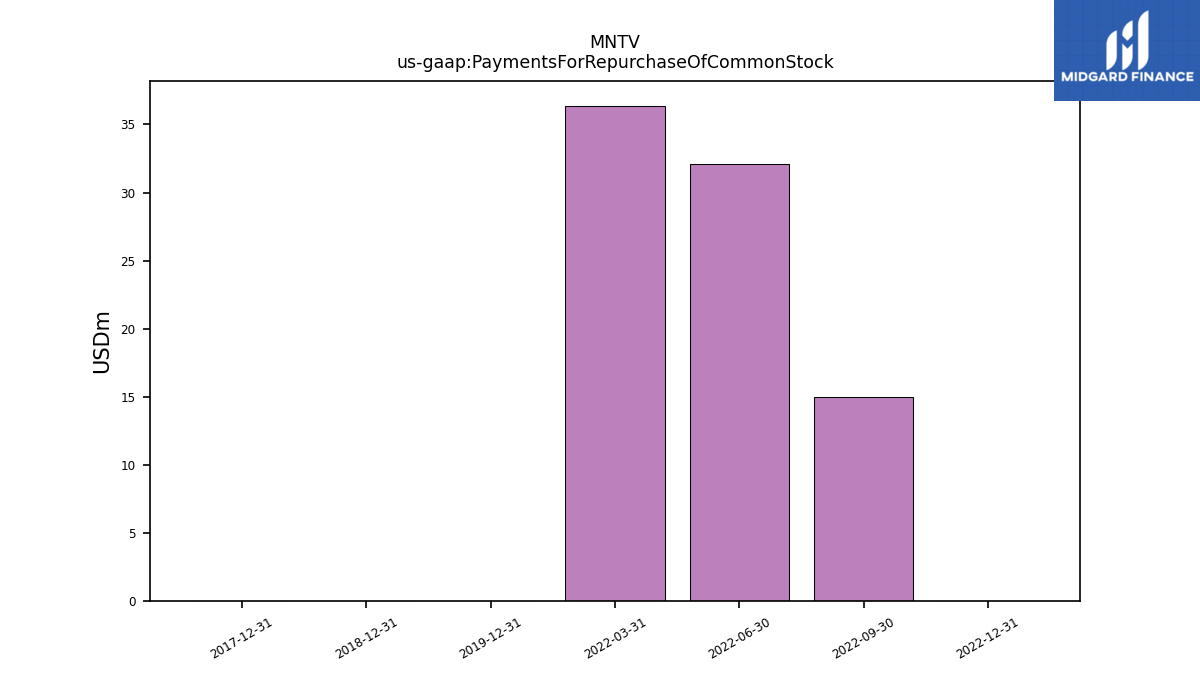
| Payments For Repurchase Of Common Stock | NA | 0.00 | 14.99 | 32.12 | 36.38 | NA | NA | NA | NA | NA | NA | NA | NA | 0.00 | NA | NA | NA | 0.00 | NA | NA | NA | 0.00 | NA |
| 2023-03-31 | 2022-12-31 | 2022-09-30 | 2022-06-30 | 2022-03-31 | 2021-12-31 | 2021-09-30 | 2021-06-30 | 2021-03-31 | 2020-12-31 | 2020-09-30 | 2020-06-30 | 2020-03-31 | 2019-12-31 | 2019-09-30 | 2019-06-30 | 2019-03-31 | 2018-12-31 | 2018-09-30 | 2018-06-30 | 2018-03-31 | 2017-12-31 | 2017-09-30 | ||
|---|---|---|---|---|---|---|---|---|---|---|---|---|---|---|---|---|---|---|---|---|---|---|---|---|
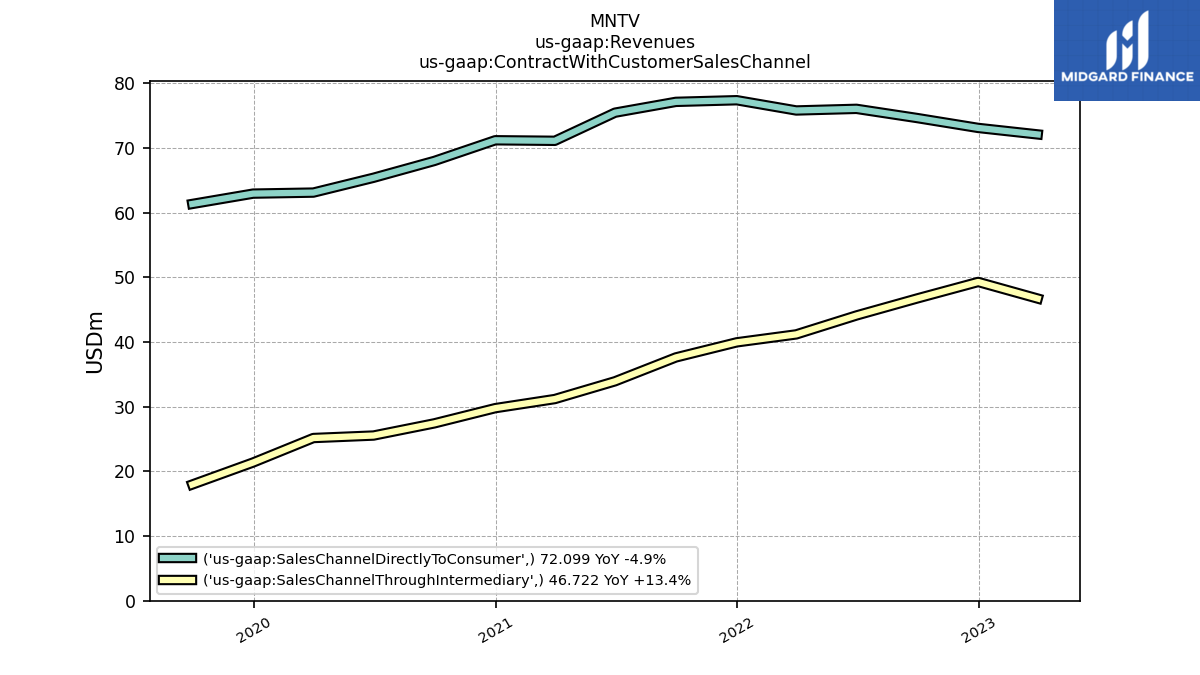
| Revenues | 118.82 | 122.39 | 121.38 | 120.16 | 116.99 | 117.34 | 114.75 | 109.39 | 102.30 | 100.97 | 95.43 | 90.94 | 88.27 | 84.32 | 79.32 | 75.14 | 68.64 | 67.93 | 65.20 | 62.70 | 58.49 | 57.01 | 55.31 | |
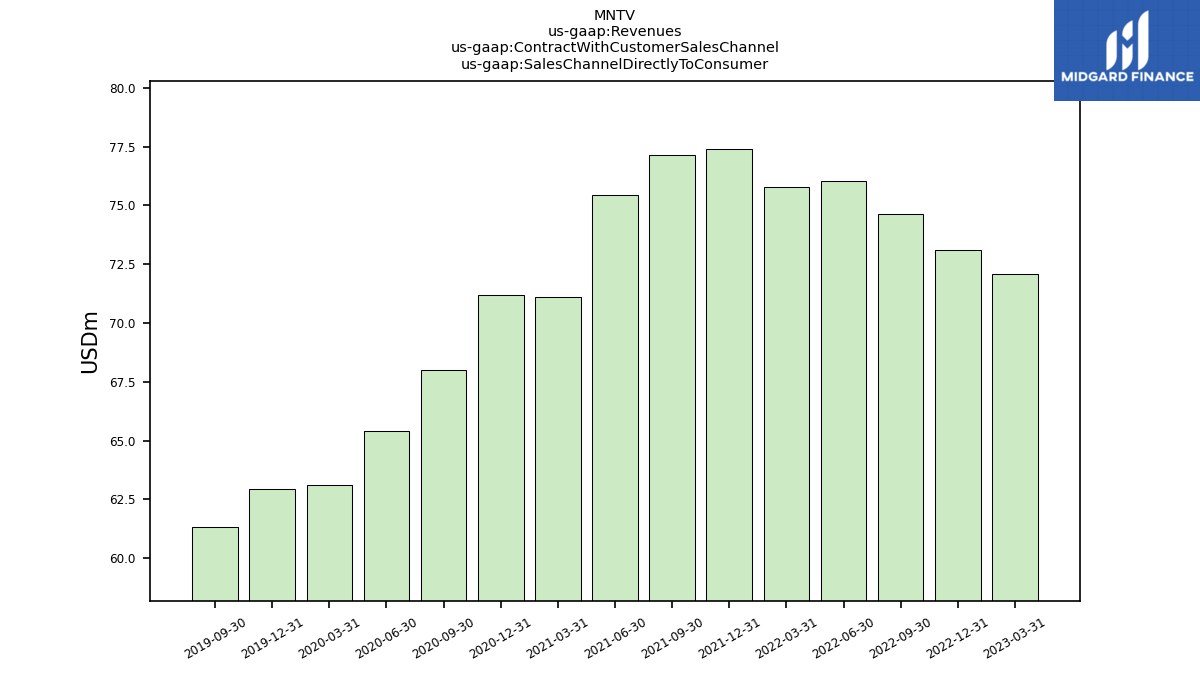
| Sales Channel Directly To Consumer | 72.10 | 73.10 | 74.63 | 76.06 | 75.80 | 77.39 | 77.13 | 75.46 | 71.11 | 71.20 | 68.00 | 65.40 | 63.11 | 62.95 | 61.35 | NA | NA | NA | NA | NA | NA | NA | NA | |
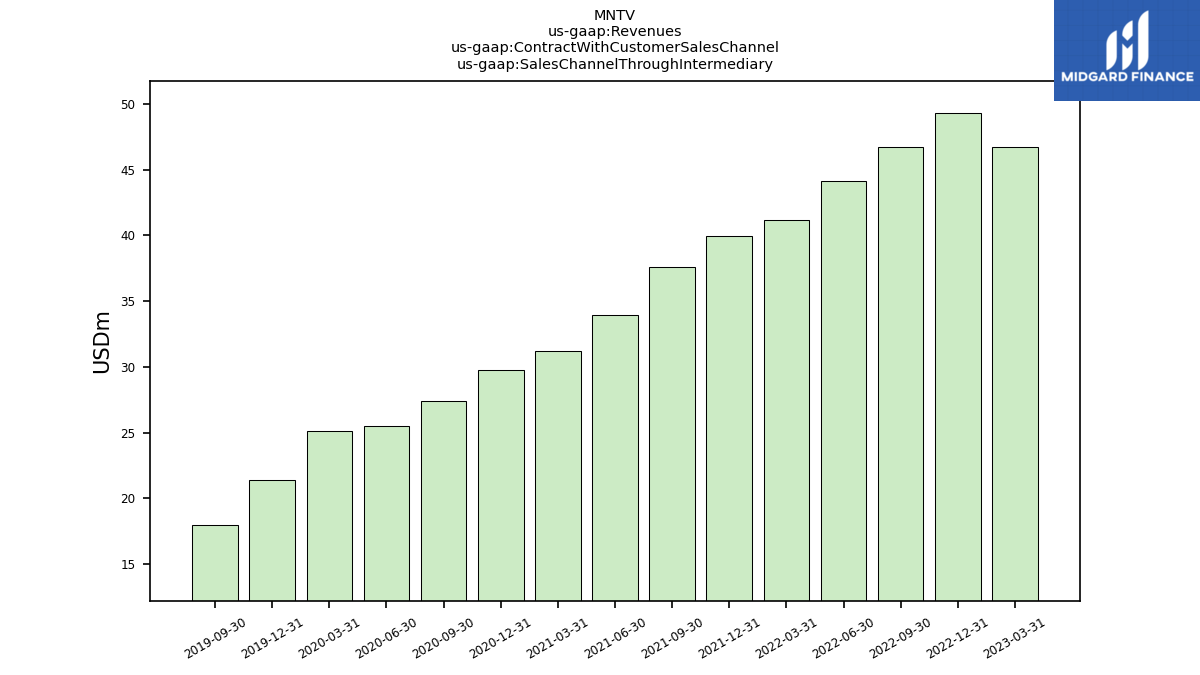
| Sales Channel Through Intermediary | 46.72 | 49.29 | 46.75 | 44.11 | 41.18 | 39.95 | 37.62 | 33.93 | 31.19 | 29.78 | 27.43 | 25.54 | 25.16 | 21.38 | 17.97 | NA | NA | NA | NA | NA | NA | NA | NA |