
| 2024-03-31 | 2023-12-31 | 2023-09-30 | 2023-06-30 | 2023-03-31 | 2022-12-31 | 2022-09-30 | 2022-06-30 | 2022-03-31 | 2021-12-31 | 2021-09-30 | 2021-06-30 | 2021-03-31 | 2020-12-31 | 2020-09-30 | 2020-06-30 | 2020-03-31 | 2019-12-31 | 2019-09-30 | 2019-06-30 | 2019-03-31 | 2018-12-31 | 2018-09-30 | 2018-06-30 | 2018-03-31 | 2017-12-31 | 2017-09-30 | 2017-06-30 | 2017-03-31 | 2016-12-31 | 2016-09-30 | 2016-06-30 | 2016-03-31 | 2015-12-31 | 2015-09-30 | 2015-06-30 | 2015-03-31 | 2014-12-31 | 2014-09-30 | 2014-06-30 | 2014-03-31 | 2013-12-31 | 2013-09-30 | 2013-06-30 | 2013-03-31 | 2012-12-31 | 2012-09-30 | 2012-06-30 | 2012-03-31 | 2011-12-31 | 2011-09-30 | 2011-06-30 | 2011-03-31 | 2010-12-31 | 2010-09-30 | 2010-06-30 | ||
|---|---|---|---|---|---|---|---|---|---|---|---|---|---|---|---|---|---|---|---|---|---|---|---|---|---|---|---|---|---|---|---|---|---|---|---|---|---|---|---|---|---|---|---|---|---|---|---|---|---|---|---|---|---|---|---|---|---|
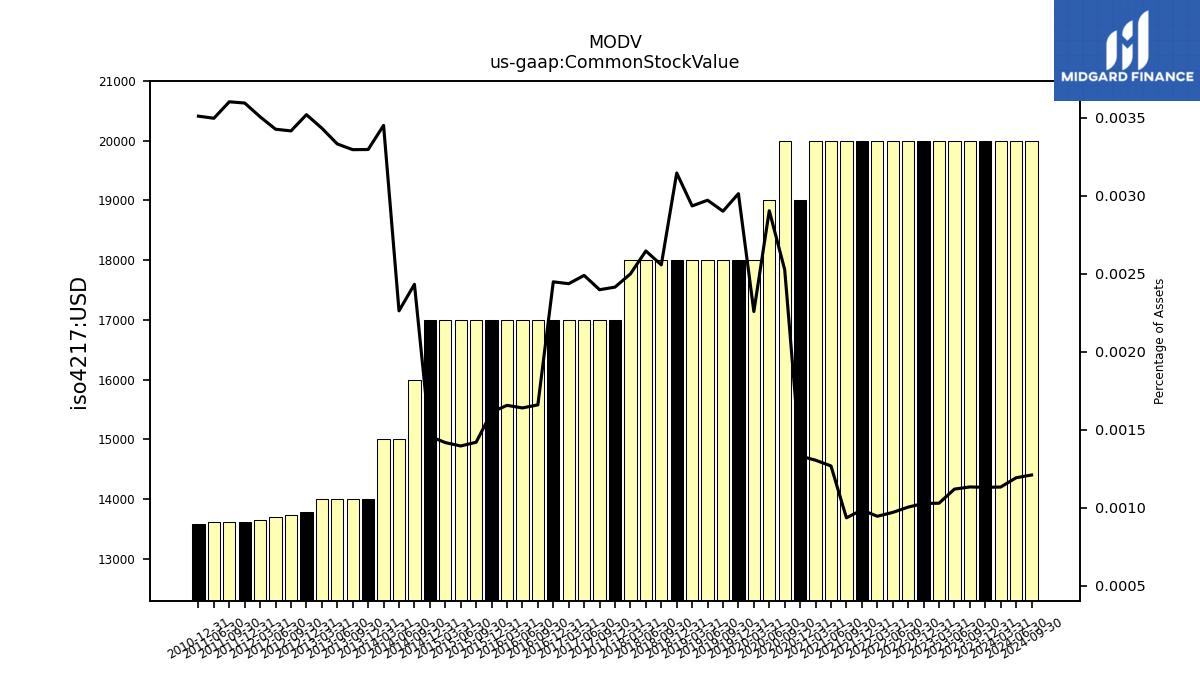
| Common Stock Value | 0.02 | 0.02 | 0.02 | 0.02 | 0.02 | 0.02 | 0.02 | 0.02 | 0.02 | 0.02 | 0.02 | 0.02 | 0.02 | 0.02 | 0.02 | 0.02 | 0.02 | 0.02 | 0.02 | 0.02 | 0.02 | 0.02 | 0.02 | 0.02 | 0.02 | 0.02 | 0.02 | 0.02 | 0.02 | 0.02 | 0.02 | 0.02 | 0.02 | 0.02 | 0.02 | 0.02 | 0.02 | 0.02 | 0.02 | 0.01 | 0.01 | 0.01 | 0.01 | 0.01 | 0.01 | 0.01 | 0.01 | 0.01 | 0.01 | 0.01 | 0.01 | 0.01 | NA | 0.01 | NA | NA | |
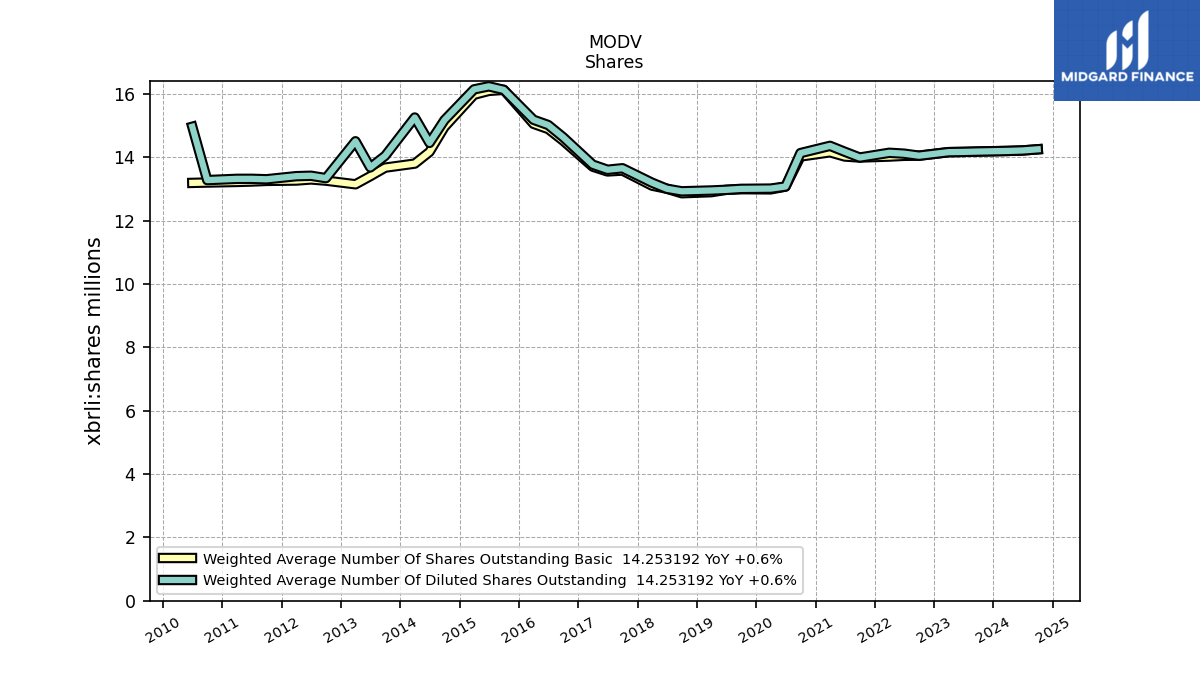
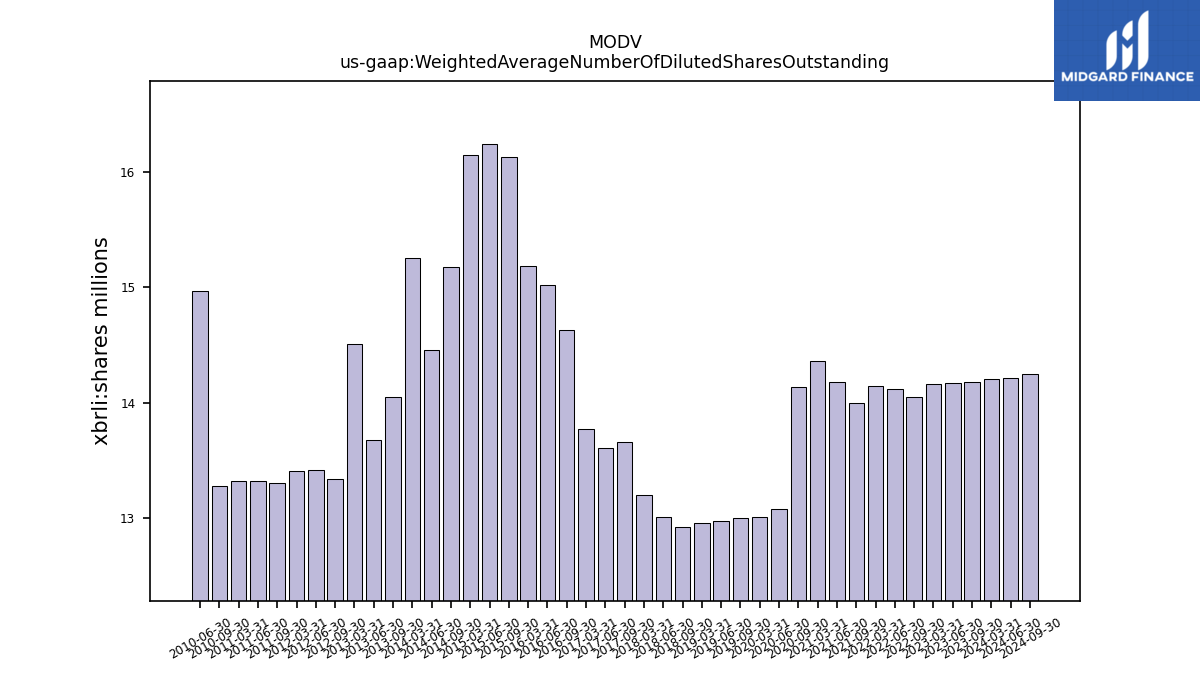
| Weighted Average Number Of Diluted Shares Outstanding | 14.20 | NA | 14.18 | 14.17 | 14.16 | NA | 14.05 | 14.12 | 14.14 | NA | 13.99 | 14.18 | 14.36 | NA | 14.13 | 13.08 | 13.01 | NA | 13.00 | 12.97 | 12.95 | NA | 12.93 | 13.01 | 13.20 | NA | 13.66 | 13.61 | 13.77 | NA | 14.63 | 15.02 | 15.19 | NA | 16.13 | 16.24 | 16.15 | NA | 15.18 | 14.45 | 15.26 | NA | 14.05 | 13.68 | 14.51 | NA | 13.34 | 13.42 | 13.40 | NA | 13.31 | 13.32 | 13.32 | NA | 13.28 | 14.97 | |
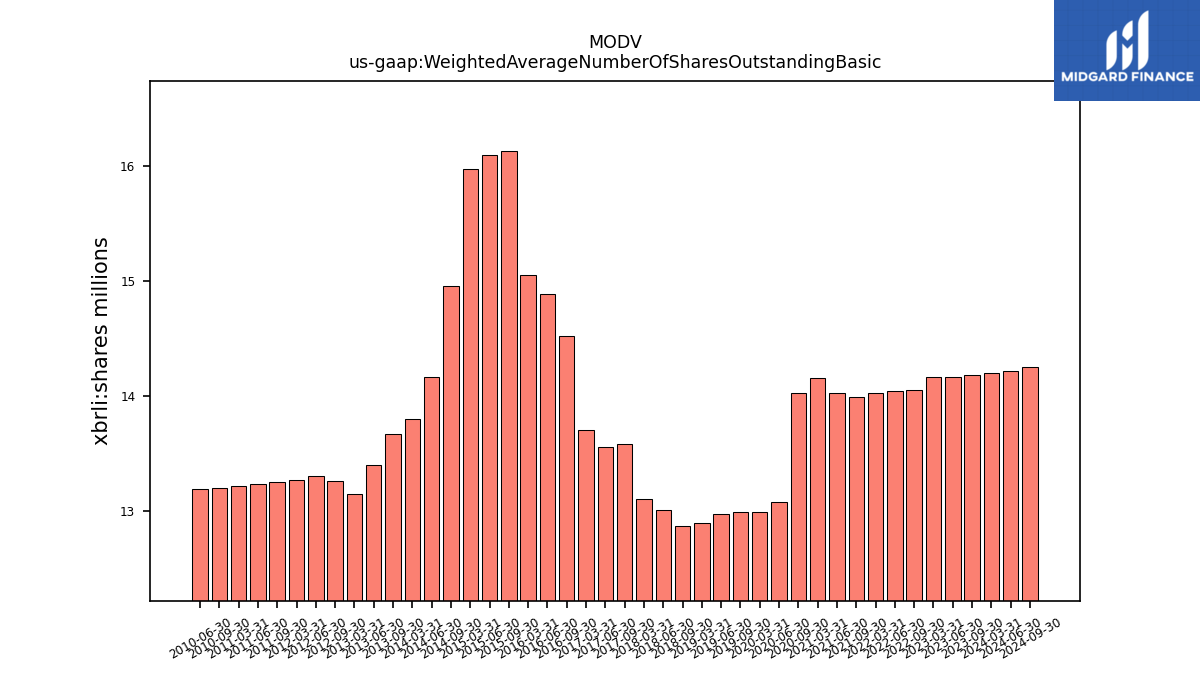
| Weighted Average Number Of Shares Outstanding Basic | 14.20 | NA | 14.18 | 14.17 | 14.16 | NA | 14.05 | 14.05 | 14.02 | NA | 13.99 | 14.03 | 14.16 | NA | 14.03 | 13.08 | 12.99 | NA | 12.99 | 12.97 | 12.90 | NA | 12.87 | 13.01 | 13.11 | NA | 13.58 | 13.55 | 13.70 | NA | 14.52 | 14.89 | 15.06 | NA | 16.13 | 16.10 | 15.98 | NA | 14.96 | 14.17 | 13.80 | NA | 13.67 | 13.40 | 13.15 | NA | 13.26 | 13.30 | 13.27 | NA | 13.26 | 13.24 | 13.22 | NA | 13.20 | 13.19 | |
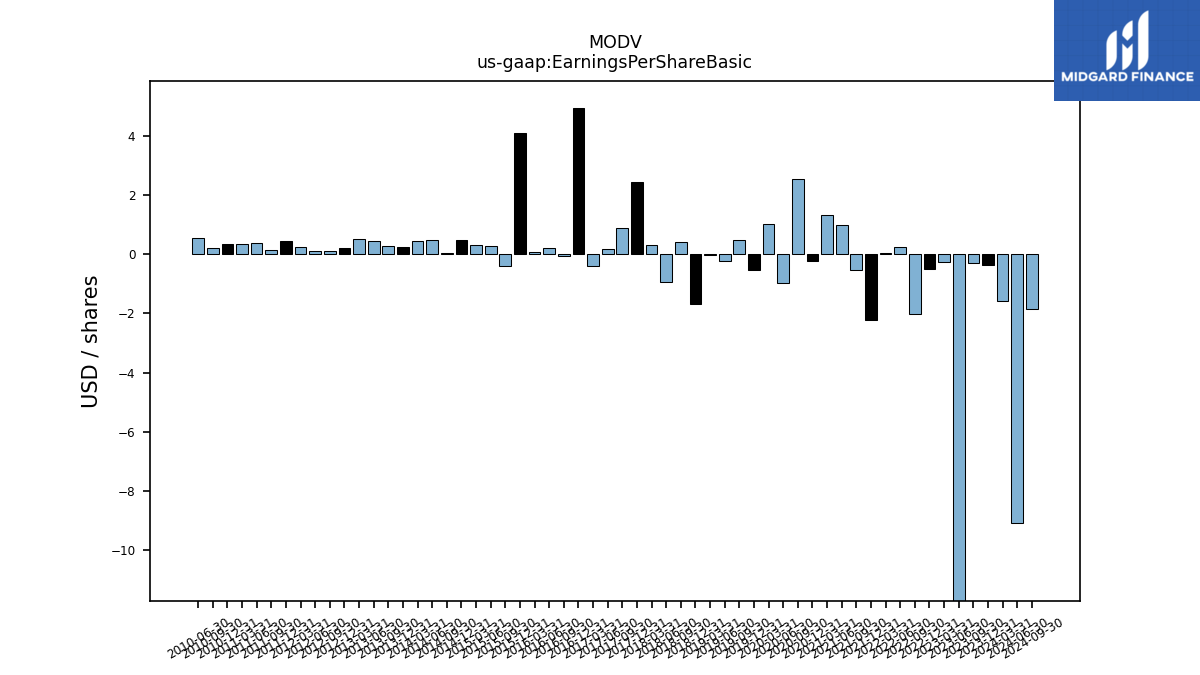
| Earnings Per Share Basic | -1.57 | -0.37 | -0.30 | -13.47 | -0.28 | -0.49 | -2.03 | 0.24 | 0.02 | -2.24 | -0.54 | 0.97 | 1.33 | -0.22 | 2.52 | -0.98 | 1.00 | -0.55 | 0.47 | -0.22 | -0.04 | -1.67 | 0.41 | -0.95 | 0.29 | 2.43 | 0.88 | 0.18 | -0.40 | 4.92 | -0.05 | 0.21 | 0.07 | 4.07 | -0.41 | 0.26 | 0.32 | 0.46 | 0.02 | 0.47 | 0.45 | 0.24 | 0.26 | 0.44 | 0.51 | 0.22 | 0.09 | 0.11 | 0.23 | 0.43 | 0.15 | 0.37 | 0.34 | 0.33 | 0.22 | 0.55 | |
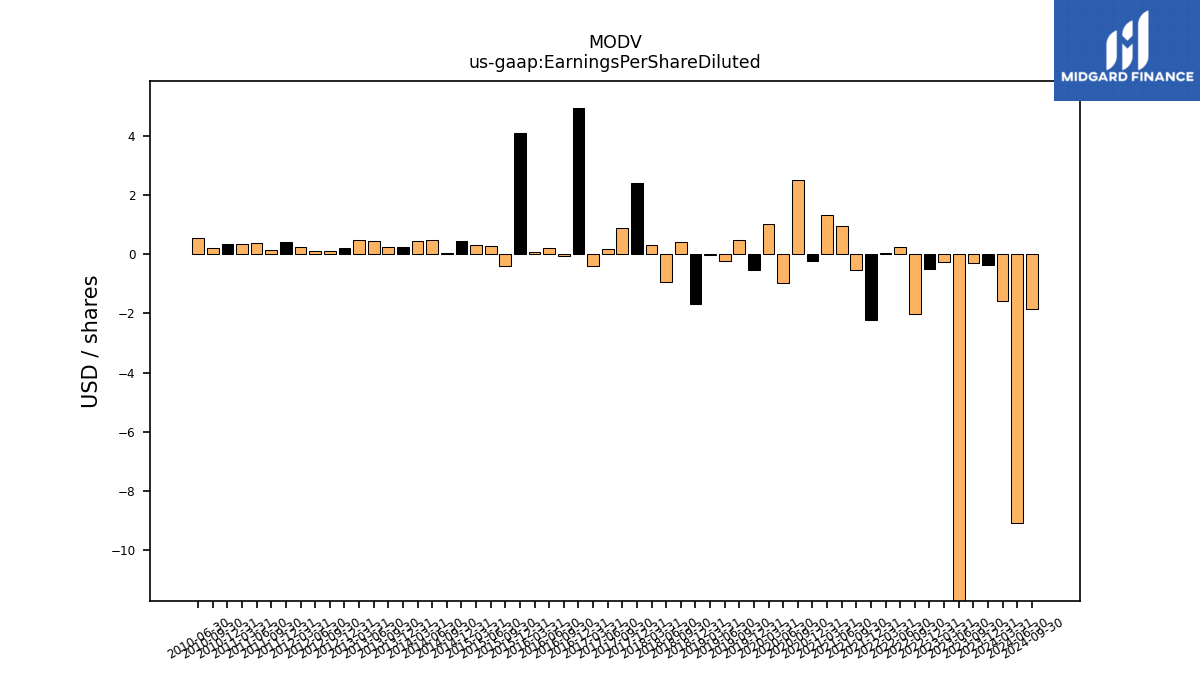
| Earnings Per Share Diluted | -1.57 | -0.37 | -0.30 | -13.47 | -0.28 | -0.49 | -2.03 | 0.24 | 0.02 | -2.21 | -0.54 | 0.96 | 1.31 | -0.22 | 2.50 | -0.98 | 1.00 | -0.55 | 0.47 | -0.22 | -0.04 | -1.67 | 0.41 | -0.95 | 0.29 | 2.41 | 0.88 | 0.18 | -0.40 | 4.92 | -0.05 | 0.21 | 0.07 | 4.07 | -0.41 | 0.26 | 0.32 | 0.45 | 0.02 | 0.46 | 0.44 | 0.24 | 0.25 | 0.43 | 0.49 | 0.22 | 0.09 | 0.11 | 0.23 | 0.42 | 0.15 | 0.36 | 0.34 | 0.34 | 0.22 | 0.54 |
| 2024-03-31 | 2023-12-31 | 2023-09-30 | 2023-06-30 | 2023-03-31 | 2022-12-31 | 2022-09-30 | 2022-06-30 | 2022-03-31 | 2021-12-31 | 2021-09-30 | 2021-06-30 | 2021-03-31 | 2020-12-31 | 2020-09-30 | 2020-06-30 | 2020-03-31 | 2019-12-31 | 2019-09-30 | 2019-06-30 | 2019-03-31 | 2018-12-31 | 2018-09-30 | 2018-06-30 | 2018-03-31 | 2017-12-31 | 2017-09-30 | 2017-06-30 | 2017-03-31 | 2016-12-31 | 2016-09-30 | 2016-06-30 | 2016-03-31 | 2015-12-31 | 2015-09-30 | 2015-06-30 | 2015-03-31 | 2014-12-31 | 2014-09-30 | 2014-06-30 | 2014-03-31 | 2013-12-31 | 2013-09-30 | 2013-06-30 | 2013-03-31 | 2012-12-31 | 2012-09-30 | 2012-06-30 | 2012-03-31 | 2011-12-31 | 2011-09-30 | 2011-06-30 | 2011-03-31 | 2010-12-31 | 2010-09-30 | 2010-06-30 | ||
|---|---|---|---|---|---|---|---|---|---|---|---|---|---|---|---|---|---|---|---|---|---|---|---|---|---|---|---|---|---|---|---|---|---|---|---|---|---|---|---|---|---|---|---|---|---|---|---|---|---|---|---|---|---|---|---|---|---|
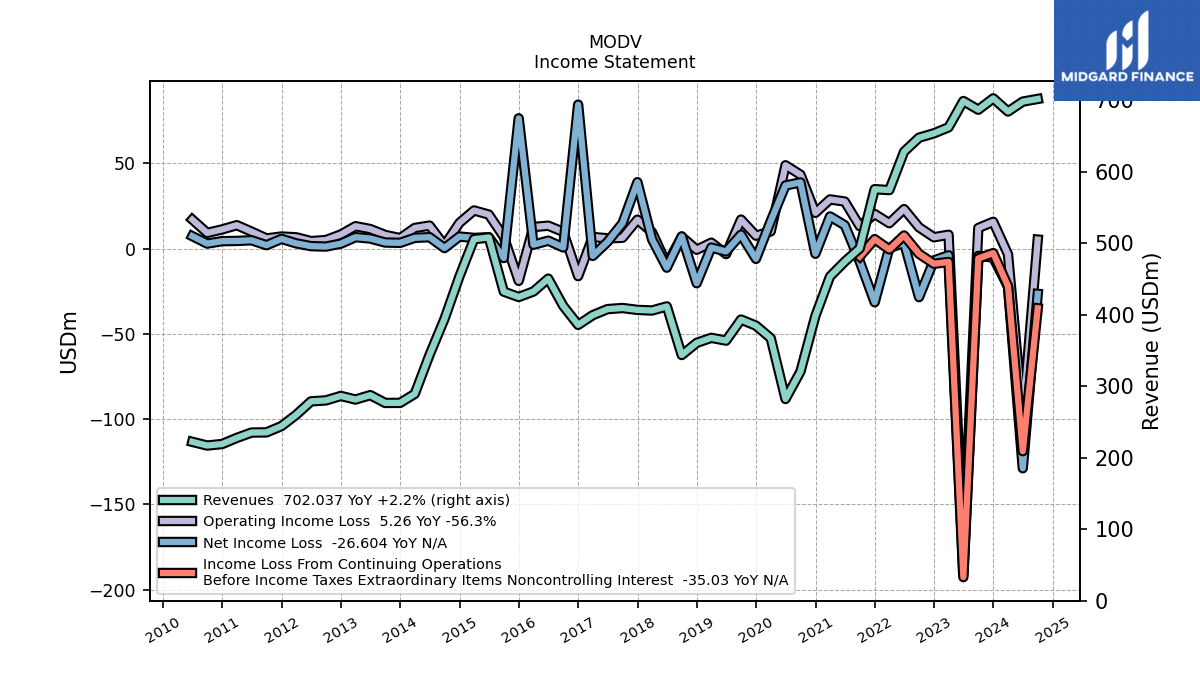
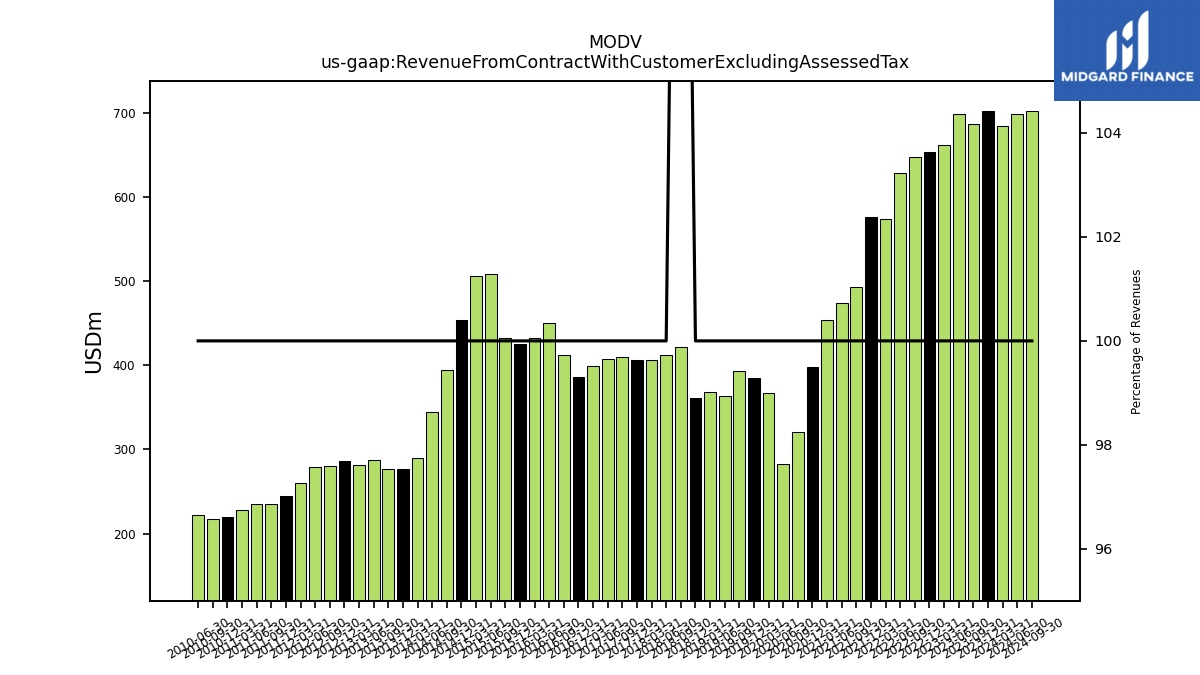
| Revenue From Contract With Customer Excluding Assessed Tax | 684.45 | 702.83 | 686.92 | 699.11 | 662.31 | 653.92 | 647.78 | 628.22 | 574.48 | 575.77 | 493.06 | 474.45 | 453.61 | 398.51 | 320.62 | 282.26 | 367.29 | 384.83 | 393.38 | 363.91 | 367.81 | 360.76 | 421.32 | 411.79 | 406.05 | 406.89 | 409.52 | 407.98 | 399.49 | 385.96 | 412.51 | 450.63 | 432.65 | 424.93 | 432.45 | 508.25 | 505.80 | 453.60 | 394.22 | 343.95 | 289.40 | 276.85 | 276.71 | 287.64 | 281.49 | 286.52 | 280.29 | 278.94 | 260.15 | 244.31 | 235.55 | 235.31 | 227.81 | 219.27 | 217.15 | 222.32 | |
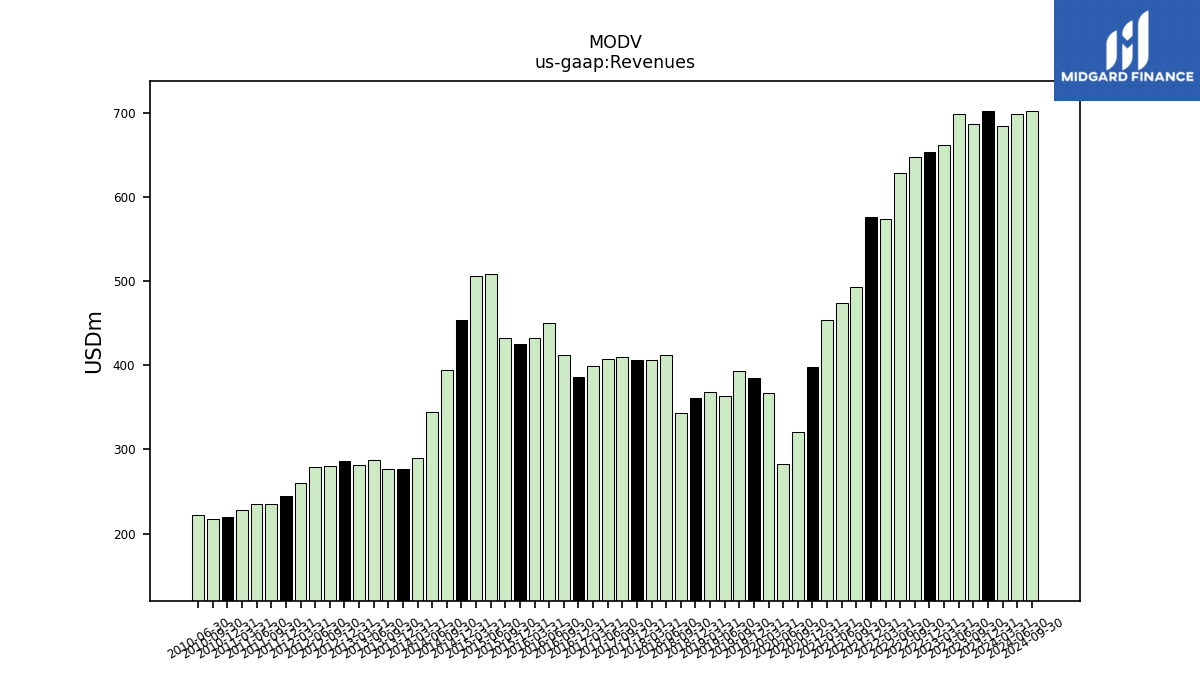
| Revenues | 684.45 | 702.83 | 686.92 | 699.11 | 662.31 | 653.92 | 647.78 | 628.22 | 574.48 | 575.77 | 493.06 | 474.45 | 453.61 | 398.51 | 320.62 | 282.26 | 367.29 | 384.83 | 393.38 | 363.91 | 367.81 | 360.76 | 343.77 | 411.79 | 406.05 | 406.89 | 409.52 | 407.98 | 399.49 | 385.96 | 412.51 | 450.63 | 432.65 | 424.93 | 432.45 | 508.25 | 505.80 | 453.60 | 394.22 | 343.95 | 289.40 | 276.85 | 276.71 | 287.64 | 281.49 | 286.52 | 280.29 | 278.94 | 260.15 | 244.31 | 235.55 | 235.31 | 227.81 | 219.27 | 217.15 | 222.32 | |
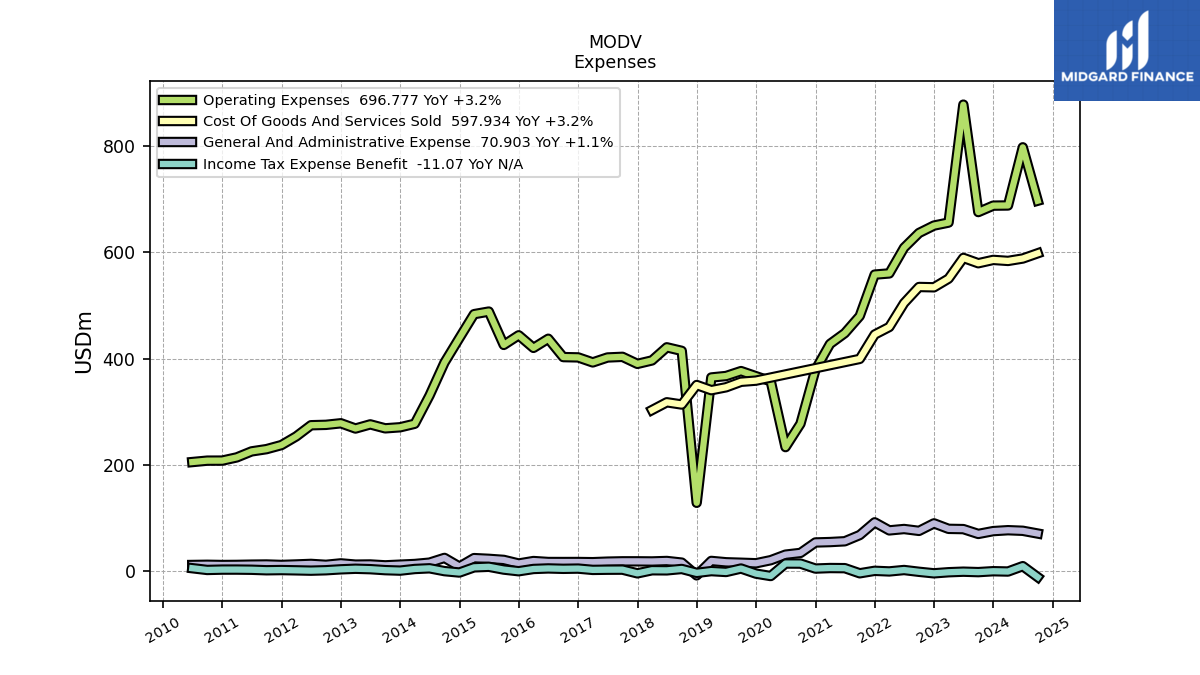
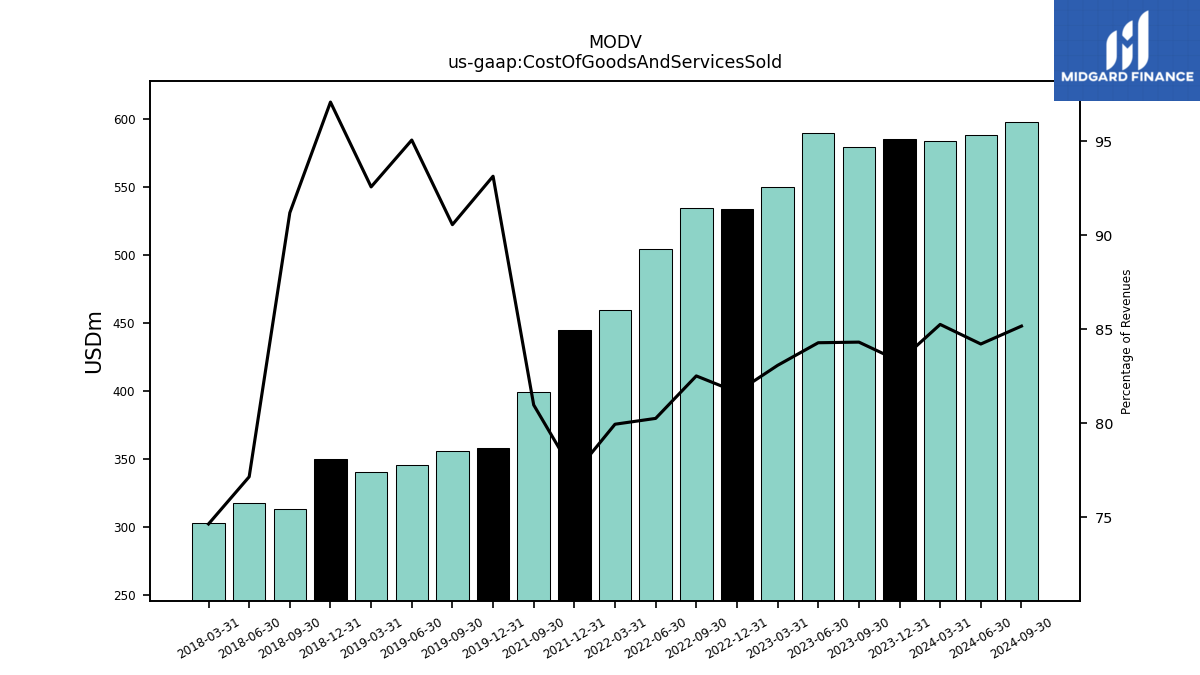
| Cost Of Goods And Services Sold | 583.57 | 585.48 | 579.21 | 589.25 | 550.27 | 533.97 | 534.56 | 504.23 | 459.31 | 445.13 | 399.27 | NA | NA | NA | NA | NA | NA | 358.44 | 356.27 | 345.95 | 340.50 | 350.24 | 313.51 | 317.74 | 303.12 | NA | NA | NA | NA | NA | NA | NA | NA | NA | NA | NA | NA | NA | NA | NA | NA | NA | NA | NA | NA | NA | NA | NA | NA | NA | NA | NA | NA | NA | NA | NA | |
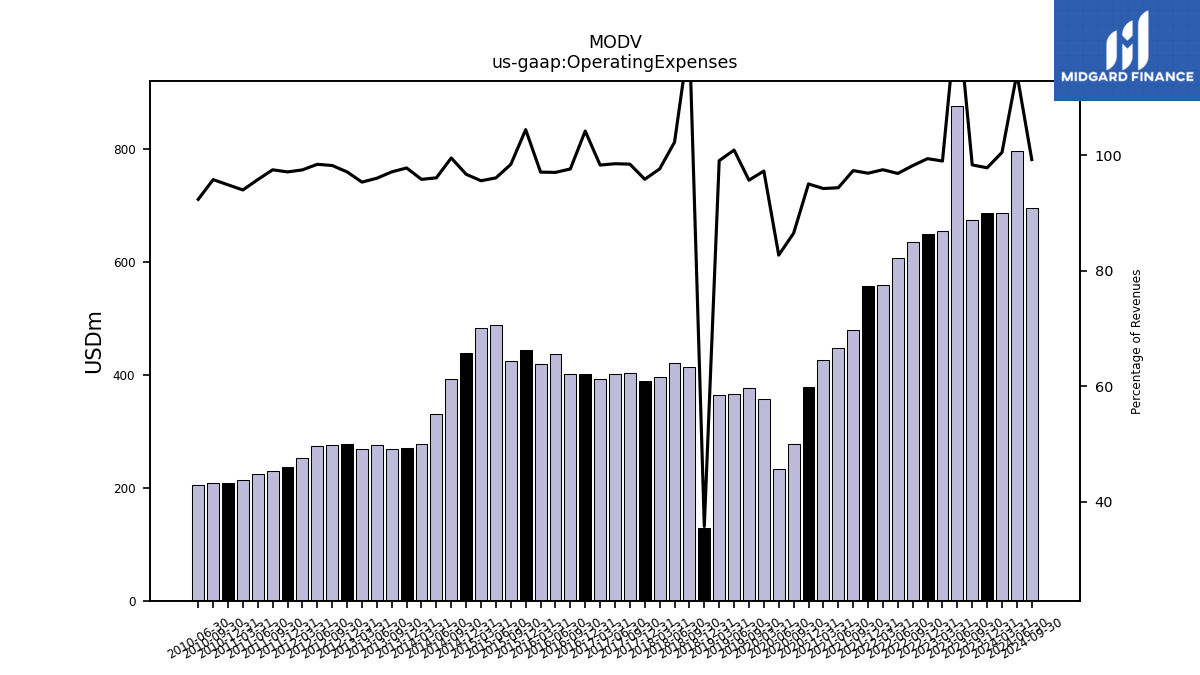
| Operating Expenses | 687.85 | 687.54 | 675.43 | 877.50 | 655.67 | 650.07 | 636.12 | 608.40 | 560.07 | 557.86 | 479.93 | 447.73 | 427.44 | 378.69 | 277.29 | 233.41 | 357.25 | NA | 376.40 | 367.16 | 364.37 | 128.68 | 414.45 | 421.11 | 396.45 | 389.95 | 403.21 | 401.98 | 392.71 | 402.15 | 402.72 | 437.24 | 420.00 | 443.77 | 425.57 | 488.33 | 483.45 | 438.63 | 392.38 | 330.49 | 277.32 | 270.74 | 268.74 | 276.18 | 268.38 | 278.26 | 275.30 | 274.57 | 253.55 | 237.26 | 229.61 | 225.37 | 214.10 | 208.04 | 207.97 | 205.33 | |
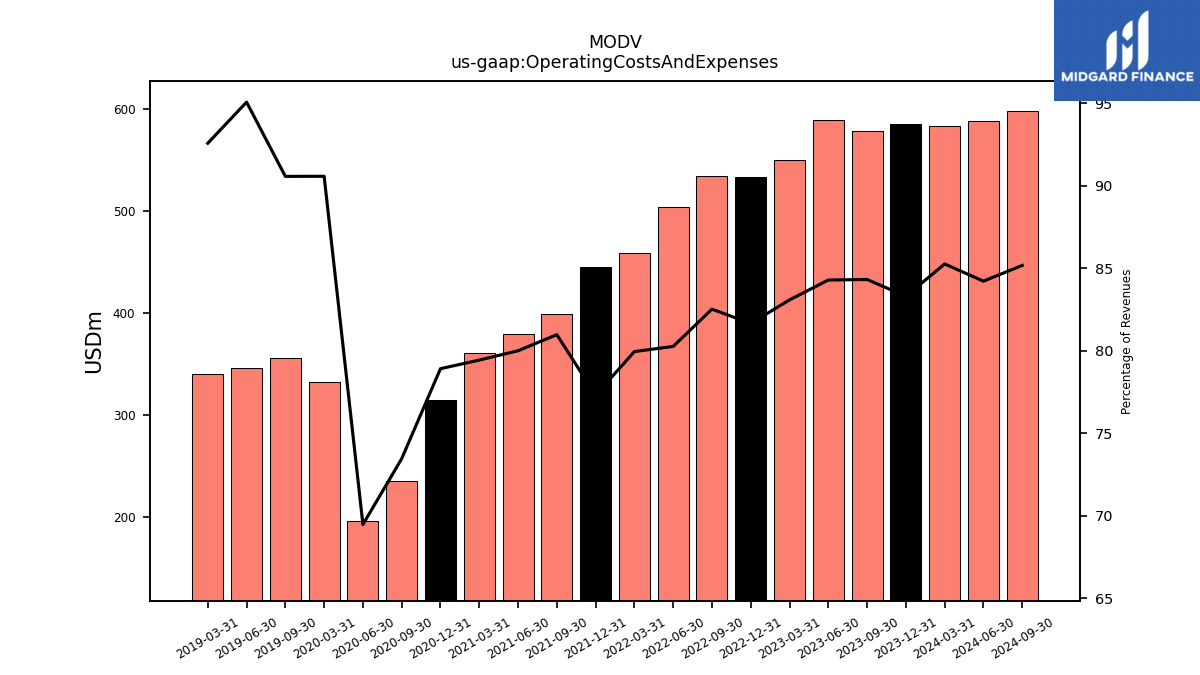
| Operating Costs And Expenses | 583.57 | 585.48 | 579.21 | 589.25 | 550.27 | 533.97 | 534.56 | 504.23 | 459.31 | 445.13 | 399.27 | 379.57 | 360.33 | 314.49 | 235.54 | 196.11 | 332.66 | NA | 356.27 | 345.95 | 340.50 | NA | NA | NA | NA | NA | NA | NA | NA | NA | NA | NA | NA | NA | NA | NA | NA | NA | NA | NA | NA | NA | NA | NA | NA | NA | NA | NA | NA | NA | NA | NA | NA | NA | NA | NA | |
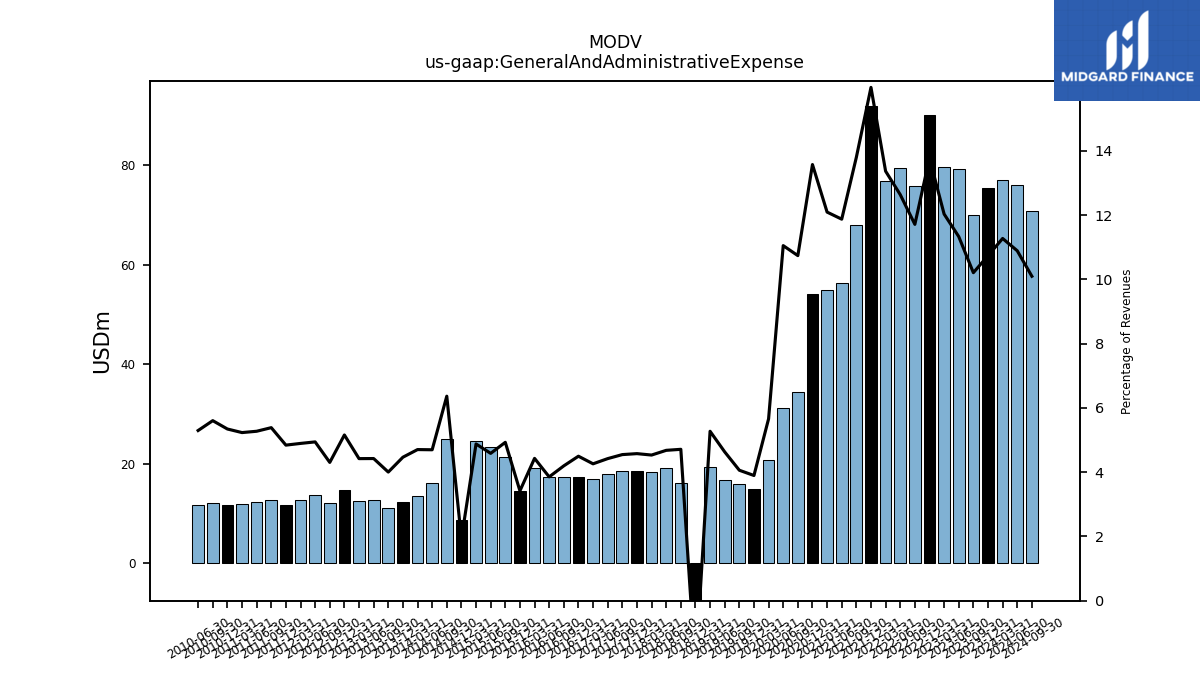
| General And Administrative Expense | 77.18 | 75.47 | 70.14 | 79.24 | 79.71 | 90.06 | 75.89 | 79.41 | 76.81 | 92.00 | 68.05 | 56.35 | 54.87 | 54.10 | 34.44 | 31.20 | 20.80 | 15.00 | 15.98 | 16.86 | 19.40 | -7.80 | 16.20 | 19.28 | 18.41 | 18.63 | 18.63 | 18.05 | 17.03 | 17.36 | 17.32 | 17.37 | 19.17 | 14.53 | 21.32 | 23.32 | 24.68 | 8.75 | 25.10 | 16.16 | 13.62 | 12.37 | 11.08 | 12.73 | 12.45 | 14.78 | 12.07 | 13.79 | 12.74 | 11.83 | 12.69 | 12.41 | 11.92 | 11.72 | 12.17 | 11.78 | |
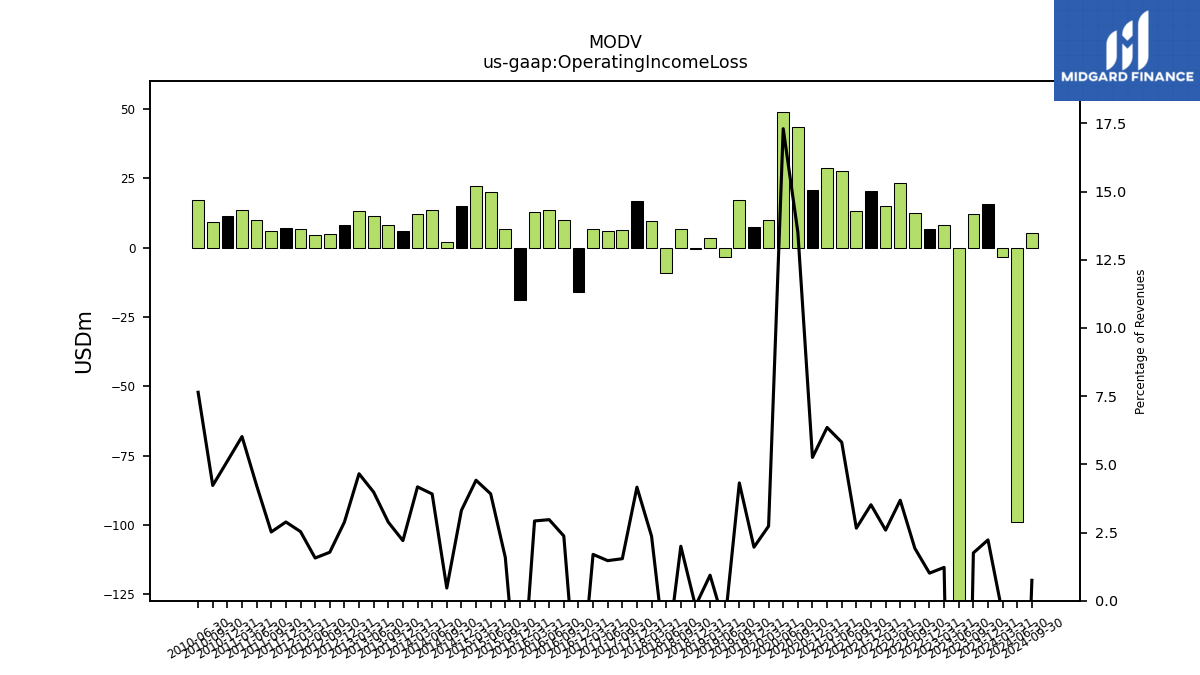
| Operating Income Loss | -3.40 | 15.68 | 12.04 | -175.76 | 8.10 | 6.62 | 12.45 | 23.15 | 14.87 | 20.26 | 13.12 | 27.57 | 28.82 | 20.94 | 43.33 | 48.84 | 10.04 | 7.55 | 16.99 | -3.25 | 3.44 | -0.69 | 6.87 | -9.31 | 9.60 | 16.94 | 6.31 | 6.00 | 6.79 | -16.19 | 9.79 | 13.39 | 12.65 | -18.95 | 6.88 | 19.92 | 22.34 | 15.02 | 1.84 | 13.46 | 12.08 | 6.10 | 7.98 | 11.45 | 13.11 | 8.26 | 4.98 | 4.37 | 6.59 | 7.05 | 5.94 | 9.94 | 13.71 | 11.22 | 9.18 | 16.99 | |
| Interest Income Expense Net | -18.69 | -18.35 | -17.84 | -16.97 | -15.96 | -15.53 | -15.56 | -15.47 | -15.40 | -14.67 | -17.70 | -8.29 | -8.42 | -15.48 | -0.38 | -1.50 | -0.24 | -0.06 | -0.19 | -0.30 | -0.30 | -0.86 | -0.35 | -0.24 | -0.33 | -0.29 | -0.30 | -0.33 | -0.35 | 0.76 | -0.70 | -3.44 | -3.63 | -3.48 | -3.81 | -4.54 | -6.01 | -10.38 | -1.37 | -1.26 | -1.58 | 12.21 | -1.88 | -1.69 | -1.75 | NA | NA | NA | NA | NA | NA | NA | NA | NA | NA | NA | |
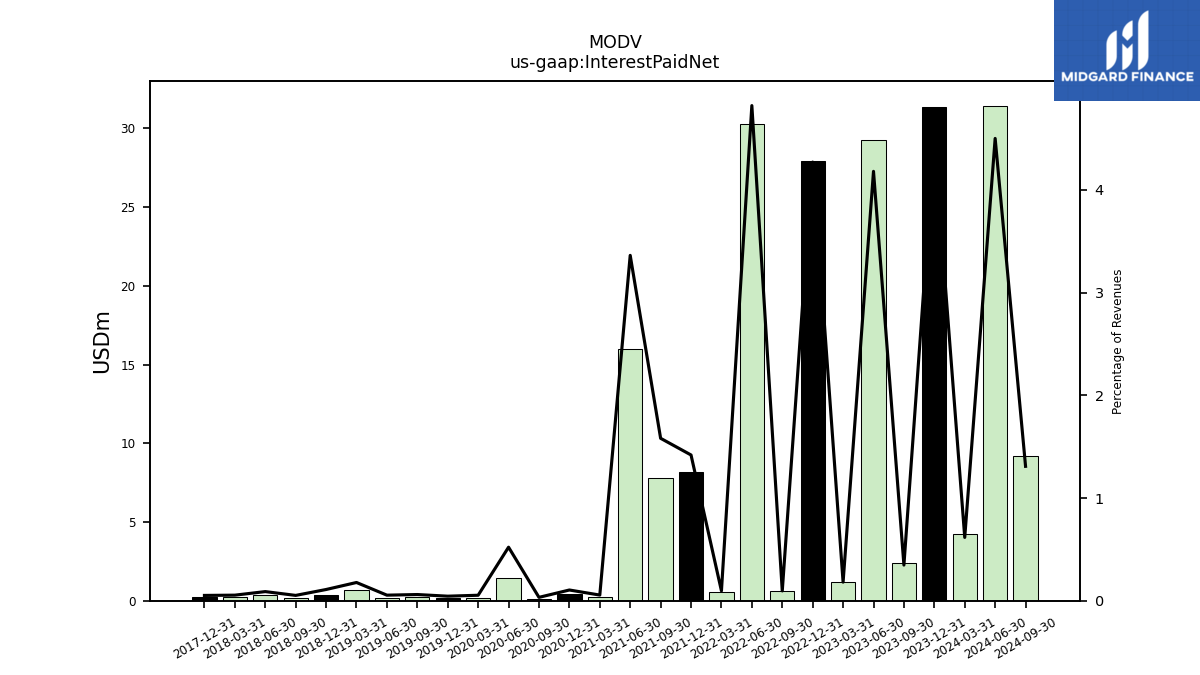
| Interest Paid Net | 4.22 | 31.38 | 2.39 | 29.23 | 1.20 | 27.93 | 0.62 | 30.29 | 0.55 | 8.17 | 7.80 | 15.96 | 0.25 | 0.42 | 0.11 | 1.47 | 0.20 | 0.17 | 0.24 | 0.20 | 0.65 | 0.40 | 0.18 | 0.37 | 0.22 | 0.21 | NA | NA | NA | NA | NA | NA | NA | NA | NA | NA | NA | NA | NA | NA | NA | NA | NA | NA | NA | NA | NA | NA | NA | NA | NA | NA | NA | NA | NA | NA | |
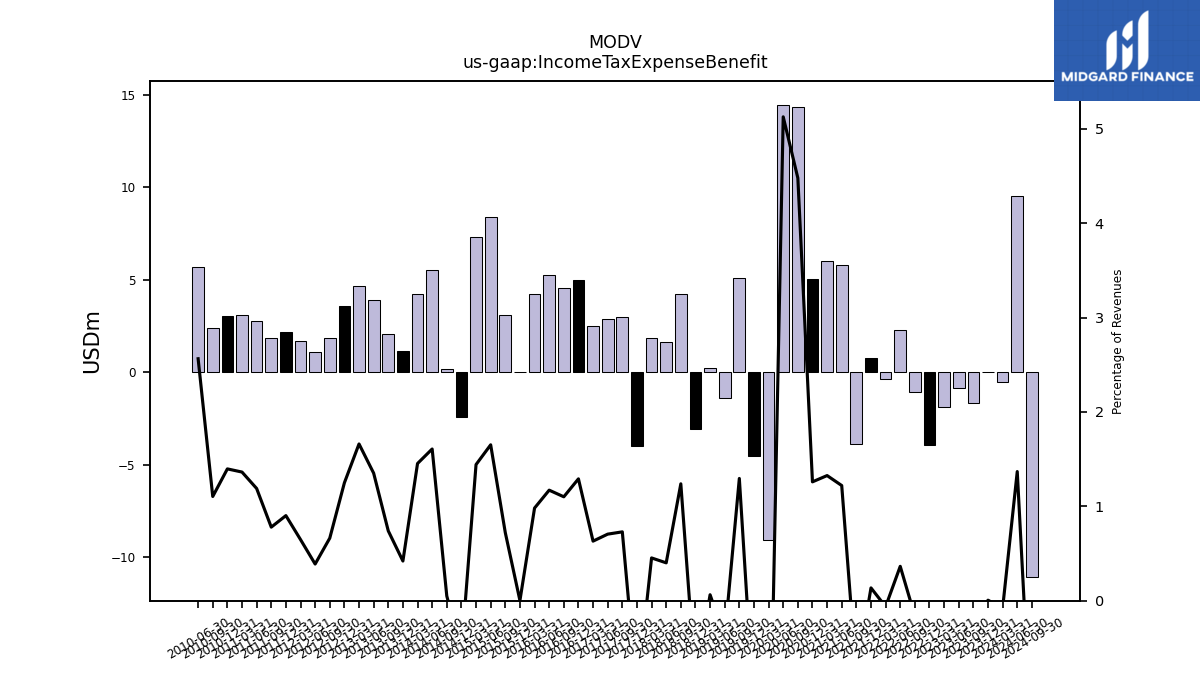
| Income Tax Expense Benefit | -0.54 | 0.04 | -1.66 | -0.83 | -1.87 | -3.91 | -1.05 | 2.29 | -0.36 | 0.79 | -3.86 | 5.79 | 6.02 | 5.02 | 14.36 | 14.47 | -9.05 | -4.51 | 5.10 | -1.39 | 0.23 | -3.07 | 4.26 | 1.65 | 1.84 | -3.99 | 2.99 | 2.88 | 2.52 | 4.99 | 4.54 | 5.28 | 4.25 | 0.01 | 3.12 | 8.40 | 7.30 | -2.43 | 0.20 | 5.53 | 4.21 | 1.17 | 2.05 | 3.89 | 4.68 | 3.58 | 1.86 | 1.08 | 1.69 | 2.20 | 1.84 | 2.80 | 3.11 | 3.06 | 2.40 | 5.70 | |
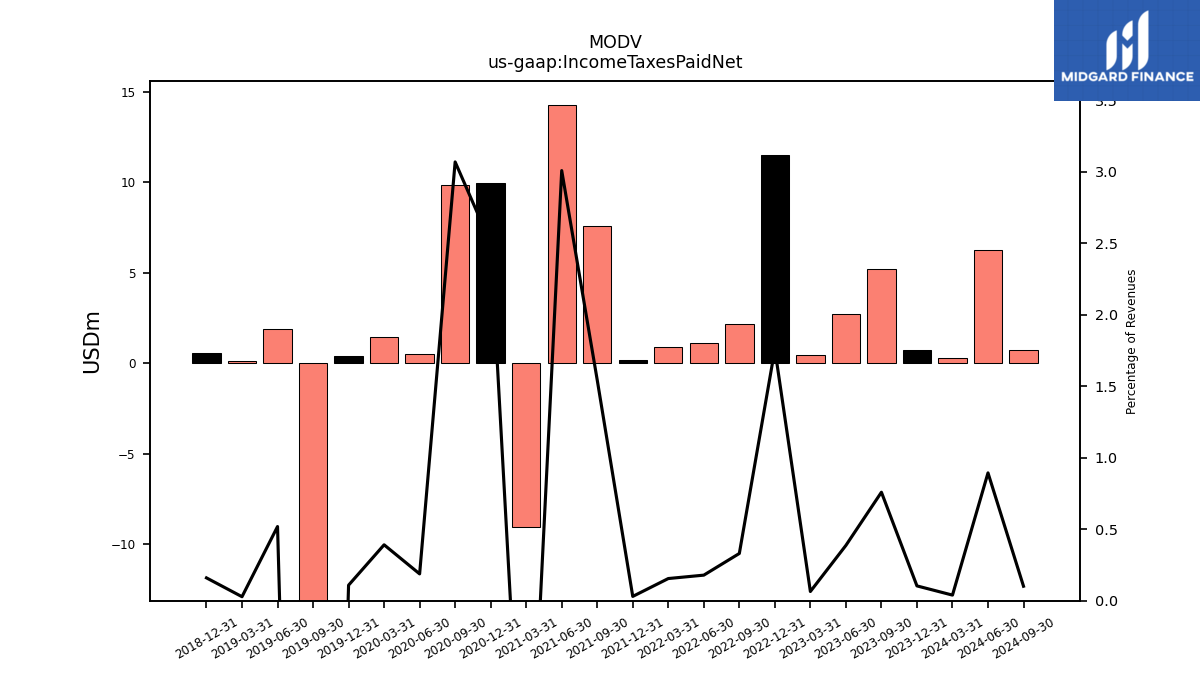
| Income Taxes Paid Net | 0.27 | 0.73 | 5.21 | 2.71 | 0.43 | 11.50 | 2.14 | 1.12 | 0.89 | 0.17 | 7.61 | 14.27 | -9.03 | 9.96 | 9.84 | 0.53 | 1.44 | 0.42 | -32.45 | 1.89 | 0.10 | 0.58 | NA | NA | NA | NA | NA | NA | NA | NA | NA | NA | NA | NA | NA | NA | NA | NA | NA | NA | NA | NA | NA | NA | NA | NA | NA | NA | NA | NA | NA | NA | NA | NA | NA | NA | |
| Profit Loss | -22.30 | -5.25 | -4.30 | -190.94 | -3.96 | -6.95 | -28.50 | 3.33 | 0.32 | -31.53 | -7.57 | 13.67 | 18.84 | -3.06 | 38.80 | 37.00 | 16.10 | -6.06 | 8.15 | -1.71 | 0.58 | -20.48 | 7.33 | -11.40 | 5.73 | 39.08 | 14.95 | 3.74 | -3.95 | 82.77 | 0.95 | 4.00 | 2.13 | 75.78 | -5.41 | 6.58 | 6.25 | NA | NA | NA | NA | NA | NA | NA | NA | NA | NA | NA | NA | NA | NA | NA | NA | NA | NA | NA | |
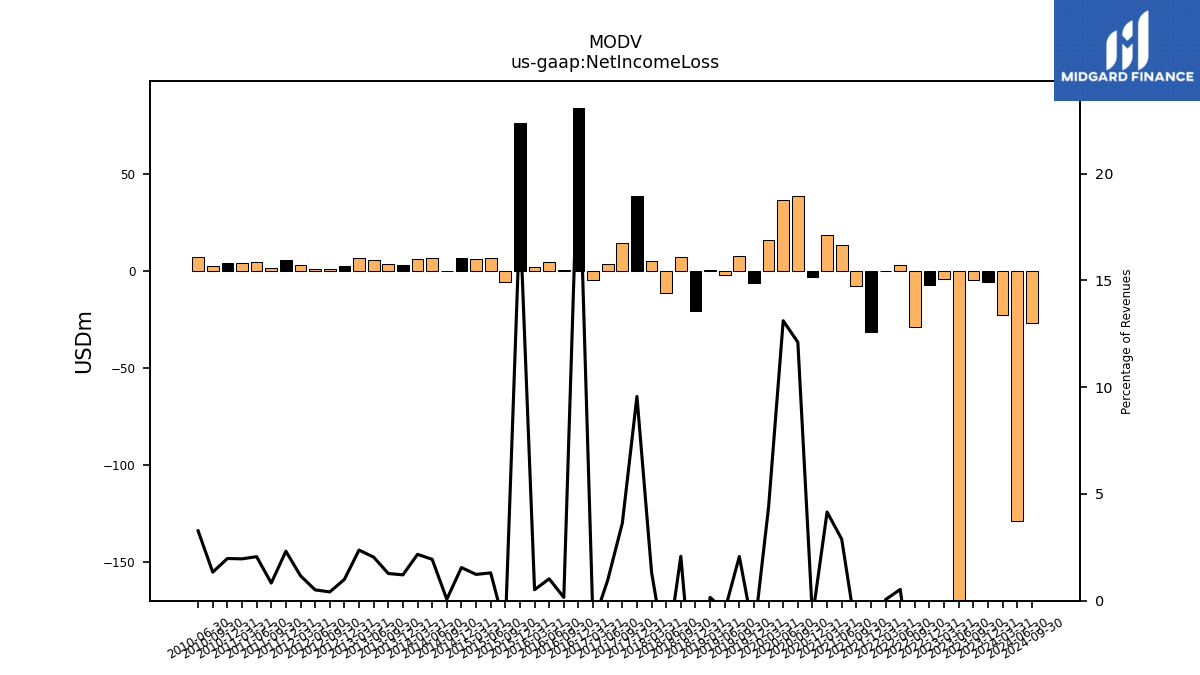
| Net Income Loss | -22.30 | -5.25 | -4.30 | -190.94 | -3.96 | -6.95 | -28.50 | 3.33 | 0.32 | -31.53 | -7.57 | 13.67 | 18.84 | -3.06 | 38.80 | 37.00 | 16.10 | -6.06 | 8.15 | -1.71 | 0.58 | -20.35 | 7.15 | -11.21 | 5.43 | 38.93 | 14.85 | 3.92 | -4.33 | 84.42 | 0.65 | 4.62 | 2.23 | 76.40 | -5.57 | 6.63 | 6.24 | 7.05 | 0.27 | 6.67 | 6.29 | 3.36 | 3.53 | 5.88 | 6.68 | 2.87 | 1.16 | 1.42 | 3.04 | 5.67 | 1.95 | 4.85 | 4.47 | 4.34 | 2.91 | 7.28 | |
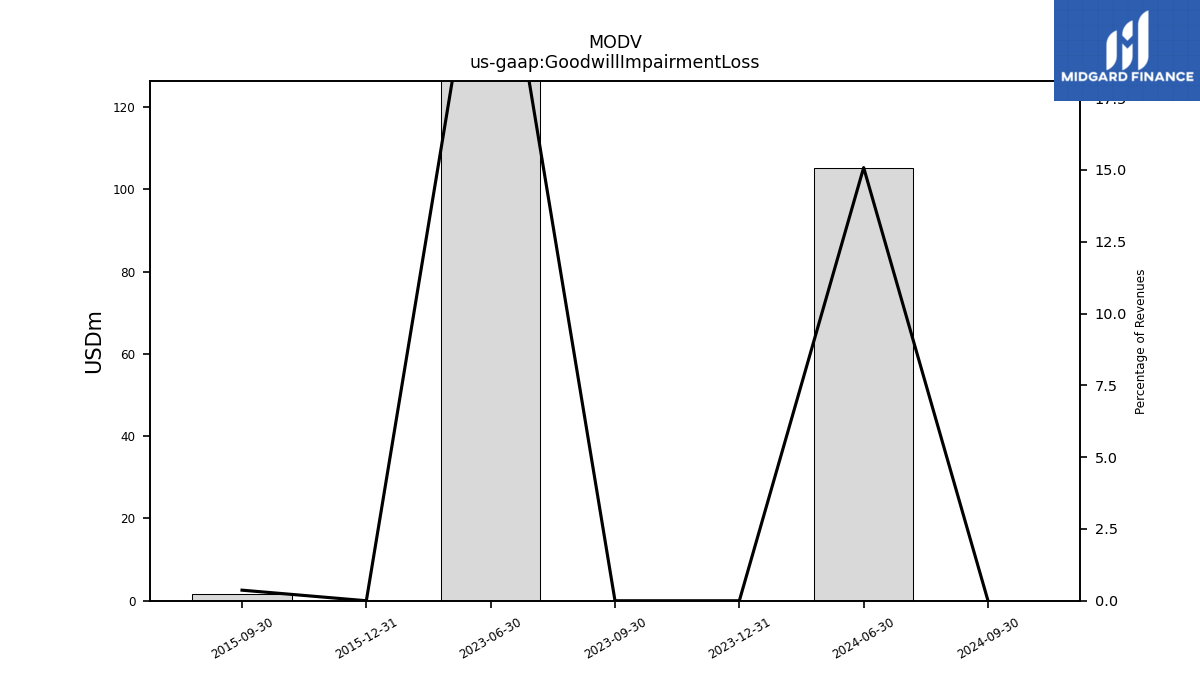
| Goodwill Impairment Loss | NA | 0.00 | 0.00 | 183.10 | NA | NA | NA | NA | NA | NA | NA | NA | NA | NA | NA | NA | NA | NA | NA | NA | NA | NA | NA | NA | NA | NA | NA | NA | NA | NA | NA | NA | NA | 0.00 | 1.59 | NA | NA | NA | NA | NA | NA | NA | NA | NA | NA | NA | NA | NA | NA | NA | NA | NA | NA | NA | NA | NA |
| 2024-03-31 | 2023-12-31 | 2023-09-30 | 2023-06-30 | 2023-03-31 | 2022-12-31 | 2022-09-30 | 2022-06-30 | 2022-03-31 | 2021-12-31 | 2021-09-30 | 2021-06-30 | 2021-03-31 | 2020-12-31 | 2020-09-30 | 2020-06-30 | 2020-03-31 | 2019-12-31 | 2019-09-30 | 2019-06-30 | 2019-03-31 | 2018-12-31 | 2018-09-30 | 2018-06-30 | 2018-03-31 | 2017-12-31 | 2017-09-30 | 2017-06-30 | 2017-03-31 | 2016-12-31 | 2016-09-30 | 2016-06-30 | 2016-03-31 | 2015-12-31 | 2015-09-30 | 2015-06-30 | 2015-03-31 | 2014-12-31 | 2014-09-30 | 2014-06-30 | 2014-03-31 | 2013-12-31 | 2013-09-30 | 2013-06-30 | 2013-03-31 | 2012-12-31 | 2012-09-30 | 2012-06-30 | 2012-03-31 | 2011-12-31 | 2011-09-30 | 2011-06-30 | 2011-03-31 | 2010-12-31 | 2010-09-30 | 2010-06-30 | ||
|---|---|---|---|---|---|---|---|---|---|---|---|---|---|---|---|---|---|---|---|---|---|---|---|---|---|---|---|---|---|---|---|---|---|---|---|---|---|---|---|---|---|---|---|---|---|---|---|---|---|---|---|---|---|---|---|---|---|
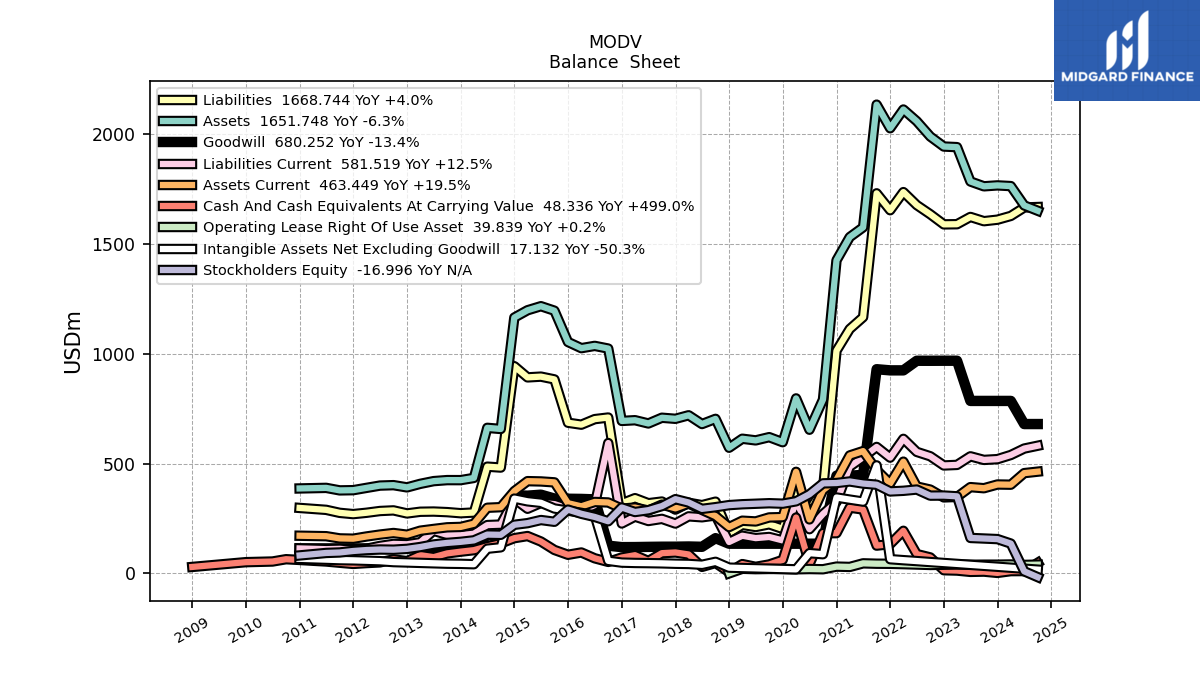
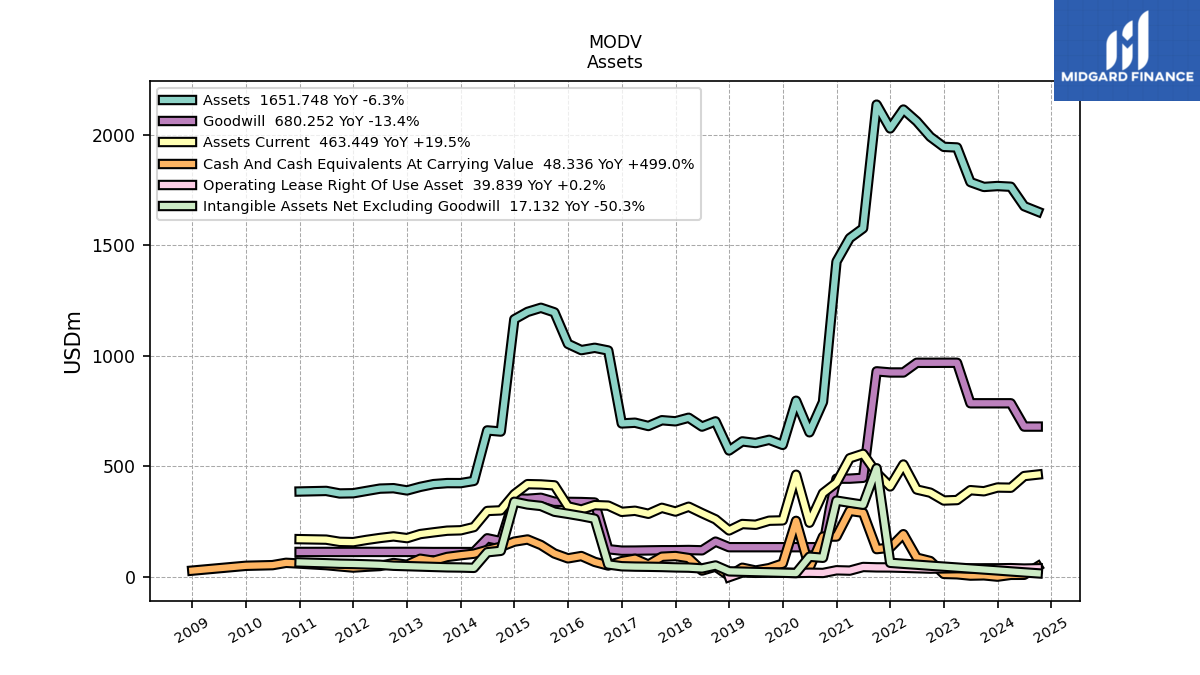
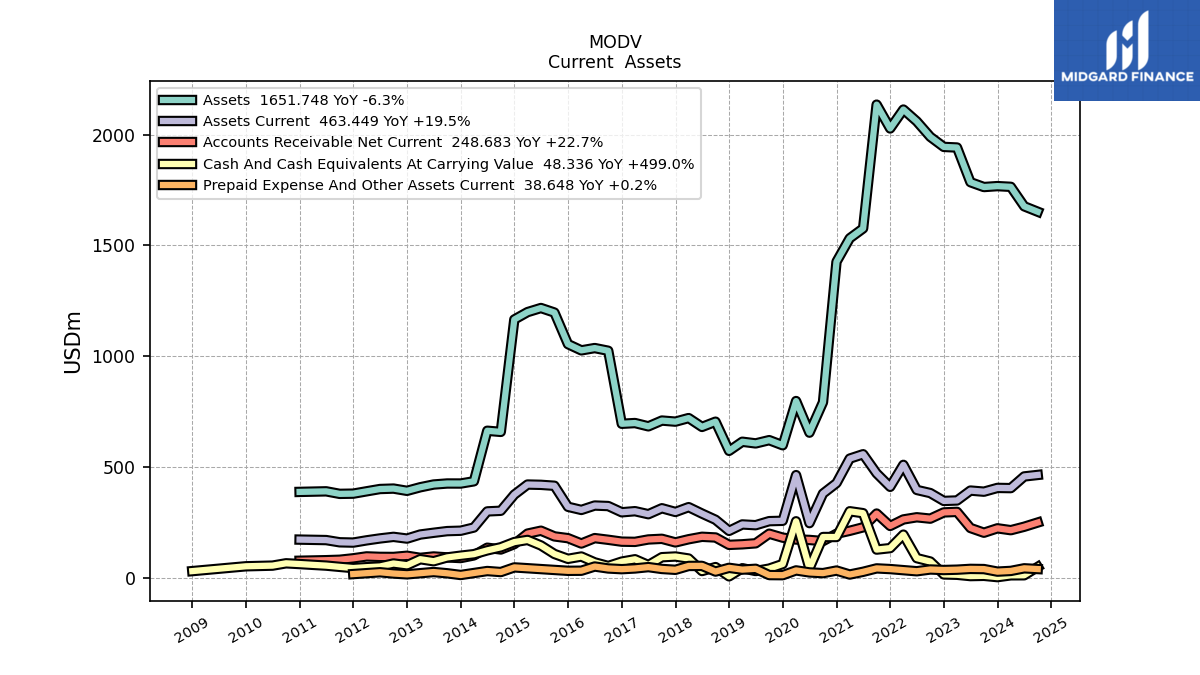
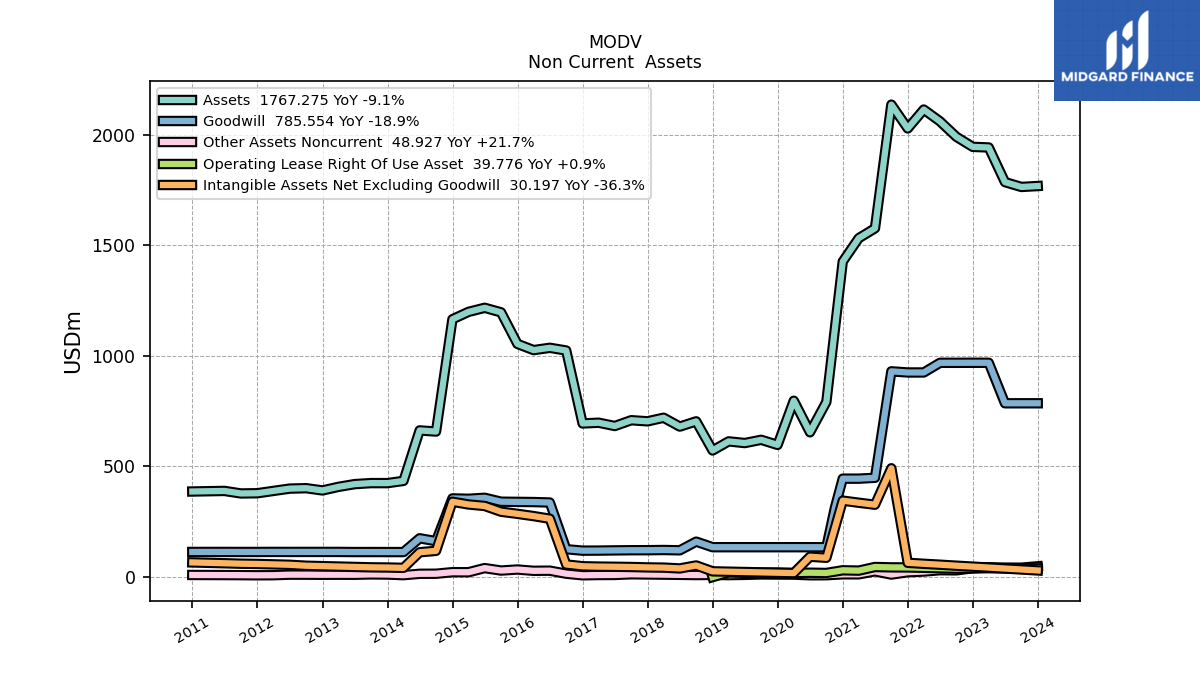
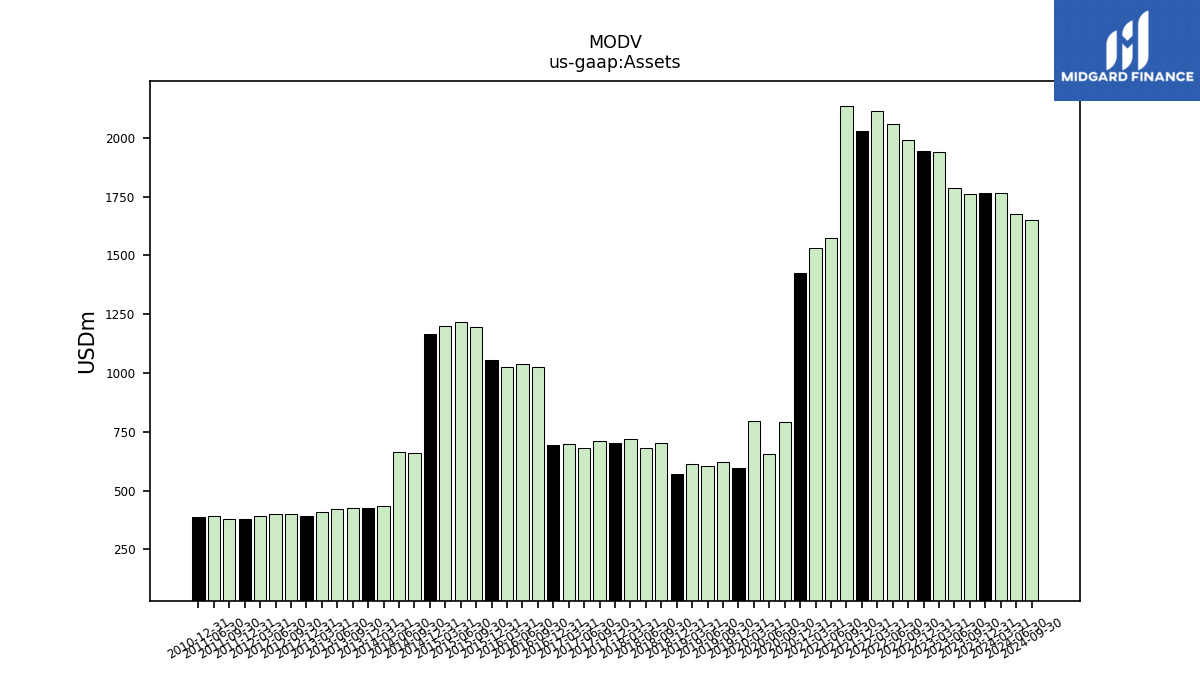
| Assets | 1764.05 | 1767.28 | 1763.09 | 1785.02 | 1941.53 | 1944.27 | 1989.85 | 2059.56 | 2112.98 | 2027.42 | 2135.15 | 1576.20 | 1531.78 | 1425.91 | 791.63 | 654.33 | 797.12 | 597.38 | 620.54 | 605.83 | 613.39 | 572.25 | 703.96 | 680.24 | 720.24 | 704.09 | 708.99 | 682.88 | 697.76 | 694.39 | 1024.06 | 1036.27 | 1025.85 | 1053.98 | 1196.55 | 1217.04 | 1198.56 | 1165.24 | 657.77 | 662.99 | 434.72 | 424.76 | 424.88 | 420.24 | 407.87 | 391.74 | 401.92 | 399.92 | 389.58 | 379.05 | 378.08 | 389.49 | NA | 386.93 | NA | NA | |
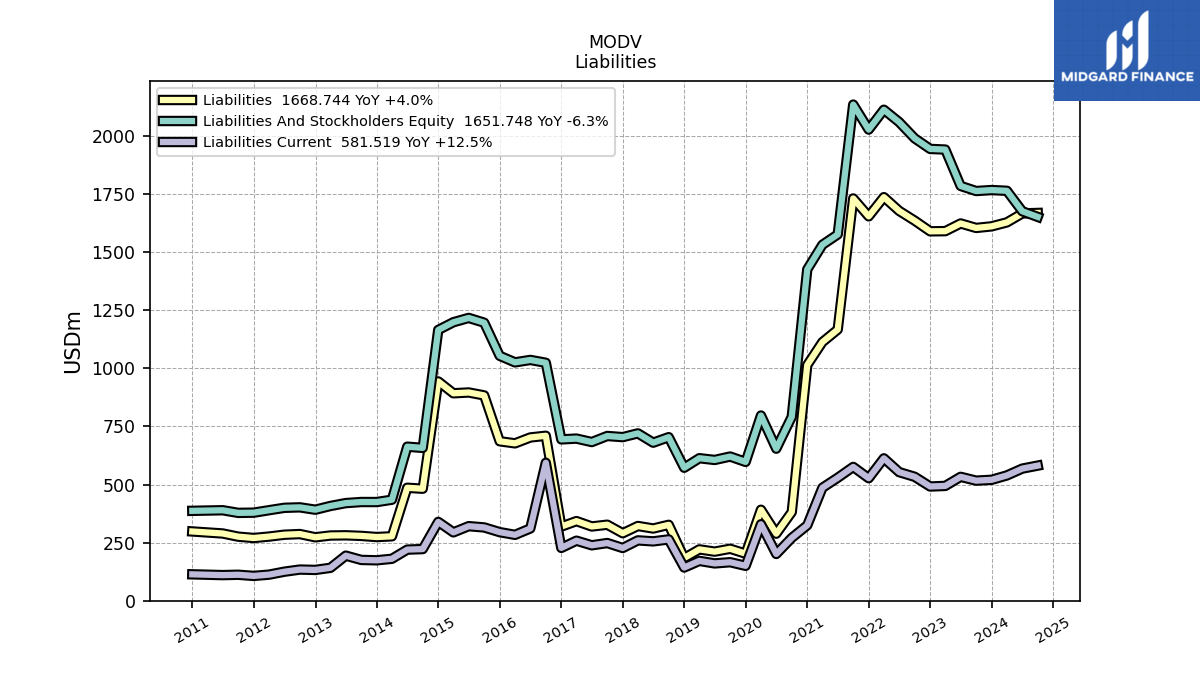
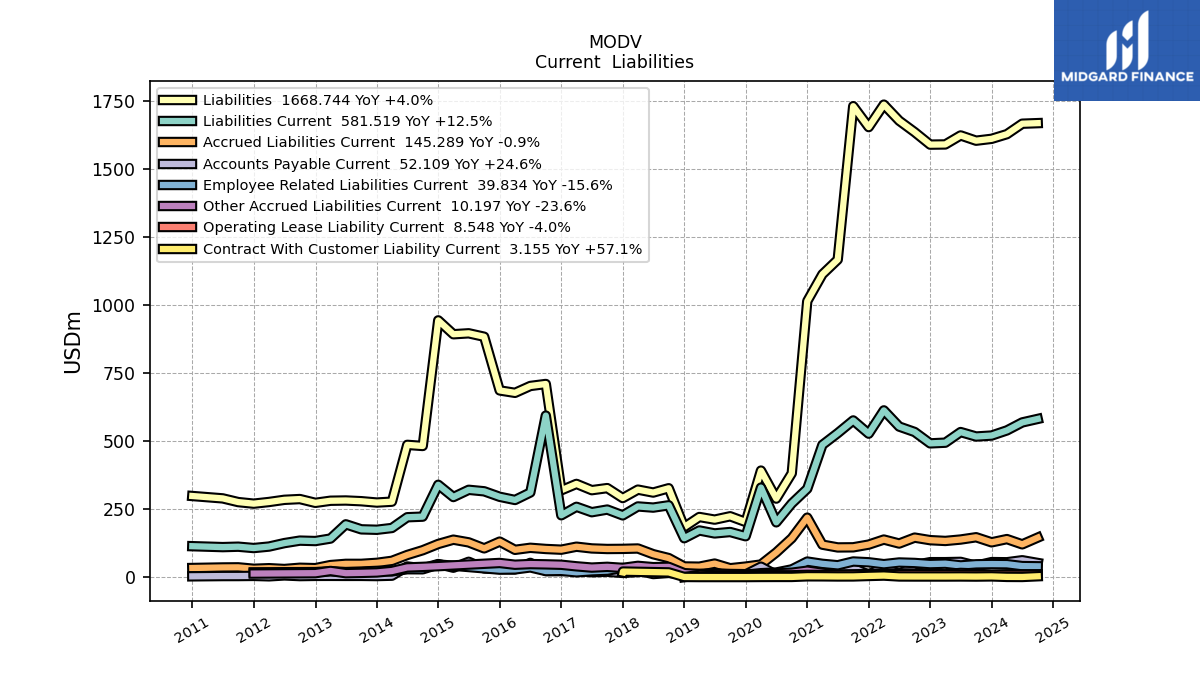
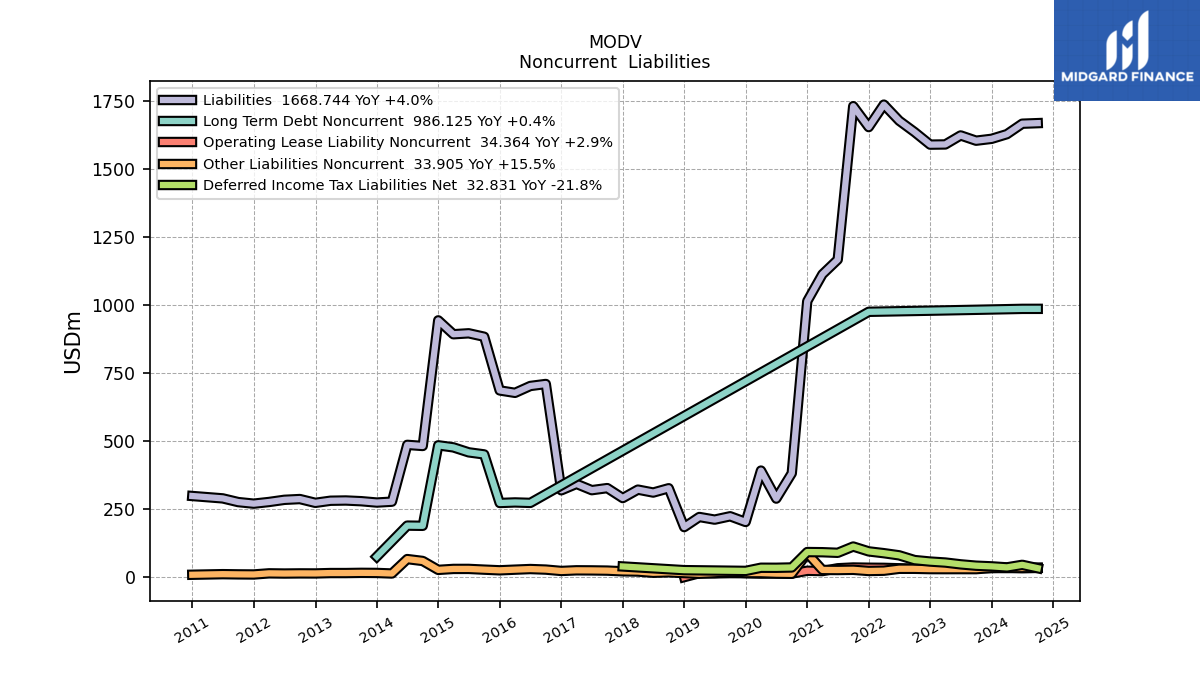
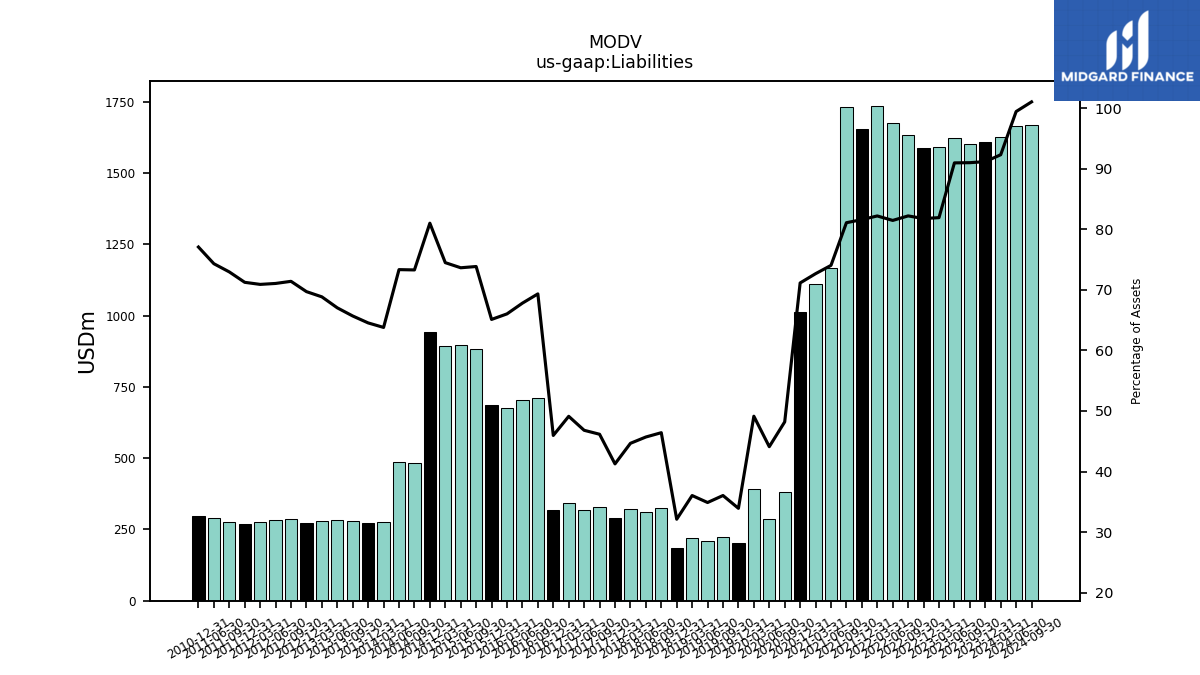
| Liabilities | 1628.21 | 1611.08 | 1604.22 | 1623.58 | 1590.43 | 1589.72 | 1635.70 | 1677.62 | 1736.78 | 1654.16 | 1731.17 | 1166.94 | 1113.02 | 1014.30 | 381.57 | 288.58 | 391.64 | 202.67 | 223.65 | 211.35 | 221.06 | 183.86 | 326.72 | 310.88 | 321.64 | 290.53 | 327.24 | 319.64 | 342.71 | 319.15 | 709.96 | 702.62 | 677.34 | 686.27 | 883.62 | 896.24 | 892.74 | 943.83 | 482.03 | 486.20 | 277.31 | 274.12 | 279.06 | 281.67 | 280.77 | 273.05 | 286.98 | 284.15 | 276.20 | 270.03 | 275.83 | 289.43 | NA | 298.18 | NA | NA | |
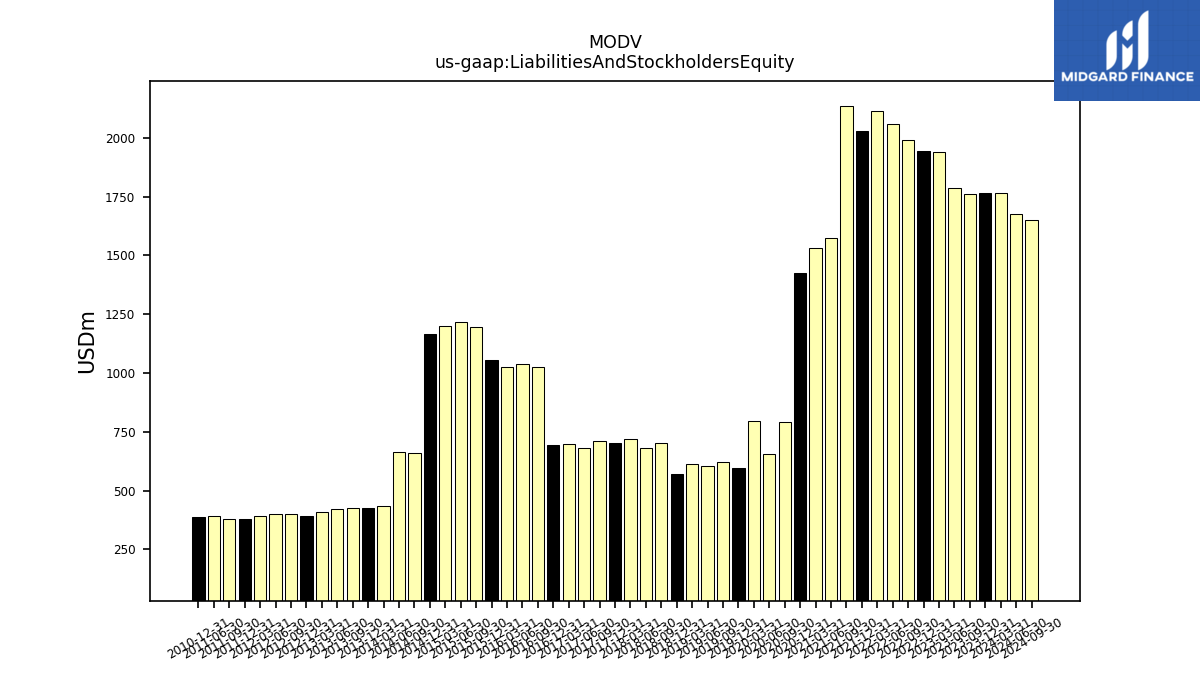
| Liabilities And Stockholders Equity | 1764.05 | 1767.28 | 1763.09 | 1785.02 | 1941.53 | 1944.27 | 1989.85 | 2059.56 | 2112.98 | 2027.42 | 2135.15 | 1576.20 | 1531.78 | 1425.91 | 791.63 | 654.33 | 797.12 | 597.38 | 620.54 | 605.83 | 613.39 | 572.25 | 703.96 | 680.24 | 720.24 | 704.09 | 708.99 | 682.88 | 697.76 | 694.39 | 1024.06 | 1036.27 | 1025.85 | 1053.98 | 1196.55 | 1217.04 | 1198.56 | 1165.24 | 657.77 | 662.99 | 434.72 | 424.76 | 424.88 | 420.24 | 407.87 | 391.74 | 401.92 | 399.92 | 389.58 | 379.05 | 378.08 | 389.49 | NA | 386.93 | NA | NA | |
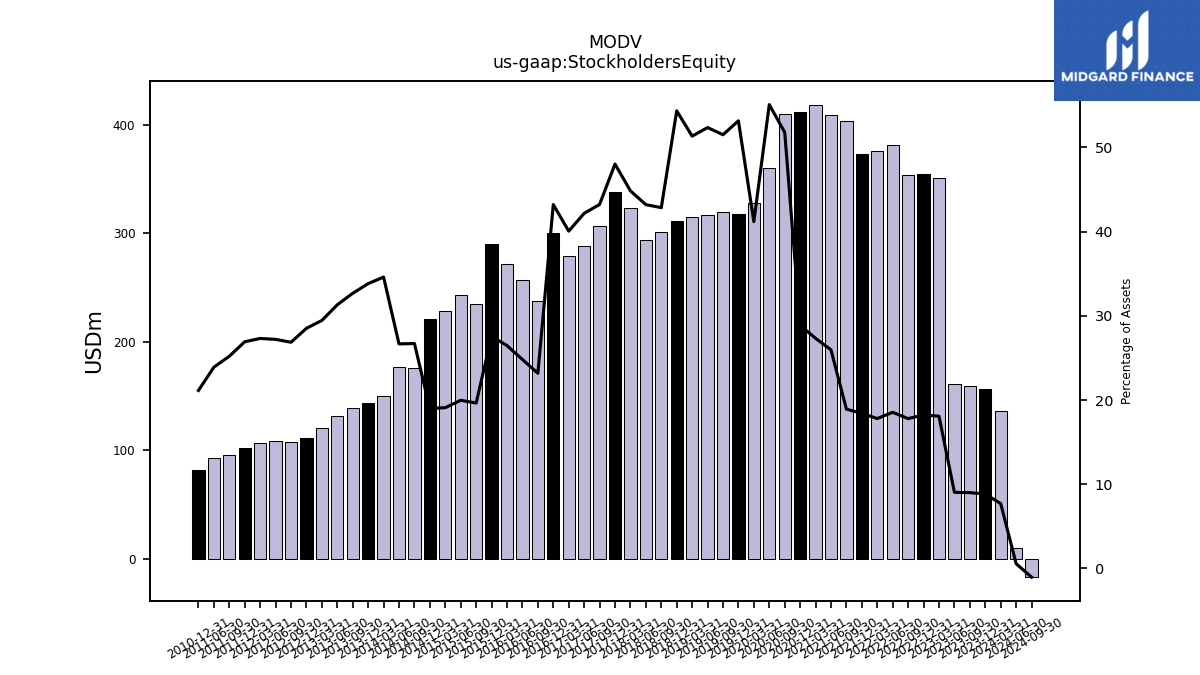
| Stockholders Equity | 135.84 | 156.19 | 158.86 | 161.44 | 351.10 | 354.56 | 354.15 | 381.94 | 376.20 | 373.27 | 403.99 | 409.26 | 418.75 | 411.61 | 410.07 | 360.46 | 328.36 | 317.59 | 319.65 | 317.24 | 314.94 | 311.00 | 301.64 | 293.93 | 323.00 | 338.18 | 306.51 | 288.00 | 279.55 | 300.10 | 237.37 | 257.18 | 271.48 | 290.58 | 235.05 | 243.08 | 228.87 | 221.36 | 175.72 | 176.82 | 150.45 | 143.68 | 138.86 | 131.61 | 120.14 | 111.73 | 107.98 | 108.81 | 106.43 | 102.06 | 95.30 | 93.10 | NA | 81.79 | NA | NA |
| 2024-03-31 | 2023-12-31 | 2023-09-30 | 2023-06-30 | 2023-03-31 | 2022-12-31 | 2022-09-30 | 2022-06-30 | 2022-03-31 | 2021-12-31 | 2021-09-30 | 2021-06-30 | 2021-03-31 | 2020-12-31 | 2020-09-30 | 2020-06-30 | 2020-03-31 | 2019-12-31 | 2019-09-30 | 2019-06-30 | 2019-03-31 | 2018-12-31 | 2018-09-30 | 2018-06-30 | 2018-03-31 | 2017-12-31 | 2017-09-30 | 2017-06-30 | 2017-03-31 | 2016-12-31 | 2016-09-30 | 2016-06-30 | 2016-03-31 | 2015-12-31 | 2015-09-30 | 2015-06-30 | 2015-03-31 | 2014-12-31 | 2014-09-30 | 2014-06-30 | 2014-03-31 | 2013-12-31 | 2013-09-30 | 2013-06-30 | 2013-03-31 | 2012-12-31 | 2012-09-30 | 2012-06-30 | 2012-03-31 | 2011-12-31 | 2011-09-30 | 2011-06-30 | 2011-03-31 | 2010-12-31 | 2010-09-30 | 2010-06-30 | ||
|---|---|---|---|---|---|---|---|---|---|---|---|---|---|---|---|---|---|---|---|---|---|---|---|---|---|---|---|---|---|---|---|---|---|---|---|---|---|---|---|---|---|---|---|---|---|---|---|---|---|---|---|---|---|---|---|---|---|
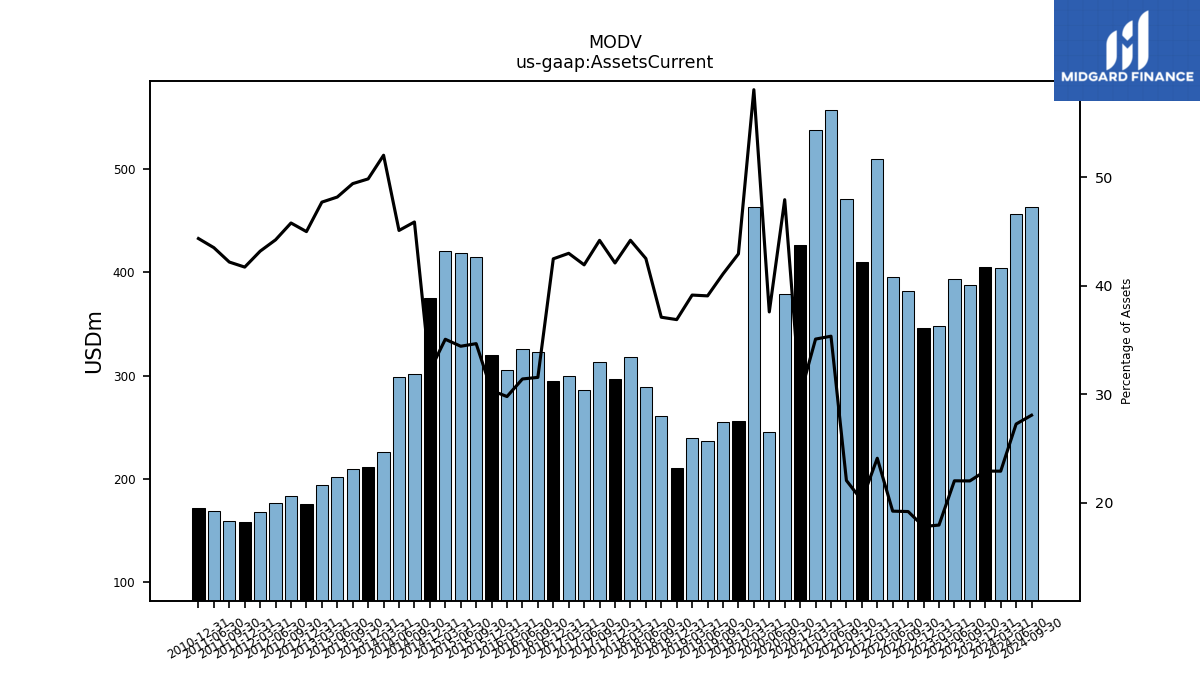
| Assets Current | 404.00 | 404.92 | 387.94 | 392.95 | 348.23 | 346.15 | 381.71 | 395.78 | 509.06 | 409.83 | 470.65 | 557.02 | 537.23 | 426.62 | 379.34 | 245.88 | 462.75 | 256.43 | 254.89 | 236.61 | 240.01 | 210.98 | 261.09 | 289.08 | 318.19 | 296.33 | 313.18 | 286.22 | 299.87 | 294.91 | 323.04 | 325.38 | 305.49 | 319.72 | 414.66 | 418.82 | 420.18 | 374.65 | 301.68 | 298.90 | 226.11 | 211.67 | 209.88 | 202.41 | 194.53 | 176.20 | 183.96 | 176.85 | 168.20 | 158.09 | 159.45 | 169.41 | NA | 171.57 | NA | NA | |
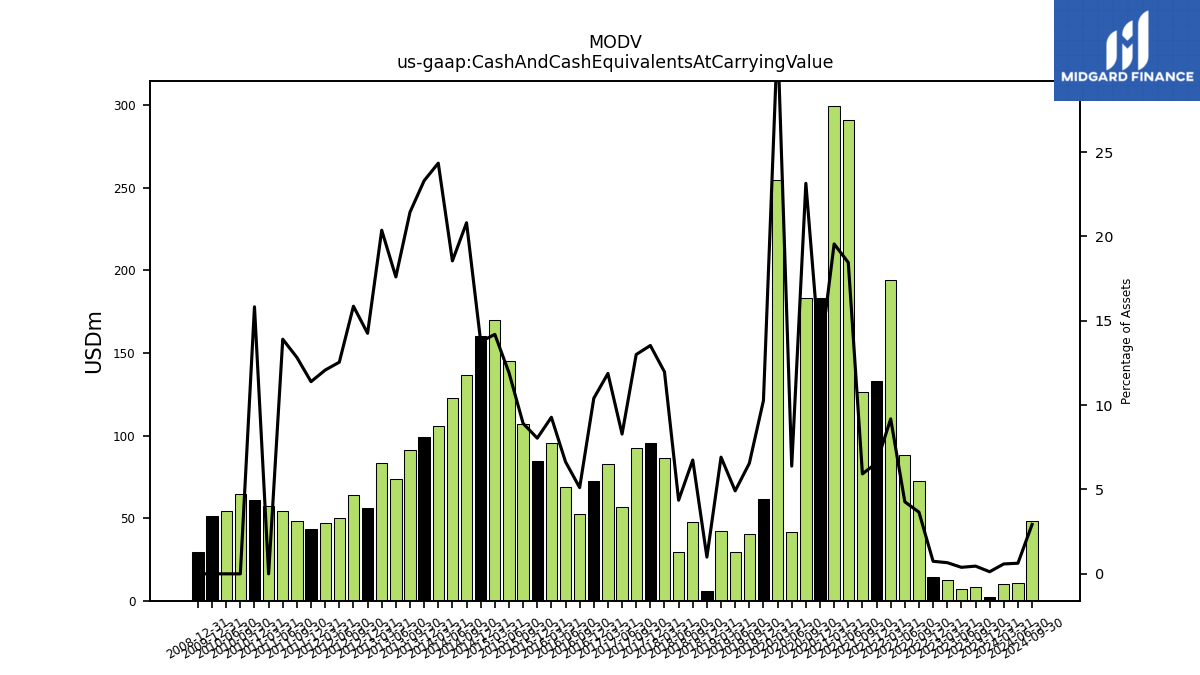
| Cash And Cash Equivalents At Carrying Value | 10.34 | 2.22 | 8.07 | 6.90 | 12.85 | 14.45 | 72.70 | 87.96 | 194.06 | 133.14 | 126.51 | 290.91 | 299.56 | 183.28 | 183.28 | 41.79 | 254.37 | 61.37 | 40.64 | 29.80 | 42.42 | 5.68 | 47.49 | 29.70 | 86.23 | 95.31 | 92.18 | 56.58 | 82.88 | 72.26 | 52.36 | 68.82 | 95.22 | 84.77 | 106.72 | 145.16 | 170.13 | 160.41 | 136.90 | 123.00 | 105.84 | 99.00 | 91.10 | 73.97 | 83.08 | 55.86 | 63.76 | 50.18 | 47.05 | 43.18 | 48.51 | 54.17 | 57.62 | 61.26 | 64.62 | 54.14 | |
| Cash Cash Equivalents Restricted Cash And Restricted Cash Equivalents | 10.87 | 2.78 | 8.61 | 7.47 | 13.38 | 14.97 | 72.73 | 87.98 | 194.47 | 133.42 | 126.69 | 290.93 | 299.61 | 183.36 | 186.82 | 45.09 | 254.48 | 61.67 | 41.72 | 34.42 | 50.62 | 12.37 | 52.25 | 39.97 | 92.09 | 101.61 | 99.28 | 64.50 | 96.42 | 86.39 | NA | NA | NA | 104.83 | NA | NA | NA | NA | NA | NA | NA | NA | NA | NA | NA | NA | NA | NA | NA | NA | NA | NA | NA | NA | NA | NA | |
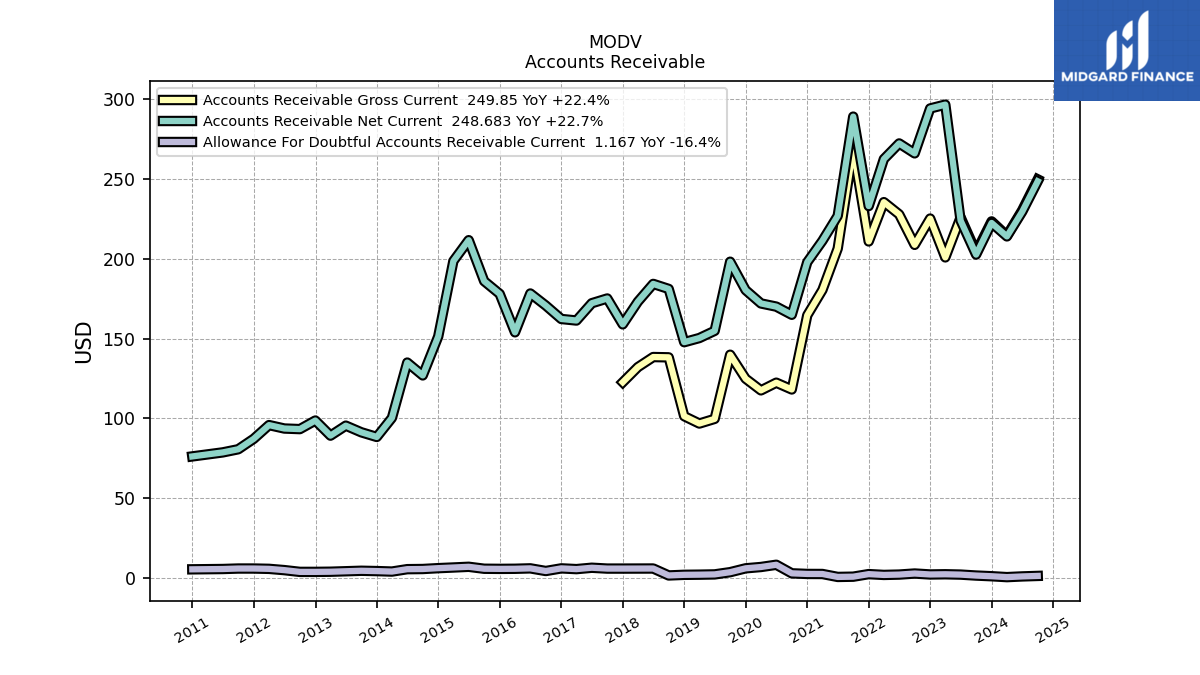
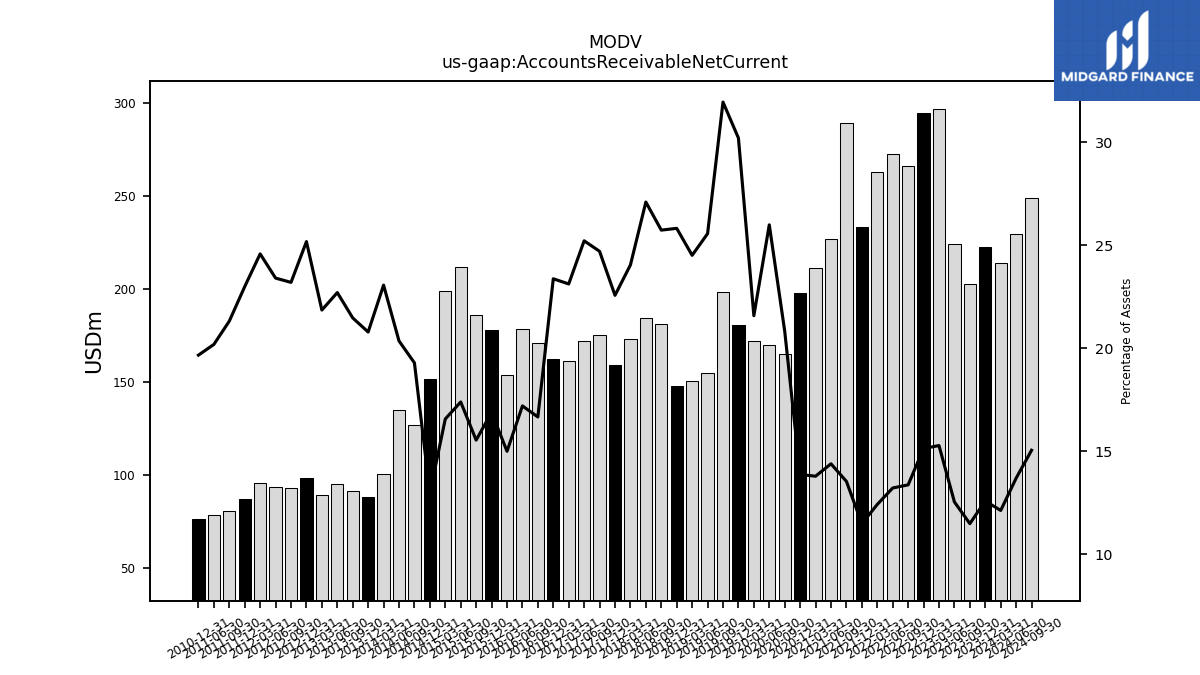
| Accounts Receivable Net Current | 214.11 | 222.54 | 202.70 | 224.01 | 296.75 | 294.34 | 266.18 | 272.40 | 262.59 | 233.12 | 289.23 | 226.97 | 211.34 | 197.94 | 164.94 | 170.06 | 172.05 | 180.42 | 198.23 | 154.86 | 150.35 | 147.76 | 181.16 | 184.31 | 173.18 | 158.93 | 175.16 | 172.19 | 161.34 | 162.31 | 170.72 | 178.29 | 153.94 | 178.05 | 186.04 | 211.74 | 198.64 | 151.34 | 126.92 | 134.97 | 100.28 | 88.31 | 91.25 | 95.41 | 89.15 | 98.63 | 93.24 | 93.61 | 95.76 | 87.16 | 80.61 | 78.64 | NA | 76.11 | NA | NA | |
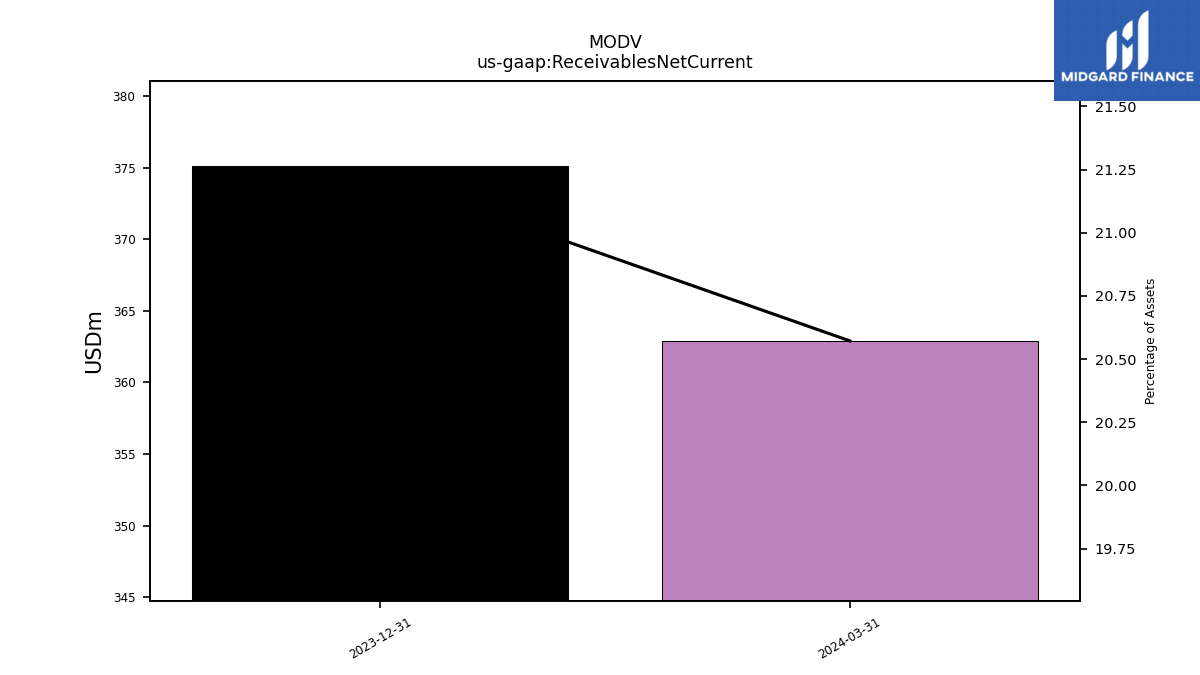
| Receivables Net Current | 362.90 | 375.10 | NA | NA | NA | NA | NA | NA | NA | NA | NA | NA | NA | NA | NA | NA | NA | NA | NA | NA | NA | NA | NA | NA | NA | NA | NA | NA | NA | NA | NA | NA | NA | NA | NA | NA | NA | NA | NA | NA | NA | NA | NA | NA | NA | NA | NA | NA | NA | NA | NA | NA | NA | NA | NA | NA | |
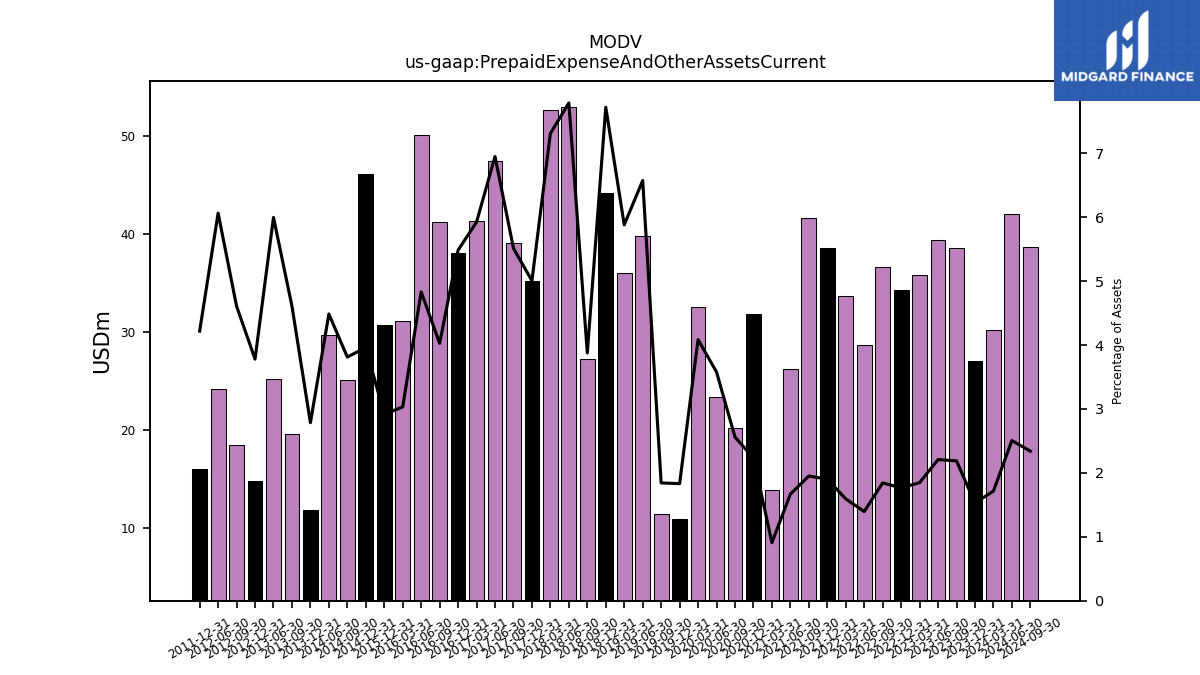
| Prepaid Expense And Other Assets Current | 30.25 | 27.03 | 38.57 | 39.41 | 35.86 | 34.33 | 36.68 | 28.73 | 33.67 | 38.55 | 41.66 | 26.27 | 13.93 | 31.89 | 20.27 | 23.41 | 32.55 | 10.94 | 11.44 | 39.82 | 36.06 | 44.17 | 27.29 | 52.96 | 52.65 | 35.24 | 39.08 | 47.45 | 41.33 | 38.08 | 41.24 | 50.07 | 31.11 | 30.72 | NA | NA | NA | 46.16 | 25.07 | 29.74 | NA | 11.83 | 19.58 | 25.20 | NA | 14.81 | 18.52 | 24.25 | NA | 15.99 | NA | NA | NA | NA | NA | NA |
| 2024-03-31 | 2023-12-31 | 2023-09-30 | 2023-06-30 | 2023-03-31 | 2022-12-31 | 2022-09-30 | 2022-06-30 | 2022-03-31 | 2021-12-31 | 2021-09-30 | 2021-06-30 | 2021-03-31 | 2020-12-31 | 2020-09-30 | 2020-06-30 | 2020-03-31 | 2019-12-31 | 2019-09-30 | 2019-06-30 | 2019-03-31 | 2018-12-31 | 2018-09-30 | 2018-06-30 | 2018-03-31 | 2017-12-31 | 2017-09-30 | 2017-06-30 | 2017-03-31 | 2016-12-31 | 2016-09-30 | 2016-06-30 | 2016-03-31 | 2015-12-31 | 2015-09-30 | 2015-06-30 | 2015-03-31 | 2014-12-31 | 2014-09-30 | 2014-06-30 | 2014-03-31 | 2013-12-31 | 2013-09-30 | 2013-06-30 | 2013-03-31 | 2012-12-31 | 2012-09-30 | 2012-06-30 | 2012-03-31 | 2011-12-31 | 2011-09-30 | 2011-06-30 | 2011-03-31 | 2010-12-31 | 2010-09-30 | 2010-06-30 | ||
|---|---|---|---|---|---|---|---|---|---|---|---|---|---|---|---|---|---|---|---|---|---|---|---|---|---|---|---|---|---|---|---|---|---|---|---|---|---|---|---|---|---|---|---|---|---|---|---|---|---|---|---|---|---|---|---|---|---|
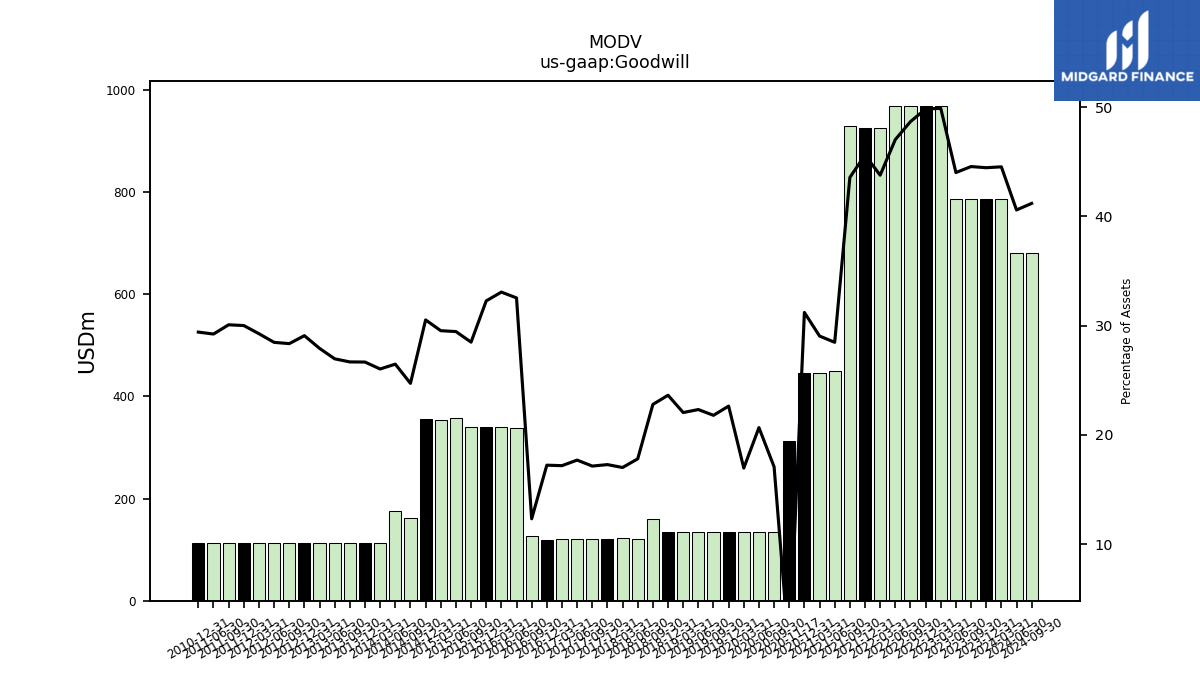
| Goodwill | 785.55 | 785.55 | 785.55 | 785.55 | 968.65 | 968.65 | 968.42 | 968.48 | 924.79 | 924.79 | 929.99 | 448.76 | 444.93 | 444.93 | 135.22 | 135.22 | 135.22 | 135.22 | 135.22 | 135.22 | 135.22 | 135.22 | 160.42 | 121.14 | 122.54 | 121.67 | 121.56 | 120.82 | 119.89 | 119.62 | 126.17 | 337.16 | 339.23 | 340.03 | 340.85 | 358.48 | 354.00 | 355.64 | 162.56 | 175.52 | 113.15 | 113.26 | 113.34 | 113.30 | 113.87 | 113.92 | 113.95 | 113.85 | 113.98 | 113.74 | 113.71 | 113.84 | NA | 113.78 | NA | NA | |
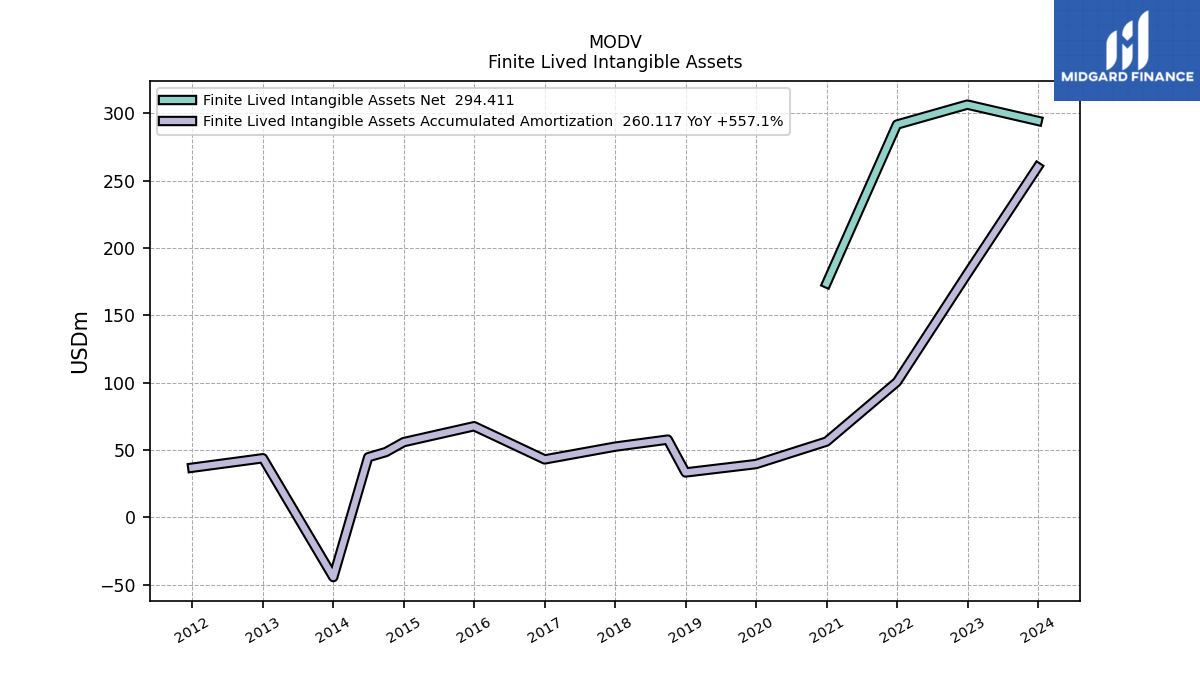
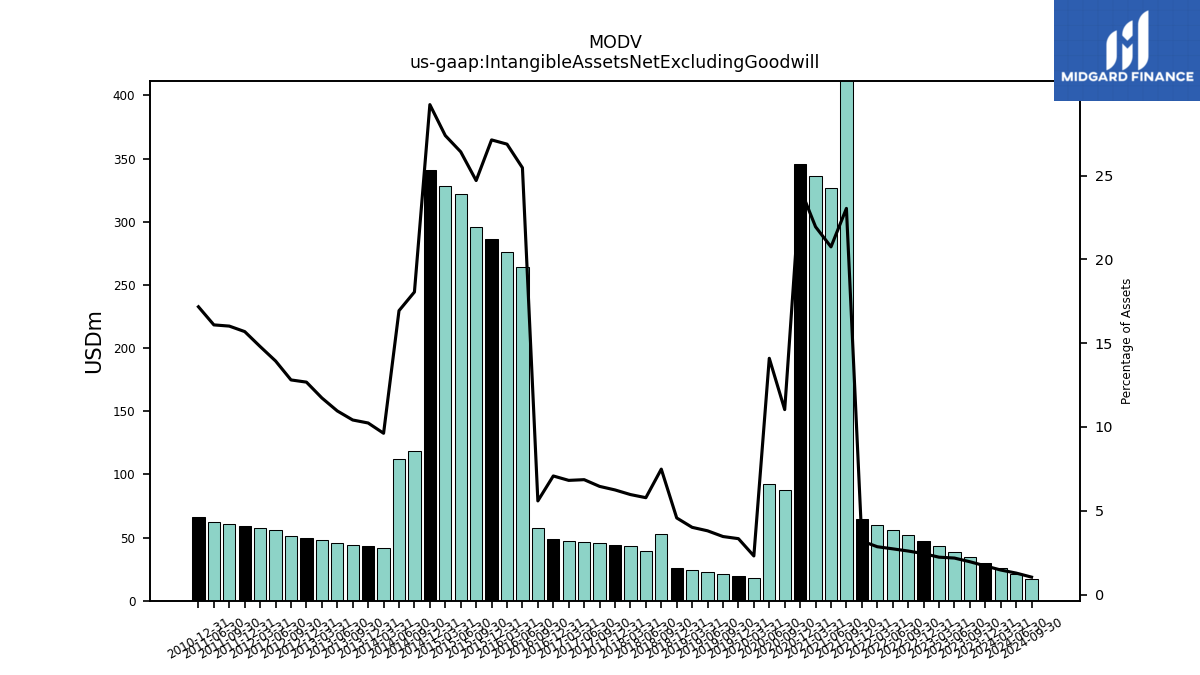
| Intangible Assets Net Excluding Goodwill | 25.78 | 30.20 | 34.48 | 38.83 | 43.25 | 47.43 | 51.64 | 56.13 | 60.25 | 64.70 | 492.00 | 327.01 | 336.15 | 345.65 | 87.36 | 92.24 | 18.35 | 19.91 | 21.47 | 23.03 | 24.59 | 26.15 | 52.67 | 39.30 | 42.96 | 43.94 | 45.75 | 46.80 | 47.53 | 49.12 | 57.20 | 263.92 | 275.73 | 285.95 | 295.60 | 321.54 | 328.29 | 340.67 | 118.75 | 112.30 | 41.83 | 43.48 | 44.25 | 46.04 | 47.85 | 49.65 | 51.47 | 55.73 | 57.65 | 59.47 | 60.56 | 62.67 | NA | 66.44 | NA | NA | |
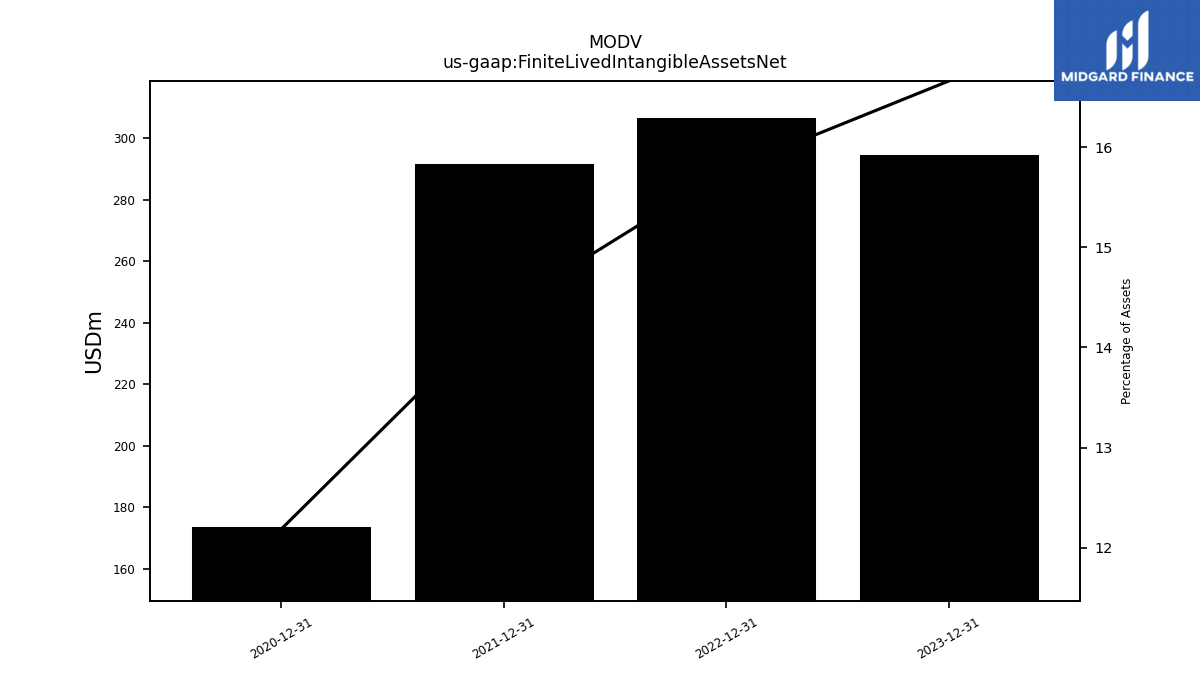
| Finite Lived Intangible Assets Net | NA | 294.41 | NA | NA | NA | 306.46 | NA | NA | NA | 291.65 | NA | NA | NA | 173.78 | NA | NA | NA | NA | NA | NA | NA | NA | NA | NA | NA | NA | NA | NA | NA | NA | NA | NA | NA | NA | NA | NA | NA | NA | NA | NA | NA | NA | NA | NA | NA | NA | NA | NA | NA | NA | NA | NA | NA | NA | NA | NA | |
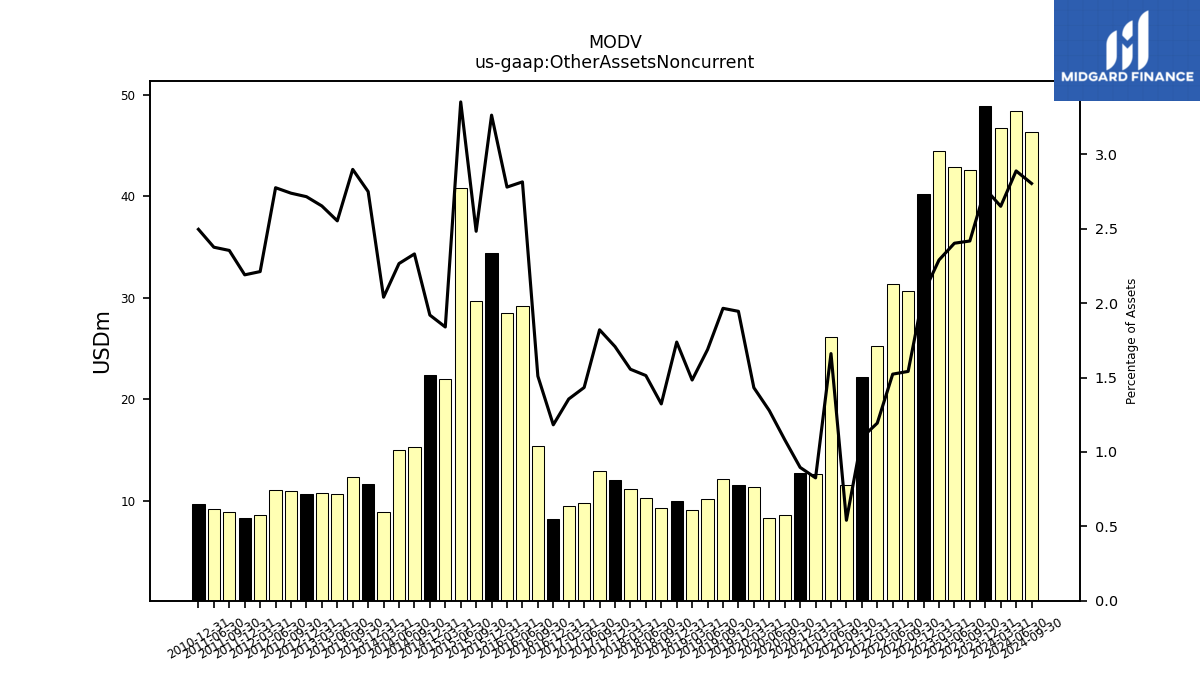
| Other Assets Noncurrent | 46.77 | 48.93 | 42.63 | 42.89 | 44.46 | 40.21 | 30.67 | 31.37 | 25.23 | 22.22 | 11.55 | 26.18 | 12.65 | 12.78 | 8.57 | 8.37 | 11.41 | 11.62 | 12.20 | 10.23 | 9.10 | 9.95 | 9.31 | 10.30 | 11.21 | 12.03 | 12.91 | 9.79 | 9.46 | 8.21 | 15.46 | 29.17 | 28.52 | 34.40 | 29.71 | 40.80 | 22.05 | 22.37 | 15.33 | 15.03 | 8.87 | 11.68 | 12.32 | 10.73 | 10.82 | 10.64 | 11.01 | 11.10 | 8.62 | 8.30 | 8.90 | 9.25 | NA | 9.66 | NA | NA |
| 2024-03-31 | 2023-12-31 | 2023-09-30 | 2023-06-30 | 2023-03-31 | 2022-12-31 | 2022-09-30 | 2022-06-30 | 2022-03-31 | 2021-12-31 | 2021-09-30 | 2021-06-30 | 2021-03-31 | 2020-12-31 | 2020-09-30 | 2020-06-30 | 2020-03-31 | 2019-12-31 | 2019-09-30 | 2019-06-30 | 2019-03-31 | 2018-12-31 | 2018-09-30 | 2018-06-30 | 2018-03-31 | 2017-12-31 | 2017-09-30 | 2017-06-30 | 2017-03-31 | 2016-12-31 | 2016-09-30 | 2016-06-30 | 2016-03-31 | 2015-12-31 | 2015-09-30 | 2015-06-30 | 2015-03-31 | 2014-12-31 | 2014-09-30 | 2014-06-30 | 2014-03-31 | 2013-12-31 | 2013-09-30 | 2013-06-30 | 2013-03-31 | 2012-12-31 | 2012-09-30 | 2012-06-30 | 2012-03-31 | 2011-12-31 | 2011-09-30 | 2011-06-30 | 2011-03-31 | 2010-12-31 | 2010-09-30 | 2010-06-30 | ||
|---|---|---|---|---|---|---|---|---|---|---|---|---|---|---|---|---|---|---|---|---|---|---|---|---|---|---|---|---|---|---|---|---|---|---|---|---|---|---|---|---|---|---|---|---|---|---|---|---|---|---|---|---|---|---|---|---|---|
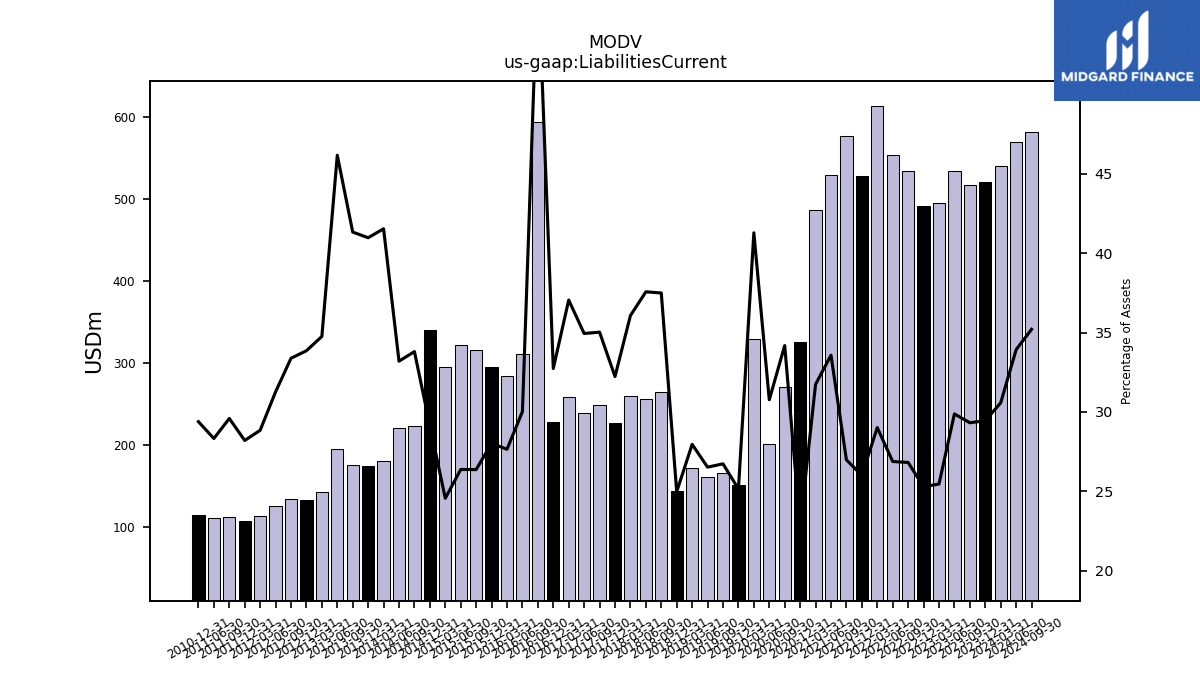
| Liabilities Current | 539.31 | 520.40 | 516.85 | 533.24 | 494.16 | 491.60 | 533.51 | 553.43 | 612.94 | 527.23 | 575.97 | 529.25 | 486.08 | 324.75 | 270.59 | 201.31 | 329.14 | 150.19 | 165.84 | 160.65 | 171.47 | 142.88 | 263.97 | 255.56 | 259.80 | 226.93 | 248.34 | 238.62 | 258.52 | 227.32 | 593.80 | 311.07 | 283.59 | 295.27 | 315.46 | 320.93 | 294.31 | 339.46 | 222.33 | 220.09 | 180.61 | 174.06 | 175.64 | 194.07 | 141.76 | 132.63 | 134.17 | 125.03 | 112.36 | 106.89 | 111.86 | 110.32 | NA | 113.69 | NA | NA | |
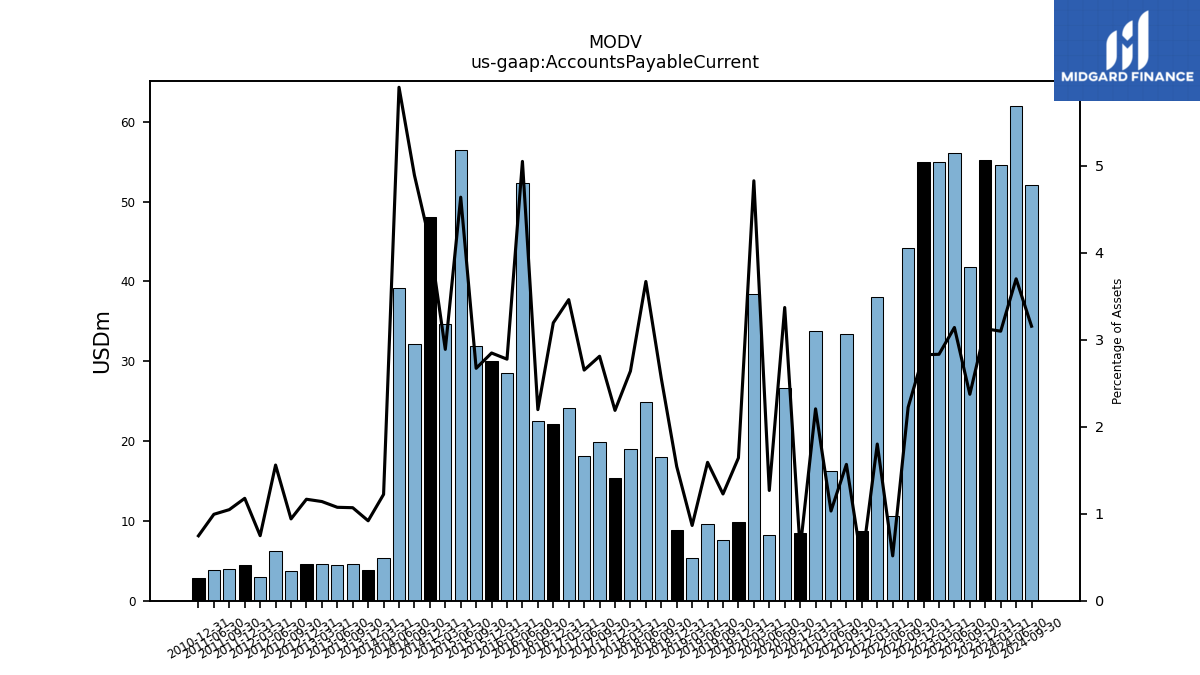
| Accounts Payable Current | 54.65 | 55.24 | 41.83 | 56.05 | 54.99 | 54.96 | 44.24 | 10.62 | 38.05 | 8.69 | 33.46 | 16.25 | 33.78 | 8.46 | 26.68 | 8.29 | 38.47 | 9.80 | 7.61 | 9.63 | 5.31 | 8.83 | 17.99 | 24.96 | 19.01 | 15.40 | 19.92 | 18.10 | 24.14 | 22.18 | 22.49 | 52.32 | 28.48 | 30.01 | 31.96 | 56.44 | 34.63 | 48.06 | 32.16 | 39.12 | 5.31 | 3.90 | 4.54 | 4.51 | 4.65 | 4.57 | 3.78 | 6.24 | 2.91 | 4.46 | 3.96 | 3.87 | NA | 2.89 | NA | NA | |
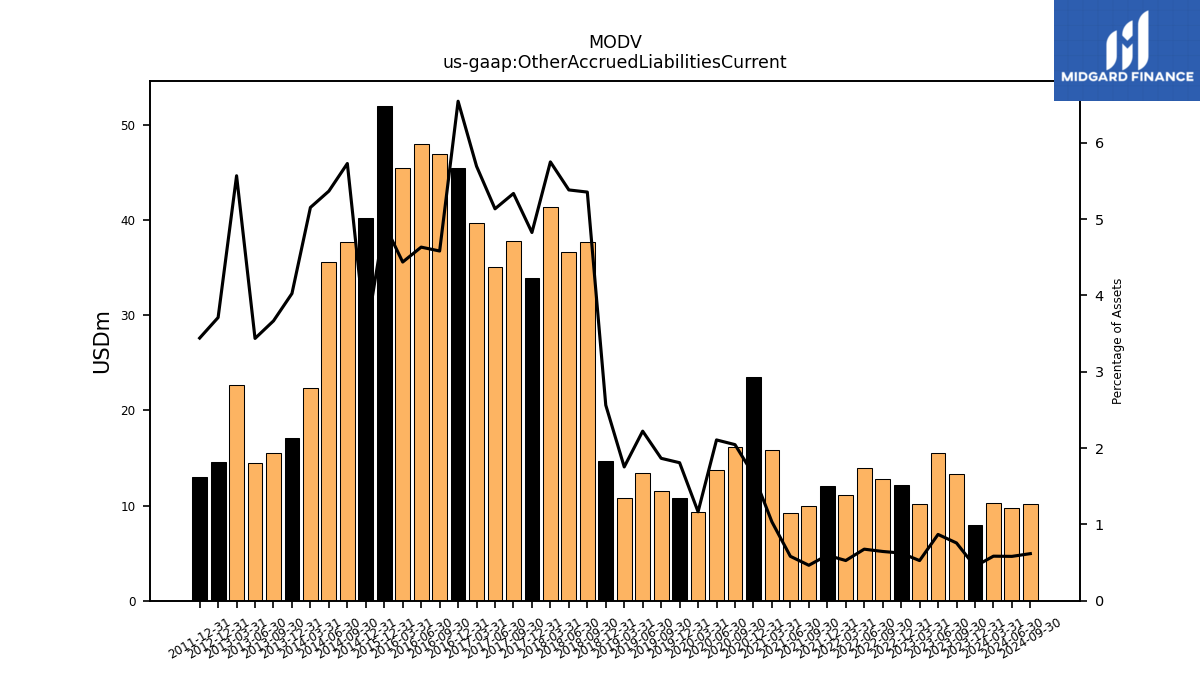
| Other Accrued Liabilities Current | 10.30 | 7.97 | 13.35 | 15.51 | 10.22 | 12.14 | 12.85 | 13.92 | 11.14 | 12.09 | 9.92 | 9.18 | 15.84 | 23.56 | 16.20 | 13.79 | 9.29 | 10.80 | 11.58 | 13.46 | 10.76 | 14.67 | 37.70 | 36.62 | 41.42 | 33.98 | 37.84 | 35.07 | 39.72 | 45.45 | 46.93 | 48.02 | 45.53 | 52.03 | NA | NA | NA | 40.28 | 37.68 | 35.59 | 22.40 | 17.10 | 15.58 | 14.44 | 22.71 | 14.54 | NA | NA | NA | 13.05 | NA | NA | NA | NA | NA | NA | |
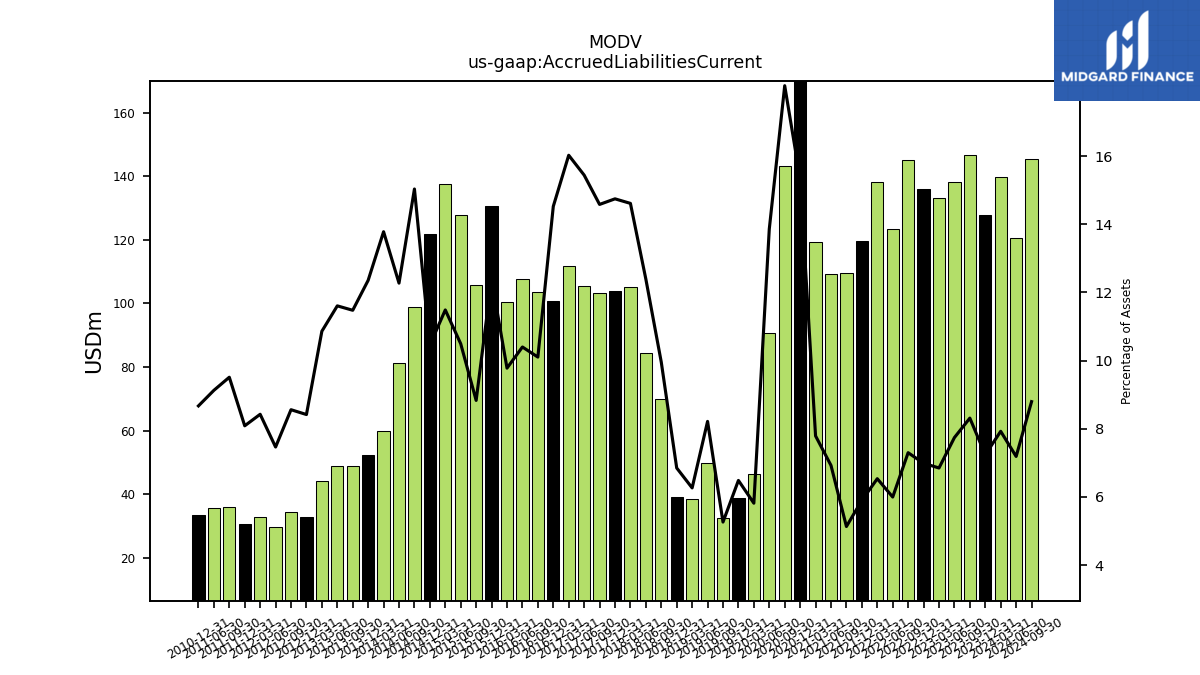
| Accrued Liabilities Current | 139.81 | 127.90 | 146.56 | 138.18 | 132.98 | 135.86 | 145.22 | 123.50 | 138.07 | 119.56 | 109.57 | 109.14 | 119.33 | 218.67 | 143.03 | 90.69 | 46.36 | 38.73 | 32.65 | 49.77 | 38.42 | 39.19 | 70.07 | 84.29 | 105.26 | 103.84 | 103.40 | 105.46 | 111.83 | 100.87 | 103.47 | 107.77 | 100.33 | 130.55 | 105.68 | 127.72 | 137.68 | 121.86 | 98.90 | 81.38 | 59.92 | 52.48 | 48.77 | 48.78 | 44.30 | 32.98 | 34.40 | 29.85 | 32.82 | 30.65 | 35.96 | 35.55 | NA | 33.55 | NA | NA | |
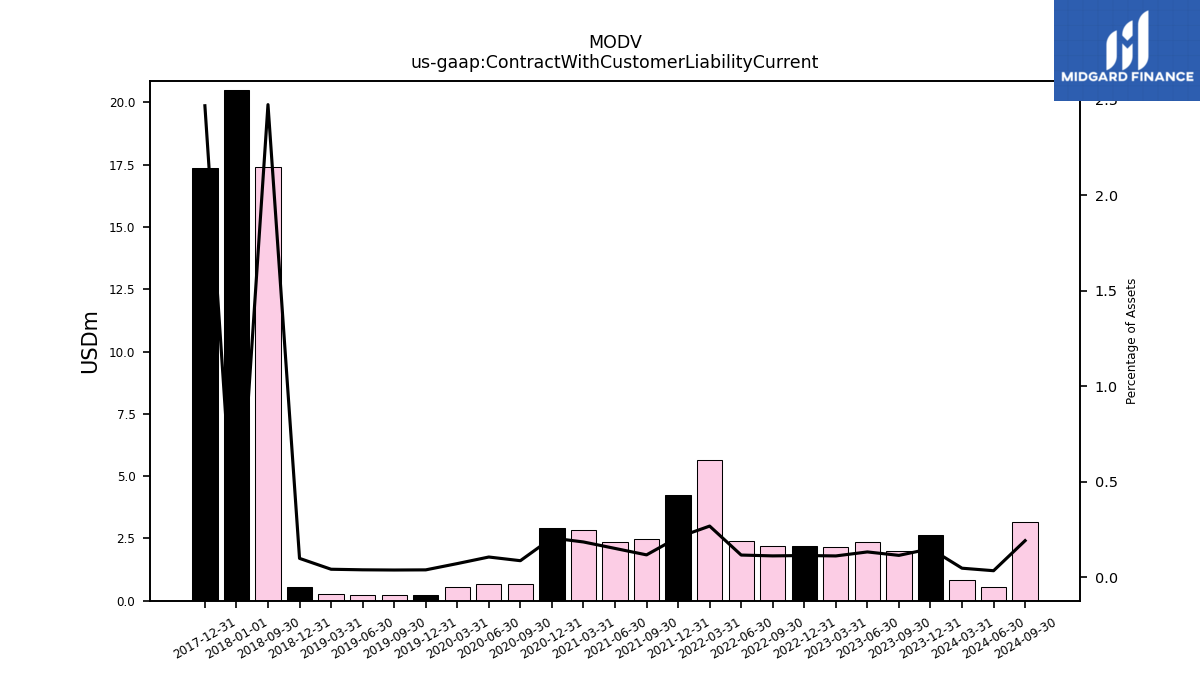
| Contract With Customer Liability Current | 0.82 | 2.63 | 2.01 | 2.35 | 2.15 | 2.20 | 2.21 | 2.38 | 5.65 | 4.23 | 2.49 | 2.37 | 2.82 | 2.92 | 0.68 | 0.69 | 0.56 | 0.23 | 0.23 | 0.23 | 0.25 | 0.56 | 17.42 | NA | NA | 17.38 | NA | NA | NA | NA | NA | NA | NA | NA | NA | NA | NA | NA | NA | NA | NA | NA | NA | NA | NA | NA | NA | NA | NA | NA | NA | NA | NA | NA | NA | NA |
| 2024-03-31 | 2023-12-31 | 2023-09-30 | 2023-06-30 | 2023-03-31 | 2022-12-31 | 2022-09-30 | 2022-06-30 | 2022-03-31 | 2021-12-31 | 2021-09-30 | 2021-06-30 | 2021-03-31 | 2020-12-31 | 2020-09-30 | 2020-06-30 | 2020-03-31 | 2019-12-31 | 2019-09-30 | 2019-06-30 | 2019-03-31 | 2018-12-31 | 2018-09-30 | 2018-06-30 | 2018-03-31 | 2017-12-31 | 2017-09-30 | 2017-06-30 | 2017-03-31 | 2016-12-31 | 2016-09-30 | 2016-06-30 | 2016-03-31 | 2015-12-31 | 2015-09-30 | 2015-06-30 | 2015-03-31 | 2014-12-31 | 2014-09-30 | 2014-06-30 | 2014-03-31 | 2013-12-31 | 2013-09-30 | 2013-06-30 | 2013-03-31 | 2012-12-31 | 2012-09-30 | 2012-06-30 | 2012-03-31 | 2011-12-31 | 2011-09-30 | 2011-06-30 | 2011-03-31 | 2010-12-31 | 2010-09-30 | 2010-06-30 | ||
|---|---|---|---|---|---|---|---|---|---|---|---|---|---|---|---|---|---|---|---|---|---|---|---|---|---|---|---|---|---|---|---|---|---|---|---|---|---|---|---|---|---|---|---|---|---|---|---|---|---|---|---|---|---|---|---|---|---|
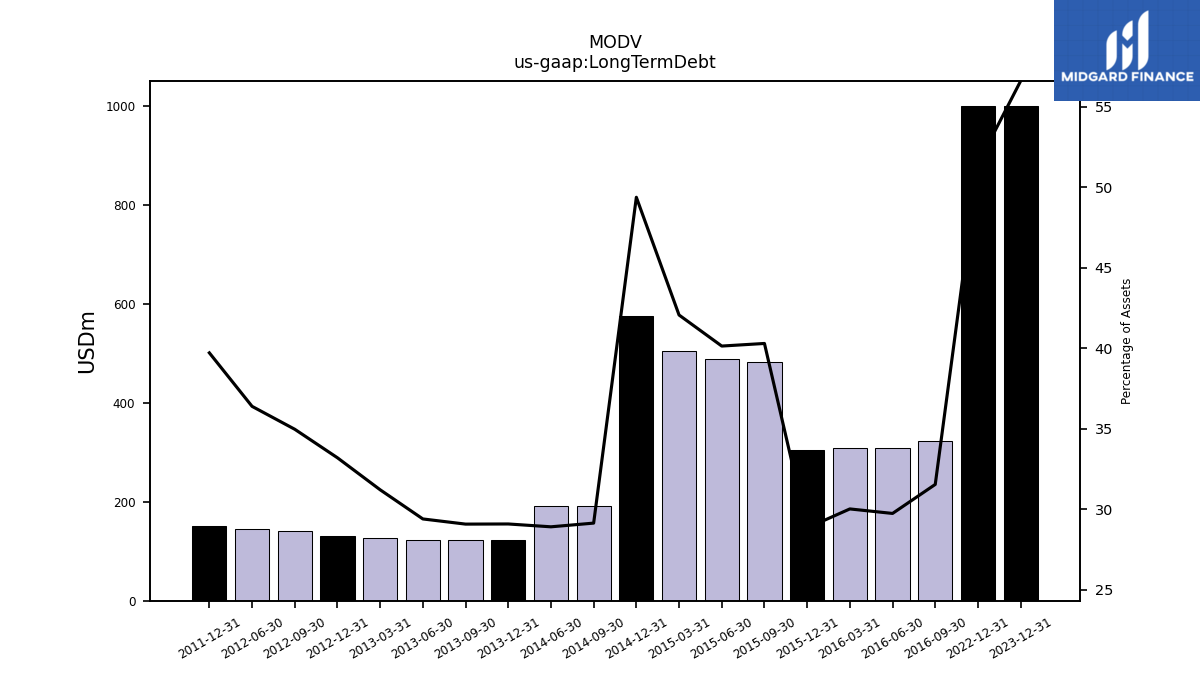
| Long Term Debt | NA | 1000.00 | NA | NA | NA | 1000.00 | NA | NA | NA | NA | NA | NA | NA | NA | NA | NA | NA | NA | NA | NA | NA | NA | NA | NA | NA | NA | NA | NA | NA | NA | 322.90 | 308.08 | 307.85 | 303.85 | 482.04 | 488.33 | 504.02 | 575.21 | 191.60 | 191.60 | NA | 123.50 | 123.50 | 123.50 | 127.25 | 130.00 | 140.50 | 145.49 | NA | 150.49 | NA | NA | NA | NA | NA | NA | |
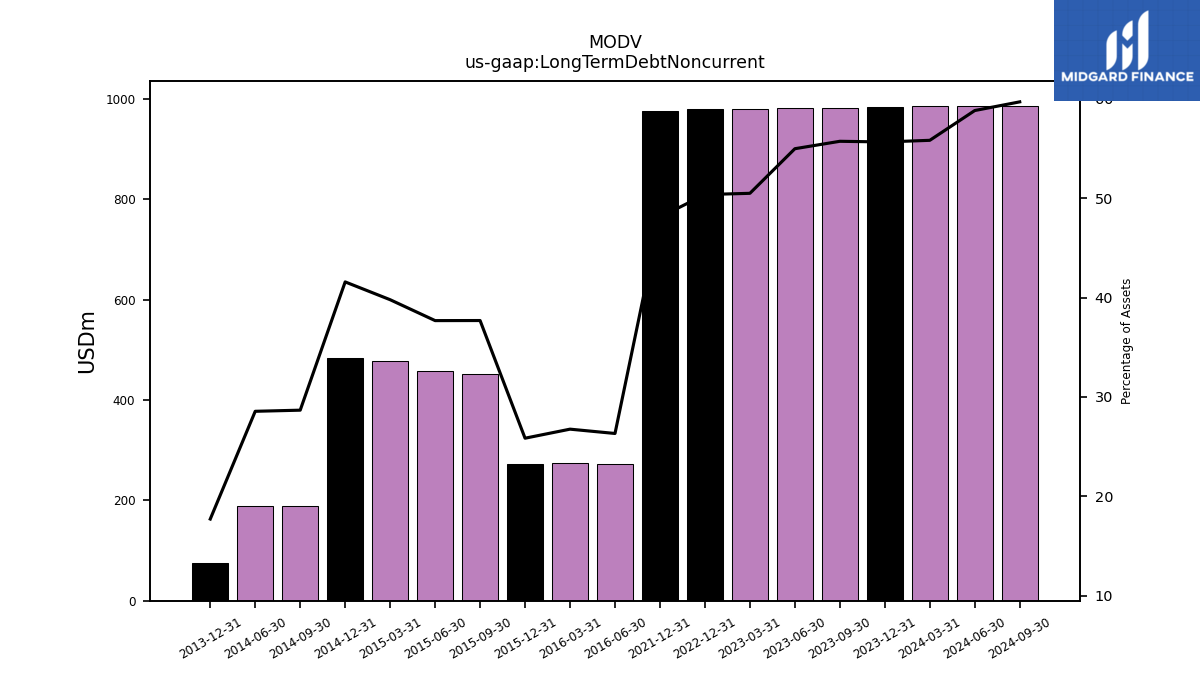
| Long Term Debt Noncurrent | 984.90 | 983.76 | 982.63 | 981.53 | 980.43 | 979.36 | NA | NA | NA | 975.23 | NA | NA | NA | NA | NA | NA | NA | NA | NA | NA | NA | NA | NA | NA | NA | NA | NA | NA | NA | NA | NA | 272.83 | 274.54 | 272.47 | 451.04 | 458.67 | 476.90 | 484.52 | 188.60 | 189.35 | NA | 75.25 | NA | NA | NA | NA | NA | NA | NA | NA | NA | NA | NA | NA | NA | NA | |
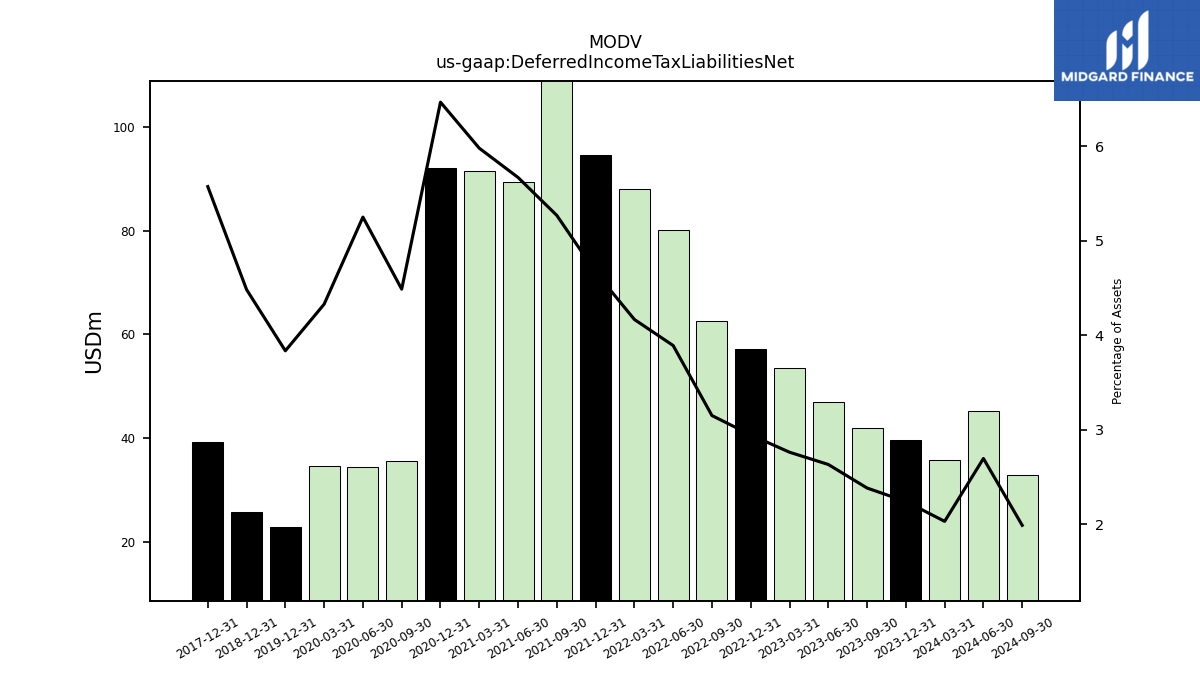
| Deferred Income Tax Liabilities Net | 35.81 | 39.58 | 42.00 | 46.97 | 53.61 | 57.24 | 62.67 | 80.12 | 88.03 | 94.61 | 112.46 | 89.35 | 91.58 | 92.19 | 35.52 | 34.35 | 34.50 | 22.91 | NA | NA | NA | 25.65 | NA | NA | NA | 39.23 | NA | NA | NA | NA | NA | NA | NA | NA | NA | NA | NA | NA | NA | NA | NA | NA | NA | NA | NA | NA | NA | NA | NA | NA | NA | NA | NA | NA | NA | NA | |
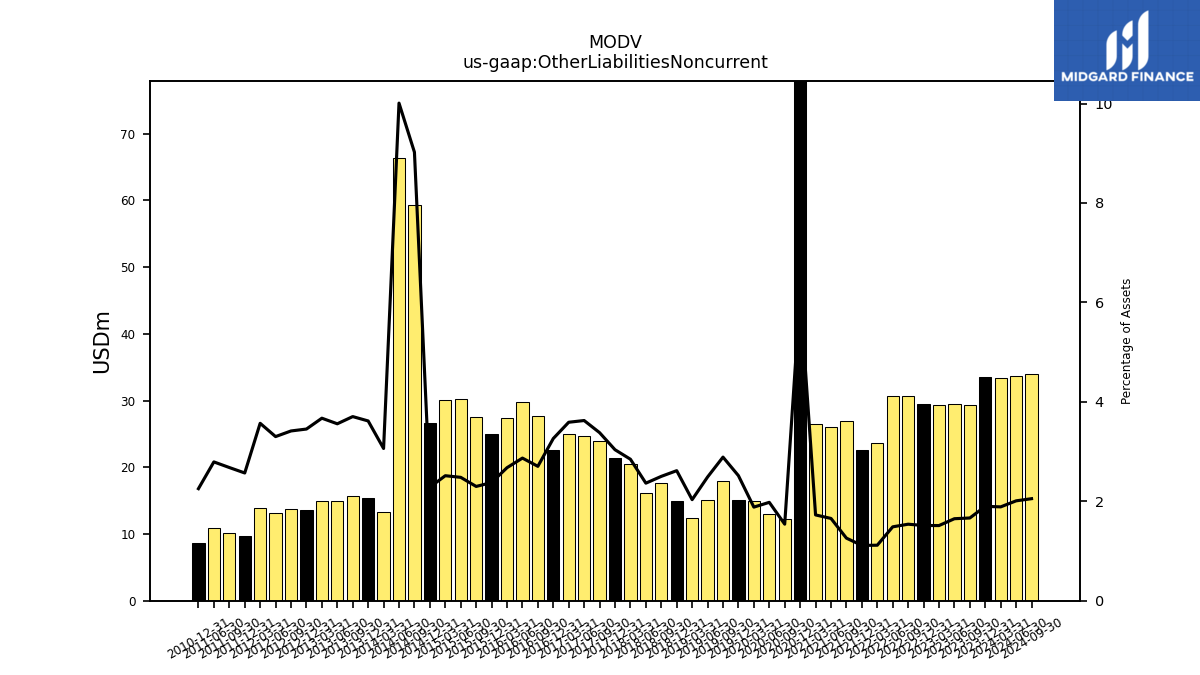
| Other Liabilities Noncurrent | 33.30 | 33.55 | 29.35 | 29.45 | 29.36 | 29.43 | 30.63 | 30.62 | 23.60 | 22.56 | 26.89 | 26.09 | 26.44 | 87.94 | 12.20 | 12.95 | 15.01 | 15.03 | 17.93 | 15.08 | 12.47 | 14.97 | 17.61 | 16.09 | 20.50 | 21.39 | 23.97 | 24.75 | 25.05 | 22.66 | 27.68 | 29.73 | 27.45 | 25.05 | 27.51 | 30.20 | 30.14 | 26.61 | 59.34 | 66.35 | 13.31 | 15.36 | 15.74 | 14.96 | 14.97 | 13.53 | 13.72 | 13.20 | 13.90 | 9.74 | 10.13 | 10.88 | NA | 8.72 | NA | NA | |
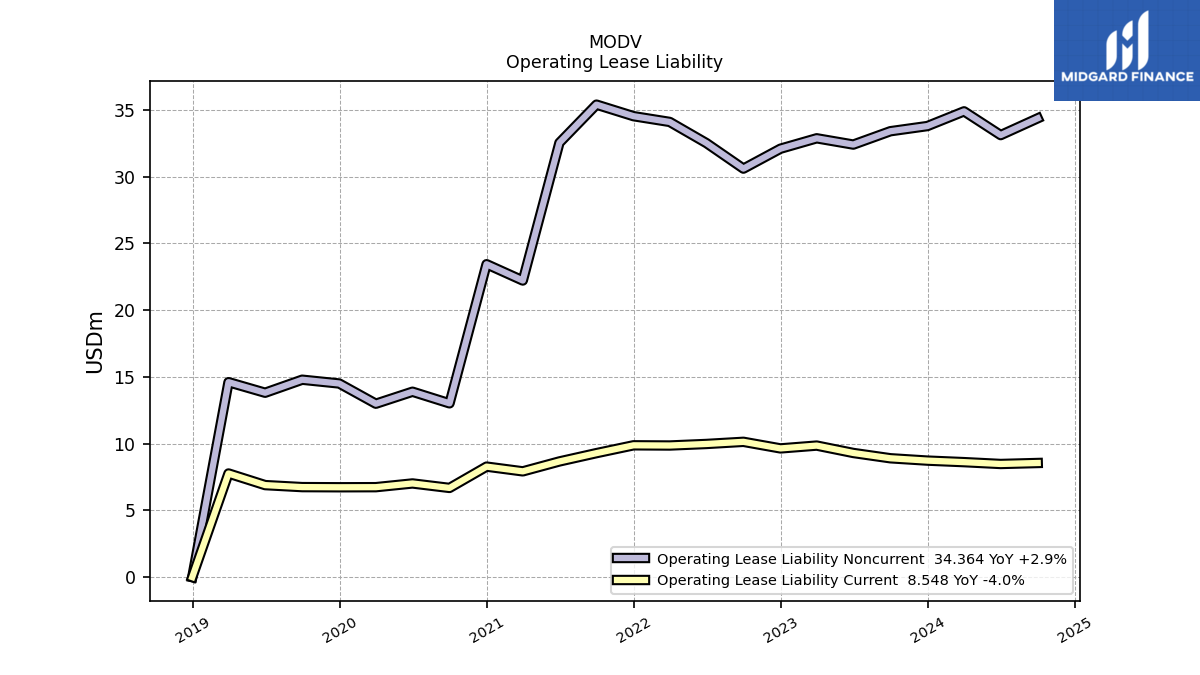
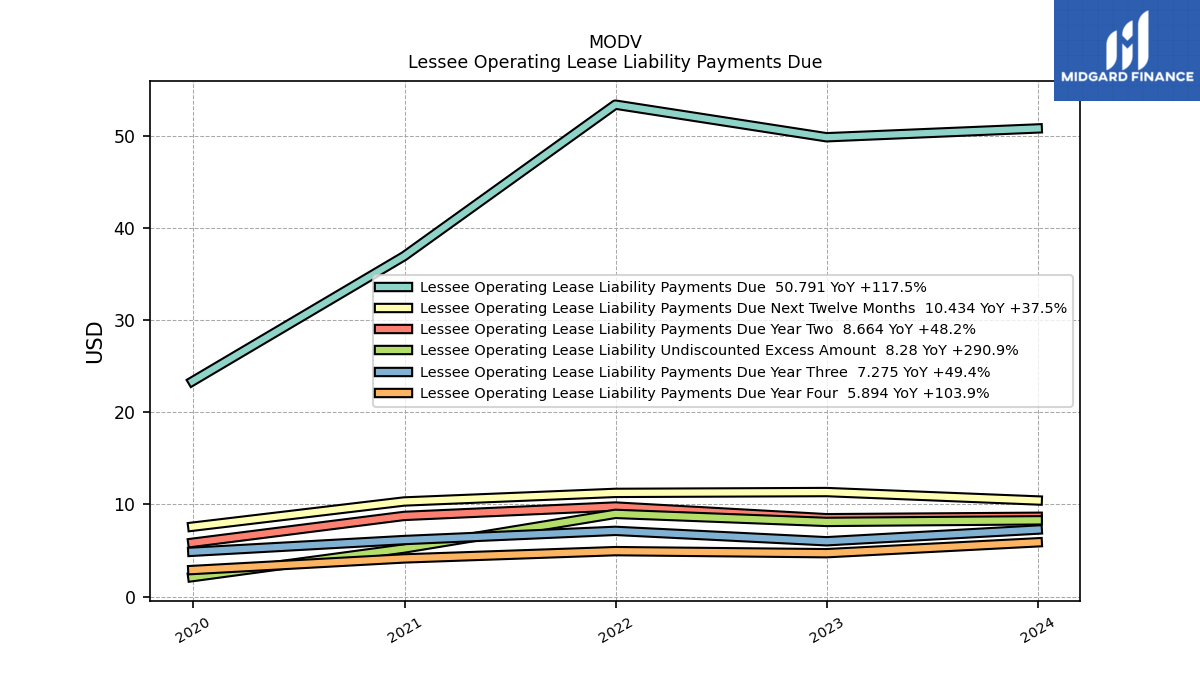
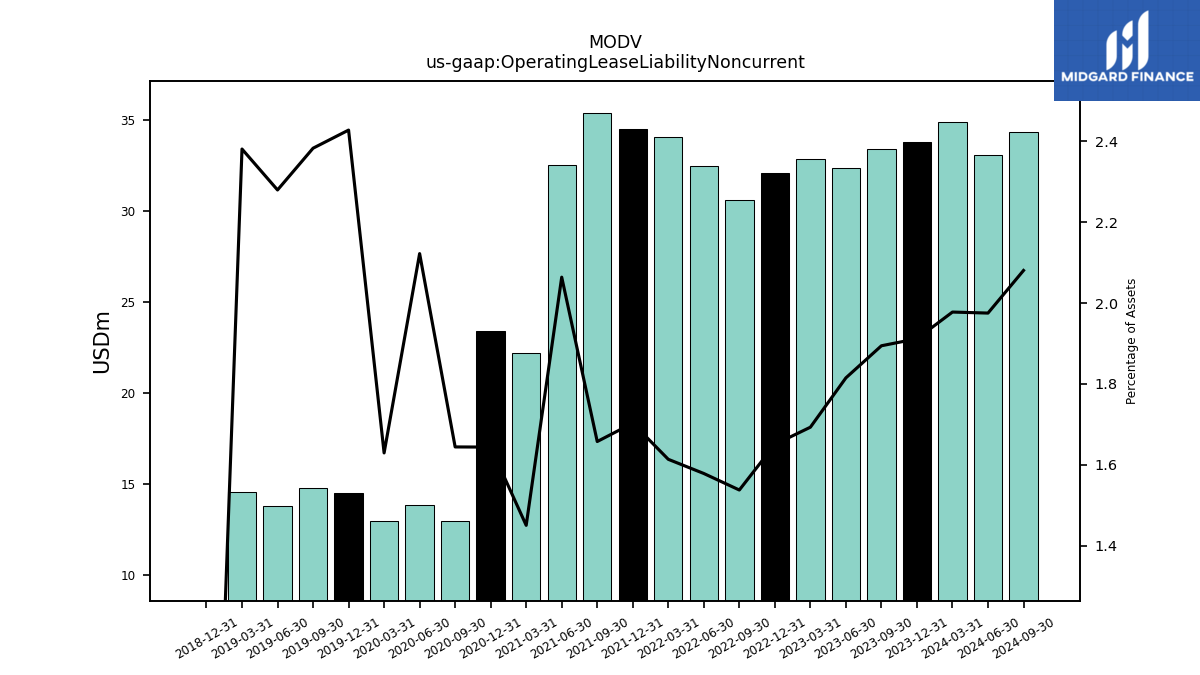
| Operating Lease Liability Noncurrent | 34.89 | 33.78 | 33.40 | 32.40 | 32.87 | 32.09 | 30.59 | 32.51 | 34.09 | 34.52 | 35.39 | 32.53 | 22.21 | 23.44 | 13.02 | 13.89 | 12.99 | 14.50 | 14.79 | 13.81 | 14.60 | 0.00 | NA | NA | NA | NA | NA | NA | NA | NA | NA | NA | NA | NA | NA | NA | NA | NA | NA | NA | NA | NA | NA | NA | NA | NA | NA | NA | NA | NA | NA | NA | NA | NA | NA | NA |
| 2024-03-31 | 2023-12-31 | 2023-09-30 | 2023-06-30 | 2023-03-31 | 2022-12-31 | 2022-09-30 | 2022-06-30 | 2022-03-31 | 2021-12-31 | 2021-09-30 | 2021-06-30 | 2021-03-31 | 2020-12-31 | 2020-09-30 | 2020-06-30 | 2020-03-31 | 2019-12-31 | 2019-09-30 | 2019-06-30 | 2019-03-31 | 2018-12-31 | 2018-09-30 | 2018-06-30 | 2018-03-31 | 2017-12-31 | 2017-09-30 | 2017-06-30 | 2017-03-31 | 2016-12-31 | 2016-09-30 | 2016-06-30 | 2016-03-31 | 2015-12-31 | 2015-09-30 | 2015-06-30 | 2015-03-31 | 2014-12-31 | 2014-09-30 | 2014-06-30 | 2014-03-31 | 2013-12-31 | 2013-09-30 | 2013-06-30 | 2013-03-31 | 2012-12-31 | 2012-09-30 | 2012-06-30 | 2012-03-31 | 2011-12-31 | 2011-09-30 | 2011-06-30 | 2011-03-31 | 2010-12-31 | 2010-09-30 | 2010-06-30 | ||
|---|---|---|---|---|---|---|---|---|---|---|---|---|---|---|---|---|---|---|---|---|---|---|---|---|---|---|---|---|---|---|---|---|---|---|---|---|---|---|---|---|---|---|---|---|---|---|---|---|---|---|---|---|---|---|---|---|---|
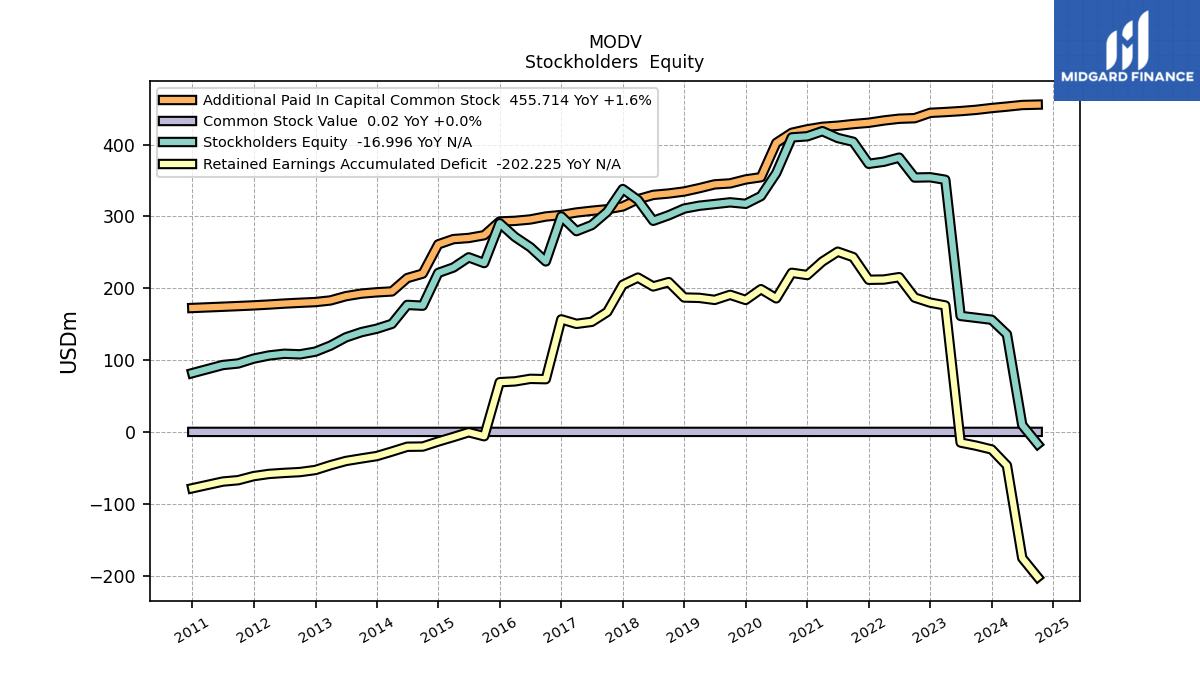
| Stockholders Equity | 135.84 | 156.19 | 158.86 | 161.44 | 351.10 | 354.56 | 354.15 | 381.94 | 376.20 | 373.27 | 403.99 | 409.26 | 418.75 | 411.61 | 410.07 | 360.46 | 328.36 | 317.59 | 319.65 | 317.24 | 314.94 | 311.00 | 301.64 | 293.93 | 323.00 | 338.18 | 306.51 | 288.00 | 279.55 | 300.10 | 237.37 | 257.18 | 271.48 | 290.58 | 235.05 | 243.08 | 228.87 | 221.36 | 175.72 | 176.82 | 150.45 | 143.68 | 138.86 | 131.61 | 120.14 | 111.73 | 107.98 | 108.81 | 106.43 | 102.06 | 95.30 | 93.10 | NA | 81.79 | NA | NA | |
| Common Stock Value | 0.02 | 0.02 | 0.02 | 0.02 | 0.02 | 0.02 | 0.02 | 0.02 | 0.02 | 0.02 | 0.02 | 0.02 | 0.02 | 0.02 | 0.02 | 0.02 | 0.02 | 0.02 | 0.02 | 0.02 | 0.02 | 0.02 | 0.02 | 0.02 | 0.02 | 0.02 | 0.02 | 0.02 | 0.02 | 0.02 | 0.02 | 0.02 | 0.02 | 0.02 | 0.02 | 0.02 | 0.02 | 0.02 | 0.02 | 0.01 | 0.01 | 0.01 | 0.01 | 0.01 | 0.01 | 0.01 | 0.01 | 0.01 | 0.01 | 0.01 | 0.01 | 0.01 | NA | 0.01 | NA | NA | |
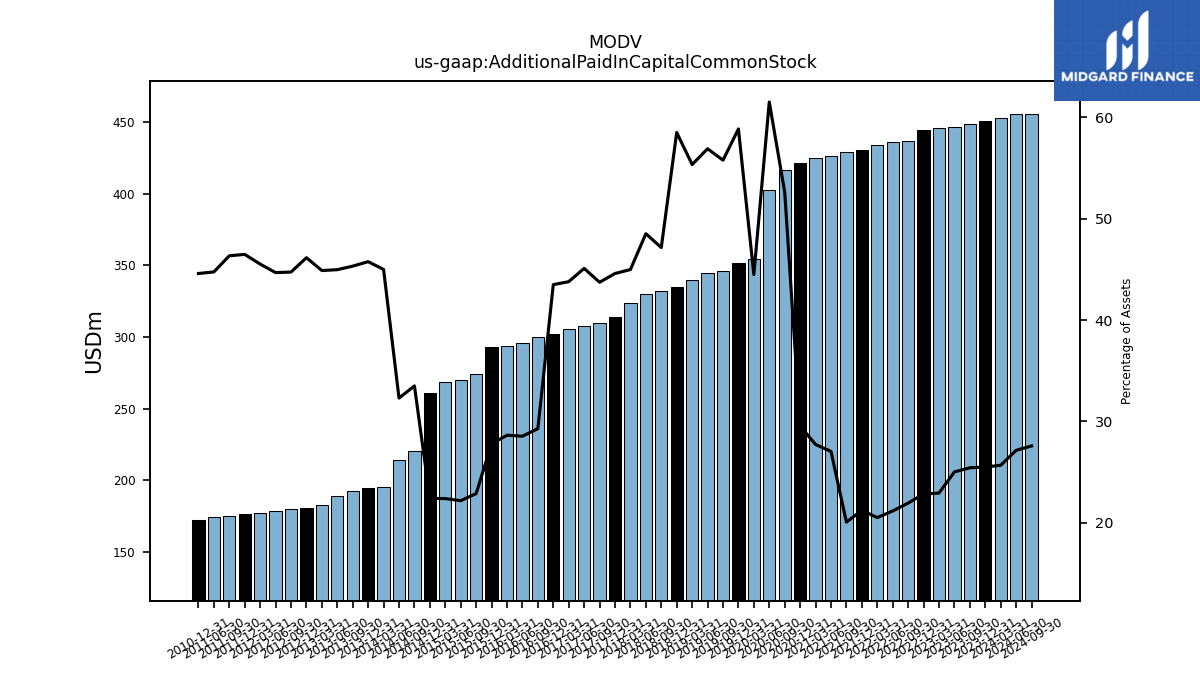
| Additional Paid In Capital Common Stock | 452.95 | 450.94 | 448.44 | 446.69 | 445.38 | 444.25 | 436.84 | 436.08 | 433.64 | 430.45 | 428.64 | 426.31 | 424.79 | 421.32 | 416.50 | 402.43 | 354.63 | 351.53 | 346.03 | 344.68 | 339.40 | 334.74 | 331.95 | 330.01 | 323.97 | 313.95 | 310.02 | 307.93 | 305.52 | 302.01 | 299.95 | 295.81 | 293.84 | 293.01 | 273.86 | 270.03 | 268.44 | 261.15 | 220.39 | 214.19 | 195.58 | 194.36 | 192.55 | 188.98 | 183.06 | 180.78 | 179.79 | 178.69 | 177.33 | 176.17 | 175.20 | 174.28 | NA | 172.54 | NA | NA | |
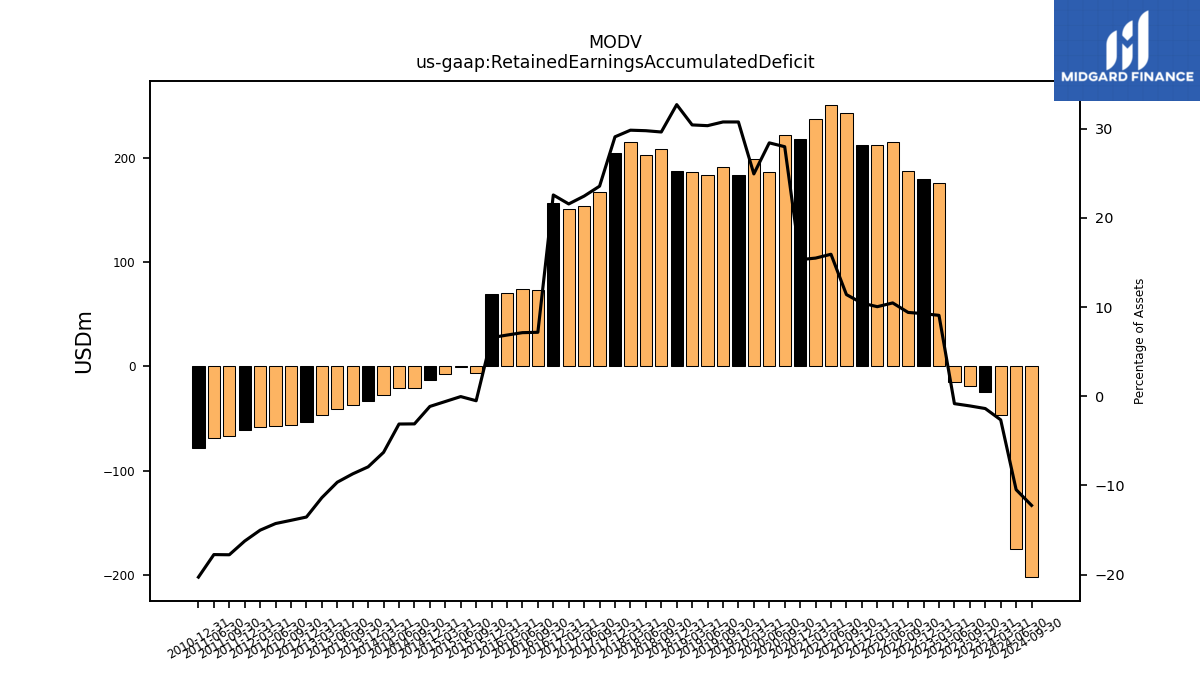
| Retained Earnings Accumulated Deficit | -46.74 | -24.44 | -19.18 | -14.88 | 176.06 | 180.02 | 186.97 | 215.47 | 212.15 | 211.83 | 243.36 | 250.93 | 237.25 | 218.41 | 221.51 | 185.92 | 198.74 | 183.73 | 190.86 | 183.81 | 186.62 | 187.13 | 208.59 | 202.55 | 214.87 | 204.82 | 167.00 | 153.27 | 150.45 | 156.72 | 73.41 | 73.87 | 70.34 | 69.21 | -6.07 | -0.49 | -7.13 | -13.37 | -20.42 | -20.68 | -27.35 | -33.64 | -37.00 | -40.52 | -46.40 | -53.08 | -55.94 | -57.10 | -58.52 | -61.56 | -67.23 | -69.18 | NA | -78.50 | NA | NA |
| 2024-03-31 | 2023-12-31 | 2023-09-30 | 2023-06-30 | 2023-03-31 | 2022-12-31 | 2022-09-30 | 2022-06-30 | 2022-03-31 | 2021-12-31 | 2021-09-30 | 2021-06-30 | 2021-03-31 | 2020-12-31 | 2020-09-30 | 2020-06-30 | 2020-03-31 | 2019-12-31 | 2019-09-30 | 2019-06-30 | 2019-03-31 | 2018-12-31 | 2018-09-30 | 2018-06-30 | 2018-03-31 | 2017-12-31 | 2017-09-30 | 2017-06-30 | 2017-03-31 | 2016-12-31 | 2016-09-30 | 2016-06-30 | 2016-03-31 | 2015-12-31 | 2015-09-30 | 2015-06-30 | 2015-03-31 | 2014-12-31 | 2014-09-30 | 2014-06-30 | 2014-03-31 | 2013-12-31 | 2013-09-30 | 2013-06-30 | 2013-03-31 | 2012-12-31 | 2012-09-30 | 2012-06-30 | 2012-03-31 | 2011-12-31 | 2011-09-30 | 2011-06-30 | 2011-03-31 | 2010-12-31 | 2010-09-30 | 2010-06-30 | ||
|---|---|---|---|---|---|---|---|---|---|---|---|---|---|---|---|---|---|---|---|---|---|---|---|---|---|---|---|---|---|---|---|---|---|---|---|---|---|---|---|---|---|---|---|---|---|---|---|---|---|---|---|---|---|---|---|---|---|
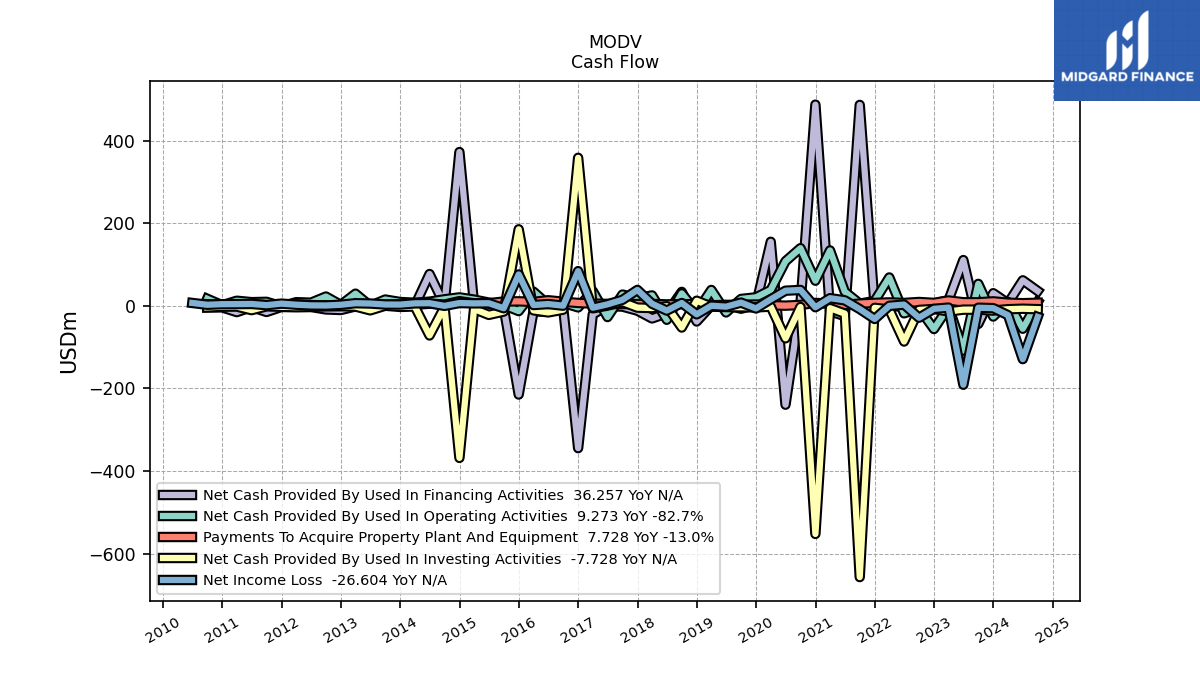
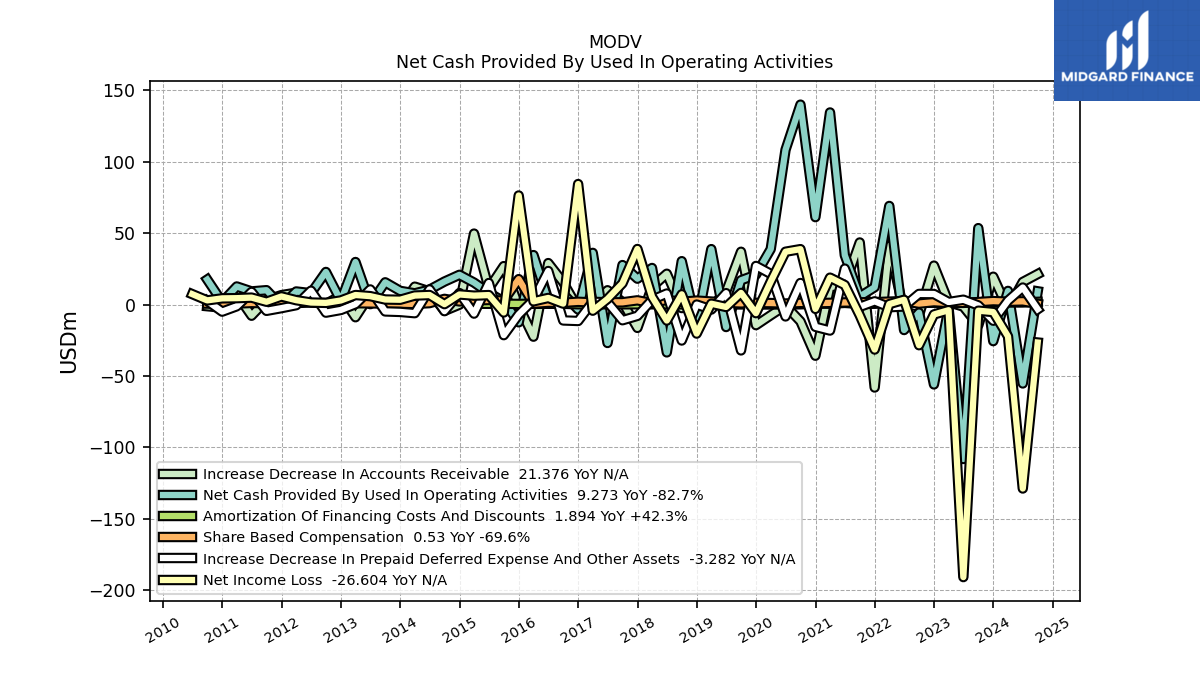
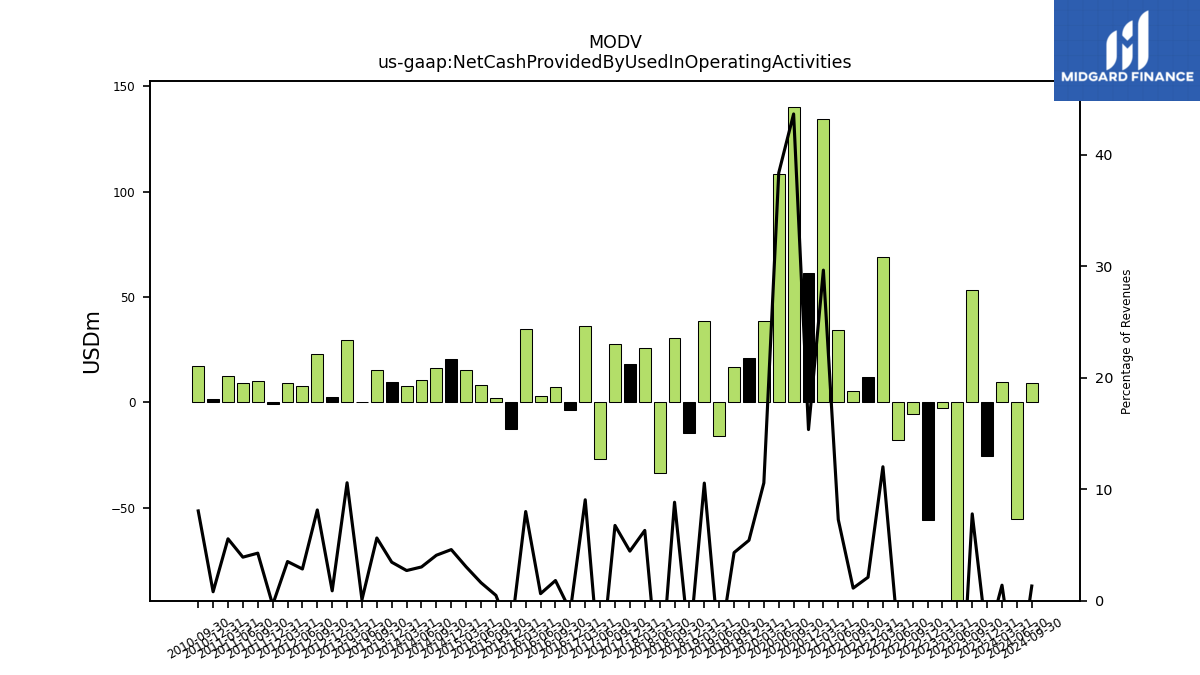
| Net Cash Provided By Used In Operating Activities | 9.56 | -25.64 | 53.55 | -108.22 | -2.65 | -55.97 | -5.68 | -17.86 | 69.07 | 12.15 | 5.58 | 34.55 | 134.56 | 61.21 | 140.04 | 108.36 | 38.83 | 20.87 | 17.00 | -15.76 | 38.83 | -14.57 | 30.39 | -33.53 | 25.62 | 18.11 | 27.67 | -26.94 | 36.20 | -3.50 | 7.48 | 2.86 | 34.63 | -12.45 | 2.09 | 8.22 | 15.38 | 20.82 | 16.10 | 10.43 | 7.85 | 9.58 | 15.58 | 0.28 | 29.80 | 2.55 | 22.84 | 7.95 | 9.15 | -0.88 | 10.06 | 9.20 | 12.66 | 1.77 | 17.50 | NA | |
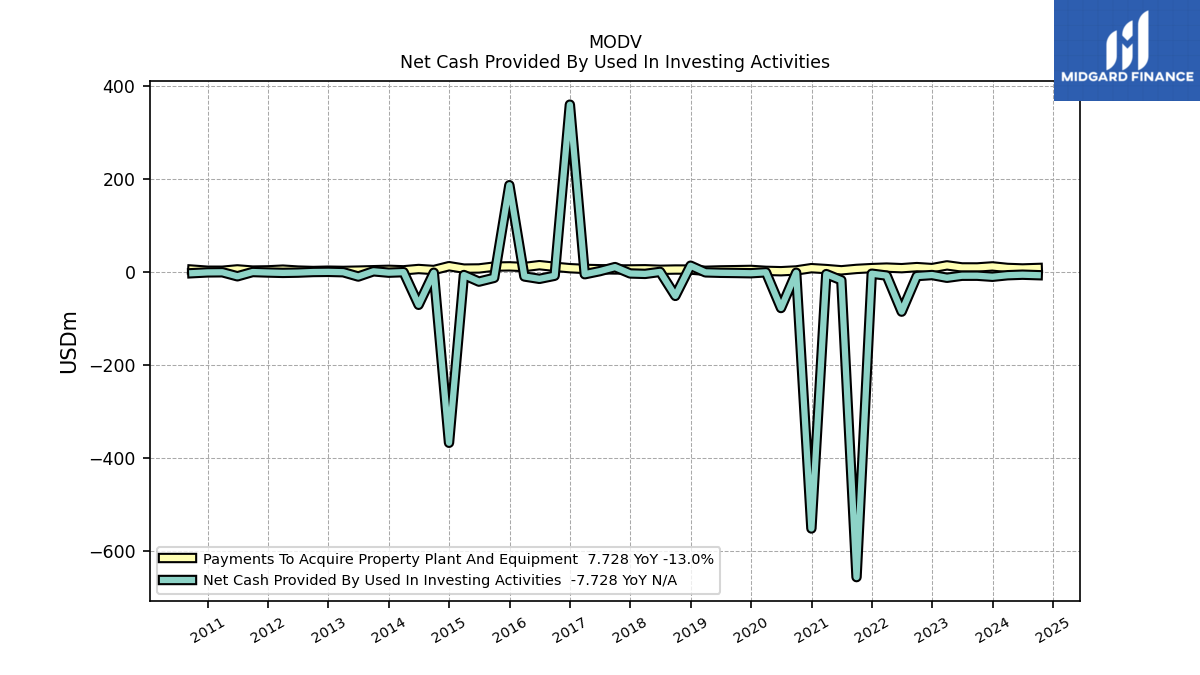
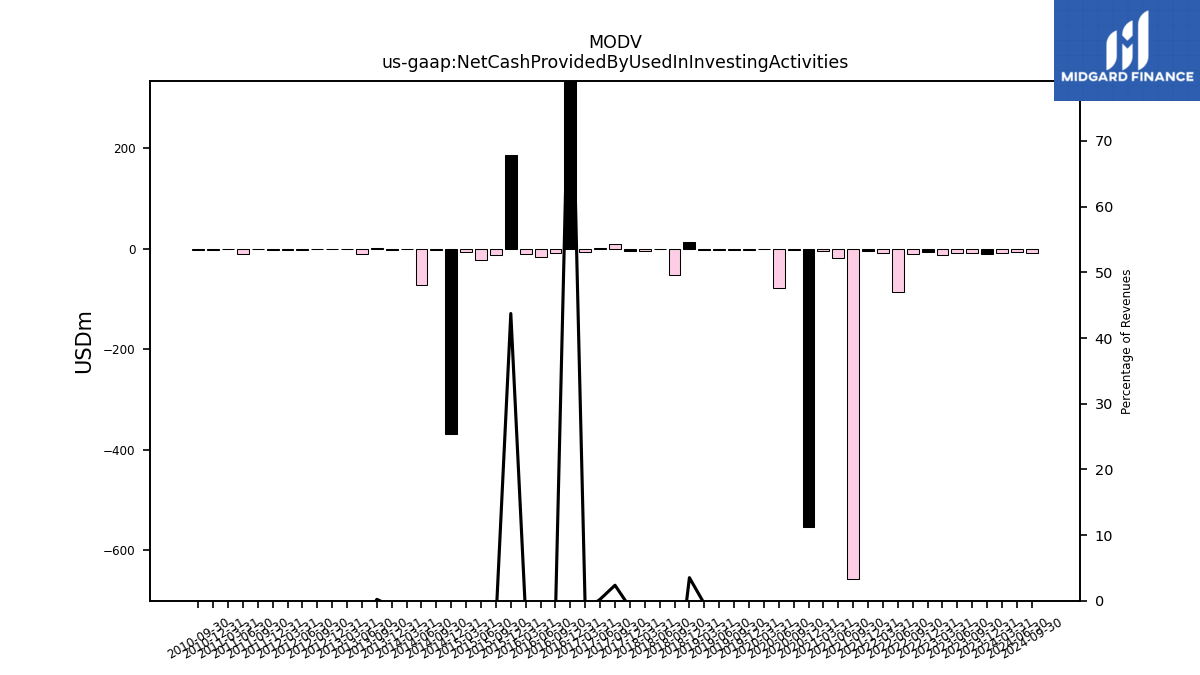
| Net Cash Provided By Used In Investing Activities | -7.86 | -11.14 | -8.88 | -8.95 | -13.32 | -7.42 | -9.63 | -86.18 | -8.58 | -4.54 | -657.11 | -18.59 | -5.39 | -552.56 | -2.46 | -78.42 | -1.57 | -3.56 | -3.02 | -2.60 | -1.68 | 12.67 | -52.33 | -0.68 | -4.99 | -4.05 | 9.66 | 0.92 | -5.71 | 359.06 | -8.97 | -15.64 | -10.53 | 185.81 | -13.53 | -21.62 | -7.37 | -368.24 | -2.43 | -71.48 | -1.20 | -2.37 | 0.58 | -10.66 | -1.40 | -0.60 | -0.96 | -2.25 | -2.83 | -2.01 | -0.98 | -10.14 | -1.49 | -1.77 | -3.45 | NA | |
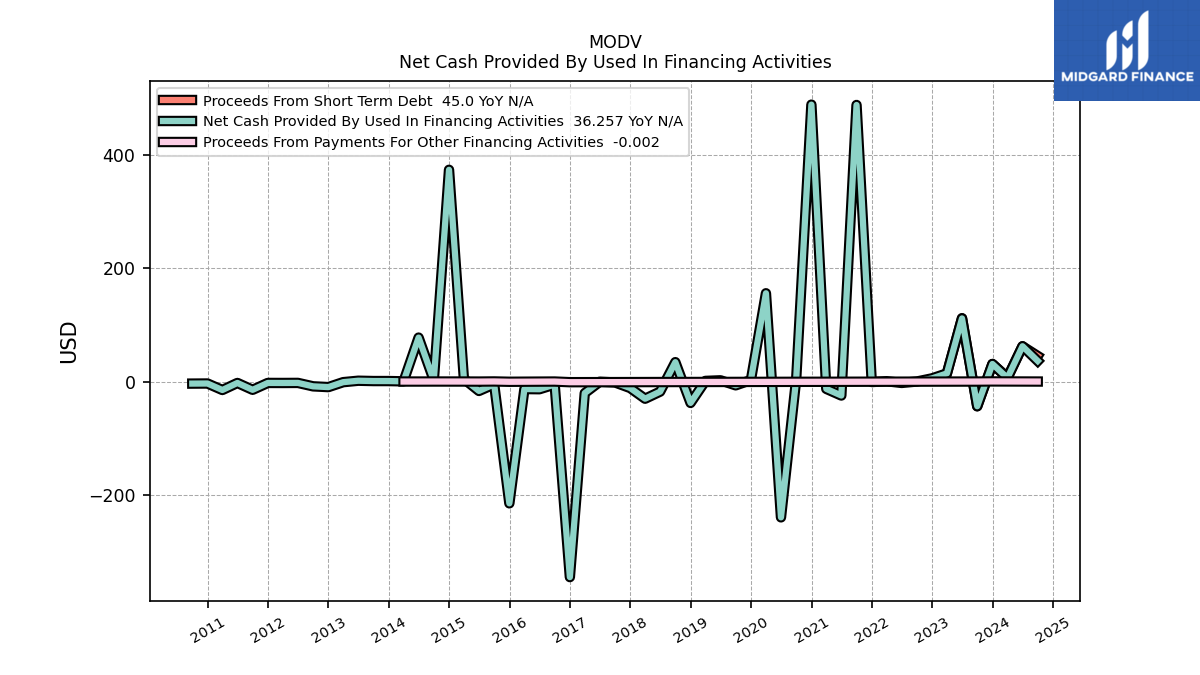
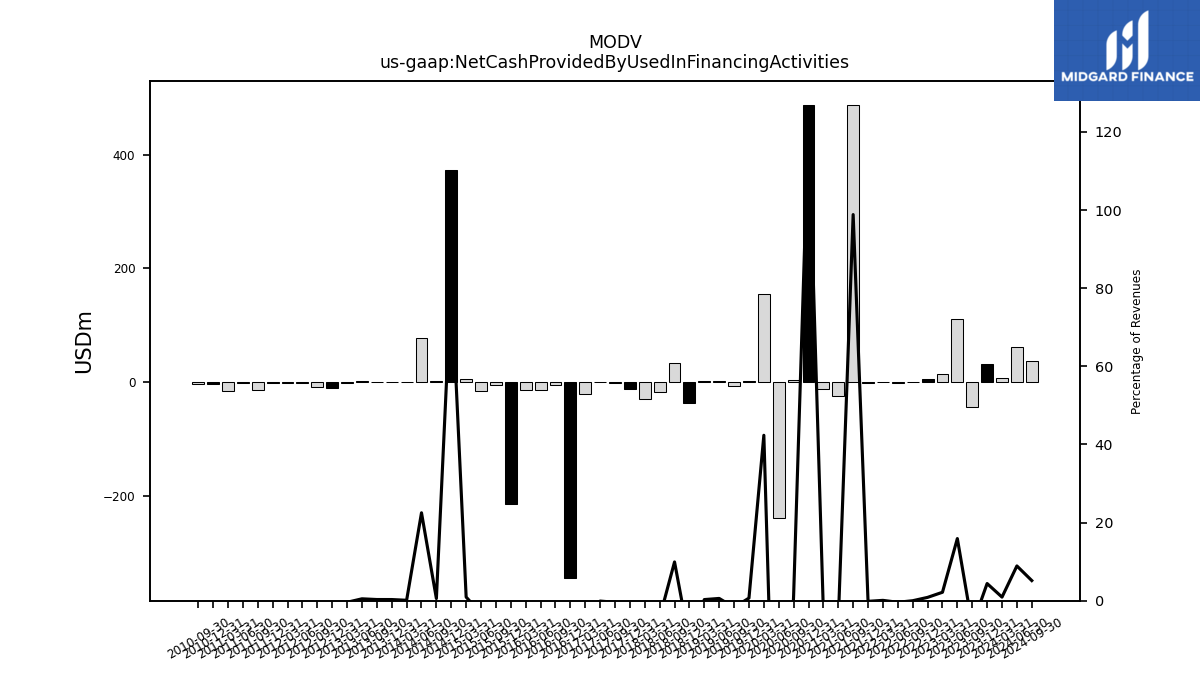
| Net Cash Provided By Used In Financing Activities | 6.38 | 30.96 | -43.52 | 111.25 | 14.38 | 5.63 | 0.06 | -2.45 | 0.57 | -0.87 | 487.29 | -24.64 | -12.93 | 487.89 | 4.15 | -239.32 | 155.55 | 2.64 | -6.67 | 2.15 | 1.11 | -37.70 | 34.15 | -17.75 | -30.26 | -11.44 | -1.60 | -0.34 | -20.41 | -344.59 | -5.21 | -13.52 | -13.21 | -214.62 | -4.79 | -16.59 | 4.75 | 373.07 | 2.23 | 77.43 | 0.36 | 0.85 | 0.87 | 1.43 | -1.10 | -9.79 | -8.46 | -2.41 | -2.53 | -2.47 | -14.58 | -2.50 | -14.91 | -3.46 | -3.63 | NA |
| 2024-03-31 | 2023-12-31 | 2023-09-30 | 2023-06-30 | 2023-03-31 | 2022-12-31 | 2022-09-30 | 2022-06-30 | 2022-03-31 | 2021-12-31 | 2021-09-30 | 2021-06-30 | 2021-03-31 | 2020-12-31 | 2020-09-30 | 2020-06-30 | 2020-03-31 | 2019-12-31 | 2019-09-30 | 2019-06-30 | 2019-03-31 | 2018-12-31 | 2018-09-30 | 2018-06-30 | 2018-03-31 | 2017-12-31 | 2017-09-30 | 2017-06-30 | 2017-03-31 | 2016-12-31 | 2016-09-30 | 2016-06-30 | 2016-03-31 | 2015-12-31 | 2015-09-30 | 2015-06-30 | 2015-03-31 | 2014-12-31 | 2014-09-30 | 2014-06-30 | 2014-03-31 | 2013-12-31 | 2013-09-30 | 2013-06-30 | 2013-03-31 | 2012-12-31 | 2012-09-30 | 2012-06-30 | 2012-03-31 | 2011-12-31 | 2011-09-30 | 2011-06-30 | 2011-03-31 | 2010-12-31 | 2010-09-30 | 2010-06-30 | ||
|---|---|---|---|---|---|---|---|---|---|---|---|---|---|---|---|---|---|---|---|---|---|---|---|---|---|---|---|---|---|---|---|---|---|---|---|---|---|---|---|---|---|---|---|---|---|---|---|---|---|---|---|---|---|---|---|---|---|
| Net Cash Provided By Used In Operating Activities | 9.56 | -25.64 | 53.55 | -108.22 | -2.65 | -55.97 | -5.68 | -17.86 | 69.07 | 12.15 | 5.58 | 34.55 | 134.56 | 61.21 | 140.04 | 108.36 | 38.83 | 20.87 | 17.00 | -15.76 | 38.83 | -14.57 | 30.39 | -33.53 | 25.62 | 18.11 | 27.67 | -26.94 | 36.20 | -3.50 | 7.48 | 2.86 | 34.63 | -12.45 | 2.09 | 8.22 | 15.38 | 20.82 | 16.10 | 10.43 | 7.85 | 9.58 | 15.58 | 0.28 | 29.80 | 2.55 | 22.84 | 7.95 | 9.15 | -0.88 | 10.06 | 9.20 | 12.66 | 1.77 | 17.50 | NA | |
| Net Income Loss | -22.30 | -5.25 | -4.30 | -190.94 | -3.96 | -6.95 | -28.50 | 3.33 | 0.32 | -31.53 | -7.57 | 13.67 | 18.84 | -3.06 | 38.80 | 37.00 | 16.10 | -6.06 | 8.15 | -1.71 | 0.58 | -20.35 | 7.15 | -11.21 | 5.43 | 38.93 | 14.85 | 3.92 | -4.33 | 84.42 | 0.65 | 4.62 | 2.23 | 76.40 | -5.57 | 6.63 | 6.24 | 7.05 | 0.27 | 6.67 | 6.29 | 3.36 | 3.53 | 5.88 | 6.68 | 2.87 | 1.16 | 1.42 | 3.04 | 5.67 | 1.95 | 4.85 | 4.47 | 4.34 | 2.91 | 7.28 | |
| Profit Loss | -22.30 | -5.25 | -4.30 | -190.94 | -3.96 | -6.95 | -28.50 | 3.33 | 0.32 | -31.53 | -7.57 | 13.67 | 18.84 | -3.06 | 38.80 | 37.00 | 16.10 | -6.06 | 8.15 | -1.71 | 0.58 | -20.48 | 7.33 | -11.40 | 5.73 | 39.08 | 14.95 | 3.74 | -3.95 | 82.77 | 0.95 | 4.00 | 2.13 | 75.78 | -5.41 | 6.58 | 6.25 | NA | NA | NA | NA | NA | NA | NA | NA | NA | NA | NA | NA | NA | NA | NA | NA | NA | NA | NA | |
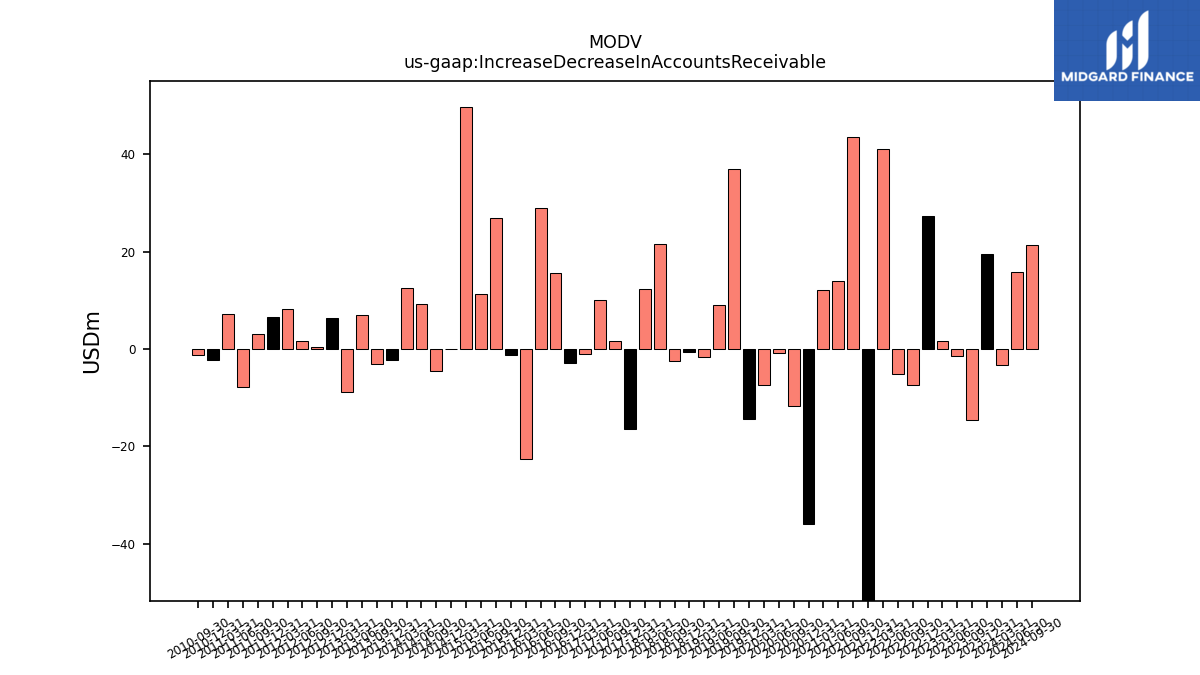
| Increase Decrease In Accounts Receivable | -3.18 | 19.51 | -14.51 | -1.46 | 1.73 | 27.27 | -7.37 | -5.17 | 41.05 | -58.14 | 43.48 | 13.89 | 12.22 | -35.87 | -11.81 | -0.72 | -7.48 | -14.45 | 36.98 | 9.02 | -1.63 | -0.52 | -2.48 | 21.58 | 12.41 | -16.36 | 1.70 | 10.01 | -1.06 | -2.78 | 15.59 | 29.05 | -22.52 | -1.20 | 26.91 | 11.21 | 49.70 | -0.09 | -4.44 | 9.20 | 12.53 | -2.15 | -3.18 | 7.05 | -8.90 | 6.28 | 0.39 | 1.63 | 8.28 | 6.60 | 3.15 | -7.84 | 7.11 | -2.18 | -1.18 | NA | |
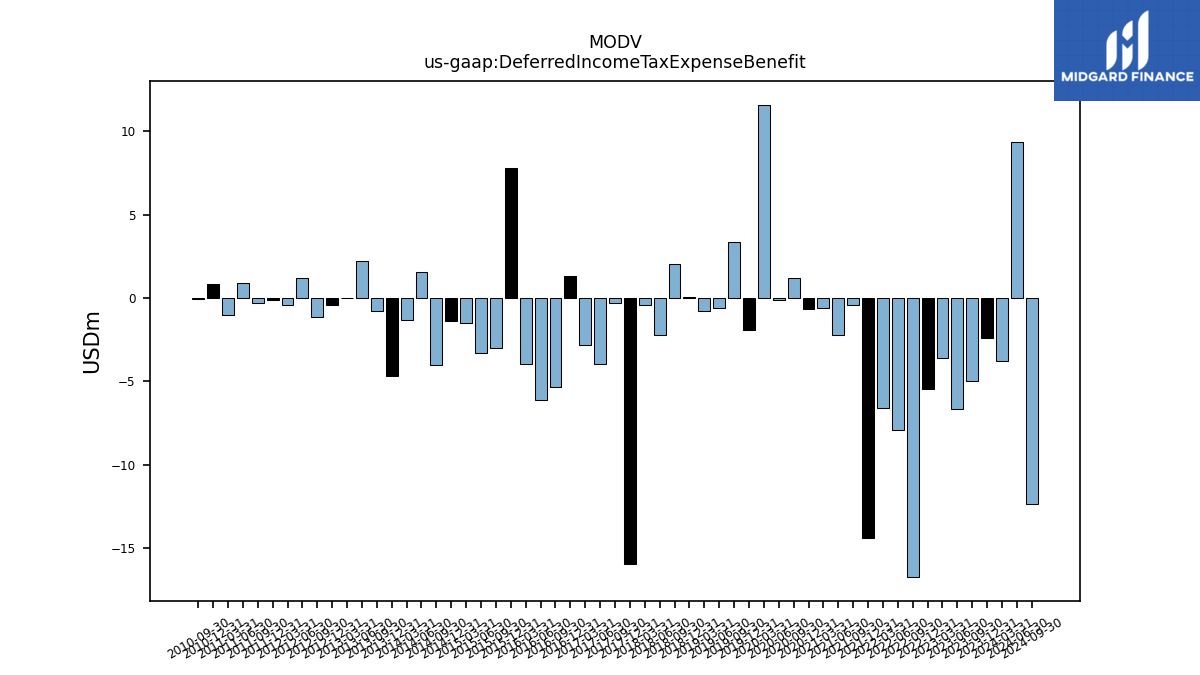
| Deferred Income Tax Expense Benefit | -3.78 | -2.42 | -4.97 | -6.64 | -3.62 | -5.43 | -16.74 | -7.91 | -6.59 | -14.40 | -0.45 | -2.23 | -0.62 | -0.69 | 1.17 | -0.15 | 11.59 | -1.92 | 3.34 | -0.58 | -0.77 | 0.06 | 2.06 | -2.22 | -0.45 | -15.93 | -0.33 | -3.94 | -2.79 | 1.32 | -5.35 | -6.14 | -3.95 | 7.80 | -3.00 | -3.30 | -1.51 | -1.39 | -4.02 | 1.54 | -1.33 | -4.68 | -0.80 | 2.21 | -0.02 | -0.40 | -1.15 | 1.17 | -0.44 | -0.10 | -0.31 | 0.90 | -1.02 | 0.83 | -0.06 | NA | |
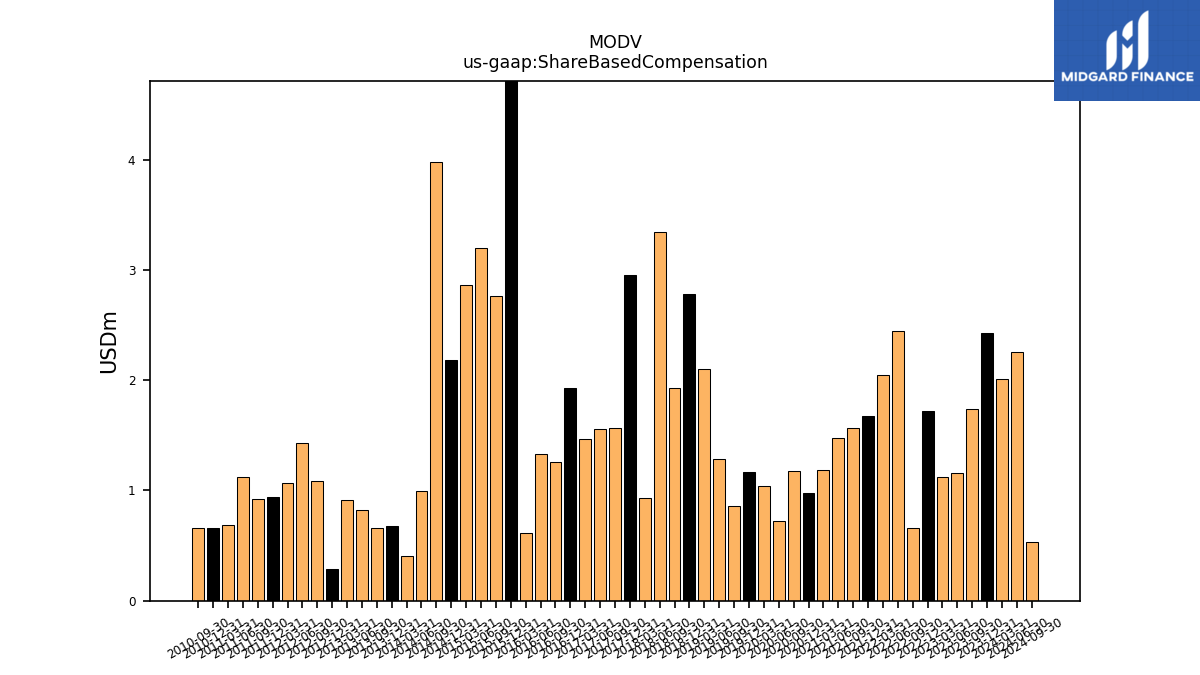
| Share Based Compensation | 2.01 | 2.43 | 1.74 | 1.16 | 1.12 | 1.72 | 0.66 | 2.45 | 2.05 | 1.68 | 1.57 | 1.47 | 1.19 | 0.98 | 1.18 | 0.73 | 1.04 | 1.17 | 0.85 | 1.29 | 2.10 | 2.78 | 1.93 | 3.35 | 0.93 | 2.96 | 1.56 | 1.55 | 1.47 | 1.93 | 1.26 | 1.33 | 0.61 | 17.80 | 2.76 | 3.19 | 2.86 | 2.19 | 3.98 | 0.99 | 0.41 | 0.68 | 0.66 | 0.83 | 0.92 | 0.29 | 1.09 | 1.43 | 1.07 | 0.94 | 0.92 | 1.12 | 0.69 | 0.66 | 0.66 | NA |
| 2024-03-31 | 2023-12-31 | 2023-09-30 | 2023-06-30 | 2023-03-31 | 2022-12-31 | 2022-09-30 | 2022-06-30 | 2022-03-31 | 2021-12-31 | 2021-09-30 | 2021-06-30 | 2021-03-31 | 2020-12-31 | 2020-09-30 | 2020-06-30 | 2020-03-31 | 2019-12-31 | 2019-09-30 | 2019-06-30 | 2019-03-31 | 2018-12-31 | 2018-09-30 | 2018-06-30 | 2018-03-31 | 2017-12-31 | 2017-09-30 | 2017-06-30 | 2017-03-31 | 2016-12-31 | 2016-09-30 | 2016-06-30 | 2016-03-31 | 2015-12-31 | 2015-09-30 | 2015-06-30 | 2015-03-31 | 2014-12-31 | 2014-09-30 | 2014-06-30 | 2014-03-31 | 2013-12-31 | 2013-09-30 | 2013-06-30 | 2013-03-31 | 2012-12-31 | 2012-09-30 | 2012-06-30 | 2012-03-31 | 2011-12-31 | 2011-09-30 | 2011-06-30 | 2011-03-31 | 2010-12-31 | 2010-09-30 | 2010-06-30 | ||
|---|---|---|---|---|---|---|---|---|---|---|---|---|---|---|---|---|---|---|---|---|---|---|---|---|---|---|---|---|---|---|---|---|---|---|---|---|---|---|---|---|---|---|---|---|---|---|---|---|---|---|---|---|---|---|---|---|---|
| Net Cash Provided By Used In Investing Activities | -7.86 | -11.14 | -8.88 | -8.95 | -13.32 | -7.42 | -9.63 | -86.18 | -8.58 | -4.54 | -657.11 | -18.59 | -5.39 | -552.56 | -2.46 | -78.42 | -1.57 | -3.56 | -3.02 | -2.60 | -1.68 | 12.67 | -52.33 | -0.68 | -4.99 | -4.05 | 9.66 | 0.92 | -5.71 | 359.06 | -8.97 | -15.64 | -10.53 | 185.81 | -13.53 | -21.62 | -7.37 | -368.24 | -2.43 | -71.48 | -1.20 | -2.37 | 0.58 | -10.66 | -1.40 | -0.60 | -0.96 | -2.25 | -2.83 | -2.01 | -0.98 | -10.14 | -1.49 | -1.77 | -3.45 | NA | |
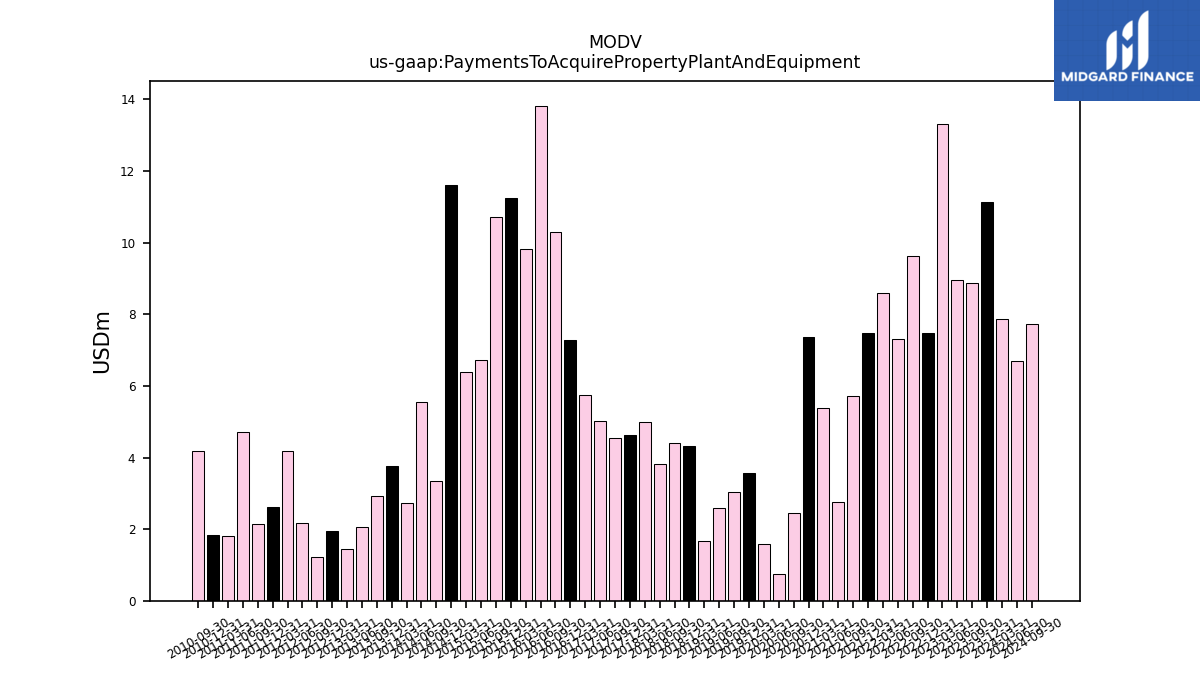
| Payments To Acquire Property Plant And Equipment | 7.86 | 11.14 | 8.88 | 8.95 | 13.32 | 7.49 | 9.62 | 7.32 | 8.58 | 7.46 | 5.72 | 2.74 | 5.39 | 7.36 | 2.46 | 0.76 | 1.57 | 3.56 | 3.02 | 2.60 | 1.68 | 4.33 | 4.40 | 3.81 | 4.99 | 4.63 | 4.55 | 5.01 | 5.74 | 7.29 | 10.29 | 13.82 | 9.81 | 11.24 | 10.71 | 6.73 | 6.39 | 11.62 | 3.36 | 5.54 | 2.72 | 3.77 | 2.92 | 2.06 | 1.44 | 1.96 | 1.24 | 2.16 | 4.17 | 2.63 | 2.15 | 4.71 | 1.82 | 1.85 | 4.17 | NA |
| 2024-03-31 | 2023-12-31 | 2023-09-30 | 2023-06-30 | 2023-03-31 | 2022-12-31 | 2022-09-30 | 2022-06-30 | 2022-03-31 | 2021-12-31 | 2021-09-30 | 2021-06-30 | 2021-03-31 | 2020-12-31 | 2020-09-30 | 2020-06-30 | 2020-03-31 | 2019-12-31 | 2019-09-30 | 2019-06-30 | 2019-03-31 | 2018-12-31 | 2018-09-30 | 2018-06-30 | 2018-03-31 | 2017-12-31 | 2017-09-30 | 2017-06-30 | 2017-03-31 | 2016-12-31 | 2016-09-30 | 2016-06-30 | 2016-03-31 | 2015-12-31 | 2015-09-30 | 2015-06-30 | 2015-03-31 | 2014-12-31 | 2014-09-30 | 2014-06-30 | 2014-03-31 | 2013-12-31 | 2013-09-30 | 2013-06-30 | 2013-03-31 | 2012-12-31 | 2012-09-30 | 2012-06-30 | 2012-03-31 | 2011-12-31 | 2011-09-30 | 2011-06-30 | 2011-03-31 | 2010-12-31 | 2010-09-30 | 2010-06-30 | ||
|---|---|---|---|---|---|---|---|---|---|---|---|---|---|---|---|---|---|---|---|---|---|---|---|---|---|---|---|---|---|---|---|---|---|---|---|---|---|---|---|---|---|---|---|---|---|---|---|---|---|---|---|---|---|---|---|---|---|
| Net Cash Provided By Used In Financing Activities | 6.38 | 30.96 | -43.52 | 111.25 | 14.38 | 5.63 | 0.06 | -2.45 | 0.57 | -0.87 | 487.29 | -24.64 | -12.93 | 487.89 | 4.15 | -239.32 | 155.55 | 2.64 | -6.67 | 2.15 | 1.11 | -37.70 | 34.15 | -17.75 | -30.26 | -11.44 | -1.60 | -0.34 | -20.41 | -344.59 | -5.21 | -13.52 | -13.21 | -214.62 | -4.79 | -16.59 | 4.75 | 373.07 | 2.23 | 77.43 | 0.36 | 0.85 | 0.87 | 1.43 | -1.10 | -9.79 | -8.46 | -2.41 | -2.53 | -2.47 | -14.58 | -2.50 | -14.91 | -3.46 | -3.63 | NA |
| 2024-03-31 | 2023-12-31 | 2023-09-30 | 2023-06-30 | 2023-03-31 | 2022-12-31 | 2022-09-30 | 2022-06-30 | 2022-03-31 | 2021-12-31 | 2021-09-30 | 2021-06-30 | 2021-03-31 | 2020-12-31 | 2020-09-30 | 2020-06-30 | 2020-03-31 | 2019-12-31 | 2019-09-30 | 2019-06-30 | 2019-03-31 | 2018-12-31 | 2018-09-30 | 2018-06-30 | 2018-03-31 | 2017-12-31 | 2017-09-30 | 2017-06-30 | 2017-03-31 | 2016-12-31 | 2016-09-30 | 2016-06-30 | 2016-03-31 | 2015-12-31 | 2015-09-30 | 2015-06-30 | 2015-03-31 | 2014-12-31 | 2014-09-30 | 2014-06-30 | 2014-03-31 | 2013-12-31 | 2013-09-30 | 2013-06-30 | 2013-03-31 | 2012-12-31 | 2012-09-30 | 2012-06-30 | 2012-03-31 | 2011-12-31 | 2011-09-30 | 2011-06-30 | 2011-03-31 | 2010-12-31 | 2010-09-30 | 2010-06-30 | ||
|---|---|---|---|---|---|---|---|---|---|---|---|---|---|---|---|---|---|---|---|---|---|---|---|---|---|---|---|---|---|---|---|---|---|---|---|---|---|---|---|---|---|---|---|---|---|---|---|---|---|---|---|---|---|---|---|---|---|
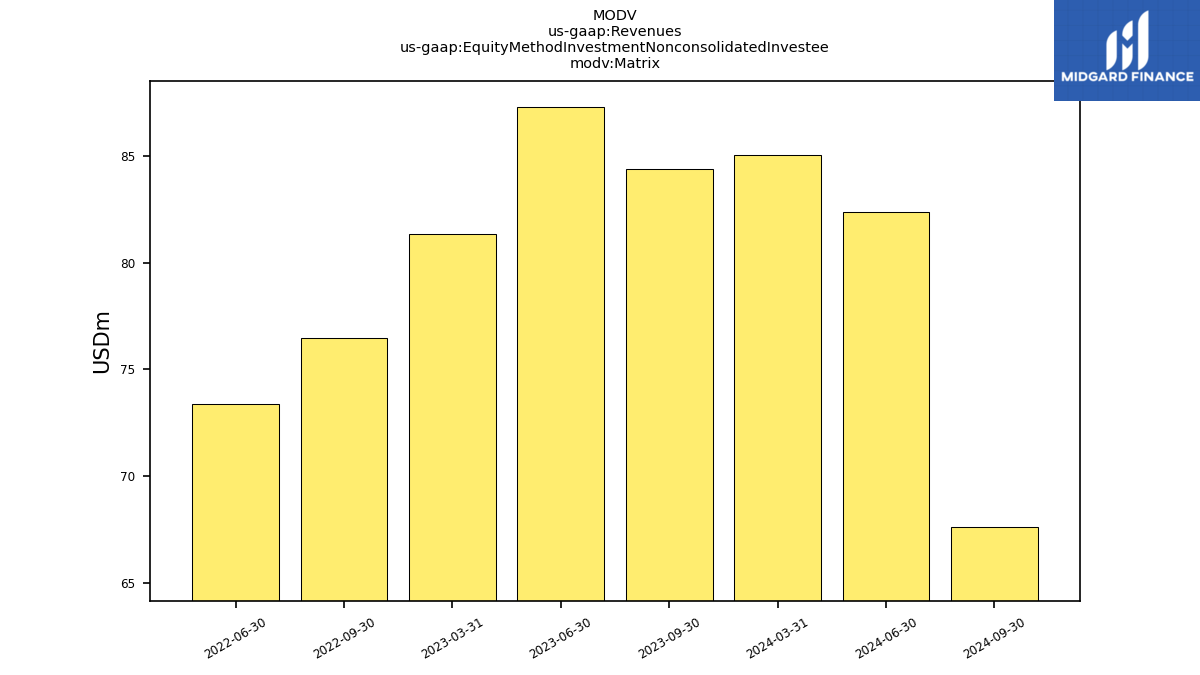
| Revenues | 684.45 | 702.83 | 686.92 | 699.11 | 662.31 | 653.92 | 647.78 | 628.22 | 574.48 | 575.77 | 493.06 | 474.45 | 453.61 | 398.51 | 320.62 | 282.26 | 367.29 | 384.83 | 393.38 | 363.91 | 367.81 | 360.76 | 343.77 | 411.79 | 406.05 | 406.89 | 409.52 | 407.98 | 399.49 | 385.96 | 412.51 | 450.63 | 432.65 | 424.93 | 432.45 | 508.25 | 505.80 | 453.60 | 394.22 | 343.95 | 289.40 | 276.85 | 276.71 | 287.64 | 281.49 | 286.52 | 280.29 | 278.94 | 260.15 | 244.31 | 235.55 | 235.31 | 227.81 | 219.27 | 217.15 | 222.32 | |
| Matrix | 85.02 | NA | 84.39 | 87.26 | 81.32 | NA | 76.46 | 73.37 | NA | NA | NA | NA | NA | NA | NA | NA | NA | NA | NA | NA | NA | NA | NA | NA | NA | NA | NA | NA | NA | NA | NA | NA | NA | NA | NA | NA | NA | NA | NA | NA | NA | NA | NA | NA | NA | NA | NA | NA | NA | NA | NA | NA | NA | NA | NA | NA | |
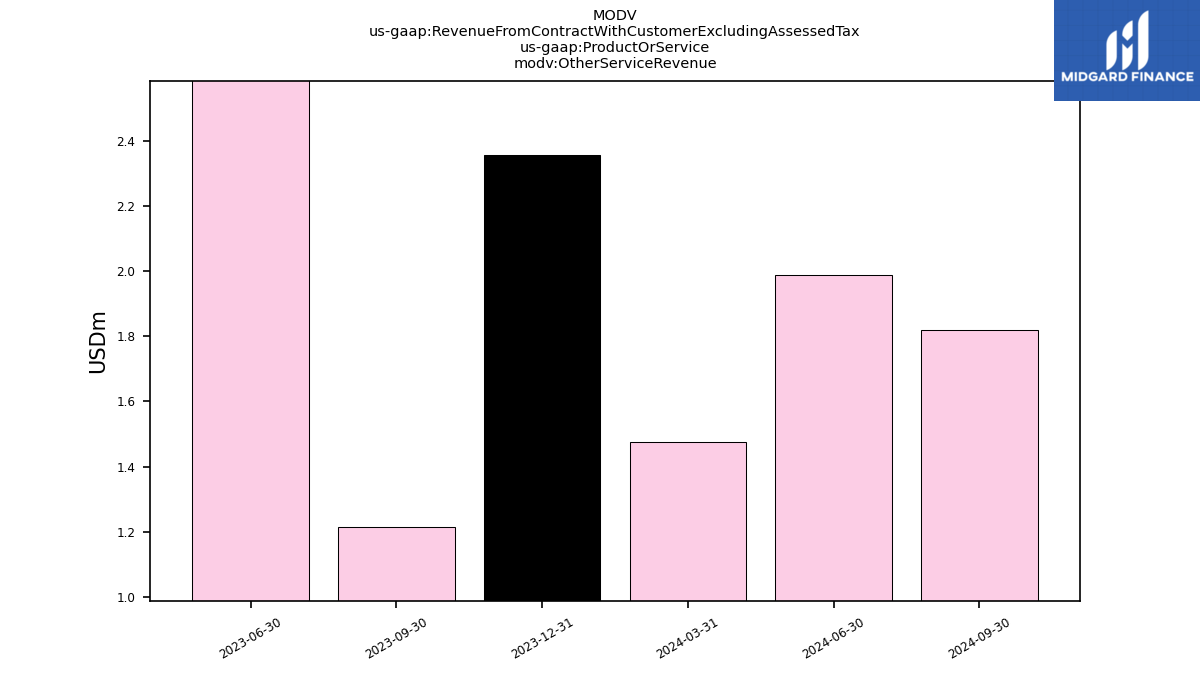
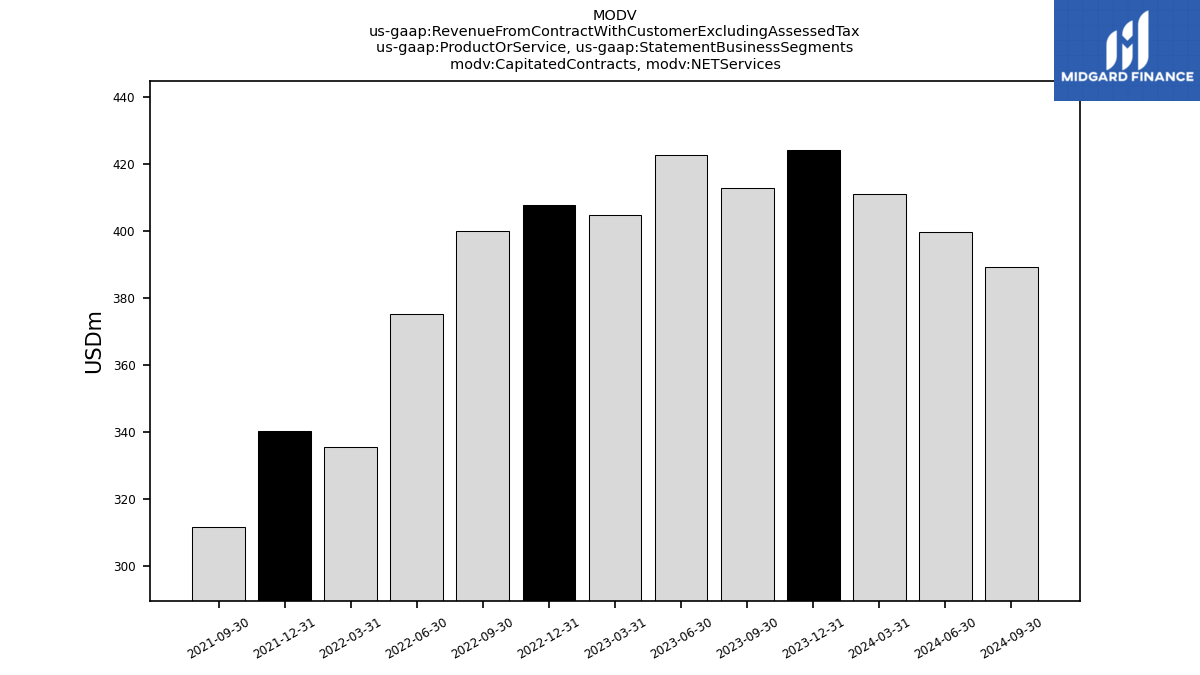
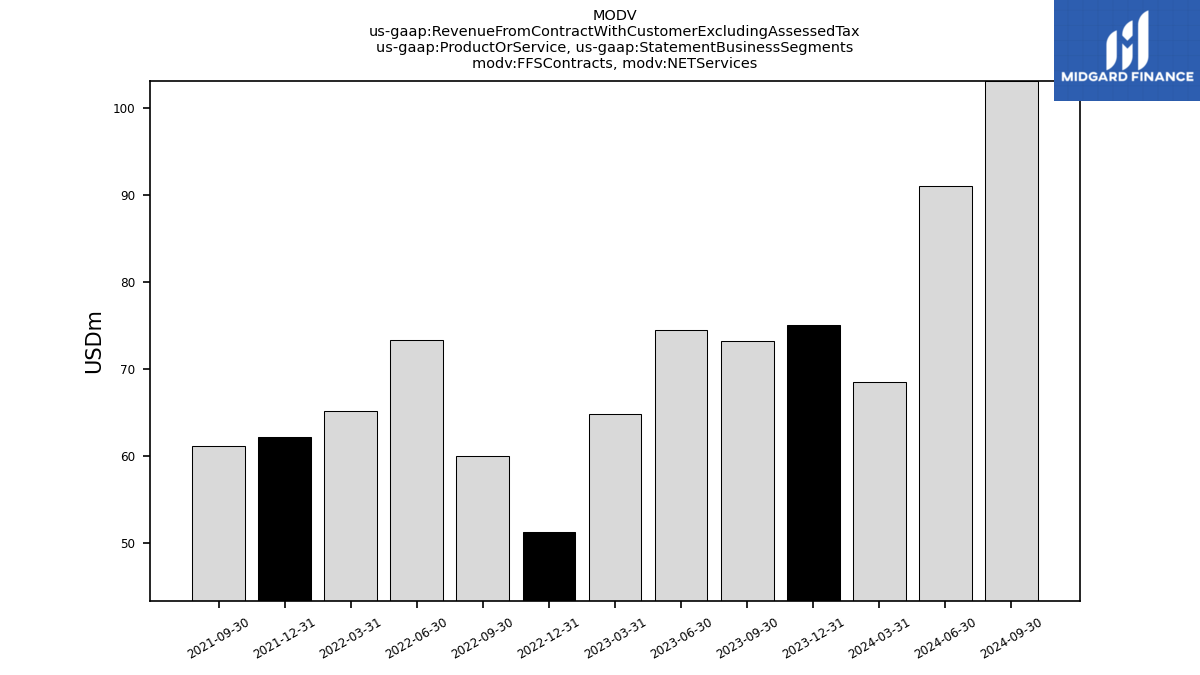
| Revenue From Contract With Customer Excluding Assessed Tax | 684.45 | 702.83 | 686.92 | 699.11 | 662.31 | 653.92 | 647.78 | 628.22 | 574.48 | 575.77 | 493.06 | 474.45 | 453.61 | 398.51 | 320.62 | 282.26 | 367.29 | 384.83 | 393.38 | 363.91 | 367.81 | 360.76 | 421.32 | 411.79 | 406.05 | 406.89 | 409.52 | 407.98 | 399.49 | 385.96 | 412.51 | 450.63 | 432.65 | 424.93 | 432.45 | 508.25 | 505.80 | 453.60 | 394.22 | 343.95 | 289.40 | 276.85 | 276.71 | 287.64 | 281.49 | 286.52 | 280.29 | 278.94 | 260.15 | 244.31 | 235.55 | 235.31 | 227.81 | 219.27 | 217.15 | 222.32 | |
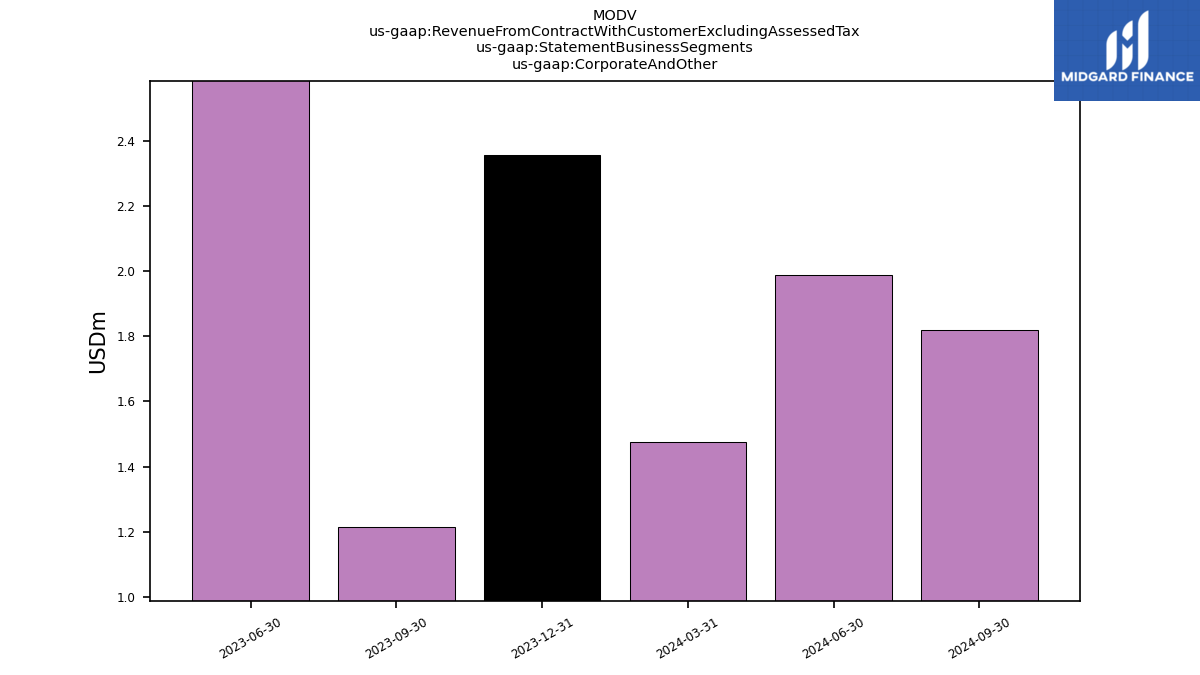
| Other Service Revenue | 1.48 | 2.35 | 1.22 | 2.60 | NA | NA | NA | NA | NA | NA | NA | NA | NA | NA | NA | NA | NA | NA | NA | NA | NA | NA | NA | NA | NA | NA | NA | NA | NA | NA | NA | NA | NA | NA | NA | NA | NA | NA | NA | NA | NA | NA | NA | NA | NA | NA | NA | NA | NA | NA | NA | NA | NA | NA | NA | NA | |
| Capitated Contracts, N E T Services | 410.81 | 424.03 | 412.76 | 422.51 | 404.69 | 407.71 | 399.86 | 375.35 | 335.72 | 340.41 | 311.91 | NA | NA | NA | NA | NA | NA | NA | NA | NA | NA | NA | NA | NA | NA | NA | NA | NA | NA | NA | NA | NA | NA | NA | NA | NA | NA | NA | NA | NA | NA | NA | NA | NA | NA | NA | NA | NA | NA | NA | NA | NA | NA | NA | NA | NA | |
| F F S Contracts, N E T Services | 68.49 | 75.03 | 73.19 | 74.47 | 64.77 | 51.28 | 59.94 | 73.38 | 65.20 | 62.11 | 61.08 | NA | NA | NA | NA | NA | NA | NA | NA | NA | NA | NA | NA | NA | NA | NA | NA | NA | NA | NA | NA | NA | NA | NA | NA | NA | NA | NA | NA | NA | NA | NA | NA | NA | NA | NA | NA | NA | NA | NA | NA | NA | NA | NA | NA | NA | |
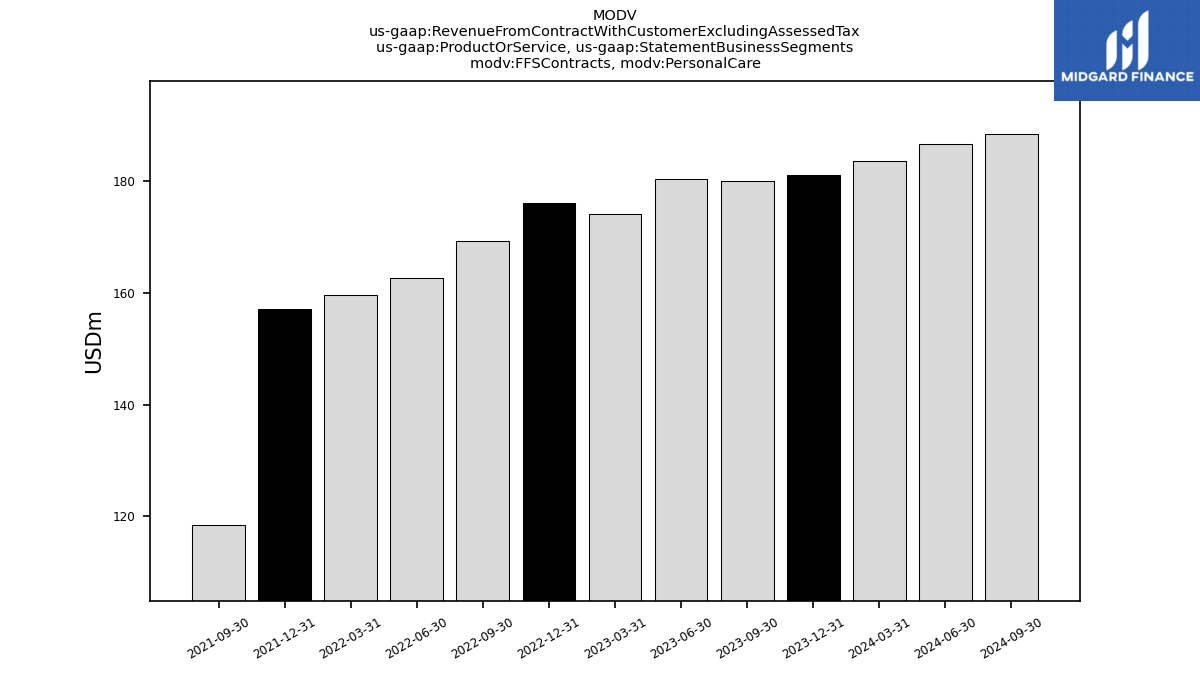
| F F S Contracts, Personal Care | 183.57 | 181.18 | 179.98 | 180.32 | 174.13 | 176.01 | 169.23 | 162.74 | 159.70 | 157.19 | 118.50 | NA | NA | NA | NA | NA | NA | NA | NA | NA | NA | NA | NA | NA | NA | NA | NA | NA | NA | NA | NA | NA | NA | NA | NA | NA | NA | NA | NA | NA | NA | NA | NA | NA | NA | NA | NA | NA | NA | NA | NA | NA | NA | NA | NA | NA | |
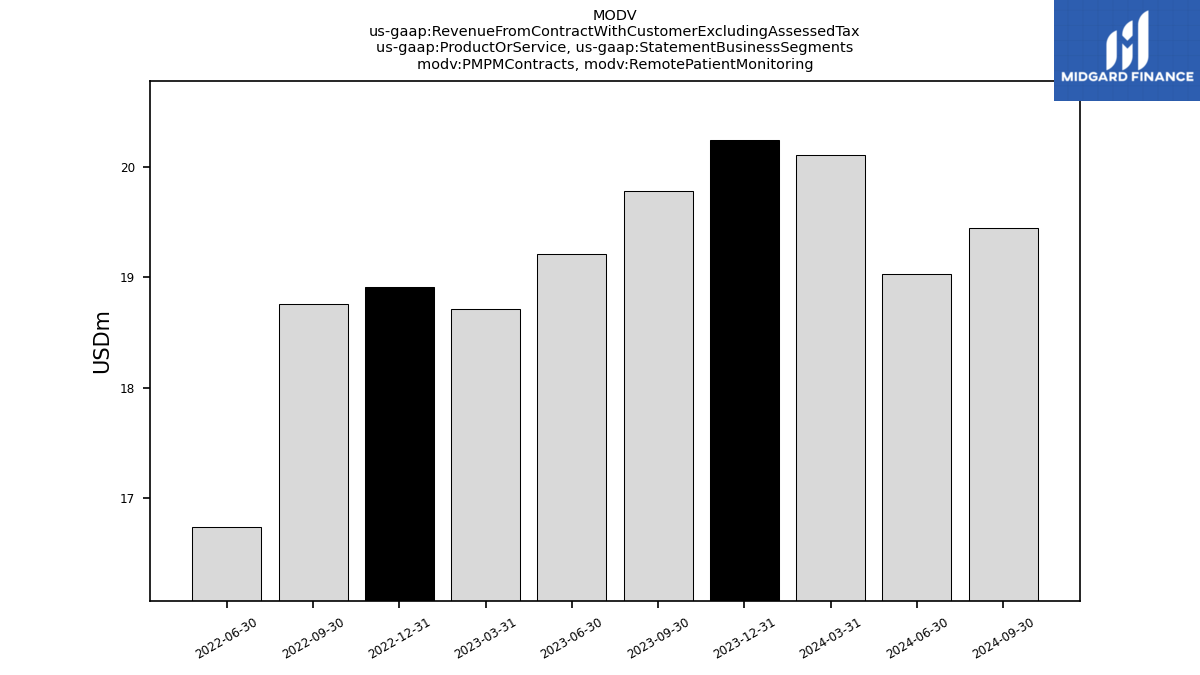
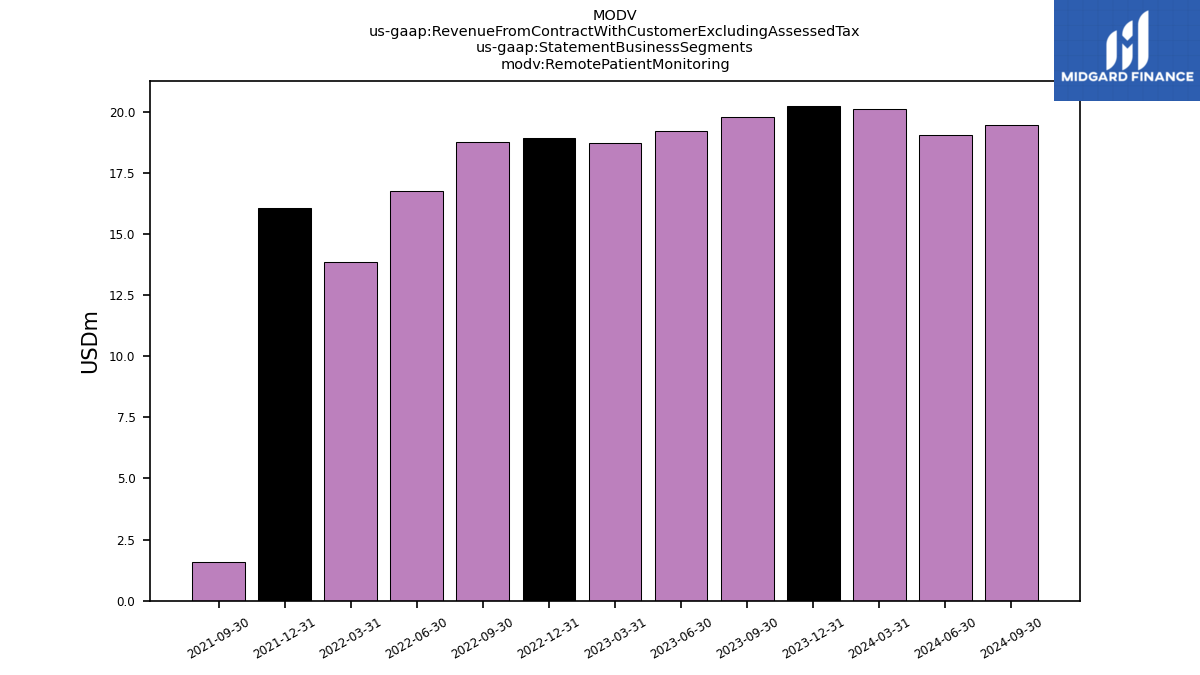
| P M P M Contracts, Remote Patient Monitoring | 20.10 | 20.24 | 19.78 | 19.21 | 18.71 | 18.91 | 18.76 | 16.75 | NA | NA | NA | NA | NA | NA | NA | NA | NA | NA | NA | NA | NA | NA | NA | NA | NA | NA | NA | NA | NA | NA | NA | NA | NA | NA | NA | NA | NA | NA | NA | NA | NA | NA | NA | NA | NA | NA | NA | NA | NA | NA | NA | NA | NA | NA | NA | NA | |
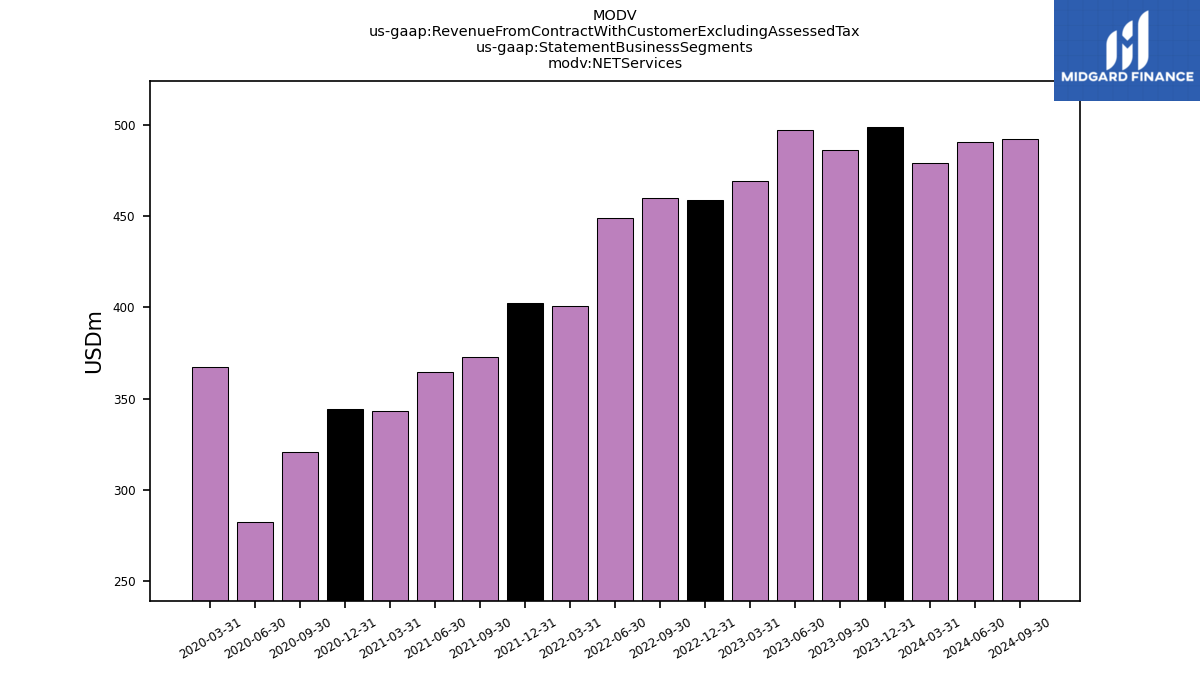
| N E T Services | 479.31 | 499.06 | 485.95 | 496.98 | 469.46 | 458.99 | 459.80 | 448.73 | 400.92 | 402.53 | 372.99 | 364.76 | 343.42 | 344.54 | 320.62 | 282.26 | 367.29 | NA | NA | NA | NA | NA | NA | NA | NA | NA | NA | NA | NA | NA | NA | NA | NA | NA | NA | NA | NA | NA | NA | NA | NA | NA | NA | NA | NA | NA | NA | NA | NA | NA | NA | NA | NA | NA | NA | NA | |
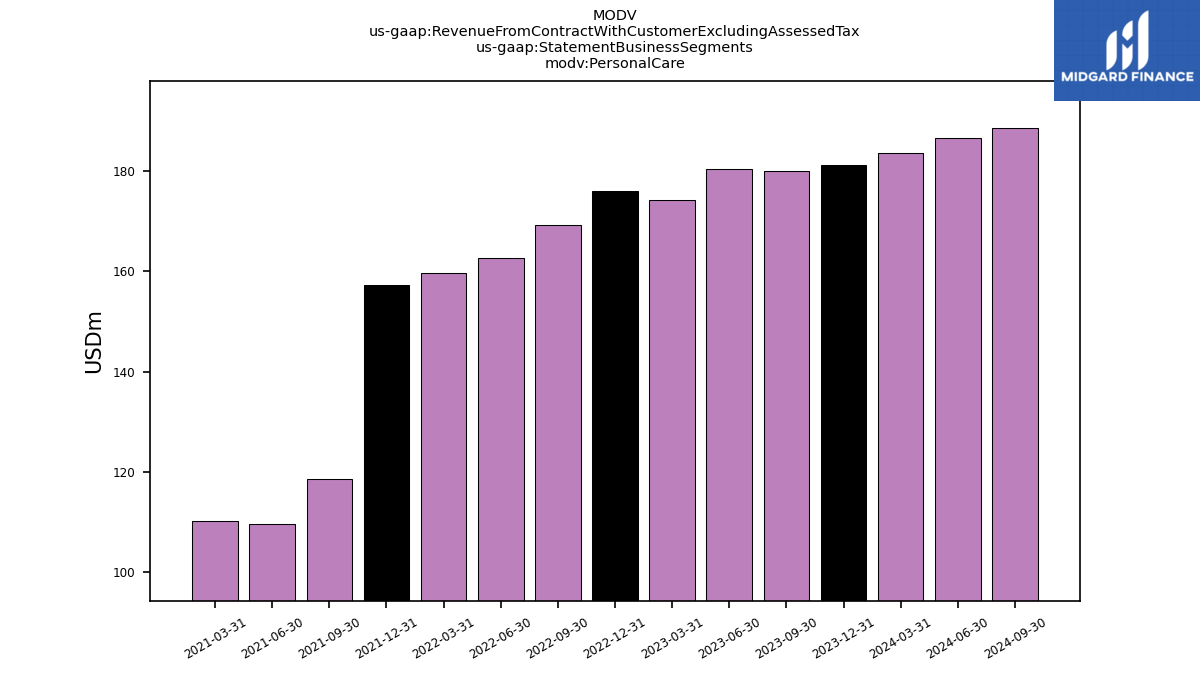
| Personal Care | 183.57 | 181.18 | 179.98 | 180.32 | 174.13 | 176.01 | 169.23 | 162.74 | 159.70 | 157.19 | 118.50 | 109.69 | 110.19 | NA | NA | NA | NA | NA | NA | NA | NA | NA | NA | NA | NA | NA | NA | NA | NA | NA | NA | NA | NA | NA | NA | NA | NA | NA | NA | NA | NA | NA | NA | NA | NA | NA | NA | NA | NA | NA | NA | NA | NA | NA | NA | NA | |
| Remote Patient Monitoring | 20.10 | 20.24 | 19.78 | 19.21 | 18.71 | 18.91 | 18.76 | 16.75 | 13.86 | 16.05 | 1.56 | NA | NA | NA | NA | NA | NA | NA | NA | NA | NA | NA | NA | NA | NA | NA | NA | NA | NA | NA | NA | NA | NA | NA | NA | NA | NA | NA | NA | NA | NA | NA | NA | NA | NA | NA | NA | NA | NA | NA | NA | NA | NA | NA | NA | NA | |
| Corporate And Other | 1.48 | 2.35 | 1.22 | 2.60 | NA | NA | NA | NA | NA | NA | NA | NA | NA | NA | NA | NA | NA | NA | NA | NA | NA | NA | NA | NA | NA | NA | NA | NA | NA | NA | NA | NA | NA | NA | NA | NA | NA | NA | NA | NA | NA | NA | NA | NA | NA | NA | NA | NA | NA | NA | NA | NA | NA | NA | NA | NA |