
| 2023-12-31 | 2023-09-30 | 2023-06-30 | 2023-03-31 | 2022-12-31 | 2022-09-30 | 2022-06-30 | 2022-03-31 | 2021-12-31 | 2021-09-30 | 2021-06-30 | 2021-03-31 | 2020-12-31 | 2020-09-30 | 2020-06-30 | 2020-03-31 | ||
|---|---|---|---|---|---|---|---|---|---|---|---|---|---|---|---|---|---|
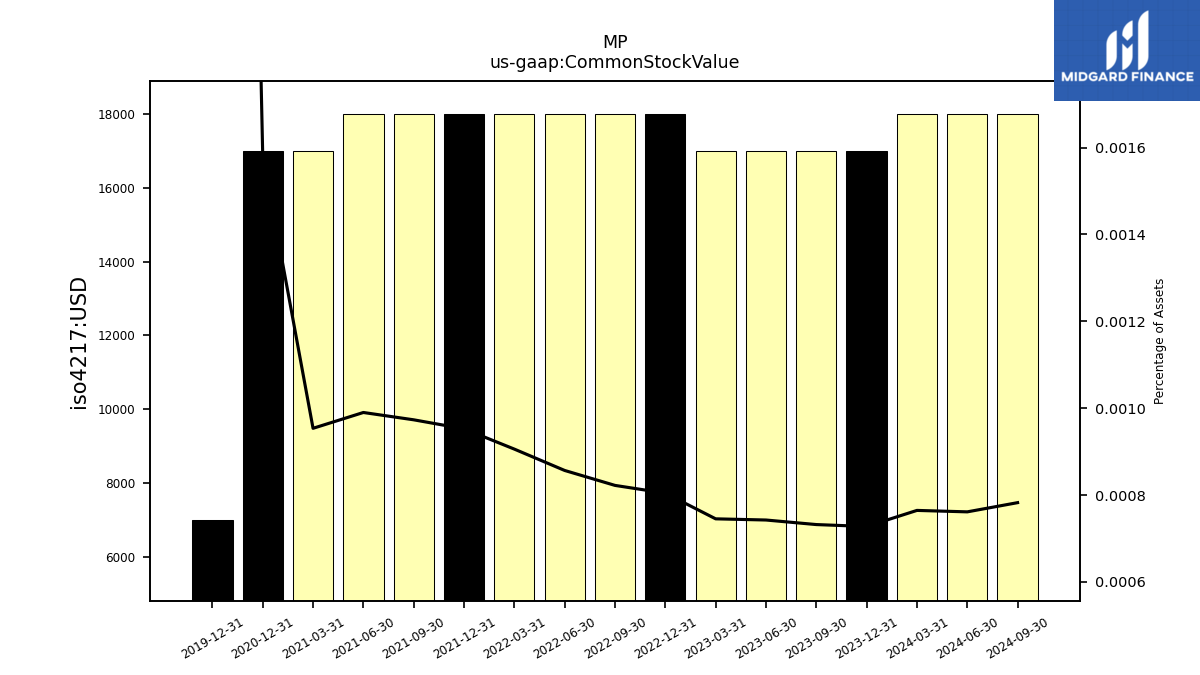
| Common Stock Value | 0.02 | 0.02 | 0.02 | 0.02 | 0.02 | 0.02 | 0.02 | 0.02 | 0.02 | 0.02 | 0.02 | 0.02 | 0.02 | NA | NA | NA | |
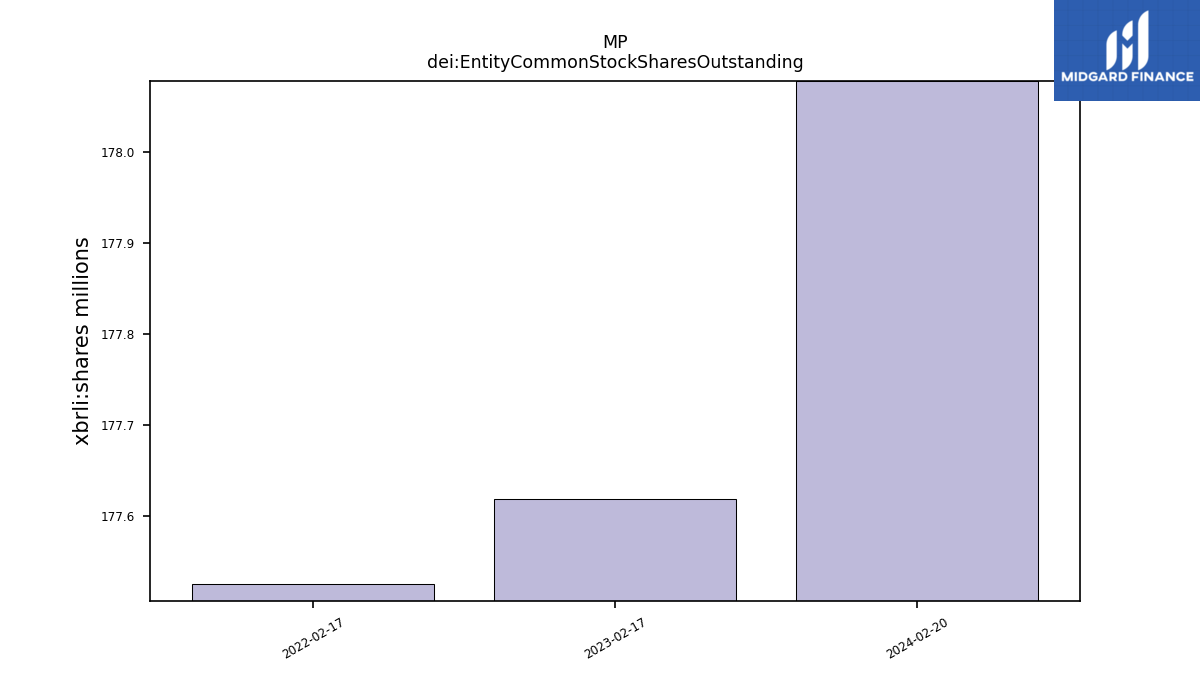
| dei: Entity Common Stock Shares Outstanding | NA | NA | NA | NA | NA | NA | NA | NA | NA | NA | NA | NA | NA | NA | NA | NA | |
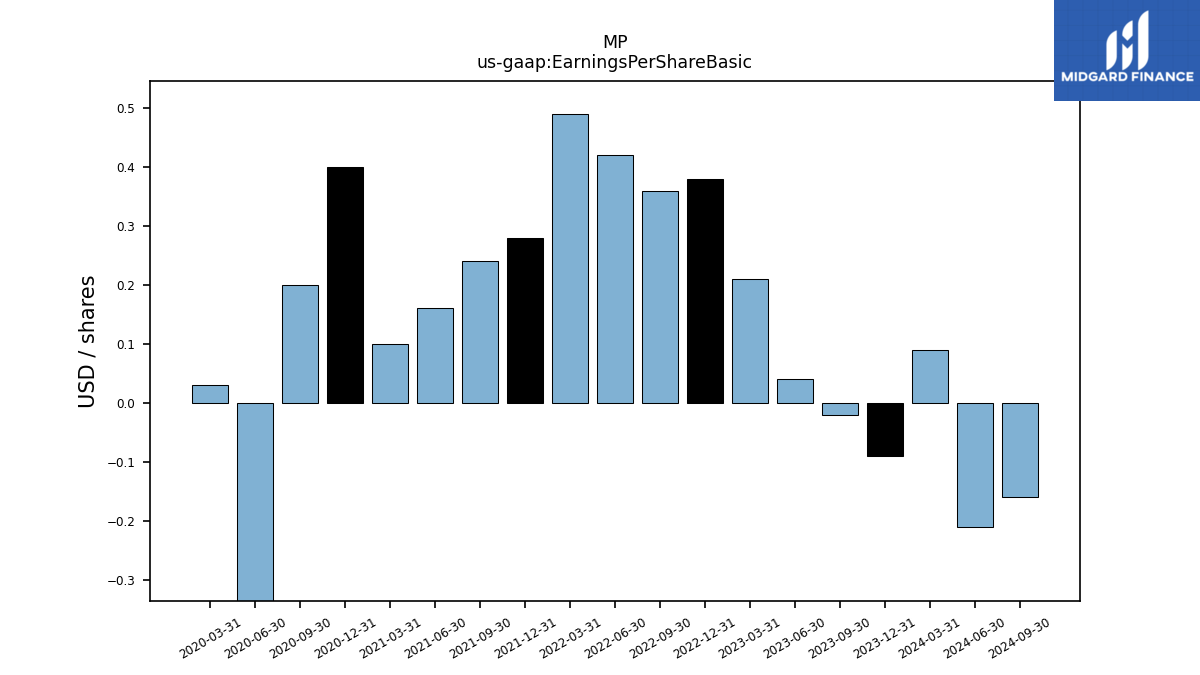
| Earnings Per Share Basic | -0.09 | -0.02 | 0.04 | 0.21 | 0.38 | 0.36 | 0.42 | 0.49 | 0.28 | 0.24 | 0.16 | 0.10 | 0.40 | 0.20 | -0.92 | 0.03 | |
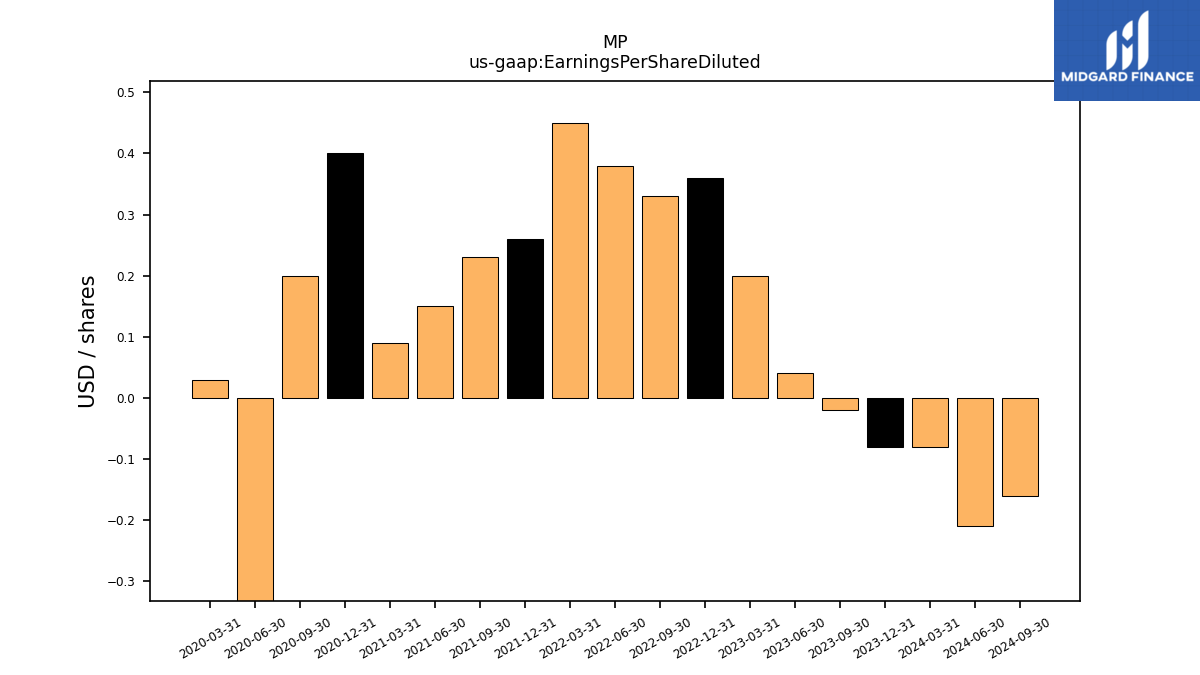
| Earnings Per Share Diluted | -0.08 | -0.02 | 0.04 | 0.20 | 0.36 | 0.33 | 0.38 | 0.45 | 0.26 | 0.23 | 0.15 | 0.09 | 0.40 | 0.20 | -0.92 | 0.03 |
| 2023-12-31 | 2023-09-30 | 2023-06-30 | 2023-03-31 | 2022-12-31 | 2022-09-30 | 2022-06-30 | 2022-03-31 | 2021-12-31 | 2021-09-30 | 2021-06-30 | 2021-03-31 | 2020-12-31 | 2020-09-30 | 2020-06-30 | 2020-03-31 | ||
|---|---|---|---|---|---|---|---|---|---|---|---|---|---|---|---|---|---|
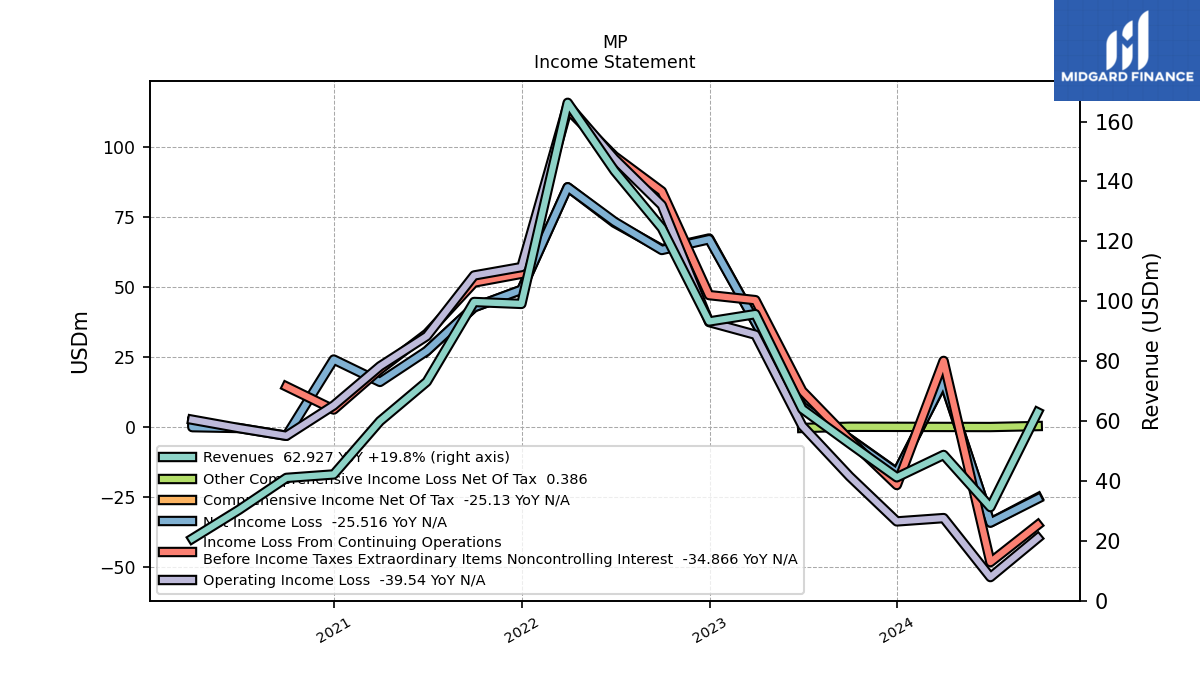
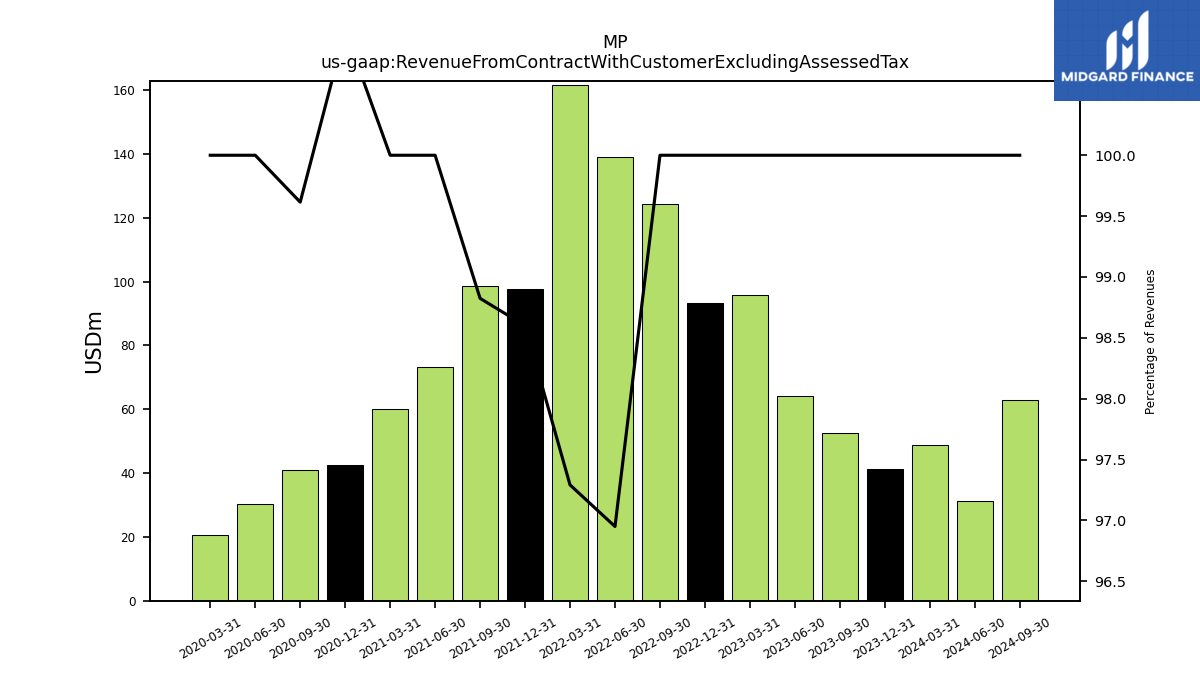
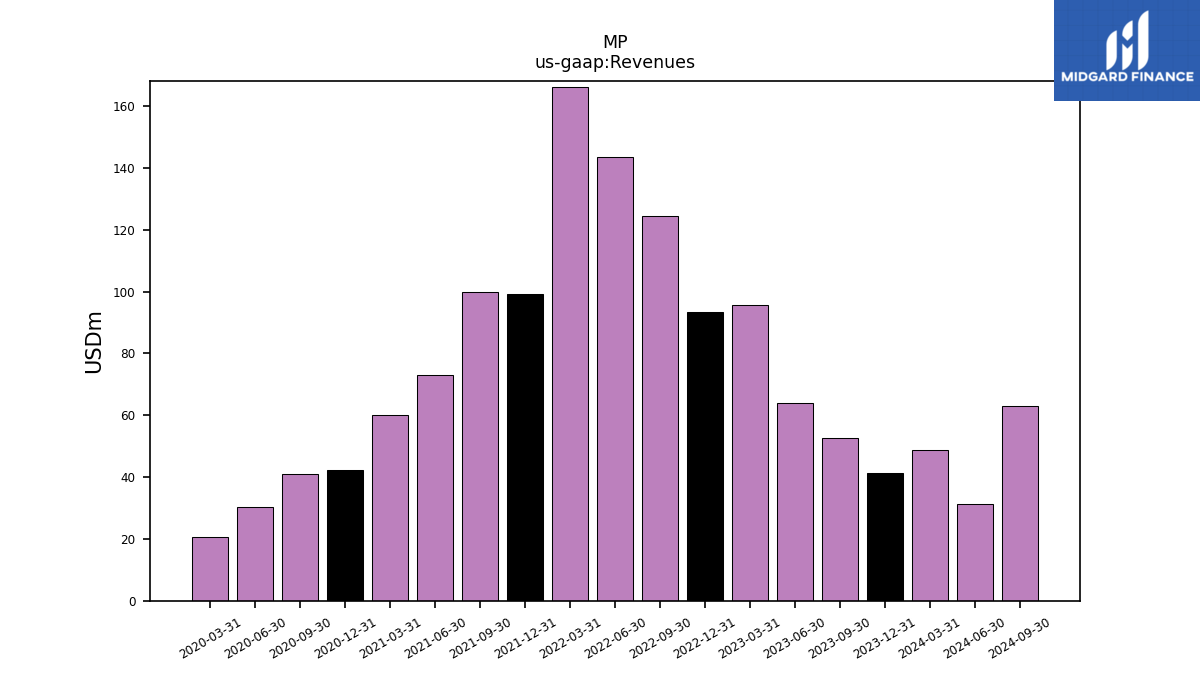
| Revenue From Contract With Customer Excluding Assessed Tax | 41.20 | 52.52 | 64.02 | 95.70 | 93.25 | 124.44 | 139.18 | 161.75 | 97.72 | 98.58 | 73.12 | 59.97 | 42.61 | 40.86 | 30.39 | 20.72 | |
| Revenues | 41.20 | 52.52 | 64.02 | 95.70 | 93.25 | 124.44 | 143.56 | 166.26 | 99.11 | 99.75 | 73.12 | 59.97 | 42.18 | 41.02 | 30.39 | 20.72 | |
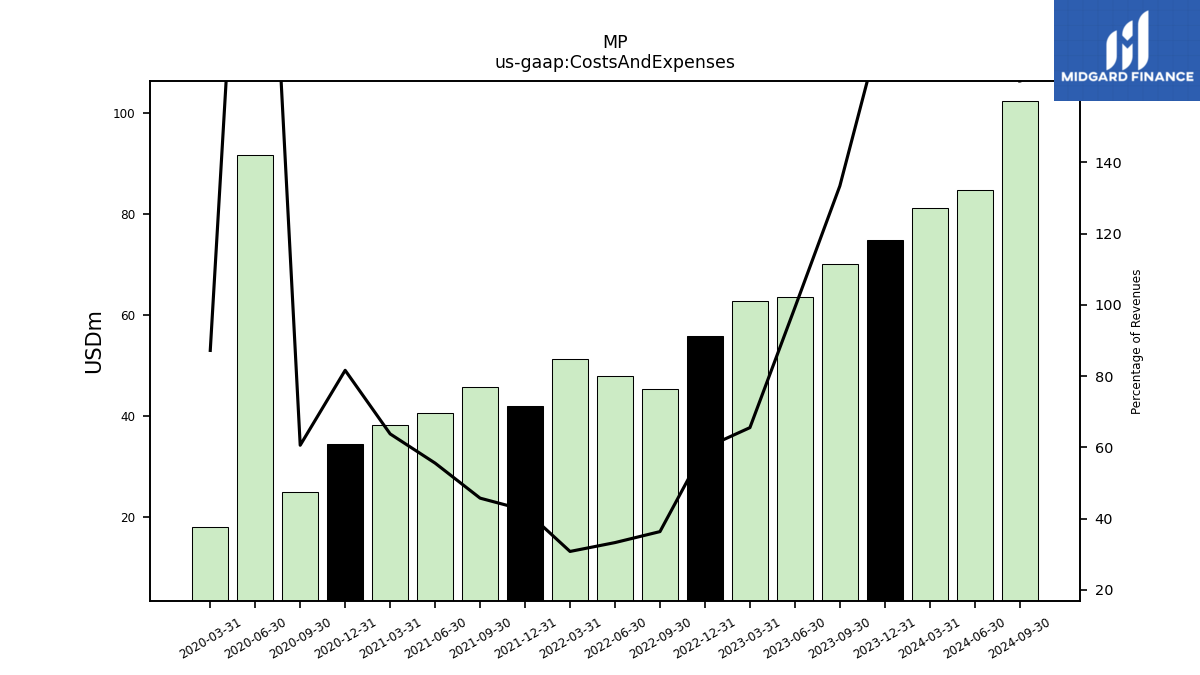
| Costs And Expenses | 74.83 | 70.05 | 63.54 | 62.74 | 55.78 | 45.28 | 47.81 | 51.23 | 42.03 | 45.66 | 40.65 | 38.26 | 34.44 | 24.87 | 91.64 | 18.07 | |
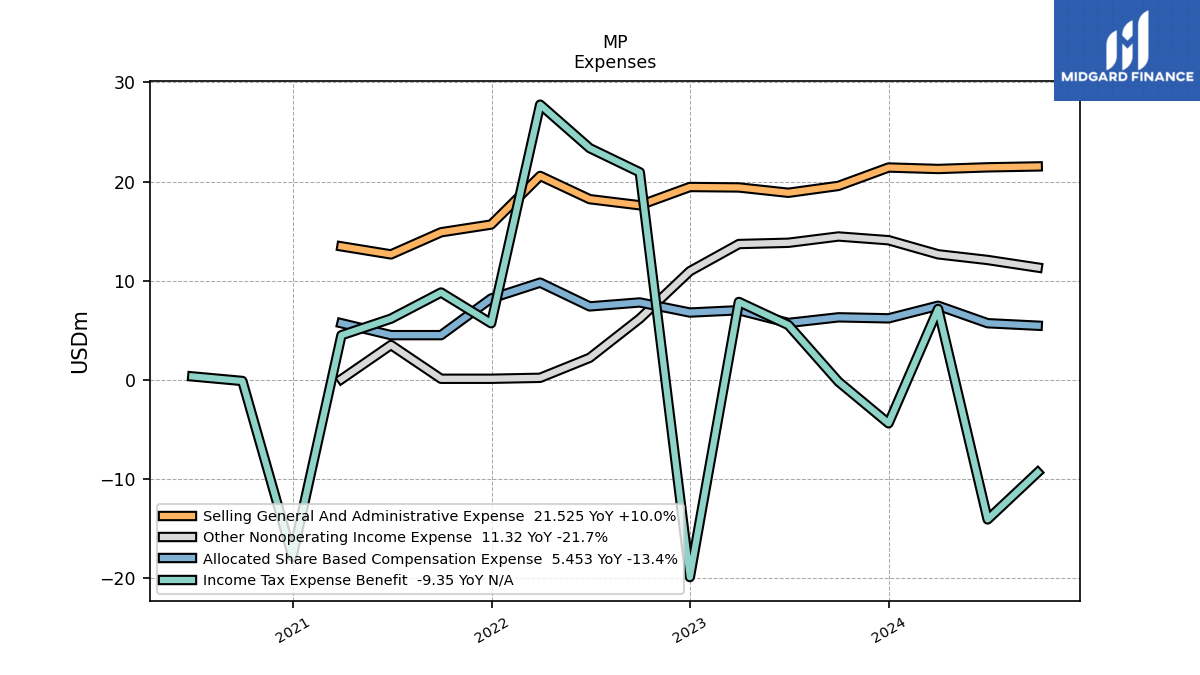
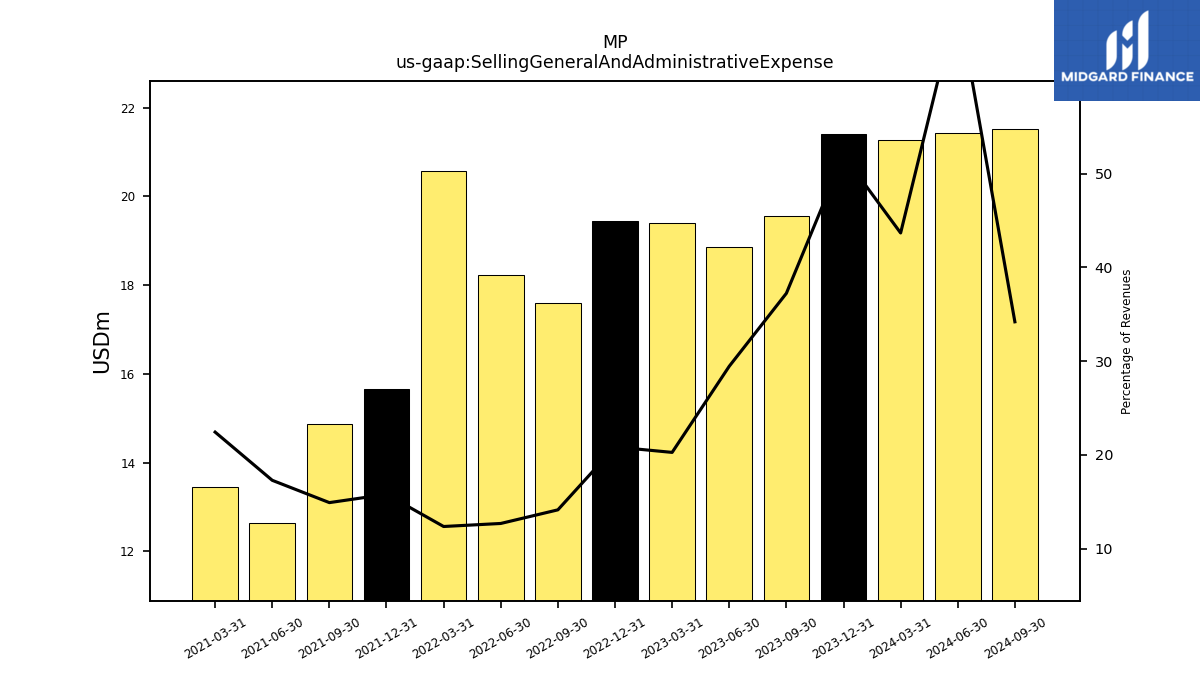
| Selling General And Administrative Expense | 21.42 | 19.56 | 18.86 | 19.40 | 19.45 | 17.60 | 18.22 | 20.57 | 15.66 | 14.88 | 12.65 | 13.46 | NA | NA | NA | NA | |
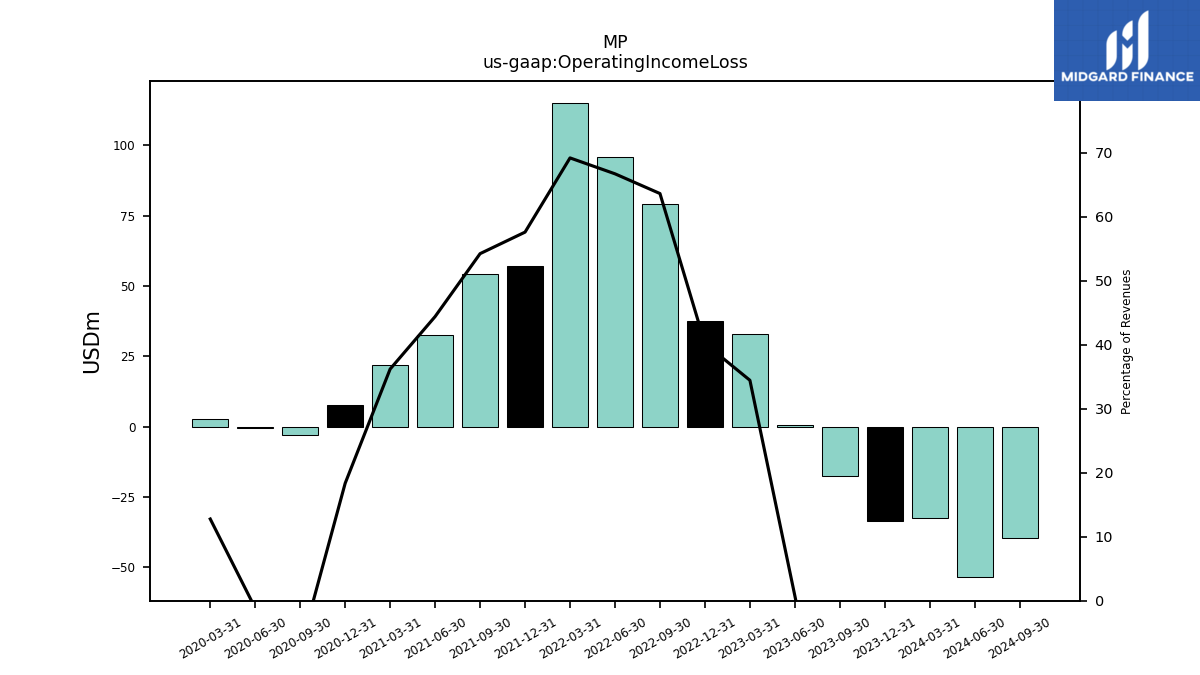
| Operating Income Loss | -33.63 | -17.54 | 0.48 | 32.96 | 37.47 | 79.17 | 95.75 | 115.02 | 57.08 | 54.09 | 32.47 | 21.71 | 7.74 | -3.10 | -0.35 | 2.65 | |
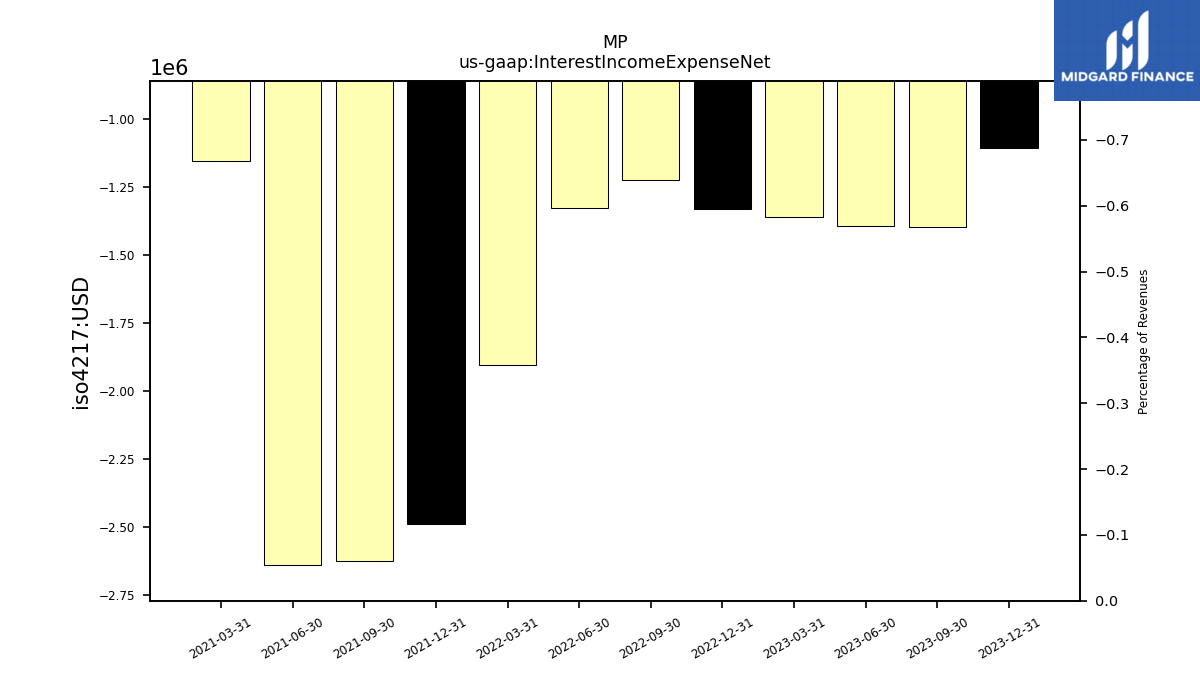
| Interest Income Expense Net | -1.11 | -1.40 | -1.39 | -1.36 | -1.33 | -1.22 | -1.33 | -1.91 | -2.49 | -2.62 | -2.64 | -1.15 | NA | NA | NA | NA | |
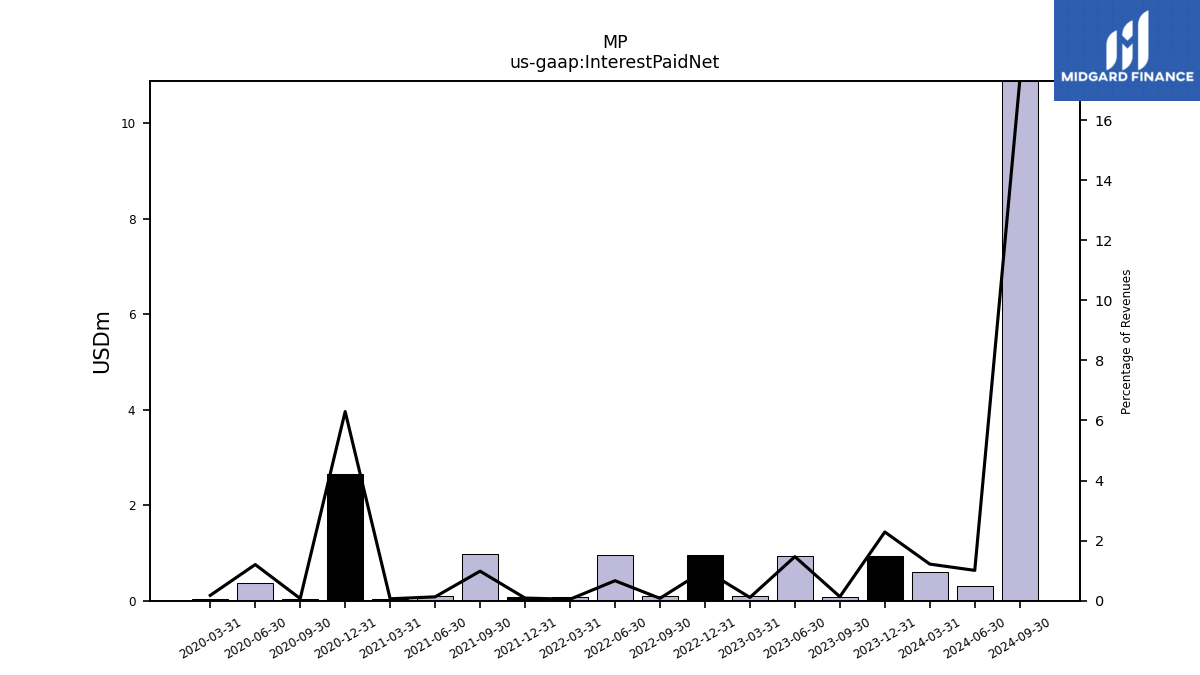
| Interest Paid Net | 0.94 | 0.07 | 0.94 | 0.10 | 0.96 | 0.10 | 0.96 | 0.08 | 0.09 | 0.98 | 0.10 | 0.04 | 2.66 | 0.03 | 0.37 | 0.04 | |
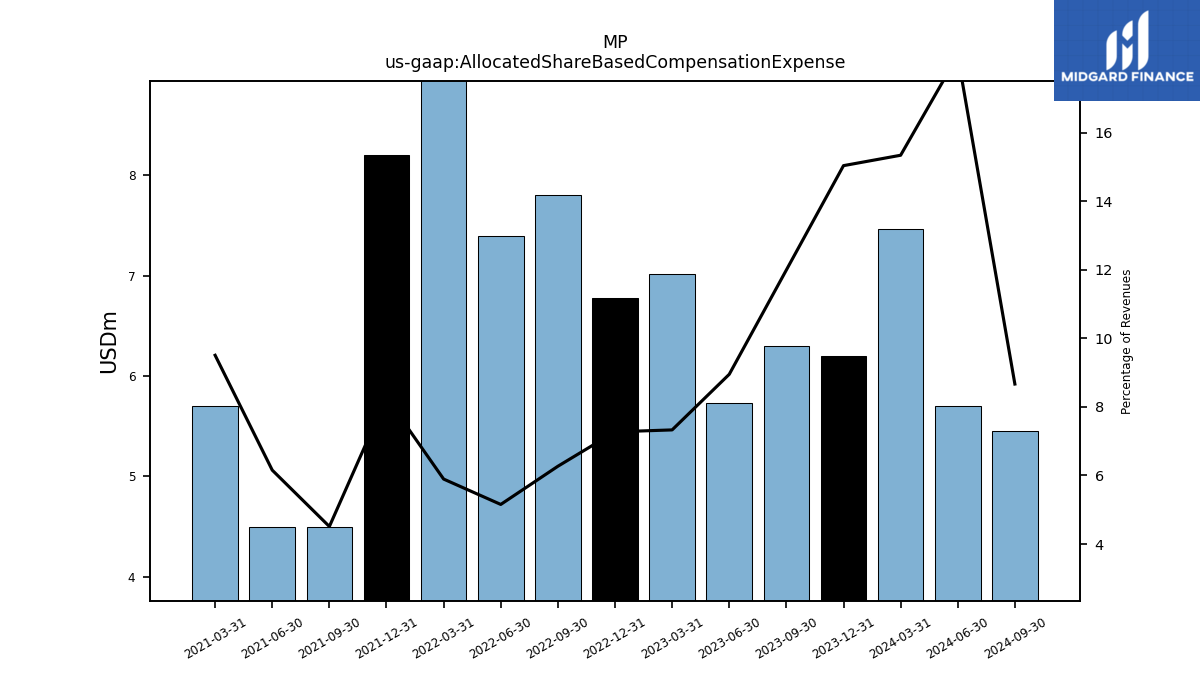
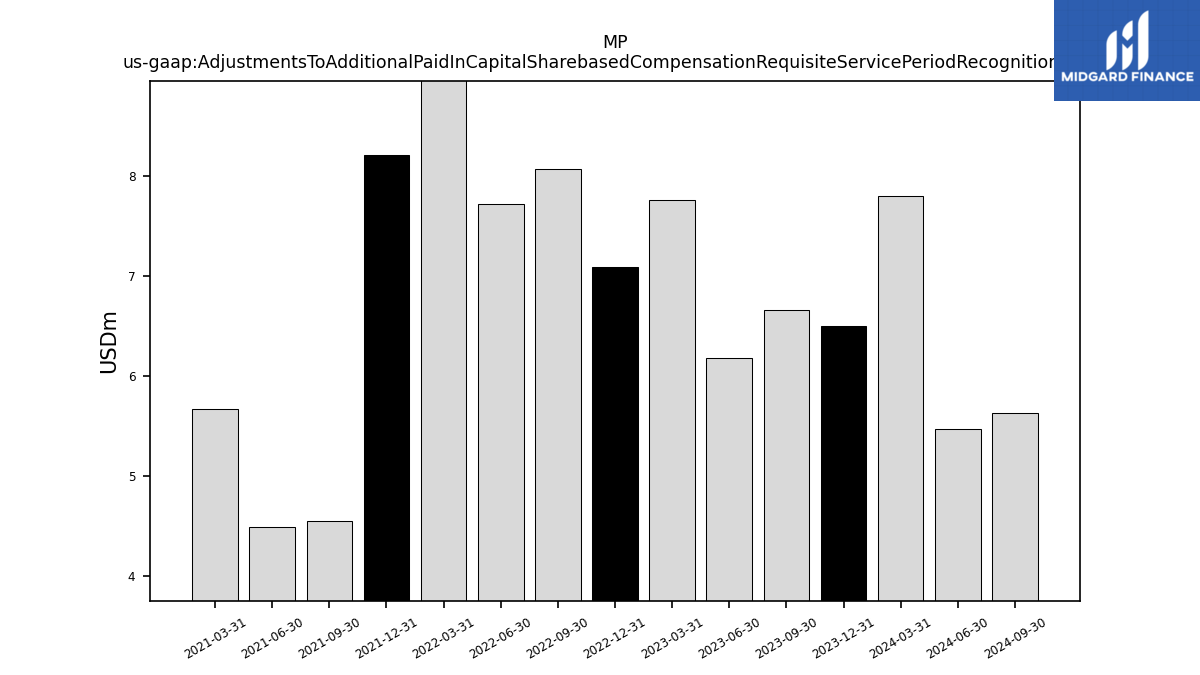
| Allocated Share Based Compensation Expense | 6.20 | 6.30 | 5.73 | 7.01 | 6.78 | 7.80 | 7.40 | 9.80 | 8.20 | 4.50 | 4.50 | 5.70 | NA | NA | NA | NA | |
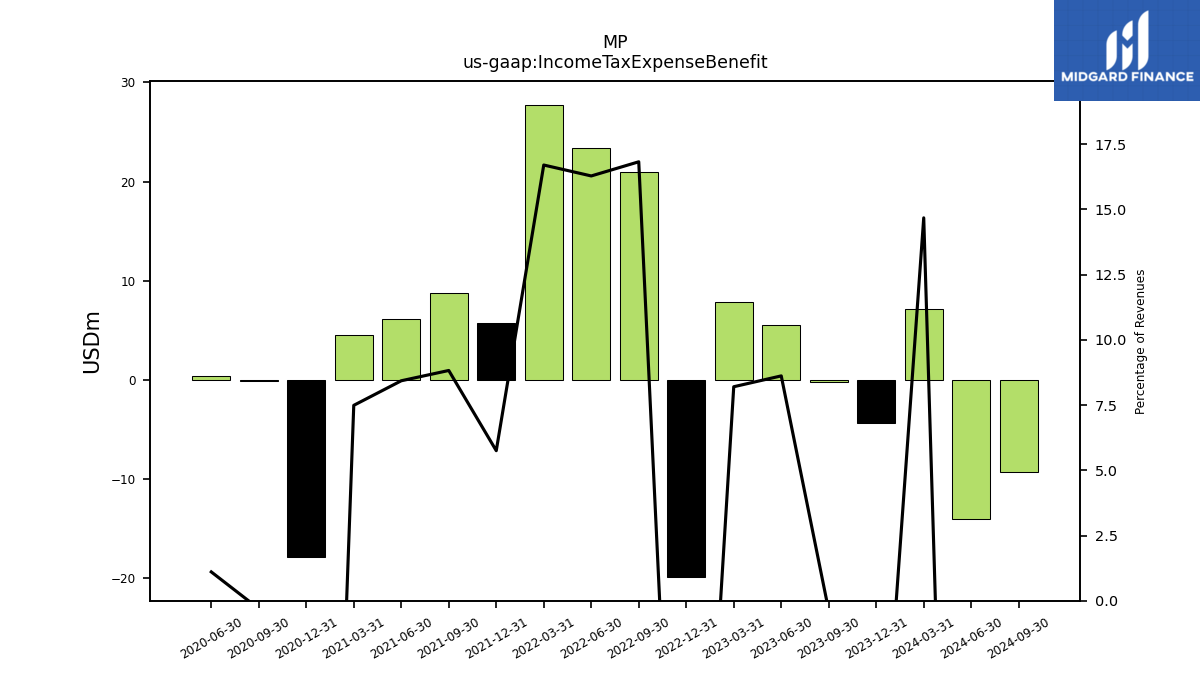
| Income Tax Expense Benefit | -4.40 | -0.20 | 5.52 | 7.85 | -19.92 | 20.93 | 23.37 | 27.76 | 5.70 | 8.80 | 6.16 | 4.49 | -17.85 | -0.12 | 0.34 | NA | |
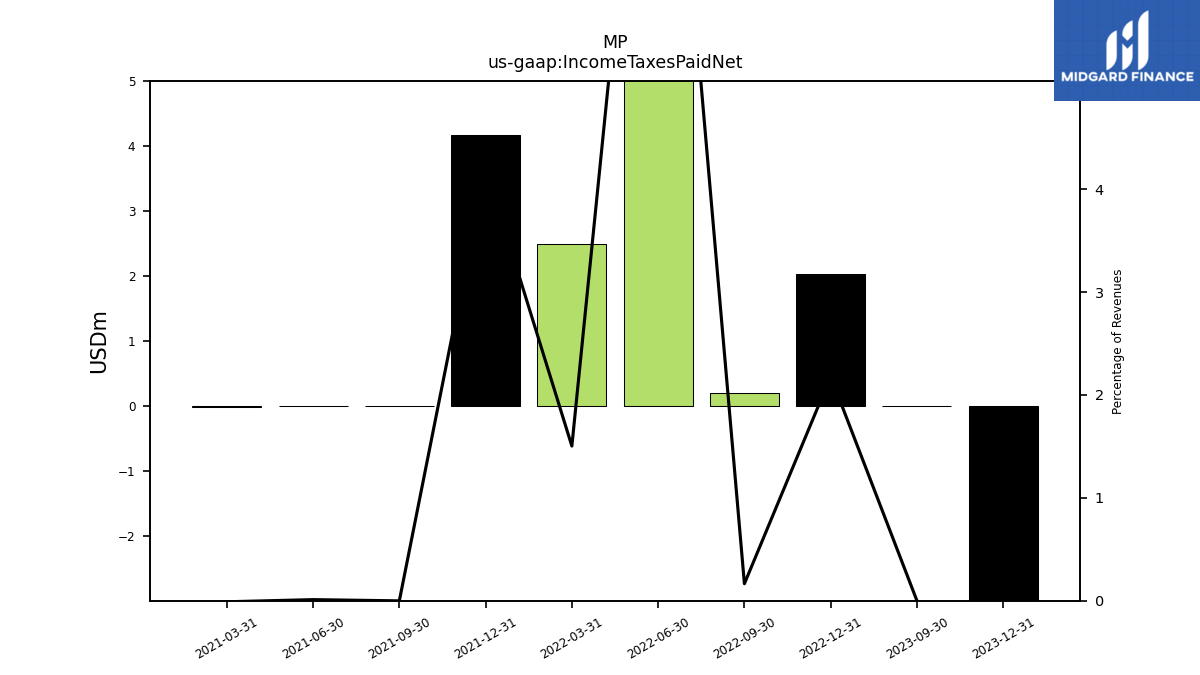
| Income Taxes Paid Net | -3.00 | 0.00 | NA | NA | 2.03 | 0.21 | 14.12 | 2.50 | 4.17 | -0.00 | 0.01 | -0.01 | NA | NA | NA | NA | |
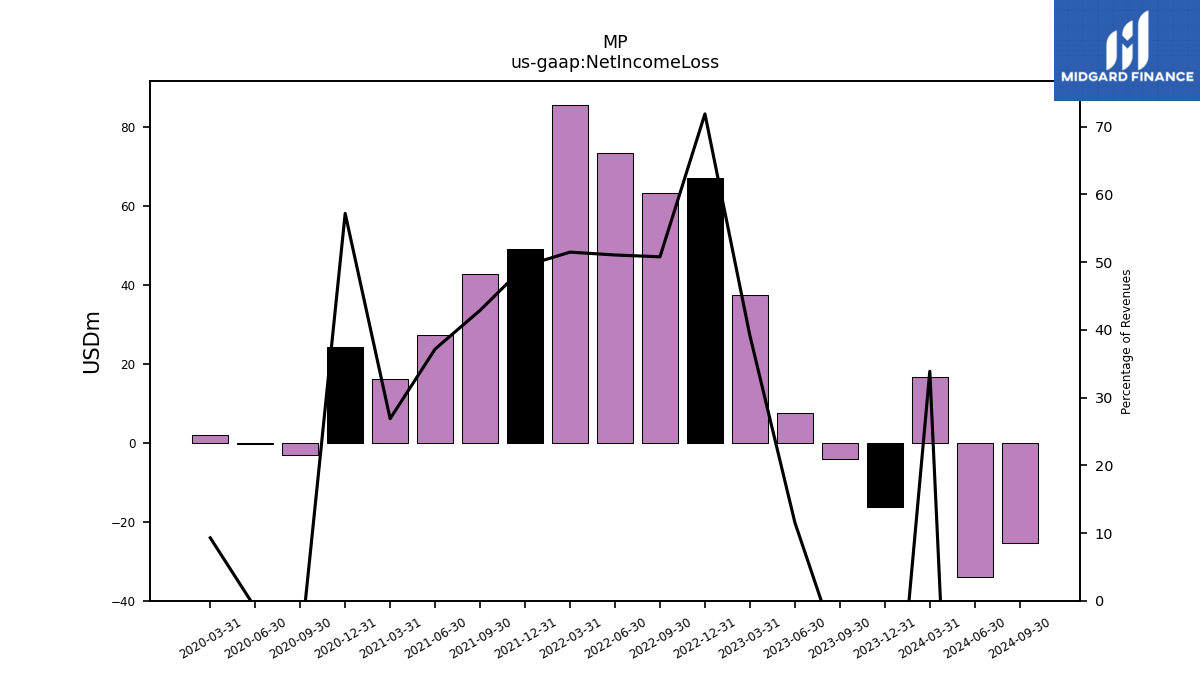
| Net Income Loss | -16.26 | -4.28 | 7.39 | 37.45 | 67.01 | 63.18 | 73.27 | 85.55 | 48.99 | 42.76 | 27.17 | 16.12 | 24.11 | -3.07 | -0.32 | 1.93 | |
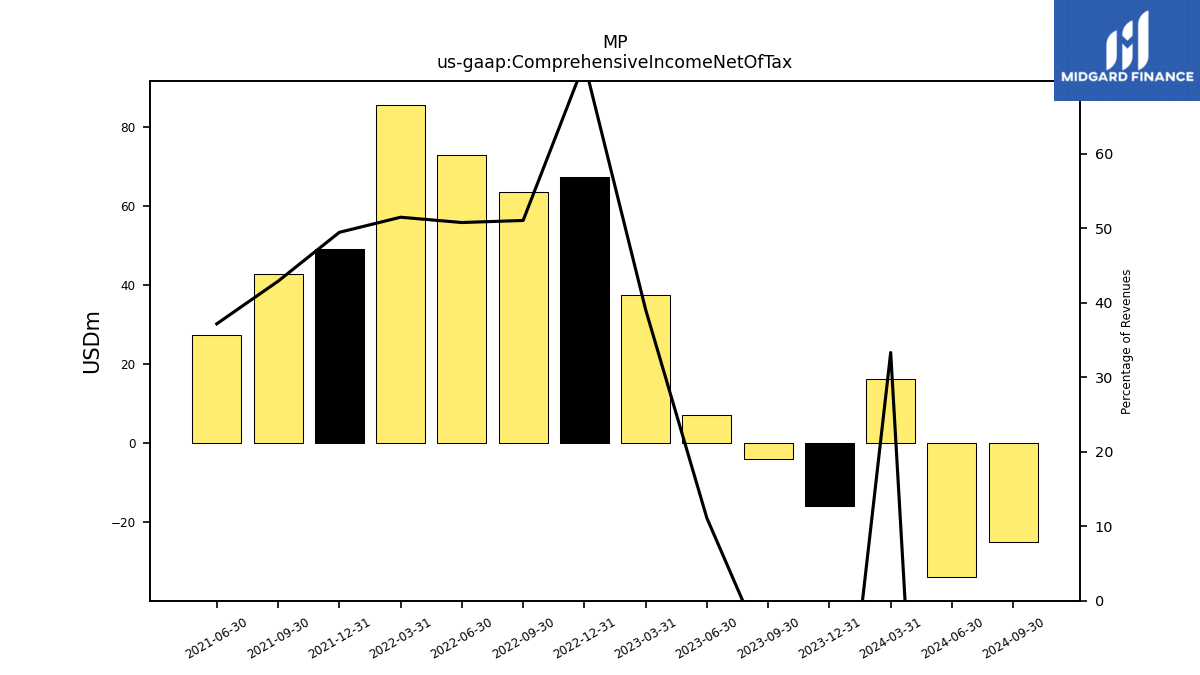
| Comprehensive Income Net Of Tax | -16.08 | -4.14 | 7.10 | 37.39 | 67.29 | 63.50 | 72.85 | 85.55 | 48.99 | 42.76 | 27.17 | NA | NA | NA | NA | NA |
| 2023-12-31 | 2023-09-30 | 2023-06-30 | 2023-03-31 | 2022-12-31 | 2022-09-30 | 2022-06-30 | 2022-03-31 | 2021-12-31 | 2021-09-30 | 2021-06-30 | 2021-03-31 | 2020-12-31 | 2020-09-30 | 2020-06-30 | 2020-03-31 | ||
|---|---|---|---|---|---|---|---|---|---|---|---|---|---|---|---|---|---|
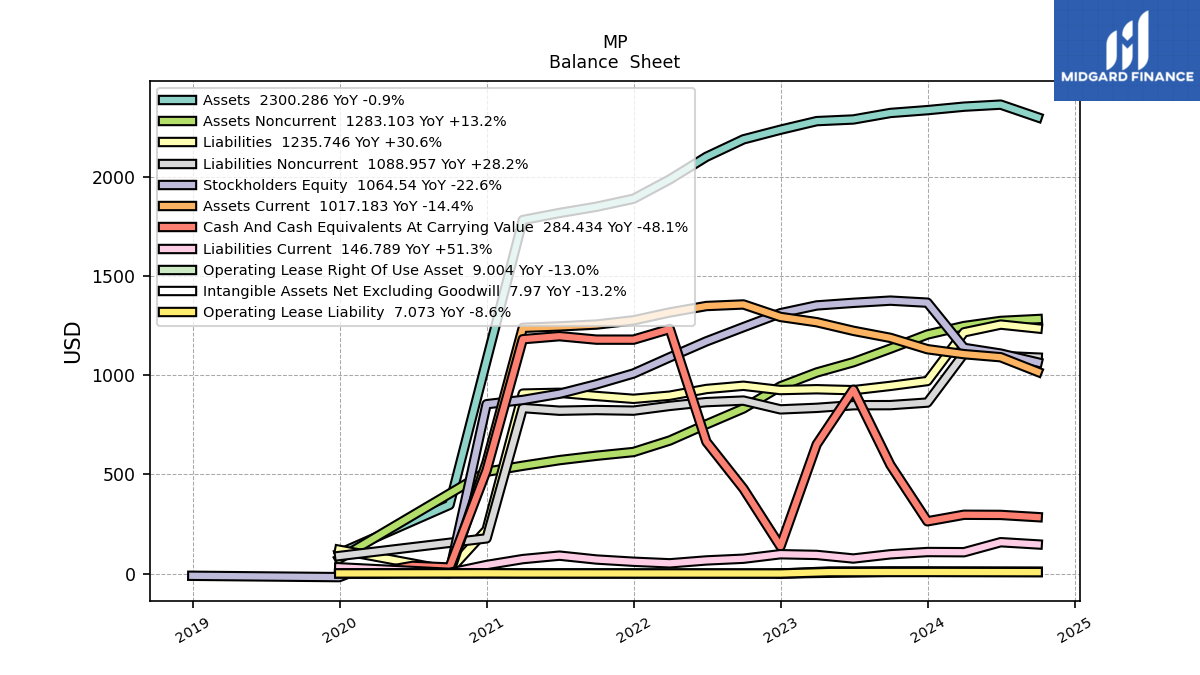
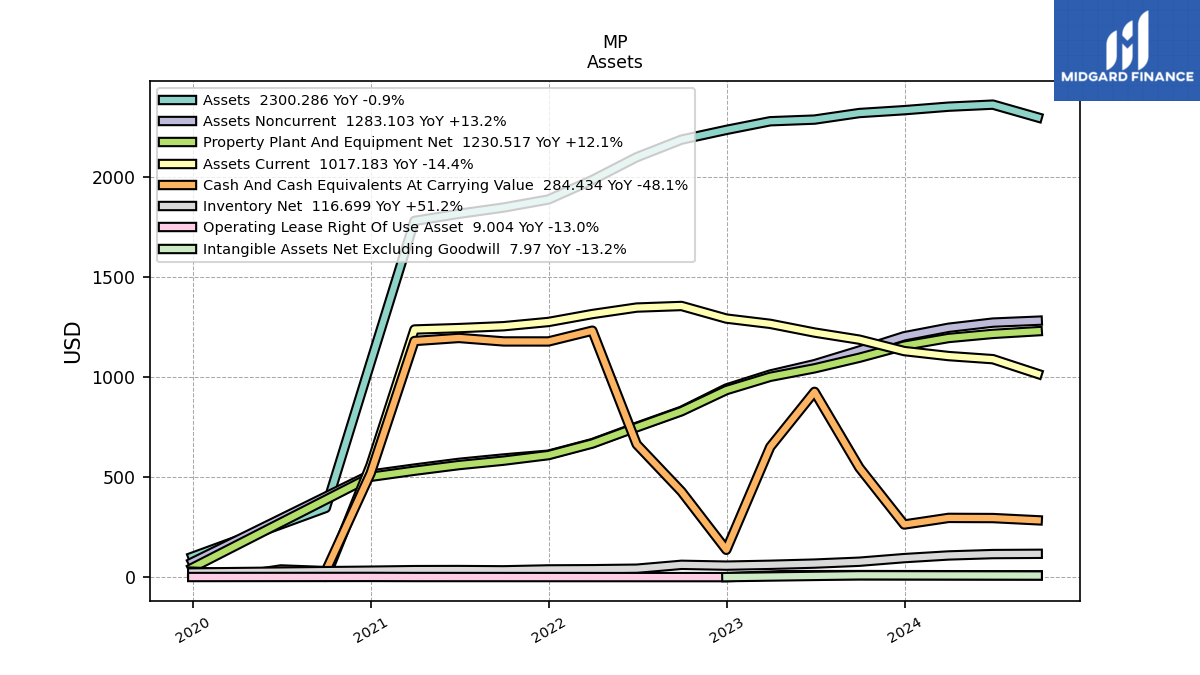
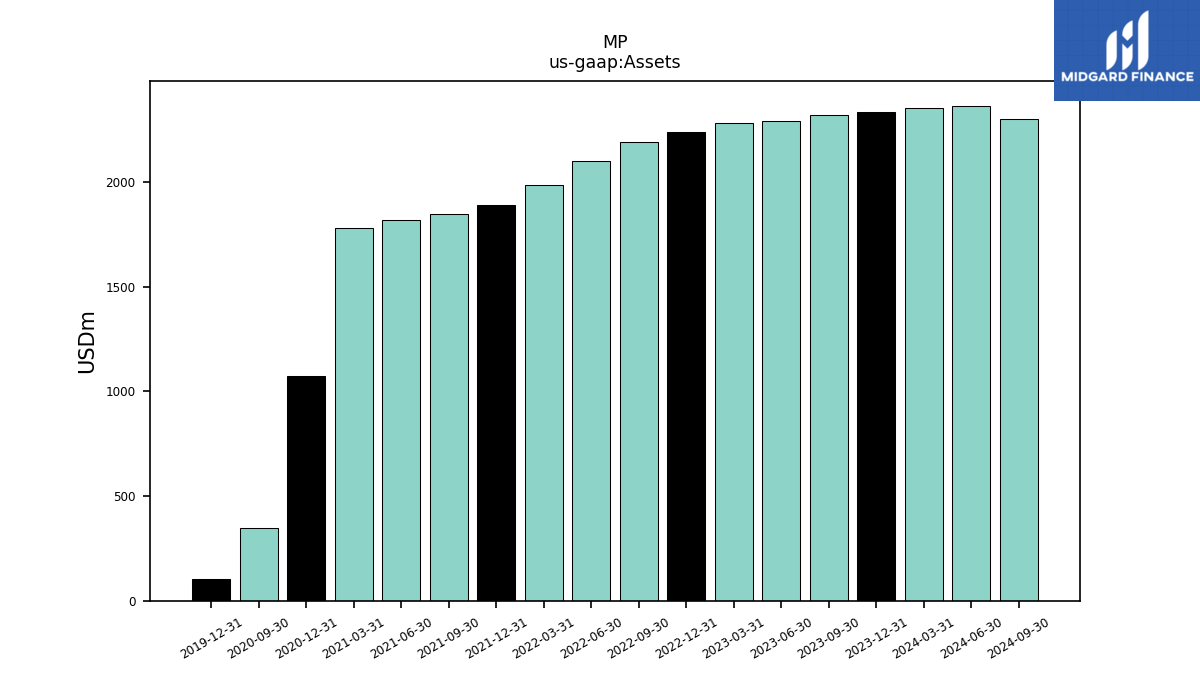
| Assets | 2336.45 | 2322.22 | 2289.45 | 2281.10 | 2237.79 | 2189.16 | 2101.24 | 1987.21 | 1889.67 | 1849.45 | 1817.96 | 1782.53 | 1074.29 | 346.31 | NA | NA | |
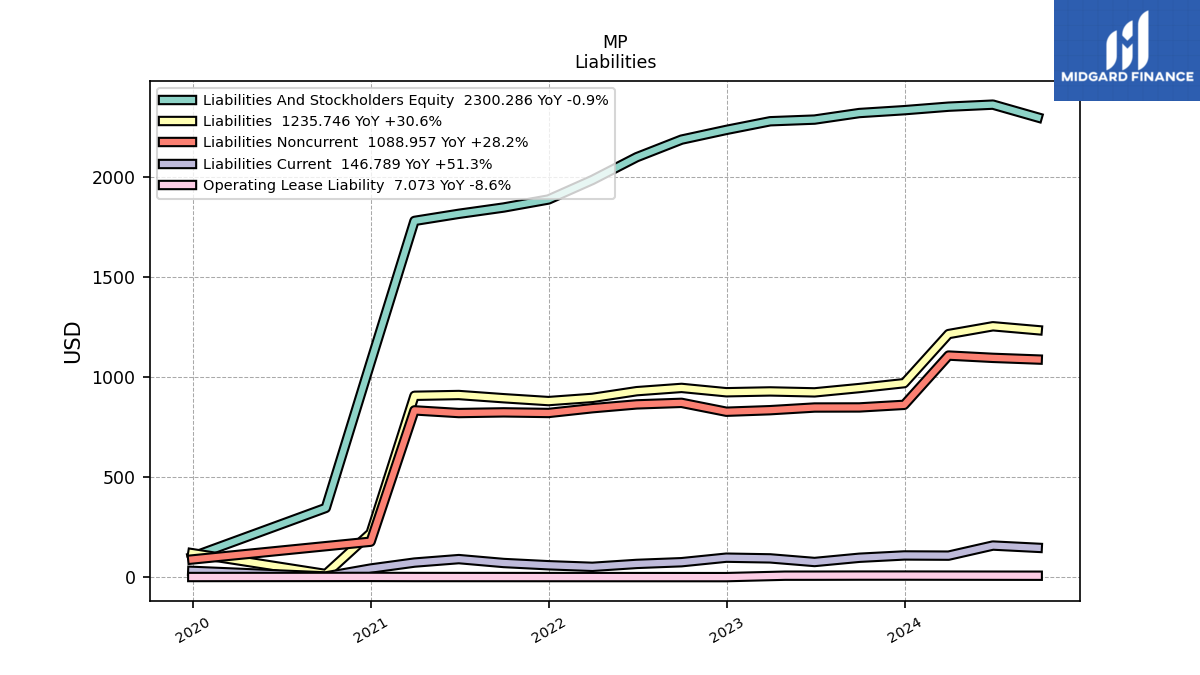
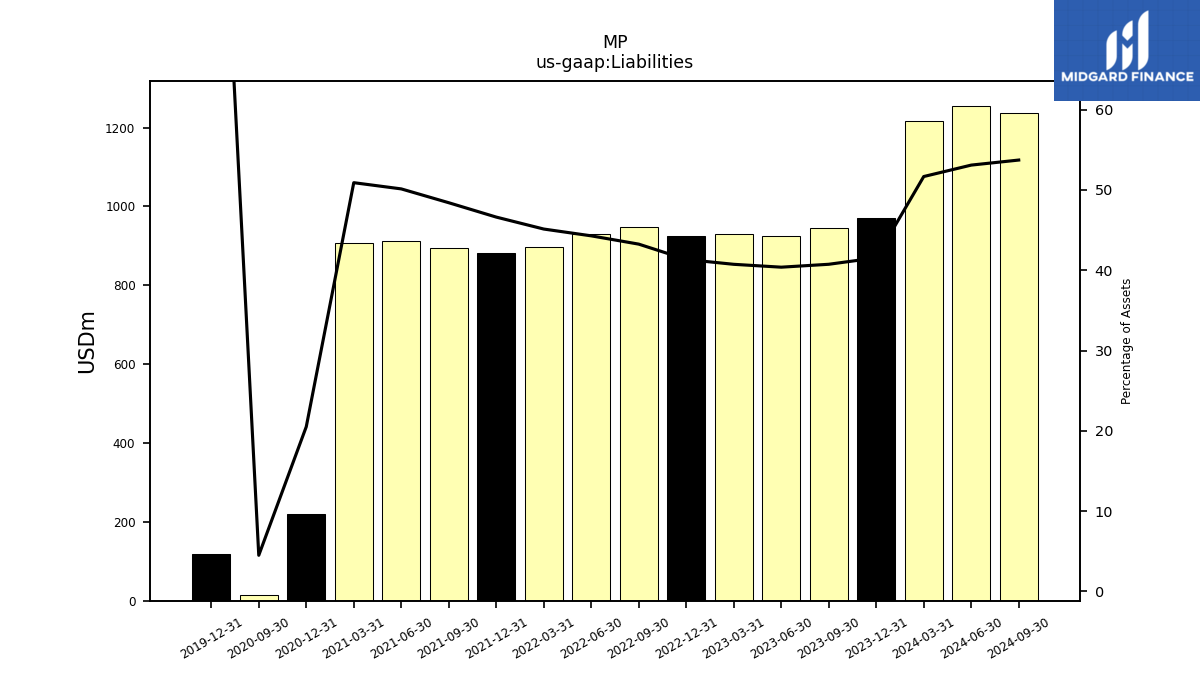
| Liabilities | 970.67 | 946.15 | 924.51 | 929.30 | 925.15 | 946.86 | 930.50 | 896.84 | 880.93 | 895.26 | 911.33 | 907.37 | 220.41 | 15.61 | NA | NA | |
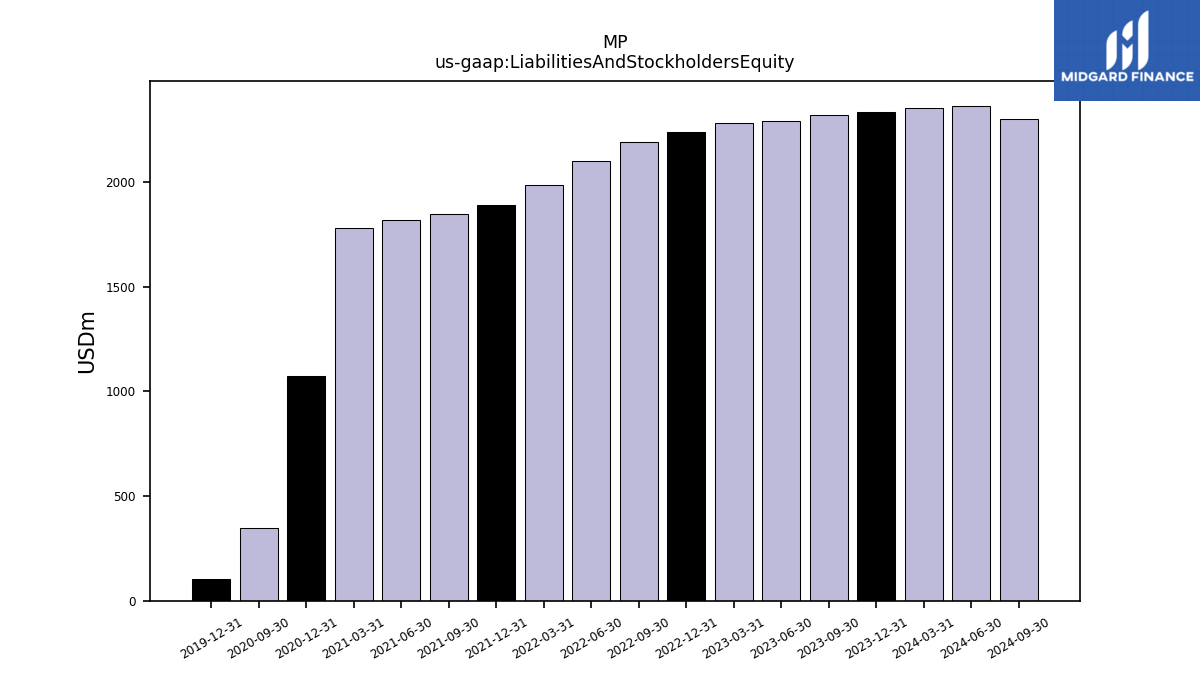
| Liabilities And Stockholders Equity | 2336.45 | 2322.22 | 2289.45 | 2281.10 | 2237.79 | 2189.16 | 2101.24 | 1987.21 | 1889.67 | 1849.45 | 1817.96 | 1782.53 | 1074.29 | 346.31 | NA | NA | |
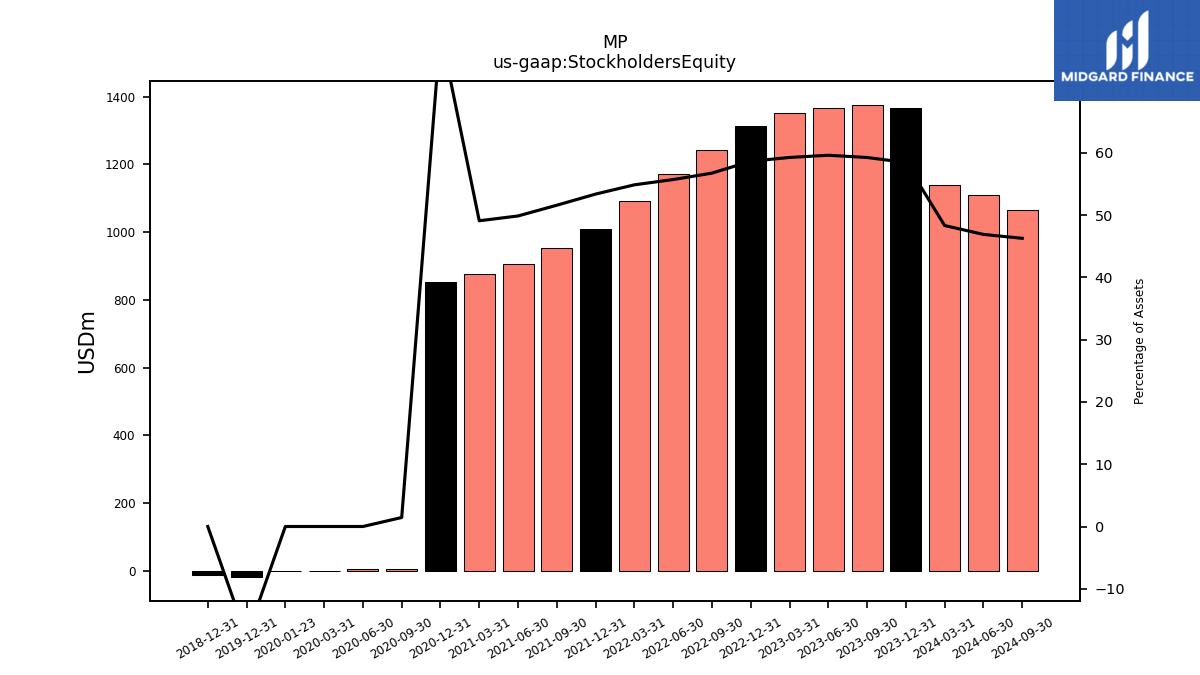
| Stockholders Equity | 1365.78 | 1376.07 | 1364.93 | 1351.81 | 1312.63 | 1242.31 | 1170.74 | 1090.37 | 1008.73 | 954.20 | 906.62 | 875.16 | 853.88 | 5.00 | 5.00 | 0.02 |
| 2023-12-31 | 2023-09-30 | 2023-06-30 | 2023-03-31 | 2022-12-31 | 2022-09-30 | 2022-06-30 | 2022-03-31 | 2021-12-31 | 2021-09-30 | 2021-06-30 | 2021-03-31 | 2020-12-31 | 2020-09-30 | 2020-06-30 | 2020-03-31 | ||
|---|---|---|---|---|---|---|---|---|---|---|---|---|---|---|---|---|---|
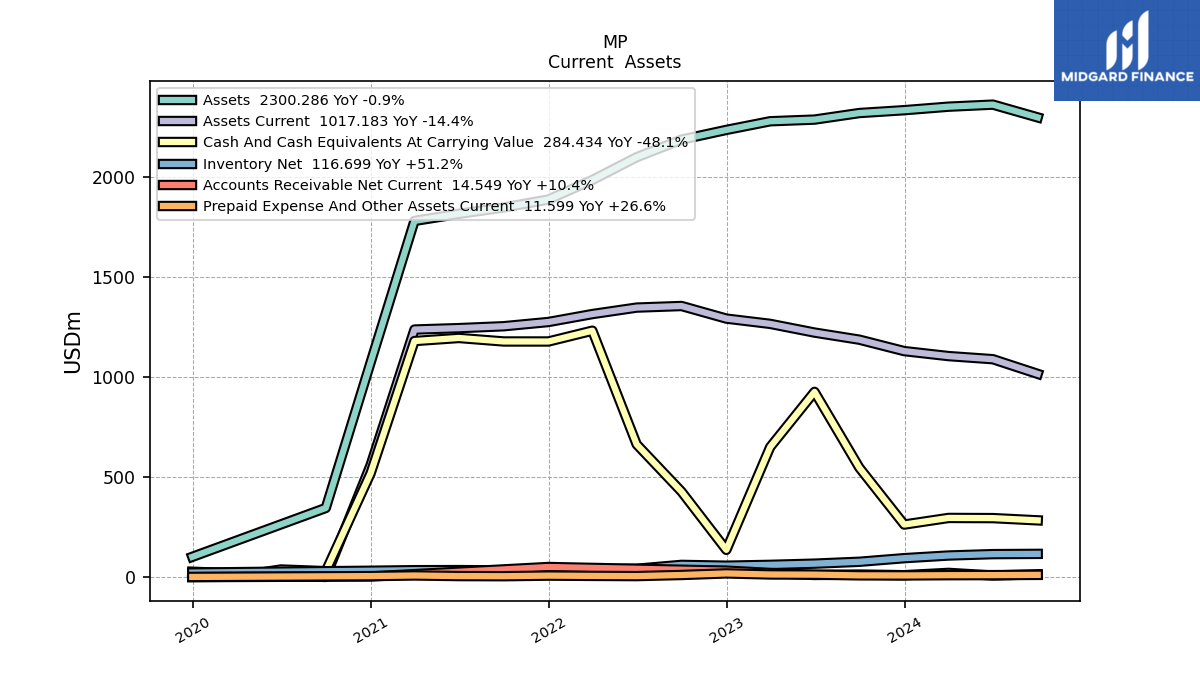
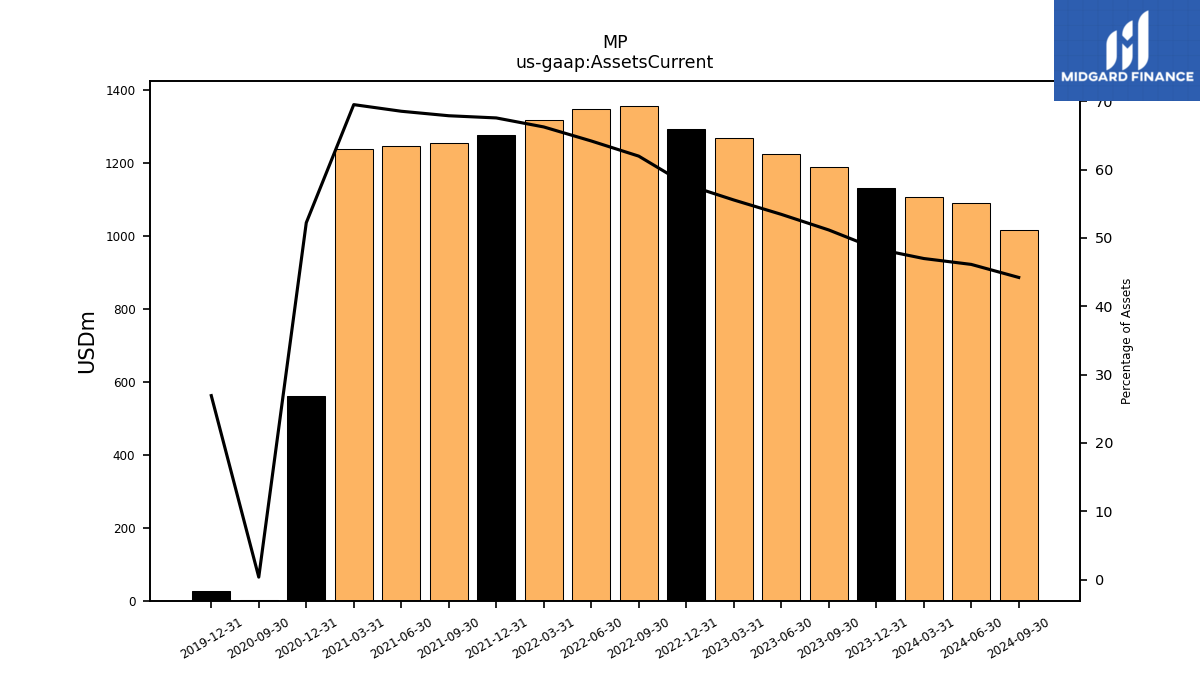
| Assets Current | 1131.18 | 1188.31 | 1223.88 | 1267.39 | 1293.83 | 1356.78 | 1348.87 | 1316.47 | 1276.81 | 1255.55 | 1246.11 | 1239.12 | 561.05 | 1.24 | NA | NA | |
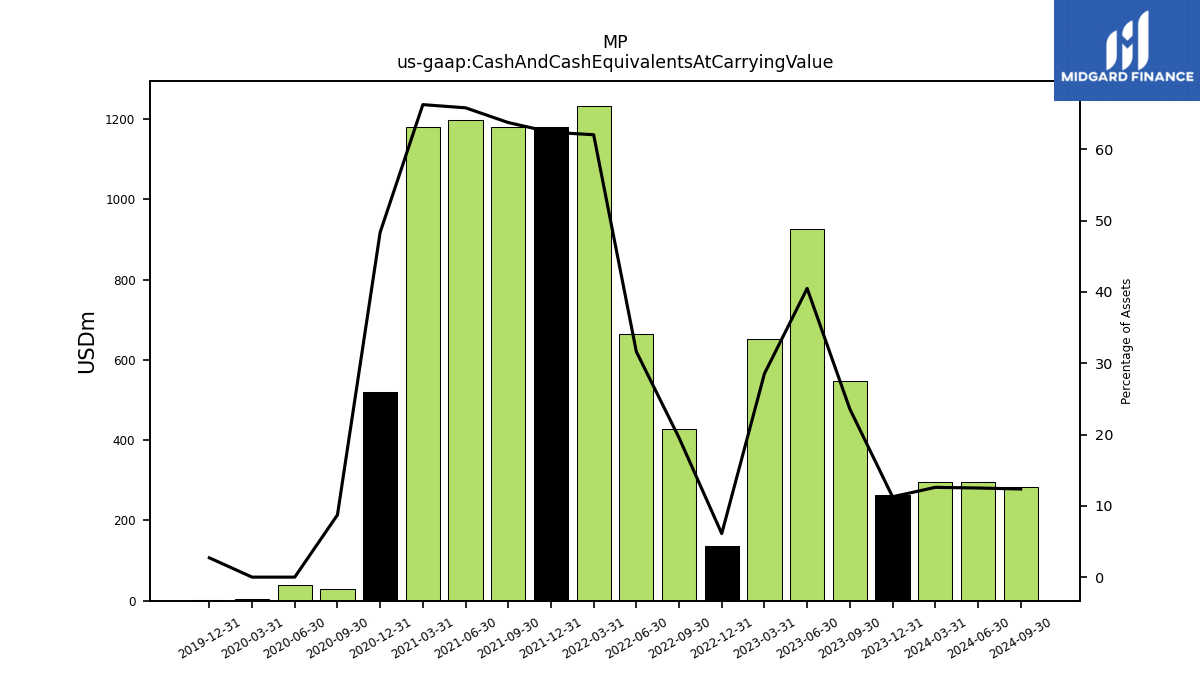
| Cash And Cash Equivalents At Carrying Value | 263.35 | 547.67 | 927.25 | 651.22 | 136.63 | 427.97 | 664.46 | 1233.30 | 1179.30 | 1179.37 | 1196.88 | 1181.52 | 519.65 | 30.24 | 38.55 | 5.38 | |
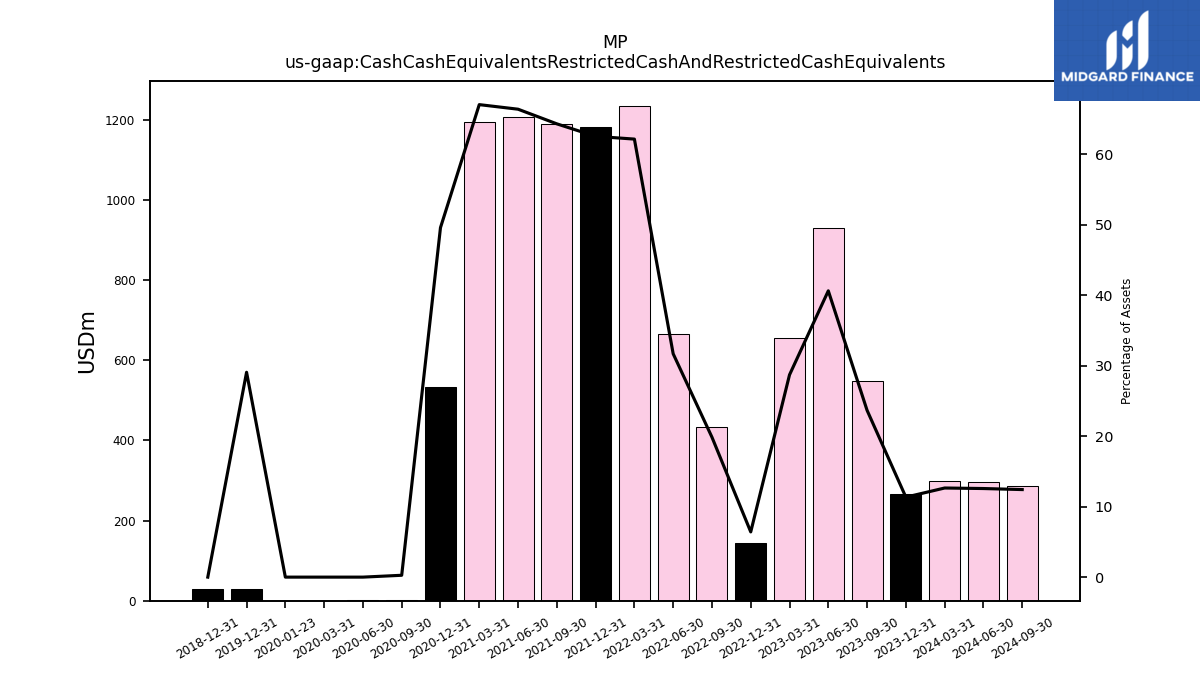
| Cash Cash Equivalents Restricted Cash And Restricted Cash Equivalents | 264.99 | 549.24 | 929.48 | 654.37 | 143.51 | 434.41 | 665.59 | 1234.41 | 1181.16 | 1188.83 | 1206.33 | 1194.39 | 532.44 | 0.91 | 1.43 | 0.03 | |
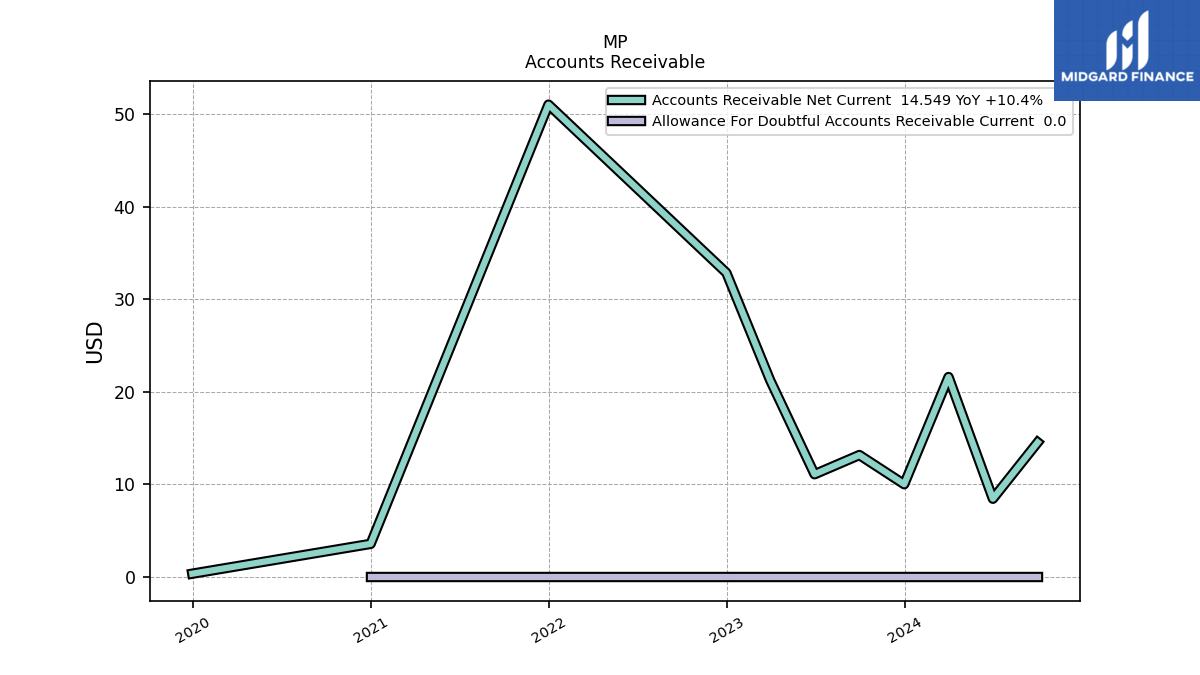
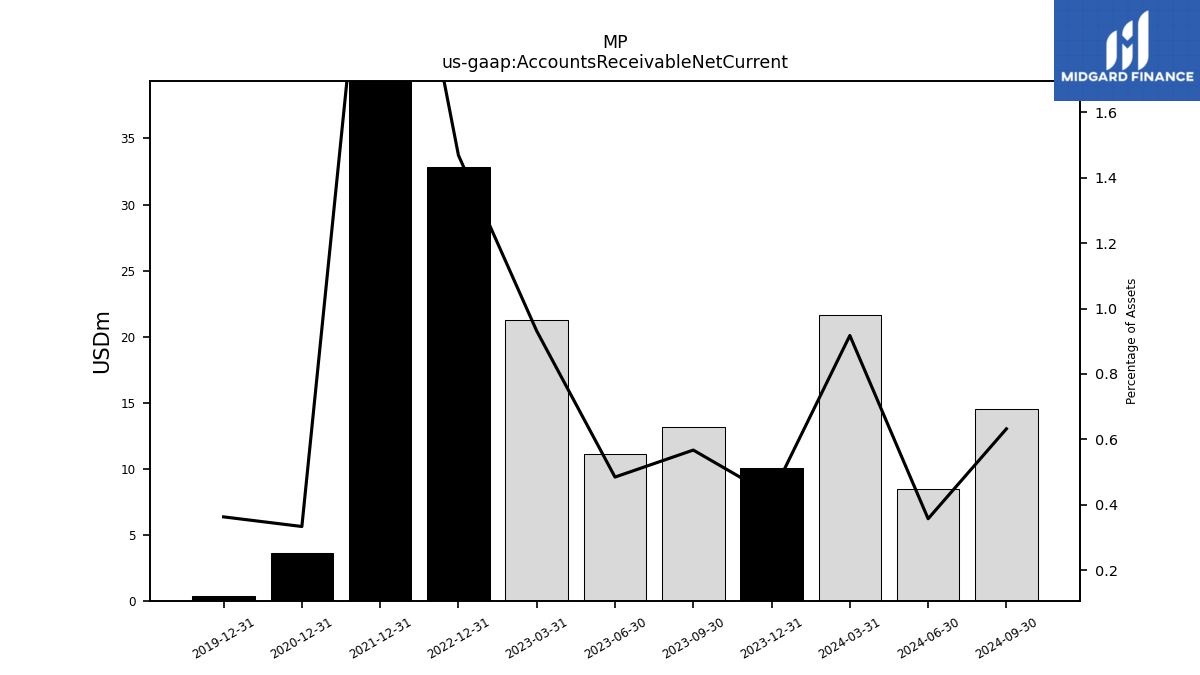
| Accounts Receivable Net Current | 10.03 | 13.18 | 11.11 | 21.25 | 32.86 | NA | NA | NA | 51.01 | NA | NA | NA | 3.59 | NA | NA | NA | |
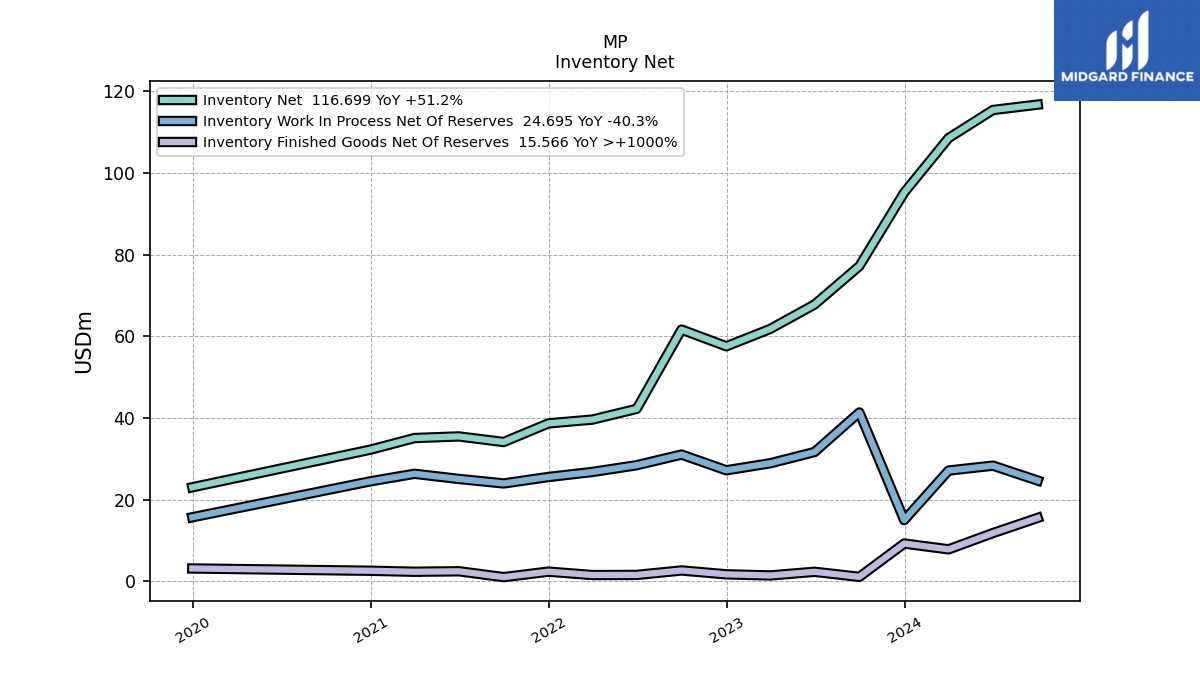
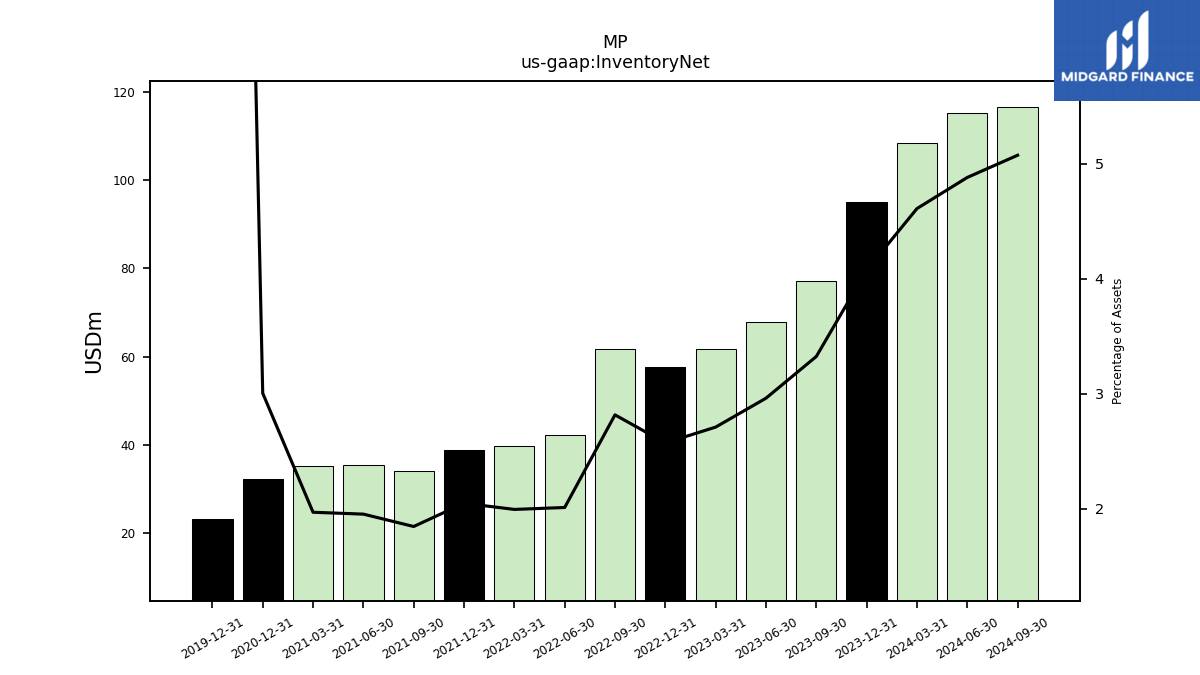
| Inventory Net | 95.18 | 77.18 | 67.78 | 61.80 | 57.55 | 61.65 | 42.24 | 39.62 | 38.69 | 34.13 | 35.50 | 35.10 | 32.27 | NA | NA | NA | |
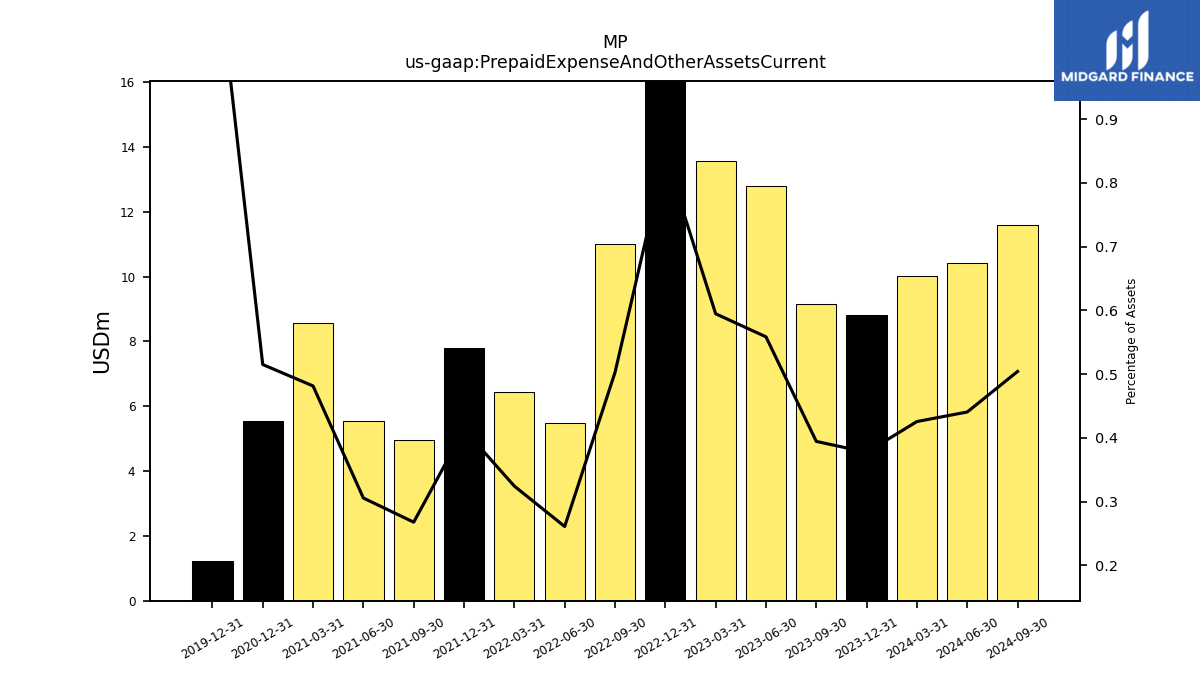
| Prepaid Expense And Other Assets Current | 8.82 | 9.16 | 12.79 | 13.57 | 18.87 | 11.00 | 5.49 | 6.45 | 7.81 | 4.95 | 5.56 | 8.58 | 5.53 | NA | NA | NA |
| 2023-12-31 | 2023-09-30 | 2023-06-30 | 2023-03-31 | 2022-12-31 | 2022-09-30 | 2022-06-30 | 2022-03-31 | 2021-12-31 | 2021-09-30 | 2021-06-30 | 2021-03-31 | 2020-12-31 | 2020-09-30 | 2020-06-30 | 2020-03-31 | ||
|---|---|---|---|---|---|---|---|---|---|---|---|---|---|---|---|---|---|
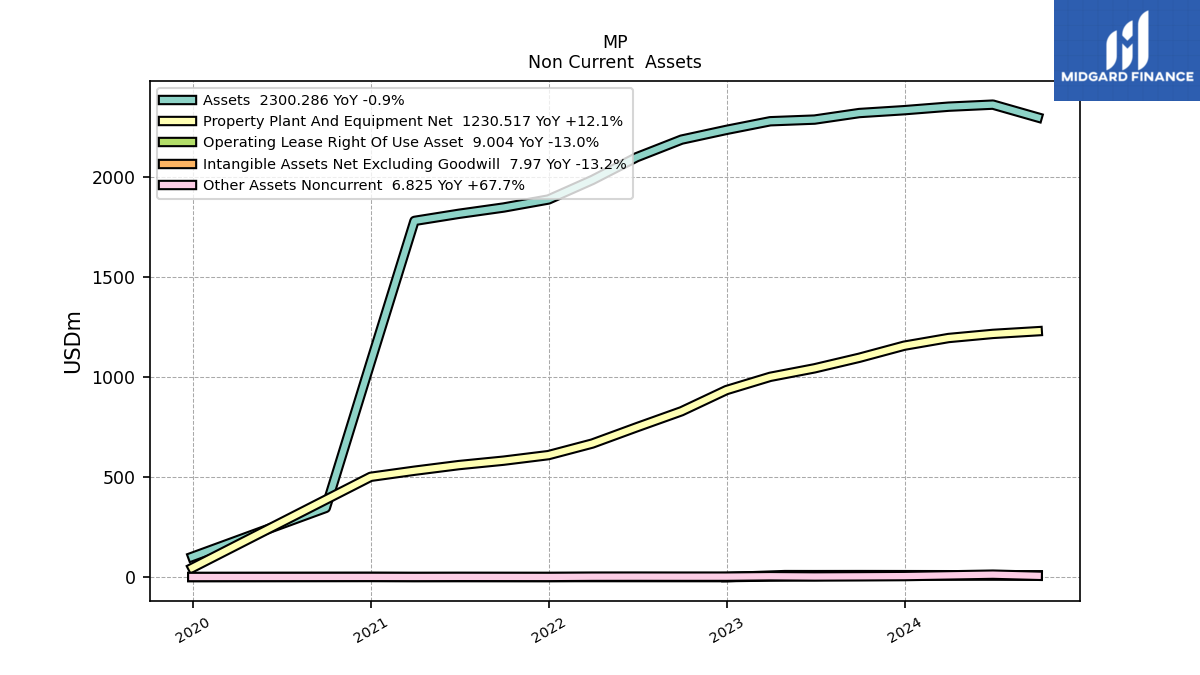
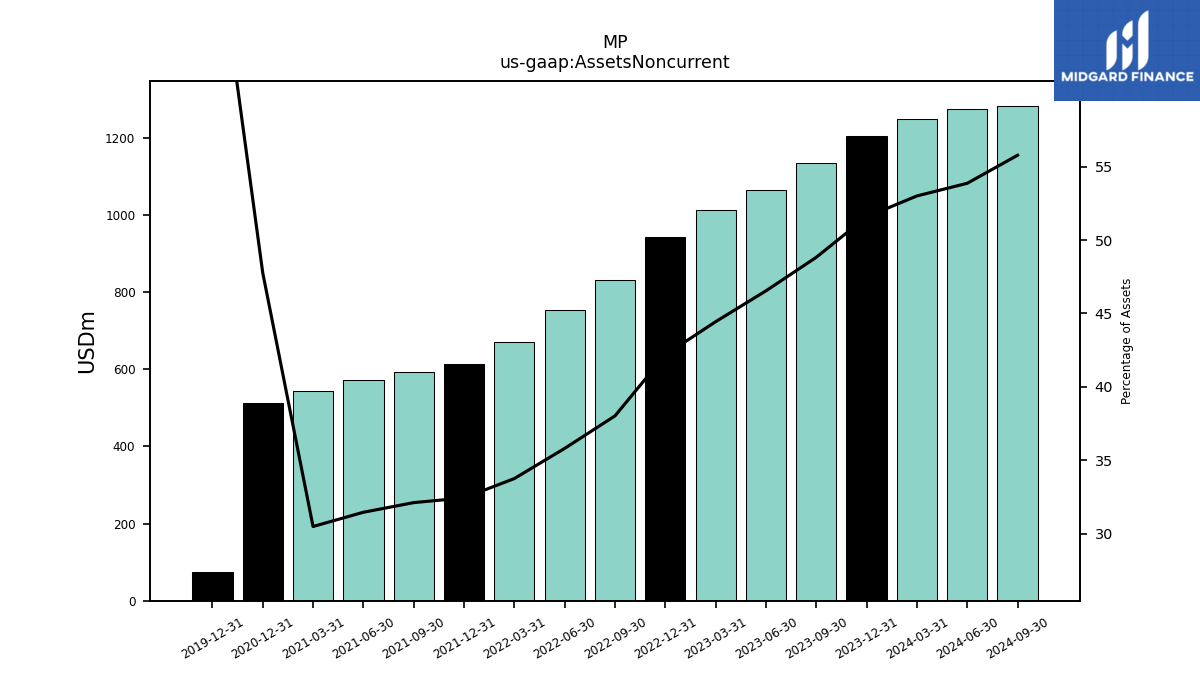
| Assets Noncurrent | 1205.28 | 1133.91 | 1065.57 | 1013.71 | 943.96 | 832.38 | 752.37 | 670.74 | 612.86 | 593.91 | 571.84 | 543.40 | 513.24 | NA | NA | NA | |
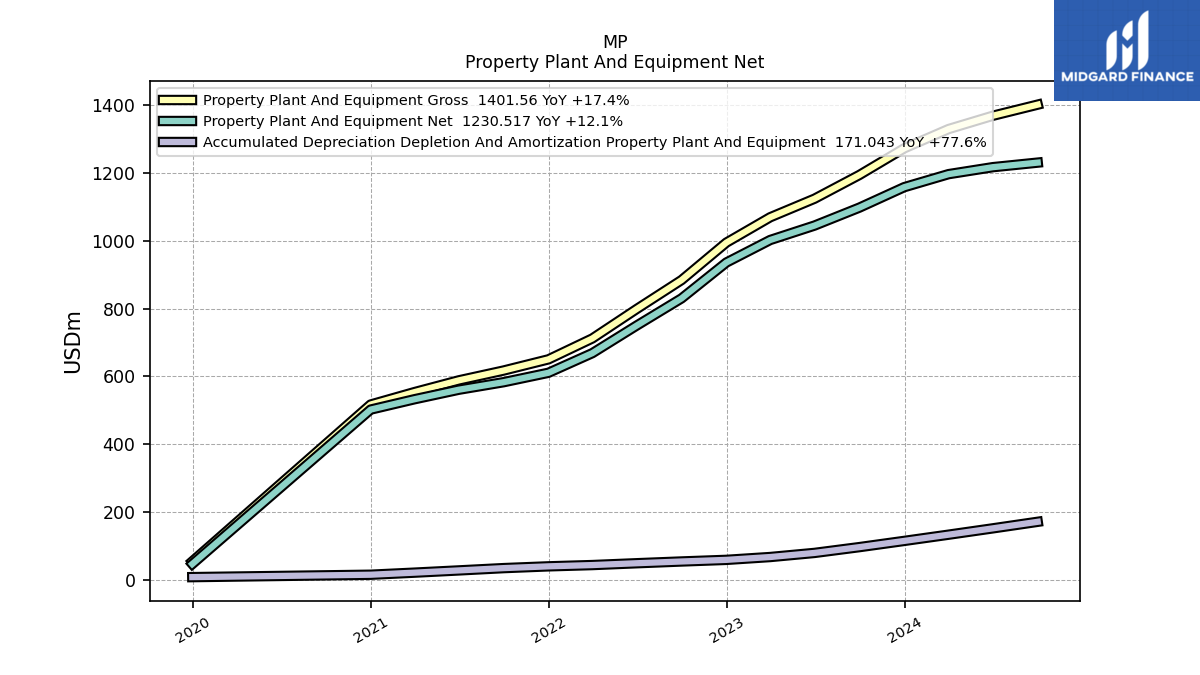
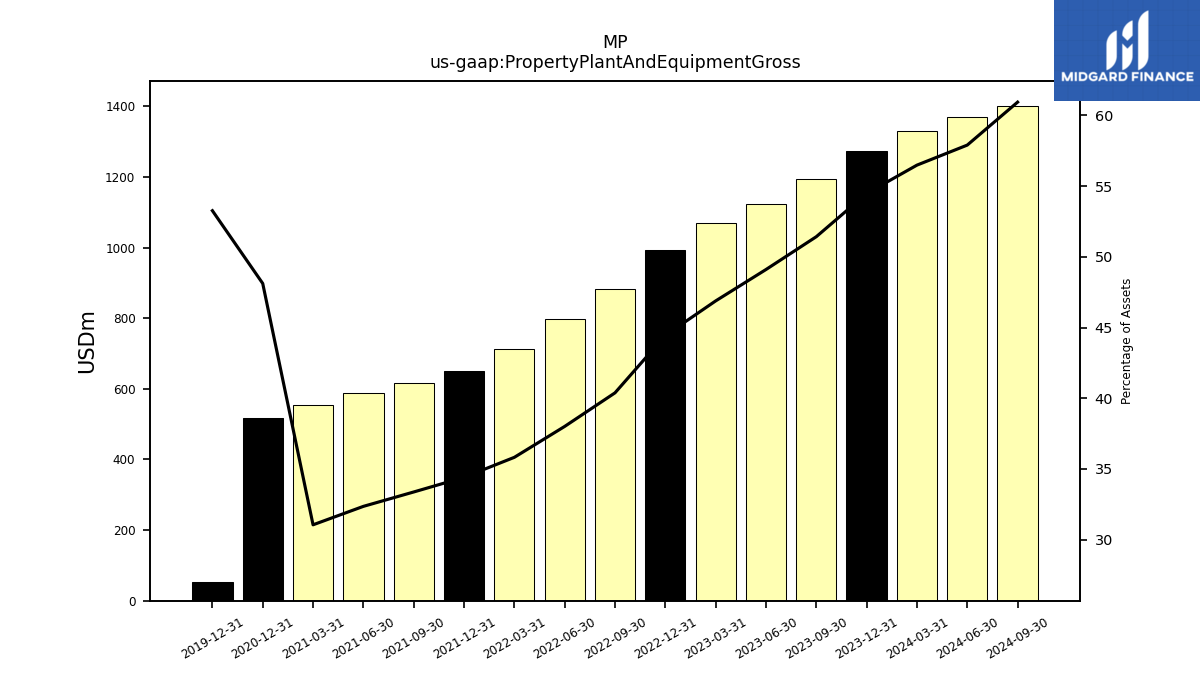
| Property Plant And Equipment Gross | 1272.68 | 1194.04 | 1124.06 | 1069.35 | 994.48 | 884.01 | 798.64 | 711.88 | 650.24 | 617.23 | 588.24 | 553.54 | 516.87 | NA | NA | NA | |
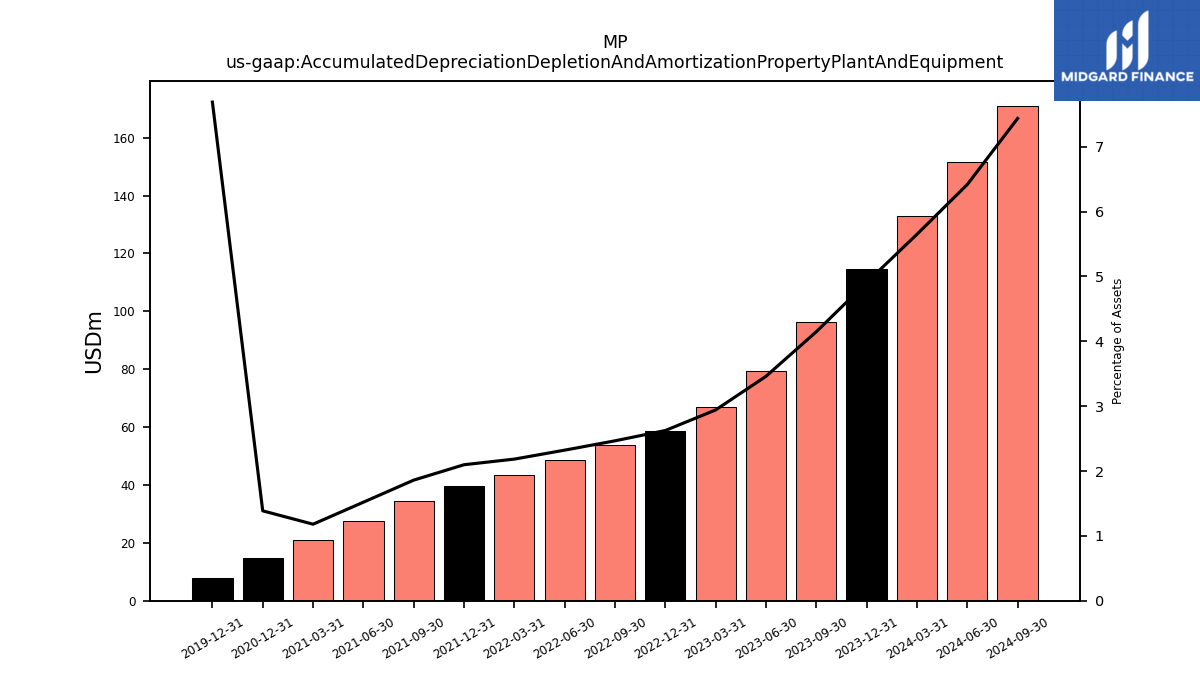
| Accumulated Depreciation Depletion And Amortization Property Plant And Equipment | 114.63 | 96.32 | 79.22 | 67.11 | 58.73 | 53.98 | 48.79 | 43.40 | 39.63 | 34.39 | 27.62 | 21.04 | 14.89 | NA | NA | NA | |
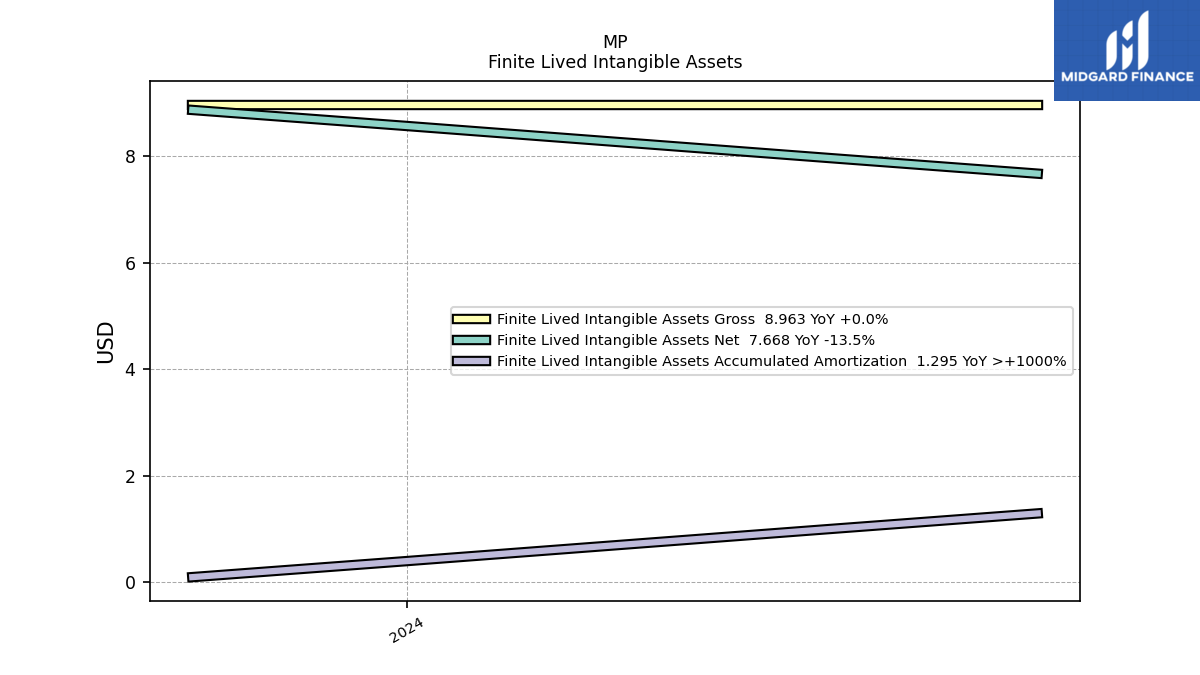
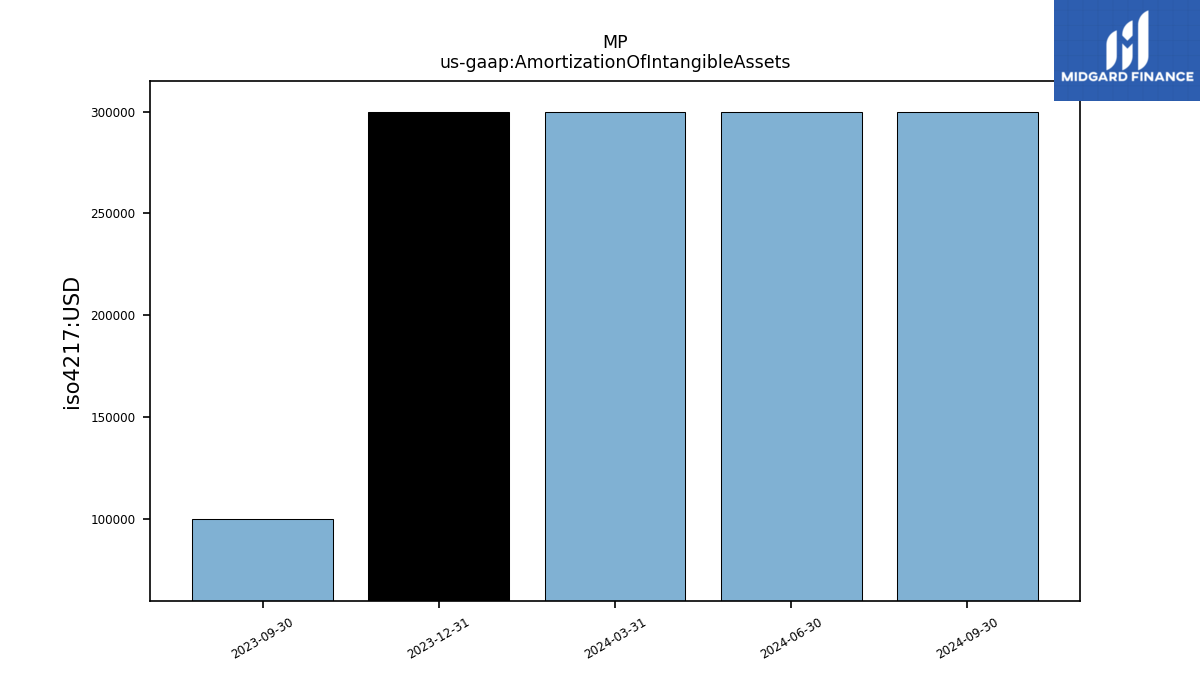
| Amortization Of Intangible Assets | 0.30 | 0.10 | NA | NA | NA | NA | NA | NA | NA | NA | NA | NA | NA | NA | NA | NA | |
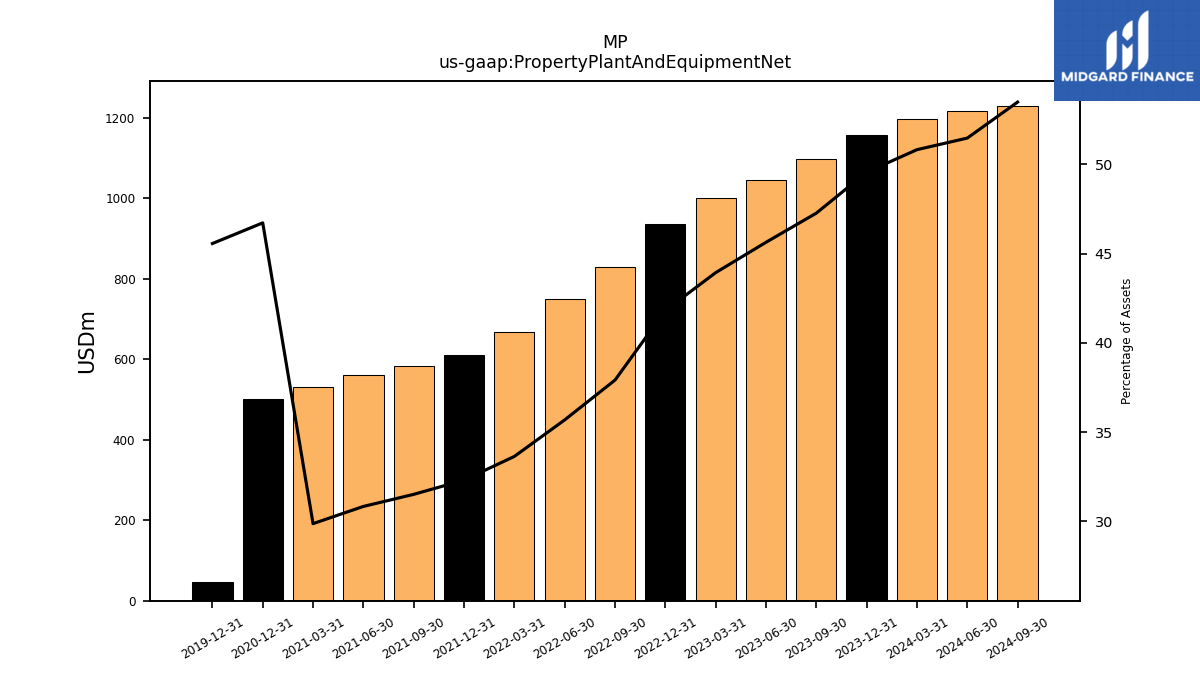
| Property Plant And Equipment Net | 1158.05 | 1097.73 | 1044.84 | 1002.24 | 935.74 | 830.03 | 749.85 | 668.49 | 610.61 | 582.84 | 560.62 | 532.50 | 501.97 | NA | NA | NA | |
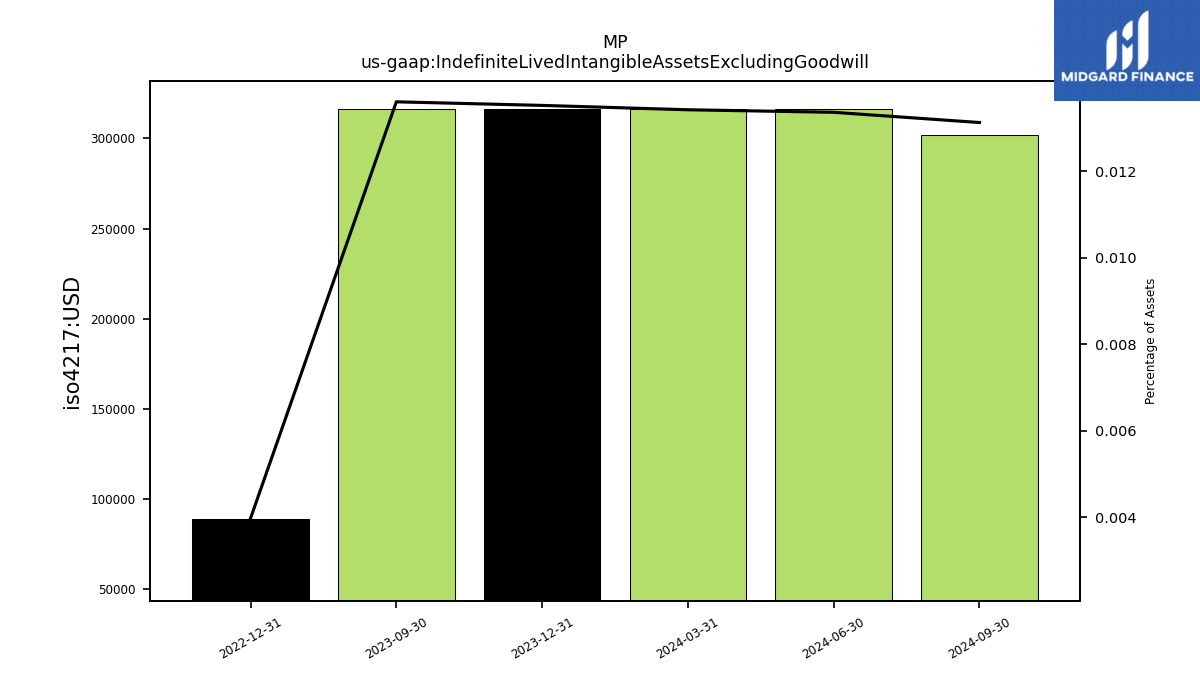
| Indefinite Lived Intangible Assets Excluding Goodwill | 0.32 | 0.32 | NA | NA | 0.09 | NA | NA | NA | NA | NA | NA | NA | NA | NA | NA | NA | |
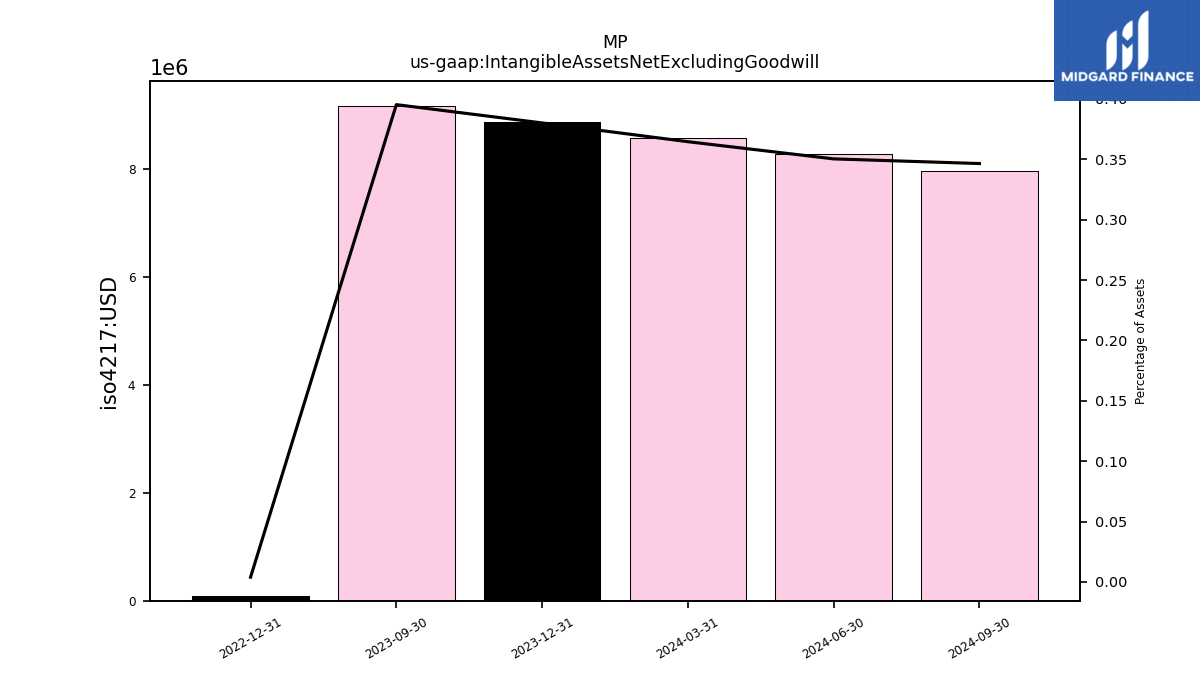
| Intangible Assets Net Excluding Goodwill | 8.88 | 9.18 | NA | NA | 0.09 | NA | NA | NA | NA | NA | NA | NA | NA | NA | NA | NA | |
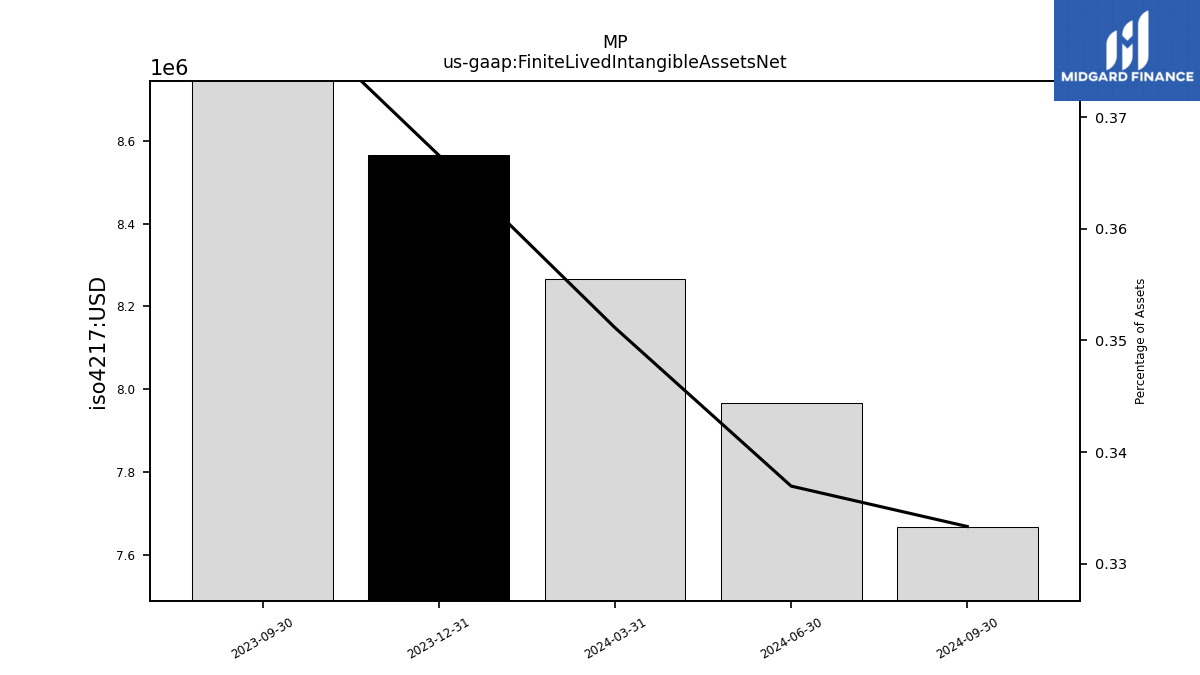
| Finite Lived Intangible Assets Net | 8.56 | 8.86 | NA | NA | NA | NA | NA | NA | NA | NA | NA | NA | NA | NA | NA | NA | |
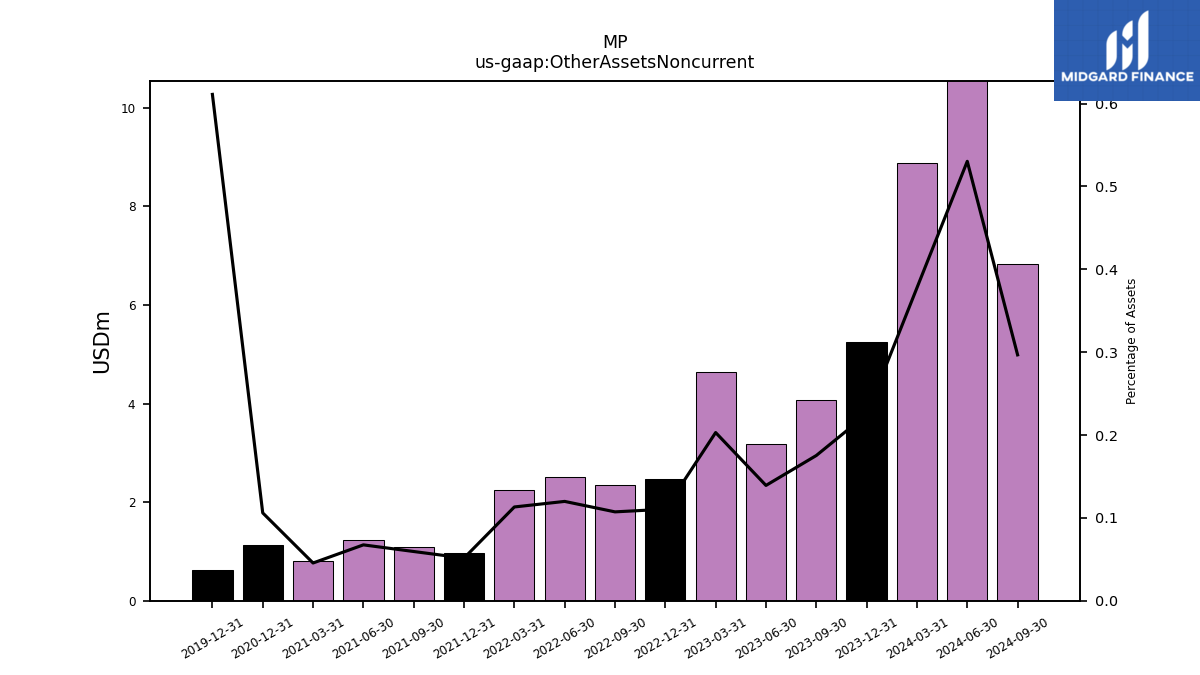
| Other Assets Noncurrent | 5.25 | 4.07 | 3.19 | 4.63 | 2.47 | 2.35 | 2.52 | 2.25 | 0.97 | 1.10 | 1.23 | 0.81 | 1.14 | NA | NA | NA | |
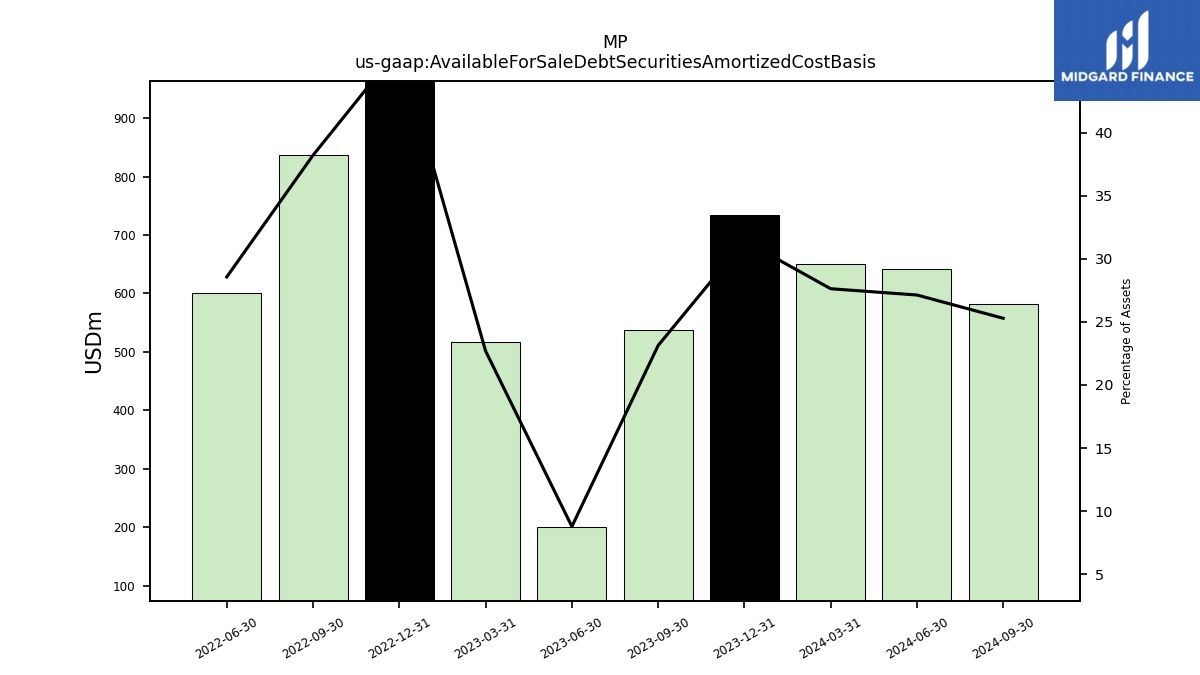
| Available For Sale Debt Securities Amortized Cost Basis | 734.33 | 537.09 | 201.05 | 517.66 | 1045.46 | 836.45 | 600.20 | NA | NA | NA | NA | NA | NA | NA | NA | NA |
| 2023-12-31 | 2023-09-30 | 2023-06-30 | 2023-03-31 | 2022-12-31 | 2022-09-30 | 2022-06-30 | 2022-03-31 | 2021-12-31 | 2021-09-30 | 2021-06-30 | 2021-03-31 | 2020-12-31 | 2020-09-30 | 2020-06-30 | 2020-03-31 | ||
|---|---|---|---|---|---|---|---|---|---|---|---|---|---|---|---|---|---|
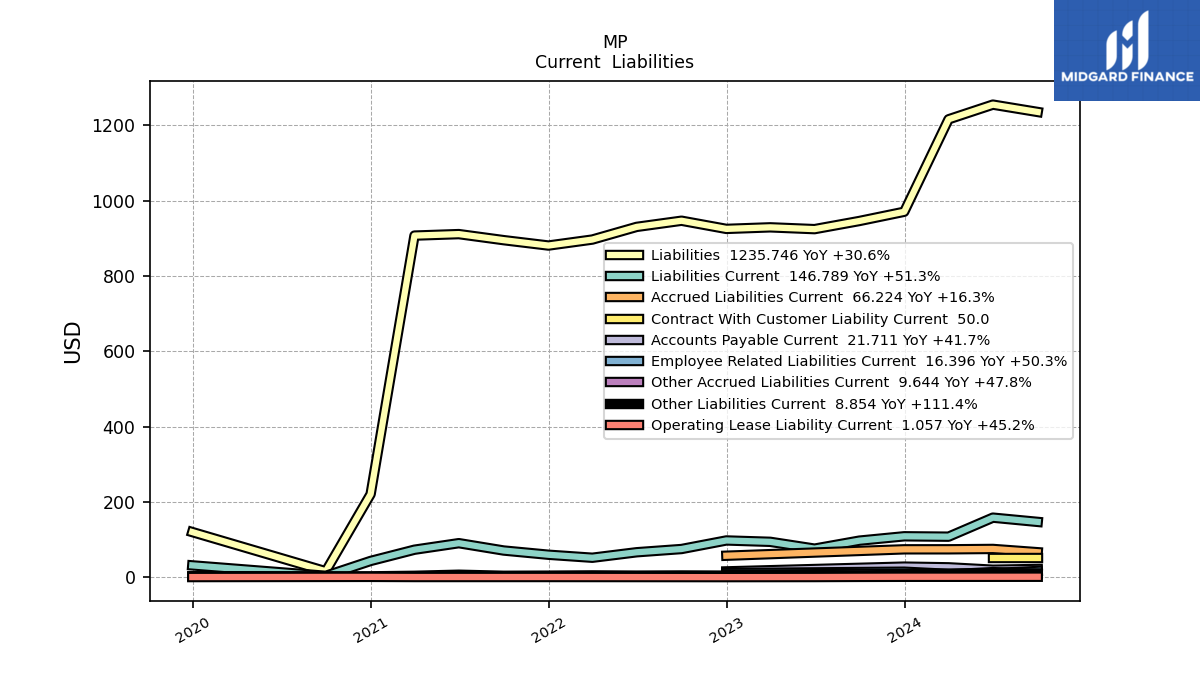
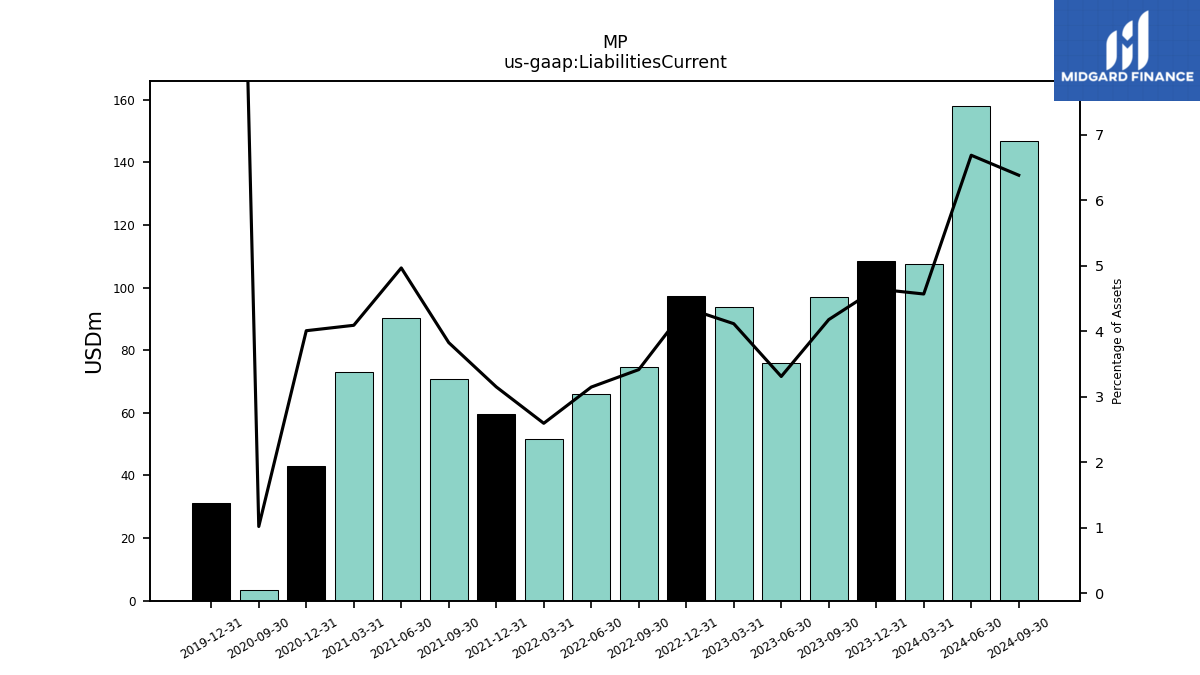
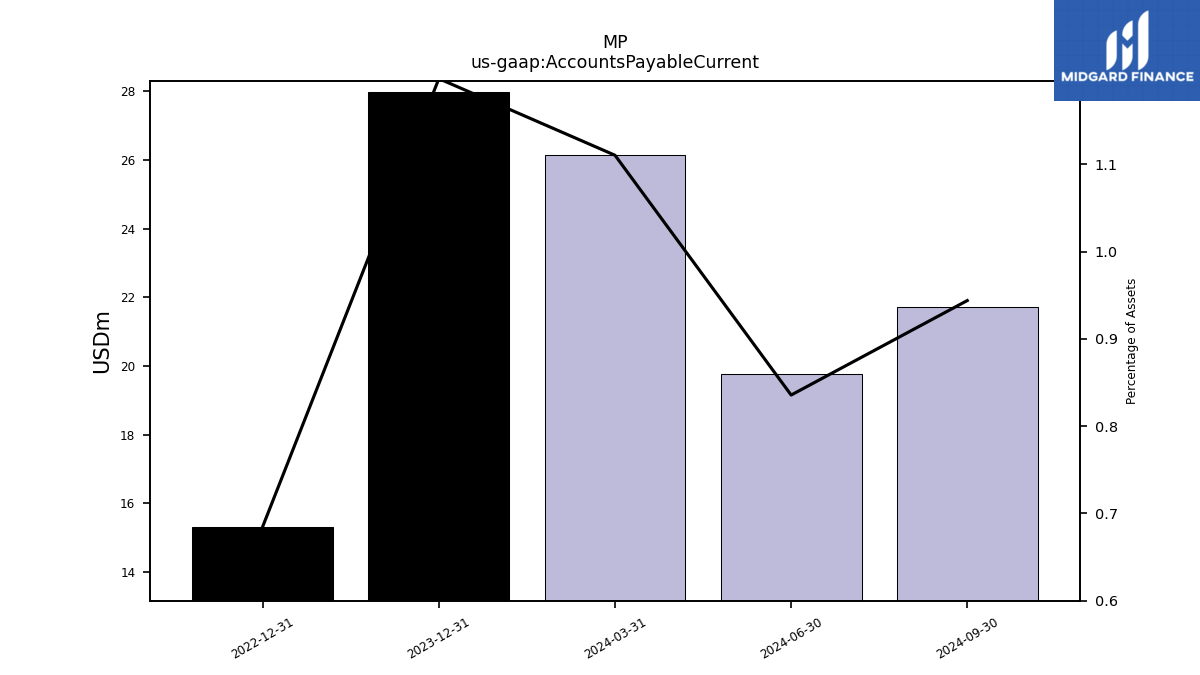
| Liabilities Current | 108.55 | 97.01 | 75.77 | 93.87 | 97.48 | 74.75 | 66.15 | 51.58 | 59.54 | 70.77 | 90.29 | 72.92 | 43.06 | 3.53 | NA | NA | |
| Accounts Payable Current | 28.00 | NA | NA | NA | 15.33 | NA | NA | NA | NA | NA | NA | NA | NA | NA | NA | NA | |
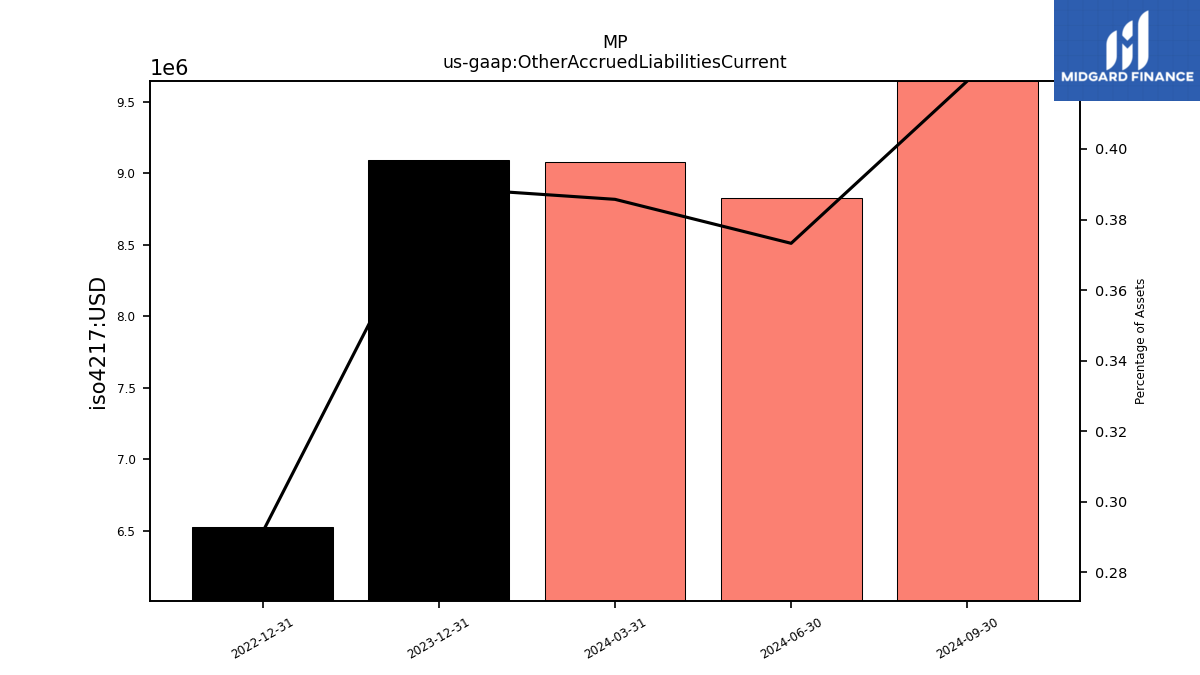
| Other Accrued Liabilities Current | 9.09 | NA | NA | NA | 6.52 | NA | NA | NA | NA | NA | NA | NA | NA | NA | NA | NA | |
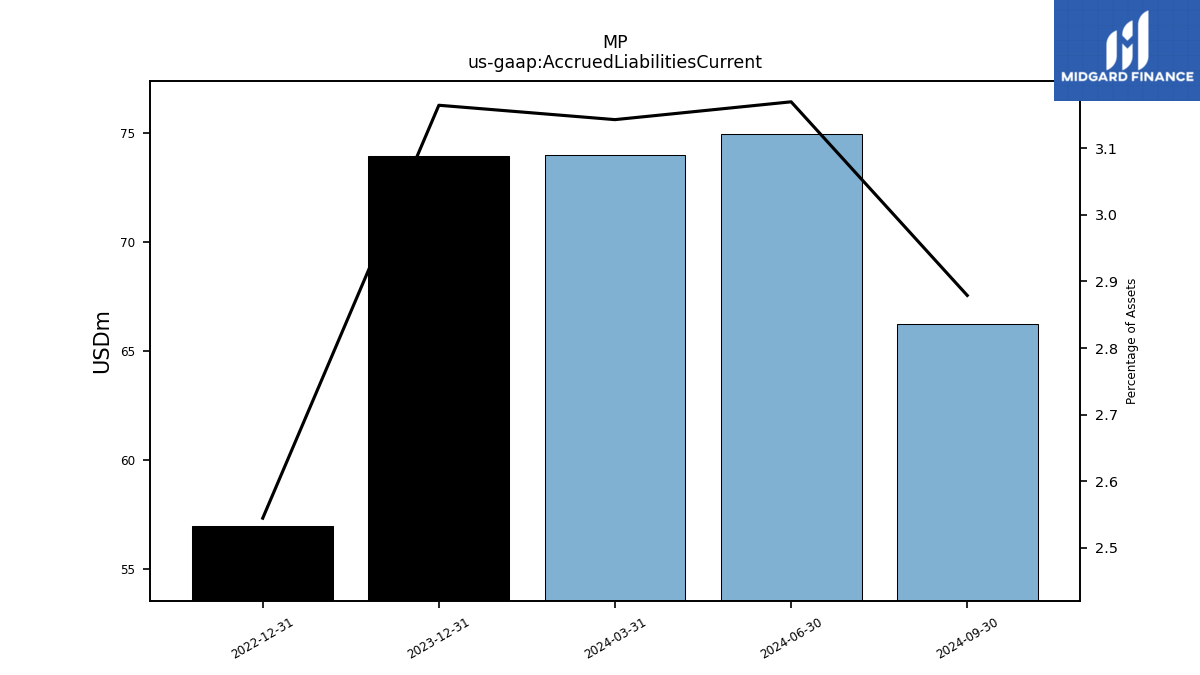
| Accrued Liabilities Current | 73.94 | NA | NA | NA | 56.94 | NA | NA | NA | NA | NA | NA | NA | NA | NA | NA | NA | |
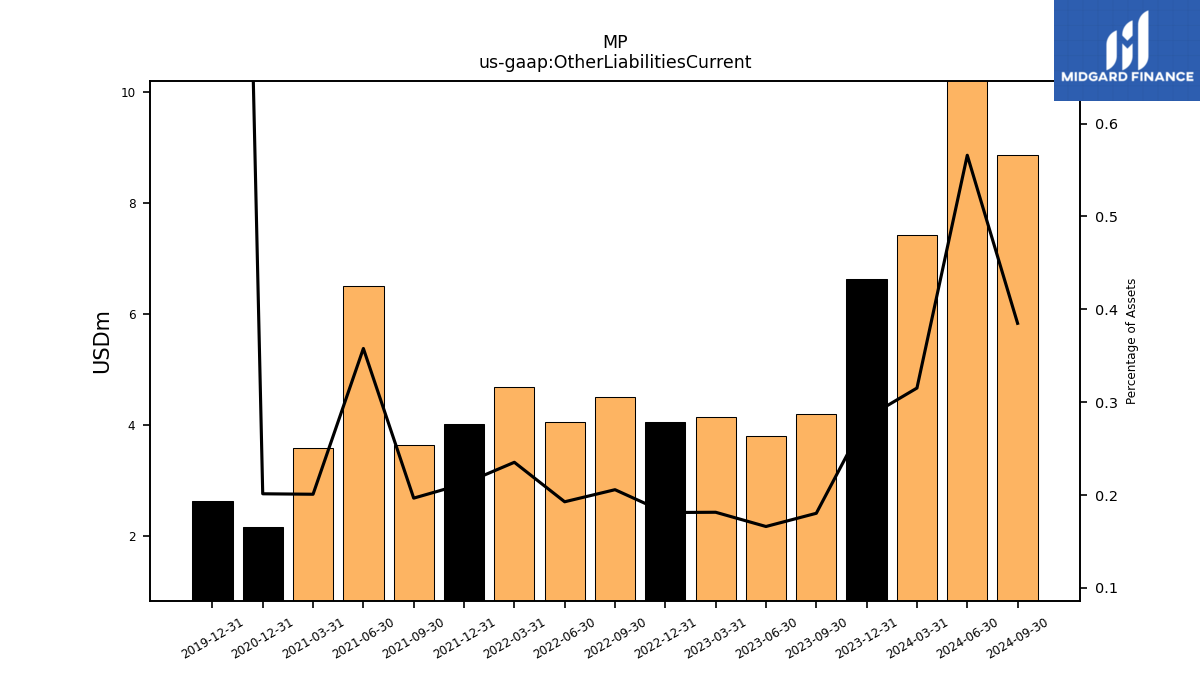
| Other Liabilities Current | 6.62 | 4.19 | 3.80 | 4.14 | 4.05 | 4.50 | 4.05 | 4.67 | 4.01 | 3.64 | 6.50 | 3.58 | 2.16 | NA | NA | NA |
| 2023-12-31 | 2023-09-30 | 2023-06-30 | 2023-03-31 | 2022-12-31 | 2022-09-30 | 2022-06-30 | 2022-03-31 | 2021-12-31 | 2021-09-30 | 2021-06-30 | 2021-03-31 | 2020-12-31 | 2020-09-30 | 2020-06-30 | 2020-03-31 | ||
|---|---|---|---|---|---|---|---|---|---|---|---|---|---|---|---|---|---|
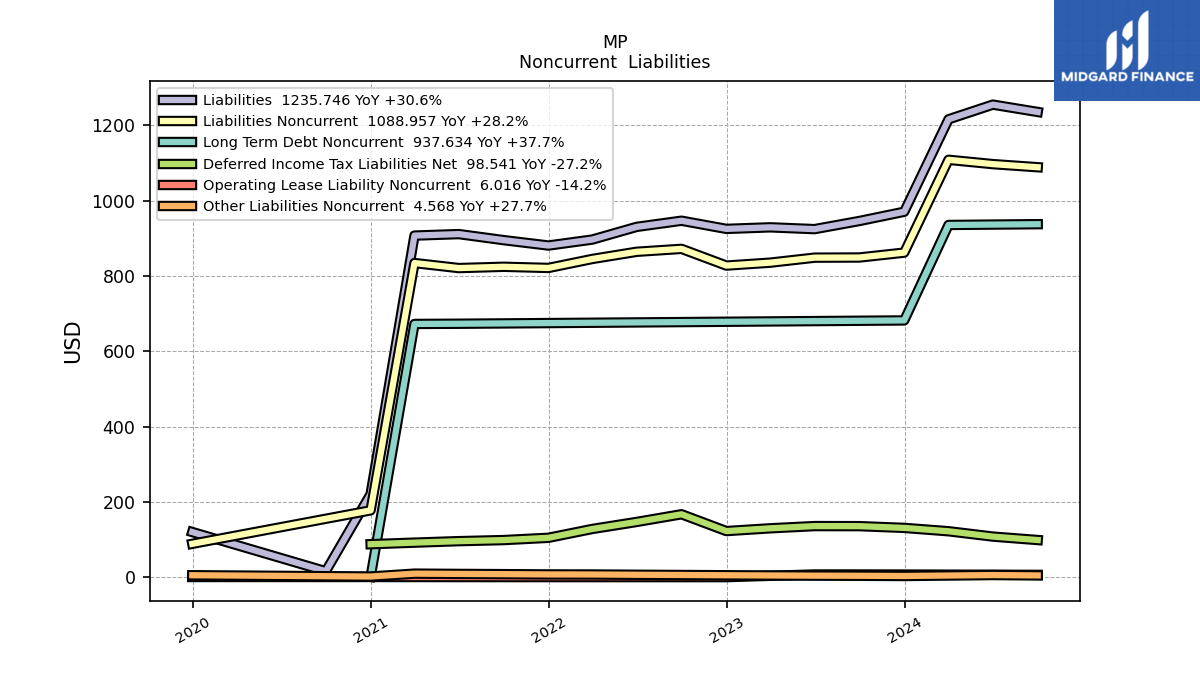
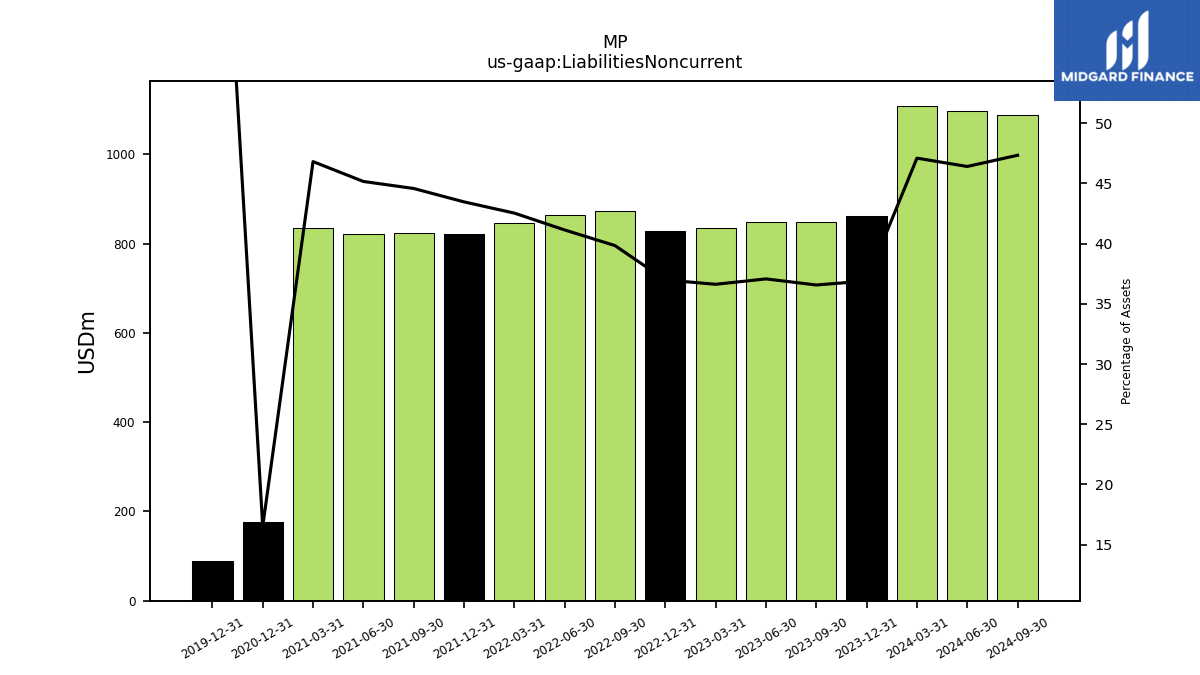
| Liabilities Noncurrent | 862.12 | 849.14 | 848.74 | 835.42 | 827.67 | 872.11 | 864.36 | 845.27 | 821.39 | 824.49 | 821.04 | 834.45 | 177.35 | NA | NA | NA | |
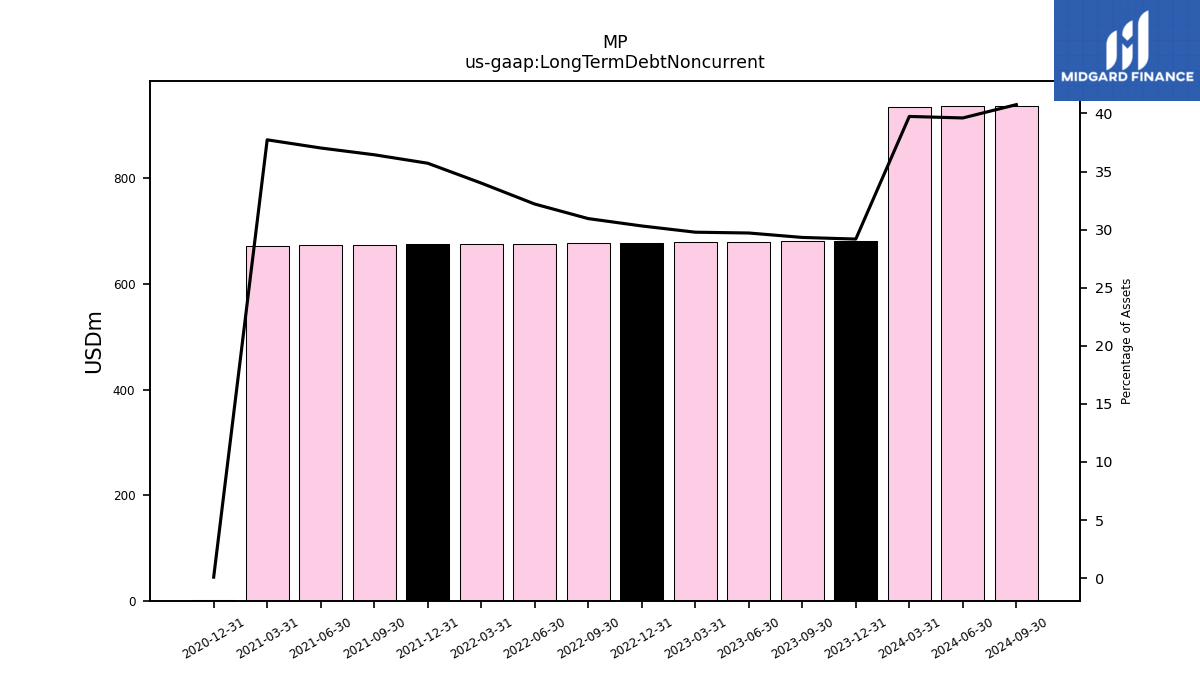
| Long Term Debt Noncurrent | 681.98 | 681.09 | 680.21 | 679.33 | 678.44 | 677.56 | 676.68 | 675.80 | 674.93 | 674.05 | 673.17 | 672.58 | 0.96 | NA | NA | NA | |
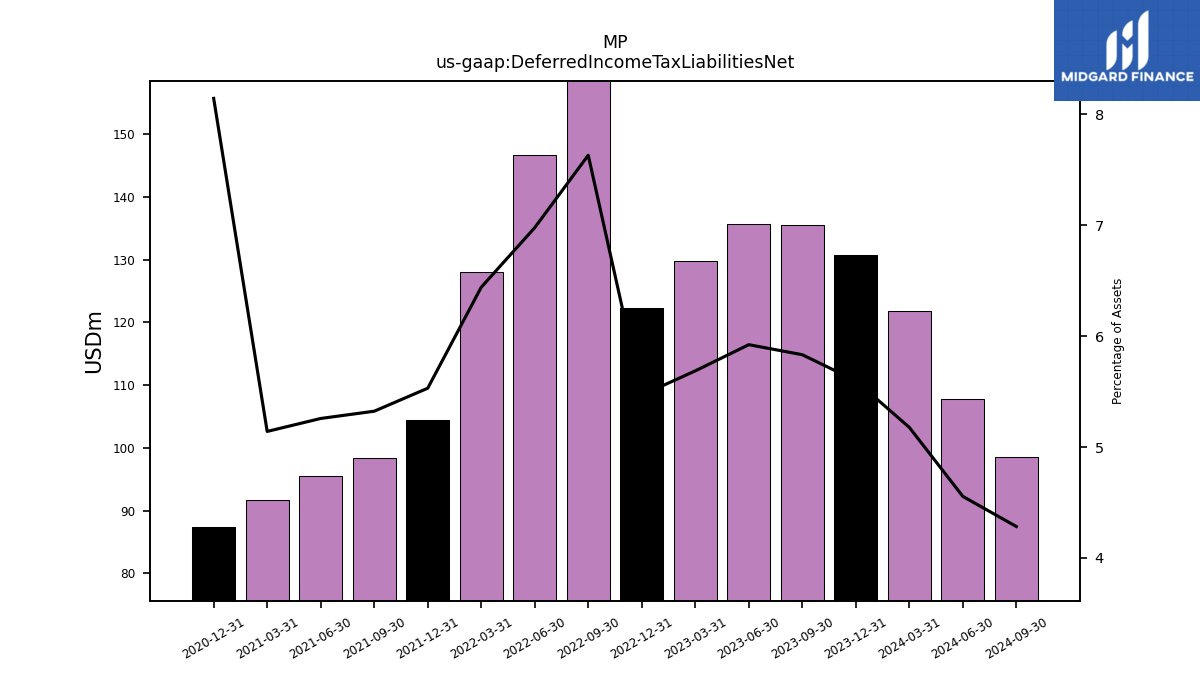
| Deferred Income Tax Liabilities Net | 130.79 | 135.44 | 135.59 | 129.71 | 122.35 | 167.03 | 146.61 | 127.98 | 104.50 | 98.44 | 95.58 | 91.64 | 87.47 | NA | NA | NA | |
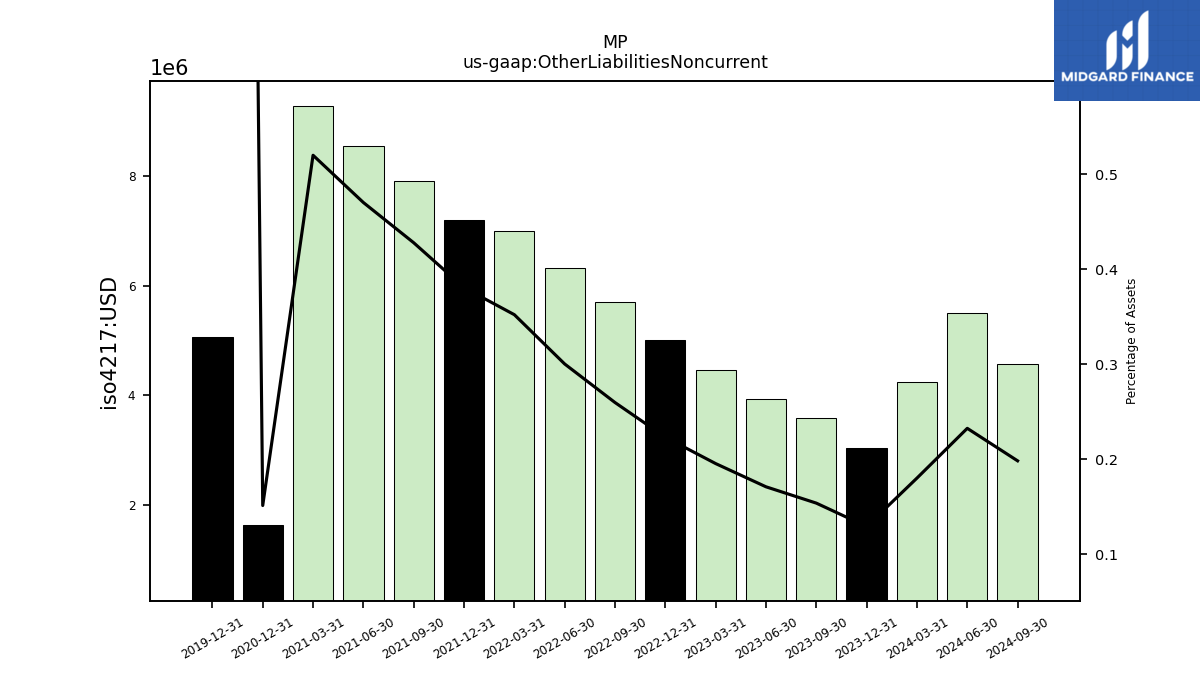
| Other Liabilities Noncurrent | 3.02 | 3.58 | 3.92 | 4.46 | 5.00 | 5.69 | 6.32 | 7.00 | 7.20 | 7.92 | 8.55 | 9.27 | 1.63 | NA | NA | NA | |
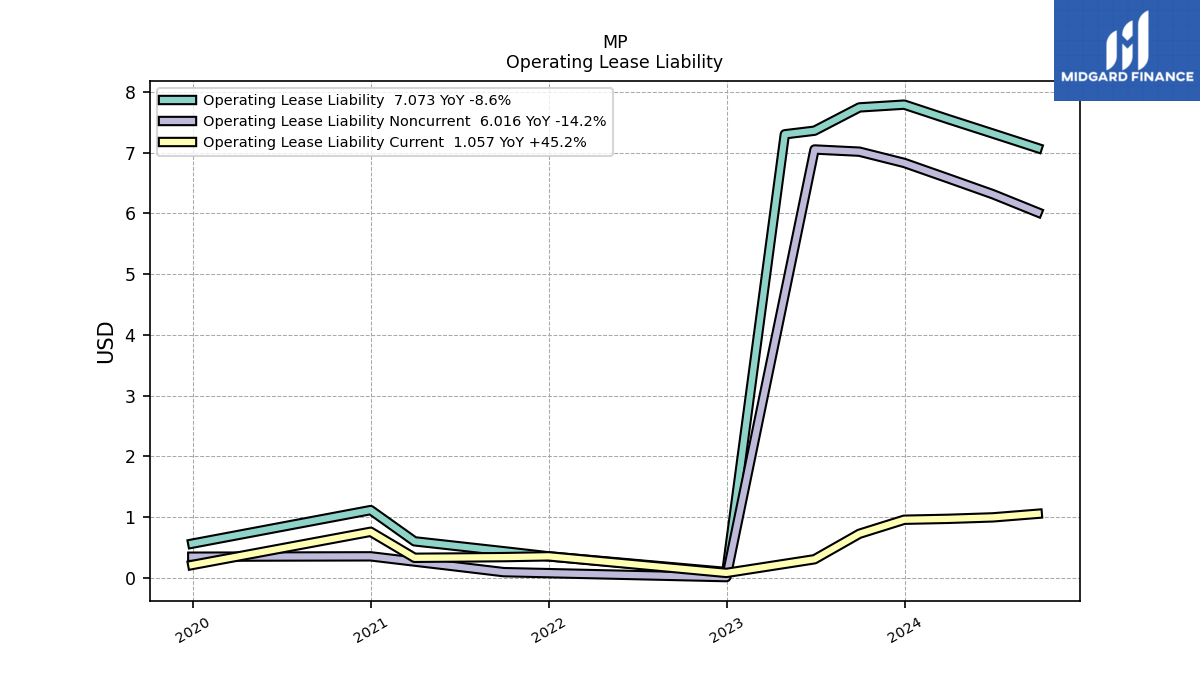
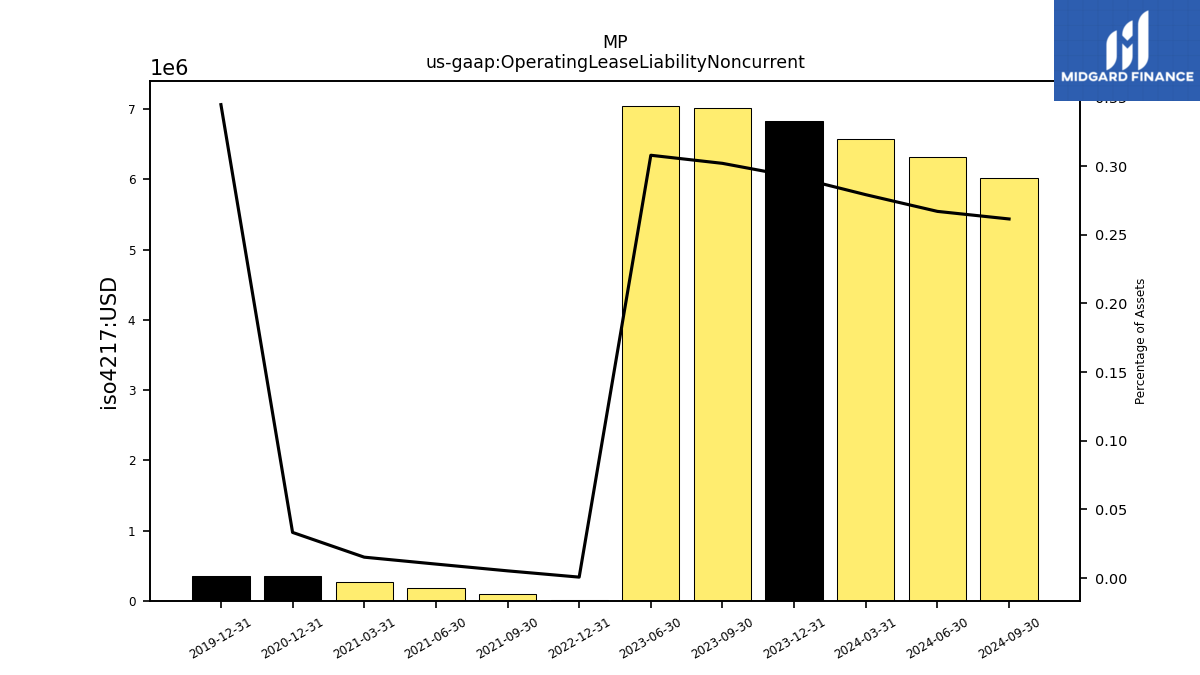
| Operating Lease Liability Noncurrent | 6.83 | 7.01 | 7.05 | NA | 0.01 | NA | NA | NA | NA | 0.10 | 0.18 | 0.27 | 0.36 | NA | NA | NA |
| 2023-12-31 | 2023-09-30 | 2023-06-30 | 2023-03-31 | 2022-12-31 | 2022-09-30 | 2022-06-30 | 2022-03-31 | 2021-12-31 | 2021-09-30 | 2021-06-30 | 2021-03-31 | 2020-12-31 | 2020-09-30 | 2020-06-30 | 2020-03-31 | ||
|---|---|---|---|---|---|---|---|---|---|---|---|---|---|---|---|---|---|
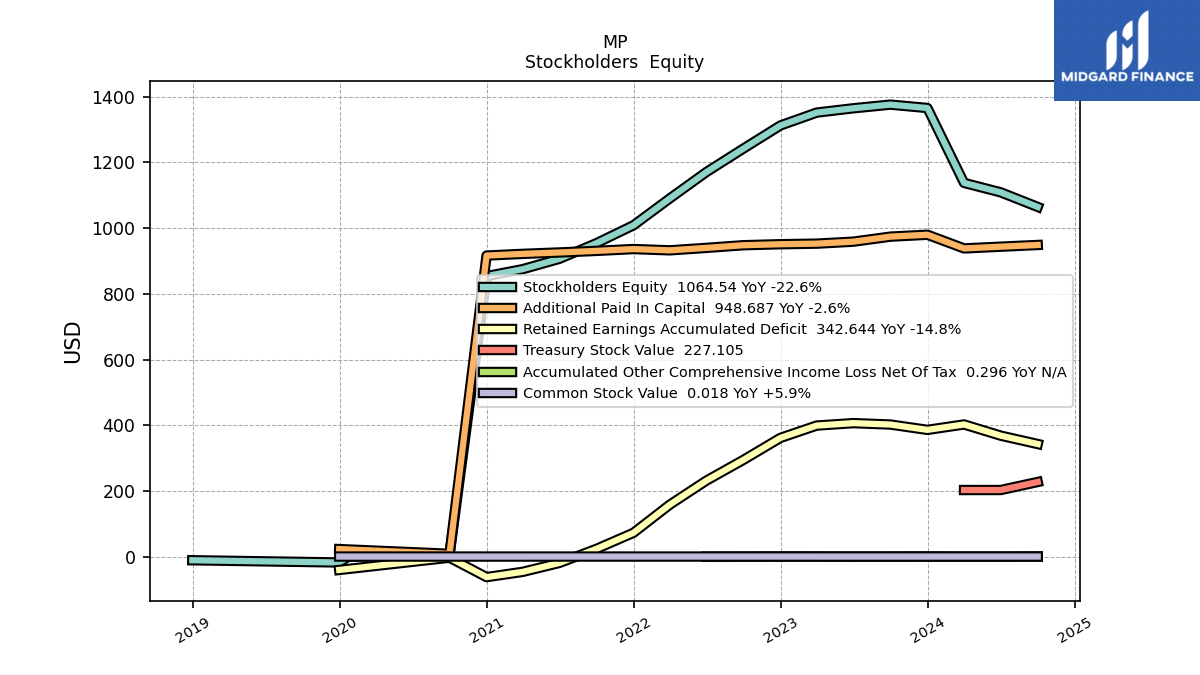
| Stockholders Equity | 1365.78 | 1376.07 | 1364.93 | 1351.81 | 1312.63 | 1242.31 | 1170.74 | 1090.37 | 1008.73 | 954.20 | 906.62 | 875.16 | 853.88 | 5.00 | 5.00 | 0.02 | |
| Common Stock Value | 0.02 | 0.02 | 0.02 | 0.02 | 0.02 | 0.02 | 0.02 | 0.02 | 0.02 | 0.02 | 0.02 | 0.02 | 0.02 | NA | NA | NA | |
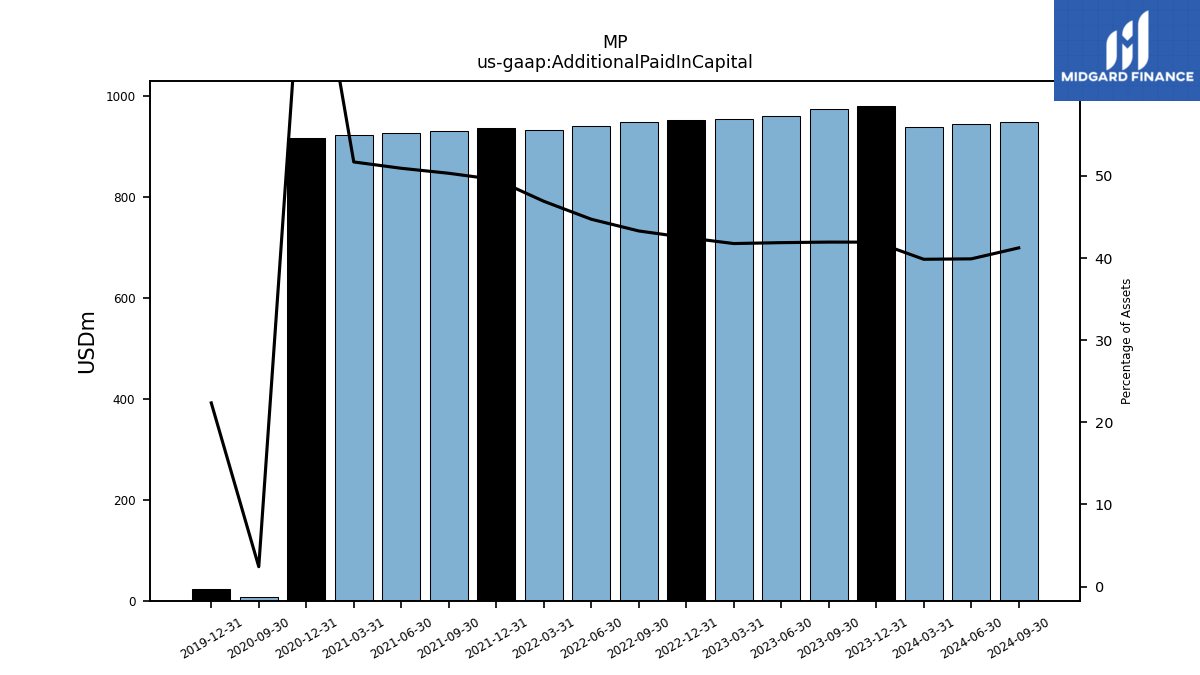
| Additional Paid In Capital | 979.89 | 974.10 | 958.82 | 952.79 | 951.01 | 947.97 | 939.90 | 932.38 | 936.30 | 930.75 | 925.94 | 921.64 | 916.48 | 8.39 | NA | NA | |
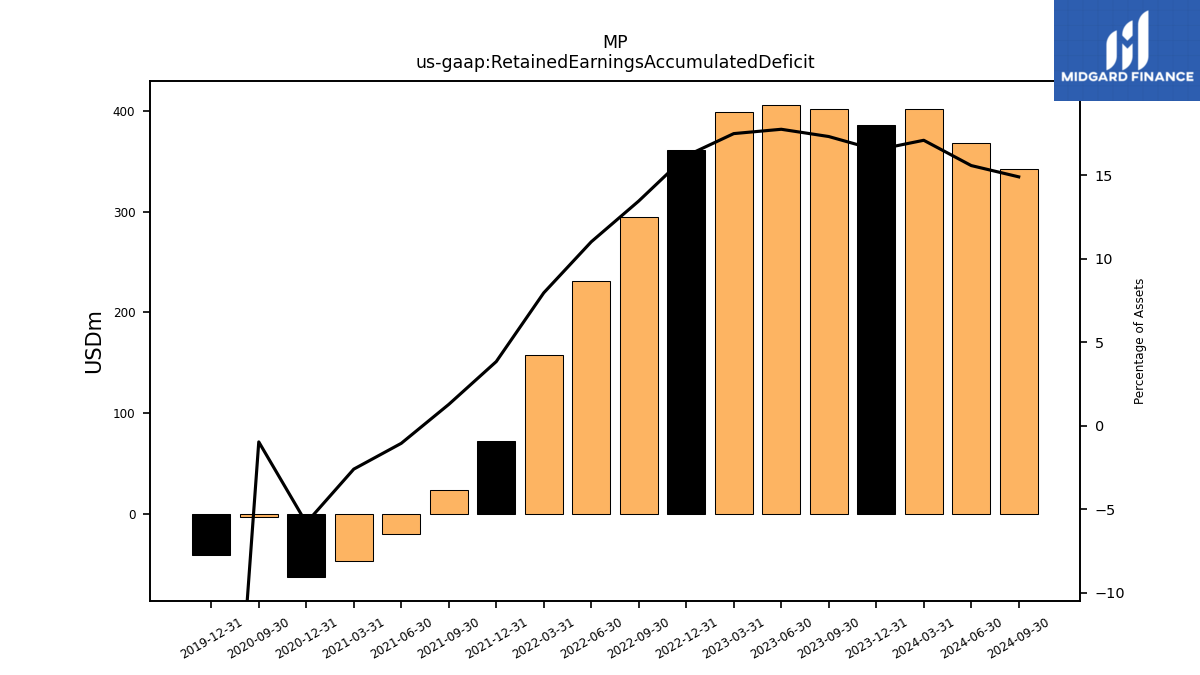
| Retained Earnings Accumulated Deficit | 385.73 | 401.99 | 406.26 | 398.87 | 361.42 | 294.41 | 231.24 | 157.97 | 72.42 | 23.43 | -19.34 | -46.50 | -62.62 | -3.39 | NA | NA | |
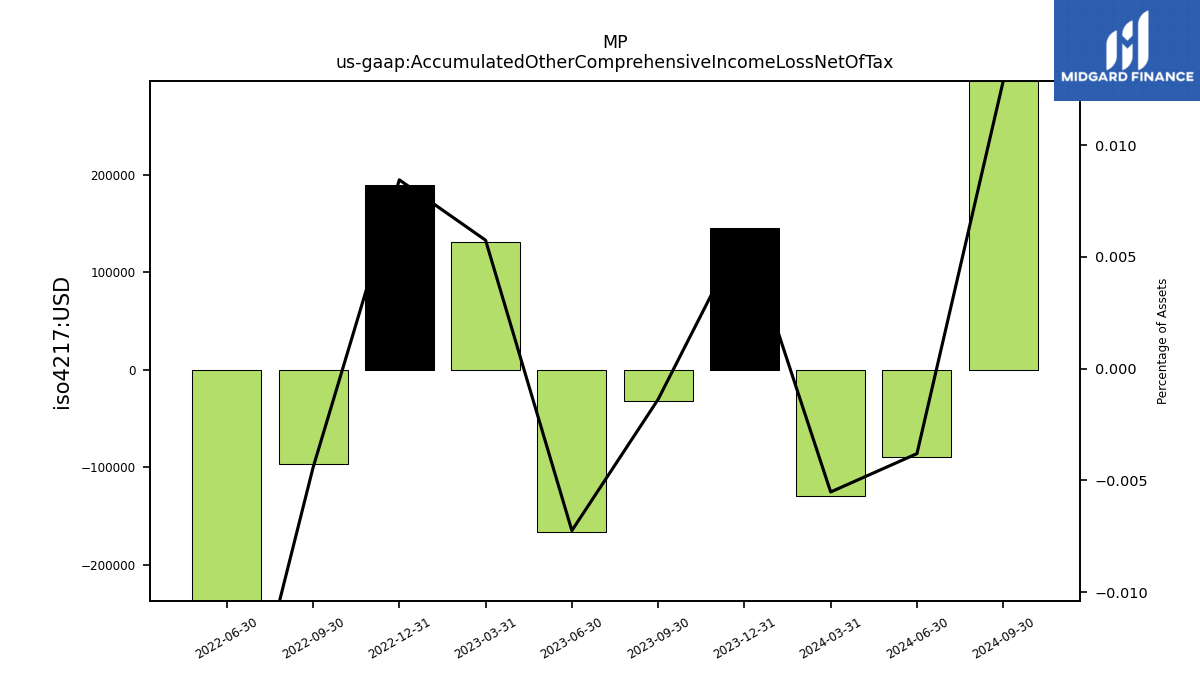
| Accumulated Other Comprehensive Income Loss Net Of Tax | 0.14 | -0.03 | -0.17 | 0.13 | 0.19 | -0.10 | -0.42 | NA | NA | NA | NA | NA | NA | NA | NA | NA | |
| Adjustments To Additional Paid In Capital Sharebased Compensation Requisite Service Period Recognition Value | 6.50 | 6.67 | 6.18 | 7.76 | 7.10 | 8.07 | 7.72 | 10.18 | 8.21 | 4.55 | 4.50 | 5.67 | NA | NA | NA | NA |
| 2023-12-31 | 2023-09-30 | 2023-06-30 | 2023-03-31 | 2022-12-31 | 2022-09-30 | 2022-06-30 | 2022-03-31 | 2021-12-31 | 2021-09-30 | 2021-06-30 | 2021-03-31 | 2020-12-31 | 2020-09-30 | 2020-06-30 | 2020-03-31 | ||
|---|---|---|---|---|---|---|---|---|---|---|---|---|---|---|---|---|---|
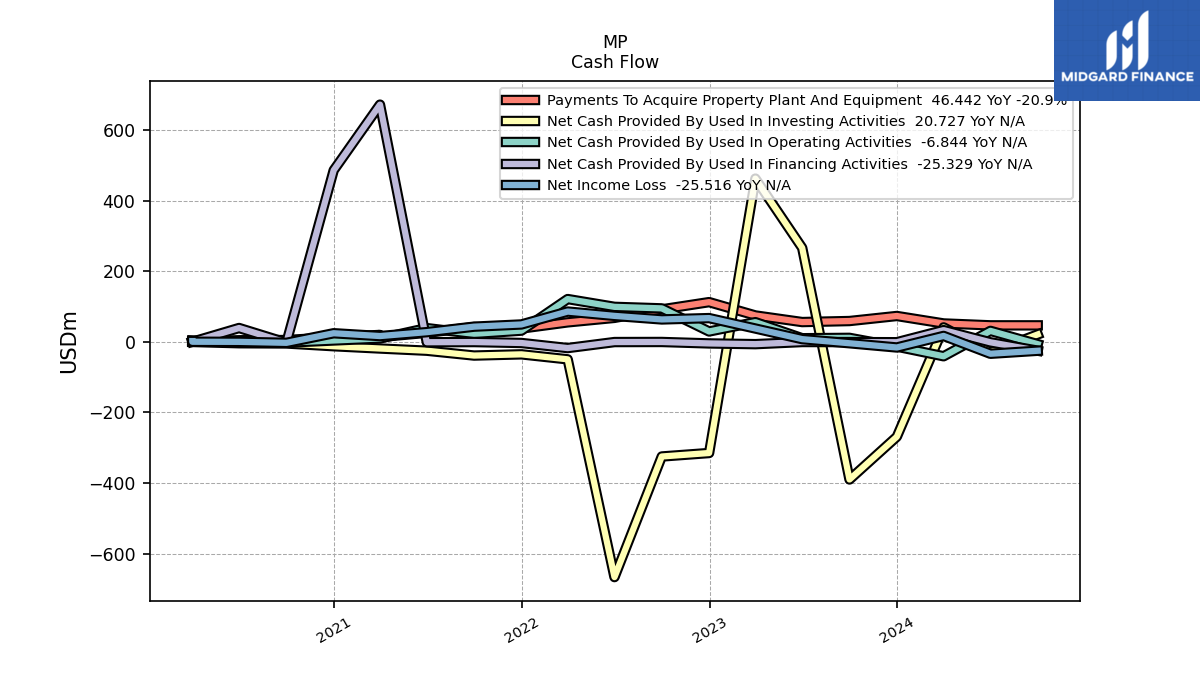
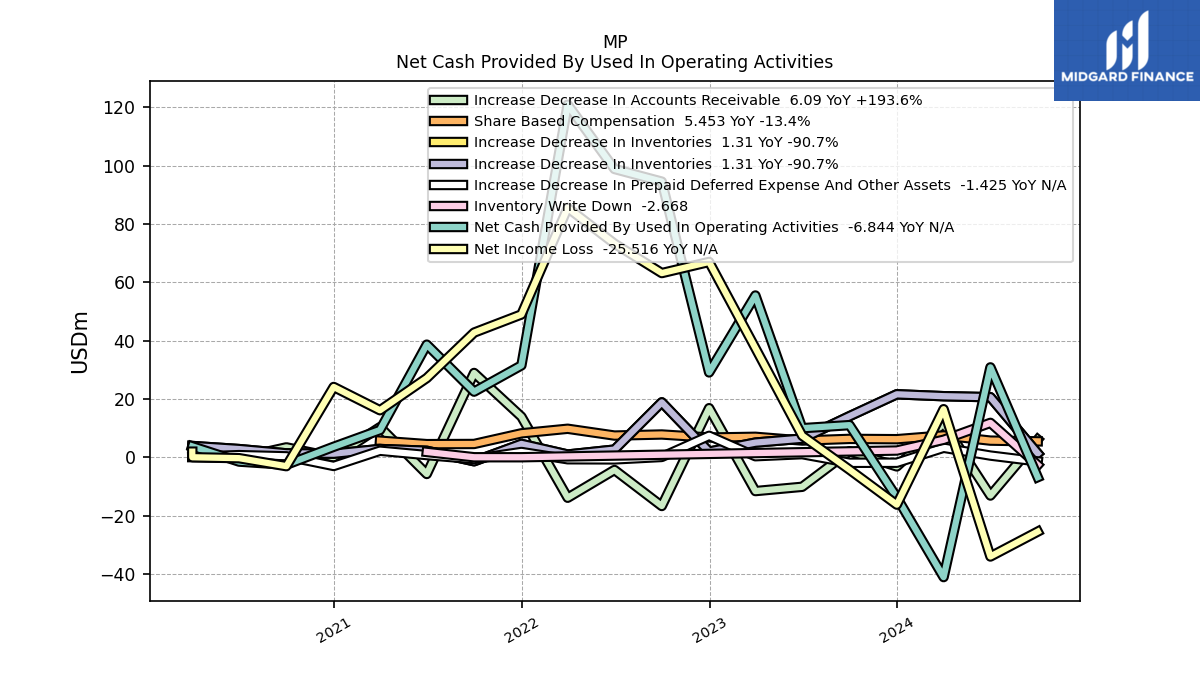
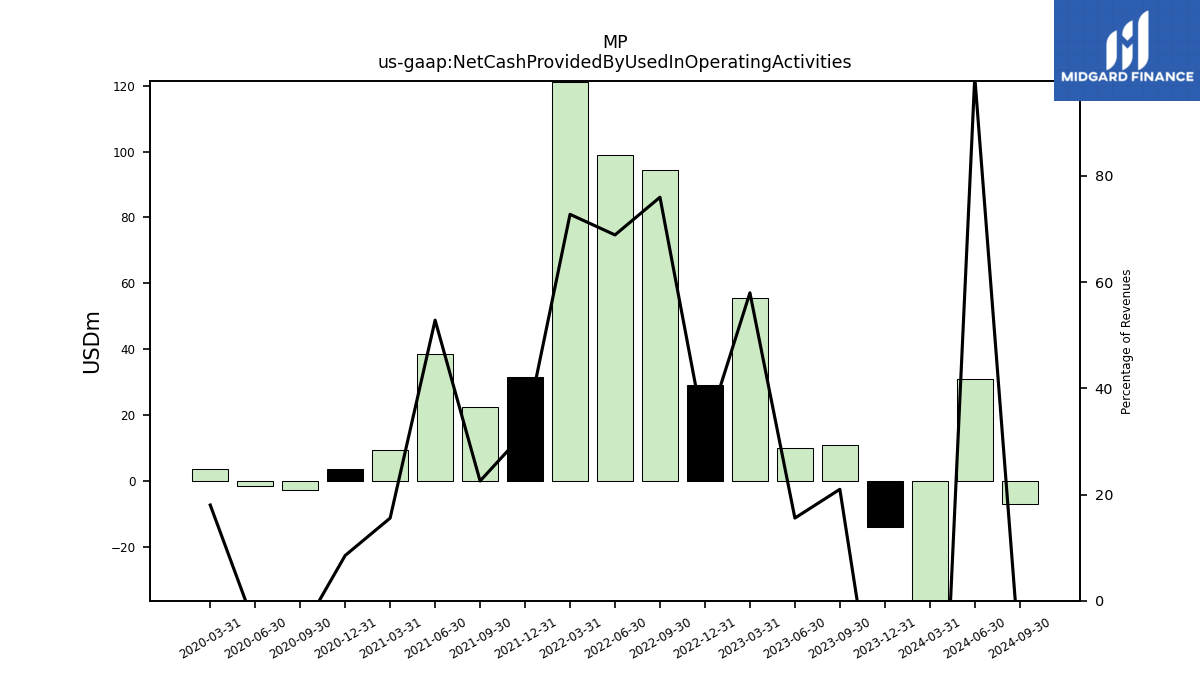
| Net Cash Provided By Used In Operating Activities | -13.78 | 11.02 | 9.97 | 55.49 | 29.09 | 94.56 | 98.89 | 120.97 | 31.51 | 22.50 | 38.63 | 9.34 | 3.60 | -2.56 | -1.49 | 3.73 | |
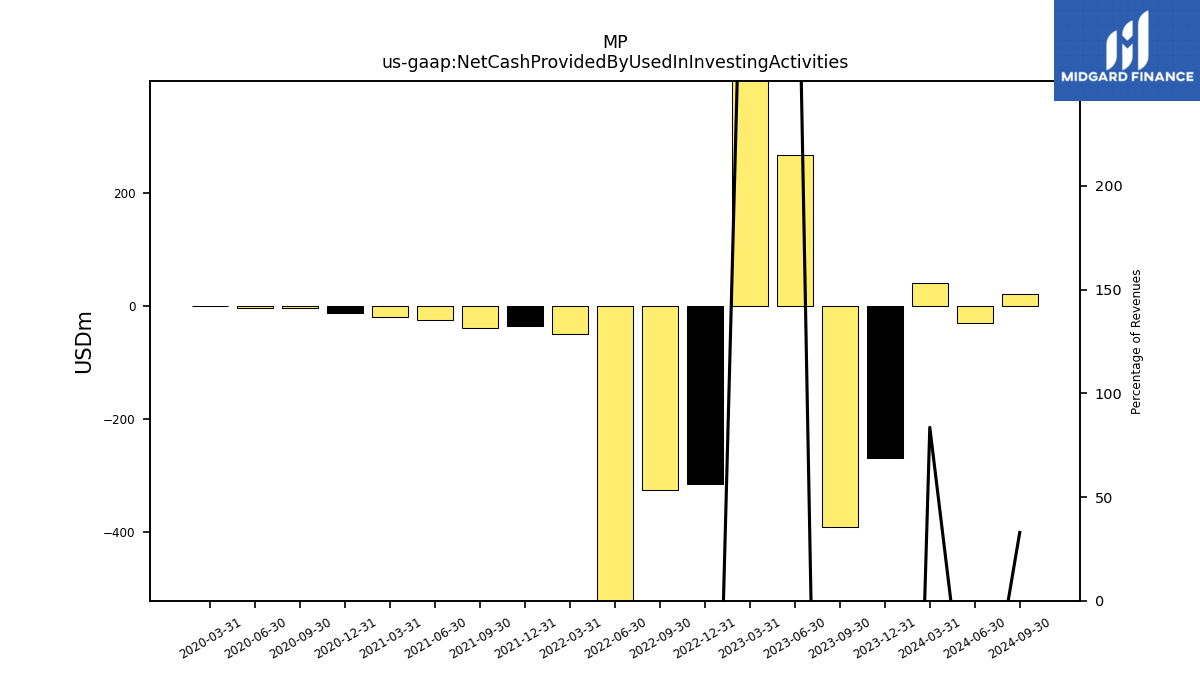
| Net Cash Provided By Used In Investing Activities | -269.13 | -390.28 | 265.93 | 462.19 | -315.24 | -325.08 | -666.85 | -49.80 | -35.68 | -39.11 | -25.39 | -19.17 | -12.68 | -4.87 | -4.21 | -0.62 | |
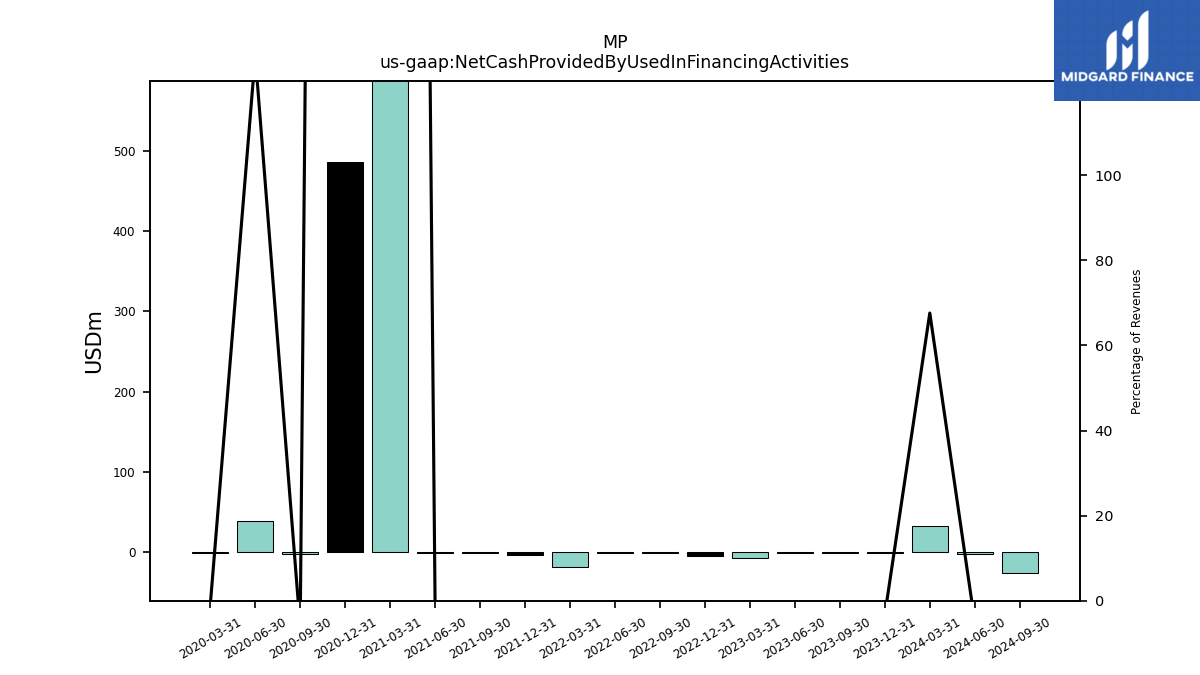
| Net Cash Provided By Used In Financing Activities | -1.34 | -0.98 | -0.78 | -6.82 | -4.76 | -0.65 | -0.87 | -17.91 | -3.50 | -0.88 | -1.30 | 671.79 | 485.77 | -2.54 | 38.94 | -0.21 |
| 2023-12-31 | 2023-09-30 | 2023-06-30 | 2023-03-31 | 2022-12-31 | 2022-09-30 | 2022-06-30 | 2022-03-31 | 2021-12-31 | 2021-09-30 | 2021-06-30 | 2021-03-31 | 2020-12-31 | 2020-09-30 | 2020-06-30 | 2020-03-31 | ||
|---|---|---|---|---|---|---|---|---|---|---|---|---|---|---|---|---|---|
| Net Cash Provided By Used In Operating Activities | -13.78 | 11.02 | 9.97 | 55.49 | 29.09 | 94.56 | 98.89 | 120.97 | 31.51 | 22.50 | 38.63 | 9.34 | 3.60 | -2.56 | -1.49 | 3.73 | |
| Net Income Loss | -16.26 | -4.28 | 7.39 | 37.45 | 67.01 | 63.18 | 73.27 | 85.55 | 48.99 | 42.76 | 27.17 | 16.12 | 24.11 | -3.07 | -0.32 | 1.93 | |
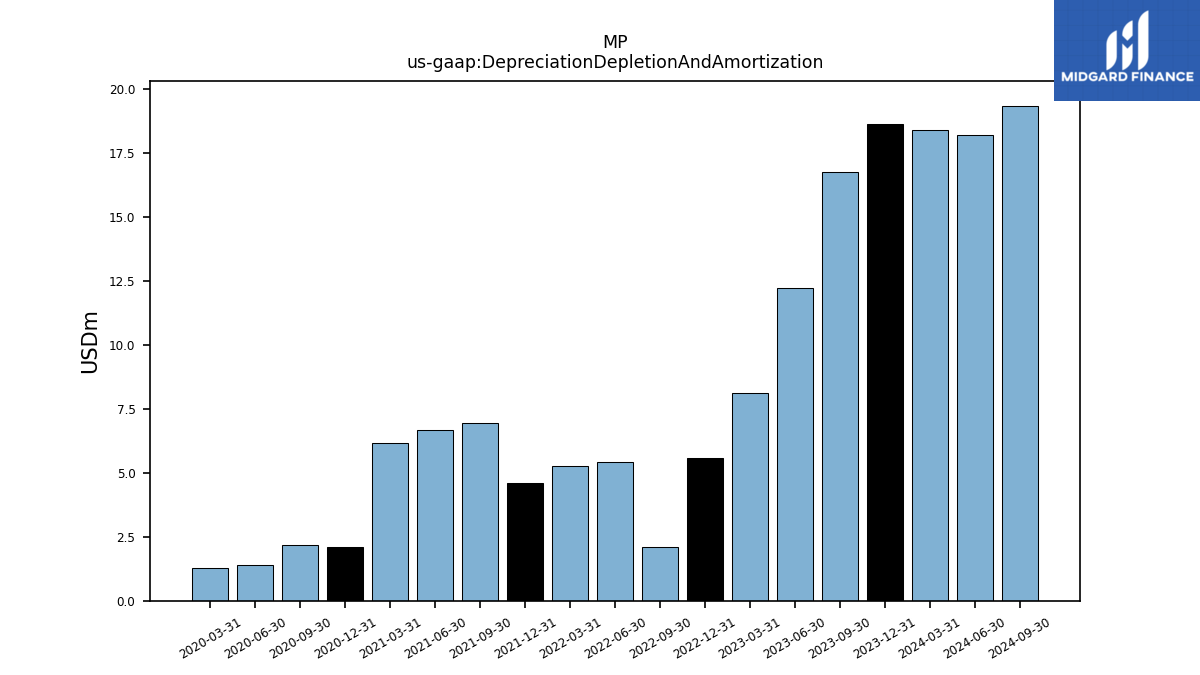
| Depreciation Depletion And Amortization | 18.63 | 16.75 | 12.20 | 8.12 | 5.59 | 2.10 | 5.41 | 5.26 | 4.62 | 6.95 | 6.67 | 6.15 | 2.10 | 2.18 | 1.38 | 1.27 | |
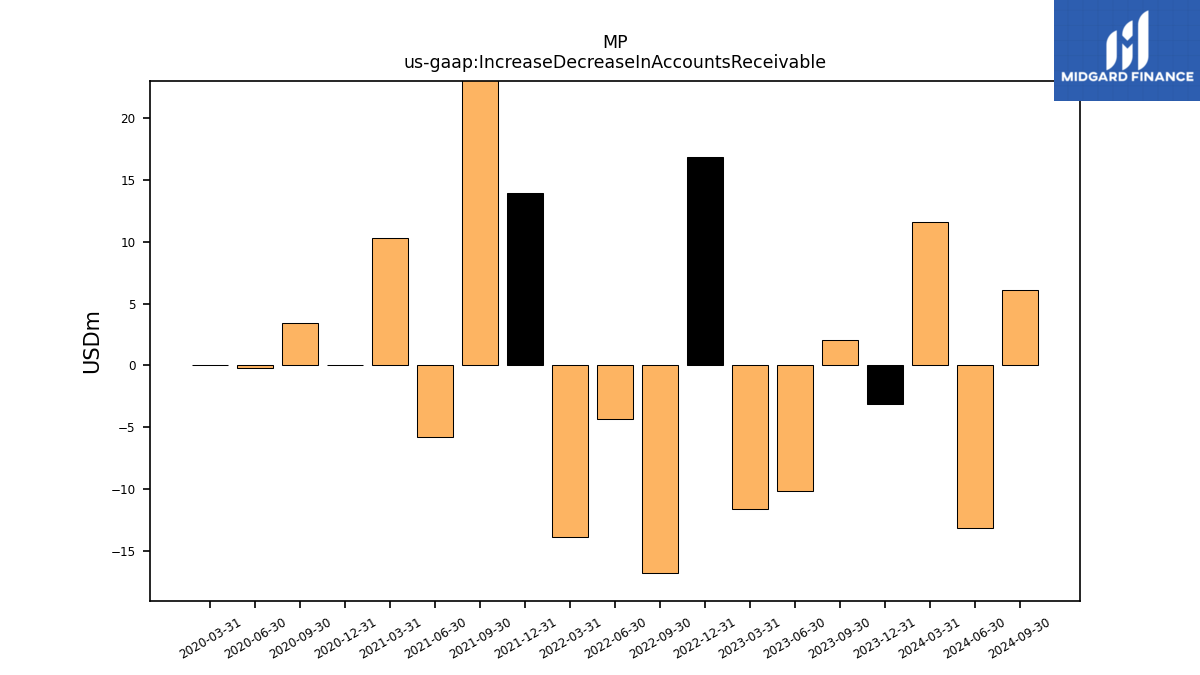
| Increase Decrease In Accounts Receivable | -3.15 | 2.07 | -10.14 | -11.61 | 16.84 | -16.73 | -4.36 | -13.90 | 13.91 | 28.92 | -5.75 | 10.34 | 0.01 | 3.39 | -0.23 | 0.04 | |
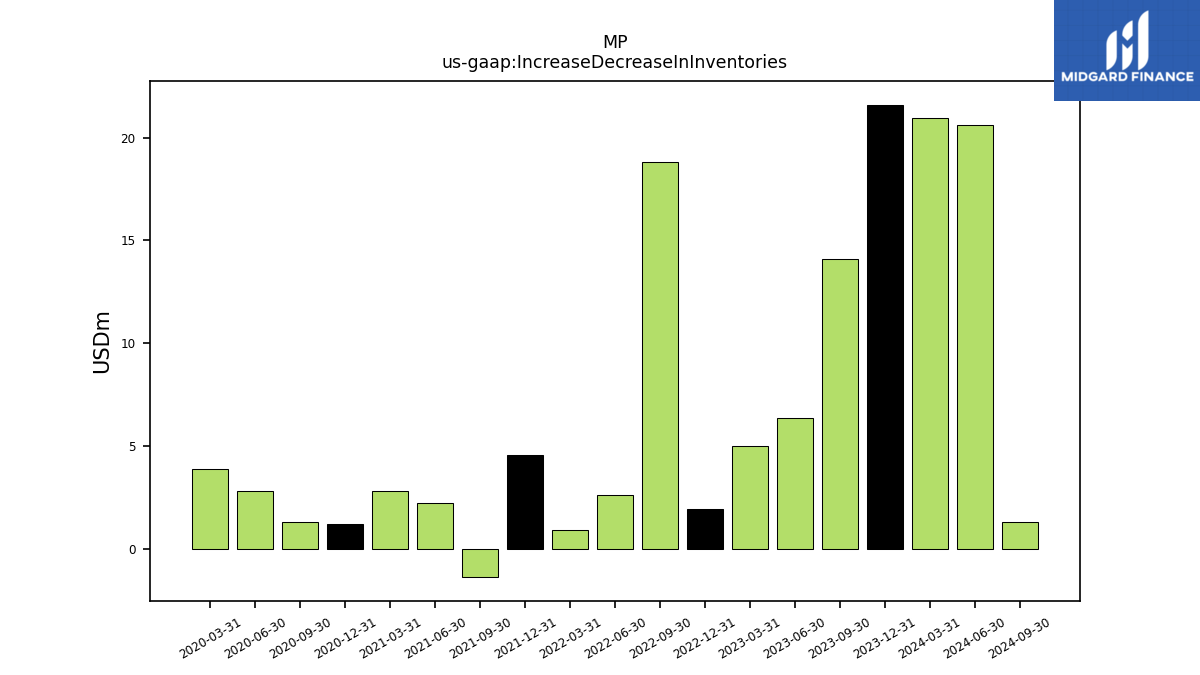
| Increase Decrease In Inventories | 21.60 | 14.09 | 6.38 | 5.02 | 1.93 | 18.83 | 2.62 | 0.93 | 4.57 | -1.38 | 2.21 | 2.83 | 1.23 | 1.33 | 2.80 | 3.86 | |
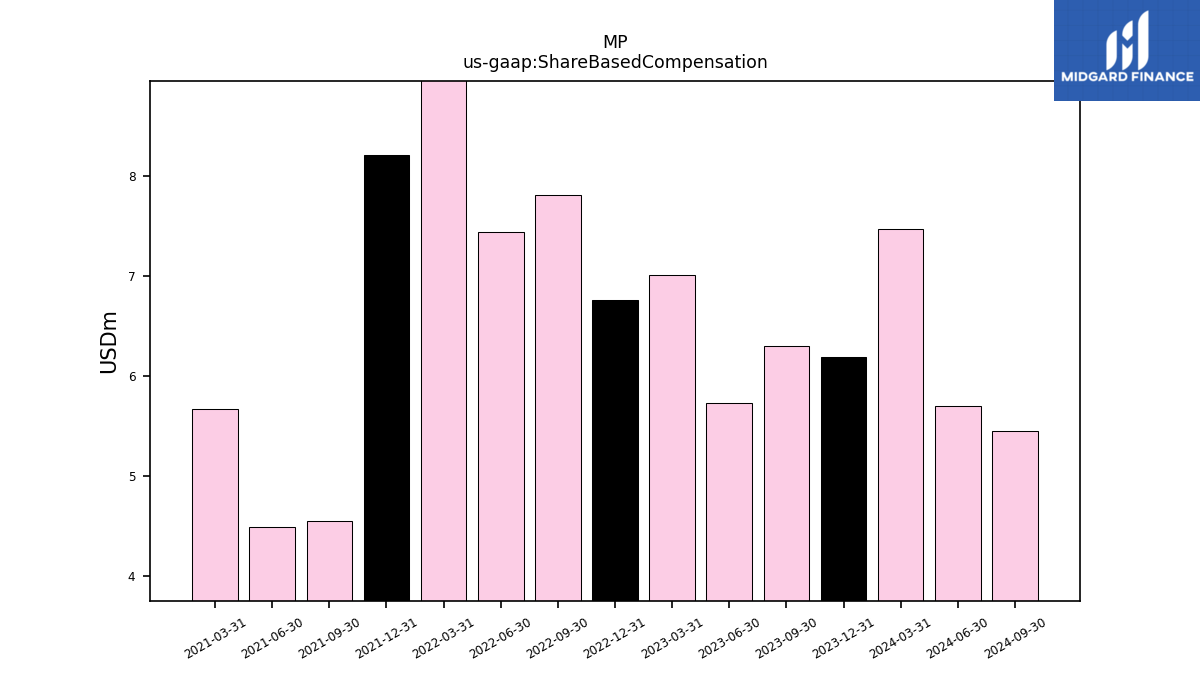
| Share Based Compensation | 6.20 | 6.30 | 5.73 | 7.01 | 6.76 | 7.81 | 7.44 | 9.77 | 8.21 | 4.55 | 4.50 | 5.67 | NA | NA | NA | NA |
| 2023-12-31 | 2023-09-30 | 2023-06-30 | 2023-03-31 | 2022-12-31 | 2022-09-30 | 2022-06-30 | 2022-03-31 | 2021-12-31 | 2021-09-30 | 2021-06-30 | 2021-03-31 | 2020-12-31 | 2020-09-30 | 2020-06-30 | 2020-03-31 | ||
|---|---|---|---|---|---|---|---|---|---|---|---|---|---|---|---|---|---|
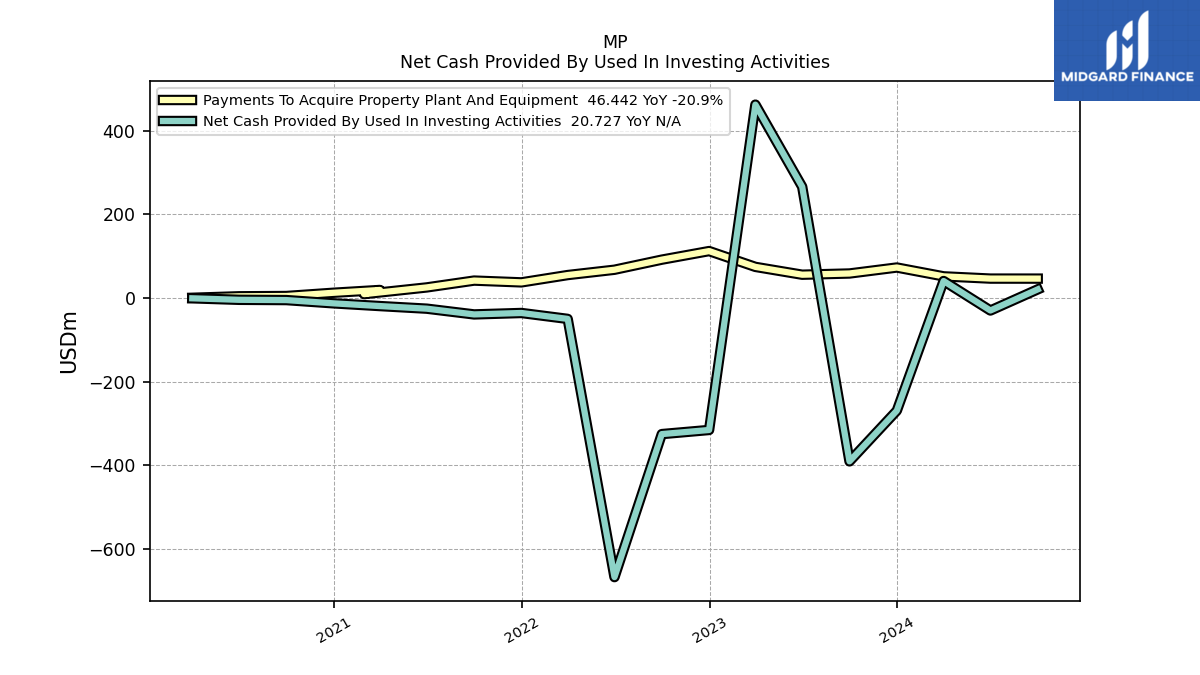
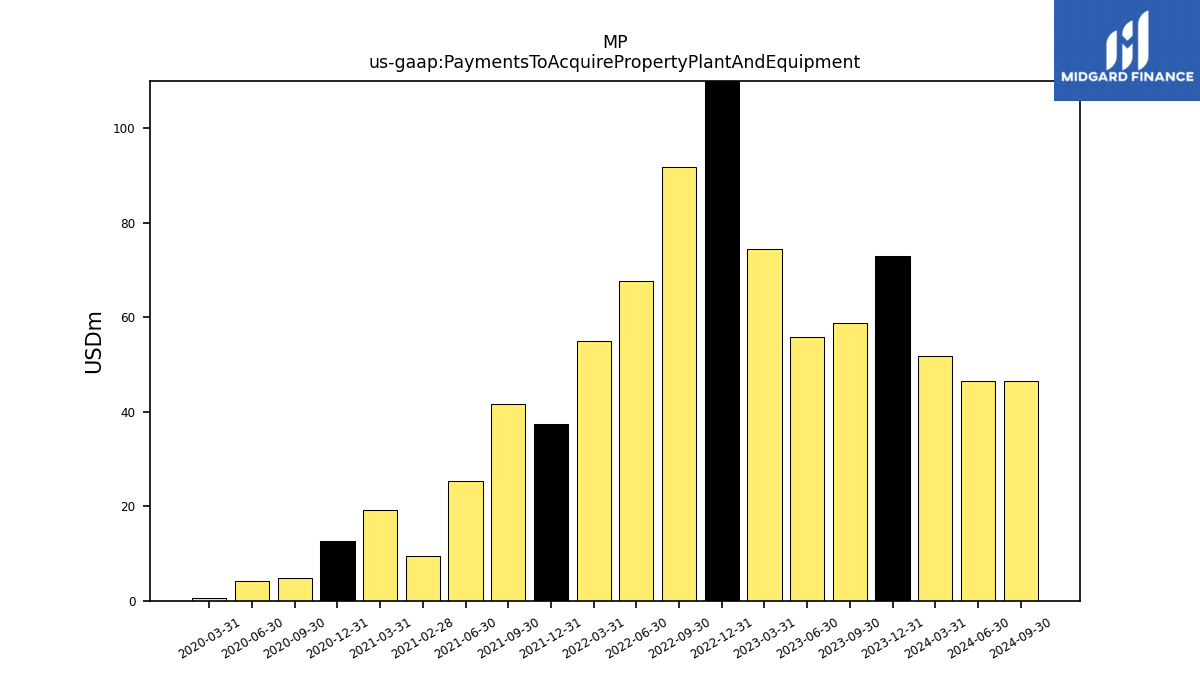
| Net Cash Provided By Used In Investing Activities | -269.13 | -390.28 | 265.93 | 462.19 | -315.24 | -325.08 | -666.85 | -49.80 | -35.68 | -39.11 | -25.39 | -19.17 | -12.68 | -4.87 | -4.21 | -0.62 | |
| Payments To Acquire Property Plant And Equipment | 72.97 | 58.69 | 55.77 | 74.46 | 112.26 | 91.75 | 67.65 | 54.93 | 37.45 | 41.73 | 25.39 | 19.30 | 12.68 | 4.87 | 4.21 | 0.62 |
| 2023-12-31 | 2023-09-30 | 2023-06-30 | 2023-03-31 | 2022-12-31 | 2022-09-30 | 2022-06-30 | 2022-03-31 | 2021-12-31 | 2021-09-30 | 2021-06-30 | 2021-03-31 | 2020-12-31 | 2020-09-30 | 2020-06-30 | 2020-03-31 | ||
|---|---|---|---|---|---|---|---|---|---|---|---|---|---|---|---|---|---|
| Net Cash Provided By Used In Financing Activities | -1.34 | -0.98 | -0.78 | -6.82 | -4.76 | -0.65 | -0.87 | -17.91 | -3.50 | -0.88 | -1.30 | 671.79 | 485.77 | -2.54 | 38.94 | -0.21 |
| 2023-12-31 | 2023-09-30 | 2023-06-30 | 2023-03-31 | 2022-12-31 | 2022-09-30 | 2022-06-30 | 2022-03-31 | 2021-12-31 | 2021-09-30 | 2021-06-30 | 2021-03-31 | 2020-12-31 | 2020-09-30 | 2020-06-30 | 2020-03-31 | ||
|---|---|---|---|---|---|---|---|---|---|---|---|---|---|---|---|---|---|
| Revenues | 41.20 | 52.52 | 64.02 | 95.70 | 93.25 | 124.44 | 143.56 | 166.26 | 99.11 | 99.75 | 73.12 | 59.97 | 42.18 | 41.02 | 30.39 | 20.72 | |
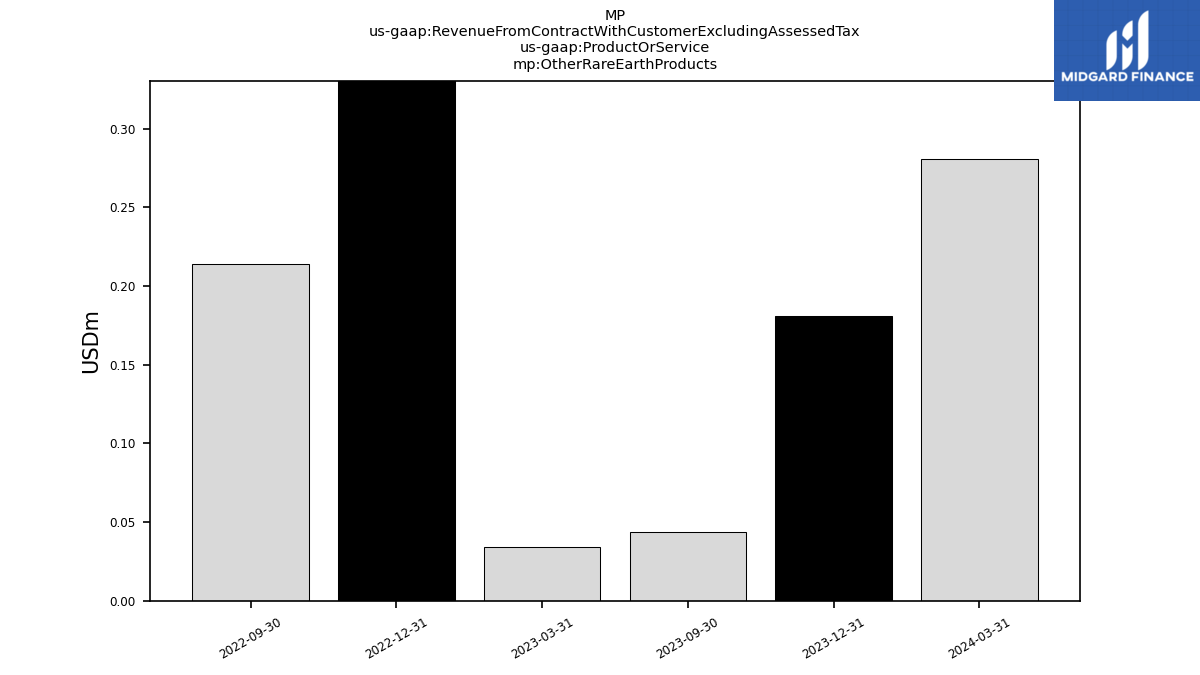
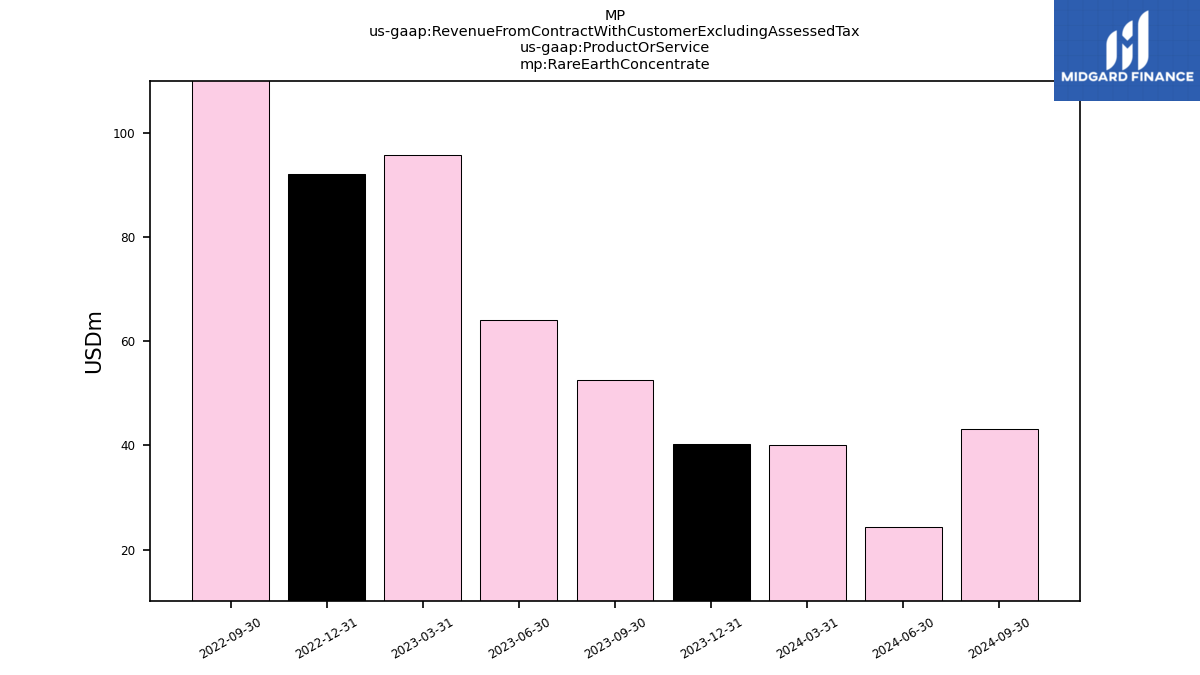
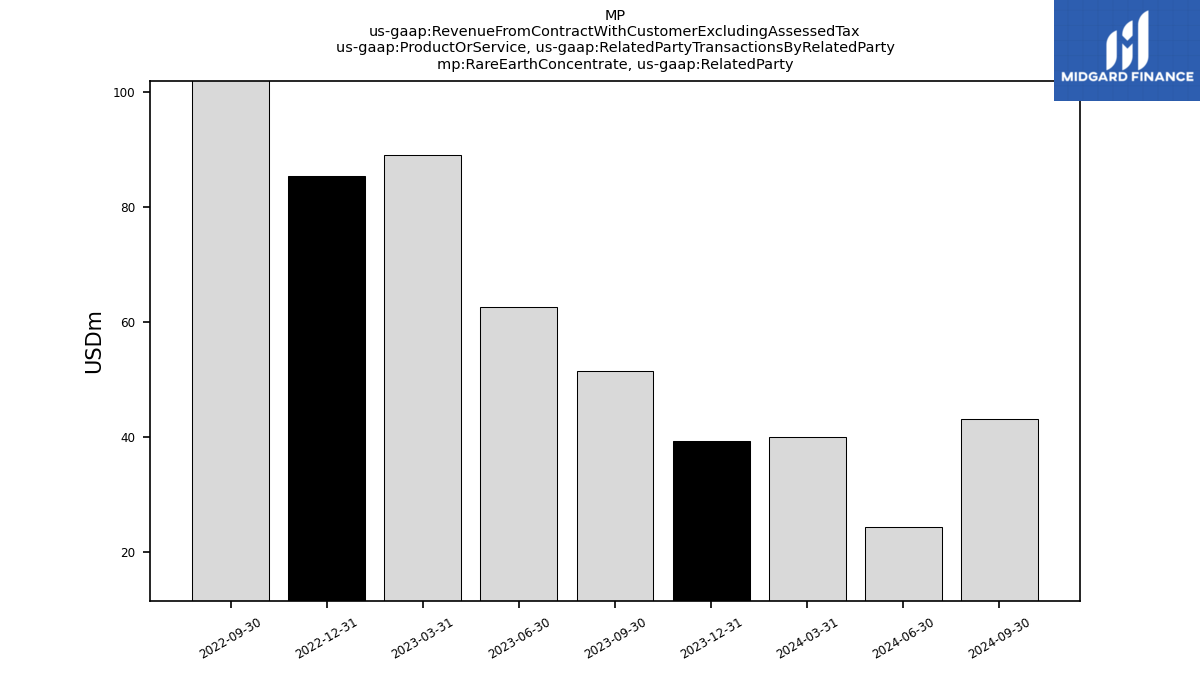
| Revenue From Contract With Customer Excluding Assessed Tax | 41.20 | 52.52 | 64.02 | 95.70 | 93.25 | 124.44 | 139.18 | 161.75 | 97.72 | 98.58 | 73.12 | 59.97 | 42.61 | 40.86 | 30.39 | 20.72 | |
| Other Rare Earth Products | 0.18 | 0.04 | NA | NA | 1.15 | 0.21 | NA | NA | NA | NA | NA | NA | NA | NA | NA | NA | |
| Rare Earth Concentrate | 40.33 | 52.47 | NA | NA | 92.10 | 124.23 | NA | NA | NA | NA | NA | NA | NA | NA | NA | NA | |
| Rare Earth Concentrate, Related Party | 39.33 | 51.50 | NA | NA | 85.51 | 114.89 | NA | NA | NA | NA | NA | NA | NA | NA | NA | NA |