
| 2024-03-31 | 2023-12-31 | 2023-09-30 | 2023-06-30 | 2023-03-31 | 2022-12-31 | 2022-09-30 | 2022-06-30 | 2022-03-31 | 2021-12-31 | 2021-09-30 | 2021-06-30 | 2021-03-31 | 2020-12-31 | 2020-09-30 | 2020-06-30 | 2020-03-31 | ||
|---|---|---|---|---|---|---|---|---|---|---|---|---|---|---|---|---|---|---|
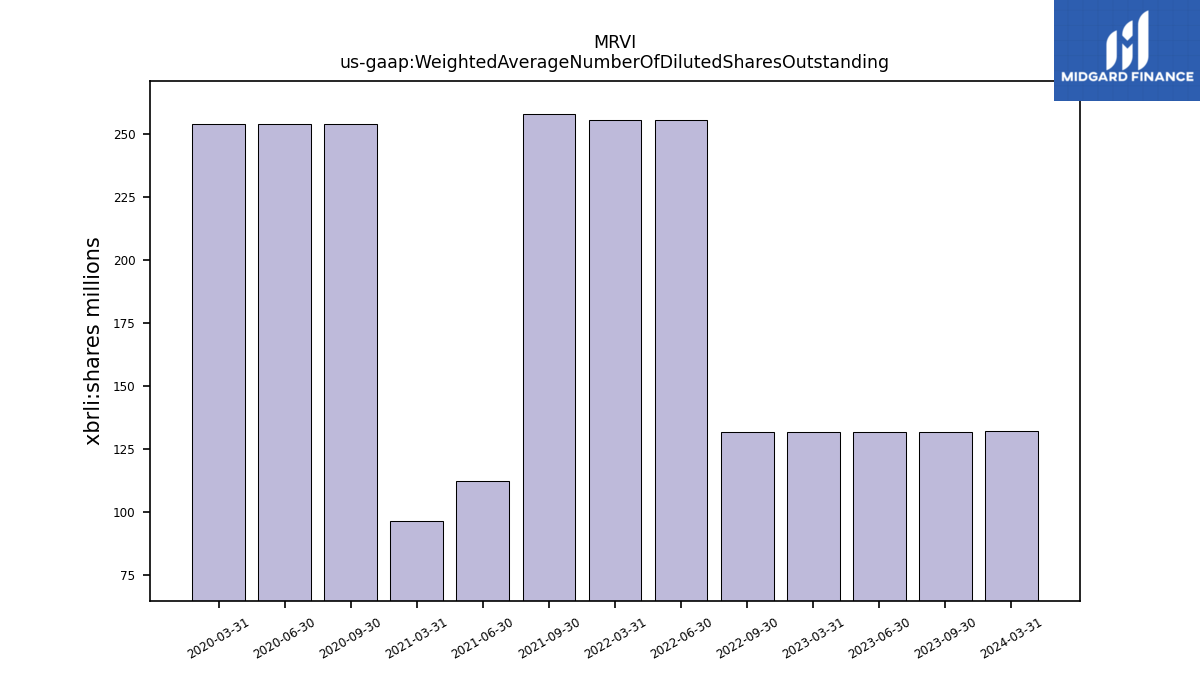
| Weighted Average Number Of Diluted Shares Outstanding | 132.33 | NA | 131.93 | 131.86 | 131.74 | NA | 131.65 | 255.36 | 255.29 | NA | 258.03 | 112.28 | 96.67 | NA | 253.92 | 253.92 | 253.92 | |
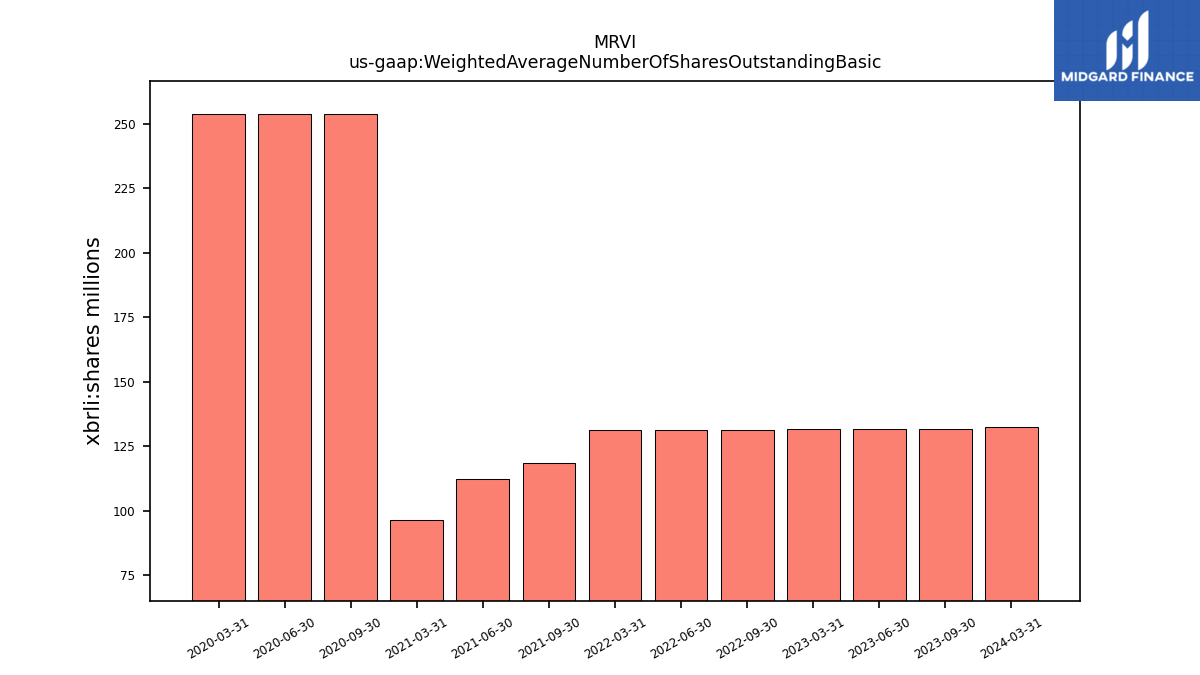
| Weighted Average Number Of Shares Outstanding Basic | 132.33 | NA | 131.93 | 131.86 | 131.74 | NA | 131.54 | 131.52 | 131.49 | NA | 118.43 | 112.20 | 96.65 | NA | 253.92 | 253.92 | 253.92 | |
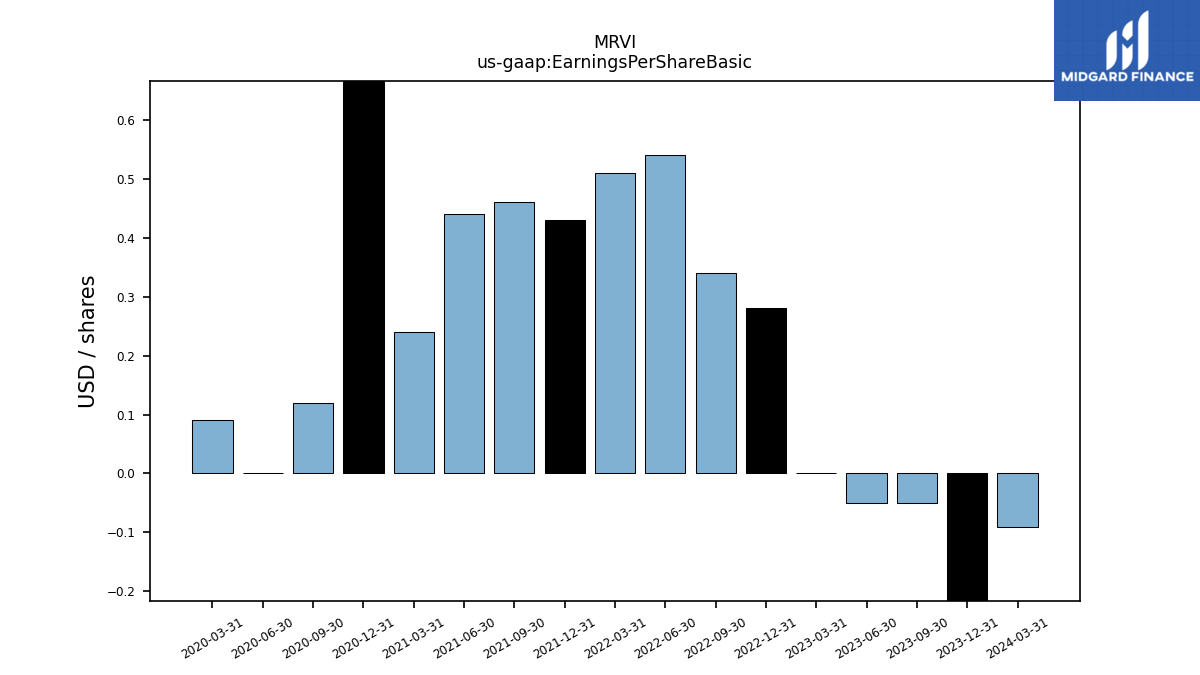
| Earnings Per Share Basic | -0.09 | -0.80 | -0.05 | -0.05 | -0.00 | 0.28 | 0.34 | 0.54 | 0.51 | 0.43 | 0.46 | 0.44 | 0.24 | 7.22 | 0.12 | 0.00 | 0.09 | |
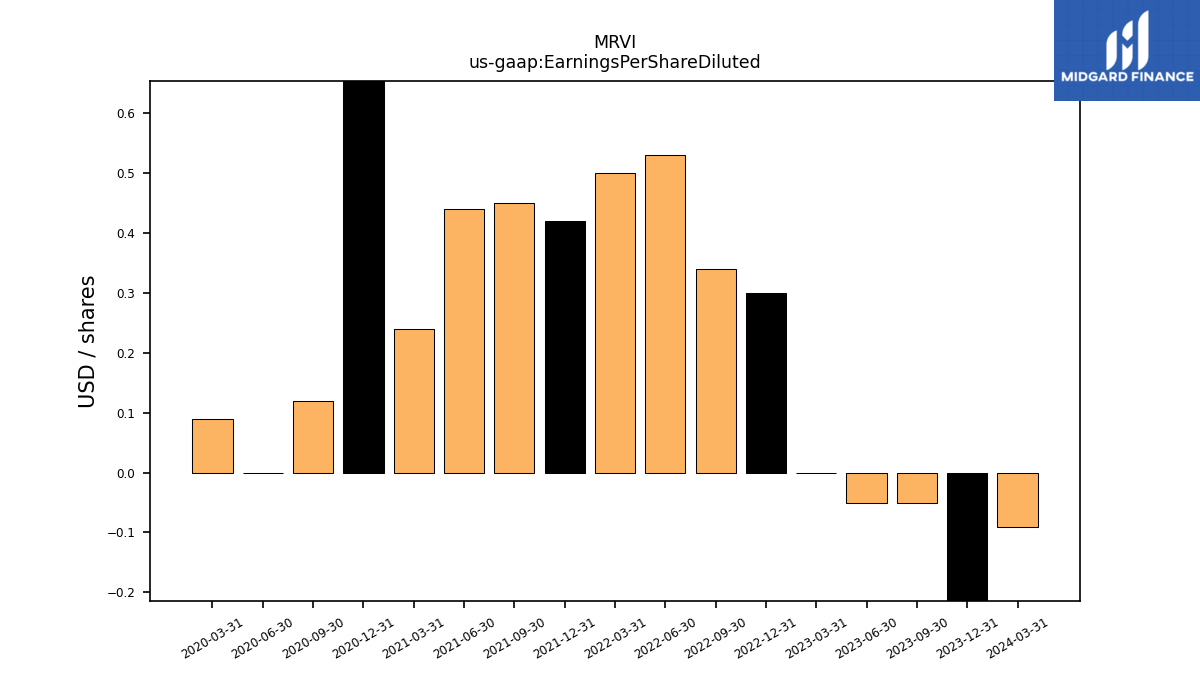
| Earnings Per Share Diluted | -0.09 | -0.80 | -0.05 | -0.05 | -0.00 | 0.30 | 0.34 | 0.53 | 0.50 | 0.42 | 0.45 | 0.44 | 0.24 | 2.15 | 0.12 | 0.00 | 0.09 |
| 2024-03-31 | 2023-12-31 | 2023-09-30 | 2023-06-30 | 2023-03-31 | 2022-12-31 | 2022-09-30 | 2022-06-30 | 2022-03-31 | 2021-12-31 | 2021-09-30 | 2021-06-30 | 2021-03-31 | 2020-12-31 | 2020-09-30 | 2020-06-30 | 2020-03-31 | ||
|---|---|---|---|---|---|---|---|---|---|---|---|---|---|---|---|---|---|---|
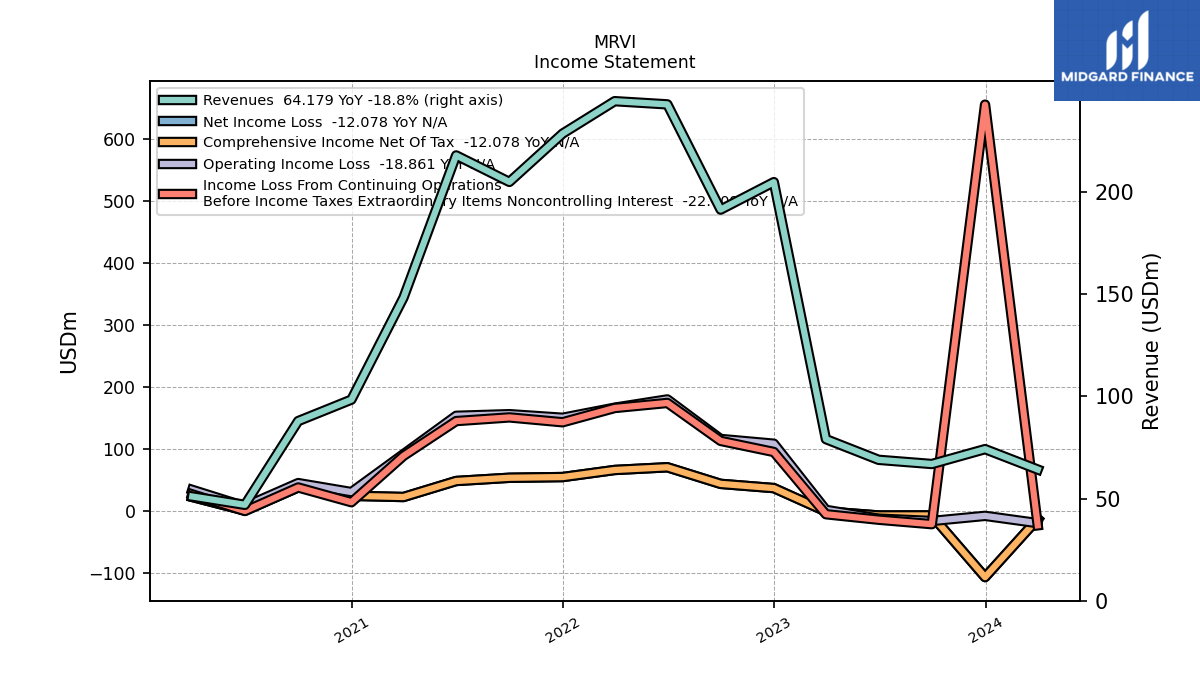
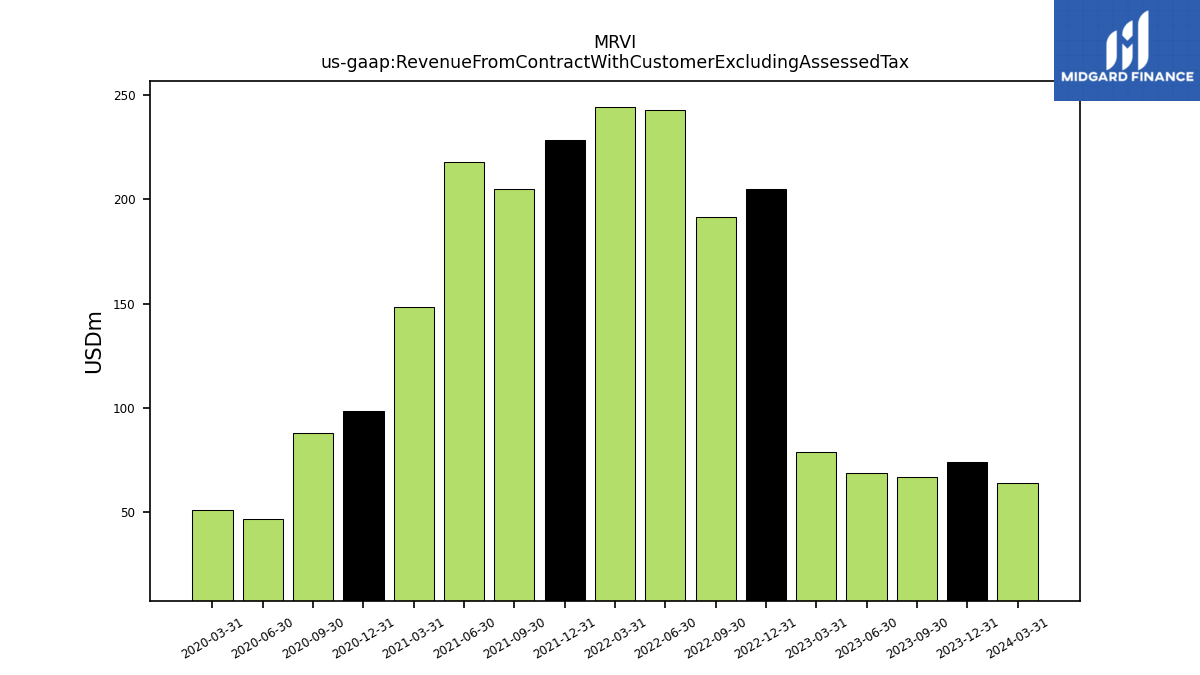
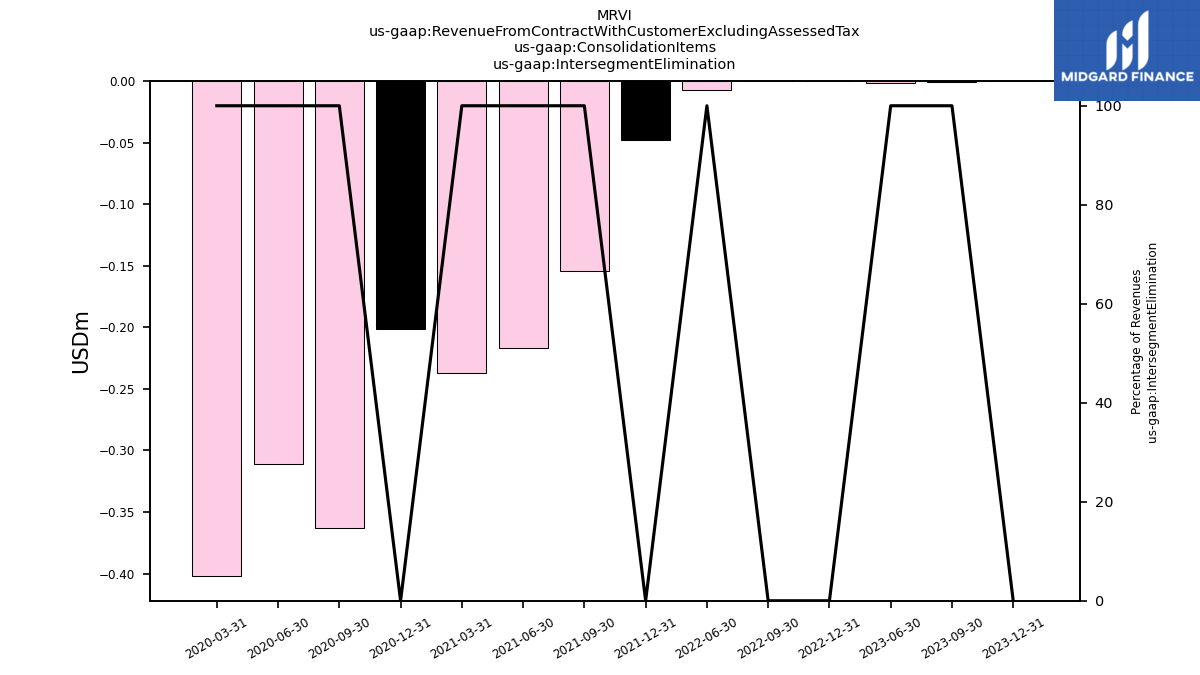
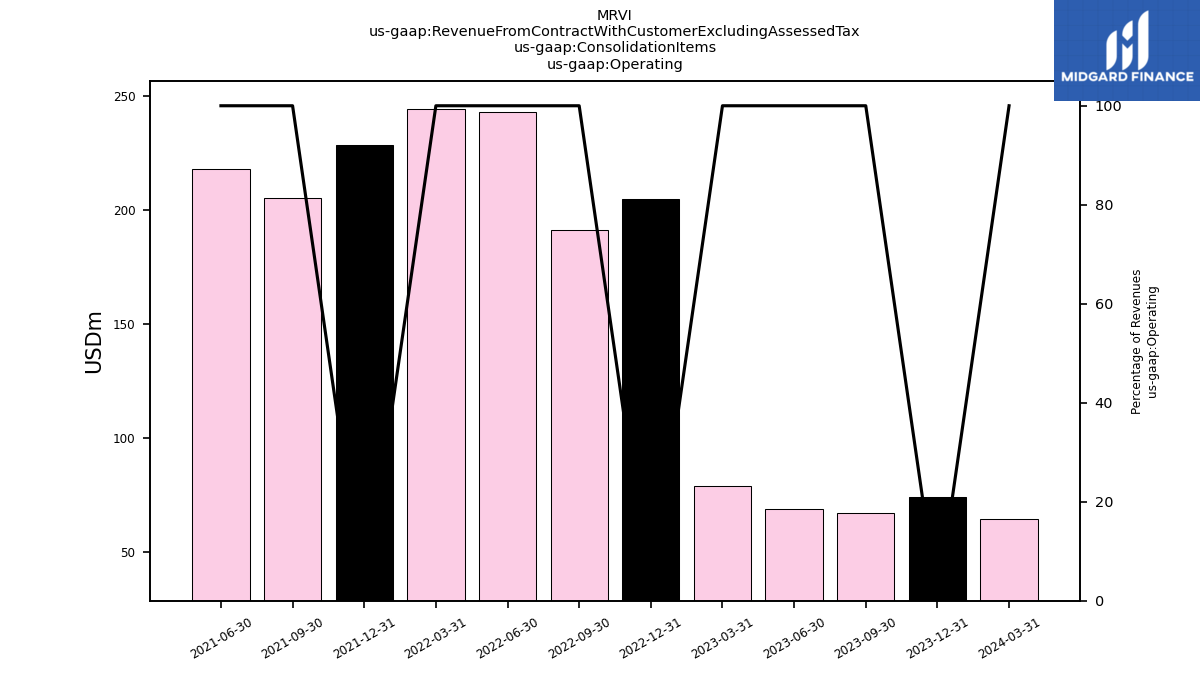
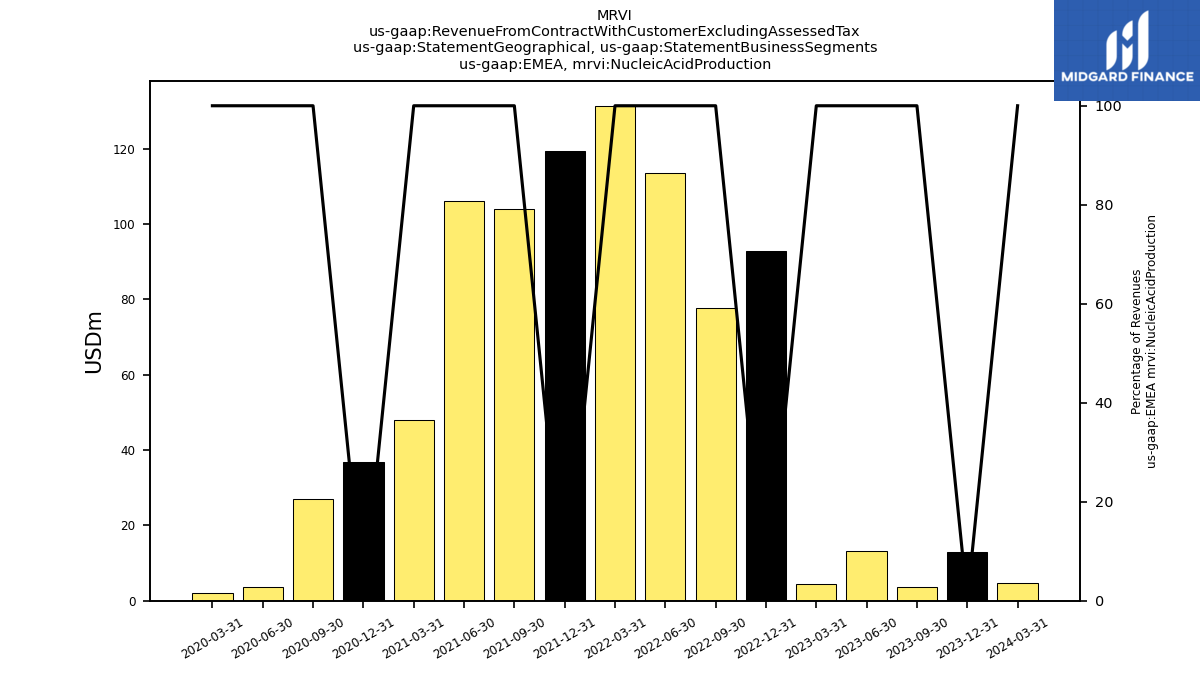
| Revenue From Contract With Customer Excluding Assessed Tax | 64.18 | 74.14 | 66.86 | 68.91 | 79.03 | 204.71 | 191.26 | 242.73 | 244.29 | 228.44 | 204.81 | 217.78 | 148.21 | 98.35 | 87.86 | 46.91 | 50.98 | |
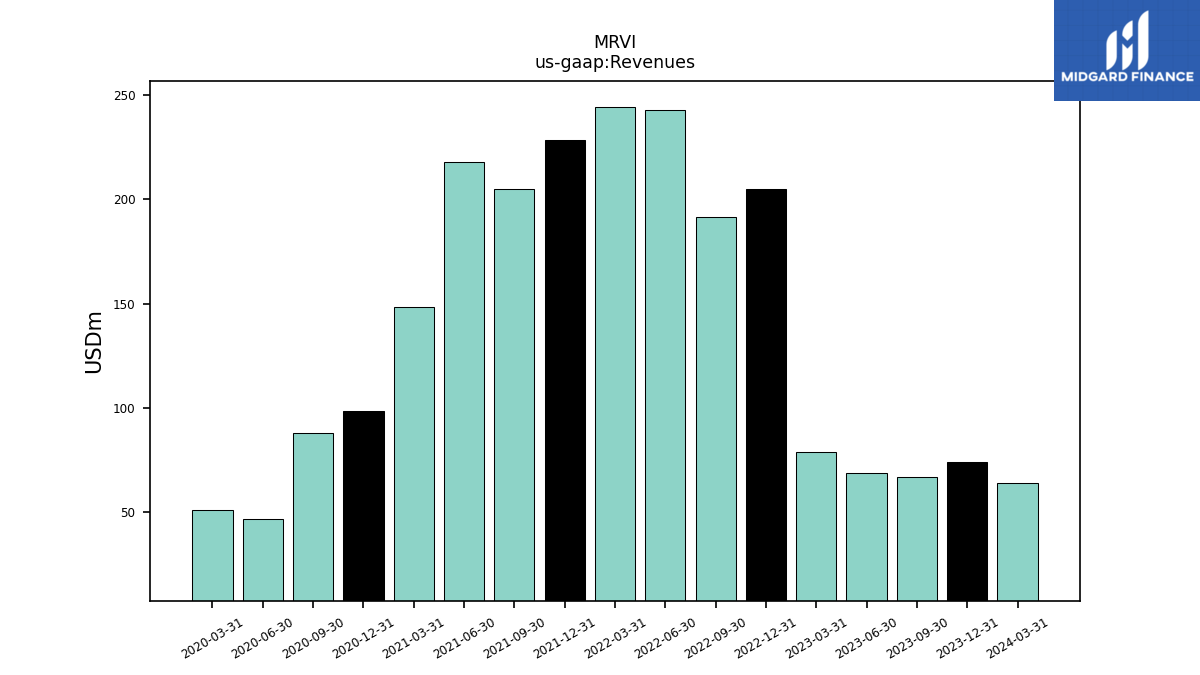
| Revenues | 64.18 | 74.14 | 66.86 | 68.91 | 79.03 | 204.71 | 191.26 | 242.73 | 244.29 | 228.44 | 204.81 | 217.78 | 148.21 | 98.35 | 87.86 | 46.91 | 50.98 | |
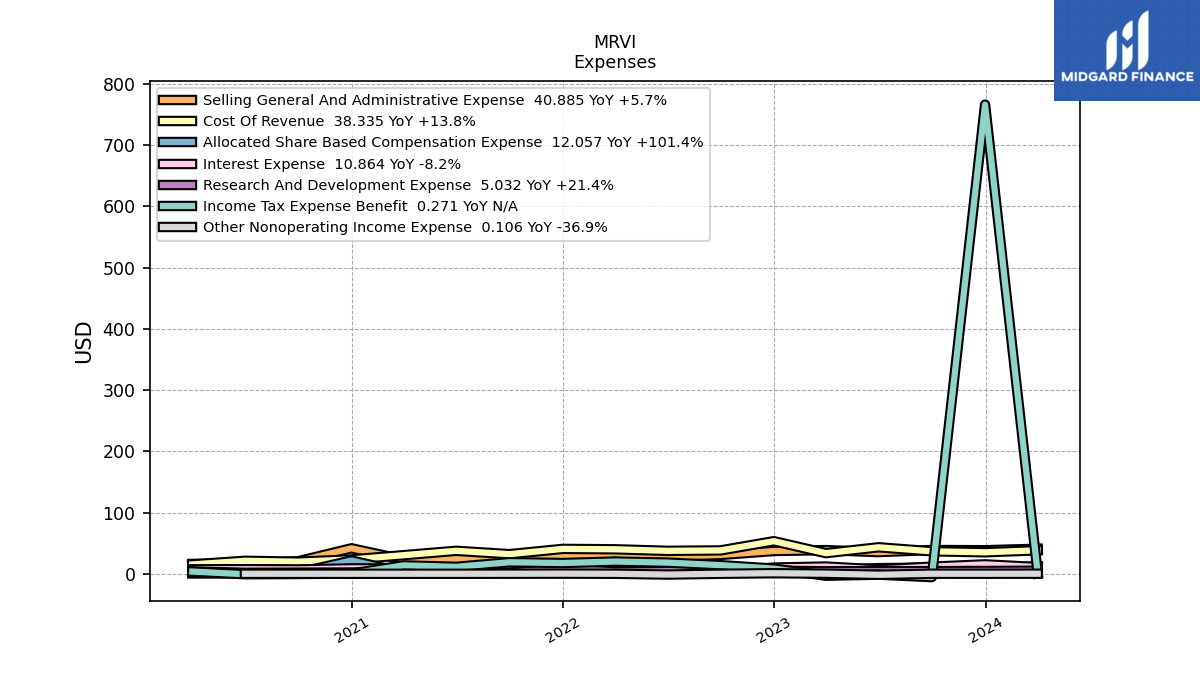
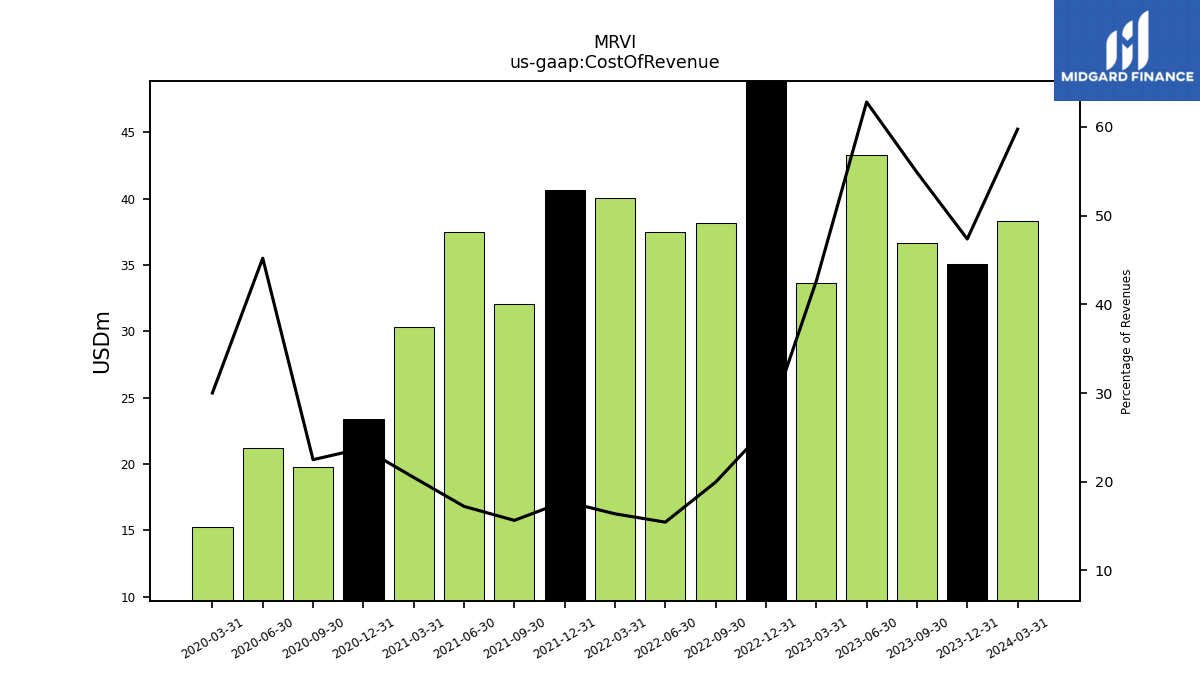
| Cost Of Revenue | 38.34 | 35.11 | 36.69 | 43.27 | 33.68 | 53.25 | 38.18 | 37.50 | 40.03 | 40.63 | 32.05 | 37.51 | 30.37 | 23.39 | 19.76 | 21.20 | 15.30 | |
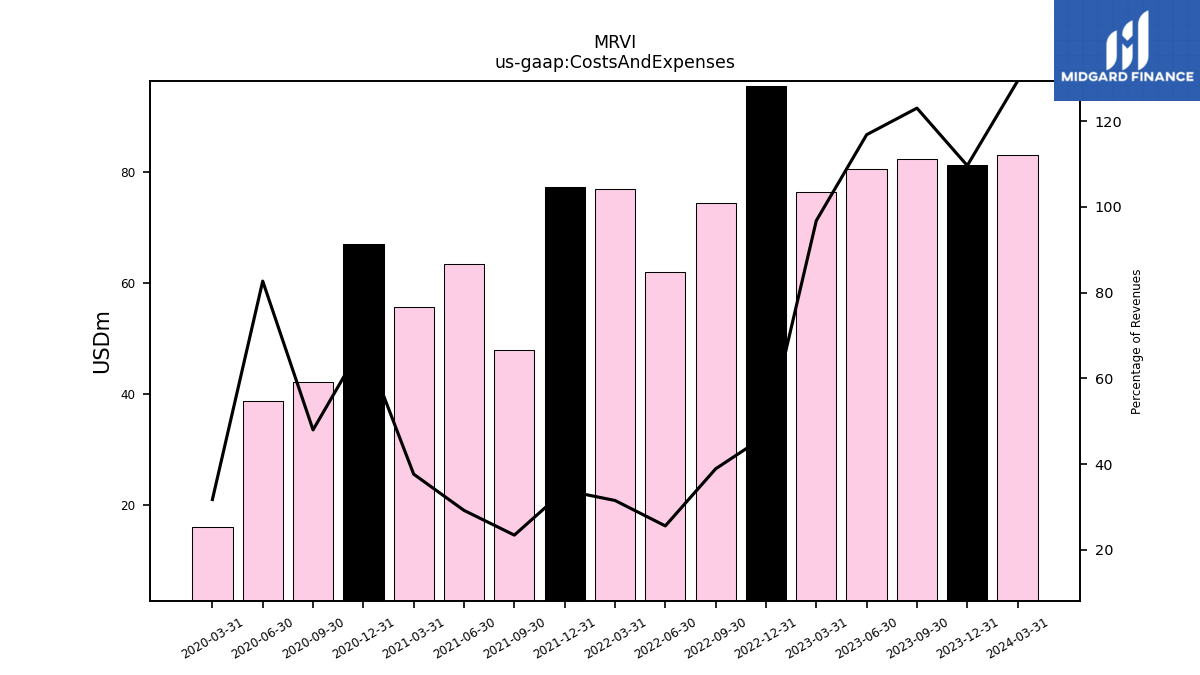
| Costs And Expenses | 83.04 | 81.29 | 82.28 | 80.53 | 76.49 | 95.47 | 74.36 | 62.03 | 76.93 | 77.36 | 47.94 | 63.53 | 55.77 | 67.11 | 42.14 | 38.78 | 16.16 | |
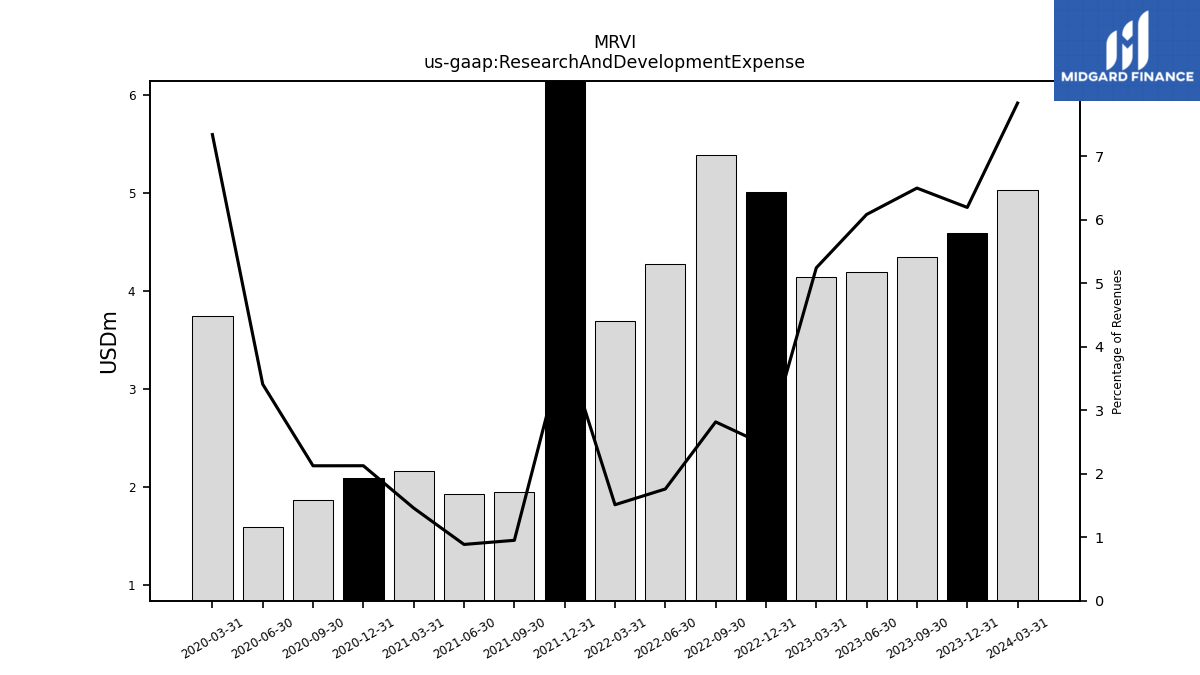
| Research And Development Expense | 5.03 | 4.59 | 4.35 | 4.19 | 4.14 | 5.01 | 5.39 | 4.27 | 3.69 | 9.17 | 1.95 | 1.93 | 2.16 | 2.09 | 1.87 | 1.60 | 3.74 | |
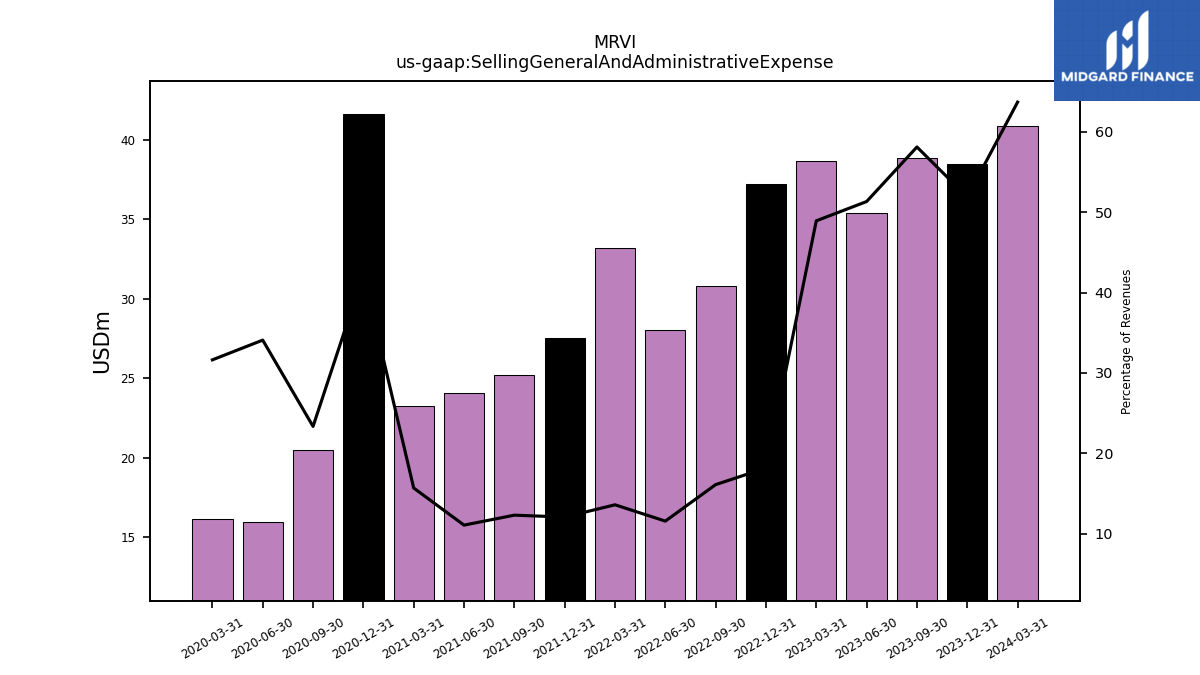
| Selling General And Administrative Expense | 40.88 | 38.48 | 38.86 | 35.38 | 38.67 | 37.20 | 30.80 | 28.06 | 33.20 | 27.55 | 25.19 | 24.09 | 23.24 | 41.62 | 20.51 | 15.99 | 16.13 | |
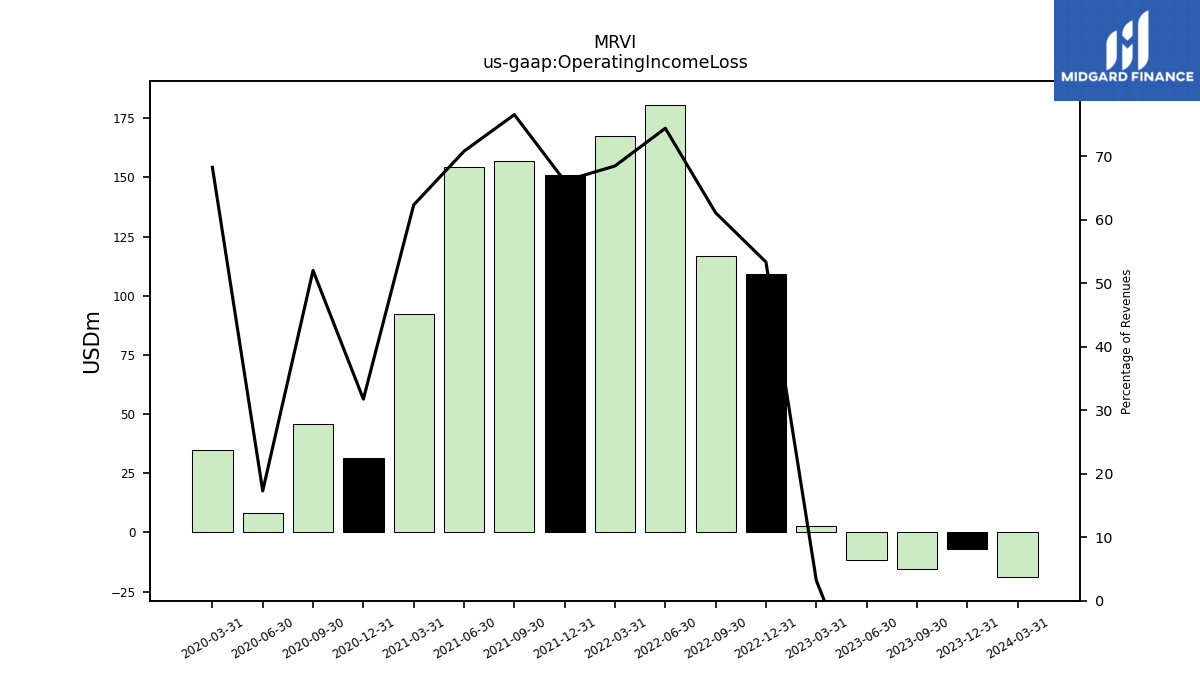
| Operating Income Loss | -18.86 | -7.15 | -15.42 | -11.61 | 2.53 | 109.25 | 116.90 | 180.70 | 167.37 | 151.09 | 156.87 | 154.25 | 92.44 | 31.25 | 45.72 | 8.12 | 34.82 | |
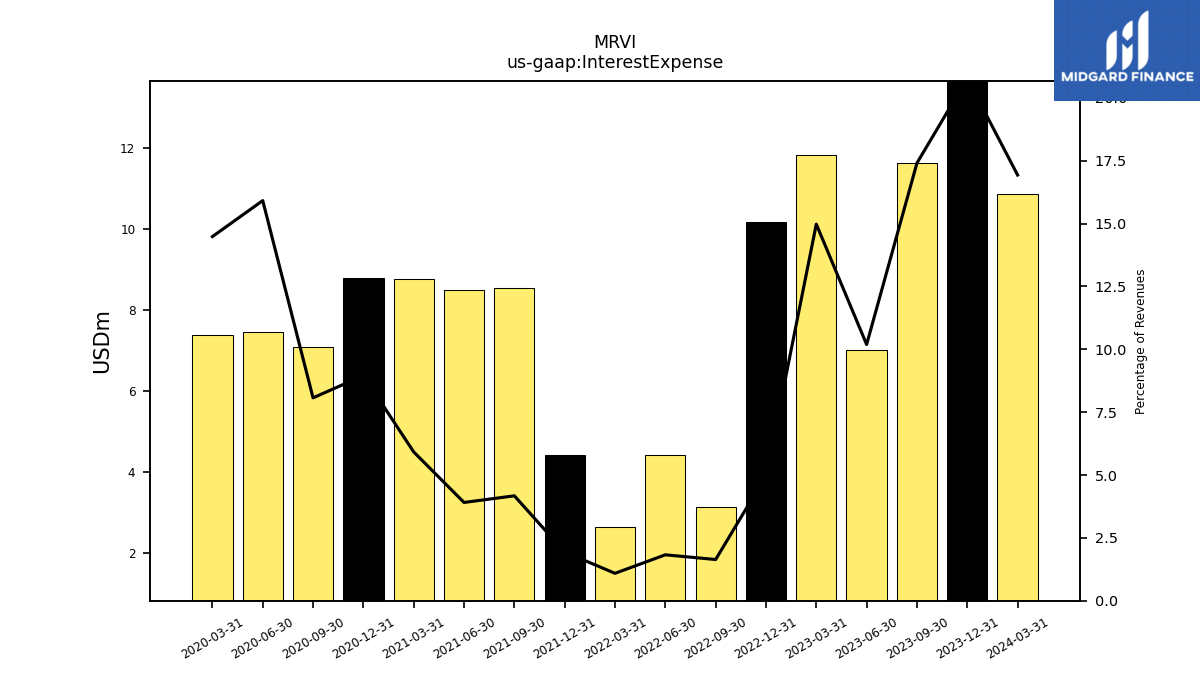
| Interest Expense | 10.86 | 15.40 | 11.64 | 7.02 | 11.83 | 10.18 | 3.14 | 4.43 | 2.66 | 4.43 | 8.54 | 8.51 | 8.77 | 8.81 | 7.09 | 7.46 | 7.38 | |
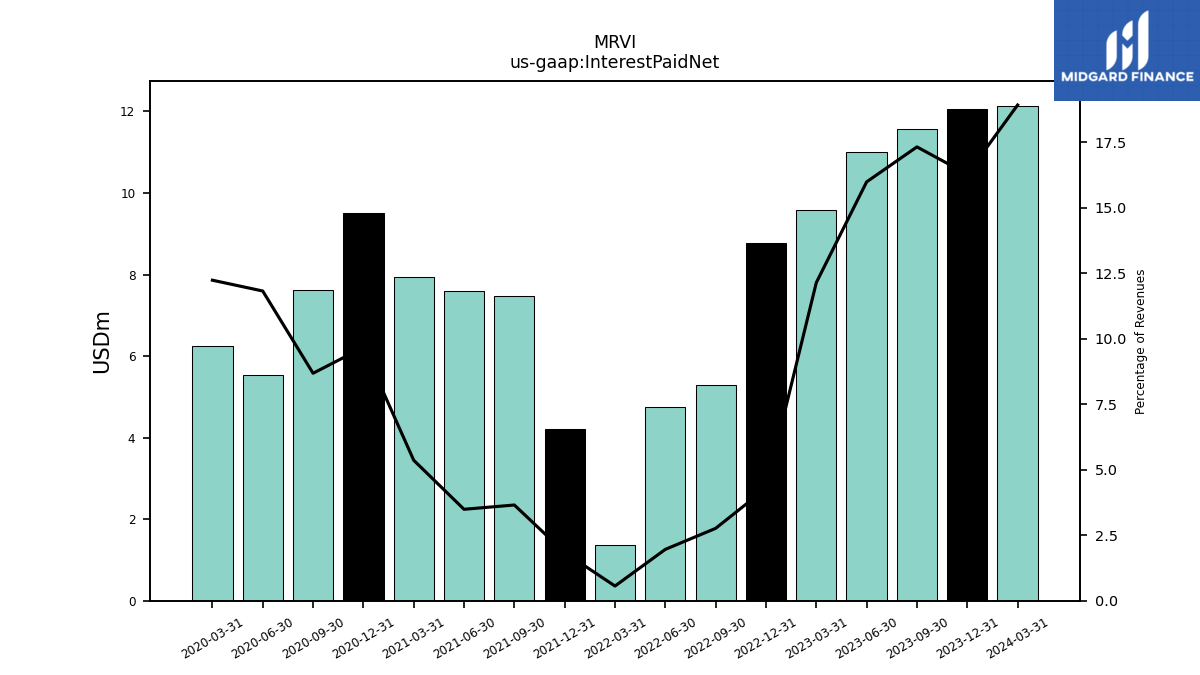
| Interest Paid Net | 12.14 | 12.07 | 11.58 | 11.02 | 9.59 | 8.78 | 5.28 | 4.76 | 1.37 | 4.20 | 7.48 | 7.60 | 7.95 | 9.51 | 7.63 | 5.54 | 6.24 | |
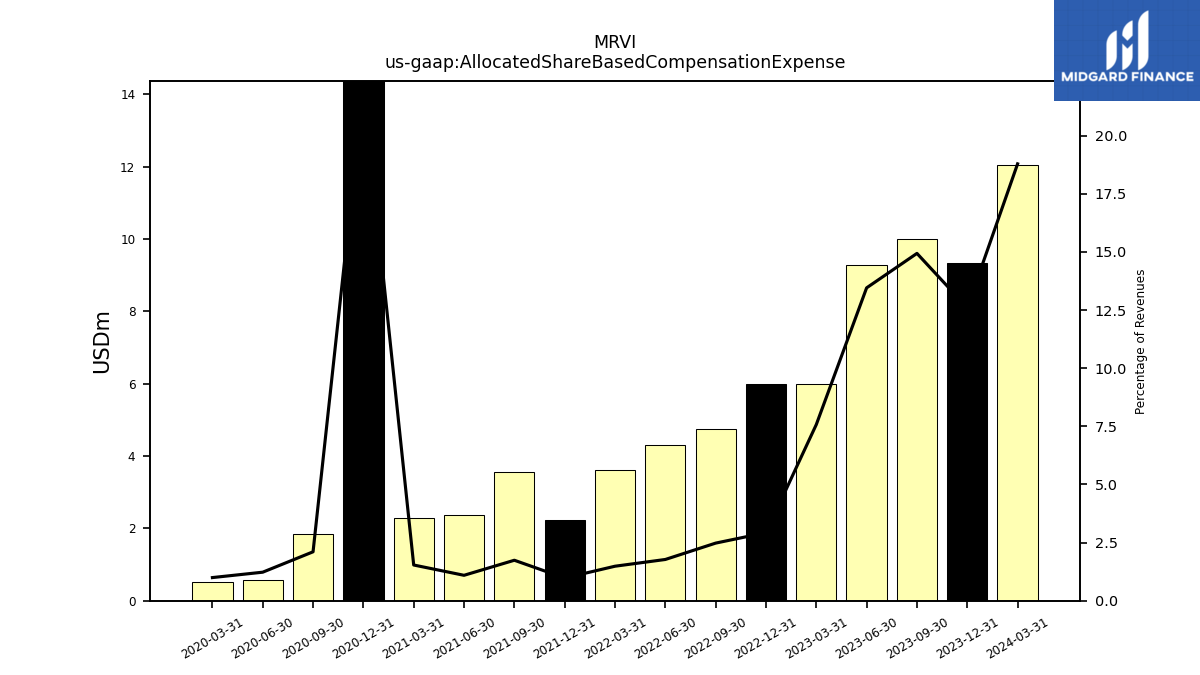
| Allocated Share Based Compensation Expense | 12.06 | 9.34 | 9.99 | 9.27 | 5.99 | 6.00 | 4.74 | 4.31 | 3.63 | 2.23 | 3.57 | 2.38 | 2.28 | 21.70 | 1.85 | 0.58 | 0.51 | |
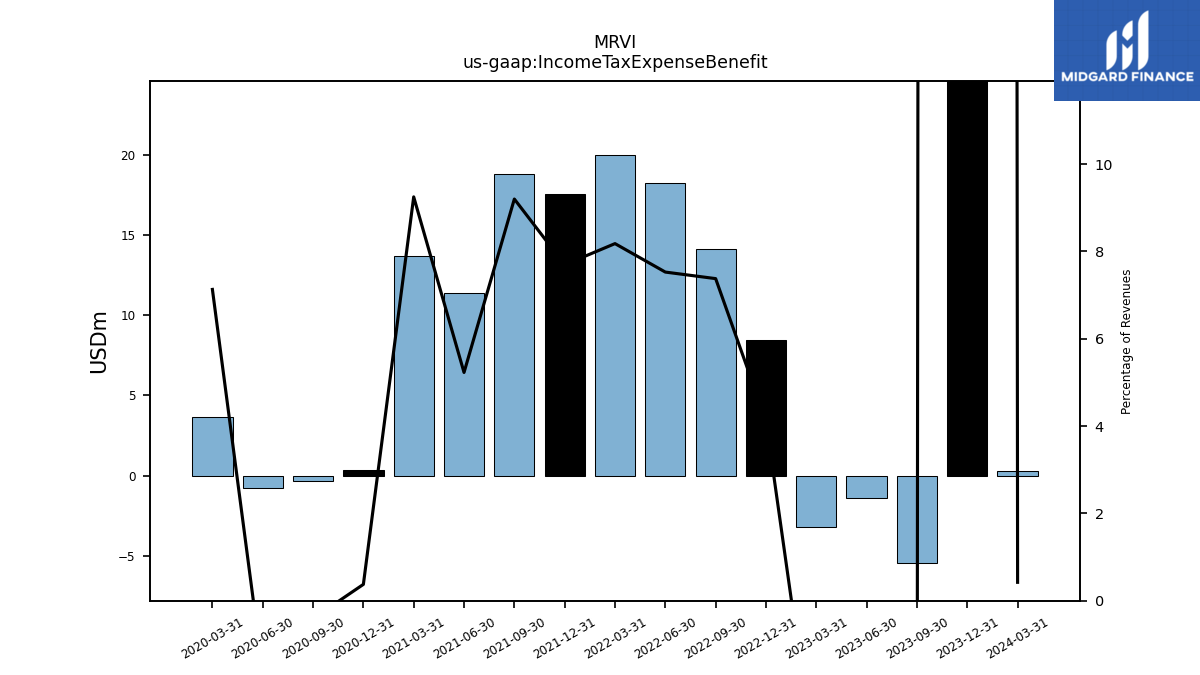
| Income Tax Expense Benefit | 0.27 | 766.17 | -5.46 | -1.42 | -3.17 | 8.45 | 14.11 | 18.27 | 19.98 | 17.58 | 18.84 | 11.39 | 13.71 | 0.37 | -0.36 | -0.77 | 3.63 | |
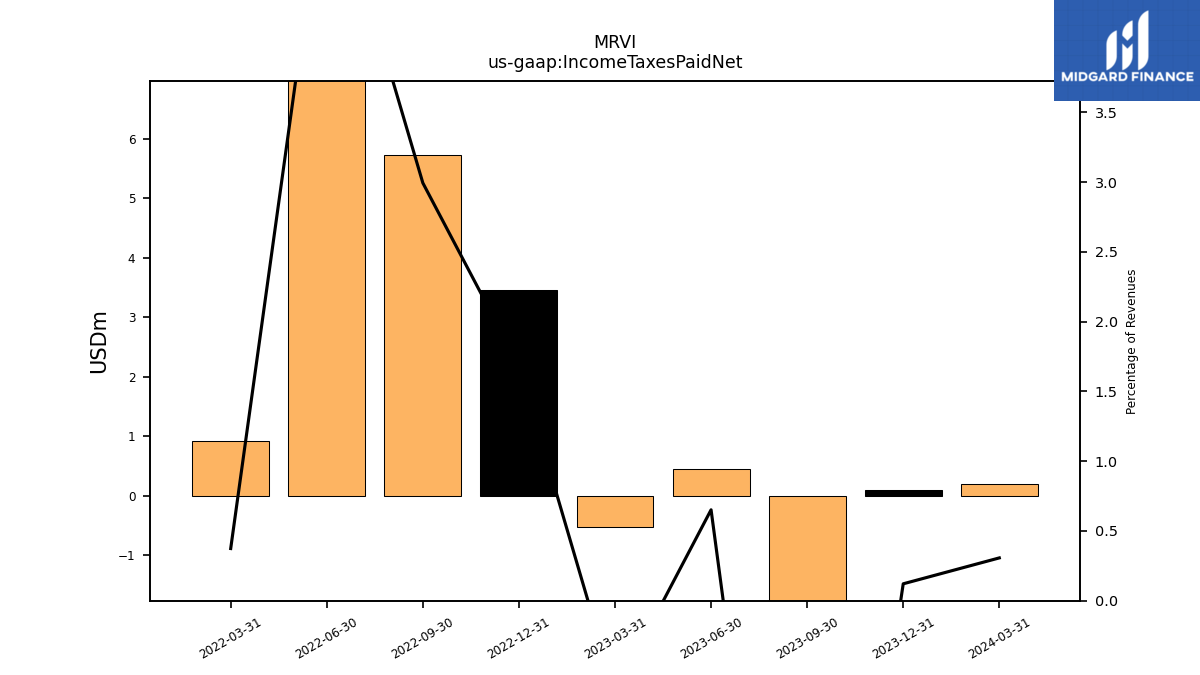
| Income Taxes Paid Net | 0.20 | 0.09 | -3.00 | 0.45 | -0.52 | 3.45 | 5.72 | 12.94 | 0.91 | NA | NA | NA | NA | NA | NA | NA | NA | |
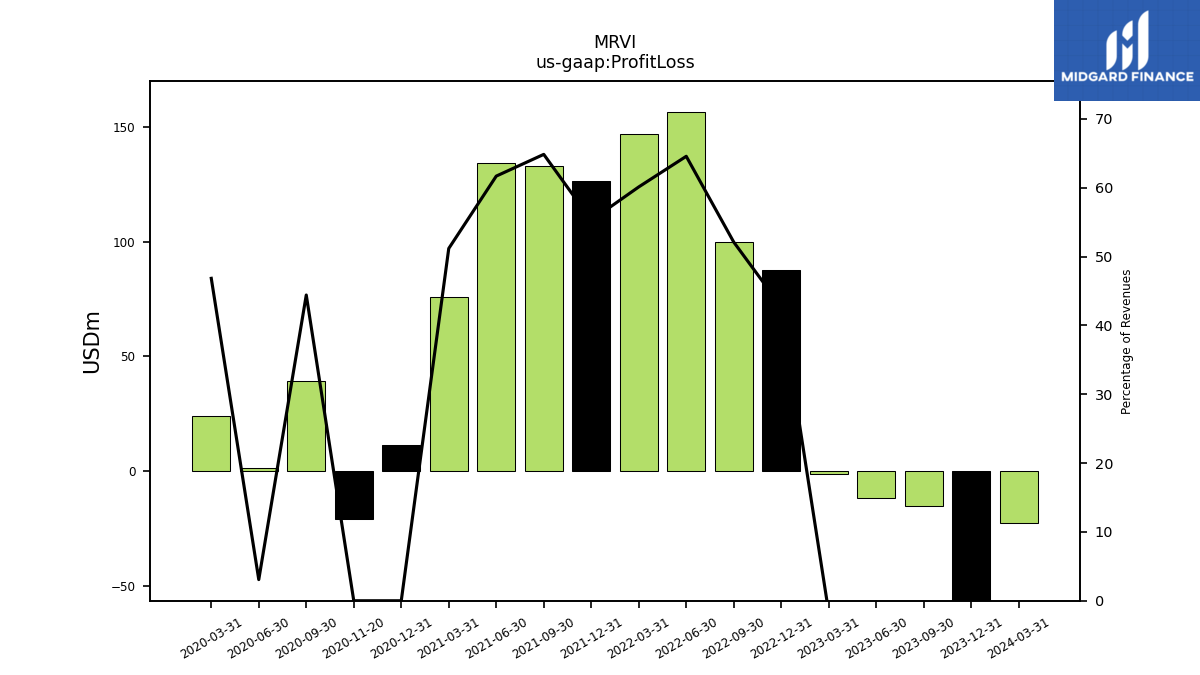
| Profit Loss | -22.68 | -109.98 | -15.10 | -11.94 | -1.35 | 87.43 | 99.65 | 156.72 | 146.86 | 126.24 | 132.81 | 134.34 | 75.85 | 11.43 | 39.02 | 1.44 | 23.88 | |
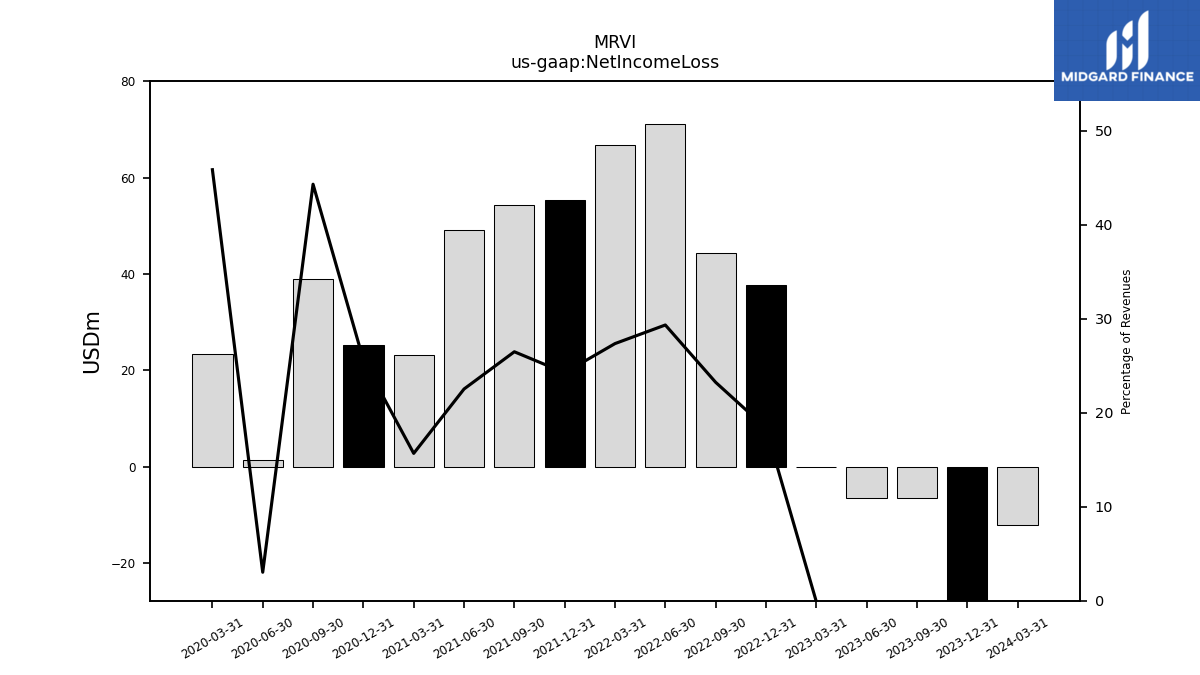
| Net Income Loss | -12.08 | -105.96 | -6.46 | -6.54 | -0.07 | 37.63 | 44.47 | 71.24 | 66.86 | 55.44 | 54.27 | 49.08 | 23.25 | 25.21 | 38.95 | 1.42 | 23.39 | |
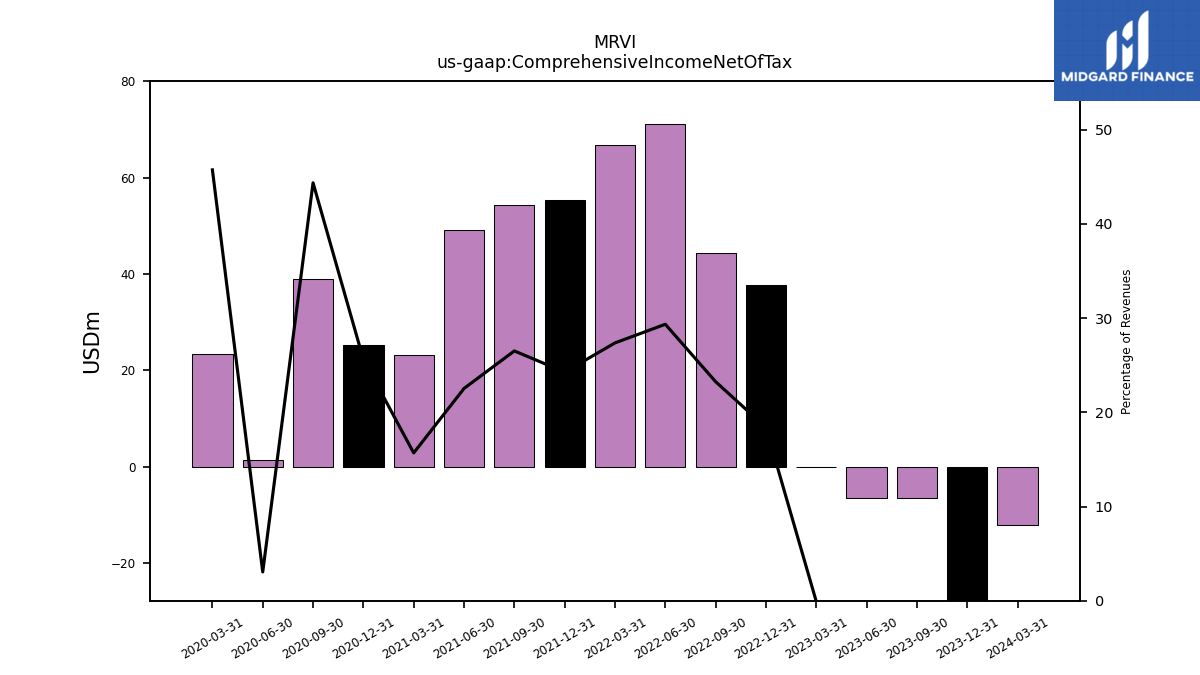
| Comprehensive Income Net Of Tax | -12.08 | -105.96 | -6.46 | -6.54 | -0.07 | 37.63 | 44.47 | 71.24 | 66.86 | 55.44 | 54.31 | 49.08 | 23.25 | 25.20 | 38.98 | 1.43 | 23.32 | |
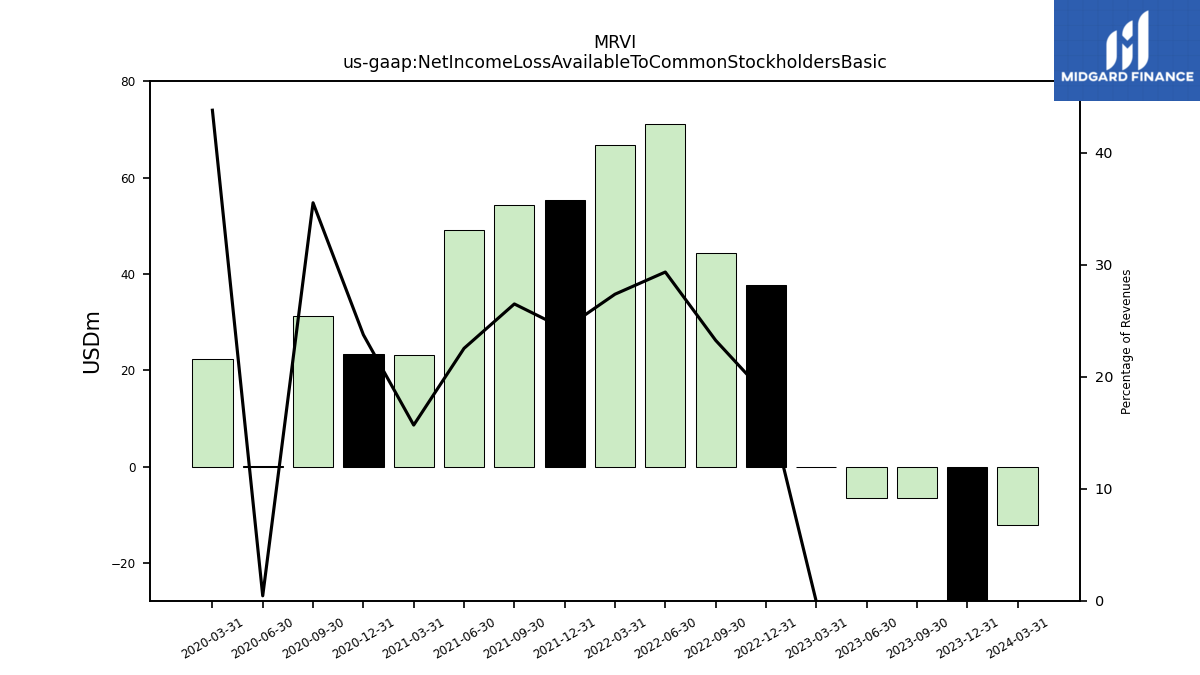
| Net Income Loss Available To Common Stockholders Basic | -12.08 | -105.96 | -6.46 | -6.54 | -0.07 | 37.63 | 44.47 | 71.24 | 66.86 | 55.44 | 54.27 | 49.08 | 23.25 | 23.36 | 31.22 | 0.21 | 22.33 | |
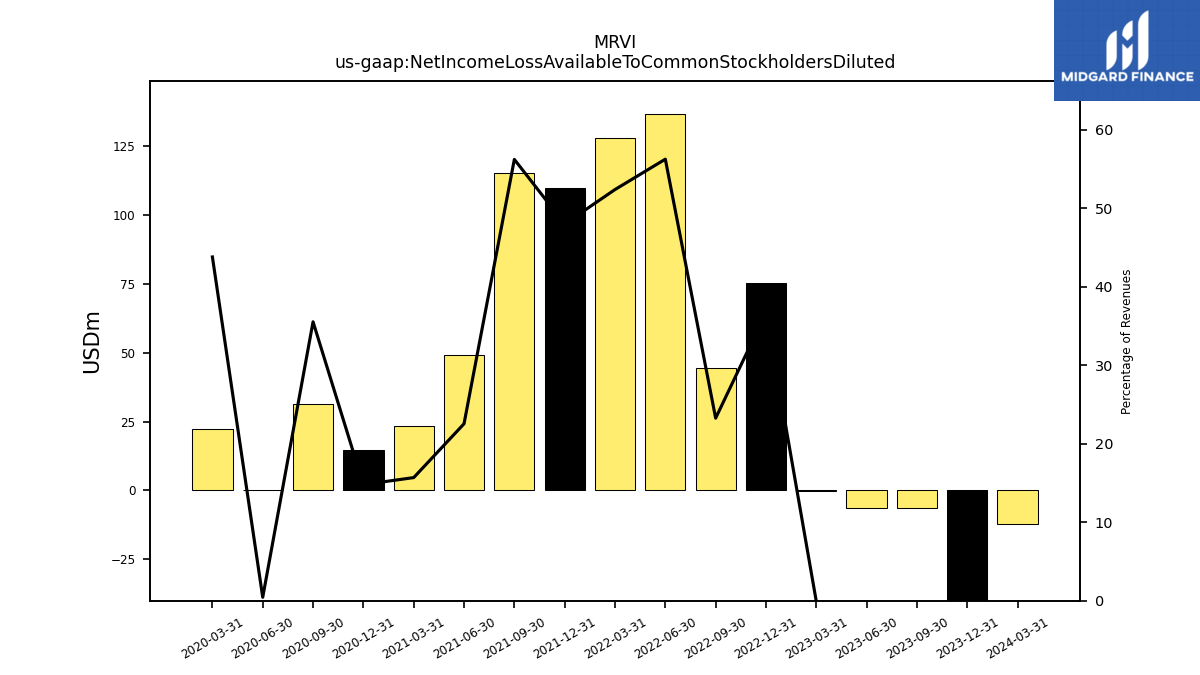
| Net Income Loss Available To Common Stockholders Diluted | -12.08 | -105.96 | -6.46 | -6.54 | -0.07 | 75.16 | 44.49 | 136.54 | 127.96 | 109.64 | 115.15 | 49.09 | 23.25 | 14.55 | 31.22 | 0.21 | 22.33 |
| 2024-03-31 | 2023-12-31 | 2023-09-30 | 2023-06-30 | 2023-03-31 | 2022-12-31 | 2022-09-30 | 2022-06-30 | 2022-03-31 | 2021-12-31 | 2021-09-30 | 2021-06-30 | 2021-03-31 | 2020-12-31 | 2020-09-30 | 2020-06-30 | 2020-03-31 | ||
|---|---|---|---|---|---|---|---|---|---|---|---|---|---|---|---|---|---|---|
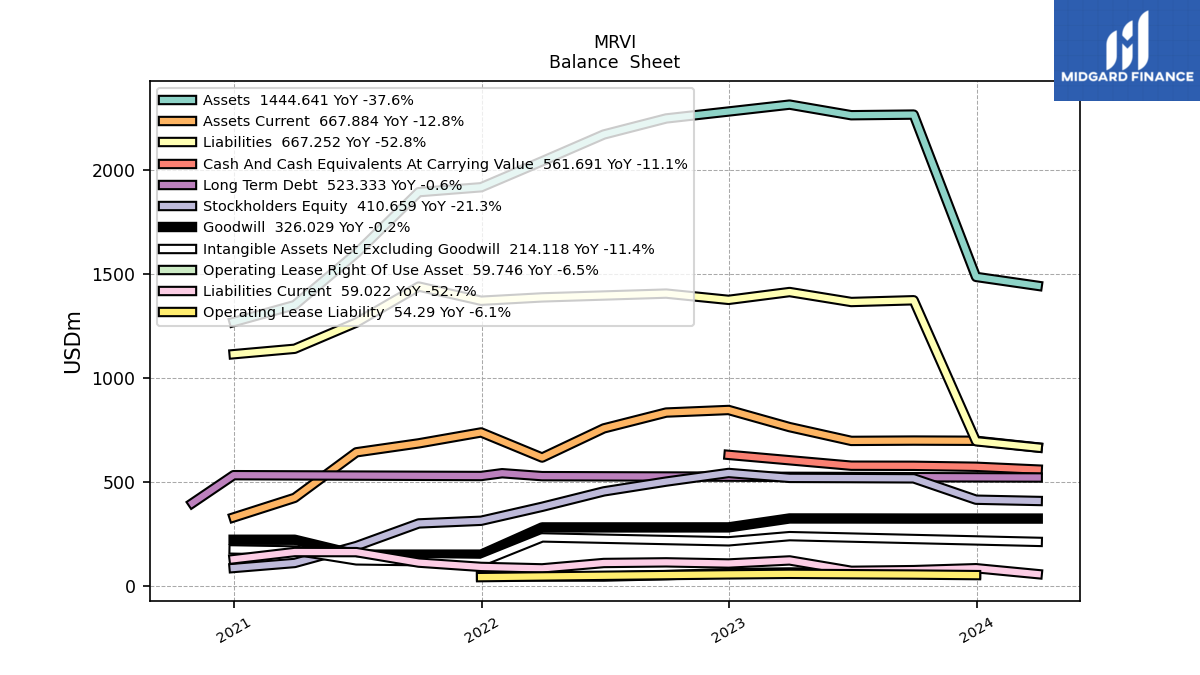
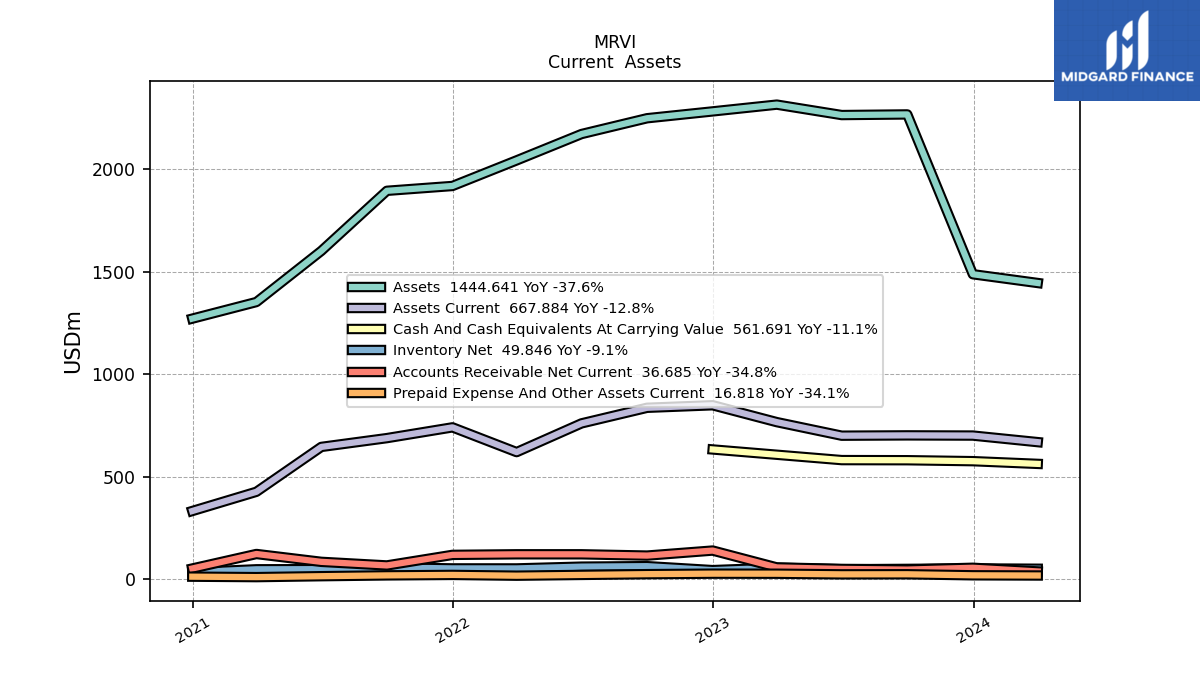
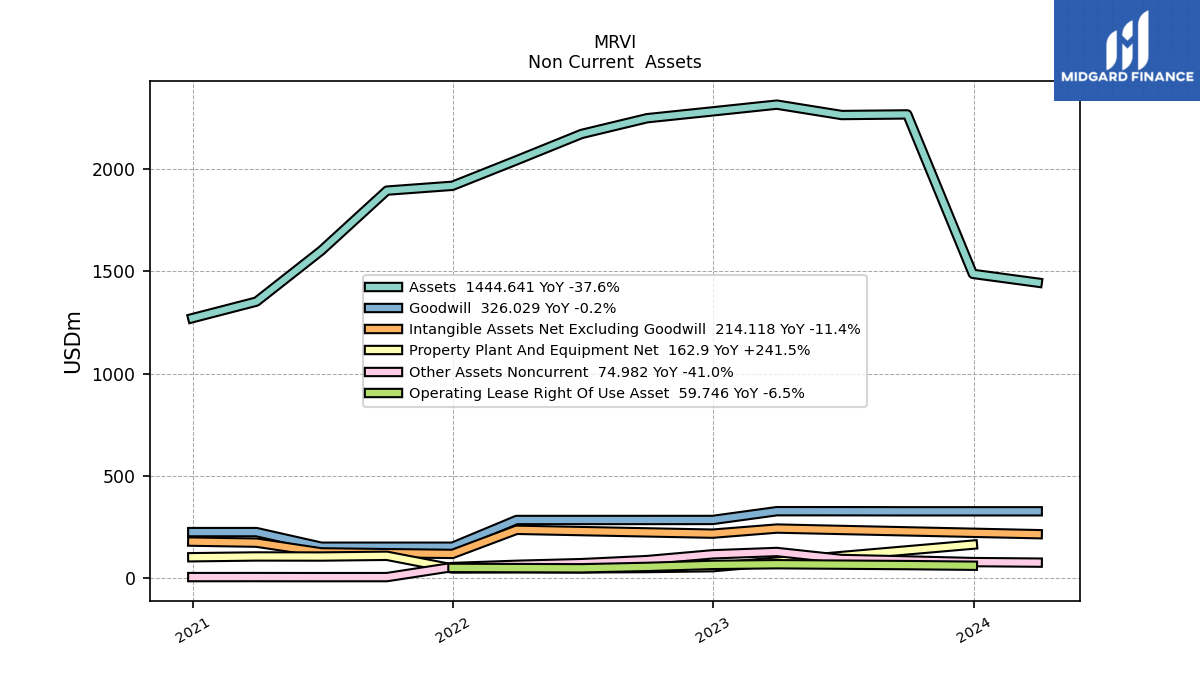
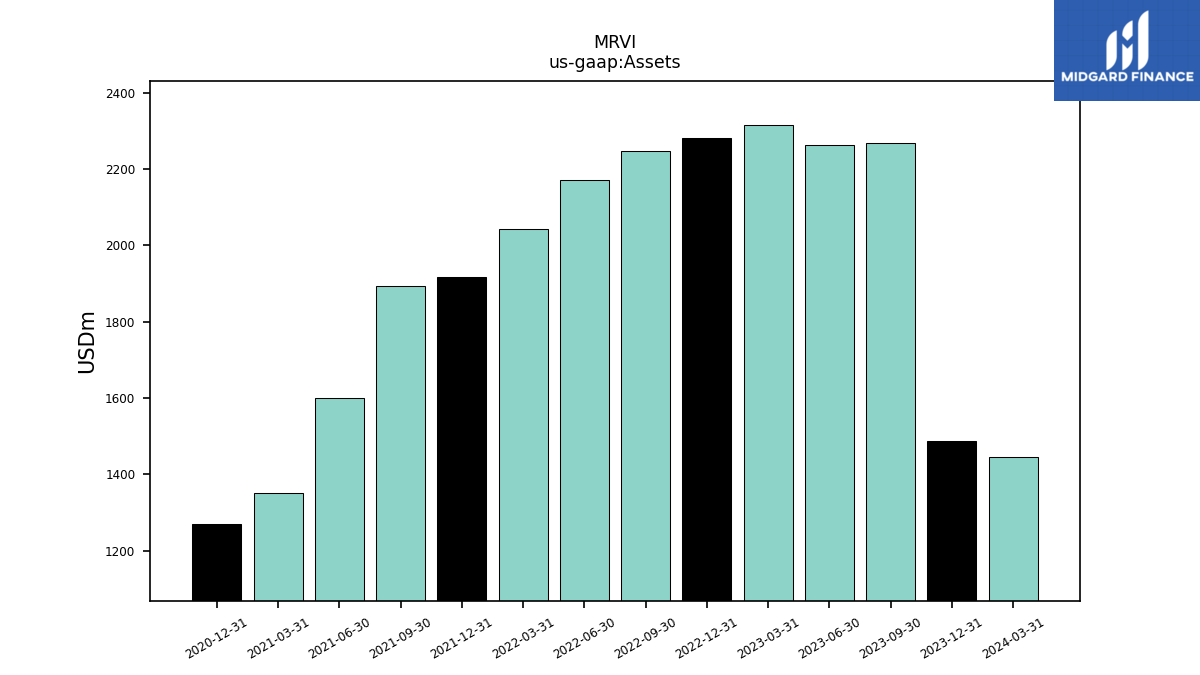
| Assets | 1444.64 | 1487.45 | 2267.55 | 2264.44 | 2315.39 | 2282.32 | 2248.90 | 2171.80 | 2043.23 | 1918.28 | 1894.68 | 1601.25 | 1351.77 | 1270.69 | NA | NA | NA | |
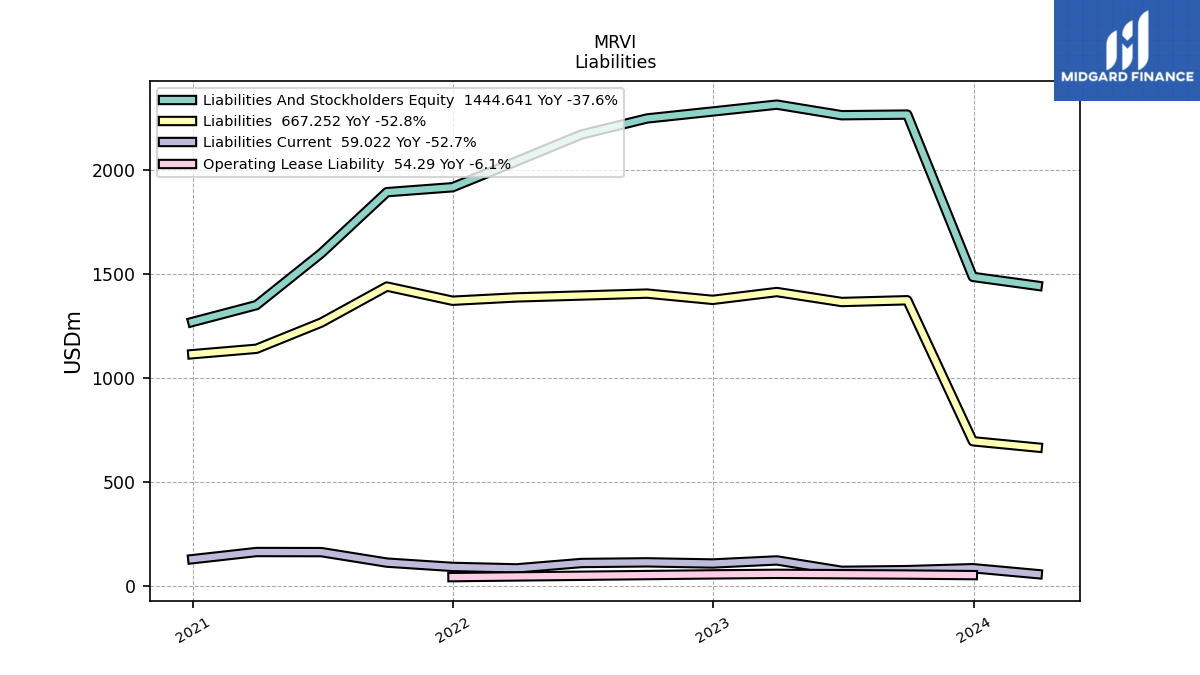
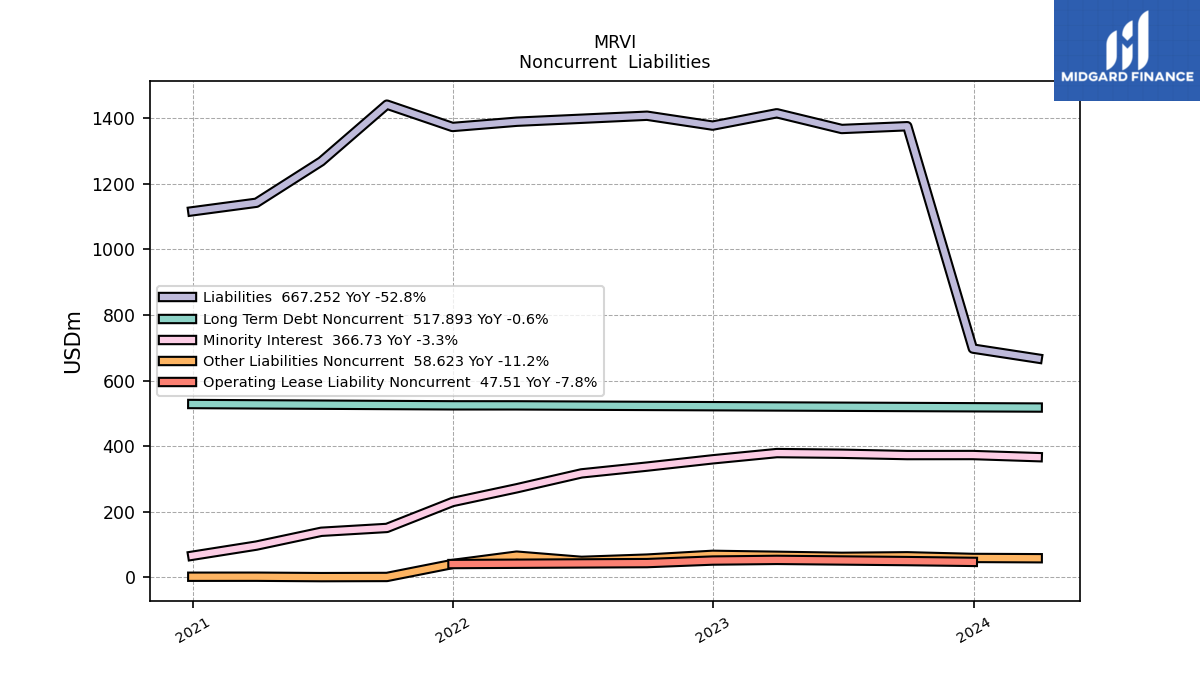
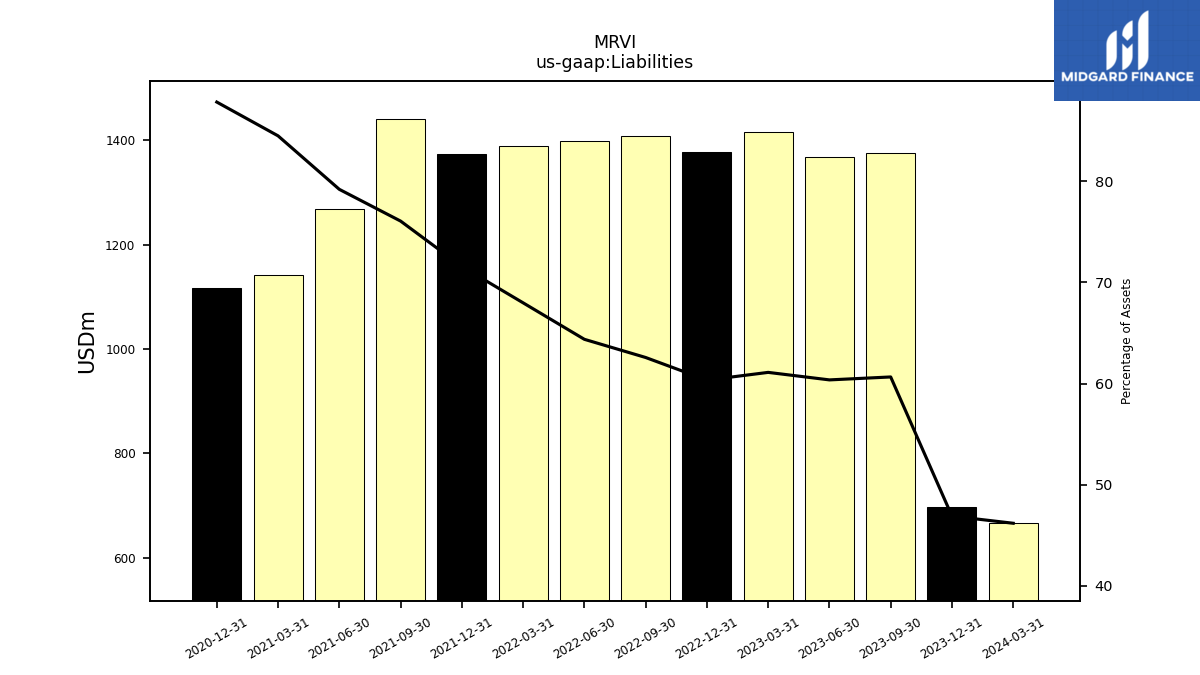
| Liabilities | 667.25 | 697.57 | 1375.27 | 1366.80 | 1414.75 | 1377.07 | 1407.23 | 1398.01 | 1388.93 | 1372.91 | 1441.07 | 1268.11 | 1142.01 | 1115.94 | NA | NA | NA | |
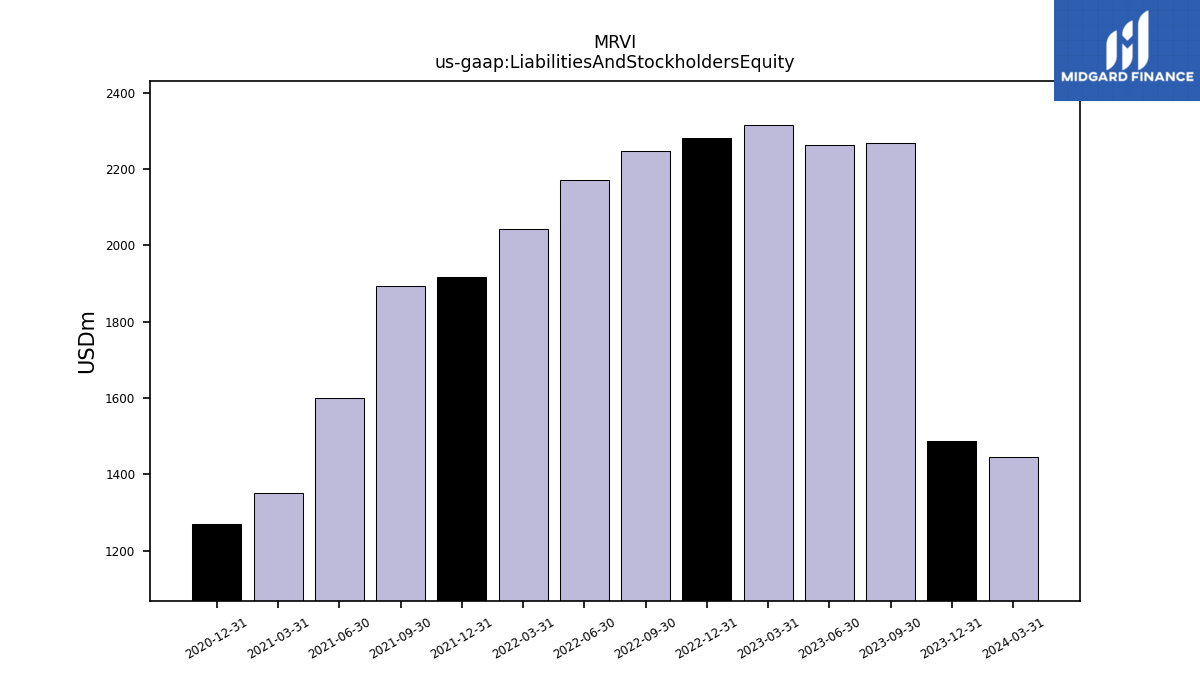
| Liabilities And Stockholders Equity | 1444.64 | 1487.45 | 2267.55 | 2264.44 | 2315.39 | 2282.32 | 2248.90 | 2171.80 | 2043.23 | 1918.28 | 1894.68 | 1601.25 | 1351.77 | 1270.69 | NA | NA | NA | |
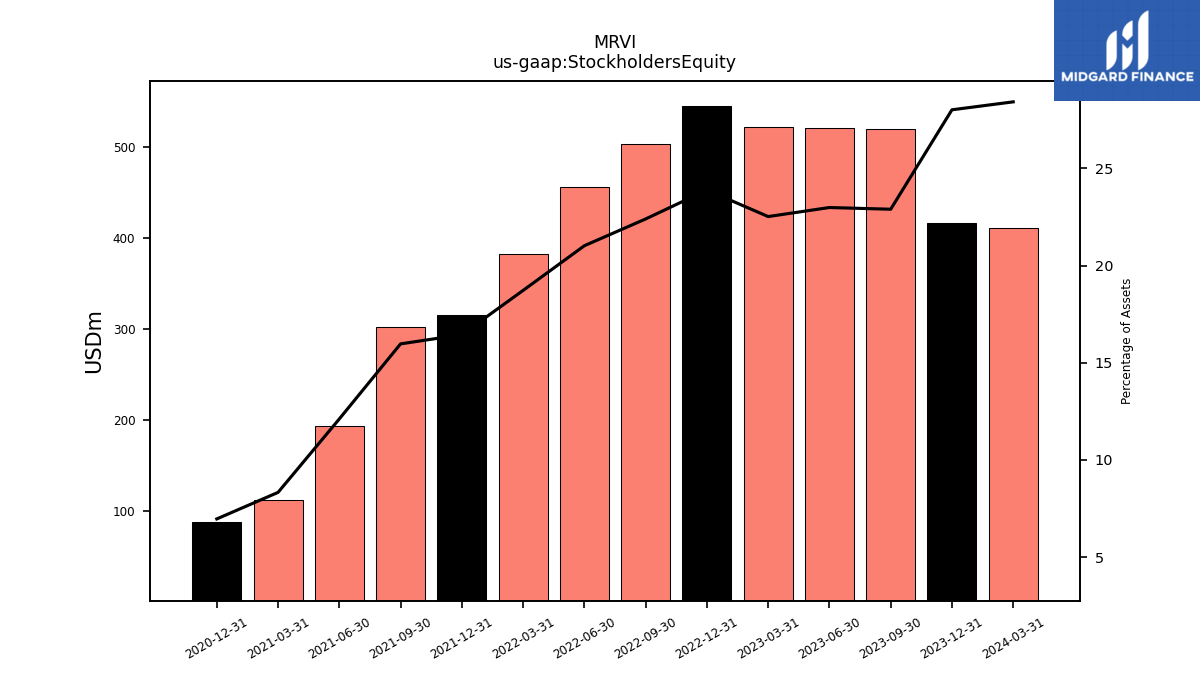
| Stockholders Equity | 410.66 | 416.75 | 519.29 | 520.57 | 521.52 | 545.22 | 503.76 | 456.59 | 382.56 | 315.50 | 302.64 | 193.92 | 112.61 | 88.51 | NA | NA | NA |
| 2024-03-31 | 2023-12-31 | 2023-09-30 | 2023-06-30 | 2023-03-31 | 2022-12-31 | 2022-09-30 | 2022-06-30 | 2022-03-31 | 2021-12-31 | 2021-09-30 | 2021-06-30 | 2021-03-31 | 2020-12-31 | 2020-09-30 | 2020-06-30 | 2020-03-31 | ||
|---|---|---|---|---|---|---|---|---|---|---|---|---|---|---|---|---|---|---|
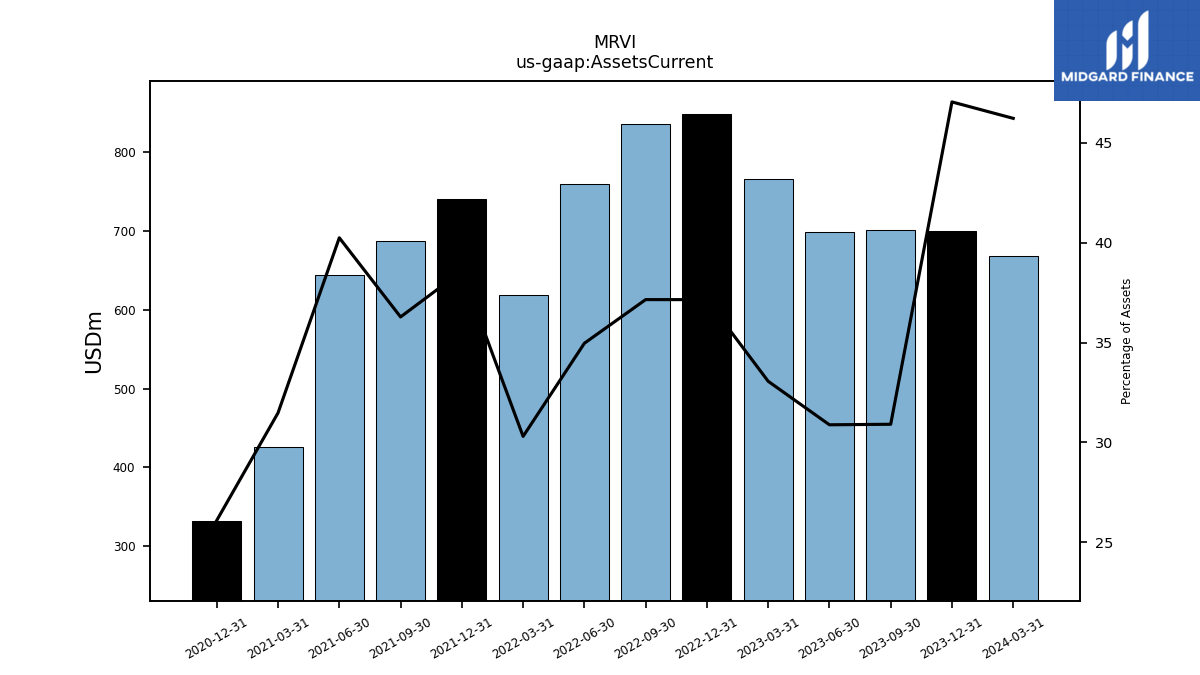
| Assets Current | 667.88 | 699.91 | 700.87 | 699.31 | 765.51 | 847.90 | 835.53 | 759.38 | 619.13 | 740.04 | 687.48 | 644.49 | 425.54 | 331.60 | NA | NA | NA | |
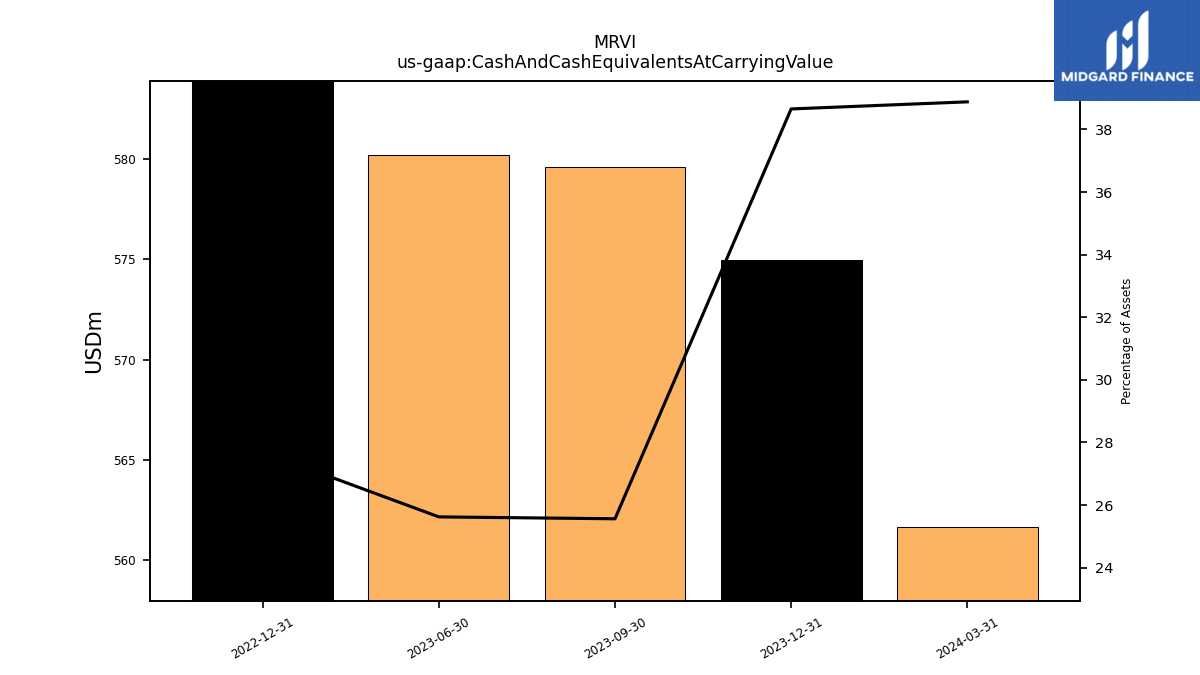
| Cash And Cash Equivalents At Carrying Value | 561.69 | 574.96 | 579.61 | 580.18 | NA | 632.14 | NA | NA | NA | NA | NA | NA | NA | NA | NA | NA | NA | |
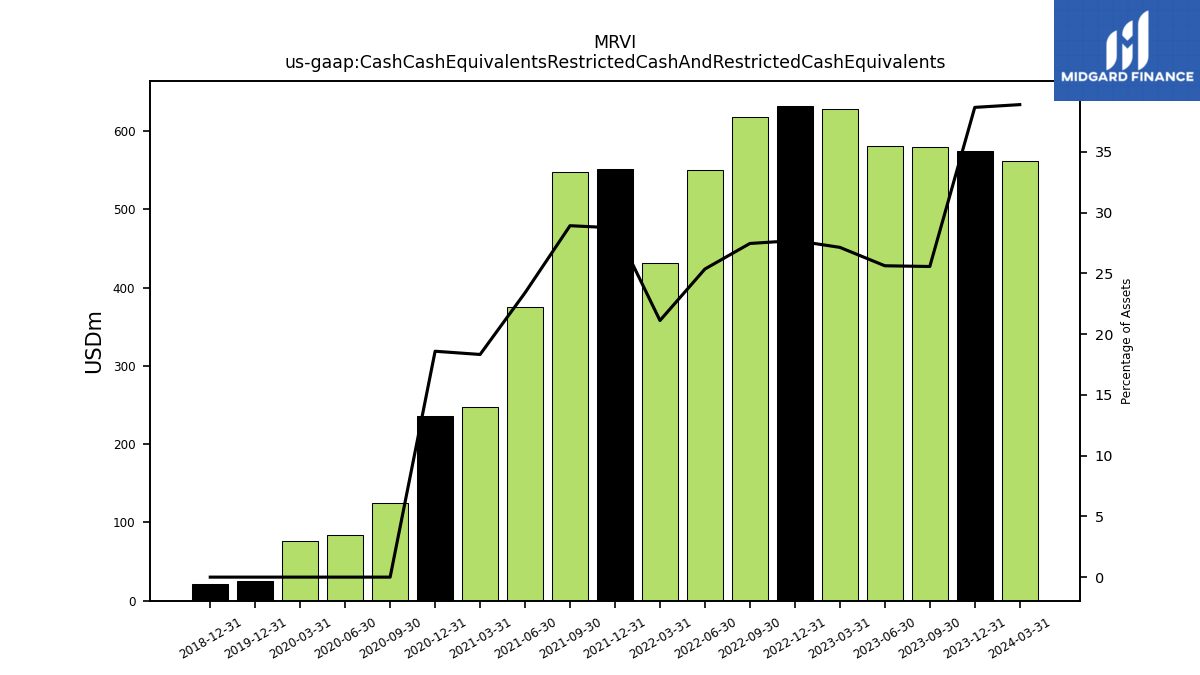
| Cash Cash Equivalents Restricted Cash And Restricted Cash Equivalents | 561.69 | 574.96 | 579.61 | 580.18 | 628.27 | 632.14 | 617.45 | 550.68 | 431.47 | 551.27 | 547.90 | 374.71 | 247.68 | 236.18 | 124.88 | 84.46 | 76.75 | |
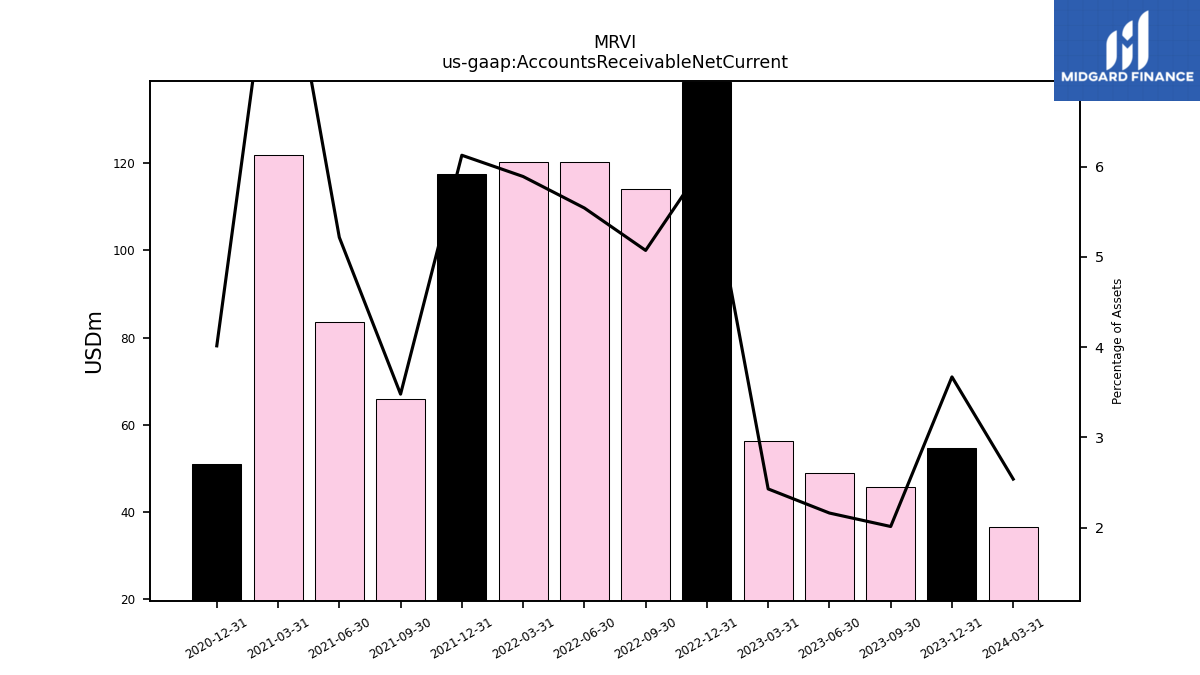
| Accounts Receivable Net Current | 36.69 | 54.60 | 45.67 | 48.99 | 56.27 | 138.62 | 114.07 | 120.35 | 120.36 | 117.51 | 65.94 | 83.53 | 121.82 | 51.02 | NA | NA | NA | |
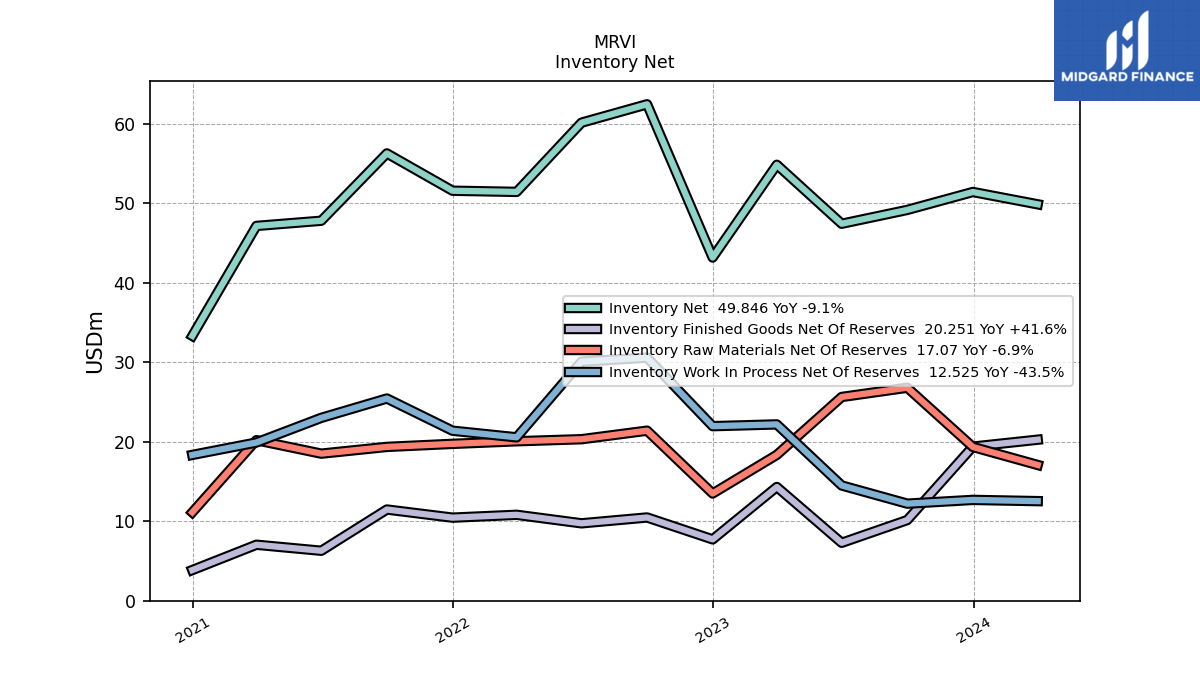
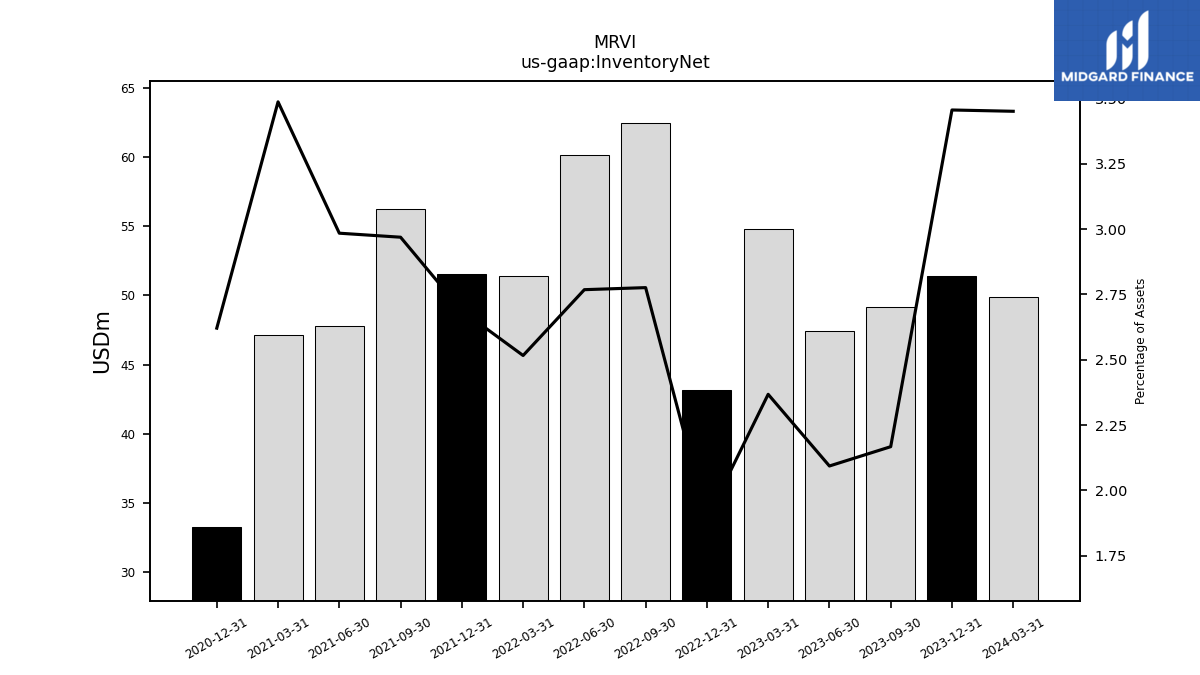
| Inventory Net | 49.85 | 51.40 | 49.14 | 47.40 | 54.82 | 43.15 | 62.42 | 60.11 | 51.41 | 51.56 | 56.25 | 47.78 | 47.13 | 33.30 | NA | NA | NA | |
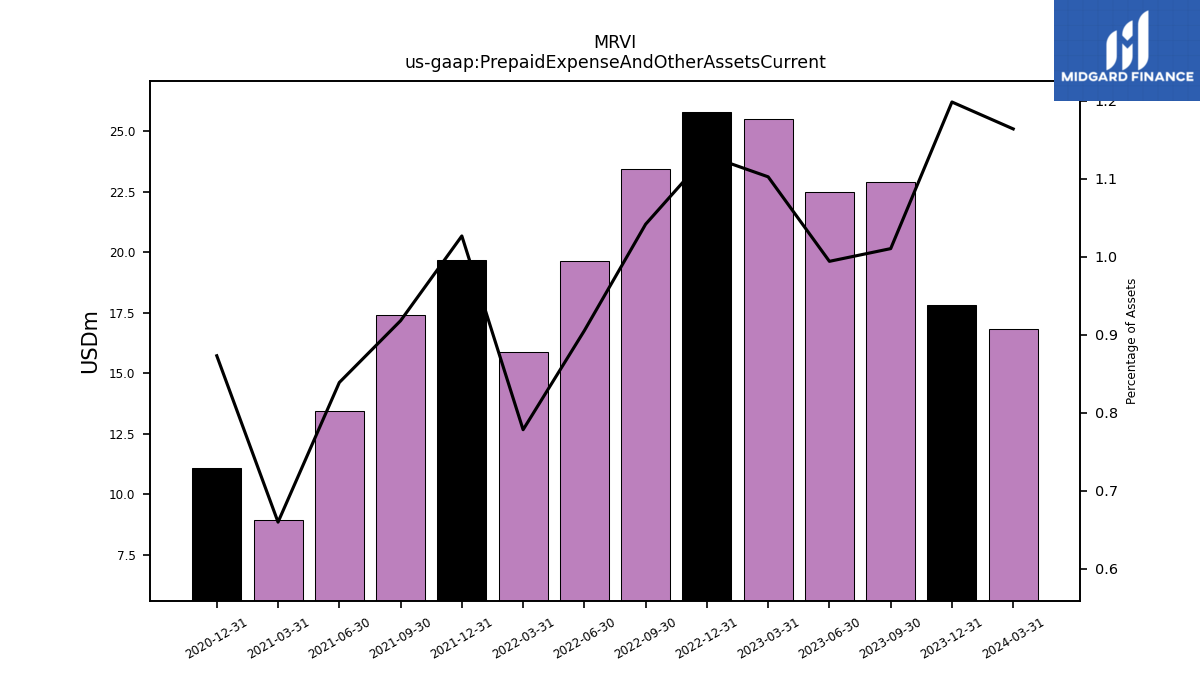
| Prepaid Expense And Other Assets Current | 16.82 | 17.83 | 22.92 | 22.52 | 25.53 | 25.80 | 23.43 | 19.66 | 15.90 | 19.70 | 17.39 | 13.43 | 8.92 | 11.10 | NA | NA | NA |
| 2024-03-31 | 2023-12-31 | 2023-09-30 | 2023-06-30 | 2023-03-31 | 2022-12-31 | 2022-09-30 | 2022-06-30 | 2022-03-31 | 2021-12-31 | 2021-09-30 | 2021-06-30 | 2021-03-31 | 2020-12-31 | 2020-09-30 | 2020-06-30 | 2020-03-31 | ||
|---|---|---|---|---|---|---|---|---|---|---|---|---|---|---|---|---|---|---|
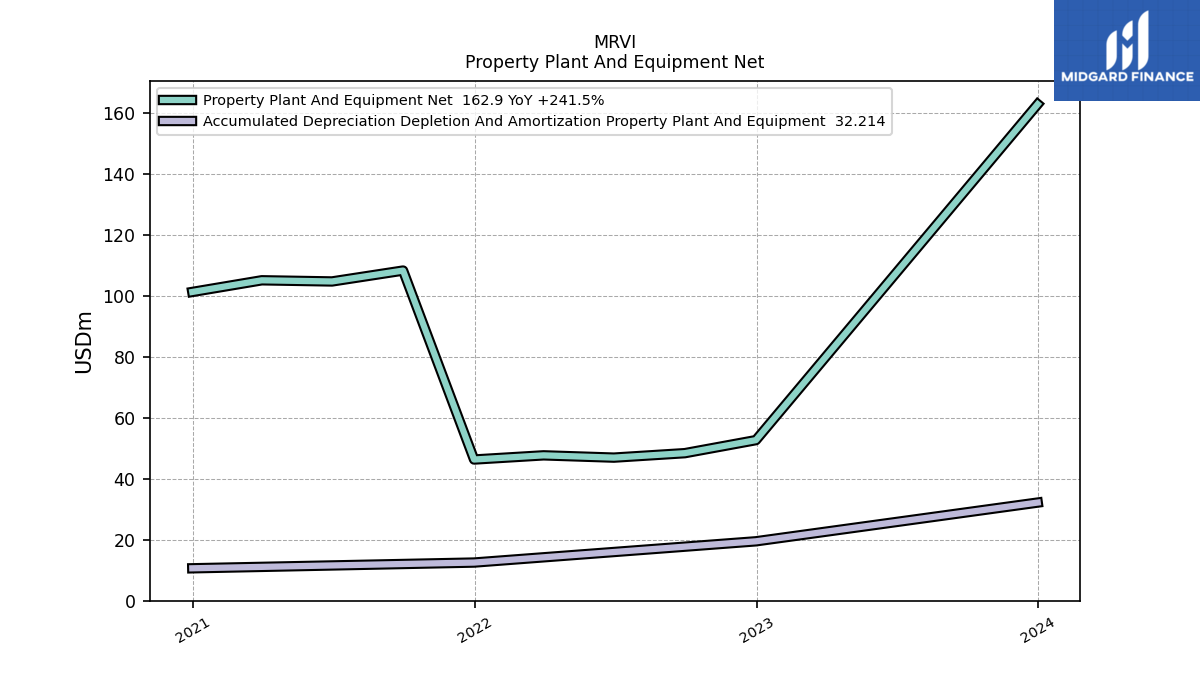
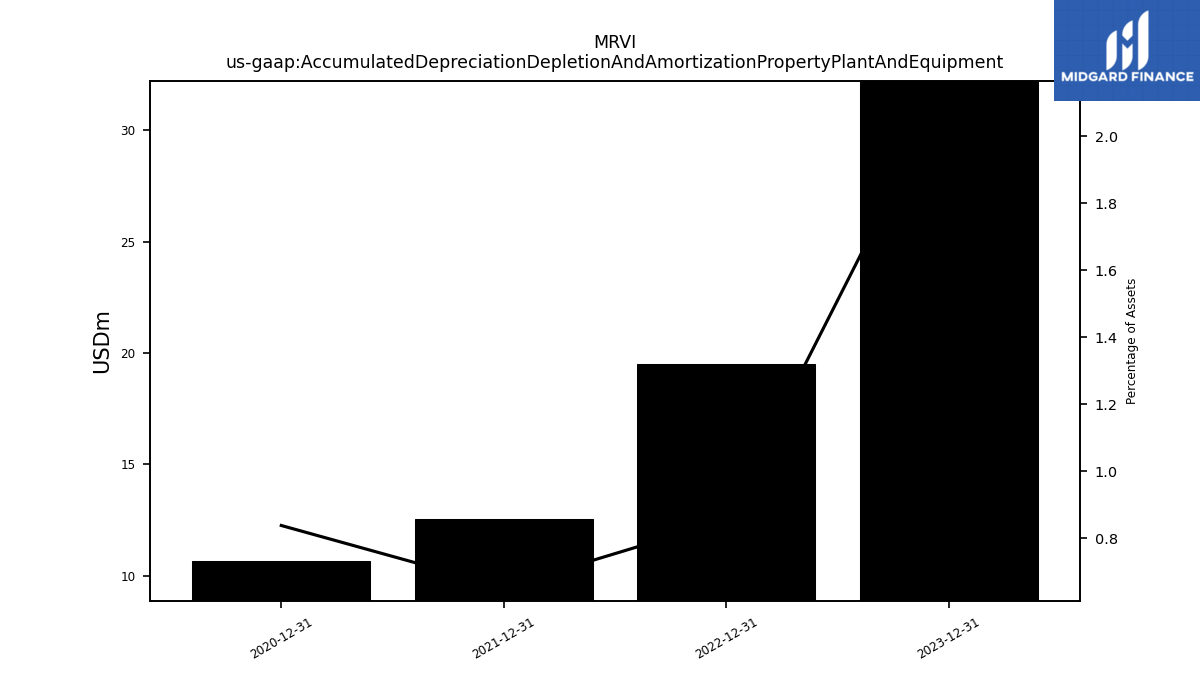
| Accumulated Depreciation Depletion And Amortization Property Plant And Equipment | NA | 32.21 | NA | NA | NA | 19.50 | NA | NA | NA | 12.53 | NA | NA | NA | 10.65 | NA | NA | NA | |
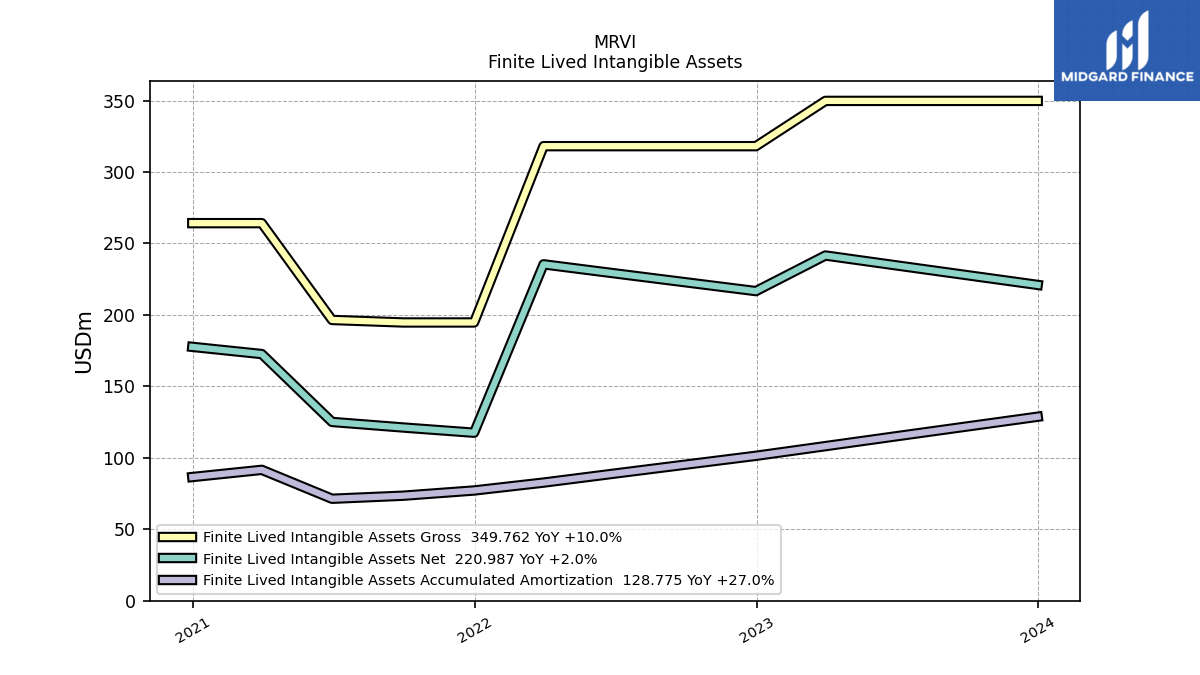
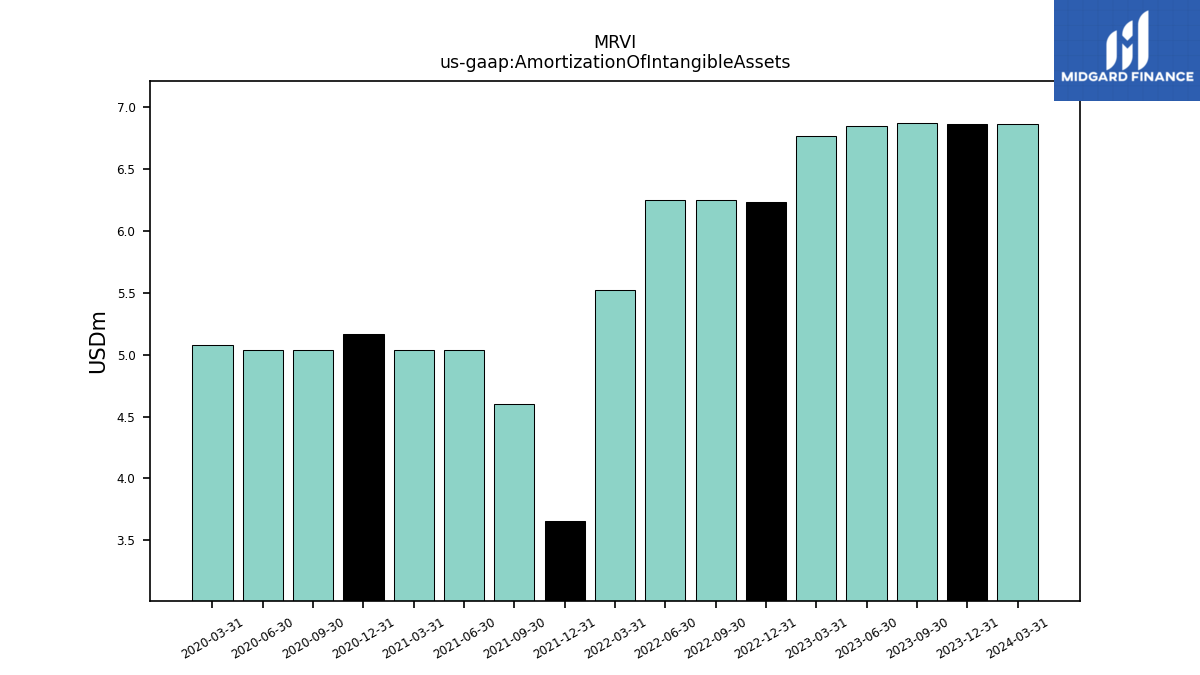
| Amortization Of Intangible Assets | 6.87 | 6.87 | 6.87 | 6.85 | 6.76 | 6.24 | 6.25 | 6.25 | 5.53 | 3.65 | 4.60 | 5.04 | 5.04 | 5.16 | 5.04 | 5.04 | 5.08 | |
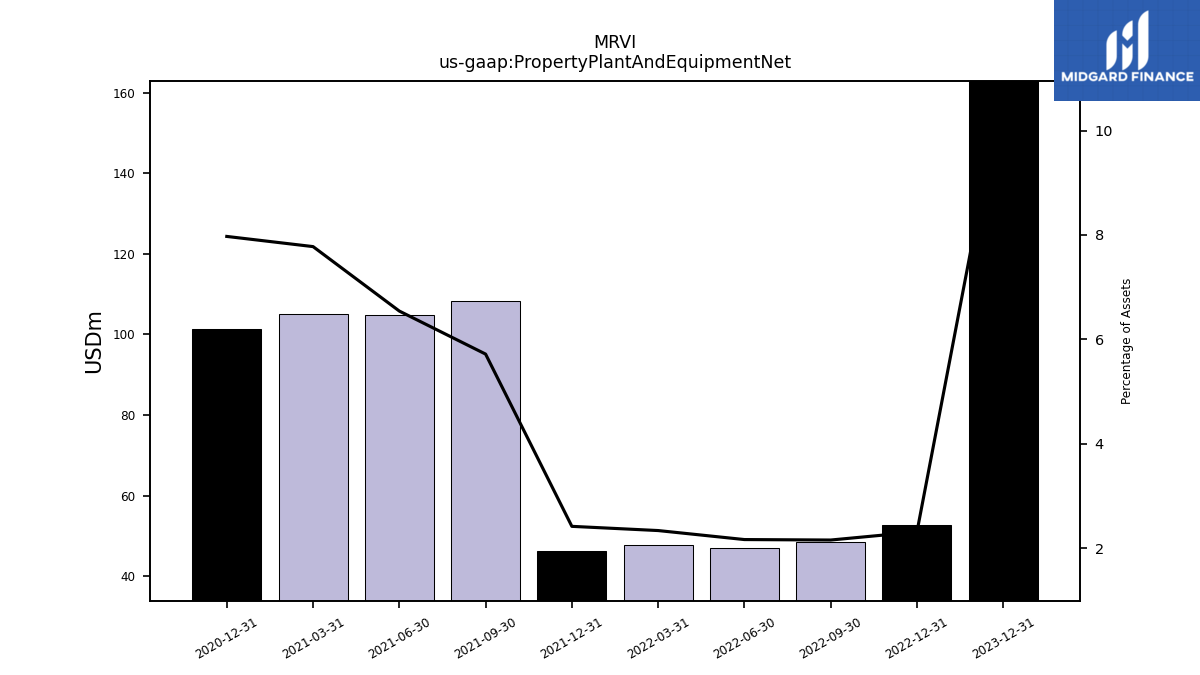
| Property Plant And Equipment Net | NA | 162.90 | NA | NA | NA | 52.69 | 48.42 | 46.96 | 47.70 | 46.33 | 108.32 | 104.75 | 105.13 | 101.31 | NA | NA | NA | |
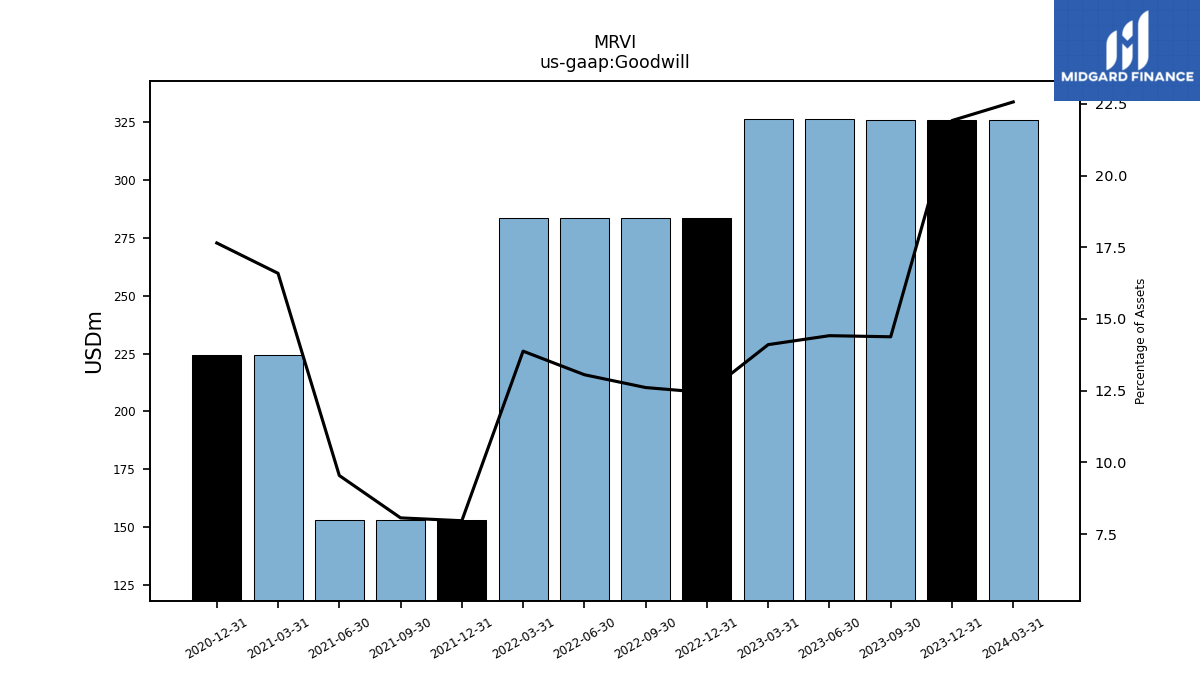
| Goodwill | 326.03 | 326.03 | 326.03 | 326.46 | 326.57 | 283.67 | 283.54 | 283.54 | 283.54 | 152.77 | 152.77 | 152.77 | 224.28 | 224.28 | NA | NA | NA | |
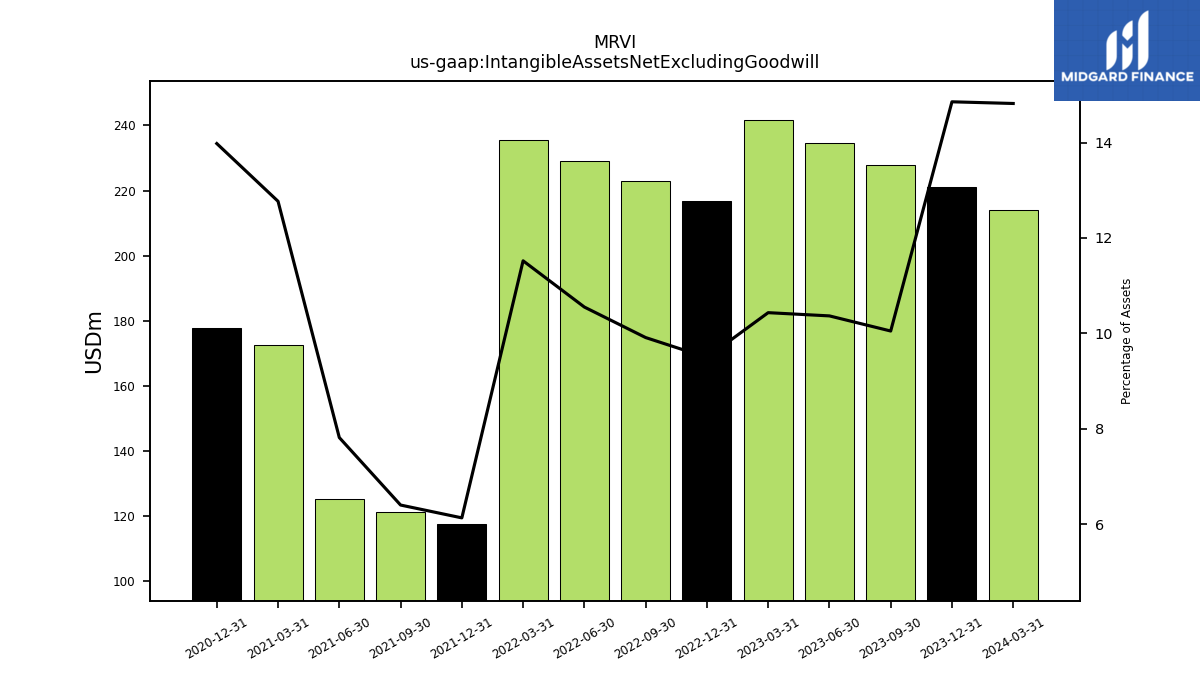
| Intangible Assets Net Excluding Goodwill | 214.12 | 220.99 | 227.86 | 234.73 | 241.58 | 216.66 | 222.90 | 229.15 | 235.41 | 117.57 | 121.22 | 125.12 | 172.62 | 177.66 | NA | NA | NA | |
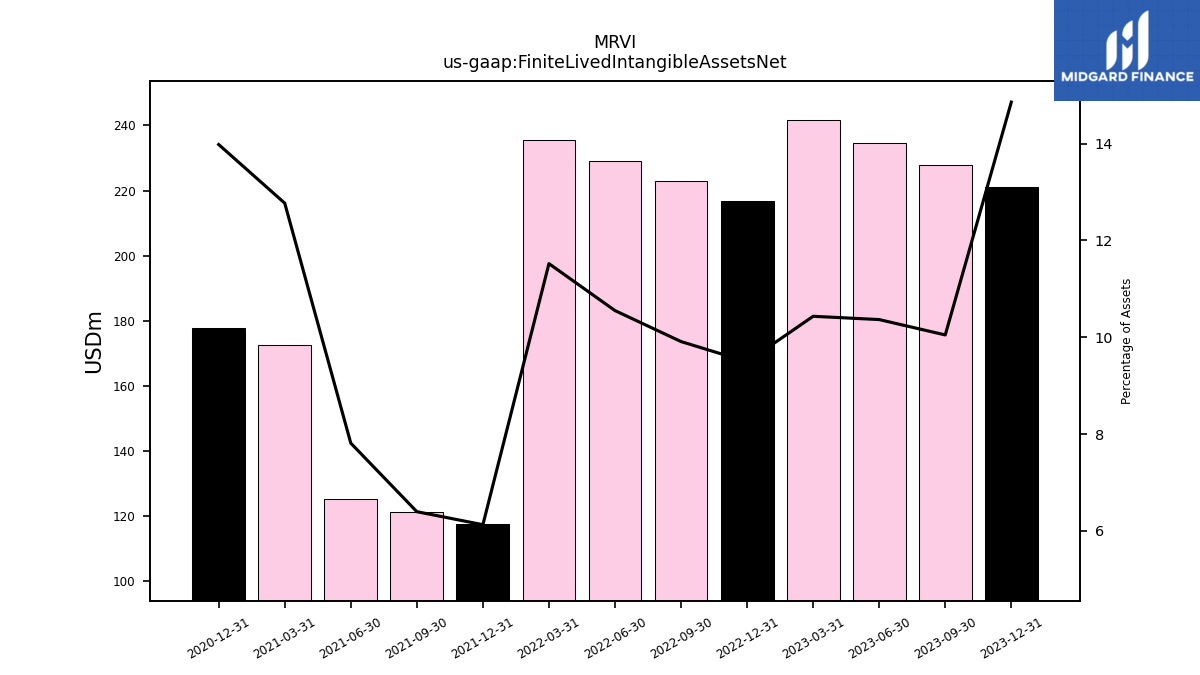
| Finite Lived Intangible Assets Net | NA | 220.99 | 227.86 | 234.73 | 241.58 | 216.66 | 222.90 | 229.15 | 235.41 | 117.57 | 121.22 | 125.12 | 172.62 | 177.66 | NA | NA | NA | |
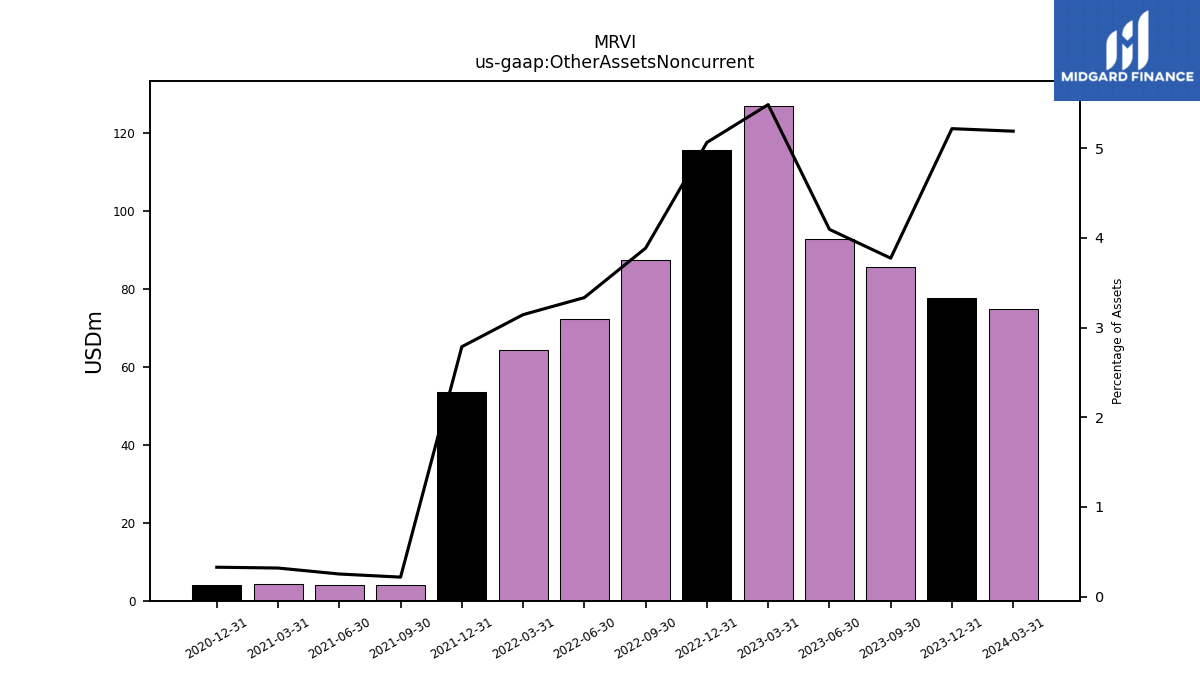
| Other Assets Noncurrent | 74.98 | 77.62 | 85.58 | 92.73 | 127.03 | 115.59 | 87.40 | 72.42 | 64.24 | 53.45 | 4.11 | 4.03 | 4.30 | 4.16 | NA | NA | NA |
| 2024-03-31 | 2023-12-31 | 2023-09-30 | 2023-06-30 | 2023-03-31 | 2022-12-31 | 2022-09-30 | 2022-06-30 | 2022-03-31 | 2021-12-31 | 2021-09-30 | 2021-06-30 | 2021-03-31 | 2020-12-31 | 2020-09-30 | 2020-06-30 | 2020-03-31 | ||
|---|---|---|---|---|---|---|---|---|---|---|---|---|---|---|---|---|---|---|
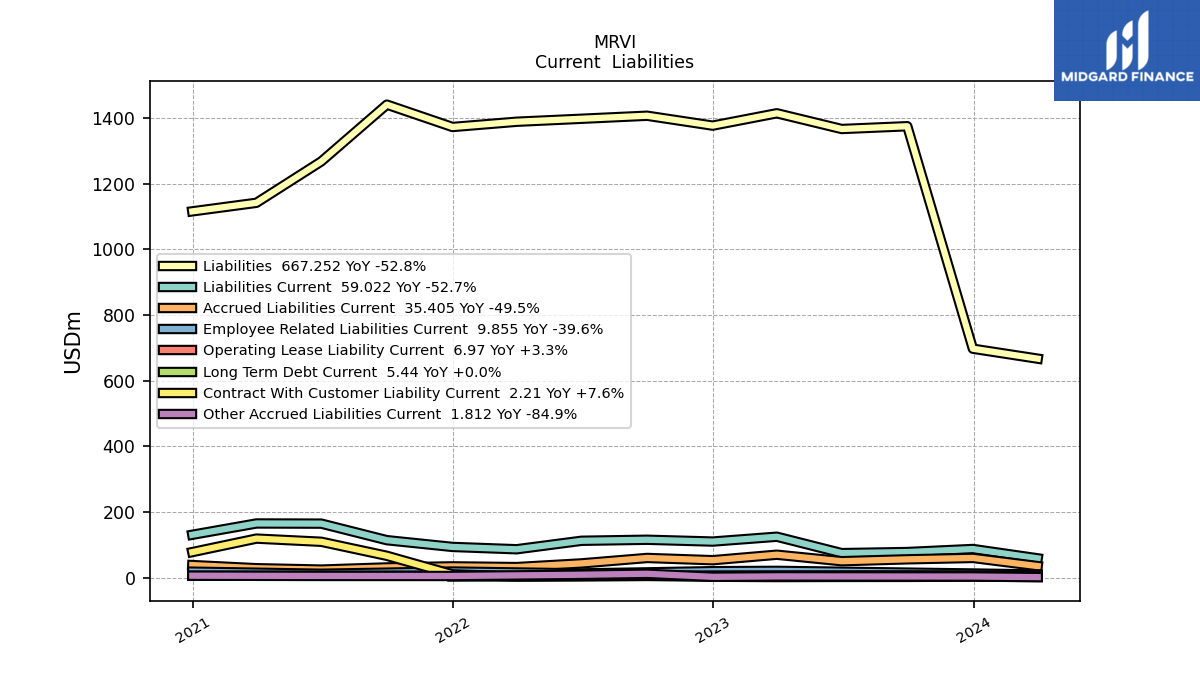
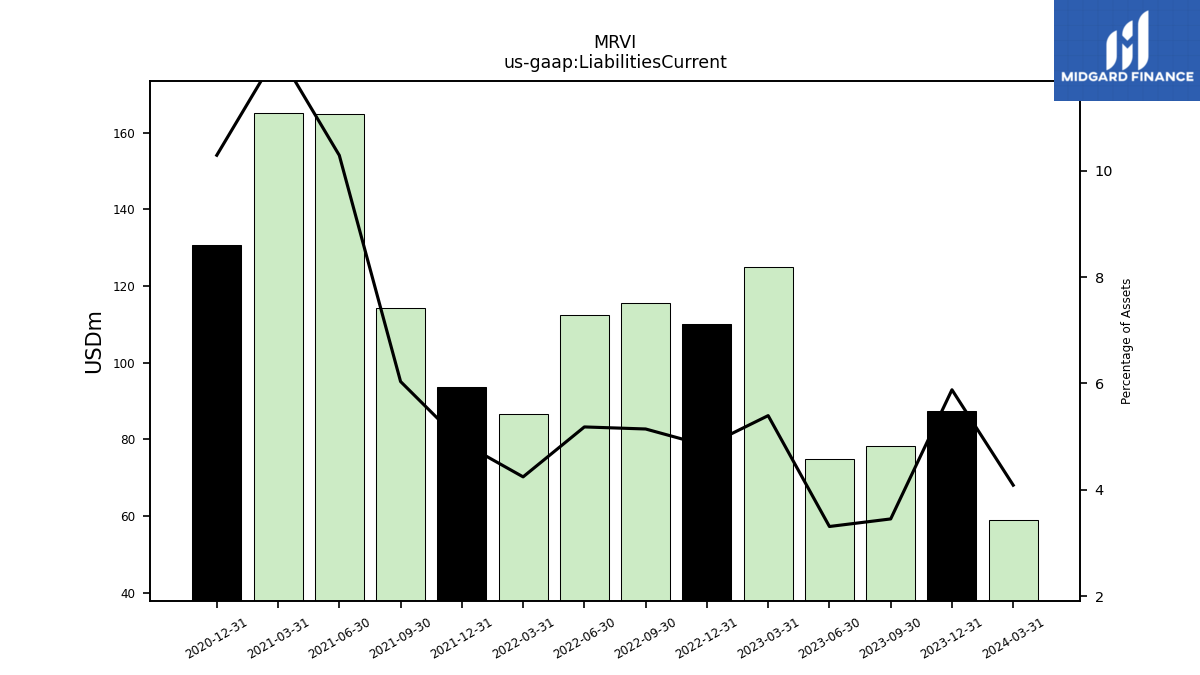
| Liabilities Current | 59.02 | 87.47 | 78.25 | 74.92 | 124.90 | 110.14 | 115.66 | 112.53 | 86.67 | 93.78 | 114.35 | 164.77 | 165.25 | 130.78 | NA | NA | NA | |
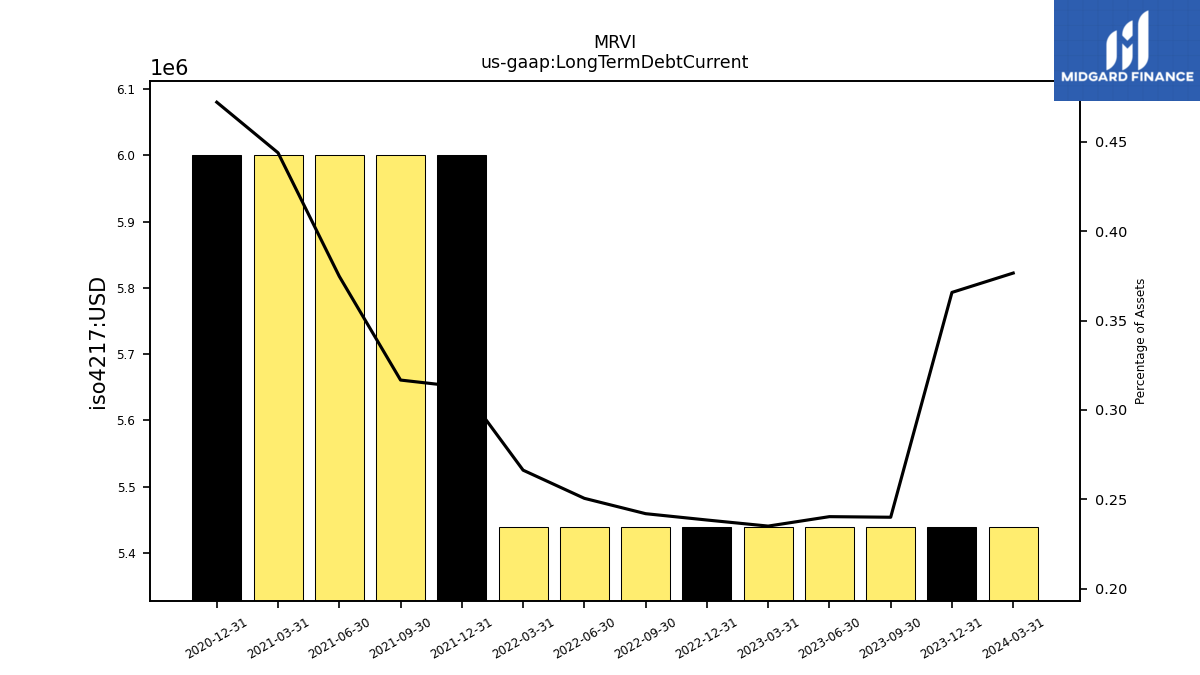
| Long Term Debt Current | 5.44 | 5.44 | 5.44 | 5.44 | 5.44 | 5.44 | 5.44 | 5.44 | 5.44 | 6.00 | 6.00 | 6.00 | 6.00 | 6.00 | NA | NA | NA | |
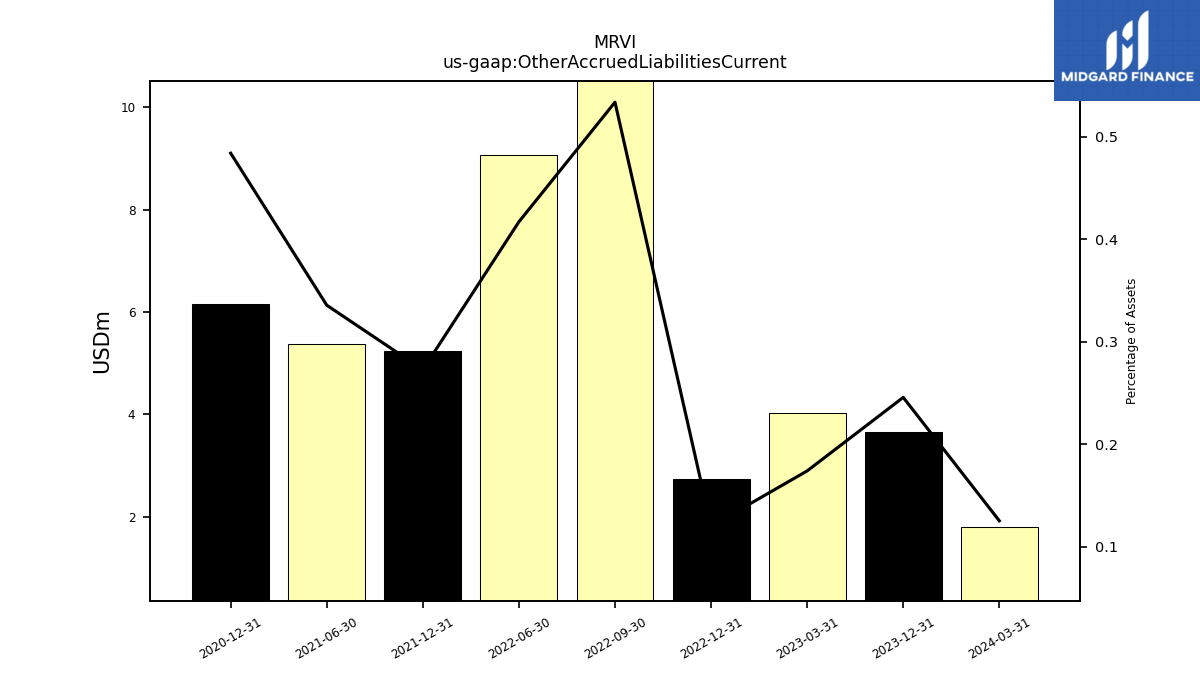
| Other Accrued Liabilities Current | 1.81 | 3.66 | NA | NA | 4.03 | 2.74 | 12.01 | 9.06 | NA | 5.23 | NA | 5.38 | NA | 6.15 | NA | NA | NA | |
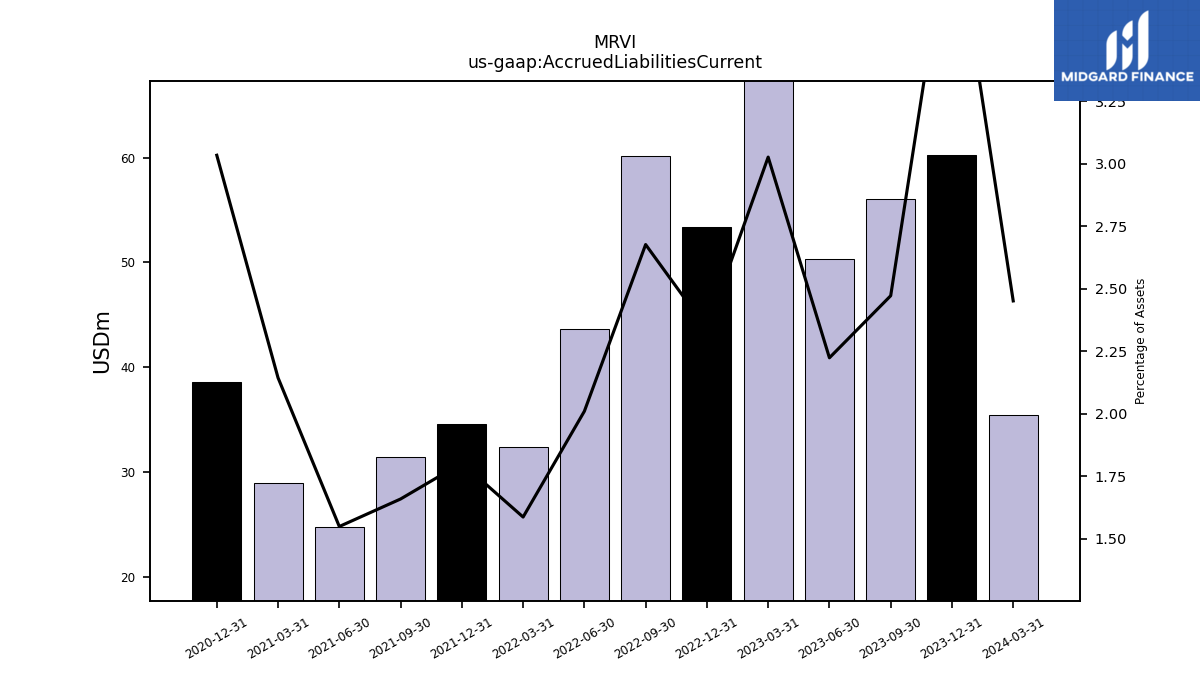
| Accrued Liabilities Current | 35.41 | 60.24 | 56.04 | 50.34 | 70.06 | 53.37 | 60.19 | 43.64 | 32.41 | 34.57 | 31.42 | 24.79 | 28.97 | 38.55 | NA | NA | NA | |
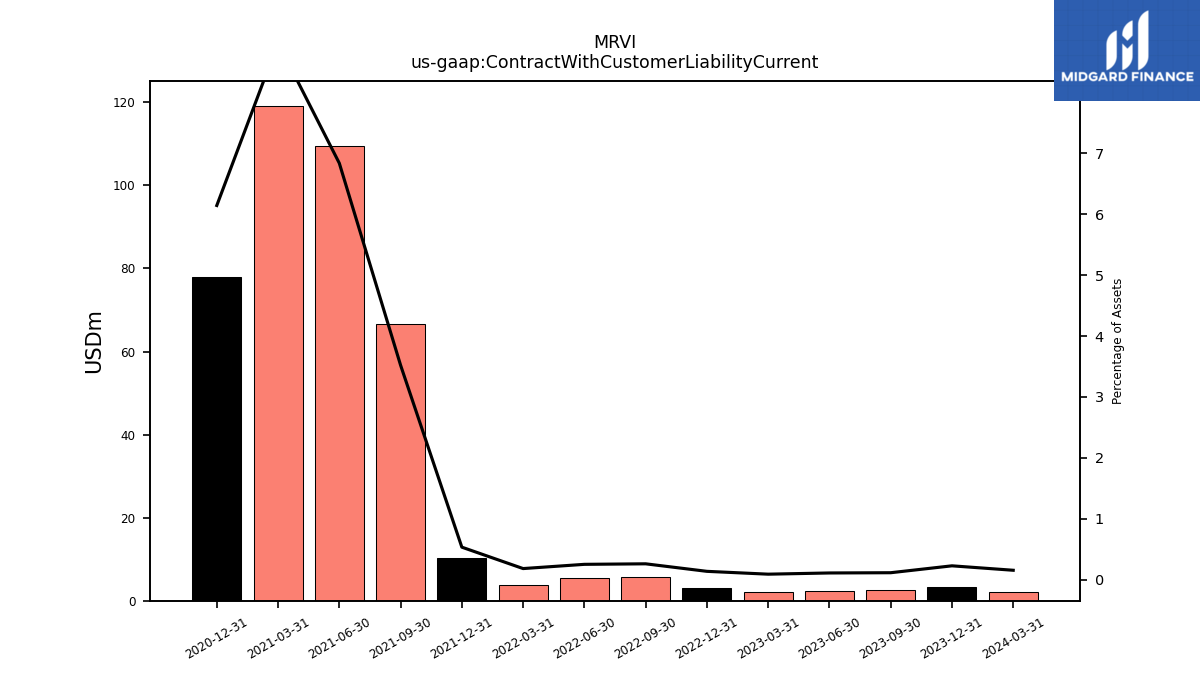
| Contract With Customer Liability Current | 2.21 | 3.36 | 2.55 | 2.46 | 2.05 | 3.09 | 5.82 | 5.43 | 3.69 | 10.21 | 66.72 | 109.49 | 119.17 | 78.06 | NA | NA | NA |
| 2024-03-31 | 2023-12-31 | 2023-09-30 | 2023-06-30 | 2023-03-31 | 2022-12-31 | 2022-09-30 | 2022-06-30 | 2022-03-31 | 2021-12-31 | 2021-09-30 | 2021-06-30 | 2021-03-31 | 2020-12-31 | 2020-09-30 | 2020-06-30 | 2020-03-31 | ||
|---|---|---|---|---|---|---|---|---|---|---|---|---|---|---|---|---|---|---|
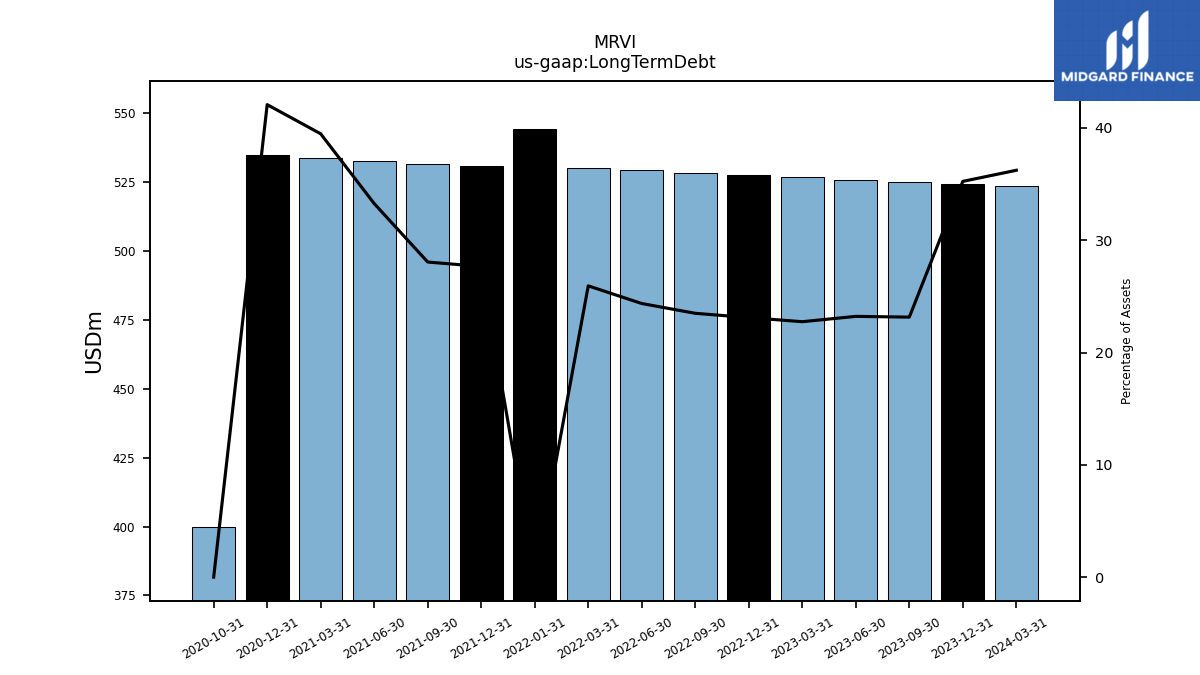
| Long Term Debt | 523.33 | 524.15 | 524.96 | 525.78 | 526.60 | 527.44 | 528.26 | 529.10 | 529.94 | 530.59 | 531.58 | 532.58 | 533.59 | 534.61 | NA | NA | NA | |
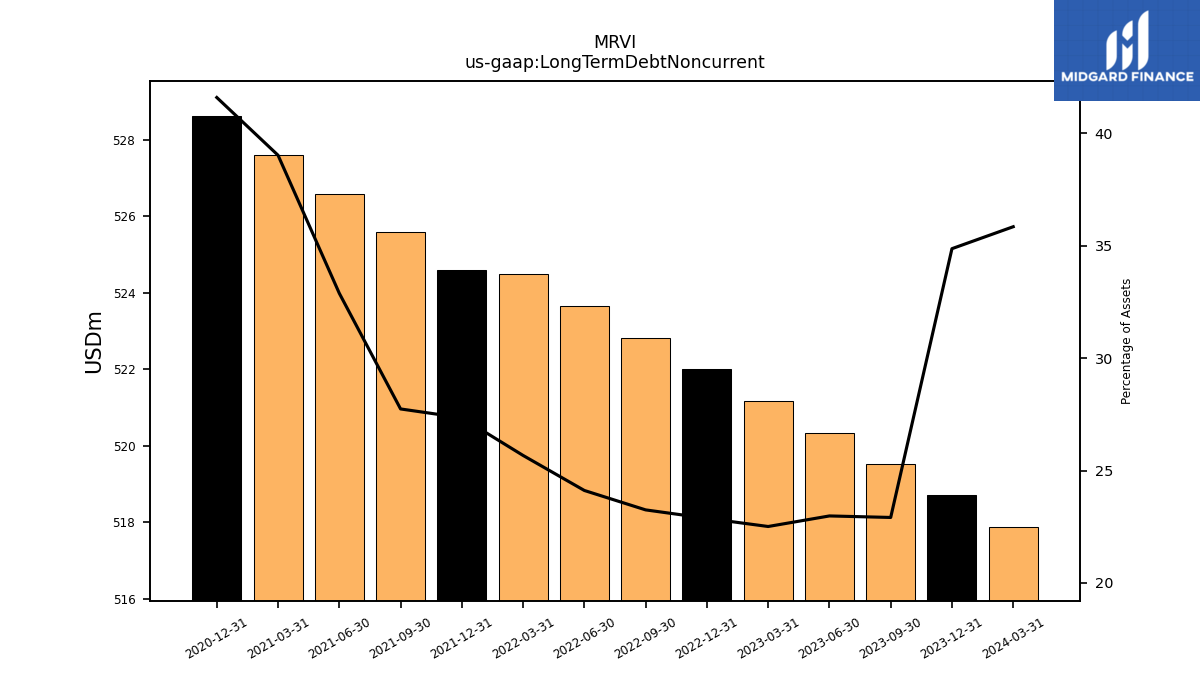
| Long Term Debt Noncurrent | 517.89 | 518.71 | 519.52 | 520.34 | 521.16 | 522.00 | 522.82 | 523.65 | 524.50 | 524.59 | 525.58 | 526.58 | 527.59 | 528.61 | NA | NA | NA | |
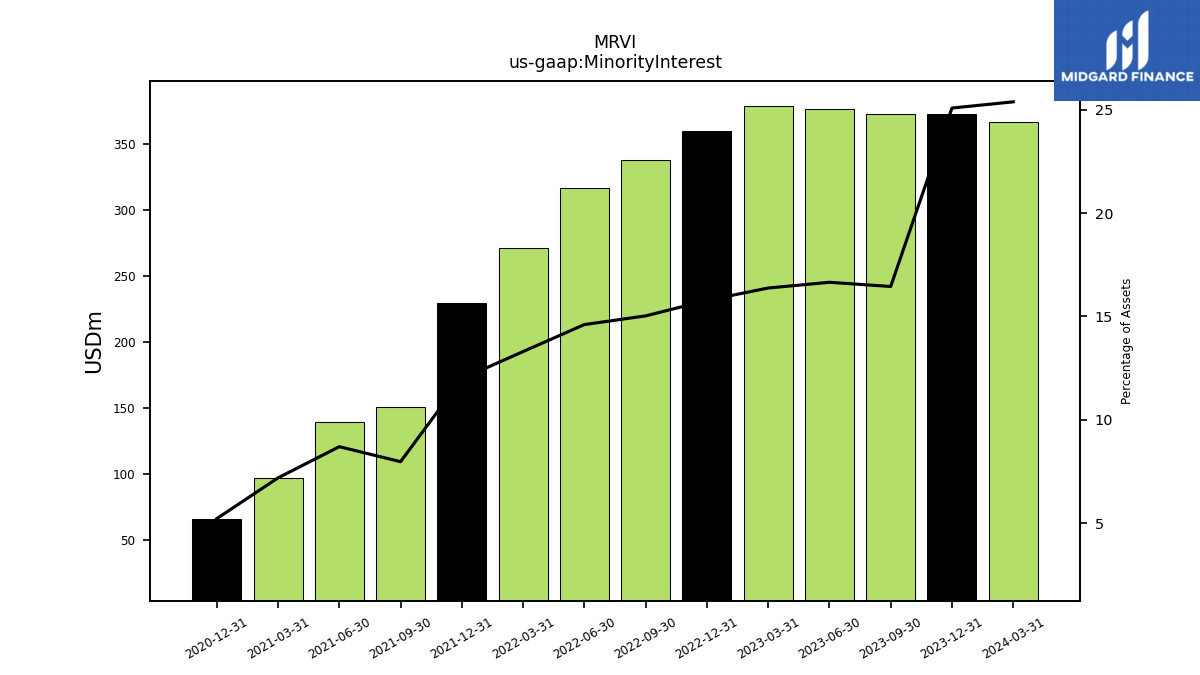
| Minority Interest | 366.73 | 373.13 | 372.99 | 377.07 | 379.12 | 360.02 | 337.91 | 317.20 | 271.74 | 229.86 | 150.98 | 139.22 | 97.14 | 66.23 | NA | NA | NA | |
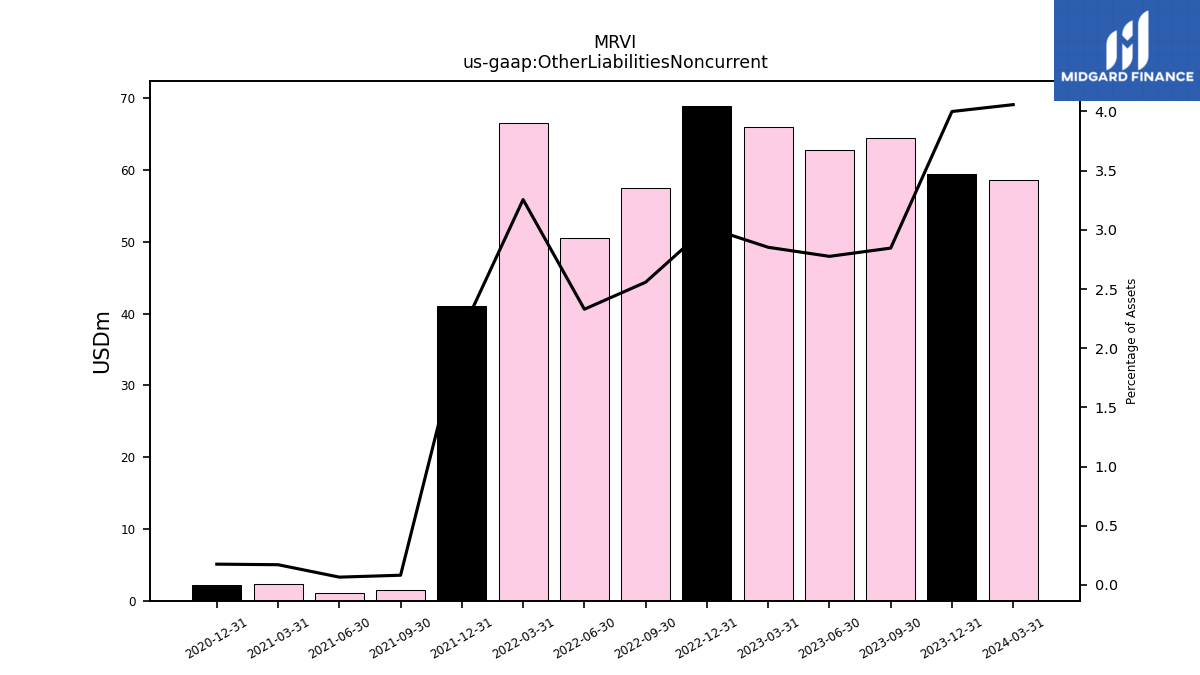
| Other Liabilities Noncurrent | 58.62 | 59.49 | 64.53 | 62.86 | 66.05 | 68.97 | 57.52 | 50.59 | 66.52 | 41.07 | 1.55 | 1.06 | 2.31 | 2.23 | NA | NA | NA | |
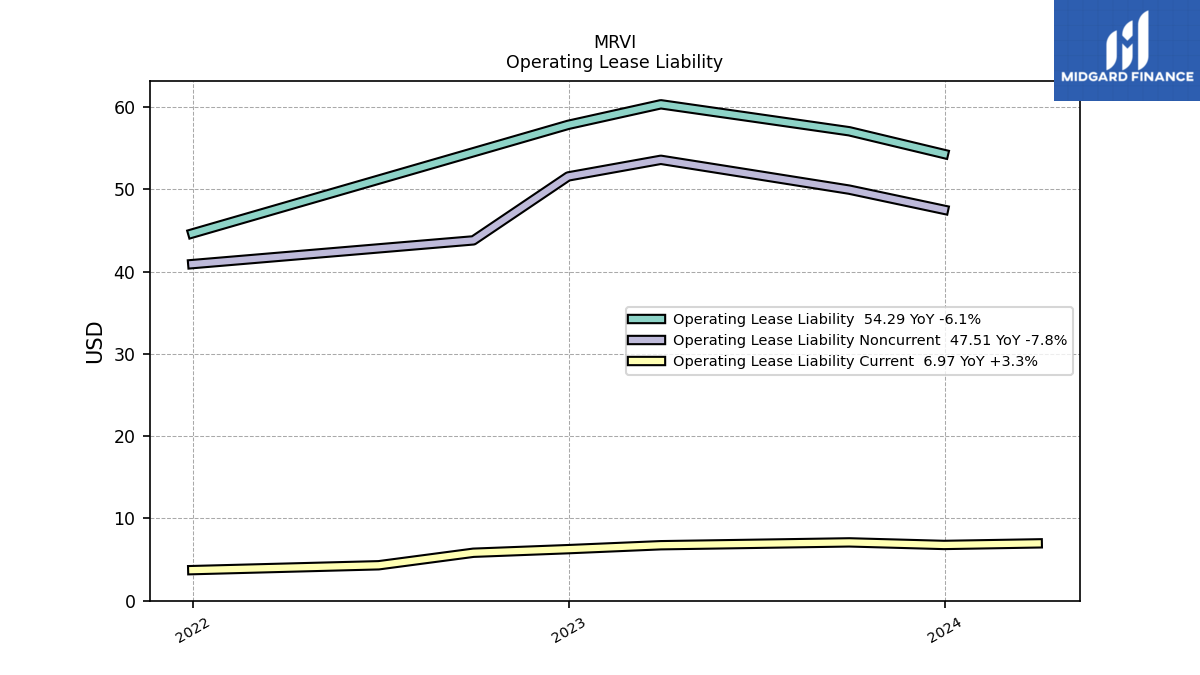
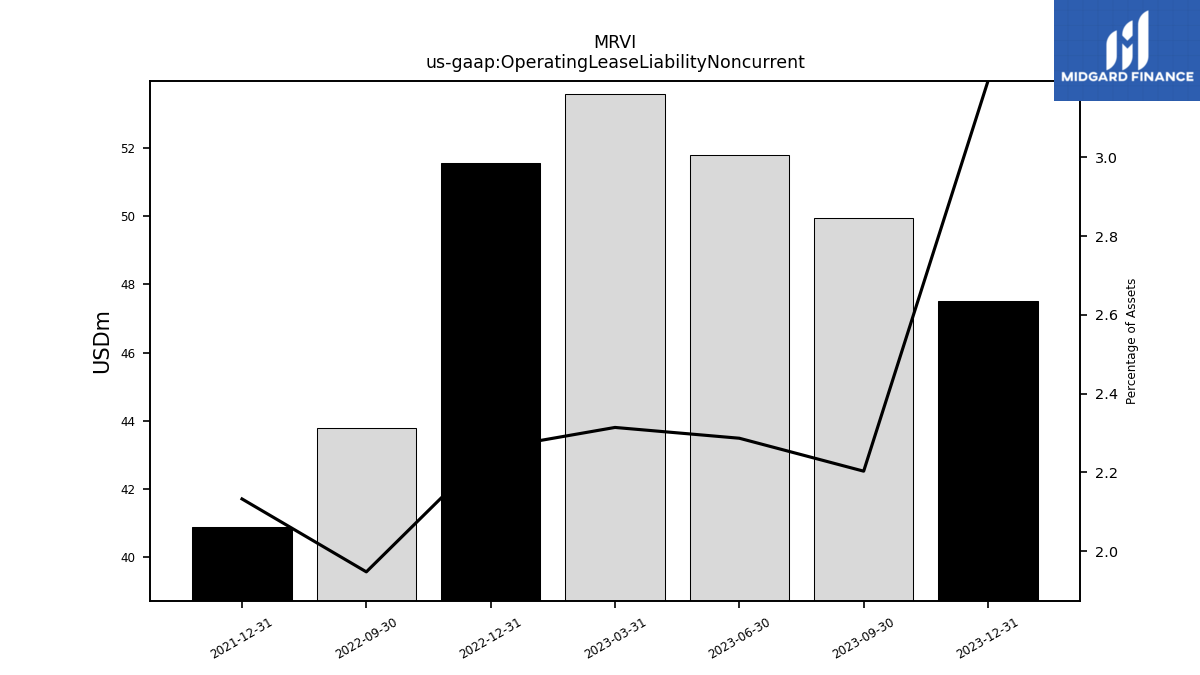
| Operating Lease Liability Noncurrent | NA | 47.51 | 49.95 | 51.78 | 53.58 | 51.56 | 43.79 | NA | NA | 40.91 | NA | NA | NA | NA | NA | NA | NA |
| 2024-03-31 | 2023-12-31 | 2023-09-30 | 2023-06-30 | 2023-03-31 | 2022-12-31 | 2022-09-30 | 2022-06-30 | 2022-03-31 | 2021-12-31 | 2021-09-30 | 2021-06-30 | 2021-03-31 | 2020-12-31 | 2020-09-30 | 2020-06-30 | 2020-03-31 | ||
|---|---|---|---|---|---|---|---|---|---|---|---|---|---|---|---|---|---|---|
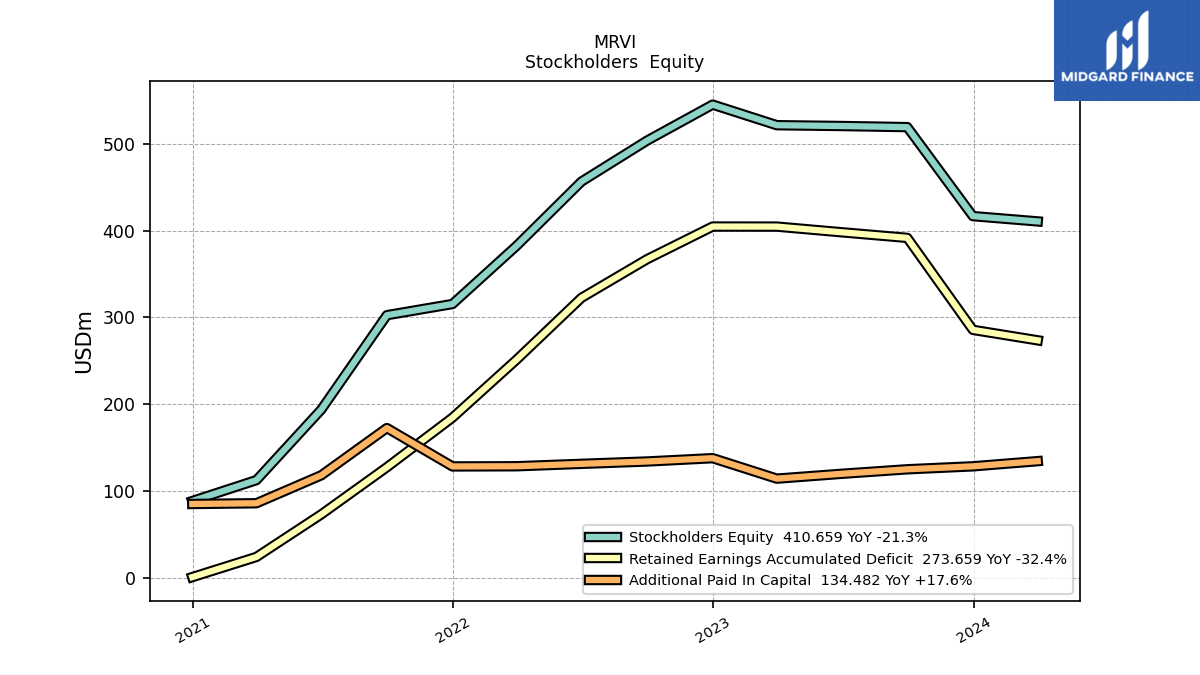
| Stockholders Equity | 410.66 | 416.75 | 519.29 | 520.57 | 521.52 | 545.22 | 503.76 | 456.59 | 382.56 | 315.50 | 302.64 | 193.92 | 112.61 | 88.51 | NA | NA | NA | |
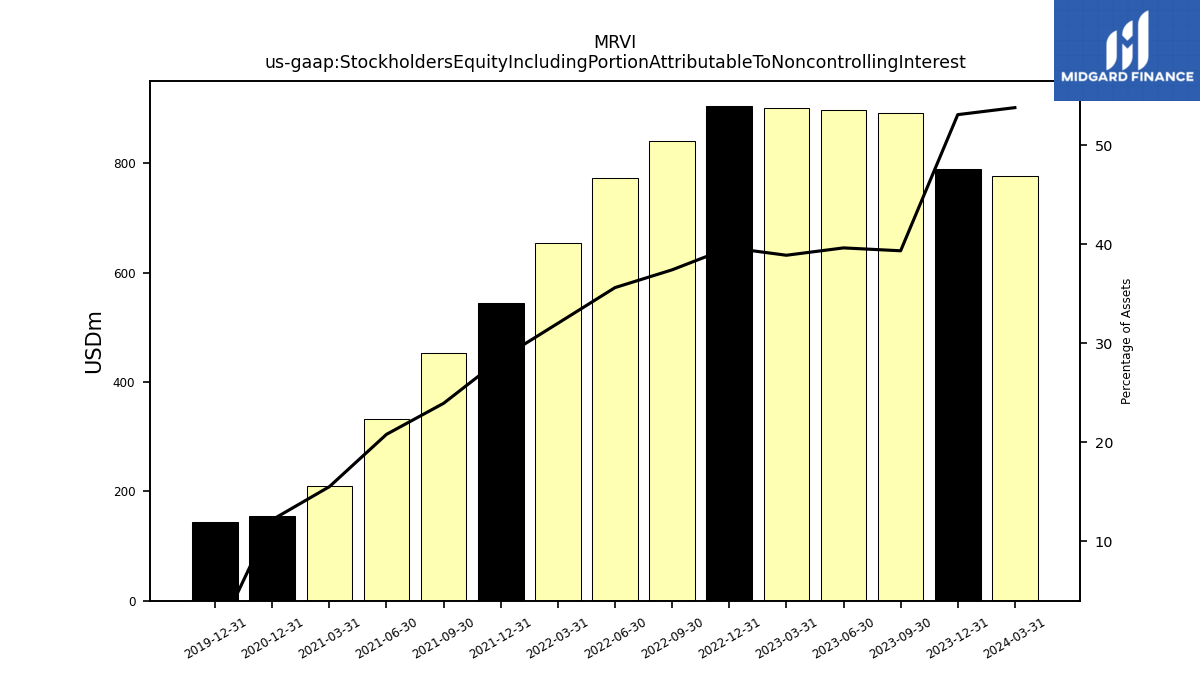
| Stockholders Equity Including Portion Attributable To Noncontrolling Interest | 777.39 | 789.88 | 892.28 | 897.64 | 900.64 | 905.24 | 841.67 | 773.79 | 654.30 | 545.36 | 453.62 | 333.14 | 209.76 | 154.75 | NA | NA | NA | |
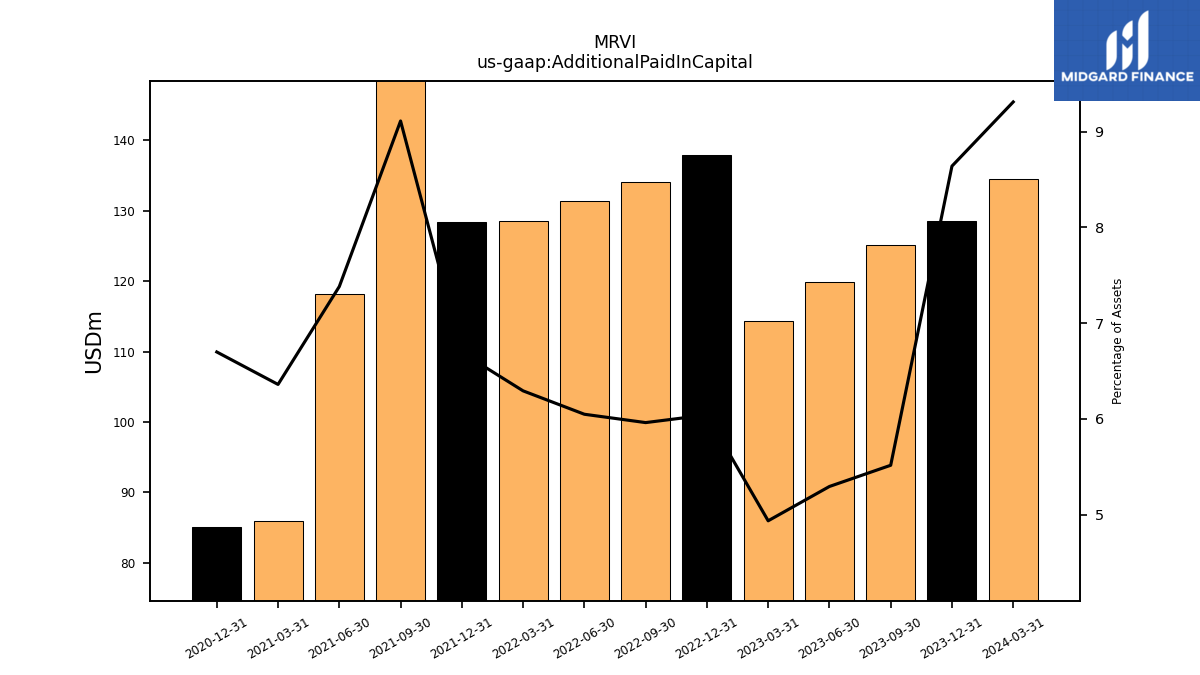
| Additional Paid In Capital | 134.48 | 128.50 | 125.09 | 119.90 | 114.31 | 137.90 | 134.08 | 131.37 | 128.58 | 128.39 | 172.61 | 118.21 | 85.98 | 85.12 | NA | NA | NA | |
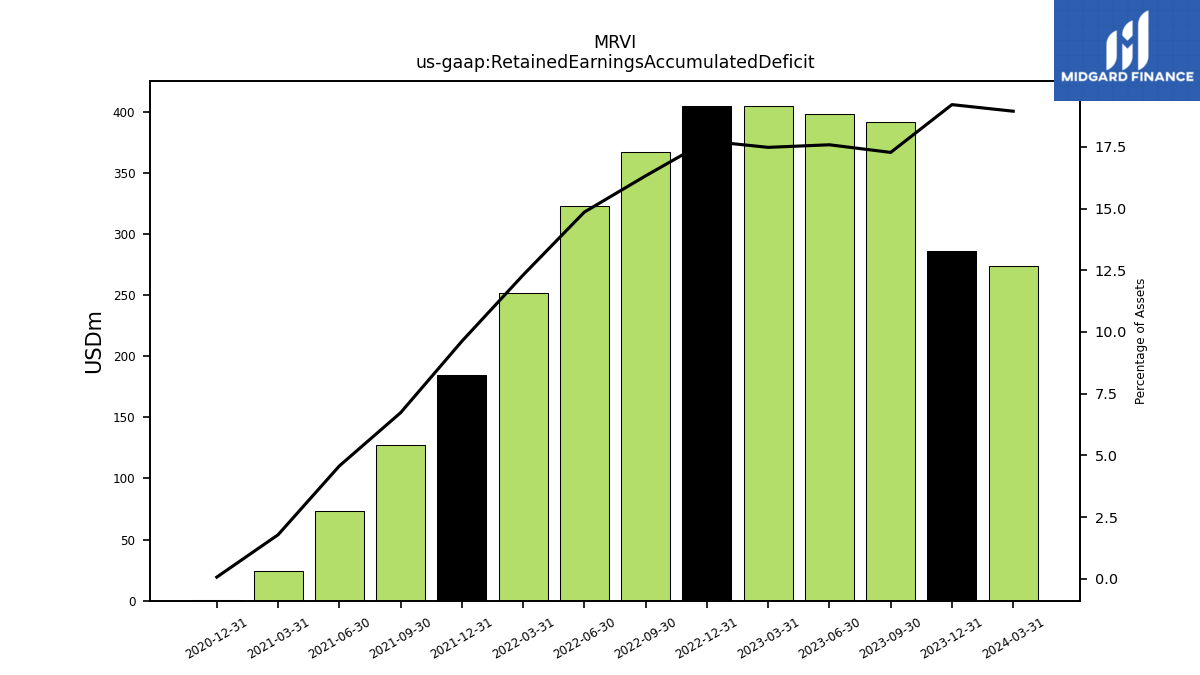
| Retained Earnings Accumulated Deficit | 273.66 | 285.74 | 391.70 | 398.16 | 404.70 | 404.77 | 367.13 | 322.66 | 251.42 | 184.56 | 127.45 | 73.18 | 24.10 | 0.85 | NA | NA | NA | |
| Minority Interest | 366.73 | 373.13 | 372.99 | 377.07 | 379.12 | 360.02 | 337.91 | 317.20 | 271.74 | 229.86 | 150.98 | 139.22 | 97.14 | 66.23 | NA | NA | NA | |
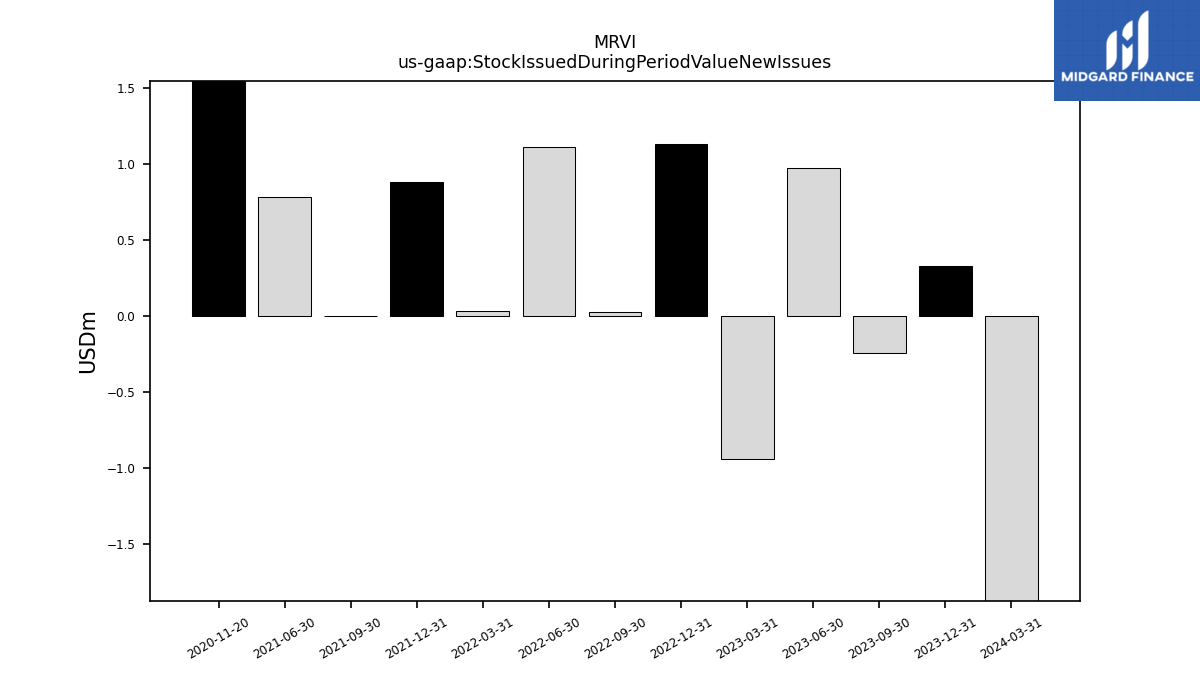
| Stock Issued During Period Value New Issues | -1.87 | 0.33 | -0.24 | 0.98 | -0.94 | 1.13 | 0.03 | 1.11 | 0.03 | 0.89 | 0.00 | 0.79 | NA | NA | NA | NA | NA | |
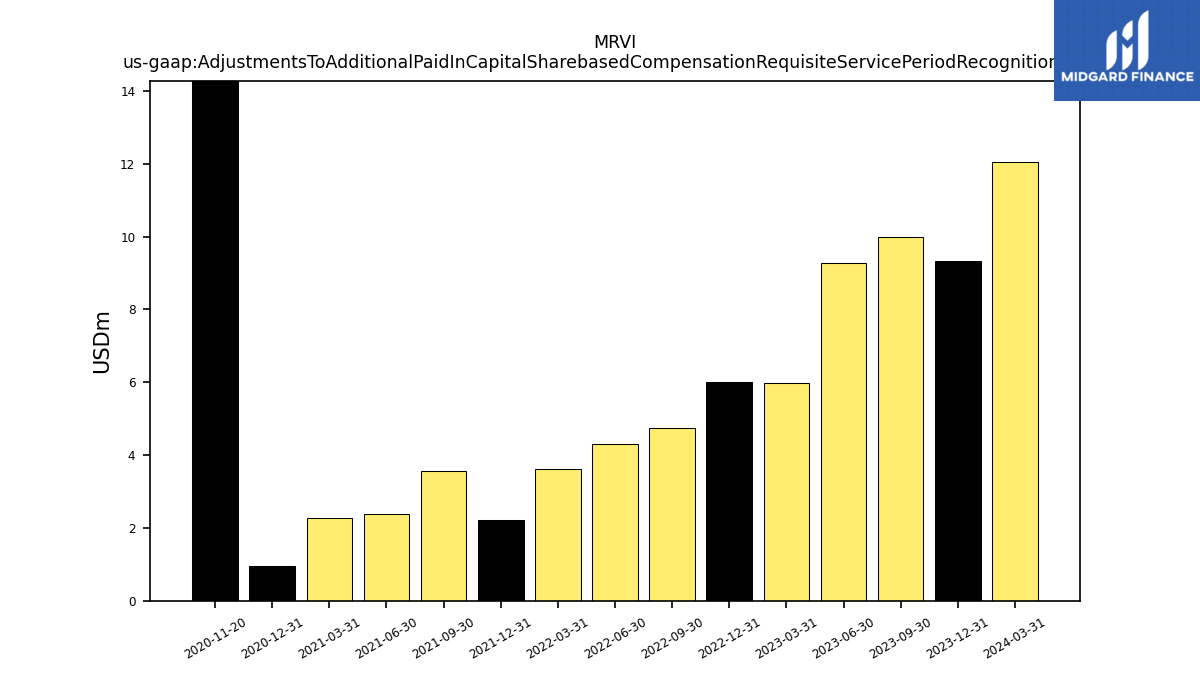
| Adjustments To Additional Paid In Capital Sharebased Compensation Requisite Service Period Recognition Value | 12.06 | 9.34 | 9.99 | 9.27 | 5.99 | 6.00 | 4.74 | 4.31 | 3.63 | 2.23 | 3.57 | 2.38 | 2.28 | 0.97 | NA | NA | NA | |
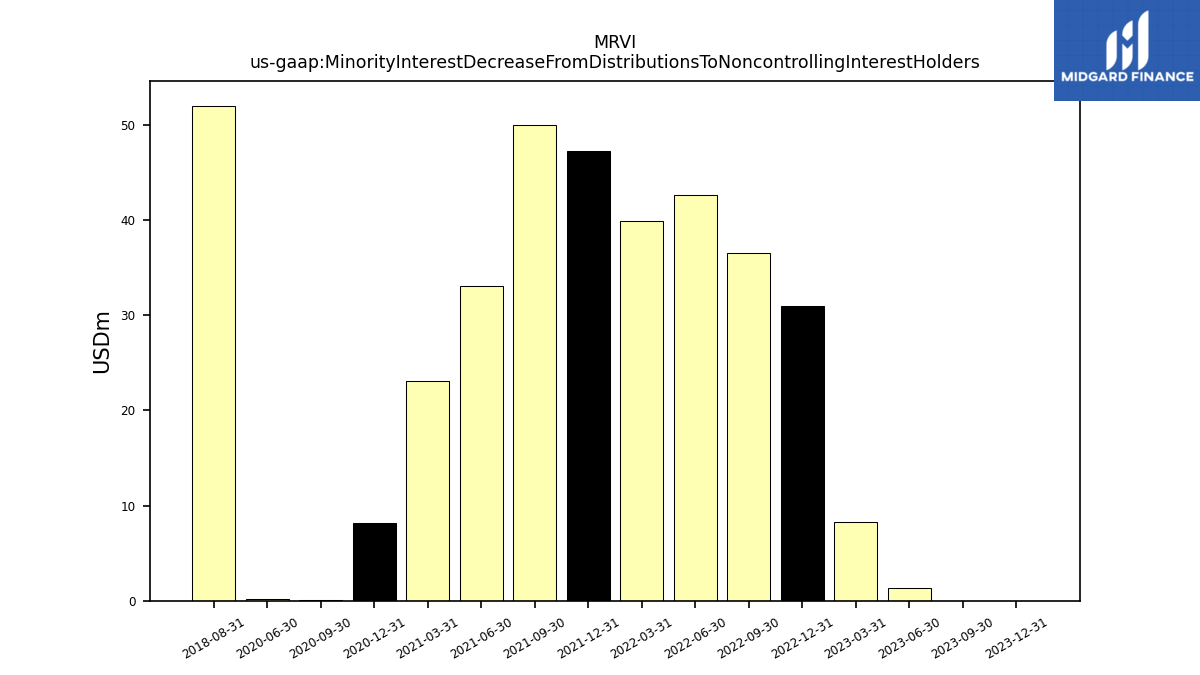
| Minority Interest Decrease From Distributions To Noncontrolling Interest Holders | NA | 0.00 | 0.00 | 1.30 | 8.30 | 30.98 | 36.54 | 42.65 | 39.89 | 47.29 | 50.00 | 33.08 | 23.13 | 8.17 | 0.12 | 0.19 | NA |
| 2024-03-31 | 2023-12-31 | 2023-09-30 | 2023-06-30 | 2023-03-31 | 2022-12-31 | 2022-09-30 | 2022-06-30 | 2022-03-31 | 2021-12-31 | 2021-09-30 | 2021-06-30 | 2021-03-31 | 2020-12-31 | 2020-09-30 | 2020-06-30 | 2020-03-31 | ||
|---|---|---|---|---|---|---|---|---|---|---|---|---|---|---|---|---|---|---|
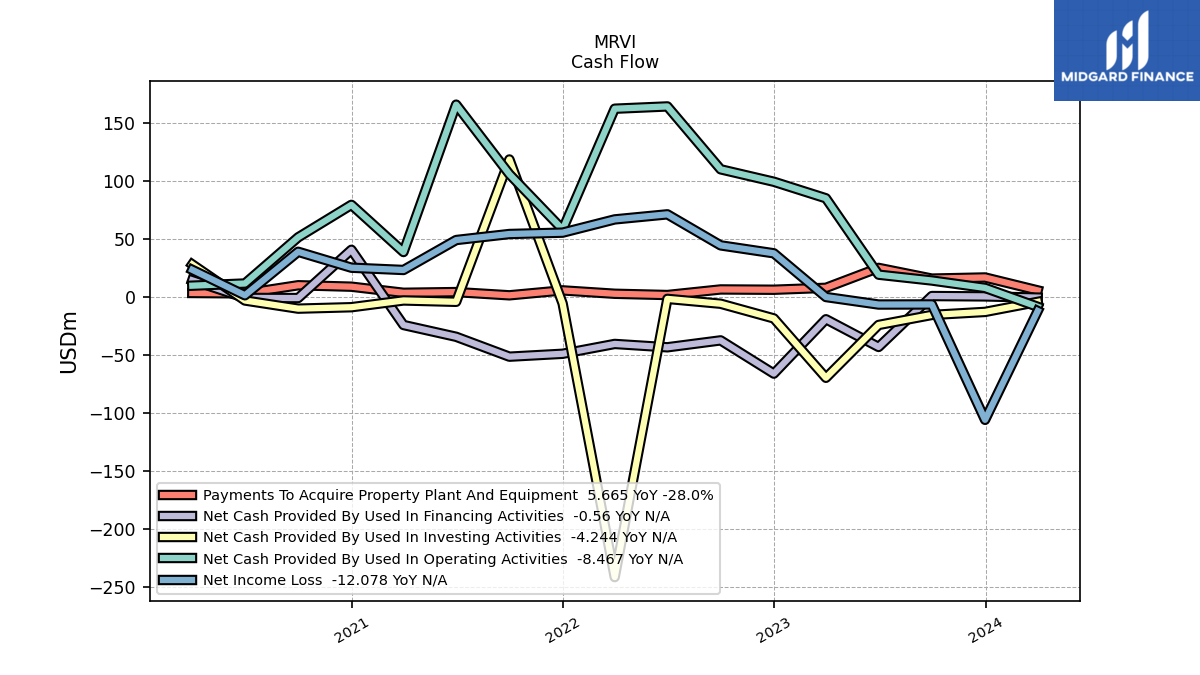
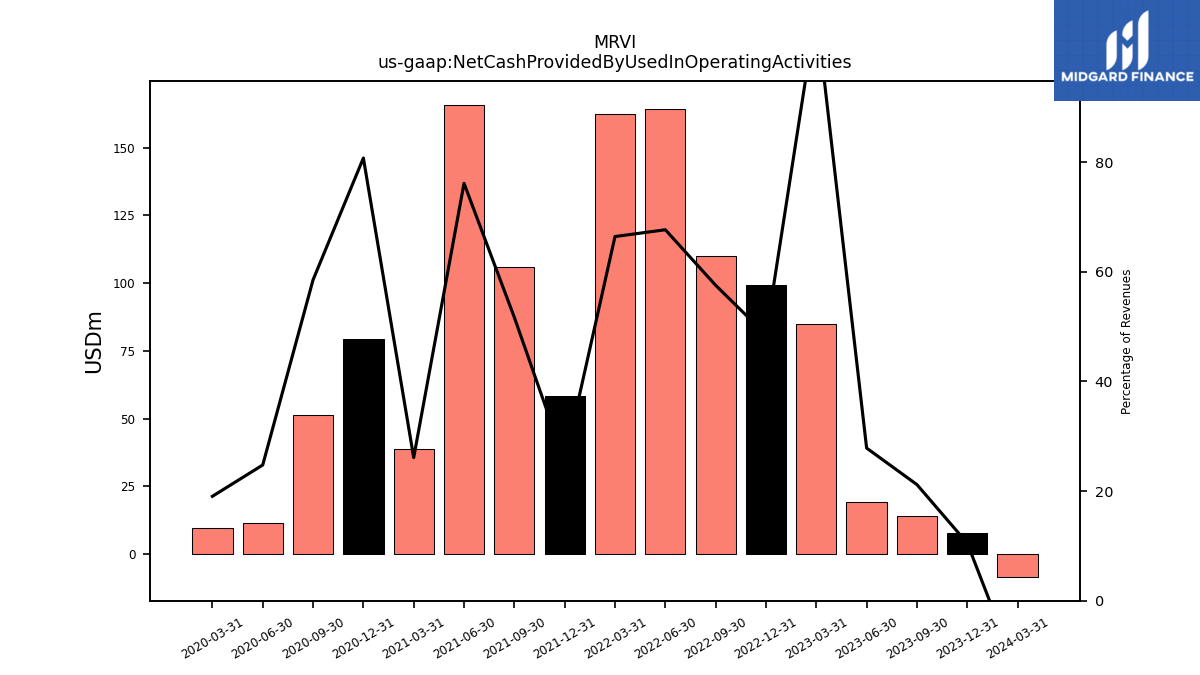
| Net Cash Provided By Used In Operating Activities | -8.47 | 7.79 | 14.17 | 19.19 | 85.07 | 99.33 | 110.06 | 164.28 | 162.30 | 58.17 | 105.86 | 165.83 | 38.72 | 79.43 | 51.43 | 11.62 | 9.71 | |
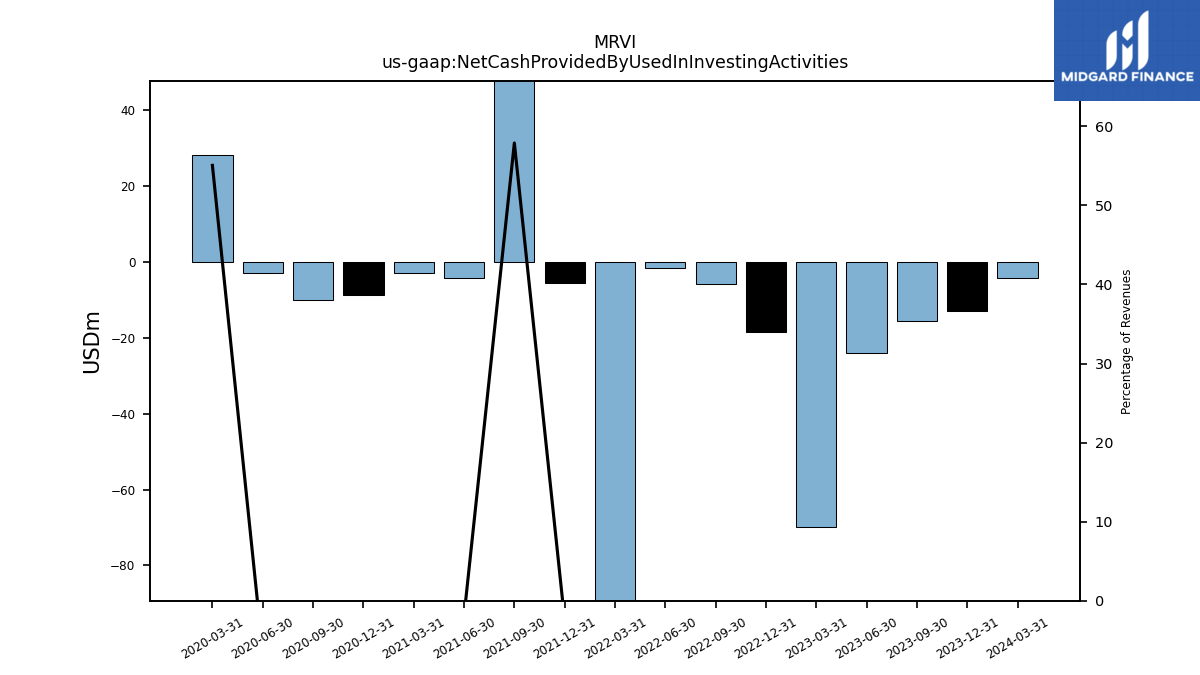
| Net Cash Provided By Used In Investing Activities | -4.24 | -12.90 | -15.52 | -24.16 | -69.73 | -18.52 | -5.85 | -1.66 | -241.58 | -5.66 | 118.55 | -4.20 | -3.03 | -8.85 | -10.09 | -3.06 | 28.07 | |
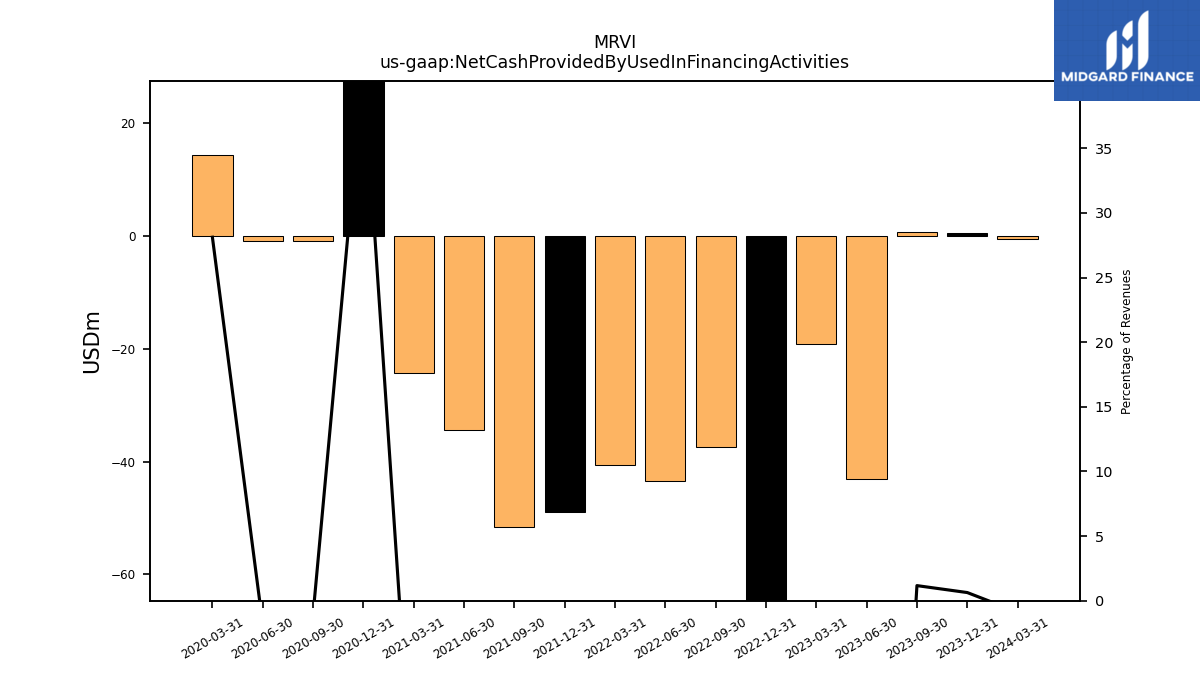
| Net Cash Provided By Used In Financing Activities | -0.56 | 0.47 | 0.78 | -43.13 | -19.21 | -66.12 | -37.44 | -43.41 | -40.52 | -49.00 | -51.50 | -34.35 | -24.20 | 40.67 | -0.94 | -0.86 | 14.34 |
| 2024-03-31 | 2023-12-31 | 2023-09-30 | 2023-06-30 | 2023-03-31 | 2022-12-31 | 2022-09-30 | 2022-06-30 | 2022-03-31 | 2021-12-31 | 2021-09-30 | 2021-06-30 | 2021-03-31 | 2020-12-31 | 2020-09-30 | 2020-06-30 | 2020-03-31 | ||
|---|---|---|---|---|---|---|---|---|---|---|---|---|---|---|---|---|---|---|
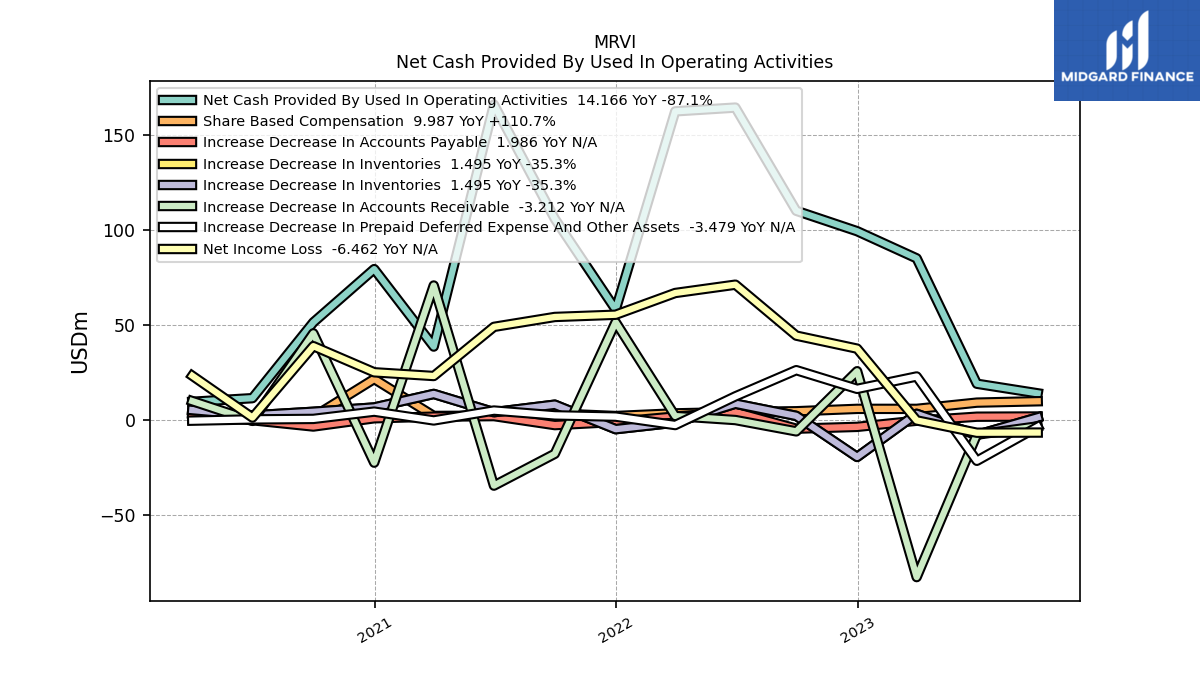
| Net Cash Provided By Used In Operating Activities | -8.47 | 7.79 | 14.17 | 19.19 | 85.07 | 99.33 | 110.06 | 164.28 | 162.30 | 58.17 | 105.86 | 165.83 | 38.72 | 79.43 | 51.43 | 11.62 | 9.71 | |
| Net Income Loss | -12.08 | -105.96 | -6.46 | -6.54 | -0.07 | 37.63 | 44.47 | 71.24 | 66.86 | 55.44 | 54.27 | 49.08 | 23.25 | 25.21 | 38.95 | 1.42 | 23.39 | |
| Profit Loss | -22.68 | -109.98 | -15.10 | -11.94 | -1.35 | 87.43 | 99.65 | 156.72 | 146.86 | 126.24 | 132.81 | 134.34 | 75.85 | 11.43 | 39.02 | 1.44 | 23.88 | |
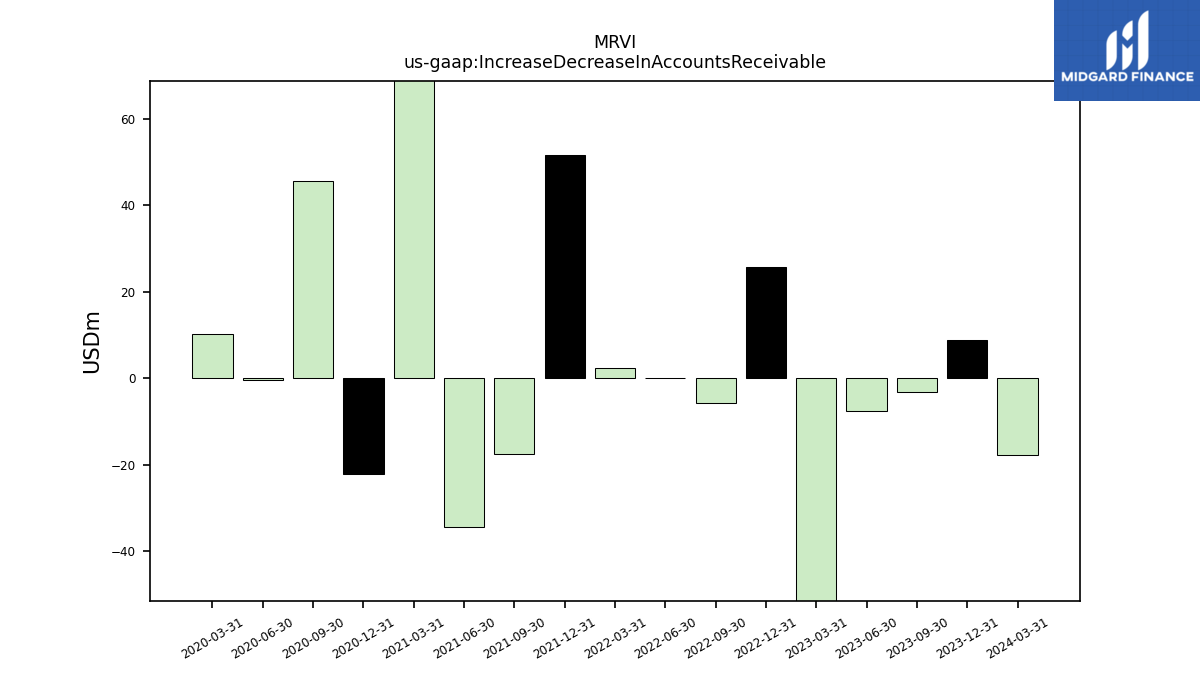
| Increase Decrease In Accounts Receivable | -17.88 | 8.79 | -3.21 | -7.56 | -82.41 | 25.77 | -5.83 | 0.12 | 2.22 | 51.54 | -17.62 | -34.34 | 70.81 | -22.28 | 45.68 | -0.34 | 10.09 | |
| Increase Decrease In Inventories | -0.82 | 2.18 | 1.50 | -7.71 | 3.38 | -19.27 | 2.31 | 8.70 | -1.20 | -4.69 | 8.19 | 4.25 | 13.83 | 6.71 | 4.46 | 2.56 | 5.37 | |
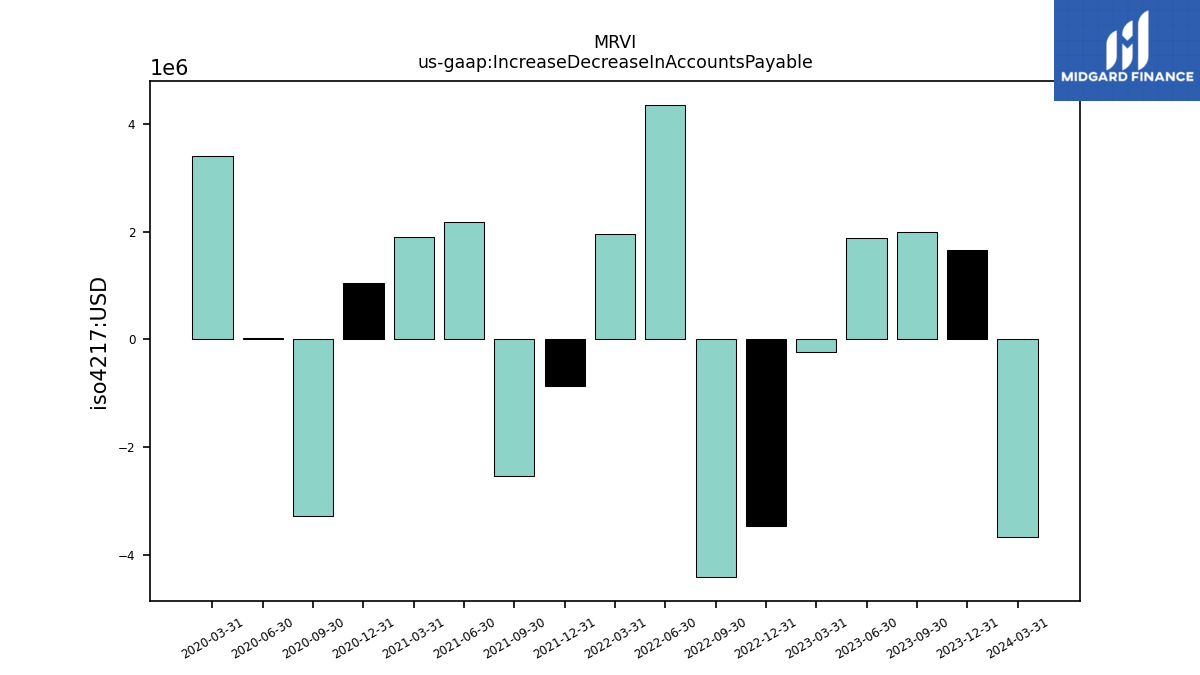
| Increase Decrease In Accounts Payable | -3.68 | 1.66 | 1.99 | 1.87 | -0.23 | -3.47 | -4.42 | 4.36 | 1.95 | -0.87 | -2.54 | 2.19 | 1.90 | 1.05 | -3.29 | 0.02 | 3.40 | |
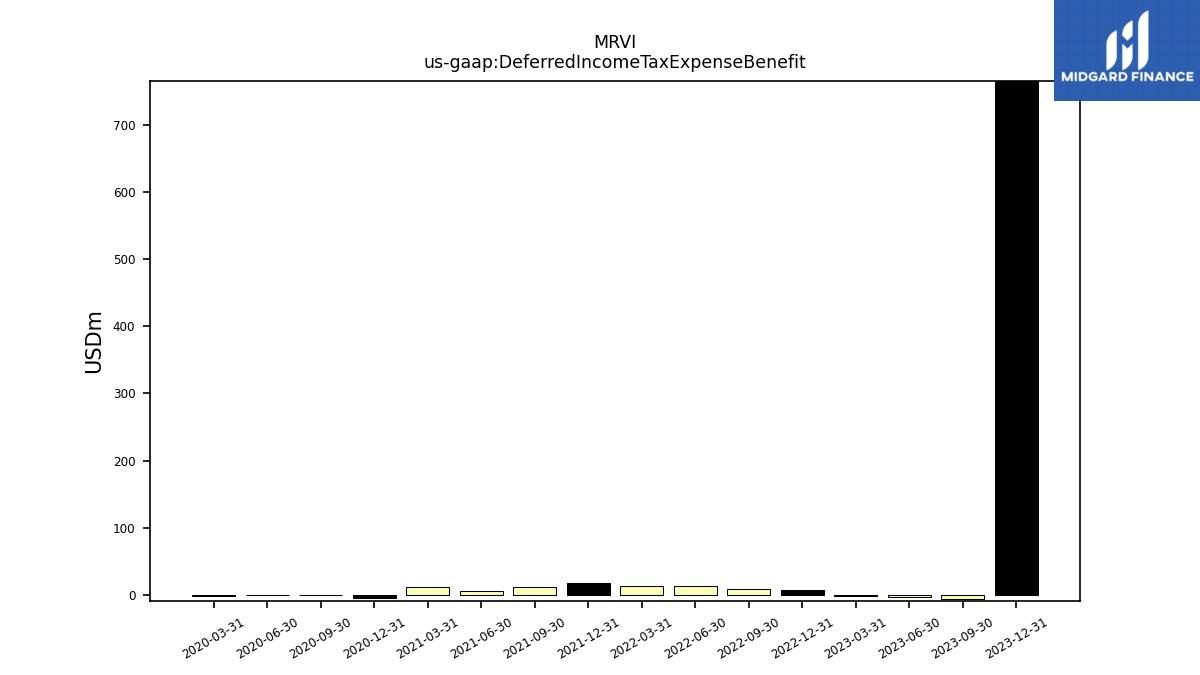
| Deferred Income Tax Expense Benefit | NA | 764.75 | -5.53 | -2.76 | -1.52 | 7.01 | 9.23 | 12.86 | 13.22 | 17.47 | 11.23 | 6.45 | 11.76 | -4.19 | -0.00 | 0.00 | -1.27 | |
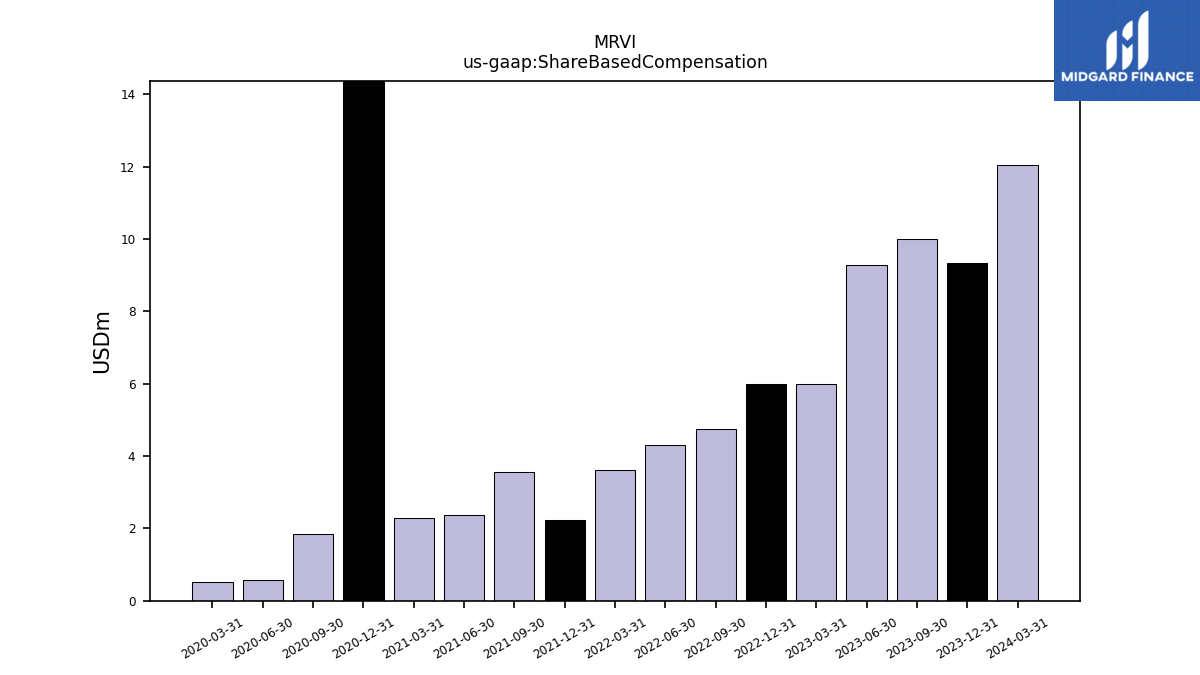
| Share Based Compensation | 12.06 | 9.34 | 9.99 | 9.27 | 5.99 | 6.00 | 4.74 | 4.31 | 3.63 | 2.23 | 3.57 | 2.38 | 2.28 | 21.70 | 1.85 | 0.58 | 0.51 | |
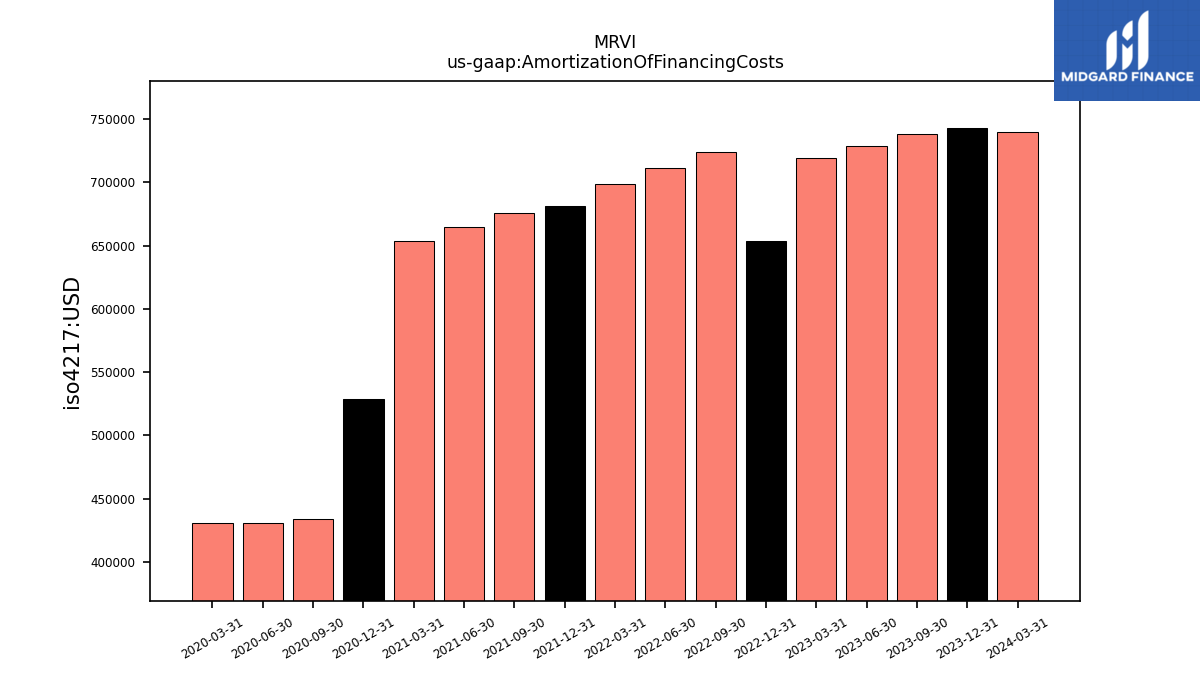
| Amortization Of Financing Costs | 0.74 | 0.74 | 0.74 | 0.73 | 0.72 | 0.65 | 0.72 | 0.71 | 0.70 | 0.68 | 0.68 | 0.67 | 0.65 | 0.53 | 0.43 | 0.43 | 0.43 |
| 2024-03-31 | 2023-12-31 | 2023-09-30 | 2023-06-30 | 2023-03-31 | 2022-12-31 | 2022-09-30 | 2022-06-30 | 2022-03-31 | 2021-12-31 | 2021-09-30 | 2021-06-30 | 2021-03-31 | 2020-12-31 | 2020-09-30 | 2020-06-30 | 2020-03-31 | ||
|---|---|---|---|---|---|---|---|---|---|---|---|---|---|---|---|---|---|---|
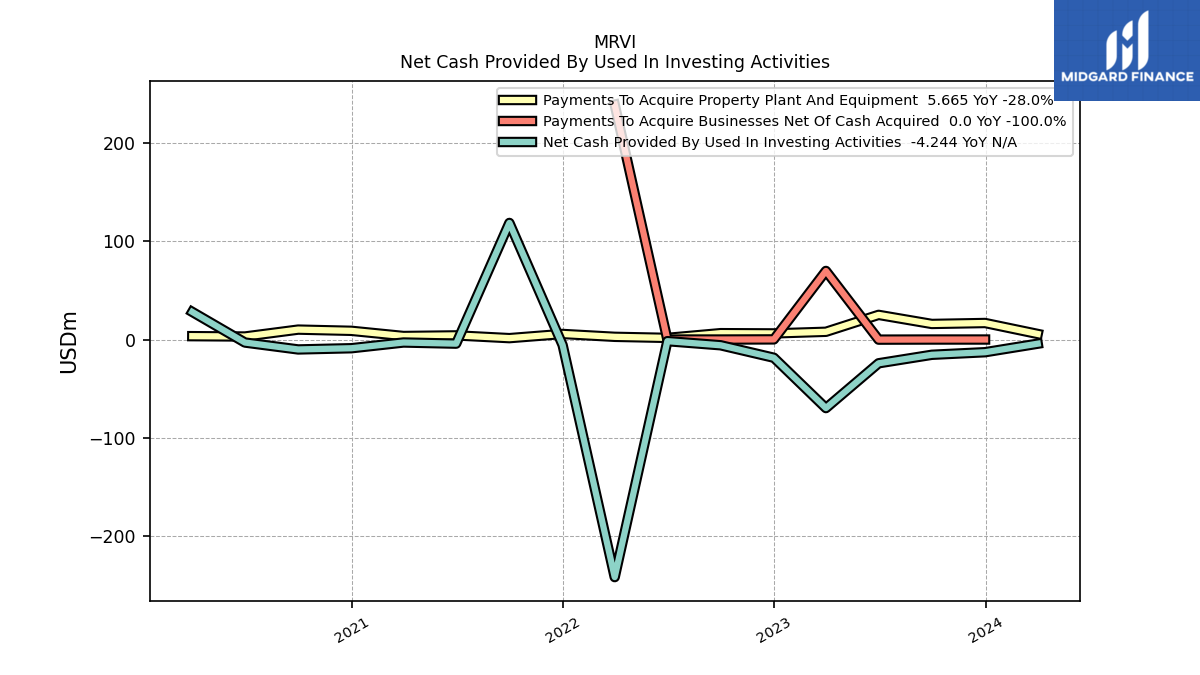
| Net Cash Provided By Used In Investing Activities | -4.24 | -12.90 | -15.52 | -24.16 | -69.73 | -18.52 | -5.85 | -1.66 | -241.58 | -5.66 | 118.55 | -4.20 | -3.03 | -8.85 | -10.09 | -3.06 | 28.07 | |
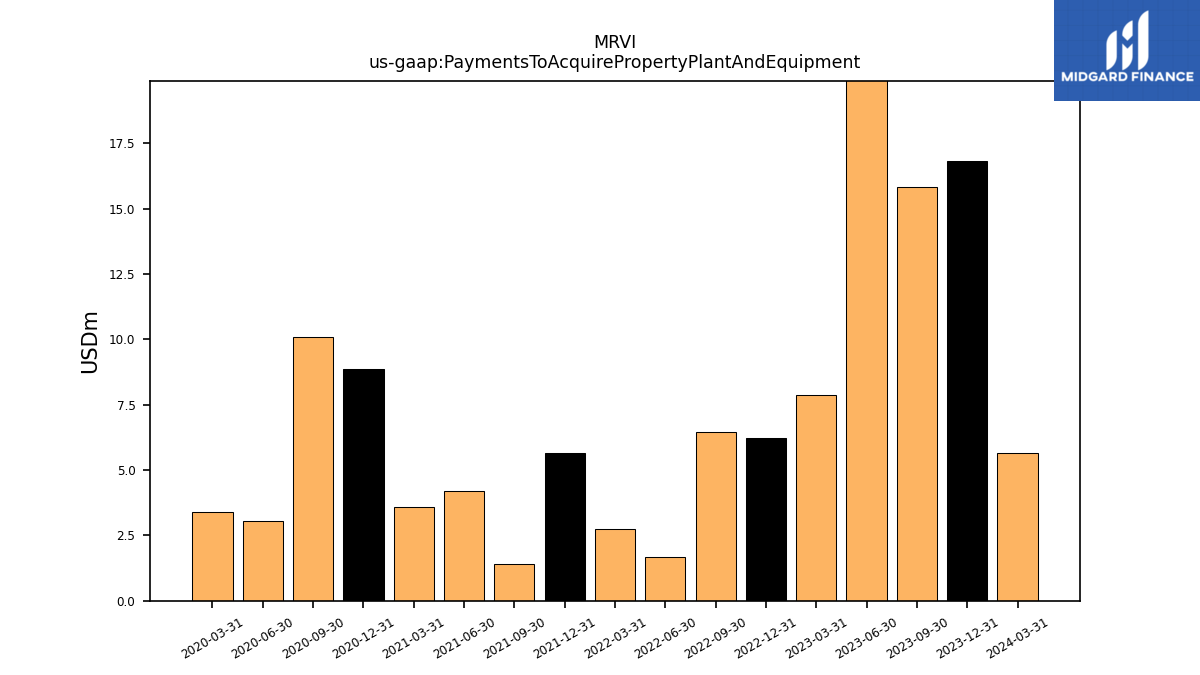
| Payments To Acquire Property Plant And Equipment | 5.67 | 16.80 | 15.83 | 25.06 | 7.87 | 6.21 | 6.47 | 1.66 | 2.75 | 5.66 | 1.41 | 4.20 | 3.58 | 8.85 | 10.09 | 3.06 | 3.41 |
| 2024-03-31 | 2023-12-31 | 2023-09-30 | 2023-06-30 | 2023-03-31 | 2022-12-31 | 2022-09-30 | 2022-06-30 | 2022-03-31 | 2021-12-31 | 2021-09-30 | 2021-06-30 | 2021-03-31 | 2020-12-31 | 2020-09-30 | 2020-06-30 | 2020-03-31 | ||
|---|---|---|---|---|---|---|---|---|---|---|---|---|---|---|---|---|---|---|
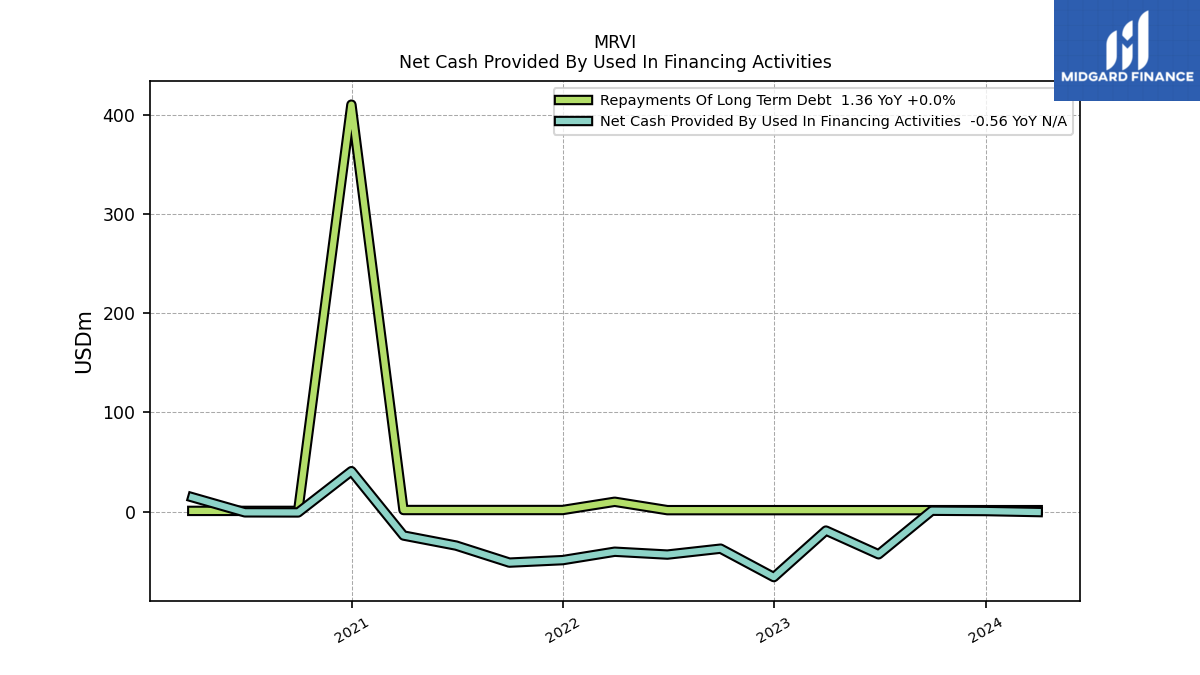
| Net Cash Provided By Used In Financing Activities | -0.56 | 0.47 | 0.78 | -43.13 | -19.21 | -66.12 | -37.44 | -43.41 | -40.52 | -49.00 | -51.50 | -34.35 | -24.20 | 40.67 | -0.94 | -0.86 | 14.34 |
| 2024-03-31 | 2023-12-31 | 2023-09-30 | 2023-06-30 | 2023-03-31 | 2022-12-31 | 2022-09-30 | 2022-06-30 | 2022-03-31 | 2021-12-31 | 2021-09-30 | 2021-06-30 | 2021-03-31 | 2020-12-31 | 2020-09-30 | 2020-06-30 | 2020-03-31 | ||
|---|---|---|---|---|---|---|---|---|---|---|---|---|---|---|---|---|---|---|
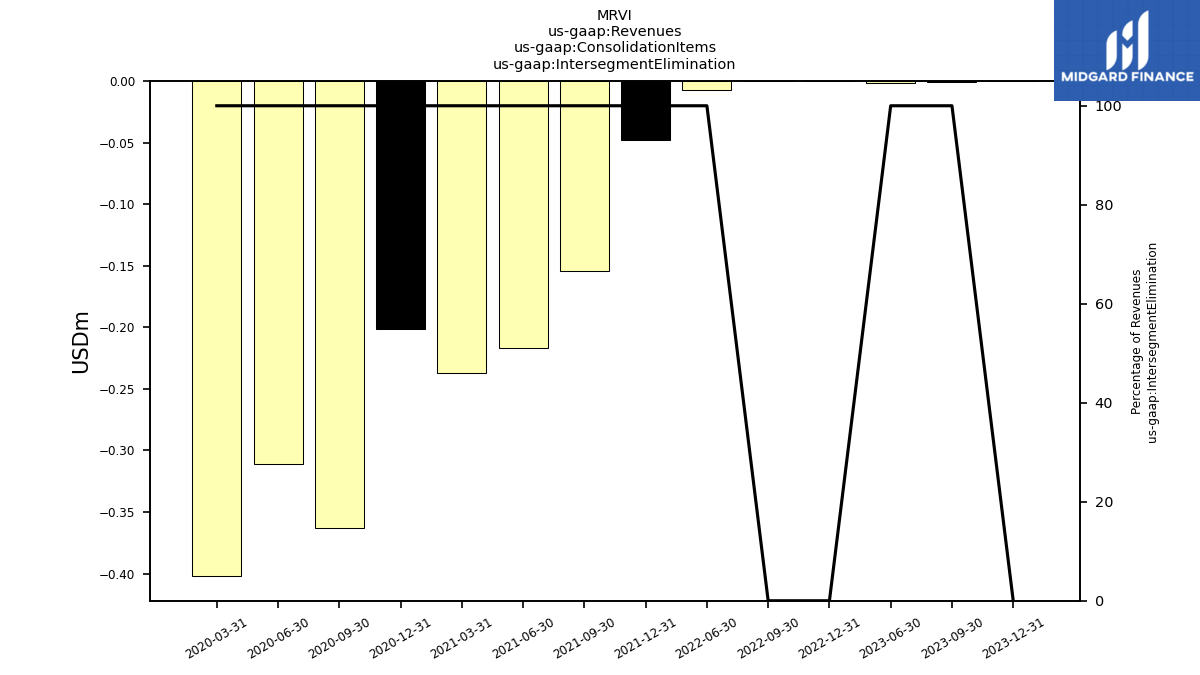
| Revenues | 64.18 | 74.14 | 66.86 | 68.91 | 79.03 | 204.71 | 191.26 | 242.73 | 244.29 | 228.44 | 204.81 | 217.78 | 148.21 | 98.35 | 87.86 | 46.91 | 50.98 | |
| Intersegment Elimination | NA | 0.00 | -0.00 | -0.00 | NA | 0.00 | 0.00 | -0.01 | NA | -0.05 | -0.15 | -0.22 | -0.24 | -0.20 | -0.36 | -0.31 | -0.40 | |
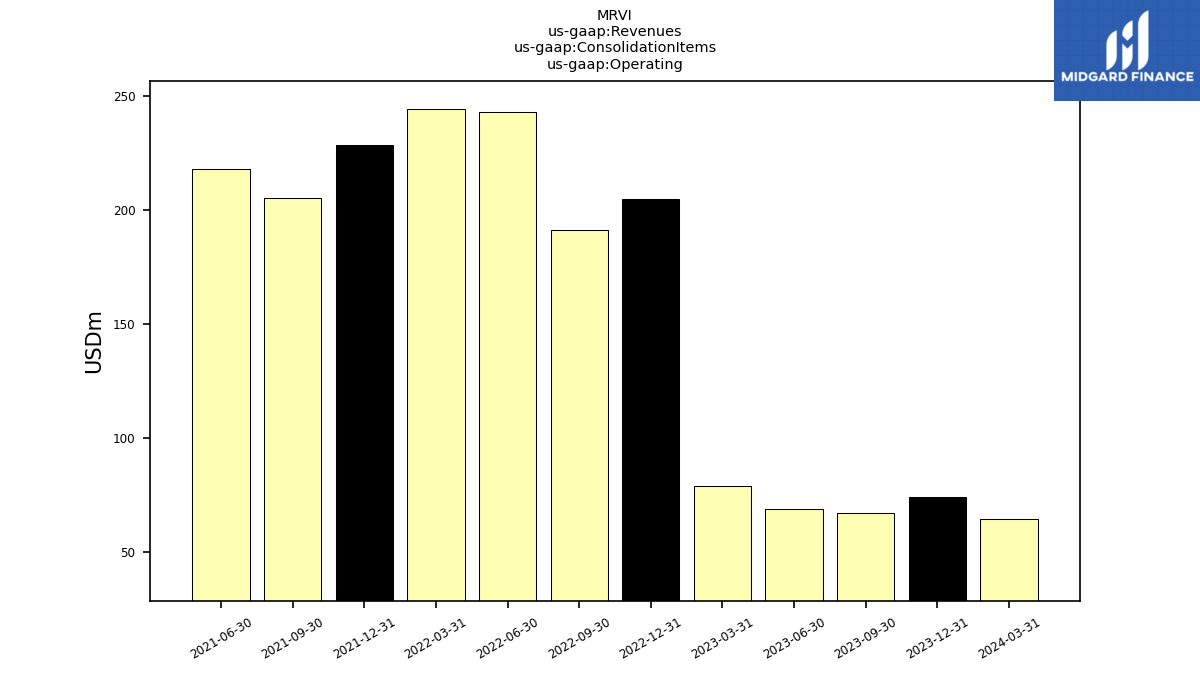
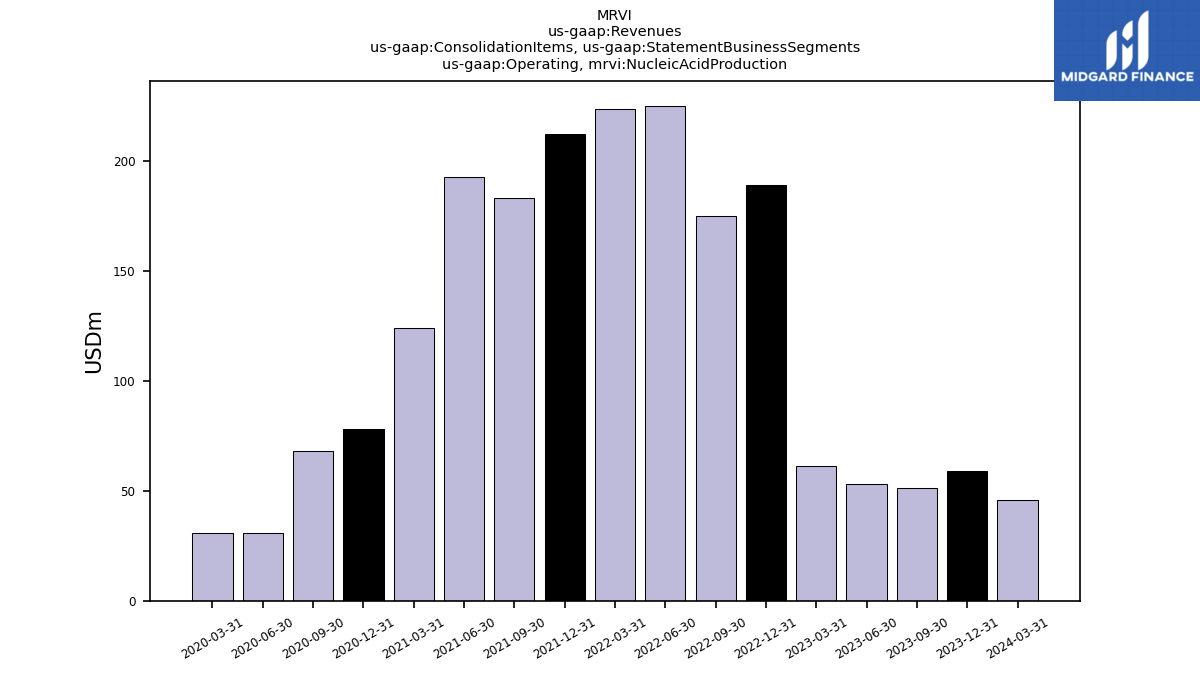
| Operating | 64.18 | 74.14 | 66.87 | 68.92 | 79.03 | 204.71 | 191.26 | 242.74 | 244.29 | 228.49 | 204.96 | 217.99 | NA | NA | NA | NA | NA | |
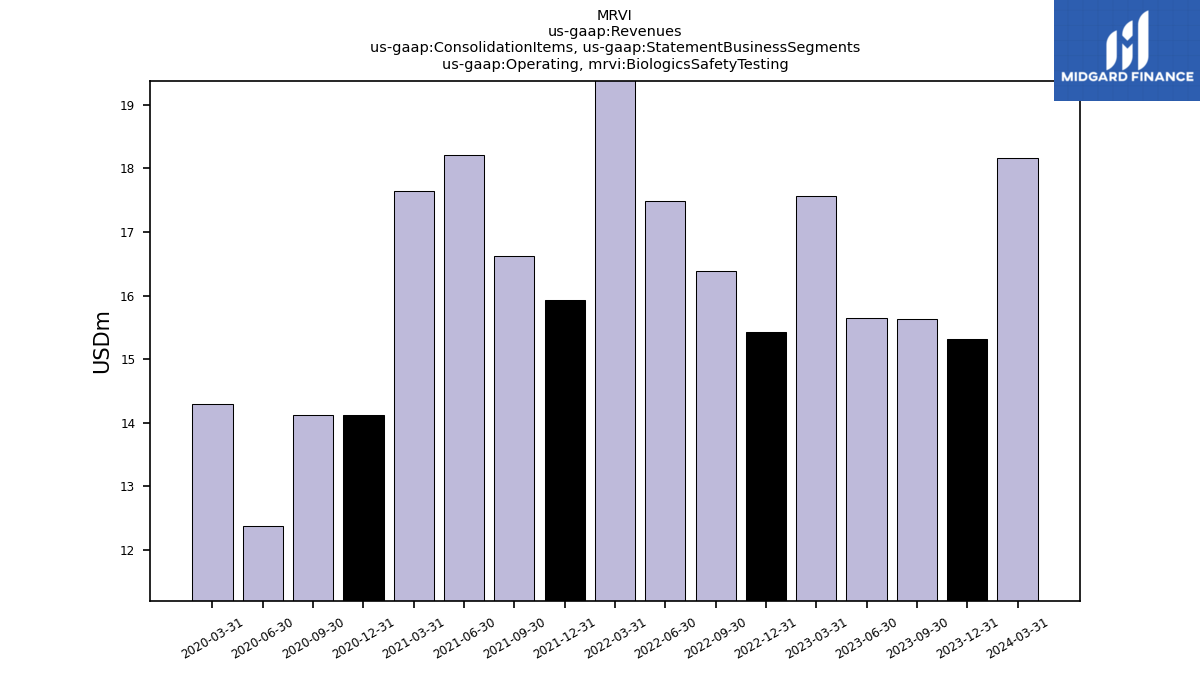
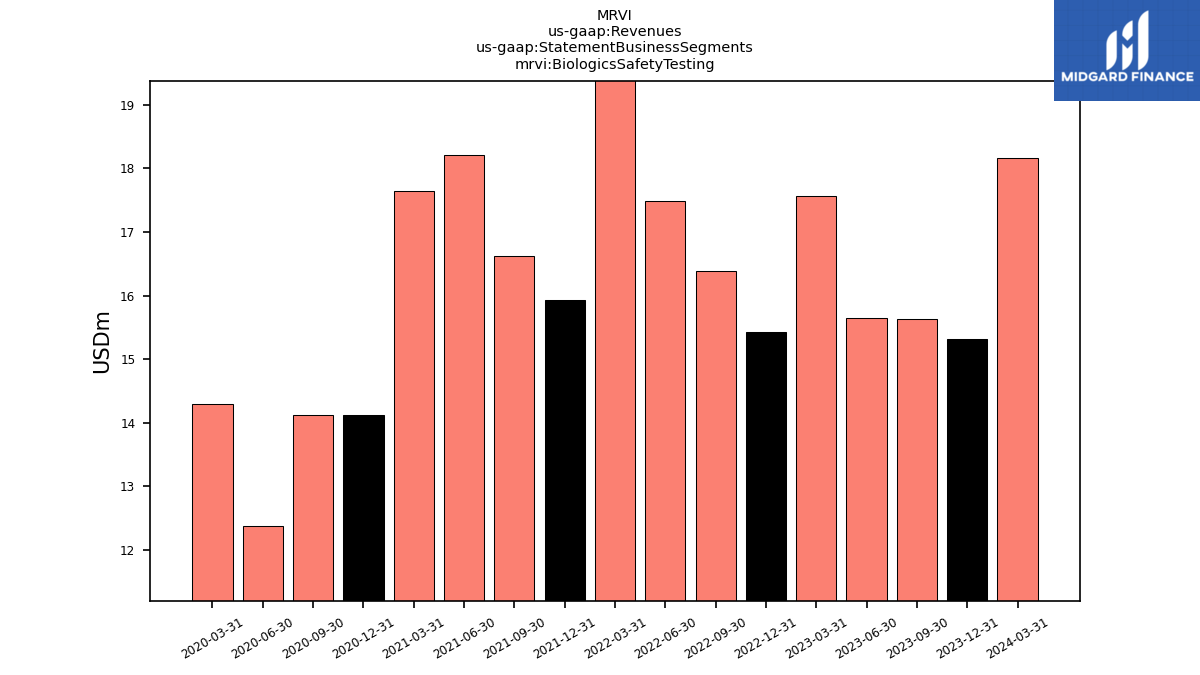
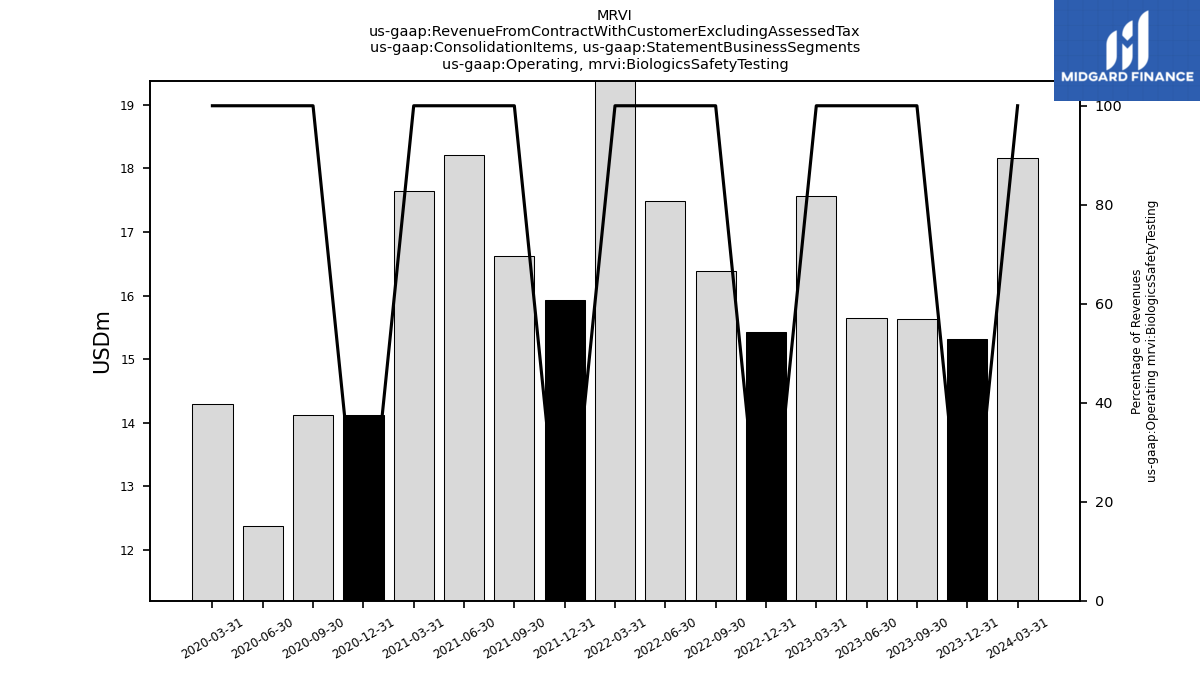
| Operating, Biologics Safety Testing | 18.16 | 15.32 | 15.64 | 15.65 | 17.57 | 15.42 | 16.38 | 17.48 | 20.64 | 15.93 | 16.63 | 18.21 | 17.65 | 14.12 | 14.11 | 12.36 | 14.29 | |
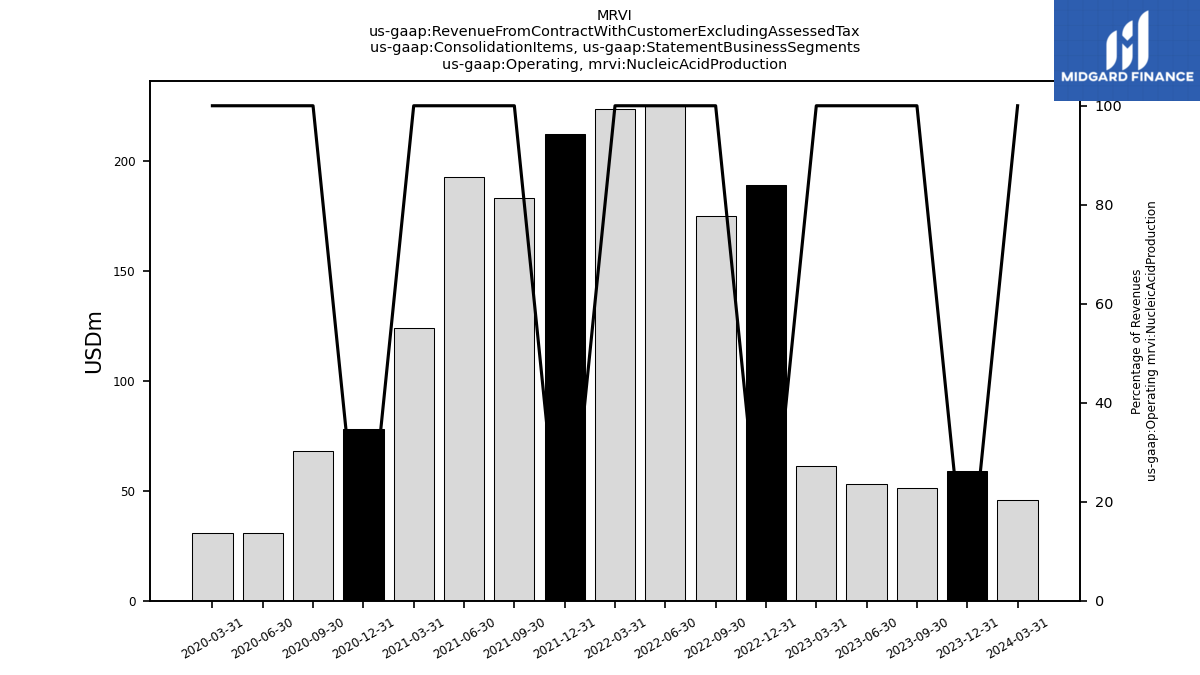
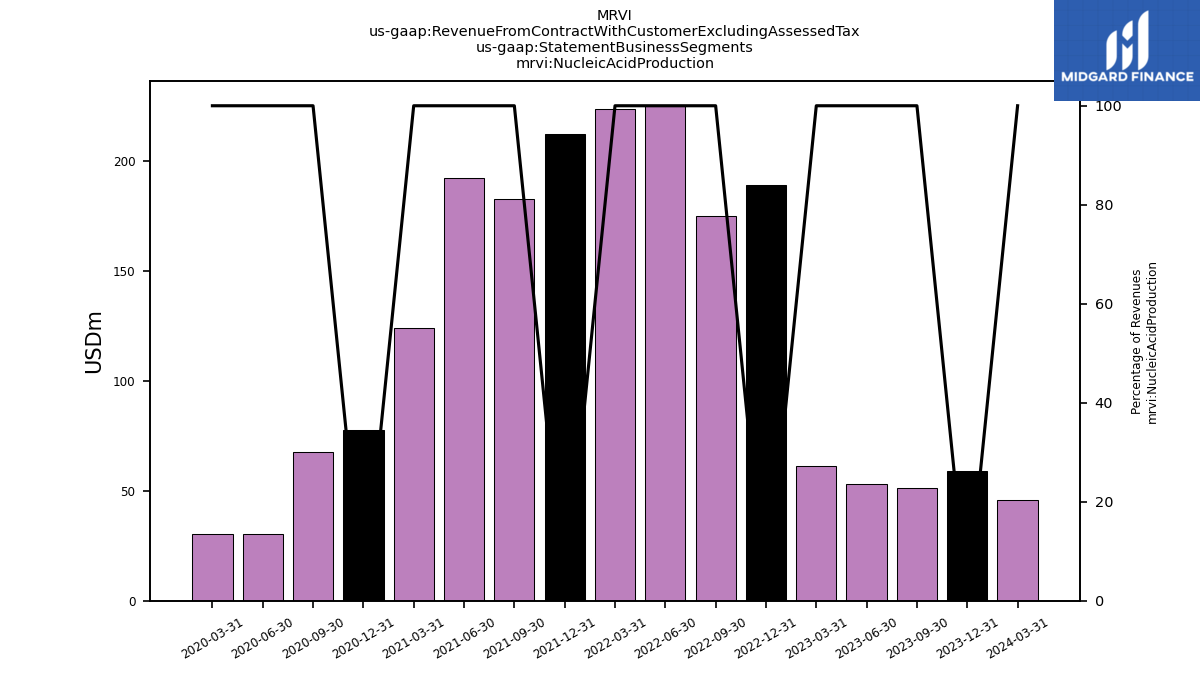
| Operating, Nucleic Acid Production | 46.02 | 58.83 | 51.23 | 53.27 | 61.45 | 189.29 | 174.88 | 225.25 | 223.65 | 212.56 | 183.06 | 192.74 | 124.17 | 77.95 | 68.02 | 30.73 | 30.89 | |
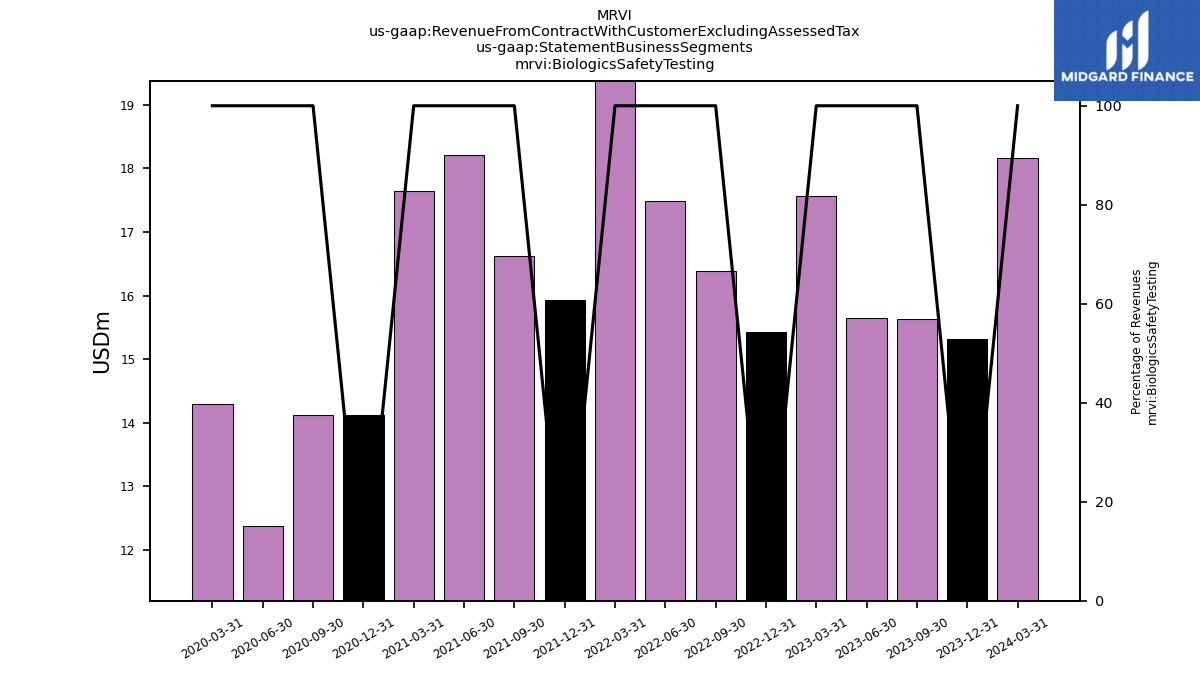
| Biologics Safety Testing | 18.16 | 15.32 | 15.64 | 15.65 | 17.57 | 15.42 | 16.38 | 17.48 | 20.64 | 15.93 | 16.63 | 18.21 | 17.65 | 14.12 | 14.11 | 12.36 | 14.29 | |
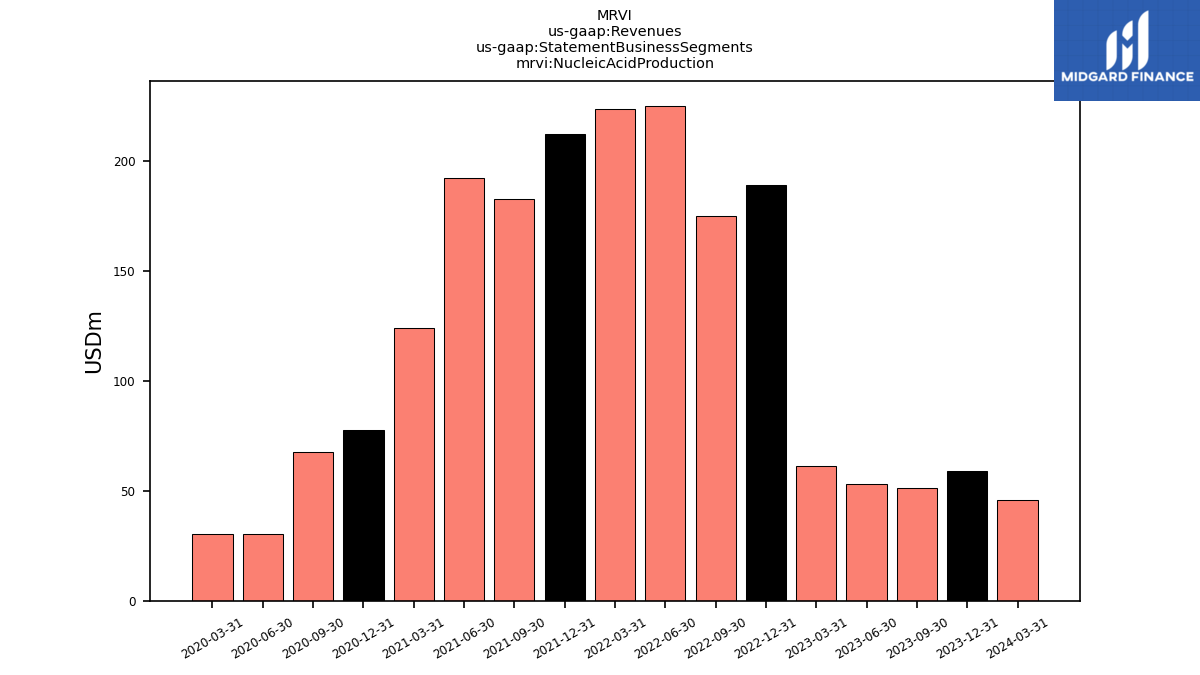
| Nucleic Acid Production | 46.02 | 58.83 | 51.23 | 53.27 | 61.45 | 189.29 | 174.88 | 225.25 | 223.65 | 212.51 | 182.90 | 192.52 | 123.93 | 77.75 | 67.66 | 30.42 | 30.49 | |
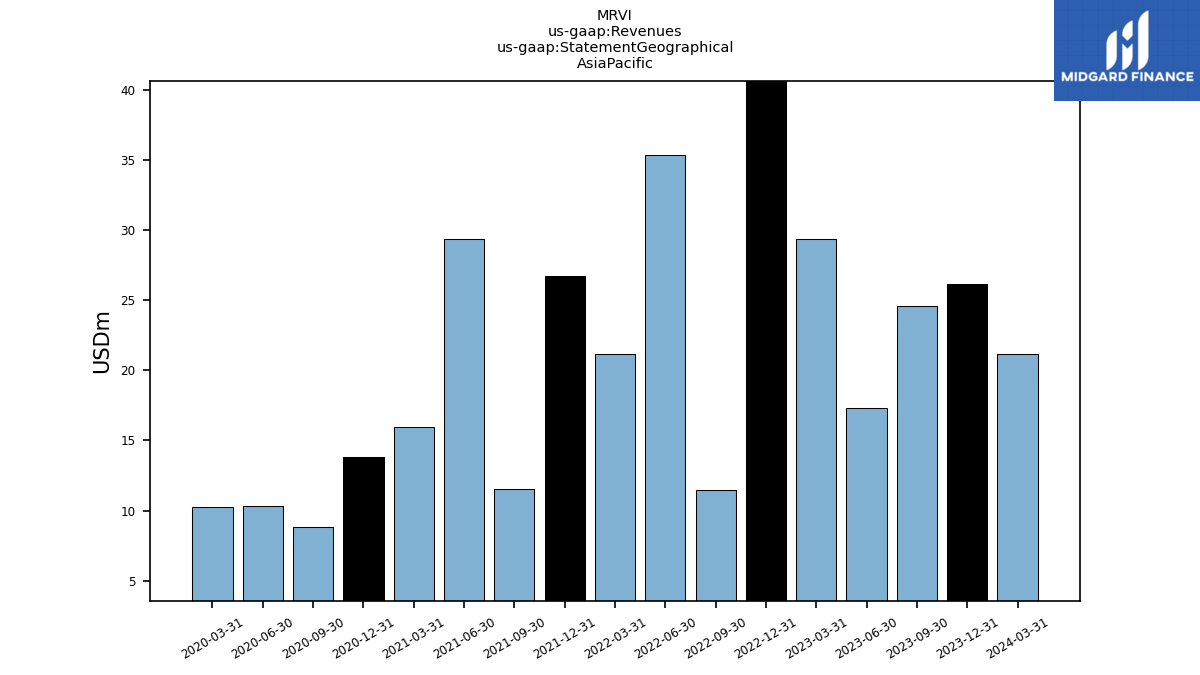
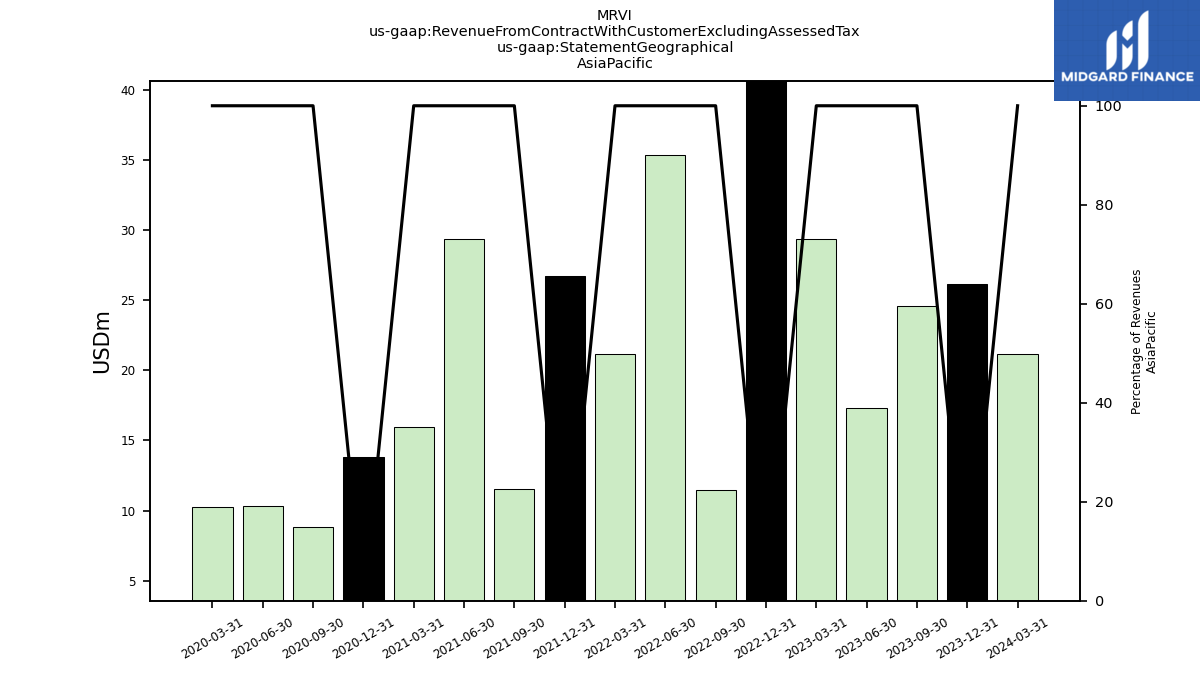
| 21.14 | 26.13 | 24.62 | 17.32 | 29.37 | 41.78 | 11.47 | 35.34 | 21.20 | 26.76 | 11.57 | 29.34 | 15.98 | 13.79 | 8.86 | 10.29 | 10.23 | ||
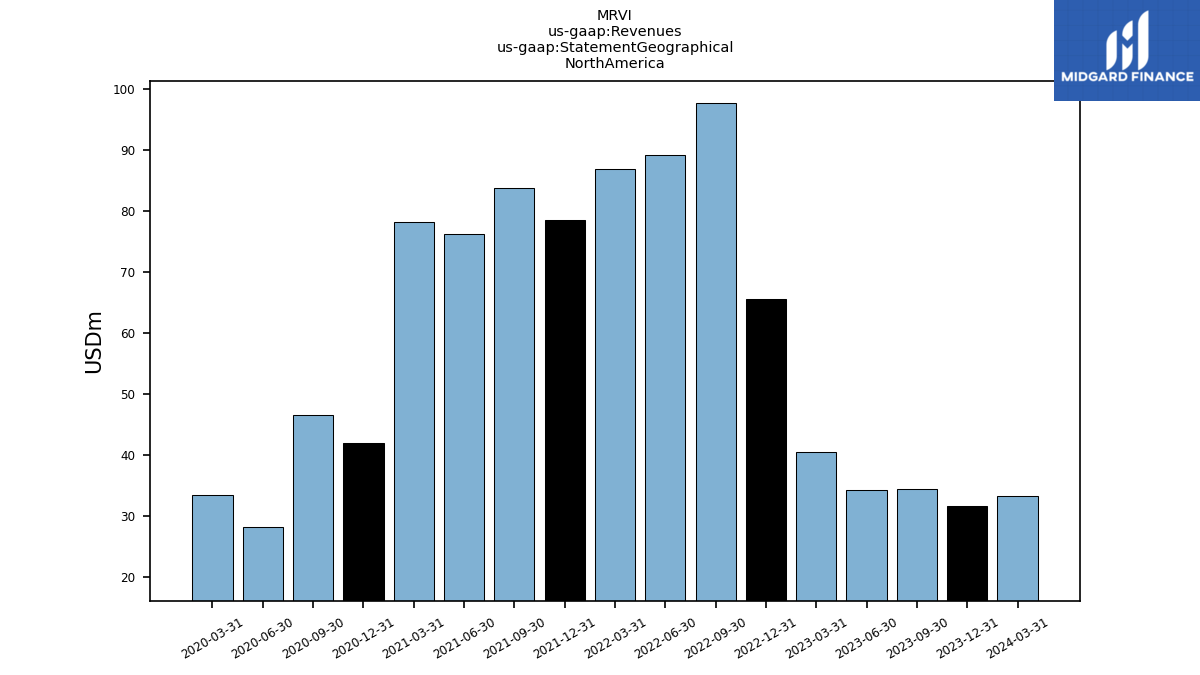
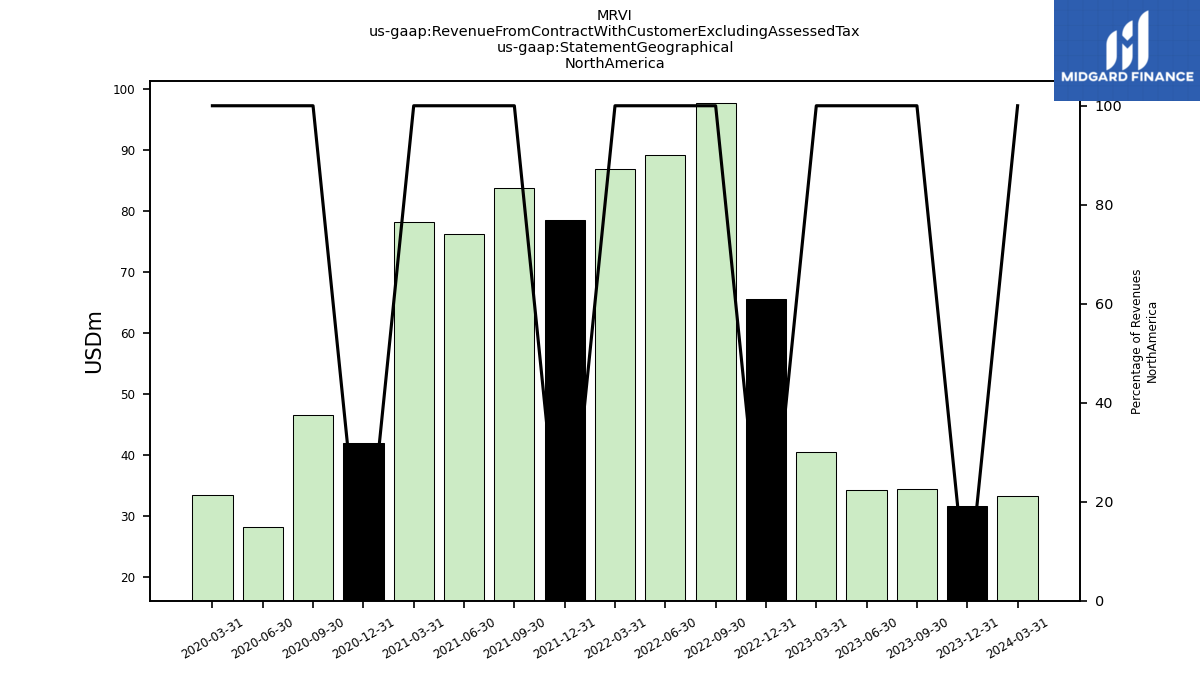
| 33.37 | 31.70 | 34.52 | 34.33 | 40.51 | 65.64 | 97.71 | 89.19 | 86.94 | 78.53 | 83.89 | 76.35 | 78.30 | 42.03 | 46.58 | 28.31 | 33.42 | ||
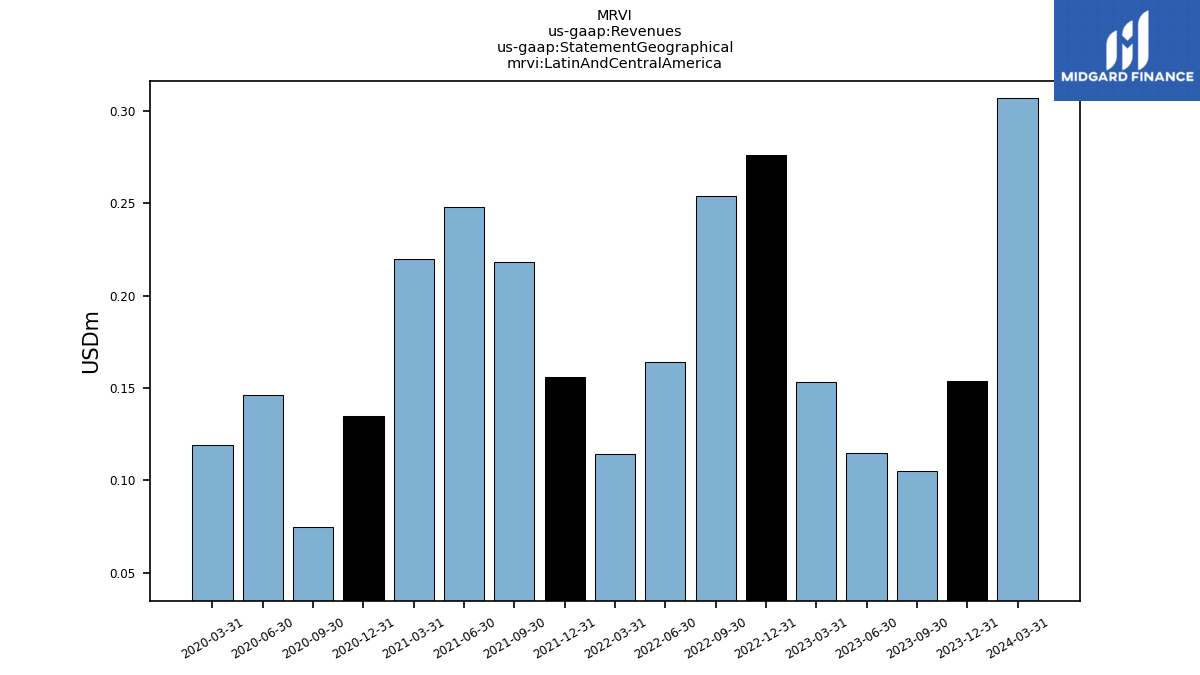
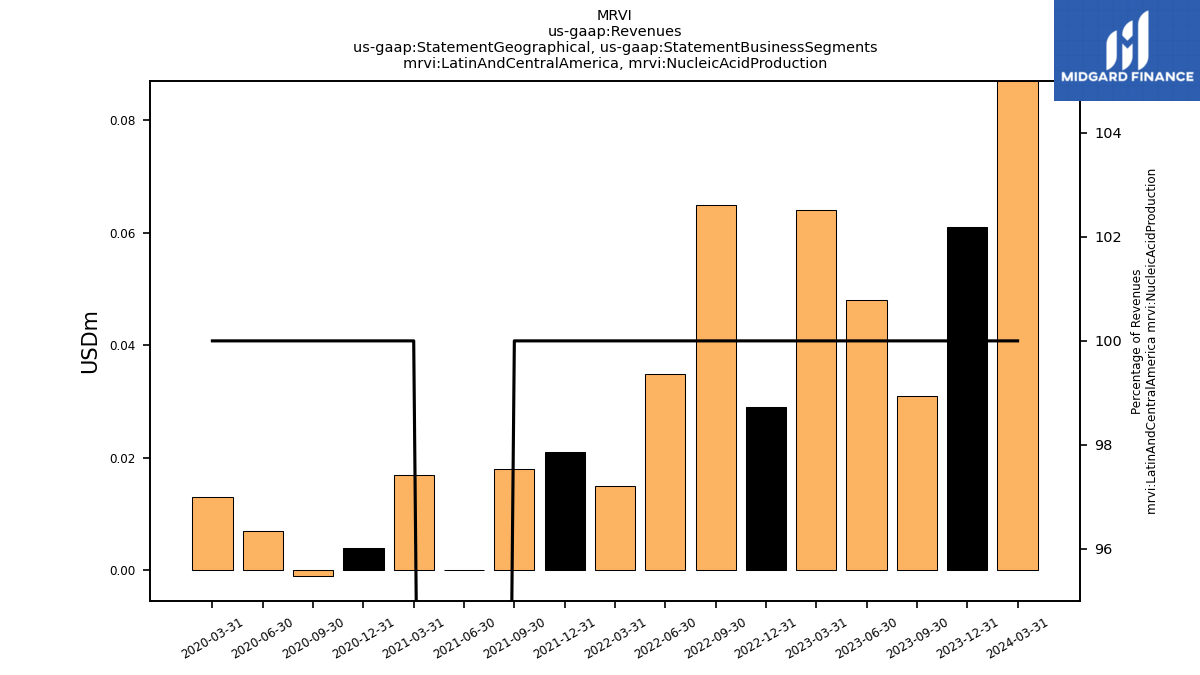
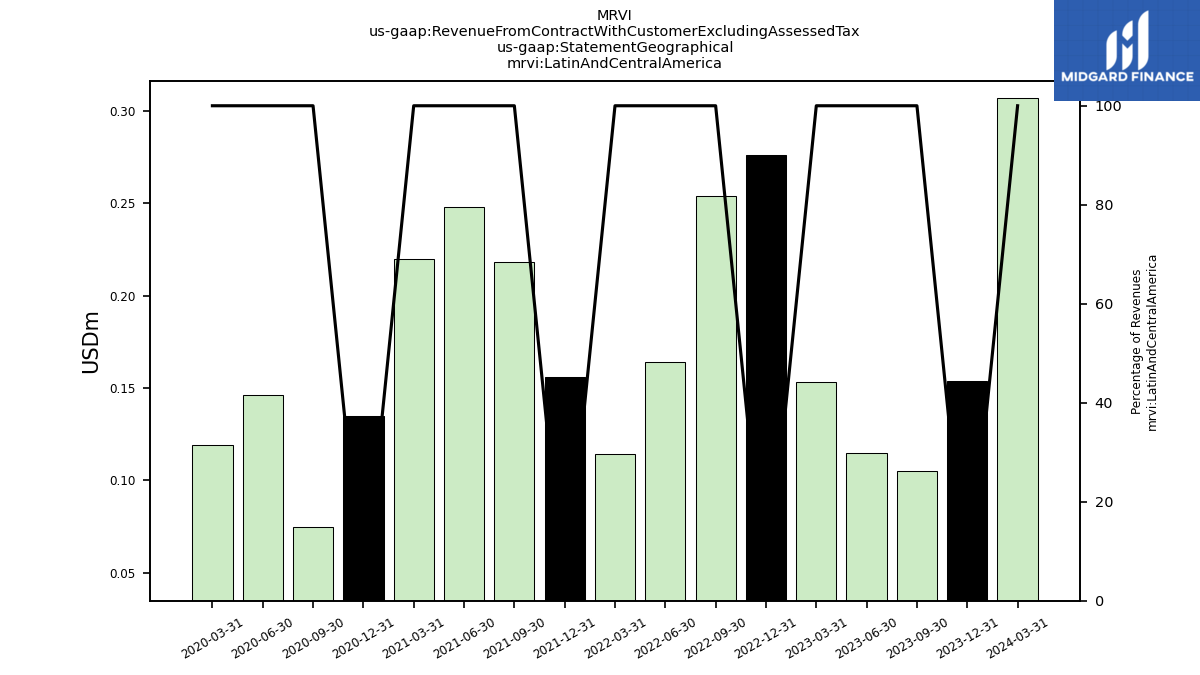
| Latin And Central America | 0.31 | 0.15 | 0.10 | 0.12 | 0.15 | 0.28 | 0.25 | 0.16 | 0.11 | 0.16 | 0.22 | 0.25 | 0.22 | 0.14 | 0.07 | 0.15 | 0.12 | |
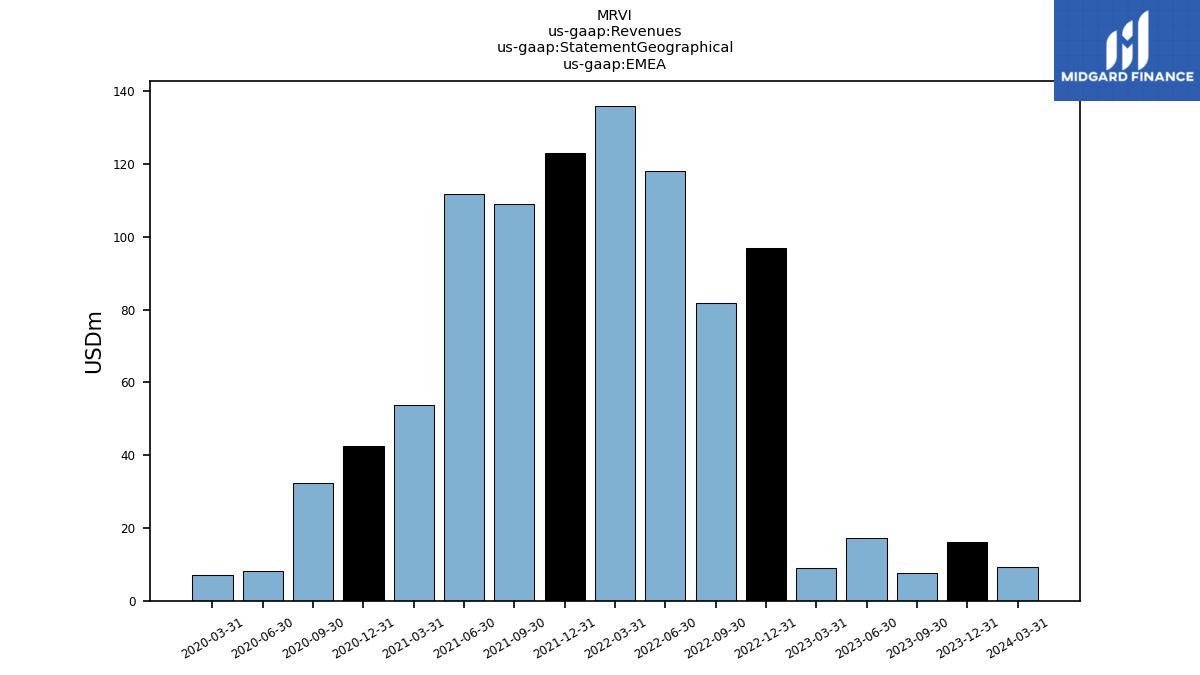
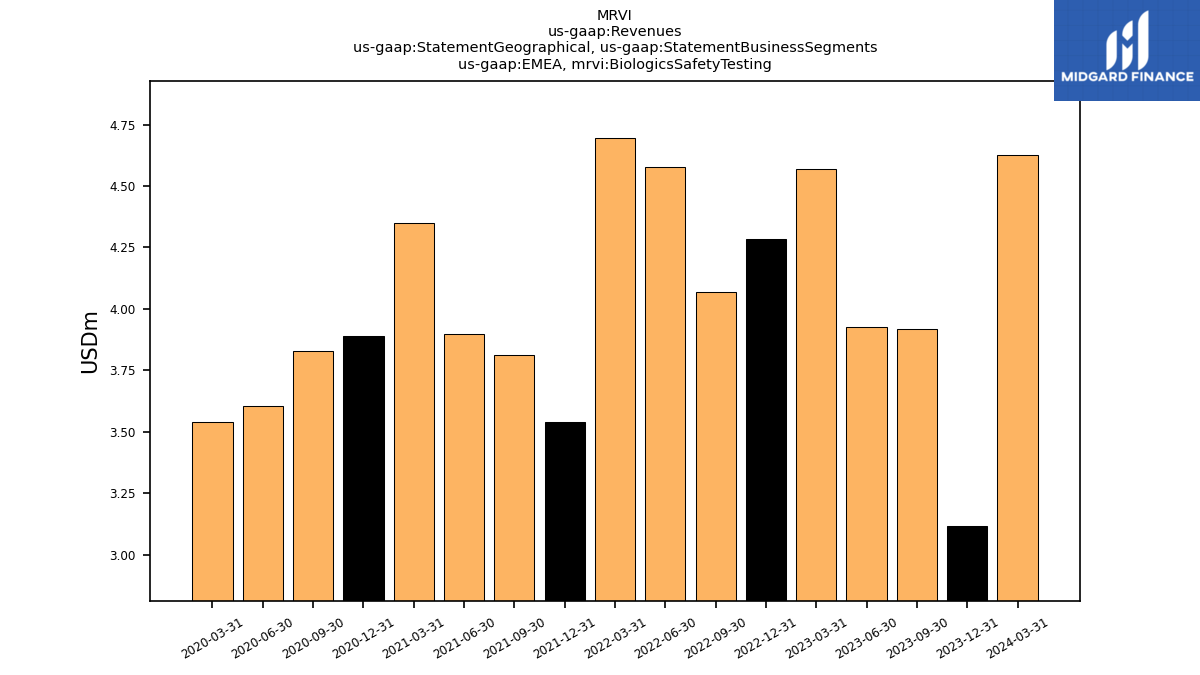
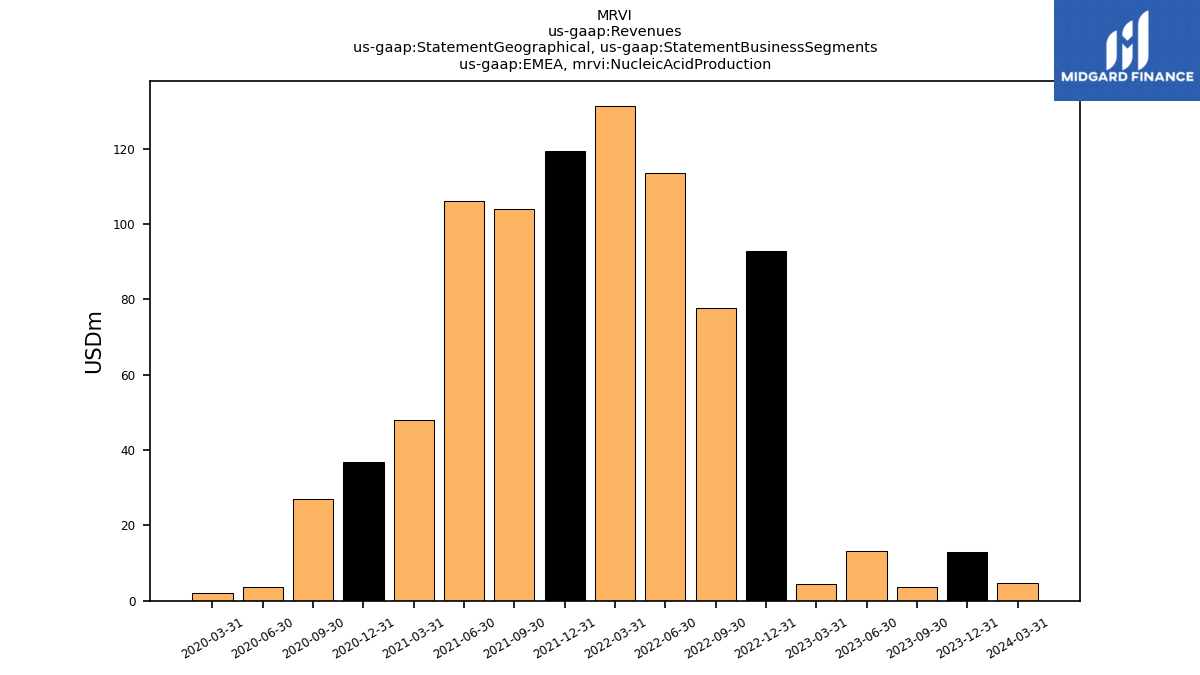
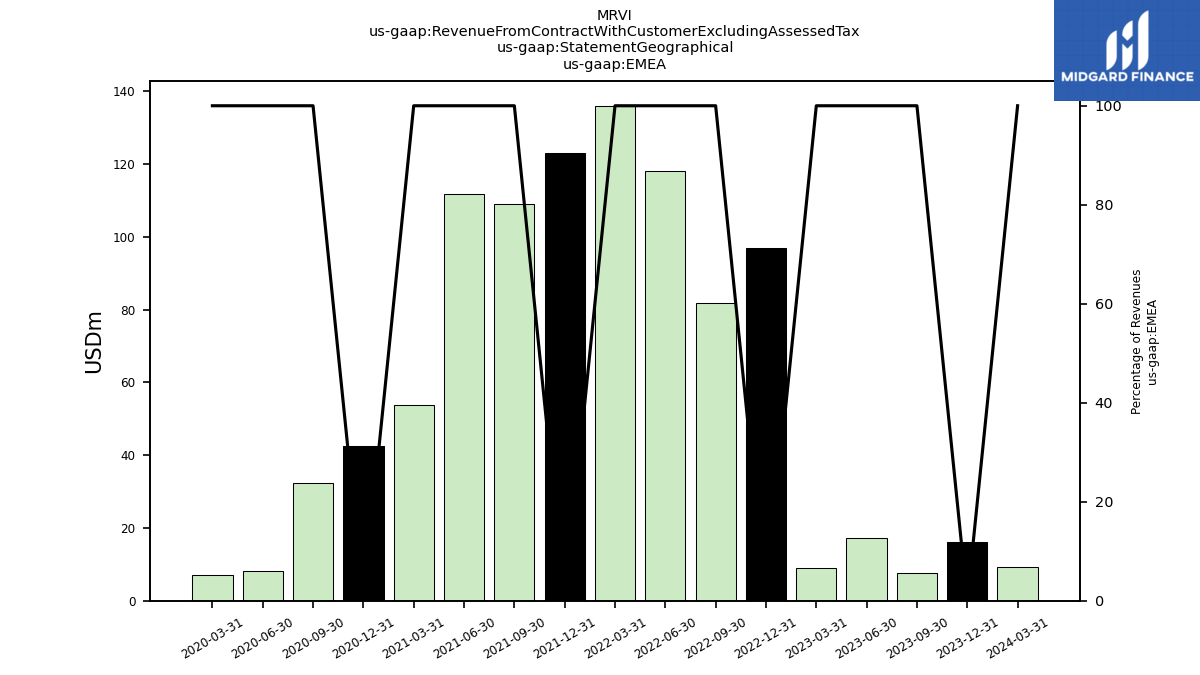
| EMEA | 9.37 | 16.16 | 7.62 | 17.15 | 8.99 | 97.02 | 81.82 | 118.04 | 136.05 | 122.99 | 109.13 | 111.84 | 53.72 | 42.40 | 32.34 | 8.16 | 7.21 | |
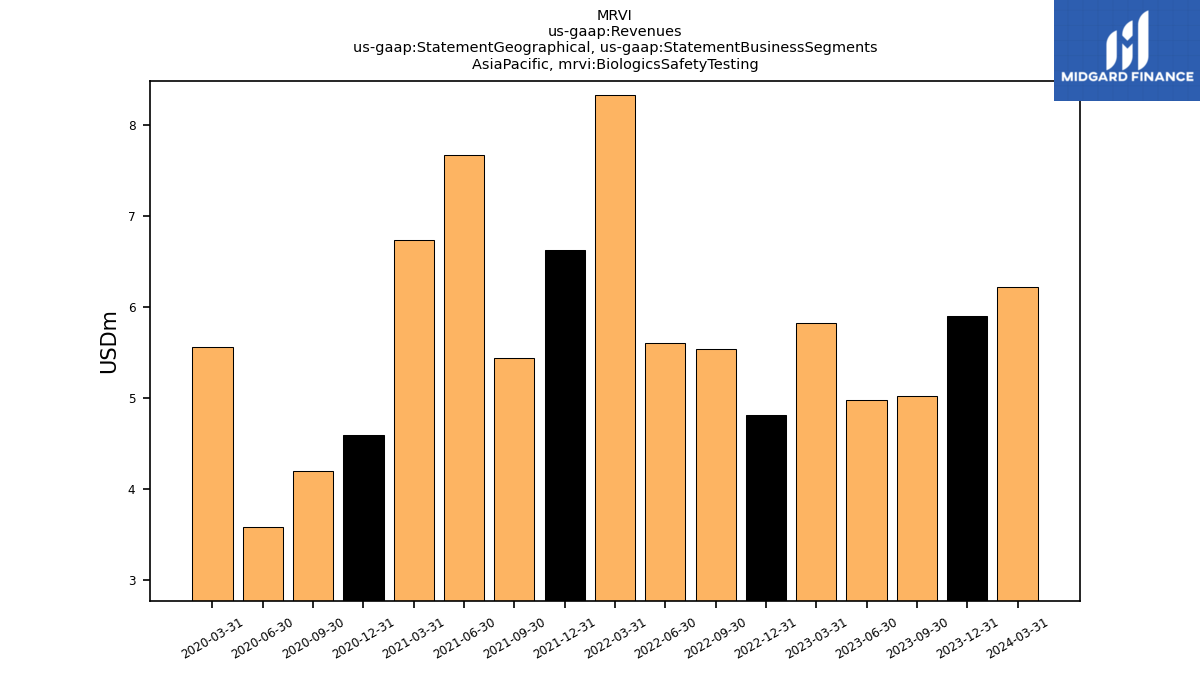
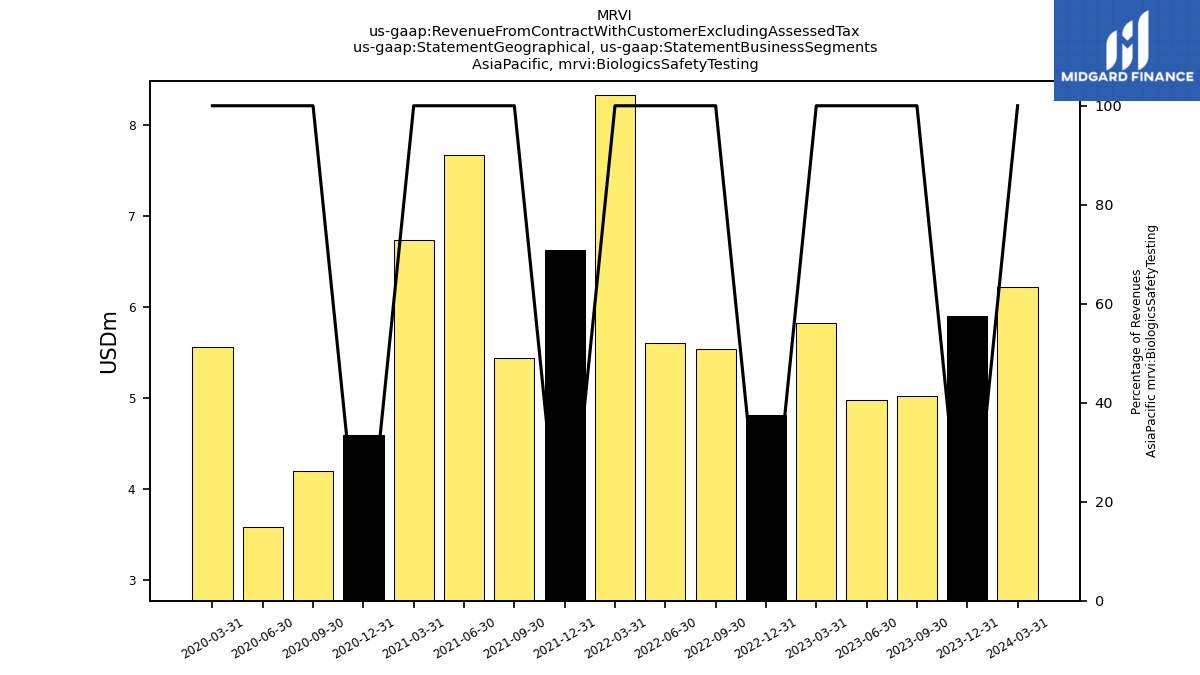
| , Biologics Safety Testing | 6.22 | 5.91 | 5.02 | 4.98 | 5.82 | 4.81 | 5.54 | 5.61 | 8.33 | 6.63 | 5.44 | 7.67 | 6.74 | 4.59 | 4.20 | 3.59 | 5.56 | |
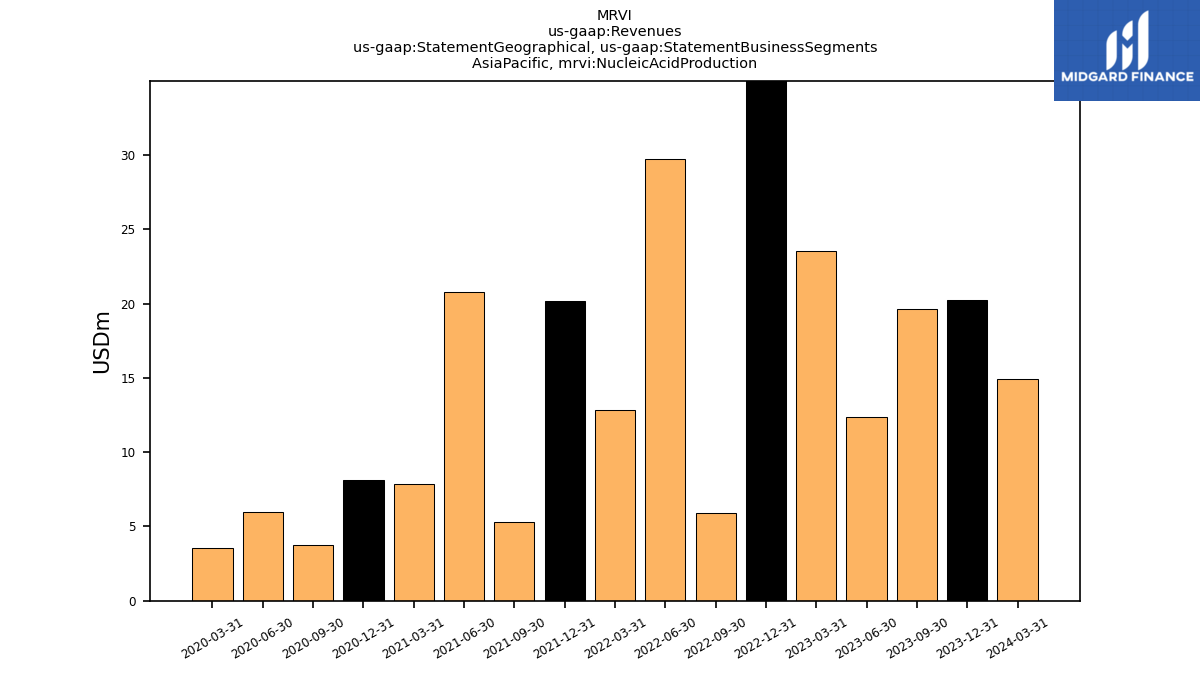
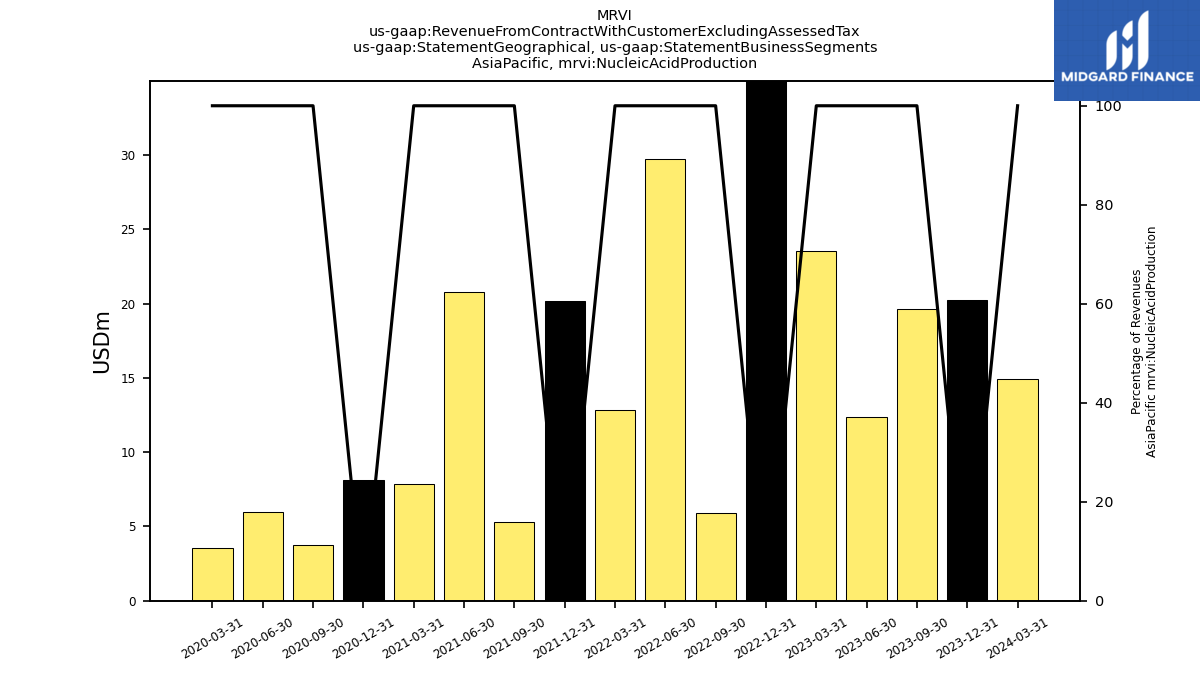
| , Nucleic Acid Production | 14.91 | 20.22 | 19.60 | 12.34 | 23.55 | 36.97 | 5.93 | 29.74 | 12.87 | 20.14 | 5.33 | 20.76 | 7.88 | 8.15 | 3.76 | 5.98 | 3.56 | |
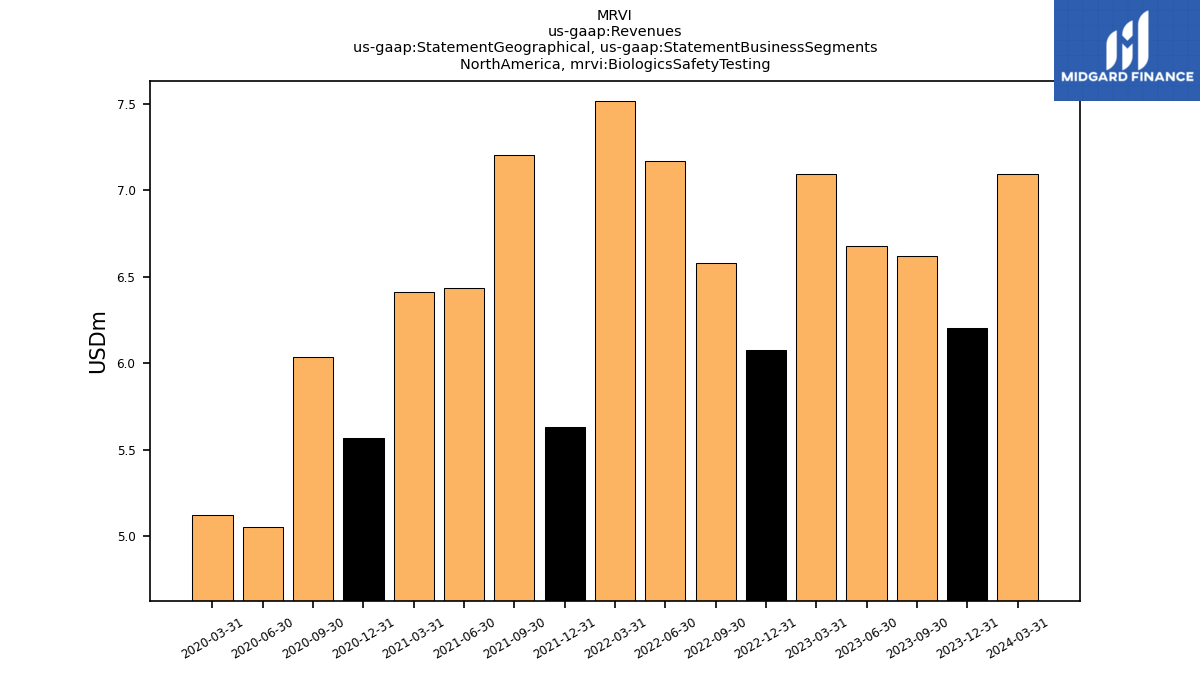
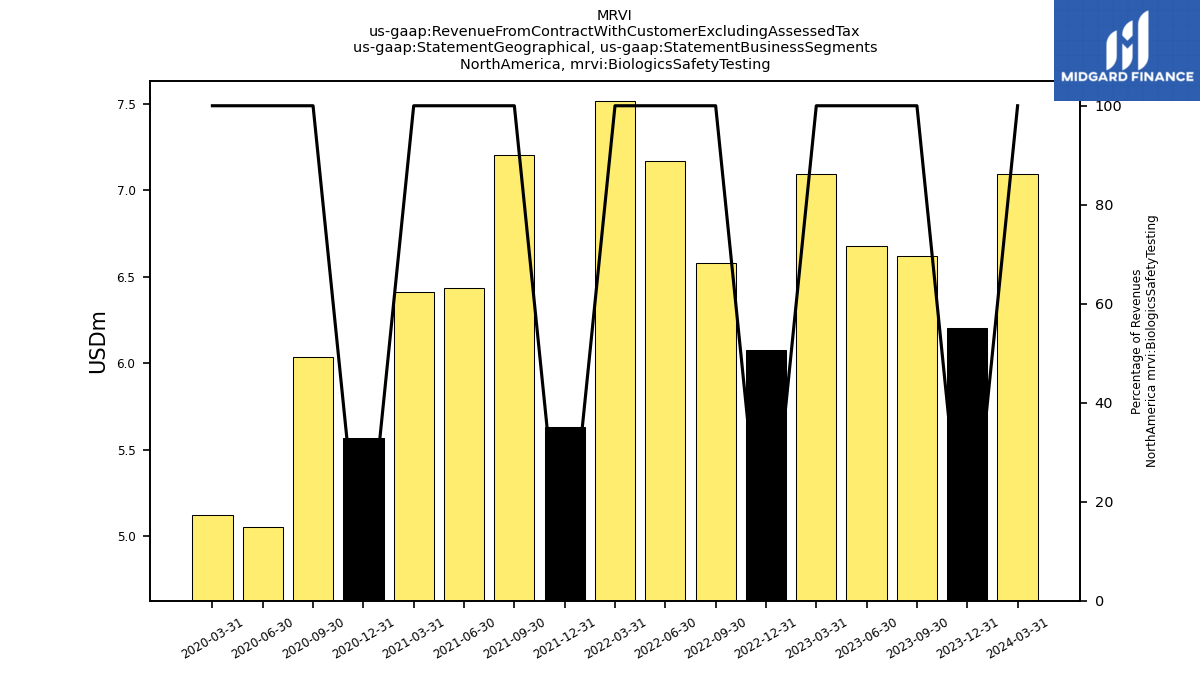
| , Biologics Safety Testing | 7.09 | 6.20 | 6.62 | 6.68 | 7.09 | 6.08 | 6.58 | 7.17 | 7.52 | 5.63 | 7.20 | 6.44 | 6.41 | 5.57 | 6.04 | 5.06 | 5.12 | |
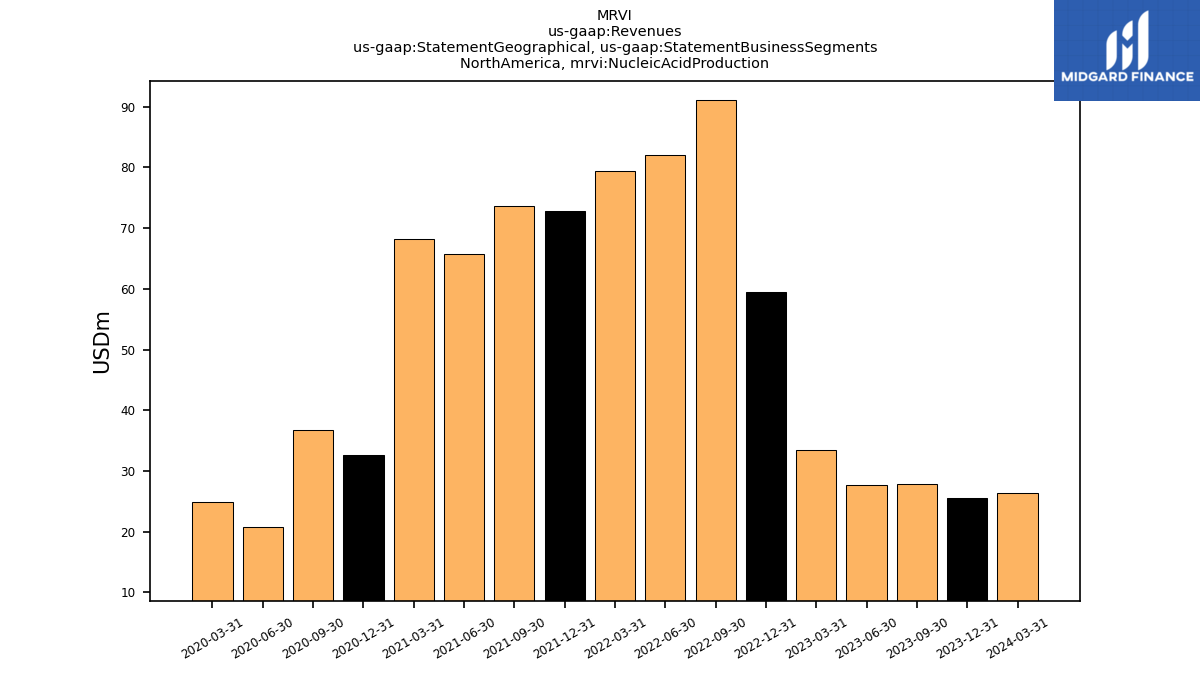
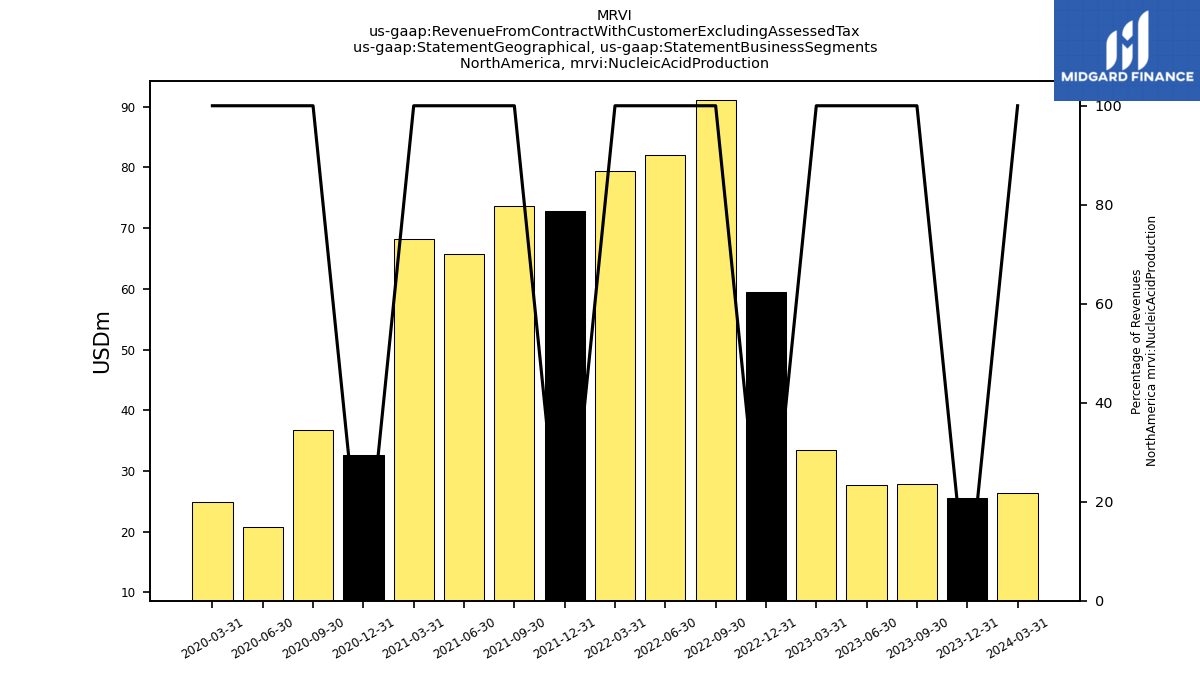
| , Nucleic Acid Production | 26.28 | 25.50 | 27.89 | 27.65 | 33.41 | 59.56 | 91.13 | 82.02 | 79.42 | 72.90 | 73.62 | 65.72 | 68.13 | 32.69 | 36.81 | 20.84 | 24.87 | |
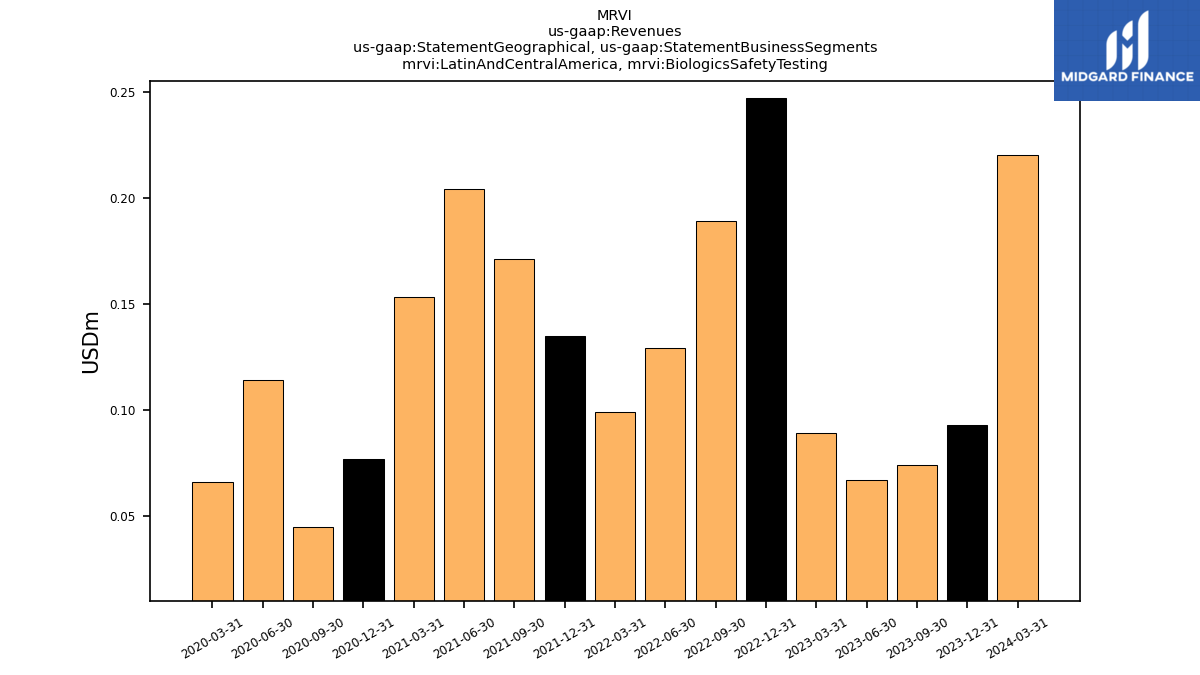
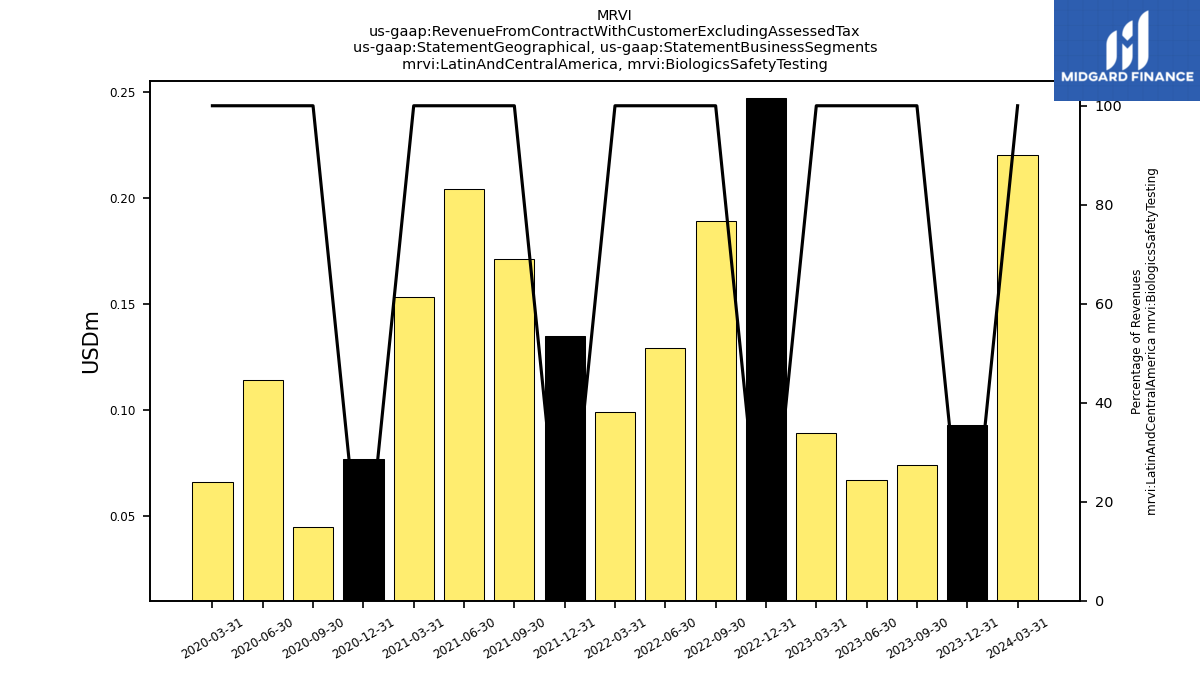
| Latin And Central America, Biologics Safety Testing | 0.22 | 0.09 | 0.07 | 0.07 | 0.09 | 0.25 | 0.19 | 0.13 | 0.10 | 0.14 | 0.17 | 0.20 | 0.15 | 0.08 | 0.04 | 0.11 | 0.07 | |
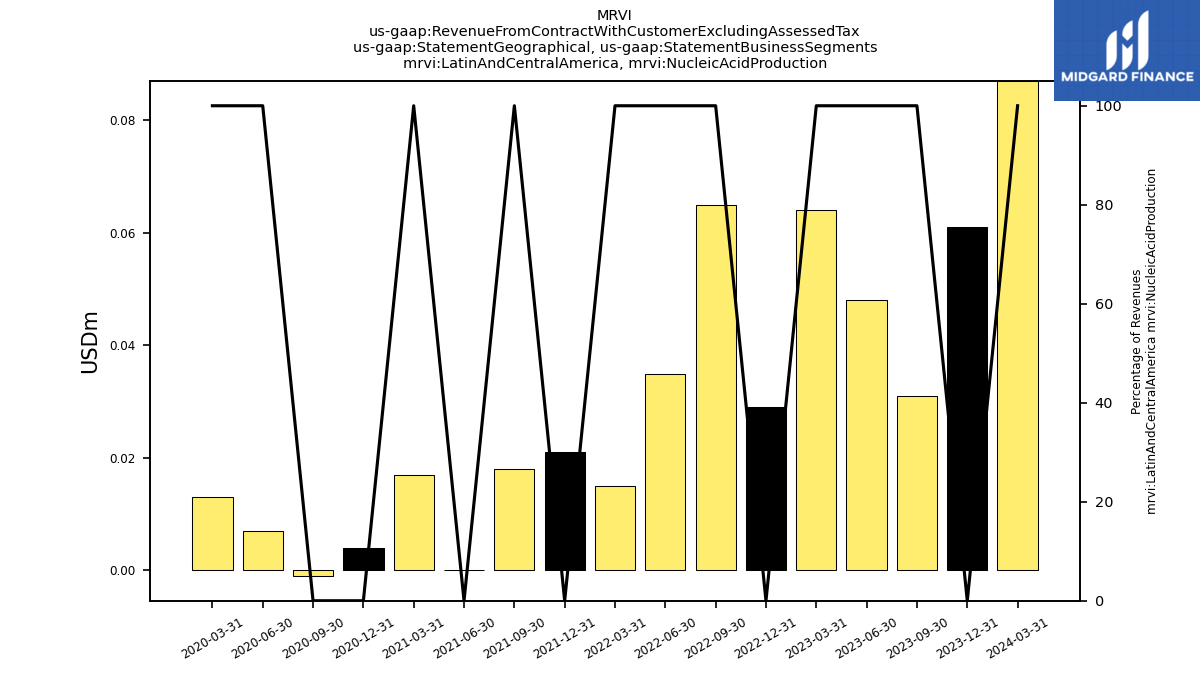
| Latin And Central America, Nucleic Acid Production | 0.09 | 0.06 | 0.03 | 0.05 | 0.06 | 0.03 | 0.07 | 0.04 | 0.01 | 0.02 | 0.02 | 0.00 | 0.02 | 0.00 | -0.00 | 0.01 | 0.01 | |
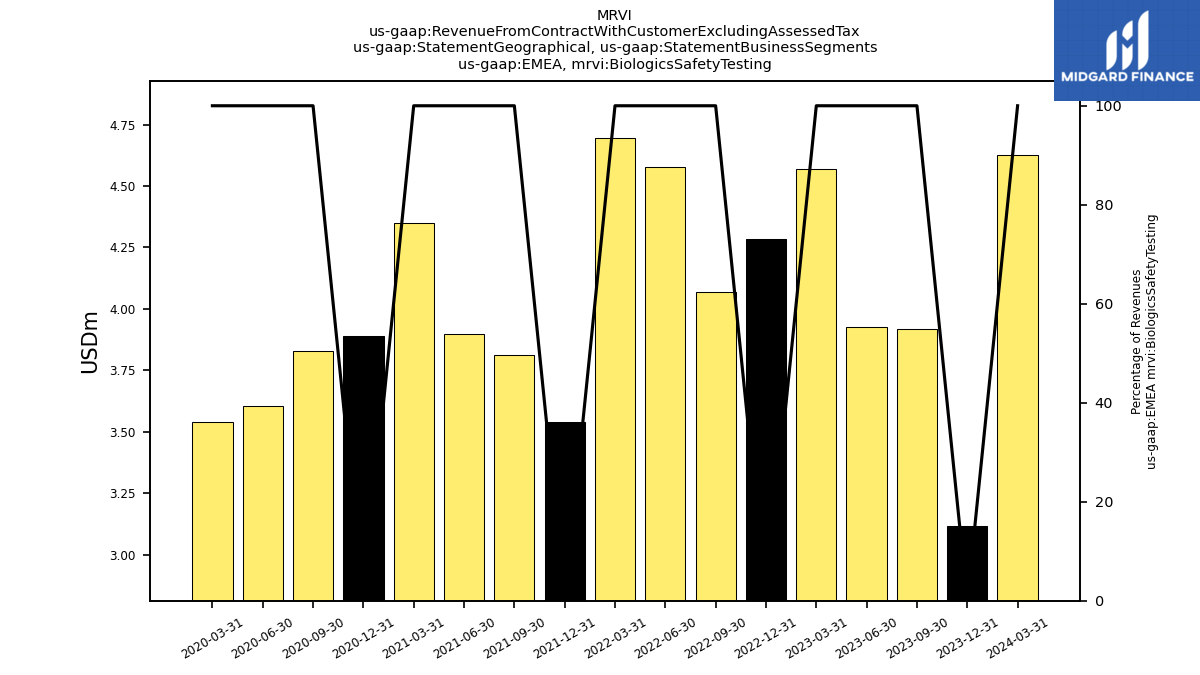
| EMEA, Biologics Safety Testing | 4.62 | 3.11 | 3.92 | 3.93 | 4.57 | 4.28 | 4.07 | 4.58 | 4.70 | 3.54 | 3.81 | 3.90 | 4.35 | 3.89 | 3.83 | 3.60 | 3.54 | |
| EMEA, Nucleic Acid Production | 4.74 | 13.04 | 3.70 | 13.22 | 4.42 | 92.73 | 77.75 | 113.46 | 131.35 | 119.45 | 103.93 | 106.05 | 47.90 | 36.91 | 27.08 | 3.60 | 2.05 | |
| Revenue From Contract With Customer Excluding Assessed Tax | 64.18 | 74.14 | 66.86 | 68.91 | 79.03 | 204.71 | 191.26 | 242.73 | 244.29 | 228.44 | 204.81 | 217.78 | 148.21 | 98.35 | 87.86 | 46.91 | 50.98 | |
| Intersegment Elimination | NA | 0.00 | -0.00 | -0.00 | NA | 0.00 | 0.00 | -0.01 | NA | -0.05 | -0.15 | -0.22 | -0.24 | -0.20 | -0.36 | -0.31 | -0.40 | |
| Operating | 64.18 | 74.14 | 66.87 | 68.92 | 79.03 | 204.71 | 191.26 | 242.74 | 244.29 | 228.49 | 204.96 | 217.99 | NA | NA | NA | NA | NA | |
| Operating, Biologics Safety Testing | 18.16 | 15.32 | 15.64 | 15.65 | 17.57 | 15.42 | 16.38 | 17.48 | 20.64 | 15.93 | 16.63 | 18.21 | 17.65 | 14.12 | 14.11 | 12.36 | 14.29 | |
| Operating, Nucleic Acid Production | 46.02 | 58.83 | 51.23 | 53.27 | 61.45 | 189.29 | 174.88 | 225.25 | 223.65 | 212.56 | 183.06 | 192.74 | 124.17 | 77.95 | 68.02 | 30.73 | 30.89 | |
| Biologics Safety Testing | 18.16 | 15.32 | 15.64 | 15.65 | 17.57 | 15.42 | 16.38 | 17.48 | 20.64 | 15.93 | 16.63 | 18.21 | 17.65 | 14.12 | 14.11 | 12.36 | 14.29 | |
| Nucleic Acid Production | 46.02 | 58.83 | 51.23 | 53.27 | 61.45 | 189.29 | 174.88 | 225.25 | 223.65 | 212.51 | 182.90 | 192.52 | 123.93 | 77.75 | 67.66 | 30.42 | 30.49 | |
| 21.14 | 26.13 | 24.62 | 17.32 | 29.37 | 41.78 | 11.47 | 35.34 | 21.20 | 26.76 | 11.57 | 29.34 | 15.98 | 13.79 | 8.86 | 10.29 | 10.23 | ||
| 33.37 | 31.70 | 34.52 | 34.33 | 40.51 | 65.64 | 97.71 | 89.19 | 86.94 | 78.53 | 83.89 | 76.35 | 78.30 | 42.03 | 46.58 | 28.31 | 33.42 | ||
| Latin And Central America | 0.31 | 0.15 | 0.10 | 0.12 | 0.15 | 0.28 | 0.25 | 0.16 | 0.11 | 0.16 | 0.22 | 0.25 | 0.22 | 0.14 | 0.07 | 0.15 | 0.12 | |
| EMEA | 9.37 | 16.16 | 7.62 | 17.15 | 8.99 | 97.02 | 81.82 | 118.04 | 136.05 | 122.99 | 109.13 | 111.84 | 53.72 | 42.40 | 32.34 | 8.16 | 7.21 | |
| , Biologics Safety Testing | 6.22 | 5.91 | 5.02 | 4.98 | 5.82 | 4.81 | 5.54 | 5.61 | 8.33 | 6.63 | 5.44 | 7.67 | 6.74 | 4.59 | 4.20 | 3.59 | 5.56 | |
| , Nucleic Acid Production | 14.91 | 20.22 | 19.60 | 12.34 | 23.55 | 36.97 | 5.93 | 29.74 | 12.87 | 20.14 | 5.33 | 20.76 | 7.88 | 8.15 | 3.76 | 5.98 | 3.56 | |
| , Biologics Safety Testing | 7.09 | 6.20 | 6.62 | 6.68 | 7.09 | 6.08 | 6.58 | 7.17 | 7.52 | 5.63 | 7.20 | 6.44 | 6.41 | 5.57 | 6.04 | 5.06 | 5.12 | |
| , Nucleic Acid Production | 26.28 | 25.50 | 27.89 | 27.65 | 33.41 | 59.56 | 91.13 | 82.02 | 79.42 | 72.90 | 73.62 | 65.72 | 68.13 | 32.69 | 36.81 | 20.84 | 24.87 | |
| Latin And Central America, Biologics Safety Testing | 0.22 | 0.09 | 0.07 | 0.07 | 0.09 | 0.25 | 0.19 | 0.13 | 0.10 | 0.14 | 0.17 | 0.20 | 0.15 | 0.08 | 0.04 | 0.11 | 0.07 | |
| Latin And Central America, Nucleic Acid Production | 0.09 | 0.06 | 0.03 | 0.05 | 0.06 | 0.03 | 0.07 | 0.04 | 0.01 | 0.02 | 0.02 | 0.00 | 0.02 | 0.00 | -0.00 | 0.01 | 0.01 | |
| EMEA, Biologics Safety Testing | 4.62 | 3.11 | 3.92 | 3.93 | 4.57 | 4.28 | 4.07 | 4.58 | 4.70 | 3.54 | 3.81 | 3.90 | 4.35 | 3.89 | 3.83 | 3.60 | 3.54 | |
| EMEA, Nucleic Acid Production | 4.74 | 13.04 | 3.70 | 13.22 | 4.42 | 92.73 | 77.75 | 113.46 | 131.35 | 119.45 | 103.93 | 106.05 | 47.90 | 36.91 | 27.08 | 3.60 | 2.05 |

