
| 2024-03-31 | 2023-09-30 | 2023-06-30 | 2023-03-31 | 2022-09-30 | 2022-06-30 | 2022-03-31 | 2021-09-30 | 2021-06-30 | 2021-03-31 | 2020-09-30 | 2020-06-30 | 2020-03-31 | 2019-09-30 | 2019-06-30 | 2019-03-31 | 2018-09-30 | 2018-06-30 | 2018-03-31 | 2017-09-30 | 2017-06-30 | 2017-03-31 | 2016-09-30 | 2016-06-30 | 2016-03-31 | 2015-09-30 | 2015-06-30 | 2015-03-31 | 2014-09-30 | 2014-06-30 | 2014-03-31 | 2013-09-30 | 2013-06-30 | 2013-03-31 | 2012-09-30 | ||
|---|---|---|---|---|---|---|---|---|---|---|---|---|---|---|---|---|---|---|---|---|---|---|---|---|---|---|---|---|---|---|---|---|---|---|---|---|
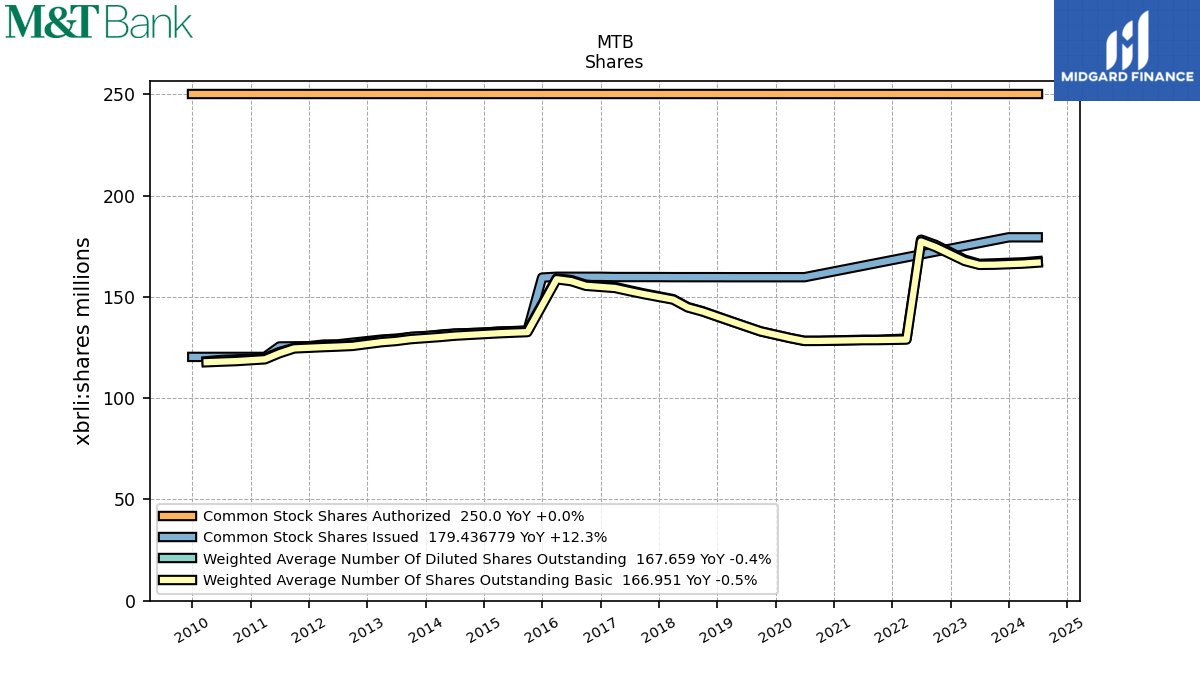
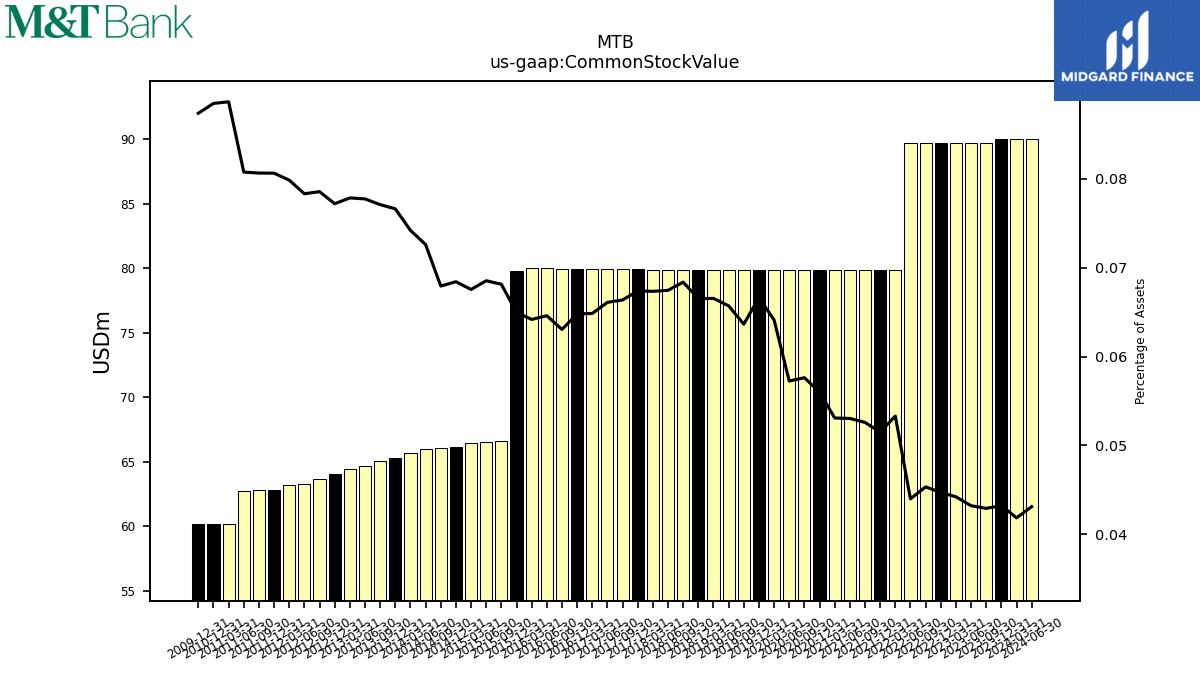
| Common Stock Value | 90.00 | 89.72 | 89.72 | 89.72 | 89.72 | 89.72 | 79.87 | 79.87 | 79.87 | 79.87 | 79.87 | 79.87 | 79.87 | 79.87 | 79.87 | 79.87 | 79.88 | 79.88 | 79.88 | 79.91 | 79.91 | 79.91 | 79.97 | 79.98 | 79.98 | 66.64 | 66.53 | 66.45 | 66.05 | 65.96 | 65.69 | 65.10 | 64.71 | 64.48 | 63.70 | |
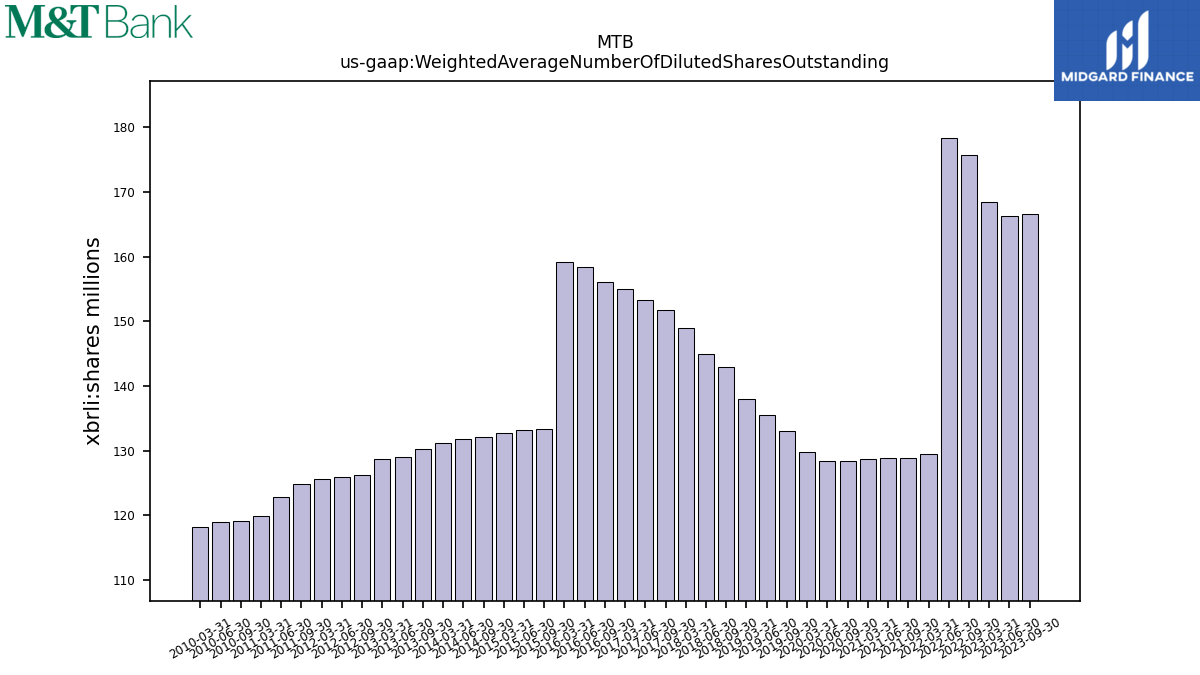
| Weighted Average Number Of Diluted Shares Outstanding | 167.08 | 166.57 | 166.32 | 168.41 | 175.68 | 178.28 | 129.42 | 128.84 | 128.84 | 128.67 | 128.35 | 128.33 | 129.75 | 133.00 | 135.46 | 137.92 | 142.98 | 145.00 | 148.91 | 151.69 | 153.28 | 154.95 | 156.03 | 158.34 | 159.18 | 133.38 | 133.12 | 132.77 | 132.13 | 131.83 | 131.13 | 130.26 | 129.02 | 128.64 | 126.29 | |
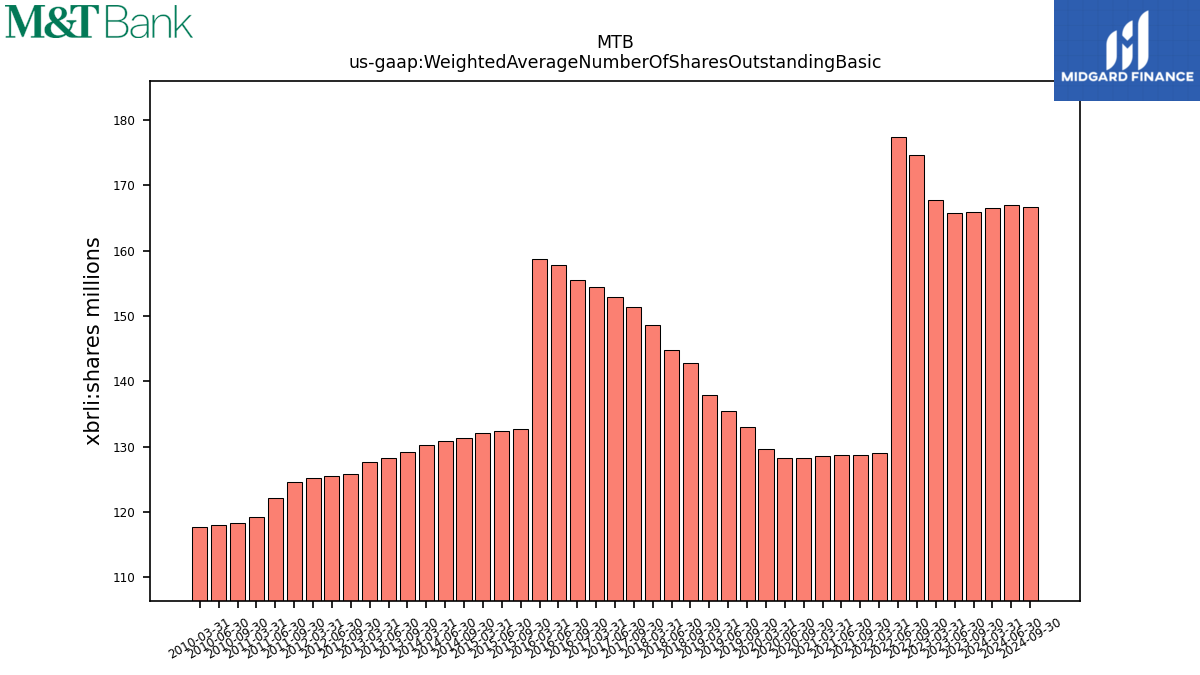
| Weighted Average Number Of Shares Outstanding Basic | 166.46 | 165.91 | 165.84 | 167.73 | 174.61 | 177.37 | 128.94 | 128.69 | 128.67 | 128.54 | 128.28 | 128.28 | 129.70 | 132.97 | 135.43 | 137.89 | 142.82 | 144.82 | 148.69 | 151.35 | 152.86 | 154.43 | 155.49 | 157.80 | 158.73 | 132.63 | 132.36 | 132.05 | 131.26 | 130.86 | 130.21 | 129.17 | 128.25 | 127.67 | 125.82 | |
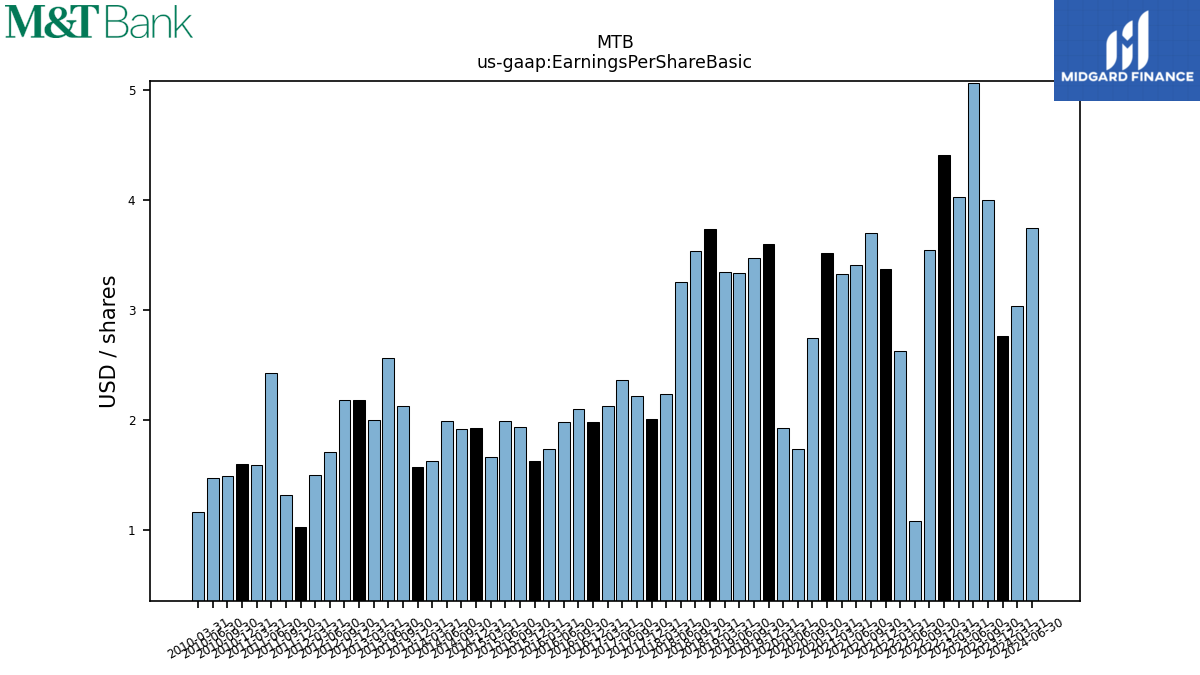
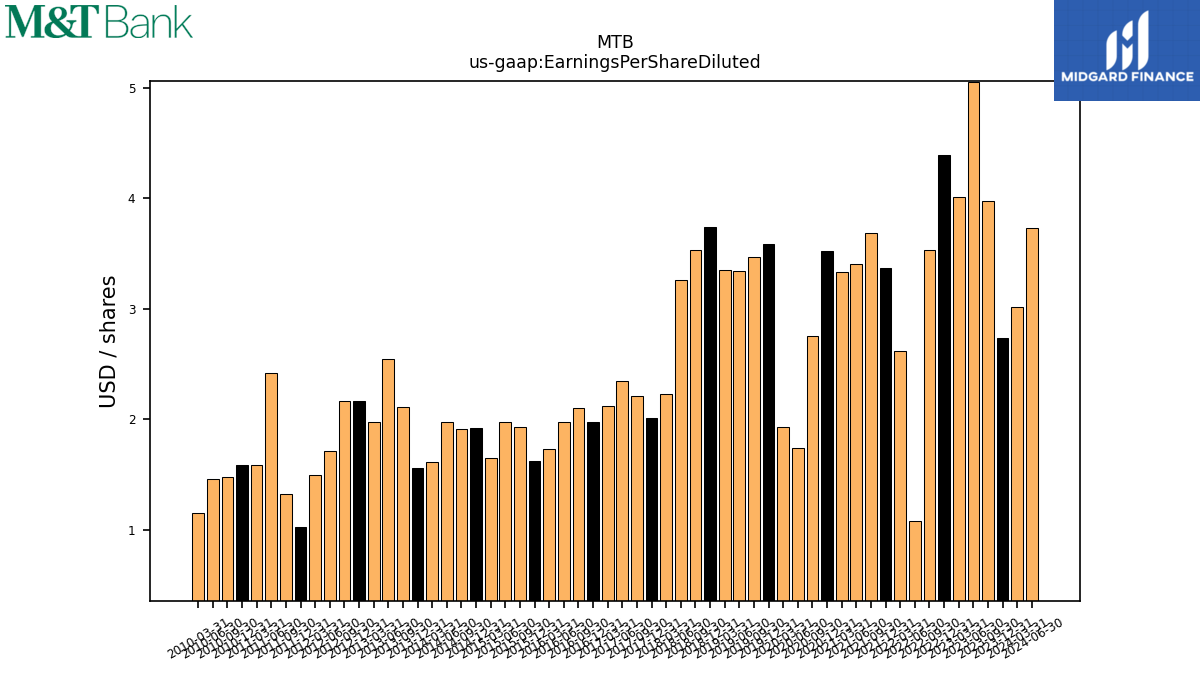
| Earnings Per Share Basic | 3.04 | 4.00 | 5.07 | 4.03 | 3.55 | 1.08 | 2.63 | 3.70 | 3.41 | 3.33 | 2.75 | 1.74 | 1.93 | 3.47 | 3.34 | 3.35 | 3.54 | 3.26 | 2.24 | 2.22 | 2.36 | 2.13 | 2.10 | 1.98 | 1.74 | 1.94 | 1.99 | 1.66 | 1.92 | 1.99 | 1.63 | 2.13 | 2.56 | 2.00 | 2.18 | |
| Earnings Per Share Diluted | 3.02 | 3.98 | 5.05 | 4.01 | 3.53 | 1.08 | 2.62 | 3.69 | 3.41 | 3.33 | 2.75 | 1.74 | 1.93 | 3.47 | 3.34 | 3.35 | 3.53 | 3.26 | 2.23 | 2.21 | 2.35 | 2.12 | 2.10 | 1.98 | 1.73 | 1.93 | 1.98 | 1.65 | 1.91 | 1.98 | 1.61 | 2.11 | 2.55 | 1.98 | 2.17 |
| 2024-03-31 | 2023-09-30 | 2023-06-30 | 2023-03-31 | 2022-09-30 | 2022-06-30 | 2022-03-31 | 2021-09-30 | 2021-06-30 | 2021-03-31 | 2020-09-30 | 2020-06-30 | 2020-03-31 | 2019-09-30 | 2019-06-30 | 2019-03-31 | 2018-09-30 | 2018-06-30 | 2018-03-31 | 2017-09-30 | 2017-06-30 | 2017-03-31 | 2016-09-30 | 2016-06-30 | 2016-03-31 | 2015-09-30 | 2015-06-30 | 2015-03-31 | 2014-09-30 | 2014-06-30 | 2014-03-31 | 2013-09-30 | 2013-06-30 | 2013-03-31 | 2012-09-30 | ||
|---|---|---|---|---|---|---|---|---|---|---|---|---|---|---|---|---|---|---|---|---|---|---|---|---|---|---|---|---|---|---|---|---|---|---|---|---|
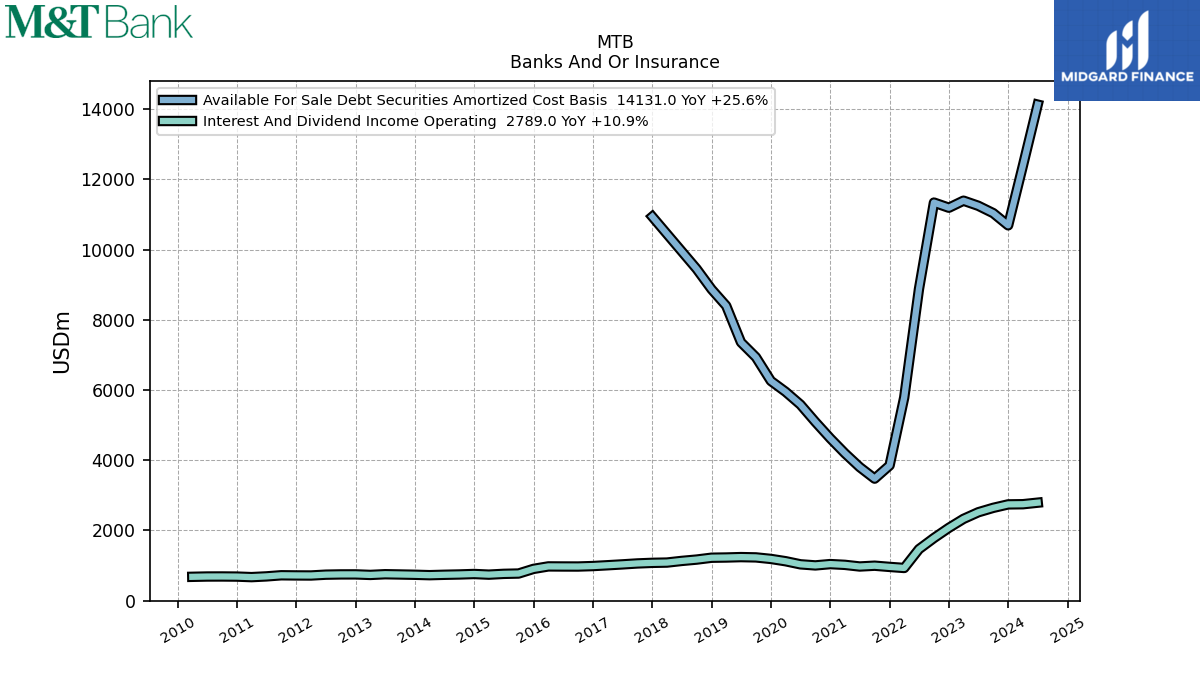
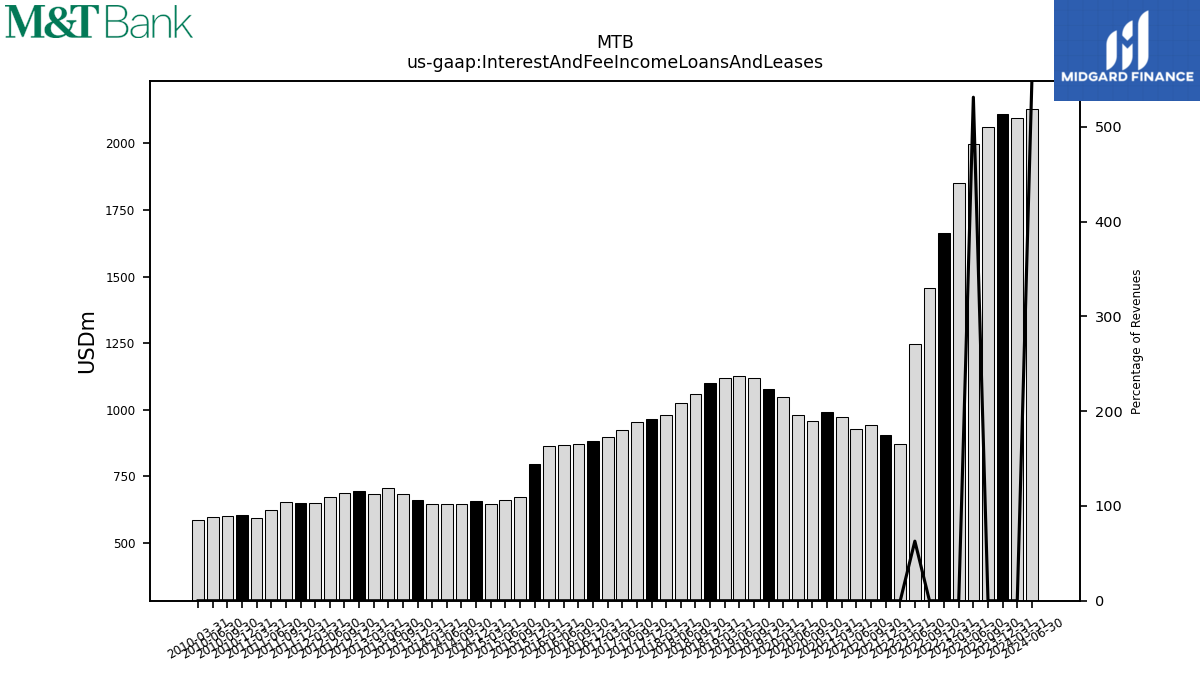
| Interest And Fee Income Loans And Leases | 2097.00 | 2061.57 | 1997.81 | 1849.66 | 1455.61 | 1246.74 | 870.60 | 944.42 | 926.97 | 972.58 | 956.59 | 980.37 | 1046.82 | 1119.66 | 1125.58 | 1117.91 | 1060.83 | 1024.47 | 979.97 | 953.66 | 924.64 | 898.04 | 871.35 | 867.48 | 863.38 | 672.09 | 662.63 | 647.18 | 647.28 | 645.03 | 645.22 | 683.48 | 705.39 | 682.46 | 687.47 | |
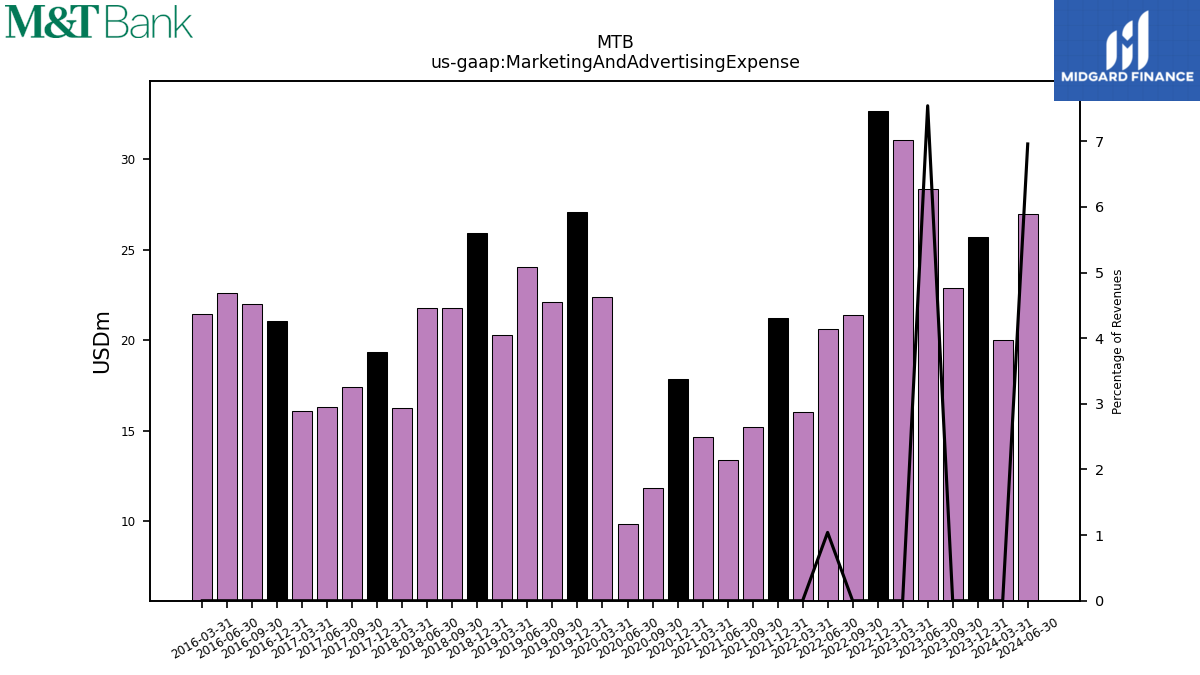
| Marketing And Advertising Expense | 20.00 | 22.90 | 28.35 | 31.06 | 21.40 | 20.64 | 16.02 | 15.21 | 13.36 | 14.63 | 11.86 | 9.84 | 22.38 | 22.09 | 24.05 | 20.27 | 21.78 | 21.77 | 16.25 | 17.40 | 16.32 | 16.11 | 22.00 | 22.61 | 21.45 | NA | NA | NA | NA | NA | NA | NA | NA | NA | NA | |
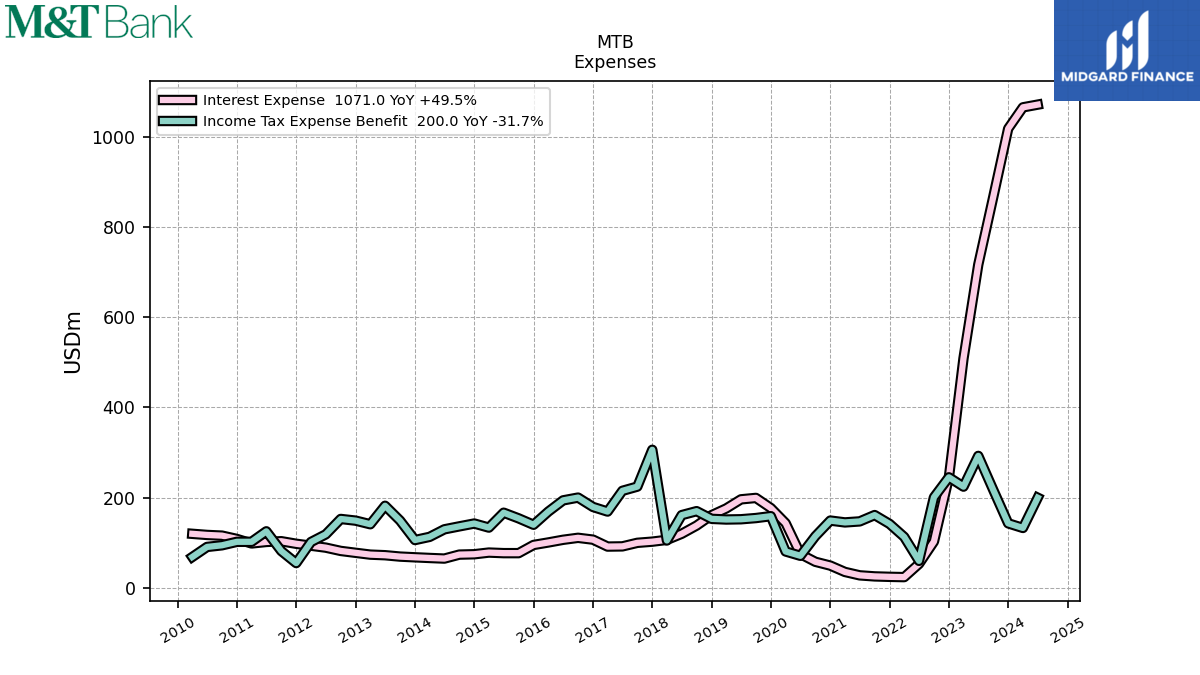
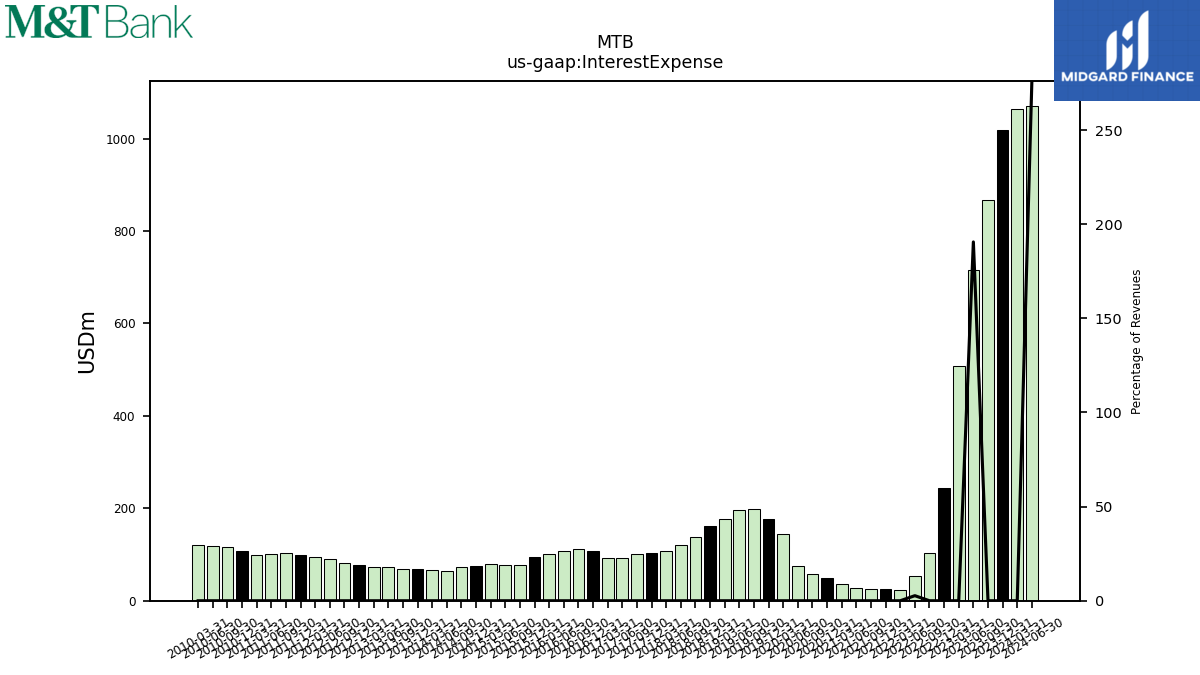
| Interest Expense | 1065.00 | 866.01 | 716.50 | 508.72 | 102.82 | 53.42 | 24.08 | 25.70 | 28.02 | 35.57 | 58.07 | 75.11 | 143.61 | 199.58 | 196.43 | 176.25 | 138.34 | 120.12 | 106.63 | 100.08 | 92.21 | 91.77 | 111.17 | 106.80 | 100.87 | 77.20 | 77.23 | 78.50 | 73.96 | 65.18 | 66.52 | 69.58 | 72.62 | 73.92 | 82.13 | |
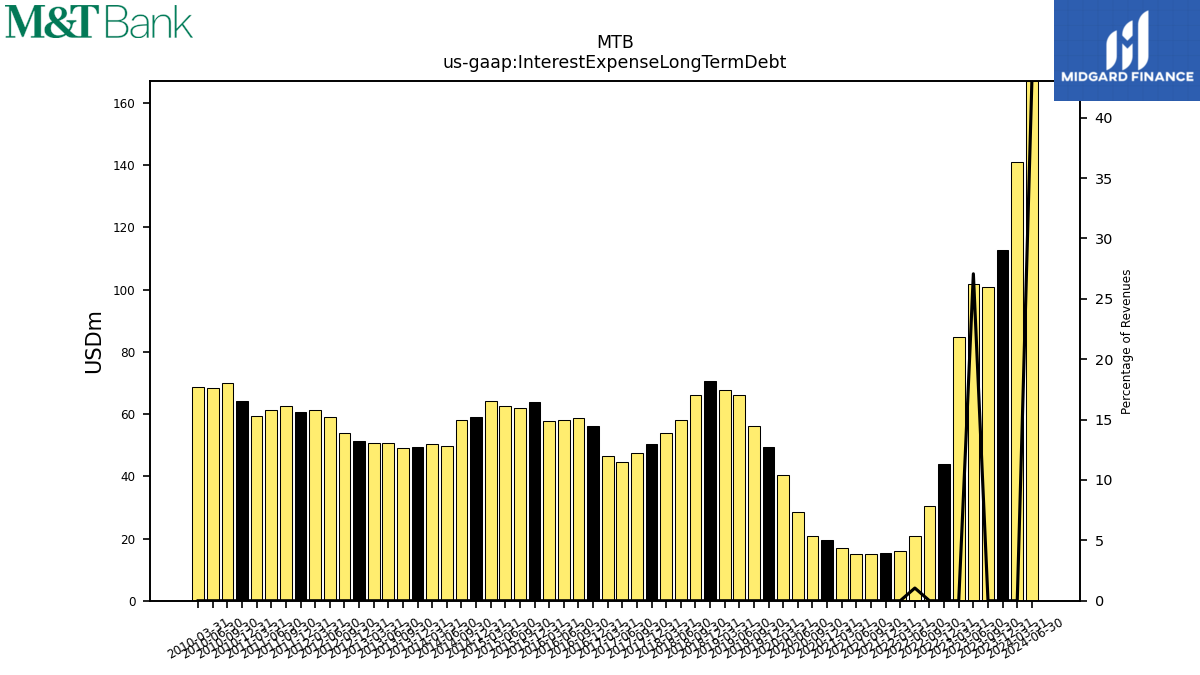
| Interest Expense Long Term Debt | 141.00 | 100.77 | 101.80 | 84.68 | 30.34 | 20.87 | 15.94 | 15.12 | 14.87 | 16.87 | 20.90 | 28.61 | 40.30 | 56.21 | 66.01 | 67.58 | 66.05 | 58.09 | 53.91 | 47.51 | 44.71 | 46.66 | 58.85 | 58.08 | 57.89 | 62.08 | 62.64 | 64.05 | 58.05 | 49.60 | 50.44 | 49.11 | 50.73 | 50.75 | 53.75 | |
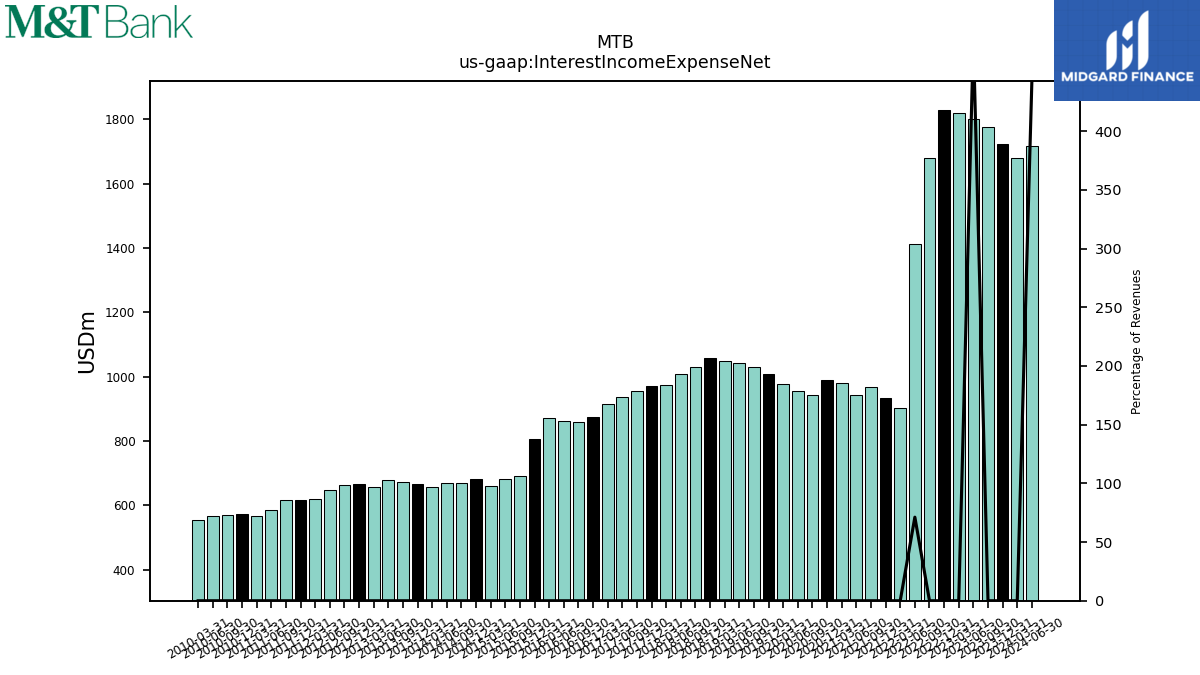
| Interest Income Expense Net | 1680.00 | 1775.39 | 1799.13 | 1818.26 | 1678.69 | 1411.72 | 904.17 | 967.25 | 942.34 | 981.39 | 943.10 | 957.14 | 976.80 | 1029.89 | 1041.48 | 1050.06 | 1029.04 | 1008.79 | 975.52 | 957.13 | 938.20 | 914.26 | 858.34 | 863.82 | 871.96 | 692.83 | 683.13 | 659.59 | 669.06 | 669.11 | 656.43 | 673.11 | 677.59 | 656.05 | 662.72 | |
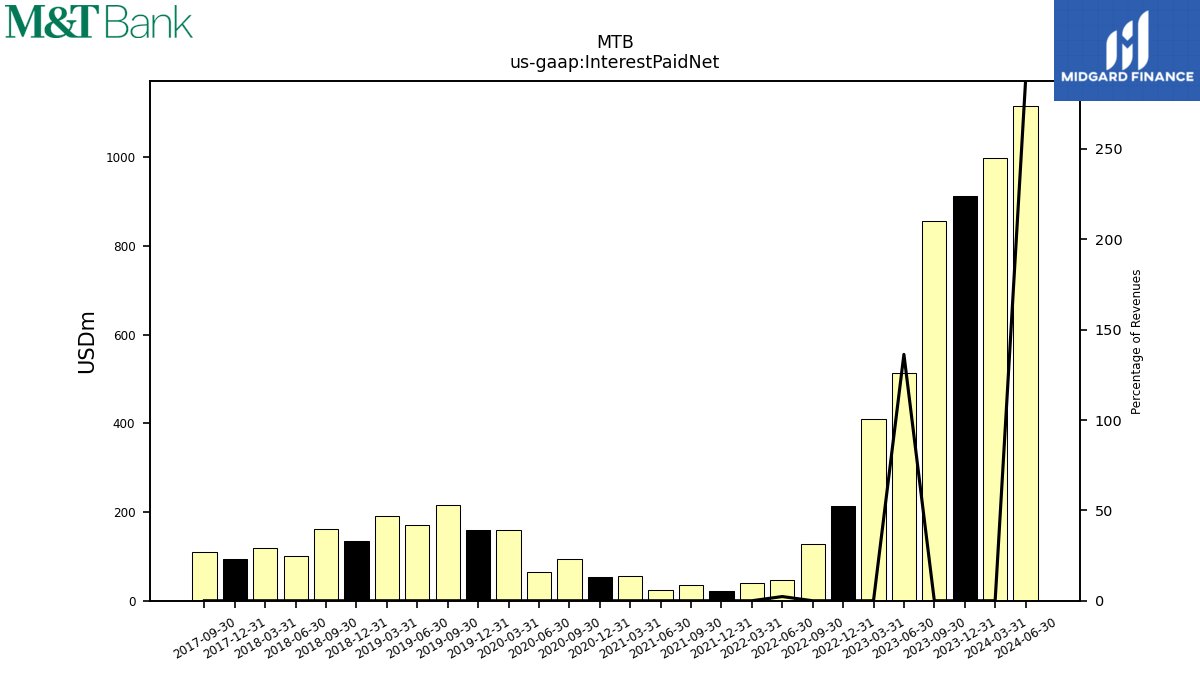
| Interest Paid Net | 999.00 | 856.10 | 512.57 | 410.42 | 127.84 | 46.03 | 40.68 | 36.56 | 24.46 | 55.38 | 95.20 | 65.01 | 158.86 | 216.11 | 169.87 | 191.31 | 162.41 | 100.39 | 118.34 | 111.02 | NA | NA | NA | NA | NA | NA | NA | NA | NA | NA | NA | NA | NA | NA | NA | |
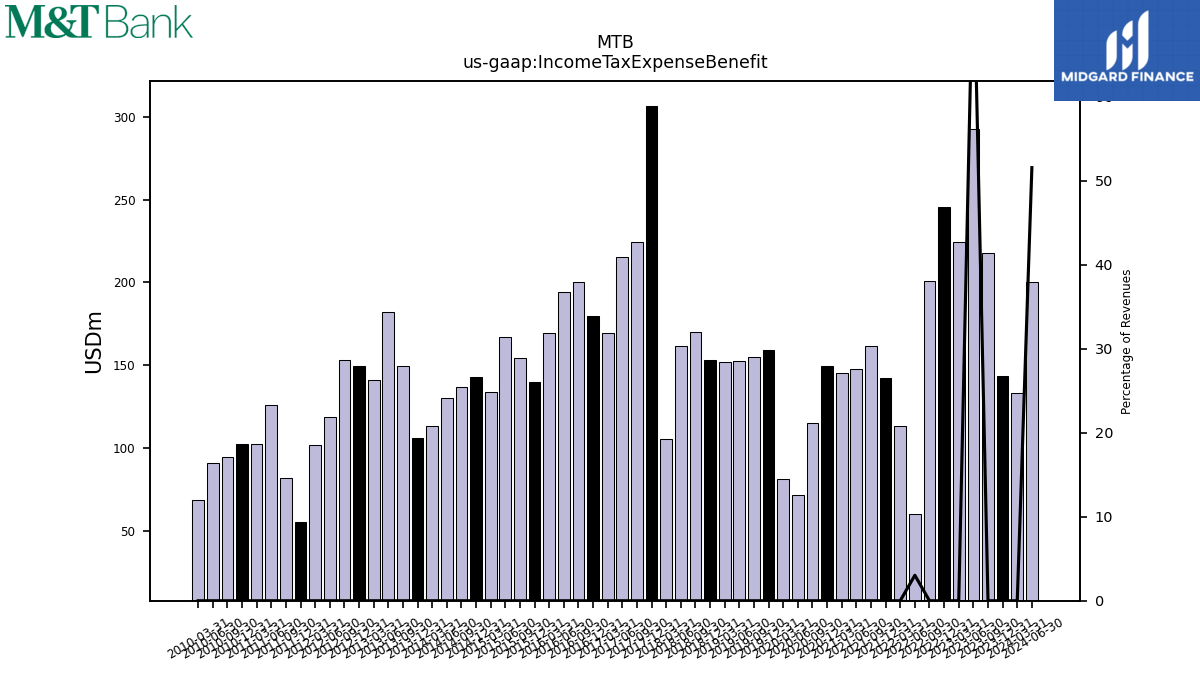
| Income Tax Expense Benefit | 133.00 | 217.49 | 292.71 | 224.54 | 200.92 | 60.14 | 113.15 | 161.58 | 147.56 | 145.30 | 114.75 | 71.31 | 80.93 | 154.97 | 152.28 | 151.74 | 170.26 | 161.46 | 105.26 | 224.62 | 215.33 | 169.33 | 200.31 | 194.15 | 169.27 | 154.31 | 166.84 | 133.80 | 136.54 | 130.00 | 113.25 | 149.39 | 182.22 | 141.22 | 152.97 | |
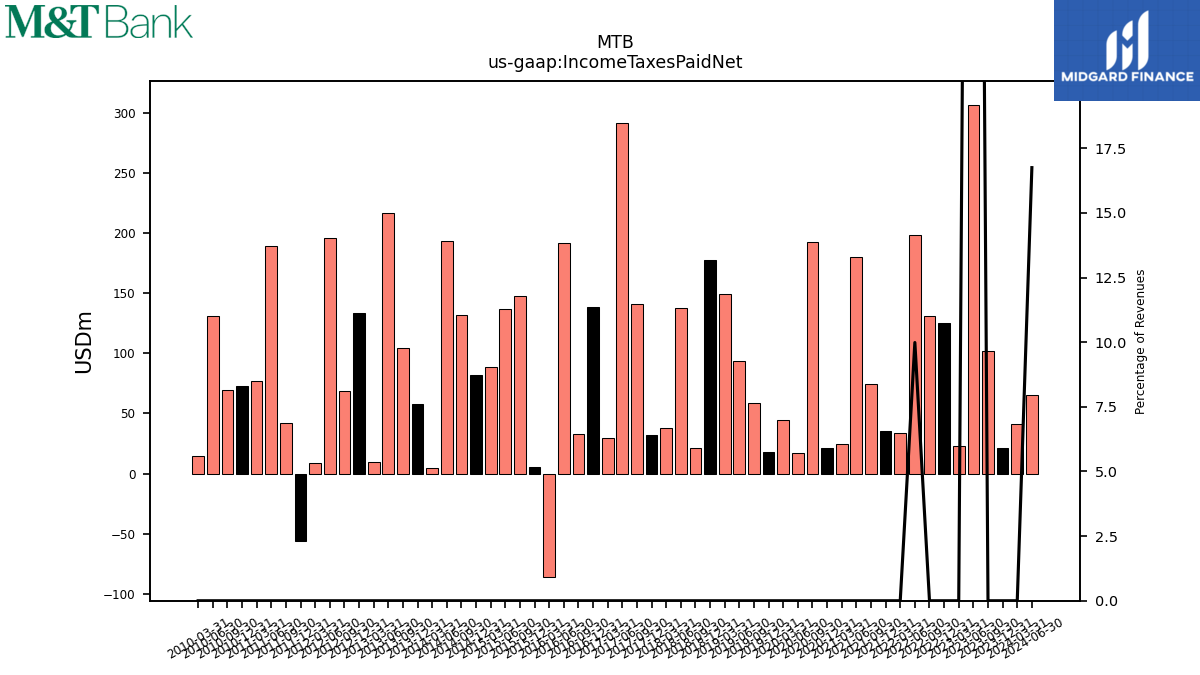
| Income Taxes Paid Net | 41.00 | 101.60 | 306.73 | 22.47 | 131.18 | 198.05 | 33.64 | 74.52 | 180.04 | 24.22 | 192.71 | 17.10 | 44.66 | 59.04 | 93.86 | 149.55 | 21.63 | 137.62 | 38.00 | 141.06 | 291.83 | 29.27 | 33.01 | 191.51 | -86.15 | 147.91 | 136.53 | 88.58 | 131.59 | 193.24 | 4.79 | 104.71 | 216.86 | 9.54 | 68.25 | |
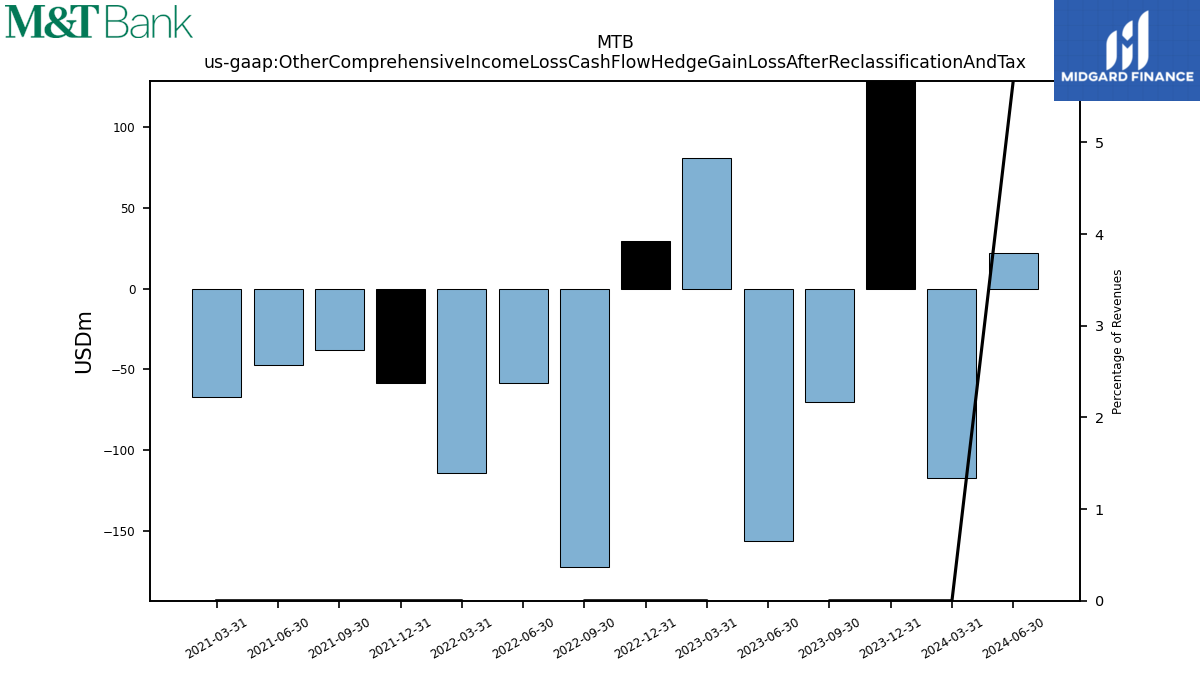
| Other Comprehensive Income Loss Cash Flow Hedge Gain Loss After Reclassification And Tax | -117.00 | -70.25 | -156.29 | 80.93 | -172.28 | -58.19 | -114.06 | -38.04 | -47.36 | -66.78 | NA | NA | NA | NA | NA | NA | NA | NA | NA | NA | NA | NA | NA | NA | NA | NA | NA | NA | NA | NA | NA | NA | NA | NA | NA | |
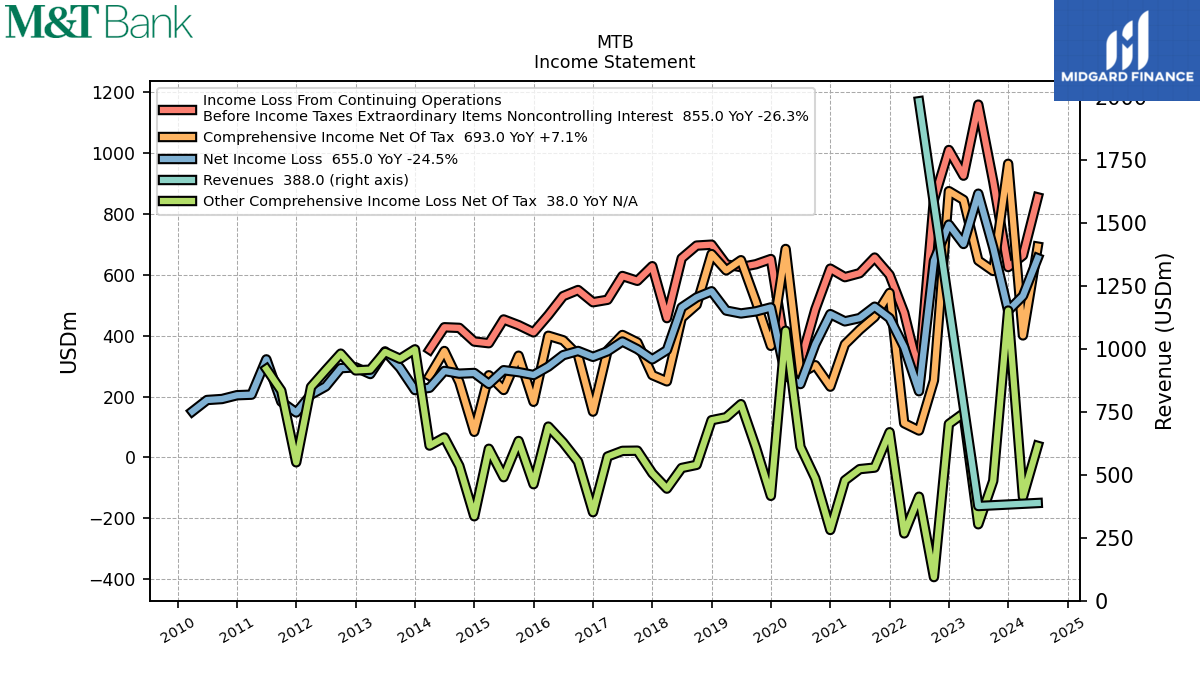
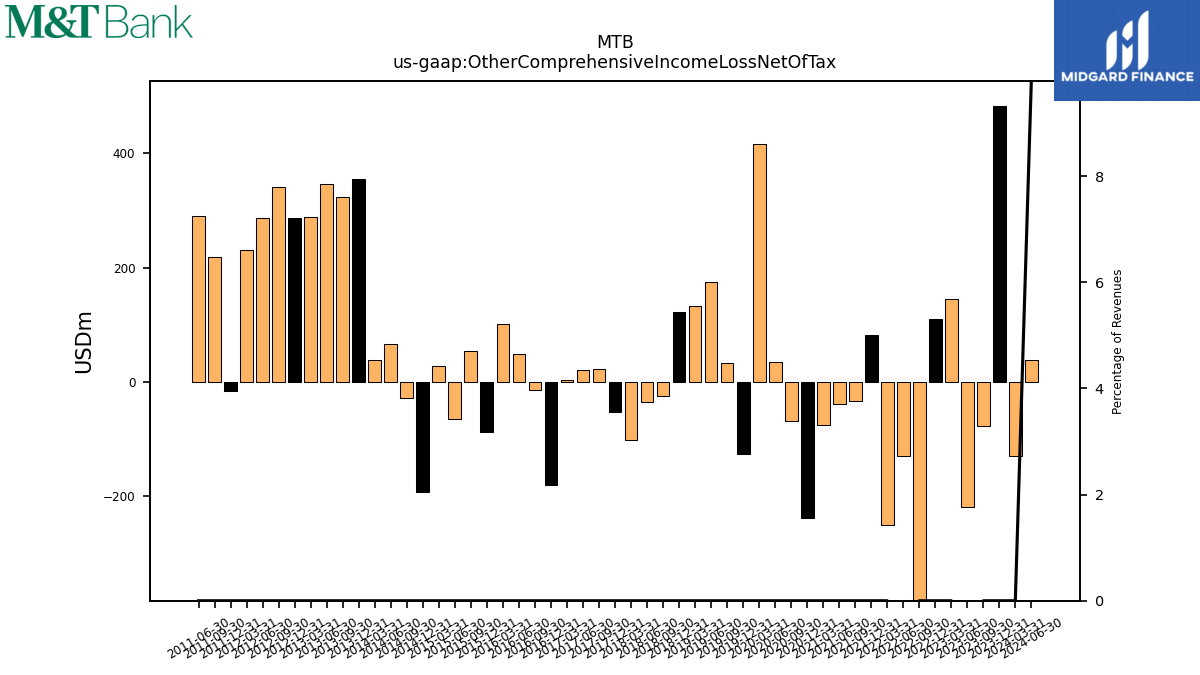
| Other Comprehensive Income Loss Net Of Tax | -130.00 | -77.08 | -219.79 | 145.03 | -393.50 | -129.10 | -249.81 | -33.45 | -38.50 | -75.45 | -69.13 | 34.80 | 416.51 | 32.65 | 175.05 | 132.07 | -24.46 | -34.70 | -102.58 | 22.17 | 21.49 | 3.07 | -13.54 | 49.17 | 101.44 | 54.03 | -65.01 | 28.50 | -27.84 | 65.57 | 38.90 | 324.19 | 346.65 | 288.42 | 341.24 | |
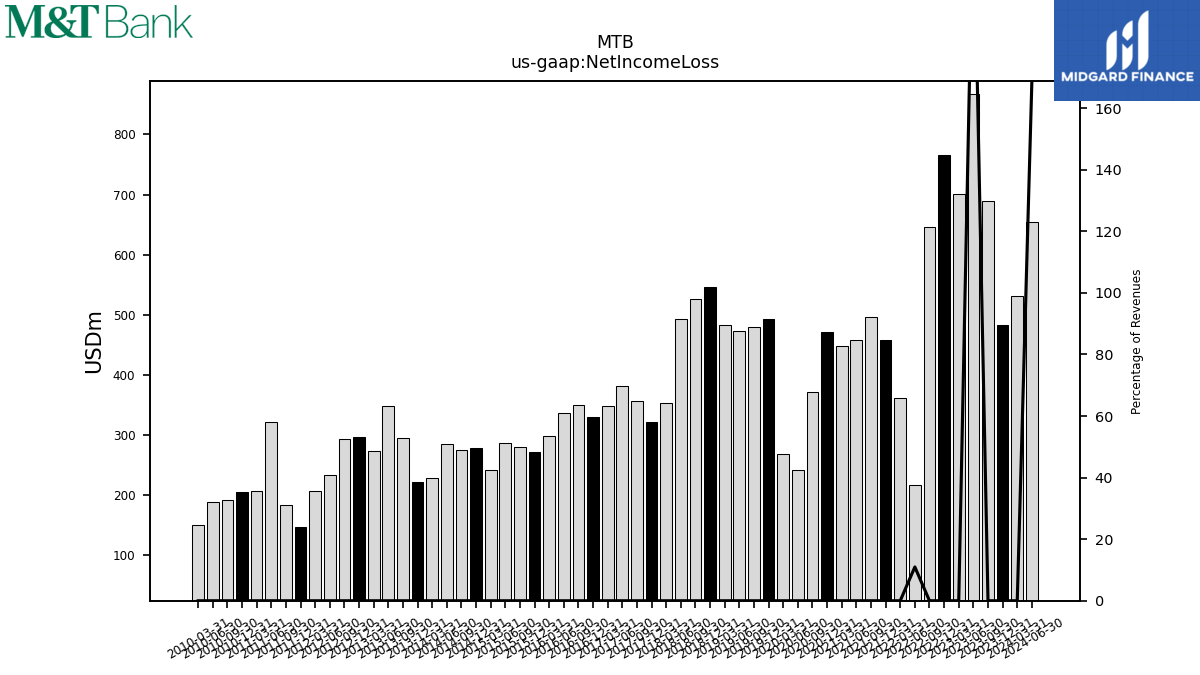
| Net Income Loss | 531.00 | 689.94 | 867.03 | 701.62 | 646.60 | 217.52 | 362.17 | 495.46 | 458.07 | 447.25 | 372.14 | 241.05 | 268.82 | 480.08 | 473.26 | 482.74 | 526.09 | 493.16 | 352.61 | 355.92 | 381.05 | 348.93 | 349.98 | 336.03 | 298.53 | 280.40 | 286.69 | 241.61 | 275.34 | 284.34 | 229.02 | 294.48 | 348.47 | 274.11 | 293.46 | |
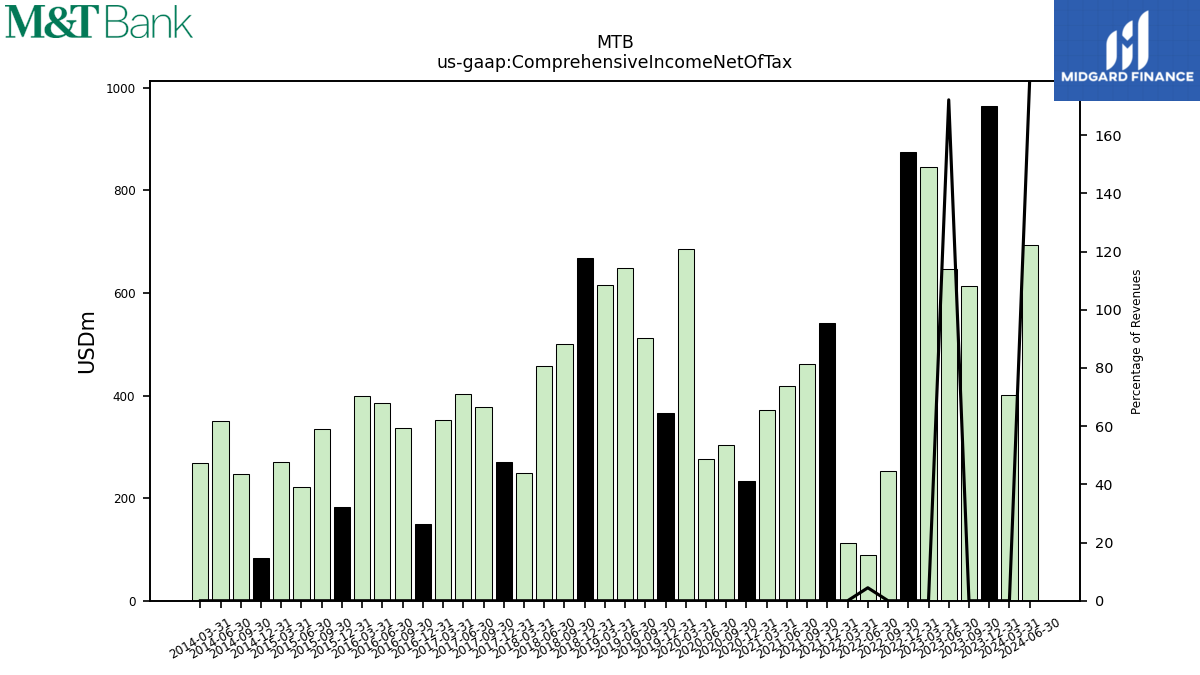
| Comprehensive Income Net Of Tax | 401.00 | 612.86 | 647.24 | 846.65 | 253.09 | 88.42 | 112.37 | 462.01 | 419.57 | 371.80 | 303.01 | 275.85 | 685.34 | 512.73 | 648.31 | 614.81 | 501.63 | 458.46 | 250.03 | 378.09 | 402.54 | 352.00 | 336.45 | 385.20 | 399.97 | 334.43 | 221.68 | 270.12 | 247.50 | 349.90 | 267.92 | NA | NA | NA | NA | |
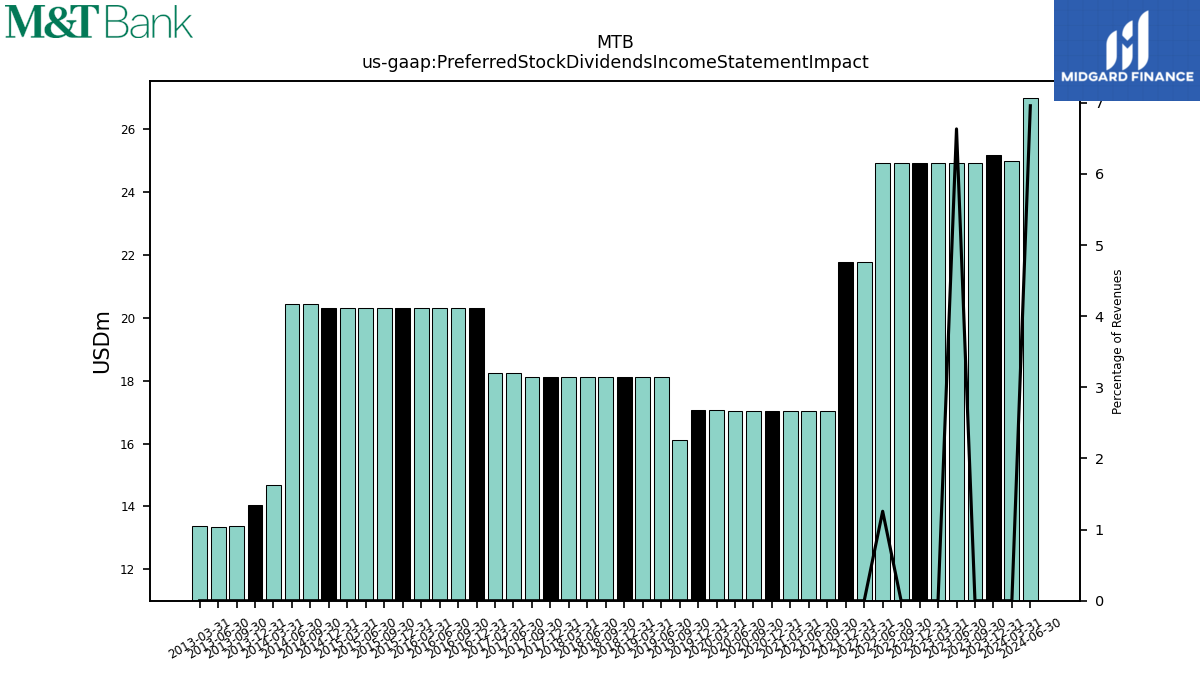
| Preferred Stock Dividends Income Statement Impact | 25.00 | 24.94 | 24.94 | 24.94 | 24.94 | 24.94 | 21.77 | 17.05 | 17.05 | 17.05 | 17.05 | 17.05 | 17.08 | 16.10 | 18.13 | 18.13 | 18.13 | 18.13 | 18.13 | 18.13 | 18.24 | 18.24 | 20.32 | 20.32 | 20.32 | 20.32 | 20.32 | 20.32 | 20.44 | 20.44 | 14.67 | 13.36 | 13.36 | 13.36 | NA | |
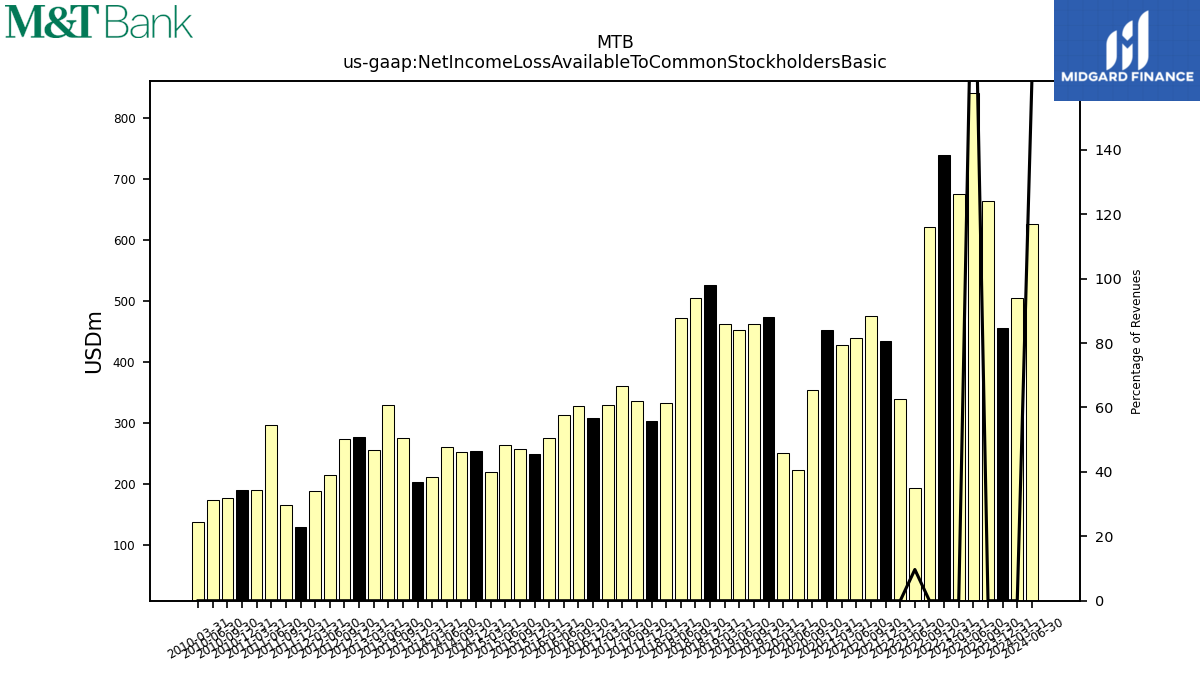
| Net Income Loss Available To Common Stockholders Basic | 505.00 | 663.76 | 840.52 | 675.51 | 620.55 | 192.24 | 339.59 | 475.96 | 438.76 | 428.09 | 353.40 | 223.10 | 250.70 | 461.41 | 452.63 | 462.09 | 505.36 | 472.60 | 332.75 | 335.80 | 360.66 | 328.56 | 326.99 | 312.97 | 275.74 | 257.34 | 263.47 | 218.83 | 251.91 | 260.68 | 211.72 | 275.34 | 328.54 | 255.08 | 273.88 | |
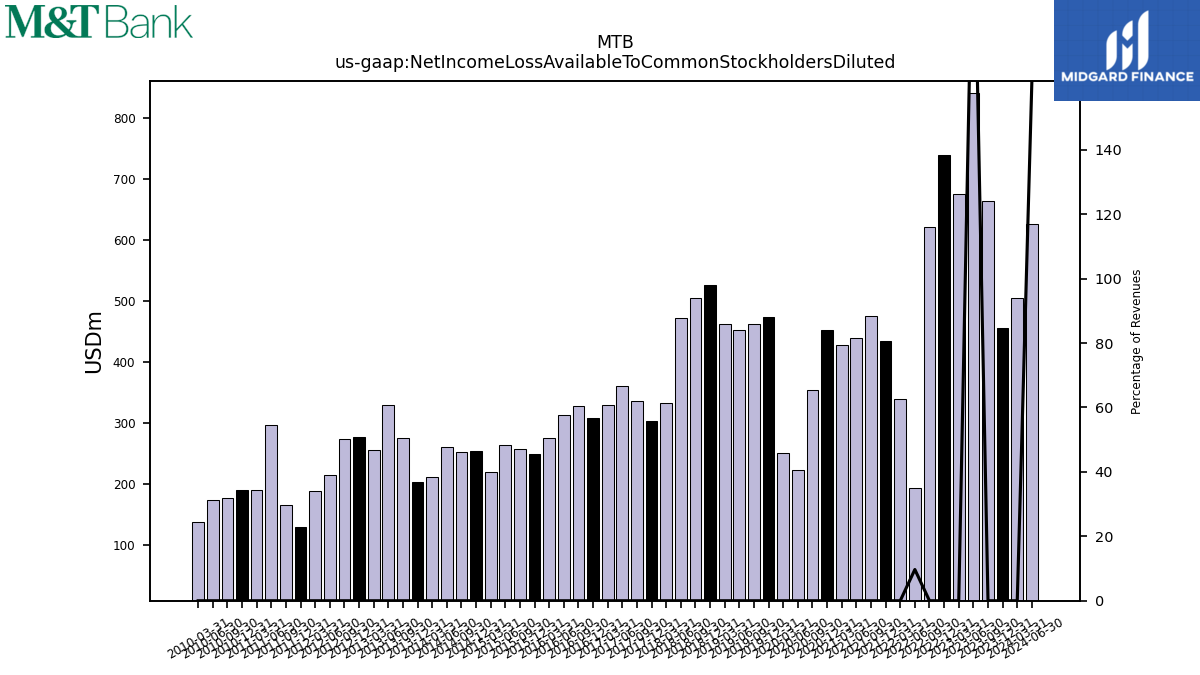
| Net Income Loss Available To Common Stockholders Diluted | 505.00 | 663.77 | 840.52 | 675.51 | 620.55 | 192.24 | 339.59 | 475.96 | 438.76 | 428.09 | 353.40 | 223.10 | 250.70 | 461.41 | 452.63 | 462.09 | 505.37 | 472.60 | 332.75 | 335.80 | 360.66 | 328.57 | 327.00 | 312.97 | 275.75 | 257.35 | 263.48 | 218.84 | 251.92 | 260.69 | 211.73 | 275.36 | 328.56 | 255.10 | 273.90 | |
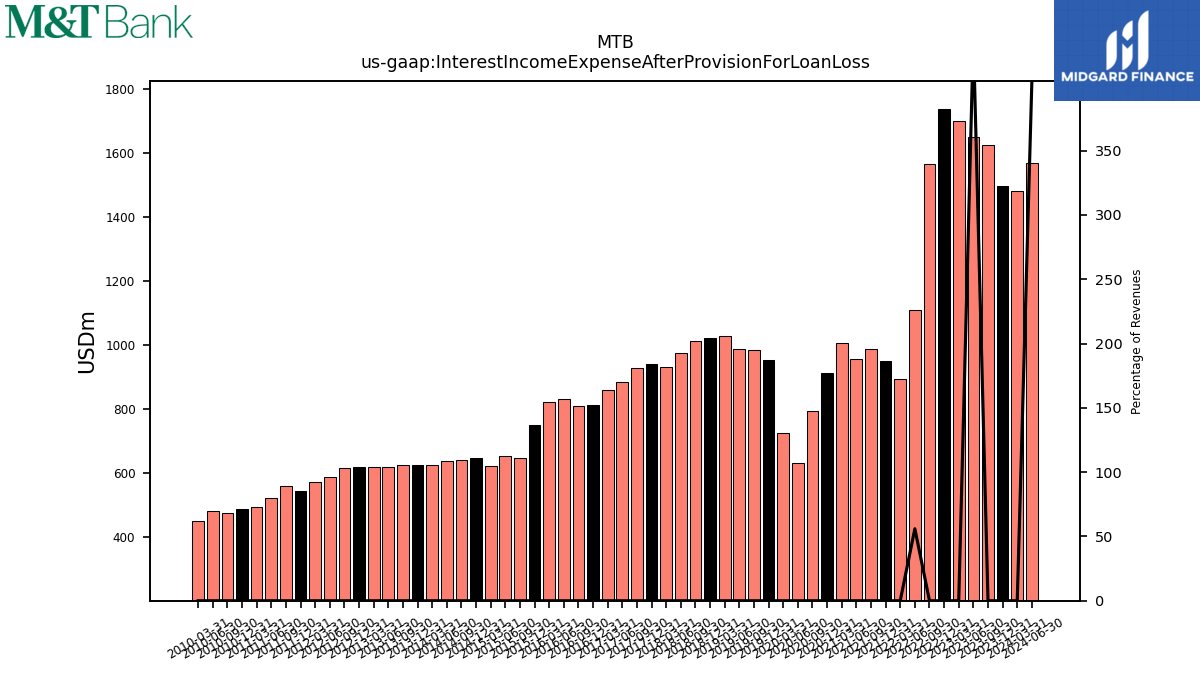
| Interest Income Expense After Provision For Loan Loss | 1480.00 | 1625.39 | 1649.13 | 1698.26 | 1563.69 | 1109.72 | 894.17 | 987.25 | 957.34 | 1006.39 | 793.10 | 632.14 | 726.80 | 984.89 | 986.48 | 1028.06 | 1013.04 | 973.79 | 932.52 | 927.13 | 886.20 | 859.26 | 811.34 | 831.82 | 822.96 | 648.83 | 653.13 | 621.59 | 640.06 | 639.11 | 624.43 | 625.11 | 620.59 | 618.05 | 616.72 | |
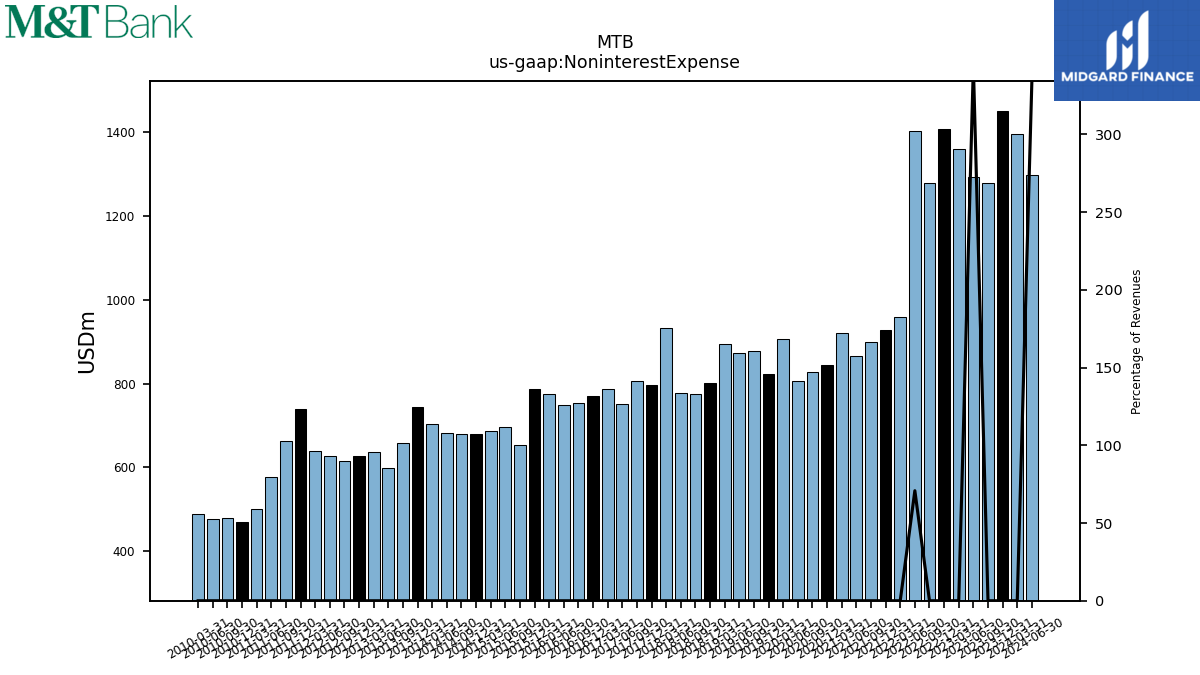
| Noninterest Expense | 1396.00 | 1277.54 | 1292.56 | 1359.23 | 1279.25 | 1403.15 | 959.74 | 899.33 | 865.35 | 919.44 | 826.77 | 807.04 | 906.42 | 877.62 | 873.03 | 894.35 | 775.98 | 776.58 | 933.34 | 806.02 | 750.63 | 787.85 | 752.39 | 749.89 | 776.10 | 653.82 | 696.63 | 686.38 | 679.28 | 681.19 | 702.27 | 658.63 | 598.59 | 635.60 | 616.03 | |
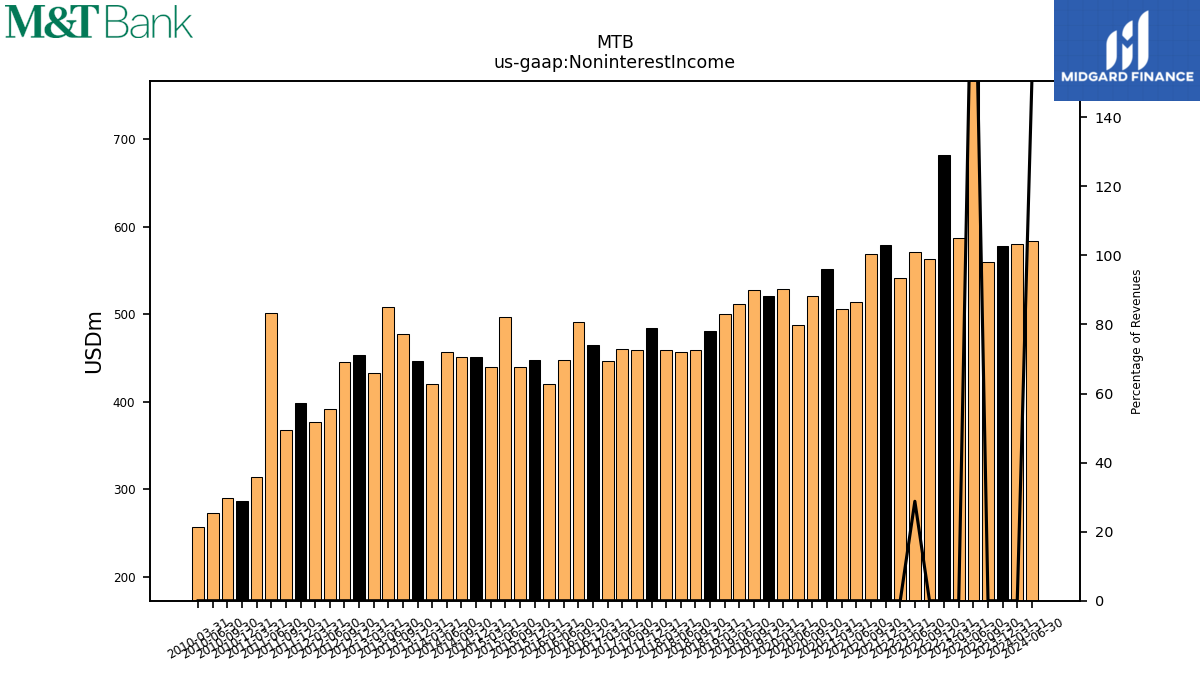
| Noninterest Income | 580.00 | 559.58 | 803.17 | 587.13 | 563.08 | 571.10 | 540.89 | 569.13 | 513.63 | 505.60 | 520.56 | 487.27 | 529.36 | 527.78 | 512.10 | 500.76 | 459.29 | 457.41 | 458.70 | 459.43 | 460.82 | 446.85 | 491.35 | 448.25 | 420.93 | 439.70 | 497.03 | 440.20 | 451.11 | 456.41 | 420.11 | 477.39 | 508.69 | 432.88 | 445.73 |
| 2024-03-31 | 2023-09-30 | 2023-06-30 | 2023-03-31 | 2022-09-30 | 2022-06-30 | 2022-03-31 | 2021-09-30 | 2021-06-30 | 2021-03-31 | 2020-09-30 | 2020-06-30 | 2020-03-31 | 2019-09-30 | 2019-06-30 | 2019-03-31 | 2018-09-30 | 2018-06-30 | 2018-03-31 | 2017-09-30 | 2017-06-30 | 2017-03-31 | 2016-09-30 | 2016-06-30 | 2016-03-31 | 2015-09-30 | 2015-06-30 | 2015-03-31 | 2014-09-30 | 2014-06-30 | 2014-03-31 | 2013-09-30 | 2013-06-30 | 2013-03-31 | 2012-09-30 | ||
|---|---|---|---|---|---|---|---|---|---|---|---|---|---|---|---|---|---|---|---|---|---|---|---|---|---|---|---|---|---|---|---|---|---|---|---|---|
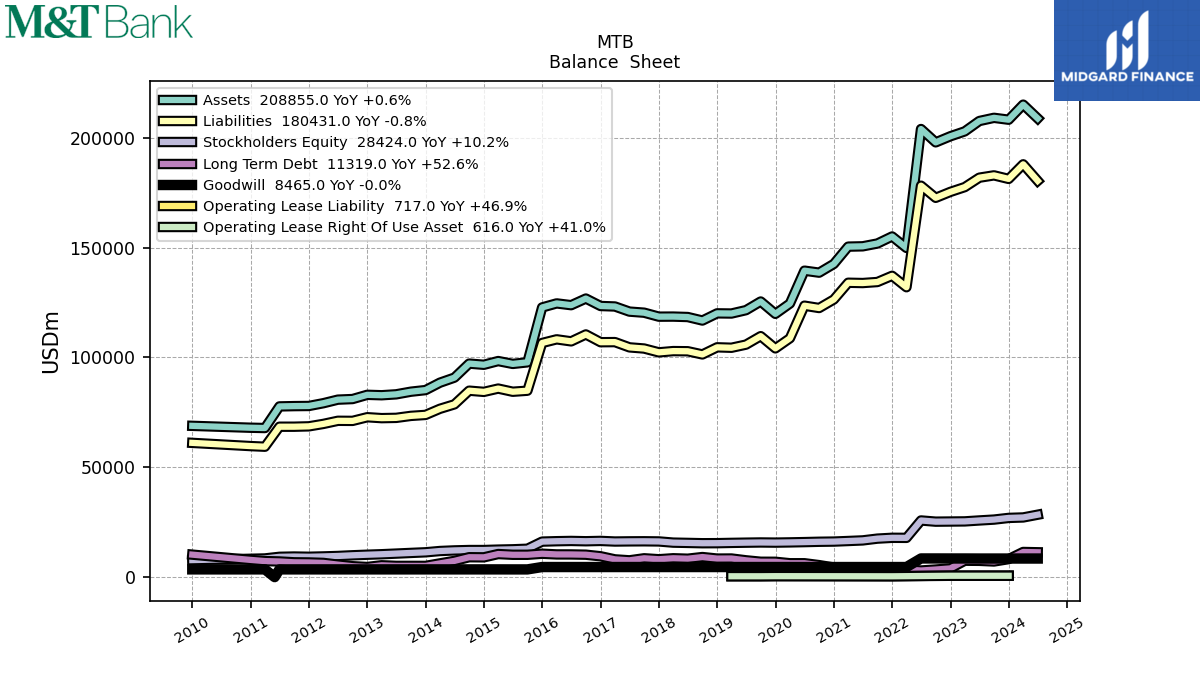
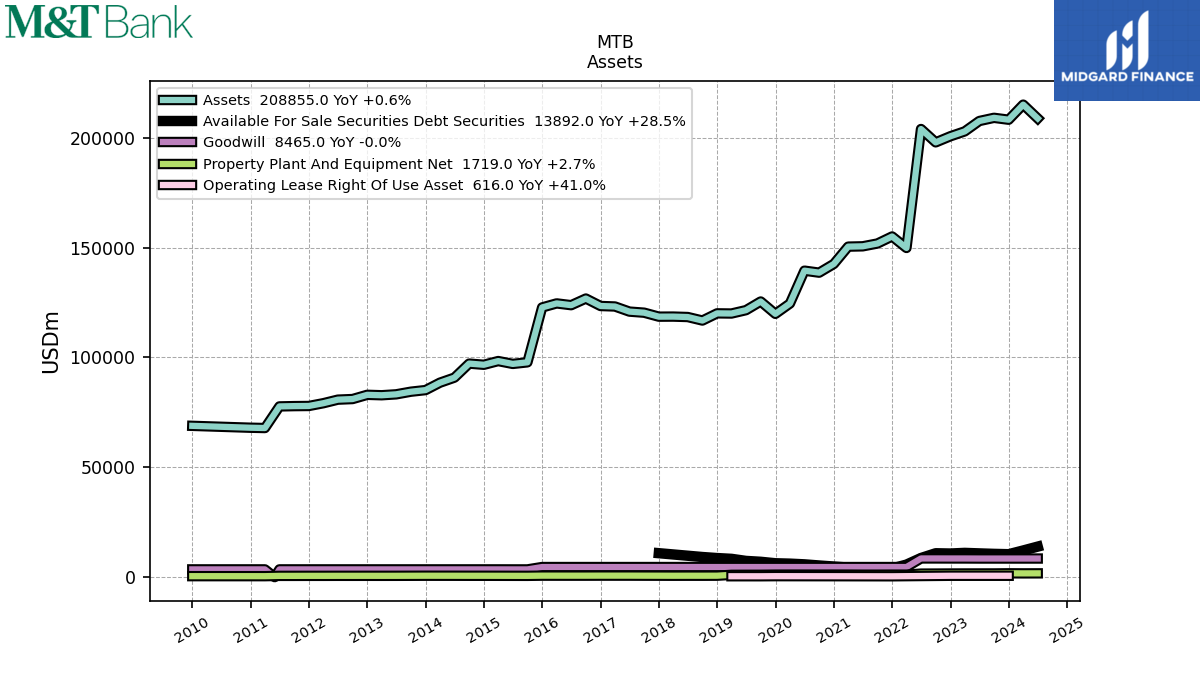
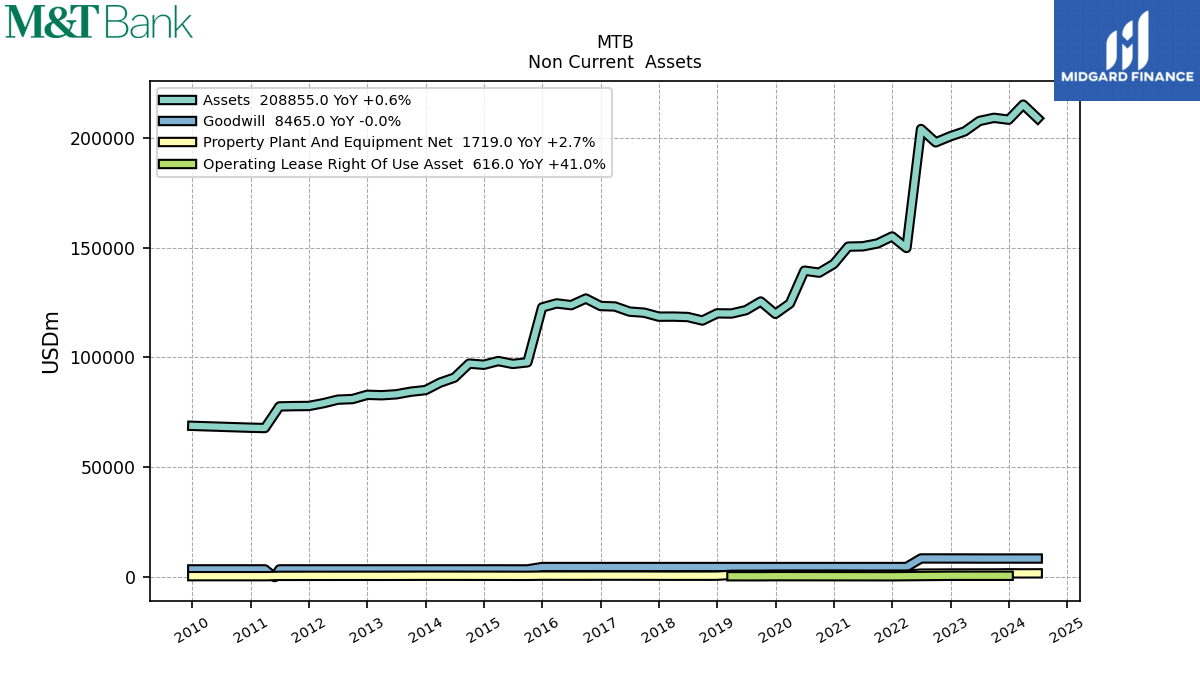
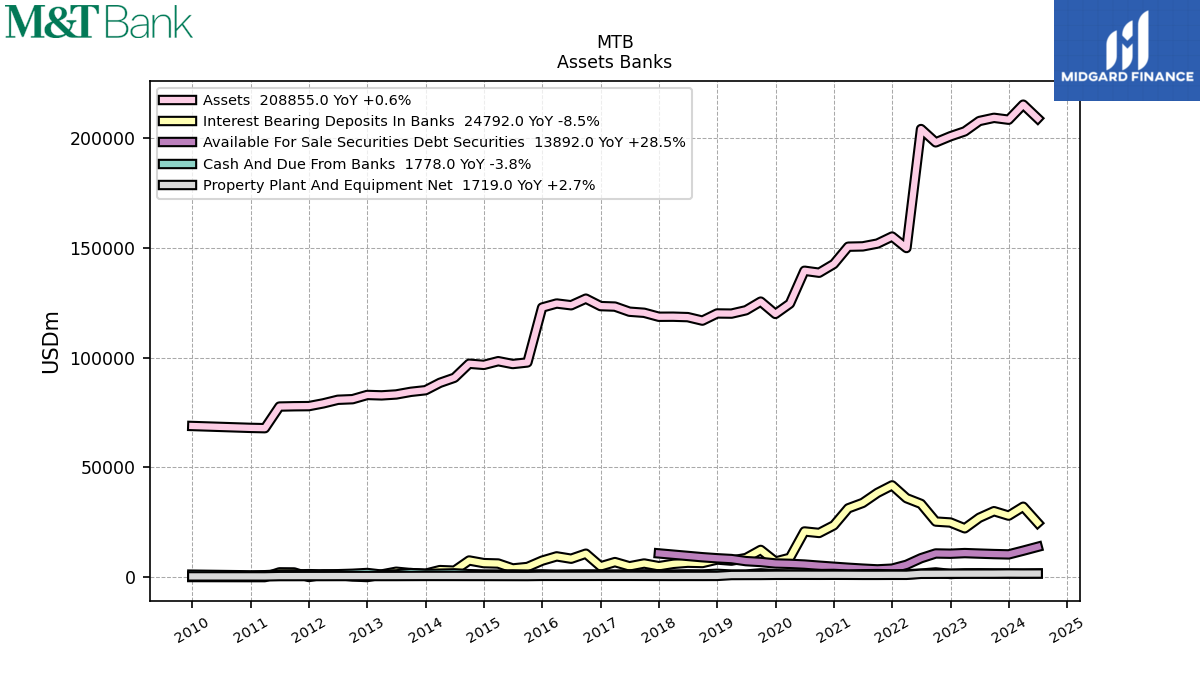
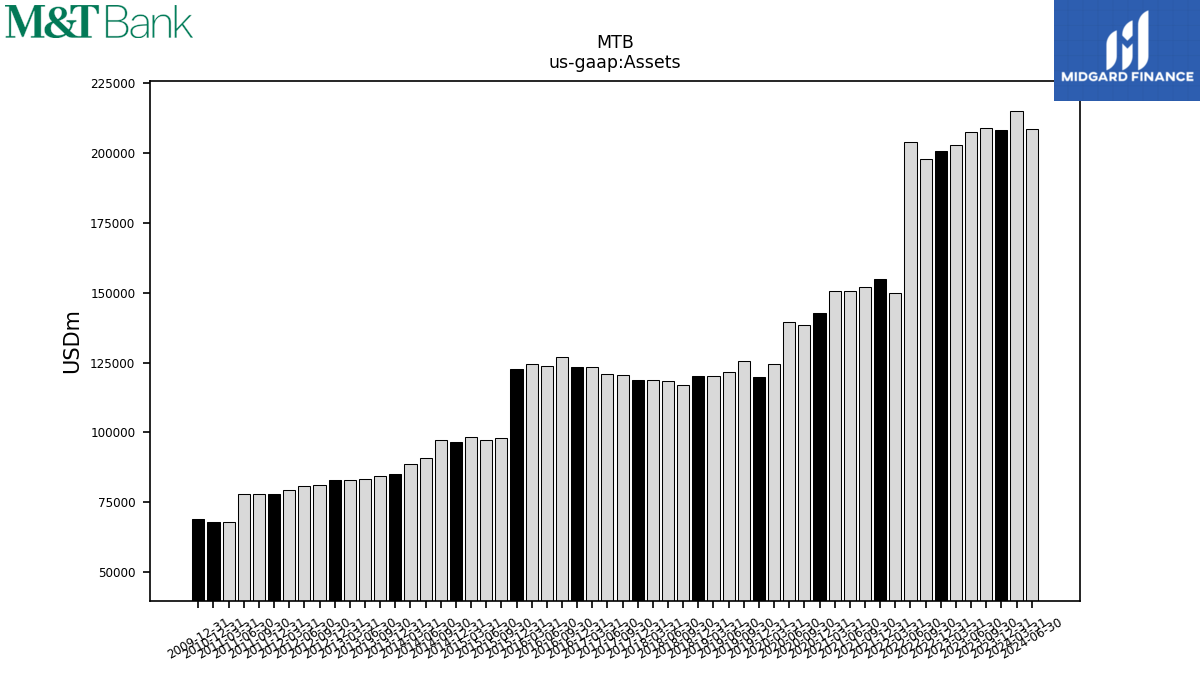
| Assets | 215137.00 | 209124.32 | 207671.73 | 202956.41 | 197955.48 | 204032.89 | 149863.55 | 151901.19 | 150622.71 | 150481.06 | 138626.74 | 139536.97 | 124577.83 | 125500.93 | 121554.90 | 120025.21 | 116827.64 | 118426.05 | 118622.82 | 120401.80 | 120896.57 | 123223.25 | 126841.03 | 123820.58 | 124625.63 | 97797.06 | 97080.08 | 98377.78 | 97228.34 | 90835.00 | 88530.36 | 84427.49 | 83229.01 | 82811.96 | 81085.23 | |
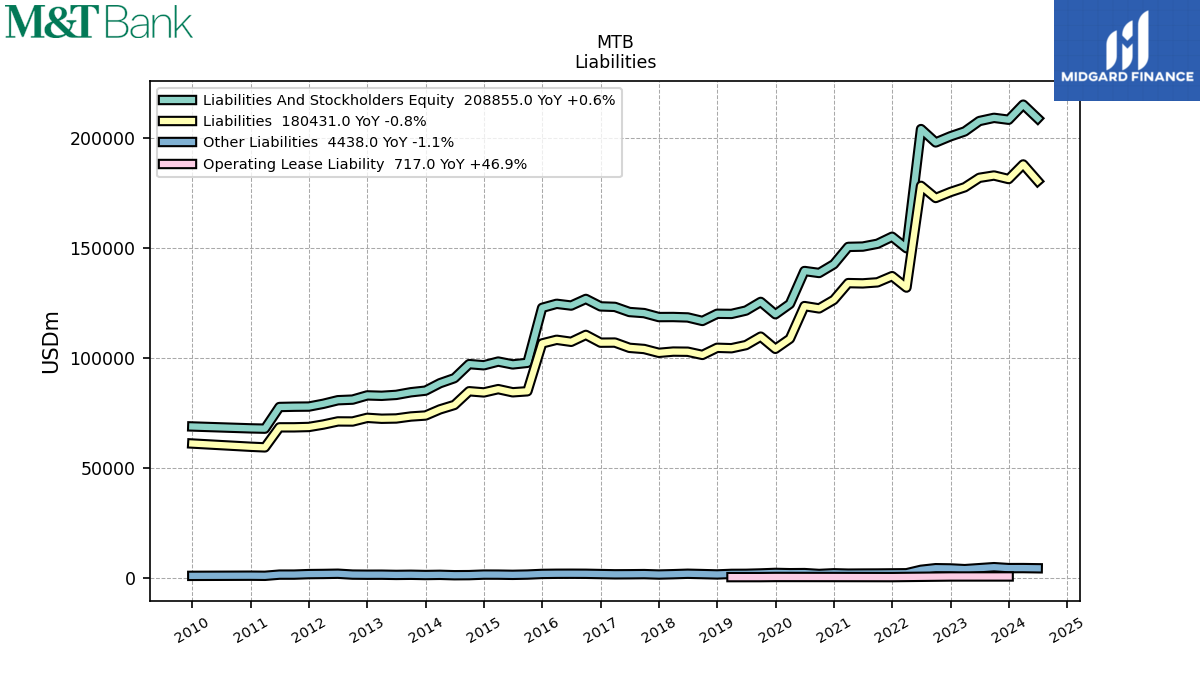
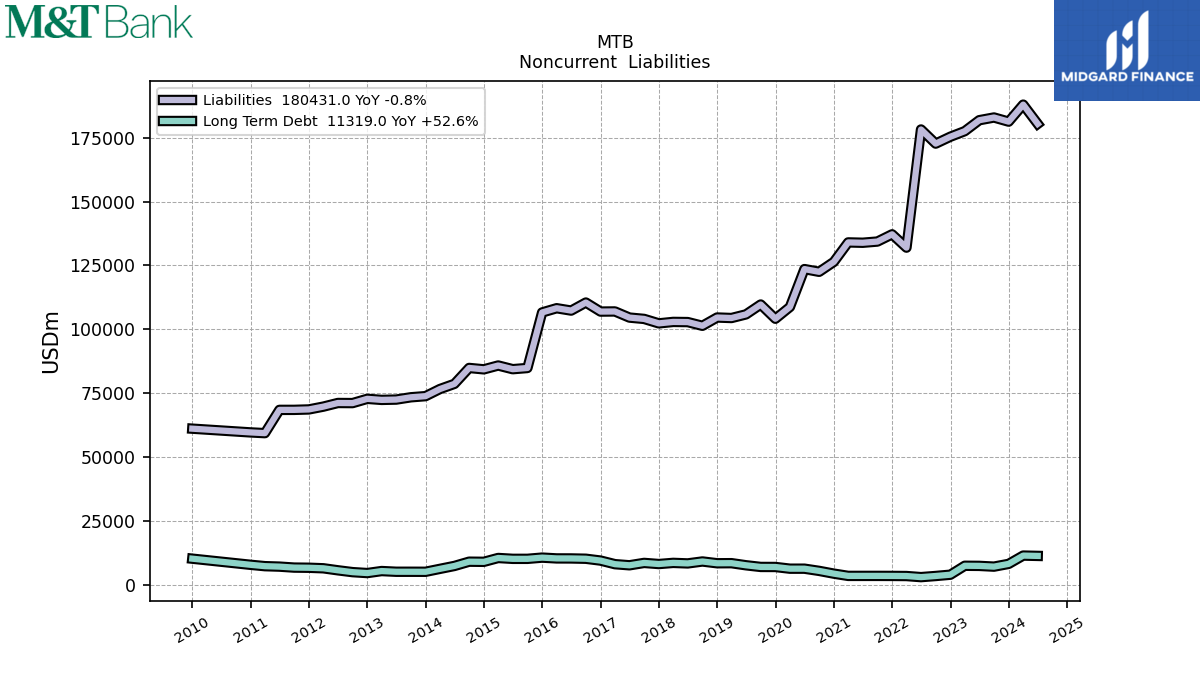
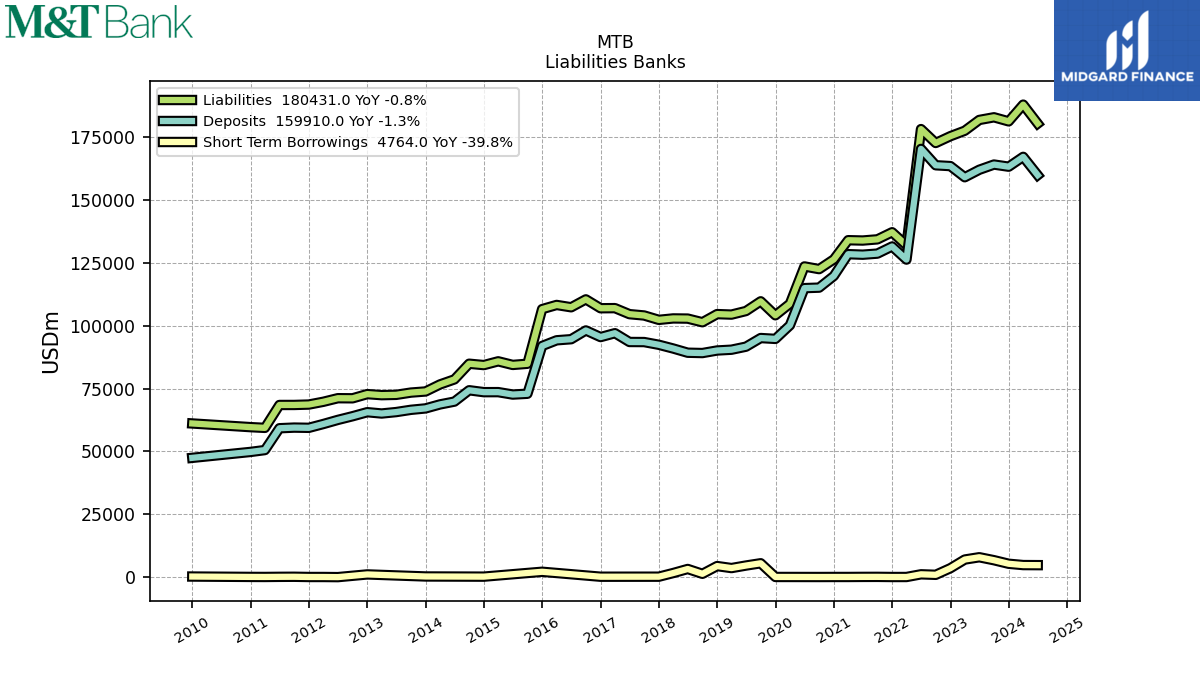
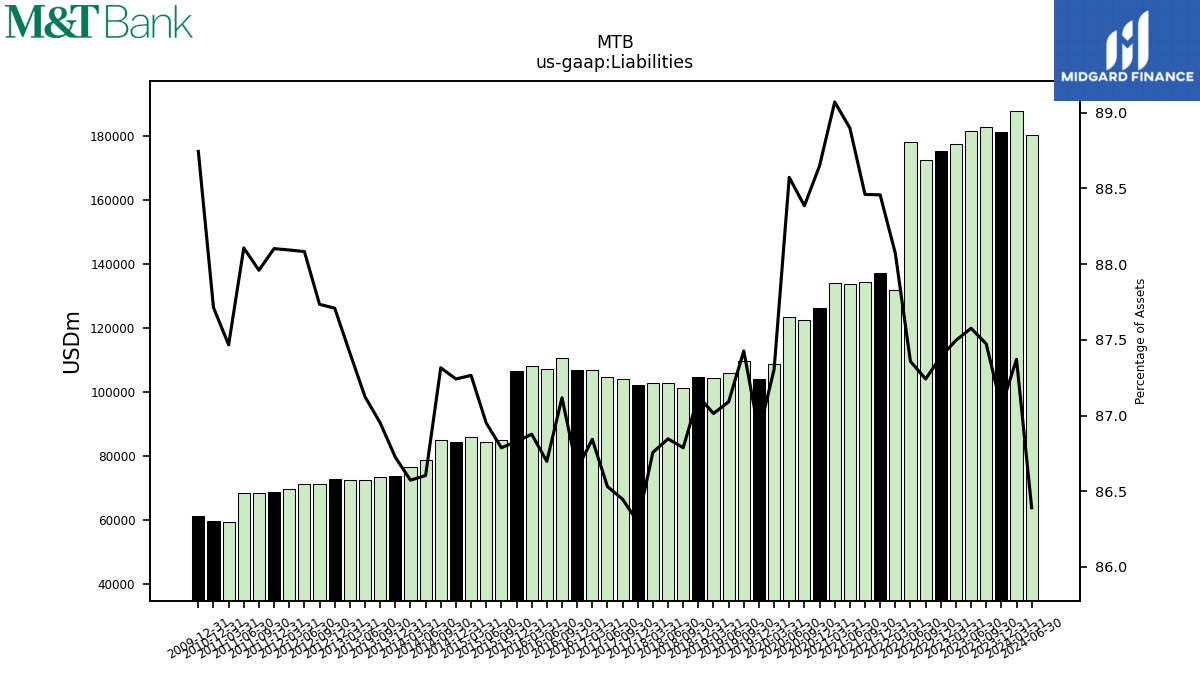
| Liabilities | 187968.00 | 182927.81 | 181870.80 | 177579.24 | 172698.99 | 178238.36 | 131987.53 | 134372.42 | 133902.40 | 134034.55 | 122525.73 | 123591.86 | 108762.04 | 109721.12 | 105863.07 | 104437.68 | 101391.55 | 102848.17 | 102913.13 | 104083.75 | 104613.03 | 107010.15 | 110500.05 | 107349.07 | 108270.58 | 84875.13 | 84412.08 | 85849.48 | 84895.03 | 78666.25 | 76643.50 | 73411.28 | 72512.68 | 72389.00 | 71139.71 | |
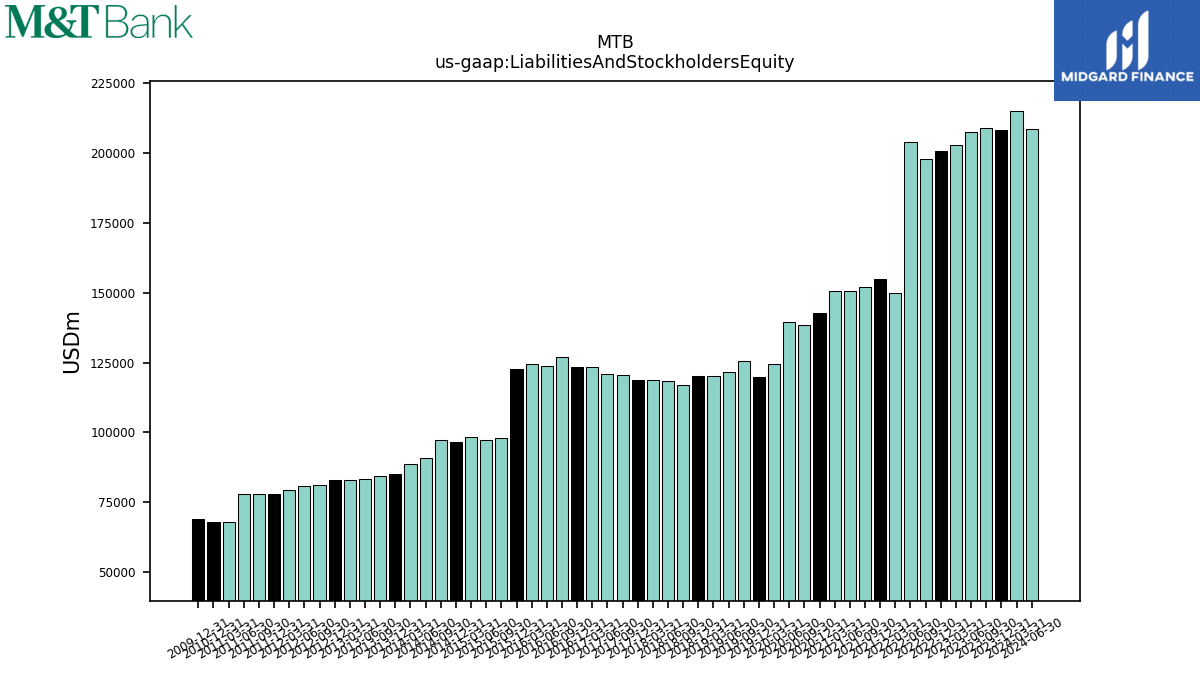
| Liabilities And Stockholders Equity | 215137.00 | 209124.32 | 207671.73 | 202956.41 | 197955.48 | 204032.89 | 149863.55 | 151901.19 | 150622.71 | 150481.06 | 138626.74 | 139536.97 | 124577.83 | 125500.93 | 121554.90 | 120025.21 | 116827.64 | 118426.05 | 118622.82 | 120401.80 | 120896.57 | 123223.25 | 126841.03 | 123820.58 | 124625.63 | 97797.06 | 97080.08 | 98377.78 | 97228.34 | 90835.00 | 88530.36 | 84427.49 | 83229.01 | 82811.96 | 81085.23 | |
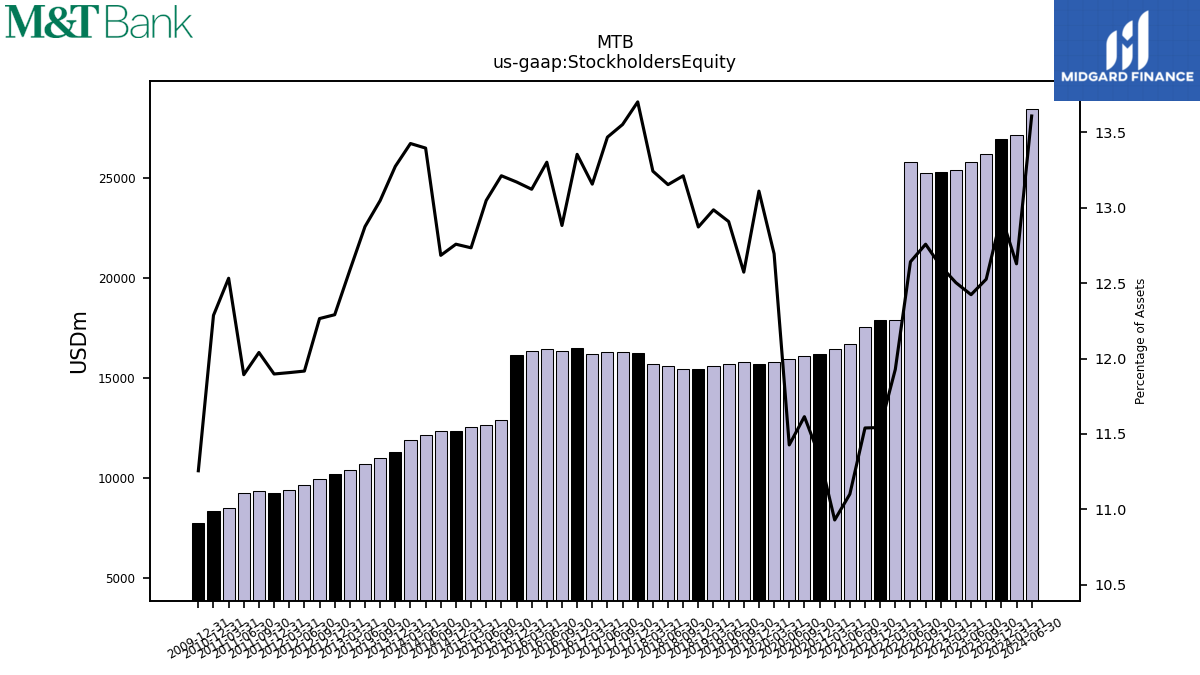
| Stockholders Equity | 27169.00 | 26196.50 | 25800.93 | 25377.17 | 25256.49 | 25794.53 | 17876.02 | 17528.77 | 16720.30 | 16446.51 | 16101.01 | 15945.10 | 15815.79 | 15779.81 | 15691.83 | 15587.53 | 15436.08 | 15577.89 | 15709.69 | 16318.05 | 16283.54 | 16213.10 | 16340.98 | 16471.51 | 16355.05 | 12921.93 | 12668.00 | 12528.30 | 12333.32 | 12168.75 | 11886.86 | 11016.20 | 10716.33 | 10422.96 | 9945.53 |
| 2024-03-31 | 2023-09-30 | 2023-06-30 | 2023-03-31 | 2022-09-30 | 2022-06-30 | 2022-03-31 | 2021-09-30 | 2021-06-30 | 2021-03-31 | 2020-09-30 | 2020-06-30 | 2020-03-31 | 2019-09-30 | 2019-06-30 | 2019-03-31 | 2018-09-30 | 2018-06-30 | 2018-03-31 | 2017-09-30 | 2017-06-30 | 2017-03-31 | 2016-09-30 | 2016-06-30 | 2016-03-31 | 2015-09-30 | 2015-06-30 | 2015-03-31 | 2014-09-30 | 2014-06-30 | 2014-03-31 | 2013-09-30 | 2013-06-30 | 2013-03-31 | 2012-09-30 | ||
|---|---|---|---|---|---|---|---|---|---|---|---|---|---|---|---|---|---|---|---|---|---|---|---|---|---|---|---|---|---|---|---|---|---|---|---|---|
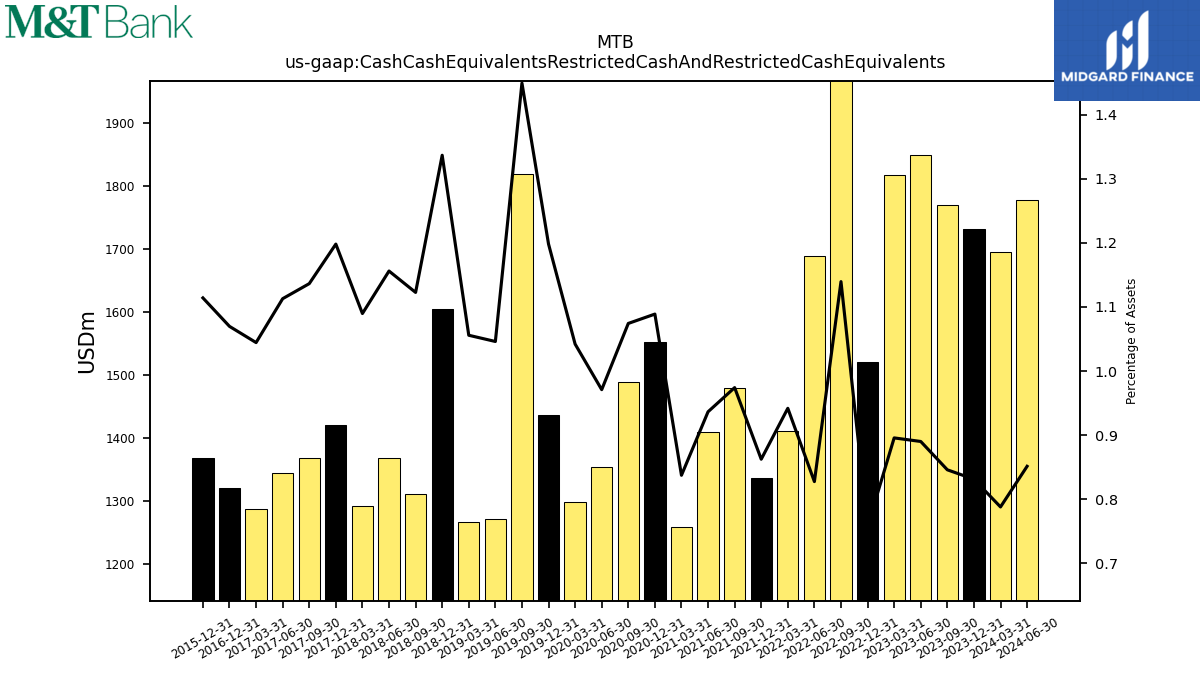
| Cash Cash Equivalents Restricted Cash And Restricted Cash Equivalents | 1695.00 | 1768.86 | 1848.39 | 1817.74 | 2255.81 | 1688.27 | 1411.46 | 1479.71 | 1410.47 | 1259.99 | 1489.23 | 1354.82 | 1298.19 | 1819.06 | 1271.61 | 1267.26 | 1311.61 | 1369.09 | 1292.66 | 1368.25 | 1345.48 | 1286.96 | NA | NA | NA | NA | NA | NA | NA | NA | NA | NA | NA | NA | NA | |
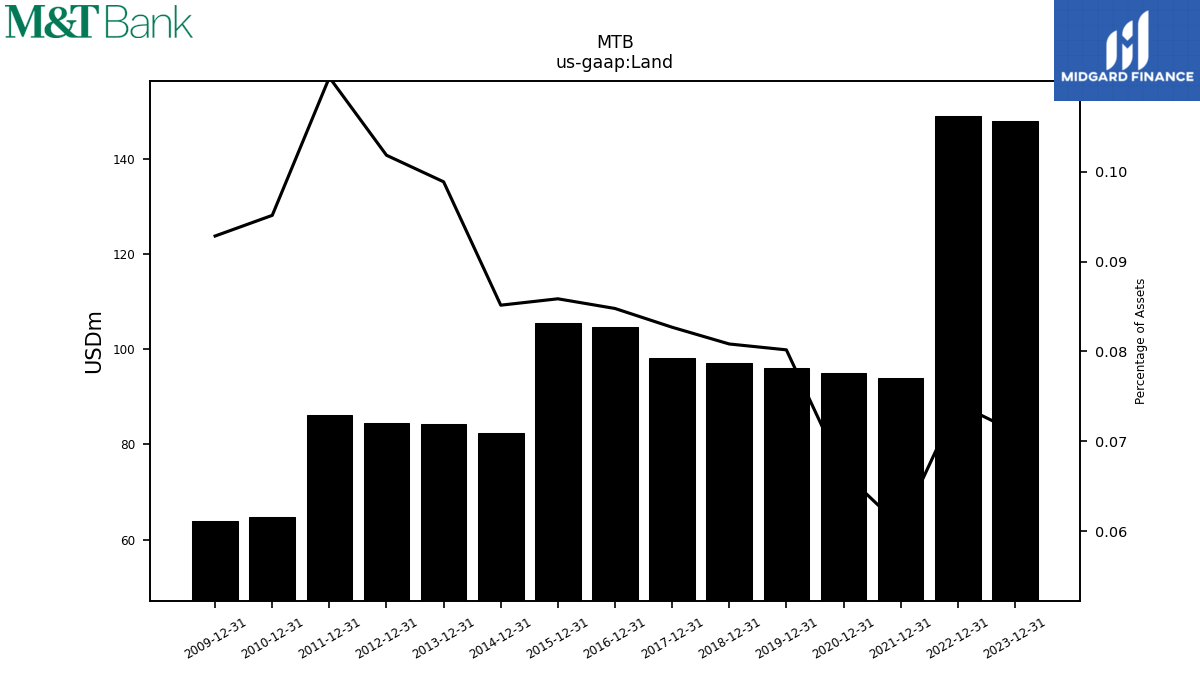
| Land | NA | NA | NA | NA | NA | NA | NA | NA | NA | NA | NA | NA | NA | NA | NA | NA | NA | NA | NA | NA | NA | NA | NA | NA | NA | NA | NA | NA | NA | NA | NA | NA | NA | NA | NA | |
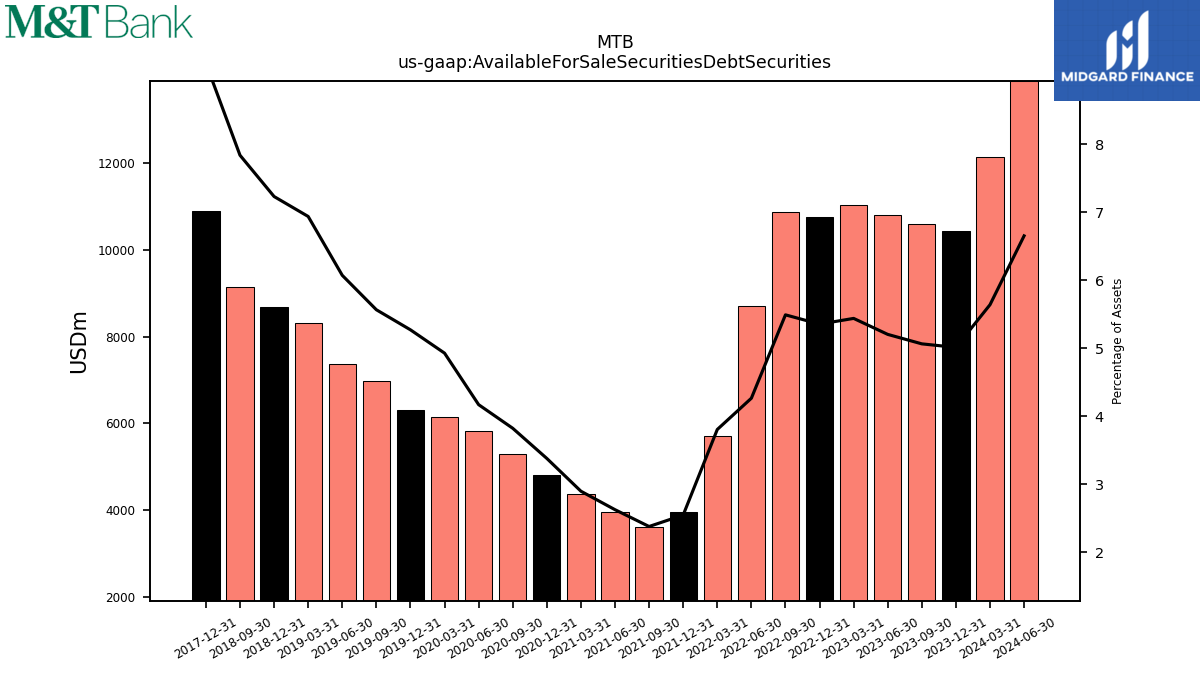
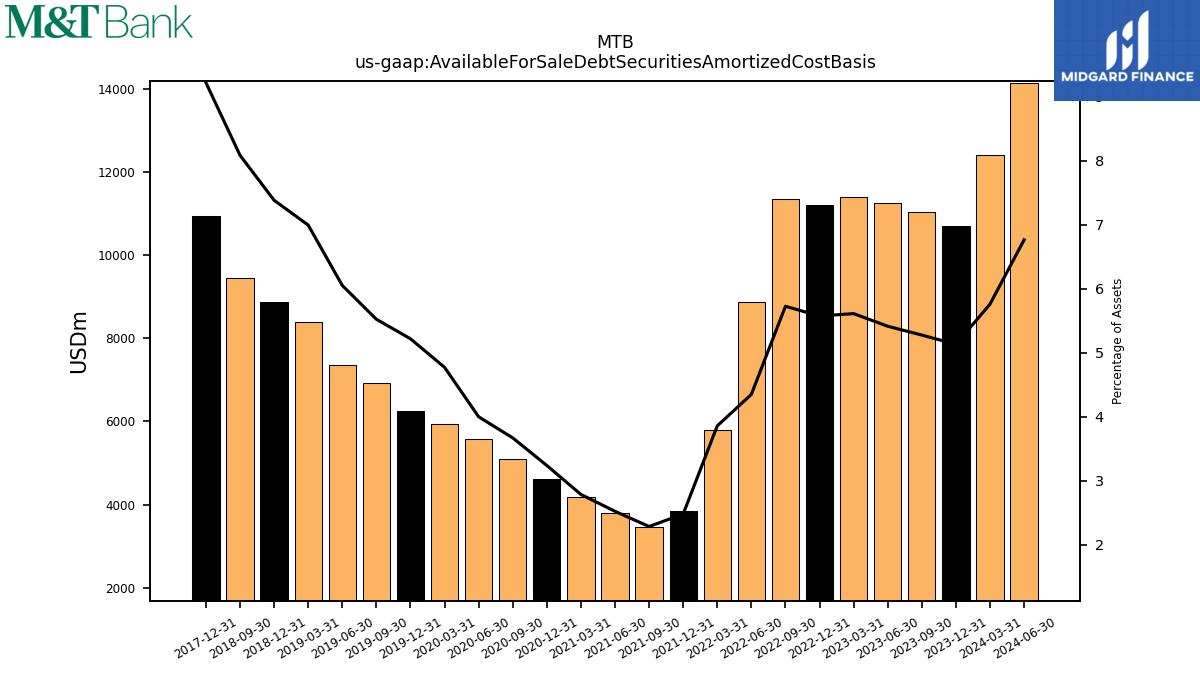
| Available For Sale Securities Debt Securities | 12134.00 | 10592.41 | 10807.66 | 11038.92 | 10870.35 | 8704.95 | 5705.20 | 3618.11 | 3959.78 | 4364.44 | 5302.34 | 5821.27 | 6139.98 | 6985.42 | 7380.34 | 8325.58 | 9154.51 | NA | NA | NA | NA | NA | NA | NA | NA | NA | NA | NA | NA | NA | NA | NA | NA | NA | NA |
| 2024-03-31 | 2023-09-30 | 2023-06-30 | 2023-03-31 | 2022-09-30 | 2022-06-30 | 2022-03-31 | 2021-09-30 | 2021-06-30 | 2021-03-31 | 2020-09-30 | 2020-06-30 | 2020-03-31 | 2019-09-30 | 2019-06-30 | 2019-03-31 | 2018-09-30 | 2018-06-30 | 2018-03-31 | 2017-09-30 | 2017-06-30 | 2017-03-31 | 2016-09-30 | 2016-06-30 | 2016-03-31 | 2015-09-30 | 2015-06-30 | 2015-03-31 | 2014-09-30 | 2014-06-30 | 2014-03-31 | 2013-09-30 | 2013-06-30 | 2013-03-31 | 2012-09-30 | ||
|---|---|---|---|---|---|---|---|---|---|---|---|---|---|---|---|---|---|---|---|---|---|---|---|---|---|---|---|---|---|---|---|---|---|---|---|---|
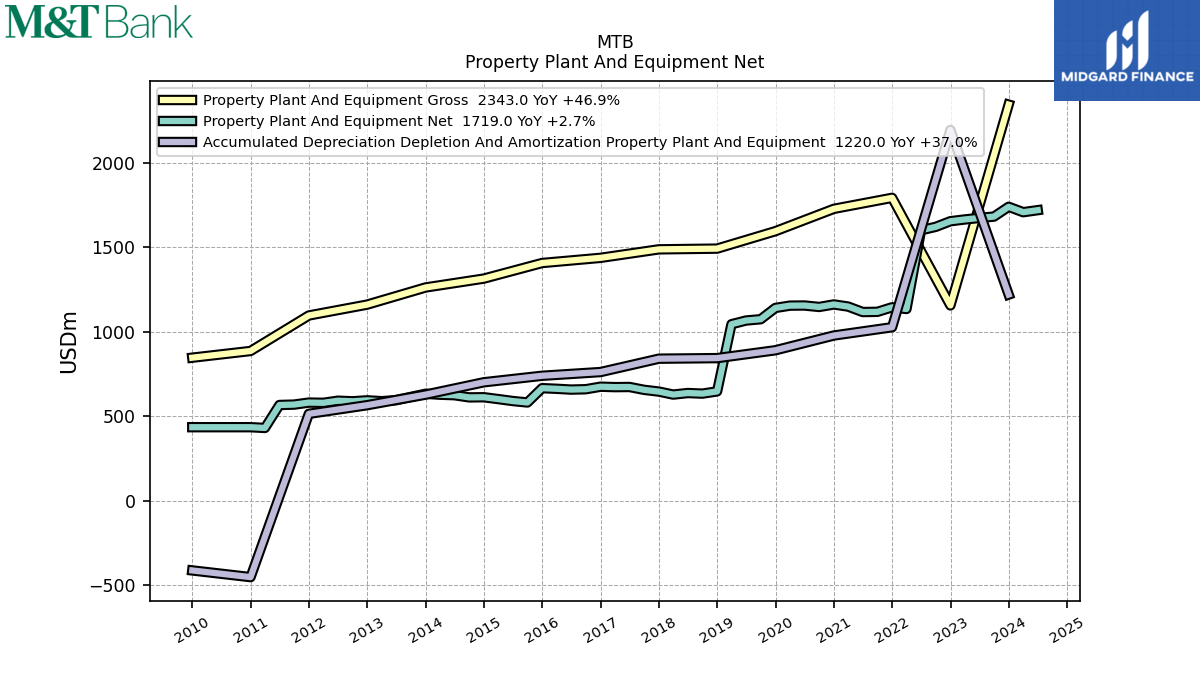
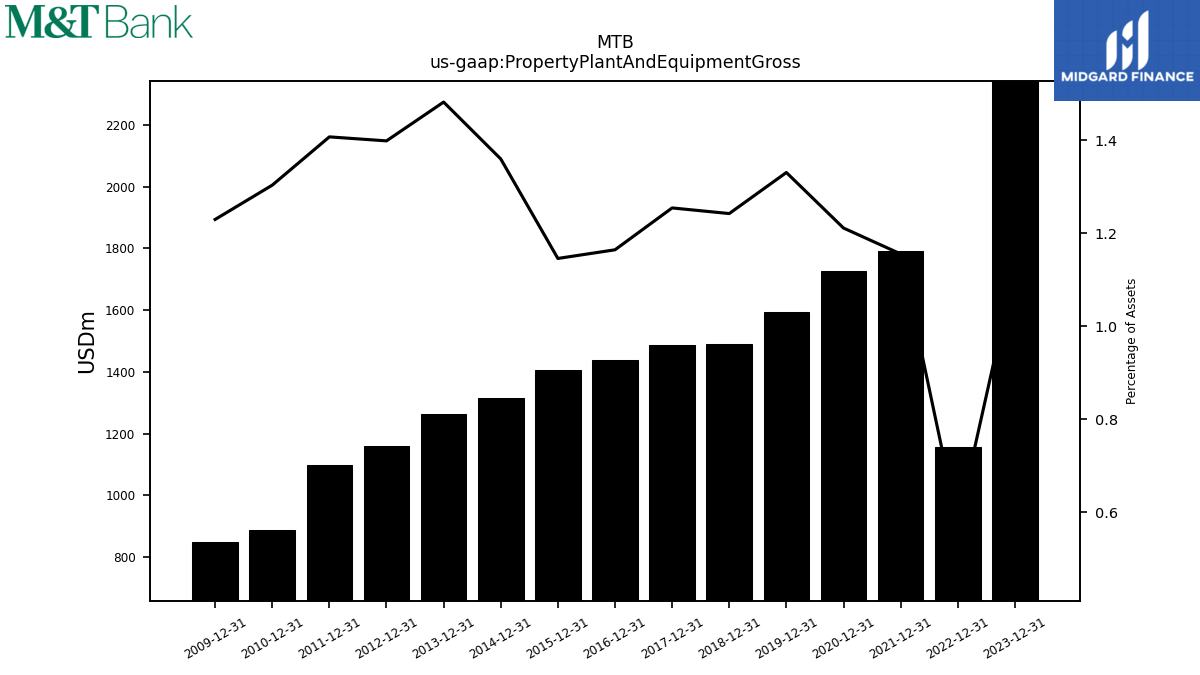
| Property Plant And Equipment Gross | NA | NA | NA | NA | NA | NA | NA | NA | NA | NA | NA | NA | NA | NA | NA | NA | NA | NA | NA | NA | NA | NA | NA | NA | NA | NA | NA | NA | NA | NA | NA | NA | NA | NA | NA | |
| Furniture And Fixtures Gross | NA | NA | NA | NA | NA | NA | NA | NA | NA | NA | NA | NA | NA | NA | NA | NA | NA | NA | NA | NA | NA | NA | NA | NA | NA | NA | NA | NA | NA | NA | NA | NA | NA | NA | NA | |
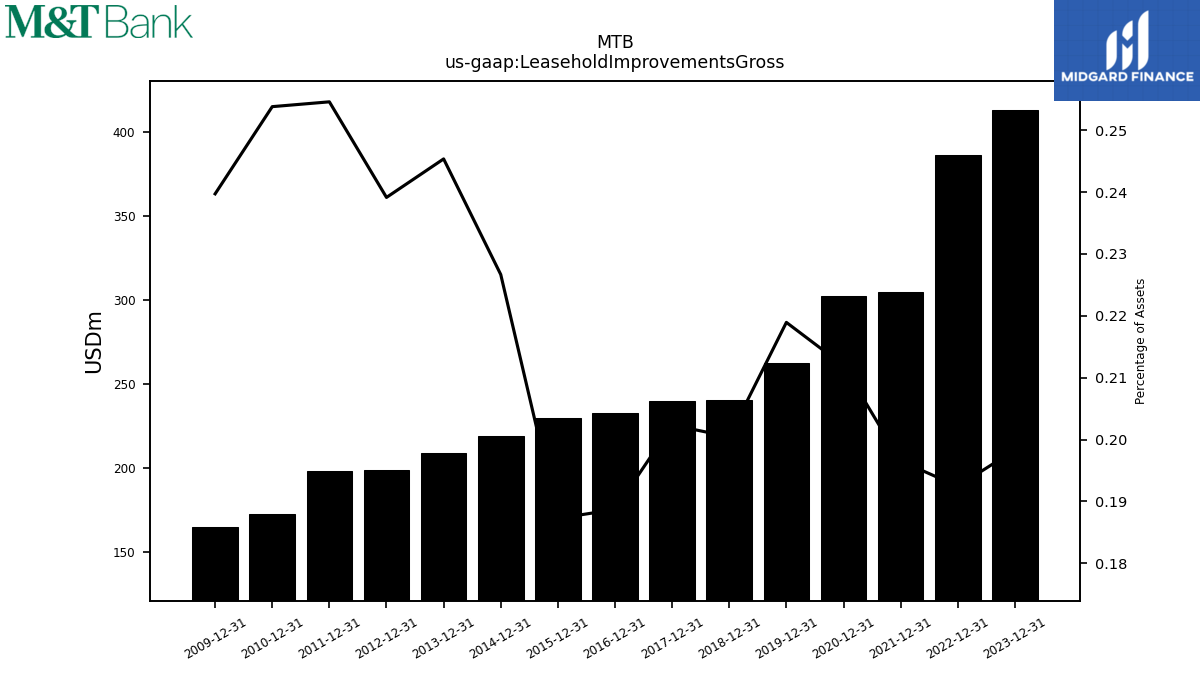
| Leasehold Improvements Gross | NA | NA | NA | NA | NA | NA | NA | NA | NA | NA | NA | NA | NA | NA | NA | NA | NA | NA | NA | NA | NA | NA | NA | NA | NA | NA | NA | NA | NA | NA | NA | NA | NA | NA | NA | |
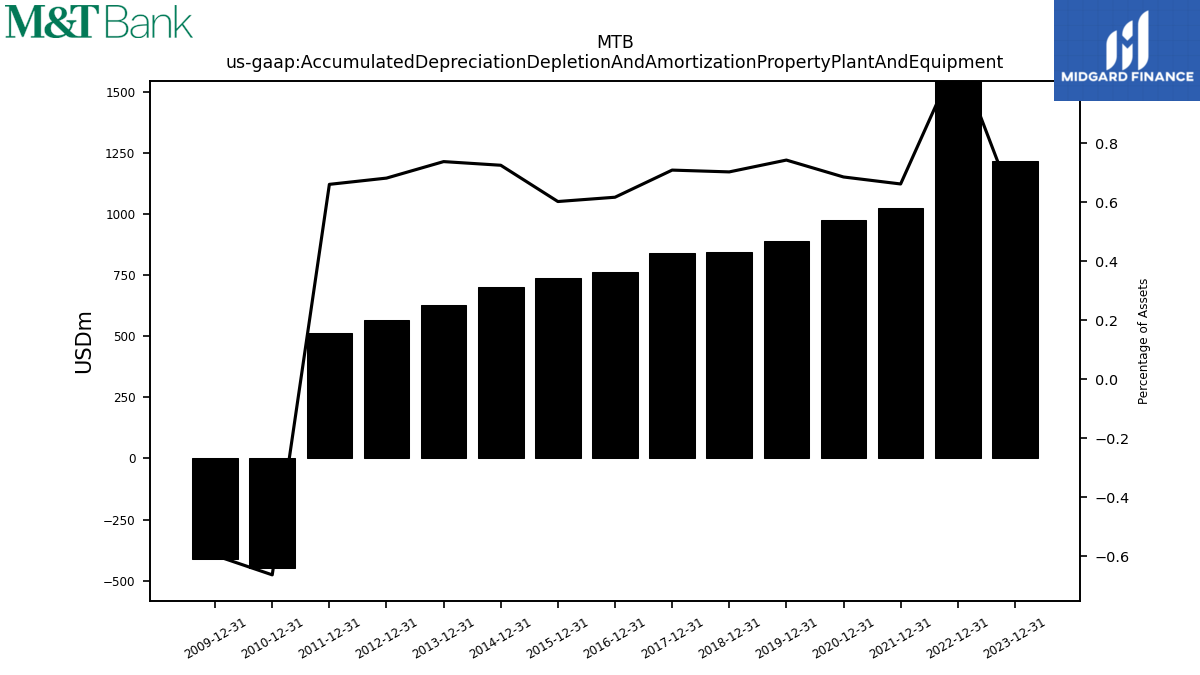
| Accumulated Depreciation Depletion And Amortization Property Plant And Equipment | NA | NA | NA | NA | NA | NA | NA | NA | NA | NA | NA | NA | NA | NA | NA | NA | NA | NA | NA | NA | NA | NA | NA | NA | NA | NA | NA | NA | NA | NA | NA | NA | NA | NA | NA | |
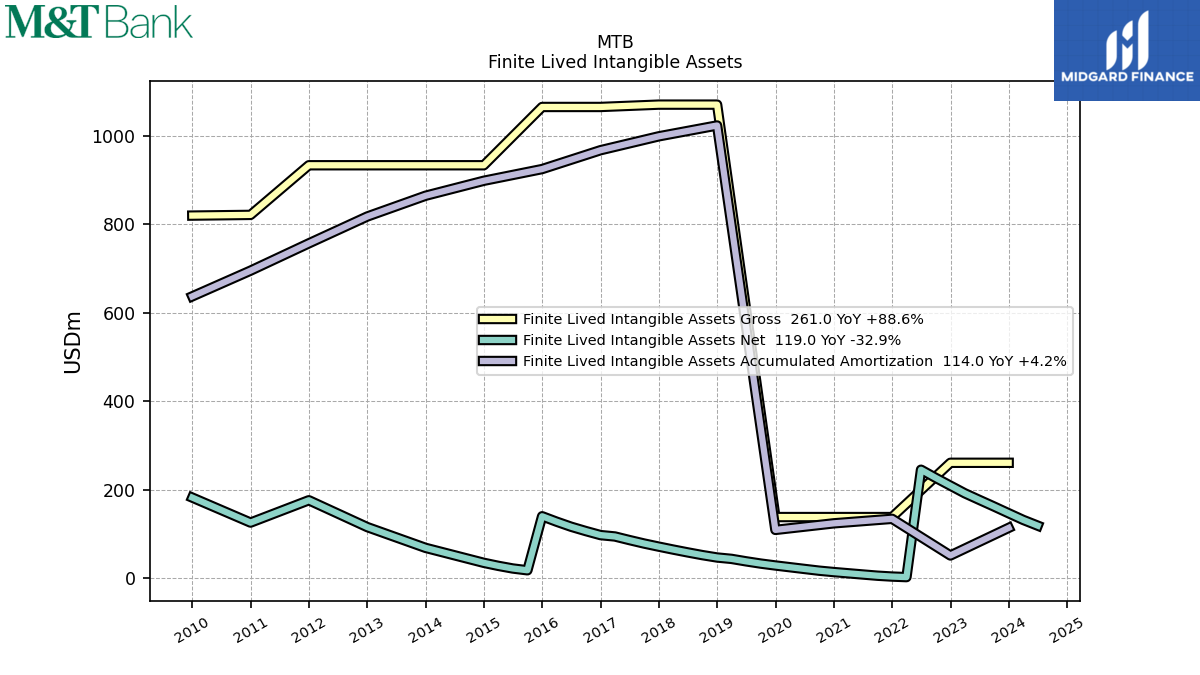
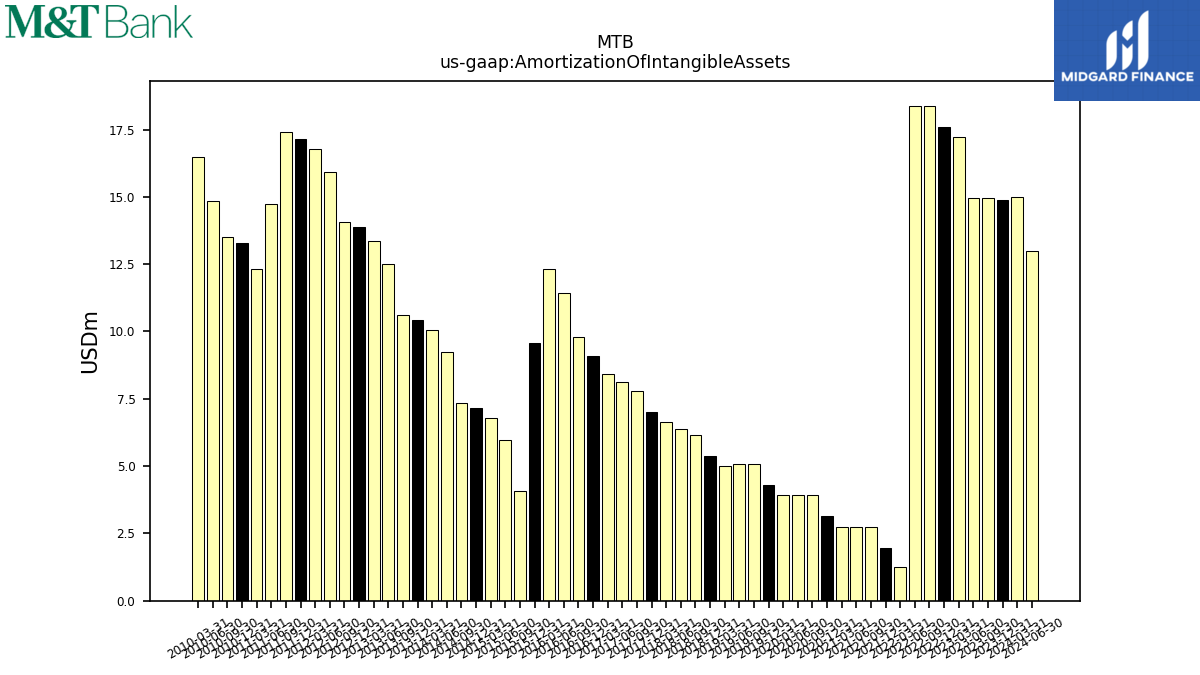
| Amortization Of Intangible Assets | 15.00 | 14.95 | 14.95 | 17.21 | 18.38 | 18.38 | 1.26 | 2.74 | 2.74 | 2.74 | 3.91 | 3.91 | 3.91 | 5.09 | 5.08 | 5.02 | 6.14 | 6.39 | 6.63 | 7.81 | 8.11 | 8.42 | 9.79 | 11.42 | 12.32 | 4.09 | 5.96 | 6.79 | 7.36 | 9.23 | 10.06 | 10.63 | 12.50 | 13.34 | 14.09 | |
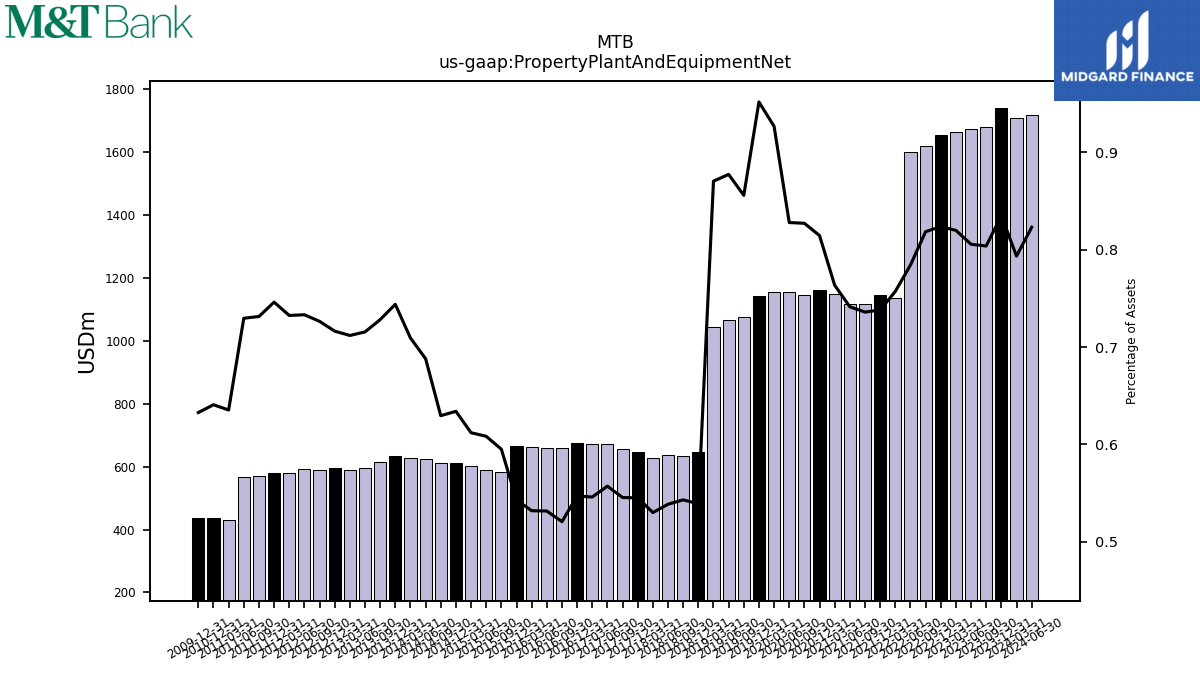
| Property Plant And Equipment Net | 1707.00 | 1681.05 | 1673.00 | 1664.02 | 1620.34 | 1600.17 | 1134.72 | 1117.90 | 1116.70 | 1148.94 | 1146.68 | 1155.28 | 1154.56 | 1074.18 | 1066.51 | 1044.76 | 634.42 | 637.81 | 628.71 | 656.71 | 673.55 | 672.77 | 660.38 | 658.22 | 662.89 | 581.98 | 590.57 | 602.10 | 612.08 | 625.01 | 627.97 | 614.79 | 595.54 | 589.57 | 589.03 | |
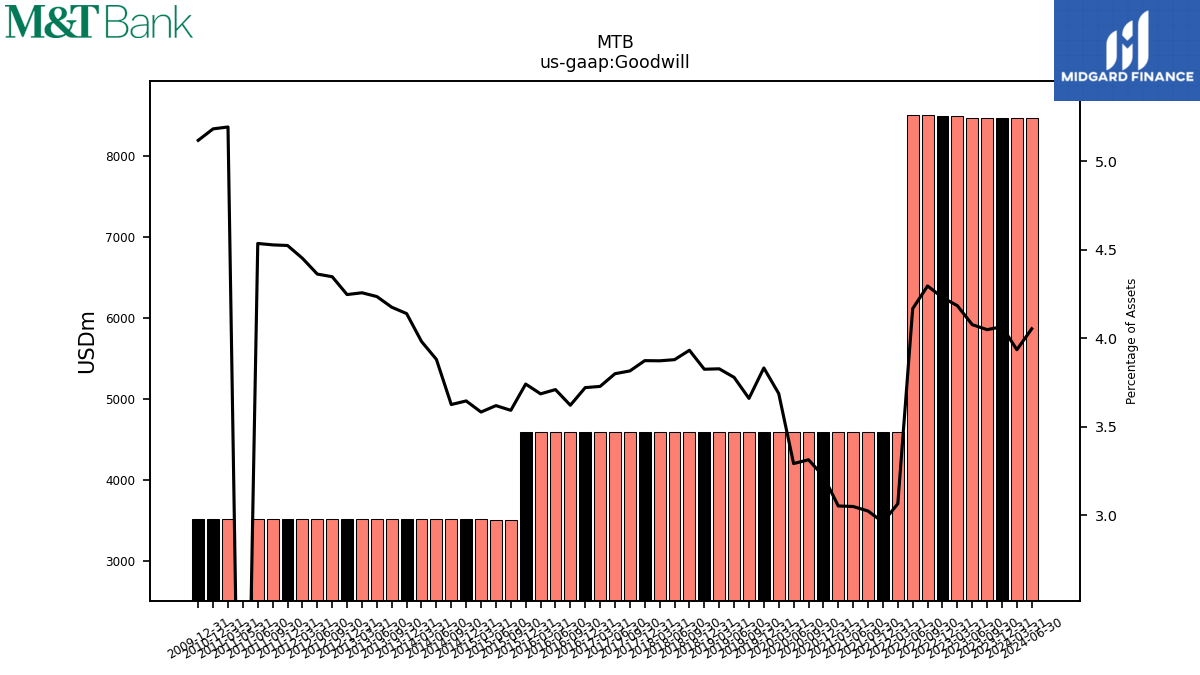
| Goodwill | 8465.00 | 8465.09 | 8465.09 | 8490.09 | 8501.36 | 8501.36 | 4593.11 | 4593.11 | 4593.11 | 4593.11 | 4593.11 | 4593.11 | 4593.11 | 4593.11 | 4593.11 | 4593.11 | 4593.11 | 4593.11 | 4593.11 | 4593.11 | 4593.11 | 4593.11 | 4593.11 | 4593.11 | 4593.11 | 3513.32 | 3513.32 | 3524.62 | 3524.62 | 3524.62 | 3524.62 | 3524.62 | 3524.62 | 3524.62 | 3524.62 | |
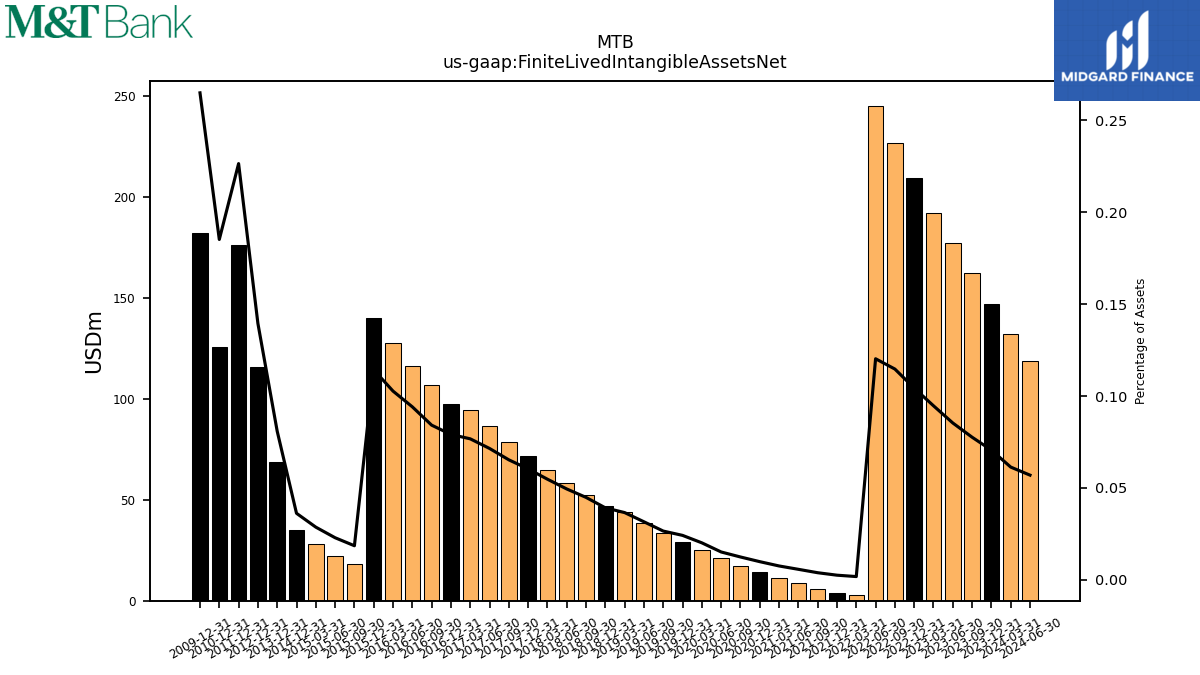
| Finite Lived Intangible Assets Net | 132.00 | 162.28 | 177.22 | 192.17 | 226.97 | 245.36 | 2.74 | 5.95 | 8.69 | 11.43 | 17.29 | 21.21 | 25.12 | 33.34 | 38.43 | 43.95 | 52.43 | 58.57 | 64.96 | 78.61 | 86.42 | 94.53 | 106.74 | 116.53 | 127.95 | 18.18 | 22.27 | 28.23 | NA | NA | NA | NA | NA | NA | NA | |
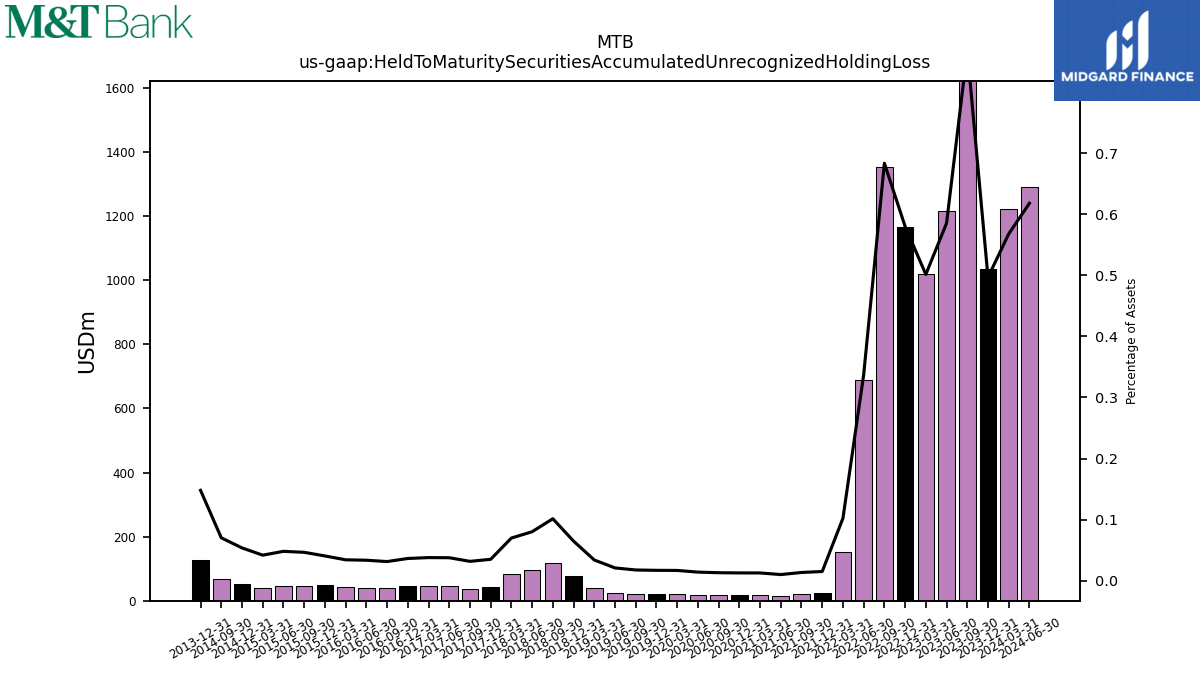
| Held To Maturity Securities Accumulated Unrecognized Holding Loss | 1222.00 | 1815.22 | 1215.87 | 1018.06 | 1353.47 | 687.56 | 153.06 | 20.21 | 14.90 | 18.87 | 17.89 | 19.41 | 20.71 | 21.84 | 25.23 | 40.55 | 118.42 | 94.81 | 82.70 | 37.96 | 45.28 | 46.44 | 39.56 | 41.33 | 42.45 | 45.31 | 46.55 | 40.99 | 68.19 | NA | NA | NA | NA | NA | NA | |
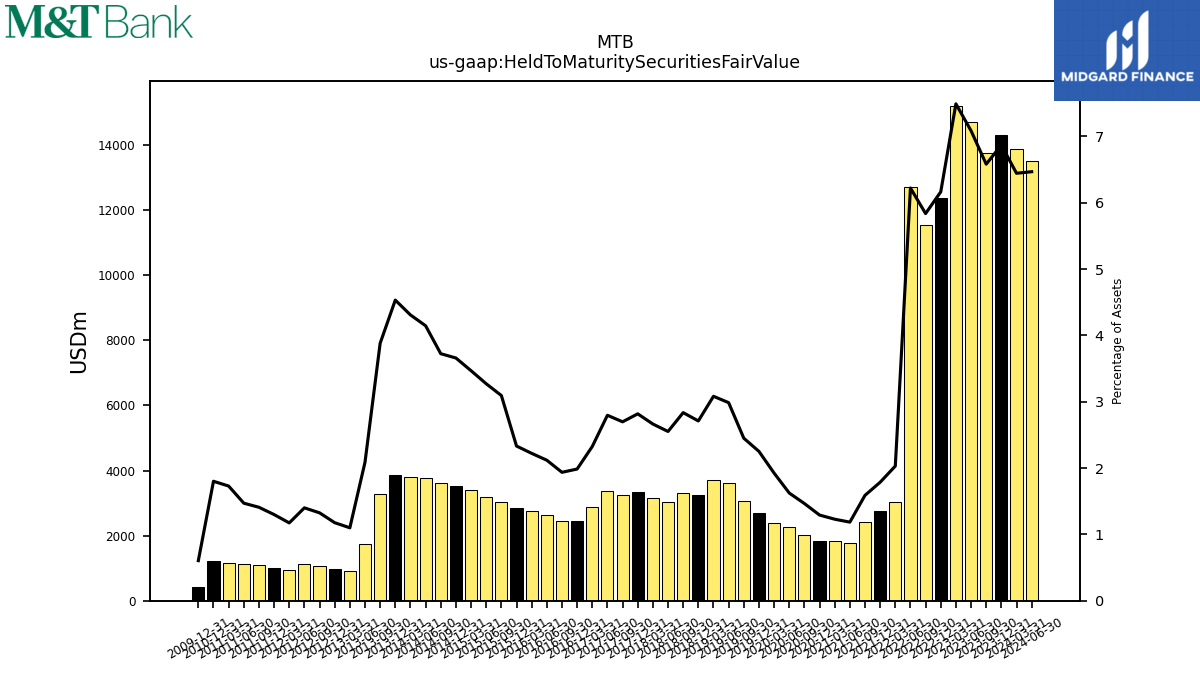
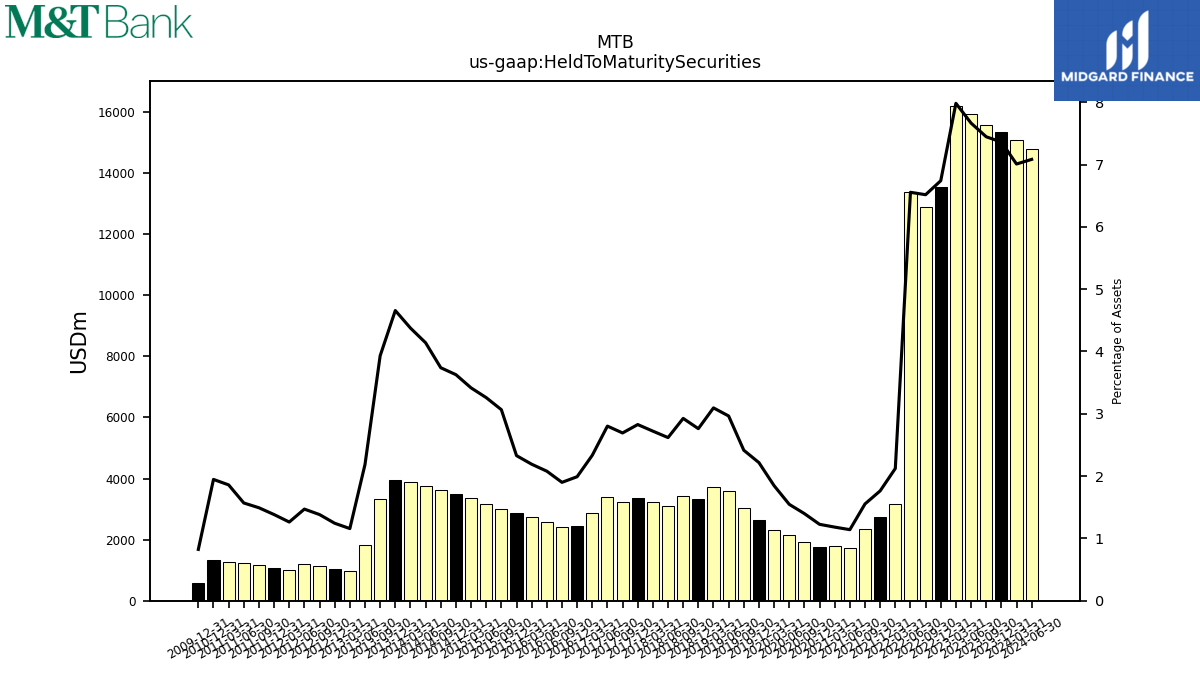
| Held To Maturity Securities Fair Value | 13865.00 | 13764.94 | 14713.50 | 15204.46 | 11554.66 | 12696.11 | 3042.71 | 2413.94 | 1785.01 | 1850.21 | 2031.93 | 2266.09 | 2397.85 | 3075.30 | 3630.16 | 3699.60 | 3313.27 | 3022.33 | 3160.22 | 3247.95 | 3380.53 | 2865.89 | 2456.10 | 2623.26 | 2769.34 | 3025.69 | 3175.85 | 3411.83 | 3621.39 | 3765.85 | 3814.77 | 3277.39 | 1737.58 | 910.78 | 1074.77 | |
| Held To Maturity Securities | 15078.00 | 15571.12 | 15918.11 | 16201.57 | 12898.86 | 13373.17 | 3180.63 | 2359.73 | 1718.20 | 1778.13 | 1938.69 | 2158.98 | 2300.64 | 3031.30 | 3604.23 | 3714.70 | 3418.72 | 3101.09 | 3228.76 | 3242.12 | 3388.27 | 2876.12 | 2409.95 | 2574.42 | 2730.61 | 2998.49 | 3164.59 | 3360.81 | 3635.82 | 3760.66 | 3873.99 | 3319.11 | 1819.69 | 959.20 | 1121.33 | |
| Available For Sale Debt Securities Amortized Cost Basis | 12397.00 | 11038.97 | 11248.46 | 11393.92 | 11340.16 | 8879.42 | 5783.70 | 3473.92 | 3801.94 | 4194.89 | 5090.06 | 5583.69 | 5948.06 | 6934.71 | 7359.44 | 8398.69 | 9449.98 | NA | NA | NA | NA | NA | NA | NA | NA | NA | NA | NA | NA | NA | NA | NA | NA | NA | NA | |
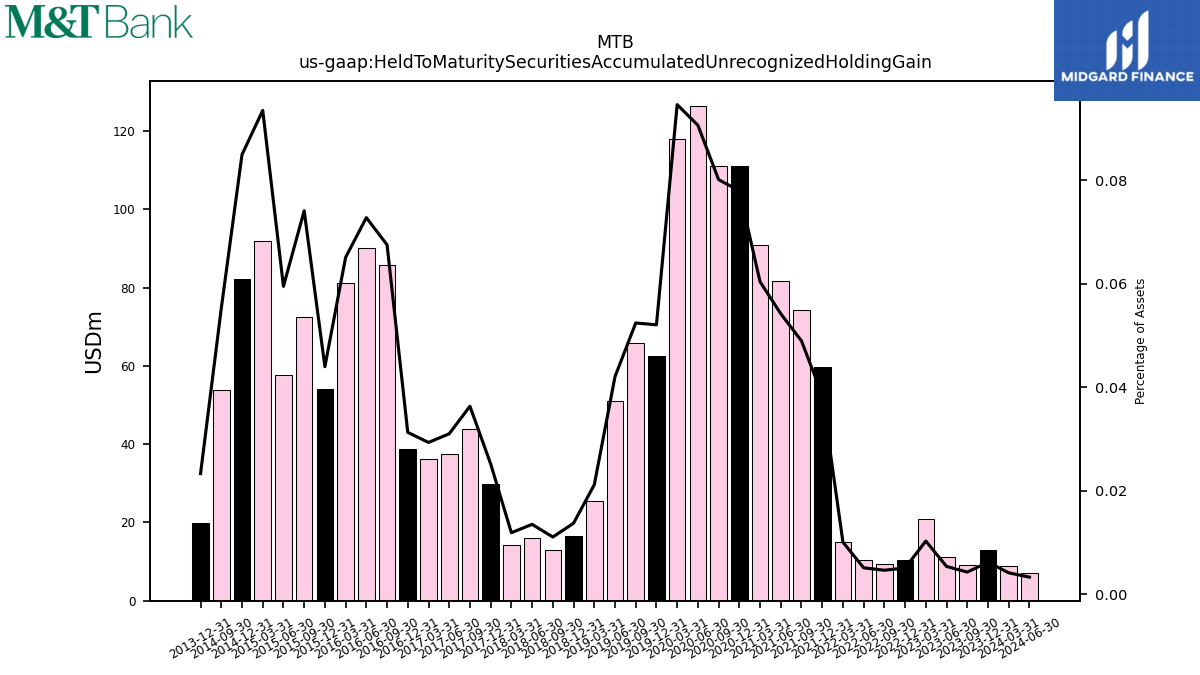
| Held To Maturity Securities Accumulated Unrecognized Holding Gain | 9.00 | 9.04 | 11.26 | 20.95 | 9.27 | 10.50 | 15.14 | 74.42 | 81.72 | 90.94 | 111.12 | 126.52 | 117.92 | 65.84 | 51.16 | 25.44 | 12.97 | 16.05 | 14.16 | 43.79 | 37.55 | 36.20 | 85.70 | 90.17 | 81.18 | 72.51 | 57.81 | 92.02 | 53.76 | NA | NA | NA | NA | NA | NA | |
| Held To Maturity Securities Accumulated Unrecognized Holding Loss | 1222.00 | 1815.22 | 1215.87 | 1018.06 | 1353.47 | 687.56 | 153.06 | 20.21 | 14.90 | 18.87 | 17.89 | 19.41 | 20.71 | 21.84 | 25.23 | 40.55 | 118.42 | 94.81 | 82.70 | 37.96 | 45.28 | 46.44 | 39.56 | 41.33 | 42.45 | 45.31 | 46.55 | 40.99 | 68.19 | NA | NA | NA | NA | NA | NA | |
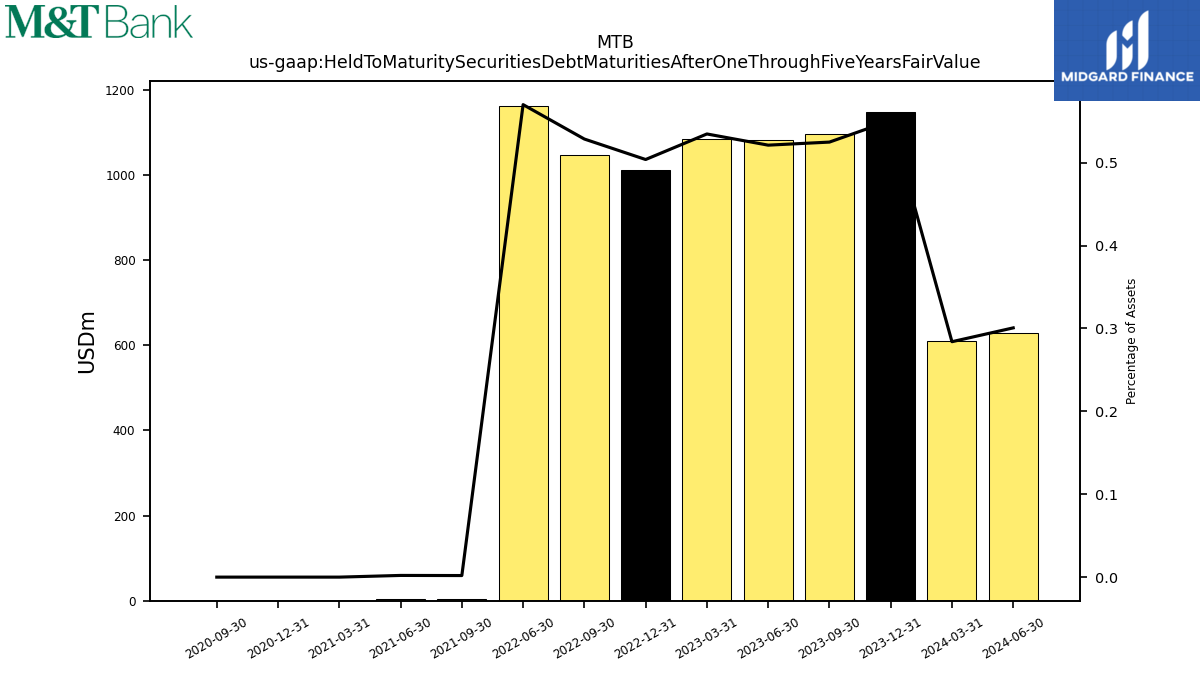
| Held To Maturity Securities Debt Maturities After One Through Five Years Fair Value | 611.00 | 1097.31 | 1082.03 | 1084.85 | 1046.00 | 1162.78 | NA | 3.06 | 3.26 | 0.18 | 0.18 | NA | NA | NA | NA | NA | NA | NA | NA | NA | NA | NA | NA | NA | NA | NA | NA | NA | NA | NA | NA | NA | NA | NA | NA | |
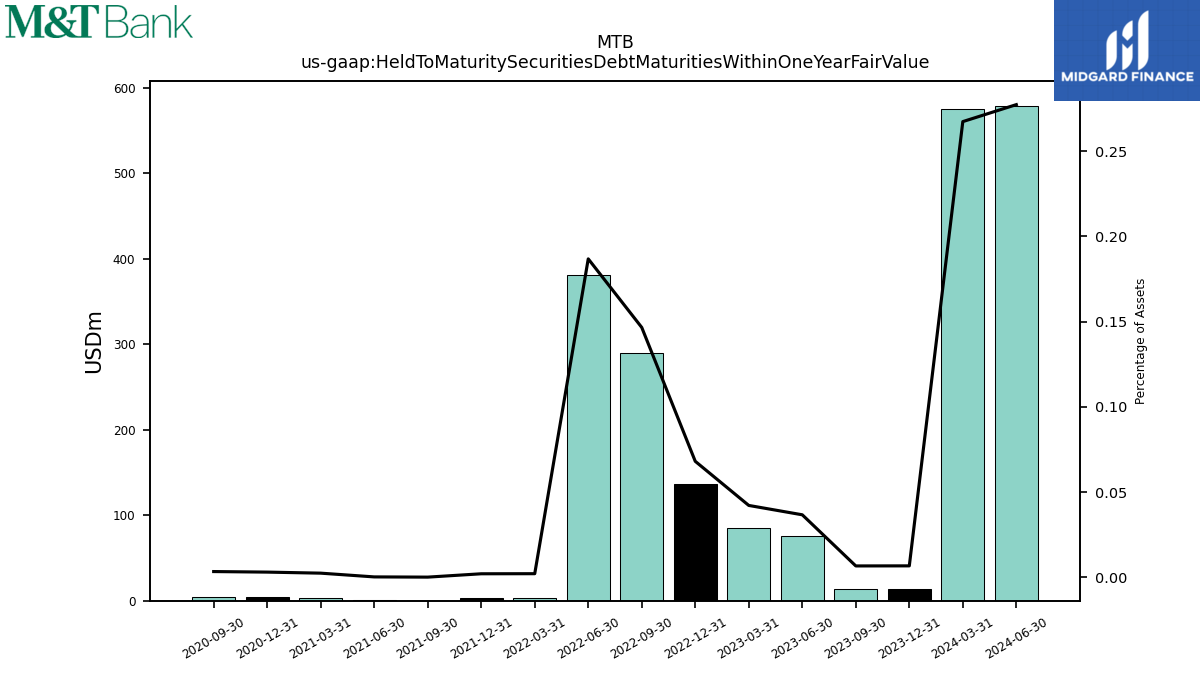
| Held To Maturity Securities Debt Maturities Within One Year Fair Value | 575.00 | 13.97 | 76.15 | 85.57 | 290.09 | 381.07 | 3.19 | 0.18 | 0.37 | 3.68 | 4.69 | NA | NA | NA | NA | NA | NA | NA | NA | NA | NA | NA | NA | NA | NA | NA | NA | NA | NA | NA | NA | NA | NA | NA | NA | |
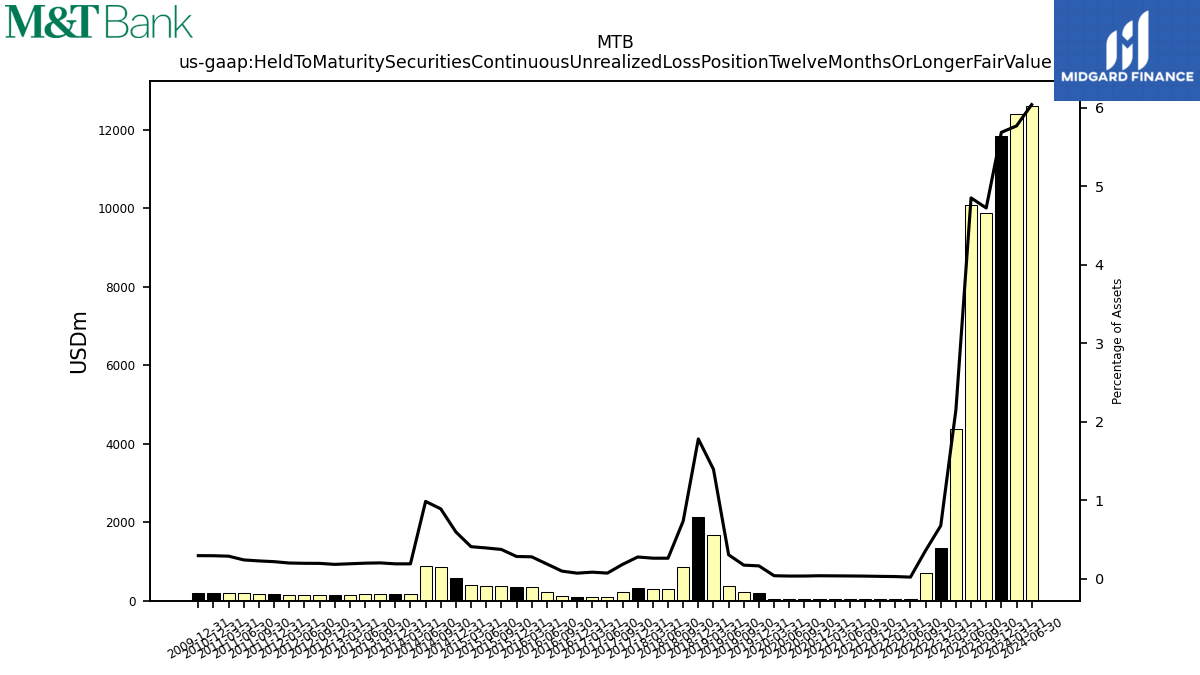
| Held To Maturity Securities Continuous Unrealized Loss Position Twelve Months Or Longer Fair Value | 12410.00 | 9877.01 | 10075.29 | 4367.70 | 710.45 | 39.35 | 39.71 | 48.87 | 51.25 | 53.13 | 46.05 | 45.91 | 46.24 | 215.81 | 369.56 | 1671.67 | 856.52 | 308.14 | 309.20 | 218.65 | 85.59 | 101.52 | 121.43 | 231.63 | 346.60 | 363.67 | 379.64 | 400.56 | 864.62 | 893.98 | 166.87 | 169.43 | 163.95 | 156.84 | 157.71 | |
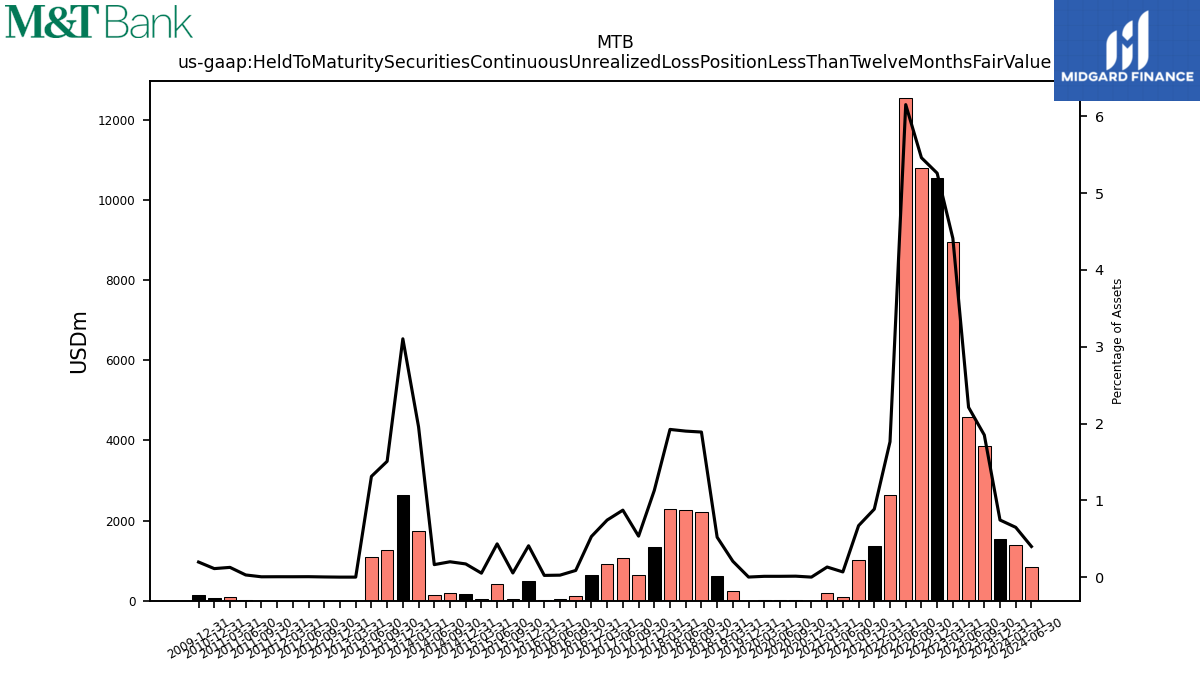
| Held To Maturity Securities Continuous Unrealized Loss Position Less Than Twelve Months Fair Value | 1397.00 | 3872.29 | 4593.23 | 8953.14 | 10810.64 | 12553.51 | 2642.97 | 1019.54 | 103.65 | 199.55 | 18.83 | 16.35 | 14.60 | NA | NA | 249.08 | 2208.11 | 2252.67 | 2282.51 | 643.79 | 1055.44 | 916.92 | 111.73 | 33.25 | 29.52 | 53.95 | 421.60 | 51.93 | 195.49 | 149.05 | 1732.64 | 1274.10 | 1092.31 | 1.06 | 2.84 | |
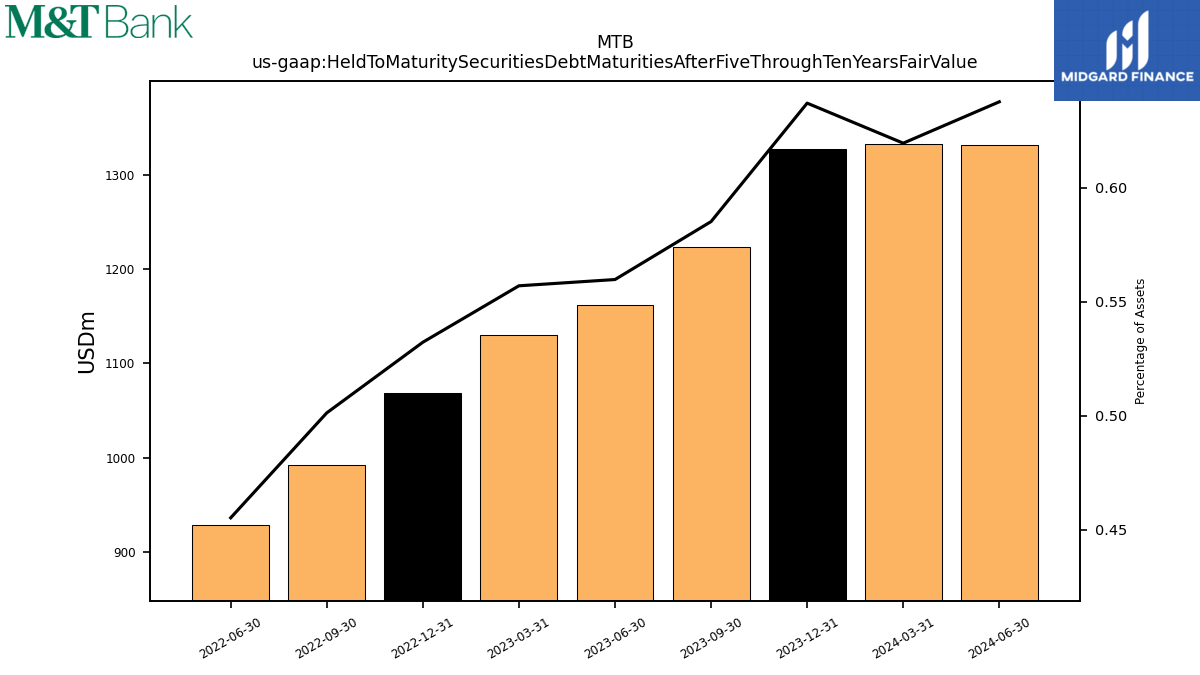
| Held To Maturity Securities Debt Maturities After Five Through Ten Years Fair Value | 1333.00 | 1223.79 | 1162.46 | 1130.49 | 992.24 | 928.73 | NA | NA | NA | NA | NA | NA | NA | NA | NA | NA | NA | NA | NA | NA | NA | NA | NA | NA | NA | NA | NA | NA | NA | NA | NA | NA | NA | NA | NA | |
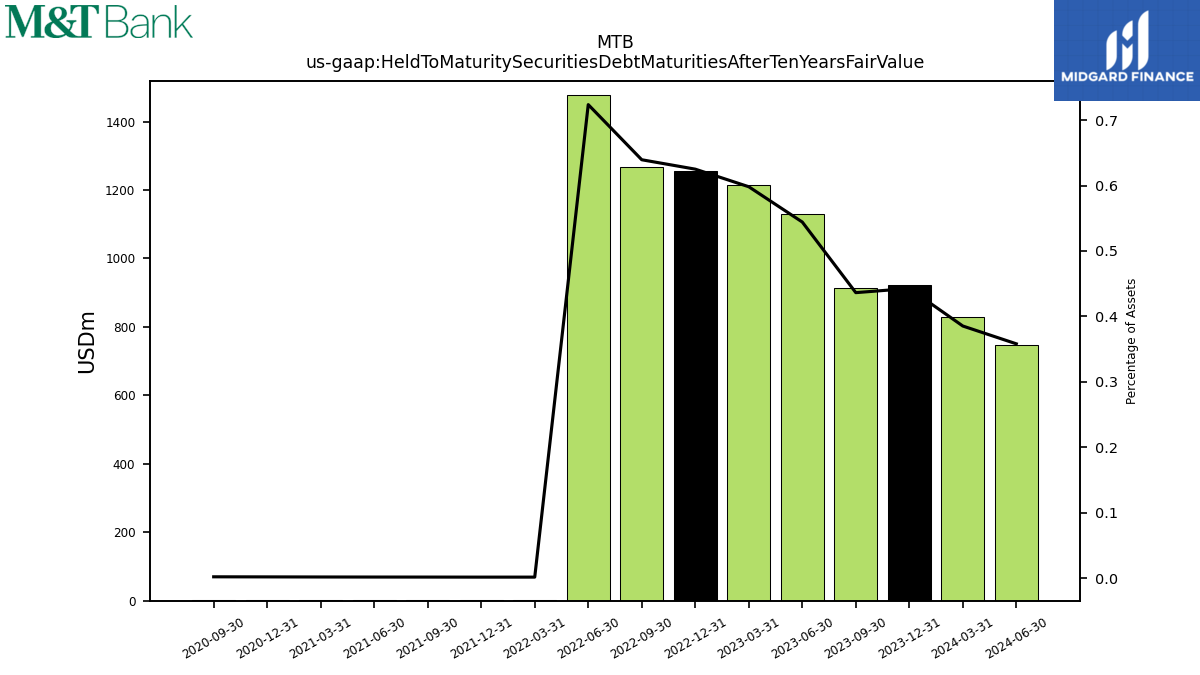
| Held To Maturity Securities Debt Maturities After Ten Years Fair Value | 829.00 | 912.47 | 1130.16 | 1213.97 | 1265.67 | 1476.40 | 2.49 | 2.62 | 2.67 | 2.80 | 2.96 | NA | NA | NA | NA | NA | NA | NA | NA | NA | NA | NA | NA | NA | NA | NA | NA | NA | NA | NA | NA | NA | NA | NA | NA |
| 2024-03-31 | 2023-09-30 | 2023-06-30 | 2023-03-31 | 2022-09-30 | 2022-06-30 | 2022-03-31 | 2021-09-30 | 2021-06-30 | 2021-03-31 | 2020-09-30 | 2020-06-30 | 2020-03-31 | 2019-09-30 | 2019-06-30 | 2019-03-31 | 2018-09-30 | 2018-06-30 | 2018-03-31 | 2017-09-30 | 2017-06-30 | 2017-03-31 | 2016-09-30 | 2016-06-30 | 2016-03-31 | 2015-09-30 | 2015-06-30 | 2015-03-31 | 2014-09-30 | 2014-06-30 | 2014-03-31 | 2013-09-30 | 2013-06-30 | 2013-03-31 | 2012-09-30 | ||
|---|---|---|---|---|---|---|---|---|---|---|---|---|---|---|---|---|---|---|---|---|---|---|---|---|---|---|---|---|---|---|---|---|---|---|---|---|
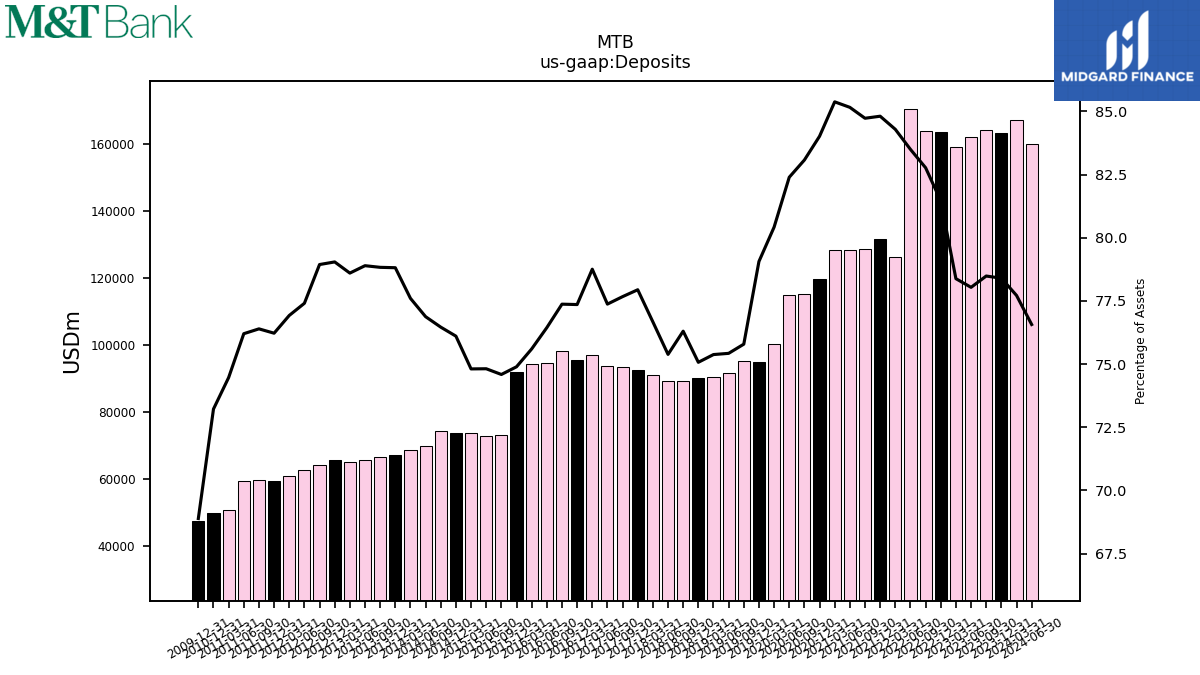
| Deposits | 167196.00 | 164127.81 | 162058.38 | 159075.24 | 163845.39 | 170358.40 | 126318.71 | 128701.30 | 128268.77 | 128476.37 | 115163.34 | 114967.96 | 100183.31 | 95113.93 | 91681.02 | 90469.75 | 89140.40 | 89272.59 | 90946.63 | 93513.39 | 93540.94 | 97042.52 | 98136.85 | 94650.10 | 94214.58 | 72944.54 | 72629.62 | 73594.12 | 74341.50 | 69829.26 | 68699.37 | 66552.14 | 65661.47 | 65089.73 | 64007.26 | |
| Line Of Credit | NA | NA | NA | NA | NA | NA | NA | NA | NA | NA | NA | NA | NA | NA | NA | NA | NA | NA | NA | NA | NA | NA | NA | NA | NA | NA | NA | NA | NA | NA | NA | NA | NA | NA | NA |
| 2024-03-31 | 2023-09-30 | 2023-06-30 | 2023-03-31 | 2022-09-30 | 2022-06-30 | 2022-03-31 | 2021-09-30 | 2021-06-30 | 2021-03-31 | 2020-09-30 | 2020-06-30 | 2020-03-31 | 2019-09-30 | 2019-06-30 | 2019-03-31 | 2018-09-30 | 2018-06-30 | 2018-03-31 | 2017-09-30 | 2017-06-30 | 2017-03-31 | 2016-09-30 | 2016-06-30 | 2016-03-31 | 2015-09-30 | 2015-06-30 | 2015-03-31 | 2014-09-30 | 2014-06-30 | 2014-03-31 | 2013-09-30 | 2013-06-30 | 2013-03-31 | 2012-09-30 | ||
|---|---|---|---|---|---|---|---|---|---|---|---|---|---|---|---|---|---|---|---|---|---|---|---|---|---|---|---|---|---|---|---|---|---|---|---|---|
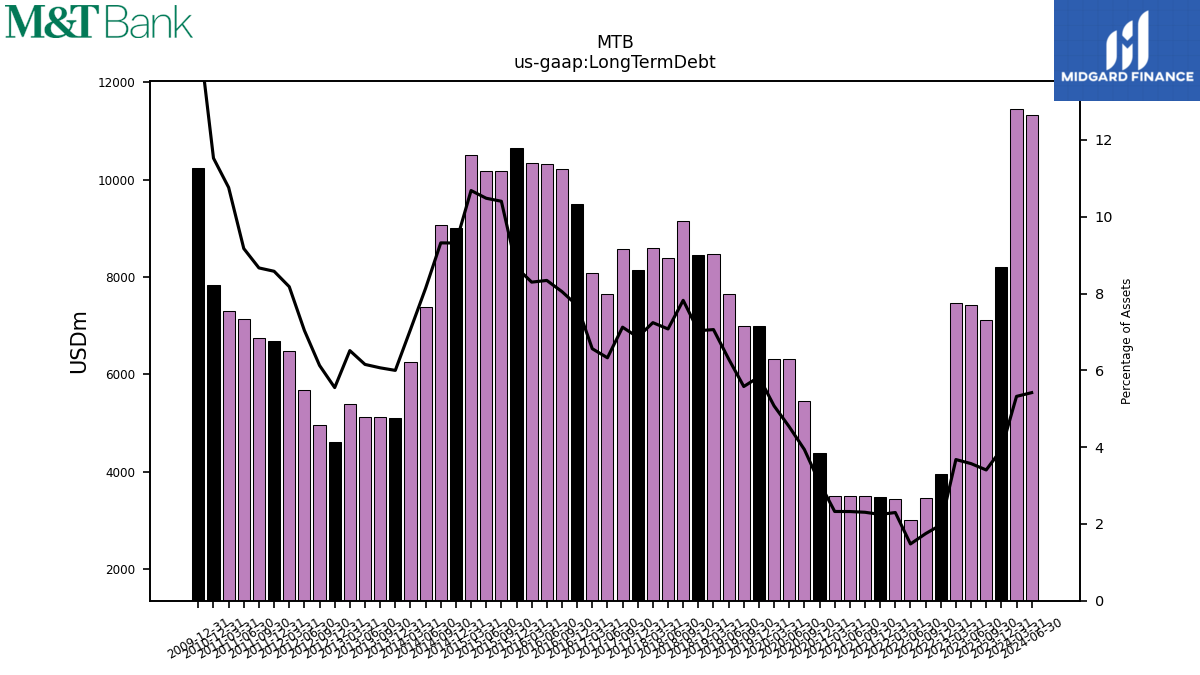
| Long Term Debt | 11450.00 | 7123.43 | 7416.64 | 7462.89 | 3459.34 | 3017.36 | 3443.59 | 3500.39 | 3499.45 | 3498.50 | 5458.89 | 6321.29 | 6321.44 | 7002.52 | 7655.51 | 8476.02 | 9140.27 | 8382.32 | 8591.05 | 8577.65 | 7649.58 | 8087.62 | 10211.16 | 10328.75 | 10341.03 | 10174.29 | 10175.91 | 10509.14 | 9061.39 | 7391.93 | 6251.20 | 5121.33 | 5122.40 | 5394.56 | 4969.54 | |
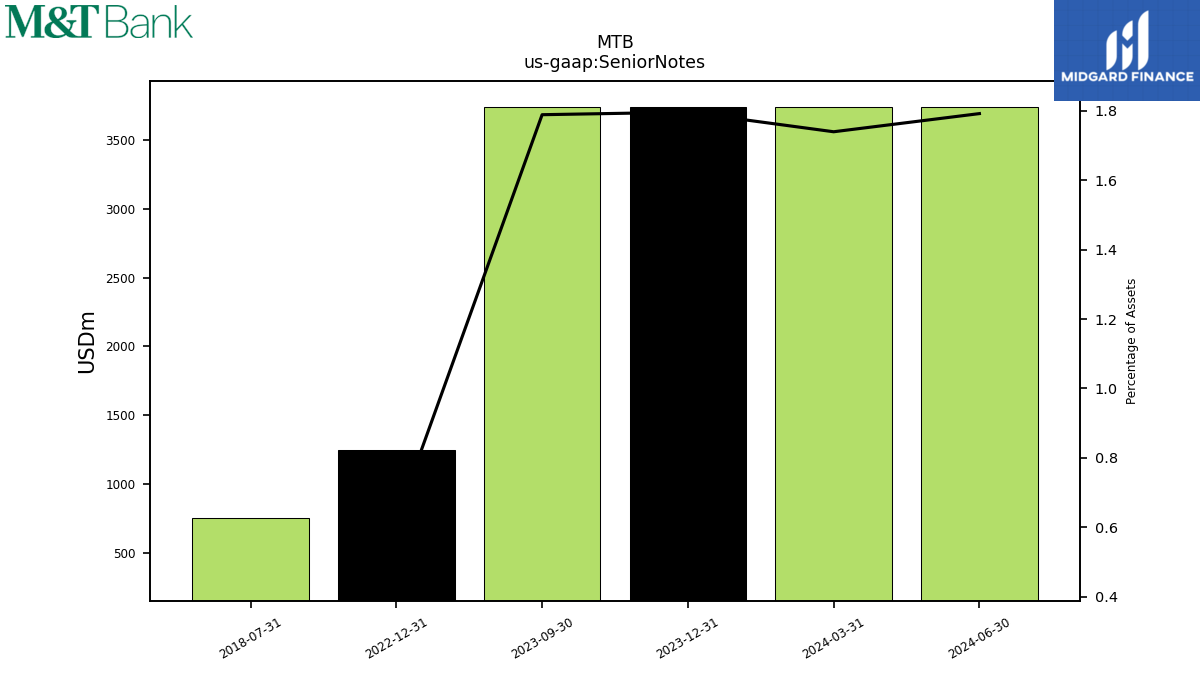
| Senior Notes | 3743.00 | 3741.16 | NA | NA | NA | NA | NA | NA | NA | NA | NA | NA | NA | NA | NA | NA | NA | NA | NA | NA | NA | NA | NA | NA | NA | NA | NA | NA | NA | NA | NA | NA | NA | NA | NA |
| 2024-03-31 | 2023-09-30 | 2023-06-30 | 2023-03-31 | 2022-09-30 | 2022-06-30 | 2022-03-31 | 2021-09-30 | 2021-06-30 | 2021-03-31 | 2020-09-30 | 2020-06-30 | 2020-03-31 | 2019-09-30 | 2019-06-30 | 2019-03-31 | 2018-09-30 | 2018-06-30 | 2018-03-31 | 2017-09-30 | 2017-06-30 | 2017-03-31 | 2016-09-30 | 2016-06-30 | 2016-03-31 | 2015-09-30 | 2015-06-30 | 2015-03-31 | 2014-09-30 | 2014-06-30 | 2014-03-31 | 2013-09-30 | 2013-06-30 | 2013-03-31 | 2012-09-30 | ||
|---|---|---|---|---|---|---|---|---|---|---|---|---|---|---|---|---|---|---|---|---|---|---|---|---|---|---|---|---|---|---|---|---|---|---|---|---|
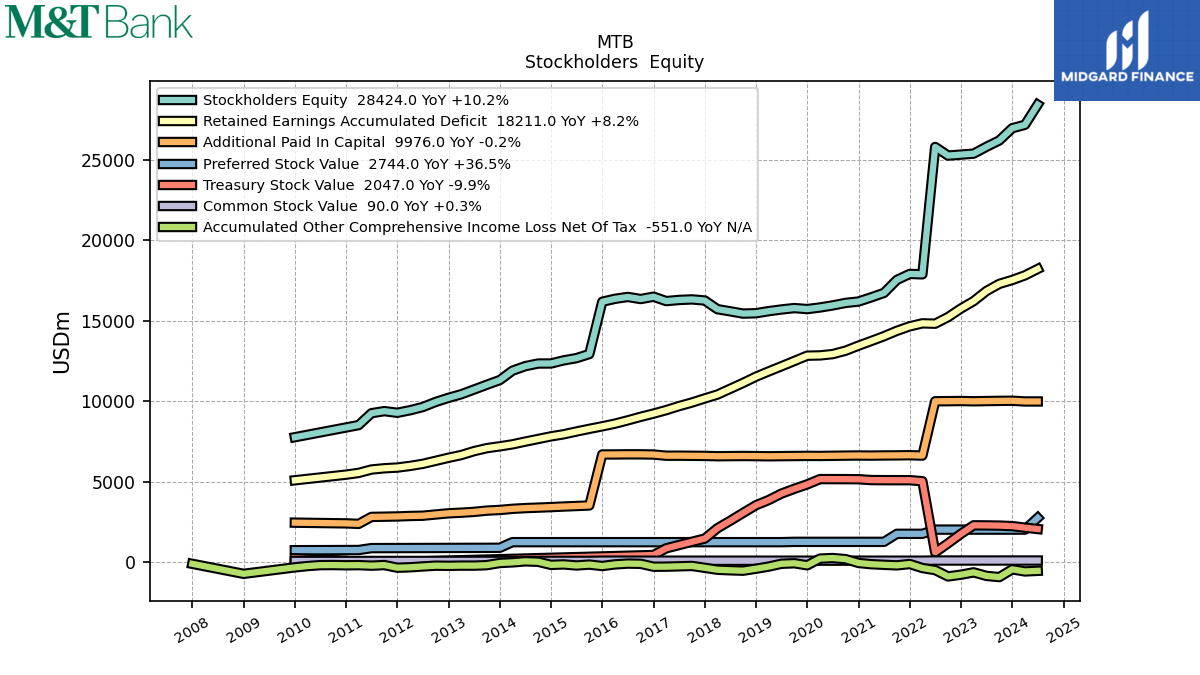
| Stockholders Equity | 27169.00 | 26196.50 | 25800.93 | 25377.17 | 25256.49 | 25794.53 | 17876.02 | 17528.77 | 16720.30 | 16446.51 | 16101.01 | 15945.10 | 15815.79 | 15779.81 | 15691.83 | 15587.53 | 15436.08 | 15577.89 | 15709.69 | 16318.05 | 16283.54 | 16213.10 | 16340.98 | 16471.51 | 16355.05 | 12921.93 | 12668.00 | 12528.30 | 12333.32 | 12168.75 | 11886.86 | 11016.20 | 10716.33 | 10422.96 | 9945.53 | |
| Common Stock Value | 90.00 | 89.72 | 89.72 | 89.72 | 89.72 | 89.72 | 79.87 | 79.87 | 79.87 | 79.87 | 79.87 | 79.87 | 79.87 | 79.87 | 79.87 | 79.87 | 79.88 | 79.88 | 79.88 | 79.91 | 79.91 | 79.91 | 79.97 | 79.98 | 79.98 | 66.64 | 66.53 | 66.45 | 66.05 | 65.96 | 65.69 | 65.10 | 64.71 | 64.48 | 63.70 | |
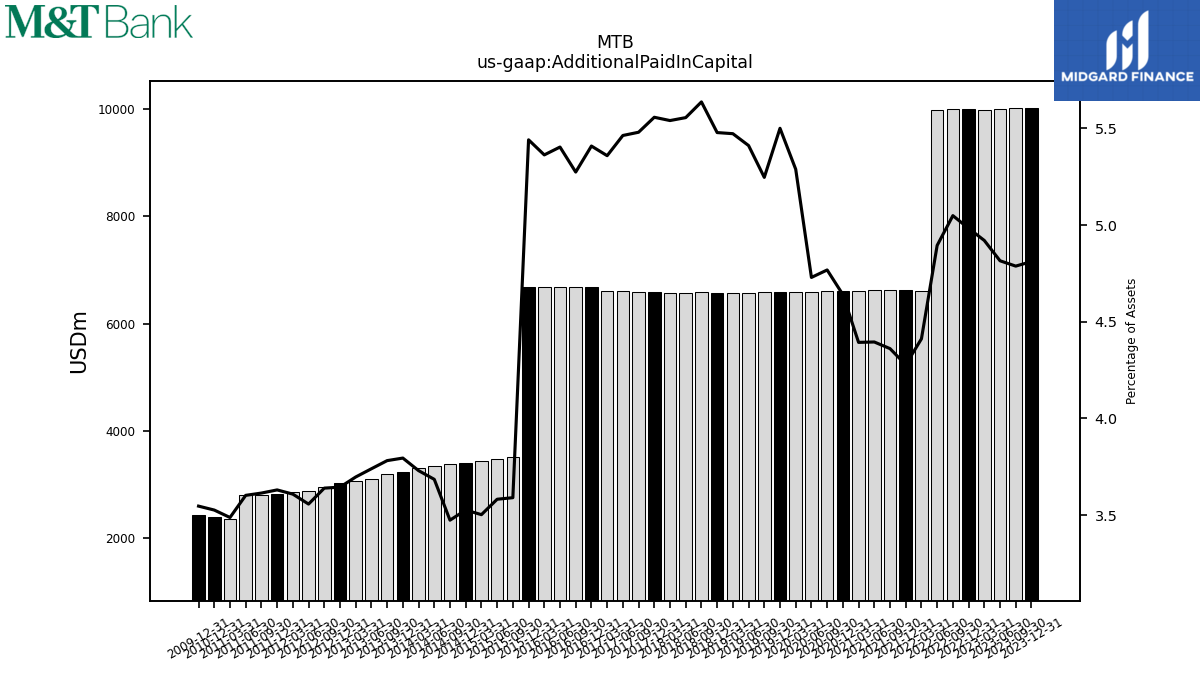
| Additional Paid In Capital | 9976.00 | 10012.44 | 10000.33 | 9986.33 | 9994.40 | 9986.88 | 6611.66 | 6624.66 | 6620.53 | 6611.15 | 6609.57 | 6599.07 | 6588.41 | 6584.70 | 6577.60 | 6568.48 | 6585.45 | 6579.40 | 6572.28 | 6598.05 | 6604.93 | 6603.35 | 6689.81 | 6690.67 | 6683.50 | 3511.18 | 3477.61 | 3445.71 | 3377.71 | 3347.31 | 3302.40 | 3192.98 | 3112.67 | 3061.78 | 2951.25 | |
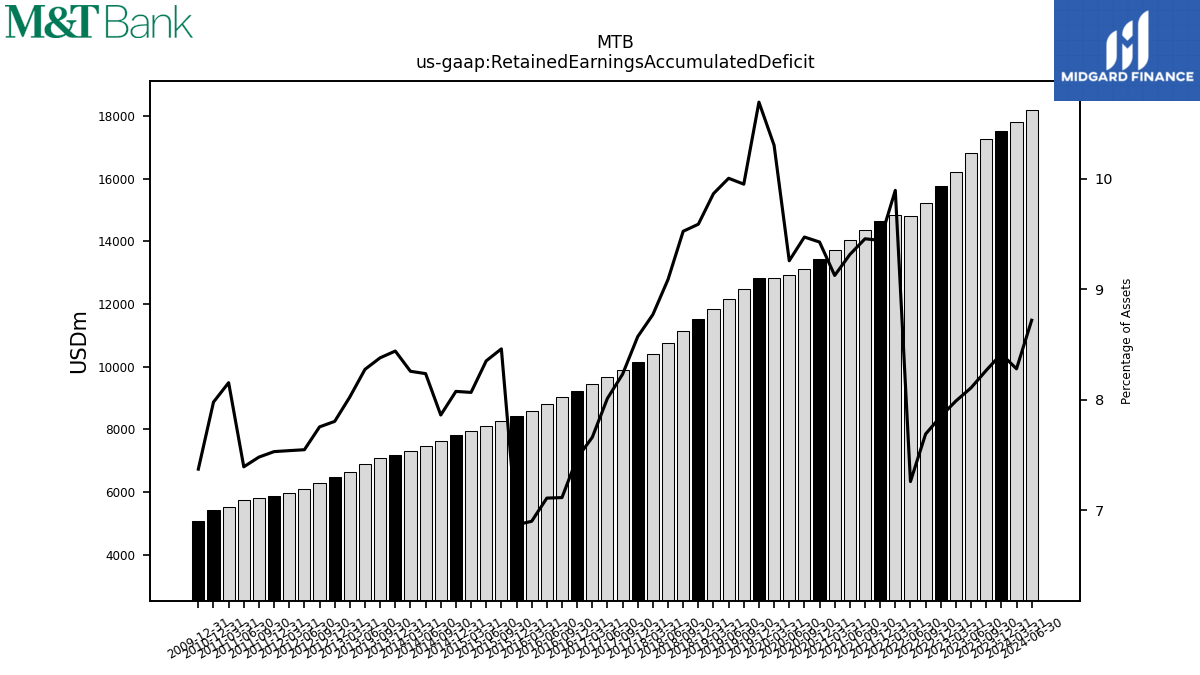
| Retained Earnings Accumulated Deficit | 17812.00 | 17284.35 | 16836.81 | 16212.09 | 15219.83 | 14808.64 | 14830.67 | 14365.91 | 14030.22 | 13731.89 | 13132.37 | 12919.34 | 12837.39 | 12490.23 | 12162.28 | 11842.37 | 11128.34 | 10763.64 | 10404.46 | 9909.42 | 9685.48 | 9437.45 | 9021.97 | 8801.31 | 8596.75 | 8273.75 | 8107.52 | 7934.82 | 7642.99 | 7481.08 | 7309.91 | 7074.29 | 6887.07 | 6645.19 | 6286.78 | |
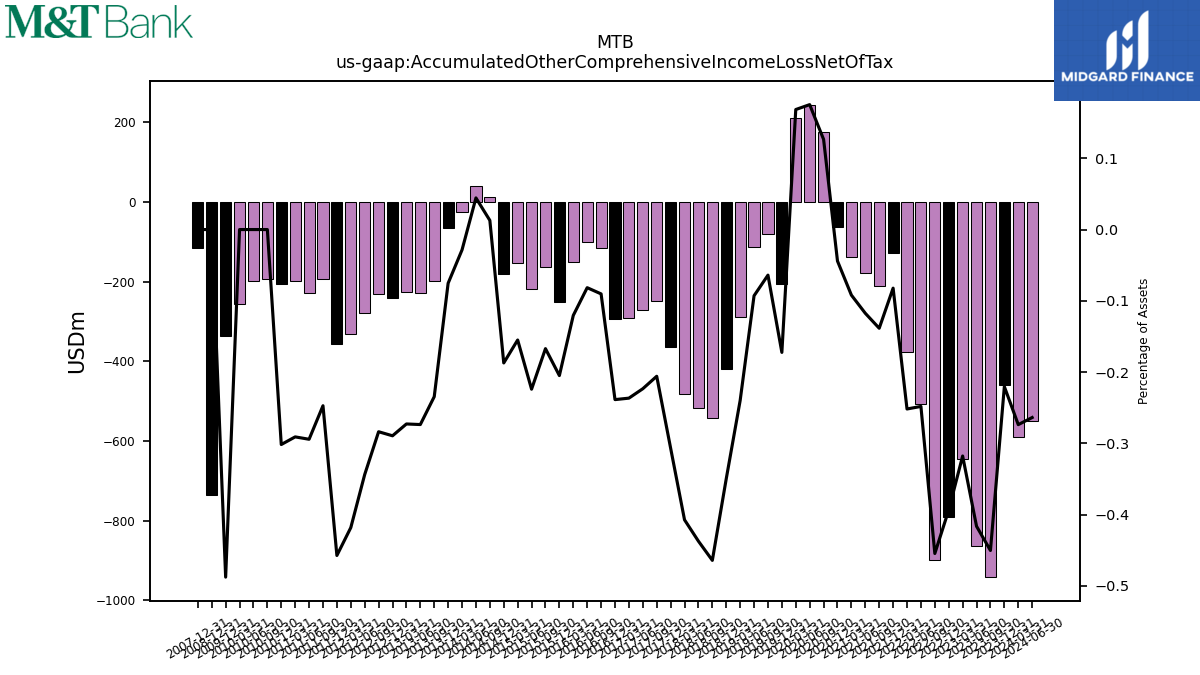
| Accumulated Other Comprehensive Income Loss Net Of Tax | -589.00 | -941.88 | -864.80 | -645.00 | -899.99 | -506.49 | -377.38 | -210.42 | -176.97 | -138.48 | 175.50 | 244.63 | 209.83 | -80.31 | -112.96 | -288.01 | -542.40 | -517.94 | -483.24 | -247.91 | -270.08 | -291.57 | -114.56 | -101.02 | -150.19 | -163.47 | -217.50 | -152.49 | 12.47 | 40.31 | -25.26 | -198.06 | -227.77 | -225.95 | -230.07 | |
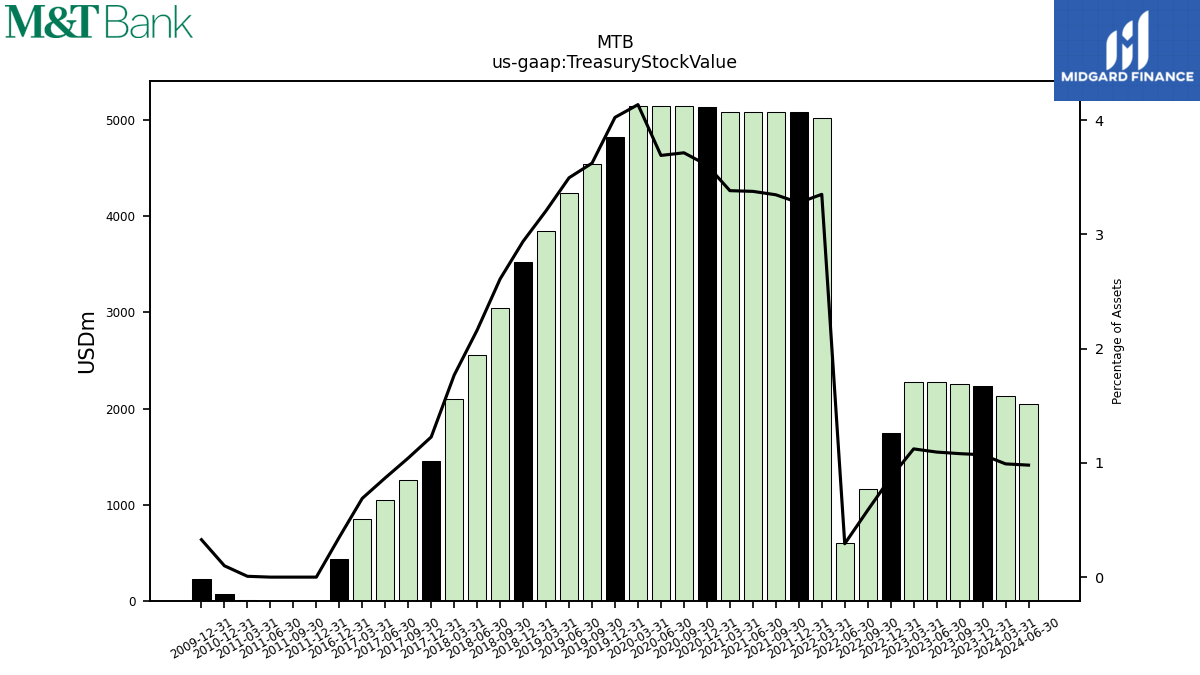
| Treasury Stock Value | 2132.00 | 2259.70 | 2272.70 | 2277.52 | 1159.15 | 595.90 | 5019.87 | 5082.45 | 5084.52 | 5089.09 | 5147.64 | 5149.12 | 5151.00 | 4546.24 | 4247.99 | 3848.20 | 3048.41 | 2560.28 | 2096.86 | 1254.73 | 1050.14 | 849.47 | NA | NA | NA | NA | NA | NA | NA | NA | NA | NA | NA | NA | NA |
| 2024-03-31 | 2023-09-30 | 2023-06-30 | 2023-03-31 | 2022-09-30 | 2022-06-30 | 2022-03-31 | 2021-09-30 | 2021-06-30 | 2021-03-31 | 2020-09-30 | 2020-06-30 | 2020-03-31 | 2019-09-30 | 2019-06-30 | 2019-03-31 | 2018-09-30 | 2018-06-30 | 2018-03-31 | 2017-09-30 | 2017-06-30 | 2017-03-31 | 2016-09-30 | 2016-06-30 | 2016-03-31 | 2015-09-30 | 2015-06-30 | 2015-03-31 | 2014-09-30 | 2014-06-30 | 2014-03-31 | 2013-09-30 | 2013-06-30 | 2013-03-31 | 2012-09-30 | ||
|---|---|---|---|---|---|---|---|---|---|---|---|---|---|---|---|---|---|---|---|---|---|---|---|---|---|---|---|---|---|---|---|---|---|---|---|---|
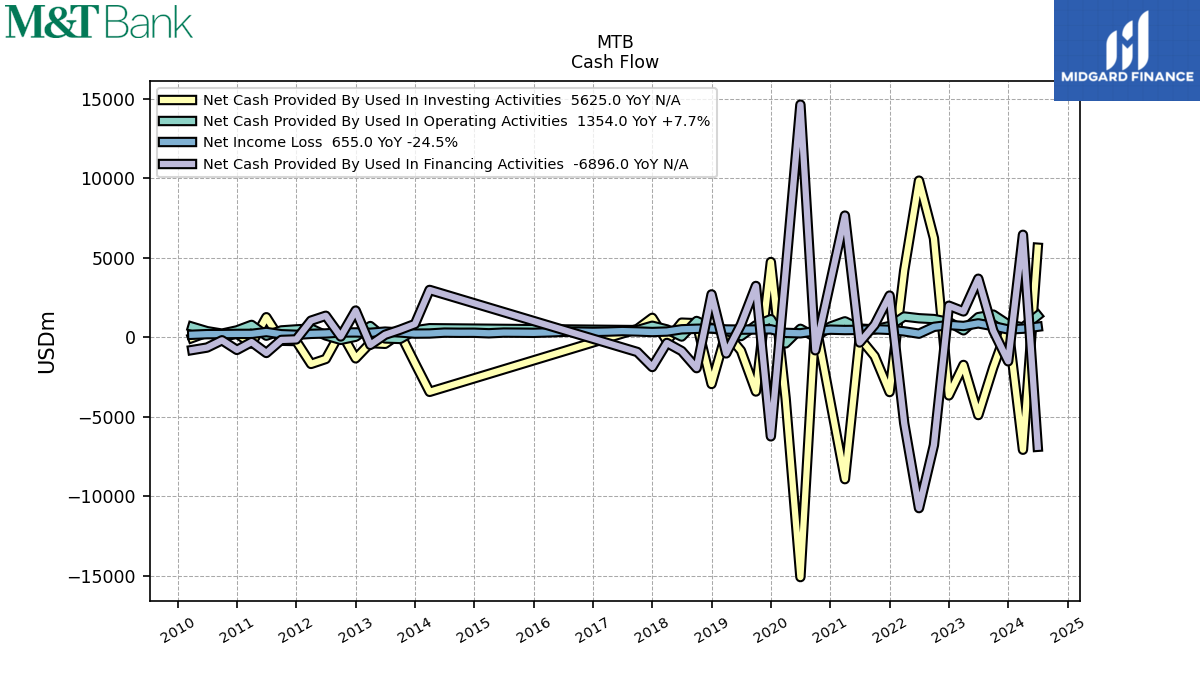
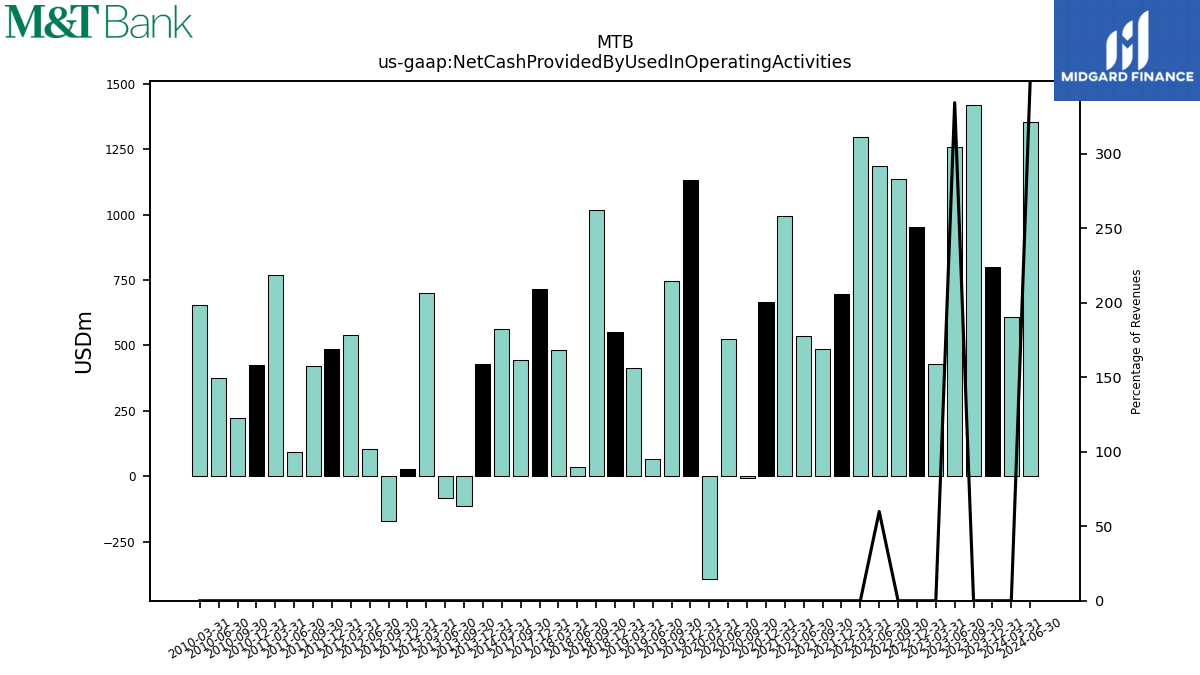
| Net Cash Provided By Used In Operating Activities | 608.00 | 1419.63 | 1257.27 | 427.81 | 1136.98 | 1187.37 | 1295.77 | 486.32 | 536.97 | 994.74 | -6.01 | 525.52 | -394.44 | 746.67 | 66.87 | 413.31 | 1018.38 | 37.06 | 484.18 | 442.58 | NA | NA | NA | NA | NA | NA | NA | NA | NA | NA | 561.10 | -112.82 | -81.90 | 698.40 | -170.85 | |
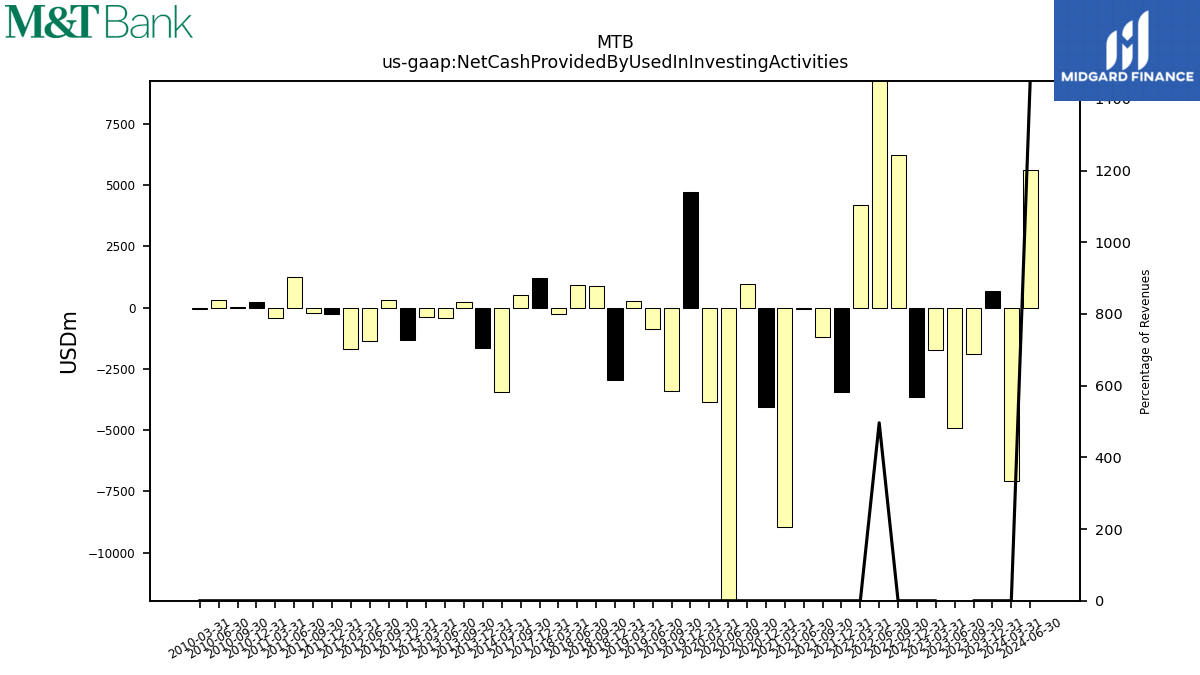
| Net Cash Provided By Used In Investing Activities | -7082.00 | -1907.43 | -4901.76 | -1747.71 | 6219.31 | 9842.98 | 4195.58 | -1195.80 | -50.62 | -8931.75 | 967.26 | -15091.89 | -3852.36 | -3418.81 | -852.12 | 271.26 | 873.74 | 911.52 | -248.53 | 514.54 | NA | NA | NA | NA | NA | NA | NA | NA | NA | NA | -3441.04 | 229.37 | -419.73 | -371.77 | 329.68 | |
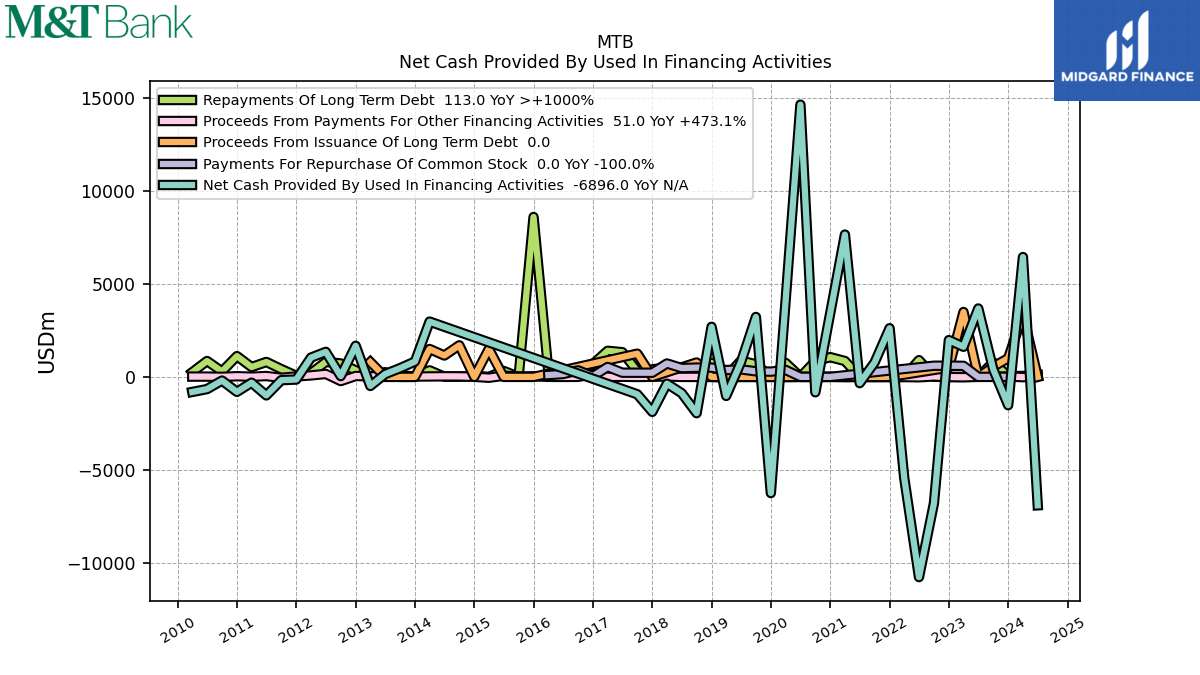
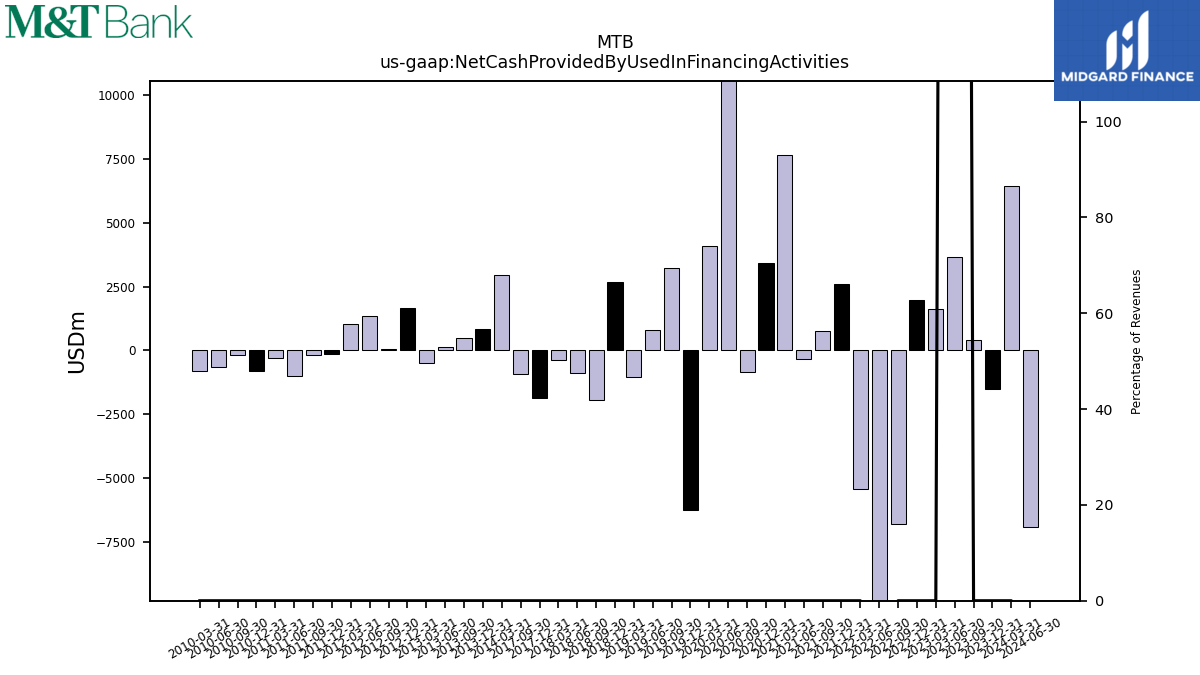
| Net Cash Provided By Used In Financing Activities | 6438.00 | 408.27 | 3675.14 | 1617.39 | -6788.76 | -10753.54 | -5417.47 | 778.73 | -335.87 | 7644.26 | -826.83 | 14622.99 | 4108.69 | 3219.59 | 789.60 | -1022.75 | -1949.60 | -872.15 | -363.87 | -934.34 | NA | NA | NA | NA | NA | NA | NA | NA | NA | NA | 2970.12 | 468.70 | 150.07 | -487.17 | 41.27 |
| 2024-03-31 | 2023-09-30 | 2023-06-30 | 2023-03-31 | 2022-09-30 | 2022-06-30 | 2022-03-31 | 2021-09-30 | 2021-06-30 | 2021-03-31 | 2020-09-30 | 2020-06-30 | 2020-03-31 | 2019-09-30 | 2019-06-30 | 2019-03-31 | 2018-09-30 | 2018-06-30 | 2018-03-31 | 2017-09-30 | 2017-06-30 | 2017-03-31 | 2016-09-30 | 2016-06-30 | 2016-03-31 | 2015-09-30 | 2015-06-30 | 2015-03-31 | 2014-09-30 | 2014-06-30 | 2014-03-31 | 2013-09-30 | 2013-06-30 | 2013-03-31 | 2012-09-30 | ||
|---|---|---|---|---|---|---|---|---|---|---|---|---|---|---|---|---|---|---|---|---|---|---|---|---|---|---|---|---|---|---|---|---|---|---|---|---|
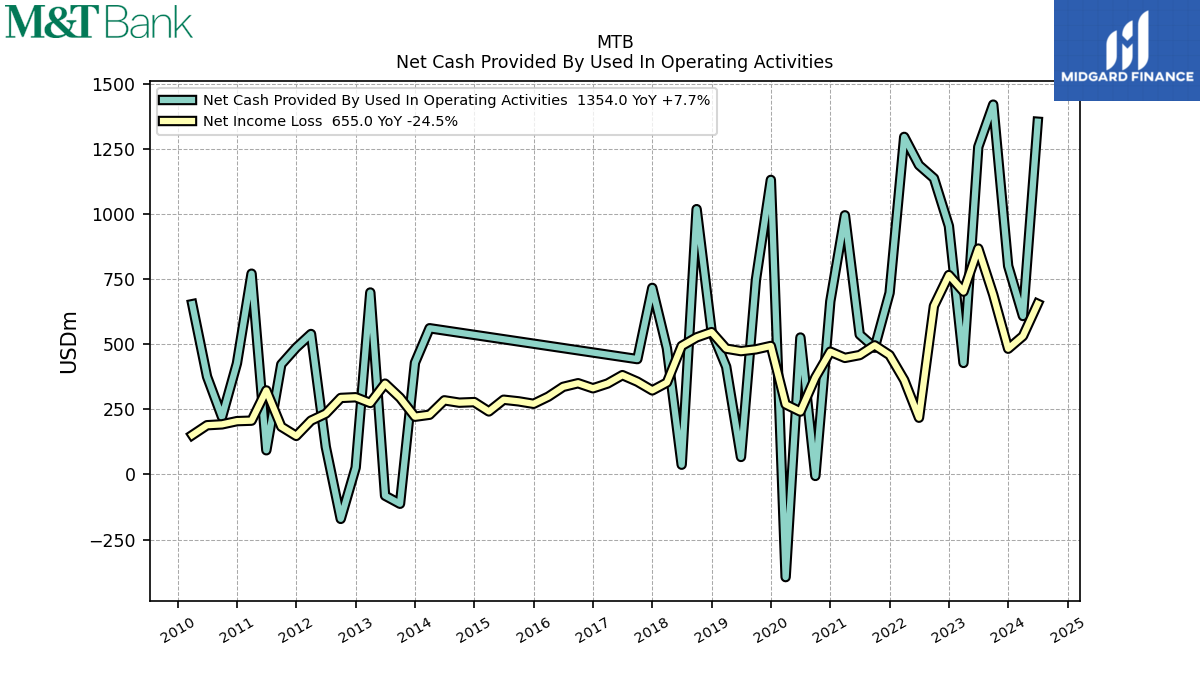
| Net Cash Provided By Used In Operating Activities | 608.00 | 1419.63 | 1257.27 | 427.81 | 1136.98 | 1187.37 | 1295.77 | 486.32 | 536.97 | 994.74 | -6.01 | 525.52 | -394.44 | 746.67 | 66.87 | 413.31 | 1018.38 | 37.06 | 484.18 | 442.58 | NA | NA | NA | NA | NA | NA | NA | NA | NA | NA | 561.10 | -112.82 | -81.90 | 698.40 | -170.85 | |
| Net Income Loss | 531.00 | 689.94 | 867.03 | 701.62 | 646.60 | 217.52 | 362.17 | 495.46 | 458.07 | 447.25 | 372.14 | 241.05 | 268.82 | 480.08 | 473.26 | 482.74 | 526.09 | 493.16 | 352.61 | 355.92 | 381.05 | 348.93 | 349.98 | 336.03 | 298.53 | 280.40 | 286.69 | 241.61 | 275.34 | 284.34 | 229.02 | 294.48 | 348.47 | 274.11 | 293.46 | |
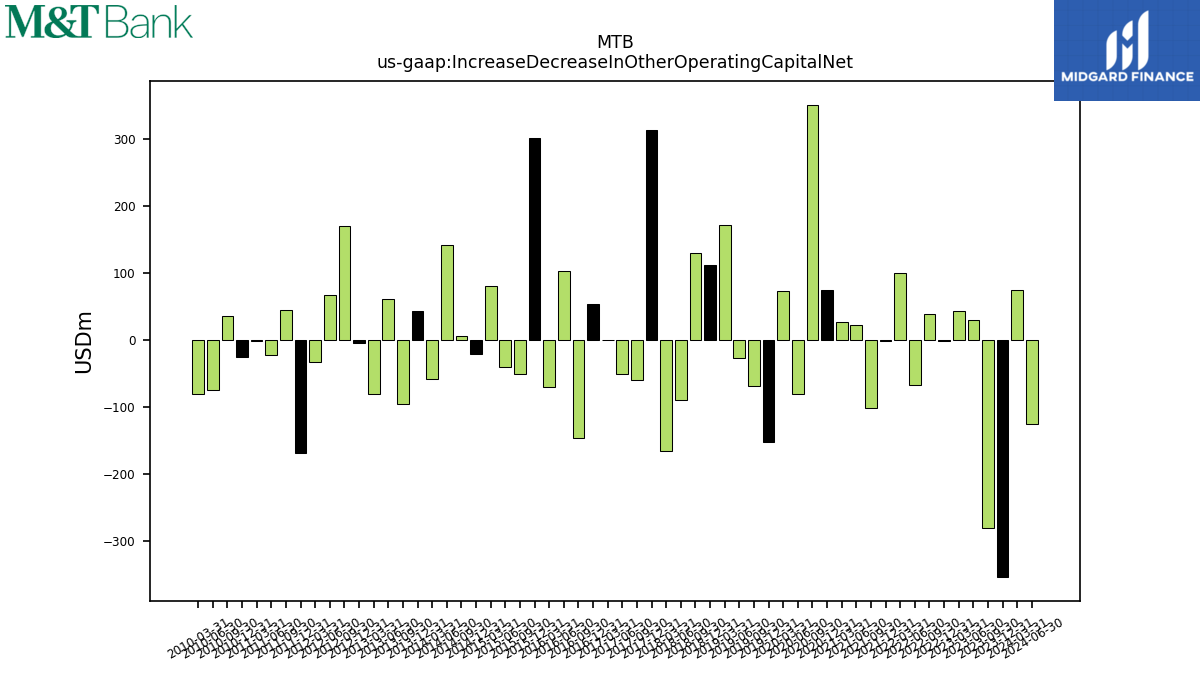
| Increase Decrease In Other Operating Capital Net | 74.00 | -280.01 | 29.34 | 42.83 | 38.59 | -66.75 | 99.16 | -101.00 | 22.90 | 27.30 | 350.49 | -79.77 | 73.36 | -69.15 | -26.59 | 171.30 | 129.65 | -90.01 | -165.11 | -59.48 | -50.87 | 0.21 | -145.99 | 102.95 | -70.77 | -50.70 | -40.58 | 80.08 | 6.61 | 140.70 | -57.88 | -95.06 | 60.31 | -80.64 | 169.29 | |
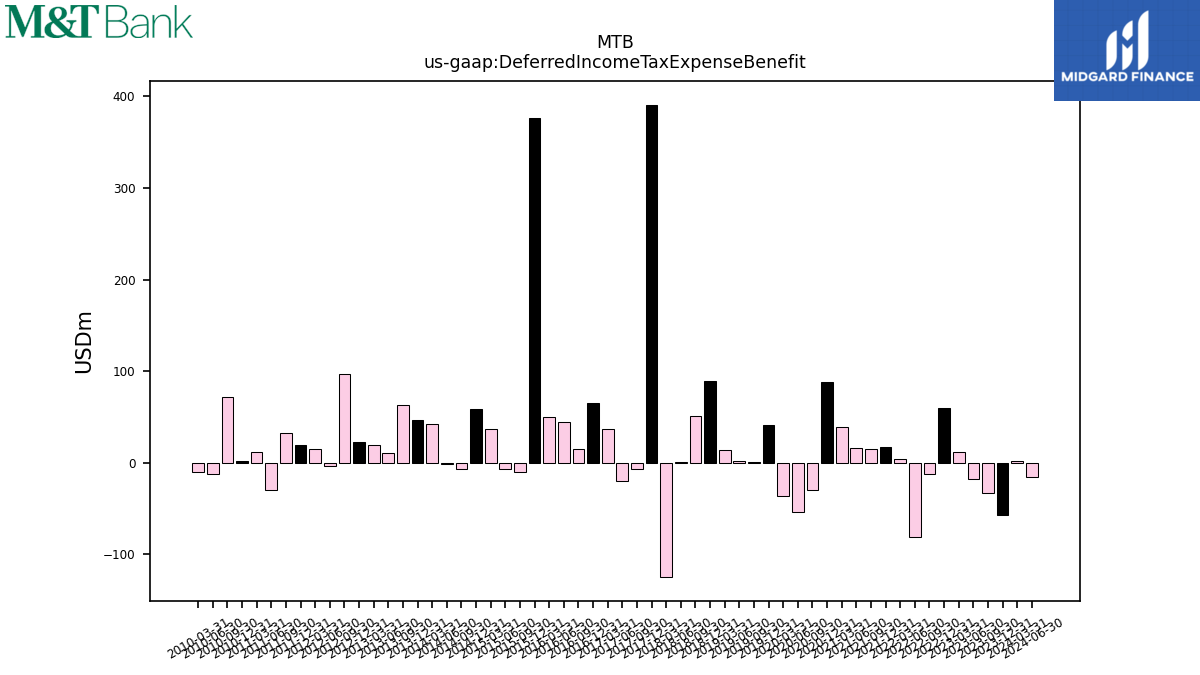
| Deferred Income Tax Expense Benefit | 2.00 | -33.23 | -18.07 | 11.38 | -12.07 | -81.50 | 4.15 | 15.04 | 15.82 | 39.33 | -29.82 | -53.85 | -36.24 | 0.87 | 2.38 | 13.44 | 50.57 | 0.79 | -124.77 | -7.21 | -19.59 | 36.73 | 14.82 | 44.38 | 50.08 | -9.74 | -7.17 | 37.05 | -7.19 | -1.29 | 42.26 | 62.86 | 11.12 | 19.25 | 96.64 |
| 2024-03-31 | 2023-09-30 | 2023-06-30 | 2023-03-31 | 2022-09-30 | 2022-06-30 | 2022-03-31 | 2021-09-30 | 2021-06-30 | 2021-03-31 | 2020-09-30 | 2020-06-30 | 2020-03-31 | 2019-09-30 | 2019-06-30 | 2019-03-31 | 2018-09-30 | 2018-06-30 | 2018-03-31 | 2017-09-30 | 2017-06-30 | 2017-03-31 | 2016-09-30 | 2016-06-30 | 2016-03-31 | 2015-09-30 | 2015-06-30 | 2015-03-31 | 2014-09-30 | 2014-06-30 | 2014-03-31 | 2013-09-30 | 2013-06-30 | 2013-03-31 | 2012-09-30 | ||
|---|---|---|---|---|---|---|---|---|---|---|---|---|---|---|---|---|---|---|---|---|---|---|---|---|---|---|---|---|---|---|---|---|---|---|---|---|
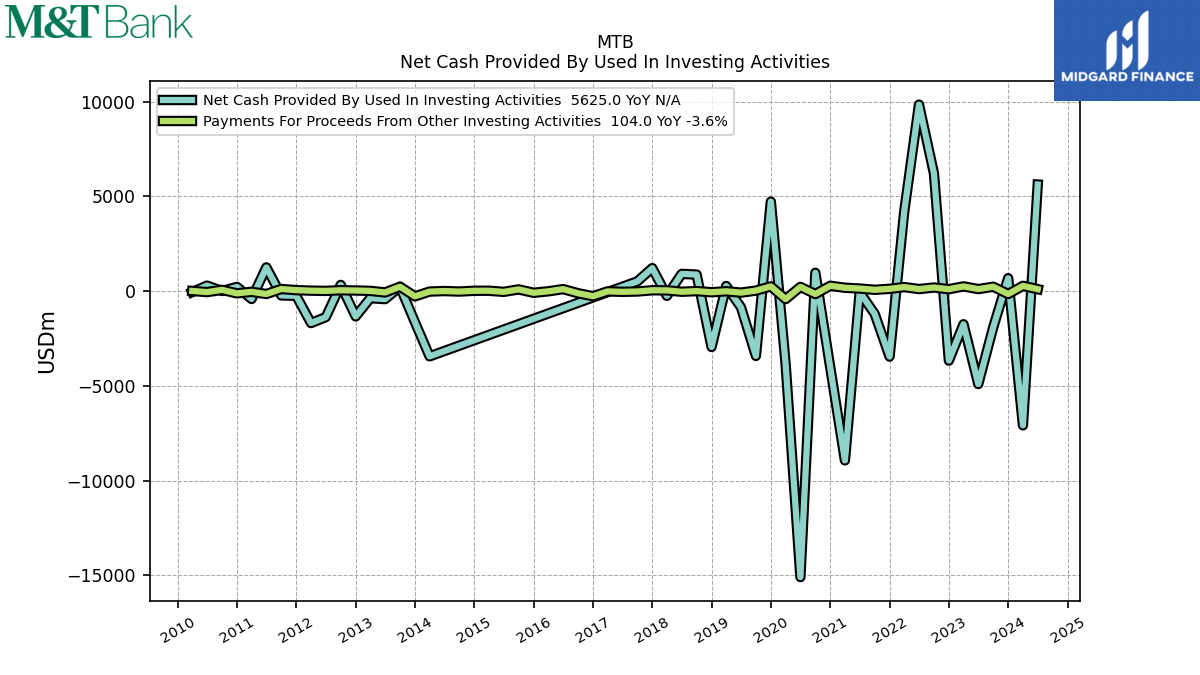
| Net Cash Provided By Used In Investing Activities | -7082.00 | -1907.43 | -4901.76 | -1747.71 | 6219.31 | 9842.98 | 4195.58 | -1195.80 | -50.62 | -8931.75 | 967.26 | -15091.89 | -3852.36 | -3418.81 | -852.12 | 271.26 | 873.74 | 911.52 | -248.53 | 514.54 | NA | NA | NA | NA | NA | NA | NA | NA | NA | NA | -3441.04 | 229.37 | -419.73 | -371.77 | 329.68 |
| 2024-03-31 | 2023-09-30 | 2023-06-30 | 2023-03-31 | 2022-09-30 | 2022-06-30 | 2022-03-31 | 2021-09-30 | 2021-06-30 | 2021-03-31 | 2020-09-30 | 2020-06-30 | 2020-03-31 | 2019-09-30 | 2019-06-30 | 2019-03-31 | 2018-09-30 | 2018-06-30 | 2018-03-31 | 2017-09-30 | 2017-06-30 | 2017-03-31 | 2016-09-30 | 2016-06-30 | 2016-03-31 | 2015-09-30 | 2015-06-30 | 2015-03-31 | 2014-09-30 | 2014-06-30 | 2014-03-31 | 2013-09-30 | 2013-06-30 | 2013-03-31 | 2012-09-30 | ||
|---|---|---|---|---|---|---|---|---|---|---|---|---|---|---|---|---|---|---|---|---|---|---|---|---|---|---|---|---|---|---|---|---|---|---|---|---|
| Net Cash Provided By Used In Financing Activities | 6438.00 | 408.27 | 3675.14 | 1617.39 | -6788.76 | -10753.54 | -5417.47 | 778.73 | -335.87 | 7644.26 | -826.83 | 14622.99 | 4108.69 | 3219.59 | 789.60 | -1022.75 | -1949.60 | -872.15 | -363.87 | -934.34 | NA | NA | NA | NA | NA | NA | NA | NA | NA | NA | 2970.12 | 468.70 | 150.07 | -487.17 | 41.27 | |
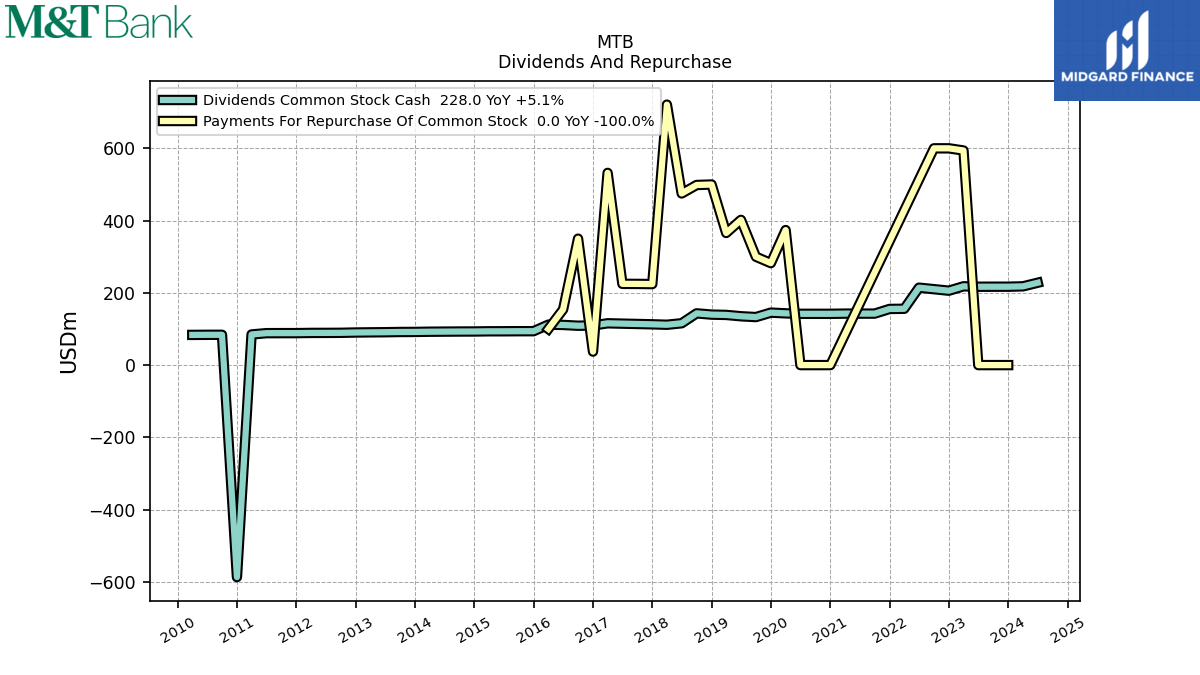
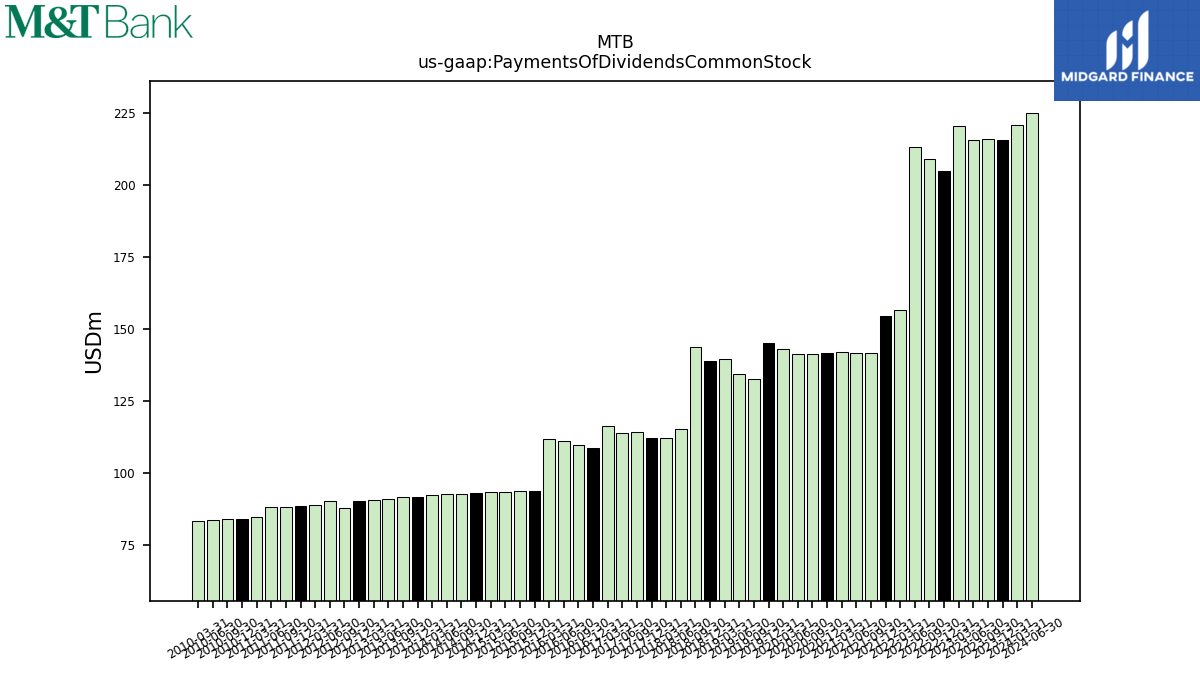
| Payments Of Dividends Common Stock | 221.00 | 215.97 | 215.85 | 220.52 | 209.15 | 213.16 | 156.66 | 141.75 | 141.75 | 142.04 | 141.51 | 141.52 | 143.17 | 132.93 | 134.44 | 139.59 | 143.81 | 115.25 | 112.32 | 114.51 | 114.09 | 116.57 | 109.86 | 111.18 | 112.00 | 93.87 | 93.65 | 93.63 | 92.98 | 92.73 | 92.41 | 91.68 | 91.05 | 90.79 | 88.03 | |
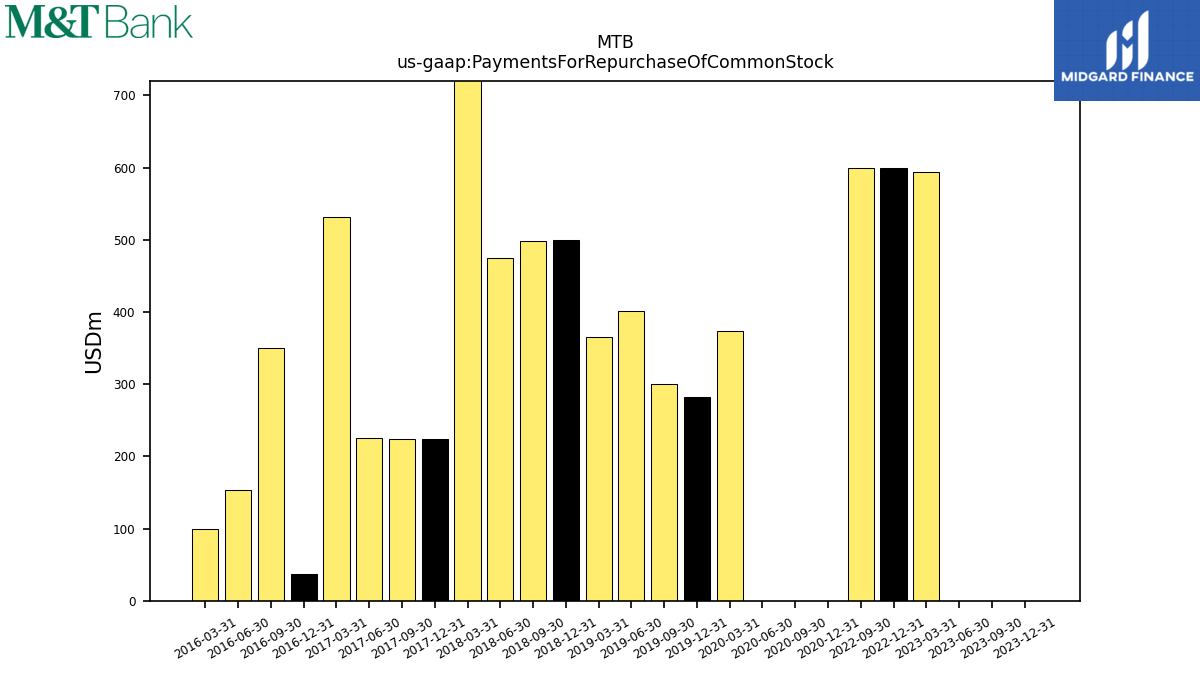
| Payments For Repurchase Of Common Stock | NA | 0.00 | 0.00 | 594.00 | 600.00 | NA | NA | NA | NA | NA | 0.00 | 0.00 | 373.75 | 299.96 | 401.98 | 365.63 | 498.50 | 475.10 | 720.97 | 224.72 | 224.89 | 532.07 | 350.00 | 154.00 | 100.00 | NA | NA | NA | NA | NA | NA | NA | NA | NA | NA |
| 2024-03-31 | 2023-09-30 | 2023-06-30 | 2023-03-31 | 2022-09-30 | 2022-06-30 | 2022-03-31 | 2021-09-30 | 2021-06-30 | 2021-03-31 | 2020-09-30 | 2020-06-30 | 2020-03-31 | 2019-09-30 | 2019-06-30 | 2019-03-31 | 2018-09-30 | 2018-06-30 | 2018-03-31 | 2017-09-30 | 2017-06-30 | 2017-03-31 | 2016-09-30 | 2016-06-30 | 2016-03-31 | 2015-09-30 | 2015-06-30 | 2015-03-31 | 2014-09-30 | 2014-06-30 | 2014-03-31 | 2013-09-30 | 2013-06-30 | 2013-03-31 | 2012-09-30 | ||
|---|---|---|---|---|---|---|---|---|---|---|---|---|---|---|---|---|---|---|---|---|---|---|---|---|---|---|---|---|---|---|---|---|---|---|---|---|
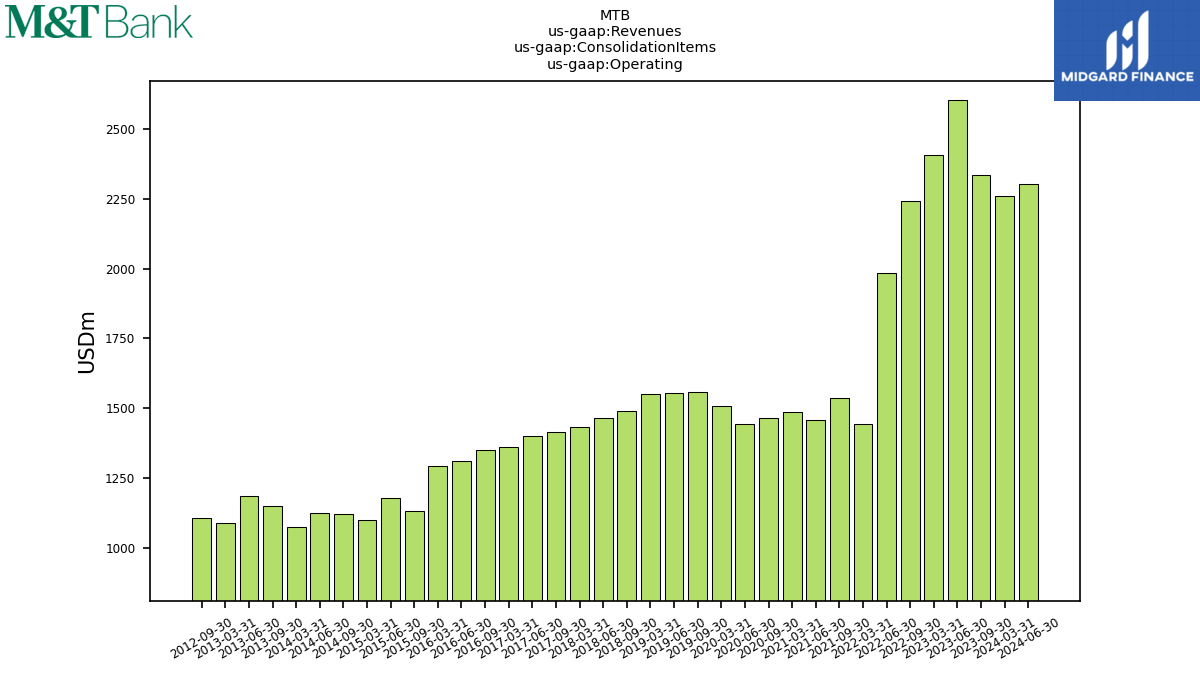
| Operating | 2260.00 | 2334.97 | 2602.30 | 2405.40 | 2241.77 | 1982.82 | 1445.06 | 1536.38 | 1455.97 | 1486.99 | 1463.66 | 1444.41 | 1506.16 | 1557.67 | 1553.58 | 1550.83 | 1488.33 | 1466.20 | 1434.21 | 1416.56 | 1399.02 | 1361.11 | 1349.69 | 1312.07 | 1292.90 | 1132.53 | 1180.15 | 1099.79 | 1120.17 | 1125.53 | 1076.54 | 1150.50 | 1186.28 | 1088.93 | 1108.45 | |
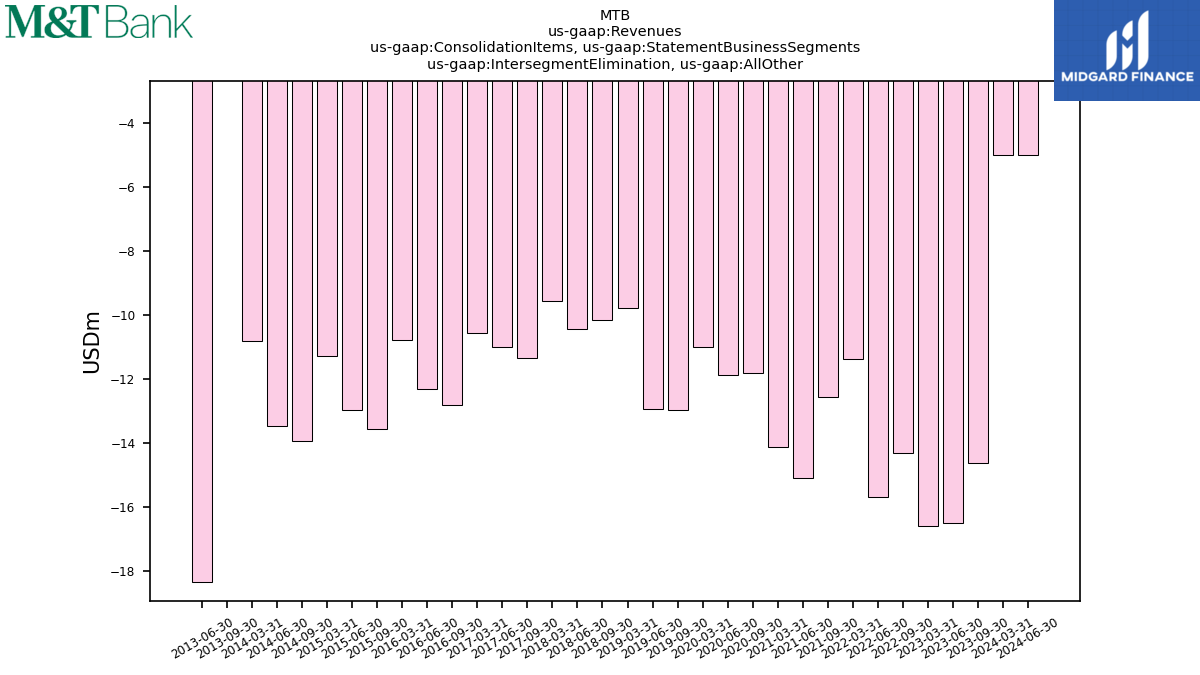
| Intersegment Elimination, All Other | -5.00 | -14.62 | -16.51 | -16.62 | -14.31 | -15.69 | -11.37 | -12.58 | -15.11 | -14.13 | -11.81 | -11.88 | -10.99 | -12.97 | -12.94 | -9.78 | -10.16 | -10.43 | -9.56 | -11.35 | -11.00 | -10.57 | -12.81 | -12.32 | -10.79 | -13.58 | -12.97 | -11.29 | -13.94 | -13.49 | -10.82 | -2.03 | -18.36 | NA | NA | |
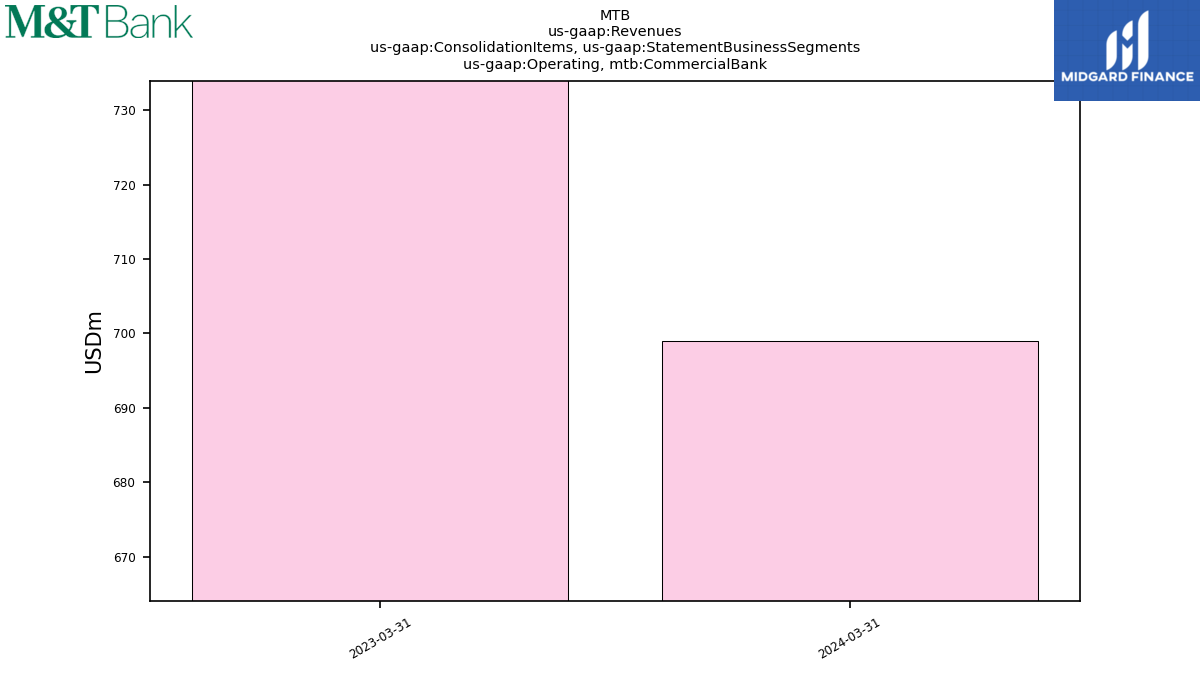
| Operating, Commercial Bank | 699.00 | NA | NA | 811.00 | NA | NA | NA | NA | NA | NA | NA | NA | NA | NA | NA | NA | NA | NA | NA | NA | NA | NA | NA | NA | NA | NA | NA | NA | NA | NA | NA | NA | NA | NA | NA | |
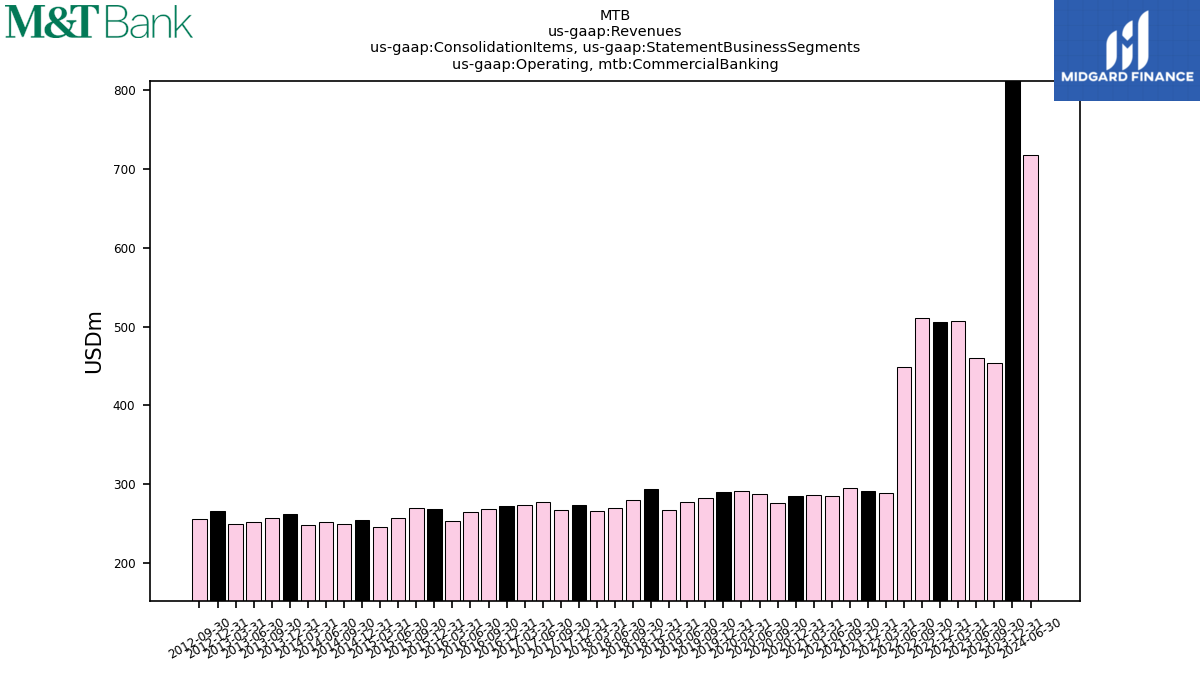
| Operating, Commercial Banking | NA | 453.33 | 460.62 | 507.02 | 510.55 | 448.44 | 289.37 | 295.21 | 284.66 | 285.91 | 276.12 | 287.52 | 291.78 | 282.76 | 278.11 | 267.49 | 280.67 | 269.50 | 266.40 | 267.82 | 277.12 | 273.85 | 268.68 | 265.48 | 253.62 | 270.55 | 257.26 | 246.58 | 249.12 | 252.50 | 248.59 | 257.32 | 252.91 | 249.85 | 255.50 | |
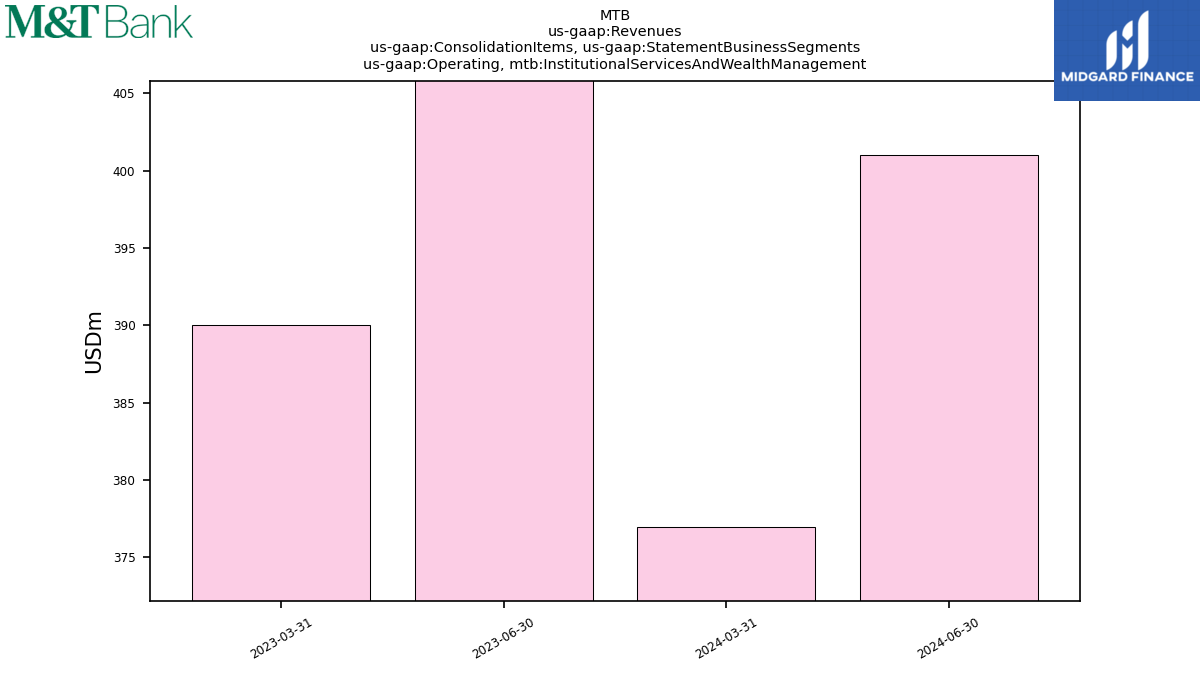
| Operating, Institutional Services And Wealth Management | 377.00 | NA | NA | 390.00 | NA | NA | NA | NA | NA | NA | NA | NA | NA | NA | NA | NA | NA | NA | NA | NA | NA | NA | NA | NA | NA | NA | NA | NA | NA | NA | NA | NA | NA | NA | NA | |
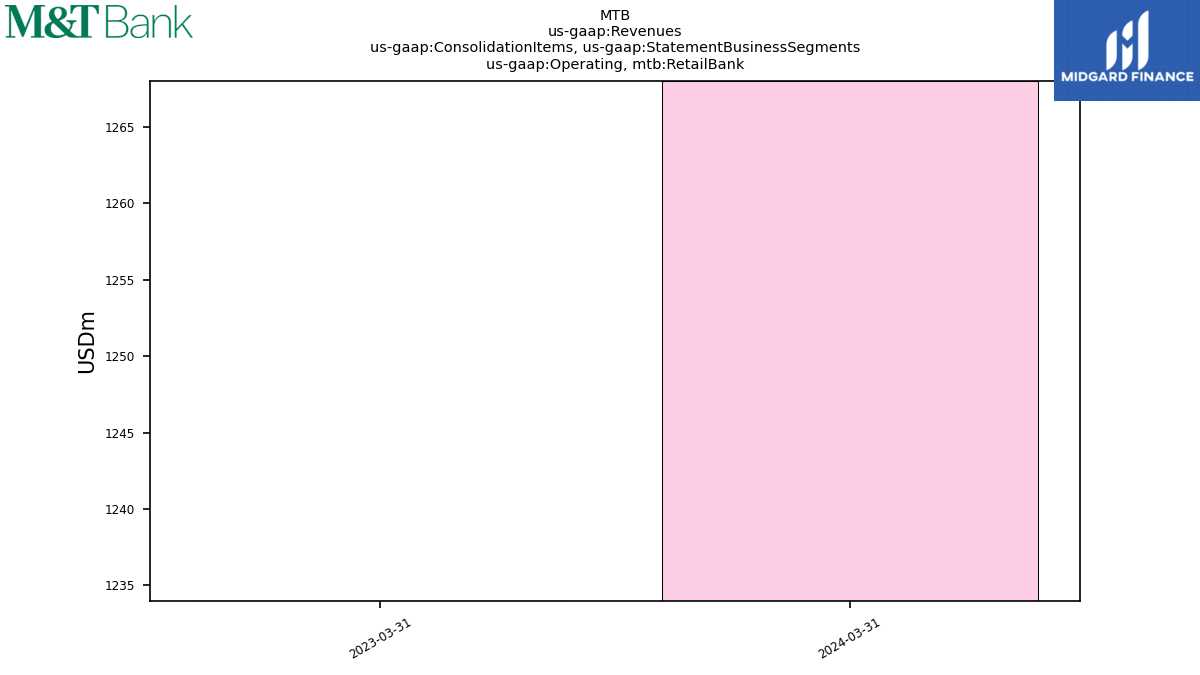
| Operating, Retail Bank | 1268.00 | NA | NA | 1234.00 | NA | NA | NA | NA | NA | NA | NA | NA | NA | NA | NA | NA | NA | NA | NA | NA | NA | NA | NA | NA | NA | NA | NA | NA | NA | NA | NA | NA | NA | NA | NA | |
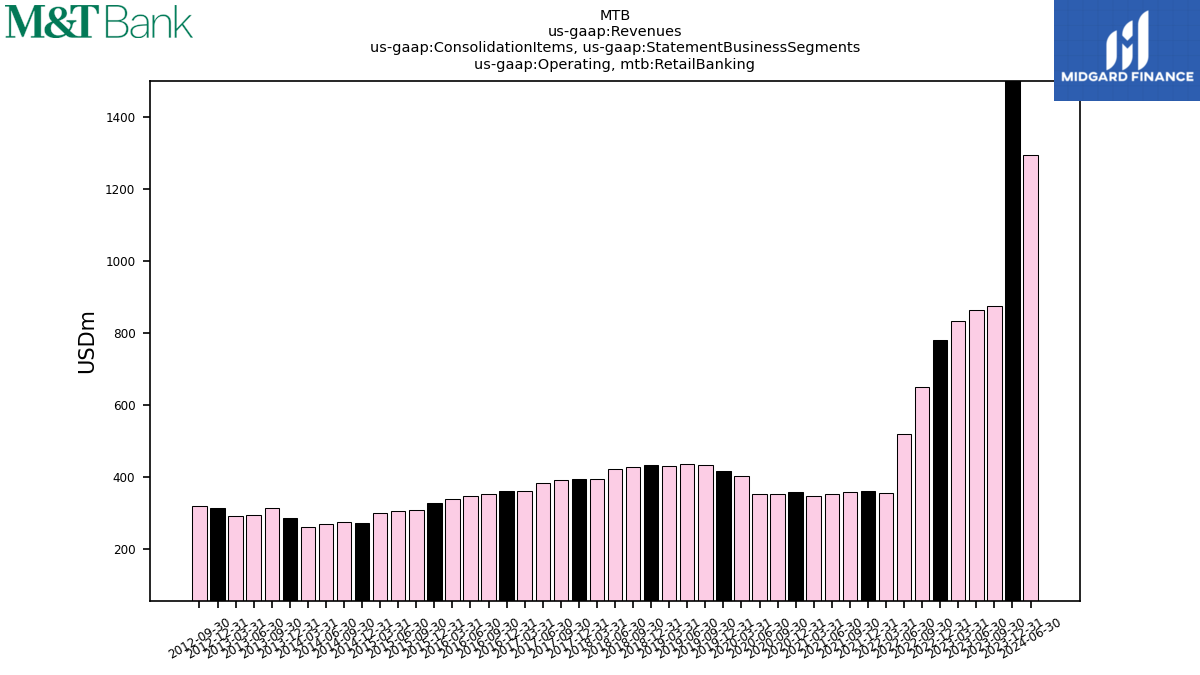
| Operating, Retail Banking | NA | 876.00 | 864.57 | 831.84 | 650.23 | 518.62 | 355.15 | 357.33 | 350.99 | 346.92 | 351.31 | 353.52 | 402.68 | 432.34 | 436.59 | 430.89 | 427.45 | 420.54 | 393.48 | 392.54 | 383.90 | 361.24 | 353.02 | 345.67 | 339.05 | 308.52 | 305.57 | 300.39 | 274.12 | 268.49 | 261.89 | 314.27 | 292.84 | 291.19 | 318.57 | |
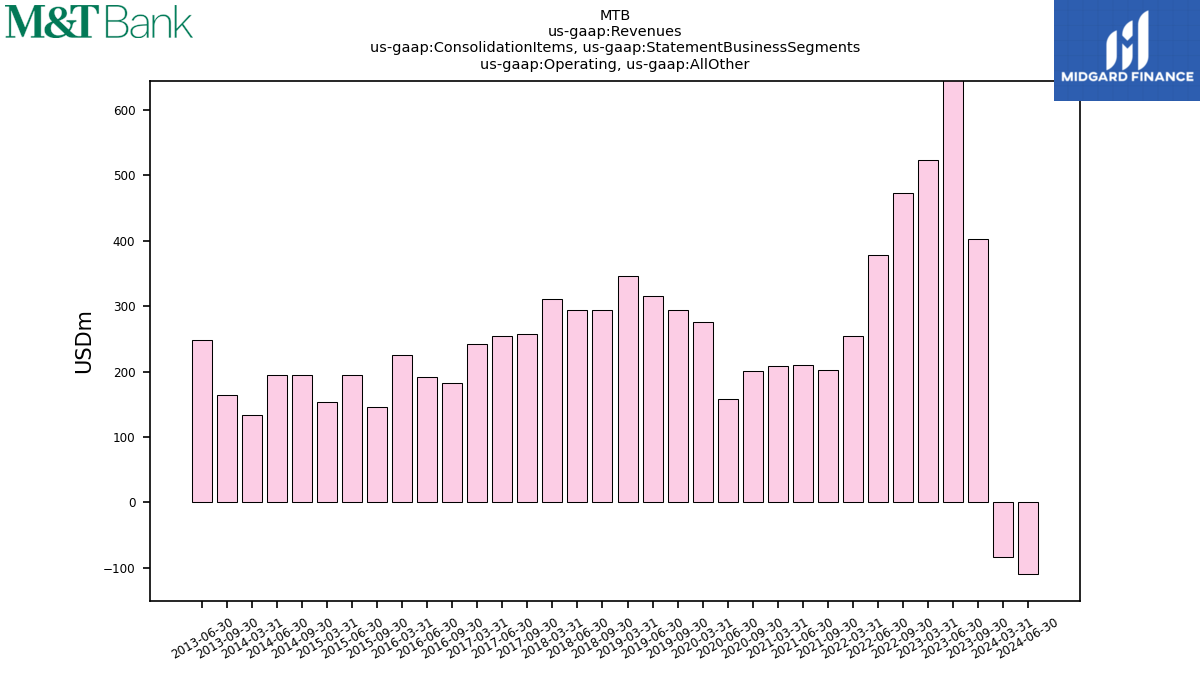
| Operating, All Other | -84.00 | 402.73 | 704.05 | 523.01 | 473.17 | 377.49 | 254.94 | 201.90 | 209.68 | 209.11 | 200.38 | 157.29 | 275.79 | 294.36 | 315.24 | 346.27 | 294.38 | 293.45 | 311.35 | 257.86 | 254.97 | 242.26 | 182.95 | 192.05 | 225.40 | 146.03 | 194.74 | 154.01 | 194.02 | 194.27 | 132.90 | 163.38 | 248.62 | NA | NA | |
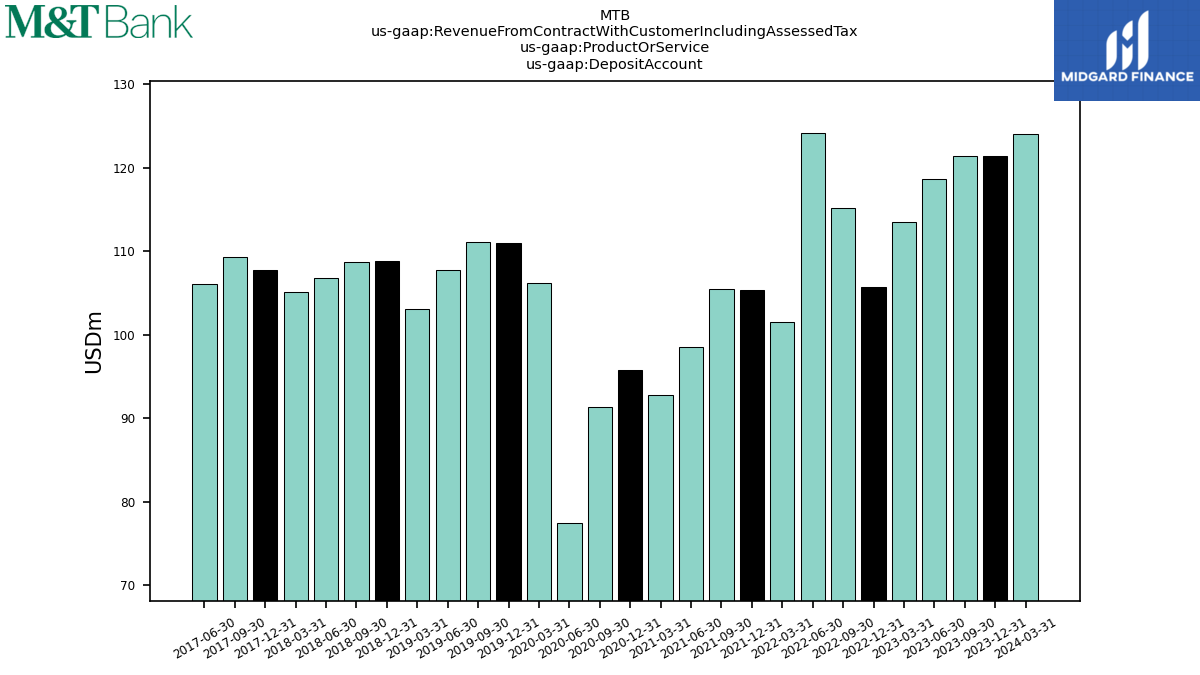
| Deposit Account | 124.00 | 121.36 | 118.70 | 113.55 | 115.21 | 124.17 | 101.51 | 105.43 | 98.52 | 92.78 | 91.36 | 77.45 | 106.16 | 111.09 | 107.79 | 103.11 | 108.65 | 106.78 | 105.11 | 109.36 | 106.06 | NA | NA | NA | NA | NA | NA | NA | NA | NA | NA | NA | NA | NA | NA | |
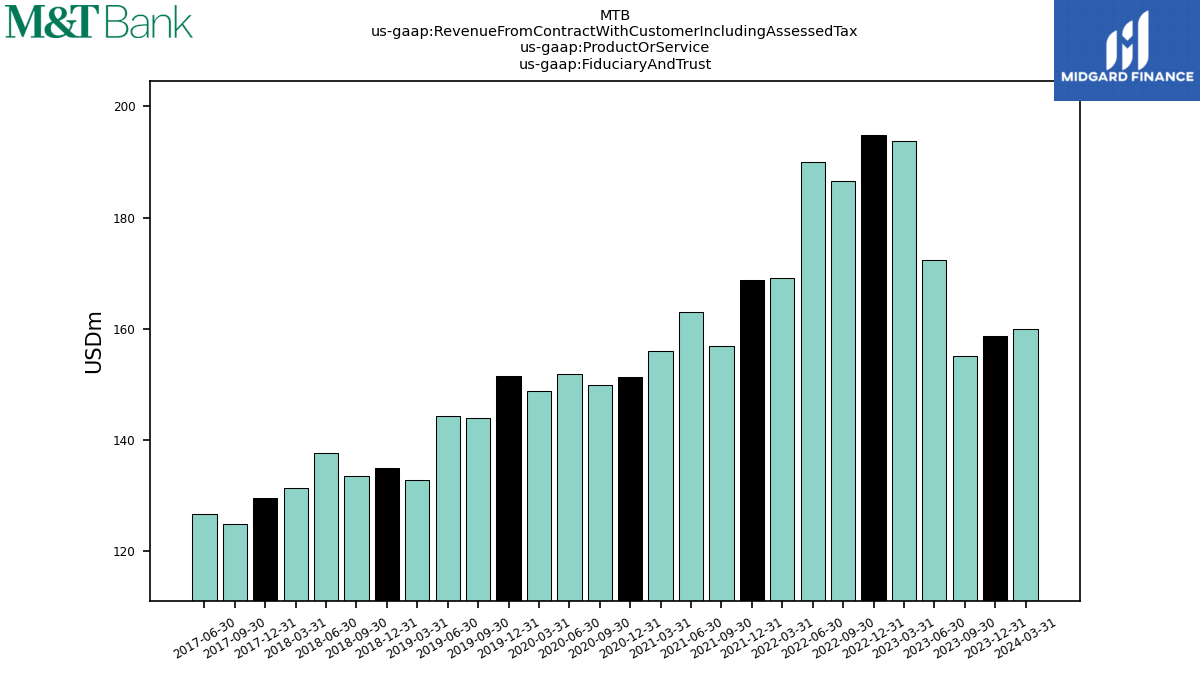
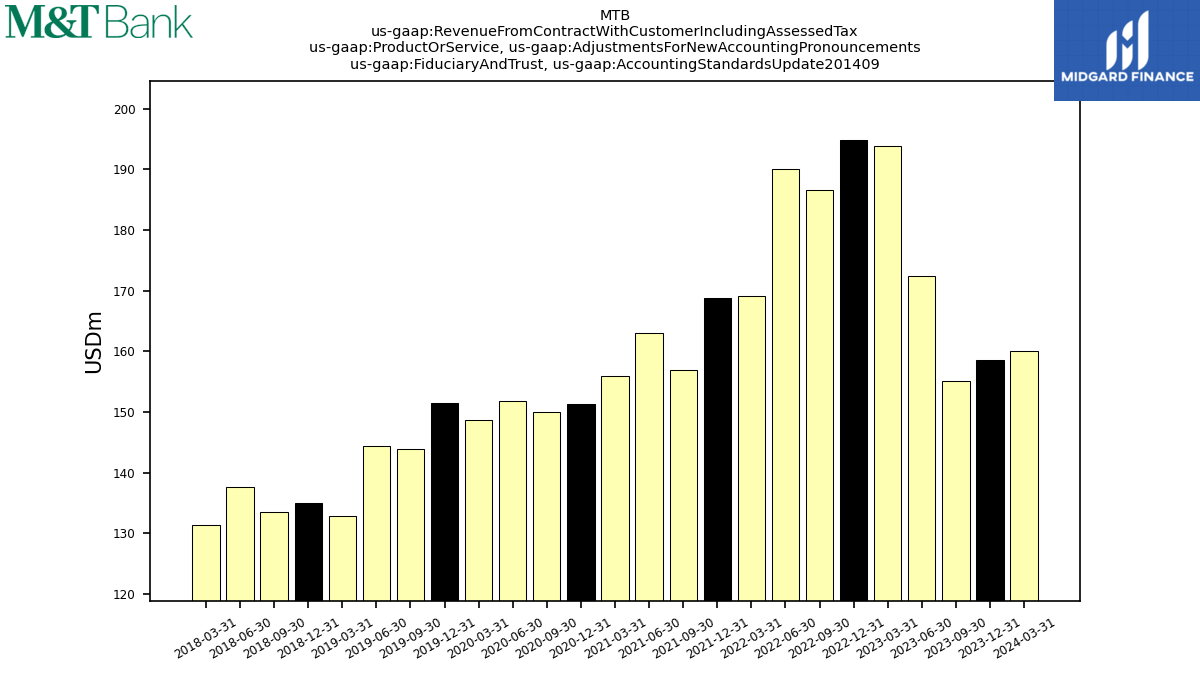
| Fiduciary And Trust | 160.00 | 155.09 | 172.46 | 193.80 | 186.58 | 190.08 | 169.21 | 156.88 | 162.99 | 156.02 | 149.94 | 151.88 | 148.75 | 143.91 | 144.38 | 132.79 | 133.54 | 137.64 | 131.38 | 124.90 | 126.80 | NA | NA | NA | NA | NA | NA | NA | NA | NA | NA | NA | NA | NA | NA | |
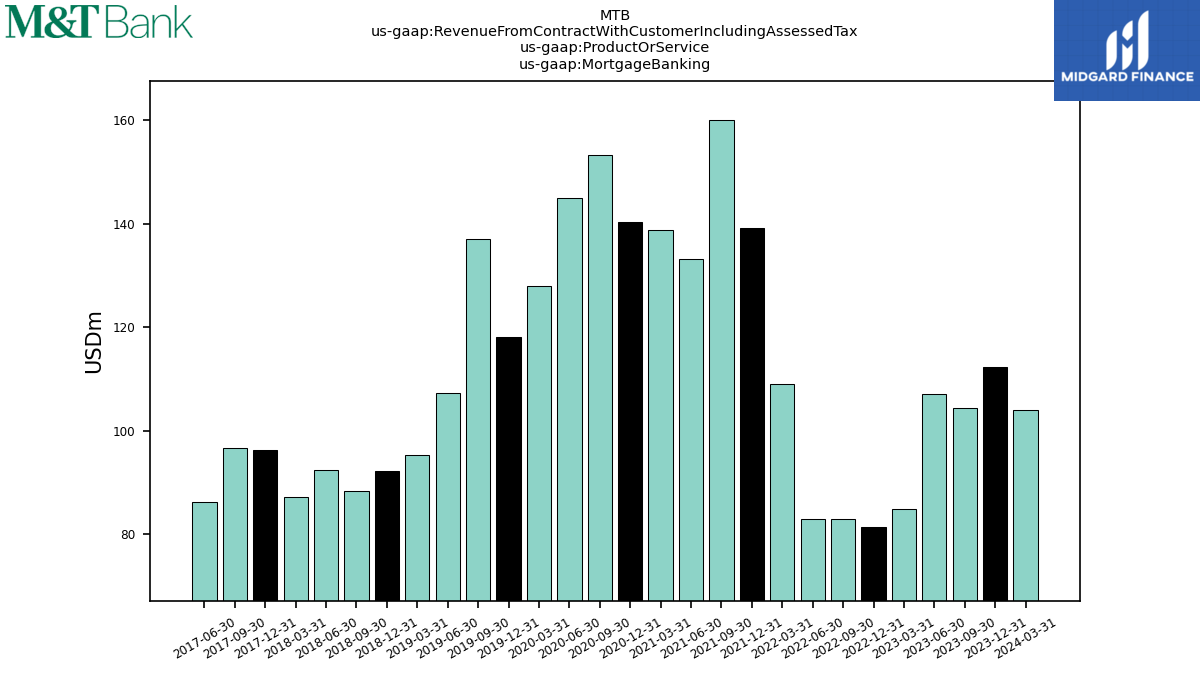
| Mortgage Banking | 104.00 | 104.48 | 107.11 | 84.98 | 83.04 | 82.93 | 109.15 | 160.00 | 133.31 | 138.75 | 153.27 | 145.02 | 127.91 | 137.00 | 107.32 | 95.31 | 88.41 | 92.50 | 87.31 | 96.74 | 86.16 | NA | NA | NA | NA | NA | NA | NA | NA | NA | NA | NA | NA | NA | NA | |
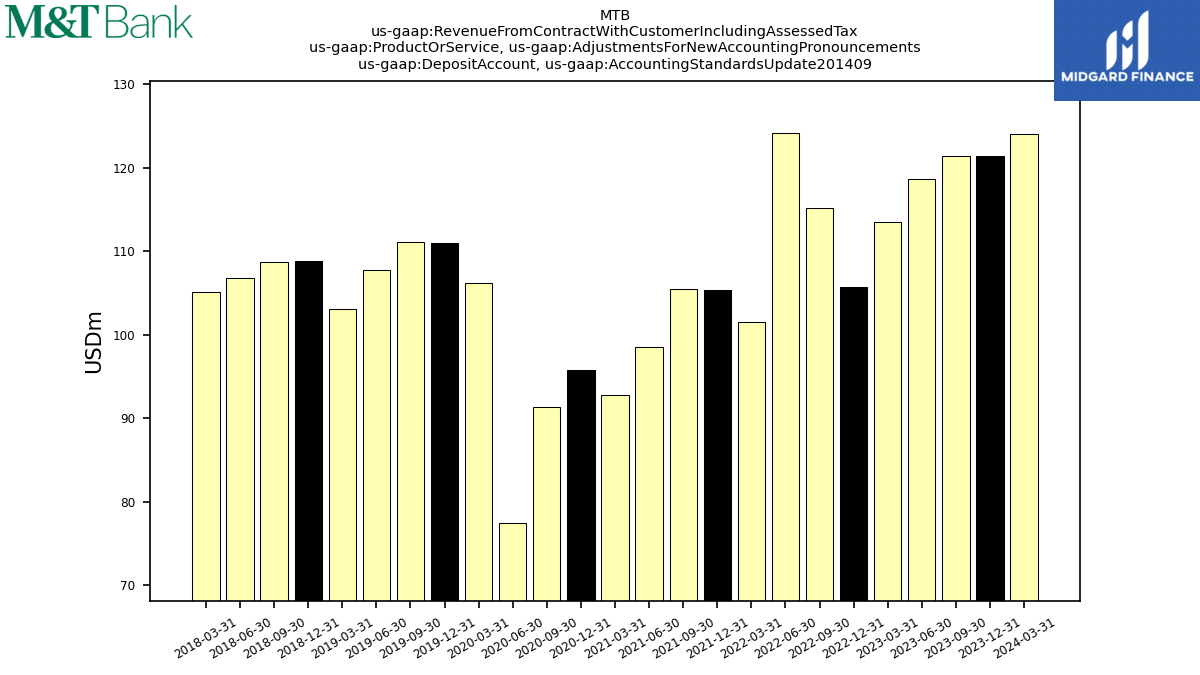
| Deposit Account, Accounting Standards Update201409 | 124.00 | 121.36 | 118.70 | 113.55 | 115.21 | 124.17 | 101.51 | 105.43 | 98.52 | 92.78 | 91.36 | 77.45 | 106.16 | 111.09 | 107.79 | 103.11 | 108.65 | 106.78 | 105.11 | NA | NA | NA | NA | NA | NA | NA | NA | NA | NA | NA | NA | NA | NA | NA | NA | |
| Fiduciary And Trust, Accounting Standards Update201409 | 160.00 | 155.09 | 172.46 | 193.80 | 186.58 | 190.08 | 169.21 | 156.88 | 162.99 | 156.02 | 149.94 | 151.88 | 148.75 | 143.91 | 144.38 | 132.79 | 133.54 | 137.64 | 131.38 | NA | NA | NA | NA | NA | NA | NA | NA | NA | NA | NA | NA | NA | NA | NA | NA | |
| Deposit Account, Accounting Standards Update201409, Commercial Bank | 40.00 | NA | NA | 34.00 | NA | NA | NA | NA | NA | NA | NA | NA | NA | NA | NA | NA | NA | NA | NA | NA | NA | NA | NA | NA | NA | NA | NA | NA | NA | NA | NA | NA | NA | NA | NA | |
| Deposit Account, Accounting Standards Update201409, Commercial Banking | NA | 31.24 | 30.23 | 28.47 | 30.41 | 29.83 | 25.57 | 25.05 | 24.95 | 24.30 | 22.82 | 22.51 | 24.16 | 23.43 | 23.09 | 23.21 | 24.17 | 24.27 | 24.65 | NA | NA | NA | NA | NA | NA | NA | NA | NA | NA | NA | NA | NA | NA | NA | NA | |
| Deposit Account, Accounting Standards Update201409, Retail Bank | 84.00 | NA | NA | 79.00 | NA | NA | NA | NA | NA | NA | NA | NA | NA | NA | NA | NA | NA | NA | NA | NA | NA | NA | NA | NA | NA | NA | NA | NA | NA | NA | NA | NA | NA | NA | NA | |
| Fiduciary And Trust, Accounting Standards Update201409, Commercial Bank | 1.00 | NA | NA | NA | NA | NA | NA | NA | NA | NA | NA | NA | NA | NA | NA | NA | NA | NA | NA | NA | NA | NA | NA | NA | NA | NA | NA | NA | NA | NA | NA | NA | NA | NA | NA | |
| Fiduciary And Trust, Accounting Standards Update201409, Institutional Services And Wealth Management | 159.00 | NA | NA | 194.00 | NA | NA | NA | NA | NA | NA | NA | NA | NA | NA | NA | NA | NA | NA | NA | NA | NA | NA | NA | NA | NA | NA | NA | NA | NA | NA | NA | NA | NA | NA | NA | |
| Fiduciary And Trust, Collective Investment Trust | NA | 0.00 | 15.00 | 45.00 | 40.00 | 40.00 | 42.00 | NA | NA | NA | NA | NA | NA | NA | NA | NA | NA | NA | NA | NA | NA | NA | NA | NA | NA | NA | NA | NA | NA | NA | NA | NA | NA | NA | NA | |
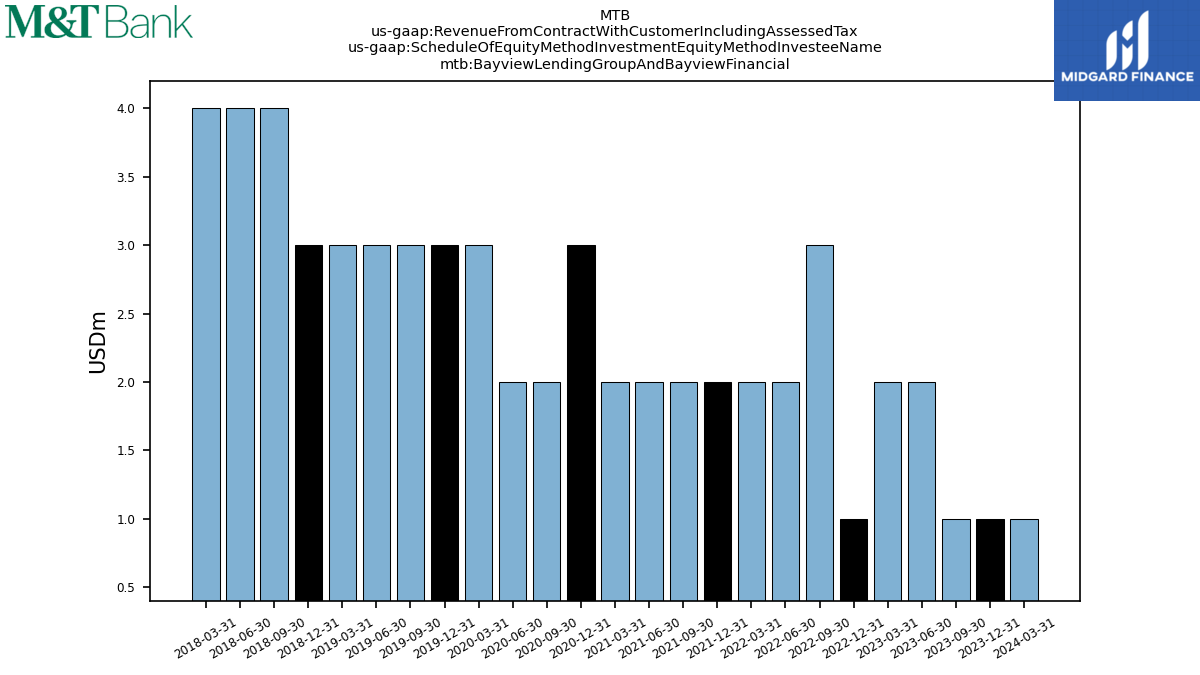
| Bayview Lending Group And Bayview Financial | 1.00 | 1.00 | 2.00 | 2.00 | 3.00 | 2.00 | 2.00 | 2.00 | 2.00 | 2.00 | 2.00 | 2.00 | 3.00 | 3.00 | 3.00 | 3.00 | 4.00 | 4.00 | 4.00 | NA | NA | NA | NA | NA | NA | NA | NA | NA | NA | NA | NA | NA | NA | NA | NA |