
| 2023-12-29 | 2023-09-29 | 2023-06-30 | 2023-03-31 | 2022-12-30 | 2022-09-30 | 2022-07-01 | 2022-04-01 | 2021-12-31 | 2021-10-01 | 2021-07-02 | 2021-04-02 | 2021-01-01 | 2020-10-02 | 2020-07-03 | 2020-04-03 | 2020-01-03 | 2019-09-27 | 2019-06-28 | 2019-03-29 | 2018-12-28 | 2018-09-28 | 2018-06-29 | 2018-03-30 | 2017-12-29 | 2017-09-29 | 2017-06-30 | 2017-03-31 | 2016-12-30 | 2016-09-30 | 2016-07-01 | 2016-04-01 | 2016-01-01 | 2015-10-02 | 2015-07-03 | 2015-04-03 | 2015-01-02 | 2014-10-03 | 2014-07-04 | 2014-04-04 | 2014-01-03 | 2013-09-27 | 2013-06-28 | 2013-03-29 | 2012-12-28 | 2012-09-28 | 2012-06-29 | 2012-03-30 | 2011-12-30 | 2011-09-30 | 2011-07-01 | 2011-04-01 | 2010-12-31 | ||
|---|---|---|---|---|---|---|---|---|---|---|---|---|---|---|---|---|---|---|---|---|---|---|---|---|---|---|---|---|---|---|---|---|---|---|---|---|---|---|---|---|---|---|---|---|---|---|---|---|---|---|---|---|---|---|
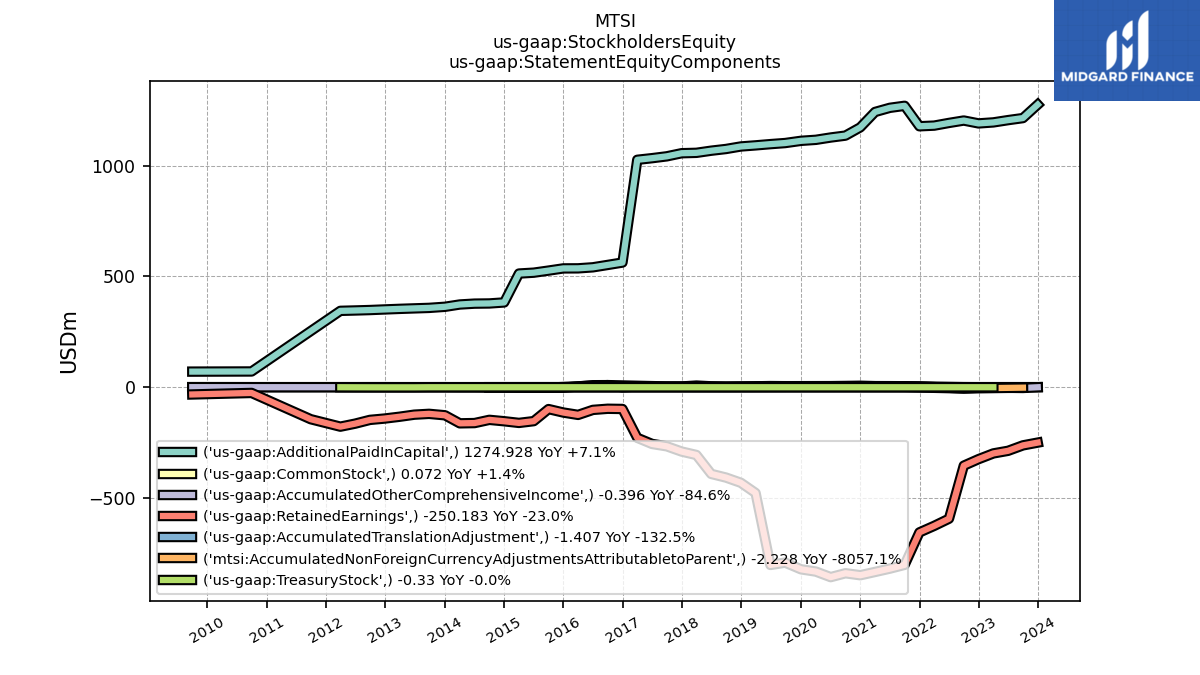
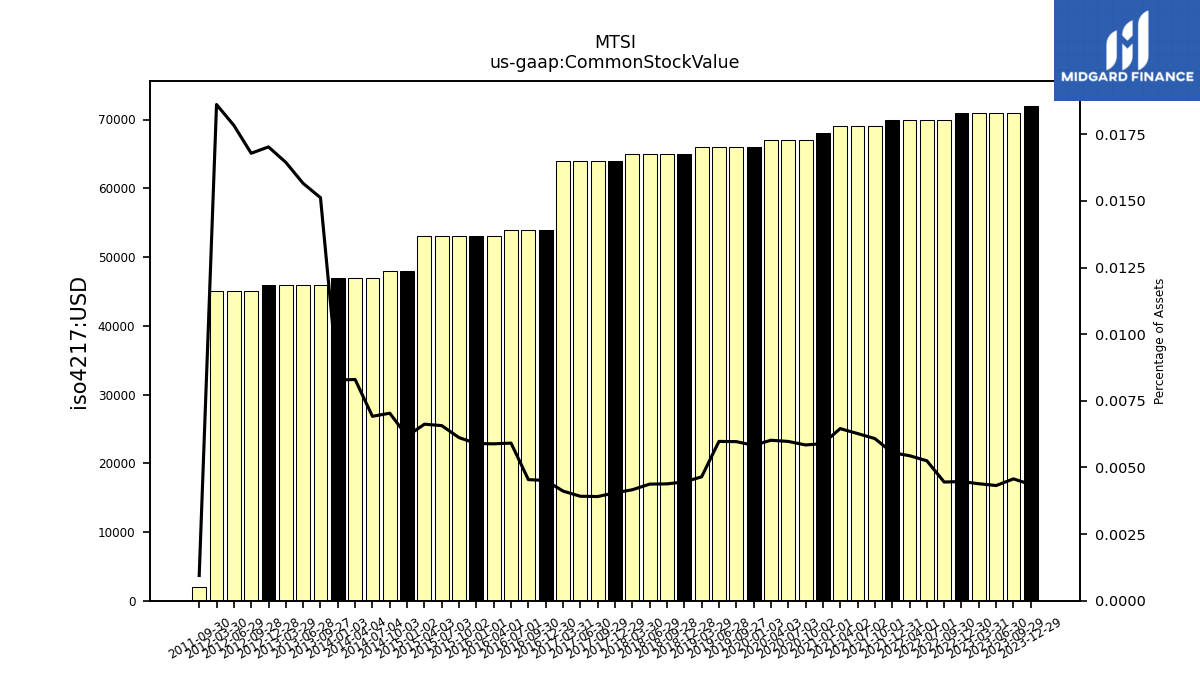
| Common Stock Value | 0.07 | 0.07 | 0.07 | 0.07 | 0.07 | 0.07 | 0.07 | 0.07 | 0.07 | 0.07 | 0.07 | 0.07 | 0.07 | 0.07 | 0.07 | 0.07 | 0.07 | 0.07 | 0.07 | 0.07 | 0.07 | 0.07 | 0.07 | 0.07 | 0.06 | 0.06 | 0.06 | 0.06 | 0.05 | 0.05 | 0.05 | 0.05 | 0.05 | 0.05 | 0.05 | 0.05 | 0.05 | 0.05 | 0.05 | 0.05 | 0.05 | 0.05 | 0.05 | 0.05 | 0.05 | 0.04 | 0.04 | 0.04 | NA | 0.00 | NA | NA | NA | |
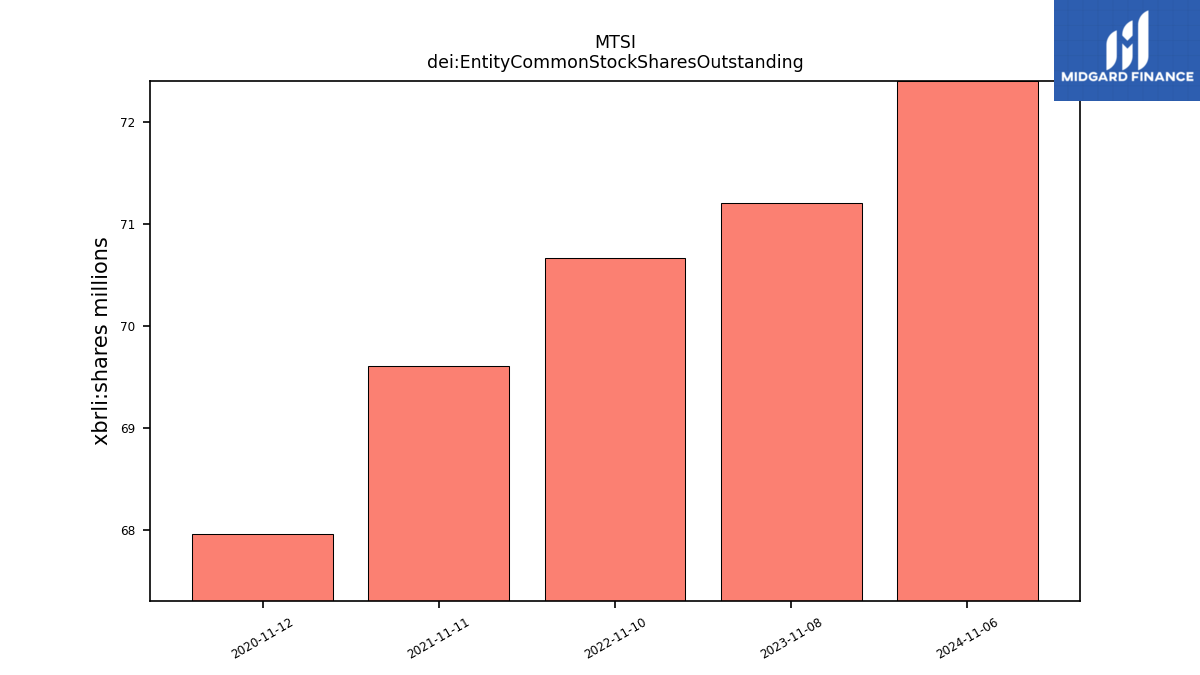
| dei: Entity Common Stock Shares Outstanding | NA | NA | NA | NA | NA | NA | NA | NA | NA | NA | NA | NA | NA | NA | NA | NA | NA | NA | NA | NA | NA | NA | NA | NA | NA | NA | NA | NA | NA | NA | NA | NA | NA | NA | NA | NA | NA | NA | NA | NA | NA | NA | NA | NA | NA | NA | NA | NA | NA | NA | NA | NA | NA | |
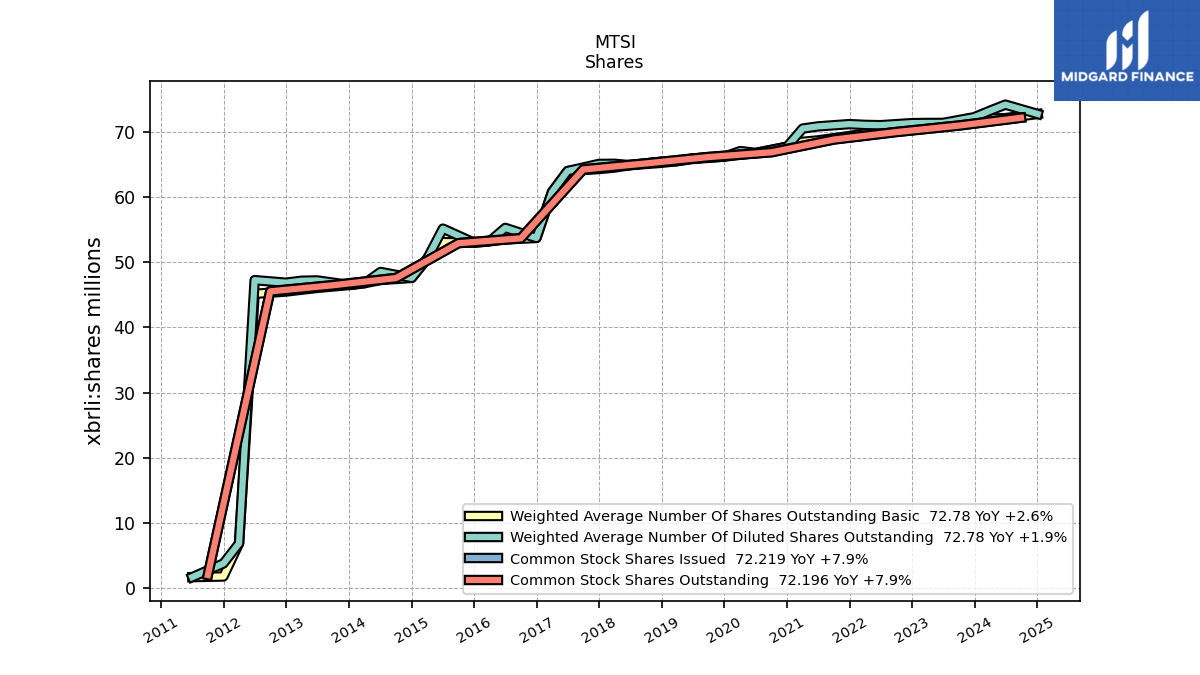
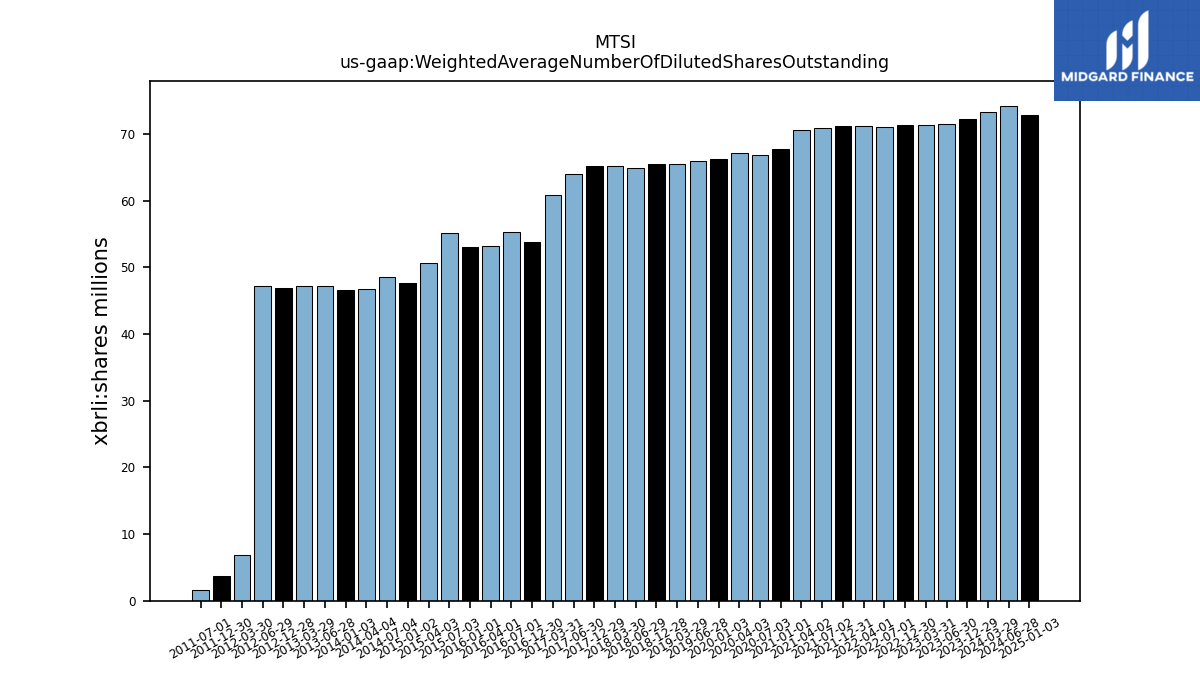
| Weighted Average Number Of Diluted Shares Outstanding | 72.29 | NA | 71.41 | 71.40 | 71.37 | NA | 71.06 | 71.11 | 71.22 | NA | 70.88 | 70.55 | 67.76 | NA | 66.80 | 67.08 | 66.24 | NA | 65.94 | 65.53 | 65.44 | NA | 64.92 | 65.13 | 65.11 | NA | 64.02 | 60.81 | 53.74 | NA | 55.29 | 53.23 | 53.02 | NA | 55.17 | 50.59 | 47.61 | NA | 48.52 | 46.81 | 46.52 | NA | 47.22 | 47.17 | 46.87 | NA | 47.26 | 6.83 | 3.75 | NA | 1.65 | NA | NA | |
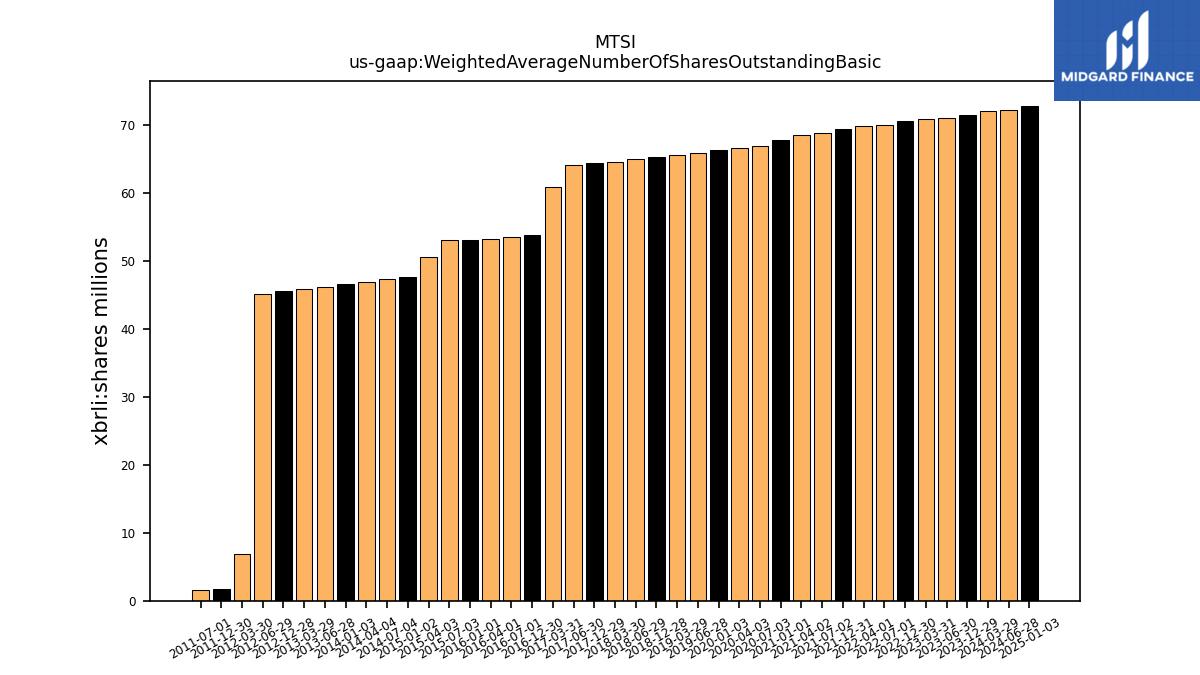
| Weighted Average Number Of Shares Outstanding Basic | 71.42 | NA | 70.94 | 70.80 | 70.48 | NA | 69.95 | 69.79 | 69.40 | NA | 68.73 | 68.50 | 67.76 | NA | 66.80 | 66.52 | 66.24 | NA | 65.86 | 65.53 | 65.28 | NA | 64.92 | 64.55 | 64.33 | NA | 64.02 | 60.81 | 53.74 | NA | 53.52 | 53.23 | 53.02 | NA | 53.10 | 50.59 | 47.61 | NA | 47.28 | 46.81 | 46.52 | NA | 46.07 | 45.79 | 45.51 | NA | 45.16 | 6.83 | 1.75 | NA | 1.65 | NA | NA | |
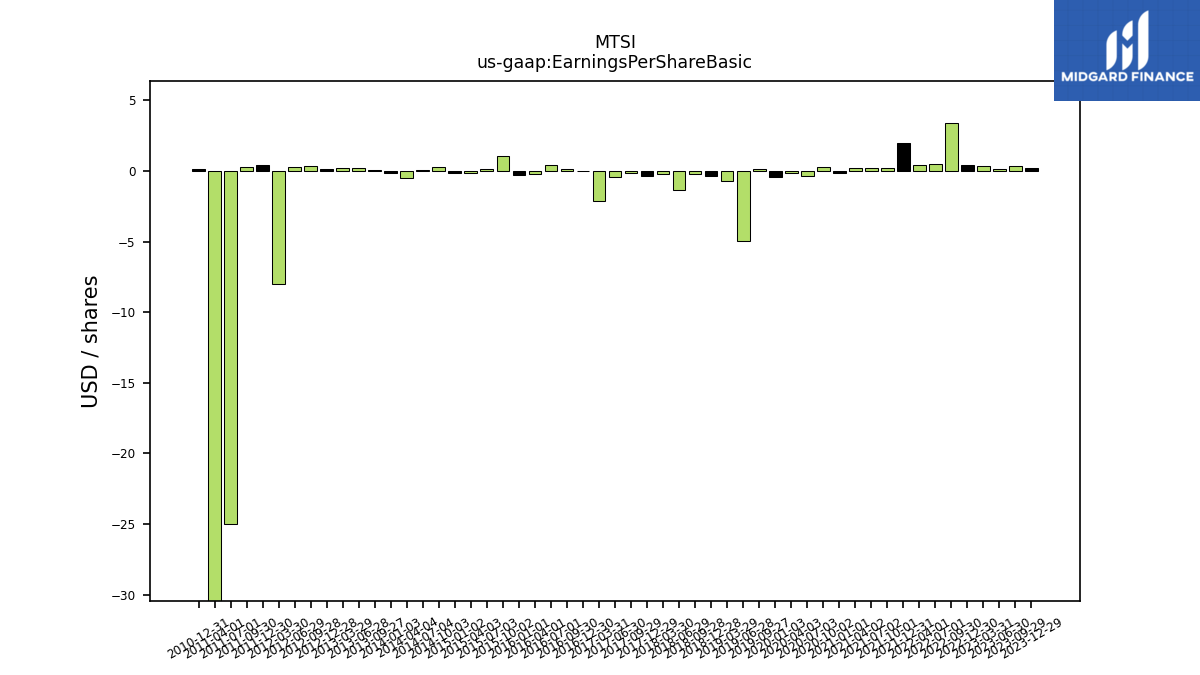
| Earnings Per Share Basic | 0.18 | 0.34 | 0.17 | 0.36 | 0.42 | 3.42 | 0.46 | 0.42 | 2.00 | 0.24 | 0.22 | 0.22 | -0.13 | 0.27 | -0.37 | -0.15 | -0.43 | 0.17 | -4.93 | -0.71 | -0.36 | -0.25 | -1.32 | -0.24 | -0.35 | -0.12 | -0.43 | -2.14 | -0.02 | 0.10 | 0.42 | -0.20 | -0.29 | 1.07 | 0.15 | -0.15 | -0.13 | 0.31 | 0.03 | -0.47 | -0.14 | 0.08 | 0.20 | 0.18 | 0.13 | 0.37 | 0.30 | -8.02 | 0.43 | 0.29 | -25.03 | -55.50 | 0.13 | |
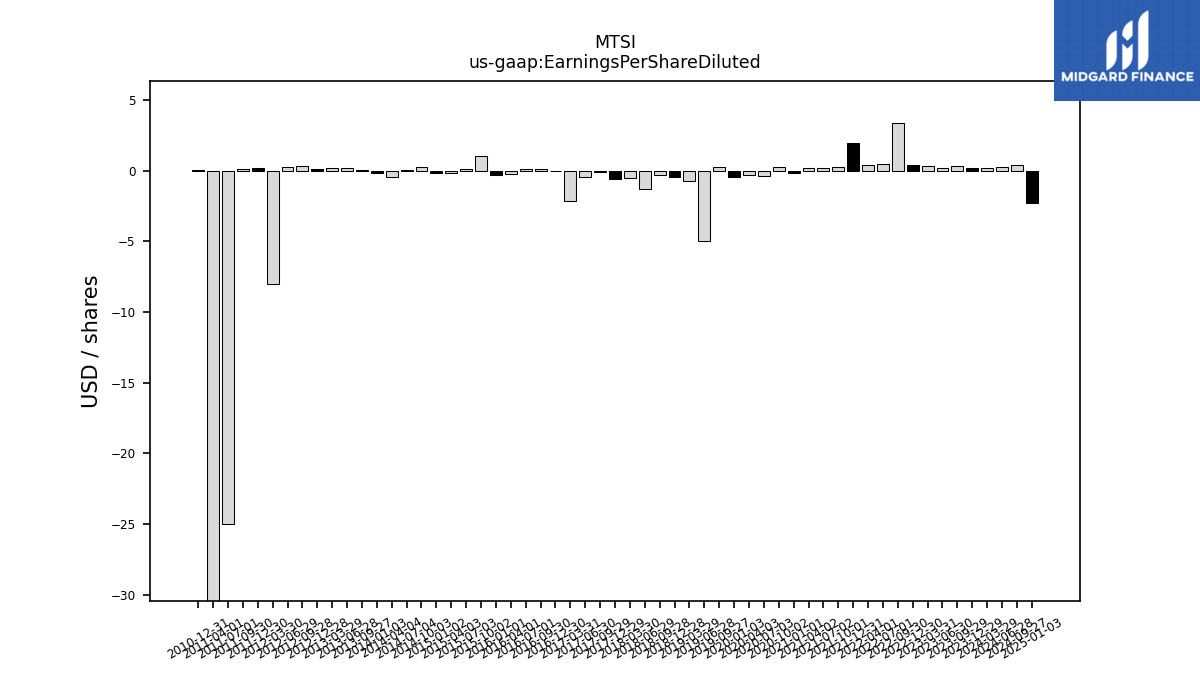
| Earnings Per Share Diluted | 0.17 | 0.34 | 0.17 | 0.36 | 0.41 | 3.36 | 0.45 | 0.42 | 1.95 | 0.24 | 0.21 | 0.21 | -0.13 | 0.27 | -0.37 | -0.28 | -0.43 | 0.25 | -4.95 | -0.71 | -0.44 | -0.29 | -1.32 | -0.50 | -0.57 | -0.12 | -0.43 | -2.14 | -0.02 | 0.10 | 0.13 | -0.20 | -0.29 | 1.07 | 0.15 | -0.15 | -0.13 | 0.30 | 0.02 | -0.47 | -0.14 | 0.08 | 0.20 | 0.17 | 0.13 | 0.36 | 0.29 | -8.02 | 0.20 | 0.12 | -25.03 | -56.44 | 0.04 |
| 2023-12-29 | 2023-09-29 | 2023-06-30 | 2023-03-31 | 2022-12-30 | 2022-09-30 | 2022-07-01 | 2022-04-01 | 2021-12-31 | 2021-10-01 | 2021-07-02 | 2021-04-02 | 2021-01-01 | 2020-10-02 | 2020-07-03 | 2020-04-03 | 2020-01-03 | 2019-09-27 | 2019-06-28 | 2019-03-29 | 2018-12-28 | 2018-09-28 | 2018-06-29 | 2018-03-30 | 2017-12-29 | 2017-09-29 | 2017-06-30 | 2017-03-31 | 2016-12-30 | 2016-09-30 | 2016-07-01 | 2016-04-01 | 2016-01-01 | 2015-10-02 | 2015-07-03 | 2015-04-03 | 2015-01-02 | 2014-10-03 | 2014-07-04 | 2014-04-04 | 2014-01-03 | 2013-09-27 | 2013-06-28 | 2013-03-29 | 2012-12-28 | 2012-09-28 | 2012-06-29 | 2012-03-30 | 2011-12-30 | 2011-09-30 | 2011-07-01 | 2011-04-01 | 2010-12-31 | ||
|---|---|---|---|---|---|---|---|---|---|---|---|---|---|---|---|---|---|---|---|---|---|---|---|---|---|---|---|---|---|---|---|---|---|---|---|---|---|---|---|---|---|---|---|---|---|---|---|---|---|---|---|---|---|---|
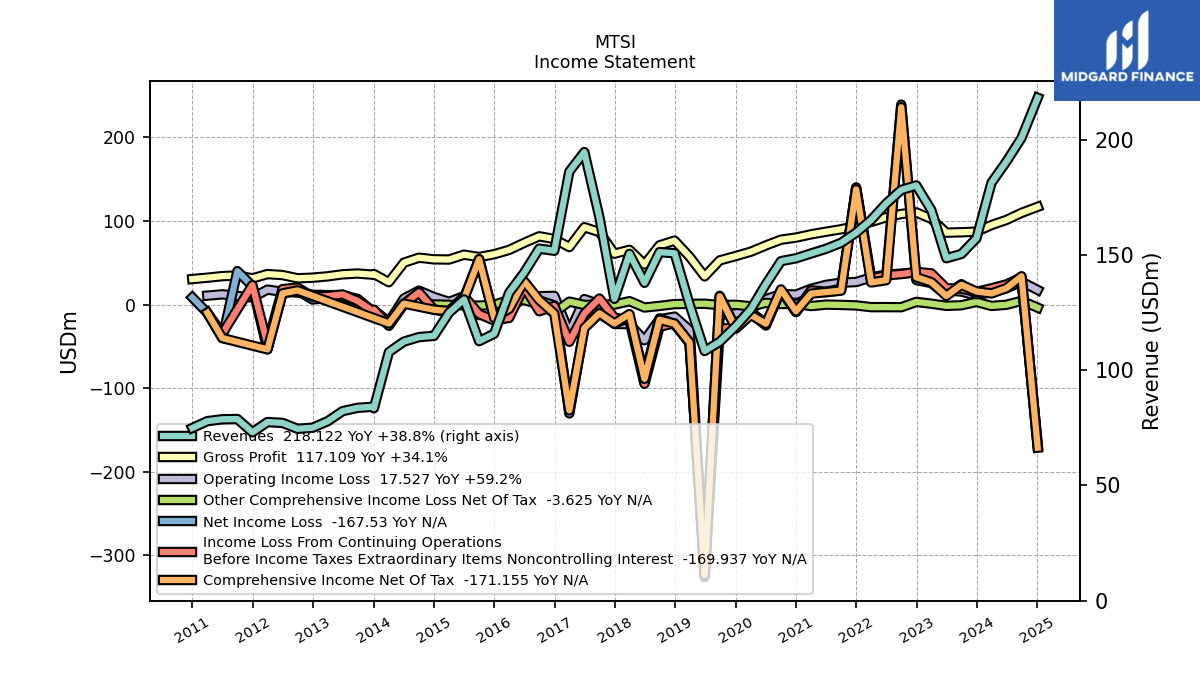
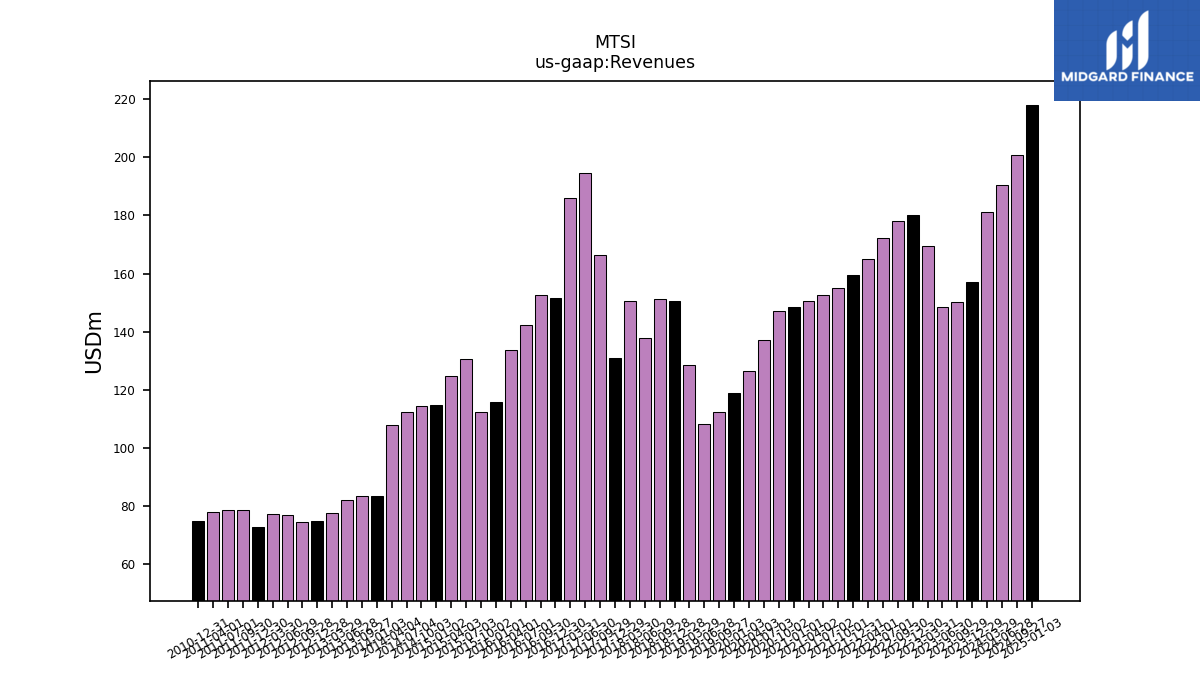
| Revenues | 157.15 | 150.38 | 148.52 | 169.41 | 180.10 | 178.14 | 172.26 | 165.15 | 159.62 | 155.21 | 152.62 | 150.58 | 148.50 | 147.25 | 137.27 | 126.42 | 119.10 | 112.25 | 108.31 | 128.47 | 150.69 | 151.19 | 137.87 | 150.41 | 130.93 | 166.38 | 194.56 | 186.08 | 151.75 | 152.70 | 142.29 | 133.58 | 115.77 | 112.56 | 130.66 | 124.89 | 114.86 | 114.32 | 112.36 | 107.83 | 83.47 | 83.66 | 82.22 | 77.82 | 75.01 | 74.56 | 77.12 | 77.48 | 73.03 | 78.80 | 78.70 | 77.88 | 74.91 | |
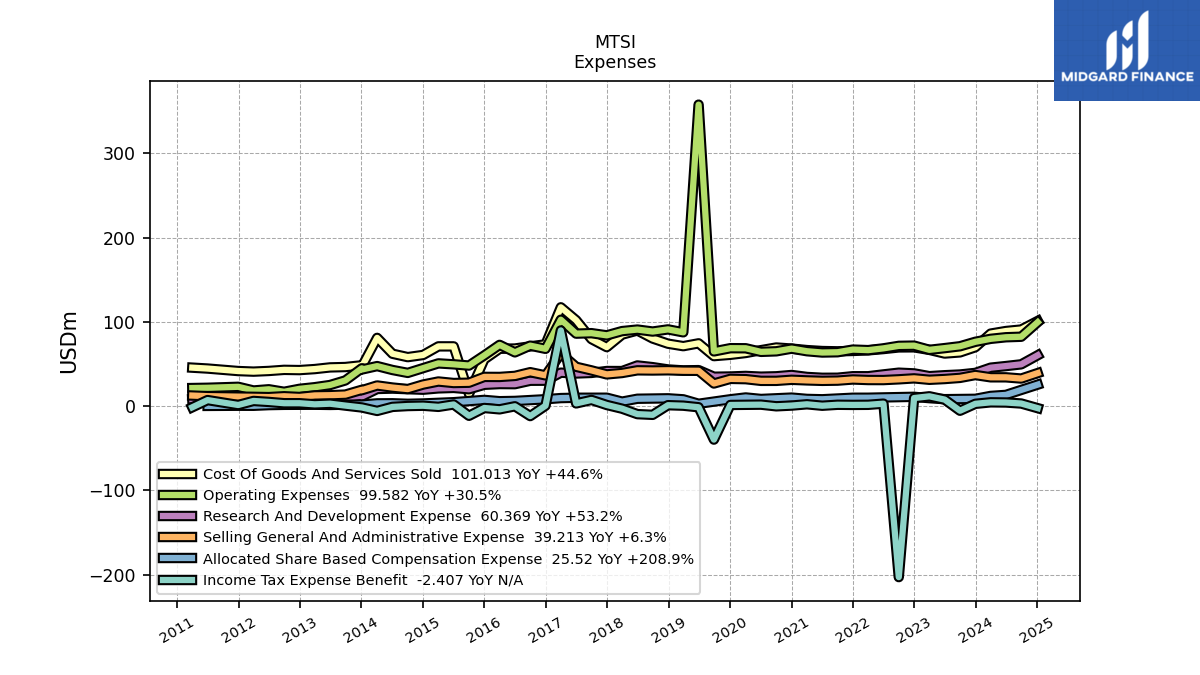
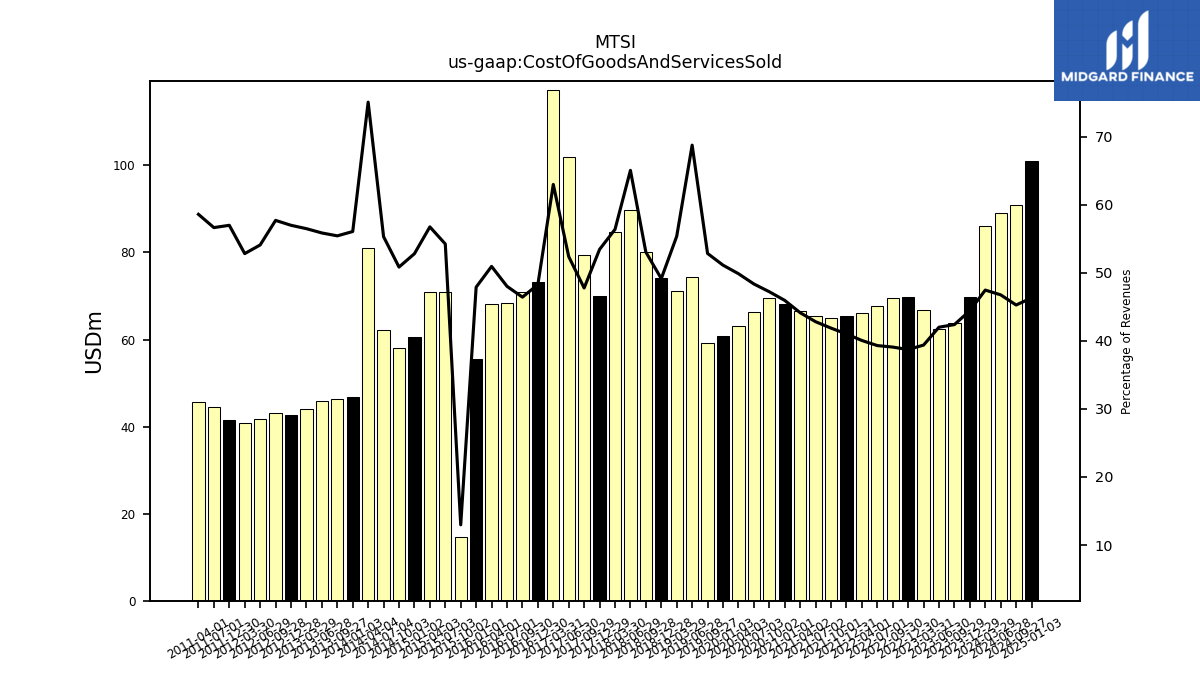
| Cost Of Goods And Services Sold | 69.84 | 63.75 | 62.40 | 66.72 | 69.75 | 69.64 | 67.72 | 66.16 | 65.48 | 65.00 | 65.35 | 66.47 | 68.24 | 69.53 | 66.39 | 63.05 | 60.89 | 59.32 | 74.48 | 71.14 | 74.06 | 80.21 | 89.70 | 84.81 | 69.97 | 79.48 | 101.93 | 117.22 | 73.26 | 70.89 | 68.33 | 68.05 | 55.46 | 14.60 | 70.88 | 70.88 | 60.66 | 58.13 | 62.15 | 80.96 | 46.80 | 46.38 | 45.93 | 43.96 | 42.75 | 43.03 | 41.72 | 40.93 | 41.62 | NA | 44.58 | 45.64 | NA | |
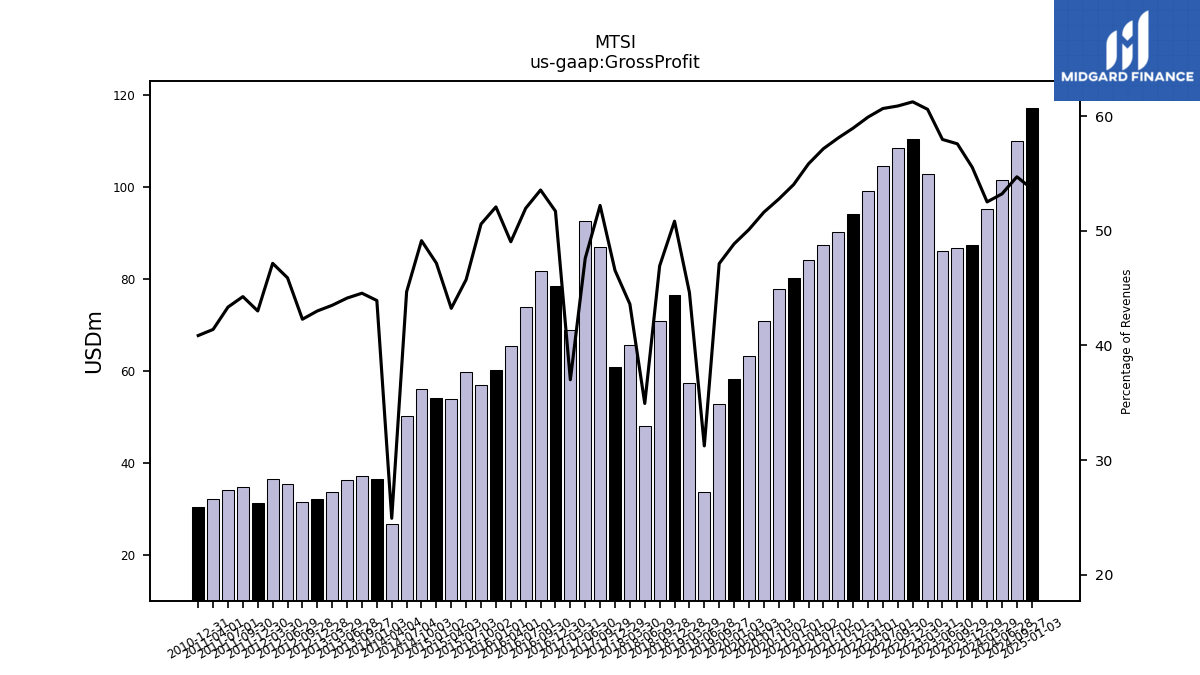
| Gross Profit | 87.31 | 86.63 | 86.13 | 102.69 | 110.36 | 108.51 | 104.54 | 98.99 | 94.14 | 90.21 | 87.27 | 84.11 | 80.26 | 77.72 | 70.88 | 63.37 | 58.20 | 52.92 | 33.83 | 57.33 | 76.62 | 70.98 | 48.17 | 65.60 | 60.95 | 86.90 | 92.63 | 68.86 | 78.50 | 81.80 | 73.96 | 65.53 | 60.32 | 56.96 | 59.78 | 54.01 | 54.20 | 56.19 | 50.21 | 26.86 | 36.66 | 37.28 | 36.29 | 33.86 | 32.27 | 31.53 | 35.40 | 36.55 | 31.41 | 34.88 | 34.12 | 32.24 | 30.61 | |
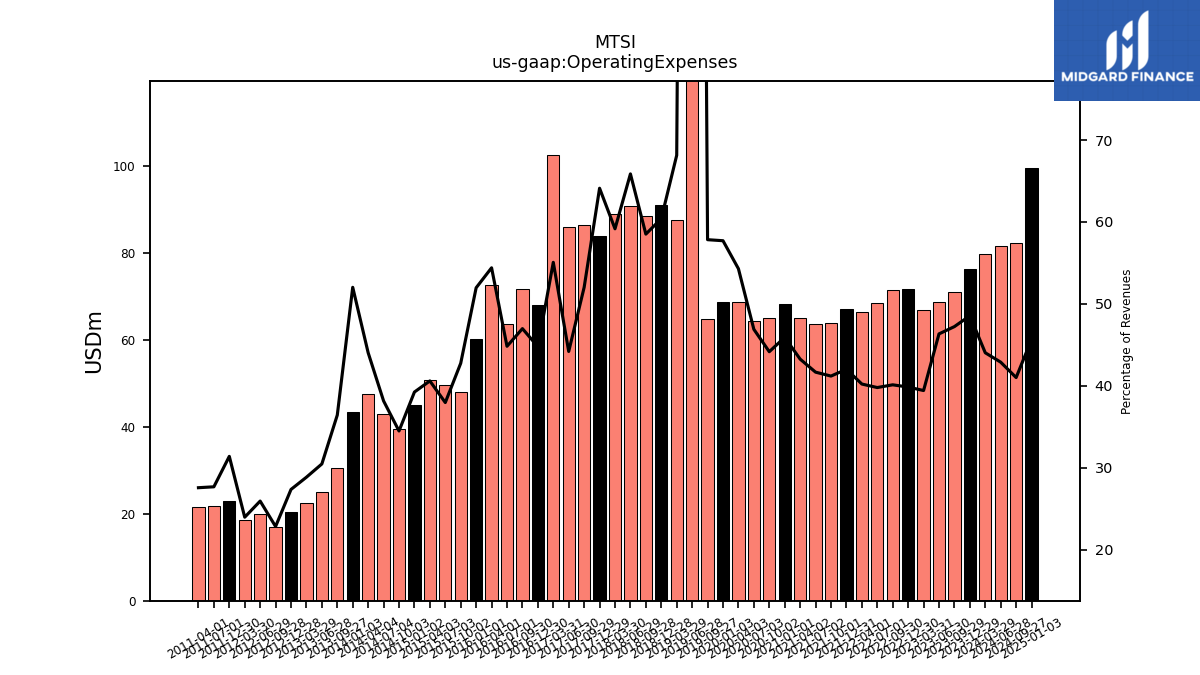
| Operating Expenses | 76.30 | 71.02 | 68.82 | 66.79 | 71.77 | 71.48 | 68.54 | 66.42 | 67.07 | 63.93 | 63.59 | 65.14 | 68.19 | 65.03 | 64.38 | 68.64 | 68.73 | 64.92 | 357.60 | 87.54 | 91.02 | 88.47 | 90.81 | 89.00 | 83.95 | 86.55 | 85.98 | 102.48 | 67.96 | 71.74 | 63.78 | 72.68 | 60.16 | 48.13 | 49.60 | 50.70 | 45.07 | 39.42 | 42.88 | 47.49 | 43.42 | 30.48 | 25.05 | 22.45 | 20.52 | 17.02 | 20.00 | 18.57 | 22.92 | NA | 21.78 | 21.47 | NA | |
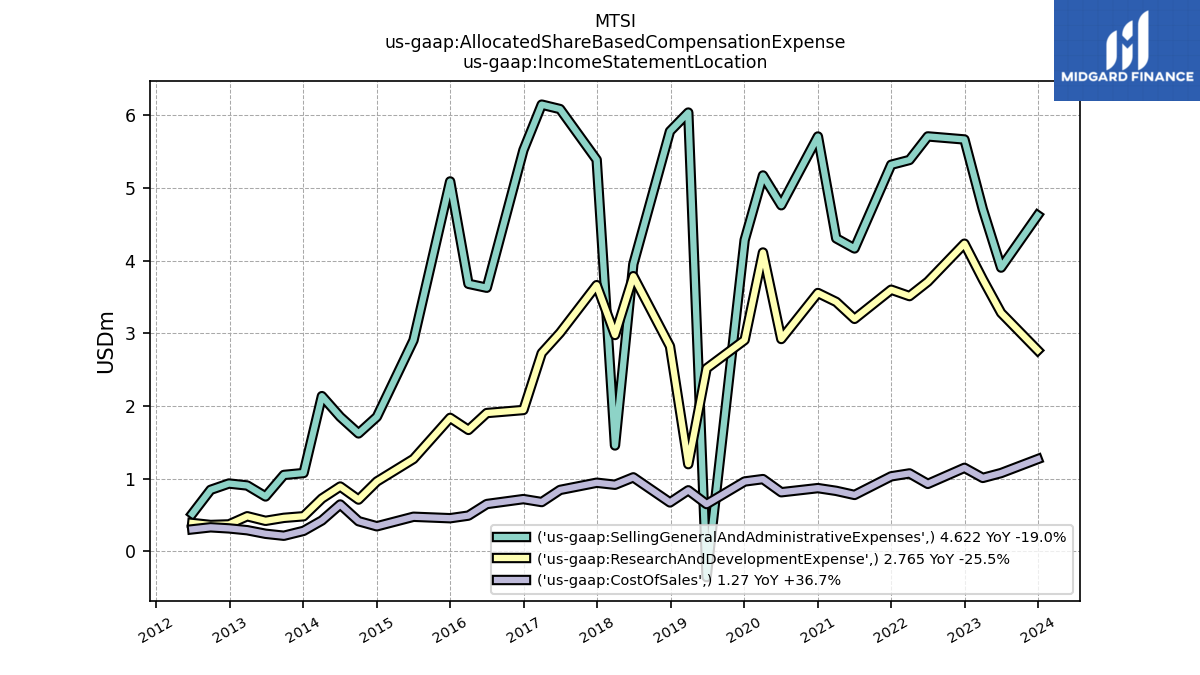
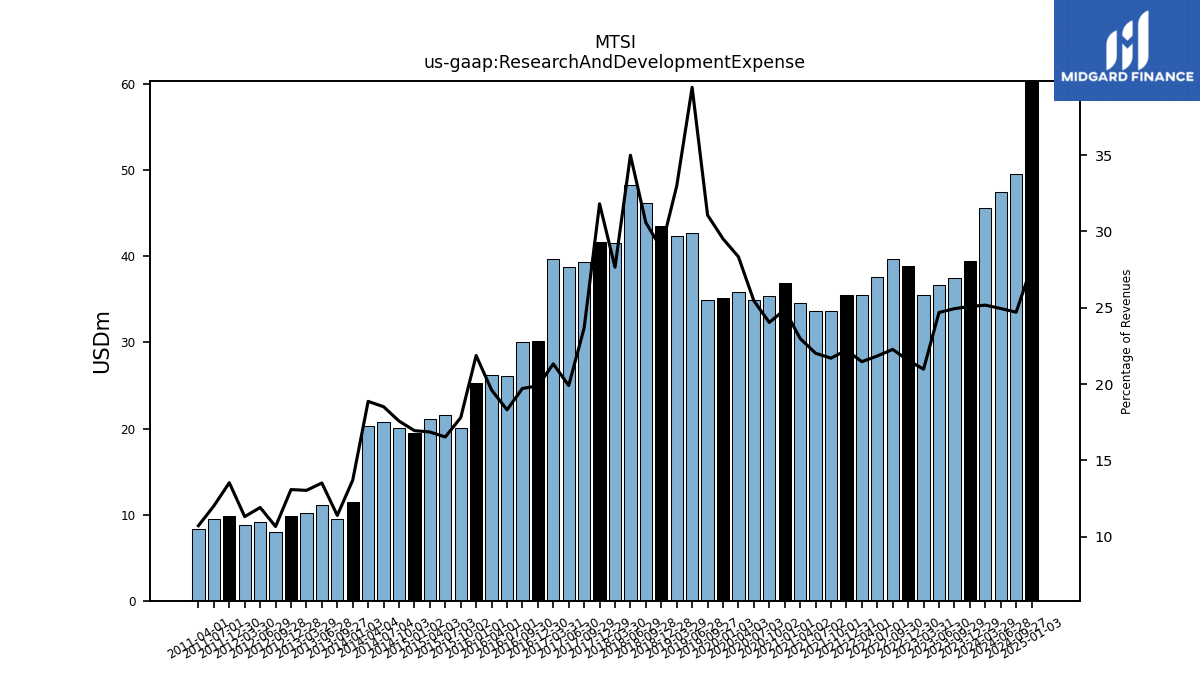
| Research And Development Expense | 39.41 | 37.51 | 36.67 | 35.54 | 38.83 | 39.68 | 37.62 | 35.45 | 35.47 | 33.68 | 33.61 | 34.62 | 36.94 | 35.40 | 34.95 | 35.83 | 35.16 | 34.88 | 42.71 | 42.36 | 43.52 | 46.23 | 48.24 | 41.60 | 41.65 | 39.40 | 38.73 | 39.69 | 30.17 | 30.11 | 26.06 | 26.20 | 25.32 | 20.04 | 21.61 | 21.06 | 19.47 | 20.10 | 20.81 | 20.35 | 11.45 | 9.54 | 11.12 | 10.15 | 9.82 | 7.96 | 9.19 | 8.77 | 9.89 | NA | 9.46 | 8.36 | NA | |
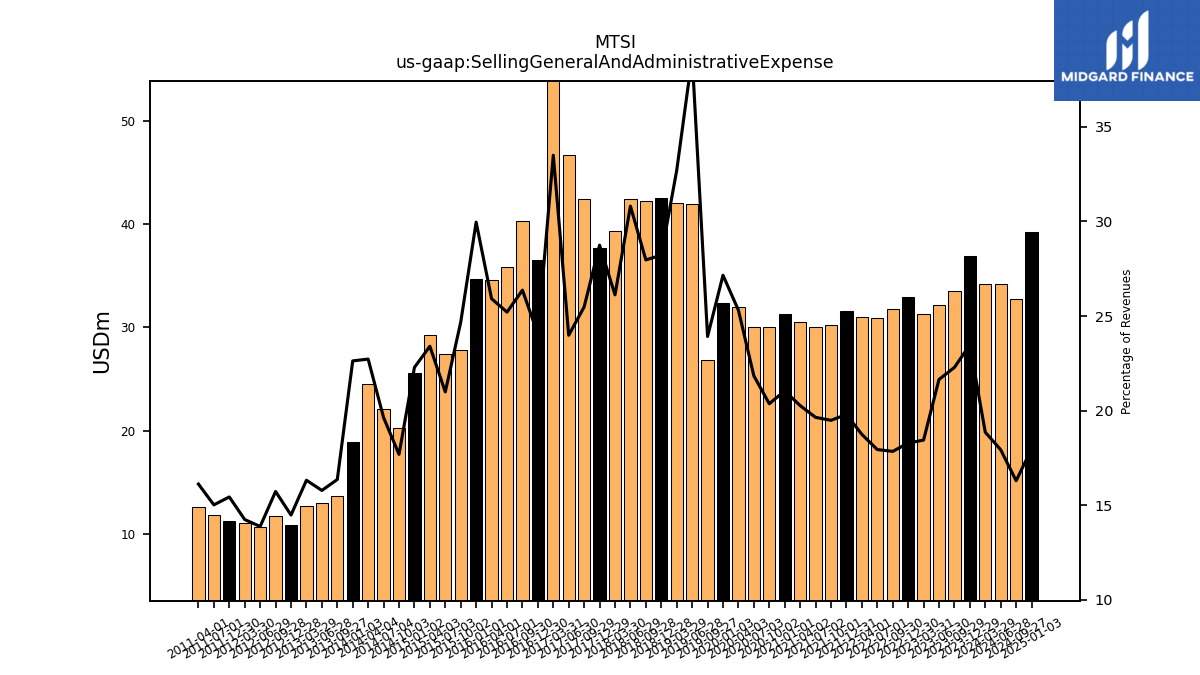
| Selling General And Administrative Expense | 36.89 | 33.51 | 32.15 | 31.25 | 32.94 | 31.80 | 30.91 | 30.96 | 31.60 | 30.25 | 29.98 | 30.52 | 31.25 | 29.99 | 29.98 | 31.99 | 32.34 | 26.85 | 41.92 | 42.00 | 42.52 | 42.28 | 42.47 | 39.29 | 37.63 | 42.40 | 46.67 | 62.33 | 36.50 | 40.26 | 35.87 | 34.62 | 34.69 | 27.78 | 27.43 | 29.23 | 25.60 | 20.23 | 22.07 | 24.50 | 18.89 | 13.69 | 12.98 | 12.71 | 10.87 | 11.73 | 10.71 | 11.04 | 11.28 | NA | 11.82 | 12.56 | NA | |
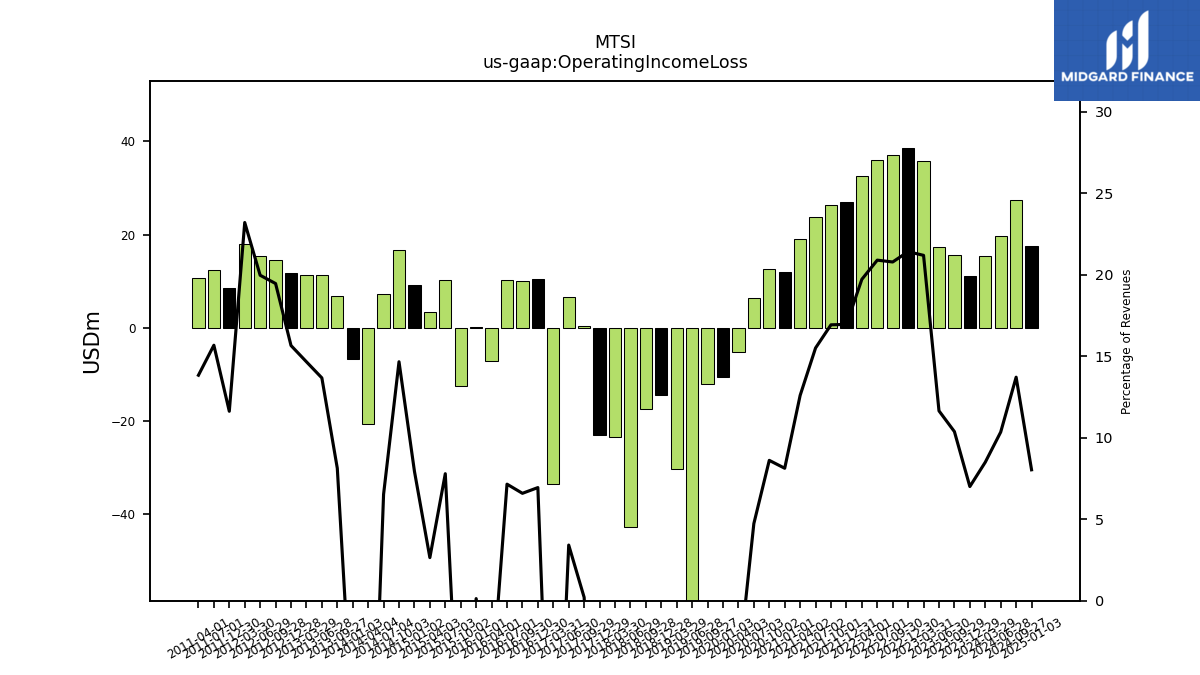
| Operating Income Loss | 11.01 | 15.61 | 17.31 | 35.90 | 38.58 | 37.03 | 36.00 | 32.57 | 27.07 | 26.28 | 23.67 | 18.97 | 12.07 | 12.69 | 6.50 | -5.27 | -10.53 | -11.99 | -323.77 | -30.21 | -14.40 | -17.49 | -42.64 | -23.40 | -22.99 | 0.35 | 6.65 | -33.62 | 10.54 | 10.07 | 10.18 | -7.15 | 0.15 | -12.53 | 10.19 | 3.31 | 9.13 | 16.77 | 7.34 | -20.62 | -6.76 | 6.80 | 11.24 | 11.41 | 11.75 | 14.51 | 15.40 | 17.98 | 8.49 | NA | 12.34 | 10.78 | NA | |
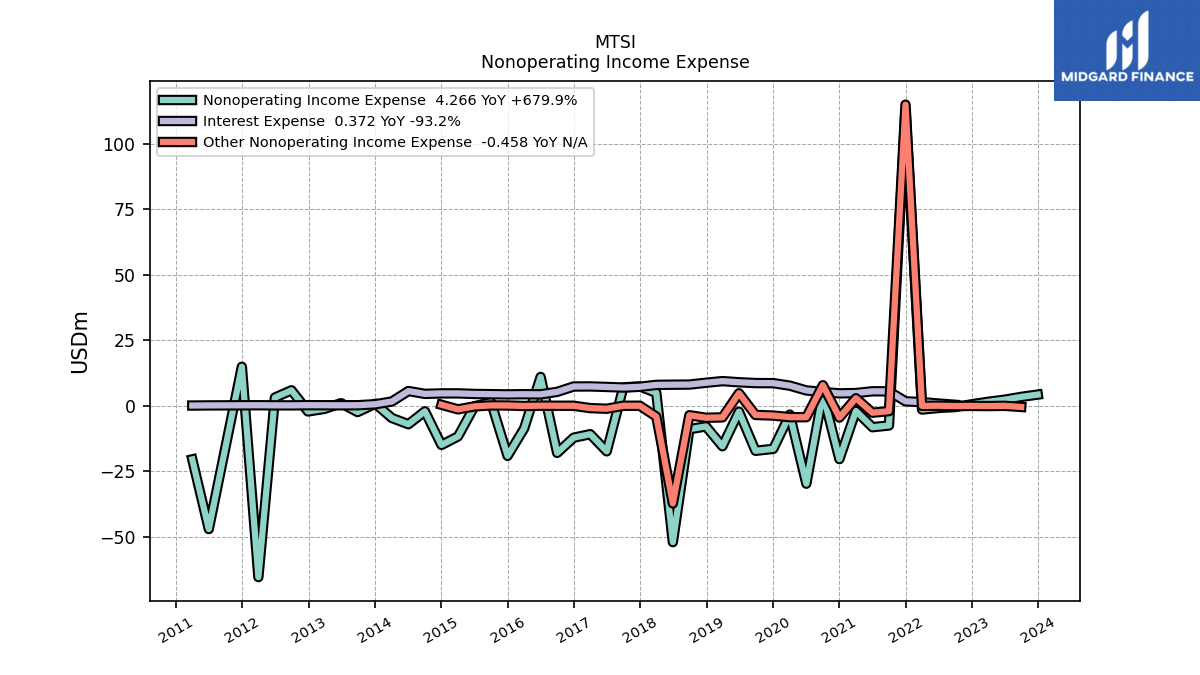
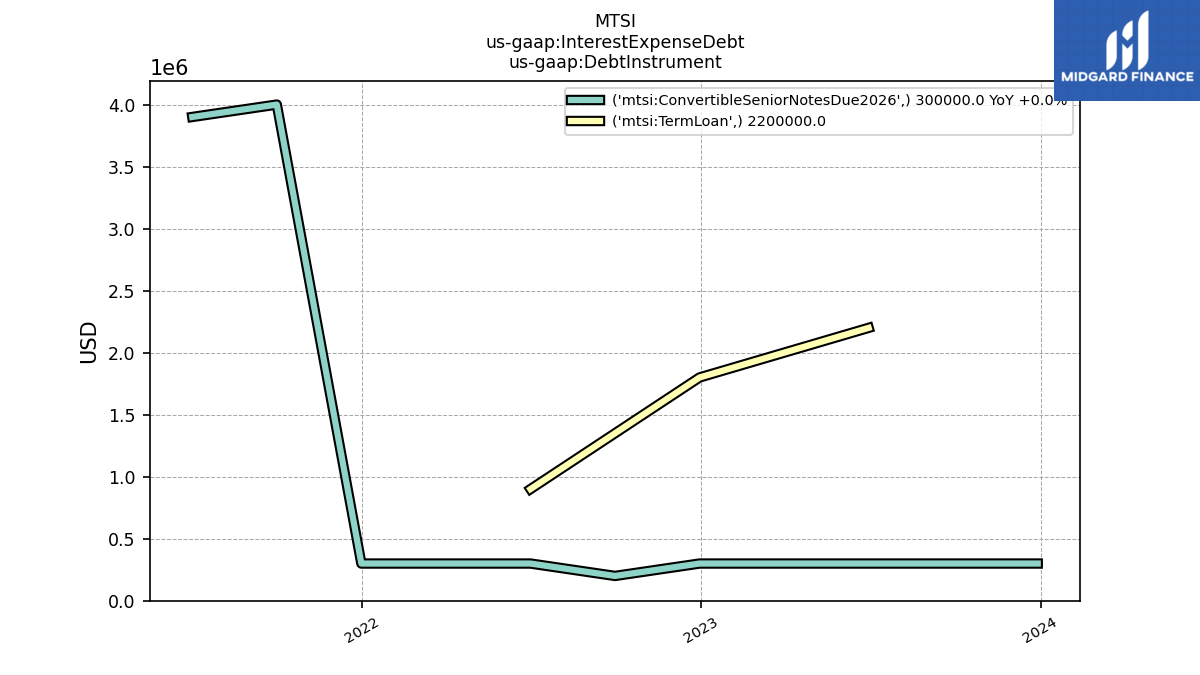
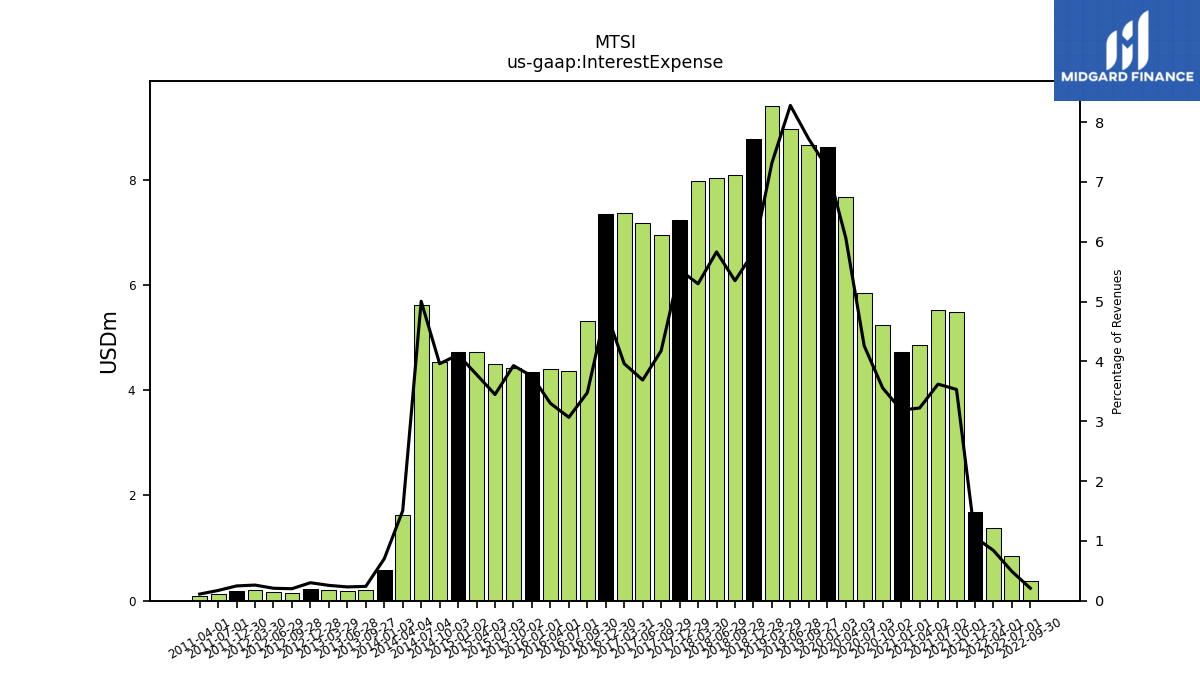
| Interest Expense | NA | NA | NA | NA | NA | 0.37 | 0.84 | 1.39 | 1.69 | 5.48 | 5.53 | 4.85 | 4.73 | 5.24 | 5.85 | 7.67 | 8.62 | 8.66 | 8.97 | 9.40 | 8.77 | 8.09 | 8.04 | 7.97 | 7.24 | 6.95 | 7.18 | 7.37 | 7.35 | 5.31 | 4.36 | 4.41 | 4.35 | 4.42 | 4.50 | 4.72 | 4.72 | 4.53 | 5.62 | 1.62 | 0.59 | 0.20 | 0.19 | 0.20 | 0.23 | 0.15 | 0.16 | 0.20 | 0.18 | NA | 0.14 | 0.09 | NA | |
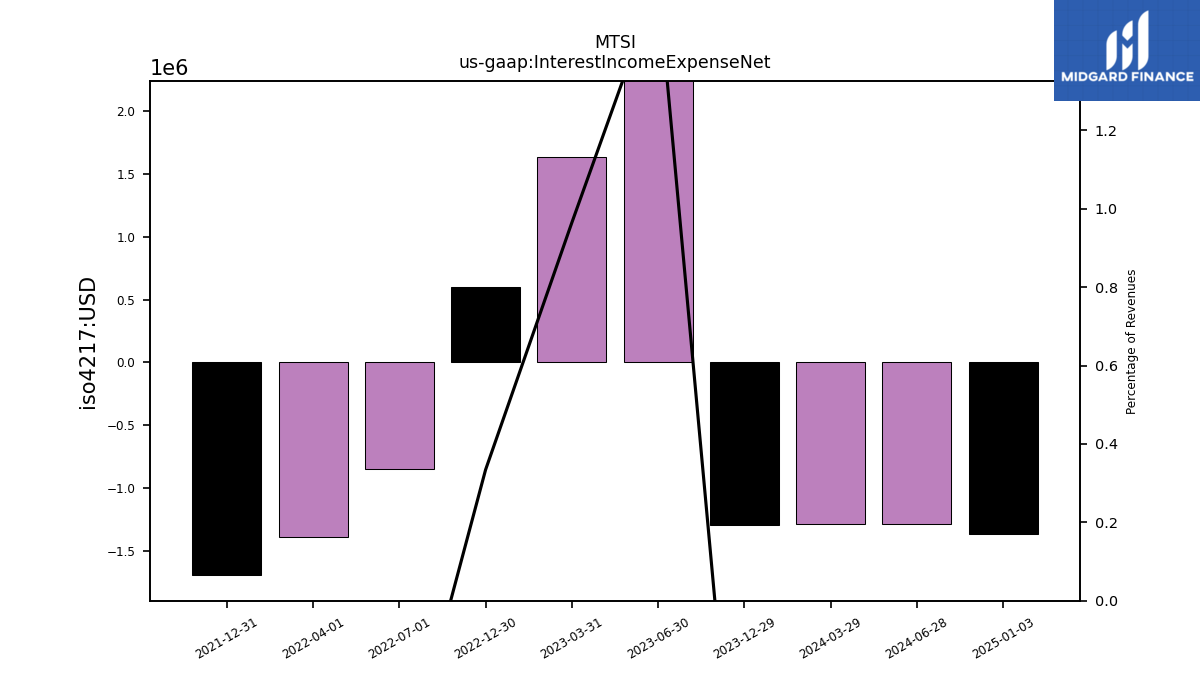
| Interest Income Expense Net | -1.29 | NA | 2.34 | 1.63 | 0.60 | NA | -0.84 | -1.39 | -1.69 | NA | NA | NA | NA | NA | NA | NA | NA | NA | NA | NA | NA | NA | NA | NA | NA | NA | NA | NA | NA | NA | NA | NA | NA | NA | NA | NA | NA | NA | NA | NA | NA | NA | NA | NA | NA | NA | NA | NA | NA | NA | NA | NA | NA | |
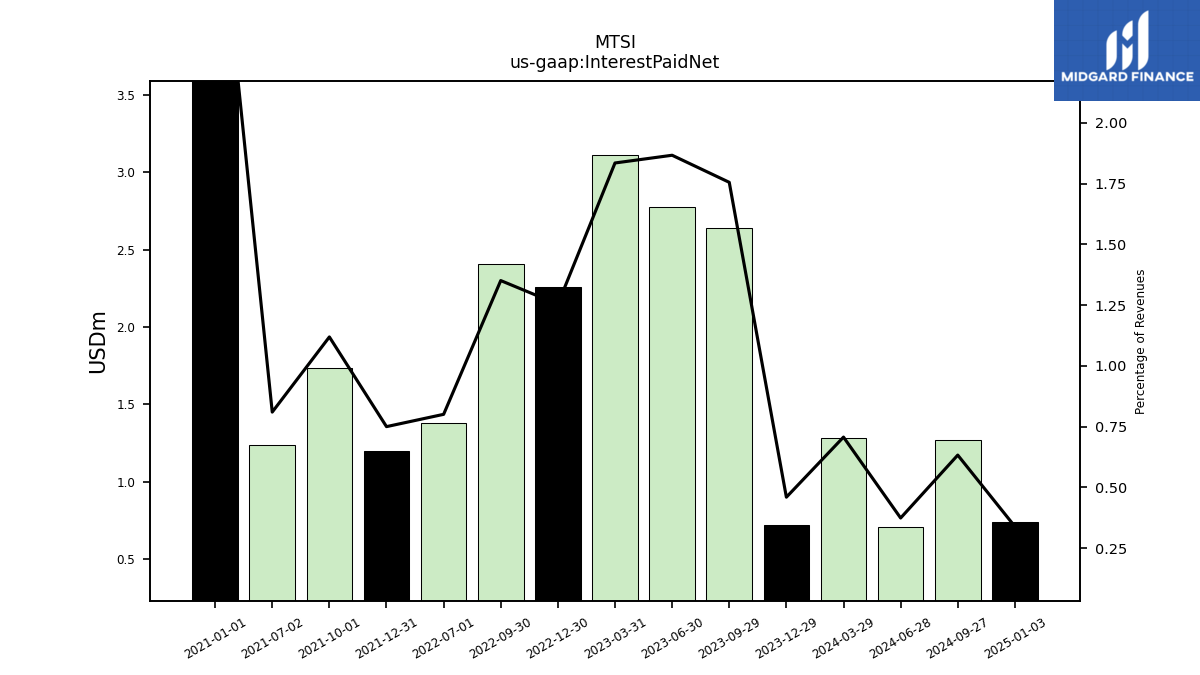
| Interest Paid Net | 0.72 | 2.64 | 2.77 | 3.11 | 2.26 | 2.41 | 1.38 | NA | 1.20 | 1.74 | 1.24 | NA | 4.59 | NA | NA | NA | NA | NA | NA | NA | NA | NA | NA | NA | NA | NA | NA | NA | NA | NA | NA | NA | NA | NA | NA | NA | NA | NA | NA | NA | NA | NA | NA | NA | NA | NA | NA | NA | NA | NA | NA | NA | NA | |
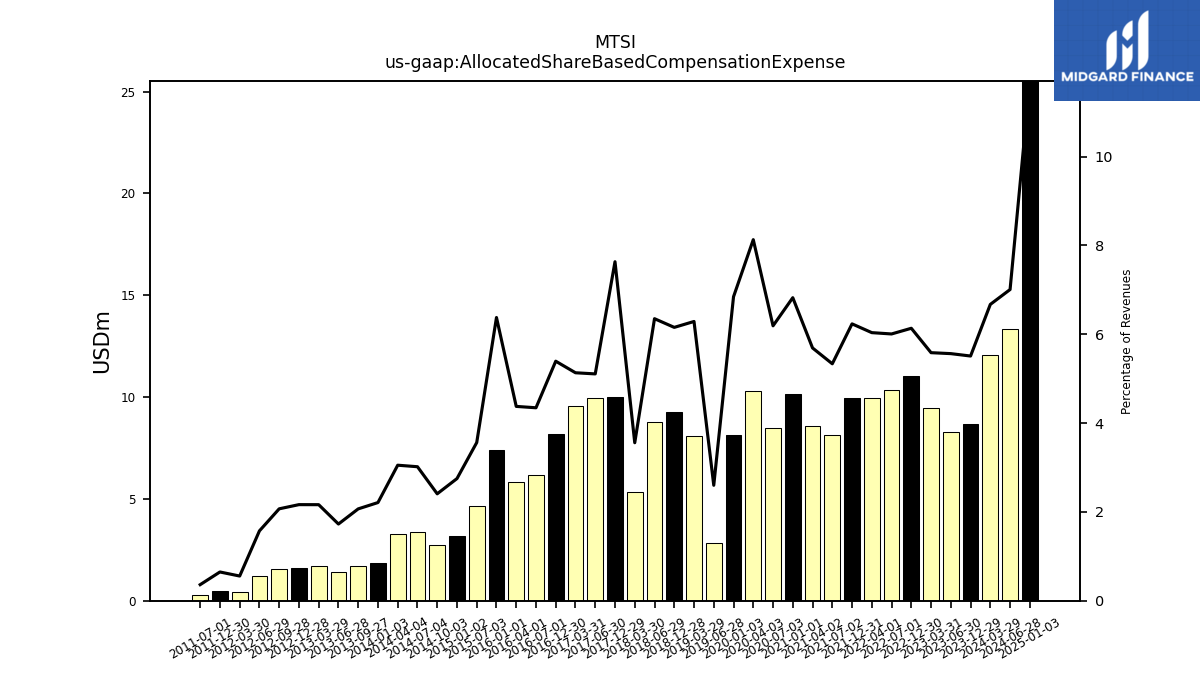
| Allocated Share Based Compensation Expense | 8.66 | NA | 8.26 | 9.46 | 11.05 | NA | 10.35 | 9.97 | 9.95 | NA | 8.14 | 8.57 | 10.13 | NA | 8.49 | 10.28 | 8.15 | NA | 2.81 | 8.08 | 9.27 | NA | 8.75 | 5.35 | 9.99 | NA | 9.94 | 9.55 | 8.18 | NA | 6.18 | 5.84 | 7.38 | NA | 4.65 | NA | 3.16 | 2.75 | 3.39 | 3.29 | 1.84 | 1.73 | 1.42 | 1.68 | 1.62 | 1.54 | 1.21 | 0.43 | 0.47 | NA | 0.28 | NA | NA | |
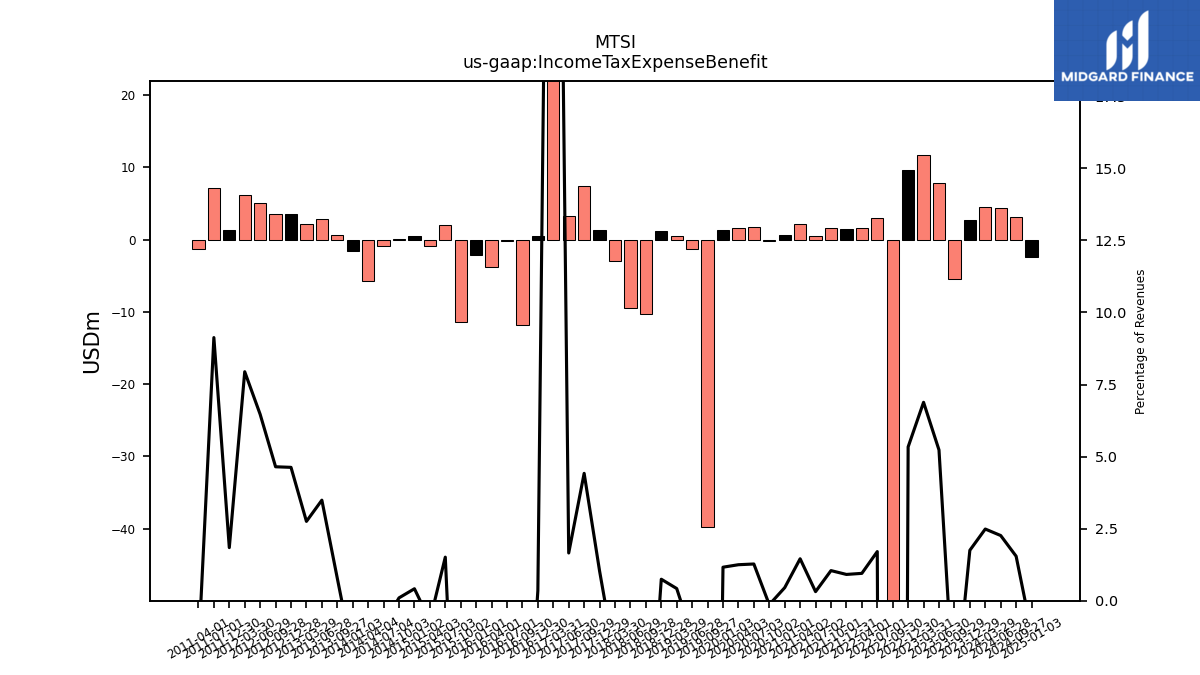
| Income Tax Expense Benefit | 2.75 | -5.46 | 7.77 | 11.66 | 9.61 | -202.80 | 2.94 | 1.57 | 1.46 | 1.62 | 0.48 | 2.19 | 0.67 | -0.20 | 1.75 | 1.58 | 1.39 | -39.70 | -1.32 | 0.54 | 1.12 | -10.32 | -9.48 | -3.02 | 1.35 | 7.35 | 3.22 | 89.81 | 0.53 | -11.80 | -0.18 | -3.80 | -2.20 | -11.45 | 1.98 | -0.86 | 0.48 | 0.11 | -0.90 | -5.68 | -1.59 | 0.65 | 2.87 | 2.14 | 3.47 | 3.46 | 4.99 | 6.16 | 1.35 | NA | 7.18 | -1.38 | NA | |
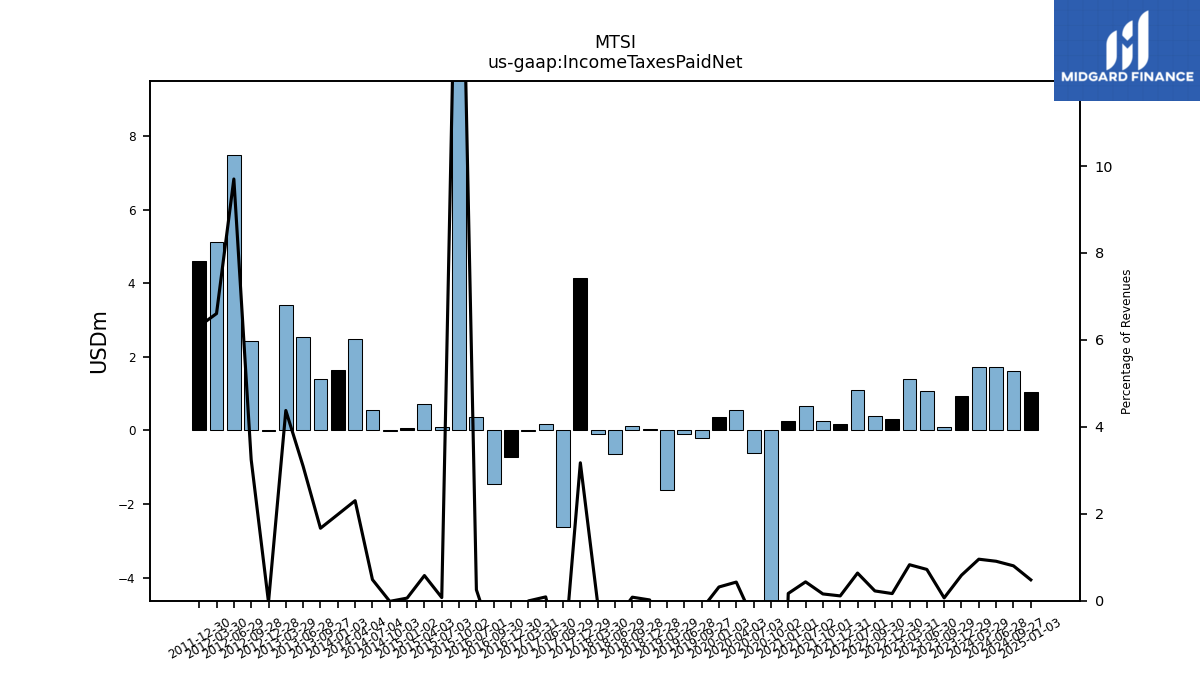
| Income Taxes Paid Net | 0.92 | 0.10 | 1.07 | 1.40 | 0.30 | 0.40 | 1.10 | NA | 0.18 | 0.24 | 0.66 | NA | 0.25 | -17.77 | -0.61 | 0.54 | 0.38 | -0.22 | -0.11 | -1.63 | 0.03 | 0.12 | -0.63 | -0.09 | 4.16 | -2.61 | 0.17 | -0.01 | -0.71 | -1.45 | 0.36 | NA | NA | 21.79 | 0.10 | 0.72 | 0.07 | -0.02 | 0.55 | 2.48 | 1.66 | 1.40 | 2.54 | 3.41 | -0.03 | 2.42 | 7.48 | 5.12 | 4.61 | NA | NA | NA | NA | |
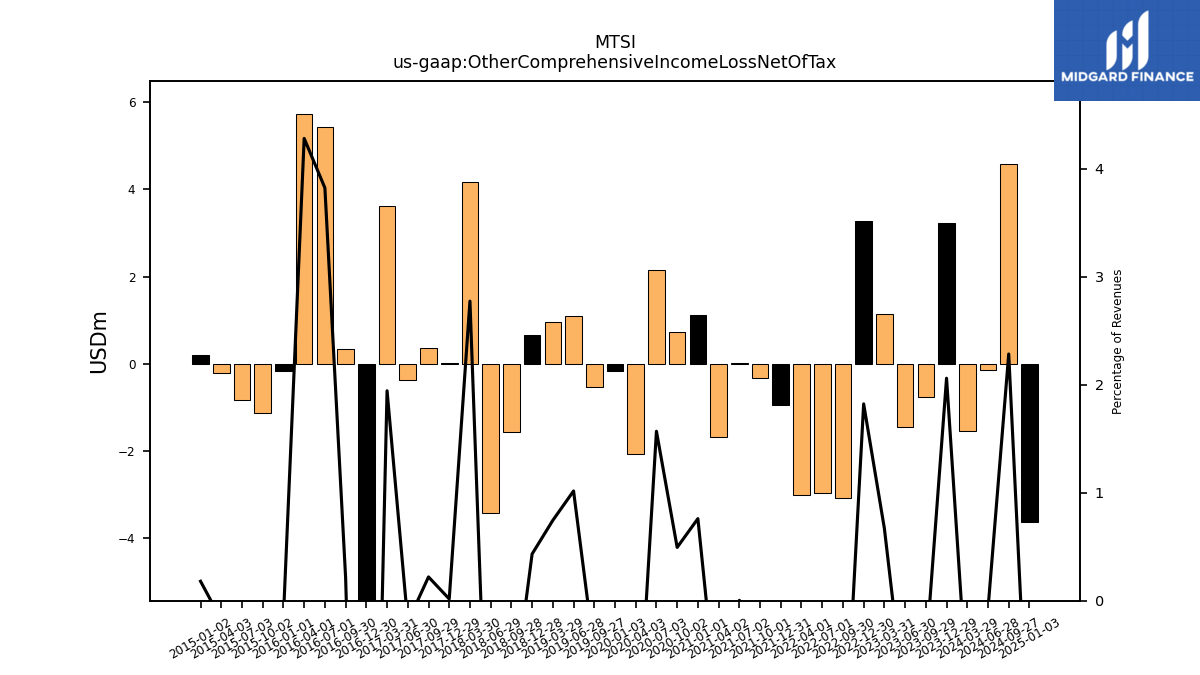
| Other Comprehensive Income Loss Net Of Tax | 3.24 | -0.75 | -1.45 | 1.13 | 3.28 | -3.08 | -2.96 | -3.01 | -0.94 | -0.32 | 0.01 | -1.68 | 1.13 | 0.73 | 2.15 | -2.06 | -0.17 | -0.54 | 1.10 | 0.96 | 0.65 | -1.57 | -3.42 | 4.17 | 0.02 | 0.37 | -0.38 | 3.62 | -9.64 | 0.33 | 5.44 | 5.72 | -0.17 | -1.14 | -0.82 | -0.22 | 0.21 | NA | NA | NA | NA | NA | NA | NA | NA | NA | NA | NA | NA | NA | NA | NA | NA | |
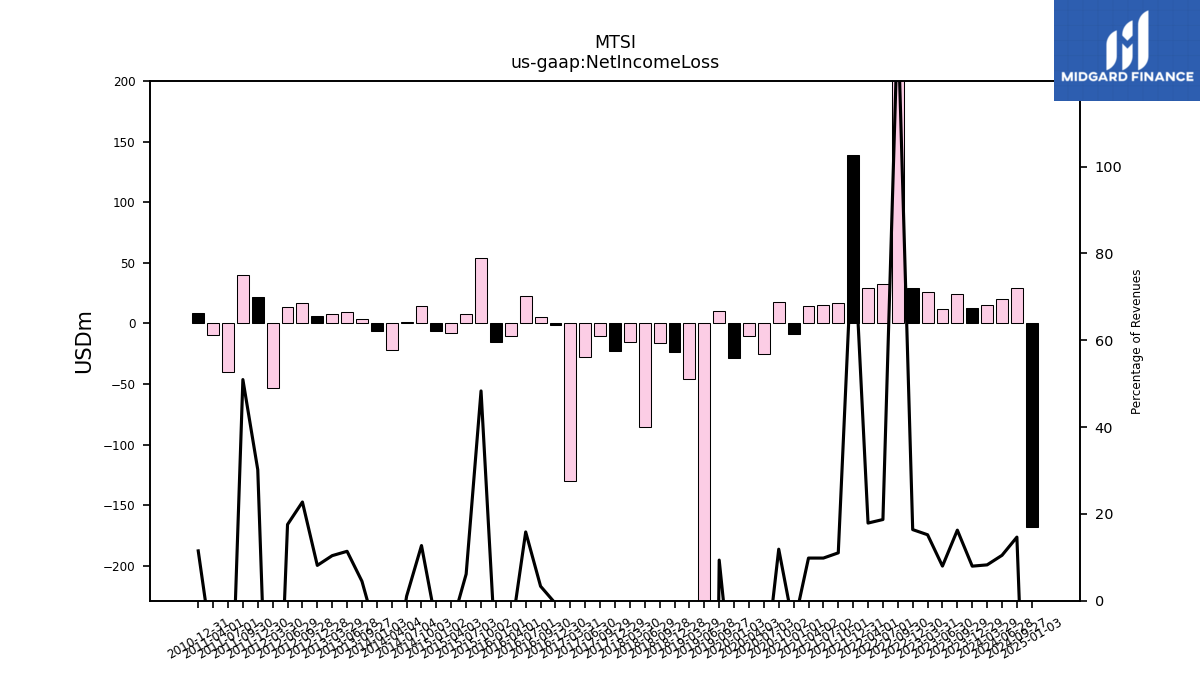
| Net Income Loss | 12.53 | 24.45 | 11.85 | 25.75 | 29.52 | 239.34 | 32.23 | 29.56 | 138.83 | 17.13 | 15.01 | 14.81 | -8.97 | 17.49 | -24.98 | -10.23 | -28.36 | 10.52 | -324.71 | -46.20 | -23.40 | -16.49 | -85.43 | -15.48 | -22.57 | -10.72 | -27.68 | -130.13 | -0.96 | 5.10 | 22.55 | -10.65 | -15.57 | 54.41 | 8.03 | -7.54 | -6.31 | 14.54 | 1.18 | -22.12 | -6.50 | 3.75 | 9.37 | 8.09 | 6.11 | 16.96 | 13.54 | -53.56 | 22.04 | 40.15 | -40.02 | -9.76 | 8.61 | |
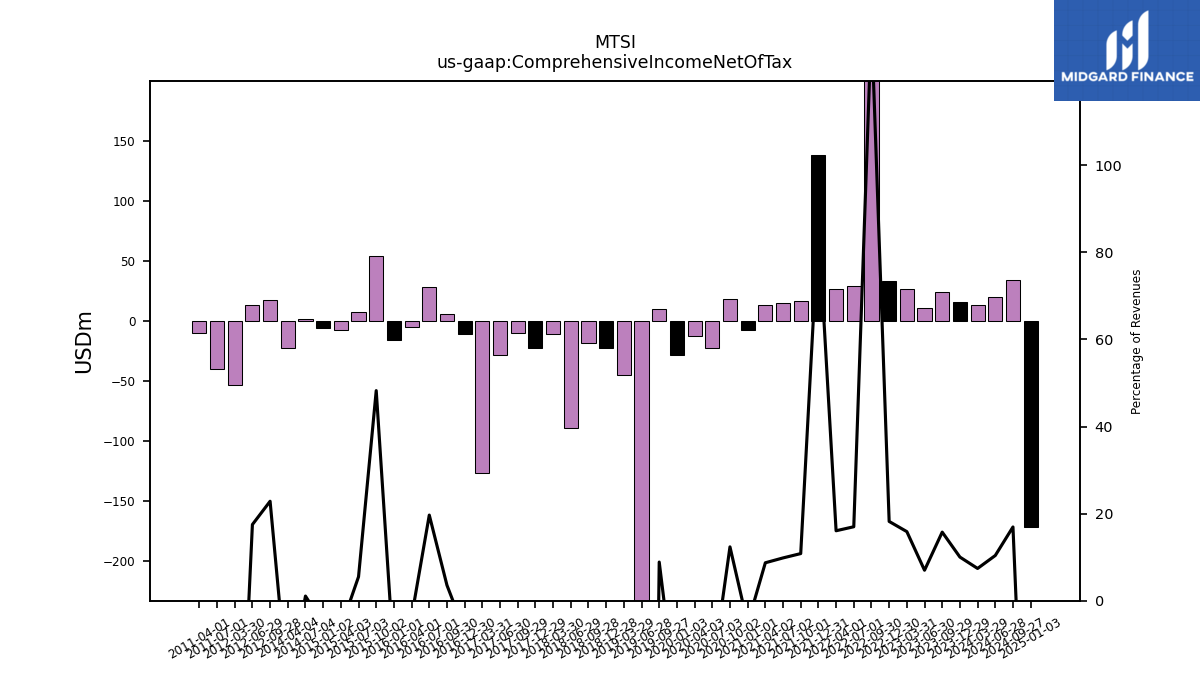
| Comprehensive Income Net Of Tax | 15.77 | 23.70 | 10.40 | 26.89 | 32.80 | 236.25 | 29.27 | 26.54 | 137.89 | 16.81 | 15.01 | 13.13 | -7.84 | 18.22 | -22.83 | -12.29 | -28.53 | 9.97 | -323.61 | -45.25 | -22.74 | -18.06 | -88.85 | -11.31 | -22.55 | -10.35 | -28.06 | -126.51 | -10.61 | 5.43 | 27.99 | -4.93 | -15.74 | 54.32 | 7.21 | -7.76 | -6.10 | NA | 1.21 | -22.55 | NA | NA | NA | NA | NA | 17.03 | 13.50 | -53.51 | NA | NA | -40.02 | -9.70 | NA | |
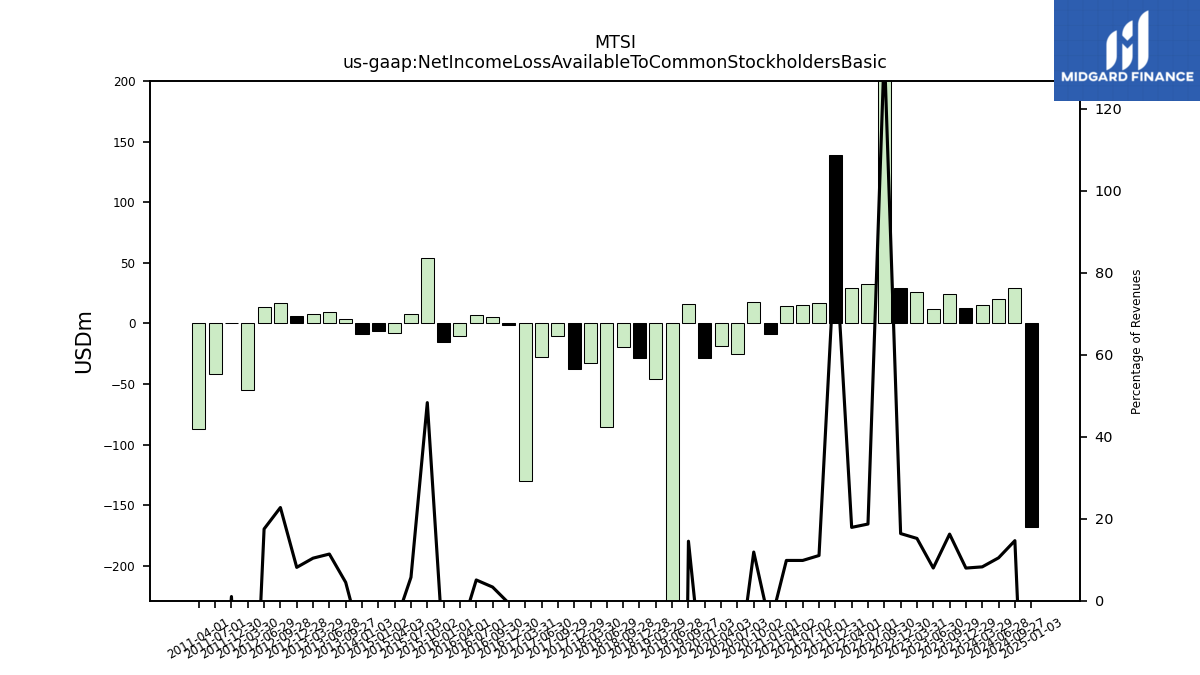
| Net Income Loss Available To Common Stockholders Basic | 12.53 | 24.45 | 11.85 | 25.75 | 29.52 | 239.34 | 32.23 | 29.56 | 138.83 | 17.13 | 15.01 | 14.81 | -8.97 | 17.49 | -24.98 | -18.87 | -28.36 | 16.30 | -326.64 | -46.20 | -28.86 | -19.24 | -85.43 | -32.50 | -37.18 | -10.72 | -27.68 | -130.13 | -0.96 | 5.10 | 7.21 | -10.65 | -15.57 | 54.41 | 7.48 | -7.54 | -6.31 | NA | NA | NA | -8.92 | 3.75 | 9.37 | 8.09 | 6.11 | 16.96 | 13.50 | -54.76 | 0.75 | NA | -41.38 | -87.31 | NA |
| 2023-12-29 | 2023-09-29 | 2023-06-30 | 2023-03-31 | 2022-12-30 | 2022-09-30 | 2022-07-01 | 2022-04-01 | 2021-12-31 | 2021-10-01 | 2021-07-02 | 2021-04-02 | 2021-01-01 | 2020-10-02 | 2020-07-03 | 2020-04-03 | 2020-01-03 | 2019-09-27 | 2019-06-28 | 2019-03-29 | 2018-12-28 | 2018-09-28 | 2018-06-29 | 2018-03-30 | 2017-12-29 | 2017-09-29 | 2017-06-30 | 2017-03-31 | 2016-12-30 | 2016-09-30 | 2016-07-01 | 2016-04-01 | 2016-01-01 | 2015-10-02 | 2015-07-03 | 2015-04-03 | 2015-01-02 | 2014-10-03 | 2014-07-04 | 2014-04-04 | 2014-01-03 | 2013-09-27 | 2013-06-28 | 2013-03-29 | 2012-12-28 | 2012-09-28 | 2012-06-29 | 2012-03-30 | 2011-12-30 | 2011-09-30 | 2011-07-01 | 2011-04-01 | 2010-12-31 | ||
|---|---|---|---|---|---|---|---|---|---|---|---|---|---|---|---|---|---|---|---|---|---|---|---|---|---|---|---|---|---|---|---|---|---|---|---|---|---|---|---|---|---|---|---|---|---|---|---|---|---|---|---|---|---|---|
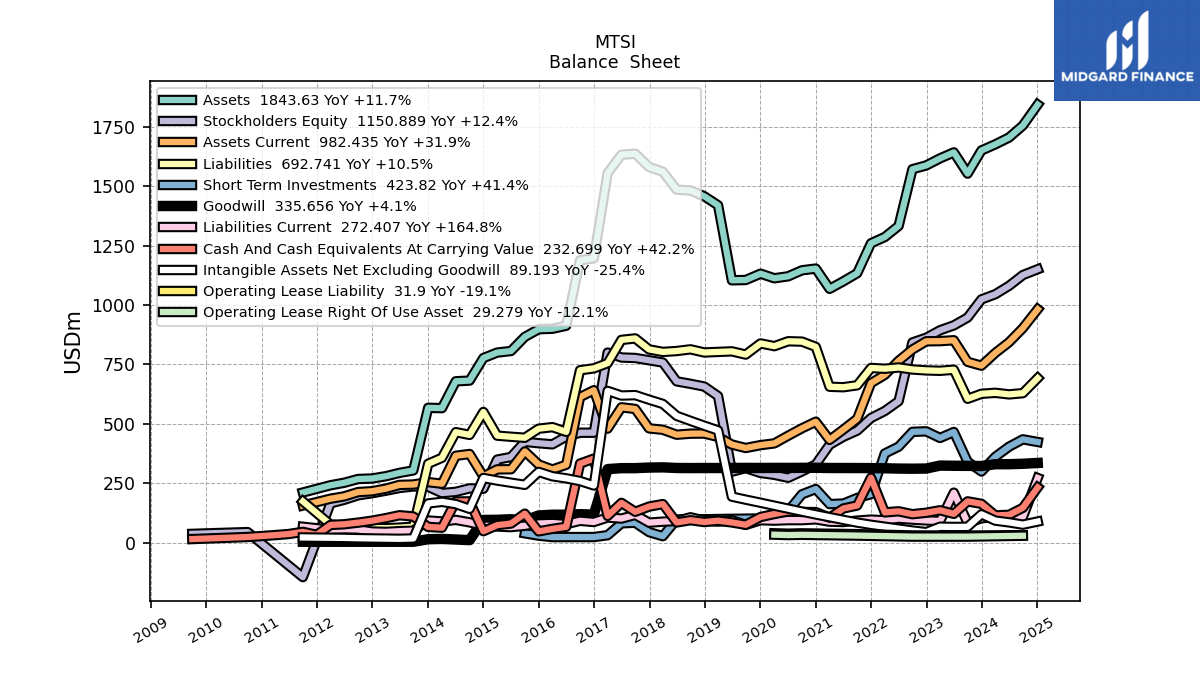
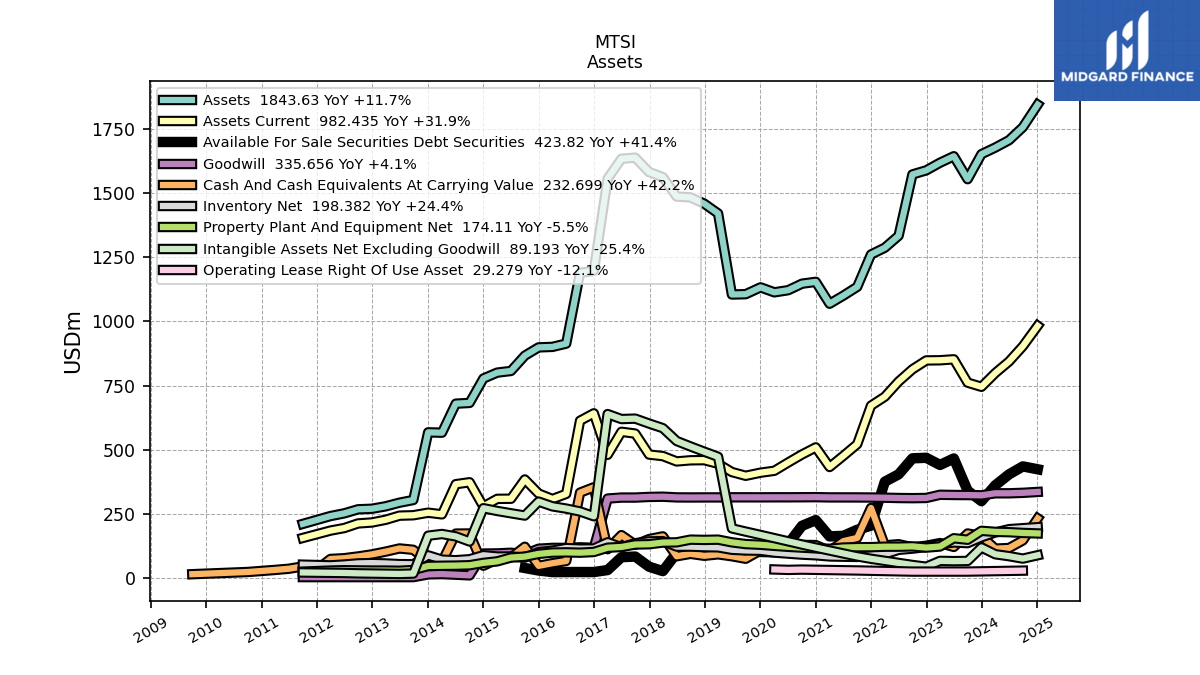
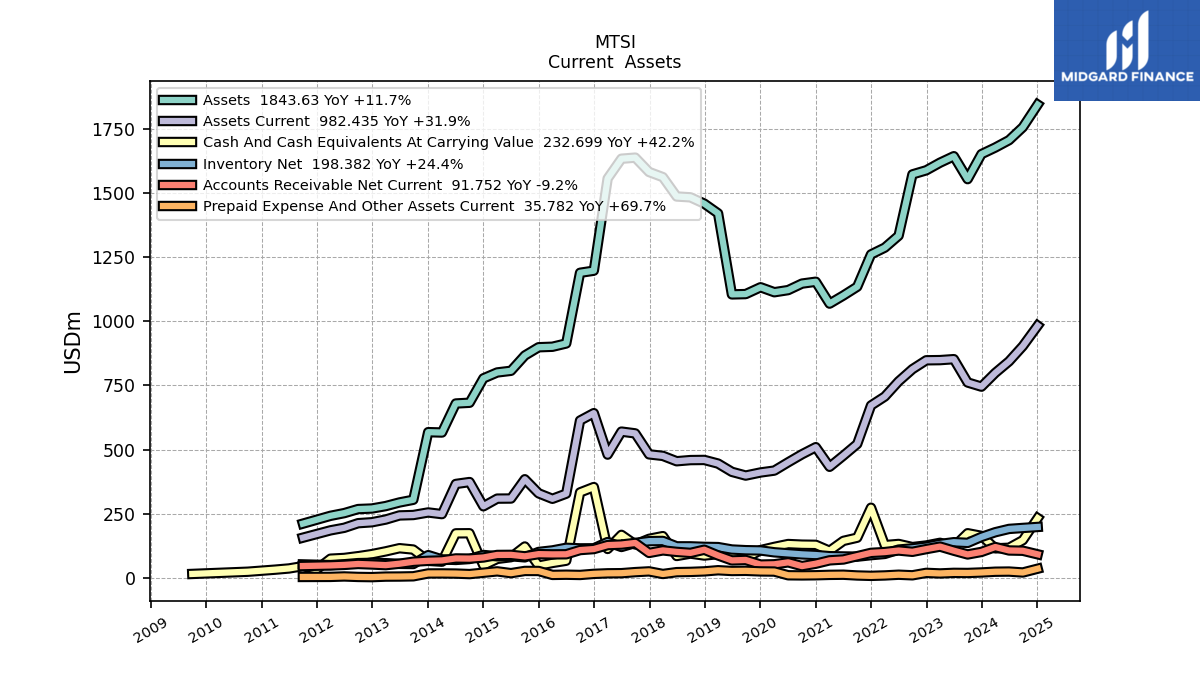
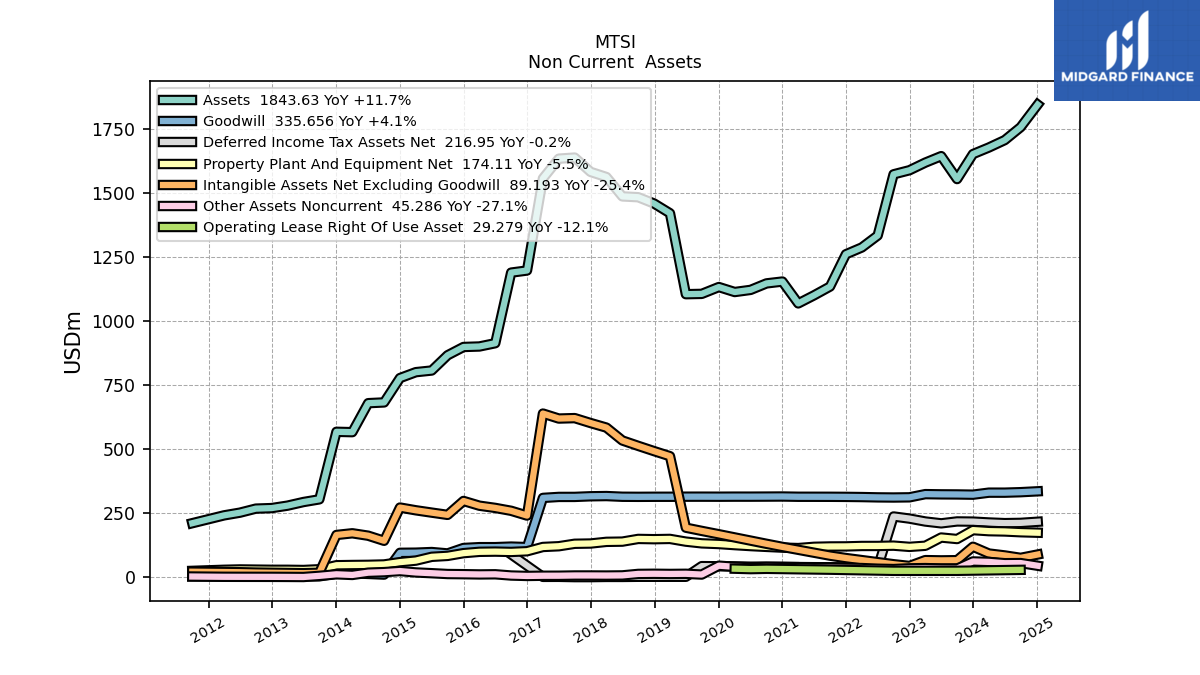
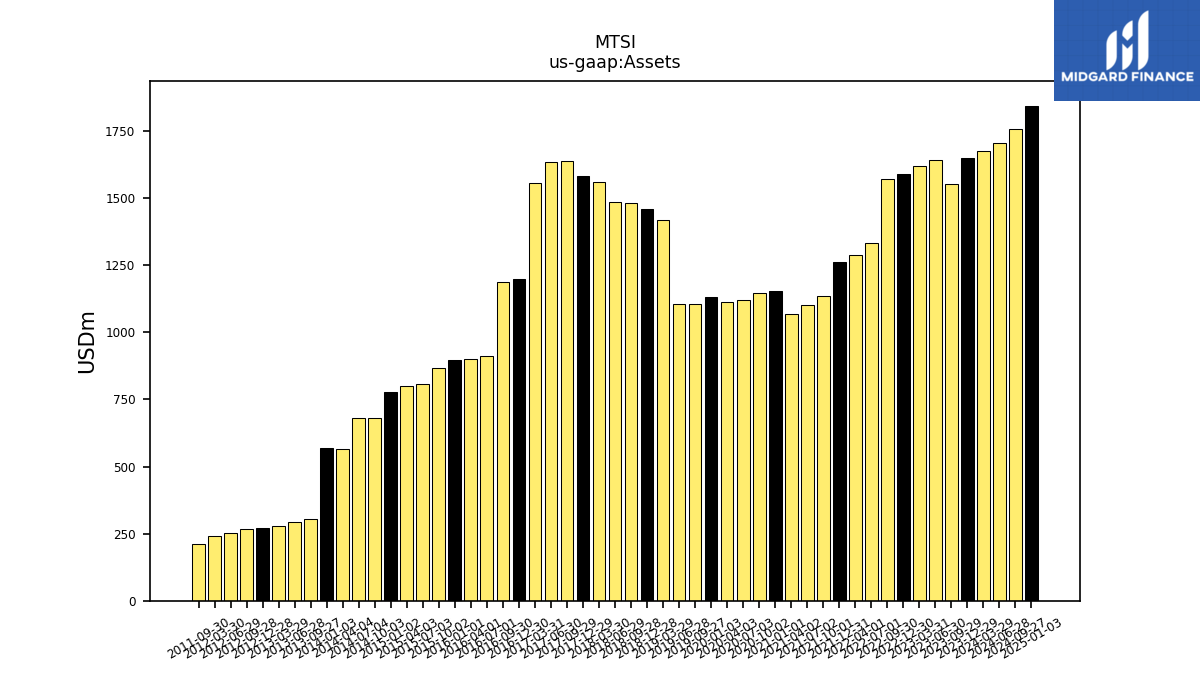
| Assets | 1650.80 | 1553.24 | 1642.71 | 1617.47 | 1587.71 | 1571.82 | 1333.07 | 1286.49 | 1260.12 | 1134.14 | 1100.11 | 1068.39 | 1153.68 | 1146.43 | 1121.13 | 1112.80 | 1132.21 | 1105.57 | 1104.33 | 1419.95 | 1457.84 | 1482.49 | 1485.71 | 1561.17 | 1581.26 | 1637.12 | 1632.88 | 1555.73 | 1196.69 | 1188.55 | 913.15 | 900.40 | 898.45 | 866.25 | 806.71 | 800.25 | 777.29 | 682.23 | 679.33 | 566.28 | 567.70 | 304.23 | 293.82 | 279.73 | 270.21 | 268.07 | 252.34 | 241.76 | NA | 211.27 | NA | NA | NA | |
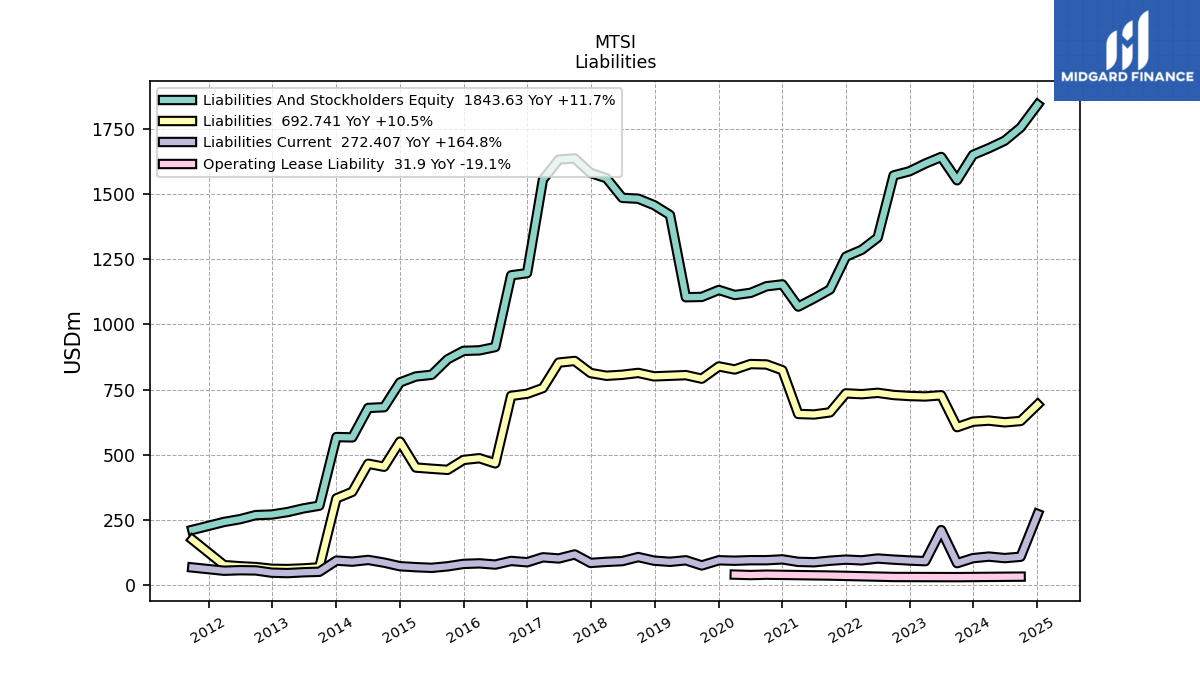
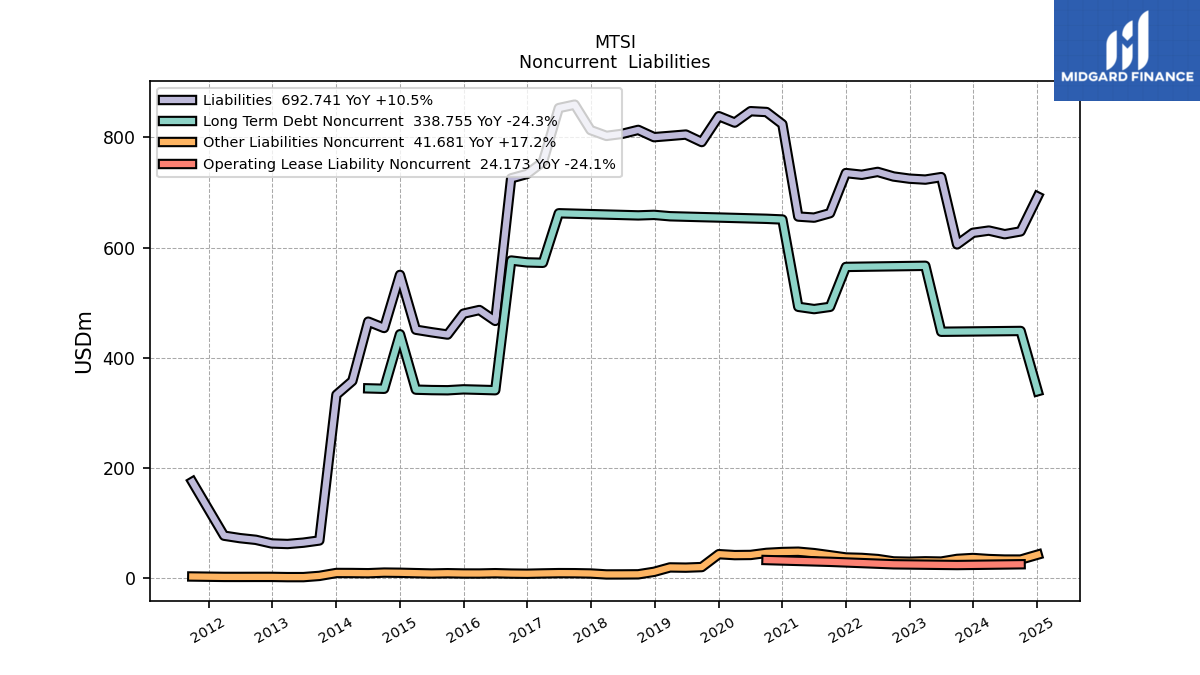
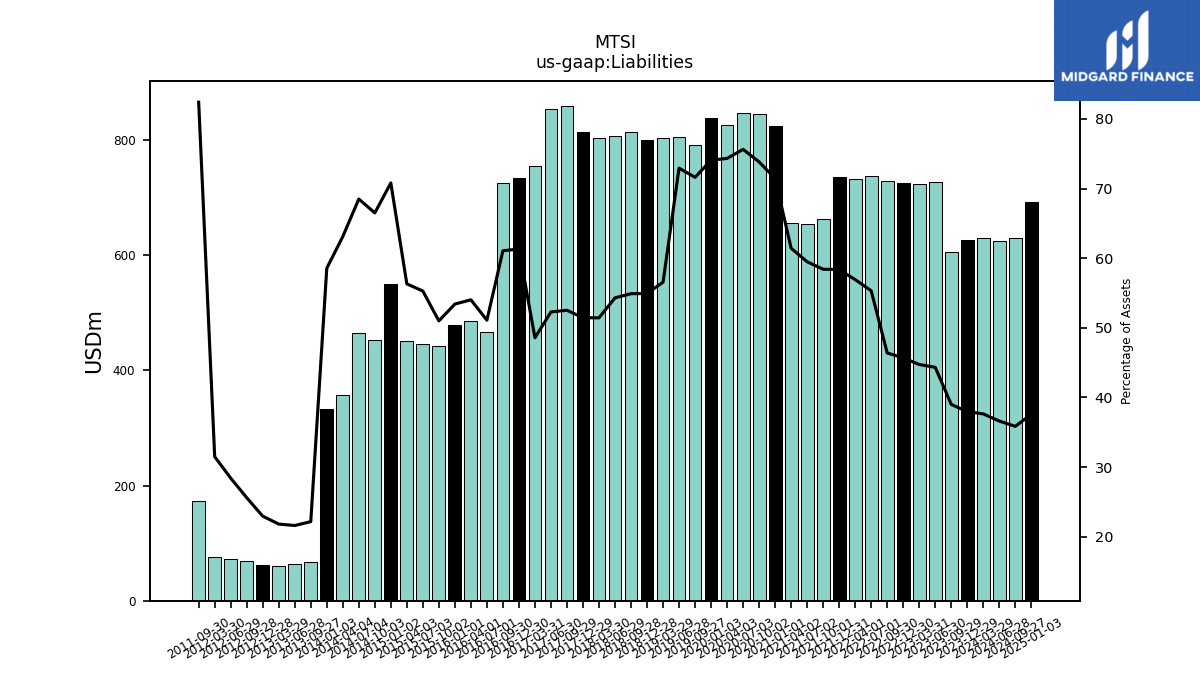
| Liabilities | 626.71 | 605.64 | 728.00 | 723.46 | 725.17 | 729.07 | 737.43 | 732.21 | 735.34 | 662.41 | 654.32 | 656.26 | 824.23 | 846.28 | 847.82 | 827.07 | 838.69 | 791.68 | 805.33 | 802.92 | 800.59 | 813.82 | 806.68 | 802.90 | 813.46 | 859.75 | 853.50 | 755.61 | 733.74 | 725.77 | 466.52 | 486.39 | 479.80 | 441.72 | 445.91 | 450.55 | 550.27 | 453.67 | 465.27 | 357.33 | 332.35 | 67.41 | 63.47 | 61.00 | 61.99 | 68.61 | 71.68 | 76.13 | NA | 174.09 | NA | NA | NA | |
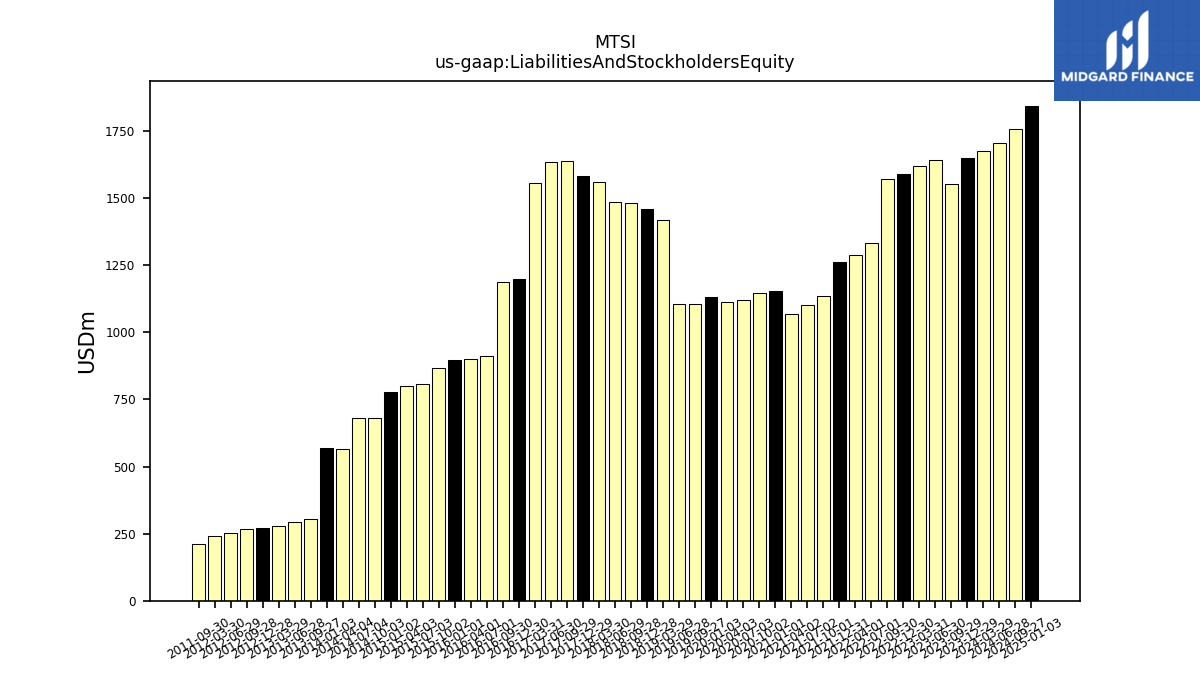
| Liabilities And Stockholders Equity | 1650.80 | 1553.24 | 1642.71 | 1617.47 | 1587.71 | 1571.82 | 1333.07 | 1286.49 | 1260.12 | 1134.14 | 1100.11 | 1068.39 | 1153.68 | 1146.43 | 1121.13 | 1112.80 | 1132.21 | 1105.57 | 1104.33 | 1419.95 | 1457.84 | 1482.49 | 1485.71 | 1561.17 | 1581.26 | 1637.12 | 1632.88 | 1555.73 | 1196.69 | 1188.55 | 913.15 | 900.40 | 898.45 | 866.25 | 806.71 | 800.25 | 777.29 | 682.23 | 679.33 | 566.28 | 567.70 | 304.23 | 293.82 | 279.73 | 270.21 | 268.07 | 252.34 | 241.76 | NA | 211.27 | NA | NA | NA | |
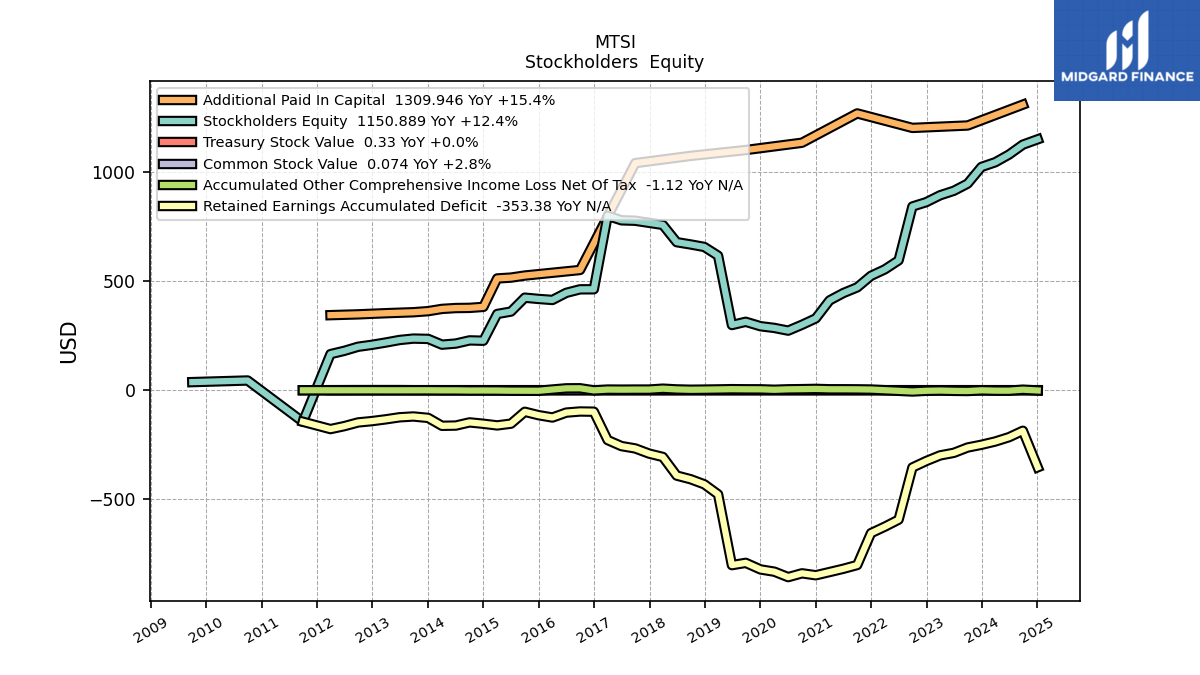
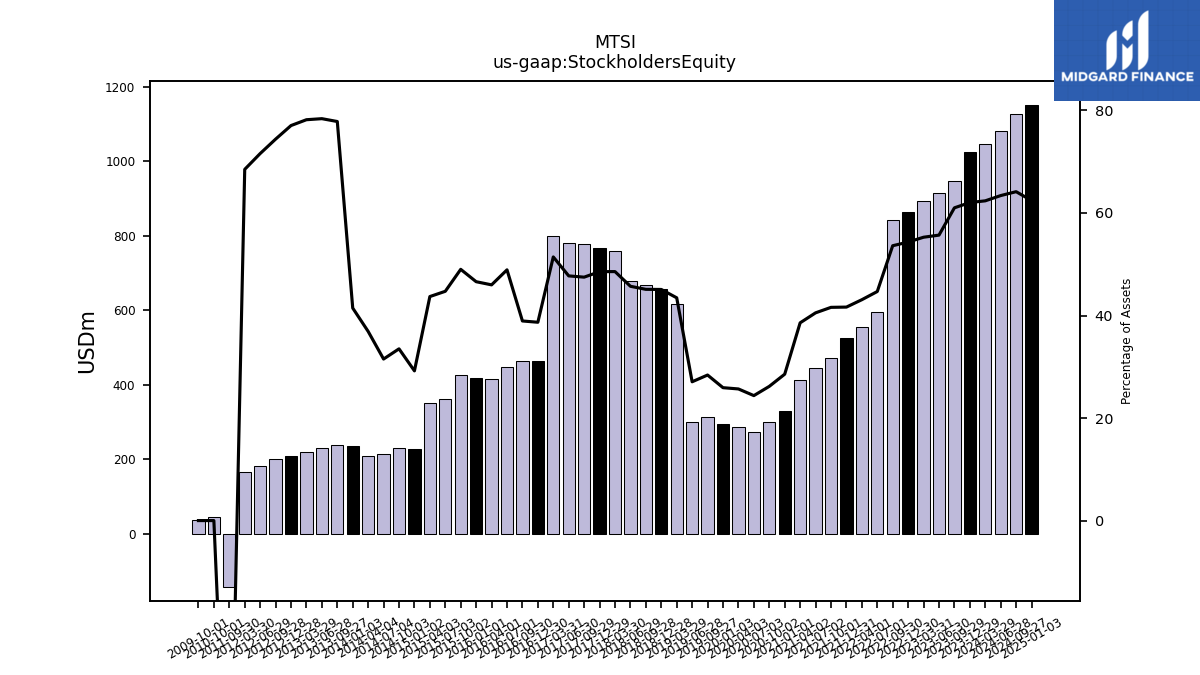
| Stockholders Equity | 1024.09 | 947.60 | 914.71 | 894.01 | 862.54 | 842.75 | 595.64 | 554.28 | 524.77 | 471.74 | 445.79 | 412.13 | 329.45 | 300.15 | 273.30 | 285.73 | 293.52 | 313.90 | 299.00 | 617.02 | 657.26 | 668.67 | 679.04 | 758.27 | 767.80 | 777.37 | 779.38 | 800.12 | 462.96 | 462.78 | 446.63 | 414.01 | 418.65 | 424.53 | 360.80 | 349.69 | 227.02 | 228.57 | 214.06 | 208.94 | 235.34 | 236.82 | 230.35 | 218.73 | 208.21 | 199.46 | 180.66 | 165.63 | NA | -144.84 | NA | NA | NA |
| 2023-12-29 | 2023-09-29 | 2023-06-30 | 2023-03-31 | 2022-12-30 | 2022-09-30 | 2022-07-01 | 2022-04-01 | 2021-12-31 | 2021-10-01 | 2021-07-02 | 2021-04-02 | 2021-01-01 | 2020-10-02 | 2020-07-03 | 2020-04-03 | 2020-01-03 | 2019-09-27 | 2019-06-28 | 2019-03-29 | 2018-12-28 | 2018-09-28 | 2018-06-29 | 2018-03-30 | 2017-12-29 | 2017-09-29 | 2017-06-30 | 2017-03-31 | 2016-12-30 | 2016-09-30 | 2016-07-01 | 2016-04-01 | 2016-01-01 | 2015-10-02 | 2015-07-03 | 2015-04-03 | 2015-01-02 | 2014-10-03 | 2014-07-04 | 2014-04-04 | 2014-01-03 | 2013-09-27 | 2013-06-28 | 2013-03-29 | 2012-12-28 | 2012-09-28 | 2012-06-29 | 2012-03-30 | 2011-12-30 | 2011-09-30 | 2011-07-01 | 2011-04-01 | 2010-12-31 | ||
|---|---|---|---|---|---|---|---|---|---|---|---|---|---|---|---|---|---|---|---|---|---|---|---|---|---|---|---|---|---|---|---|---|---|---|---|---|---|---|---|---|---|---|---|---|---|---|---|---|---|---|---|---|---|---|
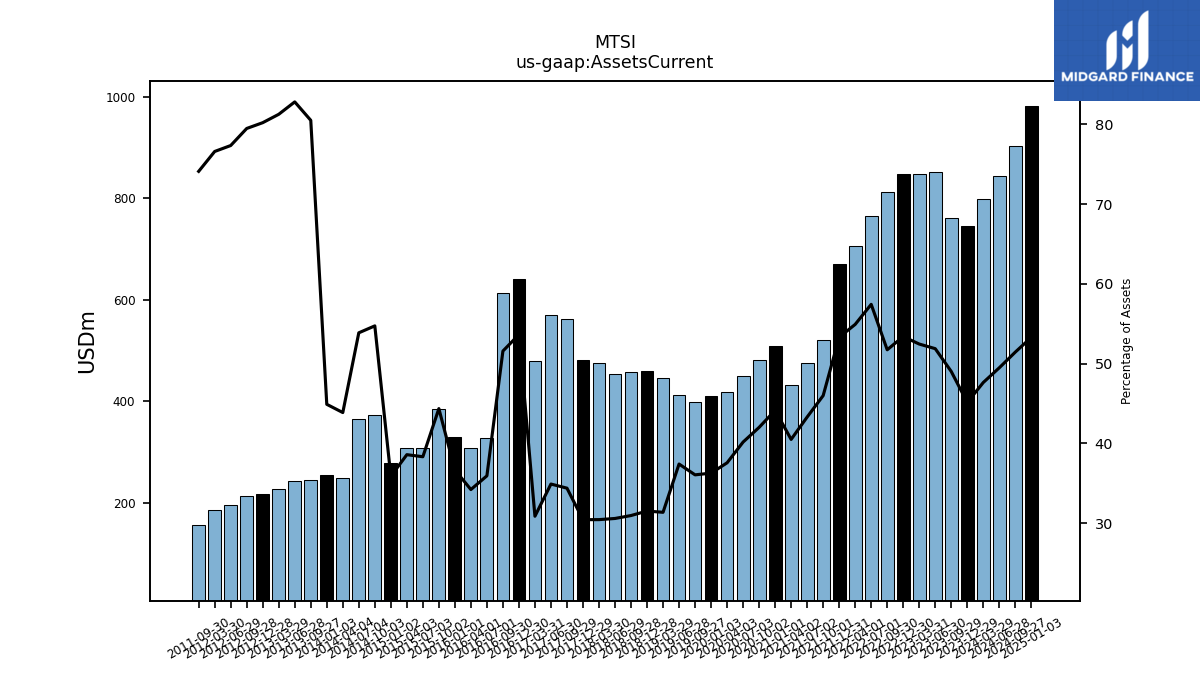
| Assets Current | 744.95 | 761.19 | 852.05 | 848.32 | 847.63 | 813.08 | 765.50 | 706.44 | 671.56 | 521.54 | 476.33 | 432.63 | 509.21 | 481.52 | 450.27 | 417.98 | 410.63 | 398.58 | 413.09 | 445.26 | 459.43 | 458.86 | 454.39 | 475.21 | 481.23 | 562.90 | 569.85 | 480.17 | 641.77 | 612.94 | 328.08 | 308.02 | 329.41 | 384.22 | 309.15 | 308.74 | 278.80 | 373.35 | 365.86 | 248.37 | 254.86 | 244.87 | 243.28 | 227.27 | 216.69 | 213.03 | 195.13 | 185.15 | NA | 156.53 | NA | NA | NA | |
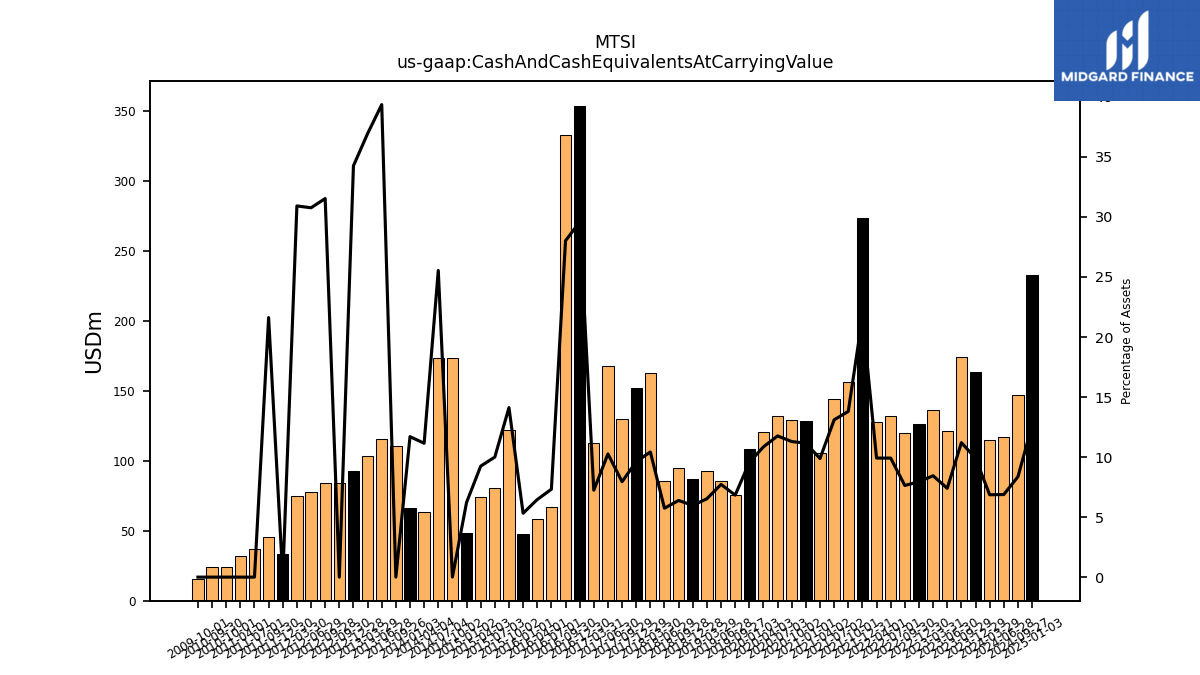
| Cash And Cash Equivalents At Carrying Value | 163.59 | 173.95 | 121.52 | 136.57 | 126.16 | 119.95 | 132.17 | 127.58 | 273.40 | 156.54 | 144.13 | 105.54 | 128.73 | 129.44 | 131.87 | 120.73 | 108.18 | 75.52 | 85.27 | 92.68 | 87.09 | 94.68 | 85.27 | 162.69 | 152.09 | 130.10 | 167.61 | 112.61 | 353.92 | 332.98 | 66.84 | 58.19 | 47.81 | 122.31 | 80.69 | 73.97 | 48.34 | NA | 173.51 | 63.14 | 66.42 | NA | 115.63 | 103.33 | 92.57 | 84.53 | 77.63 | 74.74 | 33.11 | 45.67 | 36.73 | 32.06 | NA | |
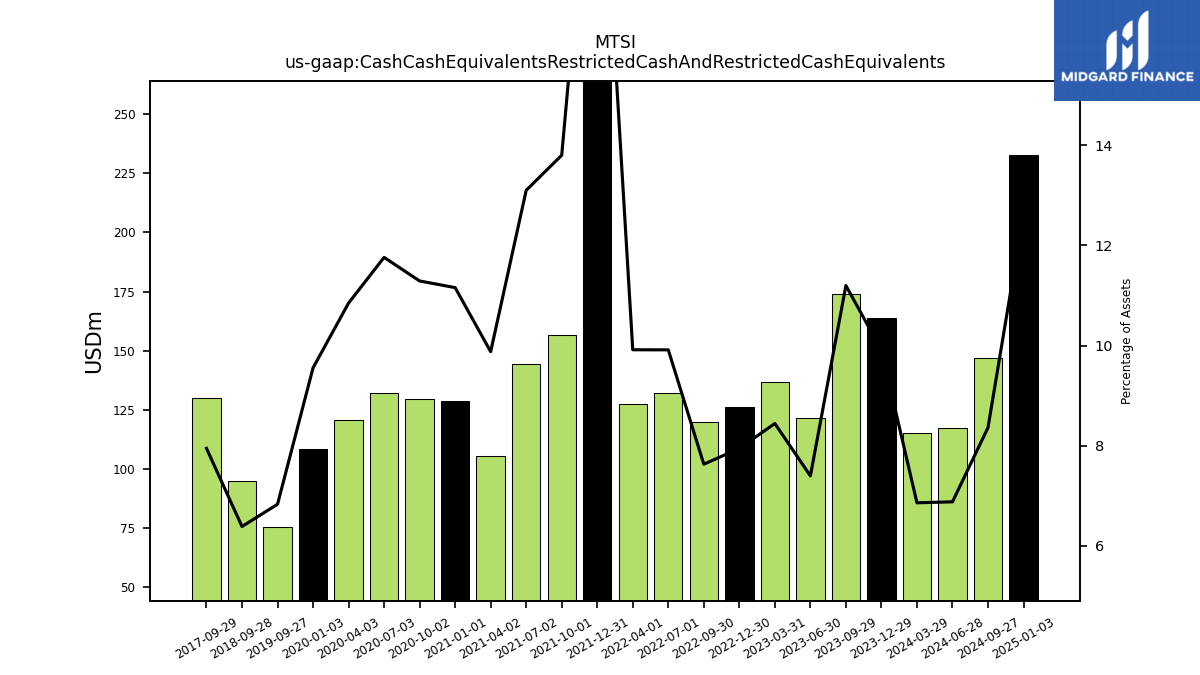
| Cash Cash Equivalents Restricted Cash And Restricted Cash Equivalents | 163.59 | 173.95 | 121.52 | 136.57 | 126.16 | 119.95 | 132.17 | 127.58 | 273.40 | 156.54 | 144.13 | 105.54 | 128.73 | 129.44 | 131.87 | 120.73 | 108.18 | 75.52 | NA | NA | NA | 94.68 | NA | NA | NA | 130.10 | NA | NA | NA | NA | NA | NA | NA | NA | NA | NA | NA | NA | NA | NA | NA | NA | NA | NA | NA | NA | NA | NA | NA | NA | NA | NA | NA | |
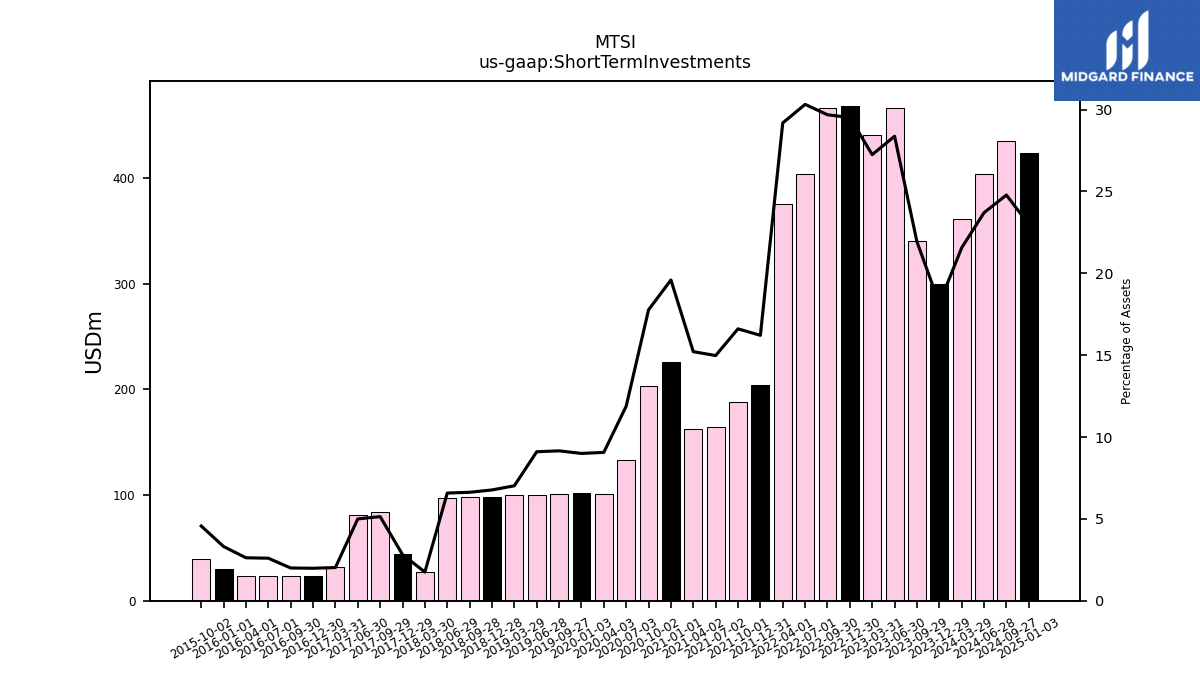
| Short Term Investments | 299.70 | 340.57 | 466.07 | 440.74 | 468.58 | 466.58 | 404.17 | 375.45 | 204.31 | 188.37 | 164.77 | 162.55 | 226.04 | 203.71 | 133.25 | 100.85 | 101.88 | 101.23 | 100.52 | 99.71 | 98.67 | 98.22 | 97.72 | 27.40 | 44.59 | 84.12 | 81.64 | 31.57 | 23.75 | 23.78 | 23.73 | 23.63 | 29.75 | 39.56 | NA | NA | NA | NA | NA | NA | NA | NA | NA | NA | NA | NA | NA | NA | NA | NA | NA | NA | NA | |
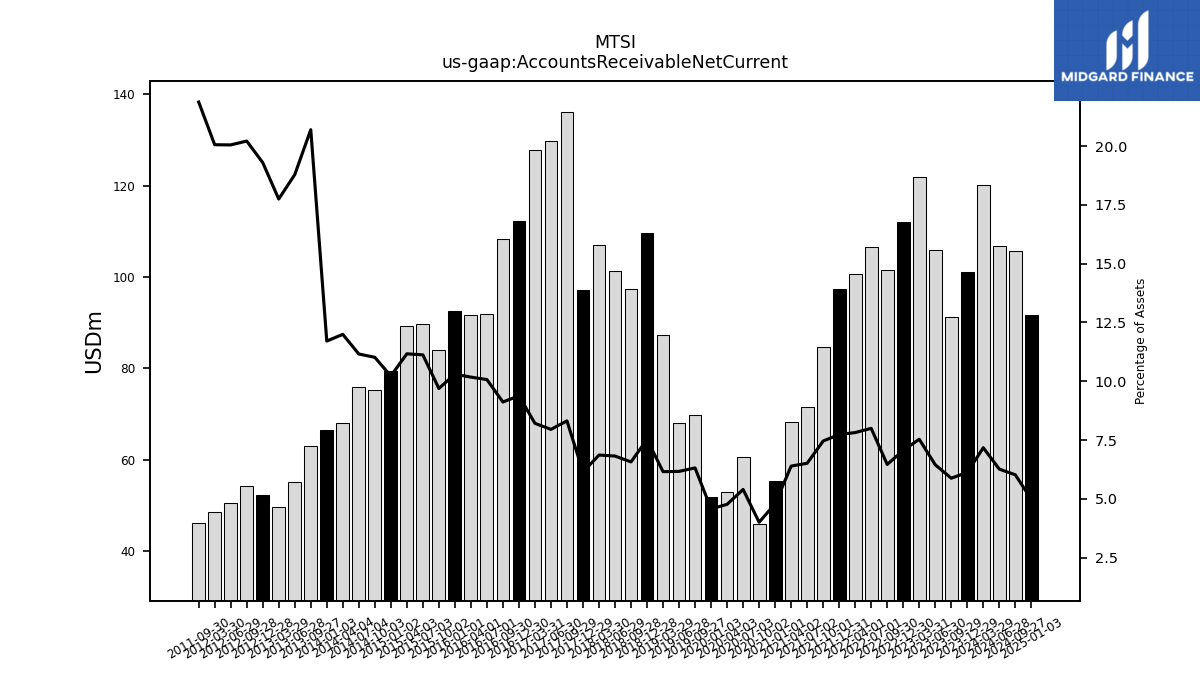
| Accounts Receivable Net Current | 101.08 | 91.25 | 105.89 | 121.82 | 112.04 | 101.55 | 106.59 | 100.55 | 97.44 | 84.57 | 71.62 | 68.28 | 55.21 | 45.88 | 60.50 | 53.00 | 51.78 | 69.79 | 68.08 | 87.39 | 109.68 | 97.38 | 101.28 | 107.09 | 97.12 | 136.10 | 129.84 | 127.71 | 112.25 | 108.33 | 91.96 | 91.60 | 92.52 | 83.95 | 89.71 | 89.35 | 79.45 | 75.16 | 75.80 | 67.91 | 66.47 | 62.96 | 55.20 | 49.65 | 52.14 | 54.18 | 50.59 | 48.49 | NA | 46.21 | NA | NA | NA | |
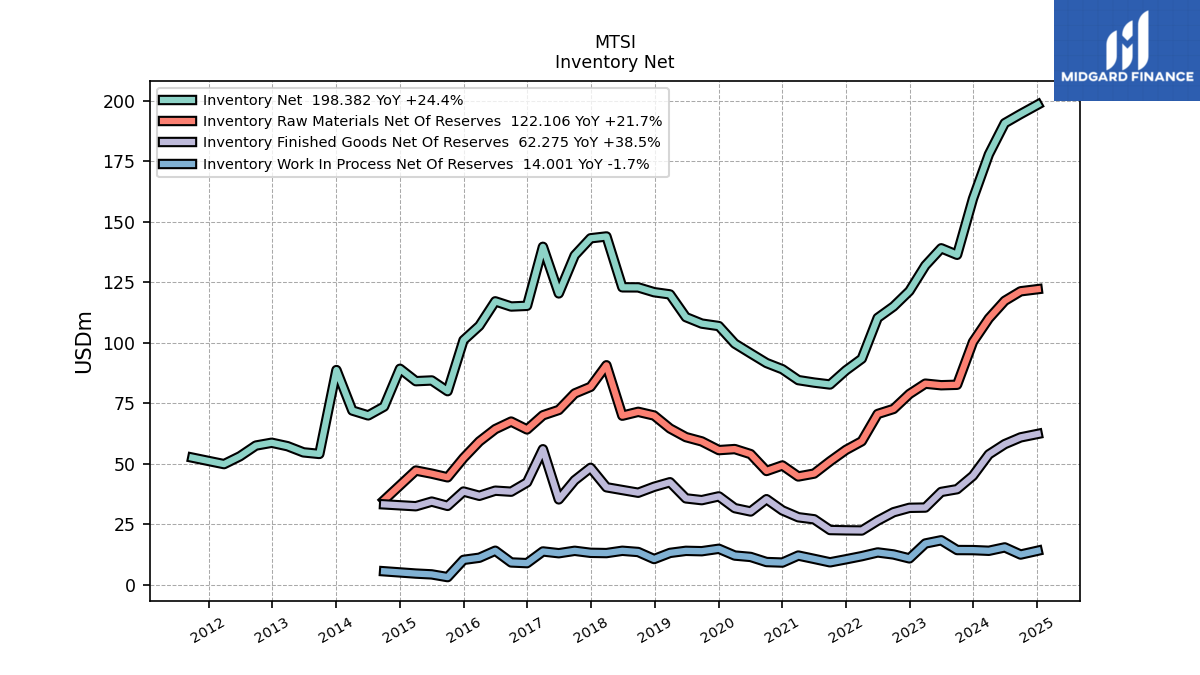
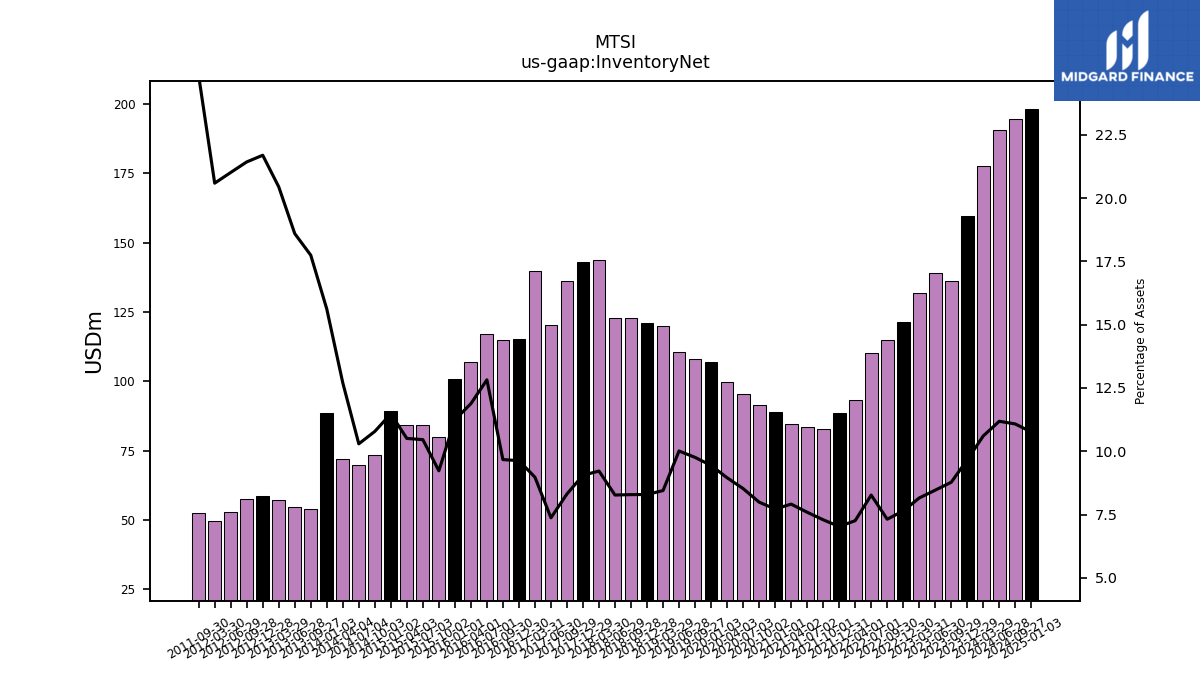
| Inventory Net | 159.50 | 136.30 | 139.01 | 131.88 | 121.33 | 114.96 | 110.23 | 93.35 | 88.54 | 82.70 | 83.50 | 84.52 | 89.02 | 91.58 | 95.58 | 99.62 | 106.86 | 107.88 | 110.55 | 119.94 | 120.86 | 122.84 | 122.87 | 143.90 | 143.14 | 136.07 | 120.34 | 139.62 | 115.22 | 114.94 | 117.08 | 106.97 | 101.00 | 79.94 | 84.37 | 84.08 | 89.21 | 73.57 | 69.92 | 71.94 | 88.69 | 53.99 | 54.65 | 57.20 | 58.63 | 57.46 | 53.03 | 49.79 | NA | 52.48 | NA | NA | NA | |
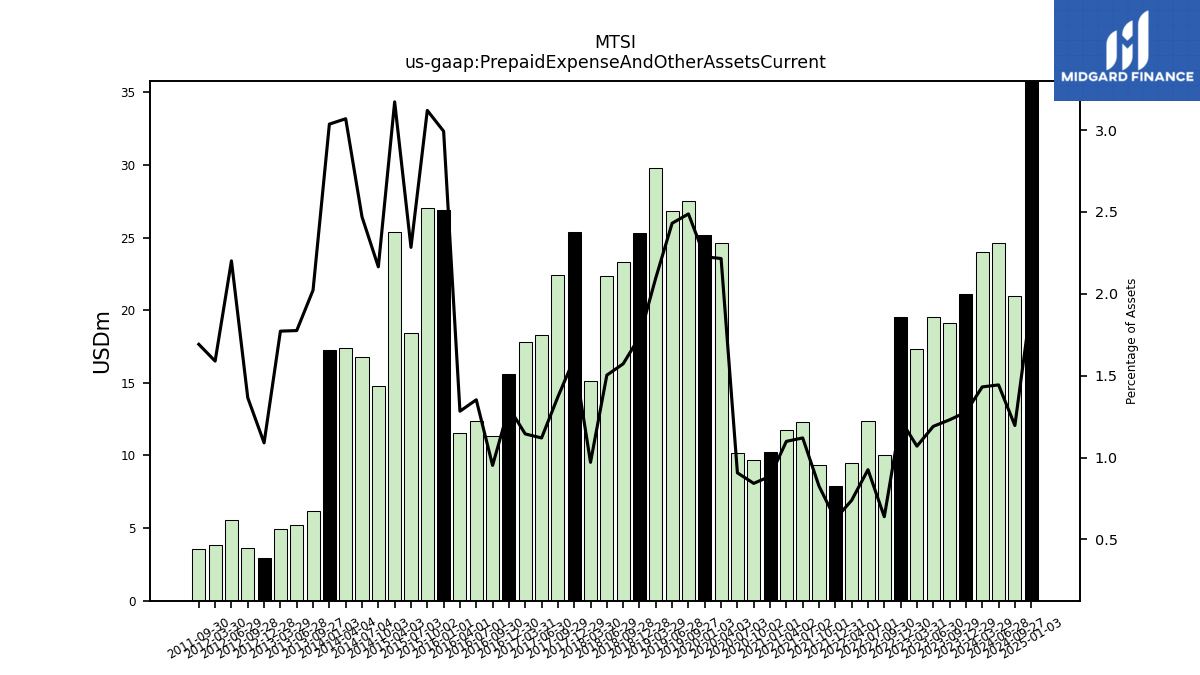
| Prepaid Expense And Other Assets Current | 21.08 | 19.11 | 19.56 | 17.30 | 19.53 | 10.04 | 12.34 | 9.51 | 7.87 | 9.37 | 12.32 | 11.74 | 10.22 | 9.66 | 10.17 | 24.66 | 25.21 | 27.51 | 26.85 | 29.78 | 25.31 | 23.31 | 22.34 | 15.16 | 25.36 | 22.44 | 18.28 | 17.80 | 15.62 | 11.32 | 12.35 | 11.55 | 26.89 | 27.03 | 18.42 | 25.39 | NA | 14.77 | 16.78 | 17.38 | 17.24 | 6.15 | 5.22 | 4.96 | 2.94 | 3.66 | 5.55 | 3.84 | NA | 3.57 | NA | NA | NA | |
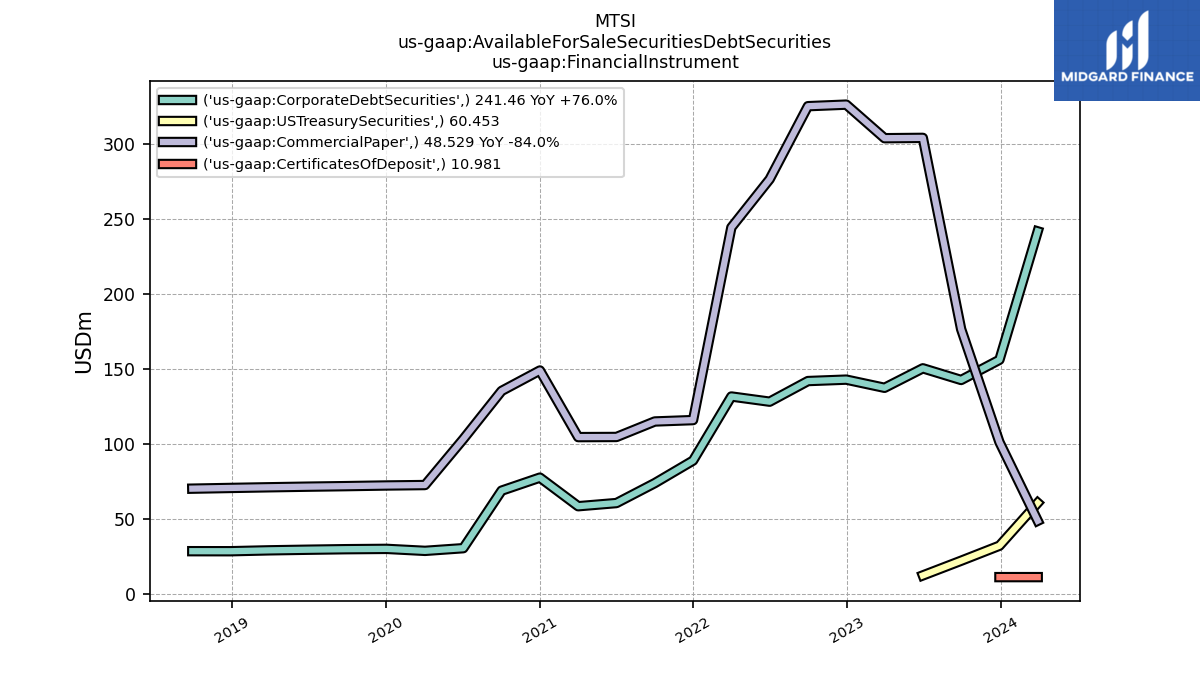
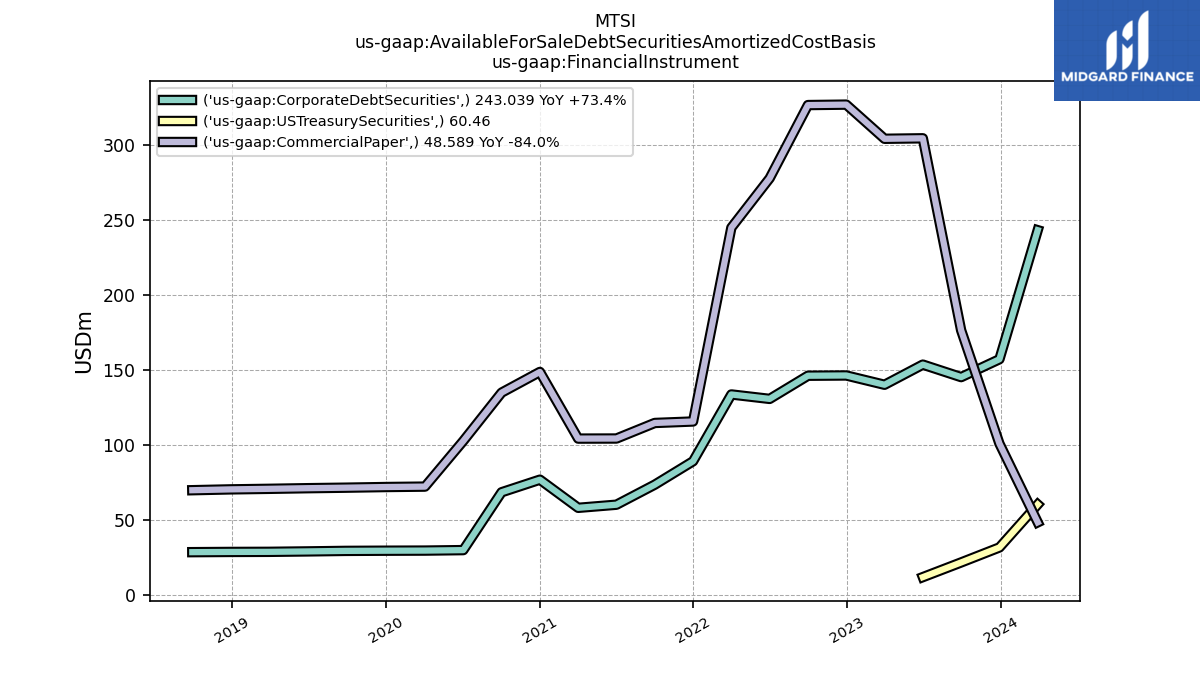
| Available For Sale Securities Debt Securities | 299.70 | 340.57 | 466.07 | 440.74 | 468.58 | 466.58 | 404.17 | 375.45 | 204.31 | 188.37 | 164.77 | 162.55 | 226.04 | 203.71 | 133.25 | 100.85 | 101.88 | 101.23 | 100.52 | 99.71 | 98.67 | 98.22 | 97.72 | 27.40 | 44.59 | 84.12 | 81.64 | 31.57 | 23.75 | 23.78 | 23.73 | 23.63 | 29.75 | 39.56 | NA | NA | NA | NA | NA | NA | NA | NA | NA | NA | NA | NA | NA | NA | NA | NA | NA | NA | NA |
| 2023-12-29 | 2023-09-29 | 2023-06-30 | 2023-03-31 | 2022-12-30 | 2022-09-30 | 2022-07-01 | 2022-04-01 | 2021-12-31 | 2021-10-01 | 2021-07-02 | 2021-04-02 | 2021-01-01 | 2020-10-02 | 2020-07-03 | 2020-04-03 | 2020-01-03 | 2019-09-27 | 2019-06-28 | 2019-03-29 | 2018-12-28 | 2018-09-28 | 2018-06-29 | 2018-03-30 | 2017-12-29 | 2017-09-29 | 2017-06-30 | 2017-03-31 | 2016-12-30 | 2016-09-30 | 2016-07-01 | 2016-04-01 | 2016-01-01 | 2015-10-02 | 2015-07-03 | 2015-04-03 | 2015-01-02 | 2014-10-03 | 2014-07-04 | 2014-04-04 | 2014-01-03 | 2013-09-27 | 2013-06-28 | 2013-03-29 | 2012-12-28 | 2012-09-28 | 2012-06-29 | 2012-03-30 | 2011-12-30 | 2011-09-30 | 2011-07-01 | 2011-04-01 | 2010-12-31 | ||
|---|---|---|---|---|---|---|---|---|---|---|---|---|---|---|---|---|---|---|---|---|---|---|---|---|---|---|---|---|---|---|---|---|---|---|---|---|---|---|---|---|---|---|---|---|---|---|---|---|---|---|---|---|---|---|
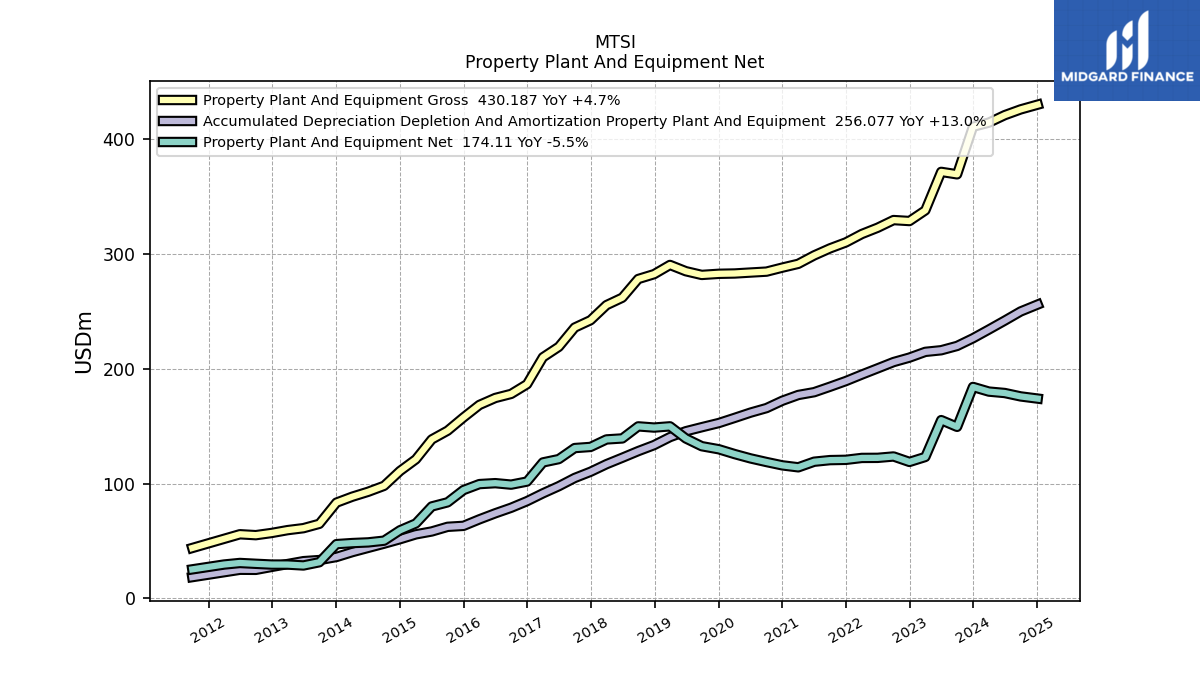
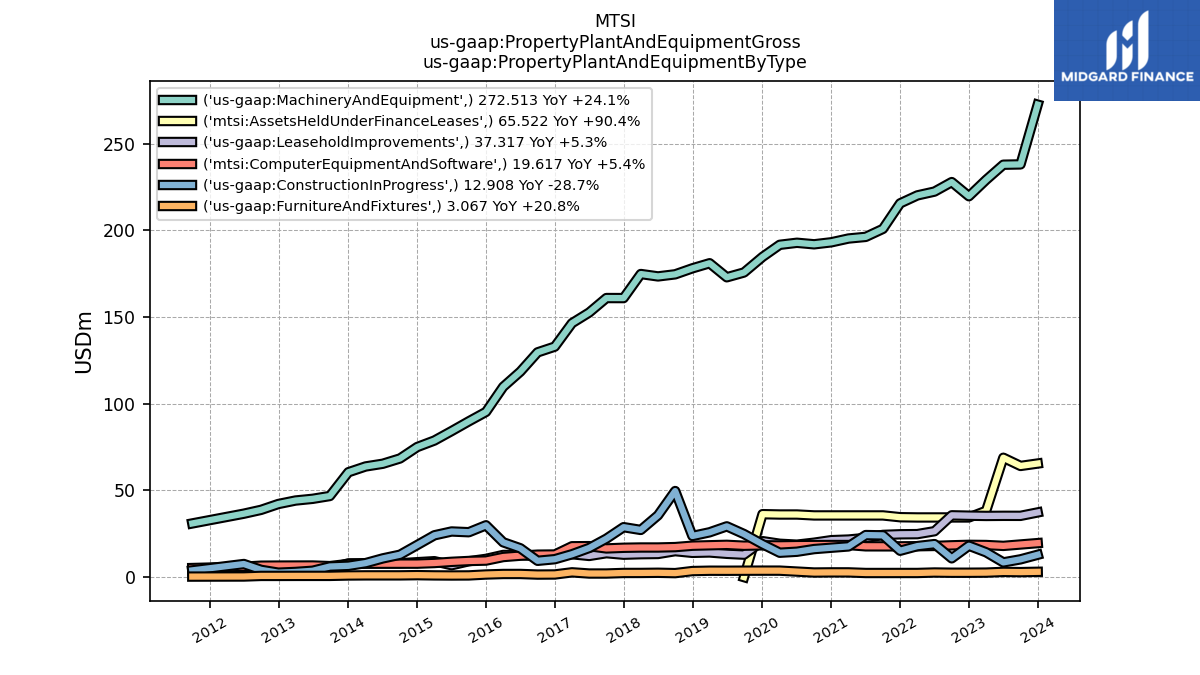
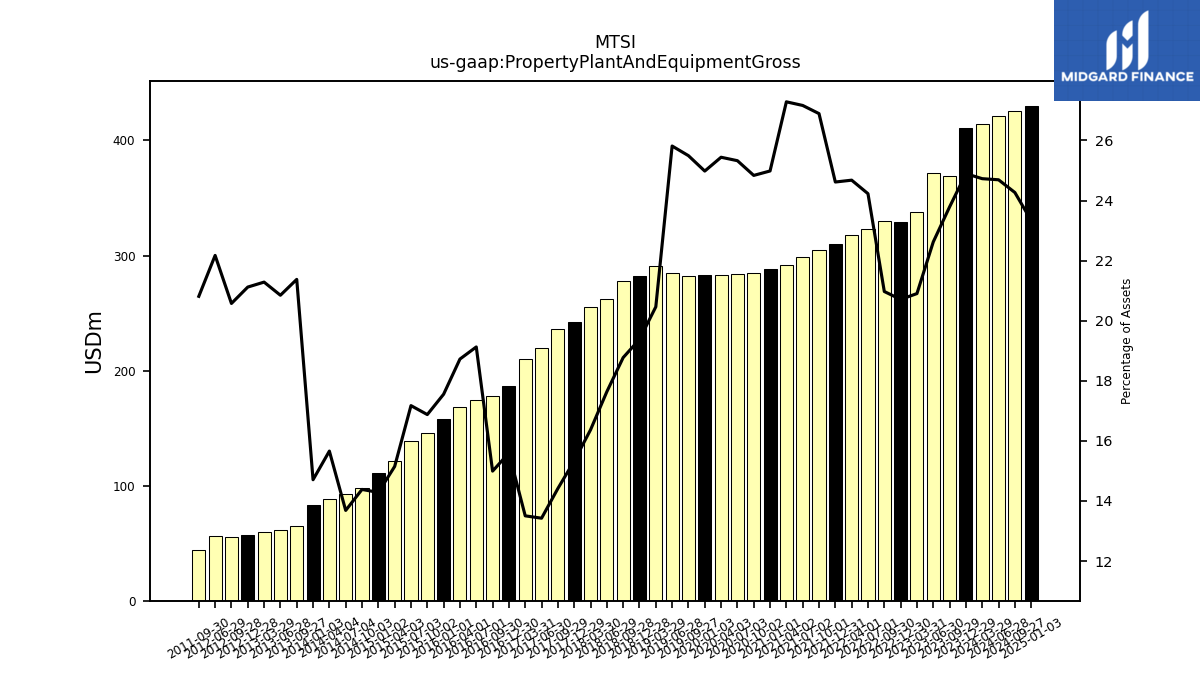
| Property Plant And Equipment Gross | 410.94 | 369.47 | 371.61 | 338.09 | 328.78 | 329.63 | 322.96 | 317.47 | 310.18 | 304.99 | 298.83 | 291.51 | 288.22 | 284.72 | 283.93 | 283.09 | 282.82 | 281.83 | 285.07 | 290.54 | 282.50 | 278.29 | 262.02 | 255.52 | 242.41 | 235.99 | 219.23 | 210.10 | 186.63 | 178.20 | 174.65 | 168.58 | 157.70 | 146.18 | 138.54 | 121.22 | 111.03 | 98.13 | 92.97 | 88.68 | 83.49 | 65.03 | 61.25 | 59.54 | 57.06 | 55.15 | 55.95 | NA | NA | 43.97 | NA | NA | NA | |
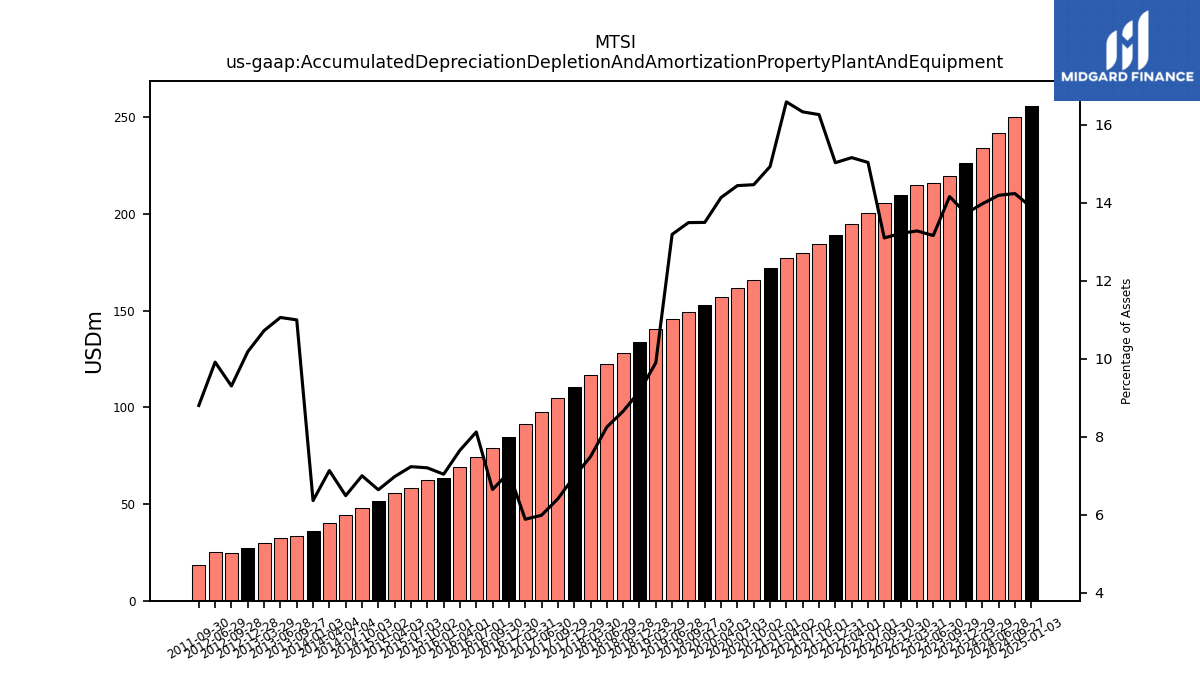
| Accumulated Depreciation Depletion And Amortization Property Plant And Equipment | 226.67 | 219.98 | 216.23 | 214.82 | 209.83 | 205.93 | 200.47 | 195.04 | 189.41 | 184.47 | 179.69 | 177.25 | 172.27 | 165.85 | 161.93 | 157.33 | 152.84 | 149.19 | 145.69 | 140.58 | 133.62 | 128.36 | 122.60 | 116.97 | 110.40 | 104.97 | 97.82 | 91.58 | 84.79 | 79.03 | 74.20 | 68.94 | 63.27 | 62.42 | 58.37 | 55.87 | 51.64 | 47.77 | 44.10 | 40.41 | 36.14 | 33.47 | 32.50 | 30.00 | 27.52 | 24.94 | 25.02 | NA | NA | 18.60 | NA | NA | NA | |
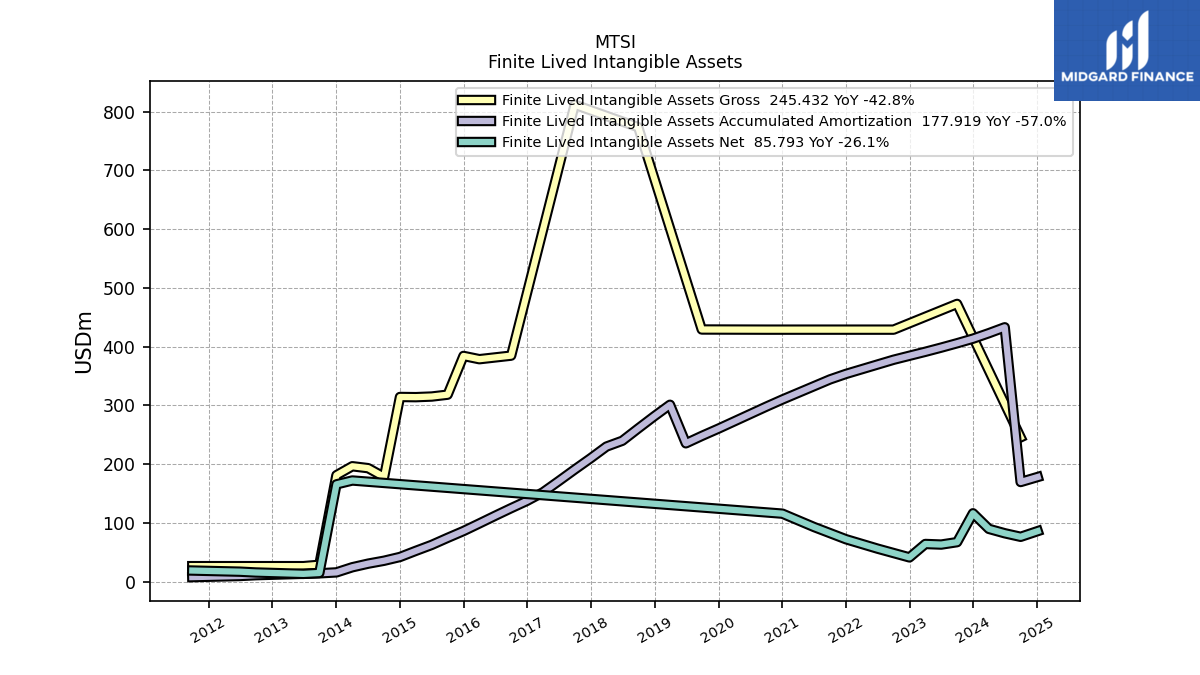
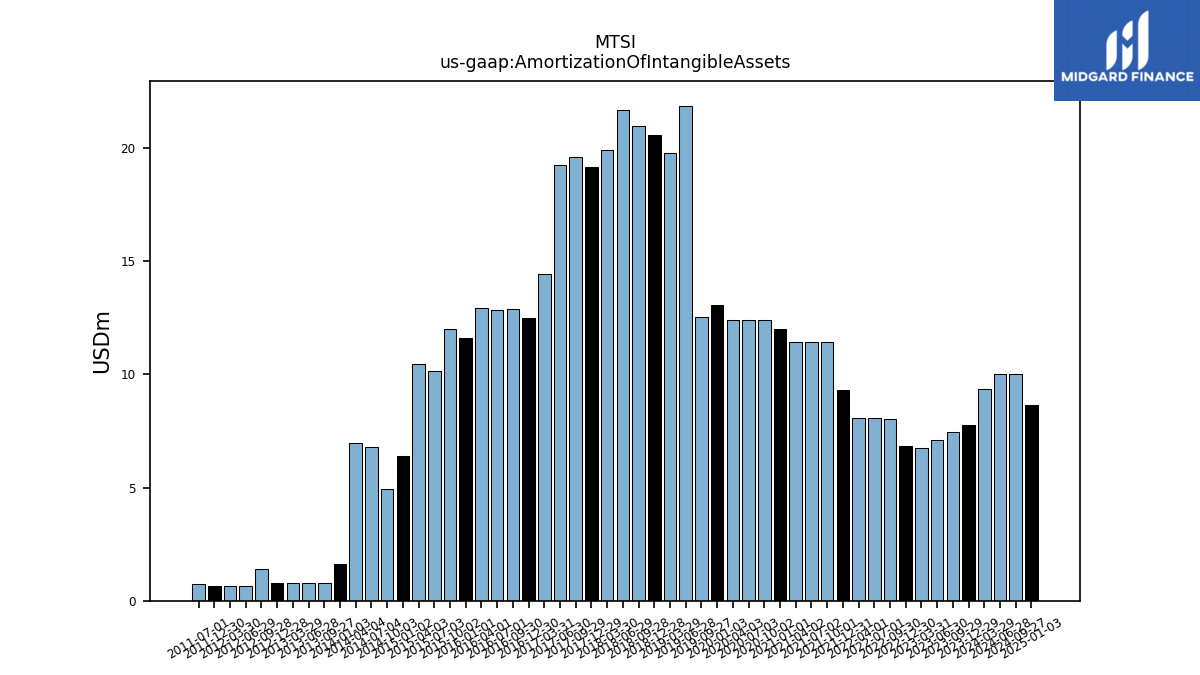
| Amortization Of Intangible Assets | 7.78 | 7.43 | 7.11 | 6.75 | 6.81 | 8.04 | 8.05 | 8.05 | 9.29 | 11.41 | 11.41 | 11.41 | 11.99 | 12.42 | 12.42 | 12.42 | 13.07 | 12.53 | 21.86 | 19.76 | 20.57 | 20.95 | 21.68 | 19.93 | 19.14 | 19.59 | 19.25 | 14.44 | 12.47 | 12.86 | 12.86 | 12.95 | 11.59 | 11.99 | 10.13 | 10.44 | 6.41 | 4.93 | 6.78 | 6.99 | 1.61 | 0.79 | 0.79 | 0.79 | 0.79 | 1.39 | 0.64 | 0.64 | 0.64 | NA | 0.74 | NA | NA | |
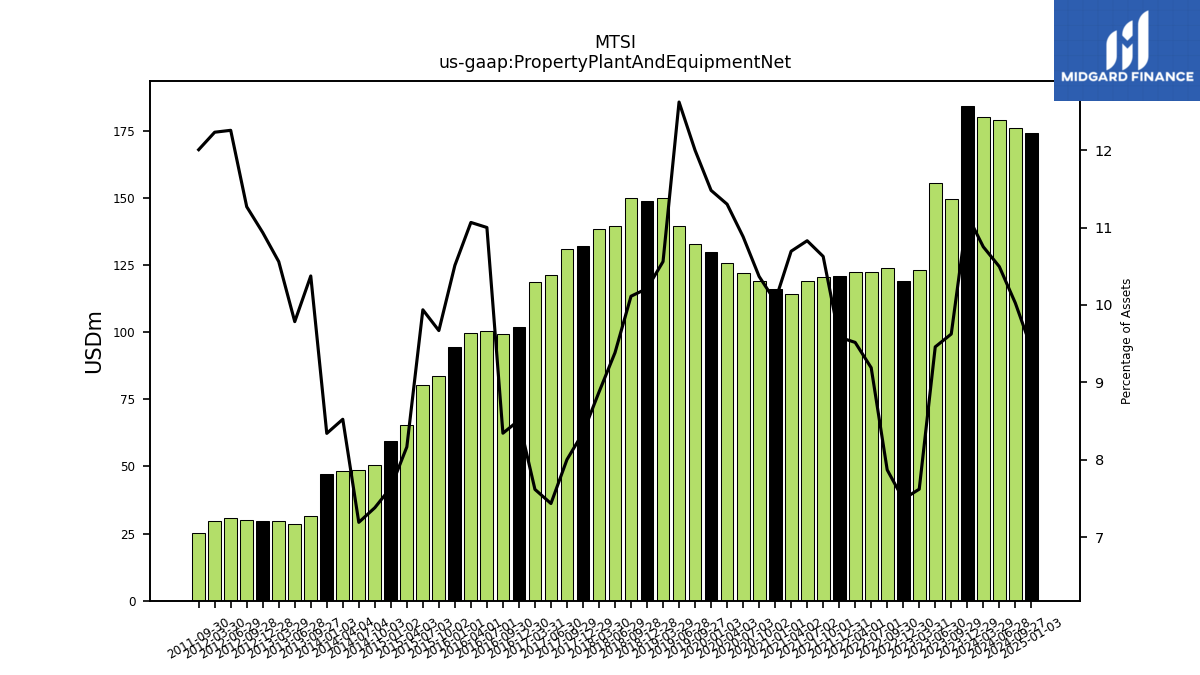
| Property Plant And Equipment Net | 184.28 | 149.50 | 155.38 | 123.27 | 118.94 | 123.70 | 122.50 | 122.43 | 120.77 | 120.53 | 119.14 | 114.25 | 115.95 | 118.87 | 122.00 | 125.77 | 129.98 | 132.65 | 139.38 | 149.95 | 148.88 | 149.92 | 139.41 | 138.54 | 132.01 | 131.02 | 121.41 | 118.52 | 101.84 | 99.17 | 100.45 | 99.64 | 94.44 | 83.76 | 80.17 | 65.35 | 59.39 | 50.36 | 48.86 | 48.27 | 47.35 | 31.56 | 28.75 | 29.54 | 29.55 | 30.21 | 30.93 | 29.57 | NA | 25.36 | NA | NA | NA | |
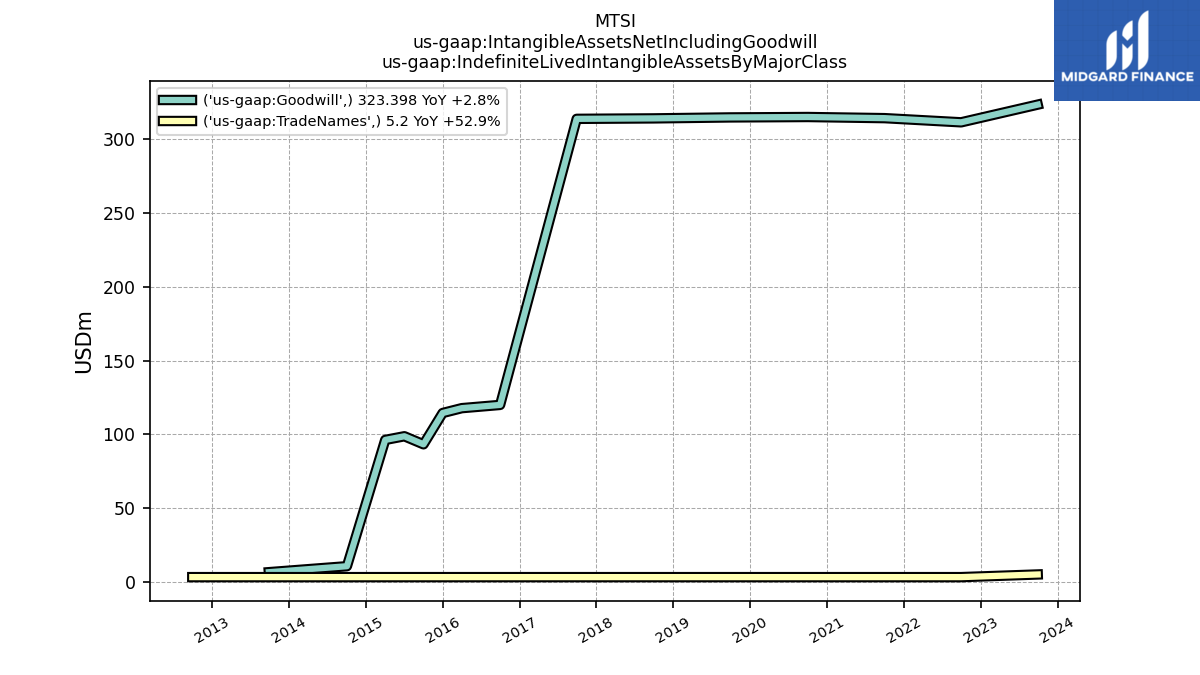
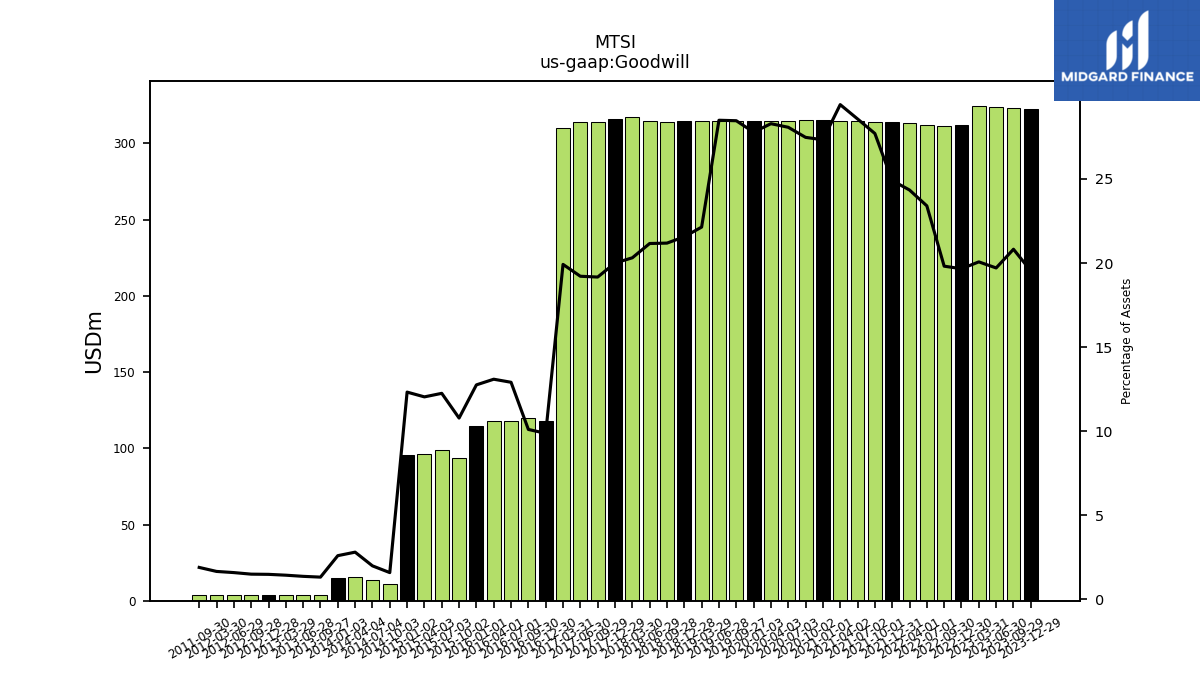
| Goodwill | 322.49 | 323.40 | 323.73 | 324.61 | 312.15 | 311.42 | 311.96 | 313.19 | 313.90 | 314.24 | 314.34 | 314.38 | 315.34 | 315.01 | 314.78 | 314.82 | 314.60 | 314.73 | 314.69 | 314.36 | 314.34 | 314.08 | 314.40 | 317.09 | 316.24 | 313.76 | 313.73 | 309.88 | 118.08 | 120.02 | 117.84 | 117.83 | 114.56 | 93.35 | 98.80 | 96.32 | 95.76 | 10.78 | 13.46 | 15.84 | 14.70 | 3.99 | 3.99 | 3.99 | 3.99 | 3.99 | 3.99 | 3.99 | NA | 3.99 | NA | NA | NA | |
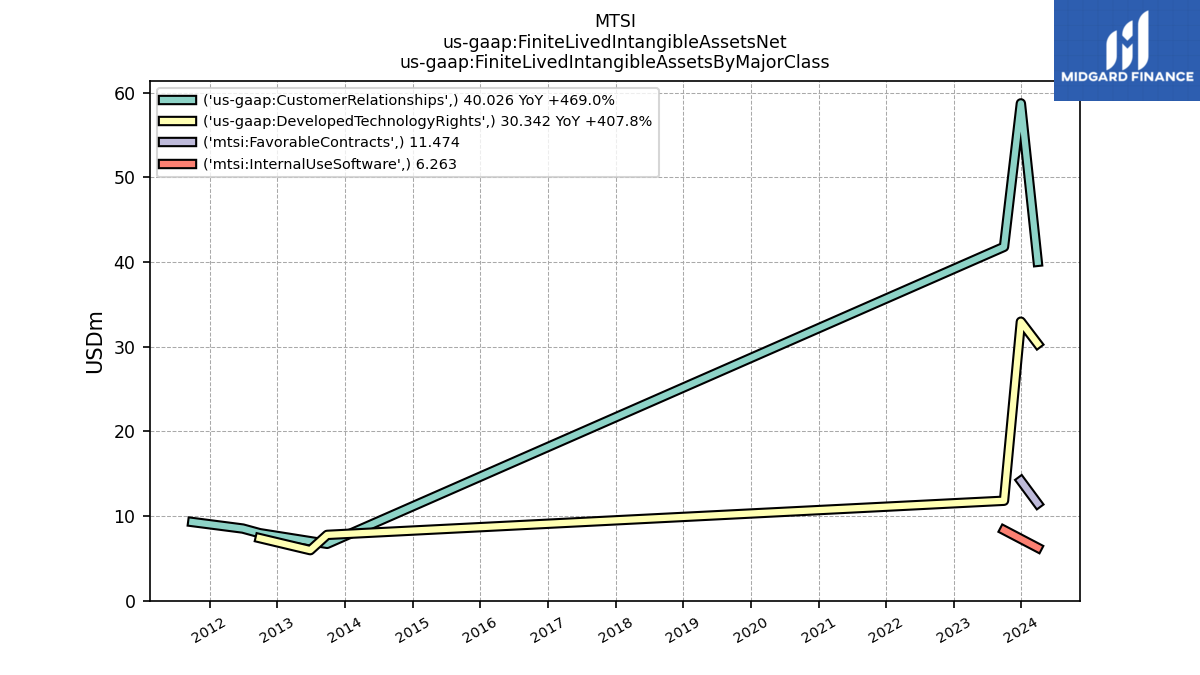
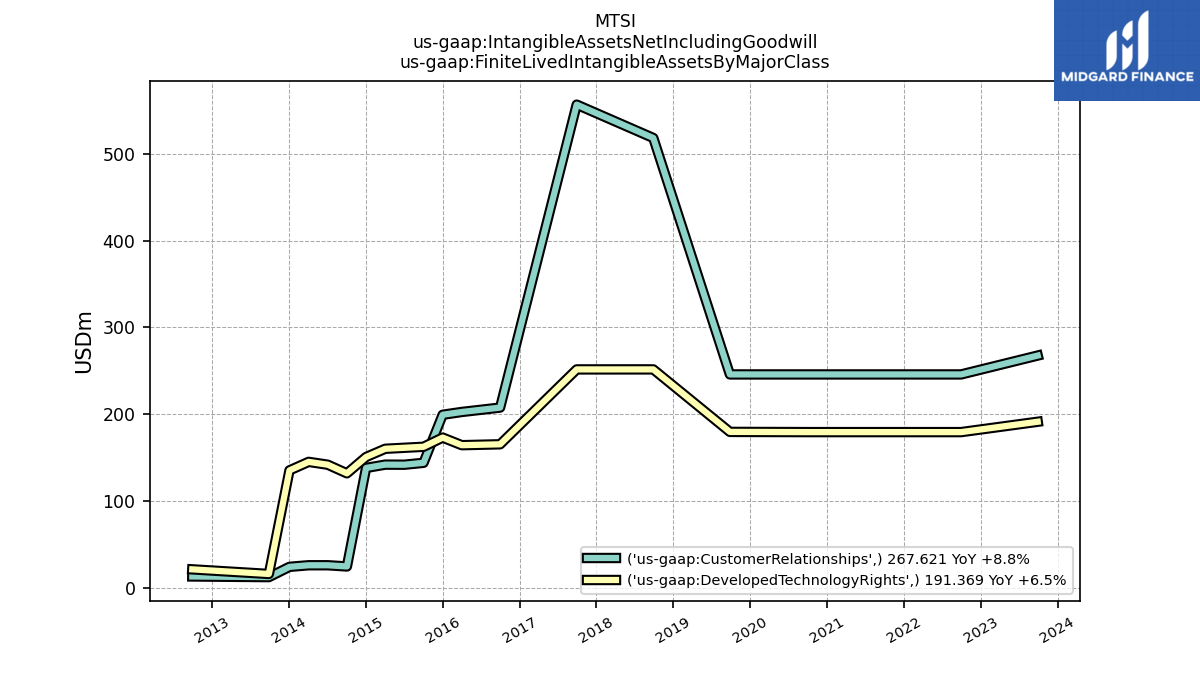
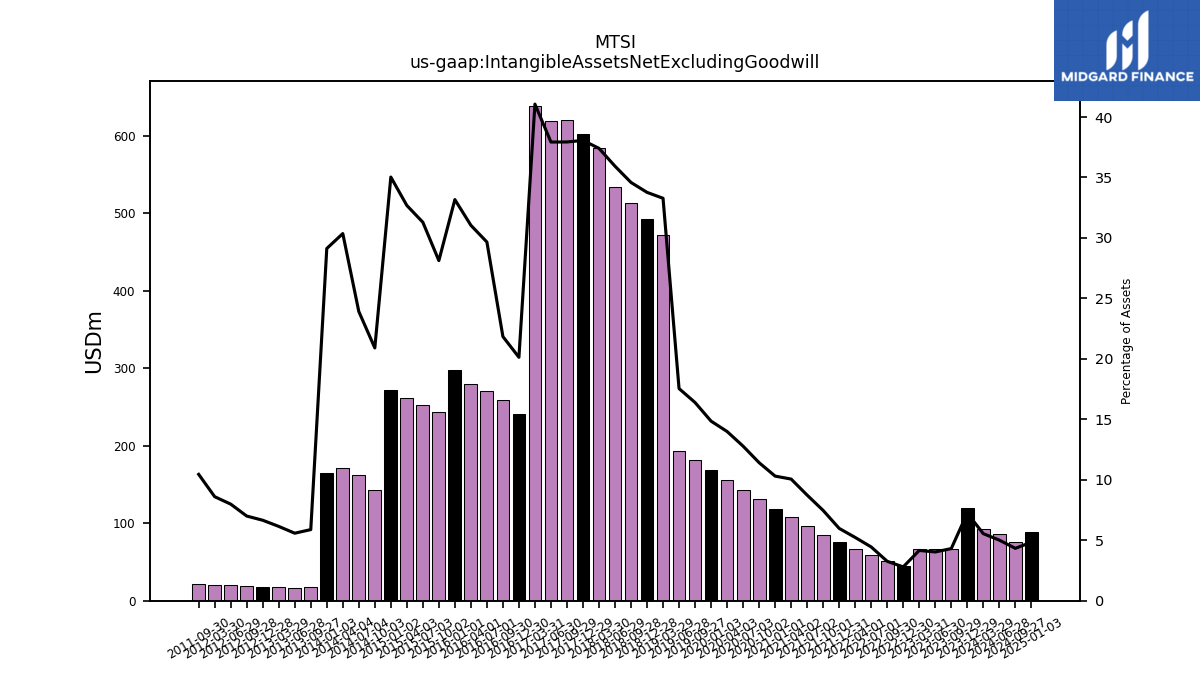
| Intangible Assets Net Excluding Goodwill | 119.53 | 66.99 | 66.29 | 67.29 | 44.44 | 51.25 | 59.29 | 67.34 | 75.40 | 84.69 | 96.09 | 107.50 | 118.91 | 130.90 | 143.32 | 155.74 | 168.15 | 181.23 | 193.76 | 472.57 | 492.32 | 512.78 | 533.88 | 584.03 | 601.92 | 621.09 | 619.37 | 638.88 | 240.93 | 259.60 | 270.86 | 279.54 | 298.03 | 243.67 | 252.50 | 261.58 | 272.32 | 142.63 | 162.49 | 171.93 | 165.36 | 17.90 | 16.41 | 17.20 | 17.99 | 18.78 | 20.16 | 20.80 | NA | 22.08 | NA | NA | NA | |
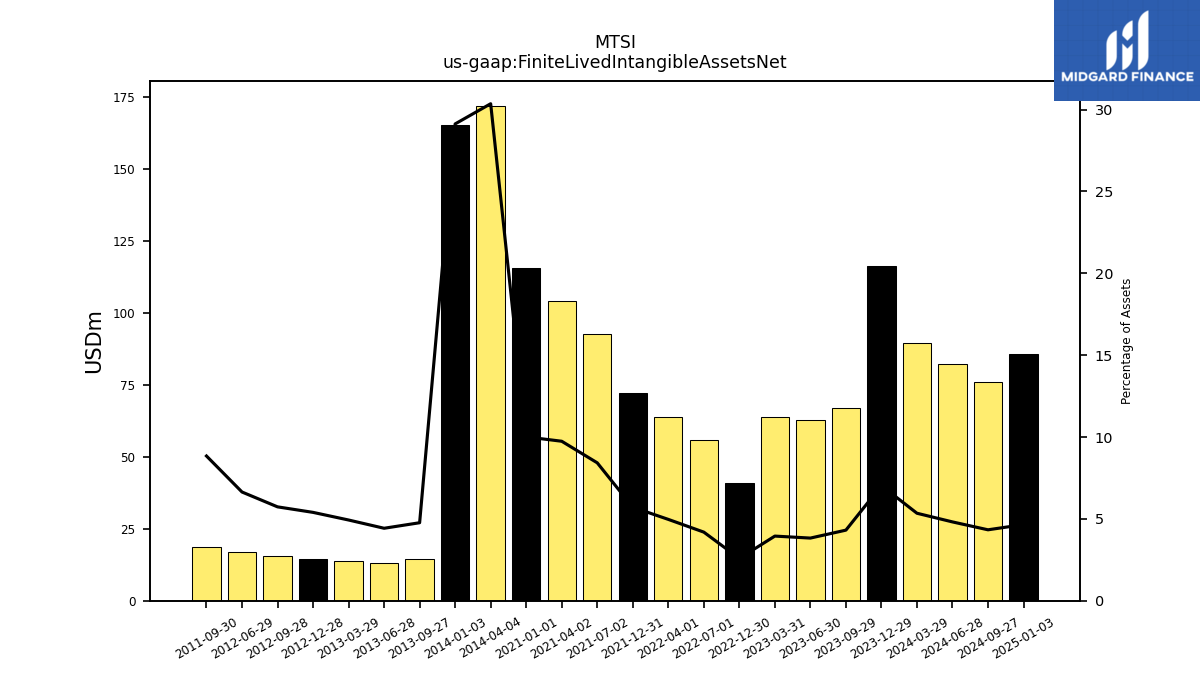
| Finite Lived Intangible Assets Net | 116.13 | NA | 62.89 | 63.89 | 41.04 | NA | 55.89 | 63.94 | 72.00 | NA | 92.69 | 104.10 | 115.50 | NA | NA | NA | NA | NA | NA | NA | NA | NA | NA | NA | NA | NA | NA | NA | NA | NA | NA | NA | NA | NA | NA | NA | NA | NA | NA | 171.93 | 165.36 | 14.50 | 13.01 | 13.80 | 14.59 | 15.38 | 16.76 | NA | NA | 18.68 | NA | NA | NA | |
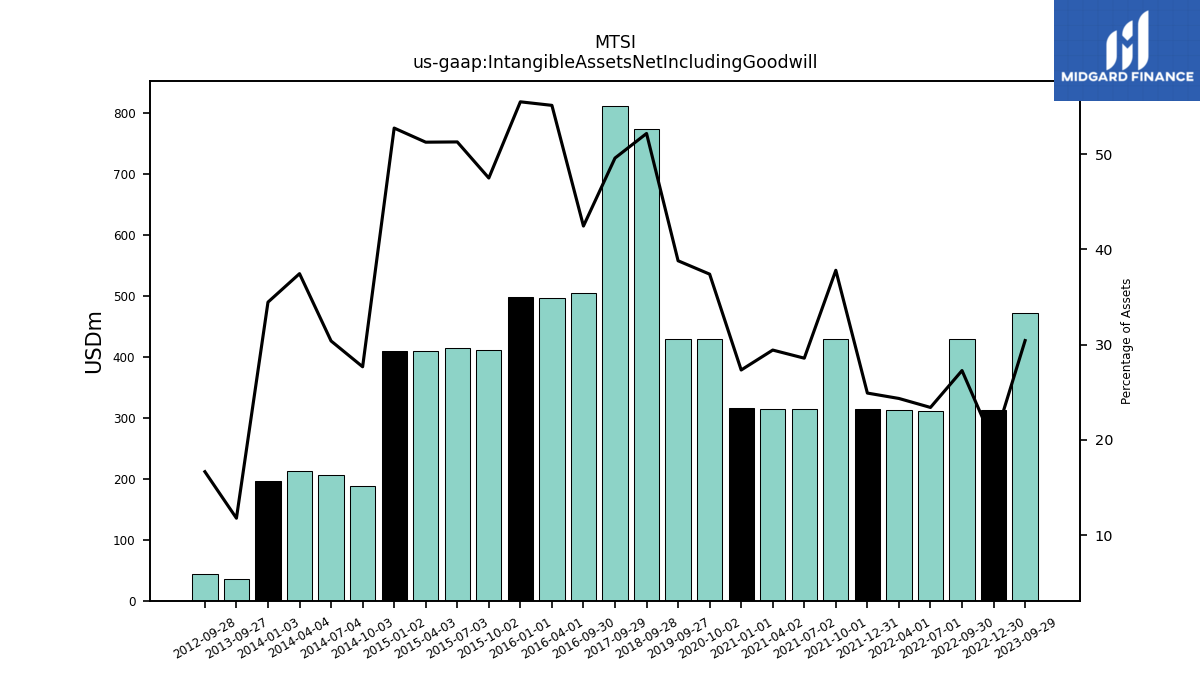
| Intangible Assets Net Including Goodwill | NA | 472.54 | NA | NA | 312.15 | 428.70 | 311.96 | 313.19 | 313.90 | 428.70 | 314.34 | 314.38 | 315.34 | 428.70 | NA | NA | NA | 428.95 | NA | NA | NA | 773.31 | NA | NA | NA | 811.70 | NA | NA | NA | 504.50 | NA | 496.25 | 498.51 | 411.35 | 413.64 | 410.12 | 409.86 | 188.78 | 206.39 | 212.05 | 195.61 | 35.83 | NA | NA | NA | 44.65 | NA | NA | NA | NA | NA | NA | NA | |
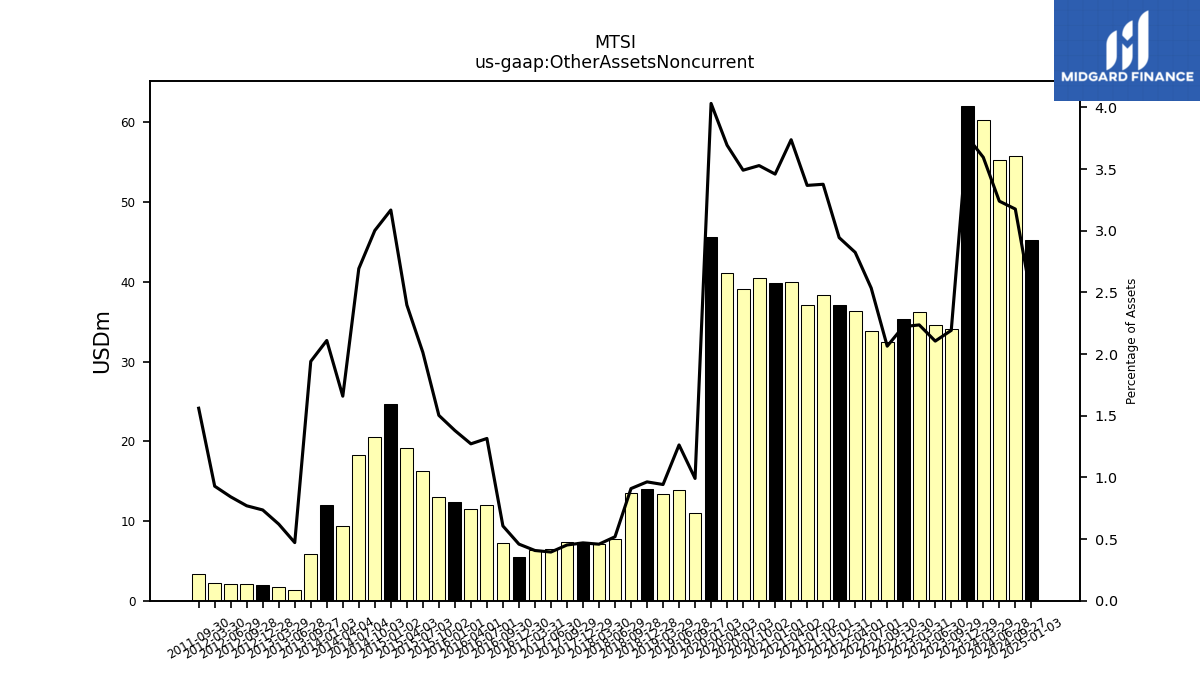
| Other Assets Noncurrent | 62.09 | 34.06 | 34.59 | 36.18 | 35.29 | 32.45 | 33.80 | 36.34 | 37.10 | 38.30 | 37.05 | 39.94 | 39.91 | 40.45 | 39.14 | 41.10 | 45.66 | 10.96 | 13.95 | 13.38 | 14.05 | 13.48 | 7.71 | 7.16 | 7.42 | 7.40 | 6.45 | 6.34 | 5.50 | 7.21 | 12.02 | 11.46 | 12.40 | 13.02 | 16.25 | 19.19 | 24.63 | 20.48 | 18.30 | 9.39 | 11.98 | 5.91 | 1.39 | 1.74 | 1.99 | 2.06 | 2.13 | 2.25 | NA | 3.30 | NA | NA | NA | |
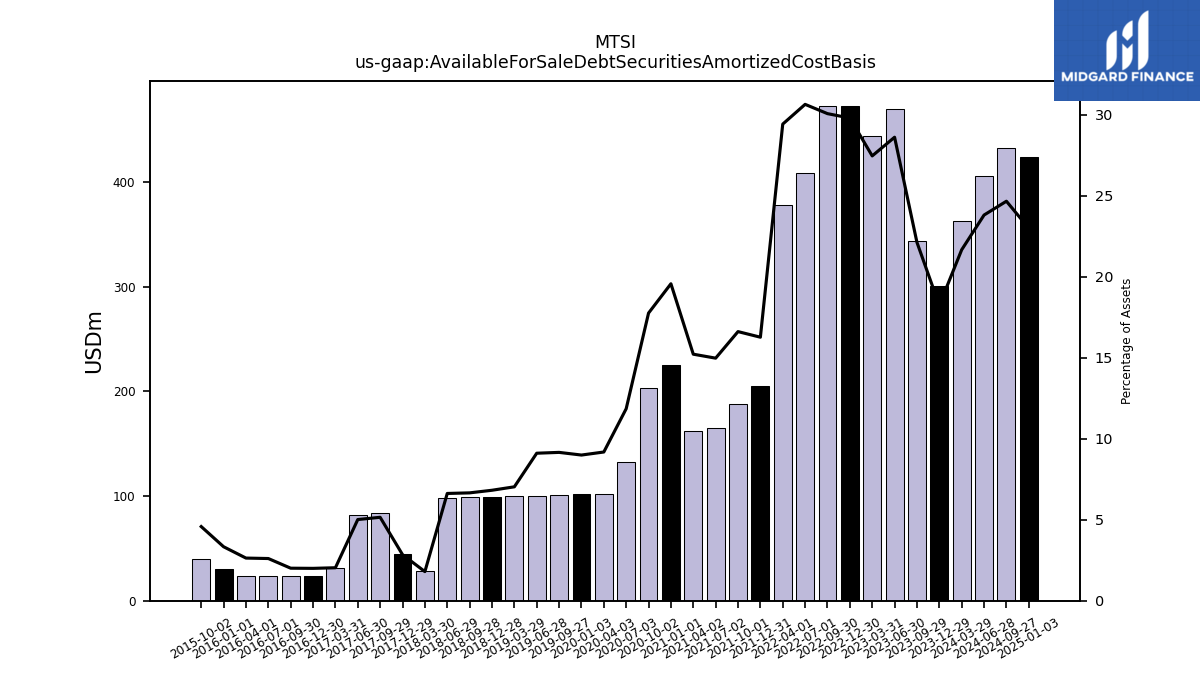
| Available For Sale Debt Securities Amortized Cost Basis | 300.97 | 343.53 | 469.89 | 444.02 | 472.95 | 472.48 | 408.35 | 378.41 | 204.94 | 188.37 | 164.69 | 162.56 | 225.68 | 203.52 | 132.85 | 102.14 | 101.80 | 101.22 | 100.54 | 99.83 | 99.40 | 98.70 | 98.37 | 28.07 | 45.00 | 84.31 | 81.84 | 31.69 | 23.92 | 23.88 | 23.79 | 23.71 | 29.95 | 39.65 | NA | NA | NA | NA | NA | NA | NA | NA | NA | NA | NA | NA | NA | NA | NA | NA | NA | NA | NA |
| 2023-12-29 | 2023-09-29 | 2023-06-30 | 2023-03-31 | 2022-12-30 | 2022-09-30 | 2022-07-01 | 2022-04-01 | 2021-12-31 | 2021-10-01 | 2021-07-02 | 2021-04-02 | 2021-01-01 | 2020-10-02 | 2020-07-03 | 2020-04-03 | 2020-01-03 | 2019-09-27 | 2019-06-28 | 2019-03-29 | 2018-12-28 | 2018-09-28 | 2018-06-29 | 2018-03-30 | 2017-12-29 | 2017-09-29 | 2017-06-30 | 2017-03-31 | 2016-12-30 | 2016-09-30 | 2016-07-01 | 2016-04-01 | 2016-01-01 | 2015-10-02 | 2015-07-03 | 2015-04-03 | 2015-01-02 | 2014-10-03 | 2014-07-04 | 2014-04-04 | 2014-01-03 | 2013-09-27 | 2013-06-28 | 2013-03-29 | 2012-12-28 | 2012-09-28 | 2012-06-29 | 2012-03-30 | 2011-12-30 | 2011-09-30 | 2011-07-01 | 2011-04-01 | 2010-12-31 | ||
|---|---|---|---|---|---|---|---|---|---|---|---|---|---|---|---|---|---|---|---|---|---|---|---|---|---|---|---|---|---|---|---|---|---|---|---|---|---|---|---|---|---|---|---|---|---|---|---|---|---|---|---|---|---|---|
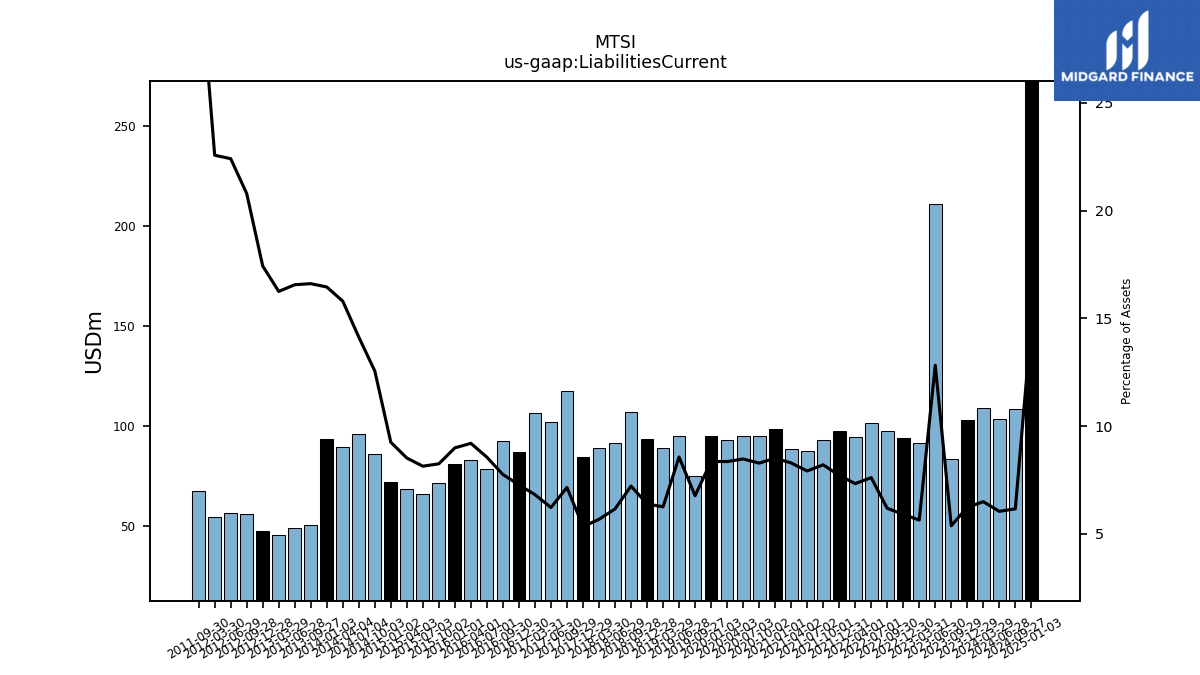
| Liabilities Current | 102.87 | 83.53 | 210.64 | 91.25 | 93.78 | 97.21 | 101.43 | 94.32 | 97.19 | 93.04 | 87.10 | 88.57 | 98.16 | 94.95 | 95.02 | 92.96 | 94.64 | 74.84 | 94.61 | 88.80 | 93.18 | 107.00 | 91.48 | 88.59 | 84.47 | 117.12 | 101.61 | 106.10 | 87.06 | 92.15 | 78.14 | 82.83 | 80.77 | 71.48 | 65.65 | 68.17 | 71.90 | 85.65 | 95.98 | 89.43 | 93.41 | 50.53 | 48.65 | 45.45 | 47.08 | 55.73 | 56.54 | 54.55 | NA | 67.11 | NA | NA | NA | |
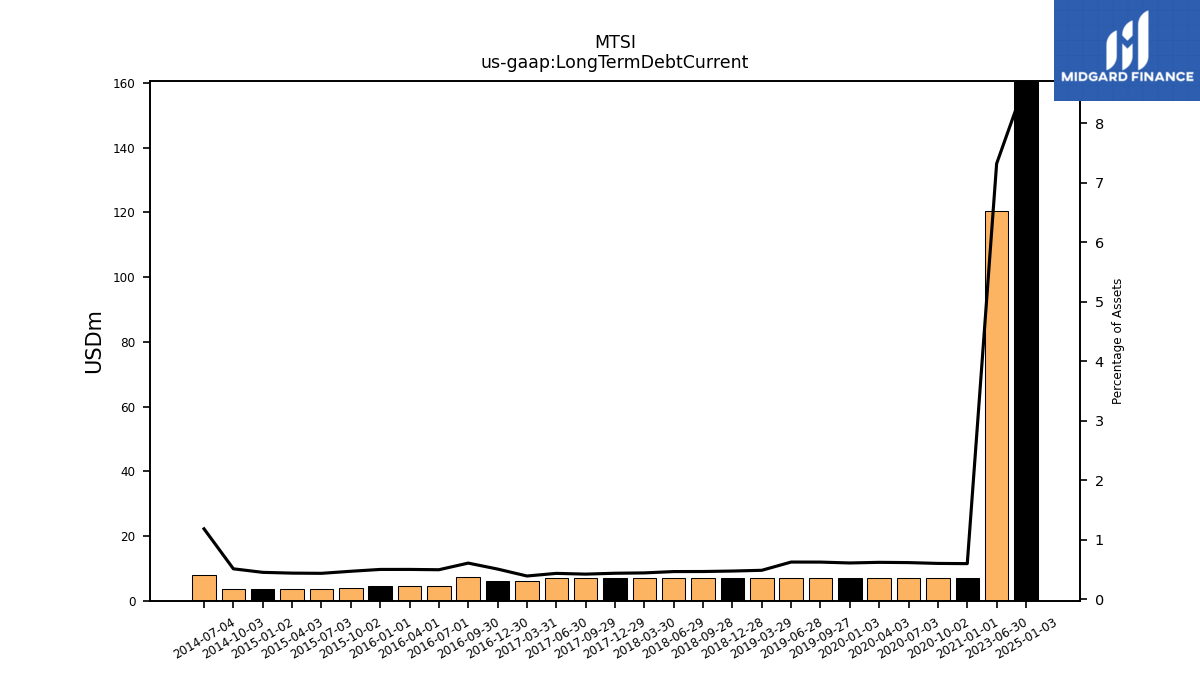
| Long Term Debt Current | NA | NA | 120.31 | NA | NA | NA | NA | NA | NA | NA | NA | NA | 6.88 | 6.88 | 6.88 | 6.88 | 6.88 | 6.88 | 6.88 | 6.88 | 6.88 | 6.88 | 6.88 | 6.88 | 6.88 | 6.88 | 7.07 | 6.05 | 6.05 | 7.20 | 4.51 | 4.50 | 4.49 | 4.06 | 3.50 | 3.50 | 3.50 | 3.48 | 8.03 | NA | NA | NA | NA | NA | NA | NA | NA | NA | NA | NA | NA | NA | NA | |
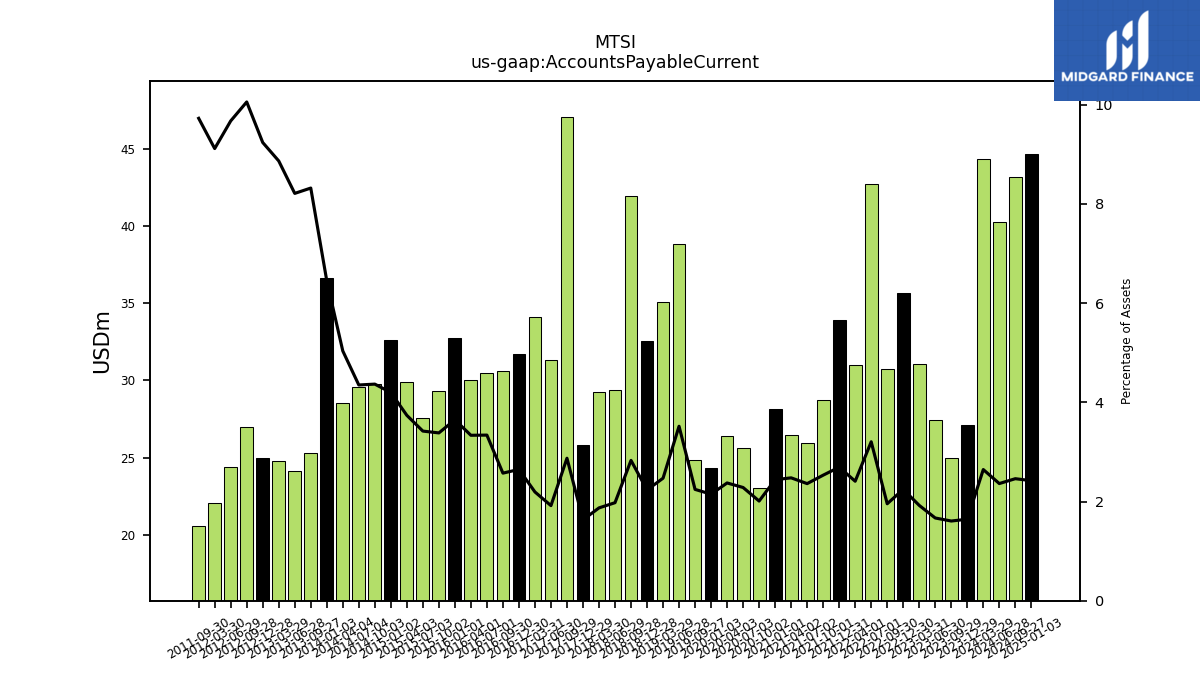
| Accounts Payable Current | 27.14 | 24.97 | 27.41 | 31.09 | 35.65 | 30.73 | 42.73 | 31.00 | 33.94 | 28.71 | 25.98 | 26.47 | 28.16 | 23.04 | 25.60 | 26.43 | 24.33 | 24.82 | 38.85 | 35.08 | 32.57 | 41.95 | 29.37 | 29.22 | 25.81 | 47.04 | 31.32 | 34.12 | 31.69 | 30.58 | 30.50 | 30.04 | 32.78 | 29.31 | 27.59 | 29.91 | 32.64 | 29.80 | 29.55 | 28.52 | 36.62 | 25.31 | 24.13 | 24.80 | 24.96 | 26.96 | 24.41 | 22.04 | NA | 20.55 | NA | NA | NA | |
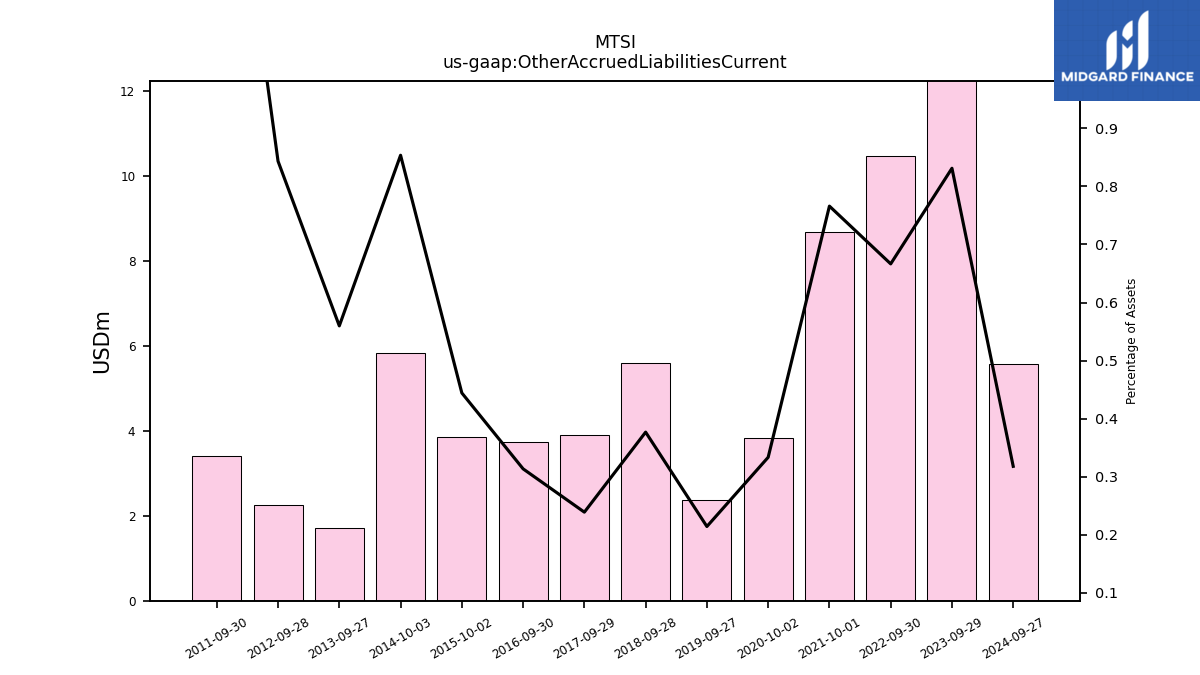
| Other Accrued Liabilities Current | NA | 12.91 | NA | NA | NA | 10.48 | NA | NA | NA | 8.69 | NA | NA | NA | 3.82 | NA | NA | NA | 2.37 | NA | NA | NA | 5.58 | NA | NA | NA | 3.91 | NA | NA | NA | 3.73 | NA | NA | NA | 3.85 | NA | NA | NA | 5.82 | NA | NA | NA | 1.70 | NA | NA | NA | 2.26 | NA | NA | NA | 3.41 | NA | NA | NA | |
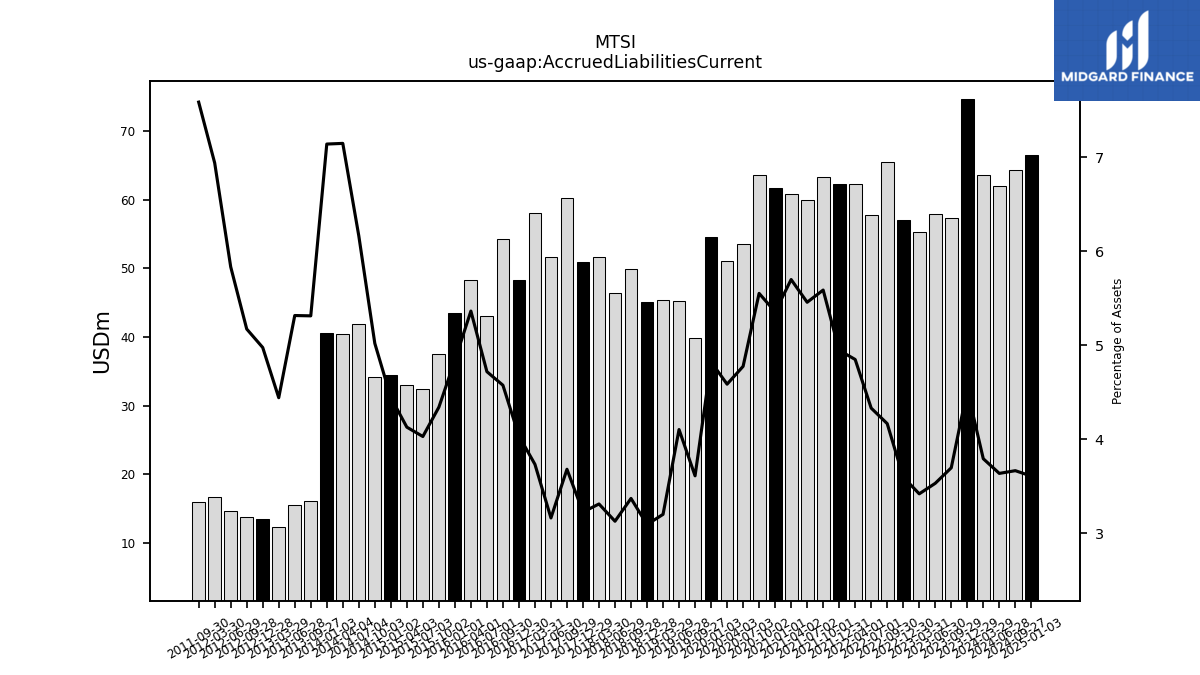
| Accrued Liabilities Current | 74.68 | 57.40 | 57.99 | 55.28 | 57.10 | 65.47 | 57.73 | 62.38 | 62.33 | 63.37 | 60.04 | 60.90 | 61.79 | 63.65 | 53.54 | 51.03 | 54.60 | 39.91 | 45.30 | 45.43 | 45.06 | 49.95 | 46.45 | 51.67 | 50.98 | 60.24 | 51.62 | 58.06 | 48.28 | 54.37 | 43.09 | 48.30 | 43.48 | 37.60 | 32.50 | 33.03 | 34.54 | 34.25 | 41.88 | 40.49 | 40.55 | 16.16 | 15.62 | 12.42 | 13.45 | 13.87 | 14.72 | 16.78 | NA | 16.03 | NA | NA | NA |
| 2023-12-29 | 2023-09-29 | 2023-06-30 | 2023-03-31 | 2022-12-30 | 2022-09-30 | 2022-07-01 | 2022-04-01 | 2021-12-31 | 2021-10-01 | 2021-07-02 | 2021-04-02 | 2021-01-01 | 2020-10-02 | 2020-07-03 | 2020-04-03 | 2020-01-03 | 2019-09-27 | 2019-06-28 | 2019-03-29 | 2018-12-28 | 2018-09-28 | 2018-06-29 | 2018-03-30 | 2017-12-29 | 2017-09-29 | 2017-06-30 | 2017-03-31 | 2016-12-30 | 2016-09-30 | 2016-07-01 | 2016-04-01 | 2016-01-01 | 2015-10-02 | 2015-07-03 | 2015-04-03 | 2015-01-02 | 2014-10-03 | 2014-07-04 | 2014-04-04 | 2014-01-03 | 2013-09-27 | 2013-06-28 | 2013-03-29 | 2012-12-28 | 2012-09-28 | 2012-06-29 | 2012-03-30 | 2011-12-30 | 2011-09-30 | 2011-07-01 | 2011-04-01 | 2010-12-31 | ||
|---|---|---|---|---|---|---|---|---|---|---|---|---|---|---|---|---|---|---|---|---|---|---|---|---|---|---|---|---|---|---|---|---|---|---|---|---|---|---|---|---|---|---|---|---|---|---|---|---|---|---|---|---|---|---|
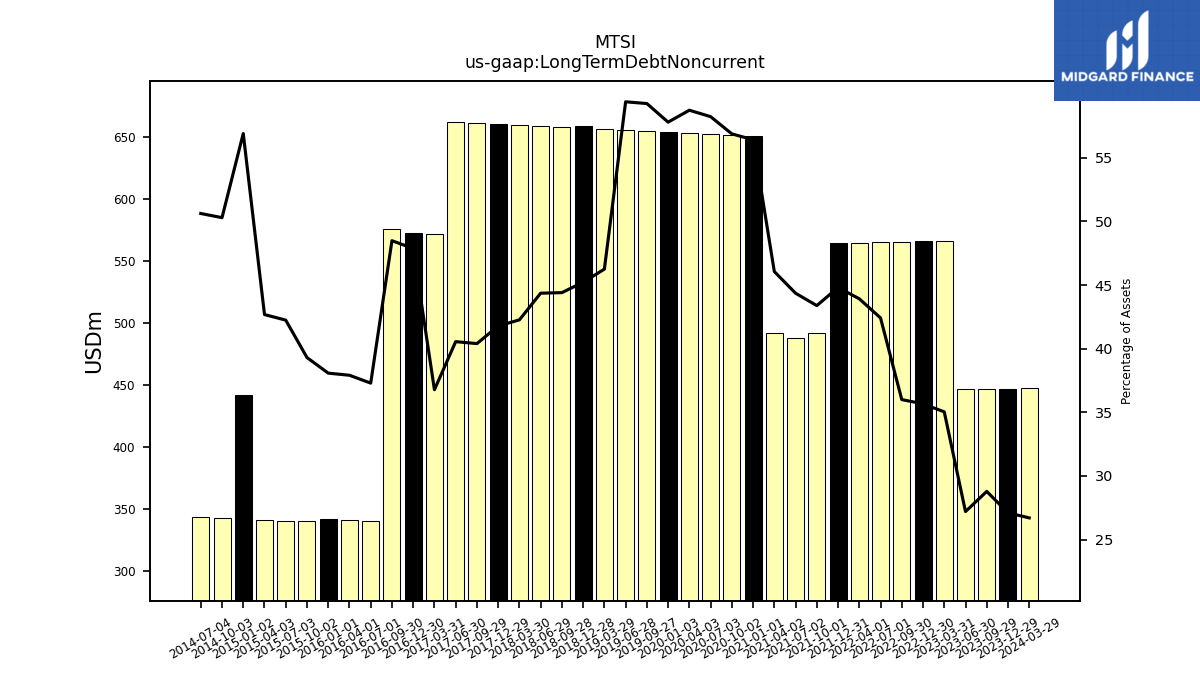
| Long Term Debt Noncurrent | 447.42 | 447.13 | 446.85 | 566.74 | 566.33 | 565.92 | 565.51 | 565.10 | 564.69 | 492.10 | 488.04 | 492.17 | 650.93 | 652.17 | 652.95 | 653.72 | 654.50 | 655.27 | 656.05 | 656.82 | 659.32 | 658.37 | 659.15 | 659.92 | 660.70 | 661.47 | 662.26 | 572.18 | 572.96 | 576.35 | 340.58 | 341.40 | 342.15 | 340.50 | 340.81 | 341.59 | 442.38 | 343.18 | 343.94 | NA | NA | NA | NA | NA | NA | NA | NA | NA | NA | NA | NA | NA | NA | |
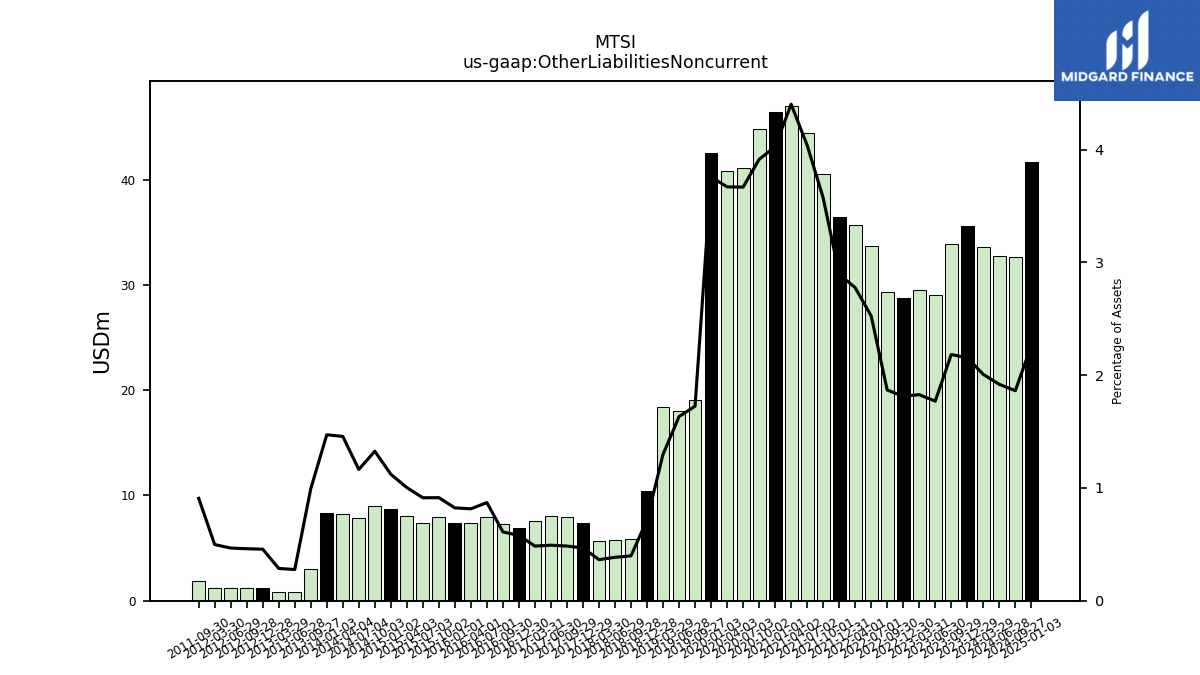
| Other Liabilities Noncurrent | 35.56 | 33.90 | 29.07 | 29.54 | 28.79 | 29.36 | 33.65 | 35.70 | 36.50 | 40.51 | 44.43 | 47.02 | 46.43 | 44.85 | 41.11 | 40.83 | 42.53 | 19.07 | 18.03 | 18.43 | 10.44 | 5.90 | 5.72 | 5.68 | 7.41 | 7.94 | 8.04 | 7.54 | 6.92 | 7.25 | 7.95 | 7.34 | 7.40 | 7.92 | 7.37 | 8.03 | 8.71 | 9.04 | 7.91 | 8.25 | 8.35 | 3.02 | 0.81 | 0.80 | 1.24 | 1.24 | 1.18 | 1.20 | NA | 1.92 | NA | NA | NA | |
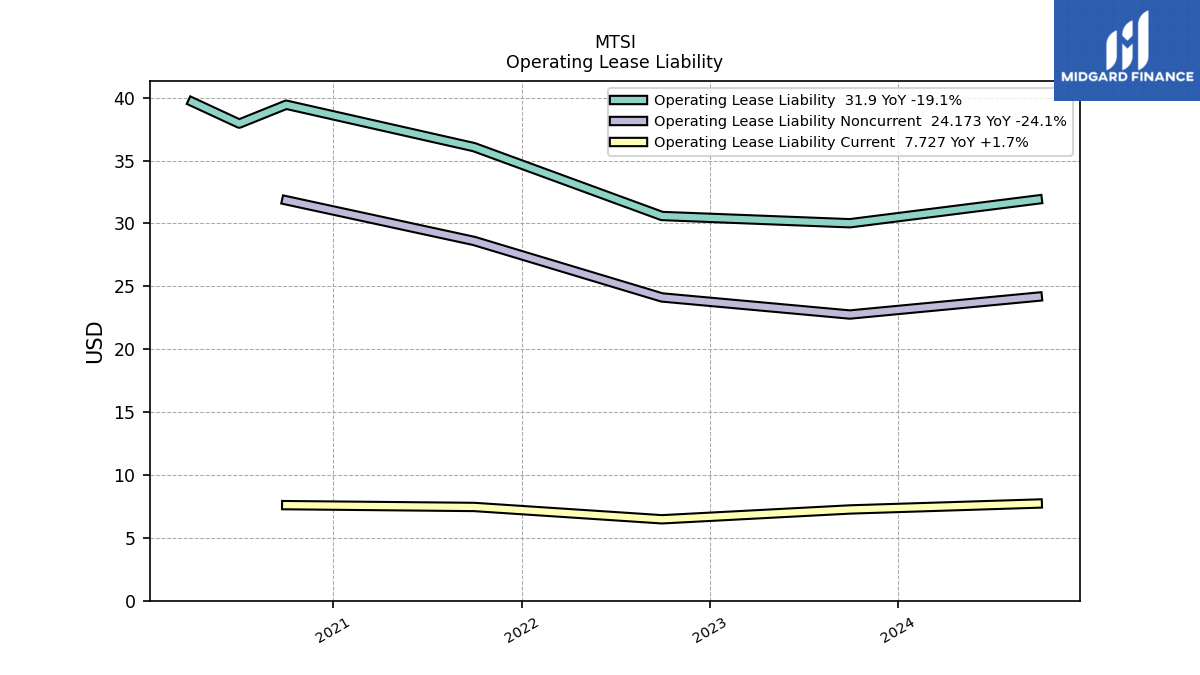
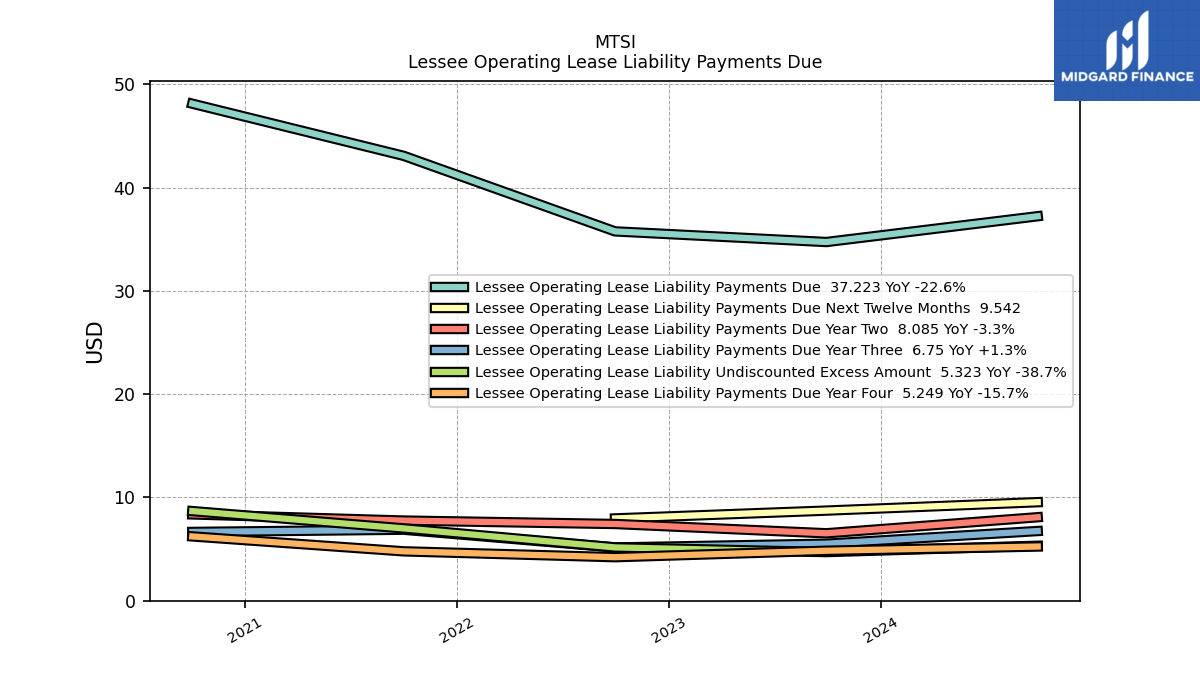
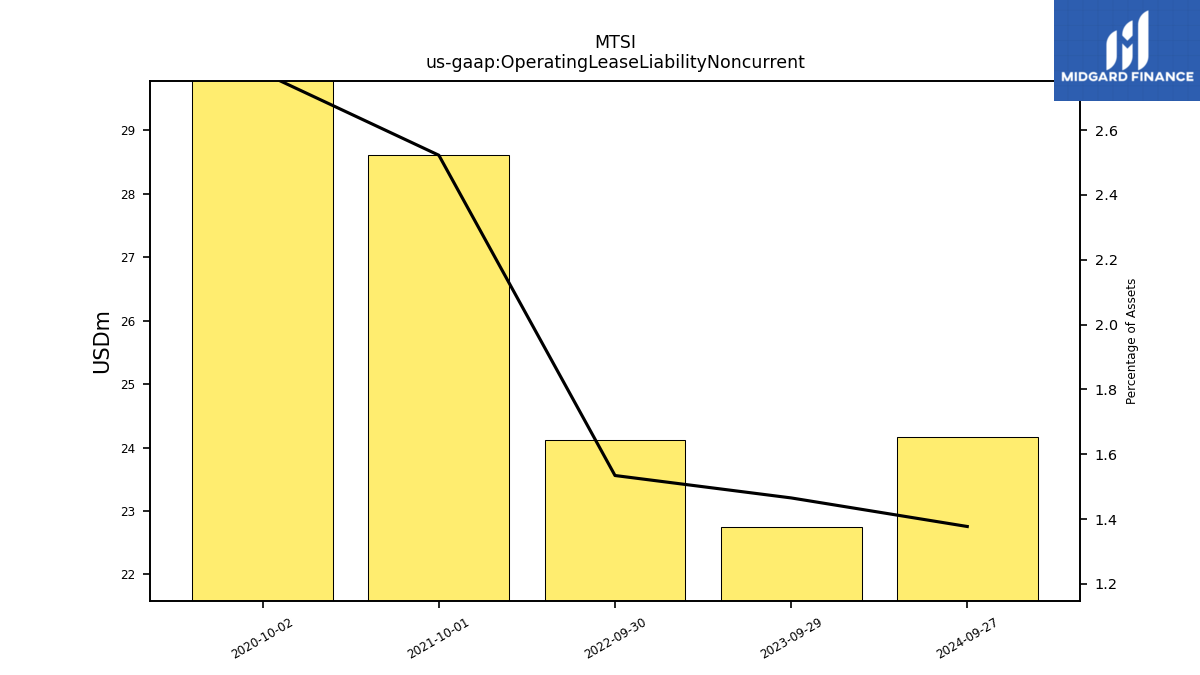
| Operating Lease Liability Noncurrent | NA | 22.76 | NA | NA | NA | 24.11 | NA | NA | NA | 28.61 | NA | NA | NA | 31.84 | NA | NA | NA | NA | NA | NA | NA | NA | NA | NA | NA | NA | NA | NA | NA | NA | NA | NA | NA | NA | NA | NA | NA | NA | NA | NA | NA | NA | NA | NA | NA | NA | NA | NA | NA | NA | NA | NA | NA |
| 2023-12-29 | 2023-09-29 | 2023-06-30 | 2023-03-31 | 2022-12-30 | 2022-09-30 | 2022-07-01 | 2022-04-01 | 2021-12-31 | 2021-10-01 | 2021-07-02 | 2021-04-02 | 2021-01-01 | 2020-10-02 | 2020-07-03 | 2020-04-03 | 2020-01-03 | 2019-09-27 | 2019-06-28 | 2019-03-29 | 2018-12-28 | 2018-09-28 | 2018-06-29 | 2018-03-30 | 2017-12-29 | 2017-09-29 | 2017-06-30 | 2017-03-31 | 2016-12-30 | 2016-09-30 | 2016-07-01 | 2016-04-01 | 2016-01-01 | 2015-10-02 | 2015-07-03 | 2015-04-03 | 2015-01-02 | 2014-10-03 | 2014-07-04 | 2014-04-04 | 2014-01-03 | 2013-09-27 | 2013-06-28 | 2013-03-29 | 2012-12-28 | 2012-09-28 | 2012-06-29 | 2012-03-30 | 2011-12-30 | 2011-09-30 | 2011-07-01 | 2011-04-01 | 2010-12-31 | ||
|---|---|---|---|---|---|---|---|---|---|---|---|---|---|---|---|---|---|---|---|---|---|---|---|---|---|---|---|---|---|---|---|---|---|---|---|---|---|---|---|---|---|---|---|---|---|---|---|---|---|---|---|---|---|---|
| Stockholders Equity | 1024.09 | 947.60 | 914.71 | 894.01 | 862.54 | 842.75 | 595.64 | 554.28 | 524.77 | 471.74 | 445.79 | 412.13 | 329.45 | 300.15 | 273.30 | 285.73 | 293.52 | 313.90 | 299.00 | 617.02 | 657.26 | 668.67 | 679.04 | 758.27 | 767.80 | 777.37 | 779.38 | 800.12 | 462.96 | 462.78 | 446.63 | 414.01 | 418.65 | 424.53 | 360.80 | 349.69 | 227.02 | 228.57 | 214.06 | 208.94 | 235.34 | 236.82 | 230.35 | 218.73 | 208.21 | 199.46 | 180.66 | 165.63 | NA | -144.84 | NA | NA | NA | |
| Common Stock Value | 0.07 | 0.07 | 0.07 | 0.07 | 0.07 | 0.07 | 0.07 | 0.07 | 0.07 | 0.07 | 0.07 | 0.07 | 0.07 | 0.07 | 0.07 | 0.07 | 0.07 | 0.07 | 0.07 | 0.07 | 0.07 | 0.07 | 0.07 | 0.07 | 0.06 | 0.06 | 0.06 | 0.06 | 0.05 | 0.05 | 0.05 | 0.05 | 0.05 | 0.05 | 0.05 | 0.05 | 0.05 | 0.05 | 0.05 | 0.05 | 0.05 | 0.05 | 0.05 | 0.05 | 0.05 | 0.04 | 0.04 | 0.04 | NA | 0.00 | NA | NA | NA | |
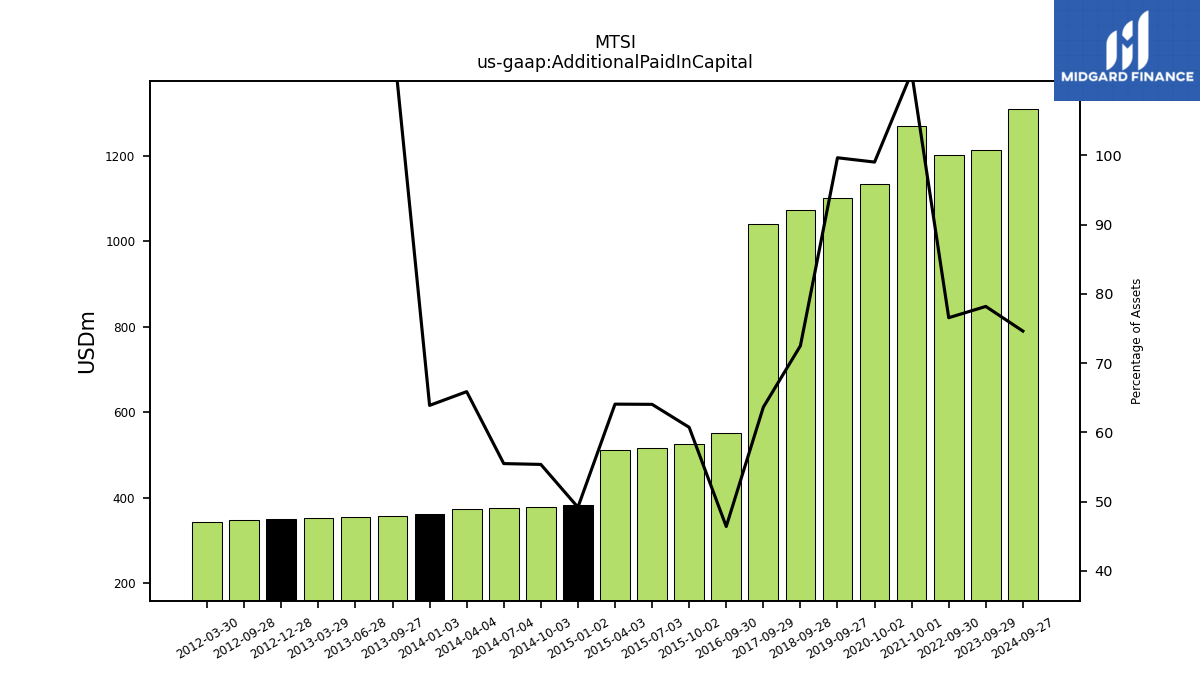
| Additional Paid In Capital | NA | 1214.20 | NA | NA | NA | 1203.14 | NA | NA | NA | 1269.60 | NA | NA | NA | 1135.13 | NA | NA | NA | 1101.58 | NA | NA | NA | 1074.73 | NA | NA | NA | 1041.64 | NA | NA | NA | 551.51 | NA | NA | NA | 526.01 | 516.60 | 512.69 | 382.27 | 377.71 | 376.92 | 373.01 | 362.67 | 357.70 | 355.50 | 353.26 | 350.70 | 347.97 | NA | 344.32 | NA | NA | NA | NA | NA | |
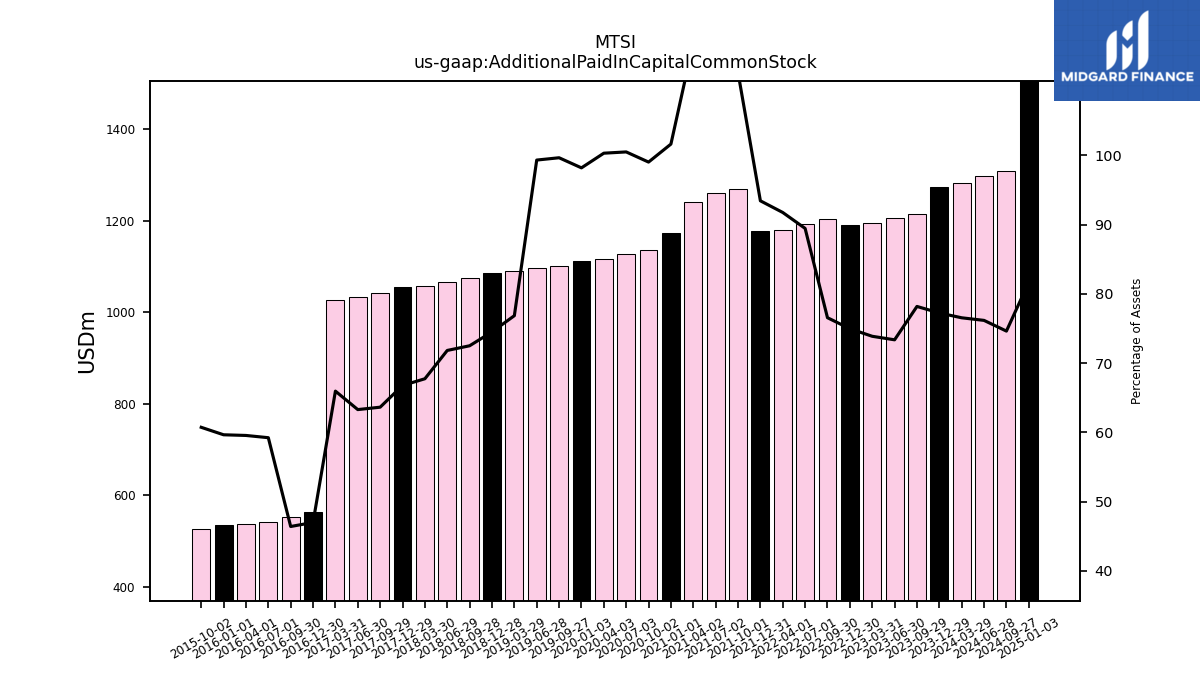
| Additional Paid In Capital Common Stock | 1274.93 | 1214.20 | 1205.01 | 1194.72 | 1190.14 | 1203.14 | 1192.29 | 1180.20 | 1177.24 | 1269.60 | 1260.47 | 1241.82 | 1172.27 | 1135.13 | 1126.51 | 1116.11 | 1111.61 | 1101.58 | 1096.65 | 1091.07 | 1086.05 | 1074.73 | 1067.03 | 1057.41 | 1055.64 | 1041.64 | 1033.30 | 1025.95 | 562.29 | 551.51 | 540.79 | 536.16 | 535.87 | 526.01 | NA | NA | NA | NA | NA | NA | NA | NA | NA | NA | NA | NA | NA | NA | NA | NA | NA | NA | NA | |
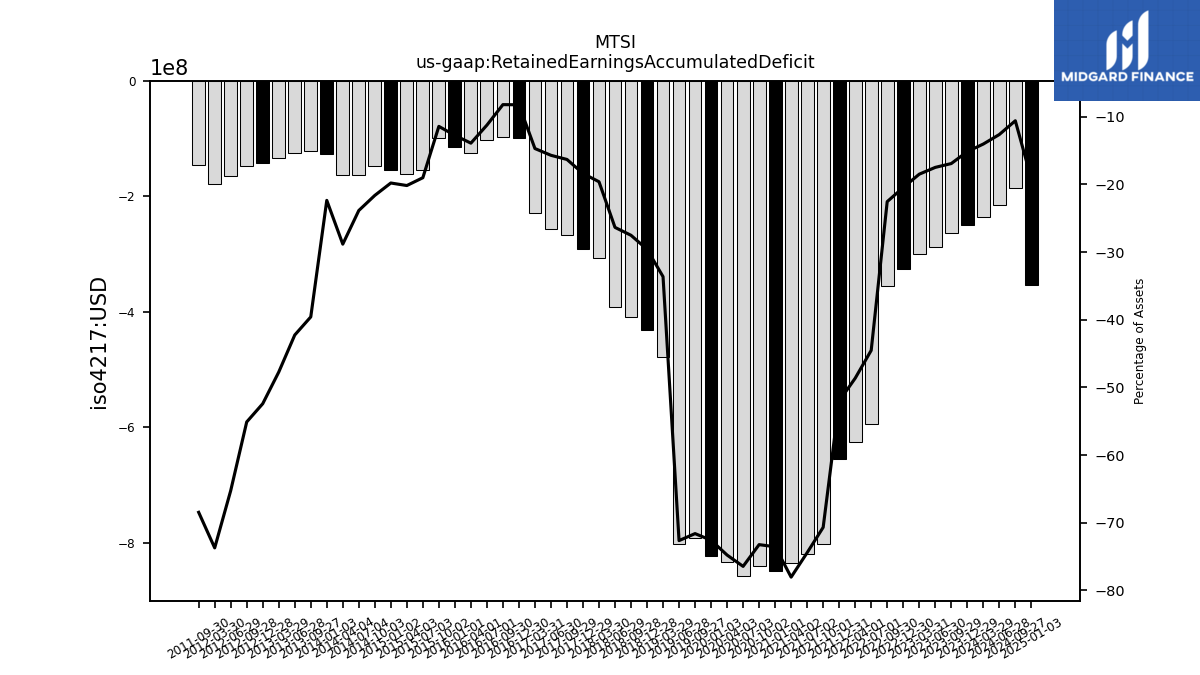
| Retained Earnings Accumulated Deficit | -250.18 | -262.71 | -287.16 | -299.01 | -324.77 | -354.29 | -593.62 | -625.86 | -655.41 | -801.75 | -818.88 | -833.89 | -848.70 | -839.73 | -857.22 | -832.24 | -822.01 | -791.77 | -802.29 | -477.58 | -431.37 | -407.98 | -391.48 | -306.05 | -290.57 | -266.98 | -256.26 | -228.58 | -98.45 | -97.49 | -102.59 | -125.14 | -114.49 | -98.92 | -153.33 | -161.35 | -153.82 | -147.51 | -162.05 | -163.23 | -126.92 | -120.42 | -124.17 | -133.54 | -141.63 | -147.74 | -164.69 | -178.24 | NA | -144.66 | NA | NA | NA | |
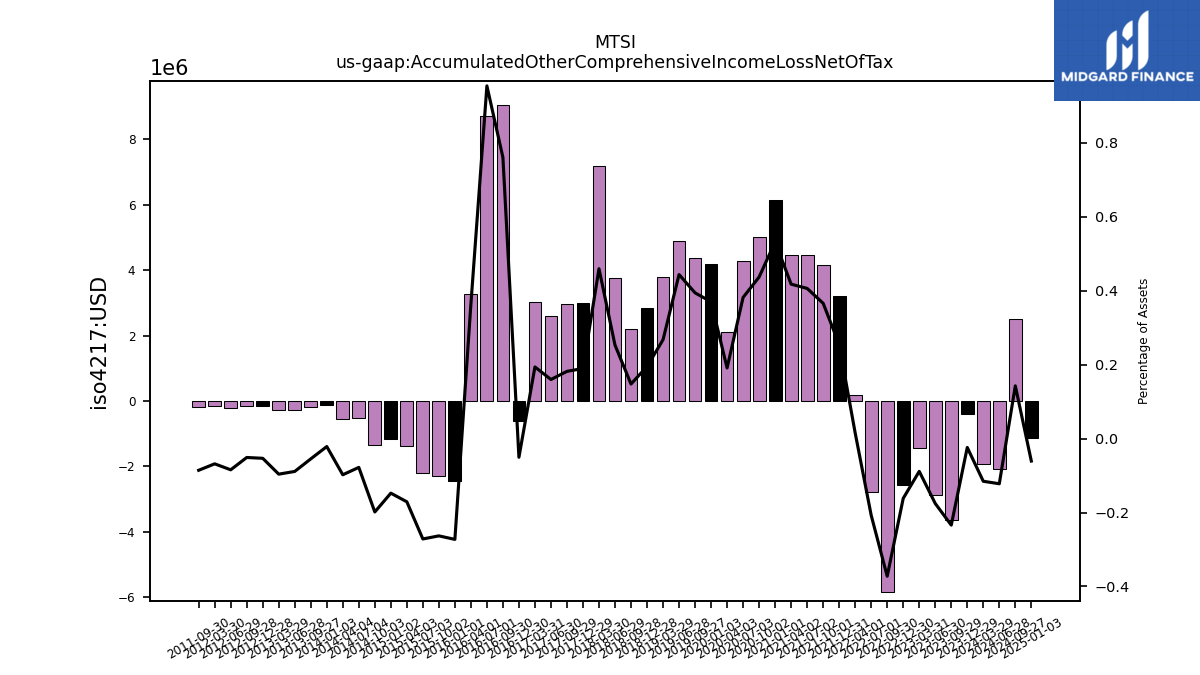
| Accumulated Other Comprehensive Income Loss Net Of Tax | -0.40 | -3.63 | -2.88 | -1.43 | -2.57 | -5.85 | -2.77 | 0.20 | 3.21 | 4.15 | 4.47 | 4.46 | 6.14 | 5.01 | 4.28 | 2.13 | 4.19 | 4.36 | 4.90 | 3.80 | 2.84 | 2.19 | 3.76 | 7.17 | 3.00 | 2.98 | 2.61 | 3.02 | -0.60 | 9.04 | 8.71 | 3.27 | -2.45 | -2.28 | -2.19 | -1.37 | -1.15 | -1.35 | -0.53 | -0.55 | -0.12 | -0.17 | -0.26 | -0.27 | -0.14 | -0.14 | -0.21 | -0.17 | NA | -0.18 | NA | NA | NA | |
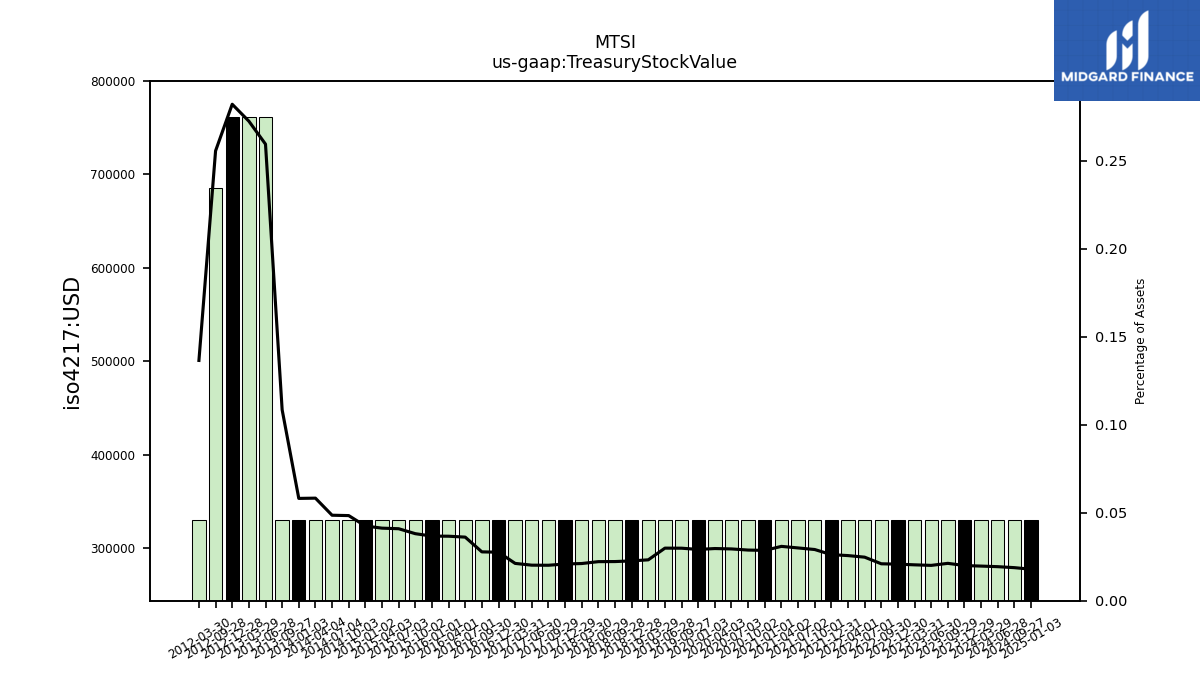
| Treasury Stock Value | 0.33 | 0.33 | 0.33 | 0.33 | 0.33 | 0.33 | 0.33 | 0.33 | 0.33 | 0.33 | 0.33 | 0.33 | 0.33 | 0.33 | 0.33 | 0.33 | 0.33 | 0.33 | 0.33 | 0.33 | 0.33 | 0.33 | 0.33 | 0.33 | 0.33 | 0.33 | 0.33 | 0.33 | 0.33 | 0.33 | 0.33 | 0.33 | 0.33 | 0.33 | 0.33 | 0.33 | 0.33 | 0.33 | 0.33 | 0.33 | 0.33 | 0.33 | 0.76 | 0.76 | 0.76 | 0.69 | NA | 0.33 | NA | NA | NA | NA | NA | |
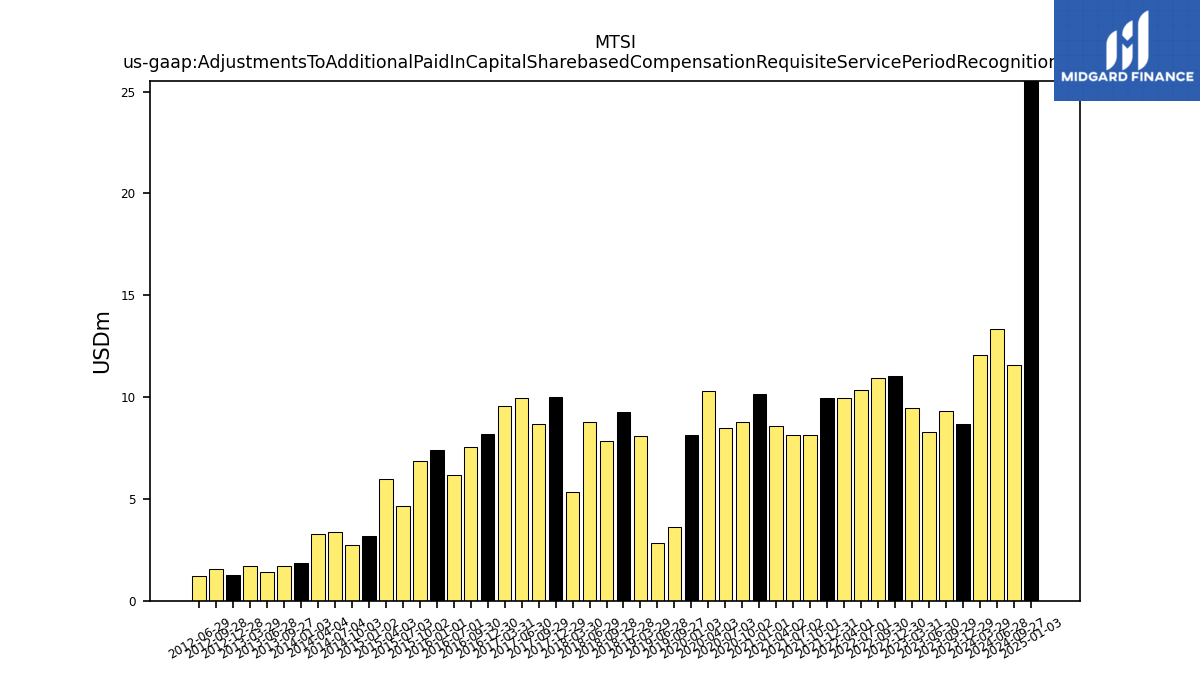
| Adjustments To Additional Paid In Capital Sharebased Compensation Requisite Service Period Recognition Value | 8.66 | 9.33 | 8.26 | 9.46 | 11.05 | 10.93 | 10.35 | 9.97 | 9.95 | 8.16 | 8.14 | 8.57 | 10.13 | 8.75 | 8.49 | 10.28 | 8.15 | 3.63 | 2.81 | 8.08 | 9.27 | 7.84 | 8.75 | 5.35 | 9.99 | 8.67 | 9.94 | 9.55 | 8.18 | 7.55 | 6.18 | NA | 7.38 | 6.87 | 4.65 | 5.97 | 3.16 | 2.75 | 3.39 | 3.29 | 1.84 | 1.73 | 1.42 | 1.68 | 1.26 | 1.57 | 1.19 | NA | NA | NA | NA | NA | NA |
| 2023-12-29 | 2023-09-29 | 2023-06-30 | 2023-03-31 | 2022-12-30 | 2022-09-30 | 2022-07-01 | 2022-04-01 | 2021-12-31 | 2021-10-01 | 2021-07-02 | 2021-04-02 | 2021-01-01 | 2020-10-02 | 2020-07-03 | 2020-04-03 | 2020-01-03 | 2019-09-27 | 2019-06-28 | 2019-03-29 | 2018-12-28 | 2018-09-28 | 2018-06-29 | 2018-03-30 | 2017-12-29 | 2017-09-29 | 2017-06-30 | 2017-03-31 | 2016-12-30 | 2016-09-30 | 2016-07-01 | 2016-04-01 | 2016-01-01 | 2015-10-02 | 2015-07-03 | 2015-04-03 | 2015-01-02 | 2014-10-03 | 2014-07-04 | 2014-04-04 | 2014-01-03 | 2013-09-27 | 2013-06-28 | 2013-03-29 | 2012-12-28 | 2012-09-28 | 2012-06-29 | 2012-03-30 | 2011-12-30 | 2011-09-30 | 2011-07-01 | 2011-04-01 | 2010-12-31 | ||
|---|---|---|---|---|---|---|---|---|---|---|---|---|---|---|---|---|---|---|---|---|---|---|---|---|---|---|---|---|---|---|---|---|---|---|---|---|---|---|---|---|---|---|---|---|---|---|---|---|---|---|---|---|---|---|
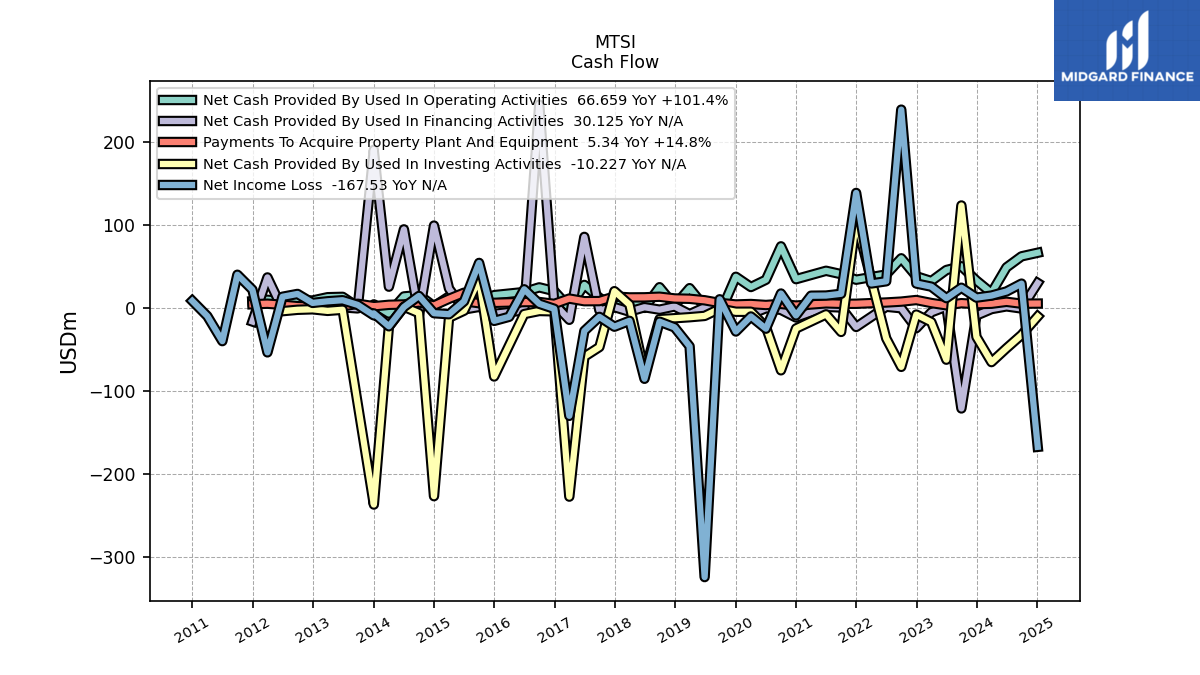
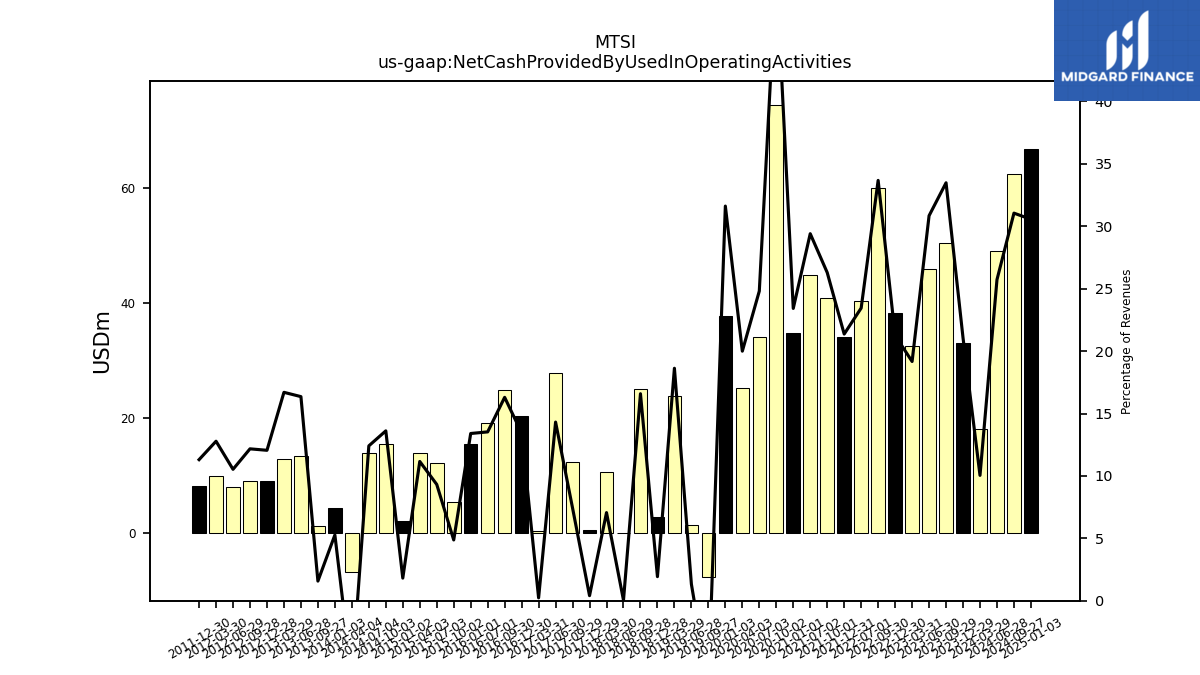
| Net Cash Provided By Used In Operating Activities | 33.10 | 50.35 | 45.82 | 32.47 | 38.27 | 59.99 | 40.39 | NA | 34.10 | 40.81 | 44.88 | NA | 34.78 | 74.40 | 34.06 | 25.28 | 37.66 | -7.58 | 1.44 | 23.93 | 2.91 | 25.08 | 0.06 | 10.62 | 0.53 | 12.36 | 27.85 | 0.43 | 20.41 | 24.89 | 19.25 | NA | 15.51 | 5.48 | 12.18 | 13.94 | 2.08 | 15.56 | 13.94 | -6.62 | 4.40 | 1.32 | 13.45 | 12.99 | 9.04 | 9.07 | 8.12 | 9.90 | 8.26 | NA | NA | NA | NA | |
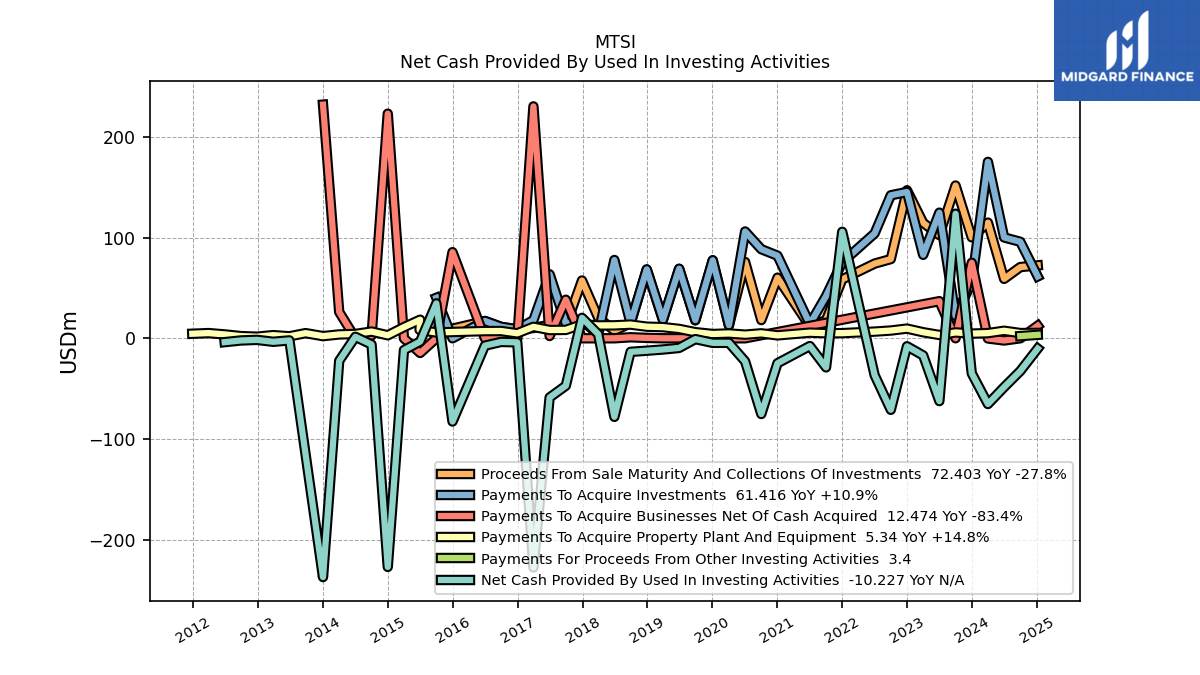
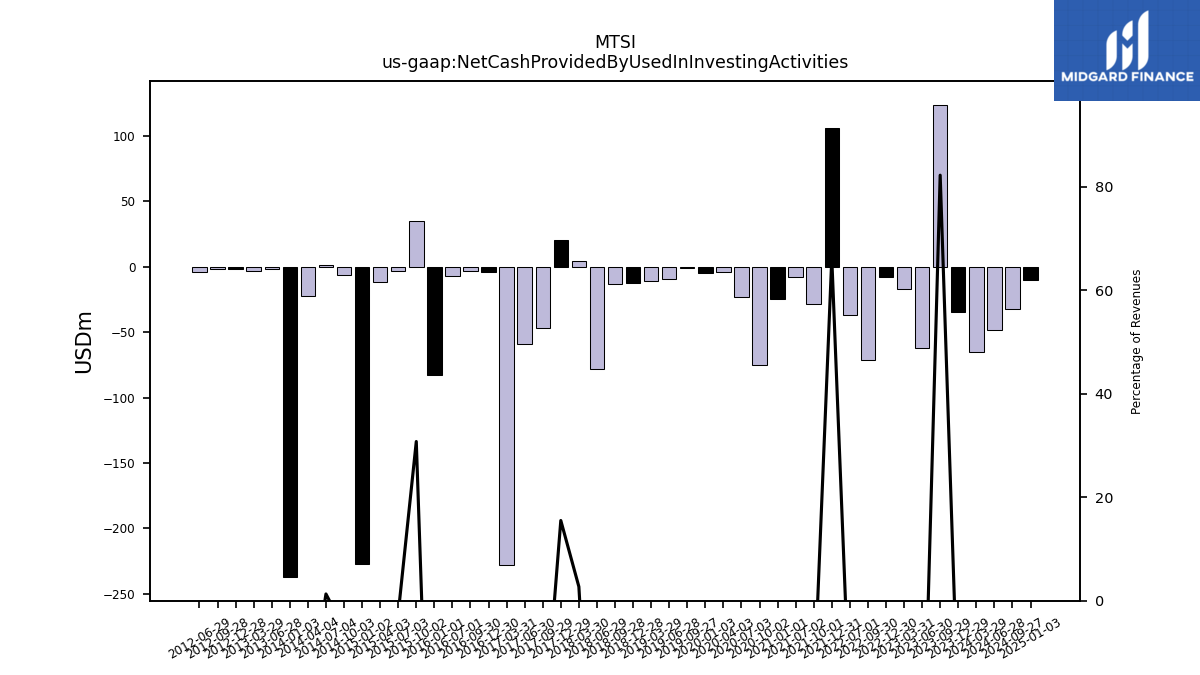
| Net Cash Provided By Used In Investing Activities | -34.77 | 123.70 | -62.39 | -17.02 | -7.95 | -71.05 | -36.60 | NA | 105.74 | -28.91 | -7.69 | NA | -24.77 | -75.22 | -22.92 | -4.51 | -4.54 | -0.83 | -9.58 | -11.13 | -12.35 | -13.47 | -78.05 | 4.09 | 20.31 | -47.13 | -58.76 | -227.63 | -4.04 | -3.63 | -7.32 | NA | -82.68 | 34.65 | -3.25 | -11.75 | -227.08 | -6.14 | 1.47 | -22.39 | -237.18 | NA | -2.10 | -3.49 | -1.58 | -2.17 | -3.85 | NA | NA | NA | NA | NA | NA | |
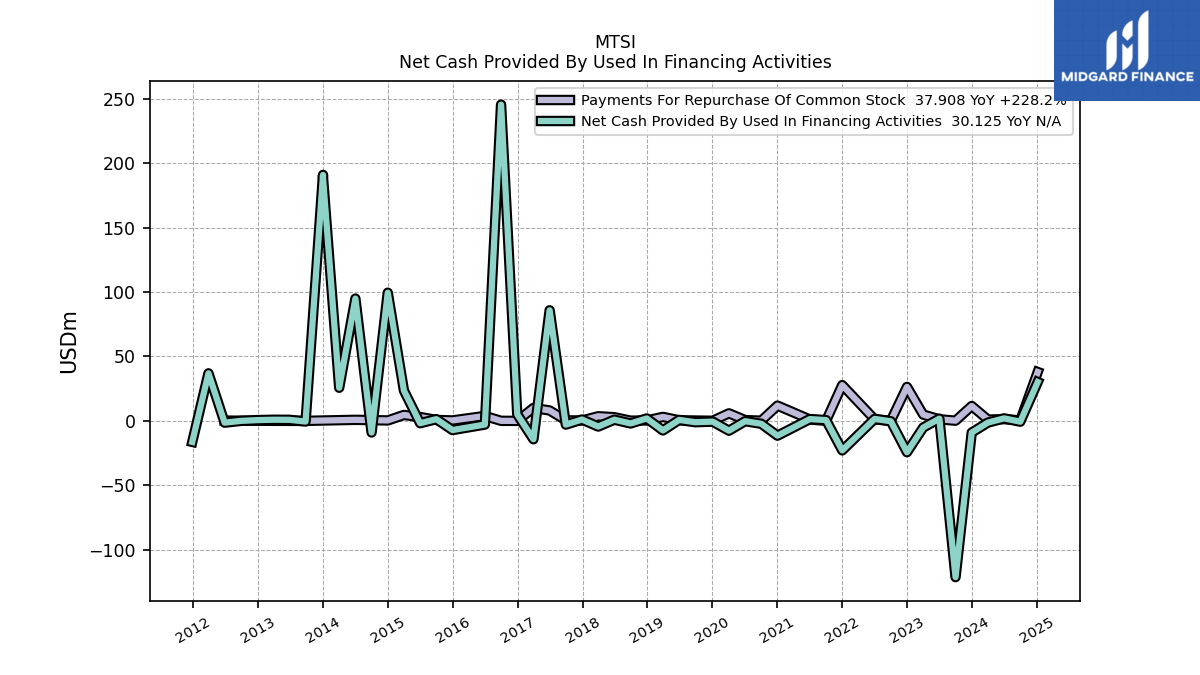
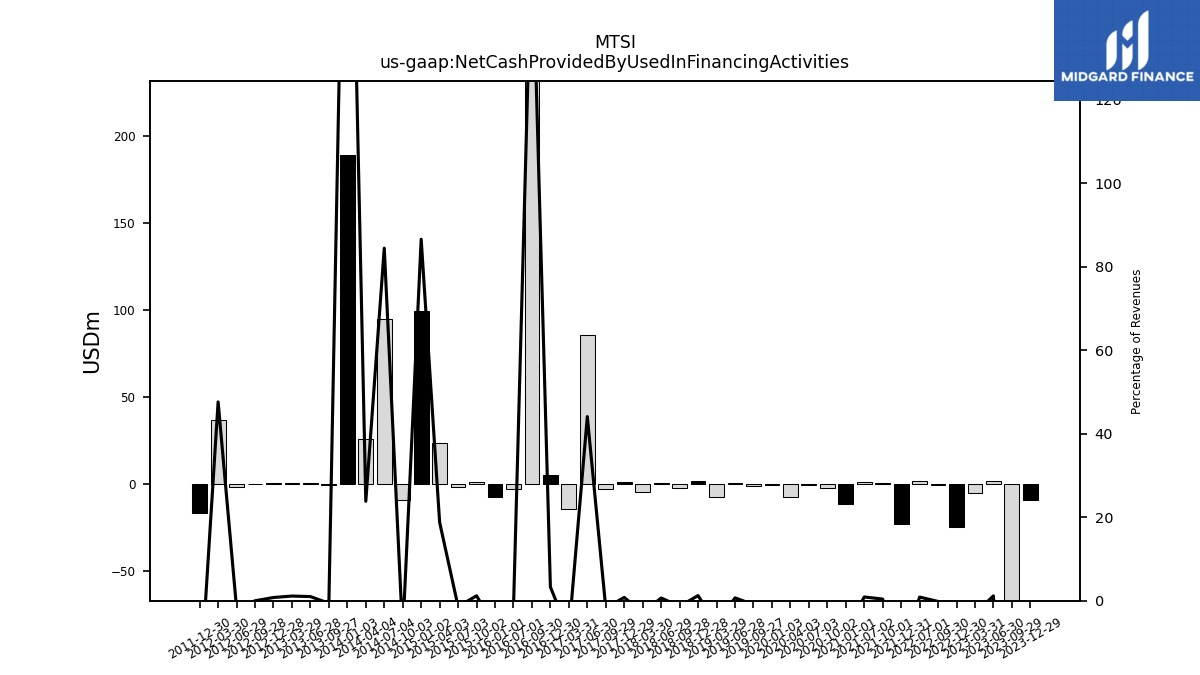
| Net Cash Provided By Used In Financing Activities | -9.05 | -121.22 | 1.73 | -5.19 | -24.33 | -0.30 | 1.51 | NA | -22.90 | 0.62 | 1.38 | NA | -11.48 | -2.25 | -0.25 | -7.62 | -0.59 | -1.04 | 0.76 | -7.41 | 1.87 | -2.00 | 0.91 | -4.41 | 1.04 | -2.90 | 85.80 | -14.26 | 5.01 | 245.36 | -2.86 | NA | -7.13 | 1.34 | -1.81 | 23.45 | 99.44 | -9.03 | 94.88 | 25.69 | 188.72 | -0.50 | 0.82 | 0.88 | 0.58 | -0.01 | -1.39 | 36.90 | -16.31 | NA | NA | NA | NA |
| 2023-12-29 | 2023-09-29 | 2023-06-30 | 2023-03-31 | 2022-12-30 | 2022-09-30 | 2022-07-01 | 2022-04-01 | 2021-12-31 | 2021-10-01 | 2021-07-02 | 2021-04-02 | 2021-01-01 | 2020-10-02 | 2020-07-03 | 2020-04-03 | 2020-01-03 | 2019-09-27 | 2019-06-28 | 2019-03-29 | 2018-12-28 | 2018-09-28 | 2018-06-29 | 2018-03-30 | 2017-12-29 | 2017-09-29 | 2017-06-30 | 2017-03-31 | 2016-12-30 | 2016-09-30 | 2016-07-01 | 2016-04-01 | 2016-01-01 | 2015-10-02 | 2015-07-03 | 2015-04-03 | 2015-01-02 | 2014-10-03 | 2014-07-04 | 2014-04-04 | 2014-01-03 | 2013-09-27 | 2013-06-28 | 2013-03-29 | 2012-12-28 | 2012-09-28 | 2012-06-29 | 2012-03-30 | 2011-12-30 | 2011-09-30 | 2011-07-01 | 2011-04-01 | 2010-12-31 | ||
|---|---|---|---|---|---|---|---|---|---|---|---|---|---|---|---|---|---|---|---|---|---|---|---|---|---|---|---|---|---|---|---|---|---|---|---|---|---|---|---|---|---|---|---|---|---|---|---|---|---|---|---|---|---|---|
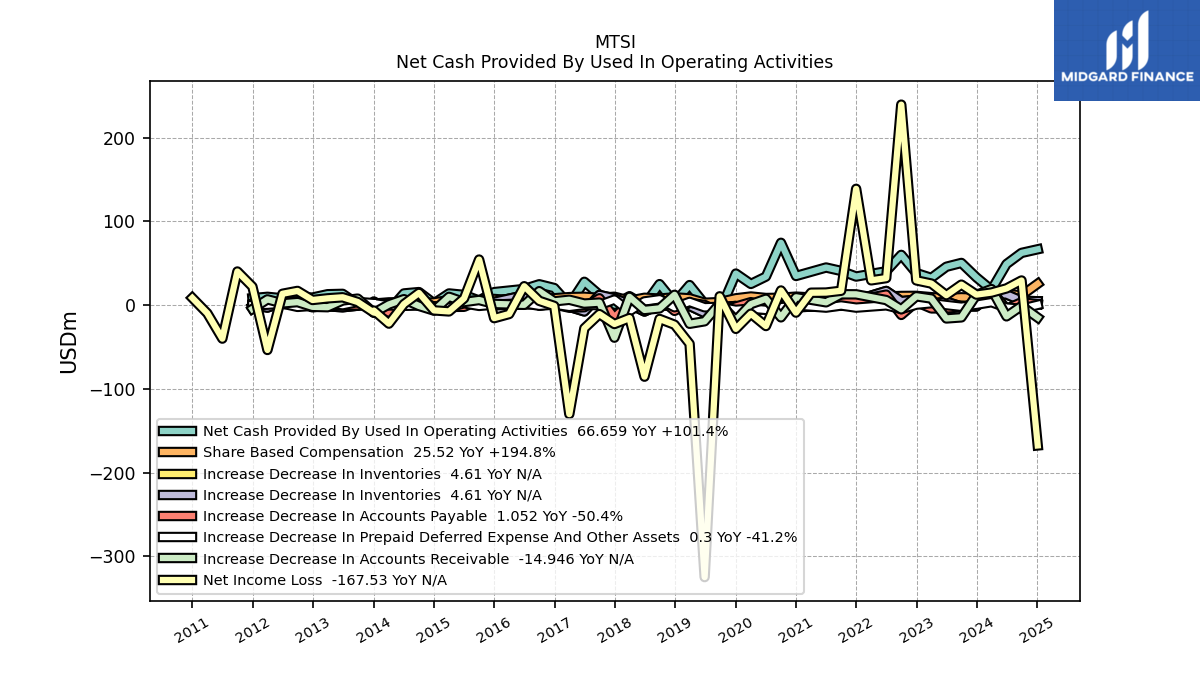
| Net Cash Provided By Used In Operating Activities | 33.10 | 50.35 | 45.82 | 32.47 | 38.27 | 59.99 | 40.39 | NA | 34.10 | 40.81 | 44.88 | NA | 34.78 | 74.40 | 34.06 | 25.28 | 37.66 | -7.58 | 1.44 | 23.93 | 2.91 | 25.08 | 0.06 | 10.62 | 0.53 | 12.36 | 27.85 | 0.43 | 20.41 | 24.89 | 19.25 | NA | 15.51 | 5.48 | 12.18 | 13.94 | 2.08 | 15.56 | 13.94 | -6.62 | 4.40 | 1.32 | 13.45 | 12.99 | 9.04 | 9.07 | 8.12 | 9.90 | 8.26 | NA | NA | NA | NA | |
| Net Income Loss | 12.53 | 24.45 | 11.85 | 25.75 | 29.52 | 239.34 | 32.23 | 29.56 | 138.83 | 17.13 | 15.01 | 14.81 | -8.97 | 17.49 | -24.98 | -10.23 | -28.36 | 10.52 | -324.71 | -46.20 | -23.40 | -16.49 | -85.43 | -15.48 | -22.57 | -10.72 | -27.68 | -130.13 | -0.96 | 5.10 | 22.55 | -10.65 | -15.57 | 54.41 | 8.03 | -7.54 | -6.31 | 14.54 | 1.18 | -22.12 | -6.50 | 3.75 | 9.37 | 8.09 | 6.11 | 16.96 | 13.54 | -53.56 | 22.04 | 40.15 | -40.02 | -9.76 | 8.61 | |
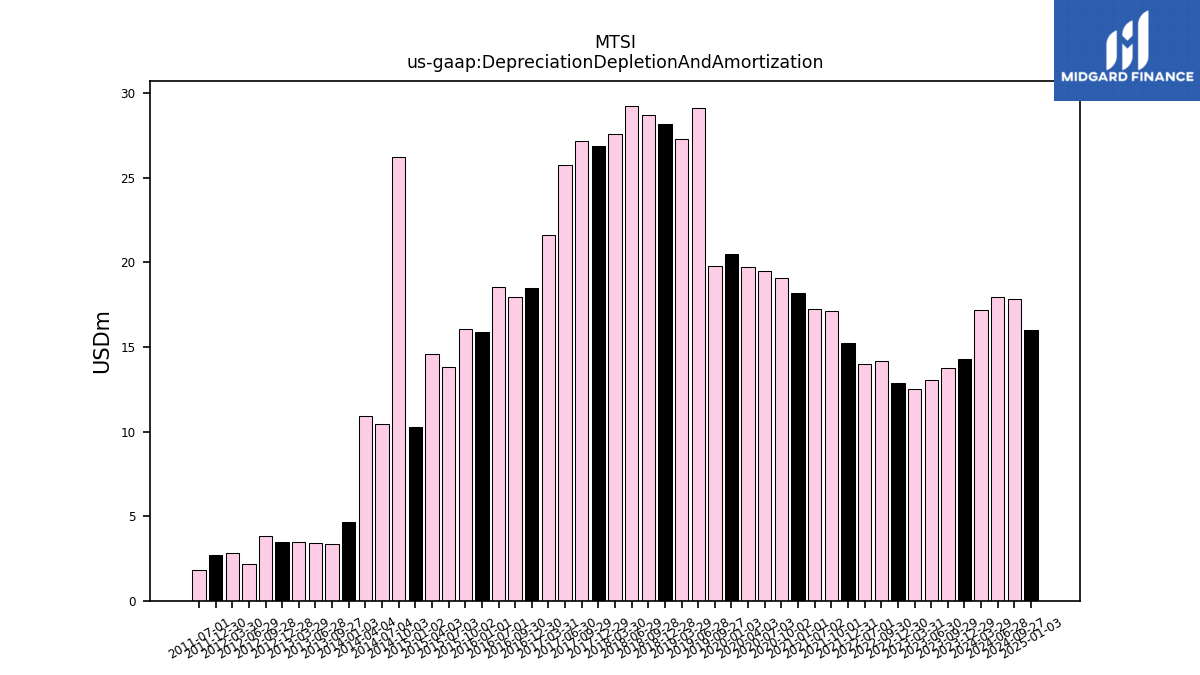
| Depreciation Depletion And Amortization | 14.29 | 13.74 | 13.05 | 12.51 | 12.86 | 14.18 | 13.97 | NA | 15.23 | 17.10 | 17.24 | NA | 18.20 | 19.07 | 19.51 | 19.74 | 20.50 | 19.81 | 29.13 | 27.29 | 28.18 | 28.69 | 29.26 | 27.57 | 26.87 | 27.18 | 25.73 | 21.62 | 18.48 | 17.98 | 18.53 | NA | 15.89 | 16.05 | 13.79 | 14.60 | 10.28 | 26.25 | 10.47 | 10.94 | 4.65 | 3.34 | 3.40 | 3.48 | 3.46 | 3.86 | 2.20 | 2.81 | 2.68 | NA | 1.80 | NA | NA | |
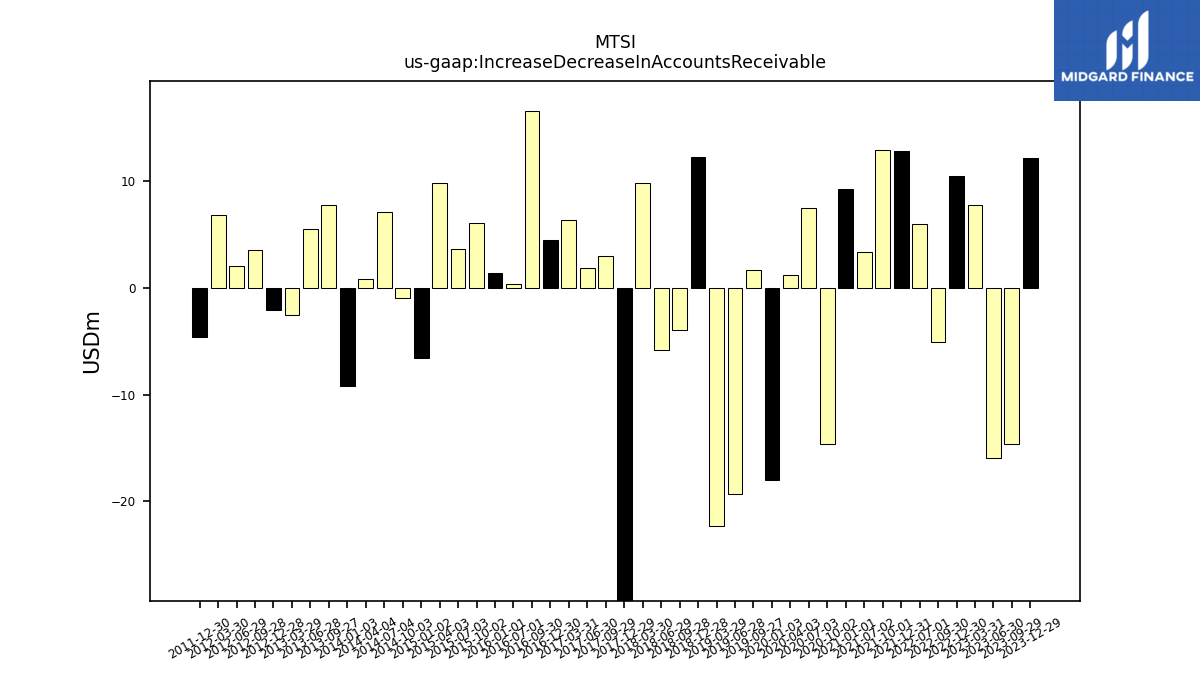
| Increase Decrease In Accounts Receivable | 12.18 | -14.64 | -15.93 | 7.83 | 10.49 | -5.04 | 6.04 | NA | 12.88 | 12.95 | 3.34 | NA | 9.32 | -14.62 | 7.50 | 1.23 | -18.01 | 1.71 | -19.30 | -22.30 | 12.31 | -3.91 | -5.78 | 9.88 | -38.87 | 3.00 | 1.88 | 6.39 | 4.49 | 16.65 | 0.35 | NA | 1.41 | 6.10 | 3.65 | 9.90 | -6.55 | -0.97 | 7.09 | 0.80 | -9.22 | 7.77 | 5.55 | -2.50 | -2.04 | 3.59 | 2.10 | 6.87 | -4.59 | NA | NA | NA | NA | |
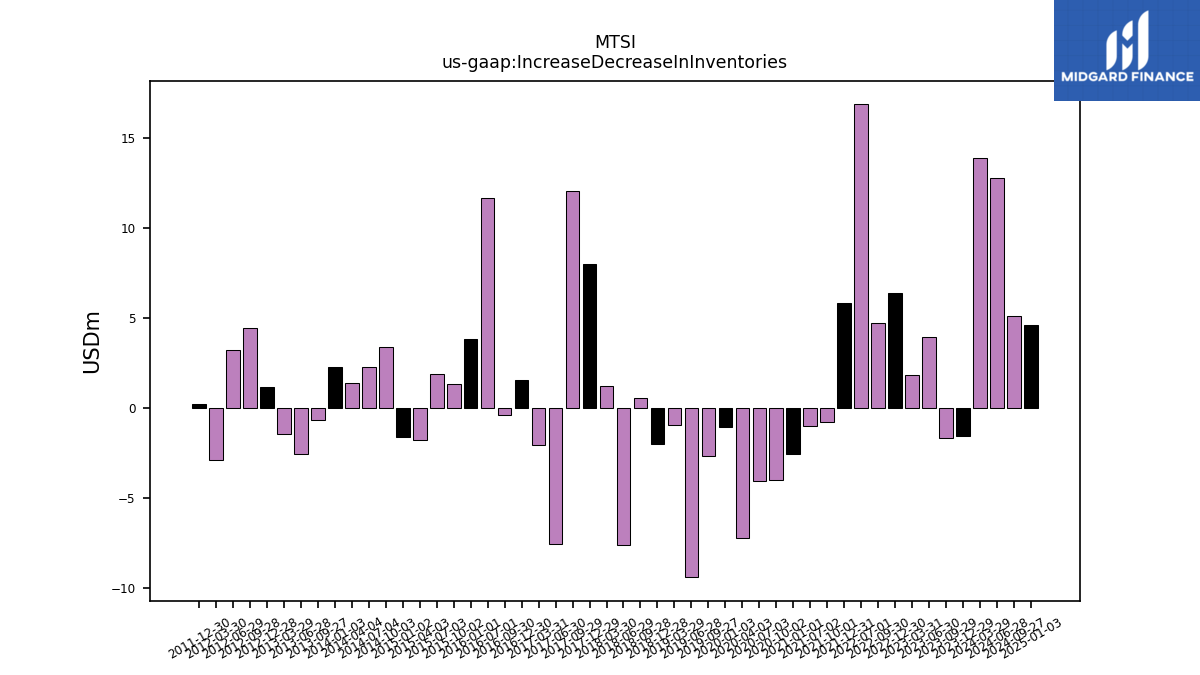
| Increase Decrease In Inventories | -1.55 | -1.64 | 3.97 | 1.86 | 6.38 | 4.73 | 16.88 | NA | 5.84 | -0.80 | -1.02 | NA | -2.57 | -3.99 | -4.05 | -7.23 | -1.02 | -2.67 | -9.39 | -0.92 | -1.99 | 0.55 | -7.62 | 1.22 | 8.02 | 12.09 | -7.54 | -2.04 | 1.58 | -0.38 | 11.68 | NA | 3.83 | 1.35 | 1.91 | -1.76 | -1.60 | 3.39 | 2.26 | 1.40 | 2.27 | -0.66 | -2.55 | -1.43 | 1.17 | 4.42 | 3.25 | -2.91 | 0.22 | NA | NA | NA | NA | |
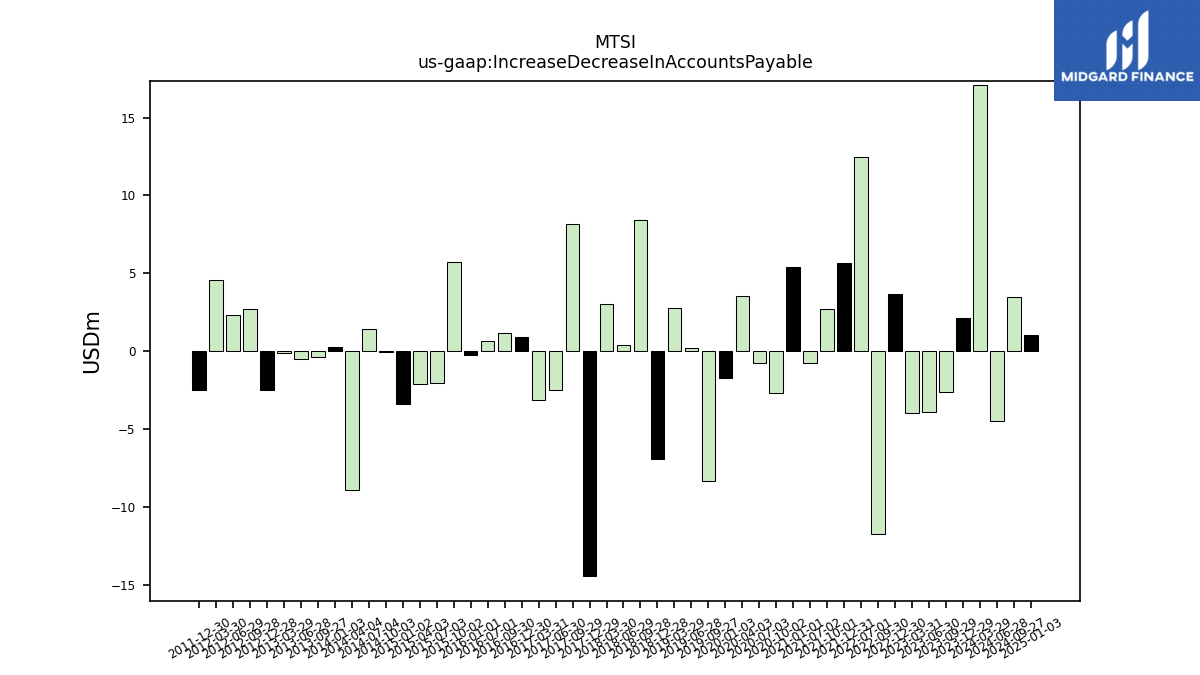
| Increase Decrease In Accounts Payable | 2.12 | -2.60 | -3.88 | -3.94 | 3.69 | -11.74 | 12.50 | NA | 5.69 | 2.71 | -0.74 | NA | 5.40 | -2.66 | -0.75 | 3.52 | -1.71 | -8.33 | 0.21 | 2.80 | -6.91 | 8.44 | 0.39 | 3.01 | -14.45 | 8.17 | -2.50 | -3.15 | 0.93 | 1.17 | 0.64 | NA | -0.27 | 5.70 | -2.01 | -2.12 | -3.42 | -0.05 | 1.39 | -8.90 | 0.24 | -0.37 | -0.47 | -0.13 | -2.52 | 2.73 | 2.33 | 4.59 | -2.48 | NA | NA | NA | NA | |
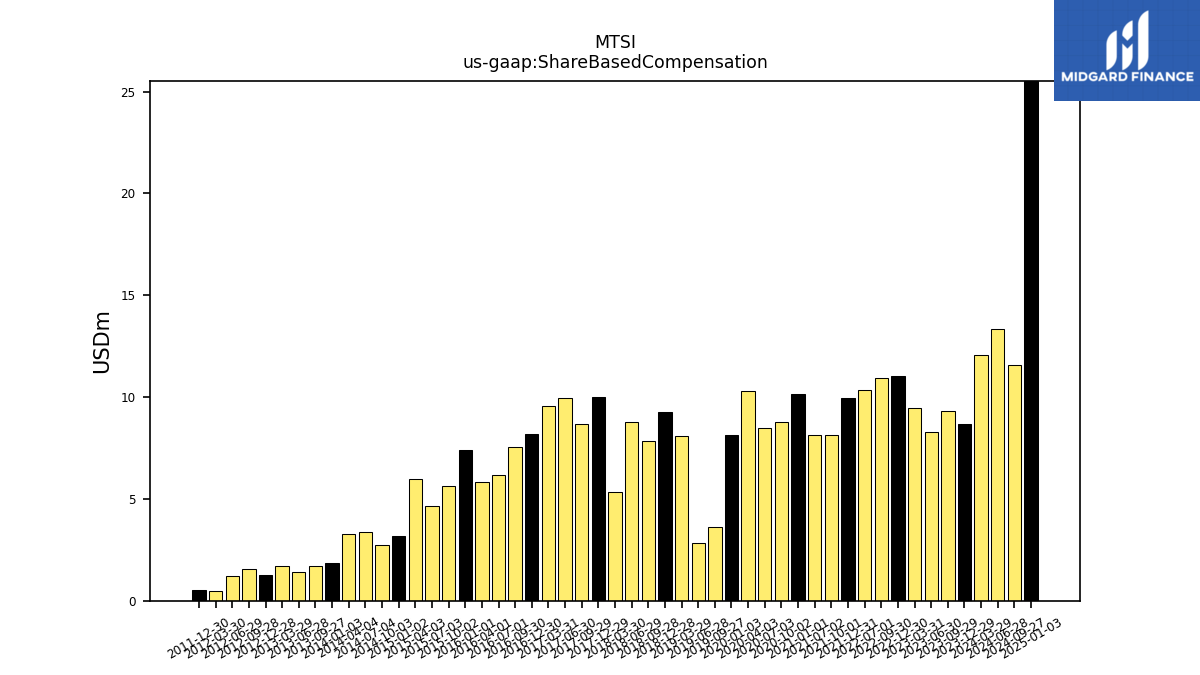
| Share Based Compensation | 8.66 | 9.33 | 8.26 | 9.46 | 11.05 | 10.93 | 10.34 | NA | 9.95 | 8.16 | 8.14 | NA | 10.13 | 8.75 | 8.49 | 10.28 | 8.15 | 3.63 | 2.81 | 8.08 | 9.27 | 7.84 | 8.75 | 5.35 | 9.99 | 8.67 | 9.94 | 9.55 | 8.18 | 7.55 | 6.18 | 5.84 | 7.38 | 5.65 | 4.65 | 5.97 | 3.16 | 2.75 | 3.39 | 3.29 | 1.84 | 1.73 | 1.42 | 1.68 | 1.26 | 1.57 | 1.19 | 0.46 | 0.53 | NA | NA | NA | NA | |
| Amortization Of Financing Costs | NA | NA | NA | NA | NA | 0.41 | 0.41 | NA | 0.46 | 0.43 | 1.07 | NA | 0.55 | 1.01 | 1.01 | 1.02 | 1.01 | 1.01 | 1.01 | 1.02 | 1.01 | 1.01 | 1.04 | 1.51 | 1.03 | 0.83 | 1.12 | 0.72 | 0.70 | 0.50 | 0.40 | NA | 0.41 | 0.40 | 0.41 | 0.40 | 0.44 | 0.38 | 2.40 | 0.12 | 0.12 | NA | NA | NA | NA | 0.07 | 0.07 | NA | NA | NA | NA | NA | NA |
| 2023-12-29 | 2023-09-29 | 2023-06-30 | 2023-03-31 | 2022-12-30 | 2022-09-30 | 2022-07-01 | 2022-04-01 | 2021-12-31 | 2021-10-01 | 2021-07-02 | 2021-04-02 | 2021-01-01 | 2020-10-02 | 2020-07-03 | 2020-04-03 | 2020-01-03 | 2019-09-27 | 2019-06-28 | 2019-03-29 | 2018-12-28 | 2018-09-28 | 2018-06-29 | 2018-03-30 | 2017-12-29 | 2017-09-29 | 2017-06-30 | 2017-03-31 | 2016-12-30 | 2016-09-30 | 2016-07-01 | 2016-04-01 | 2016-01-01 | 2015-10-02 | 2015-07-03 | 2015-04-03 | 2015-01-02 | 2014-10-03 | 2014-07-04 | 2014-04-04 | 2014-01-03 | 2013-09-27 | 2013-06-28 | 2013-03-29 | 2012-12-28 | 2012-09-28 | 2012-06-29 | 2012-03-30 | 2011-12-30 | 2011-09-30 | 2011-07-01 | 2011-04-01 | 2010-12-31 | ||
|---|---|---|---|---|---|---|---|---|---|---|---|---|---|---|---|---|---|---|---|---|---|---|---|---|---|---|---|---|---|---|---|---|---|---|---|---|---|---|---|---|---|---|---|---|---|---|---|---|---|---|---|---|---|---|
| Net Cash Provided By Used In Investing Activities | -34.77 | 123.70 | -62.39 | -17.02 | -7.95 | -71.05 | -36.60 | NA | 105.74 | -28.91 | -7.69 | NA | -24.77 | -75.22 | -22.92 | -4.51 | -4.54 | -0.83 | -9.58 | -11.13 | -12.35 | -13.47 | -78.05 | 4.09 | 20.31 | -47.13 | -58.76 | -227.63 | -4.04 | -3.63 | -7.32 | NA | -82.68 | 34.65 | -3.25 | -11.75 | -227.08 | -6.14 | 1.47 | -22.39 | -237.18 | NA | -2.10 | -3.49 | -1.58 | -2.17 | -3.85 | NA | NA | NA | NA | NA | NA | |
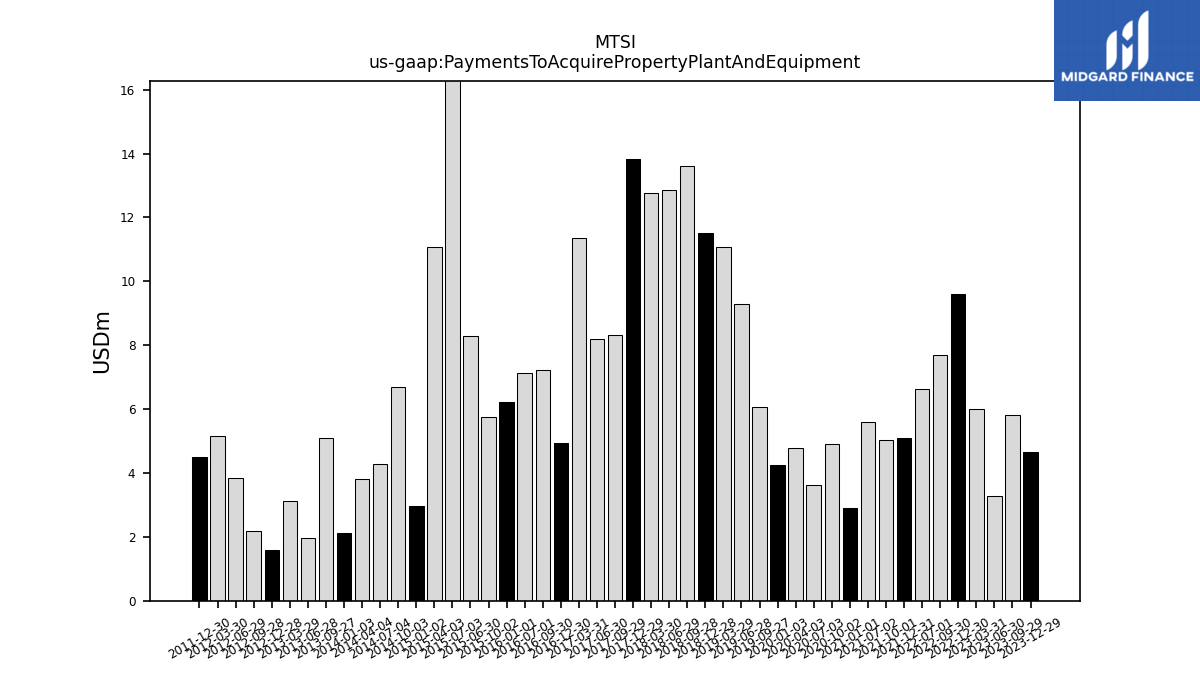
| Payments To Acquire Property Plant And Equipment | 4.65 | 5.81 | 3.28 | 6.00 | 9.62 | 7.70 | 6.63 | NA | 5.09 | 5.03 | 5.60 | NA | 2.89 | 4.92 | 3.62 | 4.79 | 4.25 | 6.06 | 9.30 | 11.08 | 11.52 | 13.60 | 12.86 | 12.76 | 13.82 | 8.31 | 8.20 | 11.35 | 4.94 | 7.23 | 7.14 | NA | 6.23 | 5.76 | 18.45 | 11.08 | 2.96 | 6.69 | 4.29 | 3.83 | 2.14 | 5.10 | 1.97 | 3.12 | 1.58 | 2.17 | 3.85 | 5.16 | 4.50 | NA | NA | NA | NA | |
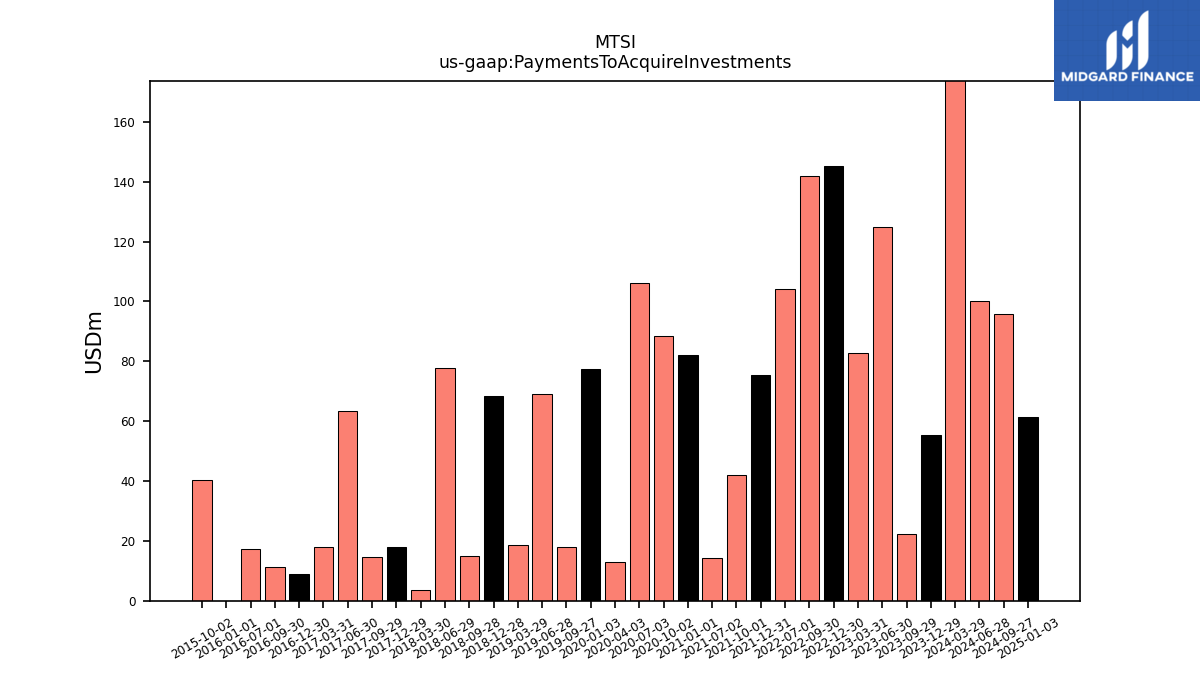
| Payments To Acquire Investments | 55.39 | 22.20 | 124.74 | 82.86 | 145.30 | 142.00 | 104.12 | NA | 75.44 | 41.88 | 14.19 | NA | 82.05 | 88.44 | 106.08 | 12.90 | 77.50 | 18.05 | 69.11 | 18.47 | 68.48 | 15.10 | 77.75 | 3.62 | 17.99 | 14.54 | 63.53 | 18.07 | 8.90 | 11.37 | 17.25 | NA | 0.00 | 40.20 | NA | NA | NA | NA | NA | NA | NA | NA | NA | NA | NA | NA | NA | NA | NA | NA | NA | NA | NA |
| 2023-12-29 | 2023-09-29 | 2023-06-30 | 2023-03-31 | 2022-12-30 | 2022-09-30 | 2022-07-01 | 2022-04-01 | 2021-12-31 | 2021-10-01 | 2021-07-02 | 2021-04-02 | 2021-01-01 | 2020-10-02 | 2020-07-03 | 2020-04-03 | 2020-01-03 | 2019-09-27 | 2019-06-28 | 2019-03-29 | 2018-12-28 | 2018-09-28 | 2018-06-29 | 2018-03-30 | 2017-12-29 | 2017-09-29 | 2017-06-30 | 2017-03-31 | 2016-12-30 | 2016-09-30 | 2016-07-01 | 2016-04-01 | 2016-01-01 | 2015-10-02 | 2015-07-03 | 2015-04-03 | 2015-01-02 | 2014-10-03 | 2014-07-04 | 2014-04-04 | 2014-01-03 | 2013-09-27 | 2013-06-28 | 2013-03-29 | 2012-12-28 | 2012-09-28 | 2012-06-29 | 2012-03-30 | 2011-12-30 | 2011-09-30 | 2011-07-01 | 2011-04-01 | 2010-12-31 | ||
|---|---|---|---|---|---|---|---|---|---|---|---|---|---|---|---|---|---|---|---|---|---|---|---|---|---|---|---|---|---|---|---|---|---|---|---|---|---|---|---|---|---|---|---|---|---|---|---|---|---|---|---|---|---|---|
| Net Cash Provided By Used In Financing Activities | -9.05 | -121.22 | 1.73 | -5.19 | -24.33 | -0.30 | 1.51 | NA | -22.90 | 0.62 | 1.38 | NA | -11.48 | -2.25 | -0.25 | -7.62 | -0.59 | -1.04 | 0.76 | -7.41 | 1.87 | -2.00 | 0.91 | -4.41 | 1.04 | -2.90 | 85.80 | -14.26 | 5.01 | 245.36 | -2.86 | NA | -7.13 | 1.34 | -1.81 | 23.45 | 99.44 | -9.03 | 94.88 | 25.69 | 188.72 | -0.50 | 0.82 | 0.88 | 0.58 | -0.01 | -1.39 | 36.90 | -16.31 | NA | NA | NA | NA | |
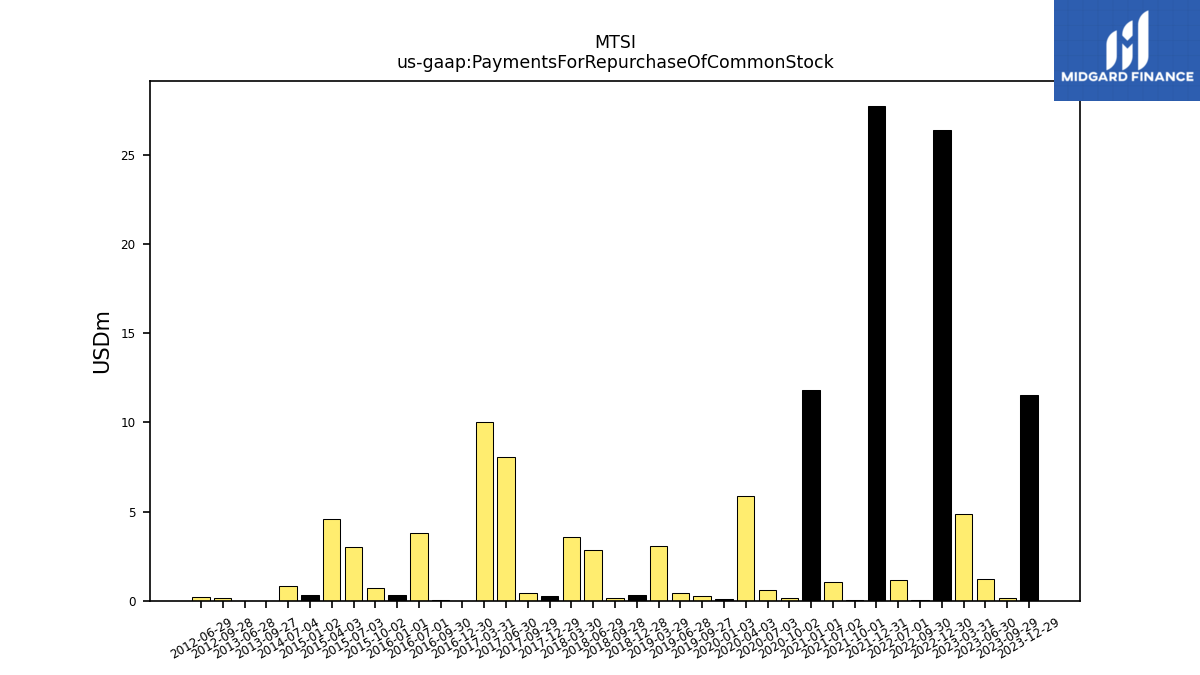
| Payments For Repurchase Of Common Stock | 11.55 | 0.14 | 1.23 | 4.88 | 26.38 | 0.07 | 1.18 | NA | 27.76 | 0.03 | 1.07 | NA | 11.84 | 0.15 | 0.61 | 5.86 | 0.09 | 0.27 | 0.45 | 3.08 | 0.34 | 0.15 | 2.83 | 3.59 | 0.26 | 0.44 | 8.06 | 10.03 | 0.00 | 0.03 | 3.81 | NA | 0.34 | 0.71 | 3.00 | 4.59 | 0.34 | NA | 0.81 | NA | NA | 0.00 | 0.00 | NA | NA | 0.14 | 0.22 | NA | NA | NA | NA | NA | NA |
| 2023-12-29 | 2023-09-29 | 2023-06-30 | 2023-03-31 | 2022-12-30 | 2022-09-30 | 2022-07-01 | 2022-04-01 | 2021-12-31 | 2021-10-01 | 2021-07-02 | 2021-04-02 | 2021-01-01 | 2020-10-02 | 2020-07-03 | 2020-04-03 | 2020-01-03 | 2019-09-27 | 2019-06-28 | 2019-03-29 | 2018-12-28 | 2018-09-28 | 2018-06-29 | 2018-03-30 | 2017-12-29 | 2017-09-29 | 2017-06-30 | 2017-03-31 | 2016-12-30 | 2016-09-30 | 2016-07-01 | 2016-04-01 | 2016-01-01 | 2015-10-02 | 2015-07-03 | 2015-04-03 | 2015-01-02 | 2014-10-03 | 2014-07-04 | 2014-04-04 | 2014-01-03 | 2013-09-27 | 2013-06-28 | 2013-03-29 | 2012-12-28 | 2012-09-28 | 2012-06-29 | 2012-03-30 | 2011-12-30 | 2011-09-30 | 2011-07-01 | 2011-04-01 | 2010-12-31 | ||
|---|---|---|---|---|---|---|---|---|---|---|---|---|---|---|---|---|---|---|---|---|---|---|---|---|---|---|---|---|---|---|---|---|---|---|---|---|---|---|---|---|---|---|---|---|---|---|---|---|---|---|---|---|---|---|
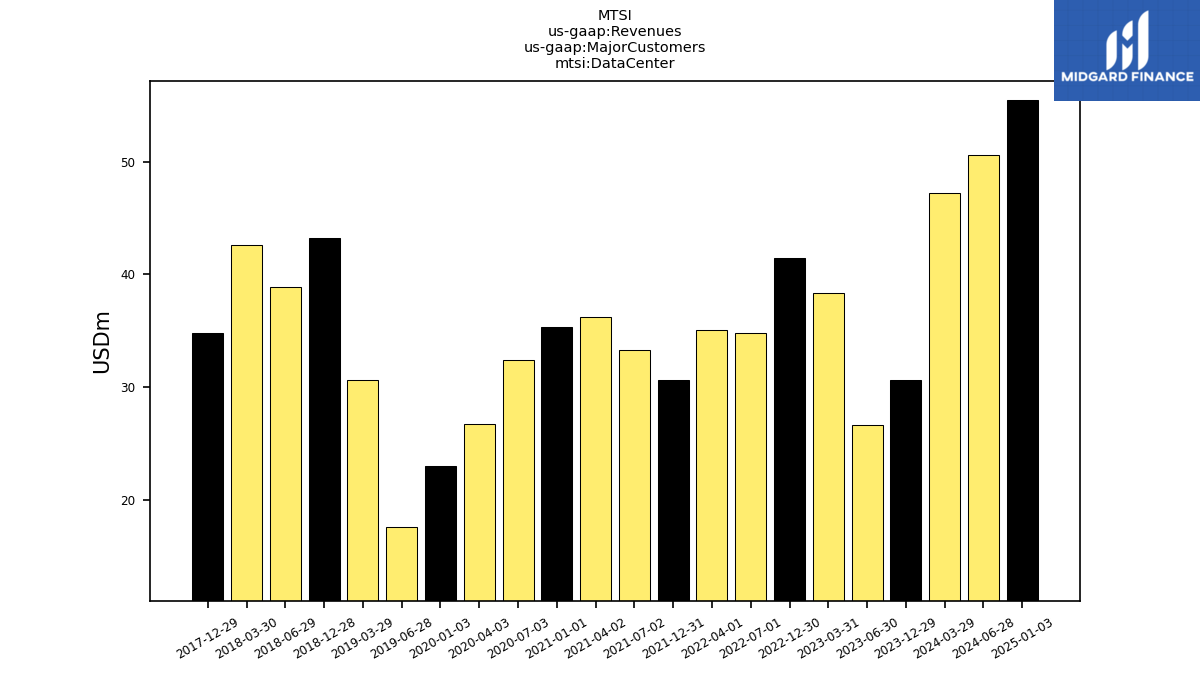
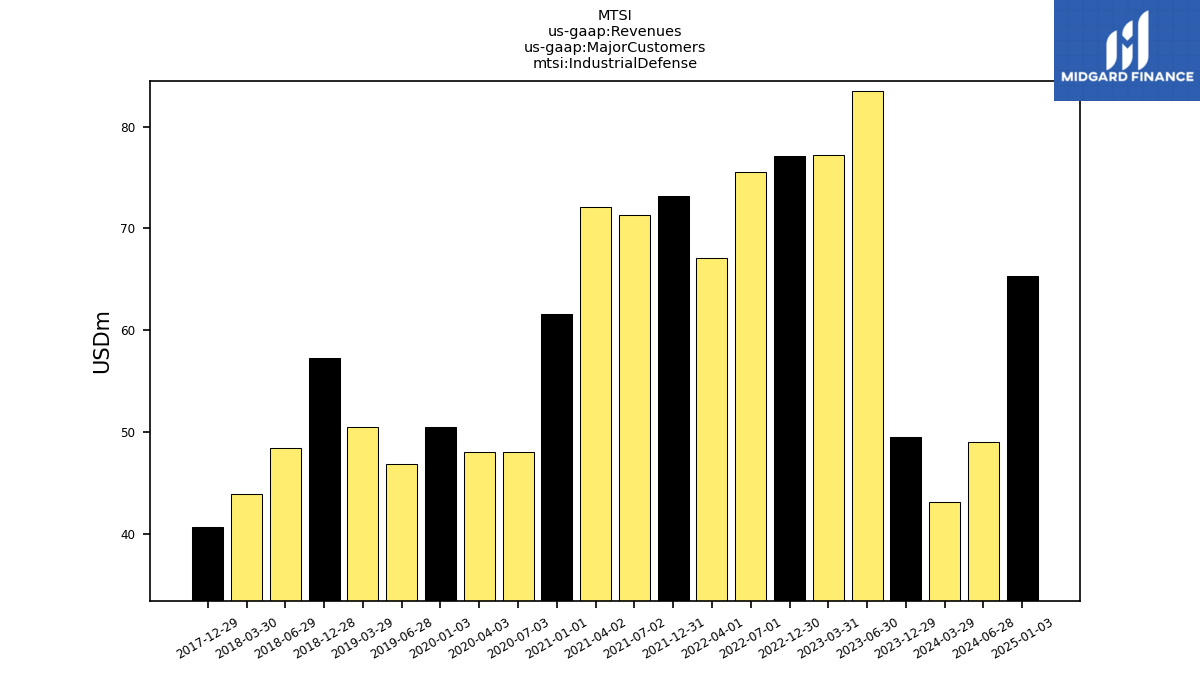
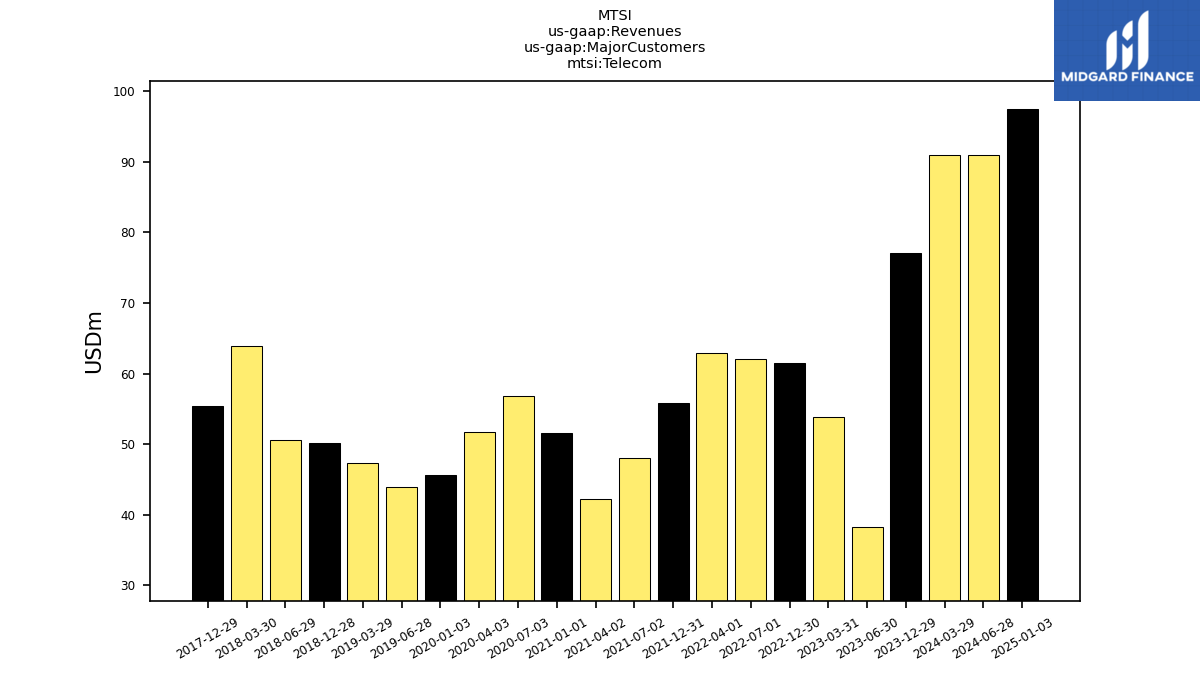
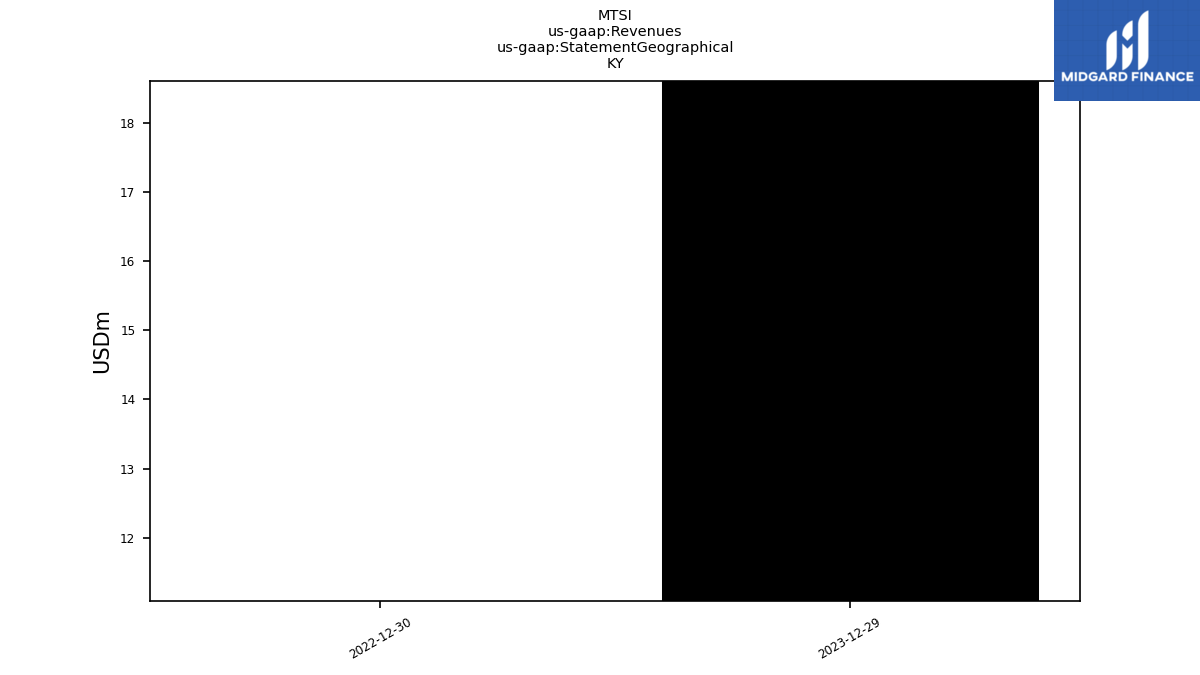
| Revenues | 157.15 | 150.38 | 148.52 | 169.41 | 180.10 | 178.14 | 172.26 | 165.15 | 159.62 | 155.21 | 152.62 | 150.58 | 148.50 | 147.25 | 137.27 | 126.42 | 119.10 | 112.25 | 108.31 | 128.47 | 150.69 | 151.19 | 137.87 | 150.41 | 130.93 | 166.38 | 194.56 | 186.08 | 151.75 | 152.70 | 142.29 | 133.58 | 115.77 | 112.56 | 130.66 | 124.89 | 114.86 | 114.32 | 112.36 | 107.83 | 83.47 | 83.66 | 82.22 | 77.82 | 75.01 | 74.56 | 77.12 | 77.48 | 73.03 | 78.80 | 78.70 | 77.88 | 74.91 | |
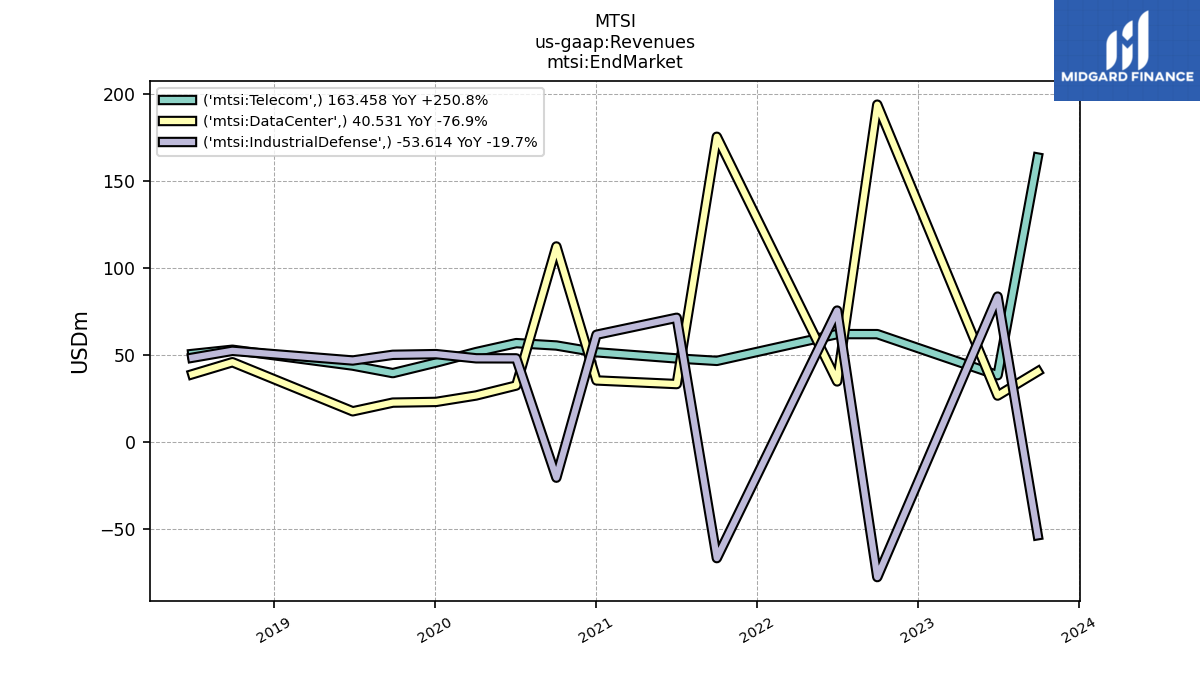
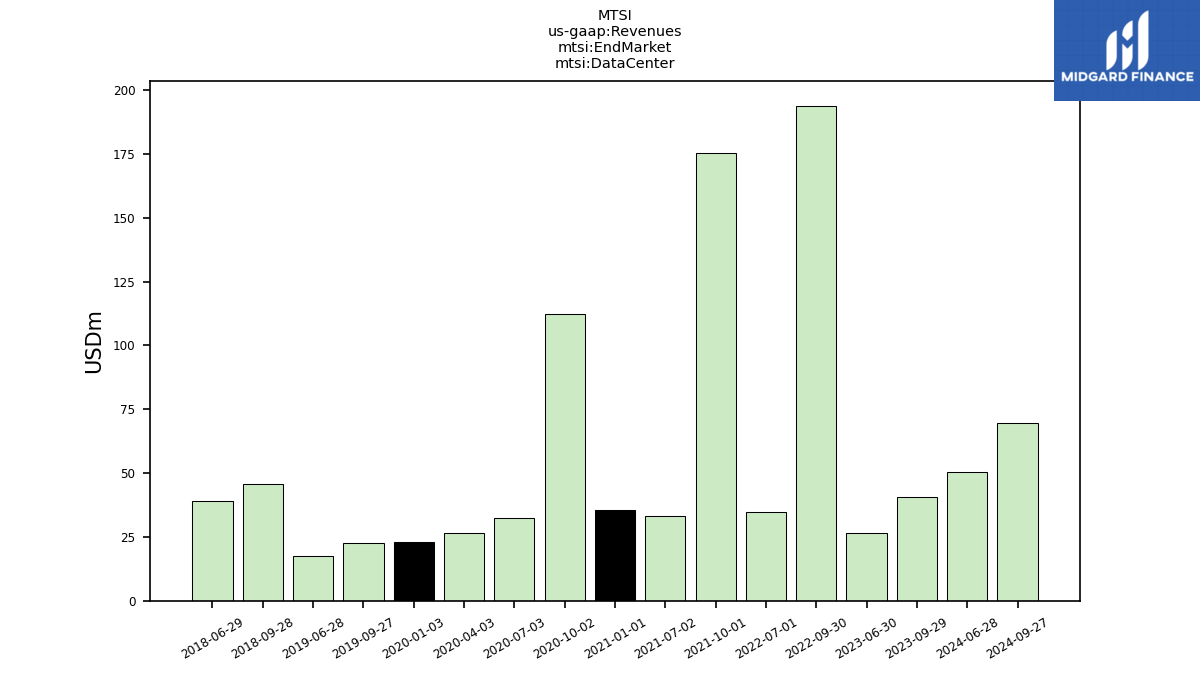
| Data Center | NA | 40.53 | 26.64 | NA | NA | 193.85 | 34.76 | NA | NA | 175.39 | 33.26 | NA | 35.35 | 112.35 | 32.43 | 26.71 | 23.01 | 22.61 | 17.61 | NA | NA | 45.83 | 38.91 | NA | NA | NA | NA | NA | NA | NA | NA | NA | NA | NA | NA | NA | NA | NA | NA | NA | NA | NA | NA | NA | NA | NA | NA | NA | NA | NA | NA | NA | NA | |
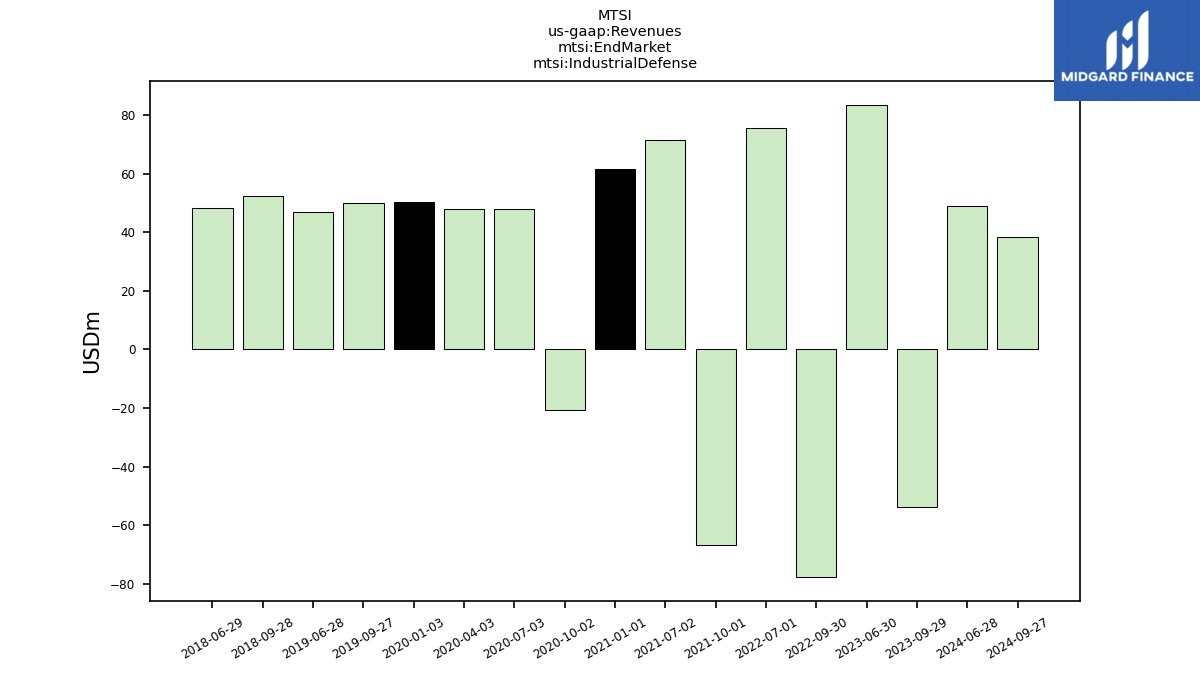
| Industrial Defense | NA | -53.61 | 83.55 | NA | NA | -77.67 | 75.51 | NA | NA | -66.77 | 71.37 | NA | 61.62 | -20.53 | 48.03 | 48.07 | 50.48 | 50.08 | 46.81 | NA | NA | 52.37 | 48.40 | NA | NA | NA | NA | NA | NA | NA | NA | NA | NA | NA | NA | NA | NA | NA | NA | NA | NA | NA | NA | NA | NA | NA | NA | NA | NA | NA | NA | NA | NA | |
| Telecom | NA | 163.46 | 38.33 | NA | NA | 61.96 | 61.99 | NA | NA | 46.59 | 47.99 | NA | 51.53 | 55.43 | 56.80 | 51.65 | 45.60 | 39.56 | 43.88 | NA | NA | 52.99 | 50.56 | NA | NA | NA | NA | NA | NA | NA | NA | NA | NA | NA | NA | NA | NA | NA | NA | NA | NA | NA | NA | NA | NA | NA | NA | NA | NA | NA | NA | NA | NA | |
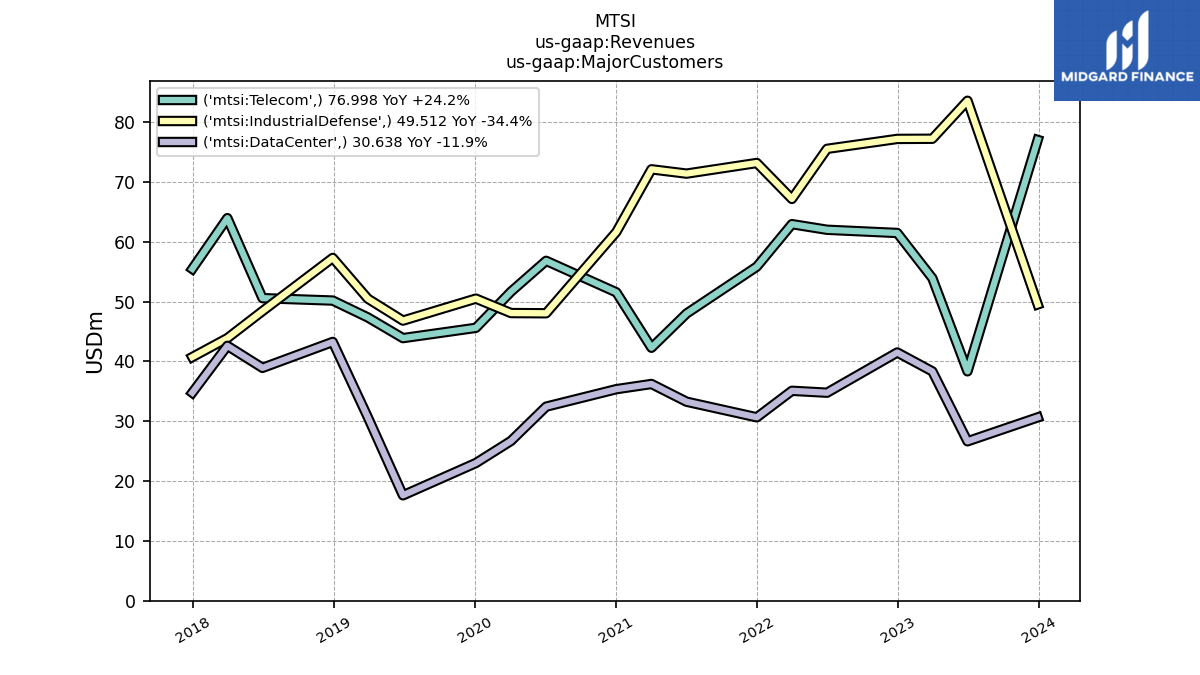
| Data Center | 30.64 | NA | 26.64 | 38.32 | 41.48 | NA | 34.76 | 35.08 | 30.65 | NA | 33.26 | 36.22 | 35.35 | NA | 32.43 | 26.71 | 23.01 | NA | 17.61 | 30.66 | 43.25 | NA | 38.91 | 42.60 | 34.76 | NA | NA | NA | NA | NA | NA | NA | NA | NA | NA | NA | NA | NA | NA | NA | NA | NA | NA | NA | NA | NA | NA | NA | NA | NA | NA | NA | NA | |
| Industrial Defense | 49.51 | NA | 83.55 | 77.19 | 77.17 | NA | 75.51 | 67.14 | 73.15 | NA | 71.37 | 72.09 | 61.62 | NA | 48.03 | 48.07 | 50.48 | NA | 46.81 | 50.47 | 57.28 | NA | 48.40 | 43.88 | 40.71 | NA | NA | NA | NA | NA | NA | NA | NA | NA | NA | NA | NA | NA | NA | NA | NA | NA | NA | NA | NA | NA | NA | NA | NA | NA | NA | NA | NA | |
| Telecom | 77.00 | NA | 38.33 | 53.89 | 61.45 | NA | 61.99 | 62.93 | 55.82 | NA | 47.99 | 42.27 | 51.53 | NA | 56.80 | 51.65 | 45.60 | NA | 43.88 | 47.34 | 50.16 | NA | 50.56 | 63.94 | 55.45 | NA | NA | NA | NA | NA | NA | NA | NA | NA | NA | NA | NA | NA | NA | NA | NA | NA | NA | NA | NA | NA | NA | NA | NA | NA | NA | NA | NA | |
| 18.60 | NA | NA | NA | 11.09 | NA | NA | NA | NA | NA | NA | NA | NA | NA | NA | NA | NA | NA | NA | NA | NA | NA | NA | NA | NA | NA | NA | NA | NA | NA | NA | NA | NA | NA | NA | NA | NA | NA | NA | NA | NA | NA | NA | NA | NA | NA | NA | NA | NA | NA | NA | NA | NA | ||
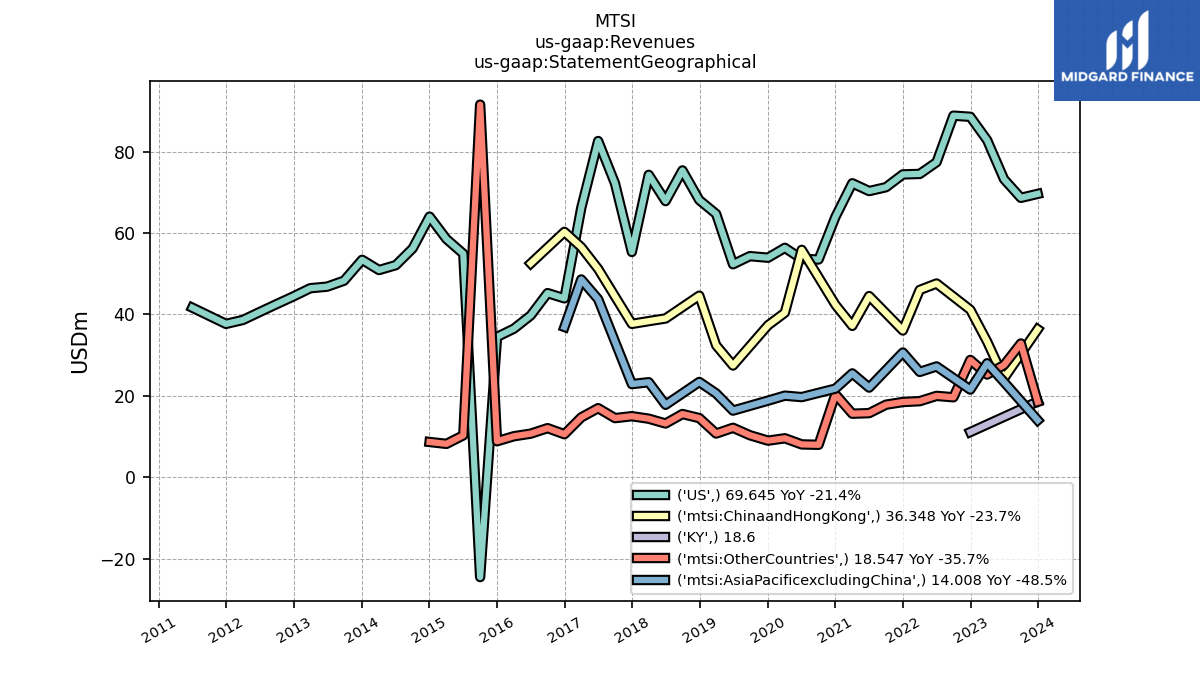
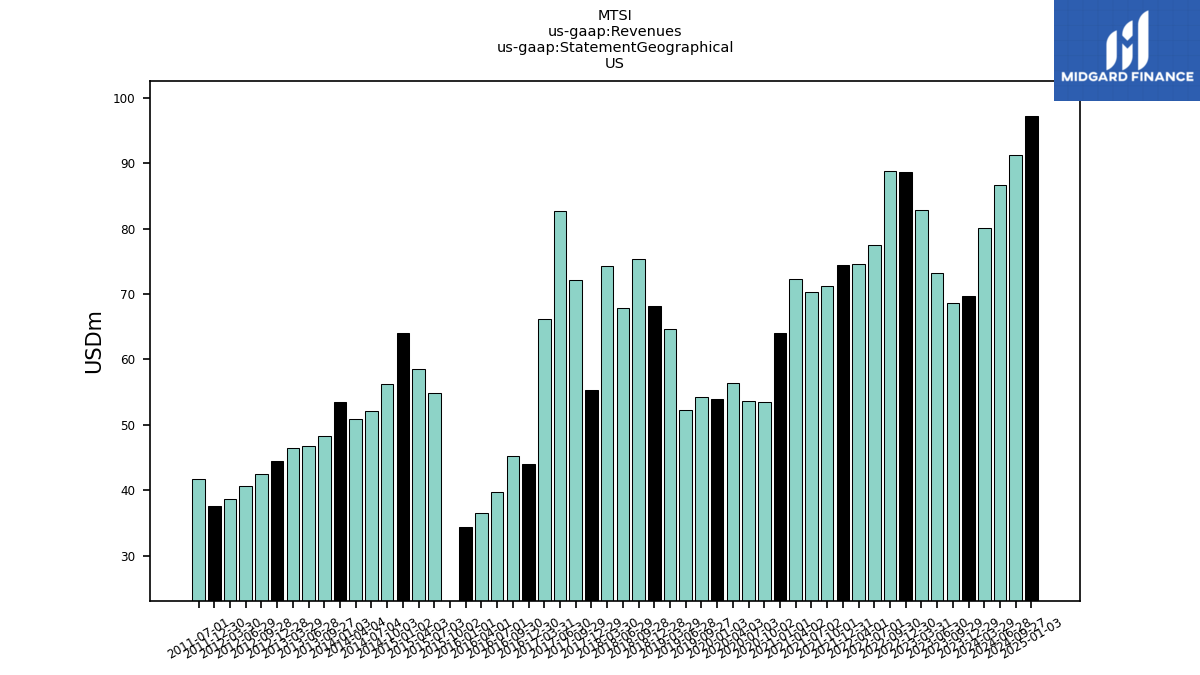
| US | 69.64 | 68.67 | 73.26 | 82.83 | 88.59 | 88.87 | 77.43 | 74.55 | 74.43 | 71.28 | 70.33 | 72.25 | 63.98 | 53.51 | 53.63 | 56.38 | 53.95 | 54.34 | 52.34 | 64.71 | 68.12 | 75.41 | 67.86 | 74.32 | 55.36 | 72.22 | 82.64 | 66.22 | 43.96 | 45.25 | 39.76 | 36.50 | 34.48 | -24.56 | 54.93 | 58.55 | 64.05 | 56.25 | 52.13 | 50.91 | 53.44 | 48.30 | 46.84 | 46.45 | 44.44 | 42.54 | 40.61 | 38.65 | 37.69 | NA | 41.68 | NA | NA | |
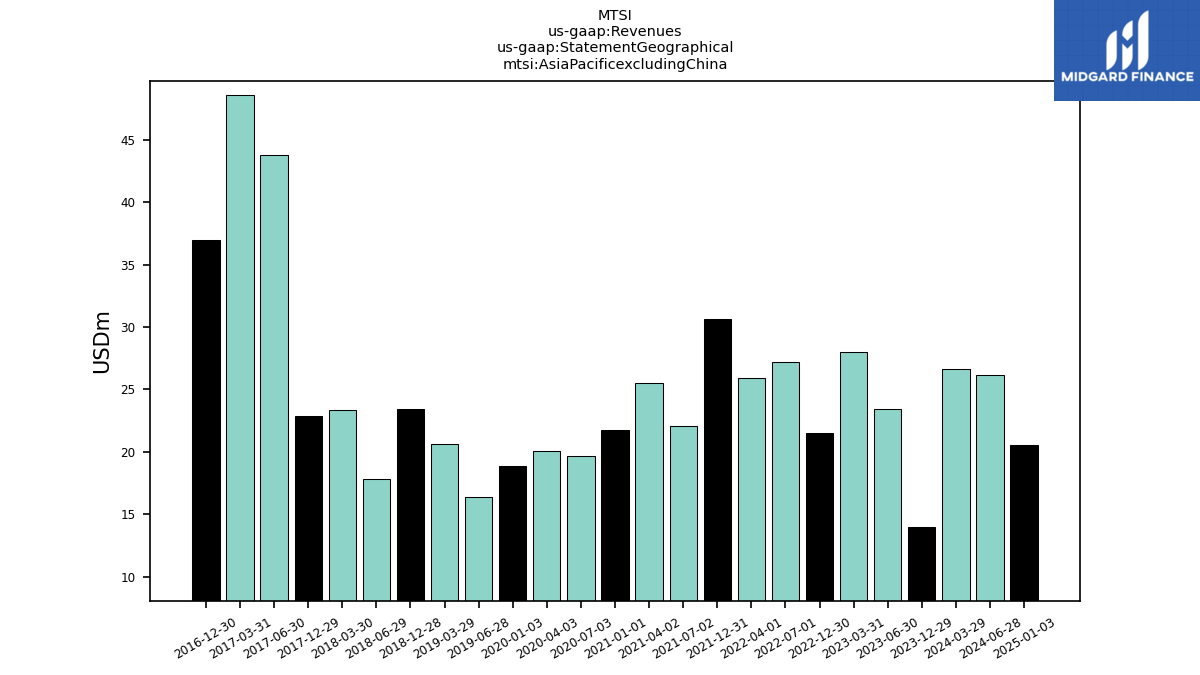
| Asia Pacificexcluding China | 14.01 | NA | 23.40 | 28.01 | 21.53 | NA | 27.23 | 25.88 | 30.65 | NA | 22.02 | 25.52 | 21.77 | NA | 19.69 | 20.04 | 18.82 | NA | 16.37 | 20.60 | 23.41 | NA | 17.80 | 23.35 | 22.89 | NA | 43.76 | 48.61 | 36.93 | NA | NA | NA | NA | NA | NA | NA | NA | NA | NA | NA | NA | NA | NA | NA | NA | NA | NA | NA | NA | NA | NA | NA | NA | |
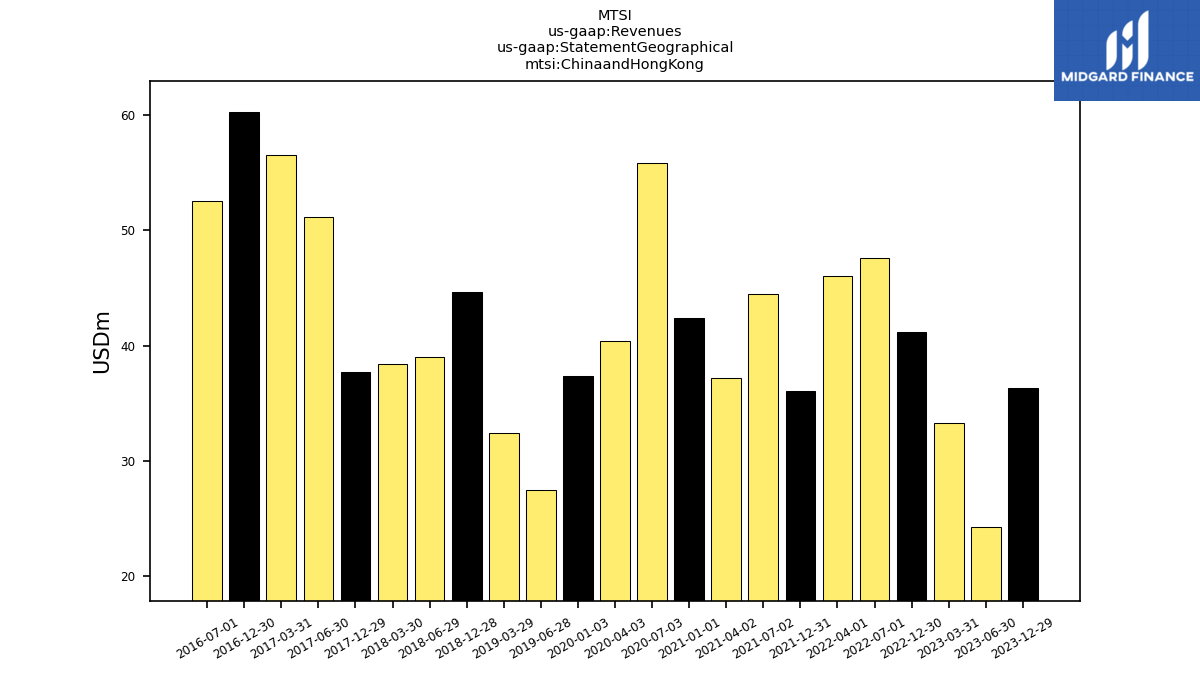
| Chinaand Hong Kong | 36.35 | NA | 24.30 | 33.33 | 41.16 | NA | 47.61 | 46.03 | 36.06 | NA | 44.52 | 37.20 | 42.38 | NA | 55.89 | 40.43 | 37.34 | NA | 27.45 | 32.42 | 44.62 | NA | 39.02 | 38.36 | 37.69 | NA | 51.19 | 56.53 | 60.30 | NA | 52.55 | NA | NA | NA | NA | NA | NA | NA | NA | NA | NA | NA | NA | NA | NA | NA | NA | NA | NA | NA | NA | NA | NA | |
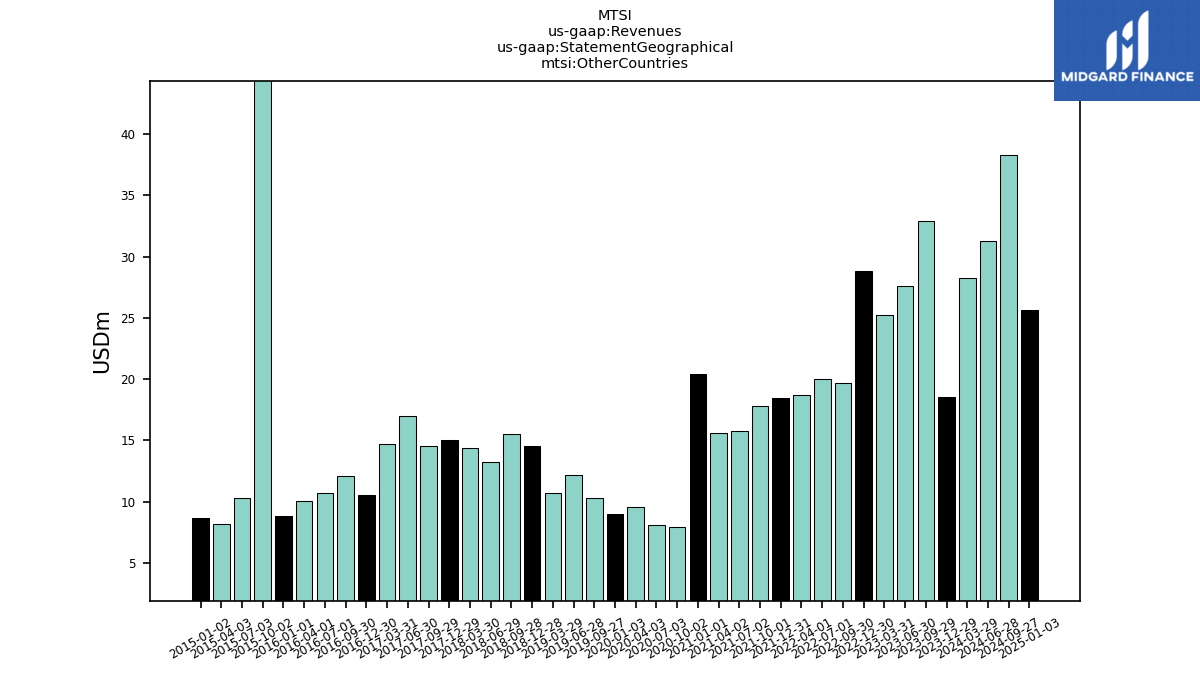
| Other Countries | 18.55 | 32.88 | 27.56 | 25.24 | 28.82 | 19.64 | 19.99 | 18.69 | 18.48 | 17.83 | 15.75 | 15.61 | 20.37 | 7.96 | 8.06 | 9.57 | 8.98 | 10.32 | 12.14 | 10.73 | 14.53 | 15.53 | 13.20 | 14.38 | 14.99 | 14.53 | 16.97 | 14.71 | 10.56 | 12.06 | 10.71 | 10.07 | 8.84 | 91.58 | 10.29 | 8.19 | 8.66 | NA | NA | NA | NA | NA | NA | NA | NA | NA | NA | NA | NA | NA | NA | NA | NA |

