
| 2023-12-31 | 2023-09-30 | 2023-06-30 | 2023-03-31 | 2022-12-31 | 2022-09-30 | 2022-06-30 | 2022-03-31 | 2021-12-31 | 2021-09-30 | 2021-06-30 | 2021-03-31 | 2020-12-31 | 2020-09-30 | 2020-06-30 | ||
|---|---|---|---|---|---|---|---|---|---|---|---|---|---|---|---|---|
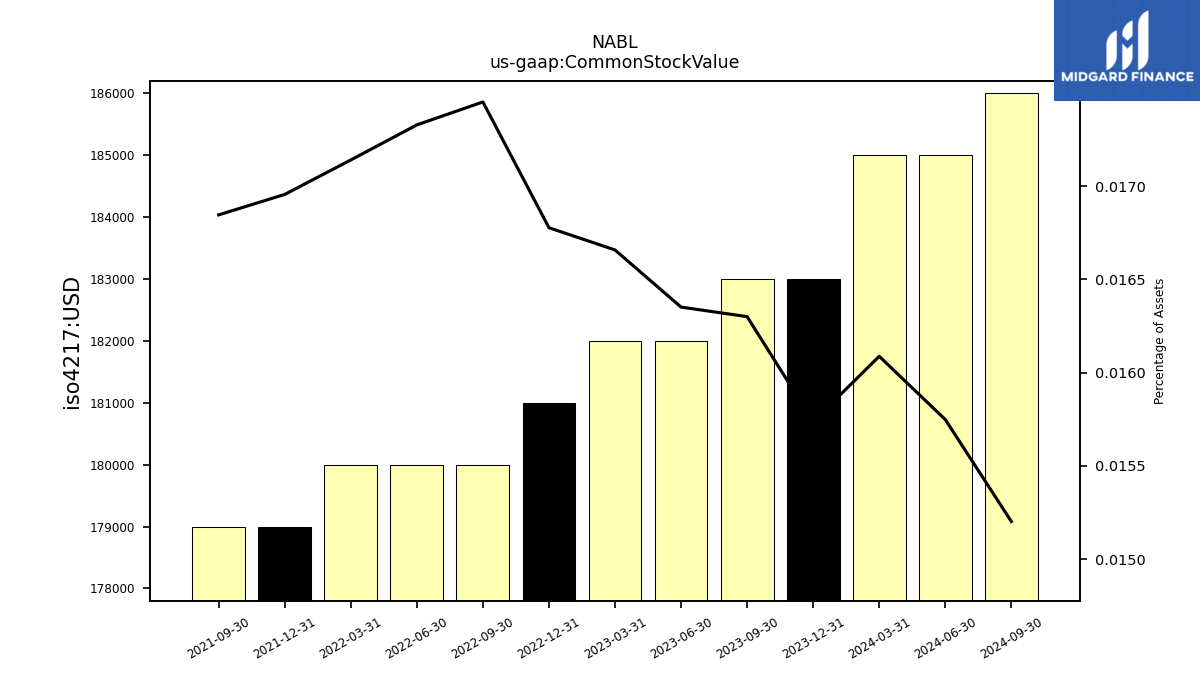
| Common Stock Value | 0.18 | 0.18 | 0.18 | 0.18 | 0.18 | 0.18 | 0.18 | 0.18 | 0.18 | 0.18 | NA | NA | NA | NA | NA | |
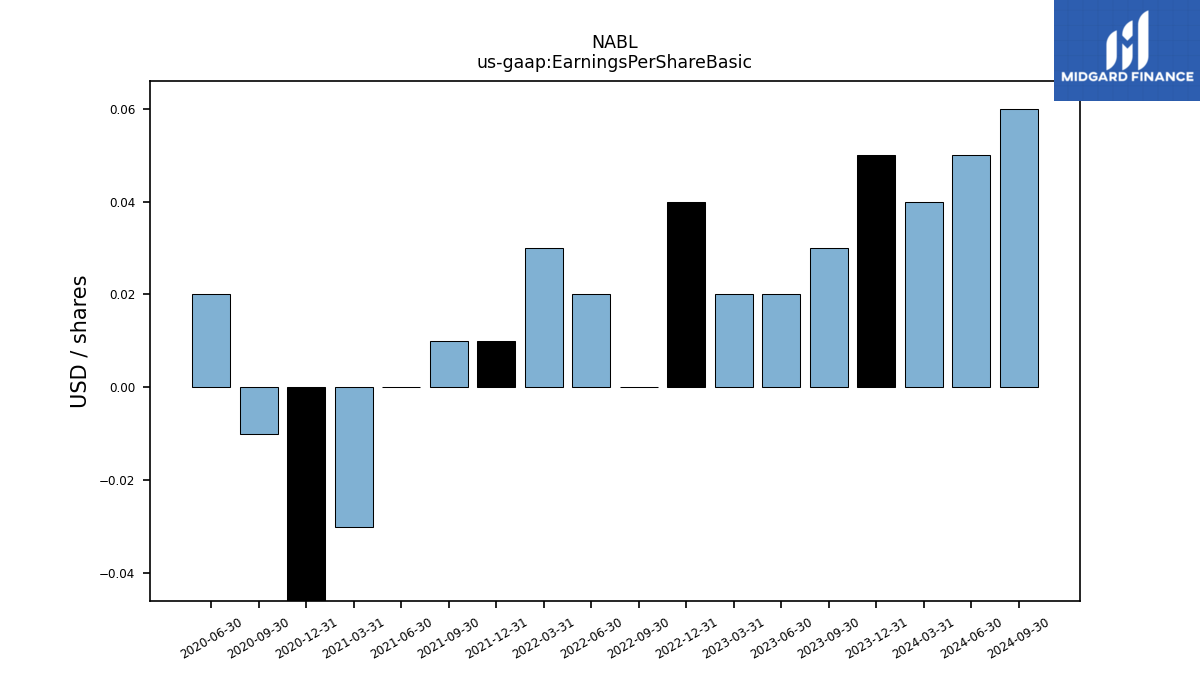
| Earnings Per Share Basic | 0.05 | 0.03 | 0.02 | 0.02 | 0.04 | 0.00 | 0.02 | 0.03 | 0.01 | 0.01 | 0.00 | -0.03 | -0.07 | -0.01 | 0.02 | |
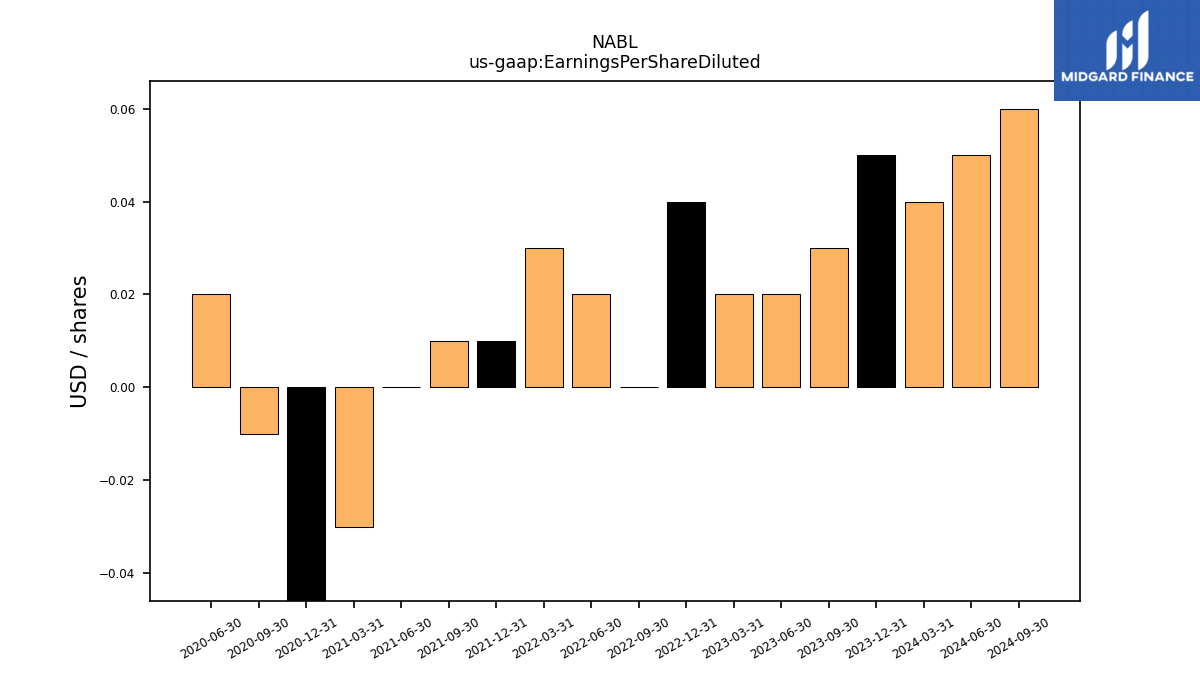
| Earnings Per Share Diluted | 0.05 | 0.03 | 0.02 | 0.02 | 0.04 | 0.00 | 0.02 | 0.03 | 0.01 | 0.01 | 0.00 | -0.03 | -0.07 | -0.01 | 0.02 |
| 2023-12-31 | 2023-09-30 | 2023-06-30 | 2023-03-31 | 2022-12-31 | 2022-09-30 | 2022-06-30 | 2022-03-31 | 2021-12-31 | 2021-09-30 | 2021-06-30 | 2021-03-31 | 2020-12-31 | 2020-09-30 | 2020-06-30 | ||
|---|---|---|---|---|---|---|---|---|---|---|---|---|---|---|---|---|
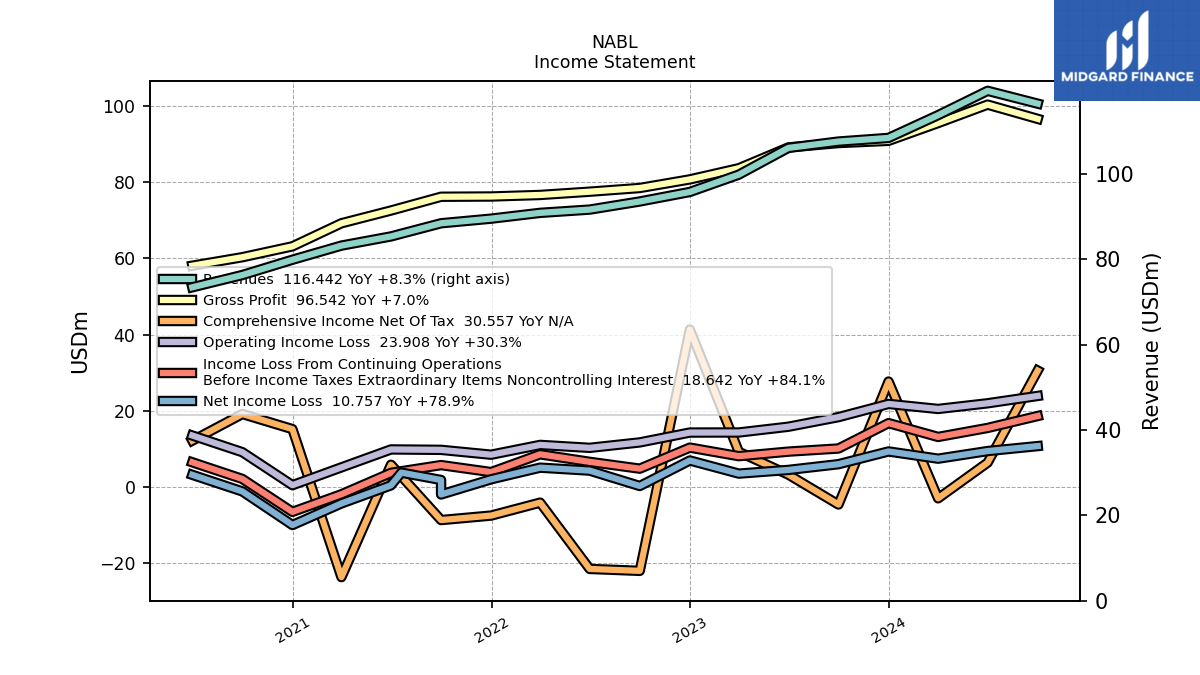
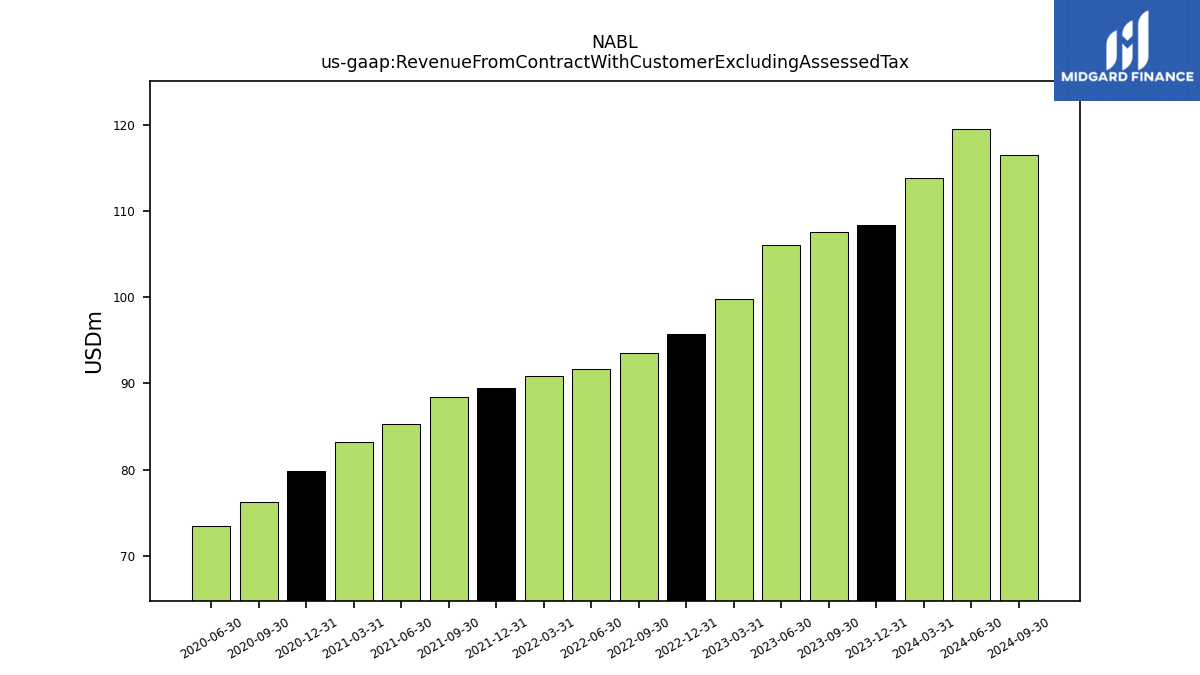
| Revenue From Contract With Customer Excluding Assessed Tax | 108.42 | 107.57 | 106.08 | 99.82 | 95.75 | 93.53 | 91.63 | 90.86 | 89.50 | 88.42 | 85.34 | 83.19 | 79.88 | 76.30 | 73.42 | |
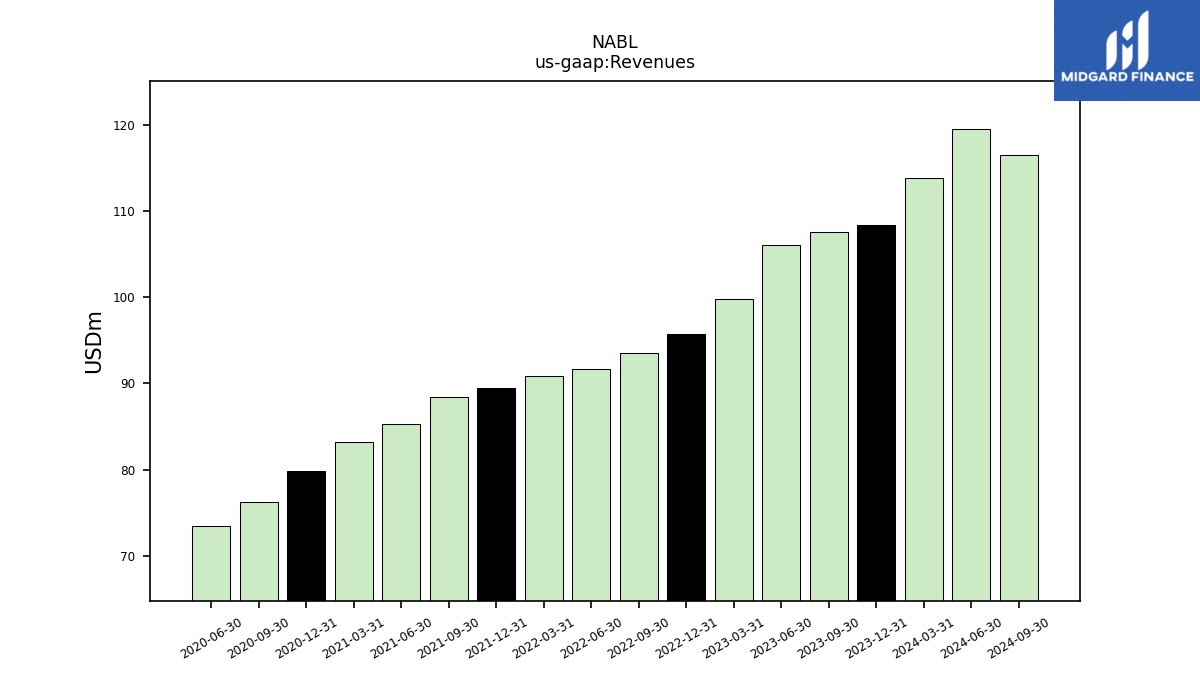
| Revenues | 108.42 | 107.57 | 106.08 | 99.82 | 95.75 | 93.53 | 91.63 | 90.86 | 89.50 | 88.42 | 85.34 | 83.19 | 79.88 | 76.30 | 73.42 | |
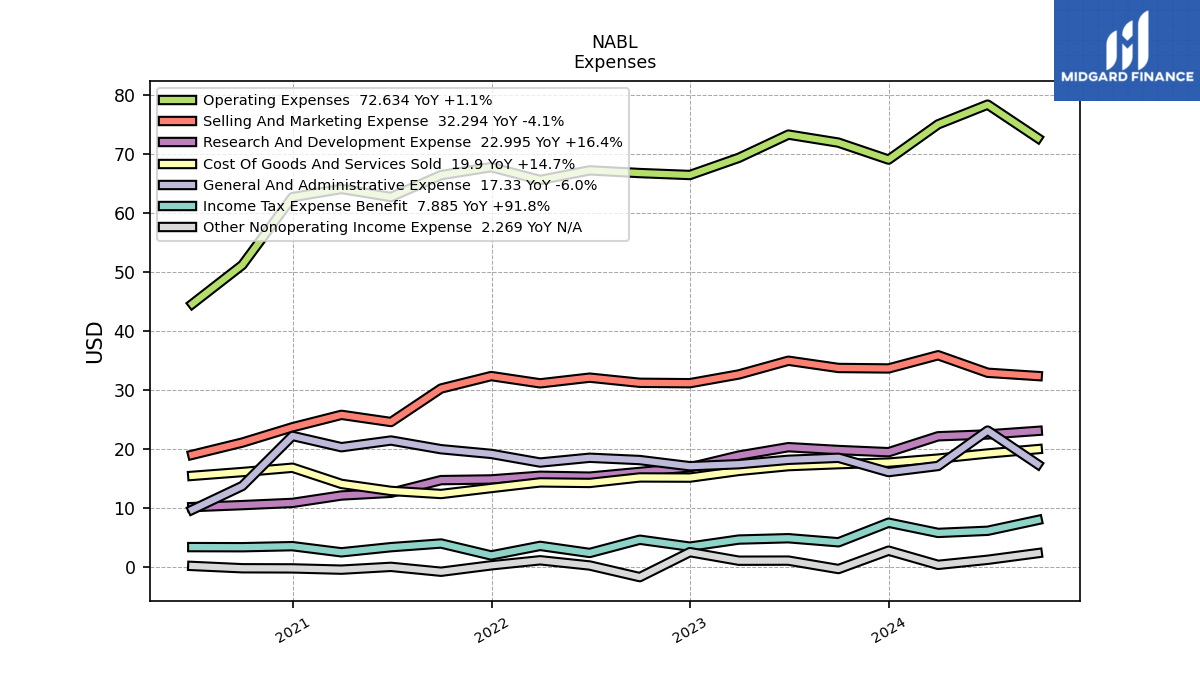
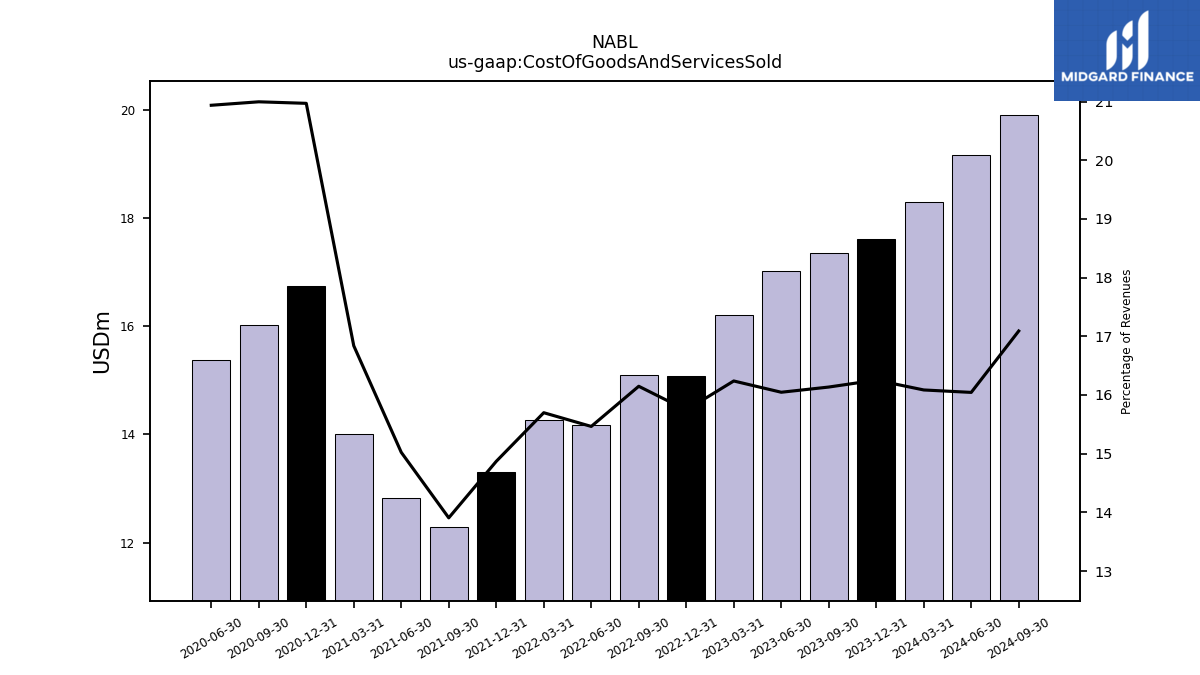
| Cost Of Goods And Services Sold | 17.62 | 17.36 | 17.02 | 16.21 | 15.07 | 15.10 | 14.17 | 14.26 | 13.31 | 12.30 | 12.82 | 14.01 | 16.75 | 16.02 | 15.37 | |
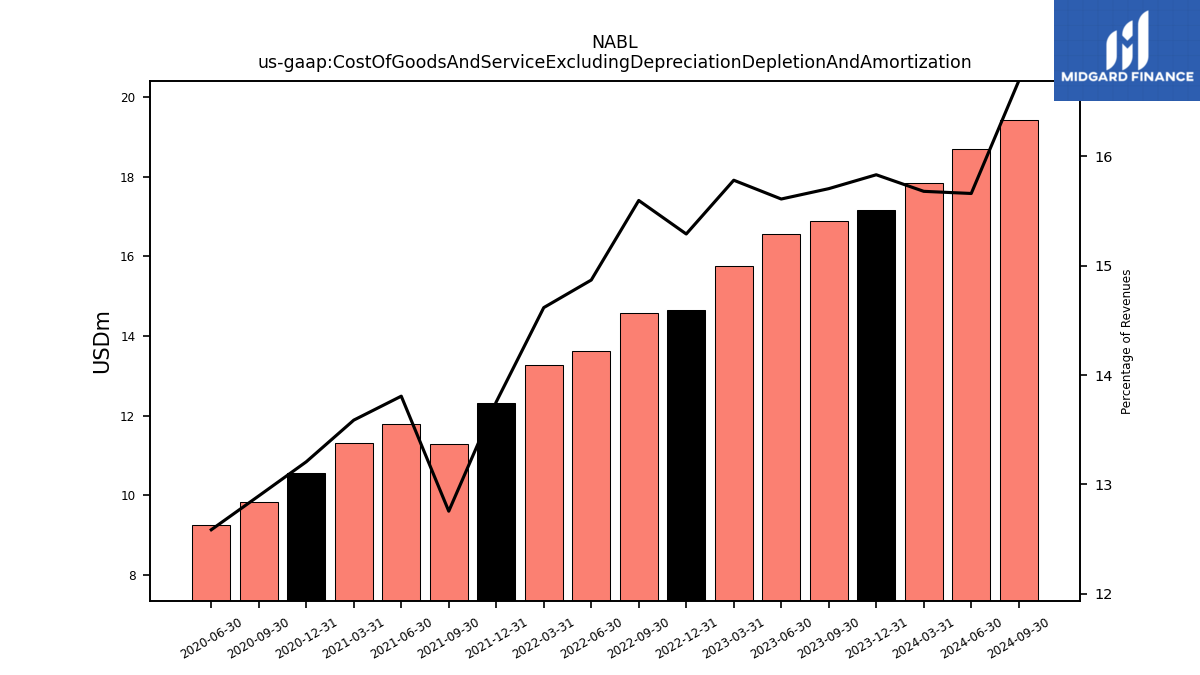
| Cost Of Goods And Service Excluding Depreciation Depletion And Amortization | 17.16 | 16.89 | 16.56 | 15.75 | 14.64 | 14.59 | 13.62 | 13.28 | 12.31 | 11.28 | 11.78 | 11.30 | 10.55 | 9.84 | 9.24 | |
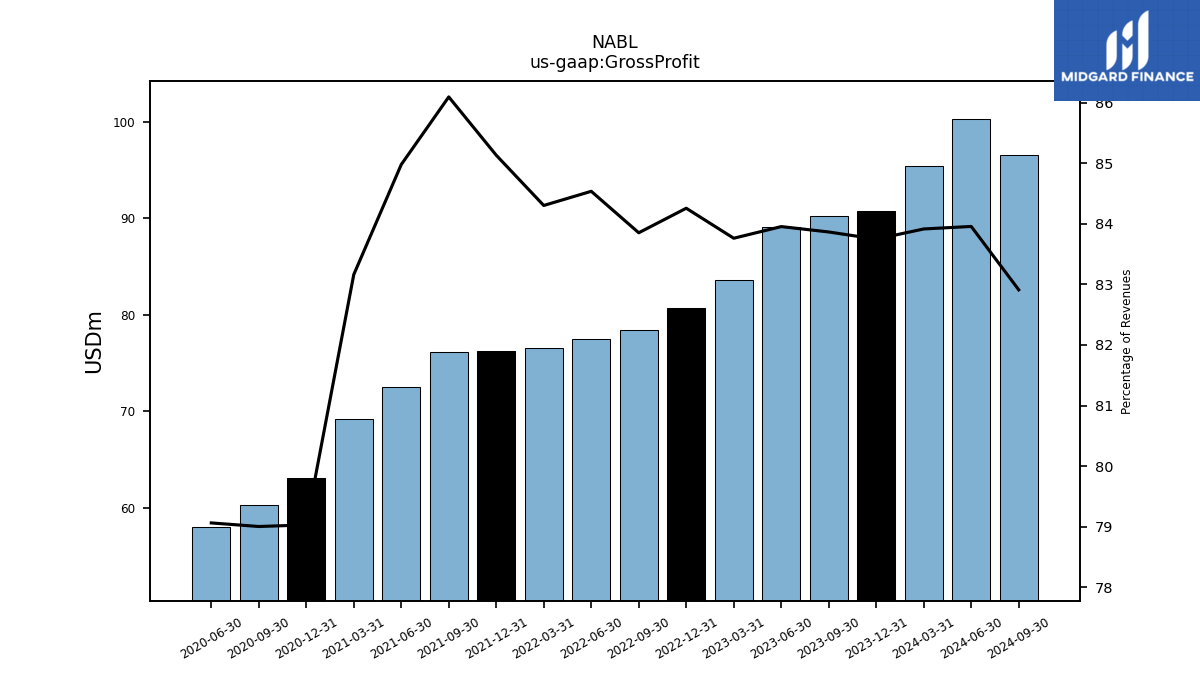
| Gross Profit | 90.79 | 90.21 | 89.06 | 83.61 | 80.68 | 78.42 | 77.46 | 76.60 | 76.19 | 76.13 | 72.52 | 69.18 | 63.13 | 60.28 | 58.05 | |
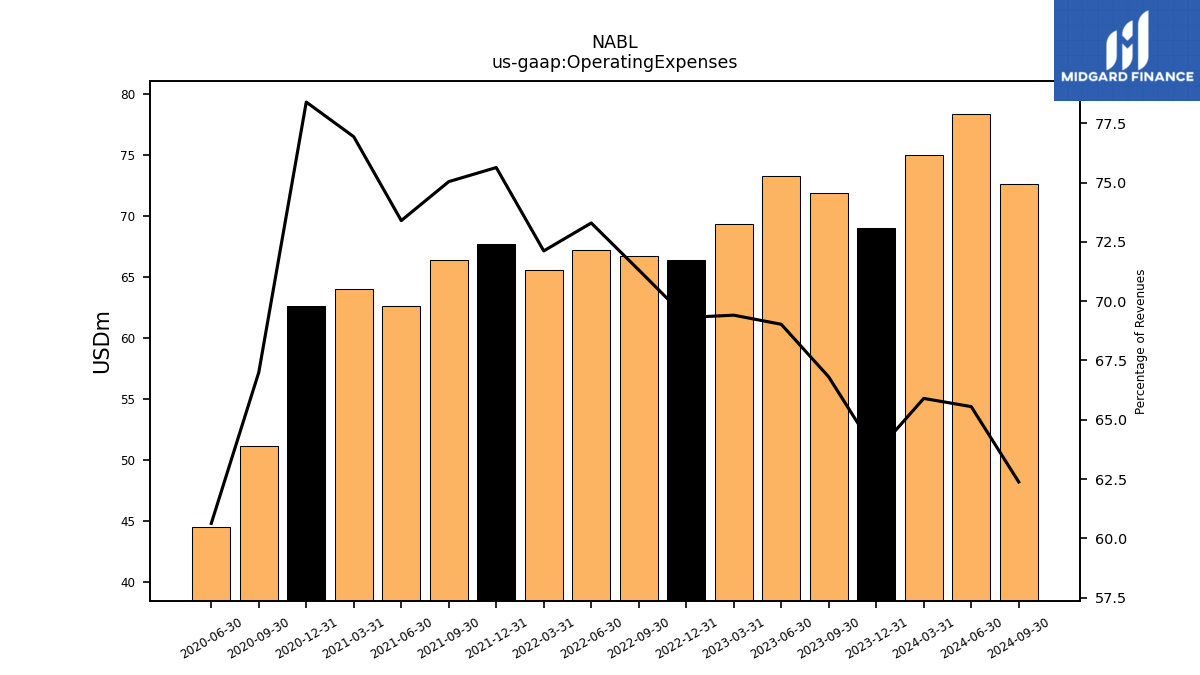
| Operating Expenses | 68.98 | 71.86 | 73.22 | 69.28 | 66.37 | 66.70 | 67.16 | 65.53 | 67.70 | 66.36 | 62.64 | 64.00 | 62.62 | 51.12 | 44.52 | |
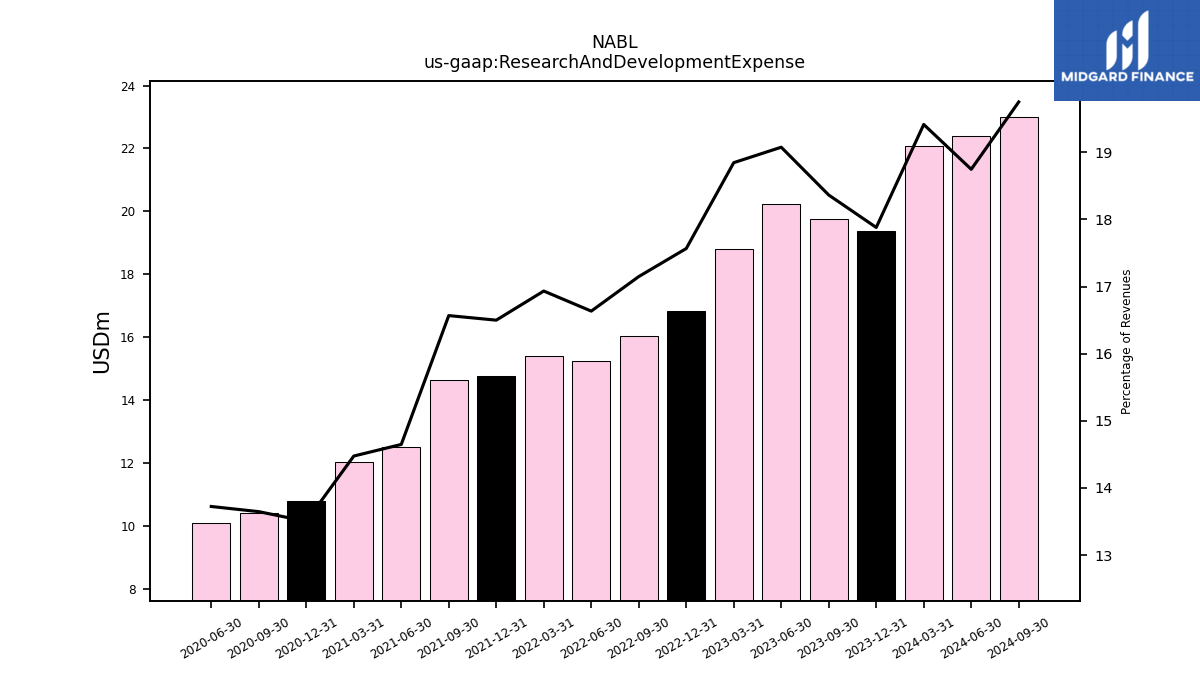
| Research And Development Expense | 19.38 | 19.75 | 20.23 | 18.81 | 16.82 | 16.04 | 15.24 | 15.38 | 14.77 | 14.65 | 12.50 | 12.04 | 10.79 | 10.41 | 10.08 | |
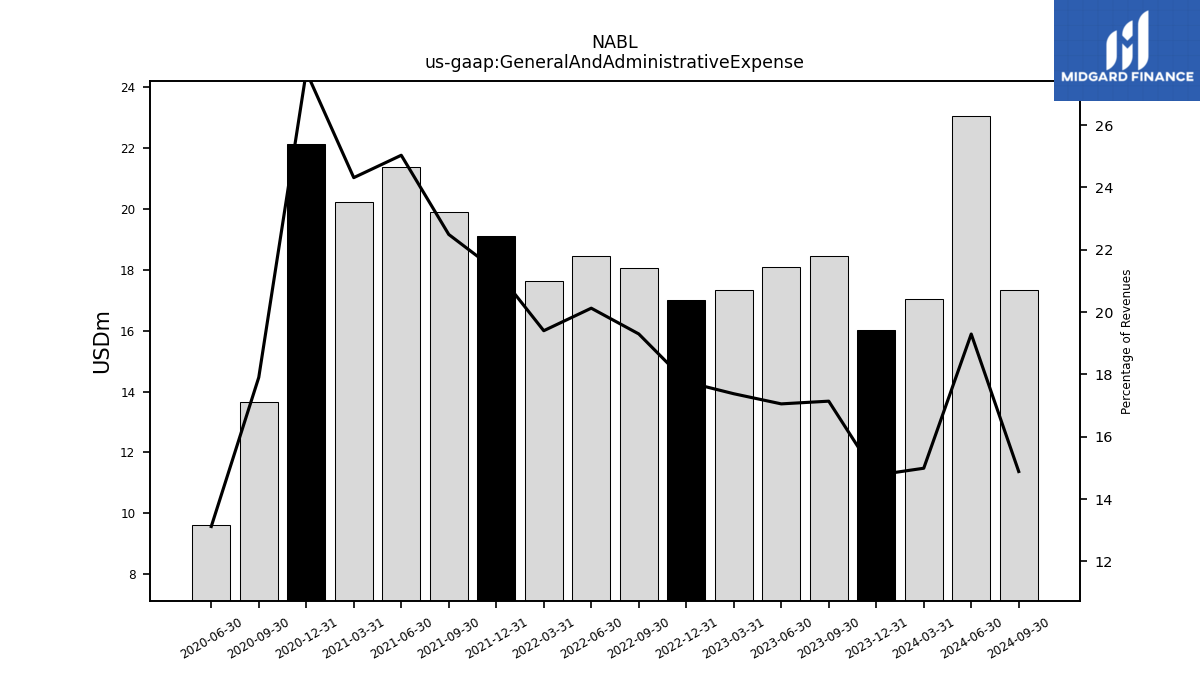
| General And Administrative Expense | 16.01 | 18.44 | 18.09 | 17.35 | 17.01 | 18.05 | 18.44 | 17.63 | 19.09 | 19.89 | 21.36 | 20.23 | 22.14 | 13.66 | 9.63 | |
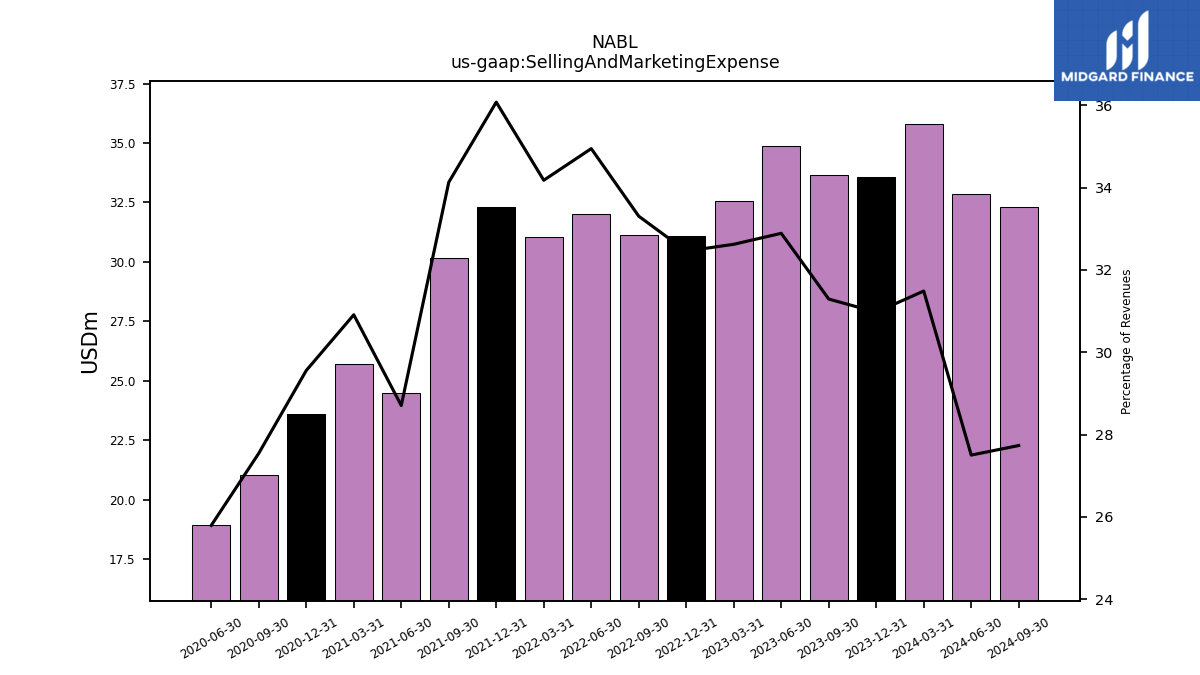
| Selling And Marketing Expense | 33.58 | 33.66 | 34.89 | 32.56 | 31.08 | 31.15 | 32.02 | 31.05 | 32.29 | 30.18 | 24.50 | 25.71 | 23.61 | 21.02 | 18.94 | |
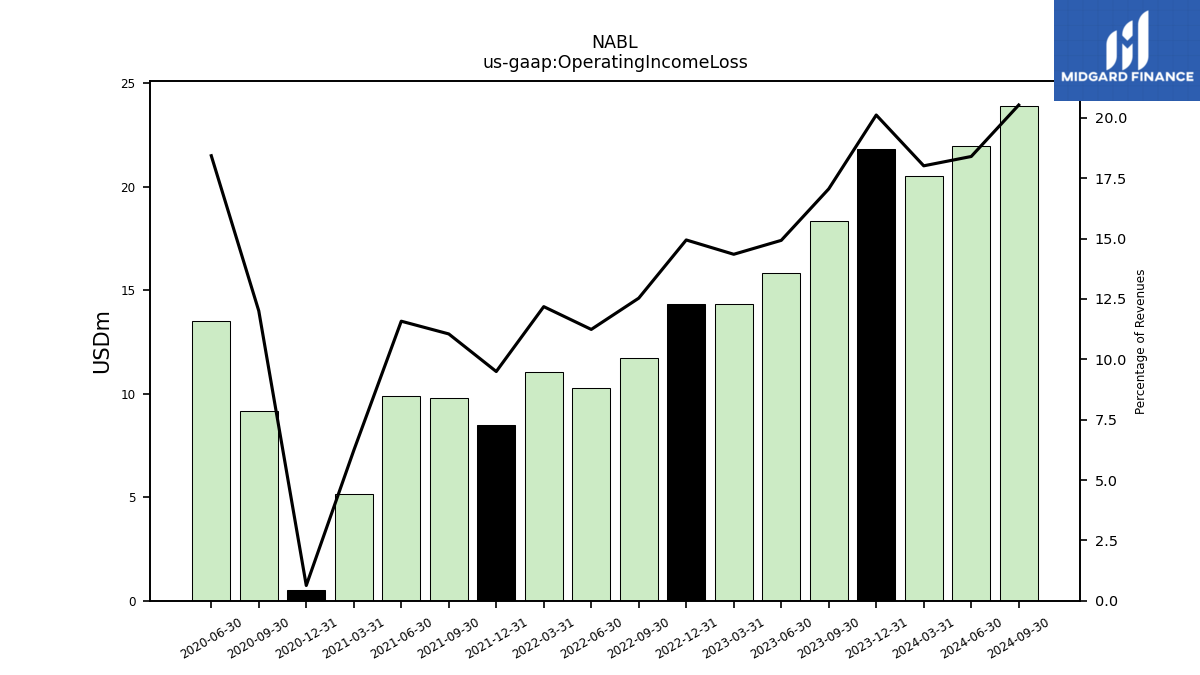
| Operating Income Loss | 21.81 | 18.35 | 15.83 | 14.32 | 14.31 | 11.72 | 10.30 | 11.07 | 8.50 | 9.77 | 9.88 | 5.18 | 0.51 | 9.16 | 13.53 | |
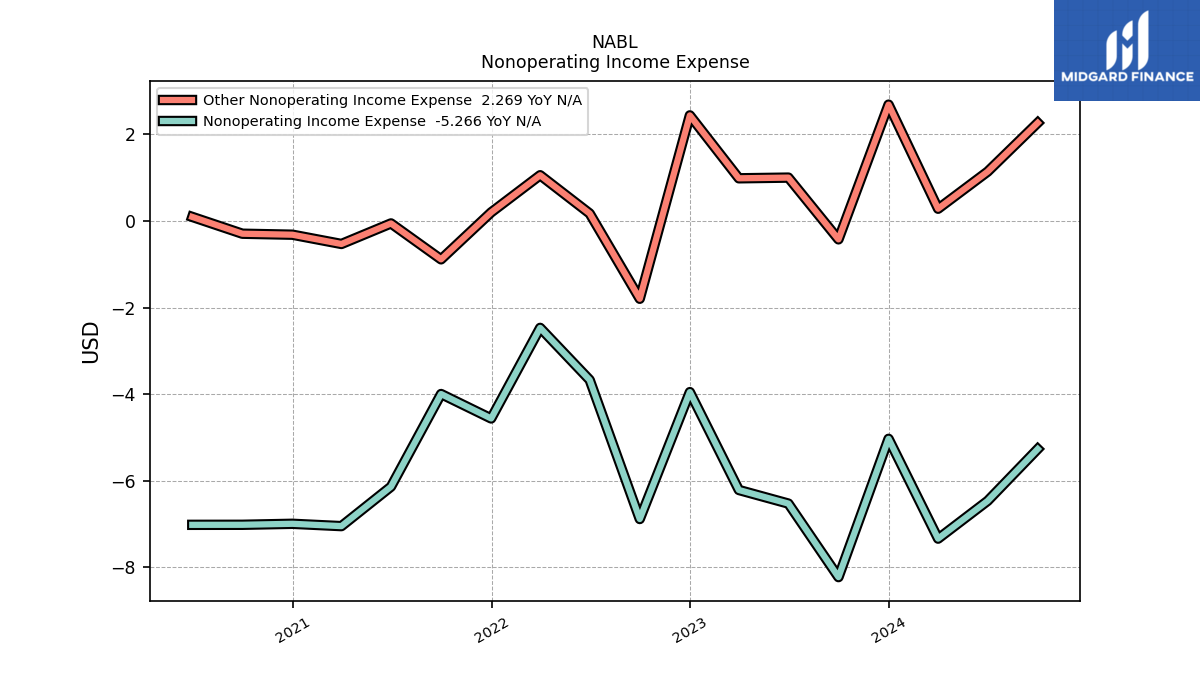
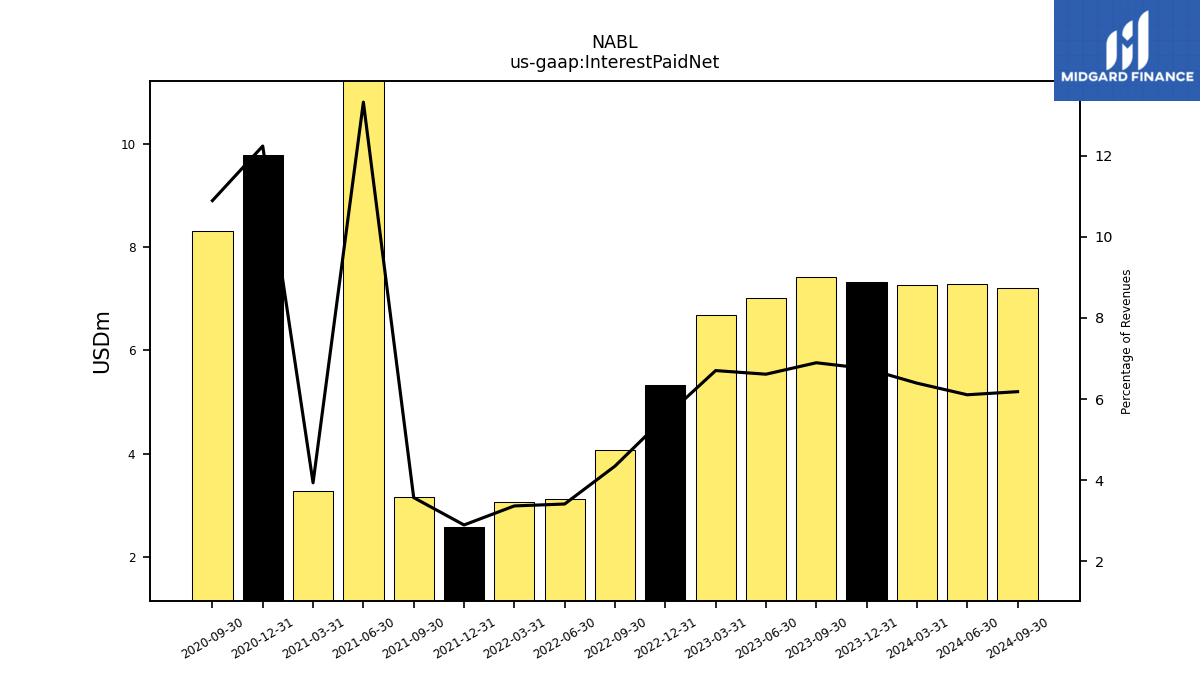
| Interest Paid Net | 7.32 | 7.42 | 7.01 | 6.69 | 5.32 | 4.07 | 3.13 | 3.06 | 2.59 | 3.16 | 11.37 | 3.27 | 9.78 | 8.31 | NA | |
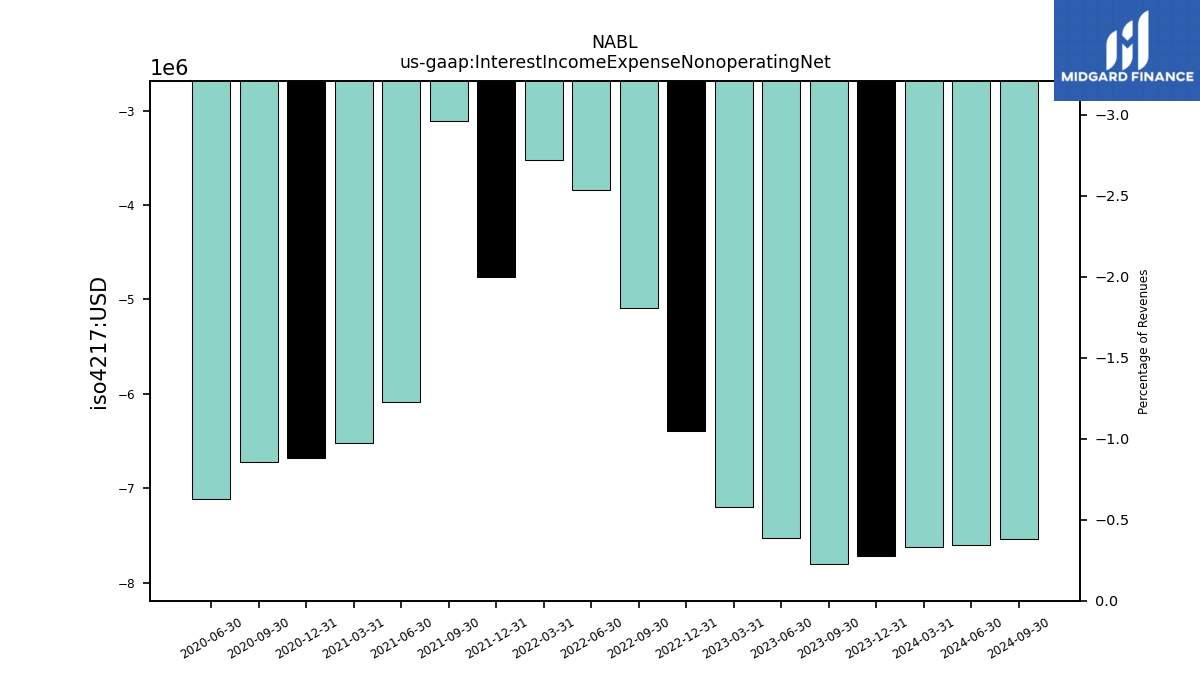
| Interest Income Expense Nonoperating Net | -7.72 | -7.80 | -7.53 | -7.20 | -6.39 | -5.09 | -3.85 | -3.53 | -4.76 | -3.11 | -6.08 | -6.52 | -6.68 | -6.72 | -7.11 | |
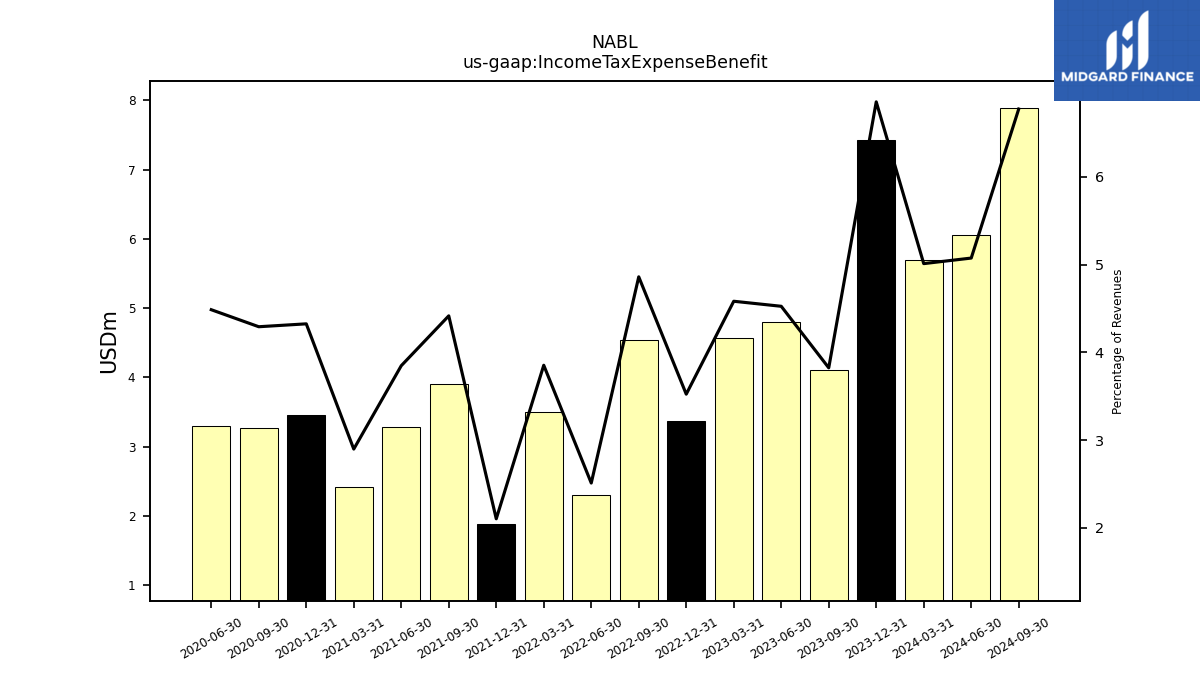
| Income Tax Expense Benefit | 7.43 | 4.11 | 4.80 | 4.57 | 3.37 | 4.54 | 2.30 | 3.50 | 1.88 | 3.90 | 3.28 | 2.41 | 3.45 | 3.27 | 3.29 | |
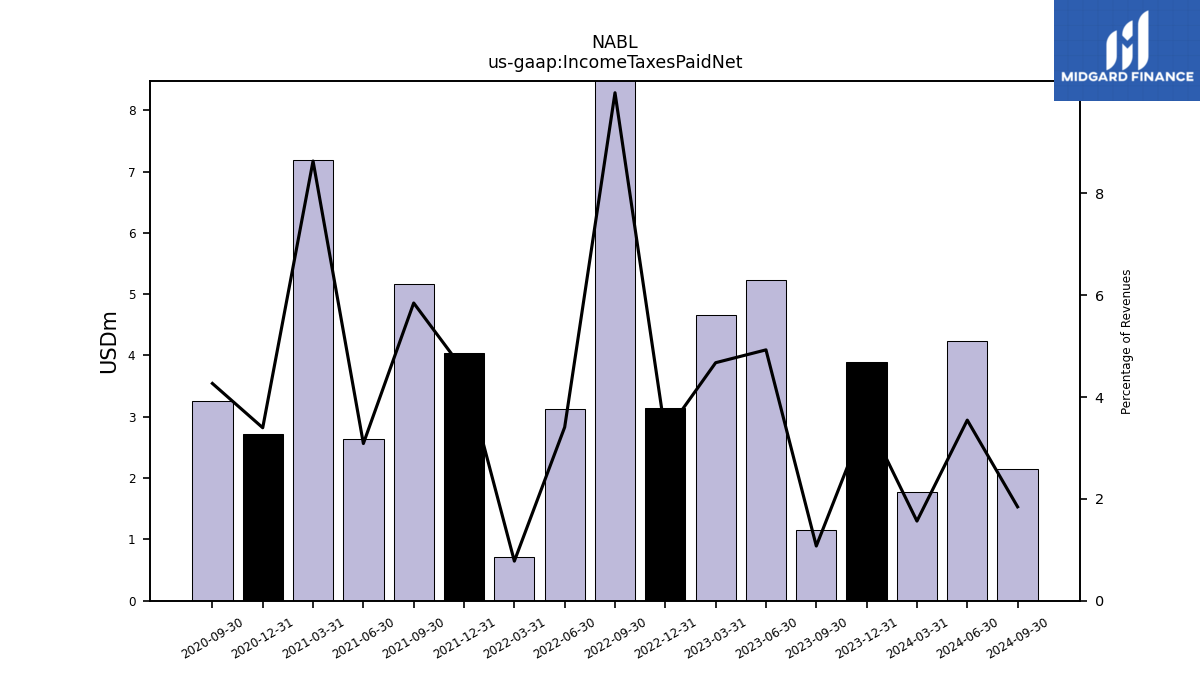
| Income Taxes Paid Net | 3.89 | 1.16 | 5.22 | 4.67 | 3.15 | 9.33 | 3.12 | 0.71 | 4.04 | 5.17 | 2.63 | 7.18 | 2.71 | 3.25 | NA | |
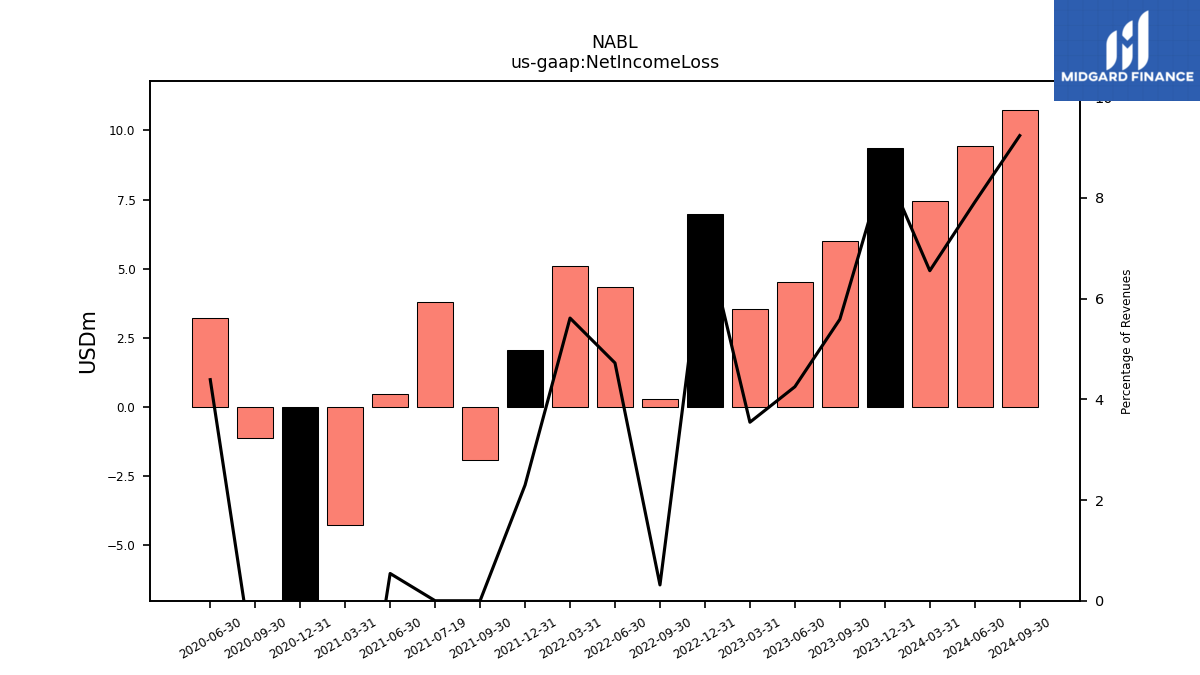
| Net Income Loss | 9.35 | 6.01 | 4.51 | 3.54 | 6.99 | 0.29 | 4.33 | 5.10 | 2.06 | -1.93 | 0.46 | -4.28 | -9.94 | -1.13 | 3.22 | |
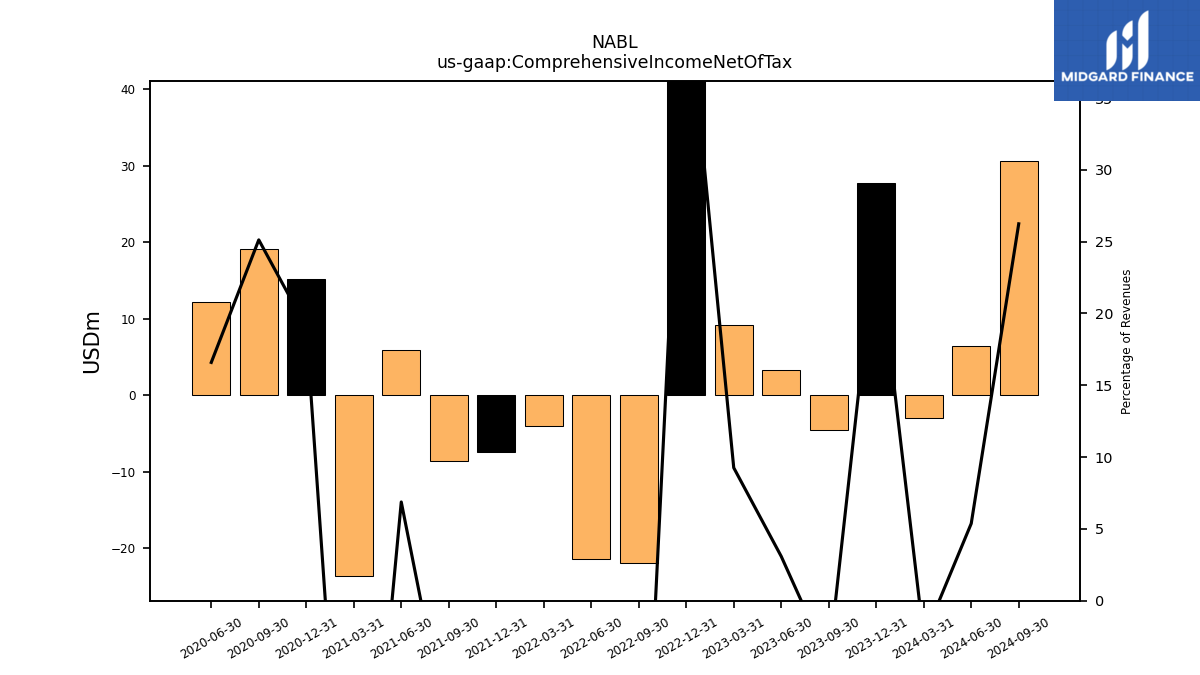
| Comprehensive Income Net Of Tax | 27.68 | -4.56 | 3.28 | 9.24 | 41.31 | -21.95 | -21.45 | -4.07 | -7.46 | -8.64 | 5.87 | -23.60 | 15.21 | 19.17 | 12.18 | |
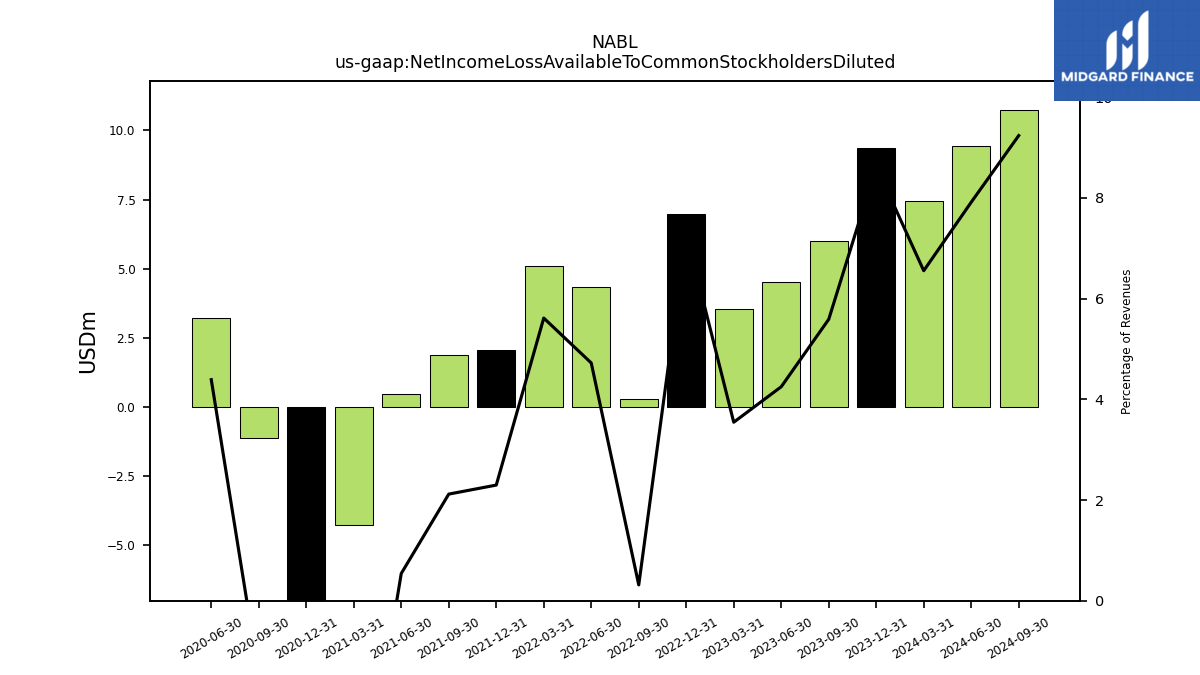
| Net Income Loss Available To Common Stockholders Diluted | 9.35 | 6.01 | 4.51 | 3.54 | 6.99 | 0.29 | 4.33 | 5.10 | 2.06 | 1.87 | 0.46 | -4.28 | -9.94 | -1.13 | 3.22 |
| 2023-12-31 | 2023-09-30 | 2023-06-30 | 2023-03-31 | 2022-12-31 | 2022-09-30 | 2022-06-30 | 2022-03-31 | 2021-12-31 | 2021-09-30 | 2021-06-30 | 2021-03-31 | 2020-12-31 | 2020-09-30 | 2020-06-30 | ||
|---|---|---|---|---|---|---|---|---|---|---|---|---|---|---|---|---|
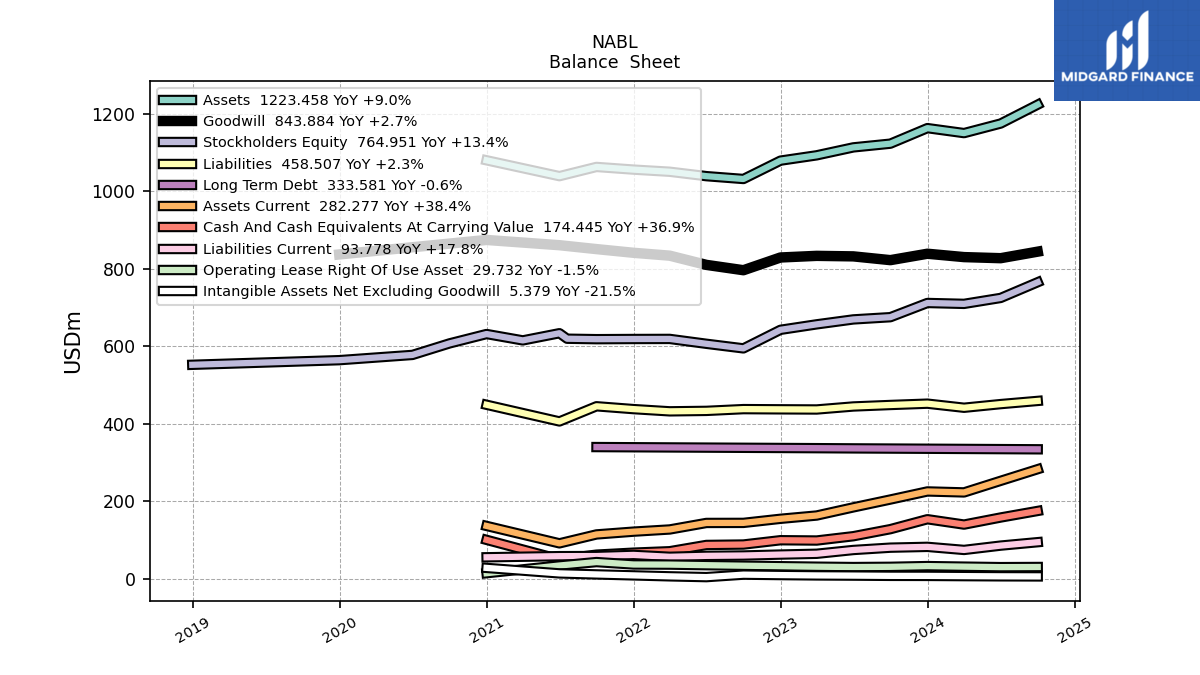
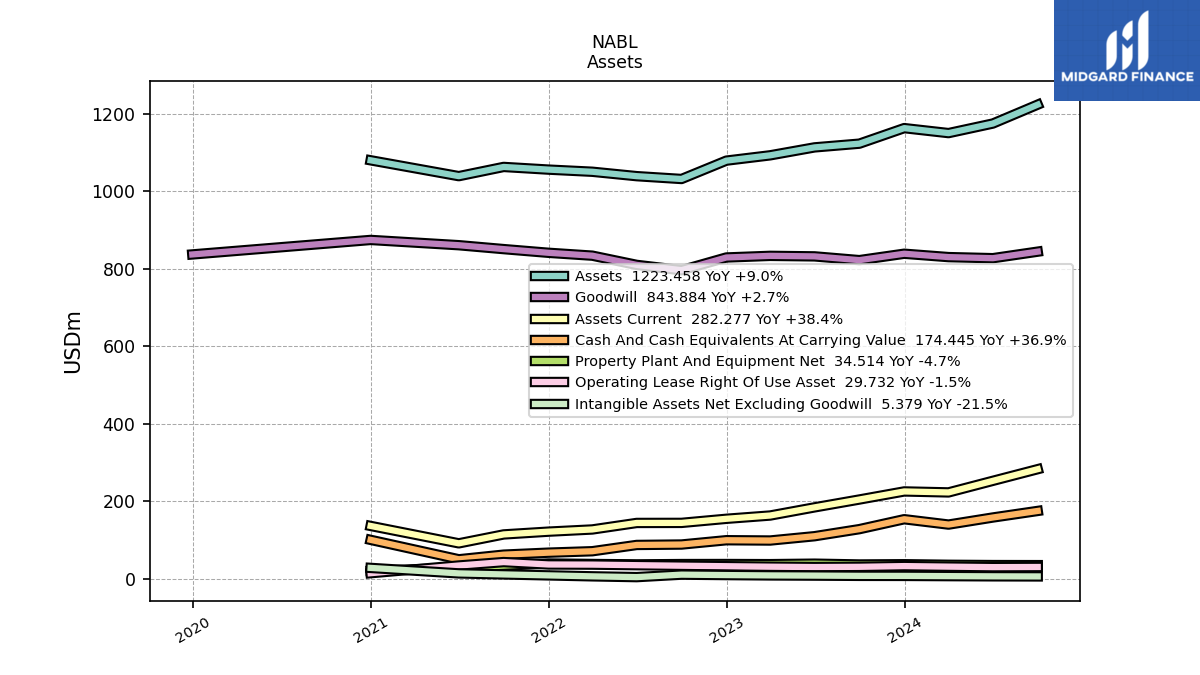
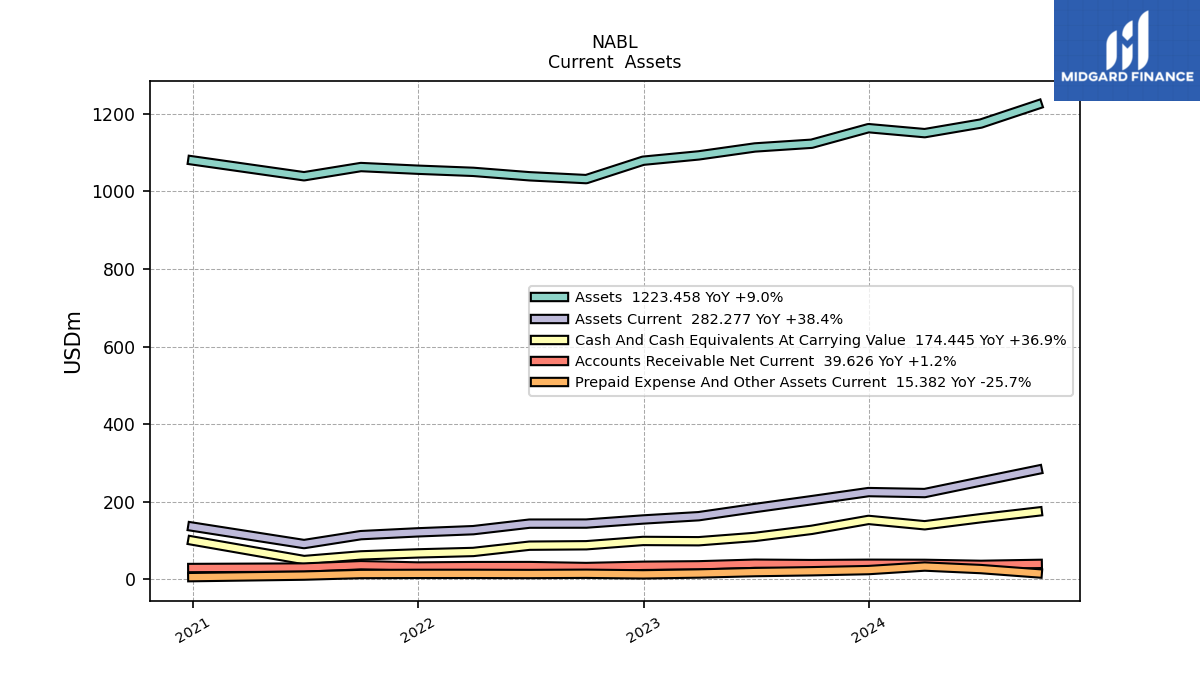
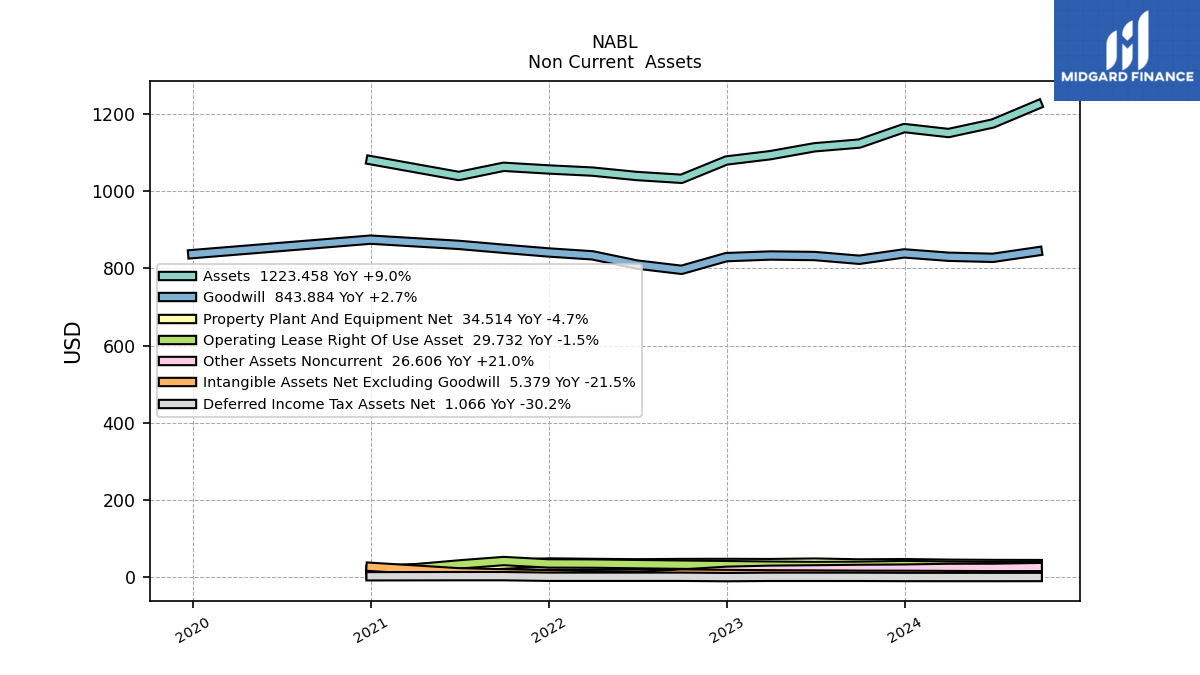
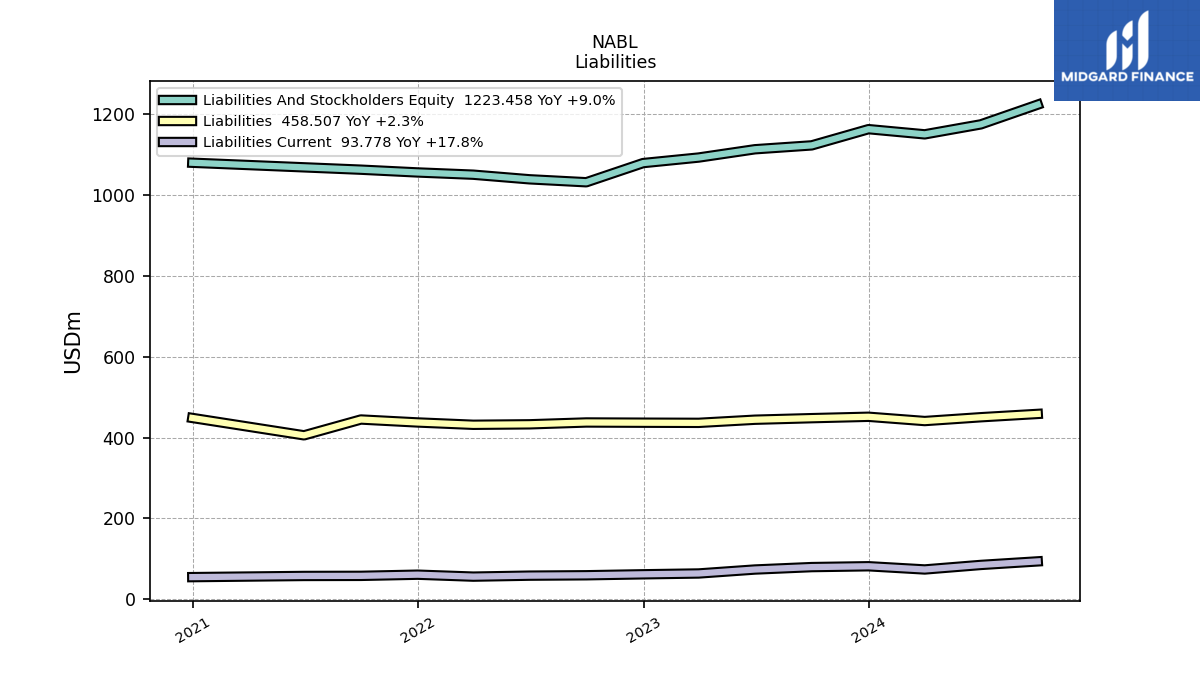
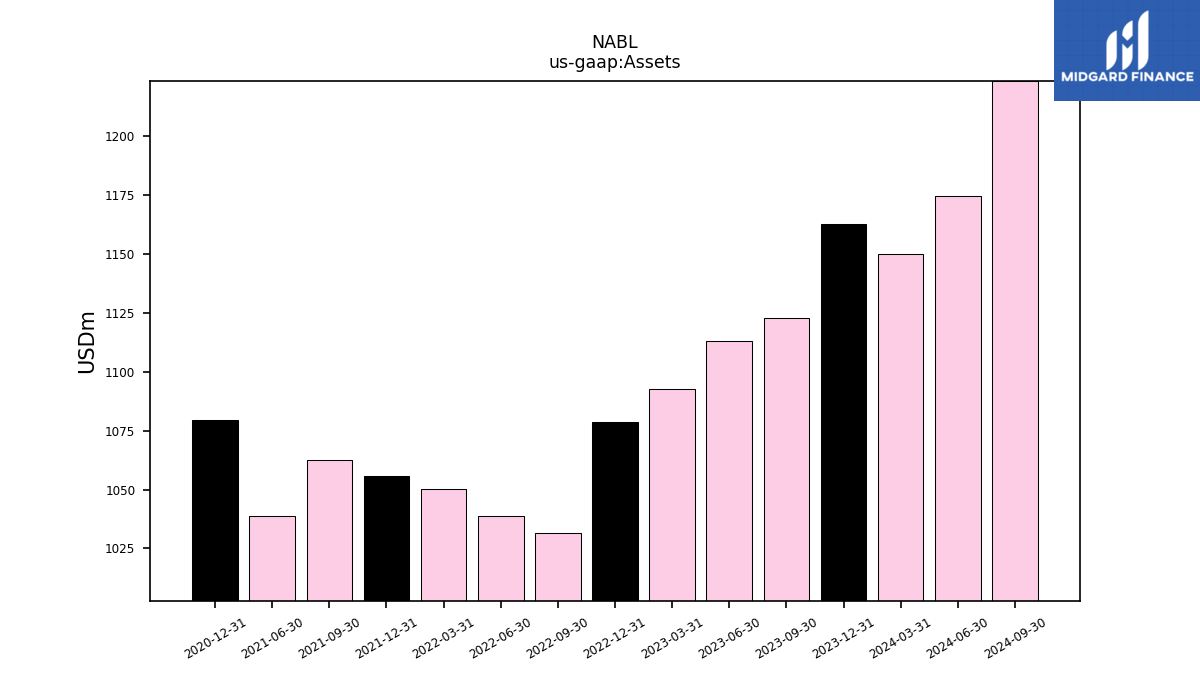
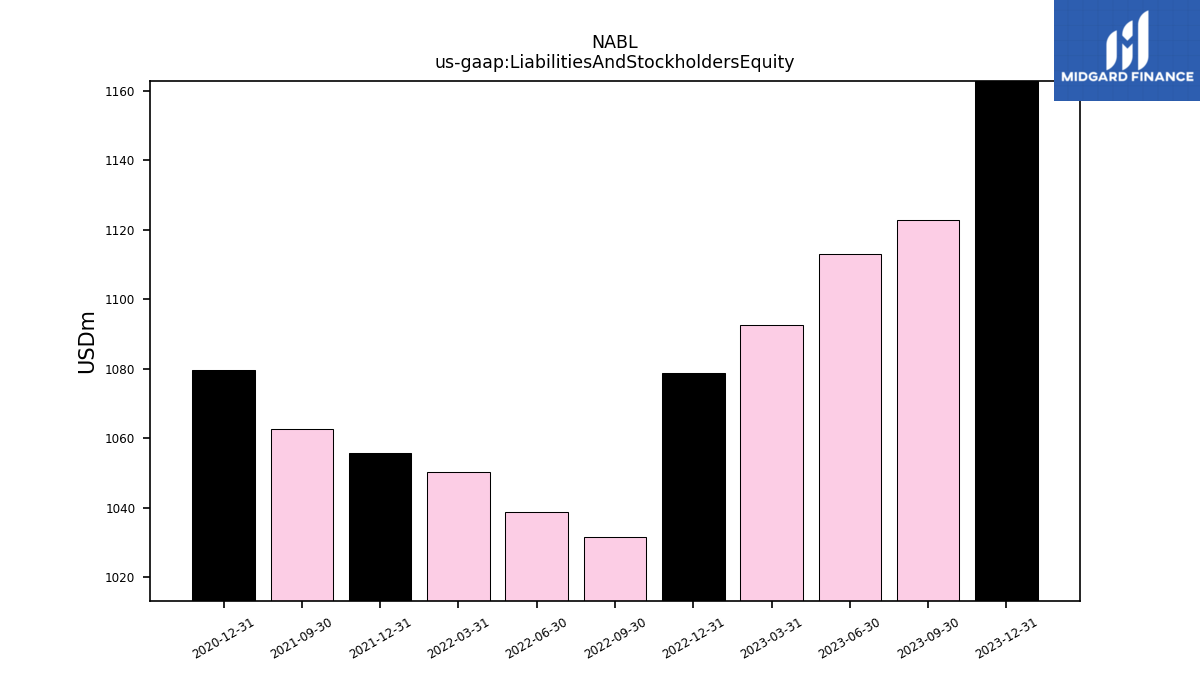
| Assets | 1162.79 | 1122.66 | 1113.04 | 1092.58 | 1078.86 | 1031.46 | 1038.77 | 1050.16 | 1055.70 | 1062.57 | 1038.79 | NA | 1079.73 | NA | NA | |
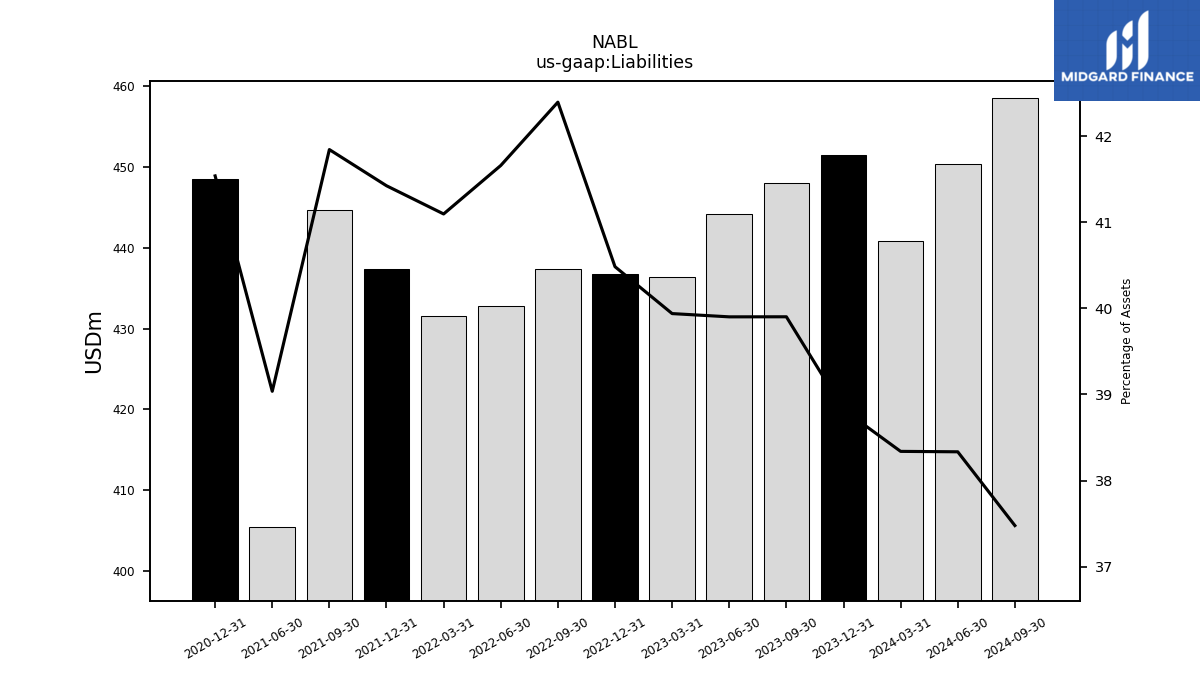
| Liabilities | 451.43 | 447.98 | 444.13 | 436.38 | 436.79 | 437.32 | 432.78 | 431.61 | 437.34 | 444.66 | 405.52 | NA | 448.54 | NA | NA | |
| Liabilities And Stockholders Equity | 1162.79 | 1122.66 | 1113.04 | 1092.58 | 1078.86 | 1031.46 | 1038.77 | 1050.16 | 1055.70 | 1062.57 | NA | NA | 1079.73 | NA | NA | |
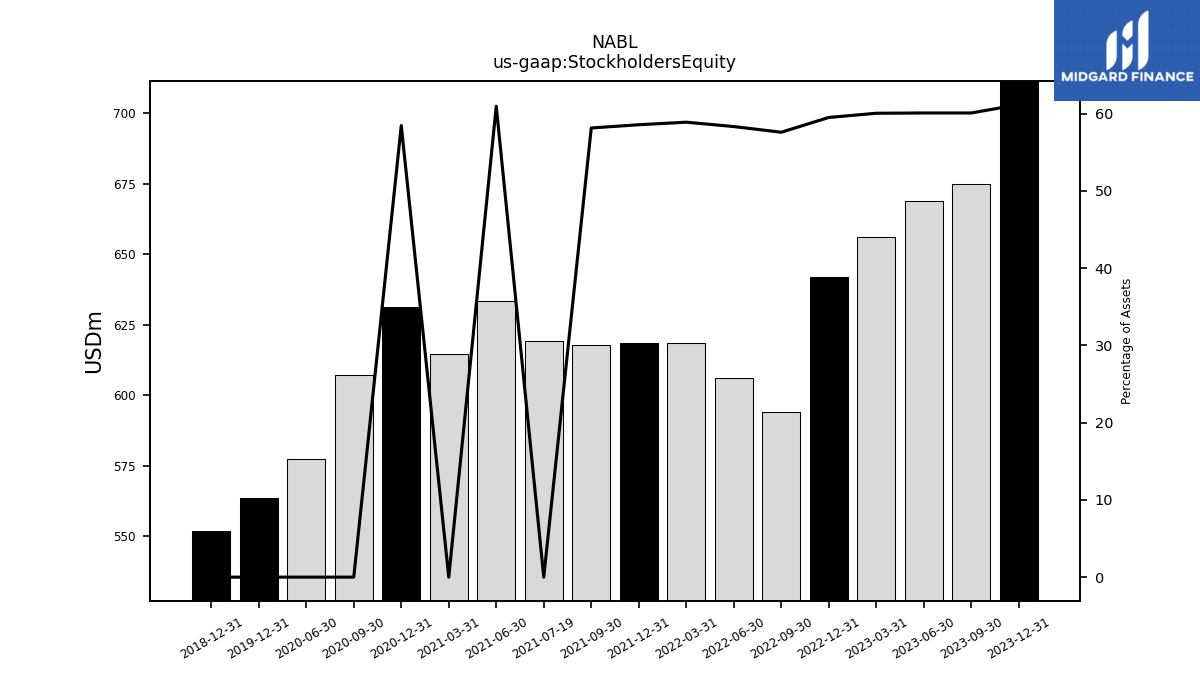
| Stockholders Equity | 711.36 | 674.68 | 668.91 | 656.20 | 642.07 | 594.13 | 605.99 | 618.55 | 618.36 | 617.91 | 633.27 | 614.73 | 631.20 | 607.00 | 577.25 |
| 2023-12-31 | 2023-09-30 | 2023-06-30 | 2023-03-31 | 2022-12-31 | 2022-09-30 | 2022-06-30 | 2022-03-31 | 2021-12-31 | 2021-09-30 | 2021-06-30 | 2021-03-31 | 2020-12-31 | 2020-09-30 | 2020-06-30 | ||
|---|---|---|---|---|---|---|---|---|---|---|---|---|---|---|---|---|
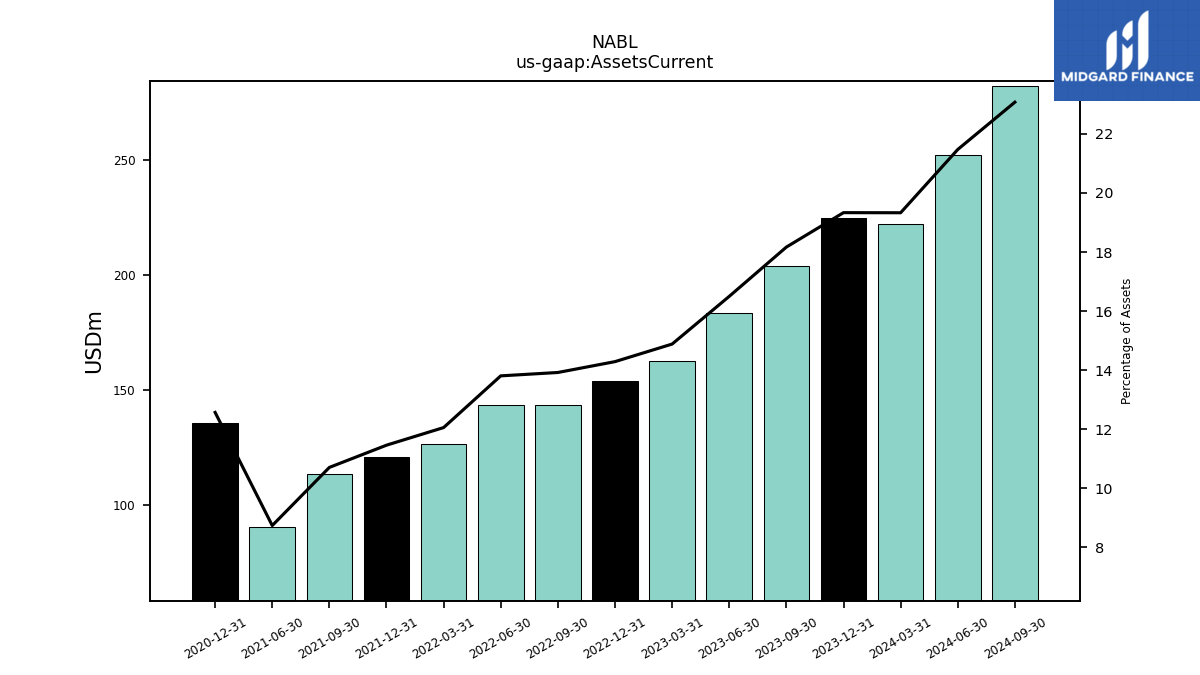
| Assets Current | 224.79 | 203.95 | 183.64 | 162.62 | 154.16 | 143.59 | 143.43 | 126.62 | 120.99 | 113.78 | 90.79 | NA | 135.72 | NA | NA | |
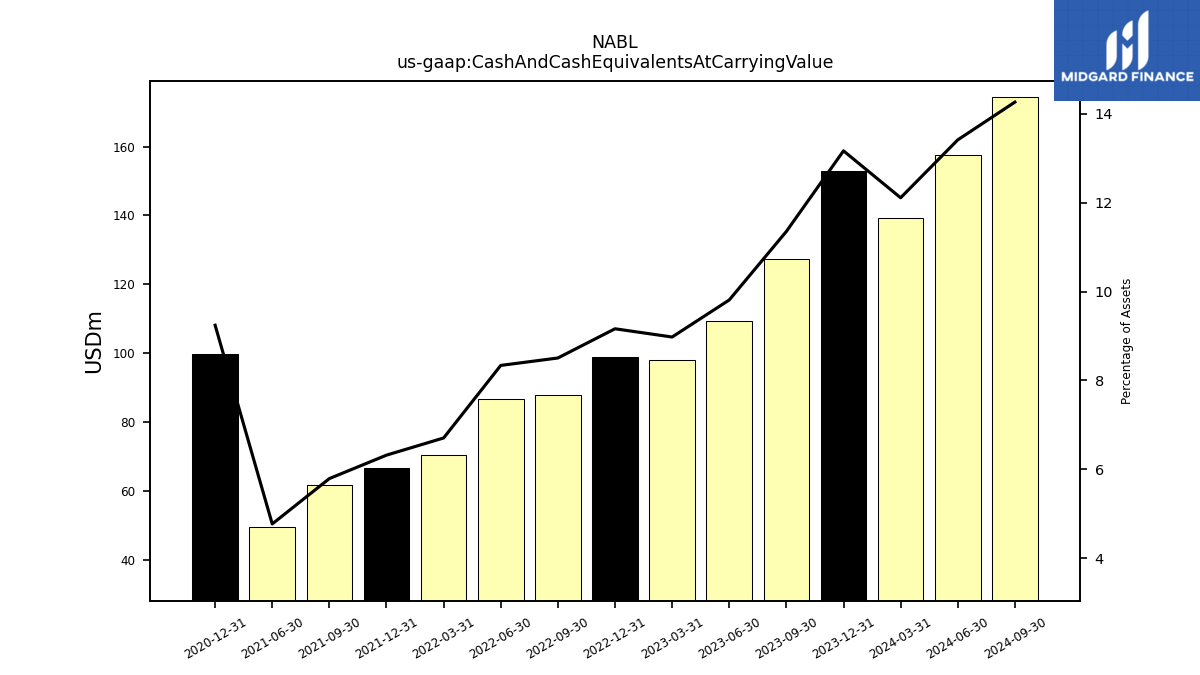
| Cash And Cash Equivalents At Carrying Value | 153.05 | 127.43 | 109.19 | 98.08 | 98.85 | 87.73 | 86.62 | 70.44 | 66.74 | 61.57 | 49.60 | NA | 99.79 | NA | NA | |
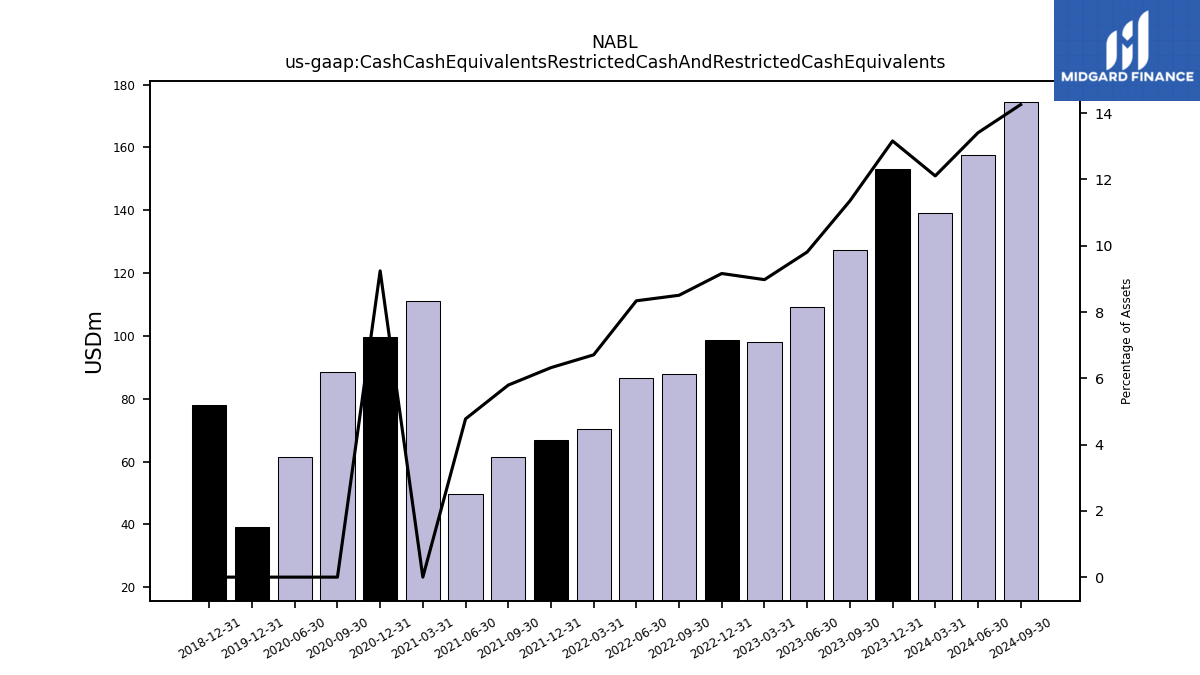
| Cash Cash Equivalents Restricted Cash And Restricted Cash Equivalents | 153.05 | 127.43 | 109.19 | 98.08 | 98.85 | 87.73 | 86.62 | 70.44 | 66.74 | 61.57 | 49.60 | 111.22 | 99.79 | 88.37 | 61.61 | |
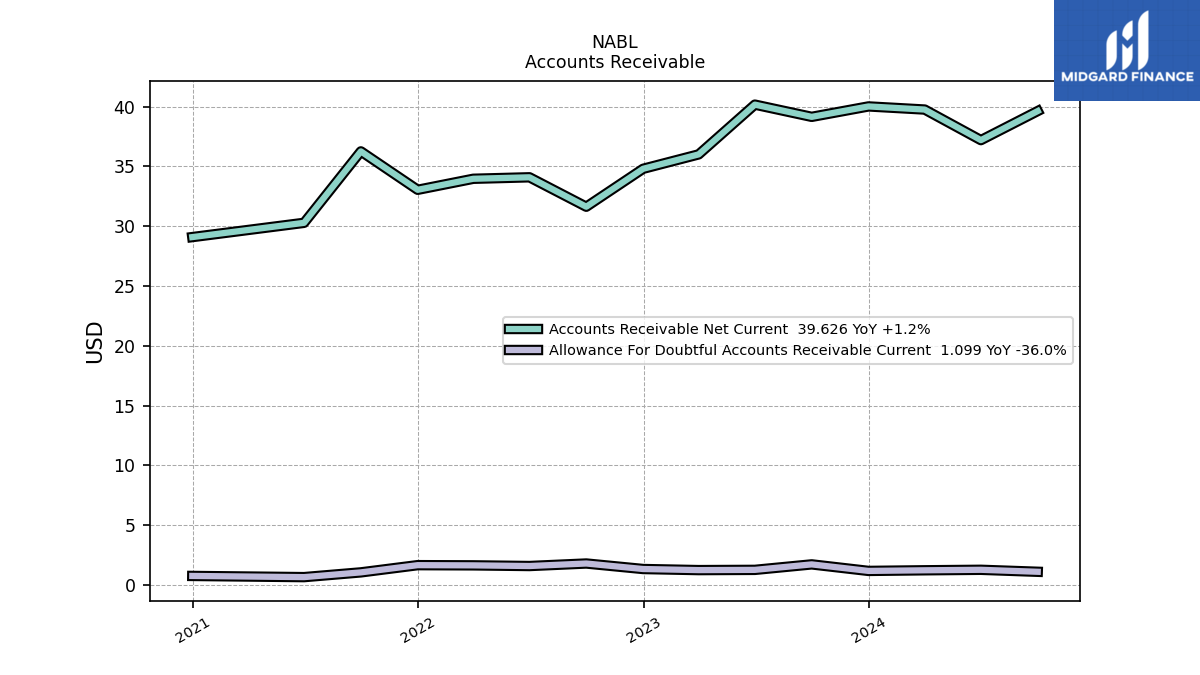
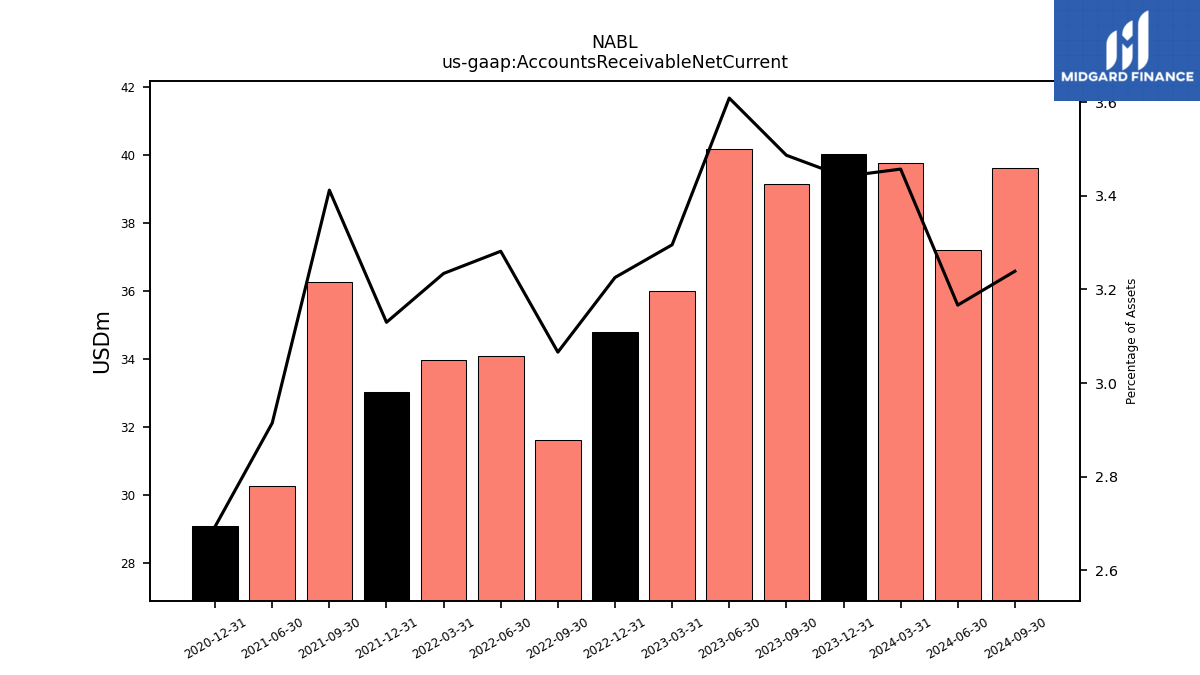
| Accounts Receivable Net Current | 40.01 | 39.14 | 40.16 | 36.00 | 34.80 | 31.62 | 34.09 | 33.96 | 33.04 | 36.25 | 30.28 | NA | 29.09 | NA | NA | |
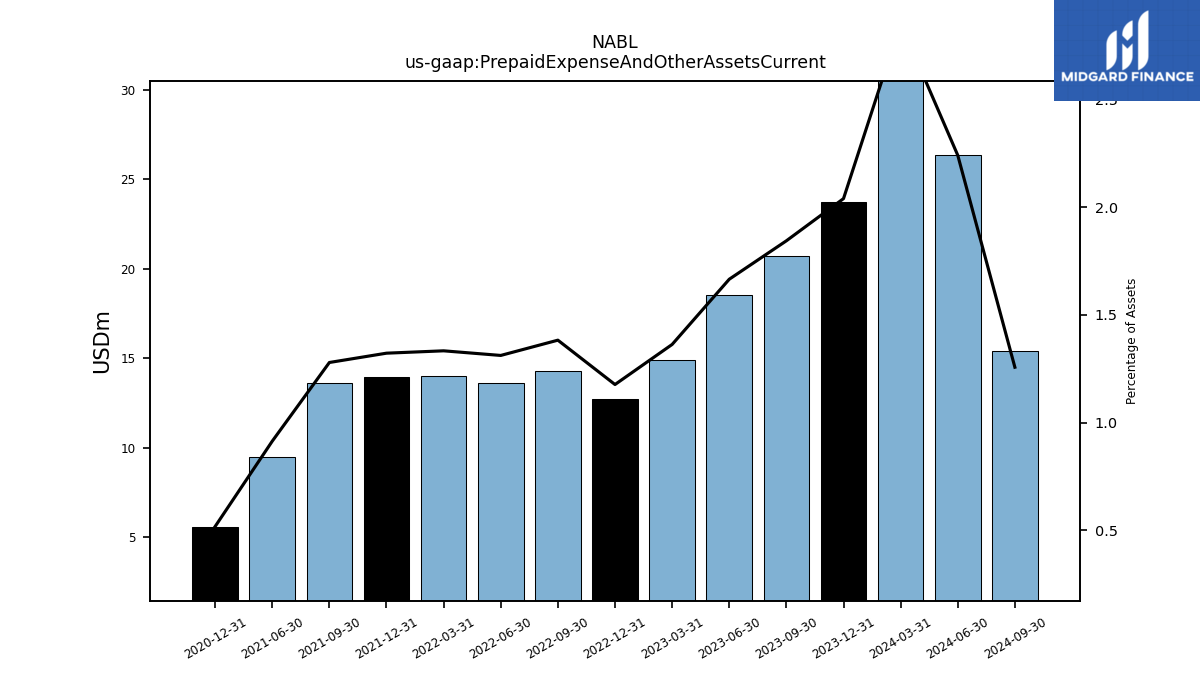
| Prepaid Expense And Other Assets Current | 23.73 | 20.71 | 18.55 | 14.89 | 12.70 | 14.27 | 13.63 | 14.00 | 13.96 | 13.59 | 9.49 | NA | 5.58 | NA | NA |
| 2023-12-31 | 2023-09-30 | 2023-06-30 | 2023-03-31 | 2022-12-31 | 2022-09-30 | 2022-06-30 | 2022-03-31 | 2021-12-31 | 2021-09-30 | 2021-06-30 | 2021-03-31 | 2020-12-31 | 2020-09-30 | 2020-06-30 | ||
|---|---|---|---|---|---|---|---|---|---|---|---|---|---|---|---|---|
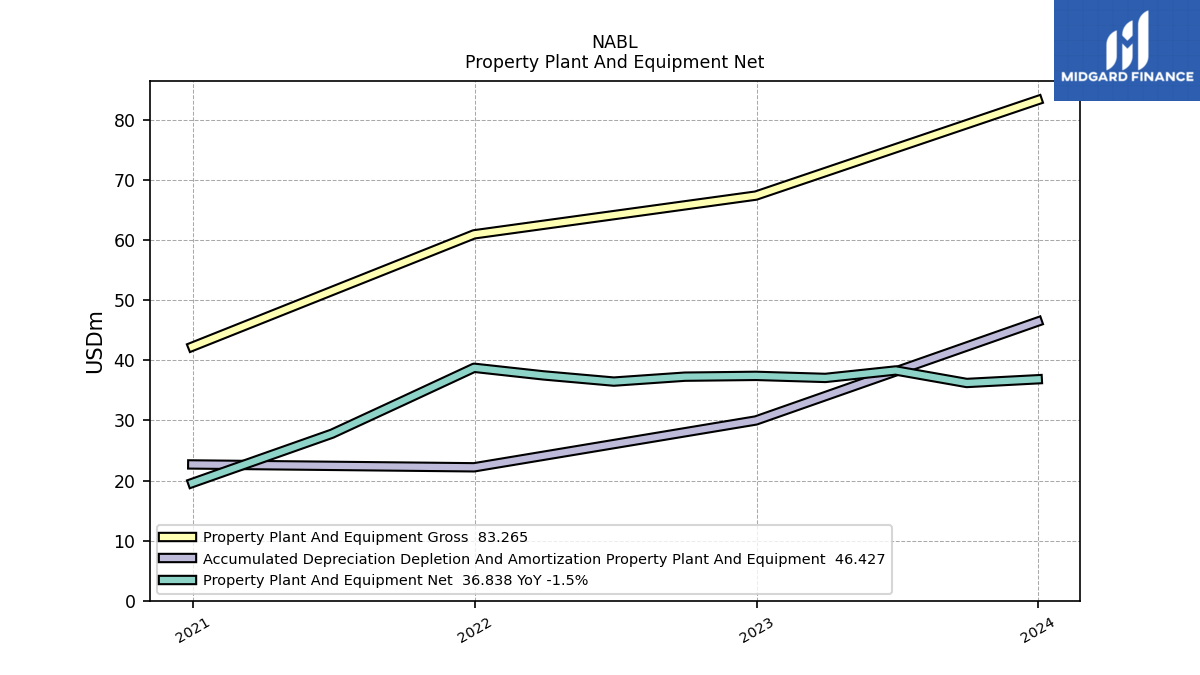
| Property Plant And Equipment Gross | 83.27 | NA | NA | NA | 67.39 | NA | NA | NA | 60.94 | NA | NA | NA | 42.26 | NA | NA | |
| Accumulated Depreciation Depletion And Amortization Property Plant And Equipment | 46.43 | NA | NA | NA | 29.99 | NA | NA | NA | 22.20 | NA | NA | NA | 22.67 | NA | NA | |
| Property Plant And Equipment Net | 36.84 | 36.22 | 38.30 | 37.06 | 37.40 | 37.27 | 36.45 | 37.48 | 38.75 | 33.25 | 27.79 | NA | 19.59 | NA | NA | |
| Goodwill | 838.50 | 821.95 | 831.67 | 833.01 | 828.79 | 795.94 | 809.71 | 833.49 | 840.92 | 850.45 | 860.50 | NA | 874.08 | NA | NA | |
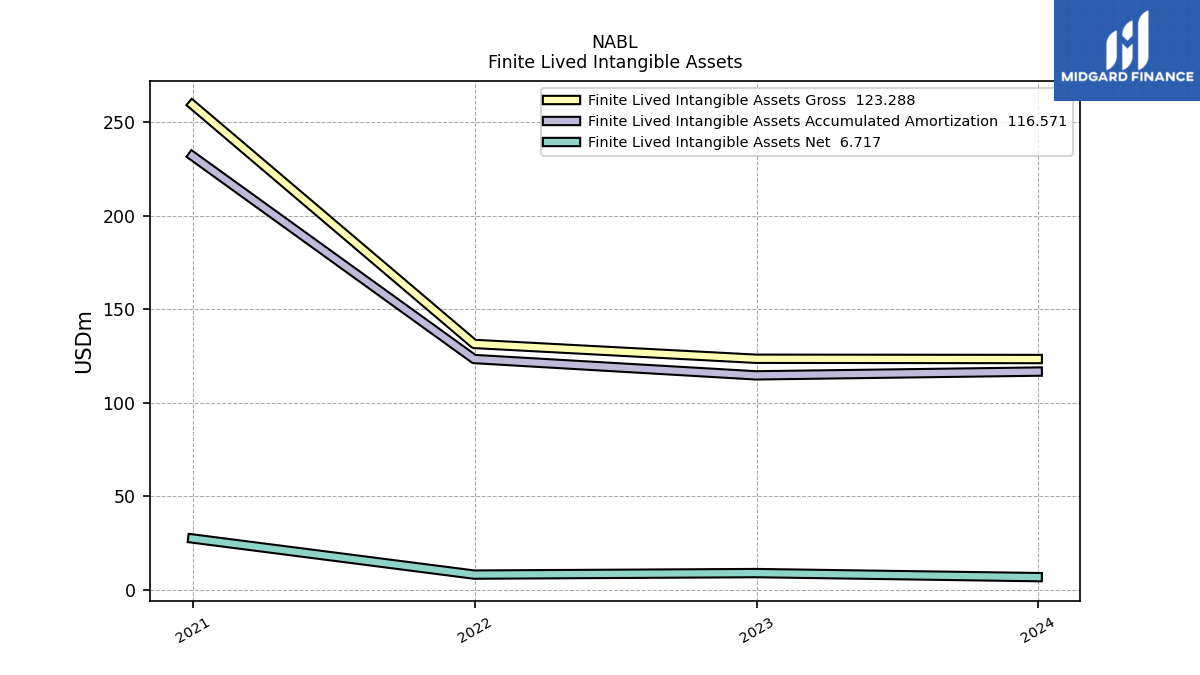
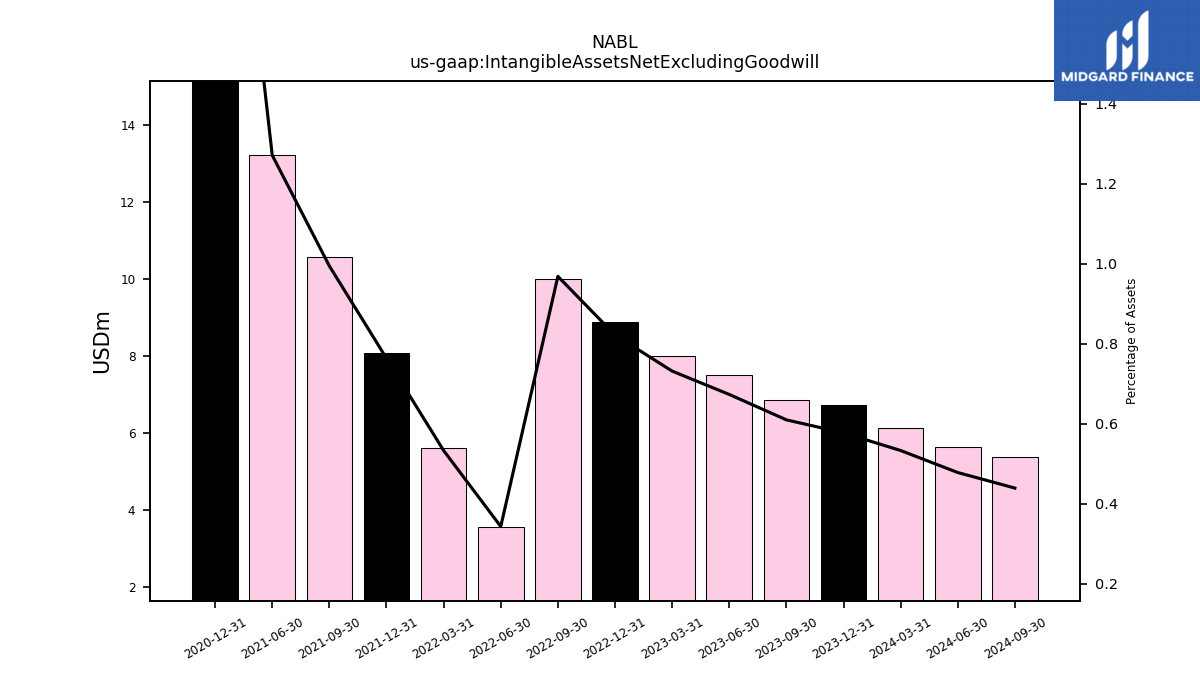
| Intangible Assets Net Excluding Goodwill | 6.72 | 6.85 | 7.50 | 8.00 | 8.87 | 9.99 | 3.57 | 5.60 | 8.07 | 10.57 | 13.21 | NA | 27.37 | NA | NA | |
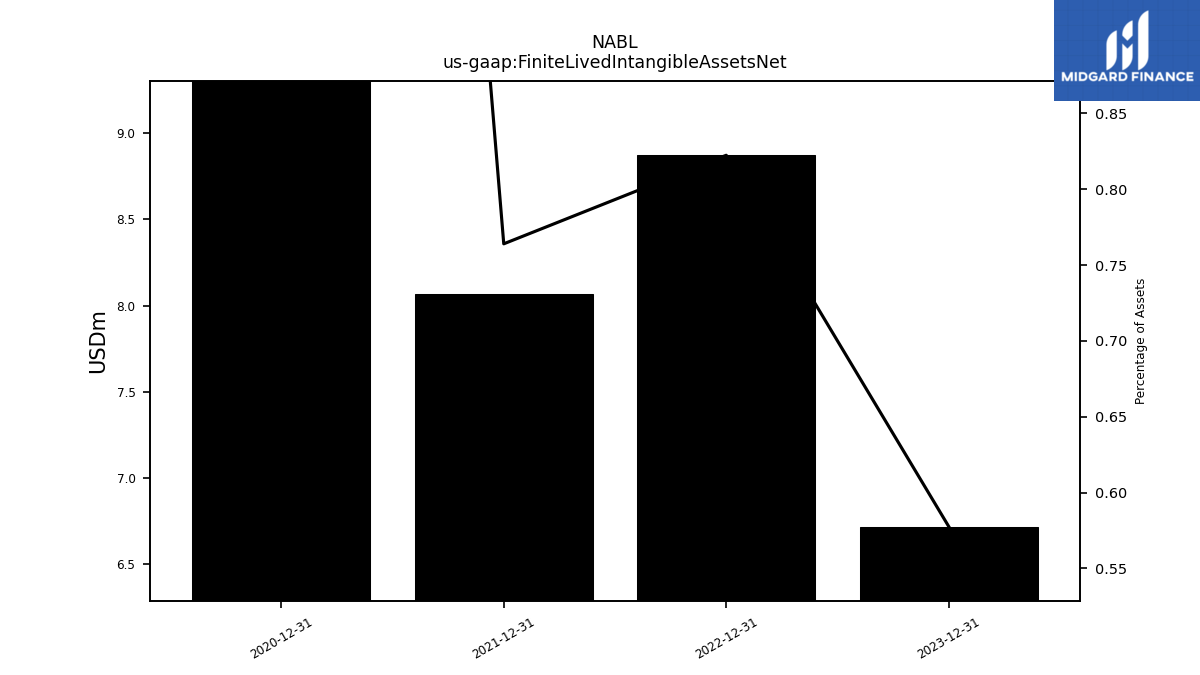
| Finite Lived Intangible Assets Net | 6.72 | NA | NA | NA | 8.87 | NA | NA | NA | 8.07 | NA | NA | NA | 27.37 | NA | NA | |
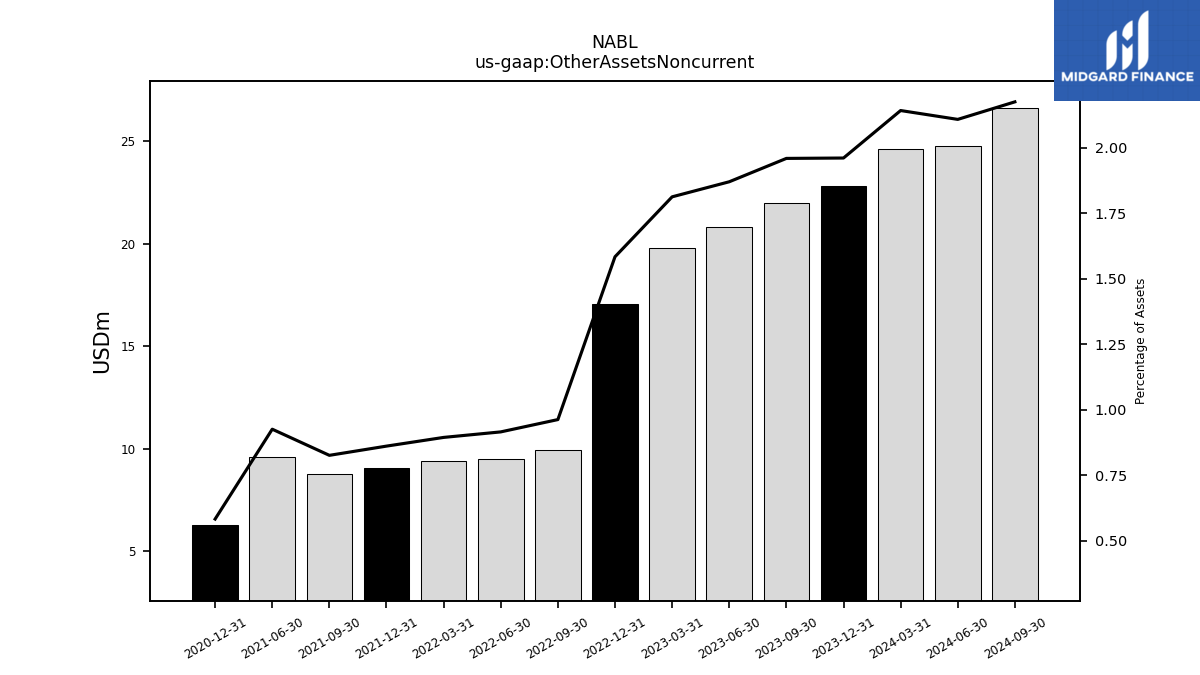
| Other Assets Noncurrent | 22.79 | 21.99 | 20.81 | 19.80 | 17.08 | 9.92 | 9.50 | 9.39 | 9.09 | 8.77 | 9.61 | NA | 6.29 | NA | NA |
| 2023-12-31 | 2023-09-30 | 2023-06-30 | 2023-03-31 | 2022-12-31 | 2022-09-30 | 2022-06-30 | 2022-03-31 | 2021-12-31 | 2021-09-30 | 2021-06-30 | 2021-03-31 | 2020-12-31 | 2020-09-30 | 2020-06-30 | ||
|---|---|---|---|---|---|---|---|---|---|---|---|---|---|---|---|---|
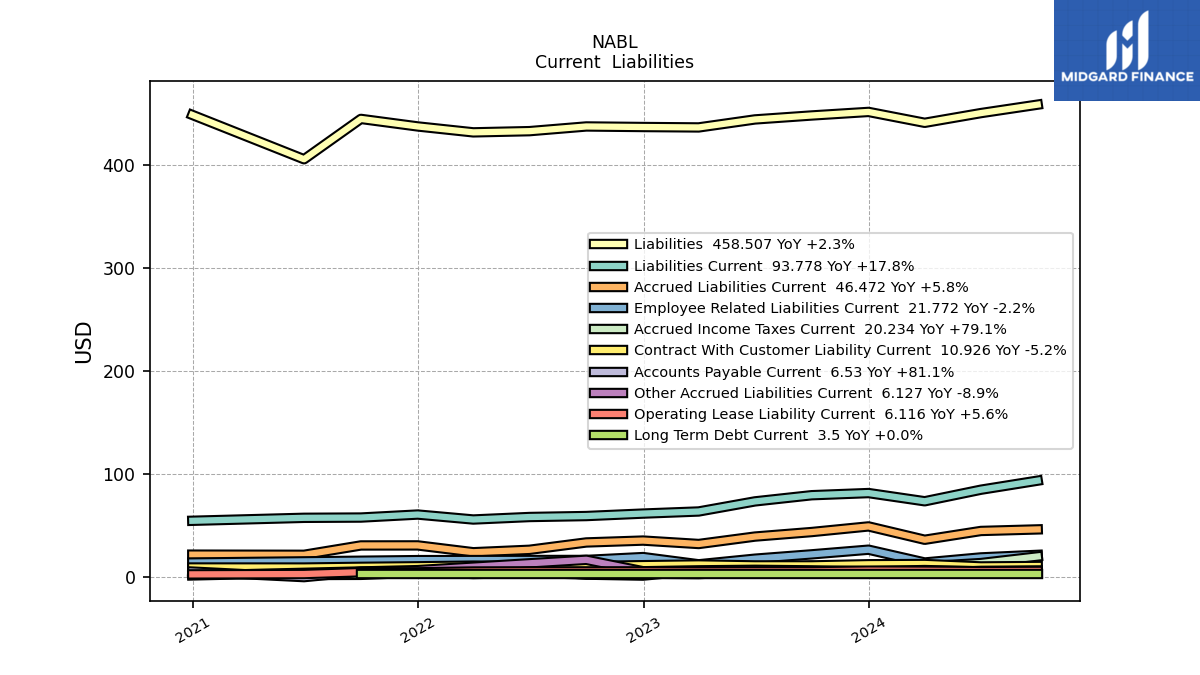
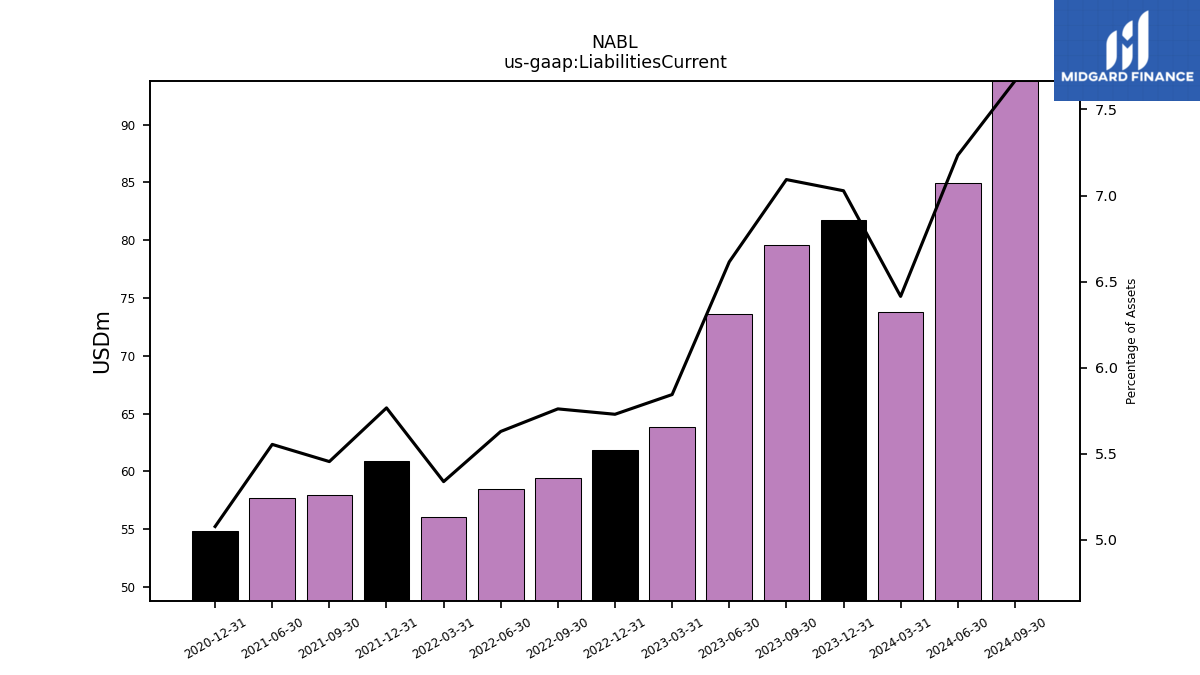
| Liabilities Current | 81.72 | 79.63 | 73.62 | 63.85 | 61.81 | 59.42 | 58.48 | 56.06 | 60.88 | 57.96 | 57.70 | NA | 54.83 | NA | NA | |
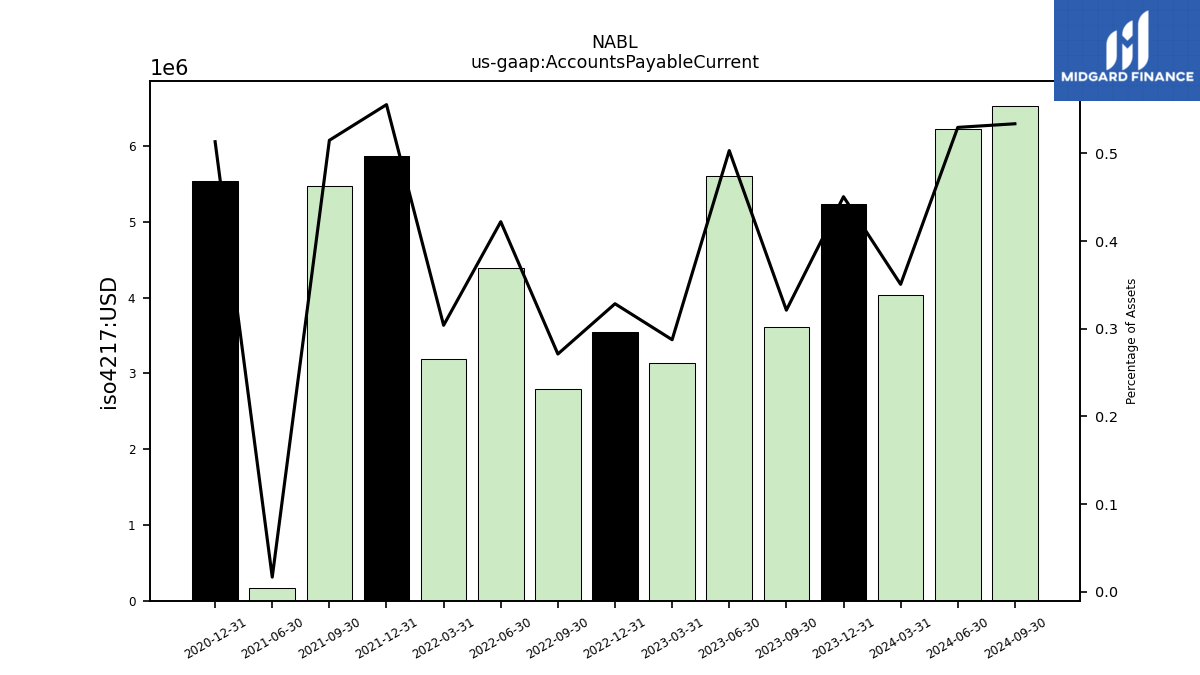
| Accounts Payable Current | 5.24 | 3.61 | 5.60 | 3.14 | 3.54 | 2.80 | 4.38 | 3.19 | 5.87 | 5.47 | 0.17 | NA | 5.54 | NA | NA | |
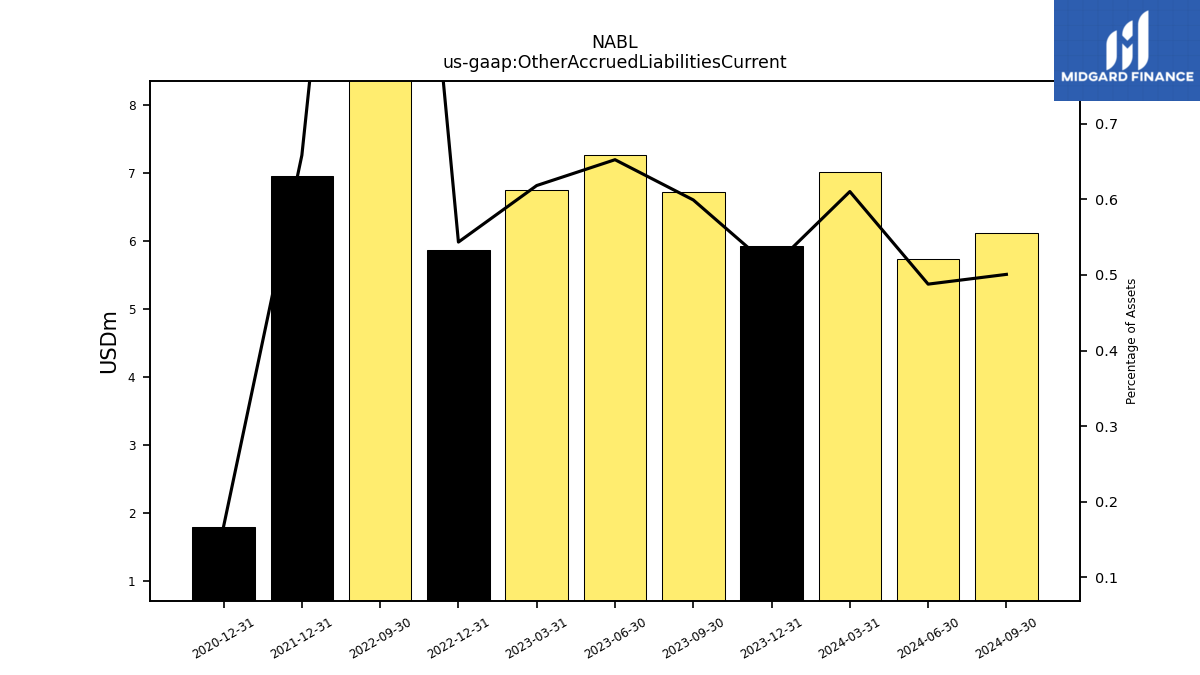
| Other Accrued Liabilities Current | 5.92 | 6.73 | 7.26 | 6.76 | 5.86 | 16.96 | NA | NA | 6.95 | NA | NA | NA | 1.80 | NA | NA | |
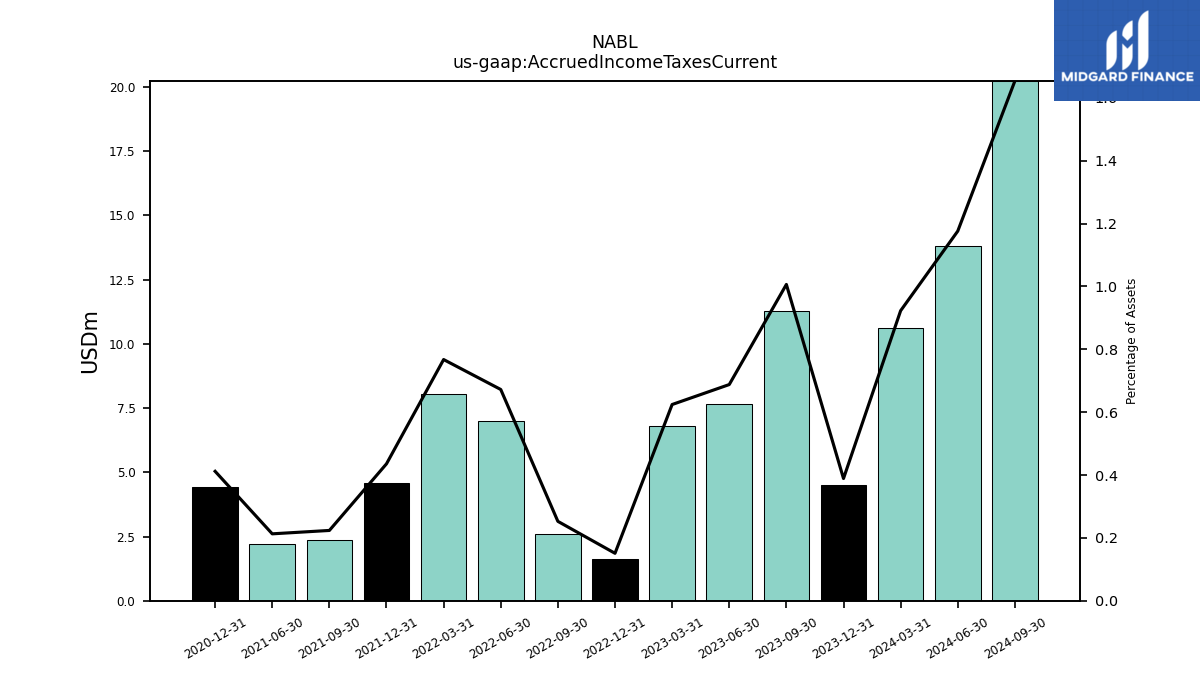
| Accrued Income Taxes Current | 4.52 | 11.30 | 7.66 | 6.82 | 1.63 | 2.61 | 6.98 | 8.06 | 4.60 | 2.38 | 2.21 | NA | 4.45 | NA | NA | |
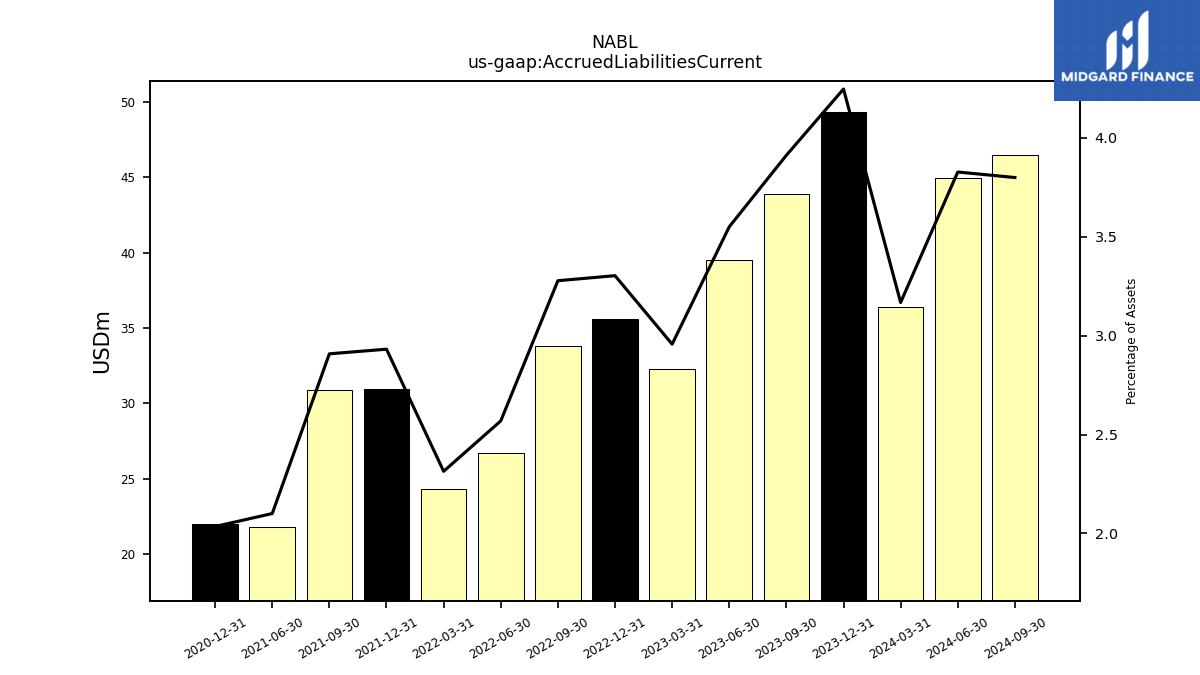
| Accrued Liabilities Current | 49.37 | 43.91 | 39.51 | 32.30 | 35.63 | 33.80 | 26.68 | 24.30 | 30.94 | 30.90 | 21.82 | NA | 21.98 | NA | NA | |
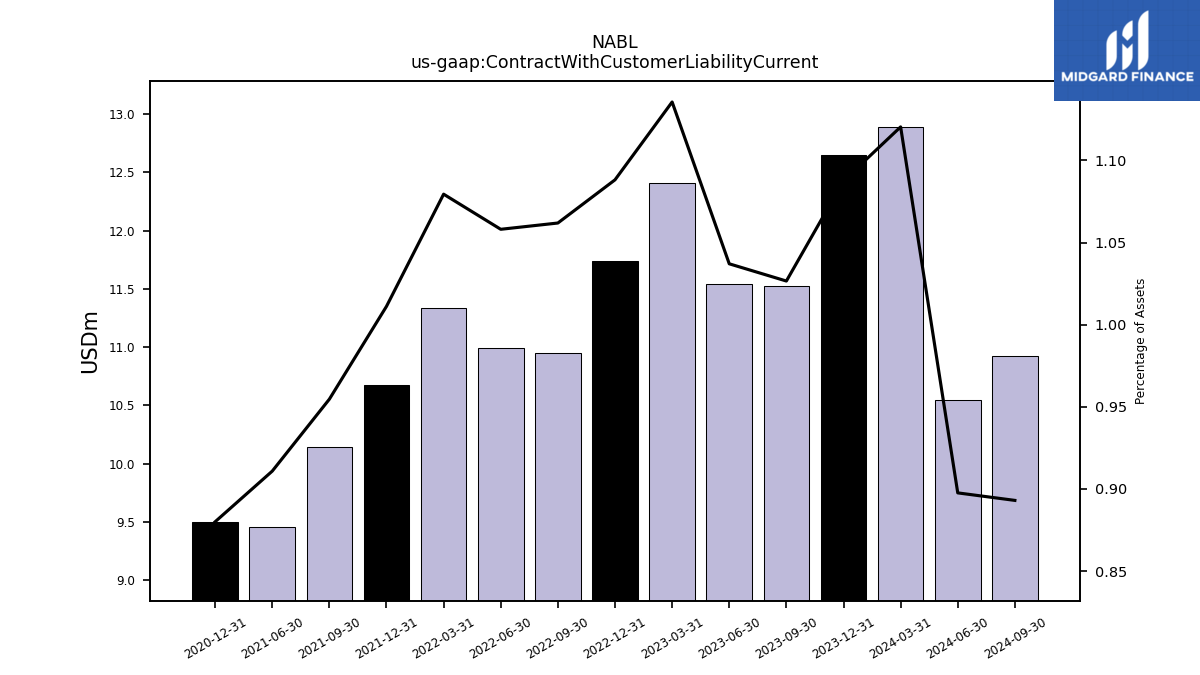
| Contract With Customer Liability Current | 12.65 | 11.53 | 11.54 | 12.41 | 11.74 | 10.95 | 10.99 | 11.34 | 10.68 | 10.14 | 9.46 | NA | 9.50 | NA | NA |
| 2023-12-31 | 2023-09-30 | 2023-06-30 | 2023-03-31 | 2022-12-31 | 2022-09-30 | 2022-06-30 | 2022-03-31 | 2021-12-31 | 2021-09-30 | 2021-06-30 | 2021-03-31 | 2020-12-31 | 2020-09-30 | 2020-06-30 | ||
|---|---|---|---|---|---|---|---|---|---|---|---|---|---|---|---|---|
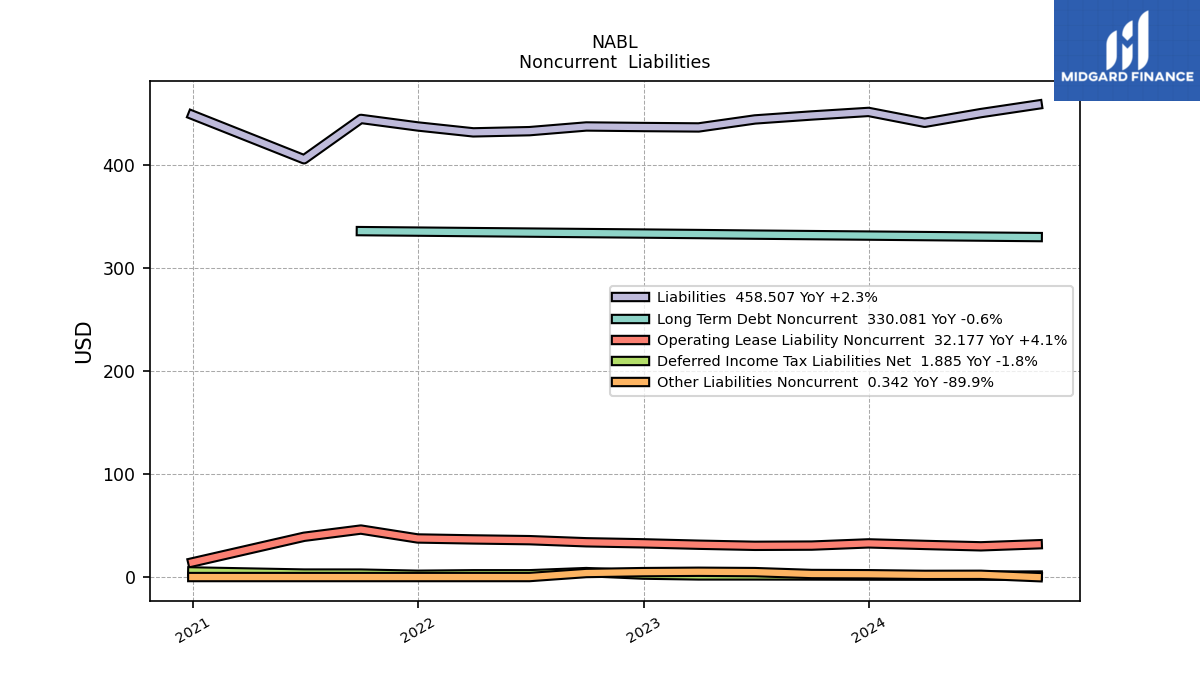
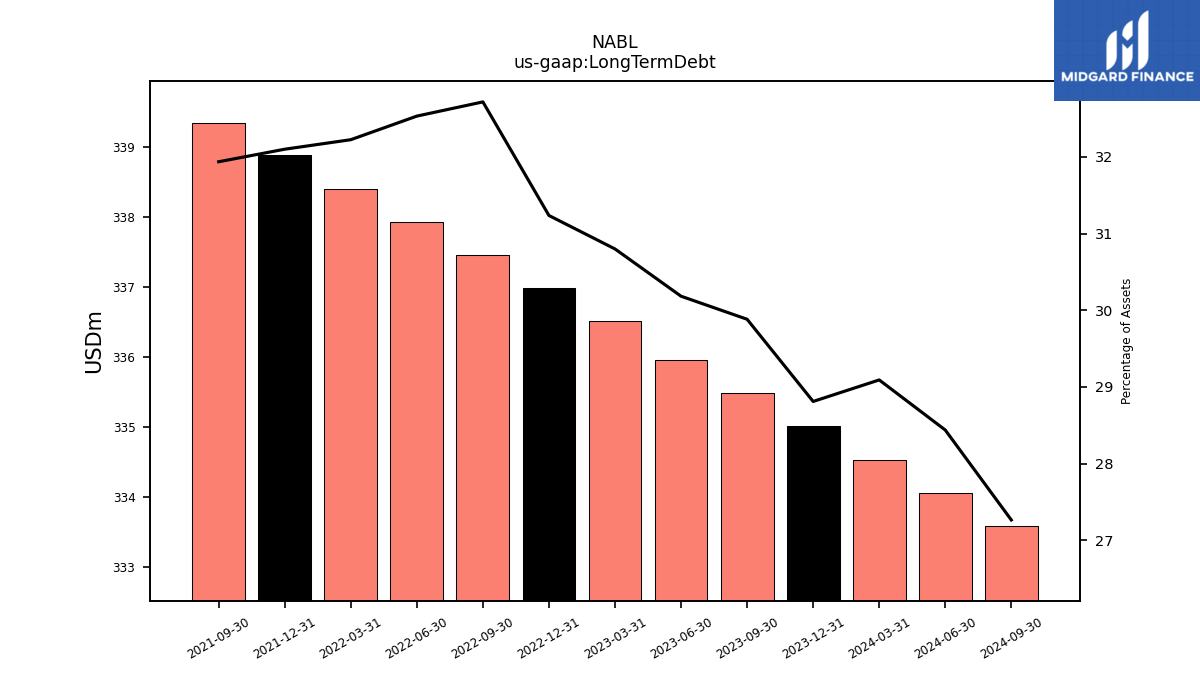
| Long Term Debt | 335.01 | 335.48 | 335.95 | 336.51 | 336.99 | 337.46 | 337.93 | 338.40 | 338.88 | 339.35 | NA | NA | NA | NA | NA | |
| Long Term Debt Noncurrent | 331.51 | 331.98 | 332.45 | 333.01 | 333.49 | 333.96 | 334.43 | 334.90 | 335.38 | 335.85 | NA | NA | NA | NA | NA | |
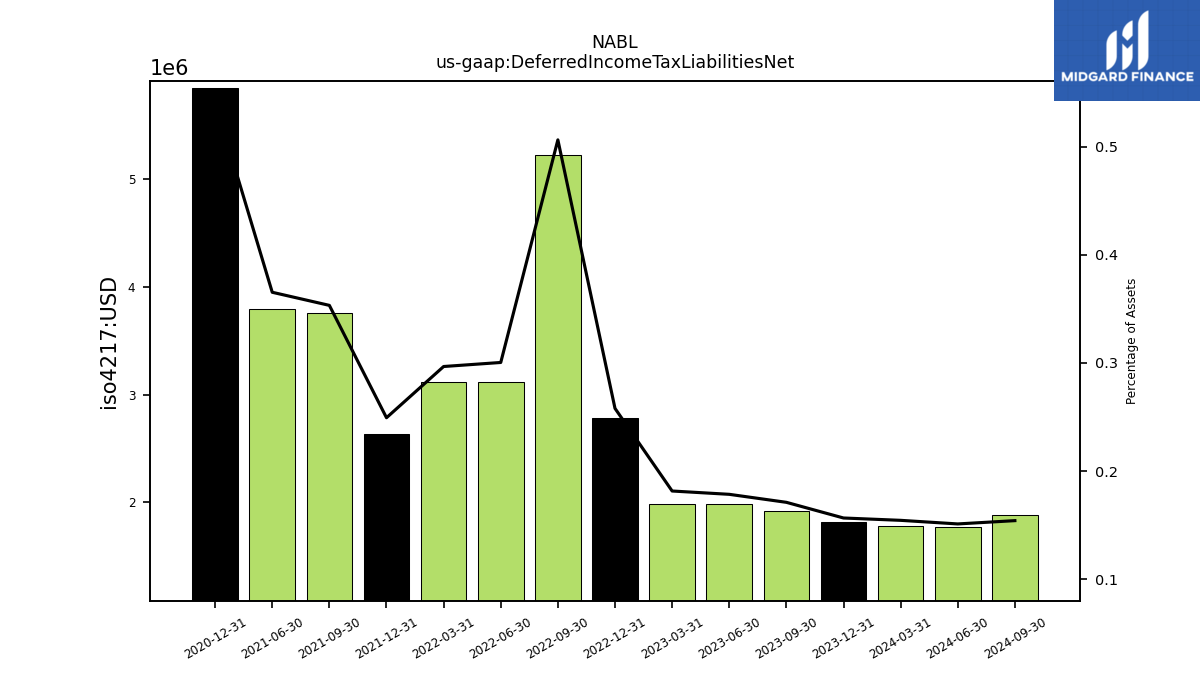
| Deferred Income Tax Liabilities Net | 1.82 | 1.92 | 1.99 | 1.98 | 2.78 | 5.22 | 3.12 | 3.12 | 2.63 | 3.75 | 3.80 | NA | 5.85 | NA | NA | |
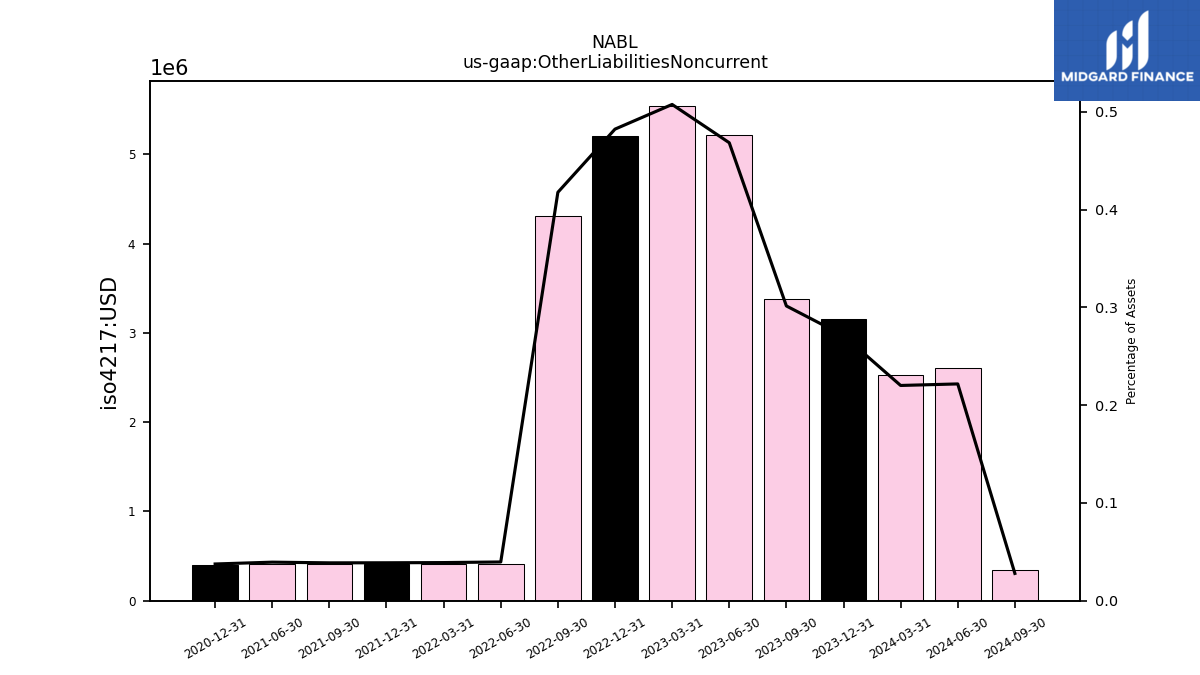
| Other Liabilities Noncurrent | 3.15 | 3.38 | 5.21 | 5.55 | 5.20 | 4.31 | 0.41 | 0.41 | 0.41 | 0.41 | 0.41 | NA | 0.41 | NA | NA | |
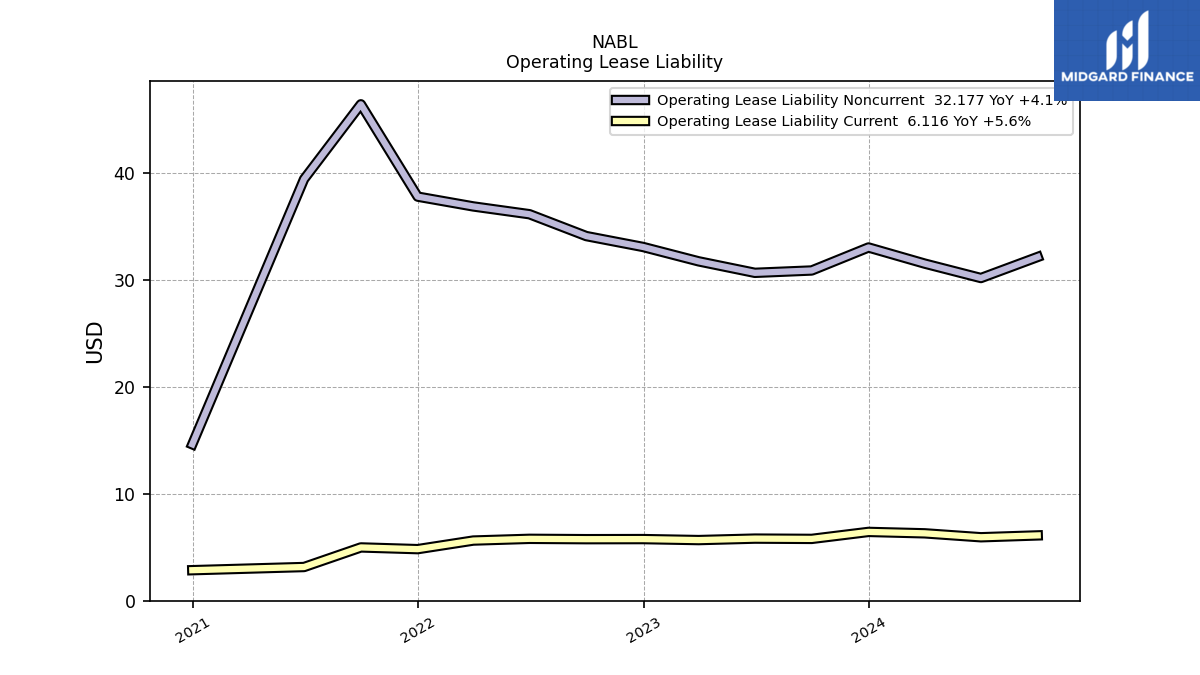
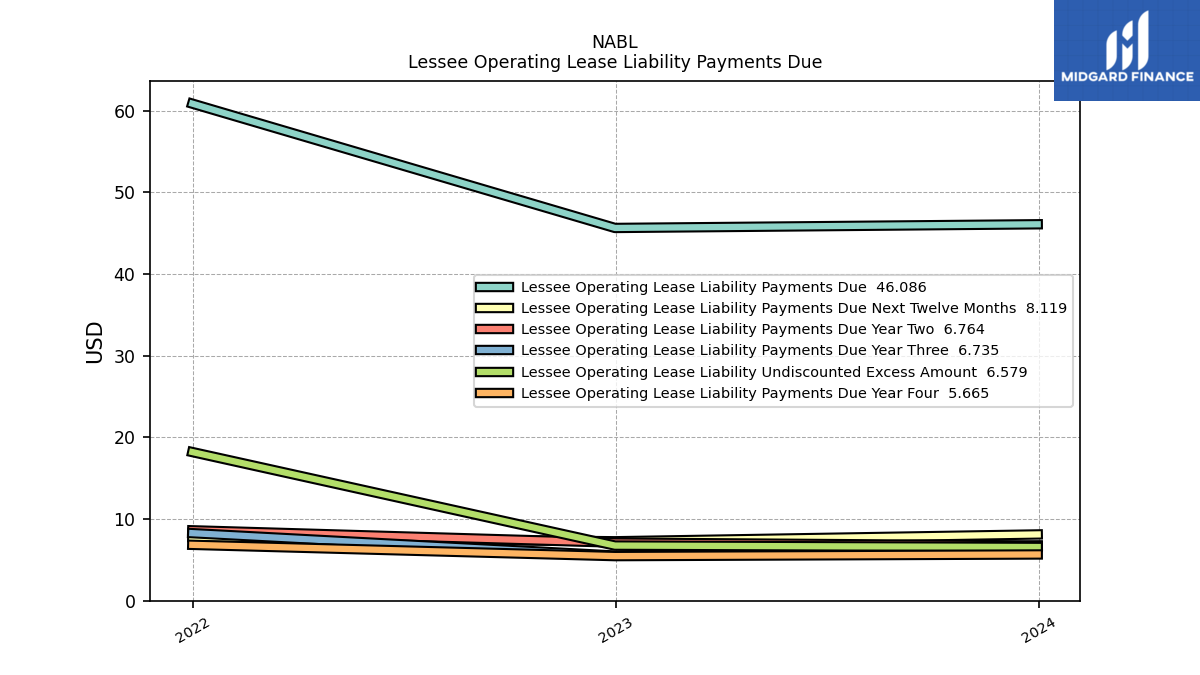
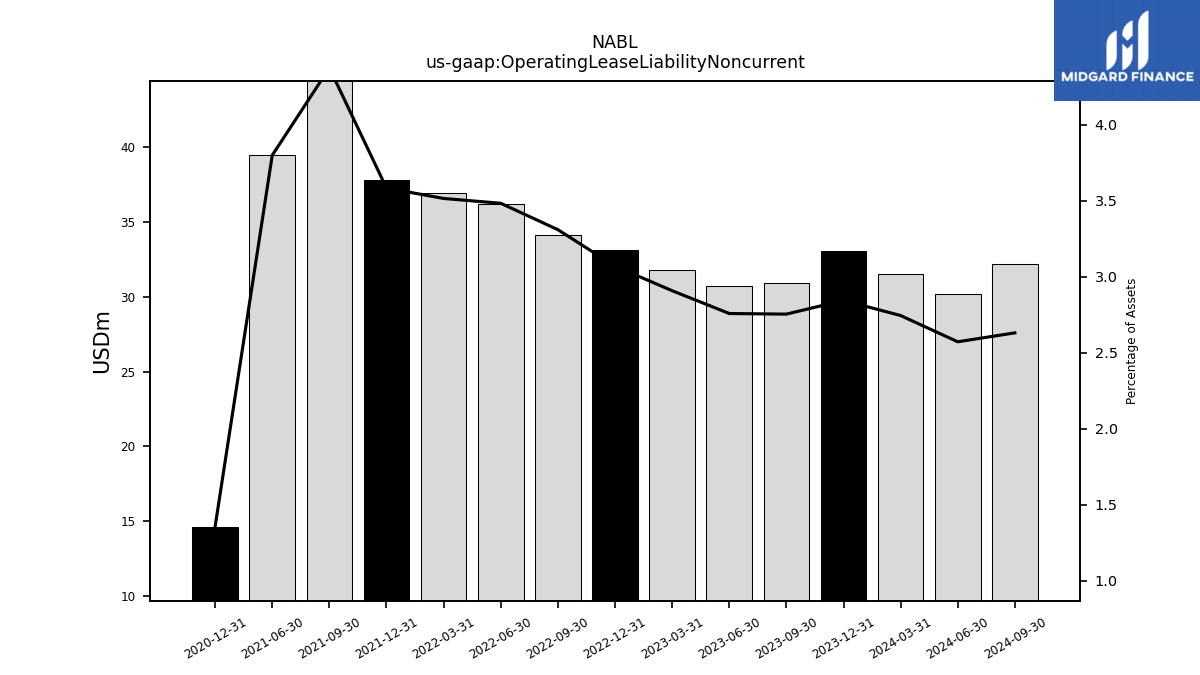
| Operating Lease Liability Noncurrent | 33.06 | 30.91 | 30.69 | 31.77 | 33.11 | 34.13 | 36.18 | 36.91 | 37.82 | 46.46 | 39.46 | NA | 14.64 | NA | NA |
| 2023-12-31 | 2023-09-30 | 2023-06-30 | 2023-03-31 | 2022-12-31 | 2022-09-30 | 2022-06-30 | 2022-03-31 | 2021-12-31 | 2021-09-30 | 2021-06-30 | 2021-03-31 | 2020-12-31 | 2020-09-30 | 2020-06-30 | ||
|---|---|---|---|---|---|---|---|---|---|---|---|---|---|---|---|---|
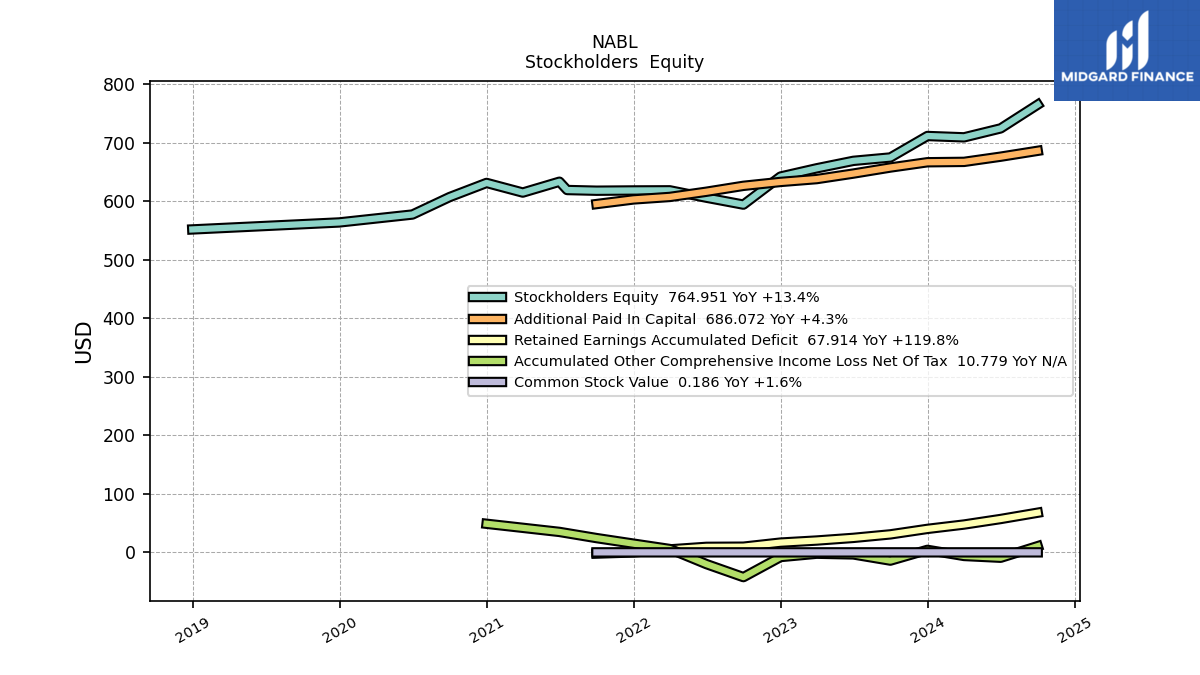
| Stockholders Equity | 711.36 | 674.68 | 668.91 | 656.20 | 642.07 | 594.13 | 605.99 | 618.55 | 618.36 | 617.91 | 633.27 | 614.73 | 631.20 | 607.00 | 577.25 | |
| Common Stock Value | 0.18 | 0.18 | 0.18 | 0.18 | 0.18 | 0.18 | 0.18 | 0.18 | 0.18 | 0.18 | NA | NA | NA | NA | NA | |
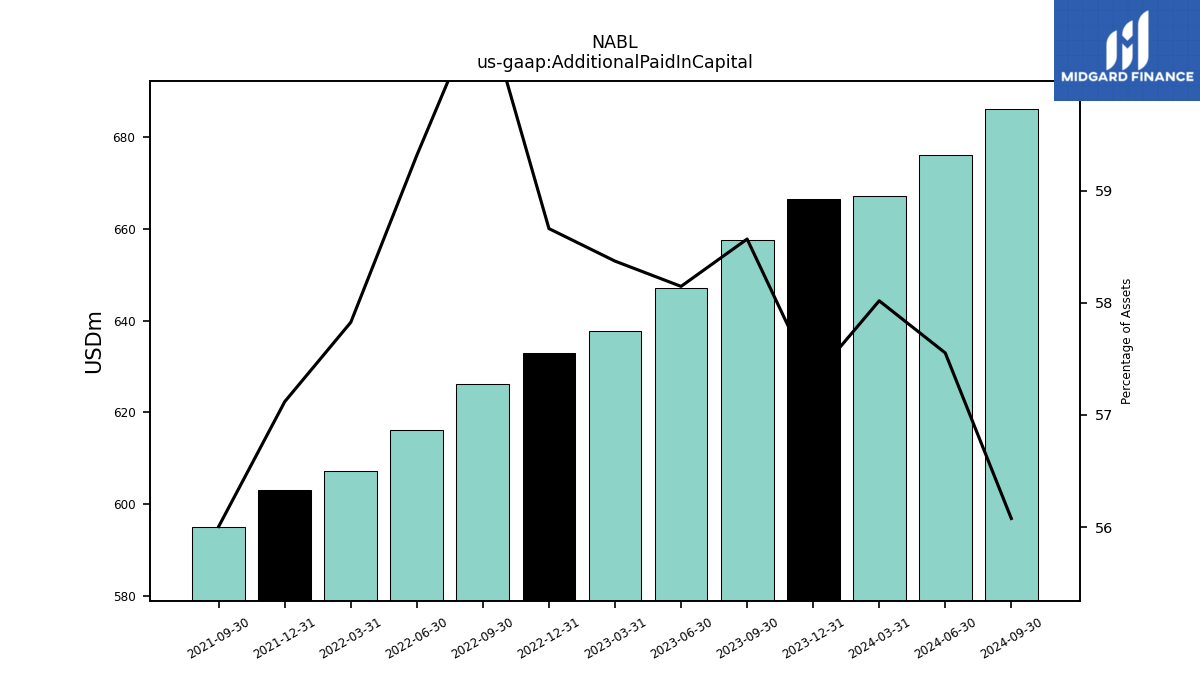
| Additional Paid In Capital | 666.52 | 657.52 | 647.19 | 637.75 | 632.87 | 626.24 | 616.15 | 607.26 | 603.00 | 595.09 | NA | NA | NA | NA | NA | |
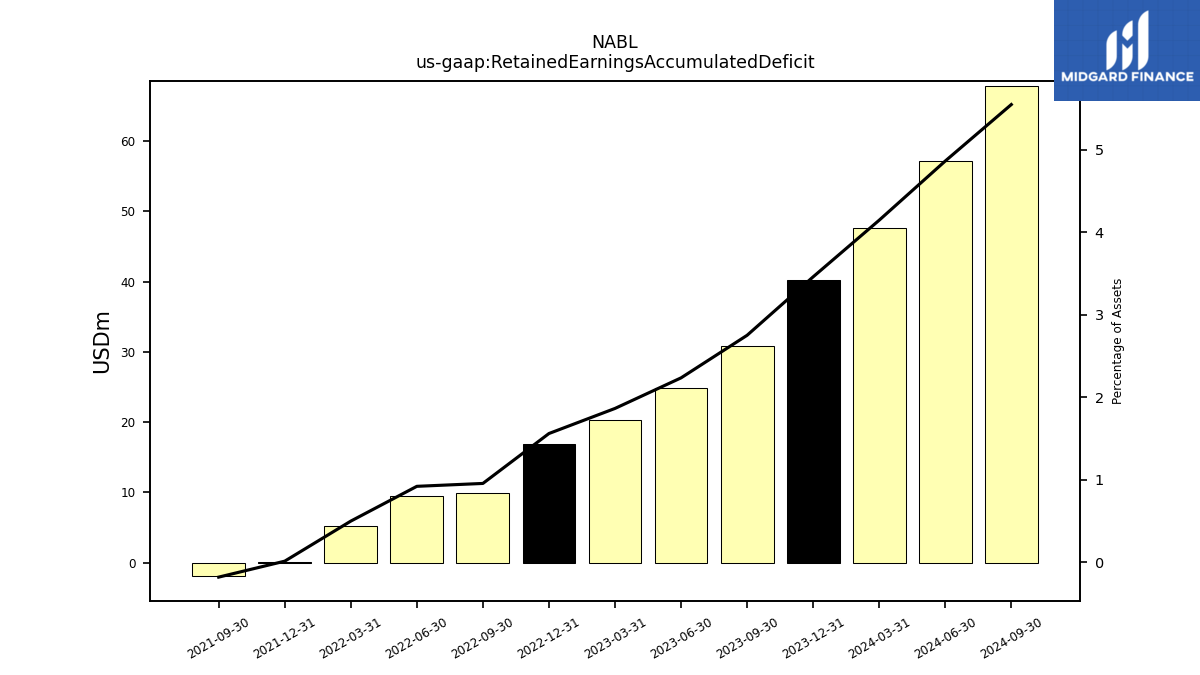
| Retained Earnings Accumulated Deficit | 40.25 | 30.89 | 24.88 | 20.37 | 16.83 | 9.85 | 9.55 | 5.23 | 0.13 | -1.93 | NA | NA | NA | NA | NA | |
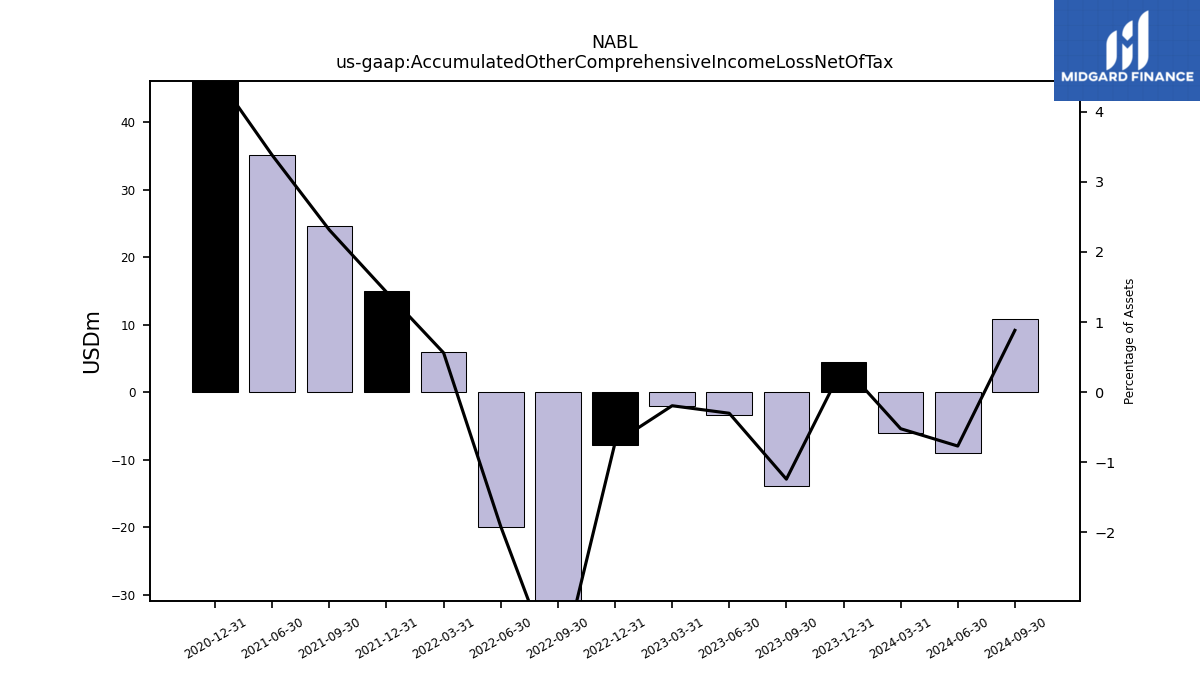
| Accumulated Other Comprehensive Income Loss Net Of Tax | 4.41 | -13.92 | -3.35 | -2.11 | -7.82 | -42.14 | -19.89 | 5.89 | 15.05 | 24.57 | 35.08 | NA | 48.99 | NA | NA | |
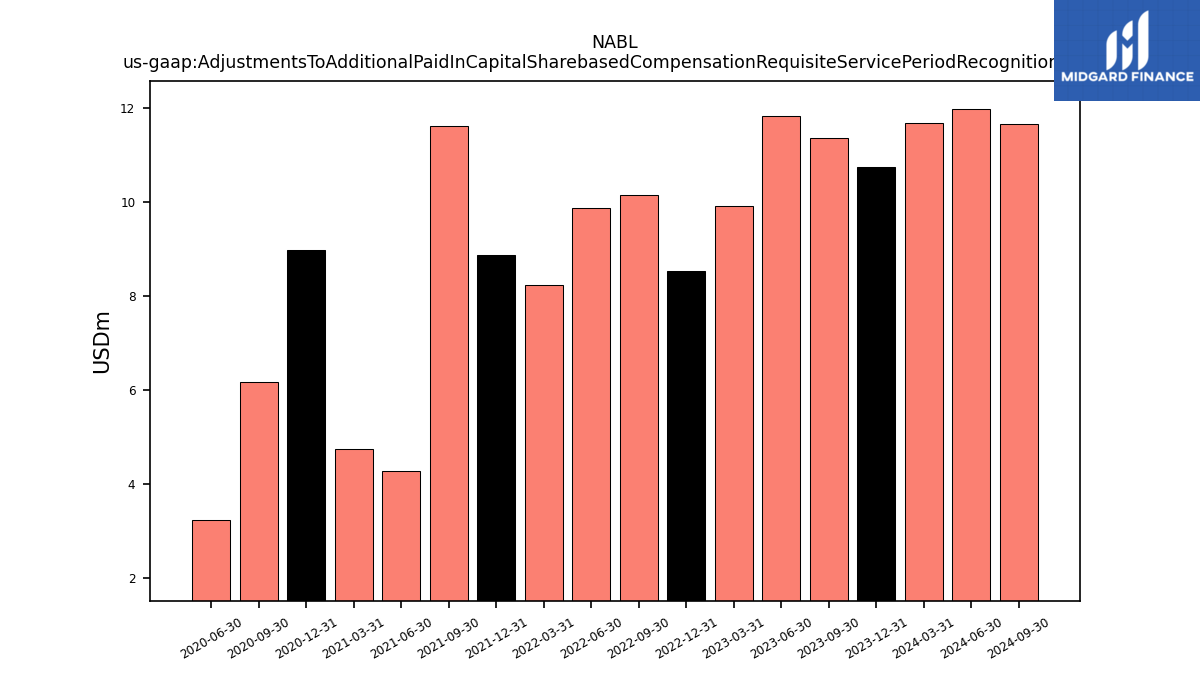
| Adjustments To Additional Paid In Capital Sharebased Compensation Requisite Service Period Recognition Value | 10.75 | 11.37 | 11.83 | 9.93 | 8.53 | 10.15 | 9.87 | 8.23 | 8.87 | 11.62 | 4.27 | 4.75 | 8.97 | 6.17 | 3.24 |
| 2023-12-31 | 2023-09-30 | 2023-06-30 | 2023-03-31 | 2022-12-31 | 2022-09-30 | 2022-06-30 | 2022-03-31 | 2021-12-31 | 2021-09-30 | 2021-06-30 | 2021-03-31 | 2020-12-31 | 2020-09-30 | 2020-06-30 | ||
|---|---|---|---|---|---|---|---|---|---|---|---|---|---|---|---|---|
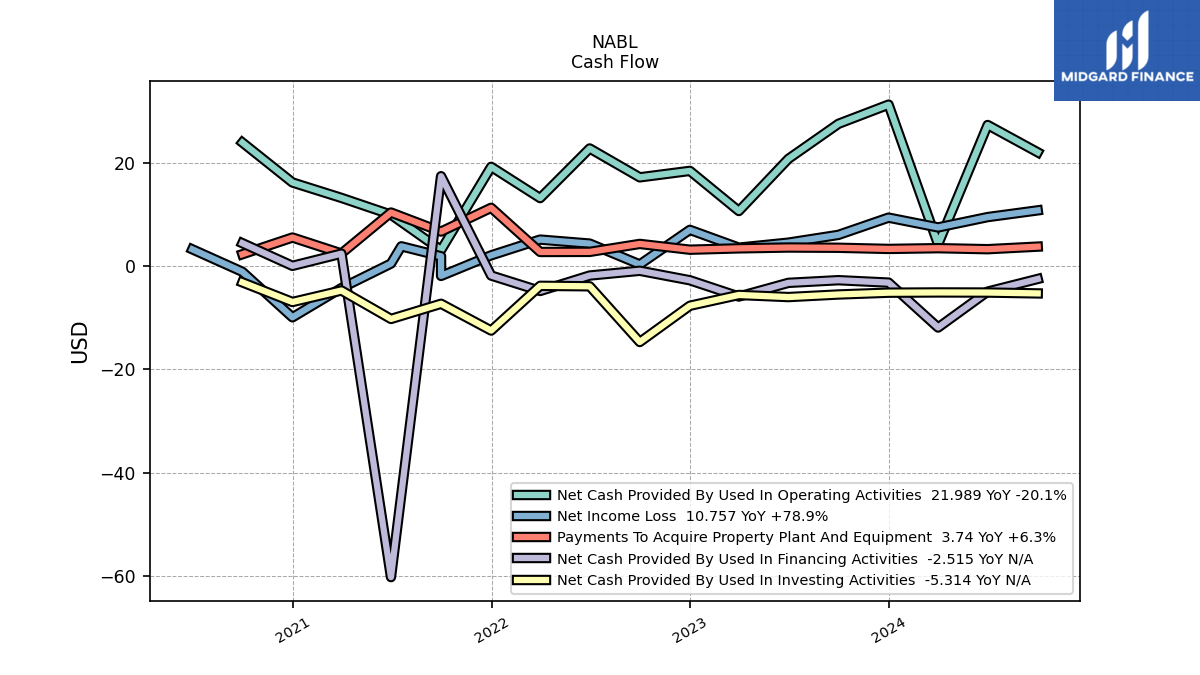
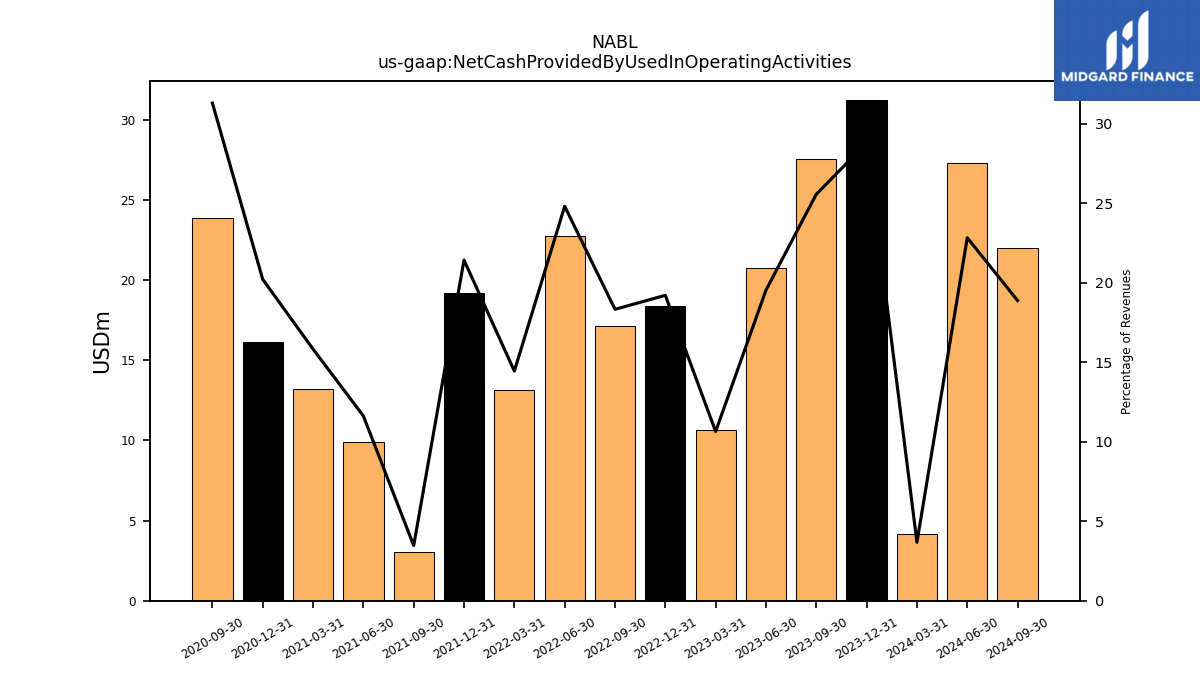
| Net Cash Provided By Used In Operating Activities | 31.22 | 27.51 | 20.73 | 10.63 | 18.40 | 17.15 | 22.74 | 13.13 | 19.18 | 3.07 | 9.92 | 13.17 | 16.15 | 23.89 | NA | |
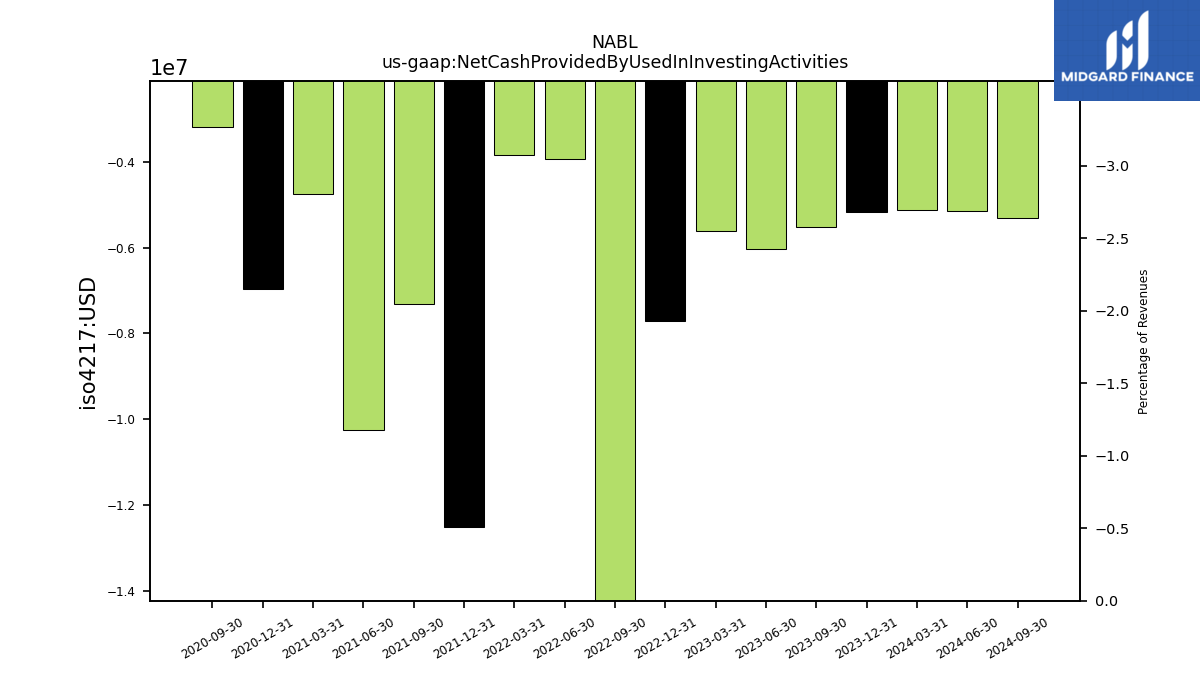
| Net Cash Provided By Used In Investing Activities | -5.17 | -5.52 | -6.02 | -5.62 | -7.71 | -14.72 | -3.94 | -3.85 | -12.50 | -7.32 | -10.26 | -4.75 | -6.98 | -3.18 | NA | |
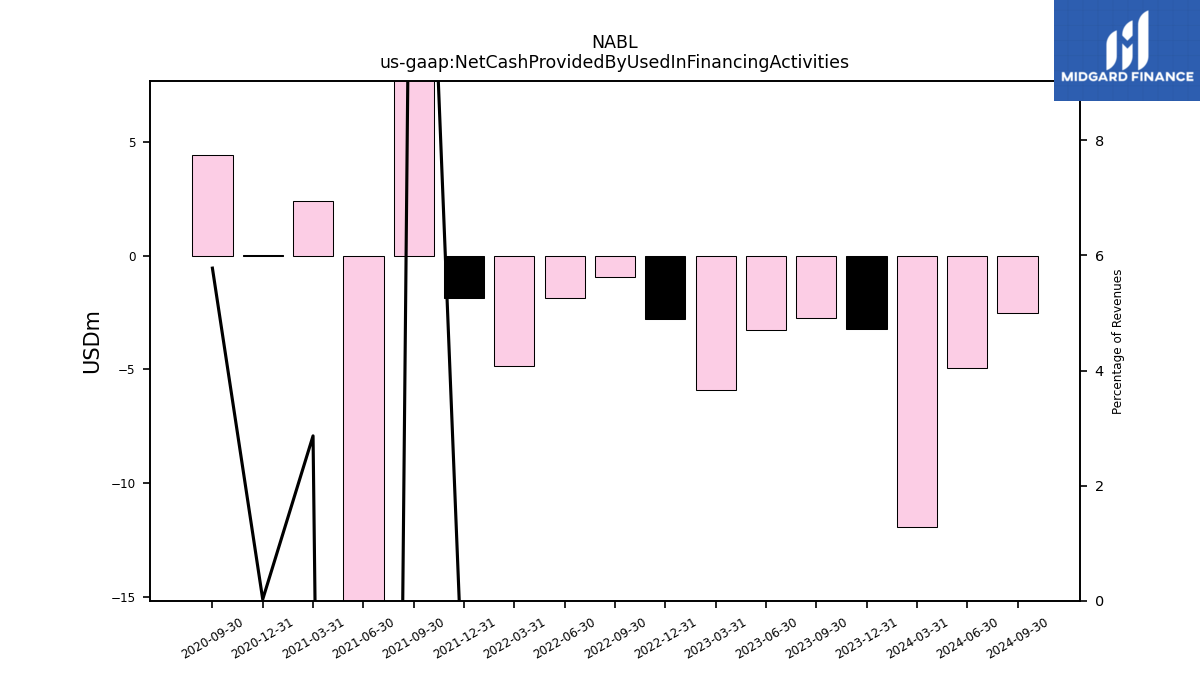
| Net Cash Provided By Used In Financing Activities | -3.22 | -2.76 | -3.27 | -5.92 | -2.77 | -0.93 | -1.85 | -4.84 | -1.86 | 17.37 | -60.22 | 2.38 | 0.02 | 4.41 | NA |
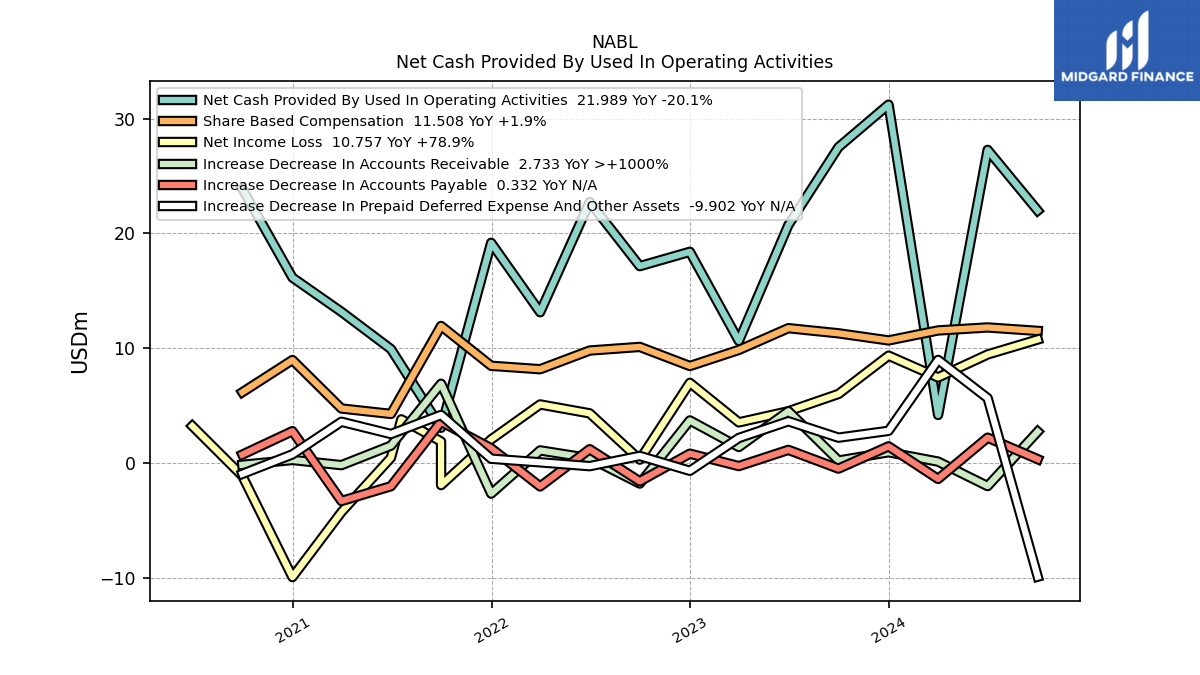
| 2023-12-31 | 2023-09-30 | 2023-06-30 | 2023-03-31 | 2022-12-31 | 2022-09-30 | 2022-06-30 | 2022-03-31 | 2021-12-31 | 2021-09-30 | 2021-06-30 | 2021-03-31 | 2020-12-31 | 2020-09-30 | 2020-06-30 | ||
|---|---|---|---|---|---|---|---|---|---|---|---|---|---|---|---|---|
| Net Cash Provided By Used In Operating Activities | 31.22 | 27.51 | 20.73 | 10.63 | 18.40 | 17.15 | 22.74 | 13.13 | 19.18 | 3.07 | 9.92 | 13.17 | 16.15 | 23.89 | NA | |
| Net Income Loss | 9.35 | 6.01 | 4.51 | 3.54 | 6.99 | 0.29 | 4.33 | 5.10 | 2.06 | -1.93 | 0.46 | -4.28 | -9.94 | -1.13 | 3.22 | |
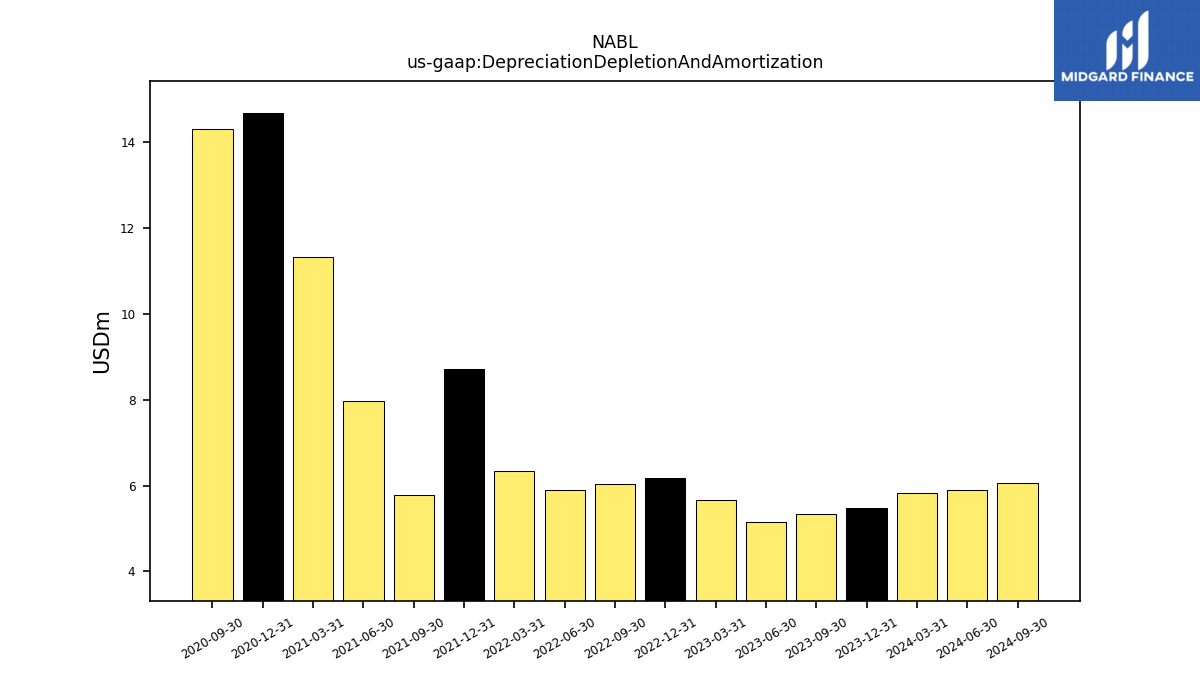
| Depreciation Depletion And Amortization | 5.48 | 5.33 | 5.15 | 5.67 | 6.17 | 6.04 | 5.89 | 6.34 | 8.71 | 5.77 | 7.96 | 11.33 | 14.69 | 14.30 | NA | |
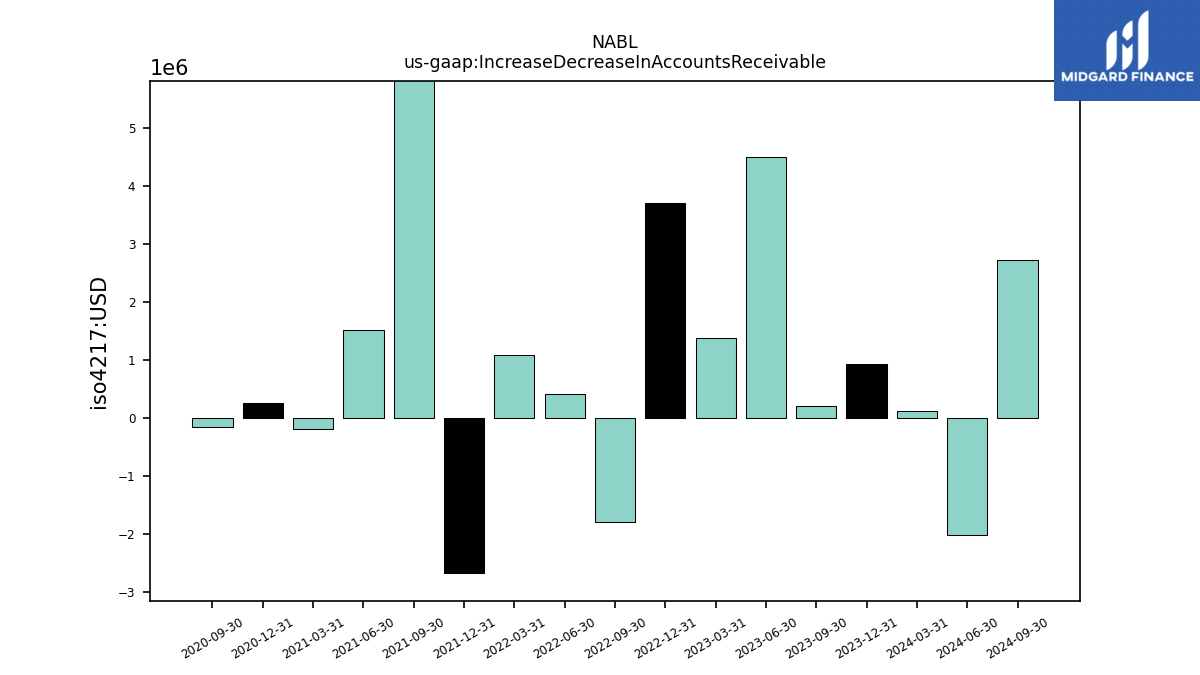
| Increase Decrease In Accounts Receivable | 0.94 | 0.21 | 4.51 | 1.39 | 3.71 | -1.79 | 0.41 | 1.10 | -2.67 | 6.91 | 1.51 | -0.19 | 0.26 | -0.16 | NA | |
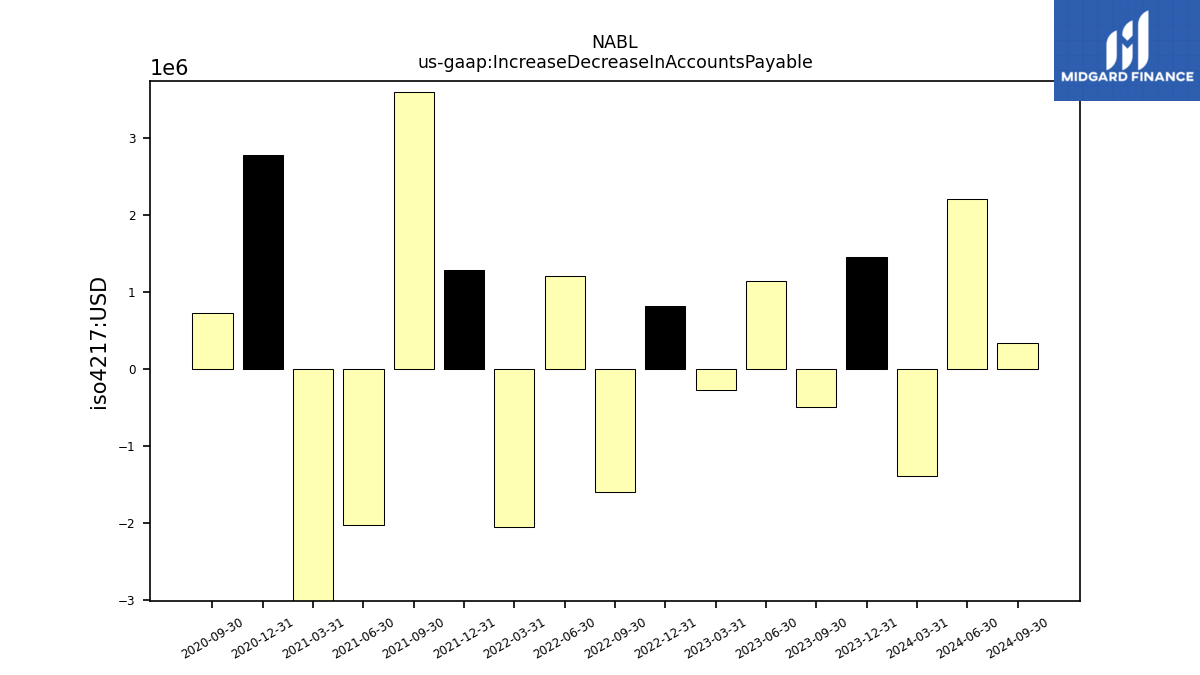
| Increase Decrease In Accounts Payable | 1.45 | -0.49 | 1.14 | -0.27 | 0.81 | -1.60 | 1.20 | -2.04 | 1.28 | 3.60 | -2.02 | -3.31 | 2.77 | 0.73 | NA | |
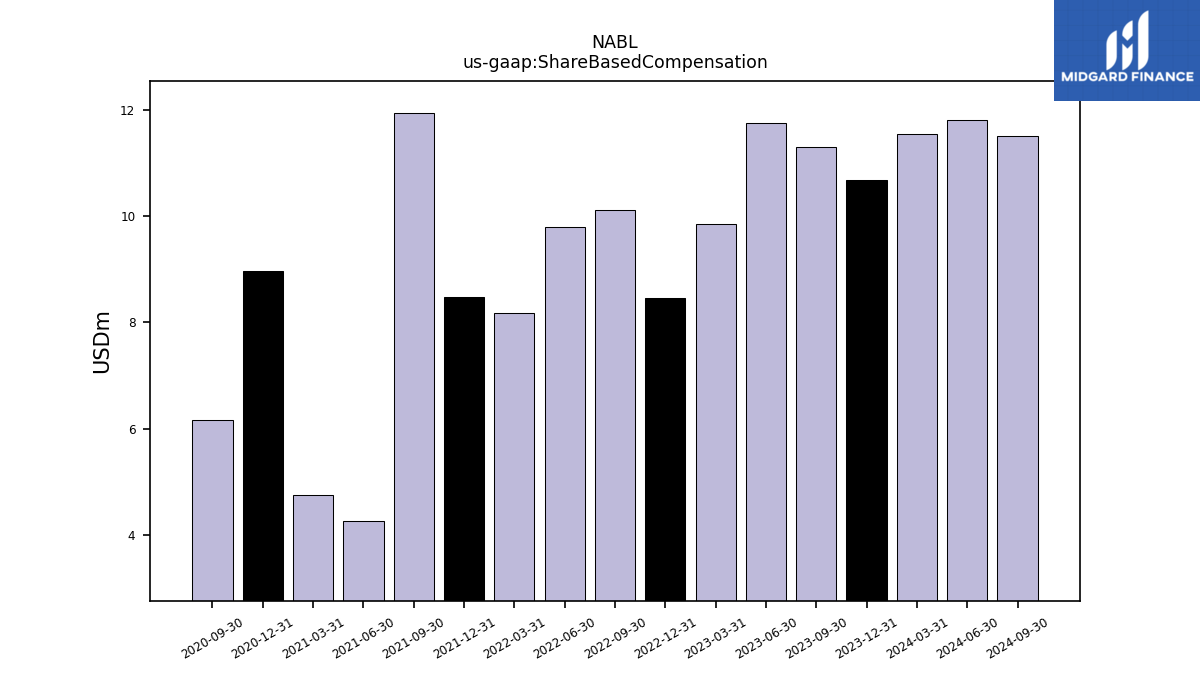
| Share Based Compensation | 10.68 | 11.30 | 11.74 | 9.85 | 8.45 | 10.11 | 9.80 | 8.17 | 8.47 | 11.94 | 4.27 | 4.75 | 8.97 | 6.17 | NA | |
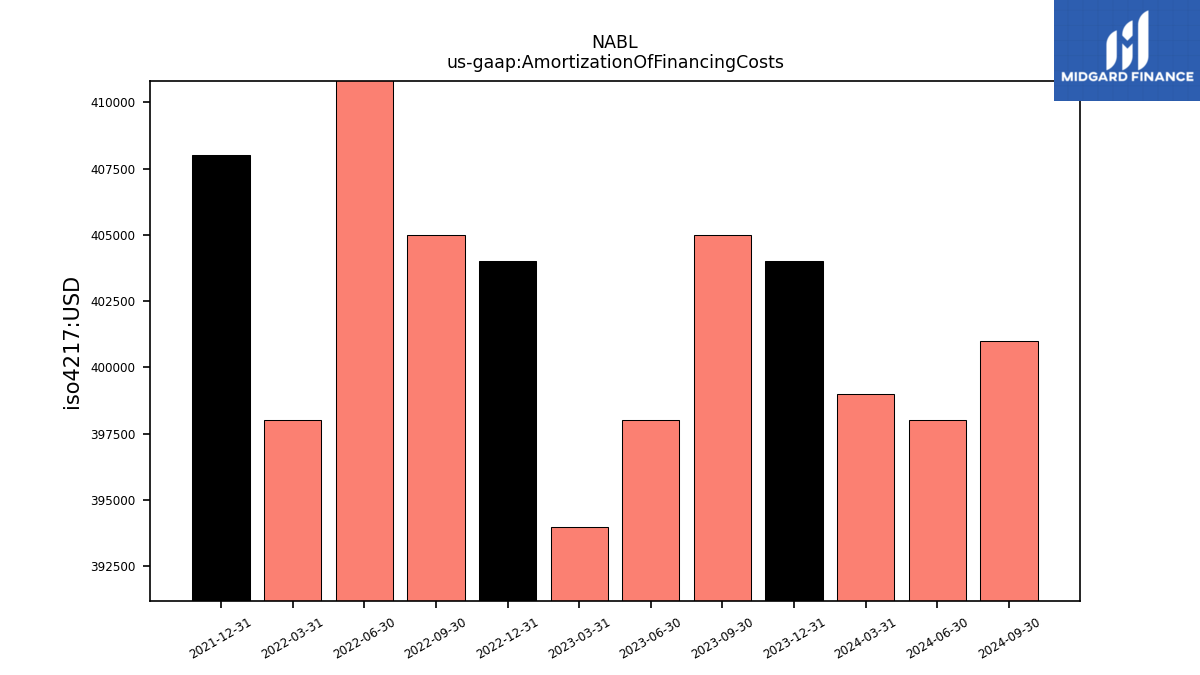
| Amortization Of Financing Costs | 0.40 | 0.41 | 0.40 | 0.39 | 0.40 | 0.41 | 0.42 | 0.40 | 0.41 | NA | NA | NA | NA | NA | NA |
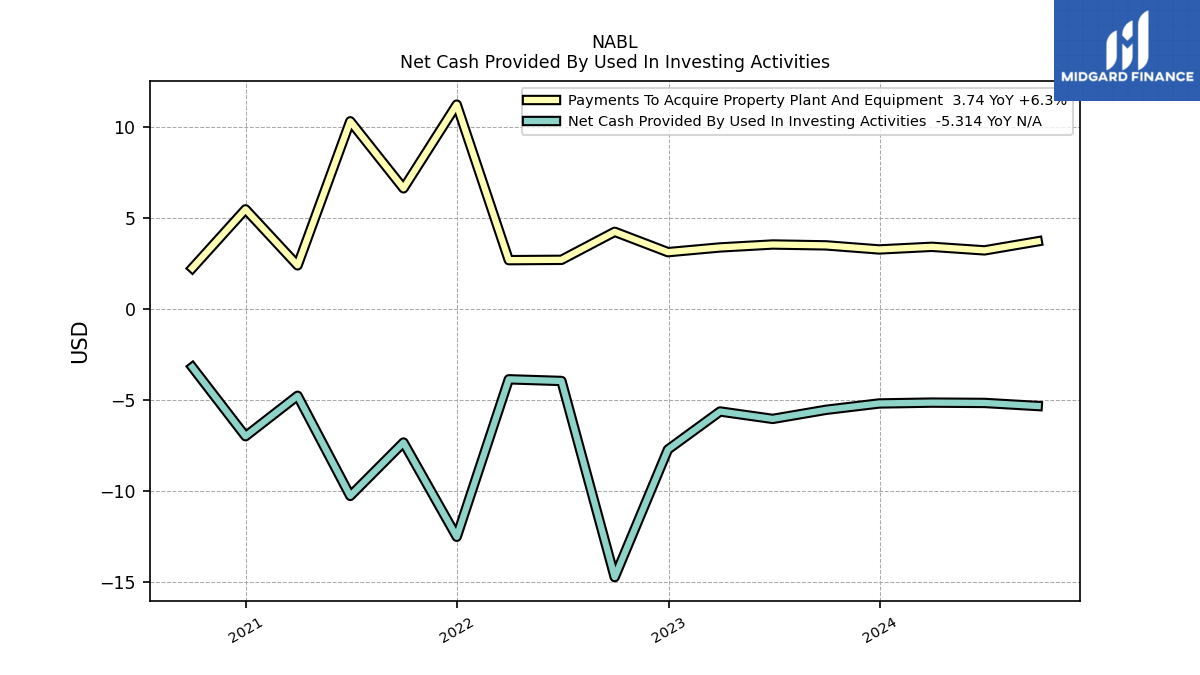
| 2023-12-31 | 2023-09-30 | 2023-06-30 | 2023-03-31 | 2022-12-31 | 2022-09-30 | 2022-06-30 | 2022-03-31 | 2021-12-31 | 2021-09-30 | 2021-06-30 | 2021-03-31 | 2020-12-31 | 2020-09-30 | 2020-06-30 | ||
|---|---|---|---|---|---|---|---|---|---|---|---|---|---|---|---|---|
| Net Cash Provided By Used In Investing Activities | -5.17 | -5.52 | -6.02 | -5.62 | -7.71 | -14.72 | -3.94 | -3.85 | -12.50 | -7.32 | -10.26 | -4.75 | -6.98 | -3.18 | NA | |
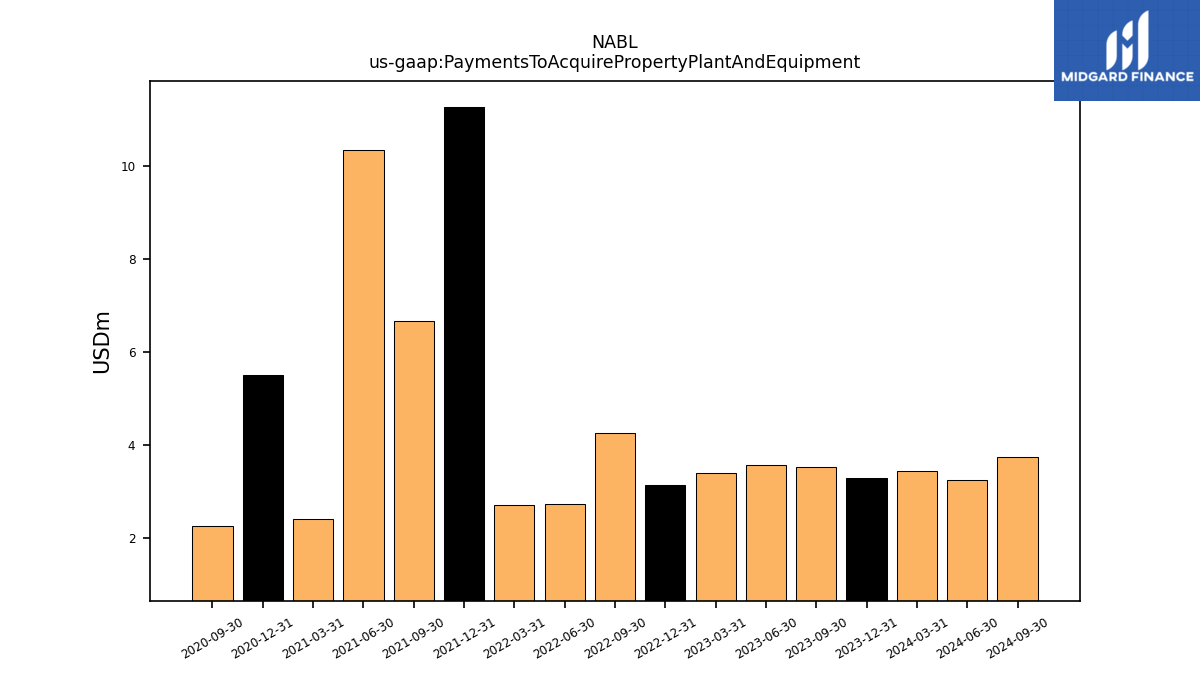
| Payments To Acquire Property Plant And Equipment | 3.29 | 3.52 | 3.56 | 3.40 | 3.14 | 4.26 | 2.72 | 2.70 | 11.26 | 6.65 | 10.34 | 2.42 | 5.50 | 2.27 | NA |
| 2023-12-31 | 2023-09-30 | 2023-06-30 | 2023-03-31 | 2022-12-31 | 2022-09-30 | 2022-06-30 | 2022-03-31 | 2021-12-31 | 2021-09-30 | 2021-06-30 | 2021-03-31 | 2020-12-31 | 2020-09-30 | 2020-06-30 | ||
|---|---|---|---|---|---|---|---|---|---|---|---|---|---|---|---|---|
| Net Cash Provided By Used In Financing Activities | -3.22 | -2.76 | -3.27 | -5.92 | -2.77 | -0.93 | -1.85 | -4.84 | -1.86 | 17.37 | -60.22 | 2.38 | 0.02 | 4.41 | NA |
| 2023-12-31 | 2023-09-30 | 2023-06-30 | 2023-03-31 | 2022-12-31 | 2022-09-30 | 2022-06-30 | 2022-03-31 | 2021-12-31 | 2021-09-30 | 2021-06-30 | 2021-03-31 | 2020-12-31 | 2020-09-30 | 2020-06-30 | ||
|---|---|---|---|---|---|---|---|---|---|---|---|---|---|---|---|---|
| Revenues | 108.42 | 107.57 | 106.08 | 99.82 | 95.75 | 93.53 | 91.63 | 90.86 | 89.50 | 88.42 | 85.34 | 83.19 | 79.88 | 76.30 | 73.42 | |
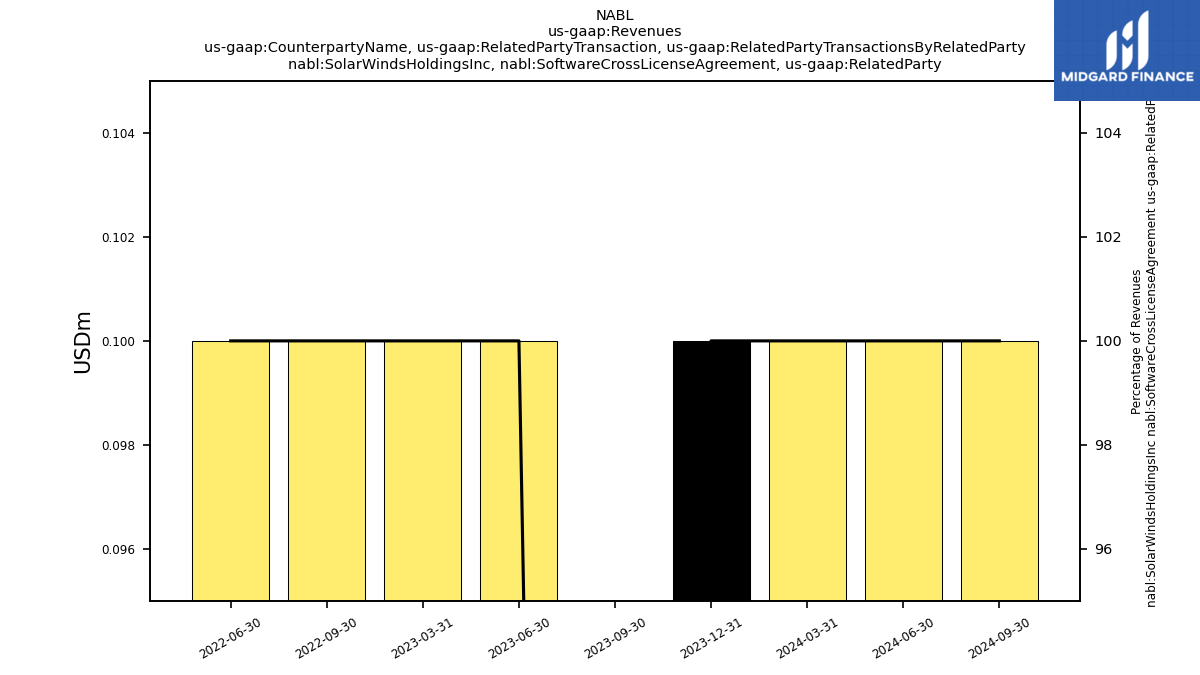
| Solar Winds Holdings Inc, Software Cross License Agreement, Related Party | 0.10 | 0.00 | 0.10 | NA | NA | 0.10 | 0.10 | NA | NA | NA | NA | NA | NA | NA | NA | |
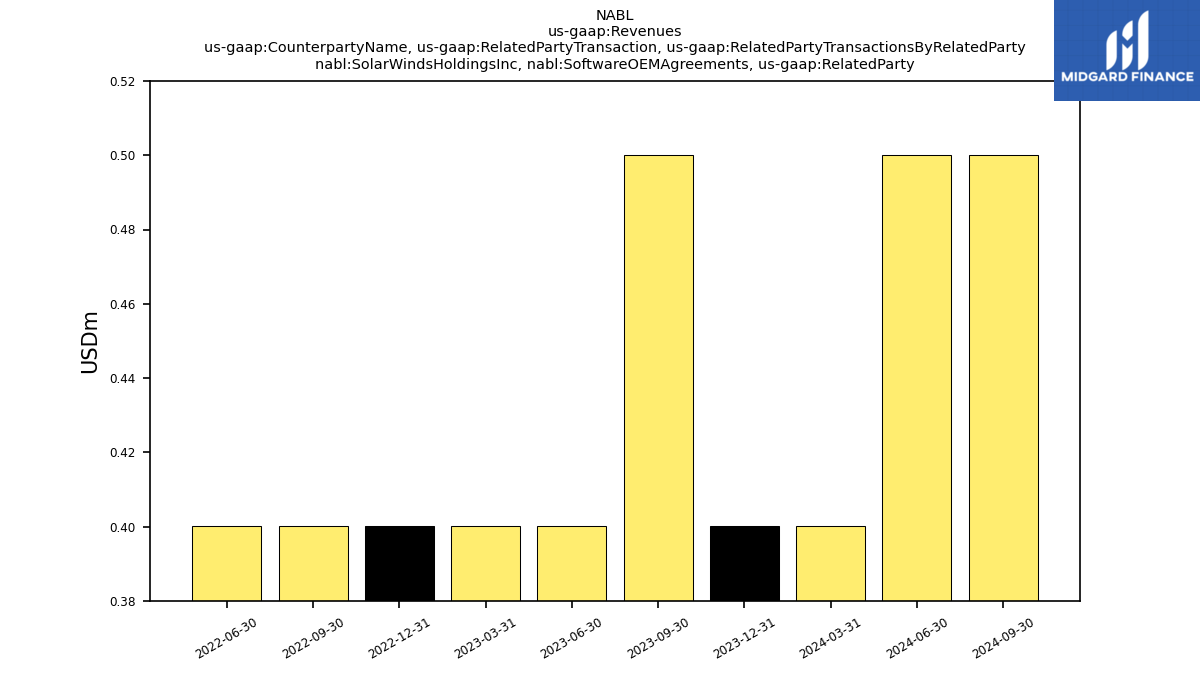
| Solar Winds Holdings Inc, Software O E M Agreements, Related Party | 0.40 | 0.50 | 0.40 | NA | 0.40 | 0.40 | 0.40 | NA | NA | NA | NA | NA | NA | NA | NA | |
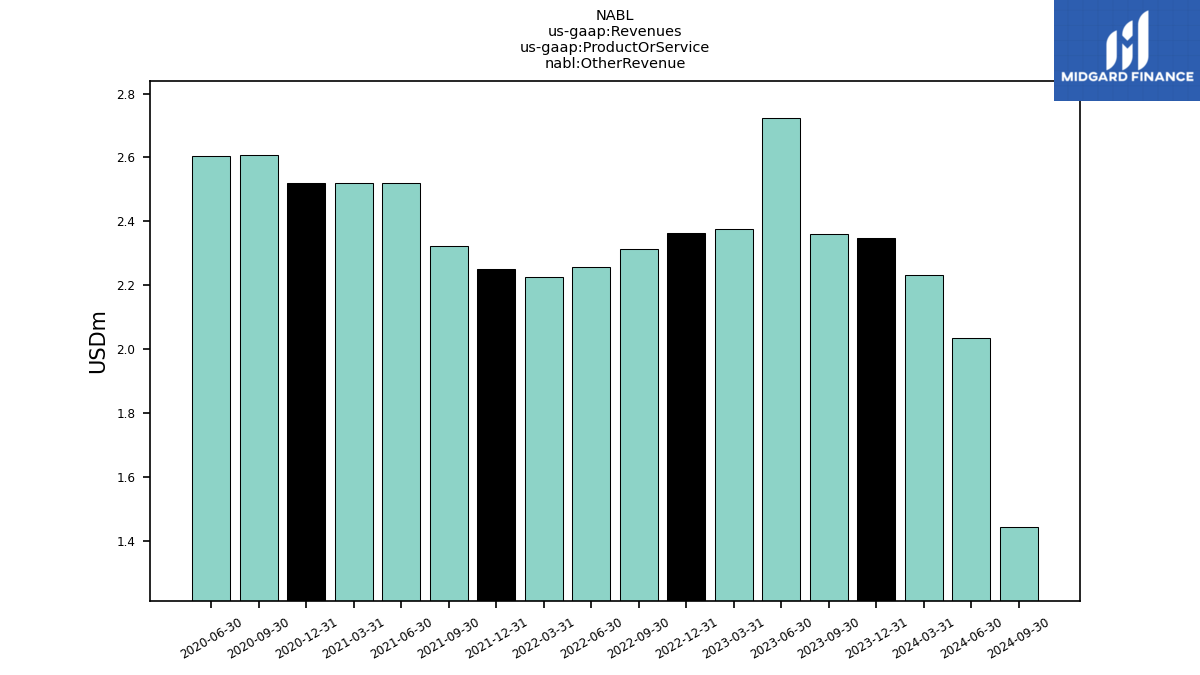
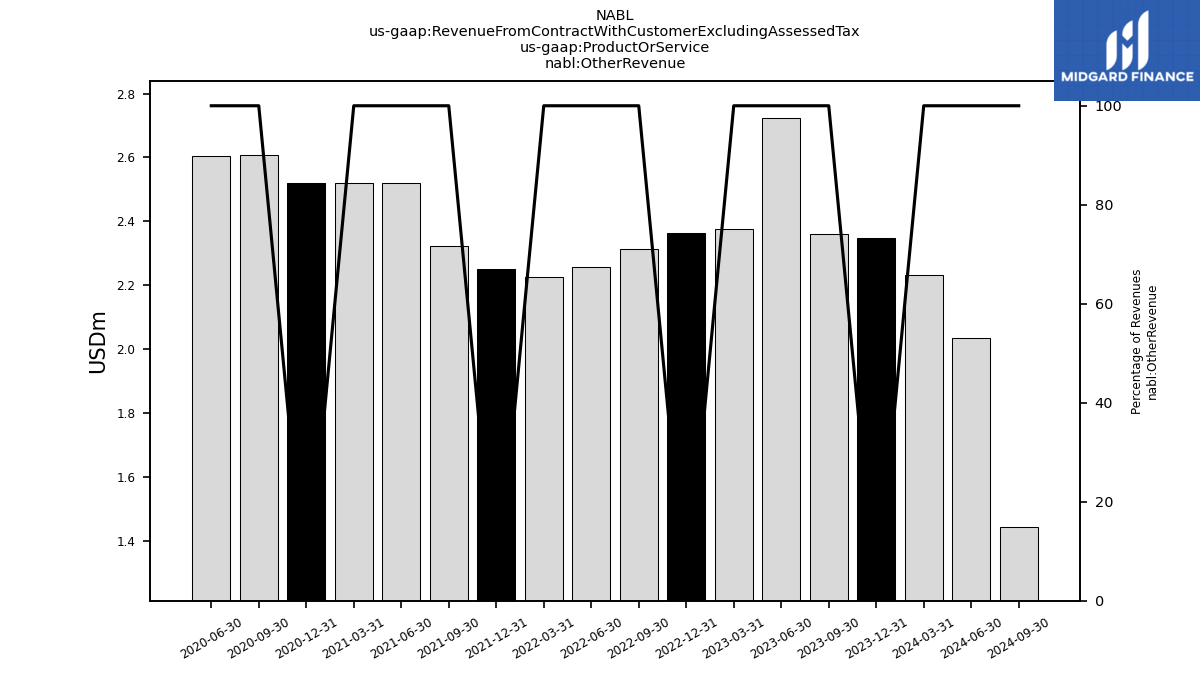
| Other Revenue | 2.35 | 2.36 | 2.73 | 2.38 | 2.36 | 2.31 | 2.26 | 2.23 | 2.25 | 2.32 | 2.52 | 2.52 | 2.52 | 2.61 | 2.60 | |
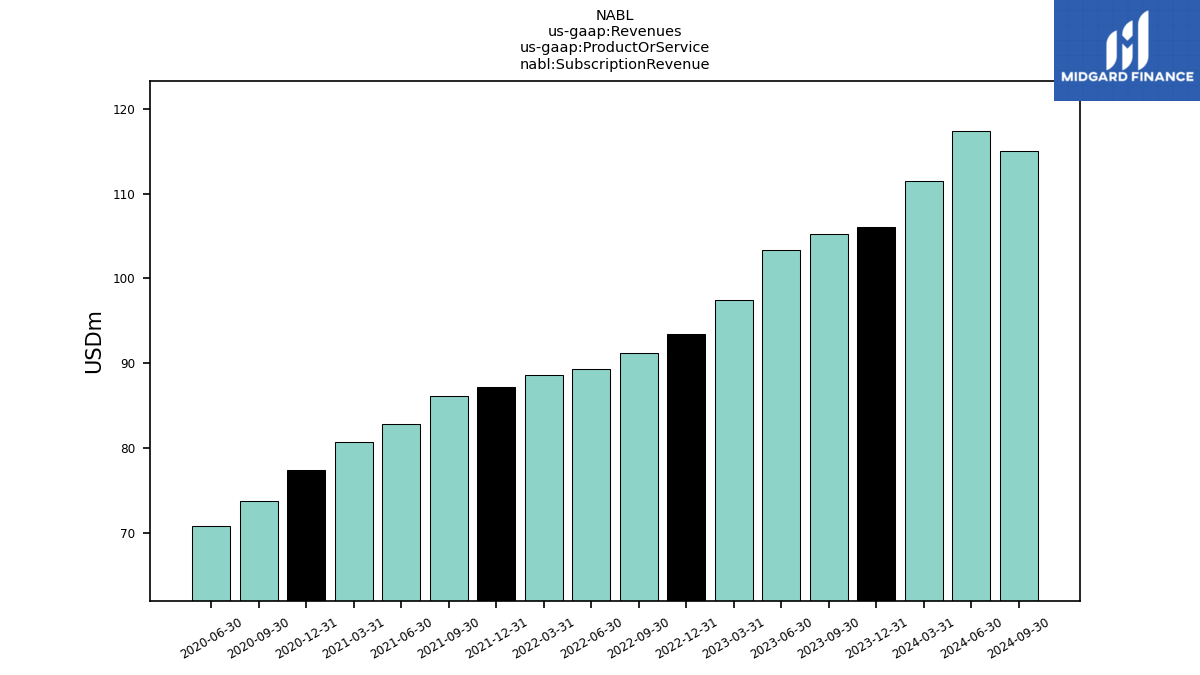
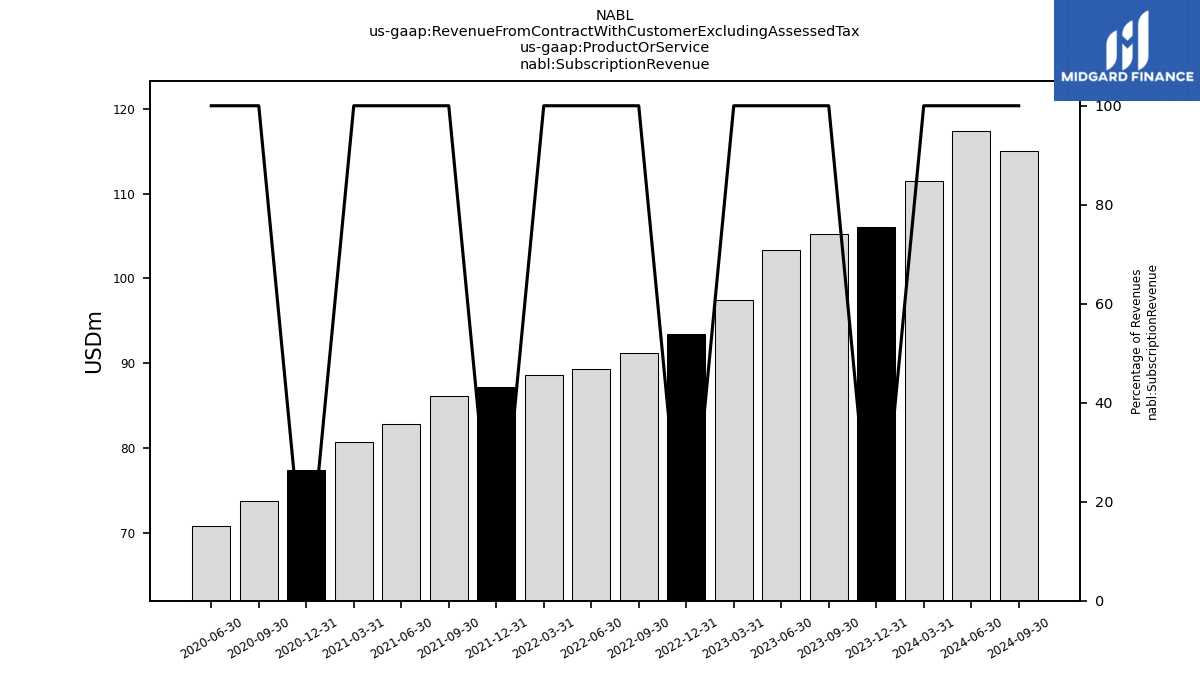
| Subscription Revenue | 106.07 | 105.21 | 103.36 | 97.44 | 93.39 | 91.21 | 89.37 | 88.64 | 87.25 | 86.10 | 82.82 | 80.67 | 77.36 | 73.69 | 70.82 | |
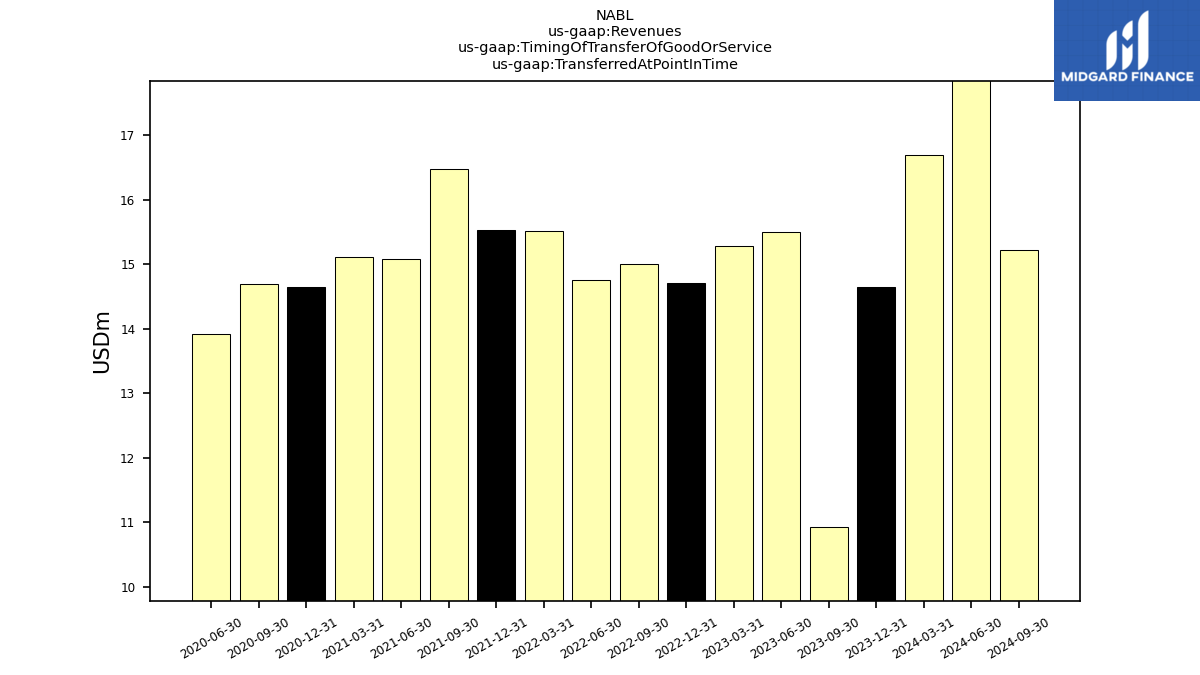
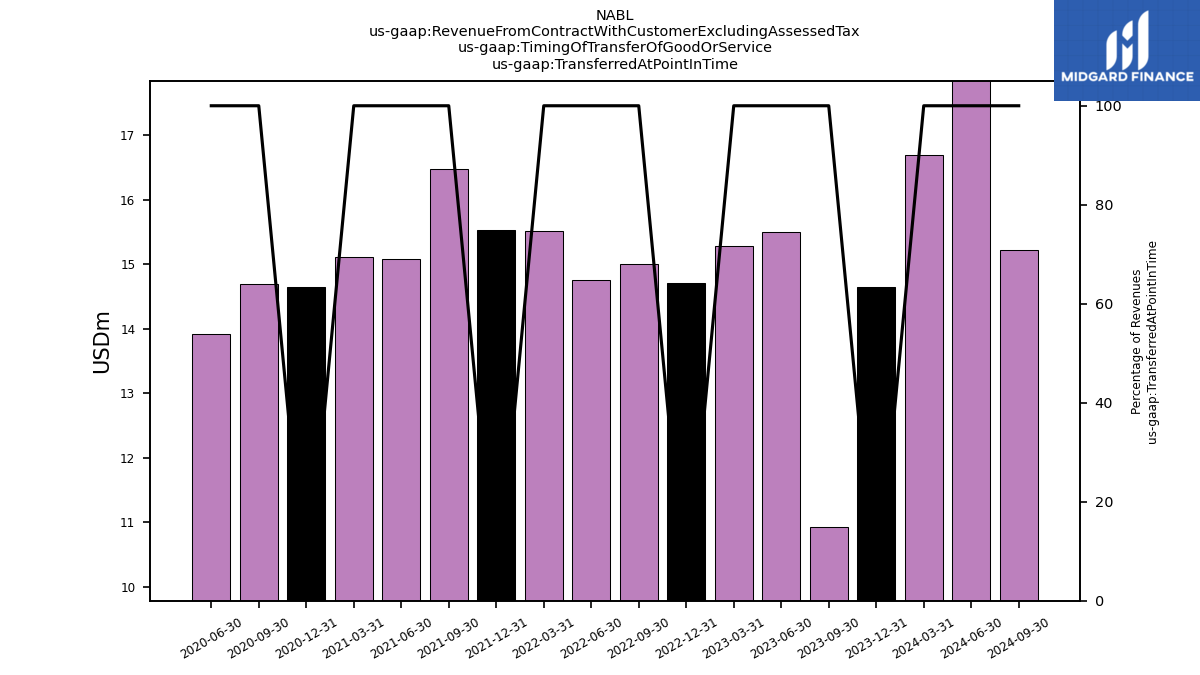
| Transferred At Point In Time | 14.65 | 10.94 | 15.49 | 15.28 | 14.71 | 15.00 | 14.75 | 15.51 | 15.53 | 16.48 | 15.08 | 15.11 | 14.64 | 14.69 | 13.92 | |
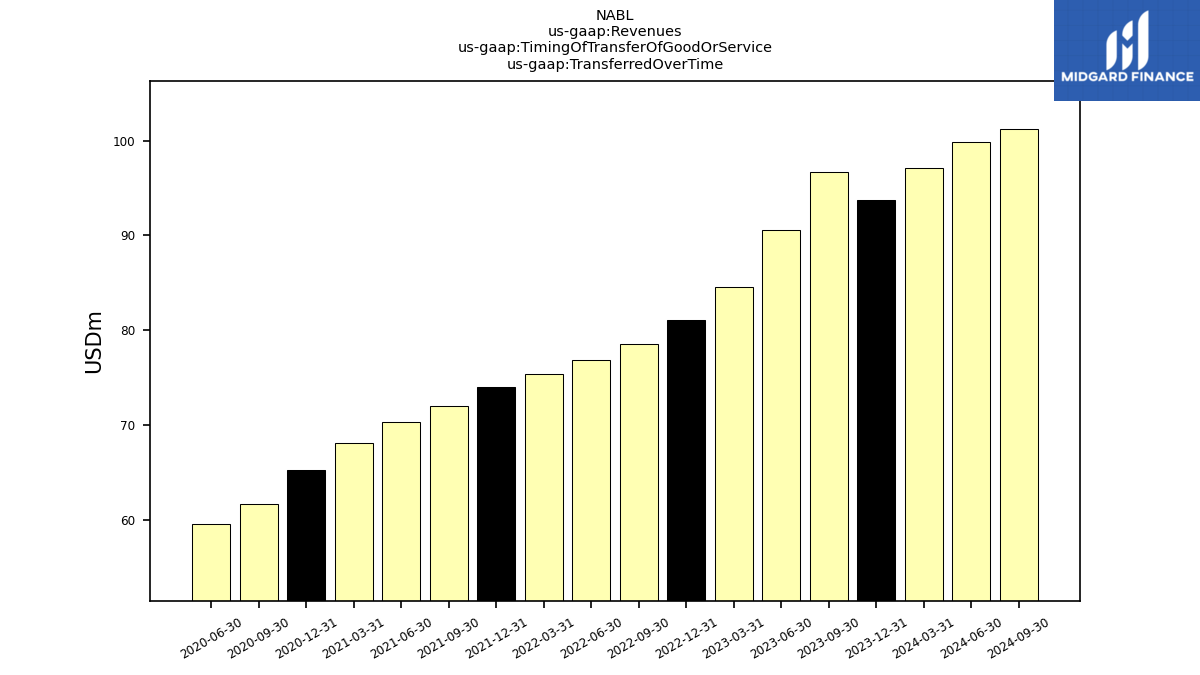
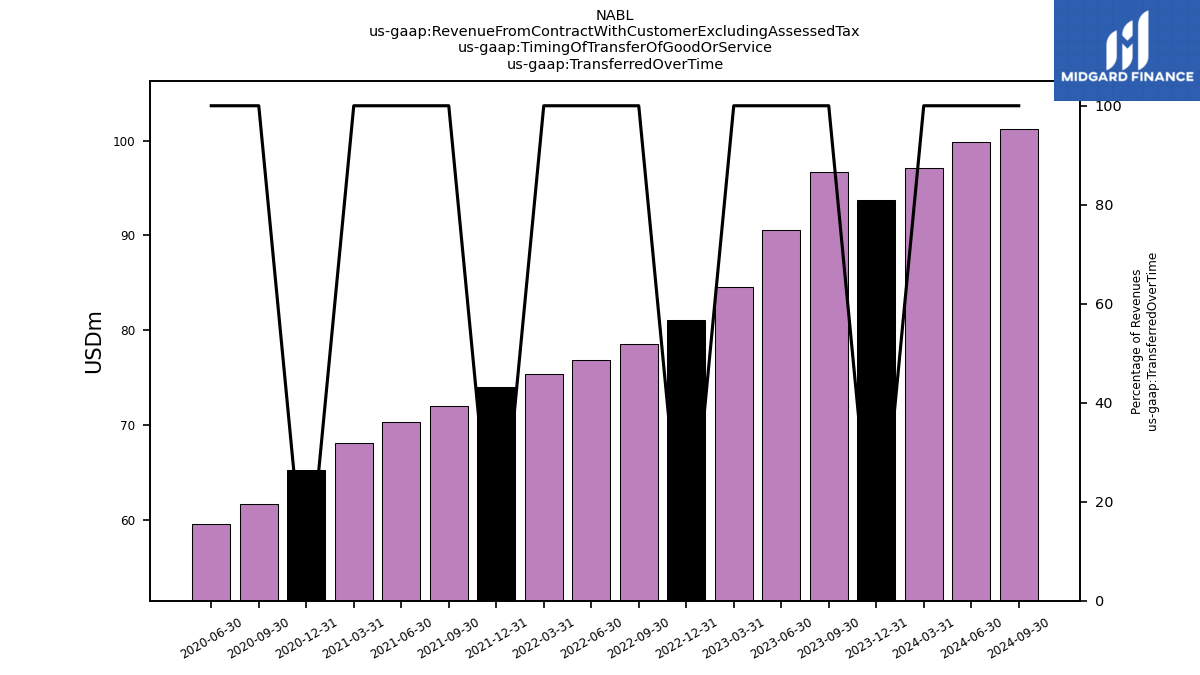
| Transferred Over Time | 93.77 | 96.63 | 90.59 | 84.54 | 81.05 | 78.53 | 76.88 | 75.35 | 73.97 | 71.94 | 70.26 | 68.08 | 65.24 | 61.61 | 59.51 | |
| Revenue From Contract With Customer Excluding Assessed Tax | 108.42 | 107.57 | 106.08 | 99.82 | 95.75 | 93.53 | 91.63 | 90.86 | 89.50 | 88.42 | 85.34 | 83.19 | 79.88 | 76.30 | 73.42 | |
| Solar Winds Holdings Inc, Software Cross License Agreement, Related Party | 0.10 | 0.00 | 0.10 | NA | NA | 0.10 | 0.10 | NA | NA | NA | NA | NA | NA | NA | NA | |
| Solar Winds Holdings Inc, Software O E M Agreements, Related Party | 0.40 | 0.50 | 0.40 | NA | 0.40 | 0.40 | 0.40 | NA | NA | NA | NA | NA | NA | NA | NA | |
| Other Revenue | 2.35 | 2.36 | 2.73 | 2.38 | 2.36 | 2.31 | 2.26 | 2.23 | 2.25 | 2.32 | 2.52 | 2.52 | 2.52 | 2.61 | 2.60 | |
| Subscription Revenue | 106.07 | 105.21 | 103.36 | 97.44 | 93.39 | 91.21 | 89.37 | 88.64 | 87.25 | 86.10 | 82.82 | 80.67 | 77.36 | 73.69 | 70.82 | |
| Transferred At Point In Time | 14.65 | 10.94 | 15.49 | 15.28 | 14.71 | 15.00 | 14.75 | 15.51 | 15.53 | 16.48 | 15.08 | 15.11 | 14.64 | 14.69 | 13.92 | |
| Transferred Over Time | 93.77 | 96.63 | 90.59 | 84.54 | 81.05 | 78.53 | 76.88 | 75.35 | 73.97 | 71.94 | 70.26 | 68.08 | 65.24 | 61.61 | 59.51 |