
| 2023-06-30 | 2023-03-31 | 2022-12-31 | 2022-09-30 | 2022-06-30 | 2022-03-31 | 2021-12-31 | 2021-09-30 | 2021-06-30 | 2021-03-31 | 2020-12-31 | 2020-09-30 | 2020-06-30 | 2020-03-31 | 2019-12-31 | 2019-09-30 | 2019-06-30 | 2019-03-31 | 2018-12-31 | 2018-09-30 | 2018-06-30 | 2018-03-31 | 2017-12-31 | 2017-09-30 | 2017-06-30 | 2017-03-31 | 2016-12-31 | 2016-09-30 | 2016-06-30 | 2016-03-31 | ||
|---|---|---|---|---|---|---|---|---|---|---|---|---|---|---|---|---|---|---|---|---|---|---|---|---|---|---|---|---|---|---|---|
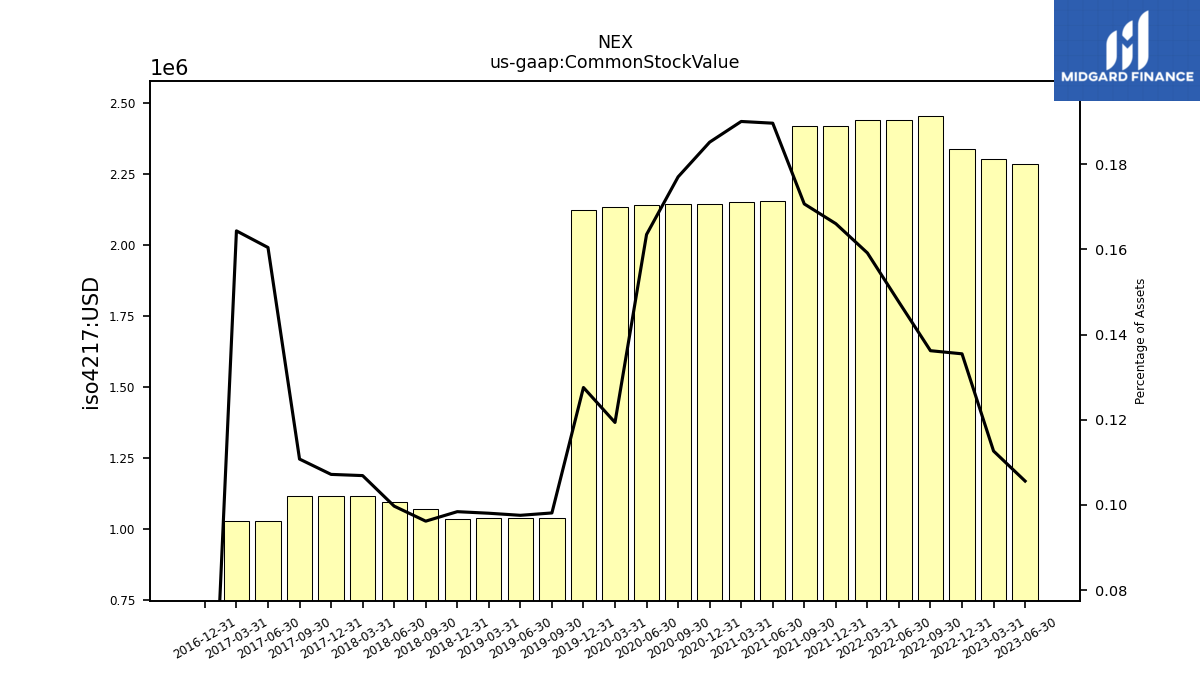
| Common Stock Value | 2.29 | 2.31 | 2.34 | 2.46 | 2.44 | 2.44 | 2.42 | 2.42 | 2.16 | 2.15 | 2.14 | 2.14 | 2.14 | 2.13 | 2.12 | 1.04 | 1.04 | 1.04 | 1.04 | 1.07 | 1.10 | 1.12 | 1.12 | 1.12 | 1.03 | 1.03 | 0.00 | NA | NA | NA | |
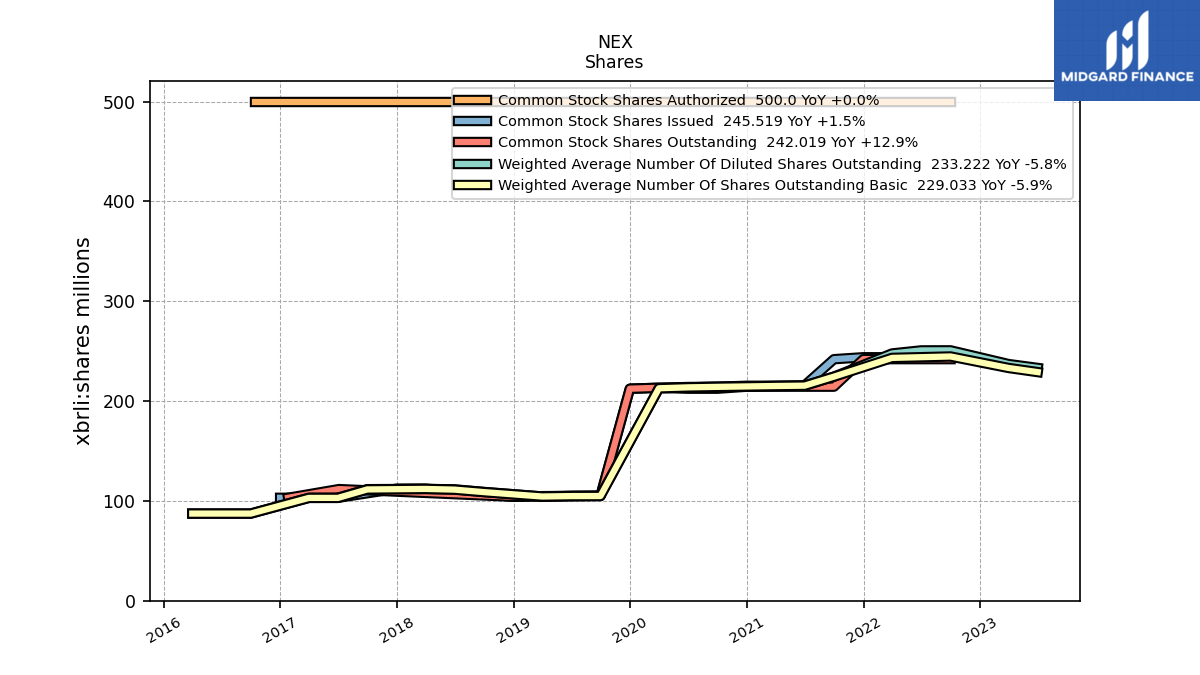
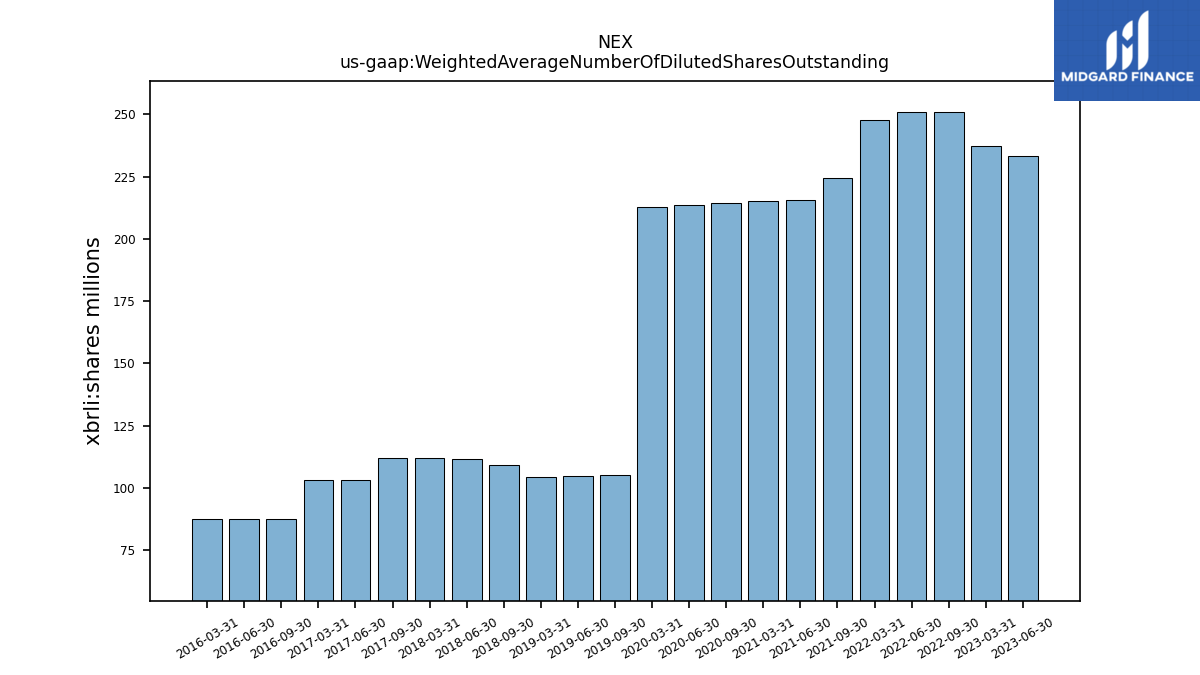
| Weighted Average Number Of Diluted Shares Outstanding | 233.22 | 237.07 | NA | 250.82 | 250.78 | 247.71 | NA | 224.48 | 215.44 | 215.11 | NA | 214.25 | 213.76 | 212.84 | NA | 105.26 | 104.84 | 104.42 | NA | 108.99 | 111.54 | 112.01 | NA | 111.75 | 103.14 | 103.11 | NA | 87.31 | 87.31 | 87.31 | |
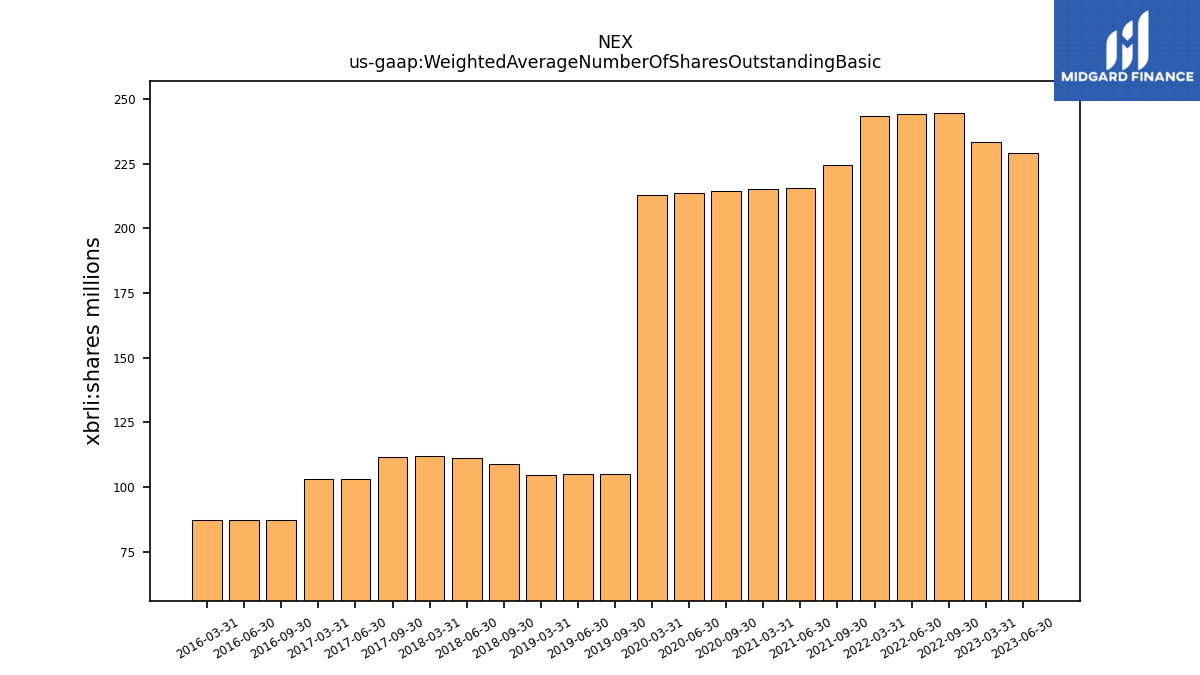
| Weighted Average Number Of Shares Outstanding Basic | 229.03 | 233.16 | NA | 244.69 | 243.97 | 243.27 | NA | 224.48 | 215.44 | 215.11 | NA | 214.25 | 213.76 | 212.84 | NA | 104.90 | 104.84 | 104.42 | NA | 108.83 | 111.32 | 112.01 | NA | 111.51 | 103.01 | 103.01 | NA | 87.31 | 87.31 | 87.31 | |
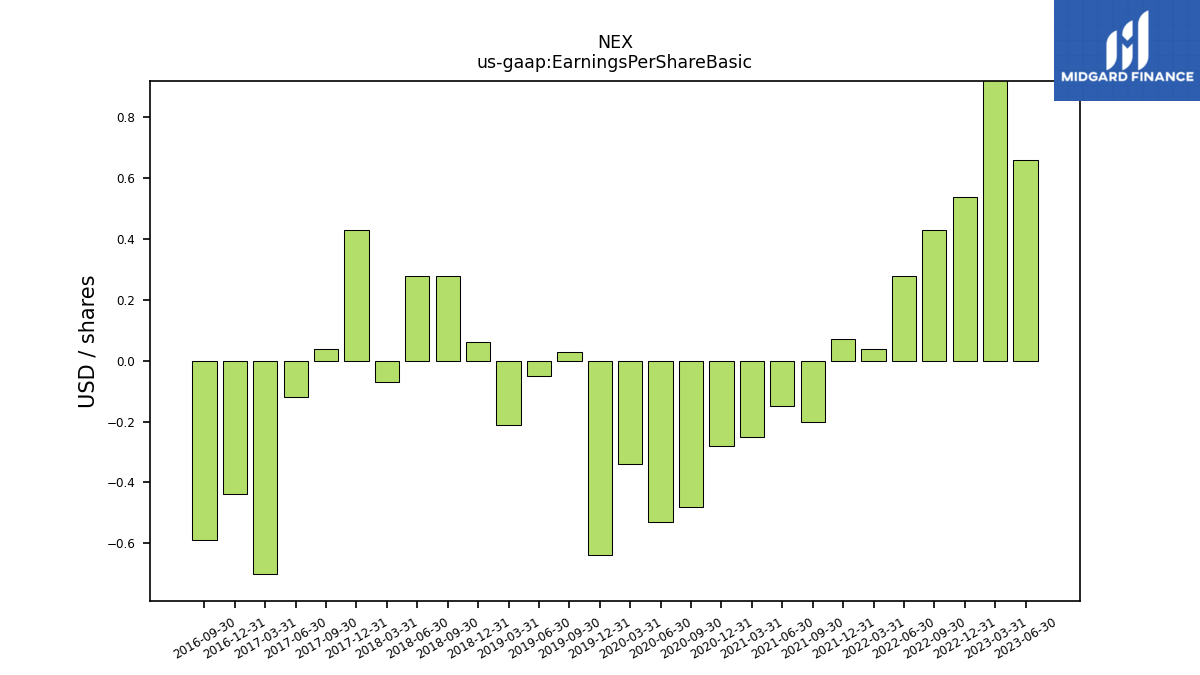
| Earnings Per Share Basic | 0.66 | 1.09 | 0.54 | 0.43 | 0.28 | 0.04 | 0.07 | -0.20 | -0.15 | -0.25 | -0.28 | -0.48 | -0.53 | -0.34 | -0.64 | 0.03 | -0.05 | -0.21 | 0.06 | 0.28 | 0.28 | -0.07 | 0.43 | 0.04 | -0.12 | -0.70 | -0.44 | -0.59 | NA | NA | |
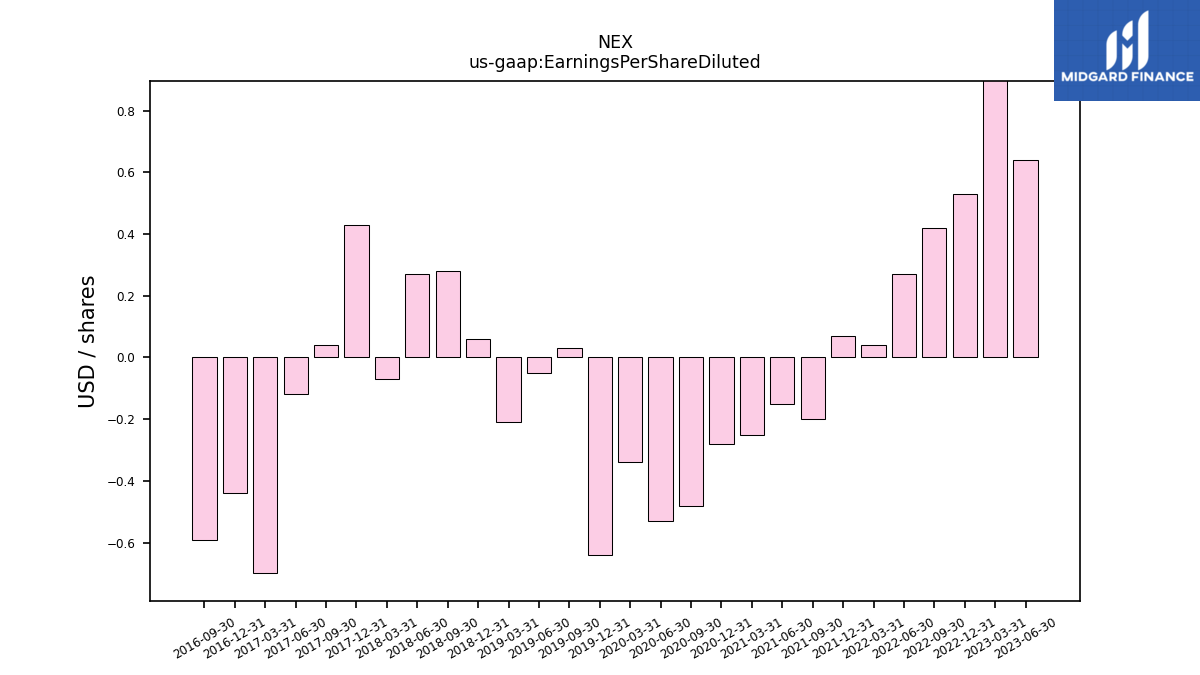
| Earnings Per Share Diluted | 0.64 | 1.07 | 0.53 | 0.42 | 0.27 | 0.04 | 0.07 | -0.20 | -0.15 | -0.25 | -0.28 | -0.48 | -0.53 | -0.34 | -0.64 | 0.03 | -0.05 | -0.21 | 0.06 | 0.28 | 0.27 | -0.07 | 0.43 | 0.04 | -0.12 | -0.70 | -0.44 | -0.59 | NA | NA |
| 2023-06-30 | 2023-03-31 | 2022-12-31 | 2022-09-30 | 2022-06-30 | 2022-03-31 | 2021-12-31 | 2021-09-30 | 2021-06-30 | 2021-03-31 | 2020-12-31 | 2020-09-30 | 2020-06-30 | 2020-03-31 | 2019-12-31 | 2019-09-30 | 2019-06-30 | 2019-03-31 | 2018-12-31 | 2018-09-30 | 2018-06-30 | 2018-03-31 | 2017-12-31 | 2017-09-30 | 2017-06-30 | 2017-03-31 | 2016-12-31 | 2016-09-30 | 2016-06-30 | 2016-03-31 | ||
|---|---|---|---|---|---|---|---|---|---|---|---|---|---|---|---|---|---|---|---|---|---|---|---|---|---|---|---|---|---|---|---|
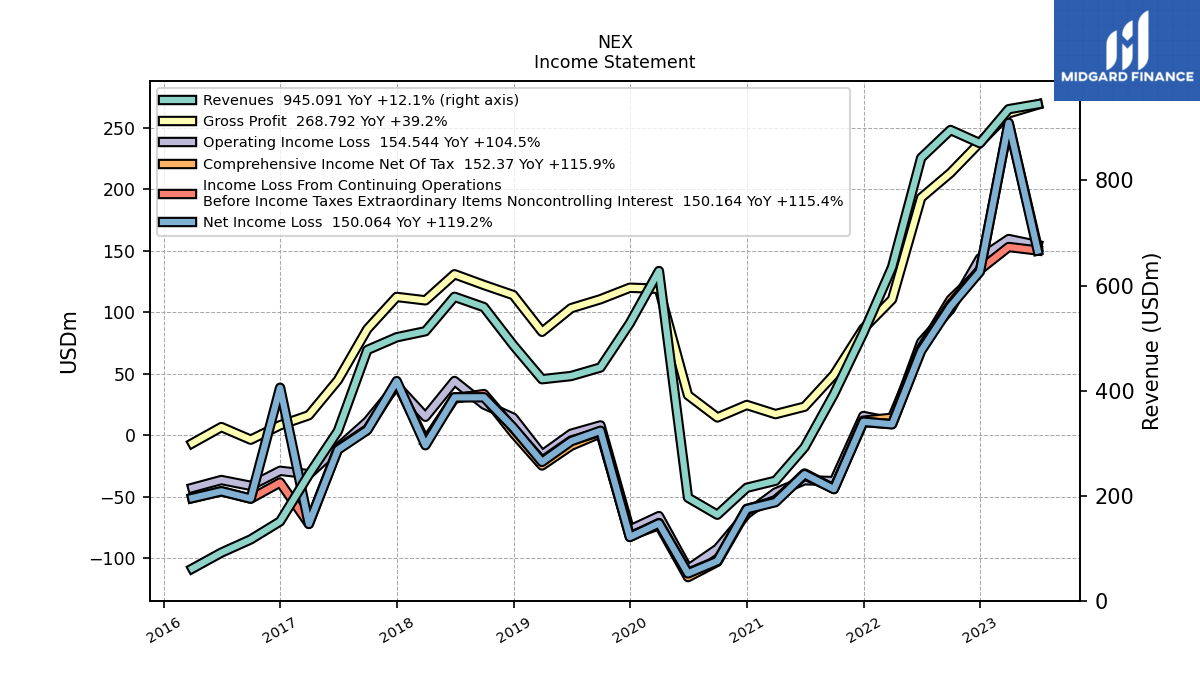
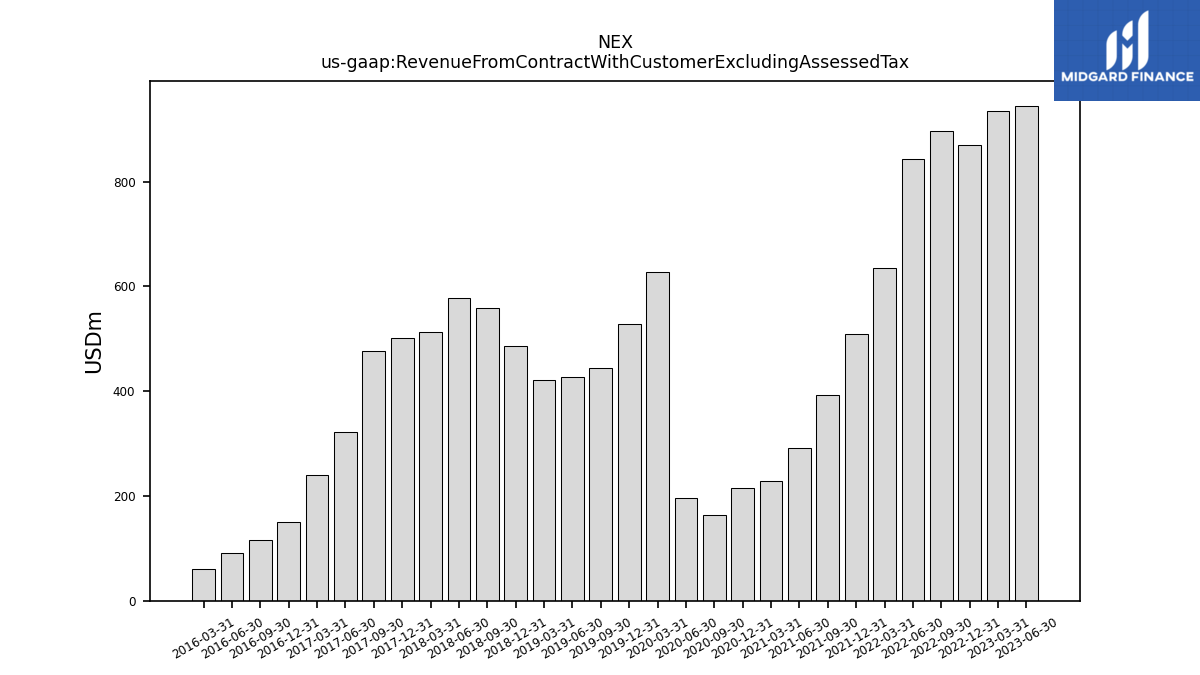
| Revenue From Contract With Customer Excluding Assessed Tax | 945.09 | 935.67 | 870.86 | 896.01 | 842.91 | 635.04 | 509.73 | 393.16 | 292.14 | 228.40 | 215.05 | 163.68 | 196.23 | 627.62 | 528.22 | 443.95 | 427.73 | 421.65 | 486.55 | 558.91 | 578.53 | 513.02 | 501.49 | 477.30 | 323.14 | 240.15 | 151.03 | 116.75 | 91.59 | 61.20 | |
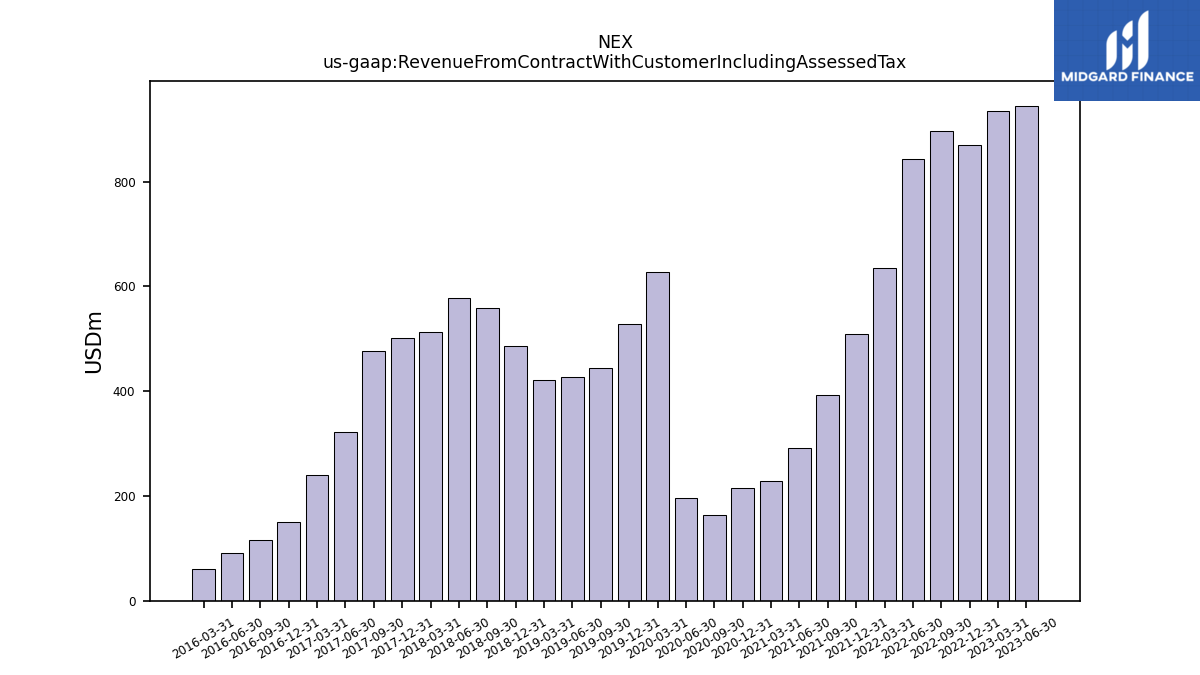
| Revenue From Contract With Customer Including Assessed Tax | 945.09 | 935.67 | 870.86 | 896.01 | 842.91 | 635.04 | 509.73 | 393.16 | 292.14 | 228.40 | 215.05 | 163.68 | 196.23 | 627.62 | 528.22 | 443.95 | 427.73 | 421.65 | 486.55 | 558.91 | 578.53 | 513.02 | 501.49 | 477.30 | 323.14 | 240.15 | 151.03 | 116.75 | 91.59 | 61.20 | |
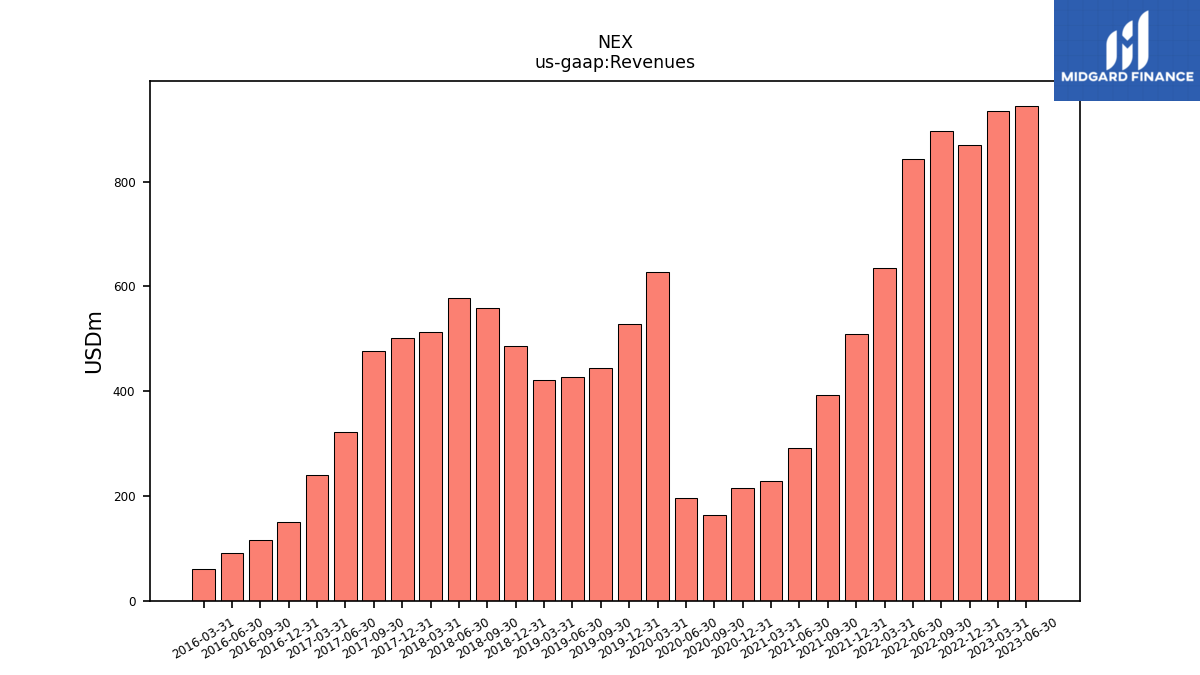
| Revenues | 945.09 | 935.67 | 870.86 | 896.01 | 842.91 | 635.04 | 509.73 | 393.16 | 292.14 | 228.40 | 215.05 | 163.68 | 196.23 | 627.62 | 528.22 | 443.95 | 427.73 | 421.65 | 486.55 | 558.91 | 578.53 | 513.02 | 501.49 | 477.30 | 323.14 | 240.15 | 151.03 | 116.75 | 91.59 | 61.20 | |
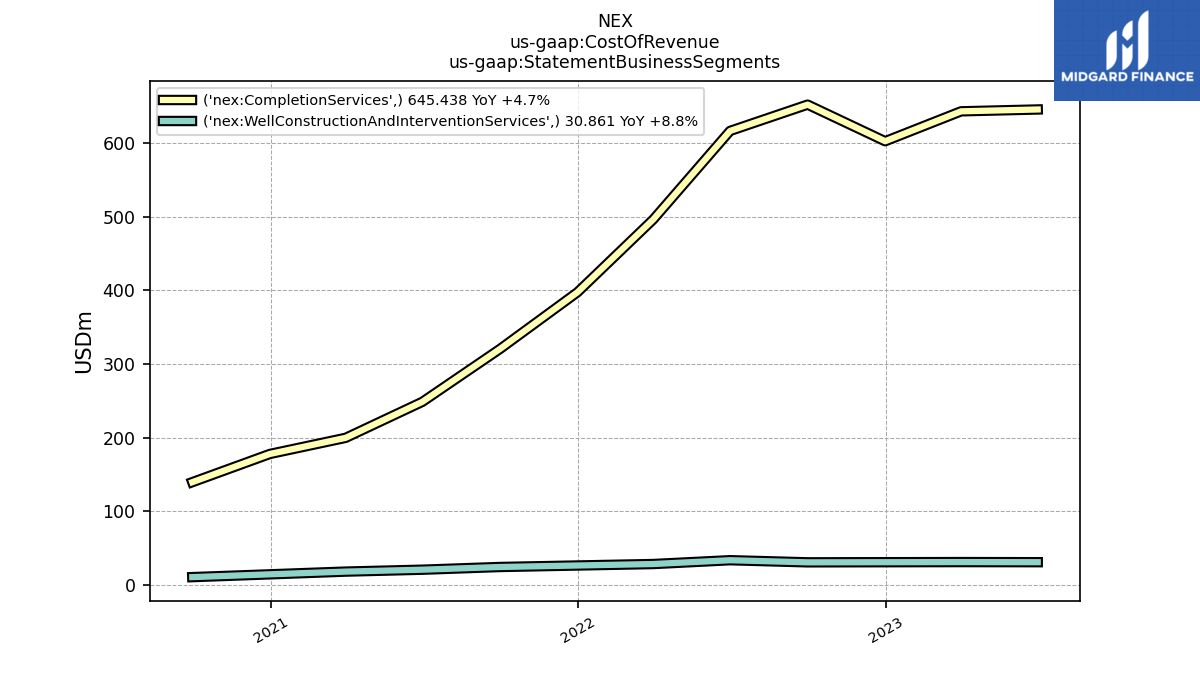
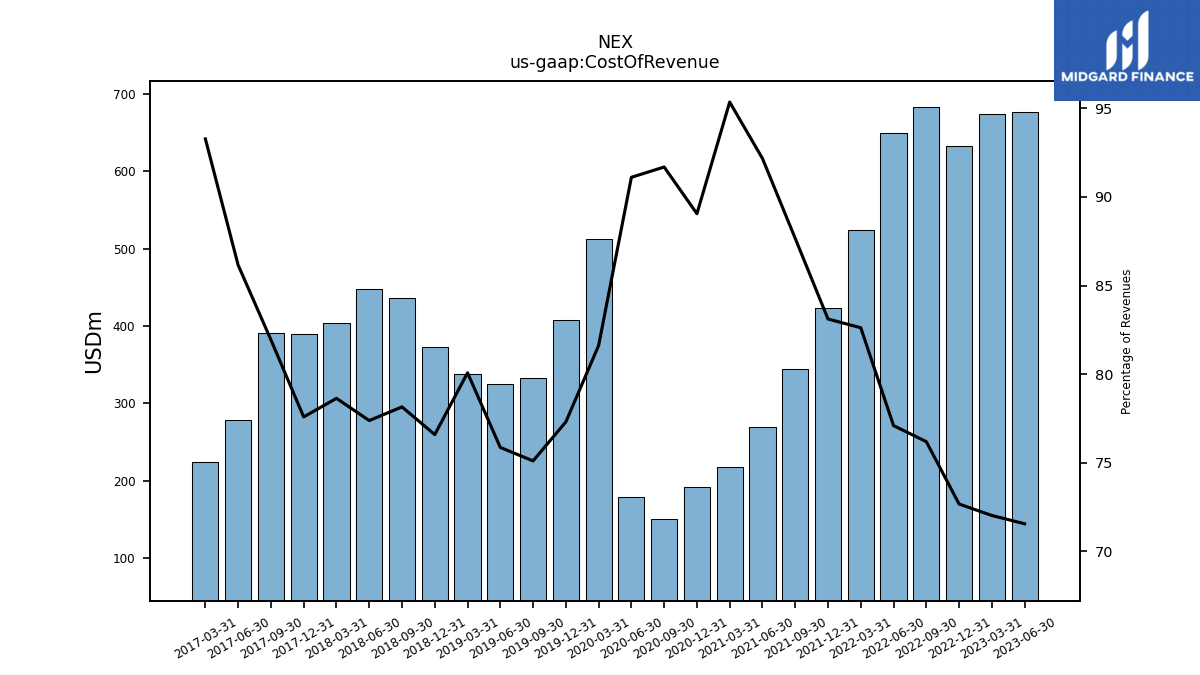
| Cost Of Revenue | 676.30 | 673.94 | 632.89 | 682.68 | 649.87 | 524.66 | 423.65 | 344.64 | 269.26 | 217.78 | 191.51 | 150.07 | 178.77 | 512.23 | 408.35 | 333.44 | 324.50 | 337.65 | 372.65 | 436.80 | 447.69 | 403.41 | 389.10 | 391.09 | 278.38 | 223.99 | NA | NA | NA | NA | |
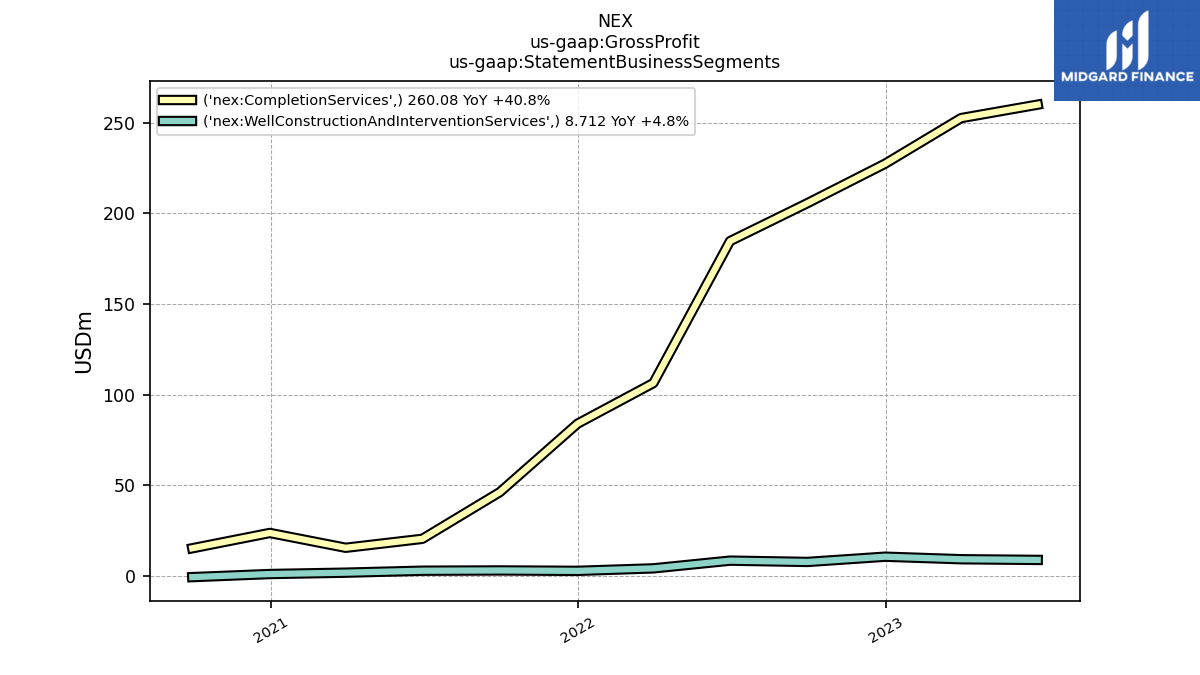
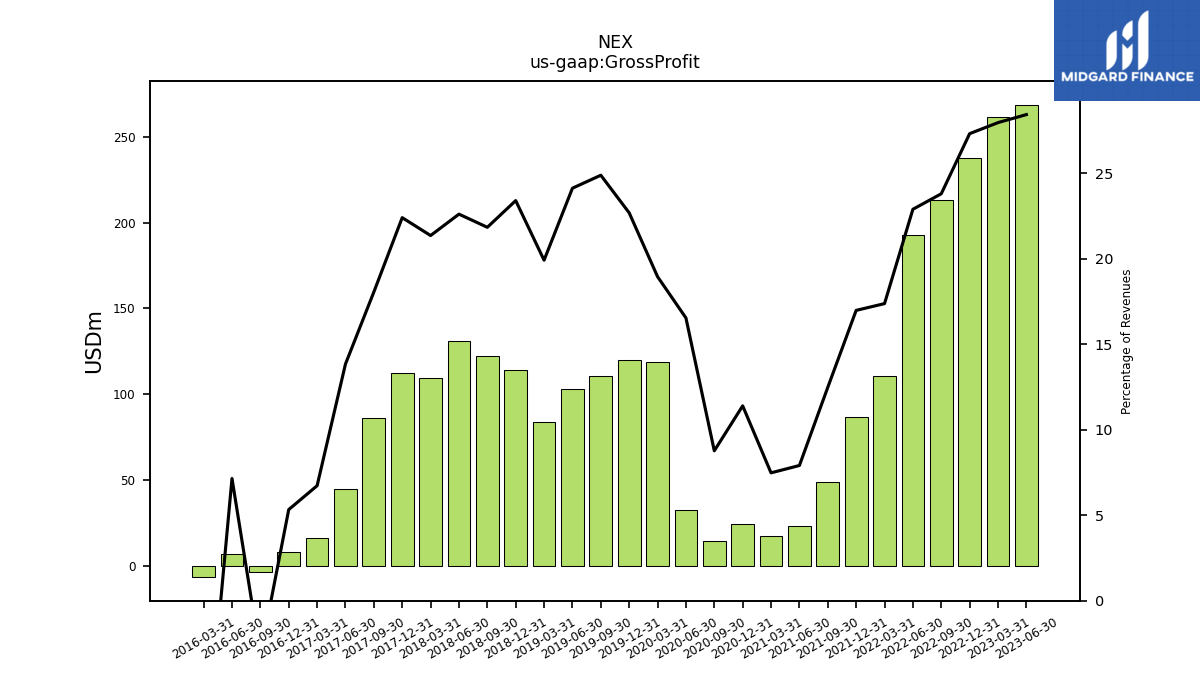
| Gross Profit | 268.79 | 261.73 | 237.97 | 213.33 | 193.05 | 110.39 | 86.59 | 49.09 | 23.12 | 17.09 | 24.52 | 14.36 | 32.47 | 119.00 | 119.87 | 110.52 | 103.23 | 84.01 | 113.89 | 122.11 | 130.85 | 109.61 | 112.39 | 86.21 | 44.75 | 16.16 | 8.05 | -3.73 | 6.55 | -6.65 | |
| Costs And Expenses | 790.55 | 776.20 | 727.06 | 793.69 | 767.33 | 624.09 | 494.18 | 430.57 | 328.83 | 275.12 | 279.15 | 256.10 | 305.13 | 693.48 | 605.08 | 436.06 | 426.63 | 437.54 | 472.40 | 533.98 | 534.50 | 498.11 | 461.25 | 466.19 | 333.45 | 271.92 | 180.05 | 157.99 | 128.12 | 104.11 | |
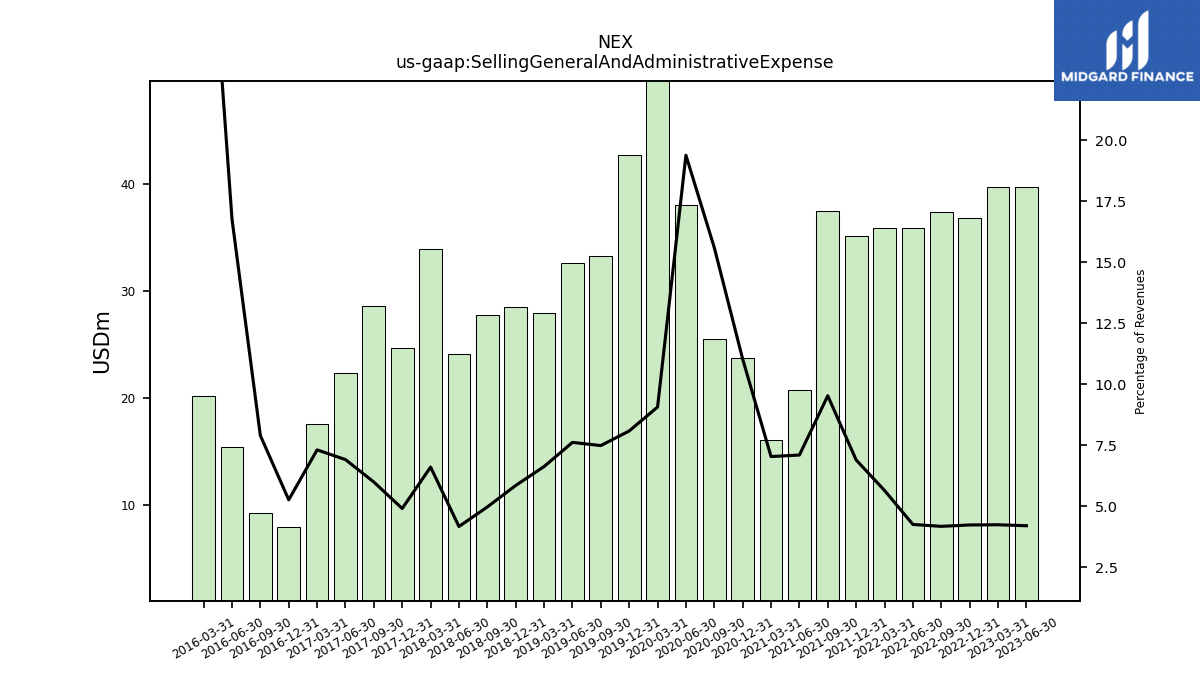
| Selling General And Administrative Expense | 39.70 | 39.68 | 36.87 | 37.41 | 35.85 | 35.86 | 35.15 | 37.45 | 20.73 | 16.07 | 23.72 | 25.52 | 38.02 | 56.88 | 42.70 | 33.23 | 32.57 | 27.94 | 28.47 | 27.78 | 24.12 | 33.88 | 24.61 | 28.59 | 22.33 | 17.55 | 7.95 | 9.22 | 15.36 | 20.16 | |
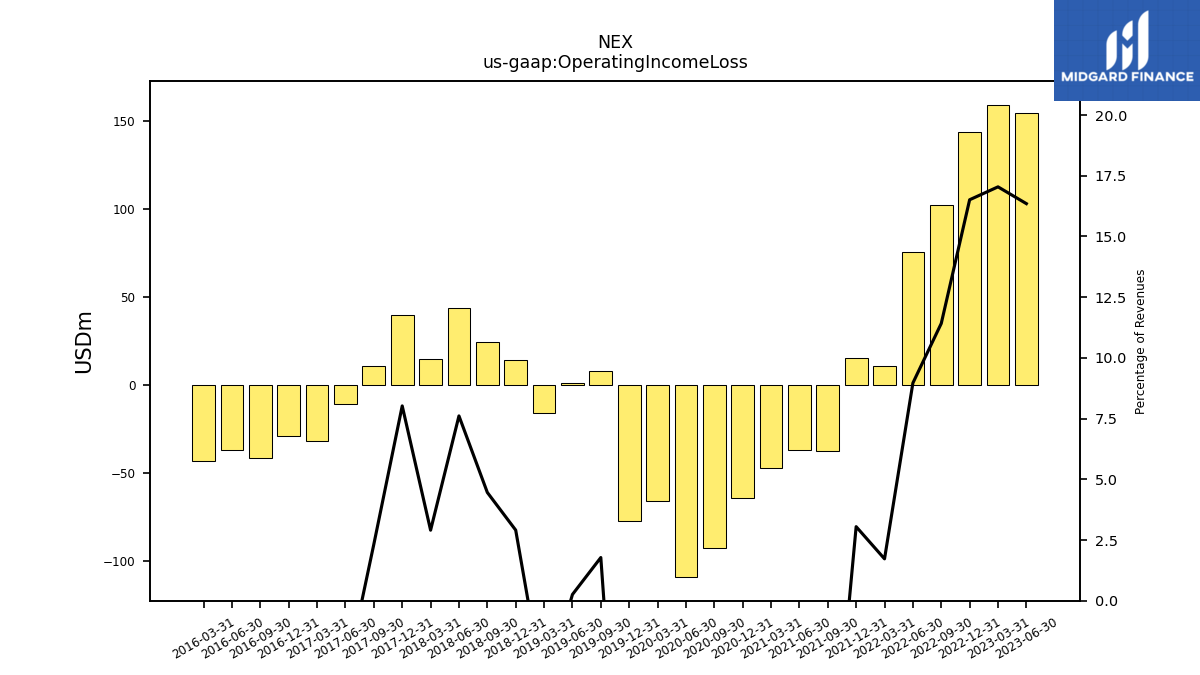
| Operating Income Loss | 154.54 | 159.47 | 143.80 | 102.32 | 75.58 | 10.96 | 15.55 | -37.41 | -36.68 | -46.72 | -64.10 | -92.42 | -108.90 | -65.85 | -76.86 | 7.90 | 1.10 | -15.88 | 14.15 | 24.93 | 44.03 | 14.90 | 40.24 | 11.12 | -10.32 | -31.76 | -29.02 | -41.23 | -36.53 | -42.92 | |
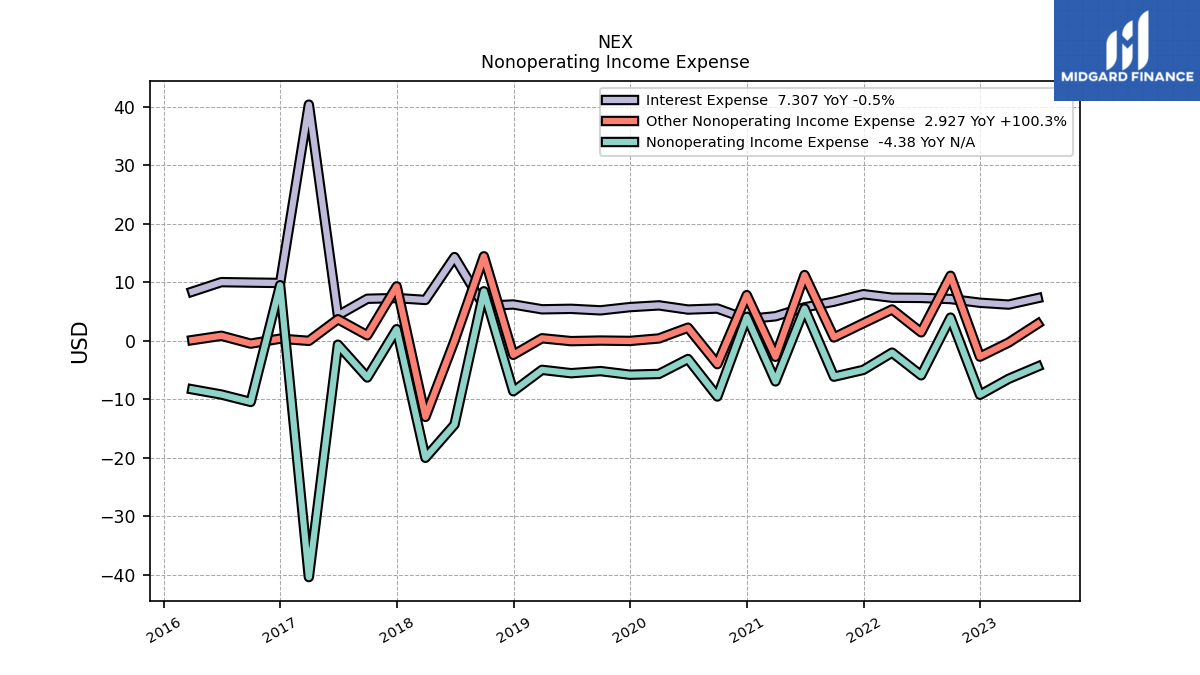
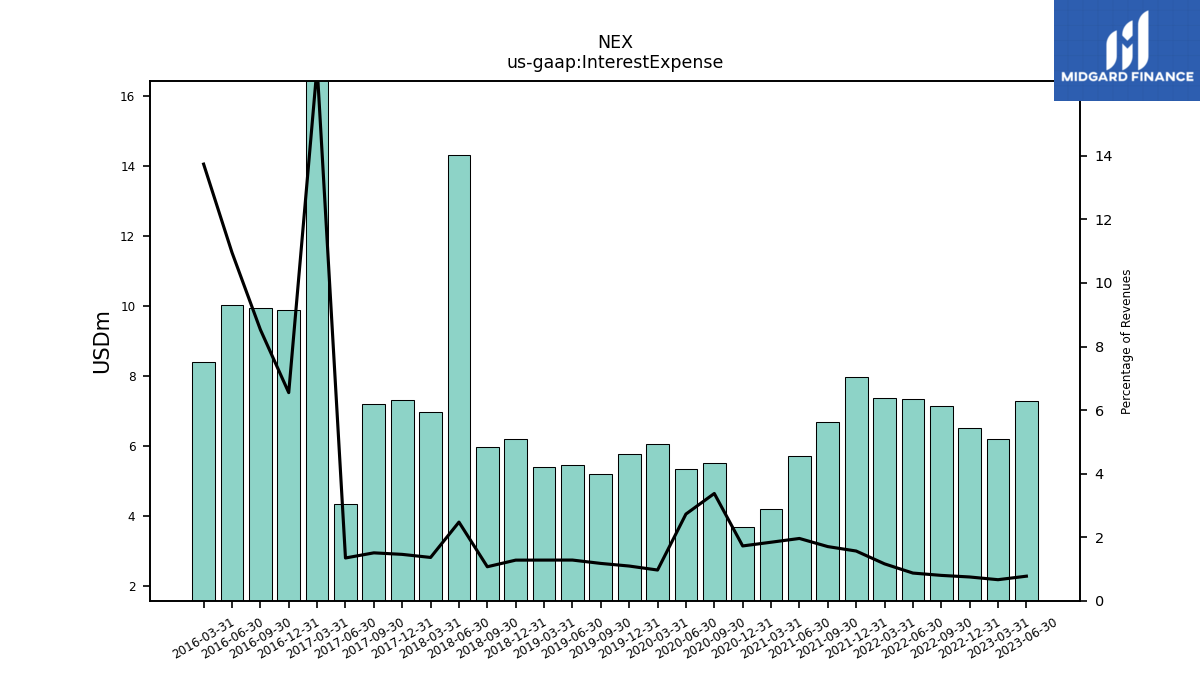
| Interest Expense | 7.31 | 6.20 | 6.51 | 7.15 | 7.34 | 7.37 | 7.98 | 6.70 | 5.73 | 4.21 | 3.71 | 5.52 | 5.35 | 6.07 | 5.77 | 5.21 | 5.48 | 5.39 | 6.22 | 5.98 | 14.32 | 6.99 | 7.32 | 7.20 | 4.35 | 40.36 | 9.89 | 9.96 | 10.04 | 8.41 | |
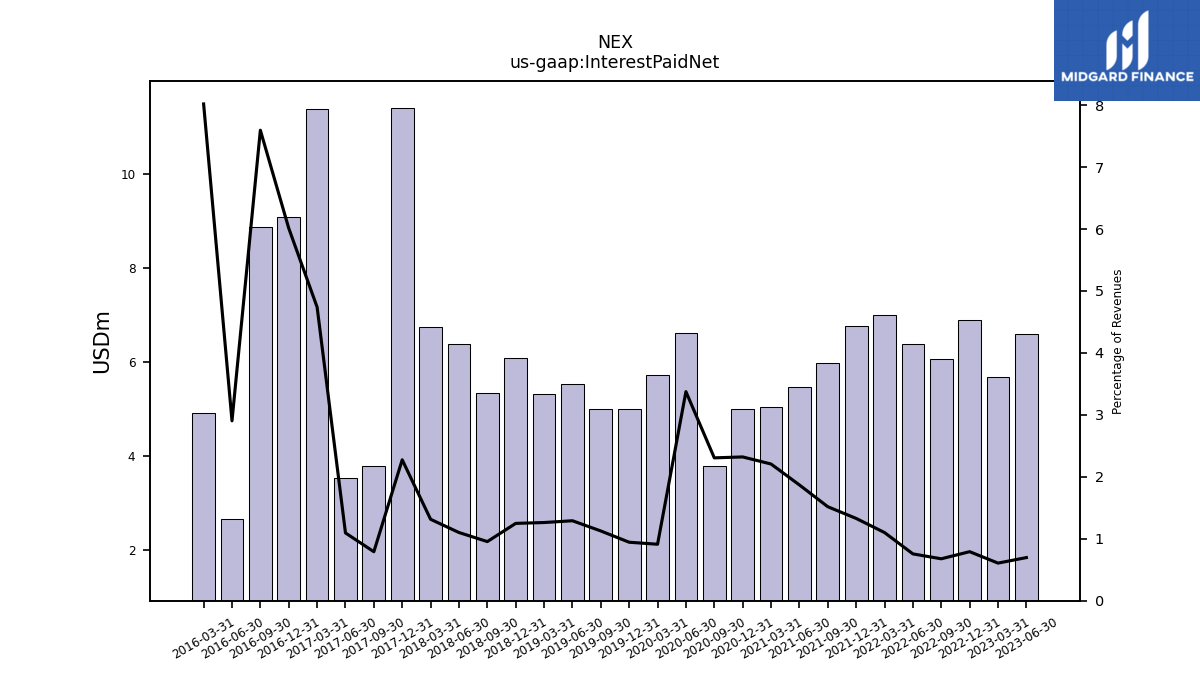
| Interest Paid Net | 6.58 | 5.68 | 6.90 | 6.07 | 6.38 | 6.99 | 6.77 | 5.97 | 5.46 | 5.04 | 4.99 | 3.77 | 6.62 | 5.72 | 4.99 | 5.00 | 5.52 | 5.32 | 6.07 | 5.34 | 6.37 | 6.75 | 11.41 | 3.78 | 3.54 | 11.38 | 9.08 | 8.87 | 2.66 | 4.91 | |
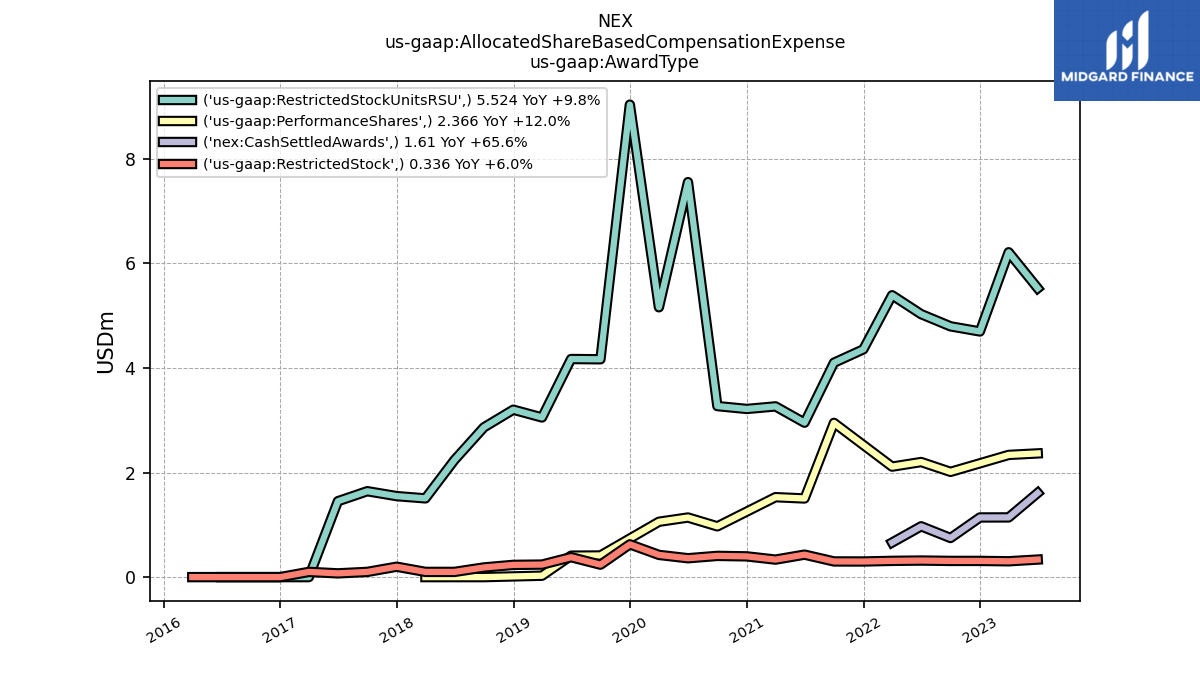
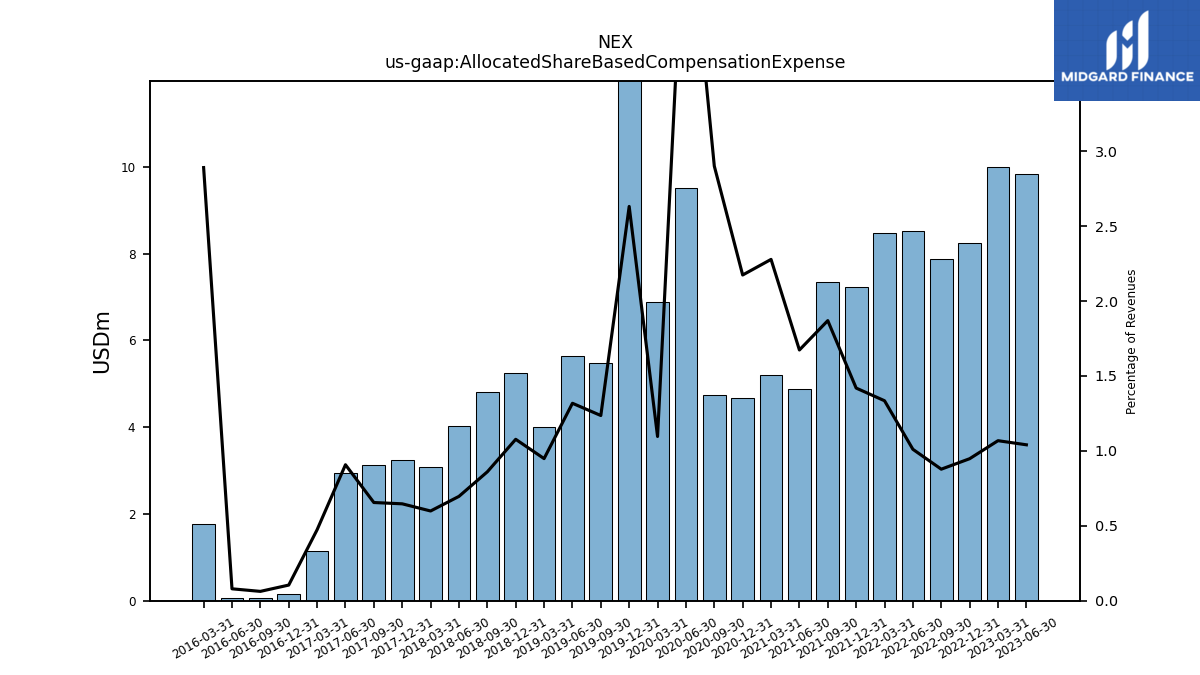
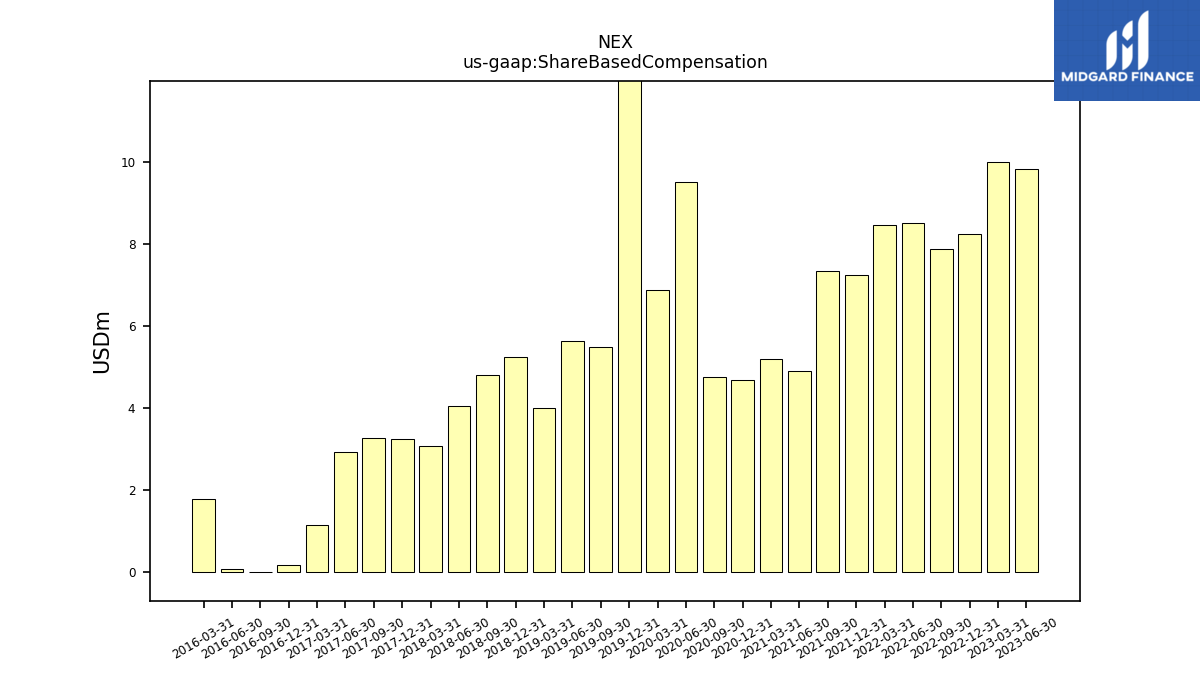
| Allocated Share Based Compensation Expense | 9.84 | 9.99 | 8.26 | 7.87 | 8.52 | 8.48 | 7.24 | 7.35 | 4.89 | 5.20 | 4.67 | 4.75 | 9.52 | 6.88 | 13.90 | 5.49 | 5.64 | 4.00 | 5.24 | 4.81 | 4.03 | 3.07 | 3.24 | 3.13 | 2.93 | 1.14 | 0.16 | 0.07 | 0.07 | 1.77 | |
| Income Tax Expense Benefit | 0.10 | -101.00 | 1.60 | 1.56 | 1.24 | 0.16 | -0.26 | 0.47 | 0.62 | 0.86 | 0.22 | 0.51 | 0.49 | 0.25 | 0.29 | -0.82 | 0.56 | 0.97 | -0.58 | 2.62 | -0.94 | 3.17 | -1.71 | 0.80 | 0.93 | -0.13 | -0.11 | 0.00 | 0.00 | 0.00 | |
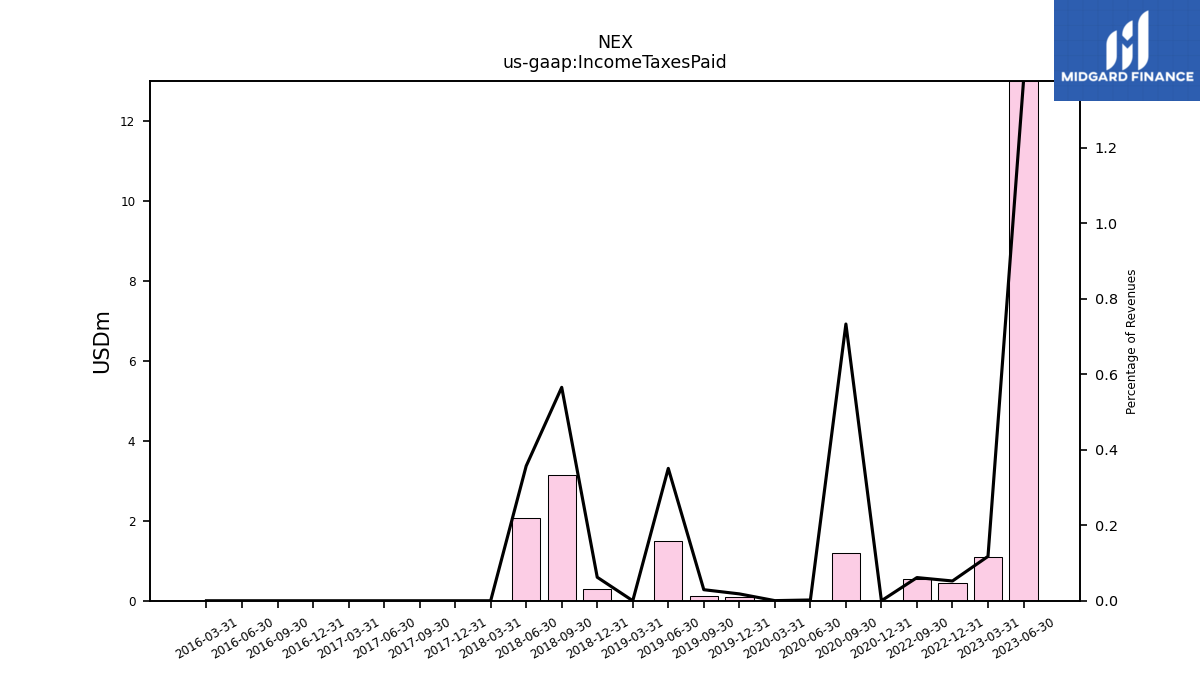
| Income Taxes Paid | 13.01 | 1.10 | 0.46 | 0.55 | NA | NA | NA | NA | NA | NA | 0.00 | 1.20 | 0.00 | 0.00 | 0.10 | 0.13 | 1.50 | 0.00 | 0.30 | 3.16 | 2.07 | 0.00 | 0.00 | 0.00 | 0.00 | 0.00 | 0.00 | 0.00 | 0.00 | 0.00 | |
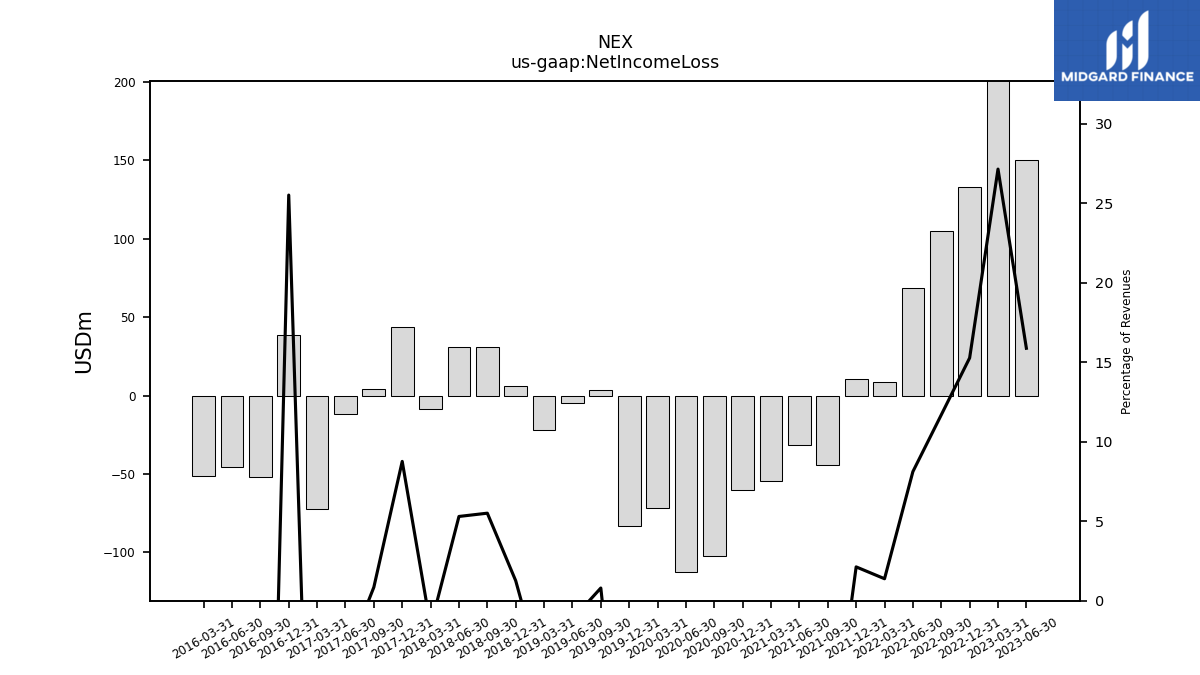
| Net Income Loss | 150.06 | 253.99 | 132.99 | 104.73 | 68.46 | 8.79 | 10.85 | -43.99 | -31.78 | -54.50 | -60.21 | -102.43 | -112.49 | -71.76 | -82.93 | 3.56 | -4.98 | -21.81 | 6.13 | 30.78 | 30.67 | -8.24 | 43.95 | 4.07 | -11.90 | -72.25 | 38.53 | -51.67 | -45.69 | -51.19 | |
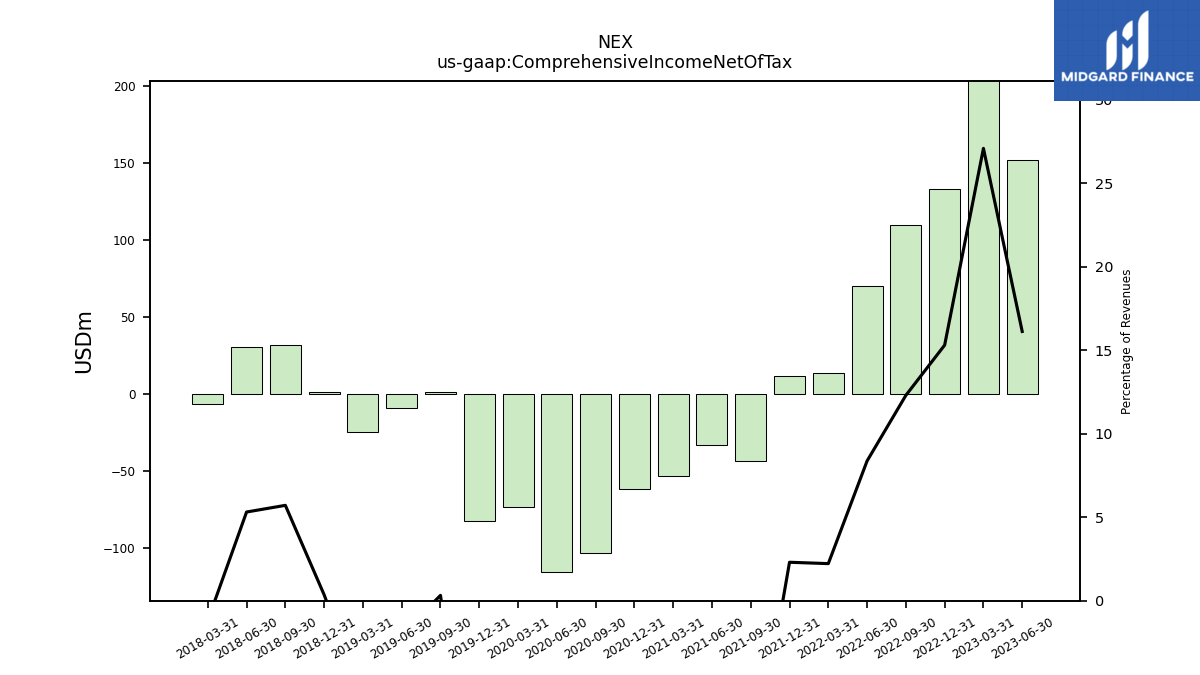
| Comprehensive Income Net Of Tax | 152.37 | 253.43 | 133.28 | 110.19 | 70.56 | 14.12 | 11.75 | -43.51 | -32.73 | -52.82 | -61.40 | -103.04 | -115.50 | -73.27 | -81.98 | 1.44 | -8.66 | -24.70 | 1.74 | 31.93 | 30.73 | -6.07 | NA | NA | NA | NA | NA | NA | NA | NA |
| 2023-06-30 | 2023-03-31 | 2022-12-31 | 2022-09-30 | 2022-06-30 | 2022-03-31 | 2021-12-31 | 2021-09-30 | 2021-06-30 | 2021-03-31 | 2020-12-31 | 2020-09-30 | 2020-06-30 | 2020-03-31 | 2019-12-31 | 2019-09-30 | 2019-06-30 | 2019-03-31 | 2018-12-31 | 2018-09-30 | 2018-06-30 | 2018-03-31 | 2017-12-31 | 2017-09-30 | 2017-06-30 | 2017-03-31 | 2016-12-31 | 2016-09-30 | 2016-06-30 | 2016-03-31 | ||
|---|---|---|---|---|---|---|---|---|---|---|---|---|---|---|---|---|---|---|---|---|---|---|---|---|---|---|---|---|---|---|---|
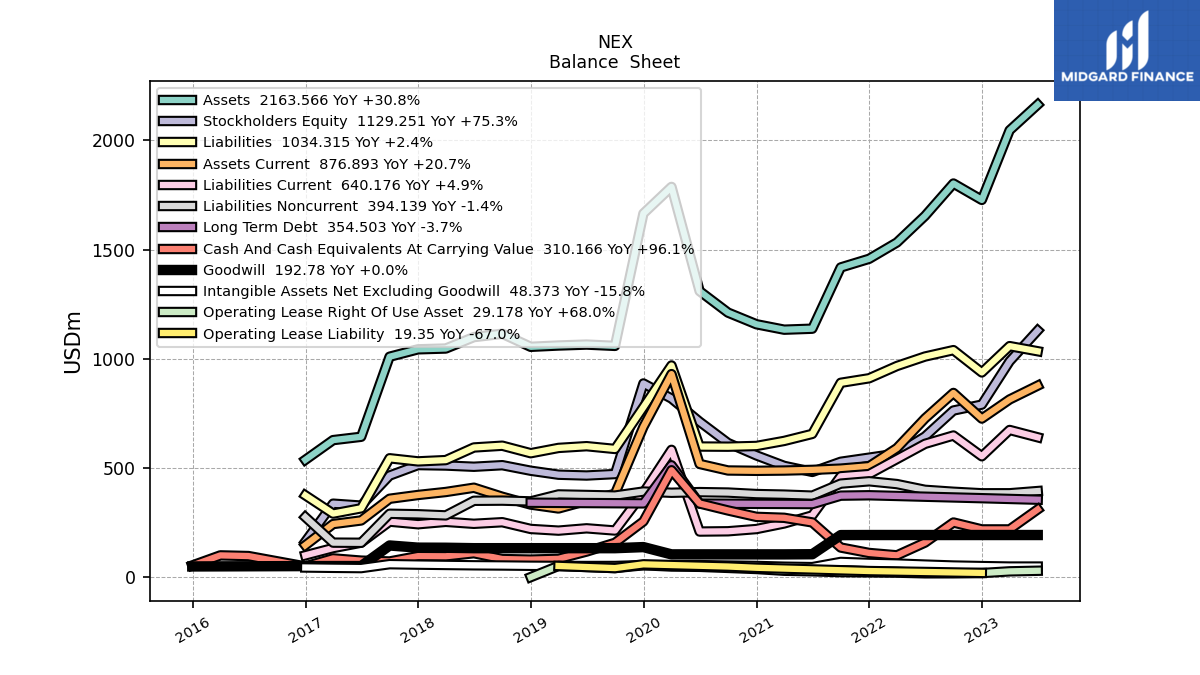
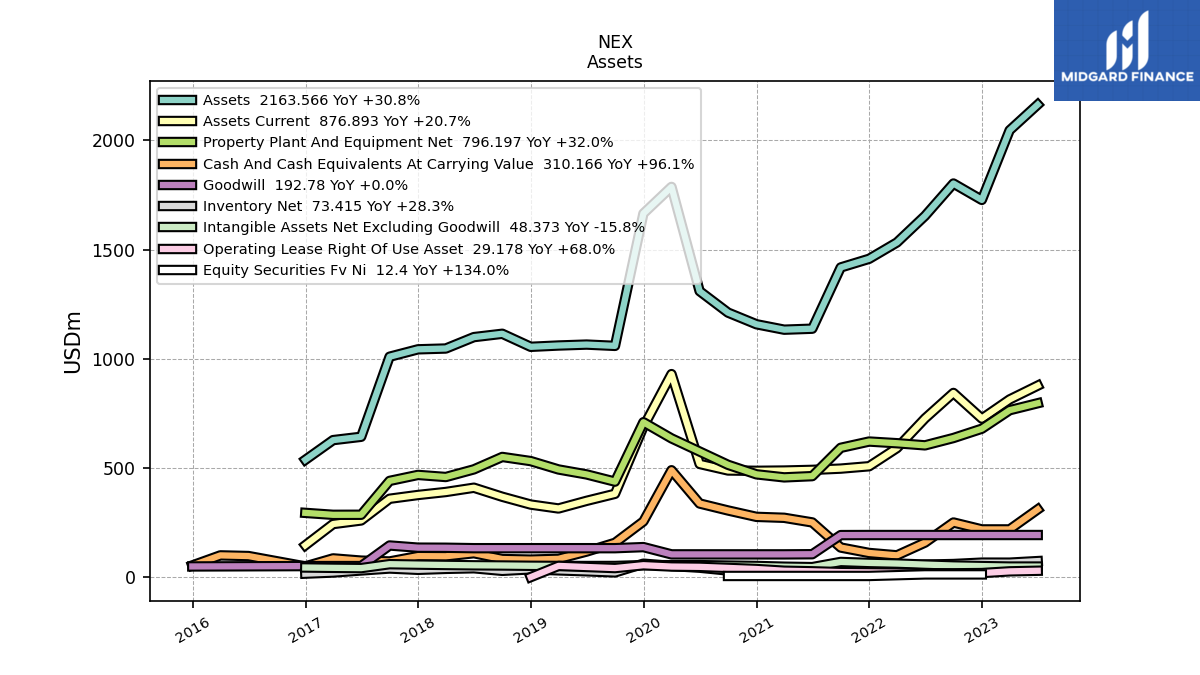
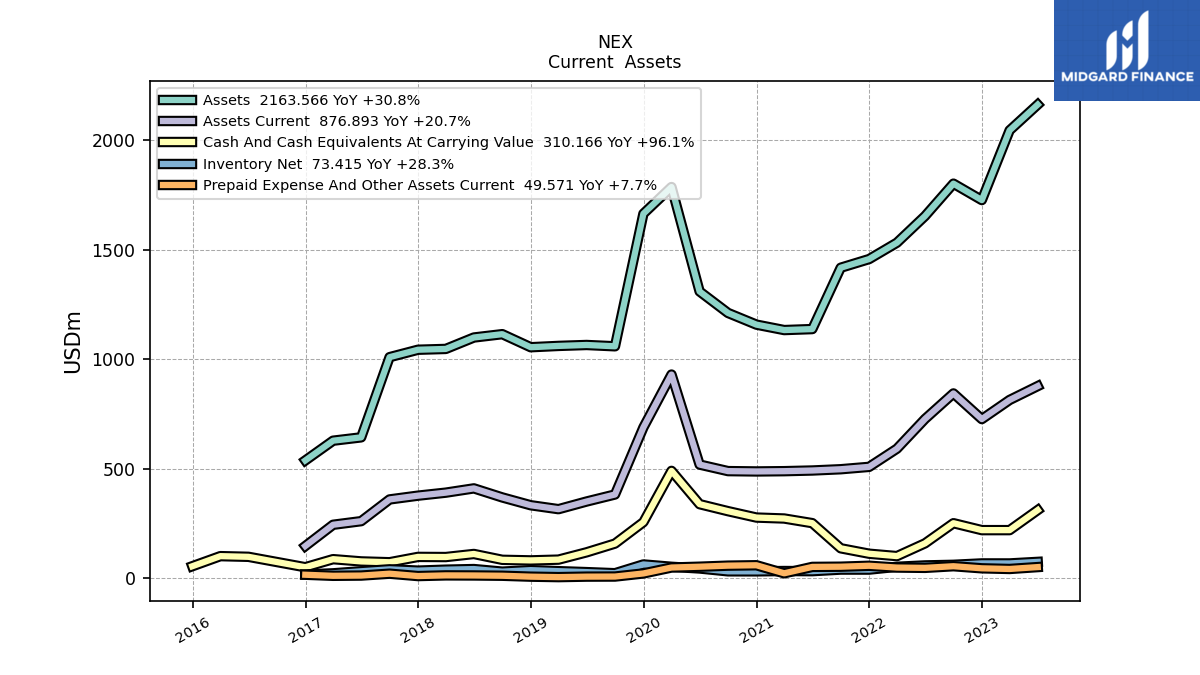
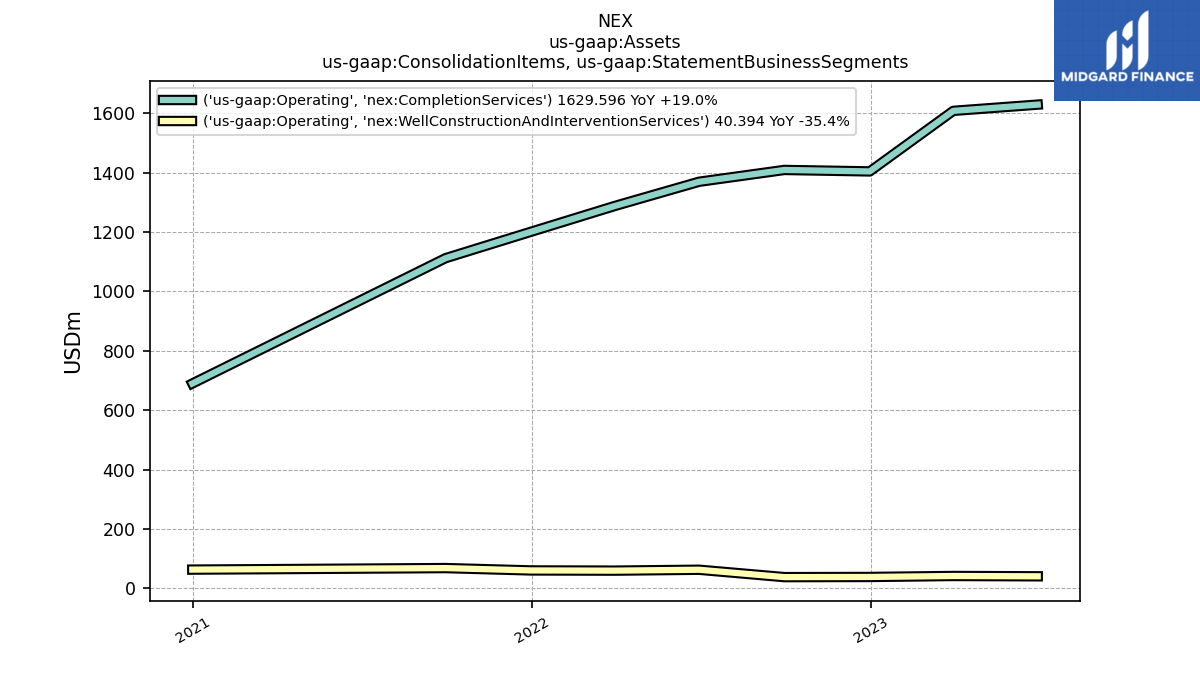
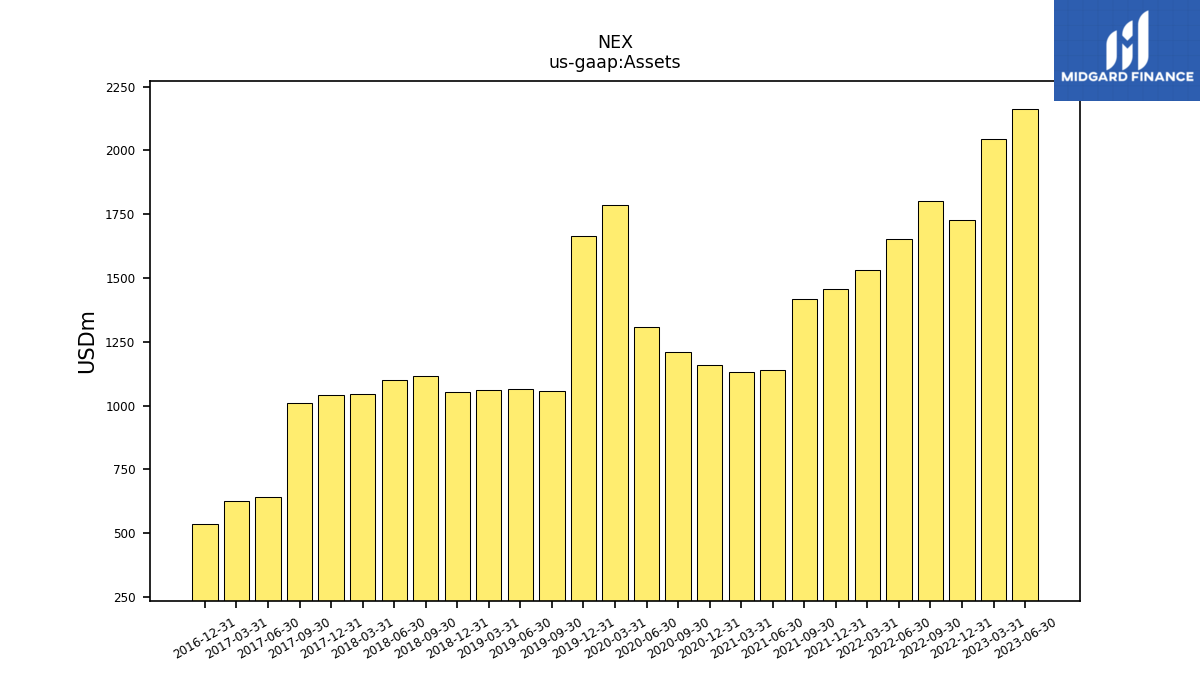
| Assets | 2163.57 | 2045.92 | 1727.17 | 1802.32 | 1654.21 | 1532.38 | 1457.58 | 1417.97 | 1137.54 | 1133.03 | 1157.89 | 1211.18 | 1309.59 | 1786.86 | 1664.91 | 1058.83 | 1064.84 | 1060.57 | 1054.58 | 1114.33 | 1099.01 | 1046.81 | 1043.12 | 1009.23 | 642.62 | 627.35 | 536.94 | NA | NA | NA | |
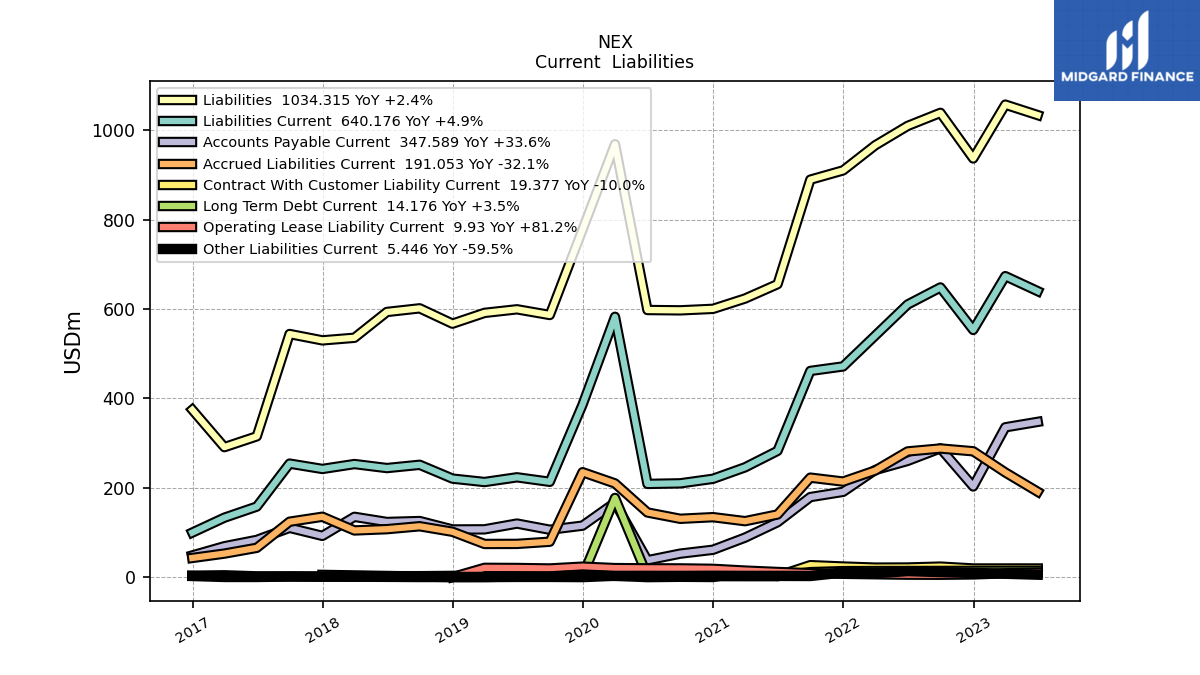
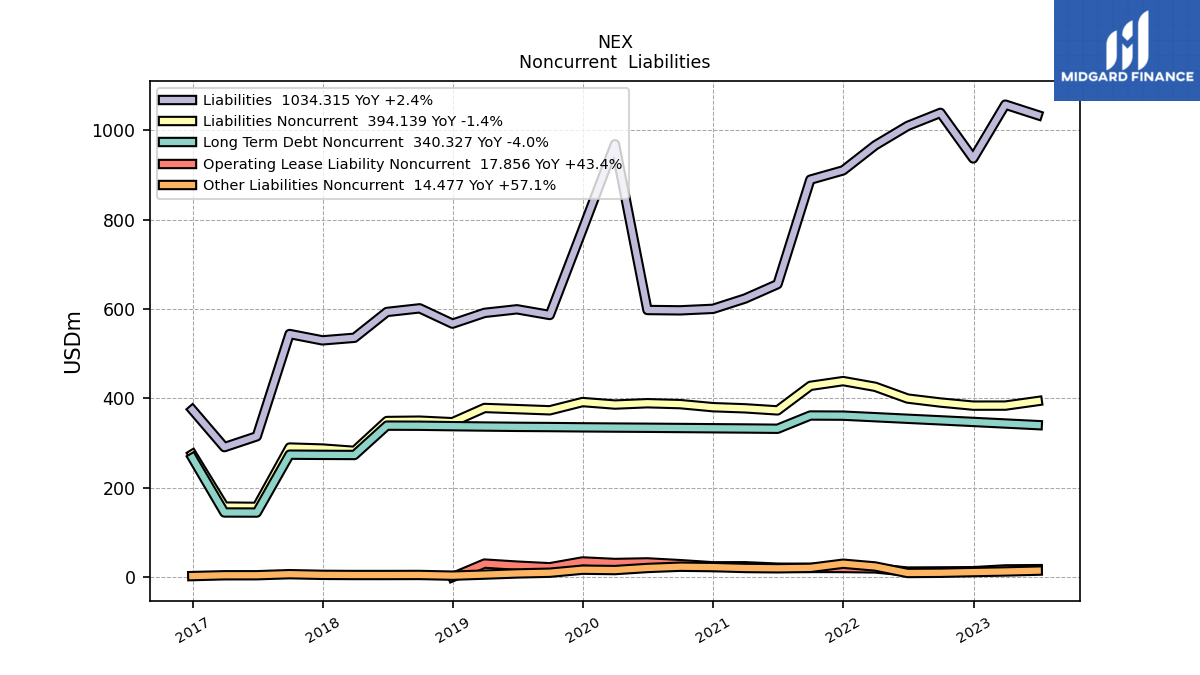
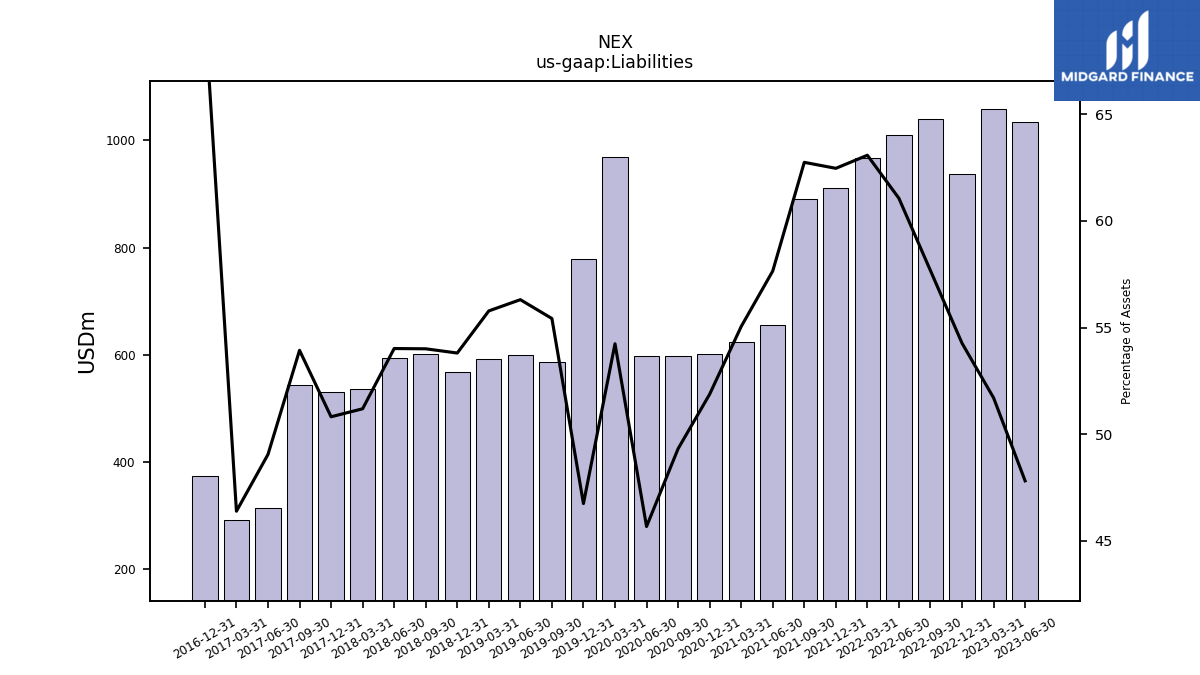
| Liabilities | 1034.32 | 1057.80 | 937.25 | 1039.40 | 1010.12 | 966.69 | 910.56 | 889.80 | 655.81 | 623.70 | 600.60 | 597.26 | 598.00 | 969.15 | 778.13 | 586.82 | 599.58 | 591.58 | 567.40 | 601.75 | 593.62 | 535.84 | 530.02 | 544.27 | 315.17 | 290.97 | 374.69 | NA | NA | NA | |
| Liabilities And Stockholders Equity | 2163.57 | 2045.92 | 1727.17 | 1802.32 | 1654.21 | 1532.38 | 1457.58 | 1417.97 | 1137.54 | 1133.03 | 1157.89 | 1211.18 | 1309.59 | 1786.86 | 1664.91 | 1058.83 | 1064.84 | 1060.57 | 1054.58 | 1114.33 | 1099.01 | 1046.81 | 1043.12 | 1009.23 | 642.62 | 627.35 | 536.94 | NA | NA | NA | |
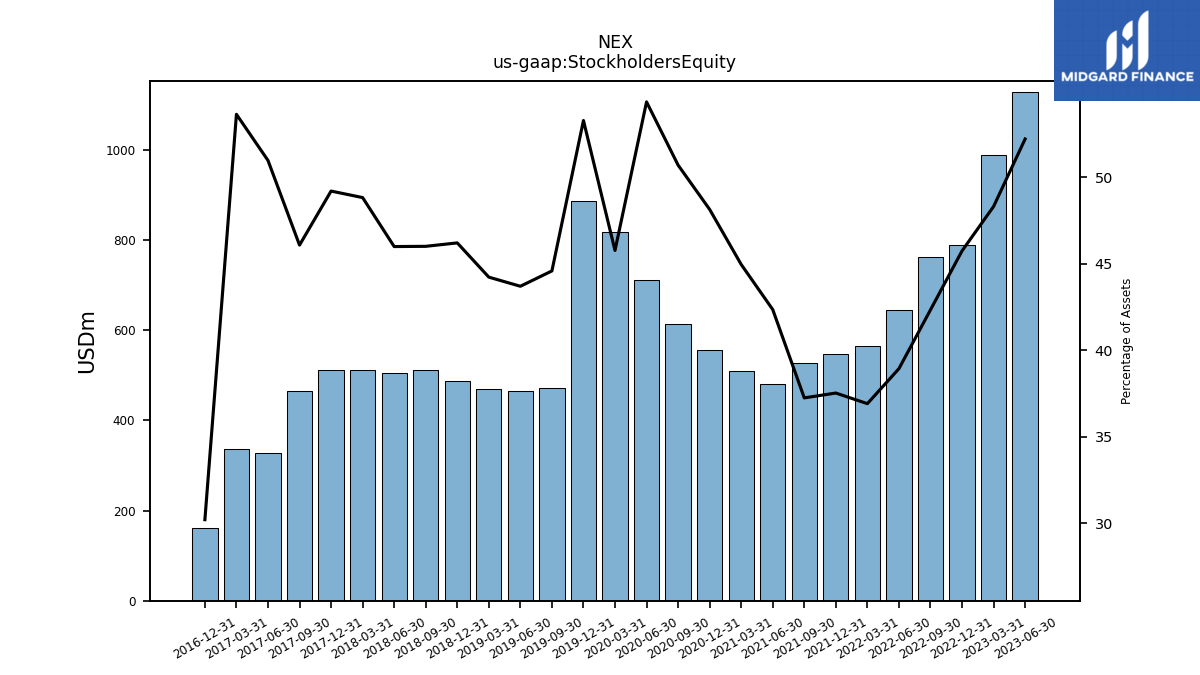
| Stockholders Equity | 1129.25 | 988.12 | 789.92 | 762.93 | 644.08 | 565.68 | 547.02 | 528.17 | 481.73 | 509.33 | 557.29 | 613.92 | 711.59 | 817.71 | 886.77 | 472.00 | 465.26 | 468.98 | 487.18 | 512.58 | 505.38 | 510.97 | 513.09 | 464.95 | 327.45 | 336.38 | 162.25 | NA | NA | NA |
| 2023-06-30 | 2023-03-31 | 2022-12-31 | 2022-09-30 | 2022-06-30 | 2022-03-31 | 2021-12-31 | 2021-09-30 | 2021-06-30 | 2021-03-31 | 2020-12-31 | 2020-09-30 | 2020-06-30 | 2020-03-31 | 2019-12-31 | 2019-09-30 | 2019-06-30 | 2019-03-31 | 2018-12-31 | 2018-09-30 | 2018-06-30 | 2018-03-31 | 2017-12-31 | 2017-09-30 | 2017-06-30 | 2017-03-31 | 2016-12-31 | 2016-09-30 | 2016-06-30 | 2016-03-31 | ||
|---|---|---|---|---|---|---|---|---|---|---|---|---|---|---|---|---|---|---|---|---|---|---|---|---|---|---|---|---|---|---|---|
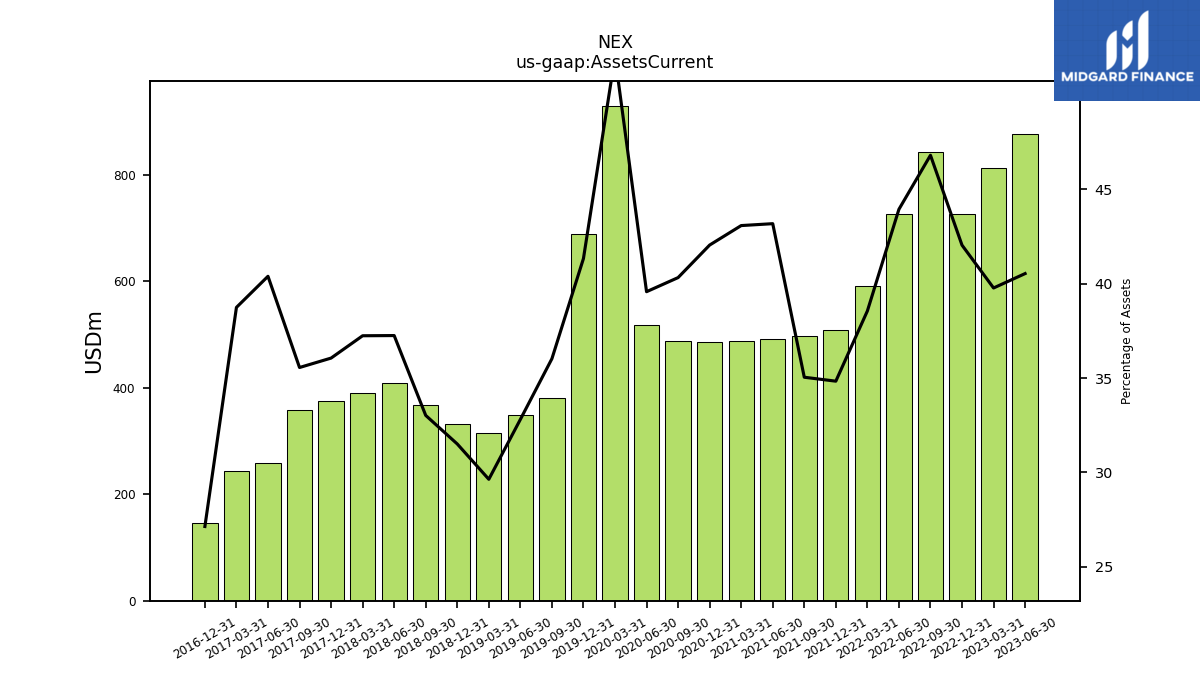
| Assets Current | 876.89 | 813.60 | 726.01 | 843.42 | 726.75 | 590.74 | 507.71 | 496.87 | 491.11 | 488.02 | 486.78 | 488.31 | 518.21 | 929.69 | 688.05 | 381.40 | 349.33 | 314.32 | 332.26 | 367.95 | 409.35 | 389.81 | 376.09 | 358.84 | 259.53 | 243.03 | 145.71 | NA | NA | NA | |
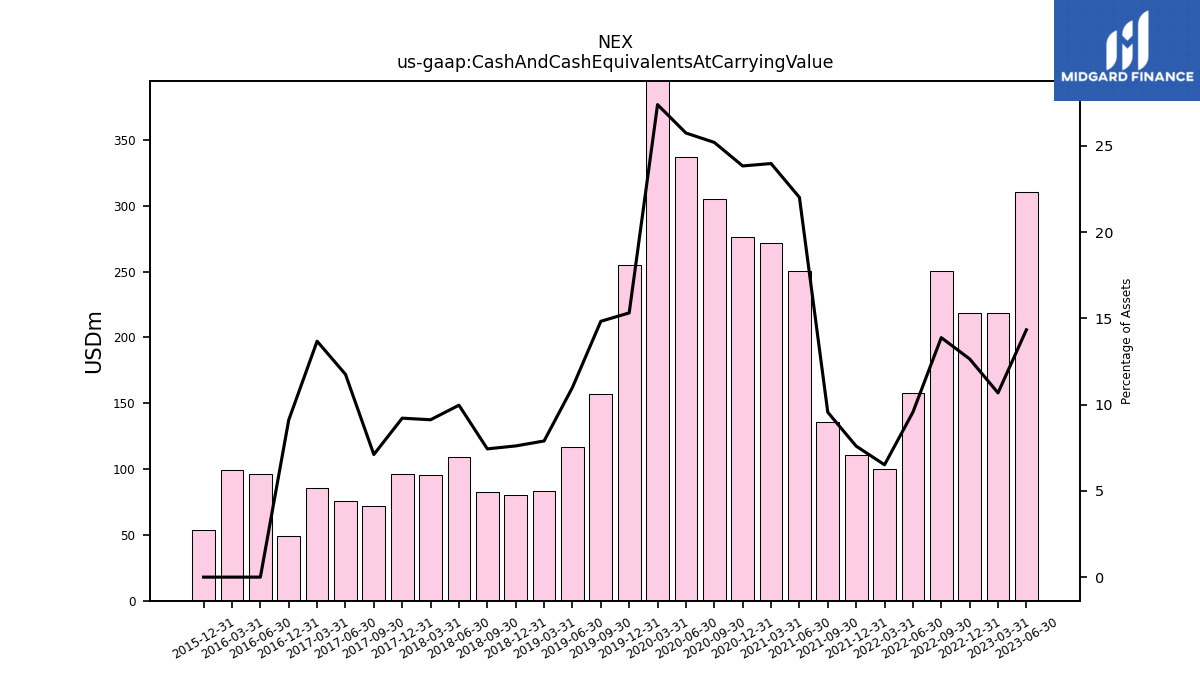
| Cash And Cash Equivalents At Carrying Value | 310.17 | 218.50 | 218.48 | 250.21 | 158.14 | 99.79 | 110.69 | 135.53 | 250.44 | 271.64 | 275.99 | 305.21 | 337.15 | 489.42 | 255.01 | 157.03 | 117.09 | 83.70 | 80.21 | 82.85 | 109.53 | 95.50 | 96.12 | 71.73 | 75.55 | 85.80 | 48.92 | NA | 96.54 | 99.60 | |
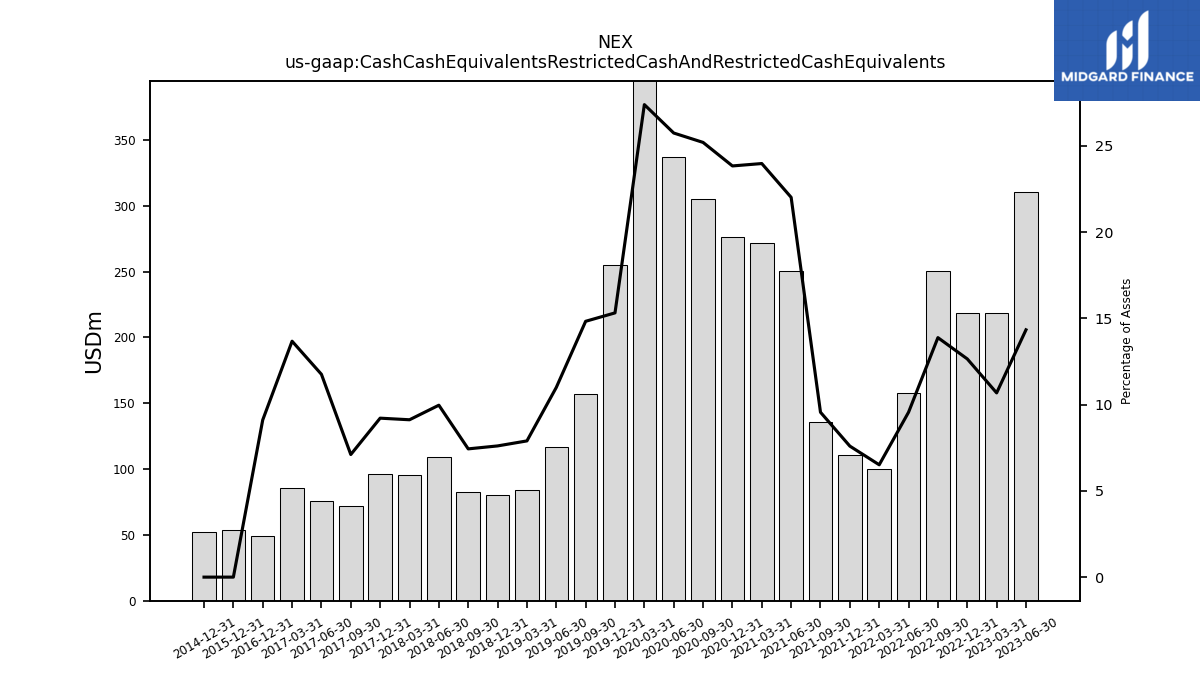
| Cash Cash Equivalents Restricted Cash And Restricted Cash Equivalents | 310.17 | 218.50 | 218.48 | 250.21 | 158.14 | 99.79 | 110.69 | 135.53 | 250.44 | 271.64 | 275.99 | 305.21 | 337.15 | 489.42 | 255.01 | 157.03 | 117.09 | 83.75 | 80.21 | 82.85 | 109.53 | 95.49 | 96.12 | 71.73 | 75.55 | 85.80 | 48.92 | NA | NA | NA | |
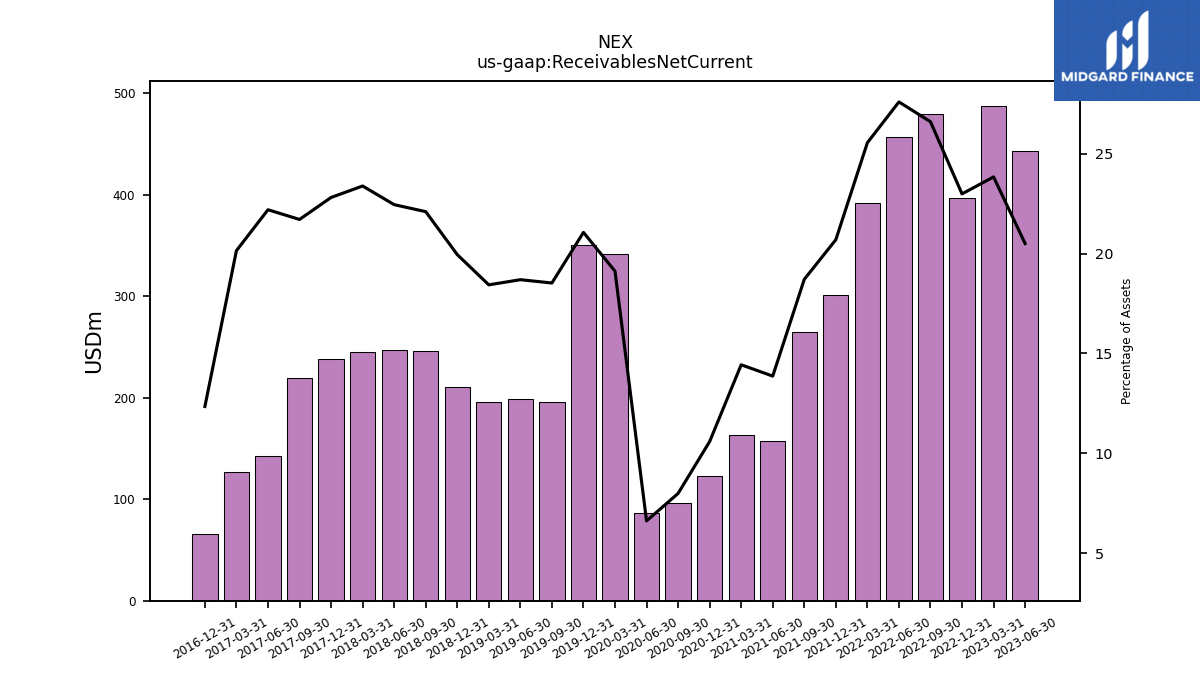
| Receivables Net Current | 443.74 | 487.90 | 397.20 | 479.67 | 456.63 | 391.68 | 301.74 | 265.39 | 157.74 | 163.54 | 122.58 | 96.74 | 86.57 | 341.74 | 350.76 | 196.22 | 199.10 | 195.56 | 210.43 | 246.34 | 246.81 | 244.88 | 238.02 | 219.17 | 142.68 | 126.43 | 66.28 | NA | NA | NA | |
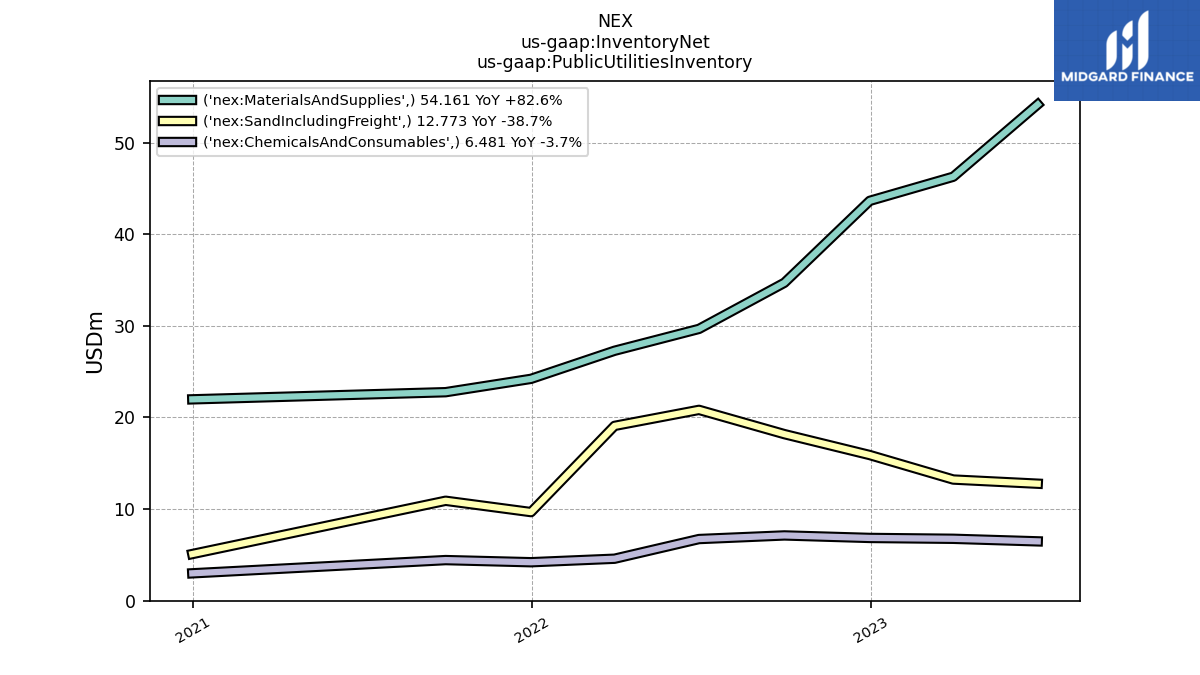
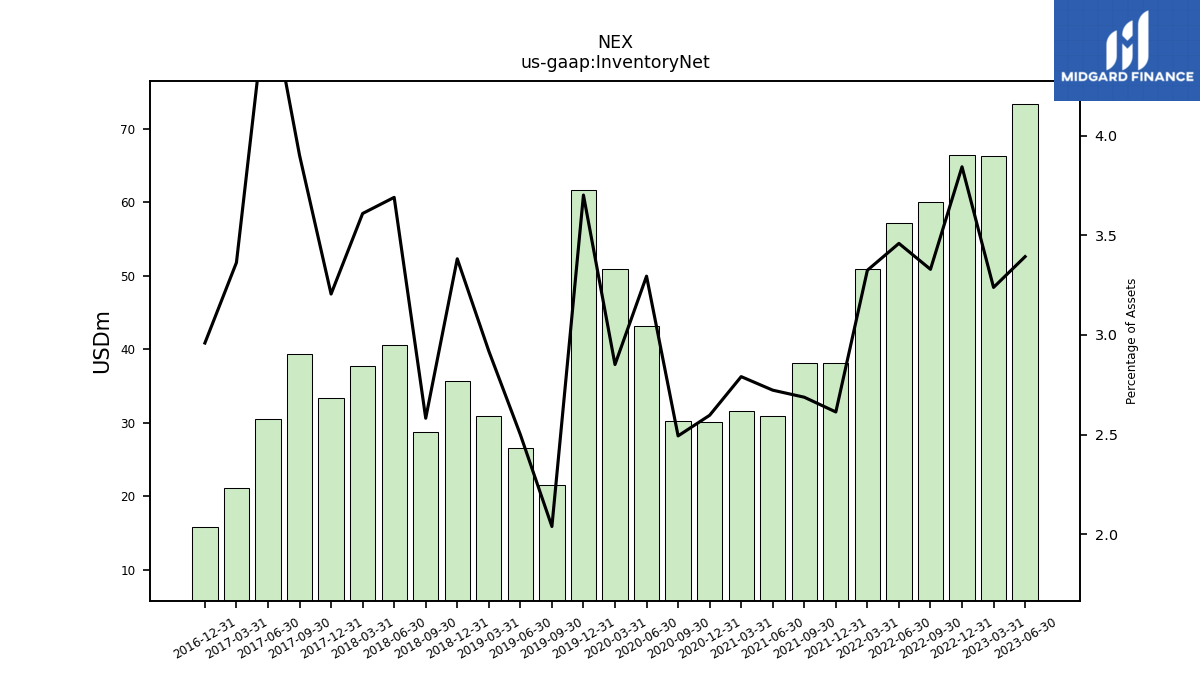
| Inventory Net | 73.42 | 66.26 | 66.39 | 60.01 | 57.23 | 50.95 | 38.09 | 38.11 | 30.97 | 31.62 | 30.07 | 30.20 | 43.15 | 50.95 | 61.64 | 21.59 | 26.62 | 30.96 | 35.67 | 28.77 | 40.56 | 37.79 | 33.44 | 39.38 | 30.50 | 21.10 | 15.89 | NA | NA | NA | |
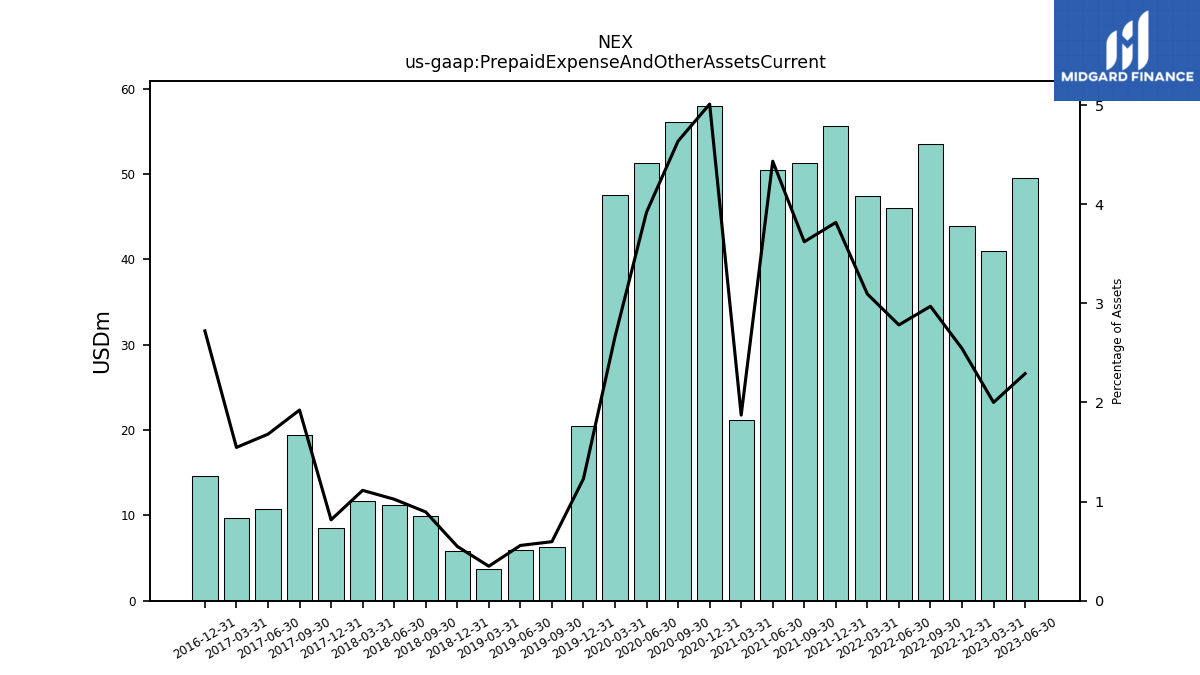
| Prepaid Expense And Other Assets Current | 49.57 | 40.94 | 43.95 | 53.53 | 46.03 | 47.41 | 55.62 | 51.35 | 50.44 | 21.22 | 58.01 | 56.16 | 51.34 | 47.57 | 20.49 | 6.31 | 5.94 | 3.69 | 5.78 | 9.98 | 11.26 | 11.66 | 8.52 | 19.41 | 10.80 | 9.70 | 14.62 | NA | NA | NA | |
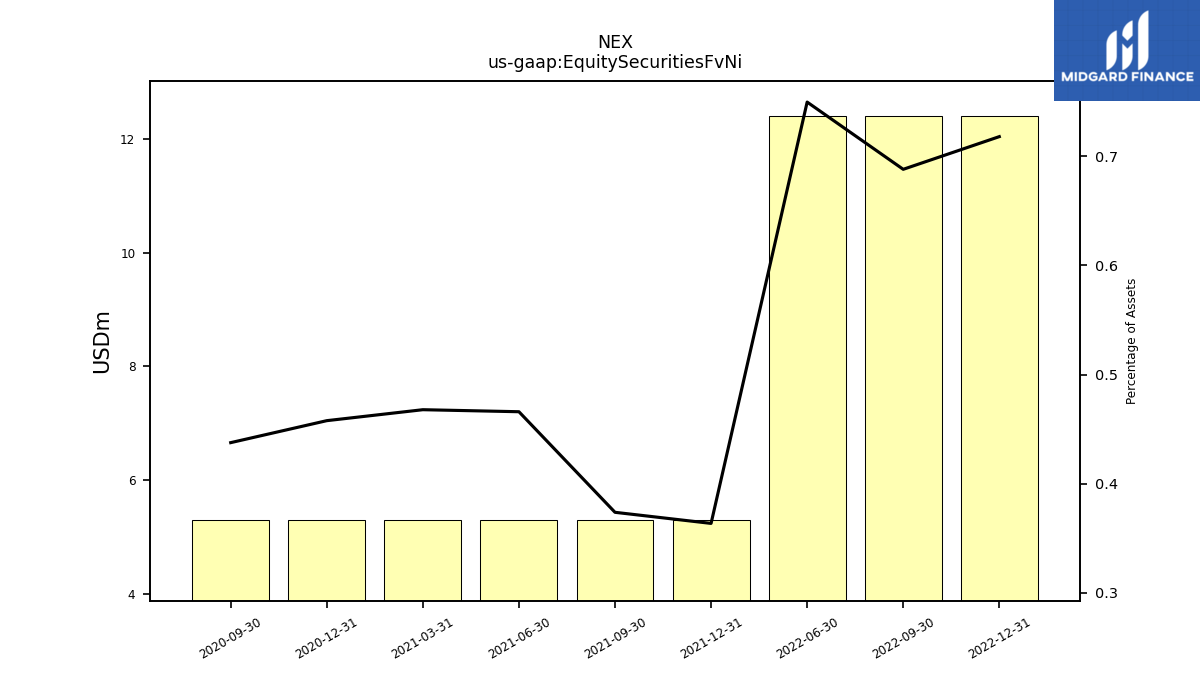
| Equity Securities Fv Ni | NA | NA | 12.40 | 12.40 | 12.40 | NA | 5.30 | 5.30 | 5.30 | 5.30 | 5.30 | 5.30 | NA | NA | NA | NA | NA | NA | NA | NA | NA | NA | NA | NA | NA | NA | NA | NA | NA | NA |
| 2023-06-30 | 2023-03-31 | 2022-12-31 | 2022-09-30 | 2022-06-30 | 2022-03-31 | 2021-12-31 | 2021-09-30 | 2021-06-30 | 2021-03-31 | 2020-12-31 | 2020-09-30 | 2020-06-30 | 2020-03-31 | 2019-12-31 | 2019-09-30 | 2019-06-30 | 2019-03-31 | 2018-12-31 | 2018-09-30 | 2018-06-30 | 2018-03-31 | 2017-12-31 | 2017-09-30 | 2017-06-30 | 2017-03-31 | 2016-12-31 | 2016-09-30 | 2016-06-30 | 2016-03-31 | ||
|---|---|---|---|---|---|---|---|---|---|---|---|---|---|---|---|---|---|---|---|---|---|---|---|---|---|---|---|---|---|---|---|
| Property Plant And Equipment Gross | NA | NA | 1658.49 | NA | NA | NA | 1525.37 | NA | NA | NA | 1388.04 | NA | NA | NA | 1396.50 | 1087.77 | 1084.39 | 1076.57 | 1085.81 | 1054.81 | 960.37 | 861.96 | 815.36 | 799.22 | 605.95 | 572.97 | 554.71 | NA | NA | NA | |
| Construction In Progress Gross | NA | NA | 23.70 | NA | NA | NA | 46.66 | NA | NA | NA | 11.96 | NA | NA | NA | 35.96 | 7.11 | 4.59 | 7.39 | 8.32 | 5.77 | 9.42 | 19.00 | 25.25 | 4.81 | 0.99 | 2.58 | 0.79 | NA | NA | NA | |
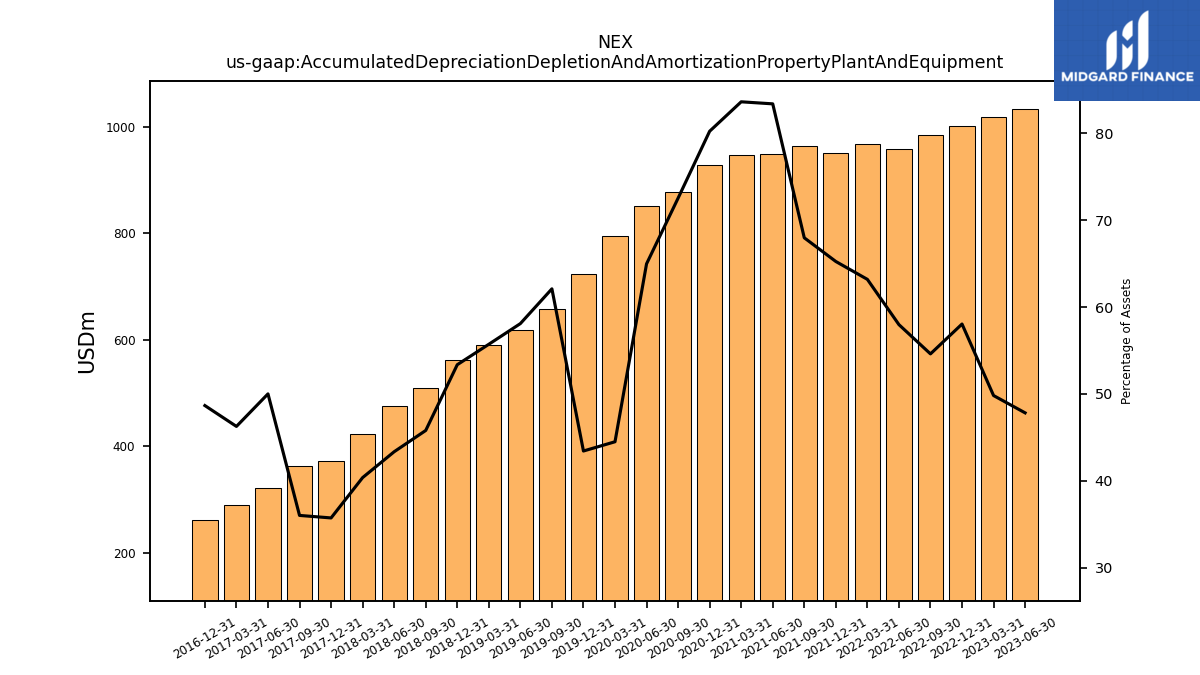
| Accumulated Depreciation Depletion And Amortization Property Plant And Equipment | 1034.69 | 1019.23 | 1002.68 | 984.32 | 959.20 | 968.44 | 951.17 | 964.00 | 948.85 | 947.75 | 929.29 | 878.73 | 851.01 | 795.05 | 723.06 | 657.62 | 618.71 | 590.98 | 562.81 | 510.31 | 476.38 | 422.56 | 372.62 | 363.43 | 321.37 | 290.23 | 261.29 | NA | NA | NA | |
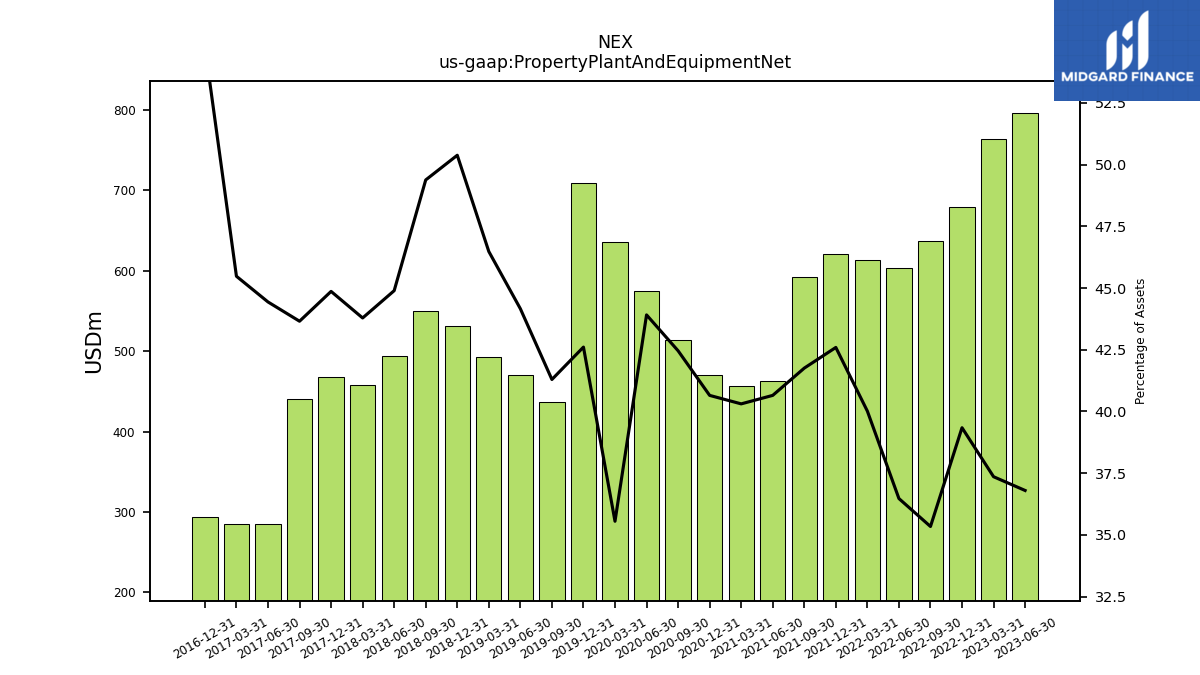
| Property Plant And Equipment Net | 796.20 | 764.31 | 679.51 | 636.95 | 603.34 | 613.16 | 620.87 | 592.11 | 462.45 | 456.71 | 470.71 | 514.26 | 575.09 | 635.28 | 709.40 | 437.26 | 470.27 | 492.98 | 531.32 | 550.27 | 493.41 | 458.39 | 468.00 | 440.60 | 285.57 | 285.31 | 294.21 | NA | NA | NA | |
| Goodwill | 192.78 | 192.78 | 192.78 | 192.78 | 192.78 | 192.78 | 192.78 | 192.45 | 104.93 | 104.20 | 104.20 | 104.20 | 104.20 | 104.20 | 137.46 | 132.52 | 132.52 | 132.52 | 132.52 | 132.52 | 132.52 | 134.54 | 134.97 | 144.88 | 50.62 | 50.62 | 50.48 | NA | NA | NA | |
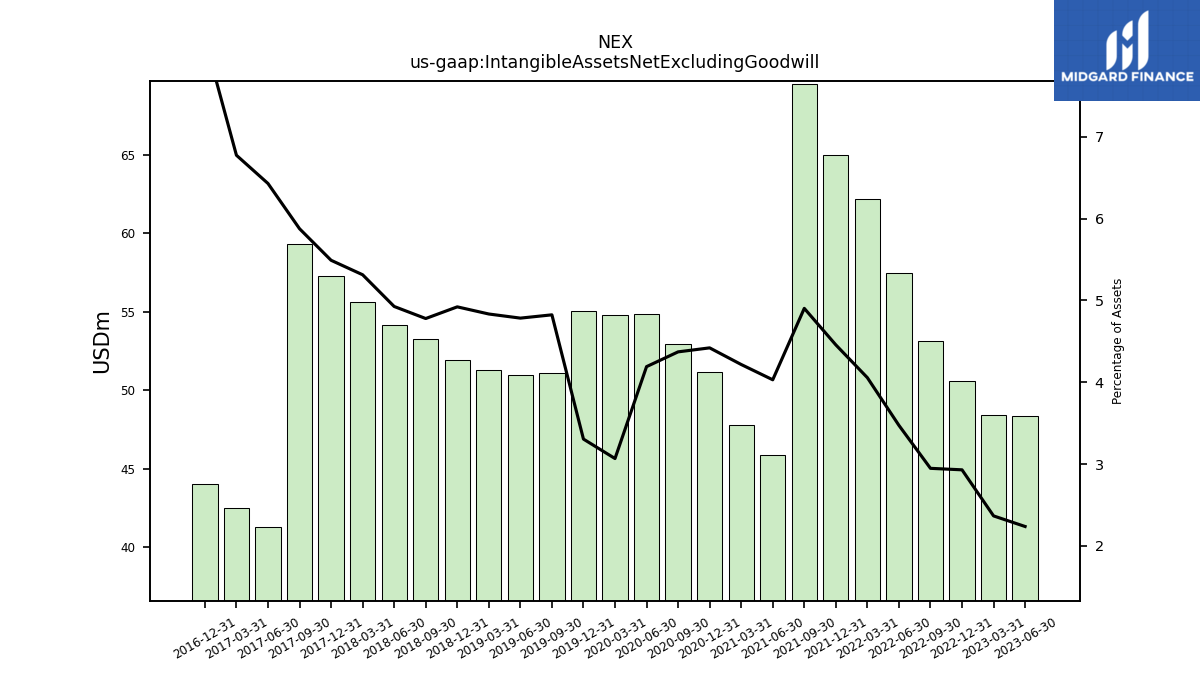
| Intangible Assets Net Excluding Goodwill | 48.37 | 48.40 | 50.59 | 53.12 | 57.44 | 62.15 | 64.96 | 69.53 | 45.84 | 47.78 | 51.18 | 52.95 | 54.88 | 54.80 | 55.02 | 51.08 | 50.94 | 51.27 | 51.90 | 53.25 | 54.14 | 55.63 | 57.28 | 59.31 | 41.32 | 42.51 | 44.02 | NA | NA | NA | |
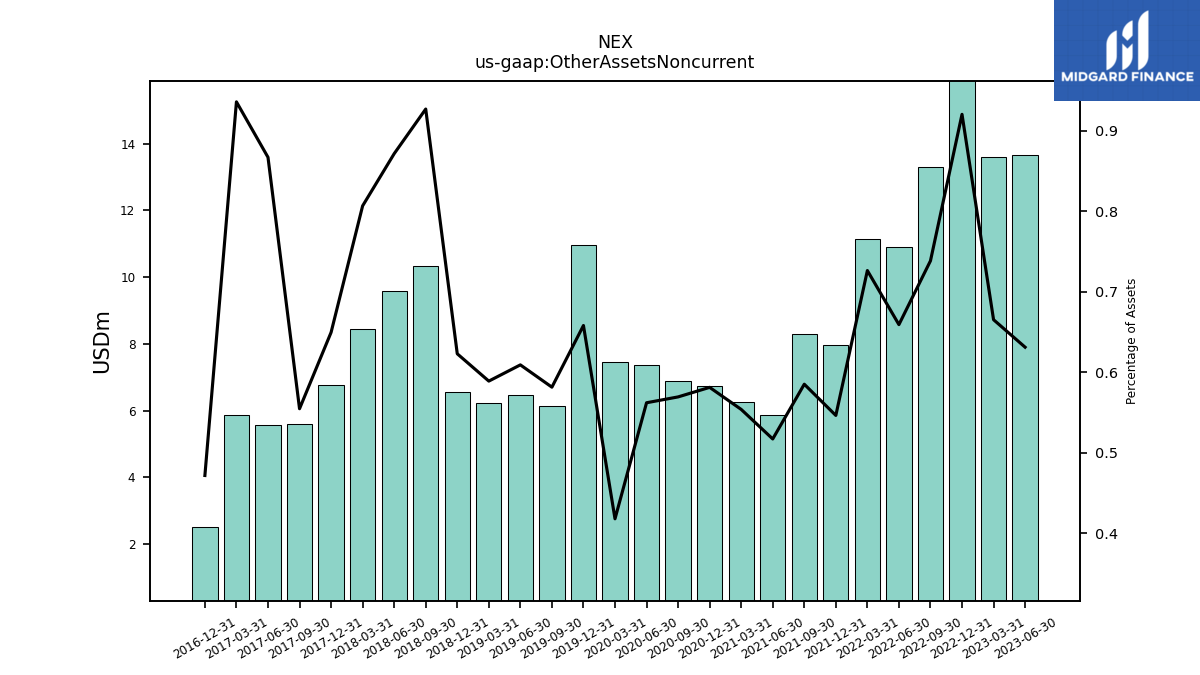
| Other Assets Noncurrent | 13.65 | 13.61 | 15.90 | 13.31 | 10.90 | 11.13 | 7.96 | 8.30 | 5.88 | 6.27 | 6.73 | 6.89 | 7.36 | 7.46 | 10.96 | 6.16 | 6.49 | 6.25 | 6.57 | 10.33 | 9.58 | 8.45 | 6.78 | 5.60 | 5.57 | 5.87 | 2.53 | NA | NA | NA | |
| Equity Securities Fv Ni | NA | NA | 12.40 | 12.40 | 12.40 | NA | 5.30 | 5.30 | 5.30 | 5.30 | 5.30 | 5.30 | NA | NA | NA | NA | NA | NA | NA | NA | NA | NA | NA | NA | NA | NA | NA | NA | NA | NA |
| 2023-06-30 | 2023-03-31 | 2022-12-31 | 2022-09-30 | 2022-06-30 | 2022-03-31 | 2021-12-31 | 2021-09-30 | 2021-06-30 | 2021-03-31 | 2020-12-31 | 2020-09-30 | 2020-06-30 | 2020-03-31 | 2019-12-31 | 2019-09-30 | 2019-06-30 | 2019-03-31 | 2018-12-31 | 2018-09-30 | 2018-06-30 | 2018-03-31 | 2017-12-31 | 2017-09-30 | 2017-06-30 | 2017-03-31 | 2016-12-31 | 2016-09-30 | 2016-06-30 | 2016-03-31 | ||
|---|---|---|---|---|---|---|---|---|---|---|---|---|---|---|---|---|---|---|---|---|---|---|---|---|---|---|---|---|---|---|---|
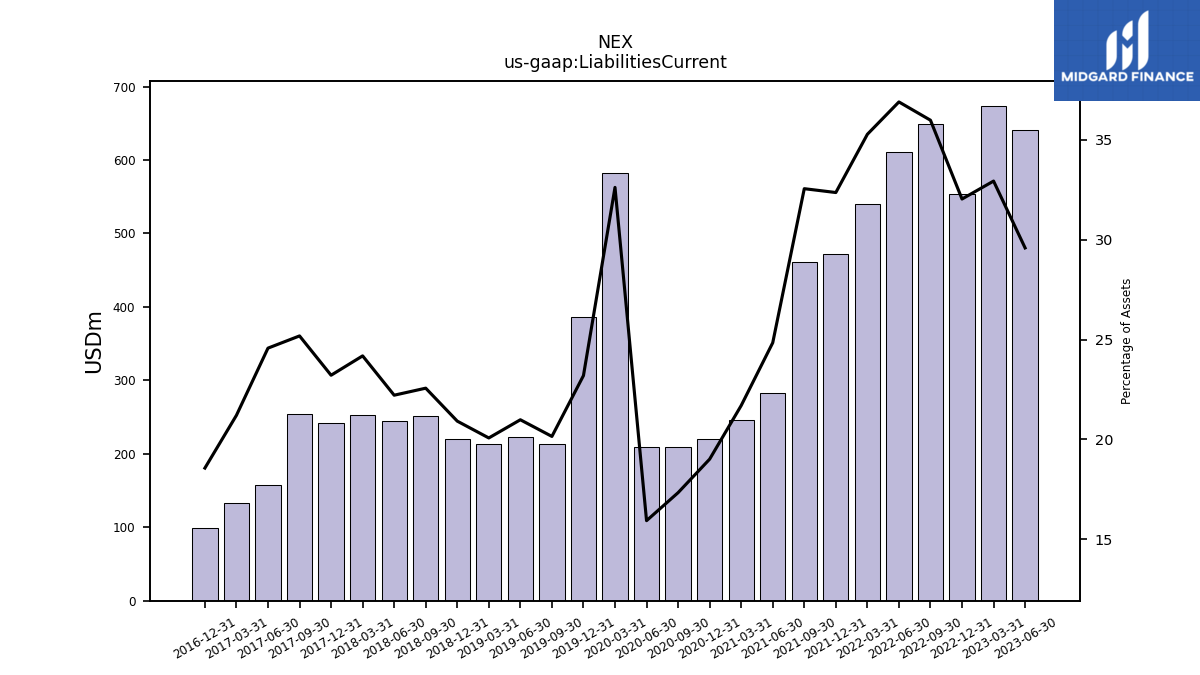
| Liabilities Current | 640.18 | 673.83 | 553.34 | 648.52 | 610.36 | 540.59 | 471.70 | 461.61 | 282.58 | 245.83 | 220.16 | 209.97 | 208.67 | 582.85 | 386.19 | 213.37 | 223.46 | 212.90 | 220.58 | 251.47 | 244.14 | 253.16 | 242.15 | 254.15 | 157.90 | 133.05 | 99.69 | NA | NA | NA | |
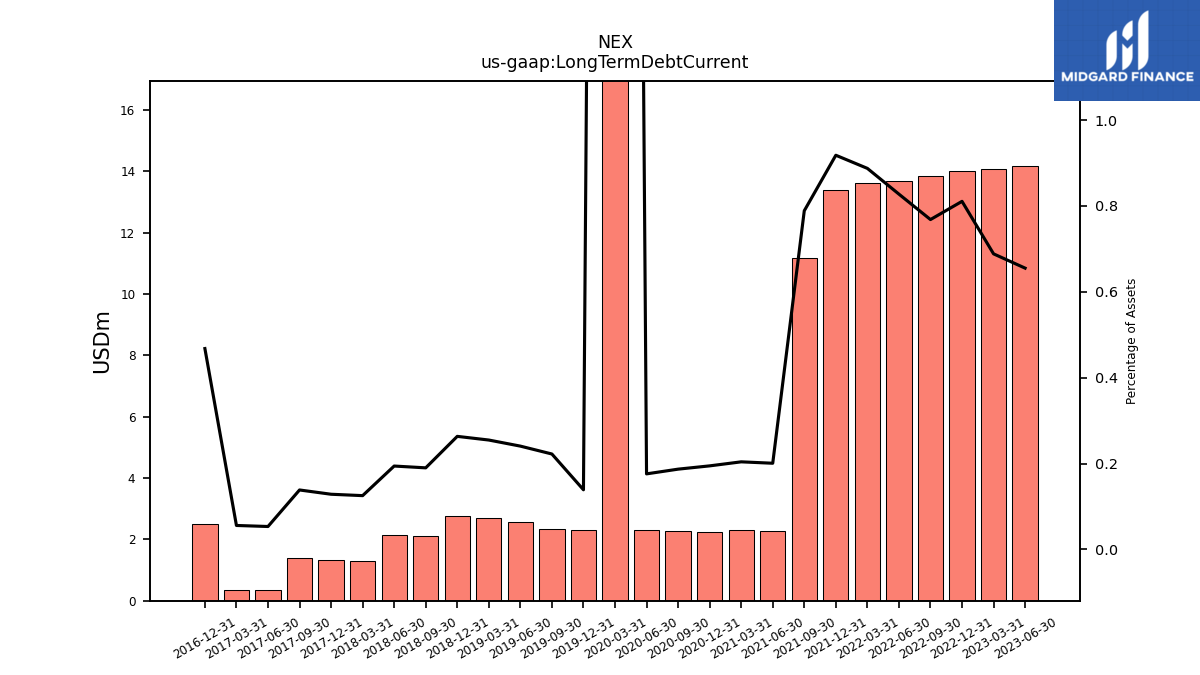
| Long Term Debt Current | 14.18 | 14.09 | 14.00 | 13.85 | 13.69 | 13.60 | 13.38 | 11.19 | 2.28 | 2.31 | 2.25 | 2.26 | 2.30 | 177.30 | 2.31 | 2.35 | 2.56 | 2.70 | 2.78 | 2.12 | 2.13 | 1.31 | 1.34 | 1.40 | 0.34 | 0.35 | 2.51 | NA | NA | NA | |
| Accounts Payable Current | 347.59 | 335.42 | 202.94 | 288.29 | 260.22 | 239.77 | 190.96 | 179.20 | 122.89 | 88.46 | 61.26 | 52.60 | 37.77 | 166.70 | 115.25 | 106.12 | 119.91 | 106.96 | 106.70 | 125.52 | 123.43 | 134.99 | 92.35 | 110.30 | 83.32 | 69.06 | 48.48 | NA | NA | NA | |
| Accrued Liabilities Current | 191.05 | 234.38 | 281.71 | 287.98 | 281.40 | 238.66 | 213.92 | 222.72 | 140.24 | 125.27 | 134.23 | 130.59 | 144.75 | 209.80 | 234.90 | 79.25 | 74.39 | 74.24 | 101.54 | 113.88 | 107.36 | 104.49 | 135.18 | 124.07 | 65.56 | 52.65 | 42.89 | NA | NA | NA | |
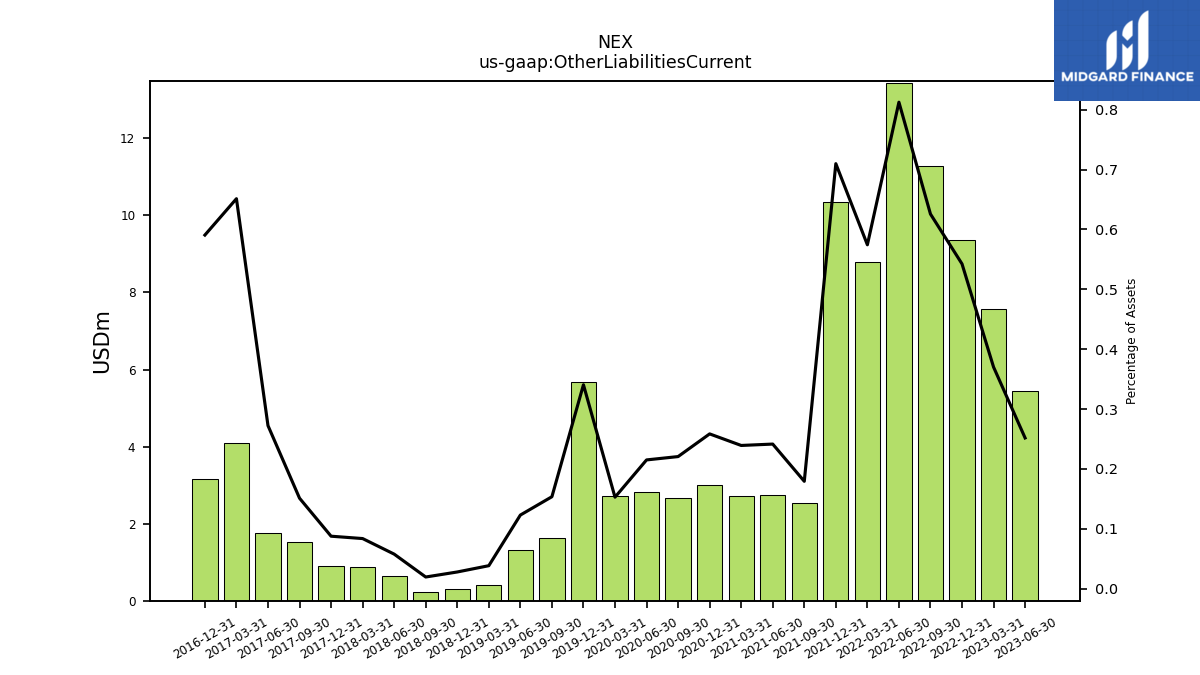
| Other Liabilities Current | 5.45 | 7.57 | 9.37 | 11.28 | 13.44 | 8.80 | 10.35 | 2.54 | 2.75 | 2.71 | 2.99 | 2.67 | 2.82 | 2.73 | 5.67 | 1.63 | 1.31 | 0.41 | 0.29 | 0.22 | 0.63 | 0.88 | 0.91 | 1.52 | 1.75 | 4.09 | 3.17 | NA | NA | NA | |
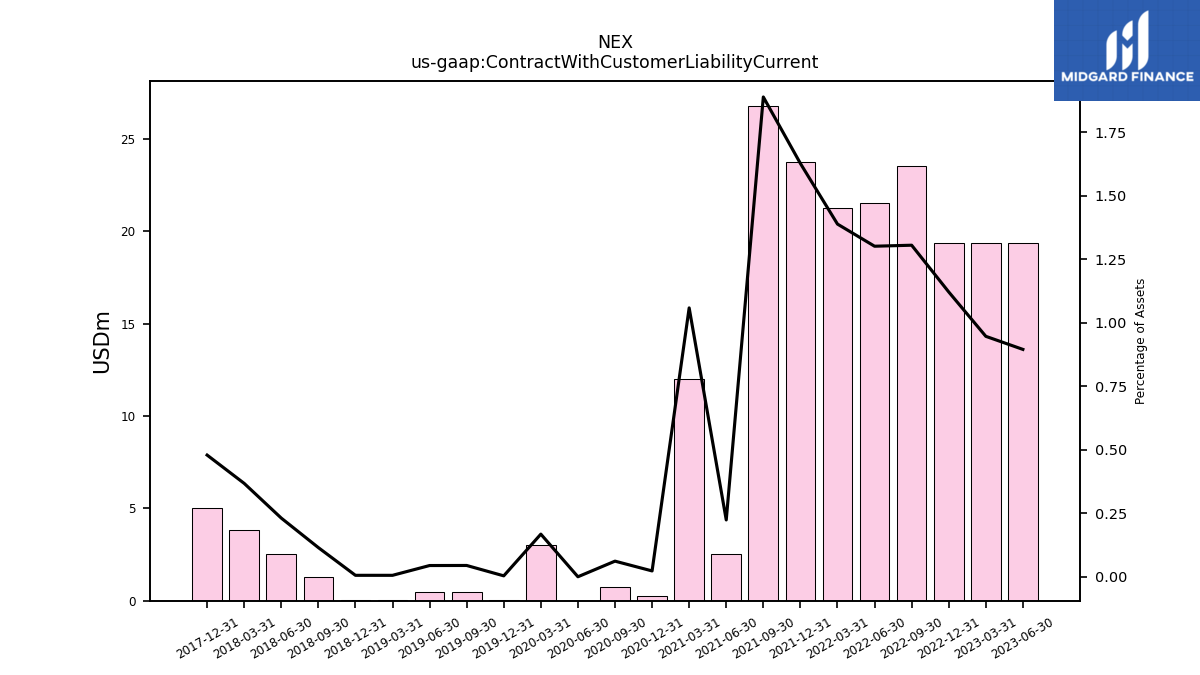
| Contract With Customer Liability Current | 19.38 | 19.38 | 19.38 | 23.54 | 21.54 | 21.29 | 23.73 | 26.80 | 2.55 | 12.00 | 0.27 | 0.74 | 0.00 | 3.00 | 0.06 | 0.47 | 0.47 | 0.06 | 0.06 | 1.28 | 2.54 | 3.85 | 5.00 | NA | NA | NA | NA | NA | NA | NA |
| 2023-06-30 | 2023-03-31 | 2022-12-31 | 2022-09-30 | 2022-06-30 | 2022-03-31 | 2021-12-31 | 2021-09-30 | 2021-06-30 | 2021-03-31 | 2020-12-31 | 2020-09-30 | 2020-06-30 | 2020-03-31 | 2019-12-31 | 2019-09-30 | 2019-06-30 | 2019-03-31 | 2018-12-31 | 2018-09-30 | 2018-06-30 | 2018-03-31 | 2017-12-31 | 2017-09-30 | 2017-06-30 | 2017-03-31 | 2016-12-31 | 2016-09-30 | 2016-06-30 | 2016-03-31 | ||
|---|---|---|---|---|---|---|---|---|---|---|---|---|---|---|---|---|---|---|---|---|---|---|---|---|---|---|---|---|---|---|---|
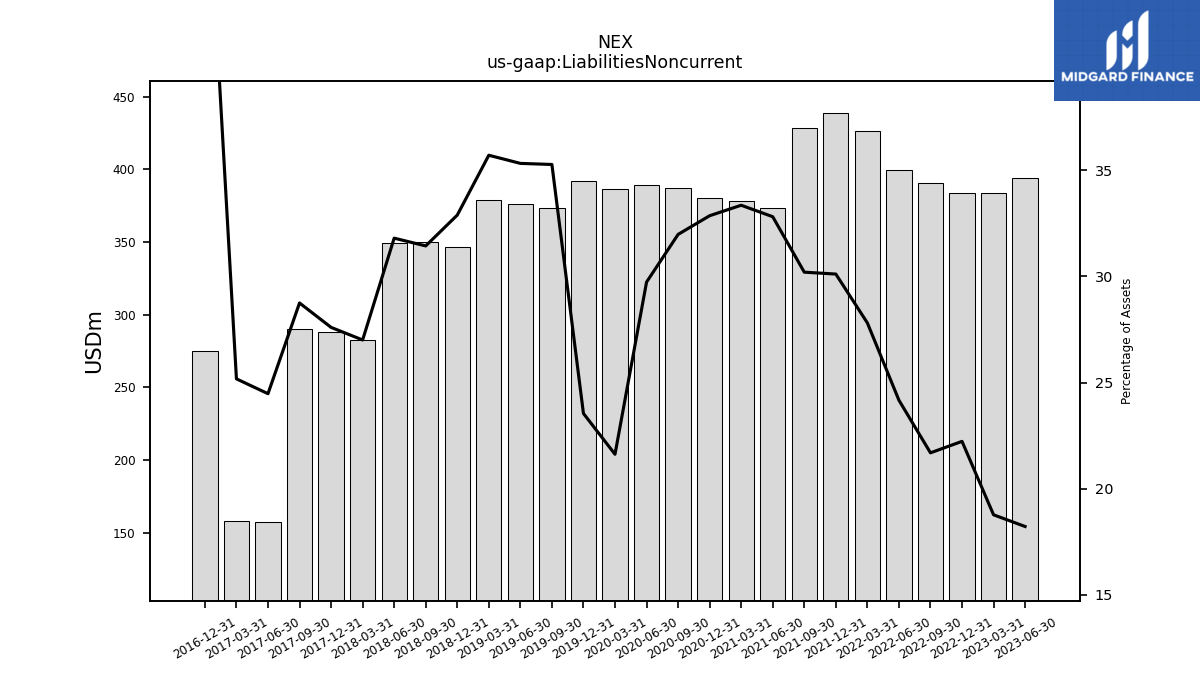
| Liabilities Noncurrent | 394.14 | 383.98 | 383.91 | 390.88 | 399.76 | 426.10 | 438.86 | 428.19 | 373.23 | 377.87 | 380.44 | 387.29 | 389.33 | 386.31 | 391.94 | 373.45 | 376.12 | 378.68 | 346.82 | 350.29 | 349.48 | 282.68 | 287.87 | 290.12 | 157.27 | 157.92 | 275.00 | NA | NA | NA | |
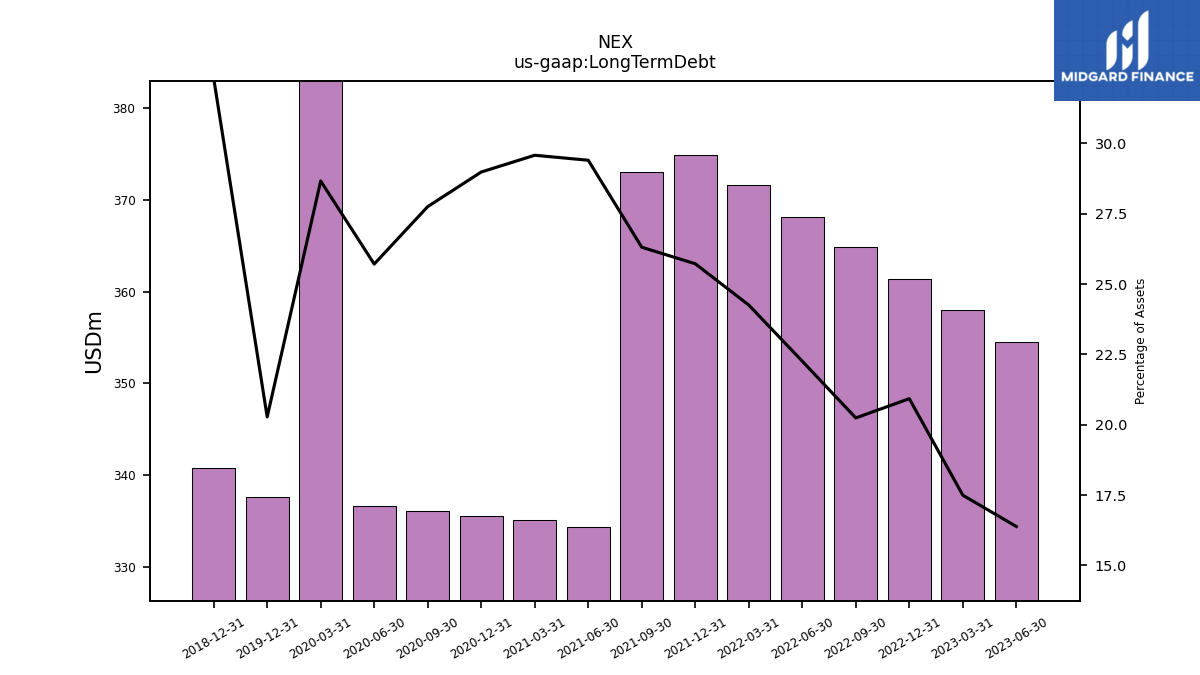
| Long Term Debt | 354.50 | 357.98 | 361.43 | 364.83 | 368.19 | 371.64 | 374.88 | 373.02 | 334.41 | 335.09 | 335.54 | 336.11 | 336.68 | 512.11 | 337.62 | NA | NA | NA | 340.73 | NA | NA | NA | NA | NA | NA | NA | NA | NA | NA | NA | |
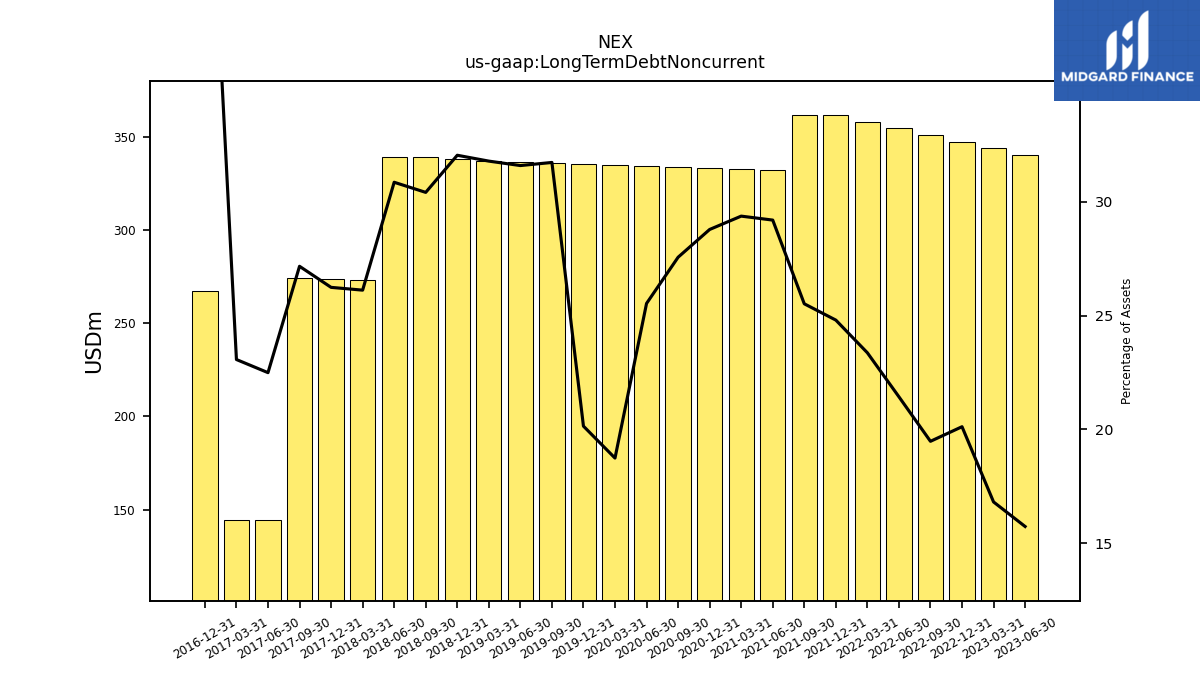
| Long Term Debt Noncurrent | 340.33 | 343.89 | 347.43 | 350.99 | 354.50 | 358.03 | 361.50 | 361.84 | 332.12 | 332.78 | 333.29 | 333.84 | 334.38 | 334.80 | 335.31 | 335.96 | 336.42 | 337.14 | 337.95 | 338.92 | 339.14 | 273.40 | 273.71 | 274.17 | 144.53 | 144.72 | 267.24 | NA | NA | NA | |
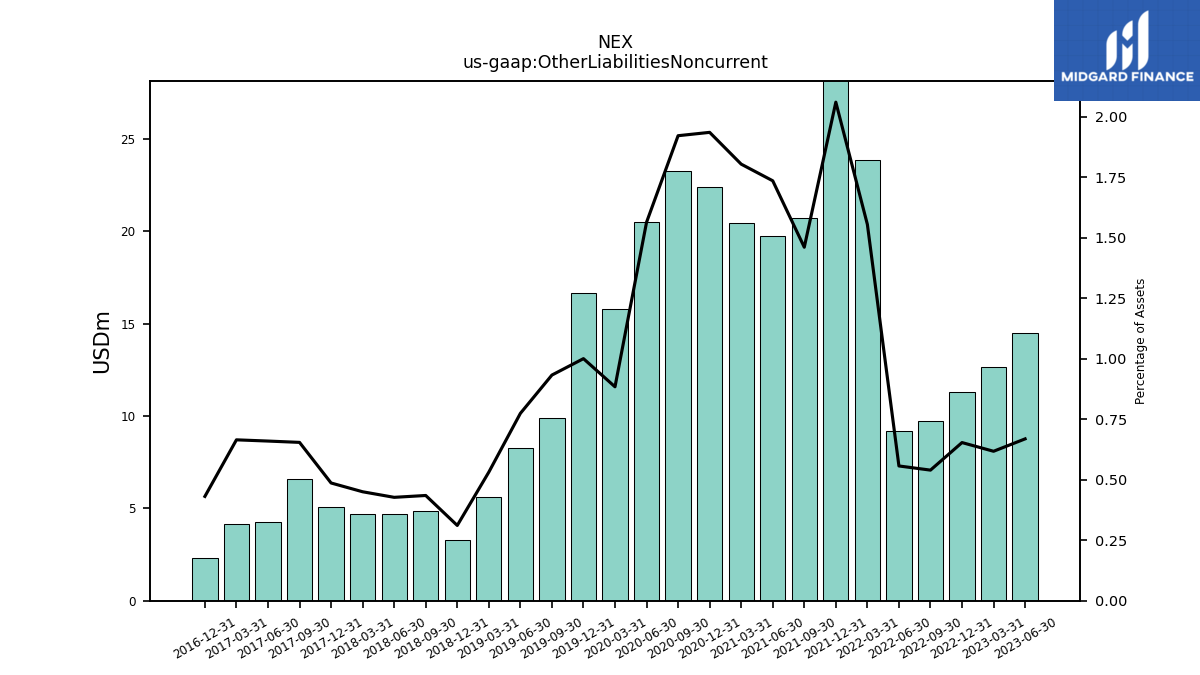
| Other Liabilities Noncurrent | 14.48 | 12.64 | 11.29 | 9.73 | 9.22 | 23.84 | 30.04 | 20.72 | 19.75 | 20.45 | 22.42 | 23.28 | 20.49 | 15.80 | 16.66 | 9.88 | 8.25 | 5.64 | 3.28 | 4.85 | 4.70 | 4.72 | 5.08 | 6.61 | 4.24 | 4.17 | 2.32 | NA | NA | NA | |
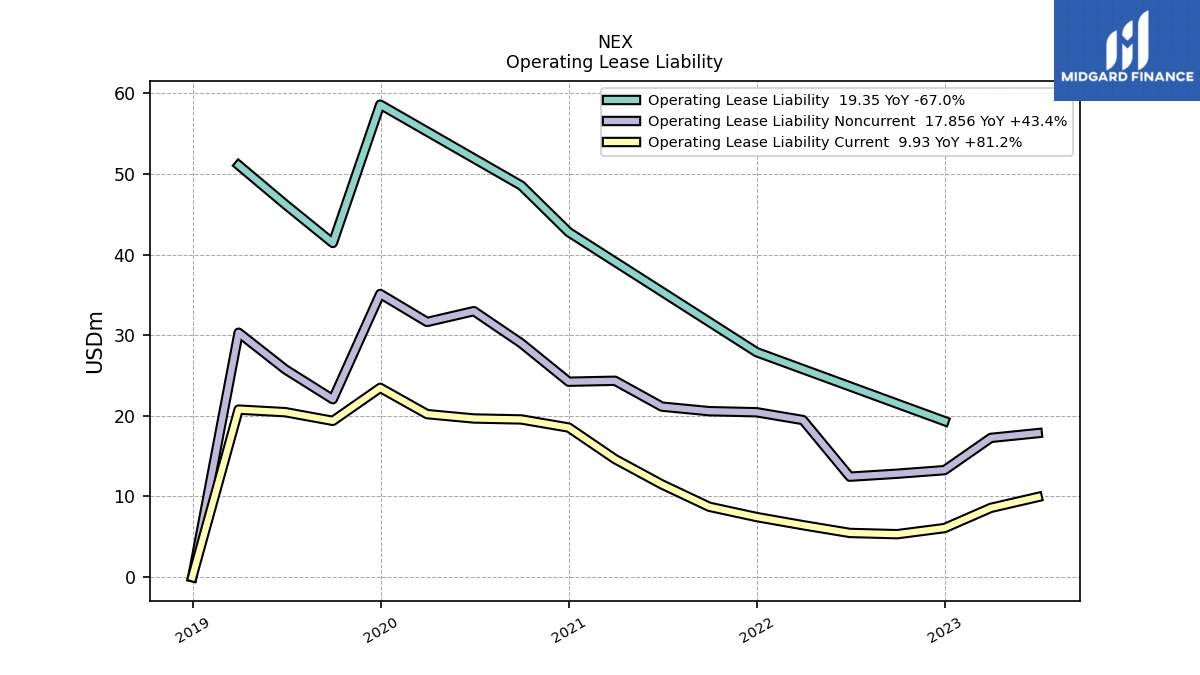
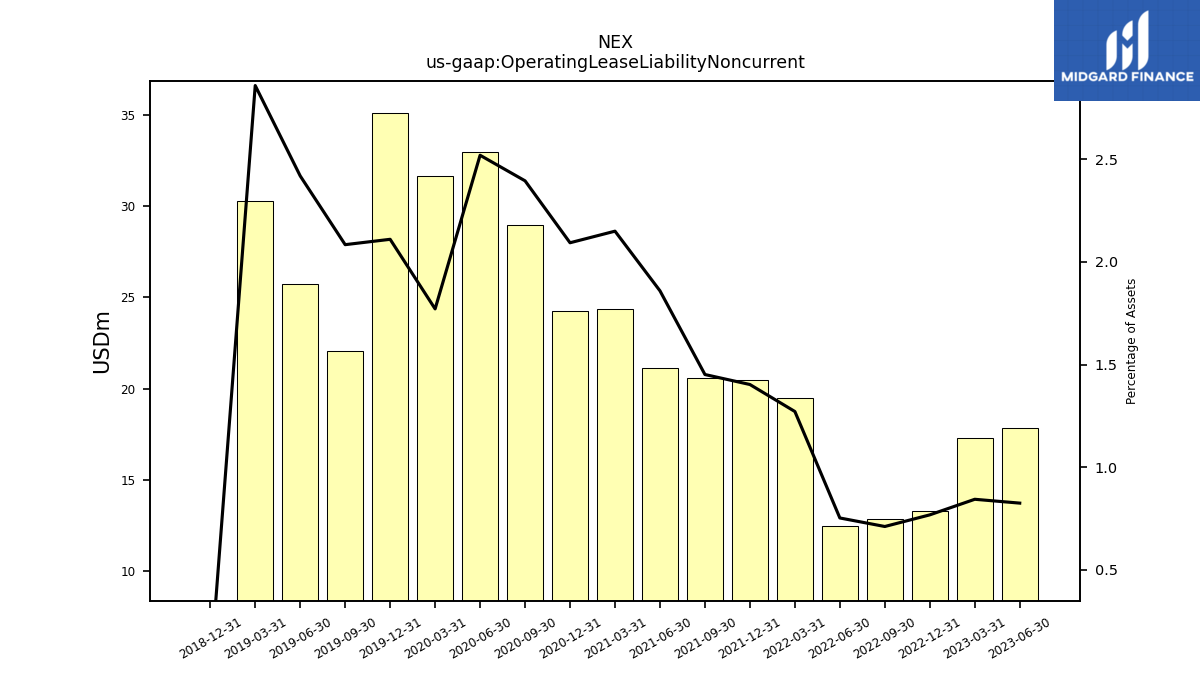
| Operating Lease Liability Noncurrent | 17.86 | 17.27 | 13.27 | 12.82 | 12.46 | 19.48 | 20.45 | 20.58 | 21.14 | 24.35 | 24.23 | 29.00 | 32.99 | 31.64 | 35.12 | 22.06 | 25.75 | 30.31 | 0.00 | NA | NA | NA | NA | NA | NA | NA | NA | NA | NA | NA |
| 2023-06-30 | 2023-03-31 | 2022-12-31 | 2022-09-30 | 2022-06-30 | 2022-03-31 | 2021-12-31 | 2021-09-30 | 2021-06-30 | 2021-03-31 | 2020-12-31 | 2020-09-30 | 2020-06-30 | 2020-03-31 | 2019-12-31 | 2019-09-30 | 2019-06-30 | 2019-03-31 | 2018-12-31 | 2018-09-30 | 2018-06-30 | 2018-03-31 | 2017-12-31 | 2017-09-30 | 2017-06-30 | 2017-03-31 | 2016-12-31 | 2016-09-30 | 2016-06-30 | 2016-03-31 | ||
|---|---|---|---|---|---|---|---|---|---|---|---|---|---|---|---|---|---|---|---|---|---|---|---|---|---|---|---|---|---|---|---|
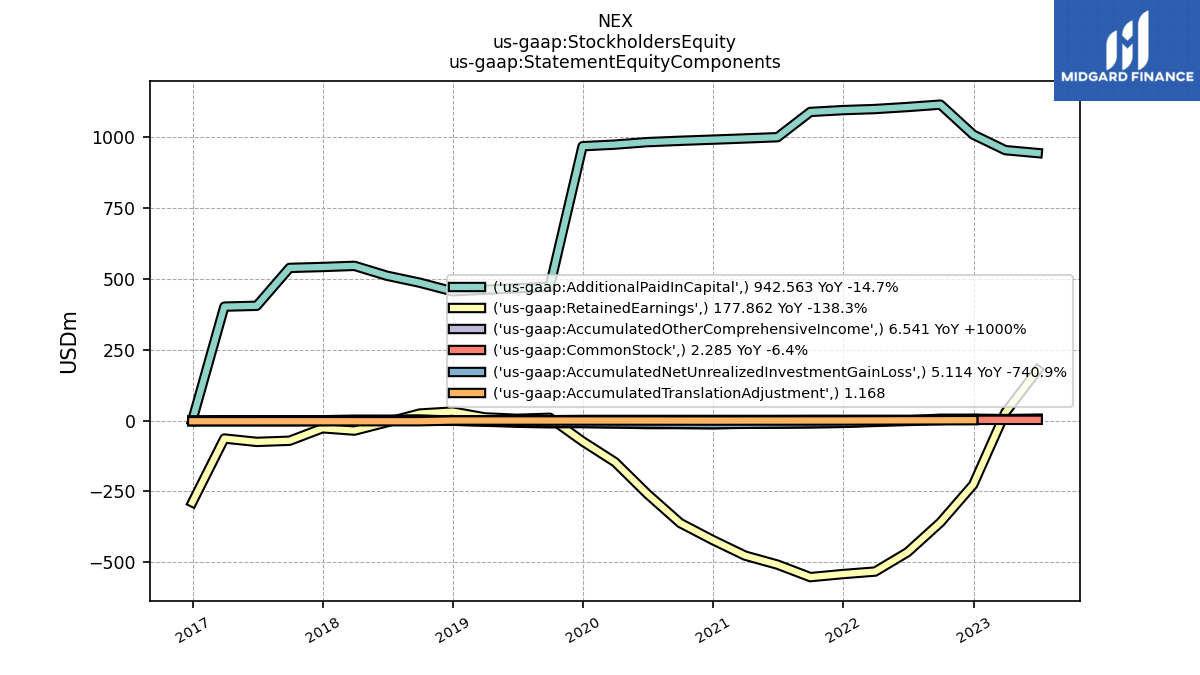
| Stockholders Equity | 1129.25 | 988.12 | 789.92 | 762.93 | 644.08 | 565.68 | 547.02 | 528.17 | 481.73 | 509.33 | 557.29 | 613.92 | 711.59 | 817.71 | 886.77 | 472.00 | 465.26 | 468.98 | 487.18 | 512.58 | 505.38 | 510.97 | 513.09 | 464.95 | 327.45 | 336.38 | 162.25 | NA | NA | NA | |
| Common Stock Value | 2.29 | 2.31 | 2.34 | 2.46 | 2.44 | 2.44 | 2.42 | 2.42 | 2.16 | 2.15 | 2.14 | 2.14 | 2.14 | 2.13 | 2.12 | 1.04 | 1.04 | 1.04 | 1.04 | 1.07 | 1.10 | 1.12 | 1.12 | 1.12 | 1.03 | 1.03 | 0.00 | NA | NA | NA | |
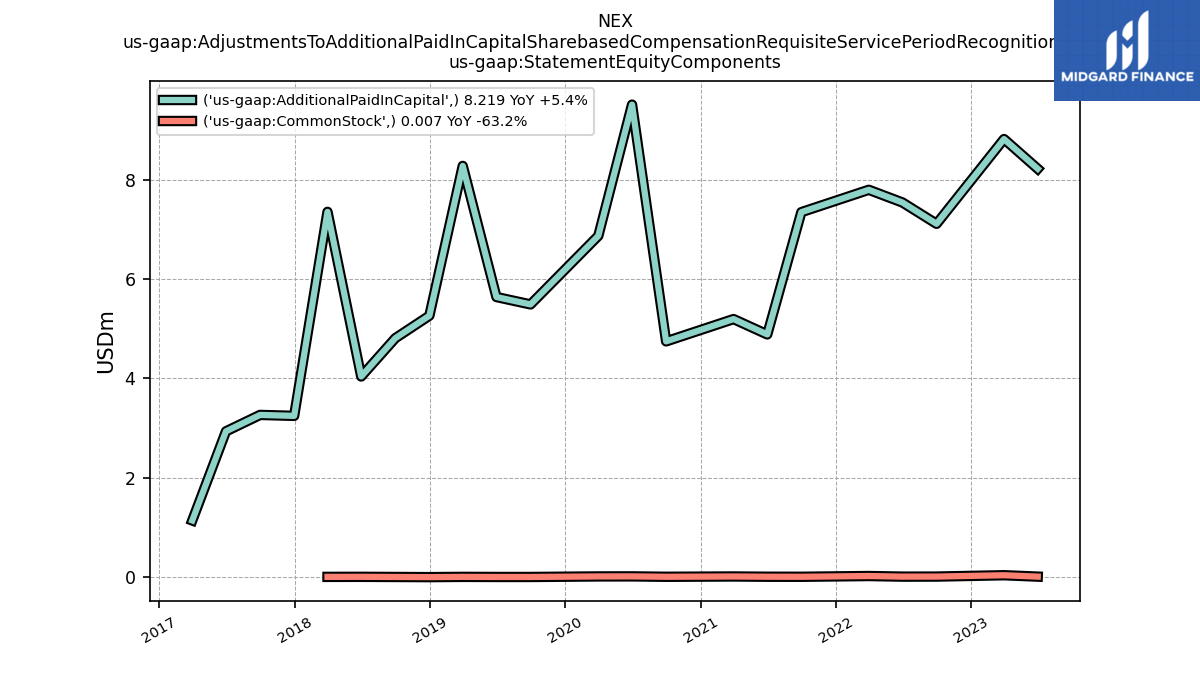
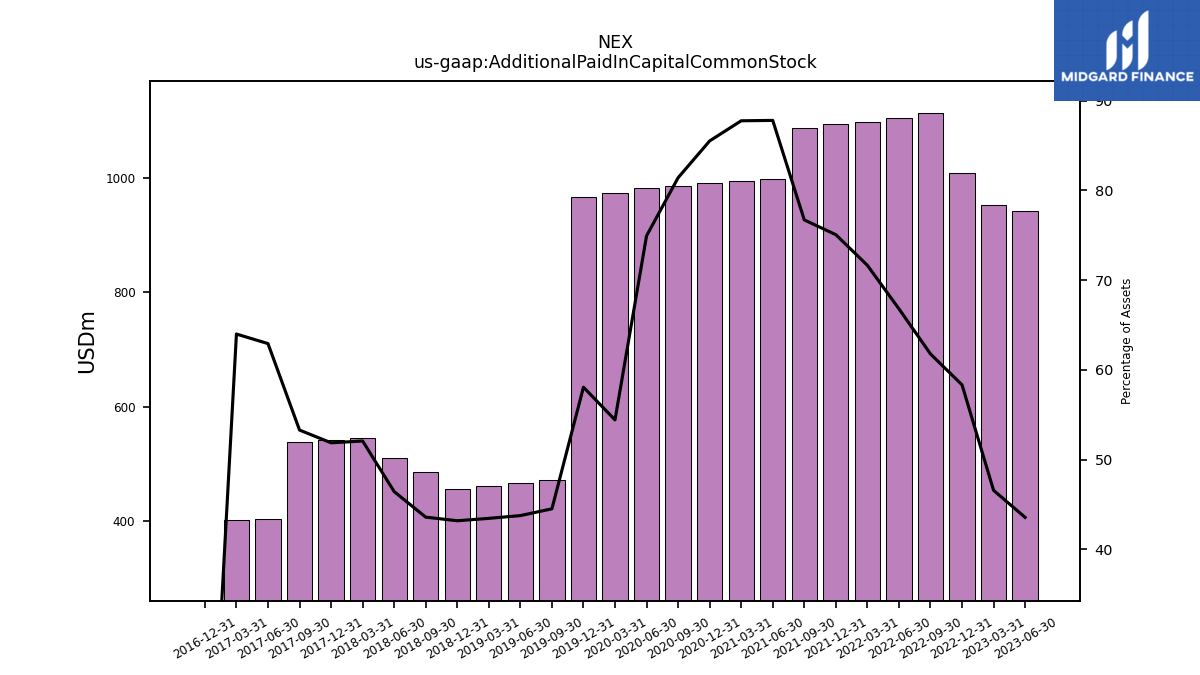
| Additional Paid In Capital Common Stock | 942.56 | 952.95 | 1007.49 | 1113.38 | 1105.01 | 1097.86 | 1094.02 | 1087.62 | 998.63 | 994.18 | 990.00 | 985.90 | 981.20 | 972.48 | 966.76 | 471.36 | 466.00 | 460.86 | 455.45 | 485.75 | 510.30 | 545.09 | 541.07 | 537.83 | 404.36 | 401.43 | 0.00 | NA | NA | NA | |
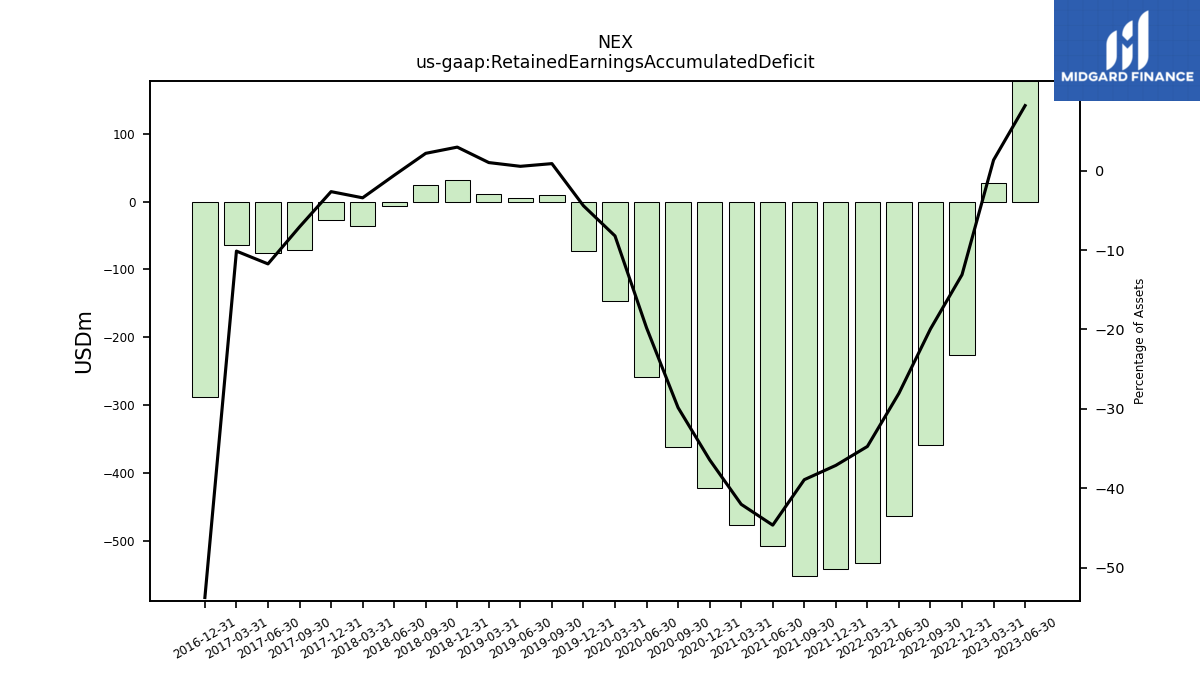
| Retained Earnings Accumulated Deficit | 177.86 | 27.80 | -226.19 | -359.18 | -463.91 | -532.37 | -541.16 | -552.02 | -508.02 | -476.24 | -421.74 | -361.54 | -259.10 | -146.61 | -73.33 | 9.60 | 6.04 | 11.02 | 31.49 | 24.56 | -6.22 | -35.62 | -27.37 | -71.32 | -75.38 | -63.49 | -288.77 | NA | NA | NA | |
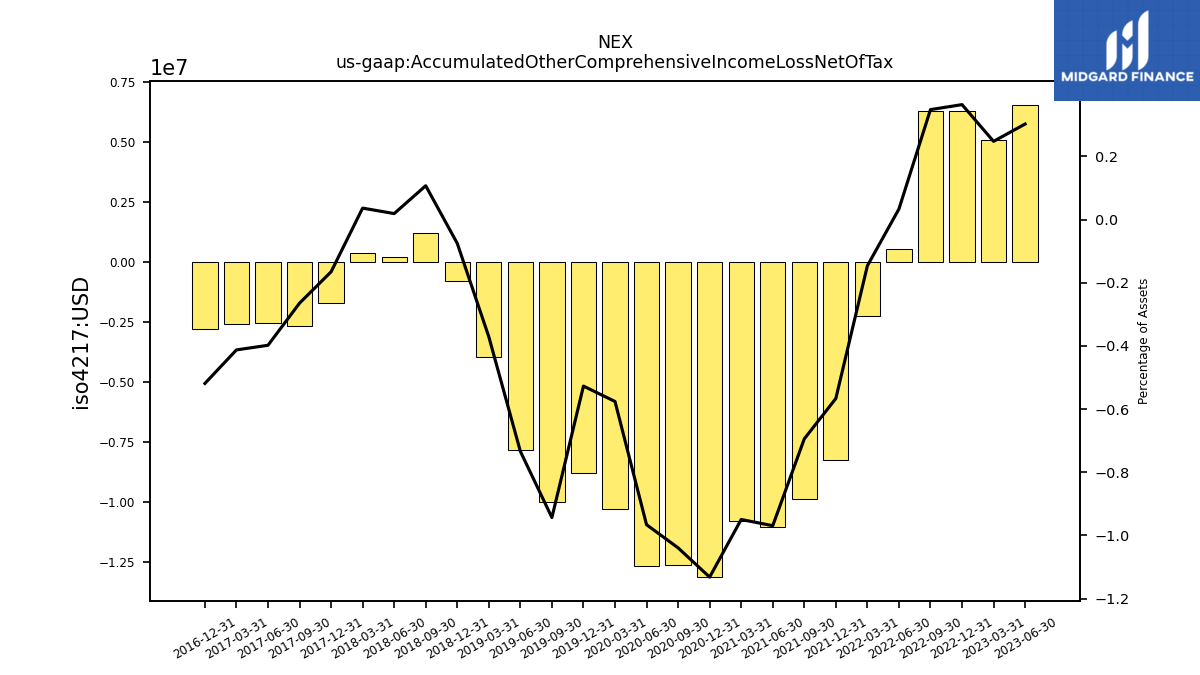
| Accumulated Other Comprehensive Income Loss Net Of Tax | 6.54 | 5.06 | 6.28 | 6.27 | 0.55 | -2.25 | -8.26 | -9.85 | -11.03 | -10.76 | -13.11 | -12.59 | -12.65 | -10.29 | -8.78 | -9.99 | -7.82 | -3.94 | -0.80 | 1.19 | 0.21 | 0.38 | -1.73 | -2.67 | -2.56 | -2.59 | -2.79 | NA | NA | NA | |
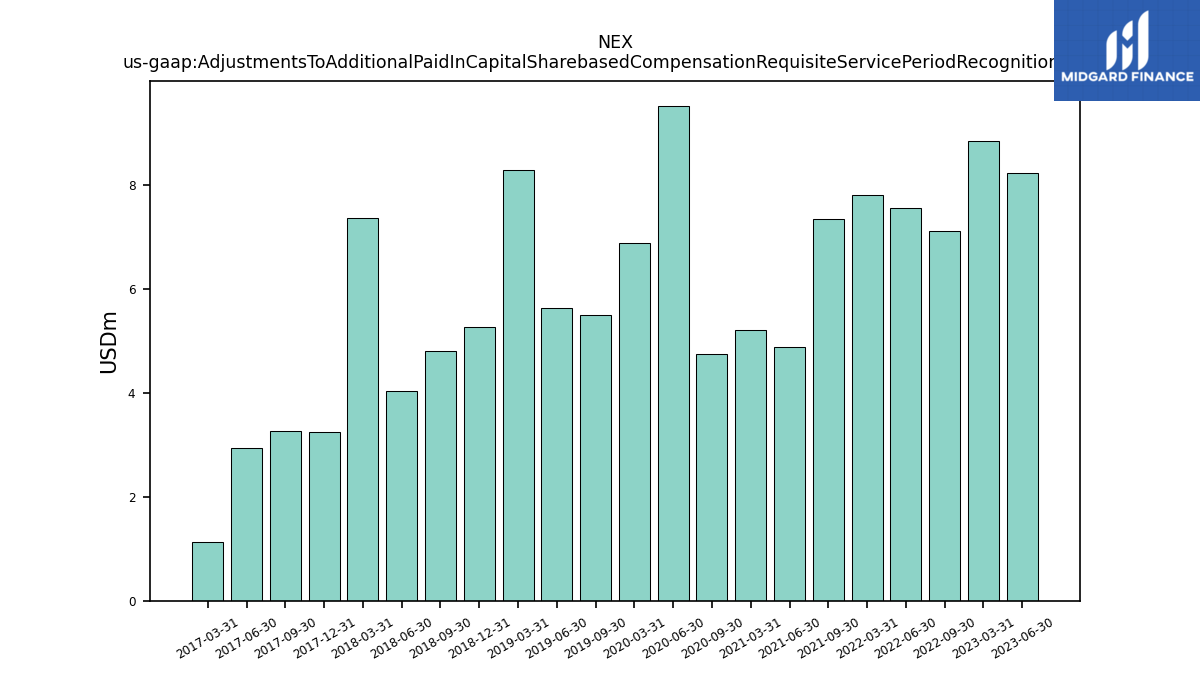
| Adjustments To Additional Paid In Capital Sharebased Compensation Requisite Service Period Recognition Value | 8.23 | 8.85 | NA | 7.12 | 7.55 | 7.82 | NA | 7.35 | 4.89 | 5.20 | NA | 4.75 | 9.52 | 6.88 | NA | 5.49 | 5.64 | 8.28 | 5.26 | 4.81 | 4.04 | 7.35 | 3.24 | 3.26 | 2.93 | 1.14 | NA | NA | NA | NA |
| 2023-06-30 | 2023-03-31 | 2022-12-31 | 2022-09-30 | 2022-06-30 | 2022-03-31 | 2021-12-31 | 2021-09-30 | 2021-06-30 | 2021-03-31 | 2020-12-31 | 2020-09-30 | 2020-06-30 | 2020-03-31 | 2019-12-31 | 2019-09-30 | 2019-06-30 | 2019-03-31 | 2018-12-31 | 2018-09-30 | 2018-06-30 | 2018-03-31 | 2017-12-31 | 2017-09-30 | 2017-06-30 | 2017-03-31 | 2016-12-31 | 2016-09-30 | 2016-06-30 | 2016-03-31 | ||
|---|---|---|---|---|---|---|---|---|---|---|---|---|---|---|---|---|---|---|---|---|---|---|---|---|---|---|---|---|---|---|---|
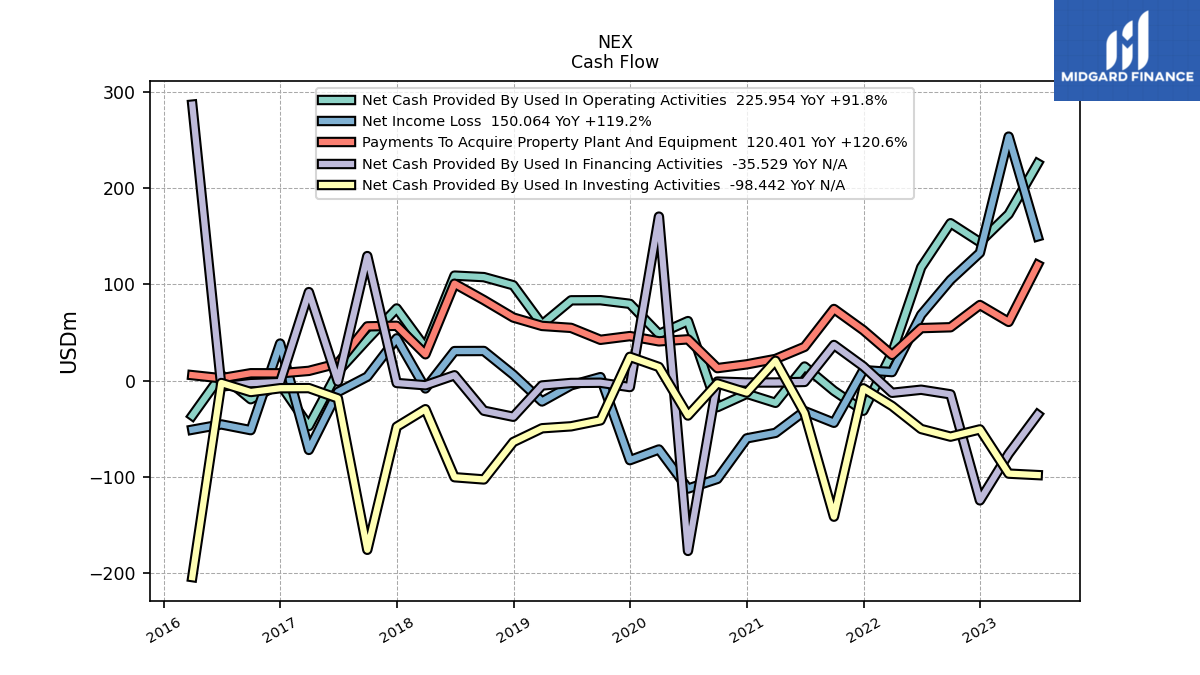
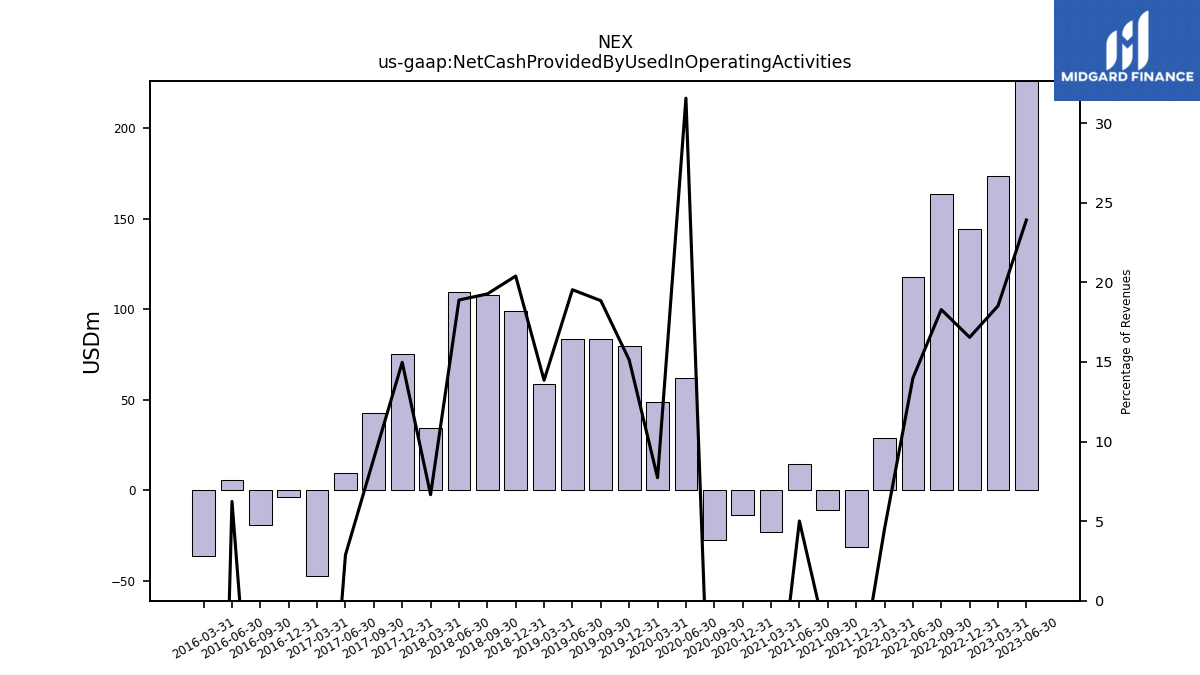
| Net Cash Provided By Used In Operating Activities | 225.95 | 173.25 | 144.07 | 163.82 | 117.83 | 28.67 | -31.47 | -10.72 | 14.63 | -23.23 | -13.79 | -27.74 | 61.93 | 48.49 | 79.88 | 83.65 | 83.54 | 58.39 | 99.21 | 107.68 | 109.25 | 34.17 | 75.08 | 42.70 | 9.32 | -47.41 | -3.69 | -19.49 | 5.71 | -36.59 | |
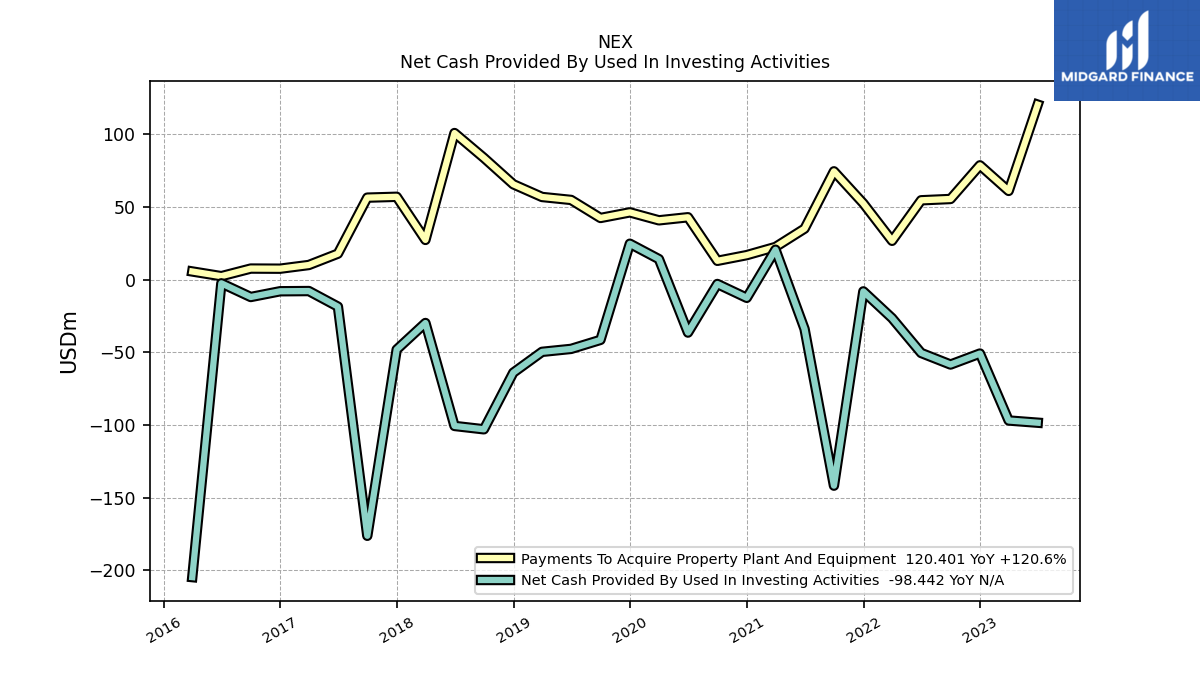
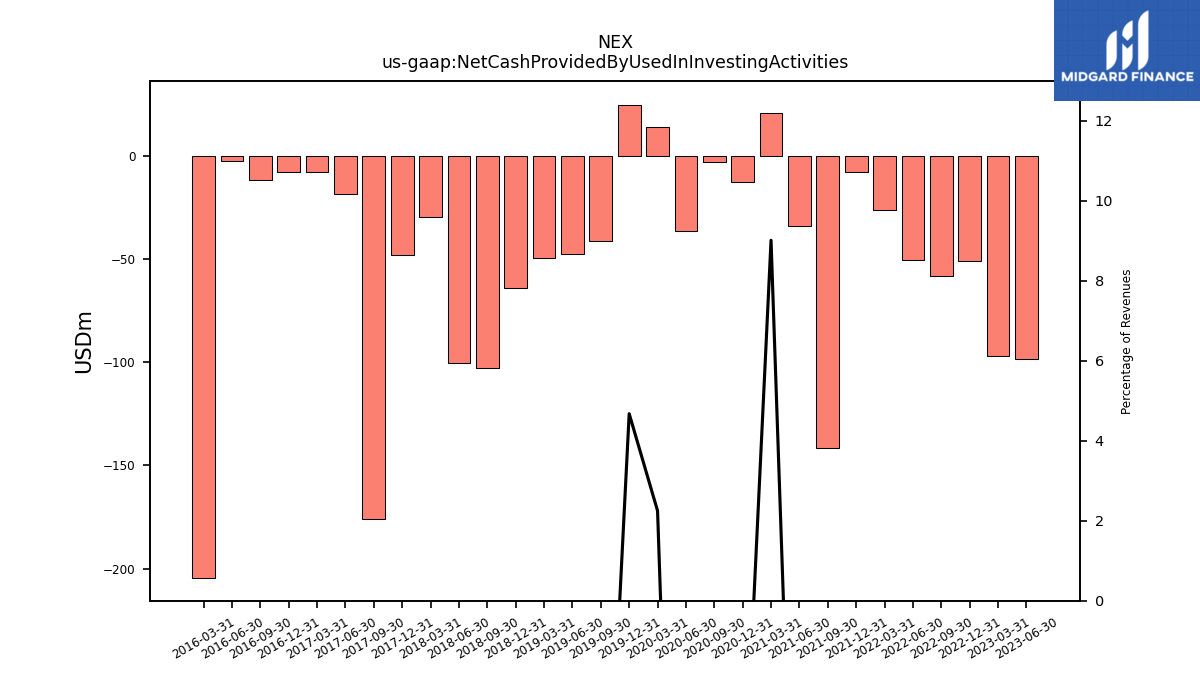
| Net Cash Provided By Used In Investing Activities | -98.44 | -96.92 | -50.84 | -58.42 | -50.46 | -26.51 | -8.08 | -141.76 | -33.95 | 20.59 | -12.54 | -2.99 | -36.44 | 14.12 | 24.70 | -41.46 | -47.66 | -49.69 | -64.03 | -102.98 | -100.67 | -29.83 | -48.10 | -176.25 | -18.57 | -7.86 | -8.00 | -11.96 | -2.52 | -204.68 | |
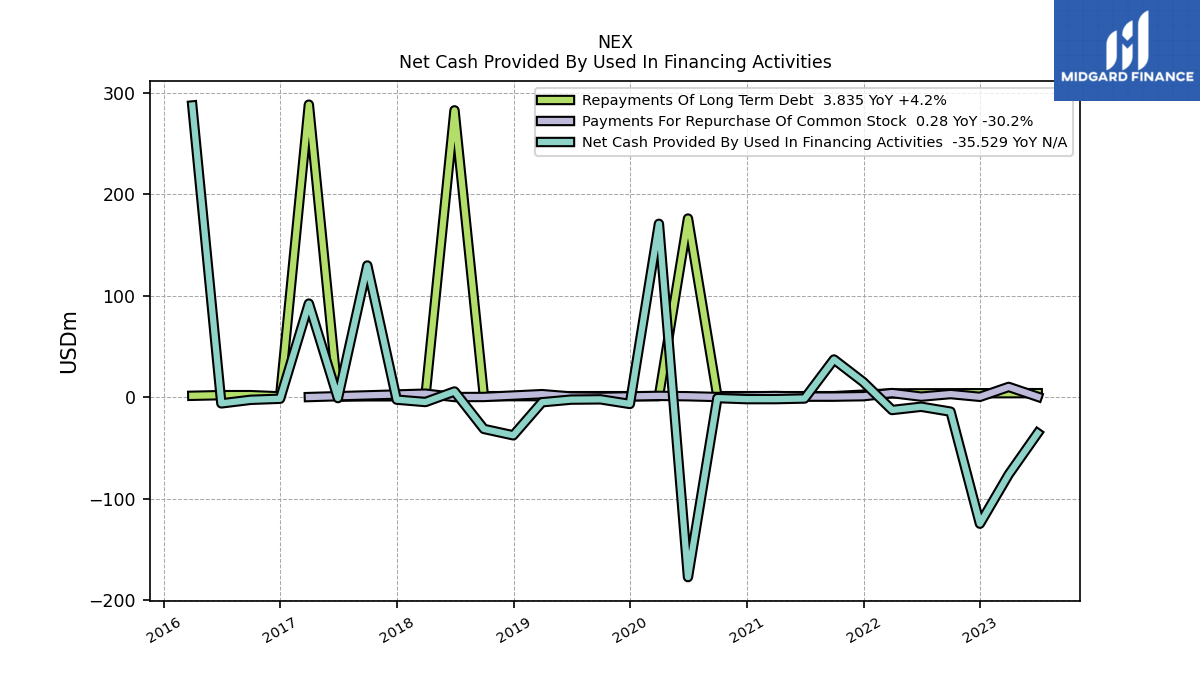
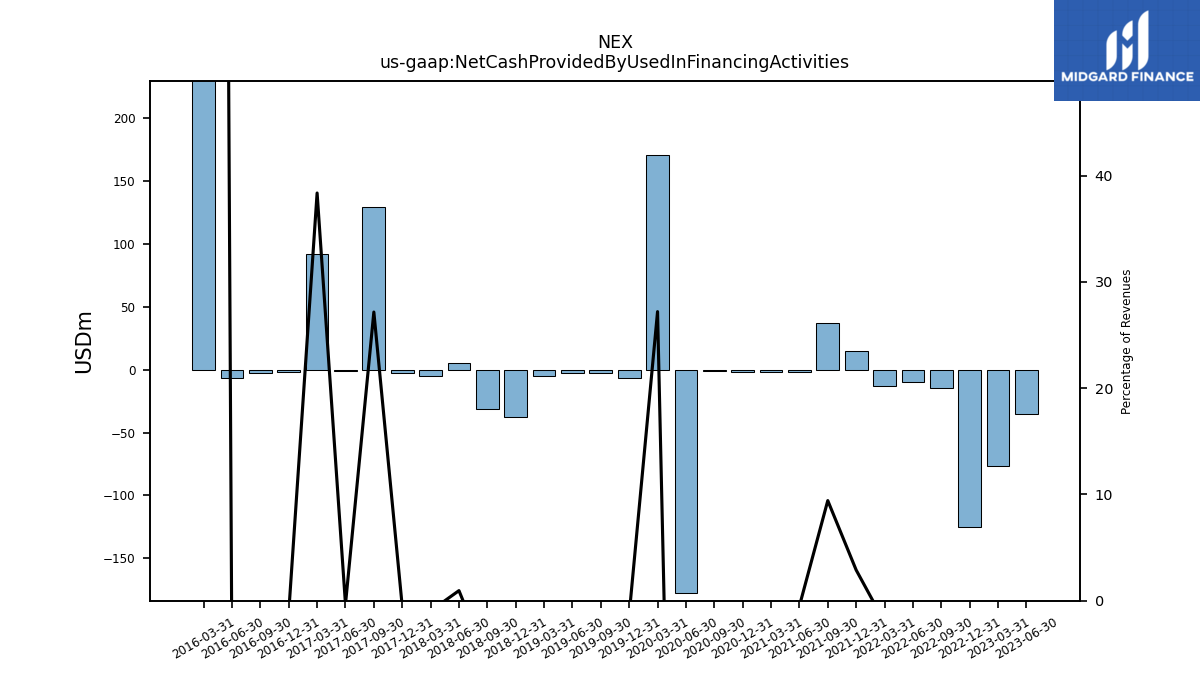
| Net Cash Provided By Used In Financing Activities | -35.53 | -76.31 | -124.79 | -14.37 | -9.57 | -12.77 | 14.75 | 37.04 | -1.45 | -2.05 | -2.06 | -1.05 | -177.41 | 170.70 | -6.82 | -2.26 | -2.54 | -5.13 | -37.72 | -31.42 | 5.51 | -4.92 | -2.57 | 129.62 | -1.04 | 92.11 | -1.67 | -2.72 | -6.25 | 287.28 |
| 2023-06-30 | 2023-03-31 | 2022-12-31 | 2022-09-30 | 2022-06-30 | 2022-03-31 | 2021-12-31 | 2021-09-30 | 2021-06-30 | 2021-03-31 | 2020-12-31 | 2020-09-30 | 2020-06-30 | 2020-03-31 | 2019-12-31 | 2019-09-30 | 2019-06-30 | 2019-03-31 | 2018-12-31 | 2018-09-30 | 2018-06-30 | 2018-03-31 | 2017-12-31 | 2017-09-30 | 2017-06-30 | 2017-03-31 | 2016-12-31 | 2016-09-30 | 2016-06-30 | 2016-03-31 | ||
|---|---|---|---|---|---|---|---|---|---|---|---|---|---|---|---|---|---|---|---|---|---|---|---|---|---|---|---|---|---|---|---|
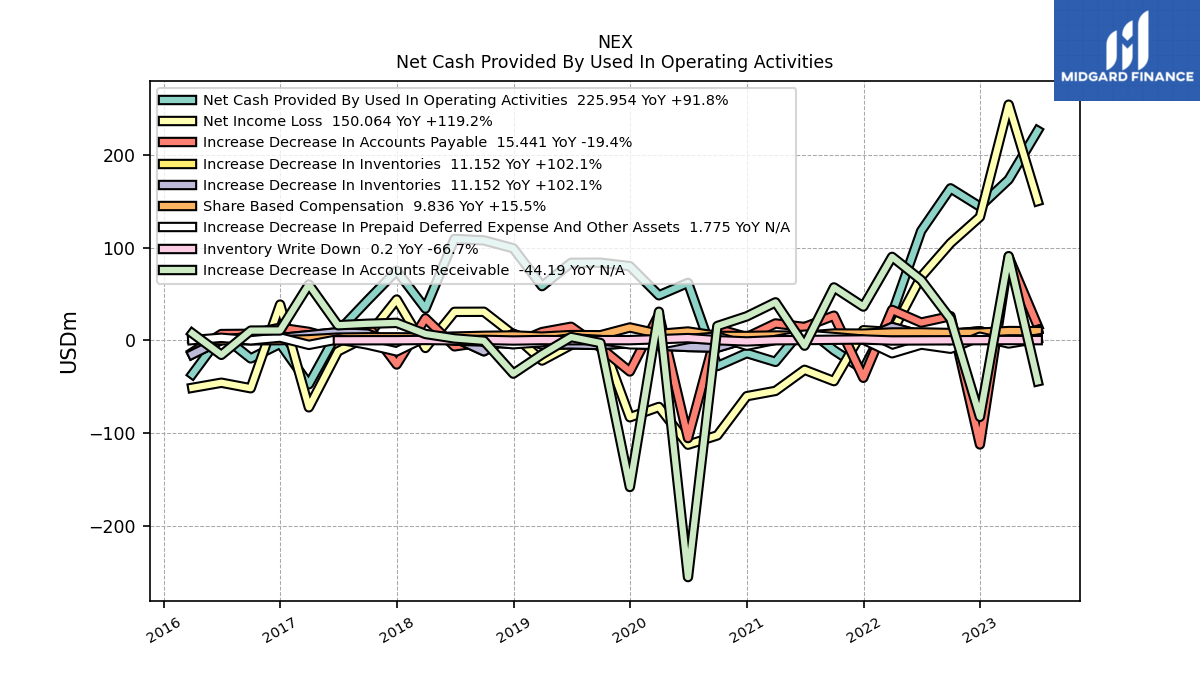
| Net Cash Provided By Used In Operating Activities | 225.95 | 173.25 | 144.07 | 163.82 | 117.83 | 28.67 | -31.47 | -10.72 | 14.63 | -23.23 | -13.79 | -27.74 | 61.93 | 48.49 | 79.88 | 83.65 | 83.54 | 58.39 | 99.21 | 107.68 | 109.25 | 34.17 | 75.08 | 42.70 | 9.32 | -47.41 | -3.69 | -19.49 | 5.71 | -36.59 | |
| Net Income Loss | 150.06 | 253.99 | 132.99 | 104.73 | 68.46 | 8.79 | 10.85 | -43.99 | -31.78 | -54.50 | -60.21 | -102.43 | -112.49 | -71.76 | -82.93 | 3.56 | -4.98 | -21.81 | 6.13 | 30.78 | 30.67 | -8.24 | 43.95 | 4.07 | -11.90 | -72.25 | 38.53 | -51.67 | -45.69 | -51.19 | |
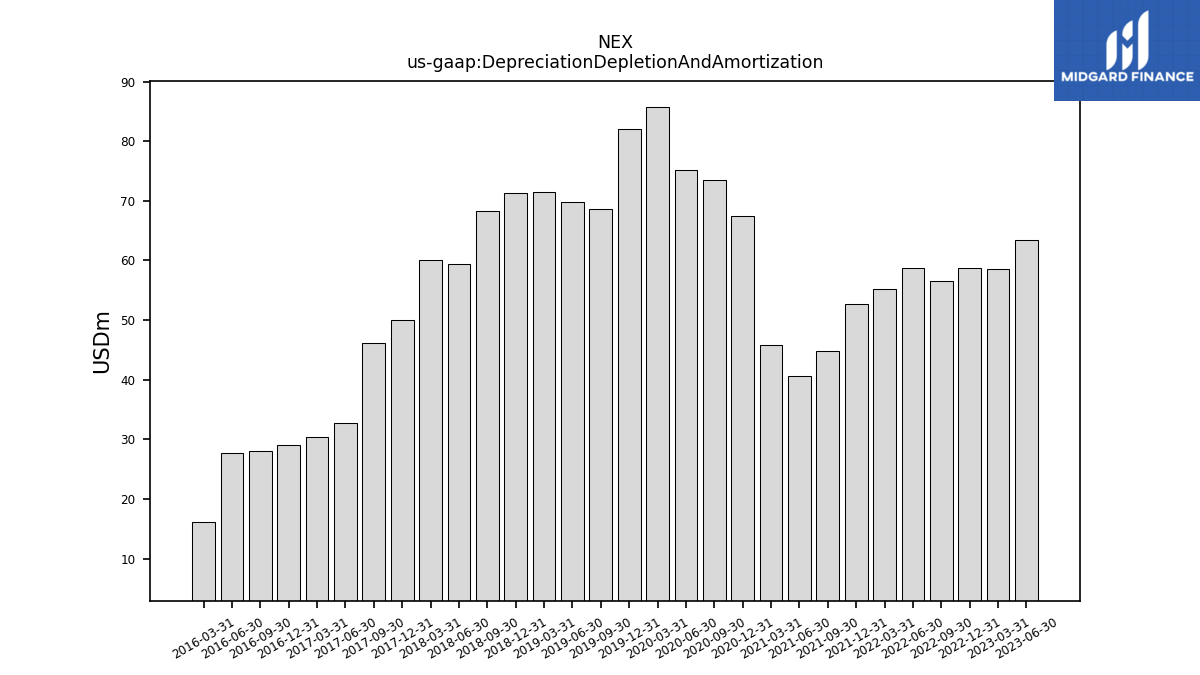
| Depreciation Depletion And Amortization | 63.50 | 58.65 | 58.76 | 56.54 | 58.79 | 55.16 | 52.76 | 44.86 | 40.67 | 45.87 | 67.40 | 73.57 | 75.26 | 85.82 | 82.08 | 68.71 | 69.89 | 71.48 | 71.40 | 68.29 | 59.40 | 60.05 | 49.96 | 46.20 | 32.74 | 30.37 | 29.03 | 28.11 | 27.72 | 16.11 | |
| Increase Decrease In Accounts Receivable | -44.19 | 90.71 | -82.48 | 23.06 | 64.96 | 89.94 | 36.35 | 57.03 | -5.80 | 40.95 | 25.84 | 15.43 | -255.18 | 30.83 | -158.09 | -2.88 | 3.54 | -15.14 | -35.92 | -0.47 | 2.04 | 6.86 | 18.81 | 17.82 | 16.26 | 60.15 | 10.62 | 10.47 | -15.67 | 7.61 | |
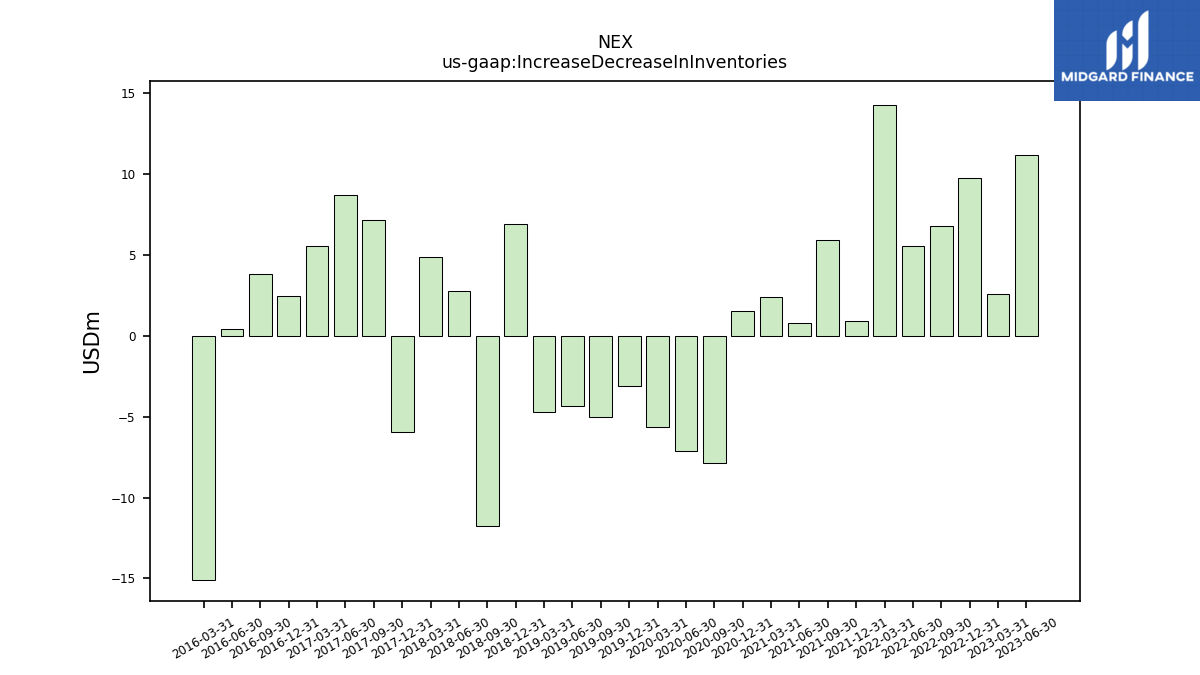
| Increase Decrease In Inventories | 11.15 | 2.59 | 9.73 | 6.74 | 5.52 | 14.26 | 0.93 | 5.93 | 0.75 | 2.36 | 1.52 | -7.89 | -7.16 | -5.65 | -3.10 | -5.04 | -4.34 | -4.71 | 6.90 | -11.79 | 2.77 | 4.84 | -5.94 | 7.17 | 8.71 | 5.54 | 2.43 | 3.78 | 0.39 | -15.08 | |
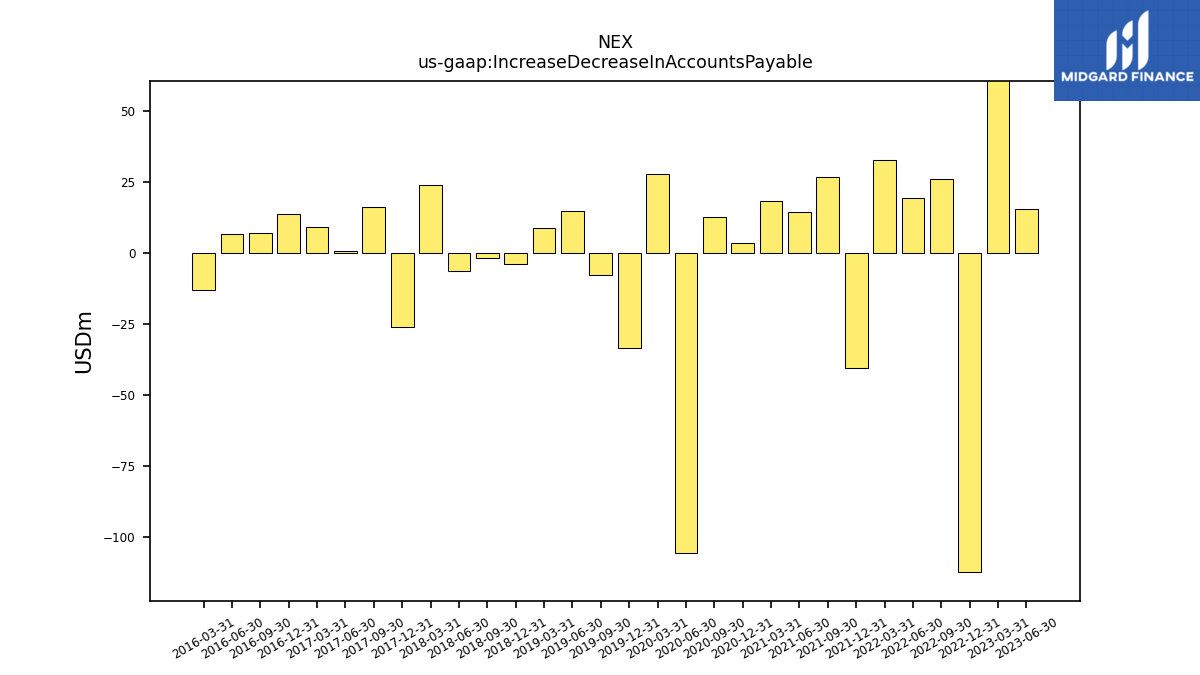
| Increase Decrease In Accounts Payable | 15.44 | 89.68 | -112.22 | 26.02 | 19.15 | 32.79 | -40.38 | 26.58 | 14.31 | 18.19 | 3.49 | 12.54 | -105.38 | 27.69 | -33.60 | -7.71 | 14.61 | 8.90 | -4.04 | -1.86 | -6.51 | 23.71 | -26.06 | 16.20 | 0.65 | 9.07 | 13.59 | 7.01 | 6.76 | -13.15 | |
| Deferred Income Tax Expense Benefit | -5.50 | -107.43 | NA | NA | NA | NA | NA | NA | NA | NA | NA | NA | NA | NA | NA | NA | NA | NA | NA | NA | NA | NA | NA | NA | NA | 0.13 | NA | NA | NA | 0.00 | |
| Share Based Compensation | 9.84 | 9.99 | 8.26 | 7.87 | 8.52 | 8.48 | 7.24 | 7.35 | 4.89 | 5.20 | 4.67 | 4.75 | 9.52 | 6.88 | 13.85 | 5.49 | 5.64 | 4.00 | 5.24 | 4.81 | 4.04 | 3.07 | 3.24 | 3.26 | 2.93 | 1.14 | 0.16 | -0.01 | 0.07 | 1.77 | |
| Amortization Of Financing Costs | 0.56 | 0.56 | 0.56 | 0.56 | 0.55 | 0.53 | 0.54 | 0.51 | 0.39 | 0.62 | 0.51 | 0.50 | 0.66 | 0.55 | 0.39 | 0.47 | 0.26 | 0.24 | 0.82 | 1.00 | 0.70 | 0.60 | 0.62 | 0.60 | 0.00 | 3.85 | 1.40 | 1.30 | 1.00 | 0.52 |
| 2023-06-30 | 2023-03-31 | 2022-12-31 | 2022-09-30 | 2022-06-30 | 2022-03-31 | 2021-12-31 | 2021-09-30 | 2021-06-30 | 2021-03-31 | 2020-12-31 | 2020-09-30 | 2020-06-30 | 2020-03-31 | 2019-12-31 | 2019-09-30 | 2019-06-30 | 2019-03-31 | 2018-12-31 | 2018-09-30 | 2018-06-30 | 2018-03-31 | 2017-12-31 | 2017-09-30 | 2017-06-30 | 2017-03-31 | 2016-12-31 | 2016-09-30 | 2016-06-30 | 2016-03-31 | ||
|---|---|---|---|---|---|---|---|---|---|---|---|---|---|---|---|---|---|---|---|---|---|---|---|---|---|---|---|---|---|---|---|
| Net Cash Provided By Used In Investing Activities | -98.44 | -96.92 | -50.84 | -58.42 | -50.46 | -26.51 | -8.08 | -141.76 | -33.95 | 20.59 | -12.54 | -2.99 | -36.44 | 14.12 | 24.70 | -41.46 | -47.66 | -49.69 | -64.03 | -102.98 | -100.67 | -29.83 | -48.10 | -176.25 | -18.57 | -7.86 | -8.00 | -11.96 | -2.52 | -204.68 | |
| Payments To Acquire Property Plant And Equipment | 120.40 | 61.03 | 78.65 | 55.48 | 54.59 | 26.70 | 52.44 | 74.52 | 35.08 | 22.46 | 16.86 | 12.93 | 42.92 | 40.80 | 46.28 | 42.41 | 54.83 | 56.87 | 65.61 | 83.78 | 100.86 | 27.31 | 56.99 | 56.41 | 17.86 | 10.07 | 7.52 | 7.61 | 2.38 | 5.61 |
| 2023-06-30 | 2023-03-31 | 2022-12-31 | 2022-09-30 | 2022-06-30 | 2022-03-31 | 2021-12-31 | 2021-09-30 | 2021-06-30 | 2021-03-31 | 2020-12-31 | 2020-09-30 | 2020-06-30 | 2020-03-31 | 2019-12-31 | 2019-09-30 | 2019-06-30 | 2019-03-31 | 2018-12-31 | 2018-09-30 | 2018-06-30 | 2018-03-31 | 2017-12-31 | 2017-09-30 | 2017-06-30 | 2017-03-31 | 2016-12-31 | 2016-09-30 | 2016-06-30 | 2016-03-31 | ||
|---|---|---|---|---|---|---|---|---|---|---|---|---|---|---|---|---|---|---|---|---|---|---|---|---|---|---|---|---|---|---|---|
| Net Cash Provided By Used In Financing Activities | -35.53 | -76.31 | -124.79 | -14.37 | -9.57 | -12.77 | 14.75 | 37.04 | -1.45 | -2.05 | -2.06 | -1.05 | -177.41 | 170.70 | -6.82 | -2.26 | -2.54 | -5.13 | -37.72 | -31.42 | 5.51 | -4.92 | -2.57 | 129.62 | -1.04 | 92.11 | -1.67 | -2.72 | -6.25 | 287.28 | |
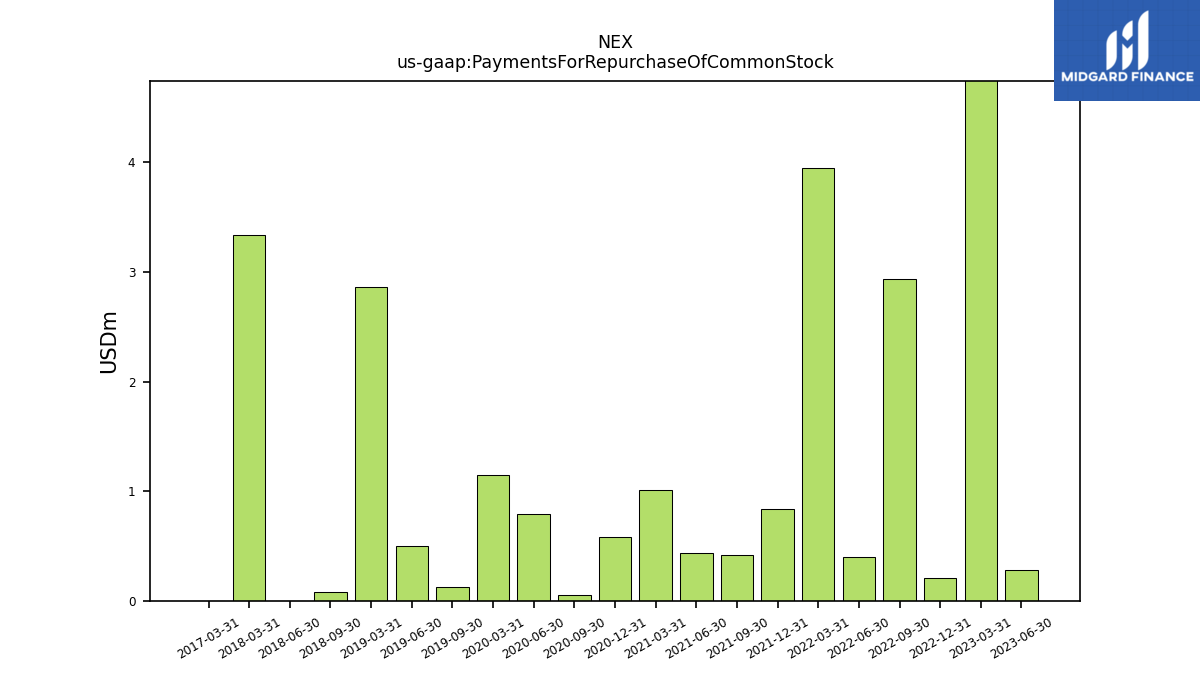
| Payments For Repurchase Of Common Stock | 0.28 | 9.98 | 0.21 | 2.94 | 0.40 | 3.95 | 0.83 | 0.42 | 0.44 | 1.01 | 0.58 | 0.05 | 0.79 | 1.15 | NA | 0.12 | 0.50 | 2.86 | NA | 0.08 | 0.00 | 3.34 | NA | NA | NA | 0.00 | NA | NA | NA | NA |
| 2023-06-30 | 2023-03-31 | 2022-12-31 | 2022-09-30 | 2022-06-30 | 2022-03-31 | 2021-12-31 | 2021-09-30 | 2021-06-30 | 2021-03-31 | 2020-12-31 | 2020-09-30 | 2020-06-30 | 2020-03-31 | 2019-12-31 | 2019-09-30 | 2019-06-30 | 2019-03-31 | 2018-12-31 | 2018-09-30 | 2018-06-30 | 2018-03-31 | 2017-12-31 | 2017-09-30 | 2017-06-30 | 2017-03-31 | 2016-12-31 | 2016-09-30 | 2016-06-30 | 2016-03-31 | ||
|---|---|---|---|---|---|---|---|---|---|---|---|---|---|---|---|---|---|---|---|---|---|---|---|---|---|---|---|---|---|---|---|
| Revenues | 945.09 | 935.67 | 870.86 | 896.01 | 842.91 | 635.04 | 509.73 | 393.16 | 292.14 | 228.40 | 215.05 | 163.68 | 196.23 | 627.62 | 528.22 | 443.95 | 427.73 | 421.65 | 486.55 | 558.91 | 578.53 | 513.02 | 501.49 | 477.30 | 323.14 | 240.15 | 151.03 | 116.75 | 91.59 | 61.20 | |
| Revenue From Contract With Customer Excluding Assessed Tax | 945.09 | 935.67 | 870.86 | 896.01 | 842.91 | 635.04 | 509.73 | 393.16 | 292.14 | 228.40 | 215.05 | 163.68 | 196.23 | 627.62 | 528.22 | 443.95 | 427.73 | 421.65 | 486.55 | 558.91 | 578.53 | 513.02 | 501.49 | 477.30 | 323.14 | 240.15 | 151.03 | 116.75 | 91.59 | 61.20 | |
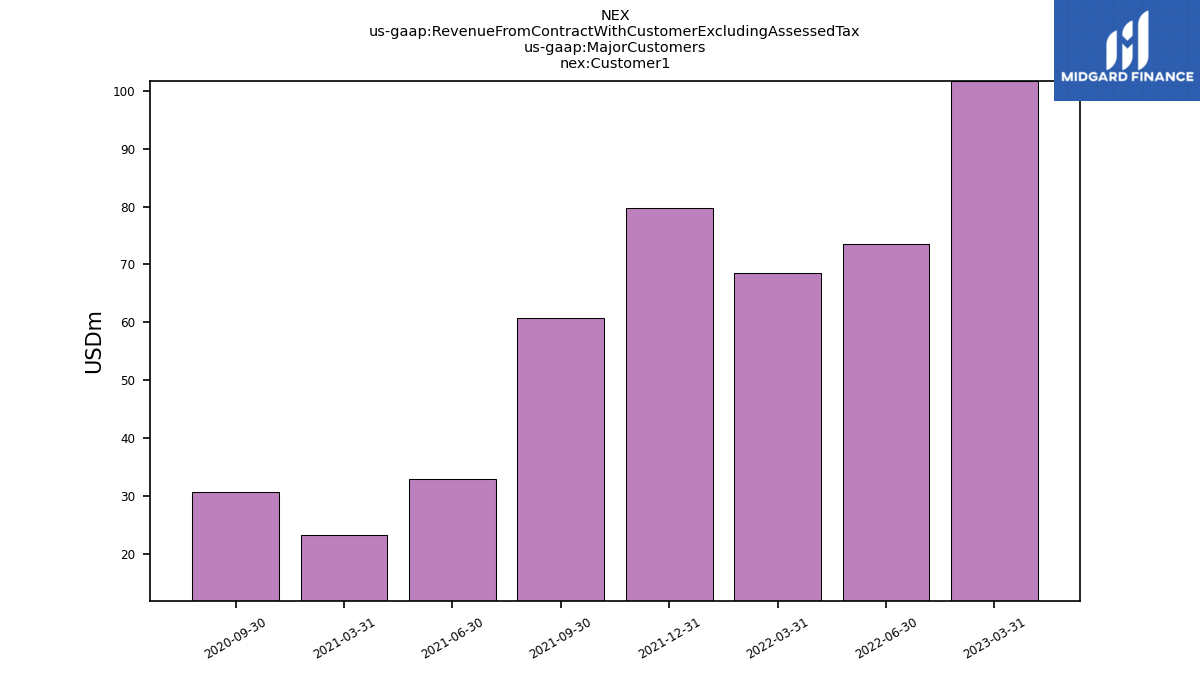
| Customer1 | NA | 101.70 | NA | NA | 73.50 | 68.60 | 79.80 | 60.80 | 33.00 | 23.20 | NA | 30.60 | NA | NA | NA | NA | NA | NA | NA | NA | NA | NA | NA | NA | NA | NA | NA | NA | NA | NA | |
| Customer1, Sales Revenue Net, Customer Concentration Risk | 111.20 | NA | NA | NA | NA | NA | NA | NA | NA | NA | NA | NA | NA | NA | NA | NA | NA | NA | NA | NA | NA | NA | NA | NA | NA | NA | NA | NA | NA | NA | |
| Largest Customer, Accounts Receivable, Customer Concentration Risk | NA | 38.40 | NA | NA | NA | NA | NA | NA | NA | NA | NA | NA | NA | NA | NA | NA | NA | NA | NA | NA | NA | NA | NA | NA | NA | NA | NA | NA | NA | NA | |
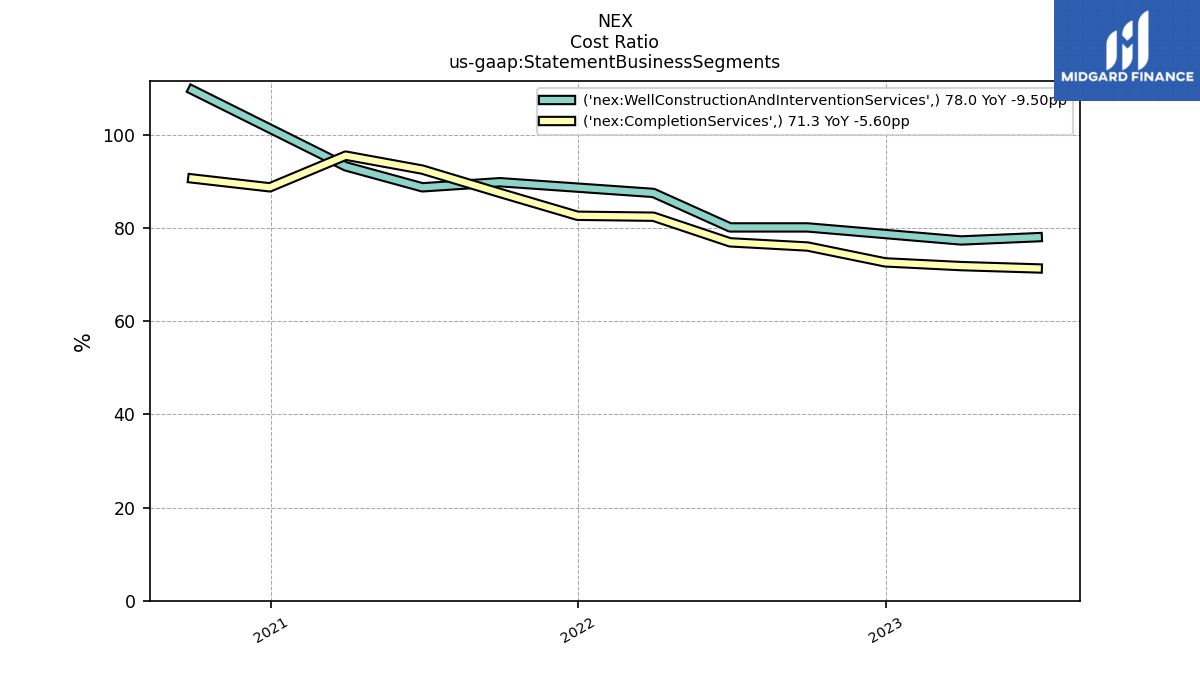
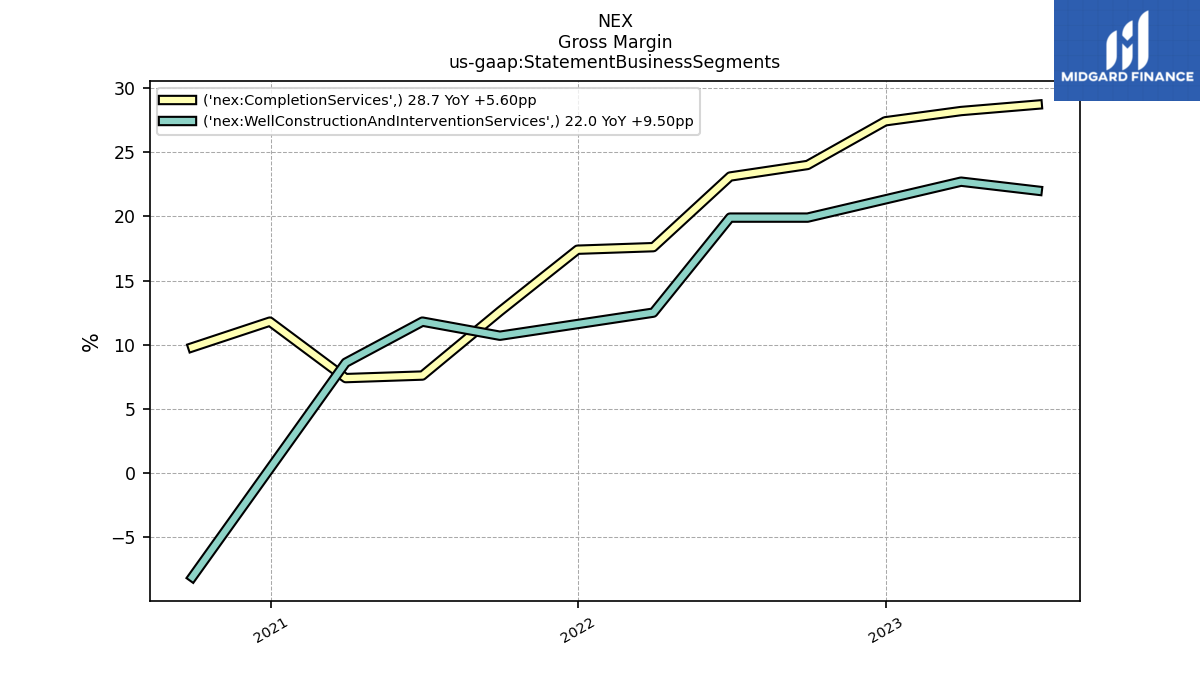
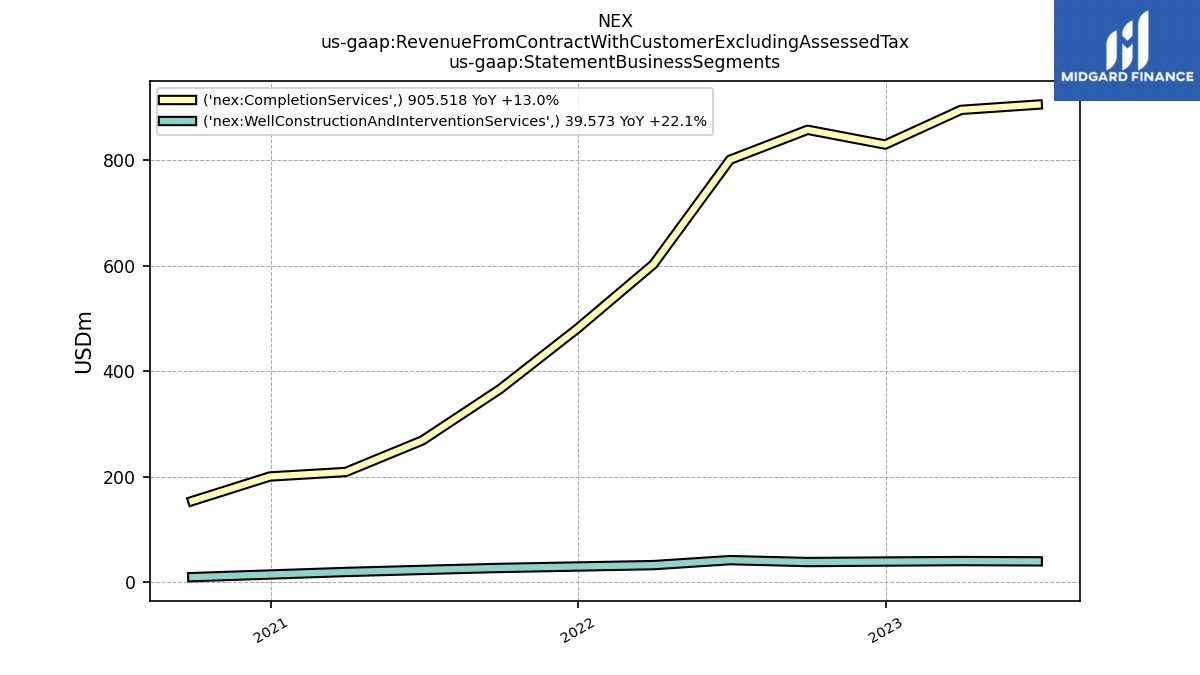
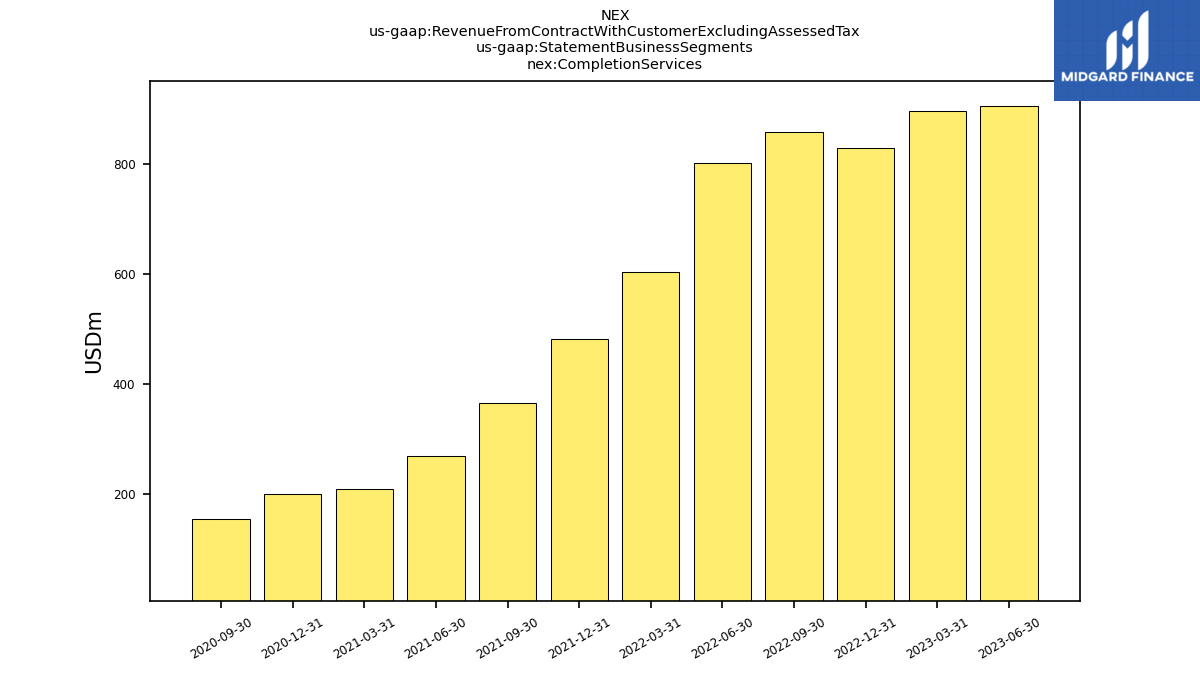
| Completion Services | 905.52 | 895.56 | 829.80 | 857.75 | 801.05 | 602.62 | 481.00 | 366.07 | 268.84 | 208.98 | 200.45 | 154.02 | NA | NA | NA | NA | NA | NA | NA | NA | NA | NA | NA | NA | NA | NA | NA | NA | NA | NA | |
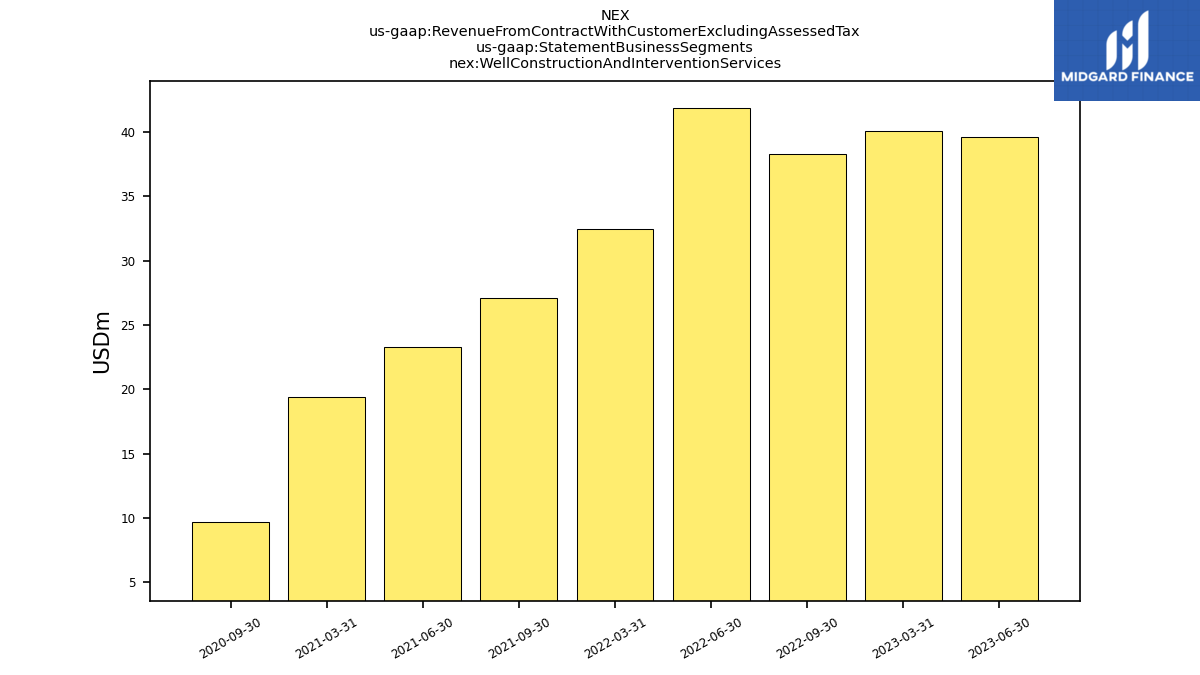
| Well Construction And Intervention Services | 39.57 | 40.11 | NA | 38.26 | 41.86 | 32.42 | NA | 27.10 | 23.31 | 19.42 | NA | 9.66 | NA | NA | NA | NA | NA | NA | NA | NA | NA | NA | NA | NA | NA | NA | NA | NA | NA | NA | |
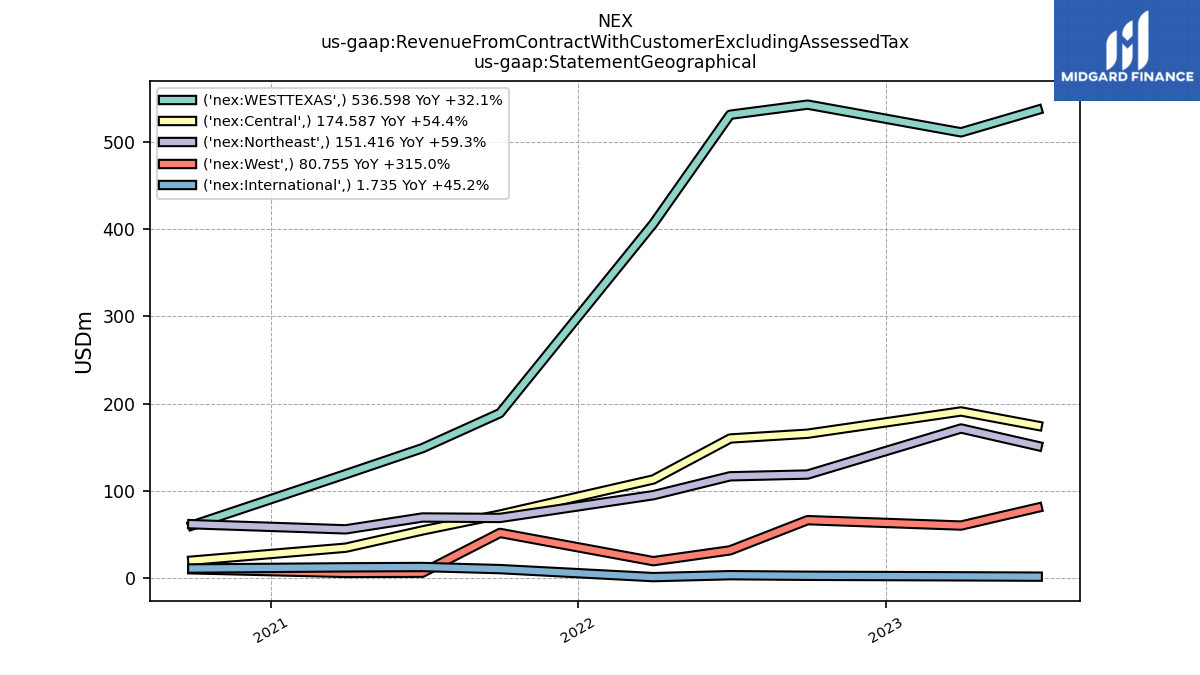
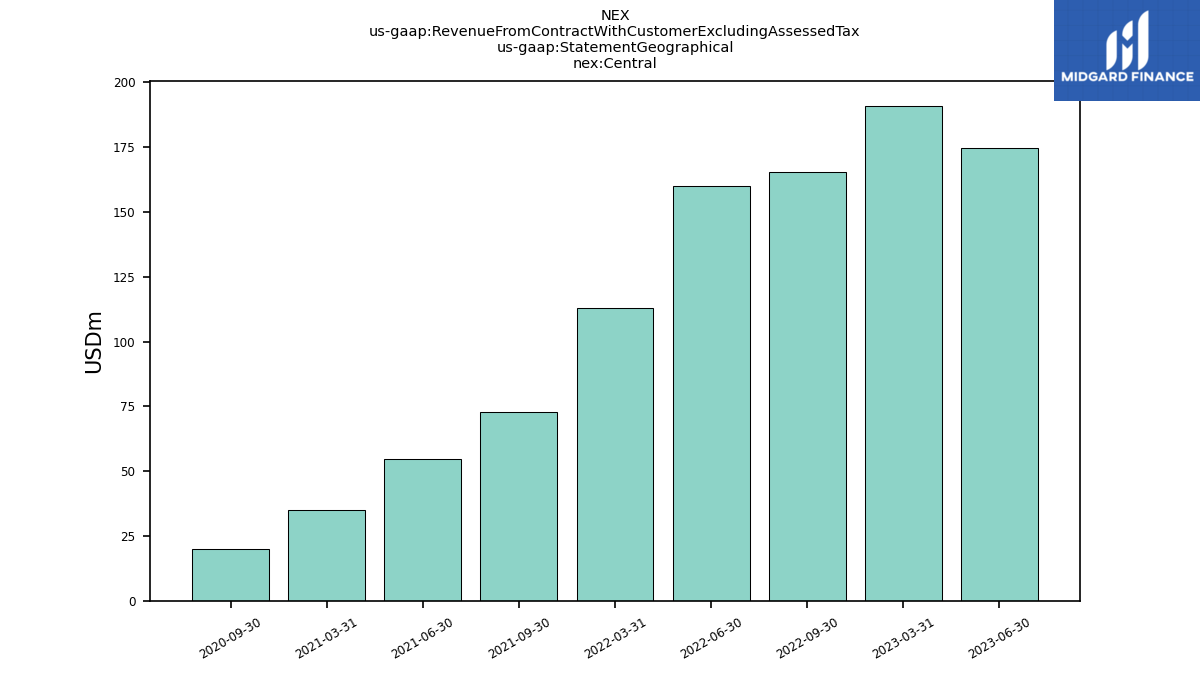
| Central | 174.59 | 191.01 | NA | 165.50 | 160.00 | 113.10 | NA | 72.86 | 54.65 | 34.90 | NA | 20.14 | NA | NA | NA | NA | NA | NA | NA | NA | NA | NA | NA | NA | NA | NA | NA | NA | NA | NA | |
| International | 1.74 | 2.11 | NA | 2.72 | 3.42 | 1.20 | NA | 10.38 | 12.79 | 12.42 | NA | 11.08 | NA | NA | NA | NA | NA | NA | NA | NA | NA | NA | NA | NA | NA | NA | NA | NA | NA | NA | |
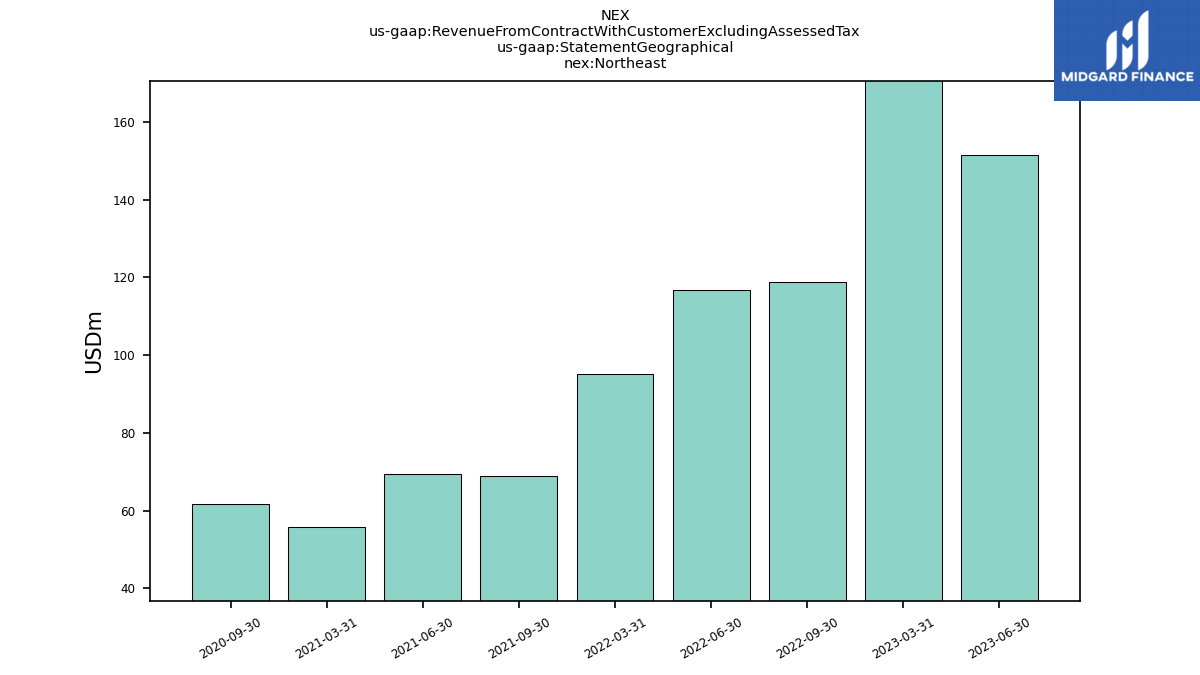
| Northeast | 151.42 | 171.49 | NA | 118.75 | 116.69 | 95.07 | NA | 69.00 | 69.51 | 55.91 | NA | 61.80 | NA | NA | NA | NA | NA | NA | NA | NA | NA | NA | NA | NA | NA | NA | NA | NA | NA | NA | |
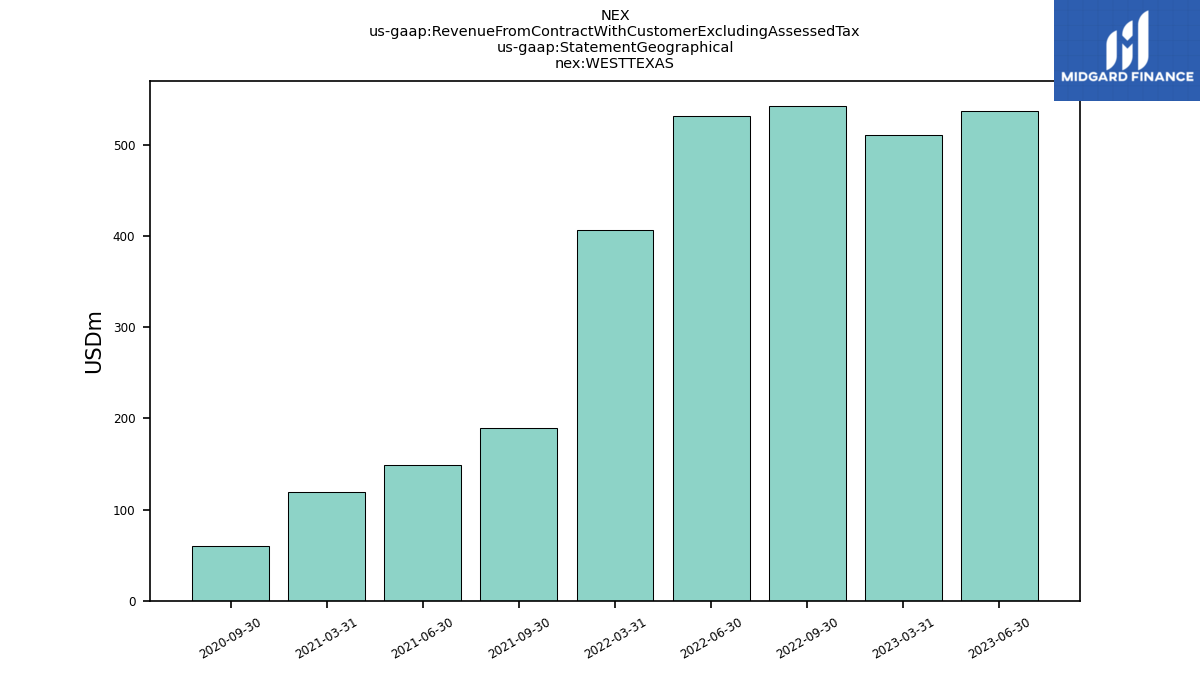
| WESTTEXAS | 536.60 | 510.80 | NA | 542.57 | 530.94 | 406.23 | NA | 189.08 | 148.93 | 119.14 | NA | 60.51 | NA | NA | NA | NA | NA | NA | NA | NA | NA | NA | NA | NA | NA | NA | NA | NA | NA | NA | |
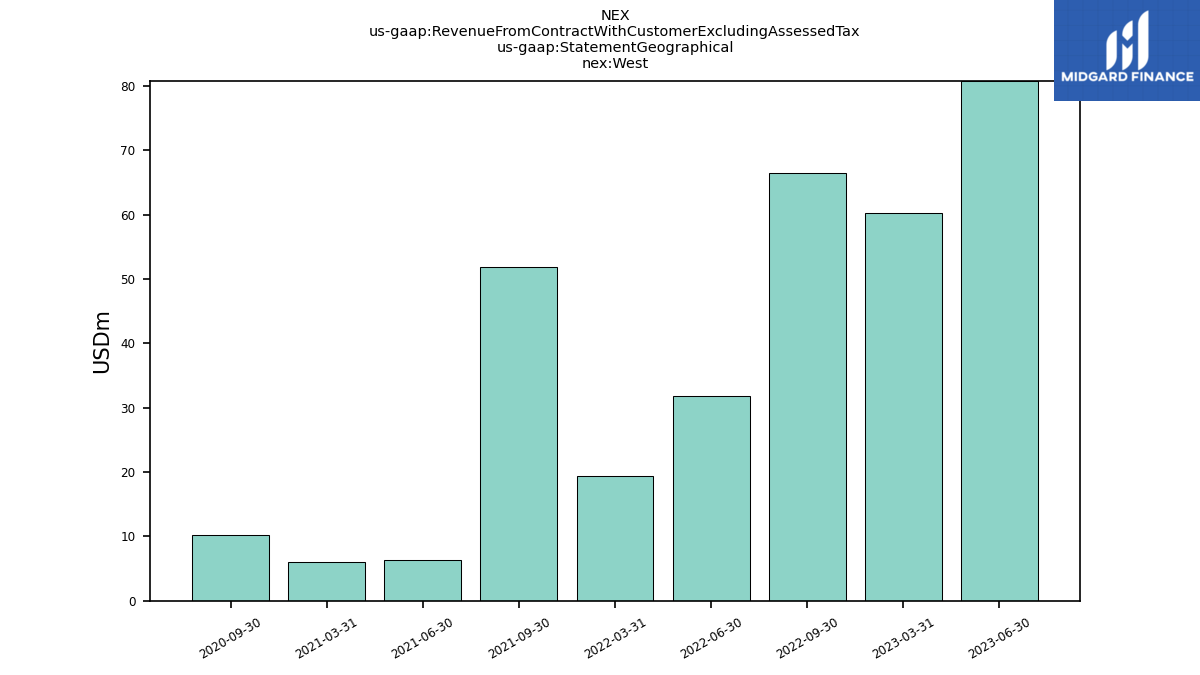
| West | 80.75 | 60.27 | NA | 66.47 | 31.86 | 19.46 | NA | 51.85 | 6.26 | 6.03 | NA | 10.14 | NA | NA | NA | NA | NA | NA | NA | NA | NA | NA | NA | NA | NA | NA | NA | NA | NA | NA | |
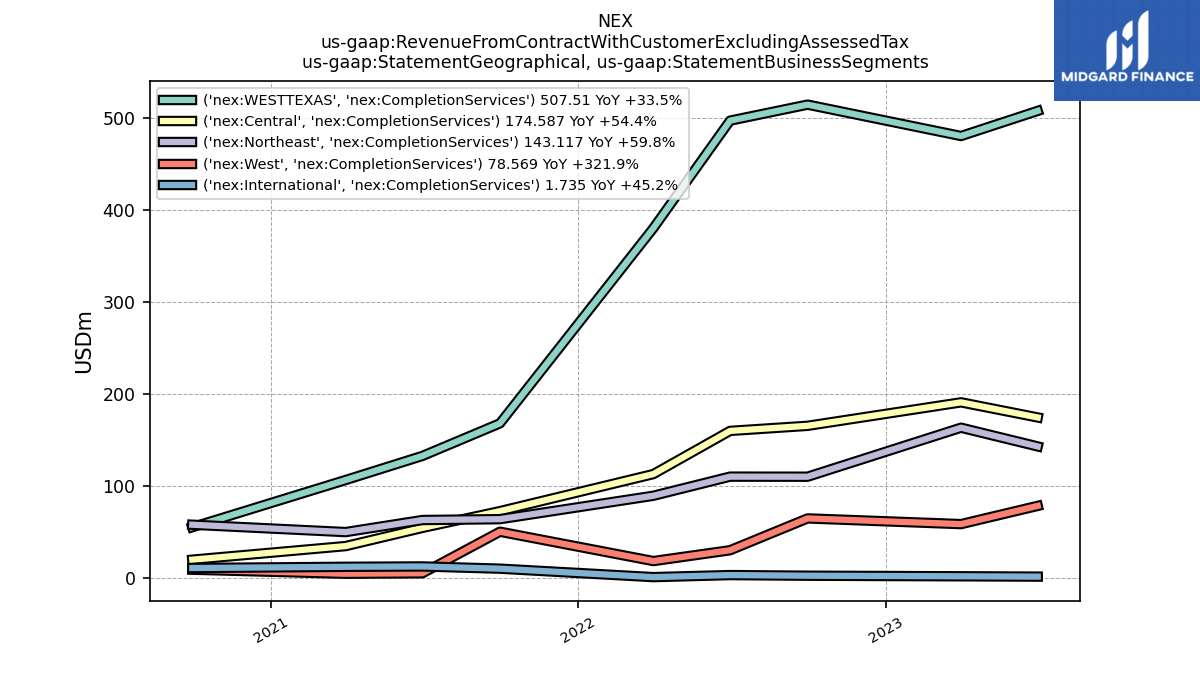
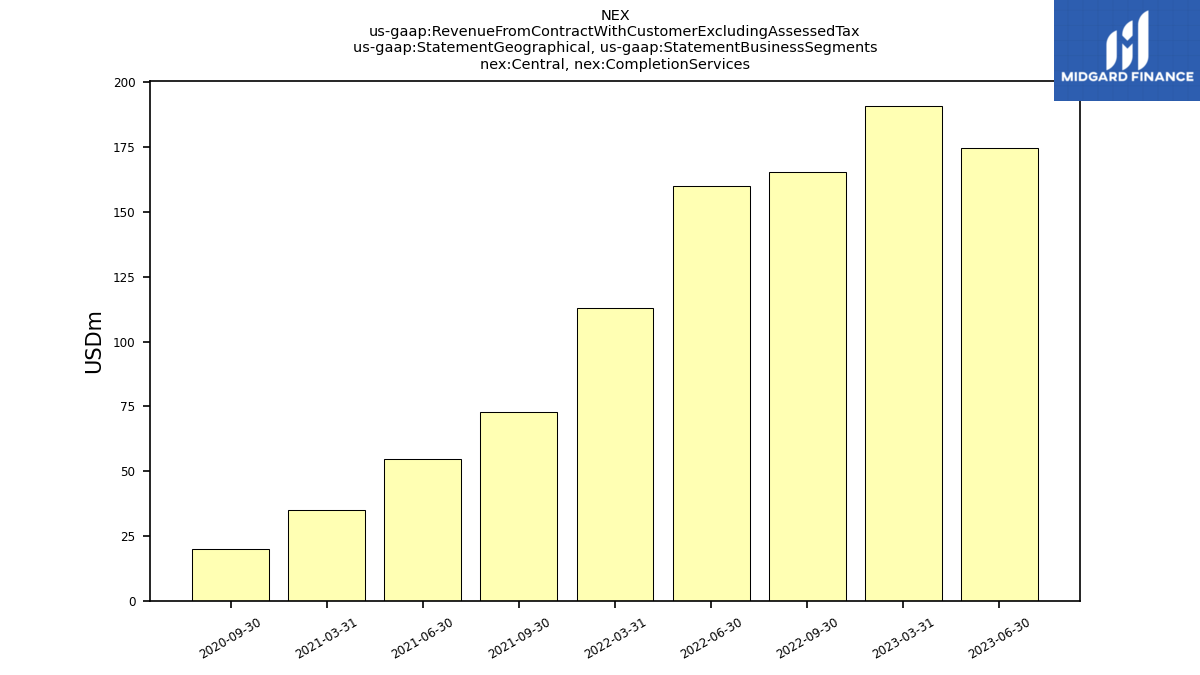
| Central, Completion Services | 174.59 | 191.01 | NA | 165.50 | 160.00 | 113.10 | NA | 72.86 | 54.65 | 34.90 | NA | 20.14 | NA | NA | NA | NA | NA | NA | NA | NA | NA | NA | NA | NA | NA | NA | NA | NA | NA | NA | |
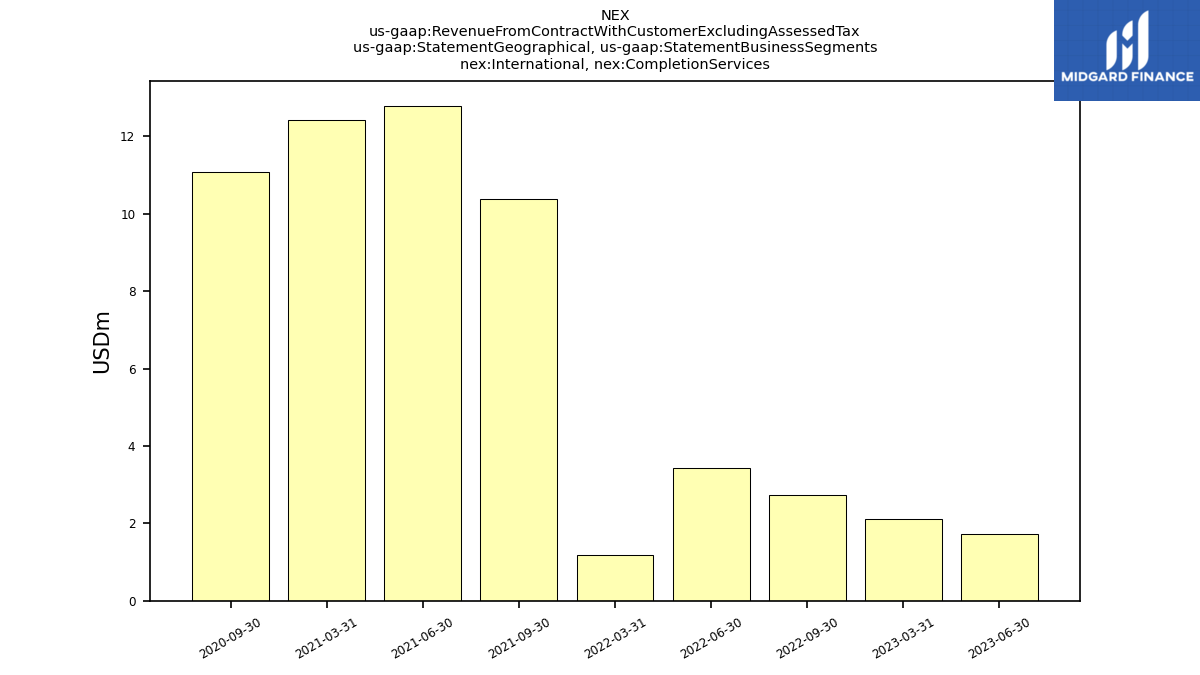
| International, Completion Services | 1.74 | 2.11 | NA | 2.72 | 3.42 | 1.20 | NA | 10.38 | 12.79 | 12.42 | NA | 11.08 | NA | NA | NA | NA | NA | NA | NA | NA | NA | NA | NA | NA | NA | NA | NA | NA | NA | NA | |
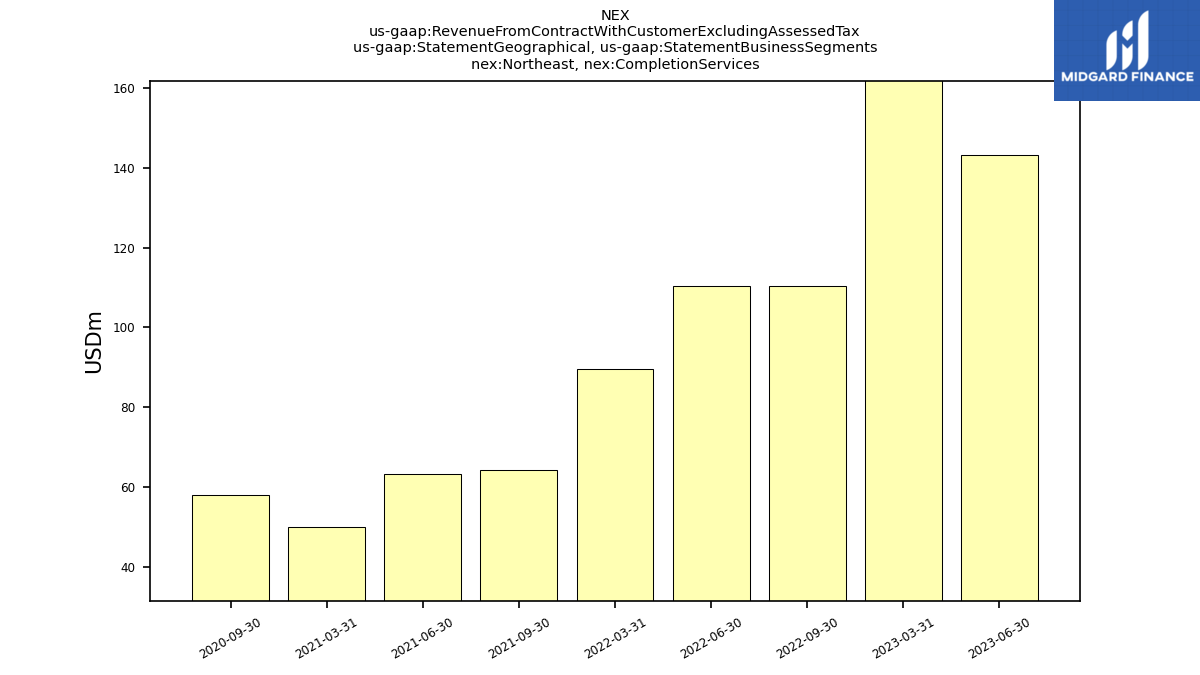
| Northeast, Completion Services | 143.12 | 163.46 | NA | 110.25 | 110.32 | 89.56 | NA | 64.14 | 63.20 | 50.11 | NA | 58.10 | NA | NA | NA | NA | NA | NA | NA | NA | NA | NA | NA | NA | NA | NA | NA | NA | NA | NA | |
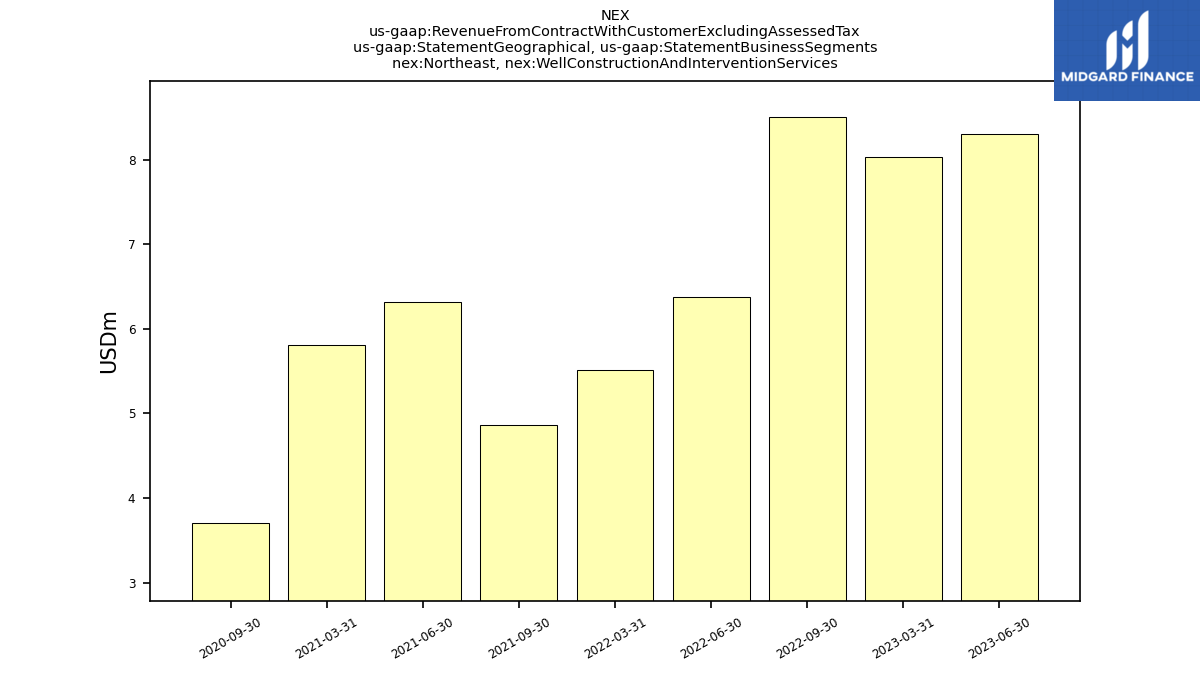
| Northeast, Well Construction And Intervention Services | 8.30 | 8.03 | NA | 8.51 | 6.38 | 5.51 | NA | 4.86 | 6.31 | 5.81 | NA | 3.70 | NA | NA | NA | NA | NA | NA | NA | NA | NA | NA | NA | NA | NA | NA | NA | NA | NA | NA | |
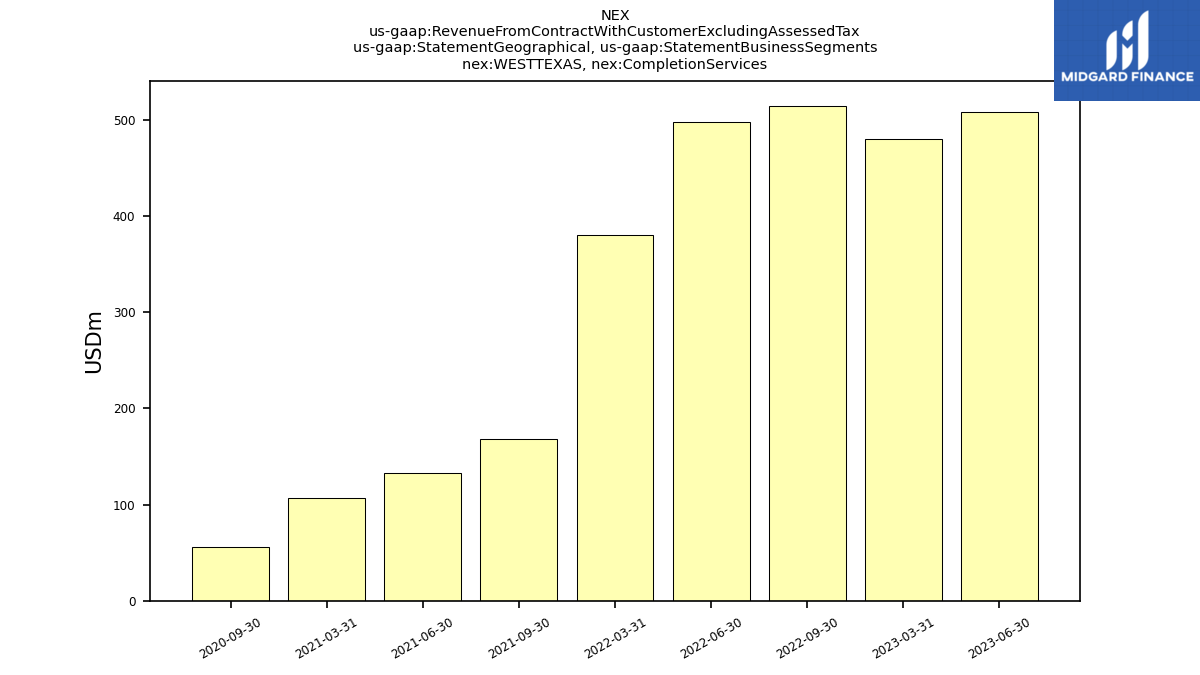
| WESTTEXAS, Completion Services | 507.51 | 480.22 | NA | 514.32 | 496.92 | 380.15 | NA | 168.18 | 132.80 | 106.67 | NA | 55.42 | NA | NA | NA | NA | NA | NA | NA | NA | NA | NA | NA | NA | NA | NA | NA | NA | NA | NA | |
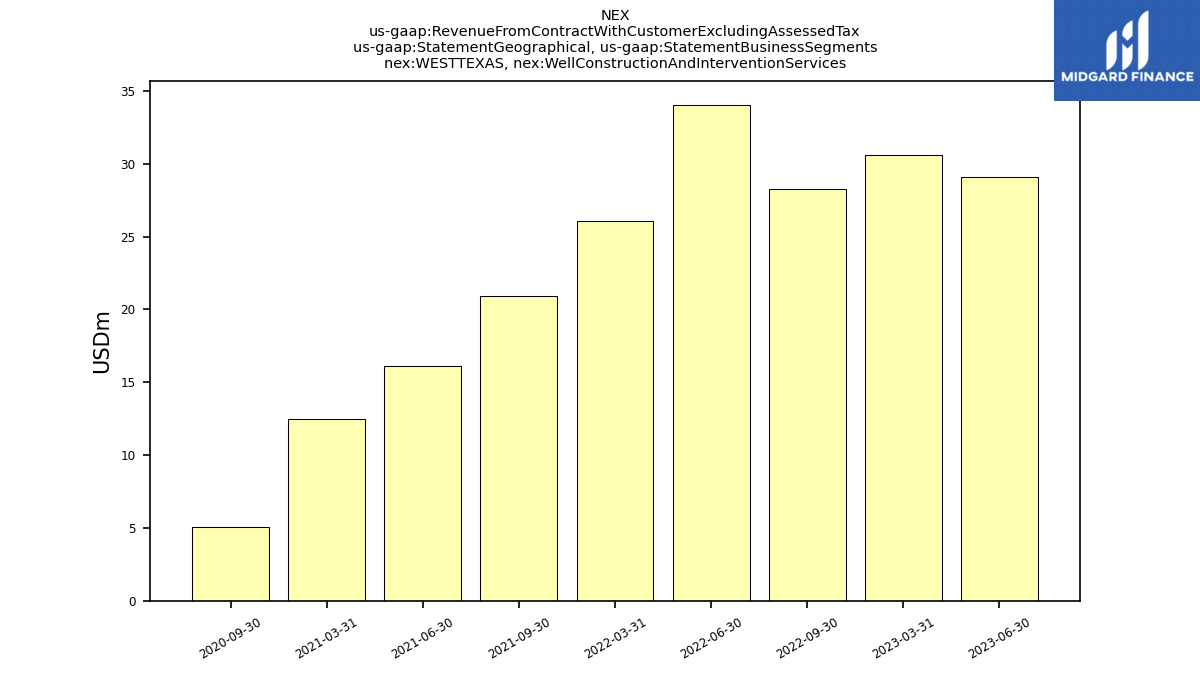
| WESTTEXAS, Well Construction And Intervention Services | 29.09 | 30.58 | NA | 28.25 | 34.02 | 26.08 | NA | 20.90 | 16.13 | 12.48 | NA | 5.09 | NA | NA | NA | NA | NA | NA | NA | NA | NA | NA | NA | NA | NA | NA | NA | NA | NA | NA | |
| West, Completion Services | 78.57 | 58.77 | NA | 64.96 | 30.40 | 18.62 | NA | 50.51 | 5.39 | 4.89 | NA | 9.28 | NA | NA | NA | NA | NA | NA | NA | NA | NA | NA | NA | NA | NA | NA | NA | NA | NA | NA | |
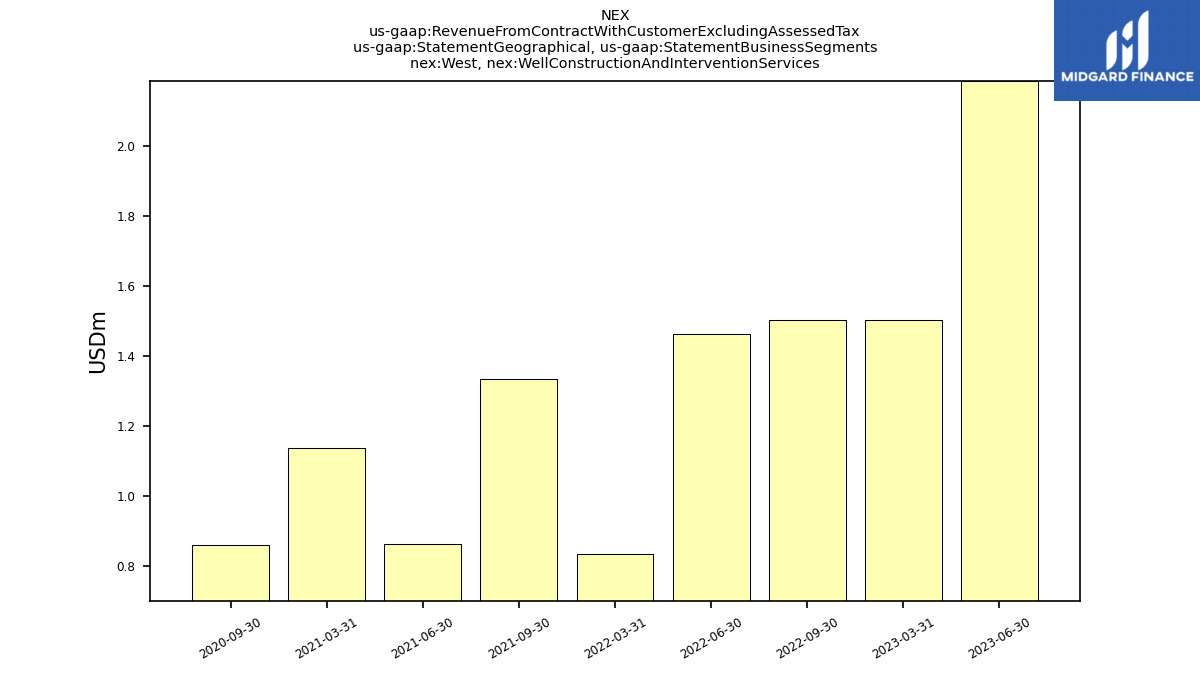
| West, Well Construction And Intervention Services | 2.19 | 1.50 | NA | 1.50 | 1.46 | 0.83 | NA | 1.34 | 0.86 | 1.14 | NA | 0.86 | NA | NA | NA | NA | NA | NA | NA | NA | NA | NA | NA | NA | NA | NA | NA | NA | NA | NA | |
| Revenue From Contract With Customer Including Assessed Tax | 945.09 | 935.67 | 870.86 | 896.01 | 842.91 | 635.04 | 509.73 | 393.16 | 292.14 | 228.40 | 215.05 | 163.68 | 196.23 | 627.62 | 528.22 | 443.95 | 427.73 | 421.65 | 486.55 | 558.91 | 578.53 | 513.02 | 501.49 | 477.30 | 323.14 | 240.15 | 151.03 | 116.75 | 91.59 | 61.20 |


