
| 2023-12-31 | 2023-09-30 | 2023-06-30 | 2023-03-31 | 2022-12-31 | 2022-09-30 | 2022-06-30 | 2022-03-31 | 2021-12-31 | 2021-09-30 | 2021-06-30 | 2021-03-31 | 2020-12-31 | 2020-09-30 | 2020-06-30 | 2020-03-31 | 2019-12-31 | 2019-09-30 | 2019-06-30 | 2019-03-31 | 2018-12-31 | 2018-09-30 | 2018-06-30 | 2018-03-31 | 2017-12-31 | 2017-09-30 | 2017-06-30 | 2017-03-31 | 2016-12-31 | 2016-09-30 | 2016-06-30 | 2016-03-31 | 2015-12-31 | 2015-09-30 | 2015-06-30 | 2015-03-31 | 2014-12-31 | 2014-09-30 | 2014-06-30 | 2014-03-31 | 2013-12-31 | 2013-09-30 | 2013-06-30 | 2013-03-31 | 2012-12-31 | 2012-09-30 | 2012-06-30 | 2012-03-31 | 2011-12-31 | 2011-09-30 | 2011-06-30 | 2011-03-31 | 2010-12-31 | 2010-09-30 | 2010-06-30 | ||
|---|---|---|---|---|---|---|---|---|---|---|---|---|---|---|---|---|---|---|---|---|---|---|---|---|---|---|---|---|---|---|---|---|---|---|---|---|---|---|---|---|---|---|---|---|---|---|---|---|---|---|---|---|---|---|---|---|
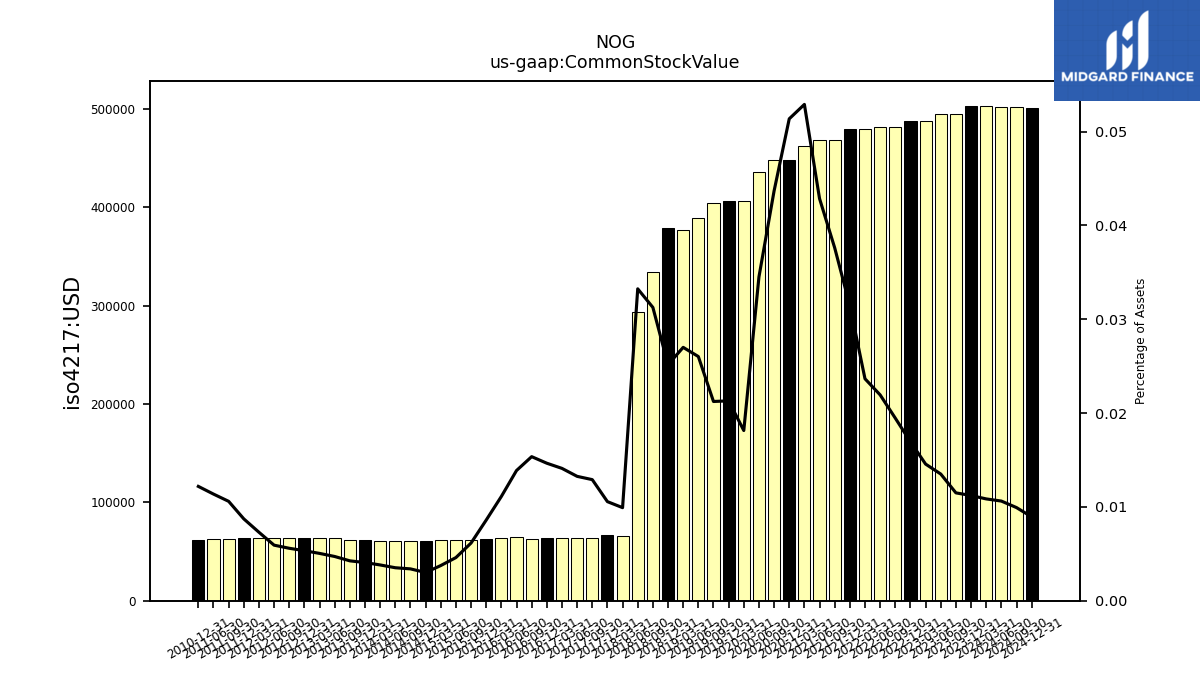
| Common Stock Value | 0.50 | 0.49 | 0.49 | 0.49 | 0.49 | 0.48 | 0.48 | 0.48 | 0.48 | 0.47 | 0.47 | 0.46 | 0.45 | 0.45 | 0.44 | 0.41 | 0.41 | 0.40 | 0.39 | 0.38 | 0.38 | 0.33 | 0.29 | 0.07 | 0.07 | 0.06 | 0.06 | 0.06 | 0.06 | 0.06 | 0.06 | 0.06 | 0.06 | 0.06 | 0.06 | 0.06 | 0.06 | 0.06 | 0.06 | 0.06 | 0.06 | 0.06 | 0.06 | 0.06 | 0.06 | 0.06 | 0.06 | 0.06 | 0.06 | 0.06 | 0.06 | NA | 0.06 | NA | NA | |
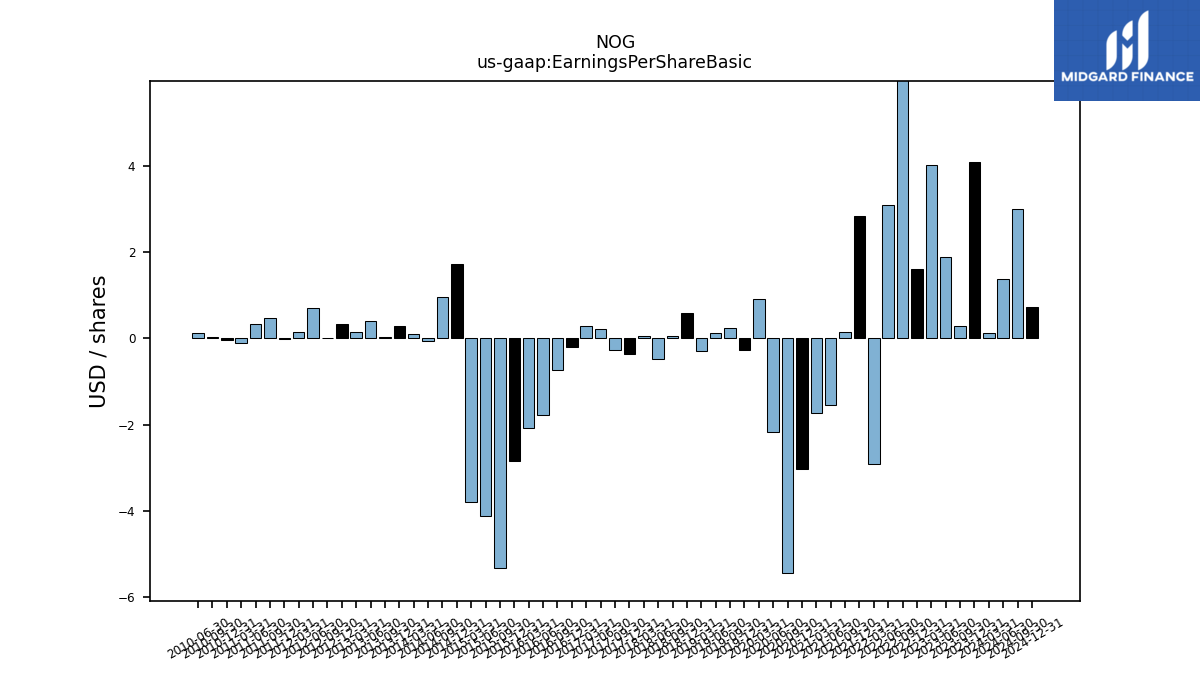
| Earnings Per Share Basic | 4.08 | 0.28 | 1.89 | 4.01 | 1.60 | 7.39 | 3.08 | -2.92 | 2.84 | 0.14 | -1.55 | -1.73 | -3.02 | -5.44 | -2.17 | 0.90 | -0.27 | 0.24 | 0.12 | -0.29 | 0.58 | 0.06 | -0.49 | 0.05 | -0.37 | -0.26 | 0.22 | 0.28 | -0.20 | -0.74 | -1.78 | -2.08 | -2.84 | -5.33 | -4.12 | -3.79 | 1.71 | 0.96 | -0.07 | 0.11 | 0.28 | 0.03 | 0.40 | 0.14 | 0.32 | 0.00 | 0.70 | 0.14 | -0.02 | 0.46 | 0.33 | -0.11 | -0.04 | 0.02 | 0.12 | |
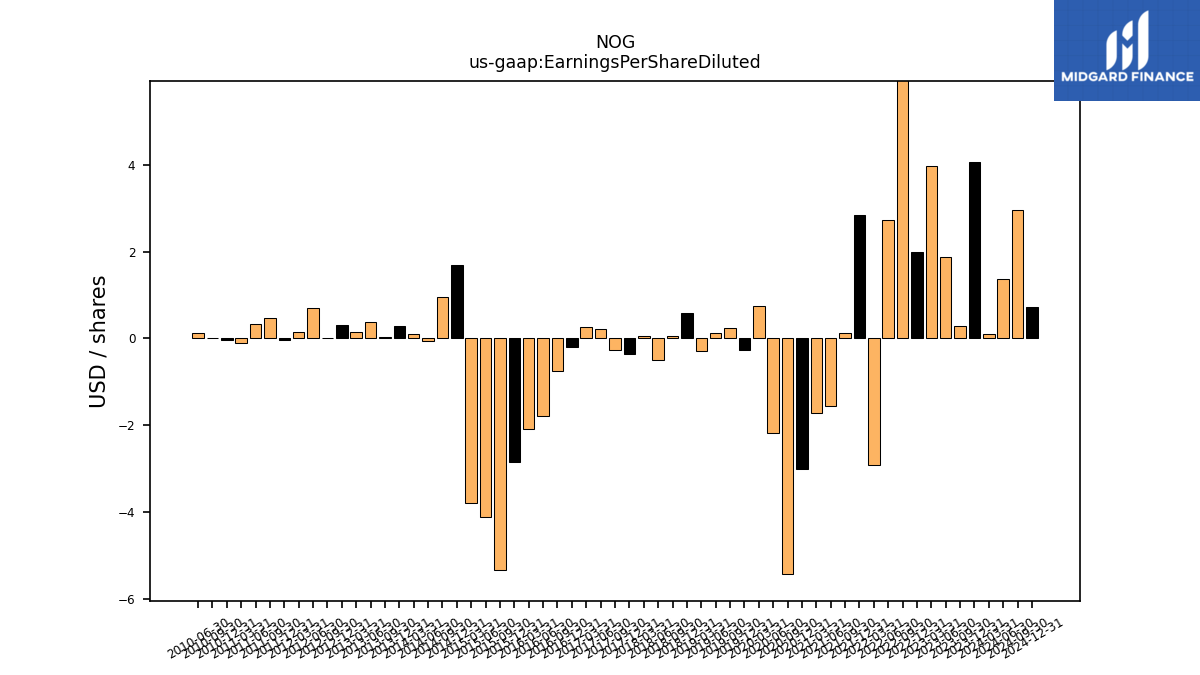
| Earnings Per Share Diluted | 4.06 | 0.28 | 1.88 | 3.98 | 2.00 | 6.77 | 2.74 | -2.92 | 2.84 | 0.13 | -1.55 | -1.73 | -3.02 | -5.44 | -2.17 | 0.74 | -0.27 | 0.24 | 0.12 | -0.29 | 0.58 | 0.06 | -0.49 | 0.05 | -0.37 | -0.26 | 0.22 | 0.27 | -0.20 | -0.74 | -1.78 | -2.08 | -2.84 | -5.33 | -4.12 | -3.79 | 1.70 | 0.95 | -0.07 | 0.11 | 0.29 | 0.03 | 0.39 | 0.14 | 0.31 | 0.00 | 0.70 | 0.14 | -0.03 | 0.46 | 0.33 | -0.11 | -0.04 | 0.02 | 0.12 |
| 2023-12-31 | 2023-09-30 | 2023-06-30 | 2023-03-31 | 2022-12-31 | 2022-09-30 | 2022-06-30 | 2022-03-31 | 2021-12-31 | 2021-09-30 | 2021-06-30 | 2021-03-31 | 2020-12-31 | 2020-09-30 | 2020-06-30 | 2020-03-31 | 2019-12-31 | 2019-09-30 | 2019-06-30 | 2019-03-31 | 2018-12-31 | 2018-09-30 | 2018-06-30 | 2018-03-31 | 2017-12-31 | 2017-09-30 | 2017-06-30 | 2017-03-31 | 2016-12-31 | 2016-09-30 | 2016-06-30 | 2016-03-31 | 2015-12-31 | 2015-09-30 | 2015-06-30 | 2015-03-31 | 2014-12-31 | 2014-09-30 | 2014-06-30 | 2014-03-31 | 2013-12-31 | 2013-09-30 | 2013-06-30 | 2013-03-31 | 2012-12-31 | 2012-09-30 | 2012-06-30 | 2012-03-31 | 2011-12-31 | 2011-09-30 | 2011-06-30 | 2011-03-31 | 2010-12-31 | 2010-09-30 | 2010-06-30 | ||
|---|---|---|---|---|---|---|---|---|---|---|---|---|---|---|---|---|---|---|---|---|---|---|---|---|---|---|---|---|---|---|---|---|---|---|---|---|---|---|---|---|---|---|---|---|---|---|---|---|---|---|---|---|---|---|---|---|
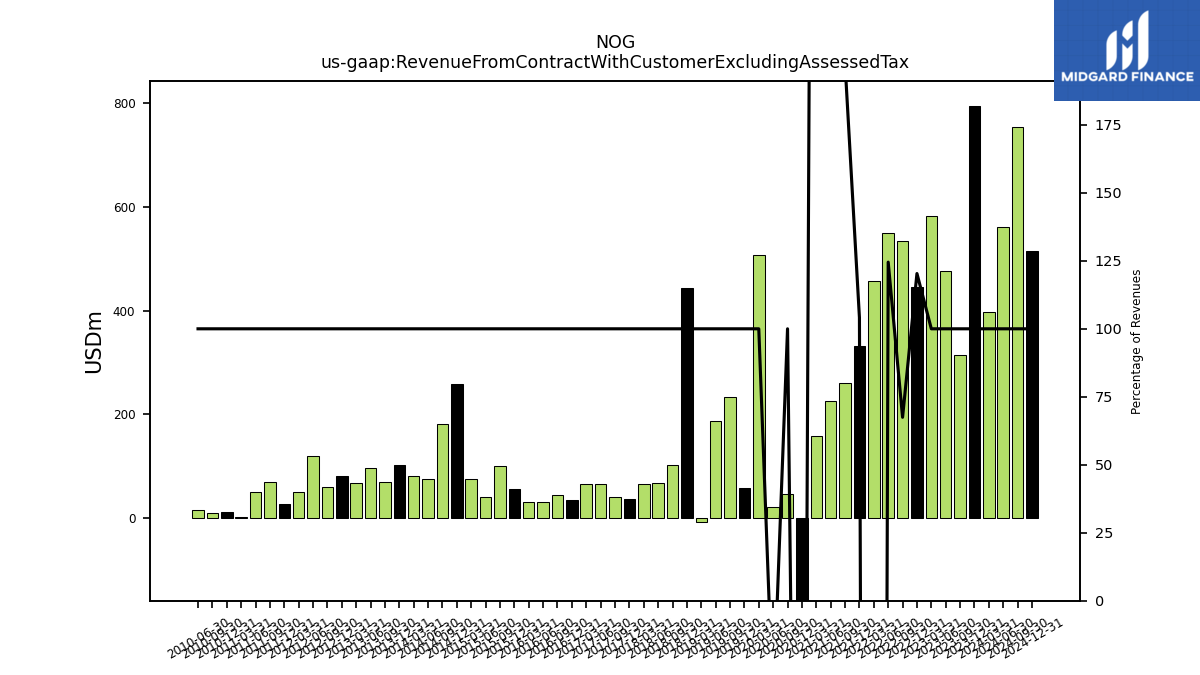
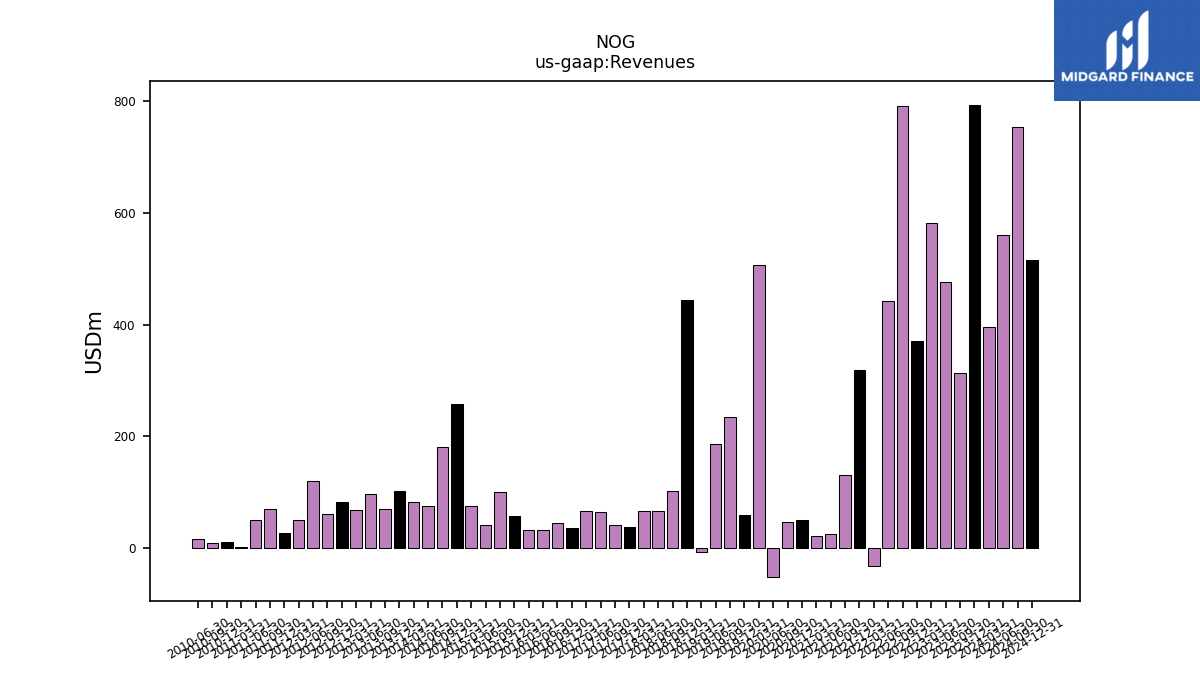
| Revenue From Contract With Customer Excluding Assessed Tax | 793.52 | 313.97 | 476.55 | 582.21 | 445.65 | 534.05 | 549.64 | 456.46 | 332.37 | 259.67 | 225.72 | 157.33 | -178.07 | 47.32 | 20.66 | 506.79 | 59.01 | 233.88 | 186.44 | -6.93 | 443.20 | 102.27 | 66.85 | 66.61 | 37.00 | 41.60 | 64.90 | 65.82 | 35.94 | 45.11 | 32.01 | 31.84 | 56.91 | 101.16 | 40.86 | 76.12 | 257.52 | 180.78 | 74.60 | 82.13 | 101.93 | 69.78 | 96.16 | 67.90 | 81.75 | 60.10 | 119.21 | 50.52 | 26.99 | 69.05 | 50.83 | 2.53 | 11.22 | 9.88 | 16.23 | |
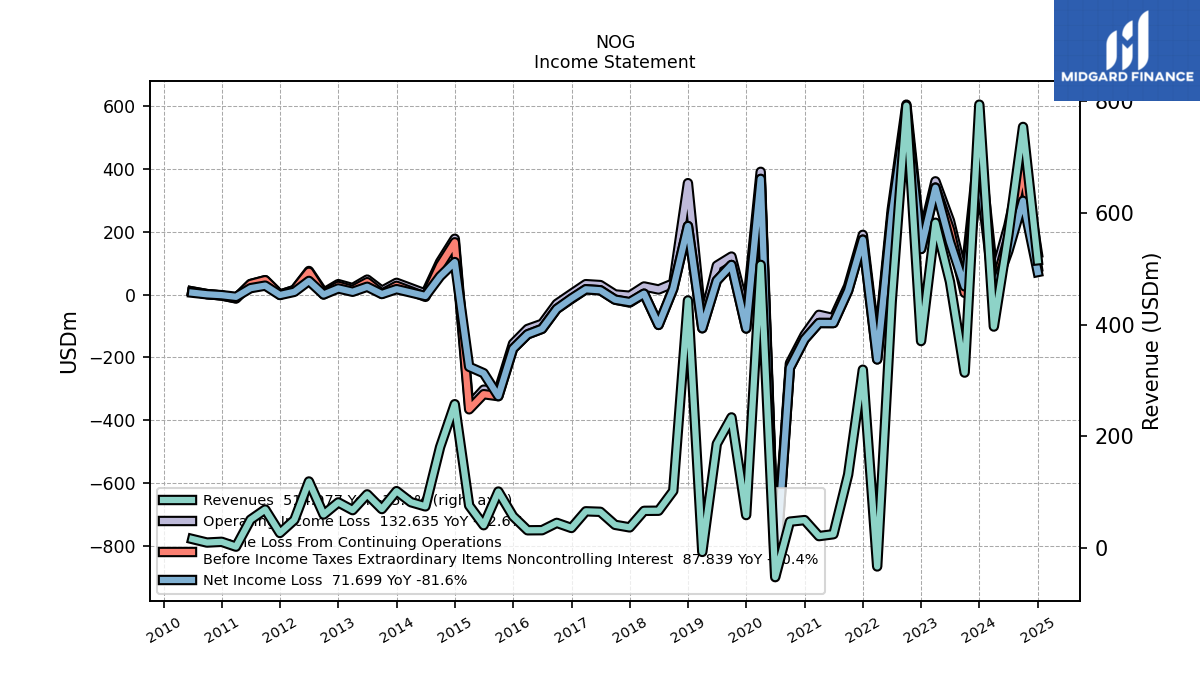
| Revenues | 793.52 | 313.97 | 476.55 | 582.21 | 370.38 | 791.64 | 441.45 | -32.93 | 319.19 | 131.51 | 24.80 | 21.40 | 50.08 | 47.32 | -51.97 | 506.79 | 59.01 | 233.88 | 186.44 | -6.93 | 443.20 | 102.27 | 66.85 | 66.61 | 37.00 | 41.60 | 64.90 | 65.82 | 35.94 | 45.11 | 32.01 | 31.84 | 56.91 | 101.16 | 40.86 | 76.12 | 257.52 | 180.78 | 74.60 | 82.13 | 101.93 | 69.78 | 96.16 | 67.90 | 81.75 | 60.10 | 119.21 | 50.52 | 26.99 | 69.05 | 50.83 | 2.53 | 11.22 | 9.88 | 16.23 | |
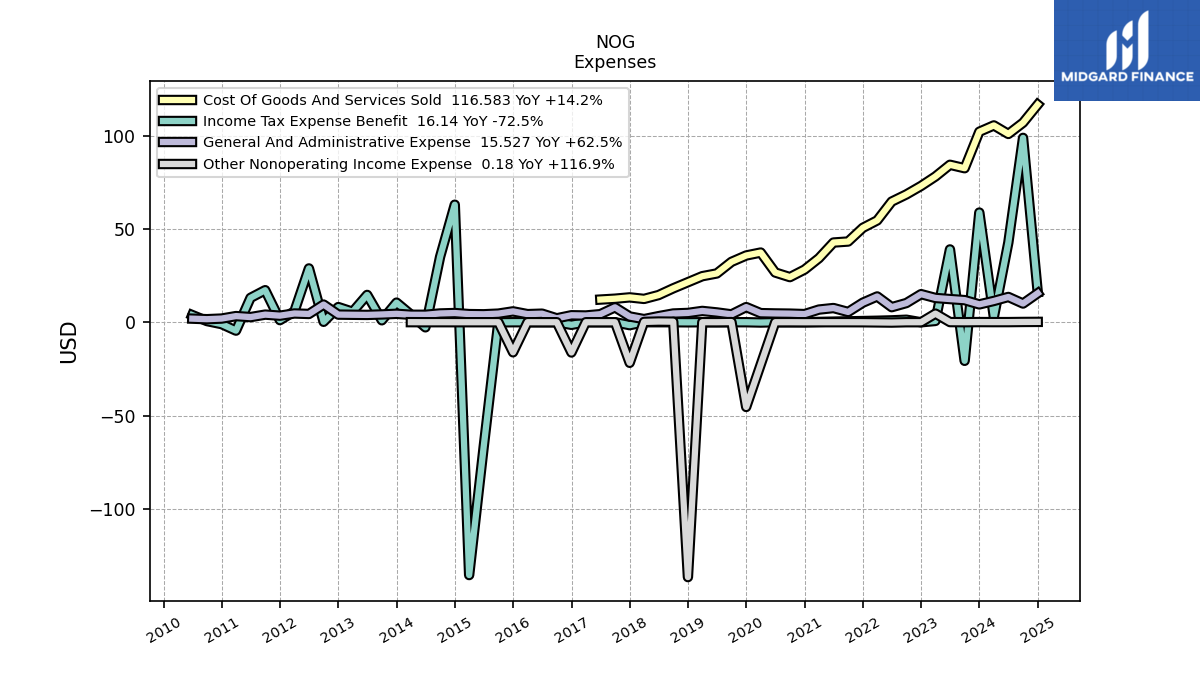
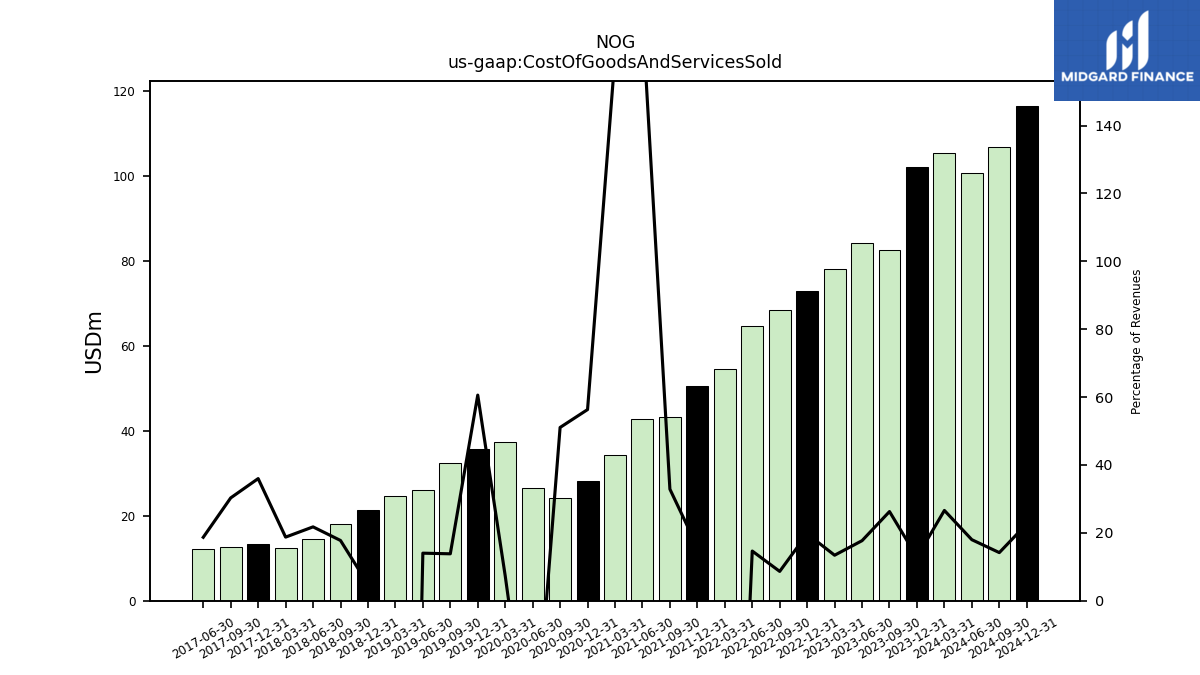
| Cost Of Goods And Services Sold | 102.06 | 82.51 | 84.35 | 78.09 | 73.02 | 68.48 | 64.64 | 54.54 | 50.57 | 43.24 | 42.70 | 34.31 | 28.20 | 24.16 | 26.64 | 37.34 | 35.75 | 32.35 | 26.13 | 24.67 | 21.45 | 18.16 | 14.55 | 12.49 | 13.32 | 12.61 | 12.14 | NA | NA | NA | NA | NA | NA | NA | NA | NA | NA | NA | NA | NA | NA | NA | NA | NA | NA | NA | NA | NA | NA | NA | NA | NA | NA | NA | NA | |
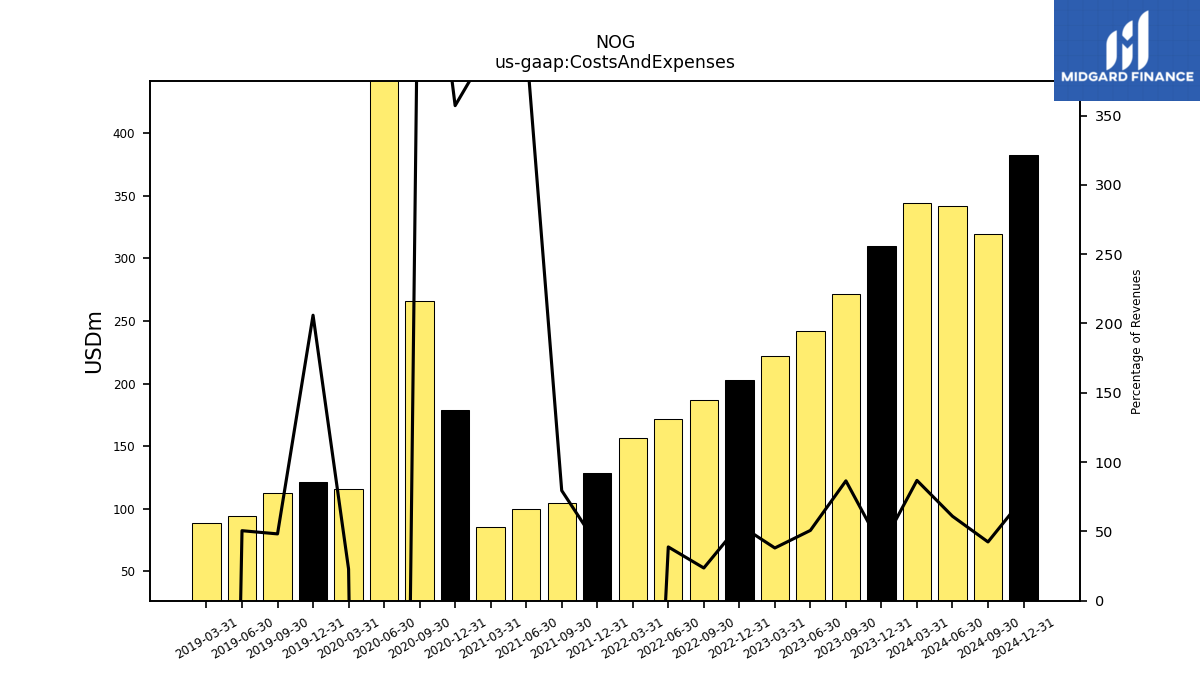
| Costs And Expenses | 309.47 | 271.54 | 241.76 | 221.62 | 202.84 | 187.00 | 171.34 | 156.15 | 128.90 | 104.54 | 99.72 | 85.77 | 178.83 | 265.98 | 832.74 | 115.91 | 121.54 | 112.78 | 94.20 | 88.37 | NA | NA | NA | NA | NA | NA | NA | NA | NA | NA | NA | NA | NA | NA | NA | NA | NA | NA | NA | NA | NA | NA | NA | NA | NA | NA | NA | NA | NA | NA | NA | NA | NA | NA | NA | |
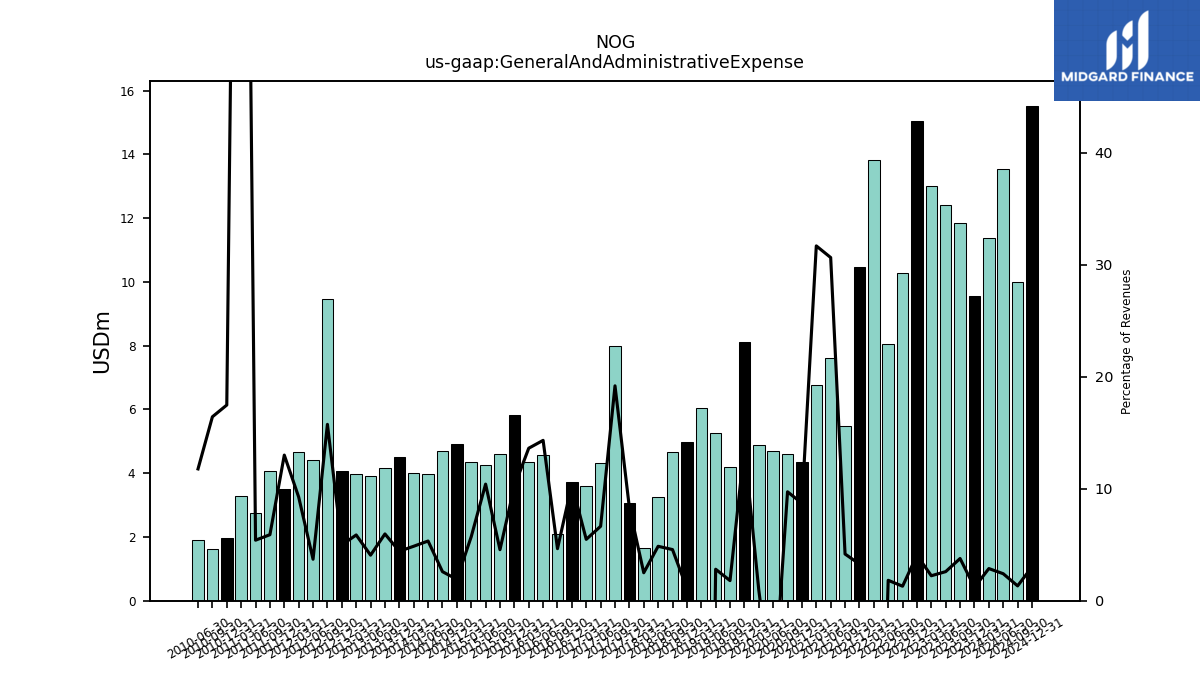
| General And Administrative Expense | 9.55 | 11.85 | 12.40 | 13.00 | 15.05 | 10.28 | 8.06 | 13.81 | 10.46 | 5.49 | 7.60 | 6.78 | 4.36 | 4.61 | 4.71 | 4.87 | 8.12 | 4.21 | 5.25 | 6.05 | 4.98 | 4.67 | 3.25 | 1.67 | 3.08 | 7.99 | 4.32 | 3.61 | 3.74 | 2.10 | 4.59 | 4.34 | 5.82 | 4.61 | 4.26 | 4.35 | 4.92 | 4.70 | 3.98 | 4.00 | 4.51 | 4.16 | 3.92 | 3.99 | 4.08 | 9.47 | 4.42 | 4.68 | 3.51 | 4.07 | 2.75 | 3.29 | 1.96 | 1.62 | 1.91 | |
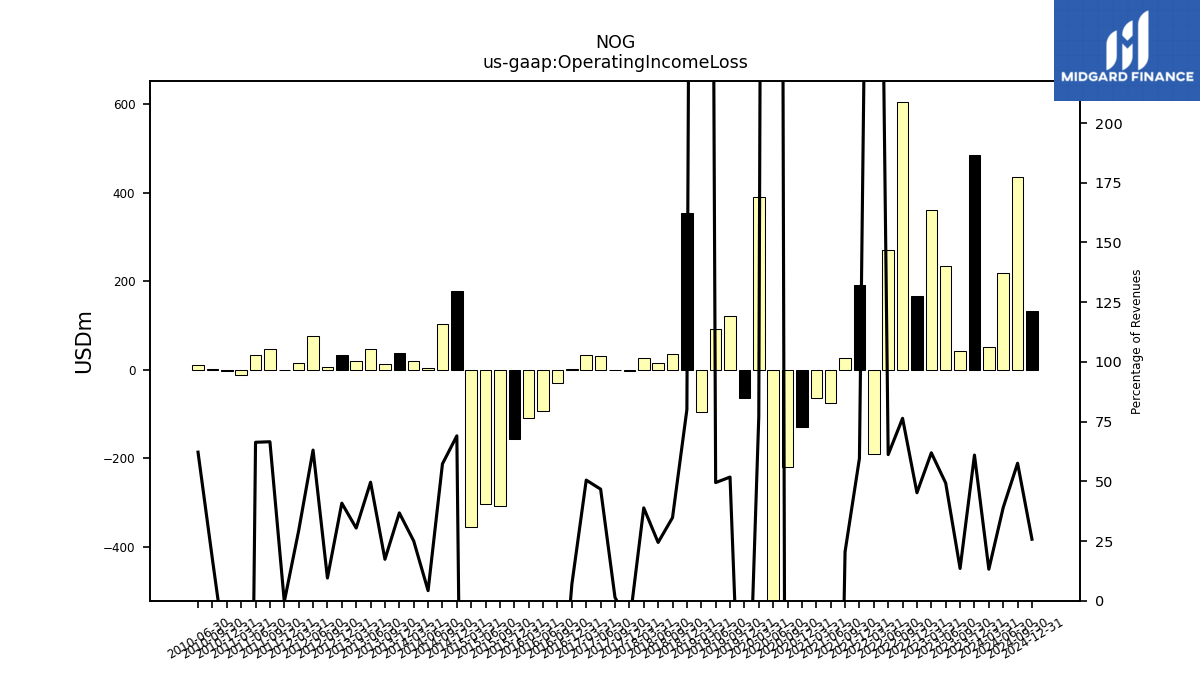
| Operating Income Loss | 484.04 | 42.44 | 234.79 | 360.59 | 167.53 | 604.64 | 270.10 | -189.08 | 190.29 | 26.96 | -74.92 | -64.37 | -128.76 | -218.65 | -884.71 | 390.88 | -62.52 | 121.10 | 92.24 | -95.31 | 354.81 | 35.60 | 16.32 | 25.91 | -3.66 | 0.58 | 30.32 | 33.24 | 2.49 | -29.47 | -92.93 | -109.38 | -156.20 | -307.17 | -302.54 | -353.48 | 177.80 | 103.65 | 3.16 | 20.56 | 37.49 | 12.11 | 47.73 | 20.66 | 33.40 | 5.72 | 75.19 | 14.83 | -0.11 | 45.97 | 33.72 | -12.33 | -2.94 | 1.72 | 10.10 | |
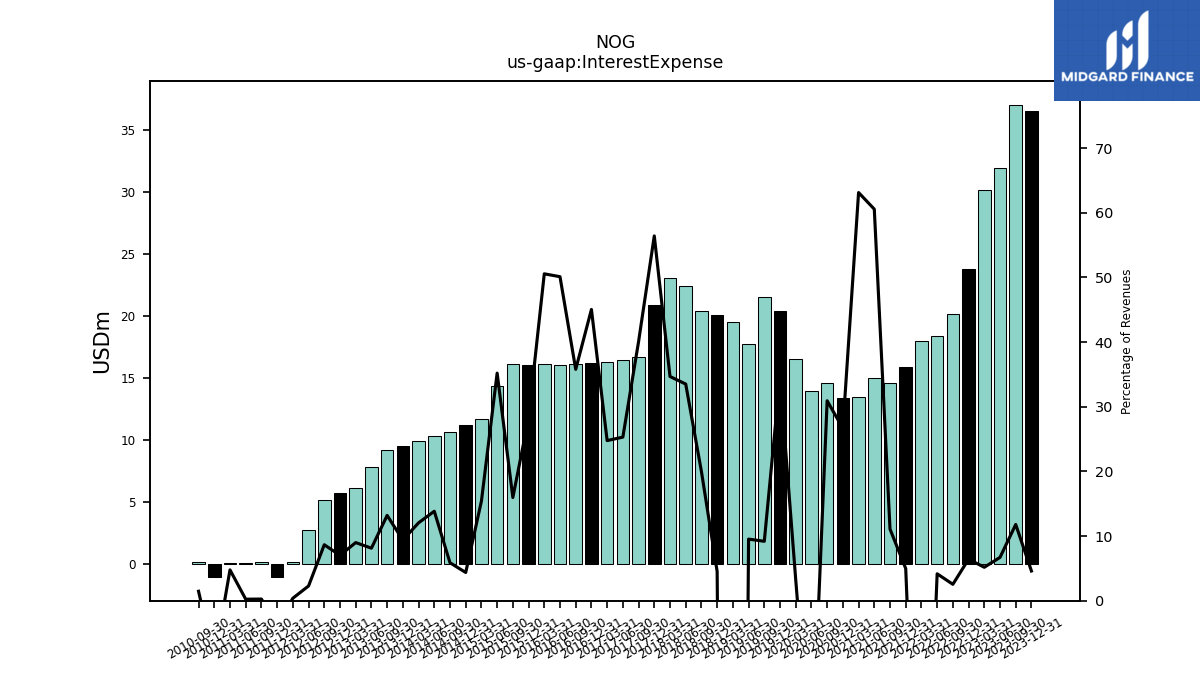
| Interest Expense | 36.51 | 37.04 | 31.97 | 30.14 | 23.81 | 20.14 | 18.41 | 17.98 | 15.90 | 14.59 | 15.02 | 13.51 | 13.36 | 14.64 | 13.96 | 16.55 | 20.39 | 21.51 | 17.78 | 19.55 | 20.06 | 20.44 | 22.40 | 23.11 | 20.88 | 16.67 | 16.43 | 16.30 | 16.20 | 16.15 | 16.05 | 16.10 | 16.08 | 16.15 | 14.39 | 11.74 | 11.26 | 10.62 | 10.33 | 9.90 | 9.57 | 9.21 | 7.82 | 6.11 | 5.74 | 5.21 | 2.73 | 0.20 | -1.01 | 0.18 | 0.12 | 0.12 | -1.04 | 0.15 | NA | |
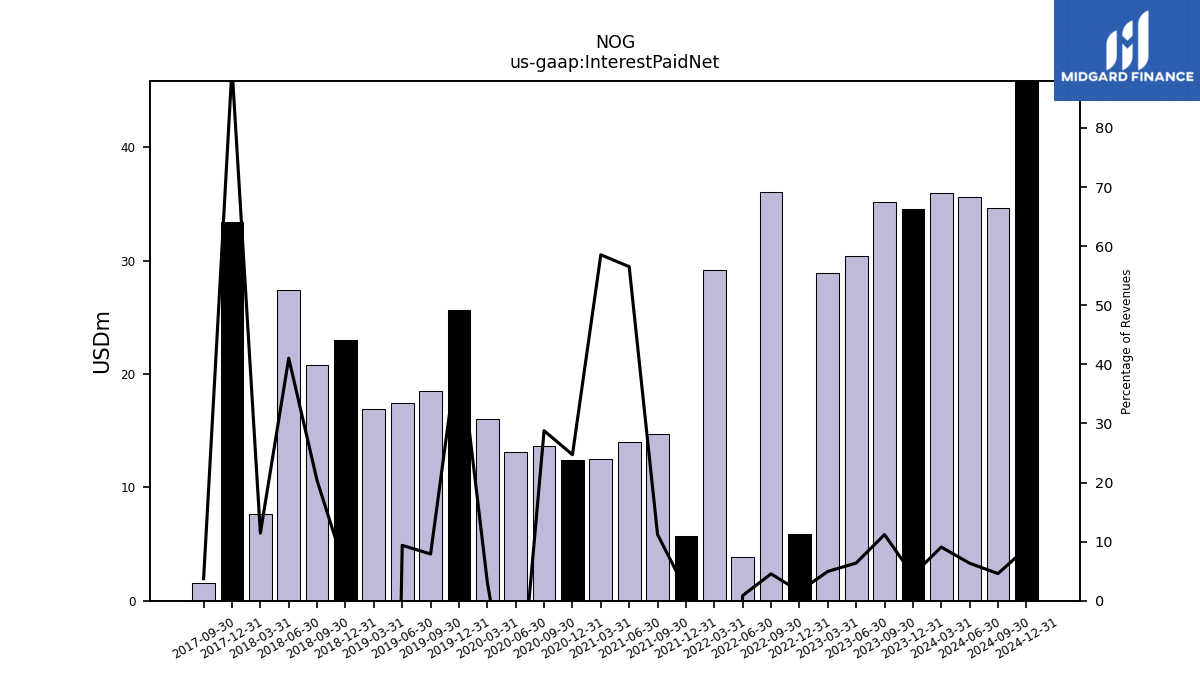
| Interest Paid Net | 34.50 | 35.13 | 30.43 | 28.88 | 5.92 | 36.02 | 3.85 | 29.15 | 5.67 | 14.74 | 14.02 | 12.53 | 12.37 | 13.62 | 13.13 | 15.99 | 25.68 | 18.51 | 17.47 | 16.93 | 23.02 | 20.79 | 27.43 | 7.63 | 33.37 | 1.56 | NA | NA | NA | NA | NA | NA | NA | NA | NA | NA | NA | NA | NA | NA | NA | NA | NA | NA | NA | NA | NA | NA | NA | NA | NA | NA | NA | NA | NA | |
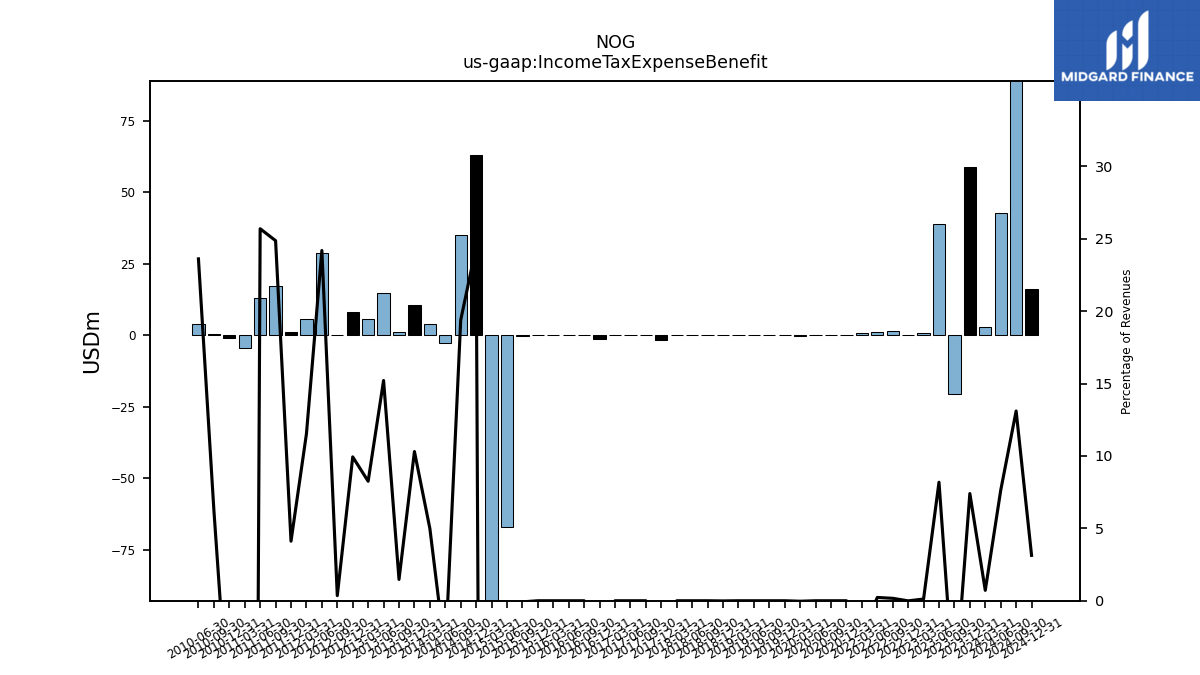
| Income Tax Expense Benefit | 58.76 | -20.69 | 39.01 | 0.69 | -0.03 | 1.33 | 1.01 | 0.79 | NA | NA | NA | NA | 0.00 | 0.00 | 0.00 | -0.17 | 0.00 | 0.00 | 0.00 | 0.00 | -0.06 | 0.00 | 0.00 | 0.00 | -1.57 | 0.00 | 0.00 | 0.00 | -1.40 | 0.00 | 0.00 | 0.00 | -0.00 | -0.08 | -66.87 | -135.48 | 62.97 | 35.05 | -2.75 | 4.10 | 10.51 | 1.03 | 14.63 | 5.60 | 8.12 | 0.21 | 28.84 | 5.83 | 1.11 | 17.17 | 13.06 | -4.51 | -1.01 | 0.62 | 3.83 | |
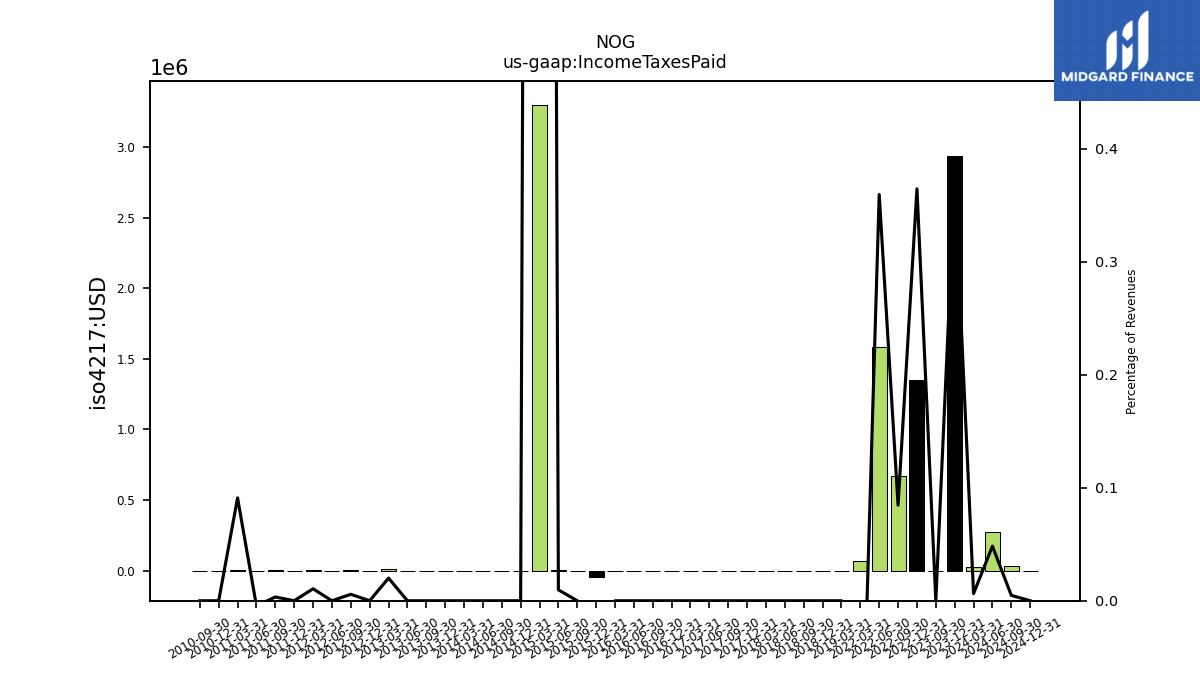
| Income Taxes Paid | 2.94 | 0.00 | NA | NA | 1.35 | 0.67 | 1.59 | 0.07 | NA | NA | NA | NA | NA | NA | NA | NA | NA | NA | NA | 0.00 | 0.00 | 0.00 | 0.00 | 0.00 | 0.00 | 0.00 | 0.00 | 0.00 | 0.00 | 0.00 | 0.00 | 0.00 | -0.05 | 0.00 | 0.00 | 3.30 | 0.00 | 0.00 | 0.00 | 0.00 | 0.00 | 0.00 | 0.00 | 0.01 | 0.00 | 0.00 | 0.00 | 0.01 | 0.00 | 0.00 | -0.00 | 0.00 | 0.00 | 0.00 | NA | |
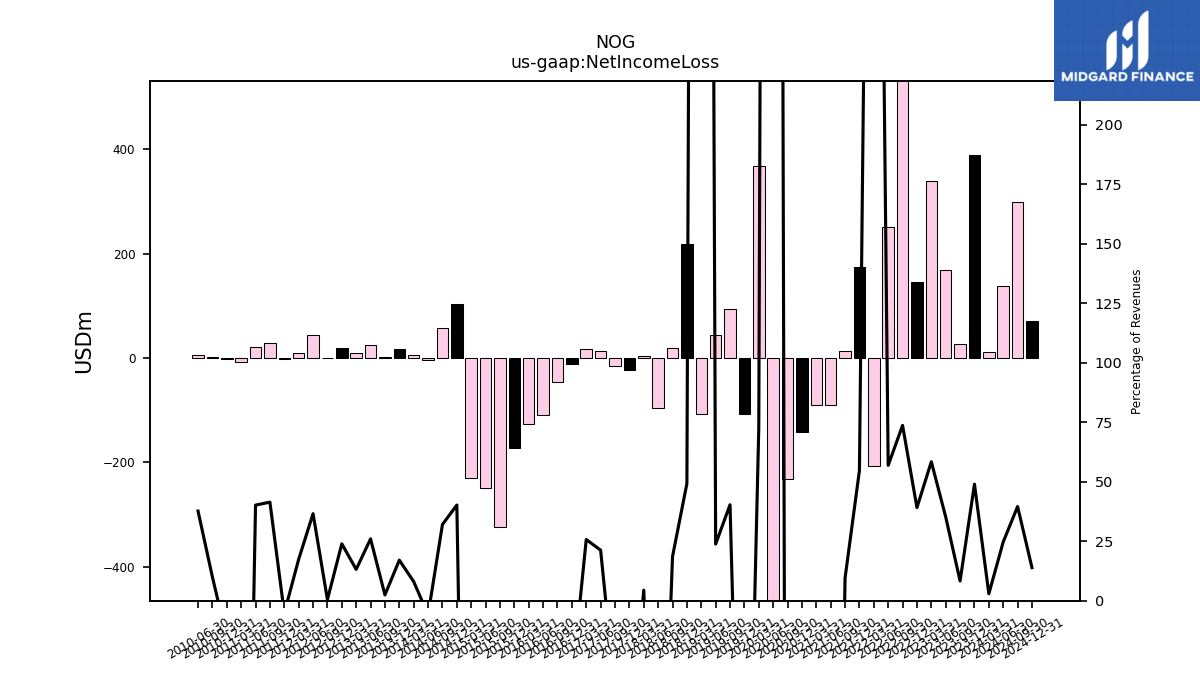
| Net Income Loss | 388.85 | 26.11 | 167.81 | 340.19 | 145.07 | 583.47 | 251.26 | -206.56 | 174.73 | 12.55 | -90.56 | -90.36 | -142.12 | -233.00 | -899.20 | 368.29 | -107.94 | 94.38 | 44.40 | -107.16 | 218.29 | 18.98 | -96.55 | 2.97 | -23.85 | -16.09 | 13.80 | 16.94 | -12.33 | -45.62 | -108.98 | -126.57 | -172.31 | -323.24 | -250.06 | -229.74 | 103.58 | 57.99 | -4.41 | 6.59 | 17.40 | 1.70 | 25.01 | 8.95 | 19.55 | 0.30 | 43.63 | 8.81 | -1.38 | 28.62 | 20.43 | -7.06 | -1.75 | 0.99 | 6.12 | |
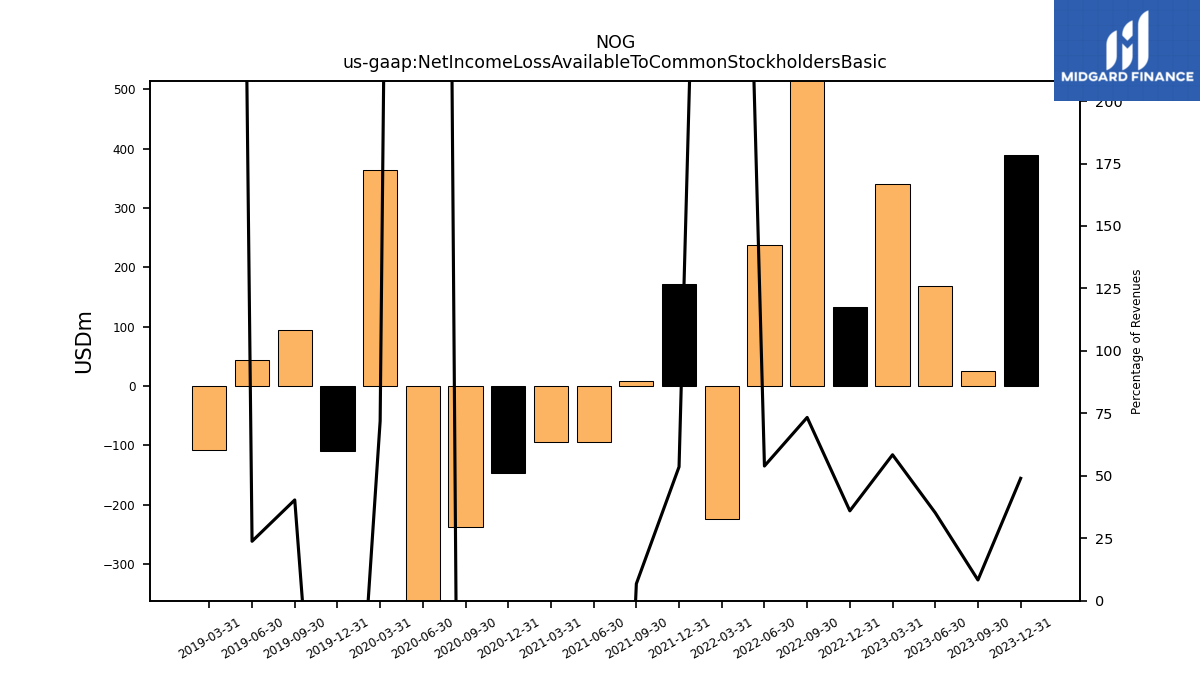
| Net Income Loss Available To Common Stockholders Basic | 388.85 | 26.11 | 167.81 | 340.19 | 133.29 | 580.86 | 238.09 | -224.53 | 171.12 | 8.95 | -94.28 | -94.19 | -146.40 | -236.72 | -902.99 | 364.56 | -108.97 | 94.38 | 44.40 | -107.16 | NA | NA | NA | NA | NA | NA | NA | NA | NA | NA | NA | NA | NA | NA | NA | NA | NA | NA | NA | NA | NA | NA | NA | NA | NA | NA | NA | NA | NA | NA | NA | NA | NA | NA | NA |
| 2023-12-31 | 2023-09-30 | 2023-06-30 | 2023-03-31 | 2022-12-31 | 2022-09-30 | 2022-06-30 | 2022-03-31 | 2021-12-31 | 2021-09-30 | 2021-06-30 | 2021-03-31 | 2020-12-31 | 2020-09-30 | 2020-06-30 | 2020-03-31 | 2019-12-31 | 2019-09-30 | 2019-06-30 | 2019-03-31 | 2018-12-31 | 2018-09-30 | 2018-06-30 | 2018-03-31 | 2017-12-31 | 2017-09-30 | 2017-06-30 | 2017-03-31 | 2016-12-31 | 2016-09-30 | 2016-06-30 | 2016-03-31 | 2015-12-31 | 2015-09-30 | 2015-06-30 | 2015-03-31 | 2014-12-31 | 2014-09-30 | 2014-06-30 | 2014-03-31 | 2013-12-31 | 2013-09-30 | 2013-06-30 | 2013-03-31 | 2012-12-31 | 2012-09-30 | 2012-06-30 | 2012-03-31 | 2011-12-31 | 2011-09-30 | 2011-06-30 | 2011-03-31 | 2010-12-31 | 2010-09-30 | 2010-06-30 | ||
|---|---|---|---|---|---|---|---|---|---|---|---|---|---|---|---|---|---|---|---|---|---|---|---|---|---|---|---|---|---|---|---|---|---|---|---|---|---|---|---|---|---|---|---|---|---|---|---|---|---|---|---|---|---|---|---|---|
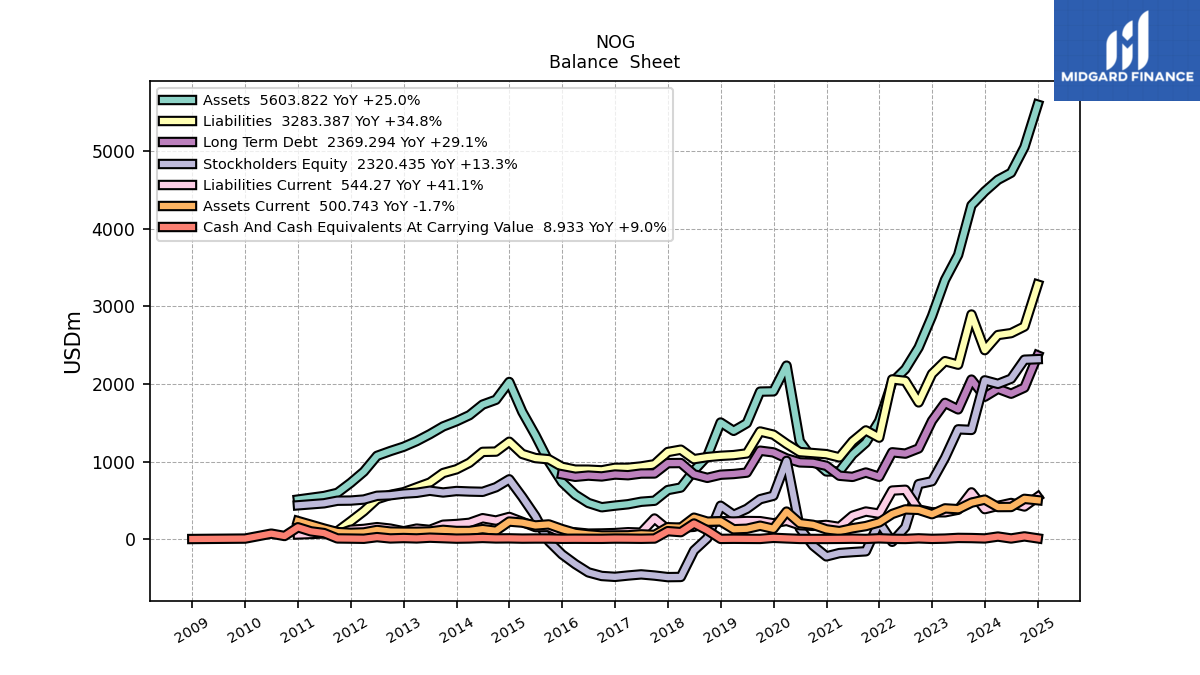
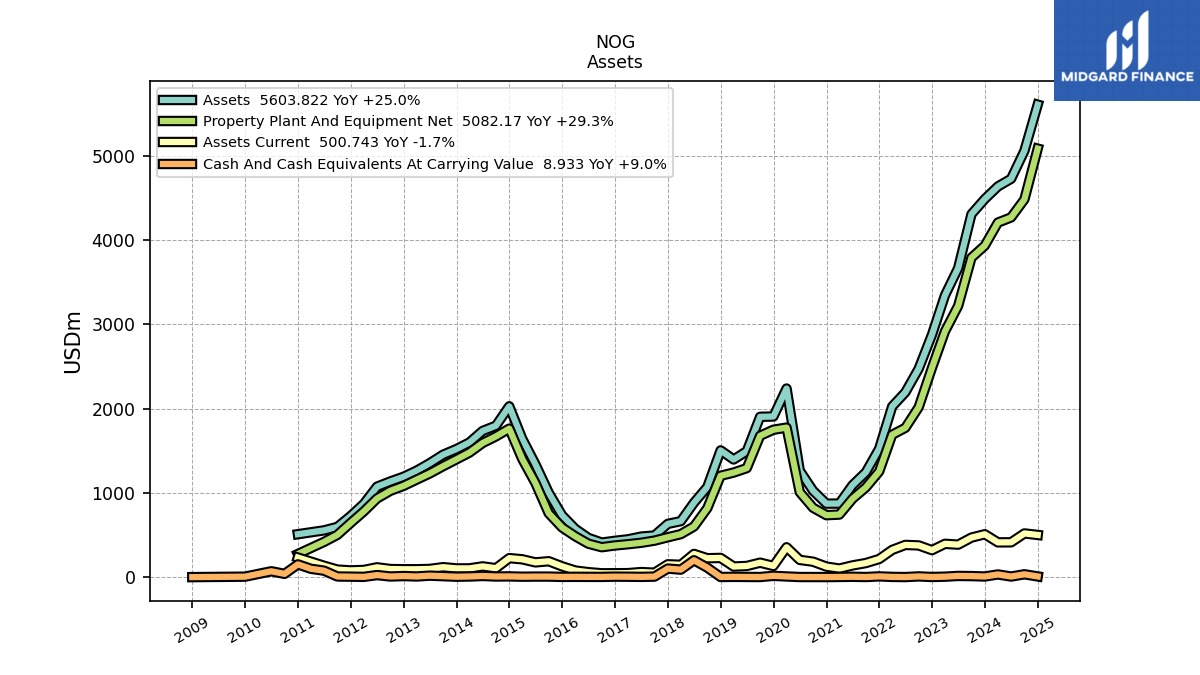
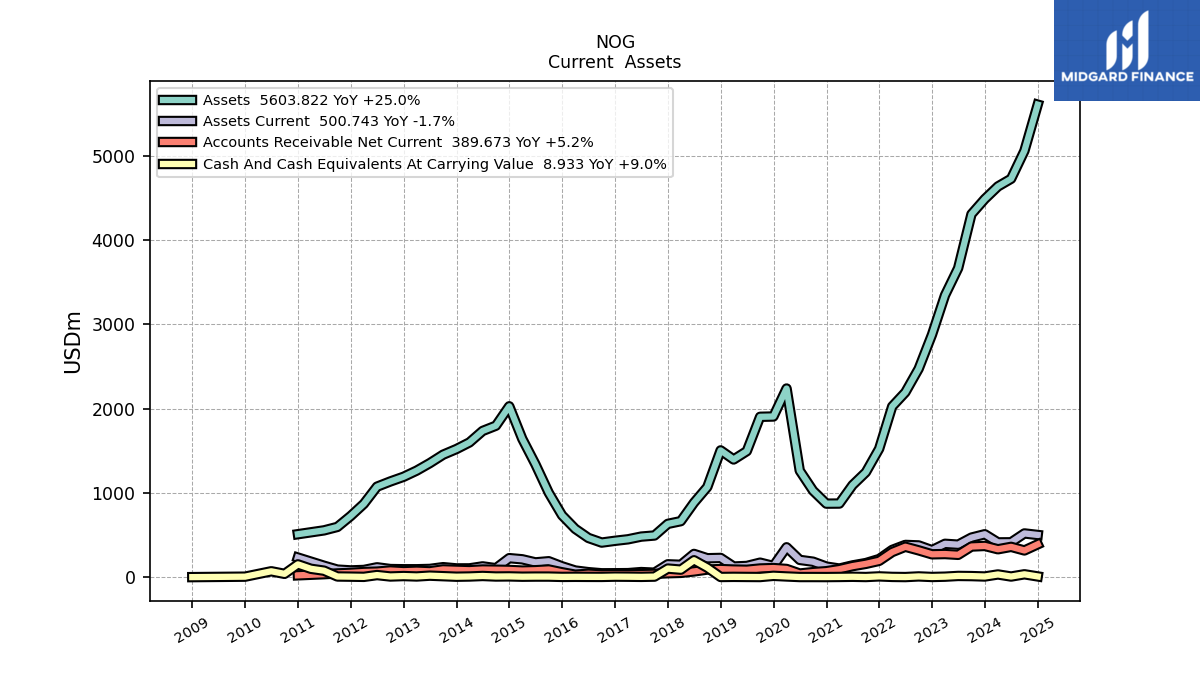
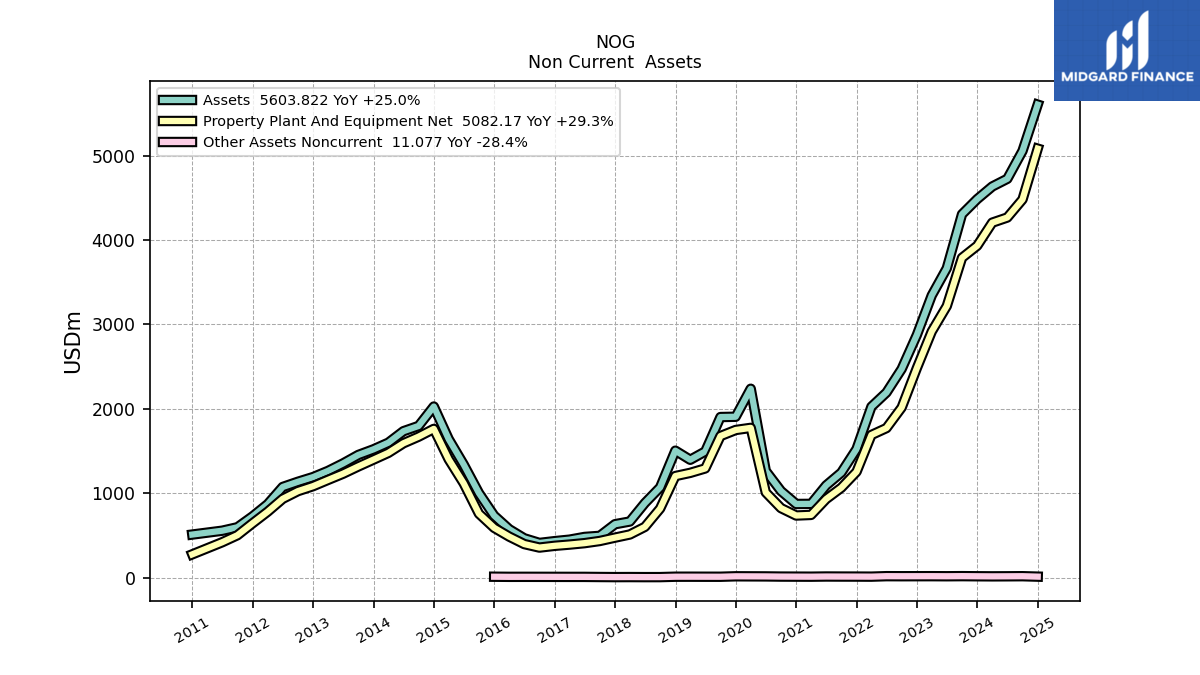
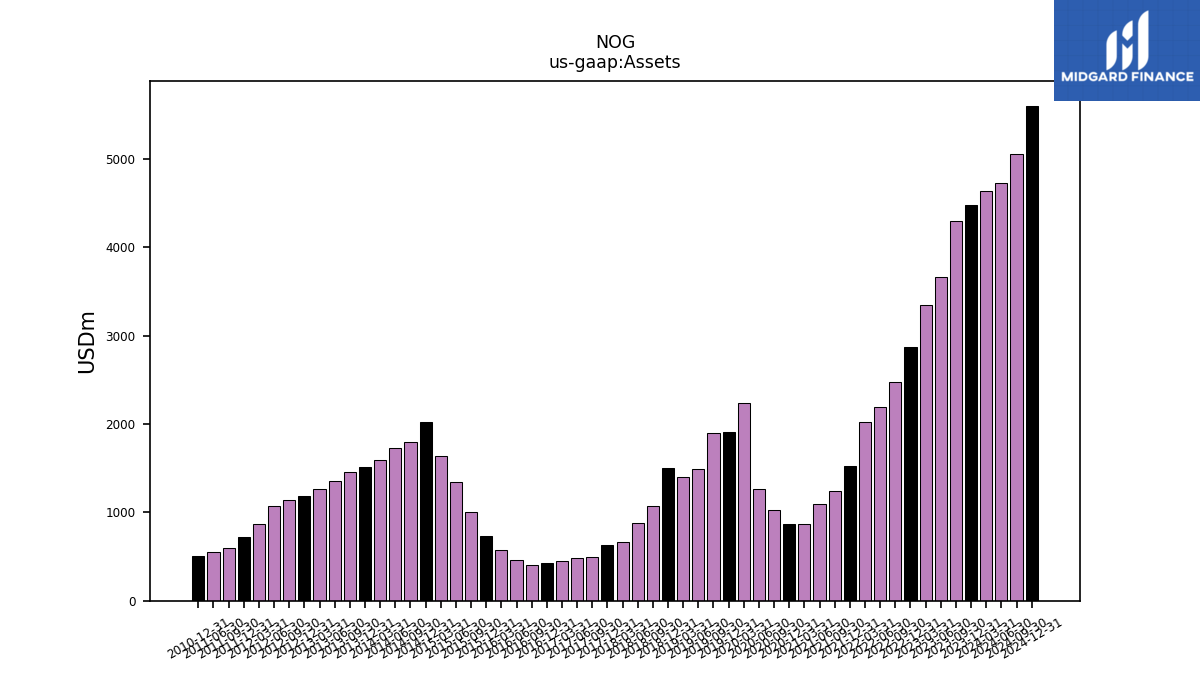
| Assets | 4484.26 | 4304.67 | 3664.75 | 3342.87 | 2875.18 | 2471.48 | 2192.24 | 2024.47 | 1522.87 | 1244.06 | 1091.81 | 873.24 | 872.09 | 1025.52 | 1263.27 | 2237.39 | 1905.46 | 1902.01 | 1494.39 | 1395.78 | 1503.65 | 1068.95 | 883.08 | 664.47 | 632.25 | 494.37 | 481.31 | 449.24 | 431.53 | 410.37 | 465.38 | 573.19 | 733.95 | 1001.24 | 1338.77 | 1640.66 | 2026.75 | 1796.57 | 1734.18 | 1598.05 | 1519.60 | 1452.74 | 1352.56 | 1263.73 | 1190.94 | 1135.22 | 1073.60 | 869.81 | 725.59 | 595.97 | 555.28 | NA | 509.69 | NA | NA | |
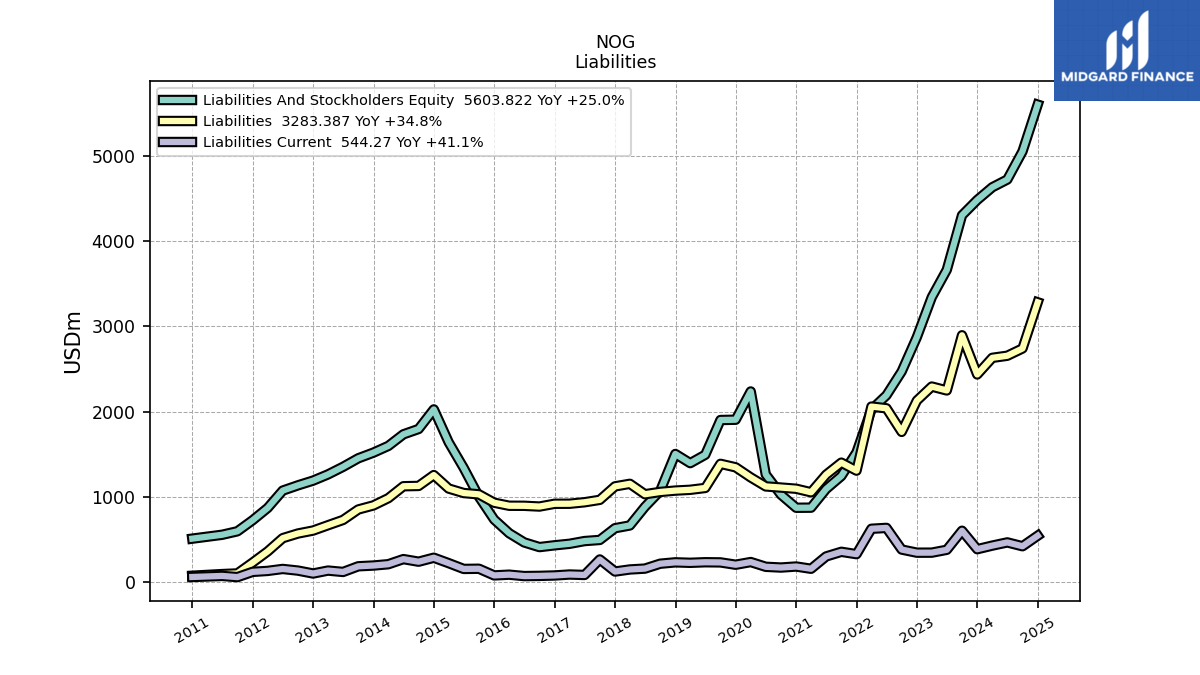
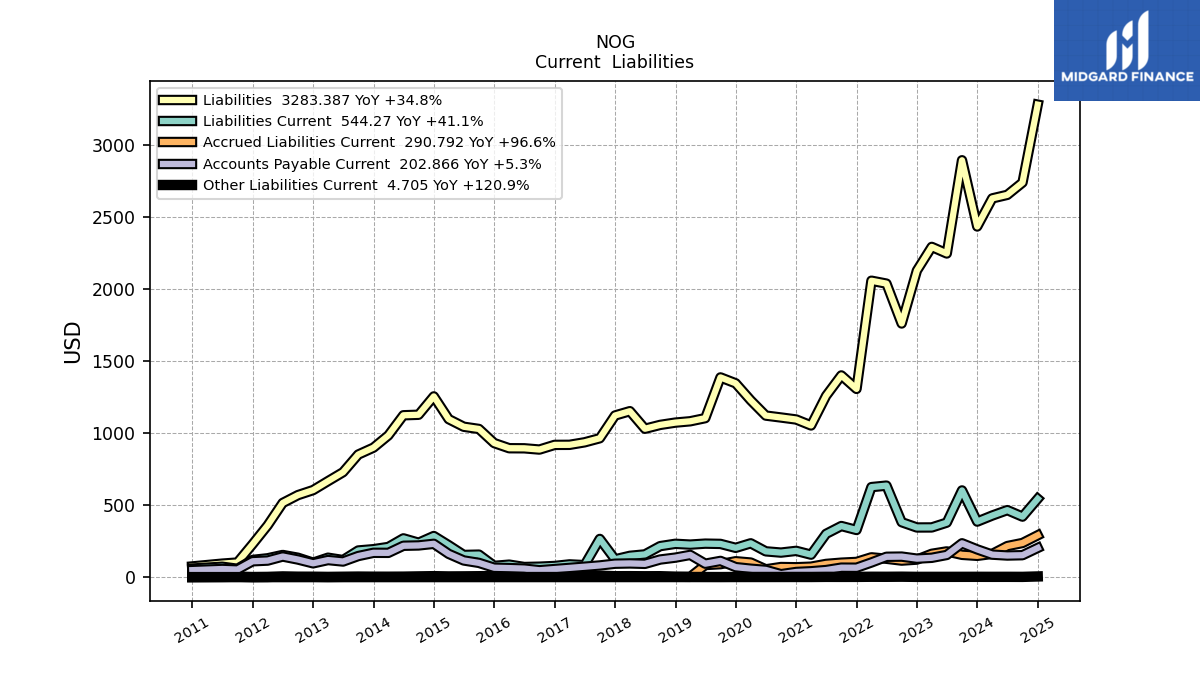
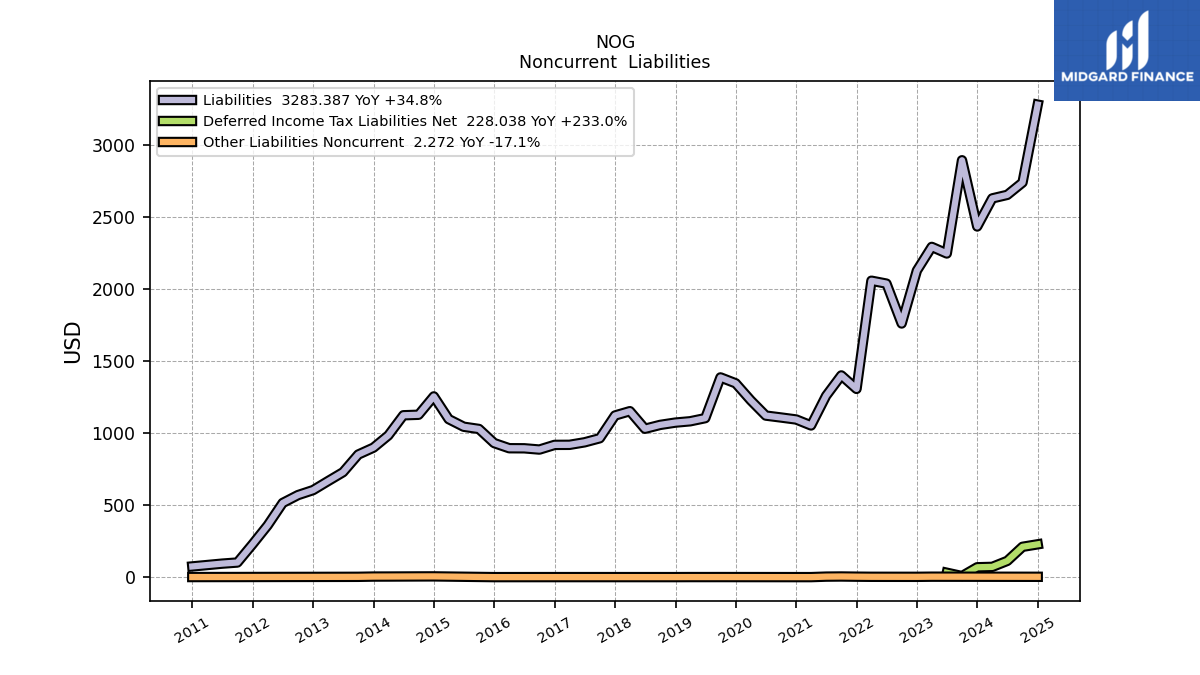
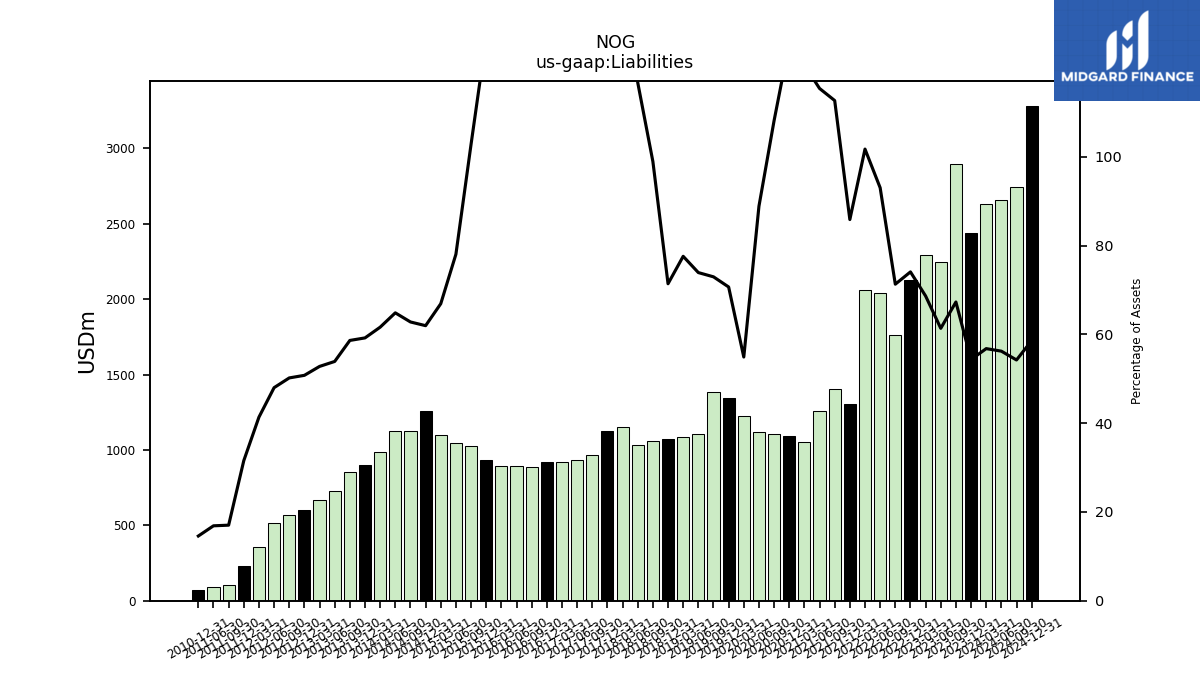
| Liabilities | 2436.58 | 2896.87 | 2248.95 | 2294.80 | 2129.92 | 1762.38 | 2039.59 | 2059.77 | 1307.73 | 1401.77 | 1260.03 | 1053.93 | 1095.39 | 1109.26 | 1122.54 | 1228.38 | 1346.82 | 1387.89 | 1104.74 | 1083.02 | 1073.78 | 1057.74 | 1030.90 | 1153.25 | 1123.09 | 964.97 | 936.78 | 919.34 | 918.95 | 886.43 | 895.18 | 895.69 | 931.55 | 1029.58 | 1044.98 | 1097.79 | 1255.88 | 1128.26 | 1124.72 | 984.82 | 899.77 | 851.87 | 729.11 | 667.07 | 604.75 | 569.84 | 515.36 | 359.76 | 229.02 | 101.47 | 93.74 | NA | 74.33 | NA | NA | |
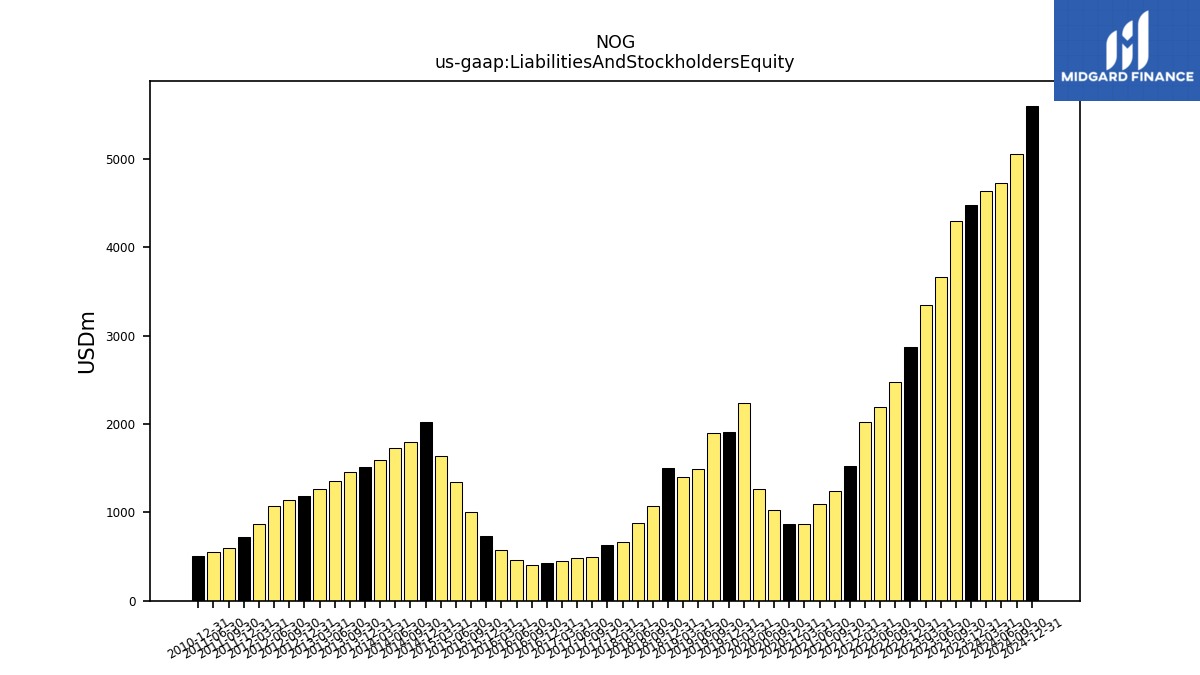
| Liabilities And Stockholders Equity | 4484.26 | 4304.67 | 3664.75 | 3342.87 | 2875.18 | 2471.48 | 2192.24 | 2024.47 | 1522.87 | 1244.06 | 1091.81 | 873.24 | 872.09 | 1025.52 | 1263.27 | 2237.39 | 1905.46 | 1902.01 | 1494.39 | 1395.78 | 1503.65 | 1068.95 | 883.08 | 664.47 | 632.25 | 494.37 | 481.31 | 449.24 | 431.53 | 410.37 | 465.38 | 573.19 | 733.95 | 1001.24 | 1338.77 | 1640.66 | 2026.75 | 1796.57 | 1734.18 | 1598.05 | 1519.60 | 1452.74 | 1352.56 | 1263.73 | 1190.94 | 1135.22 | 1073.60 | 869.81 | 725.59 | 595.97 | 555.28 | NA | 509.69 | NA | NA | |
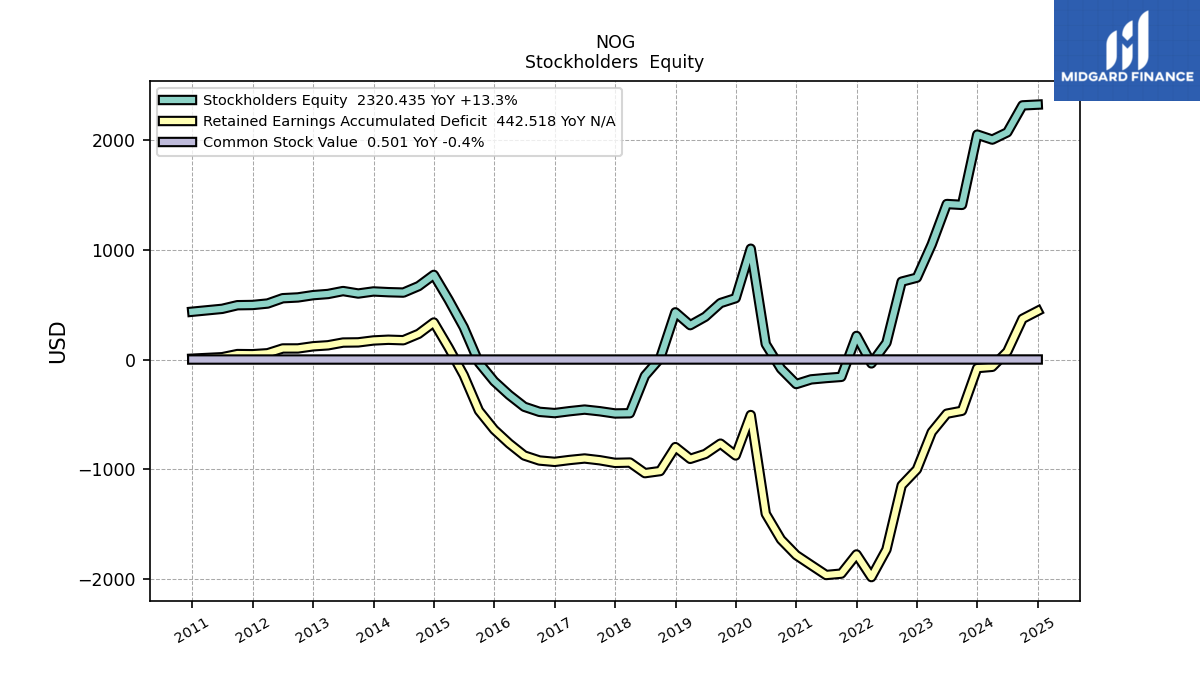
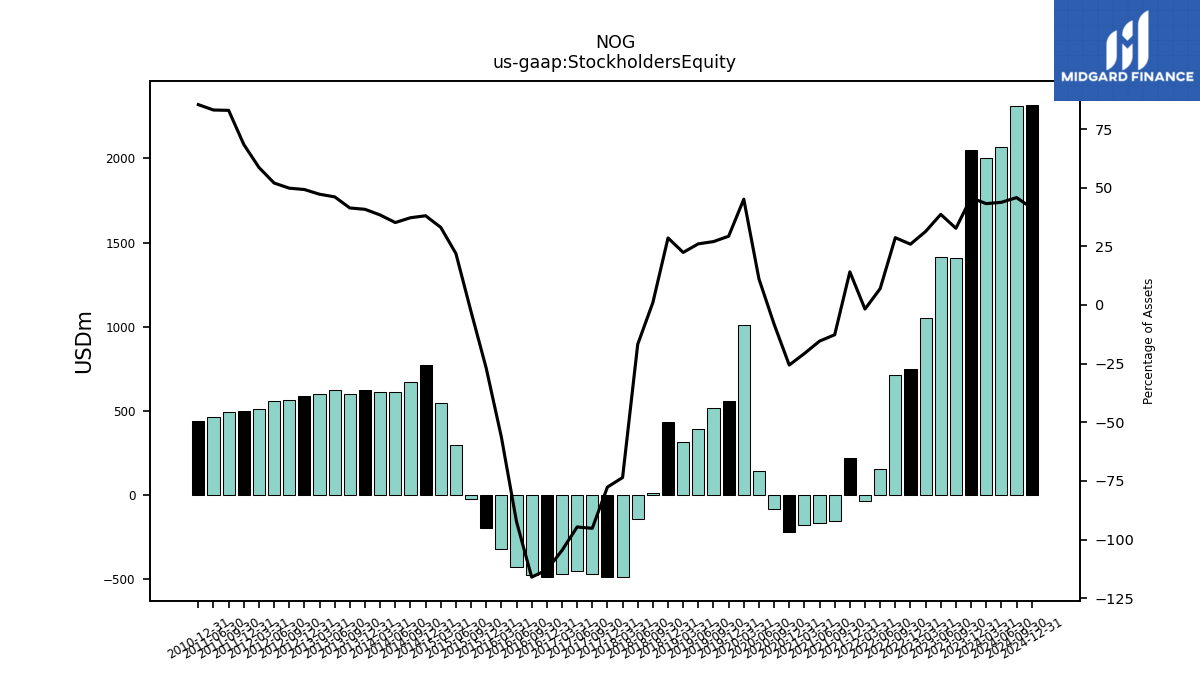
| Stockholders Equity | 2047.68 | 1407.79 | 1415.80 | 1048.07 | 745.26 | 709.10 | 152.65 | -35.30 | 215.13 | -157.71 | -168.22 | -180.68 | -223.30 | -83.73 | 140.73 | 1009.01 | 558.64 | 514.11 | 389.65 | 312.76 | 429.86 | 11.21 | -147.82 | -488.78 | -490.84 | -470.60 | -455.47 | -470.09 | -487.42 | -476.06 | -429.80 | -322.51 | -197.60 | -28.34 | 293.79 | 542.88 | 770.86 | 668.31 | 609.46 | 613.23 | 619.83 | 600.87 | 623.46 | 596.66 | 586.19 | 565.38 | 558.24 | 510.05 | 496.57 | 494.50 | 461.54 | NA | 435.36 | NA | NA |
| 2023-12-31 | 2023-09-30 | 2023-06-30 | 2023-03-31 | 2022-12-31 | 2022-09-30 | 2022-06-30 | 2022-03-31 | 2021-12-31 | 2021-09-30 | 2021-06-30 | 2021-03-31 | 2020-12-31 | 2020-09-30 | 2020-06-30 | 2020-03-31 | 2019-12-31 | 2019-09-30 | 2019-06-30 | 2019-03-31 | 2018-12-31 | 2018-09-30 | 2018-06-30 | 2018-03-31 | 2017-12-31 | 2017-09-30 | 2017-06-30 | 2017-03-31 | 2016-12-31 | 2016-09-30 | 2016-06-30 | 2016-03-31 | 2015-12-31 | 2015-09-30 | 2015-06-30 | 2015-03-31 | 2014-12-31 | 2014-09-30 | 2014-06-30 | 2014-03-31 | 2013-12-31 | 2013-09-30 | 2013-06-30 | 2013-03-31 | 2012-12-31 | 2012-09-30 | 2012-06-30 | 2012-03-31 | 2011-12-31 | 2011-09-30 | 2011-06-30 | 2011-03-31 | 2010-12-31 | 2010-09-30 | 2010-06-30 | ||
|---|---|---|---|---|---|---|---|---|---|---|---|---|---|---|---|---|---|---|---|---|---|---|---|---|---|---|---|---|---|---|---|---|---|---|---|---|---|---|---|---|---|---|---|---|---|---|---|---|---|---|---|---|---|---|---|---|
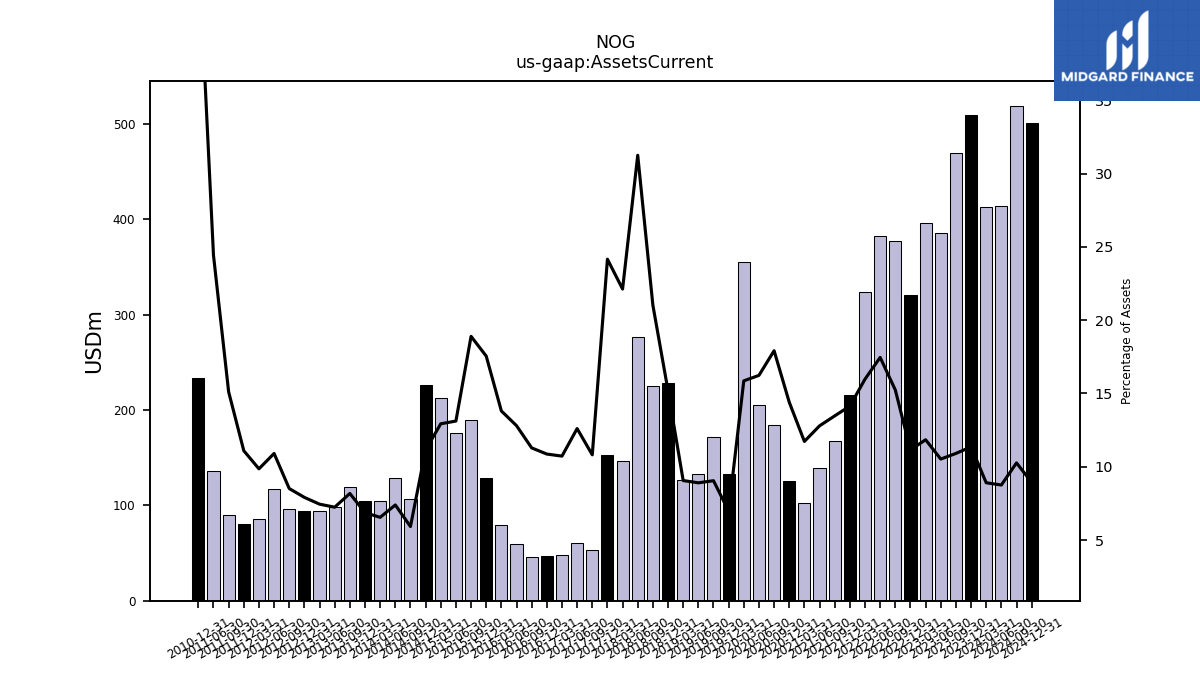
| Assets Current | 509.41 | 469.63 | 385.75 | 395.94 | 320.49 | 376.69 | 382.80 | 323.46 | 215.33 | 167.58 | 139.66 | 102.42 | 125.63 | 183.75 | 205.09 | 354.85 | 133.04 | 172.11 | 133.07 | 126.46 | 228.41 | 224.74 | 275.98 | 147.02 | 152.76 | 53.47 | 60.67 | 48.19 | 46.89 | 46.32 | 59.59 | 79.14 | 128.81 | 189.20 | 175.63 | 212.18 | 225.99 | 106.45 | 128.20 | 104.68 | 104.39 | 118.81 | 97.96 | 94.14 | 94.21 | 96.65 | 117.11 | 85.76 | 80.50 | 90.07 | 135.65 | NA | 233.02 | NA | NA | |
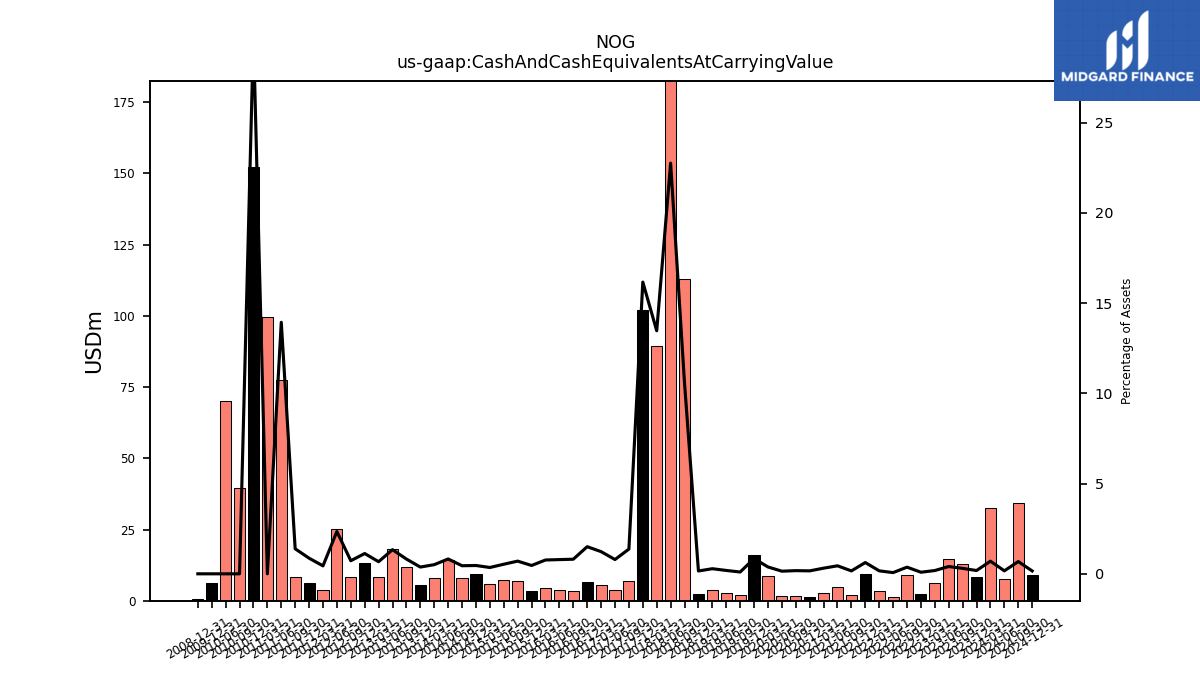
| Cash And Cash Equivalents At Carrying Value | 8.20 | 12.95 | 14.80 | 6.07 | 2.53 | 9.13 | 1.47 | 3.33 | 9.52 | 2.01 | 4.84 | 2.73 | 1.43 | 1.80 | 1.84 | 8.51 | 16.07 | 1.90 | 2.79 | 3.94 | 2.36 | 112.97 | 200.92 | 89.47 | 102.18 | 6.78 | 3.81 | 5.52 | 6.49 | 3.32 | 3.67 | 4.39 | 3.39 | 7.04 | 7.11 | 5.74 | 9.34 | 8.05 | 14.25 | 8.11 | 5.69 | 11.87 | 18.10 | 8.48 | 13.39 | 8.23 | 25.17 | 3.83 | 6.28 | 8.27 | 77.38 | 99.71 | 152.11 | 39.49 | 70.17 | |
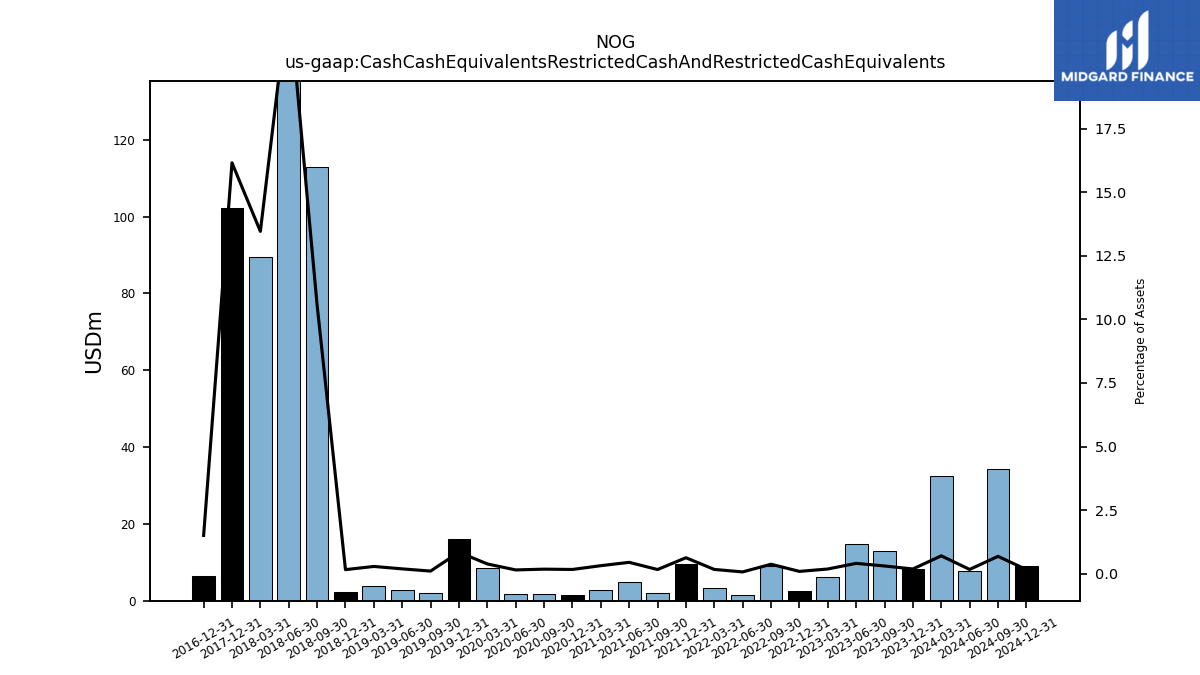
| Cash Cash Equivalents Restricted Cash And Restricted Cash Equivalents | 8.20 | 12.95 | 14.80 | 6.07 | 2.53 | 9.13 | 1.47 | 3.33 | 9.52 | 2.01 | 4.84 | 2.73 | 1.43 | 1.80 | 1.84 | 8.51 | 16.07 | 1.90 | 2.79 | 3.94 | 2.36 | 112.97 | 200.92 | 89.47 | 102.18 | NA | NA | NA | 6.49 | NA | NA | NA | NA | NA | NA | NA | NA | NA | NA | NA | NA | NA | NA | NA | NA | NA | NA | NA | NA | NA | NA | NA | NA | NA | NA | |
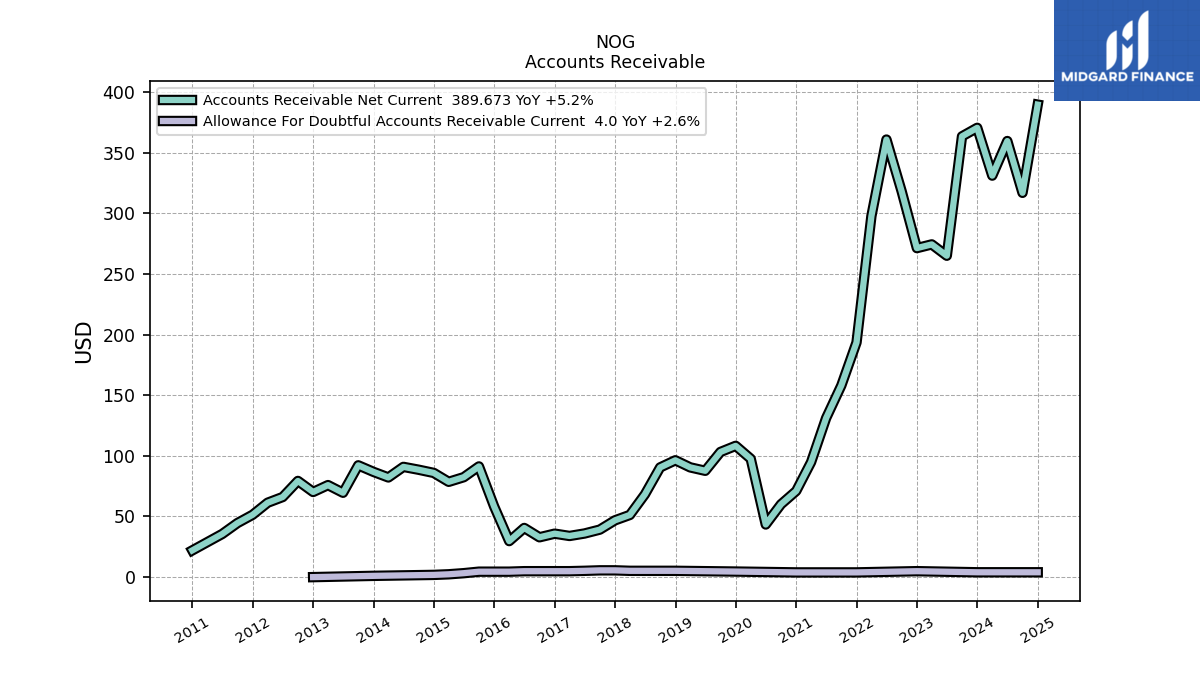
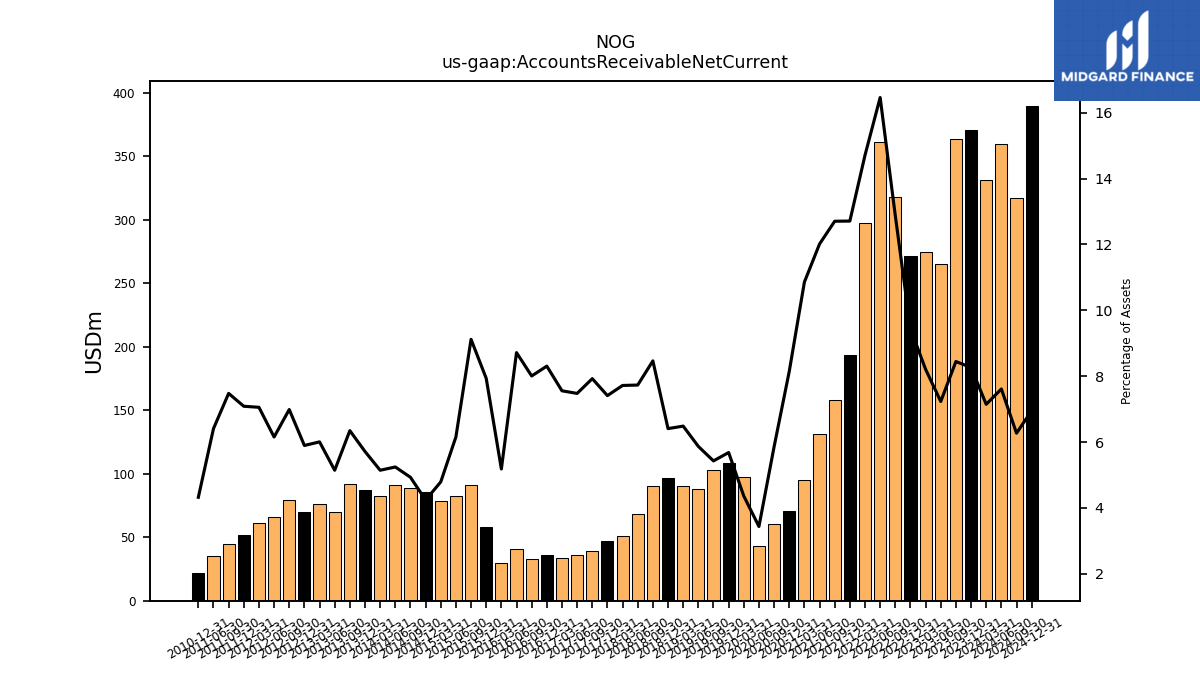
| Accounts Receivable Net Current | 370.53 | 363.52 | 265.04 | 274.40 | 271.34 | 318.14 | 360.86 | 297.75 | 193.55 | 158.05 | 131.16 | 94.80 | 71.02 | 60.07 | 43.41 | 97.58 | 108.27 | 103.23 | 87.70 | 90.51 | 96.35 | 90.48 | 68.27 | 51.28 | 46.85 | 39.18 | 35.98 | 33.95 | 35.84 | 32.86 | 40.56 | 29.70 | 58.23 | 91.29 | 82.41 | 78.59 | 85.93 | 88.58 | 90.92 | 82.20 | 86.82 | 92.20 | 69.57 | 75.89 | 70.22 | 79.32 | 66.06 | 61.37 | 51.42 | 44.56 | 35.59 | NA | 22.03 | NA | NA |
| 2023-12-31 | 2023-09-30 | 2023-06-30 | 2023-03-31 | 2022-12-31 | 2022-09-30 | 2022-06-30 | 2022-03-31 | 2021-12-31 | 2021-09-30 | 2021-06-30 | 2021-03-31 | 2020-12-31 | 2020-09-30 | 2020-06-30 | 2020-03-31 | 2019-12-31 | 2019-09-30 | 2019-06-30 | 2019-03-31 | 2018-12-31 | 2018-09-30 | 2018-06-30 | 2018-03-31 | 2017-12-31 | 2017-09-30 | 2017-06-30 | 2017-03-31 | 2016-12-31 | 2016-09-30 | 2016-06-30 | 2016-03-31 | 2015-12-31 | 2015-09-30 | 2015-06-30 | 2015-03-31 | 2014-12-31 | 2014-09-30 | 2014-06-30 | 2014-03-31 | 2013-12-31 | 2013-09-30 | 2013-06-30 | 2013-03-31 | 2012-12-31 | 2012-09-30 | 2012-06-30 | 2012-03-31 | 2011-12-31 | 2011-09-30 | 2011-06-30 | 2011-03-31 | 2010-12-31 | 2010-09-30 | 2010-06-30 | ||
|---|---|---|---|---|---|---|---|---|---|---|---|---|---|---|---|---|---|---|---|---|---|---|---|---|---|---|---|---|---|---|---|---|---|---|---|---|---|---|---|---|---|---|---|---|---|---|---|---|---|---|---|---|---|---|---|---|
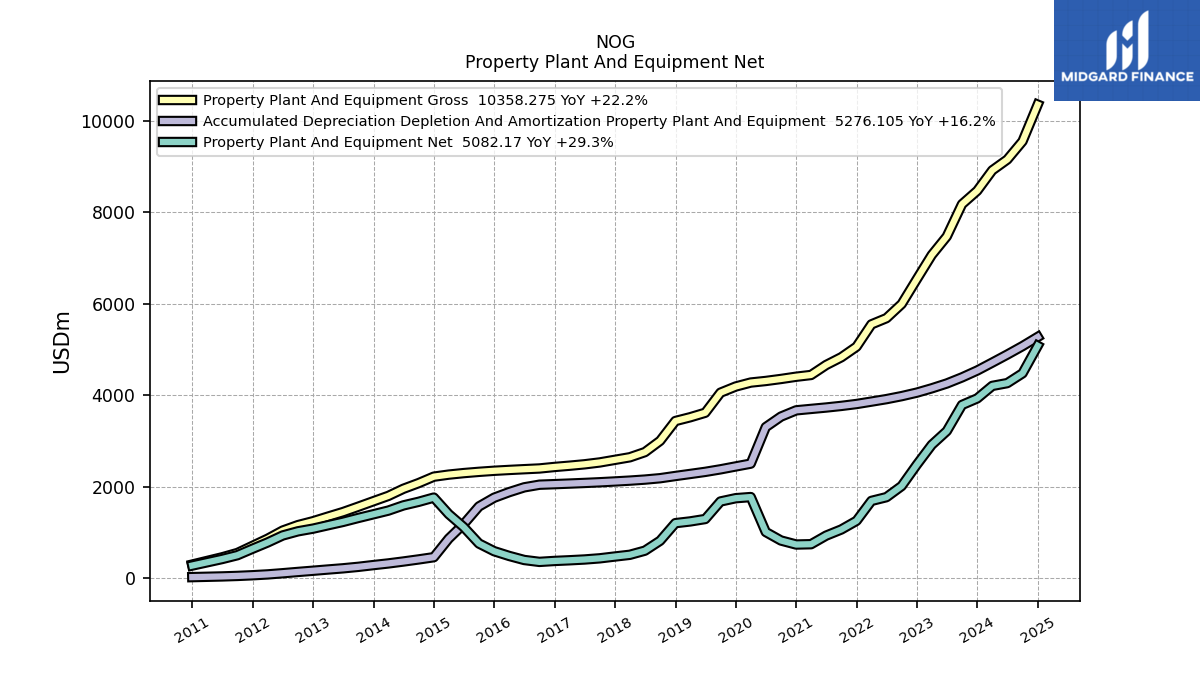
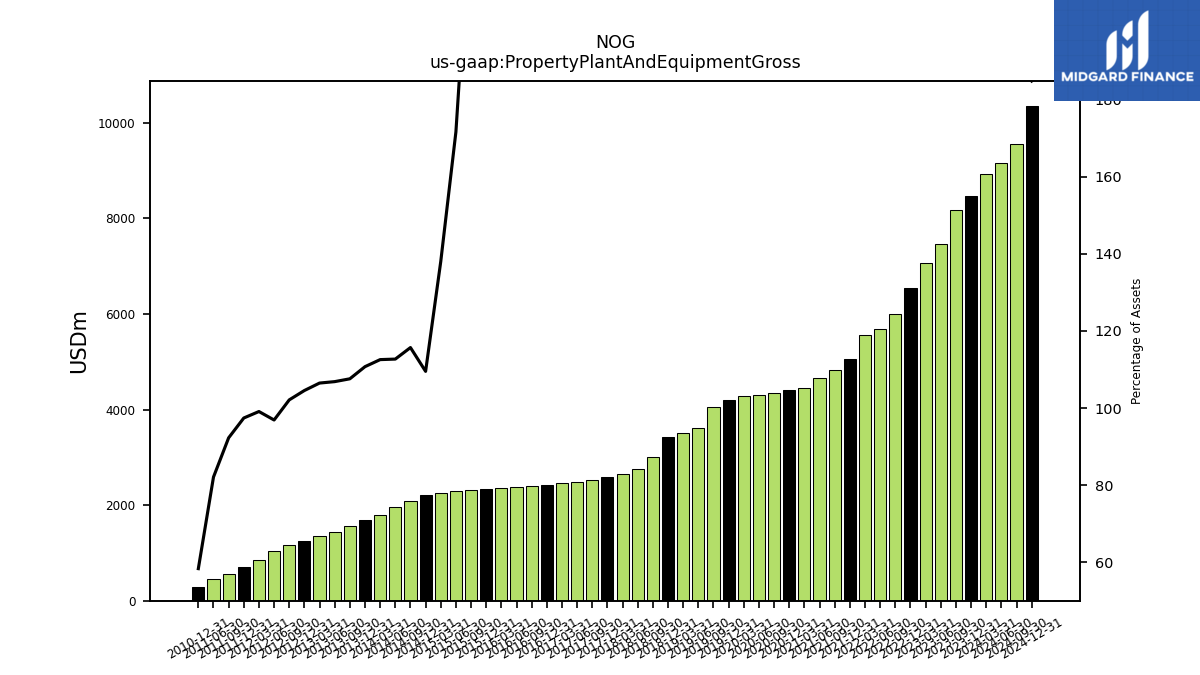
| Property Plant And Equipment Gross | 8473.37 | 8179.90 | 7475.07 | 7068.19 | 6541.11 | 5996.45 | 5687.17 | 5551.30 | 5062.38 | 4832.12 | 4662.26 | 4444.10 | 4406.02 | 4356.89 | 4313.00 | 4278.54 | 4191.81 | 4057.04 | 3618.07 | 3519.61 | 3436.73 | 3003.87 | 2756.83 | 2644.10 | 2588.17 | 2530.87 | 2490.18 | 2459.50 | 2432.20 | 2399.07 | 2383.17 | 2366.68 | 2348.60 | 2325.38 | 2297.89 | 2264.57 | 2219.97 | 2078.68 | 1954.66 | 1799.04 | 1682.92 | 1563.14 | 1445.44 | 1345.83 | 1245.28 | 1159.42 | 1040.47 | 862.09 | 706.97 | 550.02 | 455.95 | NA | 297.46 | NA | NA | |
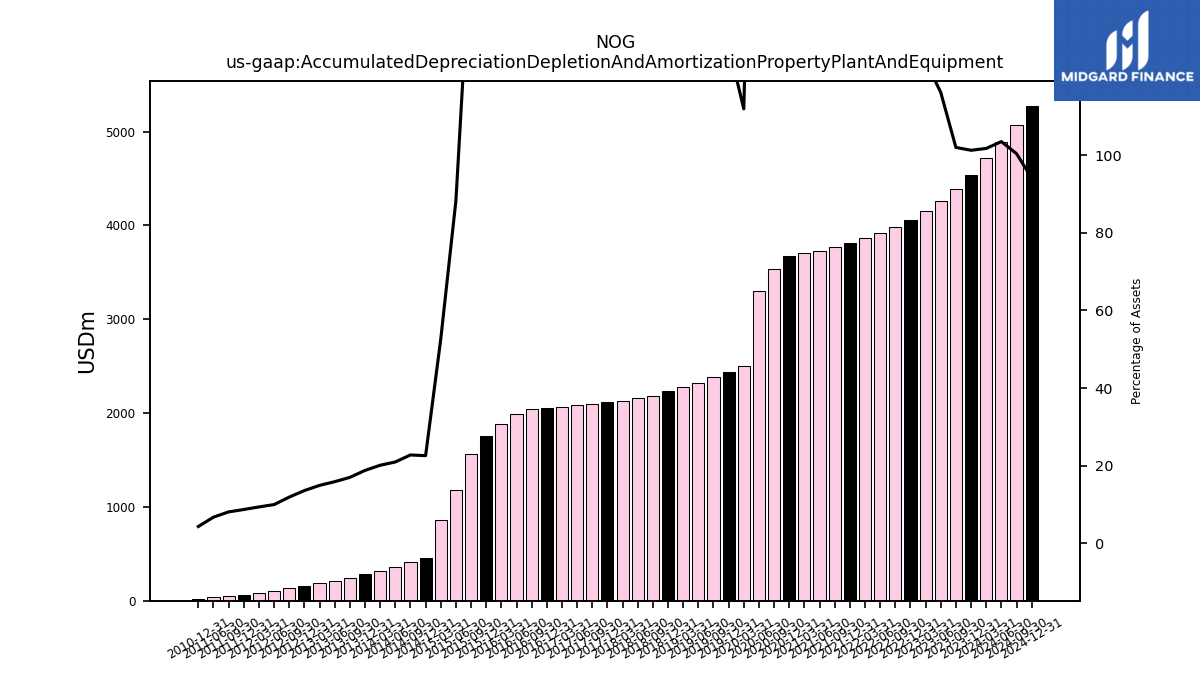
| Accumulated Depreciation Depletion And Amortization Property Plant And Equipment | 4541.81 | 4391.26 | 4258.09 | 4152.24 | 4058.18 | 3981.39 | 3915.92 | 3861.76 | 3809.04 | 3767.61 | 3732.18 | 3701.72 | 3670.81 | 3533.89 | 3303.91 | 2504.74 | 2443.22 | 2380.09 | 2324.79 | 2278.91 | 2233.99 | 2185.89 | 2155.81 | 2133.43 | 2114.95 | 2097.46 | 2082.24 | 2068.70 | 2055.99 | 2043.70 | 1986.28 | 1881.32 | 1759.28 | 1568.20 | 1182.20 | 863.57 | 458.04 | 409.24 | 363.74 | 321.60 | 285.62 | 247.02 | 214.95 | 188.79 | 162.03 | 135.35 | 107.29 | 81.67 | 63.27 | 48.33 | 37.50 | NA | 22.15 | NA | NA | |
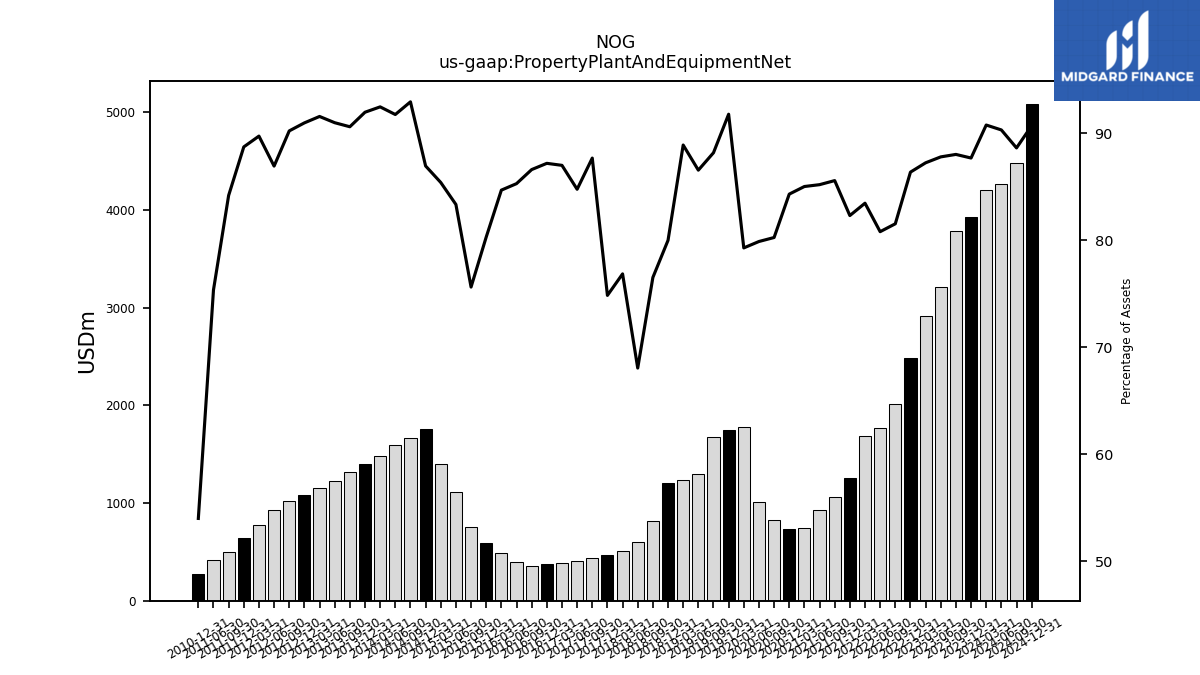
| Property Plant And Equipment Net | 3931.56 | 3788.64 | 3216.98 | 2915.94 | 2482.93 | 2015.06 | 1771.25 | 1689.55 | 1253.34 | 1064.51 | 930.08 | 742.38 | 735.20 | 823.00 | 1009.08 | 1773.80 | 1748.59 | 1676.95 | 1293.28 | 1240.69 | 1202.75 | 817.98 | 601.01 | 510.67 | 473.22 | 433.41 | 407.94 | 390.80 | 376.21 | 355.36 | 396.89 | 485.36 | 589.32 | 757.18 | 1115.69 | 1400.99 | 1761.93 | 1669.44 | 1590.93 | 1477.44 | 1397.31 | 1316.12 | 1230.49 | 1157.03 | 1083.24 | 1024.07 | 933.18 | 780.42 | 643.70 | 501.69 | 418.44 | NA | 275.31 | NA | NA | |
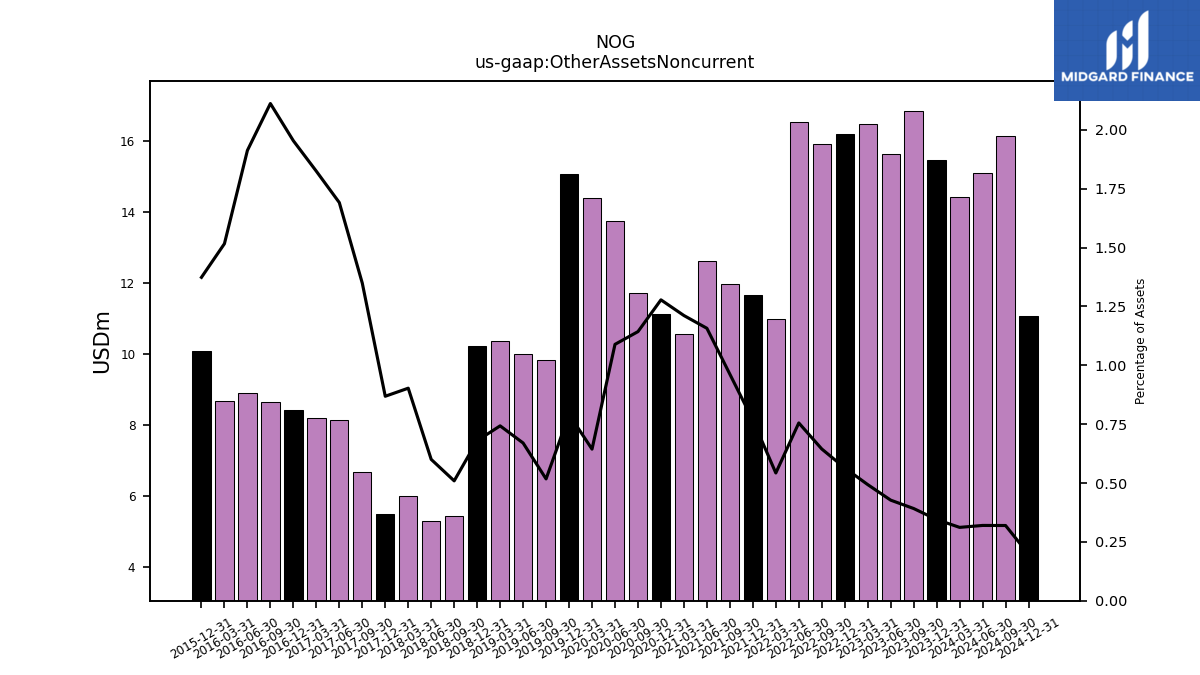
| Other Assets Noncurrent | 15.47 | 16.86 | 15.66 | 16.49 | 16.22 | 15.93 | 16.55 | 10.98 | 11.68 | 11.97 | 12.63 | 10.58 | 11.14 | 11.72 | 13.76 | 14.41 | 15.07 | 9.84 | 10.01 | 10.37 | 10.22 | 5.44 | 5.30 | 6.00 | 5.49 | 6.67 | 8.14 | 8.20 | 8.43 | 8.67 | 8.90 | 8.69 | 10.08 | NA | NA | NA | NA | NA | NA | NA | NA | NA | NA | NA | NA | NA | NA | NA | NA | NA | NA | NA | NA | NA | NA |
| 2023-12-31 | 2023-09-30 | 2023-06-30 | 2023-03-31 | 2022-12-31 | 2022-09-30 | 2022-06-30 | 2022-03-31 | 2021-12-31 | 2021-09-30 | 2021-06-30 | 2021-03-31 | 2020-12-31 | 2020-09-30 | 2020-06-30 | 2020-03-31 | 2019-12-31 | 2019-09-30 | 2019-06-30 | 2019-03-31 | 2018-12-31 | 2018-09-30 | 2018-06-30 | 2018-03-31 | 2017-12-31 | 2017-09-30 | 2017-06-30 | 2017-03-31 | 2016-12-31 | 2016-09-30 | 2016-06-30 | 2016-03-31 | 2015-12-31 | 2015-09-30 | 2015-06-30 | 2015-03-31 | 2014-12-31 | 2014-09-30 | 2014-06-30 | 2014-03-31 | 2013-12-31 | 2013-09-30 | 2013-06-30 | 2013-03-31 | 2012-12-31 | 2012-09-30 | 2012-06-30 | 2012-03-31 | 2011-12-31 | 2011-09-30 | 2011-06-30 | 2011-03-31 | 2010-12-31 | 2010-09-30 | 2010-06-30 | ||
|---|---|---|---|---|---|---|---|---|---|---|---|---|---|---|---|---|---|---|---|---|---|---|---|---|---|---|---|---|---|---|---|---|---|---|---|---|---|---|---|---|---|---|---|---|---|---|---|---|---|---|---|---|---|---|---|---|
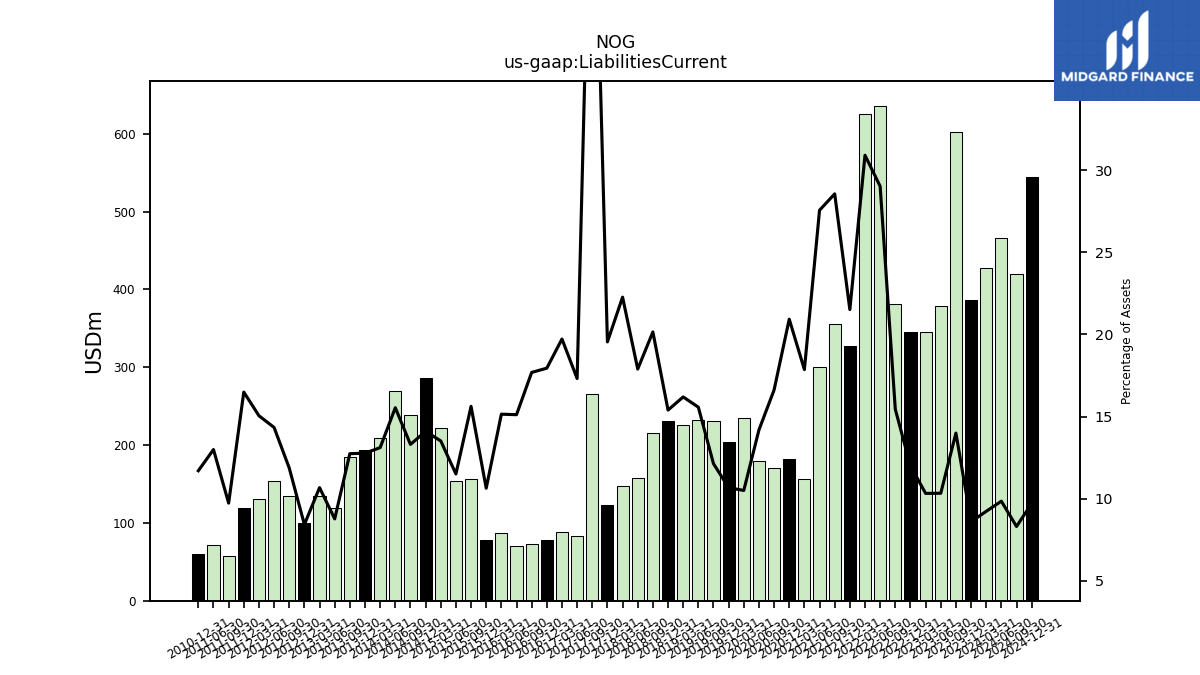
| Liabilities Current | 385.76 | 602.49 | 378.75 | 345.30 | 344.97 | 381.75 | 635.93 | 625.53 | 327.56 | 355.17 | 300.84 | 155.97 | 182.47 | 170.46 | 179.22 | 235.08 | 203.48 | 230.82 | 232.73 | 226.05 | 231.53 | 215.38 | 158.00 | 147.94 | 123.58 | 265.47 | 83.34 | 88.59 | 77.44 | 72.58 | 70.35 | 86.81 | 78.12 | 156.42 | 154.09 | 221.82 | 285.73 | 239.08 | 269.46 | 209.56 | 194.09 | 185.14 | 118.73 | 134.94 | 100.46 | 134.76 | 153.94 | 130.92 | 119.66 | 58.03 | 72.16 | NA | 59.67 | NA | NA | |
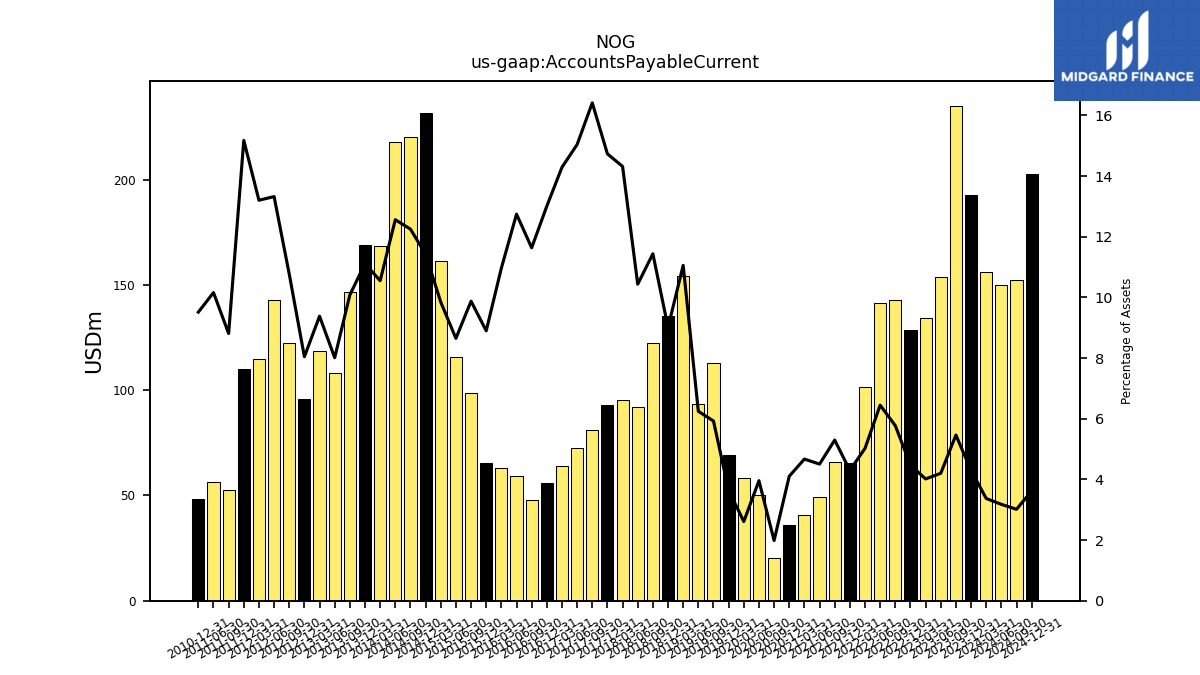
| Accounts Payable Current | 192.67 | 235.13 | 154.02 | 134.26 | 128.58 | 142.68 | 141.37 | 101.70 | 65.46 | 65.91 | 49.19 | 40.79 | 35.80 | 20.37 | 50.01 | 58.45 | 69.39 | 112.70 | 93.36 | 154.34 | 135.48 | 122.28 | 92.18 | 95.15 | 93.15 | 81.15 | 72.40 | 64.20 | 56.15 | 47.76 | 59.32 | 62.86 | 65.32 | 98.89 | 115.82 | 161.55 | 231.56 | 220.13 | 217.87 | 168.62 | 168.94 | 146.47 | 108.39 | 118.56 | 95.82 | 122.26 | 143.06 | 114.86 | 110.13 | 52.52 | 56.42 | NA | 48.50 | NA | NA | |
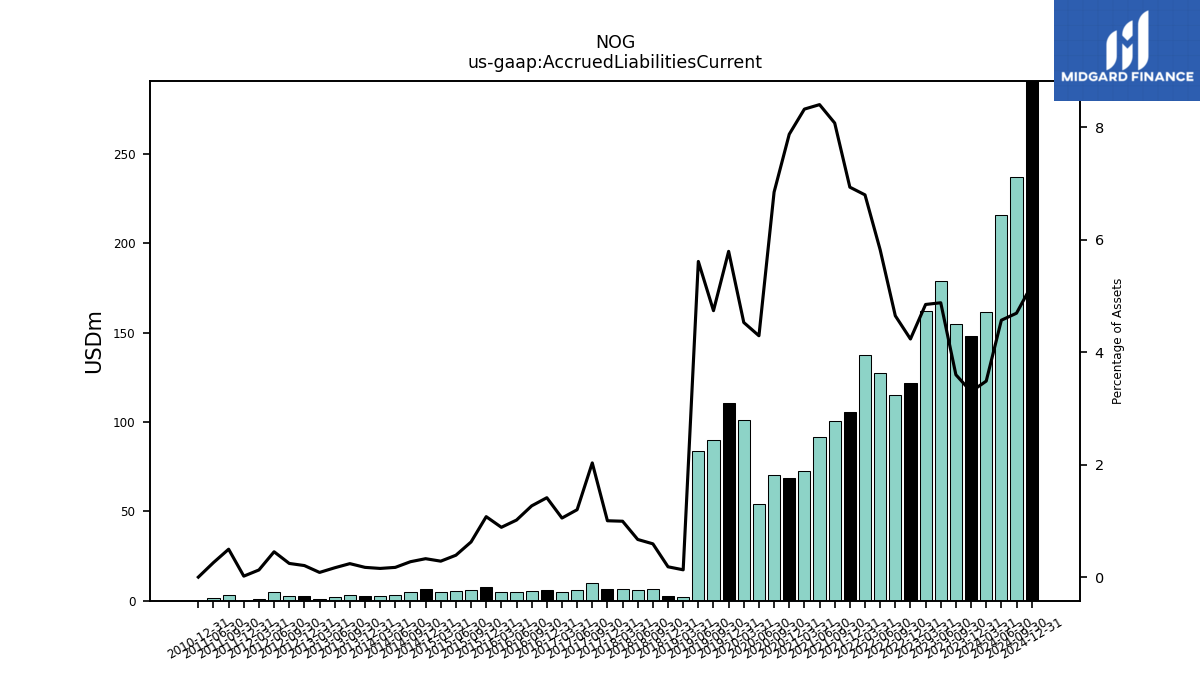
| Accrued Liabilities Current | 147.94 | 154.88 | 178.78 | 162.07 | 121.74 | 114.85 | 127.61 | 137.59 | 105.59 | 100.44 | 91.72 | 72.67 | 68.67 | 70.20 | 54.22 | 101.30 | 110.37 | 90.11 | 83.88 | 1.82 | 2.77 | 6.33 | 5.92 | 6.61 | 6.34 | 10.04 | 5.77 | 4.72 | 6.09 | 5.20 | 4.72 | 5.08 | 7.89 | 6.27 | 5.22 | 4.66 | 6.65 | 4.93 | 3.02 | 2.48 | 2.65 | 3.49 | 2.25 | 1.06 | 2.45 | 2.77 | 4.85 | 1.11 | 0.13 | 2.96 | 1.44 | NA | 0.00 | NA | NA | |
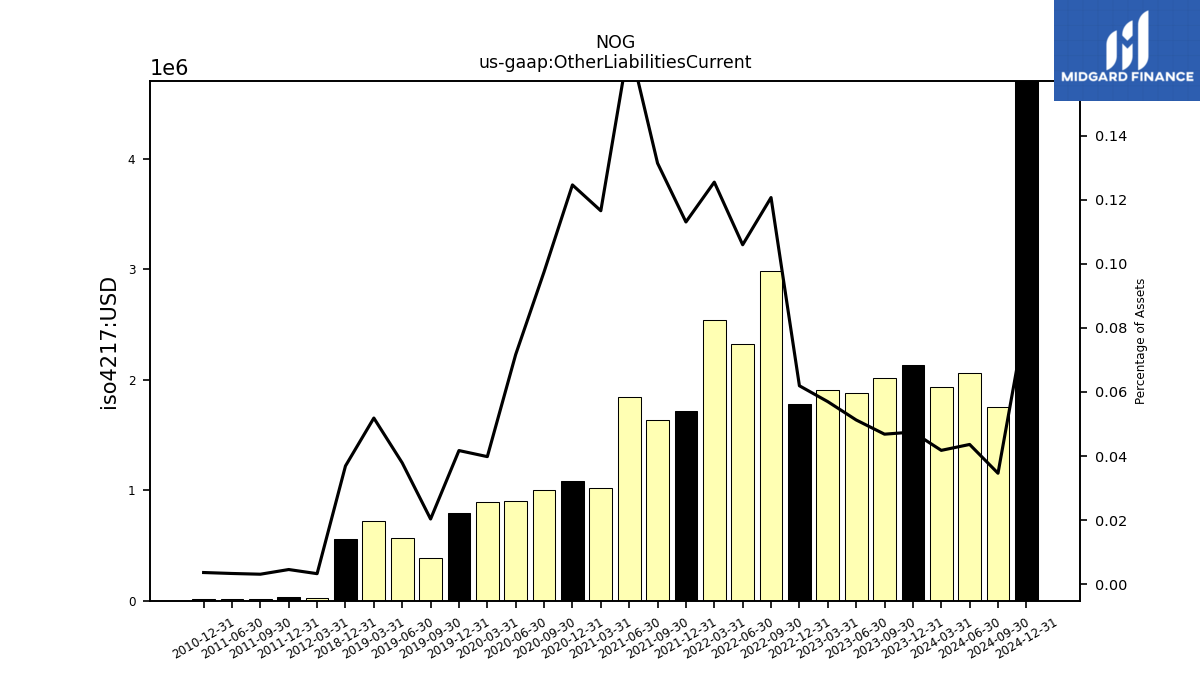
| Other Liabilities Current | 2.13 | 2.02 | 1.88 | 1.91 | 1.78 | 2.98 | 2.32 | 2.54 | 1.72 | 1.64 | 1.84 | 1.02 | 1.09 | 1.00 | 0.91 | 0.89 | 0.80 | 0.39 | 0.57 | 0.72 | 0.56 | NA | NA | NA | NA | NA | NA | NA | NA | NA | NA | NA | NA | NA | NA | NA | NA | NA | NA | NA | NA | NA | NA | NA | NA | NA | NA | 0.03 | 0.03 | 0.02 | 0.02 | NA | 0.02 | NA | NA |
| 2023-12-31 | 2023-09-30 | 2023-06-30 | 2023-03-31 | 2022-12-31 | 2022-09-30 | 2022-06-30 | 2022-03-31 | 2021-12-31 | 2021-09-30 | 2021-06-30 | 2021-03-31 | 2020-12-31 | 2020-09-30 | 2020-06-30 | 2020-03-31 | 2019-12-31 | 2019-09-30 | 2019-06-30 | 2019-03-31 | 2018-12-31 | 2018-09-30 | 2018-06-30 | 2018-03-31 | 2017-12-31 | 2017-09-30 | 2017-06-30 | 2017-03-31 | 2016-12-31 | 2016-09-30 | 2016-06-30 | 2016-03-31 | 2015-12-31 | 2015-09-30 | 2015-06-30 | 2015-03-31 | 2014-12-31 | 2014-09-30 | 2014-06-30 | 2014-03-31 | 2013-12-31 | 2013-09-30 | 2013-06-30 | 2013-03-31 | 2012-12-31 | 2012-09-30 | 2012-06-30 | 2012-03-31 | 2011-12-31 | 2011-09-30 | 2011-06-30 | 2011-03-31 | 2010-12-31 | 2010-09-30 | 2010-06-30 | ||
|---|---|---|---|---|---|---|---|---|---|---|---|---|---|---|---|---|---|---|---|---|---|---|---|---|---|---|---|---|---|---|---|---|---|---|---|---|---|---|---|---|---|---|---|---|---|---|---|---|---|---|---|---|---|---|---|---|
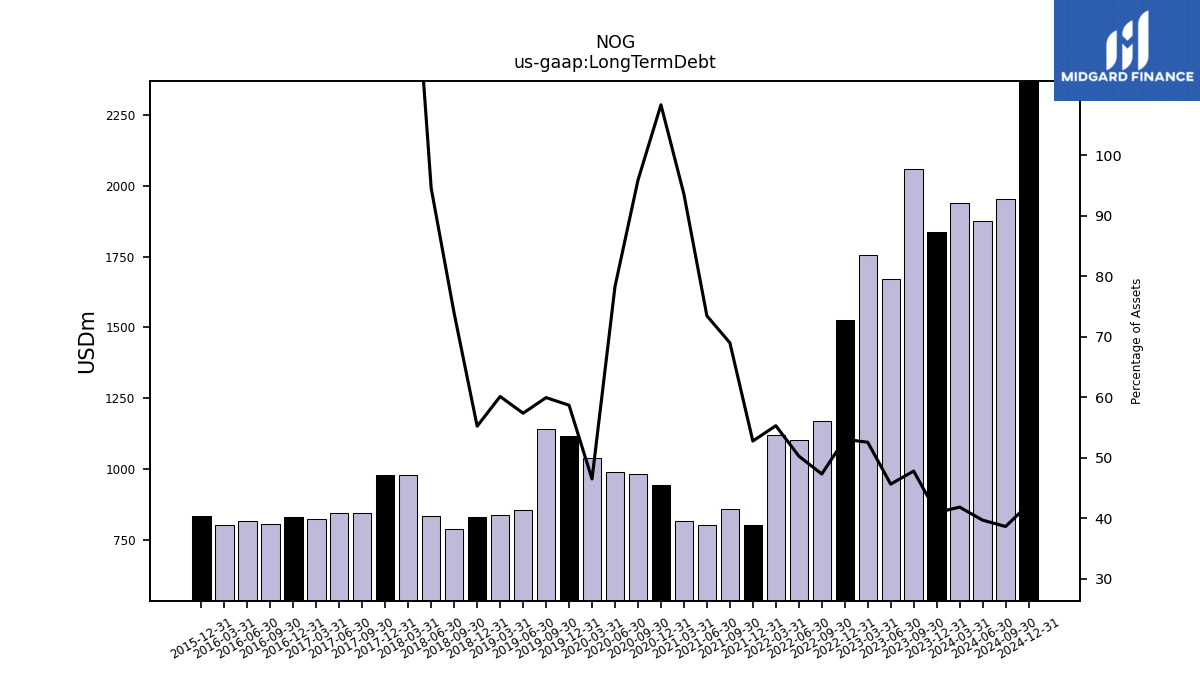
| Long Term Debt | 1835.55 | 2057.36 | 1672.55 | 1756.95 | 1525.41 | 1169.22 | 1102.21 | 1119.50 | 803.44 | 858.41 | 802.00 | 817.06 | 944.84 | 983.33 | 989.17 | 1040.28 | 1118.16 | 1140.07 | 857.20 | 839.23 | 830.20 | 789.53 | 834.77 | 980.80 | 979.32 | 846.10 | 845.28 | 823.45 | 832.60 | 807.80 | 819.00 | 803.12 | 835.29 | NA | NA | NA | NA | NA | NA | NA | NA | NA | NA | NA | NA | NA | NA | NA | NA | NA | NA | NA | NA | NA | NA | |
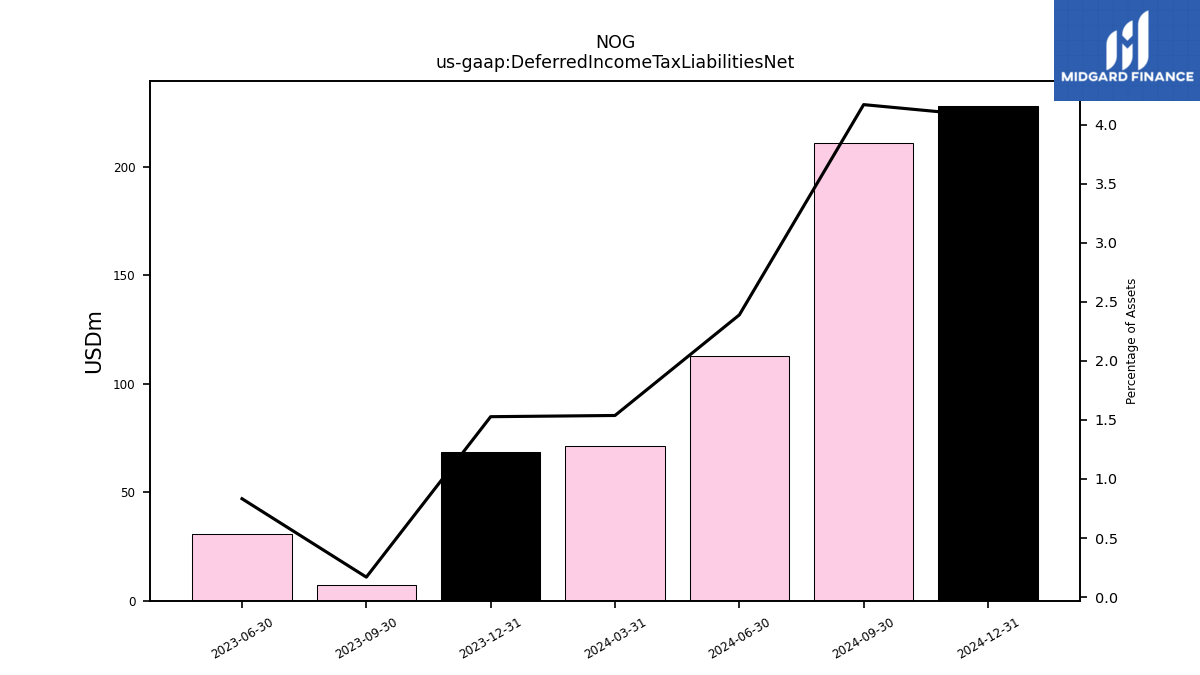
| Deferred Income Tax Liabilities Net | 68.49 | 7.29 | 30.53 | NA | NA | NA | NA | NA | NA | NA | NA | NA | NA | NA | NA | NA | NA | NA | NA | NA | NA | NA | NA | NA | NA | NA | NA | NA | NA | NA | NA | NA | NA | NA | NA | NA | NA | NA | NA | NA | NA | NA | NA | NA | NA | NA | NA | NA | NA | NA | NA | NA | NA | NA | NA | |
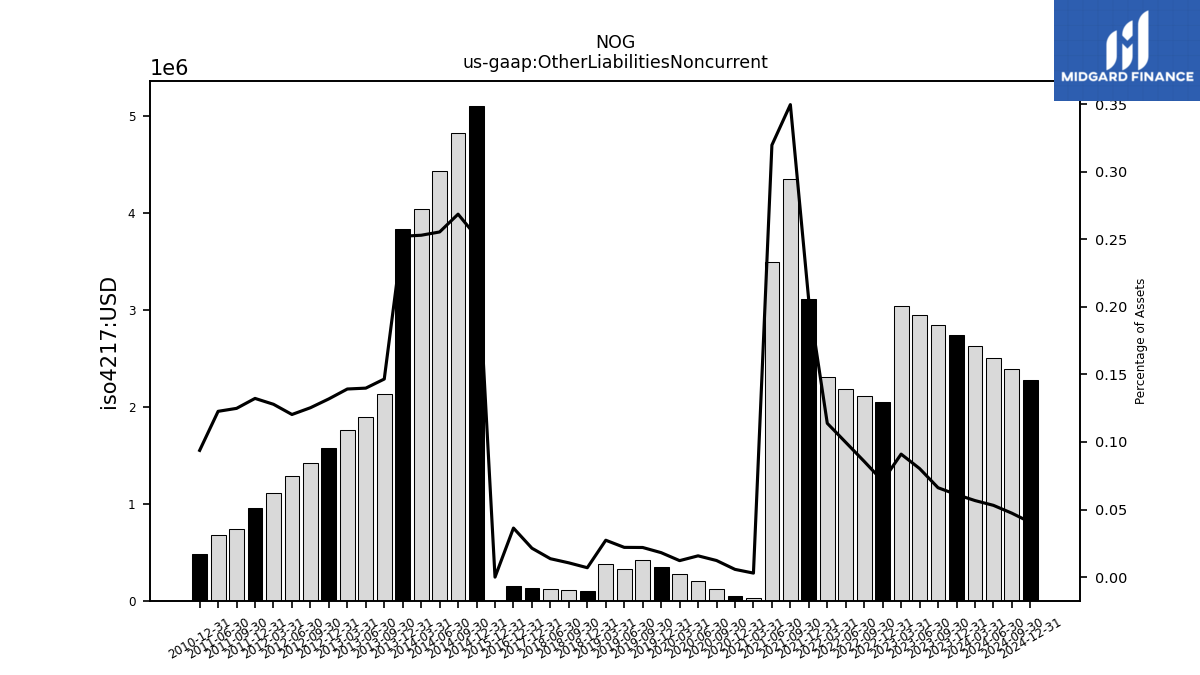
| Other Liabilities Noncurrent | 2.74 | 2.85 | 2.94 | 3.04 | 2.04 | 2.12 | 2.19 | 2.30 | 3.11 | 4.35 | 3.49 | 0.03 | 0.05 | 0.13 | 0.20 | 0.27 | 0.34 | 0.42 | 0.33 | 0.38 | 0.10 | 0.11 | 0.12 | NA | 0.14 | NA | NA | NA | 0.16 | NA | NA | NA | 0.00 | NA | NA | NA | 5.11 | 4.82 | 4.43 | 4.04 | 3.83 | 2.13 | 1.89 | 1.76 | 1.57 | 1.42 | 1.29 | 1.11 | 0.96 | 0.74 | 0.68 | NA | 0.48 | NA | NA |
| 2023-12-31 | 2023-09-30 | 2023-06-30 | 2023-03-31 | 2022-12-31 | 2022-09-30 | 2022-06-30 | 2022-03-31 | 2021-12-31 | 2021-09-30 | 2021-06-30 | 2021-03-31 | 2020-12-31 | 2020-09-30 | 2020-06-30 | 2020-03-31 | 2019-12-31 | 2019-09-30 | 2019-06-30 | 2019-03-31 | 2018-12-31 | 2018-09-30 | 2018-06-30 | 2018-03-31 | 2017-12-31 | 2017-09-30 | 2017-06-30 | 2017-03-31 | 2016-12-31 | 2016-09-30 | 2016-06-30 | 2016-03-31 | 2015-12-31 | 2015-09-30 | 2015-06-30 | 2015-03-31 | 2014-12-31 | 2014-09-30 | 2014-06-30 | 2014-03-31 | 2013-12-31 | 2013-09-30 | 2013-06-30 | 2013-03-31 | 2012-12-31 | 2012-09-30 | 2012-06-30 | 2012-03-31 | 2011-12-31 | 2011-09-30 | 2011-06-30 | 2011-03-31 | 2010-12-31 | 2010-09-30 | 2010-06-30 | ||
|---|---|---|---|---|---|---|---|---|---|---|---|---|---|---|---|---|---|---|---|---|---|---|---|---|---|---|---|---|---|---|---|---|---|---|---|---|---|---|---|---|---|---|---|---|---|---|---|---|---|---|---|---|---|---|---|---|
| Stockholders Equity | 2047.68 | 1407.79 | 1415.80 | 1048.07 | 745.26 | 709.10 | 152.65 | -35.30 | 215.13 | -157.71 | -168.22 | -180.68 | -223.30 | -83.73 | 140.73 | 1009.01 | 558.64 | 514.11 | 389.65 | 312.76 | 429.86 | 11.21 | -147.82 | -488.78 | -490.84 | -470.60 | -455.47 | -470.09 | -487.42 | -476.06 | -429.80 | -322.51 | -197.60 | -28.34 | 293.79 | 542.88 | 770.86 | 668.31 | 609.46 | 613.23 | 619.83 | 600.87 | 623.46 | 596.66 | 586.19 | 565.38 | 558.24 | 510.05 | 496.57 | 494.50 | 461.54 | NA | 435.36 | NA | NA | |
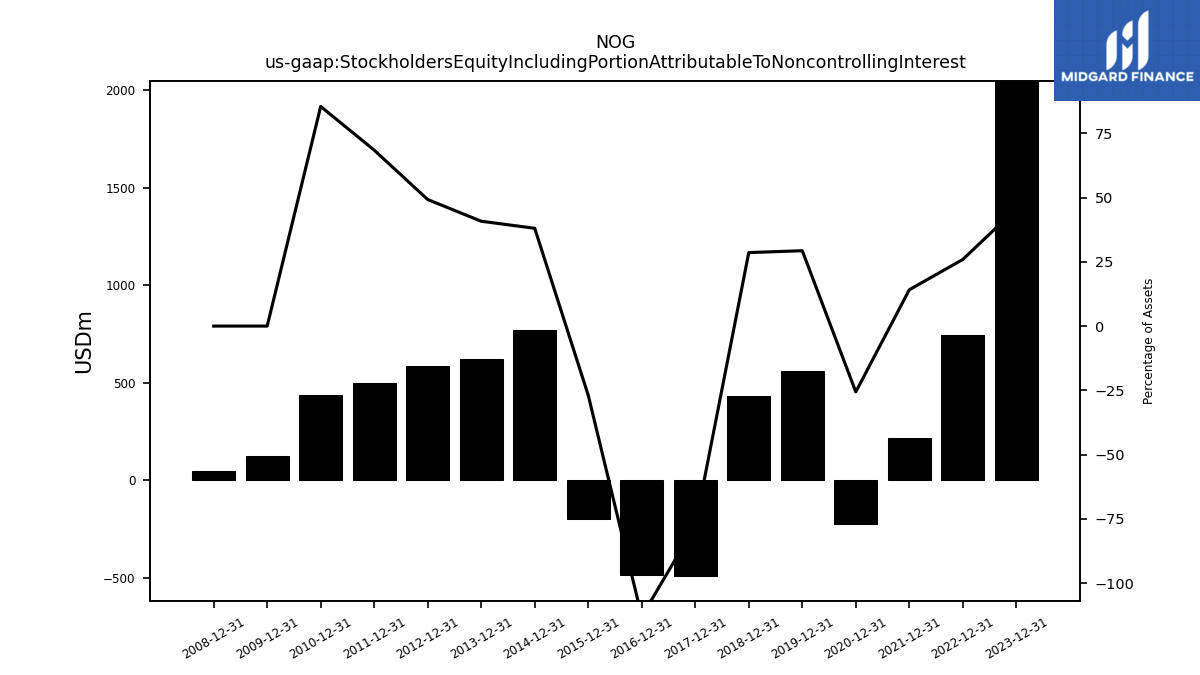
| Stockholders Equity Including Portion Attributable To Noncontrolling Interest | 2047.68 | NA | NA | NA | 745.26 | NA | NA | NA | 215.13 | NA | NA | NA | -223.30 | NA | NA | NA | 558.64 | NA | NA | NA | 429.86 | NA | NA | NA | -490.84 | NA | NA | NA | -487.42 | NA | NA | NA | -197.60 | NA | NA | NA | 770.86 | NA | NA | NA | 619.83 | NA | NA | NA | 586.19 | NA | NA | NA | 496.57 | NA | NA | NA | 435.36 | NA | NA | |
| Common Stock Value | 0.50 | 0.49 | 0.49 | 0.49 | 0.49 | 0.48 | 0.48 | 0.48 | 0.48 | 0.47 | 0.47 | 0.46 | 0.45 | 0.45 | 0.44 | 0.41 | 0.41 | 0.40 | 0.39 | 0.38 | 0.38 | 0.33 | 0.29 | 0.07 | 0.07 | 0.06 | 0.06 | 0.06 | 0.06 | 0.06 | 0.06 | 0.06 | 0.06 | 0.06 | 0.06 | 0.06 | 0.06 | 0.06 | 0.06 | 0.06 | 0.06 | 0.06 | 0.06 | 0.06 | 0.06 | 0.06 | 0.06 | 0.06 | 0.06 | 0.06 | 0.06 | NA | 0.06 | NA | NA | |
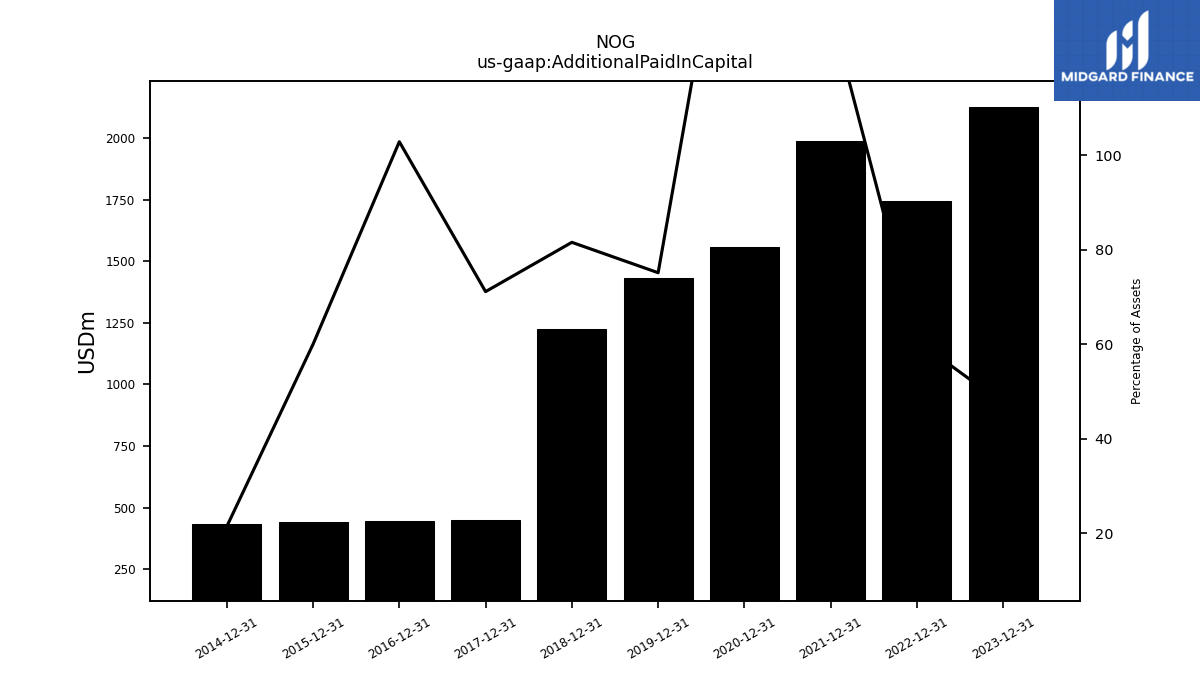
| Additional Paid In Capital | 2124.96 | NA | NA | NA | 1745.53 | NA | NA | NA | 1988.65 | NA | NA | NA | 1556.60 | NA | NA | NA | 1431.44 | NA | NA | NA | 1226.37 | NA | NA | NA | 449.67 | NA | NA | NA | 443.90 | NA | NA | NA | 440.22 | NA | NA | NA | 433.33 | NA | NA | NA | NA | NA | NA | NA | NA | NA | NA | NA | NA | NA | NA | NA | NA | NA | NA | |
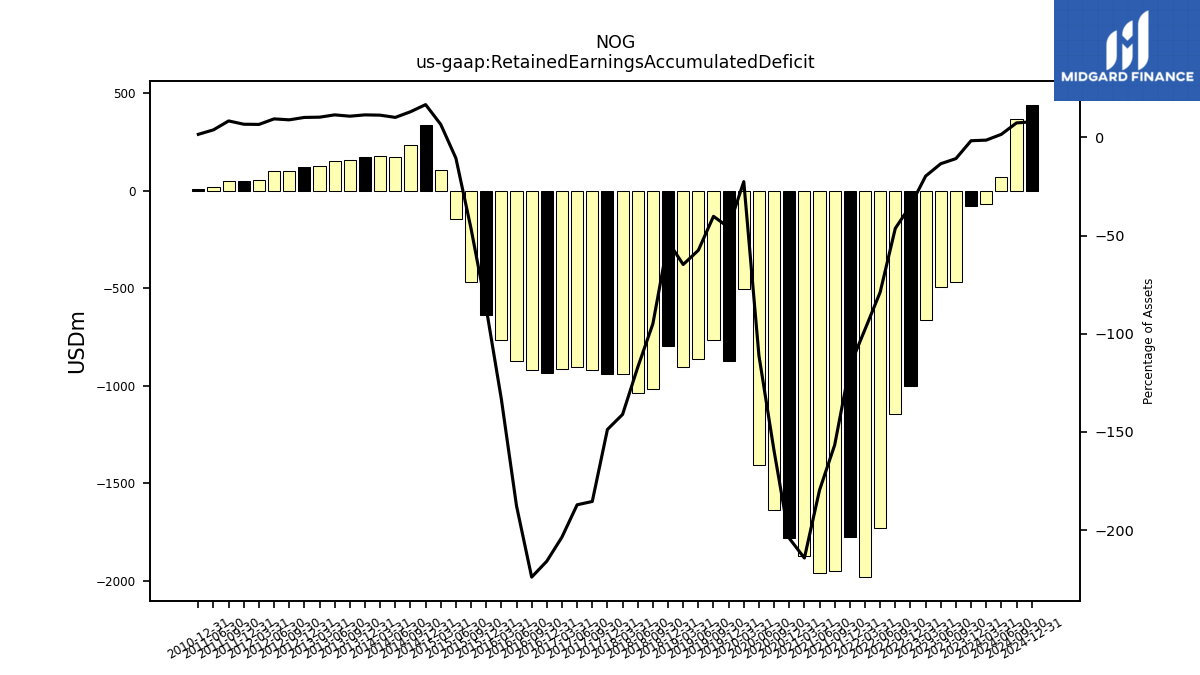
| Retained Earnings Accumulated Deficit | -77.79 | -466.64 | -492.75 | -660.57 | -1000.76 | -1145.83 | -1729.29 | -1980.56 | -1774.00 | -1948.72 | -1961.28 | -1870.71 | -1780.36 | -1638.23 | -1404.12 | -504.92 | -873.20 | -765.27 | -859.65 | -904.05 | -796.88 | -1015.18 | -1034.16 | -937.61 | -940.57 | -916.73 | -900.64 | -914.44 | -931.38 | -919.05 | -873.43 | -764.45 | -637.89 | -465.57 | -142.33 | 107.73 | 337.47 | 233.88 | 175.90 | 180.31 | 173.72 | 156.32 | 154.62 | 129.61 | 120.66 | 101.10 | 100.80 | 57.18 | 48.37 | 49.75 | 21.13 | NA | 7.76 | NA | NA |
| 2023-12-31 | 2023-09-30 | 2023-06-30 | 2023-03-31 | 2022-12-31 | 2022-09-30 | 2022-06-30 | 2022-03-31 | 2021-12-31 | 2021-09-30 | 2021-06-30 | 2021-03-31 | 2020-12-31 | 2020-09-30 | 2020-06-30 | 2020-03-31 | 2019-12-31 | 2019-09-30 | 2019-06-30 | 2019-03-31 | 2018-12-31 | 2018-09-30 | 2018-06-30 | 2018-03-31 | 2017-12-31 | 2017-09-30 | 2017-06-30 | 2017-03-31 | 2016-12-31 | 2016-09-30 | 2016-06-30 | 2016-03-31 | 2015-12-31 | 2015-09-30 | 2015-06-30 | 2015-03-31 | 2014-12-31 | 2014-09-30 | 2014-06-30 | 2014-03-31 | 2013-12-31 | 2013-09-30 | 2013-06-30 | 2013-03-31 | 2012-12-31 | 2012-09-30 | 2012-06-30 | 2012-03-31 | 2011-12-31 | 2011-09-30 | 2011-06-30 | 2011-03-31 | 2010-12-31 | 2010-09-30 | 2010-06-30 | ||
|---|---|---|---|---|---|---|---|---|---|---|---|---|---|---|---|---|---|---|---|---|---|---|---|---|---|---|---|---|---|---|---|---|---|---|---|---|---|---|---|---|---|---|---|---|---|---|---|---|---|---|---|---|---|---|---|---|
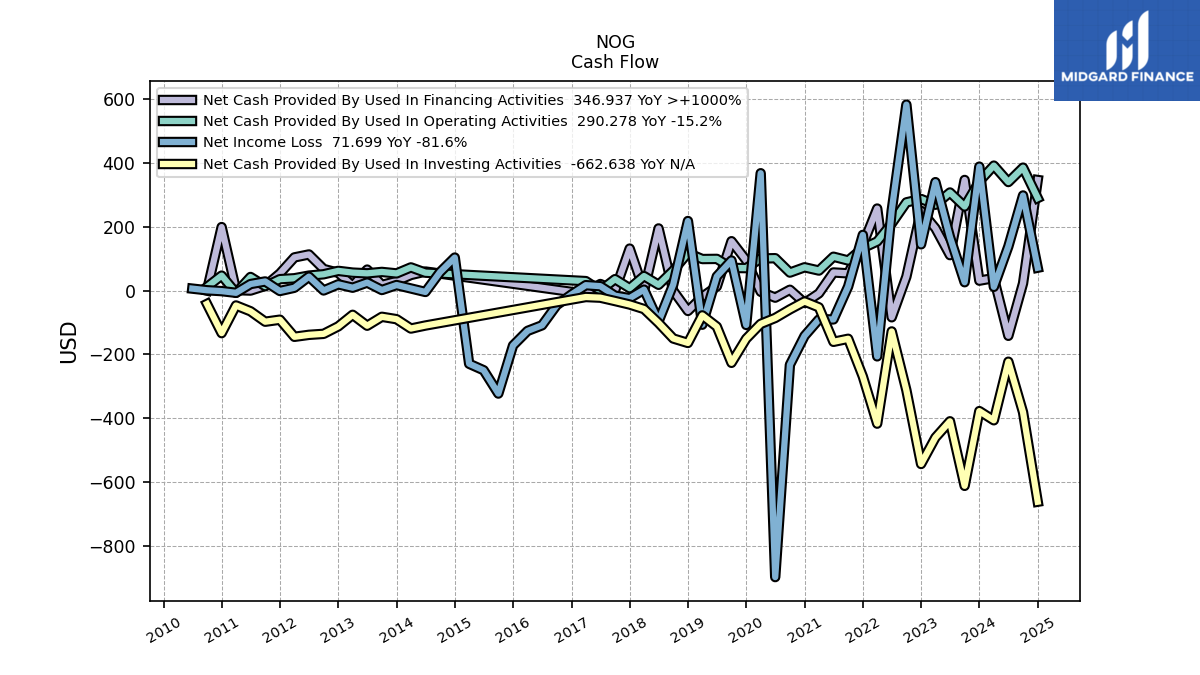
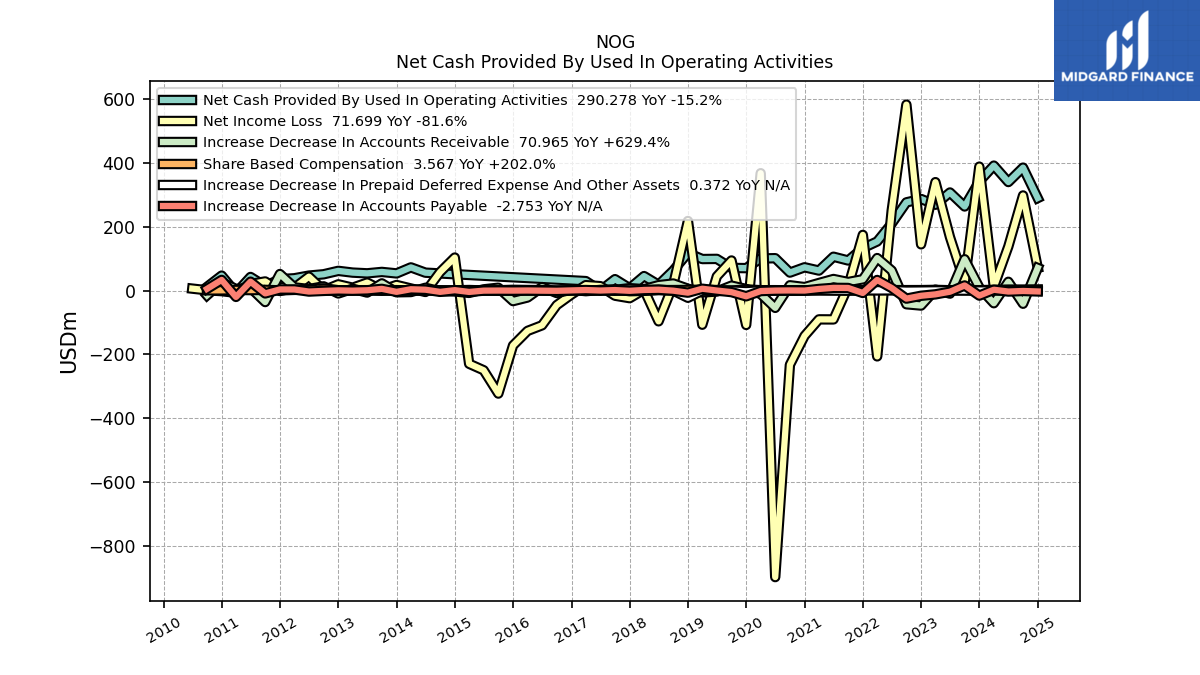
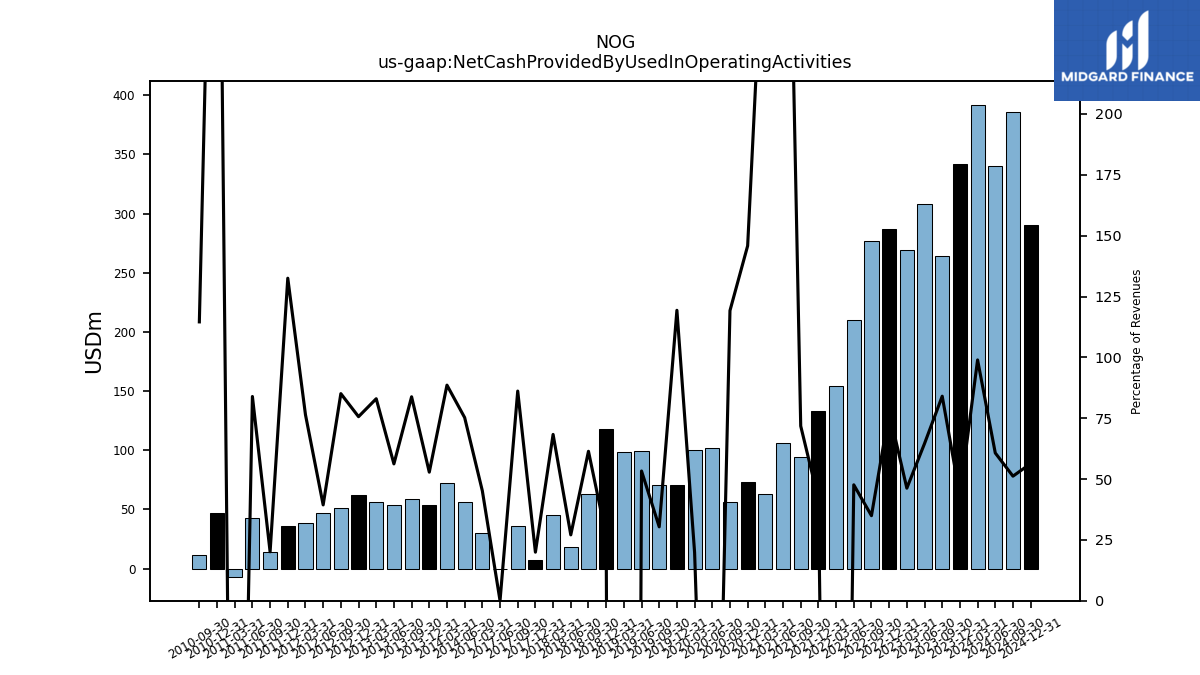
| Net Cash Provided By Used In Operating Activities | 342.36 | 263.87 | 307.79 | 269.31 | 287.38 | 276.77 | 210.24 | 154.03 | 133.10 | 94.41 | 106.19 | 62.77 | 73.03 | 56.41 | 101.58 | 100.65 | 70.43 | 71.02 | 99.39 | 98.91 | 117.85 | 62.80 | 18.10 | 45.52 | 7.39 | 35.84 | 0.03 | 29.72 | NA | NA | NA | NA | NA | NA | NA | NA | NA | NA | 56.14 | 72.75 | 53.86 | 58.48 | 54.08 | 56.36 | 61.83 | 51.14 | 46.95 | 38.61 | 35.76 | 13.89 | 42.66 | -7.16 | 46.99 | 11.32 | NA | |
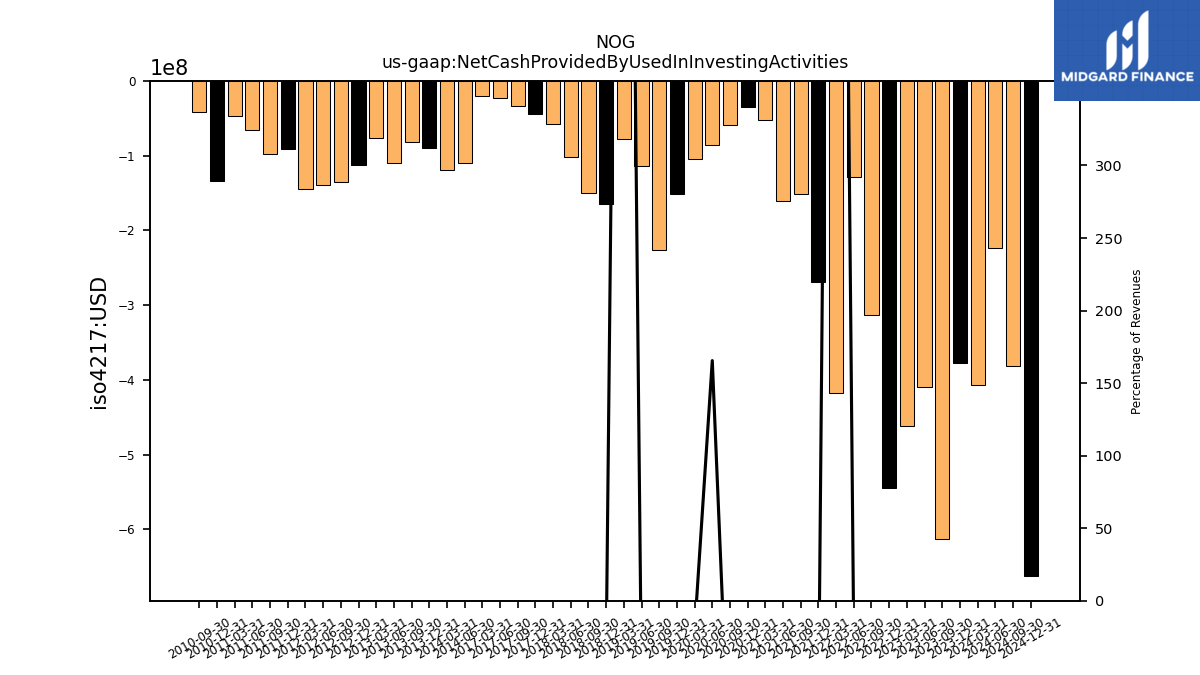
| Net Cash Provided By Used In Investing Activities | -378.14 | -612.82 | -410.16 | -461.22 | -544.24 | -312.76 | -128.18 | -417.60 | -269.62 | -151.28 | -160.87 | -52.67 | -34.37 | -59.04 | -86.01 | -104.50 | -151.18 | -226.81 | -113.23 | -77.91 | -164.43 | -150.41 | -101.66 | -58.02 | -43.79 | -32.87 | -22.31 | -20.27 | NA | NA | NA | NA | NA | NA | NA | NA | NA | NA | -109.72 | -119.20 | -89.80 | -82.31 | -110.37 | -76.05 | -112.30 | -135.83 | -138.93 | -145.11 | -91.39 | -97.76 | -64.98 | -46.74 | -133.66 | -42.00 | NA | |
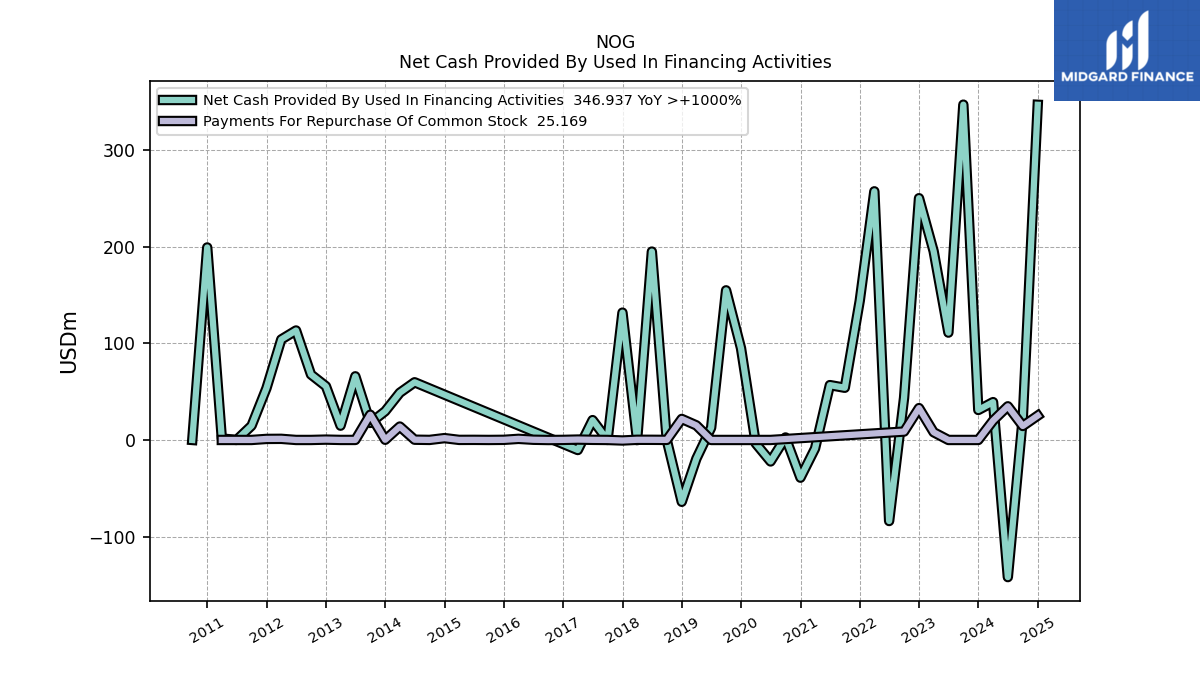
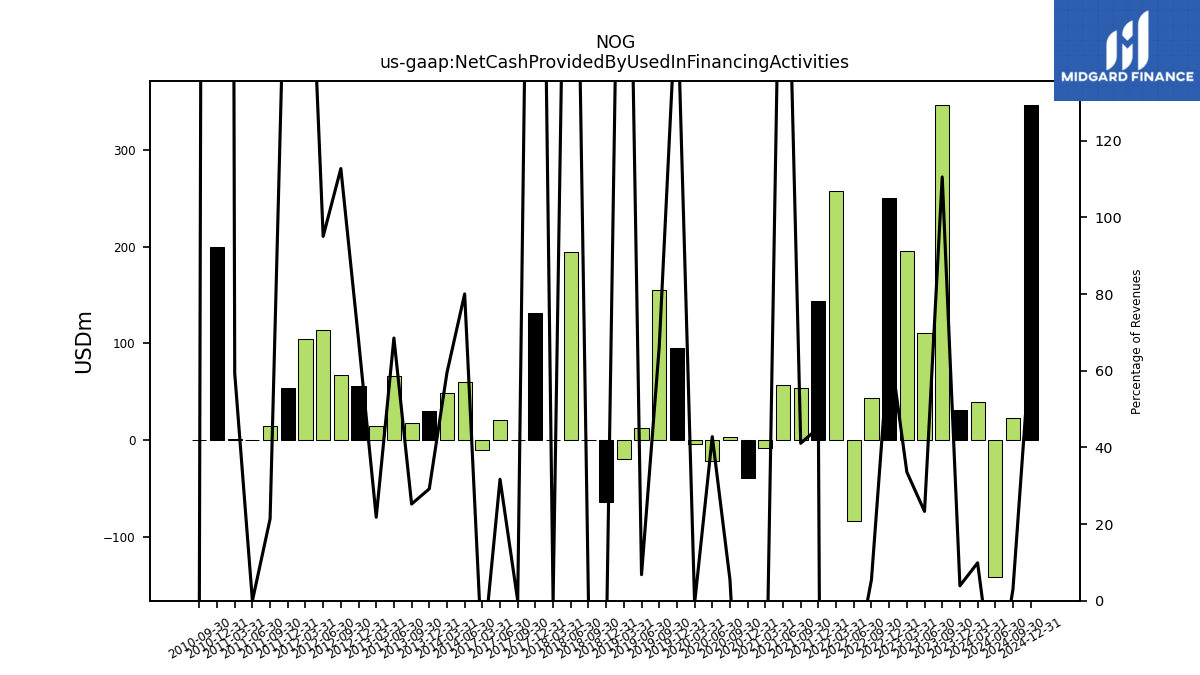
| Net Cash Provided By Used In Financing Activities | 31.02 | 347.10 | 111.11 | 195.46 | 250.25 | 43.66 | -83.92 | 257.38 | 144.03 | 54.02 | 56.80 | -8.79 | -39.03 | 2.59 | -22.25 | -3.71 | 94.92 | 154.89 | 12.69 | -19.41 | -64.03 | -0.35 | 195.01 | -0.21 | 131.81 | 0.00 | 20.57 | -10.41 | NA | NA | NA | NA | NA | NA | NA | NA | NA | NA | 59.72 | 48.87 | 29.76 | 17.61 | 65.91 | 14.79 | 55.62 | 67.76 | 113.32 | 104.05 | 53.64 | 14.75 | 0.00 | 1.50 | 199.28 | -0.01 | NA |
| 2023-12-31 | 2023-09-30 | 2023-06-30 | 2023-03-31 | 2022-12-31 | 2022-09-30 | 2022-06-30 | 2022-03-31 | 2021-12-31 | 2021-09-30 | 2021-06-30 | 2021-03-31 | 2020-12-31 | 2020-09-30 | 2020-06-30 | 2020-03-31 | 2019-12-31 | 2019-09-30 | 2019-06-30 | 2019-03-31 | 2018-12-31 | 2018-09-30 | 2018-06-30 | 2018-03-31 | 2017-12-31 | 2017-09-30 | 2017-06-30 | 2017-03-31 | 2016-12-31 | 2016-09-30 | 2016-06-30 | 2016-03-31 | 2015-12-31 | 2015-09-30 | 2015-06-30 | 2015-03-31 | 2014-12-31 | 2014-09-30 | 2014-06-30 | 2014-03-31 | 2013-12-31 | 2013-09-30 | 2013-06-30 | 2013-03-31 | 2012-12-31 | 2012-09-30 | 2012-06-30 | 2012-03-31 | 2011-12-31 | 2011-09-30 | 2011-06-30 | 2011-03-31 | 2010-12-31 | 2010-09-30 | 2010-06-30 | ||
|---|---|---|---|---|---|---|---|---|---|---|---|---|---|---|---|---|---|---|---|---|---|---|---|---|---|---|---|---|---|---|---|---|---|---|---|---|---|---|---|---|---|---|---|---|---|---|---|---|---|---|---|---|---|---|---|---|
| Net Cash Provided By Used In Operating Activities | 342.36 | 263.87 | 307.79 | 269.31 | 287.38 | 276.77 | 210.24 | 154.03 | 133.10 | 94.41 | 106.19 | 62.77 | 73.03 | 56.41 | 101.58 | 100.65 | 70.43 | 71.02 | 99.39 | 98.91 | 117.85 | 62.80 | 18.10 | 45.52 | 7.39 | 35.84 | 0.03 | 29.72 | NA | NA | NA | NA | NA | NA | NA | NA | NA | NA | 56.14 | 72.75 | 53.86 | 58.48 | 54.08 | 56.36 | 61.83 | 51.14 | 46.95 | 38.61 | 35.76 | 13.89 | 42.66 | -7.16 | 46.99 | 11.32 | NA | |
| Net Income Loss | 388.85 | 26.11 | 167.81 | 340.19 | 145.07 | 583.47 | 251.26 | -206.56 | 174.73 | 12.55 | -90.56 | -90.36 | -142.12 | -233.00 | -899.20 | 368.29 | -107.94 | 94.38 | 44.40 | -107.16 | 218.29 | 18.98 | -96.55 | 2.97 | -23.85 | -16.09 | 13.80 | 16.94 | -12.33 | -45.62 | -108.98 | -126.57 | -172.31 | -323.24 | -250.06 | -229.74 | 103.58 | 57.99 | -4.41 | 6.59 | 17.40 | 1.70 | 25.01 | 8.95 | 19.55 | 0.30 | 43.63 | 8.81 | -1.38 | 28.62 | 20.43 | -7.06 | -1.75 | 0.99 | 6.12 | |
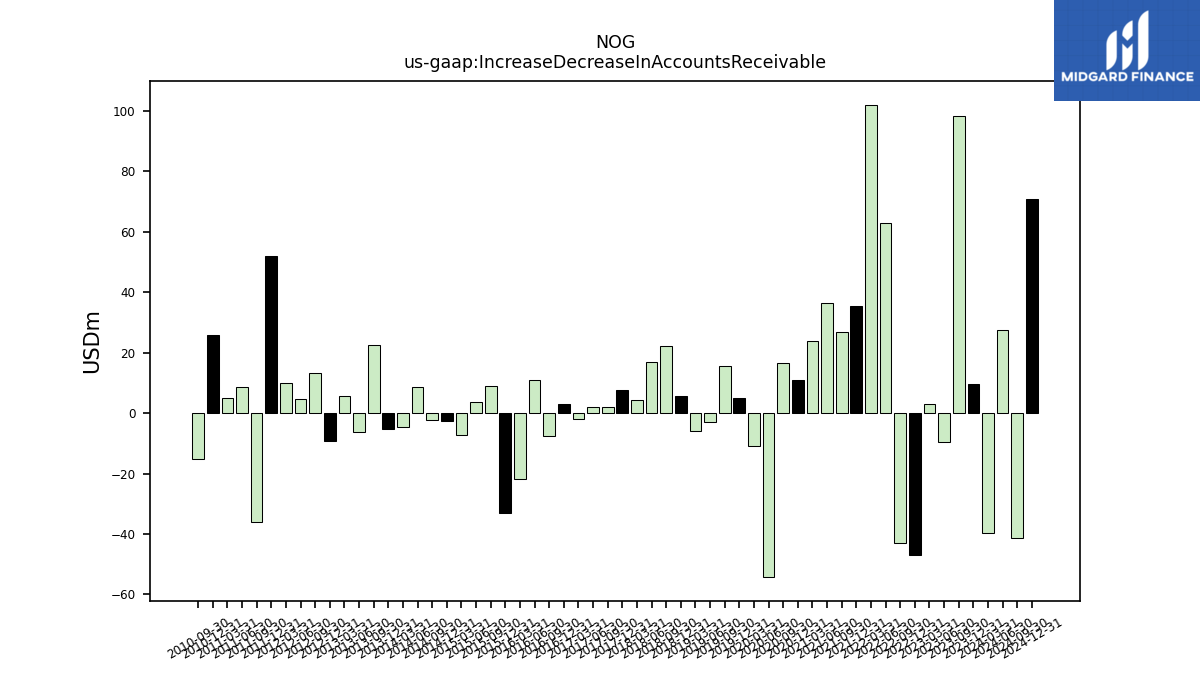
| Increase Decrease In Accounts Receivable | 9.73 | 98.28 | -9.55 | 2.87 | -47.00 | -42.92 | 62.79 | 102.03 | 35.41 | 26.79 | 36.27 | 23.69 | 10.85 | 16.56 | -54.27 | -10.79 | 4.95 | 15.43 | -2.91 | -5.94 | 5.78 | 22.11 | 16.89 | 4.34 | 7.58 | 2.00 | 2.04 | -1.89 | 2.98 | -7.70 | 10.85 | -21.74 | -33.06 | 8.89 | 3.81 | -7.34 | -2.64 | -2.35 | 8.72 | -4.62 | -5.38 | 22.63 | -6.32 | 5.67 | -9.11 | 13.26 | 4.70 | 9.95 | 51.91 | -36.08 | 8.56 | 4.99 | 25.82 | -15.10 | NA | |
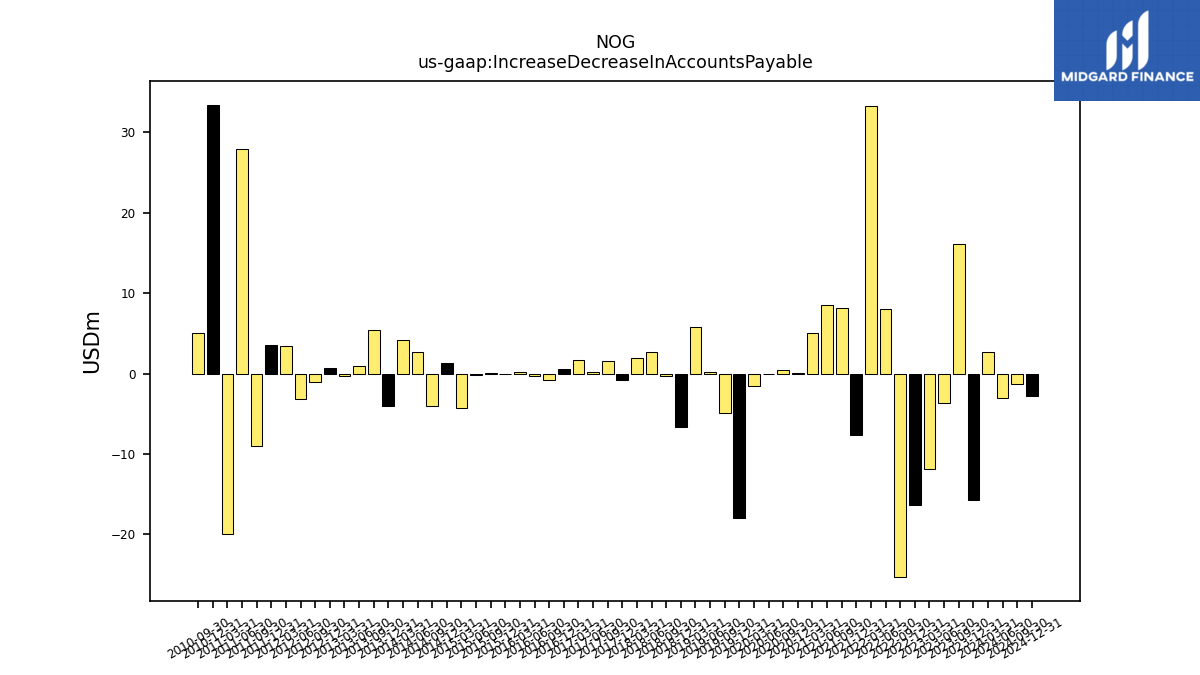
| Increase Decrease In Accounts Payable | -15.77 | 16.05 | -3.61 | -11.90 | -16.34 | -25.30 | 8.05 | 33.24 | -7.59 | 8.15 | 8.48 | 5.06 | 0.04 | 0.42 | -0.03 | -1.51 | -17.99 | -4.88 | 0.16 | 5.78 | -6.63 | -0.26 | 2.72 | 1.89 | -0.75 | 1.57 | 0.13 | 1.66 | 0.51 | -0.78 | -0.32 | 0.23 | -0.09 | 0.05 | -0.20 | -4.30 | 1.29 | -4.05 | 2.72 | 4.14 | -4.02 | 5.36 | 0.96 | -0.29 | 0.66 | -1.01 | -3.11 | 3.40 | 3.52 | -8.94 | 27.89 | -19.97 | 33.41 | 5.10 | NA | |
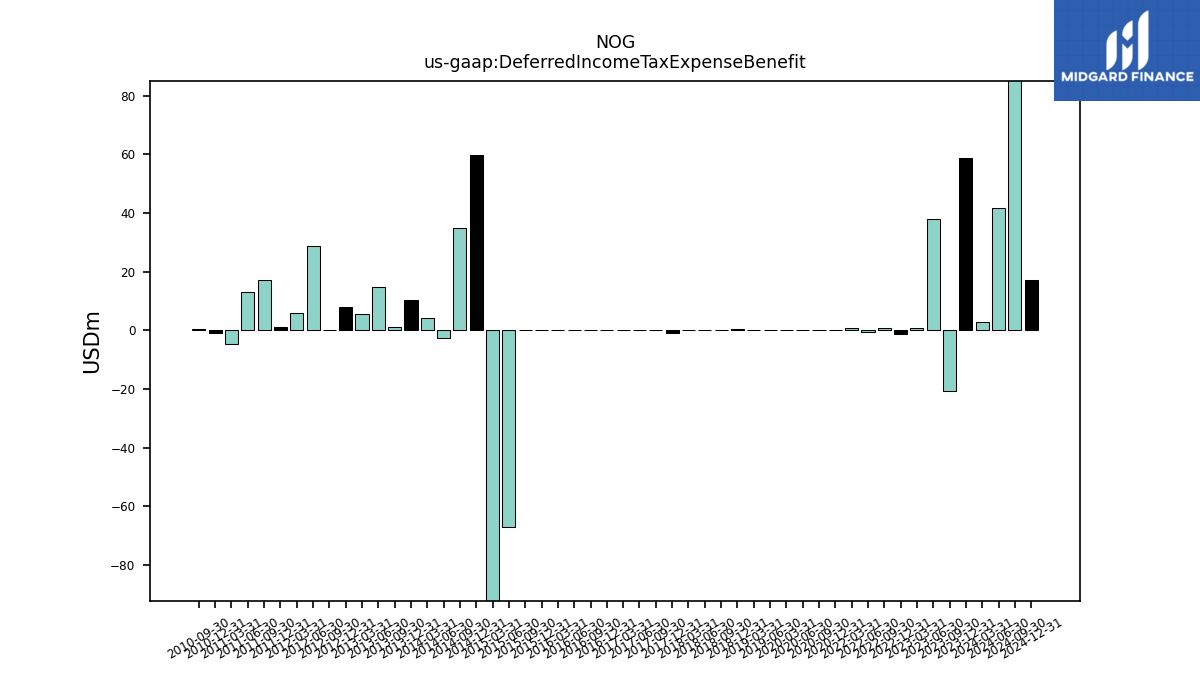
| Deferred Income Tax Expense Benefit | 58.74 | -20.69 | 38.12 | 0.69 | -1.38 | 0.66 | -0.65 | 0.79 | NA | NA | NA | NA | 0.00 | 0.00 | 0.00 | 0.21 | NA | NA | 0.00 | 0.00 | 0.36 | 0.00 | 0.00 | 0.00 | -0.79 | 0.00 | 0.00 | 0.00 | 0.00 | 0.00 | 0.00 | 0.00 | 0.00 | 0.00 | -66.87 | -135.48 | 59.71 | 35.05 | -2.75 | 4.10 | 10.51 | 1.03 | 14.63 | 5.60 | 8.11 | 0.21 | 28.84 | 5.82 | 1.11 | 17.17 | 13.06 | -4.51 | -1.01 | 0.62 | NA | |
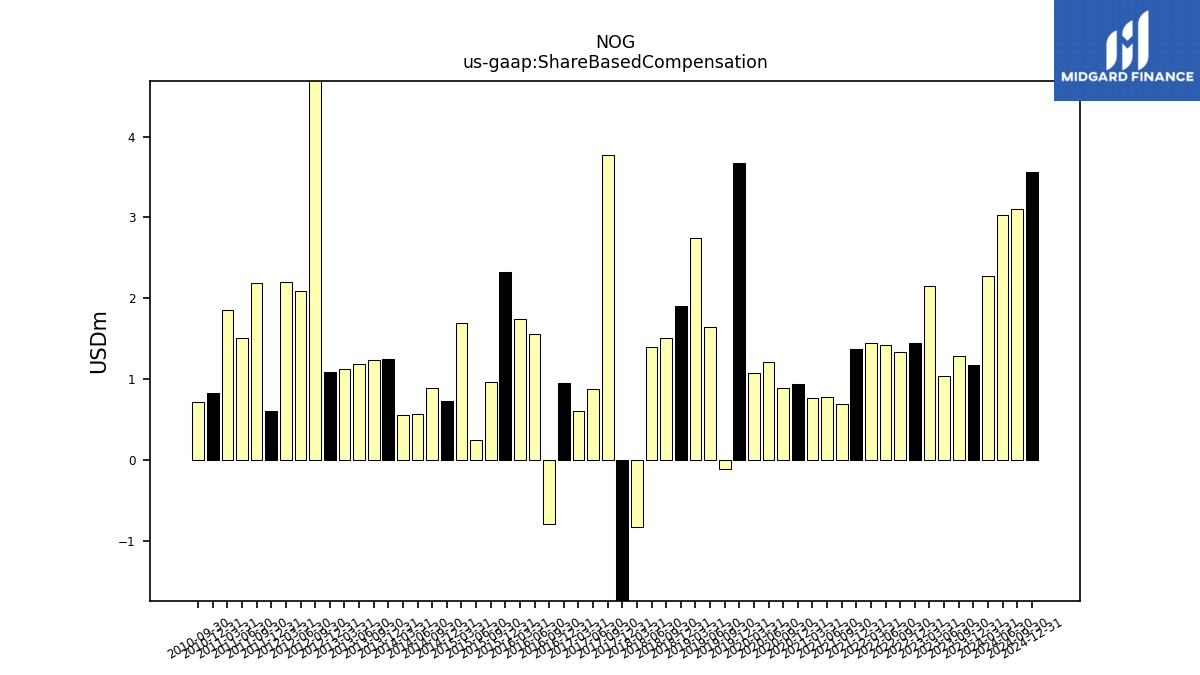
| Share Based Compensation | 1.18 | 1.29 | 1.04 | 2.15 | 1.45 | 1.34 | 1.42 | 1.45 | 1.37 | 0.70 | 0.78 | 0.77 | 0.94 | 0.89 | 1.21 | 1.08 | 3.67 | -0.11 | 1.64 | 2.75 | 1.90 | 1.51 | 1.40 | -0.82 | -1.98 | 3.77 | 0.88 | 0.61 | 0.96 | -0.79 | 1.56 | 1.74 | 2.32 | 0.97 | 0.25 | 1.70 | 0.74 | 0.89 | 0.57 | 0.56 | 1.25 | 1.24 | 1.19 | 1.12 | 1.09 | 7.00 | 2.09 | 2.20 | 0.61 | 2.19 | 1.51 | 1.86 | 0.84 | 0.72 | NA | |
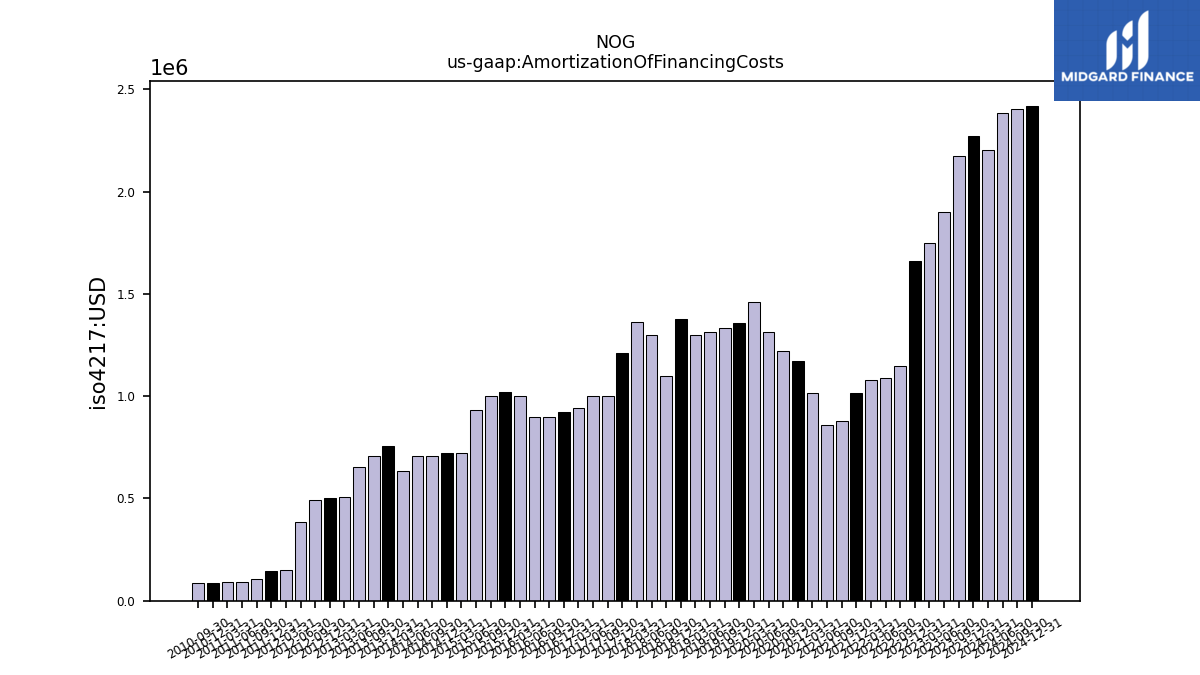
| Amortization Of Financing Costs | 2.27 | 2.17 | 1.90 | 1.75 | 1.66 | 1.15 | 1.09 | 1.08 | 1.01 | 0.88 | 0.86 | 1.01 | 1.17 | 1.22 | 1.31 | 1.46 | 1.36 | 1.33 | 1.31 | 1.30 | 1.38 | 1.10 | 1.30 | 1.36 | 1.21 | 1.00 | 1.00 | 0.94 | 0.92 | 0.90 | 0.90 | 1.00 | 1.02 | 1.00 | 0.93 | 0.72 | 0.72 | 0.71 | 0.71 | 0.63 | 0.76 | 0.71 | 0.65 | 0.51 | 0.50 | 0.49 | 0.38 | 0.15 | 0.14 | 0.11 | 0.09 | 0.09 | 0.09 | 0.09 | NA |
| 2023-12-31 | 2023-09-30 | 2023-06-30 | 2023-03-31 | 2022-12-31 | 2022-09-30 | 2022-06-30 | 2022-03-31 | 2021-12-31 | 2021-09-30 | 2021-06-30 | 2021-03-31 | 2020-12-31 | 2020-09-30 | 2020-06-30 | 2020-03-31 | 2019-12-31 | 2019-09-30 | 2019-06-30 | 2019-03-31 | 2018-12-31 | 2018-09-30 | 2018-06-30 | 2018-03-31 | 2017-12-31 | 2017-09-30 | 2017-06-30 | 2017-03-31 | 2016-12-31 | 2016-09-30 | 2016-06-30 | 2016-03-31 | 2015-12-31 | 2015-09-30 | 2015-06-30 | 2015-03-31 | 2014-12-31 | 2014-09-30 | 2014-06-30 | 2014-03-31 | 2013-12-31 | 2013-09-30 | 2013-06-30 | 2013-03-31 | 2012-12-31 | 2012-09-30 | 2012-06-30 | 2012-03-31 | 2011-12-31 | 2011-09-30 | 2011-06-30 | 2011-03-31 | 2010-12-31 | 2010-09-30 | 2010-06-30 | ||
|---|---|---|---|---|---|---|---|---|---|---|---|---|---|---|---|---|---|---|---|---|---|---|---|---|---|---|---|---|---|---|---|---|---|---|---|---|---|---|---|---|---|---|---|---|---|---|---|---|---|---|---|---|---|---|---|---|
| Net Cash Provided By Used In Investing Activities | -378.14 | -612.82 | -410.16 | -461.22 | -544.24 | -312.76 | -128.18 | -417.60 | -269.62 | -151.28 | -160.87 | -52.67 | -34.37 | -59.04 | -86.01 | -104.50 | -151.18 | -226.81 | -113.23 | -77.91 | -164.43 | -150.41 | -101.66 | -58.02 | -43.79 | -32.87 | -22.31 | -20.27 | NA | NA | NA | NA | NA | NA | NA | NA | NA | NA | -109.72 | -119.20 | -89.80 | -82.31 | -110.37 | -76.05 | -112.30 | -135.83 | -138.93 | -145.11 | -91.39 | -97.76 | -64.98 | -46.74 | -133.66 | -42.00 | NA |
| 2023-12-31 | 2023-09-30 | 2023-06-30 | 2023-03-31 | 2022-12-31 | 2022-09-30 | 2022-06-30 | 2022-03-31 | 2021-12-31 | 2021-09-30 | 2021-06-30 | 2021-03-31 | 2020-12-31 | 2020-09-30 | 2020-06-30 | 2020-03-31 | 2019-12-31 | 2019-09-30 | 2019-06-30 | 2019-03-31 | 2018-12-31 | 2018-09-30 | 2018-06-30 | 2018-03-31 | 2017-12-31 | 2017-09-30 | 2017-06-30 | 2017-03-31 | 2016-12-31 | 2016-09-30 | 2016-06-30 | 2016-03-31 | 2015-12-31 | 2015-09-30 | 2015-06-30 | 2015-03-31 | 2014-12-31 | 2014-09-30 | 2014-06-30 | 2014-03-31 | 2013-12-31 | 2013-09-30 | 2013-06-30 | 2013-03-31 | 2012-12-31 | 2012-09-30 | 2012-06-30 | 2012-03-31 | 2011-12-31 | 2011-09-30 | 2011-06-30 | 2011-03-31 | 2010-12-31 | 2010-09-30 | 2010-06-30 | ||
|---|---|---|---|---|---|---|---|---|---|---|---|---|---|---|---|---|---|---|---|---|---|---|---|---|---|---|---|---|---|---|---|---|---|---|---|---|---|---|---|---|---|---|---|---|---|---|---|---|---|---|---|---|---|---|---|---|
| Net Cash Provided By Used In Financing Activities | 31.02 | 347.10 | 111.11 | 195.46 | 250.25 | 43.66 | -83.92 | 257.38 | 144.03 | 54.02 | 56.80 | -8.79 | -39.03 | 2.59 | -22.25 | -3.71 | 94.92 | 154.89 | 12.69 | -19.41 | -64.03 | -0.35 | 195.01 | -0.21 | 131.81 | 0.00 | 20.57 | -10.41 | NA | NA | NA | NA | NA | NA | NA | NA | NA | NA | 59.72 | 48.87 | 29.76 | 17.61 | 65.91 | 14.79 | 55.62 | 67.76 | 113.32 | 104.05 | 53.64 | 14.75 | 0.00 | 1.50 | 199.28 | -0.01 | NA | |
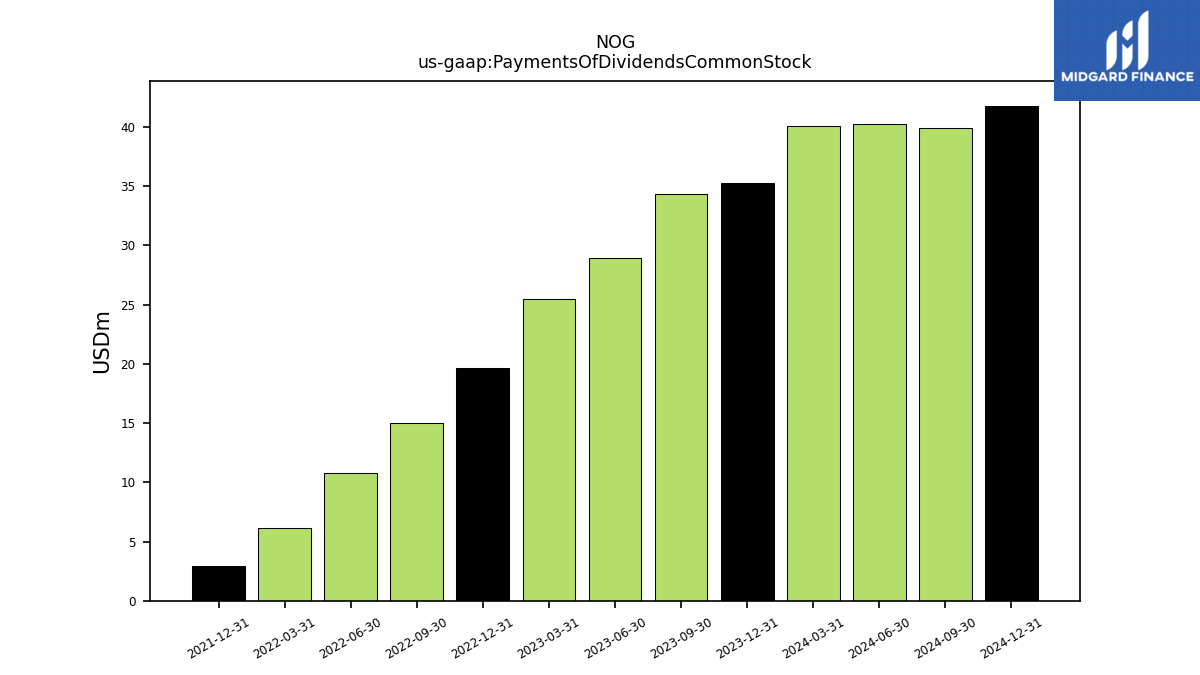
| Payments Of Dividends Common Stock | 35.25 | 34.32 | 28.92 | 25.45 | 19.64 | 15.01 | 10.78 | 6.18 | 2.96 | NA | NA | NA | NA | NA | NA | NA | NA | NA | NA | NA | NA | NA | NA | NA | NA | NA | NA | NA | NA | NA | NA | NA | NA | NA | NA | NA | NA | NA | NA | NA | NA | NA | NA | NA | NA | NA | NA | NA | NA | NA | NA | NA | NA | NA | NA | |
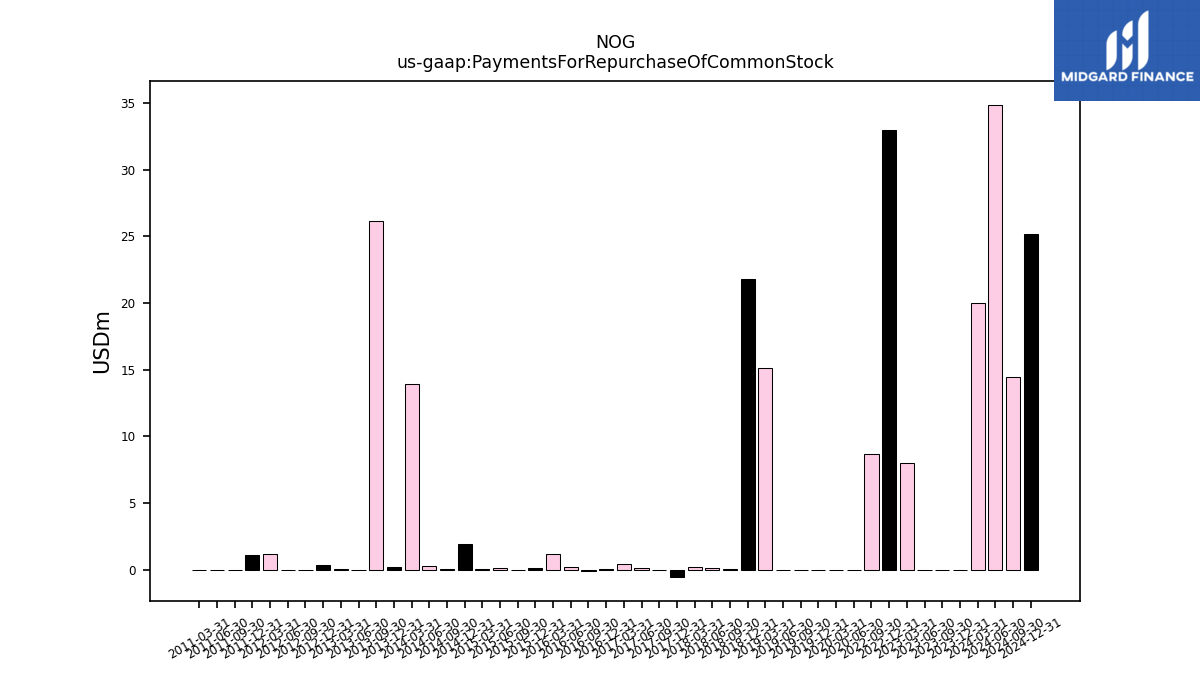
| Payments For Repurchase Of Common Stock | 0.00 | 0.00 | 0.00 | 8.00 | 33.00 | 8.69 | NA | NA | NA | NA | NA | NA | NA | NA | 0.00 | 0.00 | 0.00 | 0.00 | 0.00 | 15.11 | 21.78 | 0.07 | 0.16 | 0.19 | -0.55 | 0.00 | 0.13 | 0.41 | 0.08 | -0.06 | 0.23 | 1.16 | 0.13 | 0.01 | 0.12 | 0.08 | 1.91 | 0.05 | 0.27 | 13.90 | 0.19 | 26.13 | 0.02 | 0.03 | 0.37 | 0.00 | 0.00 | 1.17 | 1.08 | 0.00 | 0.00 | 0.00 | NA | NA | NA |
| 2023-12-31 | 2023-09-30 | 2023-06-30 | 2023-03-31 | 2022-12-31 | 2022-09-30 | 2022-06-30 | 2022-03-31 | 2021-12-31 | 2021-09-30 | 2021-06-30 | 2021-03-31 | 2020-12-31 | 2020-09-30 | 2020-06-30 | 2020-03-31 | 2019-12-31 | 2019-09-30 | 2019-06-30 | 2019-03-31 | 2018-12-31 | 2018-09-30 | 2018-06-30 | 2018-03-31 | 2017-12-31 | 2017-09-30 | 2017-06-30 | 2017-03-31 | 2016-12-31 | 2016-09-30 | 2016-06-30 | 2016-03-31 | 2015-12-31 | 2015-09-30 | 2015-06-30 | 2015-03-31 | 2014-12-31 | 2014-09-30 | 2014-06-30 | 2014-03-31 | 2013-12-31 | 2013-09-30 | 2013-06-30 | 2013-03-31 | 2012-12-31 | 2012-09-30 | 2012-06-30 | 2012-03-31 | 2011-12-31 | 2011-09-30 | 2011-06-30 | 2011-03-31 | 2010-12-31 | 2010-09-30 | 2010-06-30 | ||
|---|---|---|---|---|---|---|---|---|---|---|---|---|---|---|---|---|---|---|---|---|---|---|---|---|---|---|---|---|---|---|---|---|---|---|---|---|---|---|---|---|---|---|---|---|---|---|---|---|---|---|---|---|---|---|---|---|
| Revenues | 793.52 | 313.97 | 476.55 | 582.21 | 370.38 | 791.64 | 441.45 | -32.93 | 319.19 | 131.51 | 24.80 | 21.40 | 50.08 | 47.32 | -51.97 | 506.79 | 59.01 | 233.88 | 186.44 | -6.93 | 443.20 | 102.27 | 66.85 | 66.61 | 37.00 | 41.60 | 64.90 | 65.82 | 35.94 | 45.11 | 32.01 | 31.84 | 56.91 | 101.16 | 40.86 | 76.12 | 257.52 | 180.78 | 74.60 | 82.13 | 101.93 | 69.78 | 96.16 | 67.90 | 81.75 | 60.10 | 119.21 | 50.52 | 26.99 | 69.05 | 50.83 | 2.53 | 11.22 | 9.88 | 16.23 | |
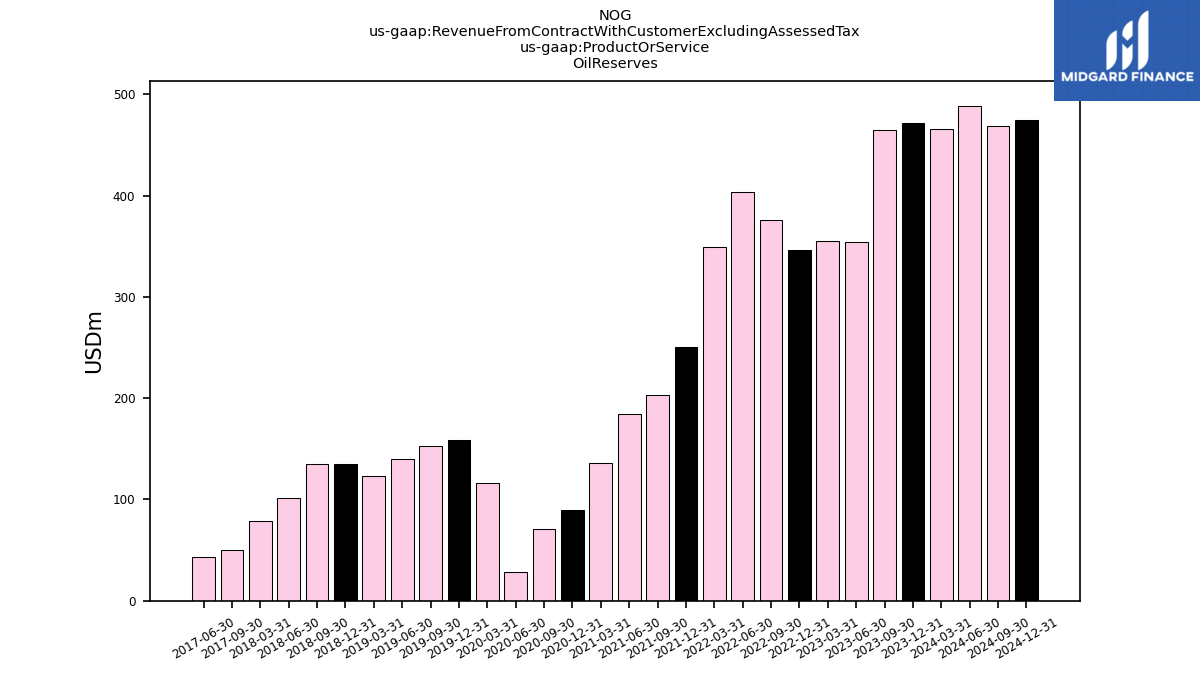
| Revenue From Contract With Customer Excluding Assessed Tax | 793.52 | 313.97 | 476.55 | 582.21 | 445.65 | 534.05 | 549.64 | 456.46 | 332.37 | 259.67 | 225.72 | 157.33 | -178.07 | 47.32 | 20.66 | 506.79 | 59.01 | 233.88 | 186.44 | -6.93 | 443.20 | 102.27 | 66.85 | 66.61 | 37.00 | 41.60 | 64.90 | 65.82 | 35.94 | 45.11 | 32.01 | 31.84 | 56.91 | 101.16 | 40.86 | 76.12 | 257.52 | 180.78 | 74.60 | 82.13 | 101.93 | 69.78 | 96.16 | 67.90 | 81.75 | 60.10 | 119.21 | 50.52 | 26.99 | 69.05 | 50.83 | 2.53 | 11.22 | 9.88 | 16.23 | |
| 472.09 | 464.79 | 353.83 | 355.38 | 346.17 | 375.73 | 403.98 | 348.83 | 250.32 | 203.23 | 184.62 | 135.60 | 89.50 | 70.60 | 28.80 | 116.30 | 158.30 | 152.80 | 139.80 | 123.60 | 134.90 | 135.00 | 101.00 | 79.10 | NA | 50.30 | 43.50 | NA | NA | NA | NA | NA | NA | NA | NA | NA | NA | NA | NA | NA | NA | NA | NA | NA | NA | NA | NA | NA | NA | NA | NA | NA | NA | NA | NA | ||
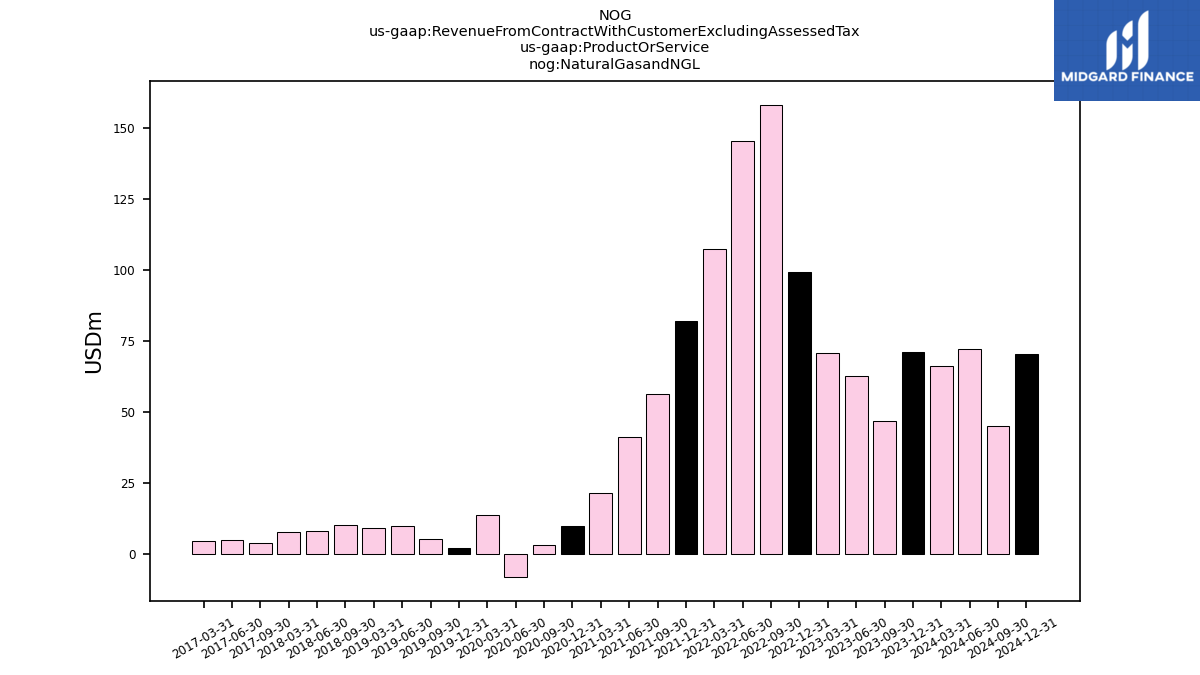
| Natural Gasand N G L | 71.31 | 46.86 | 62.66 | 70.86 | 99.48 | 158.32 | 145.66 | 107.63 | 82.05 | 56.44 | 41.10 | 21.70 | 10.00 | 3.10 | -8.10 | 13.90 | 2.30 | 5.20 | 10.00 | 9.10 | NA | 10.40 | 8.00 | 7.70 | NA | 3.90 | 4.80 | 4.50 | NA | NA | NA | NA | NA | NA | NA | NA | NA | NA | NA | NA | NA | NA | NA | NA | NA | NA | NA | NA | NA | NA | NA | NA | NA | NA | NA | |
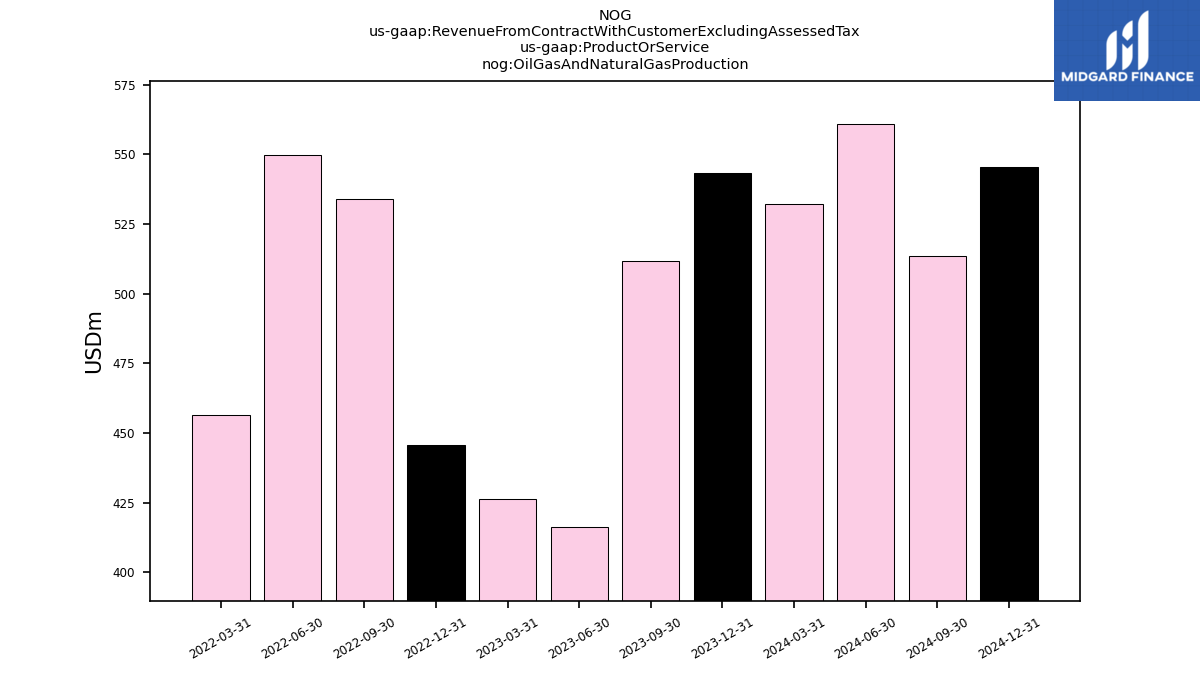
| Oil Gas And Natural Gas Production | 543.40 | 511.65 | 416.49 | 426.23 | 445.65 | 534.05 | 549.64 | 456.46 | NA | NA | NA | NA | NA | NA | NA | NA | NA | NA | NA | NA | NA | NA | NA | NA | NA | NA | NA | NA | NA | NA | NA | NA | NA | NA | NA | NA | NA | NA | NA | NA | NA | NA | NA | NA | NA | NA | NA | NA | NA | NA | NA | NA | NA | NA | NA | |
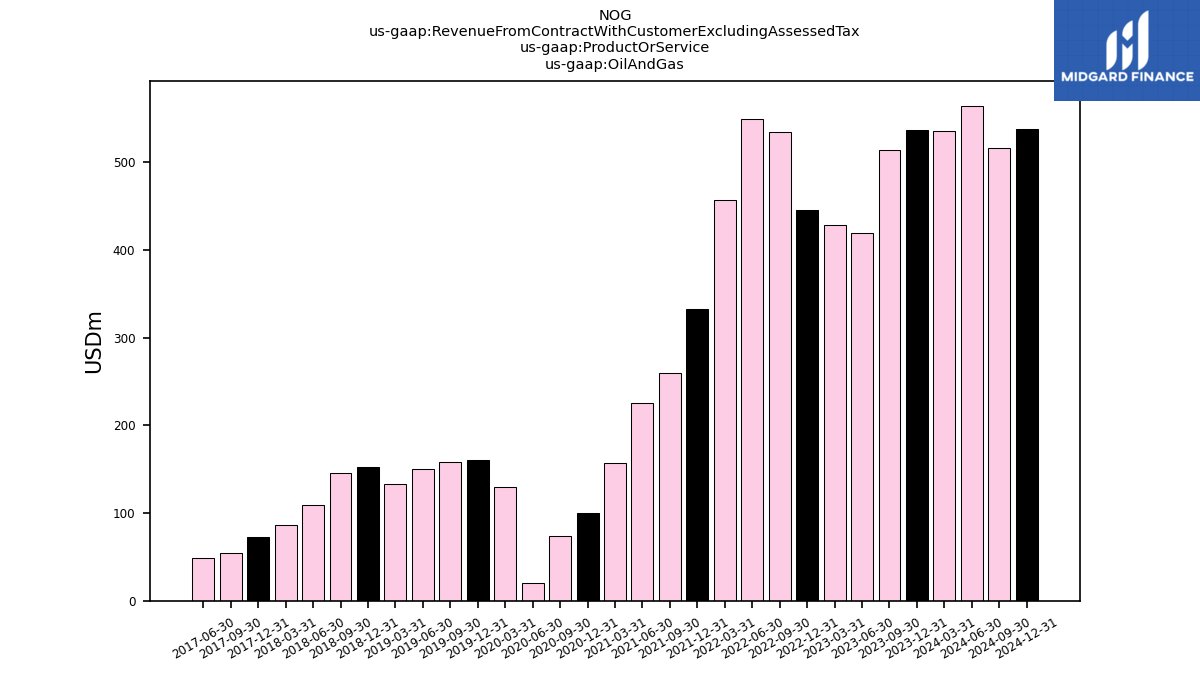
| Oil And Gas | 536.91 | 513.52 | 418.79 | 428.56 | 445.65 | 534.05 | 549.64 | 456.46 | 332.37 | 259.67 | 225.72 | 157.33 | 99.51 | 73.68 | 20.66 | 130.20 | 160.70 | 157.99 | 149.85 | 132.68 | 152.57 | 145.42 | 109.05 | 86.88 | 72.48 | 54.26 | 48.38 | NA | NA | NA | NA | NA | NA | NA | NA | NA | NA | NA | NA | NA | NA | NA | NA | NA | NA | NA | NA | NA | NA | NA | NA | NA | NA | NA | NA | |
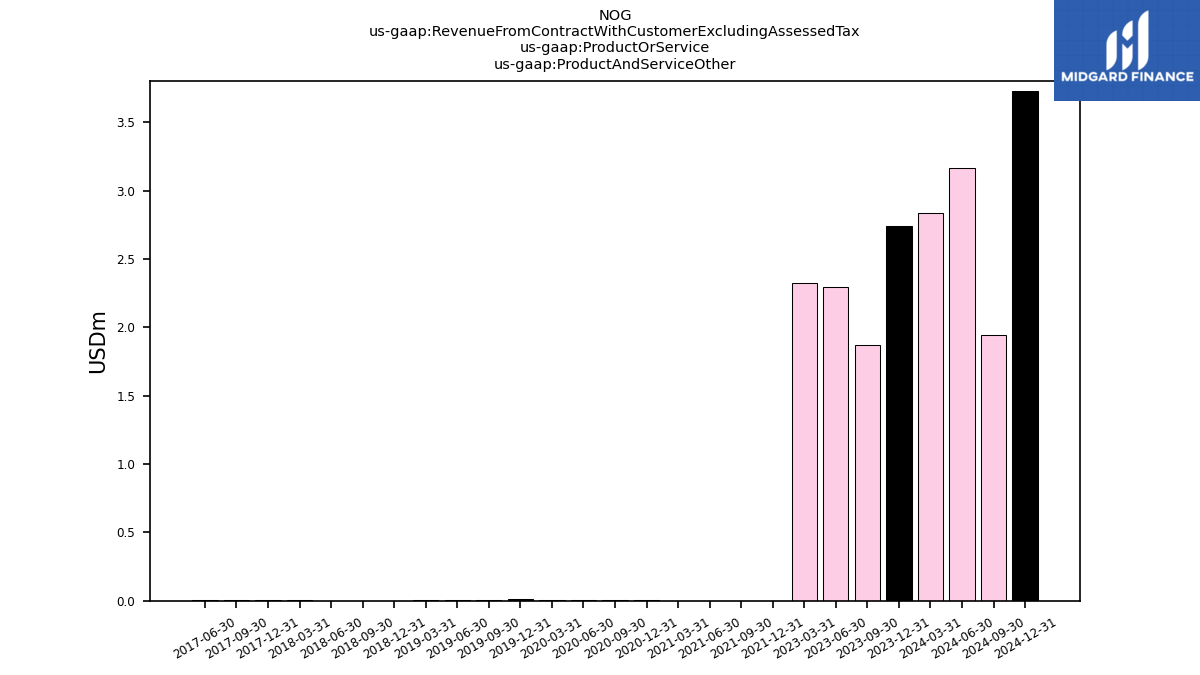
| Product And Service Other | 2.74 | 1.87 | 2.29 | 2.32 | NA | NA | NA | NA | 0.00 | 0.00 | 0.00 | 0.00 | 0.01 | 0.00 | 0.00 | 0.01 | 0.01 | 0.00 | 0.00 | 0.01 | 0.00 | 0.00 | 0.00 | 0.00 | 0.00 | 0.00 | 0.01 | NA | NA | NA | NA | NA | NA | NA | NA | NA | NA | NA | NA | NA | NA | NA | NA | NA | NA | NA | NA | NA | NA | NA | NA | NA | NA | NA | NA | |
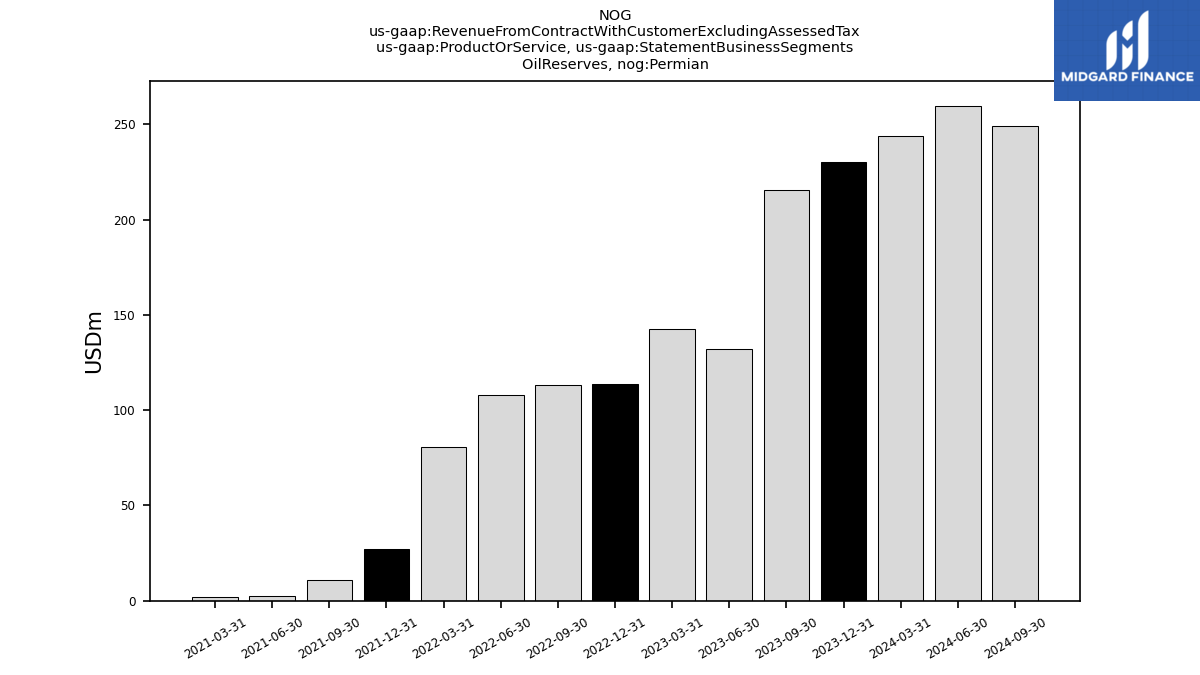
| , Permian | 230.03 | 215.52 | 132.04 | 142.66 | 113.78 | 113.17 | 107.97 | 80.82 | 27.14 | 10.81 | 2.75 | 1.81 | NA | NA | NA | NA | NA | NA | NA | NA | NA | NA | NA | NA | NA | NA | NA | NA | NA | NA | NA | NA | NA | NA | NA | NA | NA | NA | NA | NA | NA | NA | NA | NA | NA | NA | NA | NA | NA | NA | NA | NA | NA | NA | NA | |
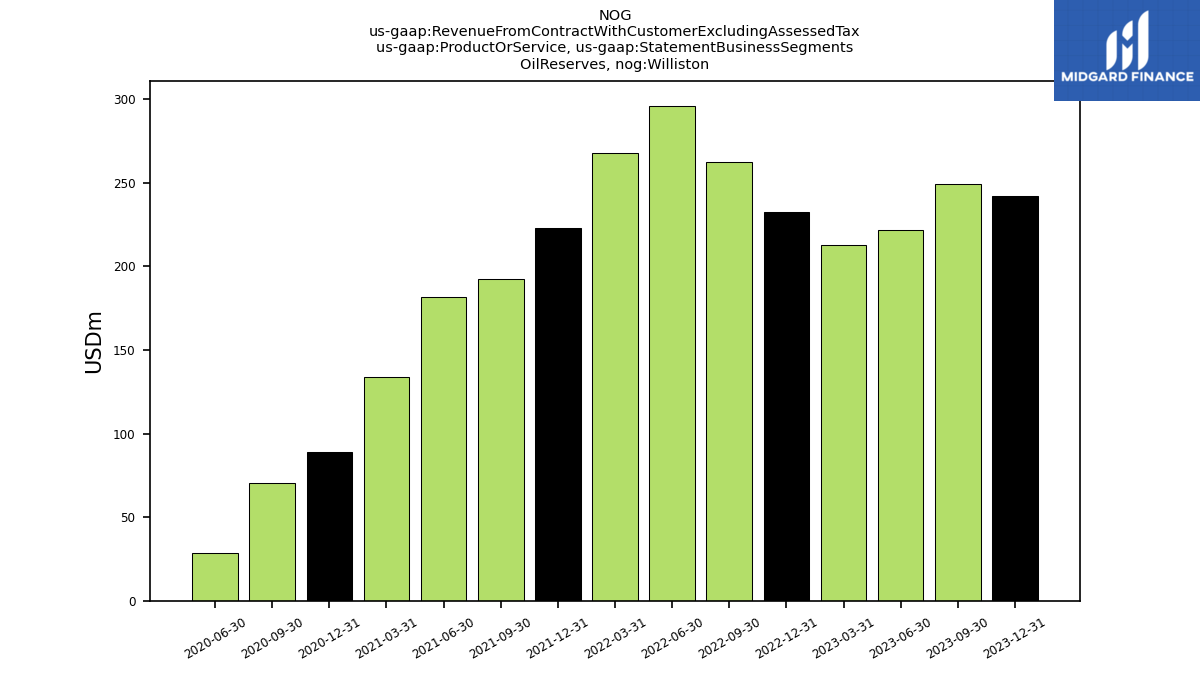
| , Williston | 242.06 | 249.28 | 221.79 | 212.72 | 232.40 | 262.57 | 296.00 | 268.01 | 223.19 | 192.42 | 181.87 | 133.84 | 89.04 | 70.59 | 28.78 | NA | NA | NA | NA | NA | NA | NA | NA | NA | NA | NA | NA | NA | NA | NA | NA | NA | NA | NA | NA | NA | NA | NA | NA | NA | NA | NA | NA | NA | NA | NA | NA | NA | NA | NA | NA | NA | NA | NA | NA | |
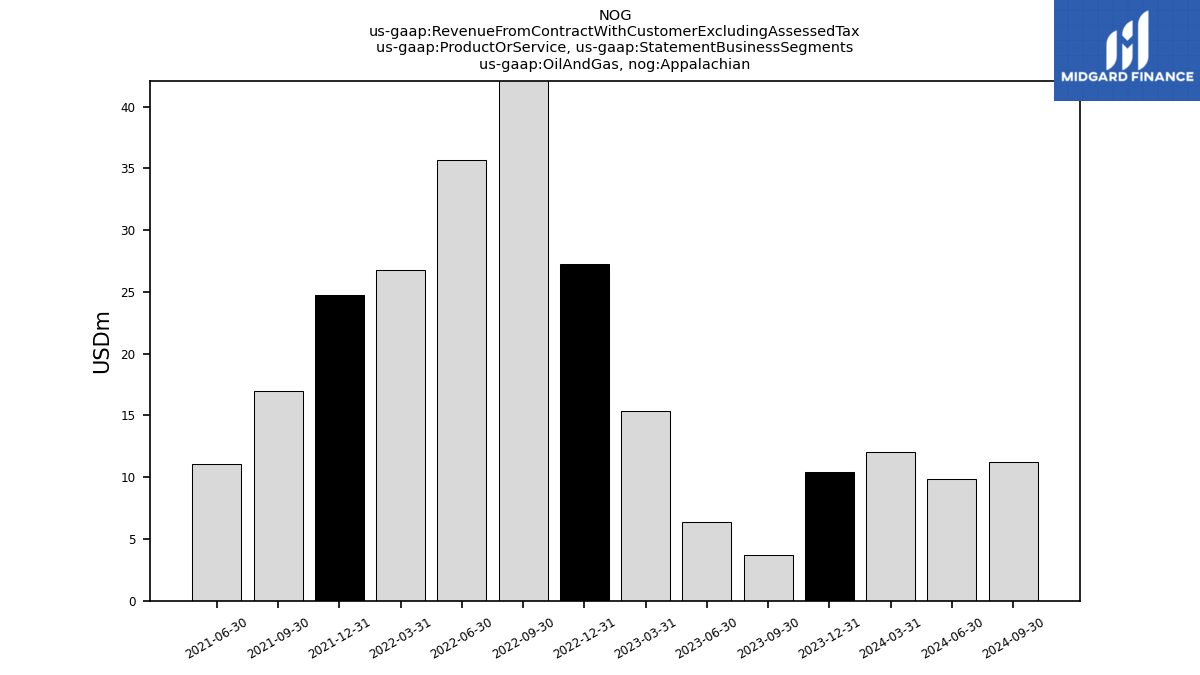
| Natural Gasand N G L, Appalachian | 10.39 | 3.74 | 6.34 | 15.33 | 27.25 | 44.96 | 35.68 | 26.80 | 24.78 | 16.99 | 11.04 | NA | NA | NA | NA | NA | NA | NA | NA | NA | NA | NA | NA | NA | NA | NA | NA | NA | NA | NA | NA | NA | NA | NA | NA | NA | NA | NA | NA | NA | NA | NA | NA | NA | NA | NA | NA | NA | NA | NA | NA | NA | NA | NA | NA | |
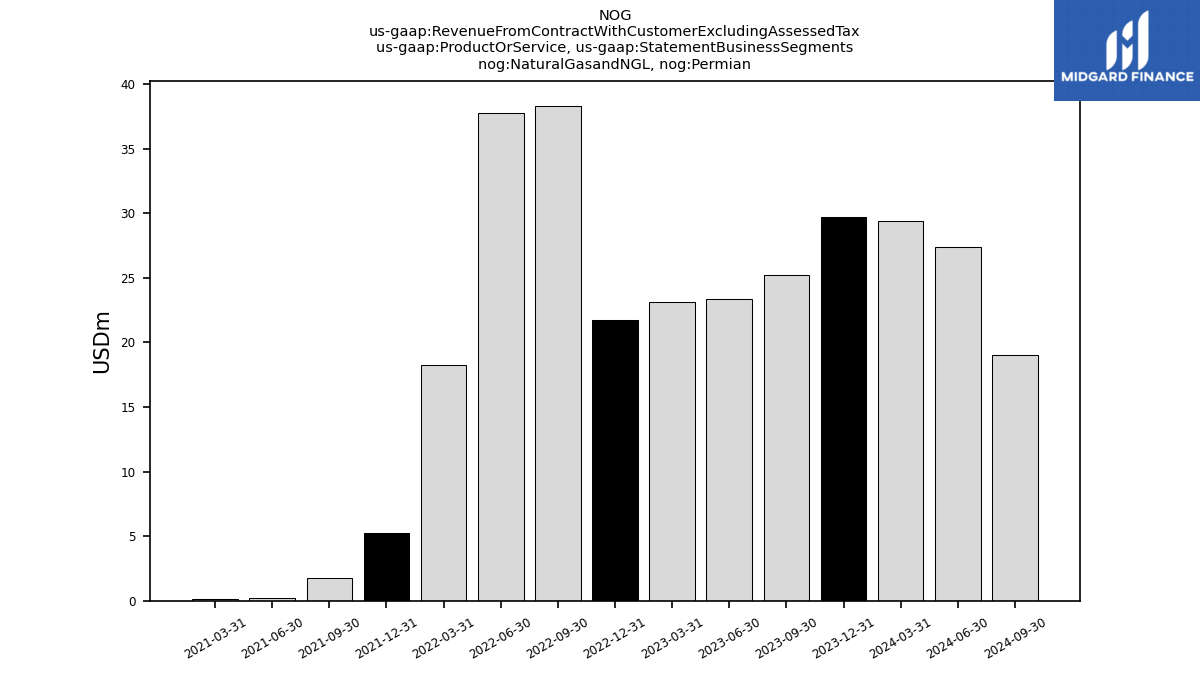
| Natural Gasand N G L, Permian | 29.70 | 25.21 | 23.36 | 23.10 | 21.73 | 38.32 | 37.77 | 18.21 | 5.26 | 1.79 | 0.21 | 0.12 | NA | NA | NA | NA | NA | NA | NA | NA | NA | NA | NA | NA | NA | NA | NA | NA | NA | NA | NA | NA | NA | NA | NA | NA | NA | NA | NA | NA | NA | NA | NA | NA | NA | NA | NA | NA | NA | NA | NA | NA | NA | NA | NA | |
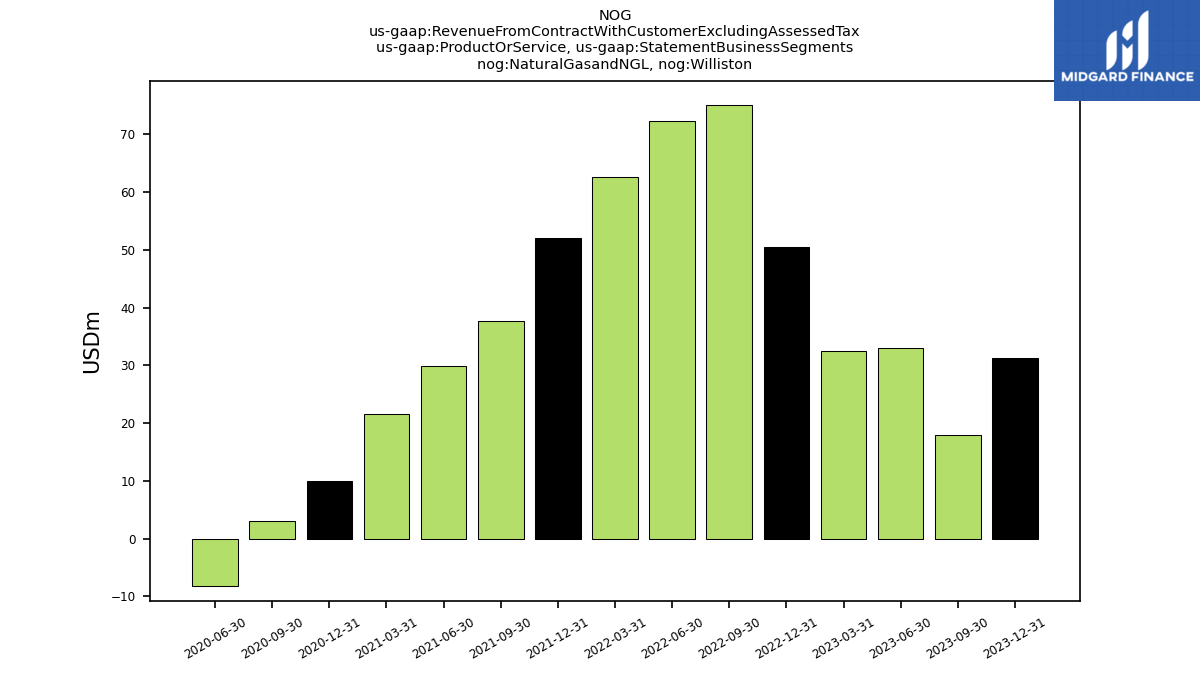
| Natural Gasand N G L, Williston | 31.22 | 17.90 | 32.95 | 32.42 | 50.49 | 75.04 | 72.22 | 62.62 | 52.01 | 37.65 | 29.86 | 21.57 | 9.94 | 3.08 | -8.12 | NA | NA | NA | NA | NA | NA | NA | NA | NA | NA | NA | NA | NA | NA | NA | NA | NA | NA | NA | NA | NA | NA | NA | NA | NA | NA | NA | NA | NA | NA | NA | NA | NA | NA | NA | NA | NA | NA | NA | NA | |
| Oil And Gas, Appalachian | 10.39 | 3.74 | 6.34 | 15.33 | 27.25 | 44.96 | 35.68 | 26.80 | 24.78 | 16.99 | 11.04 | NA | NA | NA | NA | NA | NA | NA | NA | NA | NA | NA | NA | NA | NA | NA | NA | NA | NA | NA | NA | NA | NA | NA | NA | NA | NA | NA | NA | NA | NA | NA | NA | NA | NA | NA | NA | NA | NA | NA | NA | NA | NA | NA | NA | |
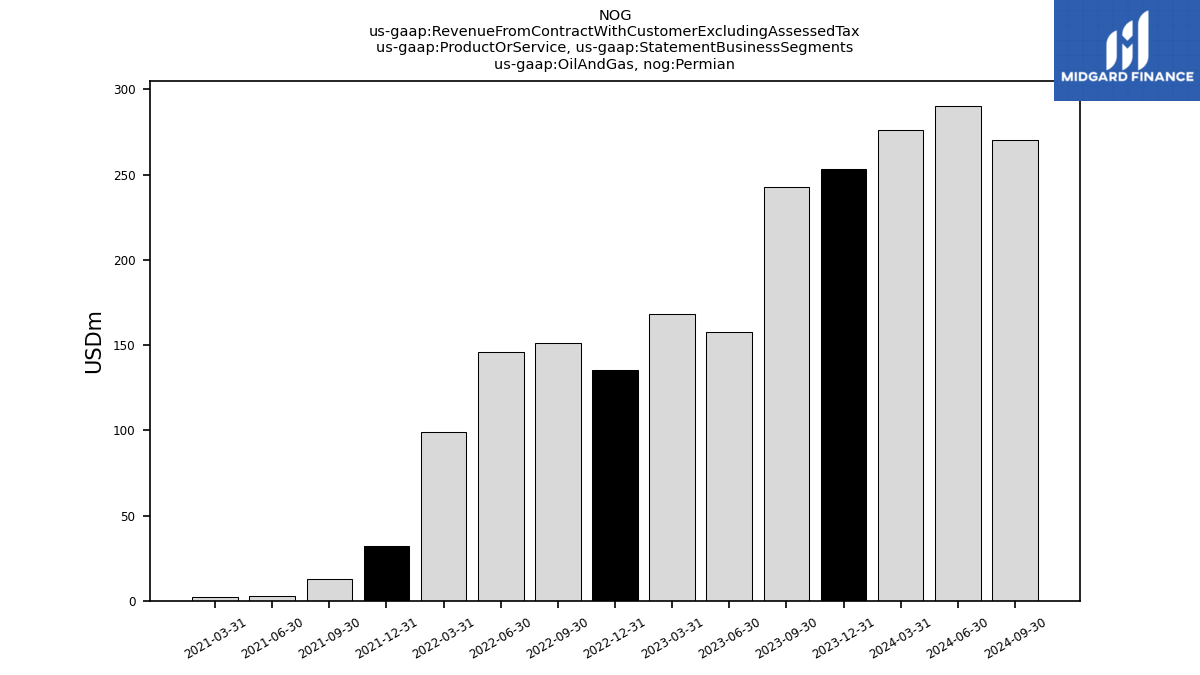
| Oil And Gas, Permian | 253.25 | 242.60 | 157.70 | 168.08 | 135.51 | 151.49 | 145.74 | 99.03 | 32.40 | 12.60 | 2.96 | 1.92 | NA | NA | NA | NA | NA | NA | NA | NA | NA | NA | NA | NA | NA | NA | NA | NA | NA | NA | NA | NA | NA | NA | NA | NA | NA | NA | NA | NA | NA | NA | NA | NA | NA | NA | NA | NA | NA | NA | NA | NA | NA | NA | NA | |
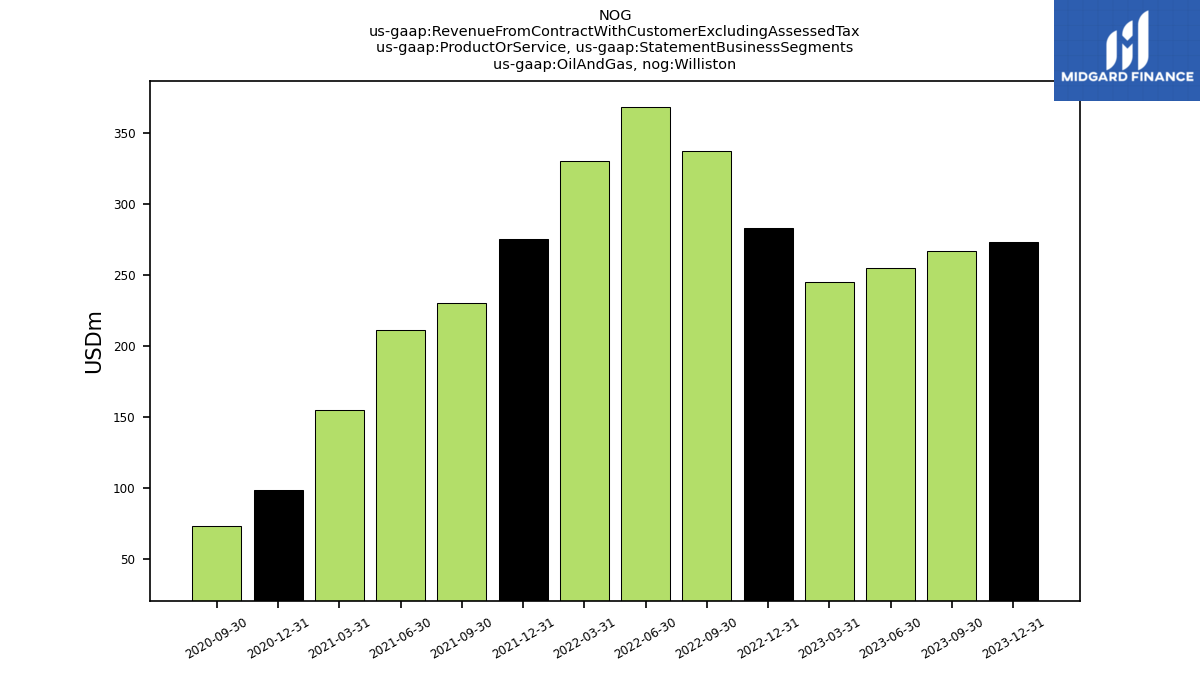
| Oil And Gas, Williston | 273.28 | 267.18 | 254.74 | 245.15 | 282.89 | 337.60 | 368.22 | 330.63 | 275.19 | 230.08 | 211.73 | 155.41 | 98.99 | 73.68 | NA | NA | NA | NA | NA | NA | NA | NA | NA | NA | NA | NA | NA | NA | NA | NA | NA | NA | NA | NA | NA | NA | NA | NA | NA | NA | NA | NA | NA | NA | NA | NA | NA | NA | NA | NA | NA | NA | NA | NA | NA |