
| 2023-09-30 | 2023-06-30 | 2022-12-31 | 2022-09-30 | 2022-06-30 | 2022-03-31 | 2021-12-31 | 2021-09-30 | 2021-06-30 | 2021-03-31 | 2020-12-31 | 2020-09-30 | 2020-06-30 | 2020-03-31 | 2019-12-31 | 2019-09-30 | 2019-06-30 | 2019-03-31 | 2018-12-31 | 2018-09-30 | 2018-06-30 | 2018-03-31 | 2017-12-31 | 2017-09-30 | 2017-06-30 | 2017-03-31 | 2016-12-31 | 2016-09-30 | 2016-06-30 | 2016-03-31 | 2015-12-31 | 2015-09-30 | 2015-06-30 | 2015-03-31 | 2014-12-31 | 2014-09-30 | 2014-06-30 | 2014-03-31 | 2013-12-31 | 2013-09-30 | 2013-06-30 | 2013-03-31 | 2012-12-31 | 2012-09-30 | ||
|---|---|---|---|---|---|---|---|---|---|---|---|---|---|---|---|---|---|---|---|---|---|---|---|---|---|---|---|---|---|---|---|---|---|---|---|---|---|---|---|---|---|---|---|---|---|
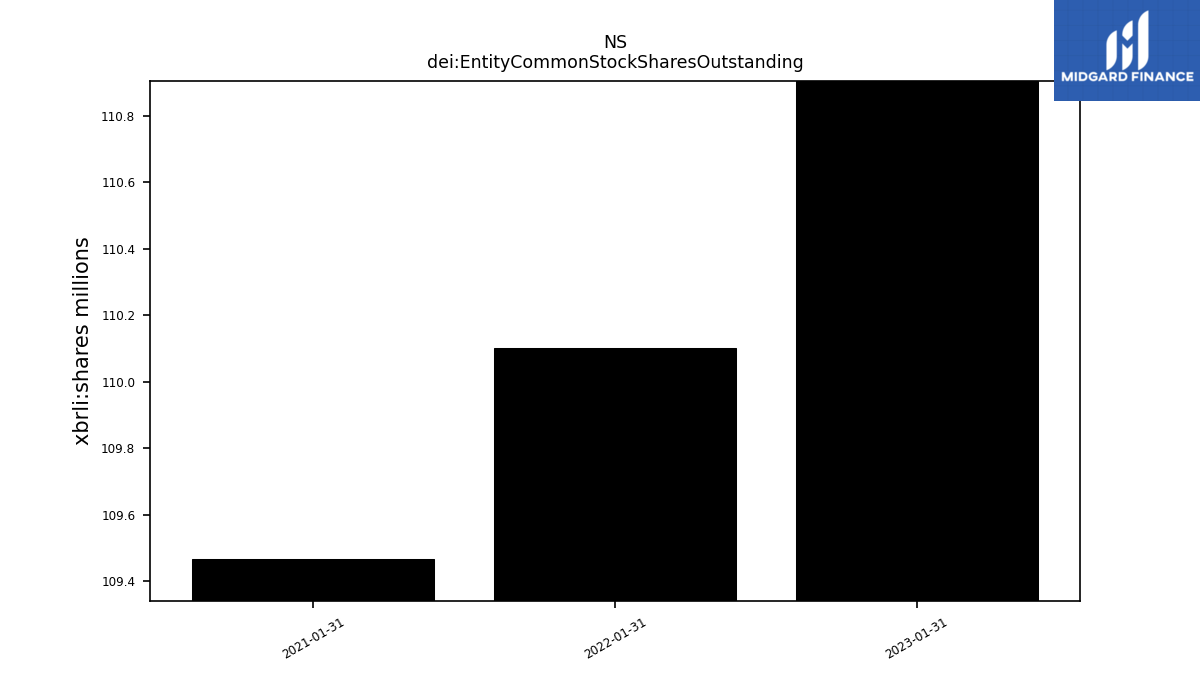
| dei: Entity Common Stock Shares Outstanding | NA | NA | NA | NA | NA | NA | NA | NA | NA | NA | NA | NA | NA | NA | NA | NA | NA | NA | NA | NA | NA | NA | NA | NA | NA | NA | NA | NA | NA | NA | NA | NA | NA | NA | NA | NA | NA | NA | NA | NA | NA | NA | NA | NA |
| 2023-09-30 | 2023-06-30 | 2022-12-31 | 2022-09-30 | 2022-06-30 | 2022-03-31 | 2021-12-31 | 2021-09-30 | 2021-06-30 | 2021-03-31 | 2020-12-31 | 2020-09-30 | 2020-06-30 | 2020-03-31 | 2019-12-31 | 2019-09-30 | 2019-06-30 | 2019-03-31 | 2018-12-31 | 2018-09-30 | 2018-06-30 | 2018-03-31 | 2017-12-31 | 2017-09-30 | 2017-06-30 | 2017-03-31 | 2016-12-31 | 2016-09-30 | 2016-06-30 | 2016-03-31 | 2015-12-31 | 2015-09-30 | 2015-06-30 | 2015-03-31 | 2014-12-31 | 2014-09-30 | 2014-06-30 | 2014-03-31 | 2013-12-31 | 2013-09-30 | 2013-06-30 | 2013-03-31 | 2012-12-31 | 2012-09-30 | ||
|---|---|---|---|---|---|---|---|---|---|---|---|---|---|---|---|---|---|---|---|---|---|---|---|---|---|---|---|---|---|---|---|---|---|---|---|---|---|---|---|---|---|---|---|---|---|
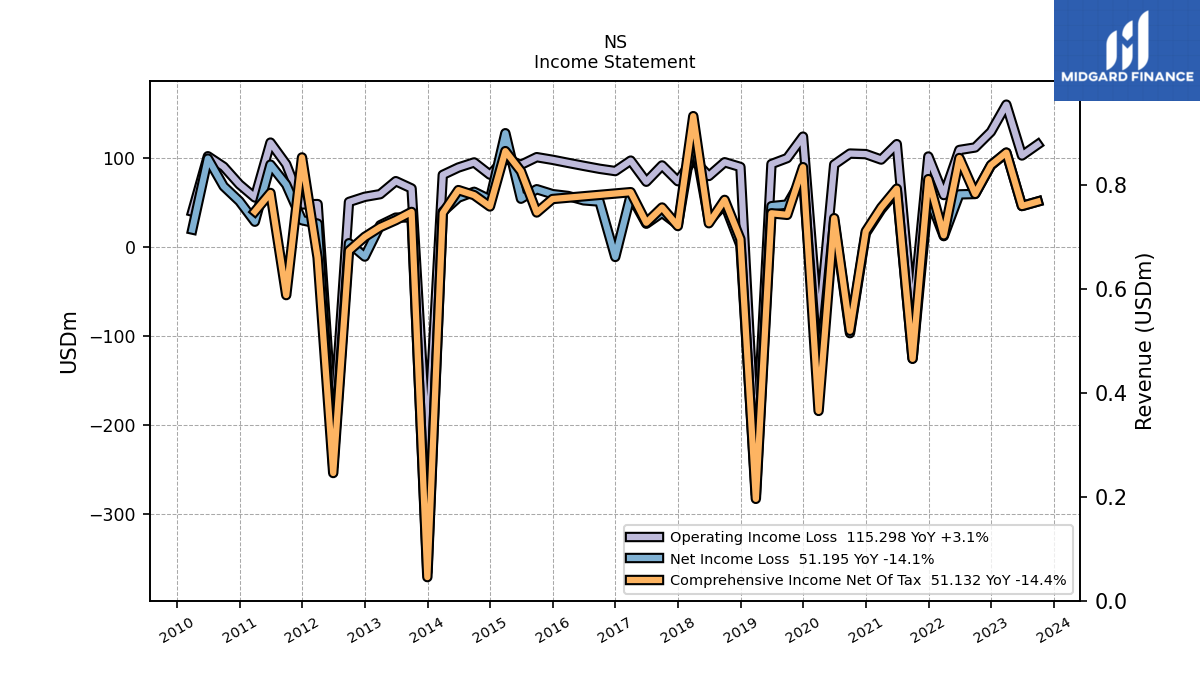
| Costs And Expenses | 295.00 | 275.46 | 300.51 | 301.36 | 321.10 | 351.44 | 315.67 | 491.53 | 311.49 | 263.36 | 282.23 | 257.55 | 246.84 | 485.85 | 275.64 | 278.08 | 279.16 | 719.57 | 419.34 | 395.09 | 406.37 | 377.40 | 376.52 | 348.85 | 362.08 | 390.29 | 386.38 | 353.46 | 346.59 | 311.14 | 366.89 | 392.57 | 478.21 | 455.66 | 600.39 | 699.32 | 660.39 | 768.11 | 998.32 | 714.14 | 830.15 | 940.25 | 496.14 | 1694.04 | |
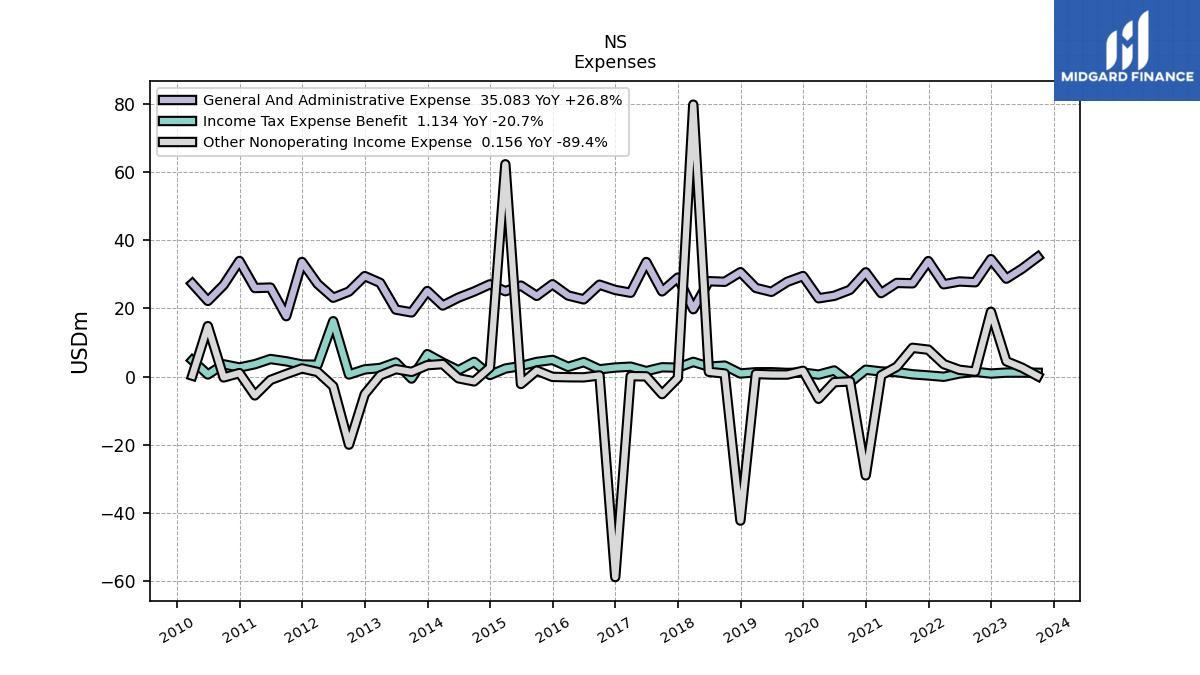
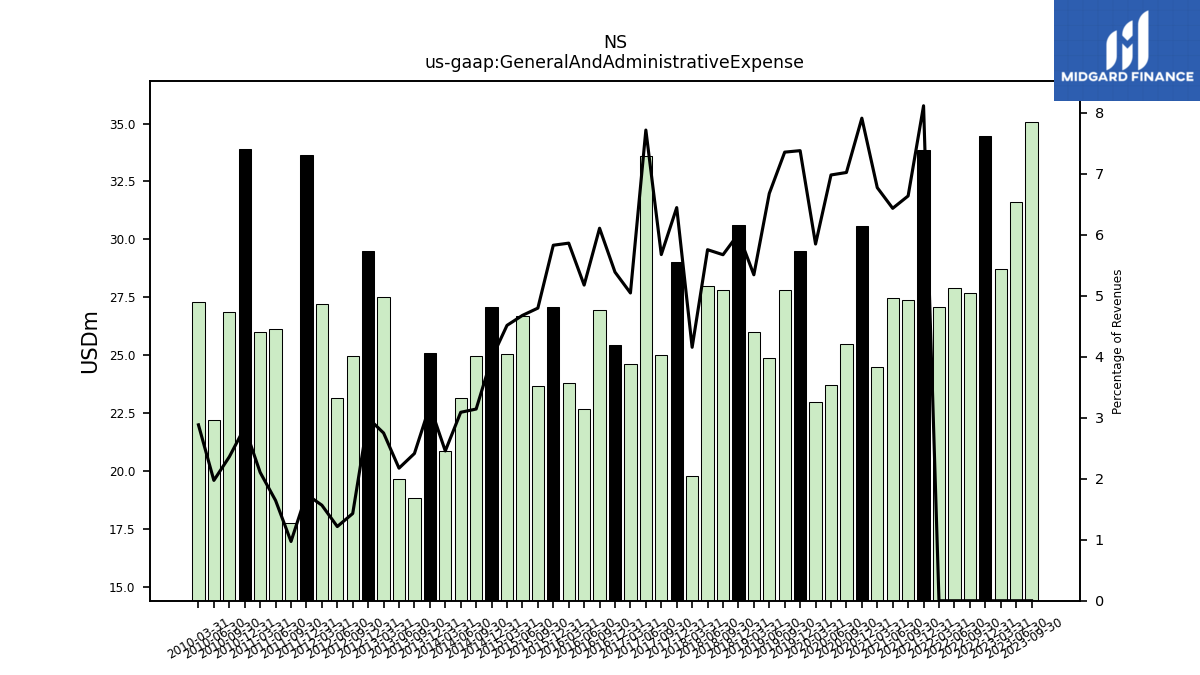
| General And Administrative Expense | 35.08 | 31.62 | 34.46 | 27.68 | 27.91 | 27.07 | 33.87 | 27.36 | 27.48 | 24.49 | 30.59 | 25.46 | 23.70 | 22.97 | 29.49 | 27.80 | 24.87 | 26.00 | 30.63 | 27.82 | 27.98 | 19.77 | 29.04 | 25.00 | 33.60 | 24.59 | 25.42 | 26.96 | 22.66 | 23.79 | 27.10 | 23.68 | 26.69 | 25.05 | 27.07 | 24.97 | 23.16 | 20.86 | 25.11 | 18.83 | 19.65 | 27.49 | 29.48 | 24.95 | |
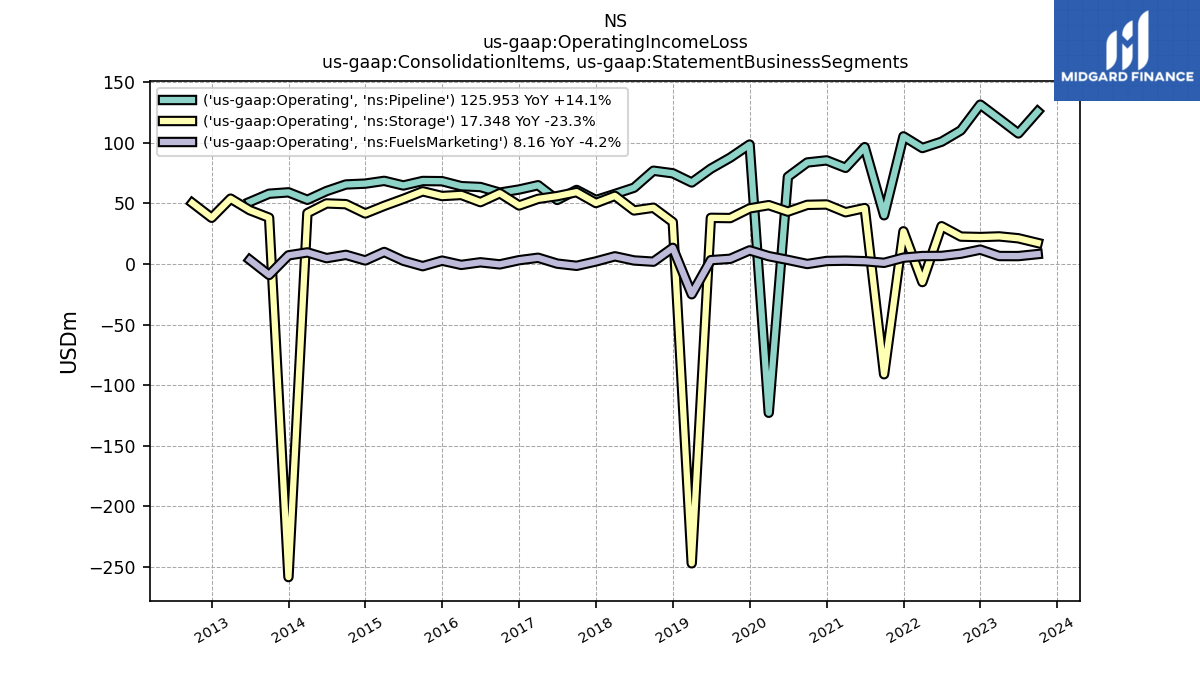
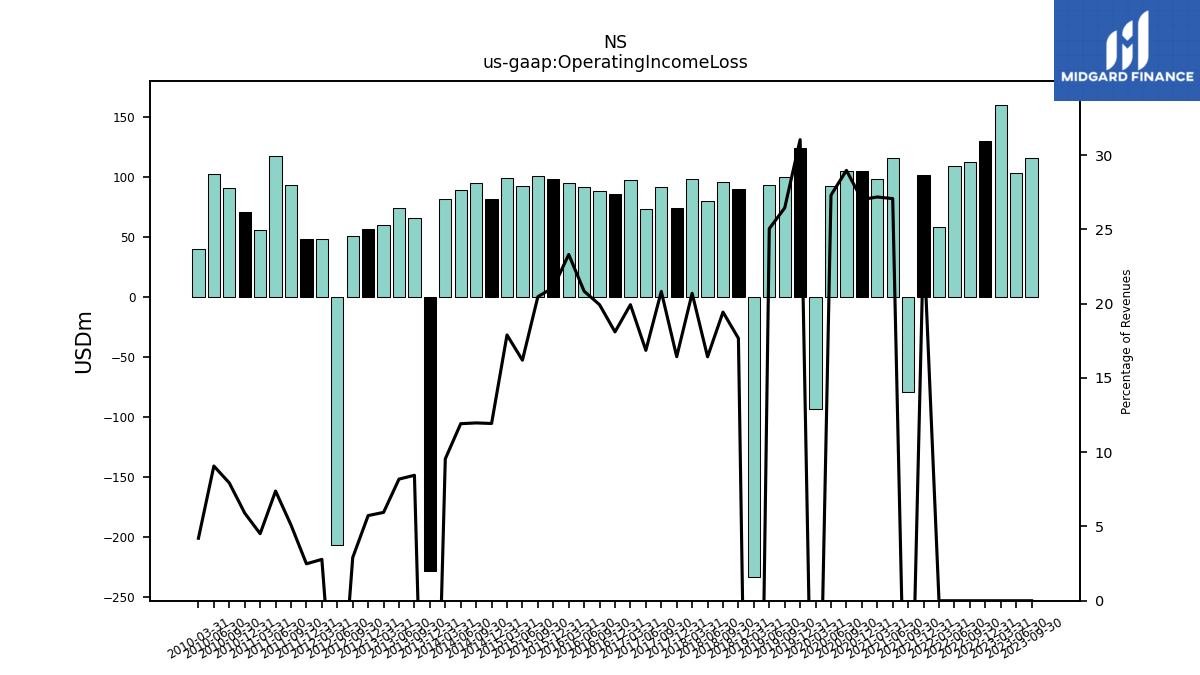
| Operating Income Loss | 115.30 | 102.87 | 129.45 | 111.88 | 109.06 | 58.43 | 101.75 | -79.19 | 115.61 | 98.29 | 104.42 | 105.04 | 92.70 | -93.06 | 124.06 | 99.97 | 93.28 | -233.10 | 89.97 | 95.28 | 79.84 | 98.48 | 74.02 | 91.72 | 73.40 | 97.14 | 85.37 | 87.95 | 91.22 | 94.56 | 98.02 | 100.99 | 92.41 | 99.28 | 81.35 | 95.10 | 89.35 | 81.10 | -228.20 | 65.87 | 74.04 | 59.46 | 56.46 | 50.72 | |
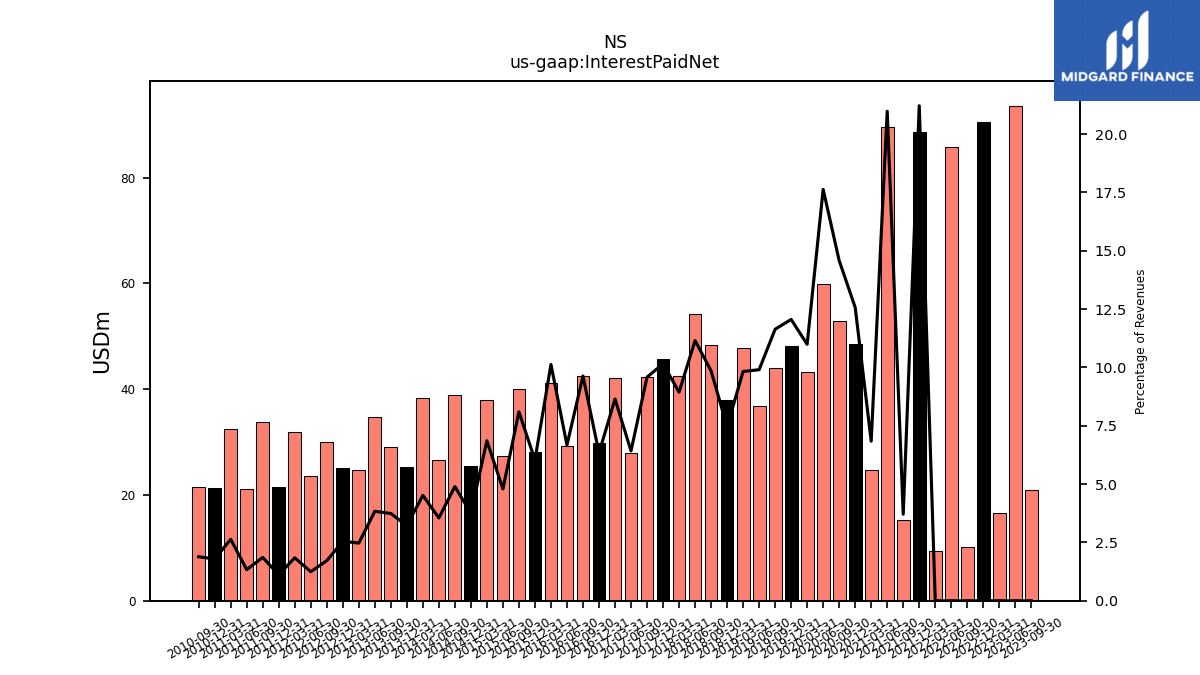
| Interest Paid Net | 20.92 | 93.59 | 90.46 | 10.13 | 85.79 | 9.32 | 88.55 | 15.29 | 89.60 | 24.74 | 48.61 | 52.87 | 59.86 | 43.17 | 48.19 | 43.99 | 36.88 | 47.80 | 37.99 | 48.33 | 54.21 | 42.55 | 45.75 | 42.22 | 27.97 | 42.15 | 29.87 | 42.52 | 29.20 | 41.08 | 28.05 | 39.96 | 27.33 | 38.04 | 25.55 | 38.88 | 26.61 | 38.35 | 25.28 | 29.16 | 34.67 | 24.70 | 25.10 | 29.94 | |
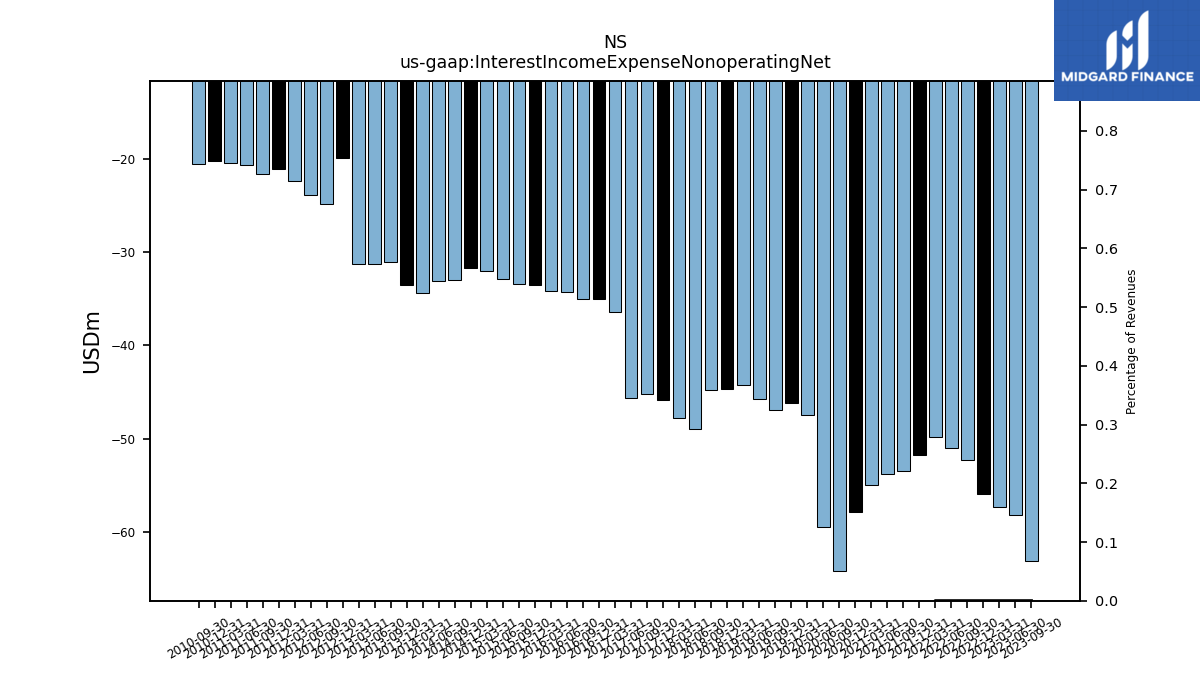
| Interest Income Expense Nonoperating Net | -63.12 | -58.17 | -55.96 | -52.29 | -50.94 | -49.82 | -51.77 | -53.51 | -53.78 | -54.92 | -57.90 | -64.17 | -59.50 | -47.49 | -46.18 | -46.90 | -45.69 | -44.27 | -44.70 | -44.83 | -48.94 | -47.77 | -45.80 | -45.26 | -45.61 | -36.41 | -34.98 | -35.02 | -34.23 | -34.12 | -33.56 | -33.45 | -32.82 | -32.04 | -31.73 | -33.01 | -33.12 | -34.42 | -33.52 | -31.08 | -31.29 | -31.23 | -19.85 | -24.87 | |
| Disposal Group Not Discontinued Operation Gain Loss On Disposal | NA | NA | NA | NA | 1.60 | NA | NA | NA | NA | NA | NA | NA | NA | NA | NA | NA | NA | NA | NA | NA | NA | NA | NA | NA | NA | NA | NA | NA | NA | NA | NA | NA | NA | NA | NA | NA | NA | NA | NA | NA | NA | NA | NA | NA | |
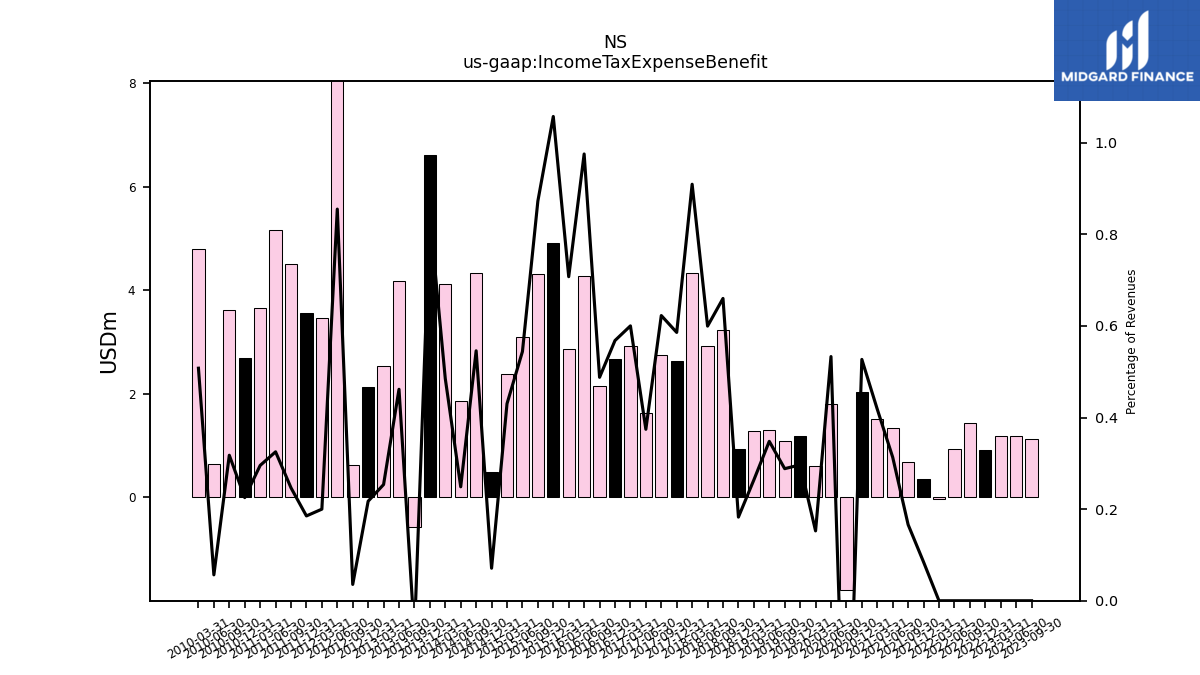
| Income Tax Expense Benefit | 1.13 | 1.19 | 0.91 | 1.43 | 0.93 | -0.03 | 0.35 | 0.69 | 1.34 | 1.51 | 2.04 | -1.78 | 1.81 | 0.60 | 1.19 | 1.09 | 1.30 | 1.28 | 0.93 | 3.24 | 2.92 | 4.33 | 2.64 | 2.74 | 1.63 | 2.92 | 2.68 | 2.15 | 4.27 | 2.87 | 4.92 | 4.31 | 3.10 | 2.39 | 0.48 | 4.33 | 1.86 | 4.12 | 6.61 | -0.56 | 4.17 | 2.54 | 2.14 | 0.62 | |
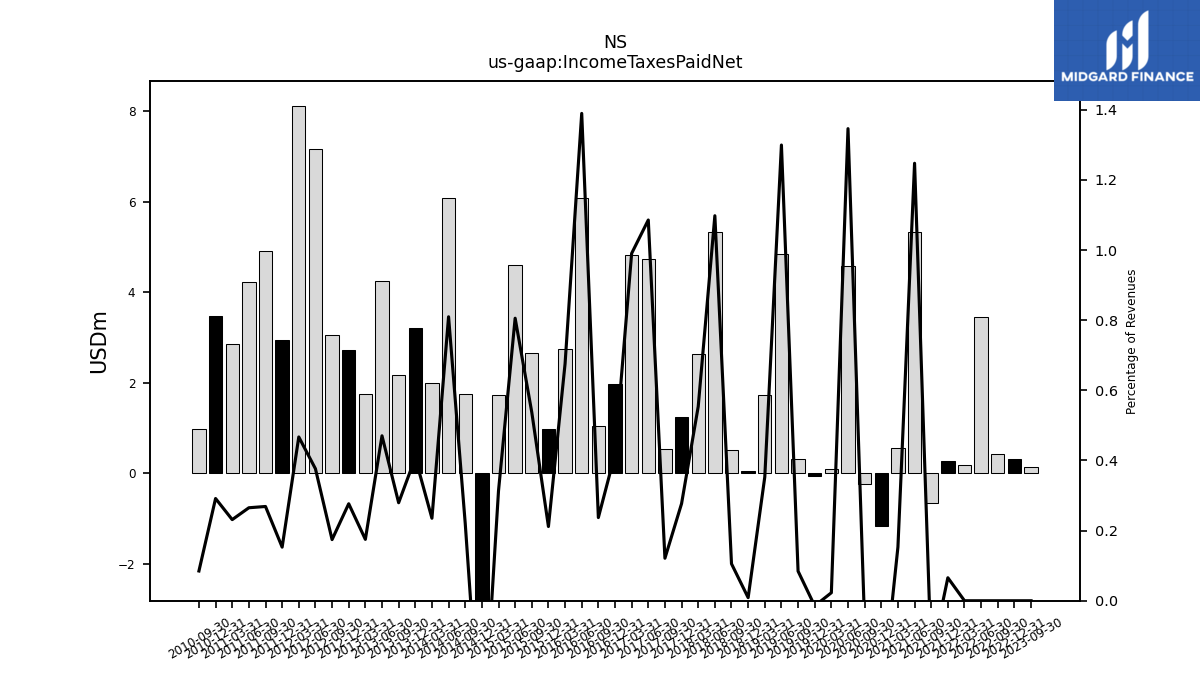
| Income Taxes Paid Net | 0.14 | NA | 0.30 | 0.42 | 3.46 | 0.18 | 0.27 | -0.67 | 5.33 | 0.55 | -1.16 | -0.24 | 4.57 | 0.09 | -0.06 | 0.32 | 4.84 | 1.72 | 0.04 | 0.52 | 5.34 | 2.63 | 1.25 | 0.53 | 4.73 | 4.83 | 1.97 | 1.05 | 6.08 | 2.74 | 0.98 | 2.65 | 4.60 | 1.74 | -3.13 | 1.76 | 6.07 | 2.00 | 3.20 | 2.18 | 4.25 | 1.75 | 2.72 | 3.04 | |
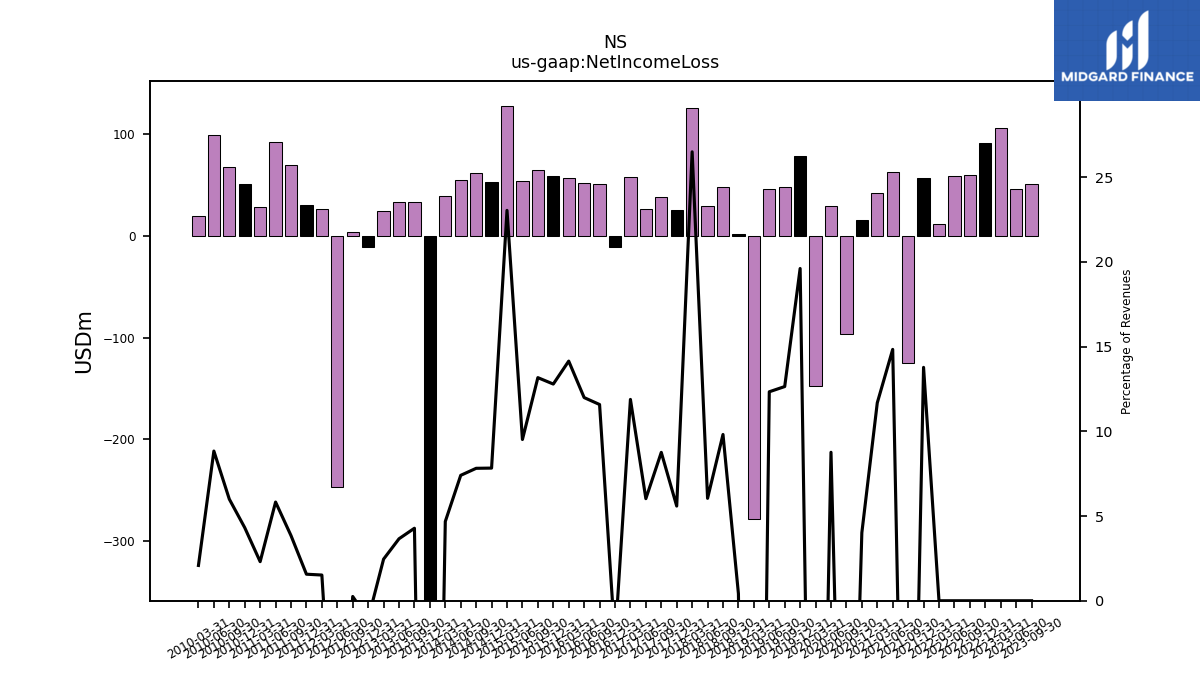
| Net Income Loss | 51.20 | 46.14 | 91.60 | 59.63 | 59.20 | 12.31 | 57.52 | -124.93 | 63.38 | 42.26 | 15.53 | -96.64 | 29.77 | -147.64 | 78.41 | 47.81 | 45.95 | -277.86 | 2.13 | 48.14 | 29.40 | 126.13 | 25.18 | 38.59 | 26.25 | 57.94 | -11.06 | 51.14 | 52.52 | 57.40 | 59.48 | 65.02 | 54.33 | 127.90 | 53.39 | 62.12 | 55.51 | 39.74 | -364.82 | 33.40 | 33.09 | 24.57 | -10.62 | 4.39 | |
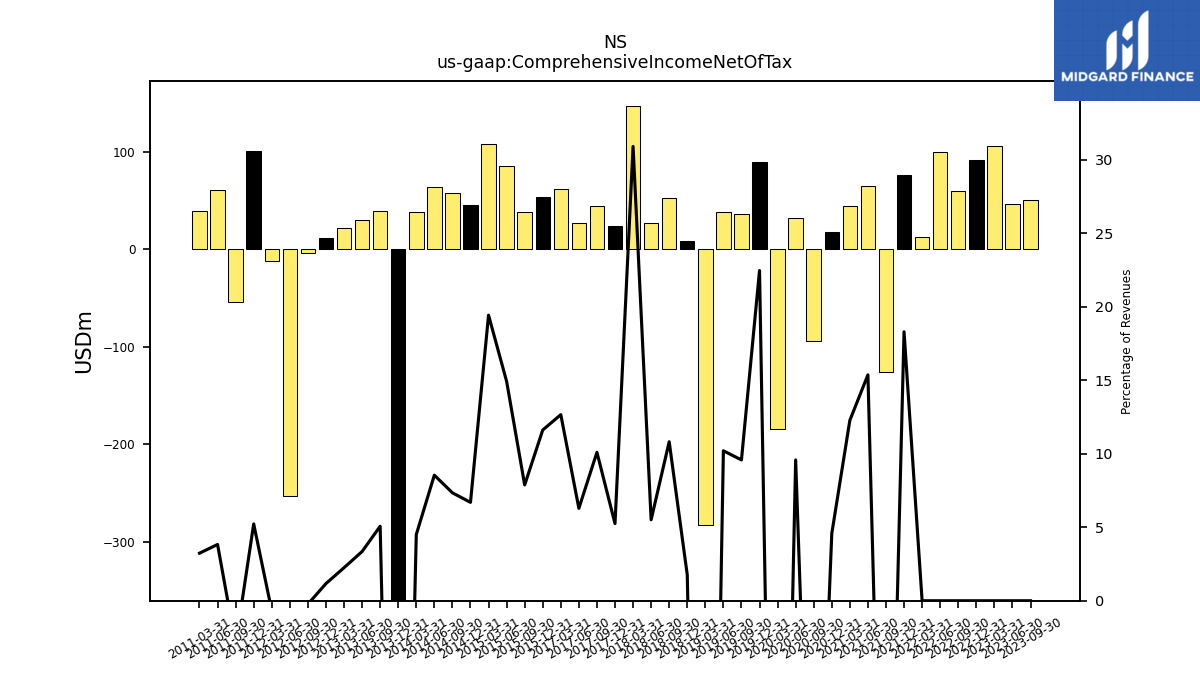
| Comprehensive Income Net Of Tax | 51.13 | 46.15 | 92.06 | 59.75 | 100.07 | 13.24 | 76.36 | -125.46 | 65.63 | 44.38 | 17.67 | -93.98 | 32.52 | -183.95 | 89.77 | 36.21 | 37.99 | -282.69 | 8.97 | 53.04 | 26.78 | 147.06 | 23.65 | 44.48 | 27.38 | 61.70 | NA | NA | NA | NA | 53.99 | 38.88 | 85.17 | 107.80 | 45.62 | 58.33 | 64.04 | 38.27 | -370.55 | 39.52 | 30.27 | 22.46 | 11.50 | -4.08 |
| 2023-09-30 | 2023-06-30 | 2022-12-31 | 2022-09-30 | 2022-06-30 | 2022-03-31 | 2021-12-31 | 2021-09-30 | 2021-06-30 | 2021-03-31 | 2020-12-31 | 2020-09-30 | 2020-06-30 | 2020-03-31 | 2019-12-31 | 2019-09-30 | 2019-06-30 | 2019-03-31 | 2018-12-31 | 2018-09-30 | 2018-06-30 | 2018-03-31 | 2017-12-31 | 2017-09-30 | 2017-06-30 | 2017-03-31 | 2016-12-31 | 2016-09-30 | 2016-06-30 | 2016-03-31 | 2015-12-31 | 2015-09-30 | 2015-06-30 | 2015-03-31 | 2014-12-31 | 2014-09-30 | 2014-06-30 | 2014-03-31 | 2013-12-31 | 2013-09-30 | 2013-06-30 | 2013-03-31 | 2012-12-31 | 2012-09-30 | ||
|---|---|---|---|---|---|---|---|---|---|---|---|---|---|---|---|---|---|---|---|---|---|---|---|---|---|---|---|---|---|---|---|---|---|---|---|---|---|---|---|---|---|---|---|---|---|
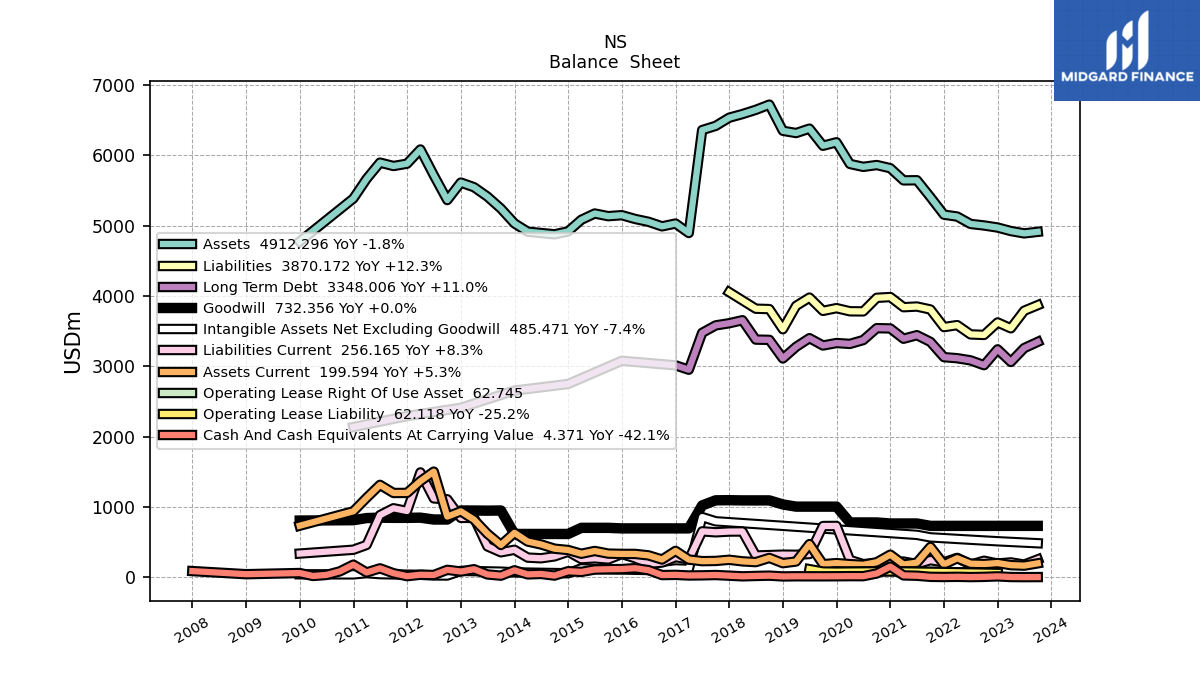
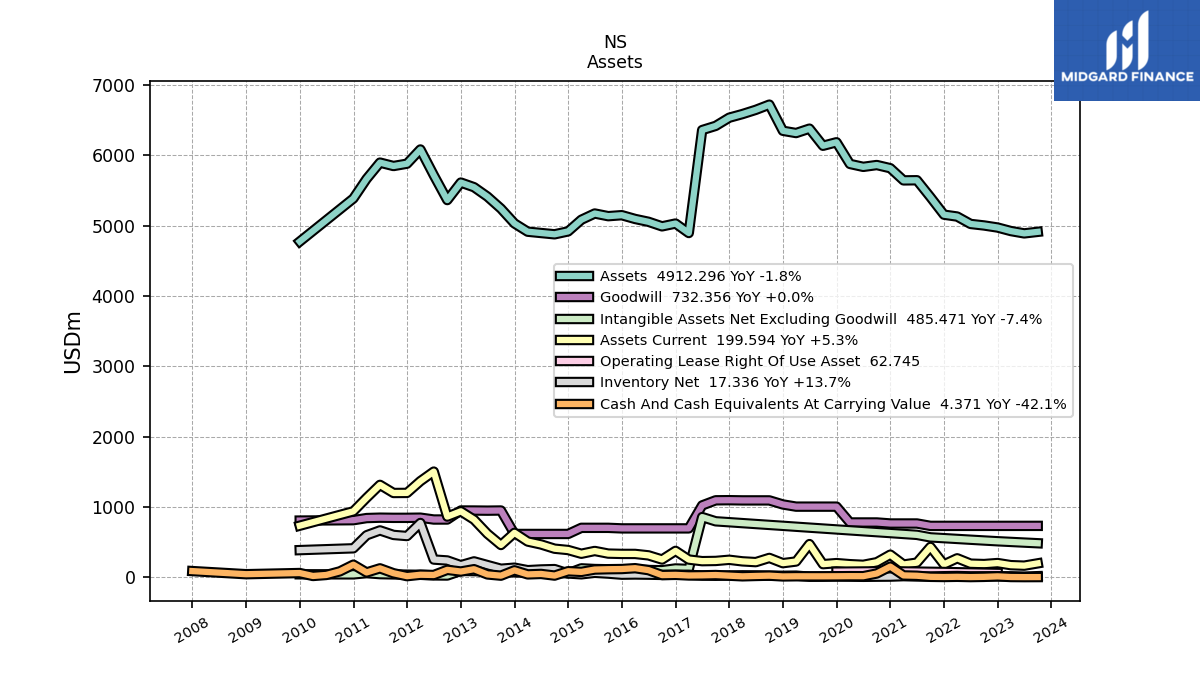
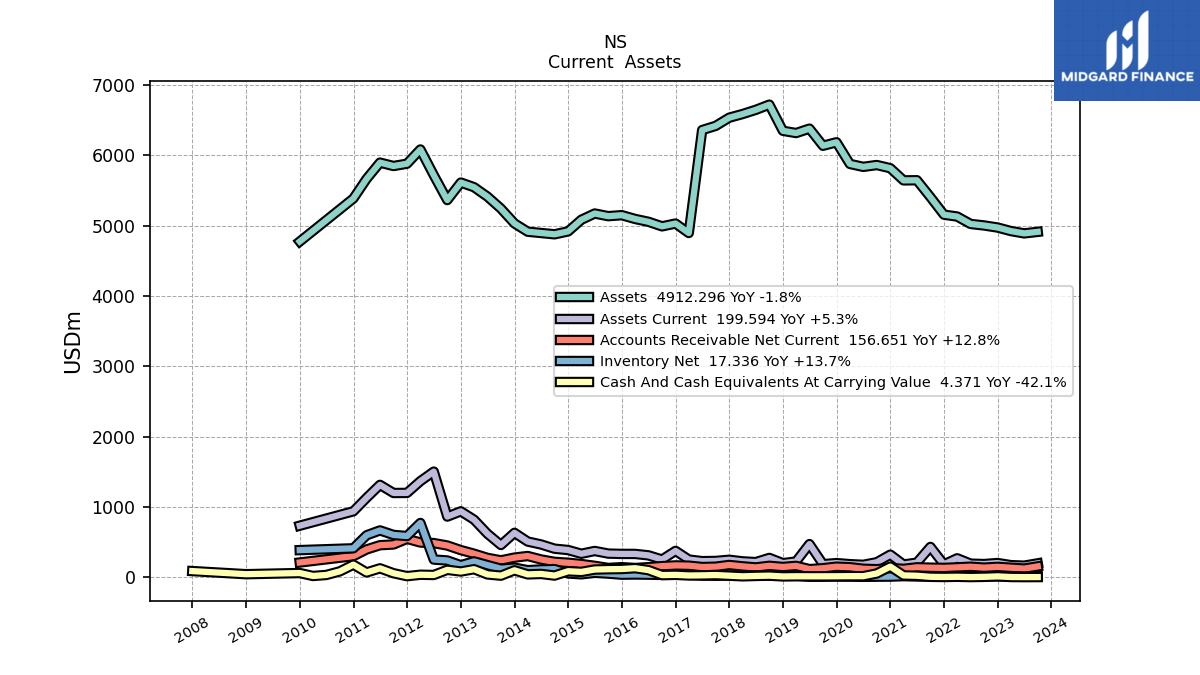
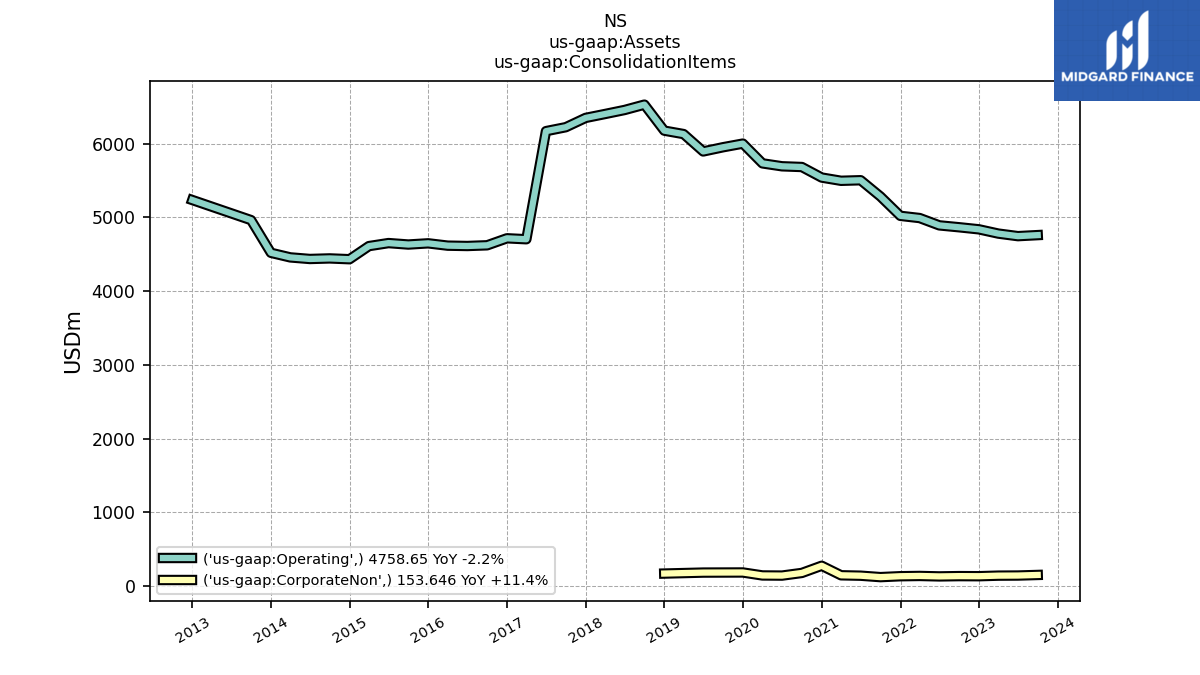
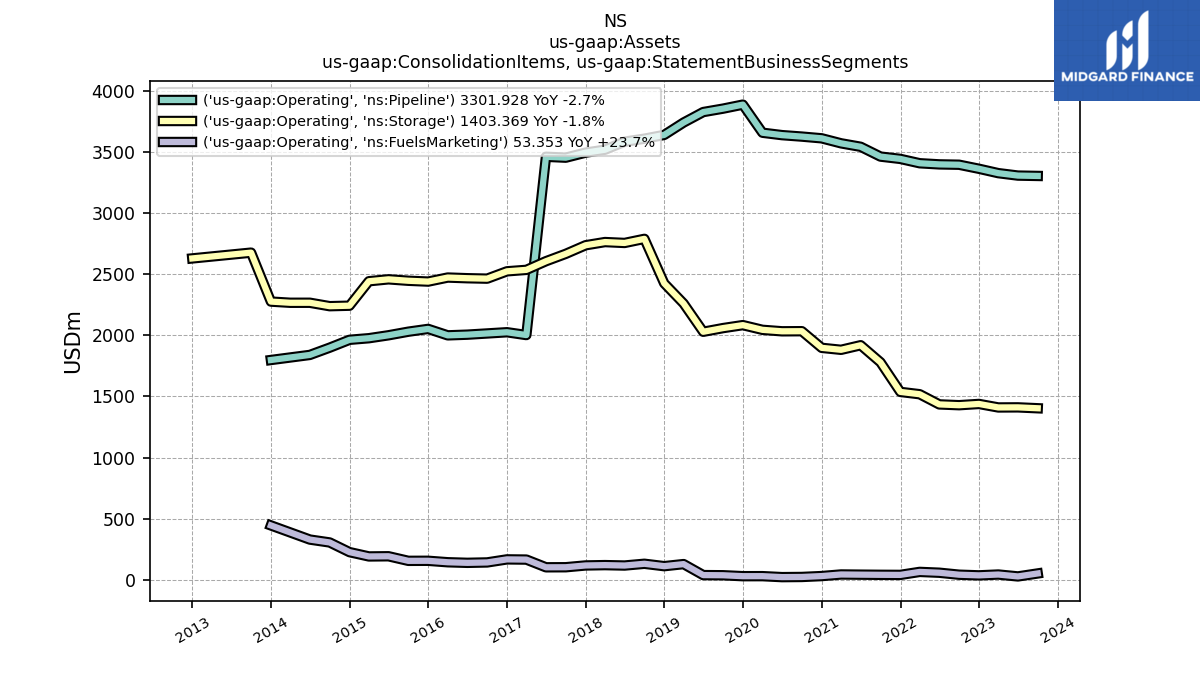
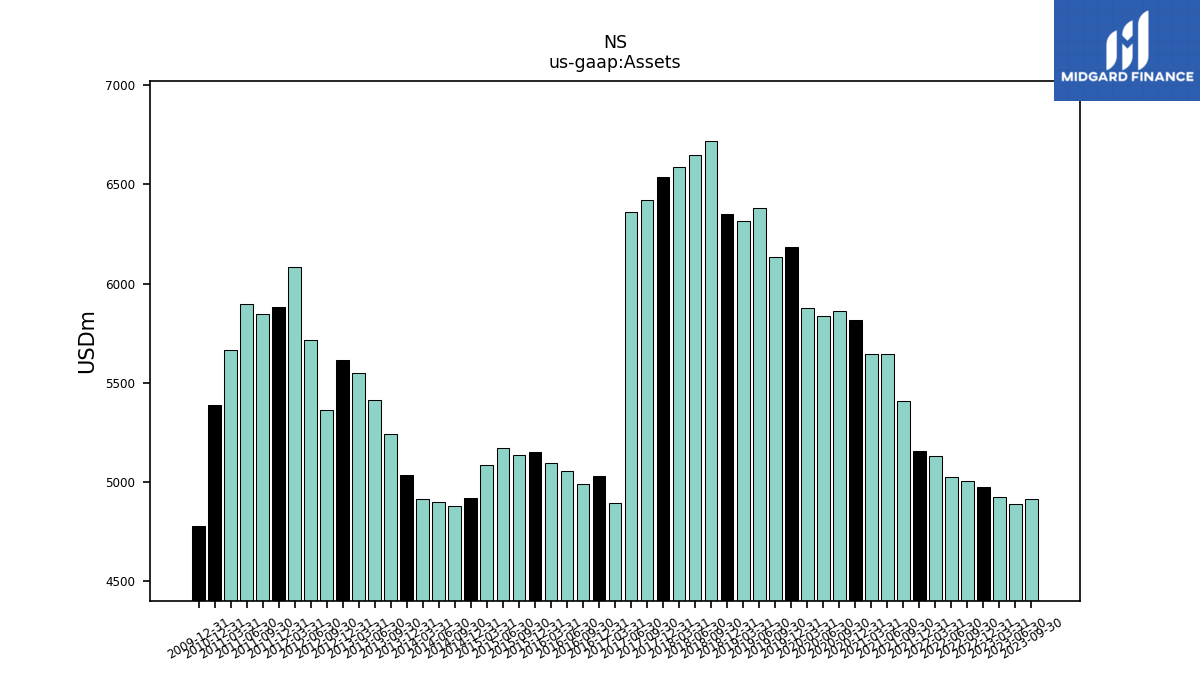
| Assets | 4912.30 | 4890.41 | 4973.69 | 5002.98 | 5024.66 | 5129.93 | 5156.33 | 5405.74 | 5645.98 | 5643.87 | 5817.02 | 5862.31 | 5836.20 | 5877.82 | 6185.99 | 6135.84 | 6379.69 | 6316.90 | 6349.14 | 6720.96 | 6646.97 | 6586.71 | 6535.23 | 6418.77 | 6359.32 | 4895.42 | 5030.55 | 4990.42 | 5055.22 | 5095.55 | 5149.26 | 5135.13 | 5173.06 | 5084.15 | 4918.80 | 4877.37 | 4895.78 | 4914.63 | 5032.19 | 5242.66 | 5413.40 | 5547.03 | 5613.09 | 5363.88 | |
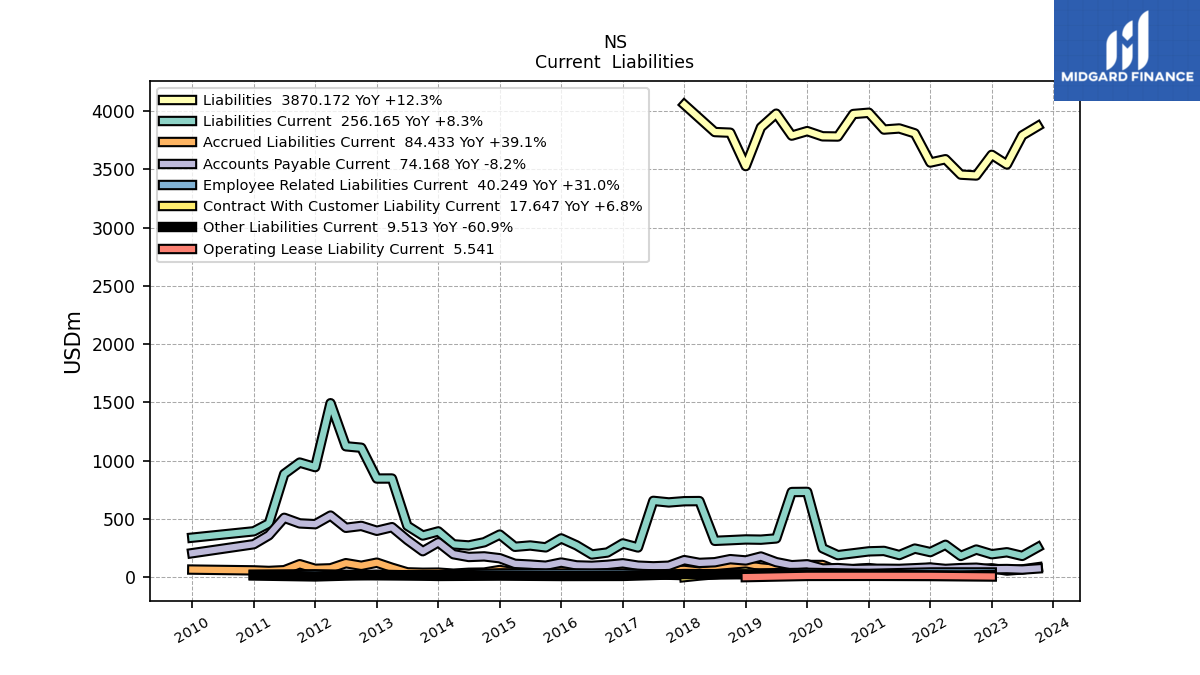
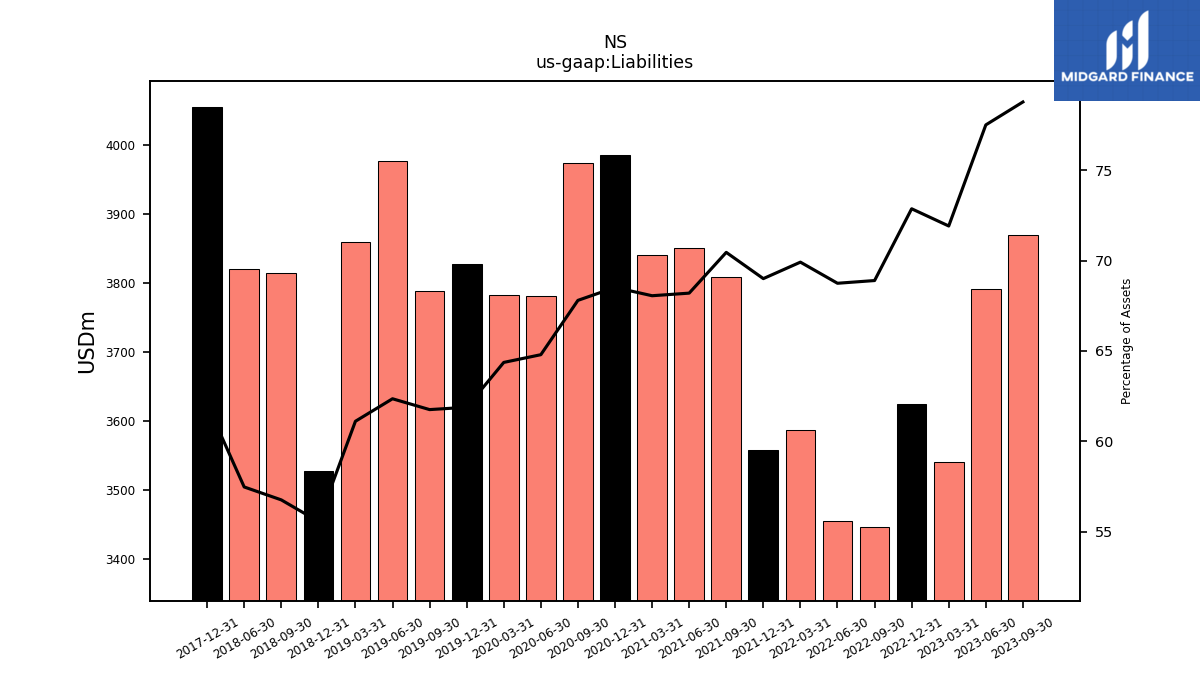
| Liabilities | 3870.17 | 3790.83 | 3624.40 | 3446.90 | 3454.27 | 3586.64 | 3558.07 | 3808.74 | 3850.54 | 3841.01 | 3985.52 | 3974.60 | 3781.34 | 3783.17 | 3827.85 | 3788.92 | 3977.79 | 3859.93 | 3527.42 | 3814.23 | 3819.78 | NA | 4055.14 | NA | NA | NA | NA | NA | NA | NA | NA | NA | NA | NA | NA | NA | NA | NA | NA | NA | NA | NA | NA | NA | |
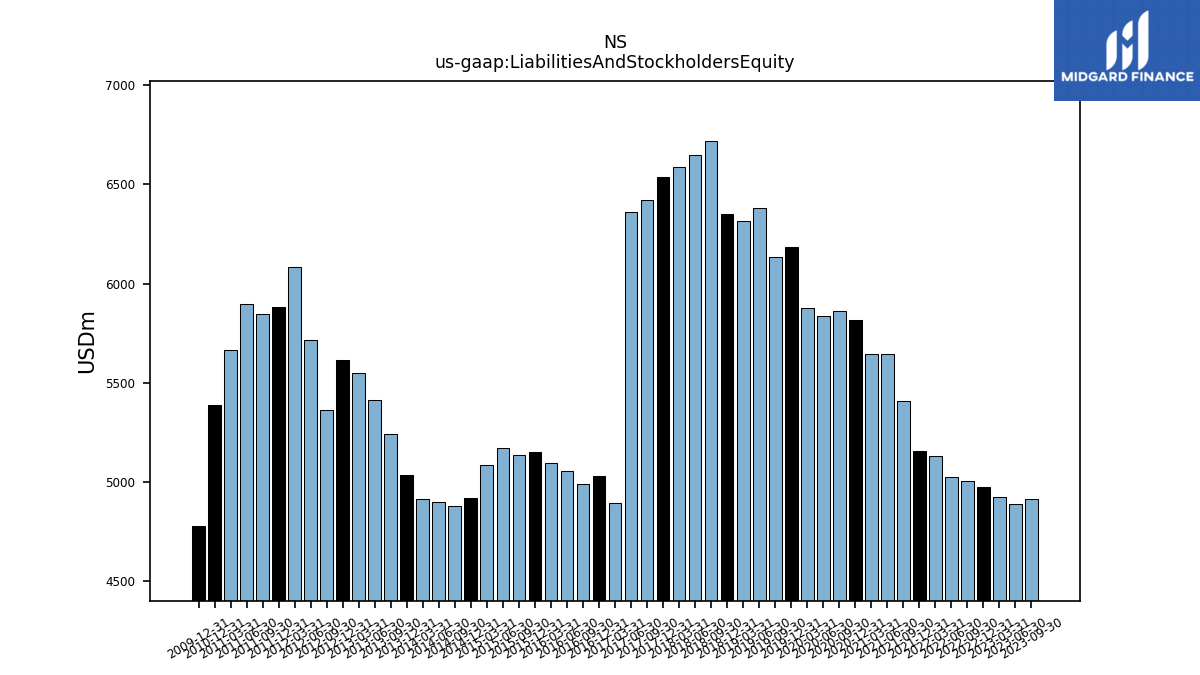
| Liabilities And Stockholders Equity | 4912.30 | 4890.41 | 4973.69 | 5002.98 | 5024.66 | 5129.93 | 5156.33 | 5405.74 | 5645.98 | 5643.87 | 5817.02 | 5862.31 | 5836.20 | 5877.82 | 6185.99 | 6135.84 | 6379.69 | 6316.90 | 6349.14 | 6720.96 | 6646.97 | 6586.71 | 6535.23 | 6418.77 | 6359.32 | 4895.42 | 5030.55 | 4990.42 | 5055.22 | 5095.55 | 5149.26 | 5135.13 | 5173.06 | 5084.15 | 4918.80 | 4877.37 | 4895.78 | 4914.63 | 5032.19 | 5242.66 | 5413.40 | 5547.03 | 5613.09 | 5363.88 |
| 2023-09-30 | 2023-06-30 | 2022-12-31 | 2022-09-30 | 2022-06-30 | 2022-03-31 | 2021-12-31 | 2021-09-30 | 2021-06-30 | 2021-03-31 | 2020-12-31 | 2020-09-30 | 2020-06-30 | 2020-03-31 | 2019-12-31 | 2019-09-30 | 2019-06-30 | 2019-03-31 | 2018-12-31 | 2018-09-30 | 2018-06-30 | 2018-03-31 | 2017-12-31 | 2017-09-30 | 2017-06-30 | 2017-03-31 | 2016-12-31 | 2016-09-30 | 2016-06-30 | 2016-03-31 | 2015-12-31 | 2015-09-30 | 2015-06-30 | 2015-03-31 | 2014-12-31 | 2014-09-30 | 2014-06-30 | 2014-03-31 | 2013-12-31 | 2013-09-30 | 2013-06-30 | 2013-03-31 | 2012-12-31 | 2012-09-30 | ||
|---|---|---|---|---|---|---|---|---|---|---|---|---|---|---|---|---|---|---|---|---|---|---|---|---|---|---|---|---|---|---|---|---|---|---|---|---|---|---|---|---|---|---|---|---|---|
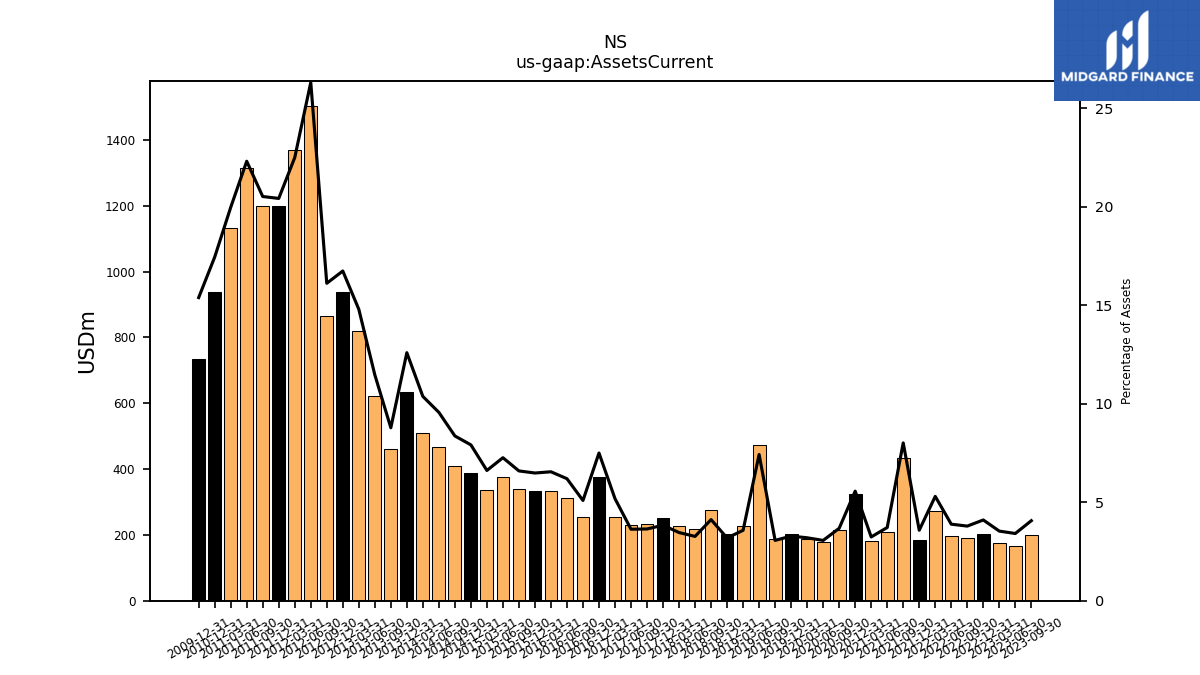
| Assets Current | 199.59 | 166.95 | 203.92 | 189.55 | 195.30 | 271.77 | 184.54 | 433.06 | 209.88 | 182.75 | 323.56 | 215.56 | 178.71 | 187.86 | 203.05 | 187.95 | 473.56 | 225.94 | 202.16 | 276.87 | 217.09 | 228.00 | 250.43 | 233.87 | 230.86 | 253.67 | 377.18 | 254.00 | 313.16 | 333.57 | 333.85 | 338.36 | 375.58 | 336.21 | 389.15 | 407.95 | 468.12 | 509.74 | 633.55 | 460.31 | 620.79 | 820.65 | 939.44 | 864.24 | |
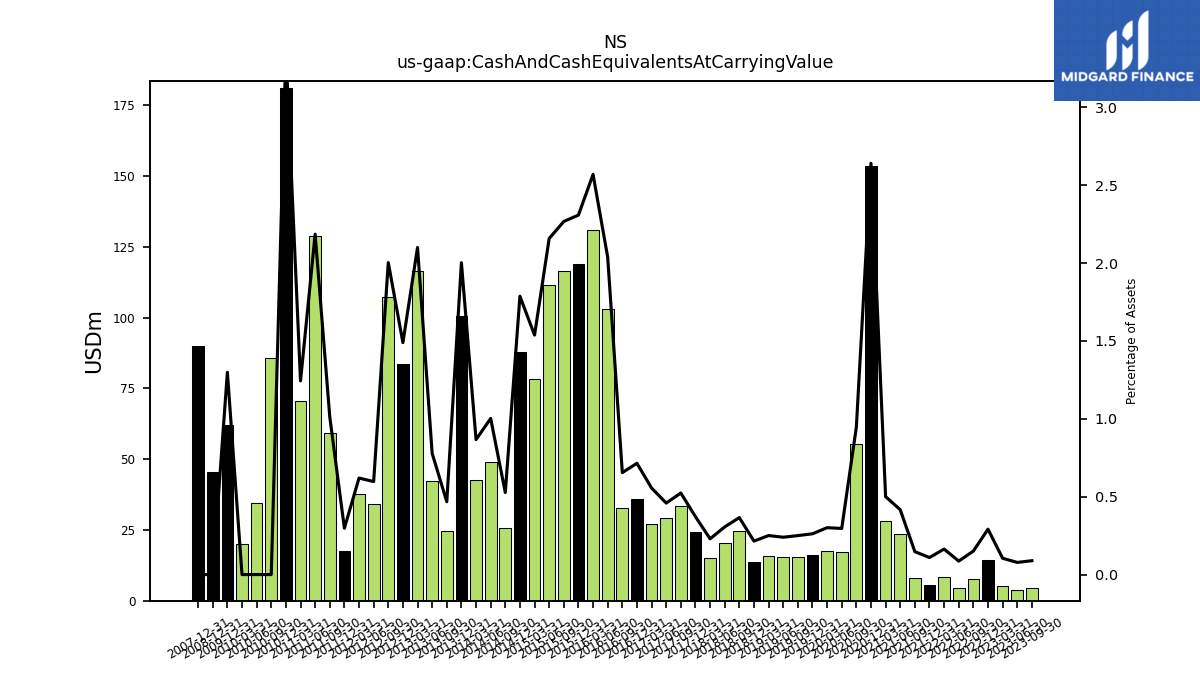
| Cash And Cash Equivalents At Carrying Value | 4.37 | 3.81 | 14.49 | 7.54 | 4.34 | 8.40 | 5.64 | 7.95 | 23.50 | 28.25 | 153.62 | 55.49 | 17.28 | 17.69 | 16.19 | 15.35 | 15.30 | 15.82 | 13.64 | 24.58 | 20.34 | 15.13 | 24.29 | 33.62 | 29.19 | 27.20 | 35.94 | 32.66 | 103.02 | 130.92 | 118.86 | 116.42 | 111.64 | 78.18 | 87.91 | 25.69 | 49.08 | 42.60 | 100.74 | 24.52 | 42.13 | 116.51 | 83.60 | 107.46 | |
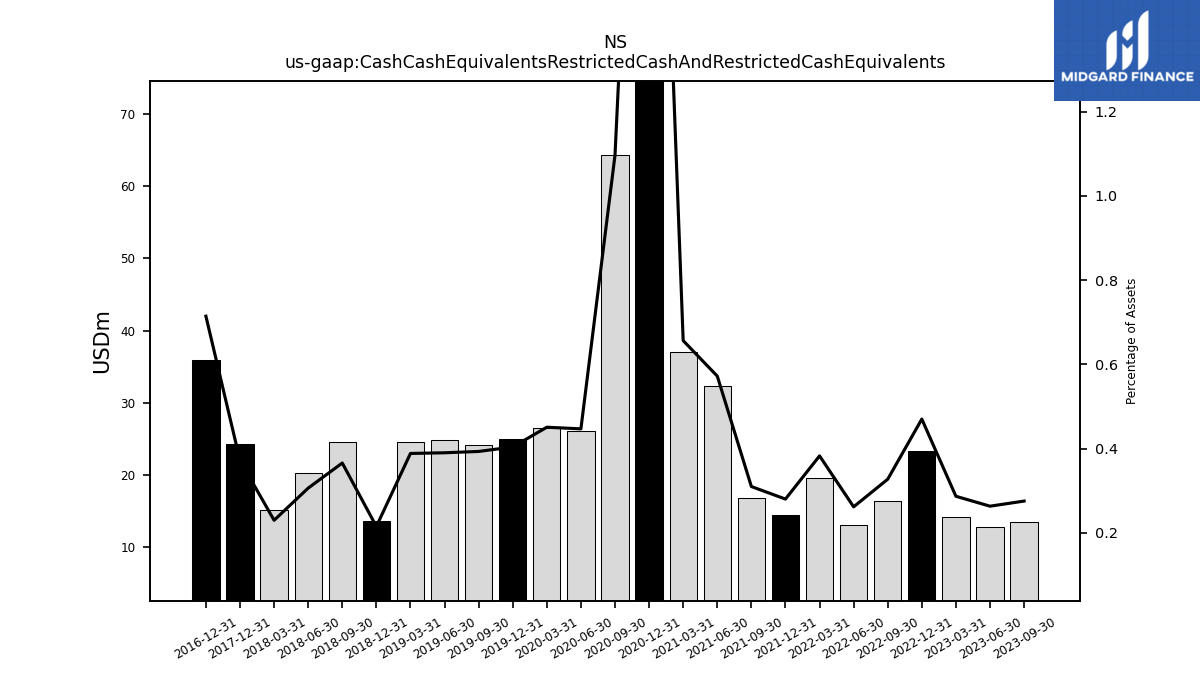
| Cash Cash Equivalents Restricted Cash And Restricted Cash Equivalents | 13.52 | 12.87 | 23.38 | 16.37 | 13.14 | 19.63 | 14.44 | 16.75 | 32.30 | 37.05 | 162.43 | 64.29 | 26.08 | 26.49 | 24.98 | 24.12 | 24.88 | 24.53 | 13.64 | 24.58 | 20.34 | 15.13 | 24.29 | NA | NA | NA | 35.94 | NA | NA | NA | NA | NA | NA | NA | NA | NA | NA | NA | NA | NA | NA | NA | NA | NA | |
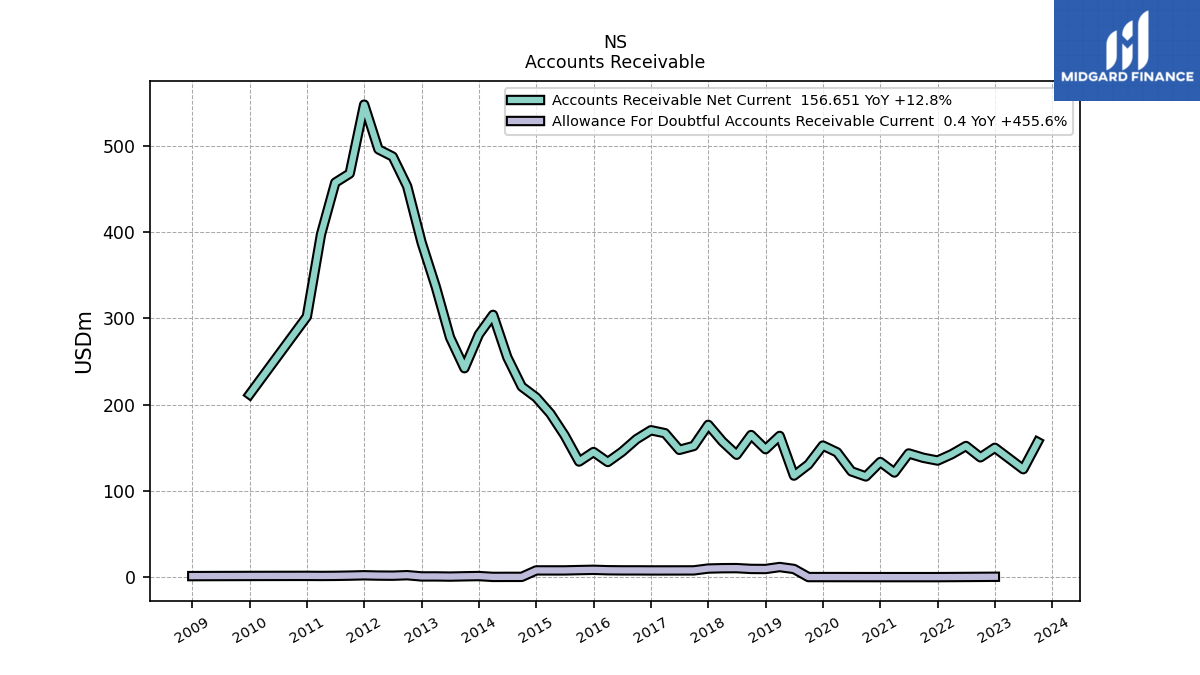
| Accounts Receivable Net Current | 156.65 | 125.12 | 149.97 | 138.87 | 152.04 | 142.53 | 135.13 | 138.39 | 143.39 | 121.25 | 133.47 | 116.73 | 122.62 | 144.67 | 152.53 | 130.55 | 117.69 | 163.74 | 148.31 | 164.77 | 141.87 | 157.27 | 176.57 | 152.07 | 147.55 | 166.84 | 170.29 | 159.98 | 145.34 | 133.47 | 145.06 | 133.97 | 164.40 | 189.66 | 208.31 | 220.84 | 254.82 | 304.06 | 281.31 | 242.20 | 277.84 | 336.76 | 387.94 | 453.14 | |
| Inventory Net | 17.34 | 10.48 | 15.40 | 15.25 | 14.79 | 19.31 | 16.64 | 11.79 | 12.81 | 17.53 | 11.06 | 10.02 | 8.20 | 10.72 | 12.39 | 10.12 | 9.45 | 25.02 | 22.71 | 24.76 | 28.07 | 29.55 | 26.86 | 23.30 | 25.77 | 37.11 | 37.95 | 35.05 | 38.70 | 41.17 | 38.75 | 53.88 | 65.35 | 43.69 | 55.71 | 117.94 | 112.84 | 102.65 | 138.15 | 123.00 | 175.28 | 227.63 | 173.23 | 240.69 | |
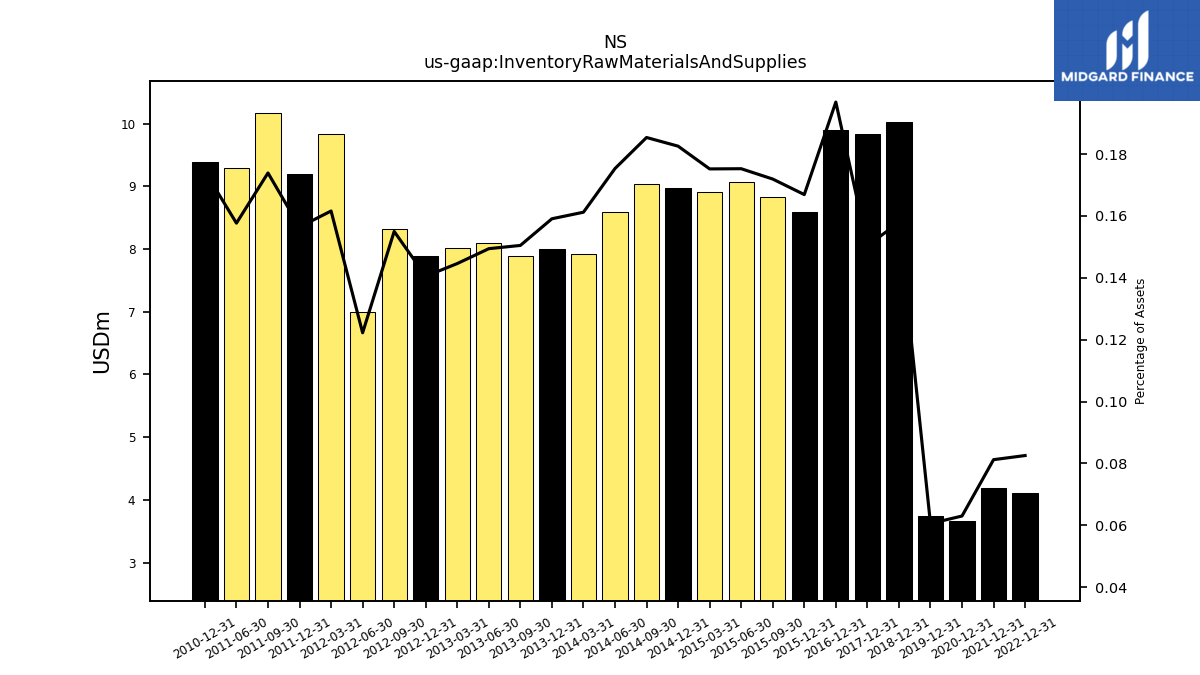
| Inventory Raw Materials And Supplies | NA | NA | 4.11 | NA | NA | NA | 4.19 | NA | NA | NA | 3.67 | NA | NA | NA | 3.75 | NA | NA | NA | 10.02 | NA | NA | NA | 9.83 | NA | NA | NA | 9.90 | NA | NA | NA | 8.60 | 8.83 | 9.07 | 8.91 | 8.98 | 9.04 | 8.58 | 7.92 | 8.01 | 7.89 | 8.09 | 8.02 | 7.89 | 8.31 |
| 2023-09-30 | 2023-06-30 | 2022-12-31 | 2022-09-30 | 2022-06-30 | 2022-03-31 | 2021-12-31 | 2021-09-30 | 2021-06-30 | 2021-03-31 | 2020-12-31 | 2020-09-30 | 2020-06-30 | 2020-03-31 | 2019-12-31 | 2019-09-30 | 2019-06-30 | 2019-03-31 | 2018-12-31 | 2018-09-30 | 2018-06-30 | 2018-03-31 | 2017-12-31 | 2017-09-30 | 2017-06-30 | 2017-03-31 | 2016-12-31 | 2016-09-30 | 2016-06-30 | 2016-03-31 | 2015-12-31 | 2015-09-30 | 2015-06-30 | 2015-03-31 | 2014-12-31 | 2014-09-30 | 2014-06-30 | 2014-03-31 | 2013-12-31 | 2013-09-30 | 2013-06-30 | 2013-03-31 | 2012-12-31 | 2012-09-30 | ||
|---|---|---|---|---|---|---|---|---|---|---|---|---|---|---|---|---|---|---|---|---|---|---|---|---|---|---|---|---|---|---|---|---|---|---|---|---|---|---|---|---|---|---|---|---|---|
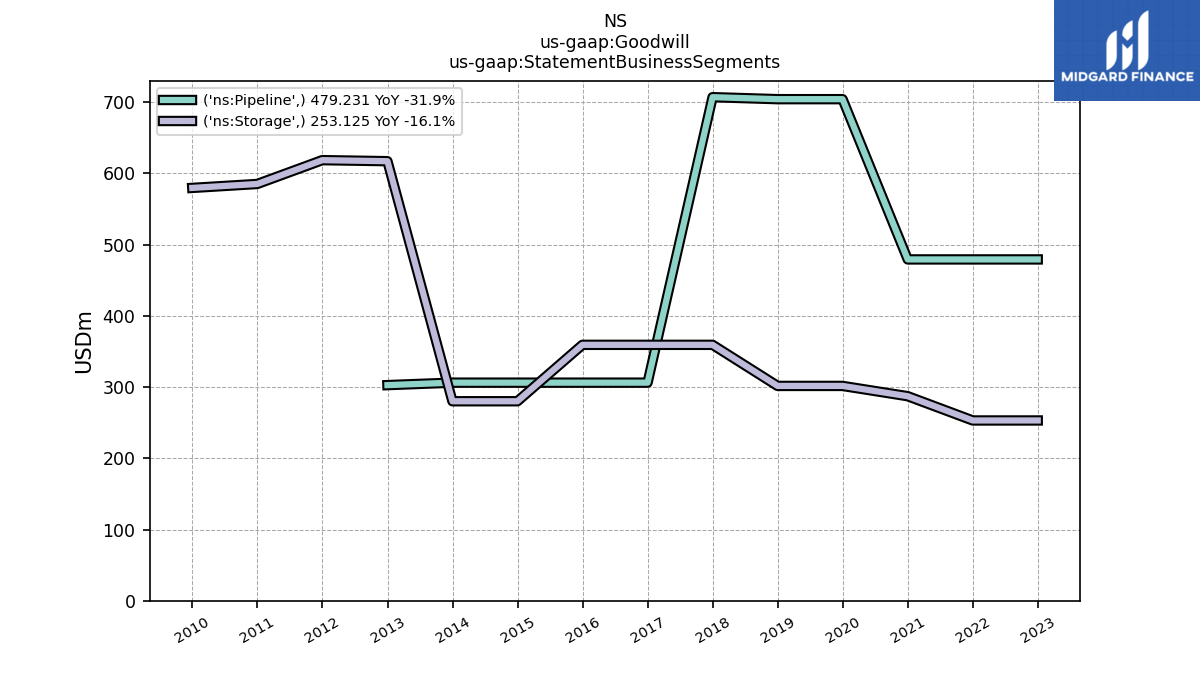
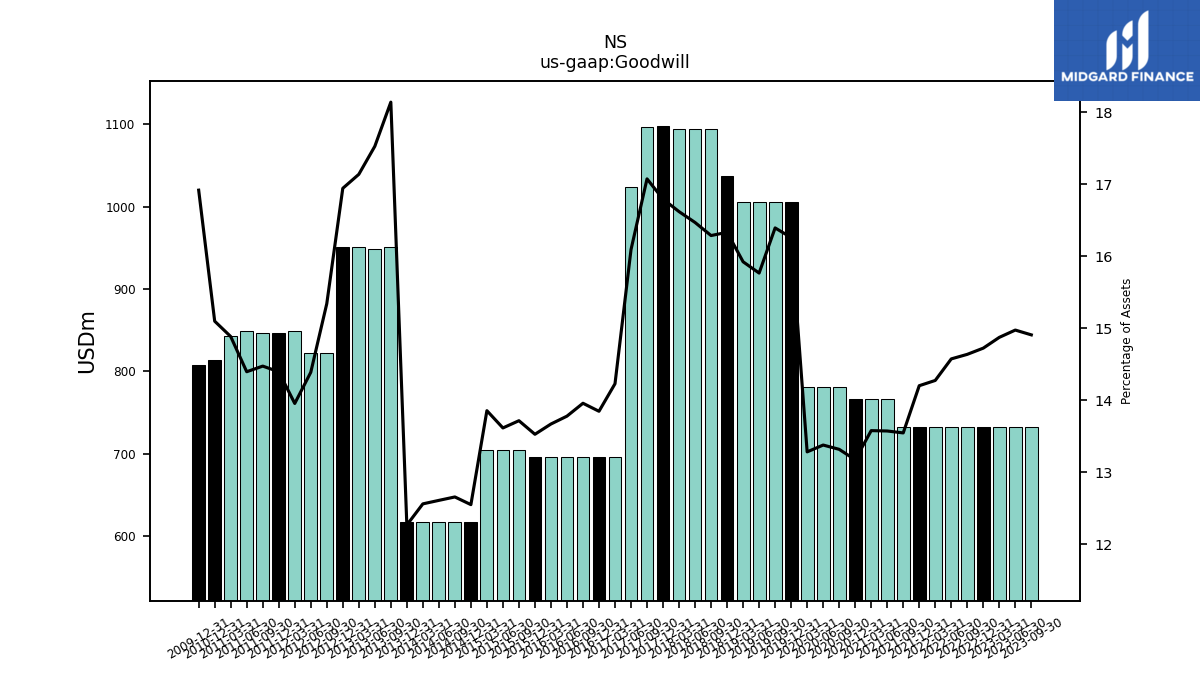
| Goodwill | 732.36 | 732.36 | 732.36 | 732.36 | 732.36 | 732.36 | 732.36 | 732.36 | 766.42 | 766.42 | 766.42 | 780.85 | 780.85 | 780.85 | 1005.85 | 1005.85 | 1005.85 | 1005.85 | 1036.98 | 1094.66 | 1094.66 | 1094.66 | 1097.47 | 1095.94 | 1023.36 | 696.64 | 696.64 | 696.64 | 696.64 | 696.64 | 696.64 | 704.40 | 704.40 | 704.49 | 617.43 | 617.43 | 617.43 | 617.43 | 617.43 | 950.96 | 948.75 | 950.59 | 951.02 | 822.91 | |
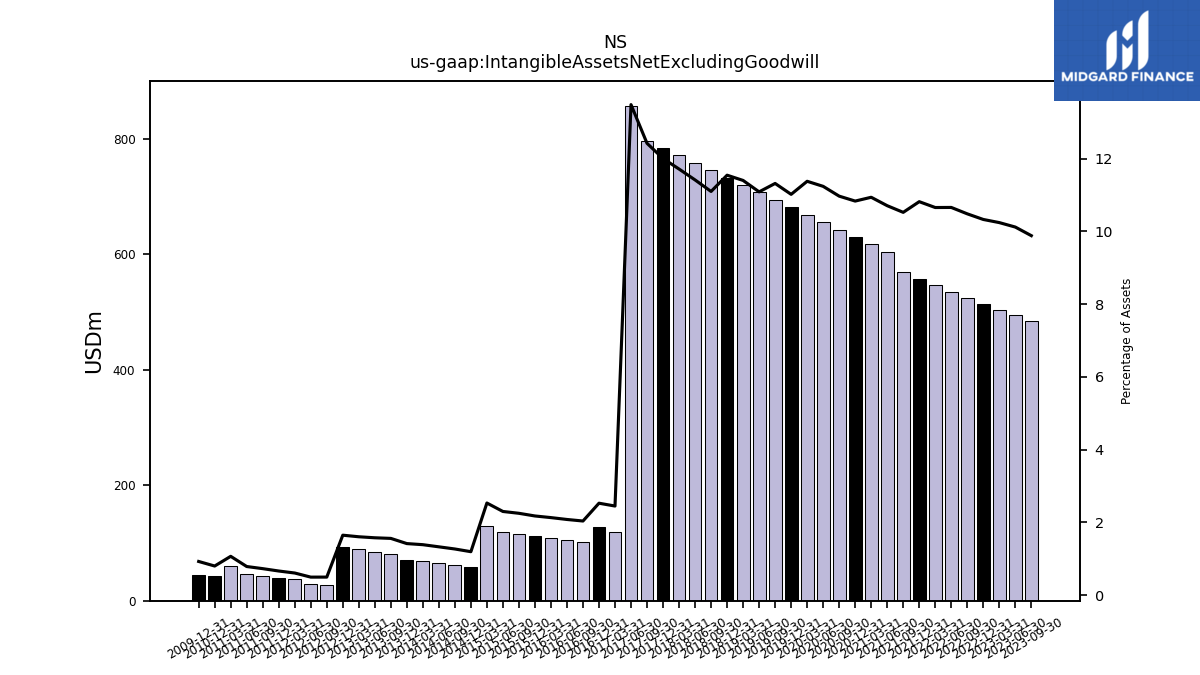
| Intangible Assets Net Excluding Goodwill | 485.47 | 494.88 | 513.70 | 524.47 | 535.57 | 546.68 | 557.78 | 568.89 | 604.50 | 617.35 | 630.21 | 643.06 | 655.92 | 668.78 | 681.63 | 694.49 | 707.34 | 720.20 | 733.06 | 745.91 | 758.77 | 771.62 | 784.48 | 797.34 | 857.62 | 119.86 | 127.08 | 101.63 | 105.09 | 108.55 | 112.01 | 115.47 | 118.93 | 128.70 | 58.67 | 61.81 | 64.96 | 68.10 | 71.25 | 81.71 | 85.28 | 88.94 | 92.44 | 26.52 | |
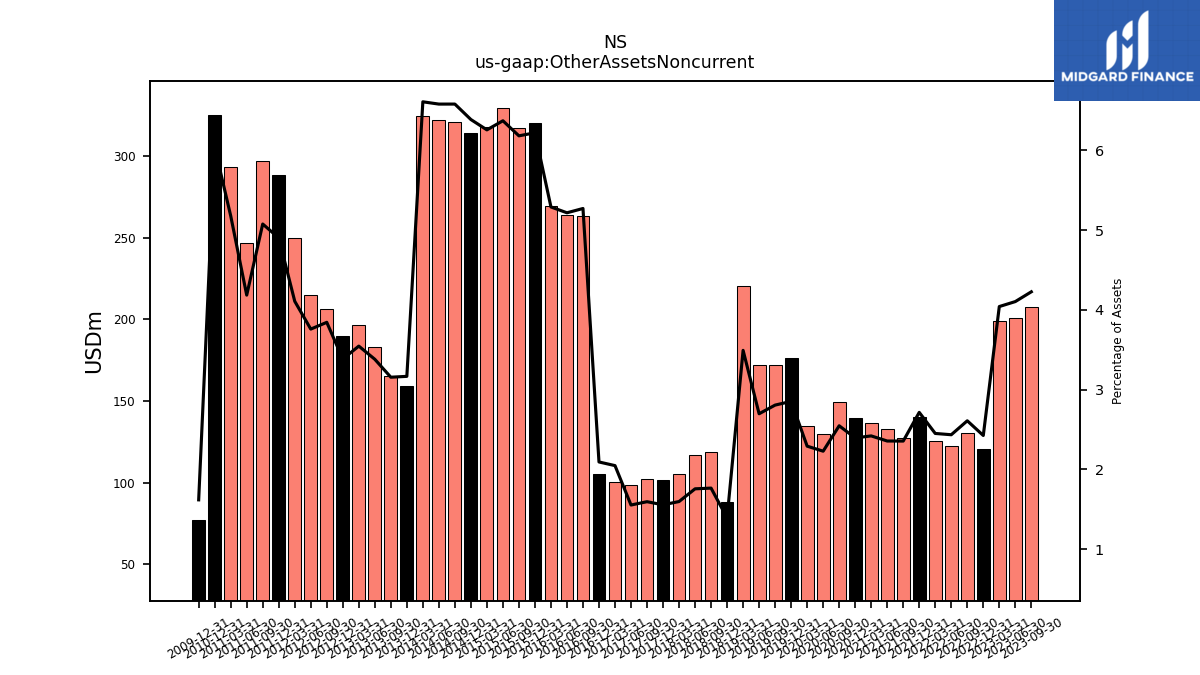
| Other Assets Noncurrent | 207.65 | 200.72 | 120.63 | 130.56 | 122.34 | 125.73 | 140.01 | 127.33 | 133.02 | 136.59 | 139.32 | 149.32 | 130.06 | 134.69 | 176.48 | 172.20 | 172.12 | 220.64 | 88.33 | 118.66 | 116.77 | 105.21 | 101.68 | 102.39 | 98.80 | 100.24 | 105.31 | 263.07 | 263.77 | 269.60 | 320.33 | 317.48 | 329.60 | 318.13 | 314.17 | 320.97 | 322.17 | 324.82 | 159.36 | 165.46 | 183.03 | 196.70 | 189.96 | 206.19 |
| 2023-09-30 | 2023-06-30 | 2022-12-31 | 2022-09-30 | 2022-06-30 | 2022-03-31 | 2021-12-31 | 2021-09-30 | 2021-06-30 | 2021-03-31 | 2020-12-31 | 2020-09-30 | 2020-06-30 | 2020-03-31 | 2019-12-31 | 2019-09-30 | 2019-06-30 | 2019-03-31 | 2018-12-31 | 2018-09-30 | 2018-06-30 | 2018-03-31 | 2017-12-31 | 2017-09-30 | 2017-06-30 | 2017-03-31 | 2016-12-31 | 2016-09-30 | 2016-06-30 | 2016-03-31 | 2015-12-31 | 2015-09-30 | 2015-06-30 | 2015-03-31 | 2014-12-31 | 2014-09-30 | 2014-06-30 | 2014-03-31 | 2013-12-31 | 2013-09-30 | 2013-06-30 | 2013-03-31 | 2012-12-31 | 2012-09-30 | ||
|---|---|---|---|---|---|---|---|---|---|---|---|---|---|---|---|---|---|---|---|---|---|---|---|---|---|---|---|---|---|---|---|---|---|---|---|---|---|---|---|---|---|---|---|---|---|
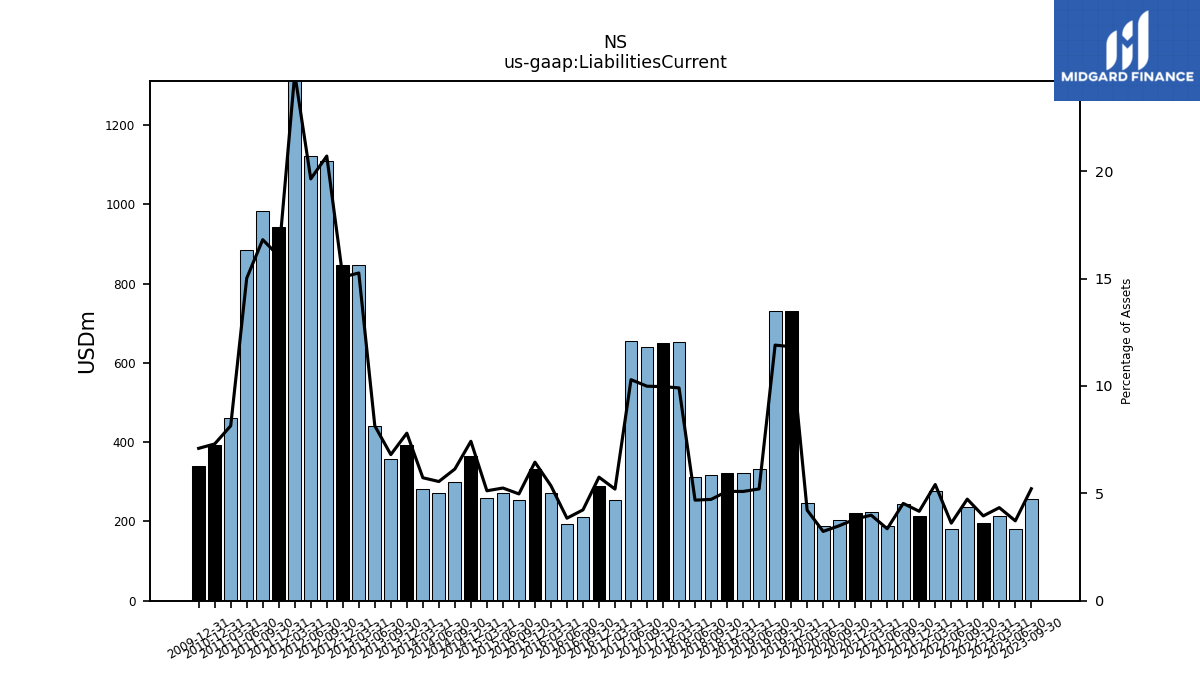
| Liabilities Current | 256.17 | 181.95 | 196.47 | 236.63 | 181.52 | 277.61 | 214.73 | 244.94 | 189.31 | 224.87 | 221.19 | 204.65 | 188.37 | 247.86 | 731.56 | 730.24 | 332.13 | 321.39 | 323.44 | 317.13 | 311.29 | 652.64 | 651.51 | 641.07 | 654.52 | 254.49 | 289.40 | 211.13 | 194.28 | 272.79 | 332.21 | 255.37 | 271.45 | 260.29 | 365.19 | 299.12 | 271.75 | 281.40 | 392.57 | 356.70 | 440.70 | 846.37 | 845.97 | 1110.40 | |
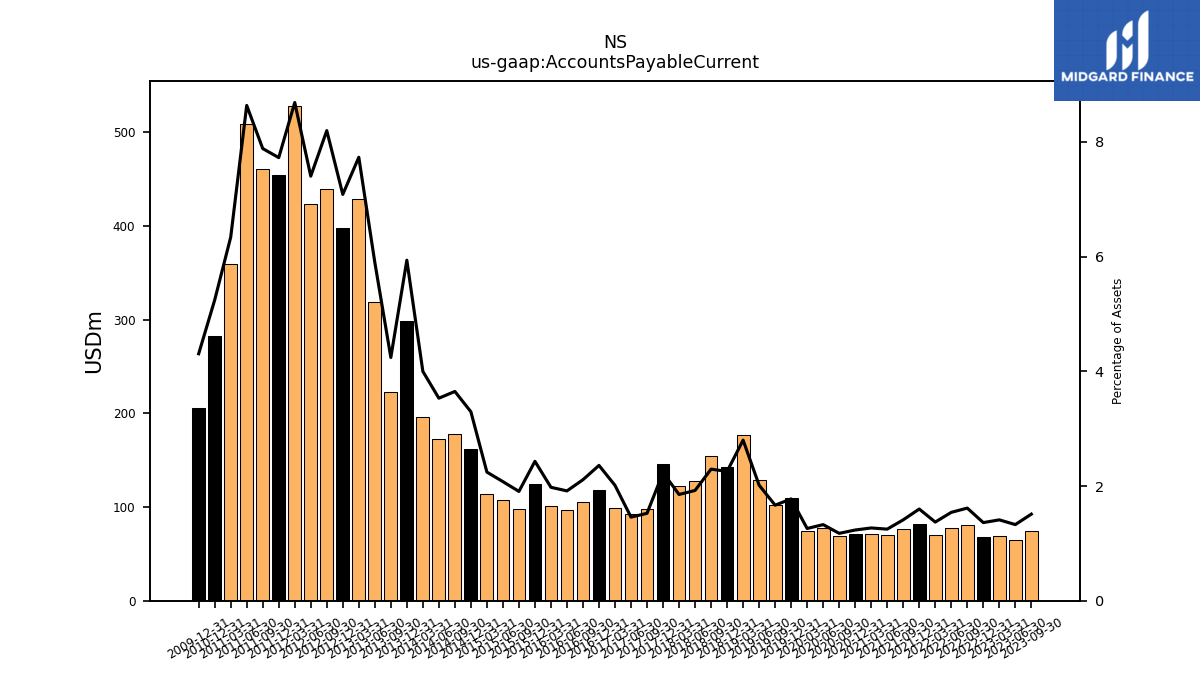
| Accounts Payable Current | 74.17 | 64.94 | 67.77 | 80.81 | 77.44 | 70.36 | 82.45 | 76.26 | 70.48 | 71.62 | 71.73 | 68.87 | 77.46 | 74.03 | 109.83 | 102.21 | 128.55 | 176.87 | 143.12 | 154.21 | 127.80 | 122.04 | 145.93 | 97.85 | 92.67 | 98.48 | 118.69 | 105.31 | 96.81 | 100.78 | 125.15 | 97.88 | 107.41 | 114.03 | 162.06 | 177.96 | 172.87 | 196.53 | 298.75 | 222.36 | 319.36 | 428.84 | 397.63 | 439.62 | |
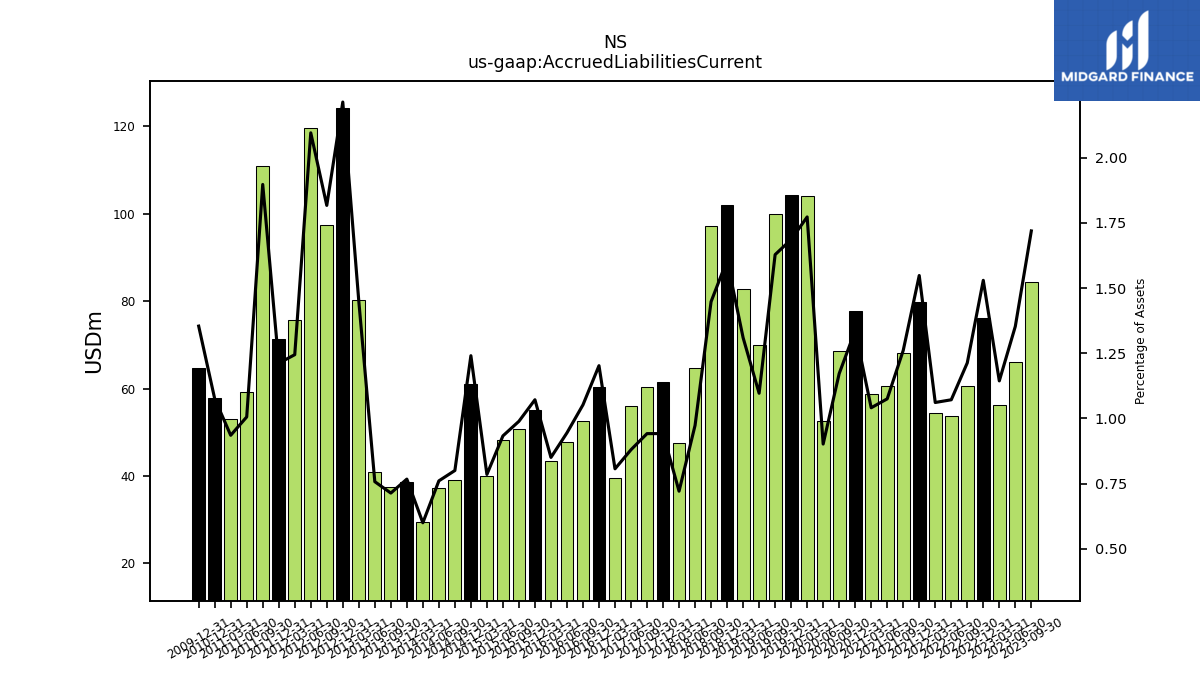
| Accrued Liabilities Current | 84.43 | 66.17 | 76.07 | 60.69 | 53.85 | 54.45 | 79.82 | 68.16 | 60.71 | 58.76 | 77.77 | 68.70 | 52.65 | 104.18 | 104.28 | 99.89 | 69.97 | 82.73 | 101.99 | 97.30 | 64.72 | 47.52 | 61.58 | 60.47 | 55.99 | 39.51 | 60.48 | 52.52 | 47.78 | 43.35 | 55.19 | 50.80 | 48.28 | 39.94 | 61.02 | 39.05 | 37.26 | 29.51 | 38.63 | 37.44 | 41.03 | 80.40 | 124.20 | 97.44 | |
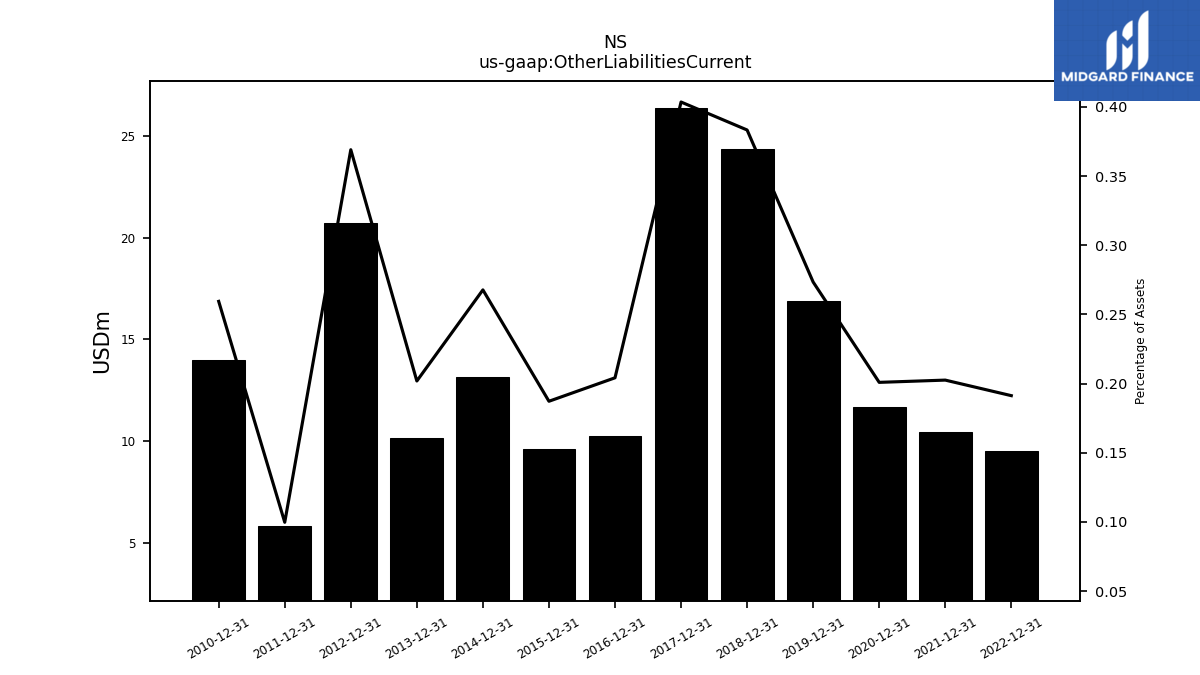
| Other Liabilities Current | NA | NA | 9.51 | NA | NA | NA | 10.44 | NA | NA | NA | 11.69 | NA | NA | NA | 16.91 | NA | NA | NA | 24.34 | NA | NA | NA | 26.37 | NA | NA | NA | 10.27 | NA | NA | NA | 9.64 | NA | NA | NA | 13.17 | NA | NA | NA | 10.16 | NA | NA | NA | 20.71 | NA | |
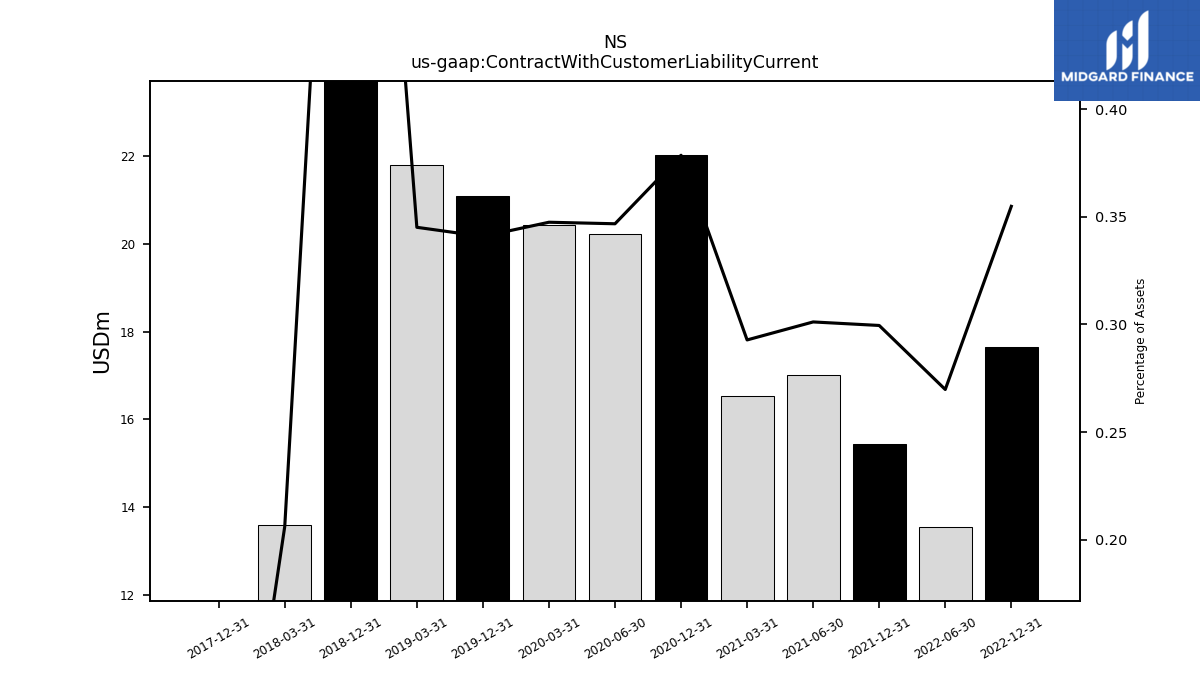
| Contract With Customer Liability Current | NA | NA | 17.65 | NA | 13.55 | NA | 15.44 | NA | 17.00 | 16.52 | 22.02 | NA | 20.23 | 20.42 | 21.08 | NA | NA | 21.80 | 46.94 | NA | NA | 13.58 | 0.00 | NA | NA | NA | NA | NA | NA | NA | NA | NA | NA | NA | NA | NA | NA | NA | NA | NA | NA | NA | NA | NA |
| 2023-09-30 | 2023-06-30 | 2022-12-31 | 2022-09-30 | 2022-06-30 | 2022-03-31 | 2021-12-31 | 2021-09-30 | 2021-06-30 | 2021-03-31 | 2020-12-31 | 2020-09-30 | 2020-06-30 | 2020-03-31 | 2019-12-31 | 2019-09-30 | 2019-06-30 | 2019-03-31 | 2018-12-31 | 2018-09-30 | 2018-06-30 | 2018-03-31 | 2017-12-31 | 2017-09-30 | 2017-06-30 | 2017-03-31 | 2016-12-31 | 2016-09-30 | 2016-06-30 | 2016-03-31 | 2015-12-31 | 2015-09-30 | 2015-06-30 | 2015-03-31 | 2014-12-31 | 2014-09-30 | 2014-06-30 | 2014-03-31 | 2013-12-31 | 2013-09-30 | 2013-06-30 | 2013-03-31 | 2012-12-31 | 2012-09-30 | ||
|---|---|---|---|---|---|---|---|---|---|---|---|---|---|---|---|---|---|---|---|---|---|---|---|---|---|---|---|---|---|---|---|---|---|---|---|---|---|---|---|---|---|---|---|---|---|
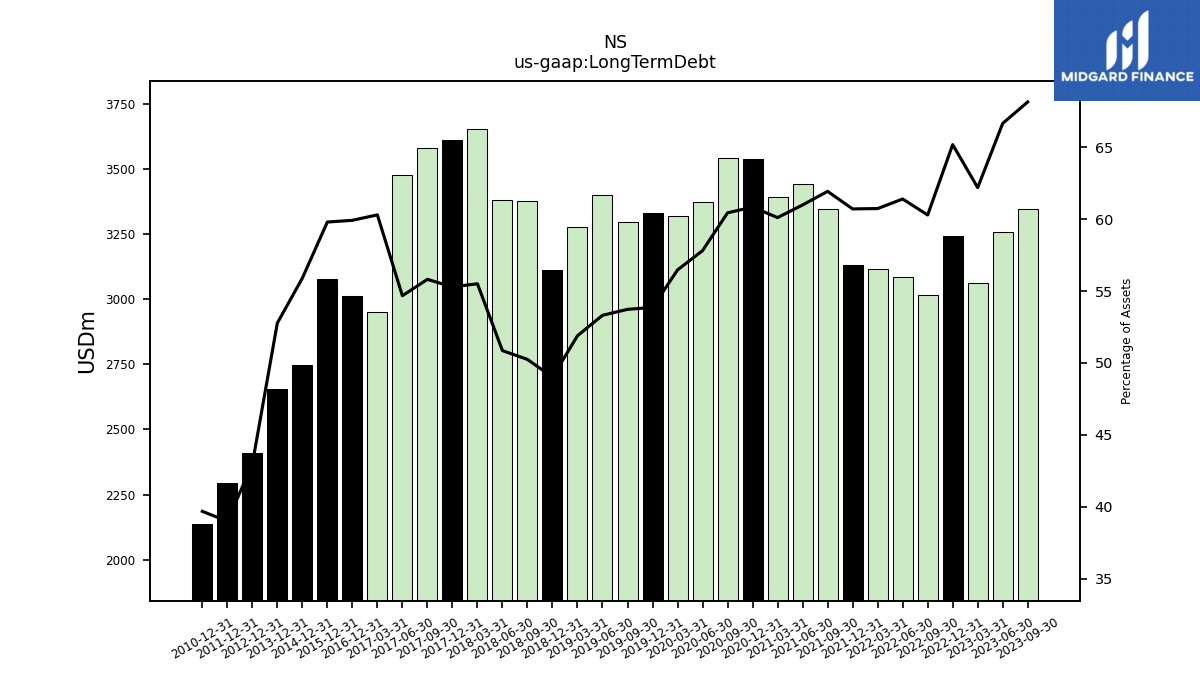
| Long Term Debt | 3348.01 | 3260.20 | 3242.29 | 3016.44 | 3085.32 | 3115.91 | 3130.62 | 3347.96 | 3443.53 | 3392.62 | 3539.26 | 3543.31 | 3374.06 | 3319.25 | 3331.84 | 3296.61 | 3401.22 | 3277.83 | 3112.00 | 3376.85 | 3380.37 | 3656.07 | 3613.06 | 3582.61 | 3476.94 | 2951.98 | 3014.36 | NA | NA | NA | 3079.35 | NA | NA | NA | 2749.45 | NA | NA | NA | 2655.55 | NA | NA | NA | 2411.00 | NA | |
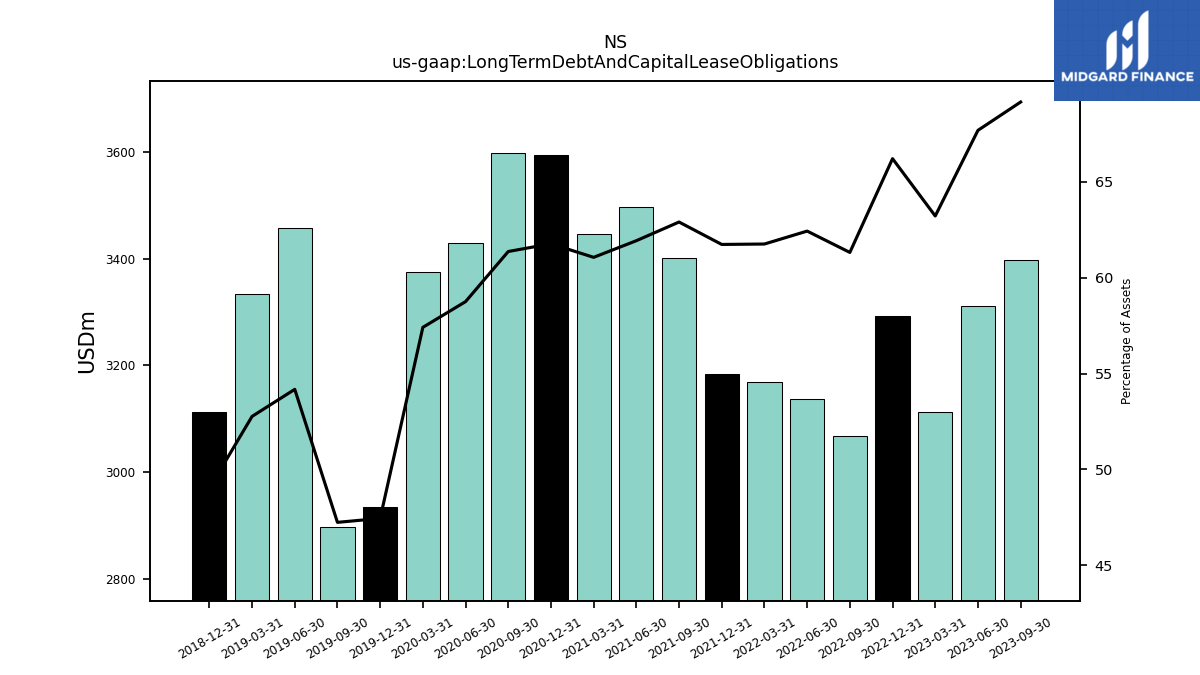
| Long Term Debt And Capital Lease Obligations | 3398.01 | 3310.56 | 3293.41 | 3068.05 | 3137.28 | 3168.43 | 3183.55 | 3400.79 | 3496.93 | 3446.60 | 3593.50 | 3597.82 | 3429.16 | 3374.75 | 2934.92 | 2898.48 | 3456.46 | 3333.22 | 3112.00 | NA | NA | NA | NA | NA | NA | NA | NA | NA | NA | NA | NA | NA | NA | NA | NA | NA | NA | NA | NA | NA | NA | NA | NA | NA | |
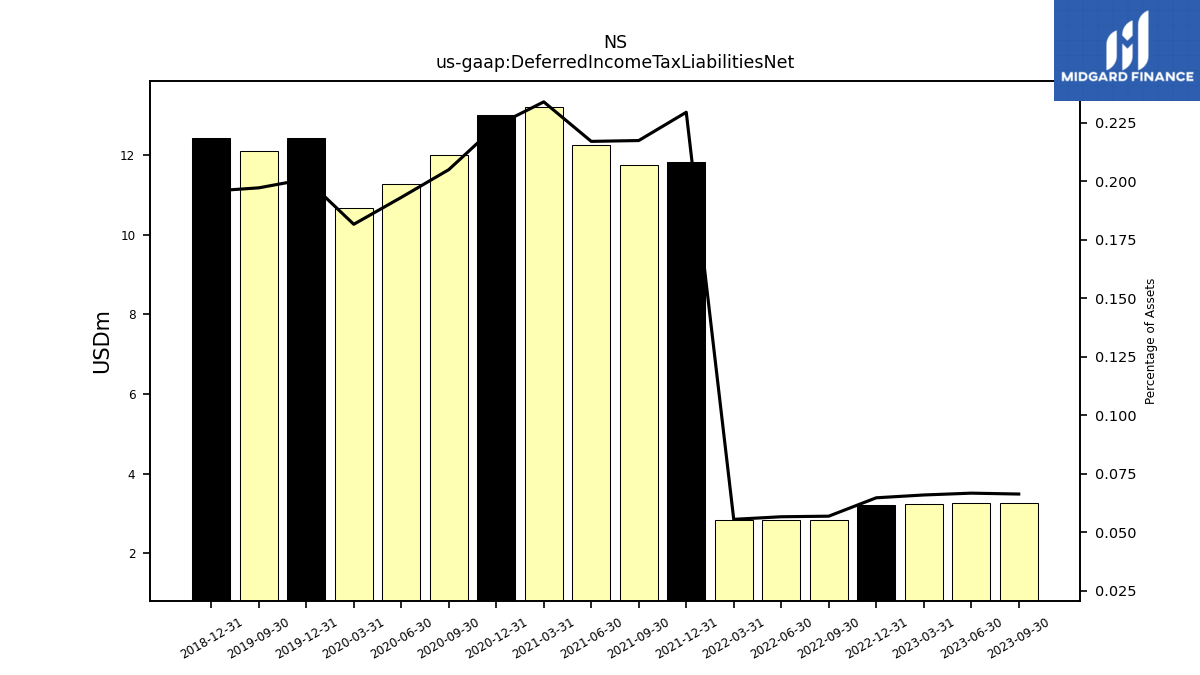
| Deferred Income Tax Liabilities Net | 3.26 | 3.26 | 3.22 | 2.85 | 2.85 | 2.85 | 11.83 | 11.75 | 12.25 | 13.20 | 13.01 | 12.01 | 11.27 | 10.67 | 12.43 | 12.10 | NA | NA | 12.43 | NA | NA | NA | NA | NA | NA | NA | NA | NA | NA | NA | NA | NA | NA | NA | NA | NA | NA | NA | NA | NA | NA | NA | NA | NA | |
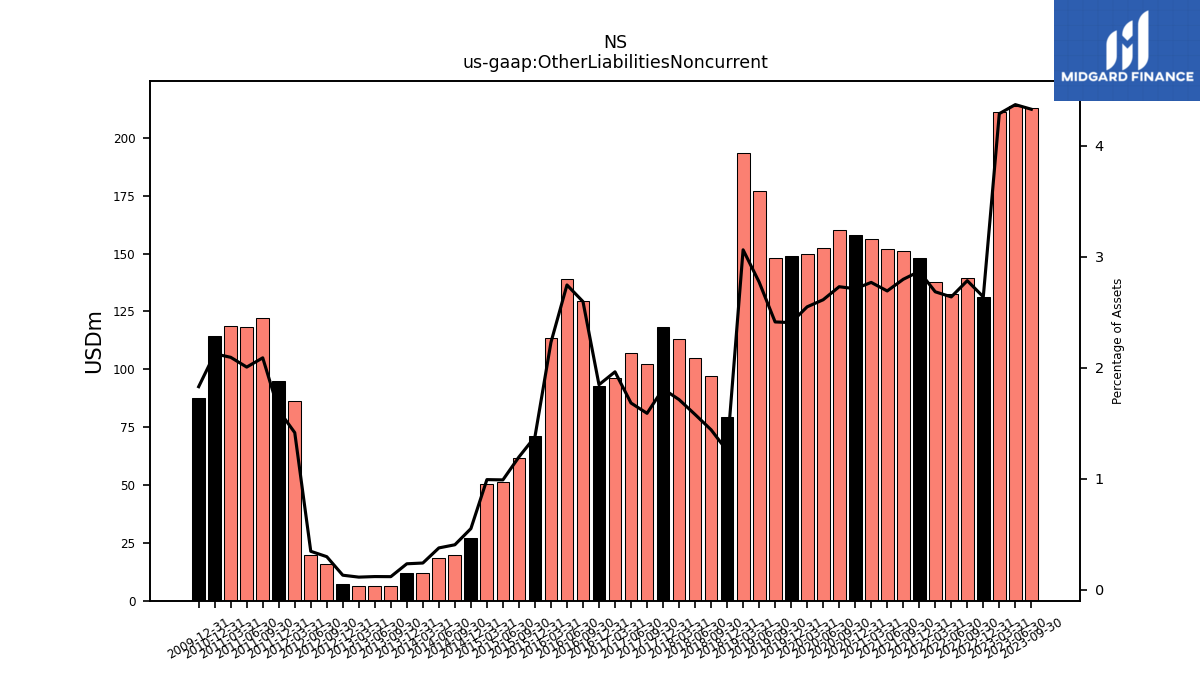
| Other Liabilities Noncurrent | 212.74 | 213.83 | 131.30 | 139.37 | 132.63 | 137.76 | 147.96 | 151.26 | 152.05 | 156.34 | 157.82 | 160.11 | 152.54 | 149.89 | 148.94 | 148.11 | 176.95 | 193.54 | 79.56 | 96.91 | 105.01 | 112.89 | 118.30 | 102.07 | 107.03 | 96.16 | 92.96 | 129.61 | 138.87 | 113.62 | 70.97 | 61.45 | 51.23 | 50.47 | 27.10 | 19.77 | 18.46 | 11.84 | 11.78 | 6.19 | 6.44 | 6.31 | 7.36 | 15.99 | |
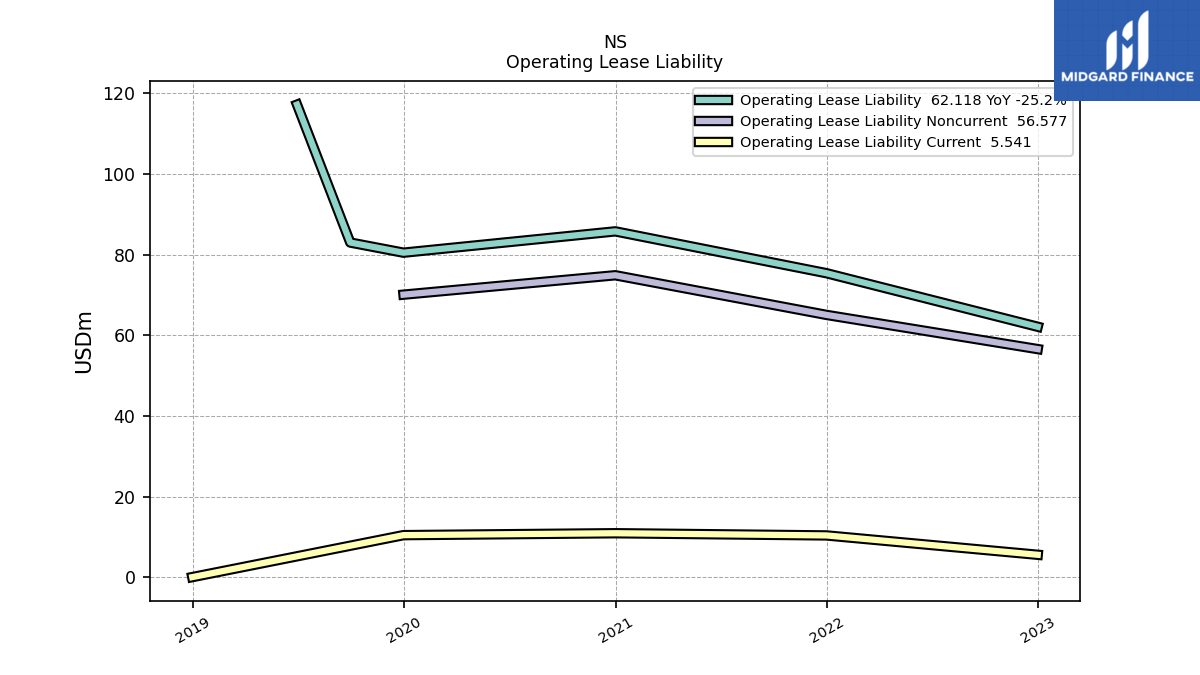
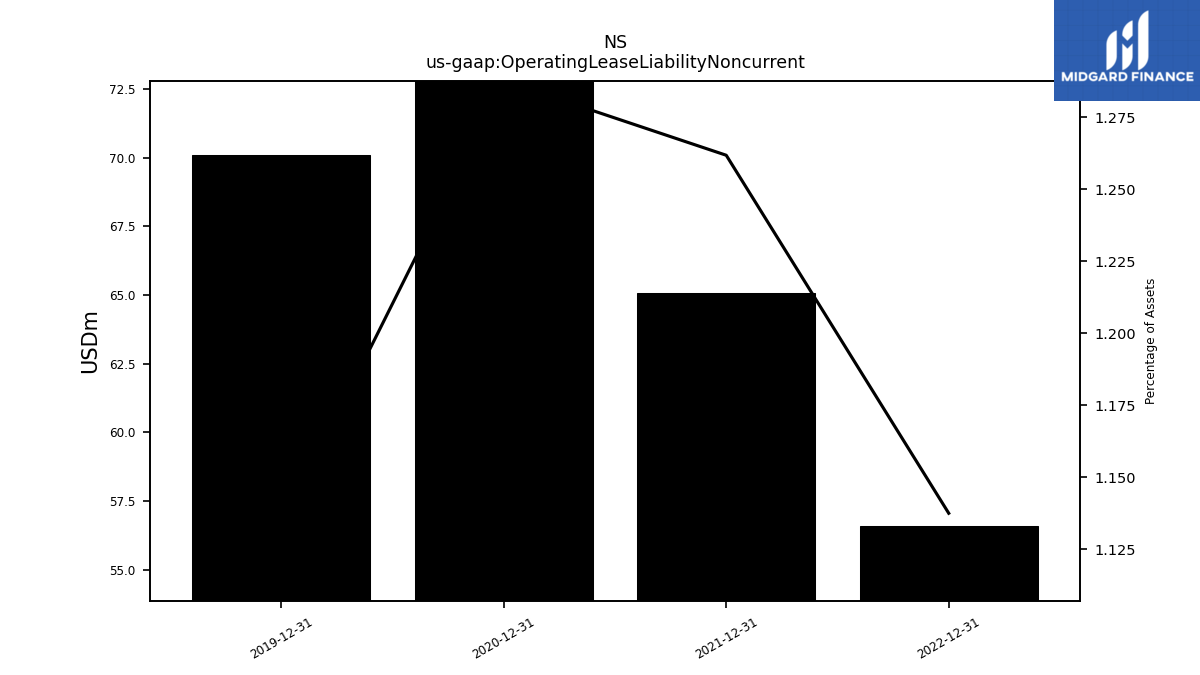
| Operating Lease Liability Noncurrent | NA | NA | 56.58 | NA | NA | NA | 65.06 | NA | NA | NA | 74.90 | NA | NA | NA | 70.08 | NA | NA | NA | NA | NA | NA | NA | NA | NA | NA | NA | NA | NA | NA | NA | NA | NA | NA | NA | NA | NA | NA | NA | NA | NA | NA | NA | NA | NA |
| 2023-09-30 | 2023-06-30 | 2022-12-31 | 2022-09-30 | 2022-06-30 | 2022-03-31 | 2021-12-31 | 2021-09-30 | 2021-06-30 | 2021-03-31 | 2020-12-31 | 2020-09-30 | 2020-06-30 | 2020-03-31 | 2019-12-31 | 2019-09-30 | 2019-06-30 | 2019-03-31 | 2018-12-31 | 2018-09-30 | 2018-06-30 | 2018-03-31 | 2017-12-31 | 2017-09-30 | 2017-06-30 | 2017-03-31 | 2016-12-31 | 2016-09-30 | 2016-06-30 | 2016-03-31 | 2015-12-31 | 2015-09-30 | 2015-06-30 | 2015-03-31 | 2014-12-31 | 2014-09-30 | 2014-06-30 | 2014-03-31 | 2013-12-31 | 2013-09-30 | 2013-06-30 | 2013-03-31 | 2012-12-31 | 2012-09-30 | ||
|---|---|---|---|---|---|---|---|---|---|---|---|---|---|---|---|---|---|---|---|---|---|---|---|---|---|---|---|---|---|---|---|---|---|---|---|---|---|---|---|---|---|---|---|---|---|
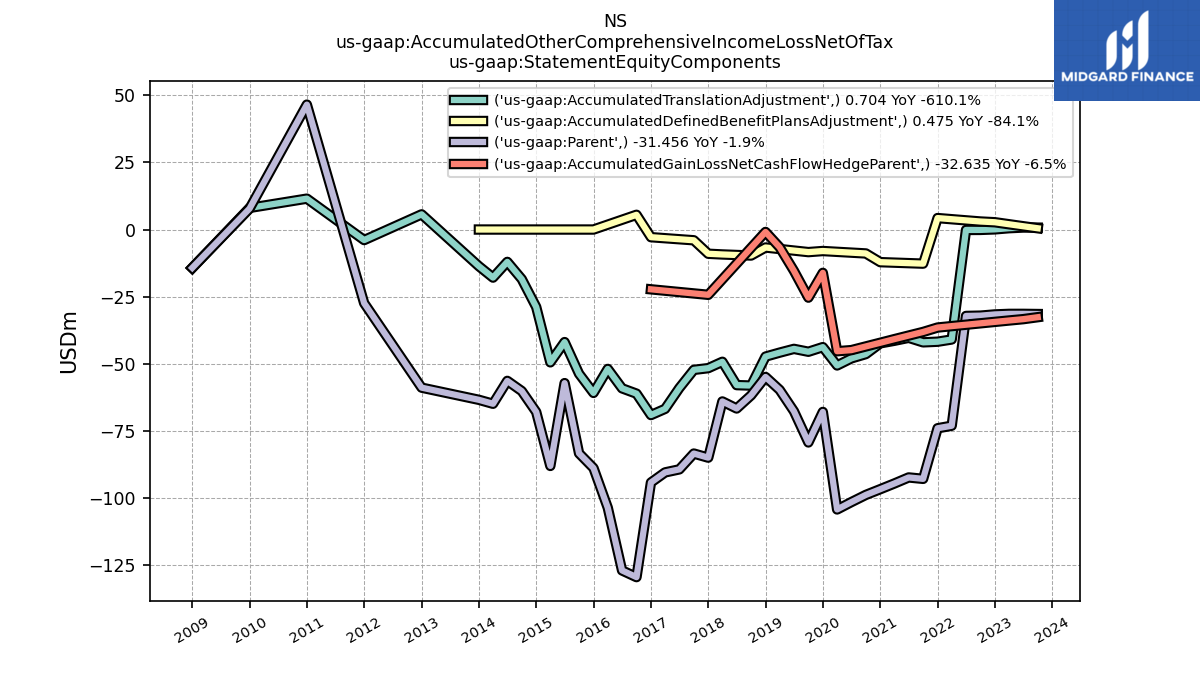
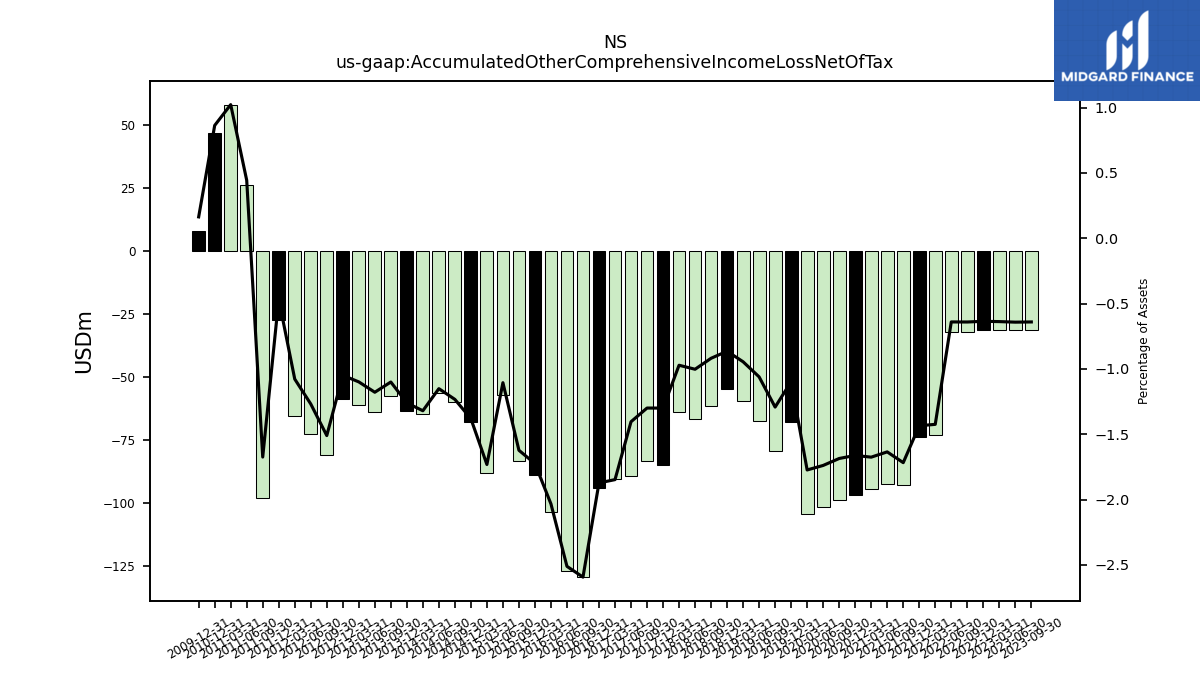
| Accumulated Other Comprehensive Income Loss Net Of Tax | -31.46 | -31.39 | -31.61 | -32.06 | -32.17 | -73.05 | -73.98 | -92.82 | -92.29 | -94.54 | -96.66 | -98.79 | -101.45 | -104.21 | -67.90 | -79.26 | -67.66 | -59.70 | -54.88 | -61.72 | -66.62 | -64.00 | -84.93 | -83.39 | -89.28 | -90.41 | -94.18 | -129.40 | -126.91 | -103.57 | -88.79 | -83.31 | -57.17 | -88.01 | -67.91 | -60.13 | -56.34 | -64.87 | -63.39 | -57.66 | -63.79 | -60.97 | -58.87 | -80.98 |
| 2023-09-30 | 2023-06-30 | 2022-12-31 | 2022-09-30 | 2022-06-30 | 2022-03-31 | 2021-12-31 | 2021-09-30 | 2021-06-30 | 2021-03-31 | 2020-12-31 | 2020-09-30 | 2020-06-30 | 2020-03-31 | 2019-12-31 | 2019-09-30 | 2019-06-30 | 2019-03-31 | 2018-12-31 | 2018-09-30 | 2018-06-30 | 2018-03-31 | 2017-12-31 | 2017-09-30 | 2017-06-30 | 2017-03-31 | 2016-12-31 | 2016-09-30 | 2016-06-30 | 2016-03-31 | 2015-12-31 | 2015-09-30 | 2015-06-30 | 2015-03-31 | 2014-12-31 | 2014-09-30 | 2014-06-30 | 2014-03-31 | 2013-12-31 | 2013-09-30 | 2013-06-30 | 2013-03-31 | 2012-12-31 | 2012-09-30 | ||
|---|---|---|---|---|---|---|---|---|---|---|---|---|---|---|---|---|---|---|---|---|---|---|---|---|---|---|---|---|---|---|---|---|---|---|---|---|---|---|---|---|---|---|---|---|---|
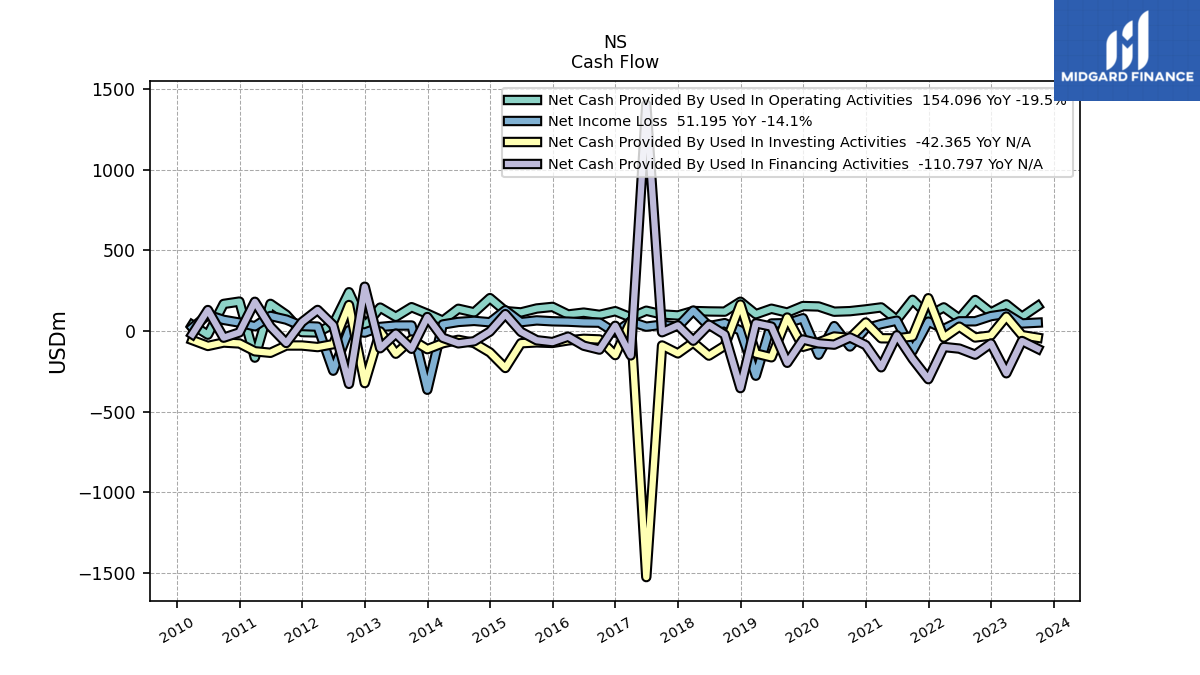
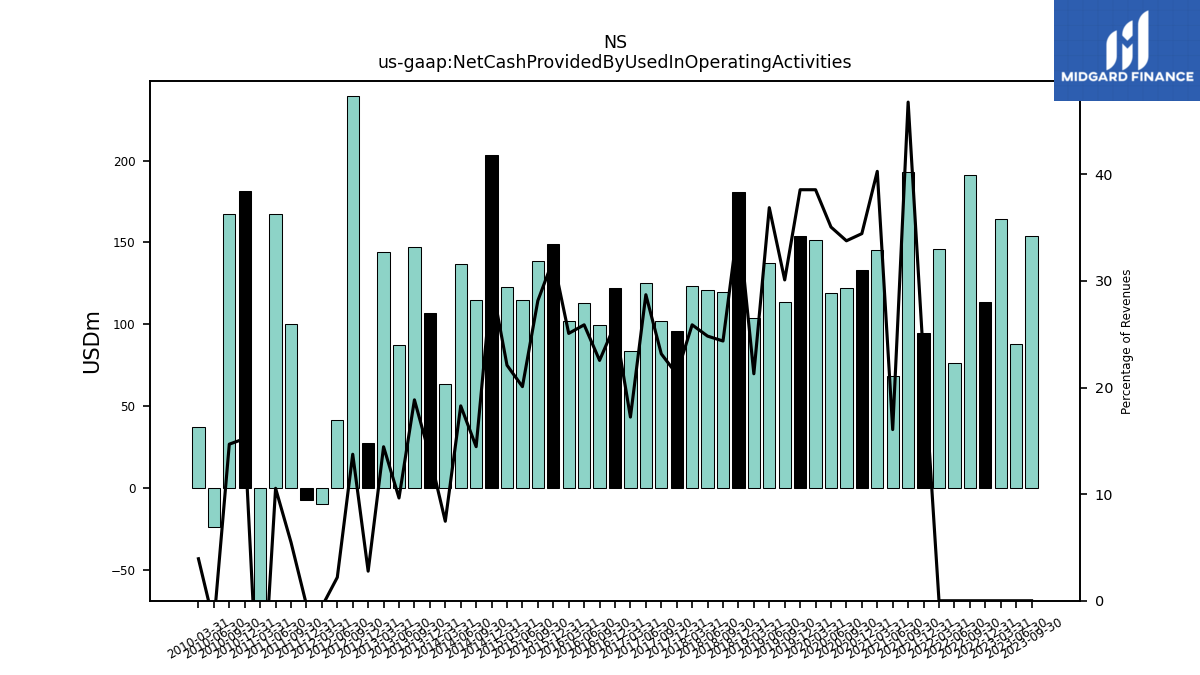
| Net Cash Provided By Used In Operating Activities | 154.10 | 87.72 | 113.77 | 191.49 | 76.46 | 145.83 | 94.38 | 192.86 | 68.58 | 145.66 | 133.14 | 122.42 | 119.01 | 151.43 | 154.10 | 113.77 | 137.33 | 103.57 | 180.89 | 119.47 | 120.69 | 123.16 | 95.78 | 102.03 | 125.01 | 83.98 | 122.21 | 99.52 | 113.31 | 101.73 | 148.81 | 138.94 | 114.61 | 122.58 | 203.33 | 114.81 | 137.06 | 63.33 | 106.68 | 146.99 | 87.16 | 144.40 | 27.32 | 239.76 | |
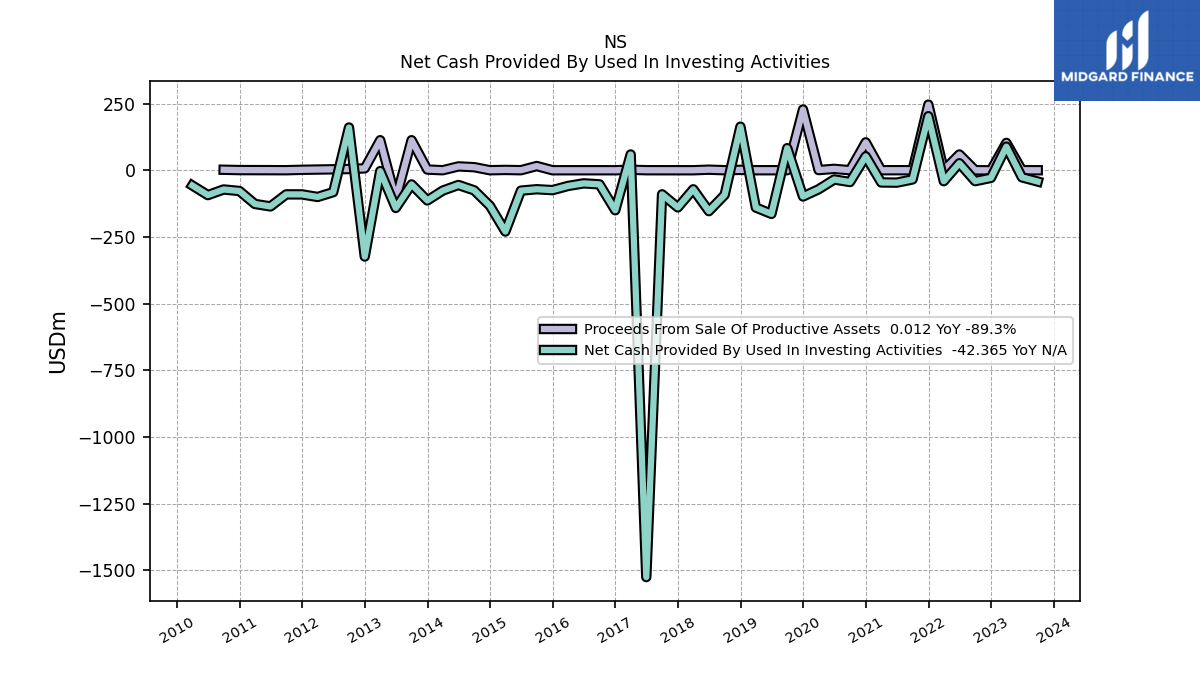
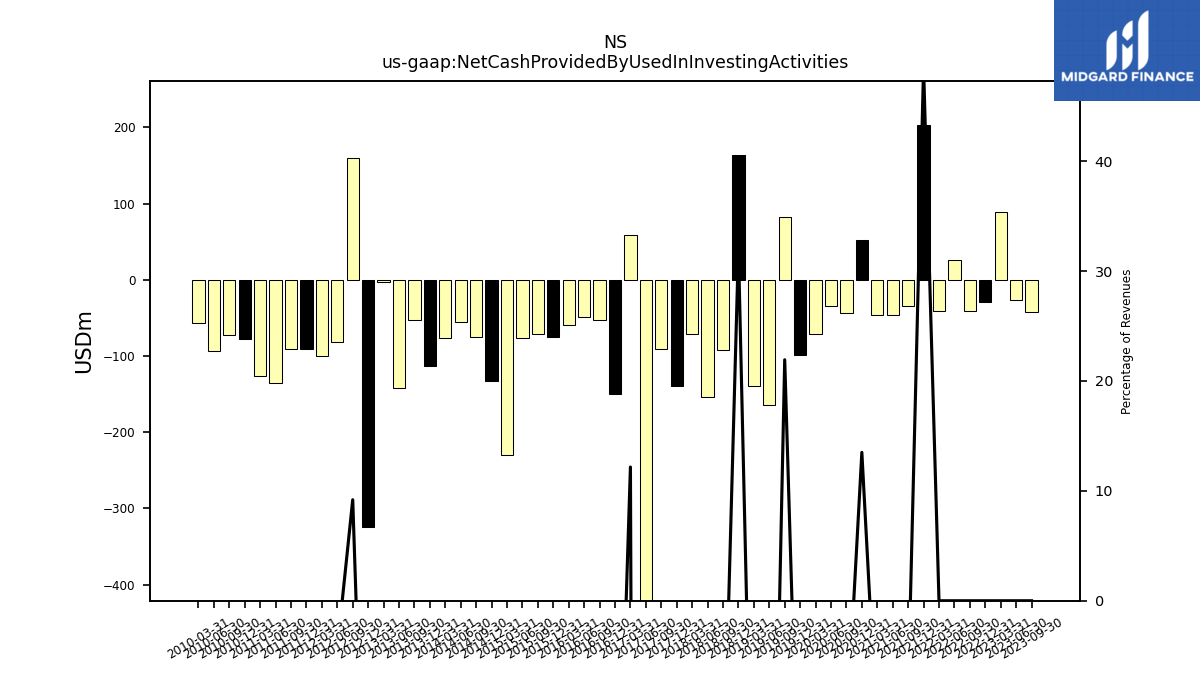
| Net Cash Provided By Used In Investing Activities | -42.37 | -26.59 | -28.66 | -40.90 | 26.30 | -41.10 | 202.70 | -34.48 | -46.45 | -45.78 | 52.22 | -44.22 | -34.66 | -71.42 | -98.49 | 82.91 | -163.72 | -139.95 | 163.44 | -92.39 | -153.37 | -71.45 | -139.40 | -90.29 | -1526.06 | 59.31 | -150.16 | -52.88 | -49.20 | -58.84 | -74.59 | -71.22 | -76.38 | -229.84 | -133.39 | -75.25 | -55.27 | -76.33 | -113.24 | -53.14 | -141.46 | -3.12 | -323.77 | 160.39 | |
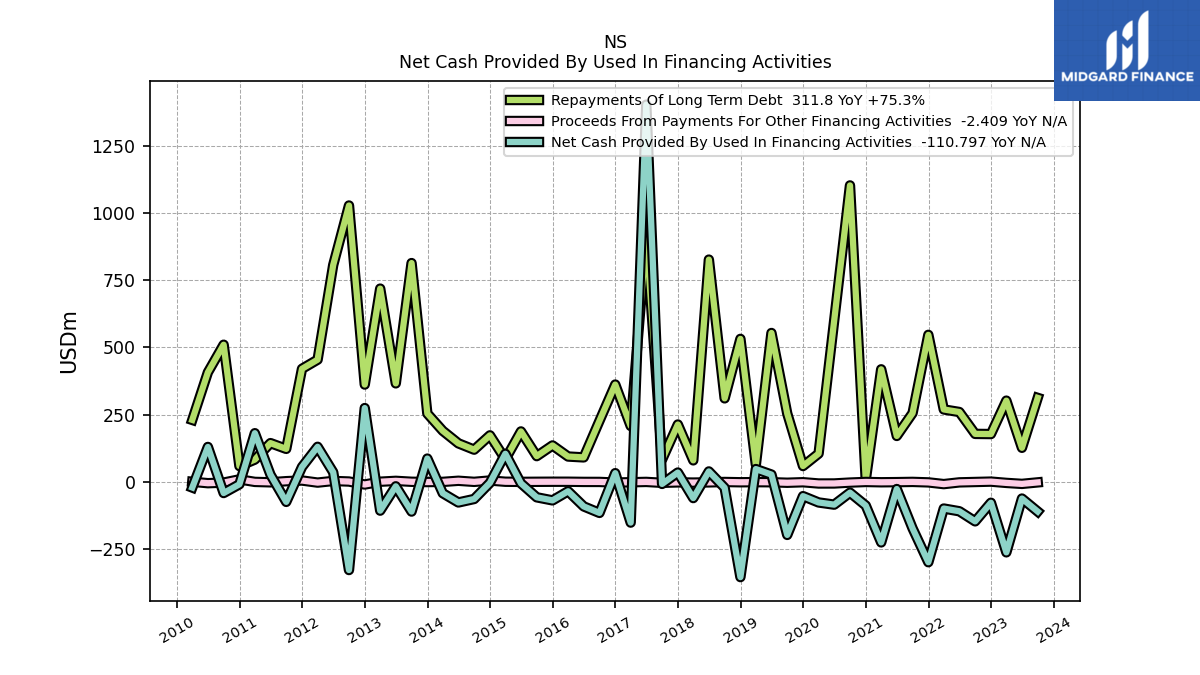
| Net Cash Provided By Used In Financing Activities | -110.80 | -62.52 | -78.06 | -147.35 | -109.83 | -99.71 | -299.34 | -173.39 | -27.12 | -225.73 | -88.52 | -40.55 | -85.23 | -77.09 | -53.55 | -197.86 | 26.64 | 47.12 | -354.77 | -22.55 | 38.30 | -60.85 | 34.21 | -8.30 | 1402.41 | -152.05 | 31.91 | -116.00 | -91.75 | -35.48 | -69.37 | -57.94 | -5.93 | 104.01 | -4.14 | -64.23 | -77.12 | -42.70 | 86.14 | -110.95 | -16.98 | -107.57 | 274.03 | -328.45 |
| 2023-09-30 | 2023-06-30 | 2022-12-31 | 2022-09-30 | 2022-06-30 | 2022-03-31 | 2021-12-31 | 2021-09-30 | 2021-06-30 | 2021-03-31 | 2020-12-31 | 2020-09-30 | 2020-06-30 | 2020-03-31 | 2019-12-31 | 2019-09-30 | 2019-06-30 | 2019-03-31 | 2018-12-31 | 2018-09-30 | 2018-06-30 | 2018-03-31 | 2017-12-31 | 2017-09-30 | 2017-06-30 | 2017-03-31 | 2016-12-31 | 2016-09-30 | 2016-06-30 | 2016-03-31 | 2015-12-31 | 2015-09-30 | 2015-06-30 | 2015-03-31 | 2014-12-31 | 2014-09-30 | 2014-06-30 | 2014-03-31 | 2013-12-31 | 2013-09-30 | 2013-06-30 | 2013-03-31 | 2012-12-31 | 2012-09-30 | ||
|---|---|---|---|---|---|---|---|---|---|---|---|---|---|---|---|---|---|---|---|---|---|---|---|---|---|---|---|---|---|---|---|---|---|---|---|---|---|---|---|---|---|---|---|---|---|
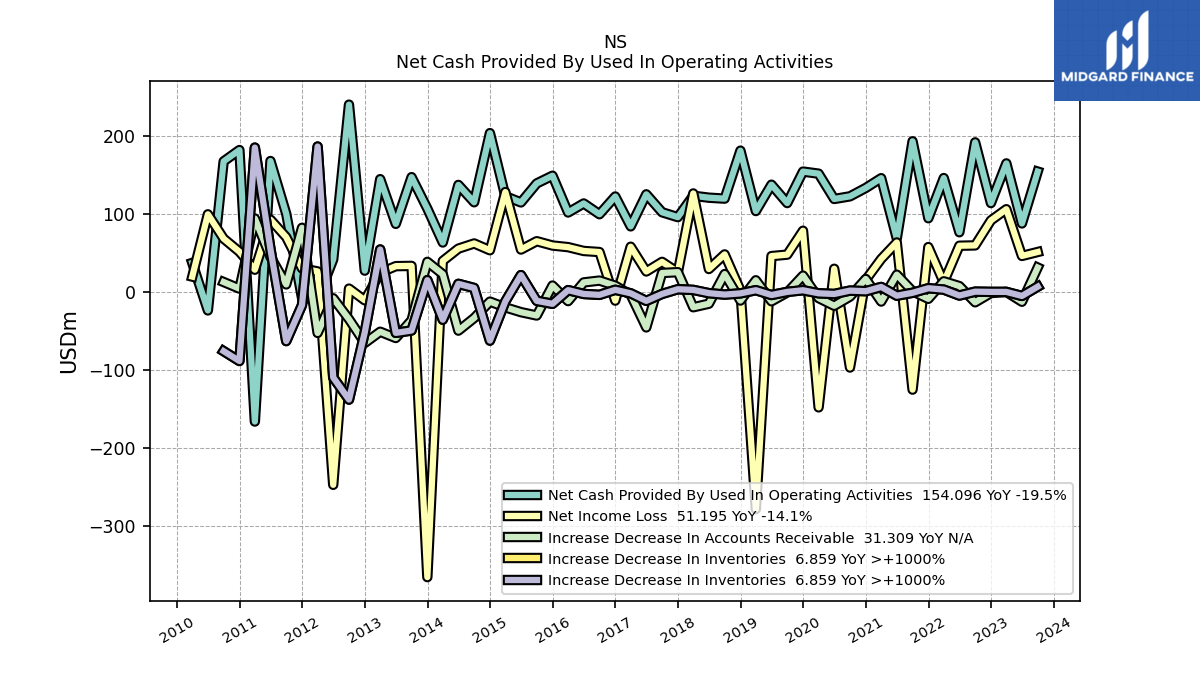
| Net Cash Provided By Used In Operating Activities | 154.10 | 87.72 | 113.77 | 191.49 | 76.46 | 145.83 | 94.38 | 192.86 | 68.58 | 145.66 | 133.14 | 122.42 | 119.01 | 151.43 | 154.10 | 113.77 | 137.33 | 103.57 | 180.89 | 119.47 | 120.69 | 123.16 | 95.78 | 102.03 | 125.01 | 83.98 | 122.21 | 99.52 | 113.31 | 101.73 | 148.81 | 138.94 | 114.61 | 122.58 | 203.33 | 114.81 | 137.06 | 63.33 | 106.68 | 146.99 | 87.16 | 144.40 | 27.32 | 239.76 | |
| Net Income Loss | 51.20 | 46.14 | 91.60 | 59.63 | 59.20 | 12.31 | 57.52 | -124.93 | 63.38 | 42.26 | 15.53 | -96.64 | 29.77 | -147.64 | 78.41 | 47.81 | 45.95 | -277.86 | 2.13 | 48.14 | 29.40 | 126.13 | 25.18 | 38.59 | 26.25 | 57.94 | -11.06 | 51.14 | 52.52 | 57.40 | 59.48 | 65.02 | 54.33 | 127.90 | 53.39 | 62.12 | 55.51 | 39.74 | -364.82 | 33.40 | 33.09 | 24.57 | -10.62 | 4.39 | |
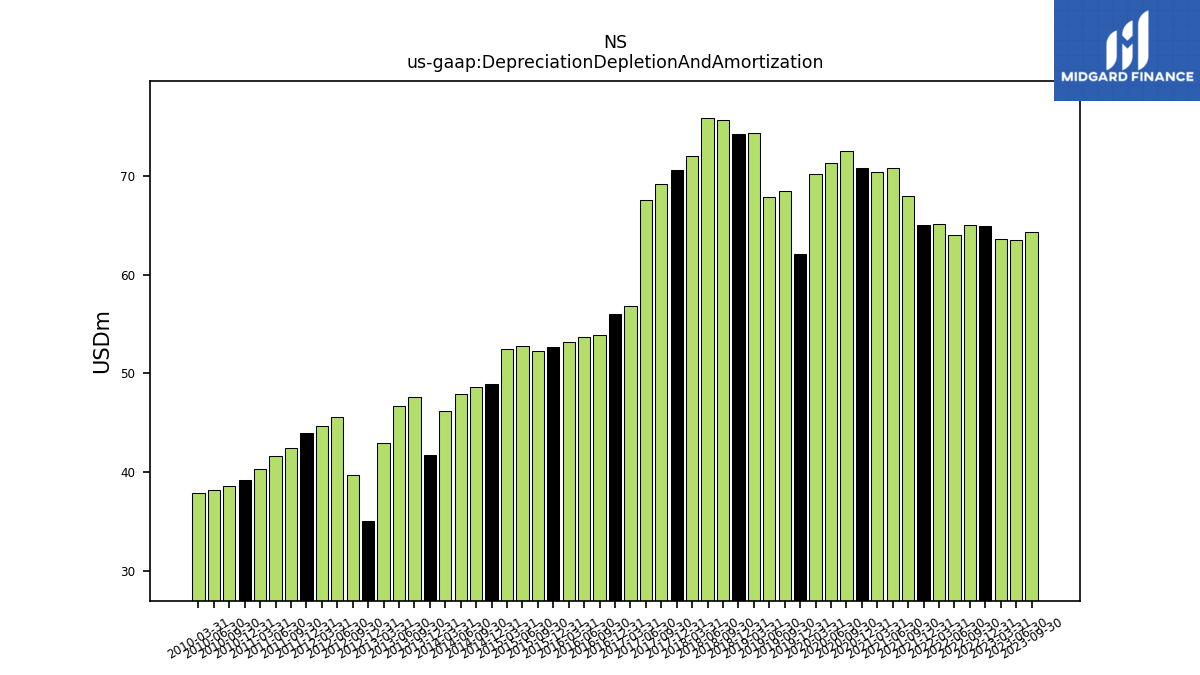
| Depreciation Depletion And Amortization | 64.30 | 63.57 | 64.97 | 65.08 | 64.06 | 65.13 | 65.03 | 68.01 | 70.88 | 70.47 | 70.88 | 72.58 | 71.39 | 70.25 | 62.09 | 68.55 | 67.88 | 74.41 | 74.30 | 75.70 | 75.86 | 72.02 | 70.59 | 69.18 | 67.60 | 56.86 | 56.00 | 53.95 | 53.65 | 53.14 | 52.69 | 52.30 | 52.77 | 52.46 | 48.94 | 48.60 | 47.94 | 46.23 | 41.74 | 47.60 | 46.66 | 42.93 | 35.08 | 39.69 | |
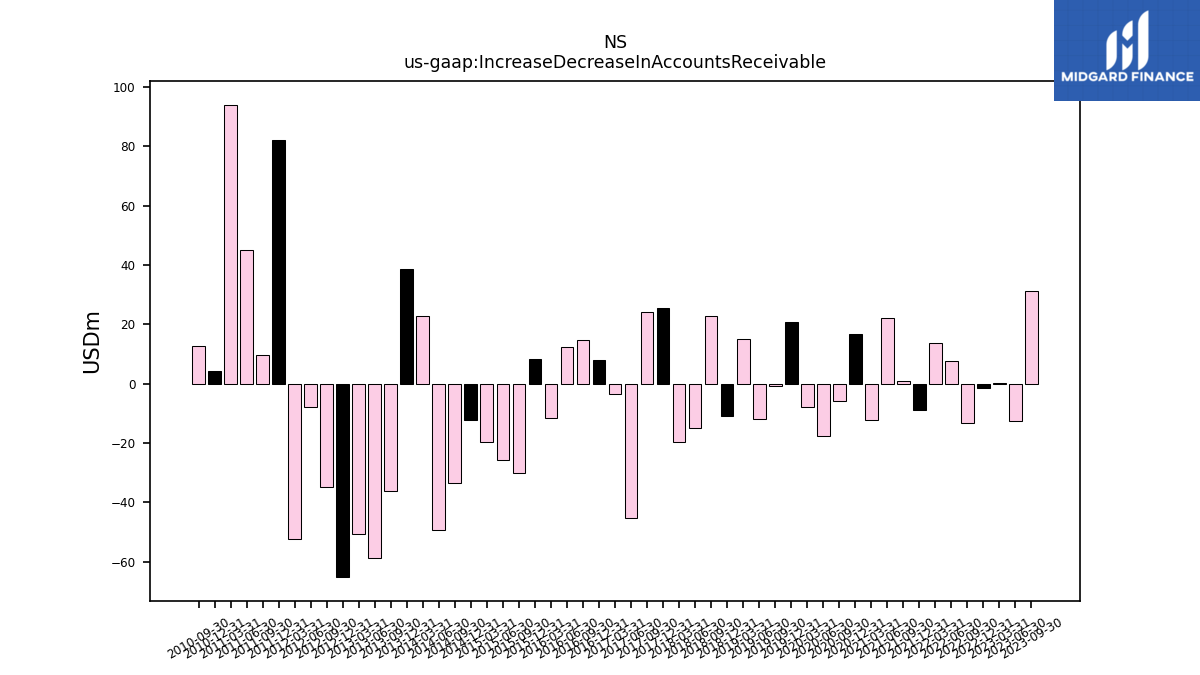
| Increase Decrease In Accounts Receivable | 31.31 | -12.49 | -1.33 | -13.17 | 7.56 | 13.70 | -8.75 | 0.91 | 22.17 | -12.23 | 16.70 | -5.90 | -17.61 | -7.78 | 20.97 | -0.63 | -11.88 | 15.03 | -10.95 | 22.99 | -14.99 | -19.52 | 25.40 | 24.34 | -45.33 | -3.54 | 8.03 | 14.63 | 12.28 | -11.71 | 8.28 | -30.10 | -25.78 | -19.65 | -12.29 | -33.32 | -49.44 | 22.75 | 38.59 | -36.11 | -58.88 | -50.81 | -65.22 | -34.79 | |
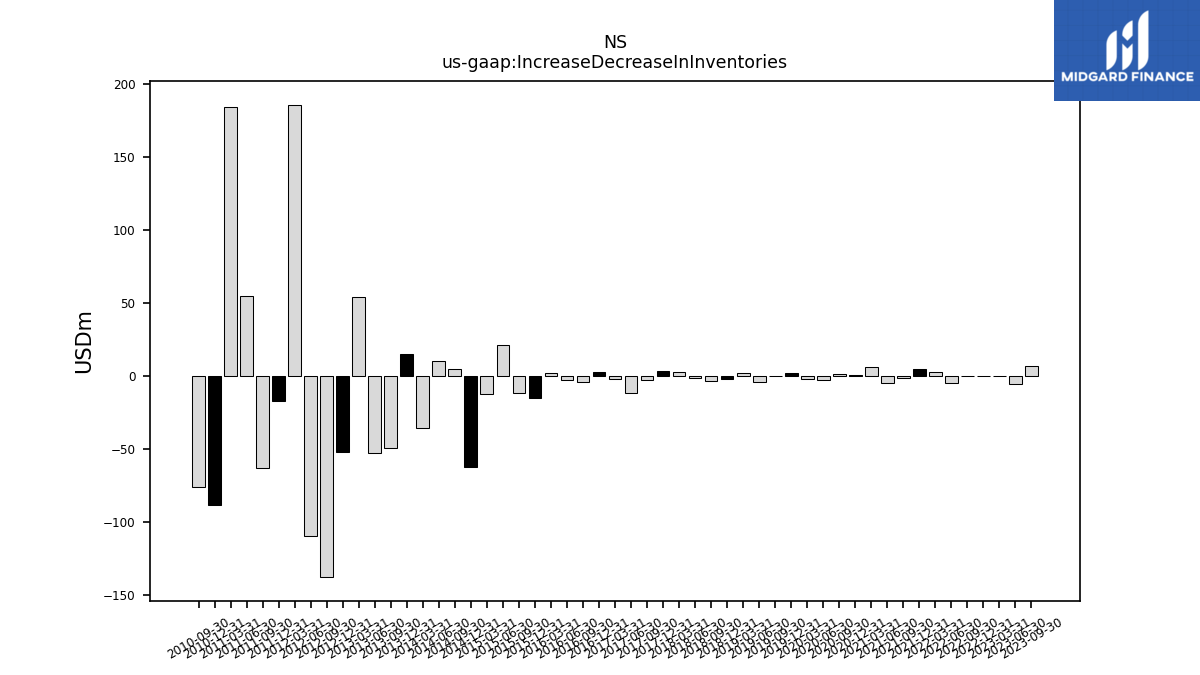
| Increase Decrease In Inventories | 6.86 | -5.04 | 0.15 | 0.46 | -4.50 | 3.06 | 4.85 | -1.01 | -4.73 | 6.47 | 1.03 | 1.81 | -2.53 | -1.65 | 2.26 | 0.15 | -3.85 | 2.30 | -1.74 | -3.31 | -1.45 | 2.69 | 3.56 | -2.49 | -11.35 | -1.66 | 2.83 | -3.67 | -2.50 | 2.40 | -15.12 | -11.31 | 21.65 | -12.00 | -62.21 | 5.16 | 10.45 | -35.48 | 15.17 | -49.24 | -52.32 | 54.42 | -51.71 | -137.66 |
| 2023-09-30 | 2023-06-30 | 2022-12-31 | 2022-09-30 | 2022-06-30 | 2022-03-31 | 2021-12-31 | 2021-09-30 | 2021-06-30 | 2021-03-31 | 2020-12-31 | 2020-09-30 | 2020-06-30 | 2020-03-31 | 2019-12-31 | 2019-09-30 | 2019-06-30 | 2019-03-31 | 2018-12-31 | 2018-09-30 | 2018-06-30 | 2018-03-31 | 2017-12-31 | 2017-09-30 | 2017-06-30 | 2017-03-31 | 2016-12-31 | 2016-09-30 | 2016-06-30 | 2016-03-31 | 2015-12-31 | 2015-09-30 | 2015-06-30 | 2015-03-31 | 2014-12-31 | 2014-09-30 | 2014-06-30 | 2014-03-31 | 2013-12-31 | 2013-09-30 | 2013-06-30 | 2013-03-31 | 2012-12-31 | 2012-09-30 | ||
|---|---|---|---|---|---|---|---|---|---|---|---|---|---|---|---|---|---|---|---|---|---|---|---|---|---|---|---|---|---|---|---|---|---|---|---|---|---|---|---|---|---|---|---|---|---|
| Net Cash Provided By Used In Investing Activities | -42.37 | -26.59 | -28.66 | -40.90 | 26.30 | -41.10 | 202.70 | -34.48 | -46.45 | -45.78 | 52.22 | -44.22 | -34.66 | -71.42 | -98.49 | 82.91 | -163.72 | -139.95 | 163.44 | -92.39 | -153.37 | -71.45 | -139.40 | -90.29 | -1526.06 | 59.31 | -150.16 | -52.88 | -49.20 | -58.84 | -74.59 | -71.22 | -76.38 | -229.84 | -133.39 | -75.25 | -55.27 | -76.33 | -113.24 | -53.14 | -141.46 | -3.12 | -323.77 | 160.39 | |
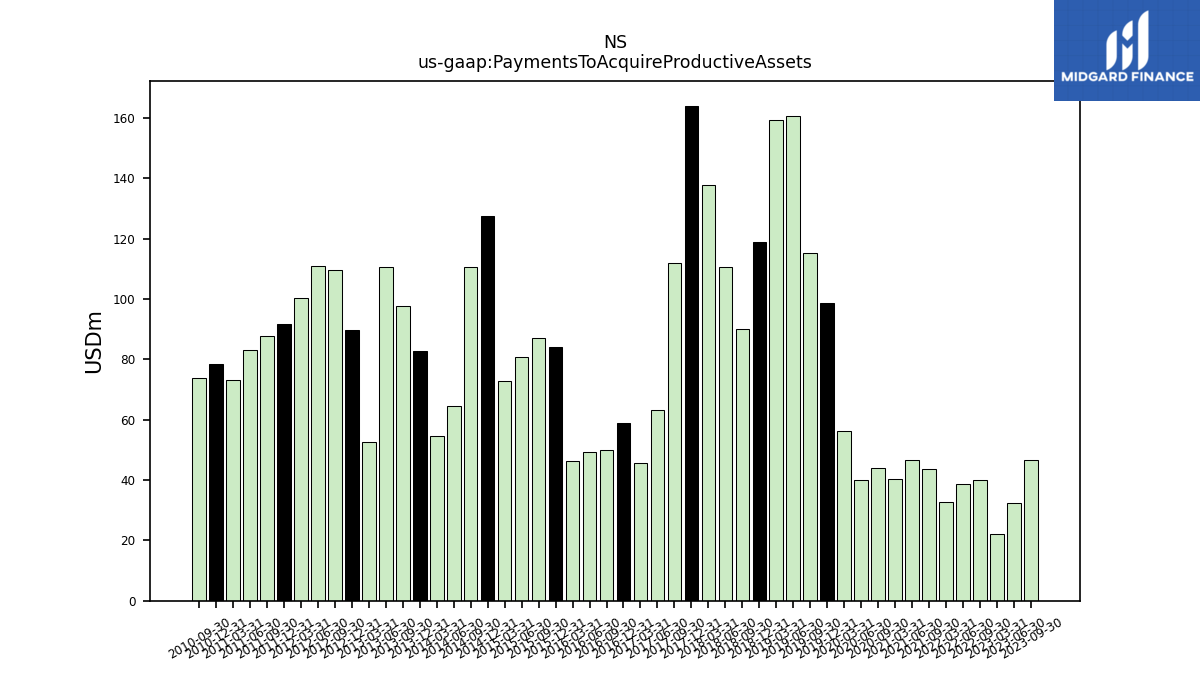
| Payments To Acquire Productive Assets | 46.56 | 32.45 | NA | 40.01 | 38.67 | 32.75 | NA | 43.77 | 46.73 | 40.46 | NA | 43.98 | 40.08 | 56.28 | 98.53 | 115.08 | 160.53 | 159.43 | 119.01 | 89.92 | 110.65 | 137.87 | 164.02 | 111.77 | 63.12 | 45.73 | 58.94 | 50.05 | 49.19 | 46.18 | 84.14 | 87.05 | 80.74 | 72.88 | 127.42 | 110.68 | 64.39 | 54.49 | 82.62 | 97.51 | 110.63 | 52.56 | 89.82 | 109.64 |
| 2023-09-30 | 2023-06-30 | 2022-12-31 | 2022-09-30 | 2022-06-30 | 2022-03-31 | 2021-12-31 | 2021-09-30 | 2021-06-30 | 2021-03-31 | 2020-12-31 | 2020-09-30 | 2020-06-30 | 2020-03-31 | 2019-12-31 | 2019-09-30 | 2019-06-30 | 2019-03-31 | 2018-12-31 | 2018-09-30 | 2018-06-30 | 2018-03-31 | 2017-12-31 | 2017-09-30 | 2017-06-30 | 2017-03-31 | 2016-12-31 | 2016-09-30 | 2016-06-30 | 2016-03-31 | 2015-12-31 | 2015-09-30 | 2015-06-30 | 2015-03-31 | 2014-12-31 | 2014-09-30 | 2014-06-30 | 2014-03-31 | 2013-12-31 | 2013-09-30 | 2013-06-30 | 2013-03-31 | 2012-12-31 | 2012-09-30 | ||
|---|---|---|---|---|---|---|---|---|---|---|---|---|---|---|---|---|---|---|---|---|---|---|---|---|---|---|---|---|---|---|---|---|---|---|---|---|---|---|---|---|---|---|---|---|---|
| Net Cash Provided By Used In Financing Activities | -110.80 | -62.52 | -78.06 | -147.35 | -109.83 | -99.71 | -299.34 | -173.39 | -27.12 | -225.73 | -88.52 | -40.55 | -85.23 | -77.09 | -53.55 | -197.86 | 26.64 | 47.12 | -354.77 | -22.55 | 38.30 | -60.85 | 34.21 | -8.30 | 1402.41 | -152.05 | 31.91 | -116.00 | -91.75 | -35.48 | -69.37 | -57.94 | -5.93 | 104.01 | -4.14 | -64.23 | -77.12 | -42.70 | 86.14 | -110.95 | -16.98 | -107.57 | 274.03 | -328.45 | |
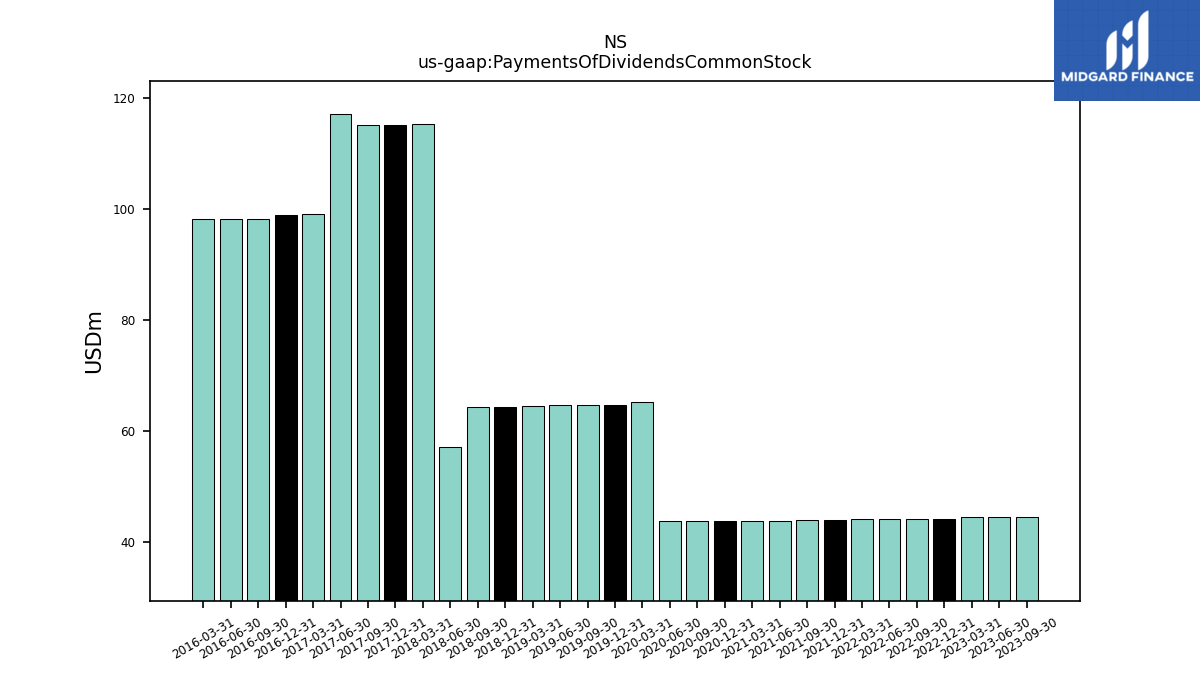
| Payments Of Dividends Common Stock | 44.36 | 44.36 | 44.12 | 44.12 | 44.12 | 44.04 | 43.83 | 43.81 | 43.81 | 43.81 | 43.68 | 43.68 | 43.68 | 65.17 | 64.67 | 64.66 | 64.66 | 64.37 | 64.23 | 64.22 | 57.05 | 115.27 | 115.08 | 115.08 | 117.12 | 99.02 | 98.81 | 98.05 | 98.05 | 98.05 | NA | NA | NA | NA | NA | NA | NA | NA | NA | NA | NA | NA | NA | NA |
| 2023-09-30 | 2023-06-30 | 2022-12-31 | 2022-09-30 | 2022-06-30 | 2022-03-31 | 2021-12-31 | 2021-09-30 | 2021-06-30 | 2021-03-31 | 2020-12-31 | 2020-09-30 | 2020-06-30 | 2020-03-31 | 2019-12-31 | 2019-09-30 | 2019-06-30 | 2019-03-31 | 2018-12-31 | 2018-09-30 | 2018-06-30 | 2018-03-31 | 2017-12-31 | 2017-09-30 | 2017-06-30 | 2017-03-31 | 2016-12-31 | 2016-09-30 | 2016-06-30 | 2016-03-31 | 2015-12-31 | 2015-09-30 | 2015-06-30 | 2015-03-31 | 2014-12-31 | 2014-09-30 | 2014-06-30 | 2014-03-31 | 2013-12-31 | 2013-09-30 | 2013-06-30 | 2013-03-31 | 2012-12-31 | 2012-09-30 | ||
|---|---|---|---|---|---|---|---|---|---|---|---|---|---|---|---|---|---|---|---|---|---|---|---|---|---|---|---|---|---|---|---|---|---|---|---|---|---|---|---|---|---|---|---|---|---|
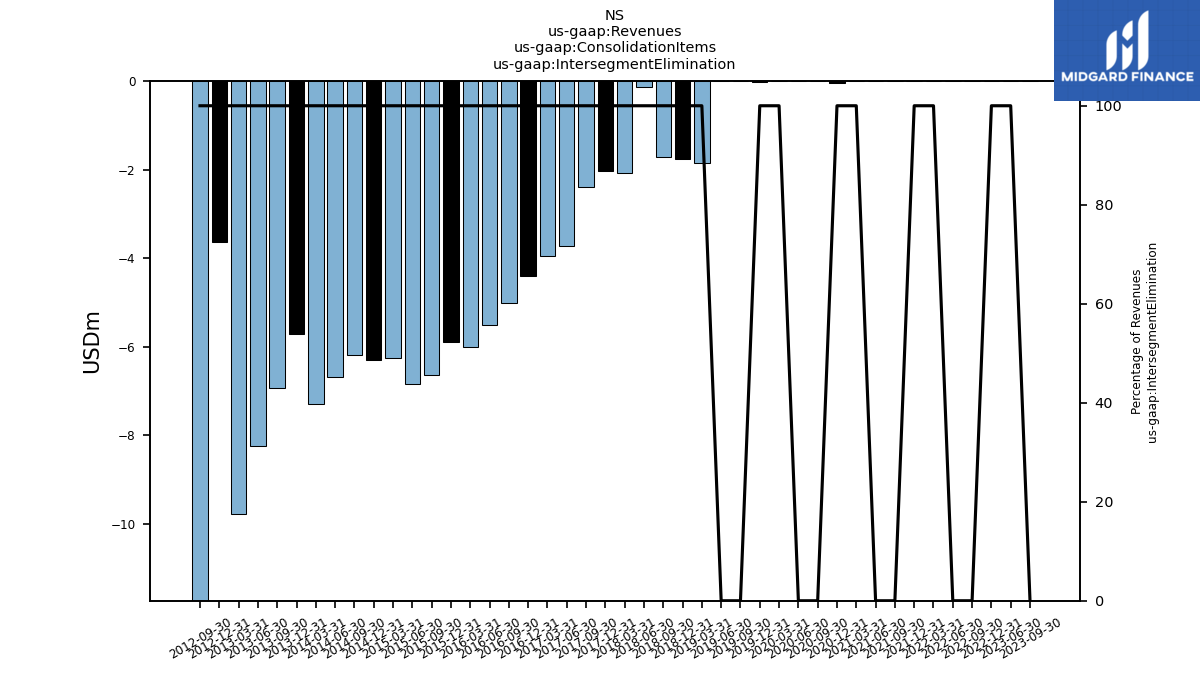
| Intersegment Elimination | 0.00 | -0.00 | -0.00 | 0.00 | 0.00 | -0.00 | -0.00 | 0.00 | 0.00 | -0.01 | -0.04 | 0.00 | 0.00 | -0.01 | -0.02 | 0.00 | 0.00 | -1.86 | -1.77 | -1.72 | -0.13 | -2.08 | -2.04 | -2.39 | -3.73 | -3.94 | -4.40 | -5.02 | -5.51 | -6.01 | -5.90 | -6.63 | -6.83 | -6.25 | -6.29 | -6.17 | -6.69 | -7.28 | -5.72 | -6.93 | -8.24 | -9.78 | -3.63 | -19.68 | |
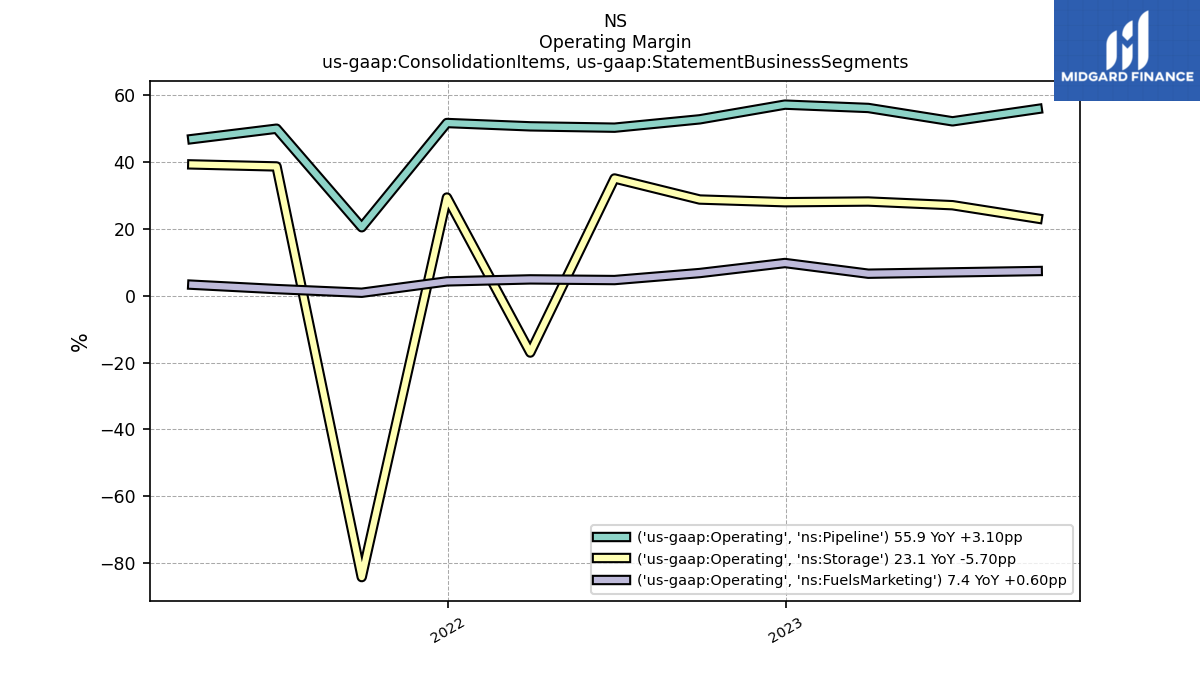
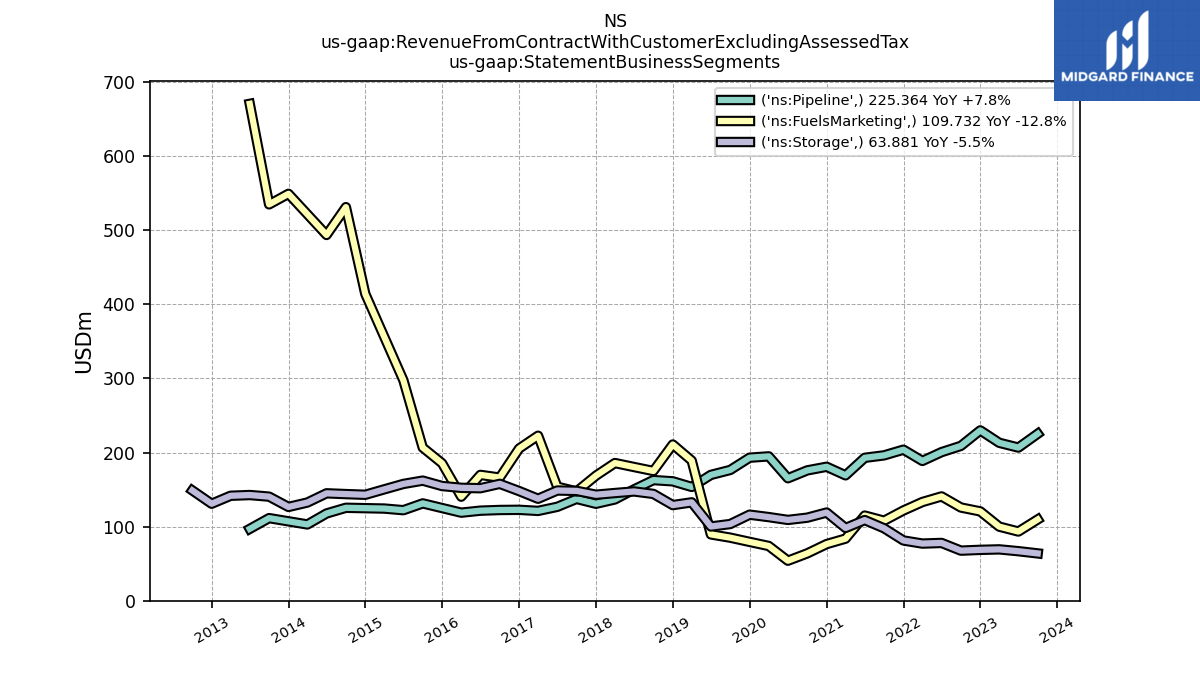
| Operating, Fuels Marketing | 109.73 | 93.43 | 120.57 | 125.84 | 140.81 | 133.26 | 121.82 | 108.00 | 114.94 | 83.86 | NA | NA | NA | NA | NA | NA | NA | NA | NA | NA | NA | NA | NA | NA | NA | NA | NA | NA | NA | NA | NA | NA | NA | NA | NA | NA | NA | NA | NA | NA | NA | NA | NA | NA | |
| Operating, Pipeline | 225.36 | 206.70 | 229.94 | 209.01 | 200.56 | 188.68 | 203.90 | 196.21 | 192.91 | 169.23 | NA | NA | NA | NA | NA | NA | NA | NA | NA | NA | NA | NA | NA | NA | NA | NA | NA | NA | NA | NA | NA | NA | NA | NA | NA | NA | NA | NA | NA | NA | NA | NA | NA | NA | |
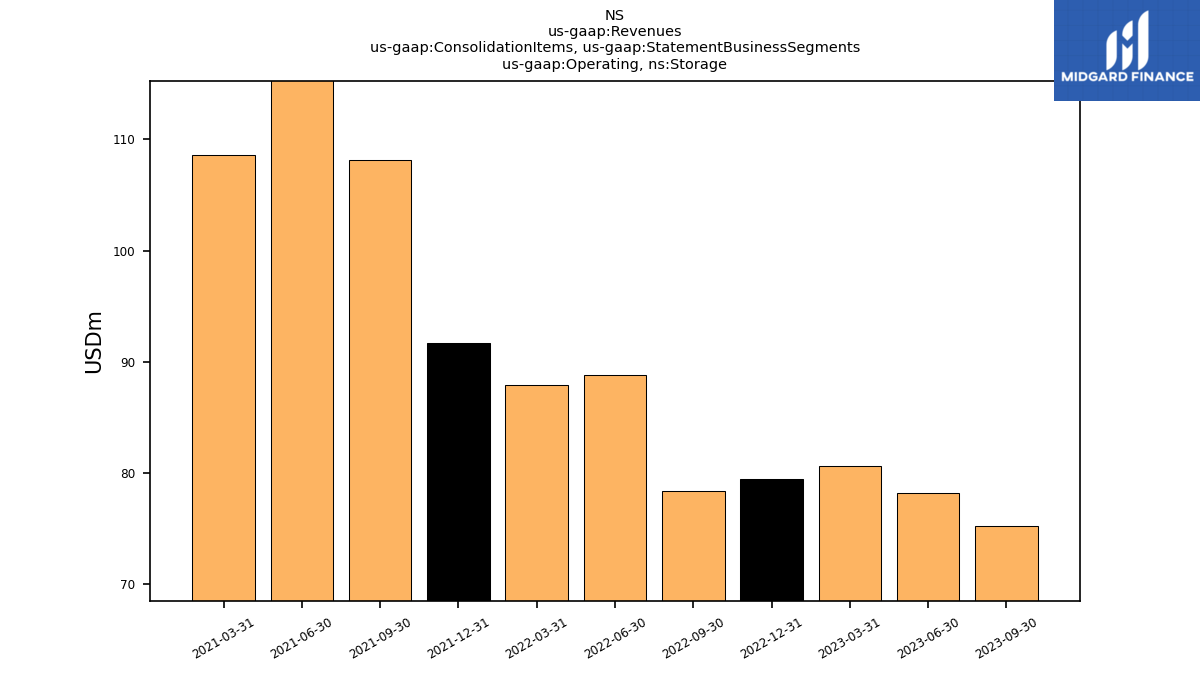
| Operating, Storage | 75.20 | 78.21 | 79.45 | 78.39 | 88.78 | 87.92 | 91.70 | 108.14 | 119.25 | 108.57 | NA | NA | NA | NA | NA | NA | NA | NA | NA | NA | NA | NA | NA | NA | NA | NA | NA | NA | NA | NA | NA | NA | NA | NA | NA | NA | NA | NA | NA | NA | NA | NA | NA | NA | |
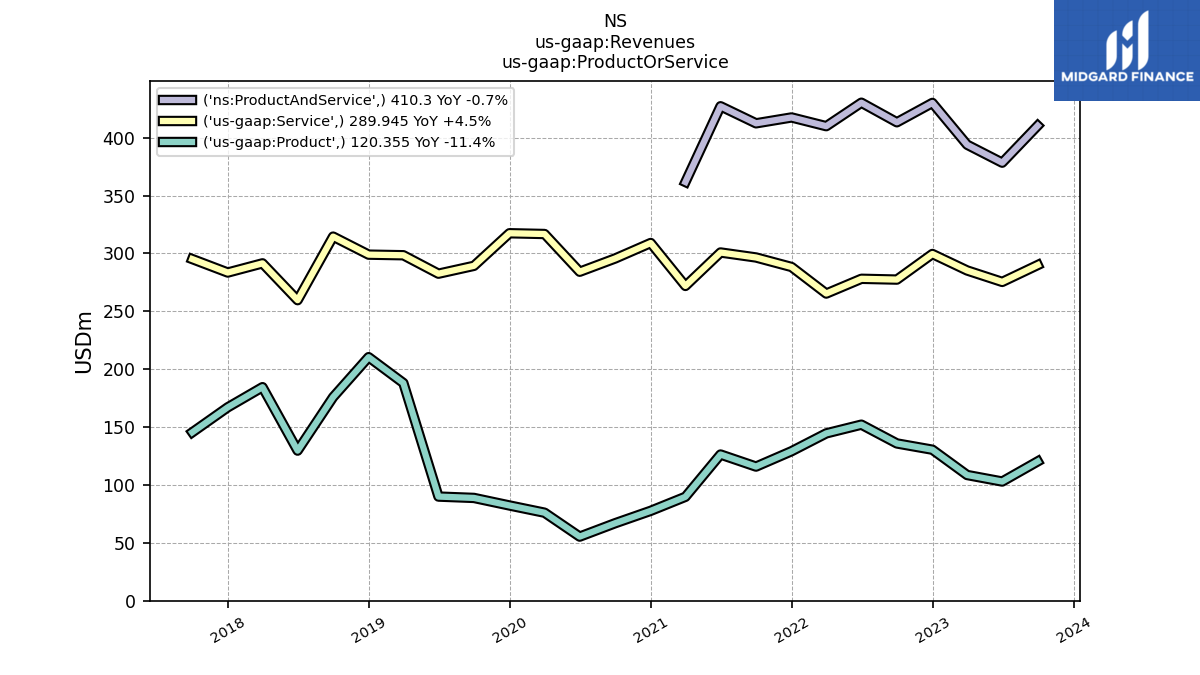
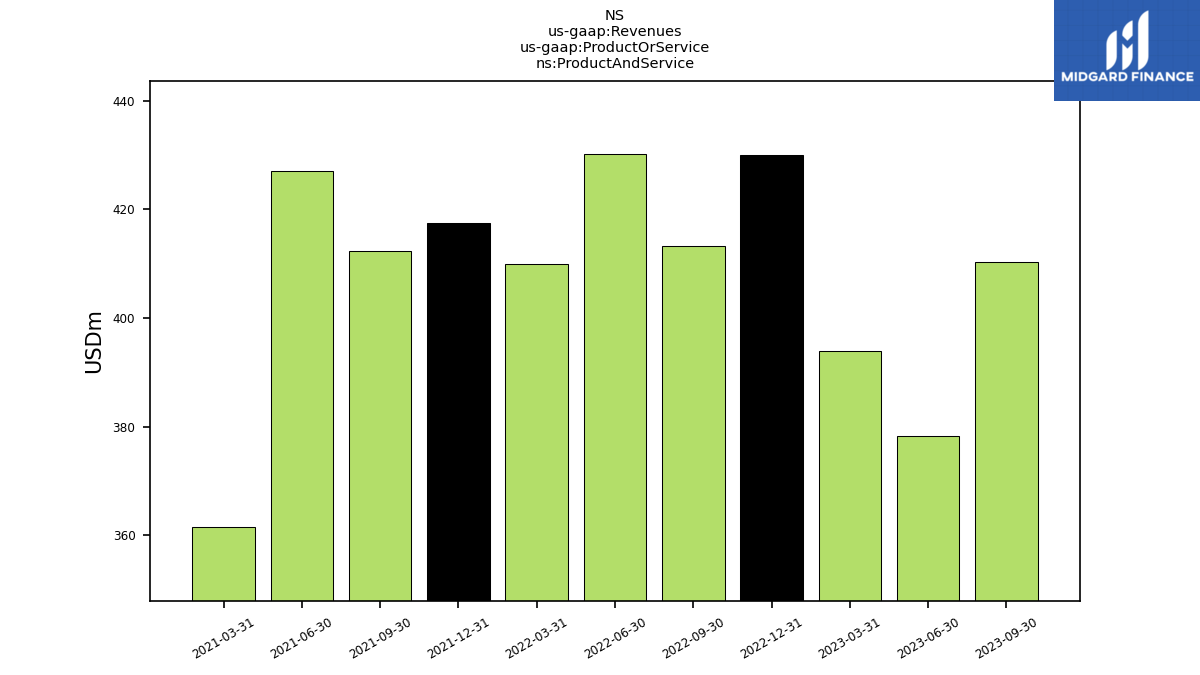
| Product And Service | 410.30 | 378.33 | 429.96 | 413.24 | 430.16 | 409.86 | 417.42 | 412.35 | 427.09 | 361.65 | NA | NA | NA | NA | NA | NA | NA | NA | NA | NA | NA | NA | NA | NA | NA | NA | NA | NA | NA | NA | NA | NA | NA | NA | NA | NA | NA | NA | NA | NA | NA | NA | NA | NA | |
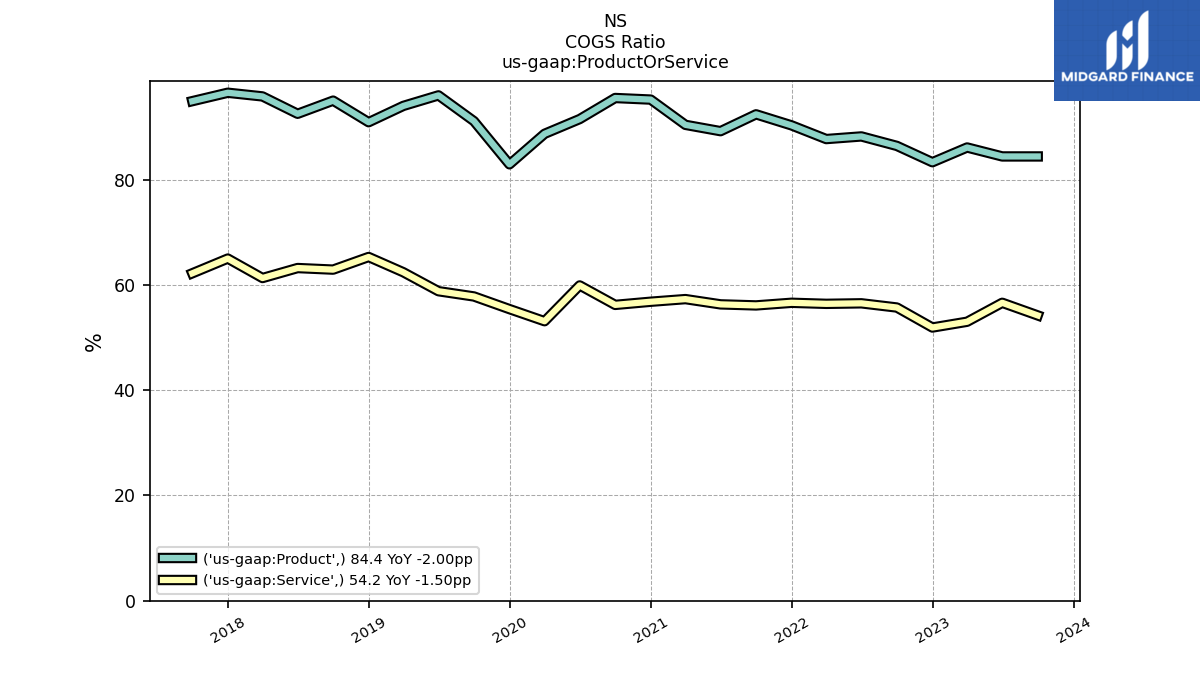
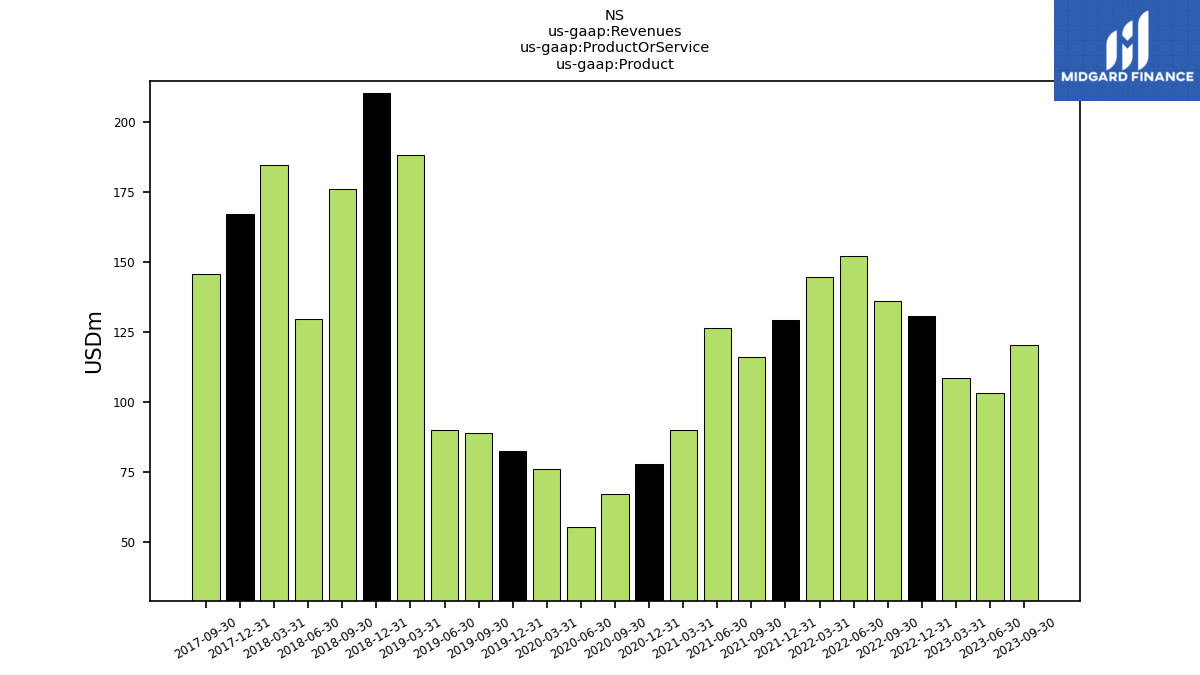
| Product | 120.36 | 102.97 | 130.46 | 135.86 | 152.09 | 144.56 | 129.15 | 115.87 | 126.31 | 89.76 | 77.67 | 66.97 | 55.39 | 76.05 | 82.28 | 88.80 | 89.97 | 188.06 | 210.38 | 175.85 | 129.66 | 184.47 | 167.07 | 145.46 | NA | NA | NA | NA | NA | NA | NA | NA | NA | NA | NA | NA | NA | NA | NA | NA | NA | NA | NA | NA | |
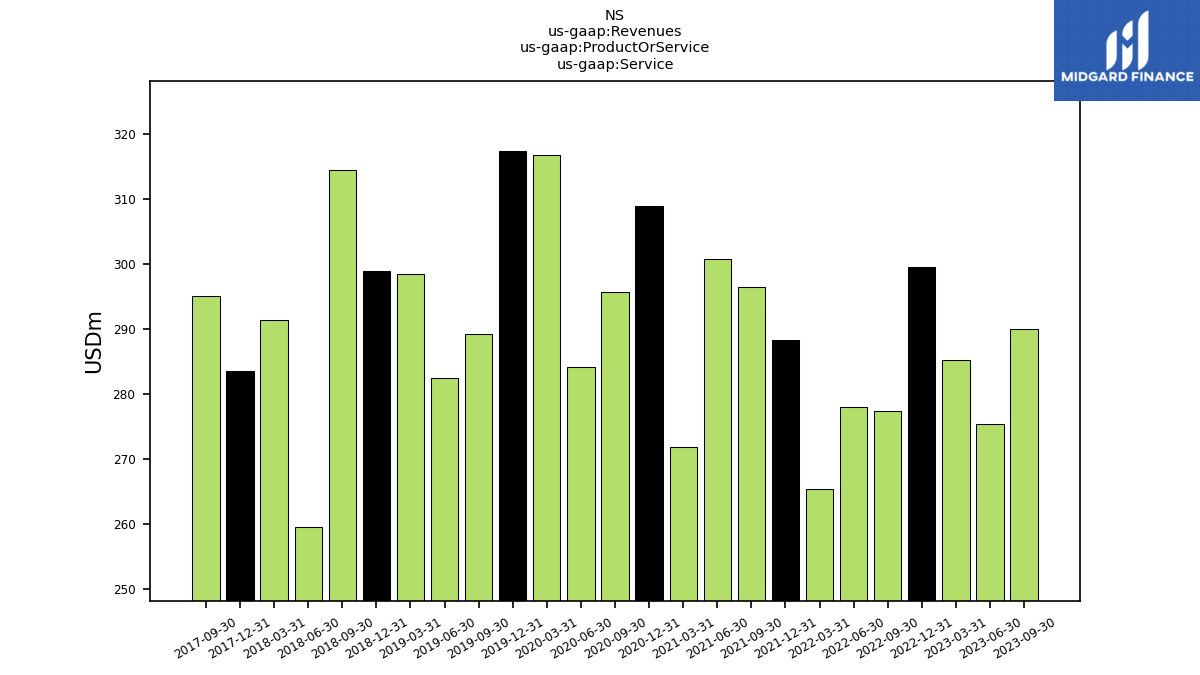
| Service | 289.94 | 275.37 | 299.50 | 277.38 | 278.07 | 265.31 | 288.27 | 296.47 | 300.79 | 271.88 | 308.98 | 295.62 | 284.15 | 316.75 | 317.41 | 289.26 | 282.47 | 298.40 | 298.93 | 314.51 | 259.60 | 291.41 | 283.46 | 295.10 | NA | NA | NA | NA | NA | NA | NA | NA | NA | NA | NA | NA | NA | NA | NA | NA | NA | NA | NA | NA | |
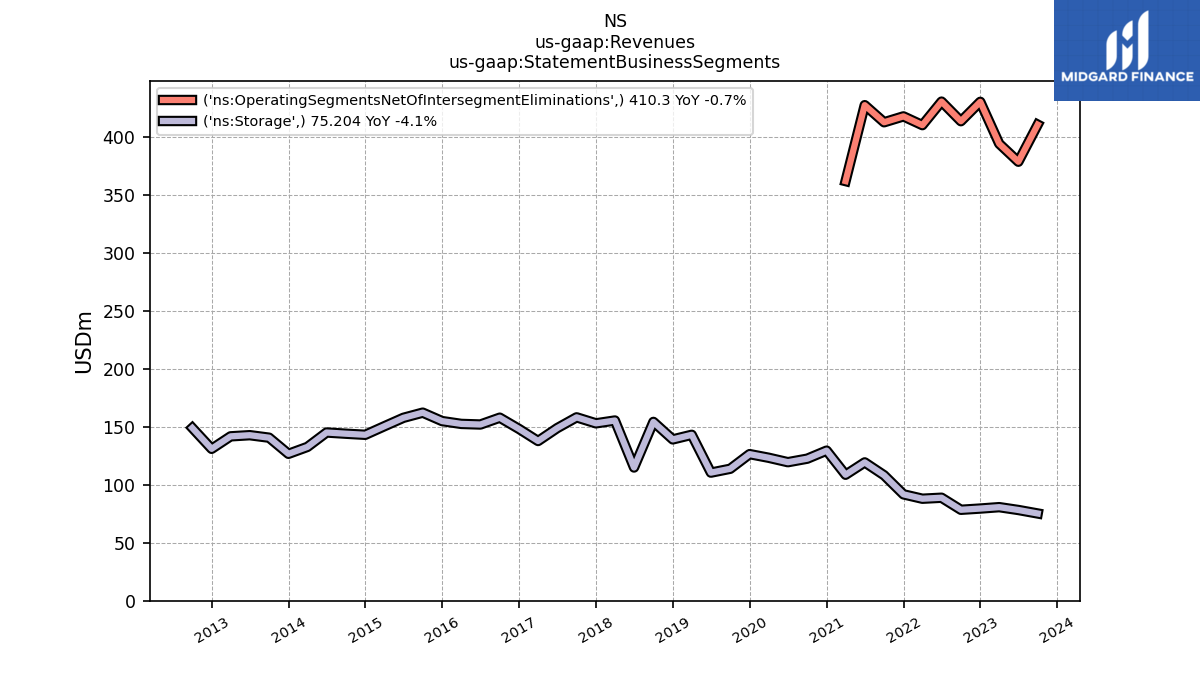
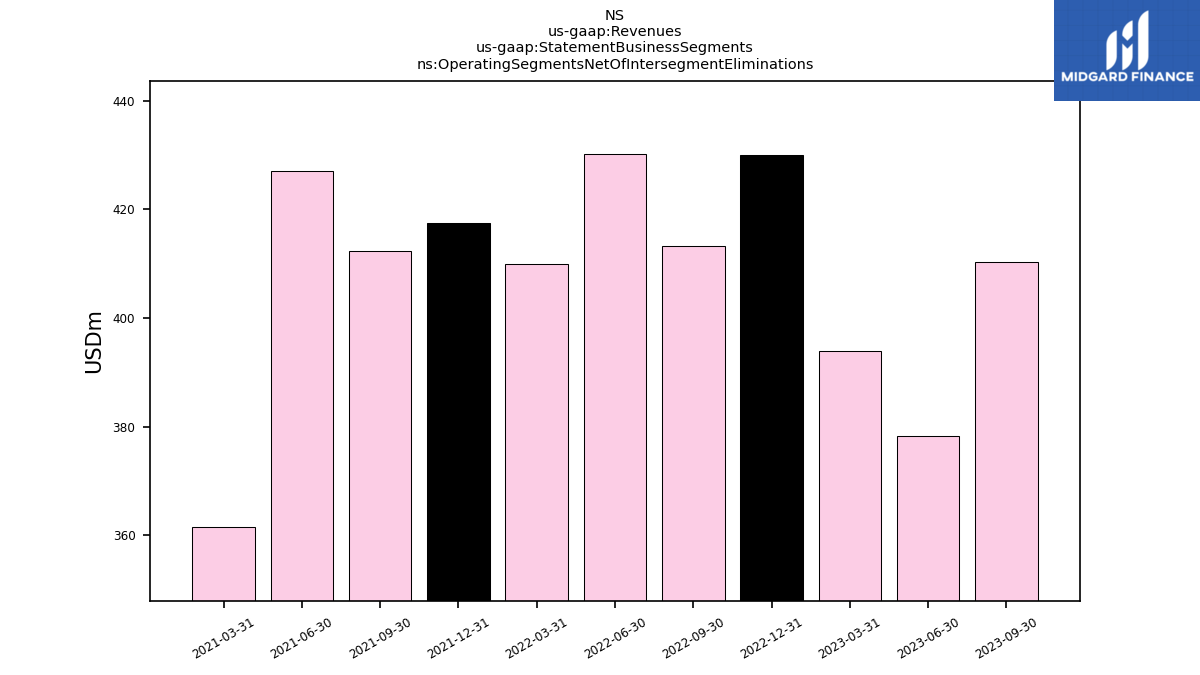
| Operating Segments Net Of Intersegment Eliminations | 410.30 | 378.33 | 429.96 | 413.24 | 430.16 | 409.86 | 417.42 | 412.35 | 427.09 | 361.65 | NA | NA | NA | NA | NA | NA | NA | NA | NA | NA | NA | NA | NA | NA | NA | NA | NA | NA | NA | NA | NA | NA | NA | NA | NA | NA | NA | NA | NA | NA | NA | NA | NA | NA | |
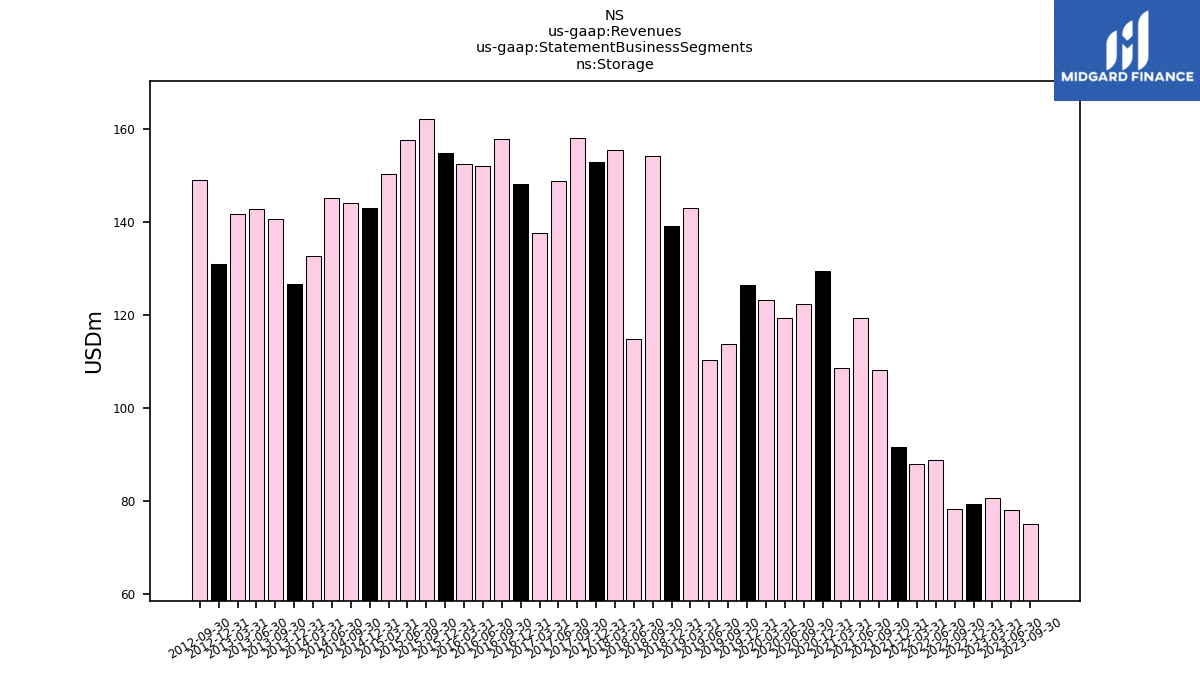
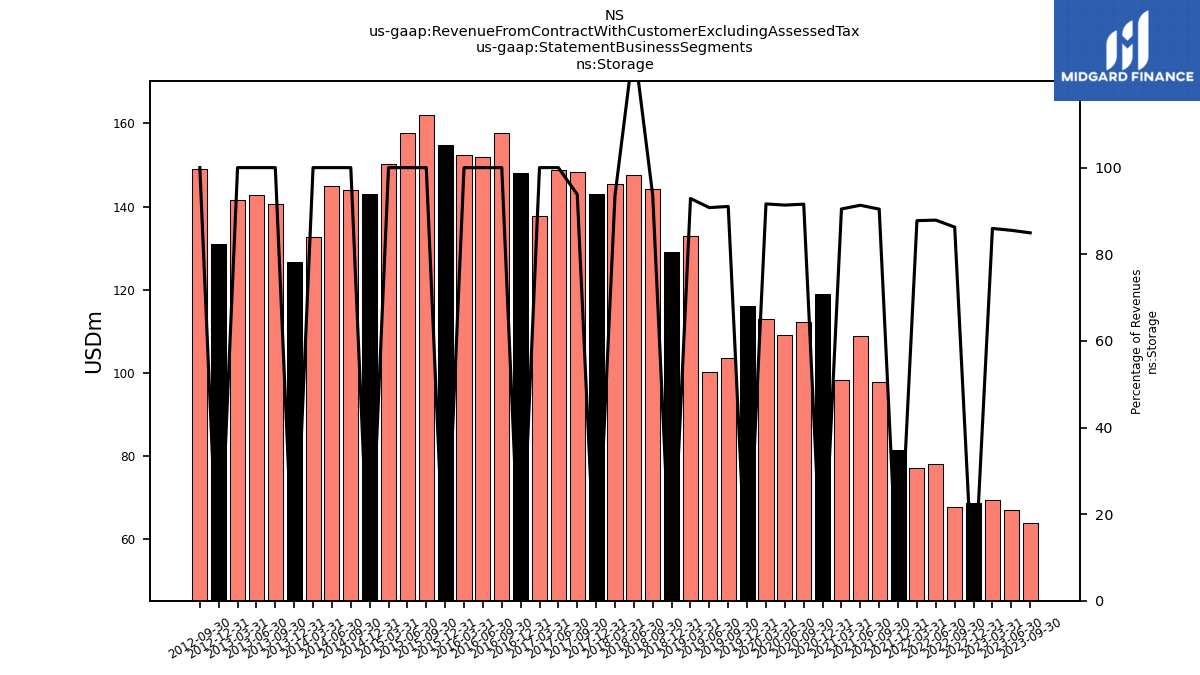
| Storage | 75.20 | 78.21 | 79.45 | 78.39 | 88.78 | 87.92 | 91.70 | 108.14 | 119.25 | 108.57 | 129.38 | 122.44 | 119.41 | 123.22 | 126.36 | 113.73 | 110.40 | 143.01 | 139.04 | 154.13 | 114.82 | 155.33 | 152.89 | 158.07 | 148.78 | 137.65 | 148.00 | 157.77 | 151.87 | 152.40 | 154.83 | 162.10 | 157.64 | 150.33 | 143.01 | 143.94 | 144.99 | 132.57 | 126.60 | 140.52 | 142.68 | 141.68 | 130.91 | 148.93 | |
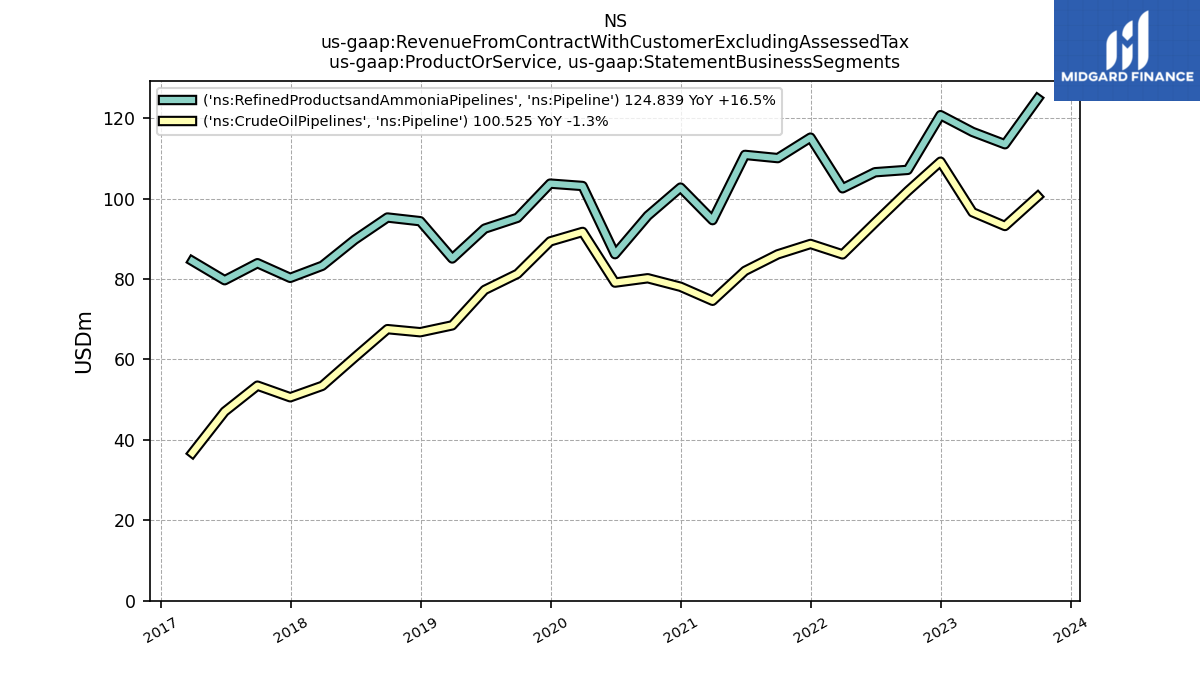
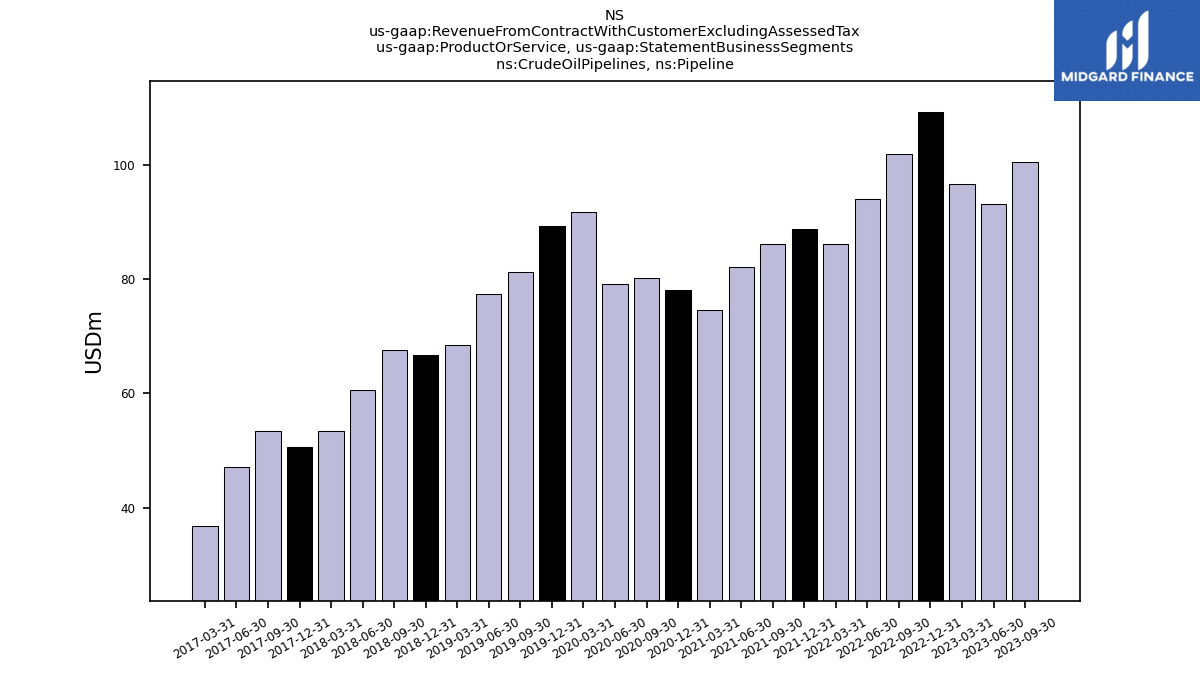
| Crude Oil Pipelines, Pipeline | 100.53 | 93.19 | 109.18 | 101.86 | 94.01 | 86.12 | 88.72 | 86.14 | 82.03 | 74.59 | 78.08 | 80.19 | 79.11 | 91.72 | 89.36 | 81.29 | 77.29 | 68.48 | 66.77 | 67.54 | 60.51 | 53.44 | 50.60 | 53.49 | 47.04 | 36.75 | NA | NA | NA | NA | NA | NA | NA | NA | NA | NA | NA | NA | NA | NA | NA | NA | NA | NA | |
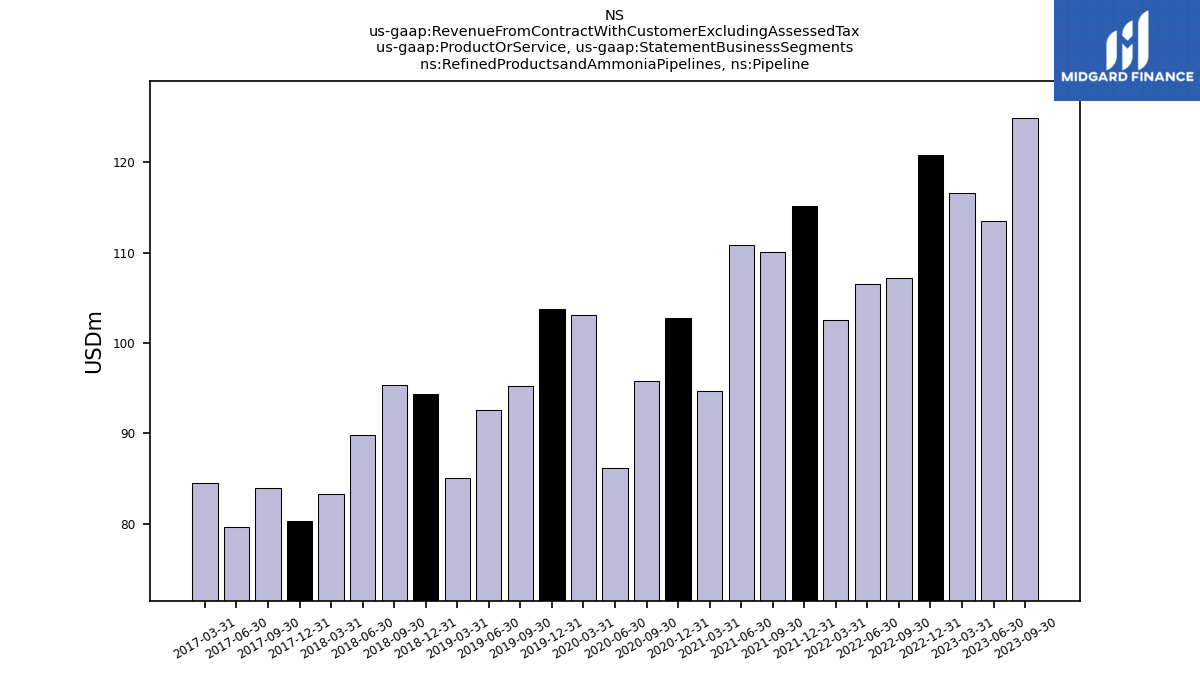
| Refined Productsand Ammonia Pipelines, Pipeline | 124.84 | 113.52 | 120.76 | 107.14 | 106.56 | 102.56 | 115.17 | 110.07 | 110.87 | 94.64 | 102.75 | 95.74 | 86.17 | 103.13 | 103.73 | 95.22 | 92.53 | 85.11 | 94.38 | 95.30 | 89.77 | 83.30 | 80.28 | 83.94 | 79.70 | 84.49 | NA | NA | NA | NA | NA | NA | NA | NA | NA | NA | NA | NA | NA | NA | NA | NA | NA | NA | |
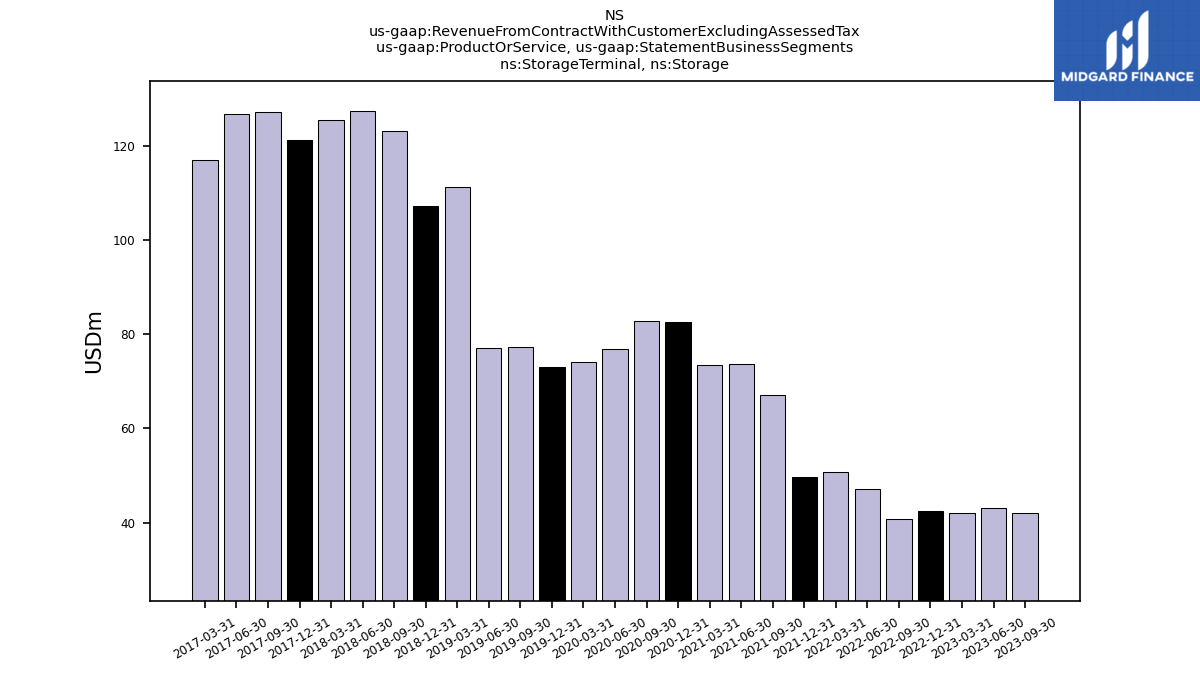
| Storage Terminal, Storage | 42.01 | 43.05 | 42.40 | 40.69 | 47.09 | 50.72 | 49.72 | 67.01 | 73.74 | 73.42 | 82.60 | 82.85 | 76.88 | 74.17 | 73.11 | 77.21 | 77.04 | 111.13 | 107.22 | 123.02 | 127.35 | 125.35 | 121.12 | 127.17 | 126.66 | 116.96 | NA | NA | NA | NA | NA | NA | NA | NA | NA | NA | NA | NA | NA | NA | NA | NA | NA | NA | |
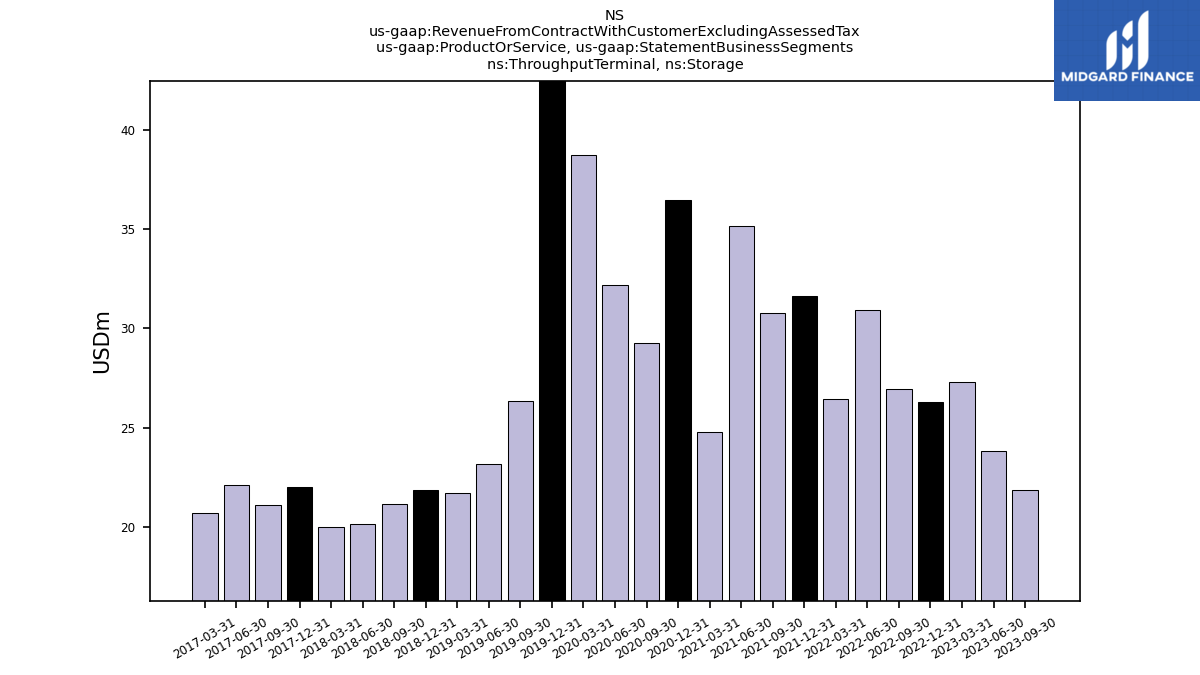
| Throughput Terminal, Storage | 21.87 | 23.84 | 26.29 | 26.93 | 30.93 | 26.44 | 31.62 | 30.77 | 35.14 | 24.79 | 36.45 | 29.26 | 32.20 | 38.72 | 43.05 | 26.33 | 23.17 | 21.69 | 21.86 | 21.14 | 20.14 | 20.02 | 22.00 | 21.12 | 22.12 | 20.69 | NA | NA | NA | NA | NA | NA | NA | NA | NA | NA | NA | NA | NA | NA | NA | NA | NA | NA | |
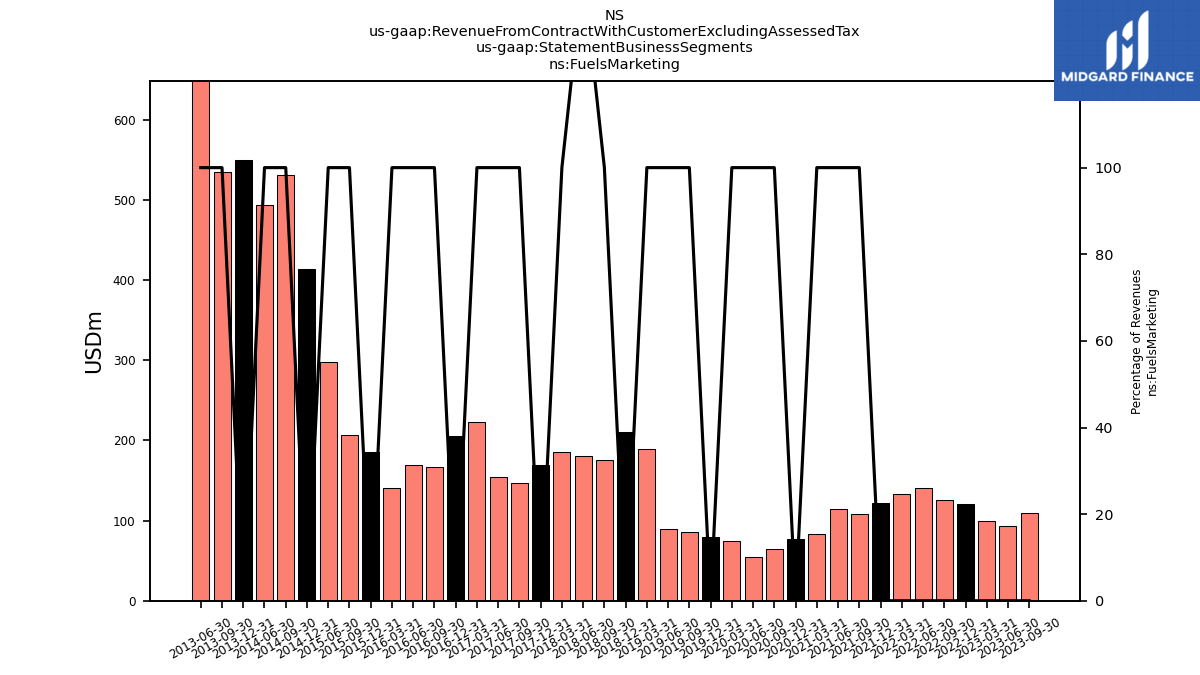
| Fuels Marketing | 109.73 | 93.43 | 120.57 | 125.84 | 140.81 | 133.26 | 121.82 | 108.00 | 114.94 | 83.86 | 76.47 | 63.95 | 54.02 | 73.90 | 79.44 | 85.15 | 89.55 | 189.07 | 210.88 | 175.11 | 180.48 | 185.84 | 168.80 | 147.46 | 153.92 | 222.70 | 205.44 | 166.19 | 169.86 | 140.45 | 185.50 | 206.70 | 297.59 | NA | 414.20 | 531.19 | 493.65 | NA | 549.17 | 534.92 | 670.60 | NA | NA | NA | |
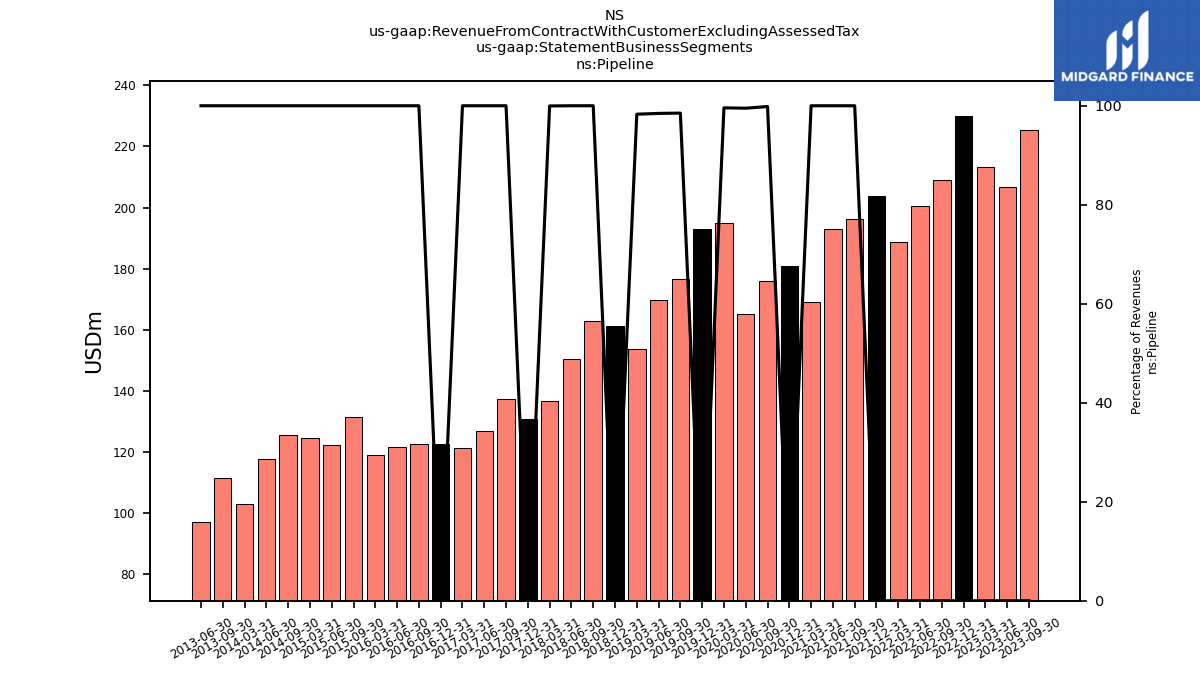
| Pipeline | 225.36 | 206.70 | 229.94 | 209.01 | 200.56 | 188.68 | 203.90 | 196.21 | 192.91 | 169.23 | 180.82 | 175.94 | 165.28 | 194.86 | 193.09 | 176.51 | 169.83 | 153.58 | 161.16 | 162.84 | 150.28 | 136.74 | 130.88 | 137.43 | 126.74 | 121.24 | 122.72 | 122.48 | 121.58 | 118.87 | NA | 131.40 | 122.21 | 124.42 | NA | 125.46 | 117.80 | 102.96 | NA | 111.51 | 96.98 | NA | NA | NA | |
| Storage | 63.88 | 66.89 | 68.69 | 67.63 | 78.02 | 77.16 | 81.34 | 97.78 | 108.89 | 98.21 | 119.05 | 112.11 | 109.08 | 112.89 | 116.17 | 103.54 | 100.21 | 132.82 | 129.08 | 144.17 | 147.49 | 145.37 | 143.11 | 148.29 | 148.78 | 137.65 | 148.00 | 157.77 | 151.87 | 152.40 | 154.83 | 162.10 | 157.64 | 150.33 | 143.01 | 143.94 | 144.99 | 132.57 | 126.60 | 140.52 | 142.68 | 141.68 | 130.91 | 148.93 |


