
| 2022-12-31 | 2022-09-30 | 2022-06-30 | 2022-03-31 | 2021-12-31 | 2021-09-30 | 2021-06-30 | 2021-03-31 | 2020-12-31 | 2020-09-30 | 2020-06-30 | 2020-03-31 | 2019-12-31 | 2019-09-30 | 2019-06-30 | 2019-03-31 | 2018-12-31 | 2018-09-30 | 2018-06-30 | 2018-03-31 | 2017-12-31 | 2017-09-30 | 2017-06-30 | 2017-03-31 | ||
|---|---|---|---|---|---|---|---|---|---|---|---|---|---|---|---|---|---|---|---|---|---|---|---|---|---|
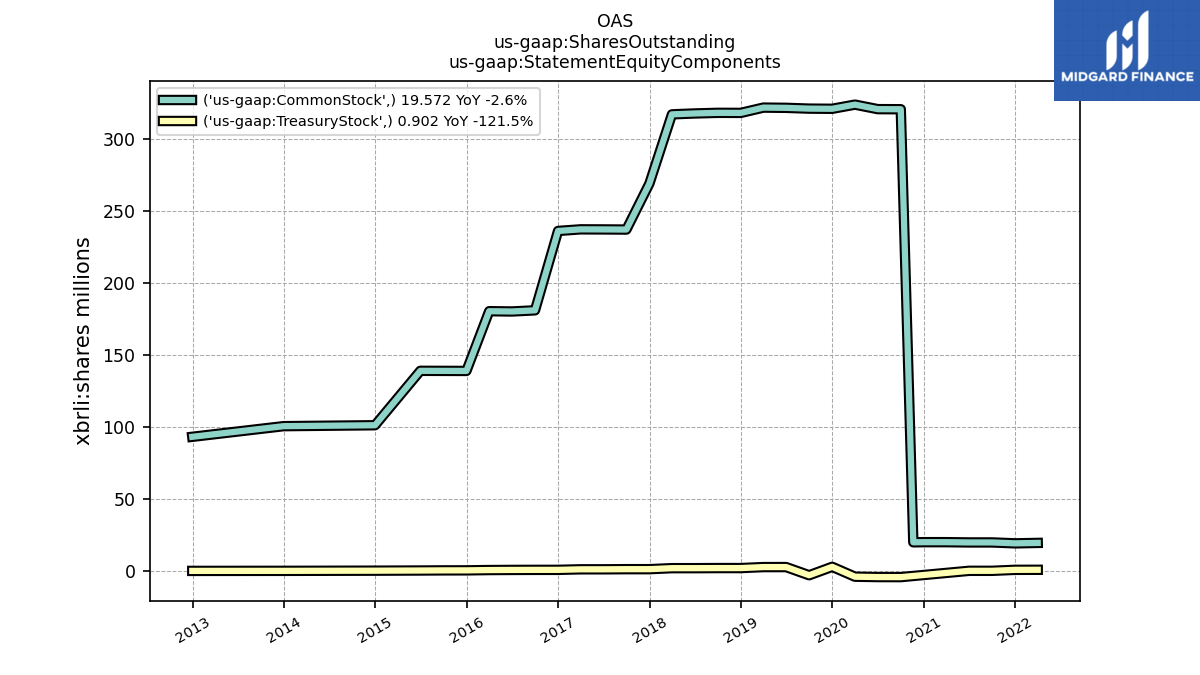
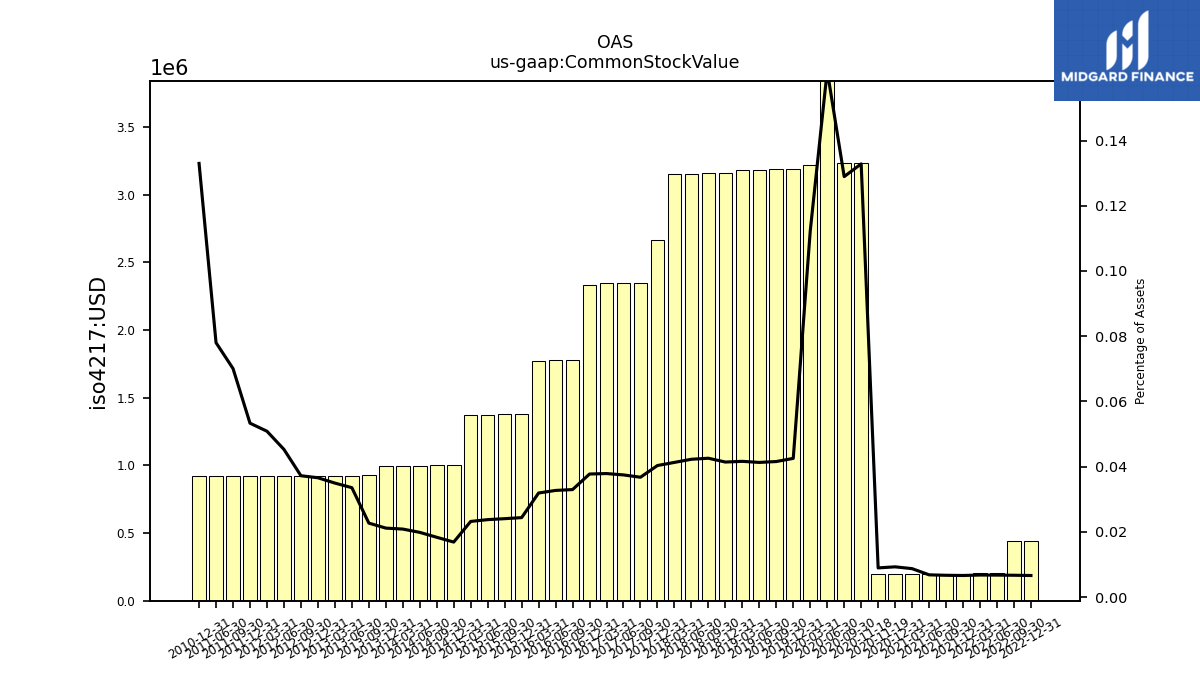
| Common Stock Value | 0.44 | 0.44 | 0.21 | 0.20 | 0.20 | 0.20 | 0.20 | 0.20 | 0.20 | 3.23 | 4.24 | 3.22 | 3.19 | 3.19 | 3.18 | 3.18 | 3.16 | 3.16 | 3.15 | 3.15 | 2.67 | 2.35 | 2.35 | 2.34 | |
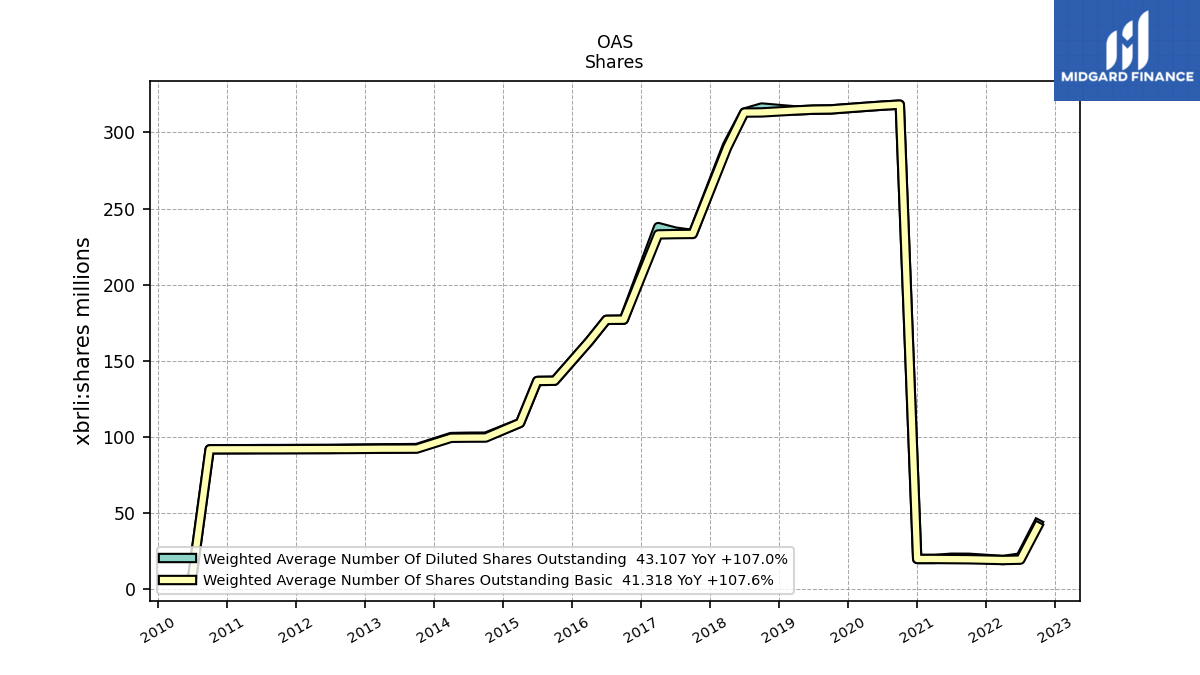
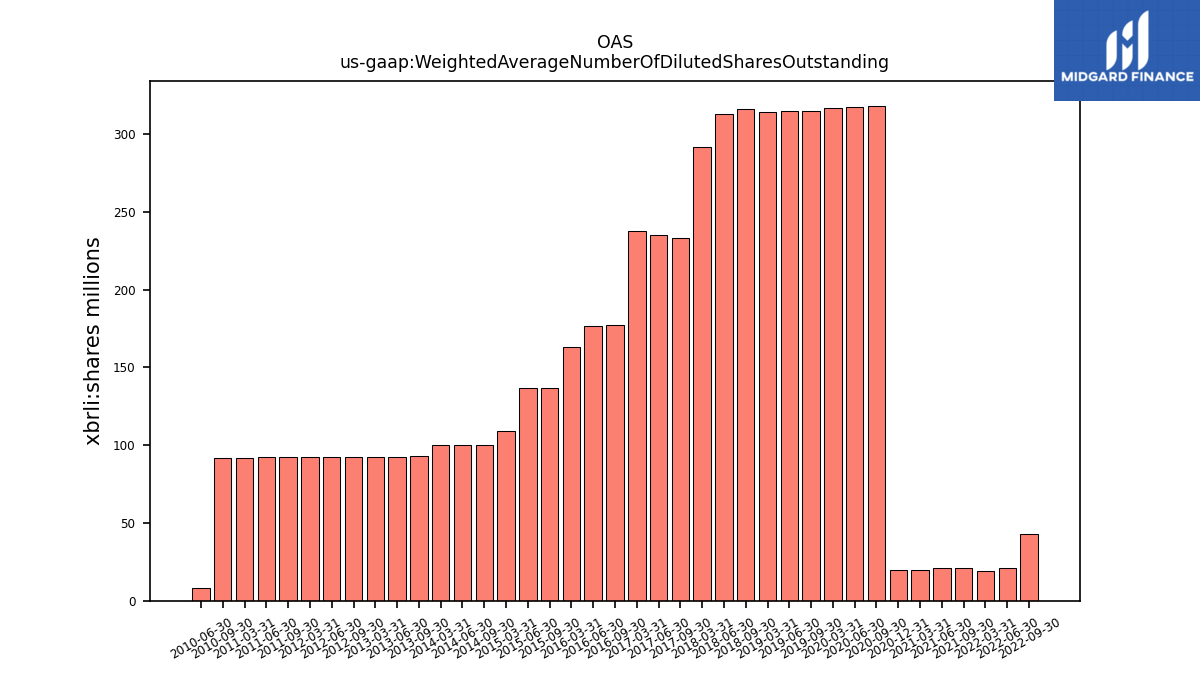
| Weighted Average Number Of Diluted Shares Outstanding | NA | 43.11 | 20.99 | 19.31 | NA | 20.79 | 20.82 | 20.00 | 19.99 | 318.29 | 317.63 | 316.83 | NA | 315.13 | 314.98 | 314.46 | NA | 316.39 | 313.07 | 291.74 | NA | 233.39 | 234.92 | 237.90 | |
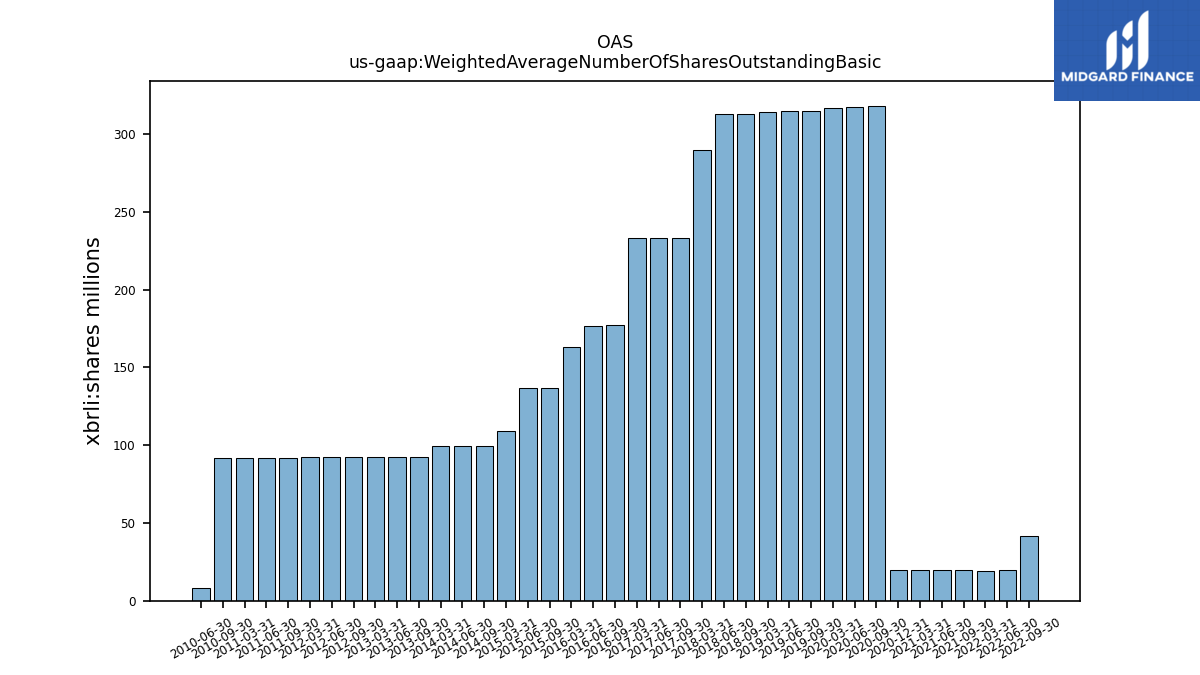
| Weighted Average Number Of Shares Outstanding Basic | NA | 41.32 | 19.55 | 19.31 | NA | 19.81 | 19.90 | 20.00 | 19.99 | 318.29 | 317.63 | 316.83 | NA | 315.13 | 314.98 | 314.46 | NA | 313.17 | 313.07 | 290.11 | NA | 233.39 | 233.28 | 233.07 | |
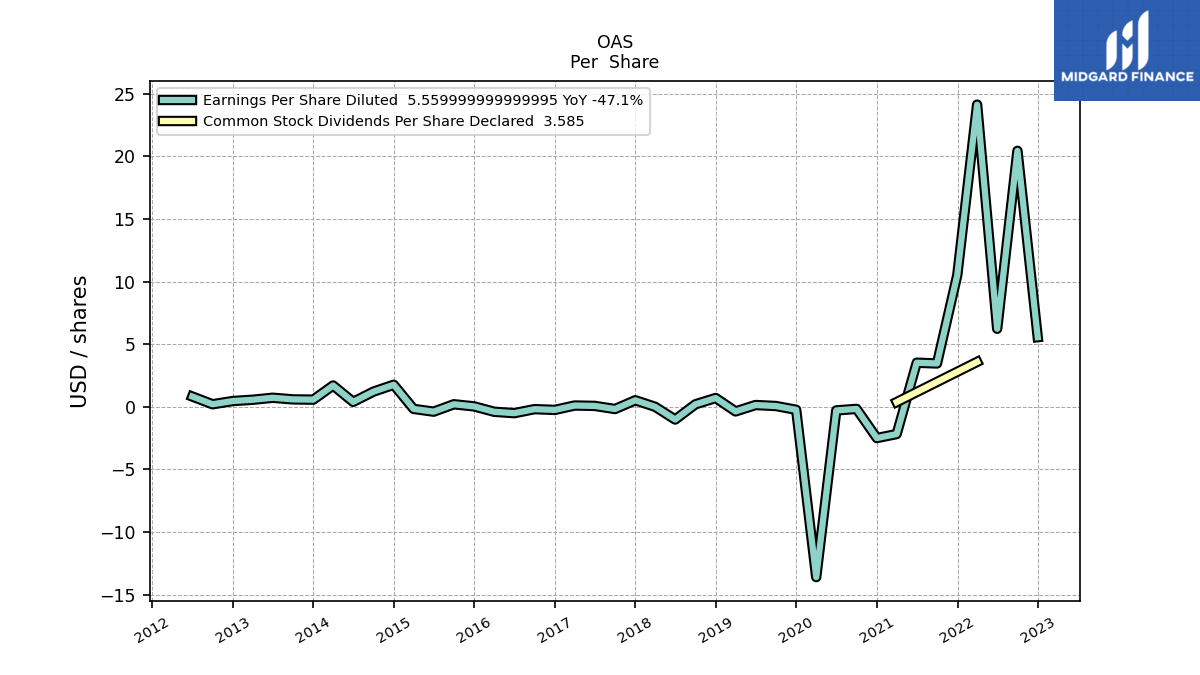
| Earnings Per Share Basic | 5.70 | 21.34 | 6.69 | 24.14 | 11.04 | 3.63 | 3.69 | -2.18 | -2.50 | -0.17 | -0.29 | -13.61 | -0.24 | 0.06 | 0.14 | -0.37 | 0.71 | 0.20 | -1.02 | 0.00 | 0.52 | -0.18 | 0.07 | 0.10 | |
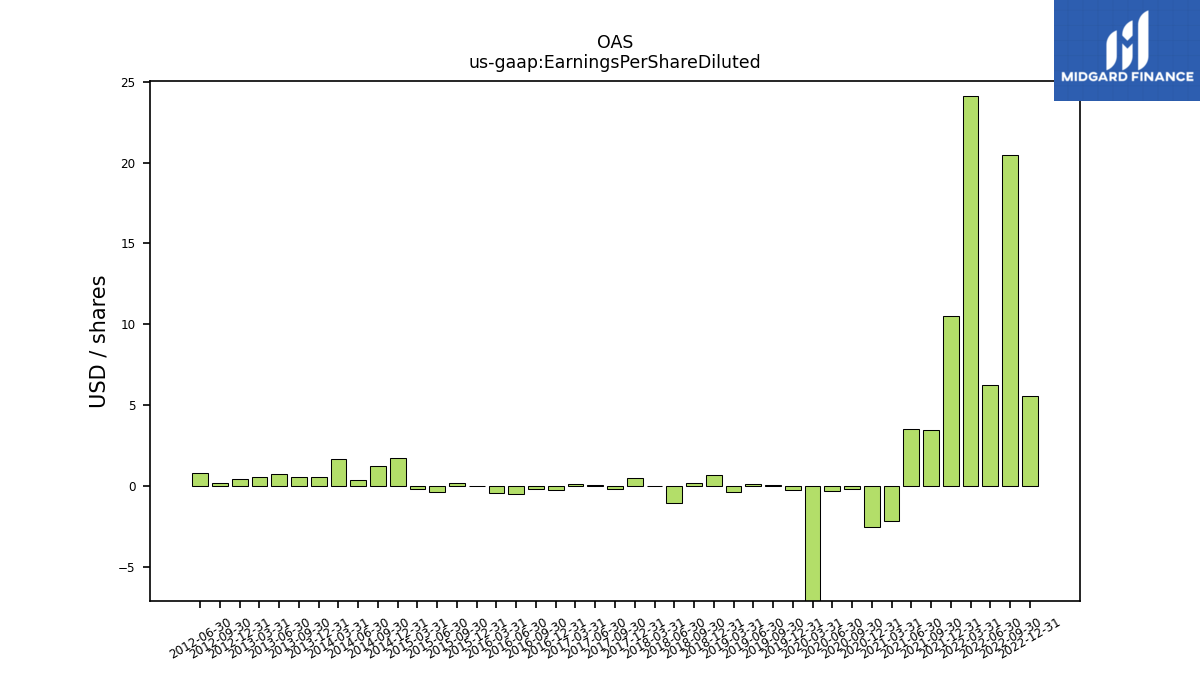
| Earnings Per Share Diluted | 5.56 | 20.45 | 6.23 | 24.14 | 10.52 | 3.46 | 3.52 | -2.18 | -2.50 | -0.17 | -0.29 | -13.61 | -0.24 | 0.06 | 0.14 | -0.37 | 0.70 | 0.20 | -1.02 | 0.00 | 0.52 | -0.18 | 0.07 | 0.10 | |
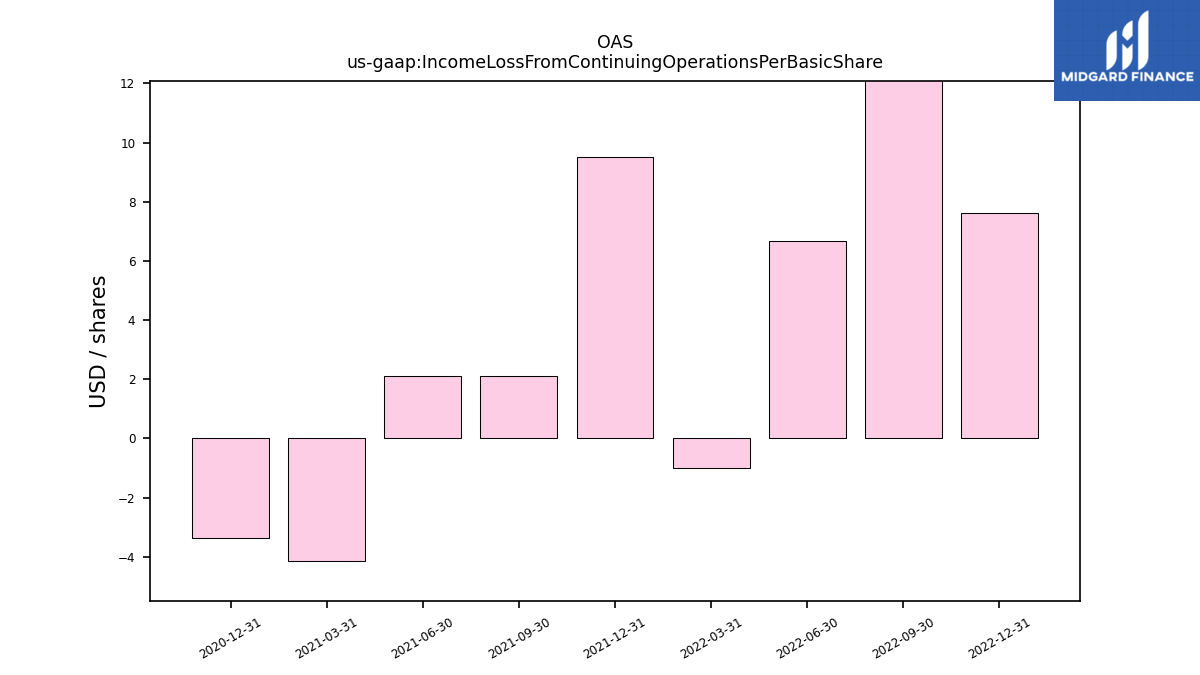
| Income Loss From Continuing Operations Per Basic Share | 0.00 | 0.00 | 0.00 | -0.00 | 0.00 | 0.00 | 0.00 | -0.00 | -0.00 | NA | NA | NA | NA | NA | NA | NA | NA | NA | NA | NA | NA | NA | NA | NA | |
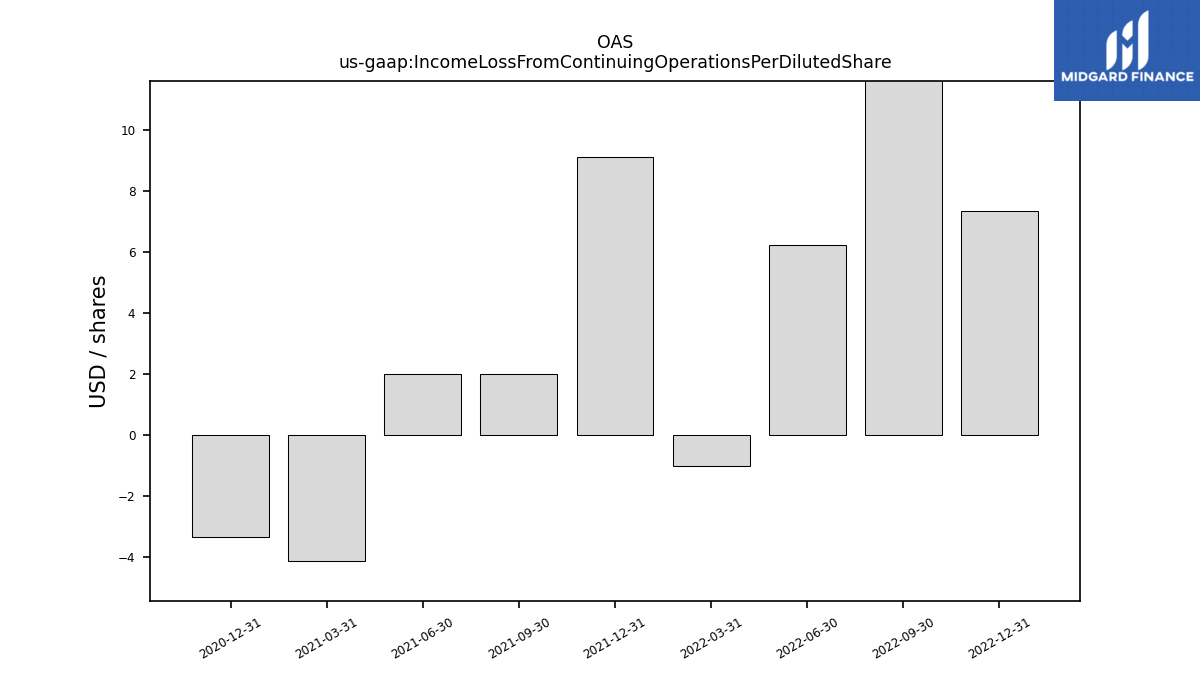
| Income Loss From Continuing Operations Per Diluted Share | 0.00 | 0.00 | 0.00 | -0.00 | 0.00 | 0.00 | 0.00 | -0.00 | -0.00 | NA | NA | NA | NA | NA | NA | NA | NA | NA | NA | NA | NA | NA | NA | NA |
| 2022-12-31 | 2022-09-30 | 2022-06-30 | 2022-03-31 | 2021-12-31 | 2021-09-30 | 2021-06-30 | 2021-03-31 | 2020-12-31 | 2020-09-30 | 2020-06-30 | 2020-03-31 | 2019-12-31 | 2019-09-30 | 2019-06-30 | 2019-03-31 | 2018-12-31 | 2018-09-30 | 2018-06-30 | 2018-03-31 | 2017-12-31 | 2017-09-30 | 2017-06-30 | 2017-03-31 | ||
|---|---|---|---|---|---|---|---|---|---|---|---|---|---|---|---|---|---|---|---|---|---|---|---|---|---|
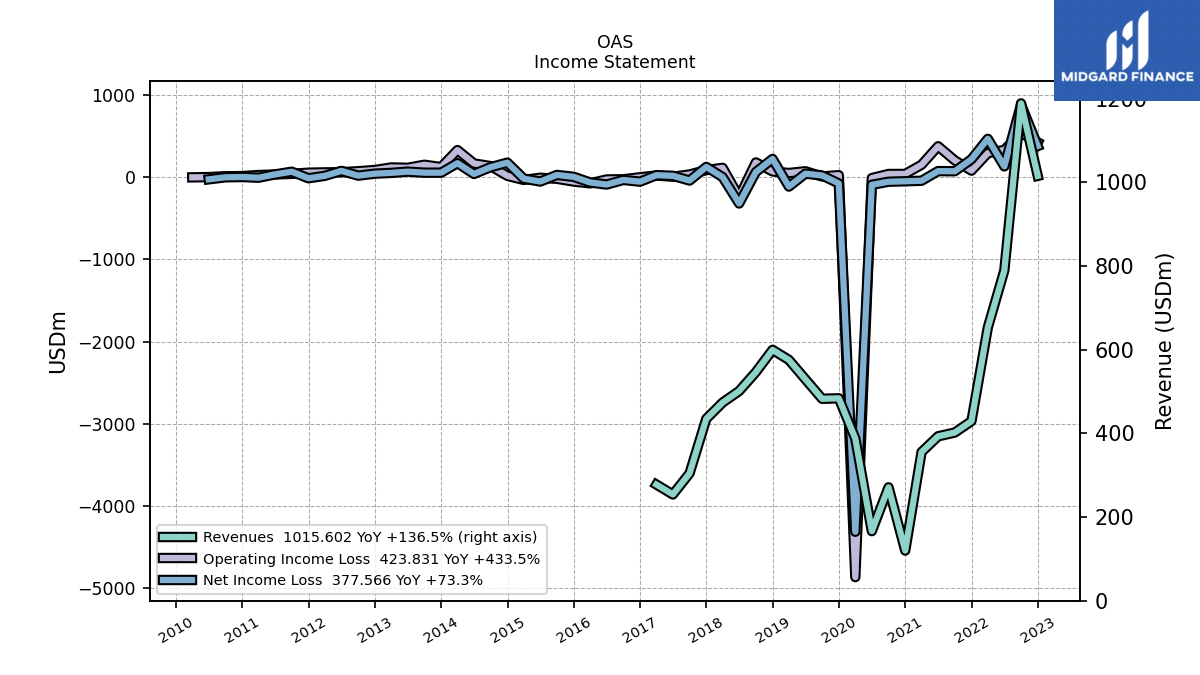
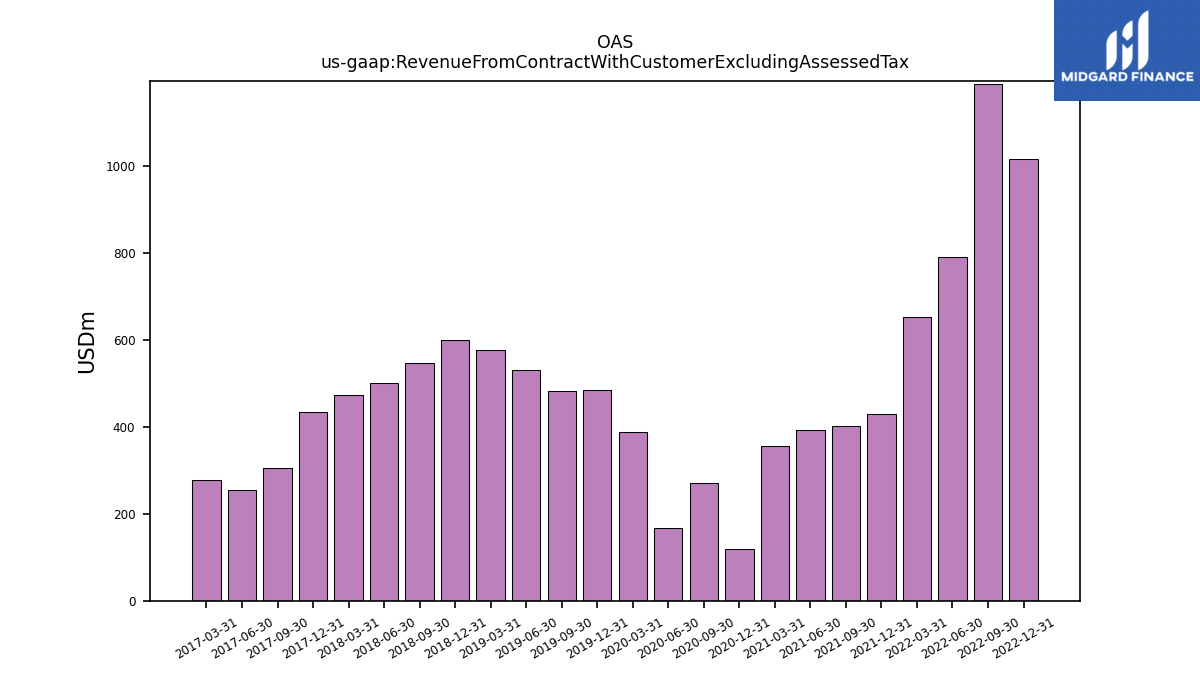
| Revenue From Contract With Customer Excluding Assessed Tax | 1015.60 | 1188.84 | 789.38 | 652.97 | 429.37 | 402.04 | 393.06 | 355.46 | 119.92 | 271.06 | 166.35 | 387.80 | 483.86 | 482.74 | 529.40 | 575.73 | 599.75 | 546.45 | 501.34 | 473.81 | 434.88 | 304.75 | 254.09 | 277.75 | |
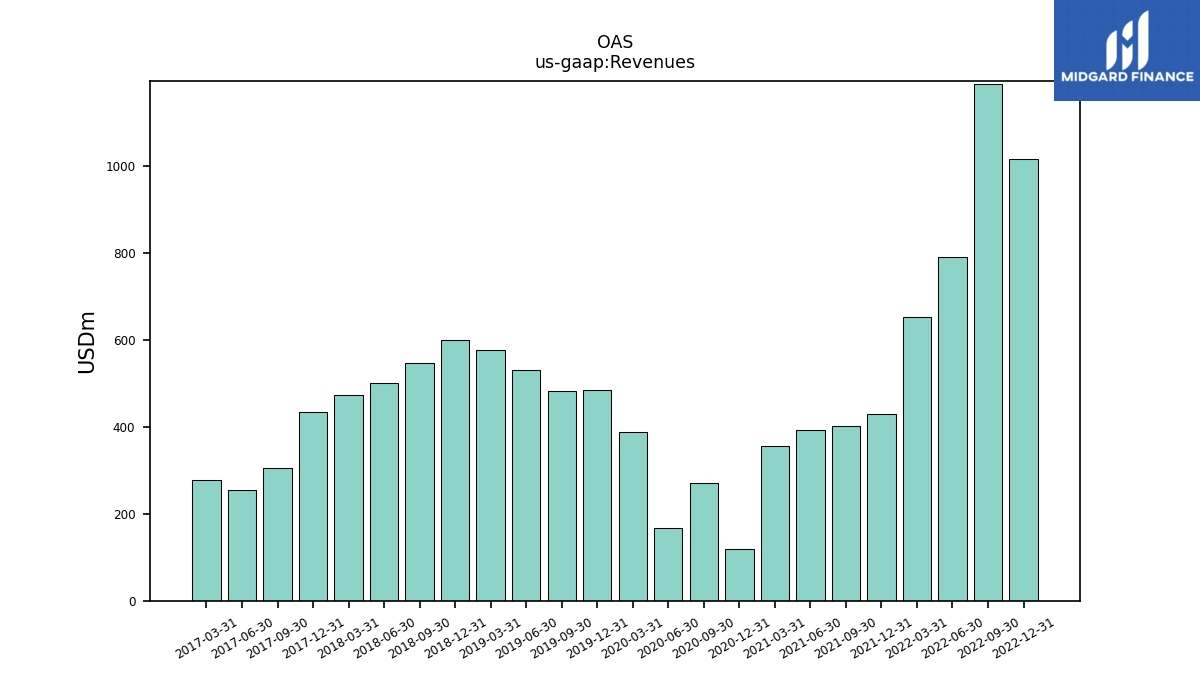
| Revenues | 1015.60 | 1188.84 | 789.38 | 652.97 | 429.37 | 402.04 | 393.06 | 355.46 | 119.92 | 271.06 | 166.35 | 387.80 | 483.86 | 482.74 | 529.40 | 575.73 | 599.75 | 546.45 | 501.34 | 473.81 | 434.88 | 304.75 | 254.09 | 277.75 | |
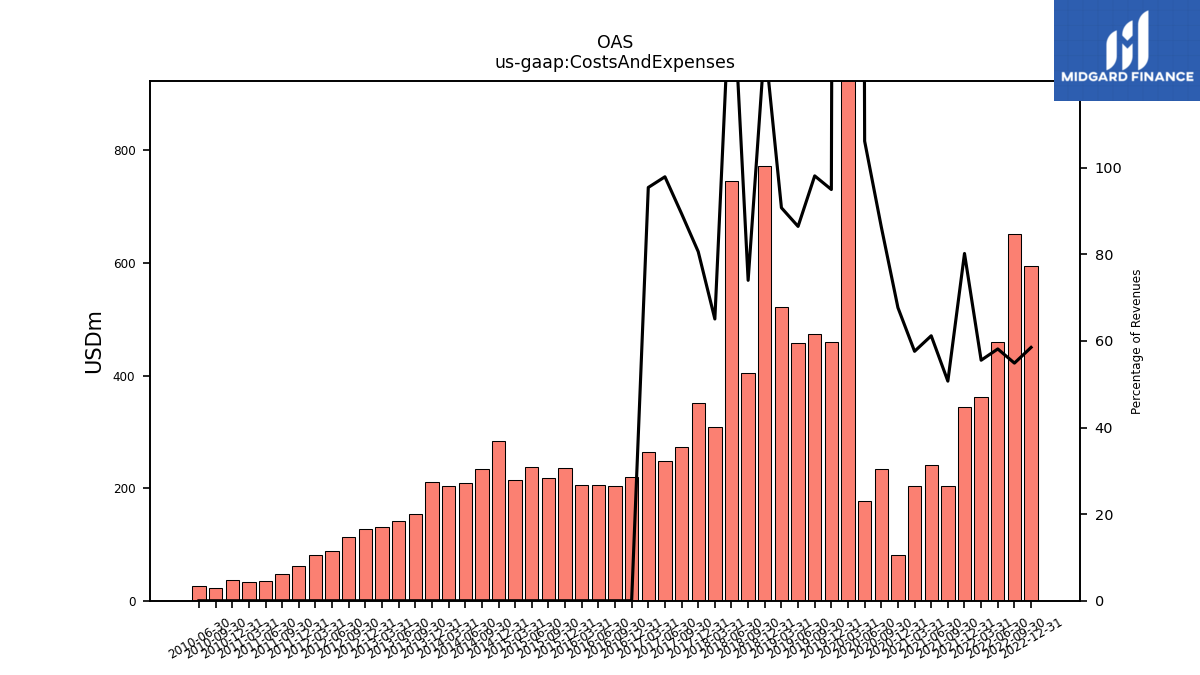
| Costs And Expenses | 594.04 | 652.29 | 458.92 | 362.62 | 344.25 | 203.85 | 240.47 | 204.71 | 81.15 | 234.01 | 176.53 | 5261.55 | 459.39 | 473.55 | 457.56 | 522.37 | 773.05 | 404.27 | 745.97 | 308.23 | 350.55 | 272.35 | 248.71 | 265.02 | |
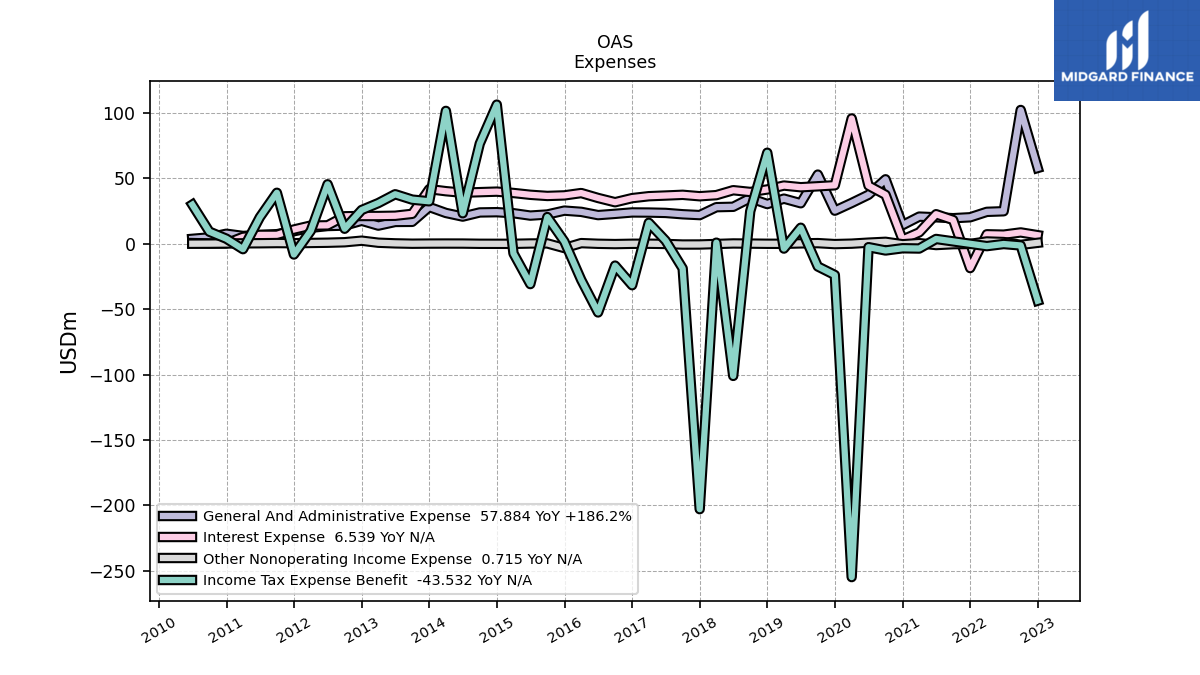
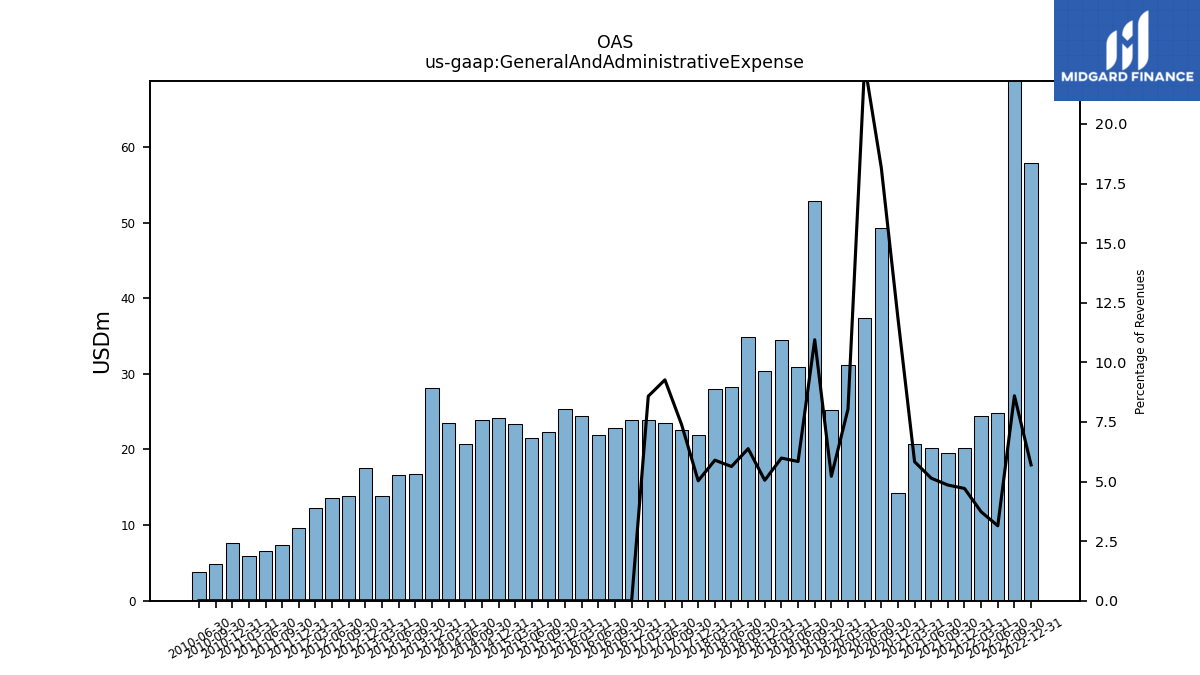
| General And Administrative Expense | 57.88 | 102.23 | 24.82 | 24.37 | 20.23 | 19.51 | 20.21 | 20.74 | 14.22 | 49.25 | 37.44 | 31.17 | 25.26 | 52.86 | 30.93 | 34.46 | 30.32 | 34.86 | 28.23 | 27.94 | 21.88 | 22.53 | 23.55 | 23.83 | |
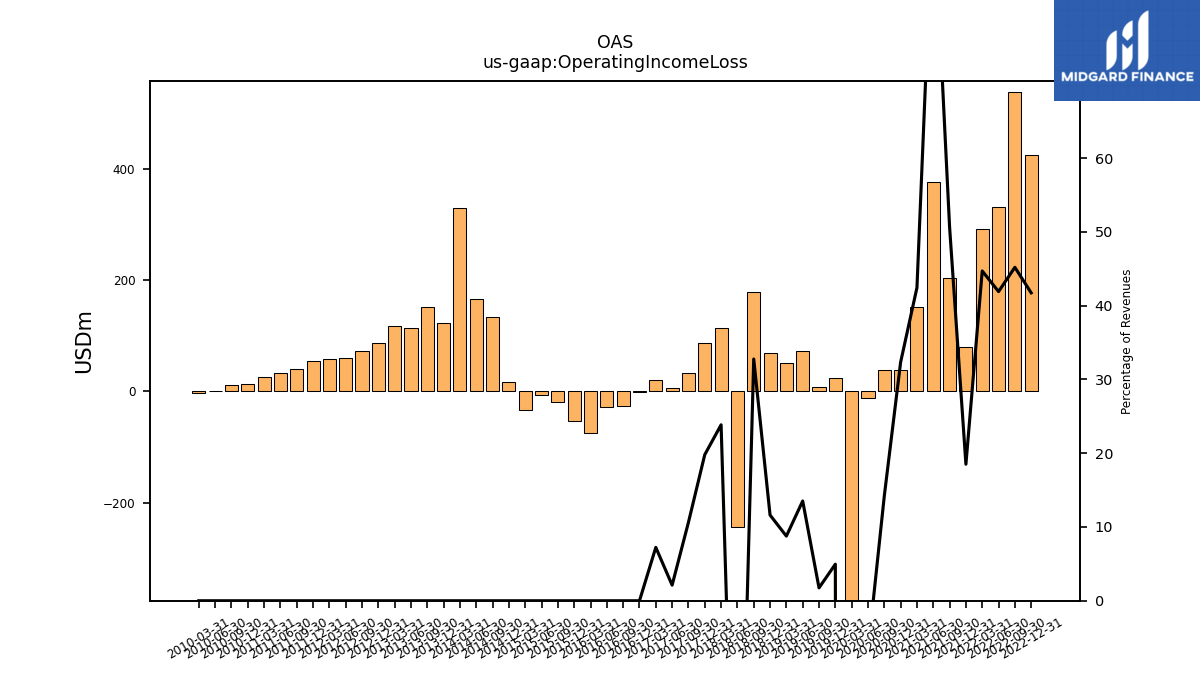
| Operating Income Loss | 423.83 | 537.31 | 330.78 | 291.87 | 79.45 | 203.59 | 375.57 | 150.84 | 38.78 | 38.52 | -11.22 | -4862.53 | 23.97 | 8.44 | 71.57 | 50.44 | 69.66 | 179.04 | -242.67 | 112.98 | 86.10 | 32.39 | 5.38 | 20.09 | |
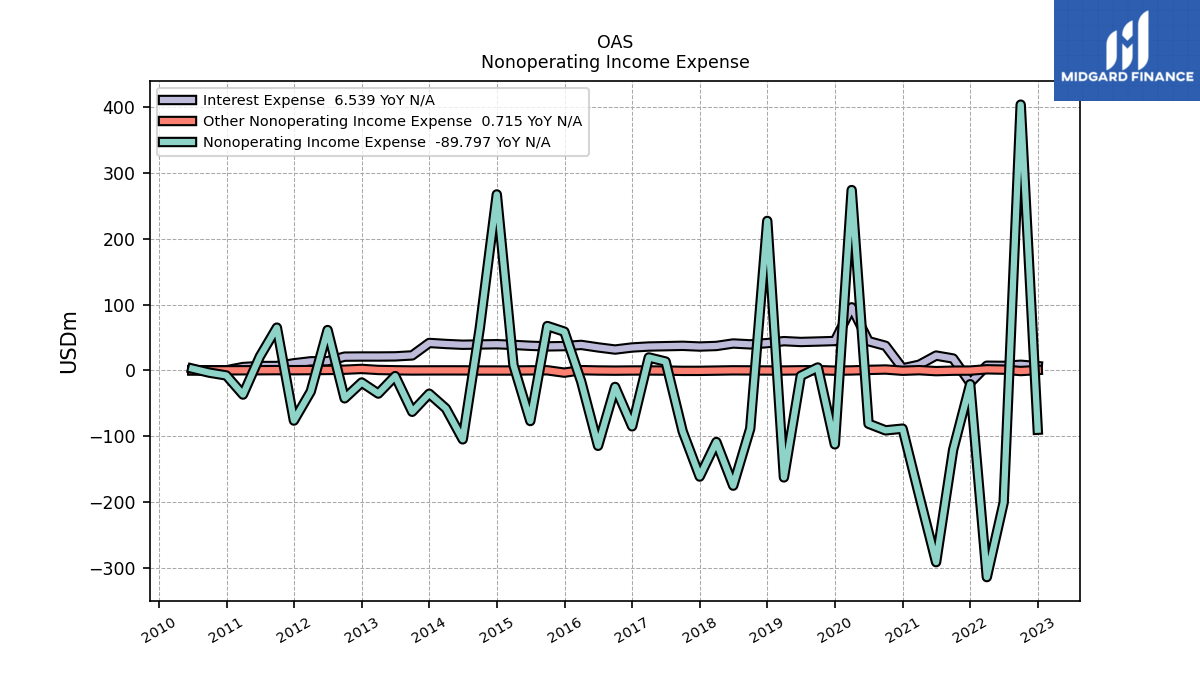
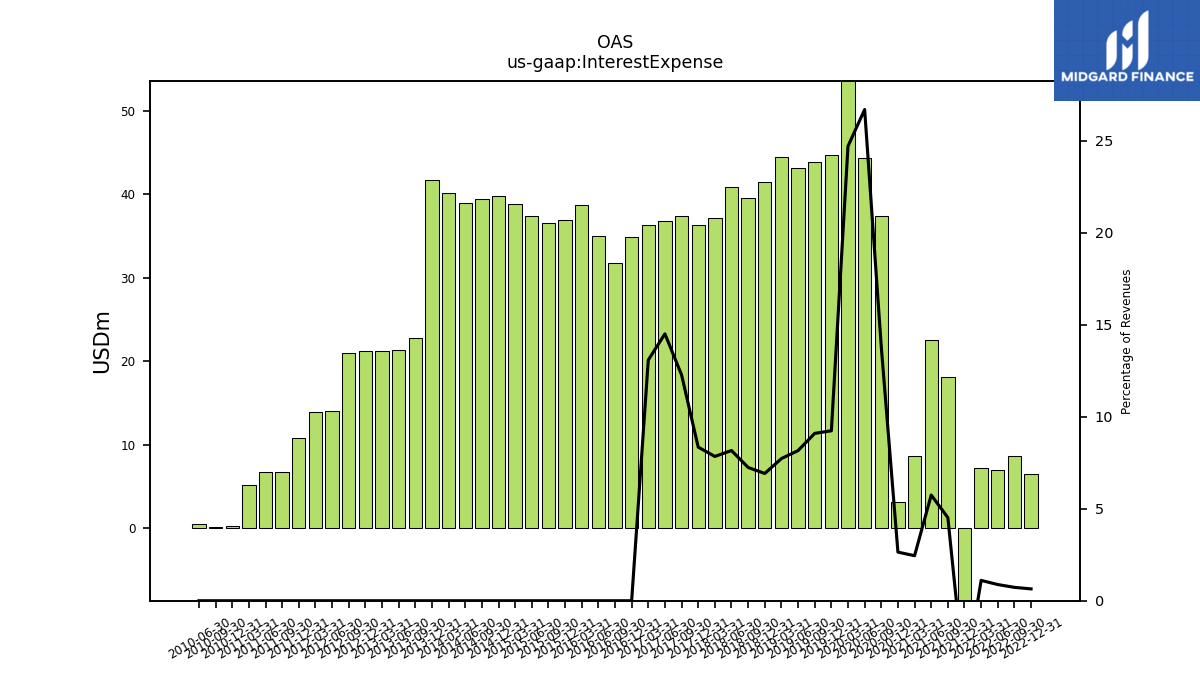
| Interest Expense | 6.54 | 8.64 | 6.95 | 7.22 | -18.61 | 18.15 | 22.57 | 8.70 | 3.17 | 37.39 | 44.39 | 95.76 | 44.67 | 43.90 | 43.19 | 44.47 | 41.47 | 39.56 | 40.91 | 37.15 | 36.29 | 37.39 | 36.84 | 36.32 | |
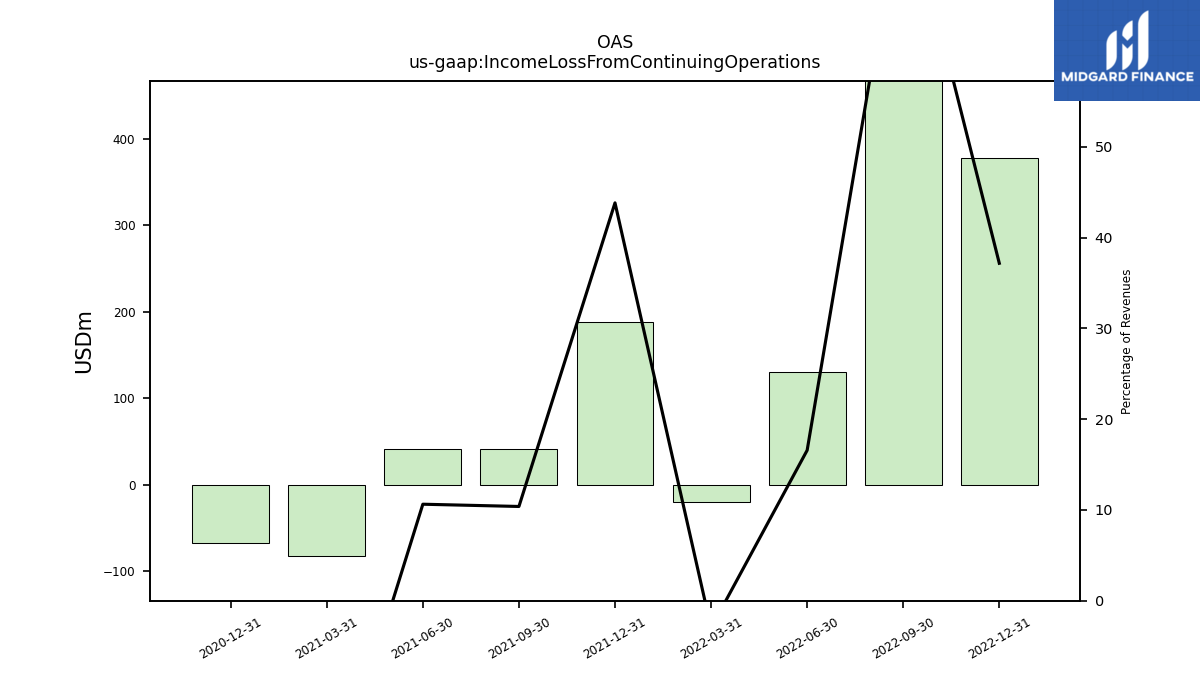
| Income Loss From Continuing Operations | 377.57 | 941.61 | 130.84 | -19.55 | 188.19 | 41.76 | 41.80 | -82.79 | -67.11 | NA | NA | NA | NA | NA | NA | NA | NA | NA | NA | NA | NA | NA | NA | NA | |
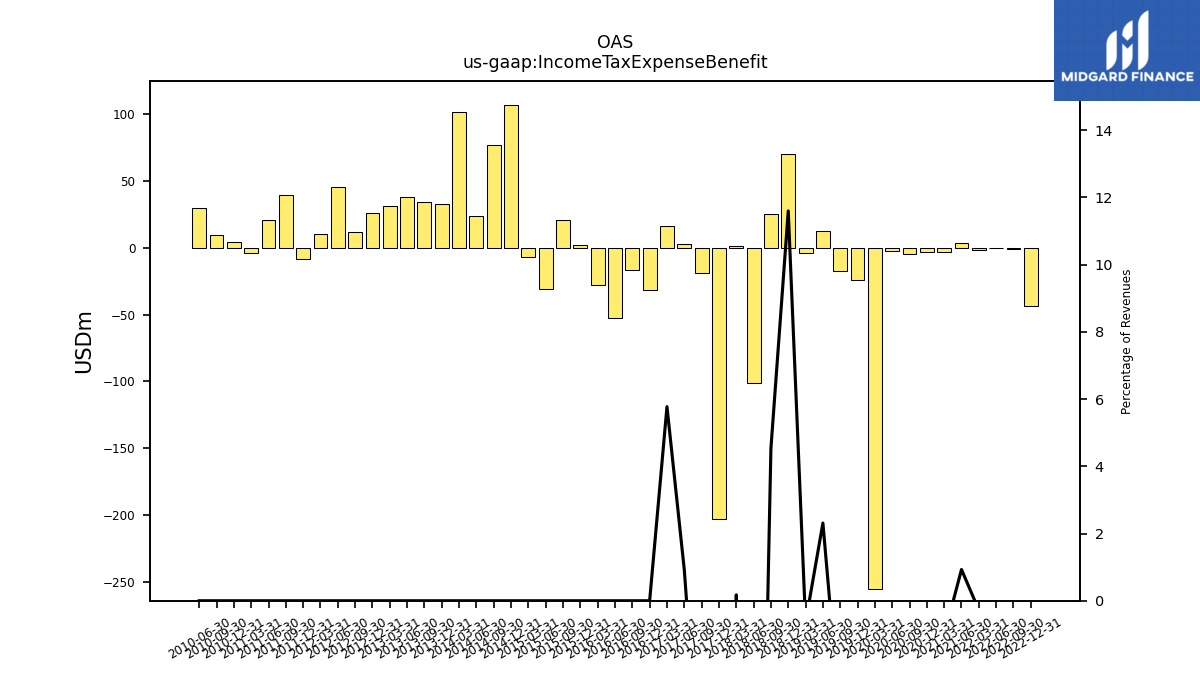
| Income Tax Expense Benefit | -43.53 | -1.31 | -0.22 | -1.83 | NA | NA | 3.65 | -3.65 | -3.45 | -5.14 | -2.61 | -254.74 | -23.88 | -17.37 | 12.24 | -3.70 | 69.55 | 24.78 | -101.00 | 0.83 | -202.83 | -18.85 | 2.34 | 16.04 | |
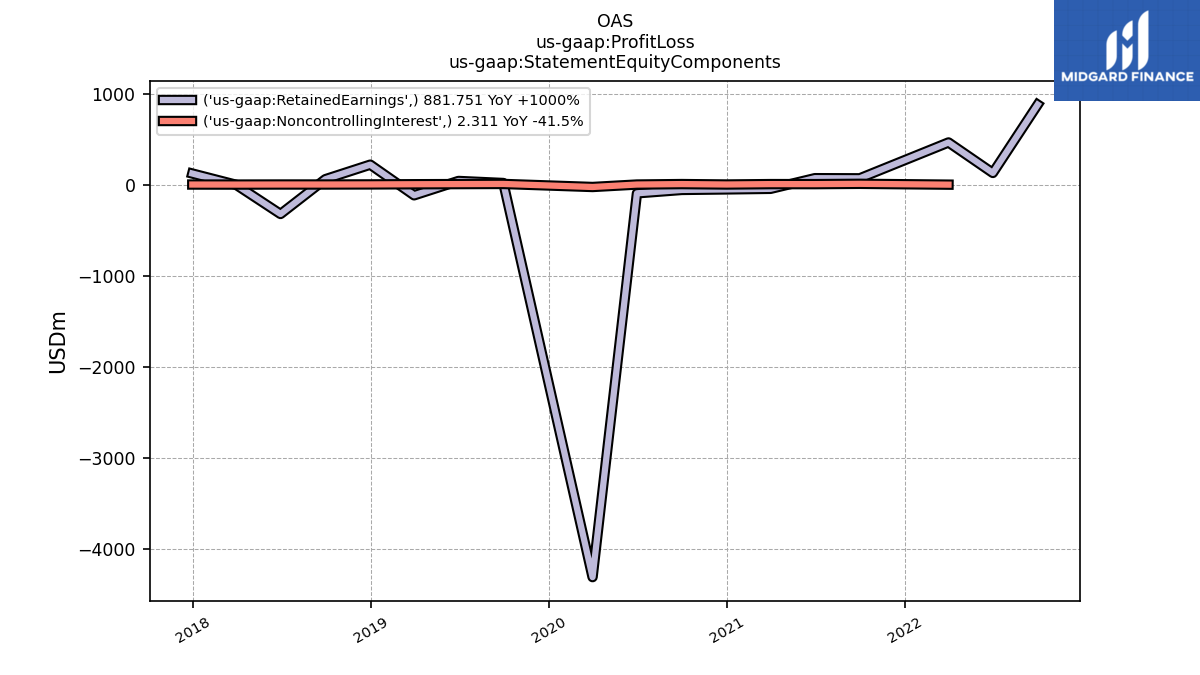
| Profit Loss | 377.57 | 881.75 | 130.84 | 468.31 | 225.92 | 83.33 | 81.31 | -35.27 | -45.96 | -47.10 | -89.35 | -4334.27 | -64.15 | 30.31 | 51.17 | -107.98 | 226.87 | 66.22 | -316.30 | 3.71 | 128.12 | -41.06 | 16.57 | 23.82 | |
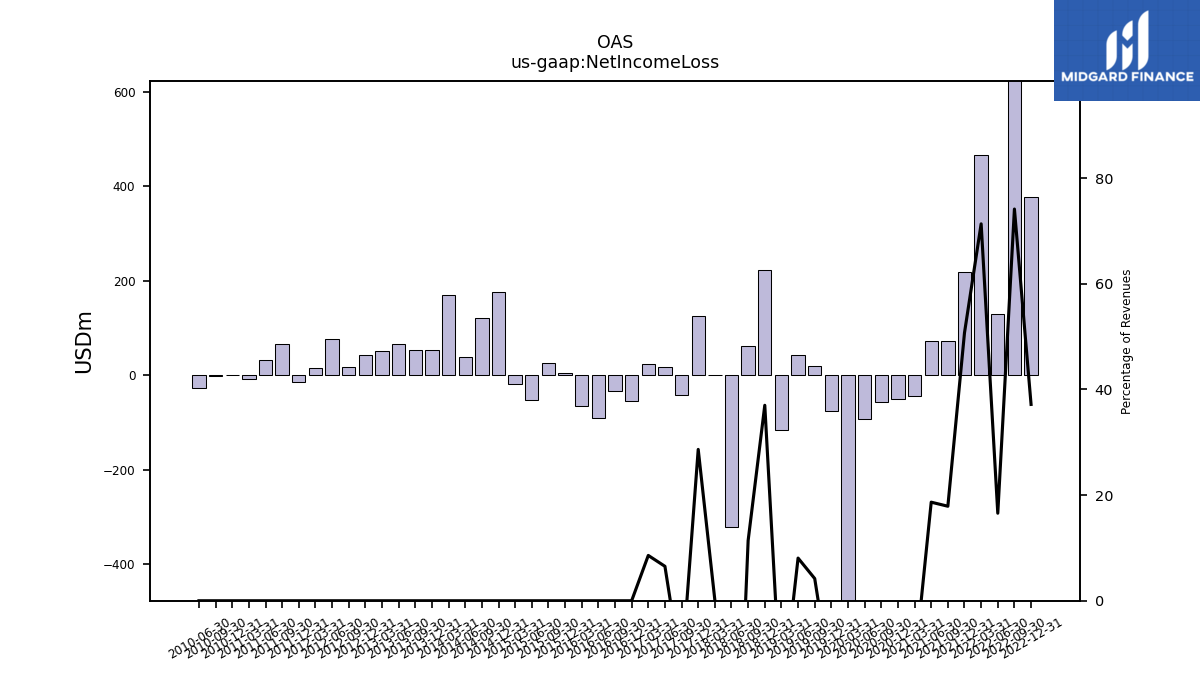
| Net Income Loss | 377.57 | 881.75 | 130.84 | 466.00 | 217.88 | 71.95 | 73.36 | -43.59 | -49.91 | -55.70 | -92.94 | -4310.86 | -76.41 | 20.29 | 42.76 | -114.88 | 221.98 | 62.34 | -320.20 | 0.59 | 124.62 | -41.21 | 16.57 | 23.82 |
| 2022-12-31 | 2022-09-30 | 2022-06-30 | 2022-03-31 | 2021-12-31 | 2021-09-30 | 2021-06-30 | 2021-03-31 | 2020-12-31 | 2020-09-30 | 2020-06-30 | 2020-03-31 | 2019-12-31 | 2019-09-30 | 2019-06-30 | 2019-03-31 | 2018-12-31 | 2018-09-30 | 2018-06-30 | 2018-03-31 | 2017-12-31 | 2017-09-30 | 2017-06-30 | 2017-03-31 | ||
|---|---|---|---|---|---|---|---|---|---|---|---|---|---|---|---|---|---|---|---|---|---|---|---|---|---|
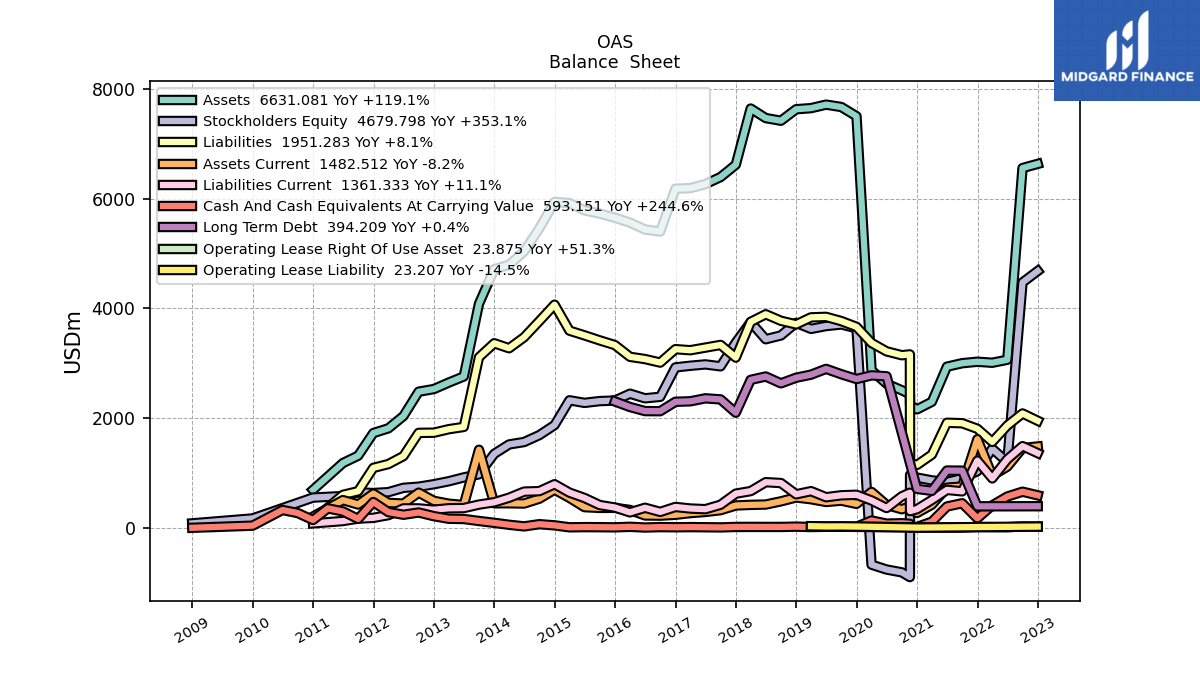
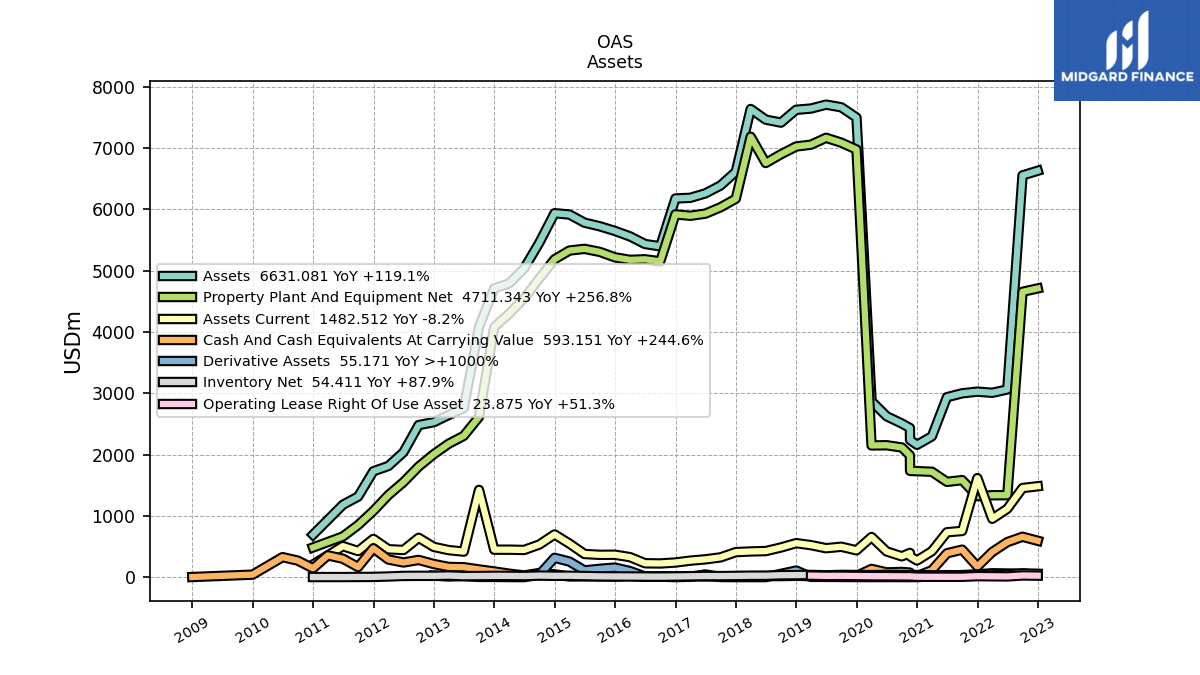
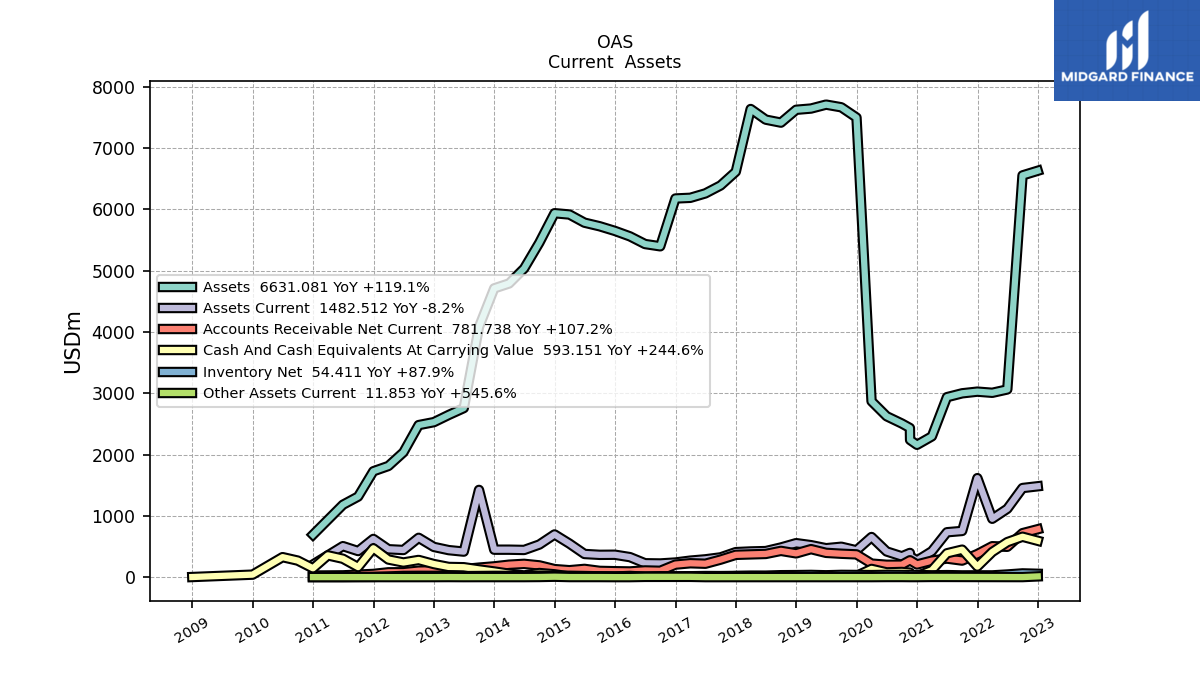
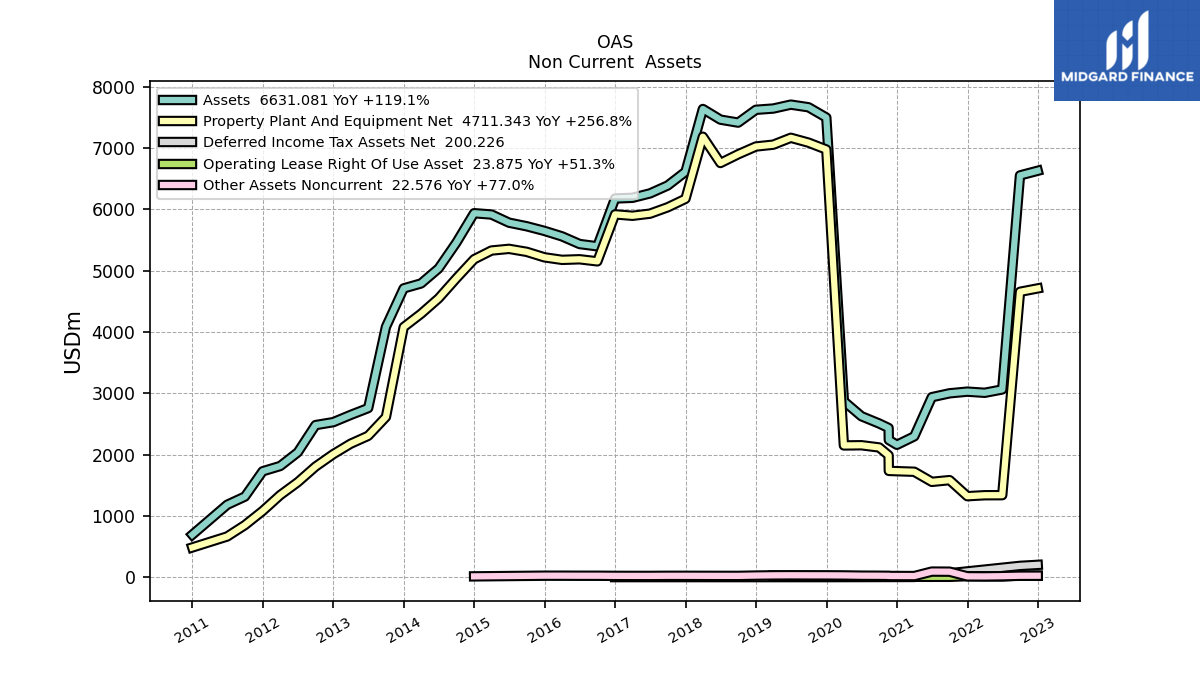
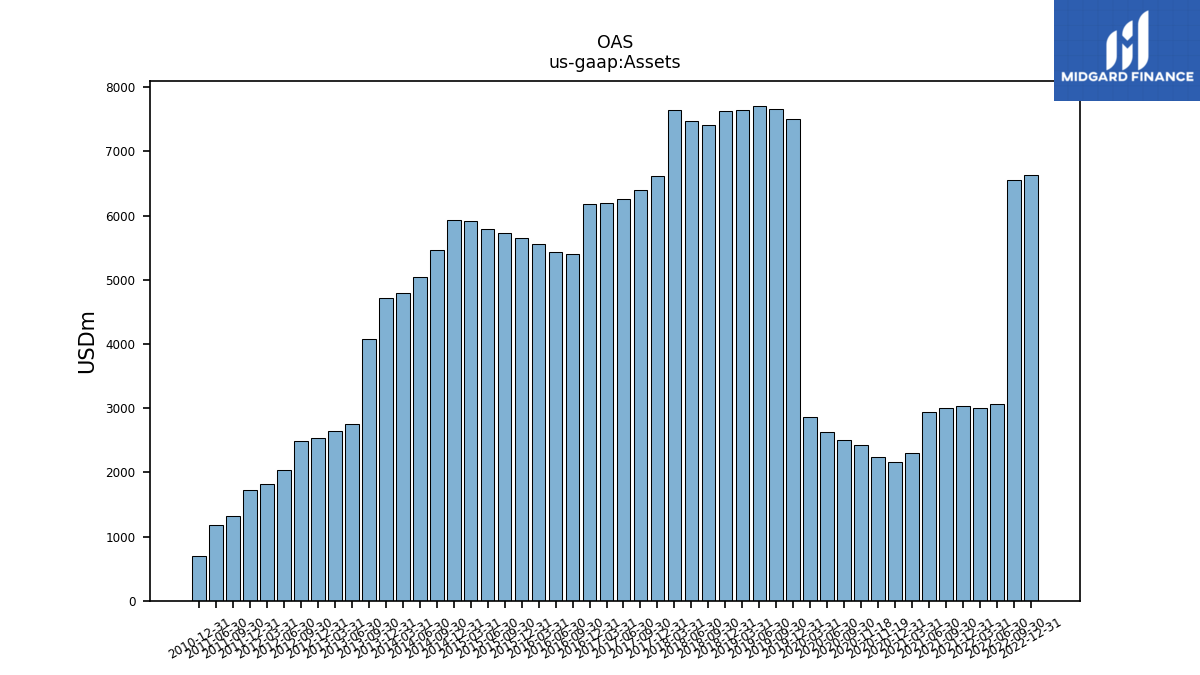
| Assets | 6631.08 | 6555.14 | 3062.41 | 3007.95 | 3026.79 | 2999.51 | 2936.72 | 2297.18 | 2159.04 | 2506.78 | 2625.63 | 2869.84 | 7499.25 | 7666.98 | 7710.29 | 7646.35 | 7626.14 | 7416.43 | 7465.34 | 7638.93 | 6615.13 | 6391.21 | 6261.72 | 6189.63 | |
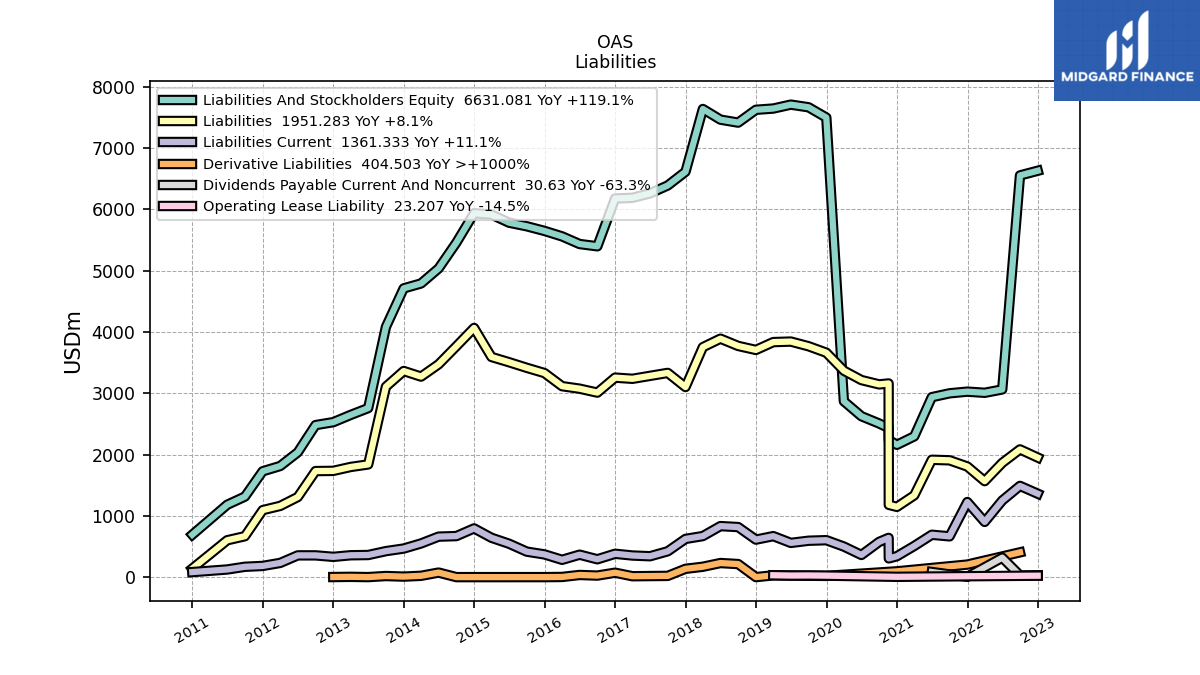
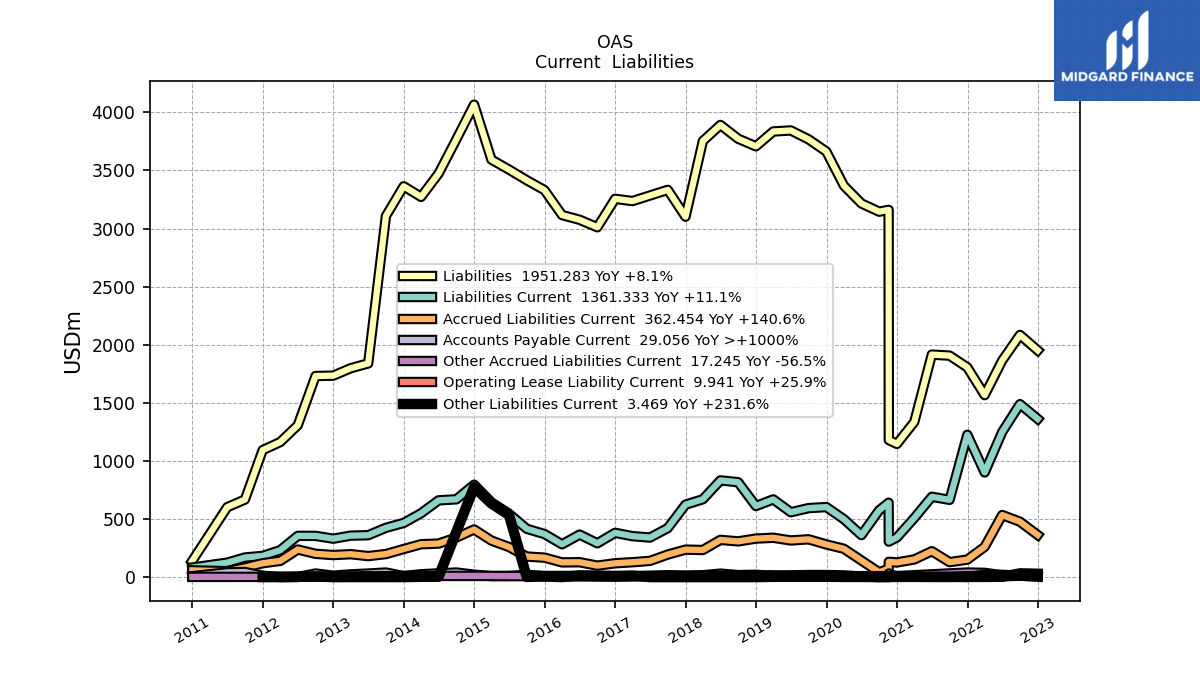
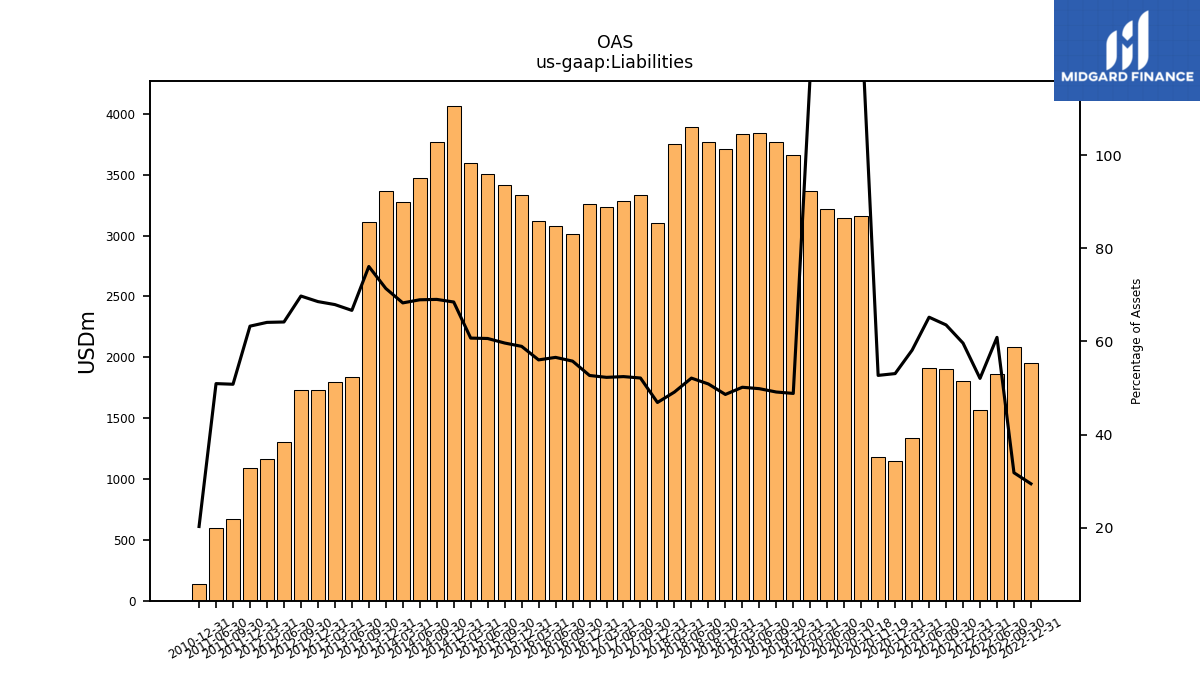
| Liabilities | 1951.28 | 2084.32 | 1864.31 | 1565.98 | 1805.21 | 1906.18 | 1914.94 | 1335.17 | 1146.30 | 3144.93 | 3215.54 | 3369.01 | 3662.17 | 3767.32 | 3843.83 | 3835.21 | 3707.26 | 3772.35 | 3891.08 | 3752.77 | 3101.55 | 3332.57 | 3284.11 | 3236.15 | |
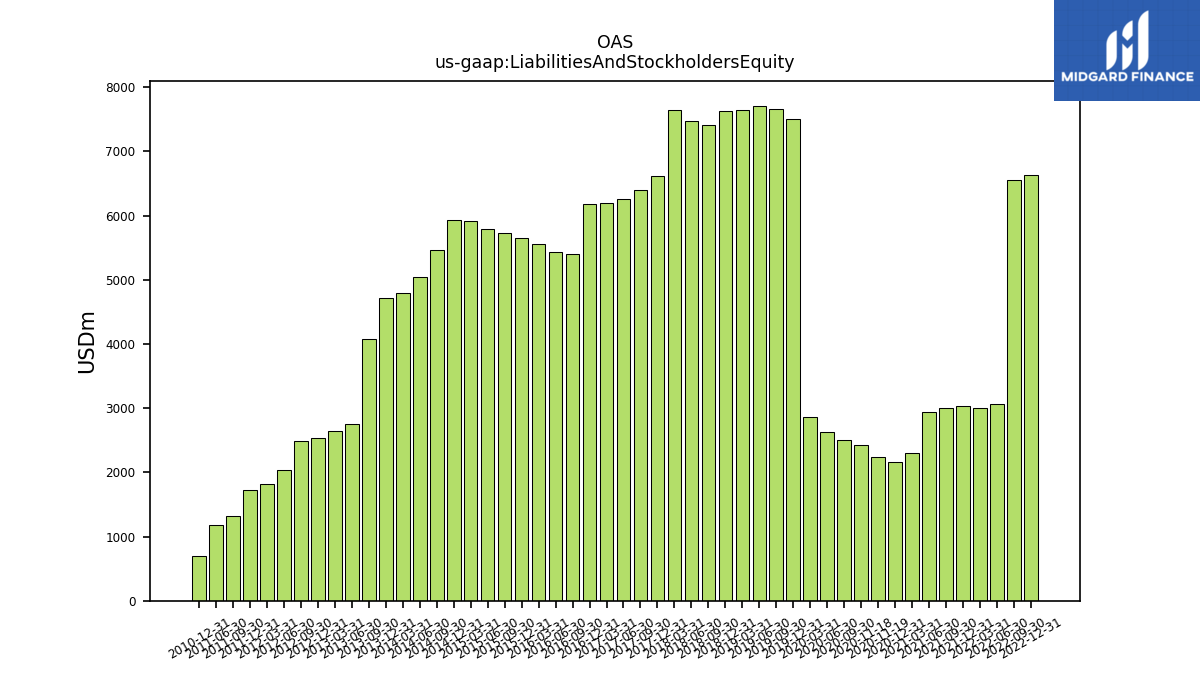
| Liabilities And Stockholders Equity | 6631.08 | 6555.14 | 3062.41 | 3007.95 | 3026.79 | 2999.51 | 2936.72 | 2297.18 | 2159.04 | 2506.78 | 2625.63 | 2869.84 | 7499.25 | 7666.98 | 7710.29 | 7646.35 | 7626.14 | 7416.43 | 7465.34 | 7638.93 | 6615.13 | 6391.21 | 6261.72 | 6189.63 | |
| Stockholders Equity | 4679.80 | 4470.81 | 1198.10 | 1441.96 | 1032.90 | 904.44 | 836.07 | 864.78 | 915.94 | -810.01 | -759.12 | -670.74 | 3636.14 | 3705.33 | 3676.77 | 3624.79 | 3734.58 | 3505.53 | 3436.14 | 3748.53 | 3375.69 | 2942.68 | 2977.61 | 2953.47 |
| 2022-12-31 | 2022-09-30 | 2022-06-30 | 2022-03-31 | 2021-12-31 | 2021-09-30 | 2021-06-30 | 2021-03-31 | 2020-12-31 | 2020-09-30 | 2020-06-30 | 2020-03-31 | 2019-12-31 | 2019-09-30 | 2019-06-30 | 2019-03-31 | 2018-12-31 | 2018-09-30 | 2018-06-30 | 2018-03-31 | 2017-12-31 | 2017-09-30 | 2017-06-30 | 2017-03-31 | ||
|---|---|---|---|---|---|---|---|---|---|---|---|---|---|---|---|---|---|---|---|---|---|---|---|---|---|
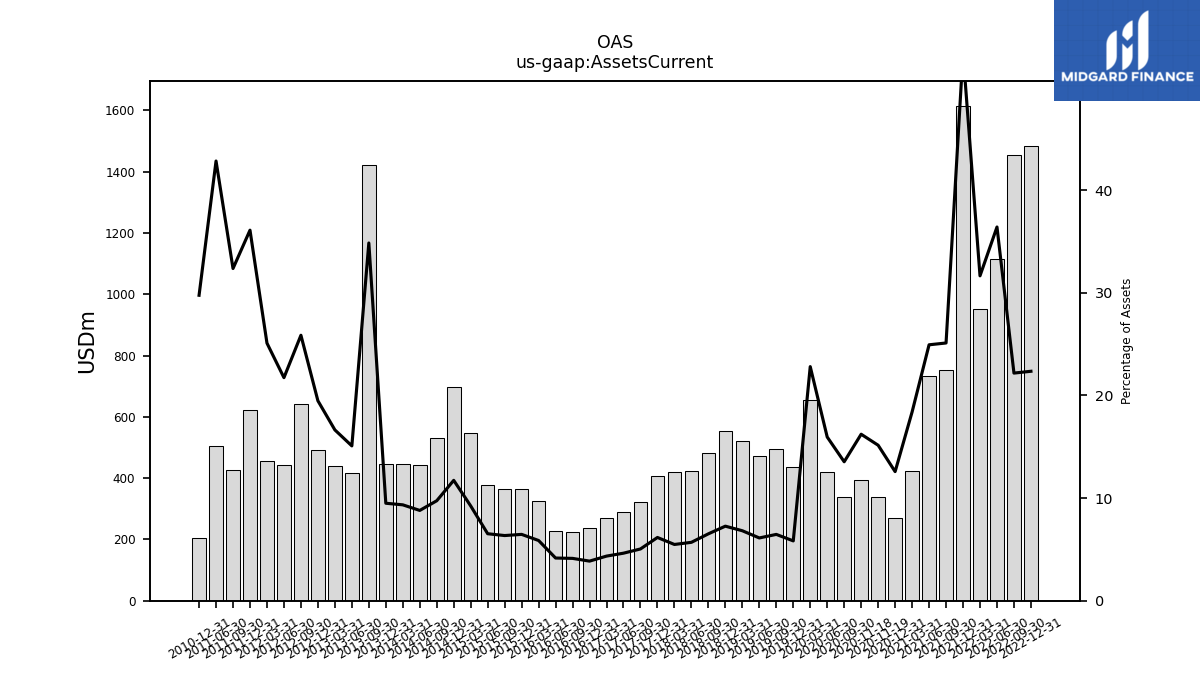
| Assets Current | 1482.51 | 1453.94 | 1115.12 | 952.16 | 1615.44 | 753.26 | 732.33 | 422.52 | 271.62 | 339.44 | 418.83 | 654.62 | 437.35 | 495.61 | 471.72 | 521.53 | 554.15 | 483.50 | 424.95 | 418.86 | 407.83 | 322.44 | 290.21 | 269.19 | |
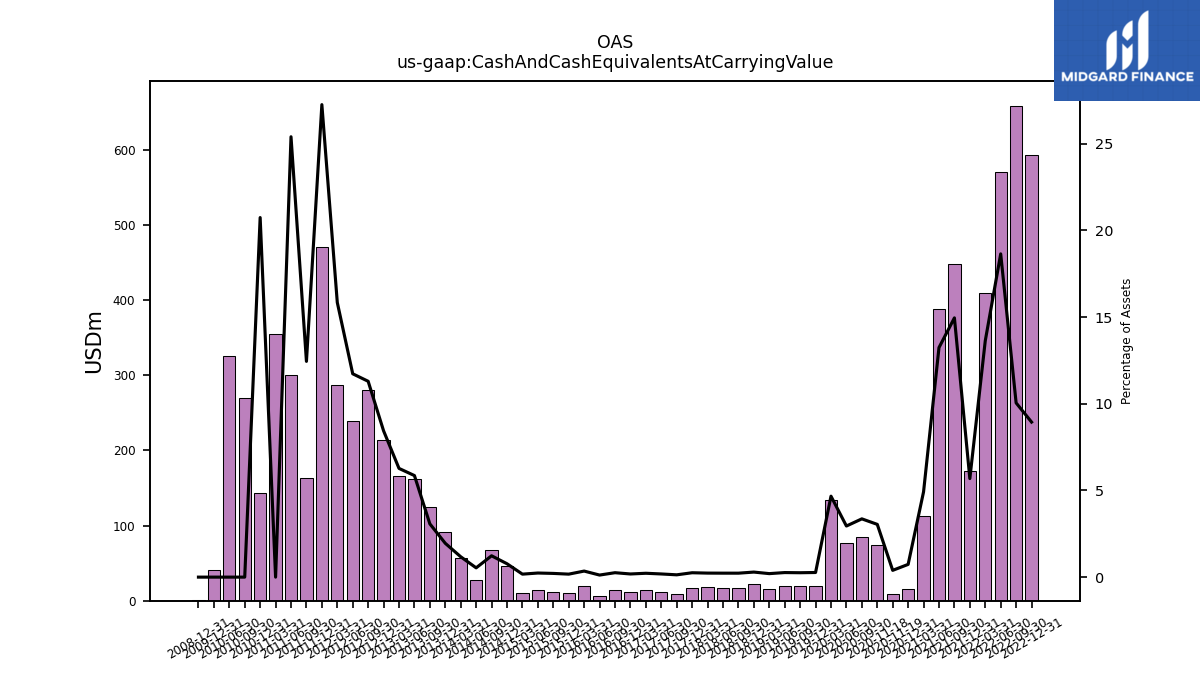
| Cash And Cash Equivalents At Carrying Value | 593.15 | 658.86 | 571.11 | 410.17 | 172.11 | 448.61 | 388.92 | 113.05 | 15.86 | 84.27 | 77.41 | 134.00 | 20.02 | 19.43 | 20.26 | 15.44 | 22.19 | 16.89 | 17.07 | 17.73 | 16.72 | 8.49 | 11.44 | 13.79 | |
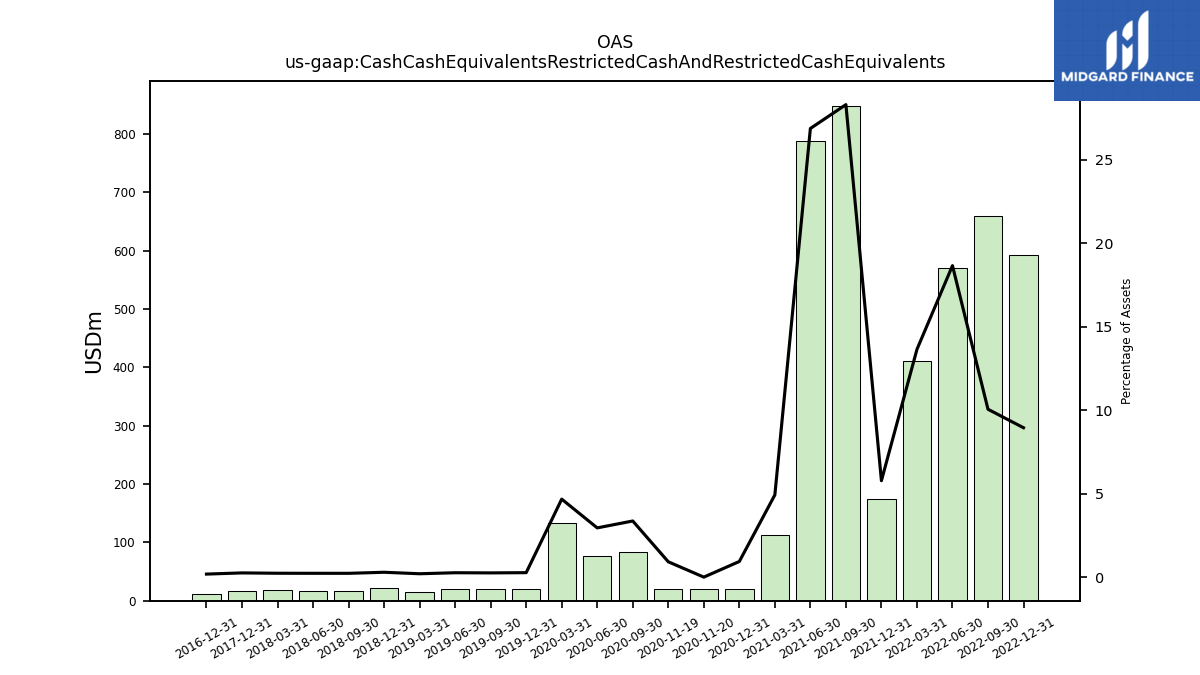
| Cash Cash Equivalents Restricted Cash And Restricted Cash Equivalents | 593.15 | 658.86 | 571.11 | 410.17 | 174.78 | 848.61 | 788.91 | 113.05 | 20.23 | 84.27 | 77.41 | 134.00 | 20.02 | 19.43 | 20.26 | 15.44 | 22.19 | 16.89 | 17.07 | 17.73 | 16.72 | NA | NA | NA | |
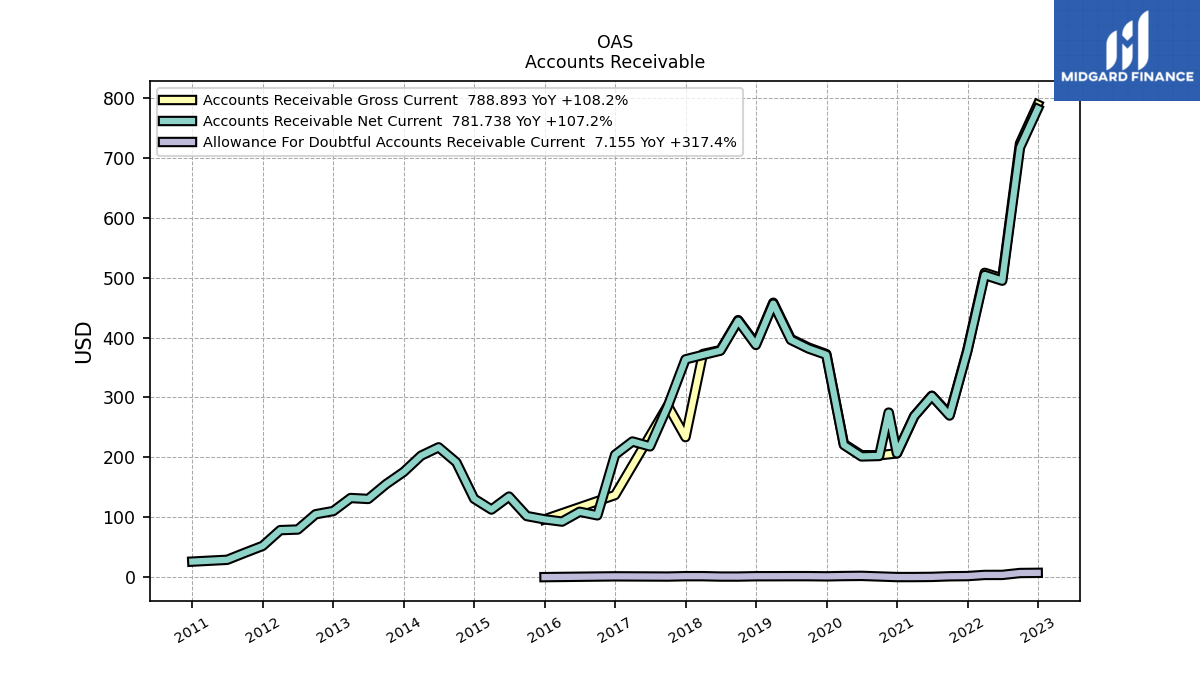
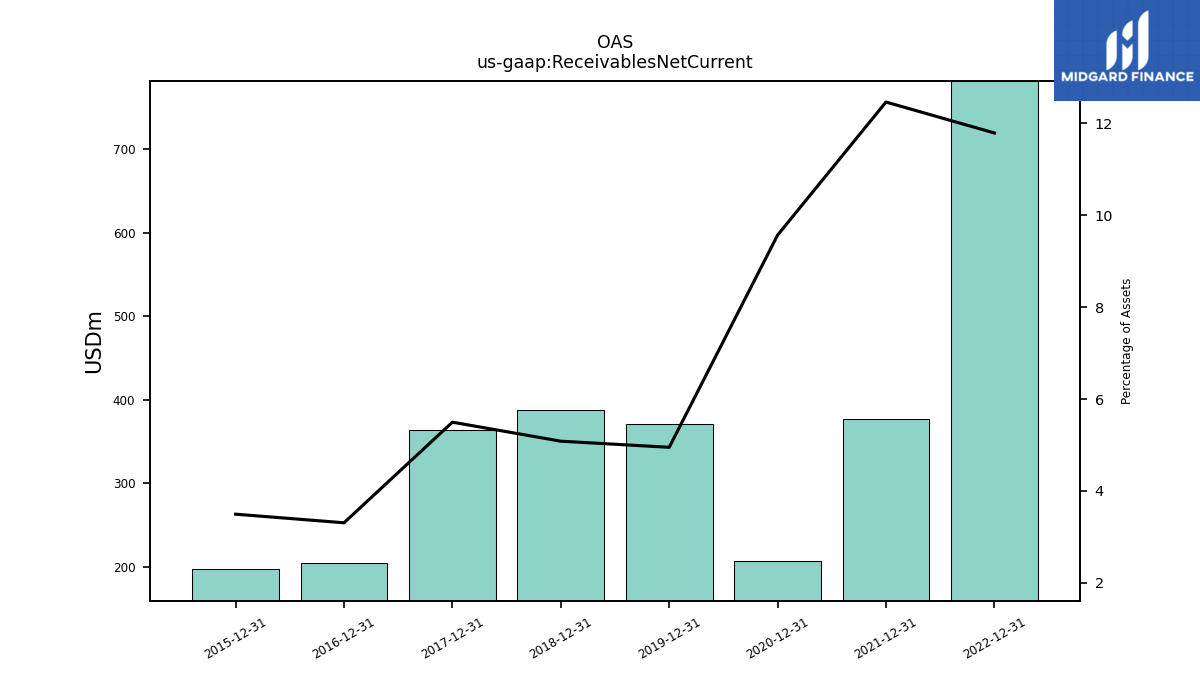
| Accounts Receivable Net Current | 781.74 | 717.15 | 494.95 | 504.44 | 377.20 | 269.74 | 302.51 | 268.82 | 206.54 | 202.27 | 201.51 | 220.65 | 371.18 | 381.62 | 396.10 | 456.64 | 387.60 | 428.18 | 378.08 | 370.98 | 363.58 | 285.38 | 218.30 | 226.43 | |
| Receivables Net Current | 781.74 | NA | NA | NA | 377.20 | NA | NA | NA | 206.54 | NA | NA | NA | 371.18 | NA | NA | NA | 387.60 | NA | NA | NA | 363.58 | NA | NA | NA | |
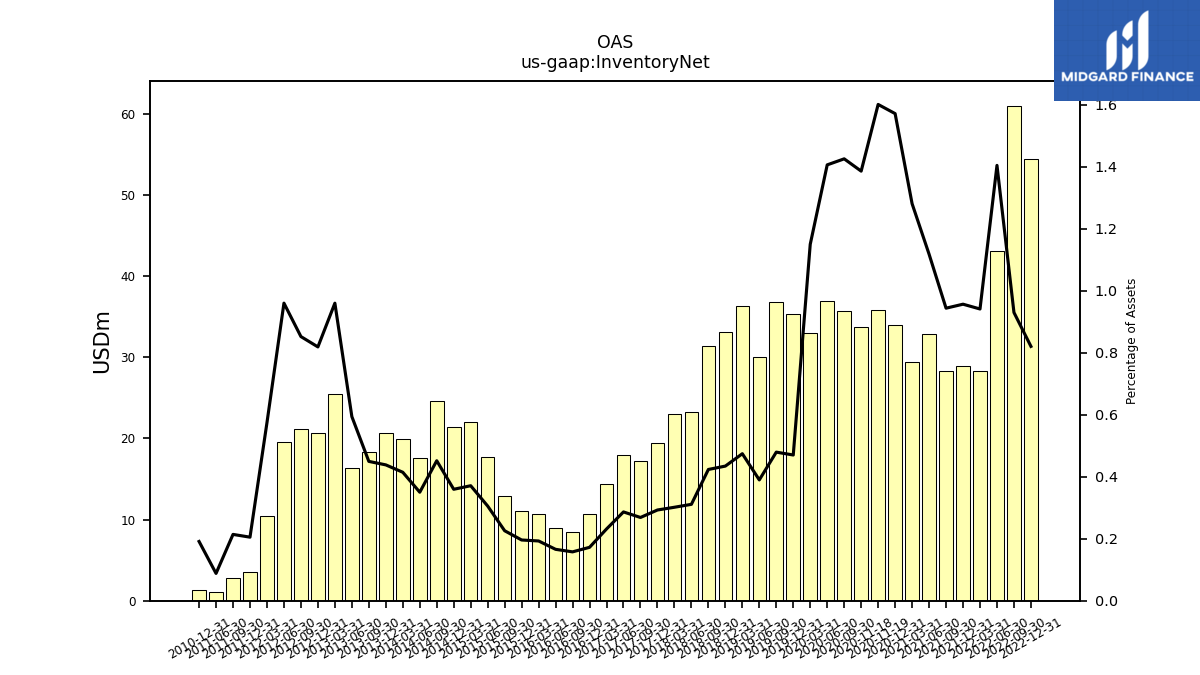
| Inventory Net | 54.41 | 60.96 | 43.01 | 28.31 | 28.96 | 28.31 | 32.83 | 29.42 | 33.93 | 35.74 | 36.92 | 33.00 | 35.26 | 36.76 | 30.06 | 36.27 | 33.13 | 31.41 | 23.22 | 23.04 | 19.37 | 17.17 | 17.94 | 14.33 | |
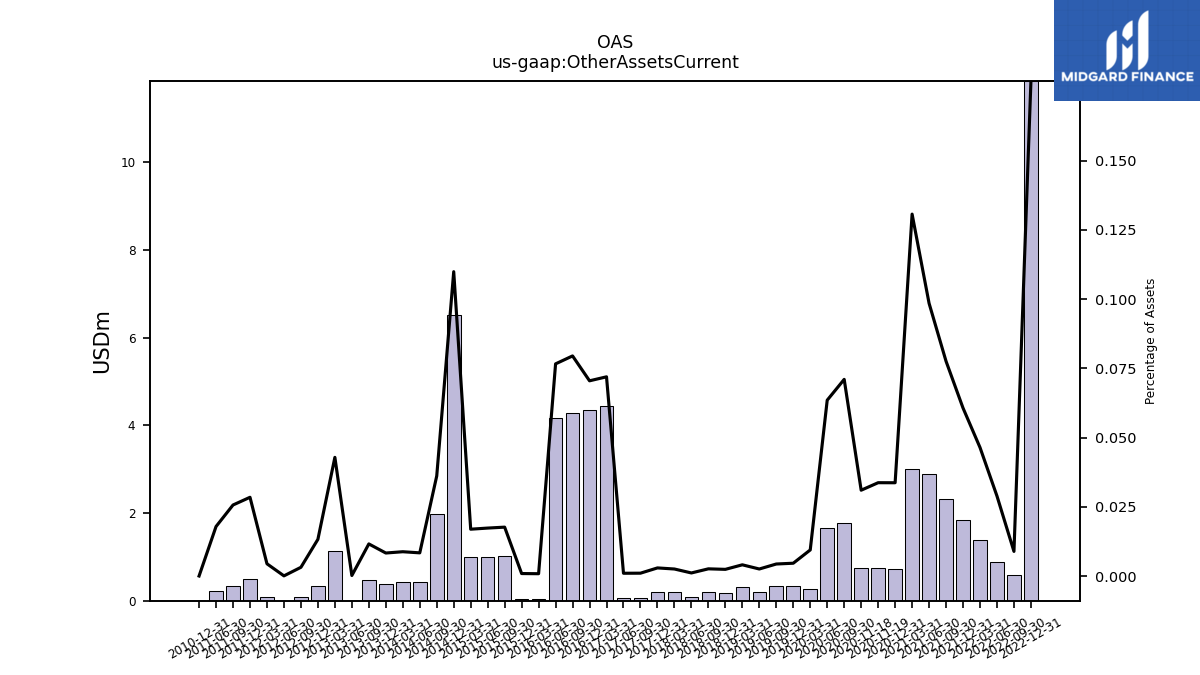
| Other Assets Current | 11.85 | 0.58 | 0.88 | 1.40 | 1.84 | 2.33 | 2.89 | 3.00 | 0.73 | 1.78 | 1.67 | 0.27 | 0.35 | 0.33 | 0.20 | 0.31 | 0.18 | 0.19 | 0.08 | 0.19 | 0.19 | 0.07 | 0.06 | 4.45 |
| 2022-12-31 | 2022-09-30 | 2022-06-30 | 2022-03-31 | 2021-12-31 | 2021-09-30 | 2021-06-30 | 2021-03-31 | 2020-12-31 | 2020-09-30 | 2020-06-30 | 2020-03-31 | 2019-12-31 | 2019-09-30 | 2019-06-30 | 2019-03-31 | 2018-12-31 | 2018-09-30 | 2018-06-30 | 2018-03-31 | 2017-12-31 | 2017-09-30 | 2017-06-30 | 2017-03-31 | ||
|---|---|---|---|---|---|---|---|---|---|---|---|---|---|---|---|---|---|---|---|---|---|---|---|---|---|
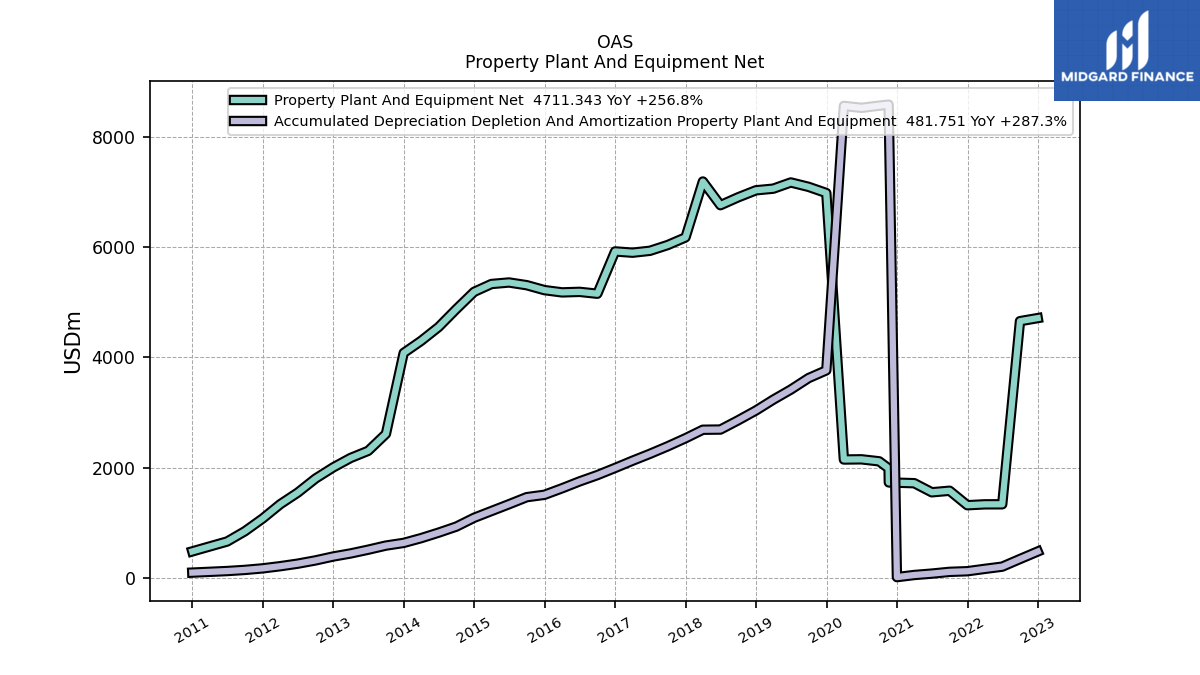
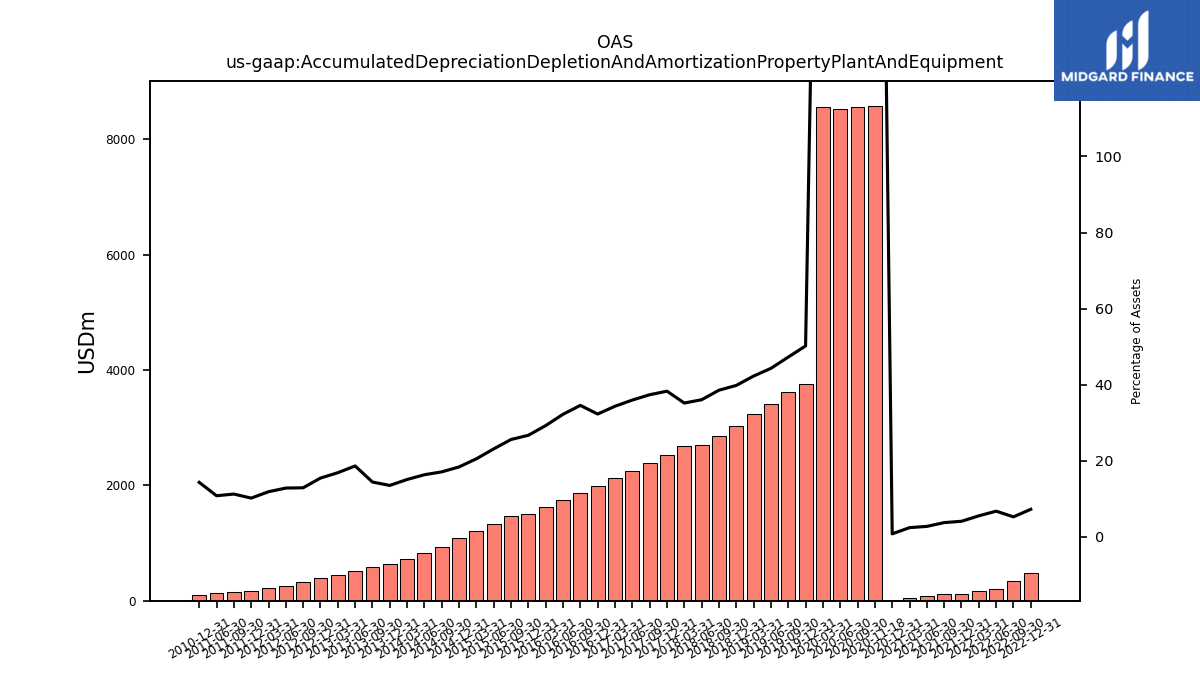
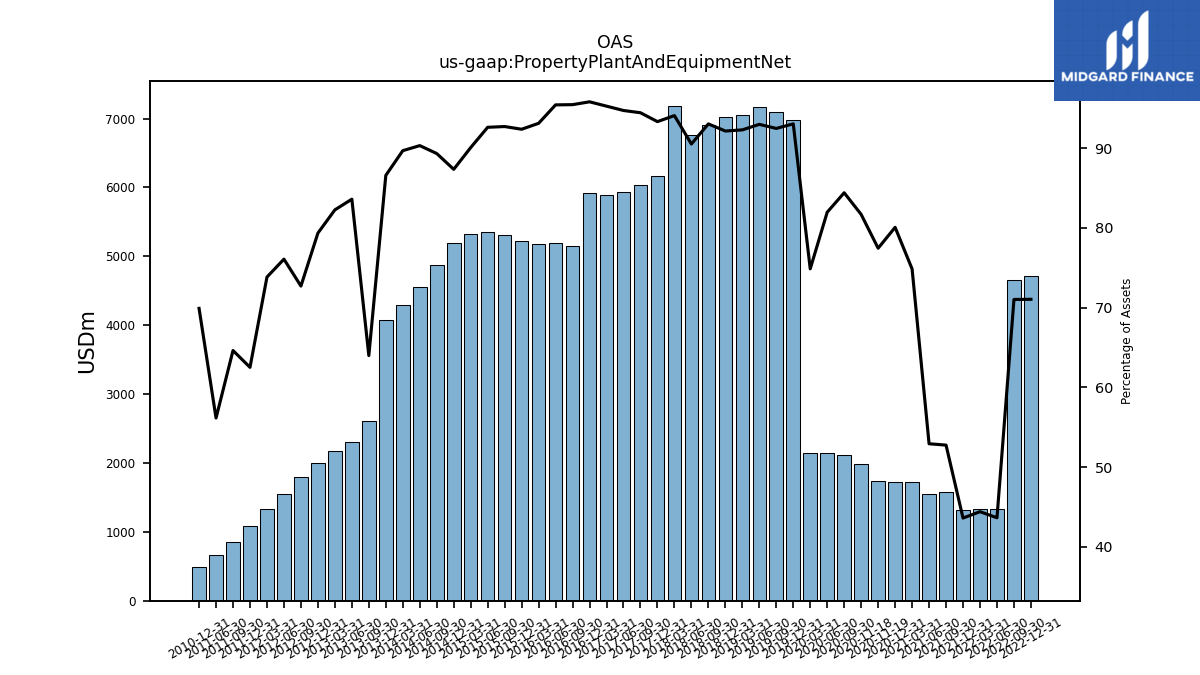
| Accumulated Depreciation Depletion And Amortization Property Plant And Equipment | 481.75 | 345.65 | 207.39 | 166.71 | 124.39 | 112.92 | 81.33 | 56.00 | 17.49 | 8560.53 | 8521.39 | 8556.57 | 3764.91 | 3624.16 | 3416.18 | 3233.11 | 3036.85 | 2859.79 | 2691.70 | 2688.36 | 2534.22 | 2388.71 | 2252.65 | 2126.14 | |
| Property Plant And Equipment Net | 4711.34 | 4656.06 | 1337.07 | 1336.34 | 1320.43 | 1582.84 | 1554.68 | 1719.55 | 1728.79 | 2115.85 | 2152.19 | 2148.68 | 6977.78 | 7089.61 | 7169.11 | 7056.74 | 7027.11 | 6900.14 | 6757.24 | 7186.61 | 6173.49 | 6035.62 | 5931.01 | 5896.48 | |
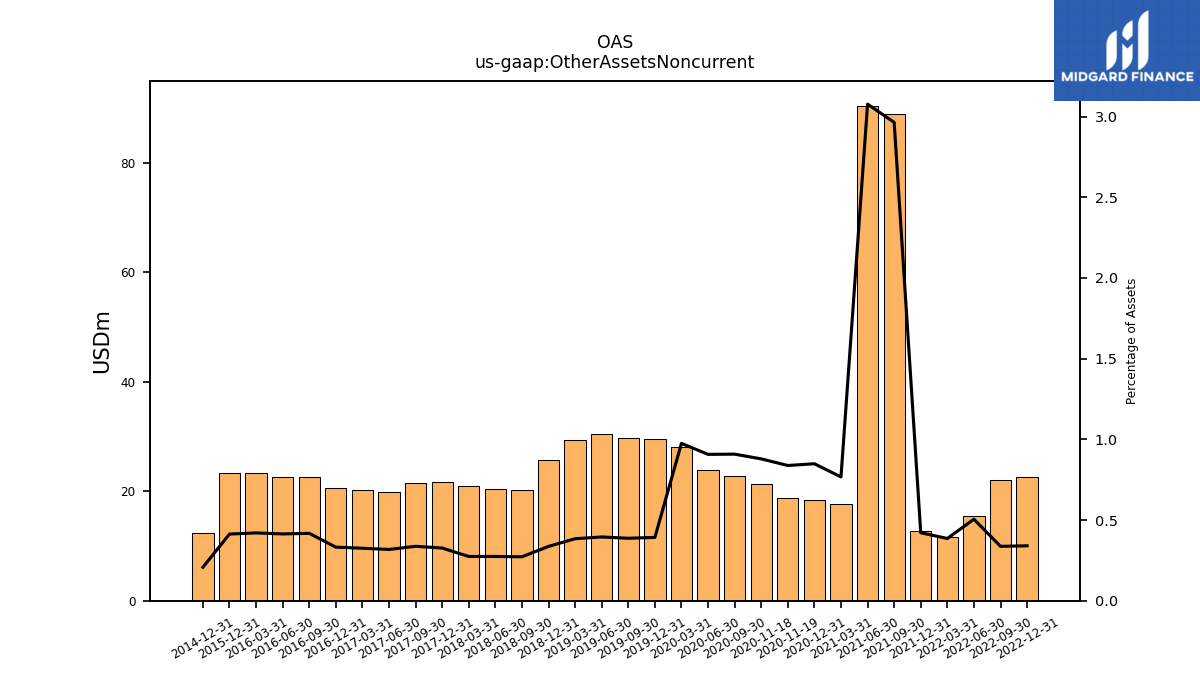
| Other Assets Noncurrent | 22.58 | 22.11 | 15.47 | 11.60 | 12.76 | 88.91 | 90.37 | 17.62 | 18.33 | 22.77 | 23.82 | 27.98 | 29.44 | 29.67 | 30.48 | 29.39 | 25.67 | 20.19 | 20.49 | 20.96 | 21.60 | 21.56 | 19.90 | 20.14 |
| 2022-12-31 | 2022-09-30 | 2022-06-30 | 2022-03-31 | 2021-12-31 | 2021-09-30 | 2021-06-30 | 2021-03-31 | 2020-12-31 | 2020-09-30 | 2020-06-30 | 2020-03-31 | 2019-12-31 | 2019-09-30 | 2019-06-30 | 2019-03-31 | 2018-12-31 | 2018-09-30 | 2018-06-30 | 2018-03-31 | 2017-12-31 | 2017-09-30 | 2017-06-30 | 2017-03-31 | ||
|---|---|---|---|---|---|---|---|---|---|---|---|---|---|---|---|---|---|---|---|---|---|---|---|---|---|
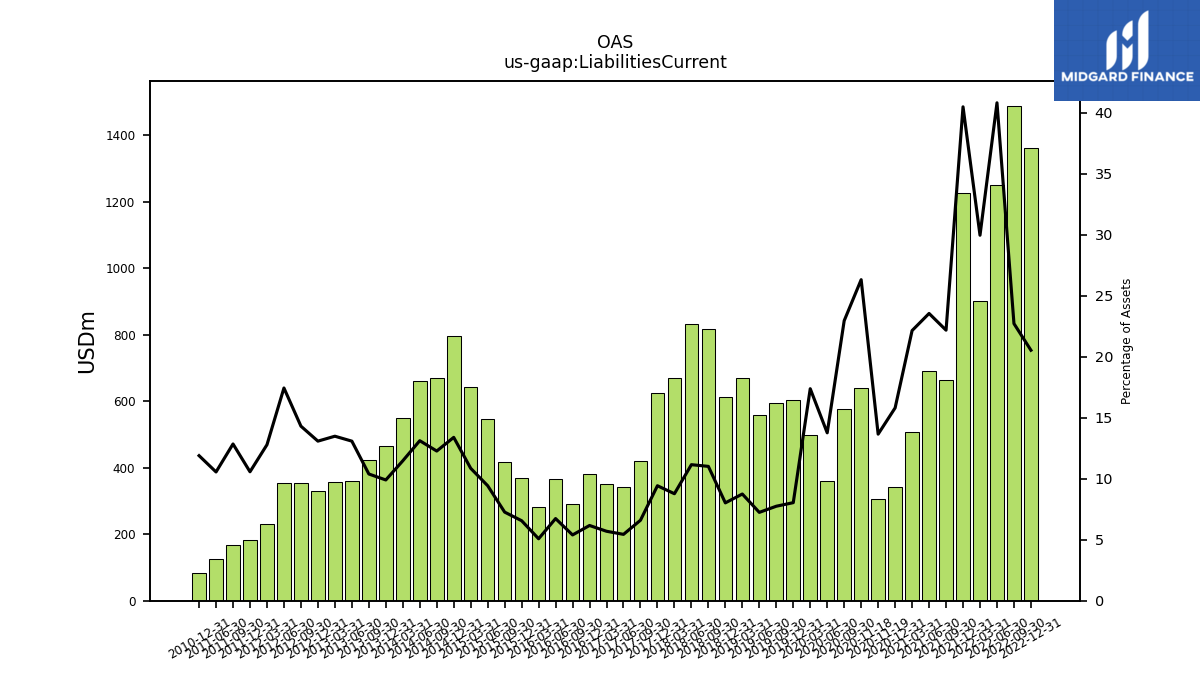
| Liabilities Current | 1361.33 | 1488.77 | 1249.72 | 900.99 | 1225.20 | 665.08 | 691.42 | 508.64 | 341.23 | 575.29 | 361.35 | 498.67 | 602.88 | 593.86 | 558.43 | 668.85 | 611.78 | 816.69 | 832.51 | 670.01 | 623.48 | 421.70 | 340.68 | 352.51 | |
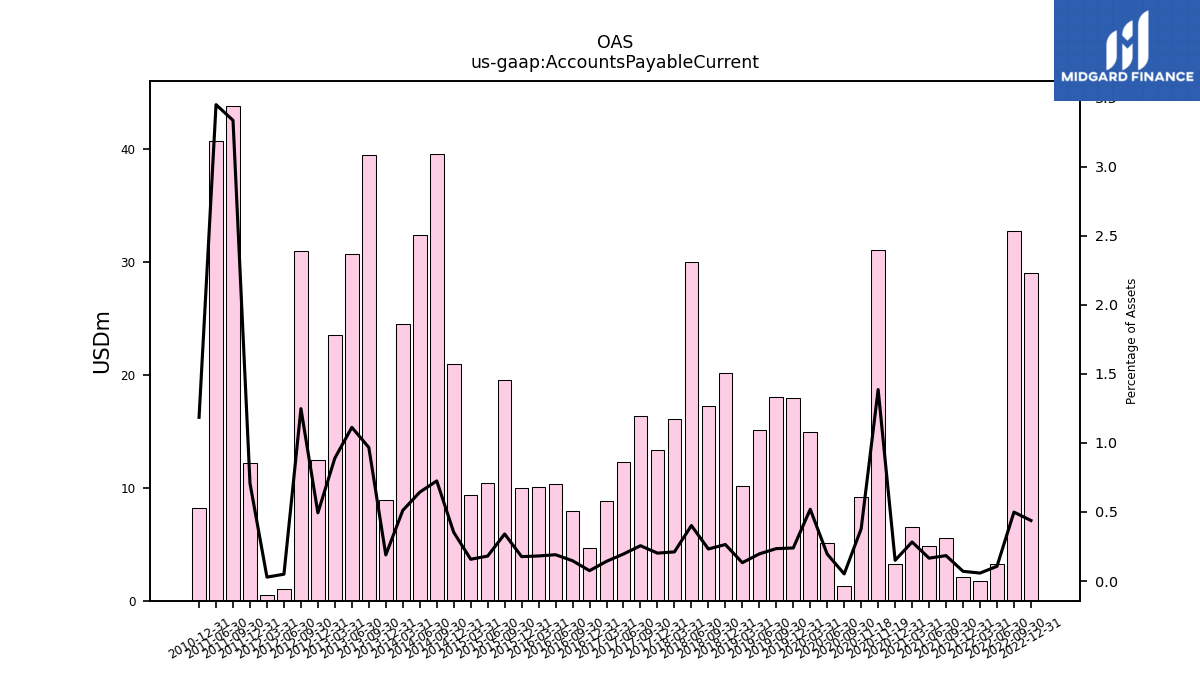
| Accounts Payable Current | 29.06 | 32.71 | 3.27 | 1.74 | 2.14 | 5.52 | 4.87 | 6.49 | 3.24 | 1.30 | 5.13 | 14.90 | 17.95 | 18.00 | 15.15 | 10.17 | 20.17 | 17.21 | 29.99 | 16.13 | 13.37 | 16.35 | 12.26 | 8.84 | |
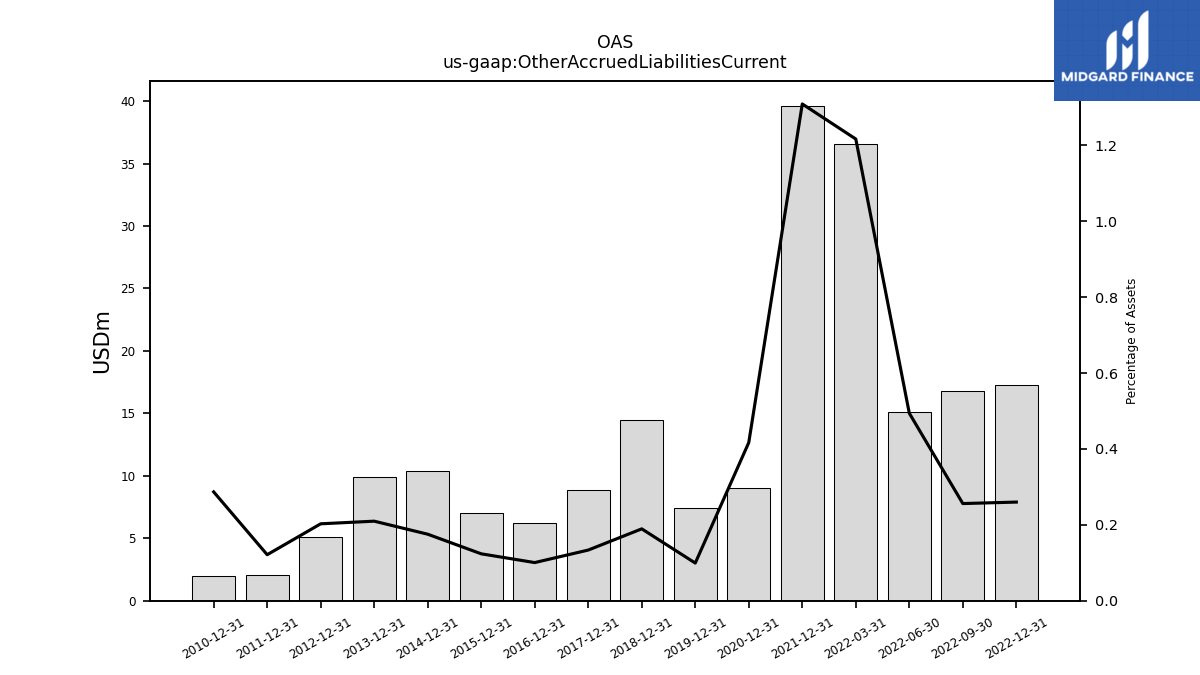
| Other Accrued Liabilities Current | 17.25 | 16.79 | 15.14 | 36.60 | 39.63 | NA | NA | NA | 9.00 | NA | NA | NA | 7.45 | NA | NA | NA | 14.45 | NA | NA | NA | 8.84 | NA | NA | NA | |
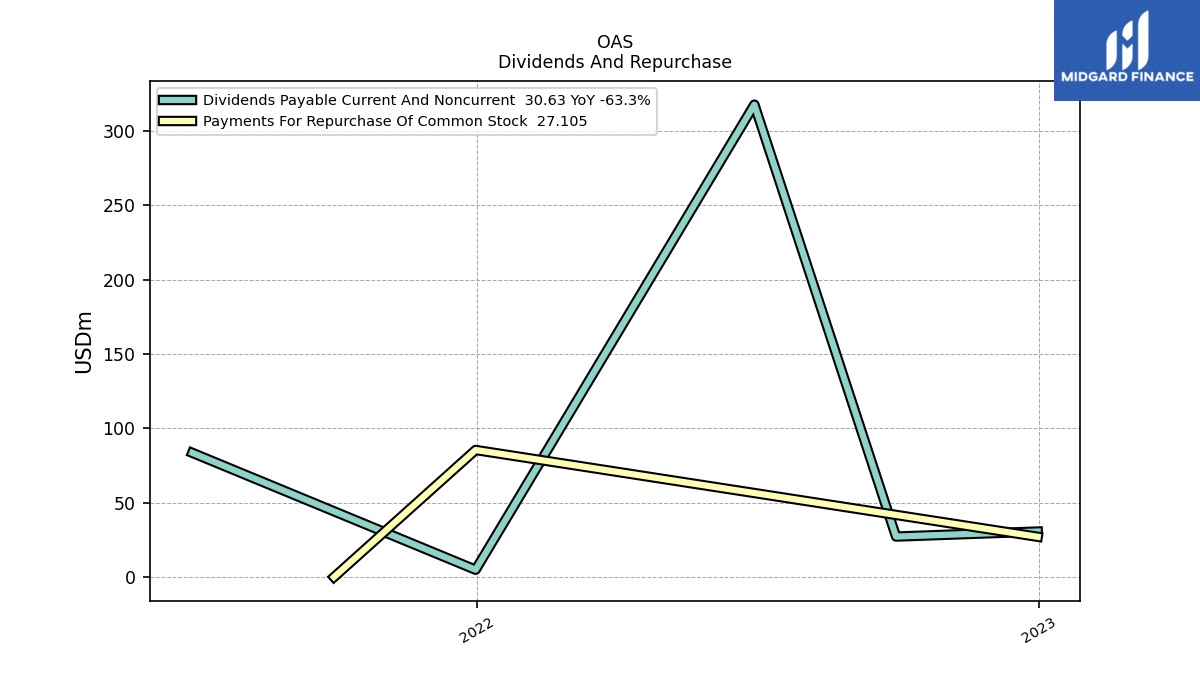
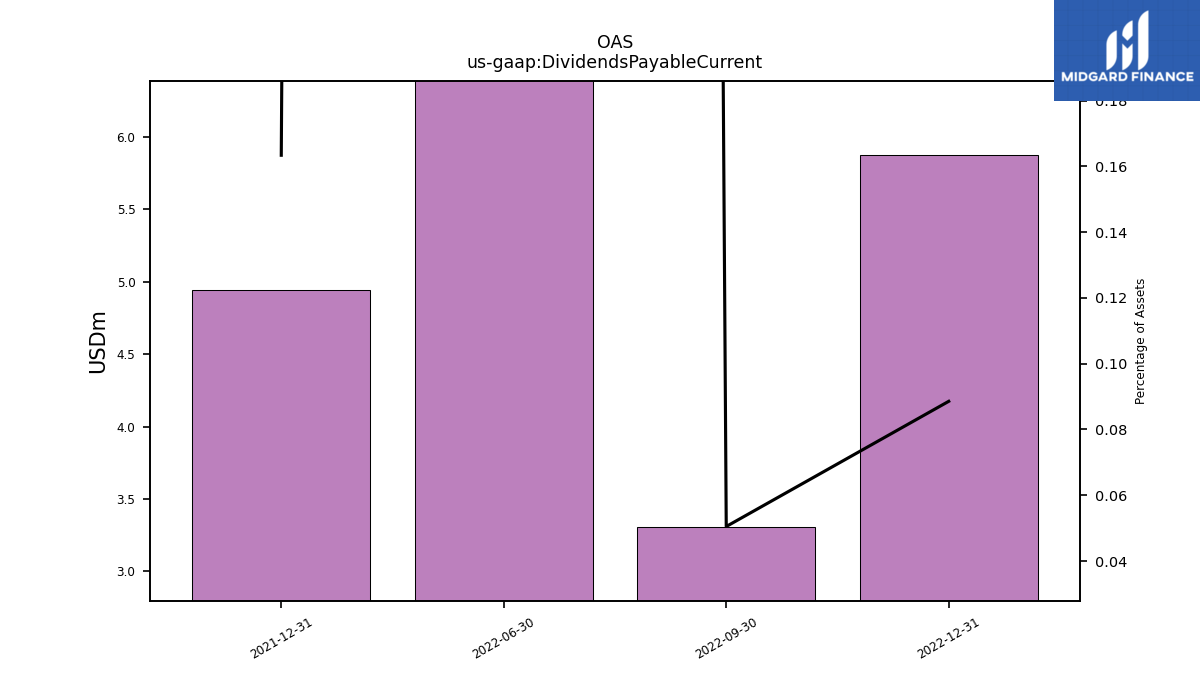
| Dividends Payable Current | 5.87 | 3.31 | 306.52 | NA | 4.95 | NA | NA | NA | NA | NA | NA | NA | NA | NA | NA | NA | NA | NA | NA | NA | NA | NA | NA | NA | |
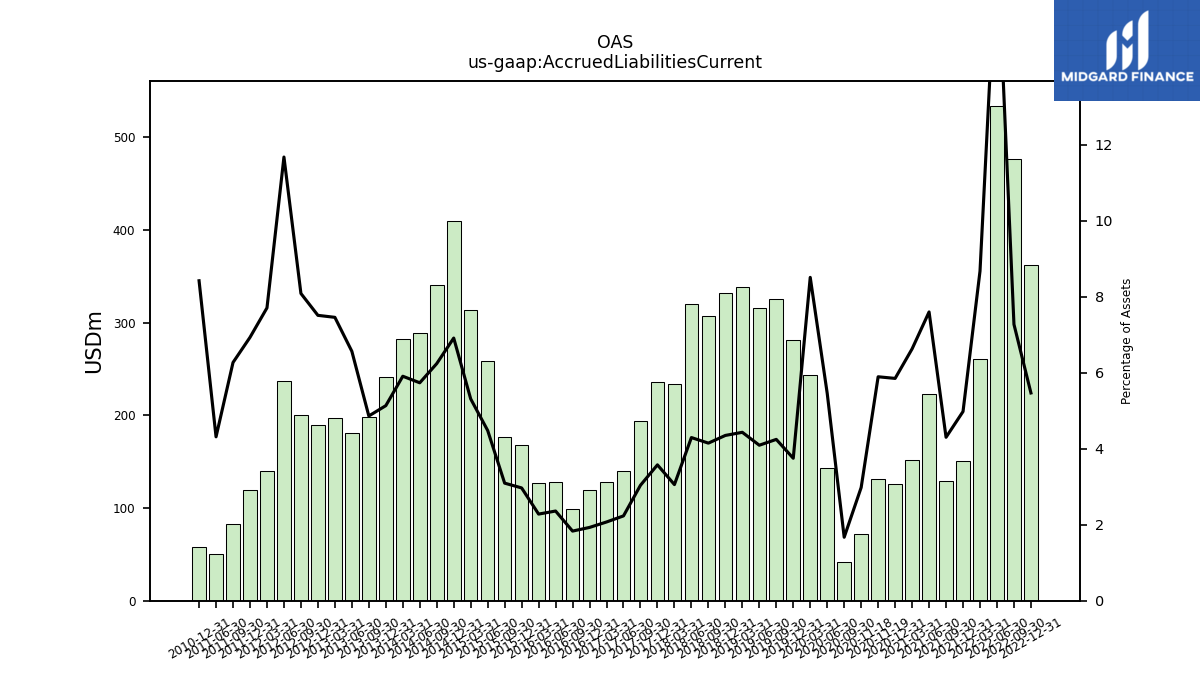
| Accrued Liabilities Current | 362.45 | 476.64 | 534.24 | 260.83 | 150.67 | 129.00 | 223.12 | 152.22 | 126.28 | 41.88 | 143.26 | 244.13 | 281.08 | 325.44 | 315.45 | 338.82 | 331.65 | 307.53 | 320.51 | 233.42 | 236.48 | 194.16 | 139.77 | 128.24 | |
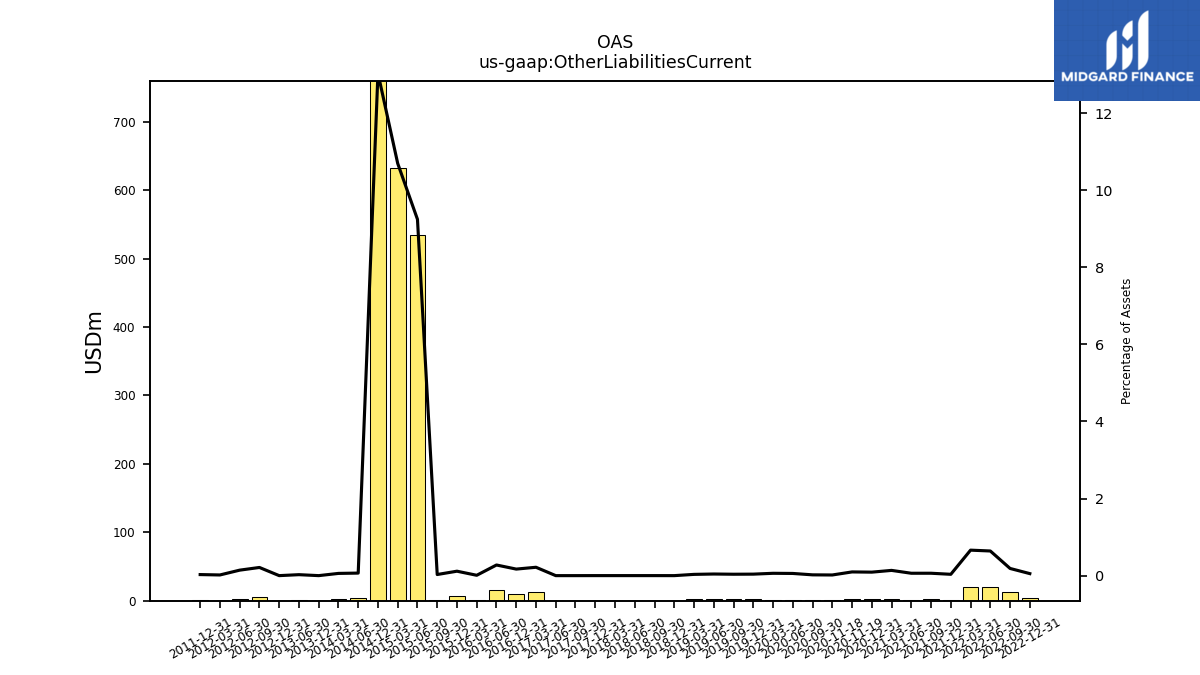
| Other Liabilities Current | 3.47 | 12.21 | 19.58 | 19.89 | 1.05 | 1.86 | 1.81 | 3.12 | 1.95 | 0.51 | 1.49 | 1.74 | 2.90 | 2.78 | 3.23 | 2.48 | 0.00 | 0.04 | 0.04 | 0.04 | 0.04 | 0.00 | 0.00 | 13.44 |
| 2022-12-31 | 2022-09-30 | 2022-06-30 | 2022-03-31 | 2021-12-31 | 2021-09-30 | 2021-06-30 | 2021-03-31 | 2020-12-31 | 2020-09-30 | 2020-06-30 | 2020-03-31 | 2019-12-31 | 2019-09-30 | 2019-06-30 | 2019-03-31 | 2018-12-31 | 2018-09-30 | 2018-06-30 | 2018-03-31 | 2017-12-31 | 2017-09-30 | 2017-06-30 | 2017-03-31 | ||
|---|---|---|---|---|---|---|---|---|---|---|---|---|---|---|---|---|---|---|---|---|---|---|---|---|---|
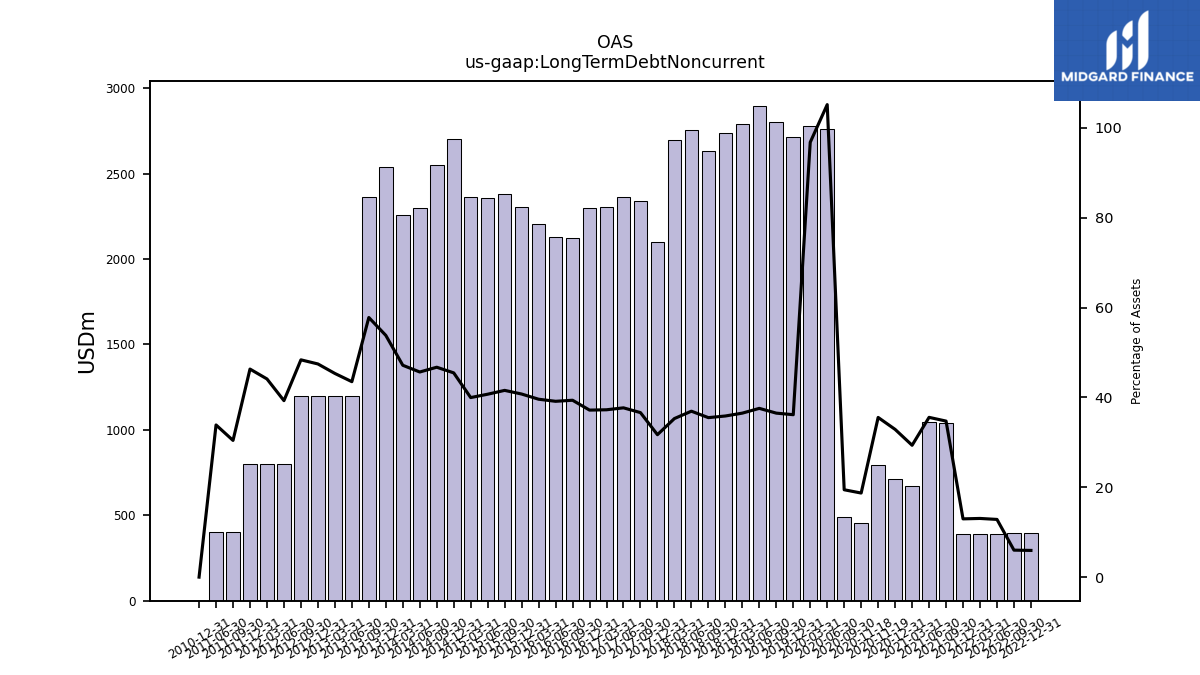
| Long Term Debt | 394.21 | 393.78 | 393.35 | 392.93 | 392.52 | 1041.89 | 1044.47 | 674.24 | 710.00 | NA | 2761.67 | 2777.93 | 2711.57 | 2798.86 | 2896.52 | 2791.33 | 2735.28 | 2633.01 | 2757.48 | 2696.53 | 2097.61 | 2340.61 | 2359.68 | 2305.88 | |
| Long Term Debt Noncurrent | 394.21 | 393.78 | 393.35 | 392.93 | 392.52 | 1041.89 | 1044.47 | 674.24 | 710.00 | 487.50 | 2761.67 | 2777.93 | 2711.57 | 2798.86 | 2896.52 | 2791.33 | 2735.28 | 2633.01 | 2757.48 | 2696.53 | 2097.61 | 2340.61 | 2359.68 | 2305.88 | |
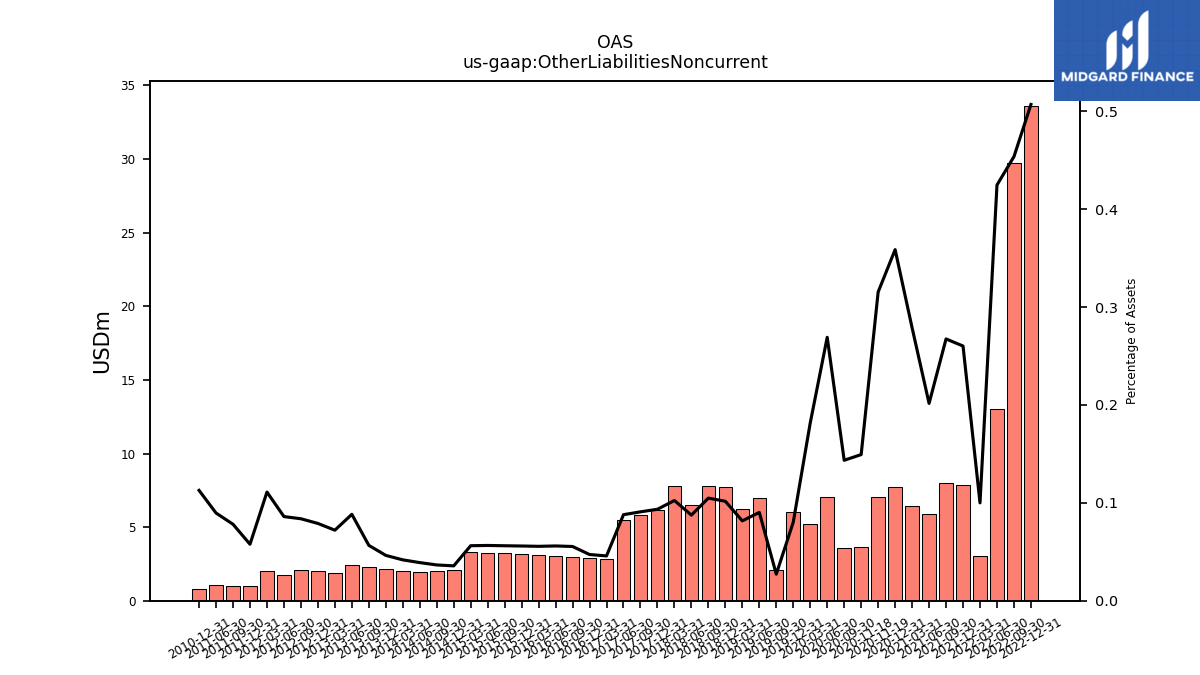
| Other Liabilities Noncurrent | 33.62 | 29.74 | 13.01 | 3.01 | 7.88 | 8.02 | 5.92 | 6.41 | 7.74 | 3.60 | 7.07 | 5.21 | 6.02 | 2.08 | 6.96 | 6.24 | 7.75 | 7.78 | 6.53 | 7.82 | 6.18 | 5.80 | 5.51 | 2.83 | |
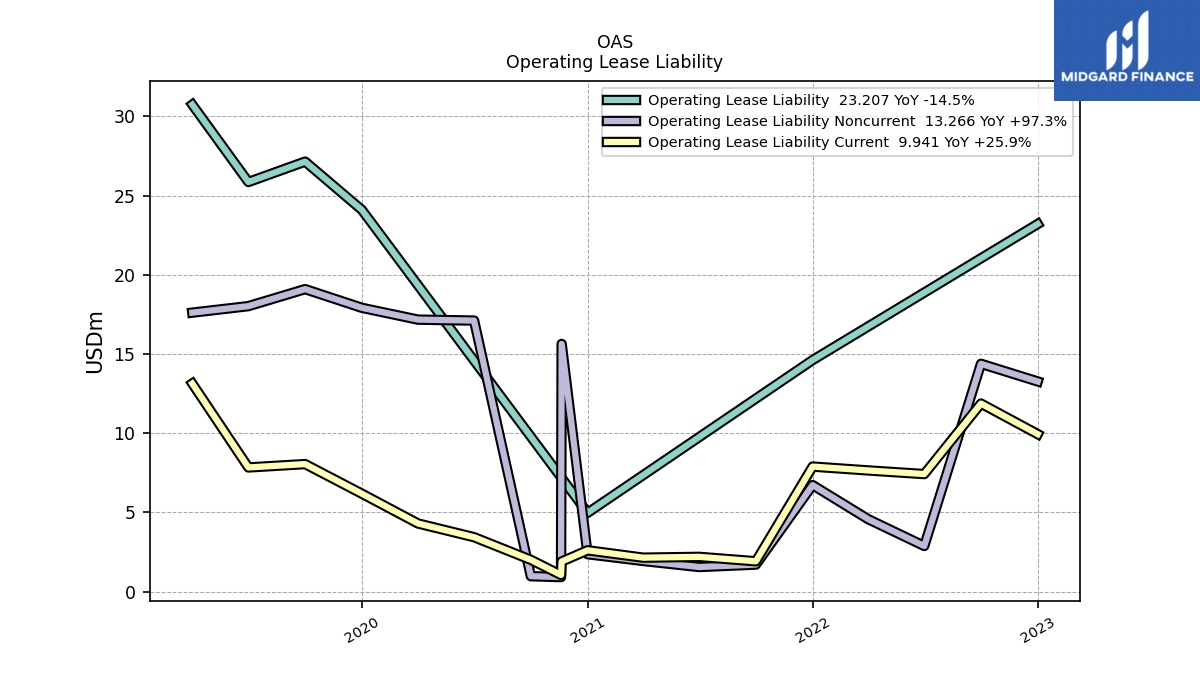
| Operating Lease Liability Noncurrent | 13.27 | 14.38 | 2.88 | 4.57 | 6.72 | 1.71 | 1.55 | 1.93 | 2.36 | 0.97 | 17.11 | 17.17 | 17.91 | 19.09 | 18.02 | 17.61 | NA | NA | NA | NA | NA | NA | NA | NA |
| 2022-12-31 | 2022-09-30 | 2022-06-30 | 2022-03-31 | 2021-12-31 | 2021-09-30 | 2021-06-30 | 2021-03-31 | 2020-12-31 | 2020-09-30 | 2020-06-30 | 2020-03-31 | 2019-12-31 | 2019-09-30 | 2019-06-30 | 2019-03-31 | 2018-12-31 | 2018-09-30 | 2018-06-30 | 2018-03-31 | 2017-12-31 | 2017-09-30 | 2017-06-30 | 2017-03-31 | ||
|---|---|---|---|---|---|---|---|---|---|---|---|---|---|---|---|---|---|---|---|---|---|---|---|---|---|
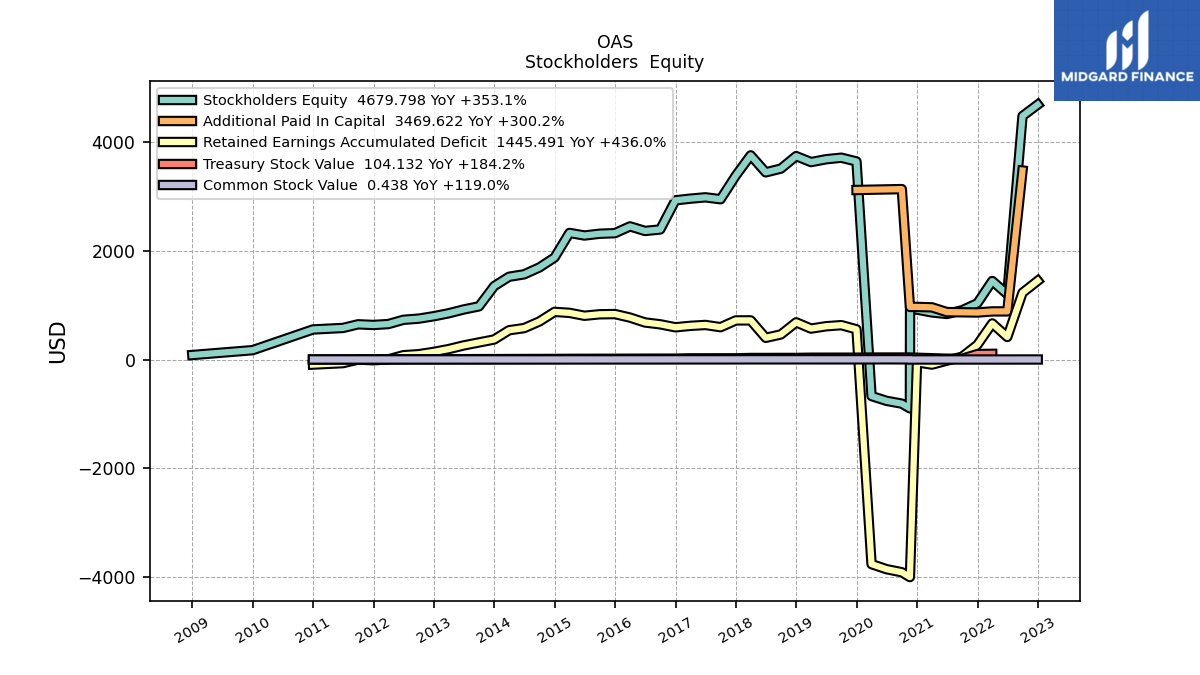
| Stockholders Equity | 4679.80 | 4470.81 | 1198.10 | 1441.96 | 1032.90 | 904.44 | 836.07 | 864.78 | 915.94 | -810.01 | -759.12 | -670.74 | 3636.14 | 3705.33 | 3676.77 | 3624.79 | 3734.58 | 3505.53 | 3436.14 | 3748.53 | 3375.69 | 2942.68 | 2977.61 | 2953.47 | |
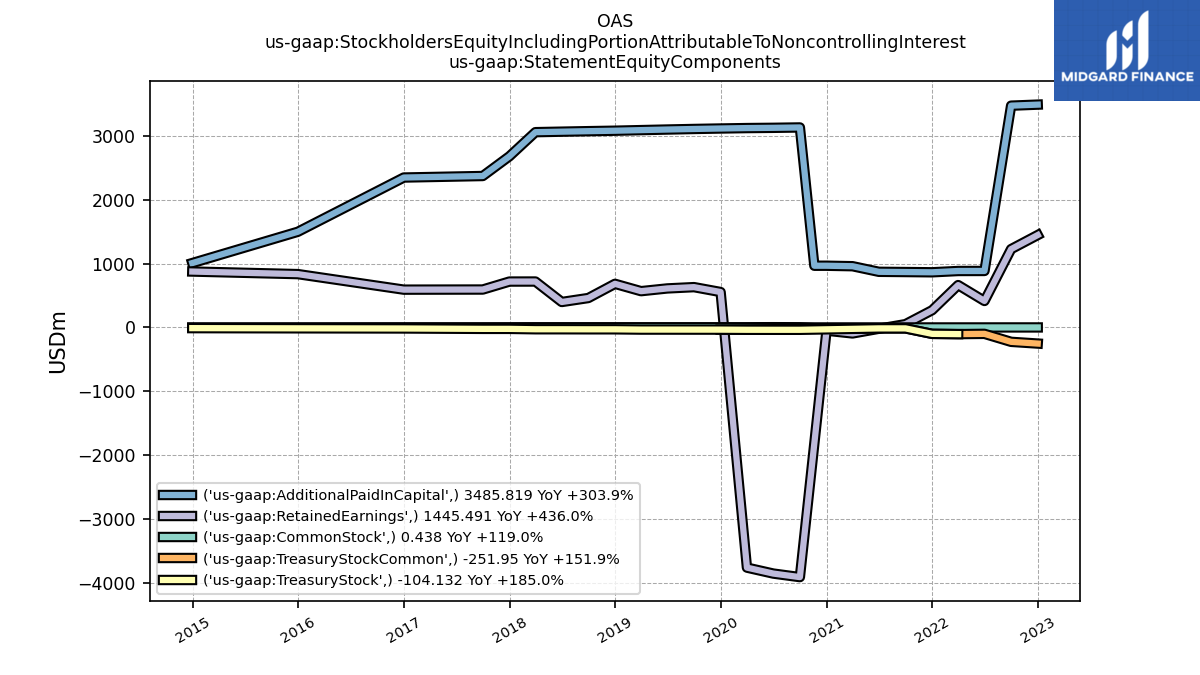
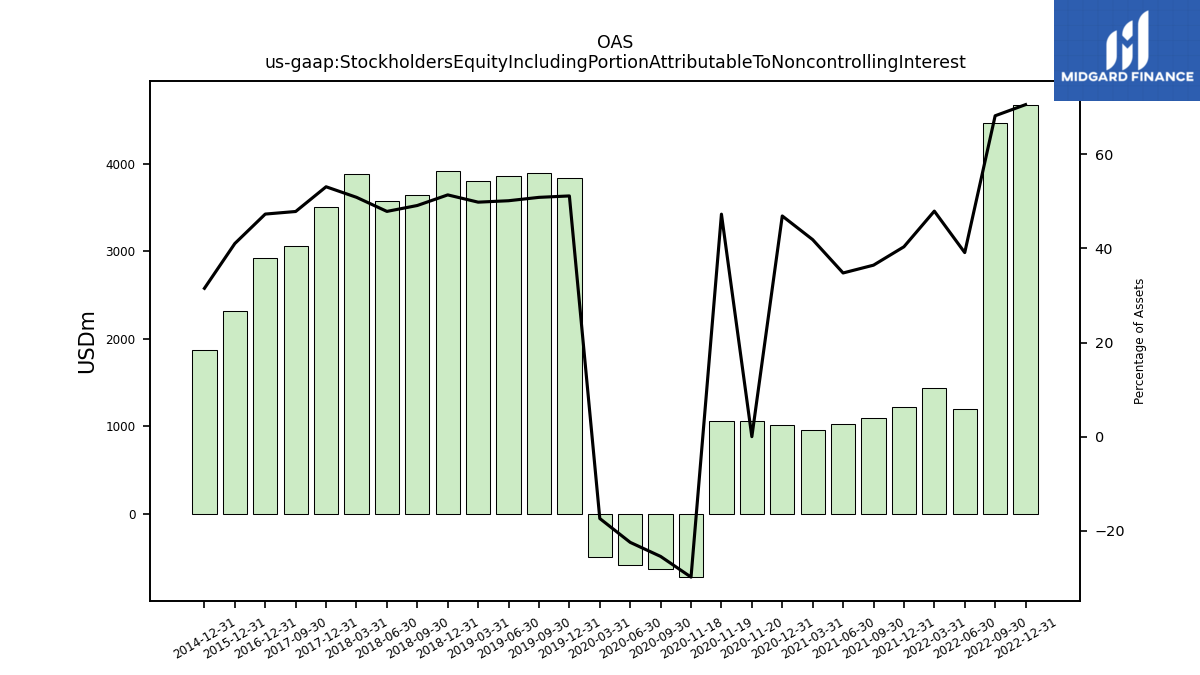
| Stockholders Equity Including Portion Attributable To Noncontrolling Interest | 4679.80 | 4470.81 | 1198.10 | 1441.96 | 1221.57 | 1093.33 | 1021.77 | 962.00 | 1012.74 | -638.15 | -589.91 | -499.17 | 3837.08 | 3899.66 | 3866.46 | 3811.14 | 3918.88 | 3644.08 | 3574.25 | 3886.16 | 3513.58 | 3058.64 | NA | NA | |
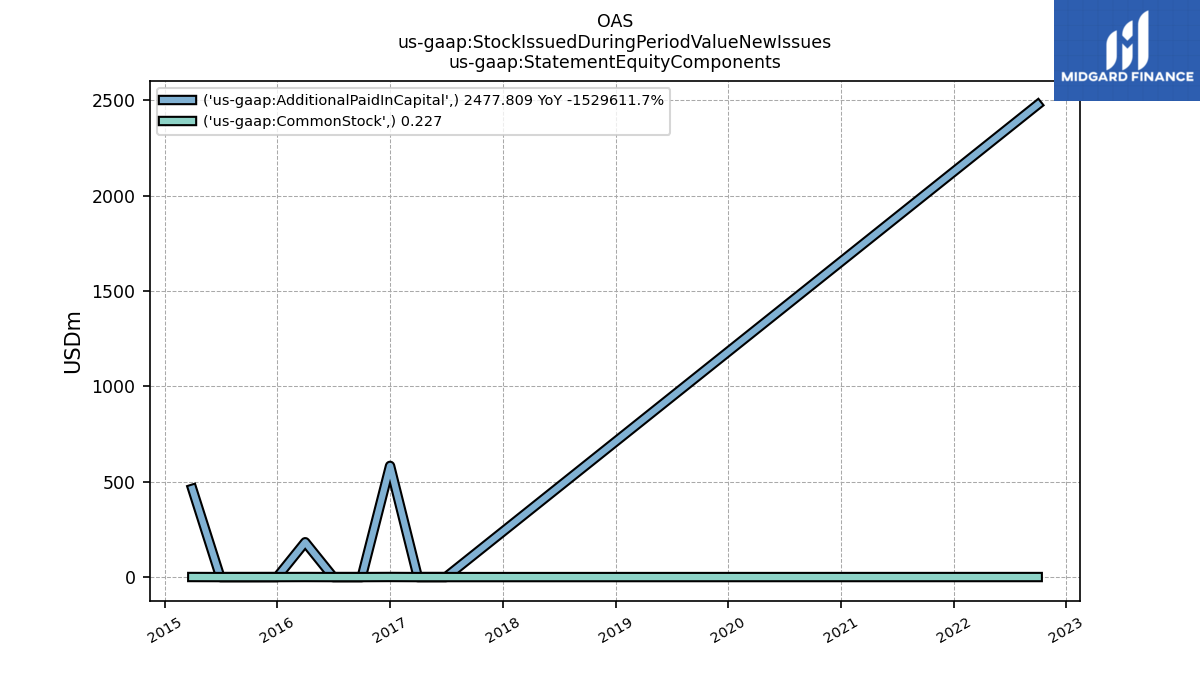
| Common Stock Value | 0.44 | 0.44 | 0.21 | 0.20 | 0.20 | 0.20 | 0.20 | 0.20 | 0.20 | 3.23 | 4.24 | 3.22 | 3.19 | 3.19 | 3.18 | 3.18 | 3.16 | 3.16 | 3.15 | 3.15 | 2.67 | 2.35 | 2.35 | 2.34 | |
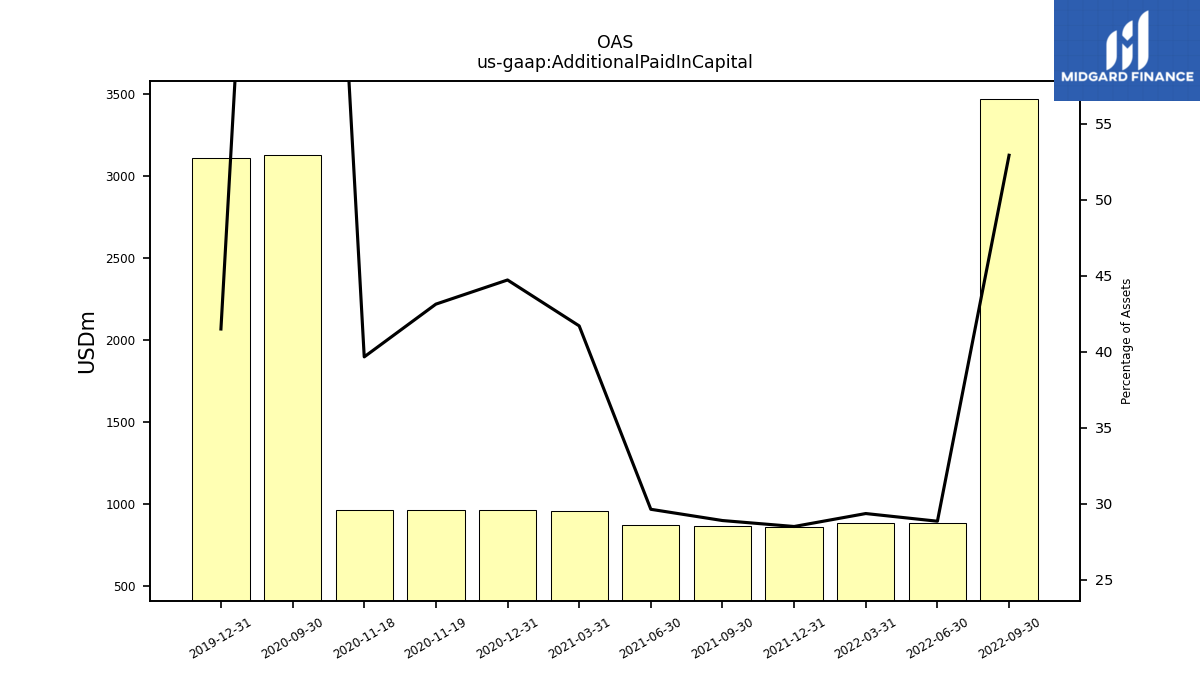
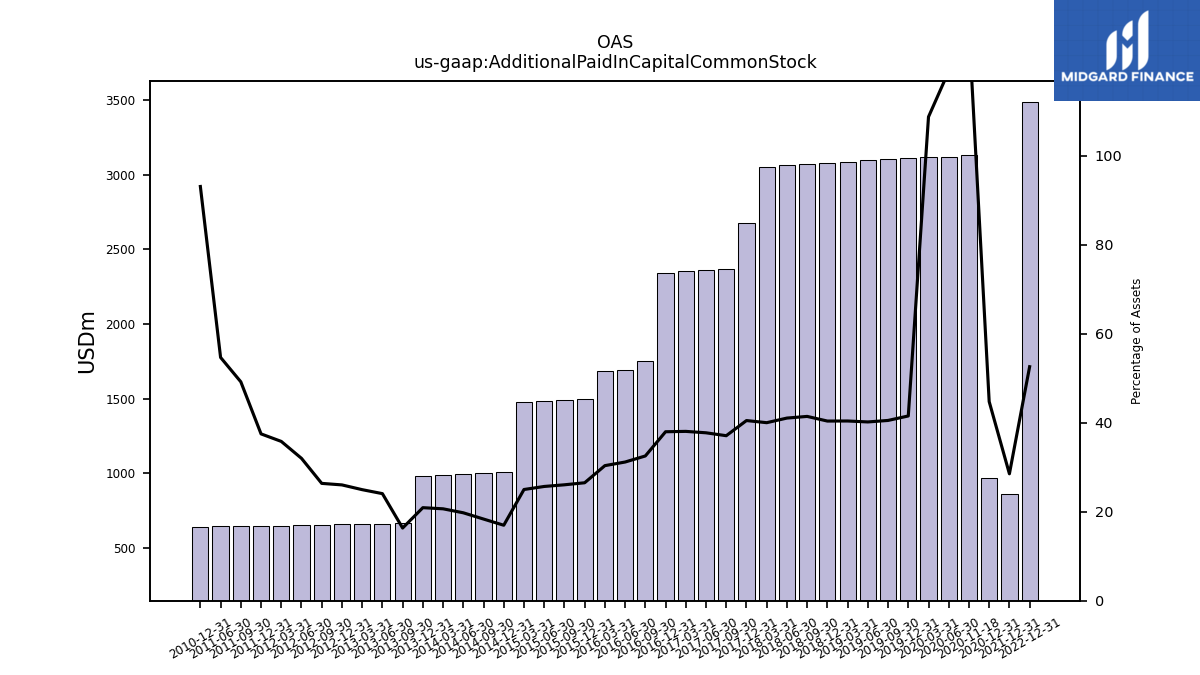
| Additional Paid In Capital | NA | 3469.62 | 883.80 | 883.27 | 863.01 | 866.99 | 870.57 | 958.08 | 965.65 | 3128.75 | NA | NA | 3112.38 | NA | NA | NA | NA | NA | NA | NA | NA | NA | NA | NA | |
| Additional Paid In Capital Common Stock | 3485.82 | NA | NA | NA | 863.01 | NA | NA | NA | 965.65 | NA | 3122.91 | 3119.05 | 3112.38 | 3104.94 | 3096.36 | 3087.08 | 3077.76 | 3070.64 | 3062.86 | 3055.00 | 2677.22 | 2369.10 | 2362.08 | 2354.49 | |
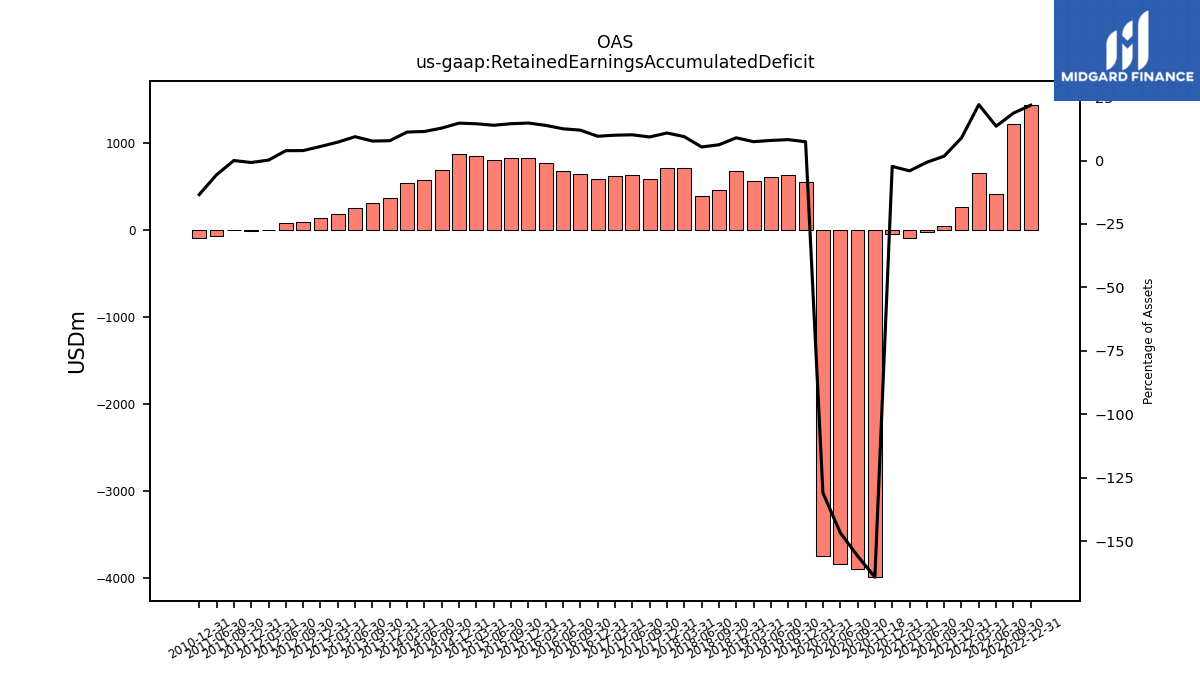
| Retained Earnings Accumulated Deficit | 1445.49 | 1225.60 | 414.09 | 662.62 | 269.69 | 51.81 | -20.14 | -93.50 | -49.91 | -3905.47 | -3849.77 | -3756.82 | 554.45 | 630.85 | 610.56 | 567.81 | 682.69 | 460.71 | 398.37 | 718.58 | 717.99 | 593.37 | 634.58 | 618.01 | |
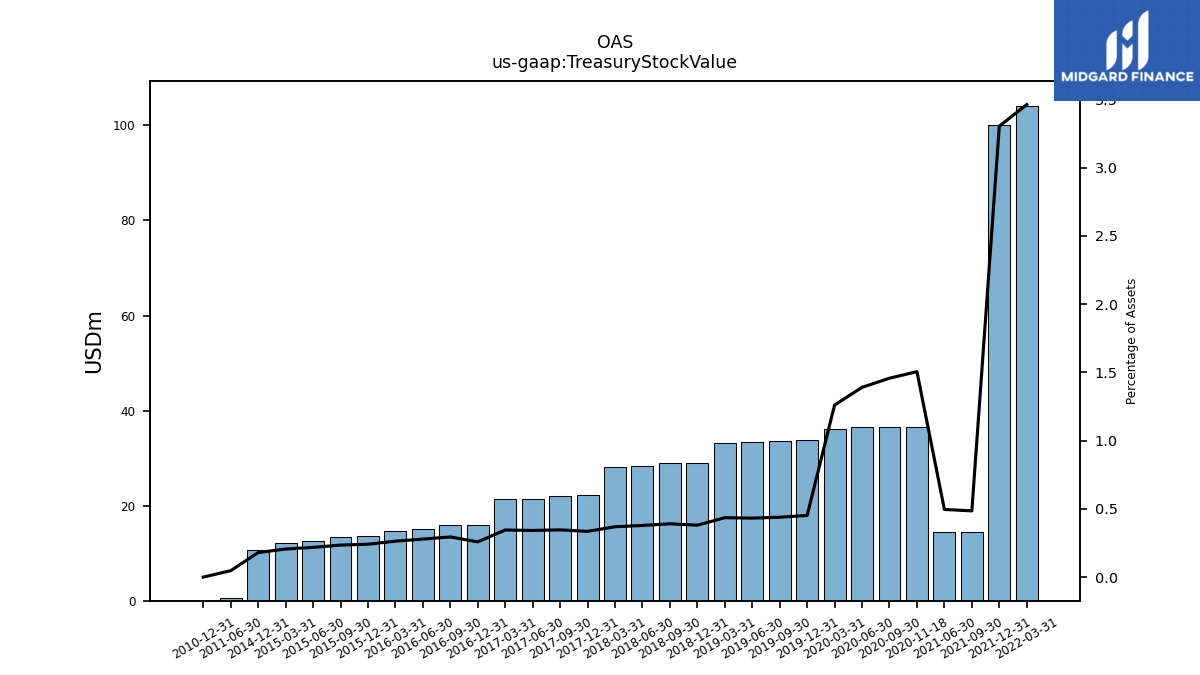
| Treasury Stock Value | NA | NA | NA | 104.13 | 100.00 | 14.56 | 14.56 | NA | NA | 36.53 | 36.51 | 36.19 | 33.88 | 33.65 | 33.33 | 33.29 | 29.02 | 28.98 | 28.24 | 28.20 | 22.18 | 22.13 | 21.40 | 21.37 | |
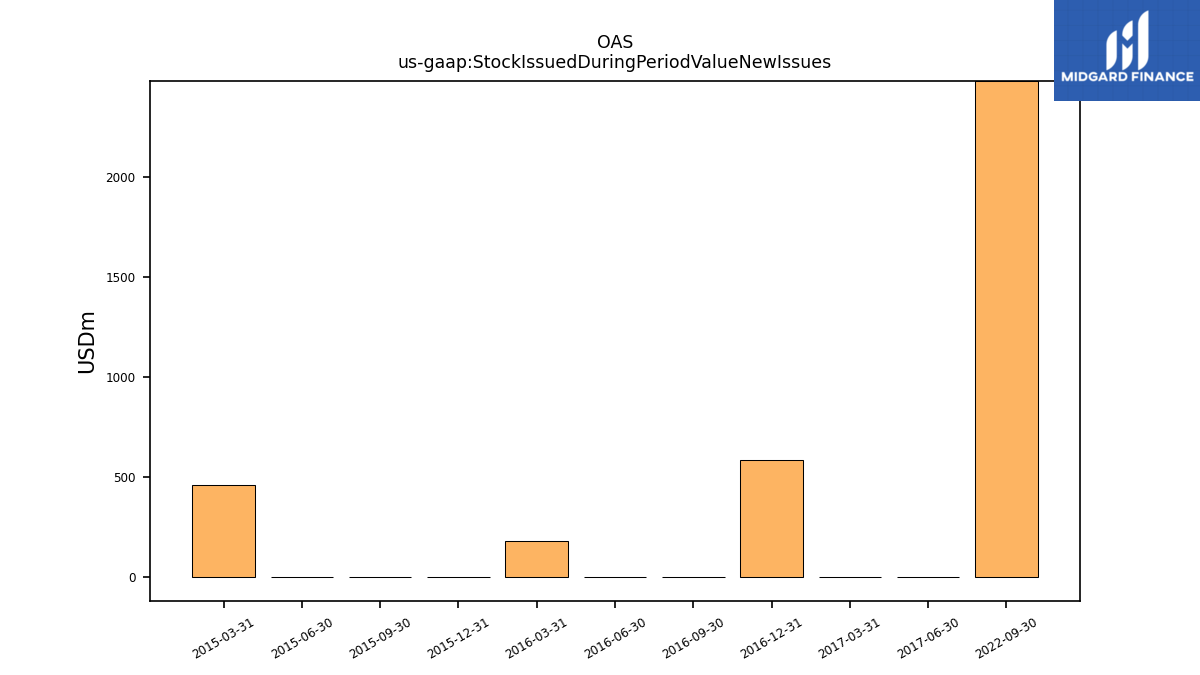
| Stock Issued During Period Value New Issues | NA | 2478.04 | NA | NA | NA | NA | NA | NA | NA | NA | NA | NA | NA | NA | NA | NA | NA | NA | NA | NA | NA | NA | 0.00 | -0.06 | |
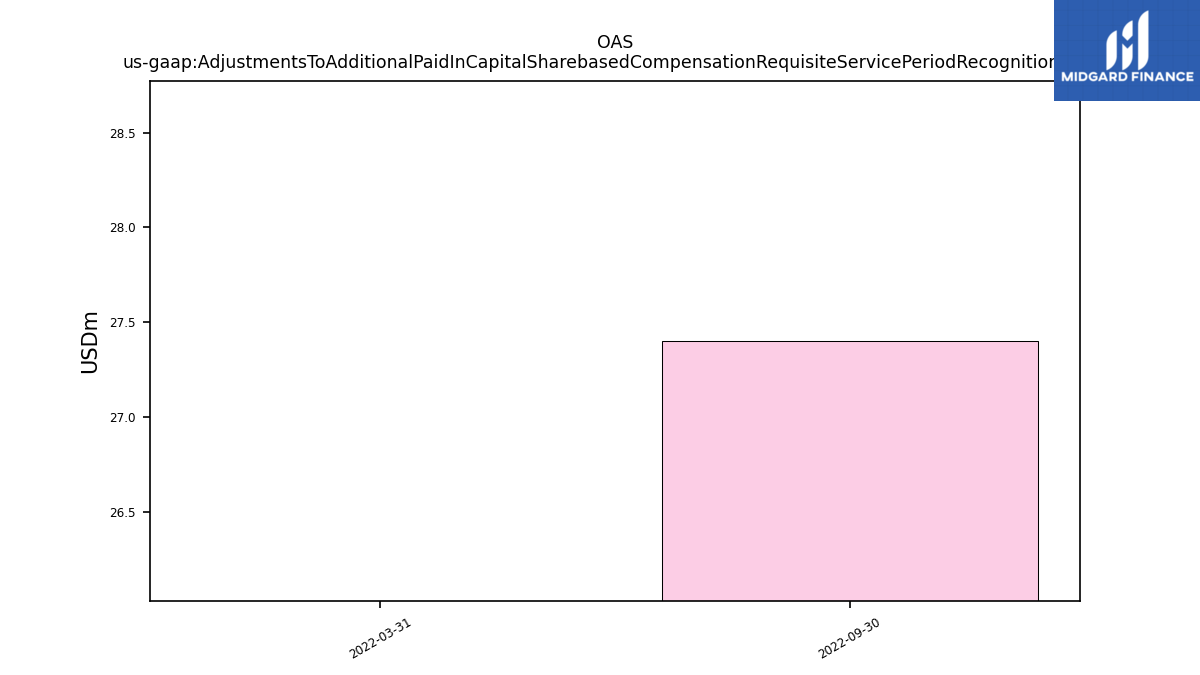
| Adjustments To Additional Paid In Capital Sharebased Compensation Requisite Service Period Recognition Value | NA | 27.40 | NA | -0.23 | NA | NA | NA | NA | NA | NA | NA | NA | NA | NA | NA | NA | NA | NA | NA | NA | NA | NA | NA | NA |
| 2022-12-31 | 2022-09-30 | 2022-06-30 | 2022-03-31 | 2021-12-31 | 2021-09-30 | 2021-06-30 | 2021-03-31 | 2020-12-31 | 2020-09-30 | 2020-06-30 | 2020-03-31 | 2019-12-31 | 2019-09-30 | 2019-06-30 | 2019-03-31 | 2018-12-31 | 2018-09-30 | 2018-06-30 | 2018-03-31 | 2017-12-31 | 2017-09-30 | 2017-06-30 | 2017-03-31 | ||
|---|---|---|---|---|---|---|---|---|---|---|---|---|---|---|---|---|---|---|---|---|---|---|---|---|---|
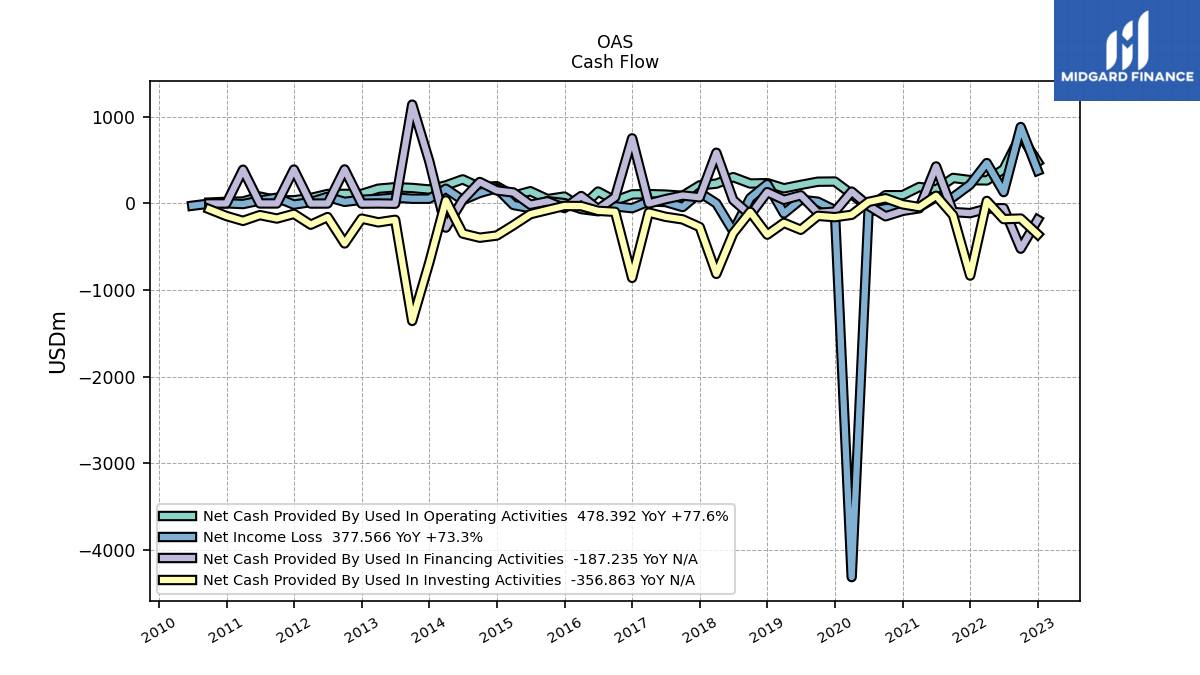
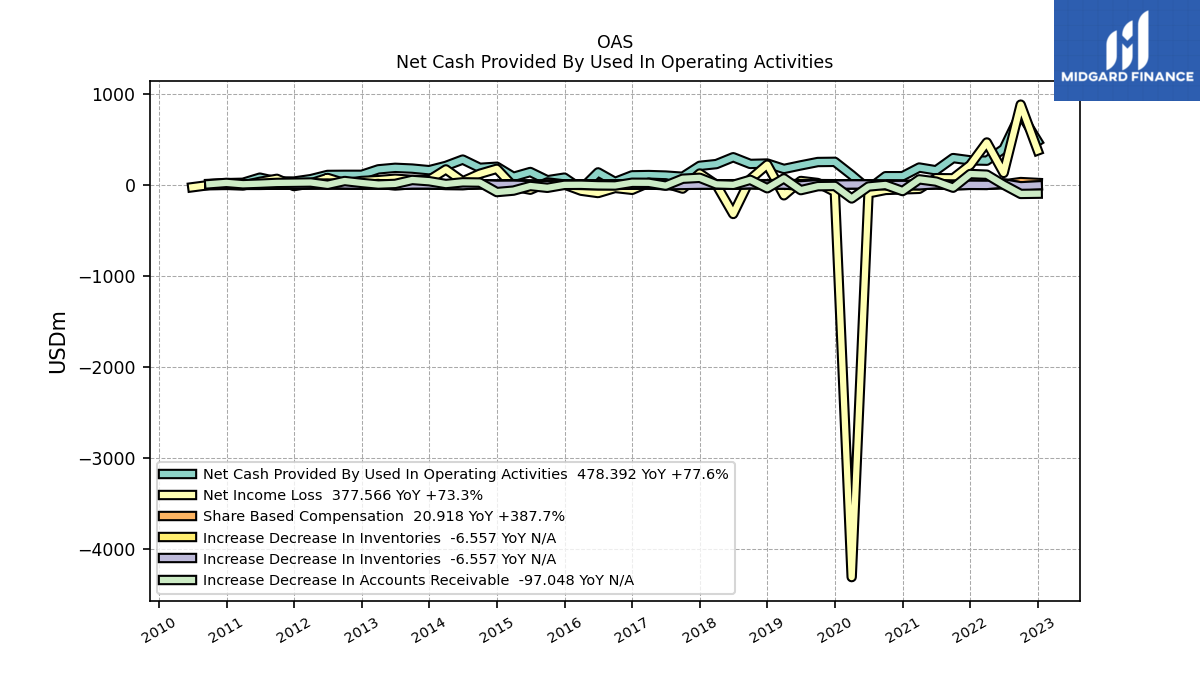
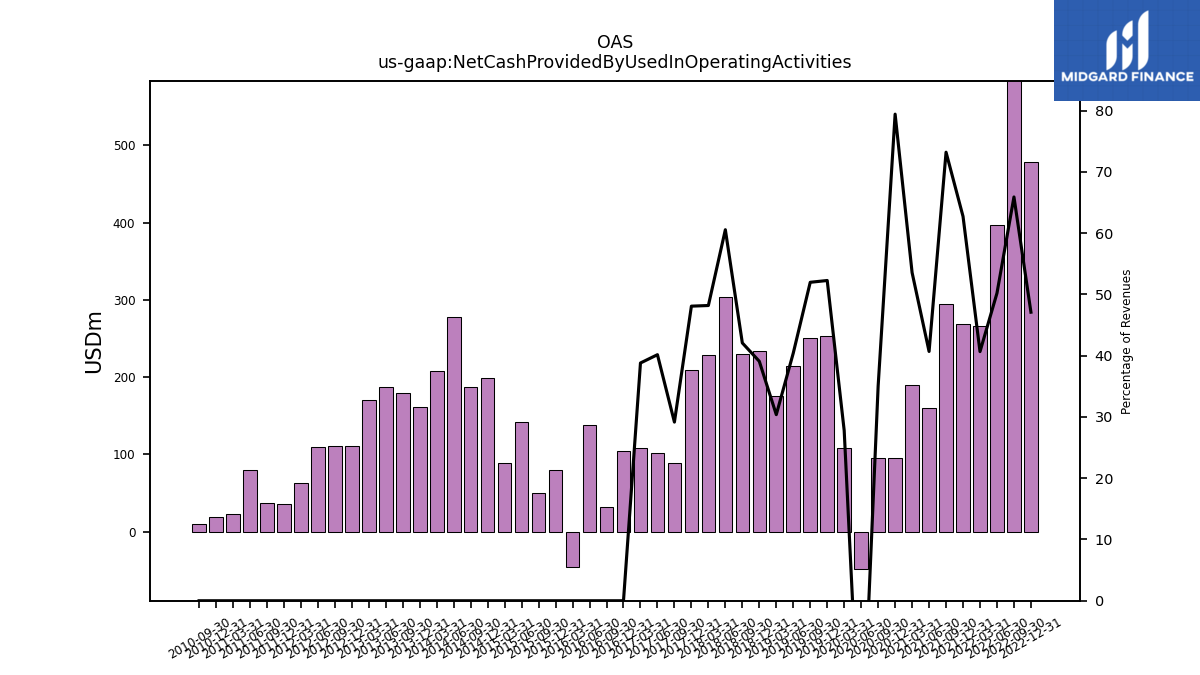
| Net Cash Provided By Used In Operating Activities | 478.39 | 783.64 | 396.41 | 265.58 | 269.39 | 294.38 | 159.95 | 190.41 | 95.25 | 95.01 | -47.88 | 107.78 | 252.96 | 250.96 | 214.01 | 174.93 | 234.42 | 229.99 | 303.66 | 228.36 | 209.14 | 88.88 | 102.06 | 107.80 | |
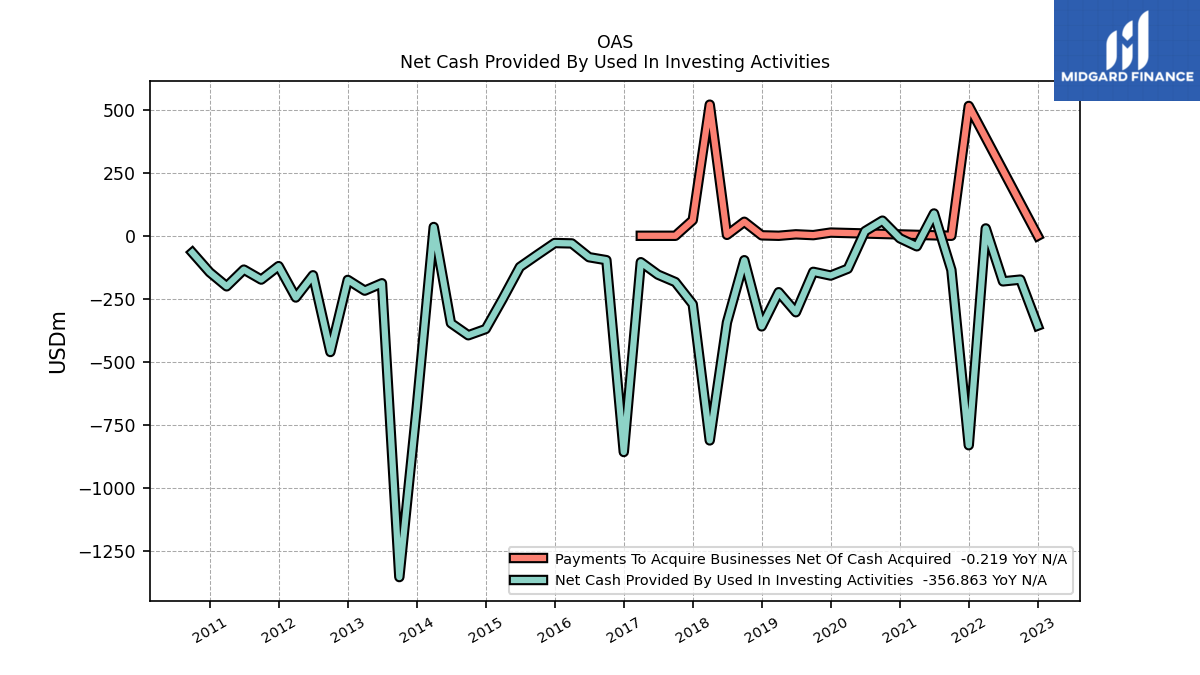
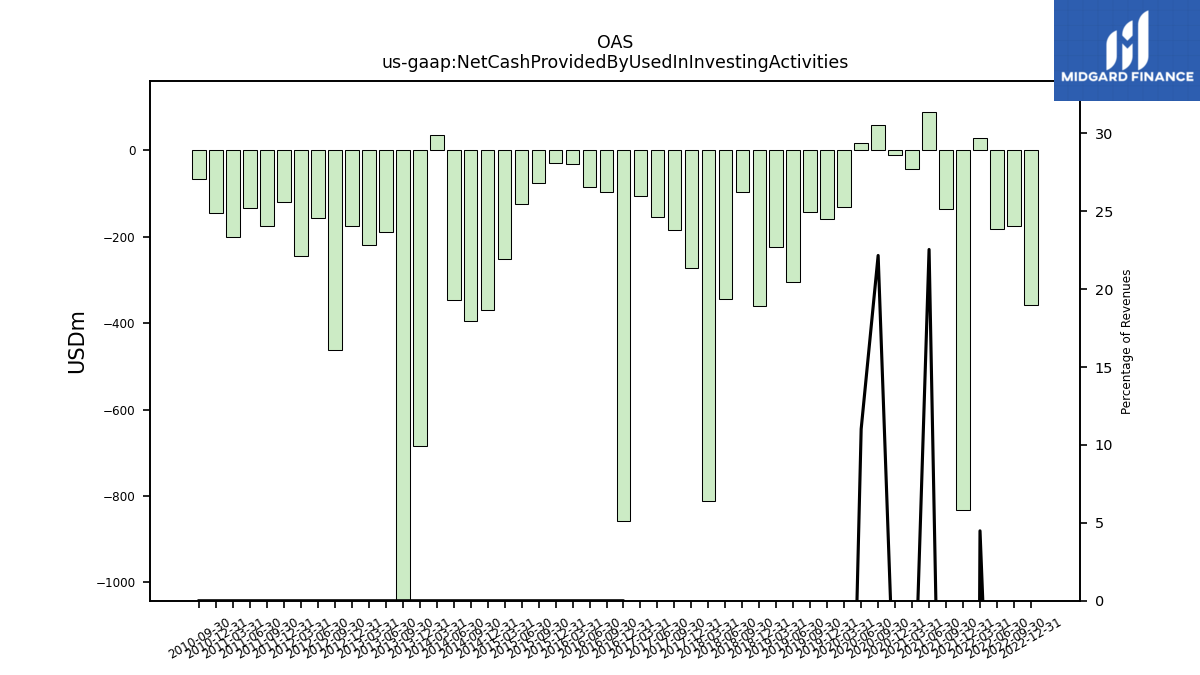
| Net Cash Provided By Used In Investing Activities | -356.86 | -174.02 | -180.98 | 29.30 | -831.74 | -135.78 | 88.62 | -41.87 | -9.88 | 60.07 | 18.33 | -130.77 | -157.94 | -143.16 | -303.65 | -224.00 | -359.83 | -96.97 | -344.17 | -812.57 | -271.81 | -183.81 | -154.38 | -104.77 | |
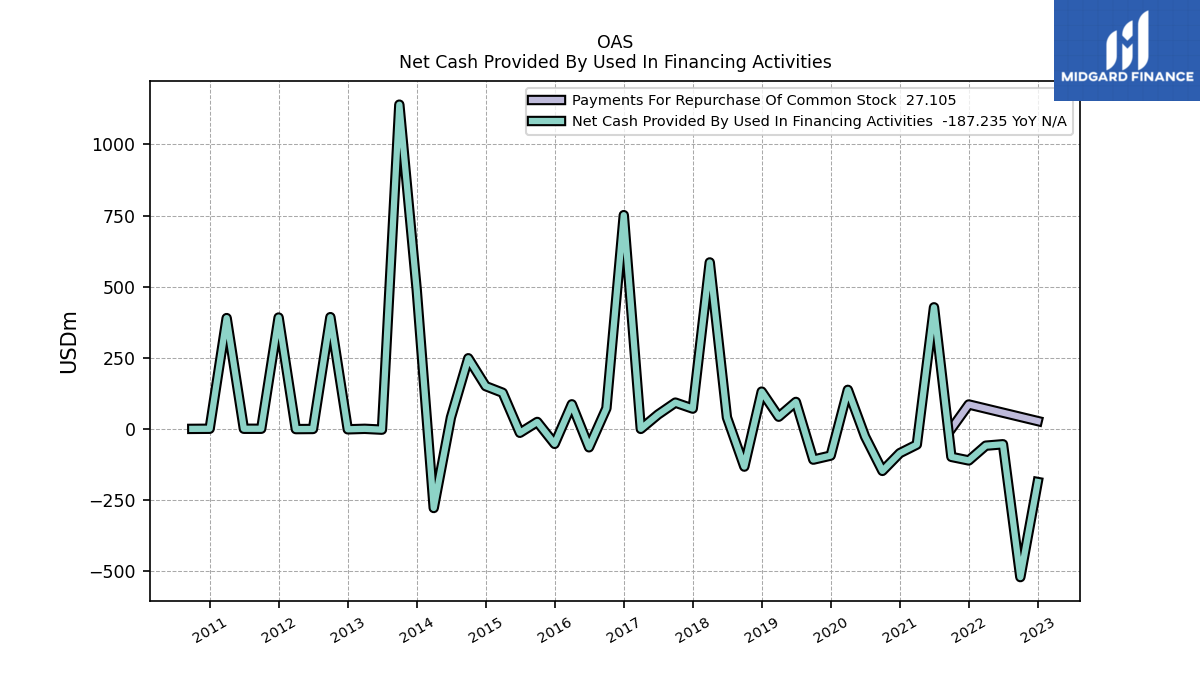
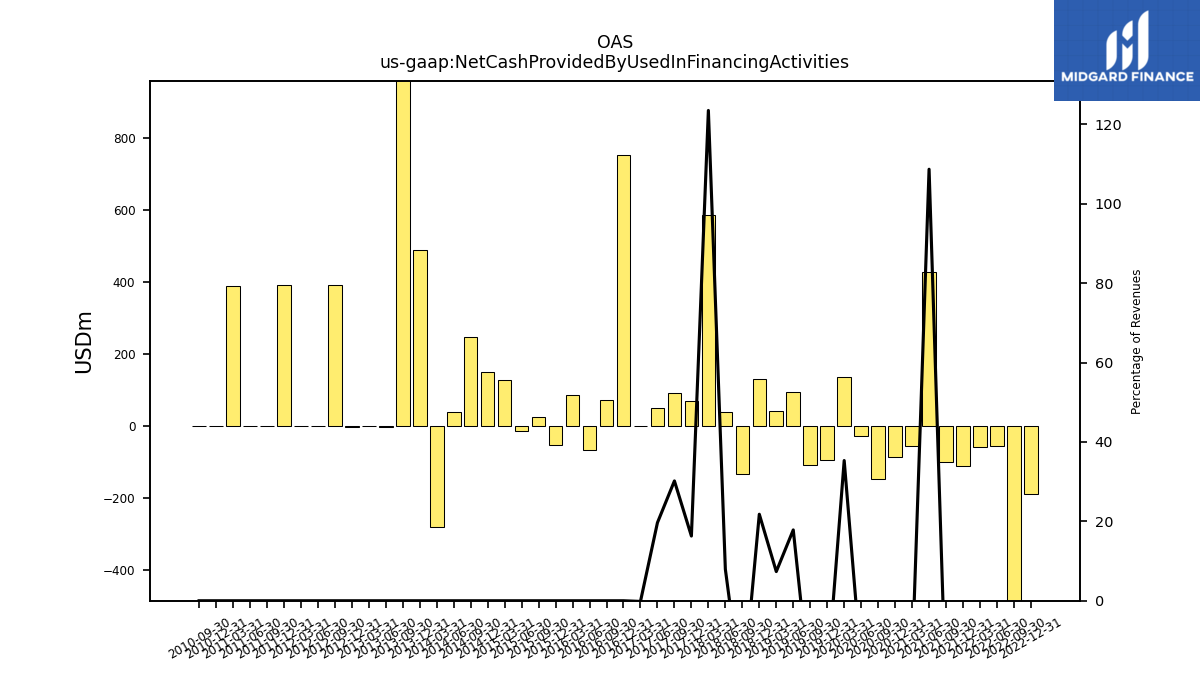
| Net Cash Provided By Used In Financing Activities | -187.24 | -521.88 | -54.49 | -59.49 | -111.48 | -98.91 | 427.29 | -55.72 | -85.70 | -148.22 | -27.05 | 136.98 | -94.42 | -108.63 | 94.46 | 42.33 | 130.71 | -133.20 | 39.85 | 585.22 | 70.90 | 91.99 | 49.97 | -0.47 |
| 2022-12-31 | 2022-09-30 | 2022-06-30 | 2022-03-31 | 2021-12-31 | 2021-09-30 | 2021-06-30 | 2021-03-31 | 2020-12-31 | 2020-09-30 | 2020-06-30 | 2020-03-31 | 2019-12-31 | 2019-09-30 | 2019-06-30 | 2019-03-31 | 2018-12-31 | 2018-09-30 | 2018-06-30 | 2018-03-31 | 2017-12-31 | 2017-09-30 | 2017-06-30 | 2017-03-31 | ||
|---|---|---|---|---|---|---|---|---|---|---|---|---|---|---|---|---|---|---|---|---|---|---|---|---|---|
| Net Cash Provided By Used In Operating Activities | 478.39 | 783.64 | 396.41 | 265.58 | 269.39 | 294.38 | 159.95 | 190.41 | 95.25 | 95.01 | -47.88 | 107.78 | 252.96 | 250.96 | 214.01 | 174.93 | 234.42 | 229.99 | 303.66 | 228.36 | 209.14 | 88.88 | 102.06 | 107.80 | |
| Net Income Loss | 377.57 | 881.75 | 130.84 | 466.00 | 217.88 | 71.95 | 73.36 | -43.59 | -49.91 | -55.70 | -92.94 | -4310.86 | -76.41 | 20.29 | 42.76 | -114.88 | 221.98 | 62.34 | -320.20 | 0.59 | 124.62 | -41.21 | 16.57 | 23.82 | |
| Profit Loss | 377.57 | 881.75 | 130.84 | 468.31 | 225.92 | 83.33 | 81.31 | -35.27 | -45.96 | -47.10 | -89.35 | -4334.27 | -64.15 | 30.31 | 51.17 | -107.98 | 226.87 | 66.22 | -316.30 | 3.71 | 128.12 | -41.06 | 16.57 | 23.82 | |
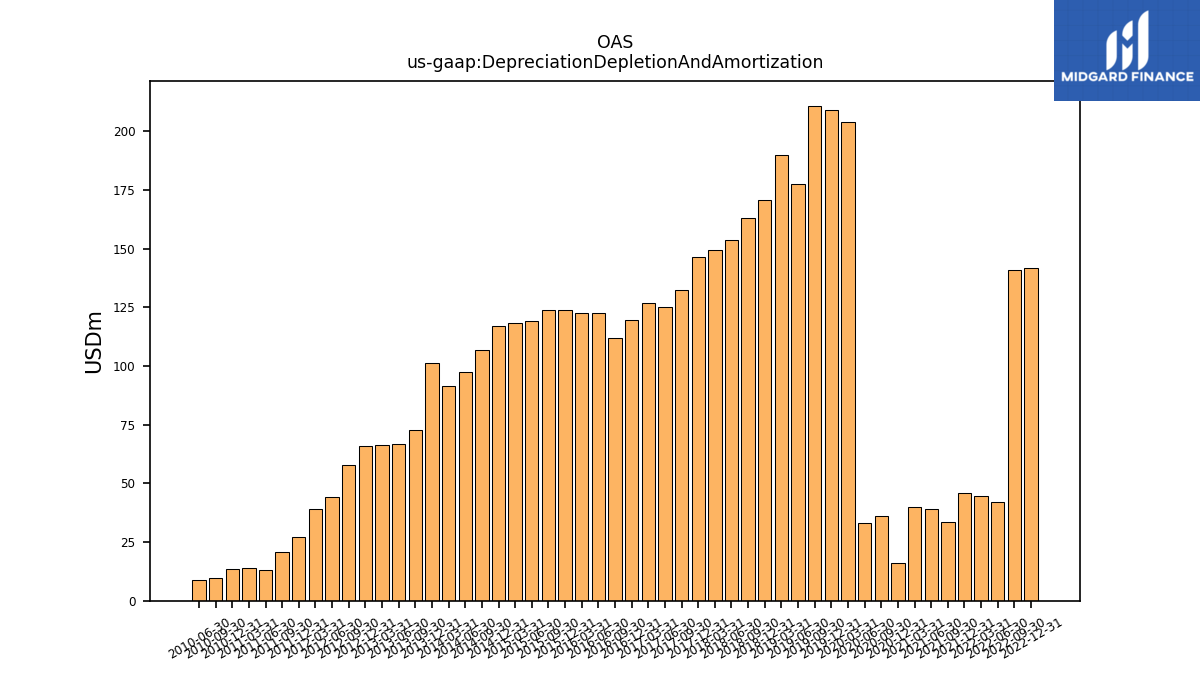
| Depreciation Depletion And Amortization | 141.80 | 141.05 | 42.14 | 44.67 | 45.72 | 33.62 | 38.97 | 39.99 | 16.09 | 36.00 | 33.13 | 203.75 | 209.17 | 210.83 | 177.36 | 189.83 | 170.48 | 162.98 | 153.57 | 149.26 | 146.56 | 132.29 | 125.29 | 126.67 | |
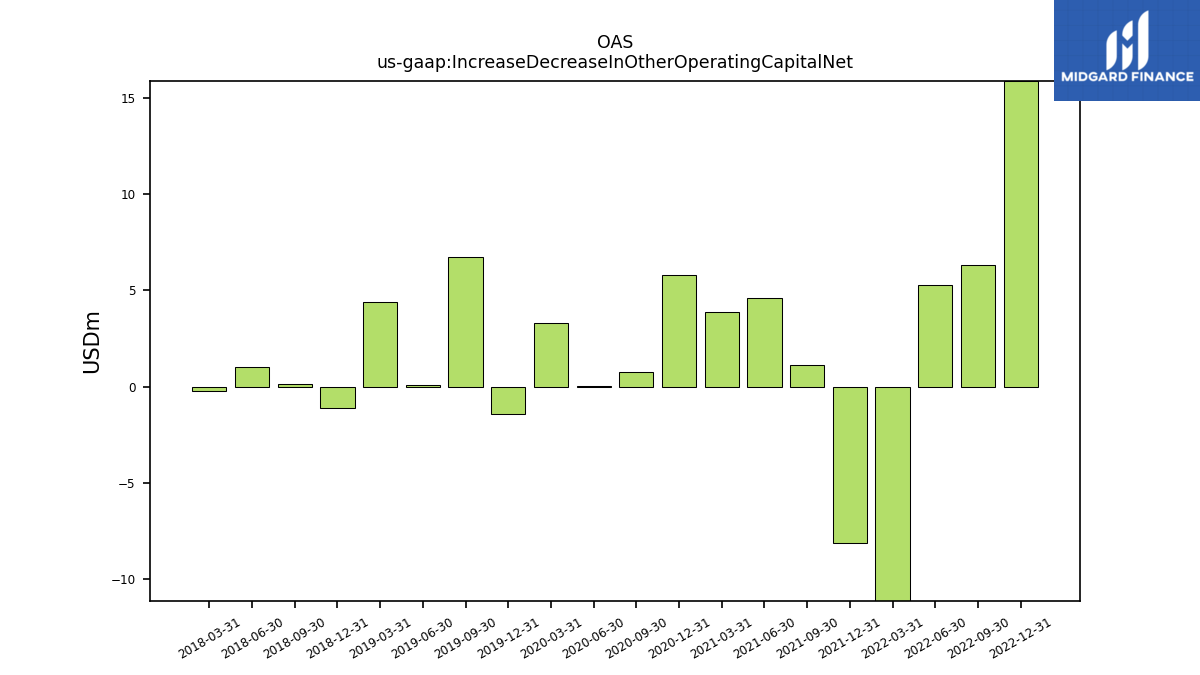
| Increase Decrease In Other Operating Capital Net | 15.86 | 6.31 | 5.27 | -16.35 | -8.14 | 1.14 | 4.62 | 3.85 | 5.80 | 0.78 | 0.02 | 3.27 | -1.42 | 6.74 | 0.08 | 4.39 | -1.12 | 0.15 | 0.99 | -0.25 | NA | NA | NA | NA | |
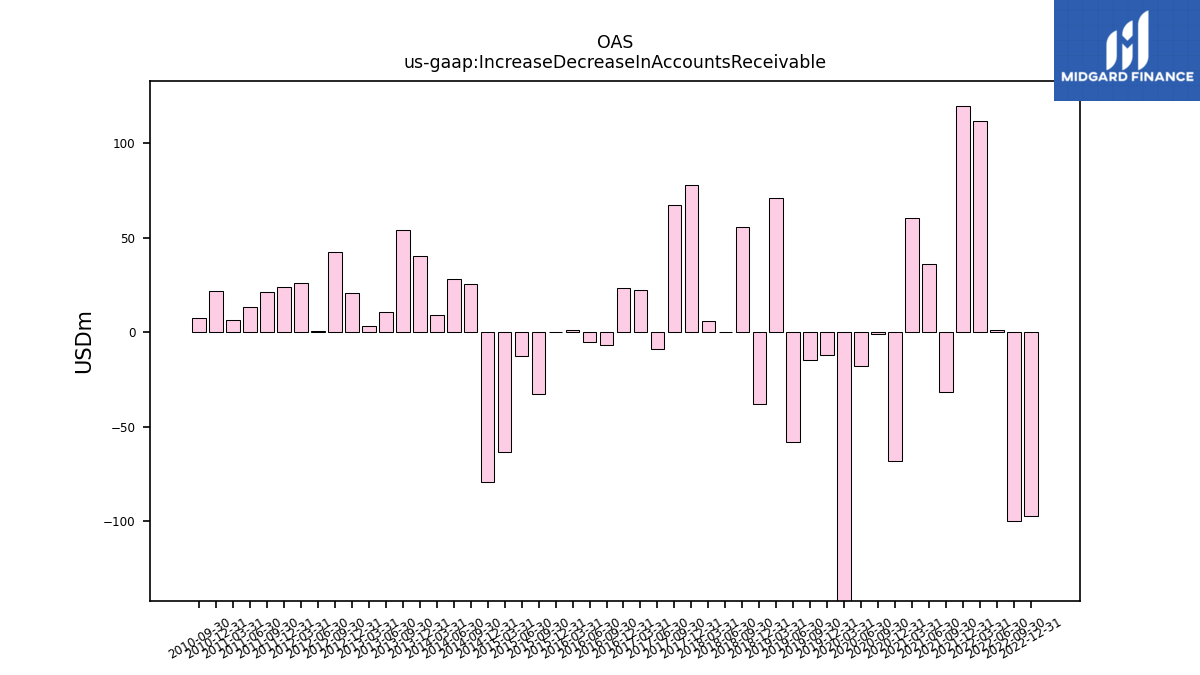
| Increase Decrease In Accounts Receivable | -97.05 | -99.68 | 0.88 | 111.81 | 119.28 | -31.38 | 36.16 | 60.54 | -68.32 | -0.88 | -18.05 | -149.82 | -12.17 | -14.47 | -58.17 | 71.08 | -37.77 | 55.41 | 0.16 | 5.71 | 77.56 | 67.28 | -8.73 | 22.48 | |
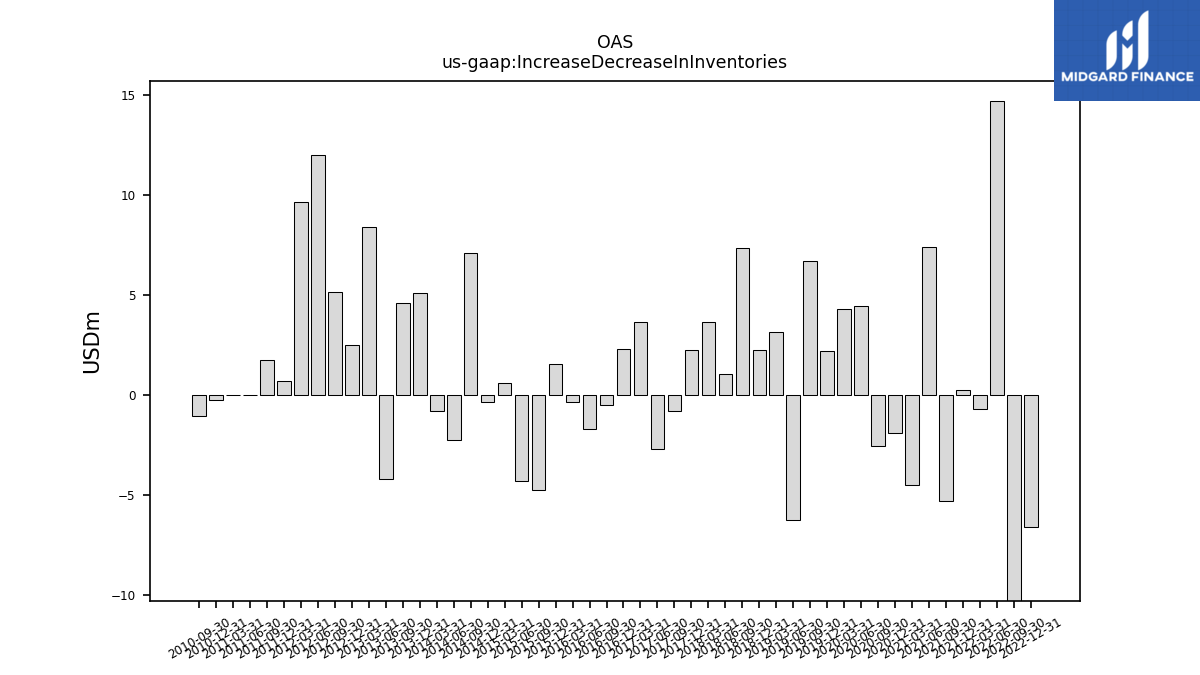
| Increase Decrease In Inventories | -6.56 | -16.24 | 14.71 | -0.67 | 0.24 | -5.29 | 7.39 | -4.51 | -1.90 | -2.53 | 4.44 | 4.30 | 2.22 | 6.71 | -6.21 | 3.18 | 2.27 | 7.36 | 1.05 | 3.67 | 2.27 | -0.77 | -2.67 | 3.68 | |
| Deferred Income Tax Expense Benefit | -121.56 | 66.67 | 0.00 | -0.01 | NA | NA | NA | -3.65 | -3.45 | -5.14 | -2.64 | -254.68 | -23.86 | -17.46 | 12.16 | -3.55 | 69.55 | 24.88 | -101.12 | 0.83 | -202.41 | -18.85 | 2.34 | 16.04 | |
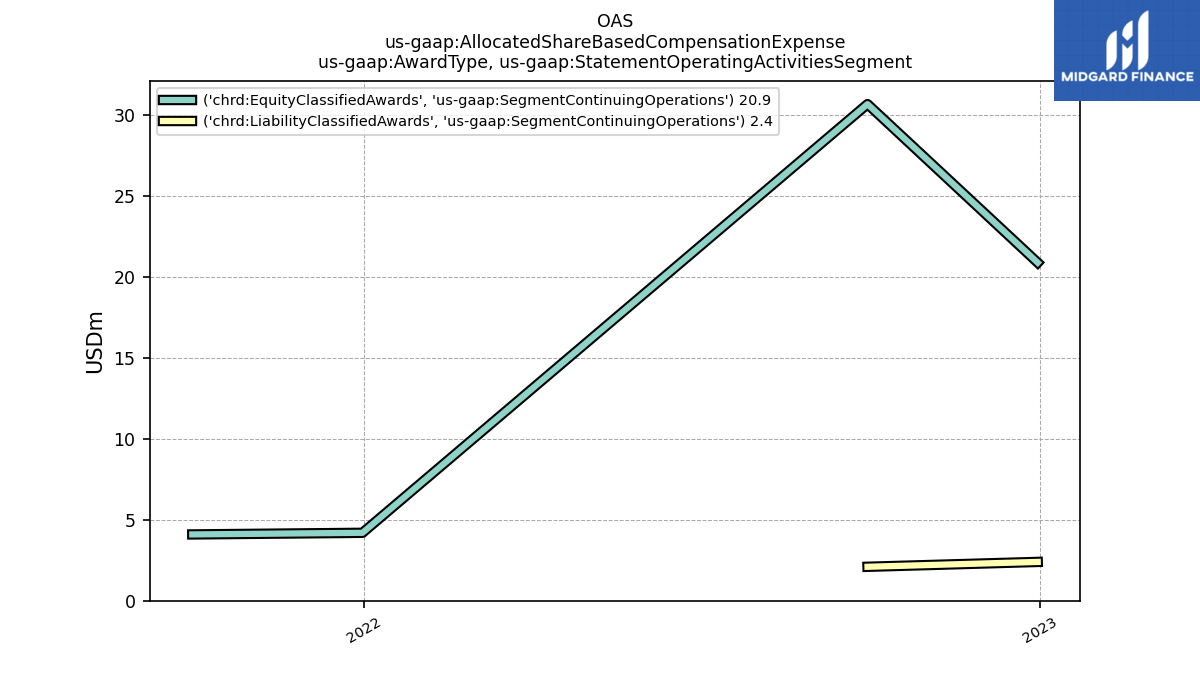
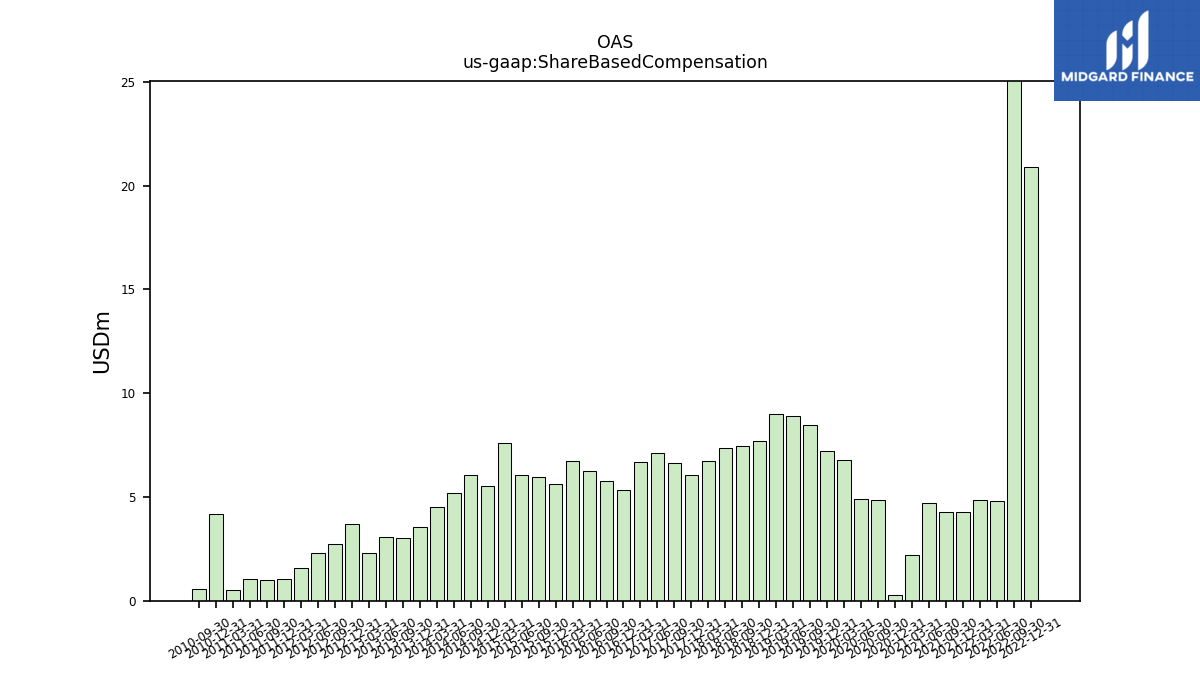
| Share Based Compensation | 20.92 | 30.69 | 4.82 | 4.85 | 4.29 | 4.29 | 4.70 | 2.20 | 0.27 | 4.83 | 4.89 | 6.81 | 7.24 | 8.45 | 8.91 | 9.01 | 7.69 | 7.46 | 7.38 | 6.75 | 6.08 | 6.63 | 7.12 | 6.71 |
| 2022-12-31 | 2022-09-30 | 2022-06-30 | 2022-03-31 | 2021-12-31 | 2021-09-30 | 2021-06-30 | 2021-03-31 | 2020-12-31 | 2020-09-30 | 2020-06-30 | 2020-03-31 | 2019-12-31 | 2019-09-30 | 2019-06-30 | 2019-03-31 | 2018-12-31 | 2018-09-30 | 2018-06-30 | 2018-03-31 | 2017-12-31 | 2017-09-30 | 2017-06-30 | 2017-03-31 | ||
|---|---|---|---|---|---|---|---|---|---|---|---|---|---|---|---|---|---|---|---|---|---|---|---|---|---|
| Net Cash Provided By Used In Investing Activities | -356.86 | -174.02 | -180.98 | 29.30 | -831.74 | -135.78 | 88.62 | -41.87 | -9.88 | 60.07 | 18.33 | -130.77 | -157.94 | -143.16 | -303.65 | -224.00 | -359.83 | -96.97 | -344.17 | -812.57 | -271.81 | -183.81 | -154.38 | -104.77 |
| 2022-12-31 | 2022-09-30 | 2022-06-30 | 2022-03-31 | 2021-12-31 | 2021-09-30 | 2021-06-30 | 2021-03-31 | 2020-12-31 | 2020-09-30 | 2020-06-30 | 2020-03-31 | 2019-12-31 | 2019-09-30 | 2019-06-30 | 2019-03-31 | 2018-12-31 | 2018-09-30 | 2018-06-30 | 2018-03-31 | 2017-12-31 | 2017-09-30 | 2017-06-30 | 2017-03-31 | ||
|---|---|---|---|---|---|---|---|---|---|---|---|---|---|---|---|---|---|---|---|---|---|---|---|---|---|
| Net Cash Provided By Used In Financing Activities | -187.24 | -521.88 | -54.49 | -59.49 | -111.48 | -98.91 | 427.29 | -55.72 | -85.70 | -148.22 | -27.05 | 136.98 | -94.42 | -108.63 | 94.46 | 42.33 | 130.71 | -133.20 | 39.85 | 585.22 | 70.90 | 91.99 | 49.97 | -0.47 | |
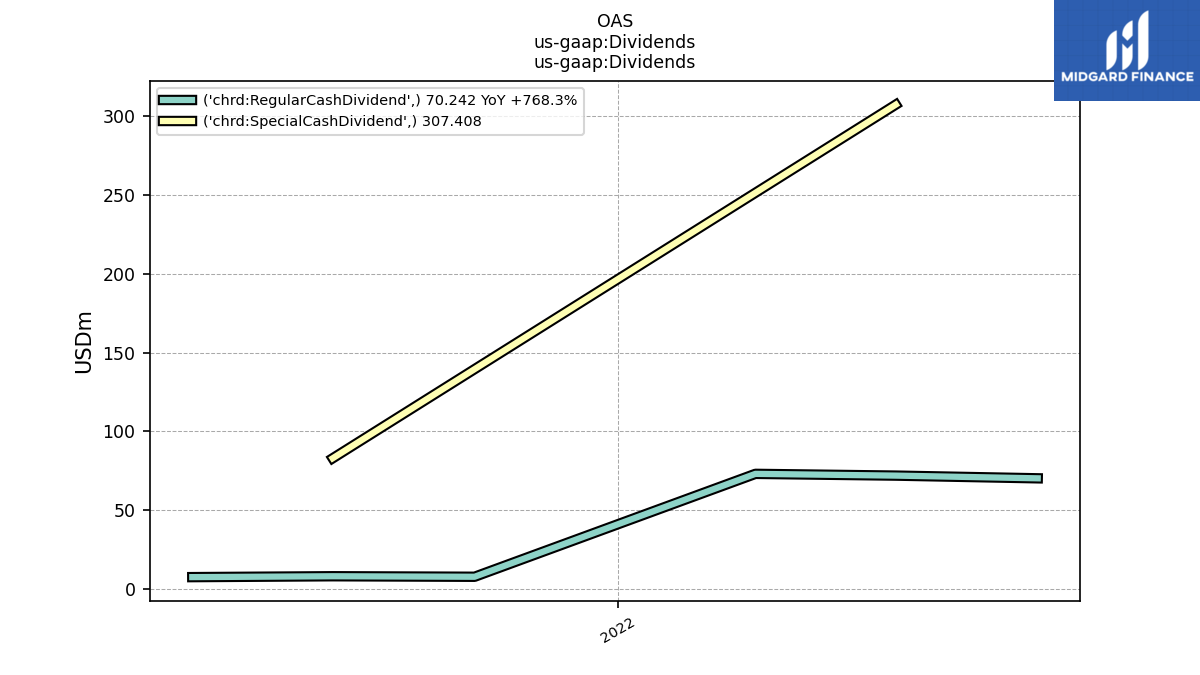
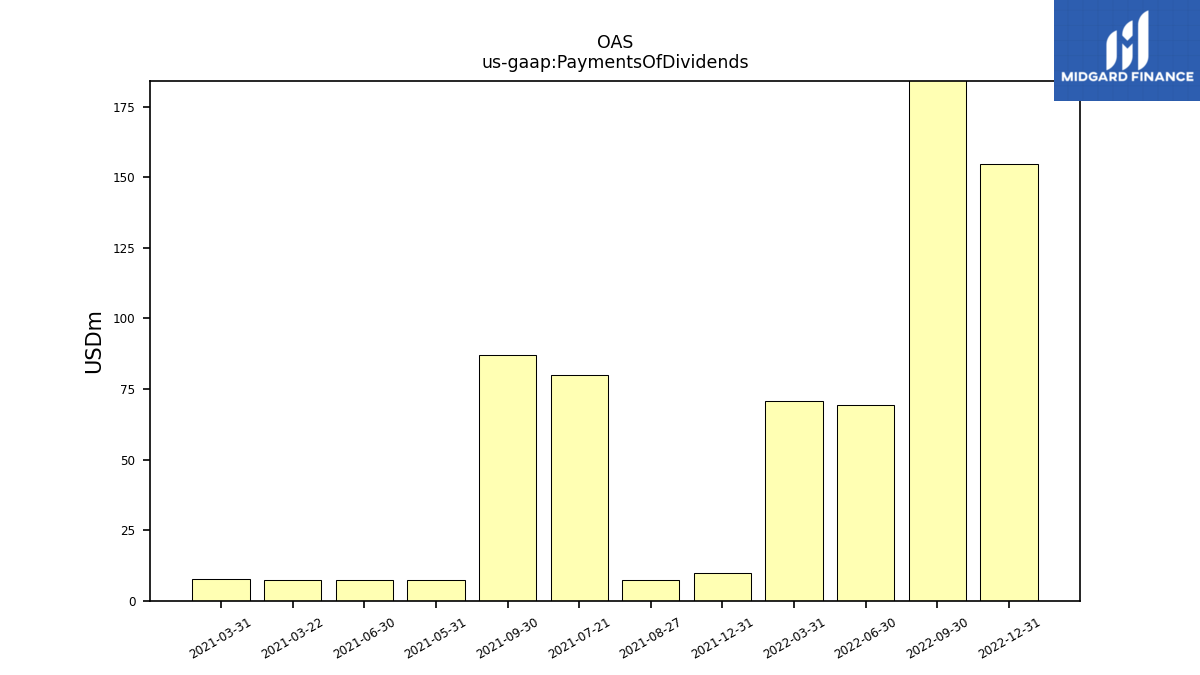
| Payments Of Dividends | 154.62 | 360.25 | 69.28 | 70.58 | 9.78 | 87.08 | 7.50 | 7.54 | NA | NA | NA | NA | NA | NA | NA | NA | NA | NA | NA | NA | NA | NA | NA | NA | |
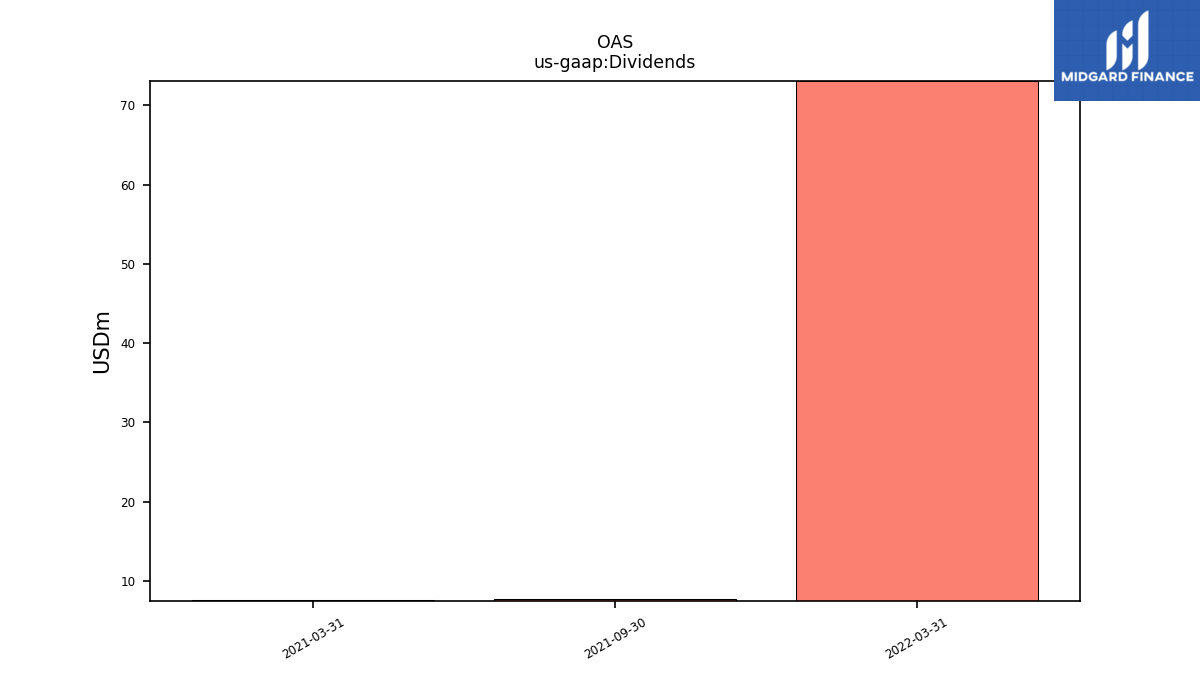
| Dividends | NA | NA | NA | 73.07 | NA | 7.76 | NA | 7.54 | NA | NA | NA | NA | NA | NA | NA | NA | NA | NA | NA | NA | NA | NA | NA | NA | |
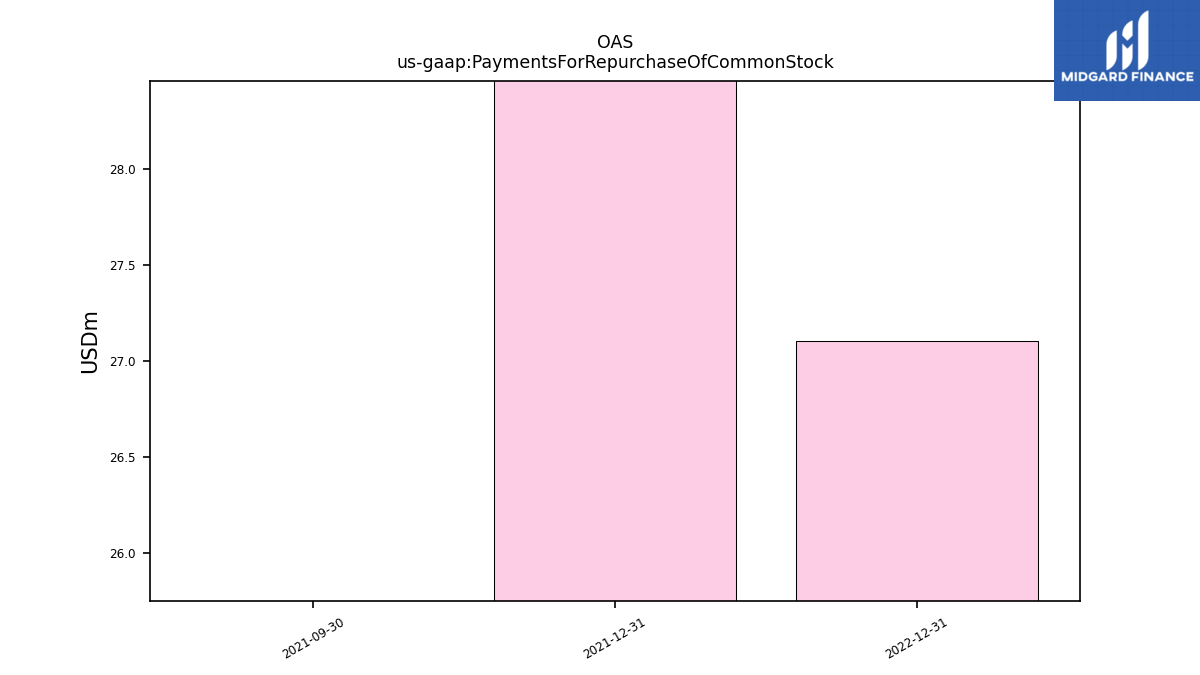
| Payments For Repurchase Of Common Stock | 27.11 | NA | NA | NA | 85.44 | 0.00 | NA | NA | NA | NA | NA | NA | NA | NA | NA | NA | NA | NA | NA | NA | NA | NA | NA | NA |
| 2022-12-31 | 2022-09-30 | 2022-06-30 | 2022-03-31 | 2021-12-31 | 2021-09-30 | 2021-06-30 | 2021-03-31 | 2020-12-31 | 2020-09-30 | 2020-06-30 | 2020-03-31 | 2019-12-31 | 2019-09-30 | 2019-06-30 | 2019-03-31 | 2018-12-31 | 2018-09-30 | 2018-06-30 | 2018-03-31 | 2017-12-31 | 2017-09-30 | 2017-06-30 | 2017-03-31 | ||
|---|---|---|---|---|---|---|---|---|---|---|---|---|---|---|---|---|---|---|---|---|---|---|---|---|---|
| Revenues | 1015.60 | 1188.84 | 789.38 | 652.97 | 429.37 | 402.04 | 393.06 | 355.46 | 119.92 | 271.06 | 166.35 | 387.80 | 483.86 | 482.74 | 529.40 | 575.73 | 599.75 | 546.45 | 501.34 | 473.81 | 434.88 | 304.75 | 254.09 | 277.75 | |
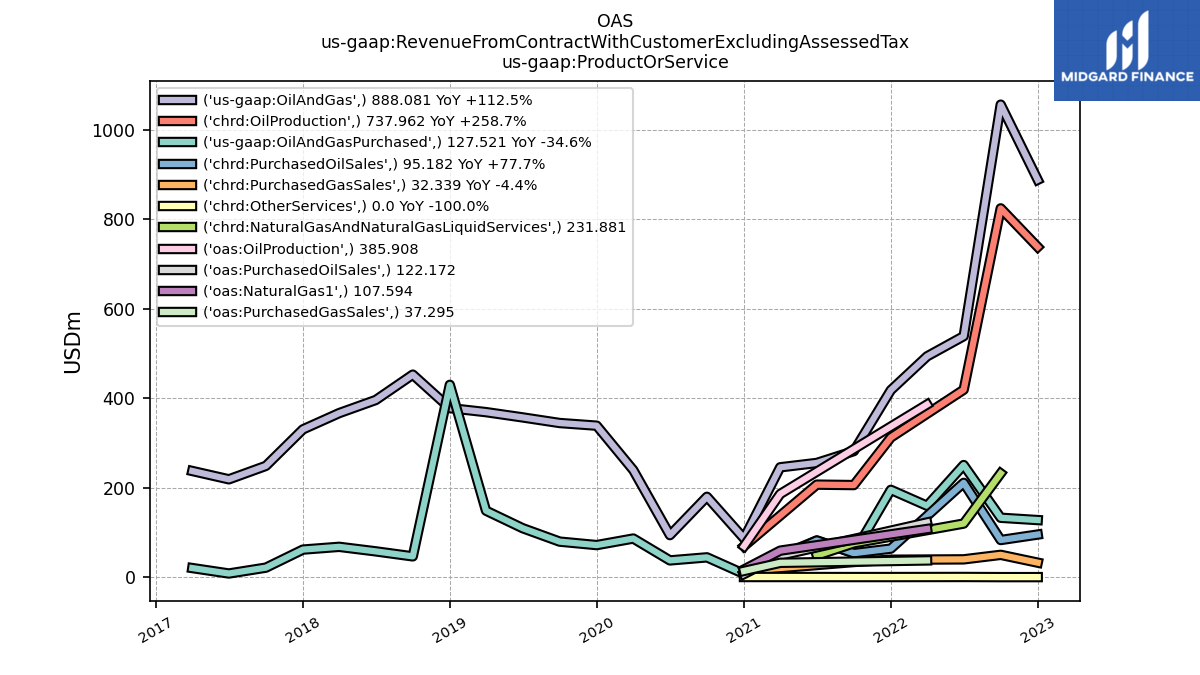
| Revenue From Contract With Customer Excluding Assessed Tax | 1015.60 | 1188.84 | 789.38 | 652.97 | 429.37 | 402.04 | 393.06 | 355.46 | 119.92 | 271.06 | 166.35 | 387.80 | 483.86 | 482.74 | 529.40 | 575.73 | 599.75 | 546.45 | 501.34 | 473.81 | 434.88 | 304.75 | 254.09 | 277.75 | |
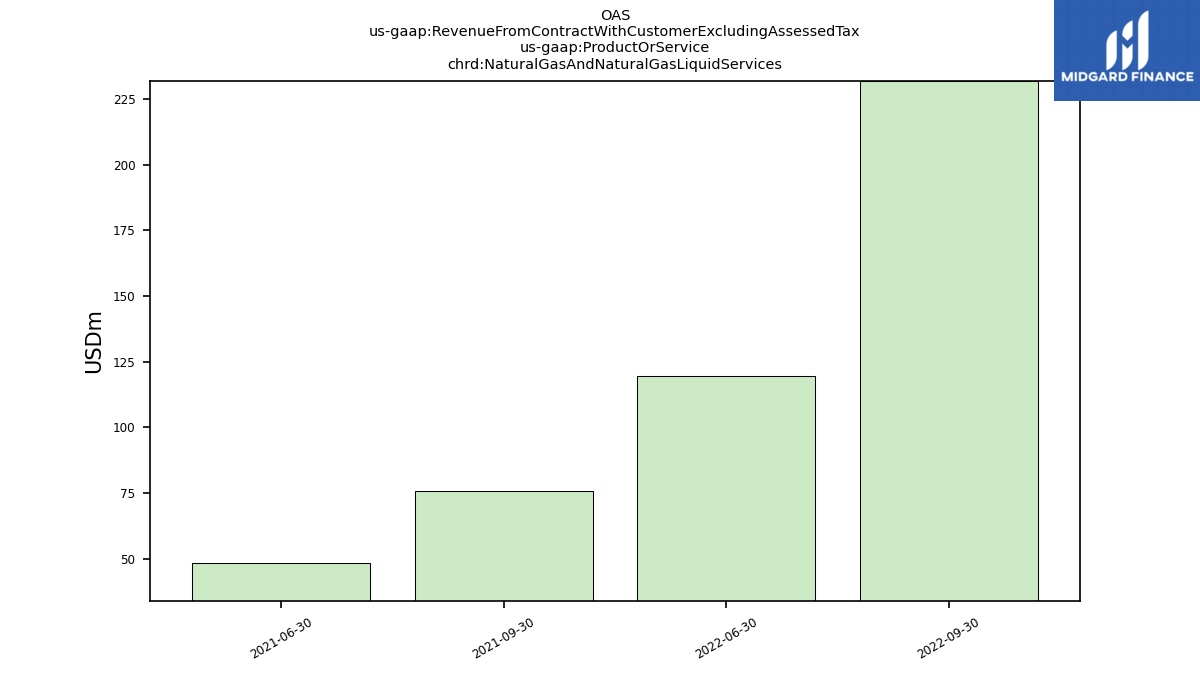
| Natural Gas And Natural Gas Liquid Services | NA | 231.88 | 119.71 | NA | NA | 75.74 | 48.27 | NA | NA | NA | NA | NA | NA | NA | NA | NA | NA | NA | NA | NA | NA | NA | NA | NA | |
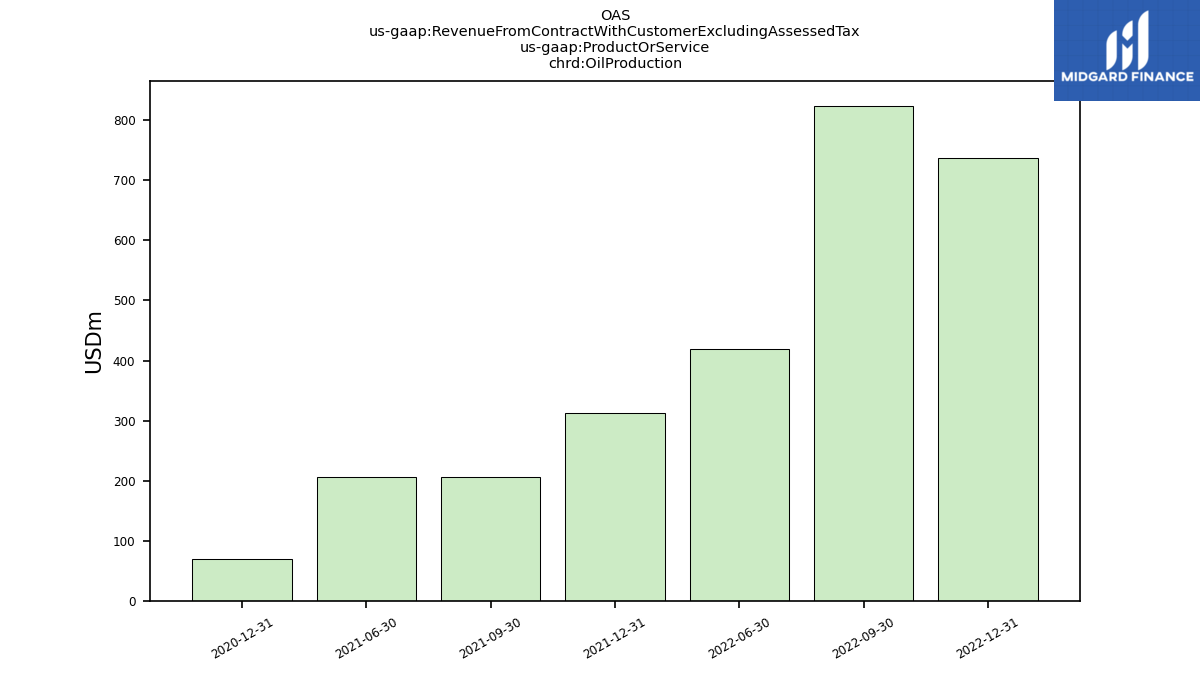
| Oil Production | 737.96 | 824.26 | 418.86 | NA | 312.10 | 205.73 | 206.73 | NA | 69.08 | NA | NA | NA | NA | NA | NA | NA | NA | NA | NA | NA | NA | NA | NA | NA | |
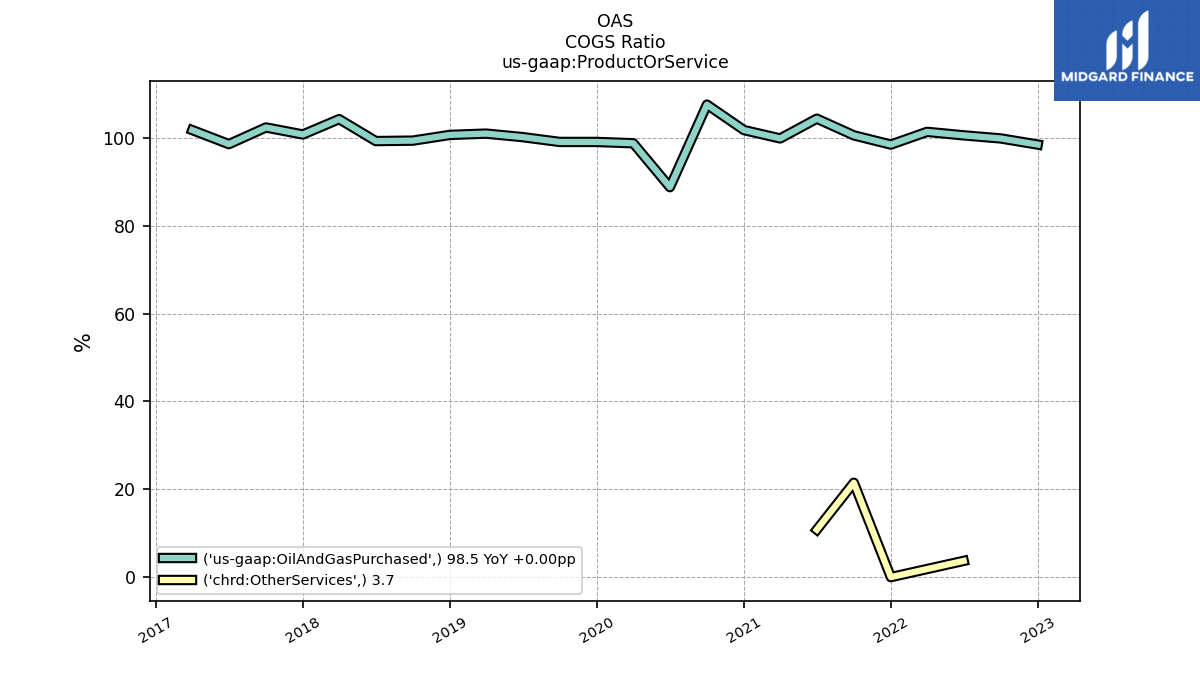
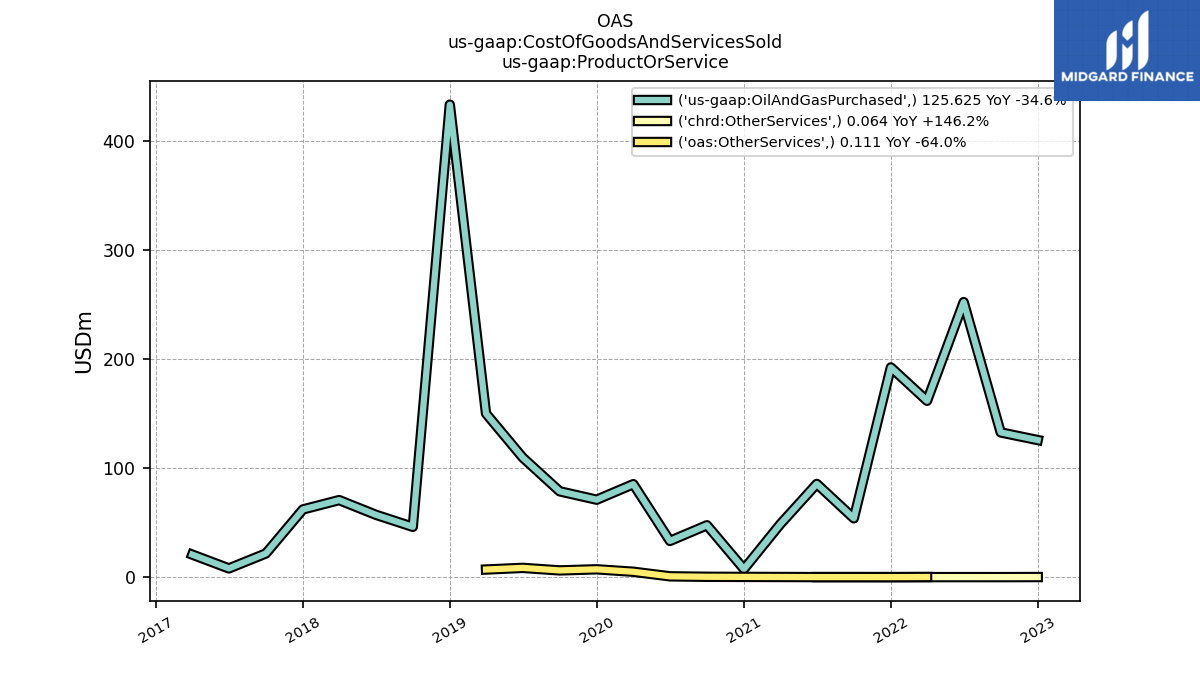
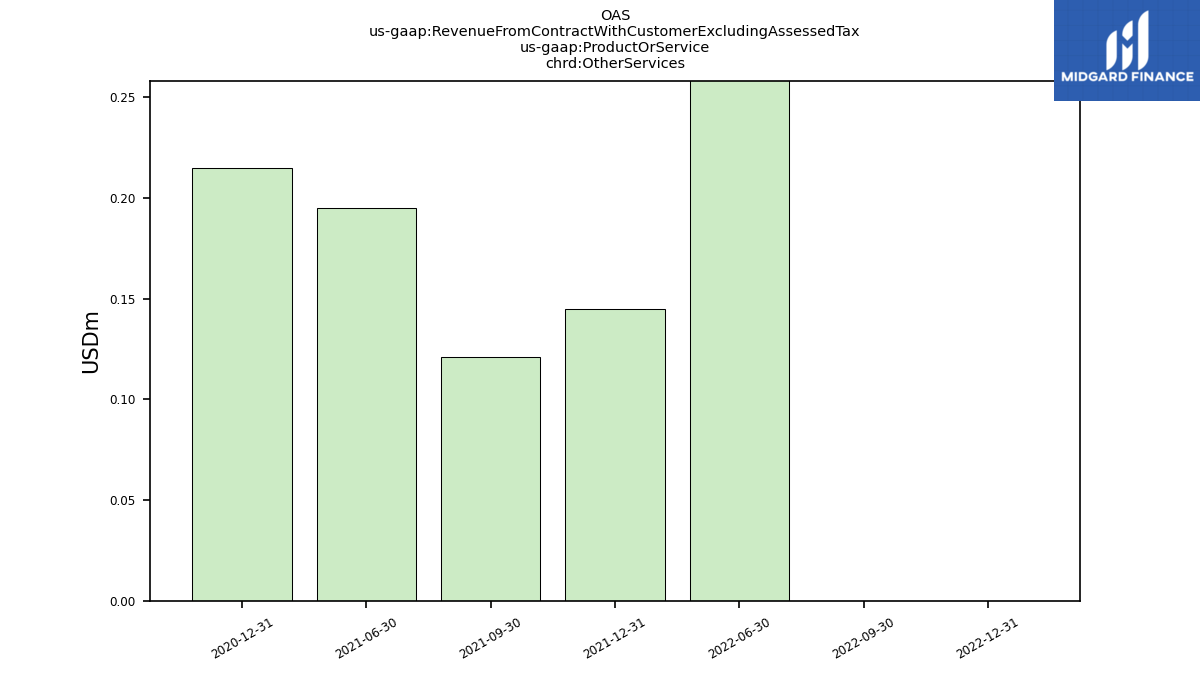
| Other Services | 0.00 | 0.00 | 0.32 | NA | 0.14 | 0.12 | 0.20 | NA | 0.21 | NA | NA | NA | NA | NA | NA | NA | NA | NA | NA | NA | NA | NA | NA | NA | |
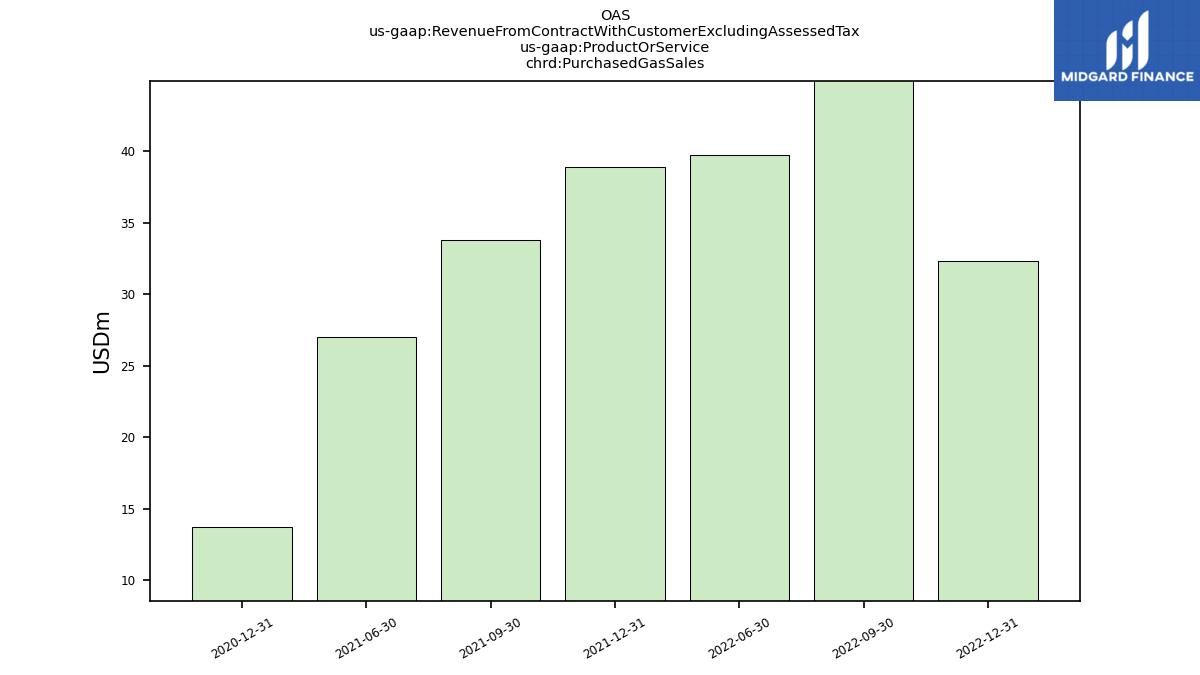
| Purchased Gas Sales | 32.34 | 49.80 | 39.73 | NA | 38.91 | 33.82 | 27.03 | NA | 13.77 | NA | NA | NA | NA | NA | NA | NA | NA | NA | NA | NA | NA | NA | NA | NA | |
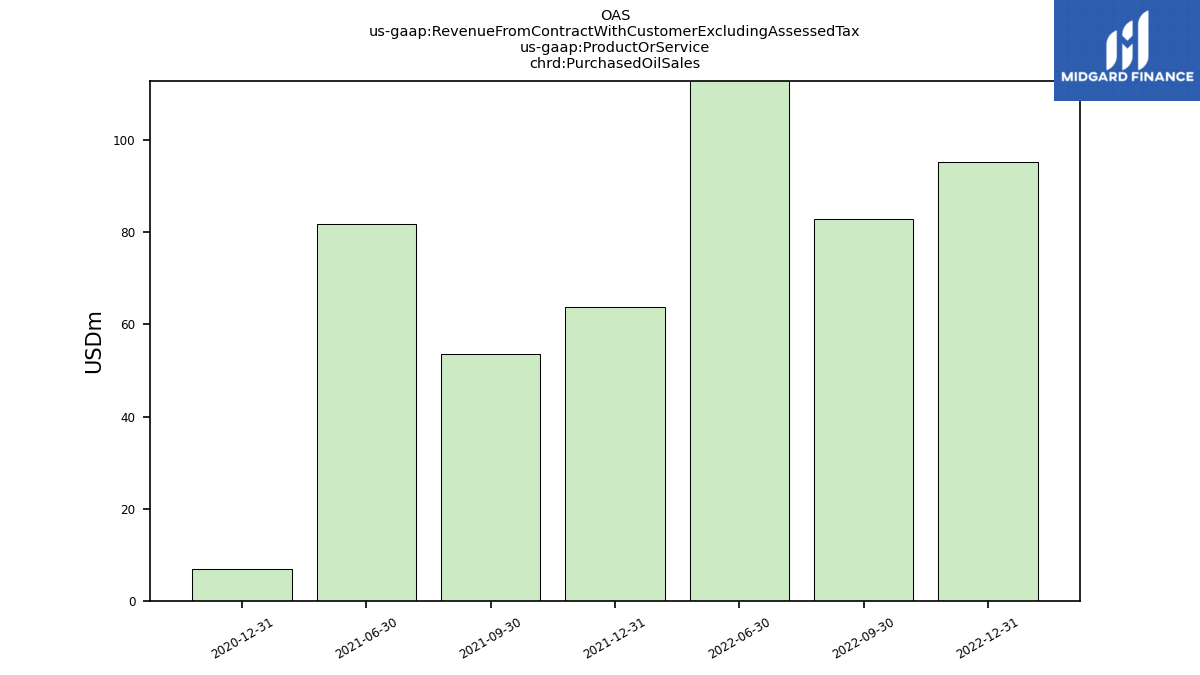
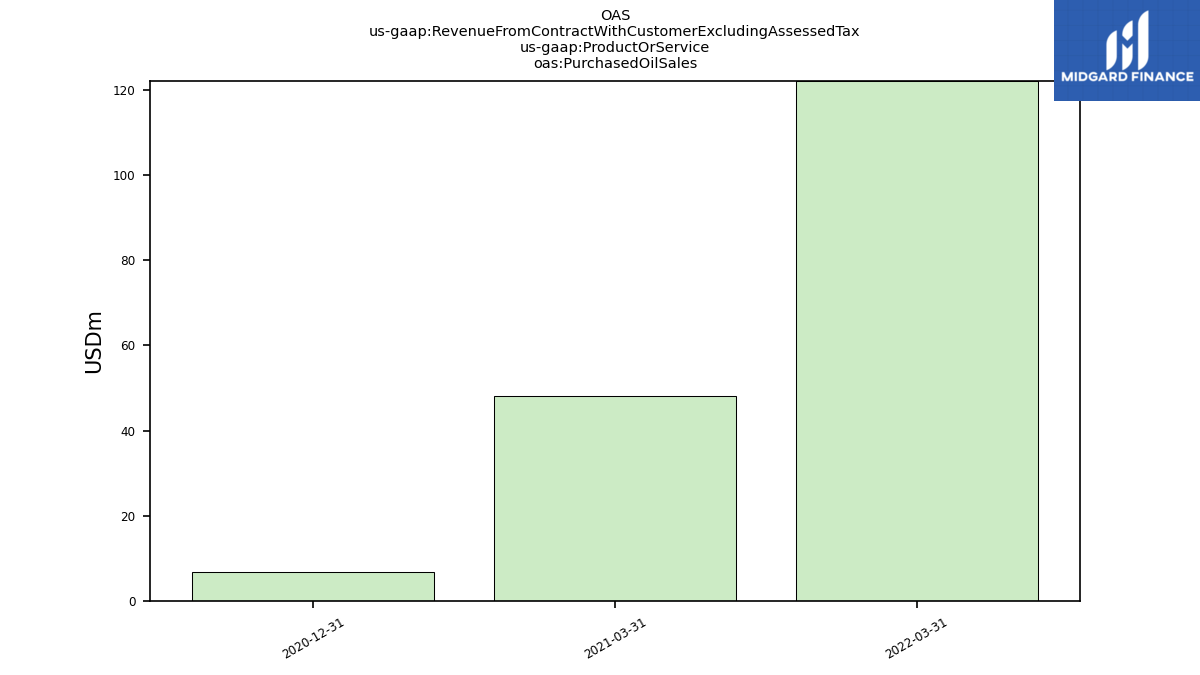
| Purchased Oil Sales | 95.18 | 82.90 | 210.76 | NA | 63.73 | 53.56 | 81.80 | NA | 6.86 | NA | NA | NA | NA | NA | NA | NA | NA | NA | NA | NA | NA | NA | NA | NA | |
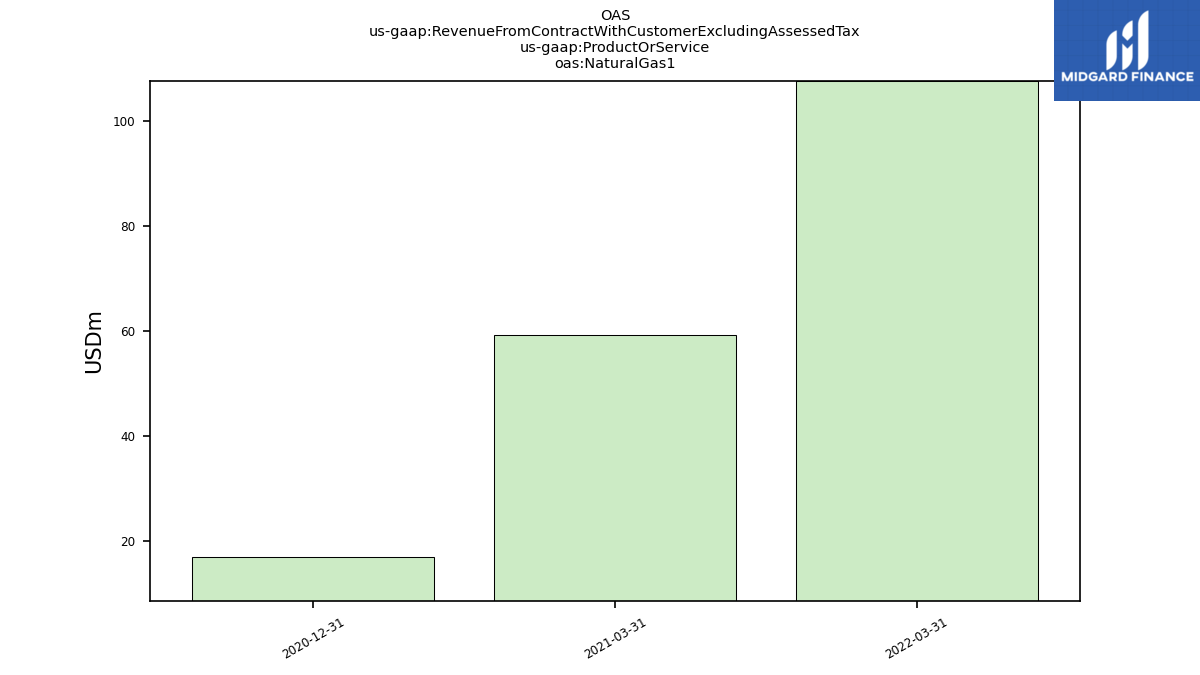
| Natural Gas1 | NA | NA | NA | 107.59 | NA | NA | NA | 59.17 | 17.07 | NA | NA | NA | NA | NA | NA | NA | NA | NA | NA | NA | NA | NA | NA | NA | |
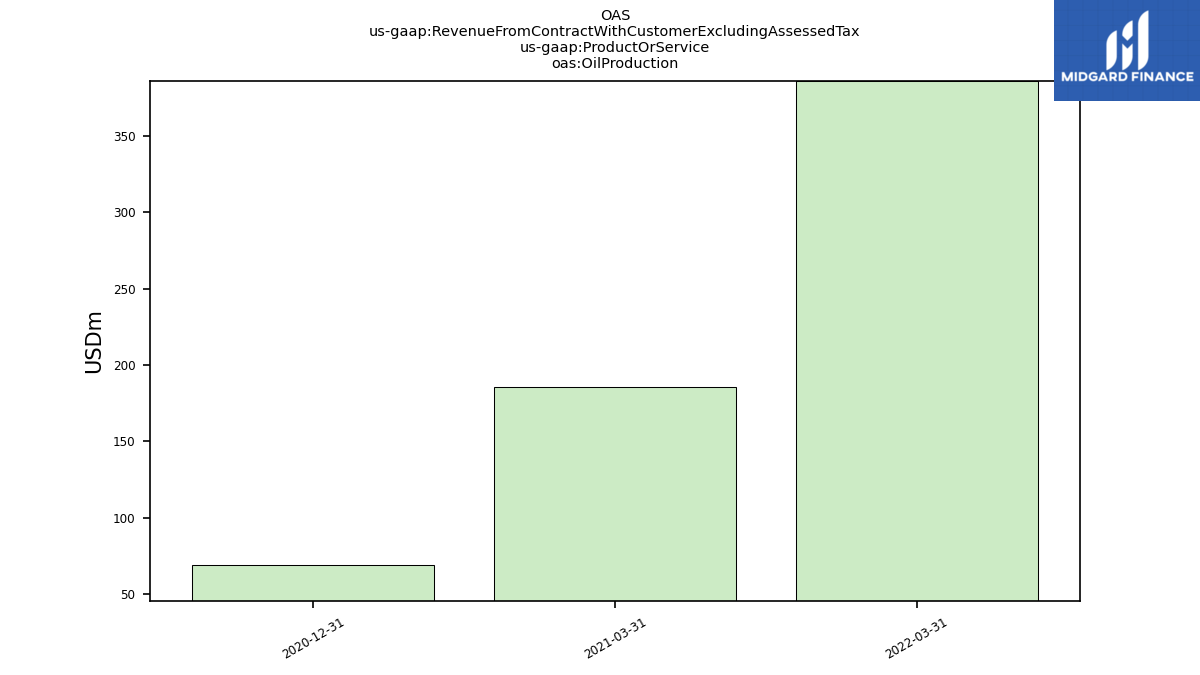
| Oil Production | NA | NA | NA | 385.91 | NA | NA | NA | 185.82 | 69.08 | NA | NA | NA | NA | NA | NA | NA | NA | NA | NA | NA | NA | NA | NA | NA | |
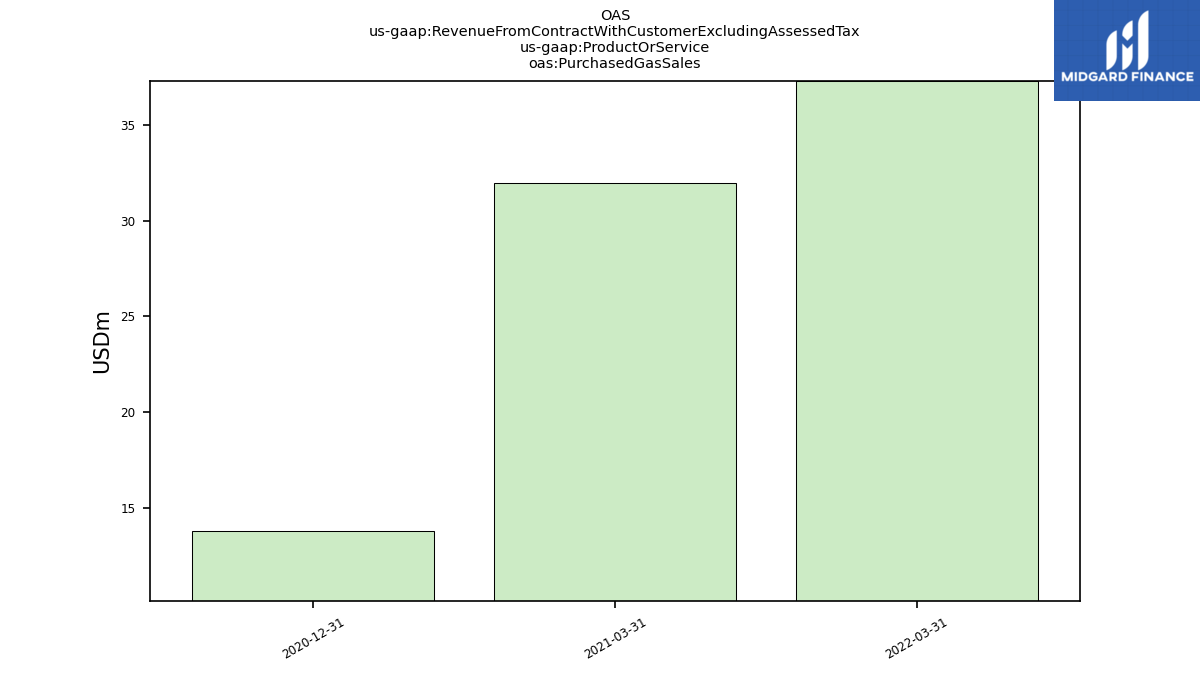
| Purchased Gas Sales | NA | NA | NA | 37.30 | NA | NA | NA | 31.98 | 13.77 | NA | NA | NA | NA | NA | NA | NA | NA | NA | NA | NA | NA | NA | NA | NA | |
| Purchased Oil Sales | NA | NA | NA | 122.17 | NA | NA | NA | 48.16 | 6.86 | NA | NA | NA | NA | NA | NA | NA | NA | NA | NA | NA | NA | NA | NA | NA | |
| Oil And Gas | 888.08 | 1056.15 | 538.57 | 493.50 | 417.93 | 281.64 | 255.23 | 245.46 | 86.44 | 179.58 | 93.83 | 239.13 | 338.51 | 344.47 | 357.00 | 368.78 | 377.79 | 452.64 | 395.92 | 366.60 | 330.29 | 248.65 | 218.63 | 237.25 | |
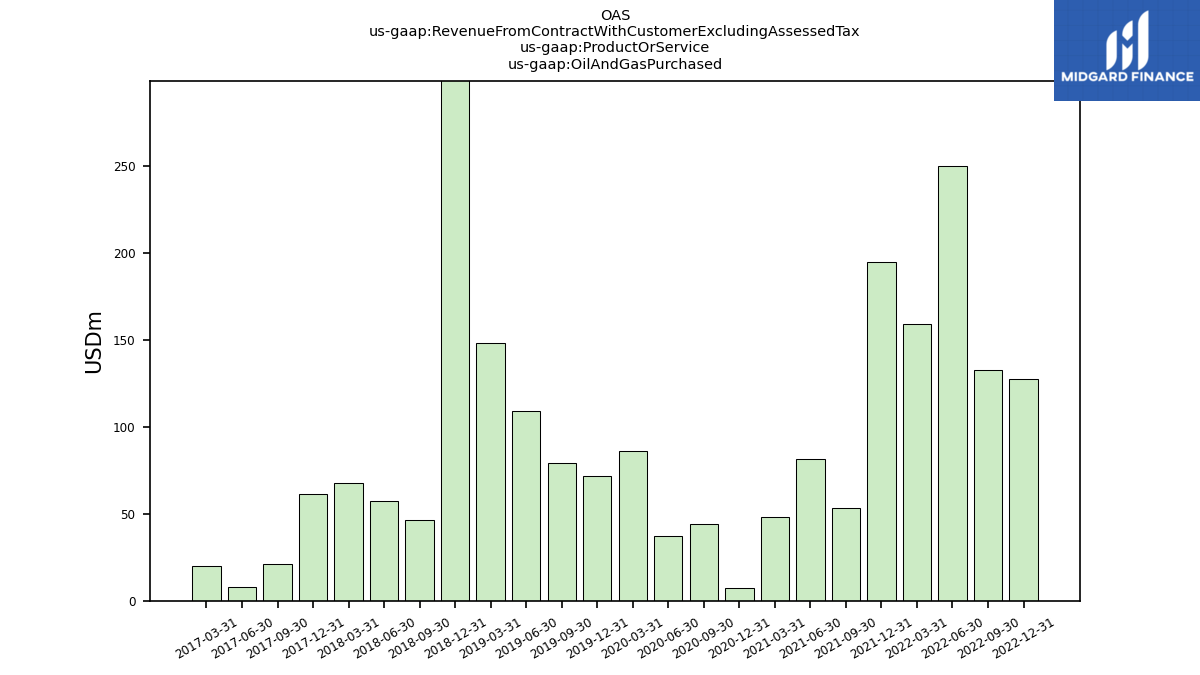
| Oil And Gas Purchased | 127.52 | 132.70 | 250.49 | 159.47 | 195.10 | 53.57 | 81.86 | 48.46 | 7.23 | 44.19 | 37.35 | 86.28 | 71.58 | 79.35 | 109.39 | 148.47 | 429.84 | 46.36 | 57.58 | 67.71 | 61.55 | 21.20 | 8.09 | 20.27 | |
| Crestwood Equity Partners L P | NA | NA | 1448.00 | NA | NA | NA | NA | NA | NA | NA | NA | NA | NA | NA | NA | NA | NA | NA | NA | NA | NA | NA | NA | NA | |
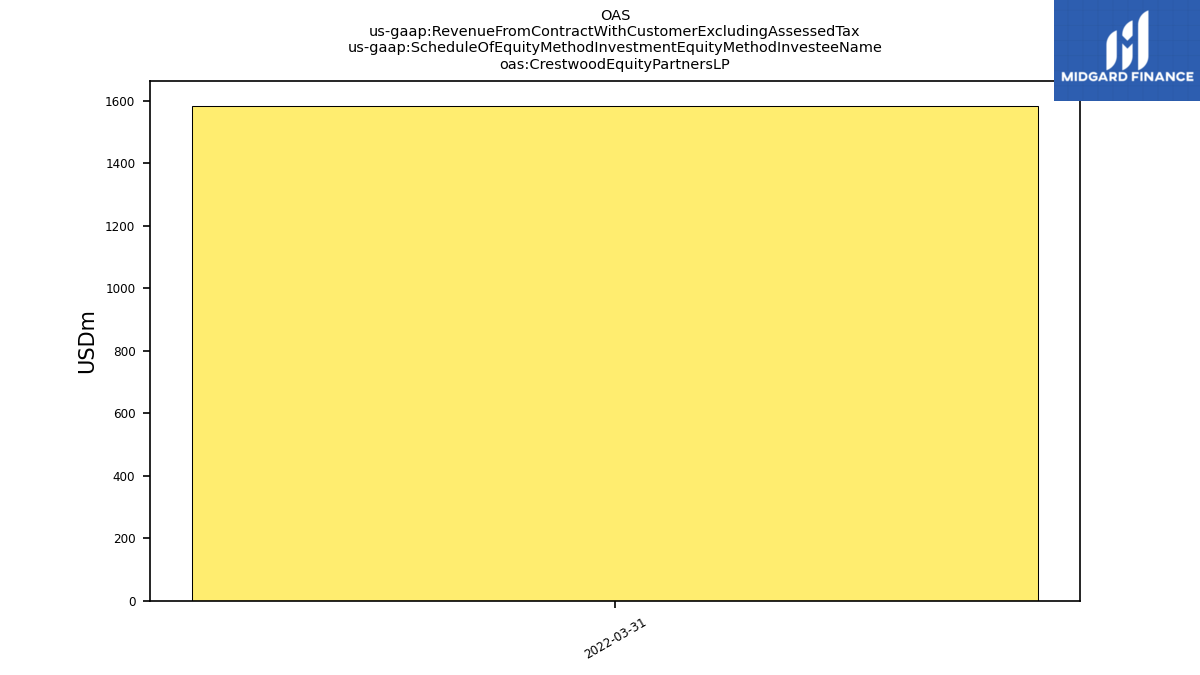
| Crestwood Equity Partners L P | NA | NA | NA | 1583.80 | NA | NA | NA | NA | NA | NA | NA | NA | NA | NA | NA | NA | NA | NA | NA | NA | NA | NA | NA | NA |
