
| 2023-03-31 | 2022-12-31 | 2022-09-30 | 2022-06-30 | 2022-03-31 | 2021-12-31 | 2021-09-30 | 2021-06-30 | 2021-03-31 | 2020-12-31 | 2020-09-30 | 2020-06-30 | 2020-03-31 | 2019-12-31 | 2019-09-30 | 2019-06-30 | 2019-03-31 | 2018-12-31 | 2018-09-30 | 2018-06-30 | 2018-03-31 | 2017-12-31 | 2017-09-30 | ||
|---|---|---|---|---|---|---|---|---|---|---|---|---|---|---|---|---|---|---|---|---|---|---|---|---|
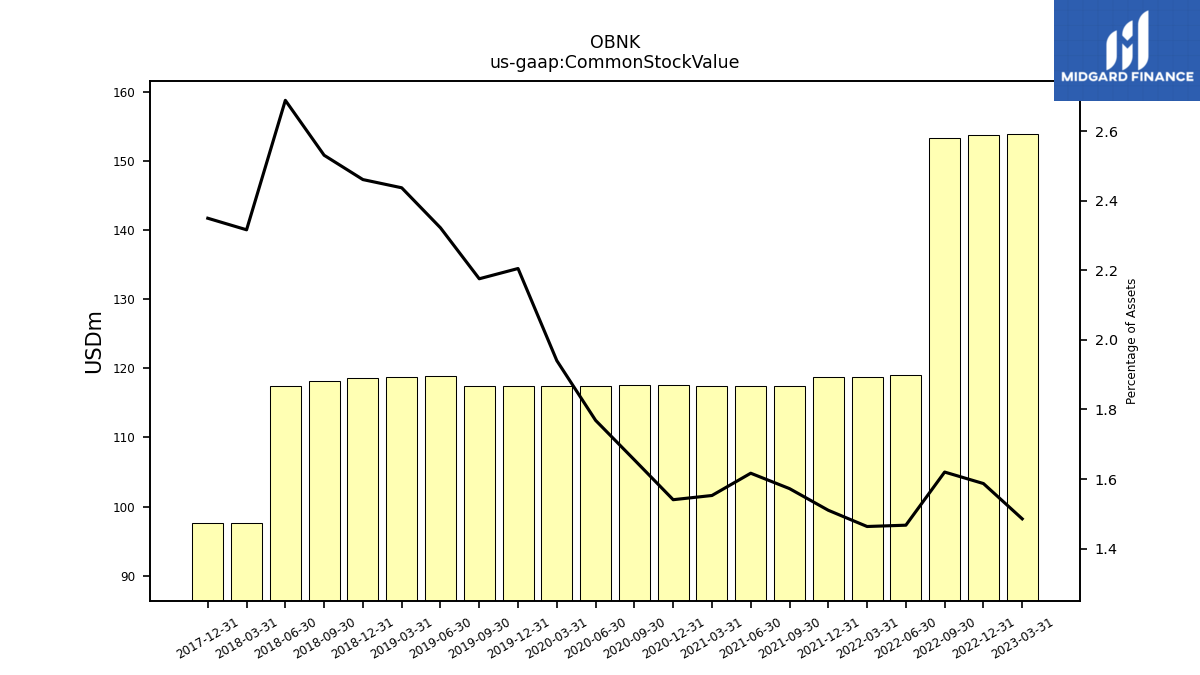
| Common Stock Value | 153.90 | 153.73 | 153.31 | 119.04 | 118.74 | 118.73 | 117.48 | 117.51 | 117.44 | 117.53 | 117.53 | 117.51 | 117.38 | 117.41 | 117.41 | 118.87 | 118.73 | 118.63 | 118.11 | 117.52 | 97.63 | 97.59 | NA | |
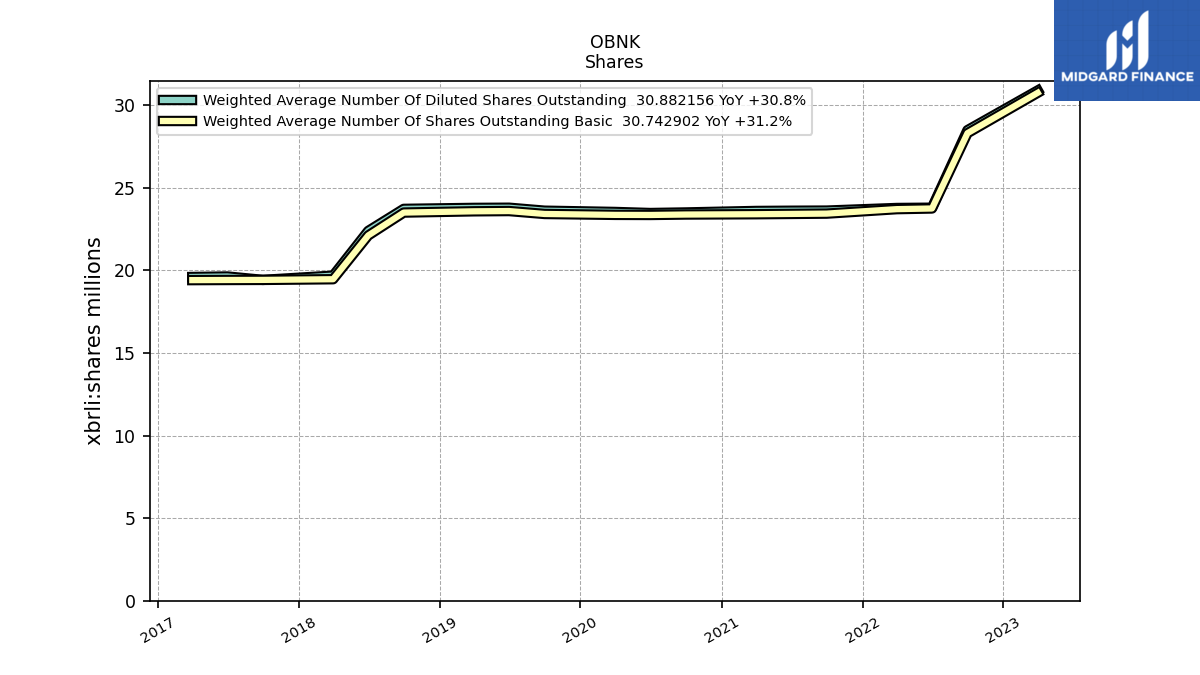
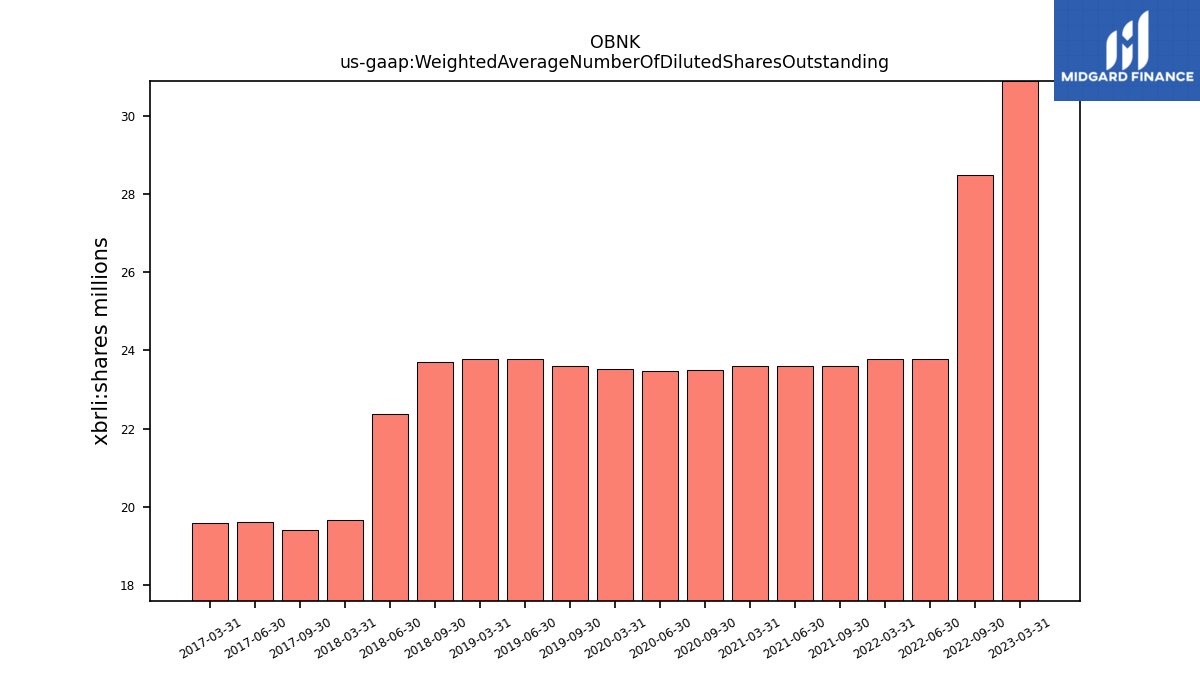
| Weighted Average Number Of Diluted Shares Outstanding | 30.88 | NA | 28.48 | 23.79 | 23.77 | NA | 23.61 | 23.60 | 23.59 | NA | 23.50 | 23.47 | 23.53 | NA | 23.61 | 23.79 | 23.78 | NA | 23.72 | 22.38 | 19.68 | NA | 19.42 | |
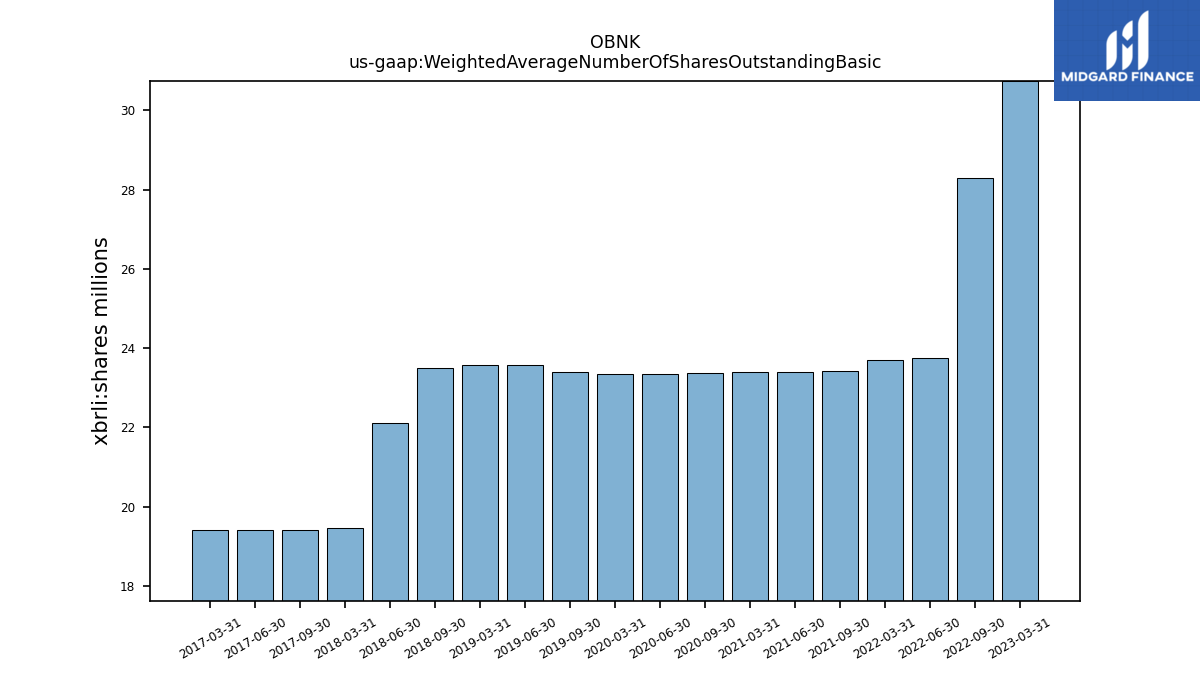
| Weighted Average Number Of Shares Outstanding Basic | 30.74 | NA | 28.30 | 23.74 | 23.70 | NA | 23.43 | 23.41 | 23.39 | NA | 23.37 | 23.35 | 23.35 | NA | 23.41 | 23.59 | 23.57 | NA | 23.49 | 22.11 | 19.46 | NA | 19.42 | |
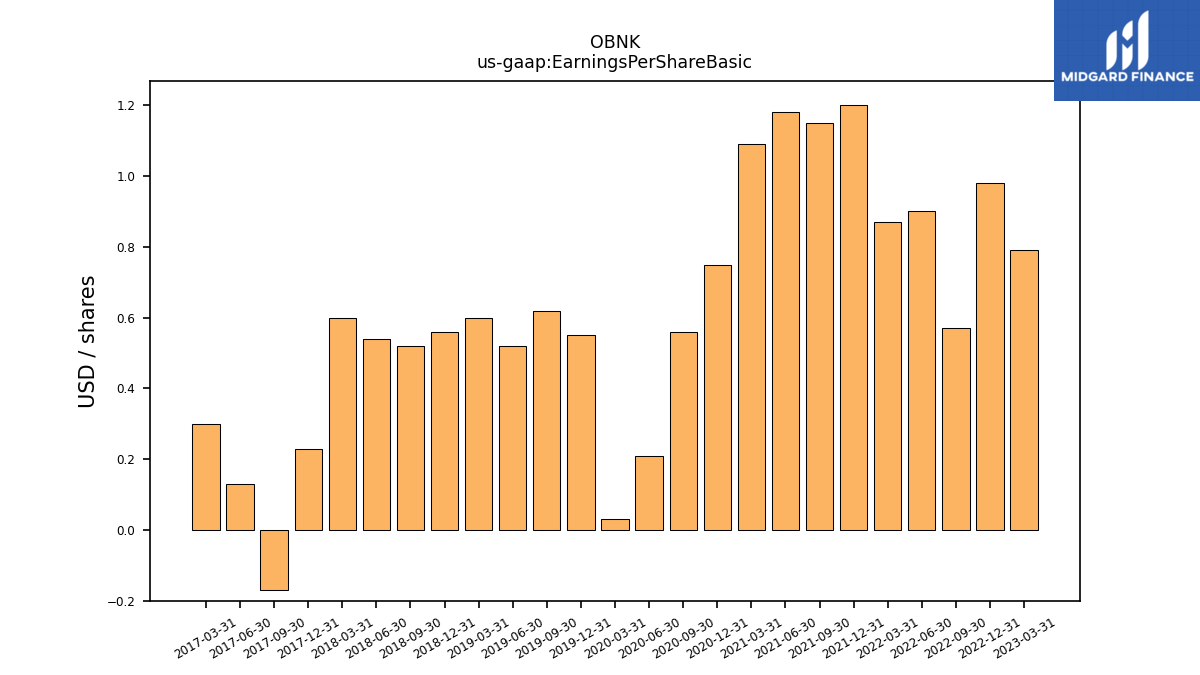
| Earnings Per Share Basic | 0.79 | 0.98 | 0.57 | 0.90 | 0.87 | 1.20 | 1.15 | 1.18 | 1.09 | 0.75 | 0.56 | 0.21 | 0.03 | 0.55 | 0.62 | 0.52 | 0.60 | 0.56 | 0.52 | 0.54 | 0.60 | 0.23 | -0.17 | |
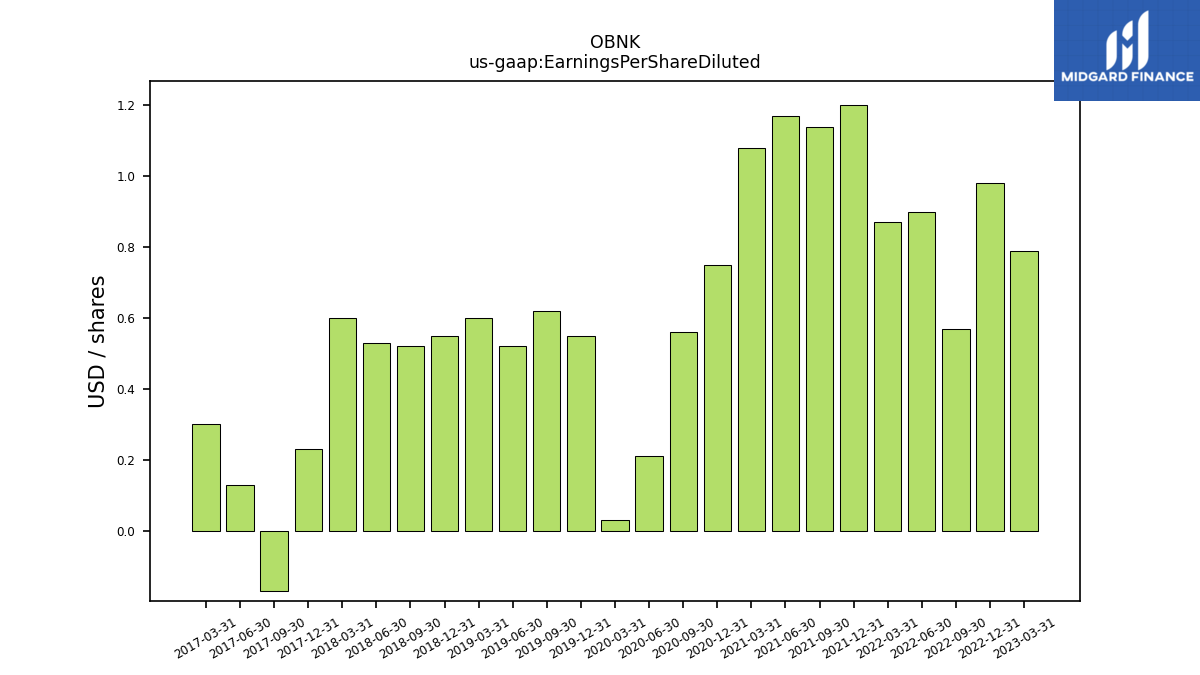
| Earnings Per Share Diluted | 0.79 | 0.98 | 0.57 | 0.90 | 0.87 | 1.20 | 1.14 | 1.17 | 1.08 | 0.75 | 0.56 | 0.21 | 0.03 | 0.55 | 0.62 | 0.52 | 0.60 | 0.55 | 0.52 | 0.53 | 0.60 | 0.23 | -0.17 |
| 2023-03-31 | 2022-12-31 | 2022-09-30 | 2022-06-30 | 2022-03-31 | 2021-12-31 | 2021-09-30 | 2021-06-30 | 2021-03-31 | 2020-12-31 | 2020-09-30 | 2020-06-30 | 2020-03-31 | 2019-12-31 | 2019-09-30 | 2019-06-30 | 2019-03-31 | 2018-12-31 | 2018-09-30 | 2018-06-30 | 2018-03-31 | 2017-12-31 | 2017-09-30 | ||
|---|---|---|---|---|---|---|---|---|---|---|---|---|---|---|---|---|---|---|---|---|---|---|---|---|
| Interest And Fee Income Loans And Leases | 106.50 | 99.18 | 79.80 | 55.99 | 51.18 | 53.26 | 53.18 | 55.53 | 56.81 | 54.19 | 54.15 | 50.72 | 50.05 | 52.33 | 53.93 | 51.46 | 49.17 | 47.82 | 43.87 | 40.22 | 37.47 | 36.92 | 36.19 | |
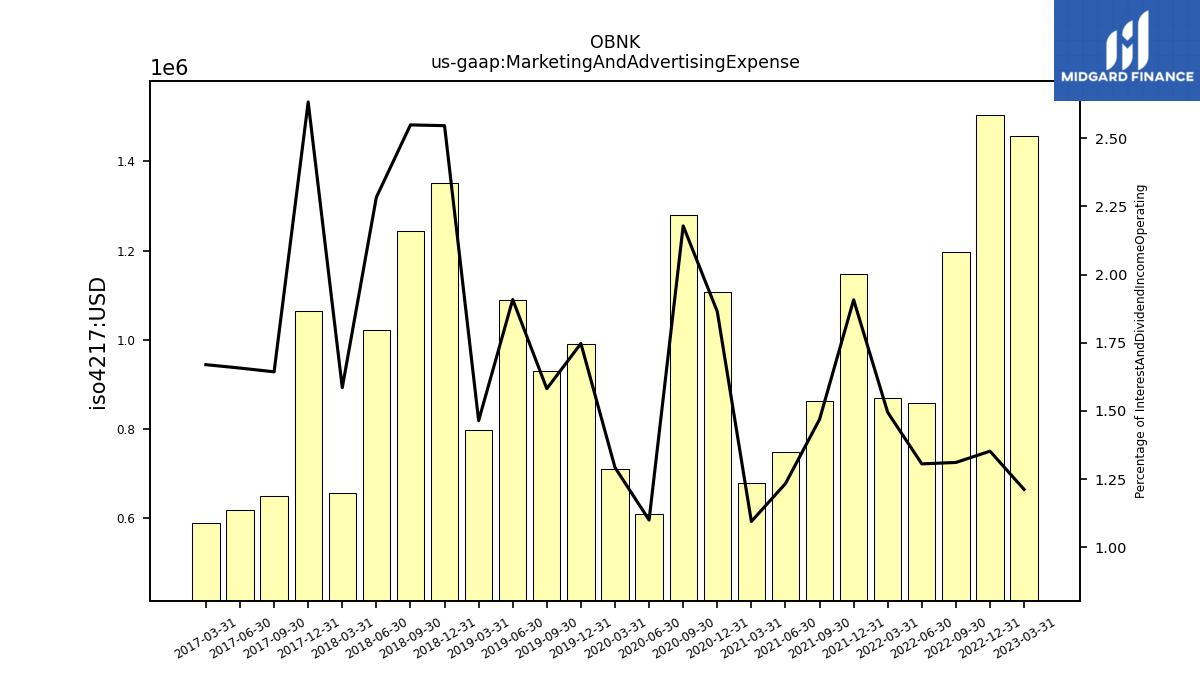
| Marketing And Advertising Expense | 1.46 | 1.50 | 1.20 | 0.86 | 0.87 | 1.15 | 0.86 | 0.75 | 0.68 | 1.11 | 1.28 | 0.61 | 0.71 | 0.99 | 0.93 | 1.09 | 0.80 | 1.35 | 1.25 | 1.02 | 0.66 | 1.06 | 0.65 | |
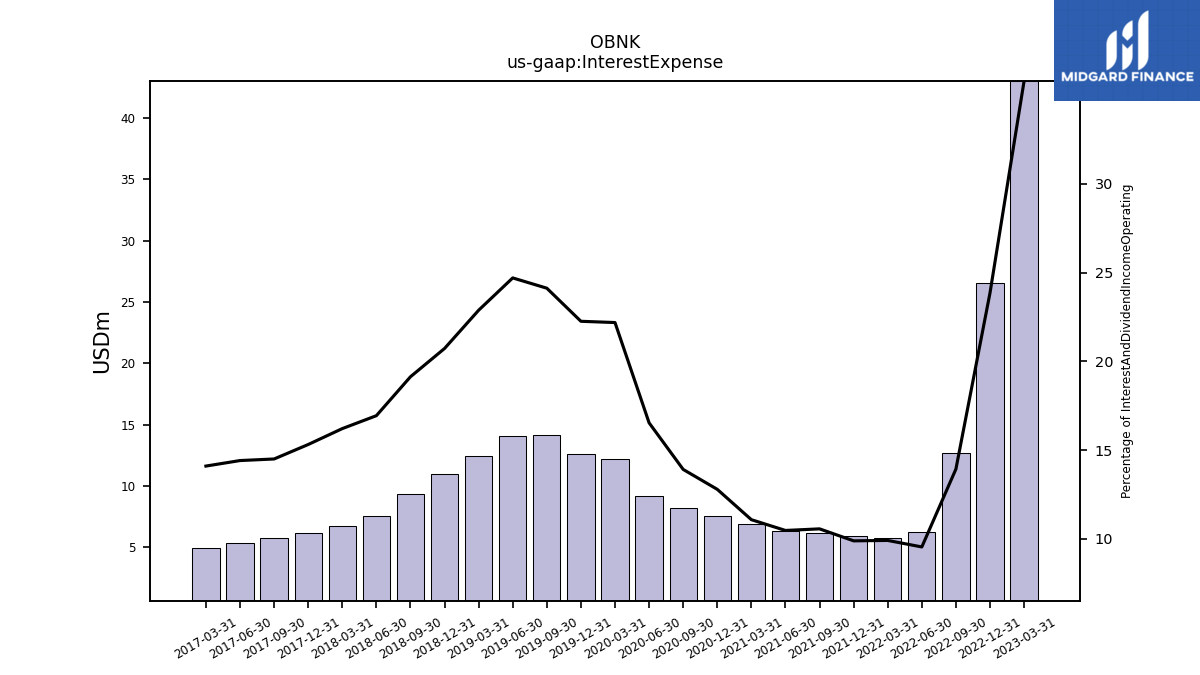
| Interest Expense | 42.99 | 26.55 | 12.71 | 6.28 | 5.78 | 5.95 | 6.21 | 6.36 | 6.89 | 7.60 | 8.18 | 9.17 | 12.21 | 12.62 | 14.18 | 14.09 | 12.47 | 11.00 | 9.35 | 7.58 | 6.72 | 6.19 | 5.75 | |
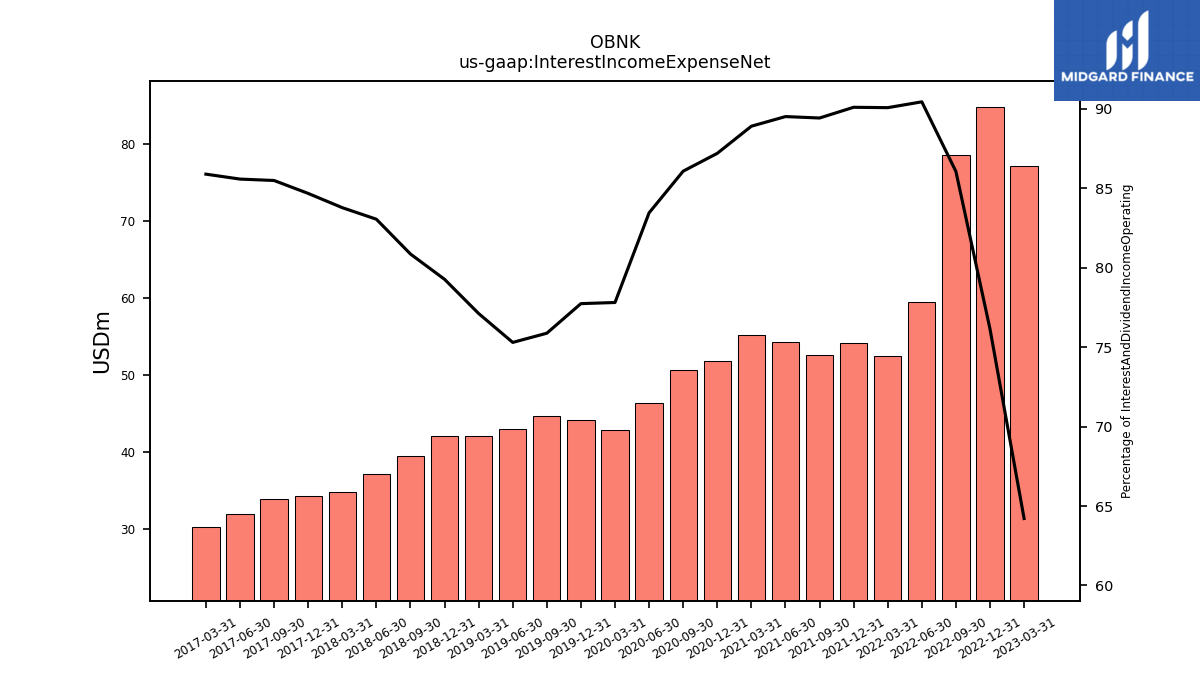
| Interest Income Expense Net | 77.15 | 84.75 | 78.52 | 59.50 | 52.50 | 54.18 | 52.54 | 54.29 | 55.24 | 51.82 | 50.62 | 46.29 | 42.81 | 44.09 | 44.62 | 42.97 | 42.03 | 42.06 | 39.50 | 37.17 | 34.72 | 34.22 | 33.87 | |
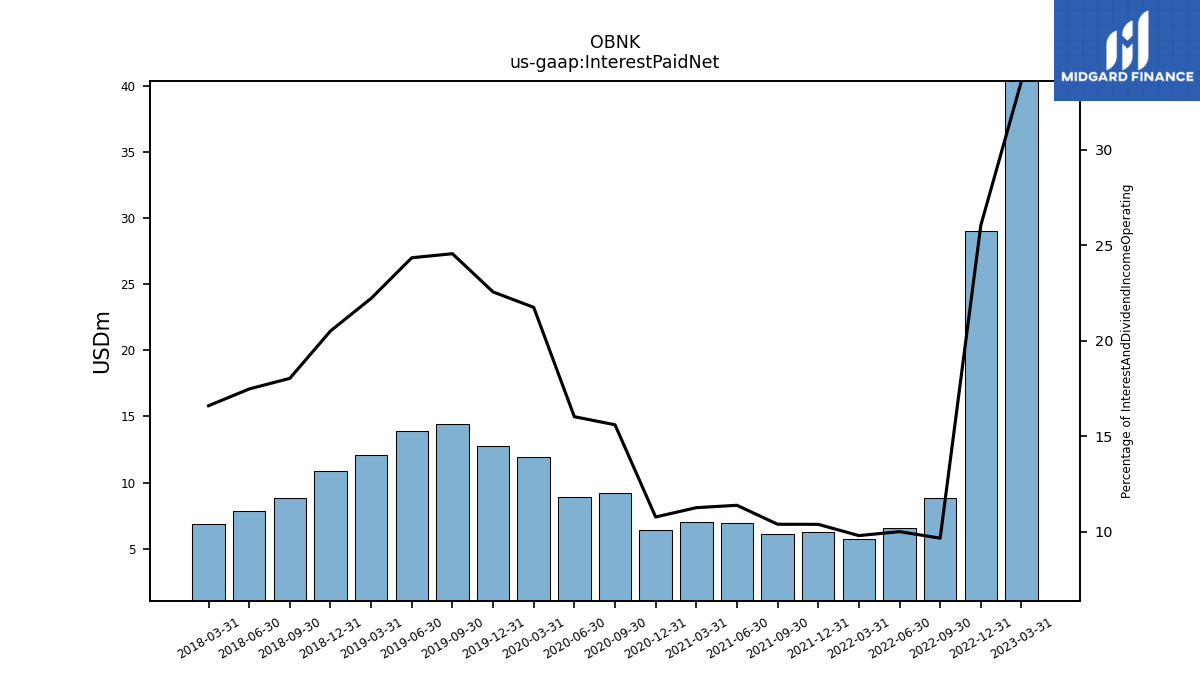
| Interest Paid Net | 40.36 | 28.98 | 8.82 | 6.59 | 5.71 | 6.25 | 6.11 | 6.91 | 7.00 | 6.40 | 9.18 | 8.89 | 11.96 | 12.79 | 14.44 | 13.89 | 12.11 | 10.88 | 8.81 | 7.82 | 6.88 | NA | NA | |
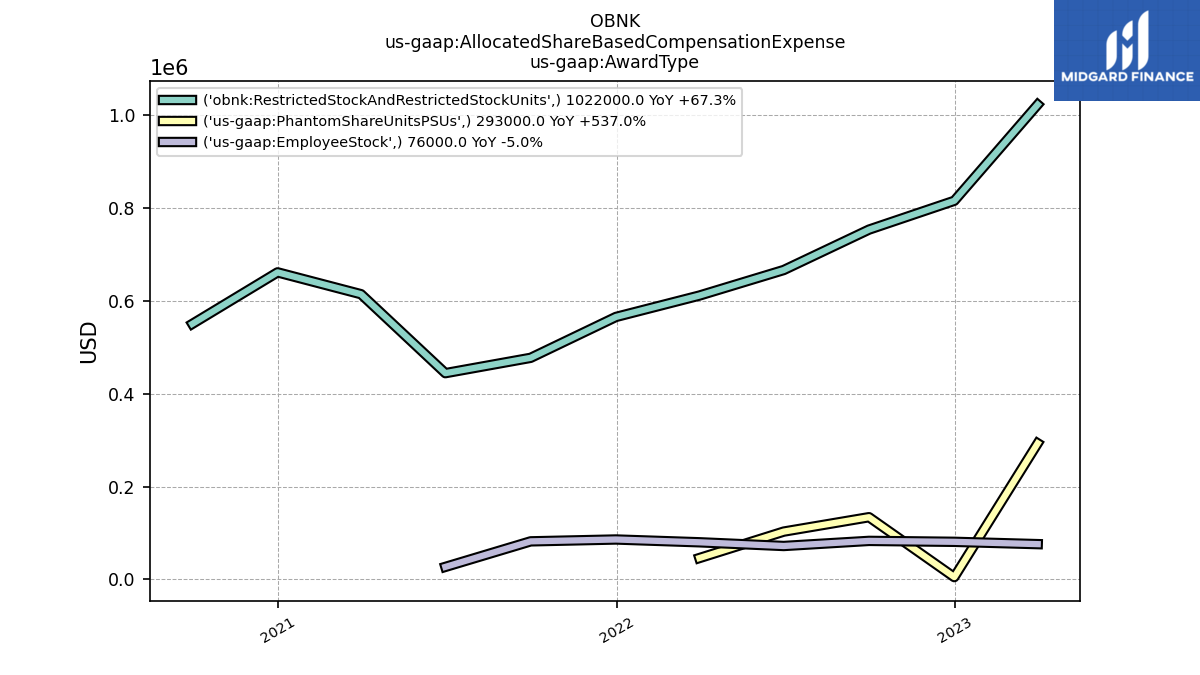
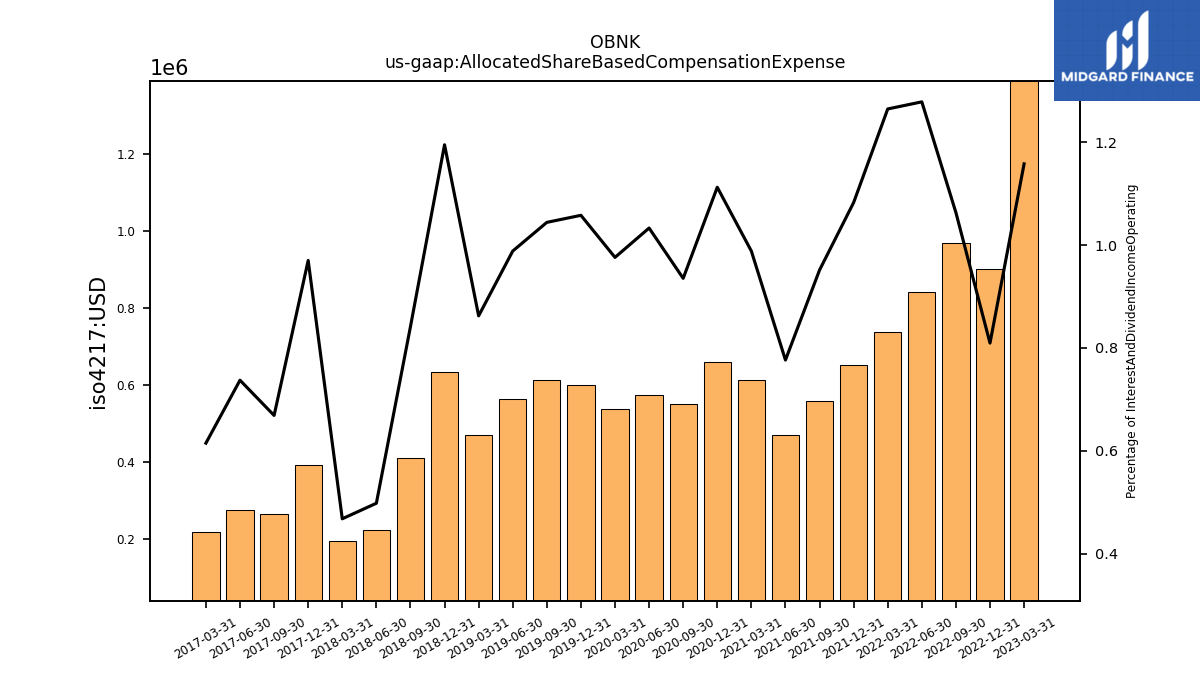
| Allocated Share Based Compensation Expense | 1.39 | 0.90 | 0.97 | 0.84 | 0.74 | 0.65 | 0.56 | 0.47 | 0.61 | 0.66 | 0.55 | 0.57 | 0.54 | 0.60 | 0.61 | 0.56 | 0.47 | 0.63 | 0.41 | 0.22 | 0.19 | 0.39 | 0.27 | |
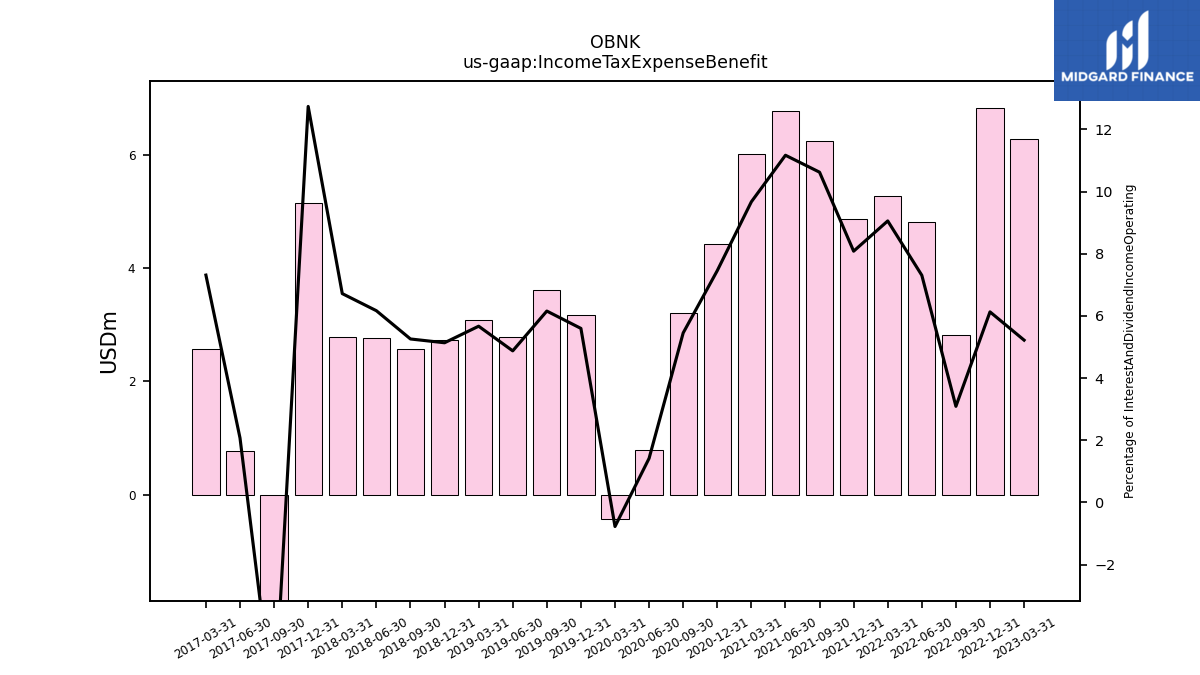
| Income Tax Expense Benefit | 6.27 | 6.82 | 2.82 | 4.81 | 5.28 | 4.86 | 6.24 | 6.77 | 6.01 | 4.43 | 3.21 | 0.79 | -0.43 | 3.17 | 3.62 | 2.78 | 3.09 | 2.73 | 2.57 | 2.76 | 2.78 | 5.15 | -2.69 | |
| Income Taxes Paid Net | 0.00 | NA | NA | NA | NA | NA | NA | NA | NA | NA | NA | NA | NA | NA | NA | NA | NA | NA | NA | NA | NA | NA | NA | |
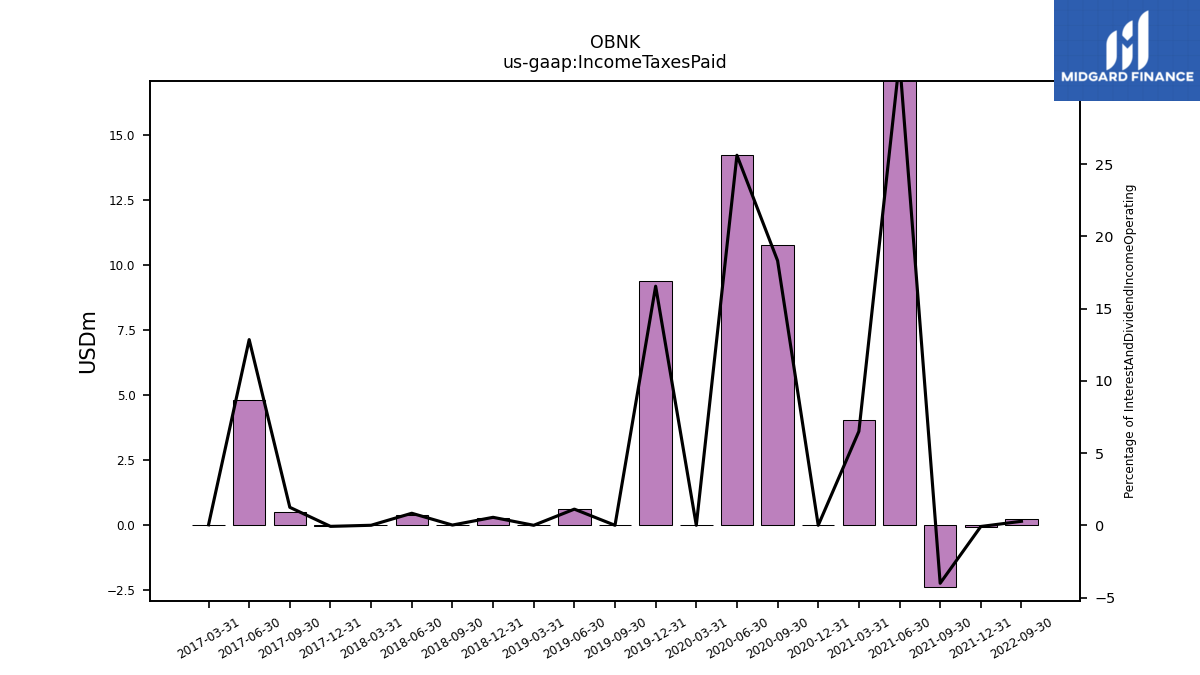
| Income Taxes Paid | NA | NA | 0.25 | NA | NA | -0.05 | -2.36 | 19.53 | 4.04 | 0.00 | 10.77 | 14.21 | 0.00 | 9.38 | 0.00 | 0.64 | 0.00 | 0.29 | 0.01 | 0.37 | 0.00 | -0.03 | 0.49 | |
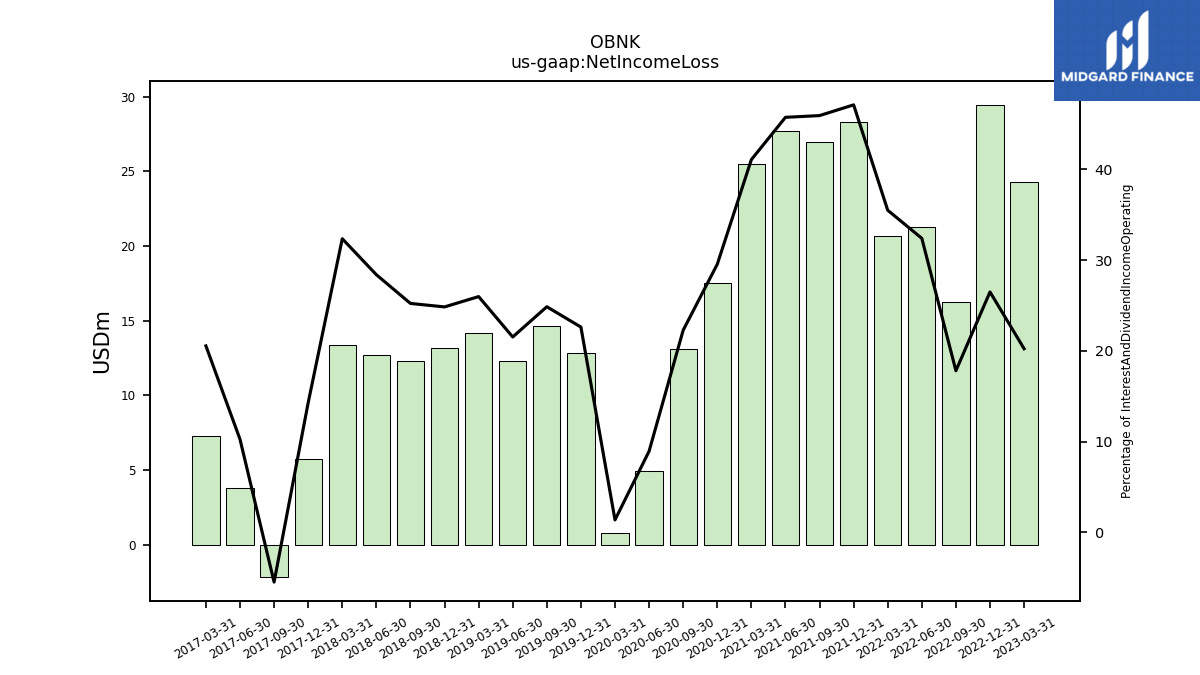
| Net Income Loss | 24.30 | 29.48 | 16.24 | 21.31 | 20.68 | 28.32 | 26.98 | 27.73 | 25.51 | 17.55 | 13.10 | 4.96 | 0.75 | 12.83 | 14.62 | 12.28 | 14.15 | 13.18 | 12.32 | 12.70 | 13.41 | 5.77 | -2.17 | |
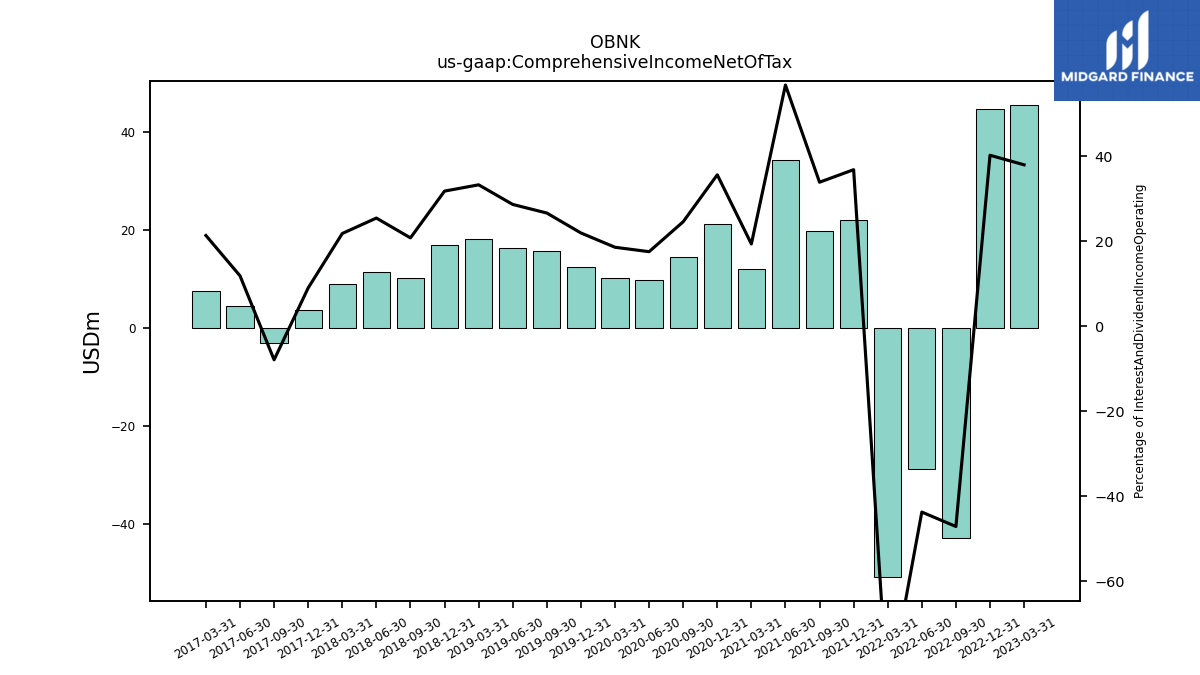
| Comprehensive Income Net Of Tax | 45.70 | 44.84 | -43.01 | -28.78 | -50.94 | 22.18 | 19.94 | 34.46 | 12.05 | 21.20 | 14.48 | 9.75 | 10.24 | 12.47 | 15.69 | 16.38 | 18.16 | 16.89 | 10.17 | 11.41 | 9.06 | 3.65 | -3.12 | |
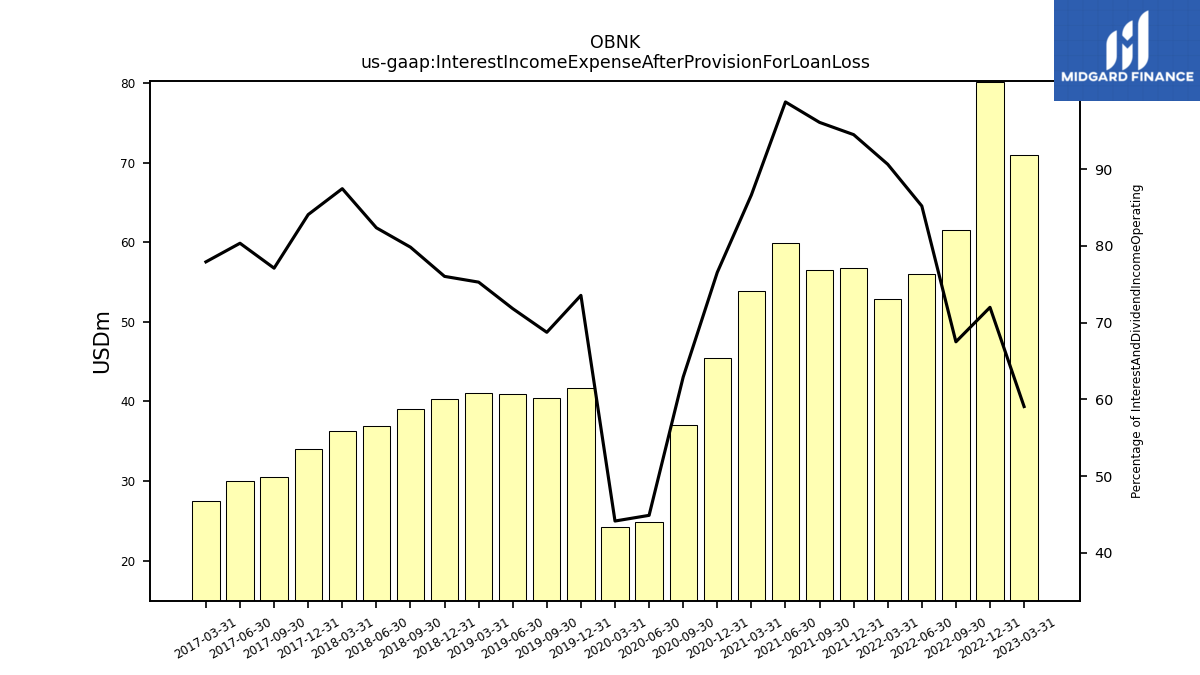
| Interest Income Expense After Provision For Loan Loss | 70.95 | 80.12 | 61.58 | 56.05 | 52.83 | 56.83 | 56.46 | 59.90 | 53.83 | 45.49 | 36.98 | 24.89 | 24.28 | 41.72 | 40.42 | 40.98 | 41.02 | 40.34 | 38.99 | 36.86 | 36.25 | 33.98 | 30.54 | |
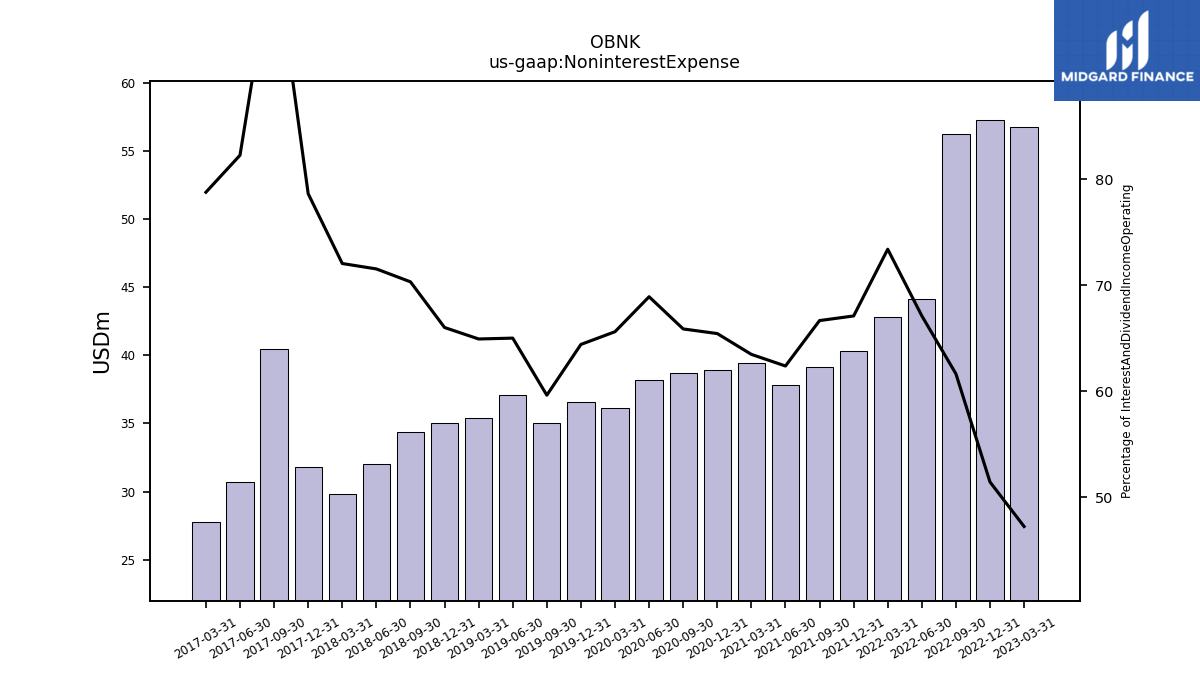
| Noninterest Expense | 56.76 | 57.25 | 56.24 | 44.15 | 42.77 | 40.35 | 39.16 | 37.83 | 39.44 | 38.88 | 38.73 | 38.22 | 36.10 | 36.53 | 35.06 | 37.09 | 35.38 | 35.02 | 34.34 | 32.01 | 29.86 | 31.77 | 40.44 | |
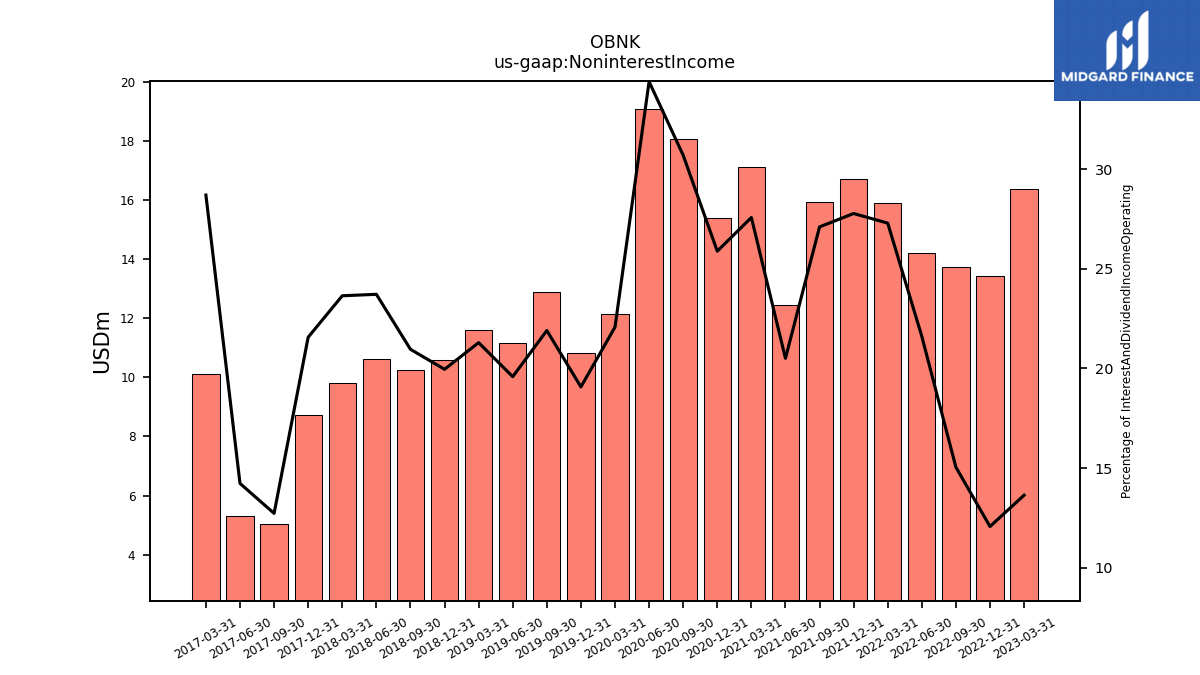
| Noninterest Income | 16.38 | 13.43 | 13.72 | 14.22 | 15.91 | 16.70 | 15.92 | 12.44 | 17.13 | 15.38 | 18.05 | 19.08 | 12.14 | 10.82 | 12.88 | 11.18 | 11.60 | 10.59 | 10.24 | 10.62 | 9.80 | 8.71 | 5.04 |
| 2023-03-31 | 2022-12-31 | 2022-09-30 | 2022-06-30 | 2022-03-31 | 2021-12-31 | 2021-09-30 | 2021-06-30 | 2021-03-31 | 2020-12-31 | 2020-09-30 | 2020-06-30 | 2020-03-31 | 2019-12-31 | 2019-09-30 | 2019-06-30 | 2019-03-31 | 2018-12-31 | 2018-09-30 | 2018-06-30 | 2018-03-31 | 2017-12-31 | 2017-09-30 | ||
|---|---|---|---|---|---|---|---|---|---|---|---|---|---|---|---|---|---|---|---|---|---|---|---|---|
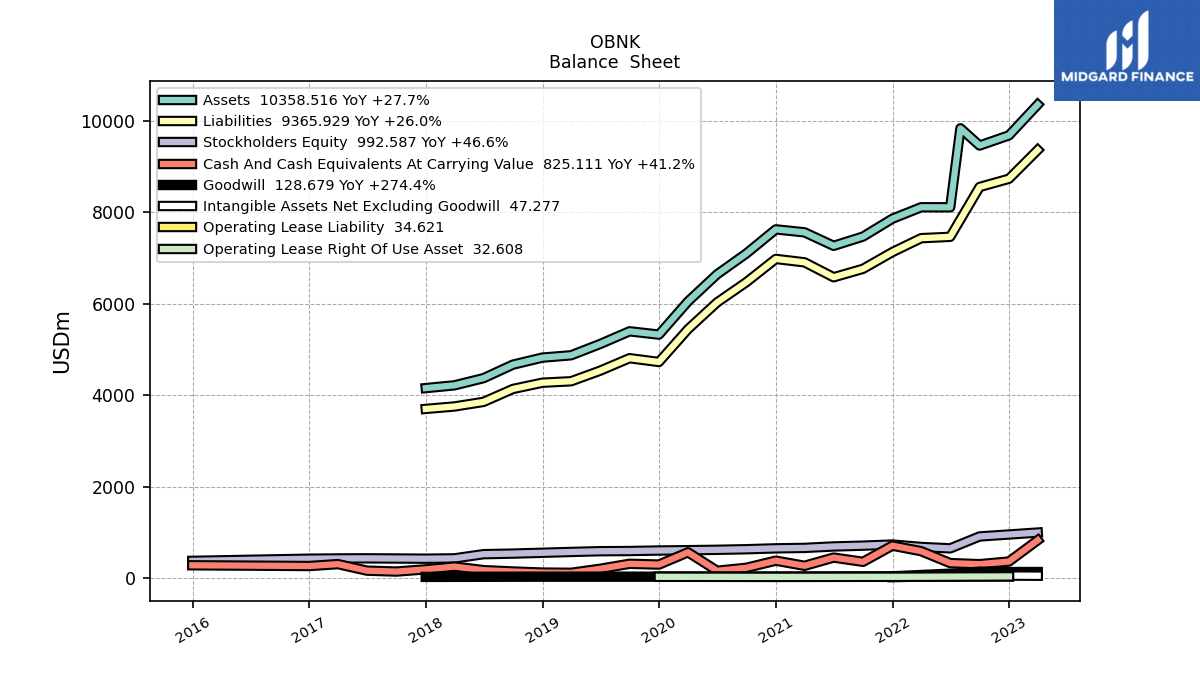
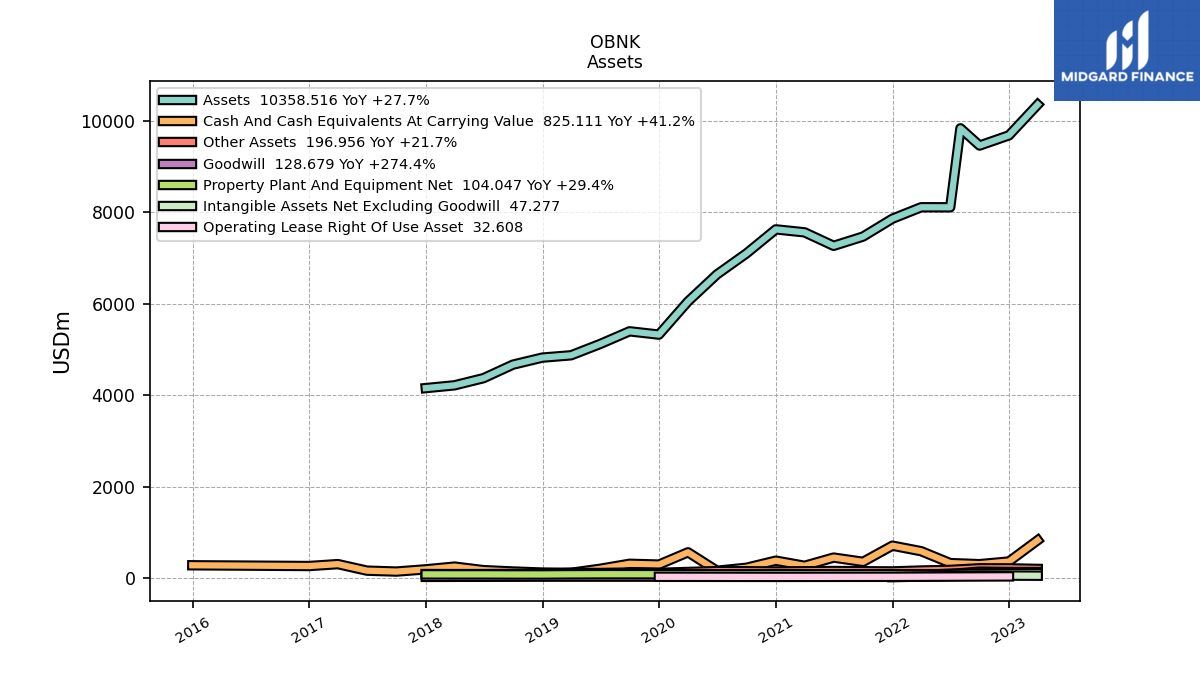
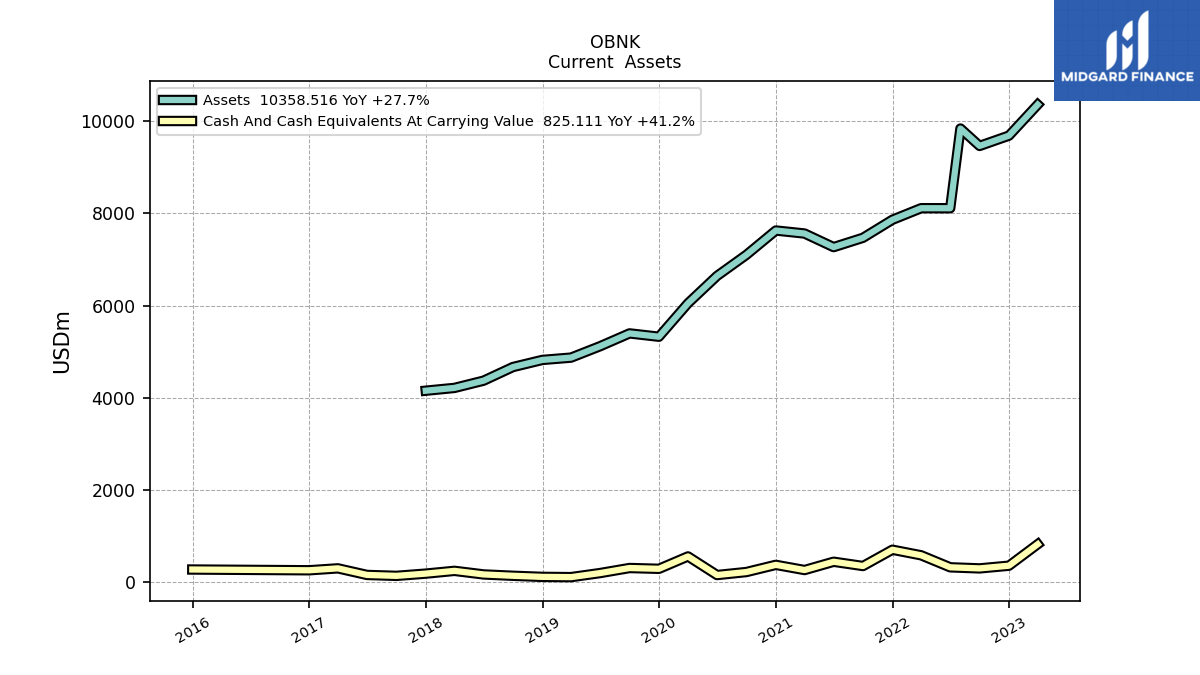
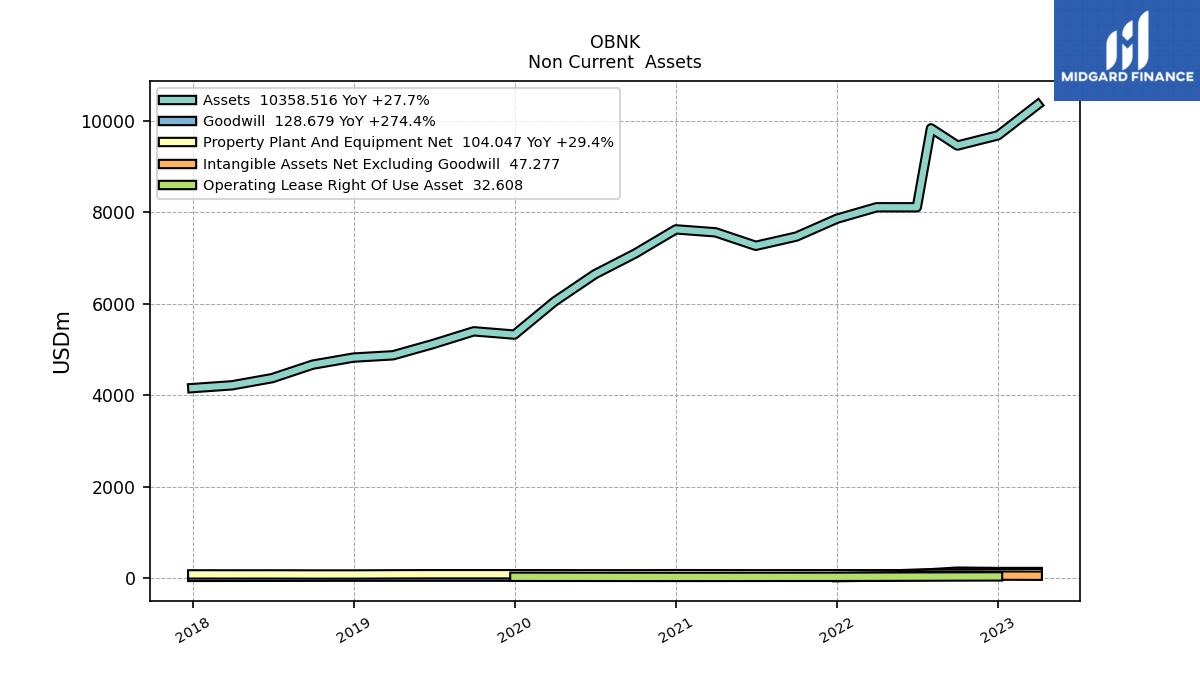
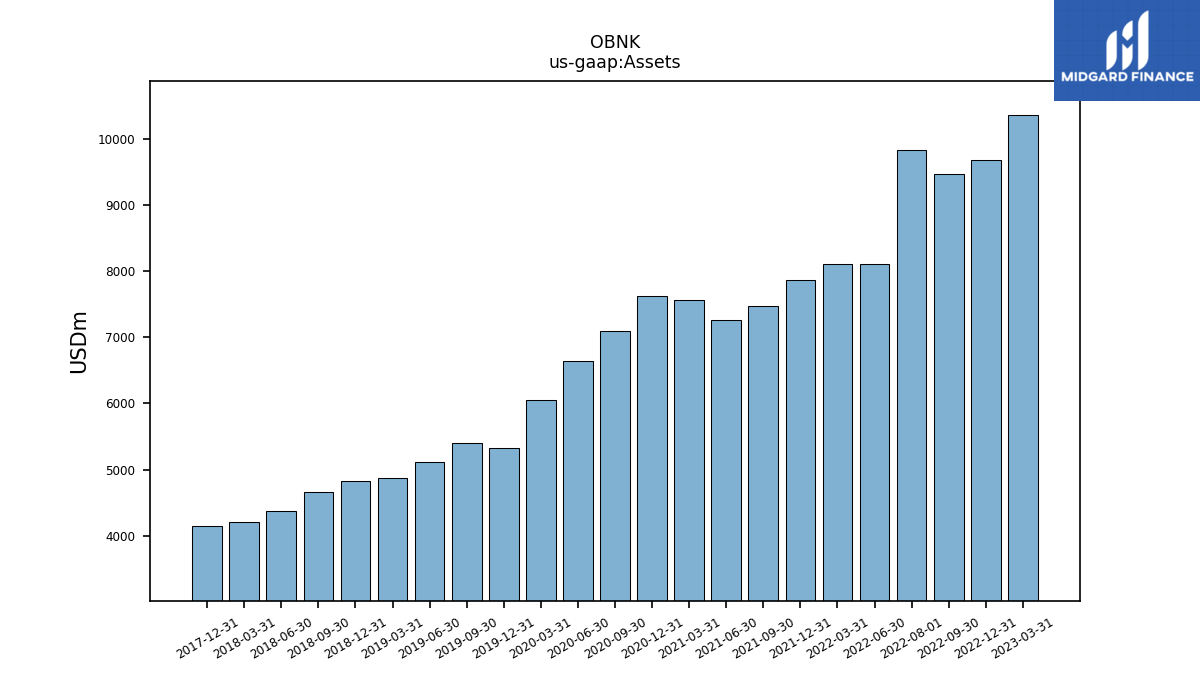
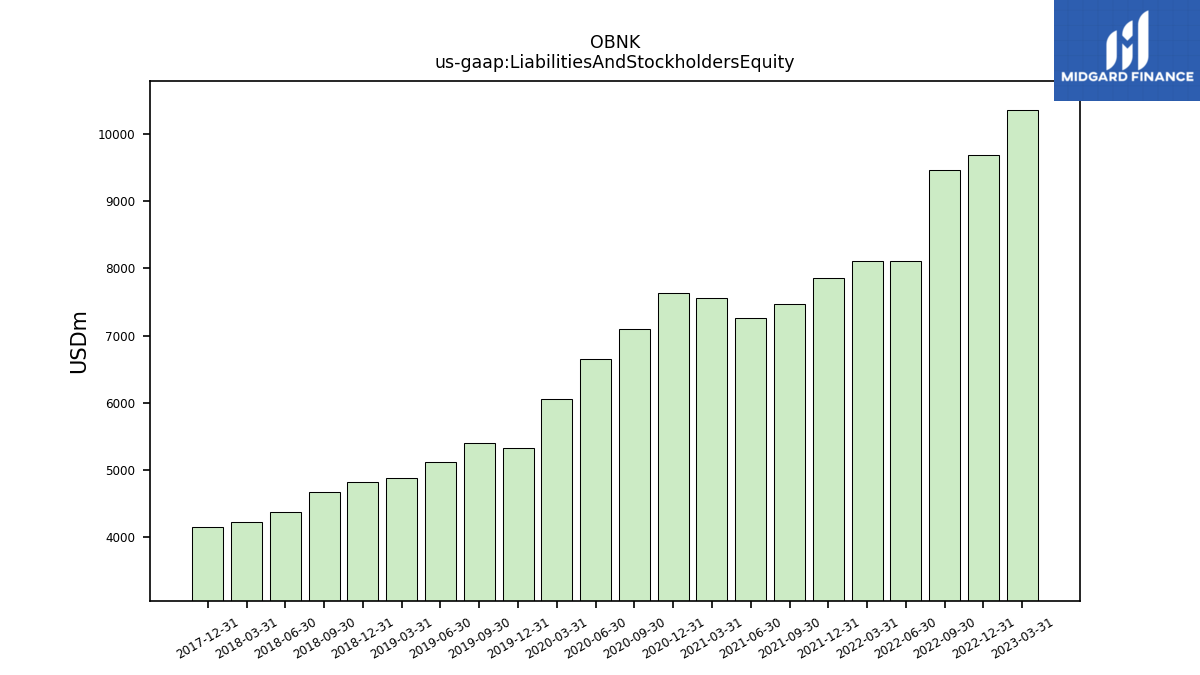
| Assets | 10358.52 | 9686.07 | 9462.64 | 8111.52 | 8112.30 | 7861.28 | 7470.48 | 7268.07 | 7563.18 | 7628.27 | 7101.34 | 6643.91 | 6049.64 | 5324.63 | 5396.93 | 5119.62 | 4872.20 | 4821.58 | 4667.56 | 4371.79 | 4214.90 | 4153.99 | NA | |
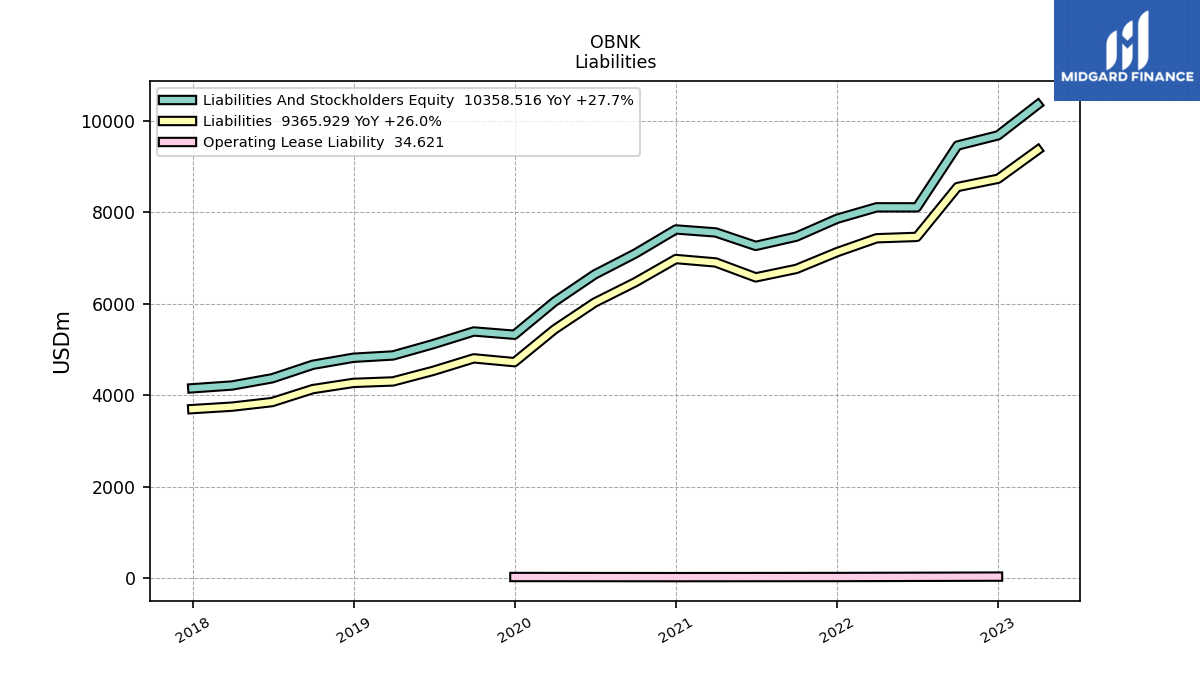
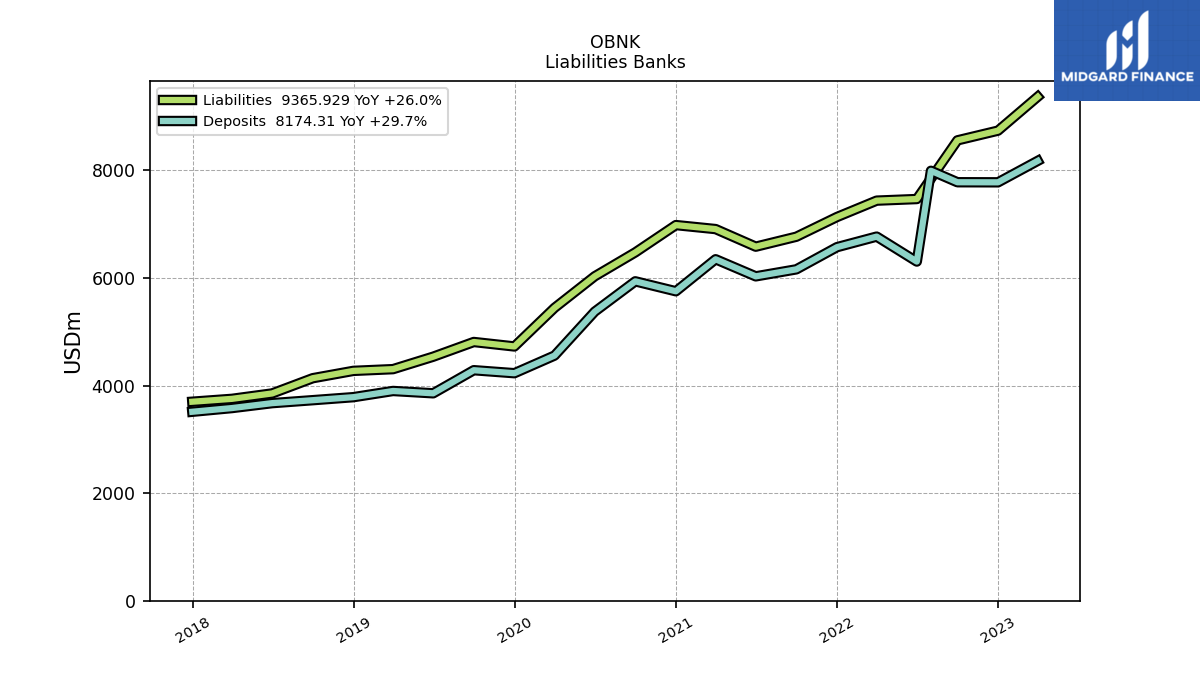
| Liabilities | 9365.93 | 8736.12 | 8555.61 | 7465.15 | 7435.43 | 7131.07 | 6764.81 | 6579.83 | 6906.82 | 6981.12 | 6473.70 | 6029.13 | 5443.01 | 4725.36 | 4808.56 | 4535.33 | 4304.08 | 4271.80 | 4135.65 | 3852.44 | 3752.07 | 3698.65 | NA | |
| Liabilities And Stockholders Equity | 10358.52 | 9686.07 | 9462.64 | 8111.52 | 8112.30 | 7861.28 | 7470.48 | 7268.07 | 7563.18 | 7628.27 | 7101.34 | 6643.91 | 6049.64 | 5324.63 | 5396.93 | 5119.62 | 4872.20 | 4821.58 | 4667.56 | 4371.79 | 4214.90 | 4153.99 | NA | |
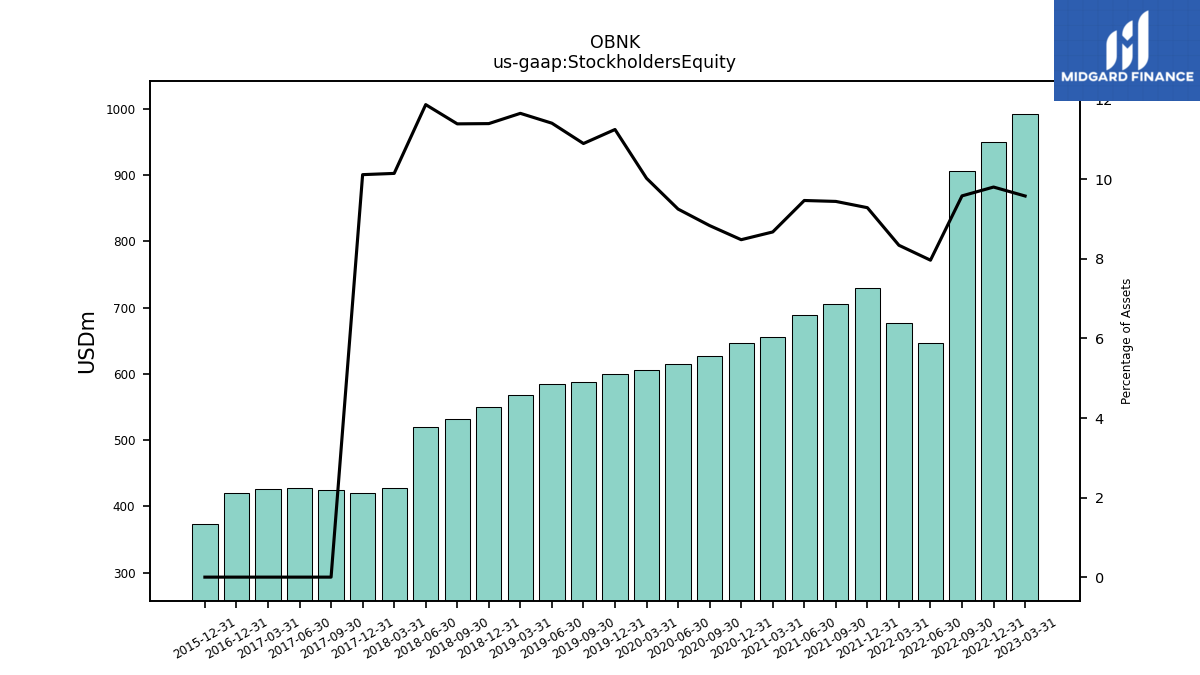
| Stockholders Equity | 992.59 | 949.94 | 907.02 | 646.37 | 676.87 | 730.21 | 705.67 | 688.24 | 656.36 | 647.15 | 627.64 | 614.78 | 606.63 | 599.26 | 588.36 | 584.29 | 568.12 | 549.78 | 531.92 | 519.36 | 427.83 | 420.35 | 424.51 |
| 2023-03-31 | 2022-12-31 | 2022-09-30 | 2022-06-30 | 2022-03-31 | 2021-12-31 | 2021-09-30 | 2021-06-30 | 2021-03-31 | 2020-12-31 | 2020-09-30 | 2020-06-30 | 2020-03-31 | 2019-12-31 | 2019-09-30 | 2019-06-30 | 2019-03-31 | 2018-12-31 | 2018-09-30 | 2018-06-30 | 2018-03-31 | 2017-12-31 | 2017-09-30 | ||
|---|---|---|---|---|---|---|---|---|---|---|---|---|---|---|---|---|---|---|---|---|---|---|---|---|
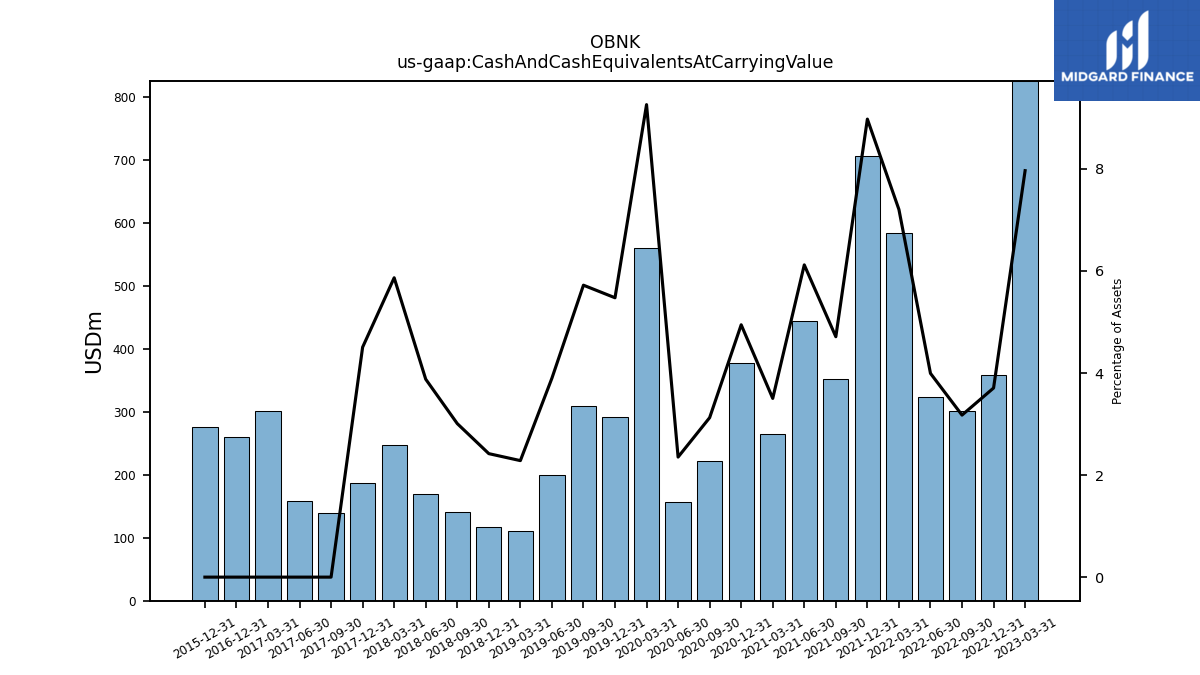
| Cash And Cash Equivalents At Carrying Value | 825.11 | 358.97 | 300.47 | 323.92 | 584.44 | 705.62 | 351.96 | 444.73 | 264.90 | 377.21 | 221.91 | 156.34 | 560.18 | 291.52 | 308.76 | 199.56 | 111.24 | 116.68 | 140.44 | 169.57 | 247.26 | 187.19 | 138.75 | |
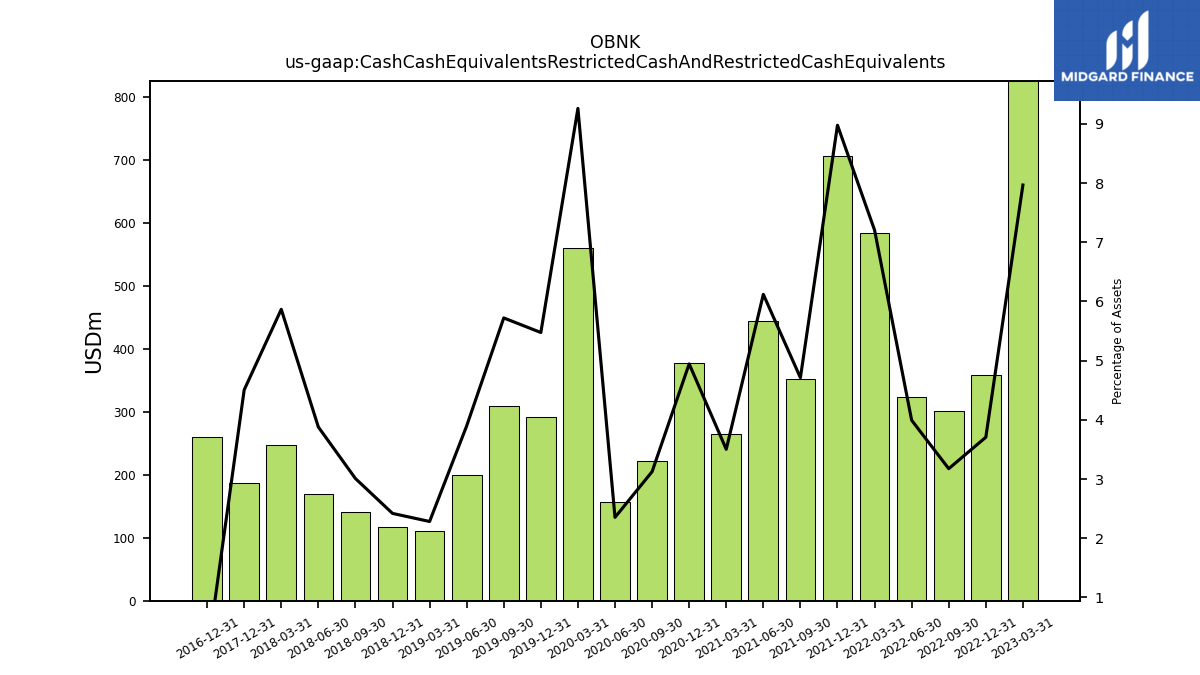
| Cash Cash Equivalents Restricted Cash And Restricted Cash Equivalents | 825.11 | 358.97 | 300.47 | 323.92 | 584.44 | 705.62 | 351.96 | 444.73 | 264.90 | 377.21 | 221.91 | 156.34 | 560.18 | 291.52 | 308.76 | 199.56 | 111.24 | 116.68 | 140.44 | 169.57 | 247.26 | 187.19 | NA |
| 2023-03-31 | 2022-12-31 | 2022-09-30 | 2022-06-30 | 2022-03-31 | 2021-12-31 | 2021-09-30 | 2021-06-30 | 2021-03-31 | 2020-12-31 | 2020-09-30 | 2020-06-30 | 2020-03-31 | 2019-12-31 | 2019-09-30 | 2019-06-30 | 2019-03-31 | 2018-12-31 | 2018-09-30 | 2018-06-30 | 2018-03-31 | 2017-12-31 | 2017-09-30 | ||
|---|---|---|---|---|---|---|---|---|---|---|---|---|---|---|---|---|---|---|---|---|---|---|---|---|
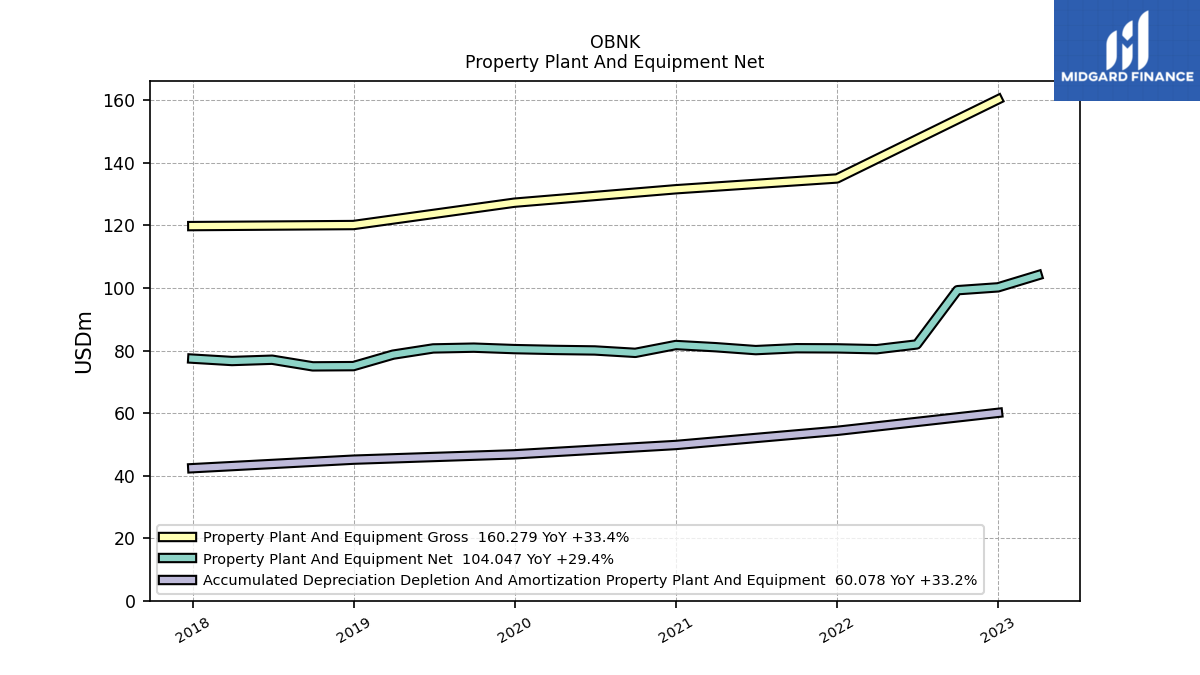
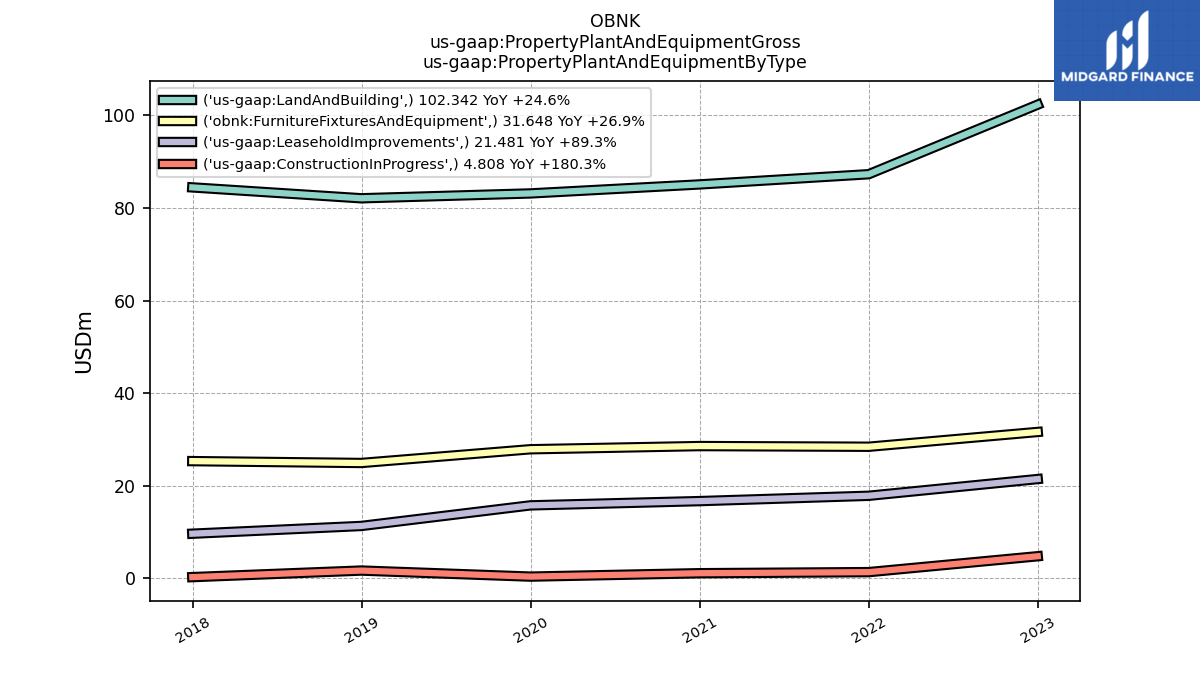
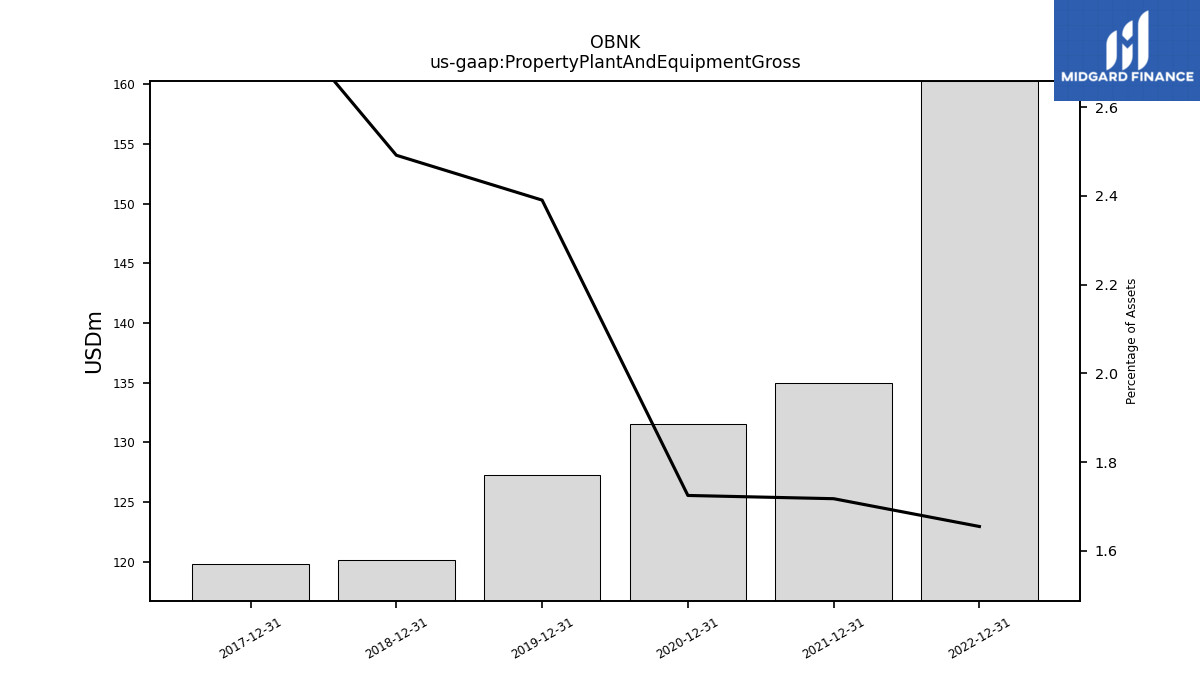
| Property Plant And Equipment Gross | NA | 160.28 | NA | NA | NA | 135.01 | NA | NA | NA | 131.56 | NA | NA | NA | 127.27 | NA | NA | NA | 120.12 | NA | NA | NA | 119.79 | NA | |
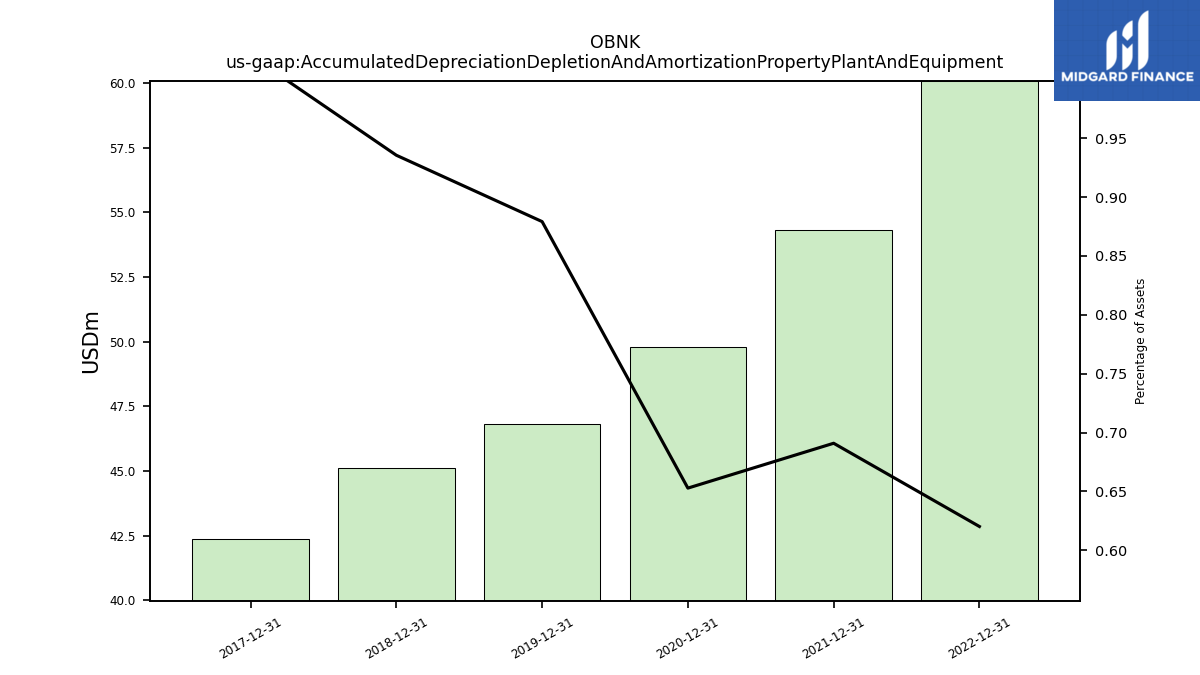
| Accumulated Depreciation Depletion And Amortization Property Plant And Equipment | NA | 60.08 | NA | NA | NA | 54.32 | NA | NA | NA | 49.80 | NA | NA | NA | 46.81 | NA | NA | NA | 45.11 | NA | NA | NA | 42.38 | NA | |
| Amortization Of Intangible Assets | 2.55 | 2.55 | 1.87 | 0.53 | 0.54 | 0.19 | 0.19 | 0.22 | 0.23 | 0.24 | 0.24 | 0.29 | 0.30 | 0.30 | 0.30 | 0.35 | 0.36 | 0.37 | 0.37 | NA | NA | NA | NA | |
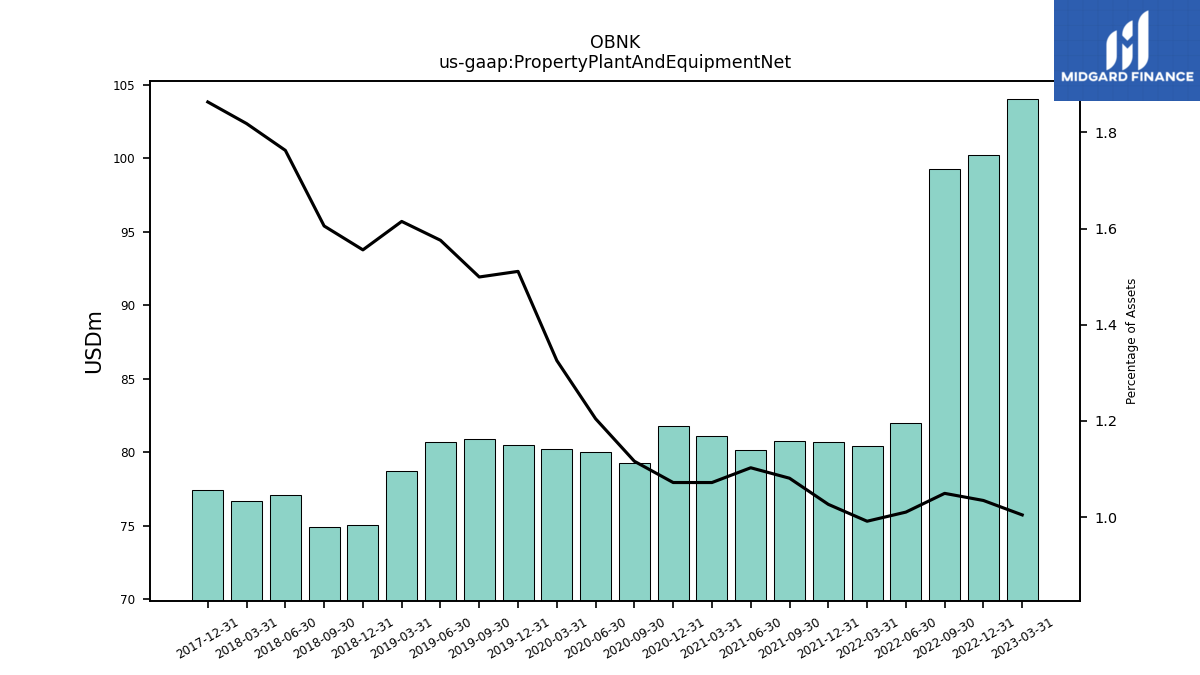
| Property Plant And Equipment Net | 104.05 | 100.20 | 99.29 | 81.95 | 80.42 | 80.69 | 80.74 | 80.13 | 81.06 | 81.76 | 79.25 | 80.03 | 80.19 | 80.46 | 80.92 | 80.67 | 78.68 | 75.01 | 74.94 | 77.06 | 76.65 | 77.41 | NA | |
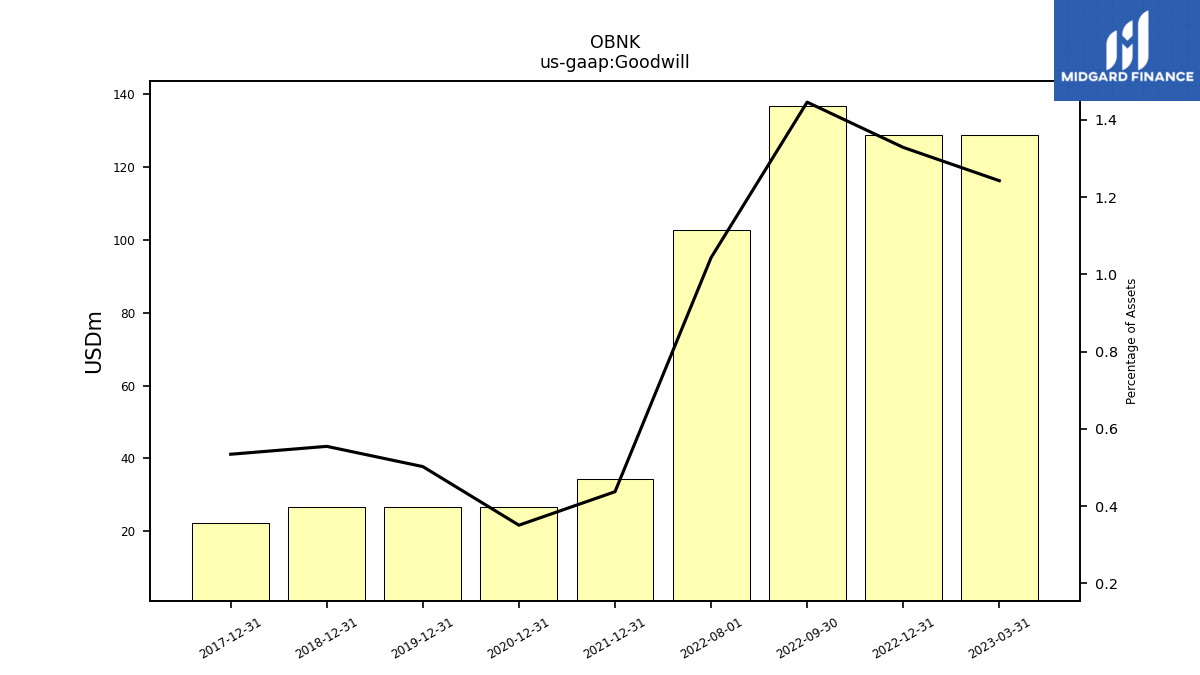
| Goodwill | 128.68 | 128.68 | 136.79 | NA | NA | 34.37 | NA | NA | NA | 26.74 | NA | NA | NA | 26.74 | NA | NA | NA | 26.74 | NA | NA | NA | 22.19 | NA | |
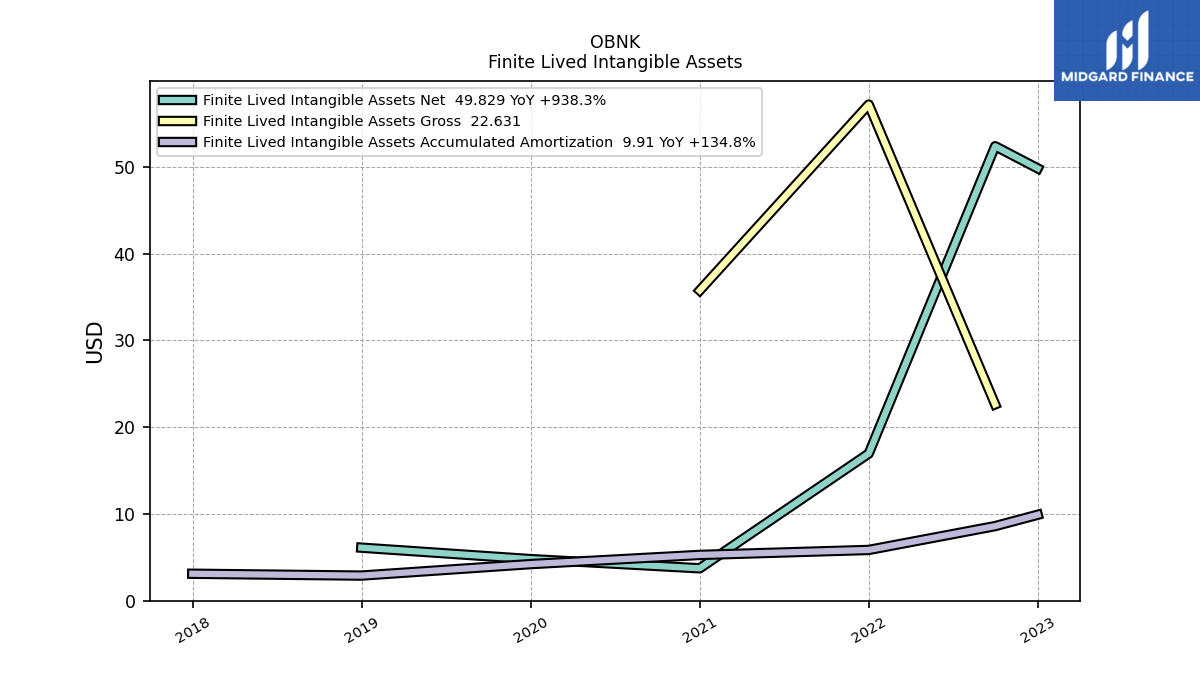
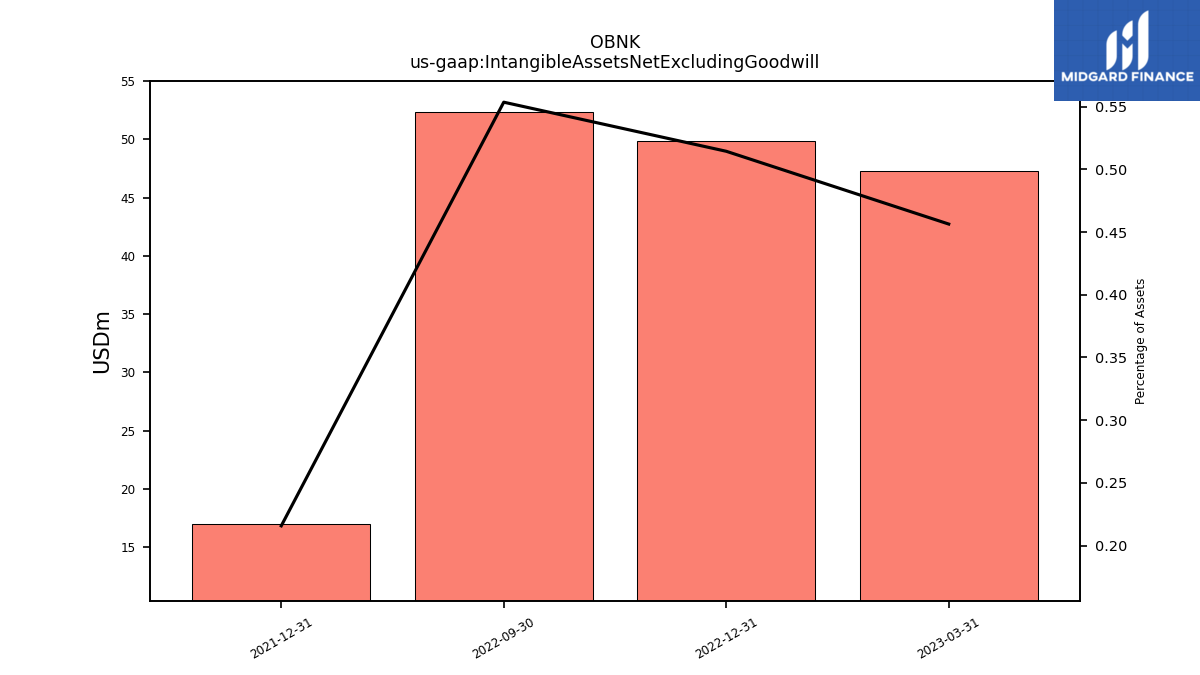
| Intangible Assets Net Excluding Goodwill | 47.28 | 49.83 | 52.38 | NA | NA | 16.96 | NA | NA | NA | NA | NA | NA | NA | NA | NA | NA | NA | NA | NA | NA | NA | NA | NA | |
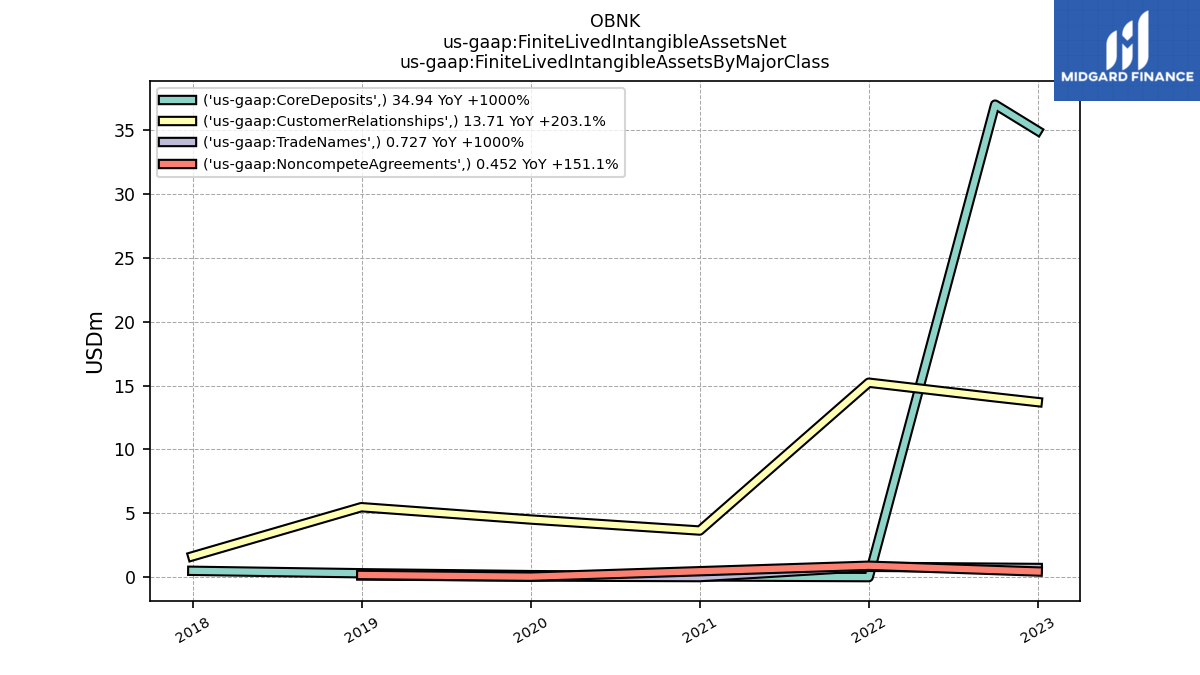
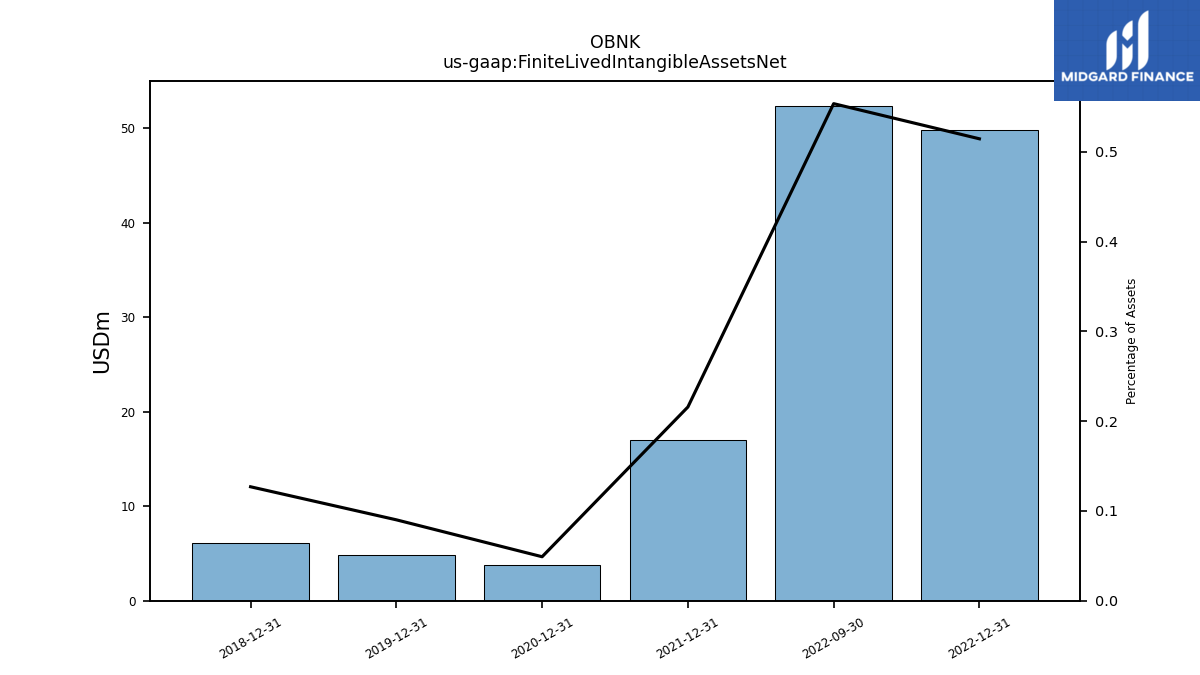
| Finite Lived Intangible Assets Net | NA | 49.83 | 52.38 | NA | NA | 16.96 | NA | NA | NA | 3.74 | NA | NA | NA | 4.80 | NA | NA | NA | 6.12 | NA | NA | NA | NA | NA | |
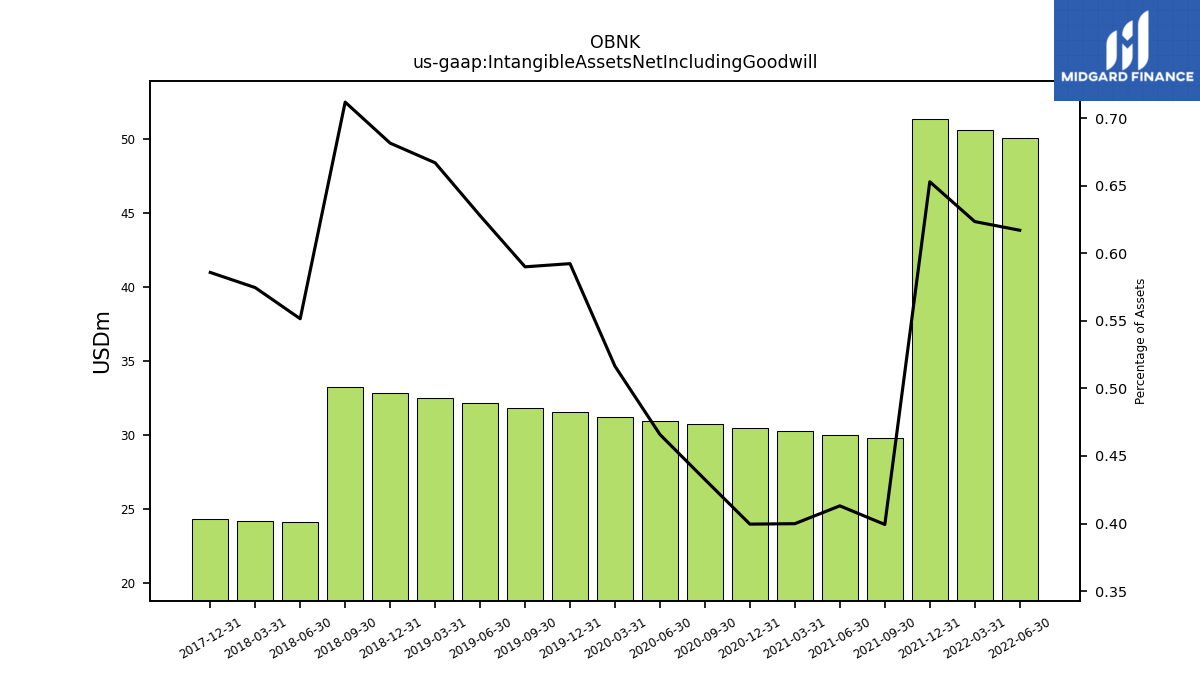
| Intangible Assets Net Including Goodwill | NA | NA | NA | 50.05 | 50.58 | 51.33 | 29.83 | 30.02 | 30.25 | 30.48 | 30.72 | 30.95 | 31.24 | 31.54 | 31.84 | 32.14 | 32.50 | 32.86 | 33.23 | 24.11 | 24.22 | 24.34 | NA | |
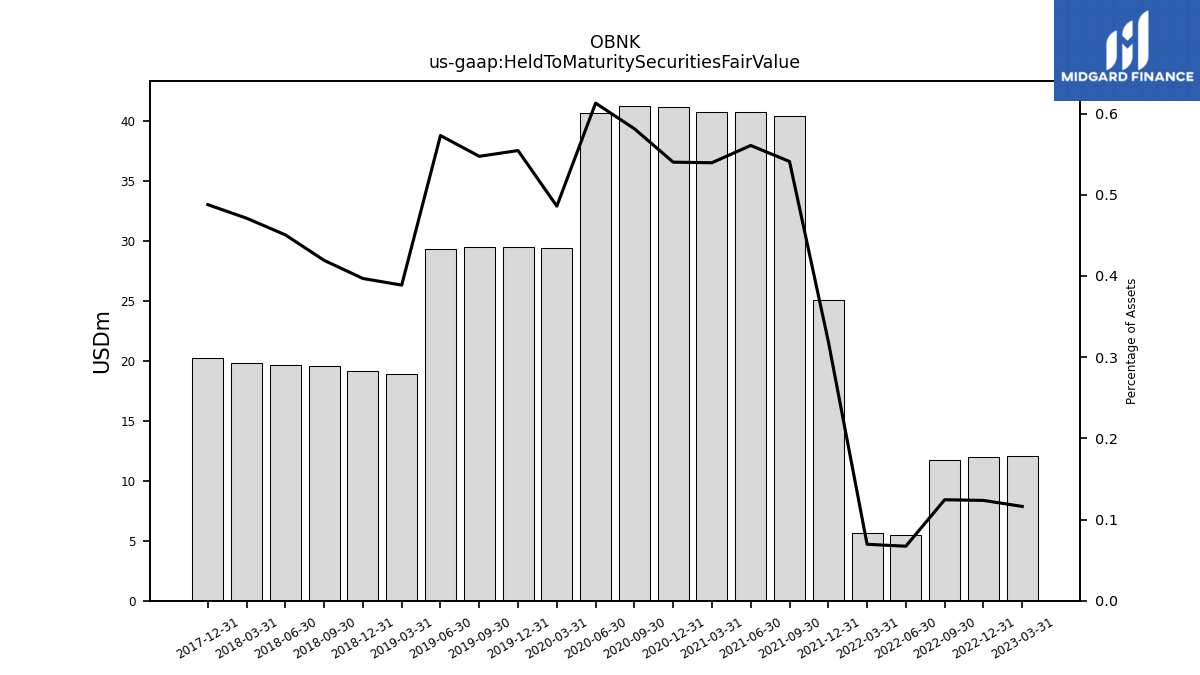
| Held To Maturity Securities Fair Value | 12.03 | 11.97 | 11.77 | 5.45 | 5.64 | 25.12 | 40.41 | 40.75 | 40.80 | 41.20 | 41.28 | 40.72 | 29.40 | 29.52 | 29.54 | 29.33 | 18.94 | 19.14 | 19.57 | 19.70 | 19.86 | 20.27 | NA | |
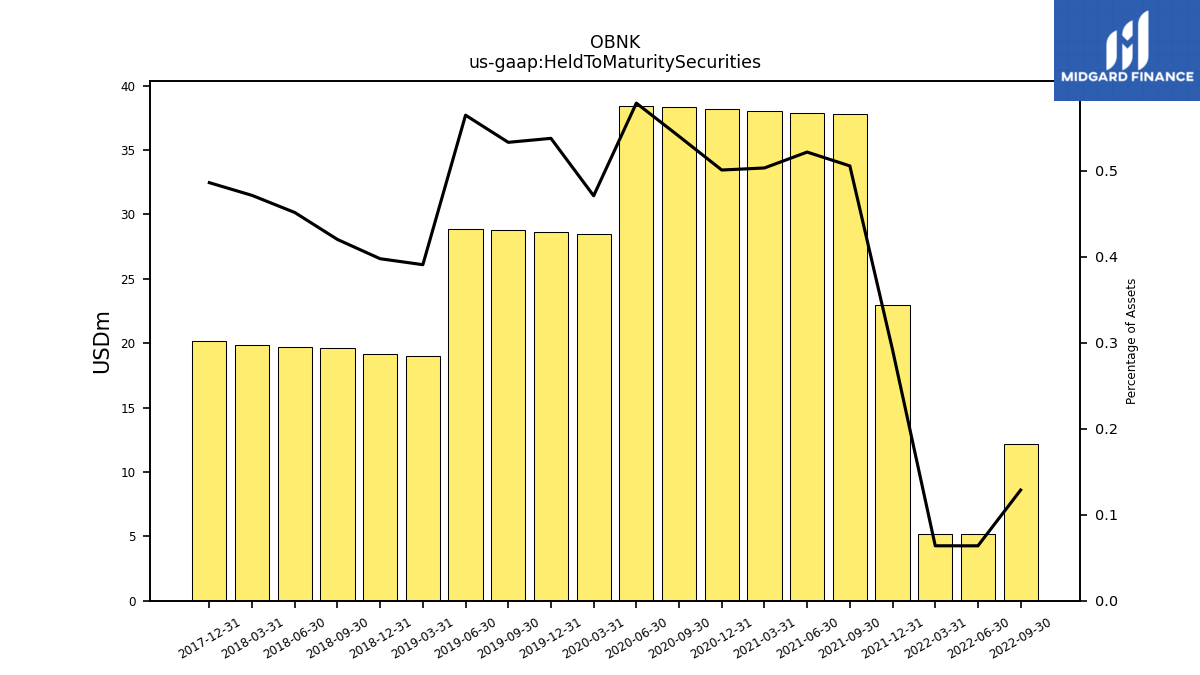
| Held To Maturity Securities | NA | NA | 12.18 | 5.18 | 5.18 | 22.93 | 37.76 | 37.91 | 38.05 | 38.19 | 38.34 | 38.43 | 28.48 | 28.62 | 28.76 | 28.90 | 19.03 | 19.17 | 19.60 | 19.73 | 19.86 | 20.19 | NA | |
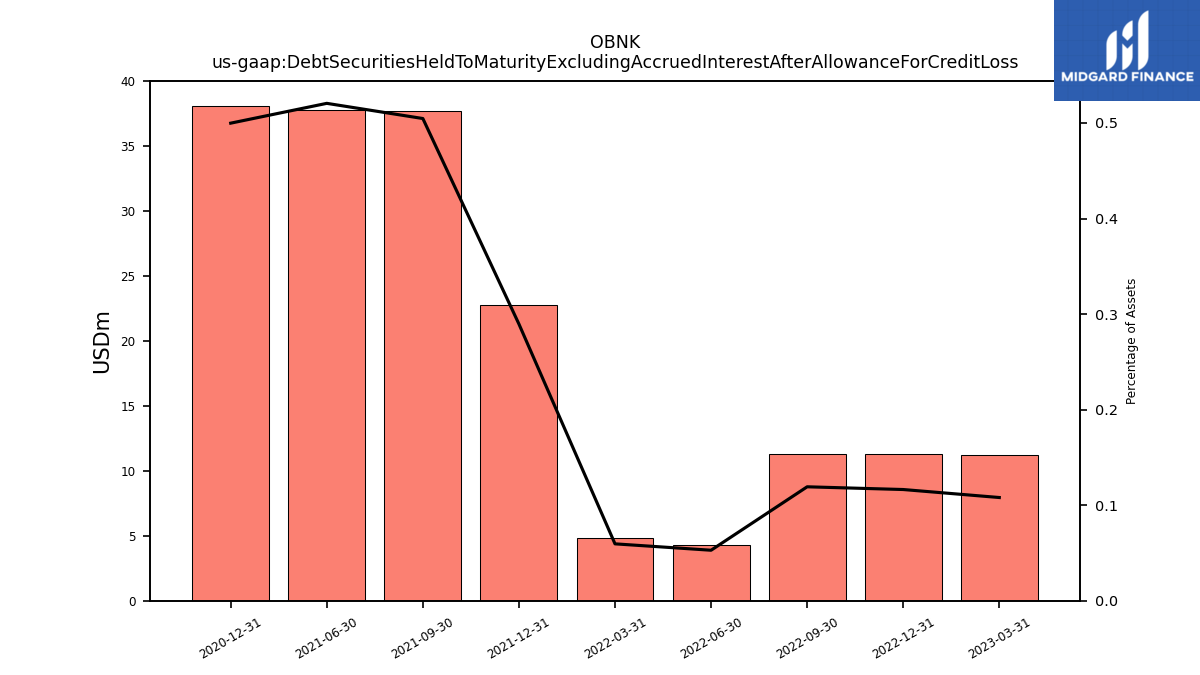
| Debt Securities Held To Maturity Excluding Accrued Interest After Allowance For Credit Loss | 11.19 | 11.28 | 11.29 | 4.29 | 4.83 | 22.77 | 37.70 | 37.84 | NA | 38.13 | NA | NA | NA | NA | NA | NA | NA | NA | NA | NA | NA | NA | NA | |
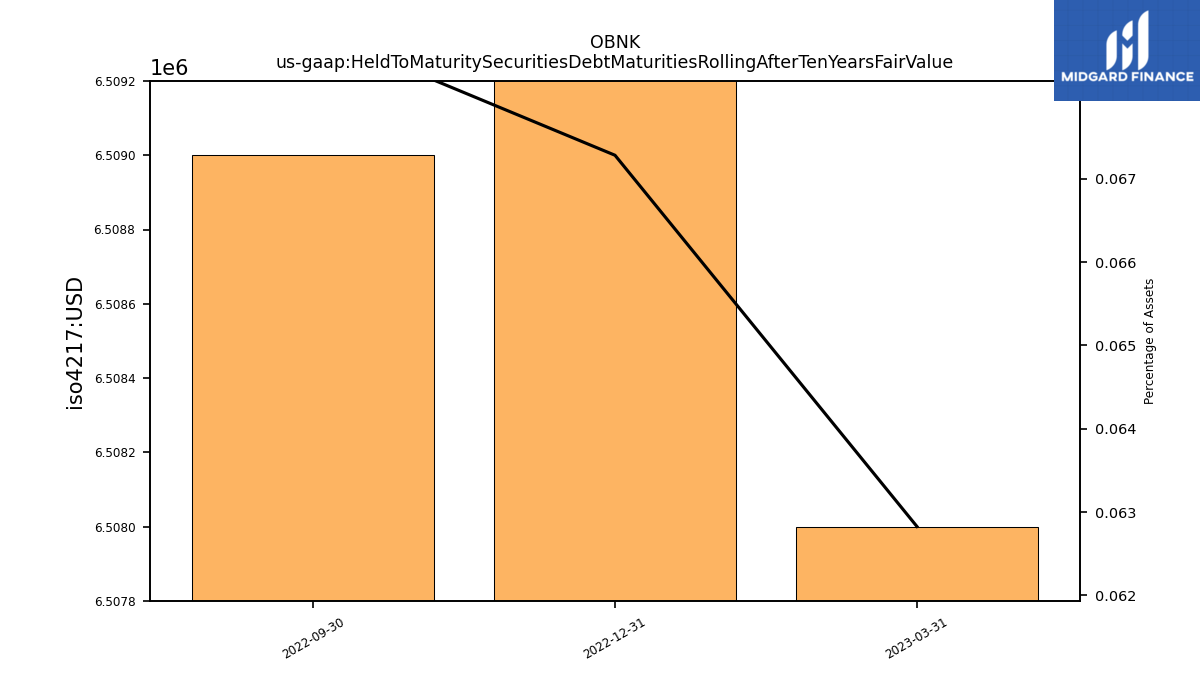
| Held To Maturity Securities Debt Maturities Rolling After Ten Years Fair Value | 6.51 | 6.52 | 6.51 | NA | NA | NA | NA | NA | NA | NA | NA | NA | NA | NA | NA | NA | NA | NA | NA | NA | NA | NA | NA | |
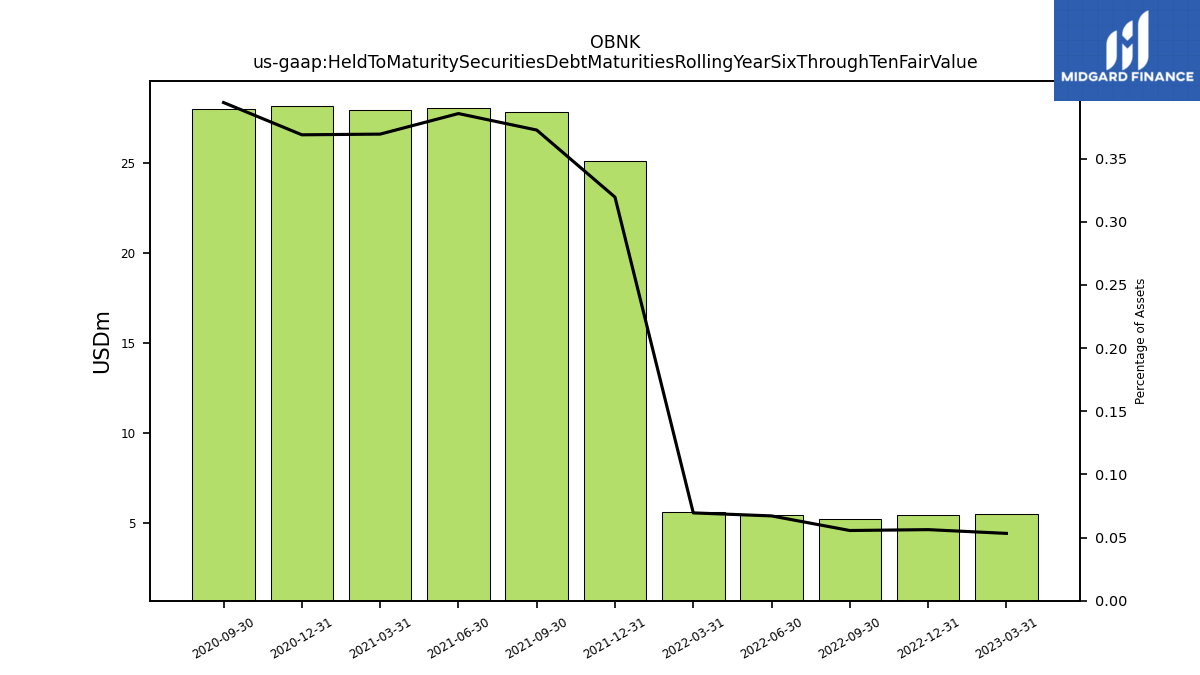
| Held To Maturity Securities Debt Maturities Rolling Year Six Through Ten Fair Value | 5.52 | 5.45 | 5.26 | 5.45 | 5.64 | 25.12 | 27.84 | 28.03 | 27.94 | 28.14 | 28.01 | NA | NA | NA | NA | NA | NA | NA | NA | NA | NA | NA | NA |
| 2023-03-31 | 2022-12-31 | 2022-09-30 | 2022-06-30 | 2022-03-31 | 2021-12-31 | 2021-09-30 | 2021-06-30 | 2021-03-31 | 2020-12-31 | 2020-09-30 | 2020-06-30 | 2020-03-31 | 2019-12-31 | 2019-09-30 | 2019-06-30 | 2019-03-31 | 2018-12-31 | 2018-09-30 | 2018-06-30 | 2018-03-31 | 2017-12-31 | 2017-09-30 | ||
|---|---|---|---|---|---|---|---|---|---|---|---|---|---|---|---|---|---|---|---|---|---|---|---|---|
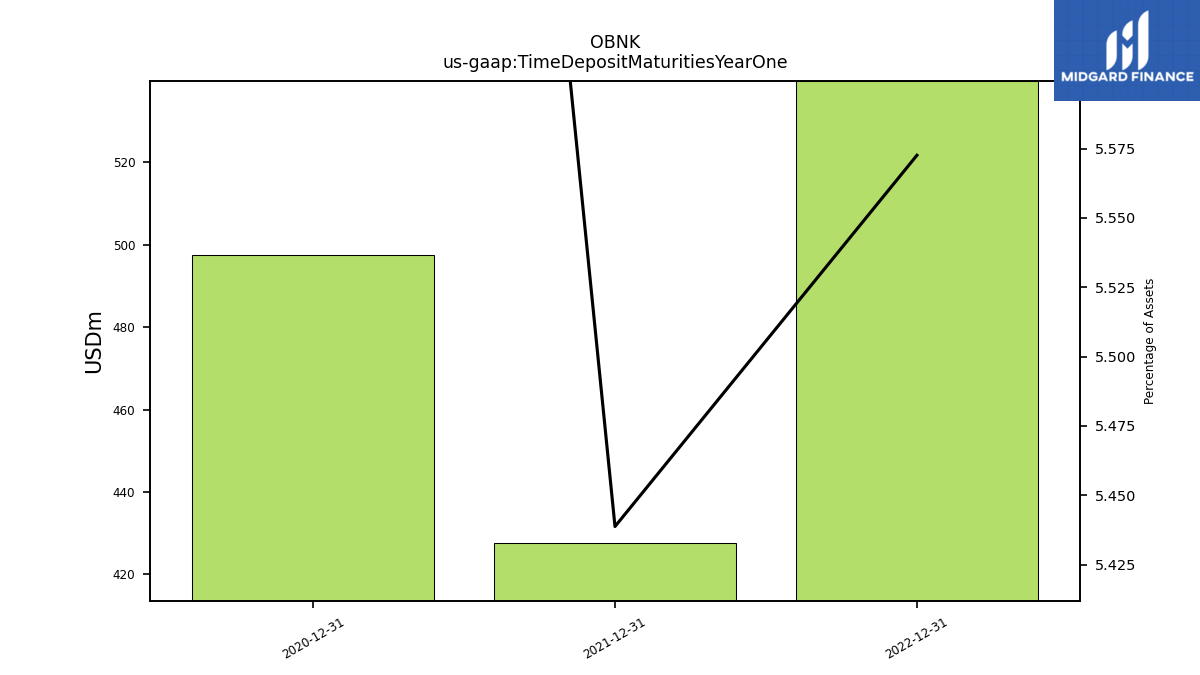
| Time Deposit Maturities Year One | NA | 539.76 | NA | NA | NA | 427.56 | NA | NA | NA | 497.52 | NA | NA | NA | NA | NA | NA | NA | NA | NA | NA | NA | NA | NA |
| 2023-03-31 | 2022-12-31 | 2022-09-30 | 2022-06-30 | 2022-03-31 | 2021-12-31 | 2021-09-30 | 2021-06-30 | 2021-03-31 | 2020-12-31 | 2020-09-30 | 2020-06-30 | 2020-03-31 | 2019-12-31 | 2019-09-30 | 2019-06-30 | 2019-03-31 | 2018-12-31 | 2018-09-30 | 2018-06-30 | 2018-03-31 | 2017-12-31 | 2017-09-30 | ||
|---|---|---|---|---|---|---|---|---|---|---|---|---|---|---|---|---|---|---|---|---|---|---|---|---|
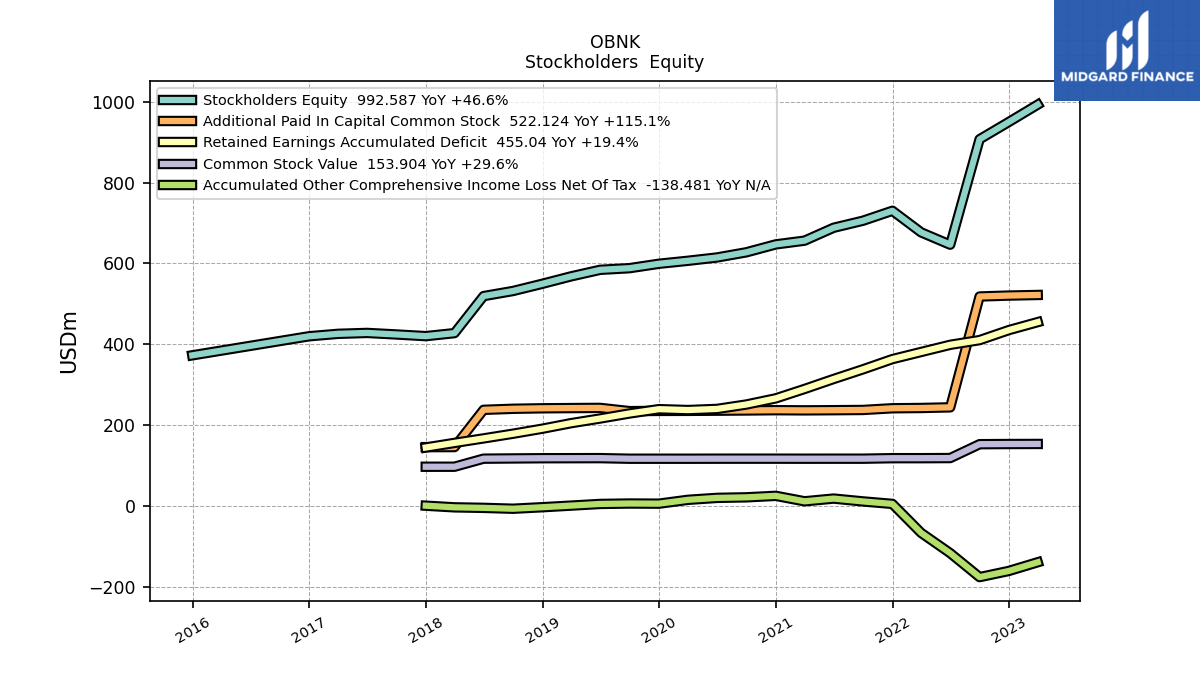
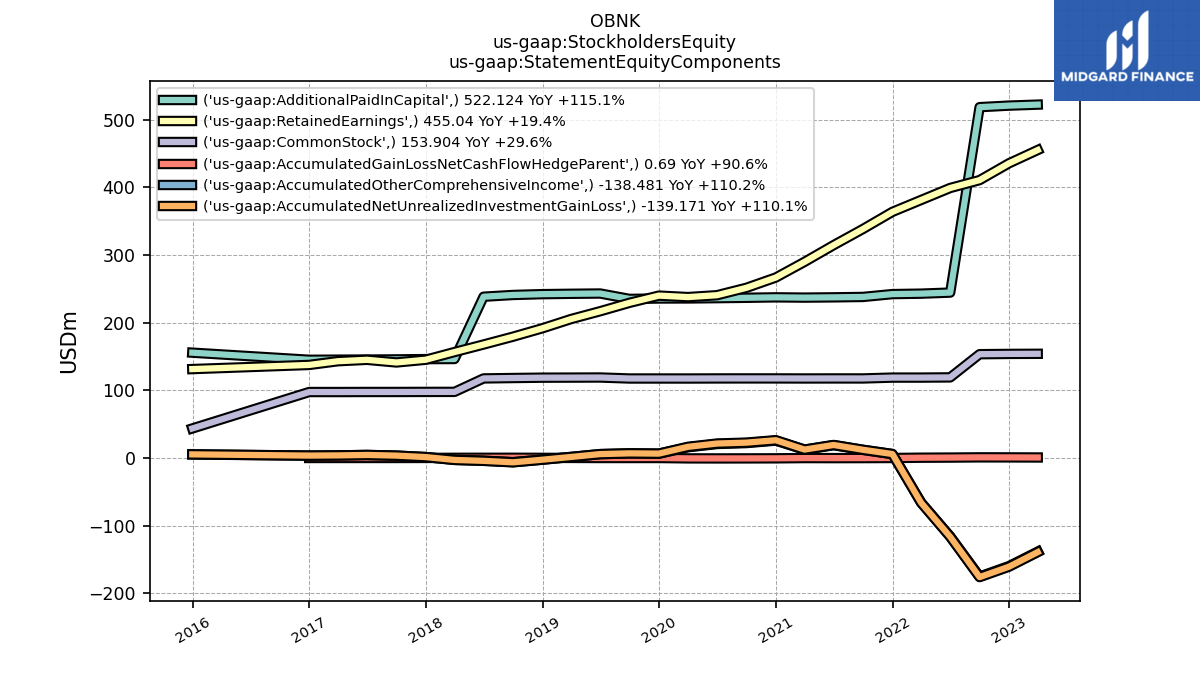
| Stockholders Equity | 992.59 | 949.94 | 907.02 | 646.37 | 676.87 | 730.21 | 705.67 | 688.24 | 656.36 | 647.15 | 627.64 | 614.78 | 606.63 | 599.26 | 588.36 | 584.29 | 568.12 | 549.78 | 531.92 | 519.36 | 427.83 | 420.35 | 424.51 | |
| Common Stock Value | 153.90 | 153.73 | 153.31 | 119.04 | 118.74 | 118.73 | 117.48 | 117.51 | 117.44 | 117.53 | 117.53 | 117.51 | 117.38 | 117.41 | 117.41 | 118.87 | 118.73 | 118.63 | 118.11 | 117.52 | 97.63 | 97.59 | NA | |
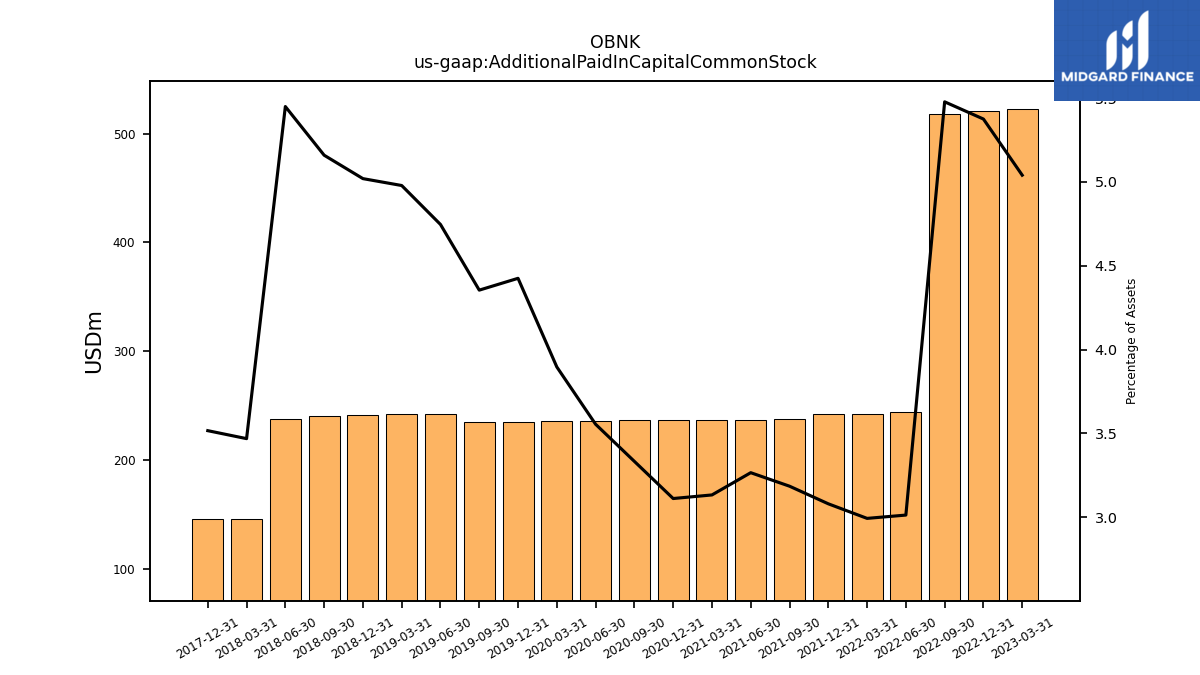
| Additional Paid In Capital Common Stock | 522.12 | 520.67 | 518.38 | 244.37 | 242.79 | 242.11 | 237.93 | 237.34 | 236.93 | 237.34 | 236.68 | 236.16 | 235.71 | 235.62 | 235.02 | 243.00 | 242.58 | 242.04 | 240.83 | 238.26 | 146.20 | 146.06 | NA | |
| Retained Earnings Accumulated Deficit | 455.04 | 435.42 | 410.57 | 398.95 | 381.22 | 363.63 | 338.39 | 314.47 | 289.79 | 266.63 | 251.43 | 240.51 | 237.72 | 239.90 | 229.25 | 216.80 | 205.29 | 191.59 | 179.18 | 167.63 | 156.50 | 145.12 | NA | |
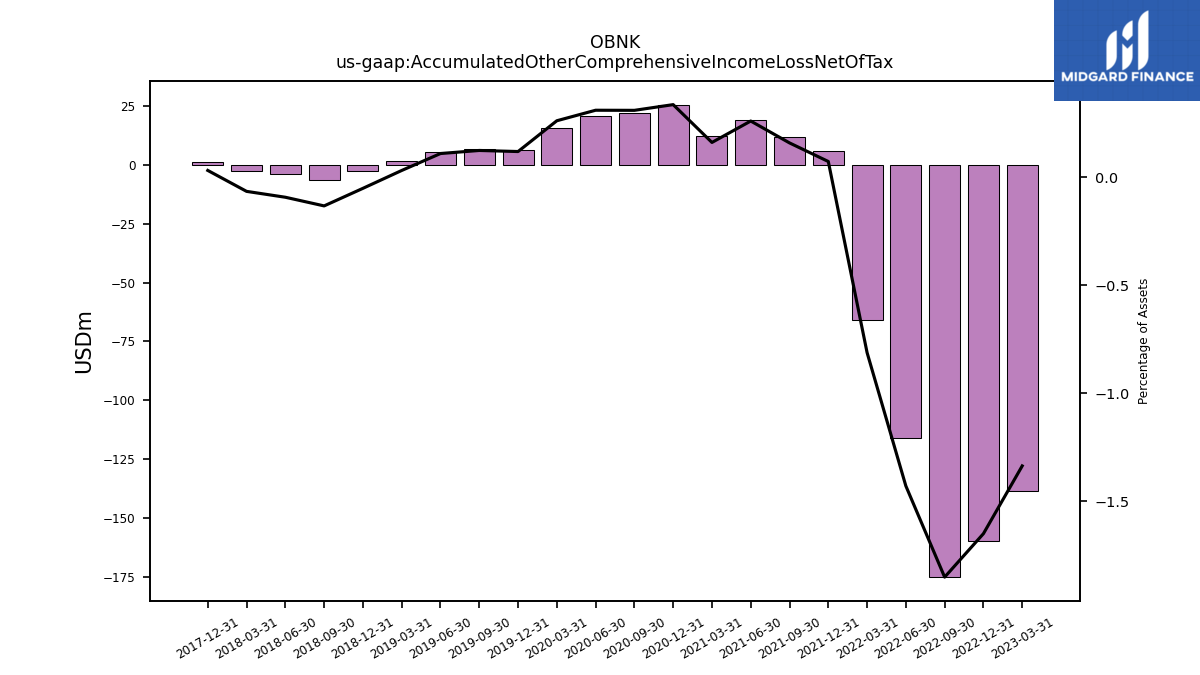
| Accumulated Other Comprehensive Income Loss Net Of Tax | -138.48 | -159.88 | -175.23 | -115.98 | -65.89 | 5.73 | 11.87 | 18.91 | 12.19 | 25.65 | 22.00 | 20.61 | 15.82 | 6.33 | 6.69 | 5.62 | 1.52 | -2.48 | -6.20 | -4.05 | -2.76 | 1.31 | NA |
| 2023-03-31 | 2022-12-31 | 2022-09-30 | 2022-06-30 | 2022-03-31 | 2021-12-31 | 2021-09-30 | 2021-06-30 | 2021-03-31 | 2020-12-31 | 2020-09-30 | 2020-06-30 | 2020-03-31 | 2019-12-31 | 2019-09-30 | 2019-06-30 | 2019-03-31 | 2018-12-31 | 2018-09-30 | 2018-06-30 | 2018-03-31 | 2017-12-31 | 2017-09-30 | ||
|---|---|---|---|---|---|---|---|---|---|---|---|---|---|---|---|---|---|---|---|---|---|---|---|---|
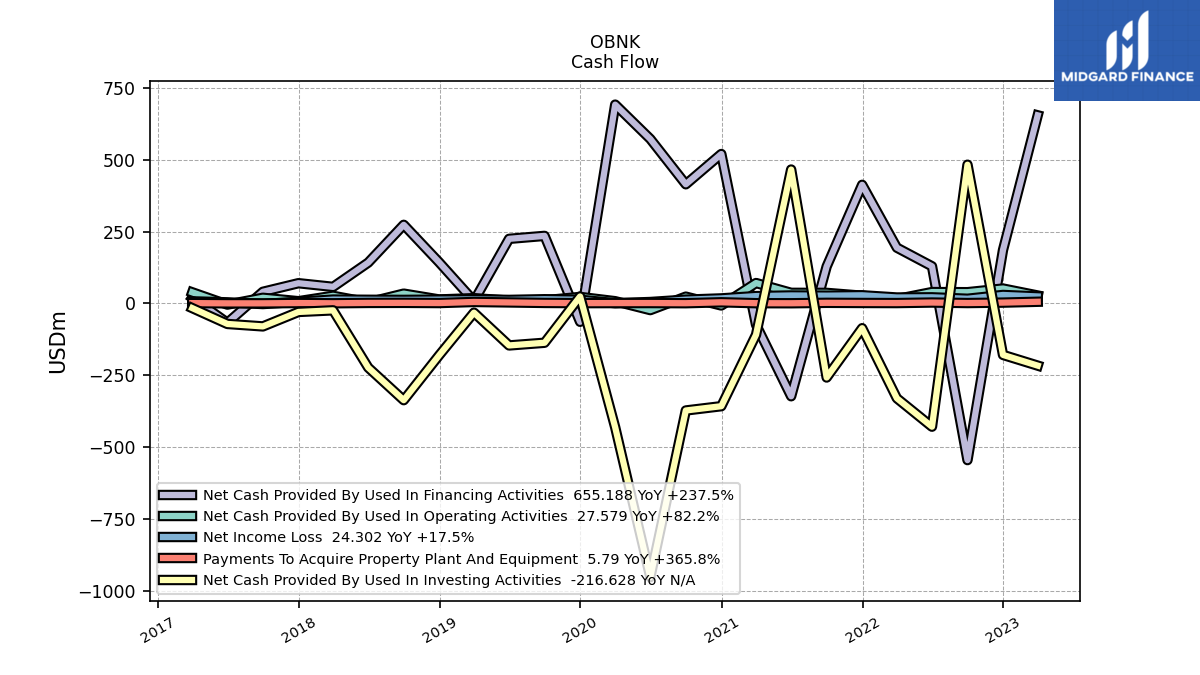
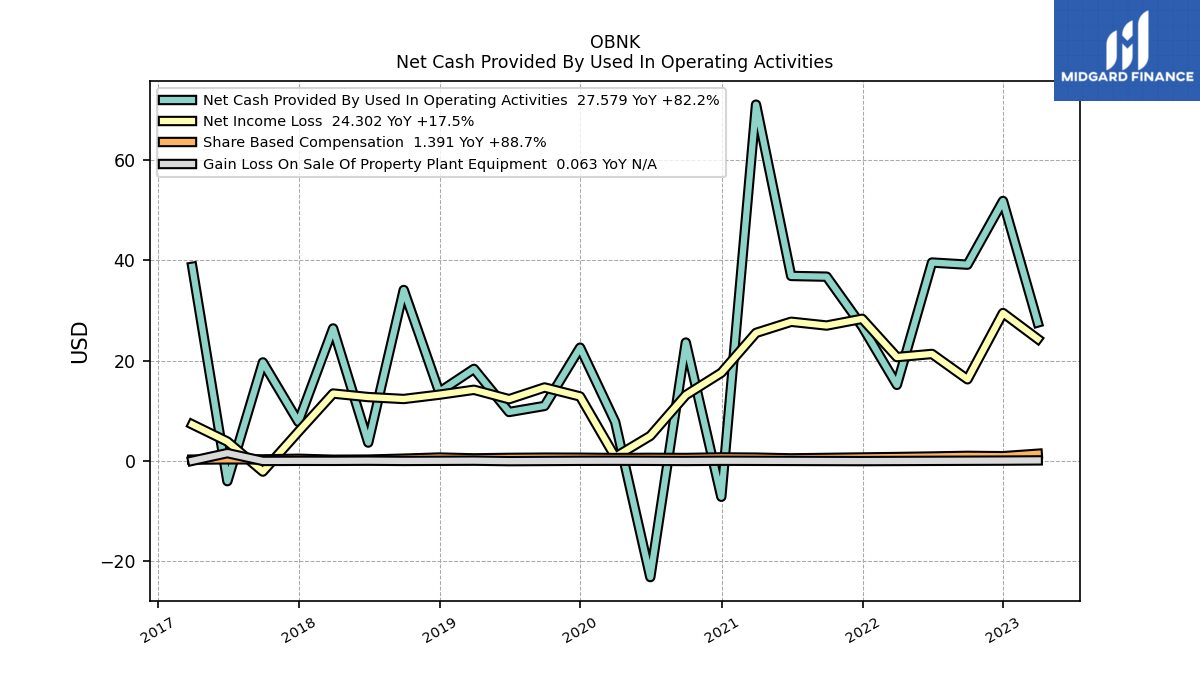
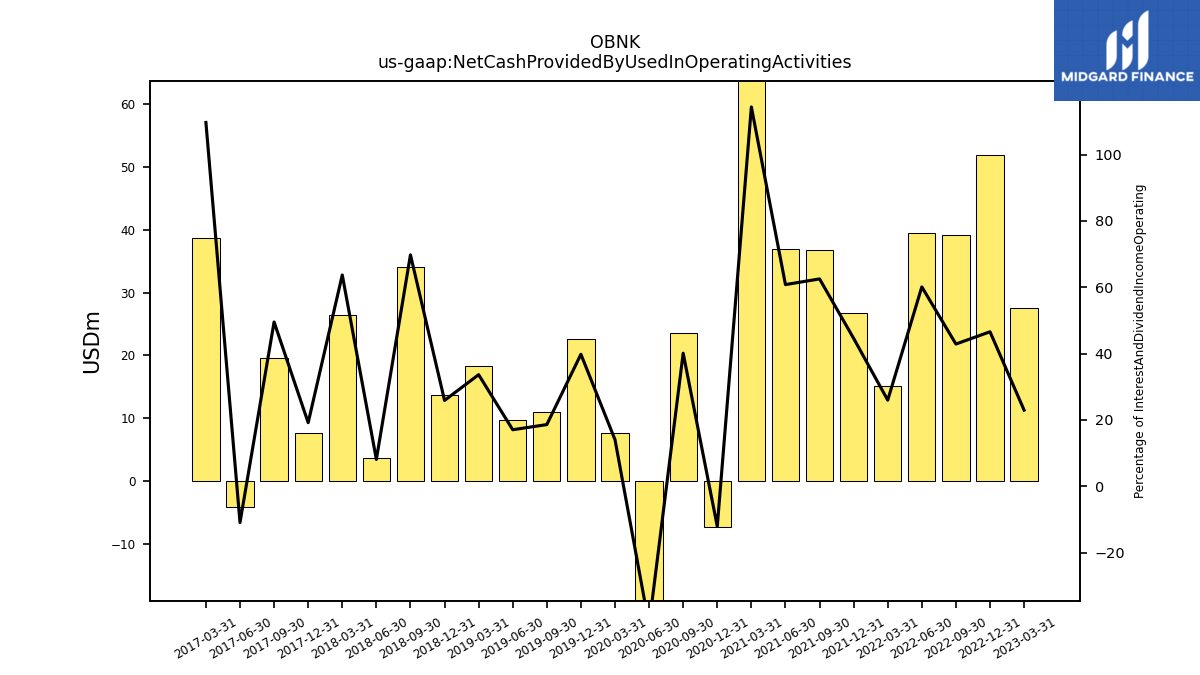
| Net Cash Provided By Used In Operating Activities | 27.58 | 51.84 | 39.12 | 39.55 | 15.13 | 26.81 | 36.73 | 36.88 | 71.07 | -7.20 | 23.59 | -23.23 | 7.73 | 22.57 | 10.93 | 9.72 | 18.33 | 13.73 | 34.08 | 3.62 | 26.40 | 7.75 | 19.62 | |
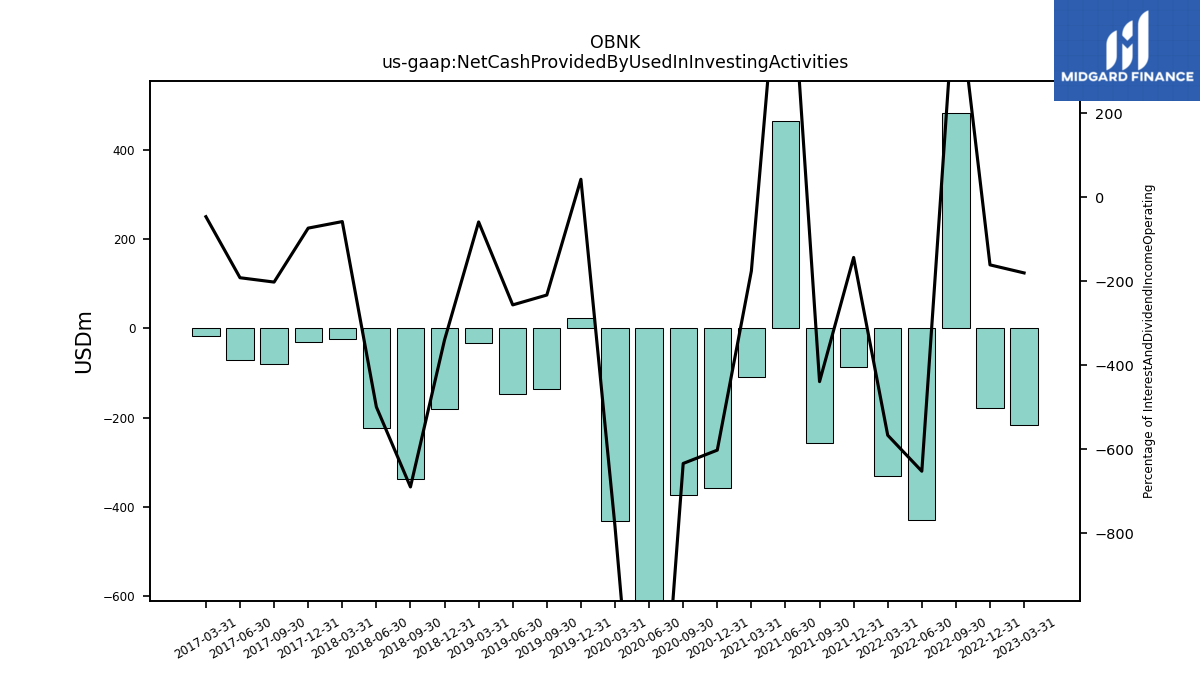
| Net Cash Provided By Used In Investing Activities | -216.63 | -179.33 | 483.18 | -429.39 | -330.45 | -86.26 | -258.07 | 466.38 | -109.19 | -357.98 | -372.90 | -953.34 | -431.51 | 24.25 | -137.00 | -146.35 | -32.09 | -180.30 | -337.05 | -223.54 | -24.04 | -29.74 | -80.06 | |
| Net Cash Provided By Used In Financing Activities | 655.19 | 185.99 | -545.76 | 129.31 | 194.14 | 413.10 | 128.57 | -323.42 | -74.19 | 520.48 | 414.89 | 572.73 | 692.45 | -64.06 | 235.27 | 224.95 | 8.32 | 142.81 | 273.83 | 142.24 | 57.71 | 70.43 | 40.52 |
| 2023-03-31 | 2022-12-31 | 2022-09-30 | 2022-06-30 | 2022-03-31 | 2021-12-31 | 2021-09-30 | 2021-06-30 | 2021-03-31 | 2020-12-31 | 2020-09-30 | 2020-06-30 | 2020-03-31 | 2019-12-31 | 2019-09-30 | 2019-06-30 | 2019-03-31 | 2018-12-31 | 2018-09-30 | 2018-06-30 | 2018-03-31 | 2017-12-31 | 2017-09-30 | ||
|---|---|---|---|---|---|---|---|---|---|---|---|---|---|---|---|---|---|---|---|---|---|---|---|---|
| Net Cash Provided By Used In Operating Activities | 27.58 | 51.84 | 39.12 | 39.55 | 15.13 | 26.81 | 36.73 | 36.88 | 71.07 | -7.20 | 23.59 | -23.23 | 7.73 | 22.57 | 10.93 | 9.72 | 18.33 | 13.73 | 34.08 | 3.62 | 26.40 | 7.75 | 19.62 | |
| Net Income Loss | 24.30 | 29.48 | 16.24 | 21.31 | 20.68 | 28.32 | 26.98 | 27.73 | 25.51 | 17.55 | 13.10 | 4.96 | 0.75 | 12.83 | 14.62 | 12.28 | 14.15 | 13.18 | 12.32 | 12.70 | 13.41 | 5.77 | -2.17 | |
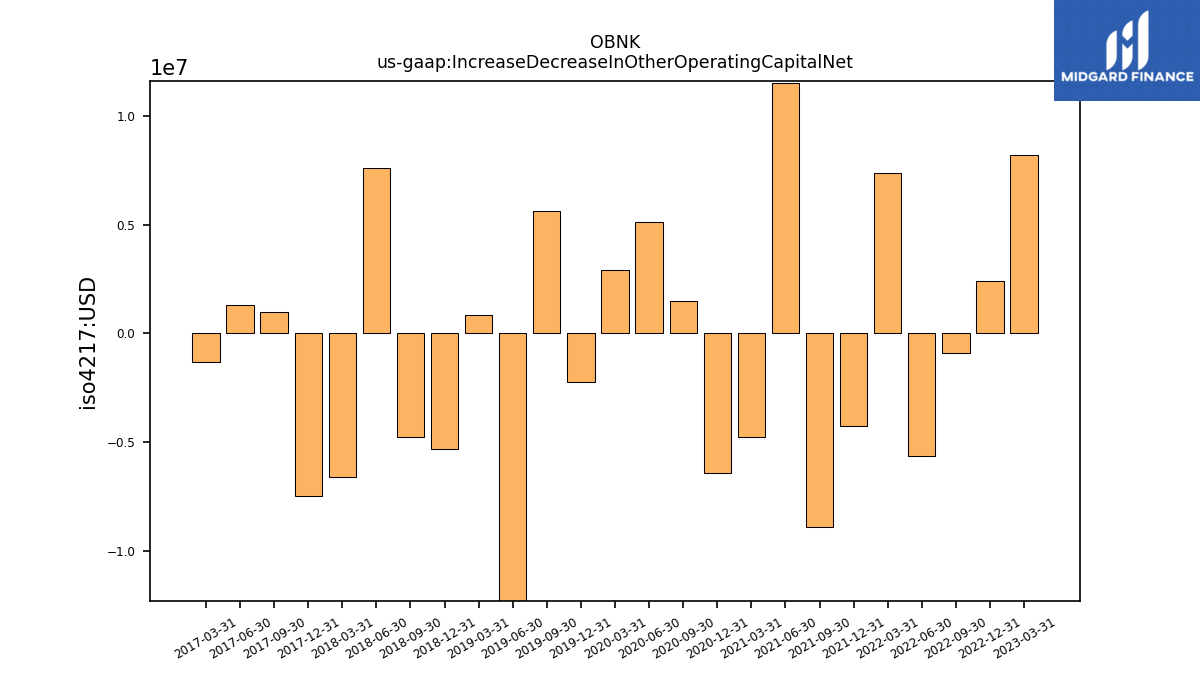
| Increase Decrease In Other Operating Capital Net | 8.20 | 2.41 | -0.91 | -5.66 | 7.36 | -4.28 | -8.89 | 11.52 | -4.79 | -6.44 | 1.51 | 5.14 | 2.94 | -2.22 | 5.65 | -12.30 | 0.83 | -5.30 | -4.75 | 7.60 | -6.61 | -7.47 | 1.00 | |
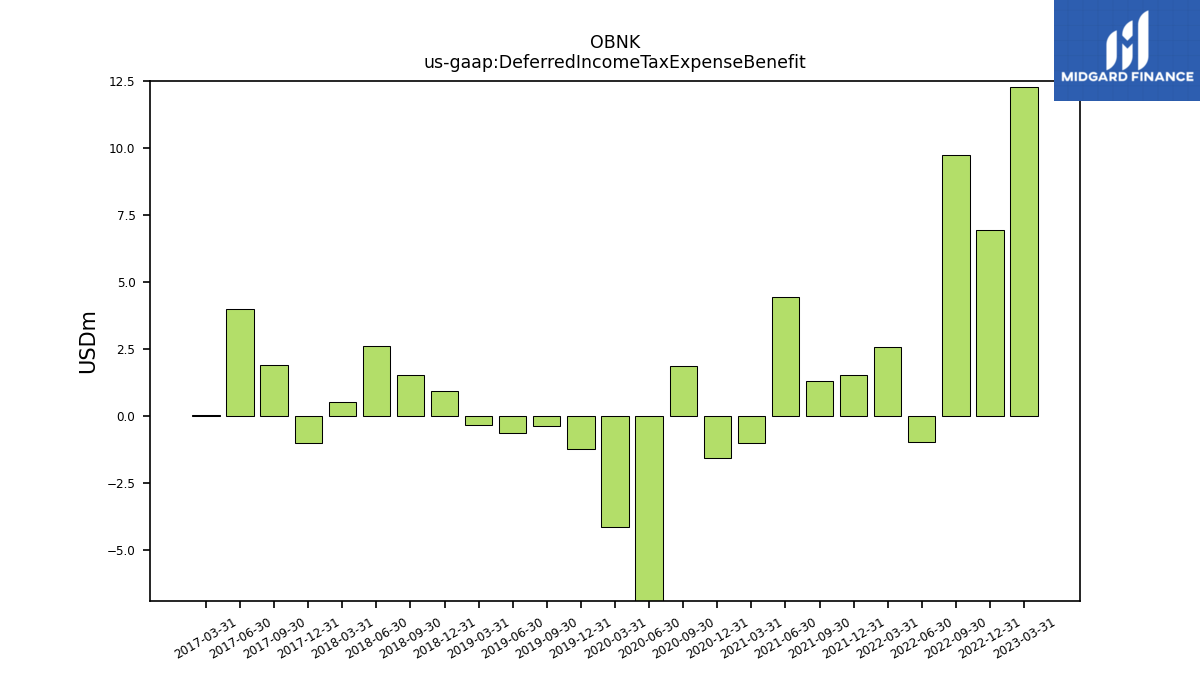
| Deferred Income Tax Expense Benefit | 12.31 | 6.95 | 9.74 | -0.96 | 2.57 | 1.52 | 1.30 | 4.45 | -0.99 | -1.58 | 1.89 | -8.07 | -4.12 | -1.24 | -0.37 | -0.64 | -0.35 | 0.95 | 1.52 | 2.63 | 0.53 | -1.01 | 1.90 | |
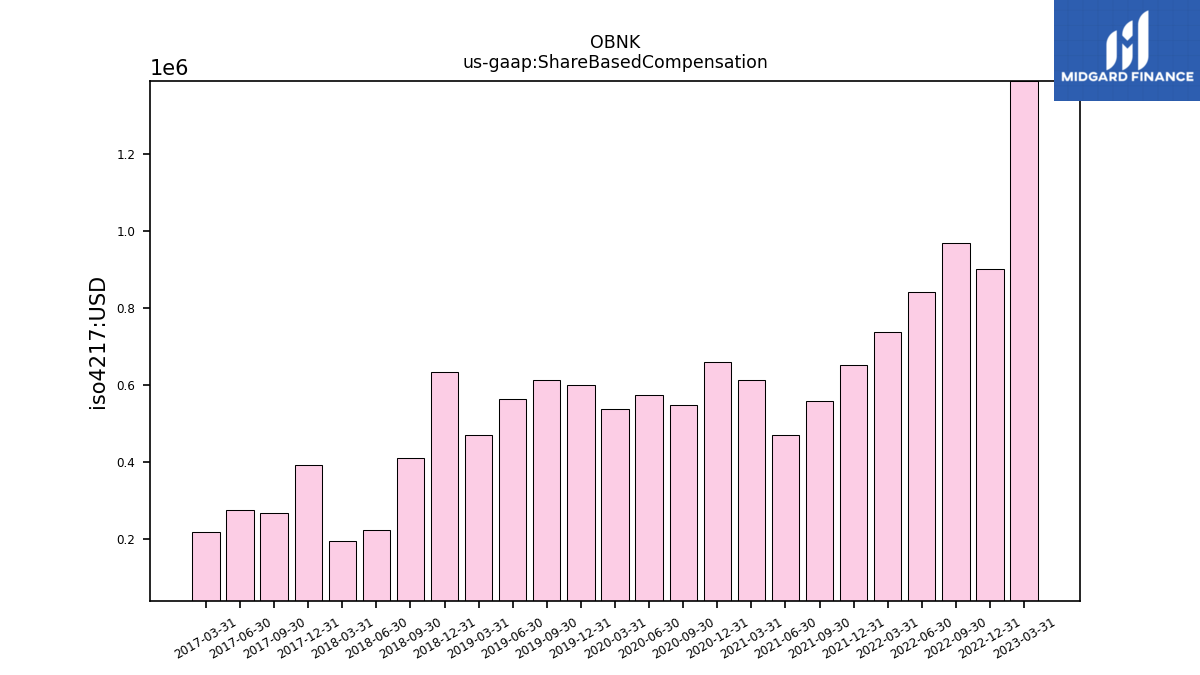
| Share Based Compensation | 1.39 | 0.90 | 0.97 | 0.84 | 0.74 | 0.65 | 0.56 | 0.47 | 0.61 | 0.66 | 0.55 | 0.57 | 0.54 | 0.60 | 0.61 | 0.56 | 0.47 | 0.63 | 0.41 | 0.22 | 0.19 | 0.39 | 0.27 |
| 2023-03-31 | 2022-12-31 | 2022-09-30 | 2022-06-30 | 2022-03-31 | 2021-12-31 | 2021-09-30 | 2021-06-30 | 2021-03-31 | 2020-12-31 | 2020-09-30 | 2020-06-30 | 2020-03-31 | 2019-12-31 | 2019-09-30 | 2019-06-30 | 2019-03-31 | 2018-12-31 | 2018-09-30 | 2018-06-30 | 2018-03-31 | 2017-12-31 | 2017-09-30 | ||
|---|---|---|---|---|---|---|---|---|---|---|---|---|---|---|---|---|---|---|---|---|---|---|---|---|
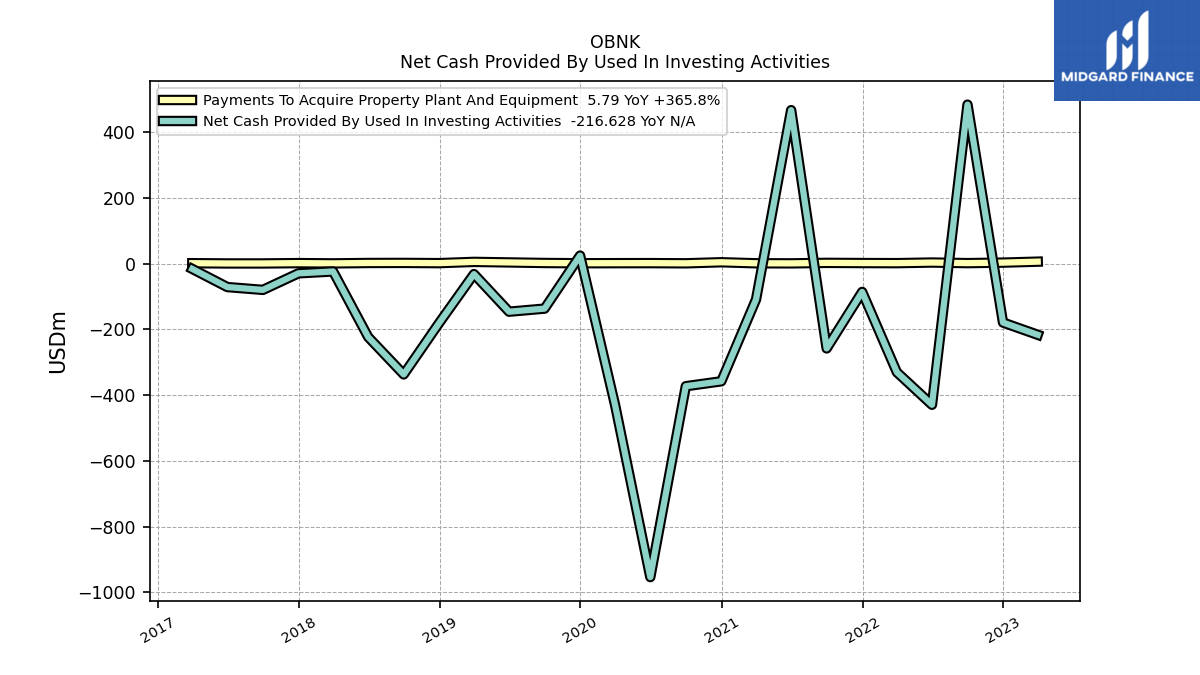
| Net Cash Provided By Used In Investing Activities | -216.63 | -179.33 | 483.18 | -429.39 | -330.45 | -86.26 | -258.07 | 466.38 | -109.19 | -357.98 | -372.90 | -953.34 | -431.51 | 24.25 | -137.00 | -146.35 | -32.09 | -180.30 | -337.05 | -223.54 | -24.04 | -29.74 | -80.06 | |
| Payments To Acquire Property Plant And Equipment | 5.79 | 2.83 | 1.31 | 3.08 | 1.24 | 1.54 | 2.08 | 0.59 | 0.81 | 3.98 | 0.74 | 1.30 | 1.17 | 0.97 | 1.70 | 3.43 | 5.06 | 1.28 | 1.94 | 1.72 | 0.54 | 1.33 | 0.31 |
| 2023-03-31 | 2022-12-31 | 2022-09-30 | 2022-06-30 | 2022-03-31 | 2021-12-31 | 2021-09-30 | 2021-06-30 | 2021-03-31 | 2020-12-31 | 2020-09-30 | 2020-06-30 | 2020-03-31 | 2019-12-31 | 2019-09-30 | 2019-06-30 | 2019-03-31 | 2018-12-31 | 2018-09-30 | 2018-06-30 | 2018-03-31 | 2017-12-31 | 2017-09-30 | ||
|---|---|---|---|---|---|---|---|---|---|---|---|---|---|---|---|---|---|---|---|---|---|---|---|---|
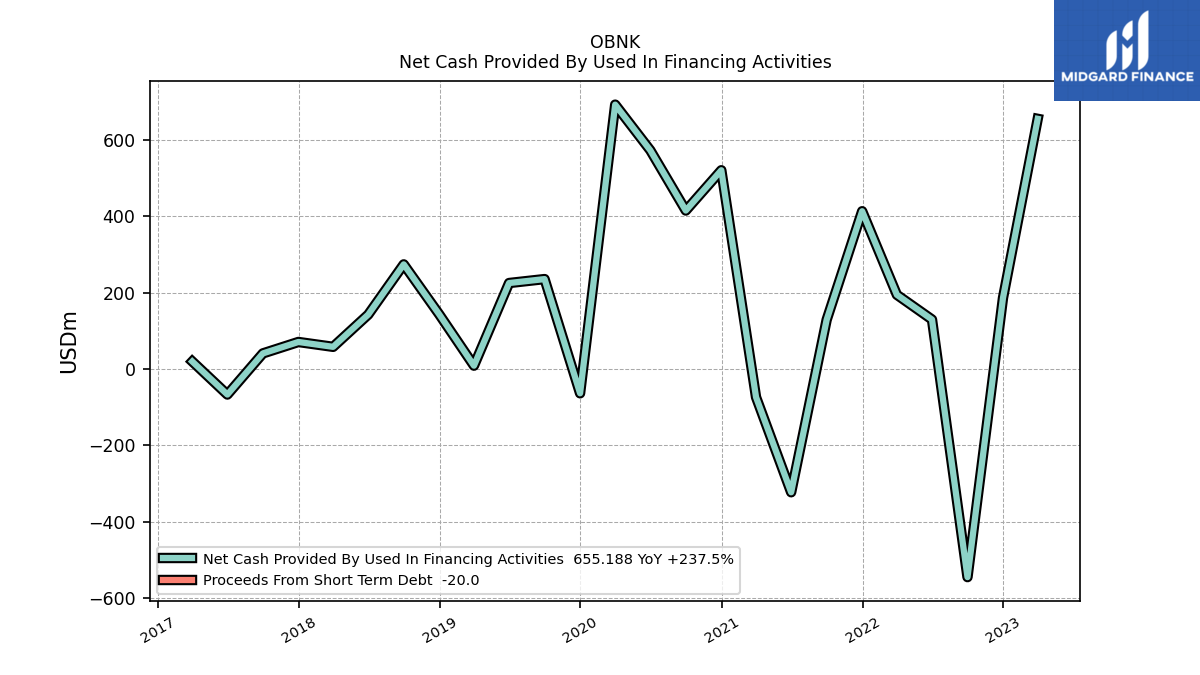
| Net Cash Provided By Used In Financing Activities | 655.19 | 185.99 | -545.76 | 129.31 | 194.14 | 413.10 | 128.57 | -323.42 | -74.19 | 520.48 | 414.89 | 572.73 | 692.45 | -64.06 | 235.27 | 224.95 | 8.32 | 142.81 | 273.83 | 142.24 | 57.71 | 70.43 | 40.52 | |
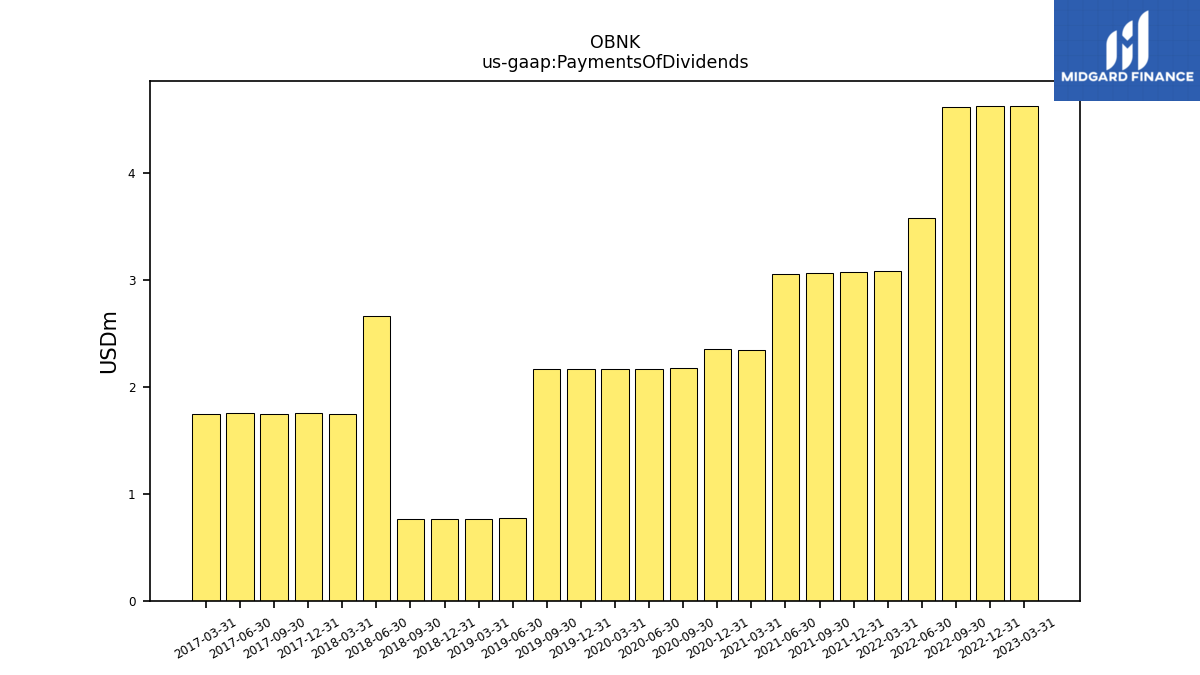
| Payments Of Dividends | 4.62 | 4.62 | 4.61 | 3.57 | 3.08 | 3.07 | 3.06 | 3.05 | 2.34 | 2.35 | 2.17 | 2.17 | 2.16 | 2.17 | 2.16 | 0.77 | 0.77 | 0.77 | 0.77 | 2.66 | 1.75 | 1.75 | 1.75 |
| 2023-03-31 | 2022-12-31 | 2022-09-30 | 2022-06-30 | 2022-03-31 | 2021-12-31 | 2021-09-30 | 2021-06-30 | 2021-03-31 | 2020-12-31 | 2020-09-30 | 2020-06-30 | 2020-03-31 | 2019-12-31 | 2019-09-30 | 2019-06-30 | 2019-03-31 | 2018-12-31 | 2018-09-30 | 2018-06-30 | 2018-03-31 | 2017-12-31 | 2017-09-30 | ||
|---|---|---|---|---|---|---|---|---|---|---|---|---|---|---|---|---|---|---|---|---|---|---|---|---|
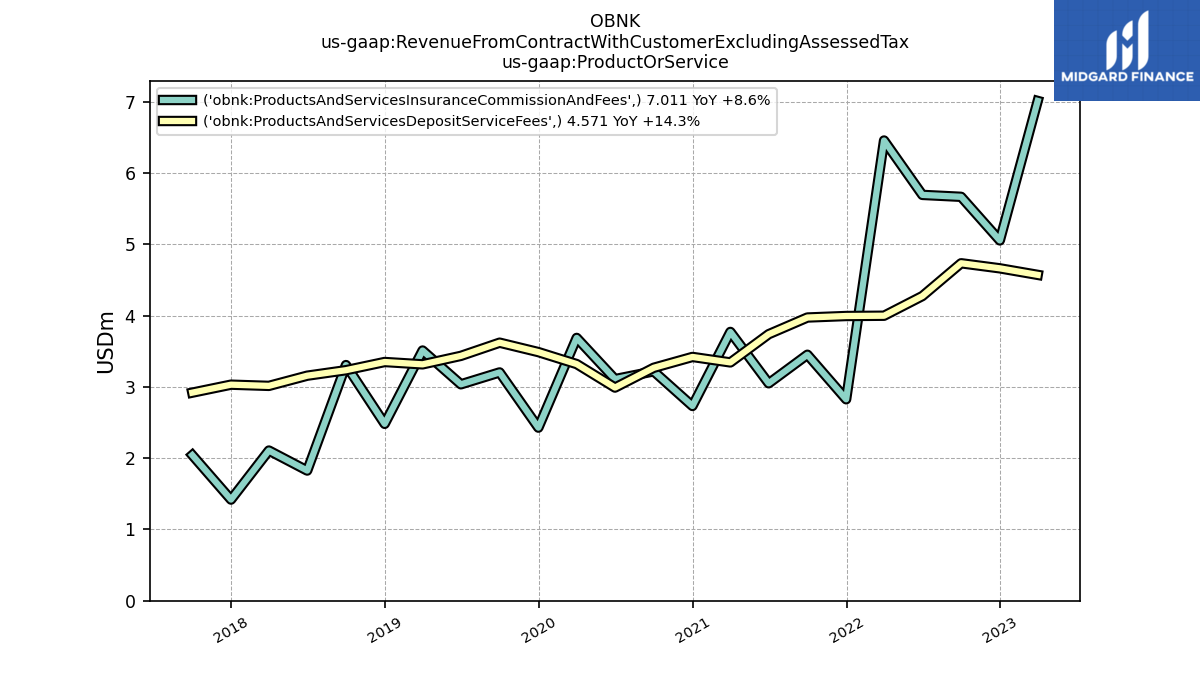
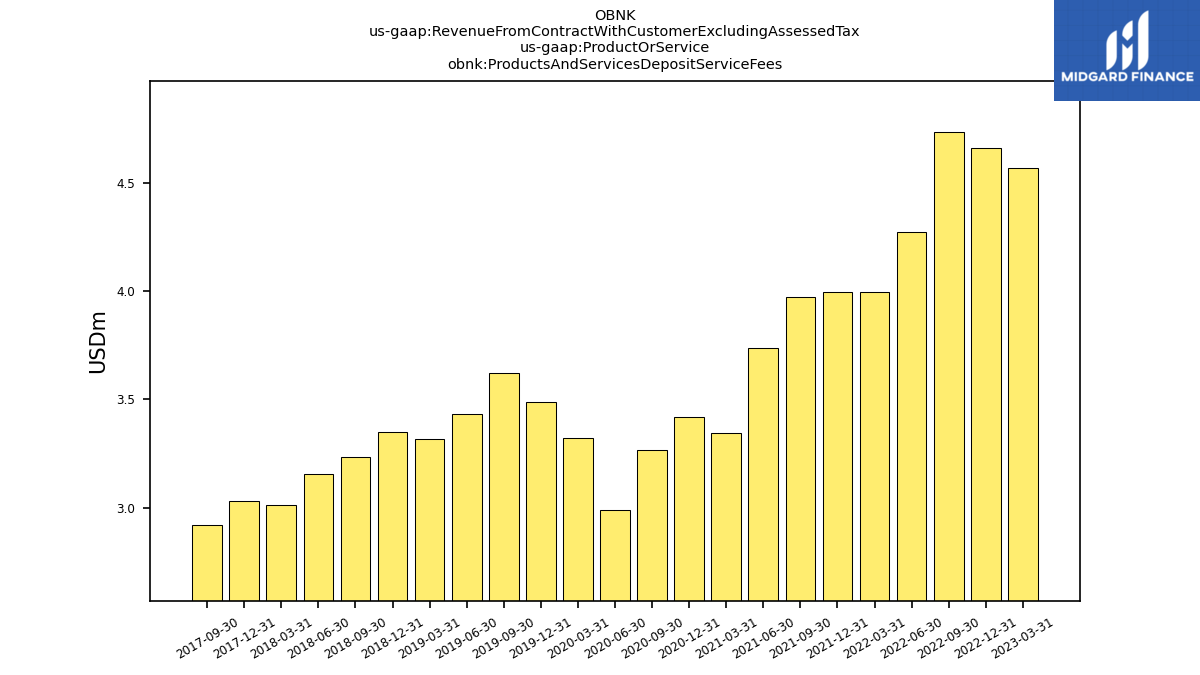
| Products And Services Deposit Service Fees | 4.57 | 4.66 | 4.73 | 4.27 | 4.00 | 3.99 | 3.97 | 3.74 | 3.34 | 3.42 | 3.27 | 2.99 | 3.32 | 3.49 | 3.62 | 3.44 | 3.32 | 3.35 | 3.23 | 3.16 | 3.01 | 3.03 | 2.92 | |
| Products And Services Insurance Commission And Fees | 7.01 | 5.05 | 5.67 | 5.69 | 6.46 | 2.83 | 3.45 | 3.05 | 3.77 | 2.73 | 3.22 | 3.11 | 3.69 | 2.43 | 3.20 | 3.04 | 3.51 | 2.48 | 3.31 | 1.83 | 2.11 | 1.42 | 2.04 |


