
| 2023-09-30 | 2023-06-30 | 2023-03-31 | 2022-12-31 | 2022-09-30 | 2022-06-30 | 2022-03-31 | 2021-12-31 | 2021-09-30 | 2021-06-30 | 2021-03-31 | 2020-12-31 | 2020-09-30 | 2020-06-30 | 2020-03-31 | 2019-12-31 | 2019-09-30 | 2019-06-30 | 2019-03-31 | 2018-12-31 | 2018-09-30 | 2018-06-30 | 2018-03-31 | 2017-12-31 | 2017-09-30 | 2017-06-30 | 2017-03-31 | 2016-12-31 | 2016-09-30 | 2016-06-30 | 2016-03-31 | 2015-12-31 | 2015-09-30 | 2015-06-30 | 2015-03-31 | 2014-12-31 | 2014-09-30 | 2014-06-30 | 2014-03-31 | 2013-12-31 | 2013-09-30 | 2013-06-30 | 2013-03-31 | 2012-12-31 | 2012-09-30 | 2012-06-30 | 2012-03-31 | 2011-12-31 | 2011-09-30 | 2011-06-30 | 2011-03-31 | 2010-12-31 | 2010-09-30 | 2010-06-30 | 2010-03-31 | ||
|---|---|---|---|---|---|---|---|---|---|---|---|---|---|---|---|---|---|---|---|---|---|---|---|---|---|---|---|---|---|---|---|---|---|---|---|---|---|---|---|---|---|---|---|---|---|---|---|---|---|---|---|---|---|---|---|---|
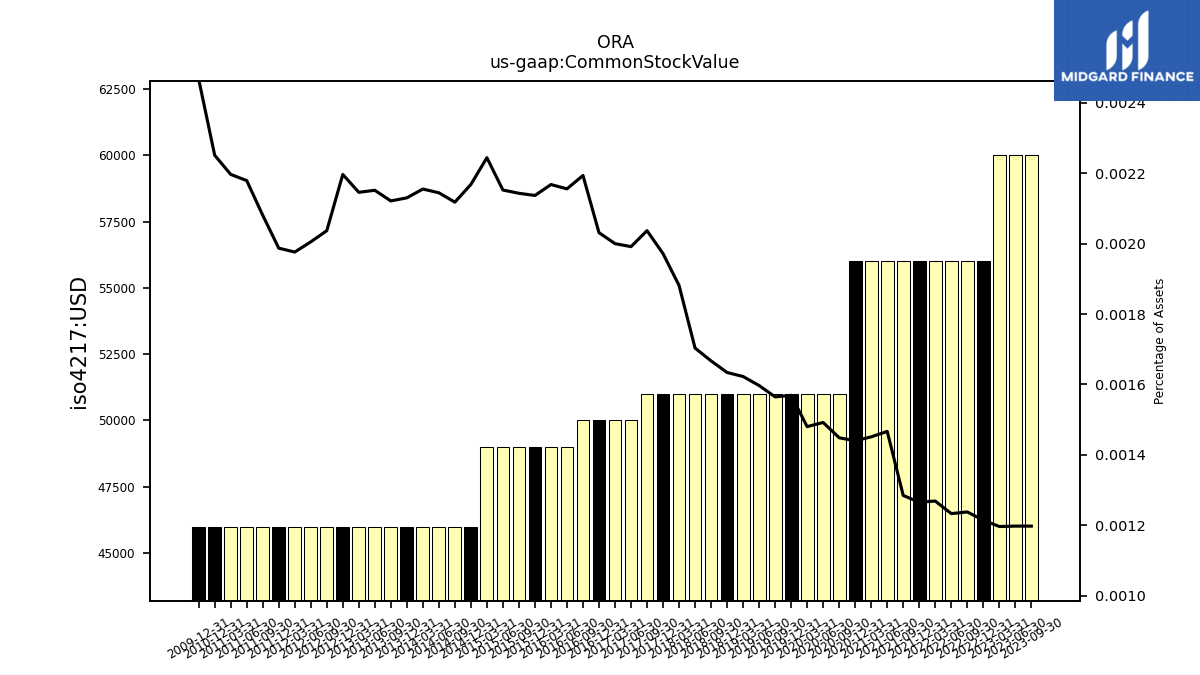
| Common Stock Value | 0.06 | 0.06 | 0.06 | 0.06 | 0.06 | 0.06 | 0.06 | 0.06 | 0.06 | 0.06 | 0.06 | 0.06 | 0.05 | 0.05 | 0.05 | 0.05 | 0.05 | 0.05 | 0.05 | 0.05 | 0.05 | 0.05 | 0.05 | 0.05 | 0.05 | 0.05 | 0.05 | 0.05 | 0.05 | 0.05 | 0.05 | 0.05 | 0.05 | 0.05 | 0.05 | 0.05 | 0.05 | 0.05 | 0.05 | 0.05 | 0.05 | 0.05 | 0.05 | 0.05 | 0.05 | 0.05 | 0.05 | 0.05 | 0.05 | 0.05 | 0.05 | 0.05 | NA | NA | NA | |
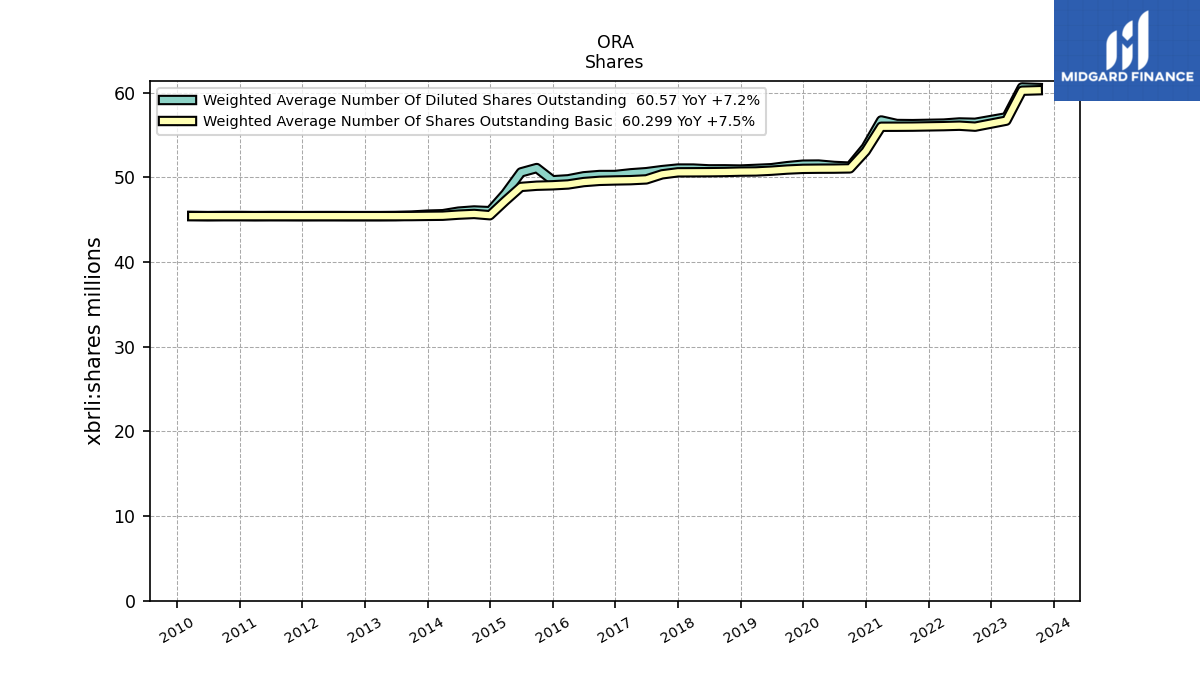
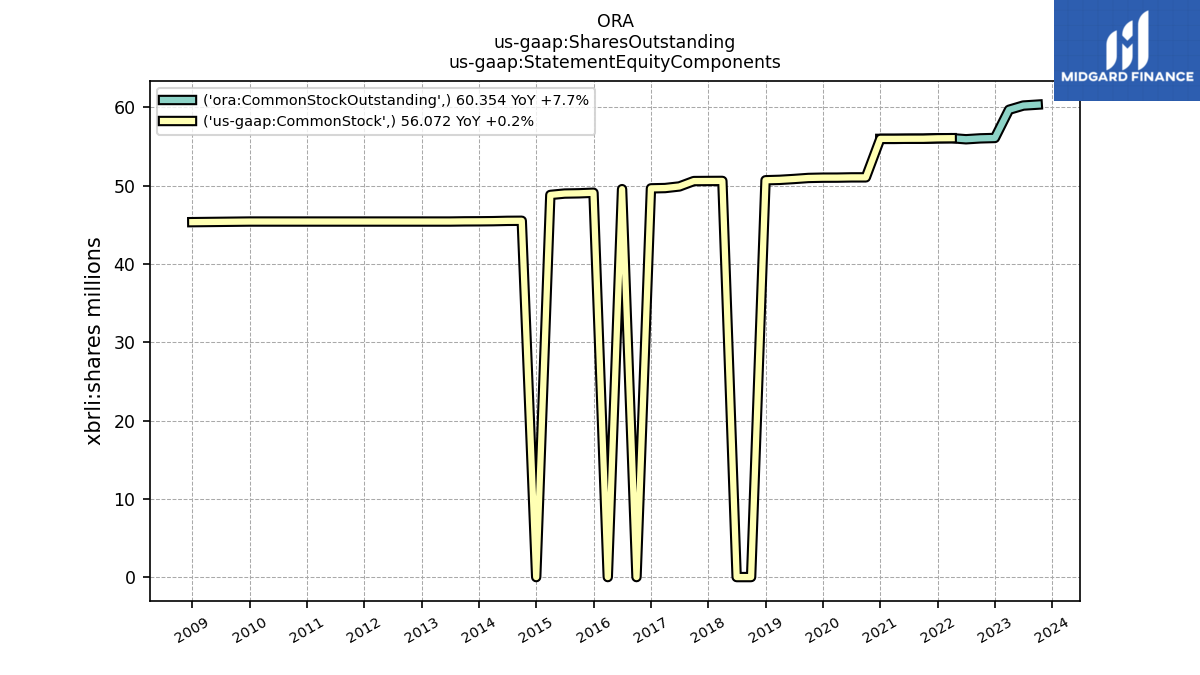
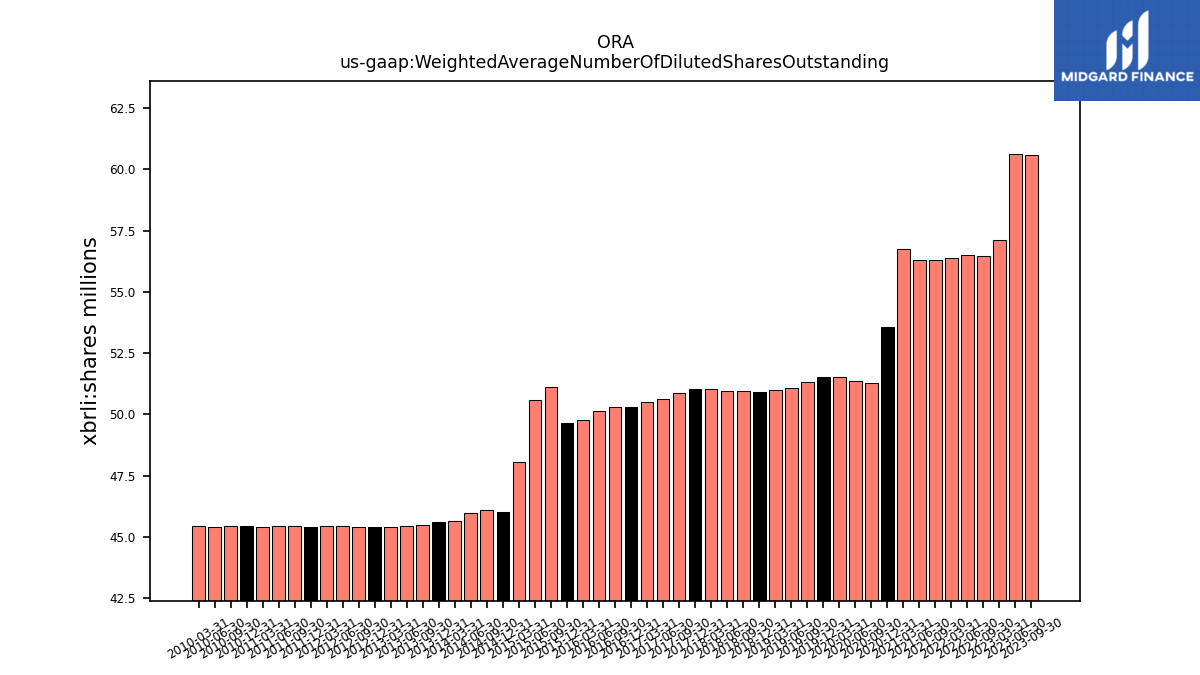
| Weighted Average Number Of Diluted Shares Outstanding | 60.57 | 60.63 | 57.10 | NA | 56.46 | 56.50 | 56.37 | NA | 56.30 | 56.32 | 56.73 | 53.55 | 51.28 | 51.36 | 51.53 | 51.51 | 51.33 | 51.09 | 51.01 | 50.94 | 50.96 | 50.96 | 51.05 | 51.05 | 50.87 | 50.62 | 50.49 | 50.29 | 50.29 | 50.14 | 49.78 | 49.67 | 51.11 | 50.60 | 48.08 | 46.02 | 46.10 | 45.96 | 45.66 | 45.61 | 45.49 | 45.45 | 45.43 | 45.43 | 45.43 | 45.44 | 45.44 | 45.43 | 45.44 | 45.44 | 45.43 | 45.45 | 45.45 | 45.43 | 45.46 | |
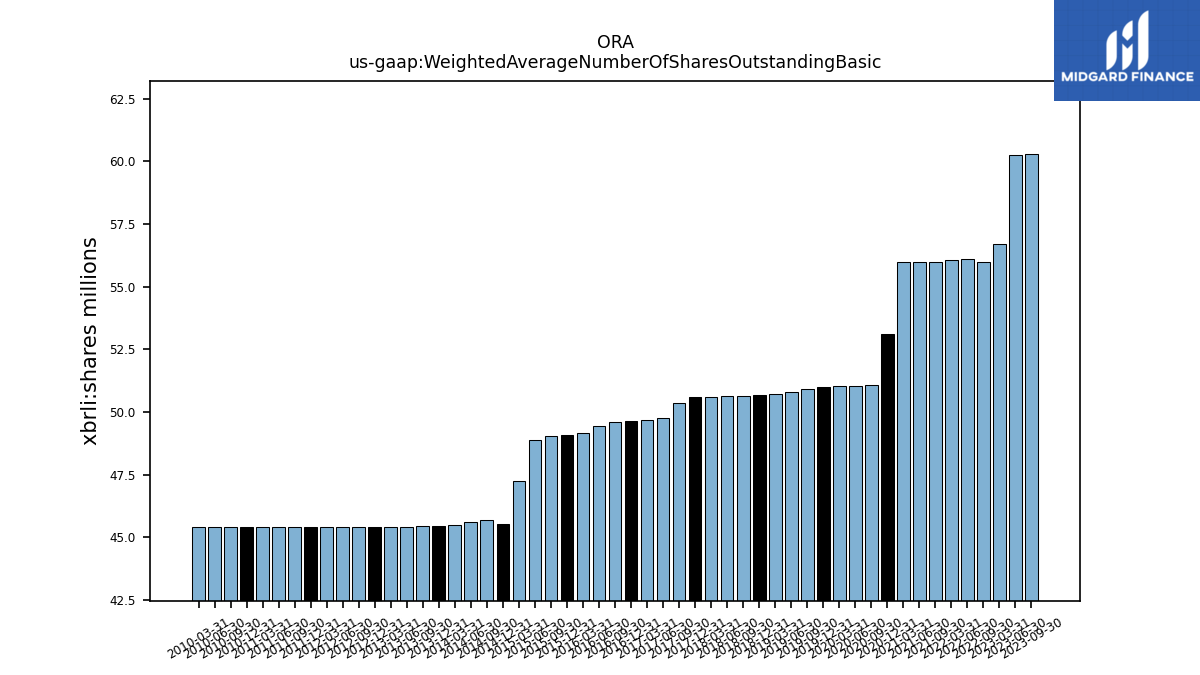
| Weighted Average Number Of Shares Outstanding Basic | 60.30 | 60.24 | 56.71 | NA | 56.00 | 56.11 | 56.06 | NA | 56.00 | 55.99 | 55.99 | 53.11 | 51.07 | 51.04 | 51.04 | 51.02 | 50.93 | 50.80 | 50.71 | 50.69 | 50.65 | 50.62 | 50.61 | 50.61 | 50.37 | 49.77 | 49.68 | 49.65 | 49.60 | 49.46 | 49.17 | 49.07 | 49.02 | 48.88 | 47.24 | 45.54 | 45.69 | 45.61 | 45.48 | 45.46 | 45.44 | 45.43 | 45.43 | 45.43 | 45.43 | 45.43 | 45.43 | 45.43 | 45.43 | 45.43 | 45.43 | 45.43 | 45.43 | 45.43 | 45.43 |
| 2023-09-30 | 2023-06-30 | 2023-03-31 | 2022-12-31 | 2022-09-30 | 2022-06-30 | 2022-03-31 | 2021-12-31 | 2021-09-30 | 2021-06-30 | 2021-03-31 | 2020-12-31 | 2020-09-30 | 2020-06-30 | 2020-03-31 | 2019-12-31 | 2019-09-30 | 2019-06-30 | 2019-03-31 | 2018-12-31 | 2018-09-30 | 2018-06-30 | 2018-03-31 | 2017-12-31 | 2017-09-30 | 2017-06-30 | 2017-03-31 | 2016-12-31 | 2016-09-30 | 2016-06-30 | 2016-03-31 | 2015-12-31 | 2015-09-30 | 2015-06-30 | 2015-03-31 | 2014-12-31 | 2014-09-30 | 2014-06-30 | 2014-03-31 | 2013-12-31 | 2013-09-30 | 2013-06-30 | 2013-03-31 | 2012-12-31 | 2012-09-30 | 2012-06-30 | 2012-03-31 | 2011-12-31 | 2011-09-30 | 2011-06-30 | 2011-03-31 | 2010-12-31 | 2010-09-30 | 2010-06-30 | 2010-03-31 | ||
|---|---|---|---|---|---|---|---|---|---|---|---|---|---|---|---|---|---|---|---|---|---|---|---|---|---|---|---|---|---|---|---|---|---|---|---|---|---|---|---|---|---|---|---|---|---|---|---|---|---|---|---|---|---|---|---|---|
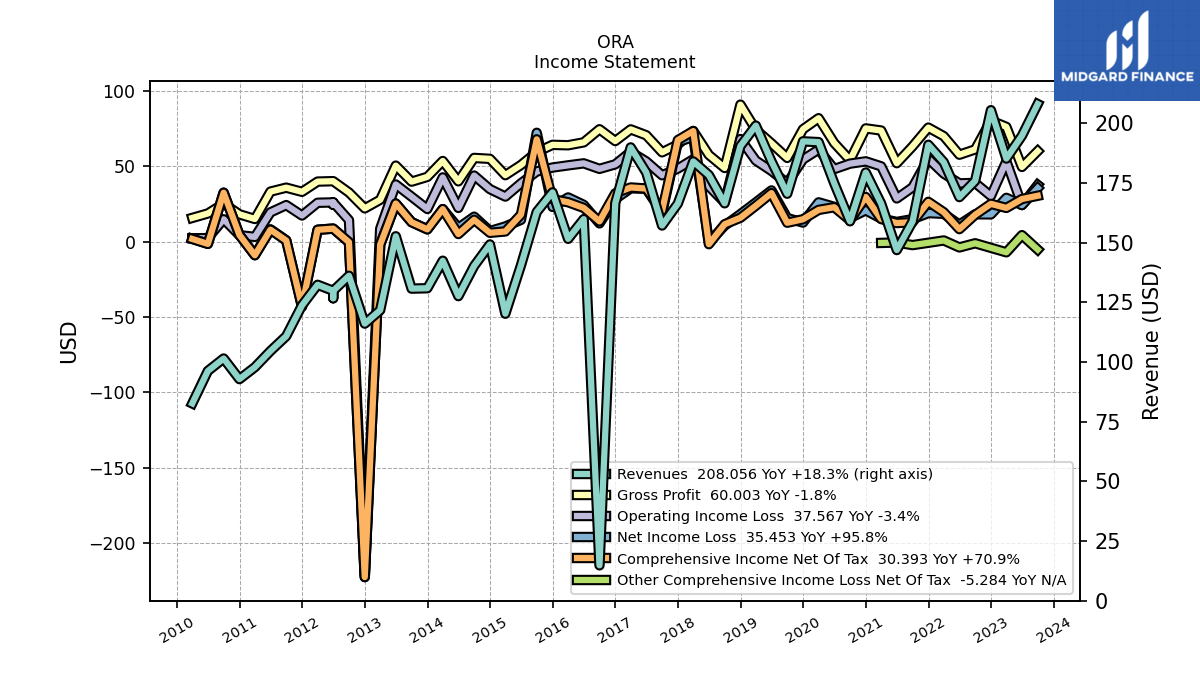
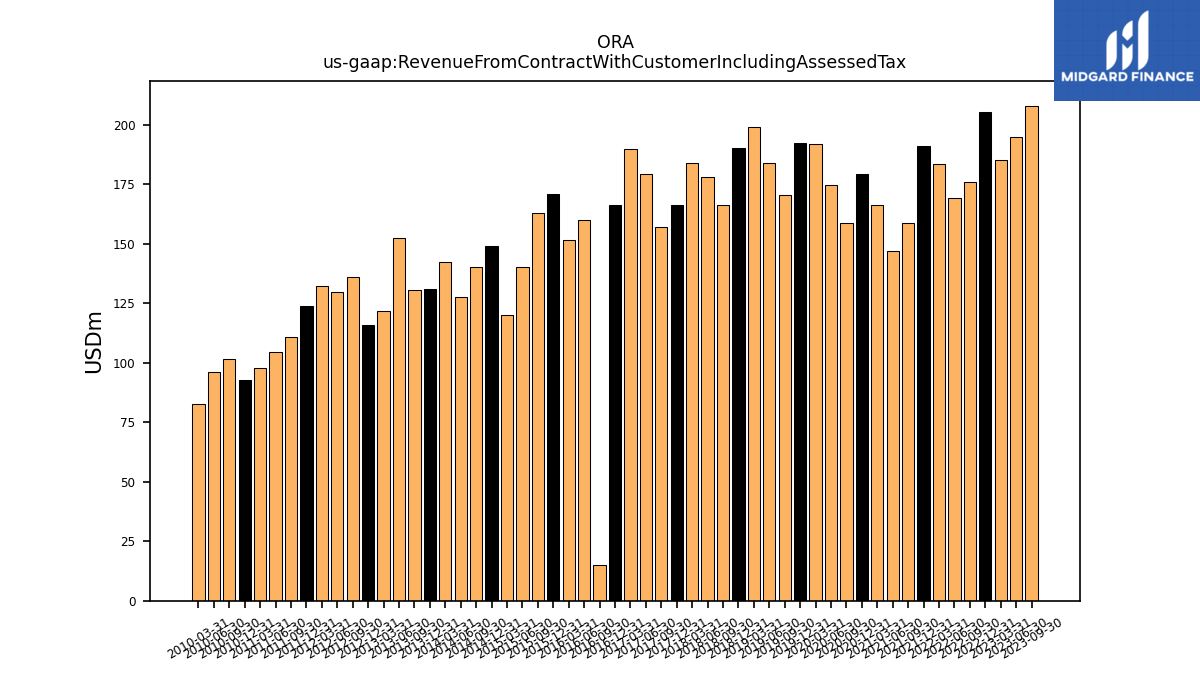
| Revenue From Contract With Customer Including Assessed Tax | 208.06 | 194.80 | 185.23 | 205.49 | 175.88 | 169.08 | 183.71 | 190.99 | 158.84 | 146.90 | 166.35 | 179.38 | 158.95 | 174.90 | 192.11 | 192.44 | 170.50 | 184.06 | 199.04 | 190.47 | 166.48 | 178.30 | 184.02 | 166.37 | 157.19 | 179.36 | 189.90 | 166.52 | 14.84 | 159.86 | 151.59 | 171.07 | 162.85 | 140.49 | 120.23 | 149.24 | 140.24 | 127.60 | 142.44 | 130.91 | 130.75 | 152.68 | 121.71 | 116.08 | 136.14 | 129.84 | 132.35 | 123.73 | 110.84 | 104.61 | 97.82 | 92.83 | 101.48 | 96.27 | 82.65 | |
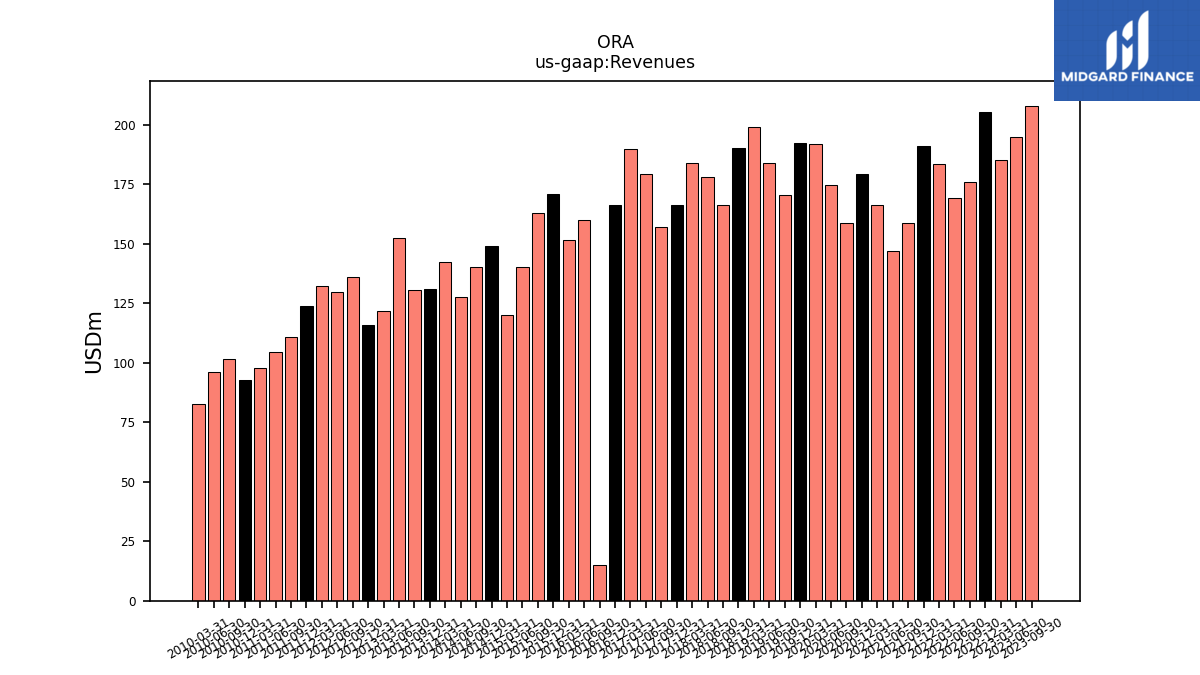
| Revenues | 208.06 | 194.80 | 185.23 | 205.49 | 175.88 | 169.08 | 183.71 | 190.99 | 158.84 | 146.90 | 166.35 | 179.38 | 158.95 | 174.90 | 192.11 | 192.44 | 170.50 | 184.06 | 199.04 | 190.47 | 166.48 | 178.30 | 184.02 | 166.37 | 157.19 | 179.36 | 189.90 | 166.52 | 14.84 | 159.86 | 151.59 | 171.07 | 162.85 | 140.49 | 120.23 | 149.24 | 140.24 | 127.60 | 142.44 | 130.91 | 130.75 | 152.68 | 121.71 | 116.08 | 136.14 | 129.84 | 132.35 | 123.73 | 110.84 | 104.61 | 97.82 | 92.83 | 101.48 | 96.27 | 82.65 | |
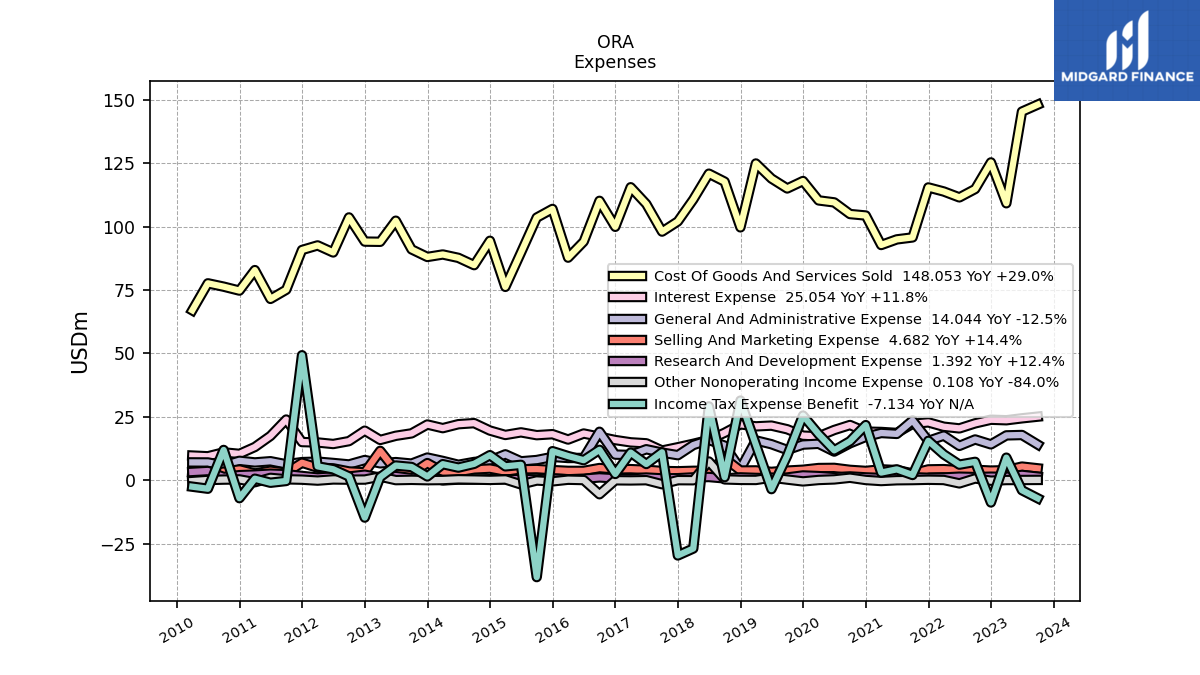
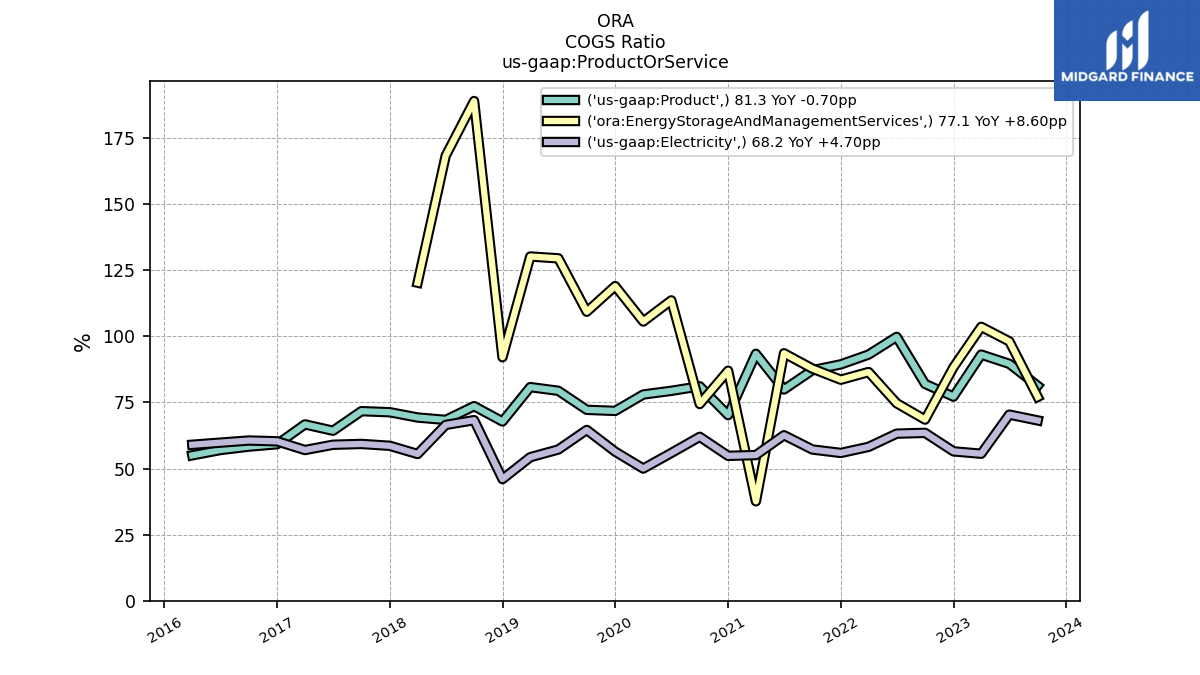
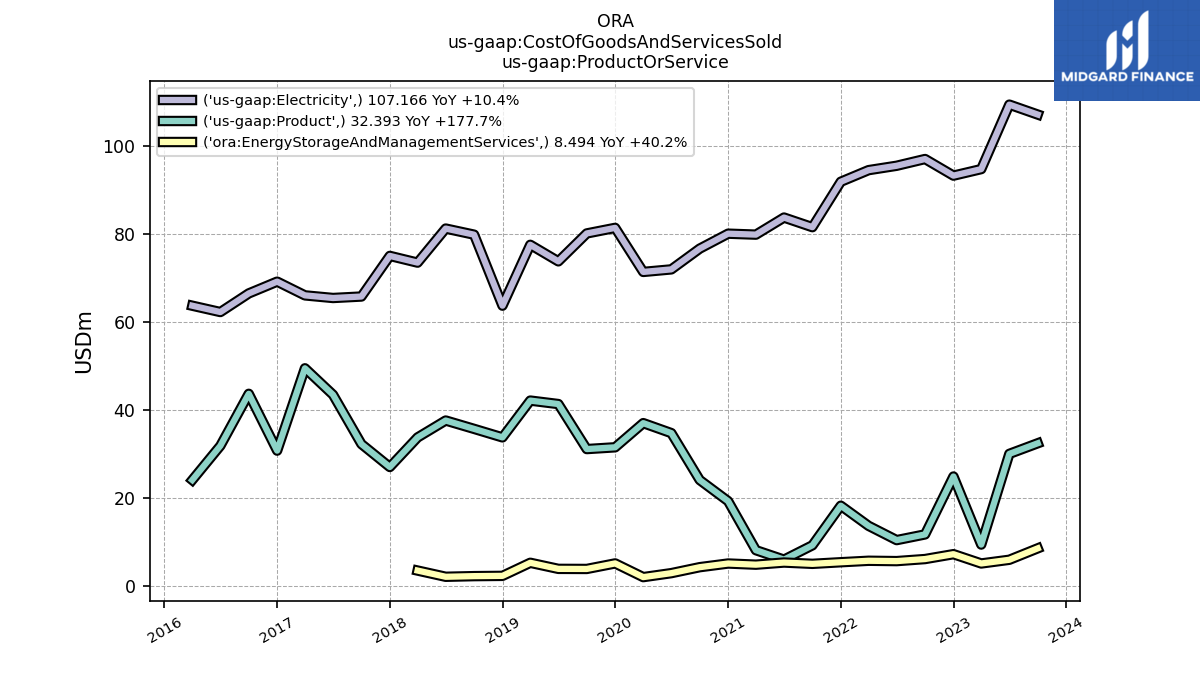
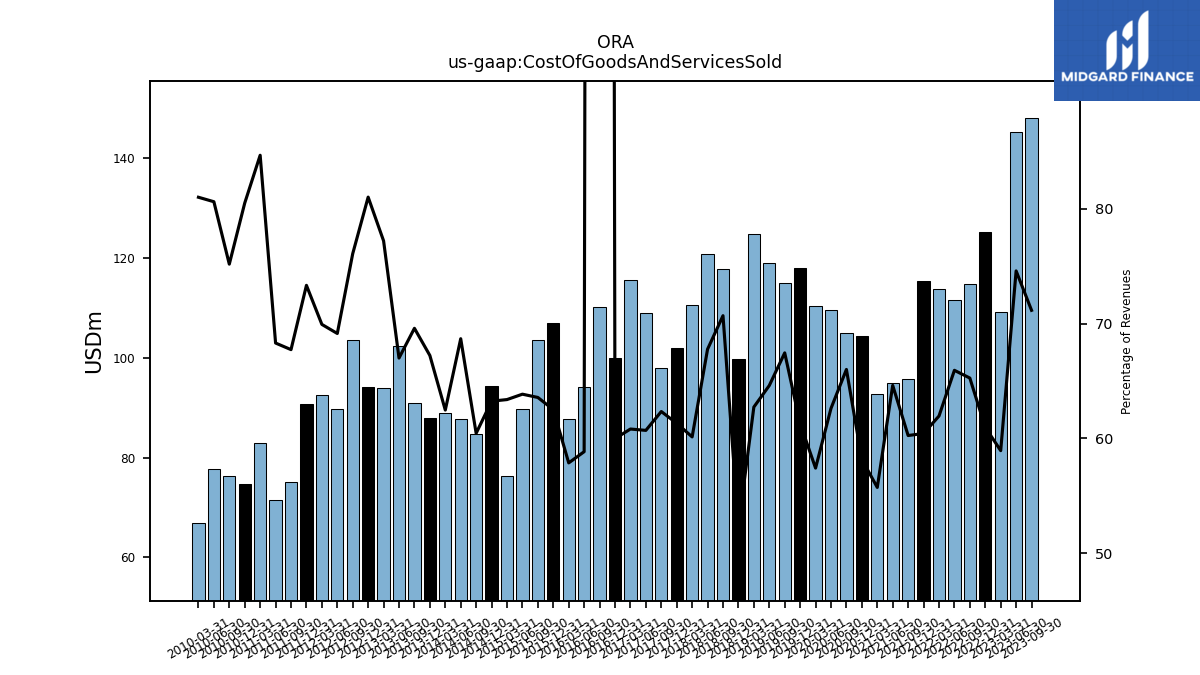
| Cost Of Goods And Services Sold | 148.05 | 145.31 | 109.16 | 125.28 | 114.78 | 111.48 | 113.81 | 115.41 | 95.70 | 94.93 | 92.70 | 104.34 | 104.92 | 109.51 | 110.30 | 117.94 | 115.00 | 118.92 | 124.86 | 99.66 | 117.69 | 120.84 | 110.65 | 102.01 | 97.99 | 108.87 | 115.49 | 99.88 | 110.13 | 94.06 | 87.72 | 106.94 | 103.52 | 89.70 | 76.21 | 94.38 | 84.77 | 87.65 | 88.98 | 88.00 | 90.99 | 102.30 | 93.98 | 94.06 | 103.60 | 89.77 | 92.56 | 90.74 | 75.08 | 71.46 | 82.83 | 74.74 | 76.29 | 77.61 | 66.96 | |
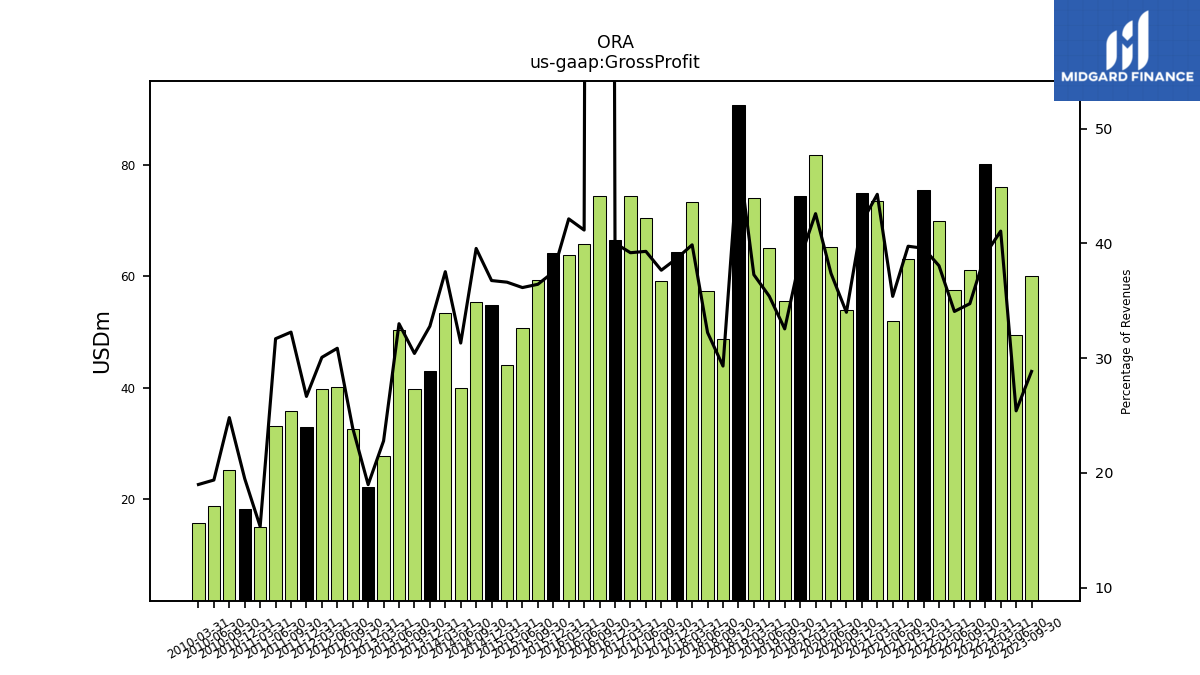
| Gross Profit | 60.00 | 49.49 | 76.07 | 80.21 | 61.11 | 57.60 | 69.91 | 75.58 | 63.14 | 51.98 | 73.65 | 75.04 | 54.03 | 65.39 | 81.82 | 74.50 | 55.49 | 65.15 | 74.18 | 90.81 | 48.79 | 57.46 | 73.37 | 64.36 | 59.19 | 70.49 | 74.41 | 66.64 | 74.49 | 65.80 | 63.87 | 64.14 | 59.33 | 50.78 | 44.02 | 54.86 | 55.48 | 39.96 | 53.46 | 42.90 | 39.76 | 50.38 | 27.73 | 22.03 | 32.54 | 40.07 | 39.79 | 32.99 | 35.76 | 33.15 | 14.99 | 18.10 | 25.18 | 18.65 | 15.69 | |
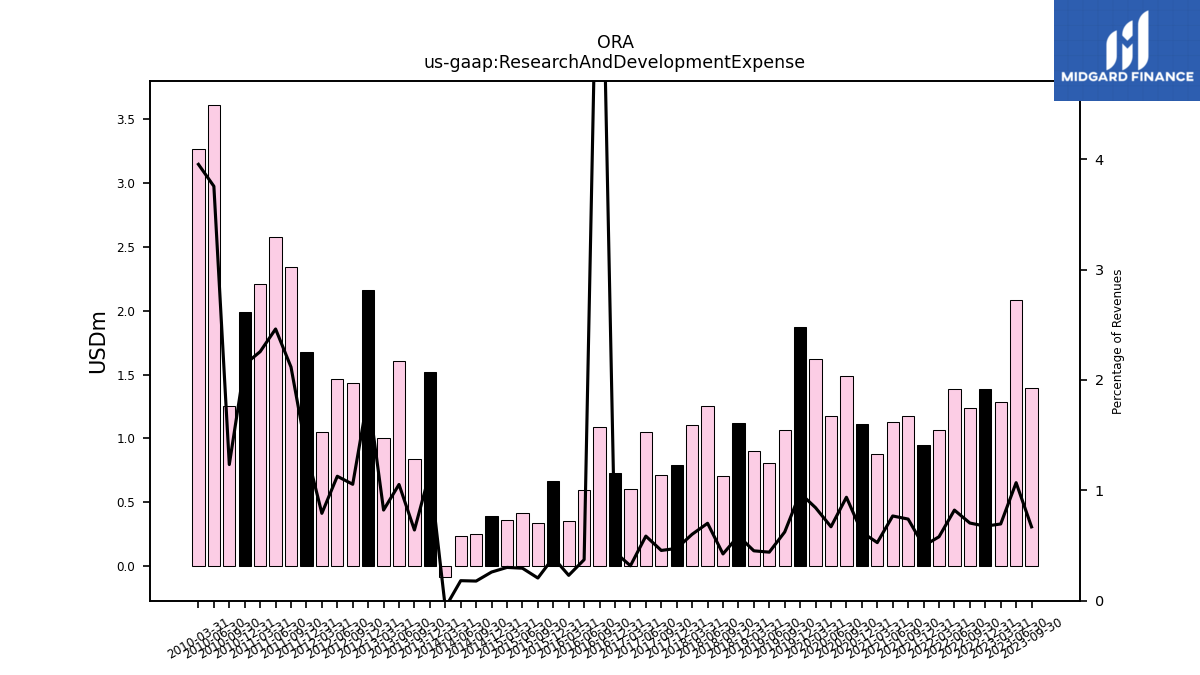
| Research And Development Expense | 1.39 | 2.08 | 1.29 | 1.39 | 1.24 | 1.39 | 1.06 | 0.95 | 1.18 | 1.13 | 0.88 | 1.11 | 1.49 | 1.17 | 1.62 | 1.88 | 1.06 | 0.81 | 0.90 | 1.12 | 0.71 | 1.25 | 1.11 | 0.79 | 0.72 | 1.05 | 0.60 | 0.73 | 1.09 | 0.59 | 0.35 | 0.67 | 0.34 | 0.41 | 0.36 | 0.39 | 0.25 | 0.23 | -0.09 | 1.52 | 0.84 | 1.61 | 1.00 | 2.16 | 1.44 | 1.46 | 1.05 | 1.67 | 2.35 | 2.58 | 2.21 | 1.99 | 1.25 | 3.61 | 3.27 | |
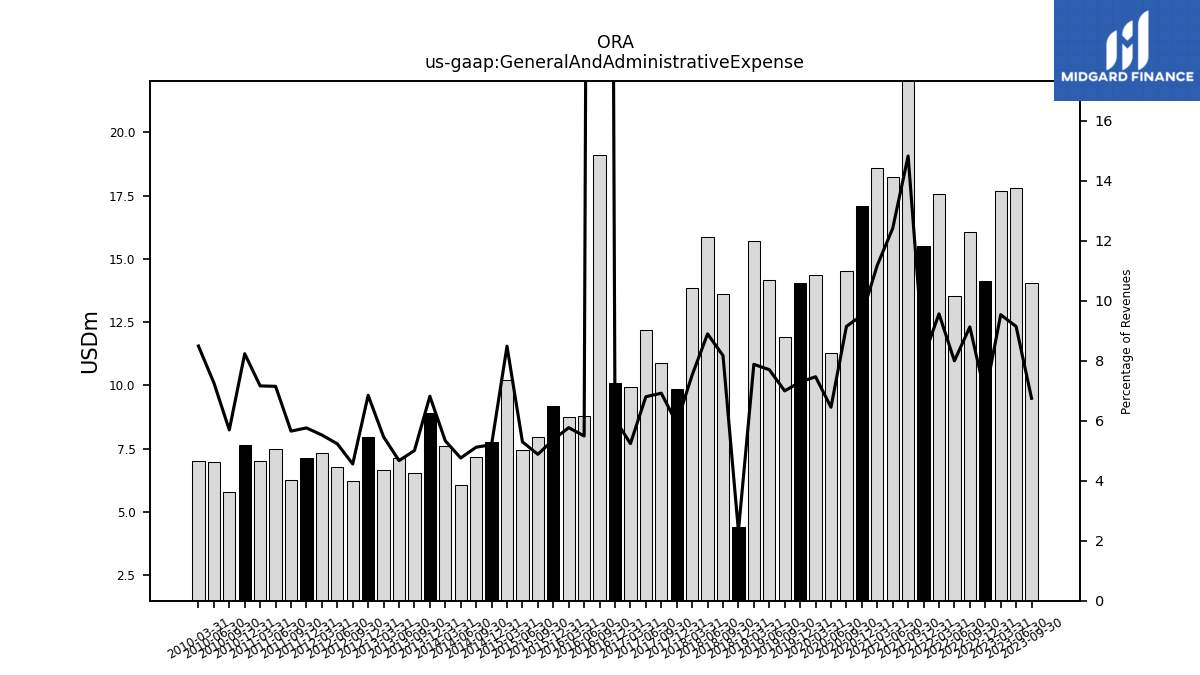
| General And Administrative Expense | 14.04 | 17.81 | 17.67 | 14.12 | 16.06 | 13.53 | 17.57 | 15.50 | 23.55 | 18.24 | 18.61 | 17.07 | 14.54 | 11.29 | 14.35 | 14.03 | 11.93 | 14.18 | 15.69 | 4.43 | 13.61 | 15.87 | 13.85 | 9.85 | 10.88 | 12.20 | 9.95 | 10.09 | 19.09 | 8.78 | 8.75 | 9.19 | 7.95 | 7.44 | 10.20 | 7.77 | 7.18 | 6.07 | 7.60 | 8.92 | 6.55 | 7.13 | 6.65 | 7.95 | 6.21 | 6.79 | 7.31 | 7.13 | 6.27 | 7.48 | 7.01 | 7.65 | 5.78 | 7.00 | 7.02 | |
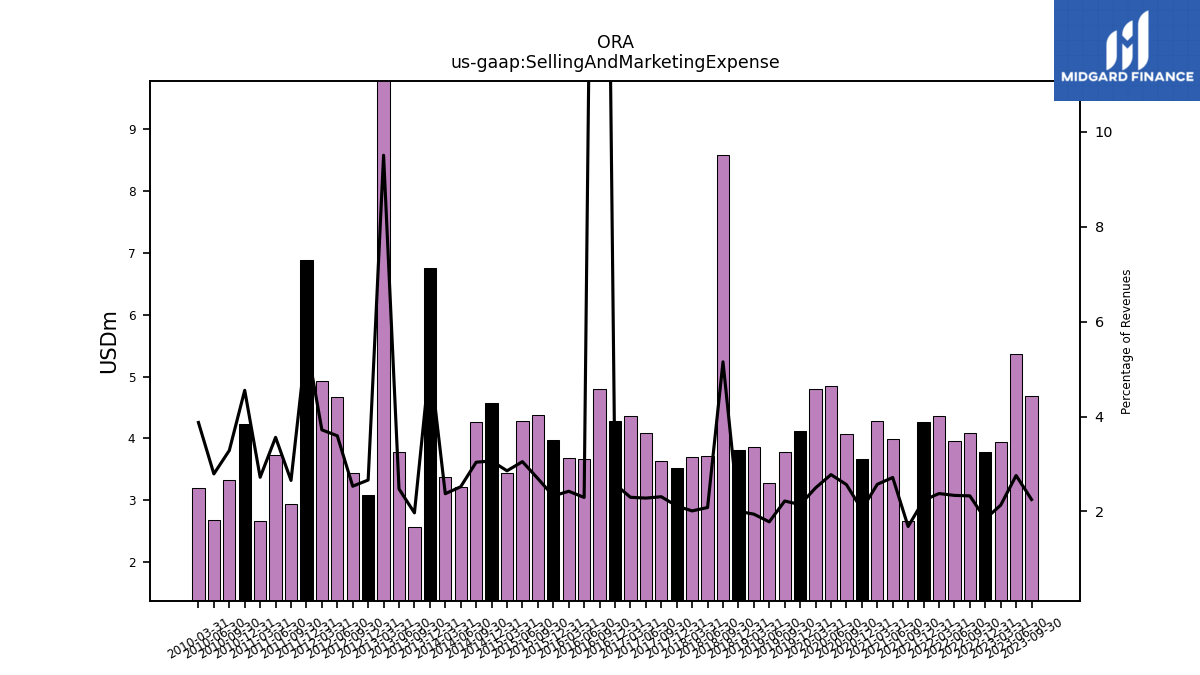
| Selling And Marketing Expense | 4.68 | 5.37 | 3.95 | 3.78 | 4.09 | 3.95 | 4.37 | 4.26 | 2.67 | 3.99 | 4.28 | 3.66 | 4.08 | 4.85 | 4.79 | 4.12 | 3.78 | 3.28 | 3.87 | 3.81 | 8.58 | 3.71 | 3.70 | 3.52 | 3.63 | 4.09 | 4.36 | 4.29 | 4.79 | 3.67 | 3.67 | 3.98 | 4.38 | 4.28 | 3.43 | 4.57 | 4.26 | 3.22 | 3.38 | 6.75 | 2.58 | 3.78 | 11.57 | 3.09 | 3.44 | 4.67 | 4.92 | 6.88 | 2.94 | 3.73 | 2.66 | 4.23 | 3.33 | 2.69 | 3.20 | |
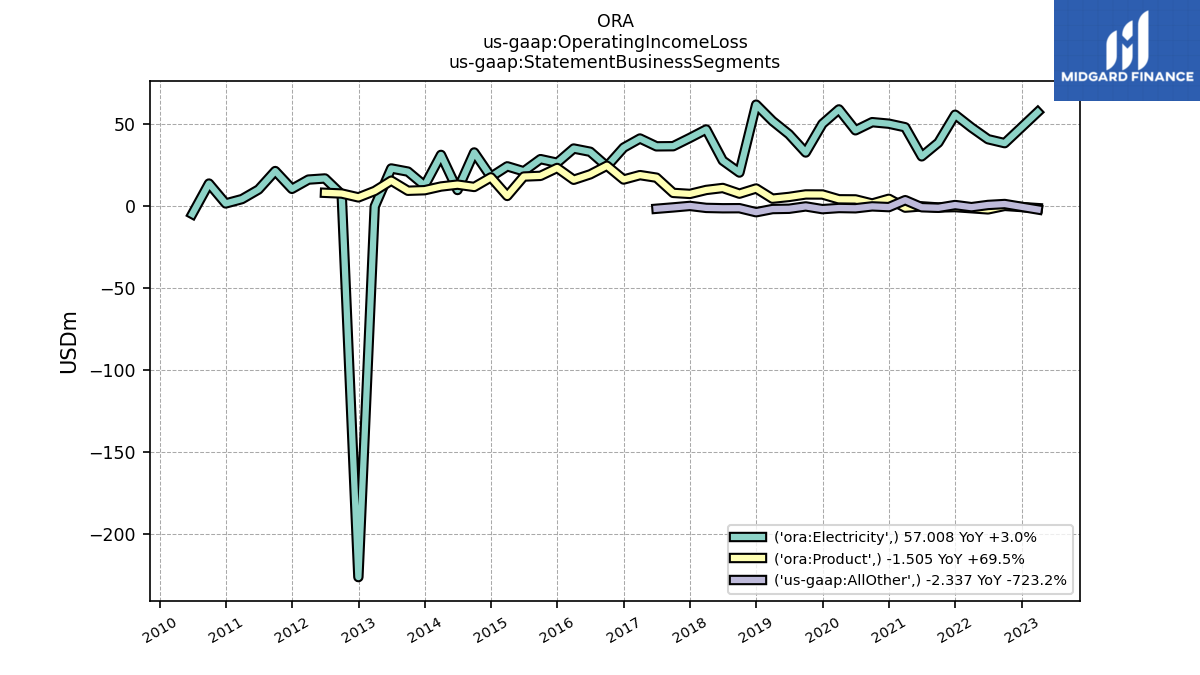
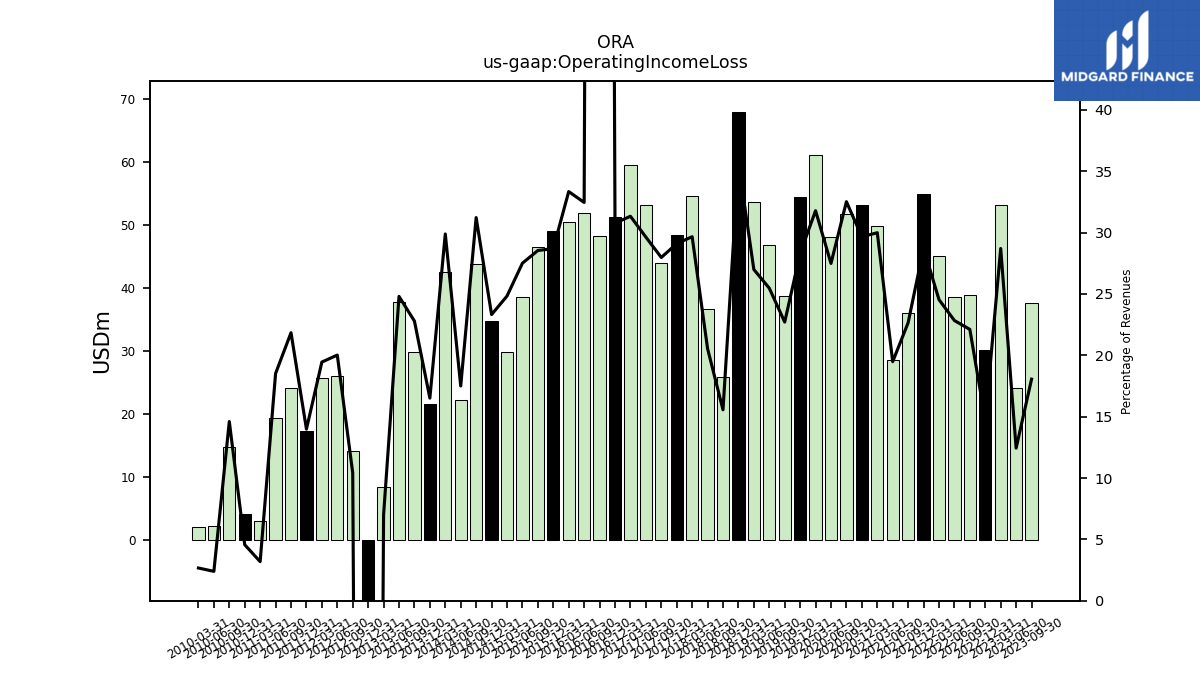
| Operating Income Loss | 37.57 | 24.22 | 53.17 | 30.23 | 38.89 | 38.61 | 45.08 | 54.86 | 35.99 | 28.62 | 49.89 | 53.20 | 51.69 | 48.08 | 61.06 | 54.47 | 38.72 | 46.88 | 53.73 | 67.98 | 25.90 | 36.63 | 54.59 | 48.40 | 43.97 | 53.15 | 59.50 | 51.23 | 48.22 | 51.89 | 50.54 | 49.09 | 46.48 | 38.64 | 29.85 | 34.80 | 43.79 | 22.33 | 42.57 | 21.61 | 29.80 | 37.86 | 8.51 | -221.01 | 14.19 | 25.99 | 25.74 | 17.31 | 24.21 | 19.37 | 3.12 | 4.24 | 14.82 | 2.31 | 2.21 | |
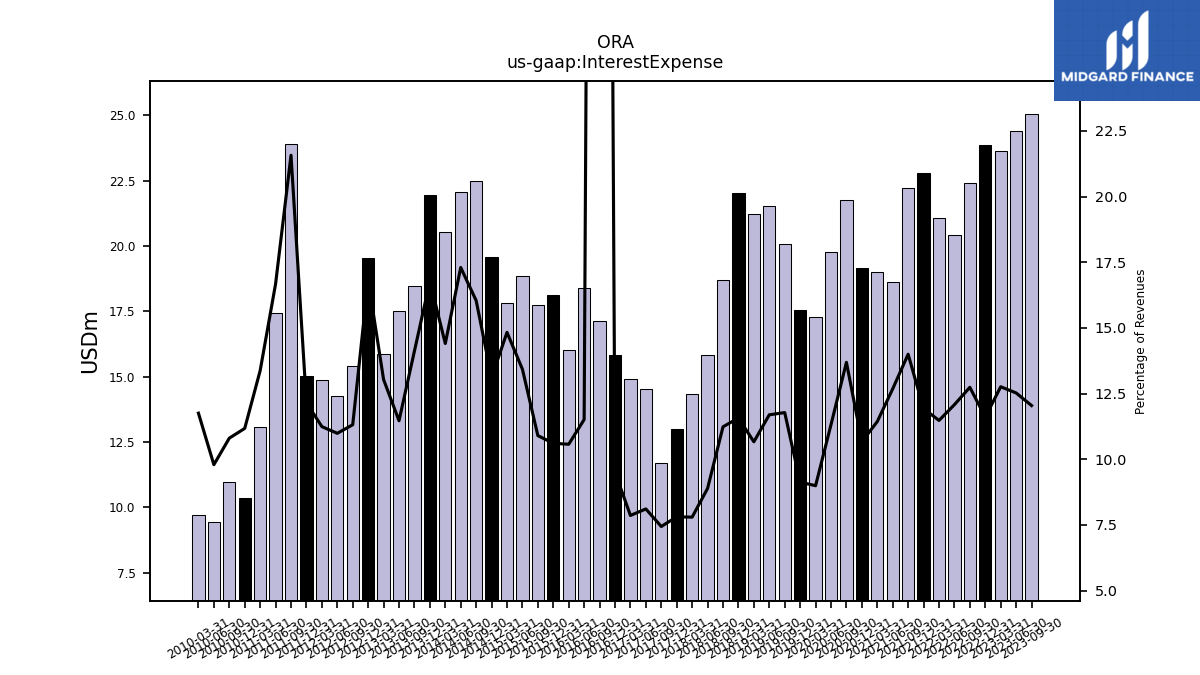
| Interest Expense | 25.05 | 24.39 | 23.63 | 23.84 | 22.40 | 20.42 | 21.08 | 22.79 | 22.23 | 18.63 | 19.02 | 19.14 | 21.76 | 19.79 | 17.27 | 17.57 | 20.08 | 21.52 | 21.22 | 22.03 | 18.70 | 15.85 | 14.34 | 12.99 | 11.69 | 14.54 | 14.92 | 15.83 | 17.14 | 18.40 | 16.02 | 18.14 | 17.75 | 18.86 | 17.83 | 19.57 | 22.49 | 22.07 | 20.52 | 21.95 | 18.46 | 17.50 | 15.86 | 19.53 | 15.40 | 14.26 | 14.88 | 15.03 | 23.91 | 17.44 | 13.08 | 10.37 | 10.96 | 9.43 | 9.71 | |
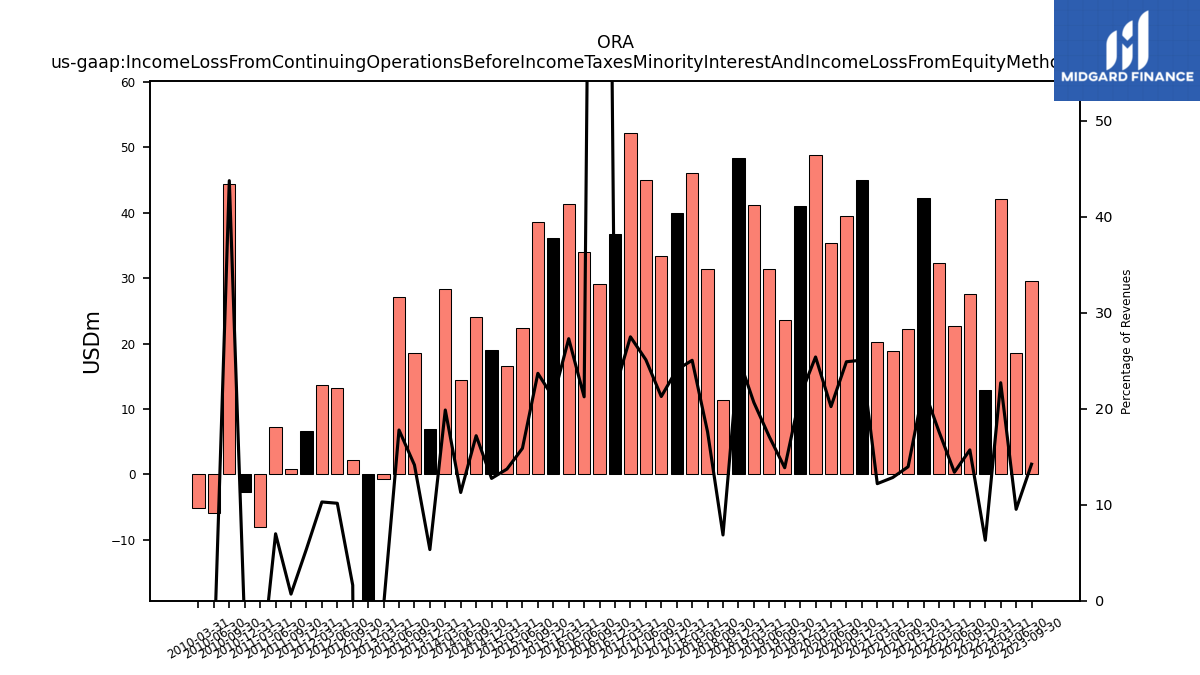
| Income Loss From Continuing Operations Before Income Taxes Minority Interest And Income Loss From Equity Method Investments | 29.60 | 18.56 | 42.08 | 12.95 | 27.64 | 22.64 | 32.38 | 42.22 | 22.18 | 18.86 | 20.29 | 44.97 | 39.58 | 35.38 | 48.79 | 41.09 | 23.63 | 31.47 | 41.12 | 48.29 | 11.41 | 31.38 | 46.10 | 40.02 | 33.45 | 45.04 | 52.22 | 36.68 | 29.05 | 33.97 | 41.39 | 36.20 | 38.58 | 22.31 | 16.50 | 19.02 | 24.11 | 14.39 | 28.31 | 6.98 | 18.50 | 27.16 | -0.68 | -236.01 | 2.21 | 13.19 | 13.62 | 6.67 | 0.77 | 7.30 | -7.97 | -2.63 | 44.41 | -5.91 | -5.10 | |
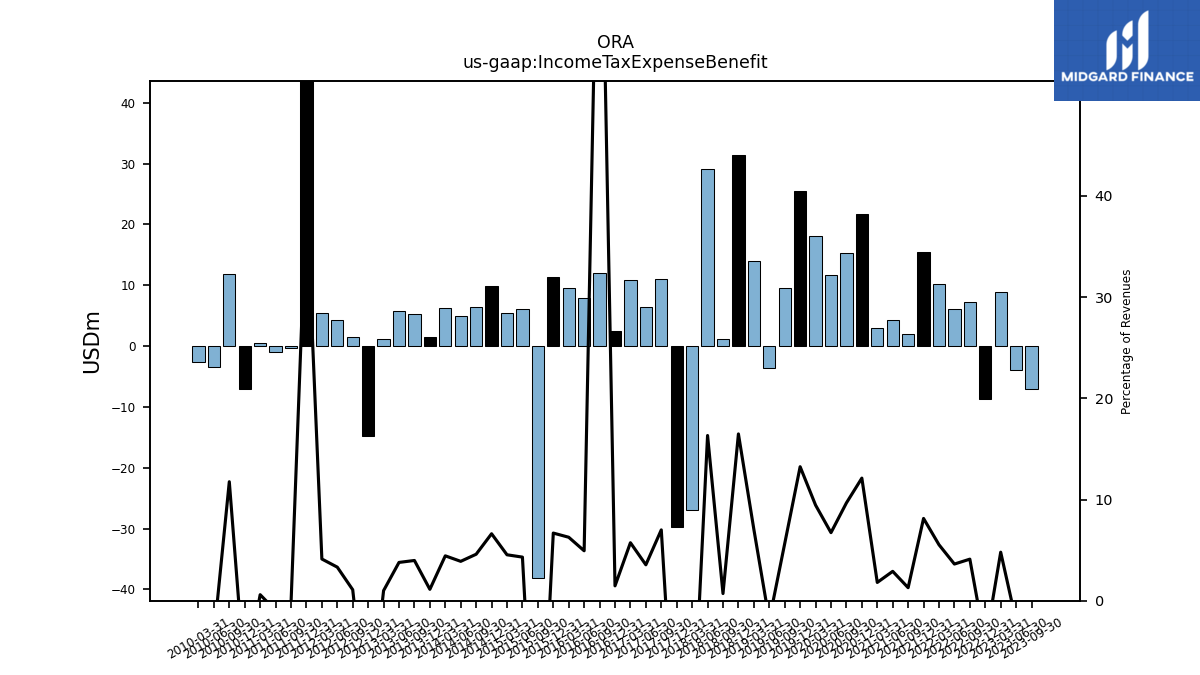
| Income Tax Expense Benefit | -7.13 | -3.96 | 8.88 | -8.78 | 7.23 | 6.13 | 10.16 | 15.53 | 2.05 | 4.27 | 3.01 | 21.73 | 15.36 | 11.77 | 18.15 | 25.48 | 9.63 | -3.53 | 14.04 | 31.39 | 1.18 | 29.11 | -26.94 | -29.67 | 11.00 | 6.37 | 10.89 | 2.45 | 11.99 | 7.89 | 9.51 | 11.44 | -38.21 | 6.06 | 5.46 | 9.88 | 6.44 | 4.97 | 6.32 | 1.48 | 5.20 | 5.78 | 1.22 | -14.74 | 1.48 | 4.31 | 5.46 | 49.26 | -0.30 | -1.01 | 0.59 | -7.11 | 11.93 | -3.37 | -2.56 | |
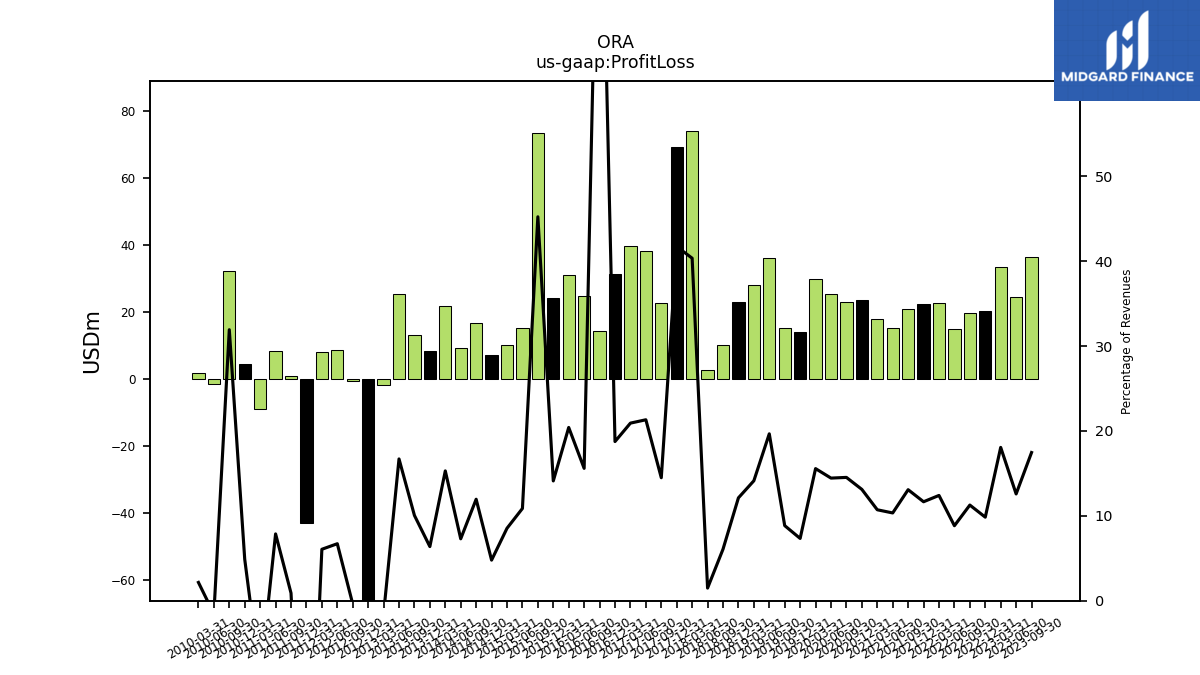
| Profit Loss | 36.33 | 24.51 | 33.46 | 20.23 | 19.83 | 14.95 | 22.79 | 22.27 | 20.78 | 15.20 | 17.83 | 23.53 | 23.10 | 25.27 | 29.91 | 14.13 | 15.09 | 36.20 | 28.13 | 23.09 | 10.11 | 2.66 | 74.26 | 69.43 | 22.78 | 38.24 | 39.73 | 31.23 | 14.41 | 24.93 | 30.95 | 24.15 | 73.66 | 15.27 | 10.27 | 7.14 | 16.77 | 9.31 | 21.79 | 8.36 | 13.14 | 25.51 | -1.90 | -222.25 | -0.52 | 8.72 | 8.03 | -43.00 | 1.00 | 8.24 | -8.96 | 4.54 | 32.40 | -1.49 | 1.78 | |
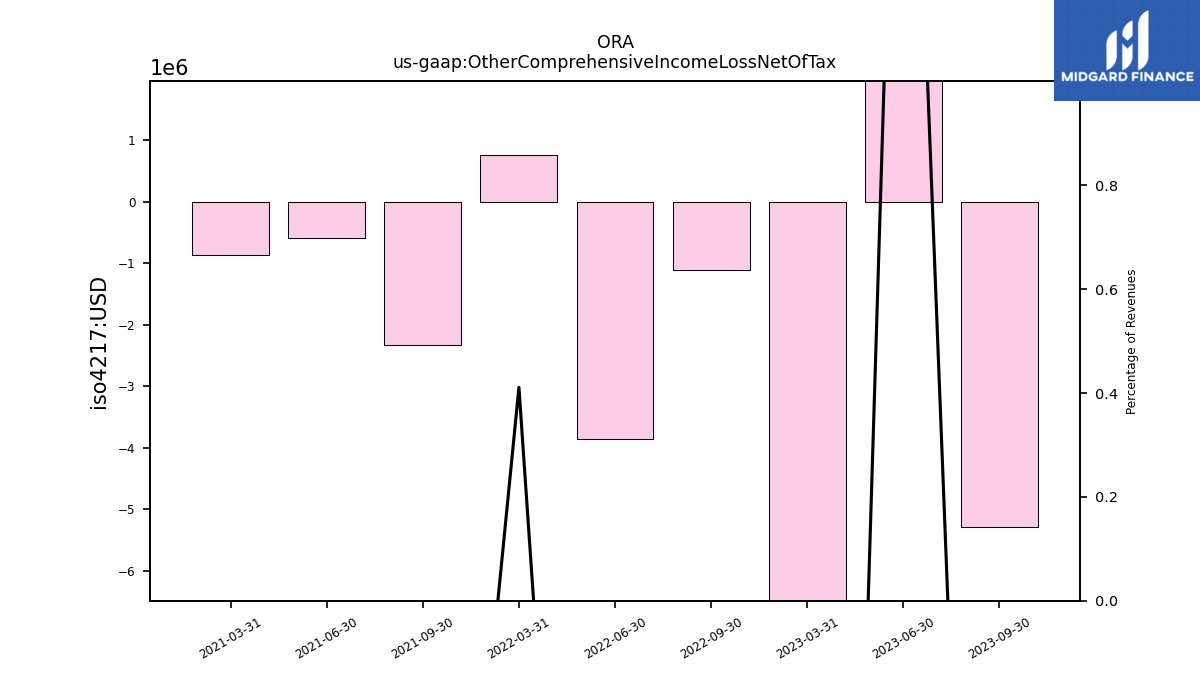
| Other Comprehensive Income Loss Net Of Tax | -5.28 | 4.29 | -7.10 | NA | -1.11 | -3.85 | 0.76 | NA | -2.33 | -0.59 | -0.87 | NA | NA | NA | NA | NA | NA | NA | NA | NA | NA | NA | NA | NA | NA | NA | NA | NA | NA | NA | NA | NA | NA | NA | NA | NA | NA | NA | NA | NA | NA | NA | NA | NA | NA | NA | NA | NA | NA | NA | NA | NA | NA | NA | NA | |
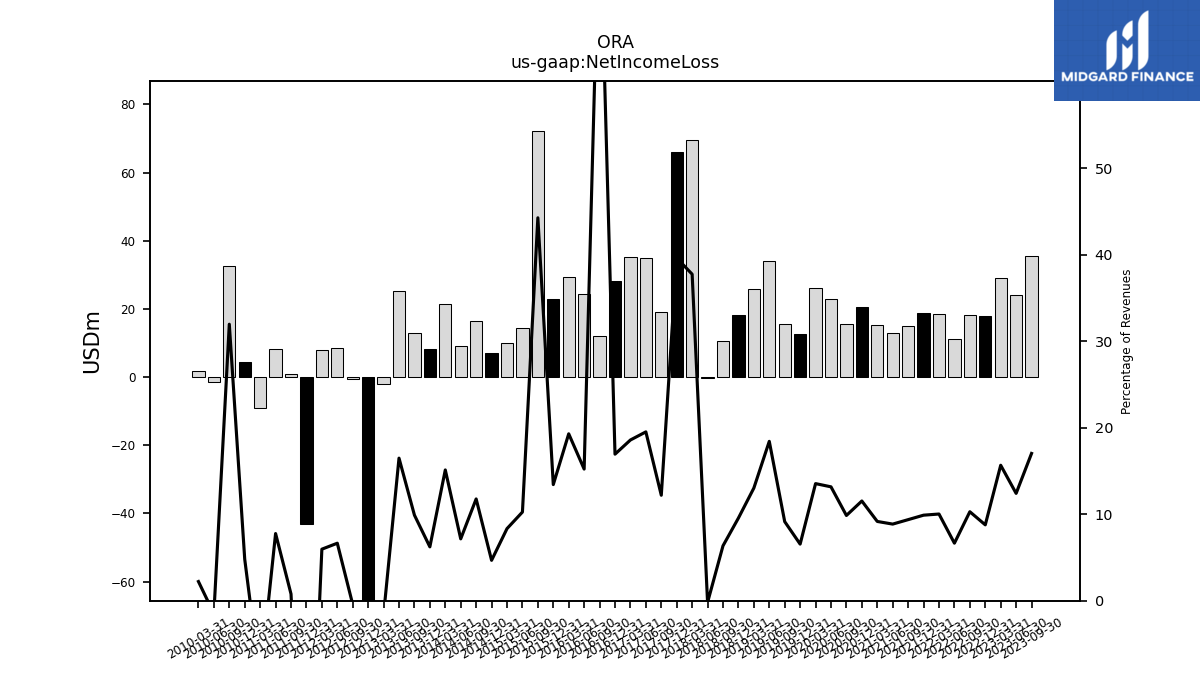
| Net Income Loss | 35.45 | 24.19 | 29.03 | 18.04 | 18.11 | 11.26 | 18.43 | 18.91 | 14.90 | 13.03 | 15.26 | 20.70 | 15.68 | 23.05 | 26.03 | 12.61 | 15.61 | 33.94 | 25.95 | 18.22 | 10.58 | -0.34 | 69.51 | 65.96 | 19.18 | 35.04 | 35.31 | 28.23 | 12.08 | 24.35 | 29.27 | 22.99 | 72.14 | 14.41 | 10.03 | 6.98 | 16.51 | 9.14 | 21.55 | 8.16 | 12.95 | 25.18 | -1.98 | -222.38 | -0.58 | 8.64 | 7.89 | -43.08 | 0.87 | 8.13 | -8.97 | 4.46 | 32.46 | -1.44 | 1.84 | |
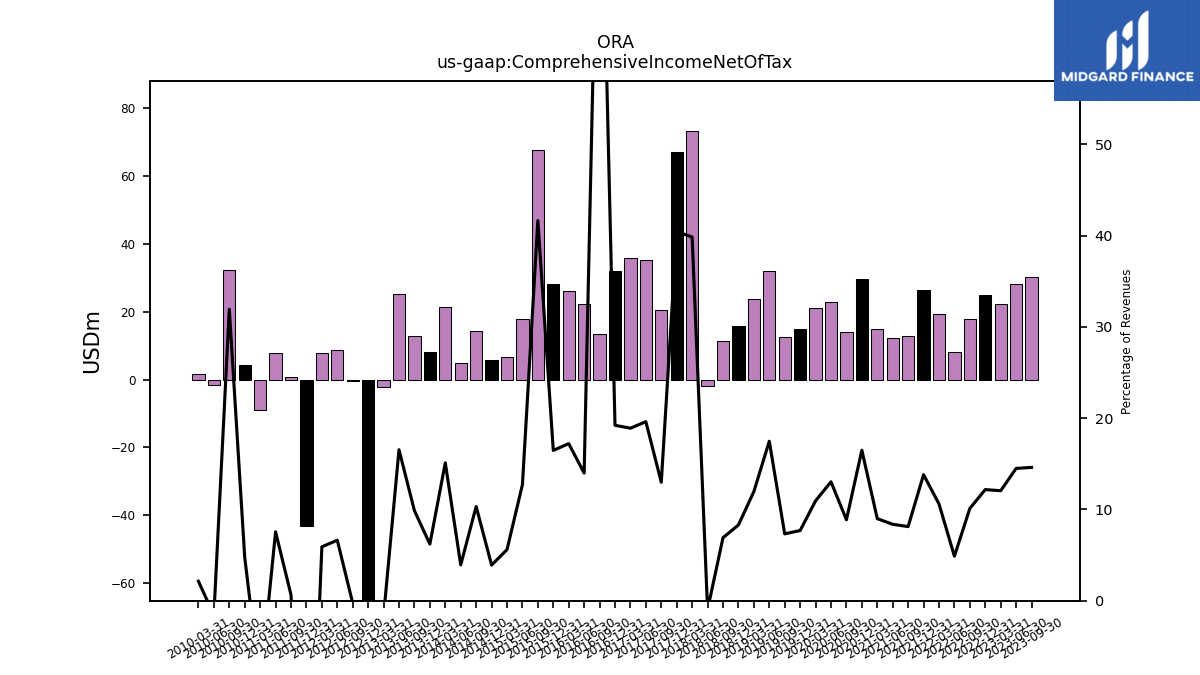
| Comprehensive Income Net Of Tax | 30.39 | 28.23 | 22.32 | 25.02 | 17.78 | 8.25 | 19.48 | 26.36 | 12.90 | 12.30 | 14.96 | 29.58 | 14.10 | 22.79 | 21.02 | 14.80 | 12.49 | 32.16 | 23.79 | 15.81 | 11.49 | -1.73 | 73.31 | 67.28 | 20.40 | 35.18 | 35.89 | 32.00 | 13.41 | 22.36 | 26.09 | 28.16 | 67.81 | 17.87 | 6.73 | 5.83 | 14.48 | 5.01 | 21.52 | 8.12 | 12.89 | 25.25 | -2.02 | -222.43 | -0.37 | 8.60 | 7.82 | -43.05 | 0.70 | 7.89 | -9.05 | 4.40 | 32.40 | -1.51 | 1.76 |
| 2023-09-30 | 2023-06-30 | 2023-03-31 | 2022-12-31 | 2022-09-30 | 2022-06-30 | 2022-03-31 | 2021-12-31 | 2021-09-30 | 2021-06-30 | 2021-03-31 | 2020-12-31 | 2020-09-30 | 2020-06-30 | 2020-03-31 | 2019-12-31 | 2019-09-30 | 2019-06-30 | 2019-03-31 | 2018-12-31 | 2018-09-30 | 2018-06-30 | 2018-03-31 | 2017-12-31 | 2017-09-30 | 2017-06-30 | 2017-03-31 | 2016-12-31 | 2016-09-30 | 2016-06-30 | 2016-03-31 | 2015-12-31 | 2015-09-30 | 2015-06-30 | 2015-03-31 | 2014-12-31 | 2014-09-30 | 2014-06-30 | 2014-03-31 | 2013-12-31 | 2013-09-30 | 2013-06-30 | 2013-03-31 | 2012-12-31 | 2012-09-30 | 2012-06-30 | 2012-03-31 | 2011-12-31 | 2011-09-30 | 2011-06-30 | 2011-03-31 | 2010-12-31 | 2010-09-30 | 2010-06-30 | 2010-03-31 | ||
|---|---|---|---|---|---|---|---|---|---|---|---|---|---|---|---|---|---|---|---|---|---|---|---|---|---|---|---|---|---|---|---|---|---|---|---|---|---|---|---|---|---|---|---|---|---|---|---|---|---|---|---|---|---|---|---|---|
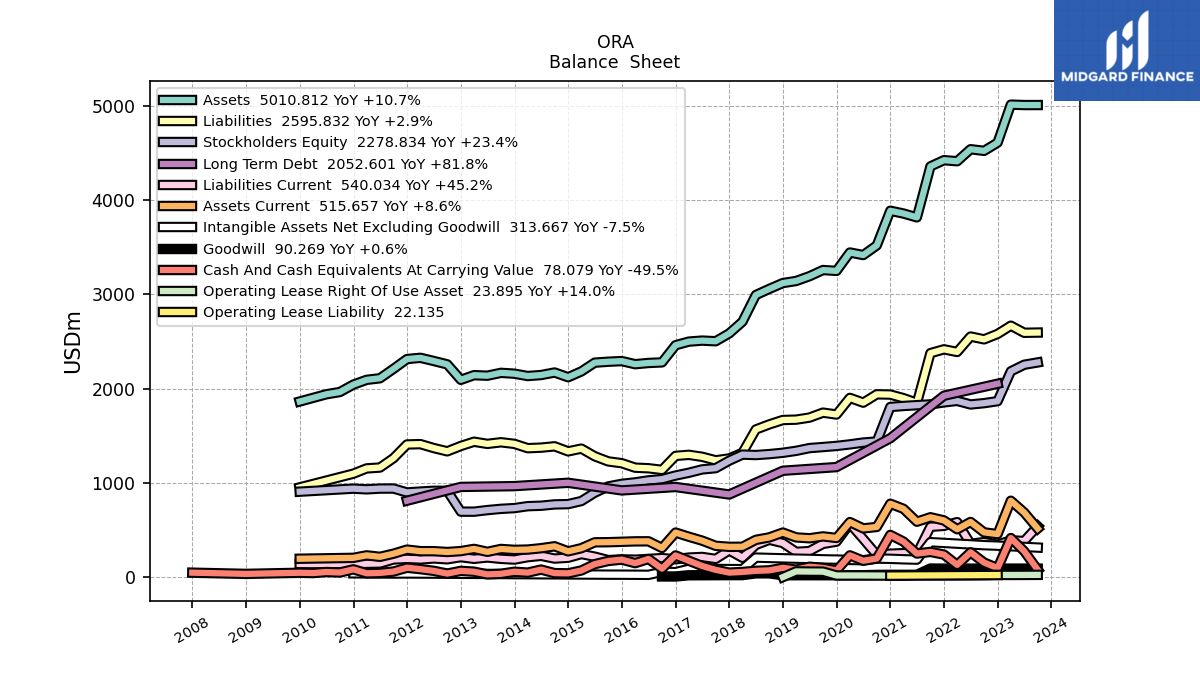
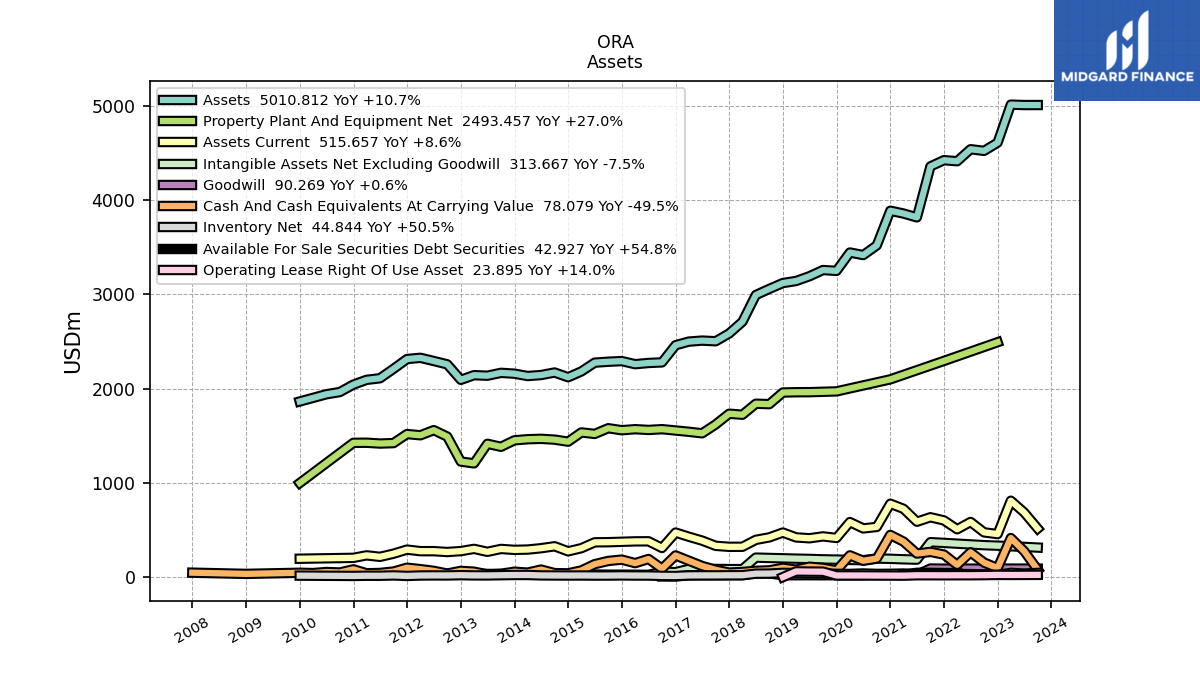
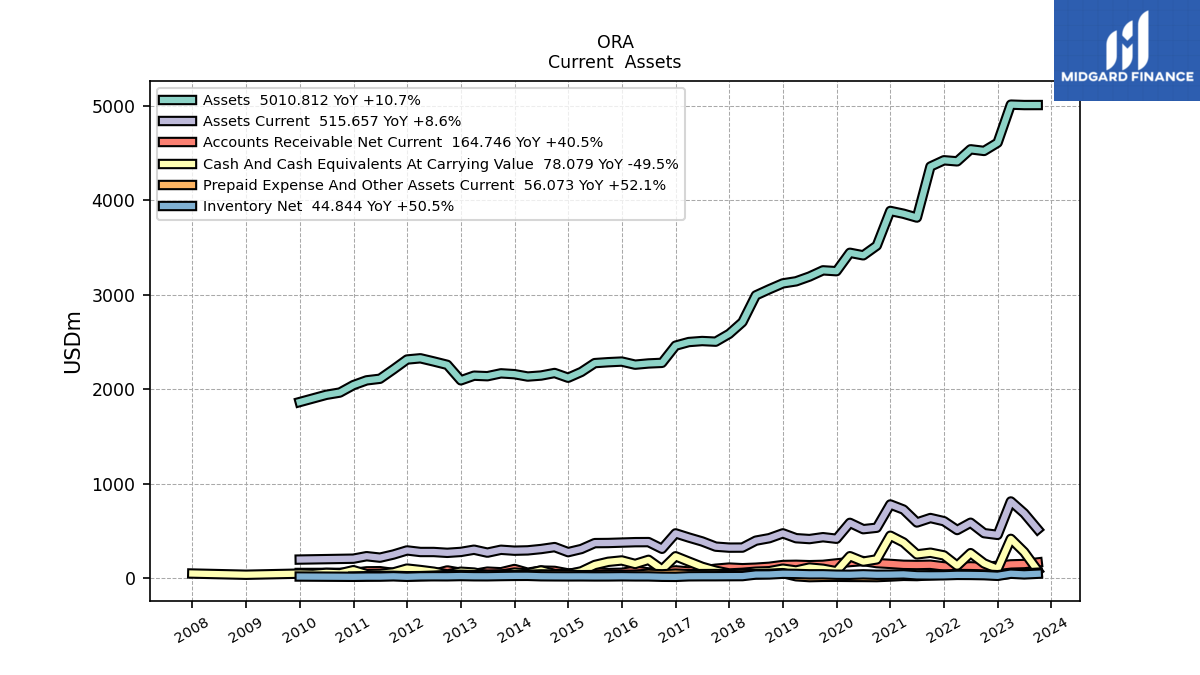
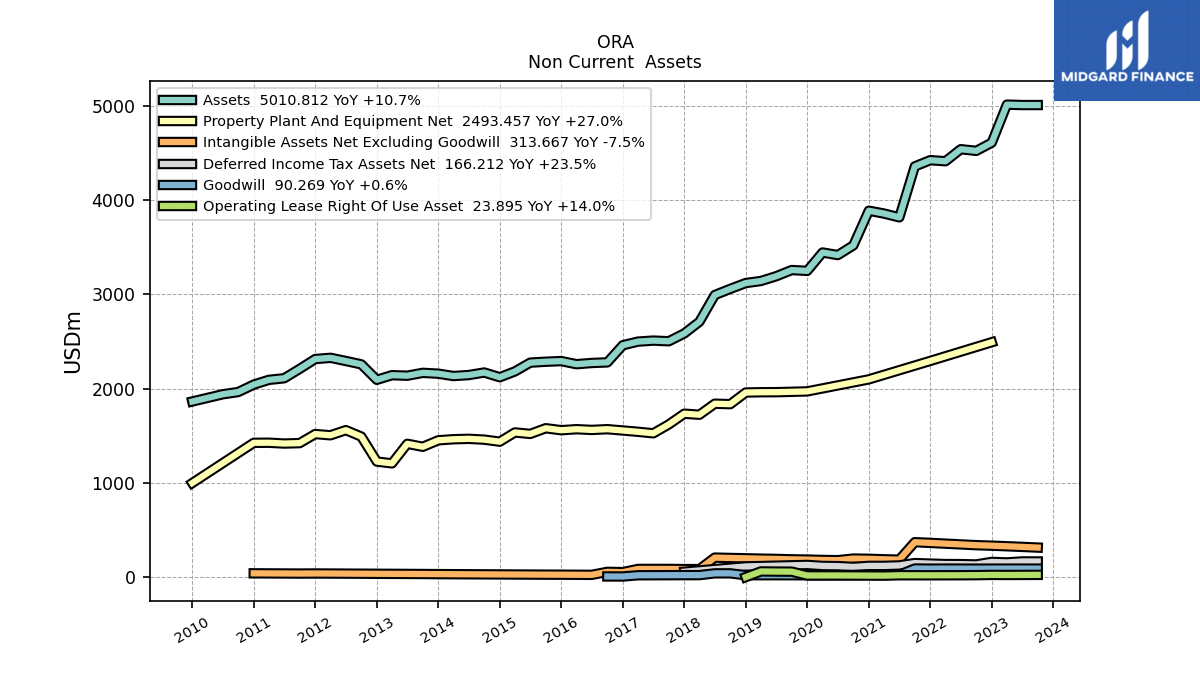
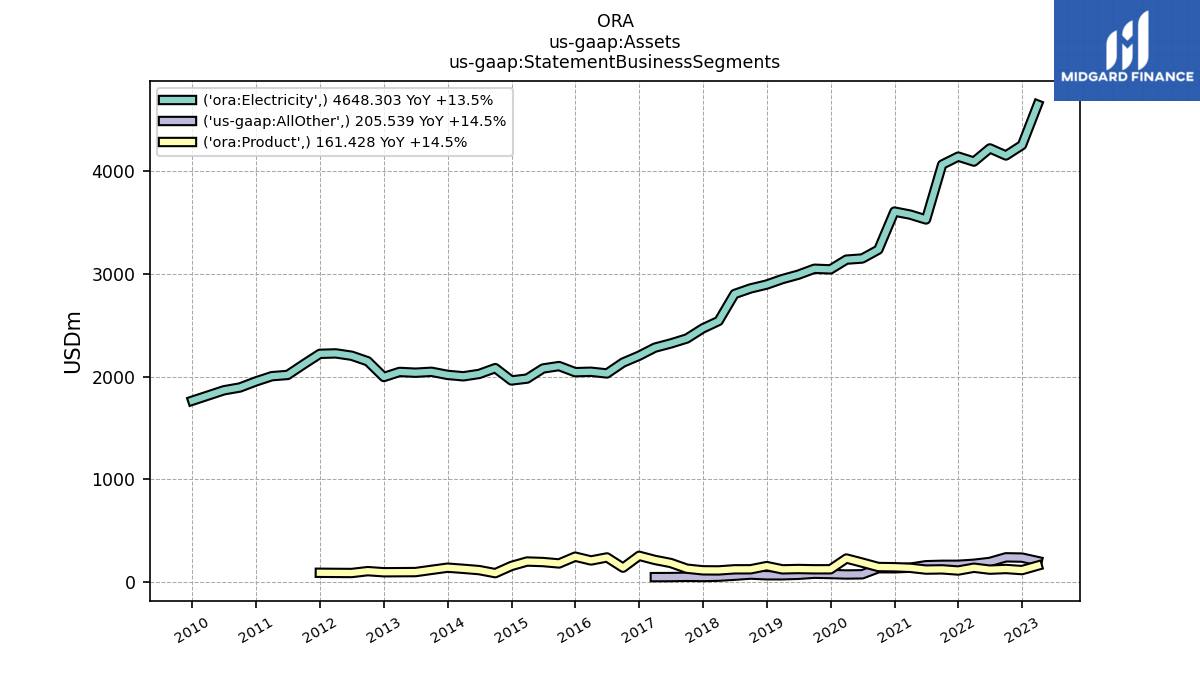
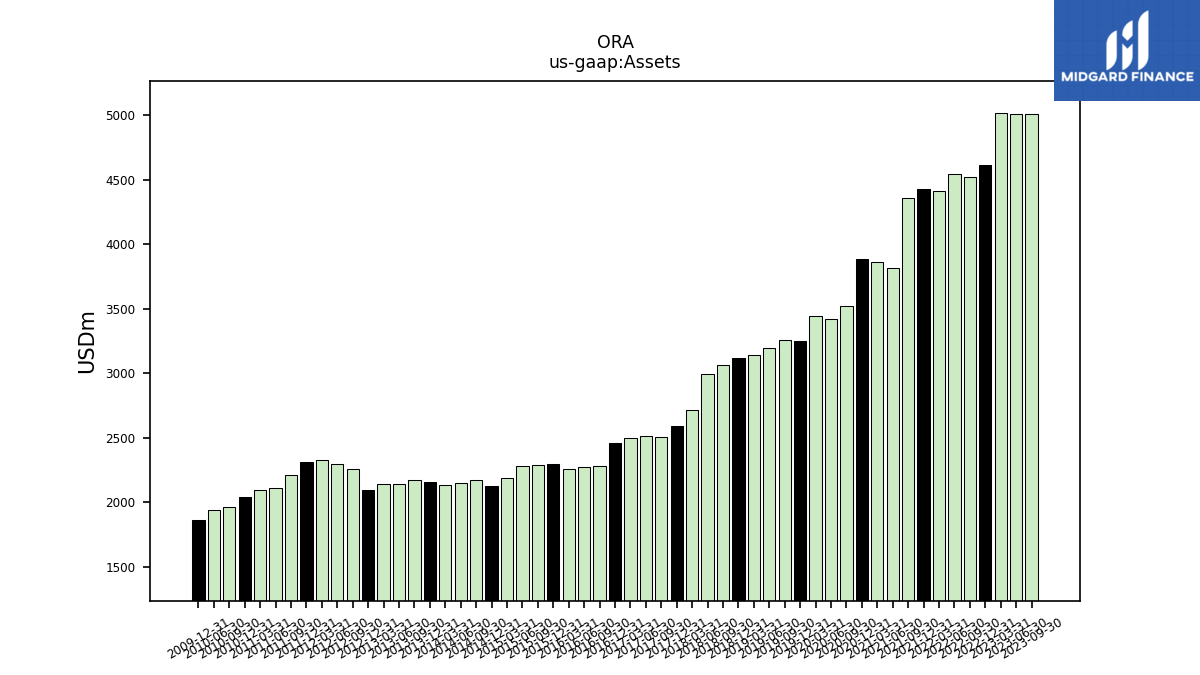
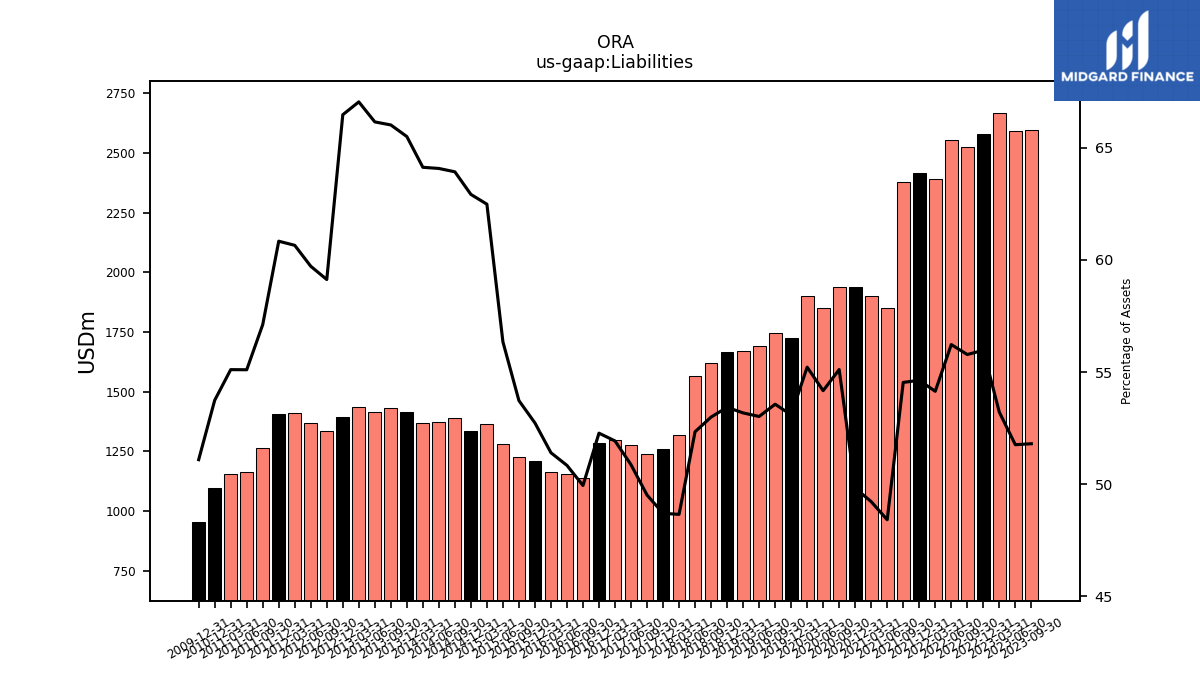
| Assets | 5010.81 | 5010.64 | 5015.27 | 4611.58 | 4524.53 | 4541.98 | 4414.19 | 4425.68 | 4359.37 | 3818.55 | 3859.21 | 3888.99 | 3520.95 | 3418.38 | 3445.61 | 3250.49 | 3259.49 | 3193.78 | 3143.21 | 3121.35 | 3059.58 | 2994.15 | 2710.82 | 2586.66 | 2503.74 | 2510.63 | 2499.89 | 2461.57 | 2279.27 | 2273.01 | 2260.13 | 2293.04 | 2286.33 | 2276.55 | 2183.33 | 2121.56 | 2171.91 | 2144.93 | 2134.35 | 2159.43 | 2168.34 | 2137.90 | 2143.57 | 2094.11 | 2258.36 | 2294.10 | 2327.77 | 2314.72 | 2210.72 | 2110.81 | 2093.95 | 2043.33 | 1964.71 | 1940.76 | NA | |
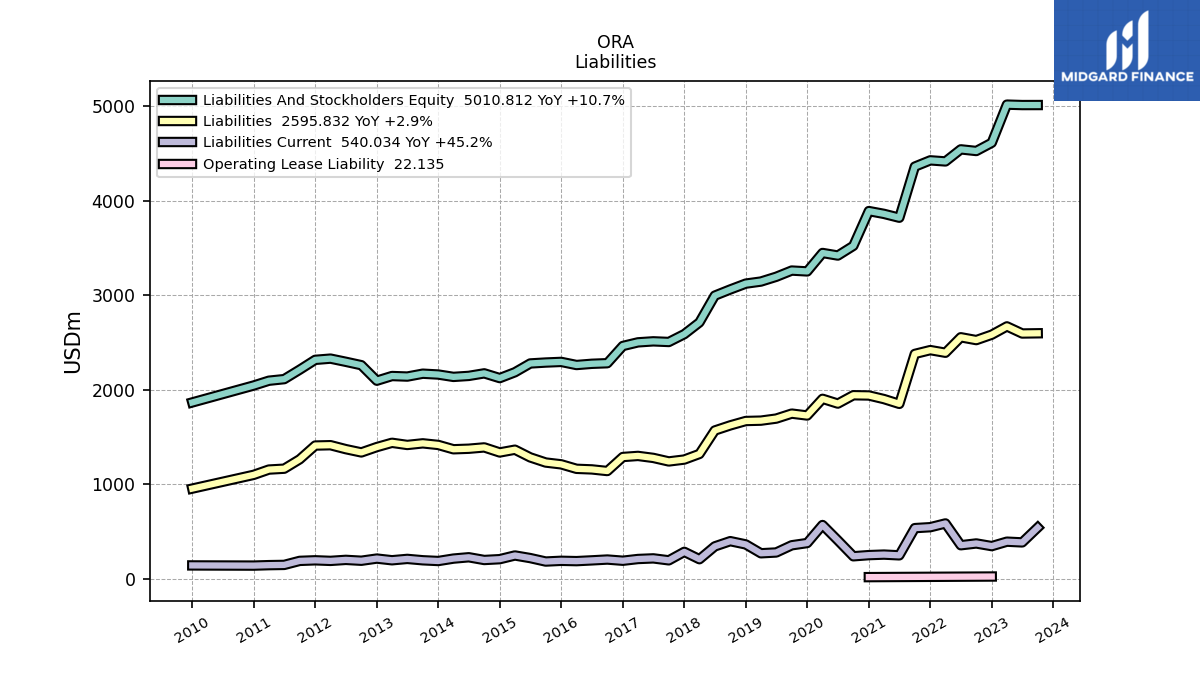
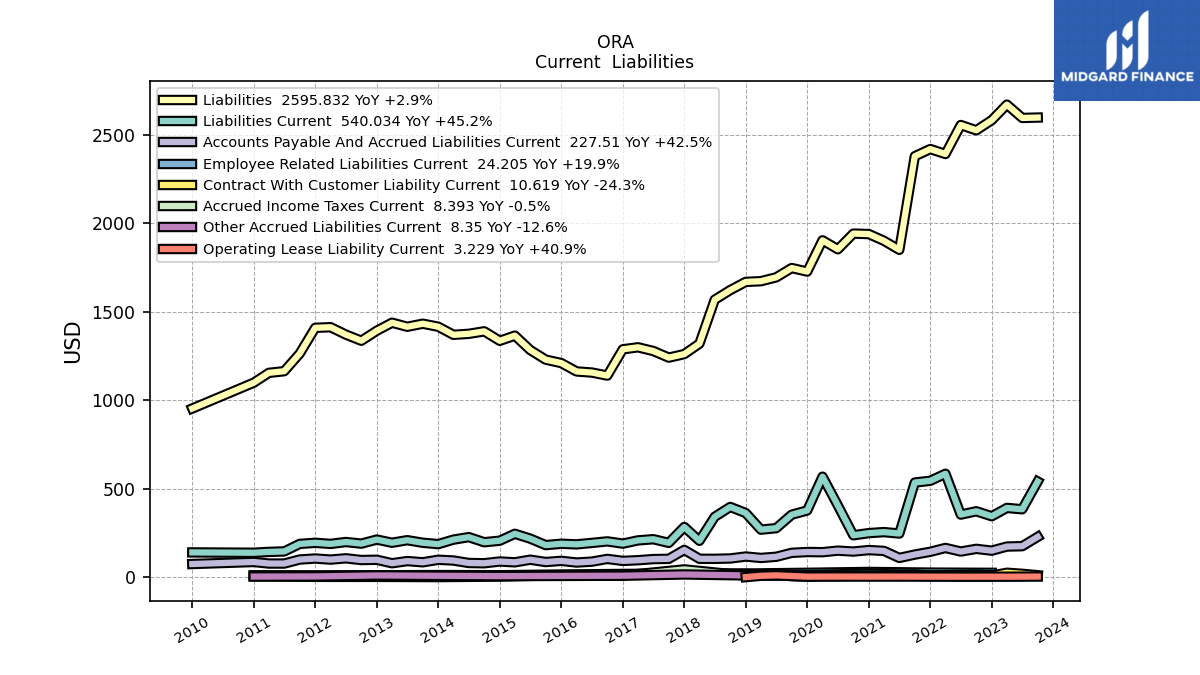
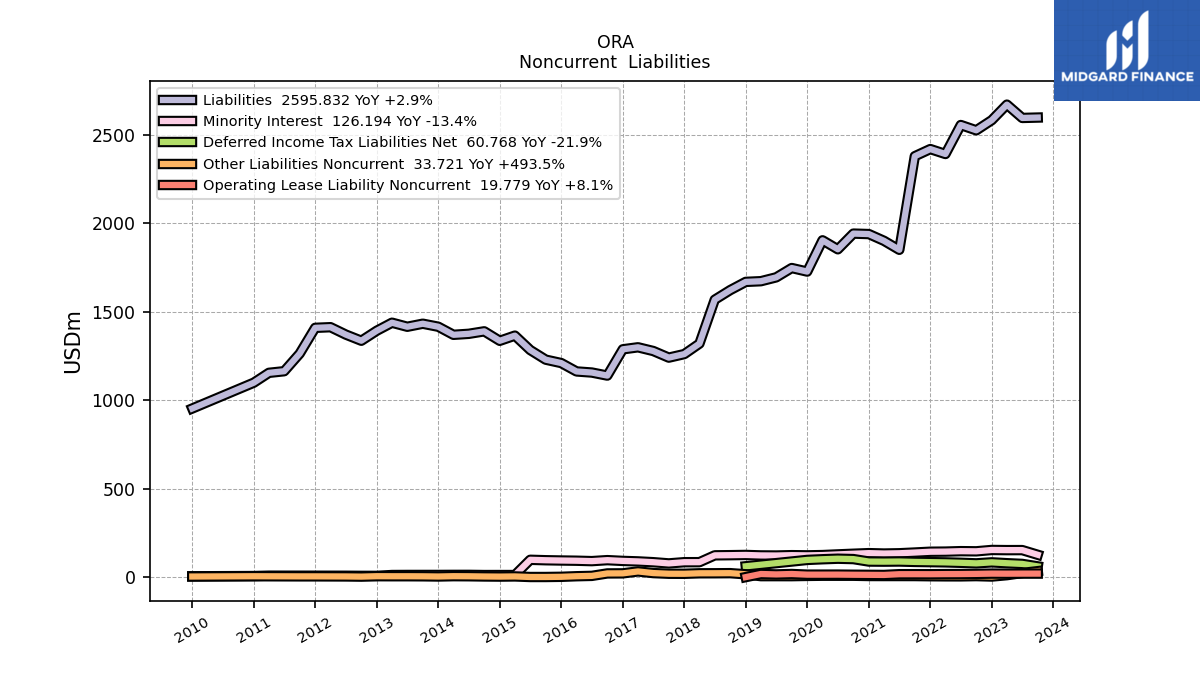
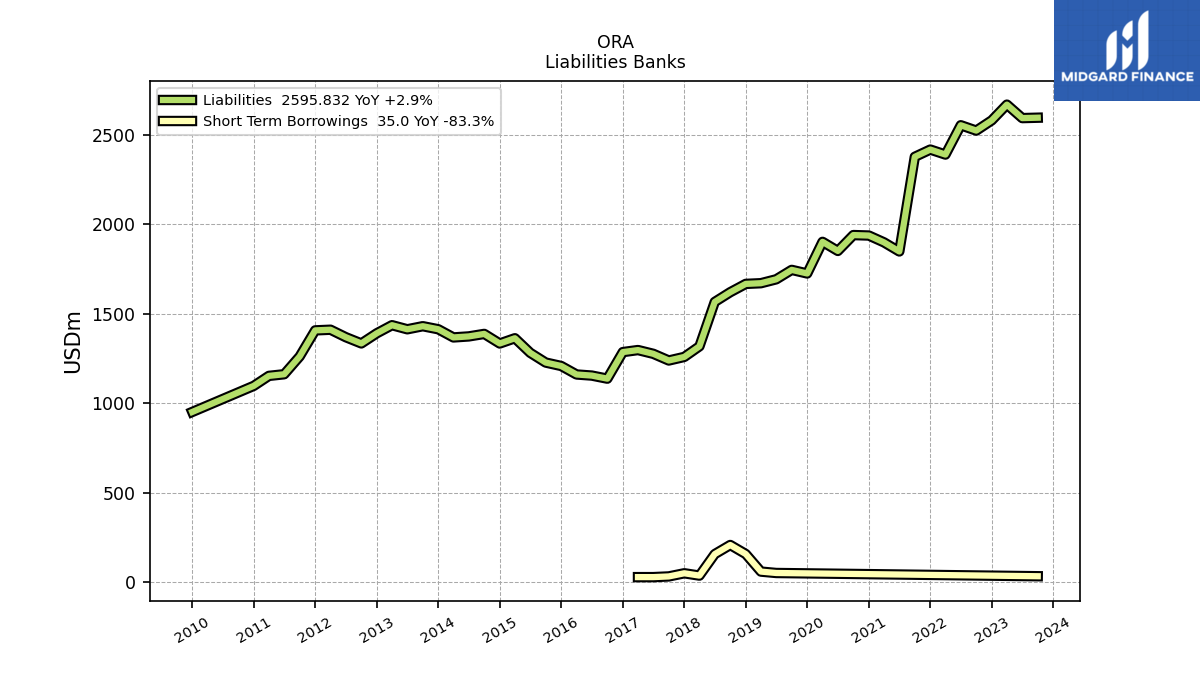
| Liabilities | 2595.83 | 2593.59 | 2668.88 | 2581.01 | 2523.82 | 2553.69 | 2389.93 | 2417.89 | 2377.47 | 1848.82 | 1899.63 | 1937.72 | 1940.40 | 1851.76 | 1902.56 | 1725.83 | 1745.96 | 1693.32 | 1671.51 | 1667.65 | 1621.37 | 1567.08 | 1318.99 | 1259.79 | 1239.81 | 1277.14 | 1298.19 | 1286.79 | 1138.36 | 1155.58 | 1161.80 | 1209.17 | 1228.38 | 1282.74 | 1364.16 | 1334.81 | 1388.37 | 1374.33 | 1368.65 | 1414.32 | 1431.37 | 1414.18 | 1437.05 | 1391.92 | 1335.21 | 1369.89 | 1411.73 | 1408.07 | 1262.62 | 1163.10 | 1153.91 | 1098.10 | NA | NA | NA | |
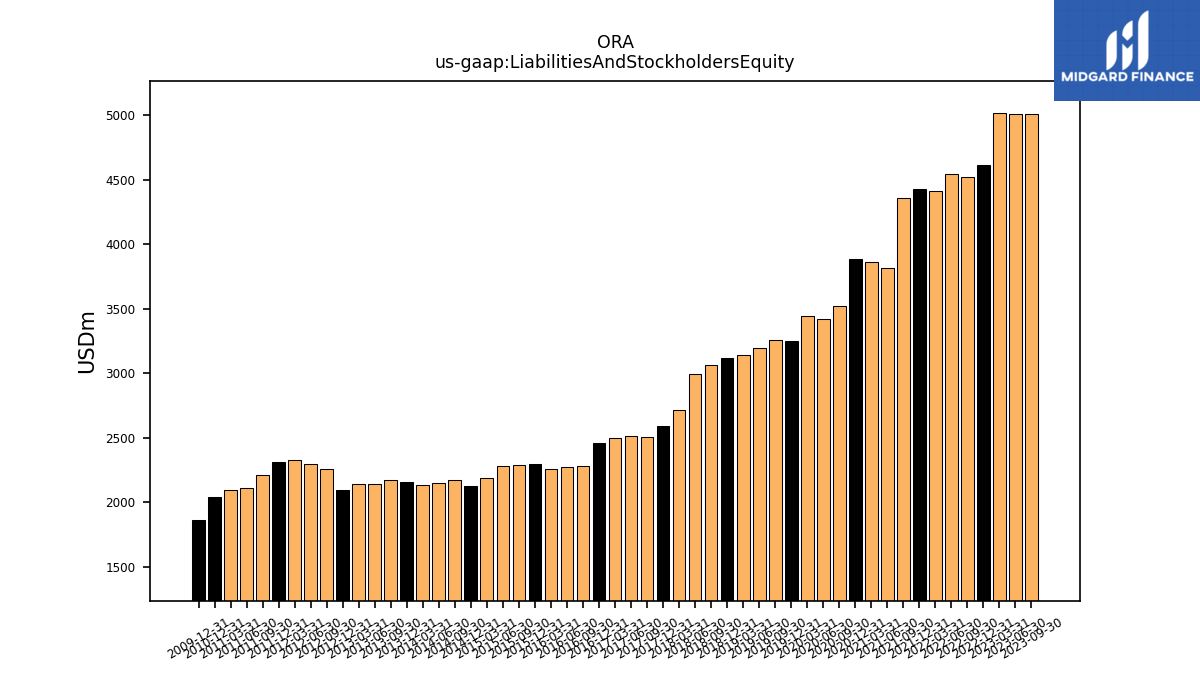
| Liabilities And Stockholders Equity | 5010.81 | 5010.64 | 5015.27 | 4611.58 | 4524.53 | 4541.98 | 4414.19 | 4425.68 | 4359.37 | 3818.55 | 3859.21 | 3888.99 | 3520.95 | 3418.38 | 3445.61 | 3250.49 | 3259.49 | 3193.78 | 3143.21 | 3121.35 | 3059.58 | 2994.15 | 2710.82 | 2586.66 | 2503.74 | 2510.63 | 2499.89 | 2461.57 | 2279.27 | 2273.01 | 2260.13 | 2293.04 | 2286.33 | 2276.55 | 2183.33 | 2121.56 | 2171.91 | 2144.93 | 2134.35 | 2159.43 | 2168.34 | 2137.90 | 2143.57 | 2094.11 | 2258.36 | 2294.10 | 2327.77 | 2314.72 | 2210.72 | 2110.81 | 2093.95 | 2043.33 | NA | NA | NA | |
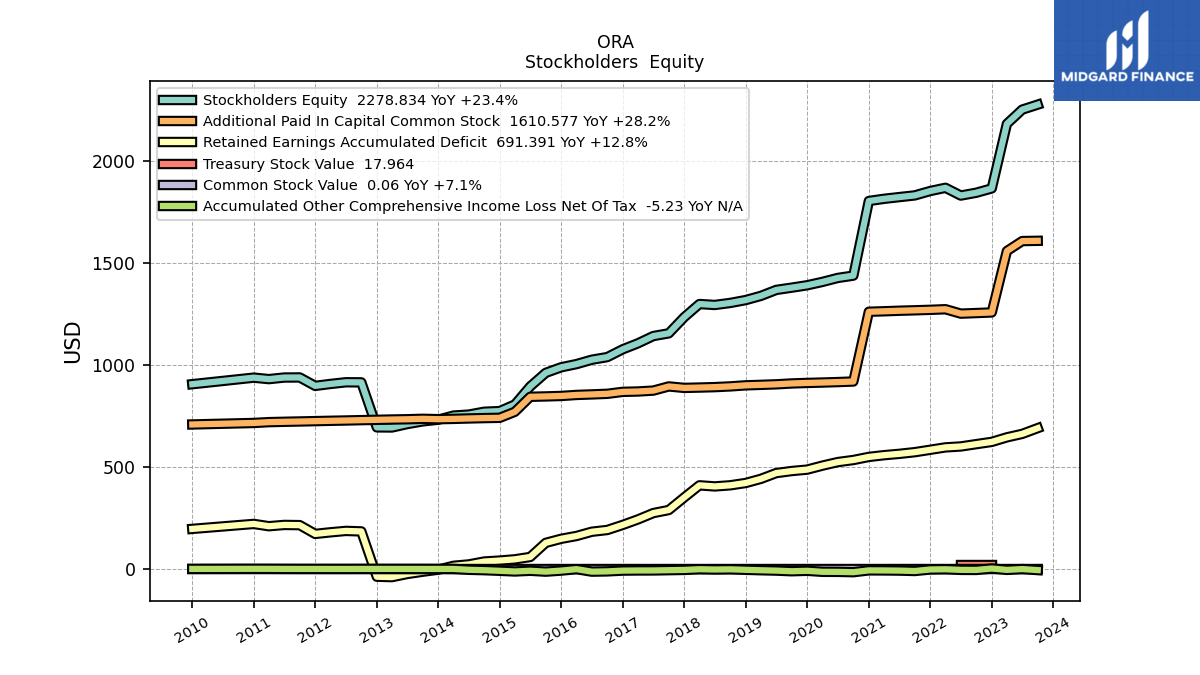
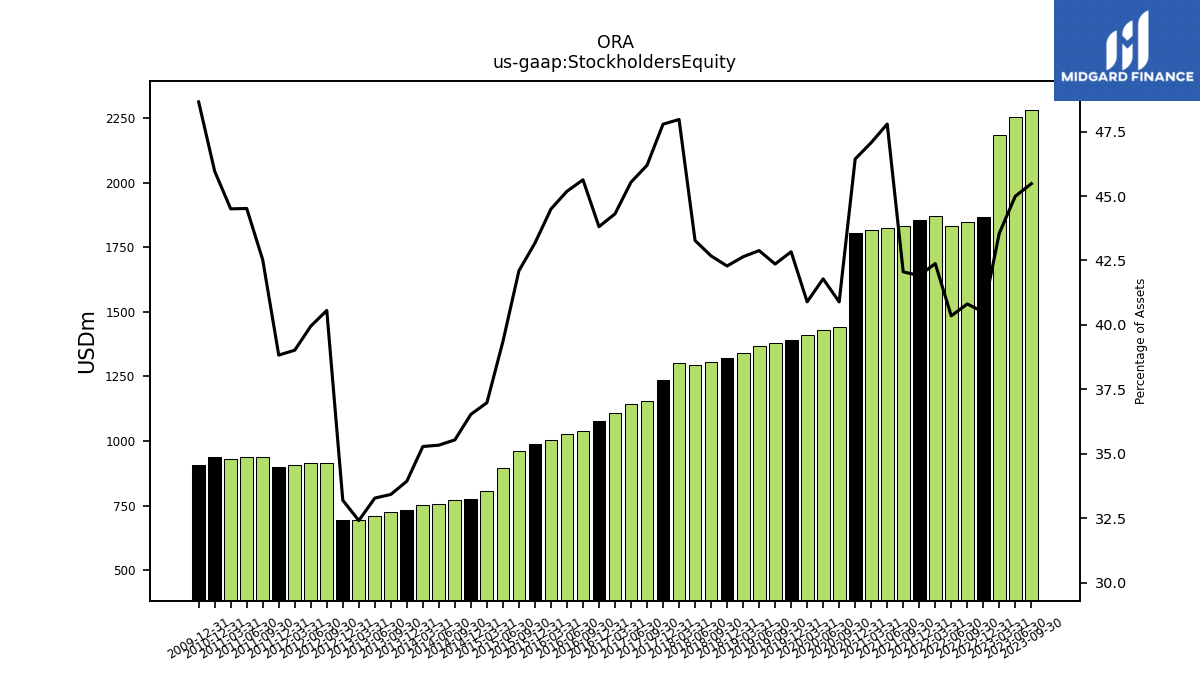
| Stockholders Equity | 2278.83 | 2254.39 | 2184.54 | 1867.57 | 1846.51 | 1832.63 | 1870.67 | 1855.00 | 1833.38 | 1825.08 | 1816.61 | 1805.98 | 1439.74 | 1428.40 | 1409.07 | 1392.42 | 1380.73 | 1369.56 | 1340.35 | 1319.84 | 1305.69 | 1295.71 | 1300.38 | 1236.14 | 1156.56 | 1143.27 | 1107.66 | 1078.42 | 1040.03 | 1027.06 | 1005.65 | 990.00 | 962.55 | 895.86 | 807.34 | 774.92 | 771.82 | 757.81 | 752.97 | 732.74 | 724.63 | 711.41 | 694.62 | 695.10 | 915.98 | 916.45 | 908.19 | 898.72 | 940.10 | 939.66 | 931.86 | 939.13 | NA | NA | NA |
| 2023-09-30 | 2023-06-30 | 2023-03-31 | 2022-12-31 | 2022-09-30 | 2022-06-30 | 2022-03-31 | 2021-12-31 | 2021-09-30 | 2021-06-30 | 2021-03-31 | 2020-12-31 | 2020-09-30 | 2020-06-30 | 2020-03-31 | 2019-12-31 | 2019-09-30 | 2019-06-30 | 2019-03-31 | 2018-12-31 | 2018-09-30 | 2018-06-30 | 2018-03-31 | 2017-12-31 | 2017-09-30 | 2017-06-30 | 2017-03-31 | 2016-12-31 | 2016-09-30 | 2016-06-30 | 2016-03-31 | 2015-12-31 | 2015-09-30 | 2015-06-30 | 2015-03-31 | 2014-12-31 | 2014-09-30 | 2014-06-30 | 2014-03-31 | 2013-12-31 | 2013-09-30 | 2013-06-30 | 2013-03-31 | 2012-12-31 | 2012-09-30 | 2012-06-30 | 2012-03-31 | 2011-12-31 | 2011-09-30 | 2011-06-30 | 2011-03-31 | 2010-12-31 | 2010-09-30 | 2010-06-30 | 2010-03-31 | ||
|---|---|---|---|---|---|---|---|---|---|---|---|---|---|---|---|---|---|---|---|---|---|---|---|---|---|---|---|---|---|---|---|---|---|---|---|---|---|---|---|---|---|---|---|---|---|---|---|---|---|---|---|---|---|---|---|---|
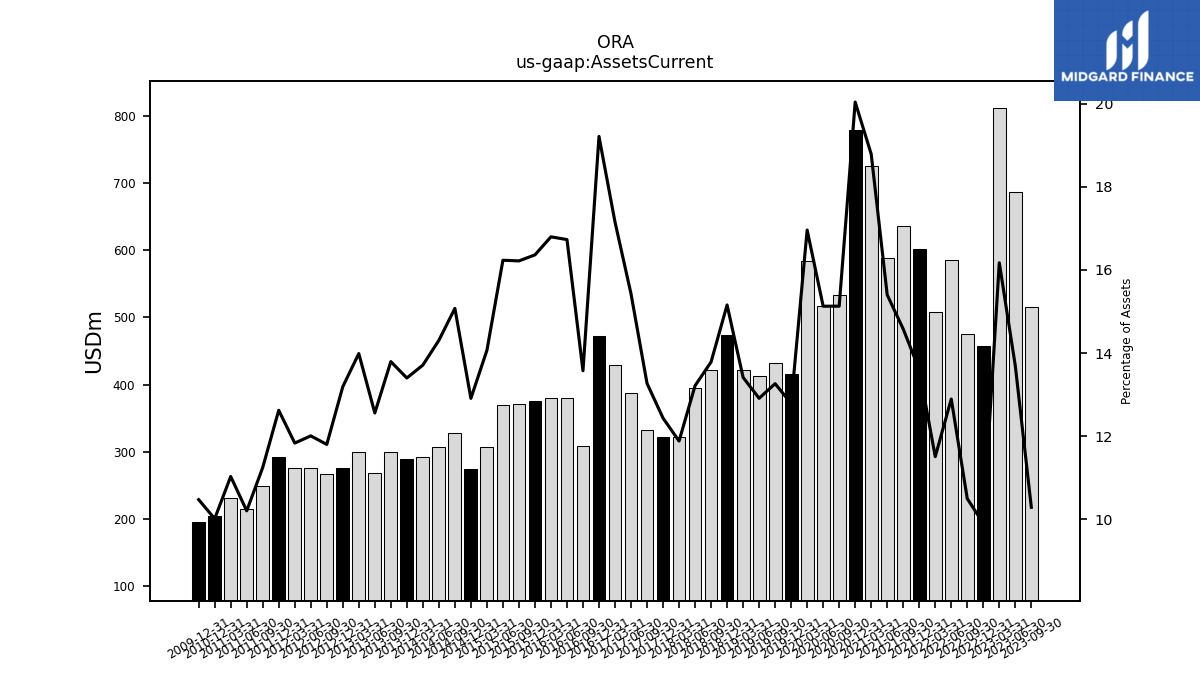
| Assets Current | 515.66 | 685.98 | 810.99 | 456.72 | 474.98 | 585.61 | 507.99 | 601.93 | 635.44 | 587.99 | 724.93 | 779.15 | 532.59 | 517.07 | 584.29 | 415.66 | 432.31 | 412.35 | 421.62 | 473.06 | 421.77 | 395.63 | 322.13 | 321.65 | 332.25 | 387.24 | 428.75 | 472.83 | 309.37 | 380.24 | 379.56 | 375.14 | 370.73 | 369.51 | 307.06 | 273.87 | 327.38 | 306.82 | 292.61 | 289.34 | 299.10 | 268.49 | 299.81 | 276.23 | 266.52 | 275.46 | 275.47 | 292.19 | 248.67 | 215.43 | 230.98 | 204.65 | NA | NA | NA | |
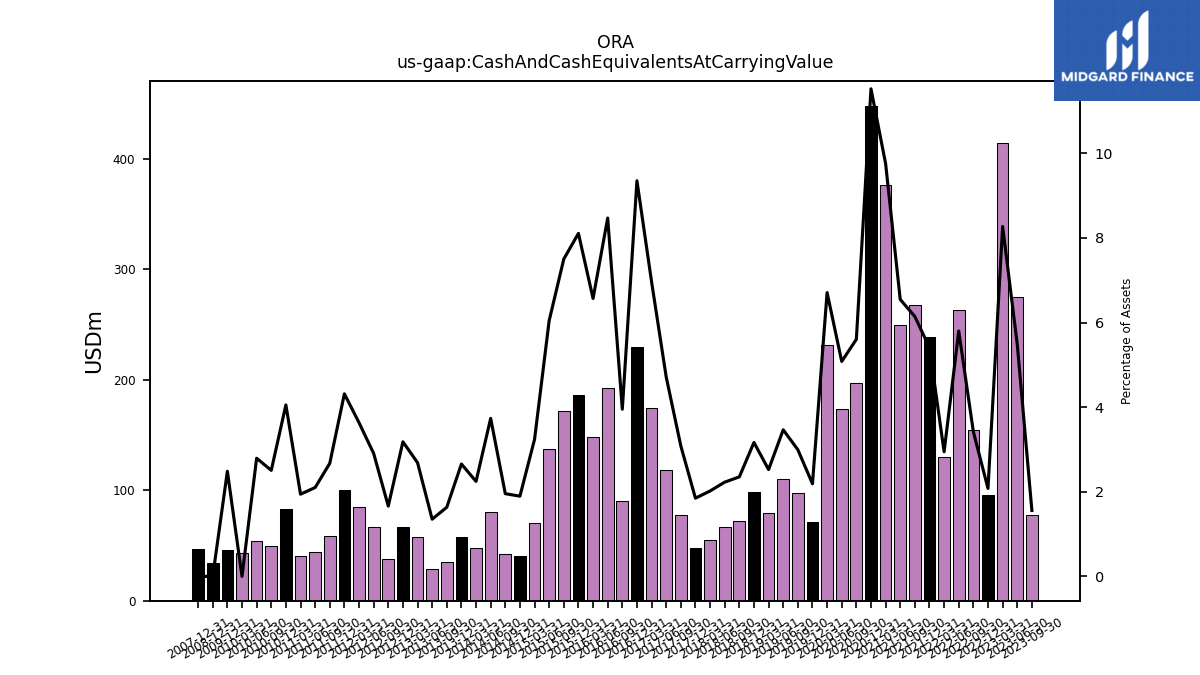
| Cash And Cash Equivalents At Carrying Value | 78.08 | 275.07 | 414.86 | 95.87 | 154.63 | 263.43 | 130.01 | 239.28 | 267.80 | 250.01 | 376.63 | 448.25 | 197.31 | 173.72 | 231.15 | 71.17 | 97.60 | 110.67 | 79.37 | 98.80 | 71.97 | 66.70 | 54.72 | 47.82 | 77.21 | 118.39 | 174.14 | 230.21 | 90.07 | 192.56 | 148.50 | 185.92 | 171.54 | 137.66 | 70.72 | 40.23 | 42.45 | 80.12 | 47.93 | 57.35 | 35.44 | 28.89 | 57.63 | 66.63 | 37.52 | 66.68 | 84.58 | 99.89 | 59.08 | 44.34 | 40.67 | 82.81 | 49.24 | 54.20 | 43.11 | |
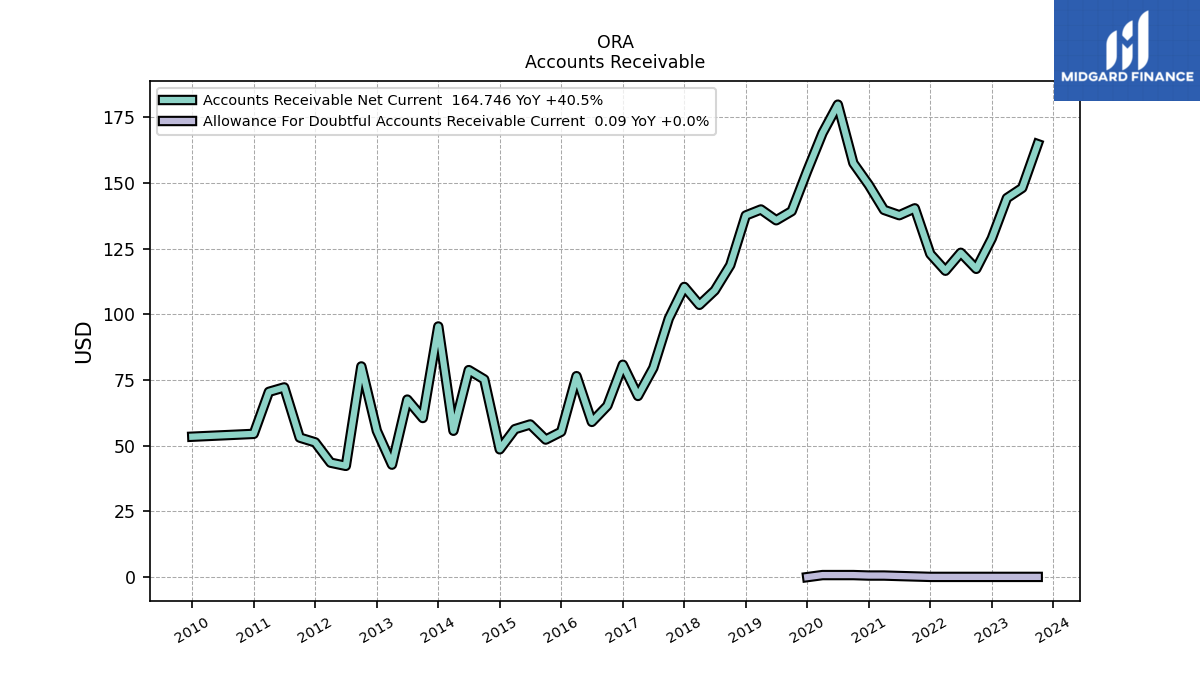
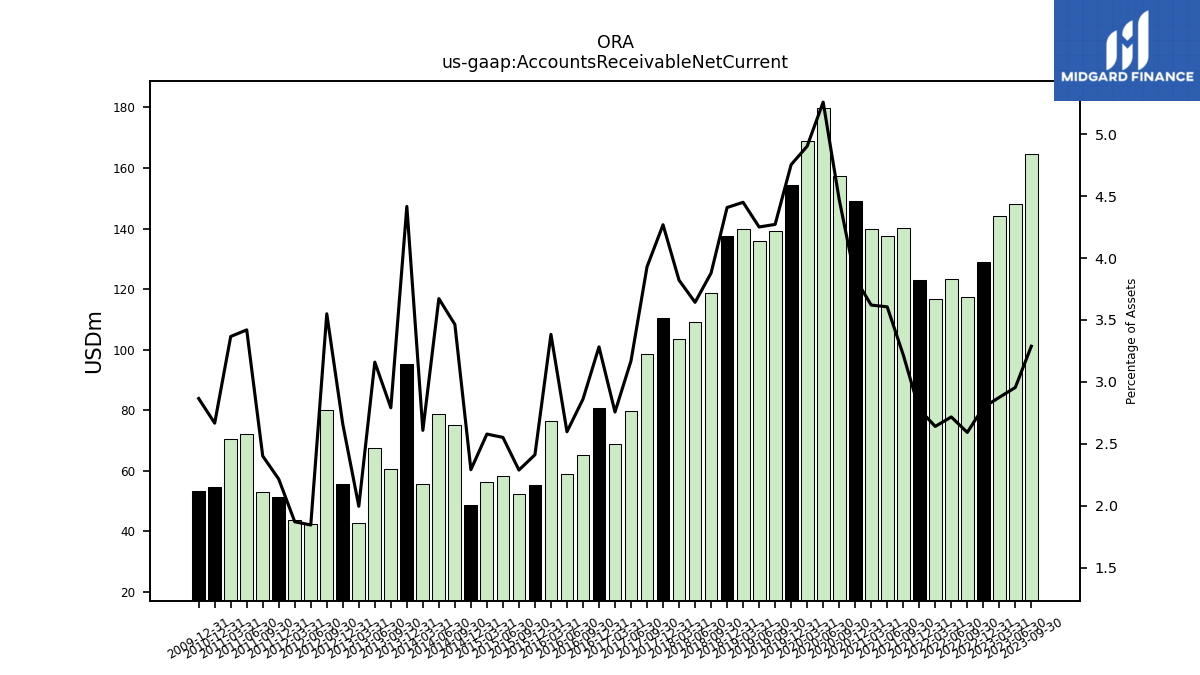
| Accounts Receivable Net Current | 164.75 | 148.06 | 144.20 | 128.82 | 117.28 | 123.40 | 116.56 | 122.94 | 140.31 | 137.69 | 139.71 | 149.17 | 157.50 | 179.76 | 168.92 | 154.53 | 139.23 | 135.76 | 139.87 | 137.58 | 118.67 | 109.06 | 103.58 | 110.41 | 98.38 | 79.59 | 68.92 | 80.81 | 65.20 | 59.04 | 76.47 | 55.30 | 52.31 | 58.09 | 56.30 | 48.61 | 75.22 | 78.76 | 55.68 | 95.36 | 60.53 | 67.55 | 42.78 | 55.68 | 80.17 | 42.31 | 43.55 | 51.27 | 53.08 | 72.19 | 70.49 | 54.49 | NA | NA | NA | |
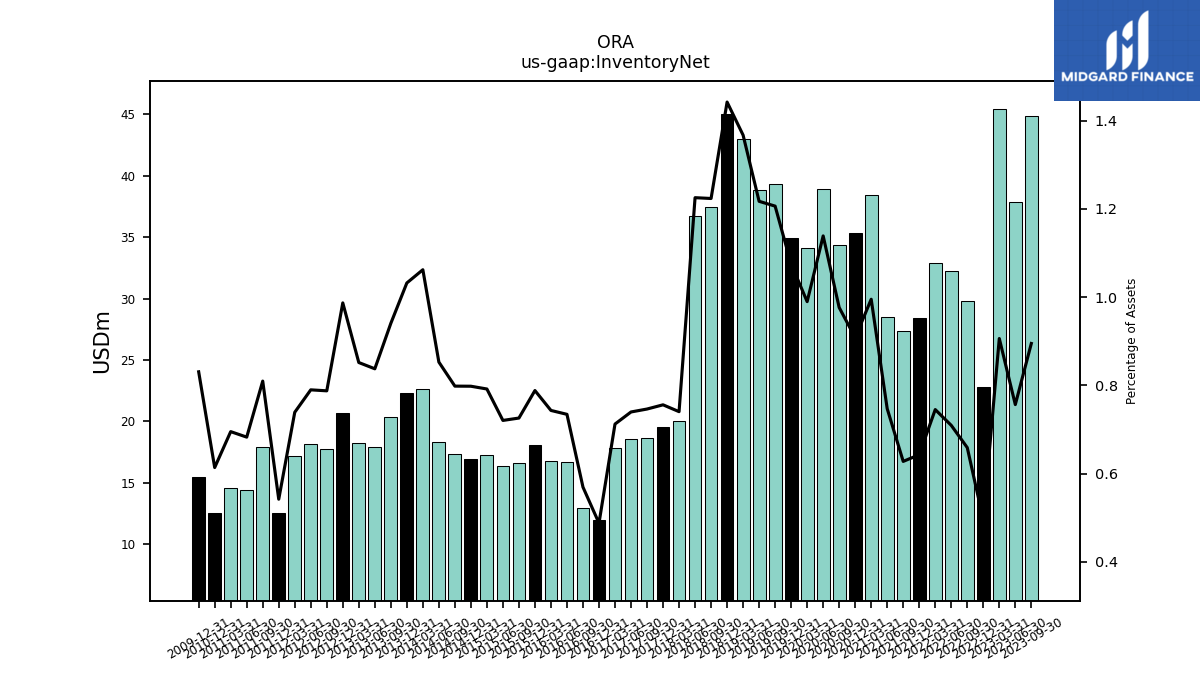
| Inventory Net | 44.84 | 37.90 | 45.45 | 22.83 | 29.80 | 32.21 | 32.89 | 28.45 | 27.36 | 28.53 | 38.41 | 35.32 | 34.38 | 38.93 | 34.11 | 34.95 | 39.32 | 38.88 | 42.98 | 45.02 | 37.44 | 36.70 | 20.07 | 19.55 | 18.68 | 18.57 | 17.80 | 12.00 | 12.97 | 16.69 | 16.80 | 18.07 | 16.59 | 16.40 | 17.29 | 16.93 | 17.34 | 18.29 | 22.67 | 22.29 | 20.40 | 17.91 | 18.26 | 20.67 | 17.79 | 18.12 | 17.20 | 12.54 | 17.90 | 14.41 | 14.55 | 12.54 | NA | NA | NA | |
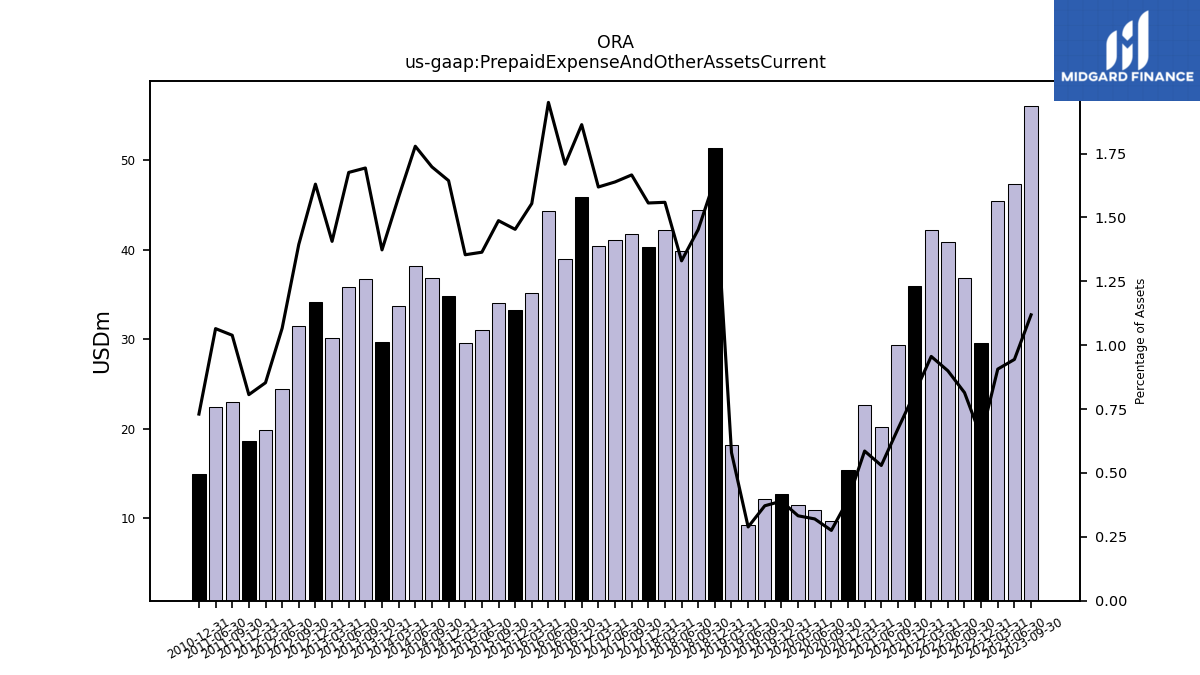
| Prepaid Expense And Other Assets Current | 56.07 | 47.33 | 45.47 | 29.57 | 36.86 | 40.88 | 42.21 | 35.92 | 29.32 | 20.22 | 22.61 | 15.35 | 9.70 | 10.95 | 11.46 | 12.67 | 12.12 | 9.22 | 18.22 | 51.44 | 44.45 | 39.84 | 42.27 | 40.27 | 41.73 | 41.15 | 40.48 | 45.87 | 38.94 | 44.33 | 35.13 | 33.33 | 34.01 | 31.05 | 29.57 | 34.88 | 36.88 | 38.16 | 33.73 | 29.65 | 36.72 | 35.84 | 30.15 | 34.14 | 31.50 | 24.47 | 19.86 | 18.67 | 22.97 | 22.48 | NA | 14.93 | NA | NA | NA | |
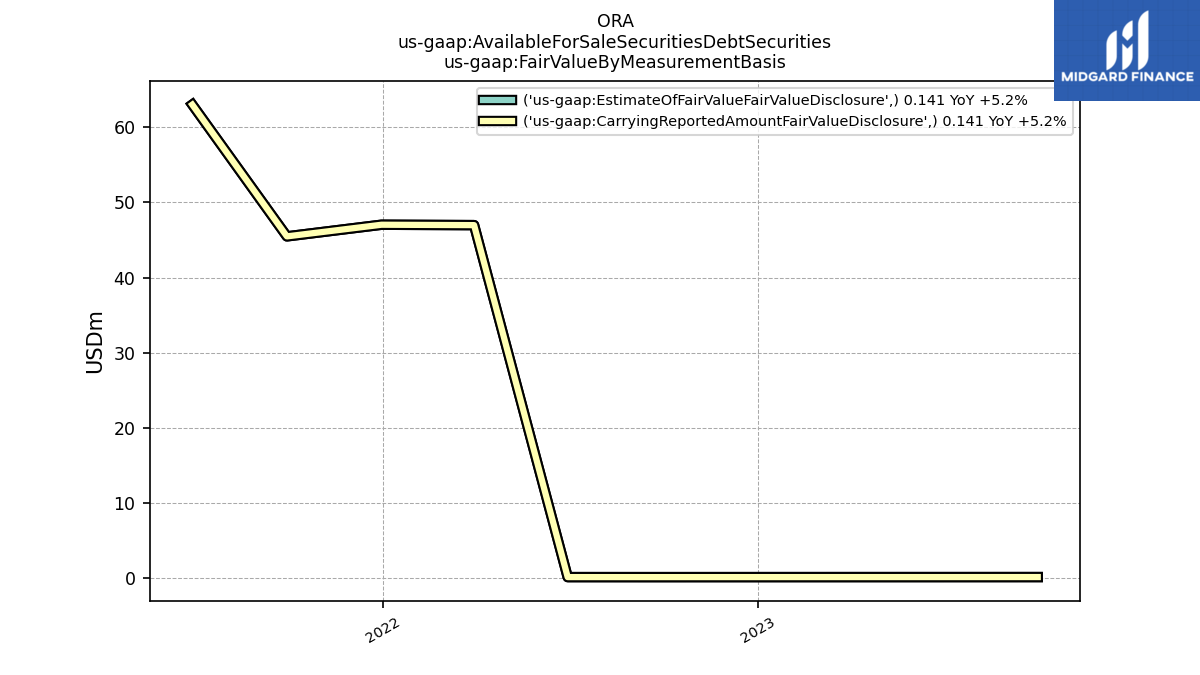
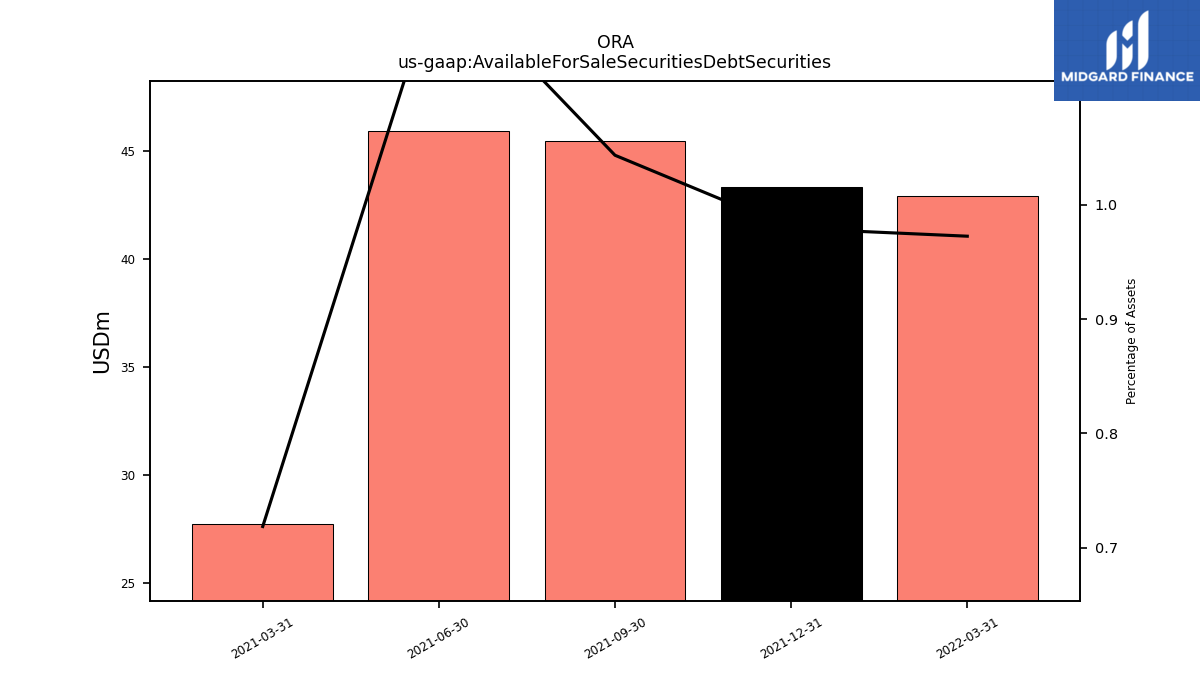
| Available For Sale Securities Debt Securities | NA | NA | NA | NA | NA | NA | 42.93 | 43.34 | 45.48 | 45.96 | 27.73 | NA | NA | NA | NA | NA | NA | NA | NA | NA | NA | NA | NA | NA | NA | NA | NA | NA | NA | NA | NA | NA | NA | NA | NA | NA | NA | NA | NA | NA | NA | NA | NA | NA | NA | NA | NA | NA | NA | NA | NA | NA | NA | NA | NA |
| 2023-09-30 | 2023-06-30 | 2023-03-31 | 2022-12-31 | 2022-09-30 | 2022-06-30 | 2022-03-31 | 2021-12-31 | 2021-09-30 | 2021-06-30 | 2021-03-31 | 2020-12-31 | 2020-09-30 | 2020-06-30 | 2020-03-31 | 2019-12-31 | 2019-09-30 | 2019-06-30 | 2019-03-31 | 2018-12-31 | 2018-09-30 | 2018-06-30 | 2018-03-31 | 2017-12-31 | 2017-09-30 | 2017-06-30 | 2017-03-31 | 2016-12-31 | 2016-09-30 | 2016-06-30 | 2016-03-31 | 2015-12-31 | 2015-09-30 | 2015-06-30 | 2015-03-31 | 2014-12-31 | 2014-09-30 | 2014-06-30 | 2014-03-31 | 2013-12-31 | 2013-09-30 | 2013-06-30 | 2013-03-31 | 2012-12-31 | 2012-09-30 | 2012-06-30 | 2012-03-31 | 2011-12-31 | 2011-09-30 | 2011-06-30 | 2011-03-31 | 2010-12-31 | 2010-09-30 | 2010-06-30 | 2010-03-31 | ||
|---|---|---|---|---|---|---|---|---|---|---|---|---|---|---|---|---|---|---|---|---|---|---|---|---|---|---|---|---|---|---|---|---|---|---|---|---|---|---|---|---|---|---|---|---|---|---|---|---|---|---|---|---|---|---|---|---|
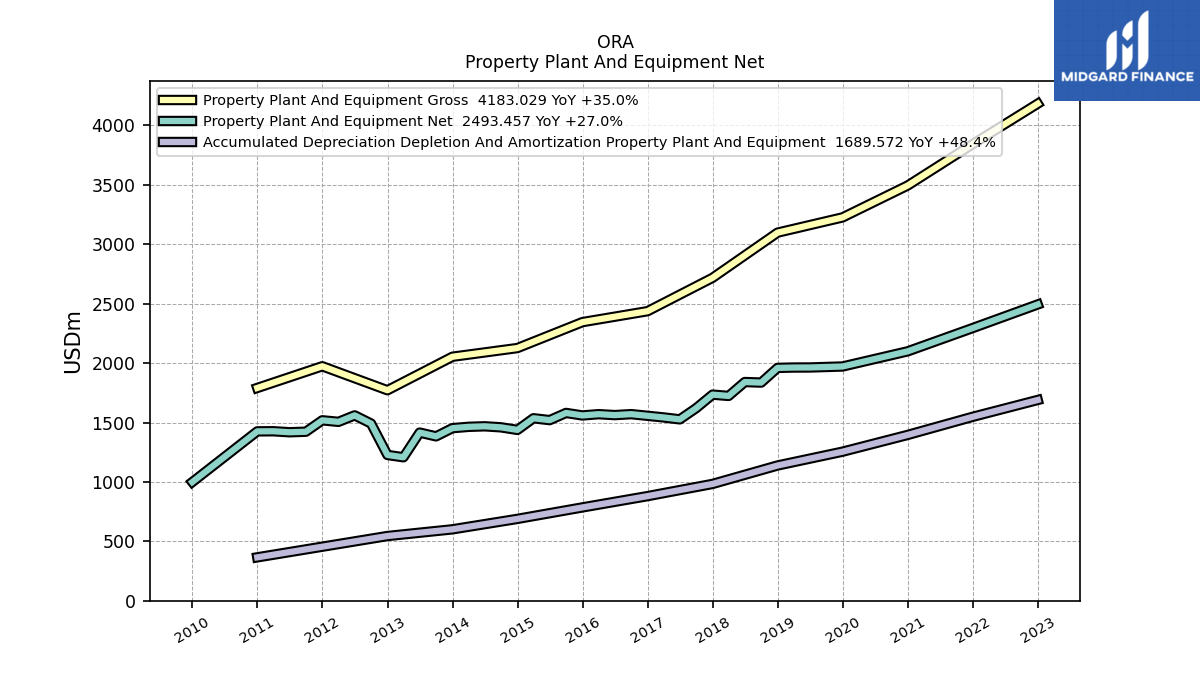
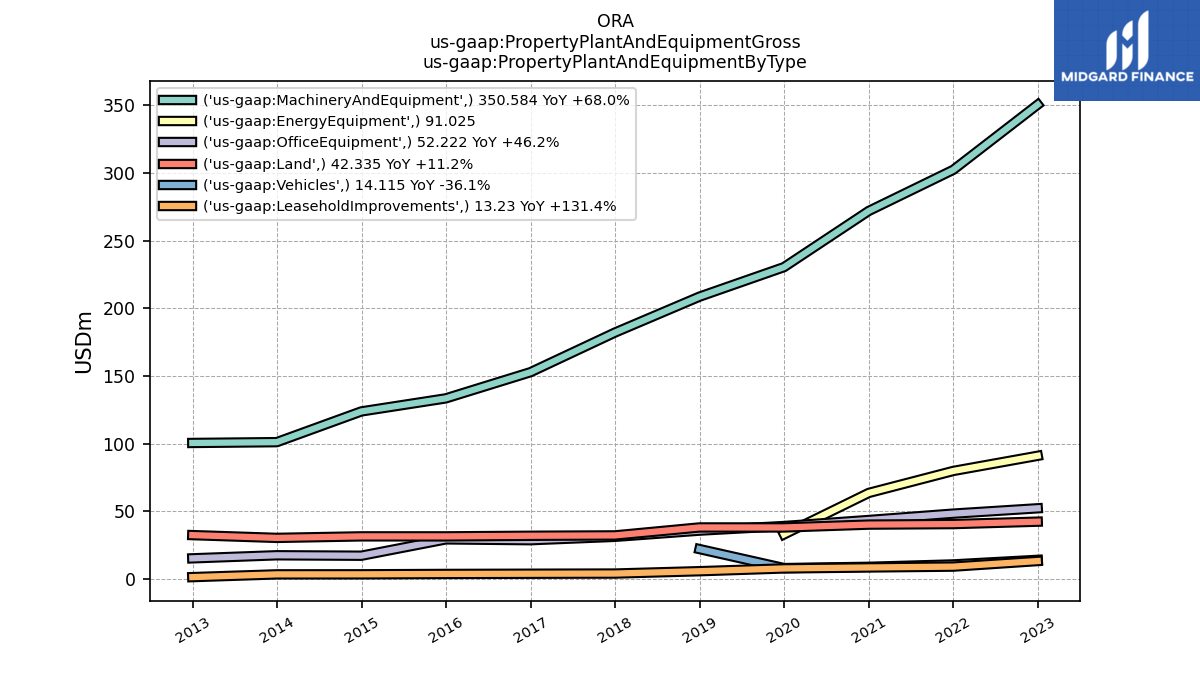
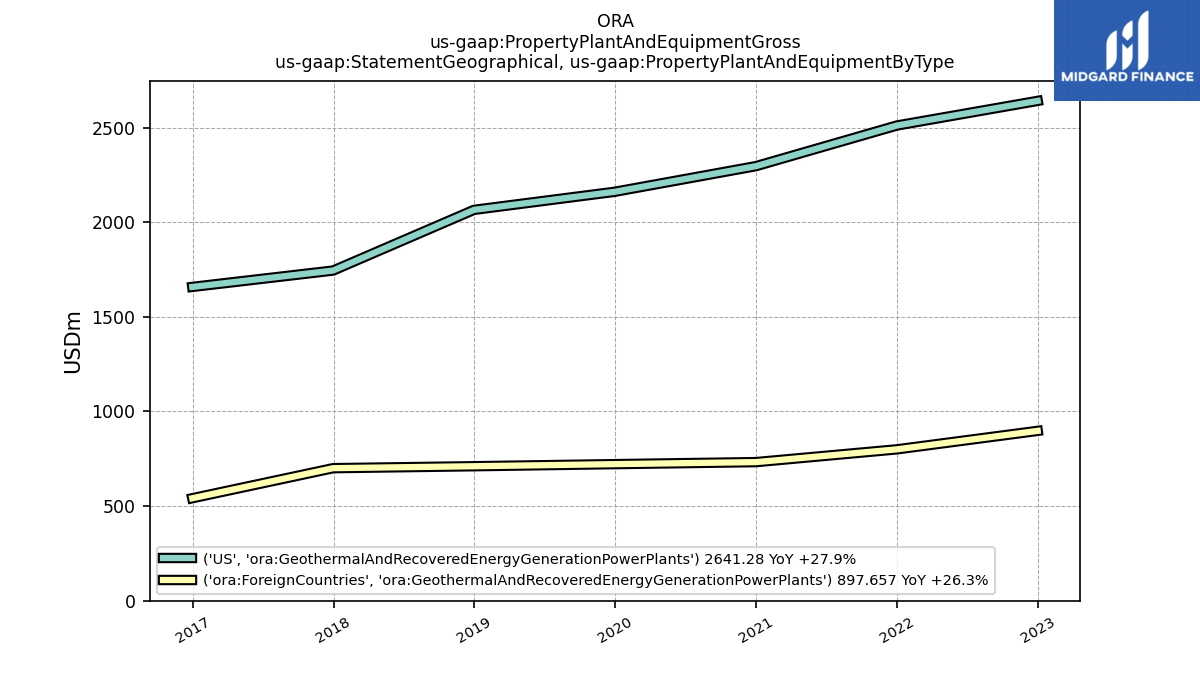
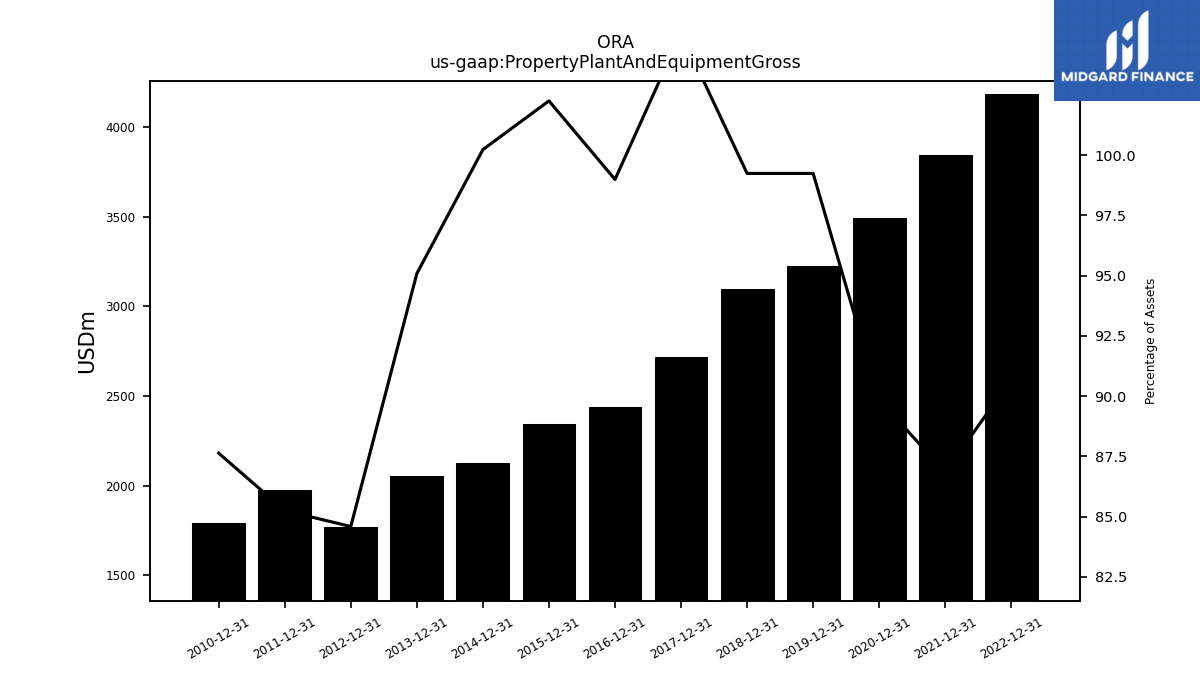
| Property Plant And Equipment Gross | NA | NA | NA | 4183.03 | NA | NA | NA | 3843.01 | NA | NA | NA | 3494.59 | NA | NA | NA | 3225.95 | NA | NA | NA | 3097.81 | NA | NA | NA | 2717.80 | NA | NA | NA | 2436.86 | NA | NA | NA | 2344.79 | NA | NA | NA | 2126.55 | NA | NA | NA | 2053.40 | NA | NA | NA | 1771.43 | NA | NA | NA | 1973.33 | NA | NA | NA | 1790.66 | NA | NA | NA | |
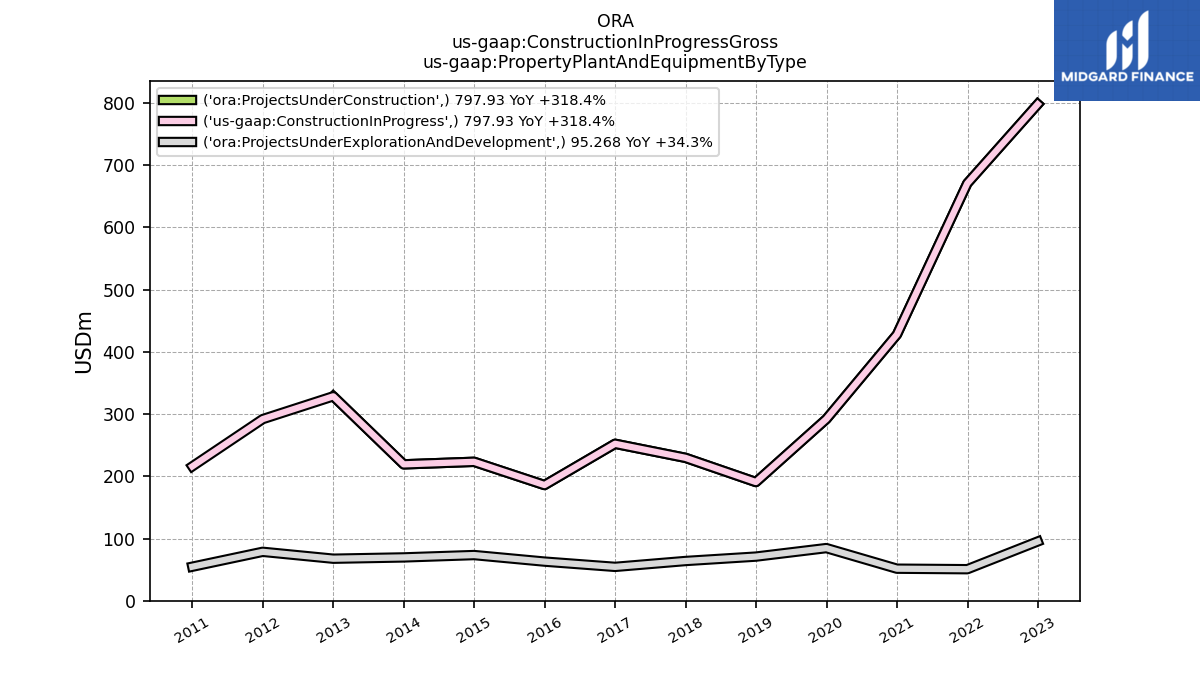
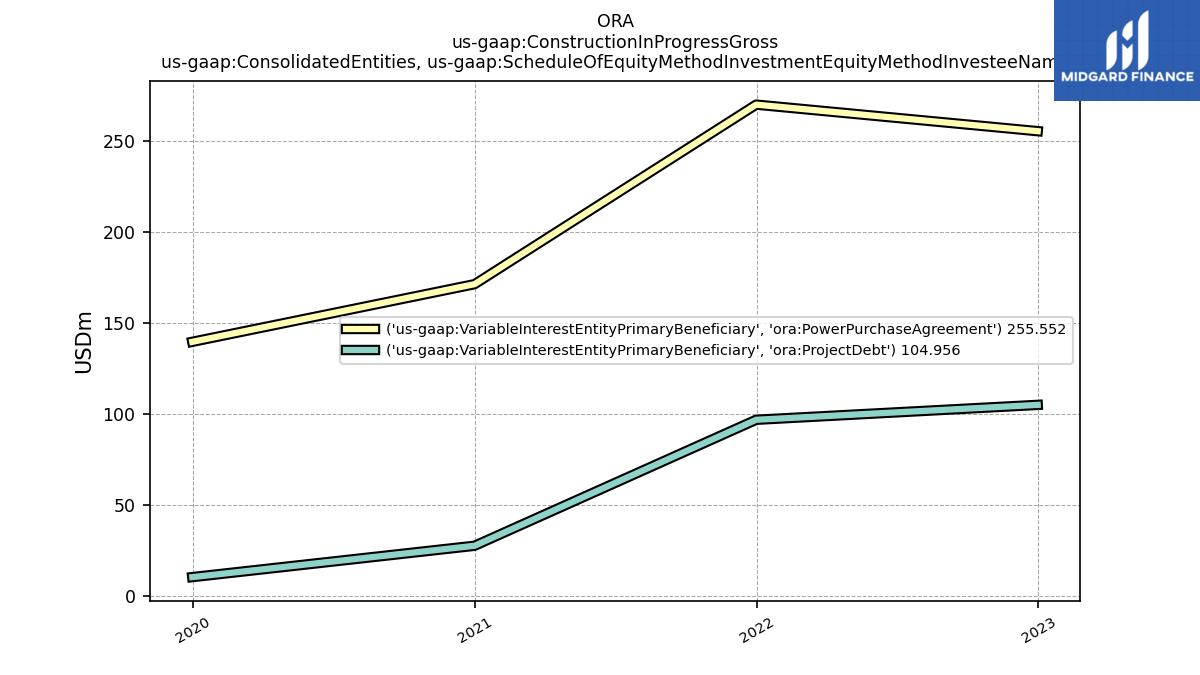
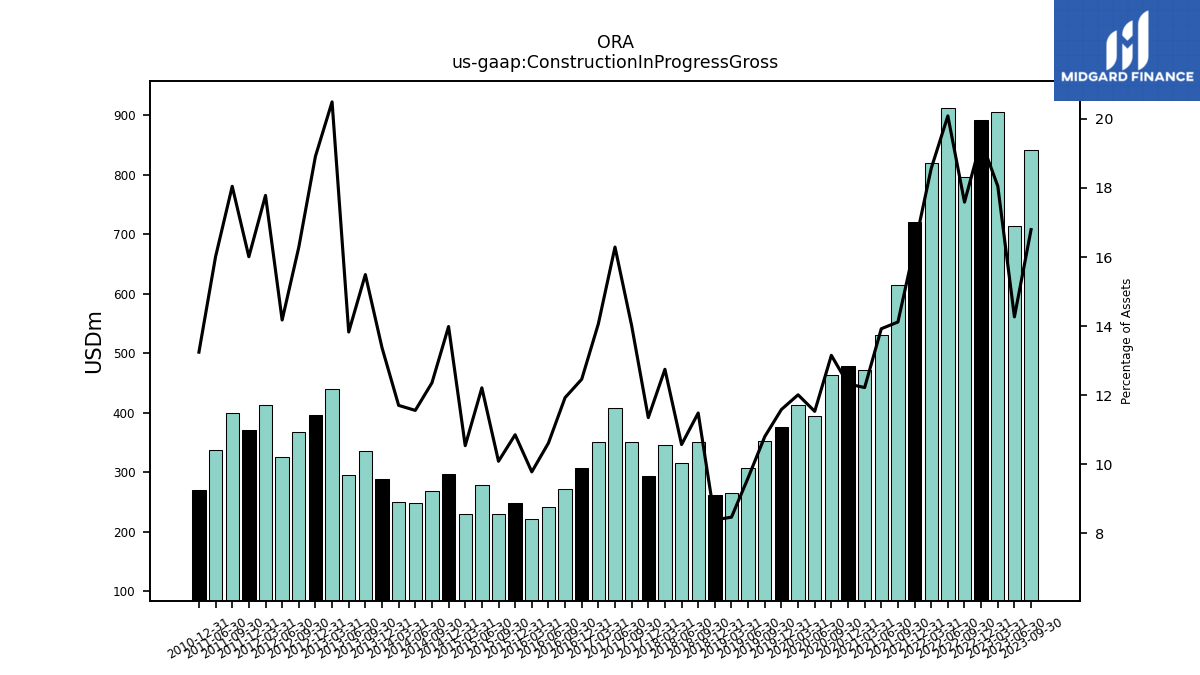
| Construction In Progress Gross | 841.54 | 714.85 | 905.50 | 893.20 | 795.89 | 912.38 | 819.56 | 721.48 | 615.48 | 531.63 | 471.55 | 479.31 | 463.07 | 394.12 | 413.79 | 376.56 | 352.01 | 306.81 | 266.08 | 261.69 | 351.29 | 316.45 | 345.56 | 293.54 | 350.87 | 408.94 | 351.64 | 306.71 | 271.85 | 241.20 | 220.98 | 248.84 | 230.56 | 277.99 | 230.04 | 296.72 | 268.35 | 247.90 | 249.78 | 288.83 | 335.92 | 295.63 | 439.30 | 396.14 | 367.76 | 325.21 | 414.00 | 370.55 | 399.00 | 337.97 | NA | 270.63 | NA | NA | NA | |
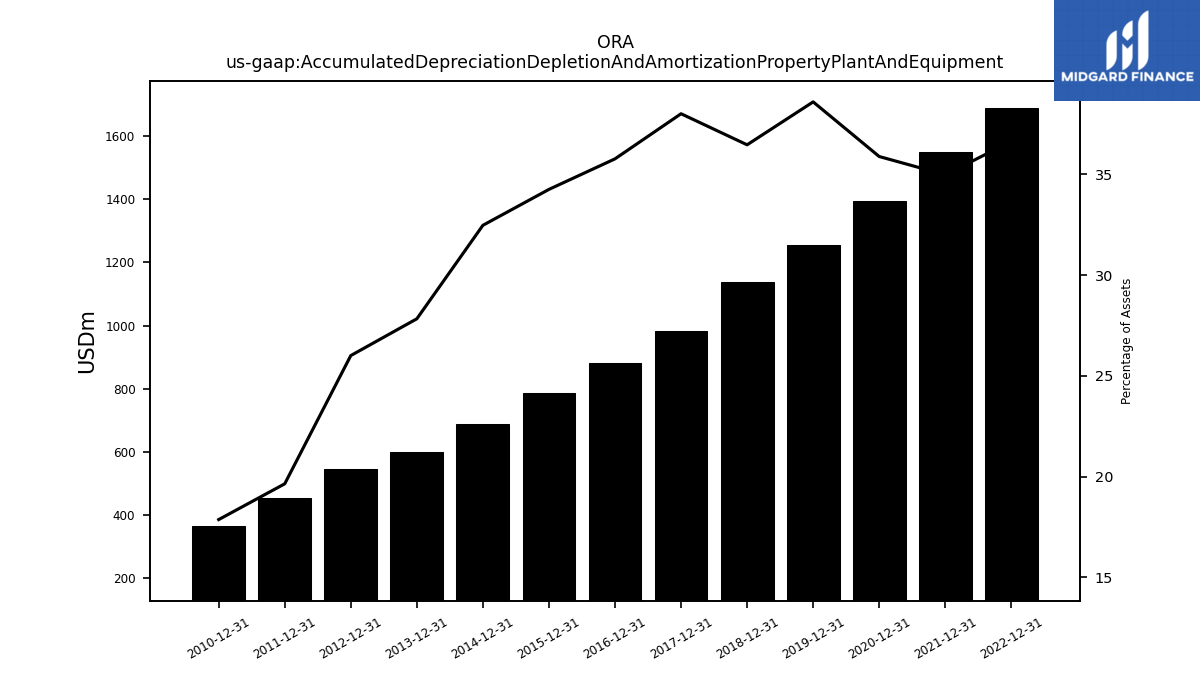
| Accumulated Depreciation Depletion And Amortization Property Plant And Equipment | NA | NA | NA | 1689.57 | NA | NA | NA | 1548.03 | NA | NA | NA | 1395.54 | NA | NA | NA | 1254.53 | NA | NA | NA | 1138.23 | NA | NA | NA | 983.11 | NA | NA | NA | 880.48 | NA | NA | NA | 785.45 | NA | NA | NA | 688.92 | NA | NA | NA | 601.07 | NA | NA | NA | 544.67 | NA | NA | NA | 454.79 | NA | NA | NA | 365.19 | NA | NA | NA | |
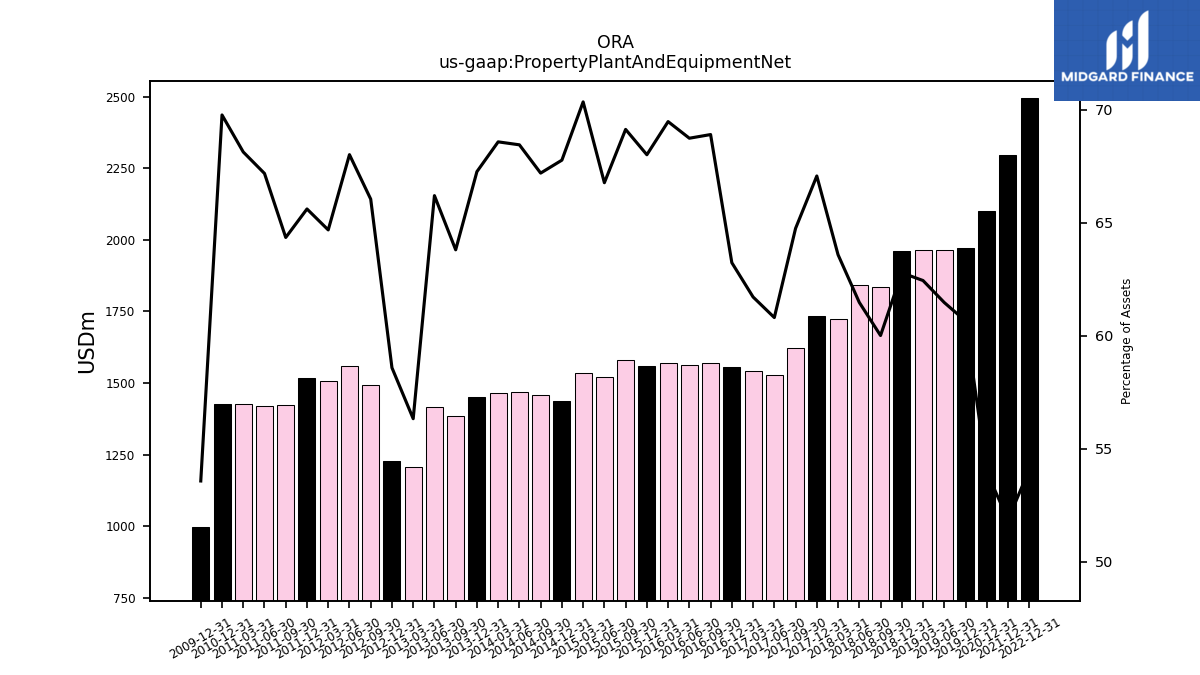
| Property Plant And Equipment Net | NA | NA | NA | 2493.46 | NA | NA | NA | 2294.97 | NA | NA | NA | 2099.05 | NA | NA | NA | 1971.41 | NA | 1963.09 | 1962.58 | 1959.58 | 1835.94 | 1840.56 | 1723.56 | 1734.69 | 1621.01 | 1526.48 | 1542.69 | 1556.38 | 1570.31 | 1562.32 | 1570.07 | 1559.34 | 1580.38 | 1519.94 | 1535.76 | 1437.64 | 1459.32 | 1468.01 | 1463.57 | 1452.34 | 1383.35 | 1415.16 | 1207.41 | 1226.76 | 1491.41 | 1560.13 | 1505.54 | 1518.53 | 1422.45 | 1417.93 | 1426.48 | 1425.47 | NA | NA | NA | |
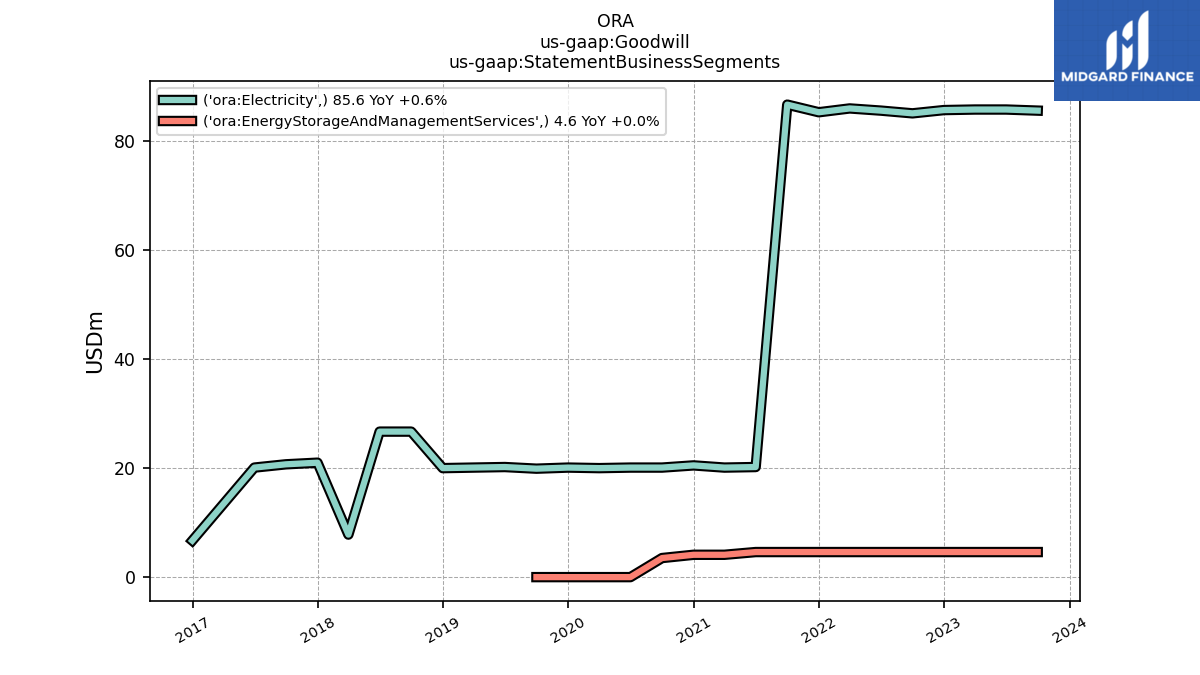
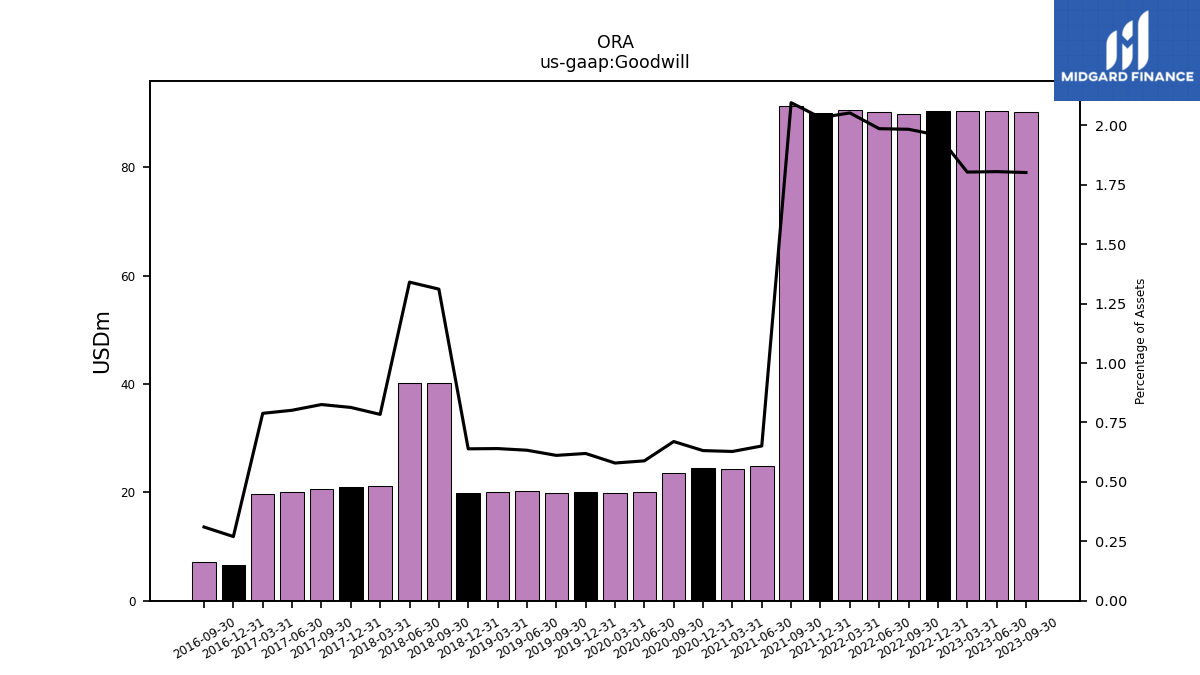
| Goodwill | 90.27 | 90.46 | 90.45 | 90.33 | 89.74 | 90.20 | 90.59 | 89.95 | 91.34 | 24.86 | 24.24 | 24.57 | 23.58 | 20.12 | 19.96 | 20.14 | 19.93 | 20.23 | 20.12 | 19.95 | 40.11 | 40.13 | 21.25 | 21.04 | 20.67 | 20.12 | 19.71 | 6.65 | 7.07 | NA | NA | NA | NA | NA | NA | NA | NA | NA | NA | NA | NA | NA | NA | NA | NA | NA | NA | NA | NA | NA | NA | NA | NA | NA | NA | |
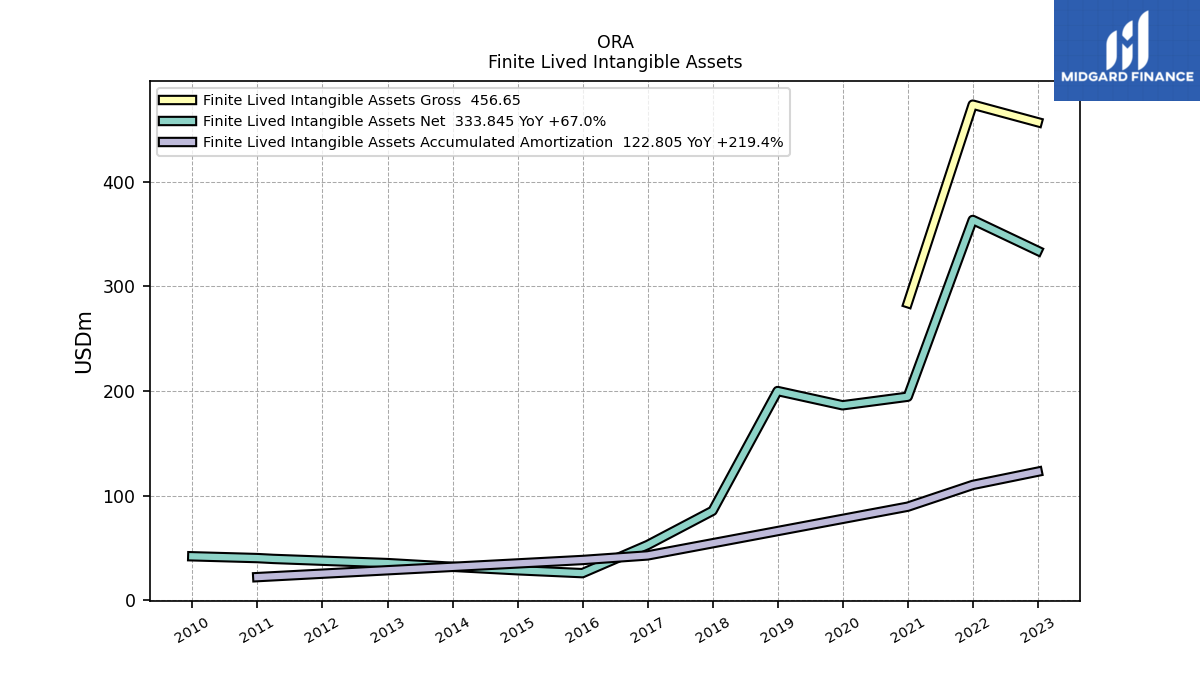
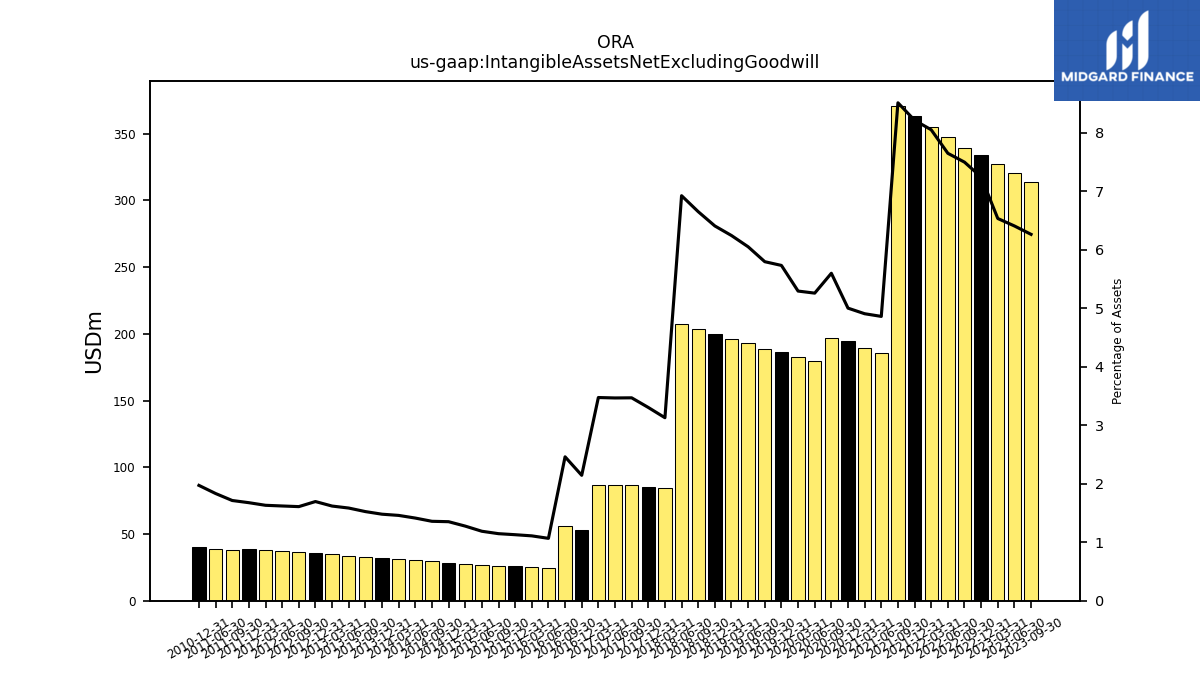
| Intangible Assets Net Excluding Goodwill | 313.67 | 320.85 | 327.54 | 333.85 | 339.04 | 347.22 | 355.19 | 363.31 | 370.89 | 185.51 | 189.25 | 194.42 | 197.00 | 179.66 | 182.31 | 186.22 | 188.81 | 193.14 | 196.12 | 199.87 | 203.38 | 207.21 | 84.77 | 85.42 | 86.81 | 86.99 | 86.80 | 52.75 | 56.05 | 24.24 | 25.06 | 25.88 | 26.20 | 27.03 | 27.85 | 28.66 | 29.48 | 30.30 | 31.12 | 31.93 | 33.03 | 33.86 | 34.68 | 35.49 | 36.32 | 37.15 | 37.96 | 38.78 | 37.86 | 38.68 | NA | 40.27 | NA | NA | NA | |
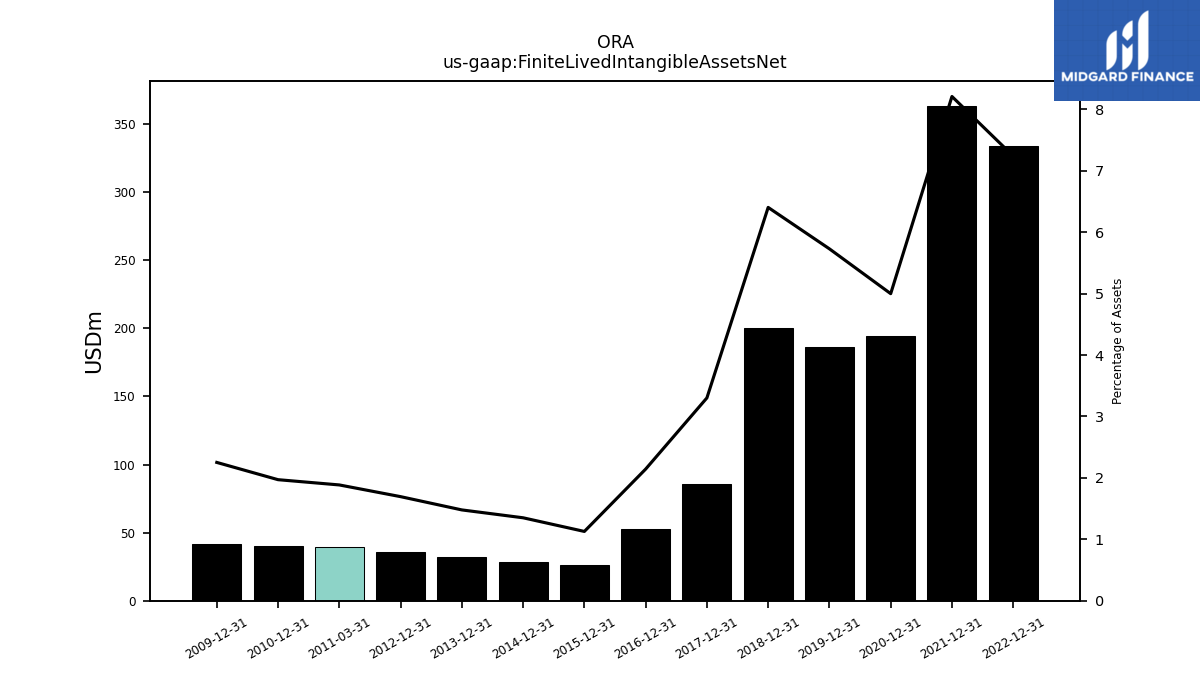
| Finite Lived Intangible Assets Net | NA | NA | NA | 333.85 | NA | NA | NA | 363.31 | NA | NA | NA | 194.42 | NA | NA | NA | 186.22 | NA | NA | NA | 199.87 | NA | NA | NA | 85.42 | NA | NA | NA | 52.75 | NA | NA | NA | 25.88 | NA | NA | NA | 28.66 | NA | NA | NA | 31.93 | NA | NA | NA | 35.49 | NA | NA | NA | NA | NA | NA | 39.48 | 40.27 | NA | NA | NA | |
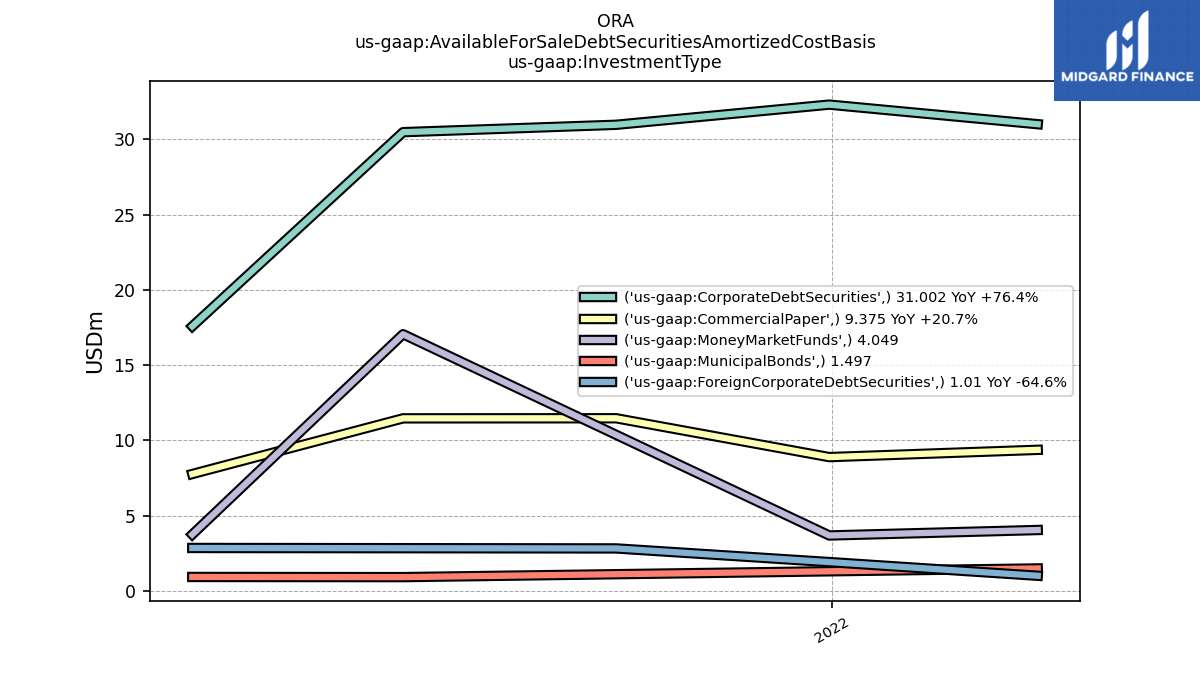
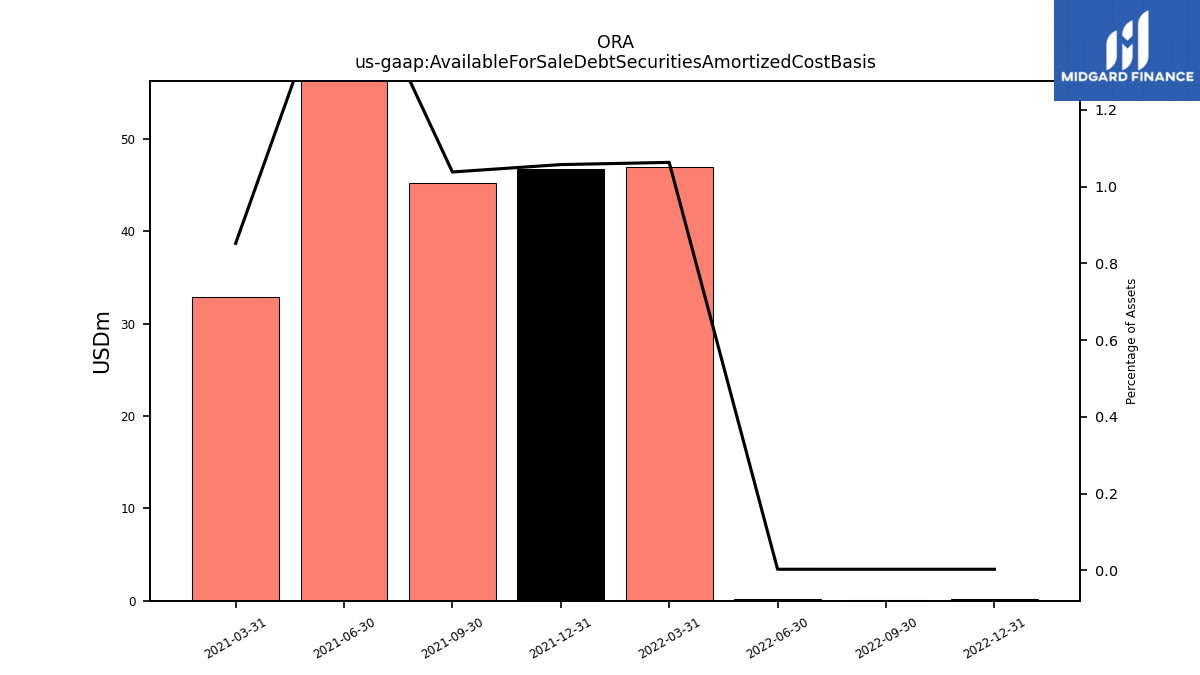
| Available For Sale Debt Securities Amortized Cost Basis | NA | NA | NA | 0.14 | 0.13 | 0.14 | 46.93 | 46.80 | 45.26 | 62.75 | 32.88 | NA | NA | NA | NA | NA | NA | NA | NA | NA | NA | NA | NA | NA | NA | NA | NA | NA | NA | NA | NA | NA | NA | NA | NA | NA | NA | NA | NA | NA | NA | NA | NA | NA | NA | NA | NA | NA | NA | NA | NA | NA | NA | NA | NA |
| 2023-09-30 | 2023-06-30 | 2023-03-31 | 2022-12-31 | 2022-09-30 | 2022-06-30 | 2022-03-31 | 2021-12-31 | 2021-09-30 | 2021-06-30 | 2021-03-31 | 2020-12-31 | 2020-09-30 | 2020-06-30 | 2020-03-31 | 2019-12-31 | 2019-09-30 | 2019-06-30 | 2019-03-31 | 2018-12-31 | 2018-09-30 | 2018-06-30 | 2018-03-31 | 2017-12-31 | 2017-09-30 | 2017-06-30 | 2017-03-31 | 2016-12-31 | 2016-09-30 | 2016-06-30 | 2016-03-31 | 2015-12-31 | 2015-09-30 | 2015-06-30 | 2015-03-31 | 2014-12-31 | 2014-09-30 | 2014-06-30 | 2014-03-31 | 2013-12-31 | 2013-09-30 | 2013-06-30 | 2013-03-31 | 2012-12-31 | 2012-09-30 | 2012-06-30 | 2012-03-31 | 2011-12-31 | 2011-09-30 | 2011-06-30 | 2011-03-31 | 2010-12-31 | 2010-09-30 | 2010-06-30 | 2010-03-31 | ||
|---|---|---|---|---|---|---|---|---|---|---|---|---|---|---|---|---|---|---|---|---|---|---|---|---|---|---|---|---|---|---|---|---|---|---|---|---|---|---|---|---|---|---|---|---|---|---|---|---|---|---|---|---|---|---|---|---|
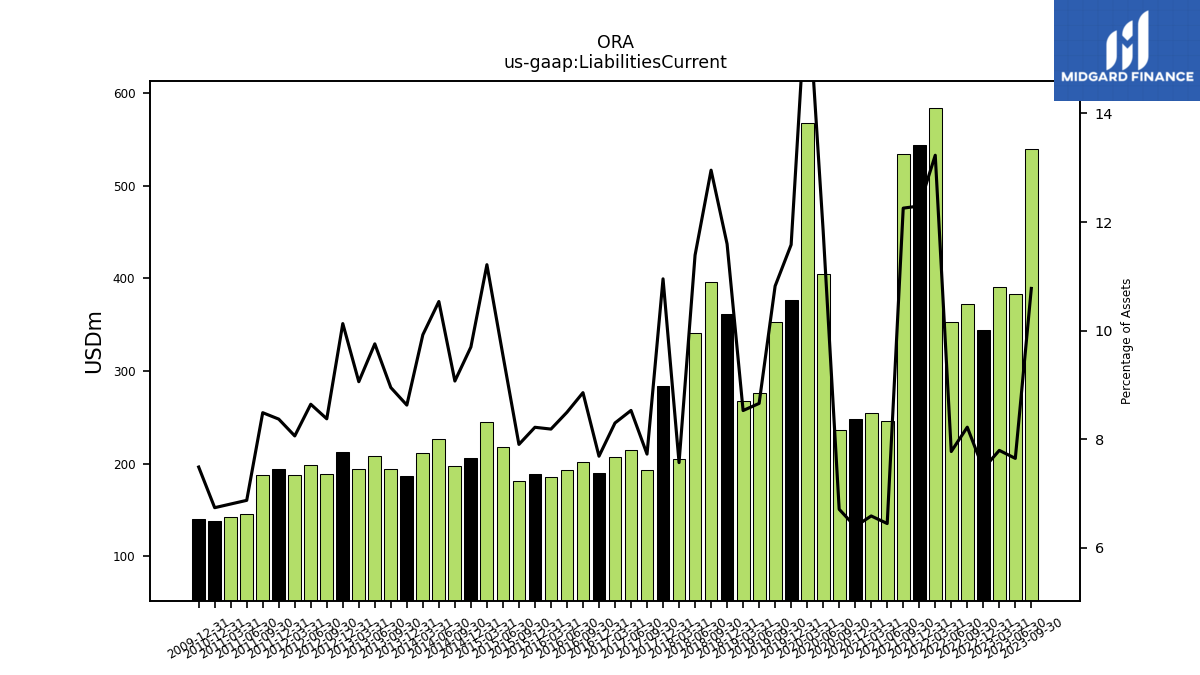
| Liabilities Current | 540.03 | 383.21 | 390.96 | 343.91 | 372.03 | 353.11 | 583.99 | 544.16 | 534.27 | 246.23 | 254.23 | 248.65 | 236.30 | 404.65 | 567.32 | 376.48 | 352.72 | 276.59 | 268.09 | 361.94 | 396.37 | 341.03 | 205.21 | 283.35 | 193.46 | 214.18 | 207.49 | 189.25 | 201.91 | 193.15 | 185.04 | 188.50 | 180.74 | 217.37 | 244.85 | 205.75 | 197.04 | 225.99 | 211.83 | 186.34 | 194.11 | 208.59 | 194.21 | 212.13 | 189.17 | 198.32 | 187.65 | 193.77 | 187.68 | 145.13 | 142.55 | 137.72 | NA | NA | NA | |
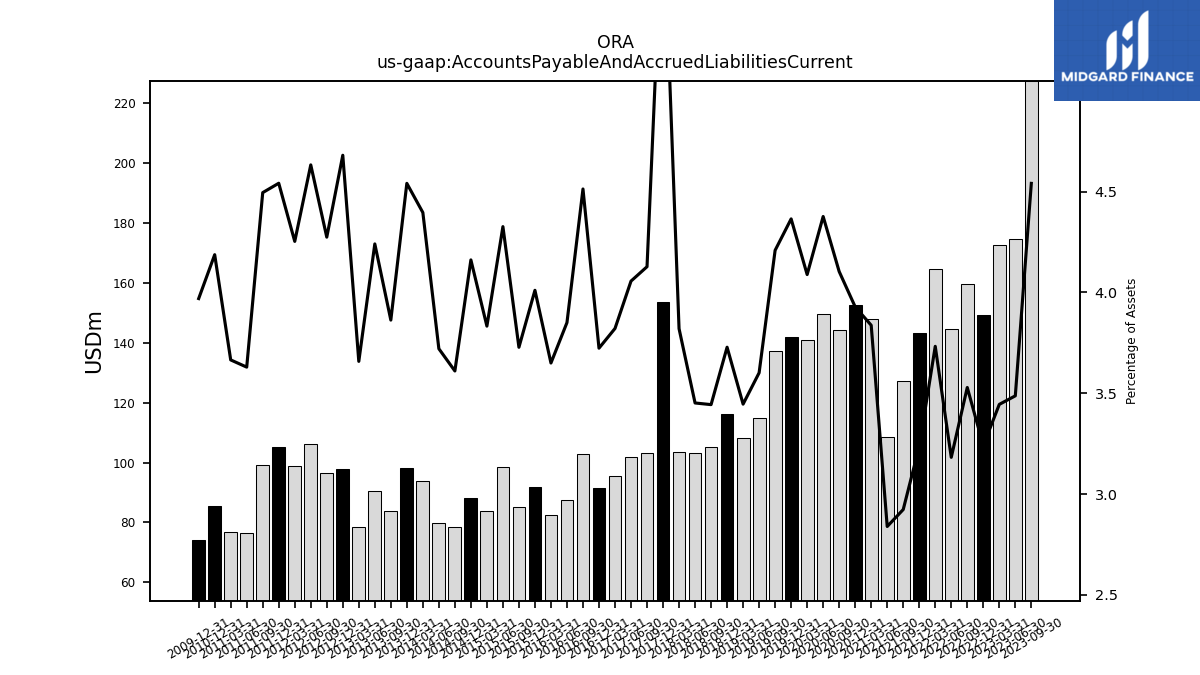
| Accounts Payable And Accrued Liabilities Current | 227.51 | 174.72 | 172.75 | 149.42 | 159.64 | 144.52 | 164.75 | 143.19 | 127.43 | 108.41 | 148.07 | 152.76 | 144.47 | 149.59 | 140.87 | 141.86 | 137.18 | 115.01 | 108.31 | 116.36 | 105.35 | 103.34 | 103.55 | 153.80 | 103.33 | 101.83 | 95.52 | 91.65 | 102.85 | 87.51 | 82.49 | 91.95 | 85.23 | 98.48 | 83.68 | 88.28 | 78.41 | 79.80 | 93.82 | 98.05 | 83.75 | 90.65 | 78.41 | 98.00 | 96.52 | 106.26 | 98.99 | 105.11 | 99.36 | 76.61 | 76.74 | 85.55 | NA | NA | NA | |
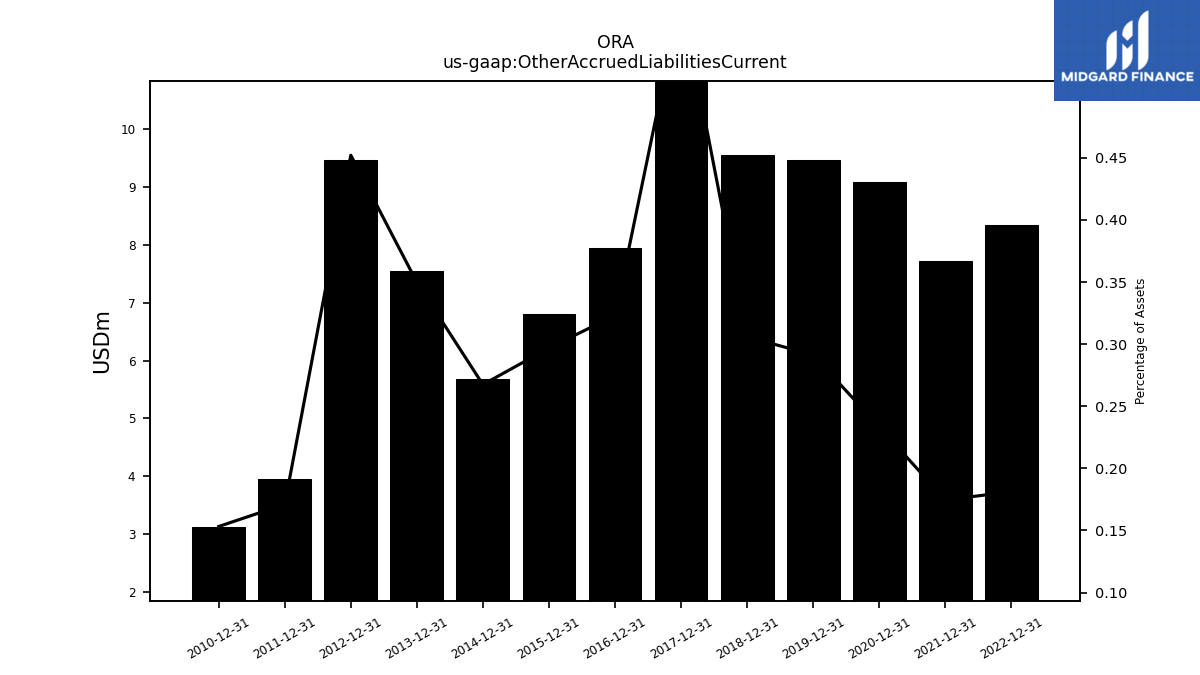
| Other Accrued Liabilities Current | NA | NA | NA | 8.35 | NA | NA | NA | 7.73 | NA | NA | NA | 9.08 | NA | NA | NA | 9.47 | NA | NA | NA | 9.55 | NA | NA | NA | 15.00 | NA | NA | NA | 7.95 | NA | NA | NA | 6.81 | NA | NA | NA | 5.67 | NA | NA | NA | 7.55 | NA | NA | NA | 9.47 | NA | NA | NA | 3.96 | NA | NA | NA | 3.13 | NA | NA | NA | |
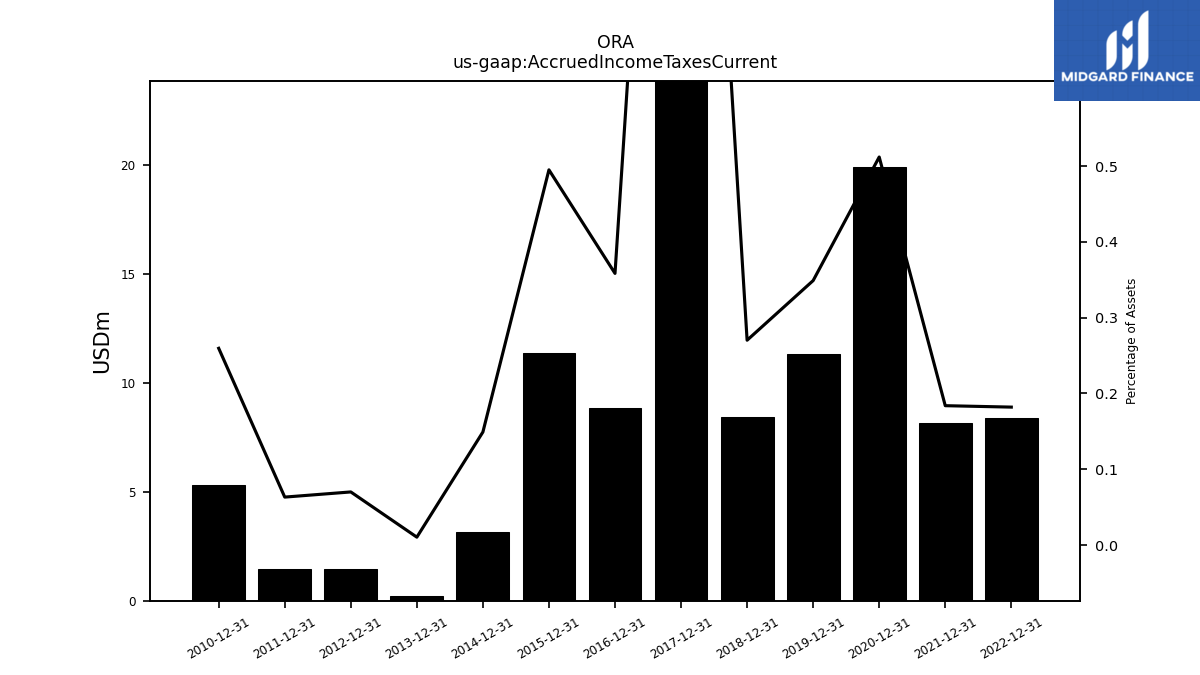
| Accrued Income Taxes Current | NA | NA | NA | 8.39 | NA | NA | NA | 8.14 | NA | NA | NA | 19.91 | NA | NA | NA | 11.34 | NA | NA | NA | 8.44 | NA | NA | NA | 43.68 | NA | NA | NA | 8.82 | NA | NA | NA | 11.35 | NA | NA | NA | 3.16 | NA | NA | NA | 0.22 | NA | NA | NA | 1.47 | NA | NA | NA | 1.46 | NA | NA | NA | 5.30 | NA | NA | NA | |
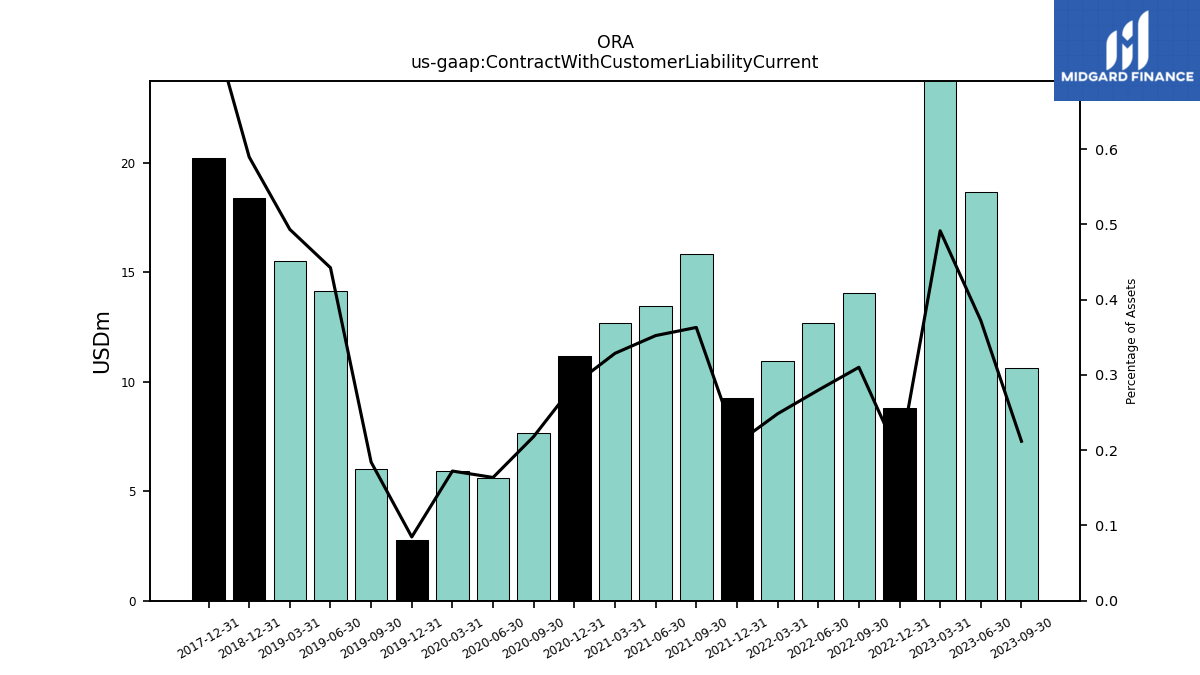
| Contract With Customer Liability Current | 10.62 | 18.65 | 24.65 | 8.79 | 14.03 | 12.71 | 10.96 | 9.25 | 15.83 | 13.45 | 12.69 | 11.18 | 7.68 | 5.60 | 5.94 | 2.75 | 6.00 | 14.13 | 15.51 | 18.40 | NA | NA | NA | 20.24 | NA | NA | NA | NA | NA | NA | NA | NA | NA | NA | NA | NA | NA | NA | NA | NA | NA | NA | NA | NA | NA | NA | NA | NA | NA | NA | NA | NA | NA | NA | NA |
| 2023-09-30 | 2023-06-30 | 2023-03-31 | 2022-12-31 | 2022-09-30 | 2022-06-30 | 2022-03-31 | 2021-12-31 | 2021-09-30 | 2021-06-30 | 2021-03-31 | 2020-12-31 | 2020-09-30 | 2020-06-30 | 2020-03-31 | 2019-12-31 | 2019-09-30 | 2019-06-30 | 2019-03-31 | 2018-12-31 | 2018-09-30 | 2018-06-30 | 2018-03-31 | 2017-12-31 | 2017-09-30 | 2017-06-30 | 2017-03-31 | 2016-12-31 | 2016-09-30 | 2016-06-30 | 2016-03-31 | 2015-12-31 | 2015-09-30 | 2015-06-30 | 2015-03-31 | 2014-12-31 | 2014-09-30 | 2014-06-30 | 2014-03-31 | 2013-12-31 | 2013-09-30 | 2013-06-30 | 2013-03-31 | 2012-12-31 | 2012-09-30 | 2012-06-30 | 2012-03-31 | 2011-12-31 | 2011-09-30 | 2011-06-30 | 2011-03-31 | 2010-12-31 | 2010-09-30 | 2010-06-30 | 2010-03-31 | ||
|---|---|---|---|---|---|---|---|---|---|---|---|---|---|---|---|---|---|---|---|---|---|---|---|---|---|---|---|---|---|---|---|---|---|---|---|---|---|---|---|---|---|---|---|---|---|---|---|---|---|---|---|---|---|---|---|---|
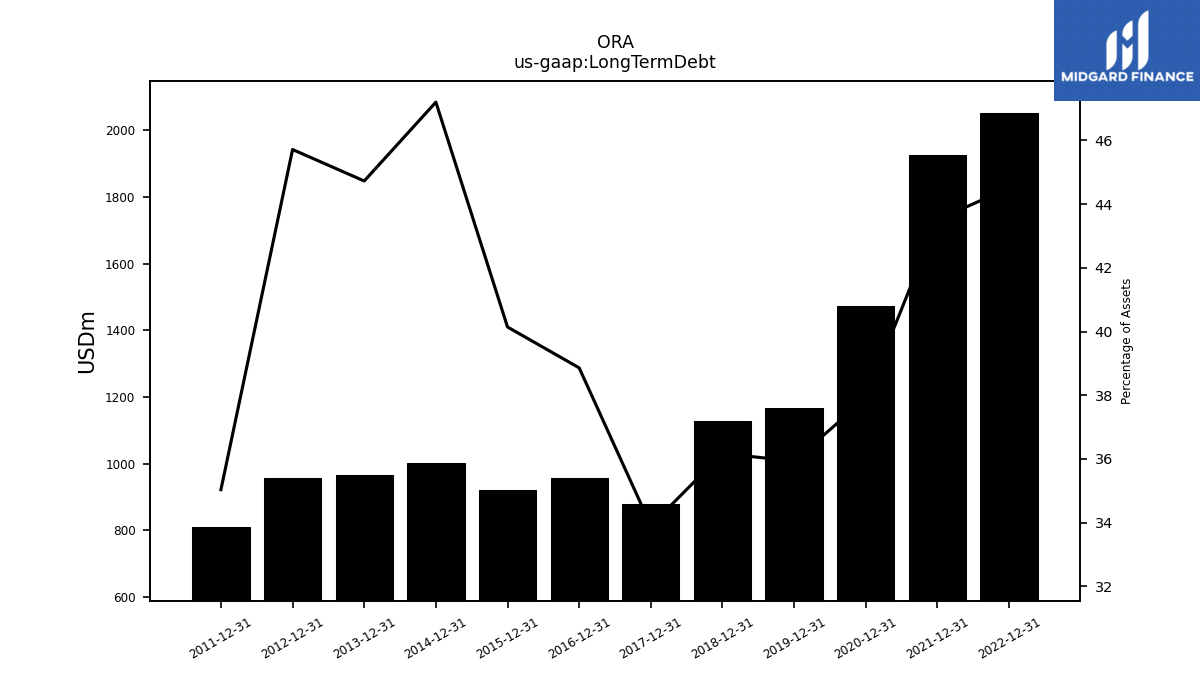
| Long Term Debt | NA | NA | NA | 2052.60 | NA | NA | NA | 1925.53 | NA | NA | NA | 1474.17 | NA | NA | NA | 1167.91 | NA | NA | NA | 1129.00 | NA | NA | NA | 877.06 | NA | NA | NA | 956.53 | NA | NA | NA | 920.47 | NA | NA | NA | 1001.41 | NA | NA | NA | 965.84 | NA | NA | NA | 957.32 | NA | NA | NA | 810.96 | NA | NA | NA | NA | NA | NA | NA | |
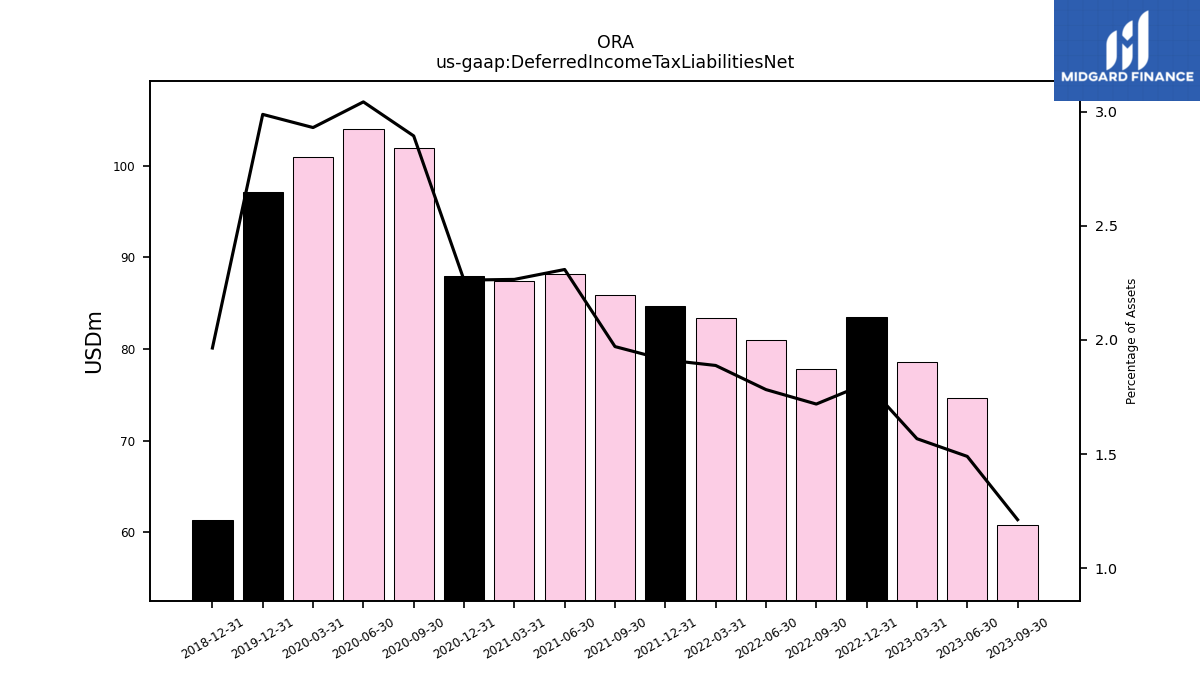
| Deferred Income Tax Liabilities Net | 60.77 | 74.66 | 78.61 | 83.47 | 77.79 | 80.97 | 83.35 | 84.66 | 85.92 | 88.16 | 87.42 | 87.97 | 101.89 | 104.01 | 100.97 | 97.13 | NA | NA | NA | 61.32 | NA | NA | NA | NA | NA | NA | NA | NA | NA | NA | NA | NA | NA | NA | NA | NA | NA | NA | NA | NA | NA | NA | NA | NA | NA | NA | NA | NA | NA | NA | NA | NA | NA | NA | NA | |
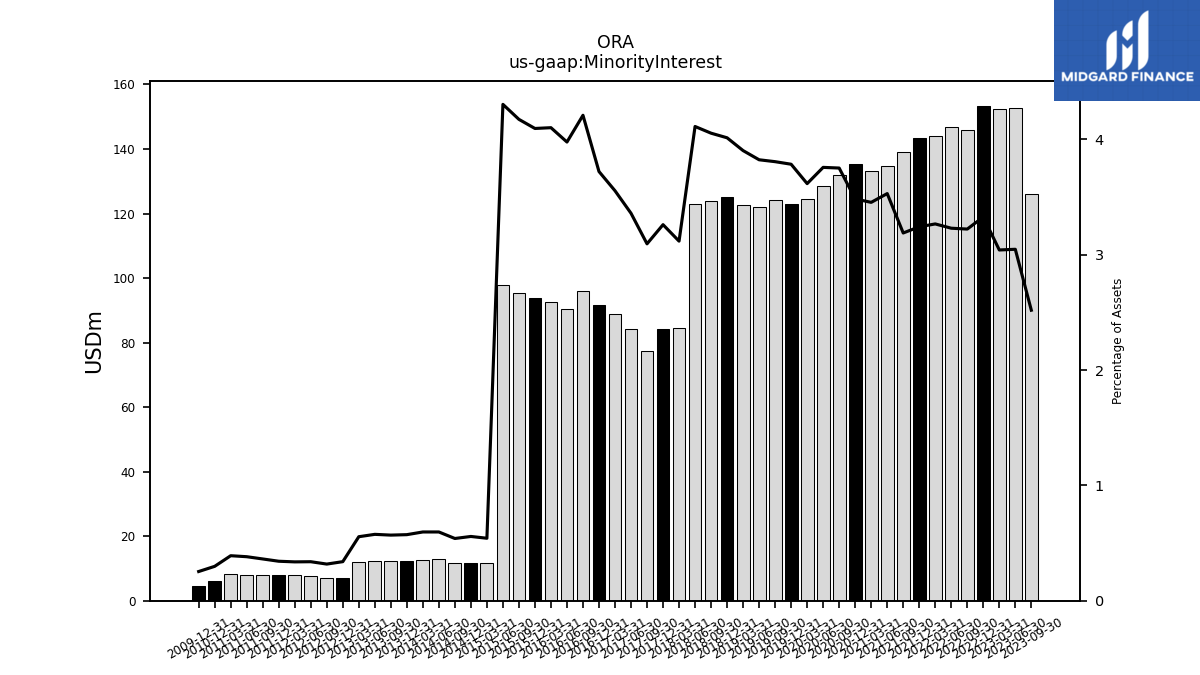
| Minority Interest | 126.19 | 152.65 | 152.49 | 153.40 | 145.77 | 146.67 | 144.18 | 143.46 | 138.97 | 134.77 | 133.27 | 135.45 | 132.06 | 128.41 | 124.59 | 122.99 | 124.06 | 122.08 | 122.65 | 125.26 | 124.00 | 123.09 | 84.50 | 84.32 | 77.46 | 84.33 | 88.84 | 91.58 | 95.91 | 90.38 | 92.68 | 93.87 | 95.40 | 97.95 | 11.83 | 11.82 | 11.72 | 12.79 | 12.72 | 12.37 | 12.34 | 12.30 | 11.90 | 7.10 | 7.18 | 7.76 | 7.84 | 7.93 | 8.01 | 8.06 | 8.18 | 6.09 | NA | NA | NA | |
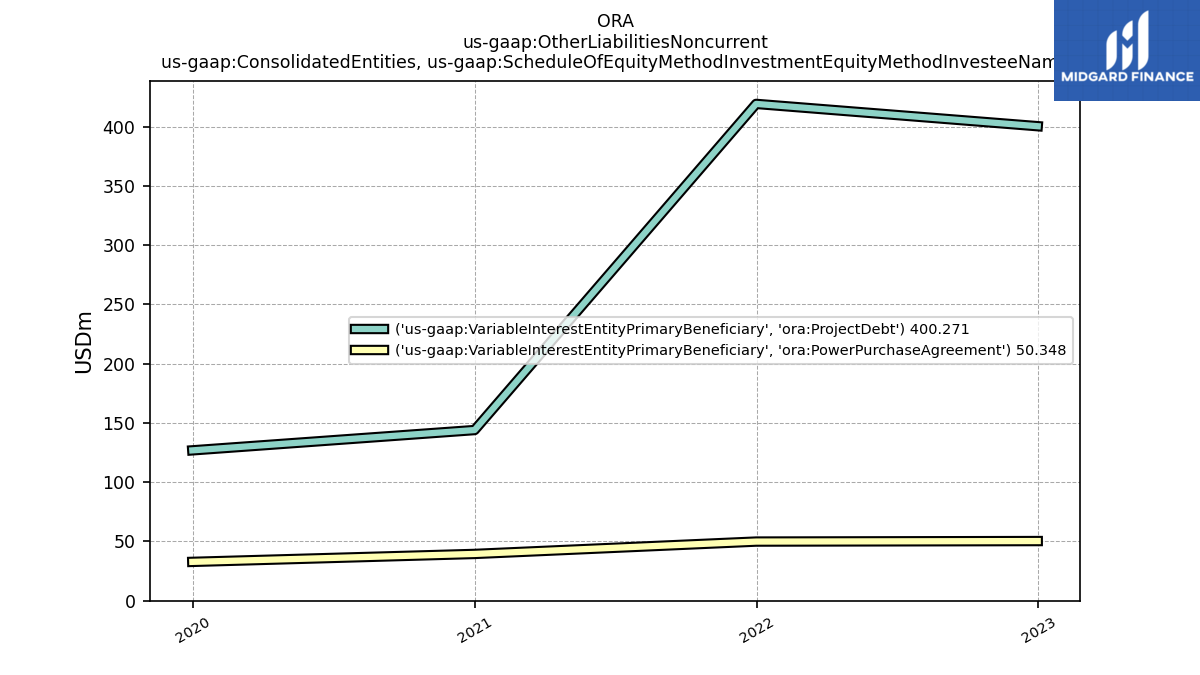
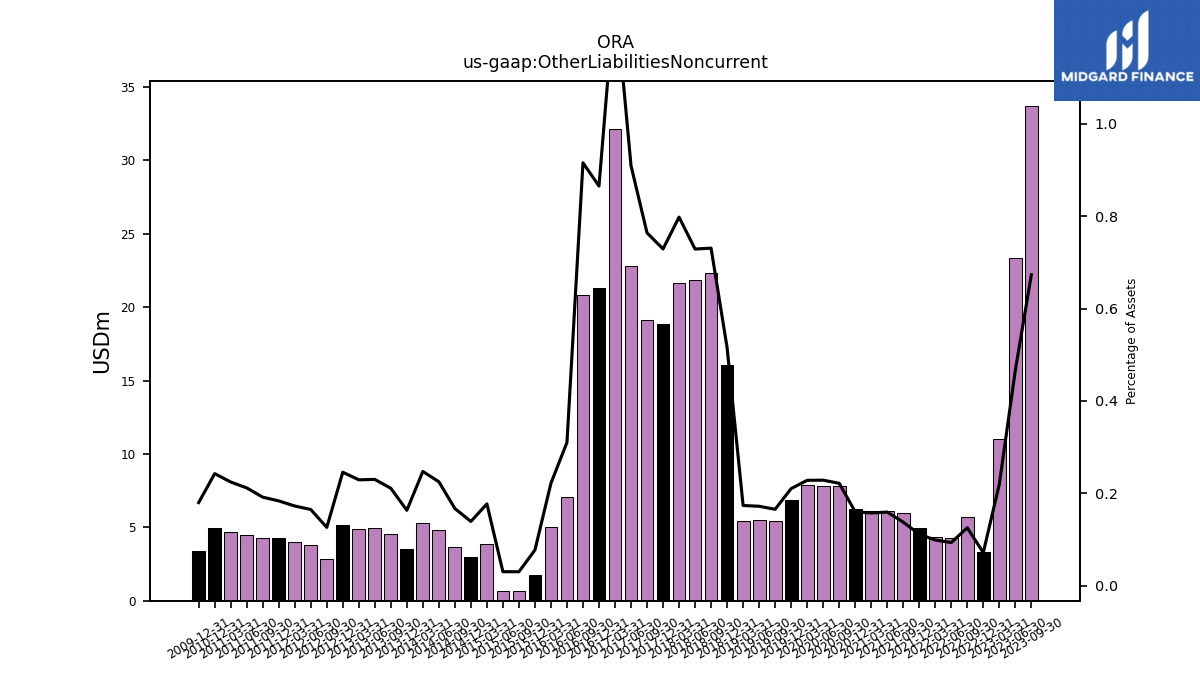
| Other Liabilities Noncurrent | 33.72 | 23.36 | 11.02 | 3.32 | 5.68 | 4.25 | 4.37 | 4.95 | 6.01 | 6.09 | 6.09 | 6.24 | 7.81 | 7.81 | 7.87 | 6.84 | 5.40 | 5.50 | 5.46 | 16.09 | 22.35 | 21.82 | 21.62 | 18.85 | 19.12 | 22.82 | 32.13 | 21.29 | 20.86 | 7.05 | 5.02 | 1.78 | 0.70 | 0.70 | 3.87 | 2.96 | 3.63 | 4.83 | 5.28 | 3.53 | 4.58 | 4.92 | 4.92 | 5.15 | 2.86 | 3.79 | 4.02 | 4.25 | 4.24 | 4.47 | 4.70 | 4.96 | NA | NA | NA | |
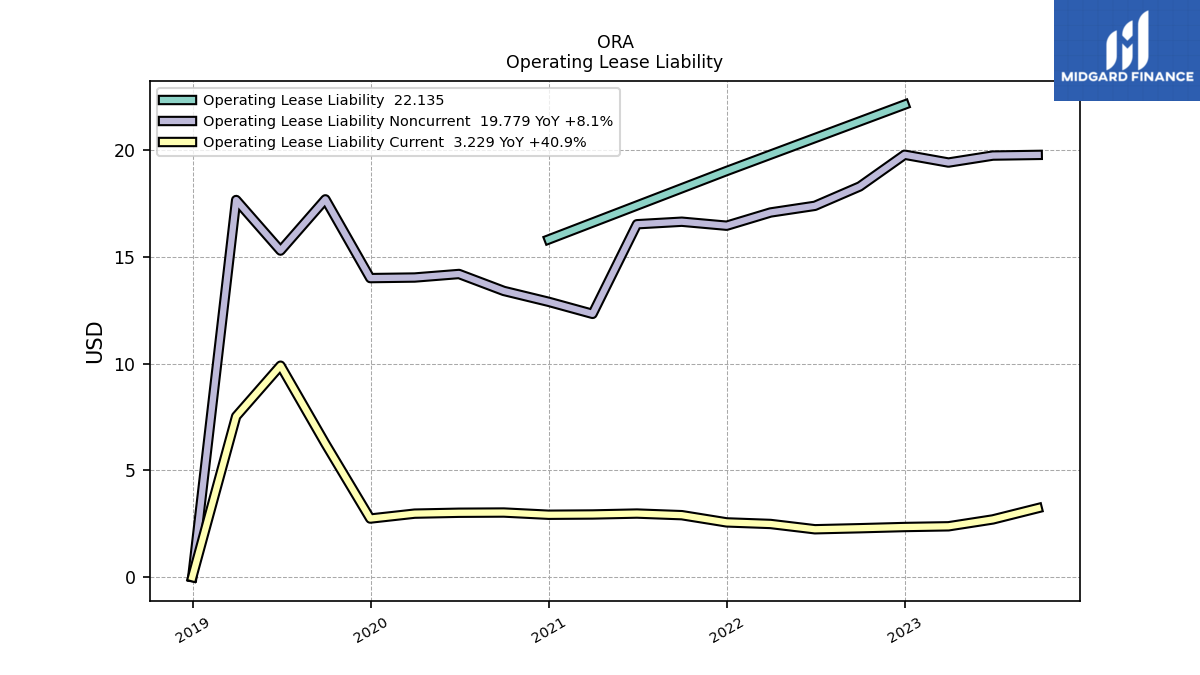
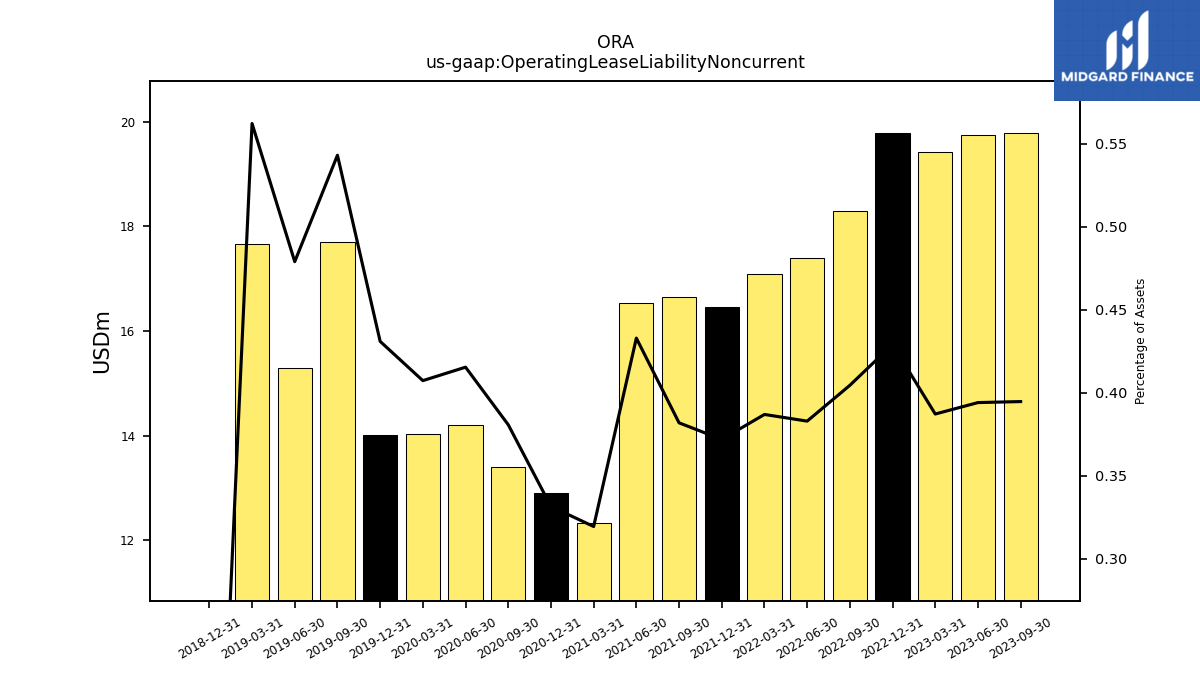
| Operating Lease Liability Noncurrent | 19.78 | 19.75 | 19.42 | 19.79 | 18.30 | 17.39 | 17.08 | 16.46 | 16.65 | 16.53 | 12.33 | 12.90 | 13.41 | 14.20 | 14.04 | 14.01 | 17.70 | 15.30 | 17.67 | 0.00 | NA | NA | NA | NA | NA | NA | NA | NA | NA | NA | NA | NA | NA | NA | NA | NA | NA | NA | NA | NA | NA | NA | NA | NA | NA | NA | NA | NA | NA | NA | NA | NA | NA | NA | NA |
| 2023-09-30 | 2023-06-30 | 2023-03-31 | 2022-12-31 | 2022-09-30 | 2022-06-30 | 2022-03-31 | 2021-12-31 | 2021-09-30 | 2021-06-30 | 2021-03-31 | 2020-12-31 | 2020-09-30 | 2020-06-30 | 2020-03-31 | 2019-12-31 | 2019-09-30 | 2019-06-30 | 2019-03-31 | 2018-12-31 | 2018-09-30 | 2018-06-30 | 2018-03-31 | 2017-12-31 | 2017-09-30 | 2017-06-30 | 2017-03-31 | 2016-12-31 | 2016-09-30 | 2016-06-30 | 2016-03-31 | 2015-12-31 | 2015-09-30 | 2015-06-30 | 2015-03-31 | 2014-12-31 | 2014-09-30 | 2014-06-30 | 2014-03-31 | 2013-12-31 | 2013-09-30 | 2013-06-30 | 2013-03-31 | 2012-12-31 | 2012-09-30 | 2012-06-30 | 2012-03-31 | 2011-12-31 | 2011-09-30 | 2011-06-30 | 2011-03-31 | 2010-12-31 | 2010-09-30 | 2010-06-30 | 2010-03-31 | ||
|---|---|---|---|---|---|---|---|---|---|---|---|---|---|---|---|---|---|---|---|---|---|---|---|---|---|---|---|---|---|---|---|---|---|---|---|---|---|---|---|---|---|---|---|---|---|---|---|---|---|---|---|---|---|---|---|---|
| Stockholders Equity | 2278.83 | 2254.39 | 2184.54 | 1867.57 | 1846.51 | 1832.63 | 1870.67 | 1855.00 | 1833.38 | 1825.08 | 1816.61 | 1805.98 | 1439.74 | 1428.40 | 1409.07 | 1392.42 | 1380.73 | 1369.56 | 1340.35 | 1319.84 | 1305.69 | 1295.71 | 1300.38 | 1236.14 | 1156.56 | 1143.27 | 1107.66 | 1078.42 | 1040.03 | 1027.06 | 1005.65 | 990.00 | 962.55 | 895.86 | 807.34 | 774.92 | 771.82 | 757.81 | 752.97 | 732.74 | 724.63 | 711.41 | 694.62 | 695.10 | 915.98 | 916.45 | 908.19 | 898.72 | 940.10 | 939.66 | 931.86 | 939.13 | NA | NA | NA | |
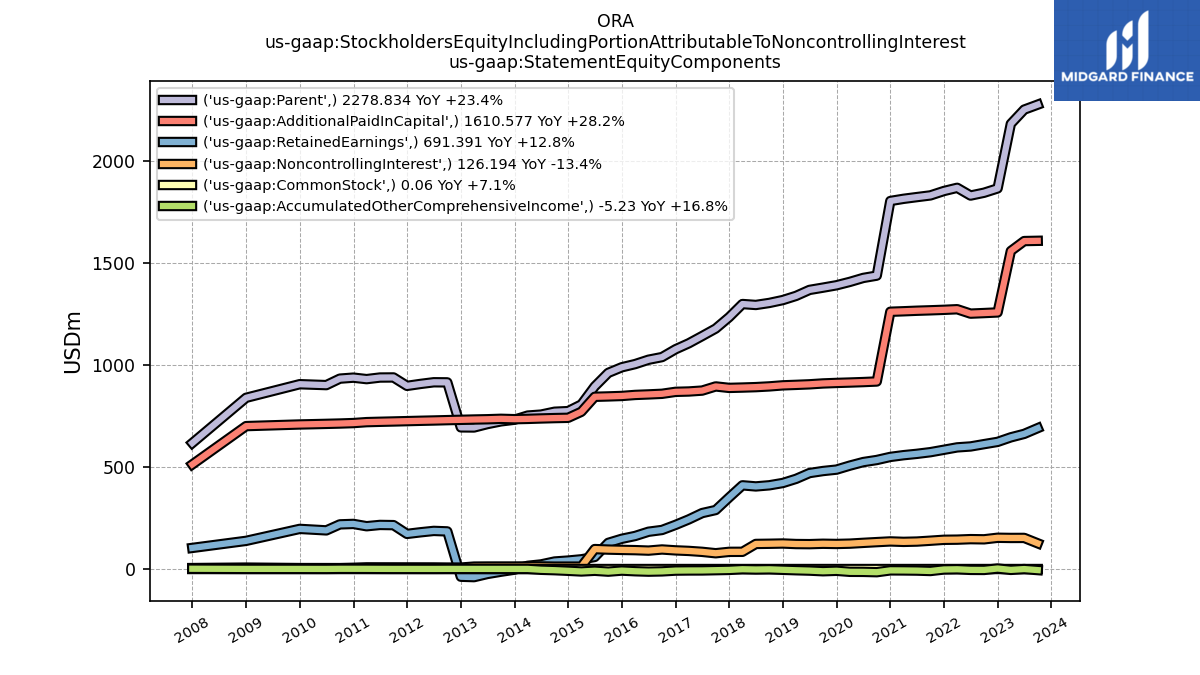
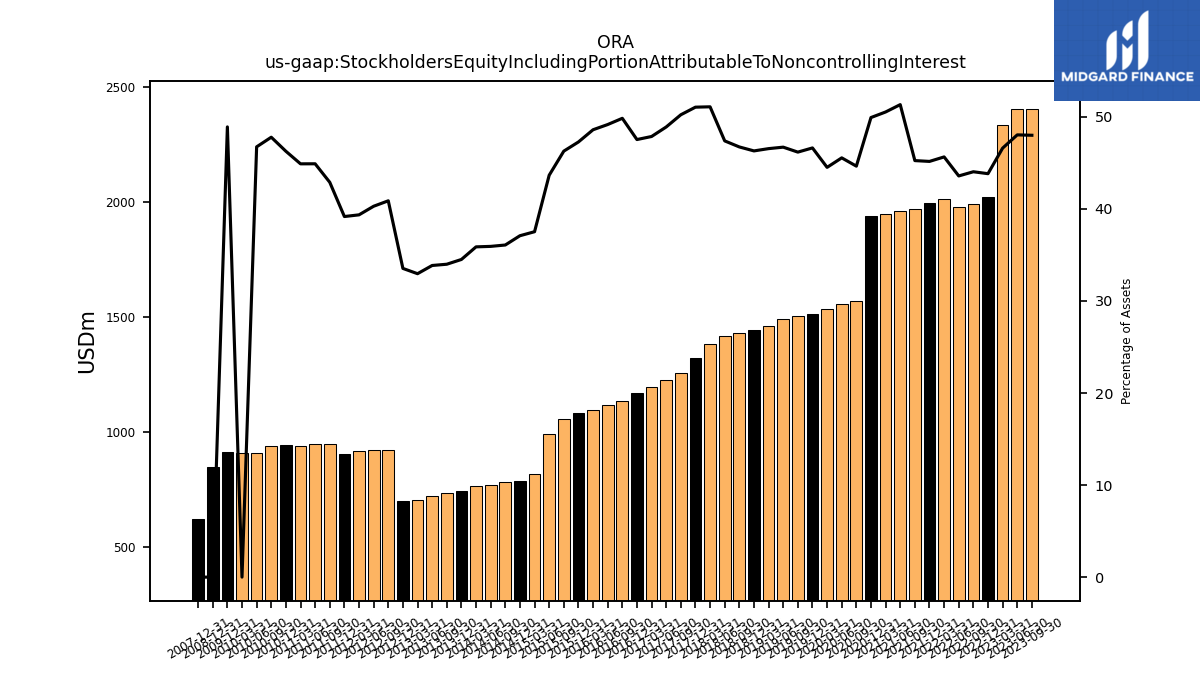
| Stockholders Equity Including Portion Attributable To Noncontrolling Interest | 2405.03 | 2407.04 | 2337.03 | 2020.97 | 1992.28 | 1979.29 | 2014.85 | 1998.46 | 1972.36 | 1959.86 | 1949.88 | 1941.44 | 1571.80 | 1556.81 | 1533.65 | 1515.41 | 1504.79 | 1491.64 | 1462.99 | 1445.10 | 1429.70 | 1418.80 | 1384.88 | 1320.46 | 1257.44 | 1227.60 | 1196.50 | 1170.01 | 1135.94 | 1117.43 | 1098.33 | 1083.87 | 1057.96 | 993.81 | 819.17 | 786.75 | 783.54 | 770.60 | 765.69 | 745.11 | 736.97 | 723.72 | 706.52 | 702.20 | 923.15 | 924.21 | 916.04 | 906.64 | 948.11 | 947.72 | 940.04 | 945.23 | 938.82 | 907.08 | 909.36 | |
| Common Stock Value | 0.06 | 0.06 | 0.06 | 0.06 | 0.06 | 0.06 | 0.06 | 0.06 | 0.06 | 0.06 | 0.06 | 0.06 | 0.05 | 0.05 | 0.05 | 0.05 | 0.05 | 0.05 | 0.05 | 0.05 | 0.05 | 0.05 | 0.05 | 0.05 | 0.05 | 0.05 | 0.05 | 0.05 | 0.05 | 0.05 | 0.05 | 0.05 | 0.05 | 0.05 | 0.05 | 0.05 | 0.05 | 0.05 | 0.05 | 0.05 | 0.05 | 0.05 | 0.05 | 0.05 | 0.05 | 0.05 | 0.05 | 0.05 | 0.05 | 0.05 | 0.05 | 0.05 | NA | NA | NA | |
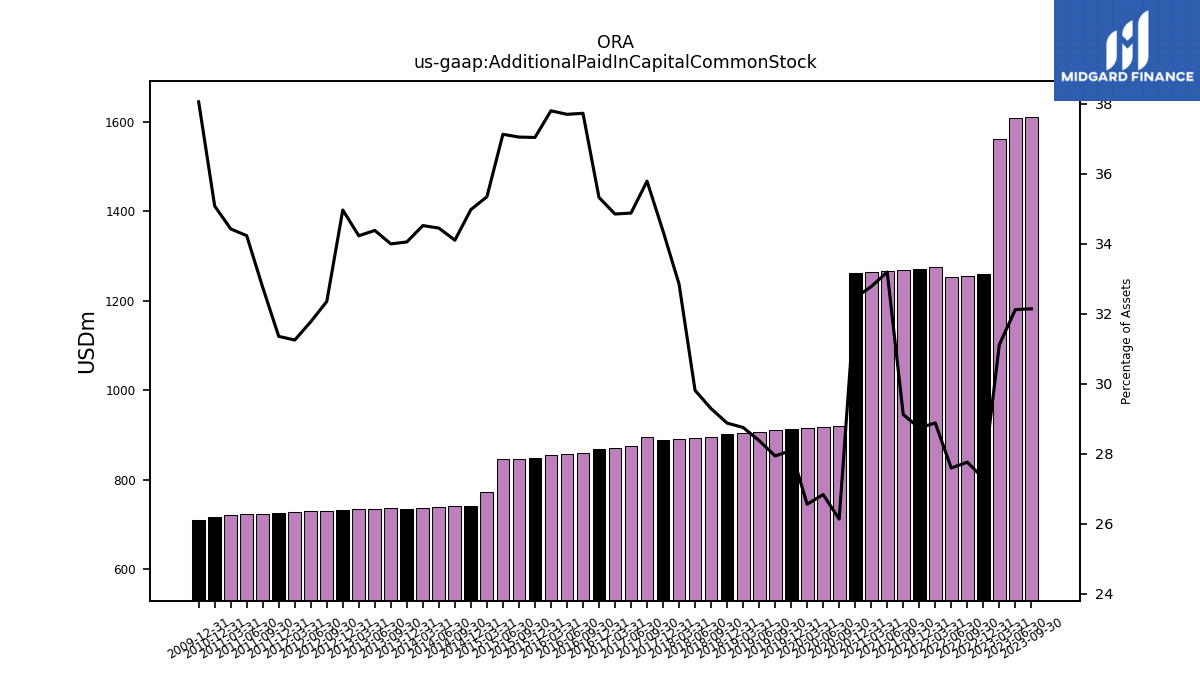
| Additional Paid In Capital Common Stock | 1610.58 | 1609.30 | 1560.44 | 1259.07 | 1256.06 | 1253.24 | 1274.84 | 1271.92 | 1269.57 | 1267.45 | 1264.83 | 1262.45 | 920.21 | 917.40 | 915.14 | 913.15 | 910.65 | 906.37 | 903.72 | 901.36 | 896.16 | 892.60 | 890.49 | 888.78 | 896.00 | 875.59 | 871.18 | 869.46 | 859.86 | 856.83 | 854.26 | 849.22 | 847.00 | 845.17 | 771.59 | 742.01 | 740.65 | 738.84 | 736.74 | 735.29 | 737.12 | 735.00 | 733.68 | 732.14 | 730.58 | 728.87 | 727.40 | 725.75 | 724.07 | 722.52 | 720.80 | 716.73 | NA | NA | NA | |
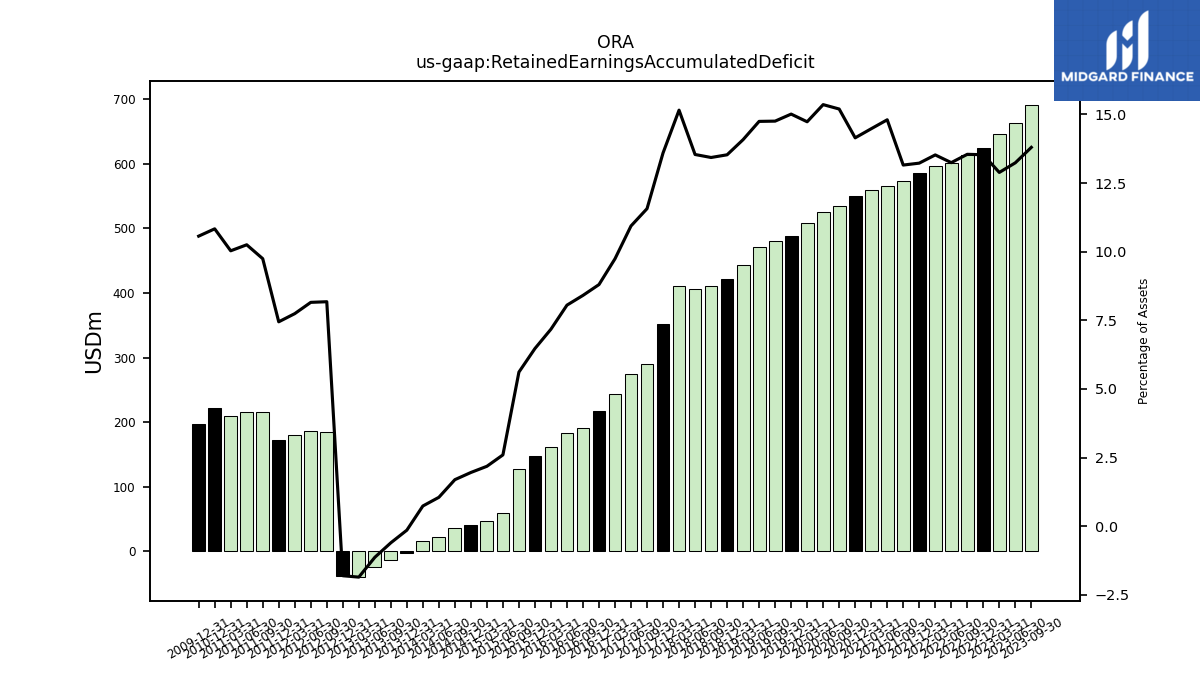
| Retained Earnings Accumulated Deficit | 691.39 | 663.17 | 646.20 | 623.91 | 612.83 | 601.44 | 596.91 | 585.21 | 573.41 | 565.22 | 558.64 | 550.10 | 534.98 | 524.86 | 507.54 | 487.87 | 480.88 | 470.88 | 442.53 | 422.22 | 410.87 | 405.35 | 410.76 | 351.62 | 289.56 | 274.57 | 243.51 | 216.64 | 191.63 | 183.02 | 162.19 | 148.40 | 128.35 | 59.16 | 47.67 | 41.54 | 36.84 | 22.60 | 15.74 | -3.09 | -13.07 | -24.20 | -39.72 | -37.73 | 184.65 | 187.05 | 180.23 | 172.33 | 215.41 | 216.36 | 210.05 | 221.31 | NA | NA | NA | |
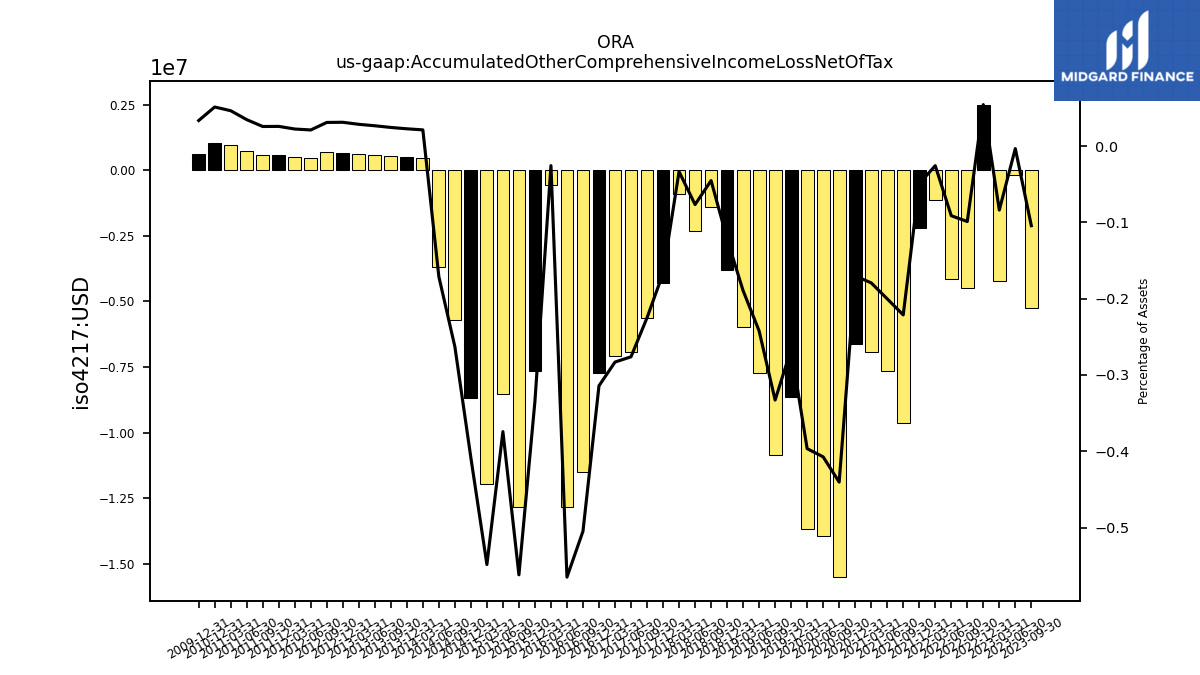
| Accumulated Other Comprehensive Income Loss Net Of Tax | -5.23 | -0.17 | -4.21 | 2.50 | -4.48 | -4.15 | -1.14 | -2.19 | -9.65 | -7.65 | -6.92 | -6.62 | -15.50 | -13.92 | -13.66 | -8.65 | -10.85 | -7.74 | -5.96 | -3.80 | -1.39 | -2.30 | -0.91 | -4.31 | -5.63 | -6.93 | -7.08 | -7.73 | -11.50 | -12.84 | -0.58 | -7.67 | -12.84 | -8.52 | -11.97 | -8.67 | -5.71 | -3.67 | 0.45 | 0.49 | 0.53 | 0.57 | 0.61 | 0.65 | 0.70 | 0.48 | 0.52 | 0.59 | 0.56 | 0.73 | 0.97 | 1.04 | NA | NA | NA | |
| Minority Interest | 126.19 | 152.65 | 152.49 | 153.40 | 145.77 | 146.67 | 144.18 | 143.46 | 138.97 | 134.77 | 133.27 | 135.45 | 132.06 | 128.41 | 124.59 | 122.99 | 124.06 | 122.08 | 122.65 | 125.26 | 124.00 | 123.09 | 84.50 | 84.32 | 77.46 | 84.33 | 88.84 | 91.58 | 95.91 | 90.38 | 92.68 | 93.87 | 95.40 | 97.95 | 11.83 | 11.82 | 11.72 | 12.79 | 12.72 | 12.37 | 12.34 | 12.30 | 11.90 | 7.10 | 7.18 | 7.76 | 7.84 | 7.93 | 8.01 | 8.06 | 8.18 | 6.09 | NA | NA | NA | |
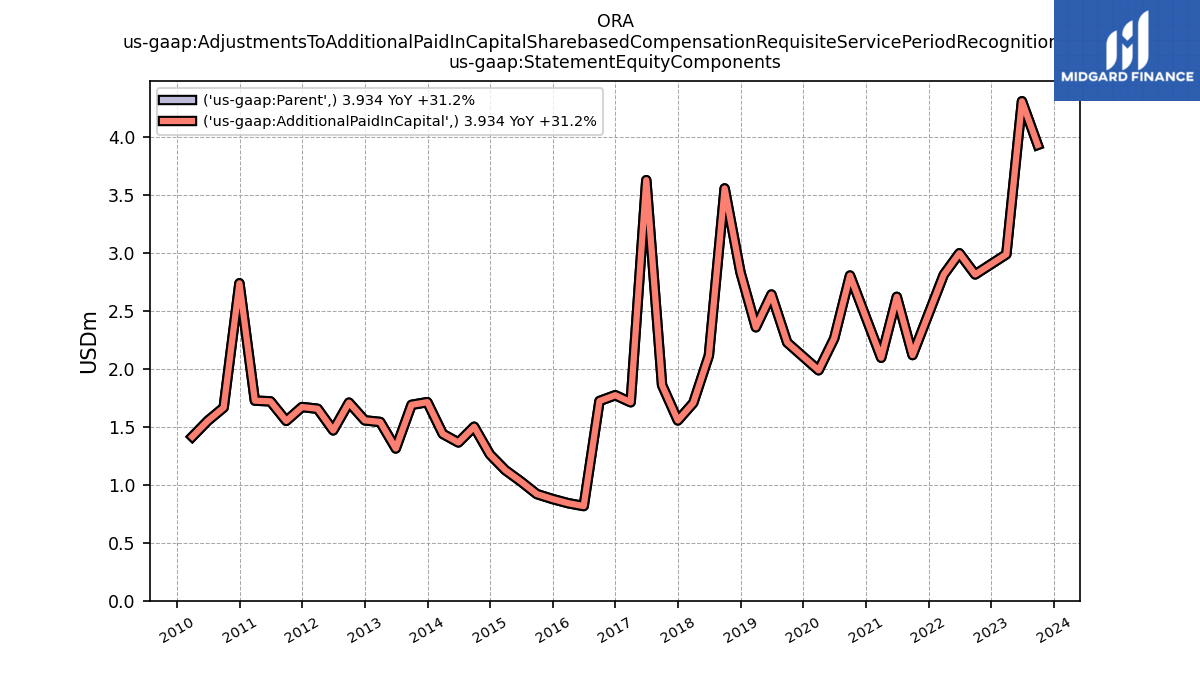
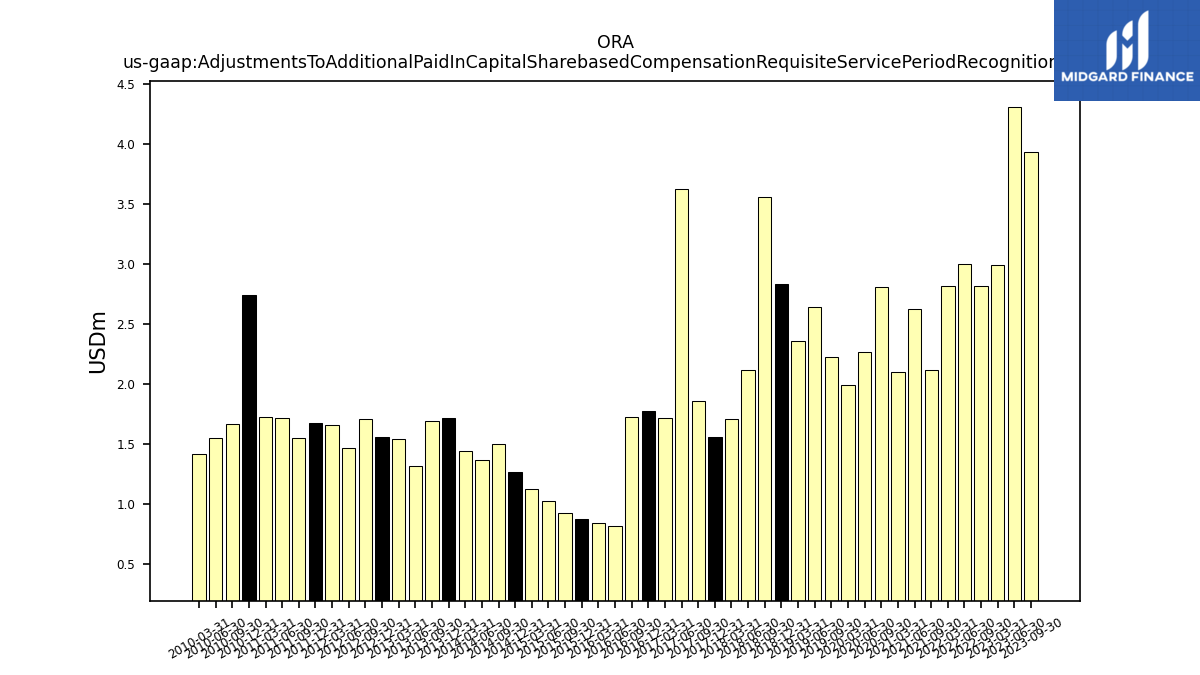
| Adjustments To Additional Paid In Capital Sharebased Compensation Requisite Service Period Recognition Value | 3.93 | 4.31 | 2.99 | NA | 2.82 | 3.00 | 2.81 | NA | 2.12 | 2.62 | 2.10 | NA | 2.81 | 2.26 | 1.99 | NA | 2.23 | 2.64 | 2.36 | 2.84 | 3.56 | 2.12 | 1.71 | 1.56 | 1.86 | 3.63 | 1.71 | 1.77 | 1.72 | 0.82 | 0.84 | 0.88 | 0.92 | 1.03 | 1.13 | 1.26 | 1.50 | 1.37 | 1.44 | 1.71 | 1.69 | 1.31 | 1.54 | 1.56 | 1.71 | 1.47 | 1.66 | 1.67 | 1.55 | 1.72 | 1.73 | 2.74 | 1.67 | 1.55 | 1.42 | |
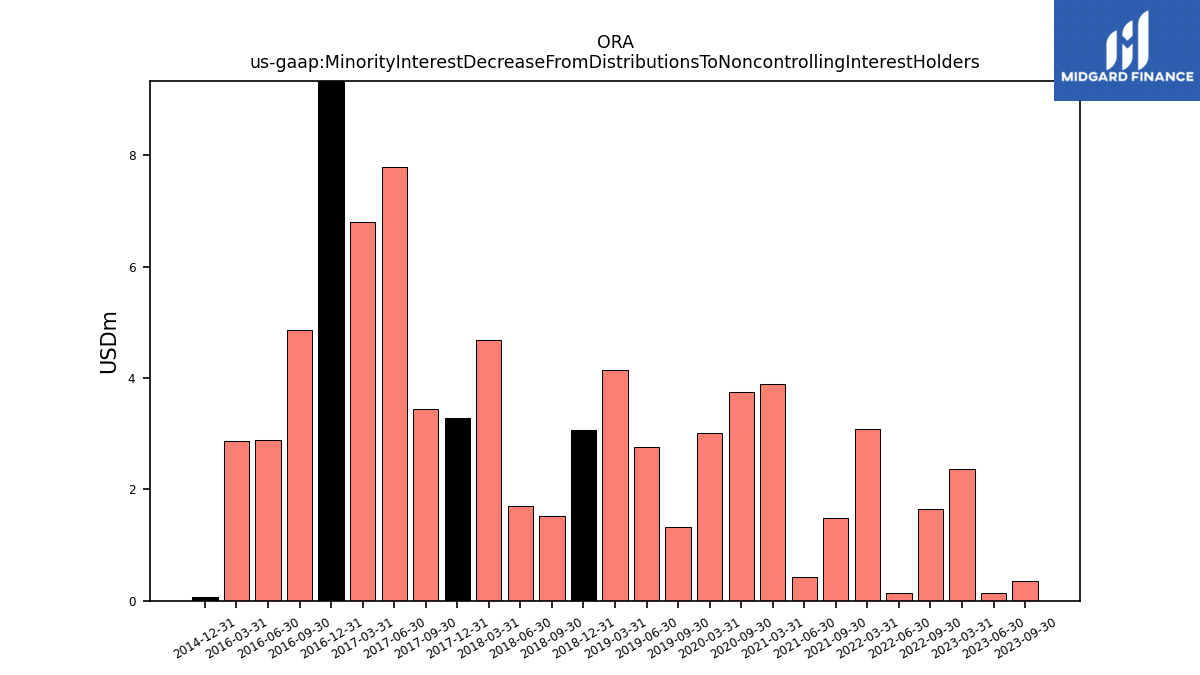
| Minority Interest Decrease From Distributions To Noncontrolling Interest Holders | 0.35 | 0.14 | 2.36 | NA | 1.65 | 0.14 | 3.09 | NA | 1.49 | 0.43 | 3.90 | NA | 3.75 | NA | 3.01 | NA | 1.33 | 2.77 | 4.15 | 3.07 | 1.52 | 1.70 | 4.67 | 3.28 | 3.44 | 7.79 | 6.81 | 46.77 | 4.87 | 2.88 | 2.87 | NA | NA | NA | NA | 0.06 | NA | NA | NA | NA | NA | NA | NA | NA | NA | NA | NA | NA | NA | NA | NA | NA | NA | NA | NA |
| 2023-09-30 | 2023-06-30 | 2023-03-31 | 2022-12-31 | 2022-09-30 | 2022-06-30 | 2022-03-31 | 2021-12-31 | 2021-09-30 | 2021-06-30 | 2021-03-31 | 2020-12-31 | 2020-09-30 | 2020-06-30 | 2020-03-31 | 2019-12-31 | 2019-09-30 | 2019-06-30 | 2019-03-31 | 2018-12-31 | 2018-09-30 | 2018-06-30 | 2018-03-31 | 2017-12-31 | 2017-09-30 | 2017-06-30 | 2017-03-31 | 2016-12-31 | 2016-09-30 | 2016-06-30 | 2016-03-31 | 2015-12-31 | 2015-09-30 | 2015-06-30 | 2015-03-31 | 2014-12-31 | 2014-09-30 | 2014-06-30 | 2014-03-31 | 2013-12-31 | 2013-09-30 | 2013-06-30 | 2013-03-31 | 2012-12-31 | 2012-09-30 | 2012-06-30 | 2012-03-31 | 2011-12-31 | 2011-09-30 | 2011-06-30 | 2011-03-31 | 2010-12-31 | 2010-09-30 | 2010-06-30 | 2010-03-31 | ||
|---|---|---|---|---|---|---|---|---|---|---|---|---|---|---|---|---|---|---|---|---|---|---|---|---|---|---|---|---|---|---|---|---|---|---|---|---|---|---|---|---|---|---|---|---|---|---|---|---|---|---|---|---|---|---|---|---|
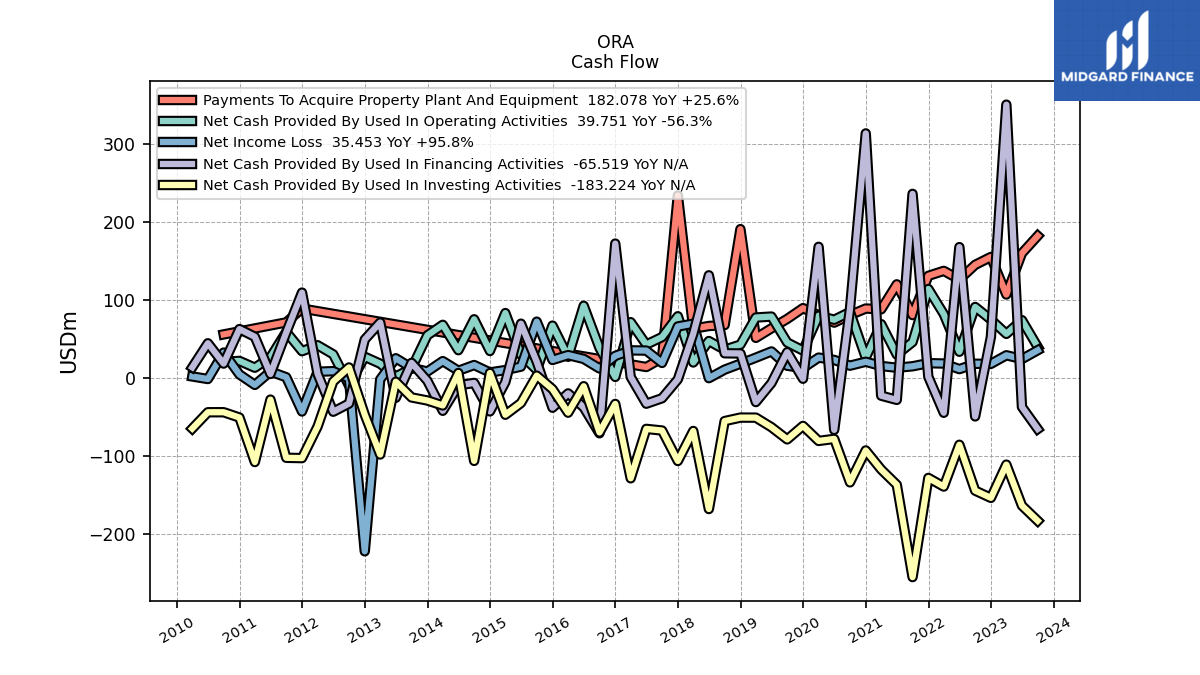
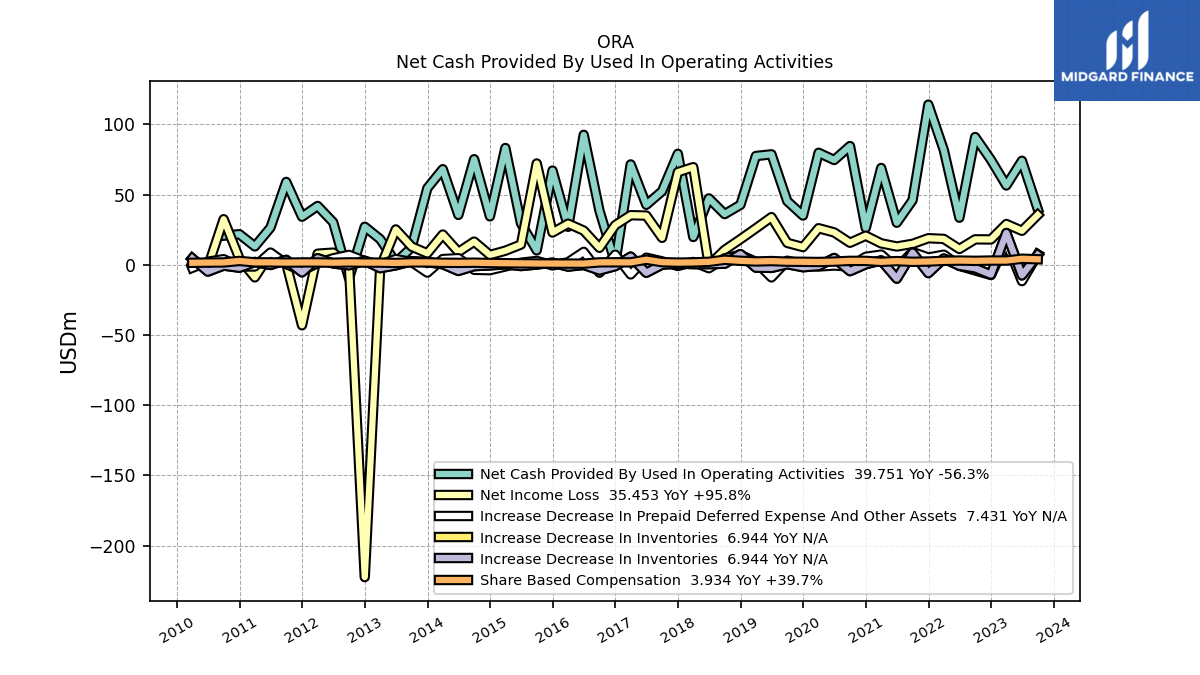
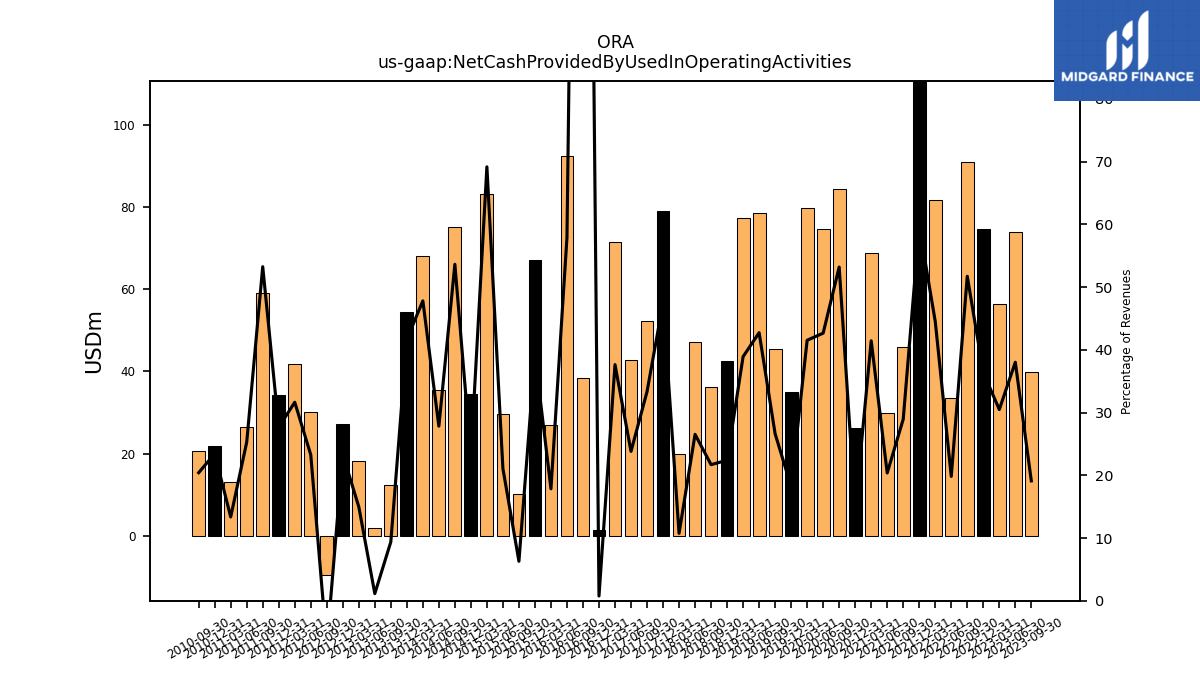
| Net Cash Provided By Used In Operating Activities | 39.75 | 74.05 | 56.46 | 74.73 | 90.96 | 33.51 | 81.78 | 114.03 | 45.95 | 29.92 | 68.92 | 26.11 | 84.54 | 74.60 | 79.76 | 35.04 | 45.37 | 78.64 | 77.44 | 42.67 | 36.11 | 47.28 | 19.77 | 79.04 | 52.38 | 42.70 | 71.46 | 1.26 | 38.45 | 92.53 | 27.04 | 67.06 | 10.24 | 29.58 | 83.15 | 34.47 | 75.19 | 35.50 | 68.08 | 54.53 | 12.28 | 1.73 | 18.22 | 27.09 | -9.70 | 30.20 | 41.87 | 34.22 | 59.01 | 26.44 | 13.07 | 21.76 | 20.71 | NA | NA | |
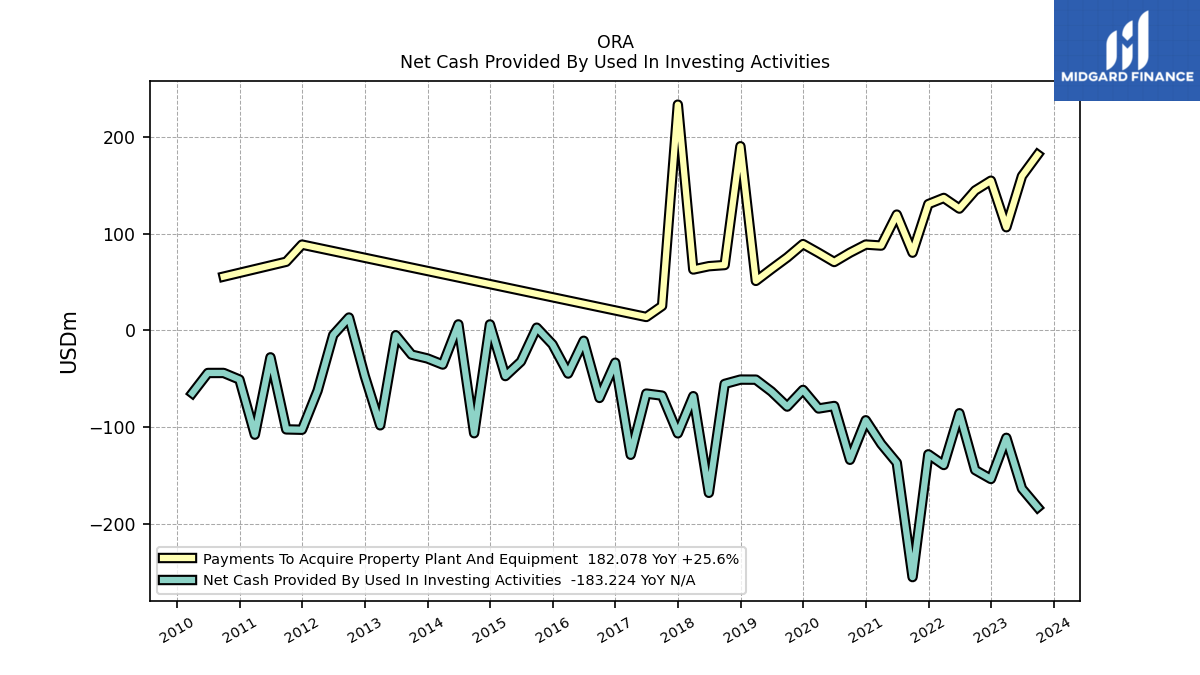
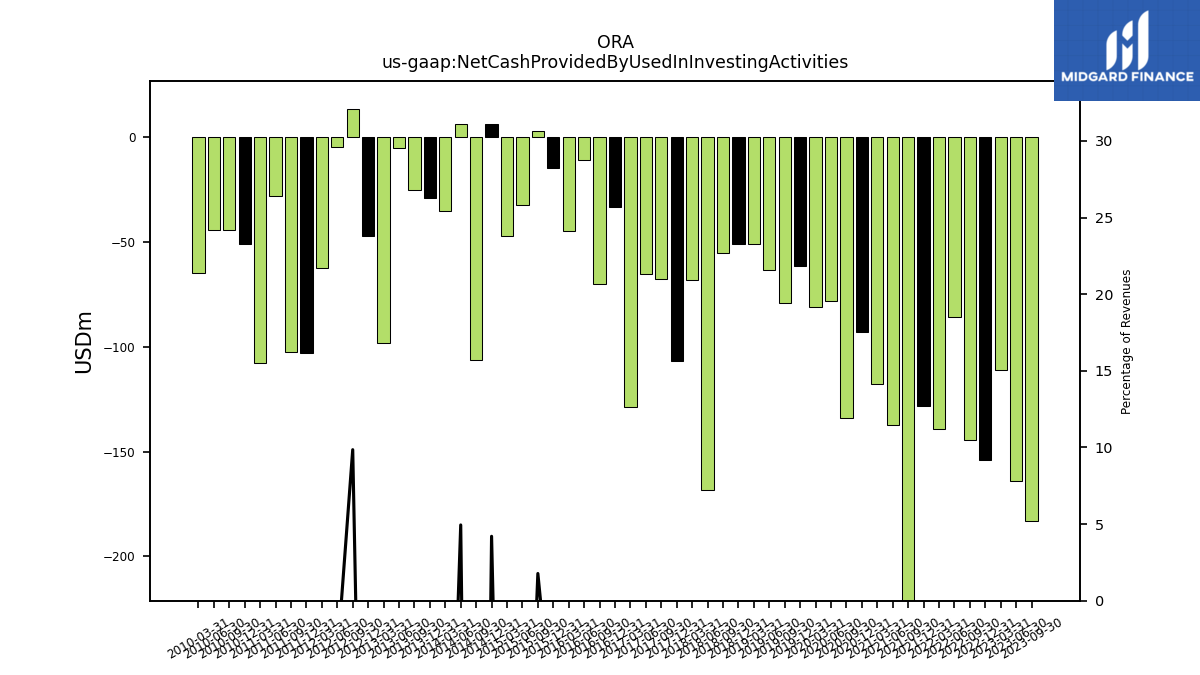
| Net Cash Provided By Used In Investing Activities | -183.22 | -163.76 | -111.18 | -153.83 | -144.54 | -85.70 | -139.33 | -128.25 | -255.43 | -137.04 | -117.47 | -93.00 | -133.94 | -78.21 | -80.82 | -61.53 | -78.84 | -63.22 | -50.94 | -50.88 | -55.36 | -168.16 | -68.03 | -106.55 | -67.47 | -65.37 | -128.74 | -33.34 | -69.90 | -10.67 | -44.62 | -14.43 | 2.90 | -32.18 | -47.26 | 6.27 | -106.42 | 6.31 | -35.32 | -28.95 | -25.03 | -4.92 | -98.24 | -47.18 | 13.42 | -4.70 | -62.33 | -102.82 | -102.44 | -27.82 | -107.92 | -50.80 | -44.01 | -44.03 | -64.98 | |
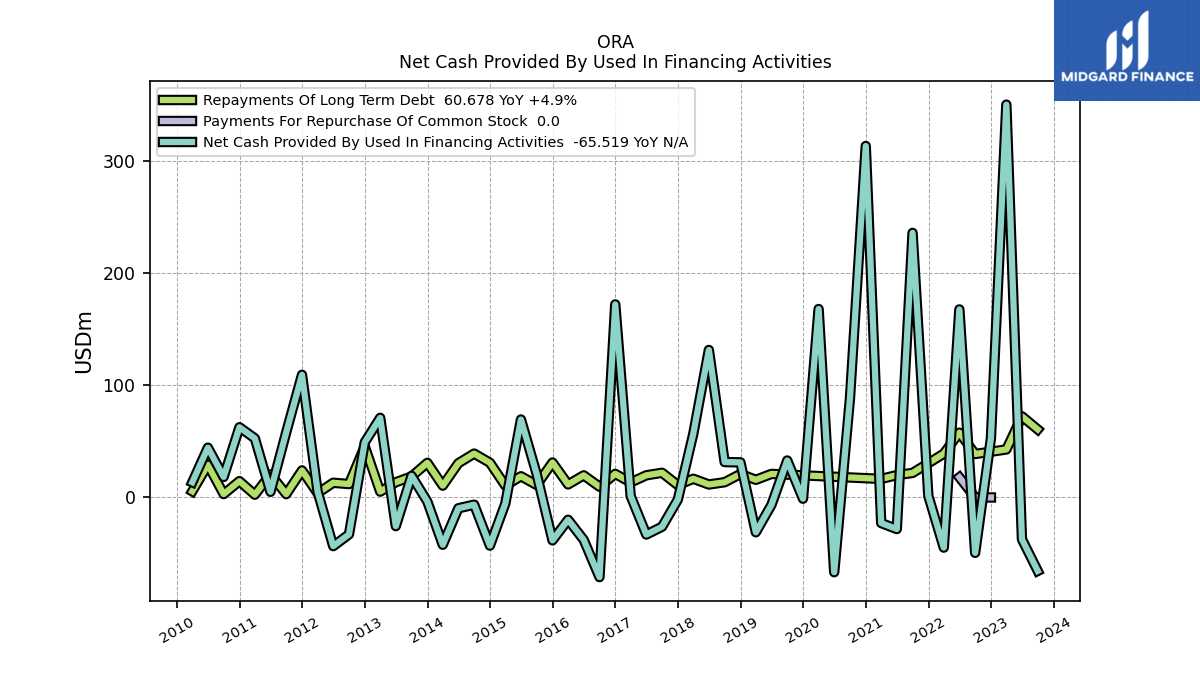
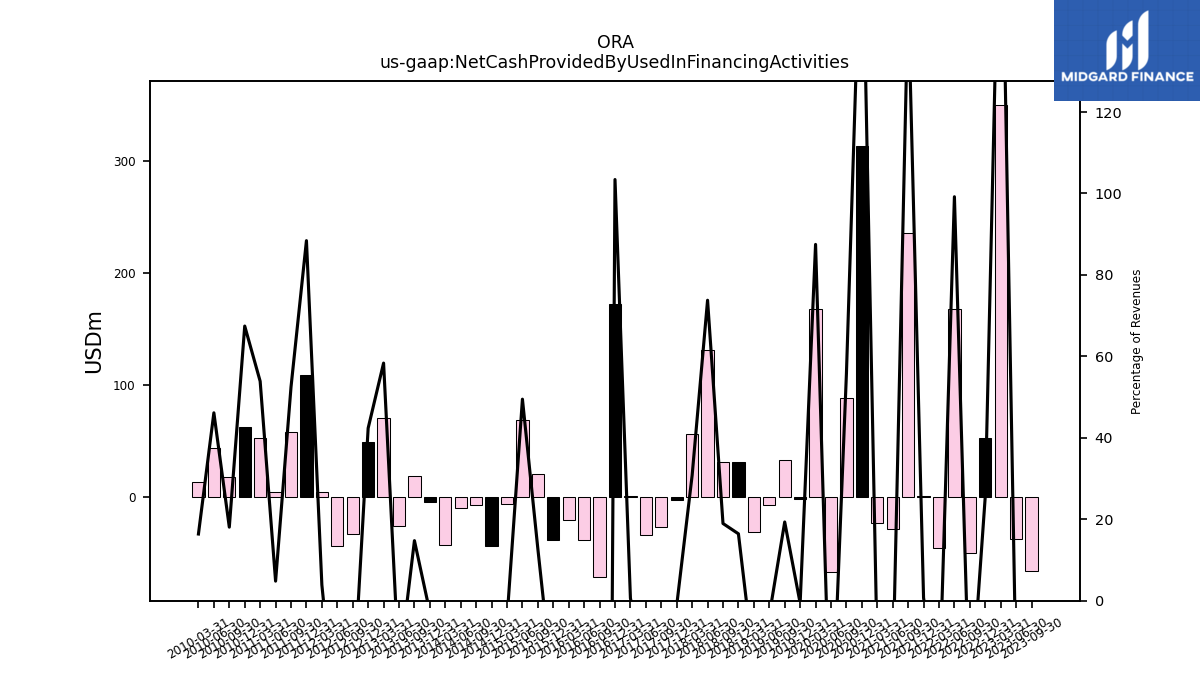
| Net Cash Provided By Used In Financing Activities | -65.52 | -37.29 | 350.38 | 52.67 | -49.41 | 167.73 | -44.72 | 1.37 | 235.99 | -28.17 | -22.81 | 313.49 | 88.57 | -66.67 | 168.09 | -1.12 | 32.98 | -6.59 | -31.04 | 31.31 | 31.58 | 131.56 | 56.68 | -1.89 | -26.09 | -33.08 | 1.20 | 172.23 | -71.04 | -37.80 | -19.84 | -38.25 | 20.74 | 69.54 | -5.40 | -42.96 | -6.44 | -9.62 | -42.18 | -3.66 | 19.30 | -25.54 | 71.03 | 49.20 | -32.88 | -43.41 | 5.15 | 109.41 | 58.18 | 5.04 | 52.72 | 62.62 | 18.34 | 44.42 | 13.54 |
| 2023-09-30 | 2023-06-30 | 2023-03-31 | 2022-12-31 | 2022-09-30 | 2022-06-30 | 2022-03-31 | 2021-12-31 | 2021-09-30 | 2021-06-30 | 2021-03-31 | 2020-12-31 | 2020-09-30 | 2020-06-30 | 2020-03-31 | 2019-12-31 | 2019-09-30 | 2019-06-30 | 2019-03-31 | 2018-12-31 | 2018-09-30 | 2018-06-30 | 2018-03-31 | 2017-12-31 | 2017-09-30 | 2017-06-30 | 2017-03-31 | 2016-12-31 | 2016-09-30 | 2016-06-30 | 2016-03-31 | 2015-12-31 | 2015-09-30 | 2015-06-30 | 2015-03-31 | 2014-12-31 | 2014-09-30 | 2014-06-30 | 2014-03-31 | 2013-12-31 | 2013-09-30 | 2013-06-30 | 2013-03-31 | 2012-12-31 | 2012-09-30 | 2012-06-30 | 2012-03-31 | 2011-12-31 | 2011-09-30 | 2011-06-30 | 2011-03-31 | 2010-12-31 | 2010-09-30 | 2010-06-30 | 2010-03-31 | ||
|---|---|---|---|---|---|---|---|---|---|---|---|---|---|---|---|---|---|---|---|---|---|---|---|---|---|---|---|---|---|---|---|---|---|---|---|---|---|---|---|---|---|---|---|---|---|---|---|---|---|---|---|---|---|---|---|---|
| Net Cash Provided By Used In Operating Activities | 39.75 | 74.05 | 56.46 | 74.73 | 90.96 | 33.51 | 81.78 | 114.03 | 45.95 | 29.92 | 68.92 | 26.11 | 84.54 | 74.60 | 79.76 | 35.04 | 45.37 | 78.64 | 77.44 | 42.67 | 36.11 | 47.28 | 19.77 | 79.04 | 52.38 | 42.70 | 71.46 | 1.26 | 38.45 | 92.53 | 27.04 | 67.06 | 10.24 | 29.58 | 83.15 | 34.47 | 75.19 | 35.50 | 68.08 | 54.53 | 12.28 | 1.73 | 18.22 | 27.09 | -9.70 | 30.20 | 41.87 | 34.22 | 59.01 | 26.44 | 13.07 | 21.76 | 20.71 | NA | NA | |
| Net Income Loss | 35.45 | 24.19 | 29.03 | 18.04 | 18.11 | 11.26 | 18.43 | 18.91 | 14.90 | 13.03 | 15.26 | 20.70 | 15.68 | 23.05 | 26.03 | 12.61 | 15.61 | 33.94 | 25.95 | 18.22 | 10.58 | -0.34 | 69.51 | 65.96 | 19.18 | 35.04 | 35.31 | 28.23 | 12.08 | 24.35 | 29.27 | 22.99 | 72.14 | 14.41 | 10.03 | 6.98 | 16.51 | 9.14 | 21.55 | 8.16 | 12.95 | 25.18 | -1.98 | -222.38 | -0.58 | 8.64 | 7.89 | -43.08 | 0.87 | 8.13 | -8.97 | 4.46 | 32.46 | -1.44 | 1.84 | |
| Profit Loss | 36.33 | 24.51 | 33.46 | 20.23 | 19.83 | 14.95 | 22.79 | 22.27 | 20.78 | 15.20 | 17.83 | 23.53 | 23.10 | 25.27 | 29.91 | 14.13 | 15.09 | 36.20 | 28.13 | 23.09 | 10.11 | 2.66 | 74.26 | 69.43 | 22.78 | 38.24 | 39.73 | 31.23 | 14.41 | 24.93 | 30.95 | 24.15 | 73.66 | 15.27 | 10.27 | 7.14 | 16.77 | 9.31 | 21.79 | 8.36 | 13.14 | 25.51 | -1.90 | -222.25 | -0.52 | 8.72 | 8.03 | -43.00 | 1.00 | 8.24 | -8.96 | 4.54 | 32.40 | -1.49 | 1.78 | |
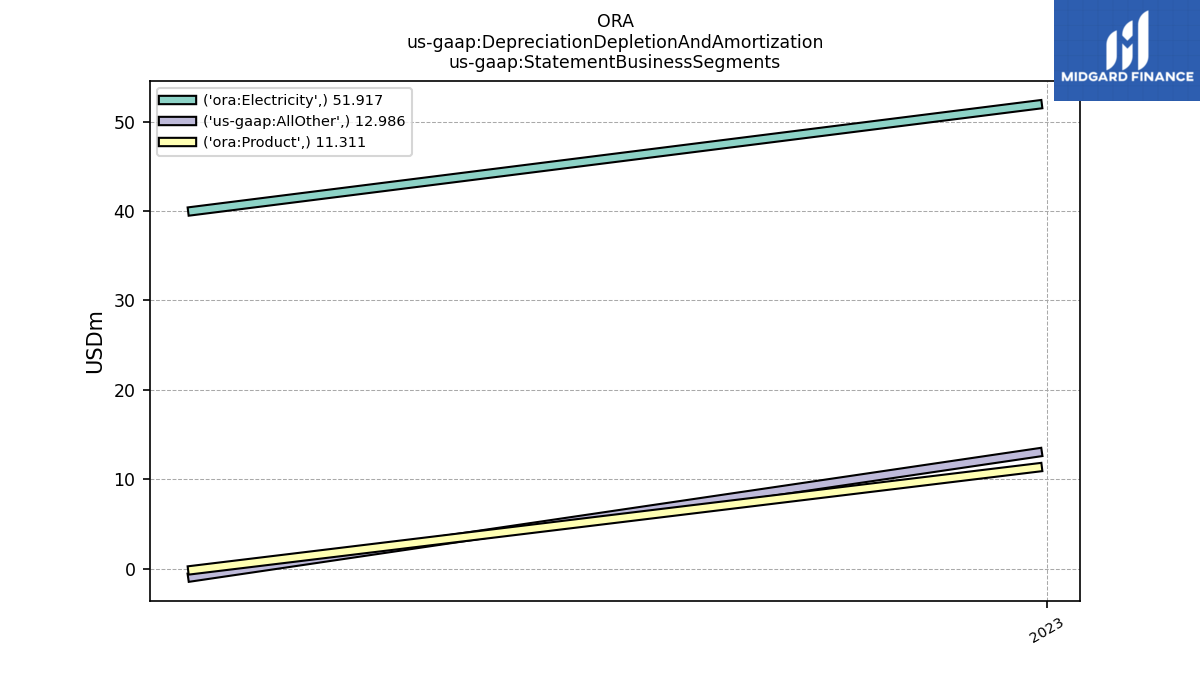
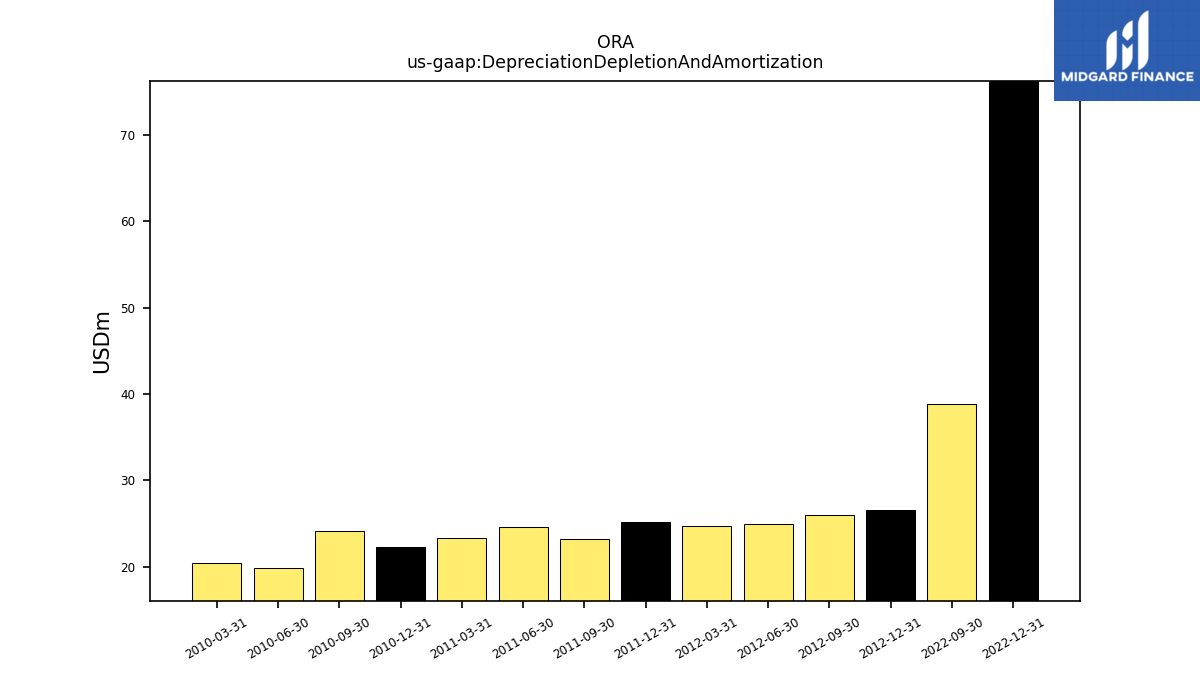
| Depreciation Depletion And Amortization | NA | NA | NA | 76.21 | 38.89 | NA | NA | NA | NA | NA | NA | NA | NA | NA | NA | NA | NA | NA | NA | NA | NA | NA | NA | NA | NA | NA | NA | NA | NA | NA | NA | NA | NA | NA | NA | NA | NA | NA | NA | NA | NA | NA | NA | 26.53 | 26.05 | 25.01 | 24.74 | 25.14 | 23.26 | 24.64 | 23.37 | 22.30 | 24.13 | 19.88 | 20.45 | |
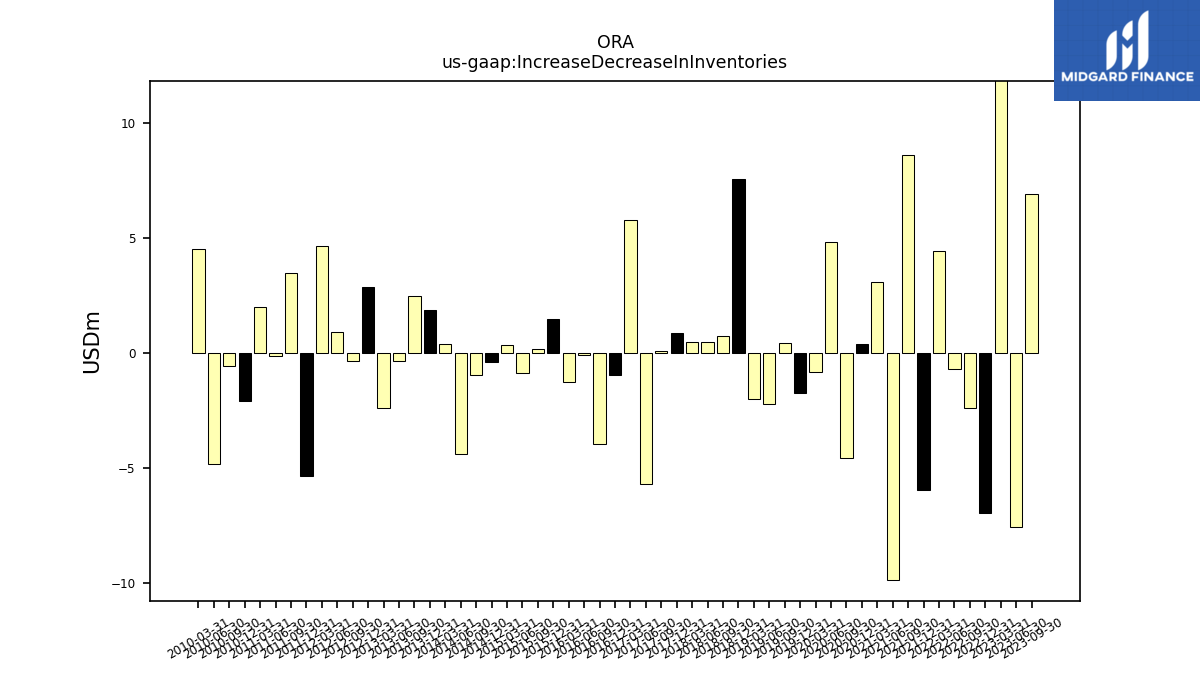
| Increase Decrease In Inventories | 6.94 | -7.55 | 22.61 | -6.97 | -2.41 | -0.68 | 4.44 | -5.94 | 8.61 | -9.88 | 3.09 | 0.39 | -4.55 | 4.83 | -0.84 | -1.72 | 0.44 | -2.21 | -2.02 | 7.59 | 0.75 | 0.48 | 0.50 | 0.86 | 0.11 | -5.70 | 5.80 | -0.96 | -3.96 | -0.10 | -1.28 | 1.48 | 0.19 | -0.89 | 0.36 | -0.41 | -0.95 | -4.38 | 0.38 | 1.89 | 2.49 | -0.35 | -2.41 | 2.88 | -0.33 | 0.92 | 4.66 | -5.36 | 3.49 | -0.15 | 2.02 | -2.08 | -0.56 | -4.84 | 4.53 | |
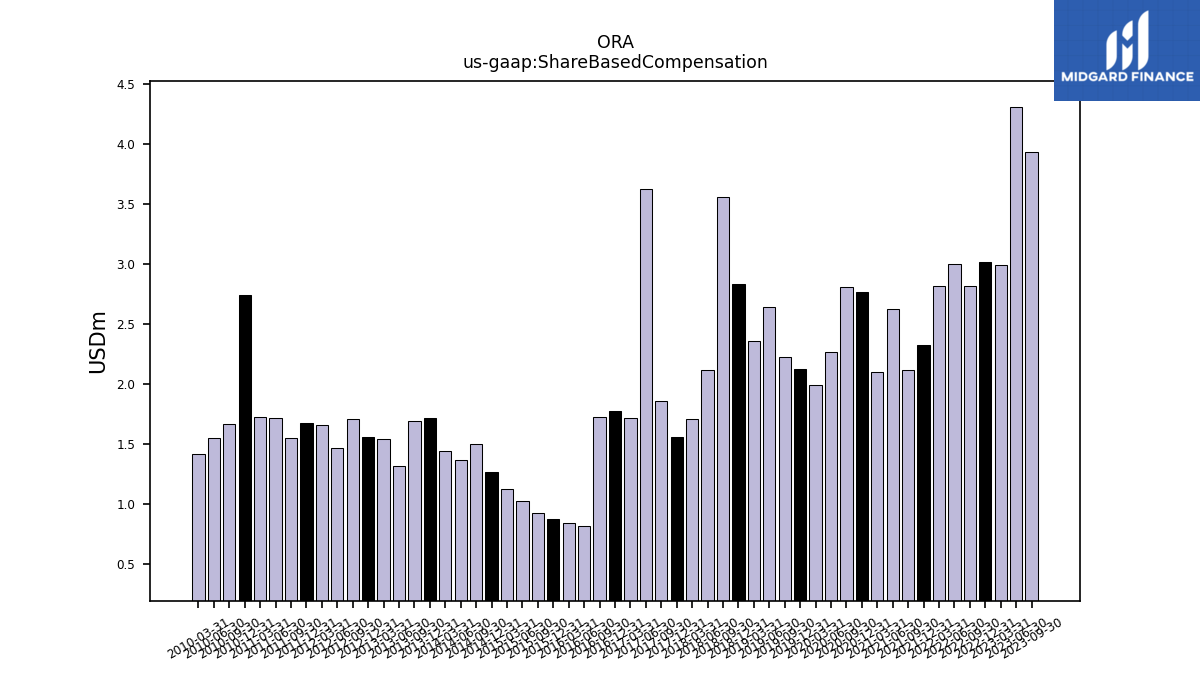
| Share Based Compensation | 3.93 | 4.31 | 2.99 | 3.02 | 2.82 | 3.00 | 2.81 | 2.33 | 2.12 | 2.62 | 2.10 | 2.77 | 2.81 | 2.26 | 1.99 | 2.13 | 2.23 | 2.64 | 2.36 | 2.84 | 3.56 | 2.12 | 1.71 | 1.56 | 1.86 | 3.63 | 1.71 | 1.77 | 1.72 | 0.82 | 0.84 | 0.88 | 0.92 | 1.03 | 1.13 | 1.26 | 1.50 | 1.37 | 1.44 | 1.71 | 1.69 | 1.31 | 1.54 | 1.56 | 1.71 | 1.47 | 1.66 | 1.67 | 1.55 | 1.72 | 1.73 | 2.74 | 1.67 | 1.55 | 1.42 |
| 2023-09-30 | 2023-06-30 | 2023-03-31 | 2022-12-31 | 2022-09-30 | 2022-06-30 | 2022-03-31 | 2021-12-31 | 2021-09-30 | 2021-06-30 | 2021-03-31 | 2020-12-31 | 2020-09-30 | 2020-06-30 | 2020-03-31 | 2019-12-31 | 2019-09-30 | 2019-06-30 | 2019-03-31 | 2018-12-31 | 2018-09-30 | 2018-06-30 | 2018-03-31 | 2017-12-31 | 2017-09-30 | 2017-06-30 | 2017-03-31 | 2016-12-31 | 2016-09-30 | 2016-06-30 | 2016-03-31 | 2015-12-31 | 2015-09-30 | 2015-06-30 | 2015-03-31 | 2014-12-31 | 2014-09-30 | 2014-06-30 | 2014-03-31 | 2013-12-31 | 2013-09-30 | 2013-06-30 | 2013-03-31 | 2012-12-31 | 2012-09-30 | 2012-06-30 | 2012-03-31 | 2011-12-31 | 2011-09-30 | 2011-06-30 | 2011-03-31 | 2010-12-31 | 2010-09-30 | 2010-06-30 | 2010-03-31 | ||
|---|---|---|---|---|---|---|---|---|---|---|---|---|---|---|---|---|---|---|---|---|---|---|---|---|---|---|---|---|---|---|---|---|---|---|---|---|---|---|---|---|---|---|---|---|---|---|---|---|---|---|---|---|---|---|---|---|
| Net Cash Provided By Used In Investing Activities | -183.22 | -163.76 | -111.18 | -153.83 | -144.54 | -85.70 | -139.33 | -128.25 | -255.43 | -137.04 | -117.47 | -93.00 | -133.94 | -78.21 | -80.82 | -61.53 | -78.84 | -63.22 | -50.94 | -50.88 | -55.36 | -168.16 | -68.03 | -106.55 | -67.47 | -65.37 | -128.74 | -33.34 | -69.90 | -10.67 | -44.62 | -14.43 | 2.90 | -32.18 | -47.26 | 6.27 | -106.42 | 6.31 | -35.32 | -28.95 | -25.03 | -4.92 | -98.24 | -47.18 | 13.42 | -4.70 | -62.33 | -102.82 | -102.44 | -27.82 | -107.92 | -50.80 | -44.01 | -44.03 | -64.98 | |
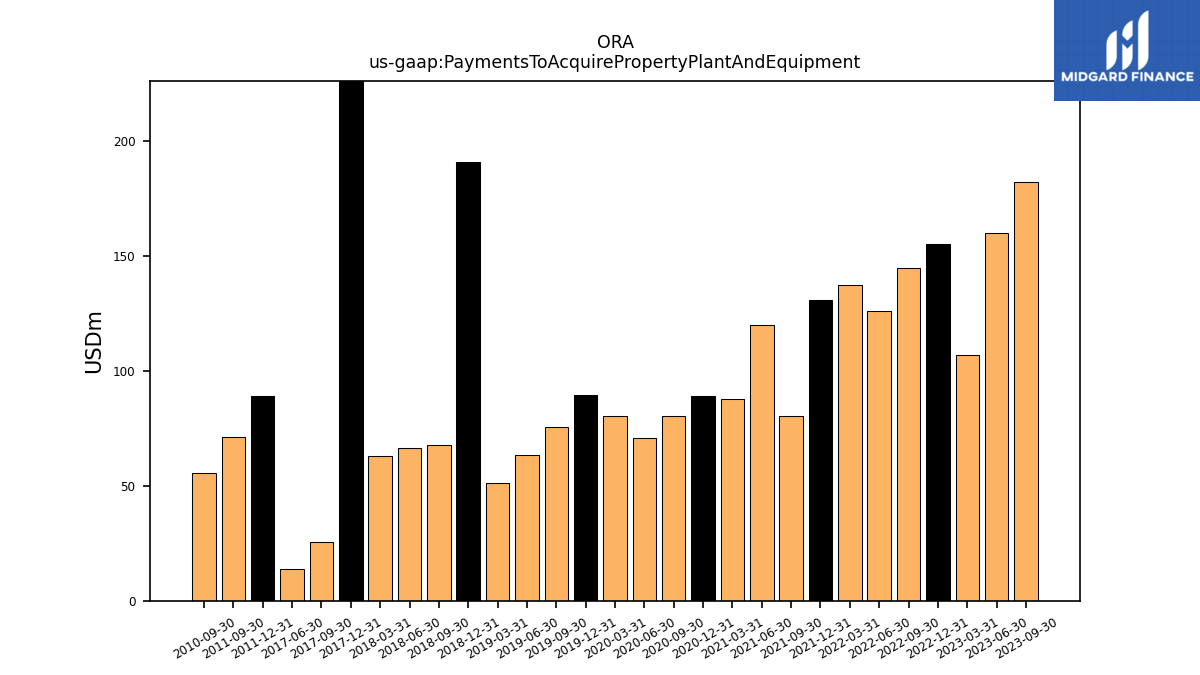
| Payments To Acquire Property Plant And Equipment | 182.08 | 159.84 | 106.88 | 155.10 | 144.94 | 126.19 | 137.25 | 130.85 | 80.53 | 119.99 | 87.90 | 88.95 | 80.53 | 70.88 | 80.38 | 89.46 | 75.65 | 63.58 | 51.30 | 190.78 | 67.74 | 66.55 | 63.11 | 233.87 | 25.37 | 13.96 | NA | NA | NA | NA | NA | NA | NA | NA | NA | NA | NA | NA | NA | NA | NA | NA | NA | NA | NA | NA | NA | 88.91 | 71.16 | NA | NA | NA | 55.76 | NA | NA |
| 2023-09-30 | 2023-06-30 | 2023-03-31 | 2022-12-31 | 2022-09-30 | 2022-06-30 | 2022-03-31 | 2021-12-31 | 2021-09-30 | 2021-06-30 | 2021-03-31 | 2020-12-31 | 2020-09-30 | 2020-06-30 | 2020-03-31 | 2019-12-31 | 2019-09-30 | 2019-06-30 | 2019-03-31 | 2018-12-31 | 2018-09-30 | 2018-06-30 | 2018-03-31 | 2017-12-31 | 2017-09-30 | 2017-06-30 | 2017-03-31 | 2016-12-31 | 2016-09-30 | 2016-06-30 | 2016-03-31 | 2015-12-31 | 2015-09-30 | 2015-06-30 | 2015-03-31 | 2014-12-31 | 2014-09-30 | 2014-06-30 | 2014-03-31 | 2013-12-31 | 2013-09-30 | 2013-06-30 | 2013-03-31 | 2012-12-31 | 2012-09-30 | 2012-06-30 | 2012-03-31 | 2011-12-31 | 2011-09-30 | 2011-06-30 | 2011-03-31 | 2010-12-31 | 2010-09-30 | 2010-06-30 | 2010-03-31 | ||
|---|---|---|---|---|---|---|---|---|---|---|---|---|---|---|---|---|---|---|---|---|---|---|---|---|---|---|---|---|---|---|---|---|---|---|---|---|---|---|---|---|---|---|---|---|---|---|---|---|---|---|---|---|---|---|---|---|
| Net Cash Provided By Used In Financing Activities | -65.52 | -37.29 | 350.38 | 52.67 | -49.41 | 167.73 | -44.72 | 1.37 | 235.99 | -28.17 | -22.81 | 313.49 | 88.57 | -66.67 | 168.09 | -1.12 | 32.98 | -6.59 | -31.04 | 31.31 | 31.58 | 131.56 | 56.68 | -1.89 | -26.09 | -33.08 | 1.20 | 172.23 | -71.04 | -37.80 | -19.84 | -38.25 | 20.74 | 69.54 | -5.40 | -42.96 | -6.44 | -9.62 | -42.18 | -3.66 | 19.30 | -25.54 | 71.03 | 49.20 | -32.88 | -43.41 | 5.15 | 109.41 | 58.18 | 5.04 | 52.72 | 62.62 | 18.34 | 44.42 | 13.54 | |
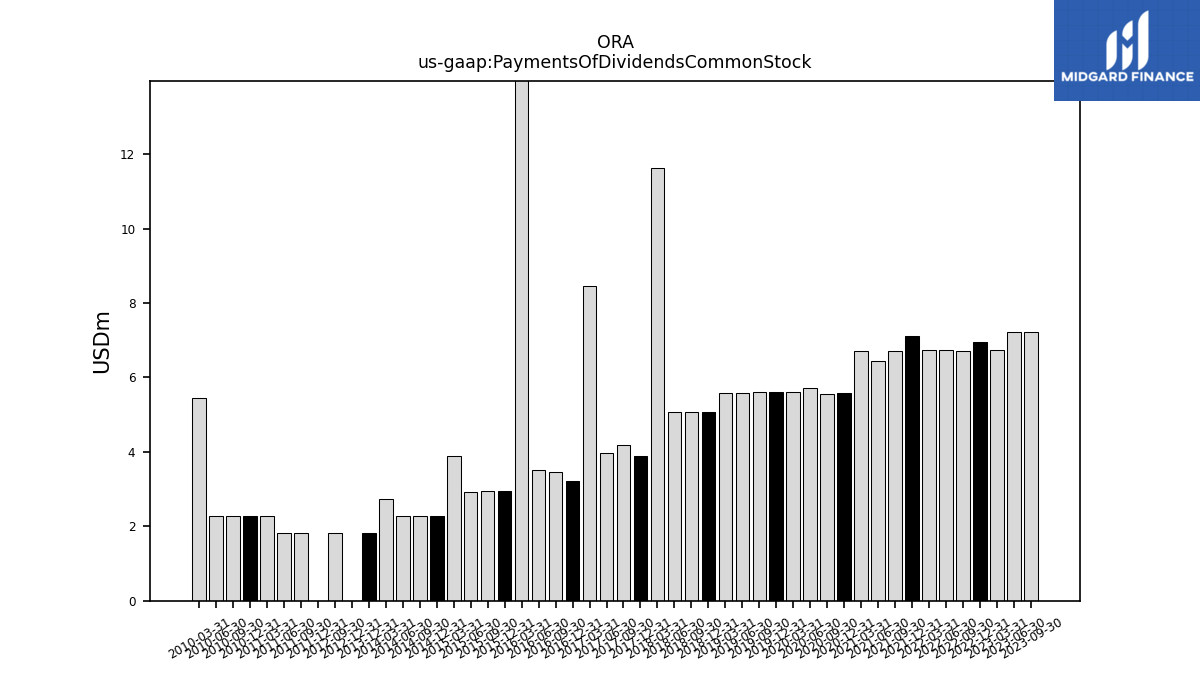
| Payments Of Dividends Common Stock | 7.23 | 7.23 | 6.73 | 6.97 | 6.72 | 6.73 | 6.73 | 7.10 | 6.72 | 6.45 | 6.72 | 5.58 | 5.56 | 5.72 | 5.61 | 5.61 | 5.61 | 5.59 | 5.58 | 5.07 | 5.06 | 5.06 | 11.64 | 3.90 | 4.19 | 3.98 | 8.45 | 3.21 | 3.47 | 3.53 | 15.47 | 2.94 | 2.94 | 2.93 | 3.90 | 2.28 | 2.28 | 2.28 | 2.73 | 1.82 | NA | NA | NA | 0.00 | 1.82 | NA | NA | 0.00 | 1.82 | 1.82 | 2.29 | 2.27 | 2.27 | 2.27 | 5.46 | |
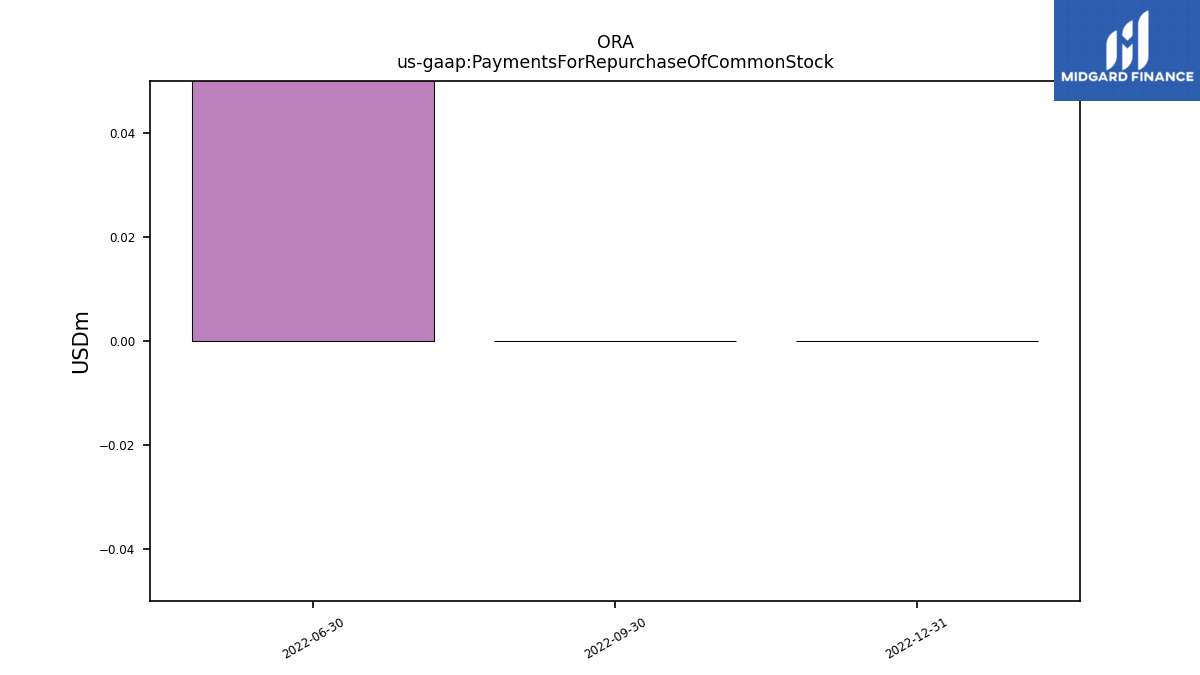
| Payments For Repurchase Of Common Stock | NA | NA | NA | 0.00 | 0.00 | 18.00 | NA | NA | NA | NA | NA | NA | NA | NA | NA | NA | NA | NA | NA | NA | NA | NA | NA | NA | NA | NA | NA | NA | NA | NA | NA | NA | NA | NA | NA | NA | NA | NA | NA | NA | NA | NA | NA | NA | NA | NA | NA | NA | NA | NA | NA | NA | NA | NA | NA |
| 2023-09-30 | 2023-06-30 | 2023-03-31 | 2022-12-31 | 2022-09-30 | 2022-06-30 | 2022-03-31 | 2021-12-31 | 2021-09-30 | 2021-06-30 | 2021-03-31 | 2020-12-31 | 2020-09-30 | 2020-06-30 | 2020-03-31 | 2019-12-31 | 2019-09-30 | 2019-06-30 | 2019-03-31 | 2018-12-31 | 2018-09-30 | 2018-06-30 | 2018-03-31 | 2017-12-31 | 2017-09-30 | 2017-06-30 | 2017-03-31 | 2016-12-31 | 2016-09-30 | 2016-06-30 | 2016-03-31 | 2015-12-31 | 2015-09-30 | 2015-06-30 | 2015-03-31 | 2014-12-31 | 2014-09-30 | 2014-06-30 | 2014-03-31 | 2013-12-31 | 2013-09-30 | 2013-06-30 | 2013-03-31 | 2012-12-31 | 2012-09-30 | 2012-06-30 | 2012-03-31 | 2011-12-31 | 2011-09-30 | 2011-06-30 | 2011-03-31 | 2010-12-31 | 2010-09-30 | 2010-06-30 | 2010-03-31 | ||
|---|---|---|---|---|---|---|---|---|---|---|---|---|---|---|---|---|---|---|---|---|---|---|---|---|---|---|---|---|---|---|---|---|---|---|---|---|---|---|---|---|---|---|---|---|---|---|---|---|---|---|---|---|---|---|---|---|
| Revenues | 208.06 | 194.80 | 185.23 | 205.49 | 175.88 | 169.08 | 183.71 | 190.99 | 158.84 | 146.90 | 166.35 | 179.38 | 158.95 | 174.90 | 192.11 | 192.44 | 170.50 | 184.06 | 199.04 | 190.47 | 166.48 | 178.30 | 184.02 | 166.37 | 157.19 | 179.36 | 189.90 | 166.52 | 14.84 | 159.86 | 151.59 | 171.07 | 162.85 | 140.49 | 120.23 | 149.24 | 140.24 | 127.60 | 142.44 | 130.91 | 130.75 | 152.68 | 121.71 | 116.08 | 136.14 | 129.84 | 132.35 | 123.73 | 110.84 | 104.61 | 97.82 | 92.83 | 101.48 | 96.27 | 82.65 | |
| Revenue From Contract With Customer Including Assessed Tax | 208.06 | 194.80 | 185.23 | 205.49 | 175.88 | 169.08 | 183.71 | 190.99 | 158.84 | 146.90 | 166.35 | 179.38 | 158.95 | 174.90 | 192.11 | 192.44 | 170.50 | 184.06 | 199.04 | 190.47 | 166.48 | 178.30 | 184.02 | 166.37 | 157.19 | 179.36 | 189.90 | 166.52 | 14.84 | 159.86 | 151.59 | 171.07 | 162.85 | 140.49 | 120.23 | 149.24 | 140.24 | 127.60 | 142.44 | 130.91 | 130.75 | 152.68 | 121.71 | 116.08 | 136.14 | 129.84 | 132.35 | 123.73 | 110.84 | 104.61 | 97.82 | 92.83 | 101.48 | 96.27 | 82.65 | |
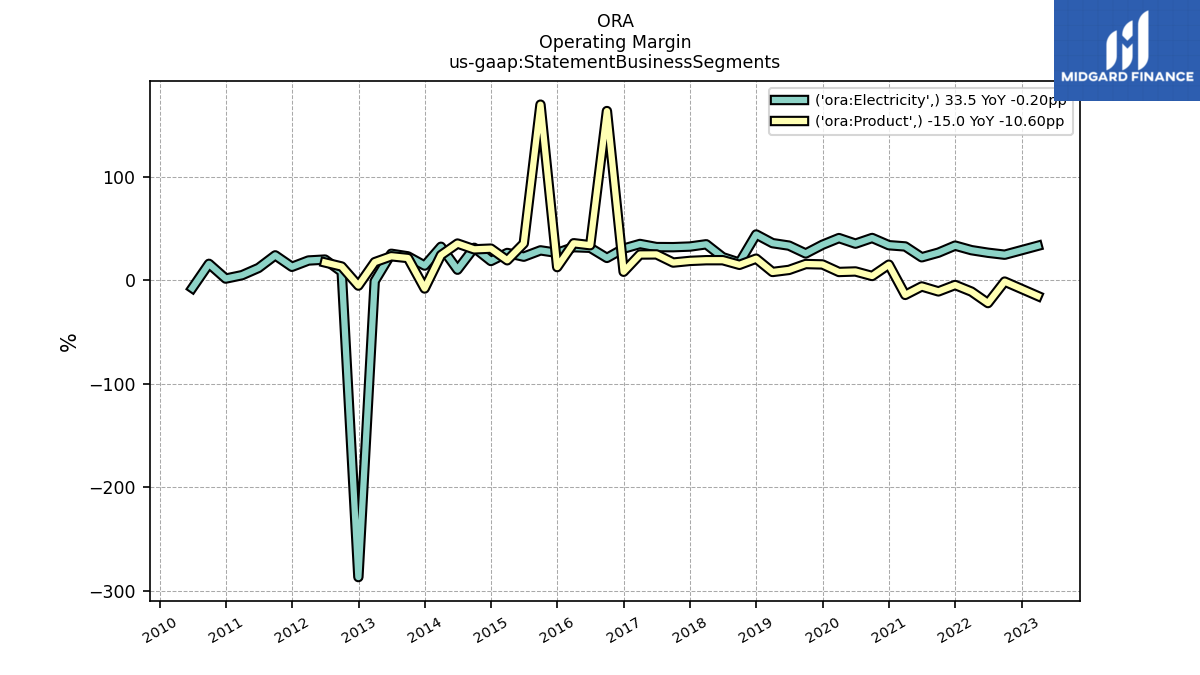
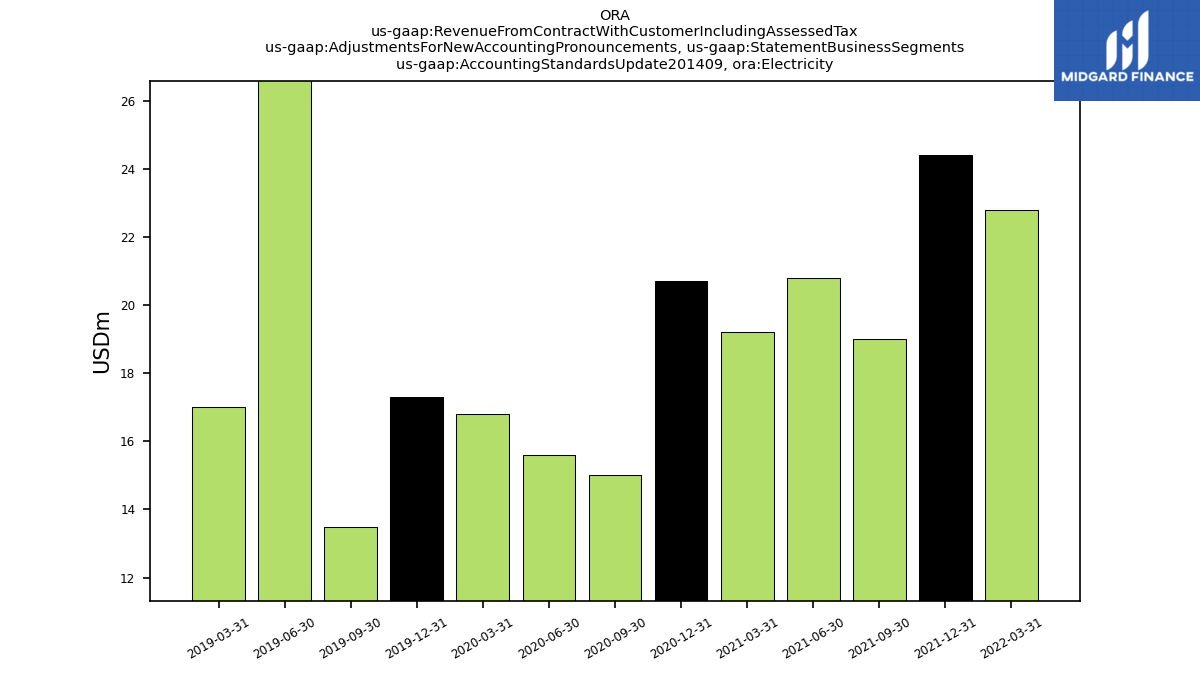
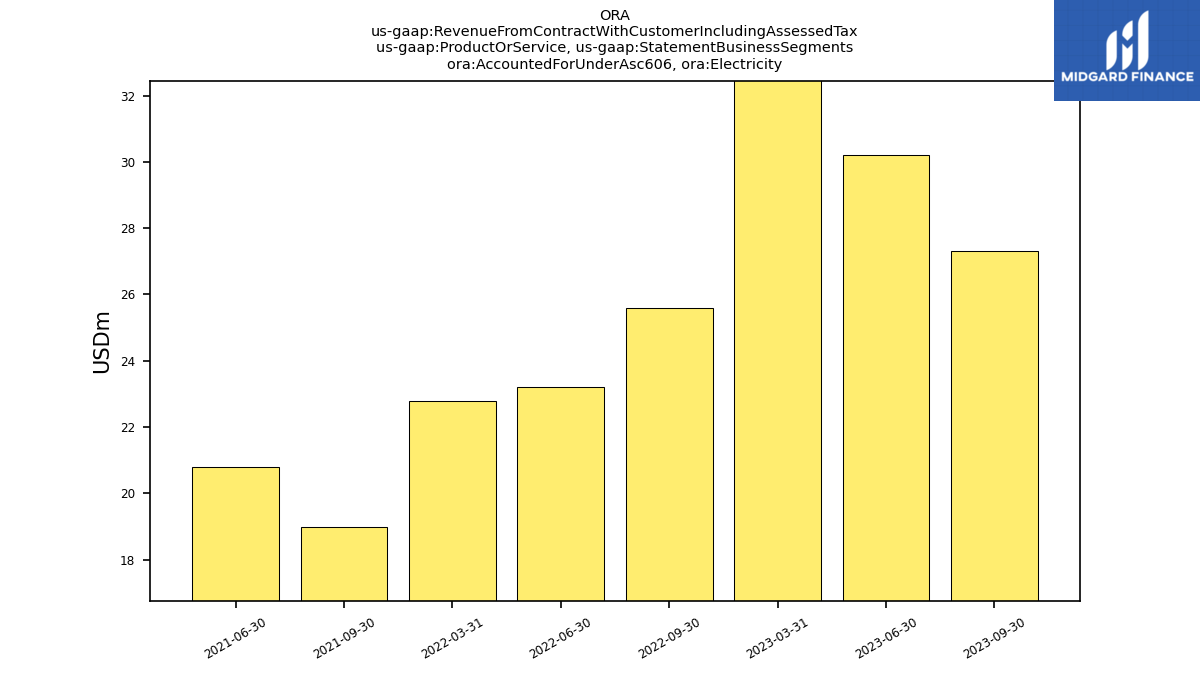
| Accounting Standards Update201409, Electricity | NA | NA | NA | NA | NA | NA | 22.80 | 24.40 | 19.00 | 20.80 | 19.20 | 20.70 | 15.00 | 15.60 | 16.80 | 17.30 | 13.50 | 32.40 | 17.00 | NA | NA | NA | NA | NA | NA | NA | NA | NA | NA | NA | NA | NA | NA | NA | NA | NA | NA | NA | NA | NA | NA | NA | NA | NA | NA | NA | NA | NA | NA | NA | NA | NA | NA | NA | NA | |
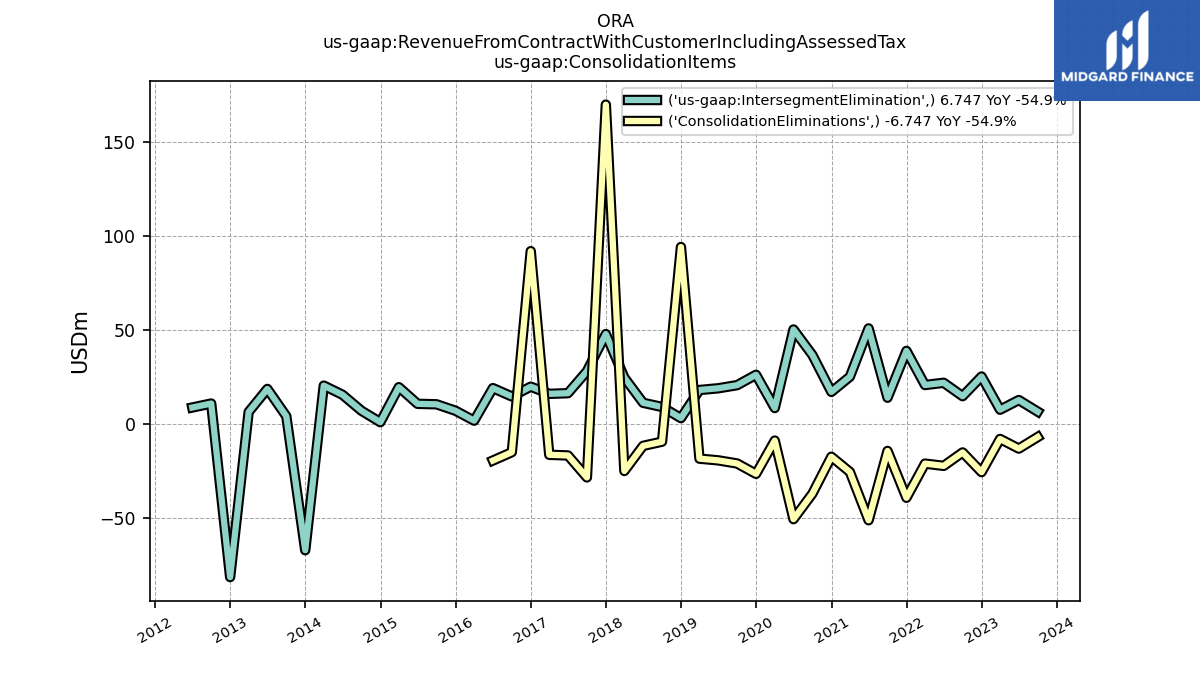
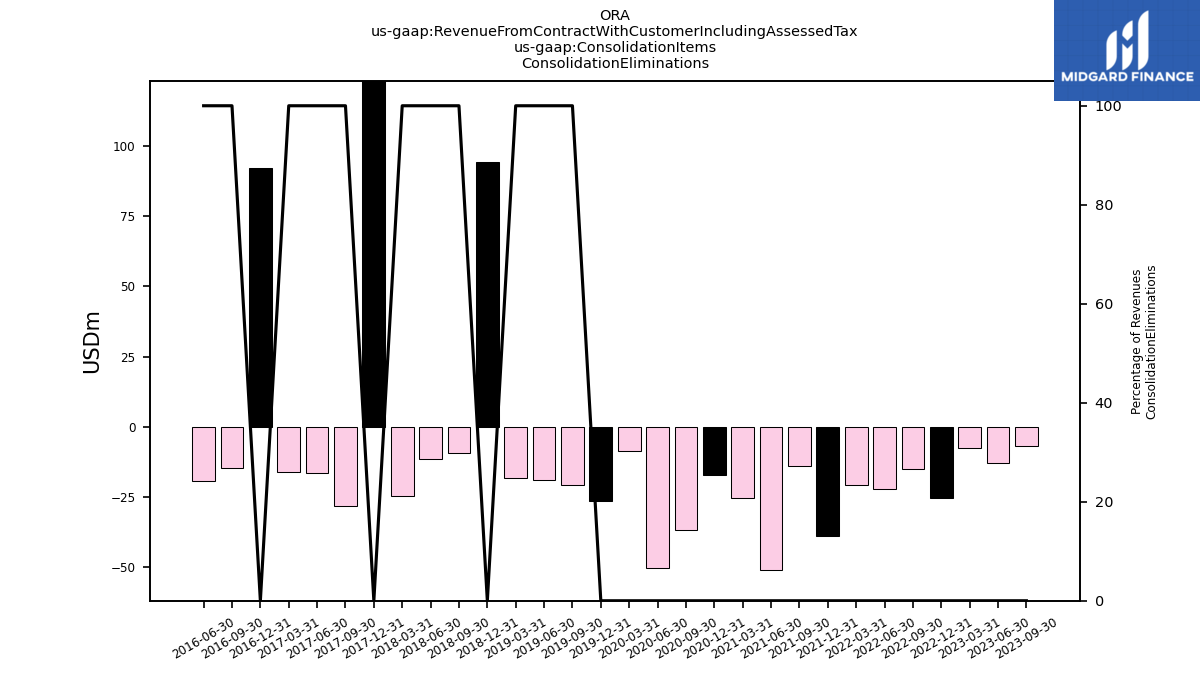
| -6.75 | -12.92 | -7.77 | -25.43 | -14.96 | -22.10 | -20.90 | -39.07 | -14.15 | -51.04 | -25.33 | -17.25 | -36.84 | -50.45 | -8.66 | -26.36 | -20.83 | -19.17 | -18.26 | 94.33 | -9.24 | -11.45 | -24.83 | 170.07 | -28.25 | -16.57 | -16.21 | 92.12 | -14.84 | -19.27 | NA | NA | NA | NA | NA | NA | NA | NA | NA | NA | NA | NA | NA | NA | NA | NA | NA | NA | NA | NA | NA | NA | NA | NA | NA | ||
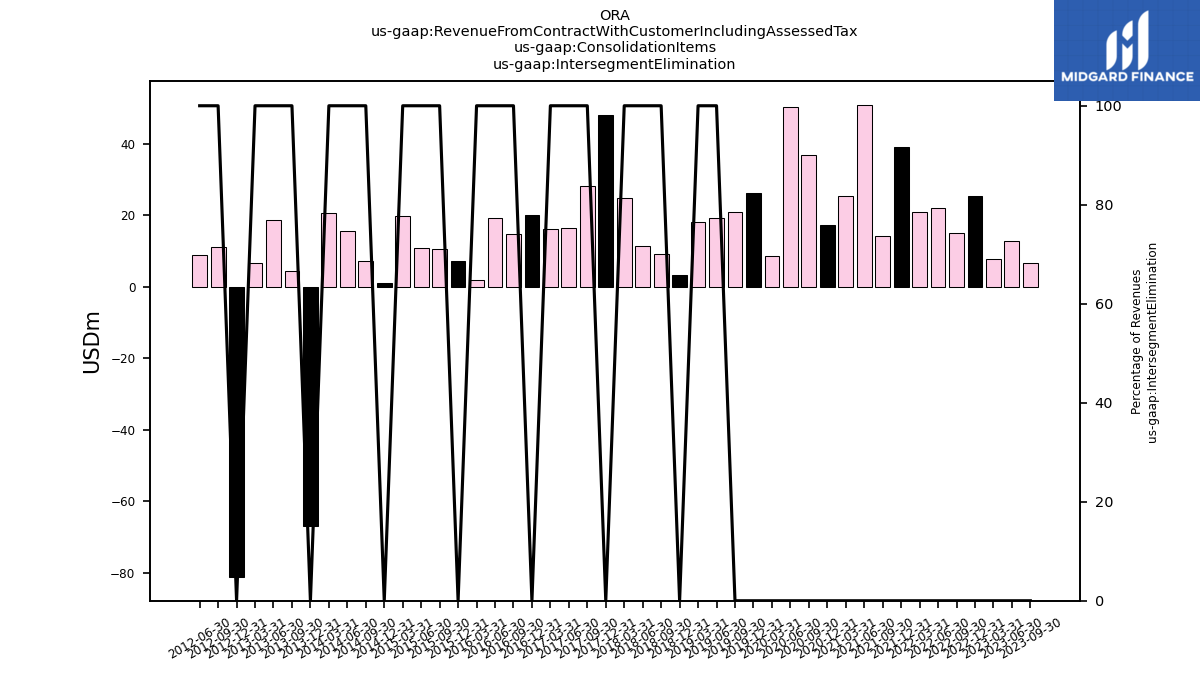
| Intersegment Elimination | 6.75 | 12.92 | 7.77 | 25.43 | 14.96 | 22.10 | 20.90 | 39.07 | 14.15 | 51.04 | 25.33 | 17.25 | 36.84 | 50.45 | 8.66 | 26.36 | 20.83 | 19.17 | 18.26 | 3.30 | 9.24 | 11.45 | 24.83 | 48.01 | 28.25 | 16.57 | 16.21 | 20.03 | 14.84 | 19.27 | 1.94 | 7.25 | 10.66 | 10.90 | 19.76 | 1.14 | 7.24 | 15.74 | 20.59 | -66.98 | 4.33 | 18.82 | 6.58 | -81.28 | 11.06 | 8.94 | NA | NA | NA | NA | NA | NA | NA | NA | NA | |
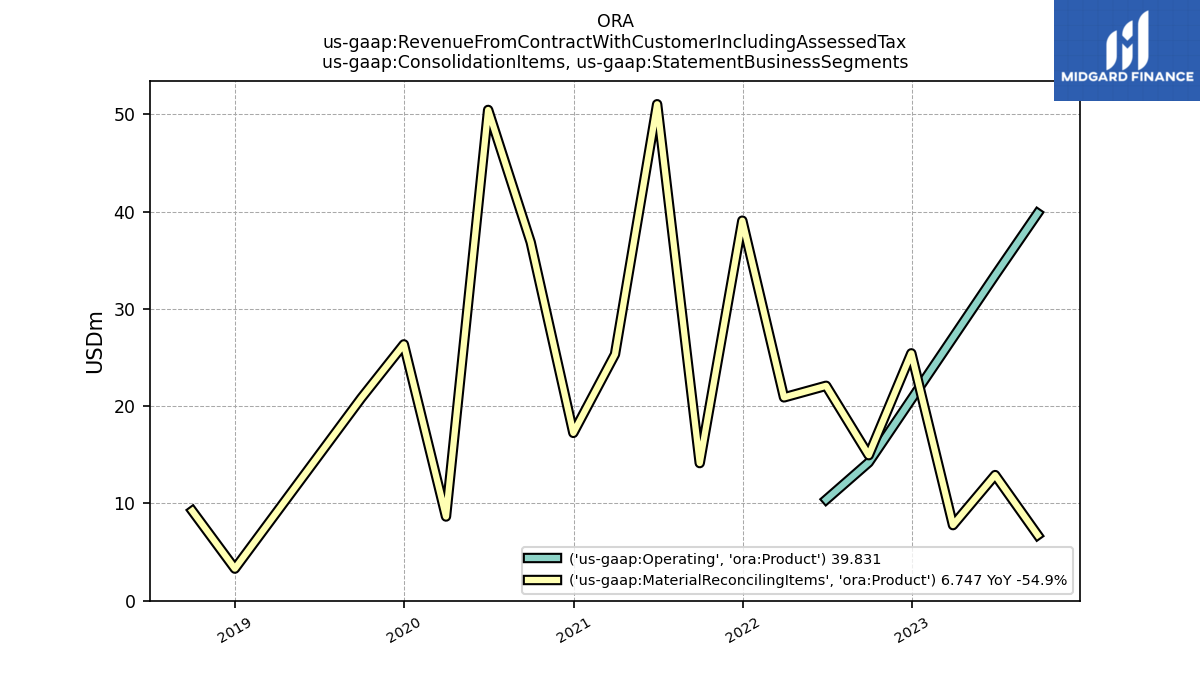
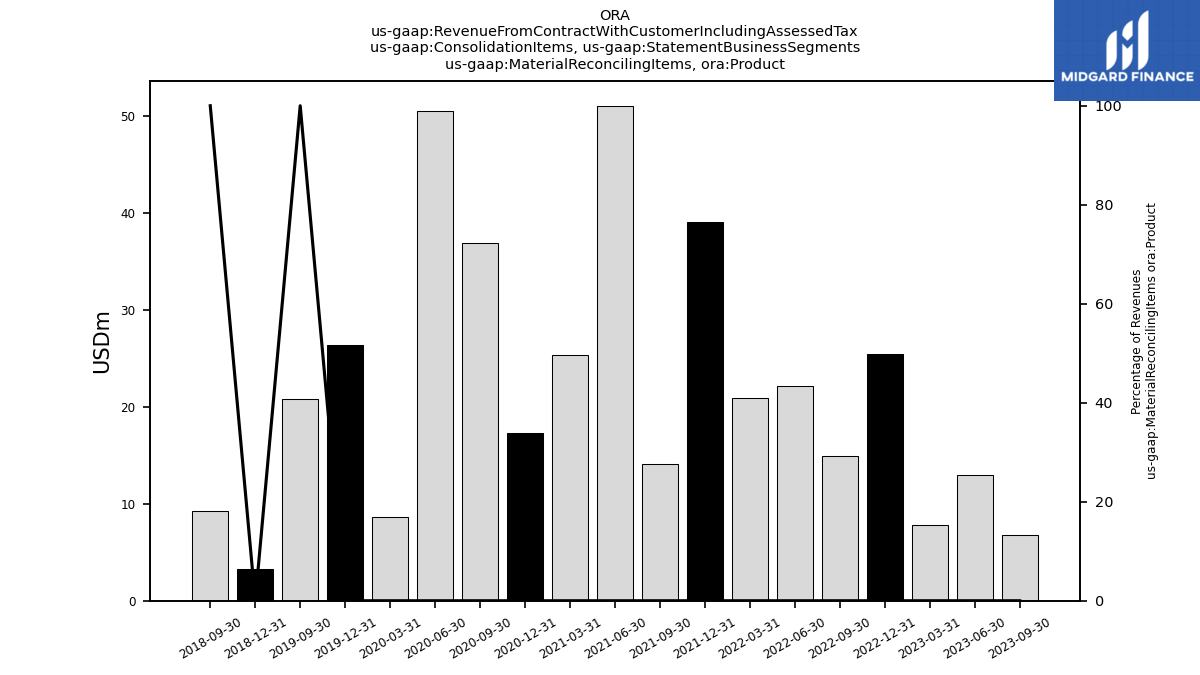
| Material Reconciling Items, Product | 6.75 | 12.92 | 7.77 | 25.43 | 14.96 | 22.10 | 20.90 | 39.07 | 14.15 | 51.04 | 25.33 | 17.25 | 36.84 | 50.45 | 8.66 | 26.36 | 20.83 | NA | NA | 3.30 | 9.24 | NA | NA | NA | NA | NA | NA | NA | NA | NA | NA | NA | NA | NA | NA | NA | NA | NA | NA | NA | NA | NA | NA | NA | NA | NA | NA | NA | NA | NA | NA | NA | NA | NA | NA | |
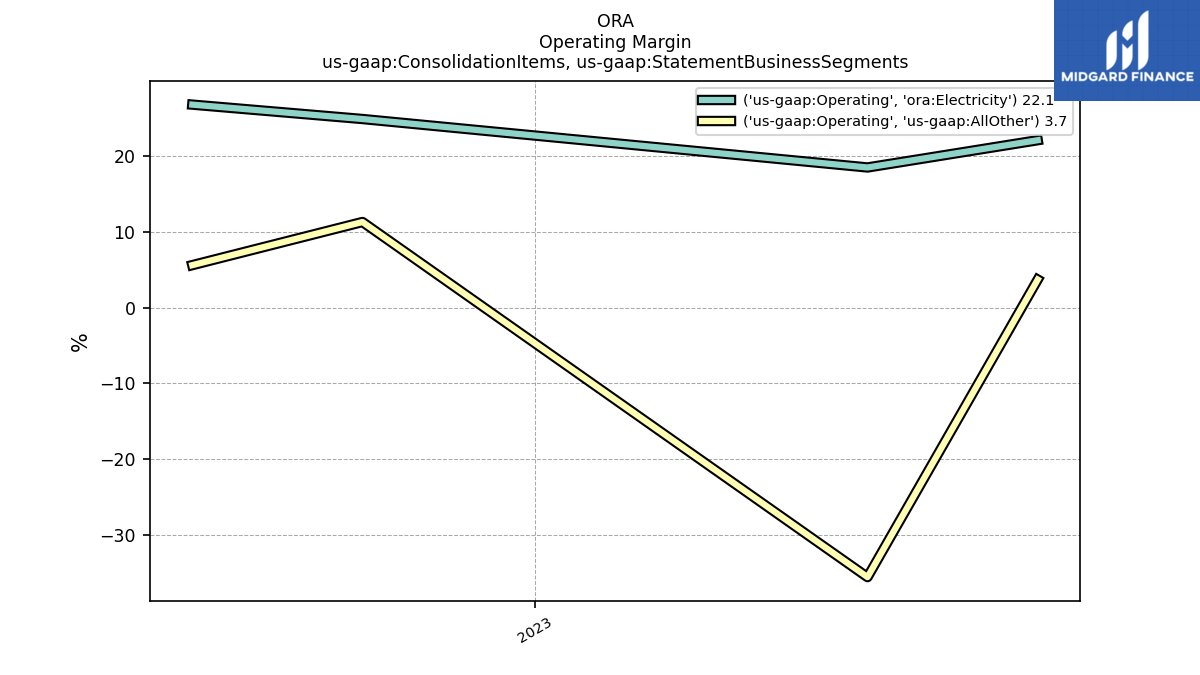
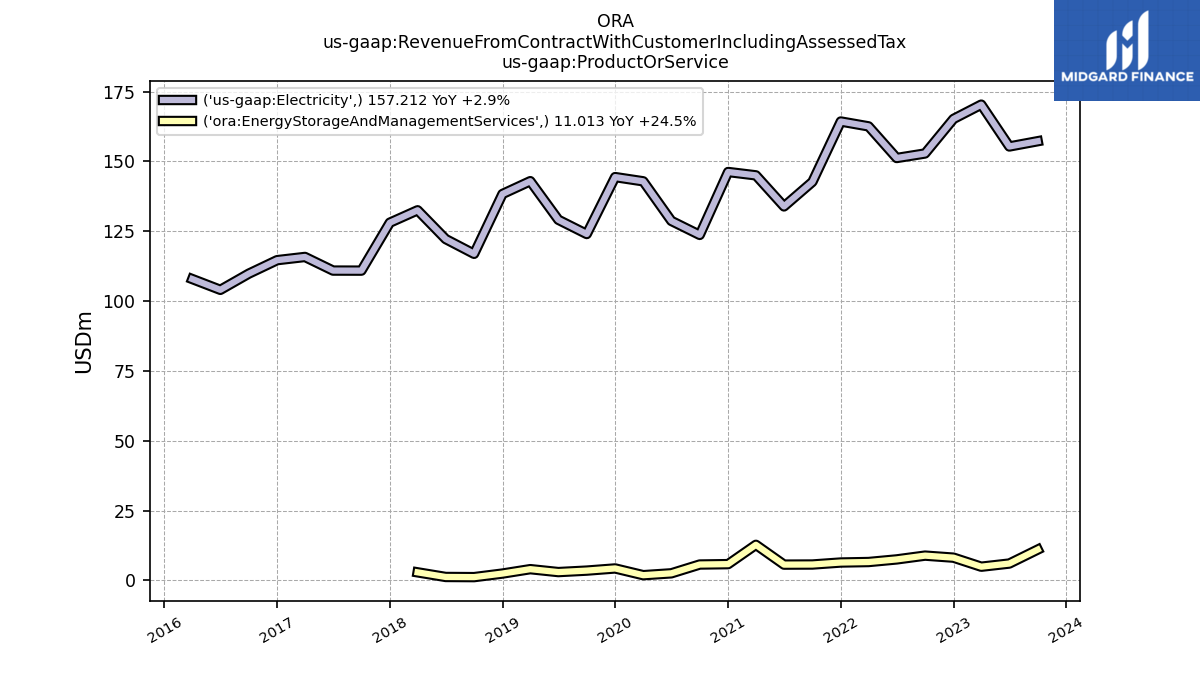
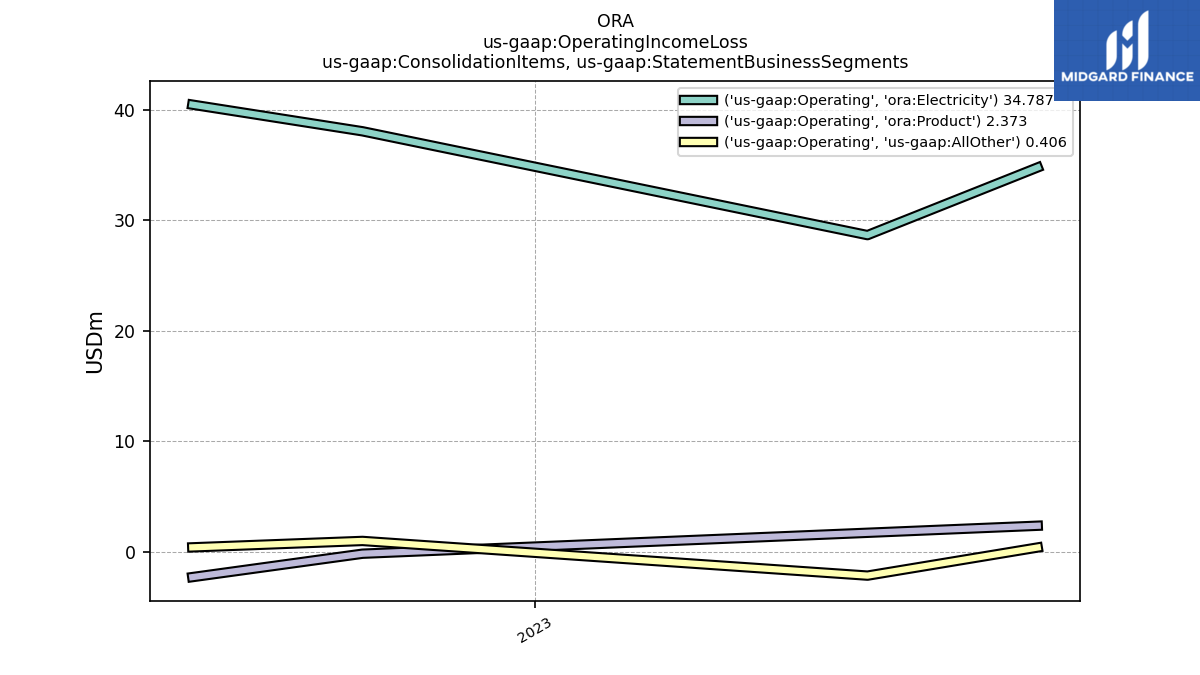
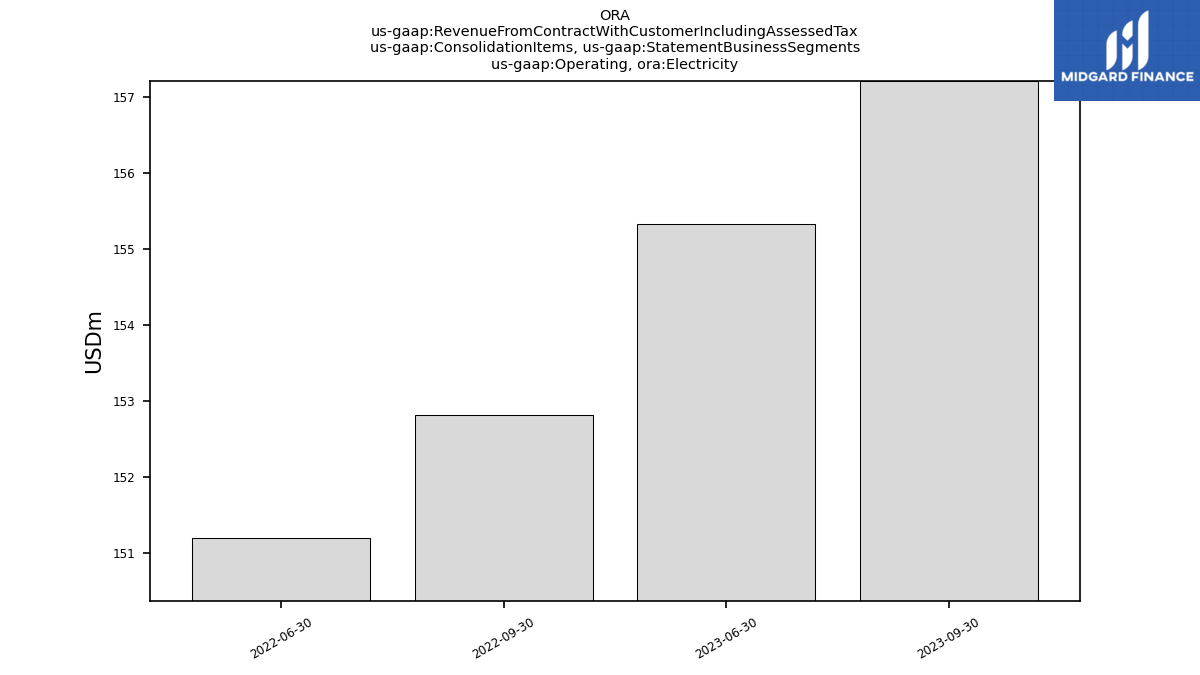
| Operating, Electricity | 157.21 | 155.32 | NA | NA | 152.82 | 151.19 | NA | NA | NA | NA | NA | NA | NA | NA | NA | NA | NA | NA | NA | NA | NA | NA | NA | NA | NA | NA | NA | NA | NA | NA | NA | NA | NA | NA | NA | NA | NA | NA | NA | NA | NA | NA | NA | NA | NA | NA | NA | NA | NA | NA | NA | NA | NA | NA | NA | |
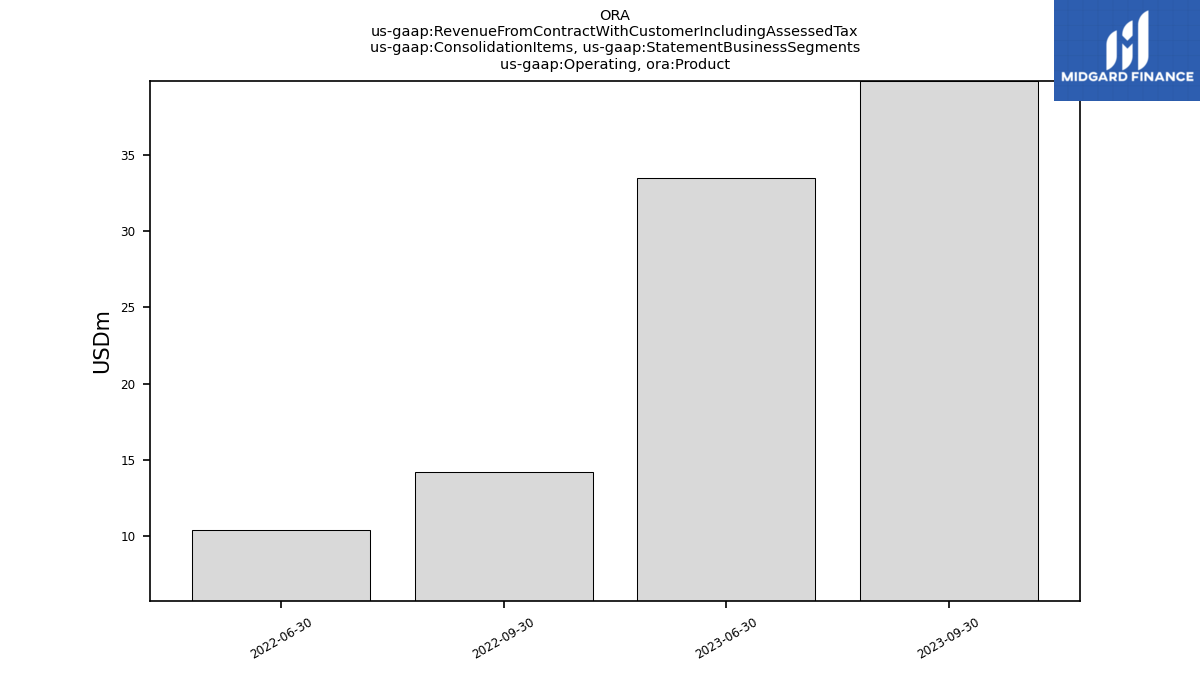
| Operating, Product | 39.83 | 33.46 | NA | NA | 14.22 | 10.39 | NA | NA | NA | NA | NA | NA | NA | NA | NA | NA | NA | NA | NA | NA | NA | NA | NA | NA | NA | NA | NA | NA | NA | NA | NA | NA | NA | NA | NA | NA | NA | NA | NA | NA | NA | NA | NA | NA | NA | NA | NA | NA | NA | NA | NA | NA | NA | NA | NA | |
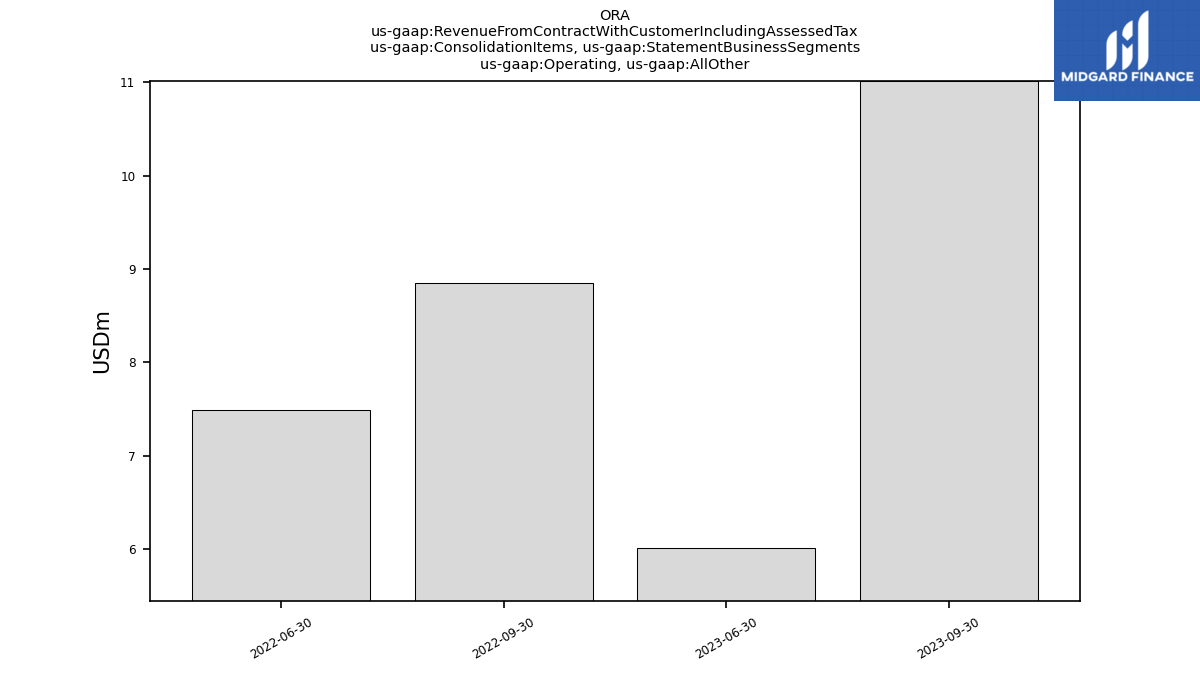
| Operating, All Other | 11.01 | 6.01 | NA | NA | 8.85 | 7.49 | NA | NA | NA | NA | NA | NA | NA | NA | NA | NA | NA | NA | NA | NA | NA | NA | NA | NA | NA | NA | NA | NA | NA | NA | NA | NA | NA | NA | NA | NA | NA | NA | NA | NA | NA | NA | NA | NA | NA | NA | NA | NA | NA | NA | NA | NA | NA | NA | NA | |
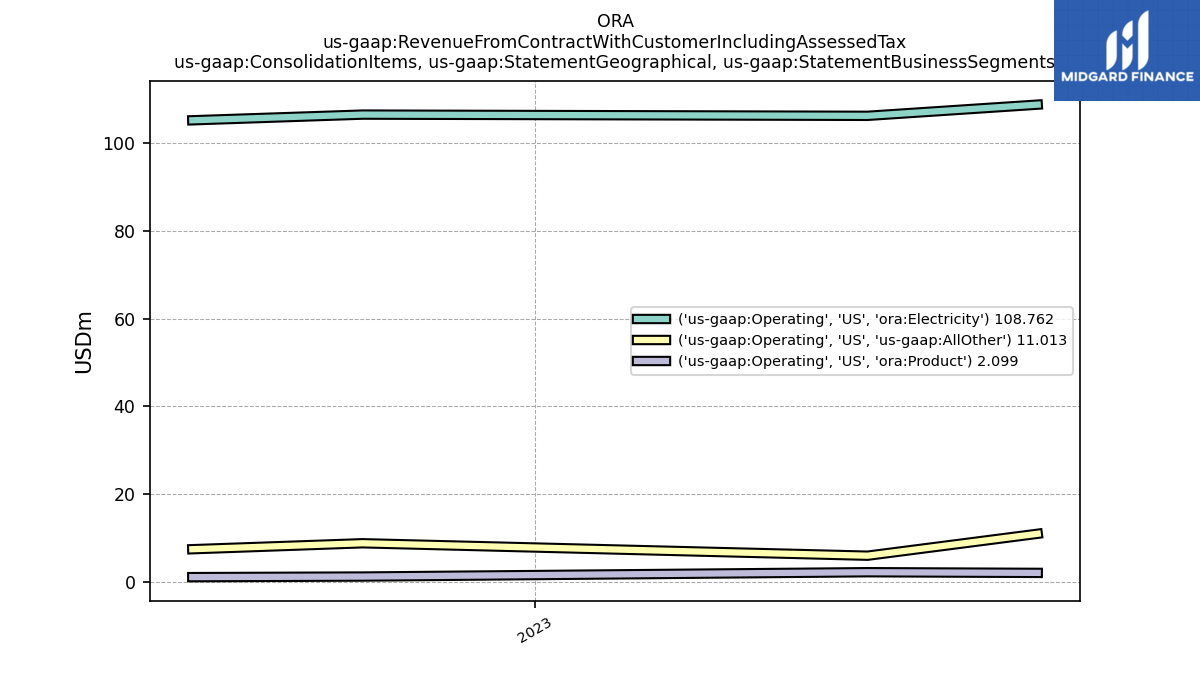
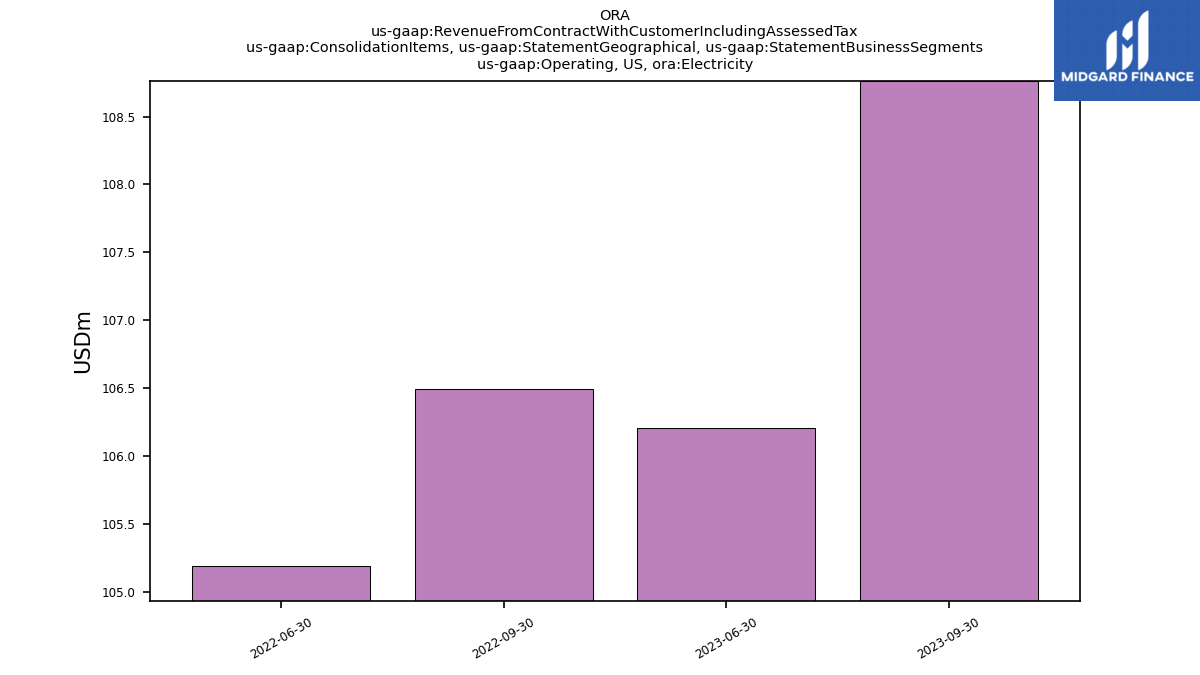
| Operating,US, Electricity | 108.76 | 106.21 | NA | NA | 106.49 | 105.19 | NA | NA | NA | NA | NA | NA | NA | NA | NA | NA | NA | NA | NA | NA | NA | NA | NA | NA | NA | NA | NA | NA | NA | NA | NA | NA | NA | NA | NA | NA | NA | NA | NA | NA | NA | NA | NA | NA | NA | NA | NA | NA | NA | NA | NA | NA | NA | NA | NA | |
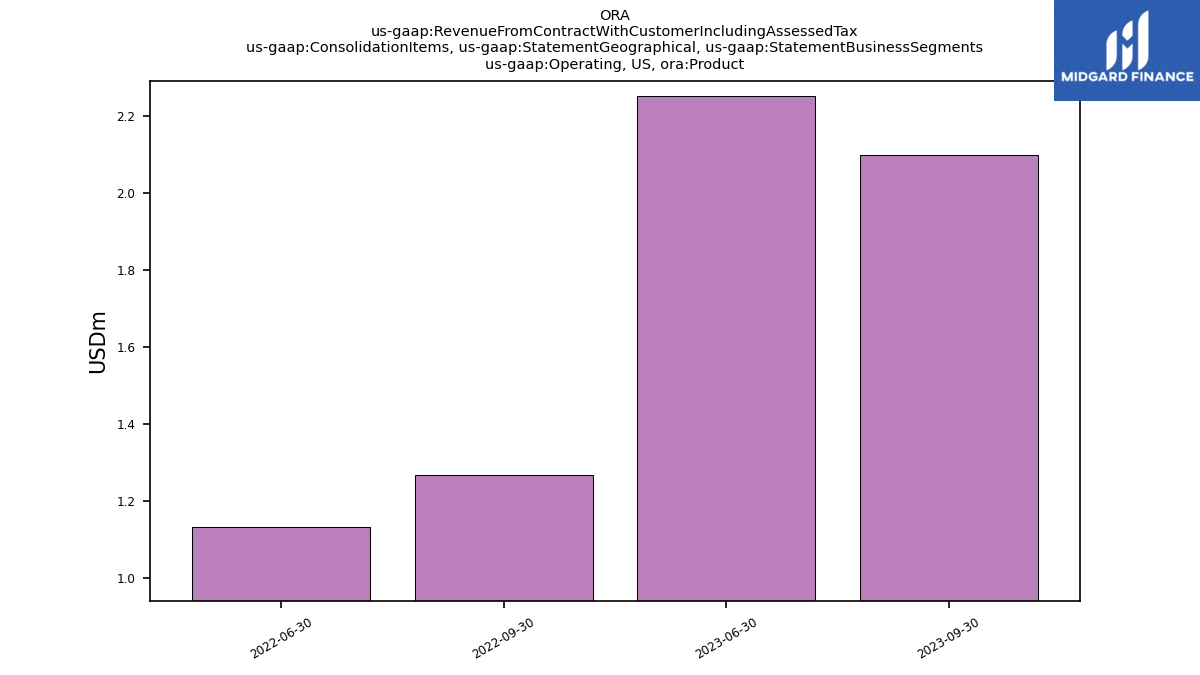
| Operating,US, Product | 2.10 | 2.25 | NA | NA | 1.27 | 1.13 | NA | NA | NA | NA | NA | NA | NA | NA | NA | NA | NA | NA | NA | NA | NA | NA | NA | NA | NA | NA | NA | NA | NA | NA | NA | NA | NA | NA | NA | NA | NA | NA | NA | NA | NA | NA | NA | NA | NA | NA | NA | NA | NA | NA | NA | NA | NA | NA | NA | |
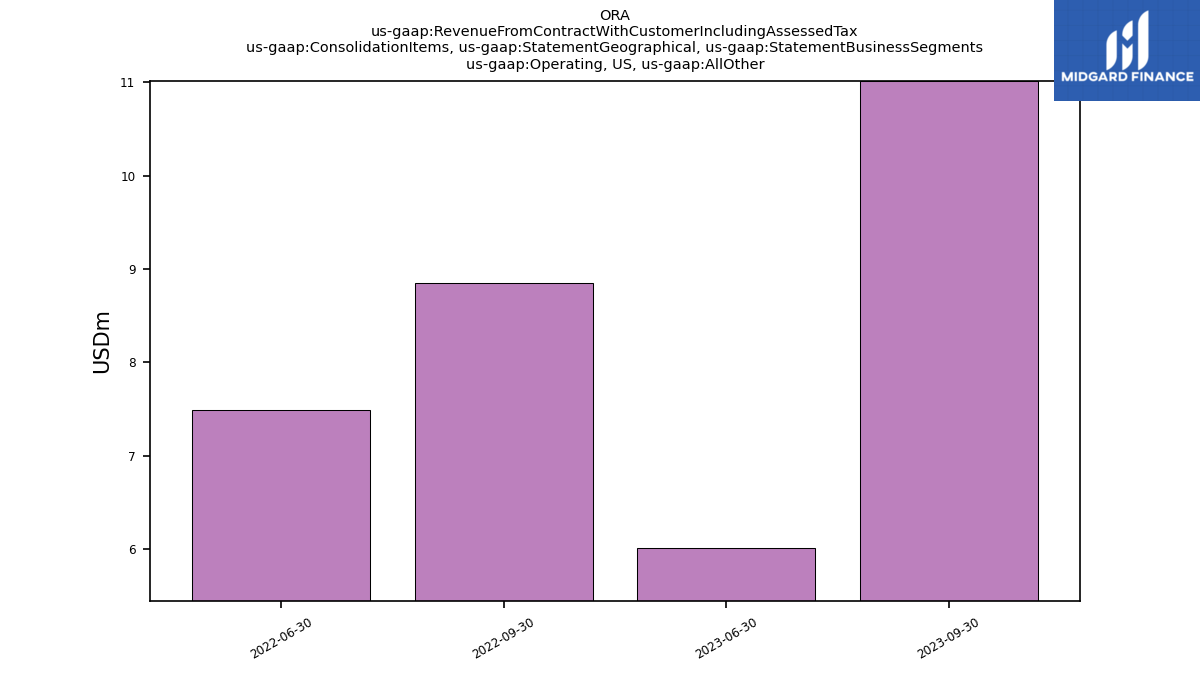
| Operating,US, All Other | 11.01 | 6.01 | NA | NA | 8.85 | 7.49 | NA | NA | NA | NA | NA | NA | NA | NA | NA | NA | NA | NA | NA | NA | NA | NA | NA | NA | NA | NA | NA | NA | NA | NA | NA | NA | NA | NA | NA | NA | NA | NA | NA | NA | NA | NA | NA | NA | NA | NA | NA | NA | NA | NA | NA | NA | NA | NA | NA | |
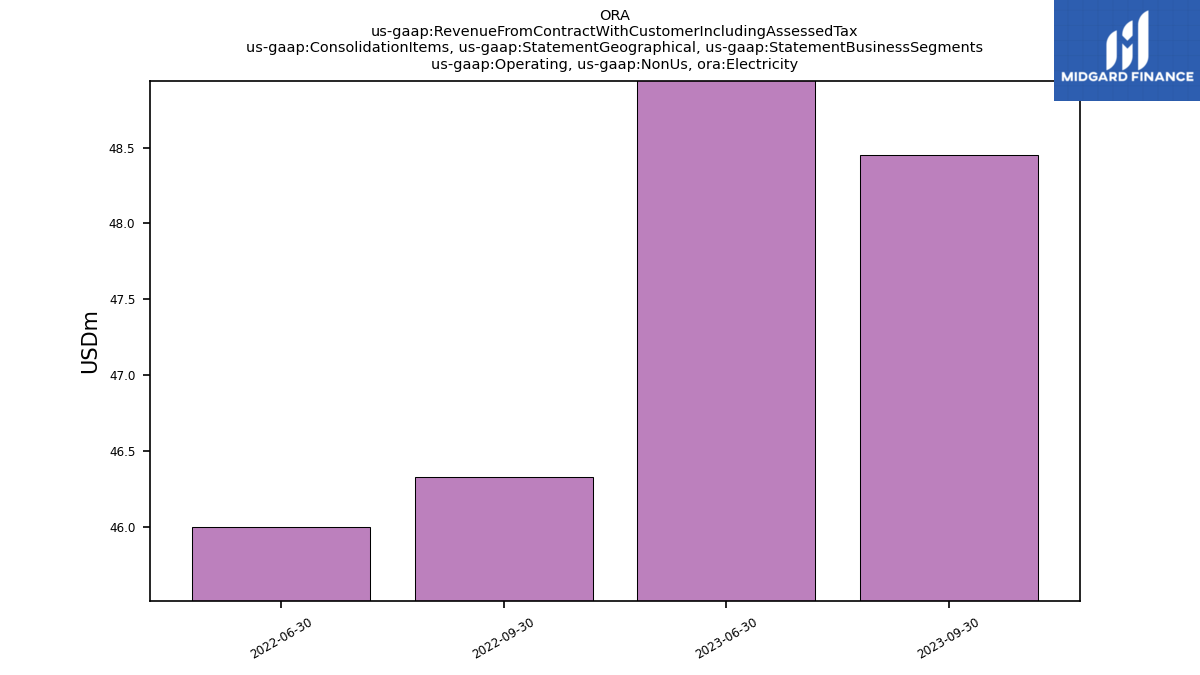
| Operating, Non Us, Electricity | 48.45 | 49.12 | NA | NA | 46.33 | 46.00 | NA | NA | NA | NA | NA | NA | NA | NA | NA | NA | NA | NA | NA | NA | NA | NA | NA | NA | NA | NA | NA | NA | NA | NA | NA | NA | NA | NA | NA | NA | NA | NA | NA | NA | NA | NA | NA | NA | NA | NA | NA | NA | NA | NA | NA | NA | NA | NA | NA | |
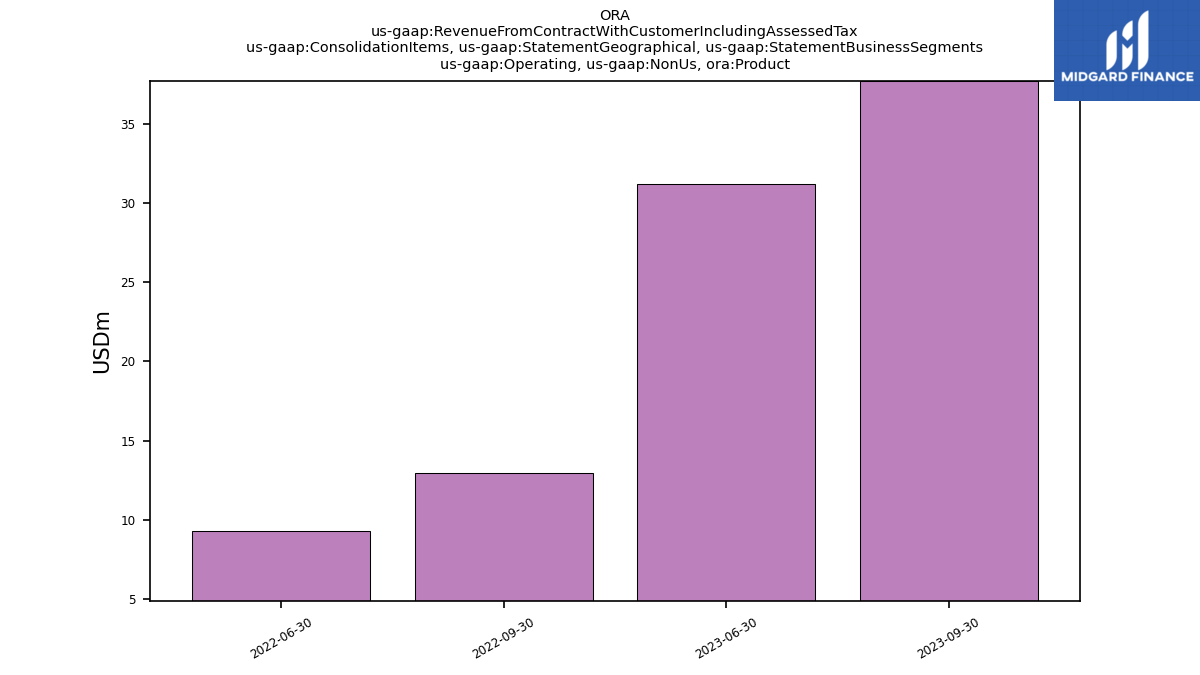
| Operating, Non Us, Product | 37.73 | 31.20 | NA | NA | 12.95 | 9.26 | NA | NA | NA | NA | NA | NA | NA | NA | NA | NA | NA | NA | NA | NA | NA | NA | NA | NA | NA | NA | NA | NA | NA | NA | NA | NA | NA | NA | NA | NA | NA | NA | NA | NA | NA | NA | NA | NA | NA | NA | NA | NA | NA | NA | NA | NA | NA | NA | NA | |
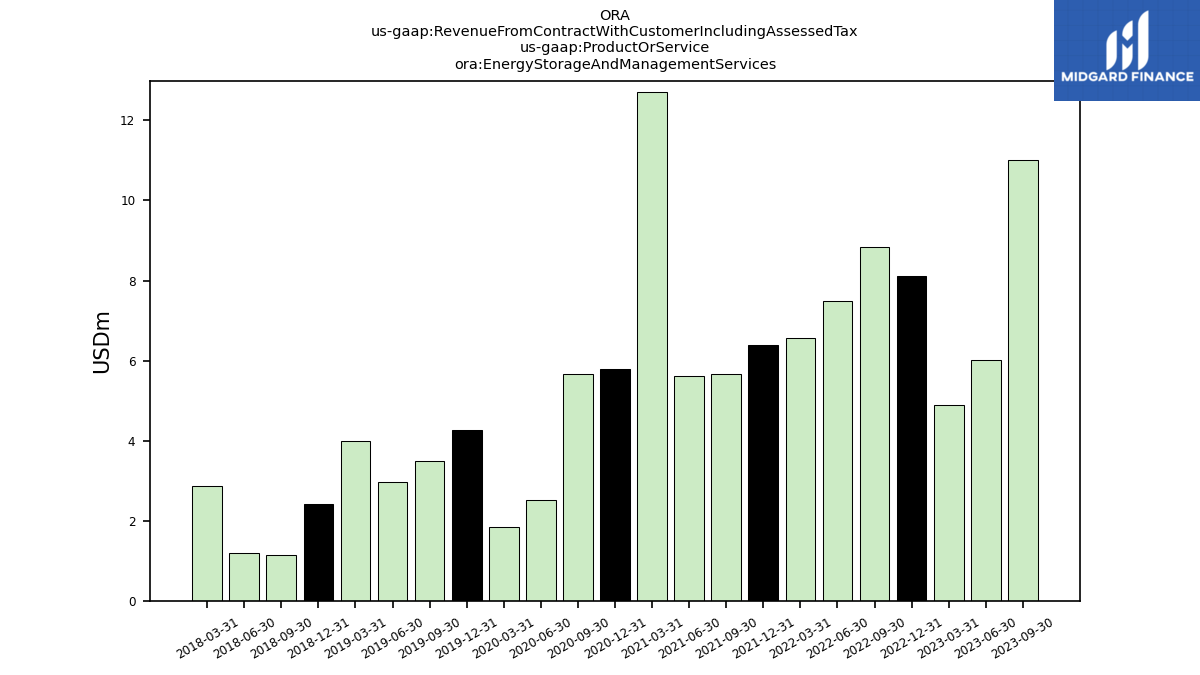
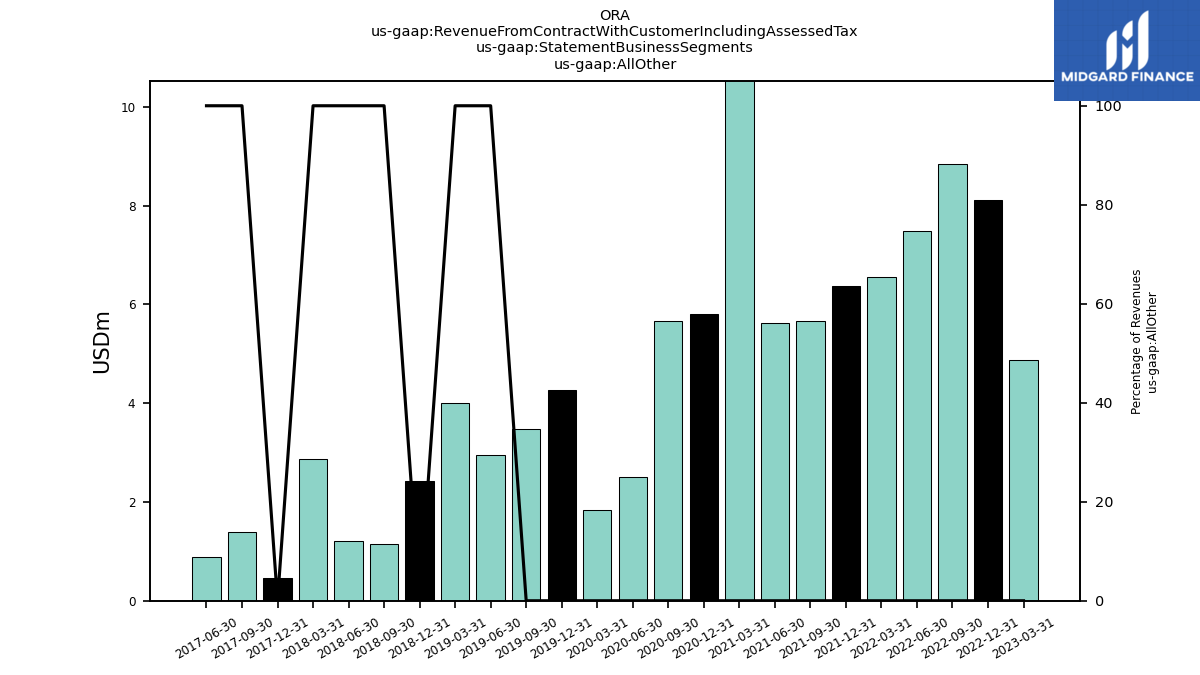
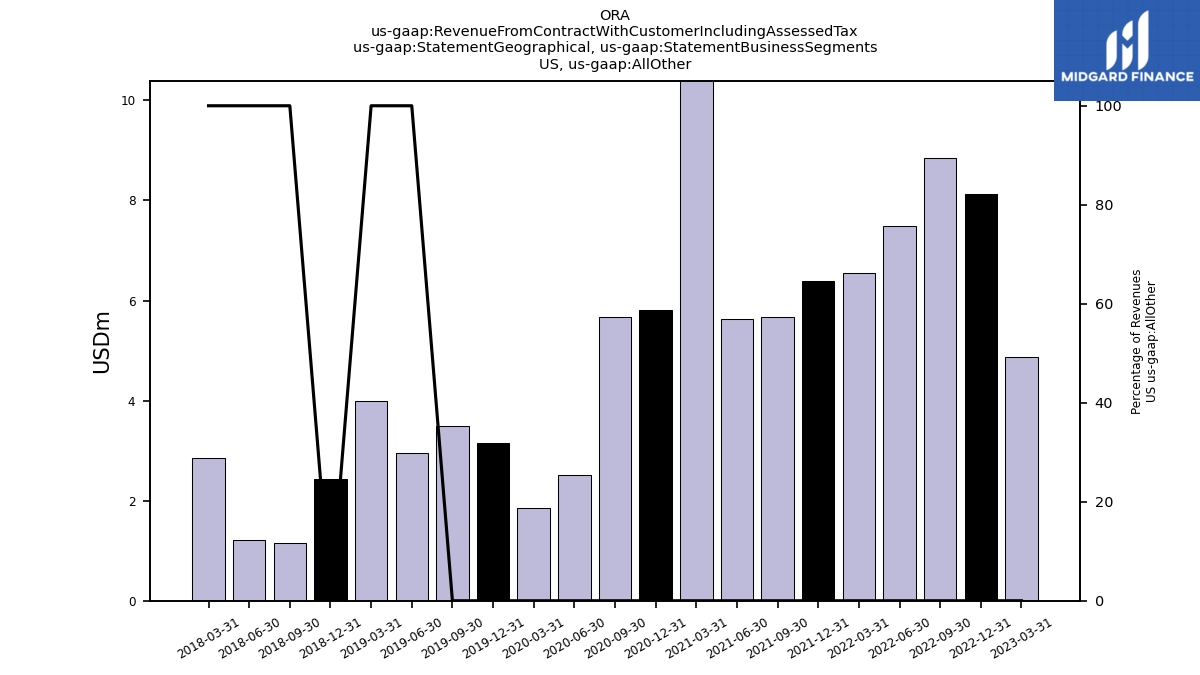
| Energy Storage And Management Services | 11.01 | 6.01 | 4.88 | 8.12 | 8.85 | 7.49 | 6.56 | 6.38 | 5.66 | 5.63 | 12.72 | 5.80 | 5.66 | 2.51 | 1.85 | 4.26 | 3.48 | 2.96 | 4.00 | 2.43 | 1.15 | 1.21 | 2.86 | NA | NA | NA | NA | NA | NA | NA | NA | NA | NA | NA | NA | NA | NA | NA | NA | NA | NA | NA | NA | NA | NA | NA | NA | NA | NA | NA | NA | NA | NA | NA | NA | |
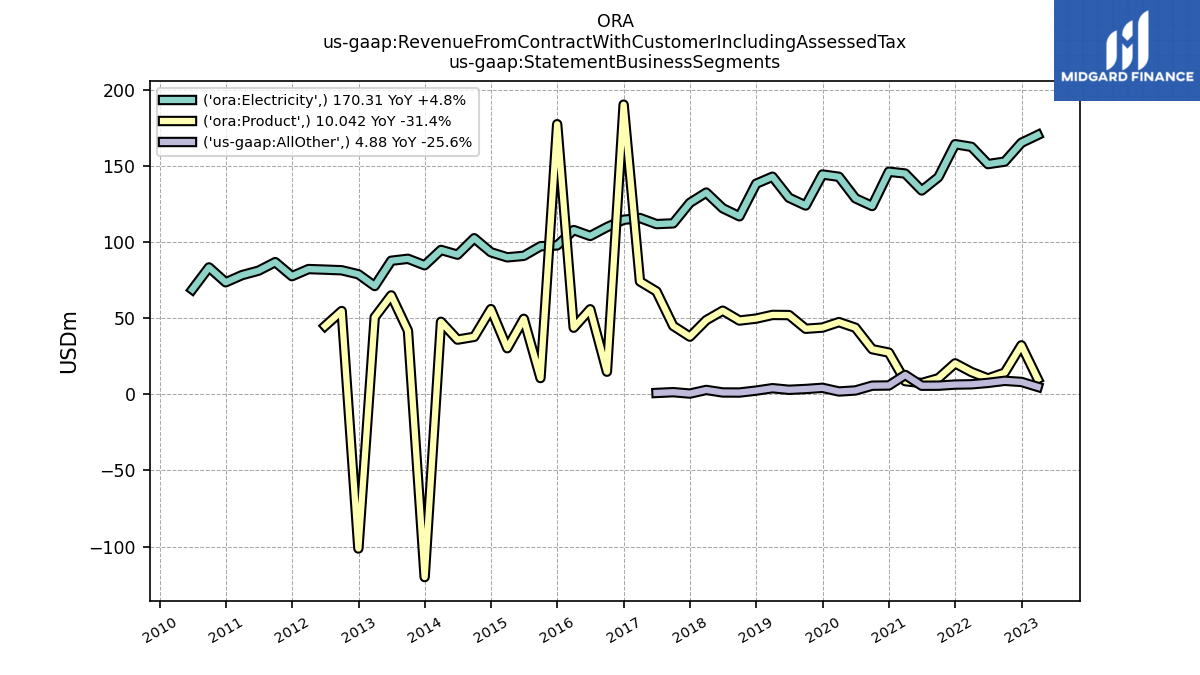
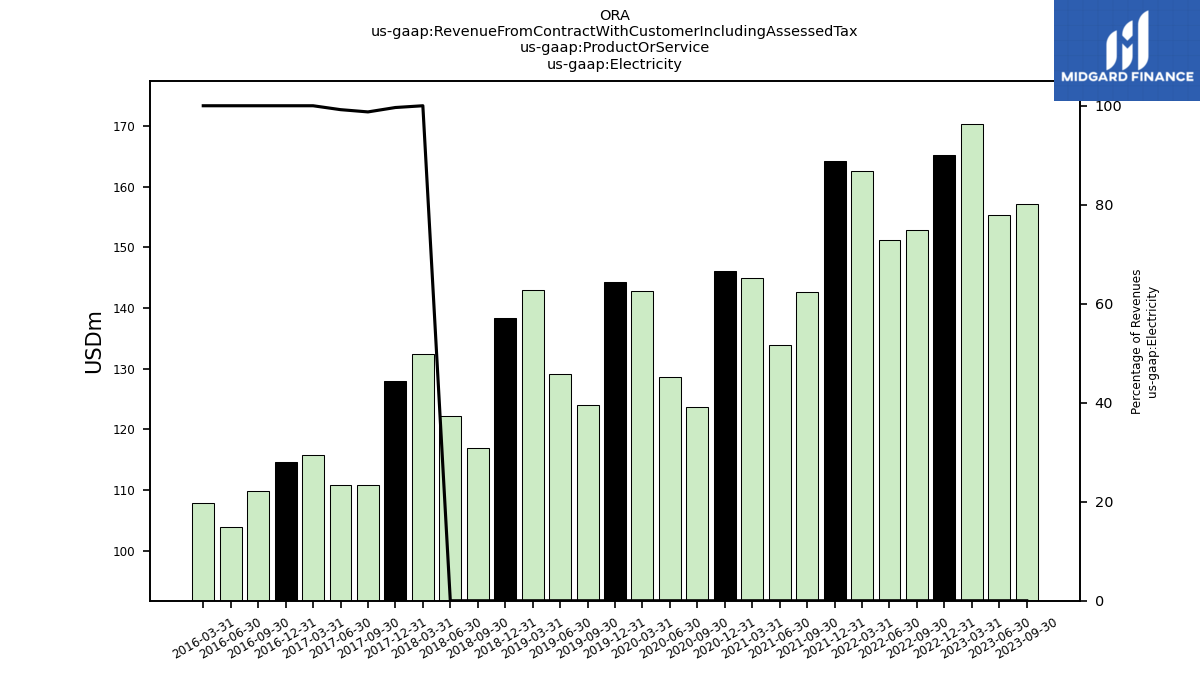
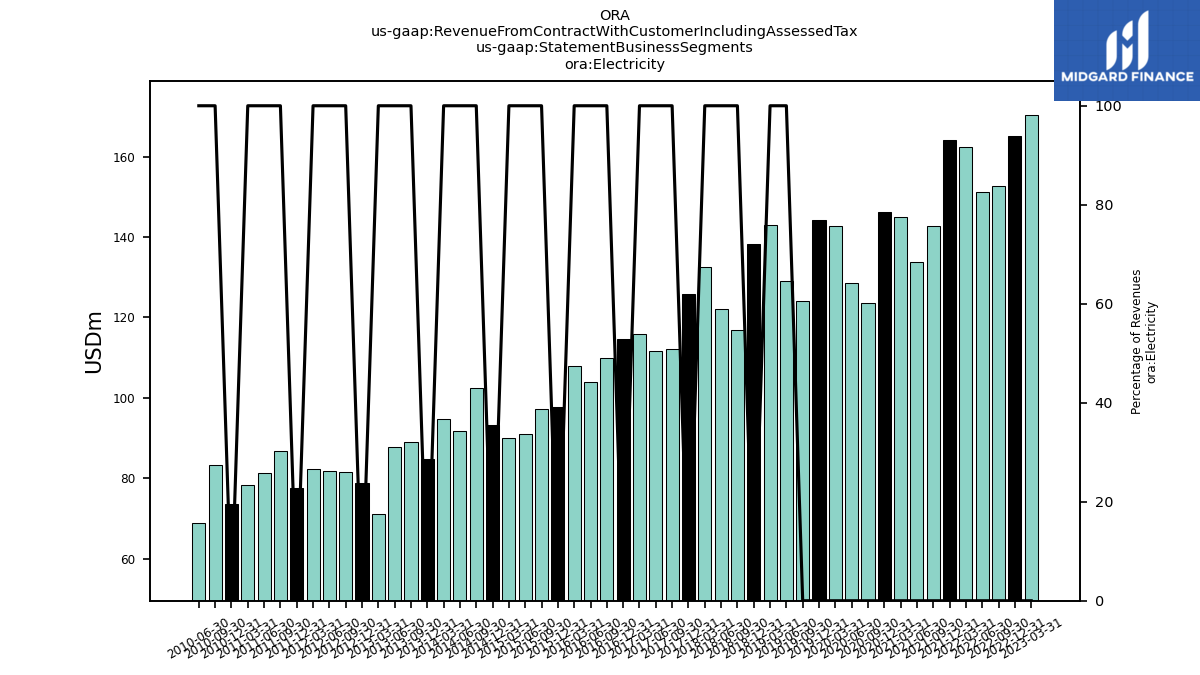
| Electricity | 157.21 | 155.32 | 170.31 | 165.19 | 152.82 | 151.19 | 162.53 | 164.27 | 142.65 | 133.86 | 144.99 | 146.19 | 123.66 | 128.69 | 142.86 | 144.37 | 123.98 | 129.08 | 142.91 | 138.32 | 116.89 | 122.18 | 132.49 | 128.04 | 110.88 | 110.90 | 115.78 | 114.63 | 109.80 | 104.00 | 107.87 | NA | NA | NA | NA | NA | NA | NA | NA | NA | NA | NA | NA | NA | NA | NA | NA | NA | NA | NA | NA | NA | NA | NA | NA | |
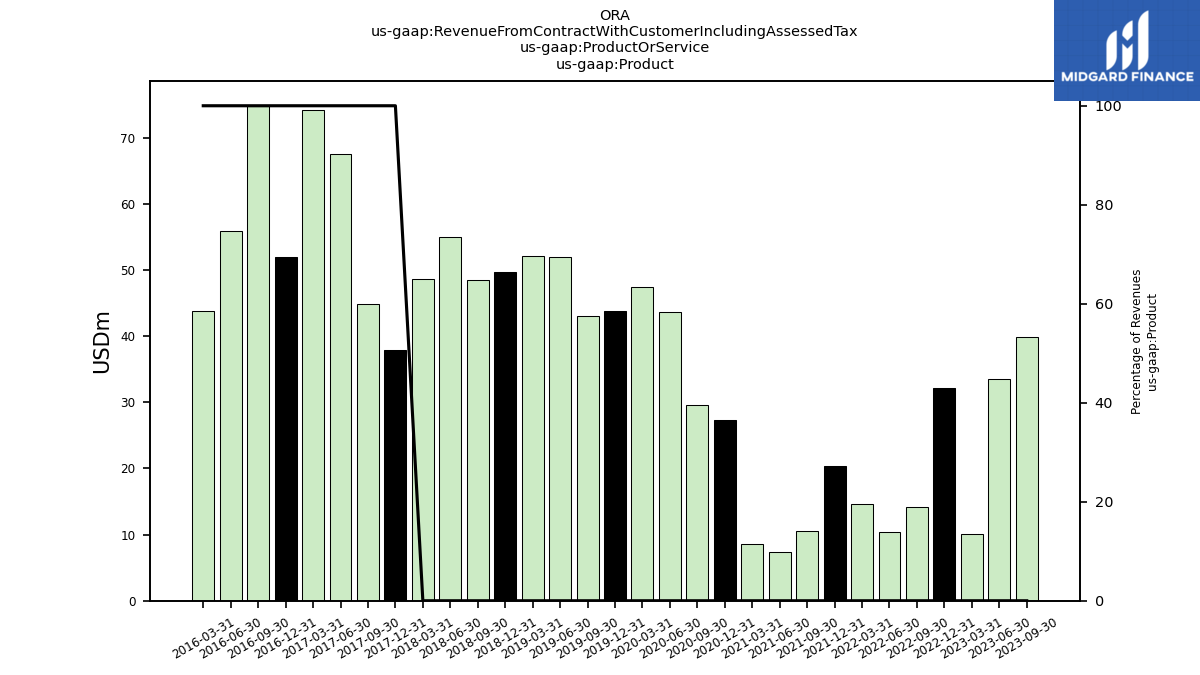
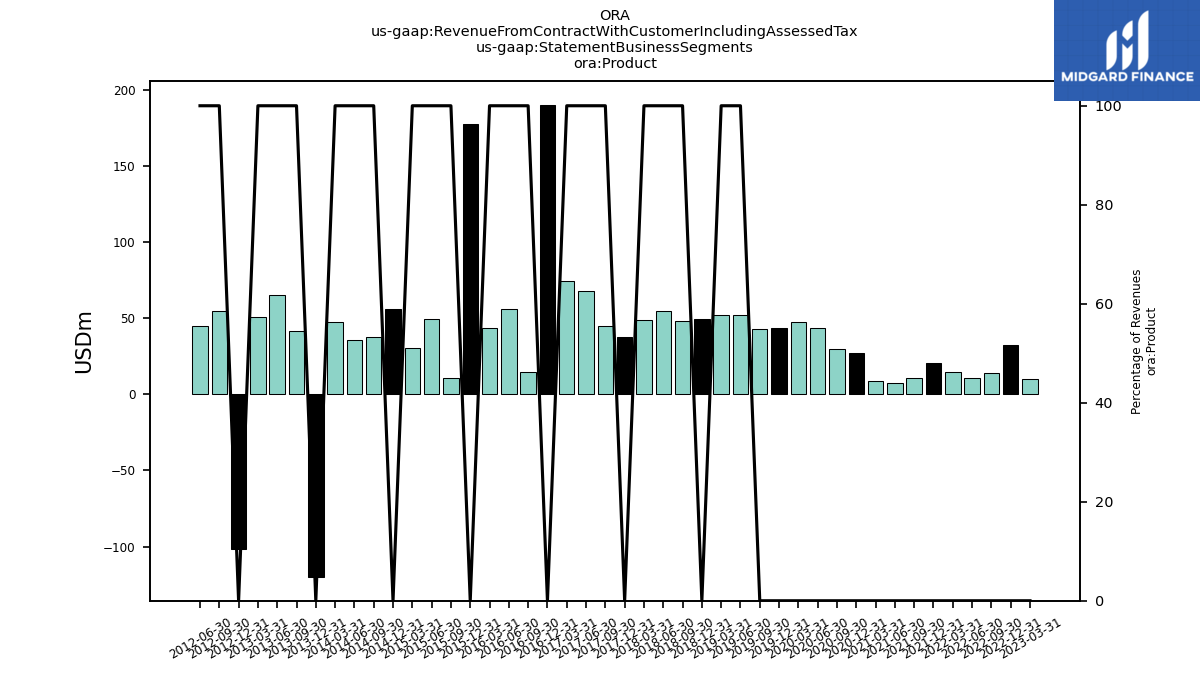
| Product | 39.83 | 33.46 | 10.04 | 32.18 | 14.22 | 10.39 | 14.63 | 20.34 | 10.53 | 7.41 | 8.64 | 27.39 | 29.62 | 43.70 | 47.41 | 43.81 | 43.04 | 52.03 | 52.13 | 49.72 | 48.44 | 54.91 | 48.67 | 37.86 | 44.91 | 67.59 | 74.12 | 51.89 | 74.82 | 55.86 | 43.73 | NA | NA | NA | NA | NA | NA | NA | NA | NA | NA | NA | NA | NA | NA | NA | NA | NA | NA | NA | NA | NA | NA | NA | NA | |
| Accounted For Under Asc606, Electricity | 27.30 | 30.20 | 32.70 | NA | 25.60 | 23.20 | 22.80 | NA | 19.00 | 20.80 | NA | NA | NA | NA | NA | NA | NA | NA | NA | NA | NA | NA | NA | NA | NA | NA | NA | NA | NA | NA | NA | NA | NA | NA | NA | NA | NA | NA | NA | NA | NA | NA | NA | NA | NA | NA | NA | NA | NA | NA | NA | NA | NA | NA | NA | |
| Electricity | NA | NA | 170.31 | 165.19 | 152.82 | 151.19 | 162.53 | 164.27 | 142.65 | 133.86 | 144.99 | 146.19 | 123.66 | 128.69 | 142.86 | 144.37 | 123.98 | 129.08 | 142.91 | 138.32 | 116.89 | 122.18 | 132.49 | 125.77 | 112.27 | 111.78 | 115.78 | 114.63 | 109.80 | 104.00 | 107.87 | 97.80 | 97.25 | 90.93 | 89.95 | 93.29 | 102.51 | 91.69 | 94.82 | 84.74 | 88.99 | 87.71 | 71.10 | 78.82 | 81.45 | 81.88 | 82.25 | 77.58 | 86.81 | 81.19 | 78.27 | 73.55 | 83.36 | 68.81 | NA | |
| Product | NA | NA | 10.04 | 32.18 | 14.22 | 10.39 | 14.63 | 20.34 | 10.53 | 7.41 | 8.64 | 27.39 | 29.62 | 43.70 | 47.41 | 43.81 | 43.04 | 52.03 | 52.13 | 49.72 | 48.44 | 54.91 | 48.67 | 37.86 | 44.91 | 67.59 | 74.12 | 190.26 | 14.84 | 55.86 | 43.73 | 177.41 | 10.66 | 49.56 | 30.28 | 55.96 | 37.74 | 35.91 | 47.62 | -120.08 | 41.76 | 64.97 | 50.61 | -101.30 | 54.69 | 44.83 | NA | NA | NA | NA | NA | NA | NA | NA | NA | |
| All Other | NA | NA | 4.88 | 8.12 | 8.85 | 7.49 | 6.56 | 6.38 | 5.66 | 5.63 | 12.72 | 5.80 | 5.66 | 2.51 | 1.85 | 4.26 | 3.48 | 2.96 | 4.00 | 2.43 | 1.15 | 1.21 | 2.86 | 0.46 | 1.40 | 0.88 | NA | NA | NA | NA | NA | NA | NA | NA | NA | NA | NA | NA | NA | NA | NA | NA | NA | NA | NA | NA | NA | NA | NA | NA | NA | NA | NA | NA | NA | |
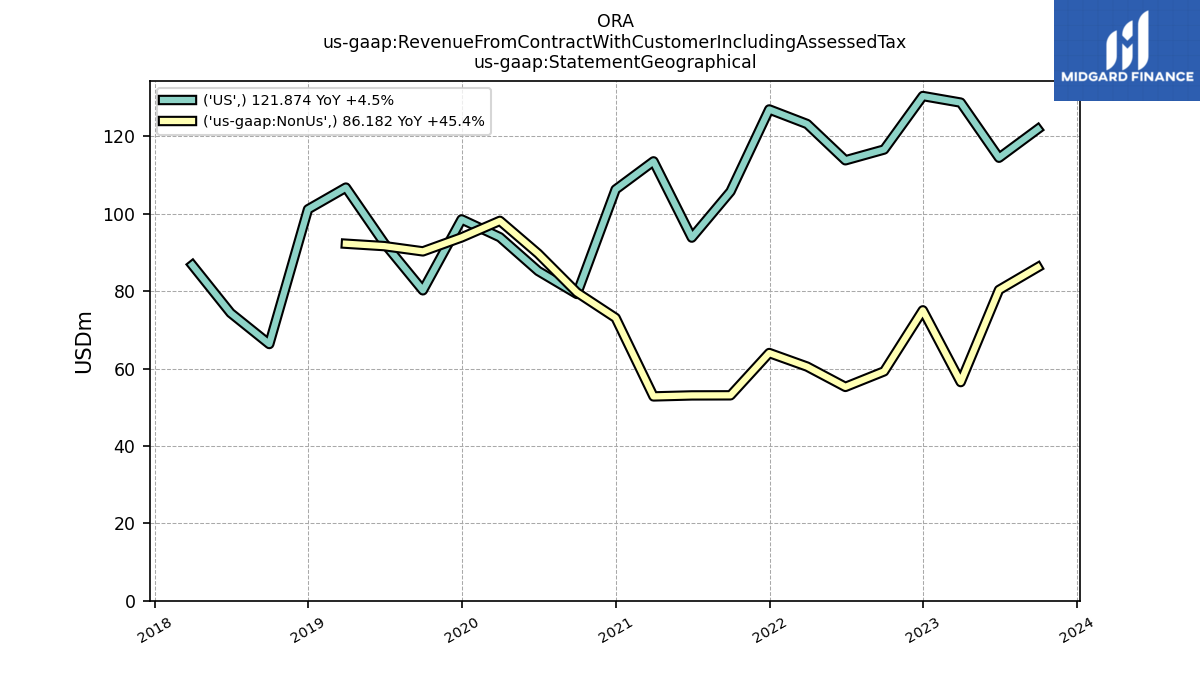
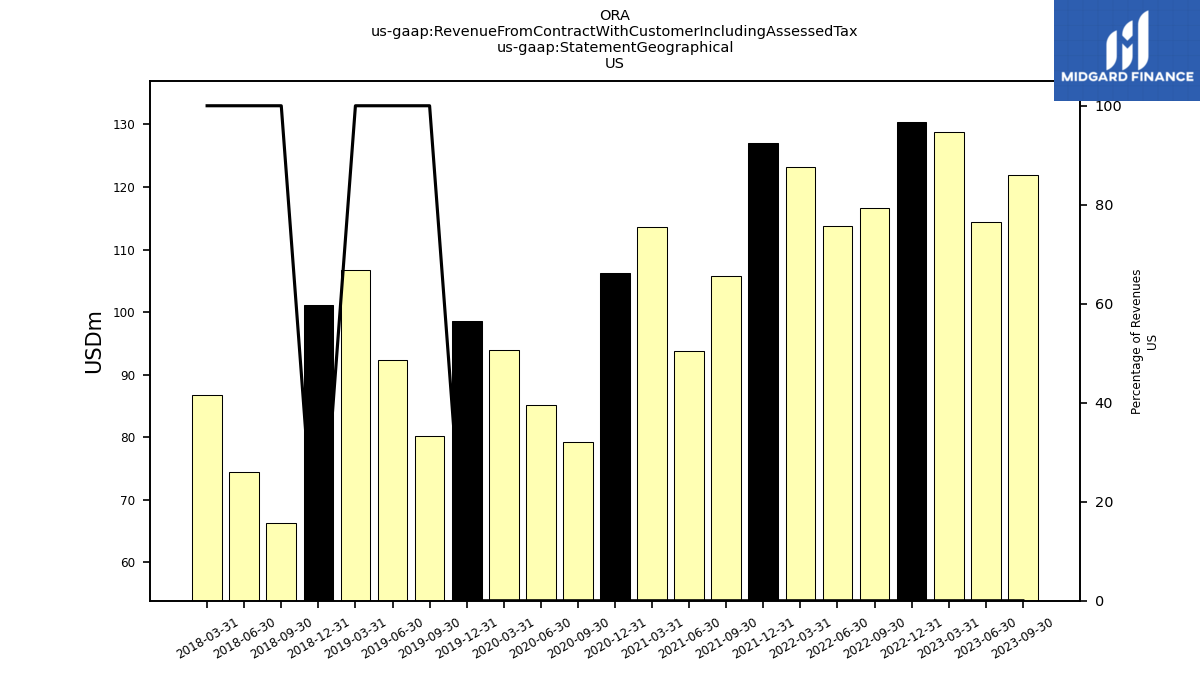
| US | 121.87 | 114.48 | 128.73 | 130.43 | 116.61 | 113.82 | 123.20 | 126.97 | 105.75 | 93.84 | 113.55 | 106.29 | 79.28 | 85.21 | 93.94 | 98.55 | 80.22 | 92.42 | 106.77 | 101.16 | 66.34 | 74.37 | 86.74 | NA | NA | NA | NA | NA | NA | NA | NA | NA | NA | NA | NA | NA | NA | NA | NA | NA | NA | NA | NA | NA | NA | NA | NA | NA | NA | NA | NA | NA | NA | NA | NA | |
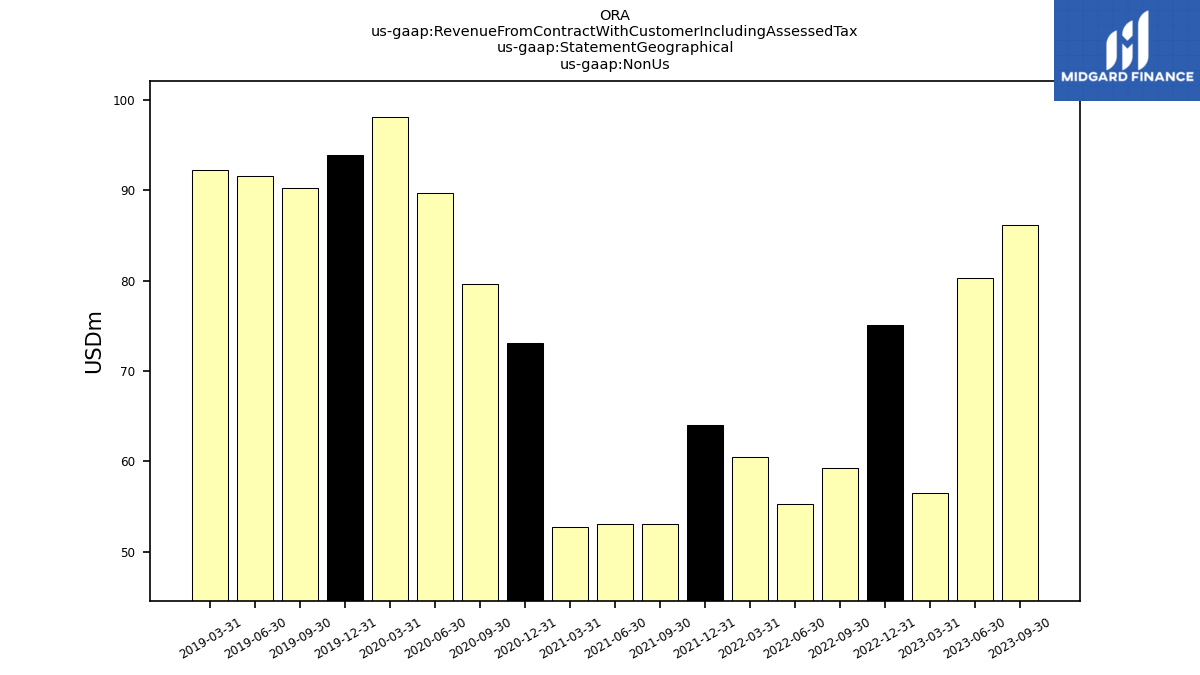
| Non Us | 86.18 | 80.32 | 56.50 | 75.06 | 59.28 | 55.26 | 60.51 | 64.02 | 53.09 | 53.06 | 52.80 | 73.09 | 79.67 | 89.69 | 98.18 | 93.89 | 90.28 | 91.65 | 92.27 | NA | NA | NA | NA | NA | NA | NA | NA | NA | NA | NA | NA | NA | NA | NA | NA | NA | NA | NA | NA | NA | NA | NA | NA | NA | NA | NA | NA | NA | NA | NA | NA | NA | NA | NA | NA | |
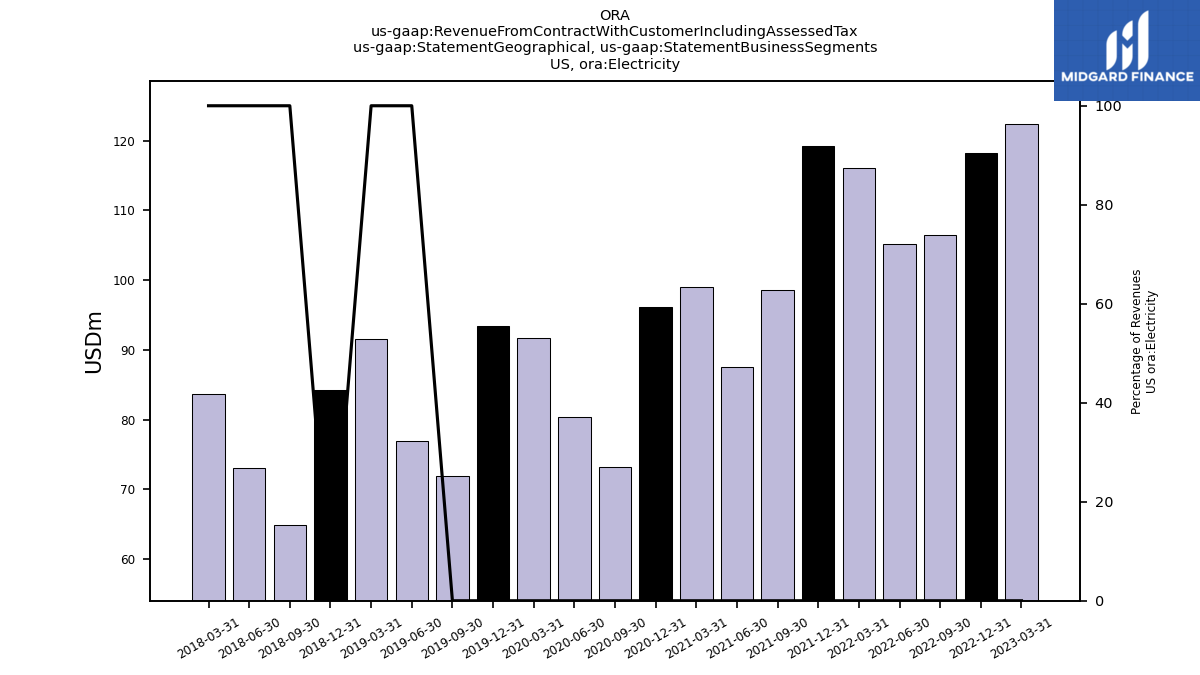
| US, Electricity | NA | NA | 122.41 | 118.21 | 106.49 | 105.19 | 116.11 | 119.21 | 98.55 | 87.56 | 98.98 | 96.10 | 73.18 | 80.43 | 91.69 | 93.42 | 71.92 | 76.93 | 91.53 | 84.23 | 64.91 | 73.14 | 83.68 | NA | NA | NA | NA | NA | NA | NA | NA | NA | NA | NA | NA | NA | NA | NA | NA | NA | NA | NA | NA | NA | NA | NA | NA | NA | NA | NA | NA | NA | NA | NA | NA | |
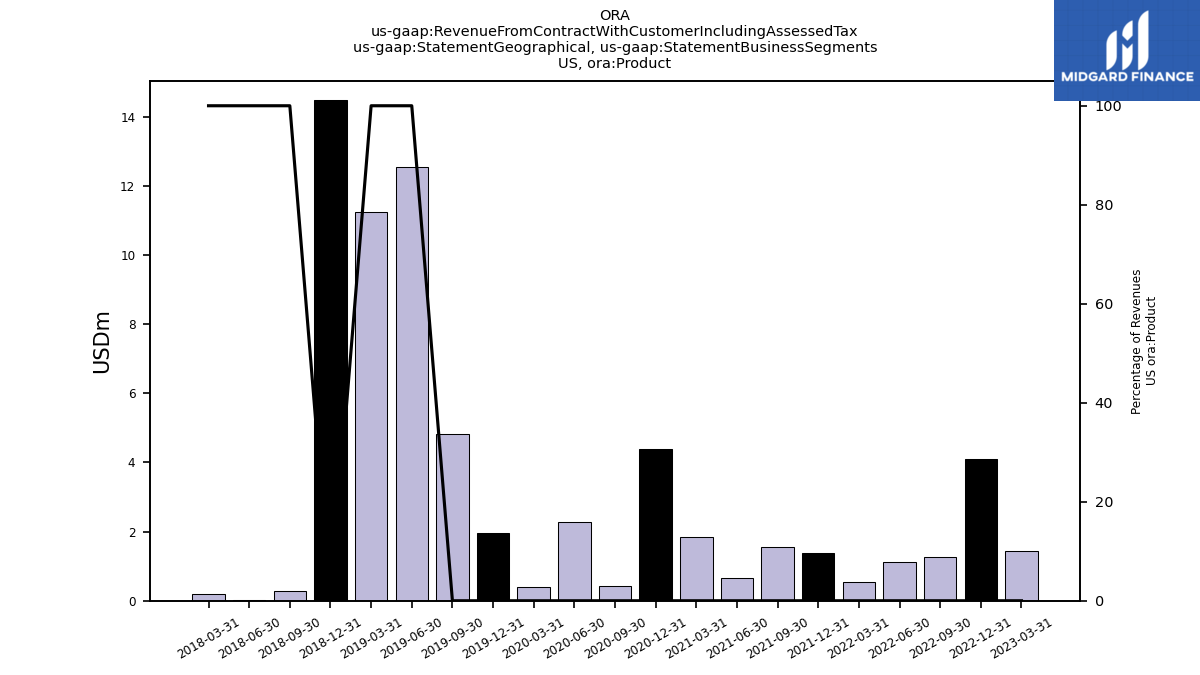
| US, Product | NA | NA | 1.44 | 4.10 | 1.27 | 1.13 | 0.54 | 1.37 | 1.54 | 0.65 | 1.85 | 4.39 | 0.43 | 2.27 | 0.40 | 1.97 | 4.82 | 12.53 | 11.24 | 14.50 | 0.28 | 0.03 | 0.19 | NA | NA | NA | NA | NA | NA | NA | NA | NA | NA | NA | NA | NA | NA | NA | NA | NA | NA | NA | NA | NA | NA | NA | NA | NA | NA | NA | NA | NA | NA | NA | NA | |
| US, All Other | NA | NA | 4.88 | 8.12 | 8.85 | 7.49 | 6.56 | 6.38 | 5.66 | 5.63 | 12.72 | 5.80 | 5.66 | 2.51 | 1.85 | 3.15 | 3.48 | 2.96 | 4.00 | 2.43 | 1.15 | 1.21 | 2.86 | NA | NA | NA | NA | NA | NA | NA | NA | NA | NA | NA | NA | NA | NA | NA | NA | NA | NA | NA | NA | NA | NA | NA | NA | NA | NA | NA | NA | NA | NA | NA | NA | |
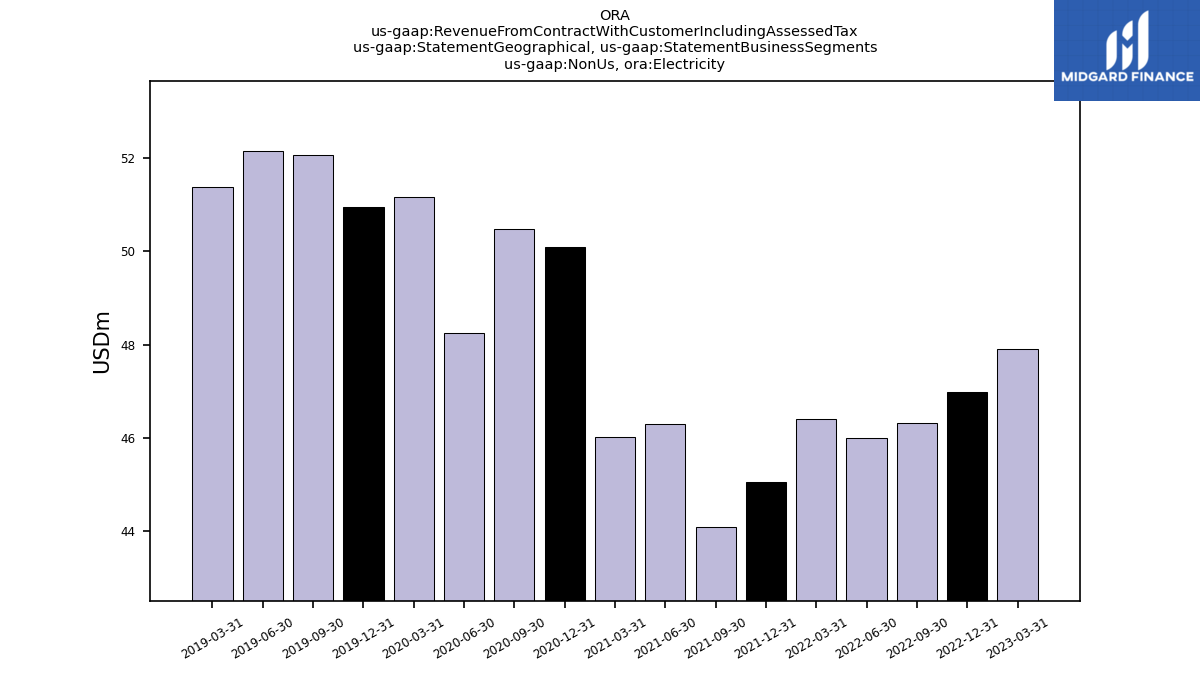
| Non Us, Electricity | NA | NA | 47.90 | 46.98 | 46.33 | 46.00 | 46.42 | 45.05 | 44.10 | 46.30 | 46.01 | 50.09 | 50.48 | 48.26 | 51.16 | 50.95 | 52.06 | 52.15 | 51.38 | NA | NA | NA | NA | NA | NA | NA | NA | NA | NA | NA | NA | NA | NA | NA | NA | NA | NA | NA | NA | NA | NA | NA | NA | NA | NA | NA | NA | NA | NA | NA | NA | NA | NA | NA | NA | |
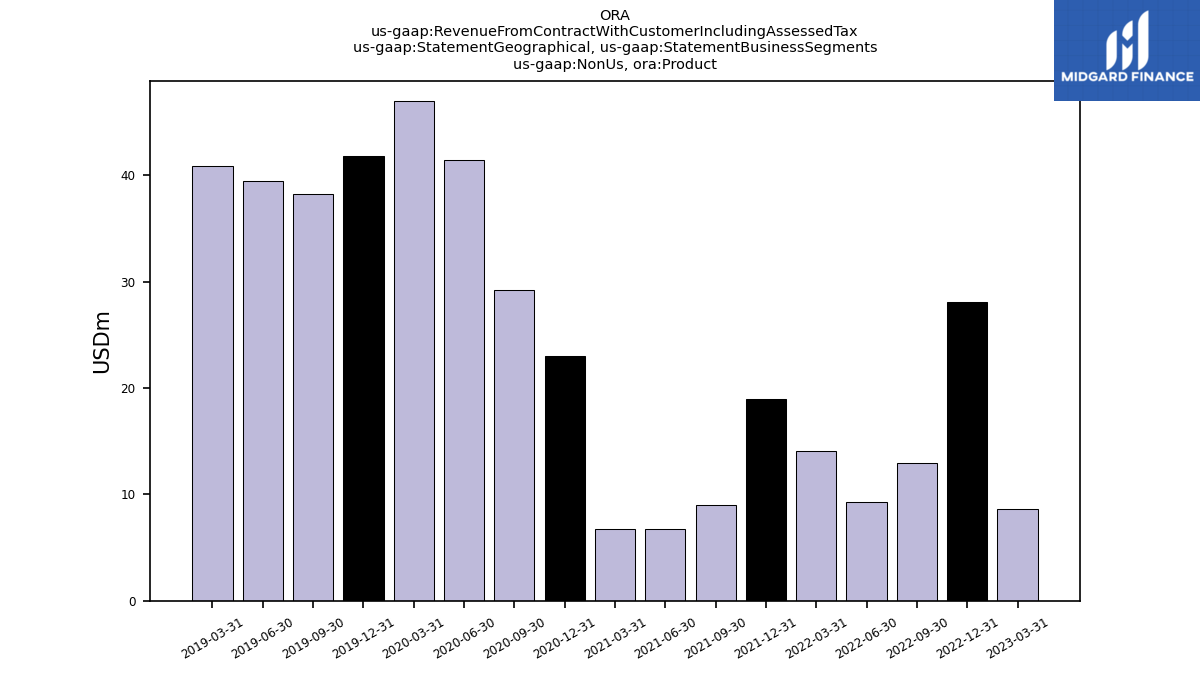
| Non Us, Product | NA | NA | 8.60 | 28.08 | 12.95 | 9.26 | 14.09 | 18.97 | 8.99 | 6.76 | 6.79 | 23.00 | 29.19 | 41.43 | 47.01 | 41.84 | 38.22 | 39.50 | 40.88 | NA | NA | NA | NA | NA | NA | NA | NA | NA | NA | NA | NA | NA | NA | NA | NA | NA | NA | NA | NA | NA | NA | NA | NA | NA | NA | NA | NA | NA | NA | NA | NA | NA | NA | NA | NA |
