
| 2023-10-31 | 2023-07-31 | 2023-04-30 | 2023-01-31 | 2022-10-31 | 2022-07-31 | 2022-04-30 | 2022-01-31 | 2021-10-31 | 2021-07-31 | 2021-04-30 | 2021-01-31 | 2020-10-31 | 2020-07-31 | 2020-04-30 | ||
|---|---|---|---|---|---|---|---|---|---|---|---|---|---|---|---|---|
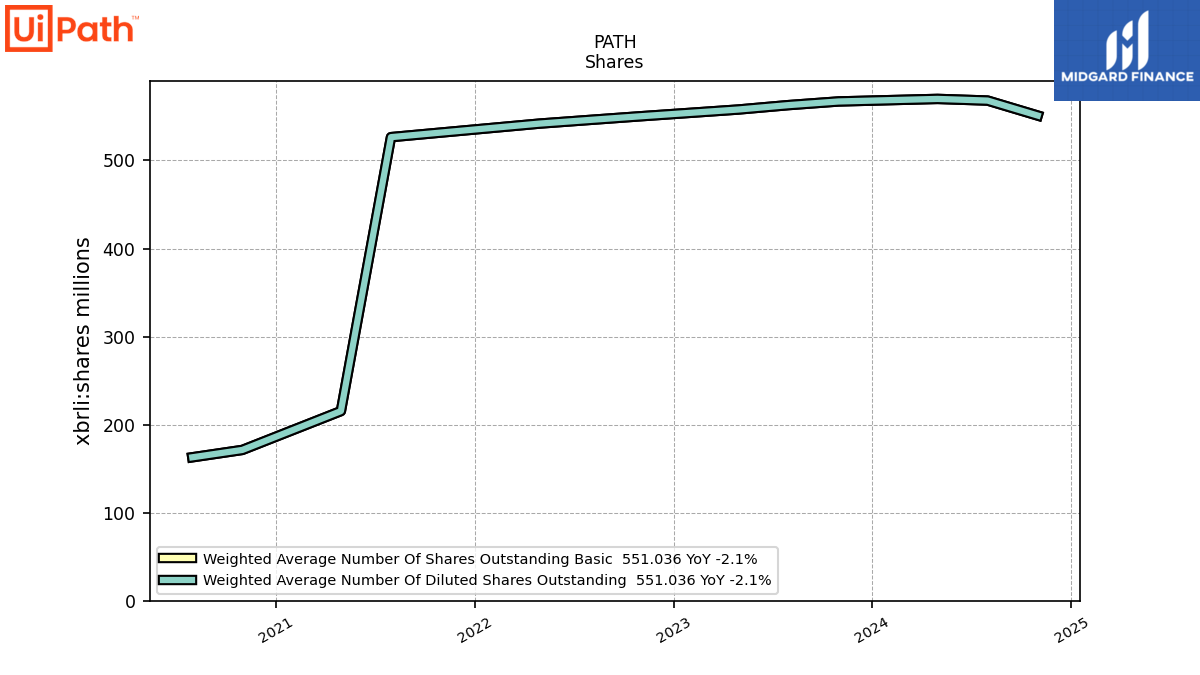
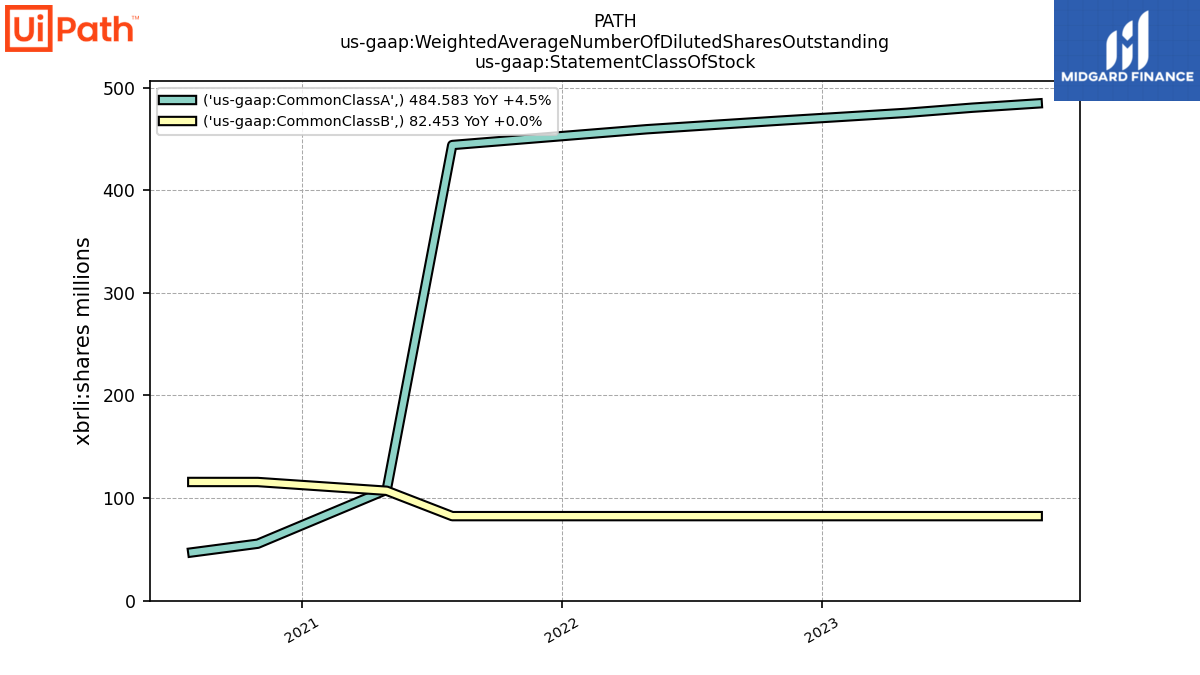
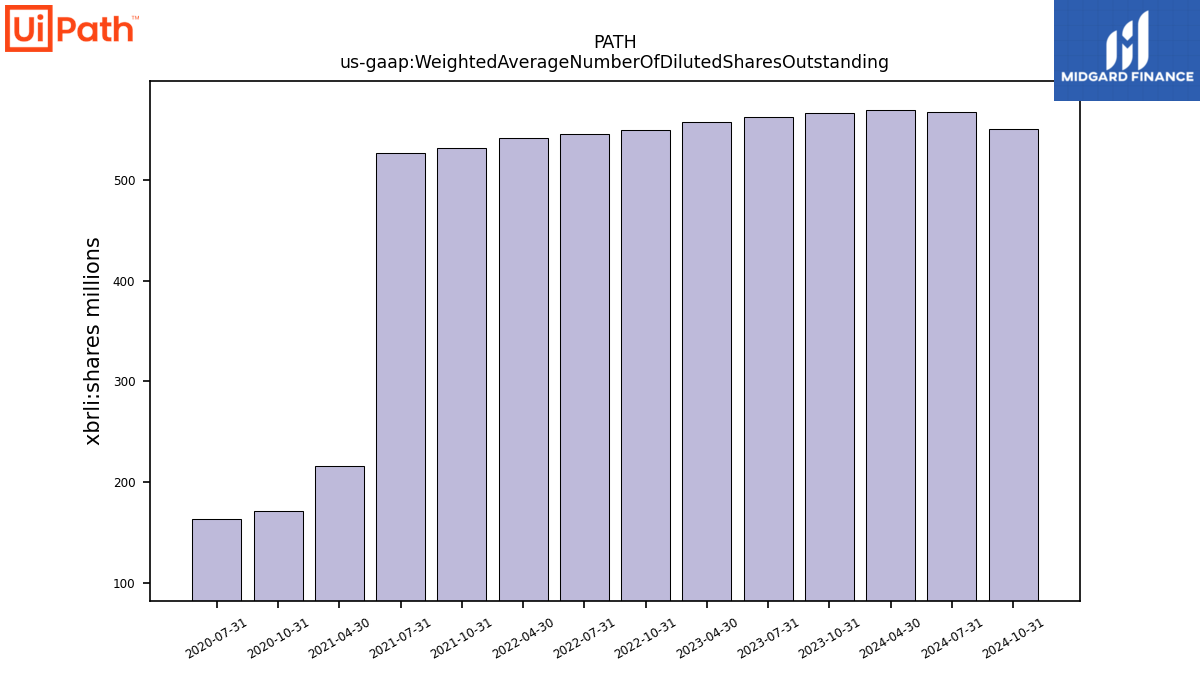
| Weighted Average Number Of Diluted Shares Outstanding | 567.04 | 562.88 | 557.88 | NA | 550.16 | 546.06 | 541.90 | NA | 531.72 | 526.51 | 215.35 | NA | 171.28 | 162.91 | NA | |
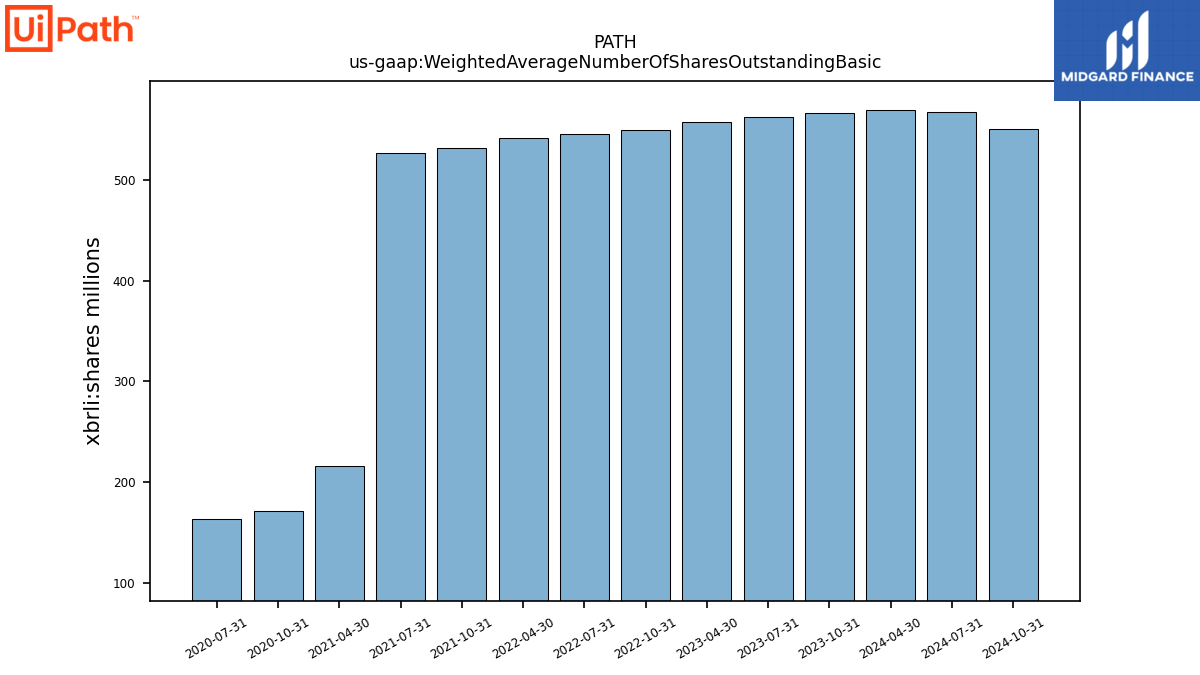
| Weighted Average Number Of Shares Outstanding Basic | 567.04 | 562.88 | 557.88 | NA | 550.16 | 546.06 | 541.90 | NA | 531.72 | 526.51 | 215.35 | NA | 171.28 | 162.91 | NA | |
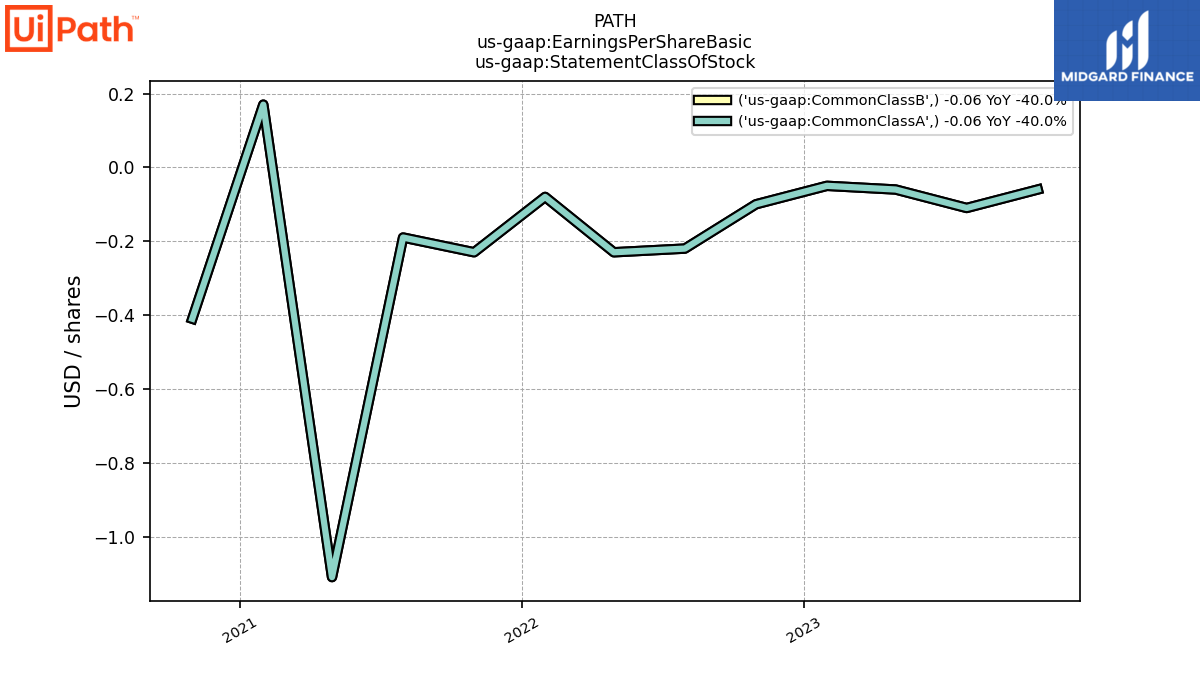
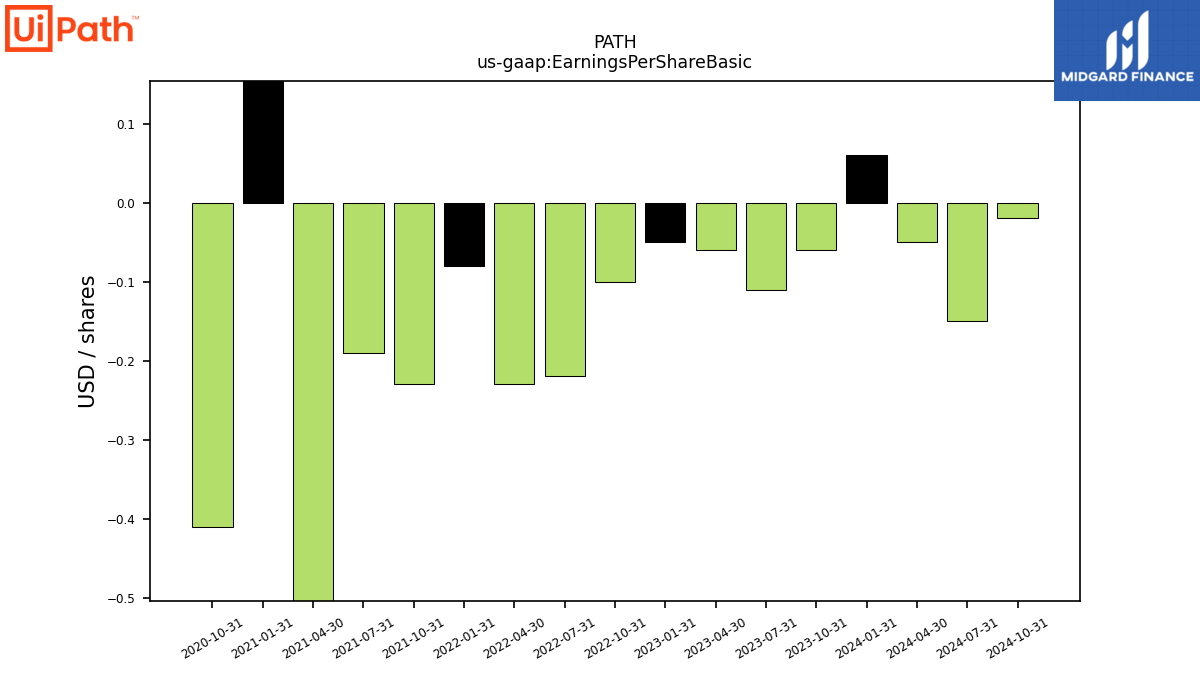
| Earnings Per Share Basic | -0.06 | -0.11 | -0.06 | -0.05 | -0.10 | -0.22 | -0.23 | -0.08 | -0.23 | -0.19 | -1.11 | 0.17 | -0.41 | NA | NA | |
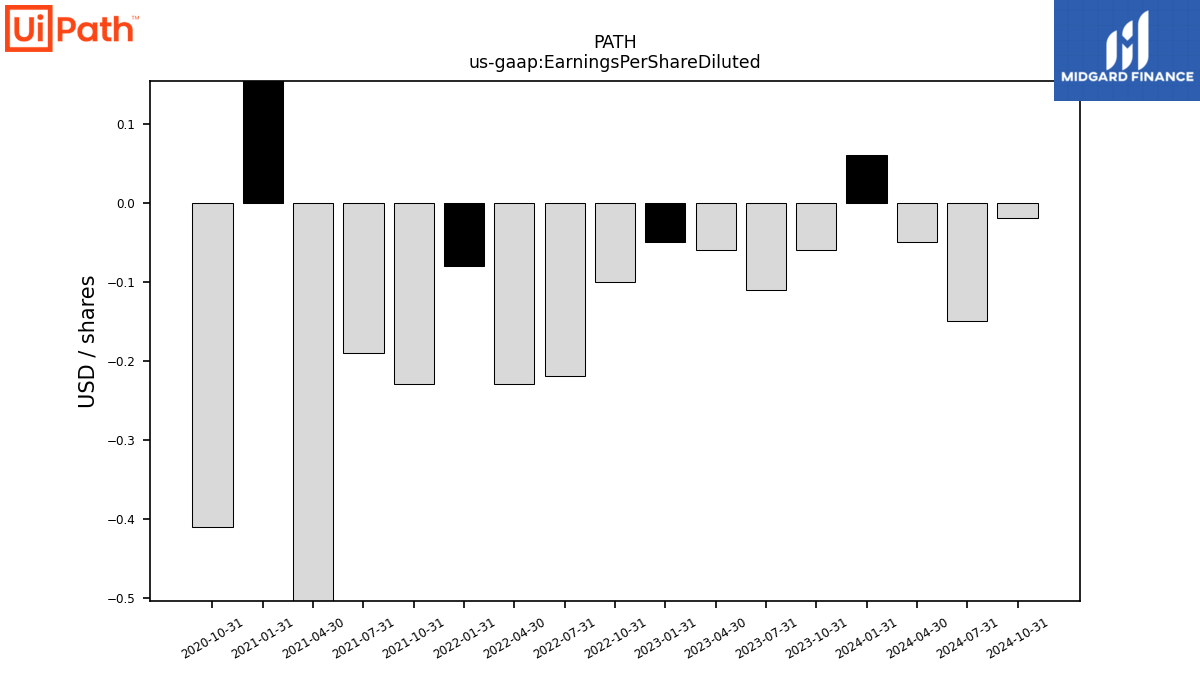
| Earnings Per Share Diluted | -0.06 | -0.11 | -0.06 | -0.05 | -0.10 | -0.22 | -0.23 | -0.08 | -0.23 | -0.19 | -1.11 | 0.17 | -0.41 | NA | NA |
| 2023-10-31 | 2023-07-31 | 2023-04-30 | 2023-01-31 | 2022-10-31 | 2022-07-31 | 2022-04-30 | 2022-01-31 | 2021-10-31 | 2021-07-31 | 2021-04-30 | 2021-01-31 | 2020-10-31 | 2020-07-31 | 2020-04-30 | ||
|---|---|---|---|---|---|---|---|---|---|---|---|---|---|---|---|---|
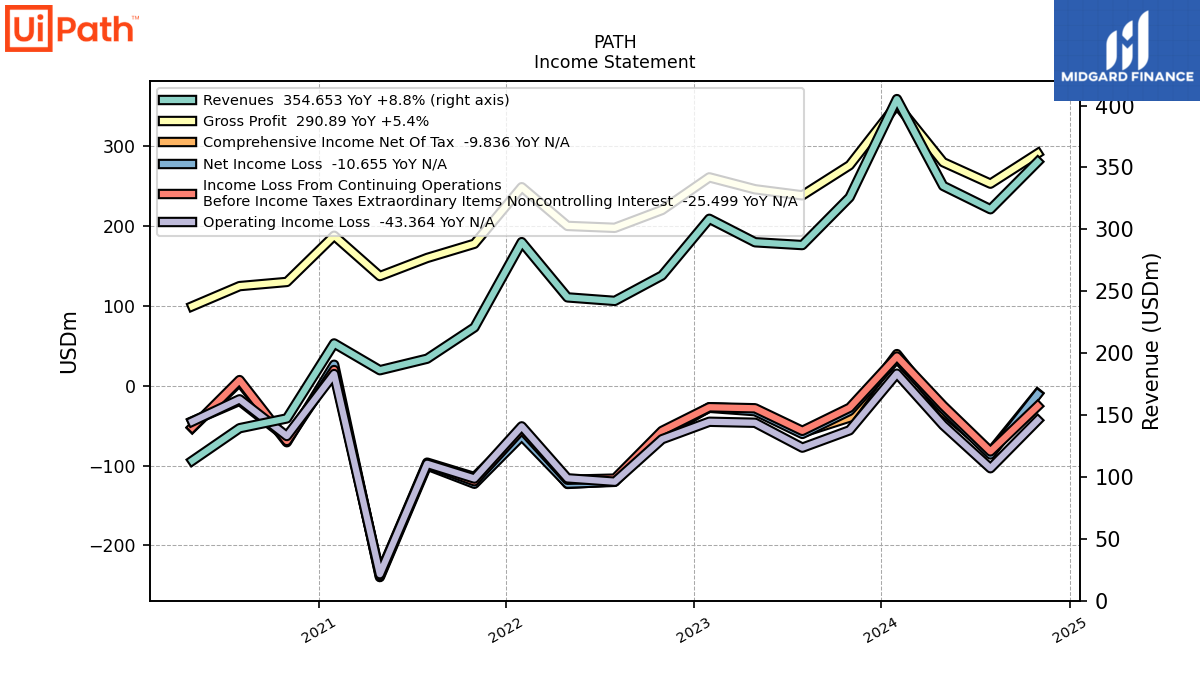
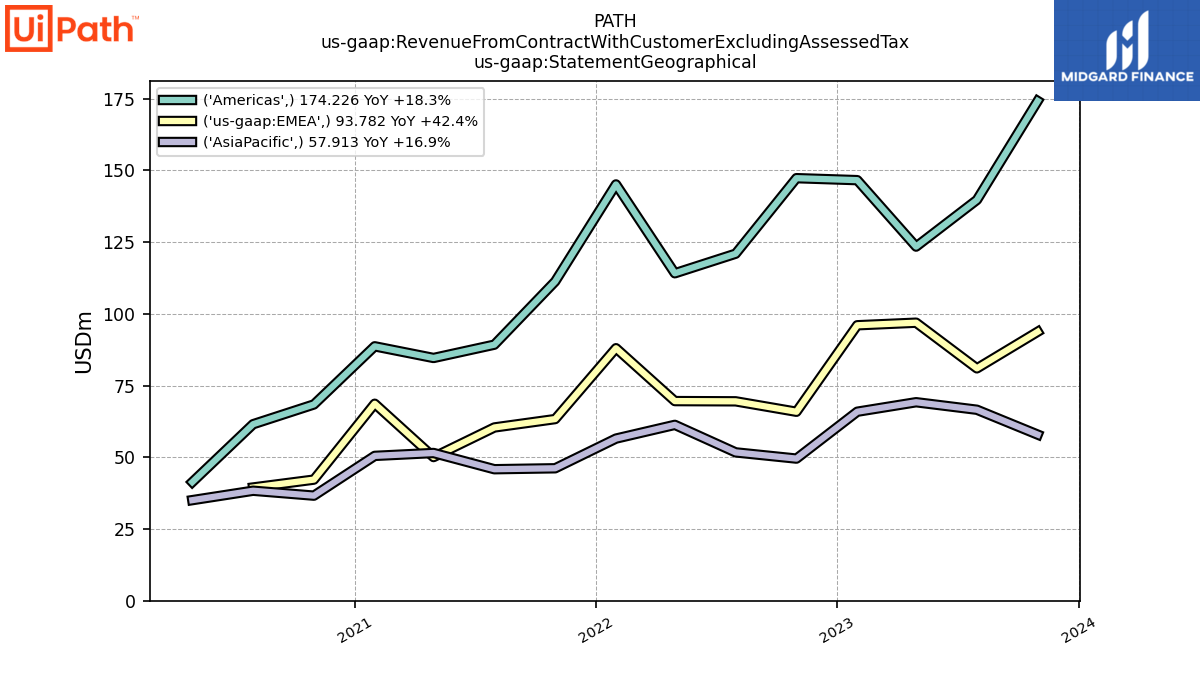
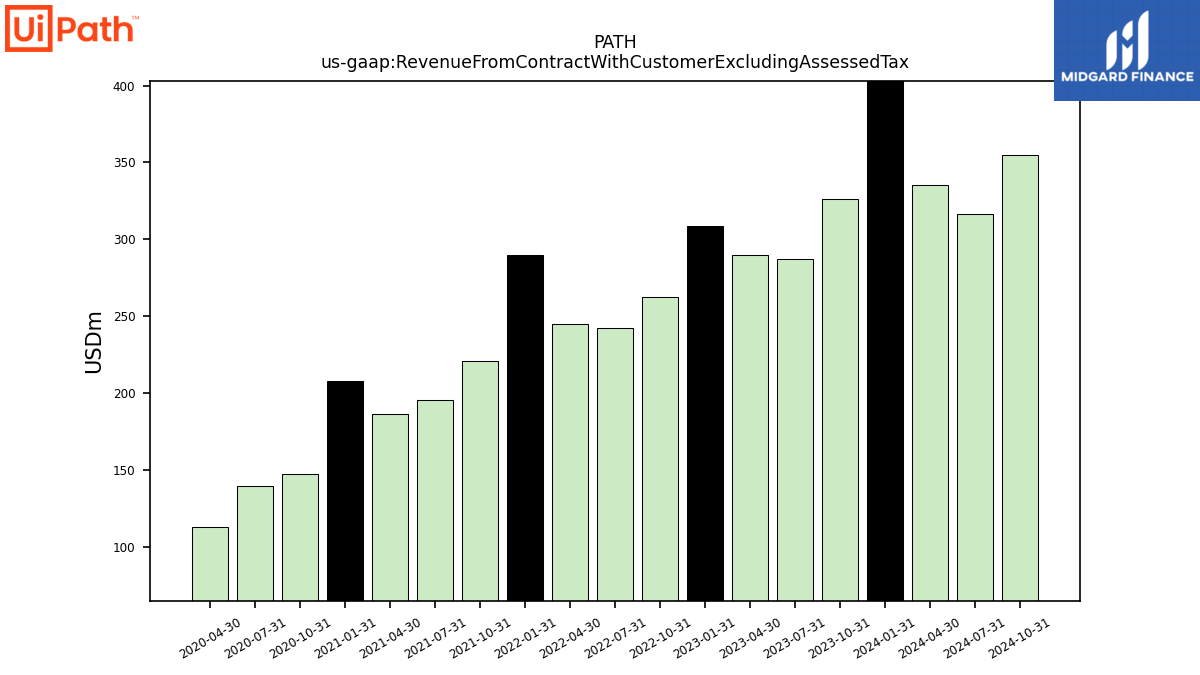
| Revenue From Contract With Customer Excluding Assessed Tax | 325.92 | 287.31 | 289.59 | 308.55 | 262.74 | 242.22 | 245.07 | 289.70 | 220.82 | 195.52 | 186.22 | 207.88 | 147.29 | 139.38 | 113.10 | |
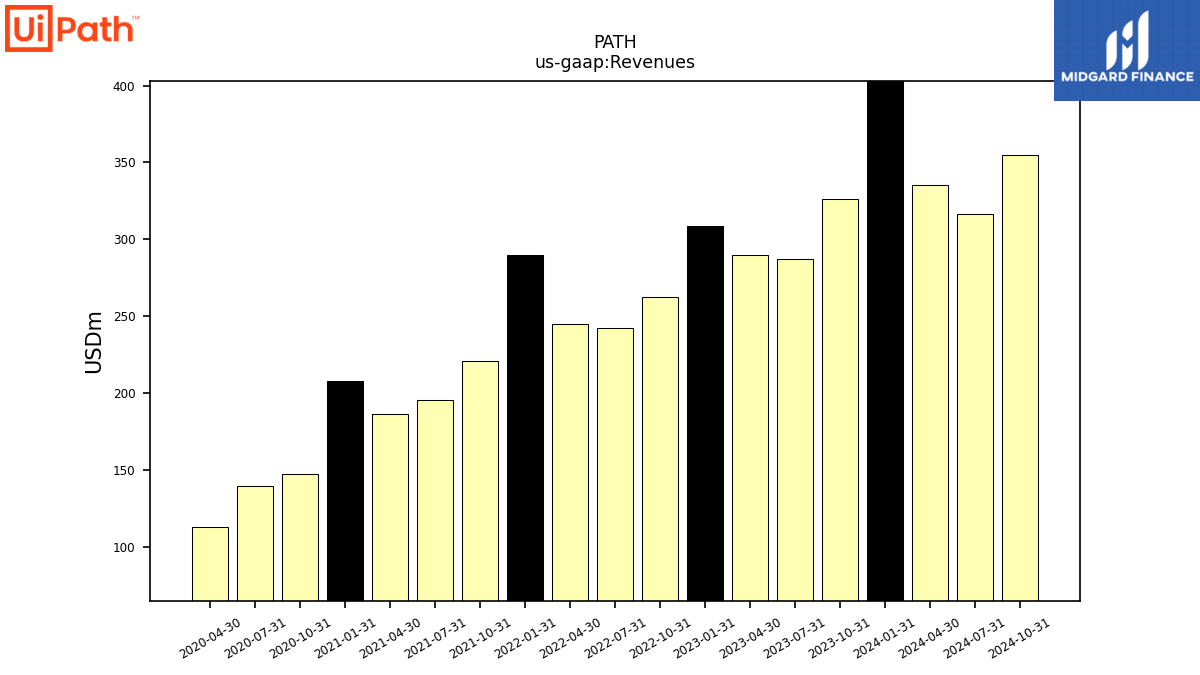
| Revenues | 325.92 | 287.31 | 289.59 | 308.55 | 262.74 | 242.22 | 245.07 | 289.70 | 220.82 | 195.52 | 186.22 | 207.88 | 147.29 | 139.38 | 113.10 | |
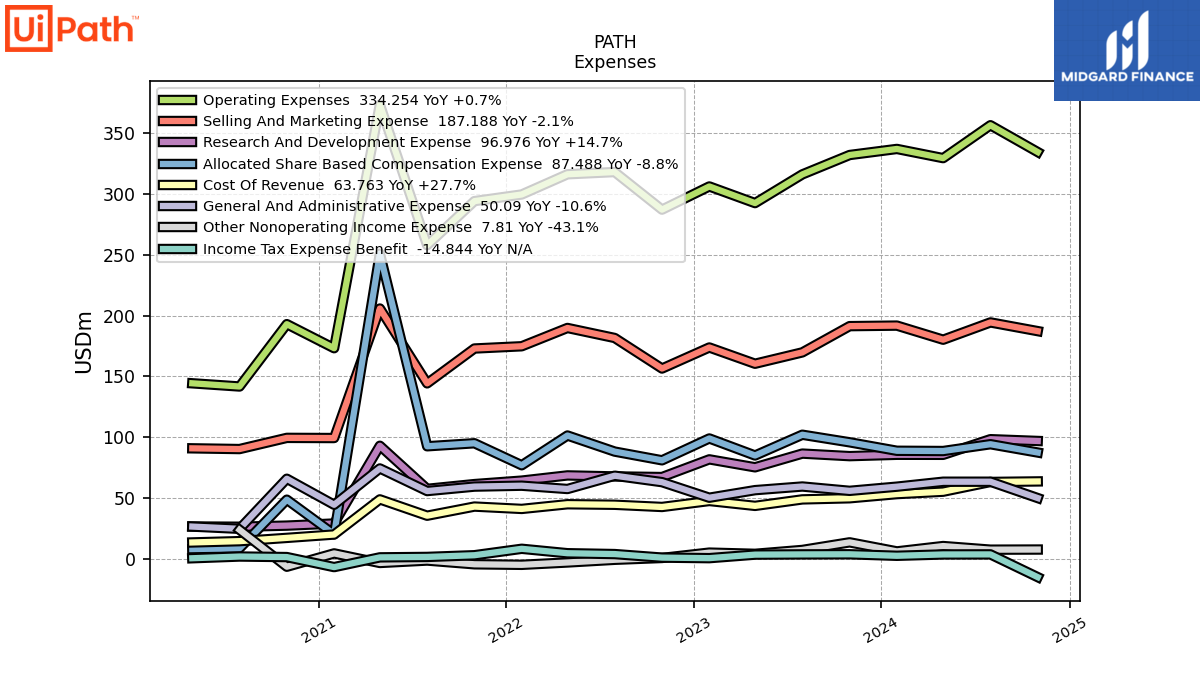
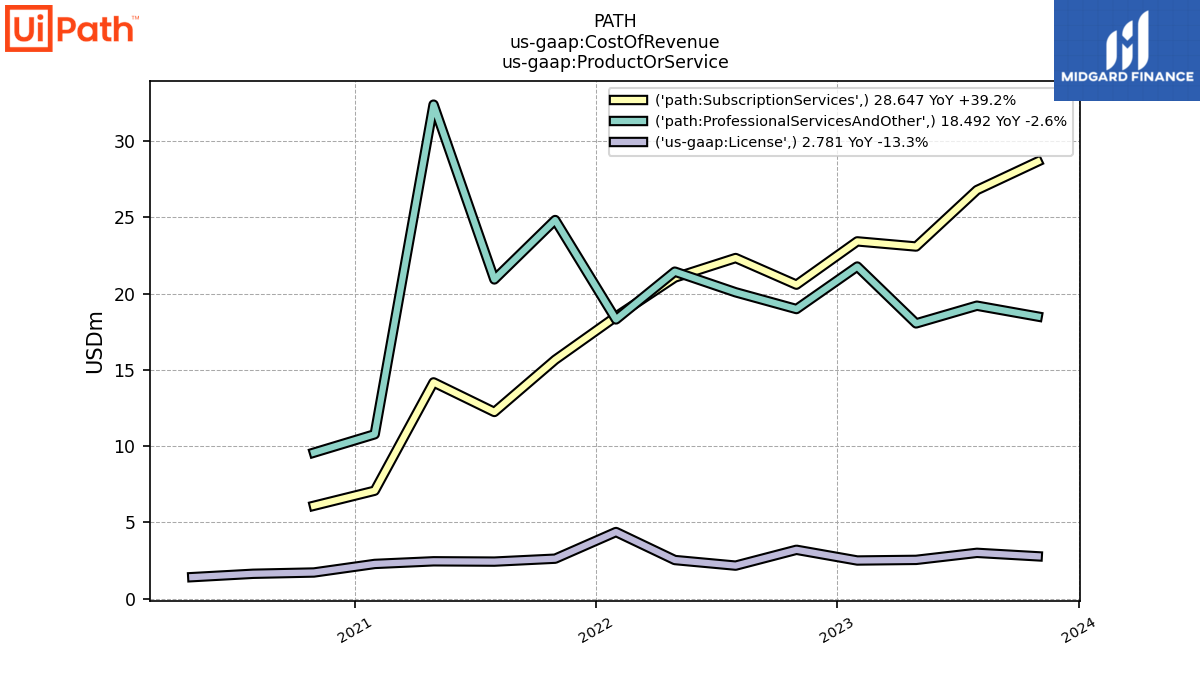
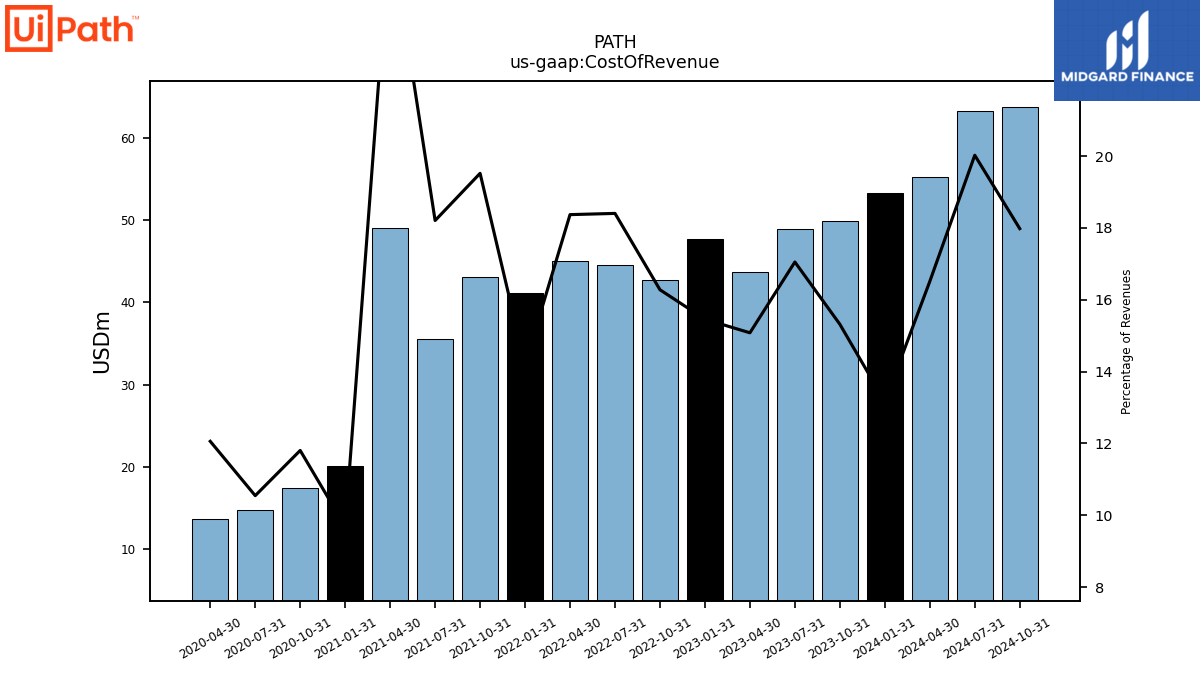
| Cost Of Revenue | 49.92 | 48.99 | 43.67 | 47.69 | 42.77 | 44.58 | 45.02 | 41.16 | 43.10 | 35.59 | 49.01 | 20.14 | 17.39 | 14.70 | 13.64 | |
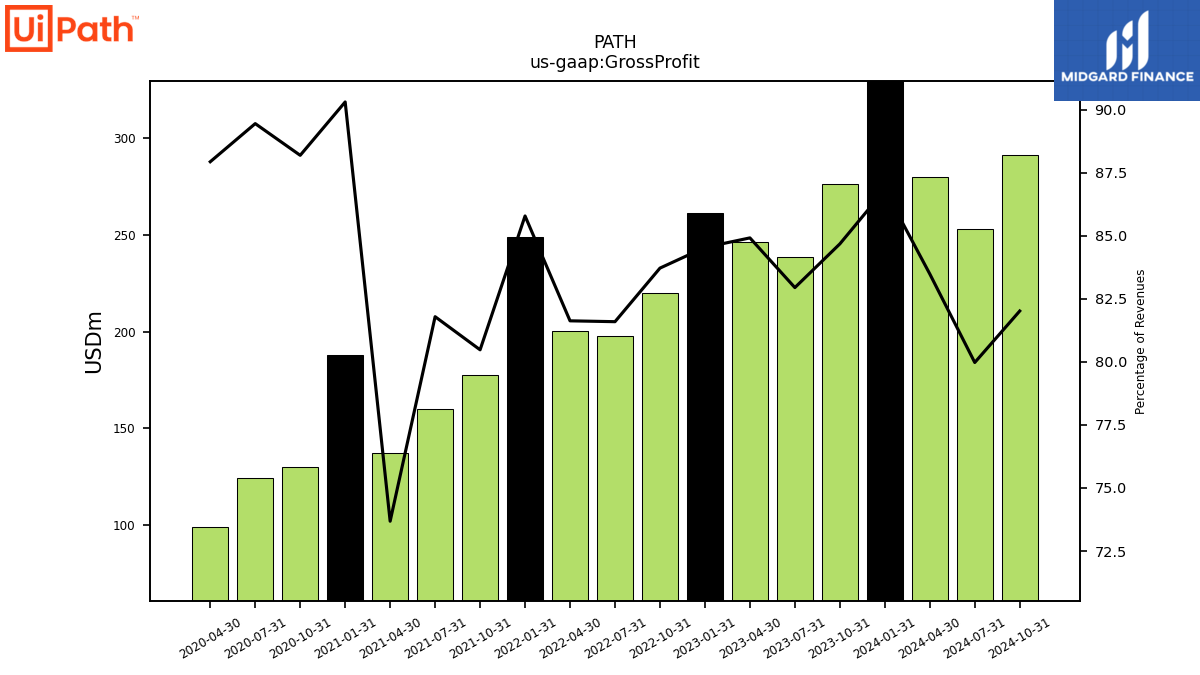
| Gross Profit | 276.00 | 238.32 | 245.92 | 260.86 | 219.98 | 197.65 | 200.05 | 248.53 | 177.72 | 159.93 | 137.21 | 187.74 | 129.90 | 124.68 | 99.47 | |
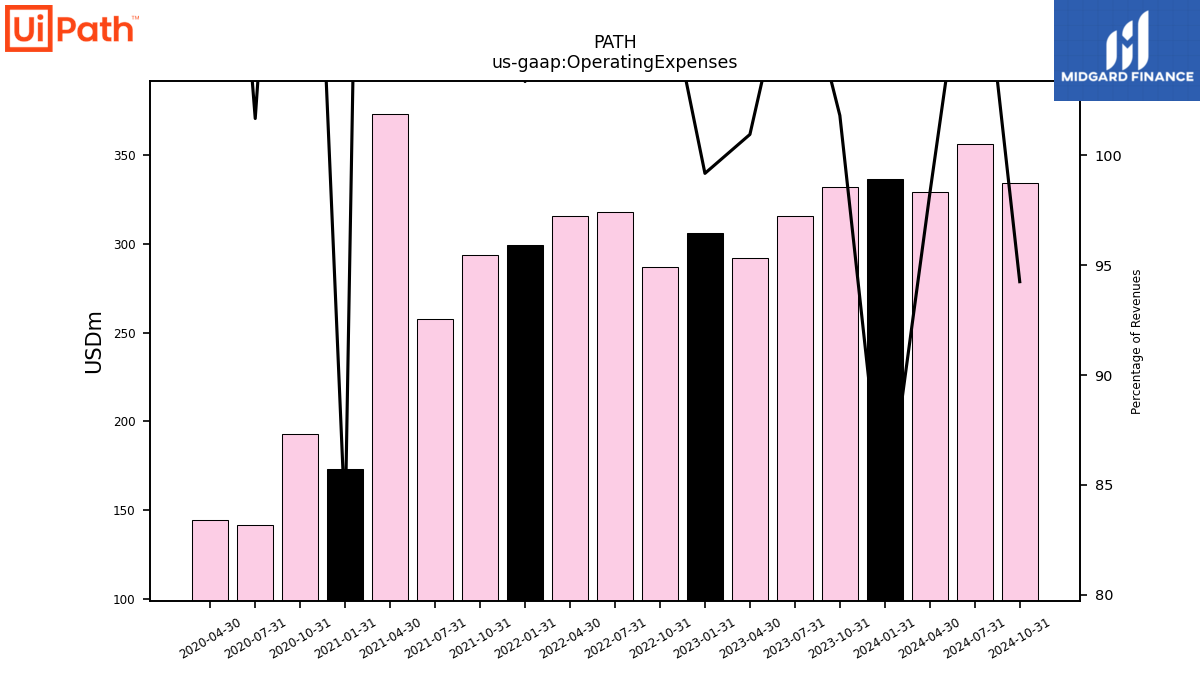
| Operating Expenses | 331.82 | 315.91 | 292.33 | 306.00 | 286.97 | 317.84 | 316.00 | 299.41 | 293.96 | 257.75 | 373.21 | 173.15 | 192.92 | 141.71 | 144.34 | |
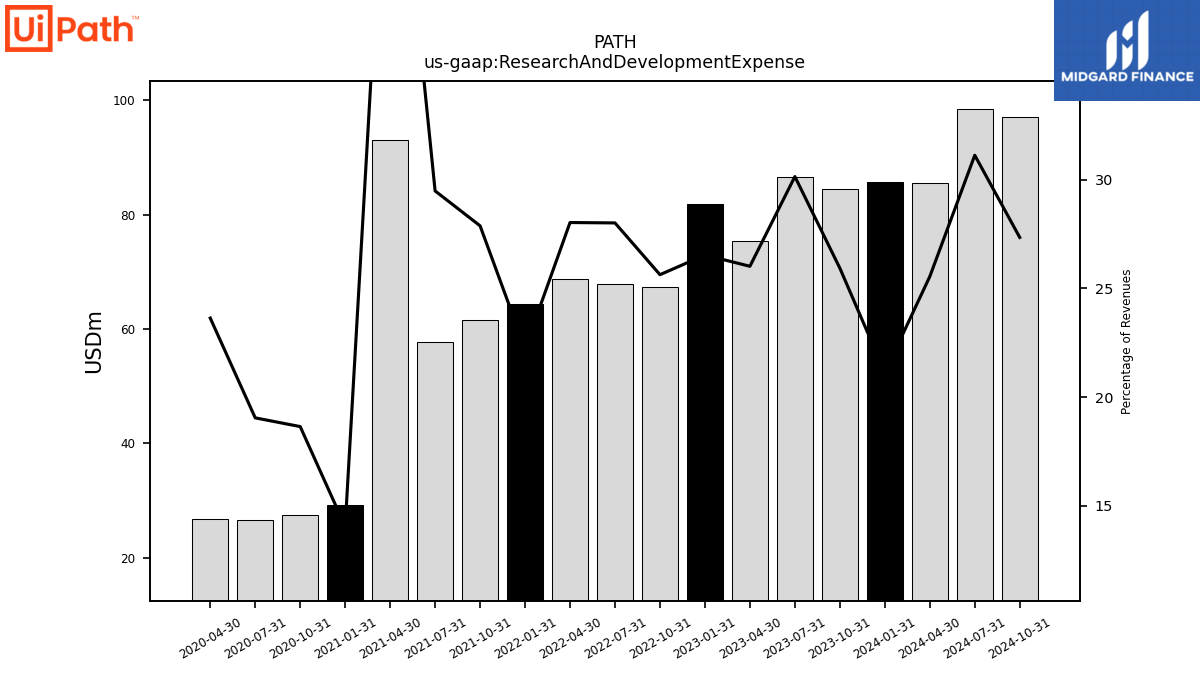
| Research And Development Expense | 84.51 | 86.61 | 75.34 | 81.87 | 67.34 | 67.85 | 68.69 | 64.41 | 61.56 | 57.65 | 93.04 | 29.19 | 27.46 | 26.54 | 26.73 | |
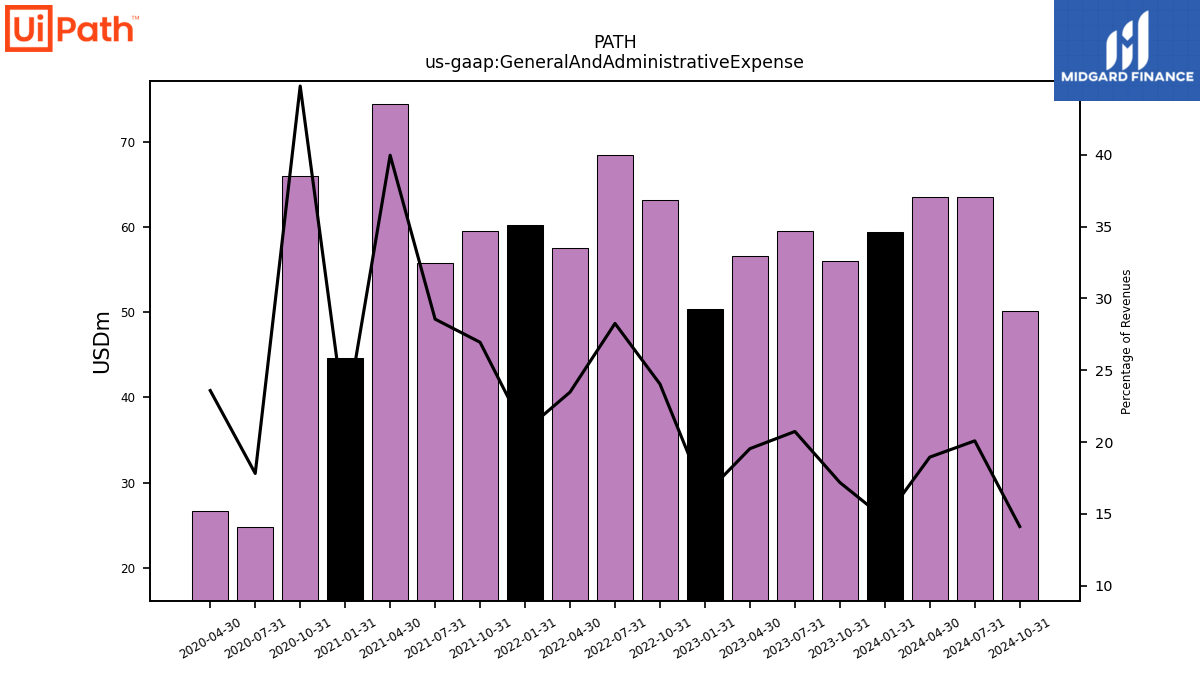
| General And Administrative Expense | 56.02 | 59.58 | 56.58 | 50.38 | 63.16 | 68.44 | 57.53 | 60.24 | 59.50 | 55.83 | 74.42 | 44.57 | 65.95 | 24.83 | 26.68 | |
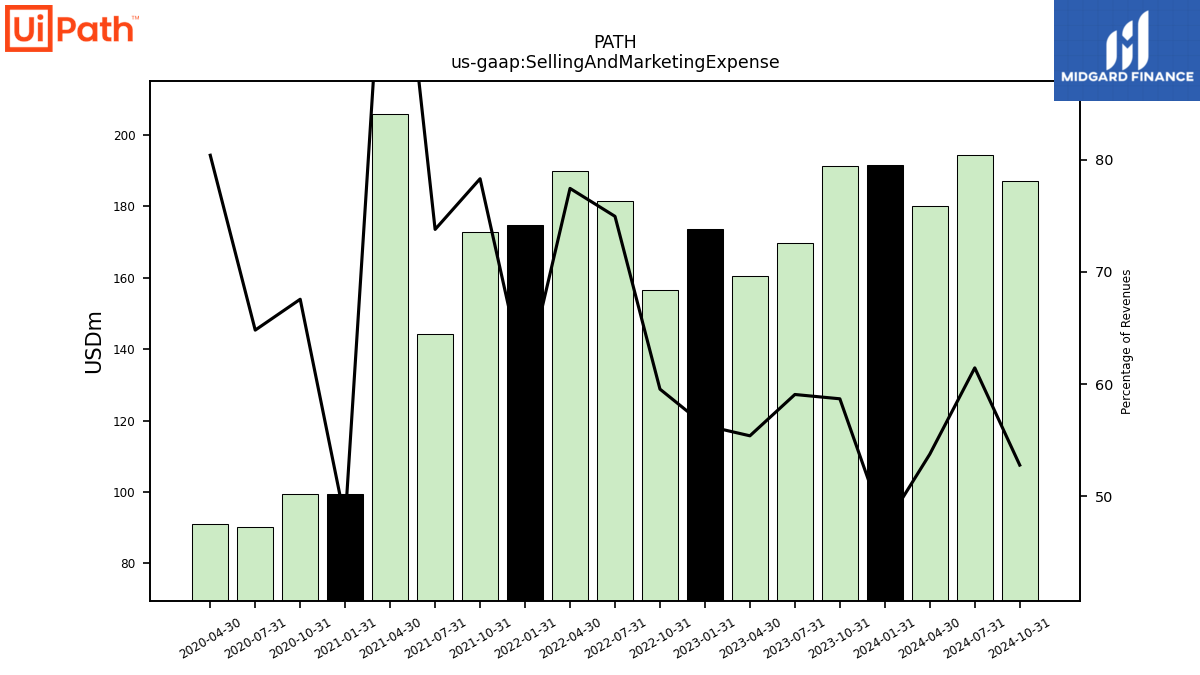
| Selling And Marketing Expense | 191.28 | 169.72 | 160.41 | 173.76 | 156.47 | 181.55 | 189.78 | 174.76 | 172.91 | 144.27 | 205.75 | 99.38 | 99.51 | 90.33 | 90.93 | |
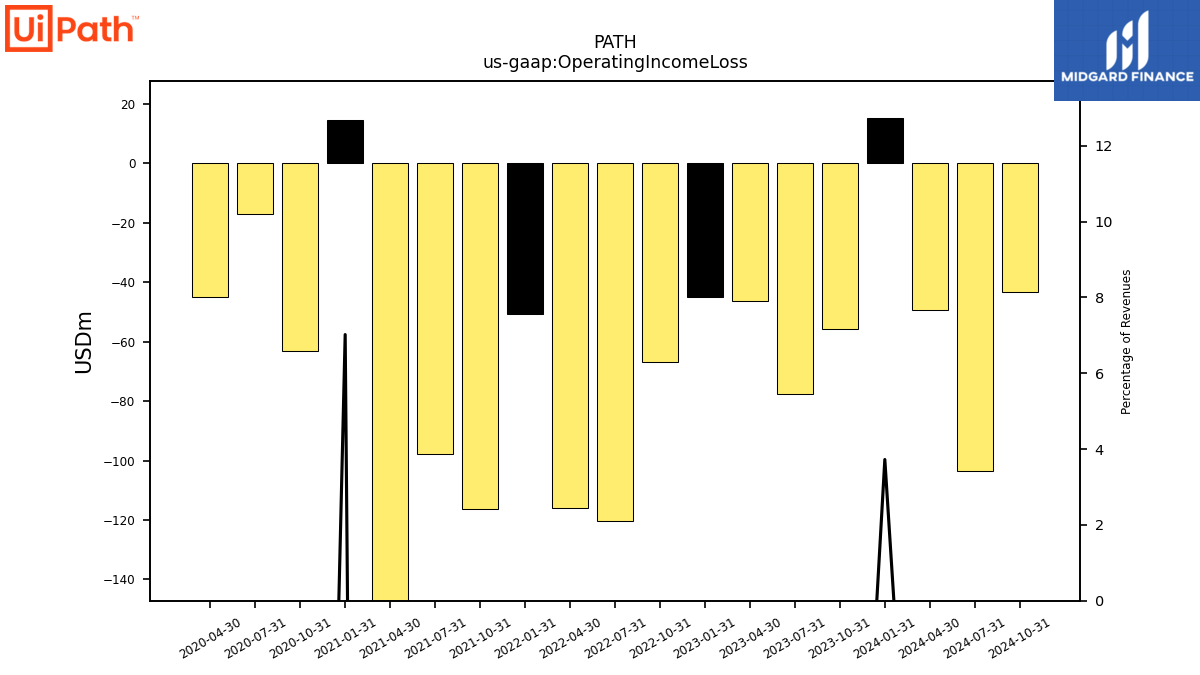
| Operating Income Loss | -55.82 | -77.58 | -46.41 | -45.15 | -66.99 | -120.19 | -115.95 | -50.88 | -116.25 | -97.82 | -236.00 | 14.59 | -63.02 | -17.03 | -44.87 | |
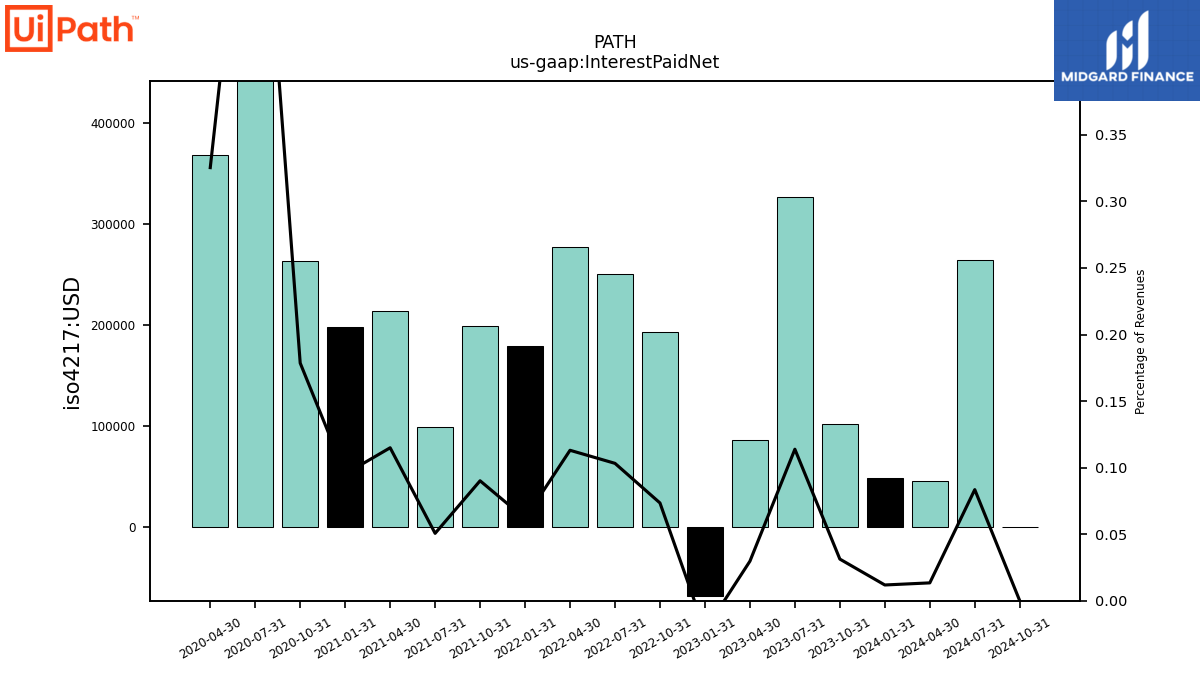
| Interest Paid Net | 0.10 | 0.33 | 0.09 | -0.07 | 0.19 | 0.25 | 0.28 | 0.18 | 0.20 | 0.10 | 0.21 | 0.20 | 0.26 | 0.88 | 0.37 | |
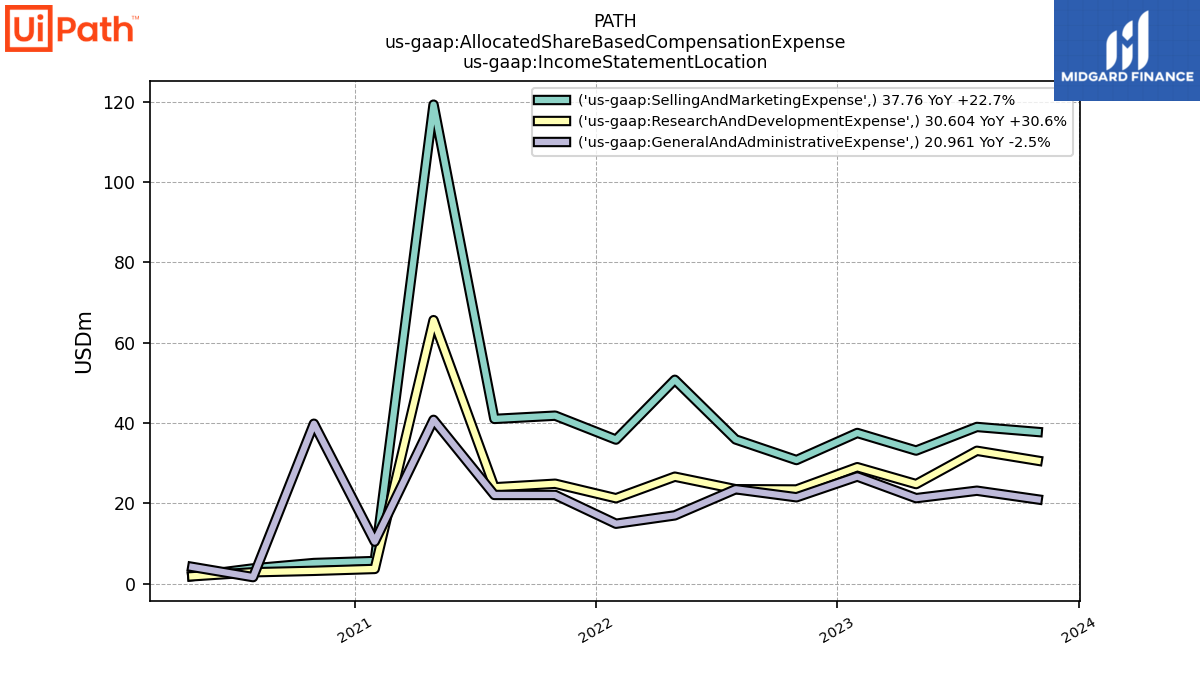
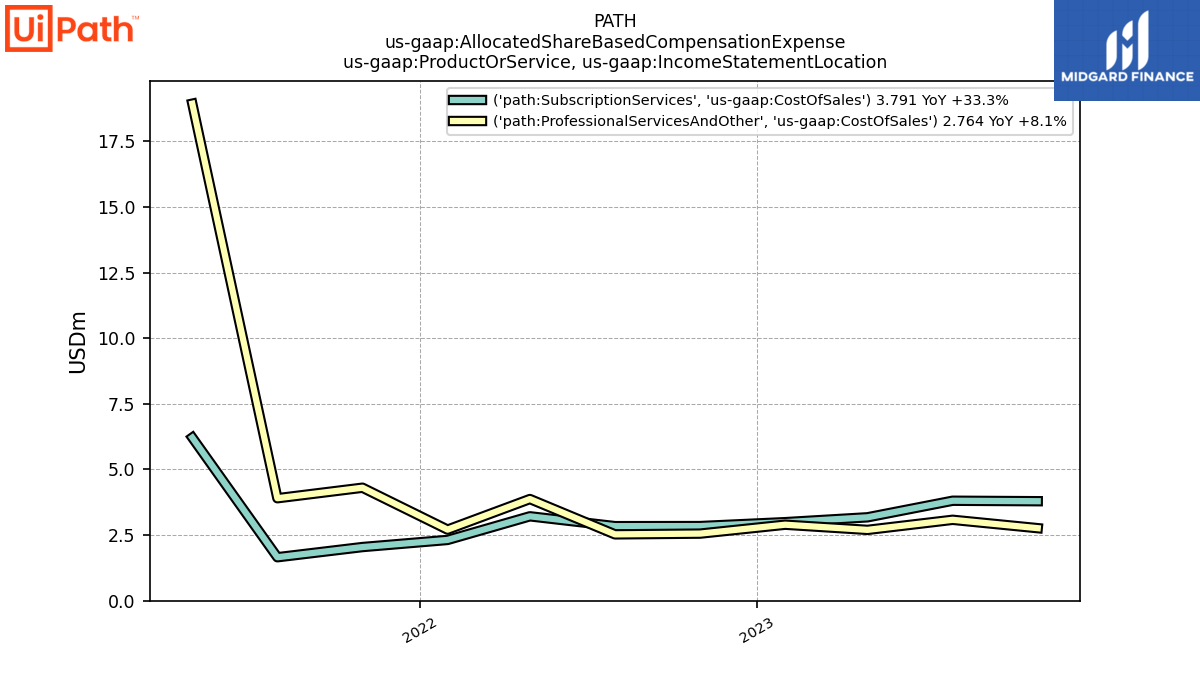
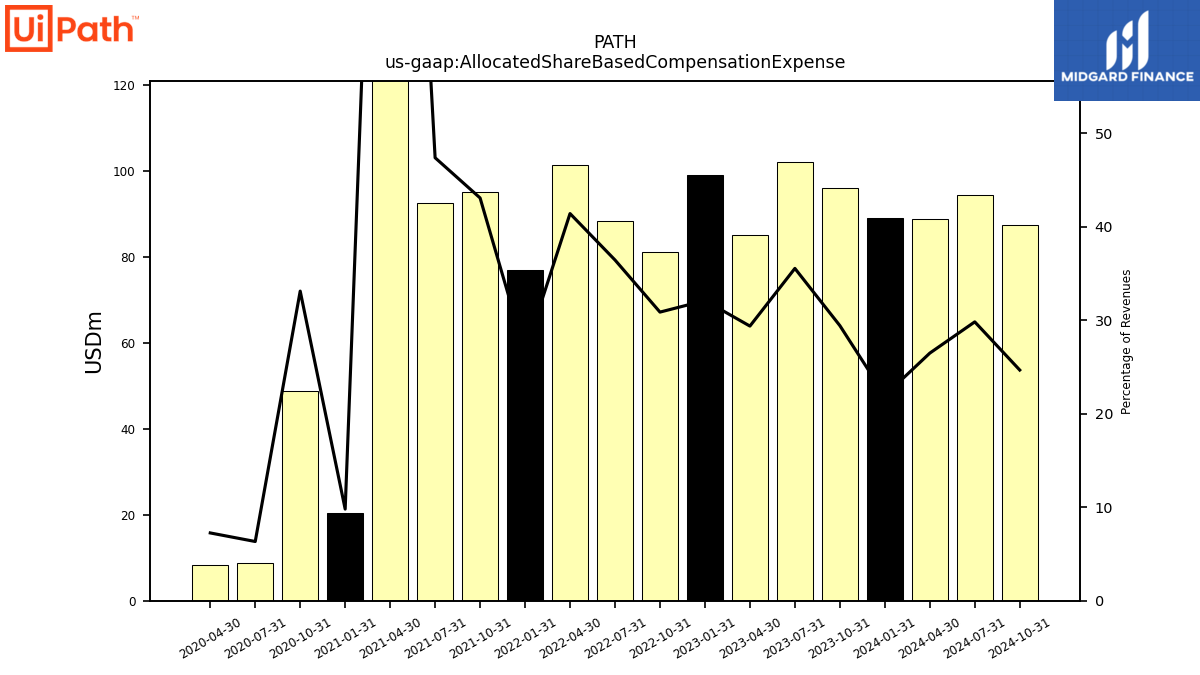
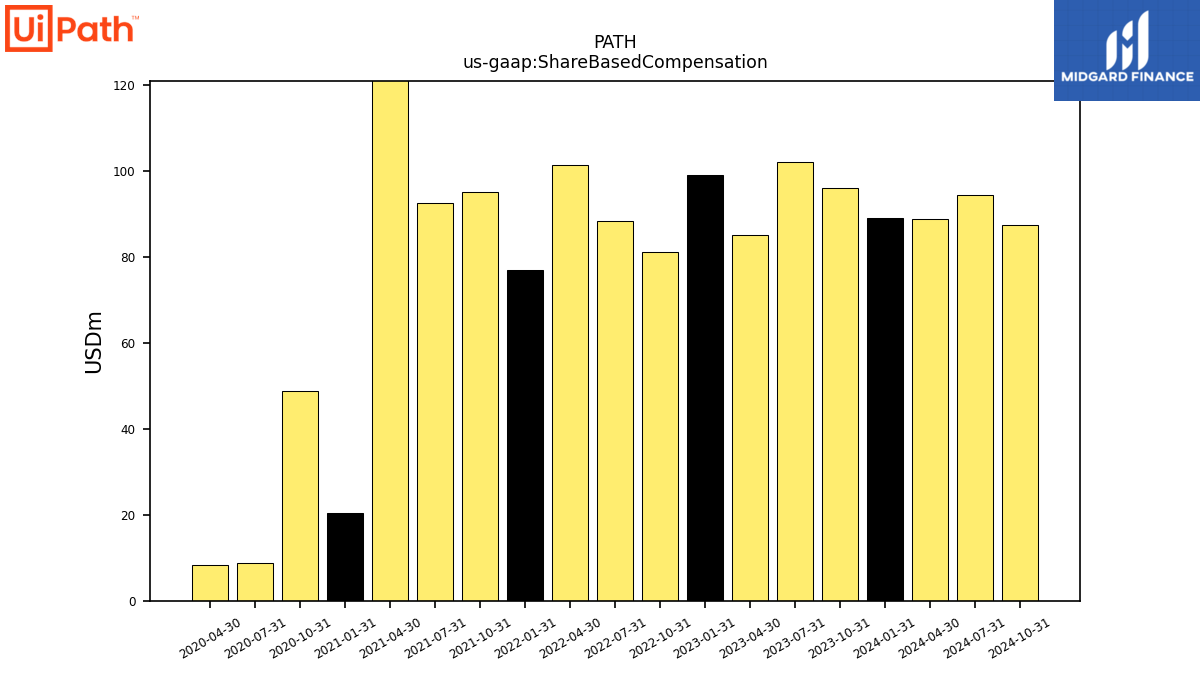
| Allocated Share Based Compensation Expense | 95.88 | 102.10 | 85.05 | 99.04 | 81.09 | 88.25 | 101.45 | 77.03 | 95.10 | 92.61 | 250.84 | 20.37 | 48.76 | 8.83 | 8.20 | |
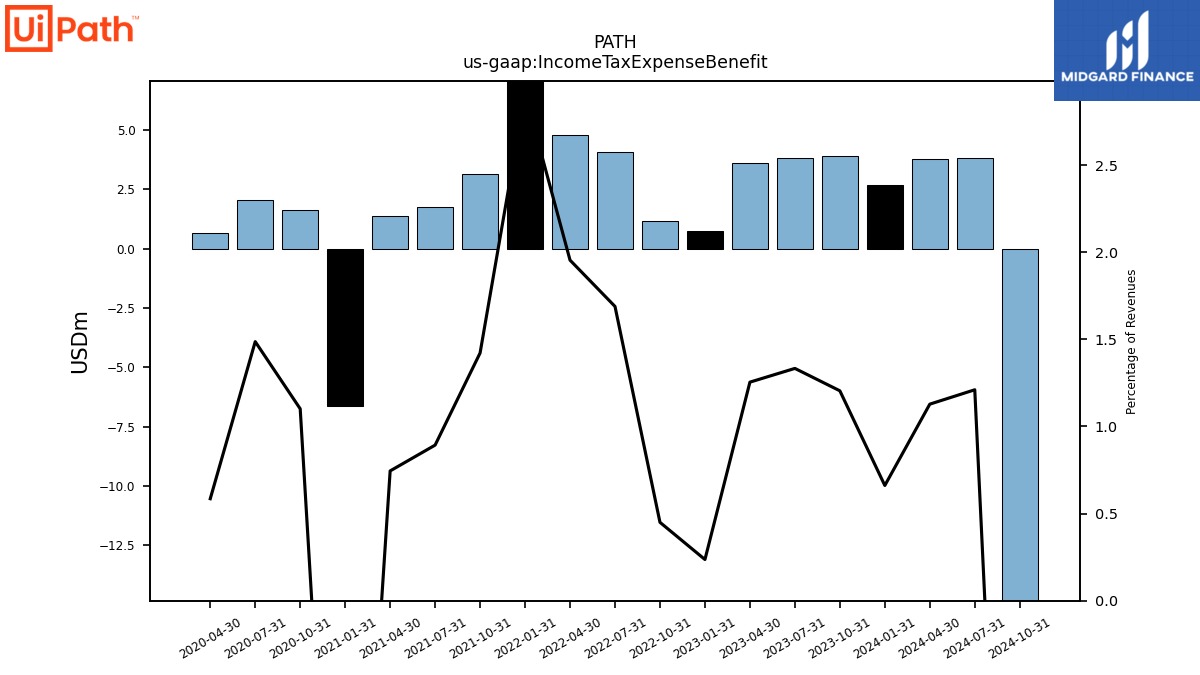
| Income Tax Expense Benefit | 3.93 | 3.83 | 3.63 | 0.73 | 1.18 | 4.09 | 4.79 | 8.43 | 3.14 | 1.75 | 1.39 | -6.62 | 1.62 | 2.07 | 0.66 | |
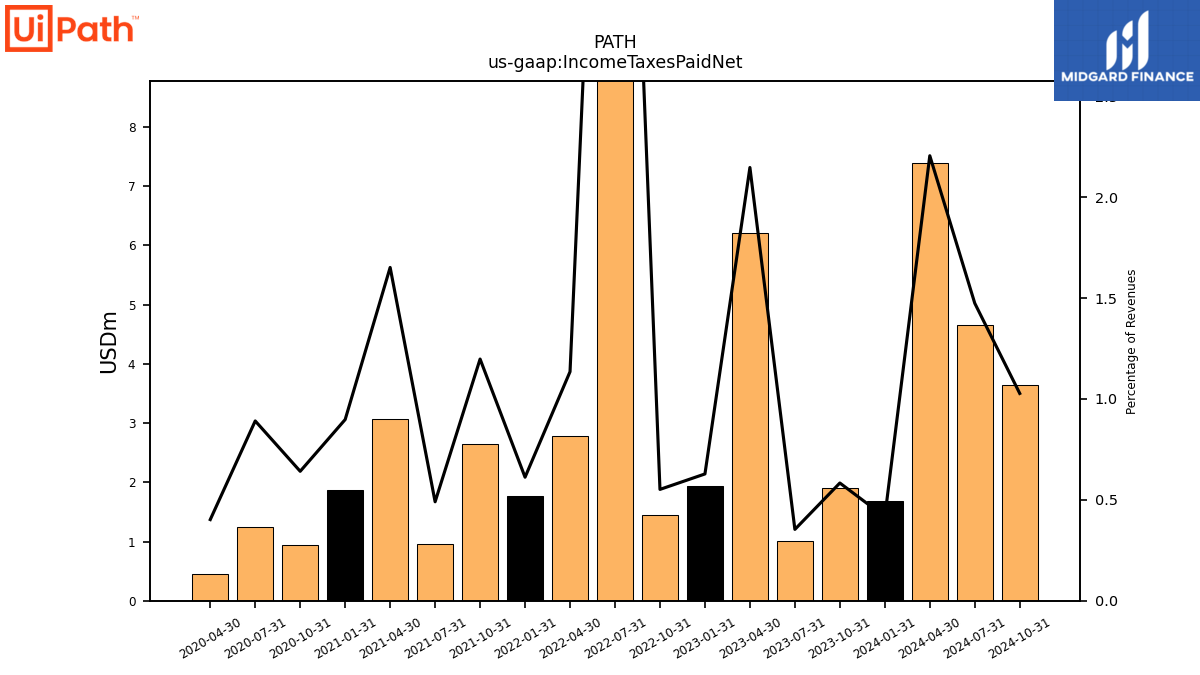
| Income Taxes Paid Net | 1.90 | 1.02 | 6.22 | 1.94 | 1.45 | 14.83 | 2.78 | 1.77 | 2.65 | 0.96 | 3.08 | 1.87 | 0.94 | 1.24 | 0.46 | |
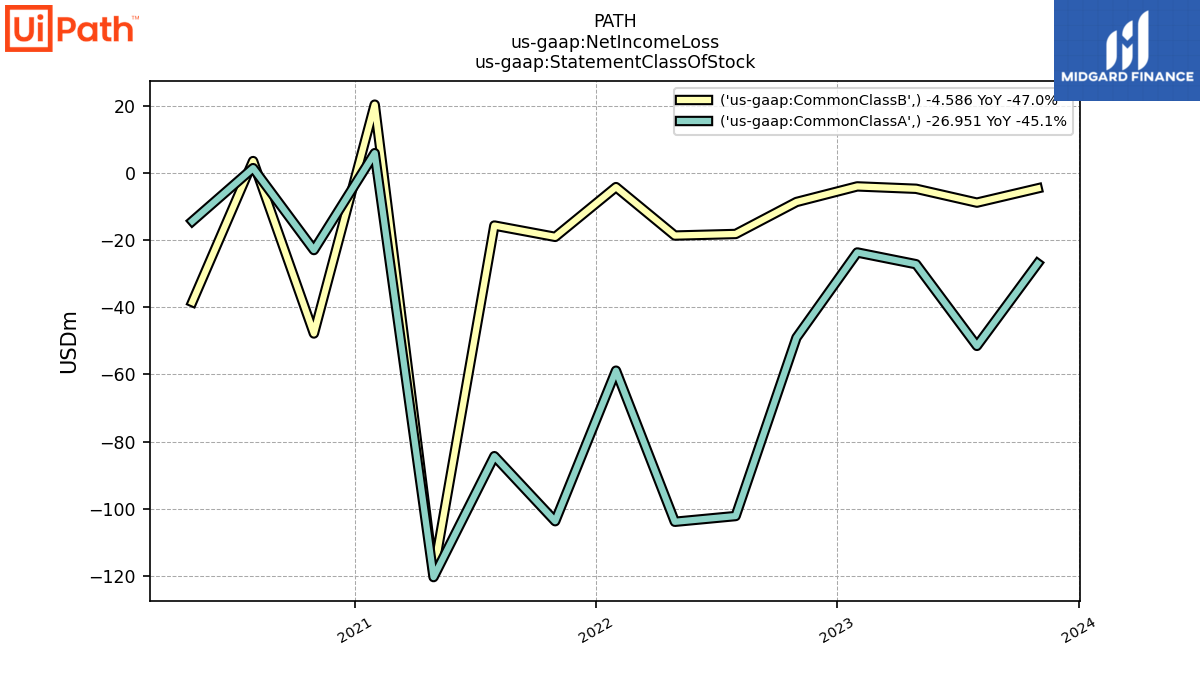
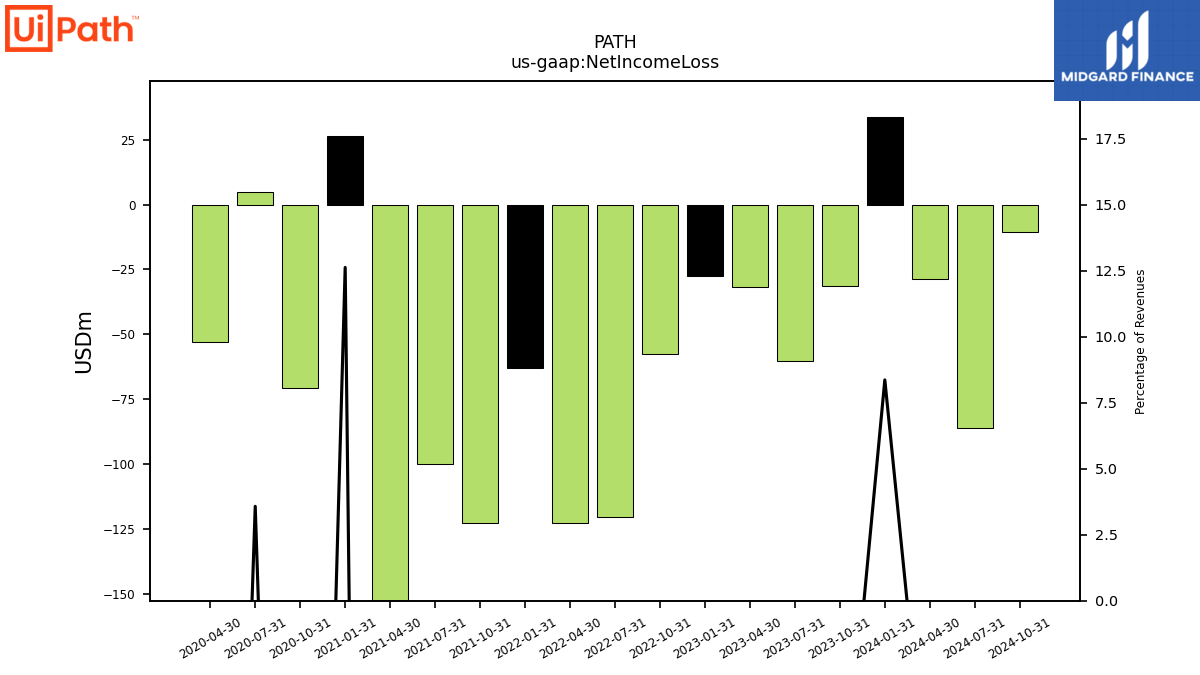
| Net Income Loss | -31.54 | -60.36 | -31.90 | -27.69 | -57.72 | -120.38 | -122.56 | -63.11 | -122.79 | -100.03 | -239.66 | 26.26 | -70.80 | 4.99 | -52.84 | |
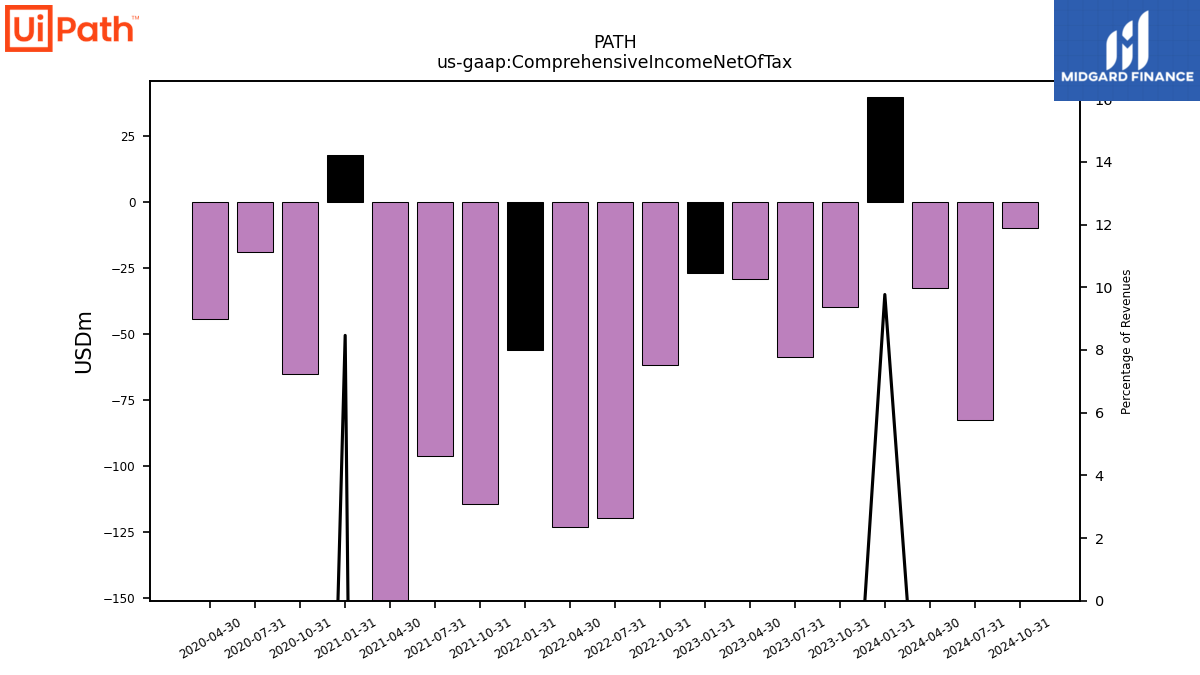
| Comprehensive Income Net Of Tax | -39.88 | -58.93 | -29.44 | -27.03 | -61.92 | -119.67 | -123.02 | -56.04 | -114.36 | -96.33 | -235.44 | 17.59 | -65.25 | -18.95 | -44.53 |
| 2023-10-31 | 2023-07-31 | 2023-04-30 | 2023-01-31 | 2022-10-31 | 2022-07-31 | 2022-04-30 | 2022-01-31 | 2021-10-31 | 2021-07-31 | 2021-04-30 | 2021-01-31 | 2020-10-31 | 2020-07-31 | 2020-04-30 | ||
|---|---|---|---|---|---|---|---|---|---|---|---|---|---|---|---|---|
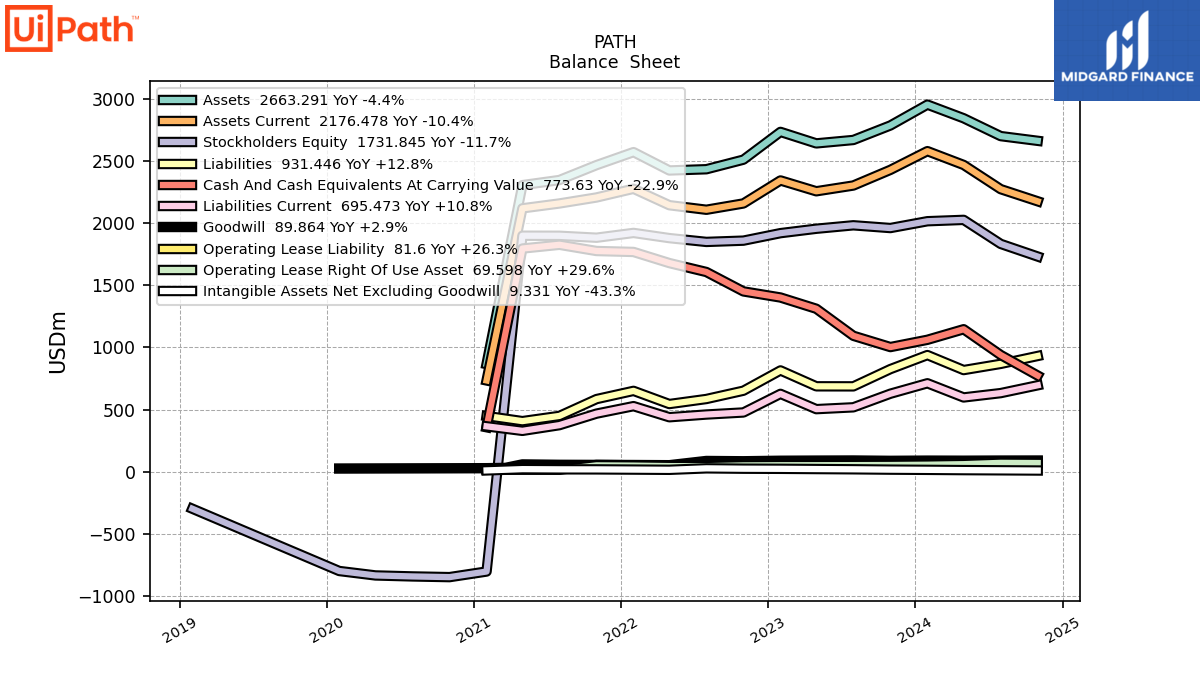
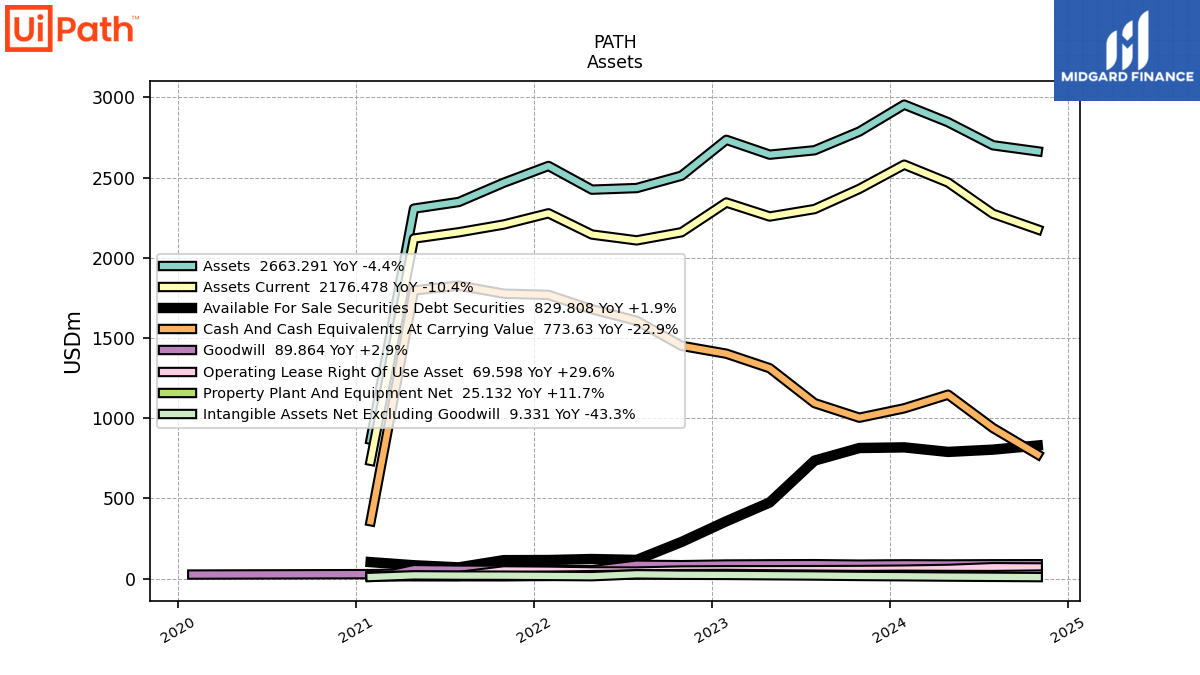
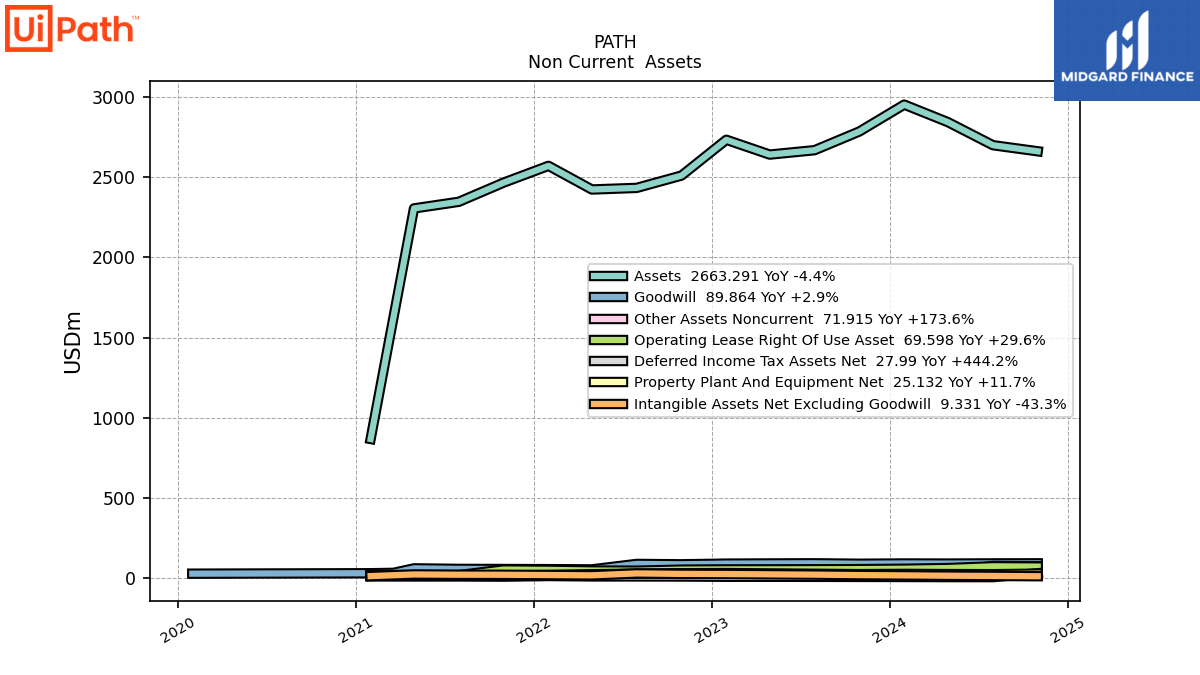
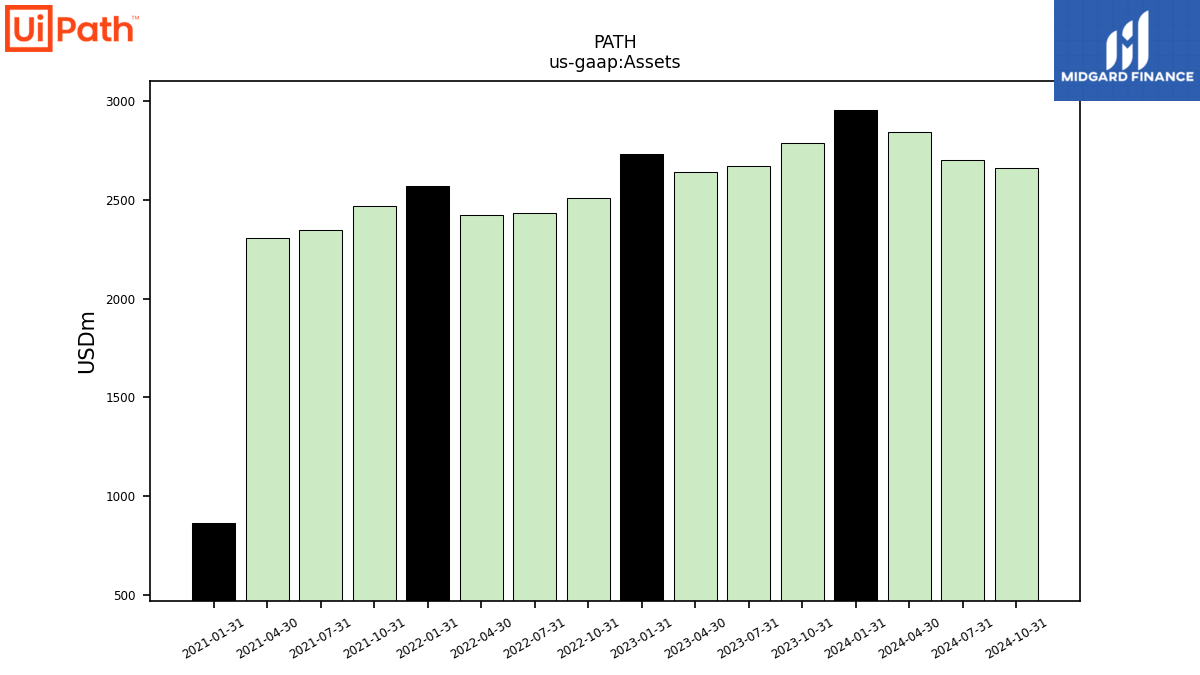
| Assets | 2787.06 | 2670.14 | 2642.68 | 2735.21 | 2511.68 | 2434.68 | 2424.72 | 2572.45 | 2467.69 | 2347.88 | 2306.57 | 866.46 | NA | NA | NA | |
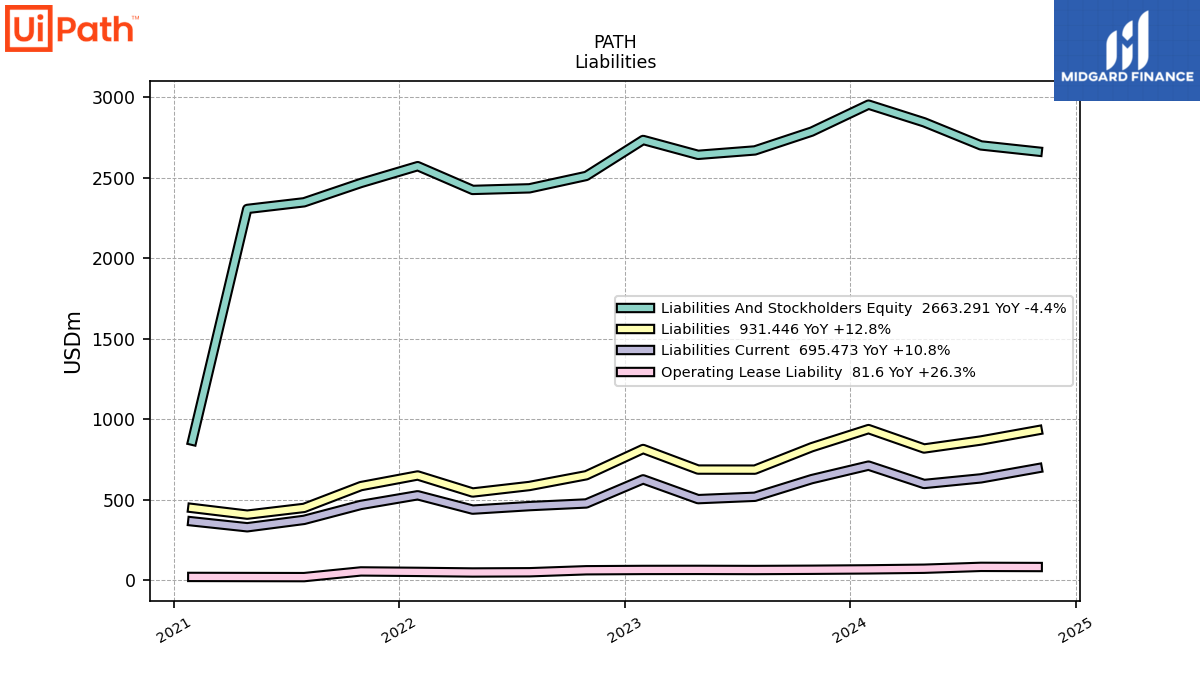
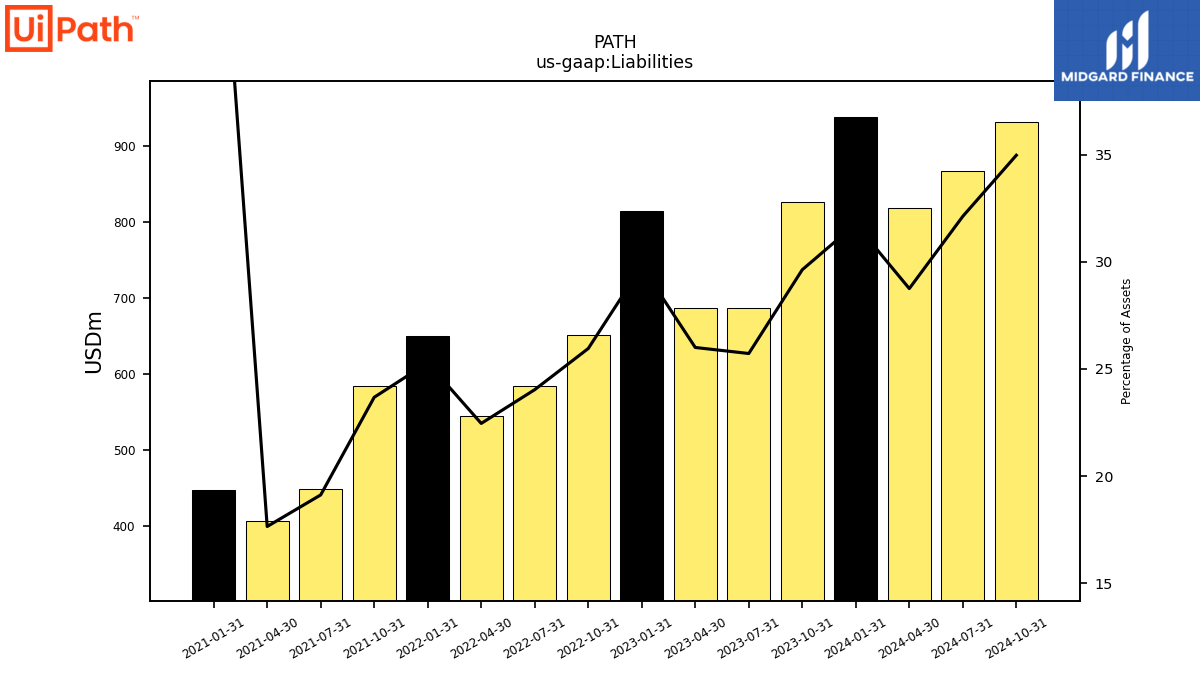
| Liabilities | 825.85 | 686.77 | 687.15 | 815.05 | 651.86 | 585.13 | 544.53 | 650.53 | 584.28 | 448.93 | 407.03 | 448.20 | NA | NA | NA | |
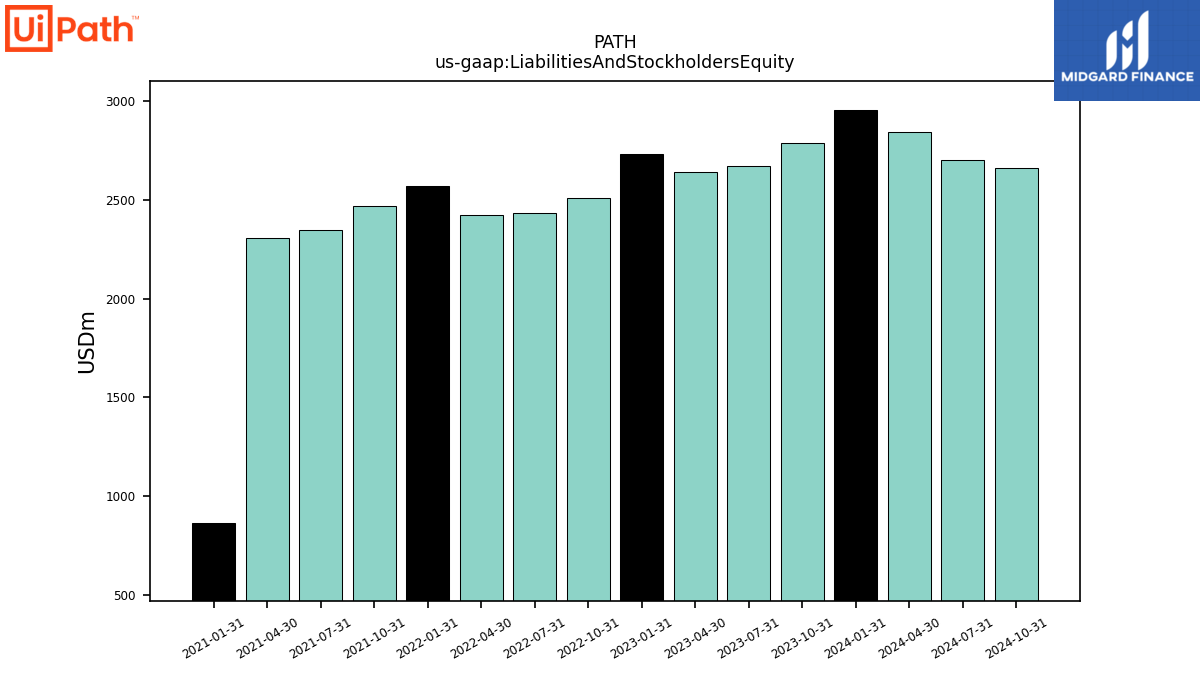
| Liabilities And Stockholders Equity | 2787.06 | 2670.14 | 2642.68 | 2735.21 | 2511.68 | 2434.68 | 2424.72 | 2572.45 | 2467.69 | 2347.88 | 2306.57 | 866.46 | NA | NA | NA | |
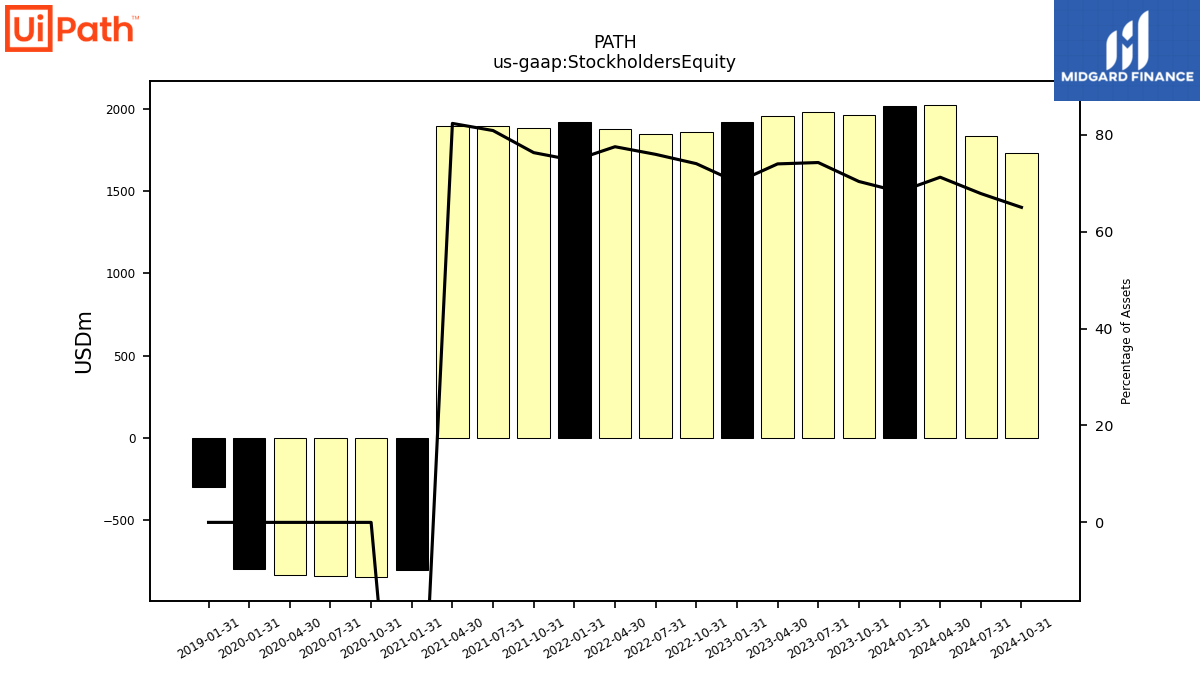
| Stockholders Equity | 1961.21 | 1983.37 | 1955.54 | 1920.16 | 1859.82 | 1849.55 | 1880.19 | 1921.92 | 1883.40 | 1898.95 | 1899.54 | -803.70 | -848.84 | -843.24 | -835.30 |
| 2023-10-31 | 2023-07-31 | 2023-04-30 | 2023-01-31 | 2022-10-31 | 2022-07-31 | 2022-04-30 | 2022-01-31 | 2021-10-31 | 2021-07-31 | 2021-04-30 | 2021-01-31 | 2020-10-31 | 2020-07-31 | 2020-04-30 | ||
|---|---|---|---|---|---|---|---|---|---|---|---|---|---|---|---|---|
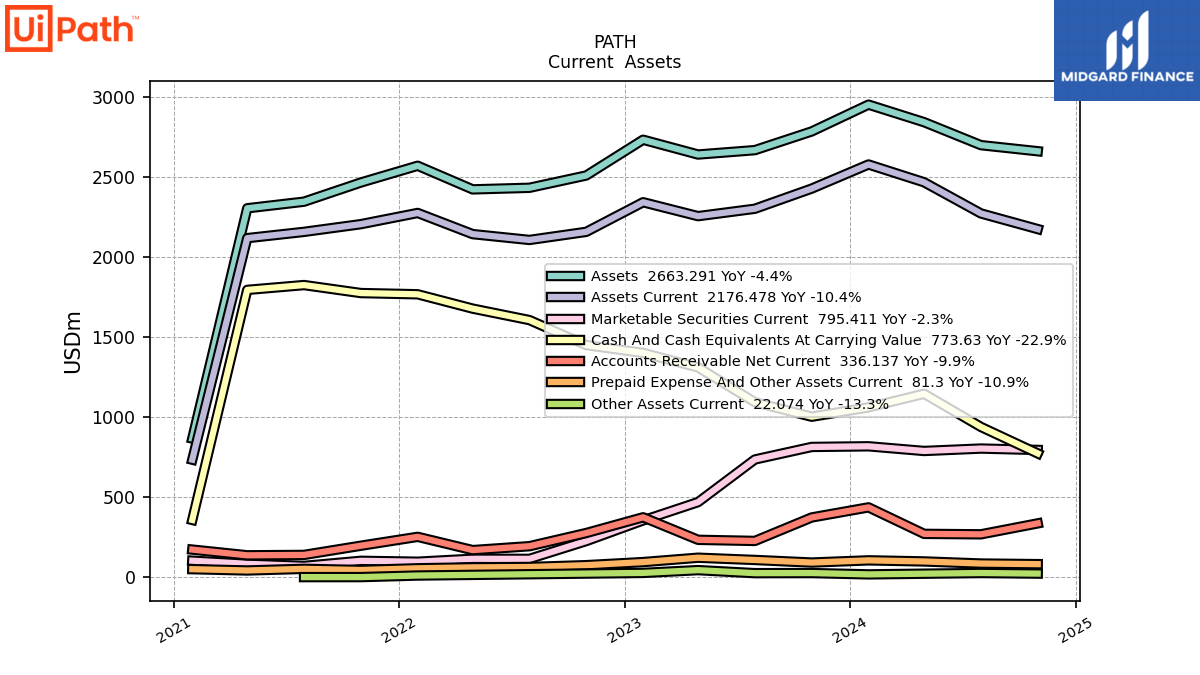
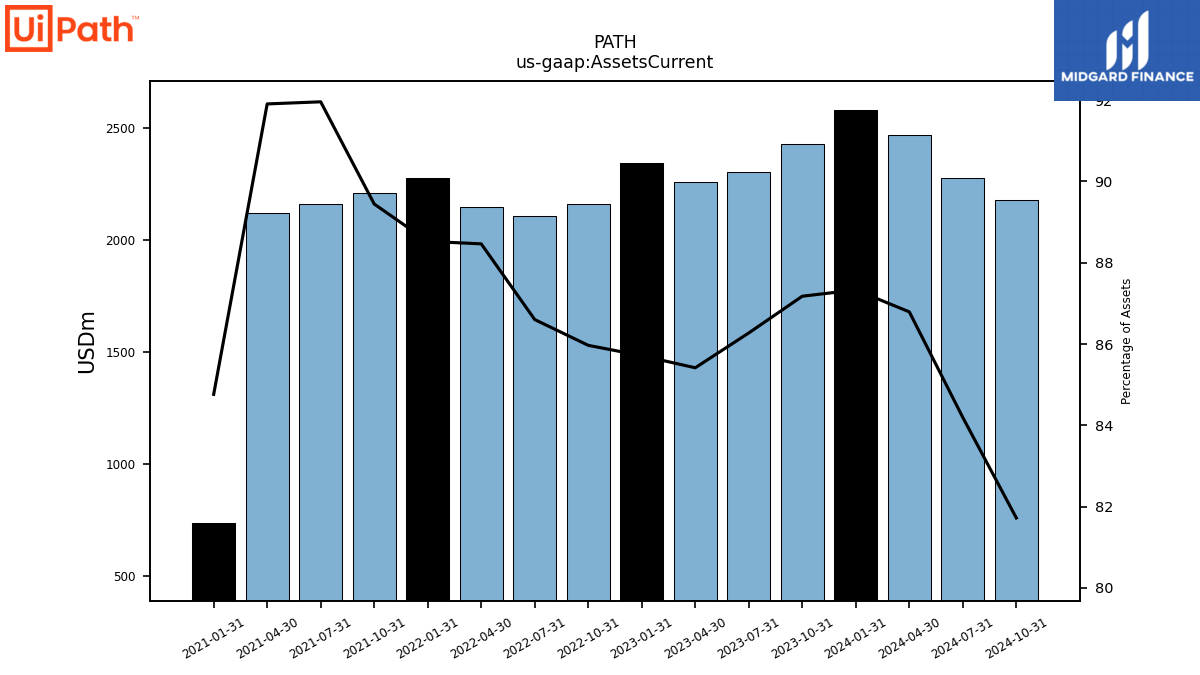
| Assets Current | 2429.65 | 2303.60 | 2257.27 | 2344.41 | 2159.24 | 2108.48 | 2145.02 | 2277.30 | 2207.22 | 2159.09 | 2119.90 | 734.43 | NA | NA | NA | |
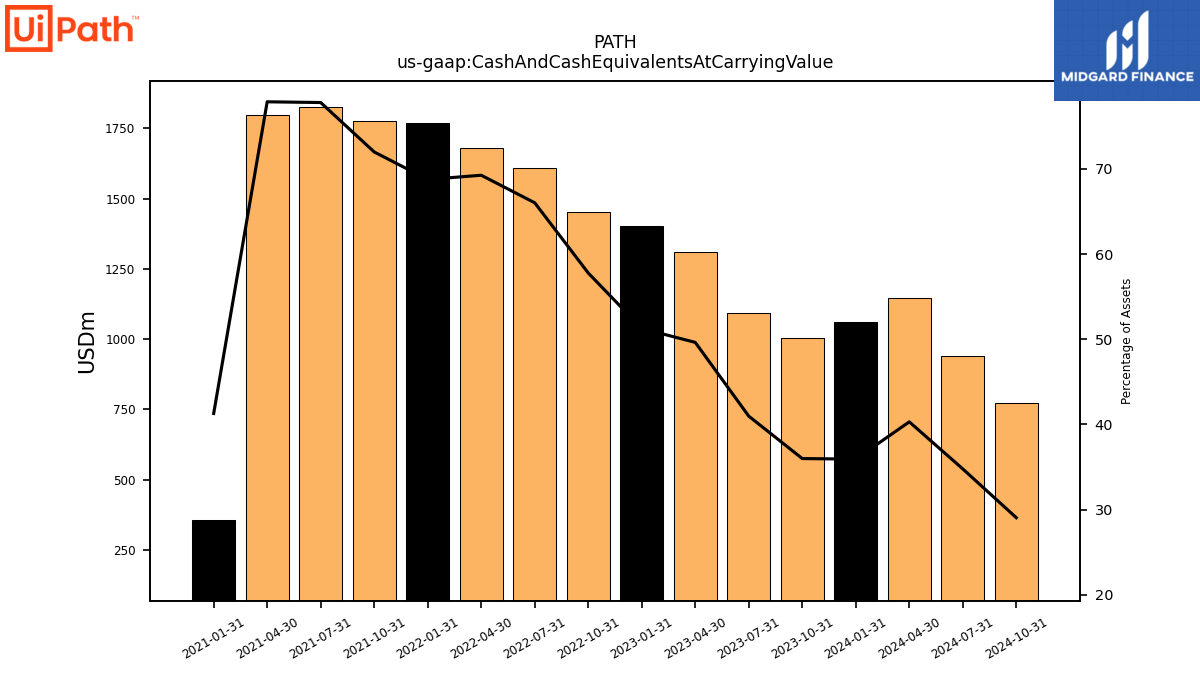
| Cash And Cash Equivalents At Carrying Value | 1003.08 | 1093.90 | 1311.58 | 1402.12 | 1451.15 | 1607.36 | 1679.22 | 1768.72 | 1776.42 | 1826.42 | 1796.27 | 357.69 | NA | NA | NA | |
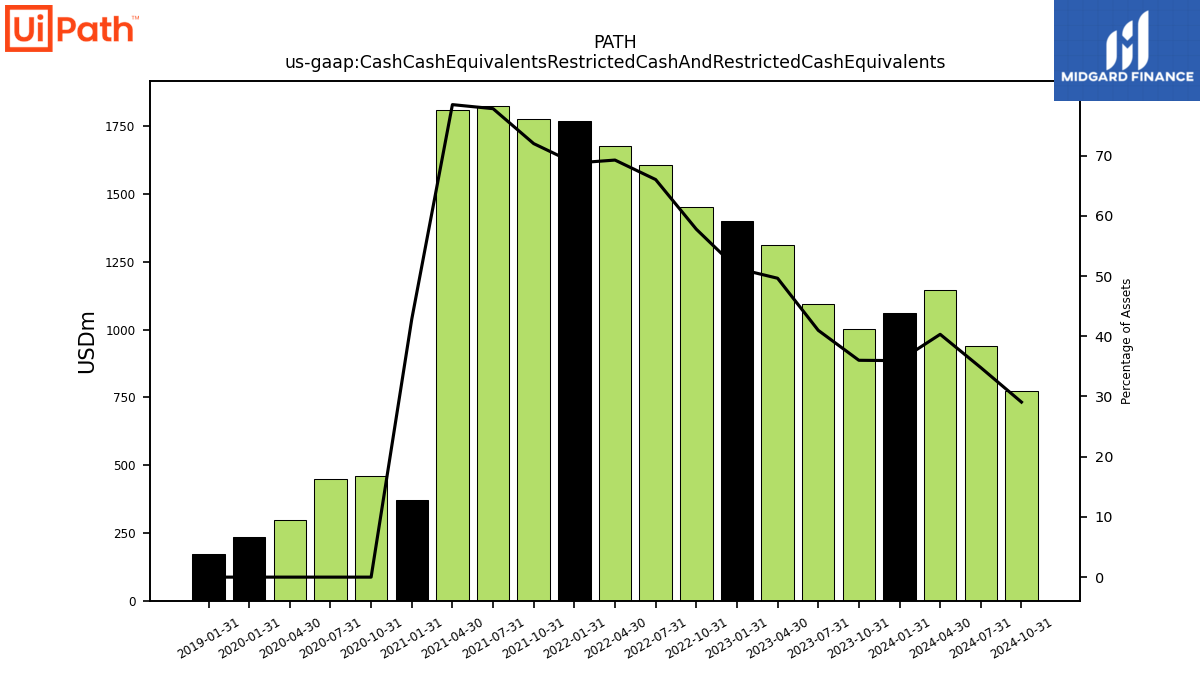
| Cash Cash Equivalents Restricted Cash And Restricted Cash Equivalents | 1003.52 | 1094.30 | 1311.58 | 1402.12 | 1451.15 | 1607.36 | 1679.22 | 1768.72 | 1776.42 | 1826.42 | 1809.77 | 371.19 | 460.66 | 450.84 | 296.86 | |
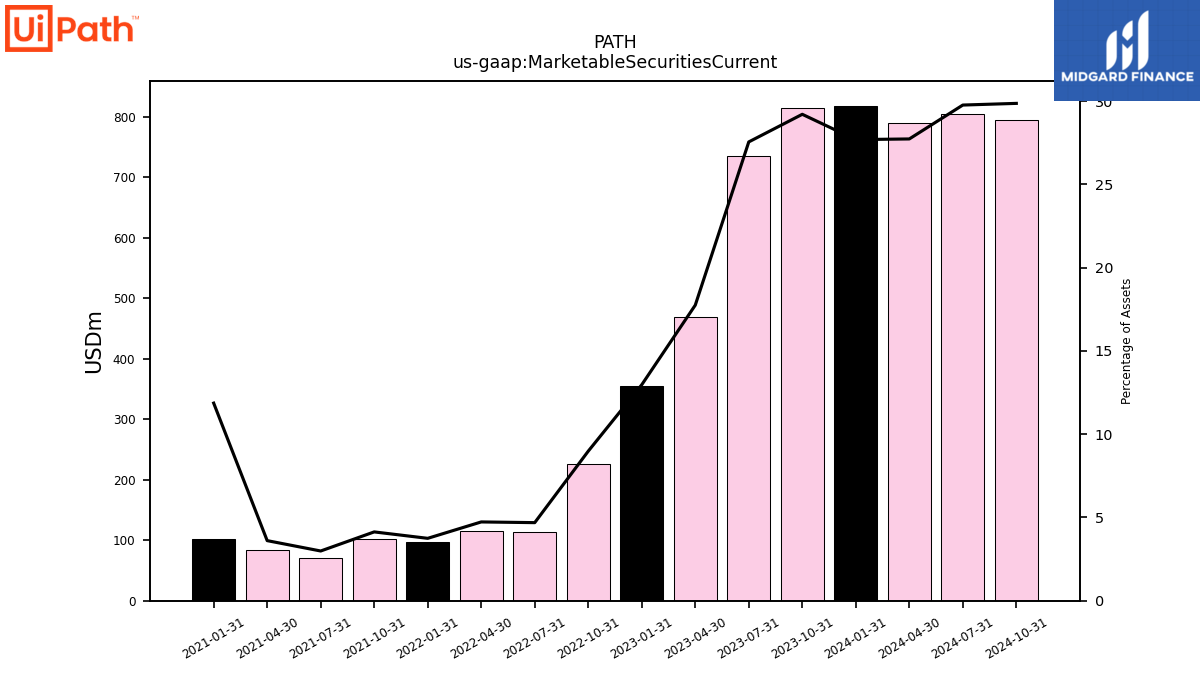
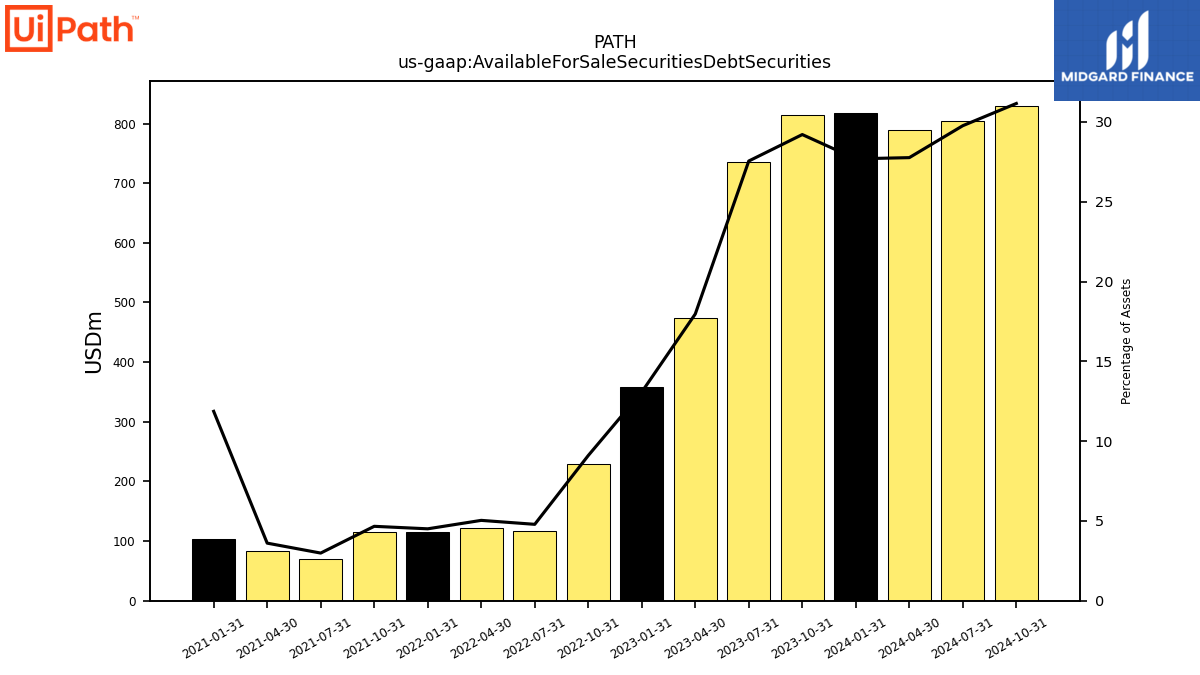
| Marketable Securities Current | 814.10 | 735.67 | 469.07 | 354.77 | 225.60 | 114.19 | 114.75 | 96.42 | 102.01 | 70.14 | 83.26 | 102.83 | NA | NA | NA | |
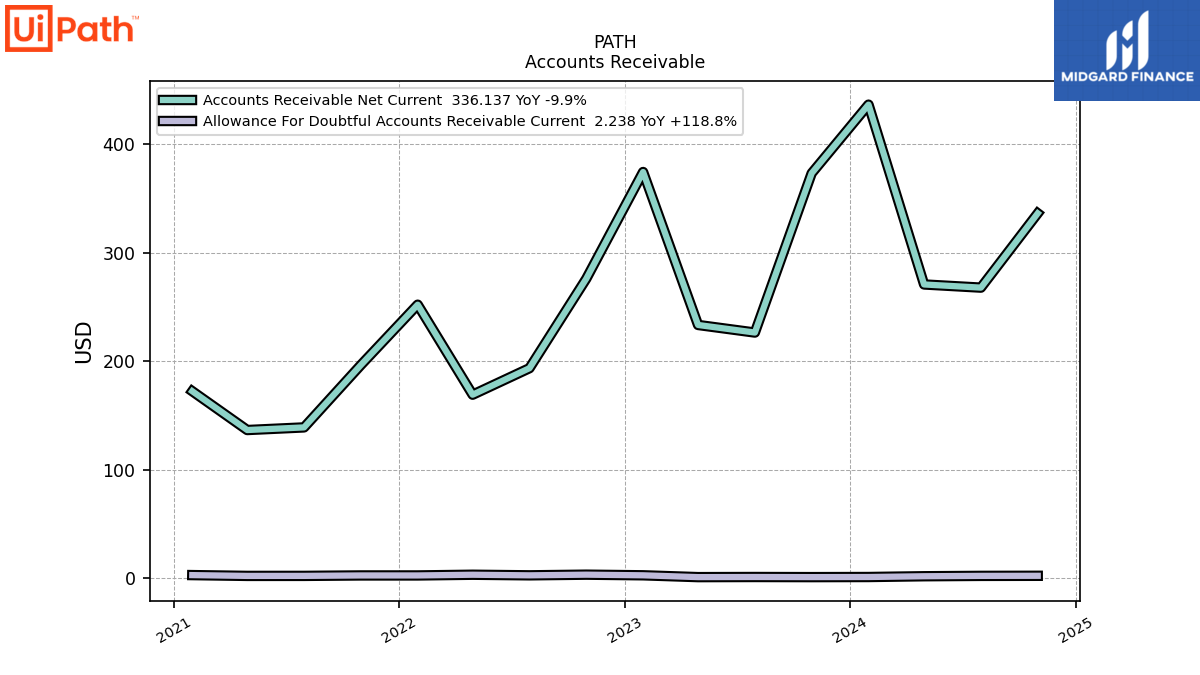
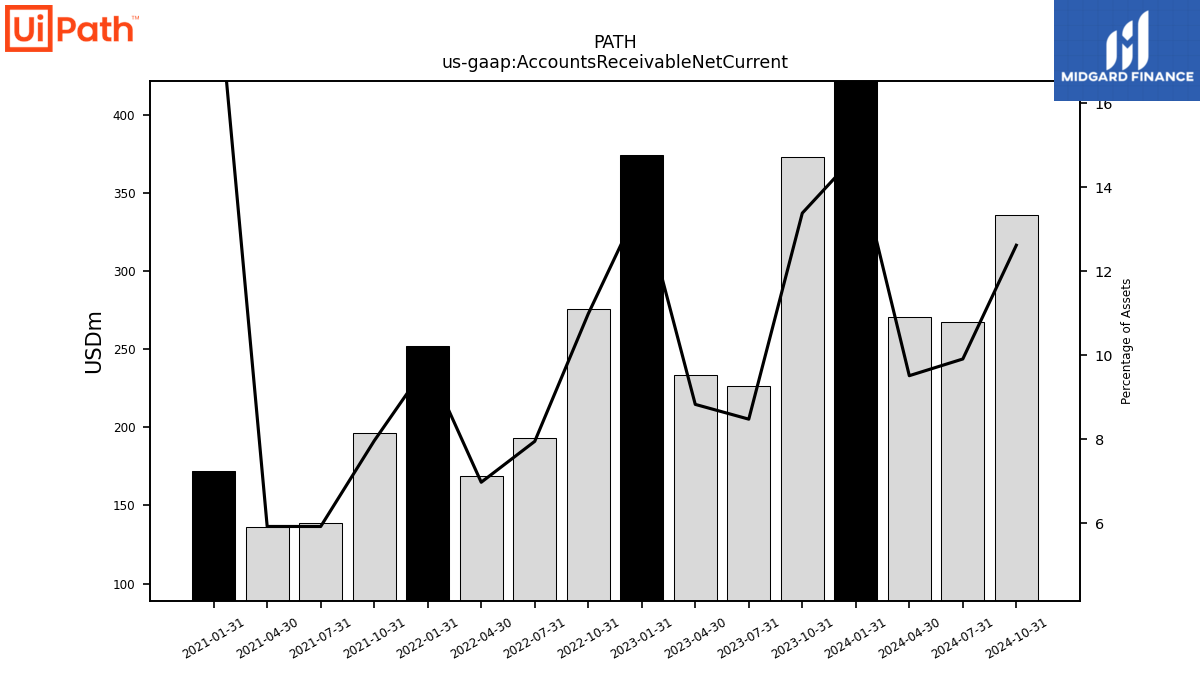
| Accounts Receivable Net Current | 373.09 | 226.33 | 233.31 | 374.22 | 275.94 | 193.48 | 169.06 | 251.99 | 196.43 | 138.94 | 136.52 | 172.29 | NA | NA | NA | |
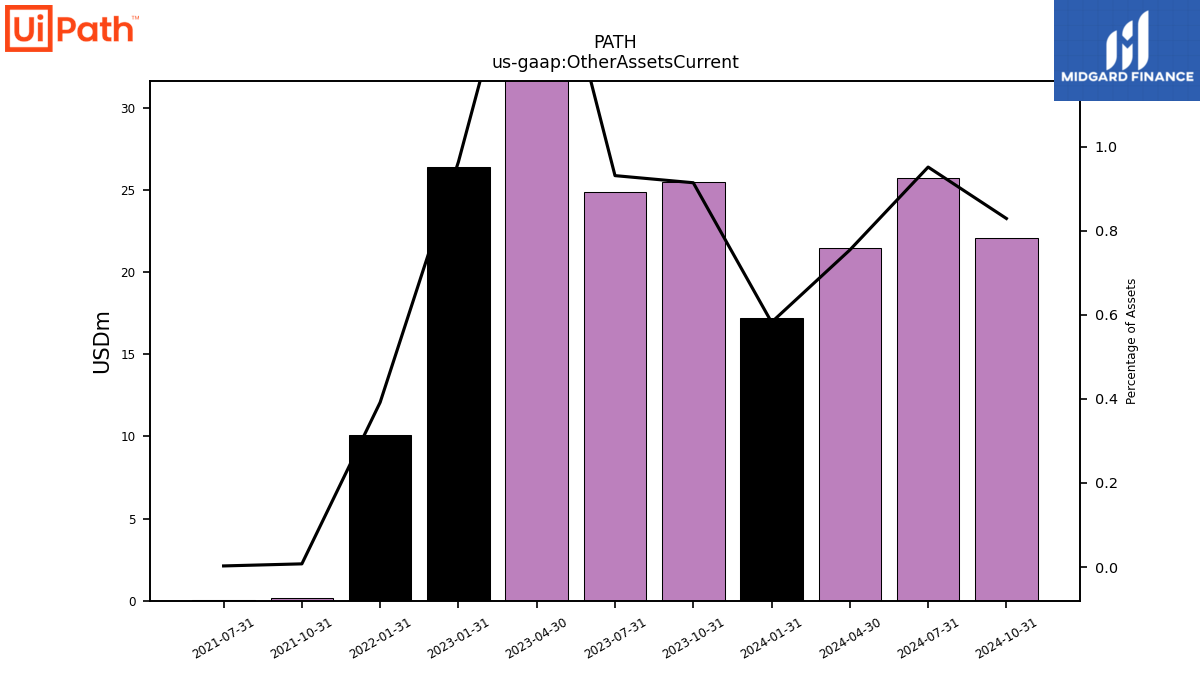
| Other Assets Current | 25.47 | 24.85 | 43.83 | 26.36 | NA | NA | NA | 10.07 | 0.19 | 0.06 | NA | NA | NA | NA | NA | |
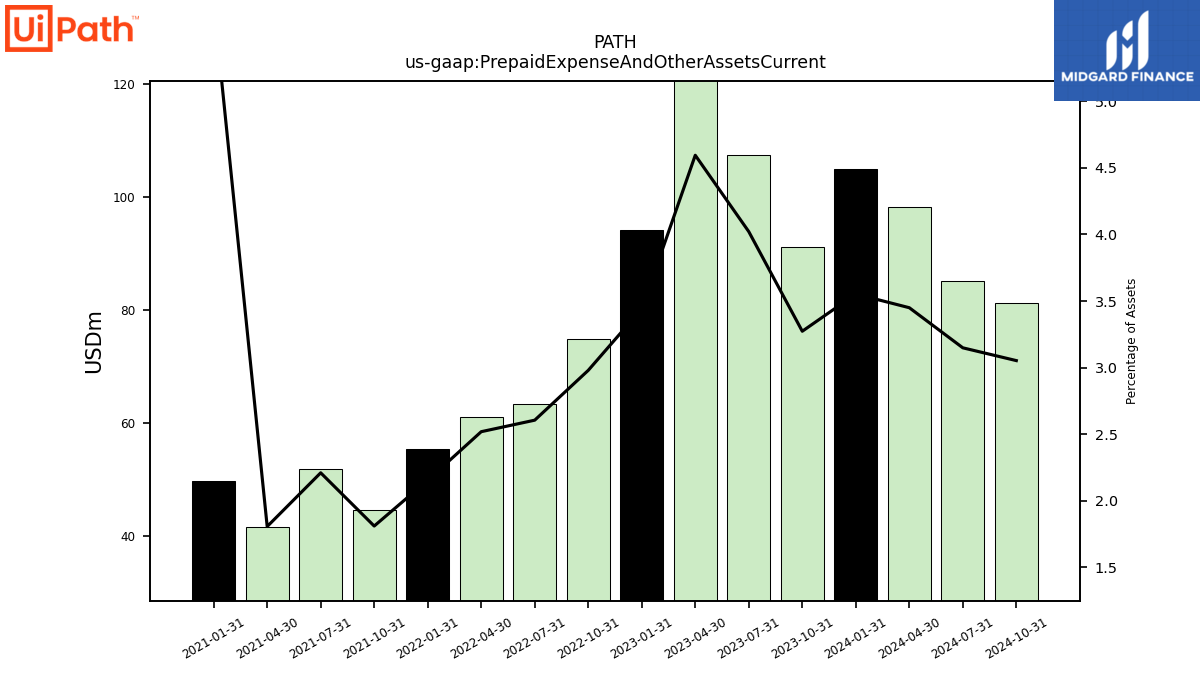
| Prepaid Expense And Other Assets Current | 91.22 | 107.37 | 121.43 | 94.15 | 74.83 | 63.43 | 61.07 | 55.42 | 44.67 | 51.89 | 41.67 | 49.75 | NA | NA | NA | |
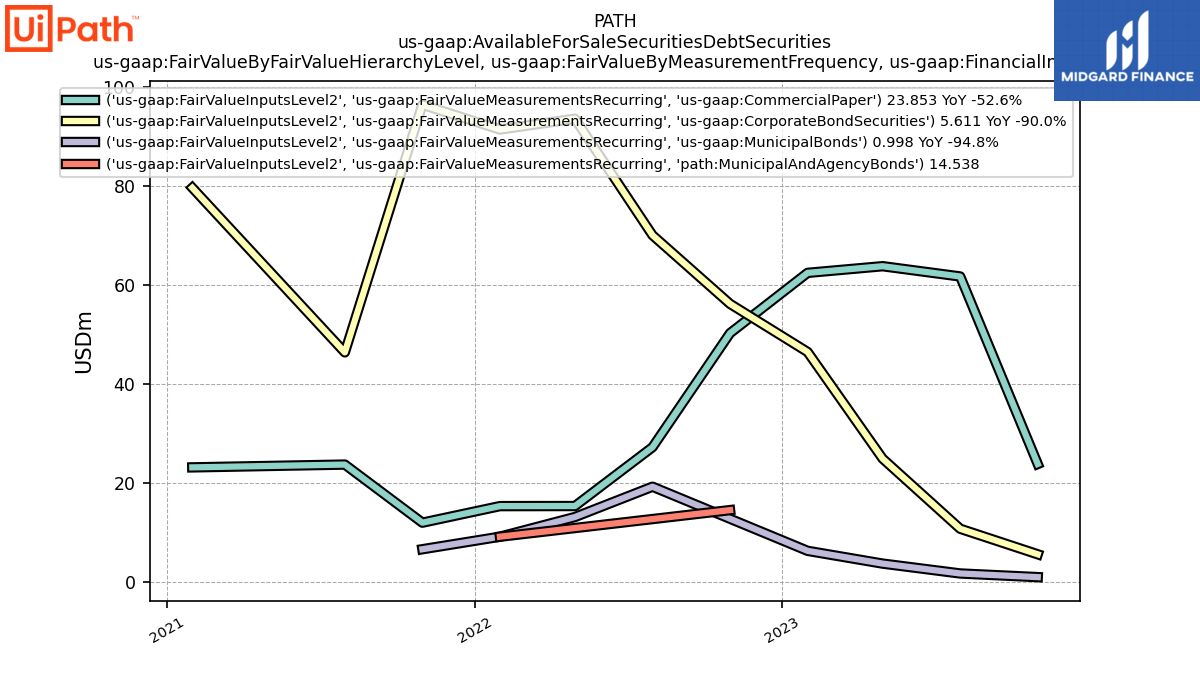
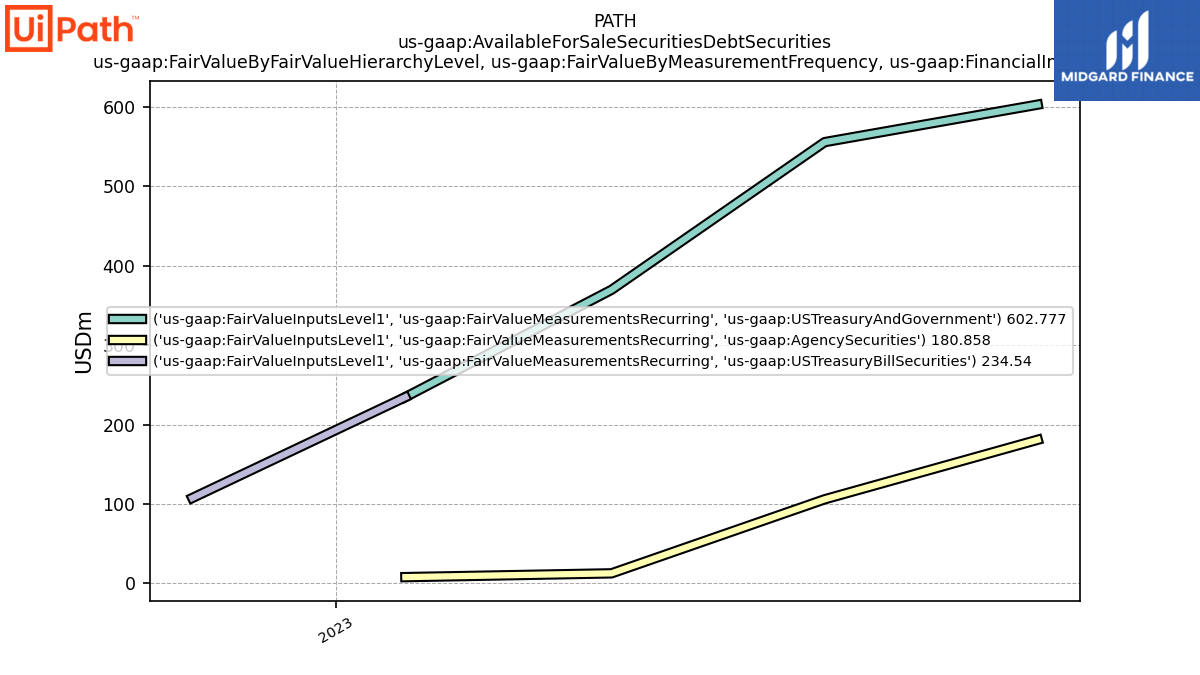
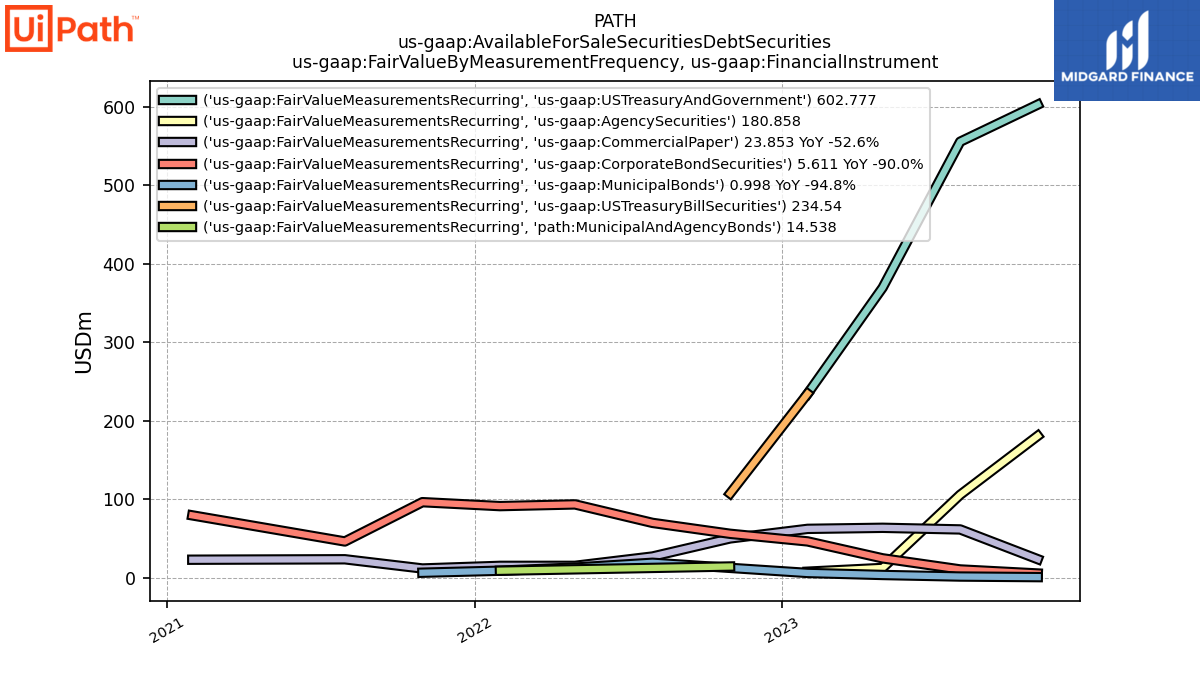
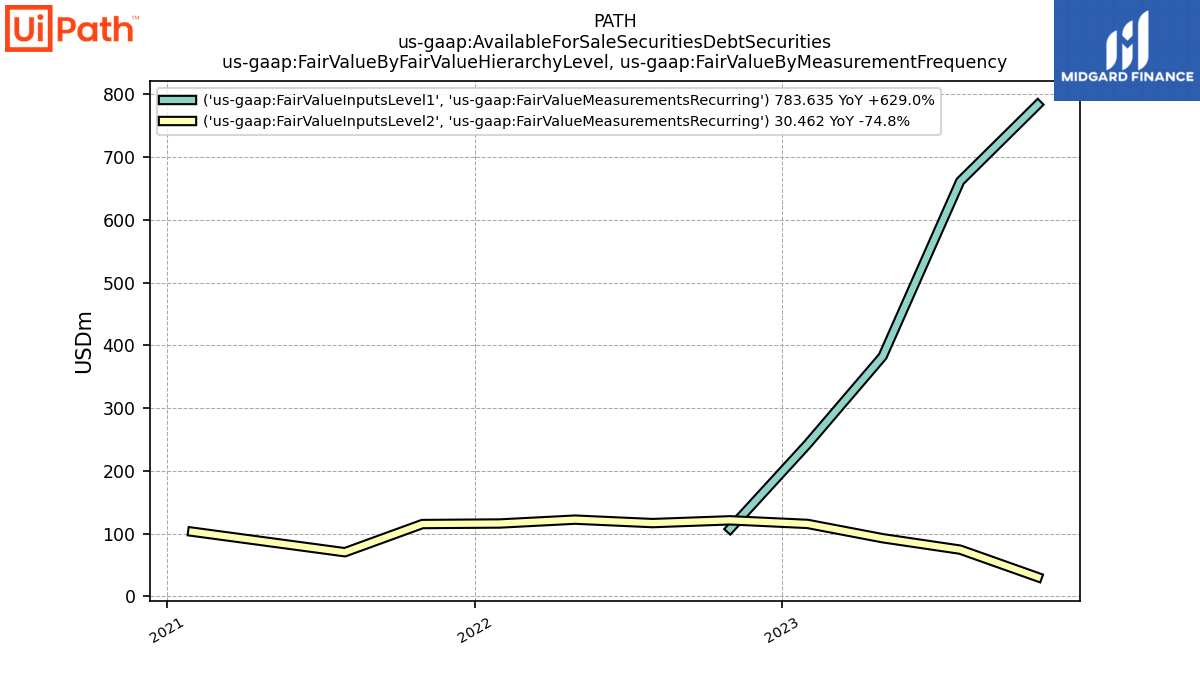
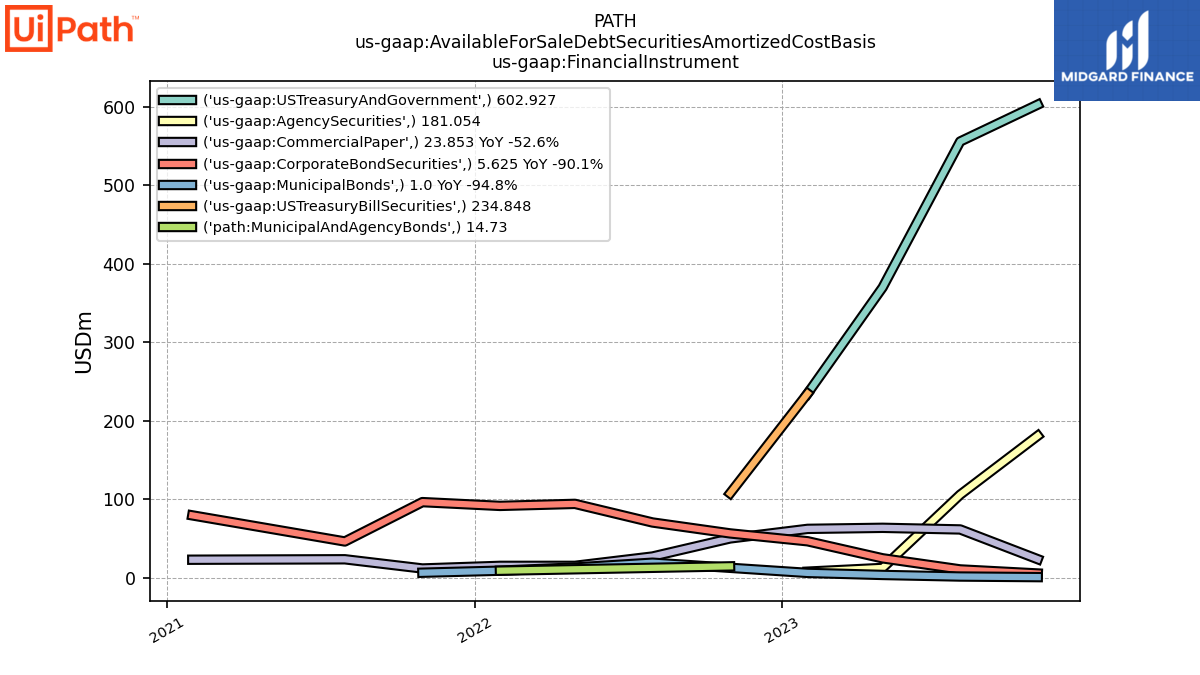
| Available For Sale Securities Debt Securities | 814.10 | 735.67 | 474.78 | 357.72 | 228.53 | 116.58 | 122.11 | 115.94 | 115.09 | 70.14 | 83.26 | 102.83 | NA | NA | NA |
| 2023-10-31 | 2023-07-31 | 2023-04-30 | 2023-01-31 | 2022-10-31 | 2022-07-31 | 2022-04-30 | 2022-01-31 | 2021-10-31 | 2021-07-31 | 2021-04-30 | 2021-01-31 | 2020-10-31 | 2020-07-31 | 2020-04-30 | ||
|---|---|---|---|---|---|---|---|---|---|---|---|---|---|---|---|---|
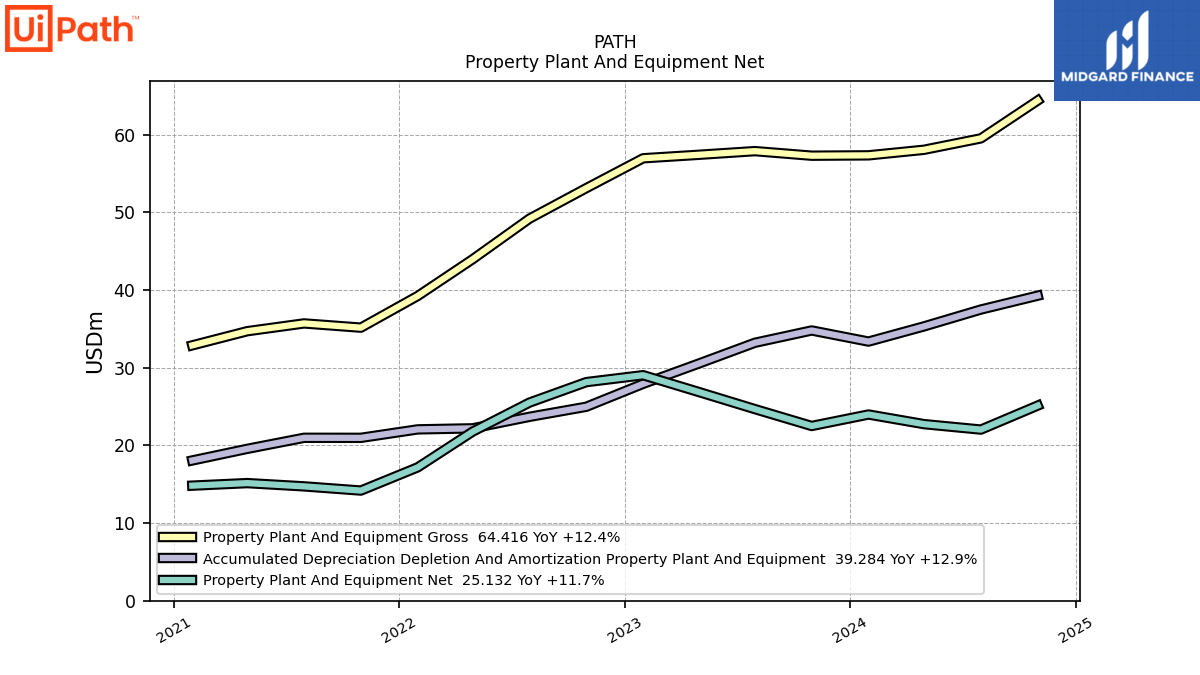
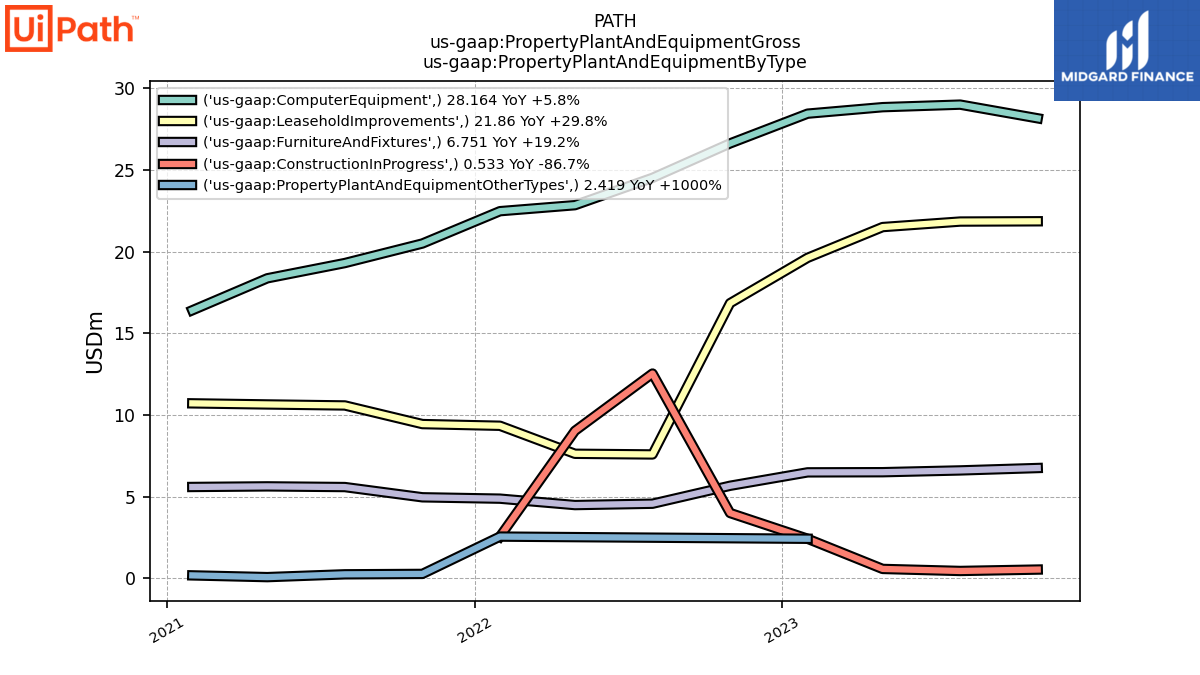
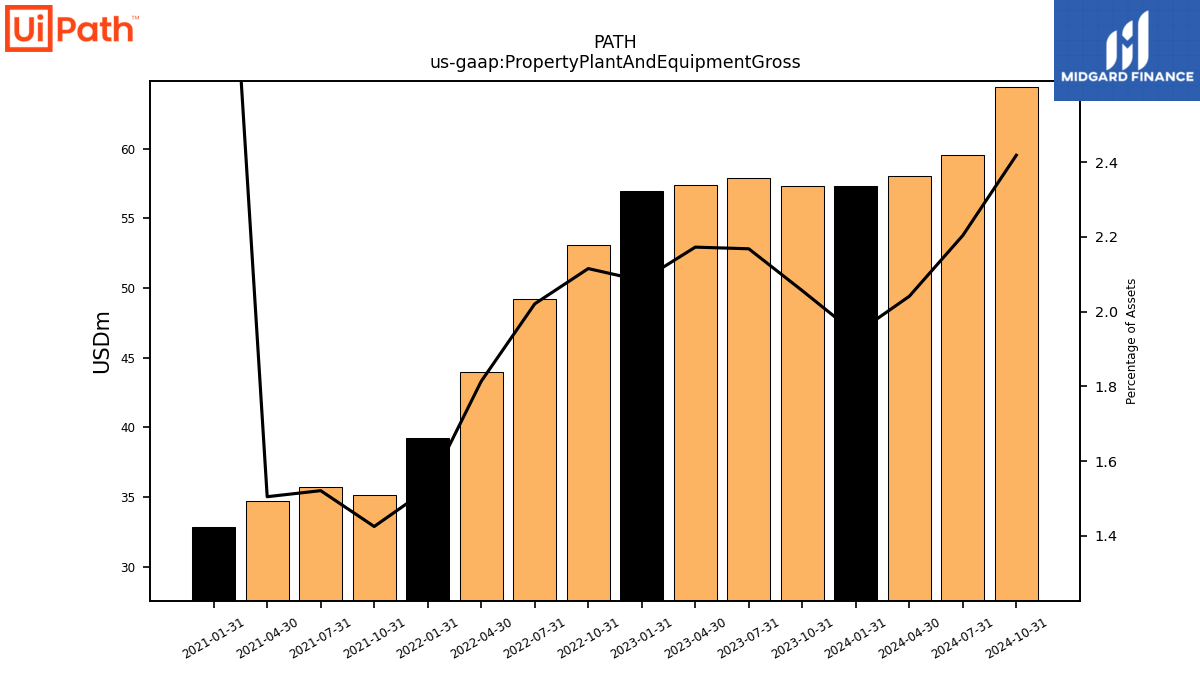
| Property Plant And Equipment Gross | 57.31 | 57.90 | 57.42 | 56.98 | 53.13 | 49.20 | 43.98 | 39.24 | 35.17 | 35.71 | 34.71 | 32.89 | NA | NA | NA | |
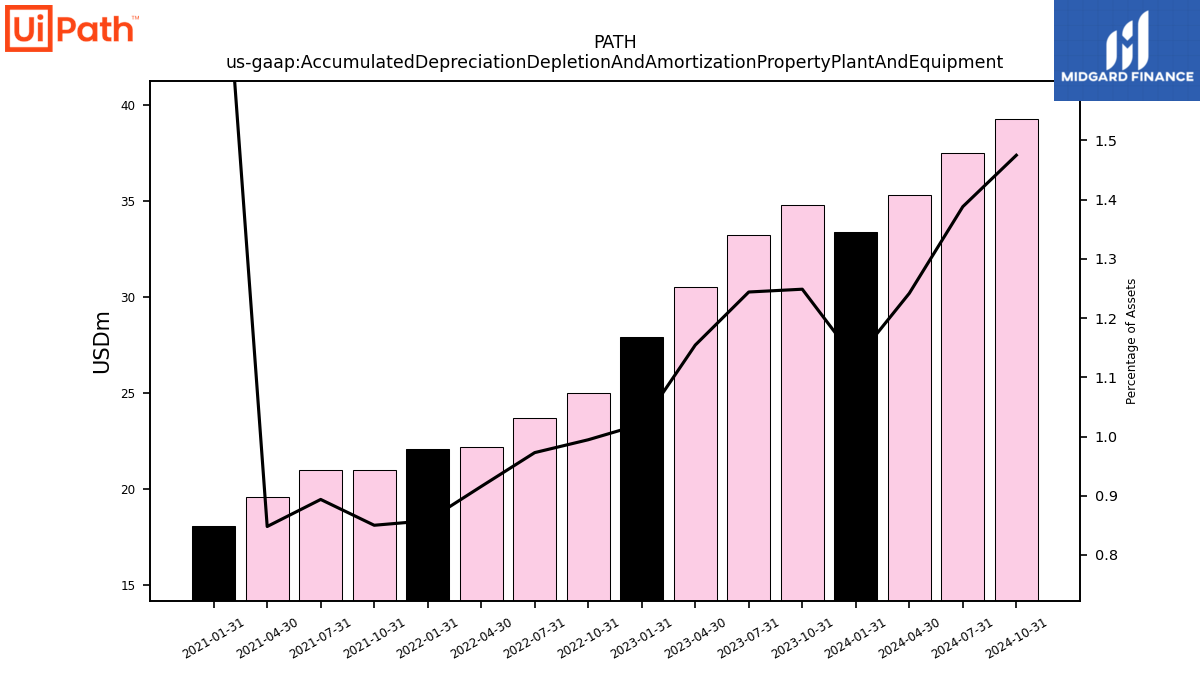
| Accumulated Depreciation Depletion And Amortization Property Plant And Equipment | 34.80 | 33.22 | 30.51 | 27.93 | 24.98 | 23.68 | 22.20 | 22.07 | 20.98 | 20.98 | 19.56 | 18.06 | NA | NA | NA | |
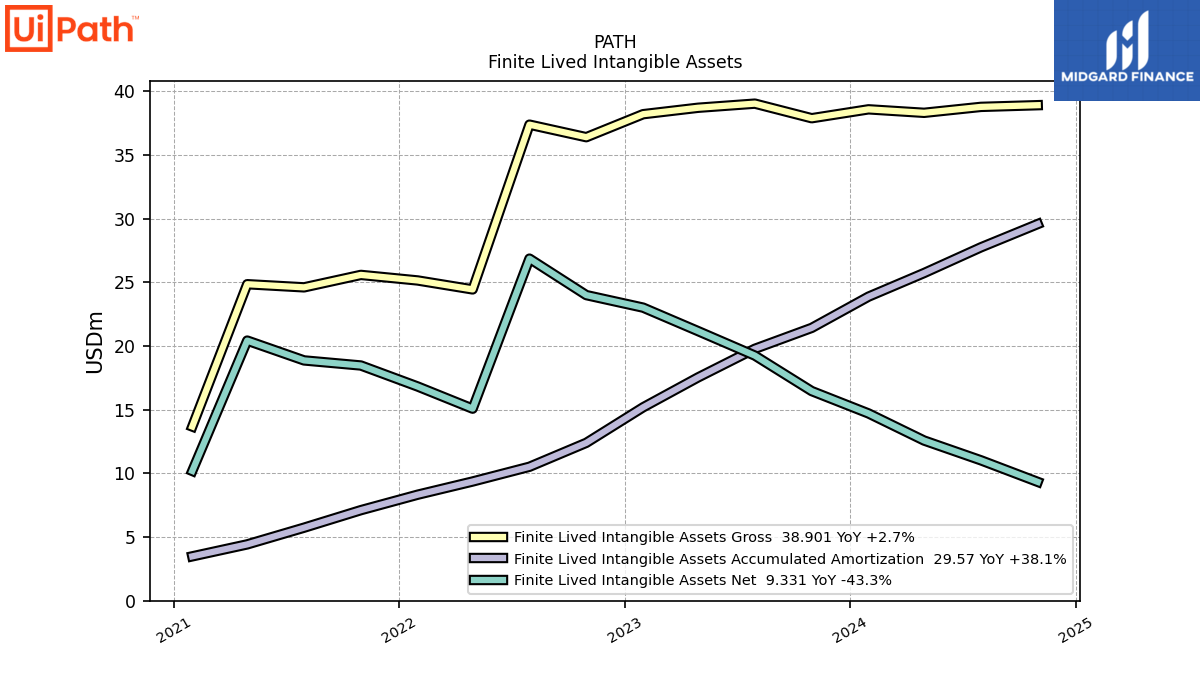
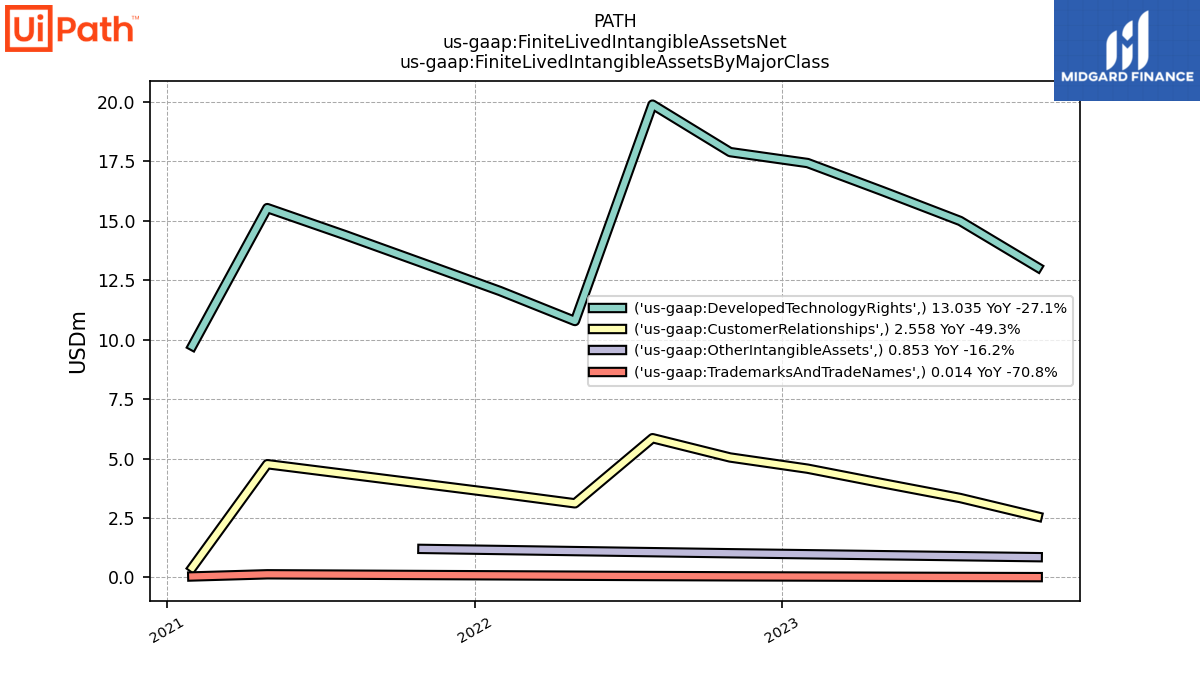
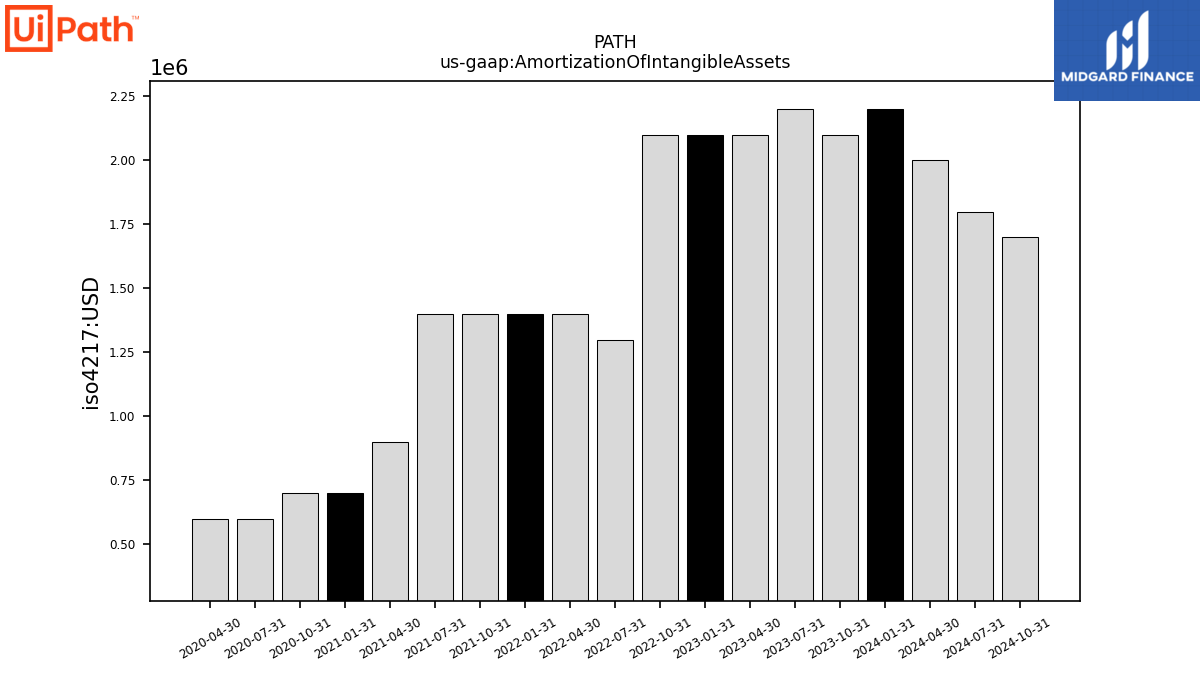
| Amortization Of Intangible Assets | 2.10 | 2.20 | 2.10 | 2.10 | 2.10 | 1.30 | 1.40 | 1.40 | 1.40 | 1.40 | 0.90 | 0.70 | 0.70 | 0.60 | 0.60 | |
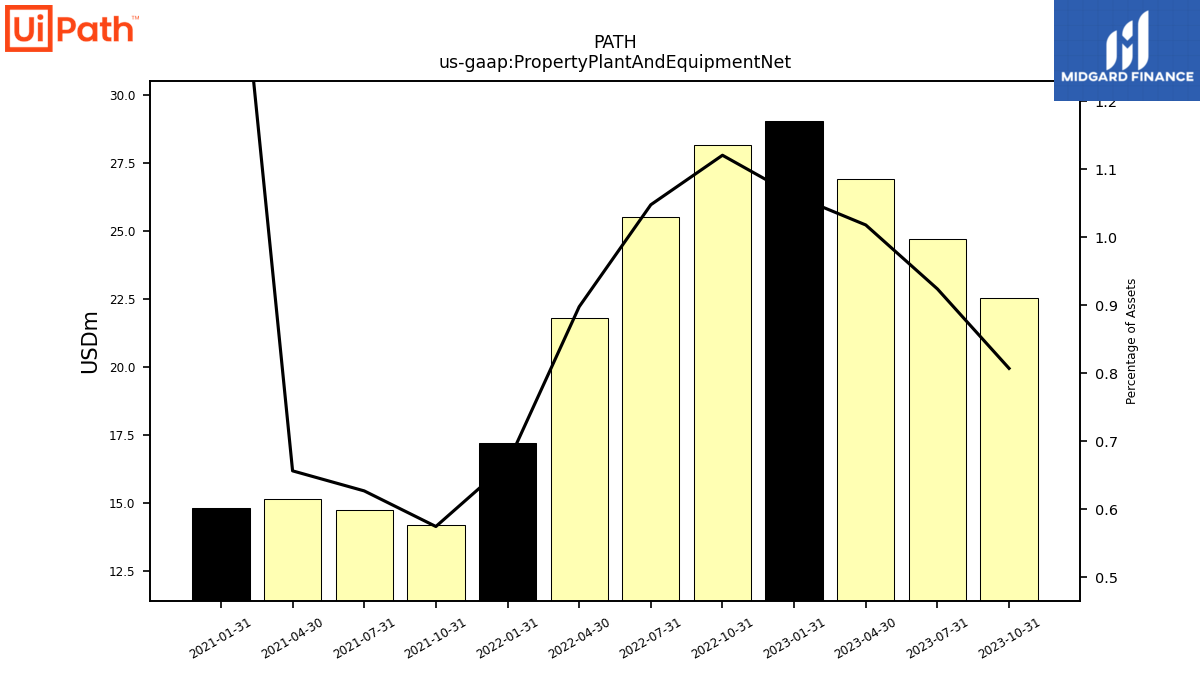
| Property Plant And Equipment Net | 22.50 | 24.68 | 26.91 | 29.05 | 28.15 | 25.52 | 21.78 | 17.18 | 14.19 | 14.73 | 15.15 | 14.82 | NA | NA | NA | |
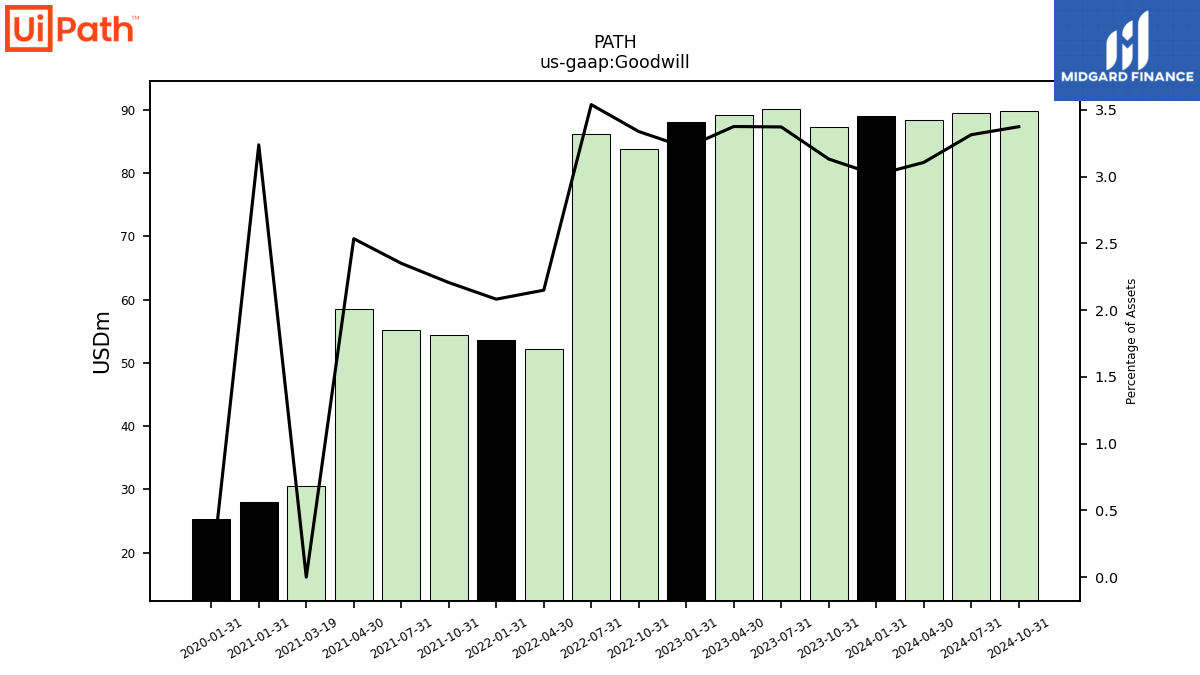
| Goodwill | 87.29 | 90.05 | 89.21 | 88.01 | 83.84 | 86.18 | 52.12 | 53.56 | 54.46 | 55.19 | 58.48 | 28.06 | NA | NA | NA | |
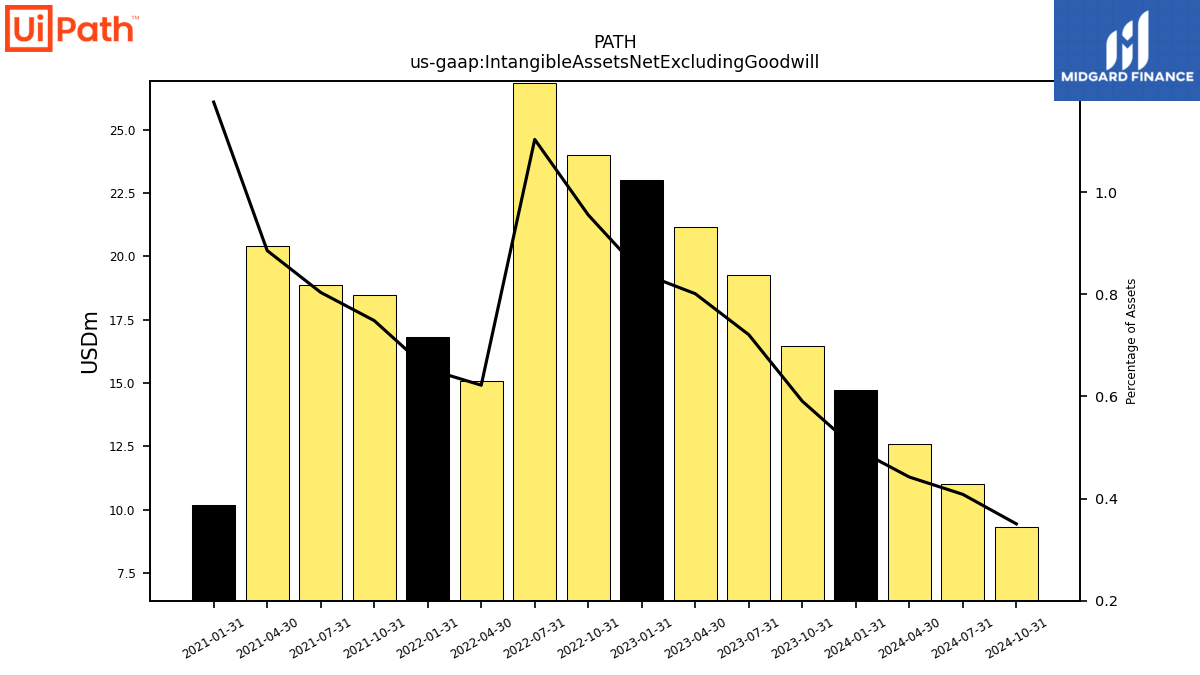
| Intangible Assets Net Excluding Goodwill | 16.46 | 19.24 | 21.17 | 23.01 | 23.99 | 26.86 | 15.08 | 16.82 | 18.47 | 18.87 | 20.42 | 10.19 | NA | NA | NA | |
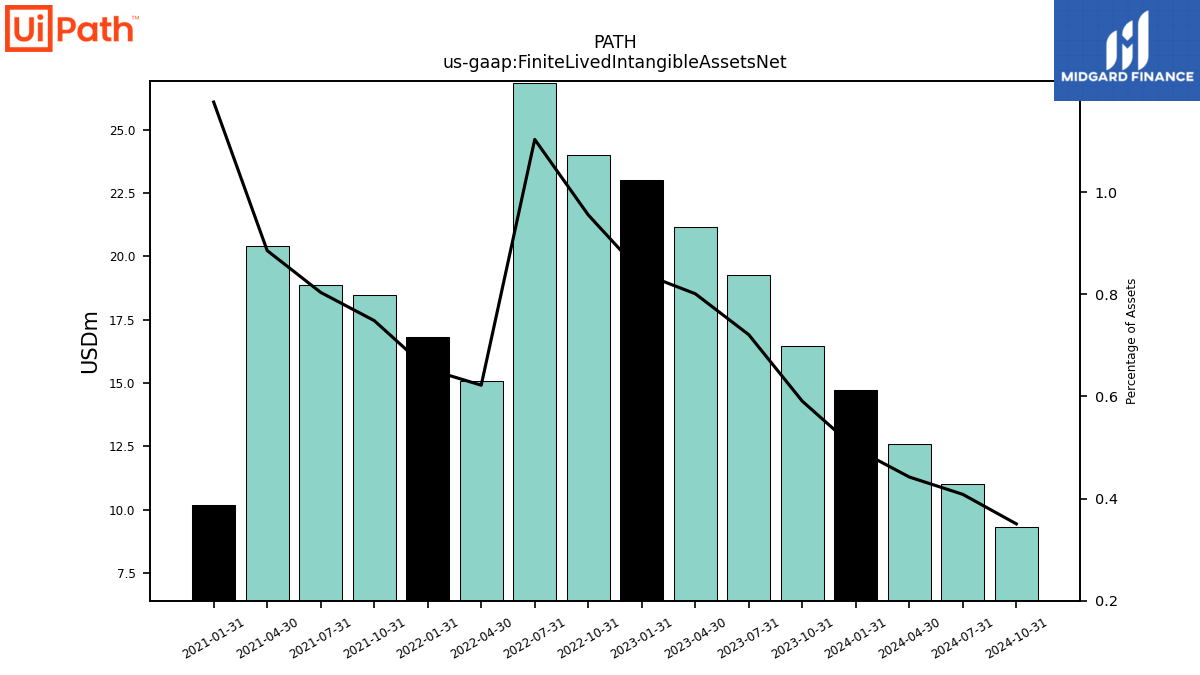
| Finite Lived Intangible Assets Net | 16.46 | 19.24 | 21.17 | 23.01 | 23.99 | 26.86 | 15.08 | 16.82 | 18.47 | 18.87 | 20.42 | 10.19 | NA | NA | NA | |
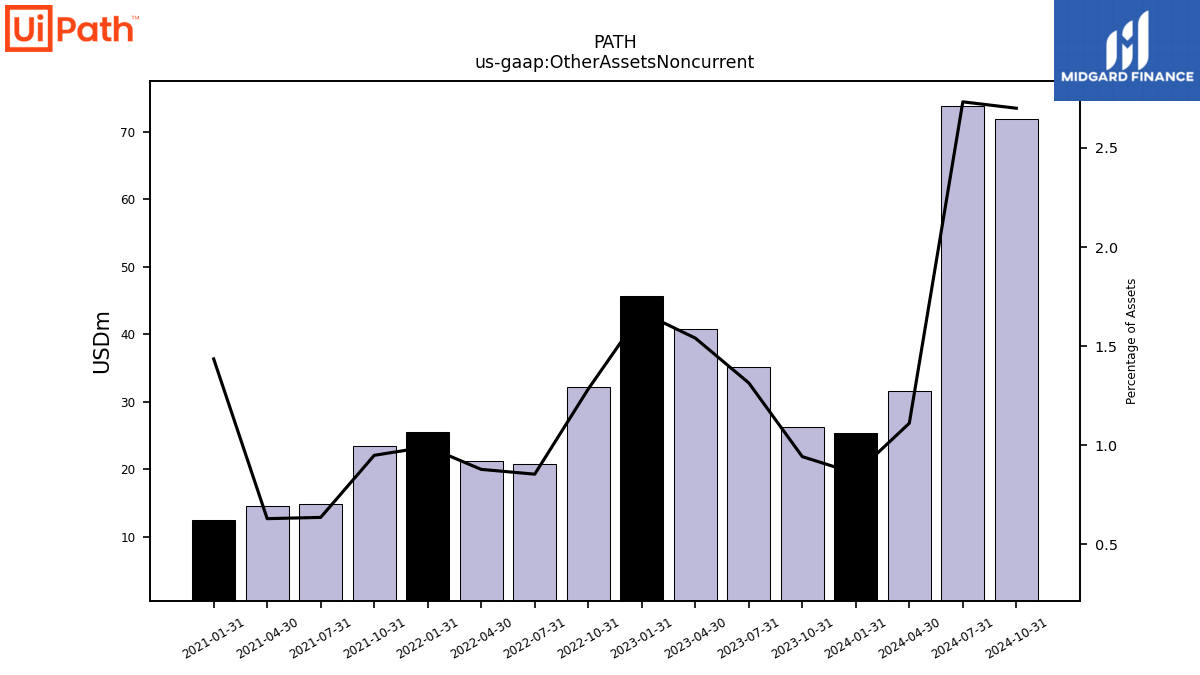
| Other Assets Noncurrent | 26.28 | 35.11 | 40.72 | 45.71 | 32.25 | 20.81 | 21.31 | 25.53 | 23.43 | 14.95 | 14.54 | 12.44 | NA | NA | NA | |
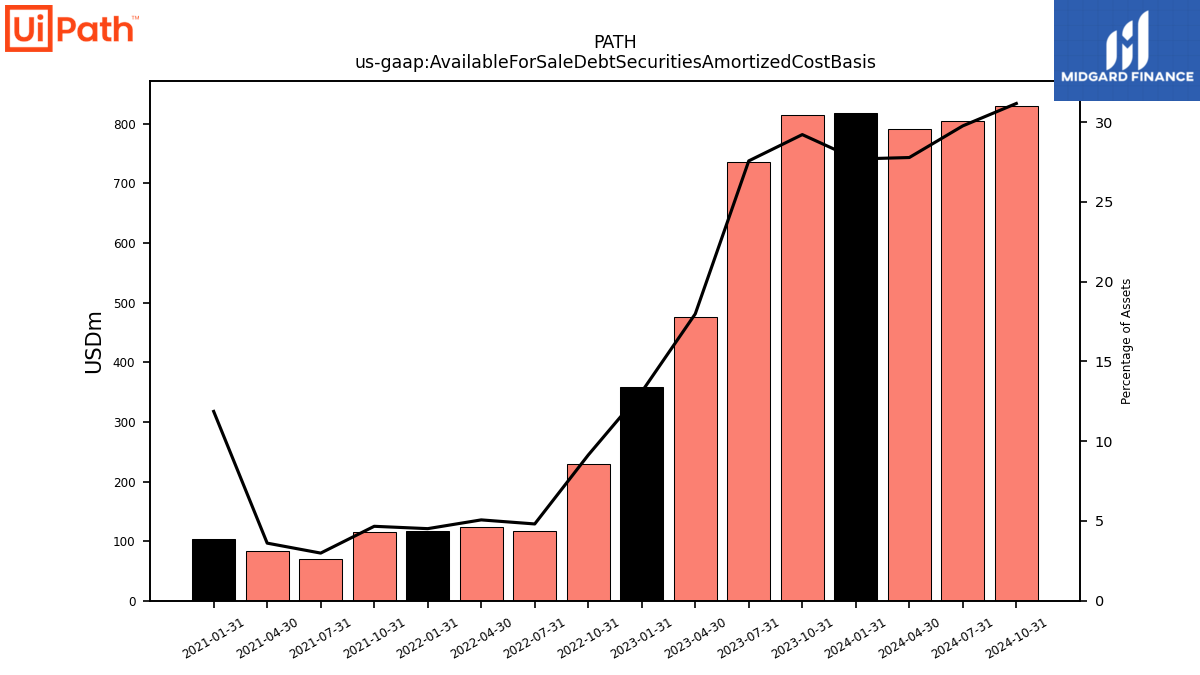
| Available For Sale Debt Securities Amortized Cost Basis | 814.46 | 736.30 | 475.26 | 358.33 | 229.44 | 117.22 | 122.91 | 116.28 | 115.18 | 70.15 | 83.31 | 102.84 | NA | NA | NA |
| 2023-10-31 | 2023-07-31 | 2023-04-30 | 2023-01-31 | 2022-10-31 | 2022-07-31 | 2022-04-30 | 2022-01-31 | 2021-10-31 | 2021-07-31 | 2021-04-30 | 2021-01-31 | 2020-10-31 | 2020-07-31 | 2020-04-30 | ||
|---|---|---|---|---|---|---|---|---|---|---|---|---|---|---|---|---|
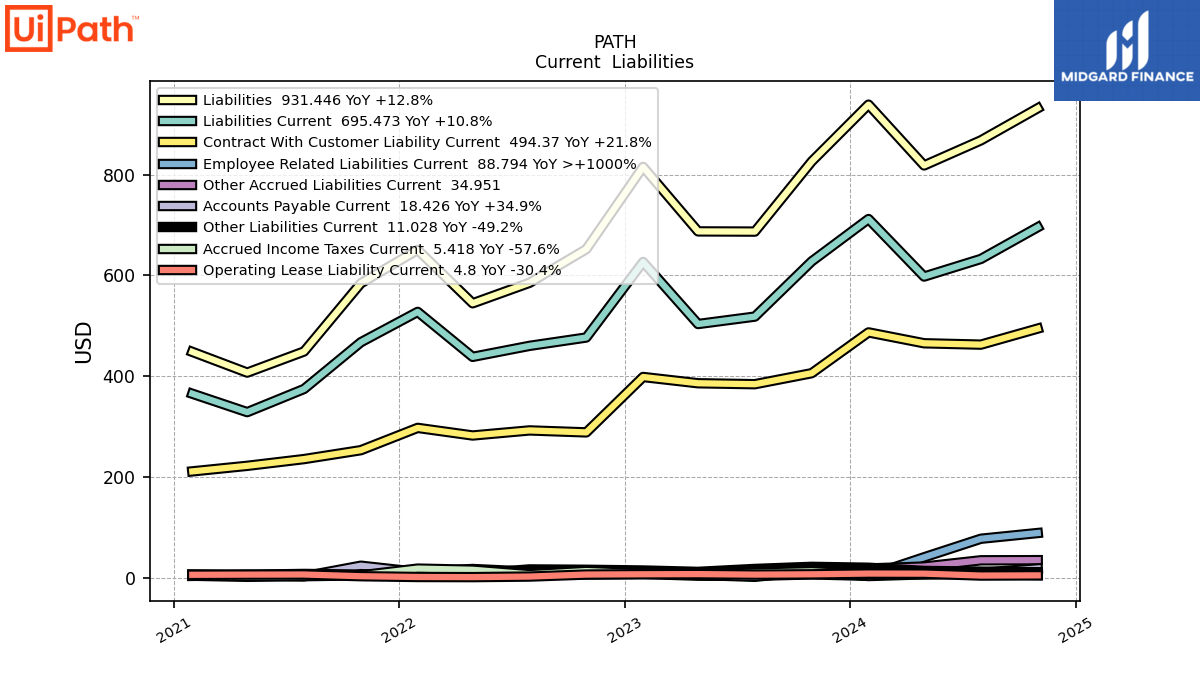
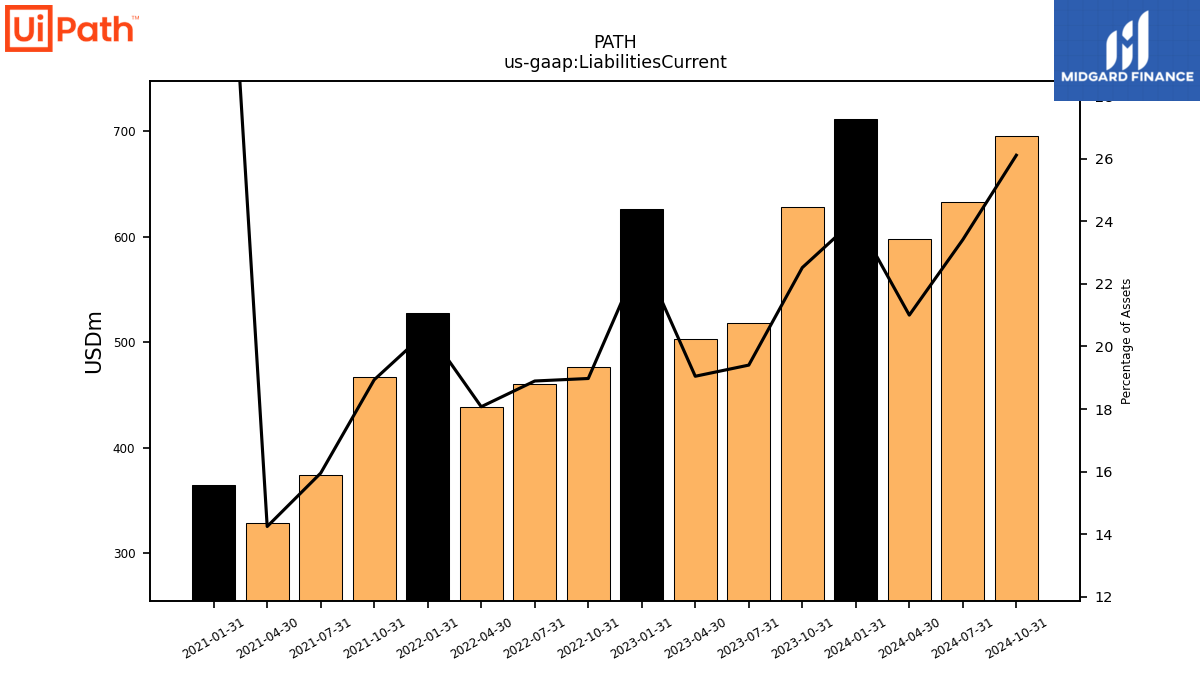
| Liabilities Current | 627.68 | 518.14 | 503.39 | 626.45 | 476.64 | 460.07 | 438.24 | 527.50 | 467.29 | 374.54 | 328.59 | 365.16 | NA | NA | NA | |
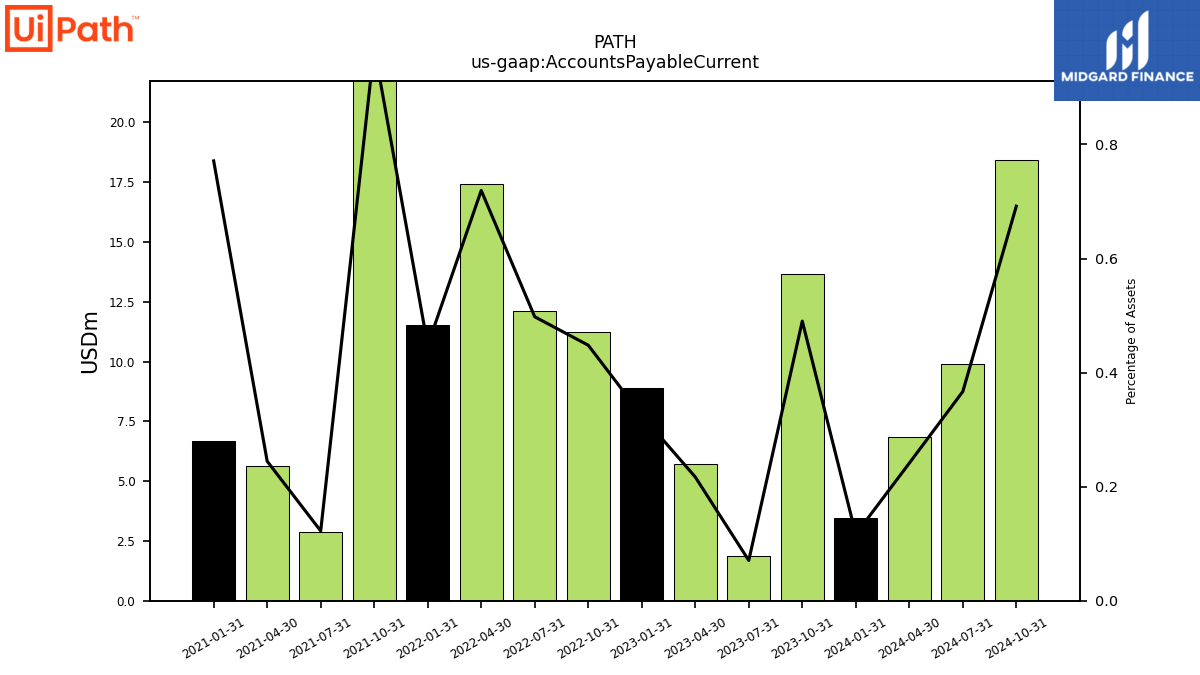
| Accounts Payable Current | 13.66 | 1.89 | 5.73 | 8.89 | 11.25 | 12.12 | 17.44 | 11.52 | 23.94 | 2.87 | 5.64 | 6.68 | NA | NA | NA | |
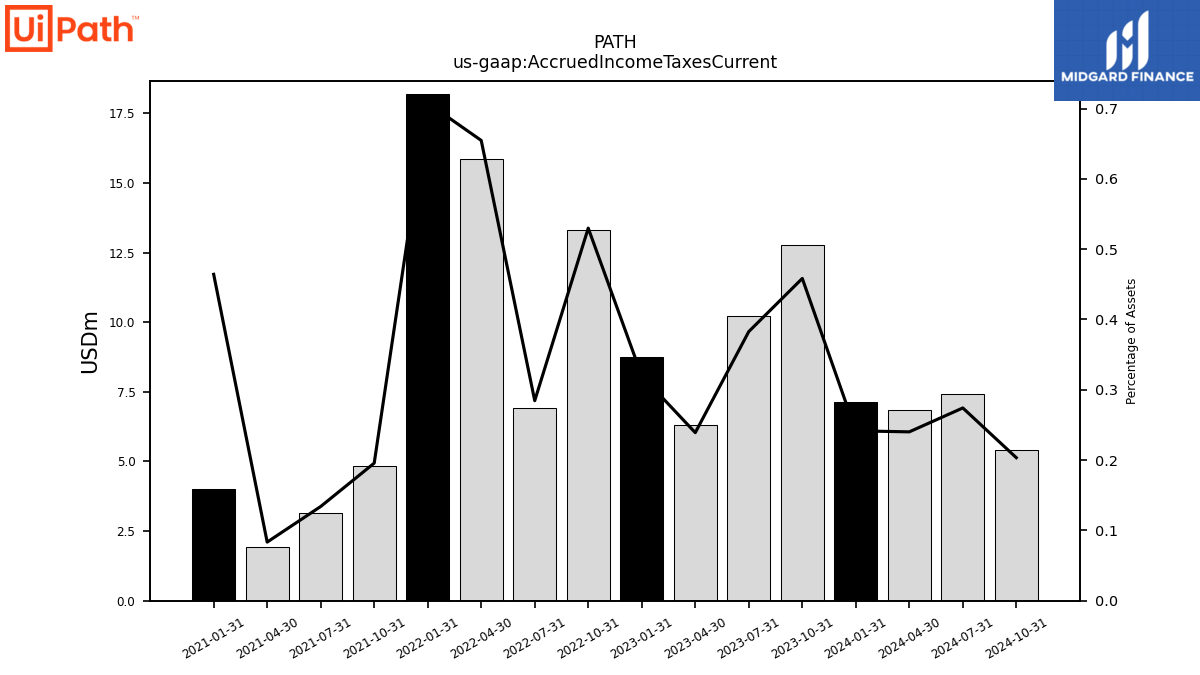
| Accrued Income Taxes Current | 12.77 | 10.22 | 6.32 | 8.75 | 13.31 | 6.93 | 15.87 | 18.21 | 4.83 | 3.15 | 1.92 | 4.02 | NA | NA | NA | |
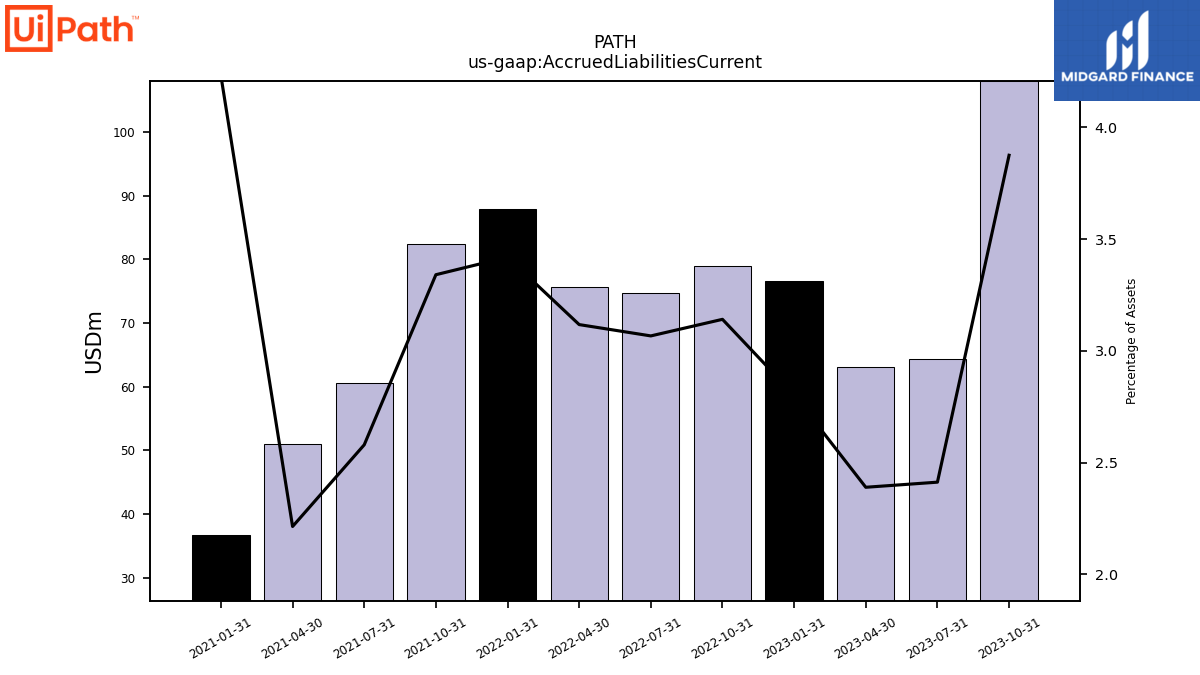
| Accrued Liabilities Current | 108.01 | 64.40 | 63.14 | 76.64 | 78.89 | 74.67 | 75.59 | 87.96 | 82.44 | 60.56 | 51.06 | 36.66 | NA | NA | NA | |
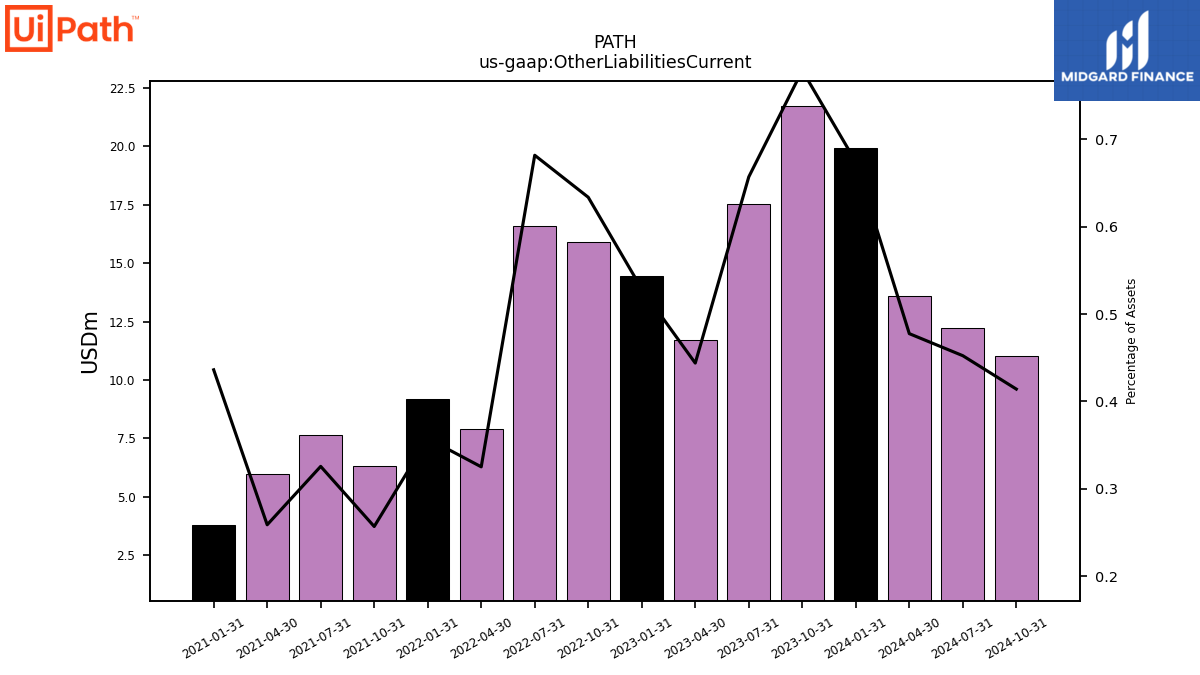
| Other Liabilities Current | 21.71 | 17.54 | 11.73 | 14.46 | 15.92 | 16.60 | 7.88 | 9.20 | 6.34 | 7.64 | 5.97 | 3.78 | NA | NA | NA | |
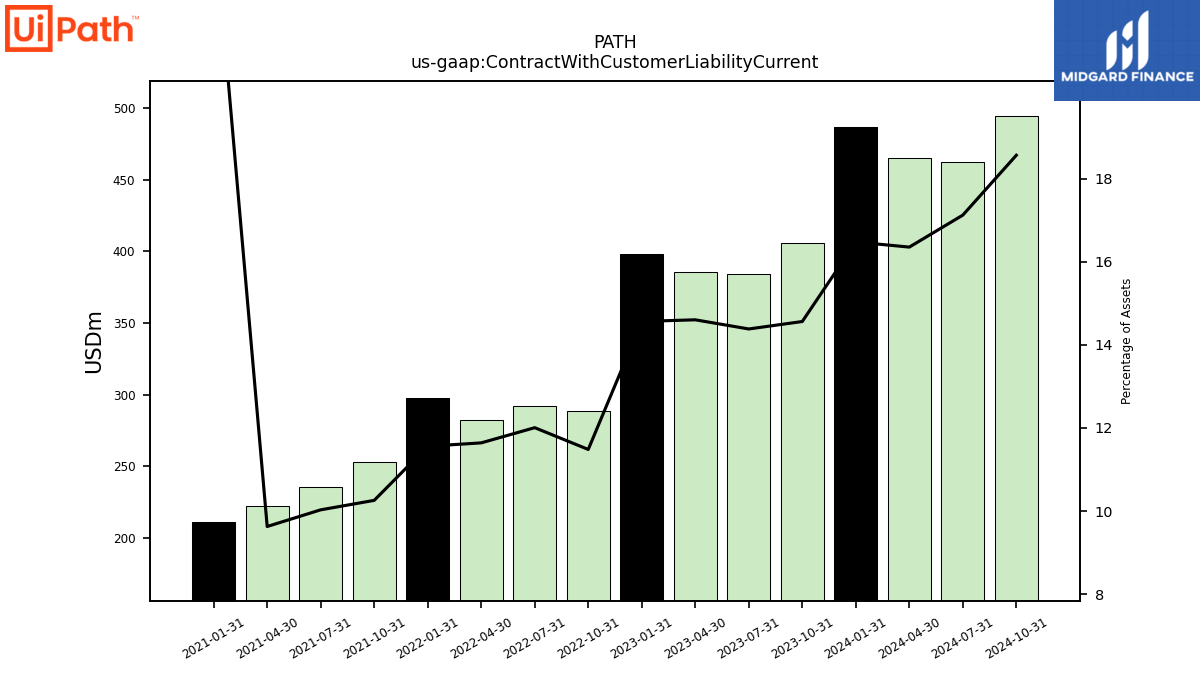
| Contract With Customer Liability Current | 405.84 | 384.01 | 385.89 | 398.33 | 288.41 | 292.32 | 282.26 | 297.36 | 253.12 | 235.48 | 222.09 | 211.08 | NA | NA | NA |
| 2023-10-31 | 2023-07-31 | 2023-04-30 | 2023-01-31 | 2022-10-31 | 2022-07-31 | 2022-04-30 | 2022-01-31 | 2021-10-31 | 2021-07-31 | 2021-04-30 | 2021-01-31 | 2020-10-31 | 2020-07-31 | 2020-04-30 | ||
|---|---|---|---|---|---|---|---|---|---|---|---|---|---|---|---|---|
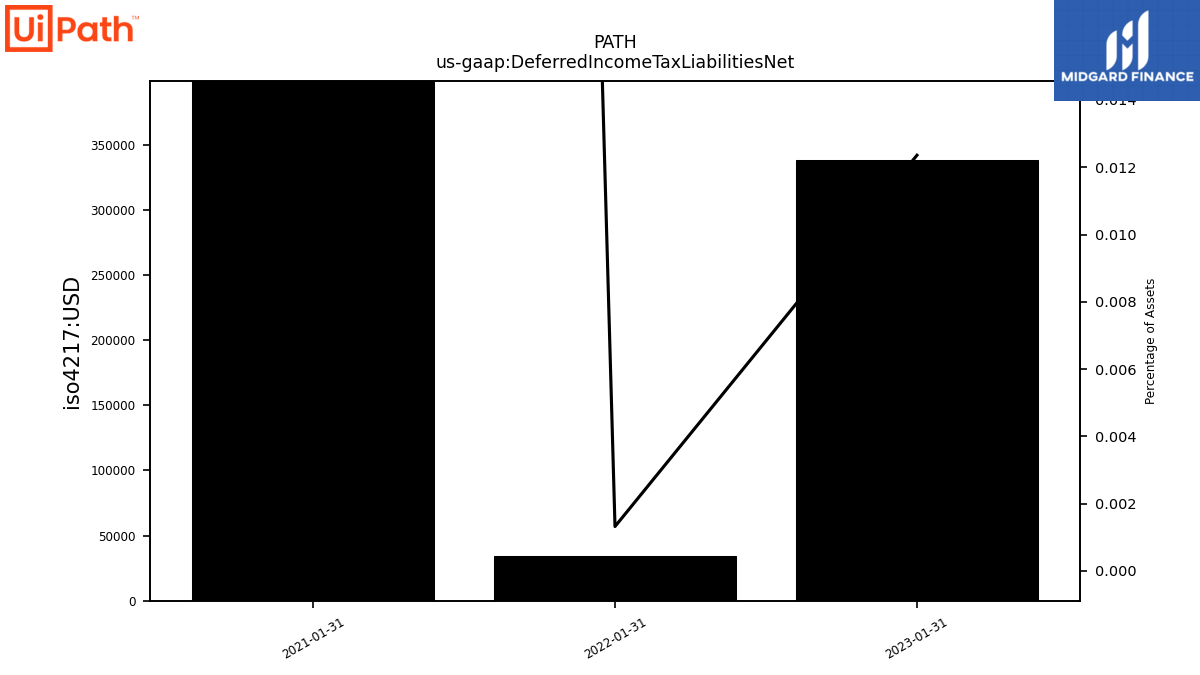
| Deferred Income Tax Liabilities Net | NA | NA | NA | 0.34 | NA | NA | NA | 0.03 | NA | NA | NA | 2.75 | NA | NA | NA | |
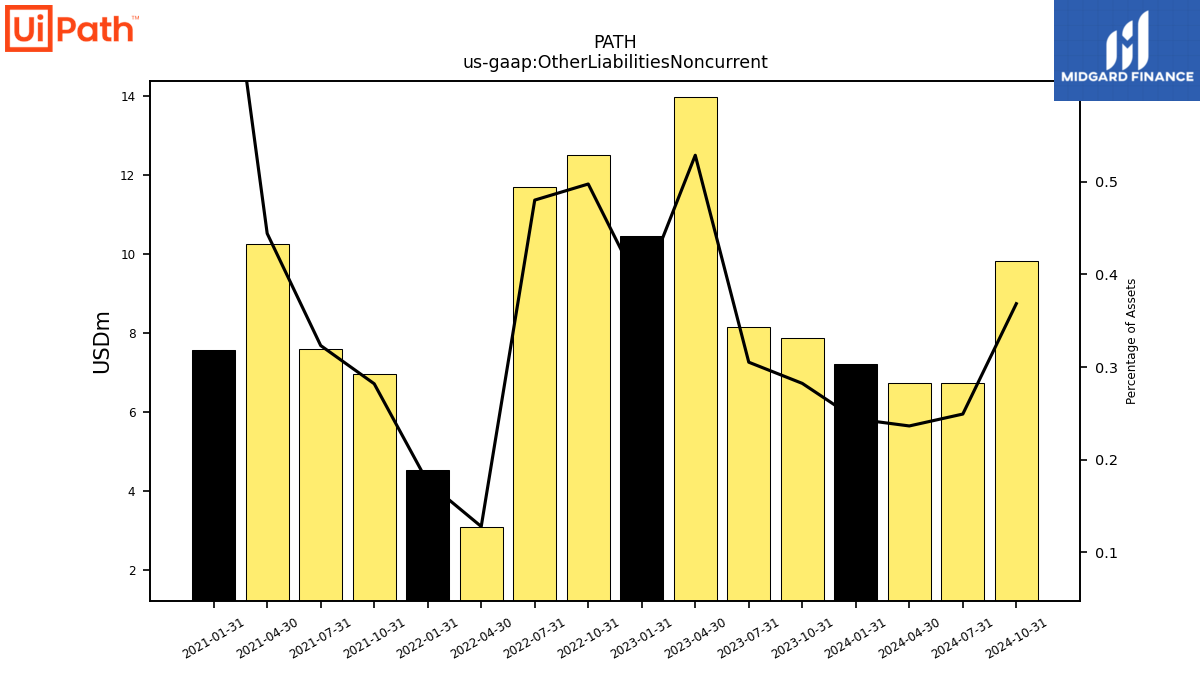
| Other Liabilities Noncurrent | 7.87 | 8.15 | 13.97 | 10.46 | 12.50 | 11.69 | 3.10 | 4.52 | 6.96 | 7.59 | 10.25 | 7.56 | NA | NA | NA | |
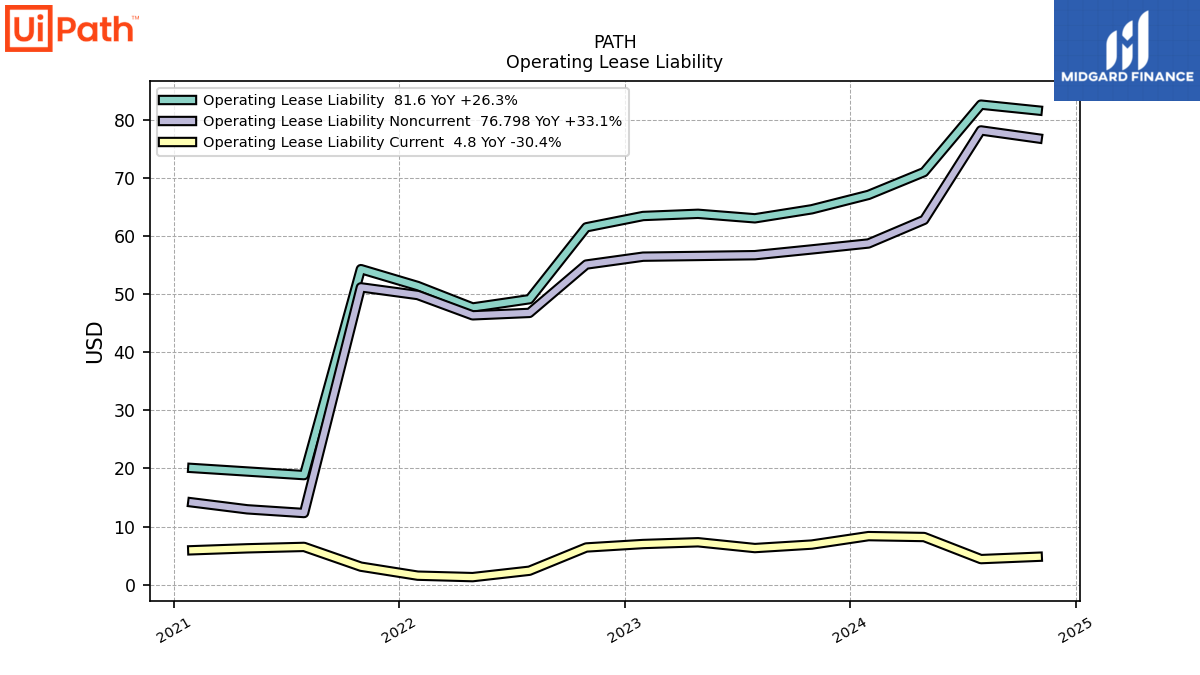
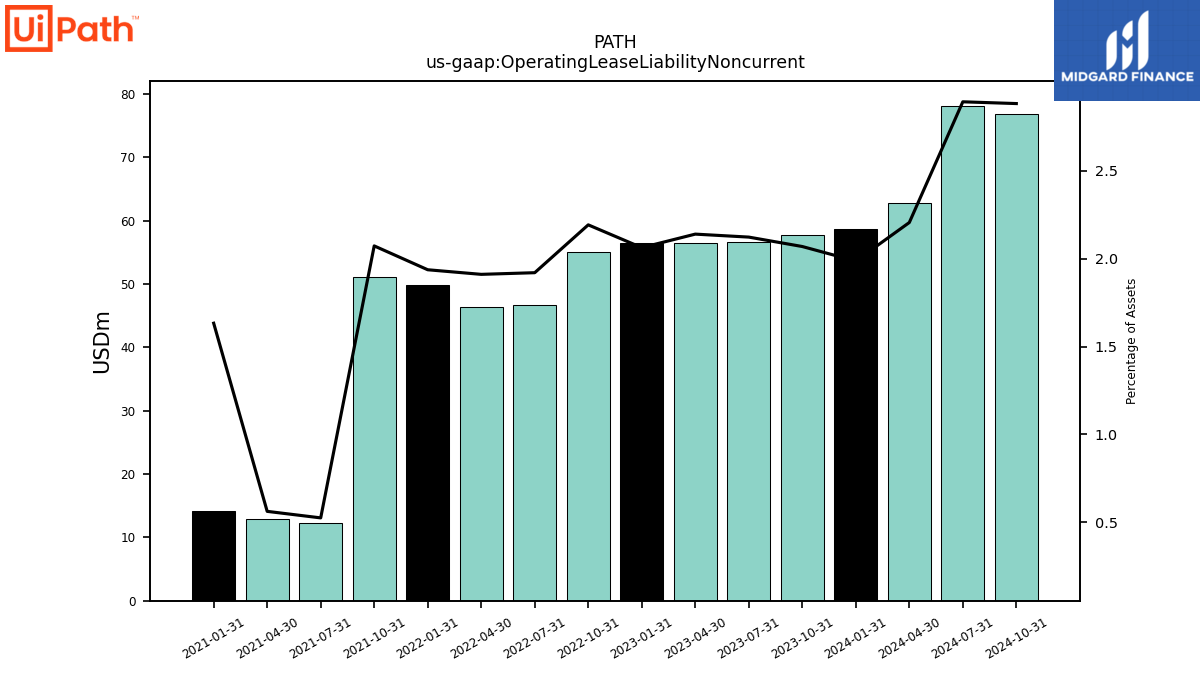
| Operating Lease Liability Noncurrent | 57.69 | 56.70 | 56.56 | 56.44 | 55.09 | 46.77 | 46.35 | 49.84 | 51.16 | 12.33 | 12.97 | 14.15 | NA | NA | NA |
| 2023-10-31 | 2023-07-31 | 2023-04-30 | 2023-01-31 | 2022-10-31 | 2022-07-31 | 2022-04-30 | 2022-01-31 | 2021-10-31 | 2021-07-31 | 2021-04-30 | 2021-01-31 | 2020-10-31 | 2020-07-31 | 2020-04-30 | ||
|---|---|---|---|---|---|---|---|---|---|---|---|---|---|---|---|---|
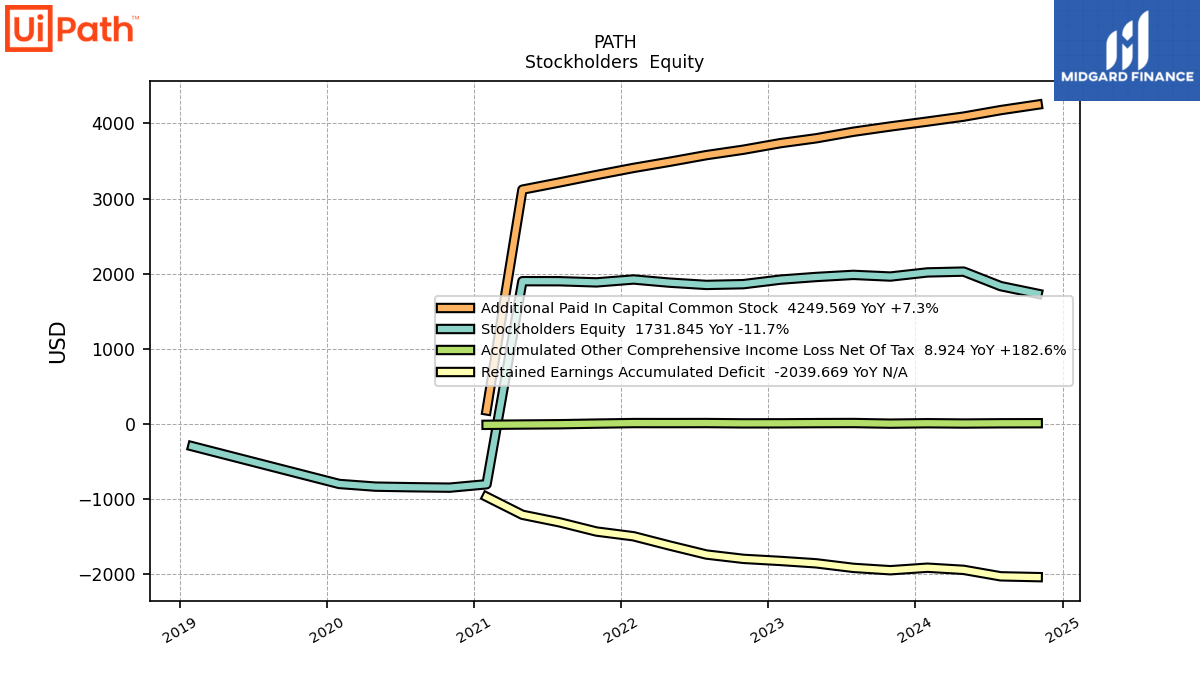
| Stockholders Equity | 1961.21 | 1983.37 | 1955.54 | 1920.16 | 1859.82 | 1849.55 | 1880.19 | 1921.92 | 1883.40 | 1898.95 | 1899.54 | -803.70 | -848.84 | -843.24 | -835.30 | |
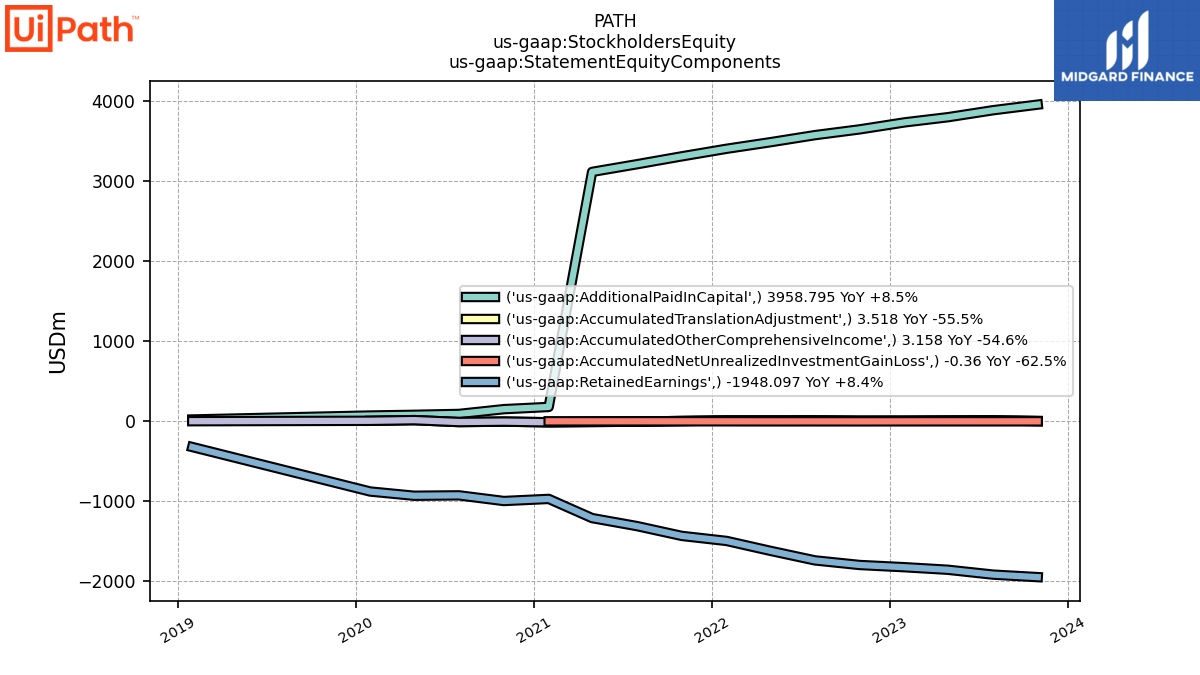
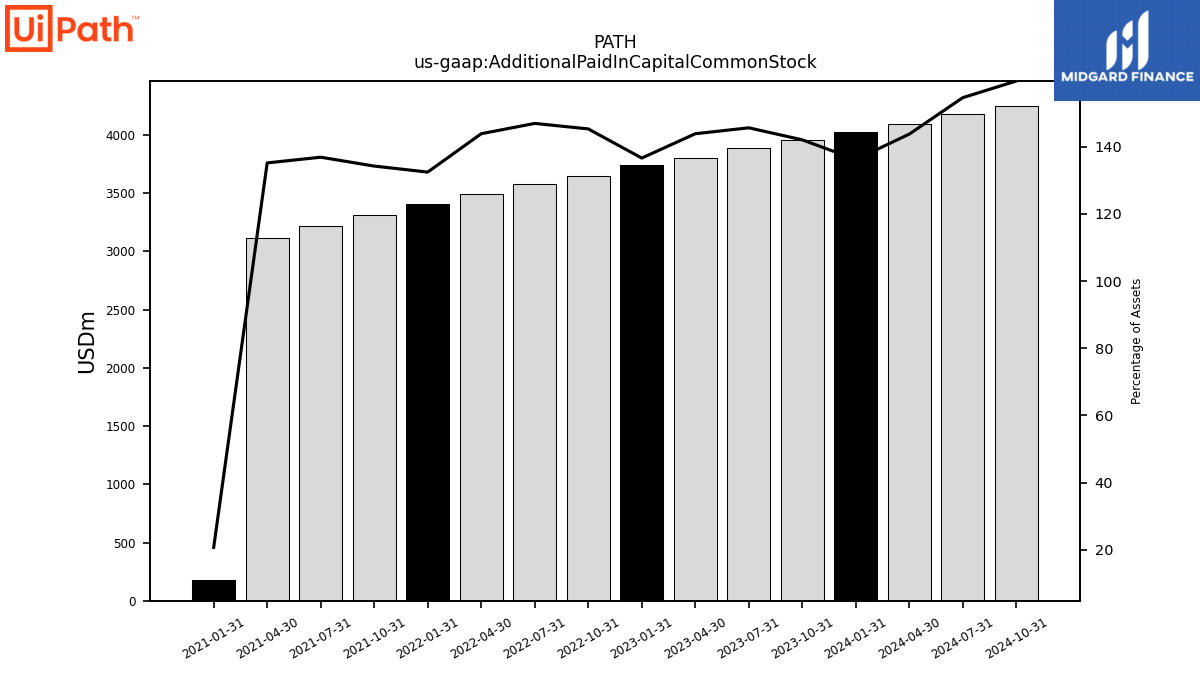
| Additional Paid In Capital Common Stock | 3958.80 | 3888.41 | 3801.66 | 3736.84 | 3649.47 | 3577.28 | 3488.26 | 3406.96 | 3312.41 | 3213.59 | 3117.85 | 179.18 | NA | NA | NA | |
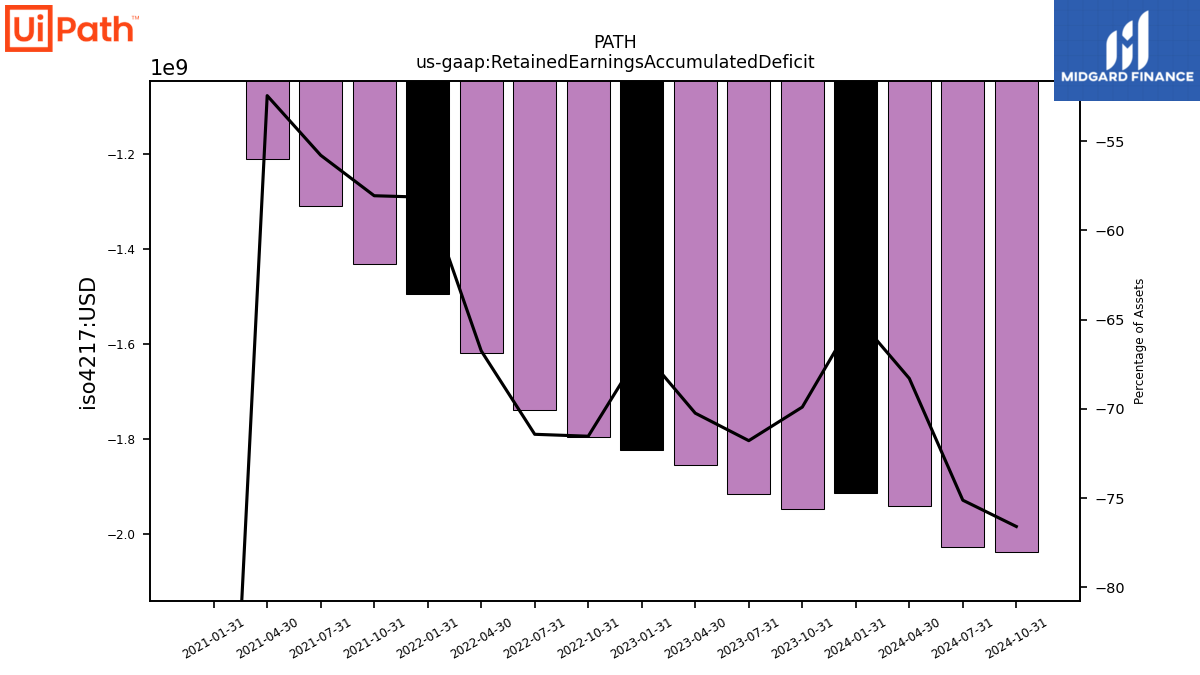
| Retained Earnings Accumulated Deficit | -1948.10 | -1916.56 | -1856.20 | -1824.30 | -1796.61 | -1738.88 | -1618.51 | -1495.95 | -1432.84 | -1310.05 | -1210.02 | -970.36 | NA | NA | NA | |
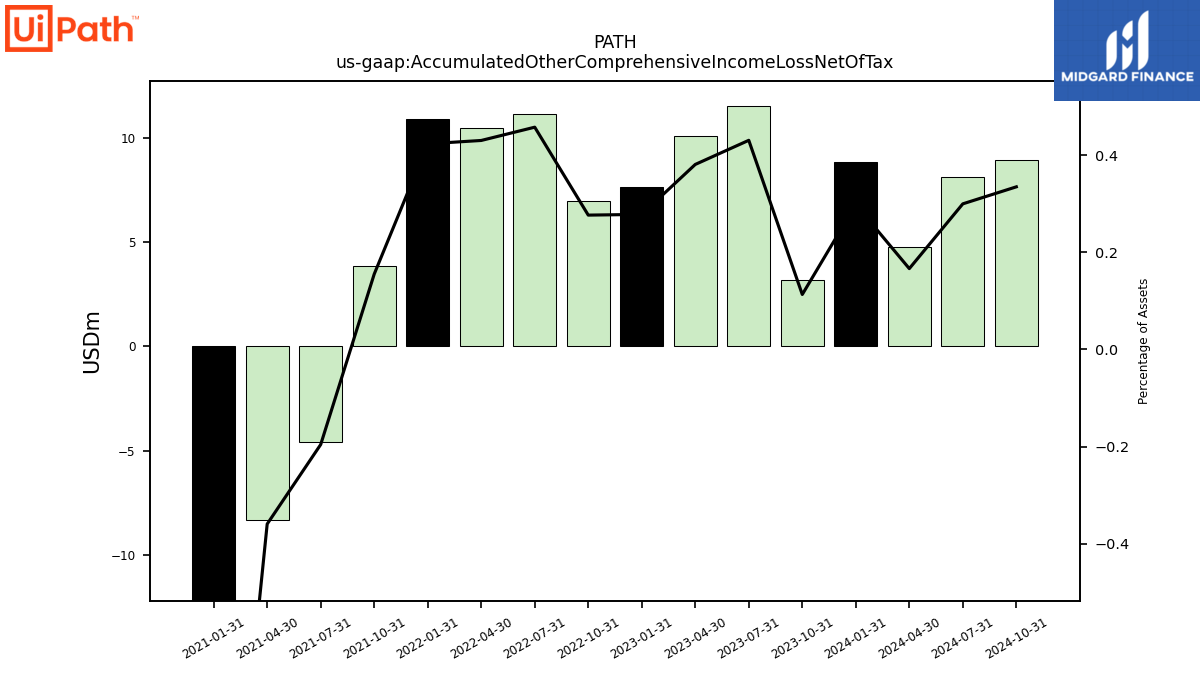
| Accumulated Other Comprehensive Income Loss Net Of Tax | 3.16 | 11.51 | 10.07 | 7.61 | 6.95 | 11.15 | 10.44 | 10.90 | 3.83 | -4.60 | -8.29 | -12.52 | NA | NA | NA | |
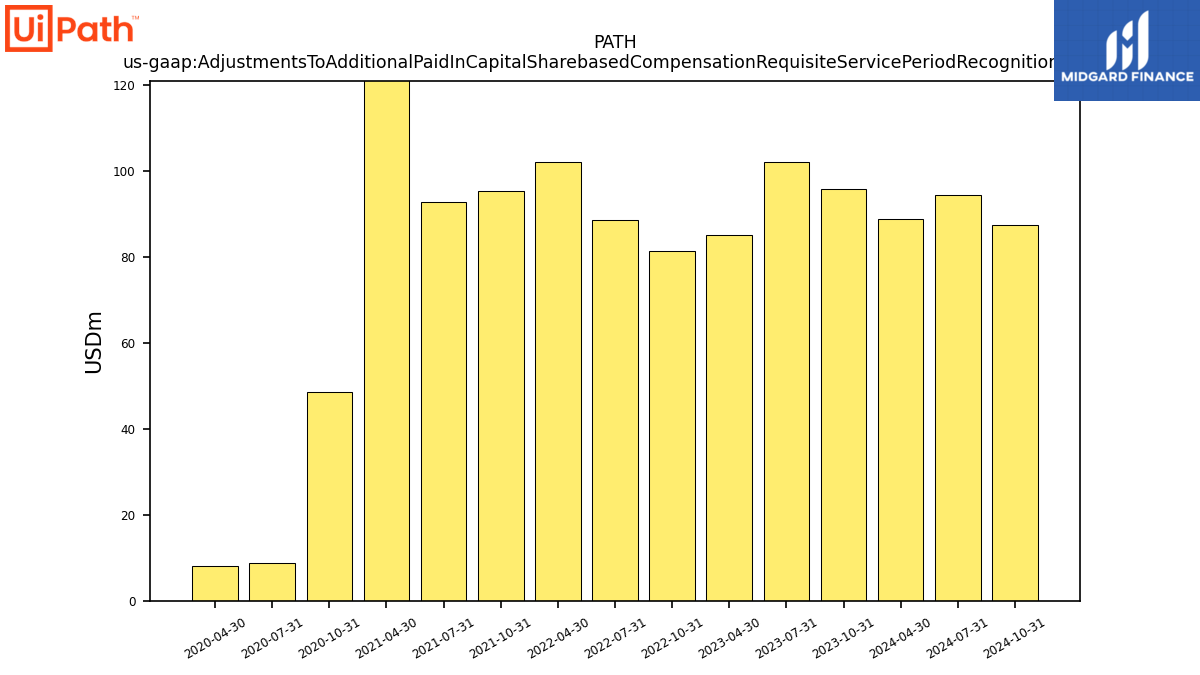
| Adjustments To Additional Paid In Capital Sharebased Compensation Requisite Service Period Recognition Value | 95.91 | 102.15 | 85.12 | NA | 81.31 | 88.53 | 102.08 | NA | 95.34 | 92.74 | 252.99 | NA | 48.64 | 8.83 | 8.17 |
| 2023-10-31 | 2023-07-31 | 2023-04-30 | 2023-01-31 | 2022-10-31 | 2022-07-31 | 2022-04-30 | 2022-01-31 | 2021-10-31 | 2021-07-31 | 2021-04-30 | 2021-01-31 | 2020-10-31 | 2020-07-31 | 2020-04-30 | ||
|---|---|---|---|---|---|---|---|---|---|---|---|---|---|---|---|---|
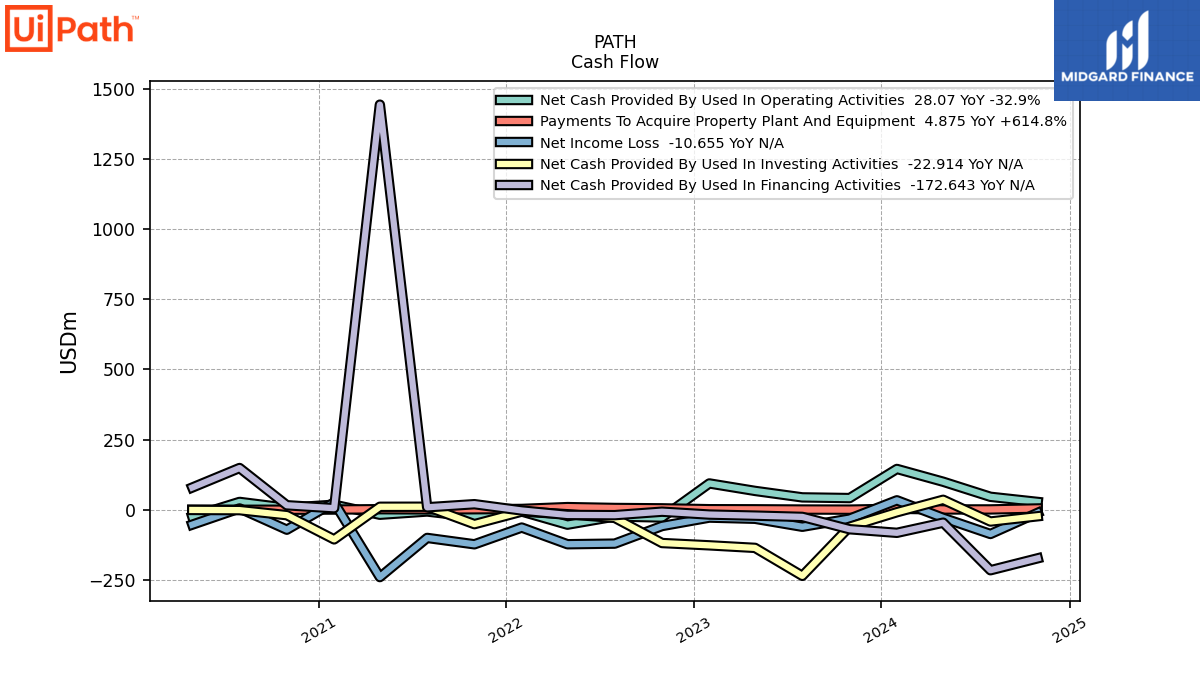
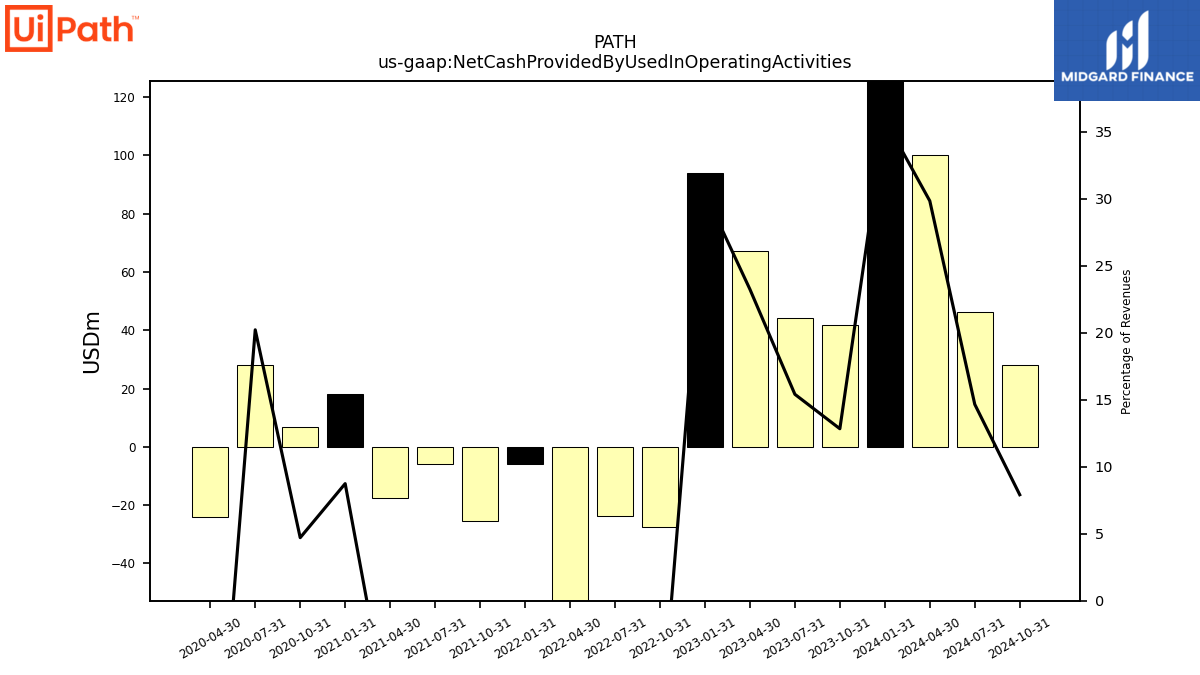
| Net Cash Provided By Used In Operating Activities | 41.85 | 44.28 | 67.34 | 93.96 | -27.32 | -23.74 | -52.88 | -6.01 | -25.43 | -6.00 | -17.52 | 18.18 | 6.94 | 28.19 | -24.13 | |
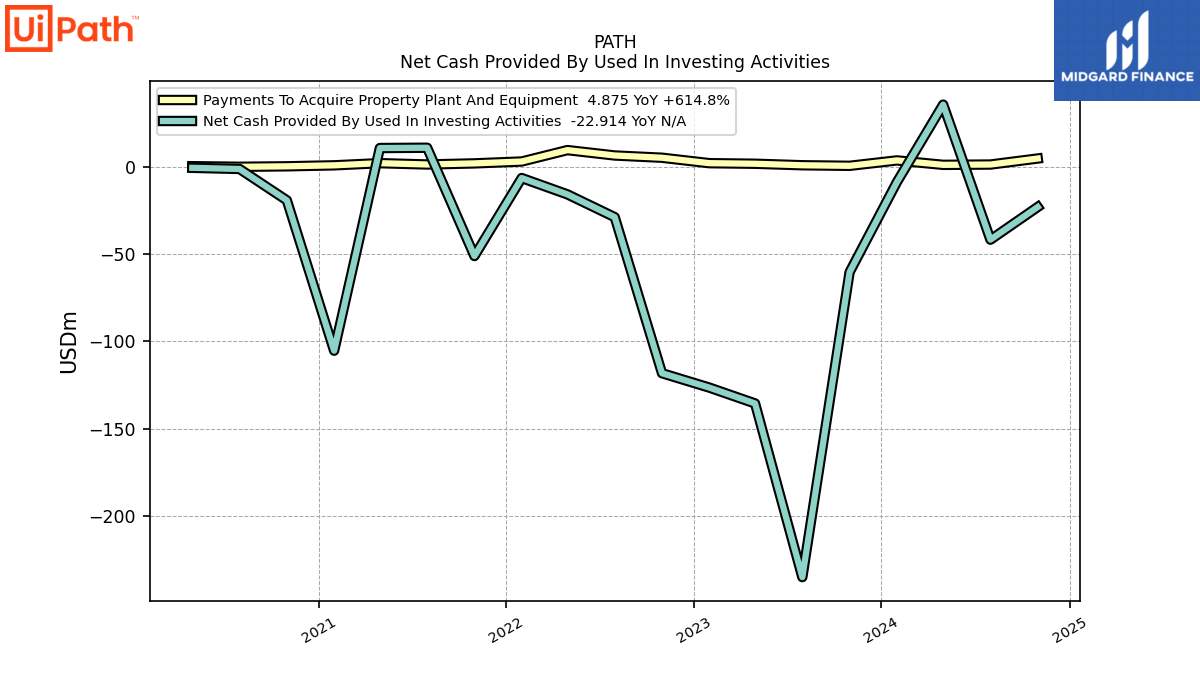
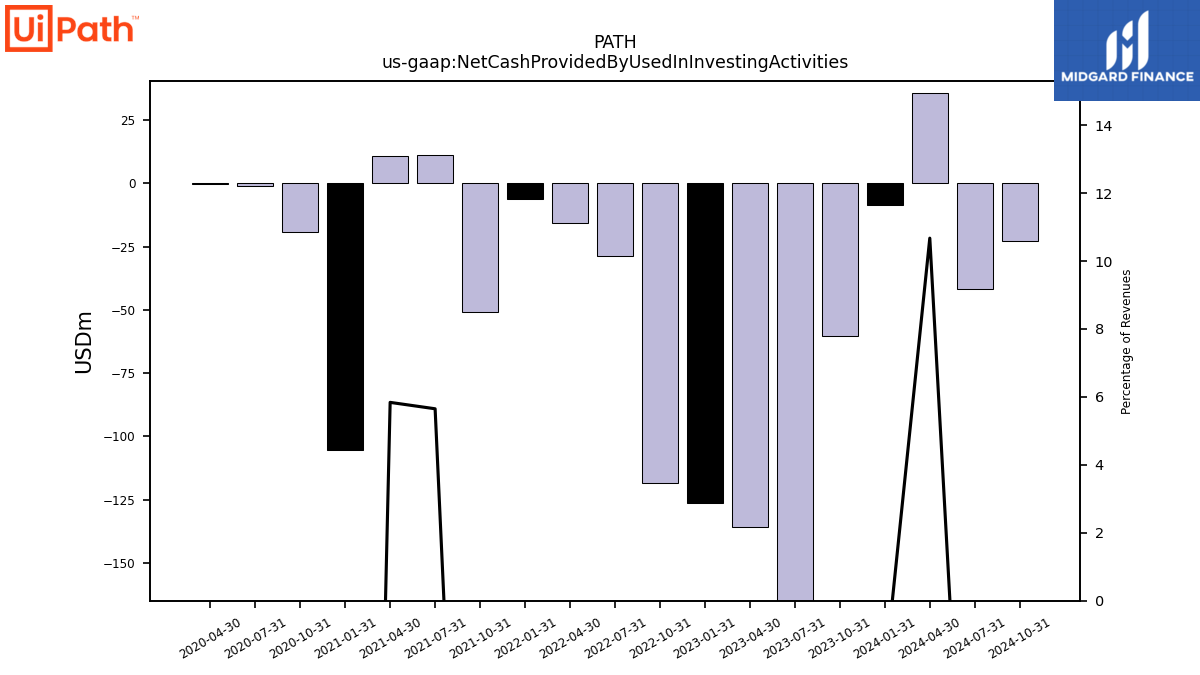
| Net Cash Provided By Used In Investing Activities | -60.25 | -235.12 | -135.55 | -126.47 | -118.23 | -28.75 | -15.70 | -6.32 | -51.04 | 11.05 | 10.87 | -105.31 | -19.09 | -1.13 | -0.46 | |
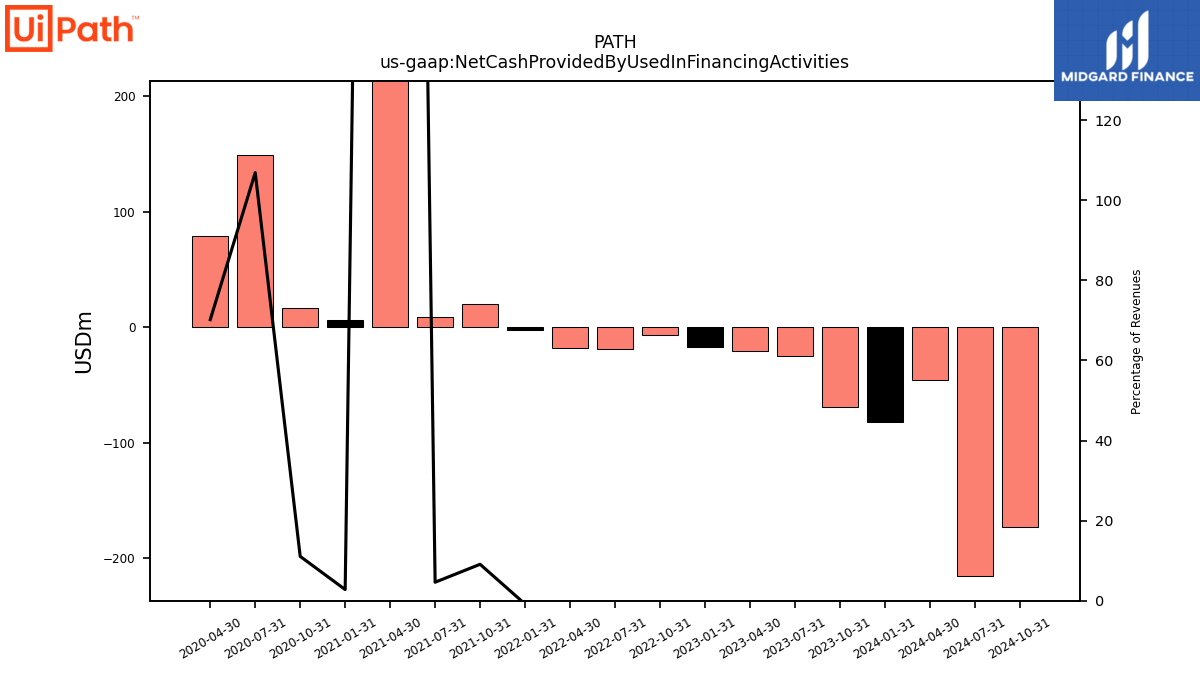
| Net Cash Provided By Used In Financing Activities | -69.15 | -25.20 | -20.63 | -16.87 | -6.64 | -18.97 | -18.19 | -2.37 | 20.09 | 9.04 | 1442.91 | 5.81 | 16.31 | 148.93 | 79.36 |
| 2023-10-31 | 2023-07-31 | 2023-04-30 | 2023-01-31 | 2022-10-31 | 2022-07-31 | 2022-04-30 | 2022-01-31 | 2021-10-31 | 2021-07-31 | 2021-04-30 | 2021-01-31 | 2020-10-31 | 2020-07-31 | 2020-04-30 | ||
|---|---|---|---|---|---|---|---|---|---|---|---|---|---|---|---|---|
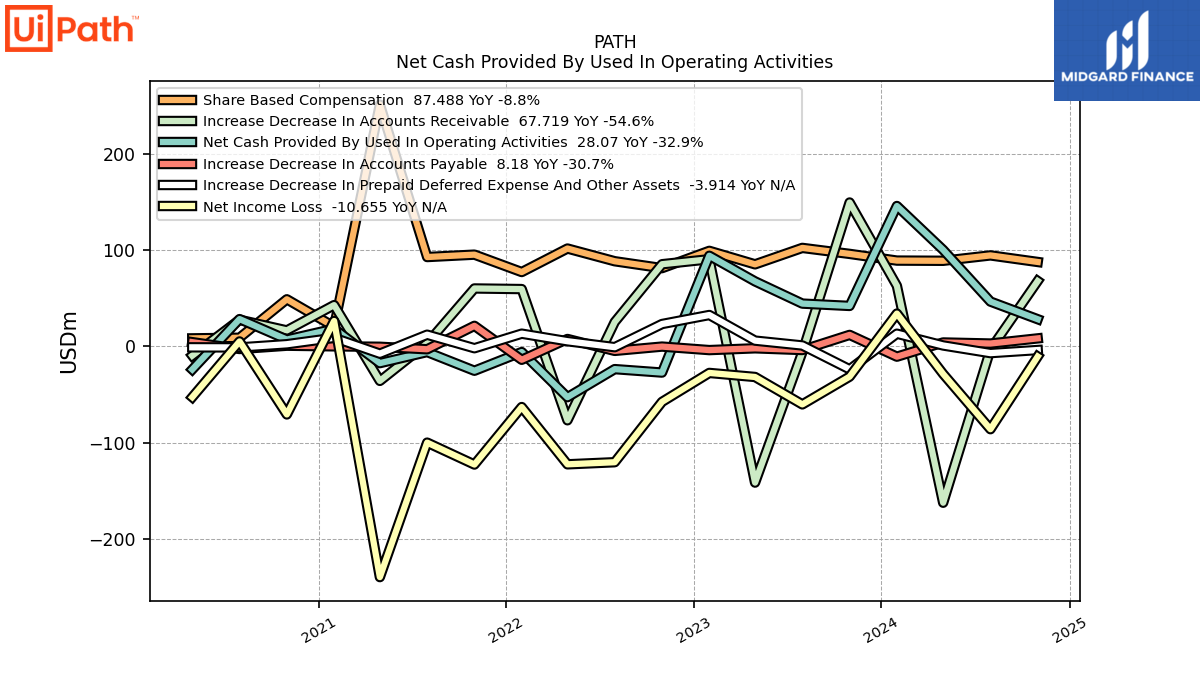
| Net Cash Provided By Used In Operating Activities | 41.85 | 44.28 | 67.34 | 93.96 | -27.32 | -23.74 | -52.88 | -6.01 | -25.43 | -6.00 | -17.52 | 18.18 | 6.94 | 28.19 | -24.13 | |
| Net Income Loss | -31.54 | -60.36 | -31.90 | -27.69 | -57.72 | -120.38 | -122.56 | -63.11 | -122.79 | -100.03 | -239.66 | 26.26 | -70.80 | 4.99 | -52.84 | |
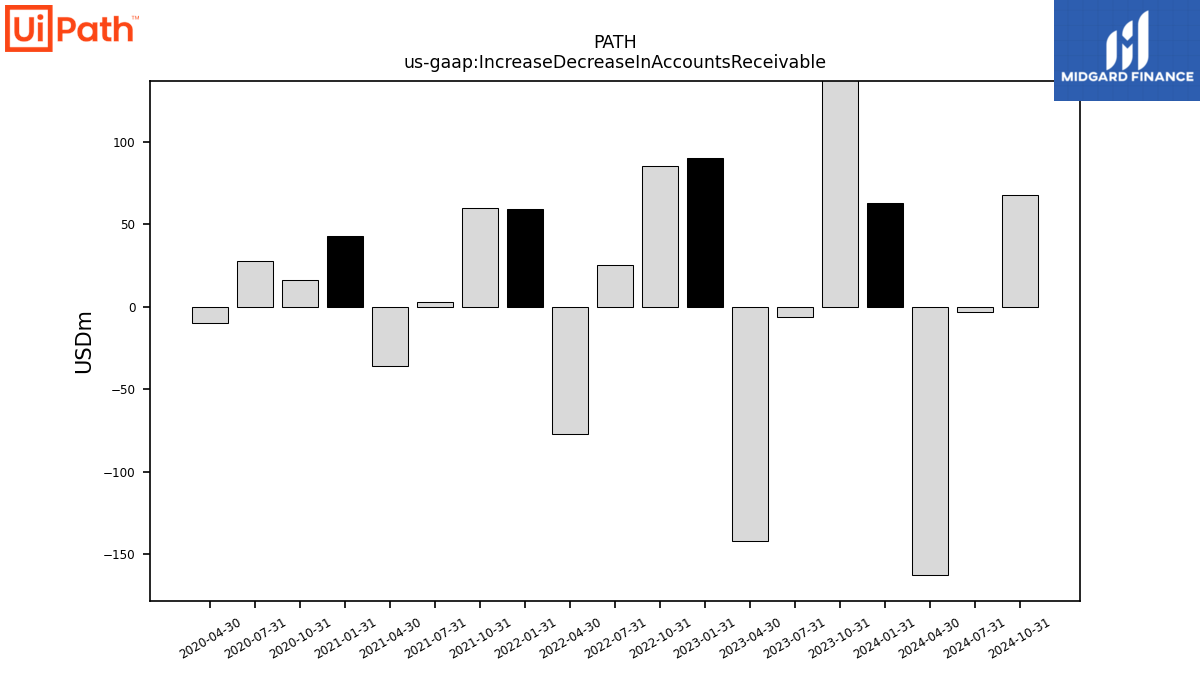
| Increase Decrease In Accounts Receivable | 149.23 | -6.17 | -141.56 | 90.33 | 85.16 | 25.16 | -76.86 | 59.36 | 59.99 | 3.01 | -35.97 | 42.72 | 16.45 | 27.51 | -9.77 | |
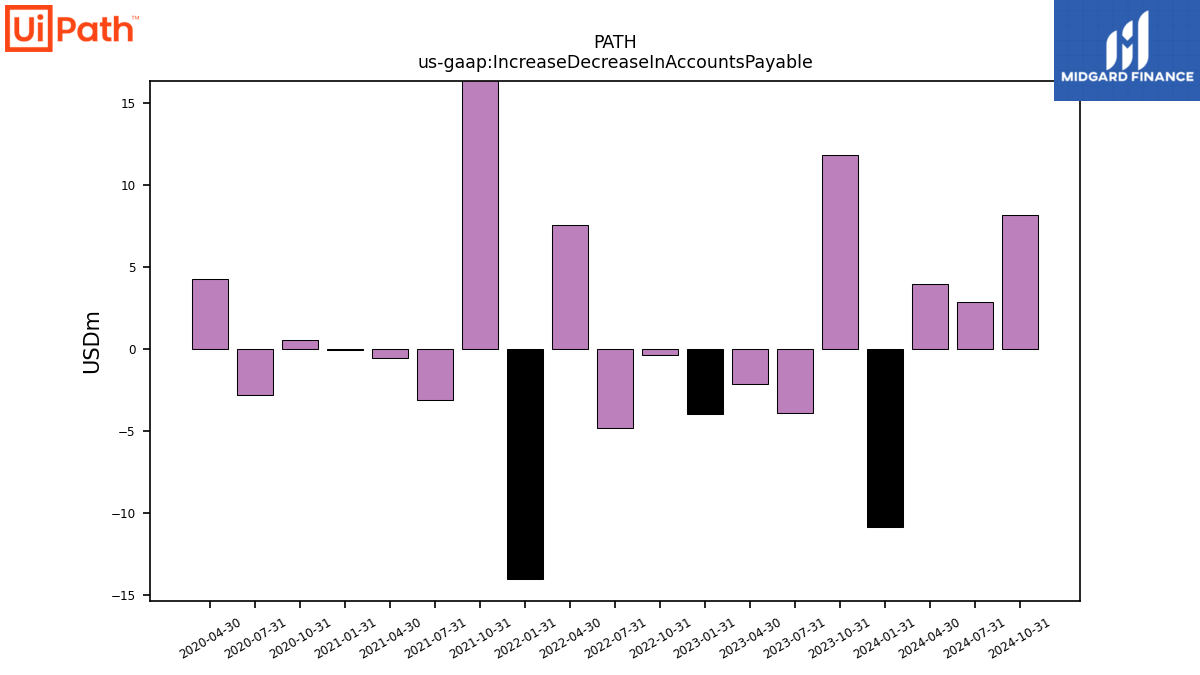
| Increase Decrease In Accounts Payable | 11.80 | -3.90 | -2.13 | -3.98 | -0.34 | -4.79 | 7.55 | -14.04 | 21.21 | -3.13 | -0.53 | -0.09 | 0.57 | -2.84 | 4.25 | |
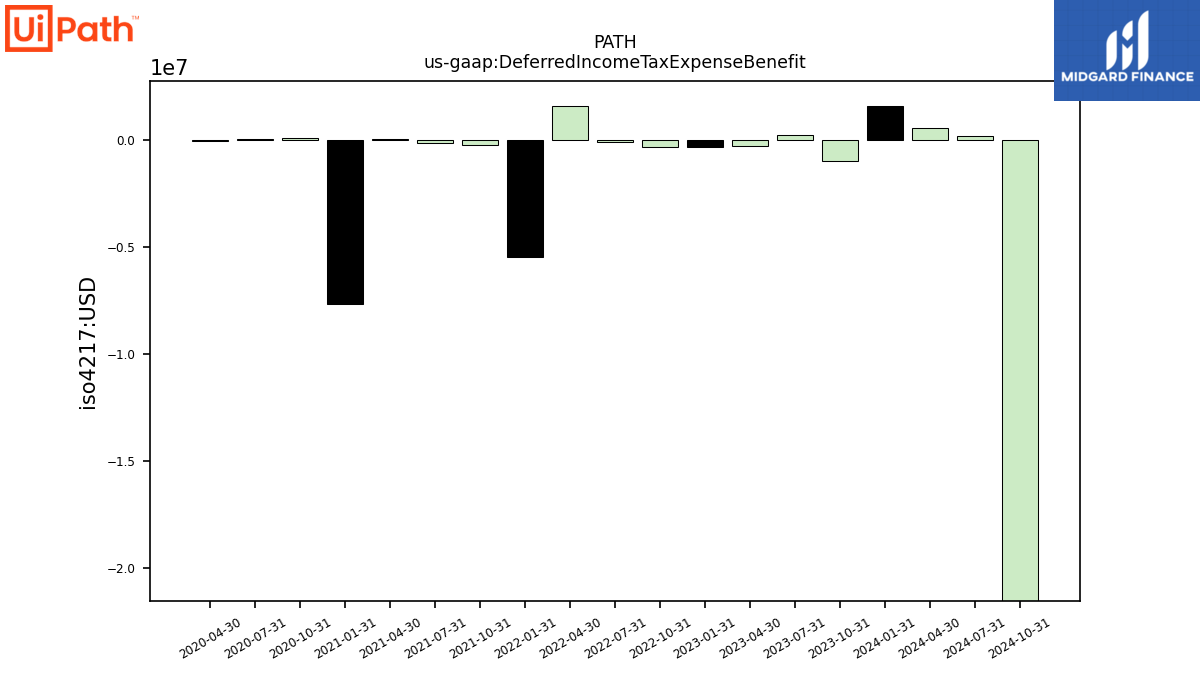
| Deferred Income Tax Expense Benefit | -0.98 | 0.21 | -0.27 | -0.31 | -0.33 | -0.09 | 1.59 | -5.47 | -0.22 | -0.15 | 0.02 | -7.66 | 0.08 | 0.04 | -0.05 | |
| Share Based Compensation | 95.88 | 102.10 | 85.05 | 99.04 | 81.09 | 88.25 | 101.45 | 77.03 | 95.10 | 92.61 | 250.84 | 20.37 | 48.76 | 8.83 | 8.20 |
| 2023-10-31 | 2023-07-31 | 2023-04-30 | 2023-01-31 | 2022-10-31 | 2022-07-31 | 2022-04-30 | 2022-01-31 | 2021-10-31 | 2021-07-31 | 2021-04-30 | 2021-01-31 | 2020-10-31 | 2020-07-31 | 2020-04-30 | ||
|---|---|---|---|---|---|---|---|---|---|---|---|---|---|---|---|---|
| Net Cash Provided By Used In Investing Activities | -60.25 | -235.12 | -135.55 | -126.47 | -118.23 | -28.75 | -15.70 | -6.32 | -51.04 | 11.05 | 10.87 | -105.31 | -19.09 | -1.13 | -0.46 | |
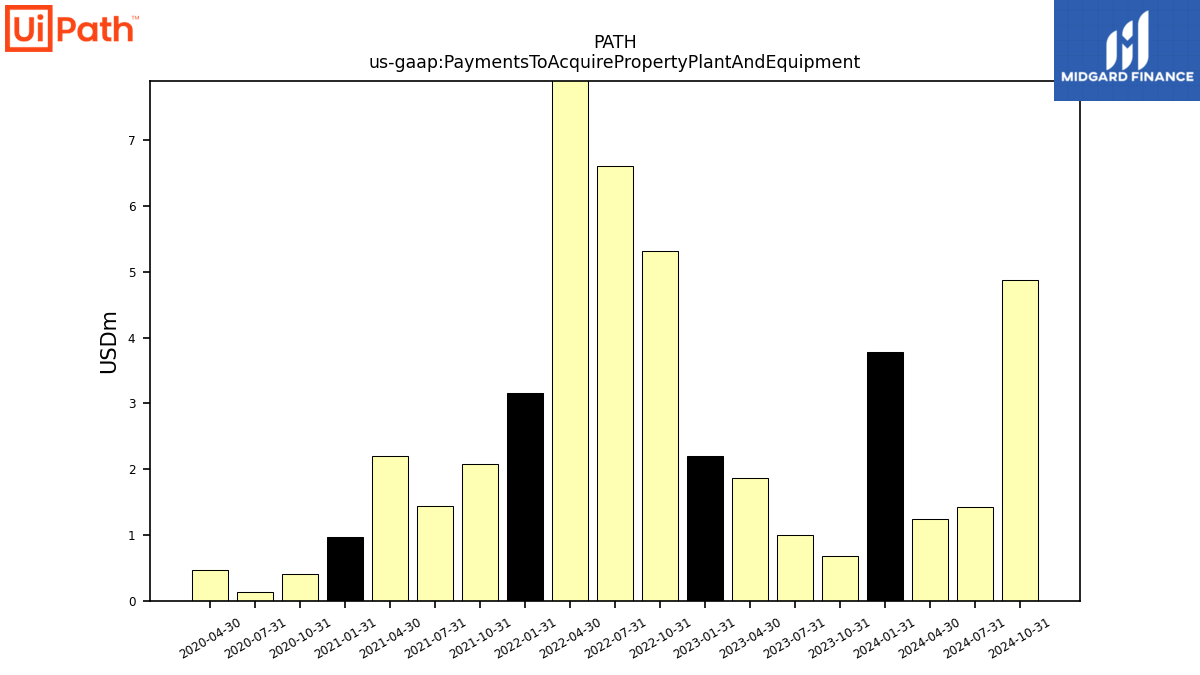
| Payments To Acquire Property Plant And Equipment | 0.68 | 1.01 | 1.87 | 2.20 | 5.32 | 6.61 | 9.69 | 3.16 | 2.08 | 1.44 | 2.20 | 0.96 | 0.40 | 0.13 | 0.46 |
| 2023-10-31 | 2023-07-31 | 2023-04-30 | 2023-01-31 | 2022-10-31 | 2022-07-31 | 2022-04-30 | 2022-01-31 | 2021-10-31 | 2021-07-31 | 2021-04-30 | 2021-01-31 | 2020-10-31 | 2020-07-31 | 2020-04-30 | ||
|---|---|---|---|---|---|---|---|---|---|---|---|---|---|---|---|---|
| Net Cash Provided By Used In Financing Activities | -69.15 | -25.20 | -20.63 | -16.87 | -6.64 | -18.97 | -18.19 | -2.37 | 20.09 | 9.04 | 1442.91 | 5.81 | 16.31 | 148.93 | 79.36 |
| 2023-10-31 | 2023-07-31 | 2023-04-30 | 2023-01-31 | 2022-10-31 | 2022-07-31 | 2022-04-30 | 2022-01-31 | 2021-10-31 | 2021-07-31 | 2021-04-30 | 2021-01-31 | 2020-10-31 | 2020-07-31 | 2020-04-30 | ||
|---|---|---|---|---|---|---|---|---|---|---|---|---|---|---|---|---|
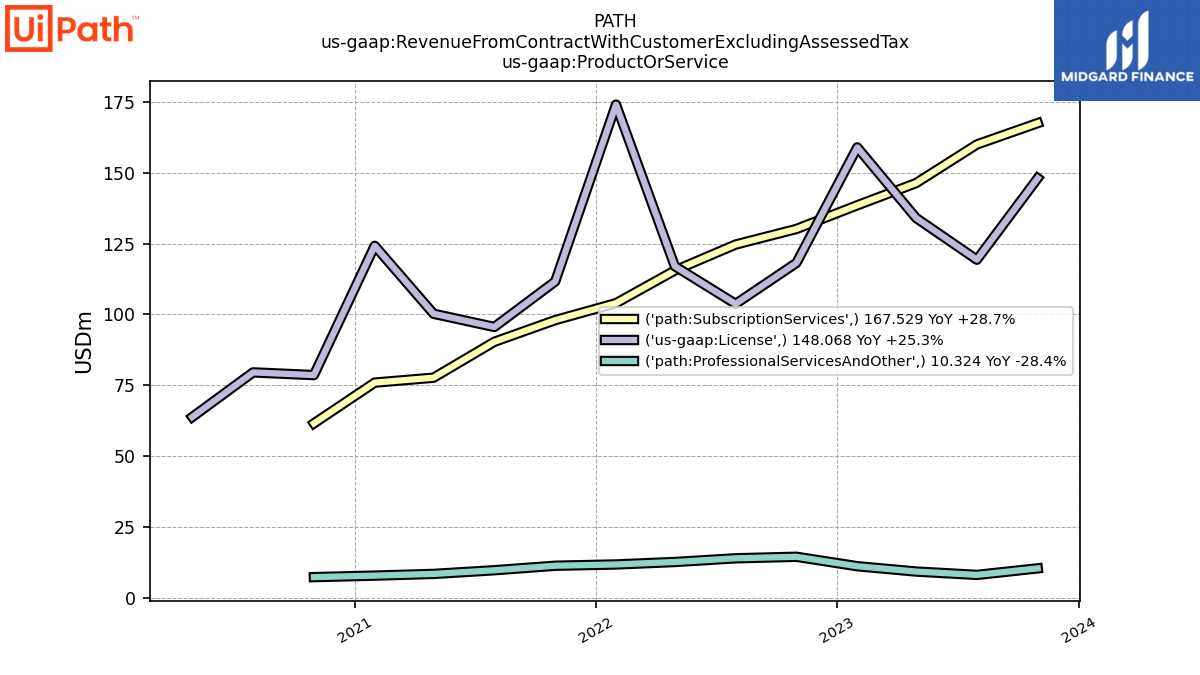
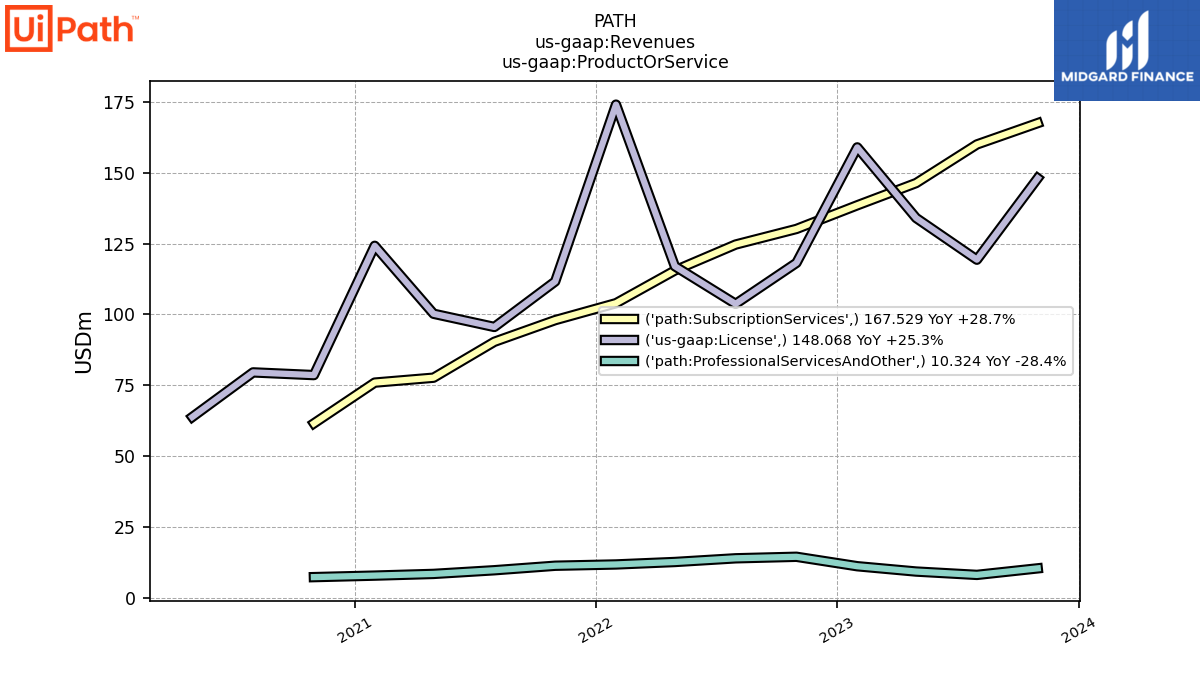
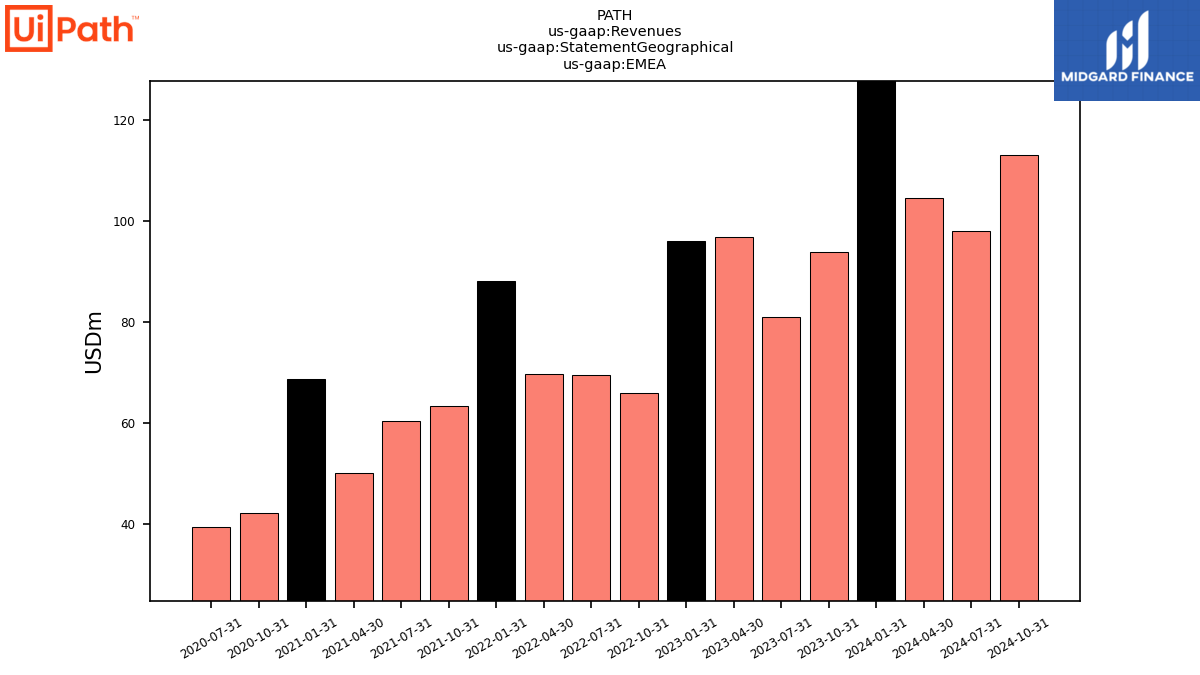
| Revenues | 325.92 | 287.31 | 289.59 | 308.55 | 262.74 | 242.22 | 245.07 | 289.70 | 220.82 | 195.52 | 186.22 | 207.88 | 147.29 | 139.38 | 113.10 | |
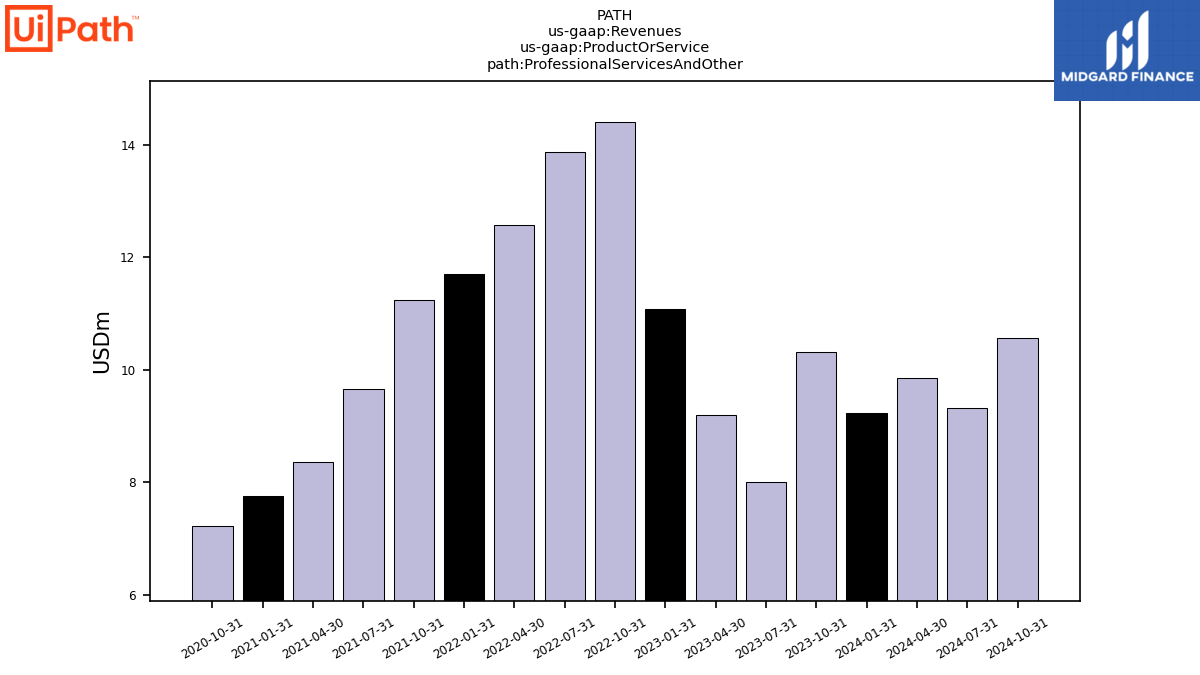
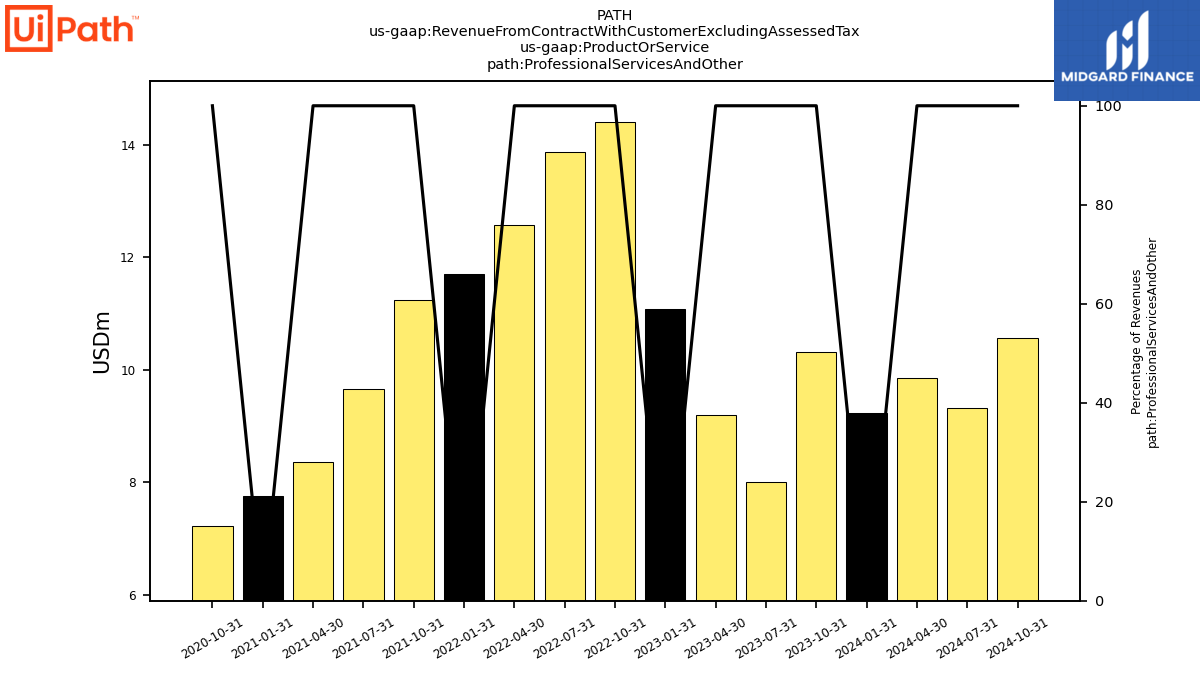
| Professional Services And Other | 10.32 | 8.01 | 9.20 | 11.07 | 14.41 | 13.87 | 12.57 | 11.70 | 11.24 | 9.65 | 8.36 | 7.76 | 7.23 | NA | NA | |
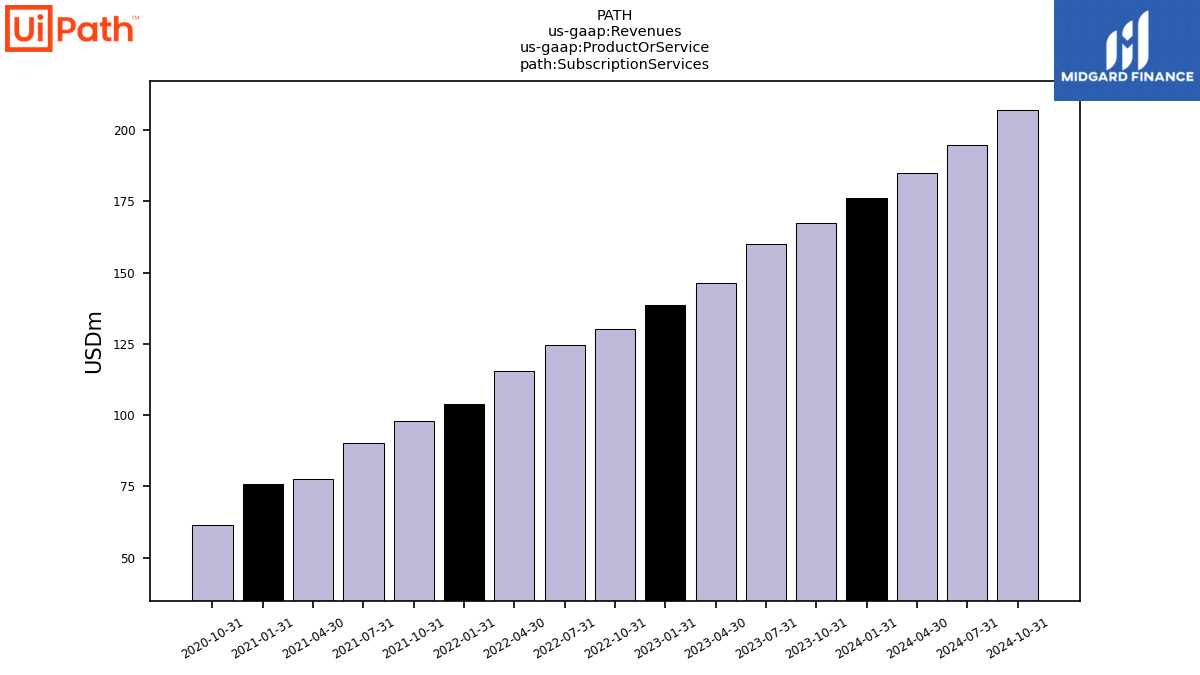
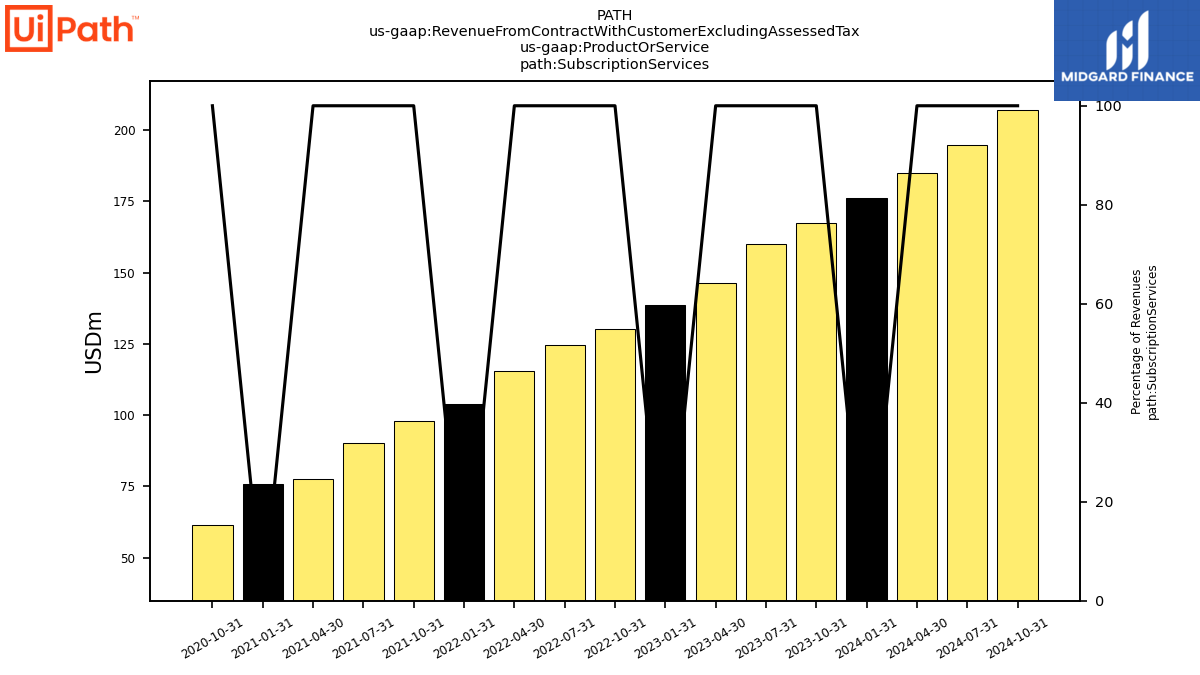
| Subscription Services | 167.53 | 160.00 | 146.35 | 138.51 | 130.16 | 124.66 | 115.49 | 103.94 | 97.96 | 90.32 | 77.64 | 75.91 | 61.51 | NA | NA | |
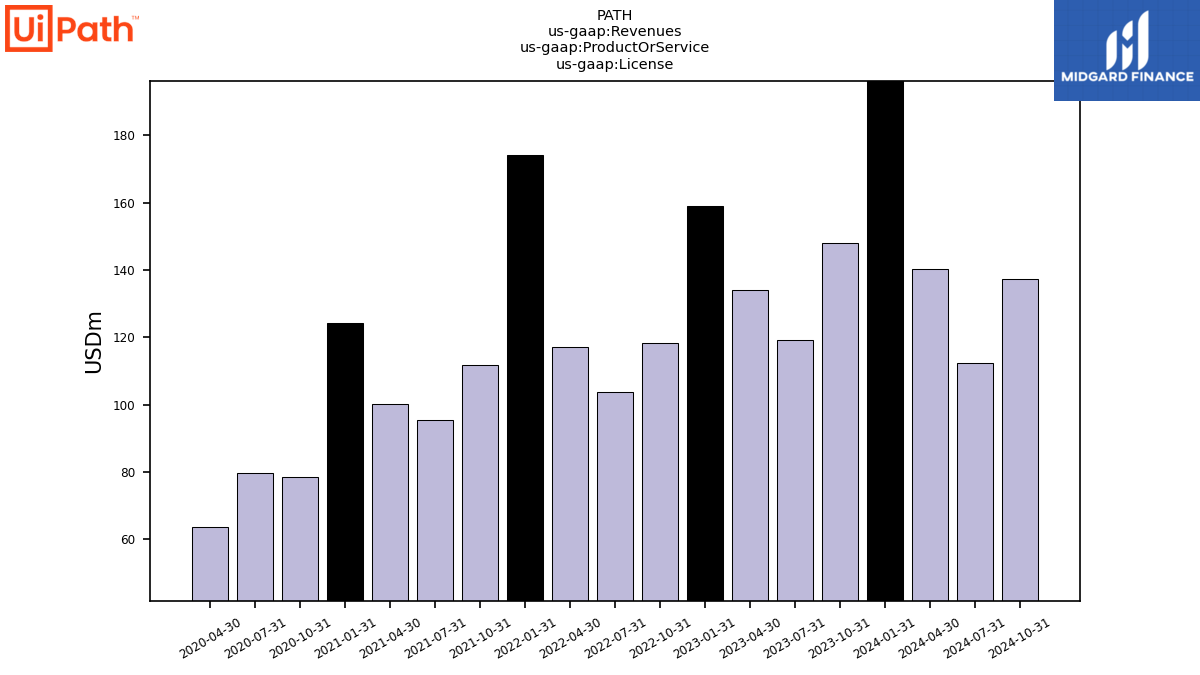
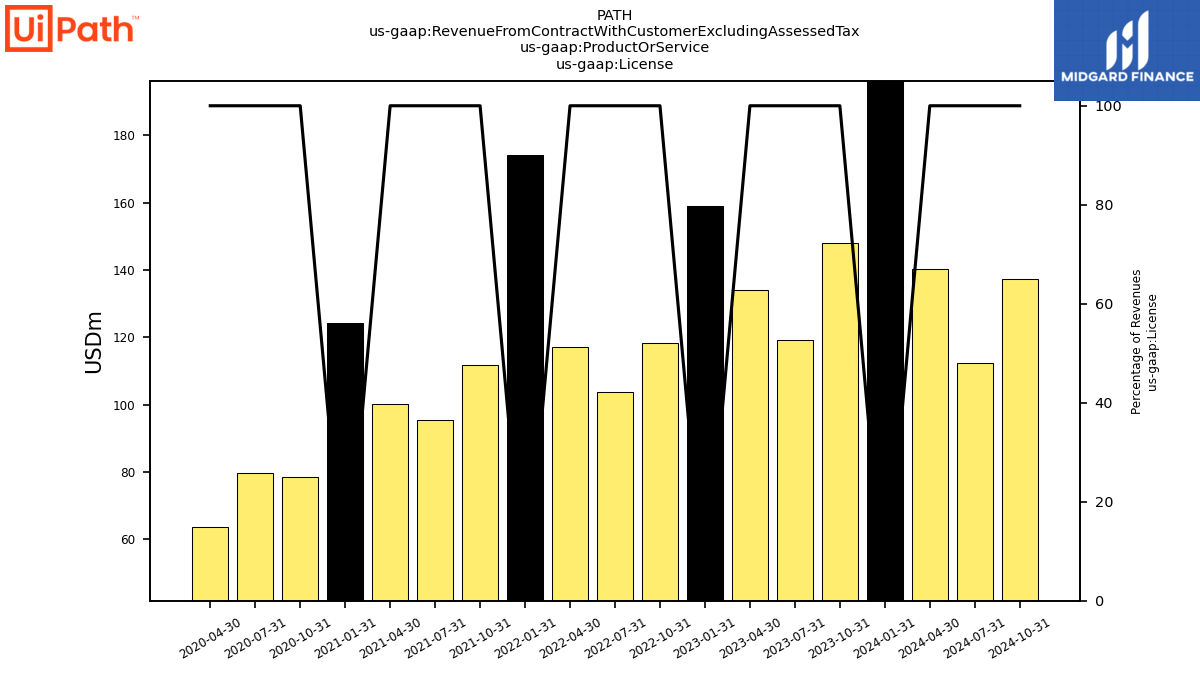
| License | 148.07 | 119.30 | 134.04 | 158.96 | 118.17 | 103.70 | 117.00 | 174.06 | 111.61 | 95.55 | 100.22 | 124.21 | 78.56 | 79.51 | 63.76 | |
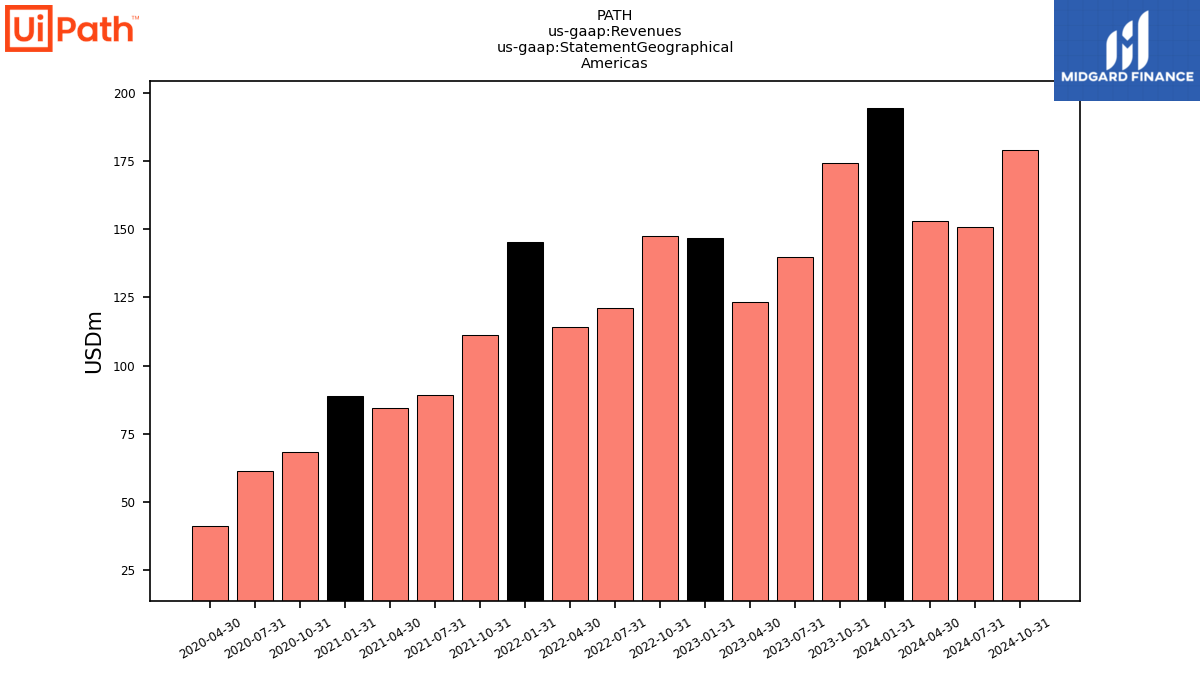
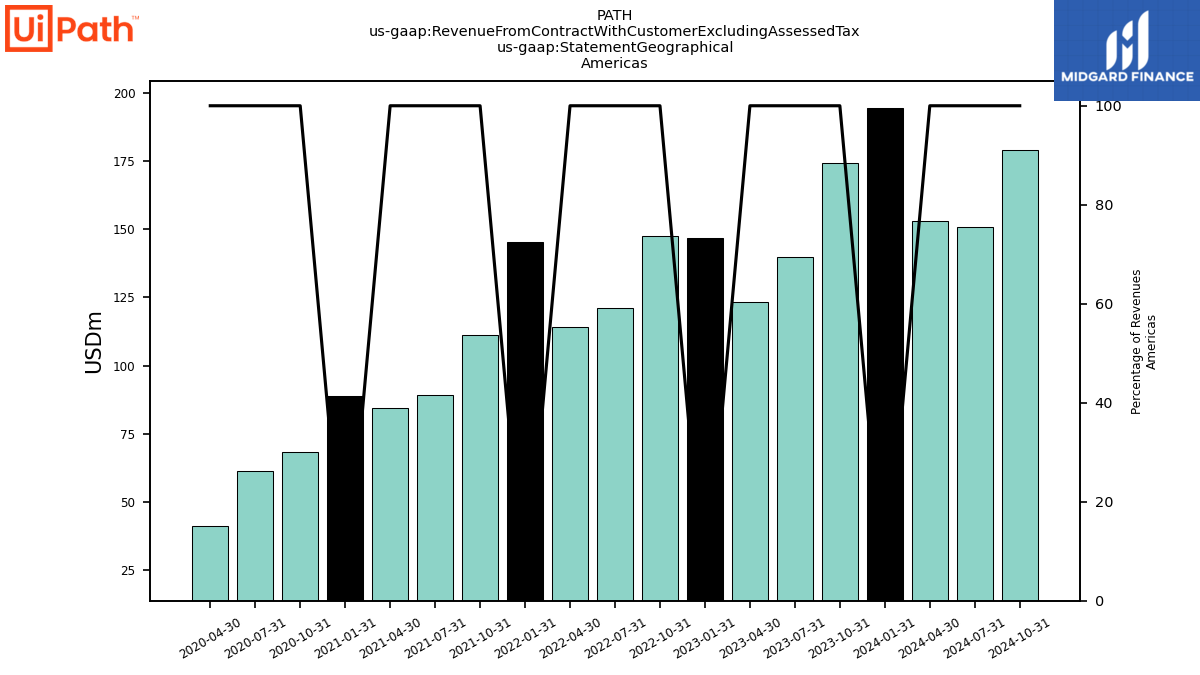
| 174.23 | 139.72 | 123.45 | 146.62 | 147.31 | 120.98 | 114.15 | 145.13 | 111.30 | 89.27 | 84.63 | 88.70 | 68.43 | 61.54 | 41.35 | ||
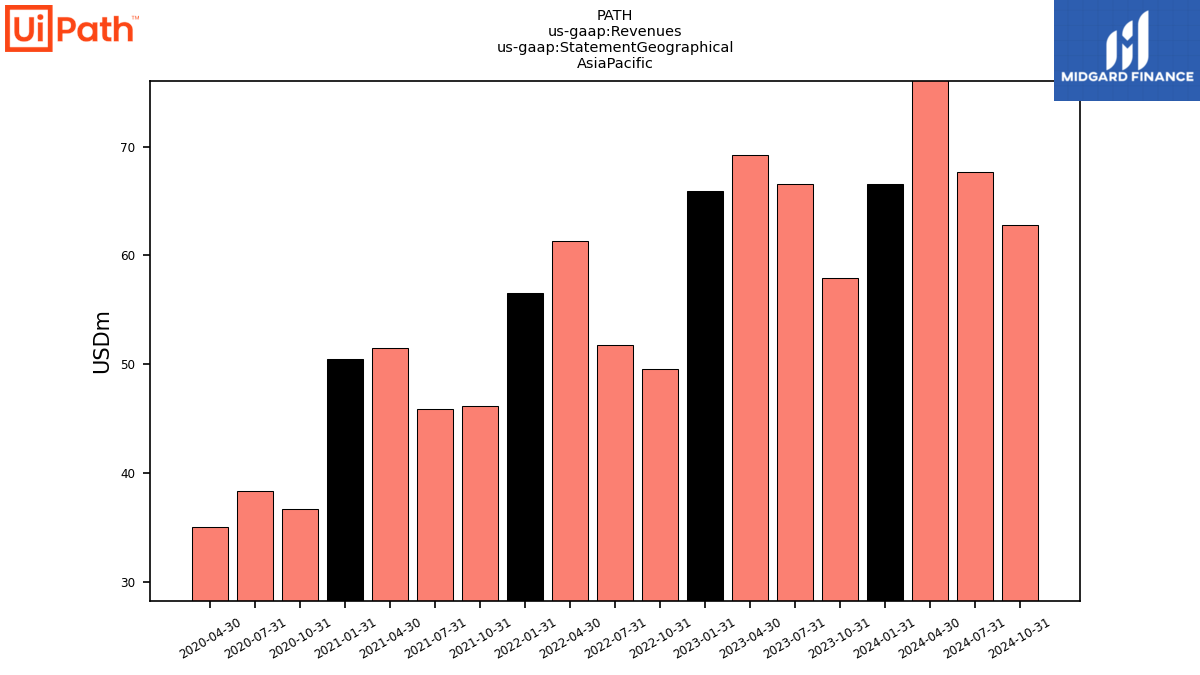
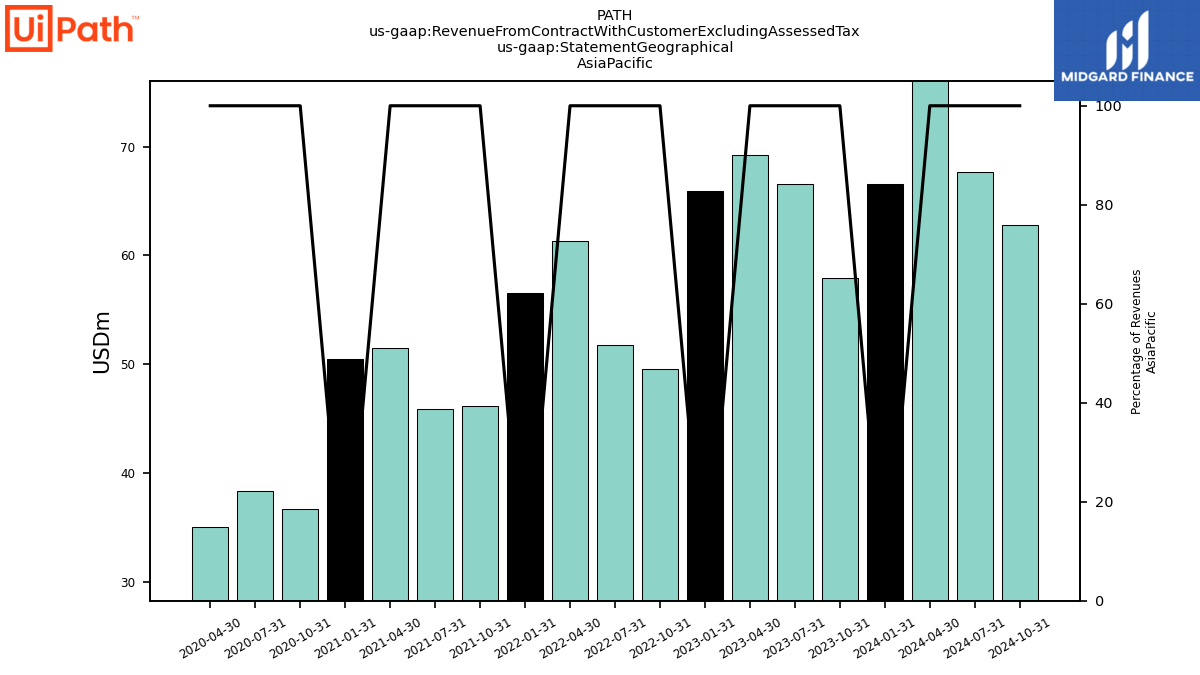
| 57.91 | 66.58 | 69.20 | 65.90 | 49.55 | 51.72 | 61.31 | 56.53 | 46.18 | 45.85 | 51.51 | 50.50 | 36.63 | 38.35 | 35.07 | ||
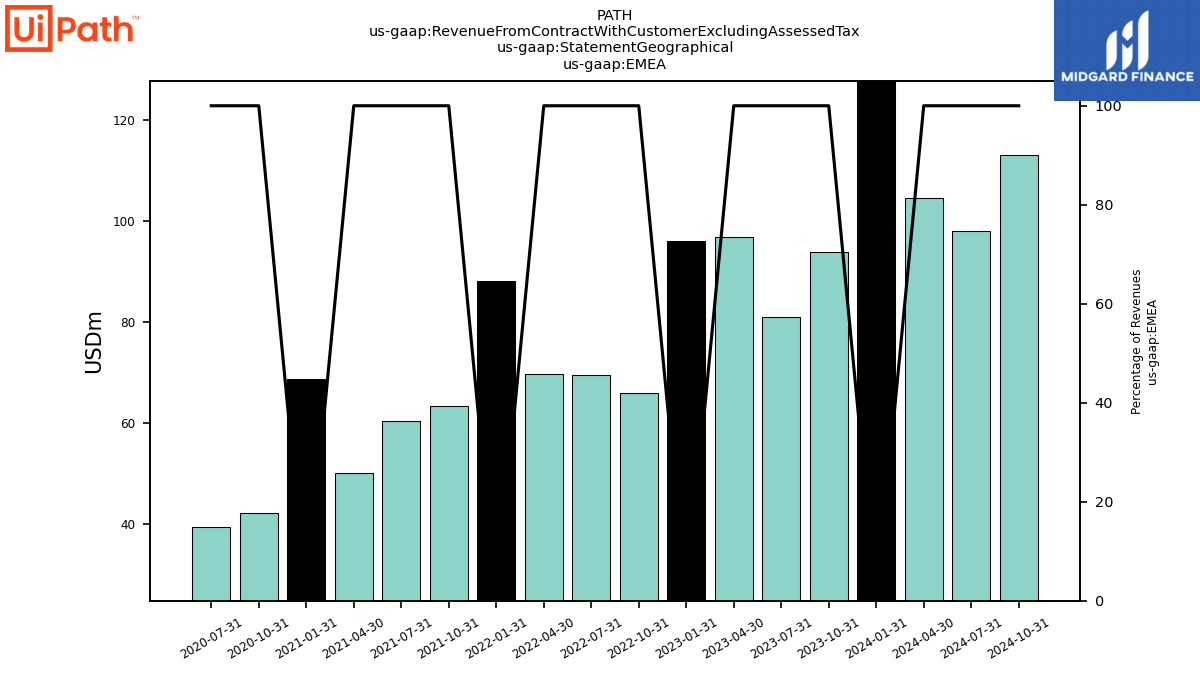
| EMEA | 93.78 | 81.01 | 96.93 | 96.03 | 65.88 | 69.52 | 69.60 | 88.03 | 63.33 | 60.41 | 50.08 | 68.68 | 42.23 | 39.48 | NA | |
| Revenue From Contract With Customer Excluding Assessed Tax | 325.92 | 287.31 | 289.59 | 308.55 | 262.74 | 242.22 | 245.07 | 289.70 | 220.82 | 195.52 | 186.22 | 207.88 | 147.29 | 139.38 | 113.10 | |
| Professional Services And Other | 10.32 | 8.01 | 9.20 | 11.07 | 14.41 | 13.87 | 12.57 | 11.70 | 11.24 | 9.65 | 8.36 | 7.76 | 7.23 | NA | NA | |
| Subscription Services | 167.53 | 160.00 | 146.35 | 138.51 | 130.16 | 124.66 | 115.49 | 103.94 | 97.96 | 90.32 | 77.64 | 75.91 | 61.51 | NA | NA | |
| License | 148.07 | 119.30 | 134.04 | 158.96 | 118.17 | 103.70 | 117.00 | 174.06 | 111.61 | 95.55 | 100.22 | 124.21 | 78.56 | 79.51 | 63.76 | |
| 174.23 | 139.72 | 123.45 | 146.62 | 147.31 | 120.98 | 114.15 | 145.13 | 111.30 | 89.27 | 84.63 | 88.70 | 68.43 | 61.54 | 41.35 | ||
| 57.91 | 66.58 | 69.20 | 65.90 | 49.55 | 51.72 | 61.31 | 56.53 | 46.18 | 45.85 | 51.51 | 50.50 | 36.63 | 38.35 | 35.07 | ||
| EMEA | 93.78 | 81.01 | 96.93 | 96.03 | 65.88 | 69.52 | 69.60 | 88.03 | 63.33 | 60.41 | 50.08 | 68.68 | 42.23 | 39.48 | NA |


