
| 2022-09-30 | 2022-06-30 | 2022-03-31 | 2021-12-31 | 2021-09-30 | 2021-06-30 | 2021-03-31 | 2020-12-31 | 2020-09-30 | 2020-06-30 | 2020-03-31 | 2019-12-31 | 2019-09-30 | 2019-06-30 | 2019-03-31 | 2018-12-31 | 2018-09-30 | 2018-06-30 | 2018-03-31 | 2017-12-31 | 2017-09-30 | 2017-06-30 | 2017-03-31 | 2016-12-31 | 2016-09-30 | 2016-06-30 | 2016-03-31 | 2015-12-31 | 2015-09-30 | 2015-06-30 | 2015-03-31 | 2014-12-31 | 2014-09-30 | 2014-06-30 | 2014-03-31 | 2013-12-31 | 2013-09-30 | 2013-06-30 | 2013-03-31 | ||
|---|---|---|---|---|---|---|---|---|---|---|---|---|---|---|---|---|---|---|---|---|---|---|---|---|---|---|---|---|---|---|---|---|---|---|---|---|---|---|---|---|
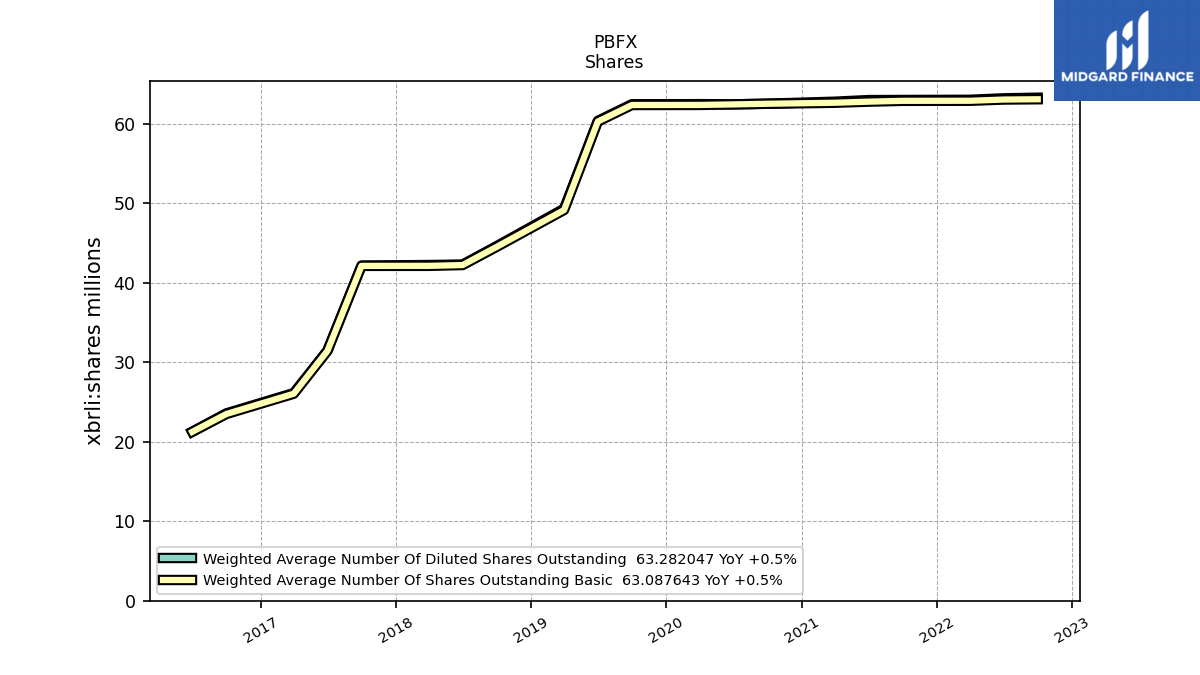
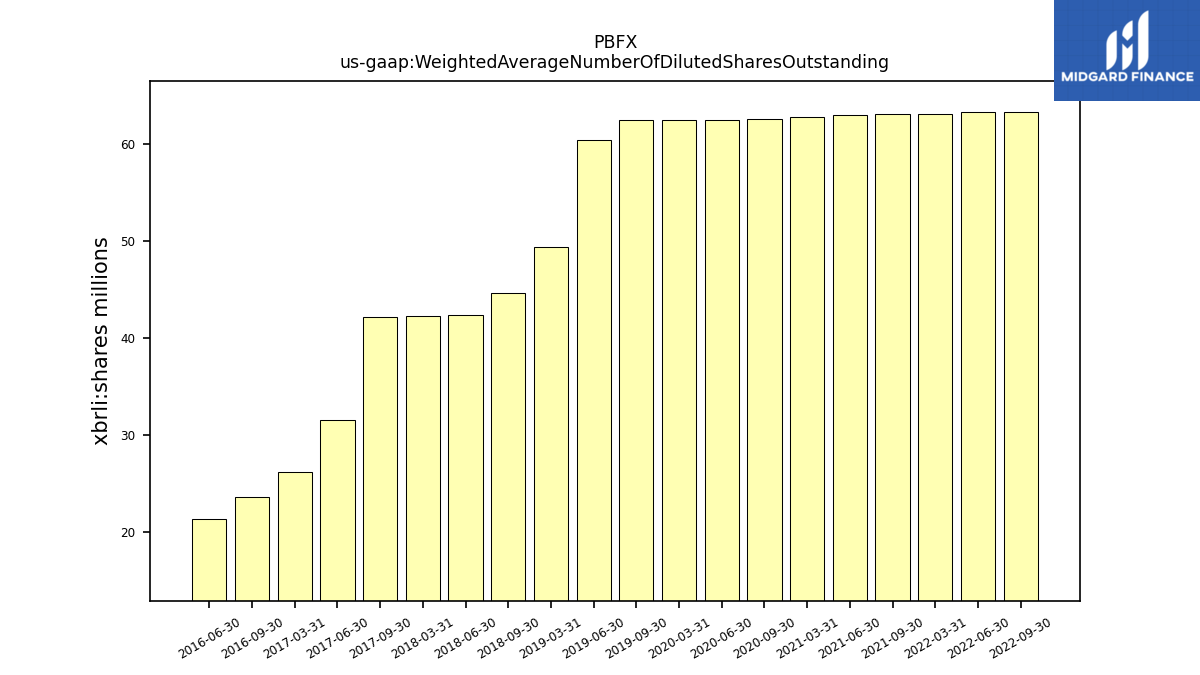
| Weighted Average Number Of Diluted Shares Outstanding | 63.28 | 63.21 | 63.02 | NA | 63.00 | 62.98 | 62.78 | NA | 62.53 | 62.45 | 62.47 | NA | 62.46 | 60.36 | 49.32 | NA | 44.61 | 42.29 | 42.24 | NA | 42.16 | 31.49 | 26.13 | NA | 23.57 | 21.26 | NA | NA | NA | NA | NA | NA | NA | NA | NA | NA | NA | NA | NA | |
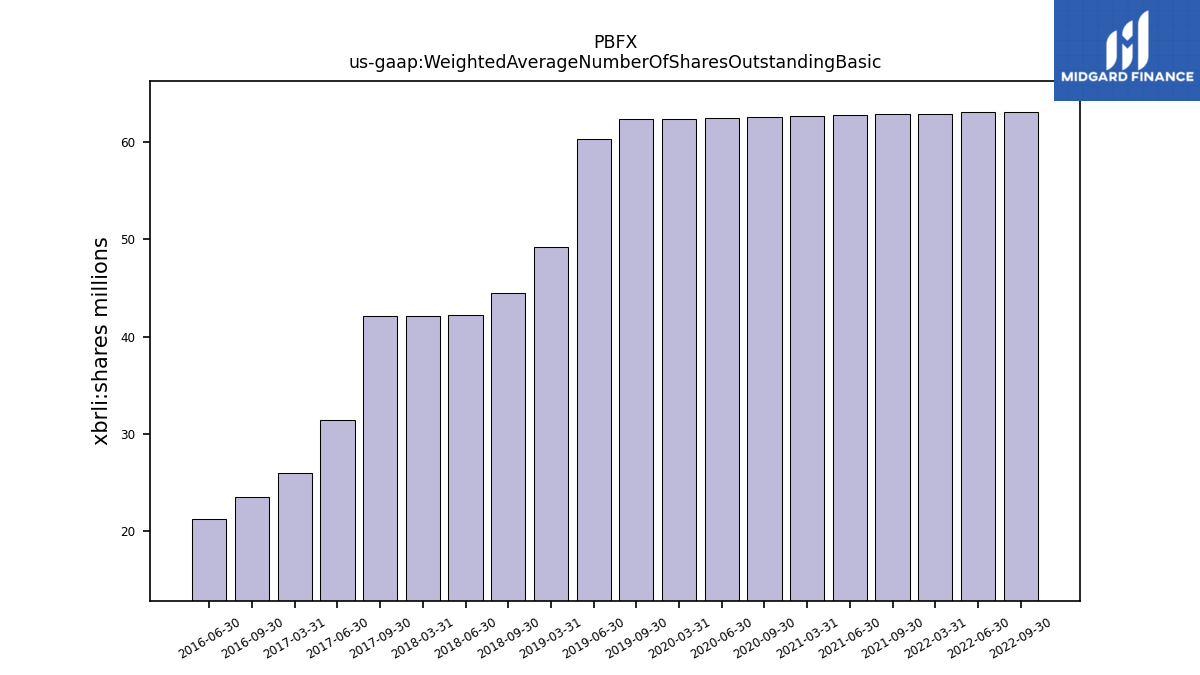
| Weighted Average Number Of Shares Outstanding Basic | 63.09 | 63.05 | 62.90 | NA | 62.89 | 62.79 | 62.65 | NA | 62.52 | 62.44 | 62.37 | NA | 62.36 | 60.28 | 49.15 | NA | 44.52 | 42.23 | 42.13 | NA | 42.13 | 31.43 | 26.04 | NA | 23.49 | 21.25 | NA | NA | NA | NA | NA | NA | NA | NA | NA | NA | NA | NA | NA | |
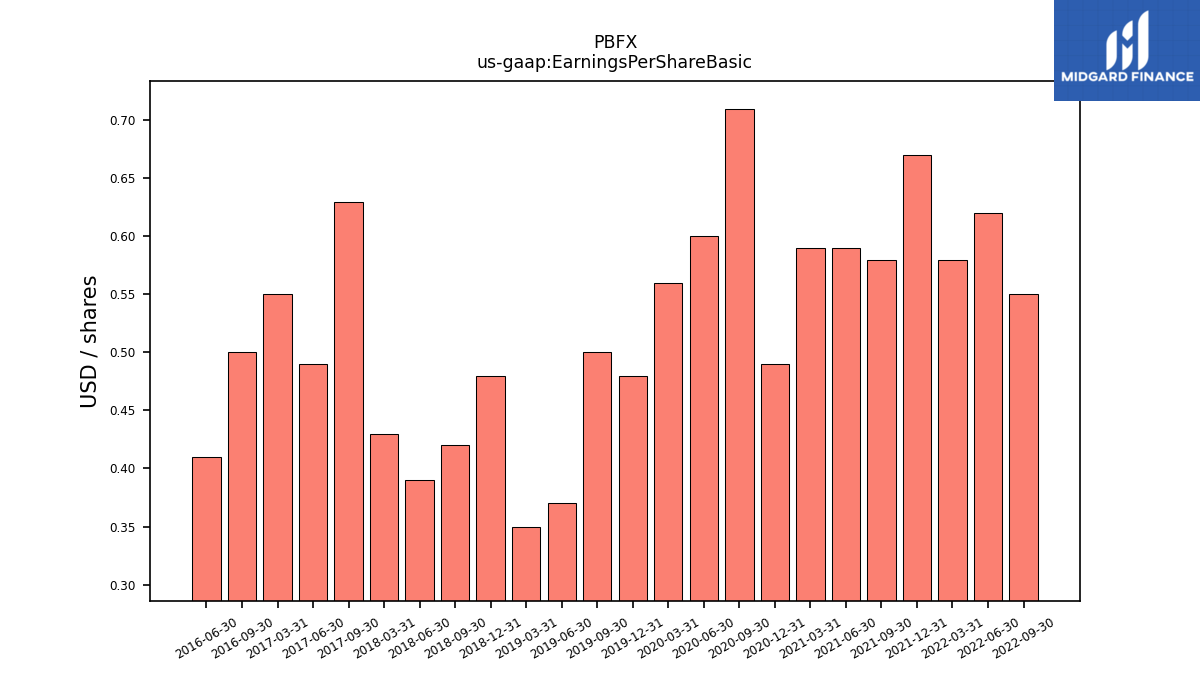
| Earnings Per Share Basic | 0.55 | 0.62 | 0.58 | 0.67 | 0.58 | 0.59 | 0.59 | 0.49 | 0.71 | 0.60 | 0.56 | 0.48 | 0.50 | 0.37 | 0.35 | 0.48 | 0.42 | 0.39 | 0.43 | NA | 0.63 | 0.49 | 0.55 | NA | 0.50 | 0.41 | NA | NA | NA | NA | NA | NA | NA | NA | NA | NA | NA | NA | NA | |
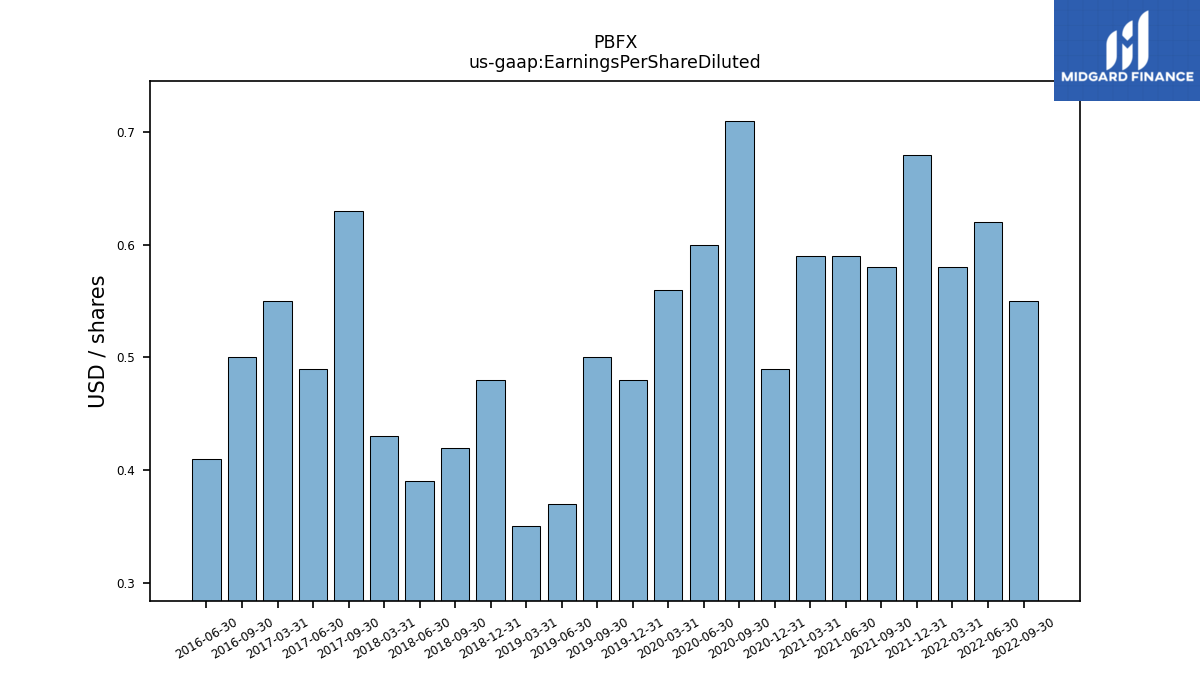
| Earnings Per Share Diluted | 0.55 | 0.62 | 0.58 | 0.68 | 0.58 | 0.59 | 0.59 | 0.49 | 0.71 | 0.60 | 0.56 | 0.48 | 0.50 | 0.37 | 0.35 | 0.48 | 0.42 | 0.39 | 0.43 | NA | 0.63 | 0.49 | 0.55 | NA | 0.50 | 0.41 | NA | NA | NA | NA | NA | NA | NA | NA | NA | NA | NA | NA | NA |
| 2022-09-30 | 2022-06-30 | 2022-03-31 | 2021-12-31 | 2021-09-30 | 2021-06-30 | 2021-03-31 | 2020-12-31 | 2020-09-30 | 2020-06-30 | 2020-03-31 | 2019-12-31 | 2019-09-30 | 2019-06-30 | 2019-03-31 | 2018-12-31 | 2018-09-30 | 2018-06-30 | 2018-03-31 | 2017-12-31 | 2017-09-30 | 2017-06-30 | 2017-03-31 | 2016-12-31 | 2016-09-30 | 2016-06-30 | 2016-03-31 | 2015-12-31 | 2015-09-30 | 2015-06-30 | 2015-03-31 | 2014-12-31 | 2014-09-30 | 2014-06-30 | 2014-03-31 | 2013-12-31 | 2013-09-30 | 2013-06-30 | 2013-03-31 | ||
|---|---|---|---|---|---|---|---|---|---|---|---|---|---|---|---|---|---|---|---|---|---|---|---|---|---|---|---|---|---|---|---|---|---|---|---|---|---|---|---|---|
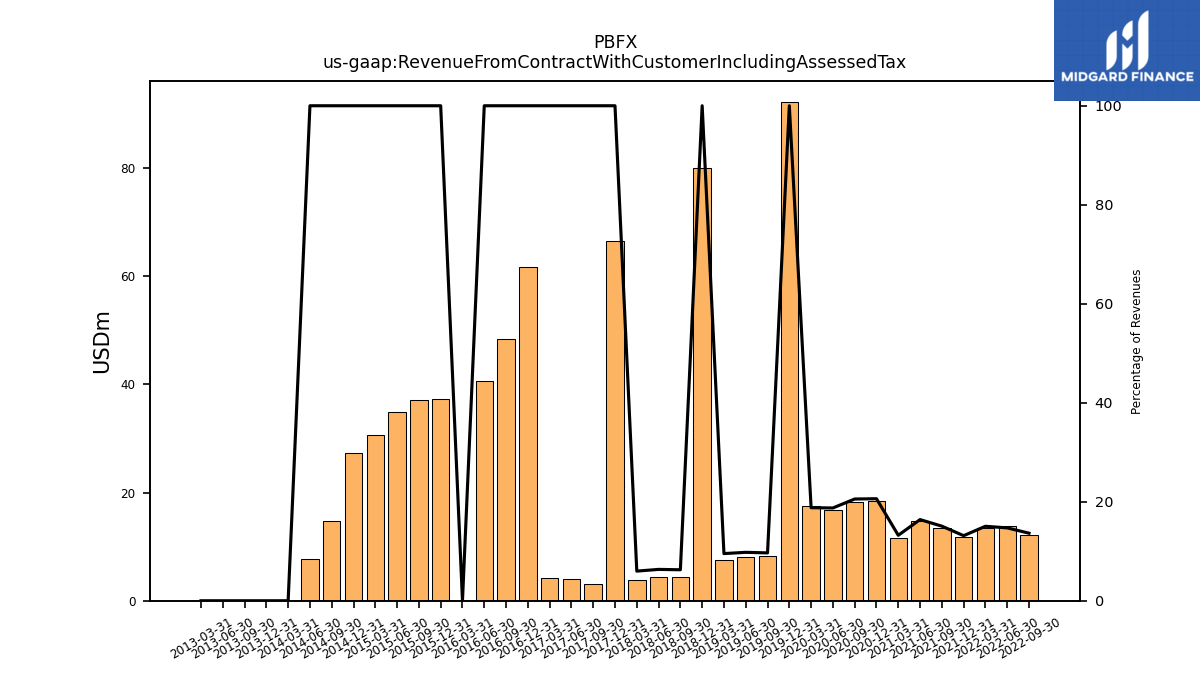
| Revenue From Contract With Customer Including Assessed Tax | 12.22 | 13.74 | 13.46 | 11.74 | 13.39 | 14.73 | 11.57 | 18.36 | 18.29 | 16.71 | 17.49 | 92.24 | 8.35 | 8.09 | 7.51 | 80.05 | 4.42 | 4.31 | 3.88 | 66.51 | 3.13 | 3.97 | 4.28 | 61.69 | 48.43 | 40.66 | 0.00 | 37.31 | 37.08 | 34.87 | 30.57 | 27.30 | 14.74 | 7.78 | 0.00 | 0.00 | 0.00 | 0.00 | 0.00 | |
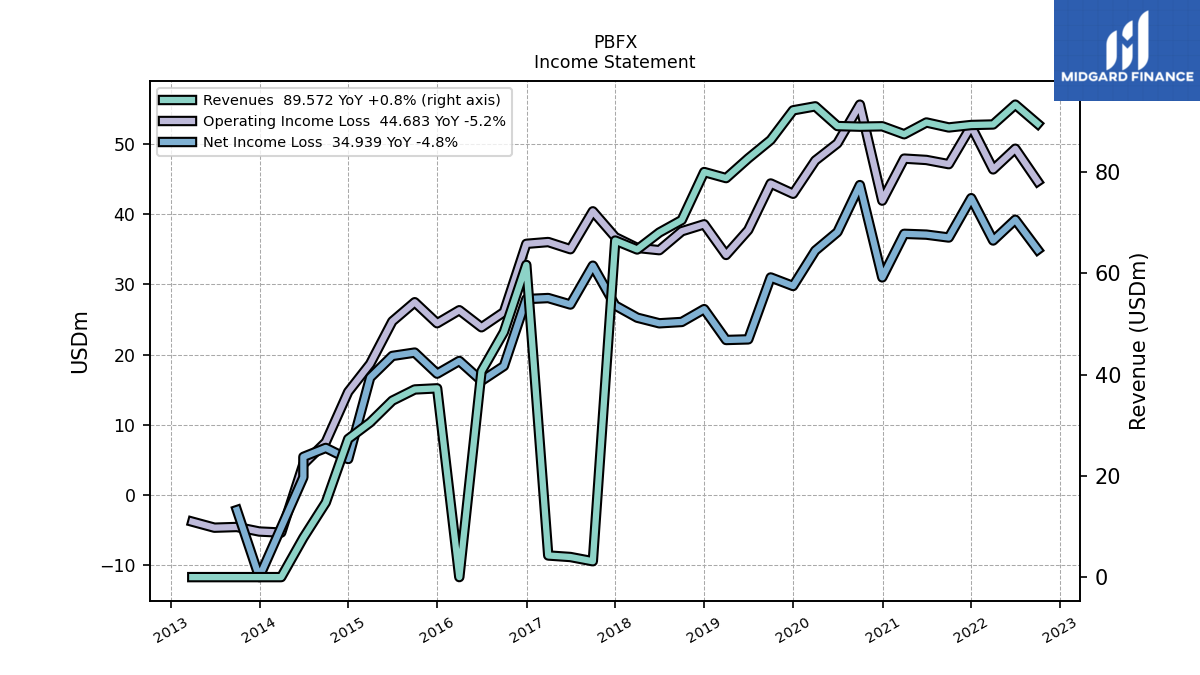
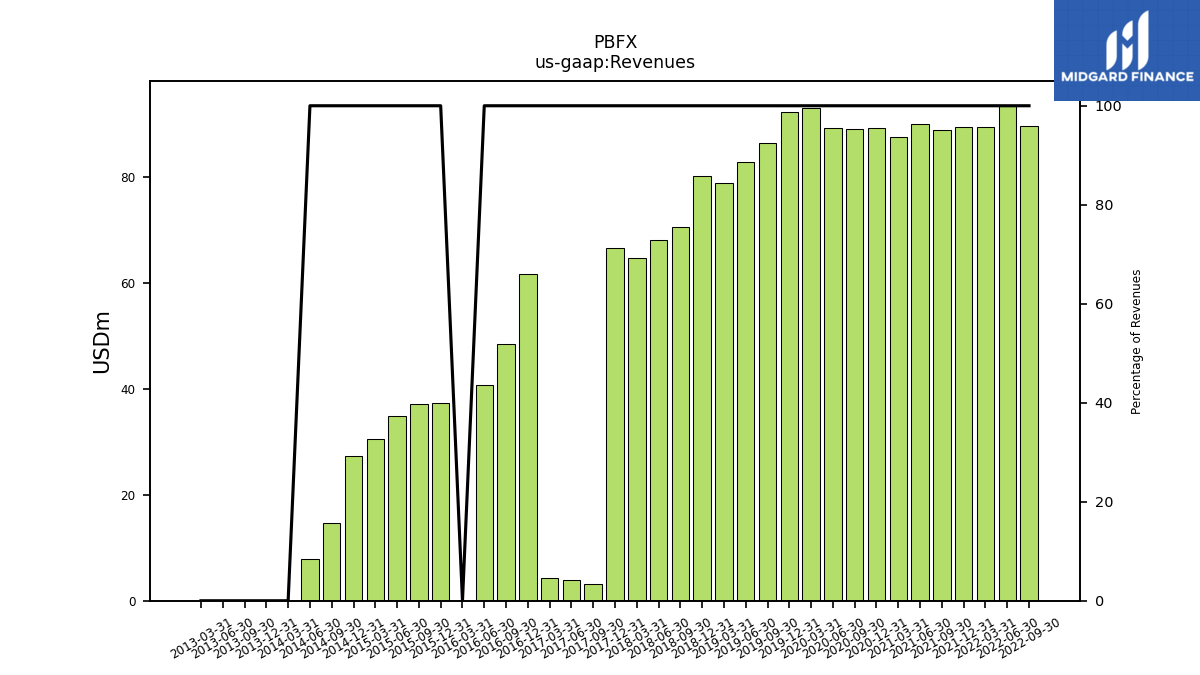
| Revenues | 89.57 | 93.37 | 89.44 | 89.34 | 88.85 | 89.84 | 87.50 | 89.09 | 89.01 | 89.13 | 93.03 | 92.24 | 86.38 | 82.75 | 78.84 | 80.05 | 70.56 | 68.10 | 64.74 | 66.51 | 3.13 | 3.97 | 4.28 | 61.69 | 48.43 | 40.66 | 0.00 | 37.31 | 37.08 | 34.87 | 30.57 | 27.30 | 14.74 | 7.78 | 0.00 | 0.00 | 0.00 | 0.00 | 0.00 | |
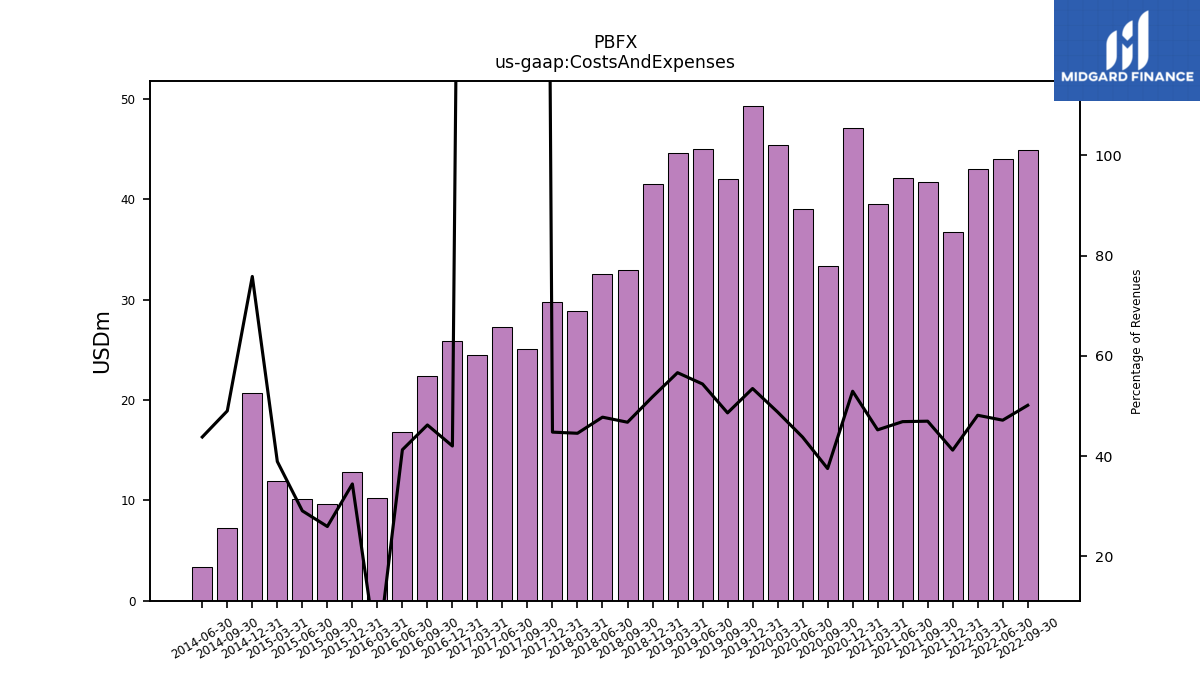
| Costs And Expenses | 44.89 | 44.02 | 43.05 | 36.79 | 41.72 | 42.10 | 39.57 | 47.15 | 33.38 | 39.01 | 45.38 | 49.32 | 41.99 | 44.99 | 44.65 | 41.47 | 32.98 | 32.52 | 28.83 | 29.78 | 25.07 | 27.31 | 24.44 | 25.91 | 22.37 | 16.77 | 10.23 | 12.84 | 9.62 | 10.13 | 11.89 | 20.70 | 7.22 | 3.41 | NA | NA | NA | NA | NA | |
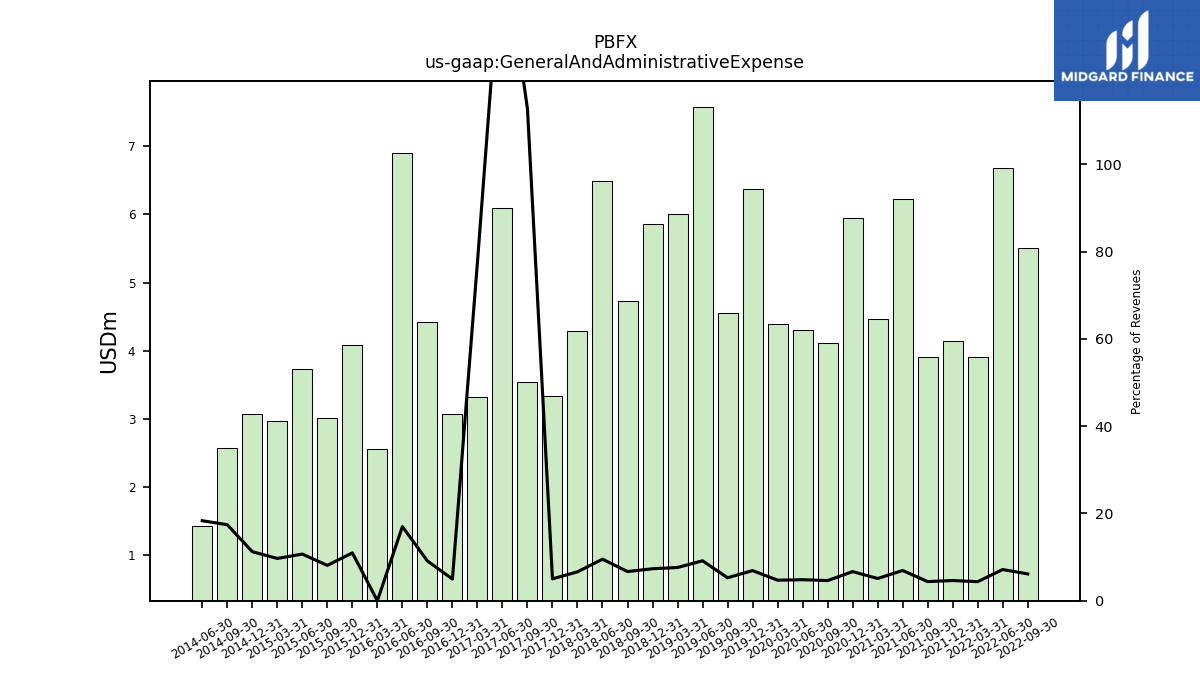
| General And Administrative Expense | 5.51 | 6.68 | 3.91 | 4.14 | 3.90 | 6.23 | 4.46 | 5.95 | 4.11 | 4.30 | 4.39 | 6.37 | 4.55 | 7.58 | 6.01 | 5.87 | 4.72 | 6.49 | 4.29 | 3.34 | 3.53 | 6.10 | 3.31 | 3.07 | 4.42 | 6.91 | 2.56 | 4.09 | 3.01 | 3.73 | 2.96 | 3.07 | 2.57 | 1.43 | NA | NA | NA | NA | NA | |
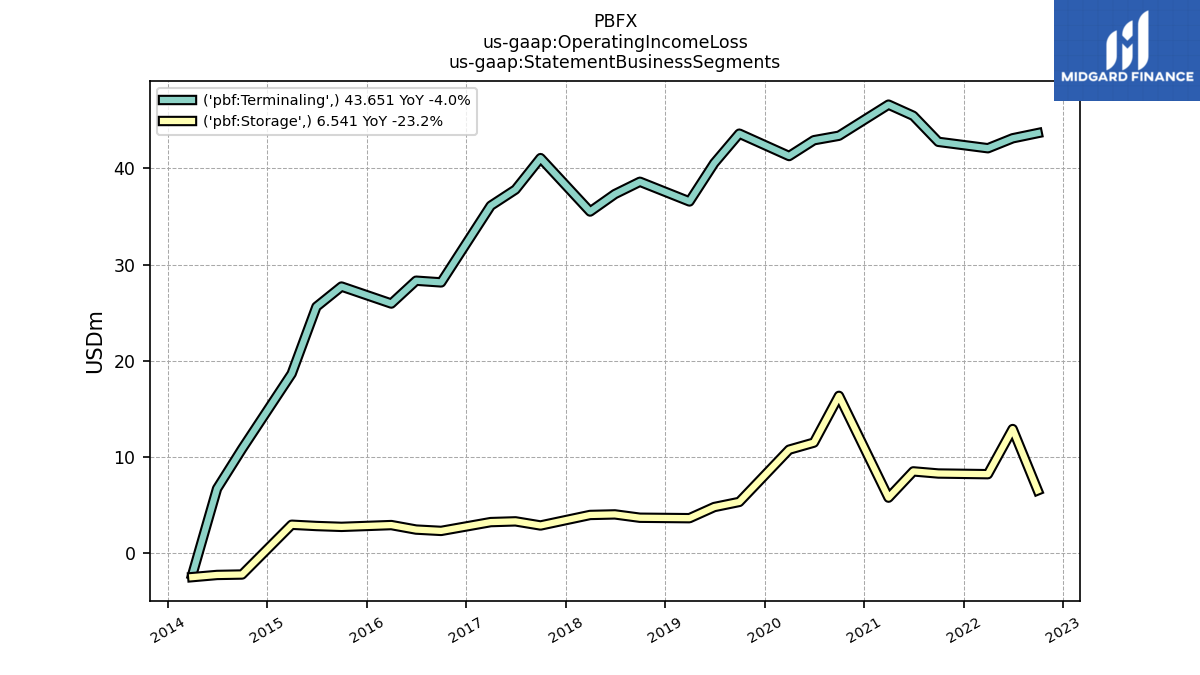
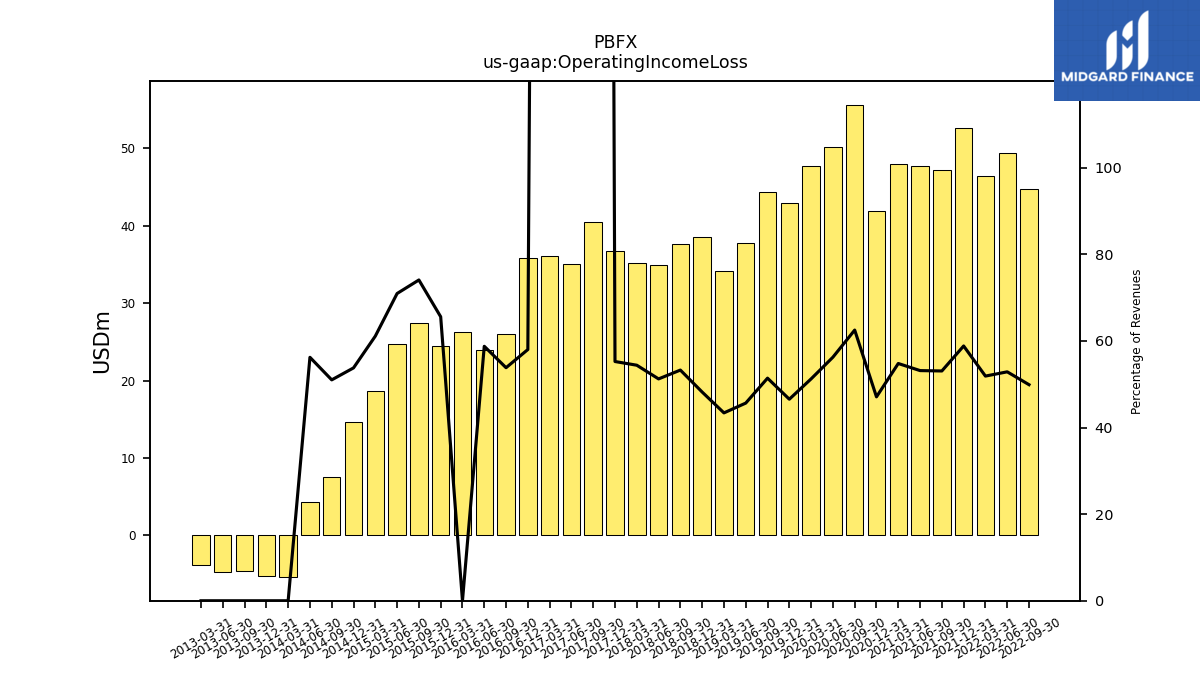
| Operating Income Loss | 44.68 | 49.35 | 46.40 | 52.55 | 47.14 | 47.74 | 47.93 | 41.94 | 55.63 | 50.12 | 47.65 | 42.92 | 44.39 | 37.76 | 34.20 | 38.57 | 37.58 | 34.88 | 35.20 | 36.74 | 40.42 | 35.02 | 36.04 | 35.78 | 26.06 | 23.89 | 26.32 | 24.46 | 27.46 | 24.73 | 18.67 | 14.68 | 7.52 | 4.37 | -5.38 | -5.22 | -4.58 | -4.68 | -3.82 | |
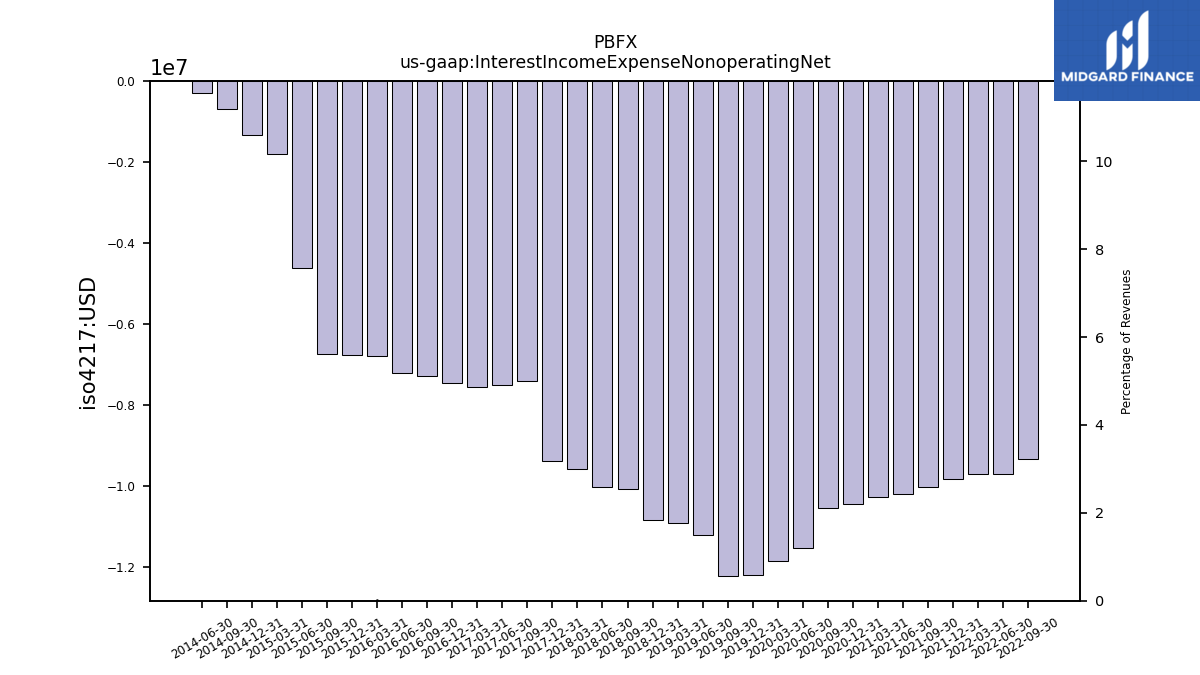
| Interest Income Expense Nonoperating Net | -9.33 | -9.71 | -9.71 | -9.83 | -10.03 | -10.21 | -10.29 | -10.45 | -10.54 | -11.54 | -11.85 | -12.20 | -12.23 | -11.22 | -10.91 | -10.86 | -10.07 | -10.03 | -9.59 | -9.38 | -7.42 | -7.51 | -7.57 | -7.46 | -7.28 | -7.21 | -6.81 | -6.76 | -6.76 | -4.62 | -1.80 | -1.34 | -0.68 | -0.29 | NA | NA | NA | NA | NA | |
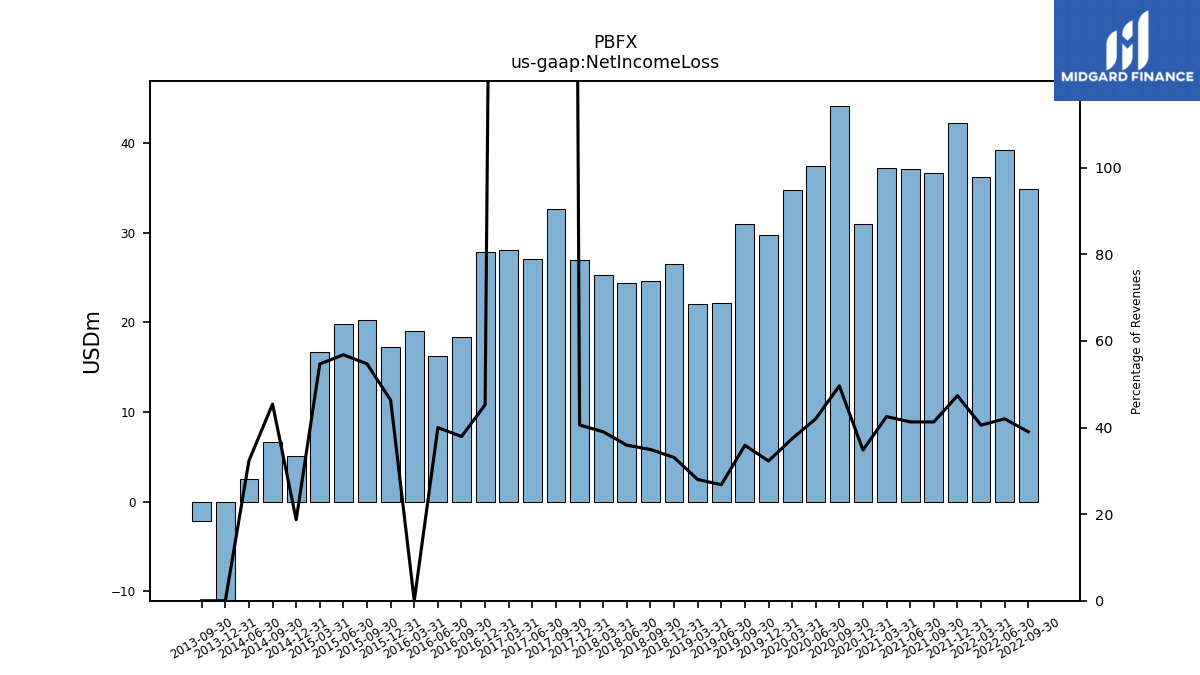
| Net Income Loss | 34.94 | 39.22 | 36.26 | 42.30 | 36.68 | 37.10 | 37.21 | 31.00 | 44.16 | 37.46 | 34.81 | 29.77 | 30.99 | 22.17 | 22.08 | 26.48 | 24.65 | 24.45 | 25.26 | 26.99 | 32.67 | 27.13 | 28.06 | 27.91 | 18.36 | 16.25 | 19.09 | 17.27 | 20.28 | 19.80 | 16.71 | 5.11 | 6.70 | 2.52 | NA | -11.72 | -2.17 | NA | NA |
| 2022-09-30 | 2022-06-30 | 2022-03-31 | 2021-12-31 | 2021-09-30 | 2021-06-30 | 2021-03-31 | 2020-12-31 | 2020-09-30 | 2020-06-30 | 2020-03-31 | 2019-12-31 | 2019-09-30 | 2019-06-30 | 2019-03-31 | 2018-12-31 | 2018-09-30 | 2018-06-30 | 2018-03-31 | 2017-12-31 | 2017-09-30 | 2017-06-30 | 2017-03-31 | 2016-12-31 | 2016-09-30 | 2016-06-30 | 2016-03-31 | 2015-12-31 | 2015-09-30 | 2015-06-30 | 2015-03-31 | 2014-12-31 | 2014-09-30 | 2014-06-30 | 2014-03-31 | 2013-12-31 | 2013-09-30 | 2013-06-30 | 2013-03-31 | ||
|---|---|---|---|---|---|---|---|---|---|---|---|---|---|---|---|---|---|---|---|---|---|---|---|---|---|---|---|---|---|---|---|---|---|---|---|---|---|---|---|---|
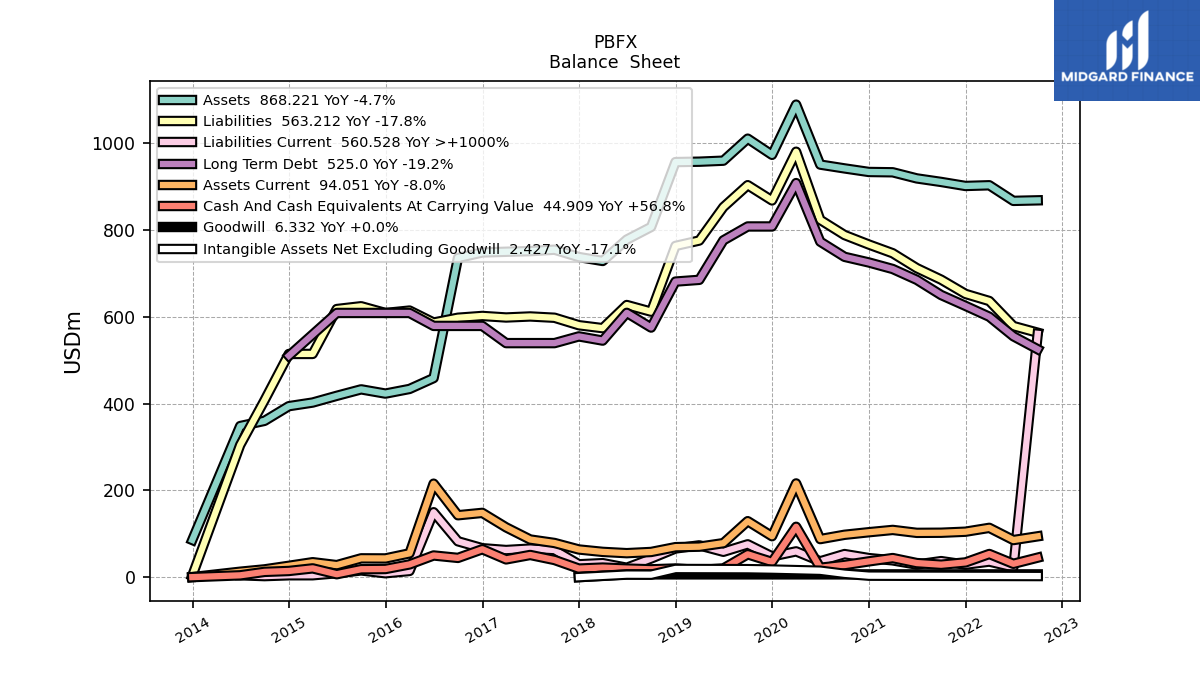
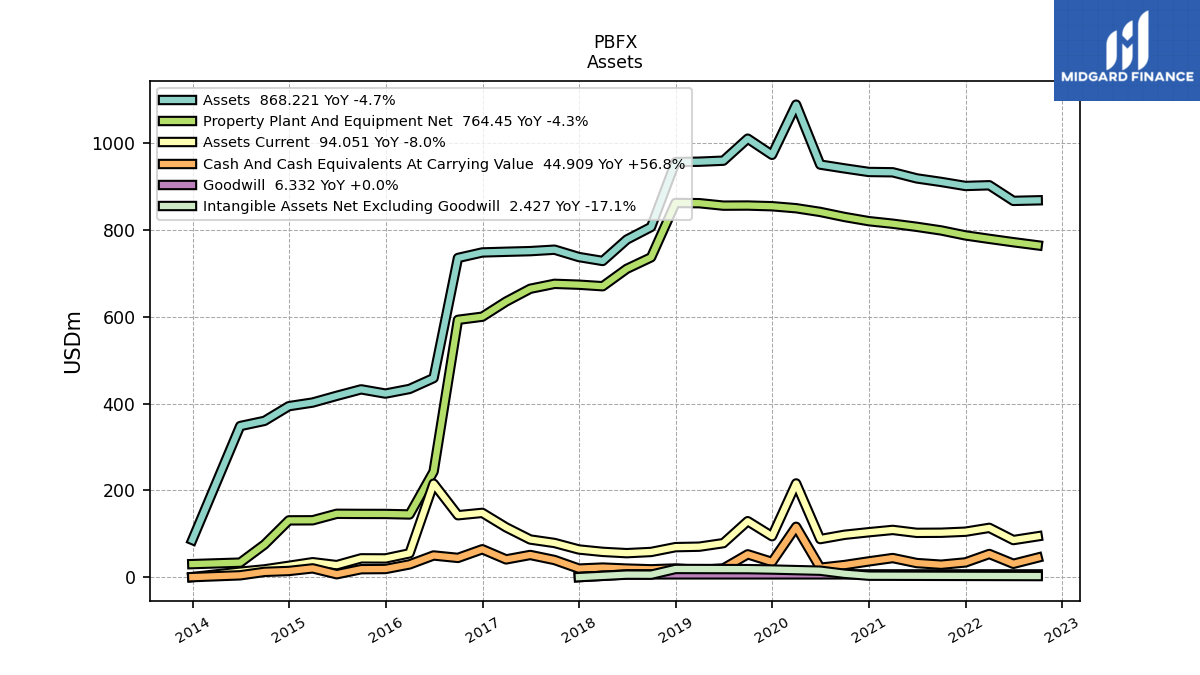
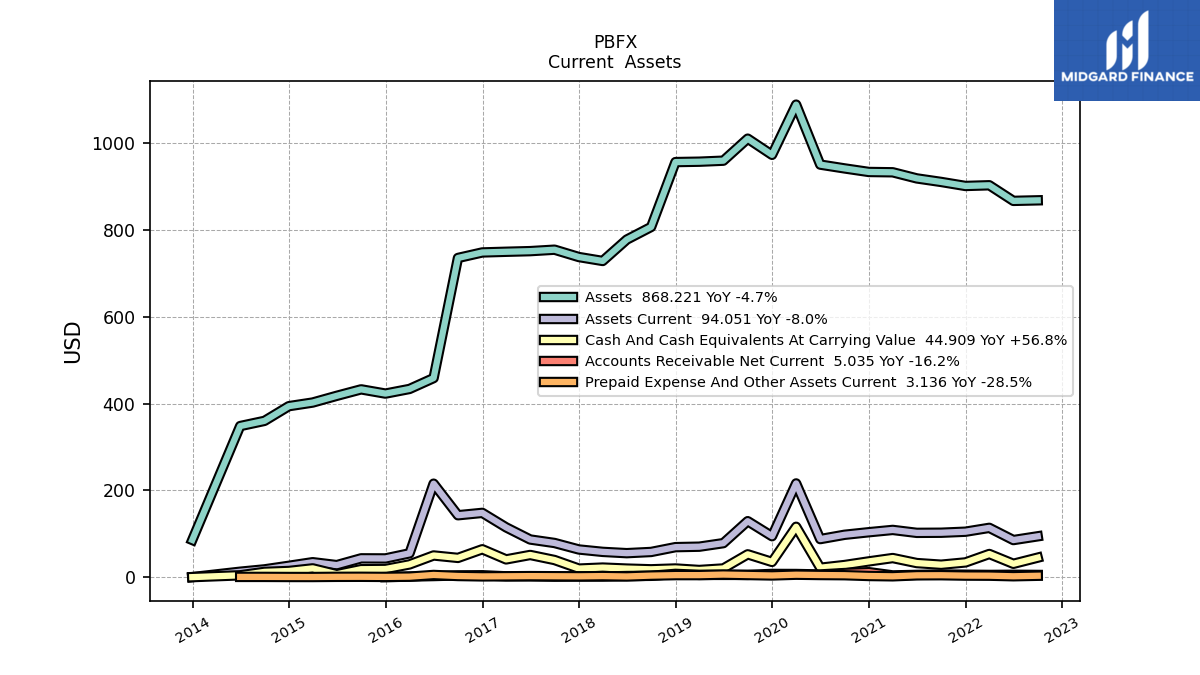
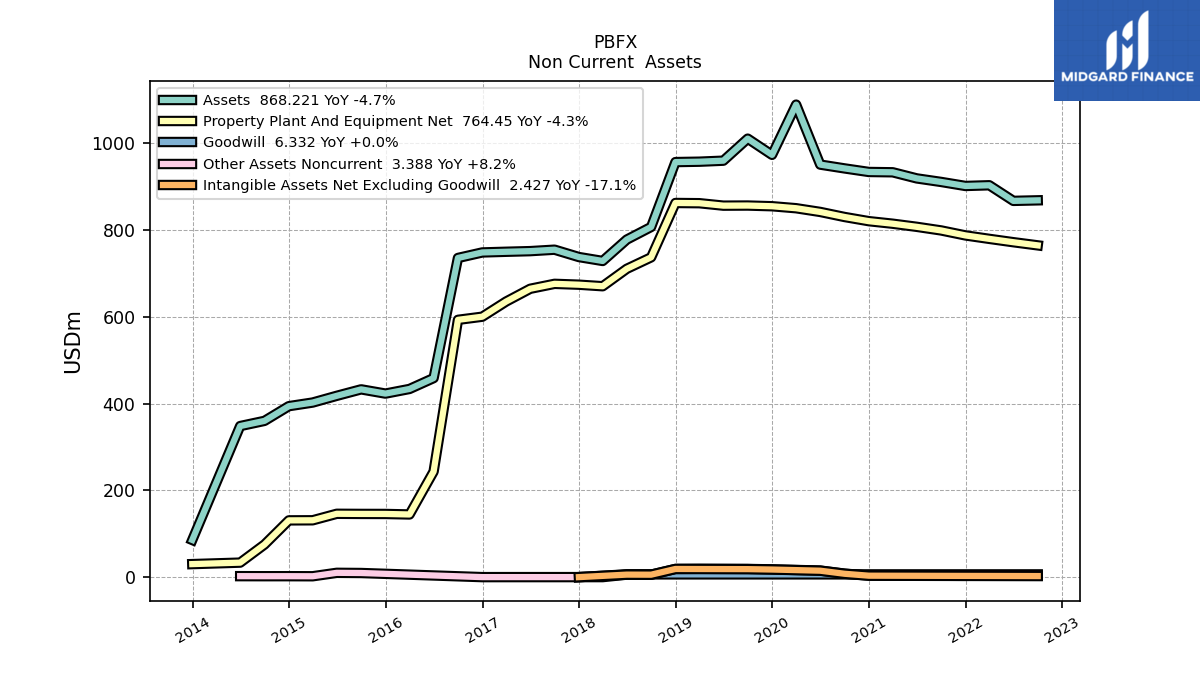
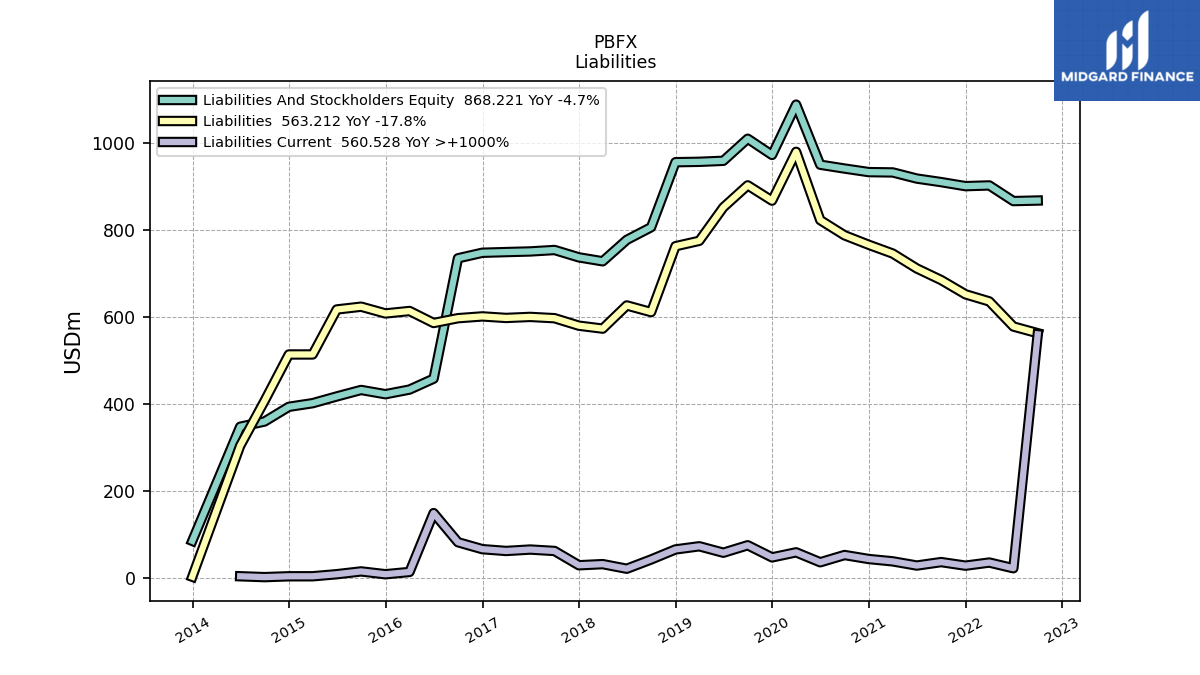
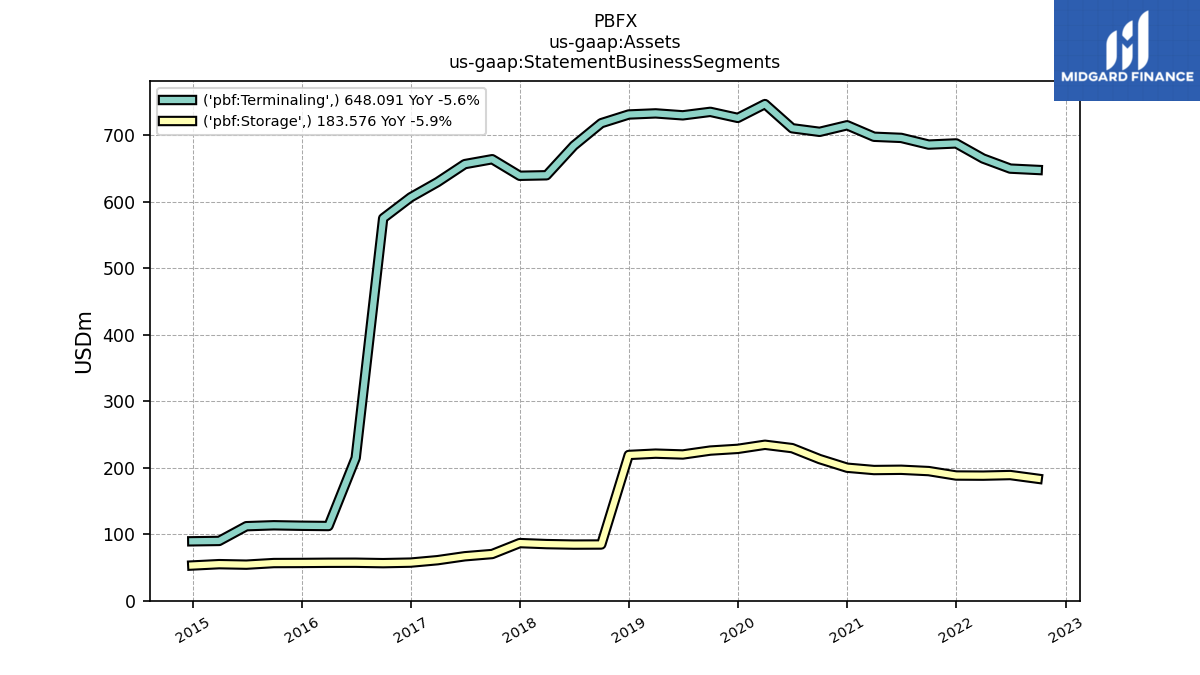
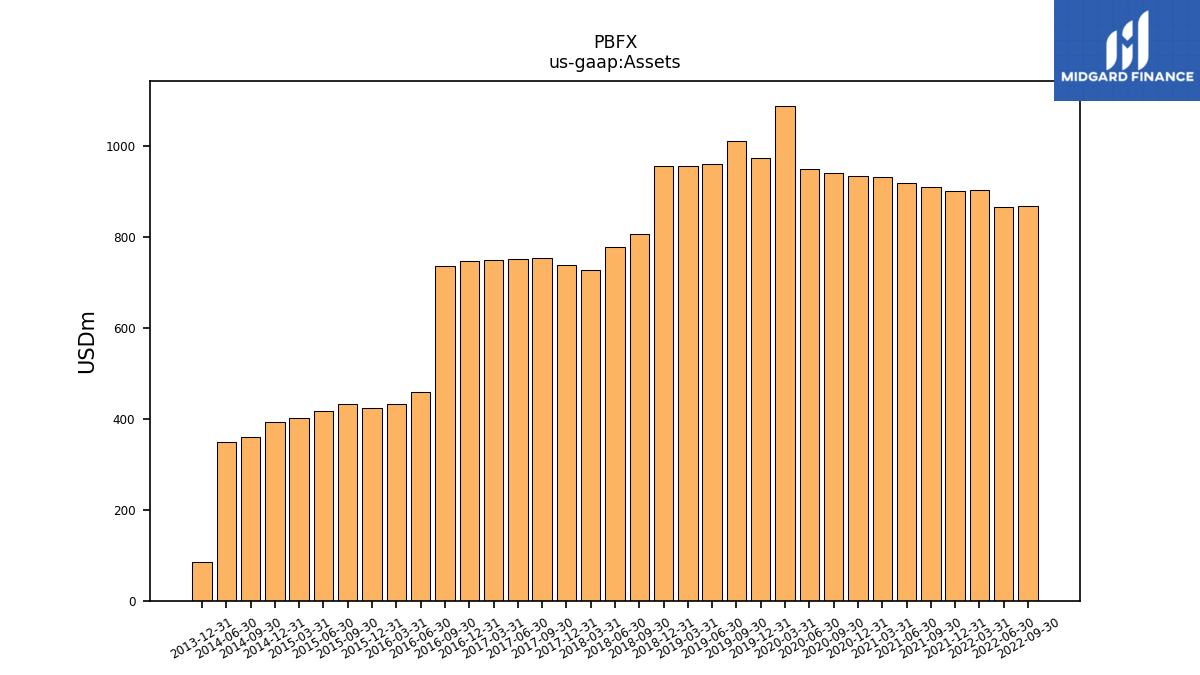
| Assets | 868.22 | 866.95 | 902.95 | 901.30 | 910.58 | 918.74 | 932.84 | 933.55 | 941.77 | 950.54 | 1088.74 | 973.00 | 1010.33 | 959.57 | 957.25 | 956.35 | 806.85 | 777.76 | 728.48 | 737.55 | 754.48 | 751.15 | 749.70 | 748.13 | 735.41 | 458.58 | 433.58 | 422.90 | 432.66 | 417.77 | 402.28 | 393.95 | 360.05 | 348.09 | NA | 85.63 | NA | NA | NA | |
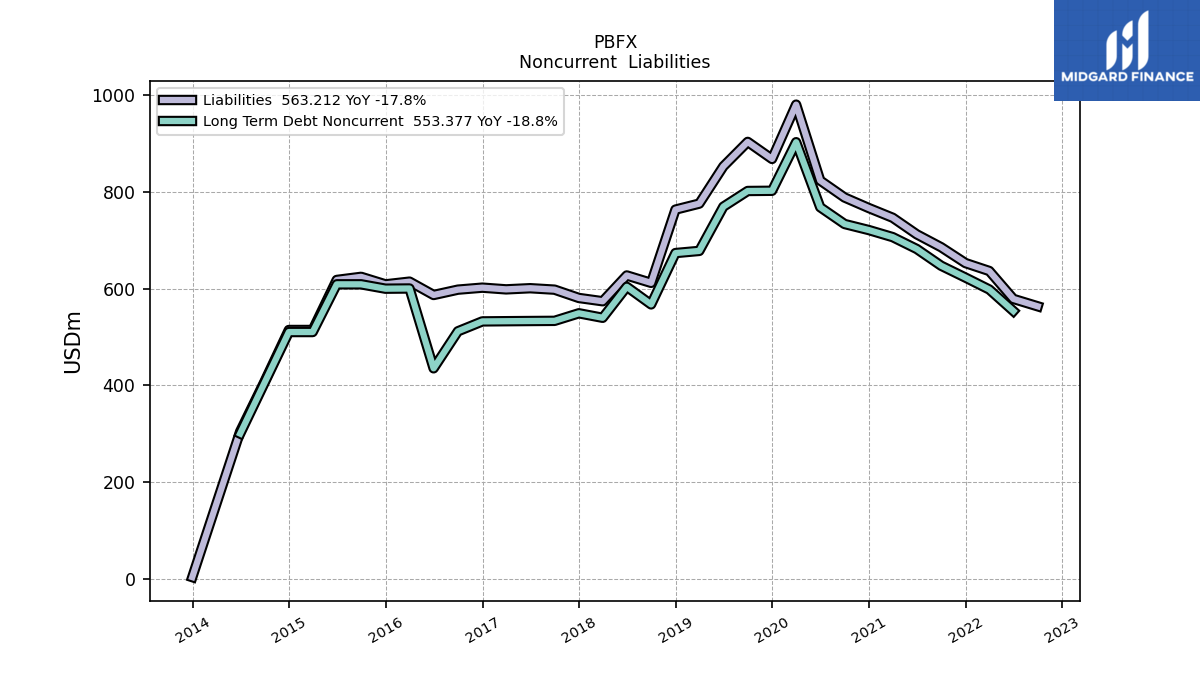
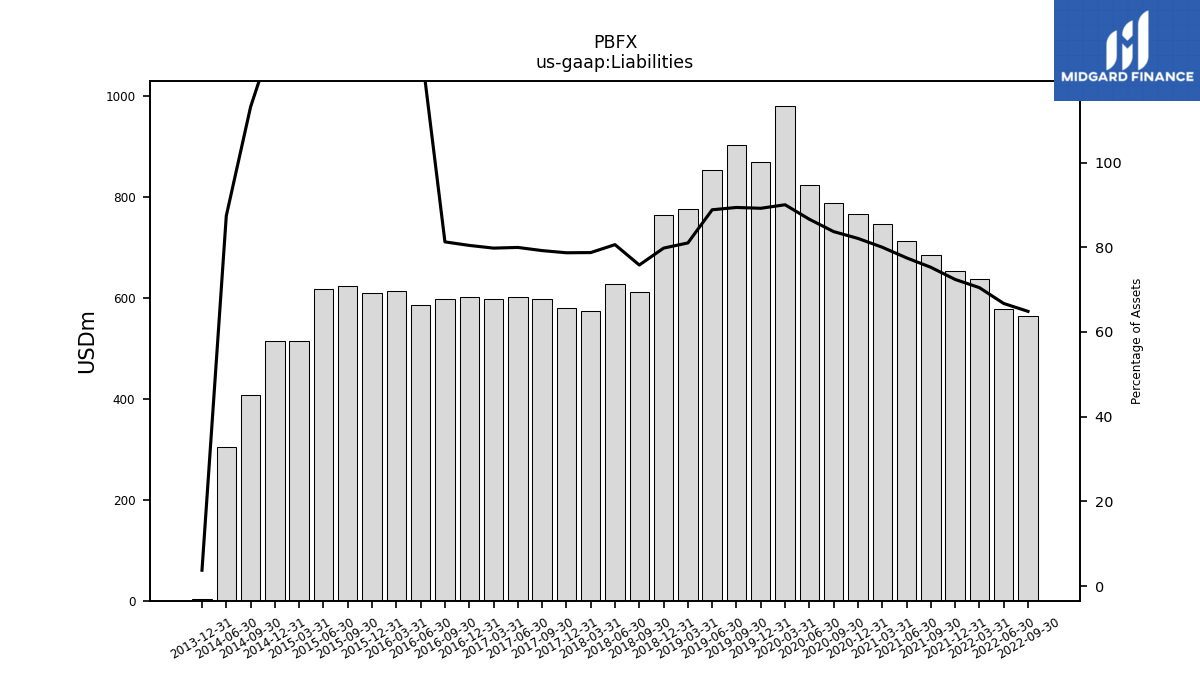
| Liabilities | 563.21 | 578.53 | 636.26 | 652.60 | 685.40 | 712.02 | 746.33 | 766.34 | 788.21 | 823.30 | 980.25 | 867.92 | 903.19 | 852.58 | 775.57 | 763.16 | 611.66 | 627.01 | 573.66 | 580.46 | 597.65 | 600.63 | 598.25 | 601.79 | 597.66 | 586.60 | 614.24 | 608.58 | 624.15 | 617.71 | 514.28 | 514.24 | 407.32 | 304.29 | NA | 3.22 | NA | NA | NA | |
| Liabilities And Stockholders Equity | 868.22 | 866.95 | 902.95 | 901.30 | 910.58 | 918.74 | 932.84 | 933.55 | 941.77 | 950.54 | 1088.74 | 973.00 | 1010.33 | 959.57 | 957.25 | 956.35 | 806.85 | 777.76 | 728.48 | 737.55 | 754.48 | 751.15 | 749.70 | 748.13 | 735.41 | 458.58 | 433.58 | 422.90 | 432.66 | 417.77 | 402.28 | 393.95 | 360.05 | 348.09 | NA | 85.63 | NA | NA | NA |
| 2022-09-30 | 2022-06-30 | 2022-03-31 | 2021-12-31 | 2021-09-30 | 2021-06-30 | 2021-03-31 | 2020-12-31 | 2020-09-30 | 2020-06-30 | 2020-03-31 | 2019-12-31 | 2019-09-30 | 2019-06-30 | 2019-03-31 | 2018-12-31 | 2018-09-30 | 2018-06-30 | 2018-03-31 | 2017-12-31 | 2017-09-30 | 2017-06-30 | 2017-03-31 | 2016-12-31 | 2016-09-30 | 2016-06-30 | 2016-03-31 | 2015-12-31 | 2015-09-30 | 2015-06-30 | 2015-03-31 | 2014-12-31 | 2014-09-30 | 2014-06-30 | 2014-03-31 | 2013-12-31 | 2013-09-30 | 2013-06-30 | 2013-03-31 | ||
|---|---|---|---|---|---|---|---|---|---|---|---|---|---|---|---|---|---|---|---|---|---|---|---|---|---|---|---|---|---|---|---|---|---|---|---|---|---|---|---|---|
| Assets Current | 94.05 | 85.41 | 113.56 | 104.65 | 102.28 | 102.00 | 108.76 | 103.48 | 97.56 | 87.61 | 215.91 | 94.20 | 128.97 | 78.29 | 70.14 | 69.07 | 57.98 | 55.20 | 58.19 | 63.70 | 78.65 | 86.69 | 114.66 | 148.06 | 142.56 | 215.39 | 54.81 | 43.10 | 43.28 | 27.66 | 34.37 | 26.09 | 17.87 | 12.45 | NA | 0.00 | NA | NA | NA | |
| Cash And Cash Equivalents At Carrying Value | 44.91 | 30.70 | 53.33 | 33.90 | 28.65 | 32.41 | 43.97 | 36.28 | 27.85 | 21.57 | 116.02 | 34.97 | 52.58 | 20.00 | 16.45 | 19.91 | 18.02 | 19.68 | 22.01 | 19.66 | 39.42 | 51.05 | 40.83 | 64.22 | 44.27 | 49.88 | 29.26 | 18.68 | 18.24 | 6.66 | 20.18 | 14.16 | 12.09 | 4.17 | NA | 0.00 | NA | NA | NA | |
| Cash Cash Equivalents Restricted Cash And Restricted Cash Equivalents | 44.91 | 30.70 | 53.33 | 33.90 | 28.65 | 32.41 | 43.97 | 36.28 | 27.85 | 21.57 | 116.02 | 34.97 | 52.58 | 20.00 | 16.45 | 19.91 | NA | NA | NA | 19.66 | NA | NA | NA | NA | NA | NA | NA | NA | NA | NA | NA | NA | NA | NA | NA | NA | NA | NA | NA | |
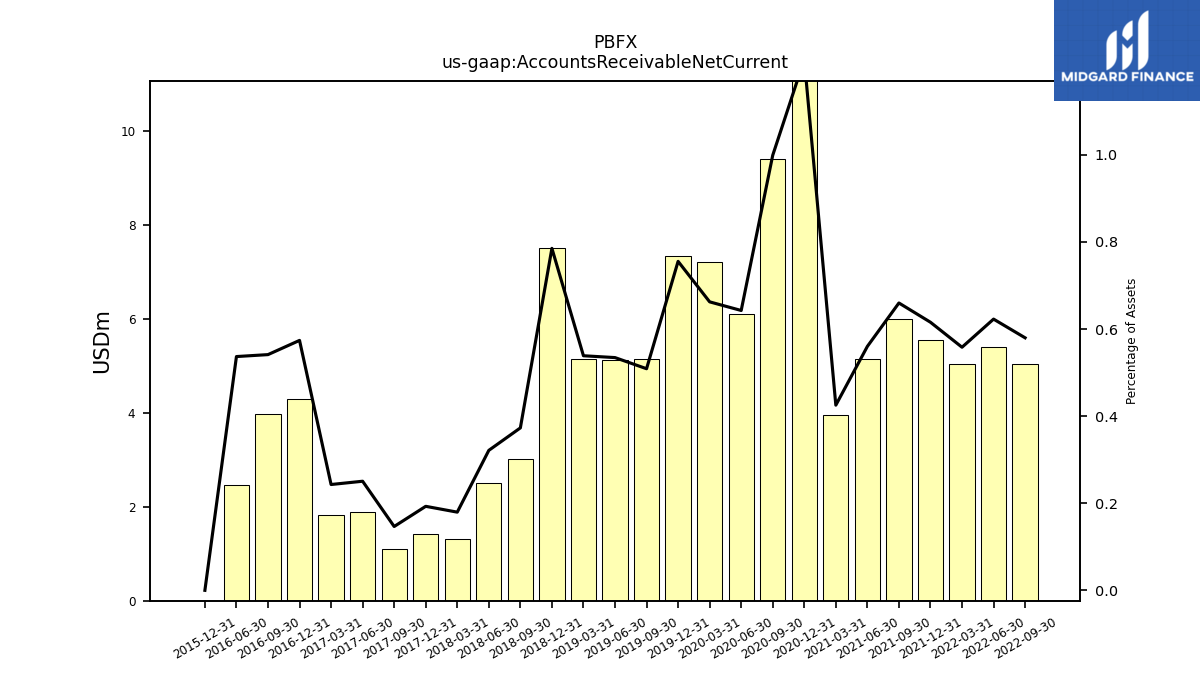
| Accounts Receivable Net Current | 5.04 | 5.40 | 5.04 | 5.55 | 6.01 | 5.15 | 3.97 | 11.38 | 9.41 | 6.11 | 7.21 | 7.35 | 5.14 | 5.13 | 5.16 | 7.51 | 3.01 | 2.50 | 1.31 | 1.42 | 1.11 | 1.88 | 1.82 | 4.29 | 3.98 | 2.46 | NA | 0.00 | NA | NA | NA | NA | NA | NA | NA | NA | NA | NA | NA | |
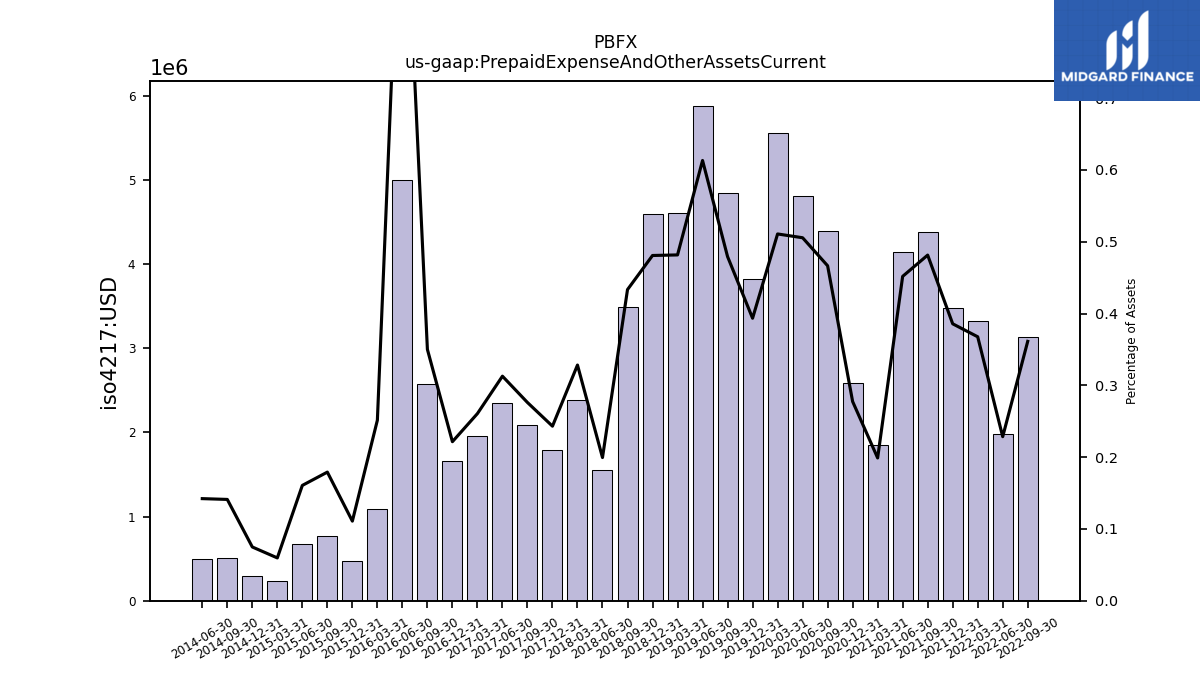
| Prepaid Expense And Other Assets Current | 3.14 | 1.98 | 3.32 | 3.48 | 4.38 | 4.15 | 1.85 | 2.59 | 4.39 | 4.80 | 5.56 | 3.83 | 4.84 | 5.88 | 4.61 | 4.60 | 3.50 | 1.55 | 2.39 | 1.79 | 2.08 | 2.35 | 1.95 | 1.66 | 2.57 | 5.00 | 1.09 | 0.47 | 0.78 | 0.67 | 0.24 | 0.29 | 0.51 | 0.49 | NA | NA | NA | NA | NA |
| 2022-09-30 | 2022-06-30 | 2022-03-31 | 2021-12-31 | 2021-09-30 | 2021-06-30 | 2021-03-31 | 2020-12-31 | 2020-09-30 | 2020-06-30 | 2020-03-31 | 2019-12-31 | 2019-09-30 | 2019-06-30 | 2019-03-31 | 2018-12-31 | 2018-09-30 | 2018-06-30 | 2018-03-31 | 2017-12-31 | 2017-09-30 | 2017-06-30 | 2017-03-31 | 2016-12-31 | 2016-09-30 | 2016-06-30 | 2016-03-31 | 2015-12-31 | 2015-09-30 | 2015-06-30 | 2015-03-31 | 2014-12-31 | 2014-09-30 | 2014-06-30 | 2014-03-31 | 2013-12-31 | 2013-09-30 | 2013-06-30 | 2013-03-31 | ||
|---|---|---|---|---|---|---|---|---|---|---|---|---|---|---|---|---|---|---|---|---|---|---|---|---|---|---|---|---|---|---|---|---|---|---|---|---|---|---|---|---|
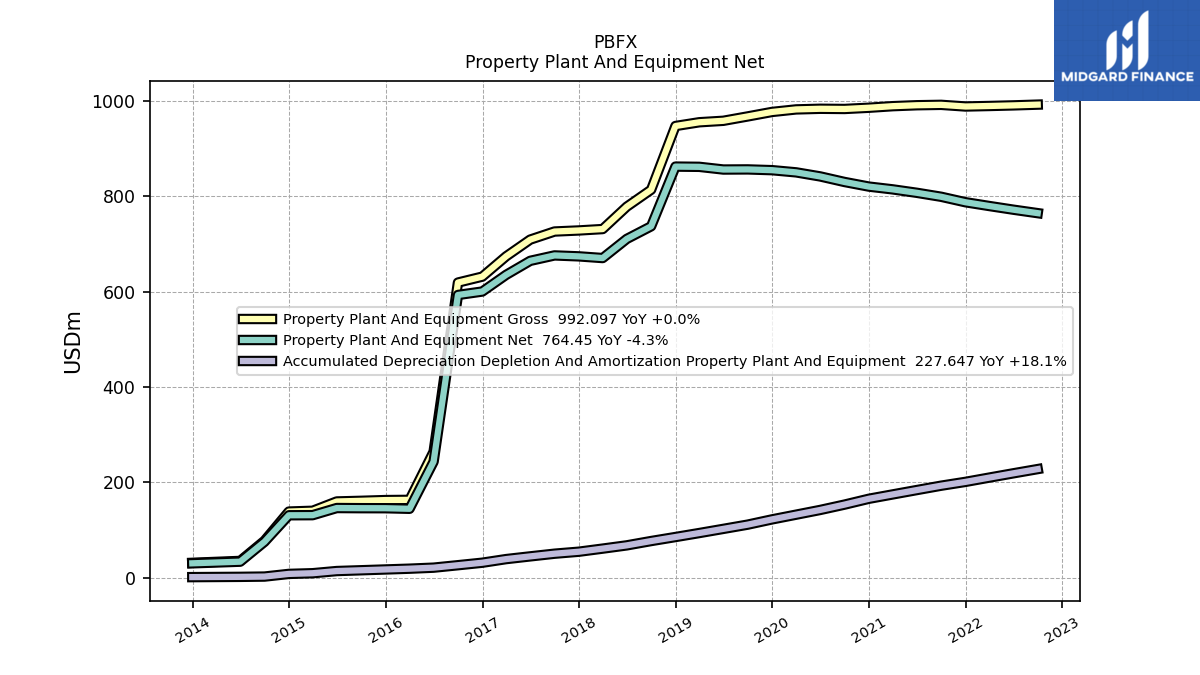
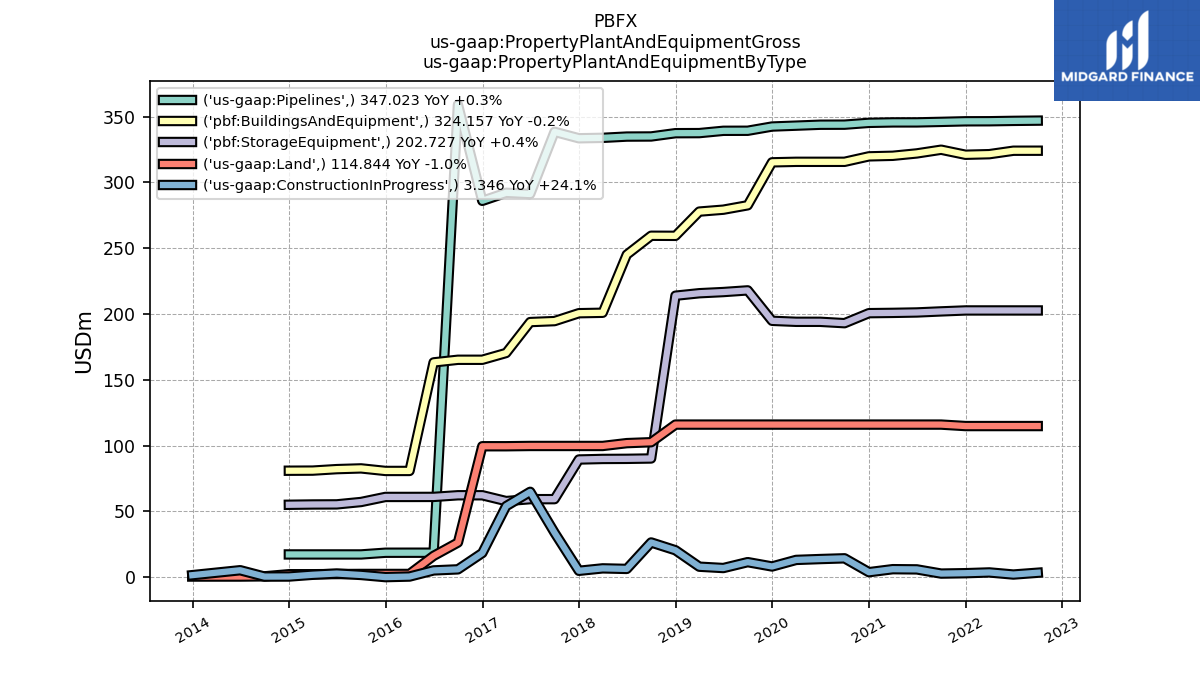
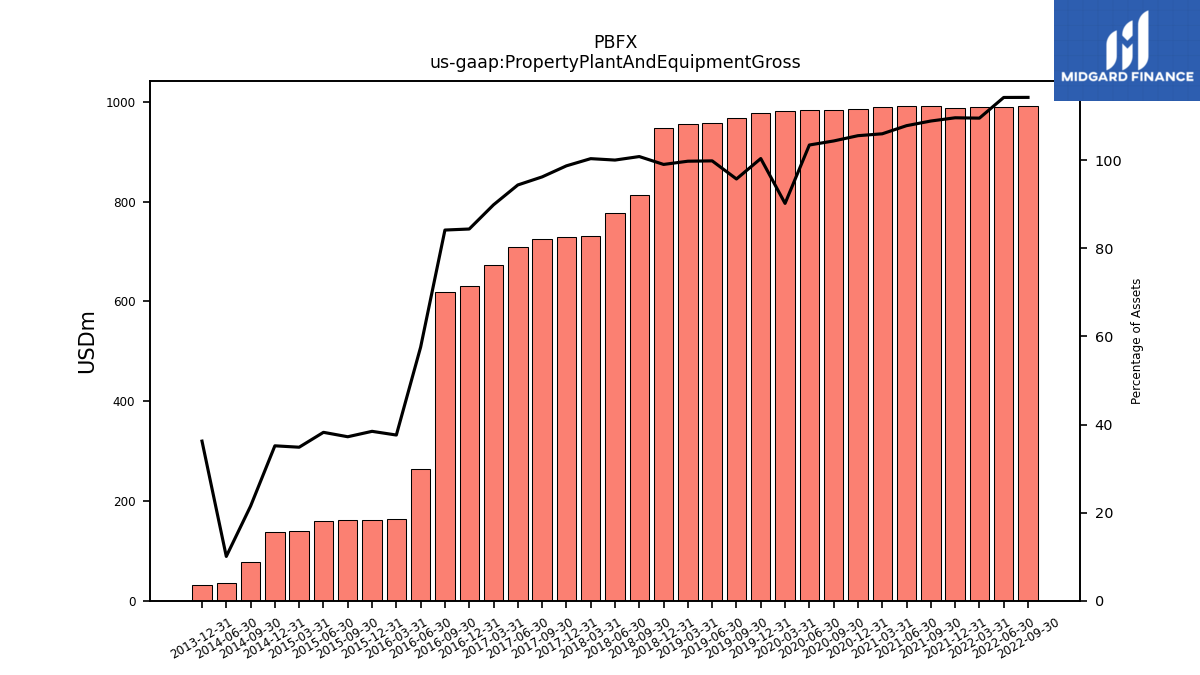
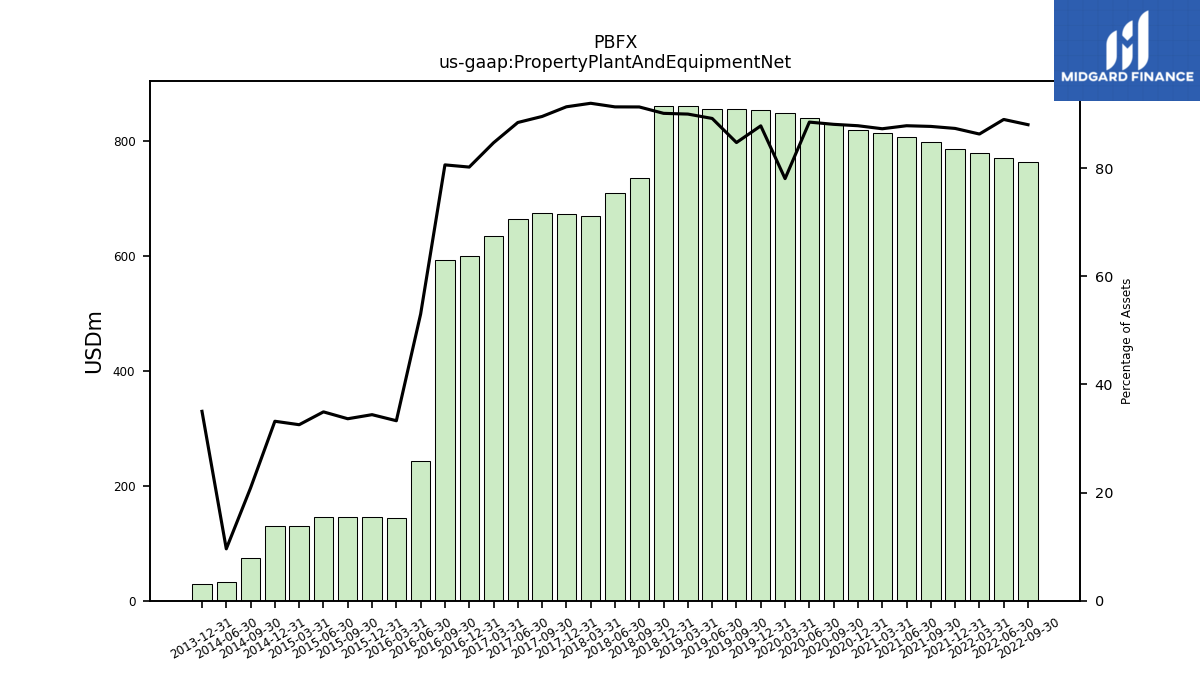
| Property Plant And Equipment Gross | 992.10 | 990.51 | 989.23 | 988.16 | 991.64 | 990.81 | 988.84 | 985.57 | 982.98 | 983.40 | 982.05 | 976.75 | 967.32 | 958.19 | 955.12 | 947.25 | 813.60 | 778.05 | 731.11 | 728.17 | 725.95 | 708.98 | 673.84 | 631.32 | 618.87 | 264.07 | 163.10 | 162.65 | 161.08 | 159.73 | 140.21 | 138.56 | 77.33 | 35.03 | NA | 31.03 | NA | NA | NA | |
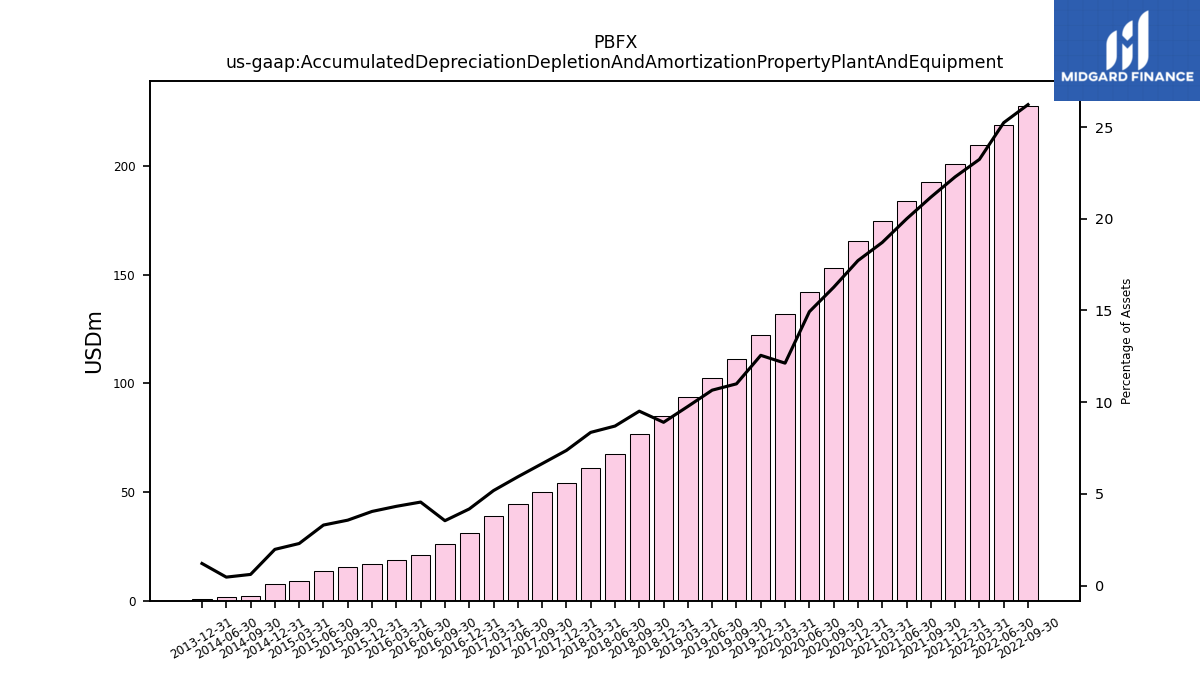
| Accumulated Depreciation Depletion And Amortization Property Plant And Equipment | 227.65 | 218.79 | 209.81 | 200.82 | 192.81 | 183.65 | 174.50 | 165.40 | 153.14 | 141.93 | 132.03 | 122.14 | 111.12 | 102.23 | 93.51 | 85.13 | 76.72 | 67.64 | 60.84 | 54.35 | 50.15 | 44.54 | 38.83 | 31.25 | 26.02 | 20.88 | 18.74 | 17.10 | 15.44 | 13.79 | 9.23 | 7.78 | 2.19 | 1.61 | NA | 1.03 | NA | NA | NA | |
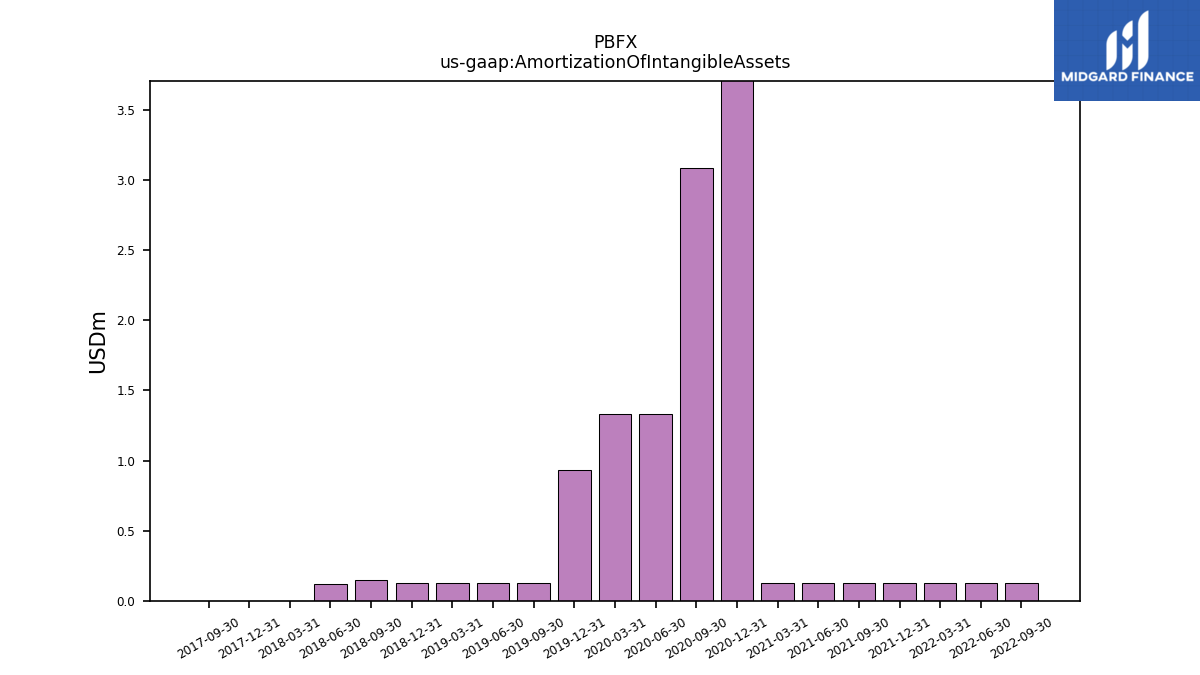
| Amortization Of Intangible Assets | 0.13 | 0.12 | 0.12 | 0.12 | 0.13 | 0.12 | 0.12 | 4.44 | 3.09 | 1.33 | 1.33 | 0.93 | 0.12 | 0.13 | 0.12 | 0.12 | 0.15 | 0.12 | 0.00 | 0.00 | 0.00 | NA | NA | NA | NA | NA | NA | NA | NA | NA | NA | NA | NA | NA | NA | NA | NA | NA | NA | |
| Property Plant And Equipment Net | 764.45 | 771.72 | 779.42 | 787.34 | 798.83 | 807.16 | 814.34 | 820.17 | 829.83 | 841.48 | 850.01 | 854.61 | 856.20 | 855.96 | 861.62 | 862.12 | 736.88 | 710.41 | 670.26 | 673.82 | 675.79 | 664.43 | 635.00 | 600.07 | 592.85 | 243.19 | 144.36 | 145.55 | 145.64 | 145.94 | 130.98 | 130.78 | 75.14 | 33.42 | NA | 30.00 | NA | NA | NA | |
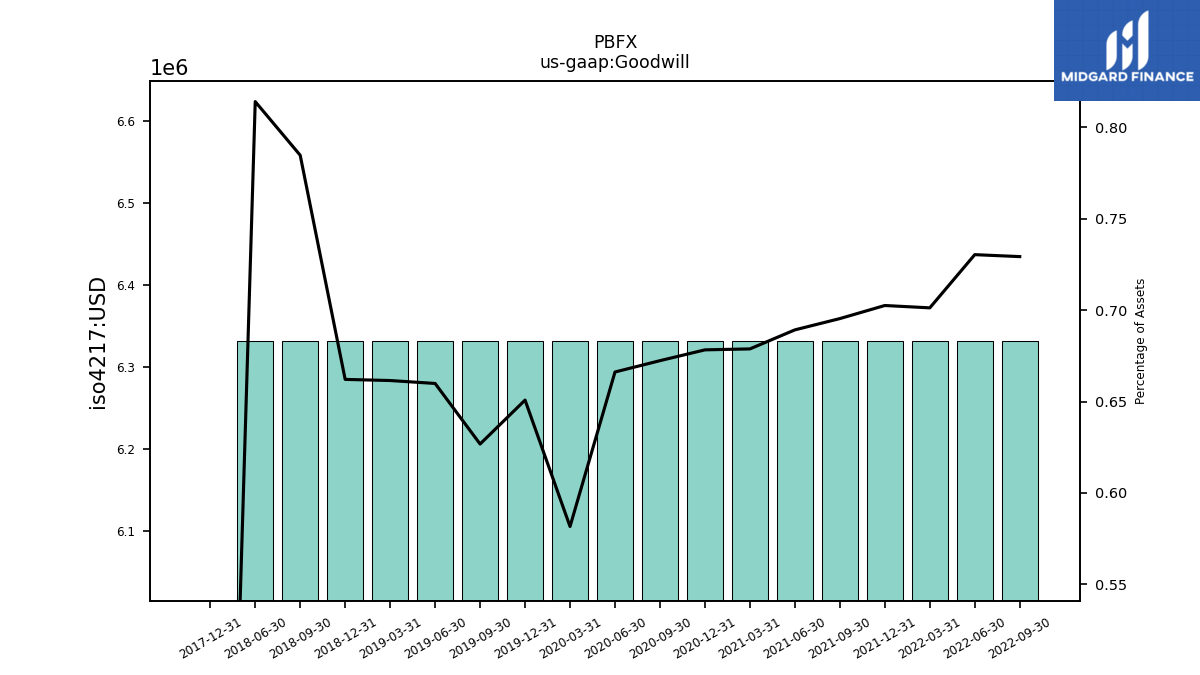
| Goodwill | 6.33 | 6.33 | 6.33 | 6.33 | 6.33 | 6.33 | 6.33 | 6.33 | 6.33 | 6.33 | 6.33 | 6.33 | 6.33 | 6.33 | 6.33 | 6.33 | 6.33 | 6.33 | NA | 0.00 | NA | NA | NA | NA | NA | NA | NA | NA | NA | NA | NA | NA | NA | NA | NA | NA | NA | NA | NA | |
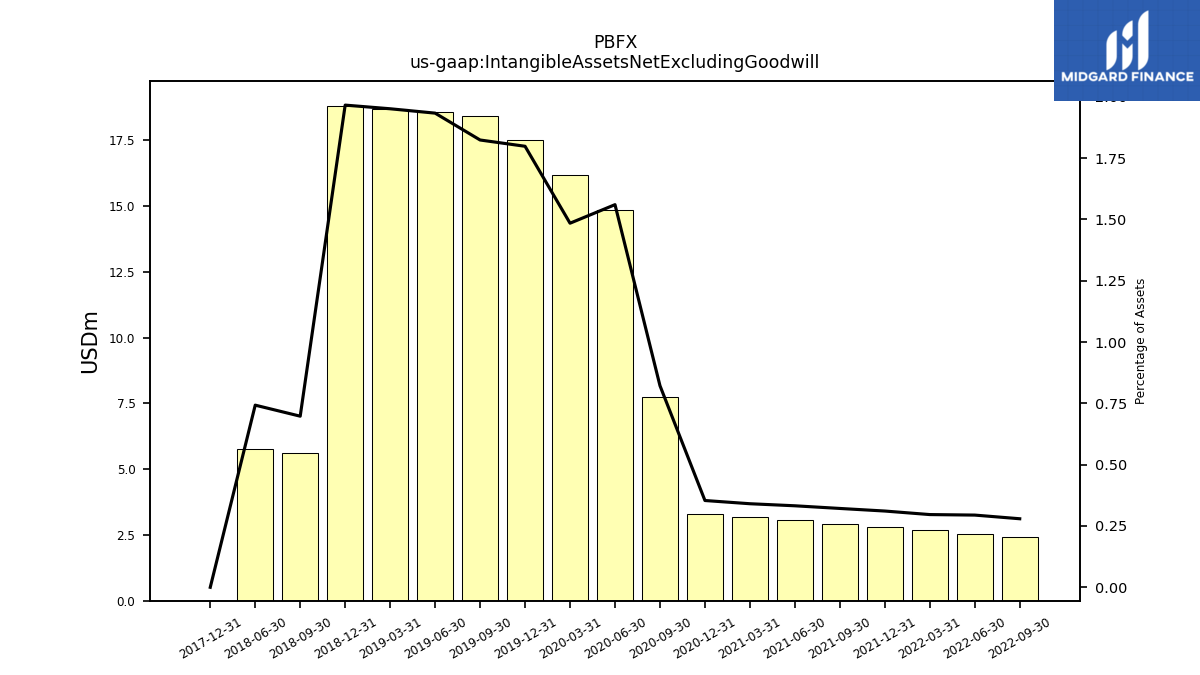
| Intangible Assets Net Excluding Goodwill | 2.43 | 2.55 | 2.68 | 2.80 | 2.93 | 3.05 | 3.18 | 3.30 | 7.74 | 14.83 | 16.16 | 17.50 | 18.43 | 18.55 | 18.68 | 18.80 | 5.63 | 5.78 | NA | 0.00 | NA | NA | NA | NA | NA | NA | NA | NA | NA | NA | NA | NA | NA | NA | NA | NA | NA | NA | NA | |
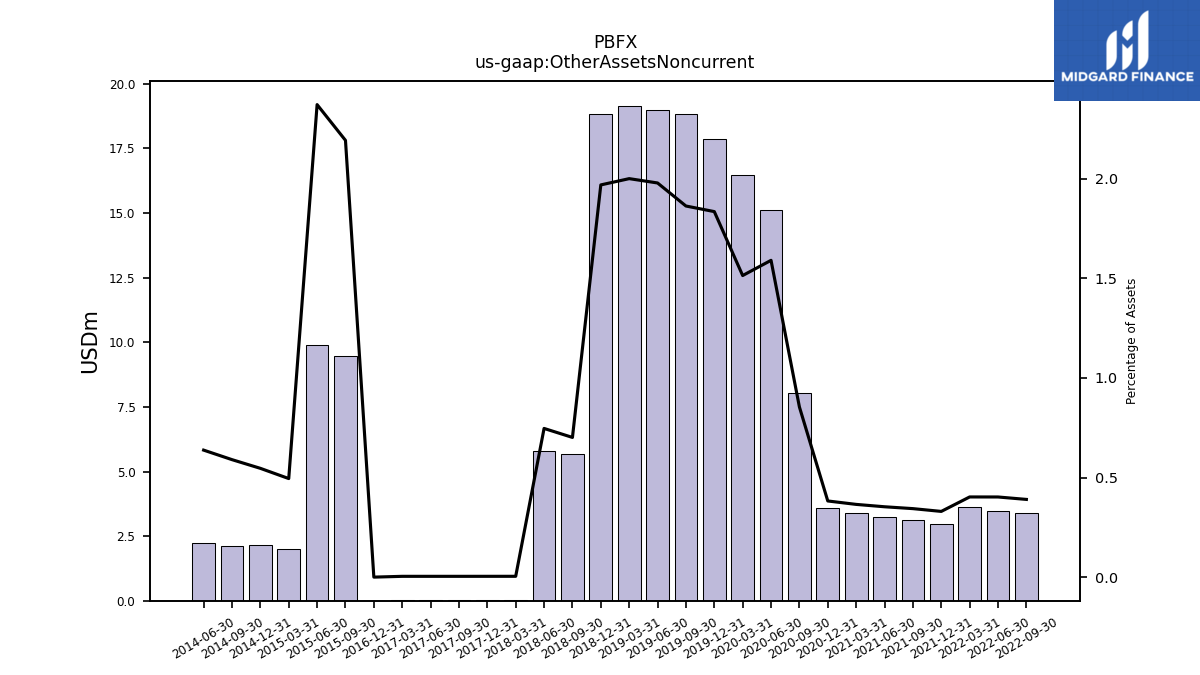
| Other Assets Noncurrent | 3.39 | 3.49 | 3.63 | 2.97 | 3.13 | 3.25 | 3.41 | 3.57 | 8.05 | 15.12 | 16.49 | 17.86 | 18.83 | 18.99 | 19.15 | 18.84 | 5.66 | 5.81 | 0.03 | 0.03 | 0.03 | 0.03 | 0.03 | 0.00 | NA | NA | NA | NA | 9.49 | 9.91 | 1.99 | 2.15 | 2.12 | 2.22 | NA | NA | NA | NA | NA |
| 2022-09-30 | 2022-06-30 | 2022-03-31 | 2021-12-31 | 2021-09-30 | 2021-06-30 | 2021-03-31 | 2020-12-31 | 2020-09-30 | 2020-06-30 | 2020-03-31 | 2019-12-31 | 2019-09-30 | 2019-06-30 | 2019-03-31 | 2018-12-31 | 2018-09-30 | 2018-06-30 | 2018-03-31 | 2017-12-31 | 2017-09-30 | 2017-06-30 | 2017-03-31 | 2016-12-31 | 2016-09-30 | 2016-06-30 | 2016-03-31 | 2015-12-31 | 2015-09-30 | 2015-06-30 | 2015-03-31 | 2014-12-31 | 2014-09-30 | 2014-06-30 | 2014-03-31 | 2013-12-31 | 2013-09-30 | 2013-06-30 | 2013-03-31 | ||
|---|---|---|---|---|---|---|---|---|---|---|---|---|---|---|---|---|---|---|---|---|---|---|---|---|---|---|---|---|---|---|---|---|---|---|---|---|---|---|---|---|
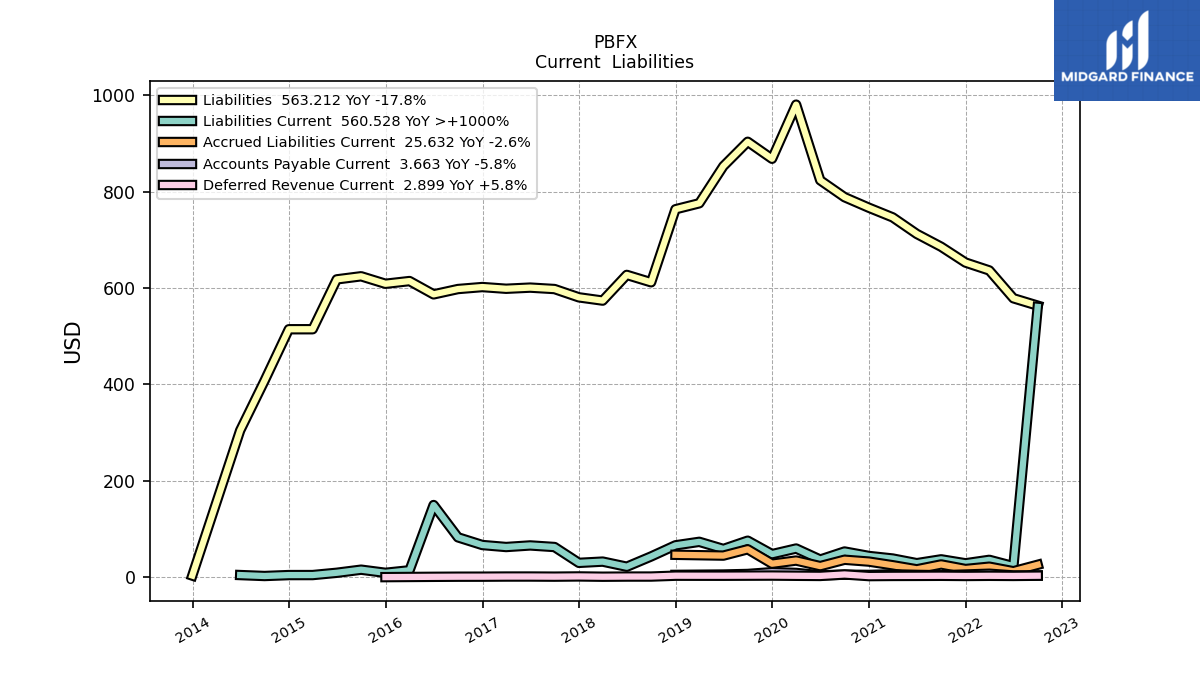
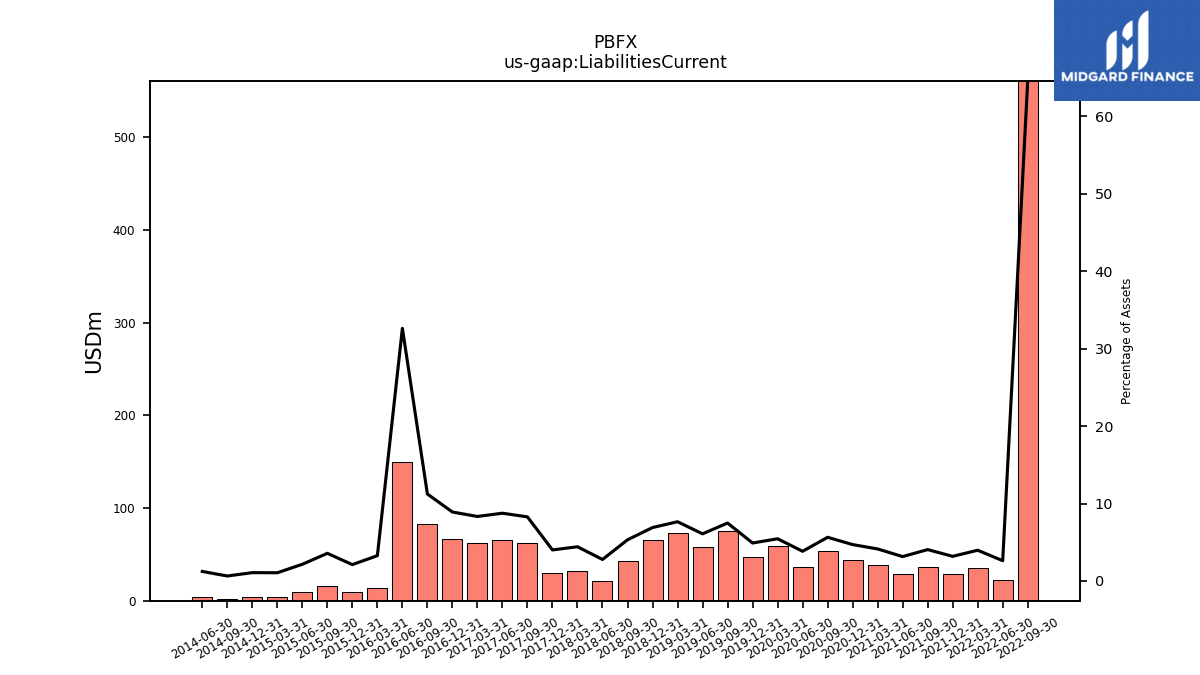
| Liabilities Current | 560.53 | 22.71 | 35.85 | 28.67 | 36.90 | 28.94 | 38.58 | 43.88 | 53.13 | 36.45 | 59.34 | 47.71 | 75.61 | 58.41 | 73.23 | 65.98 | 42.90 | 21.61 | 32.20 | 29.58 | 62.45 | 65.74 | 62.45 | 66.62 | 82.56 | 149.59 | 14.18 | 8.94 | 15.45 | 9.01 | 4.28 | 4.24 | 2.32 | 4.29 | NA | NA | NA | NA | NA | |
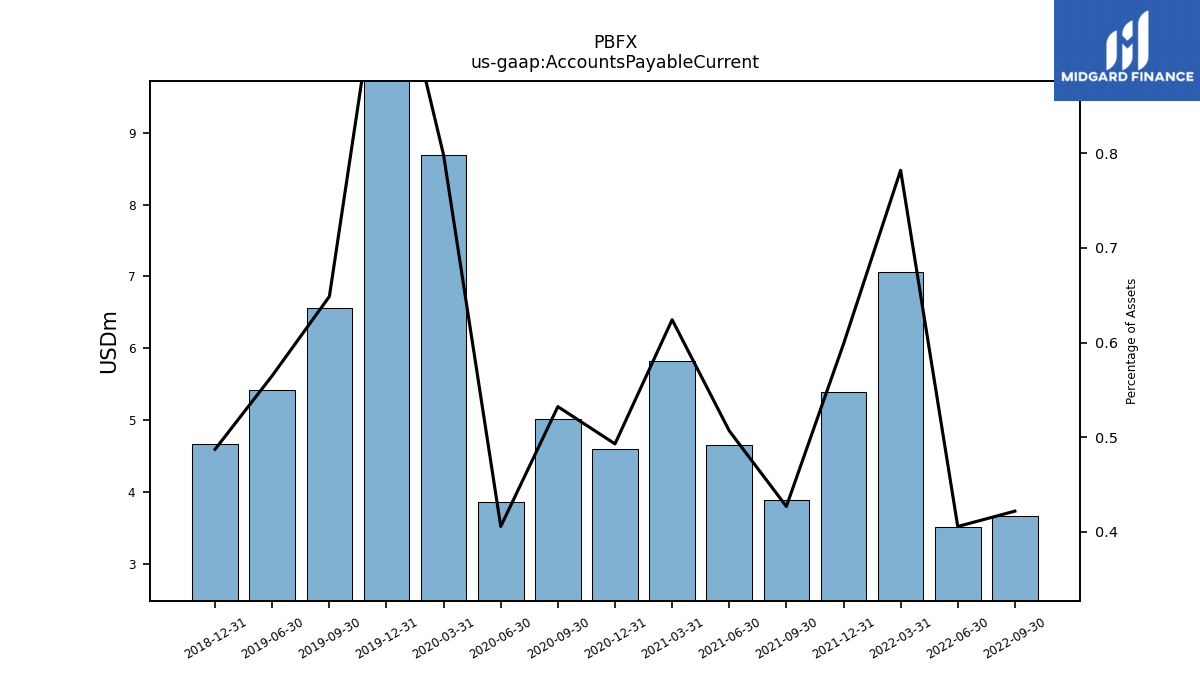
| Accounts Payable Current | 3.66 | 3.52 | 7.06 | 5.39 | 3.89 | 4.66 | 5.82 | 4.60 | 5.01 | 3.86 | 8.69 | 10.22 | 6.55 | 5.42 | NA | 4.66 | NA | NA | NA | NA | NA | NA | NA | NA | NA | NA | NA | NA | NA | NA | NA | NA | NA | NA | NA | NA | NA | NA | NA | |
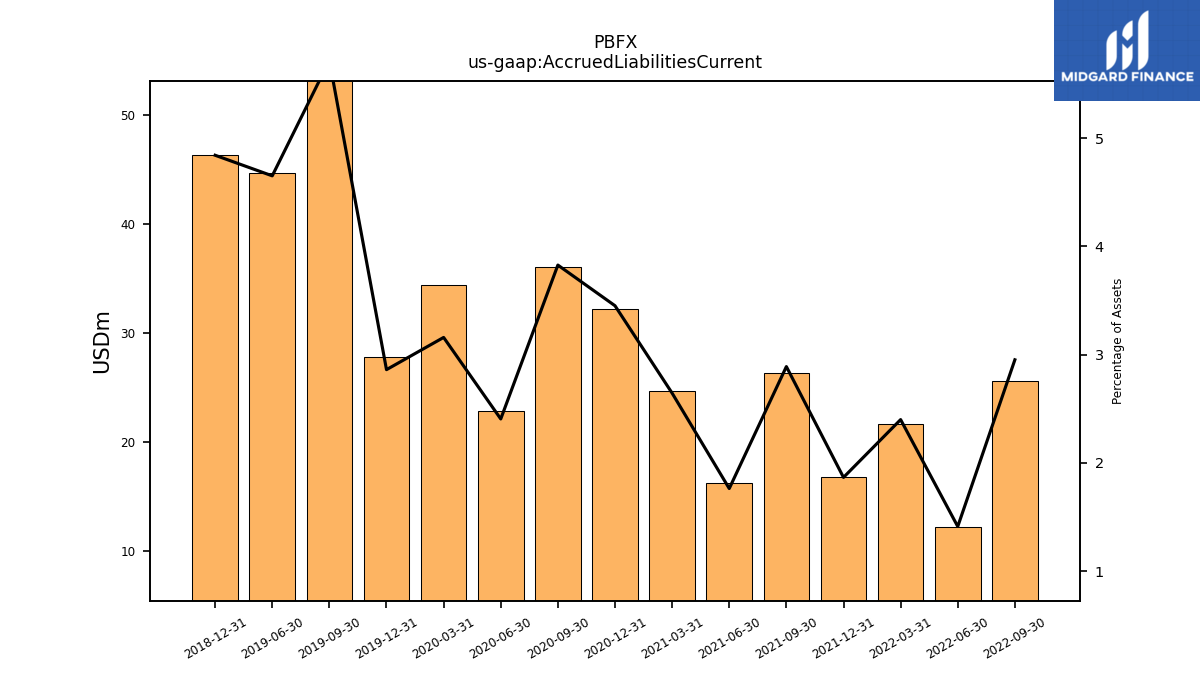
| Accrued Liabilities Current | 25.63 | 12.24 | 21.67 | 16.81 | 26.31 | 16.19 | 24.66 | 32.22 | 36.05 | 22.86 | 34.39 | 27.84 | 57.77 | 44.64 | NA | 46.31 | NA | NA | NA | NA | NA | NA | NA | NA | NA | NA | NA | NA | NA | NA | NA | NA | NA | NA | NA | NA | NA | NA | NA |
| 2022-09-30 | 2022-06-30 | 2022-03-31 | 2021-12-31 | 2021-09-30 | 2021-06-30 | 2021-03-31 | 2020-12-31 | 2020-09-30 | 2020-06-30 | 2020-03-31 | 2019-12-31 | 2019-09-30 | 2019-06-30 | 2019-03-31 | 2018-12-31 | 2018-09-30 | 2018-06-30 | 2018-03-31 | 2017-12-31 | 2017-09-30 | 2017-06-30 | 2017-03-31 | 2016-12-31 | 2016-09-30 | 2016-06-30 | 2016-03-31 | 2015-12-31 | 2015-09-30 | 2015-06-30 | 2015-03-31 | 2014-12-31 | 2014-09-30 | 2014-06-30 | 2014-03-31 | 2013-12-31 | 2013-09-30 | 2013-06-30 | 2013-03-31 | ||
|---|---|---|---|---|---|---|---|---|---|---|---|---|---|---|---|---|---|---|---|---|---|---|---|---|---|---|---|---|---|---|---|---|---|---|---|---|---|---|---|---|
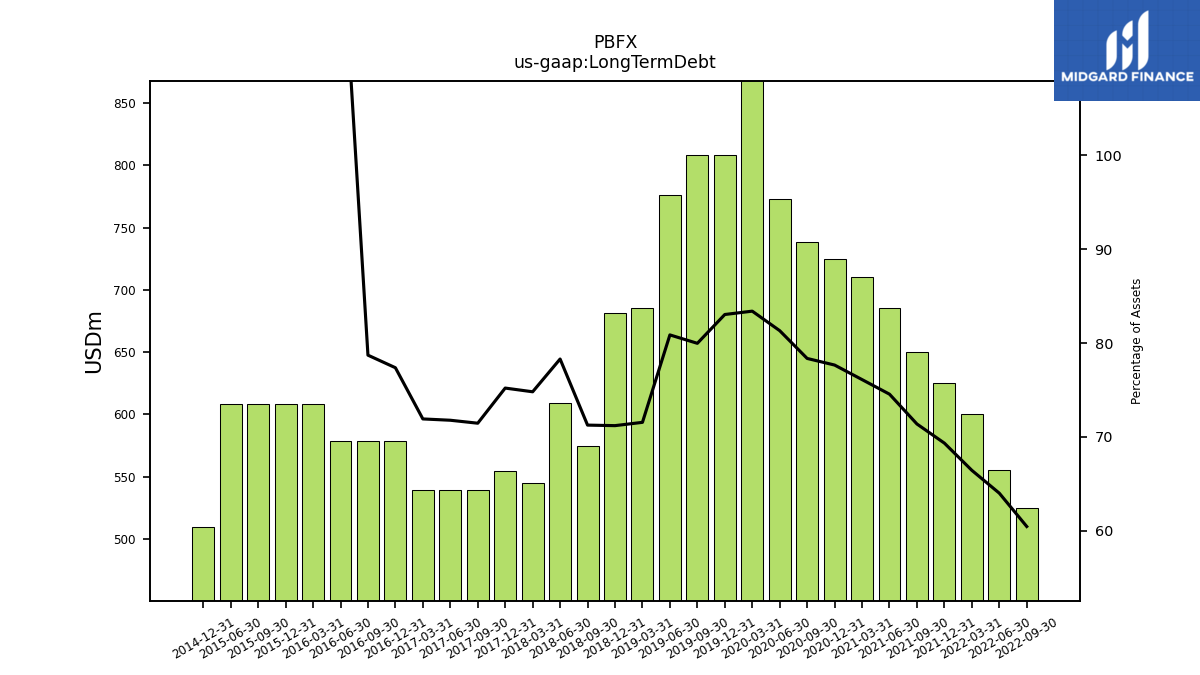
| Long Term Debt | 525.00 | 555.00 | 600.00 | 625.00 | 650.00 | 685.00 | 710.00 | 725.00 | 738.00 | 773.00 | 908.00 | 808.00 | 808.00 | 776.00 | 685.00 | 681.00 | 575.00 | 609.00 | 545.00 | 554.70 | 539.20 | 539.20 | 539.20 | 578.86 | 578.86 | 578.86 | 608.70 | 608.70 | 608.70 | 608.70 | NA | 510.00 | NA | NA | NA | NA | NA | NA | NA | |
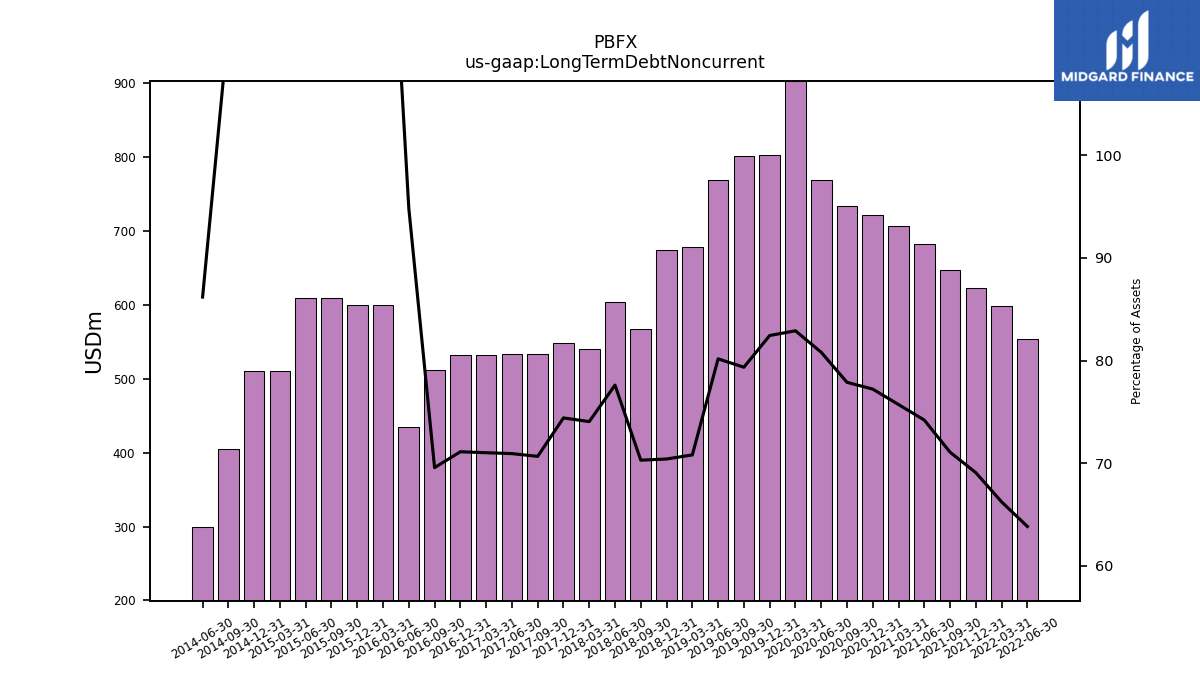
| Long Term Debt Noncurrent | NA | 553.38 | 597.96 | 622.54 | 647.12 | 681.70 | 706.27 | 720.85 | 733.41 | 768.09 | 902.54 | 802.10 | 801.66 | 769.22 | 677.77 | 673.32 | 567.15 | 603.58 | 539.46 | 548.79 | 533.14 | 532.80 | 532.43 | 532.01 | 511.59 | 434.98 | 600.06 | 599.63 | 608.70 | 608.70 | 510.00 | 510.00 | 405.00 | 300.00 | NA | NA | NA | NA | NA | |
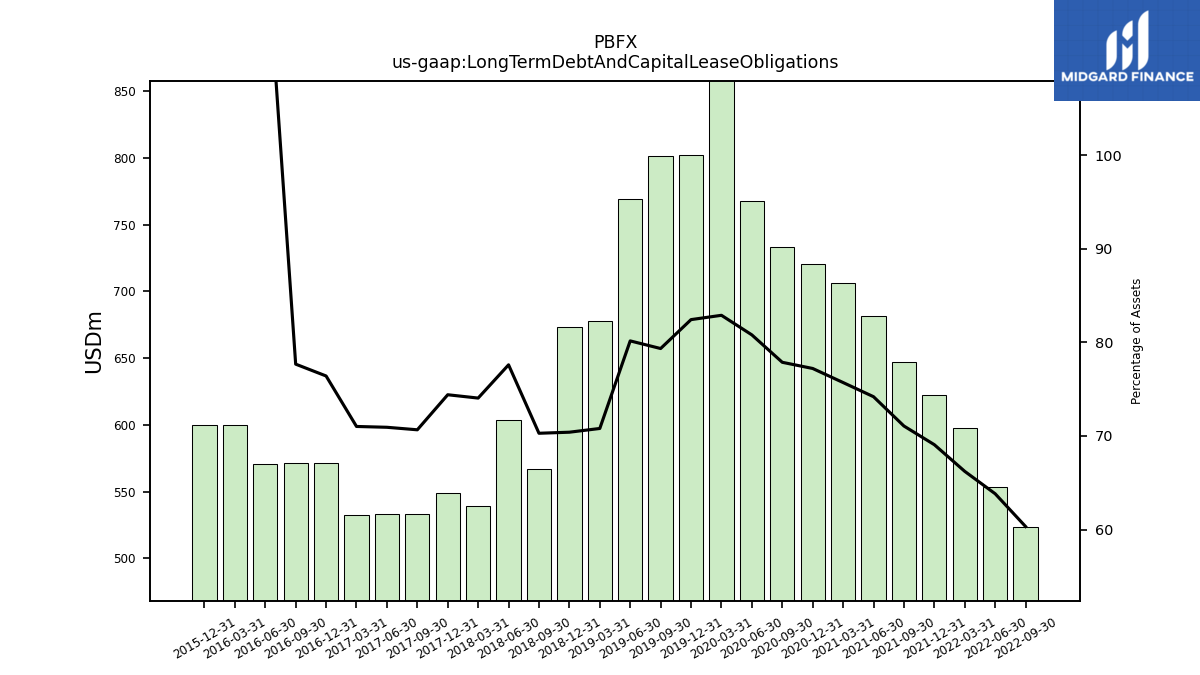
| Long Term Debt And Capital Lease Obligations | 523.79 | 553.38 | 597.96 | 622.54 | 647.12 | 681.70 | 706.27 | 720.85 | 733.41 | 768.09 | 902.54 | 802.10 | 801.66 | 769.22 | 677.77 | 673.32 | 567.15 | 603.58 | 539.46 | 548.79 | 533.14 | 532.80 | 532.43 | 571.67 | 571.26 | 570.84 | 600.06 | 599.63 | NA | NA | NA | NA | NA | NA | NA | NA | NA | NA | NA |
| 2022-09-30 | 2022-06-30 | 2022-03-31 | 2021-12-31 | 2021-09-30 | 2021-06-30 | 2021-03-31 | 2020-12-31 | 2020-09-30 | 2020-06-30 | 2020-03-31 | 2019-12-31 | 2019-09-30 | 2019-06-30 | 2019-03-31 | 2018-12-31 | 2018-09-30 | 2018-06-30 | 2018-03-31 | 2017-12-31 | 2017-09-30 | 2017-06-30 | 2017-03-31 | 2016-12-31 | 2016-09-30 | 2016-06-30 | 2016-03-31 | 2015-12-31 | 2015-09-30 | 2015-06-30 | 2015-03-31 | 2014-12-31 | 2014-09-30 | 2014-06-30 | 2014-03-31 | 2013-12-31 | 2013-09-30 | 2013-06-30 | 2013-03-31 | ||
|---|---|---|---|---|---|---|---|---|---|---|---|---|---|---|---|---|---|---|---|---|---|---|---|---|---|---|---|---|---|---|---|---|---|---|---|---|---|---|---|---|
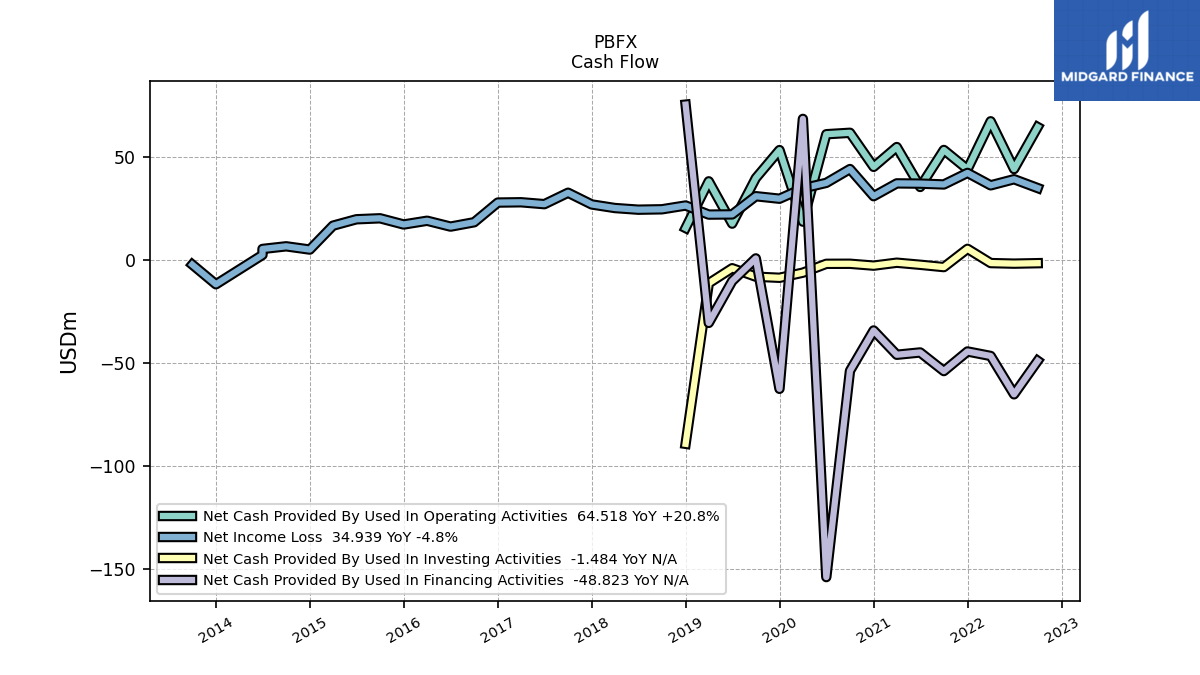
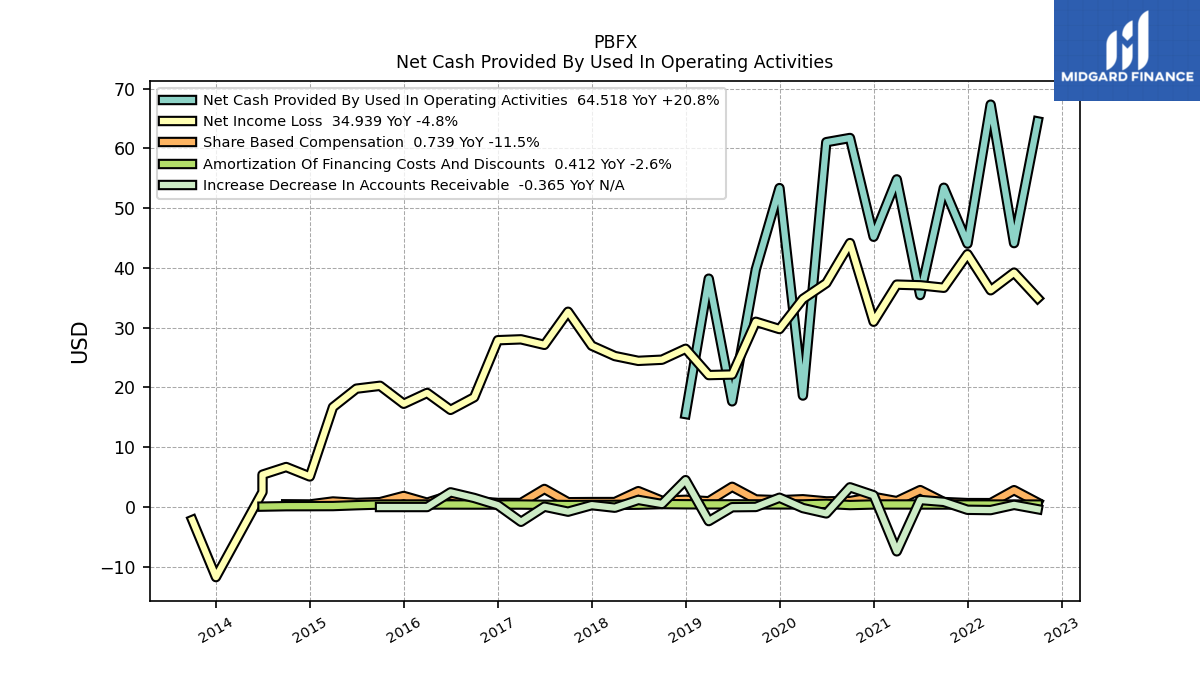
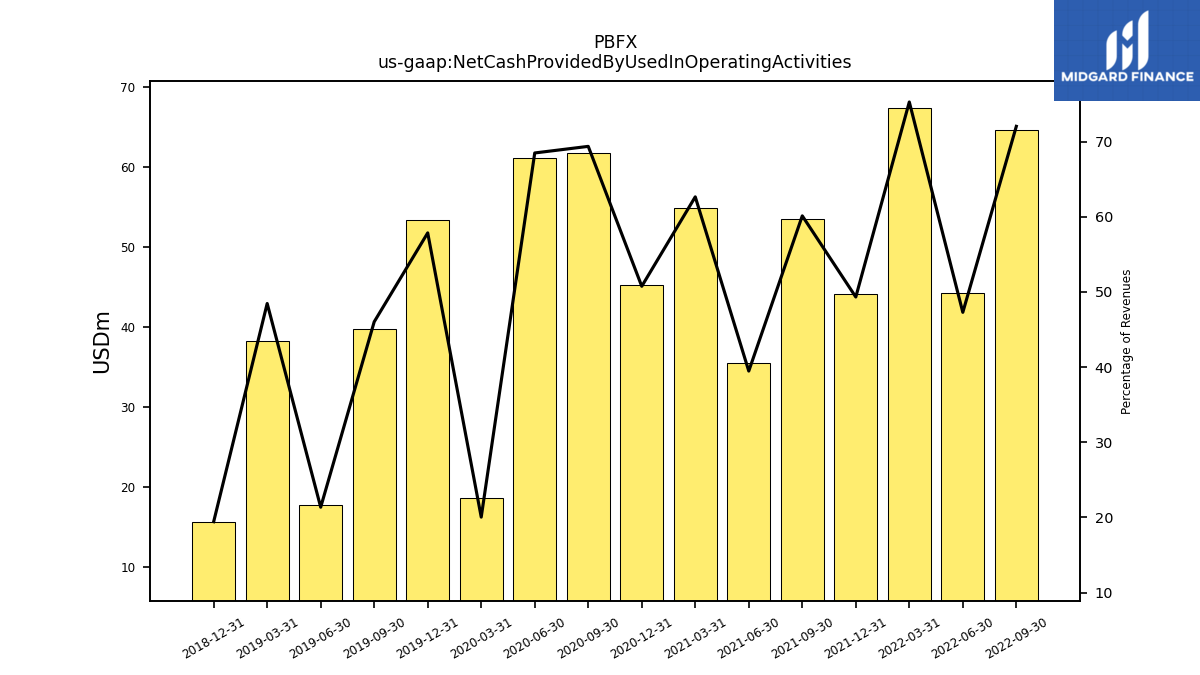
| Net Cash Provided By Used In Operating Activities | 64.52 | 44.15 | 67.32 | 44.07 | 53.42 | 35.46 | 54.82 | 45.21 | 61.74 | 61.04 | 18.65 | 53.36 | 39.76 | 17.68 | 38.21 | 15.56 | NA | NA | NA | NA | NA | NA | NA | NA | NA | NA | NA | NA | NA | NA | NA | NA | NA | NA | NA | NA | NA | NA | NA | |
| Net Cash Provided By Used In Investing Activities | -1.48 | -1.71 | -1.43 | 5.49 | -3.38 | -2.25 | -1.25 | -2.67 | -1.76 | -1.79 | -6.08 | -8.57 | -8.03 | -3.93 | -11.22 | -89.07 | NA | NA | NA | NA | NA | NA | NA | NA | NA | NA | NA | NA | NA | NA | NA | NA | NA | NA | NA | NA | NA | NA | NA | |
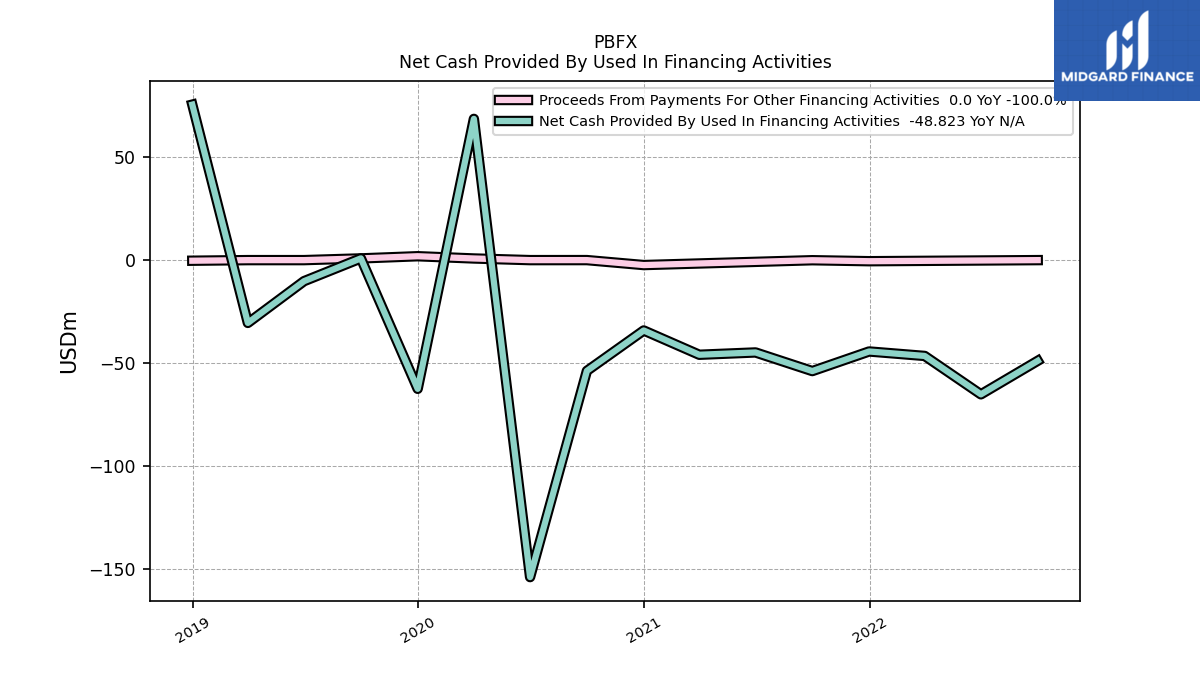
| Net Cash Provided By Used In Financing Activities | -48.82 | -65.08 | -46.46 | -44.29 | -53.80 | -44.76 | -45.89 | -34.11 | -53.70 | -153.70 | 68.49 | -62.41 | 0.85 | -10.19 | -30.45 | 75.40 | NA | NA | NA | NA | NA | NA | NA | NA | NA | NA | NA | NA | NA | NA | NA | NA | NA | NA | NA | NA | NA | NA | NA |
| 2022-09-30 | 2022-06-30 | 2022-03-31 | 2021-12-31 | 2021-09-30 | 2021-06-30 | 2021-03-31 | 2020-12-31 | 2020-09-30 | 2020-06-30 | 2020-03-31 | 2019-12-31 | 2019-09-30 | 2019-06-30 | 2019-03-31 | 2018-12-31 | 2018-09-30 | 2018-06-30 | 2018-03-31 | 2017-12-31 | 2017-09-30 | 2017-06-30 | 2017-03-31 | 2016-12-31 | 2016-09-30 | 2016-06-30 | 2016-03-31 | 2015-12-31 | 2015-09-30 | 2015-06-30 | 2015-03-31 | 2014-12-31 | 2014-09-30 | 2014-06-30 | 2014-03-31 | 2013-12-31 | 2013-09-30 | 2013-06-30 | 2013-03-31 | ||
|---|---|---|---|---|---|---|---|---|---|---|---|---|---|---|---|---|---|---|---|---|---|---|---|---|---|---|---|---|---|---|---|---|---|---|---|---|---|---|---|---|
| Net Cash Provided By Used In Operating Activities | 64.52 | 44.15 | 67.32 | 44.07 | 53.42 | 35.46 | 54.82 | 45.21 | 61.74 | 61.04 | 18.65 | 53.36 | 39.76 | 17.68 | 38.21 | 15.56 | NA | NA | NA | NA | NA | NA | NA | NA | NA | NA | NA | NA | NA | NA | NA | NA | NA | NA | NA | NA | NA | NA | NA | |
| Net Income Loss | 34.94 | 39.22 | 36.26 | 42.30 | 36.68 | 37.10 | 37.21 | 31.00 | 44.16 | 37.46 | 34.81 | 29.77 | 30.99 | 22.17 | 22.08 | 26.48 | 24.65 | 24.45 | 25.26 | 26.99 | 32.67 | 27.13 | 28.06 | 27.91 | 18.36 | 16.25 | 19.09 | 17.27 | 20.28 | 19.80 | 16.71 | 5.11 | 6.70 | 2.52 | NA | -11.72 | -2.17 | NA | NA | |
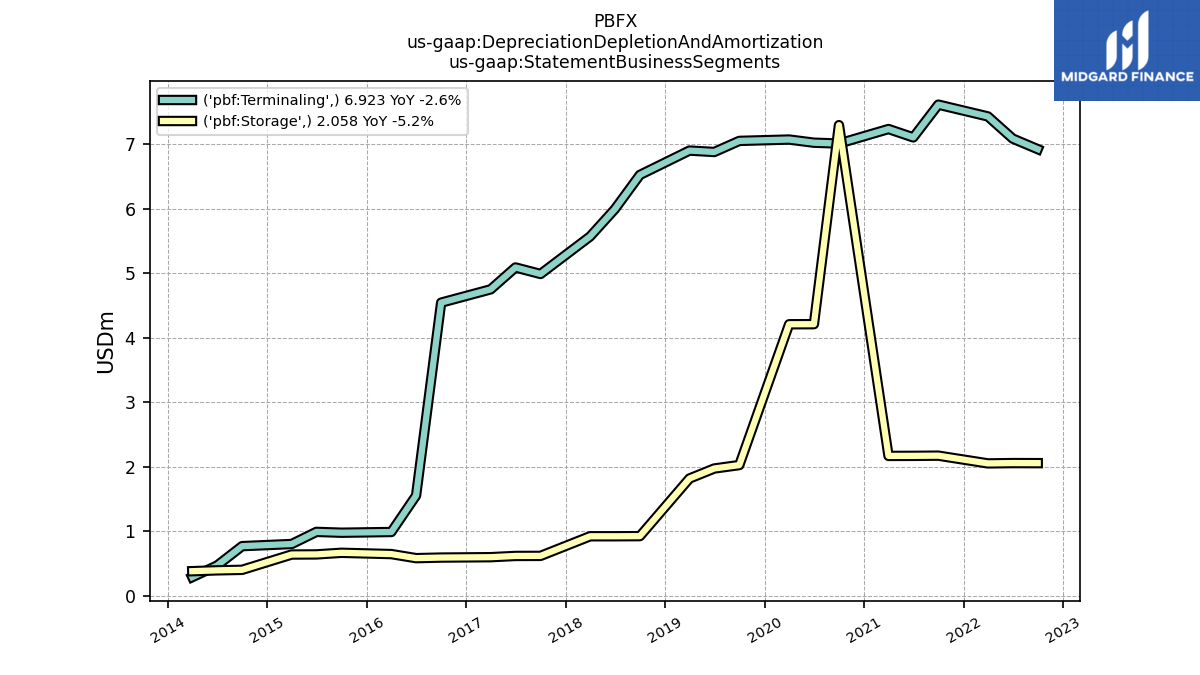
| Depreciation Depletion And Amortization | 8.98 | 9.15 | 9.48 | 9.34 | 9.79 | 9.28 | 9.40 | 16.89 | 14.30 | 11.23 | 11.28 | 11.95 | 9.08 | 8.85 | 8.72 | 8.62 | 7.45 | 6.92 | 6.50 | 7.16 | 5.61 | 5.71 | 5.35 | 5.23 | 5.14 | 2.14 | 1.64 | 1.66 | 1.65 | 1.64 | 1.45 | 2.57 | 0.59 | 0.28 | 0.68 | NA | NA | NA | NA | |
| Increase Decrease In Other Operating Capital Net | -0.25 | -0.03 | -0.27 | 0.00 | 0.05 | 0.08 | 0.09 | -2.44 | 2.74 | 1.05 | 1.11 | 0.34 | 0.01 | 1.86 | 0.08 | 0.17 | 0.21 | 1.23 | 0.07 | -0.06 | 0.02 | 1.28 | -0.17 | 0.75 | -0.01 | 0.28 | -0.01 | -0.00 | 0.00 | 0.01 | 0.01 | -0.00 | 0.01 | NA | NA | NA | NA | NA | NA | |
| Increase Decrease In Accounts Receivable | -0.36 | 0.36 | -0.51 | -0.46 | 0.86 | 1.18 | -7.42 | 1.97 | 3.30 | -1.07 | -0.17 | 1.56 | 0.01 | -0.03 | -2.35 | 4.50 | 0.51 | 1.19 | -0.12 | 0.32 | -0.78 | 0.06 | -2.47 | 0.31 | 1.52 | 2.46 | 0.00 | 0.00 | 0.00 | NA | NA | NA | NA | NA | NA | NA | NA | NA | NA | |
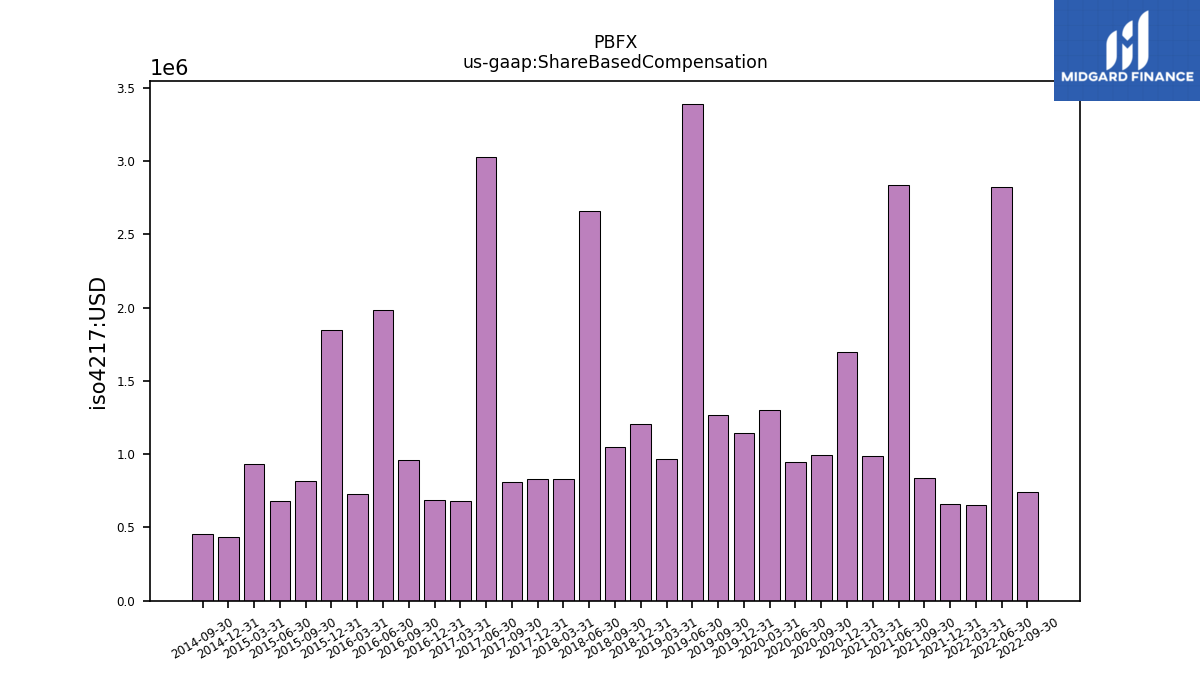
| Share Based Compensation | 0.74 | 2.82 | 0.65 | 0.66 | 0.83 | 2.83 | 0.99 | 1.70 | 0.99 | 0.94 | 1.30 | 1.14 | 1.27 | 3.39 | 0.96 | 1.21 | 1.05 | 2.66 | 0.83 | 0.83 | 0.81 | 3.03 | 0.68 | 0.69 | 0.96 | 1.98 | 0.73 | 1.85 | 0.81 | 0.68 | 0.93 | 0.43 | 0.46 | NA | NA | NA | NA | NA | NA |
| 2022-09-30 | 2022-06-30 | 2022-03-31 | 2021-12-31 | 2021-09-30 | 2021-06-30 | 2021-03-31 | 2020-12-31 | 2020-09-30 | 2020-06-30 | 2020-03-31 | 2019-12-31 | 2019-09-30 | 2019-06-30 | 2019-03-31 | 2018-12-31 | 2018-09-30 | 2018-06-30 | 2018-03-31 | 2017-12-31 | 2017-09-30 | 2017-06-30 | 2017-03-31 | 2016-12-31 | 2016-09-30 | 2016-06-30 | 2016-03-31 | 2015-12-31 | 2015-09-30 | 2015-06-30 | 2015-03-31 | 2014-12-31 | 2014-09-30 | 2014-06-30 | 2014-03-31 | 2013-12-31 | 2013-09-30 | 2013-06-30 | 2013-03-31 | ||
|---|---|---|---|---|---|---|---|---|---|---|---|---|---|---|---|---|---|---|---|---|---|---|---|---|---|---|---|---|---|---|---|---|---|---|---|---|---|---|---|---|
| Net Cash Provided By Used In Investing Activities | -1.48 | -1.71 | -1.43 | 5.49 | -3.38 | -2.25 | -1.25 | -2.67 | -1.76 | -1.79 | -6.08 | -8.57 | -8.03 | -3.93 | -11.22 | -89.07 | NA | NA | NA | NA | NA | NA | NA | NA | NA | NA | NA | NA | NA | NA | NA | NA | NA | NA | NA | NA | NA | NA | NA |
| 2022-09-30 | 2022-06-30 | 2022-03-31 | 2021-12-31 | 2021-09-30 | 2021-06-30 | 2021-03-31 | 2020-12-31 | 2020-09-30 | 2020-06-30 | 2020-03-31 | 2019-12-31 | 2019-09-30 | 2019-06-30 | 2019-03-31 | 2018-12-31 | 2018-09-30 | 2018-06-30 | 2018-03-31 | 2017-12-31 | 2017-09-30 | 2017-06-30 | 2017-03-31 | 2016-12-31 | 2016-09-30 | 2016-06-30 | 2016-03-31 | 2015-12-31 | 2015-09-30 | 2015-06-30 | 2015-03-31 | 2014-12-31 | 2014-09-30 | 2014-06-30 | 2014-03-31 | 2013-12-31 | 2013-09-30 | 2013-06-30 | 2013-03-31 | ||
|---|---|---|---|---|---|---|---|---|---|---|---|---|---|---|---|---|---|---|---|---|---|---|---|---|---|---|---|---|---|---|---|---|---|---|---|---|---|---|---|---|
| Net Cash Provided By Used In Financing Activities | -48.82 | -65.08 | -46.46 | -44.29 | -53.80 | -44.76 | -45.89 | -34.11 | -53.70 | -153.70 | 68.49 | -62.41 | 0.85 | -10.19 | -30.45 | 75.40 | NA | NA | NA | NA | NA | NA | NA | NA | NA | NA | NA | NA | NA | NA | NA | NA | NA | NA | NA | NA | NA | NA | NA |
| 2022-09-30 | 2022-06-30 | 2022-03-31 | 2021-12-31 | 2021-09-30 | 2021-06-30 | 2021-03-31 | 2020-12-31 | 2020-09-30 | 2020-06-30 | 2020-03-31 | 2019-12-31 | 2019-09-30 | 2019-06-30 | 2019-03-31 | 2018-12-31 | 2018-09-30 | 2018-06-30 | 2018-03-31 | 2017-12-31 | 2017-09-30 | 2017-06-30 | 2017-03-31 | 2016-12-31 | 2016-09-30 | 2016-06-30 | 2016-03-31 | 2015-12-31 | 2015-09-30 | 2015-06-30 | 2015-03-31 | 2014-12-31 | 2014-09-30 | 2014-06-30 | 2014-03-31 | 2013-12-31 | 2013-09-30 | 2013-06-30 | 2013-03-31 | ||
|---|---|---|---|---|---|---|---|---|---|---|---|---|---|---|---|---|---|---|---|---|---|---|---|---|---|---|---|---|---|---|---|---|---|---|---|---|---|---|---|---|
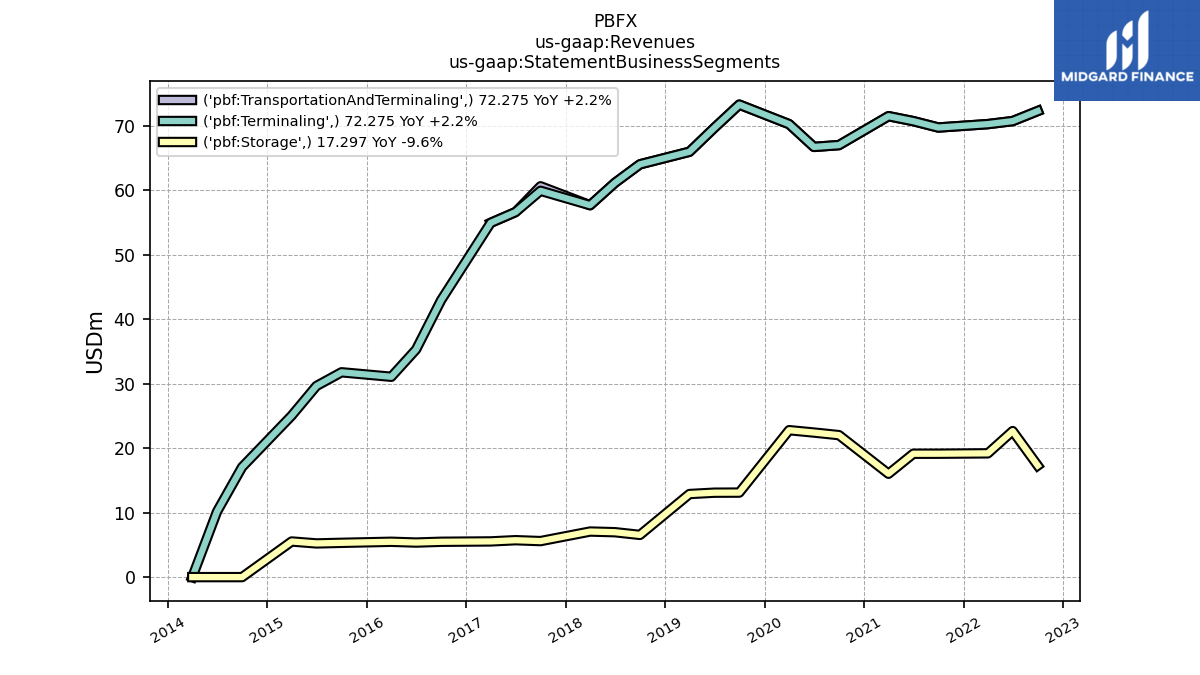
| Revenues | 89.57 | 93.37 | 89.44 | 89.34 | 88.85 | 89.84 | 87.50 | 89.09 | 89.01 | 89.13 | 93.03 | 92.24 | 86.38 | 82.75 | 78.84 | 80.05 | 70.56 | 68.10 | 64.74 | 66.51 | 3.13 | 3.97 | 4.28 | 61.69 | 48.43 | 40.66 | 0.00 | 37.31 | 37.08 | 34.87 | 30.57 | 27.30 | 14.74 | 7.78 | 0.00 | 0.00 | 0.00 | 0.00 | 0.00 | |
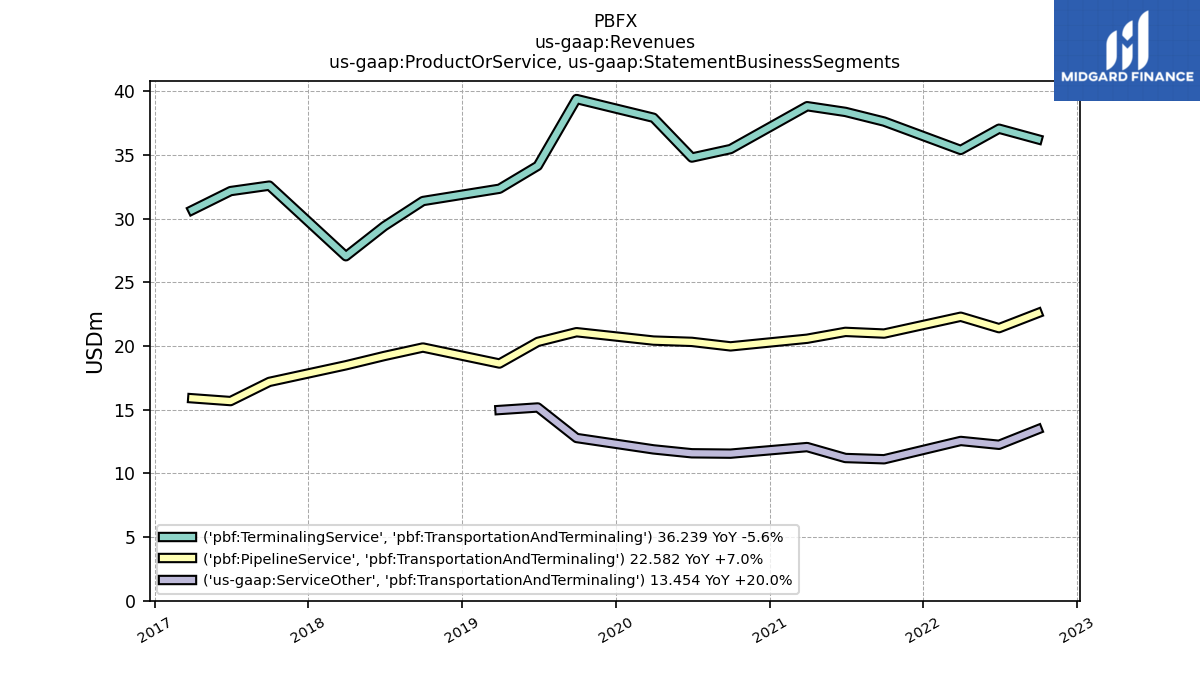
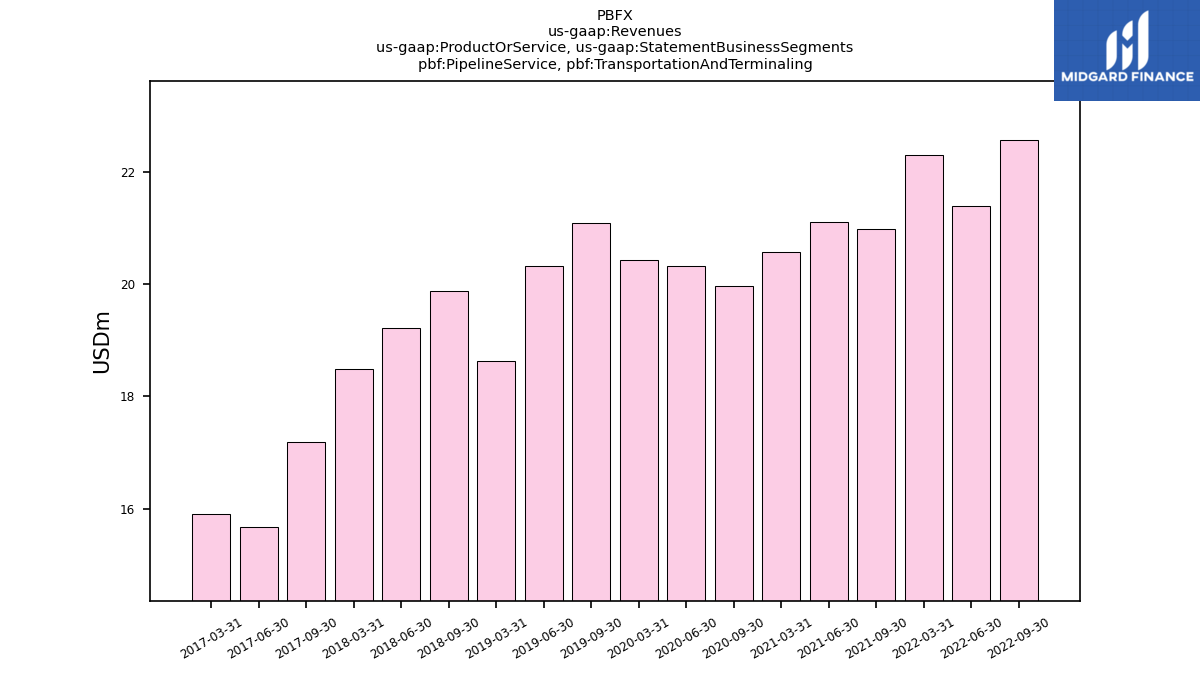
| Pipeline Service, Transportation And Terminaling | 22.58 | 21.40 | 22.30 | NA | 20.98 | 21.11 | 20.57 | NA | 19.97 | 20.33 | 20.43 | NA | 21.09 | 20.33 | 18.63 | NA | 19.89 | 19.22 | 18.49 | NA | 17.18 | 15.68 | 15.90 | NA | NA | NA | NA | NA | NA | NA | NA | NA | NA | NA | NA | NA | NA | NA | NA | |
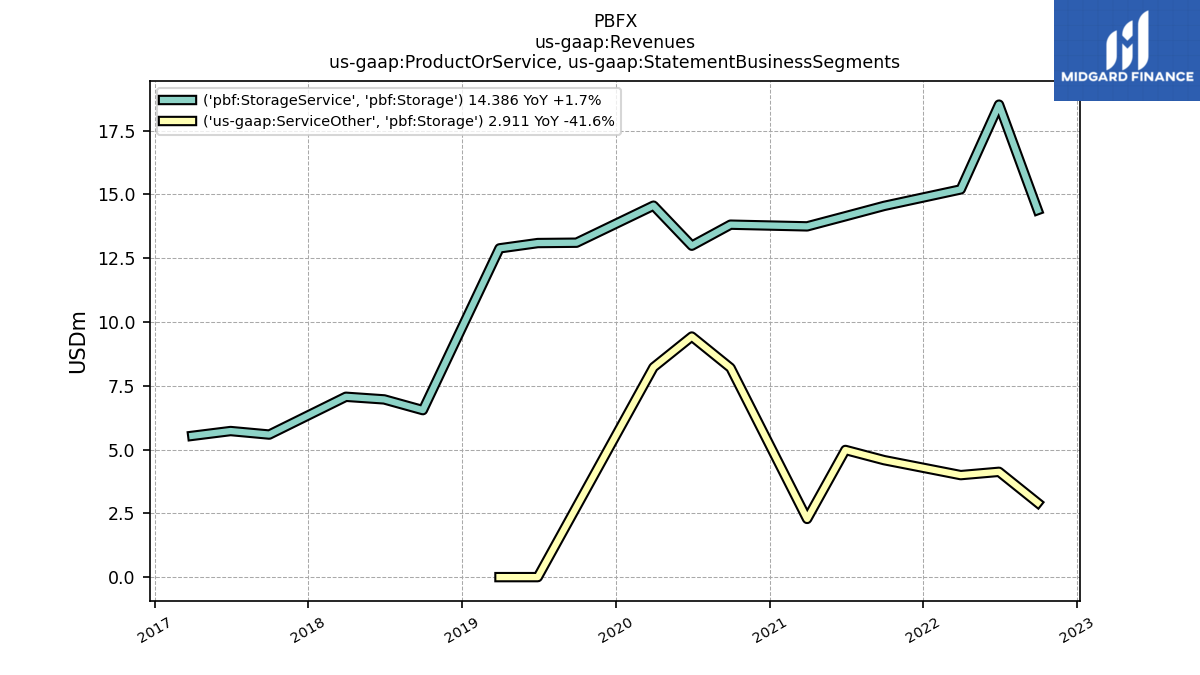
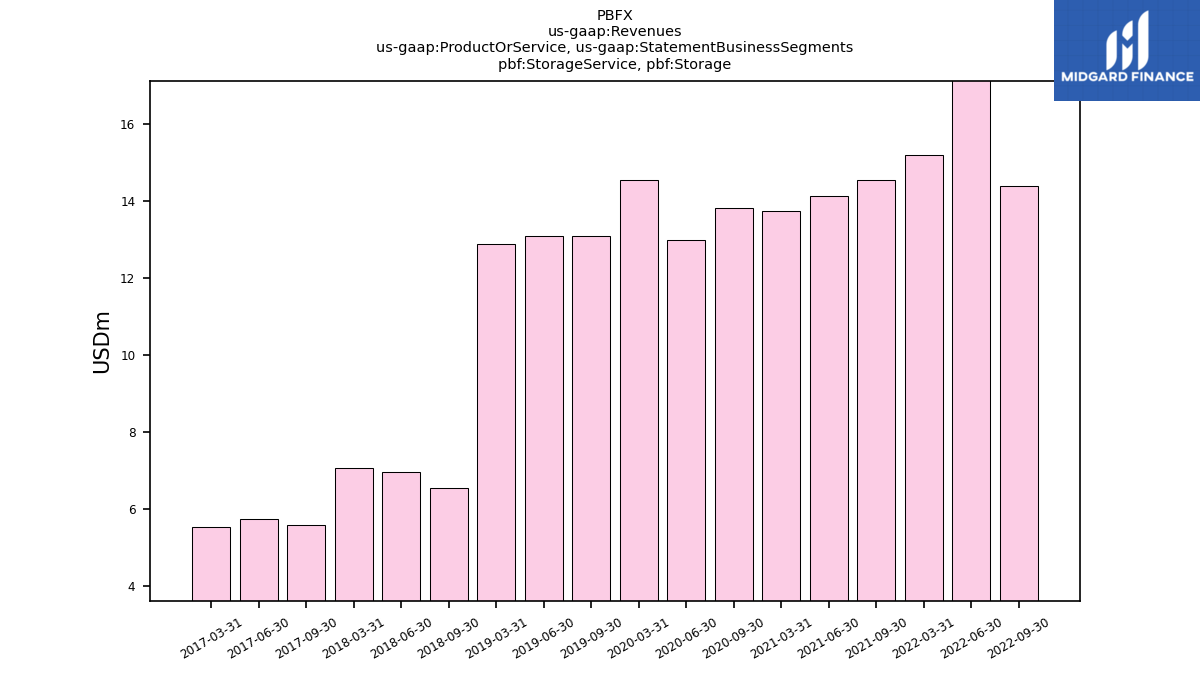
| Storage Service, Storage | 14.39 | 18.52 | 15.20 | NA | 14.55 | 14.14 | 13.75 | NA | 13.81 | 12.99 | 14.56 | NA | 13.11 | 13.09 | 12.89 | NA | 6.54 | 6.97 | 7.07 | NA | 5.59 | 5.73 | 5.54 | NA | NA | NA | NA | NA | NA | NA | NA | NA | NA | NA | NA | NA | NA | NA | NA | |
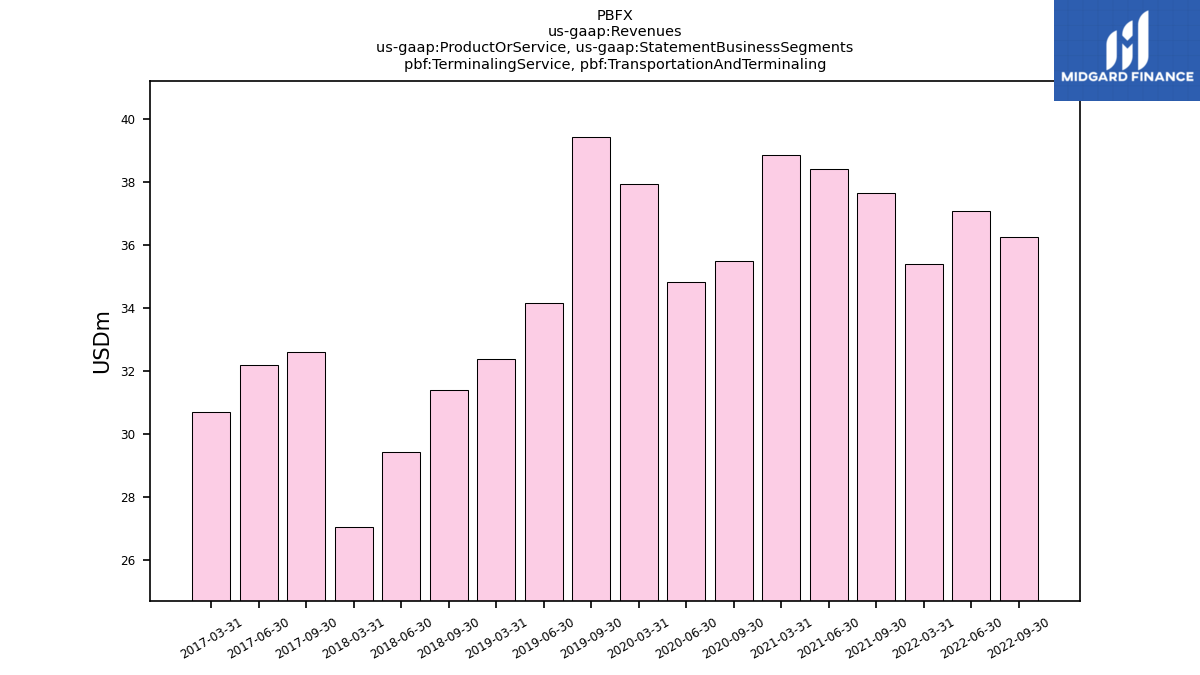
| Terminaling Service, Transportation And Terminaling | 36.24 | 37.07 | 35.40 | NA | 37.63 | 38.39 | 38.84 | NA | 35.47 | 34.80 | 37.93 | NA | 39.40 | 34.15 | 32.35 | NA | 31.39 | 29.41 | 27.05 | NA | 32.60 | 32.17 | 30.68 | NA | NA | NA | NA | NA | NA | NA | NA | NA | NA | NA | NA | NA | NA | NA | NA | |
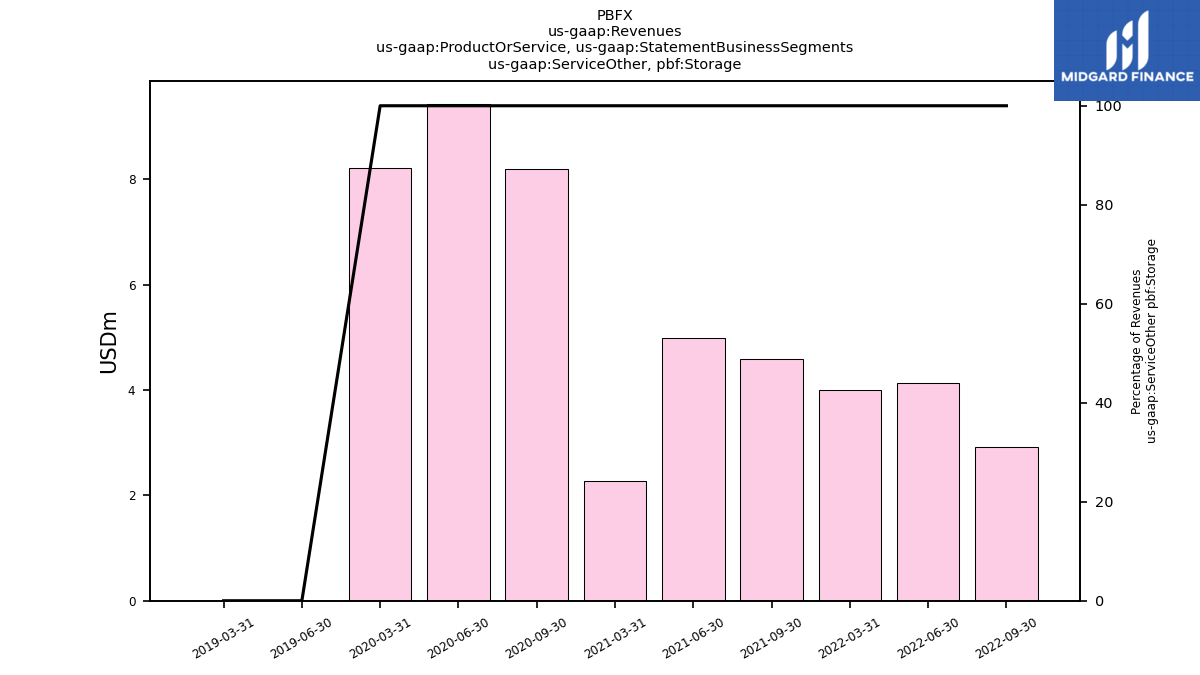
| Service Other, Storage | 2.91 | 4.13 | 4.00 | NA | 4.58 | 4.99 | 2.28 | NA | 8.20 | 9.43 | 8.22 | NA | NA | 0.00 | 0.00 | NA | NA | NA | NA | NA | NA | NA | NA | NA | NA | NA | NA | NA | NA | NA | NA | NA | NA | NA | NA | NA | NA | NA | NA | |
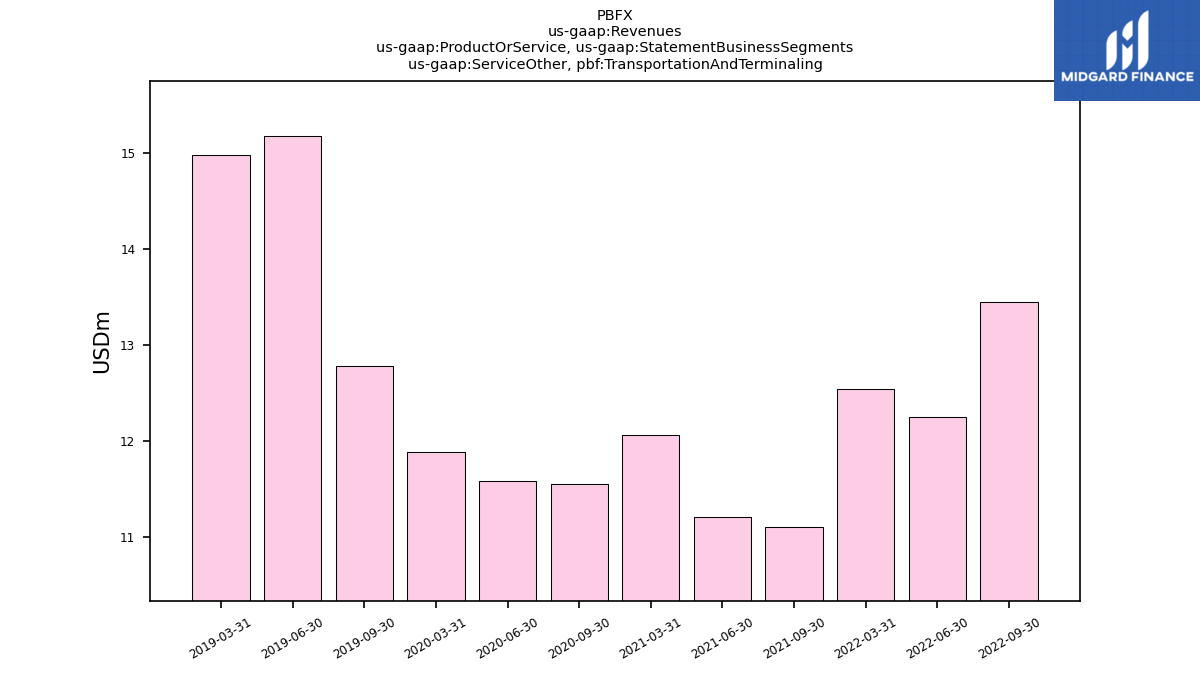
| Service Other, Transportation And Terminaling | 13.45 | 12.25 | 12.55 | NA | 11.11 | 11.21 | 12.07 | NA | 11.55 | 11.58 | 11.89 | NA | 12.78 | 15.18 | 14.98 | NA | NA | NA | NA | NA | NA | NA | NA | NA | NA | NA | NA | NA | NA | NA | NA | NA | NA | NA | NA | NA | NA | NA | NA | |
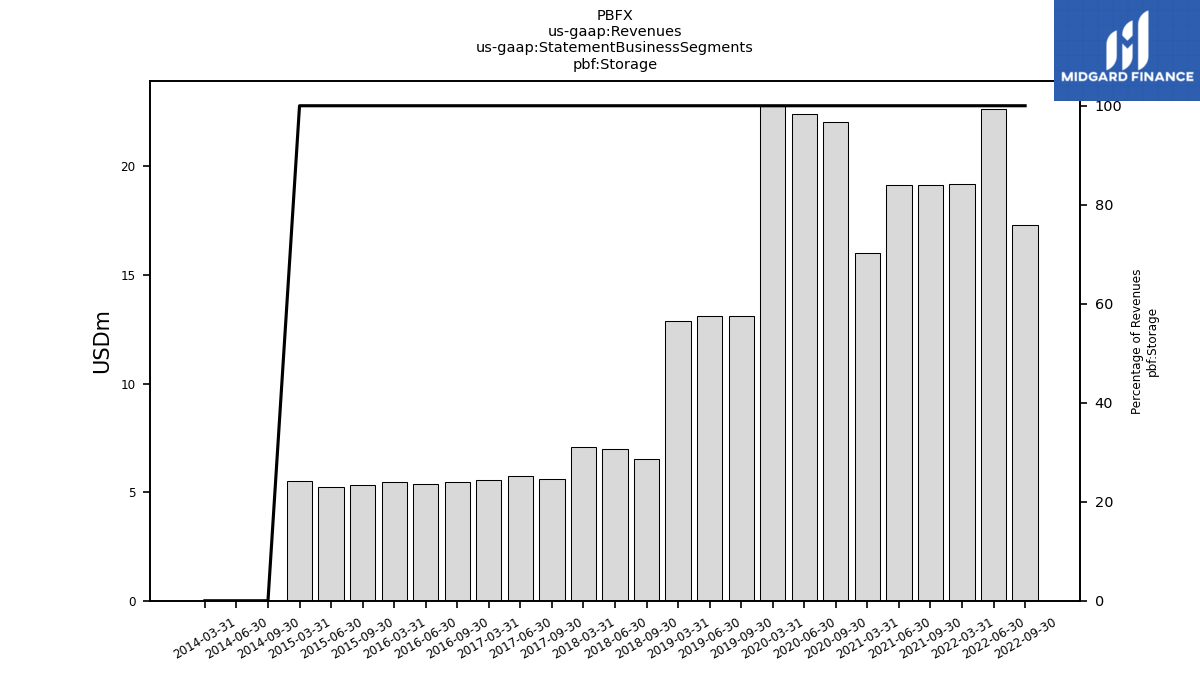
| Storage | 17.30 | 22.65 | 19.20 | NA | 19.14 | 19.13 | 16.03 | NA | 22.02 | 22.42 | 22.79 | NA | 13.11 | 13.09 | 12.89 | NA | 6.54 | 6.97 | 7.07 | NA | 5.59 | 5.73 | 5.54 | NA | 5.48 | 5.36 | 5.48 | NA | 5.32 | 5.23 | 5.53 | NA | 0.00 | 0.00 | 0.00 | NA | NA | NA | NA | |
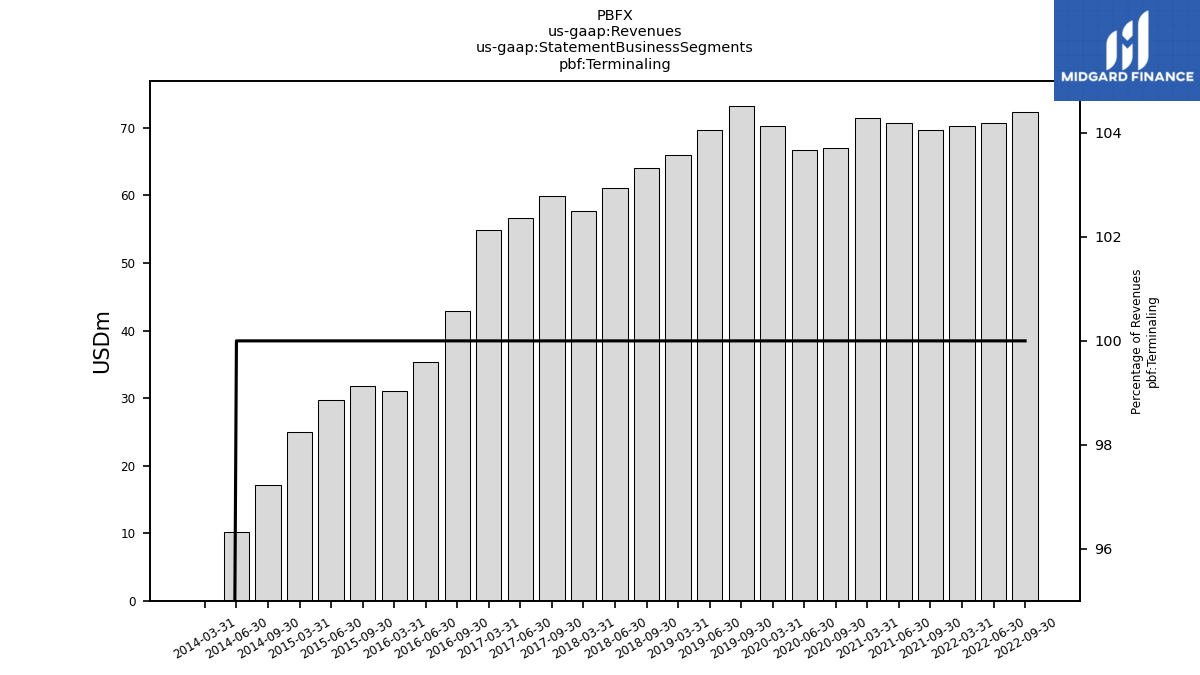
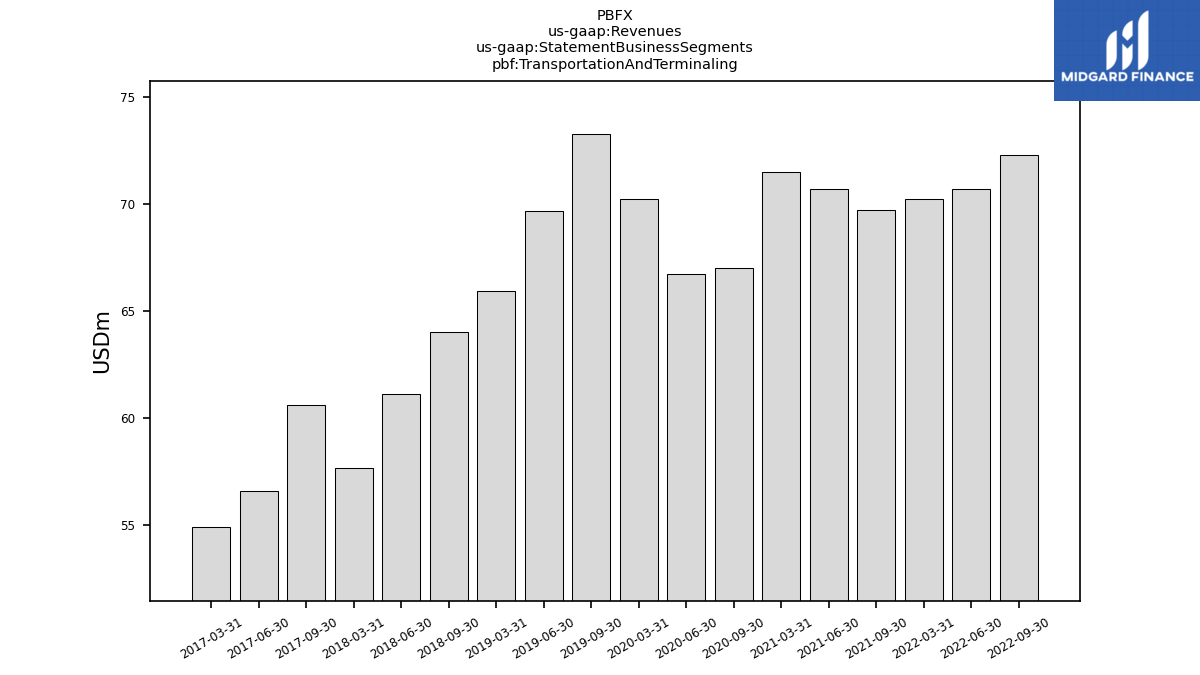
| Terminaling | 72.28 | 70.72 | 70.25 | NA | 69.72 | 70.71 | 71.48 | NA | 66.99 | 66.71 | 70.24 | NA | 73.27 | 69.66 | 65.96 | NA | 64.01 | 61.13 | 57.67 | NA | 59.91 | 56.60 | 54.94 | NA | 42.95 | 35.30 | 31.07 | NA | 31.76 | 29.64 | 25.04 | NA | 17.06 | 10.17 | 0.00 | NA | NA | NA | NA | |
| Transportation And Terminaling | 72.28 | 70.72 | 70.25 | NA | 69.72 | 70.71 | 71.48 | NA | 66.99 | 66.71 | 70.24 | NA | 73.27 | 69.66 | 65.96 | NA | 64.01 | 61.13 | 57.67 | NA | 60.61 | 56.60 | 54.94 | NA | NA | NA | NA | NA | NA | NA | NA | NA | NA | NA | NA | NA | NA | NA | NA | |
| Revenue From Contract With Customer Including Assessed Tax | 12.22 | 13.74 | 13.46 | 11.74 | 13.39 | 14.73 | 11.57 | 18.36 | 18.29 | 16.71 | 17.49 | 92.24 | 8.35 | 8.09 | 7.51 | 80.05 | 4.42 | 4.31 | 3.88 | 66.51 | 3.13 | 3.97 | 4.28 | 61.69 | 48.43 | 40.66 | 0.00 | 37.31 | 37.08 | 34.87 | 30.57 | 27.30 | 14.74 | 7.78 | 0.00 | 0.00 | 0.00 | 0.00 | 0.00 |