
| 2023-12-31 | 2023-09-30 | 2023-06-30 | 2023-03-31 | 2022-12-31 | 2022-09-30 | 2022-06-30 | 2022-03-31 | 2021-12-31 | 2021-09-30 | 2021-06-30 | 2021-03-31 | 2020-12-31 | 2020-09-30 | 2020-06-30 | 2020-03-31 | 2019-12-31 | 2019-09-30 | 2019-06-30 | 2019-03-31 | 2018-12-31 | 2018-09-30 | 2018-06-30 | 2018-03-31 | ||
|---|---|---|---|---|---|---|---|---|---|---|---|---|---|---|---|---|---|---|---|---|---|---|---|---|---|
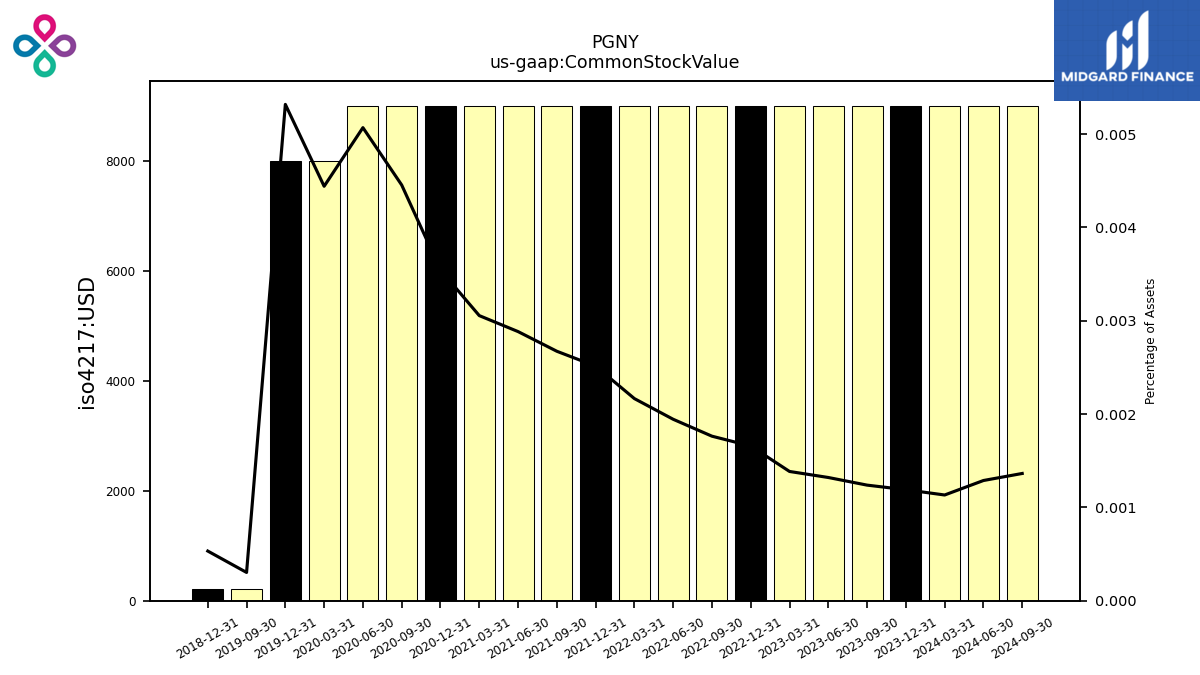
| Common Stock Value | 0.01 | 0.01 | 0.01 | 0.01 | 0.01 | 0.01 | 0.01 | 0.01 | 0.01 | 0.01 | 0.01 | 0.01 | 0.01 | 0.01 | 0.01 | 0.01 | 0.01 | 0.00 | NA | NA | 0.00 | NA | NA | NA | |
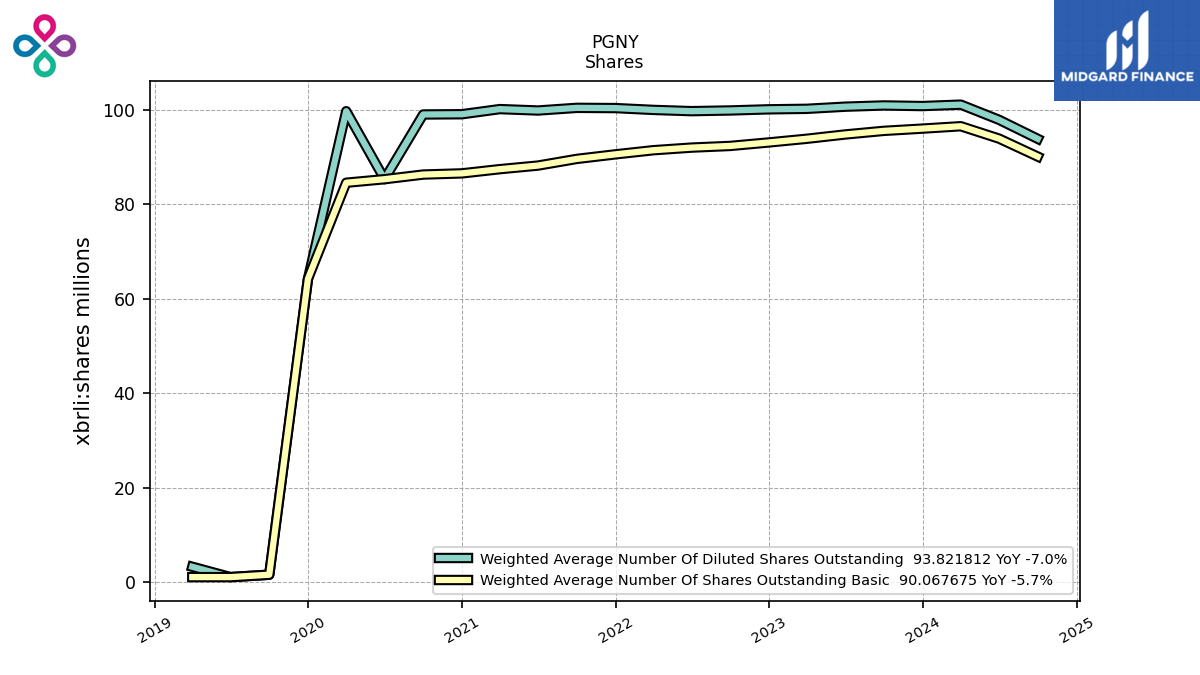
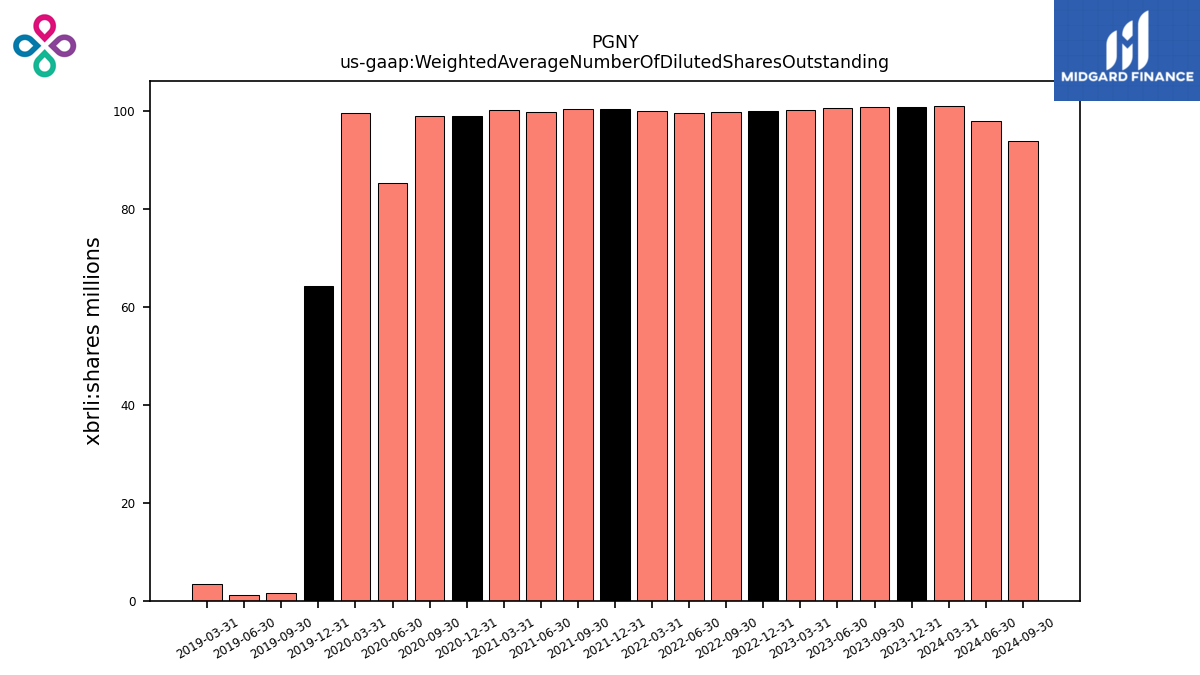
| Weighted Average Number Of Diluted Shares Outstanding | 100.75 | 100.88 | 100.62 | 100.17 | 100.06 | 99.82 | 99.67 | 99.94 | 100.32 | 100.37 | 99.81 | 100.11 | 99.02 | 98.97 | 85.28 | 99.67 | 64.19 | 1.64 | 1.14 | 3.33 | NA | NA | NA | NA | |
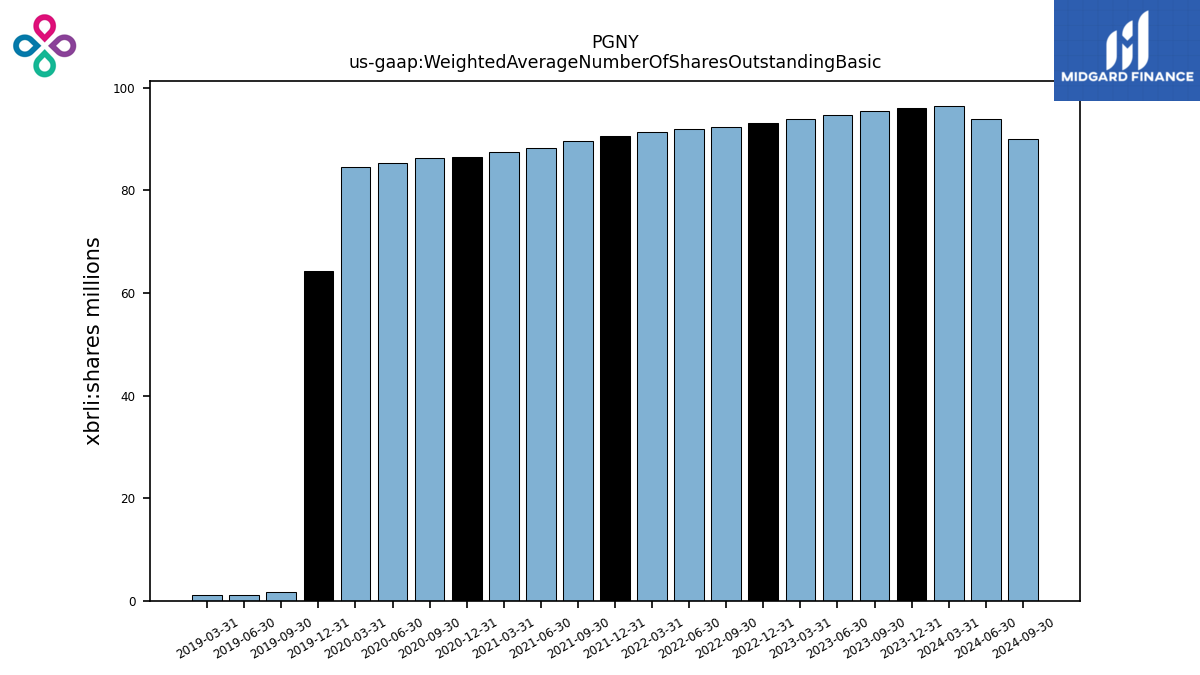
| Weighted Average Number Of Shares Outstanding Basic | 95.98 | 95.50 | 94.74 | 93.83 | 93.06 | 92.32 | 91.96 | 91.41 | 90.54 | 89.57 | 88.17 | 87.40 | 86.51 | 86.27 | 85.28 | 84.54 | 64.19 | 1.64 | 1.14 | 1.13 | NA | NA | NA | NA | |
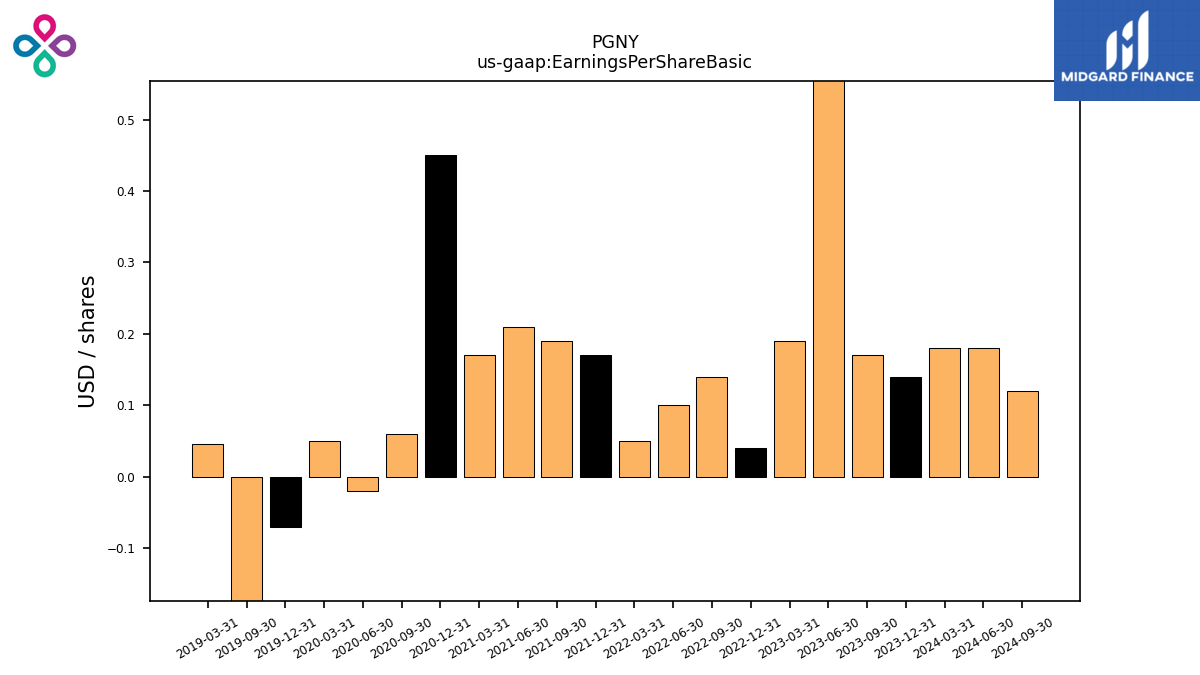
| Earnings Per Share Basic | 0.14 | 0.17 | 160.00 | 0.19 | 0.04 | 0.14 | 0.10 | 0.05 | 0.17 | 0.19 | 0.21 | 0.17 | 0.45 | 0.06 | -0.02 | 0.05 | -0.07 | -5.00 | NA | 0.05 | NA | NA | NA | NA | |
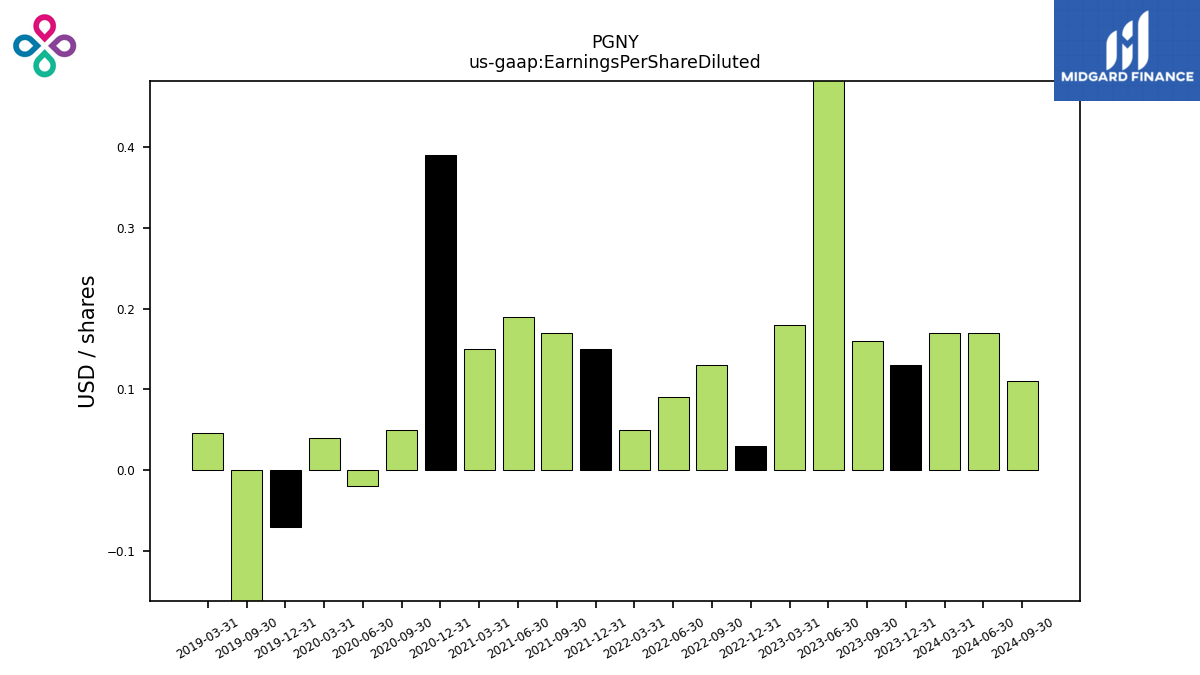
| Earnings Per Share Diluted | 0.13 | 0.16 | 150.00 | 0.18 | 0.03 | 0.13 | 0.09 | 0.05 | 0.15 | 0.17 | 0.19 | 0.15 | 0.39 | 0.05 | -0.02 | 0.04 | -0.07 | -5.00 | NA | 0.05 | NA | NA | NA | NA |
| 2023-12-31 | 2023-09-30 | 2023-06-30 | 2023-03-31 | 2022-12-31 | 2022-09-30 | 2022-06-30 | 2022-03-31 | 2021-12-31 | 2021-09-30 | 2021-06-30 | 2021-03-31 | 2020-12-31 | 2020-09-30 | 2020-06-30 | 2020-03-31 | 2019-12-31 | 2019-09-30 | 2019-06-30 | 2019-03-31 | 2018-12-31 | 2018-09-30 | 2018-06-30 | 2018-03-31 | ||
|---|---|---|---|---|---|---|---|---|---|---|---|---|---|---|---|---|---|---|---|---|---|---|---|---|---|
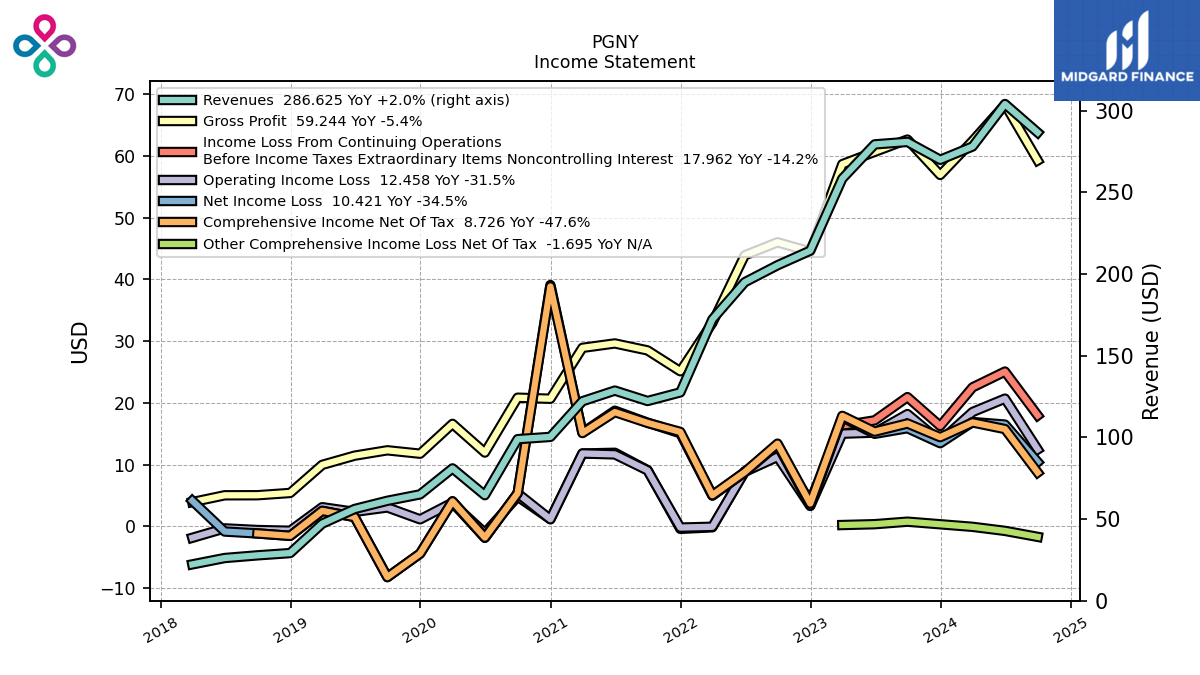
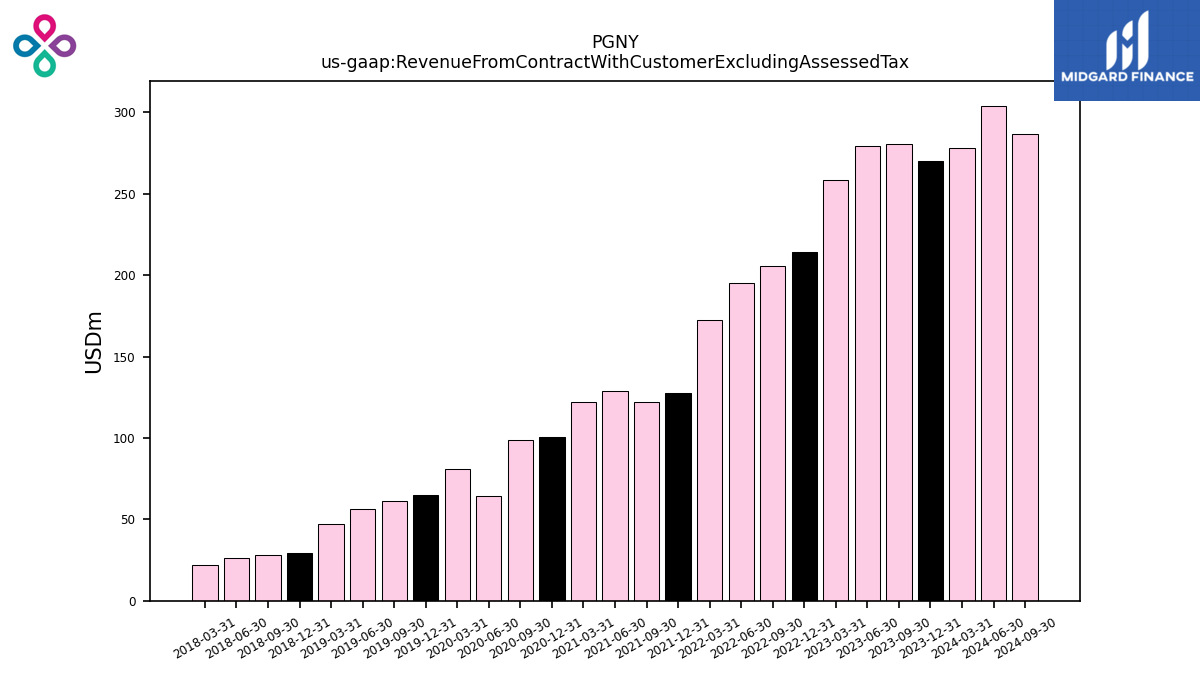
| Revenue From Contract With Customer Excluding Assessed Tax | 269.94 | 280.89 | 279.37 | 258.39 | 214.32 | 205.37 | 195.00 | 172.22 | 127.55 | 122.28 | 128.65 | 122.13 | 100.30 | 98.93 | 64.61 | 81.02 | 65.12 | 61.20 | 56.17 | 47.20 | 29.19 | 27.80 | 26.16 | 22.26 | |
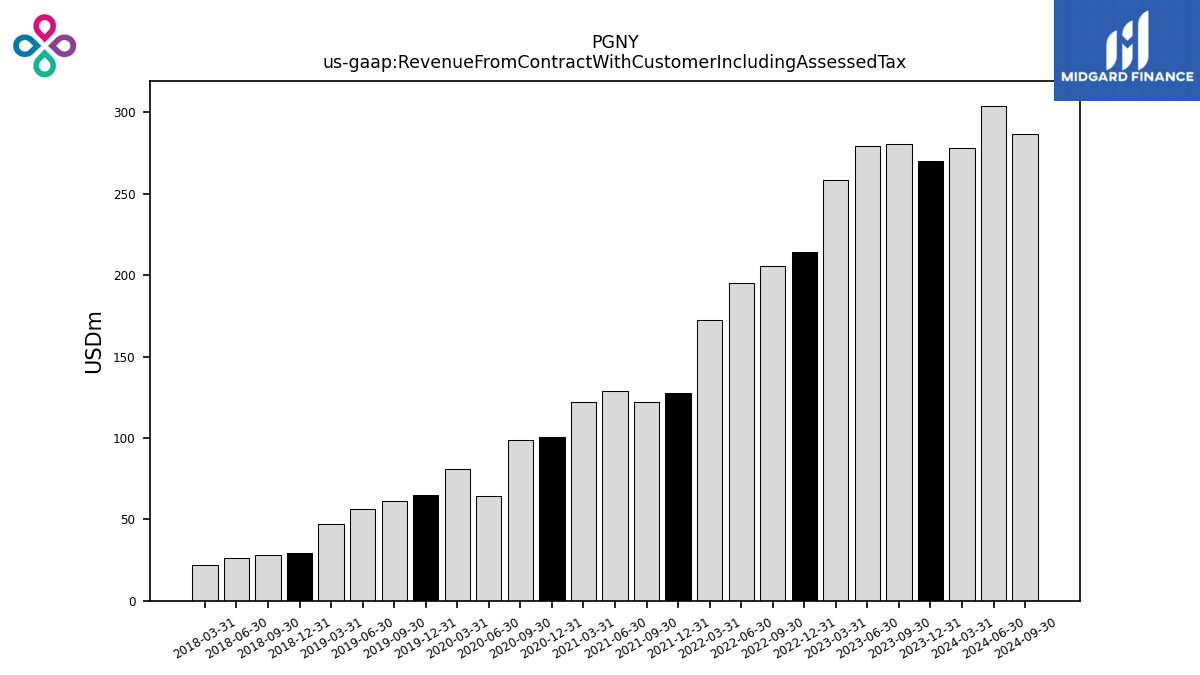
| Revenue From Contract With Customer Including Assessed Tax | 269.94 | 280.89 | 279.37 | 258.39 | 214.32 | 205.37 | 195.00 | 172.22 | 127.55 | 122.28 | 128.65 | 122.13 | 100.30 | 98.93 | 64.61 | 81.02 | 65.12 | 61.20 | 56.17 | 47.20 | 29.19 | 27.80 | 26.16 | 22.26 | |
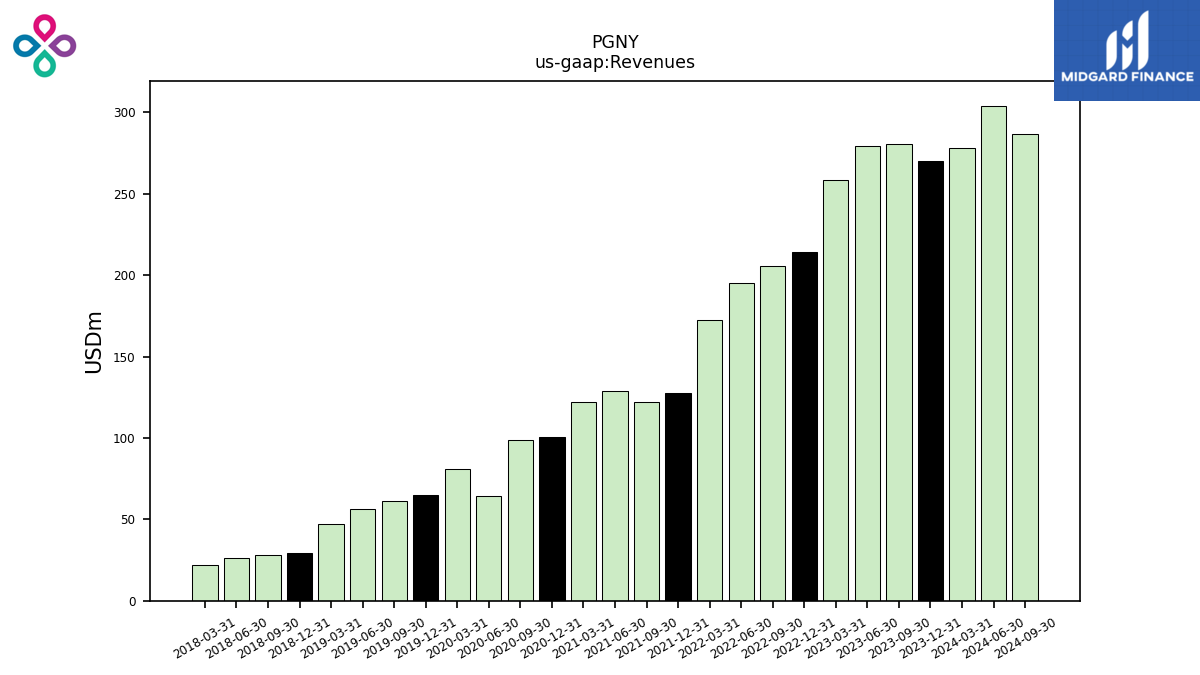
| Revenues | 269.94 | 280.89 | 279.37 | 258.39 | 214.32 | 205.37 | 195.00 | 172.22 | 127.55 | 122.28 | 128.65 | 122.13 | 100.30 | 98.93 | 64.61 | 81.02 | 65.12 | 61.20 | 56.17 | 47.20 | 29.19 | 27.80 | 26.16 | 22.26 | |
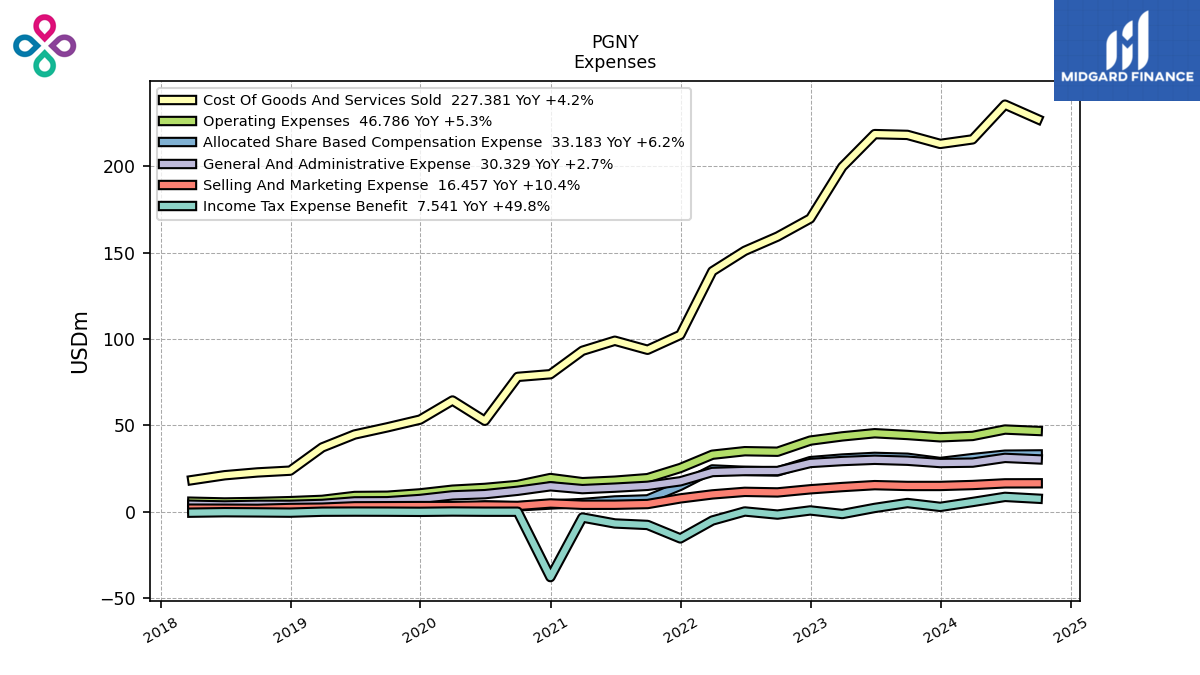
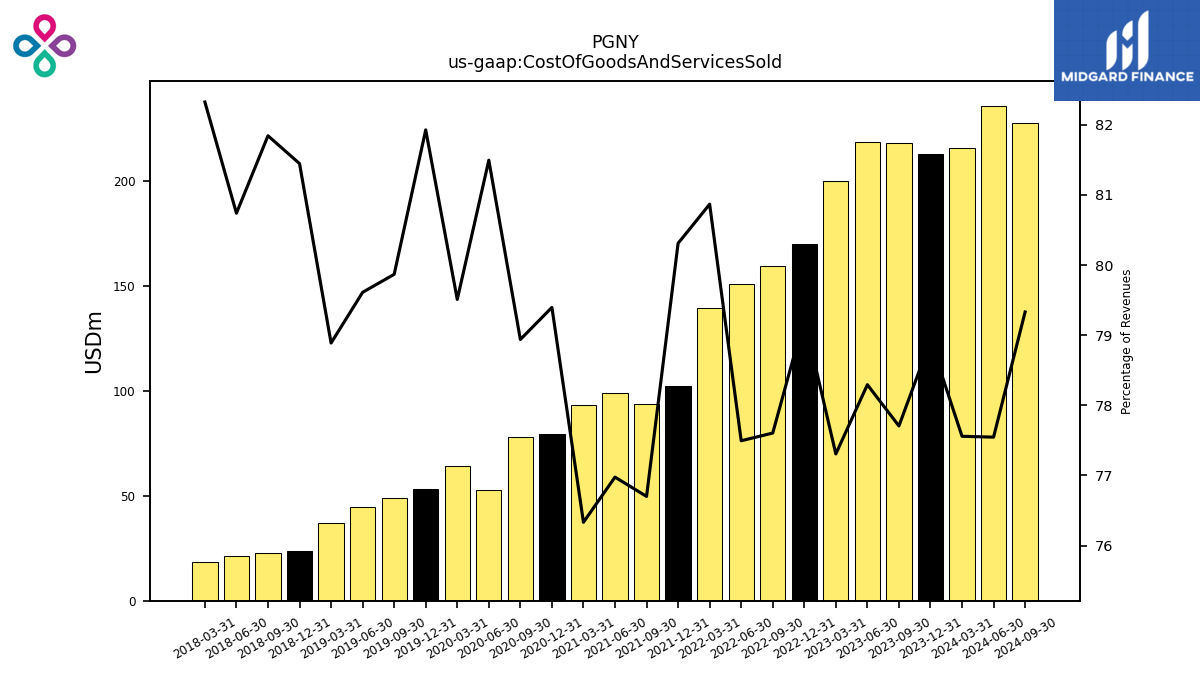
| Cost Of Goods And Services Sold | 213.05 | 218.27 | 218.73 | 199.75 | 169.83 | 159.38 | 151.12 | 139.27 | 102.44 | 93.79 | 99.03 | 93.23 | 79.64 | 78.09 | 52.65 | 64.42 | 53.35 | 48.88 | 44.72 | 37.23 | 23.77 | 22.75 | 21.12 | 18.32 | |
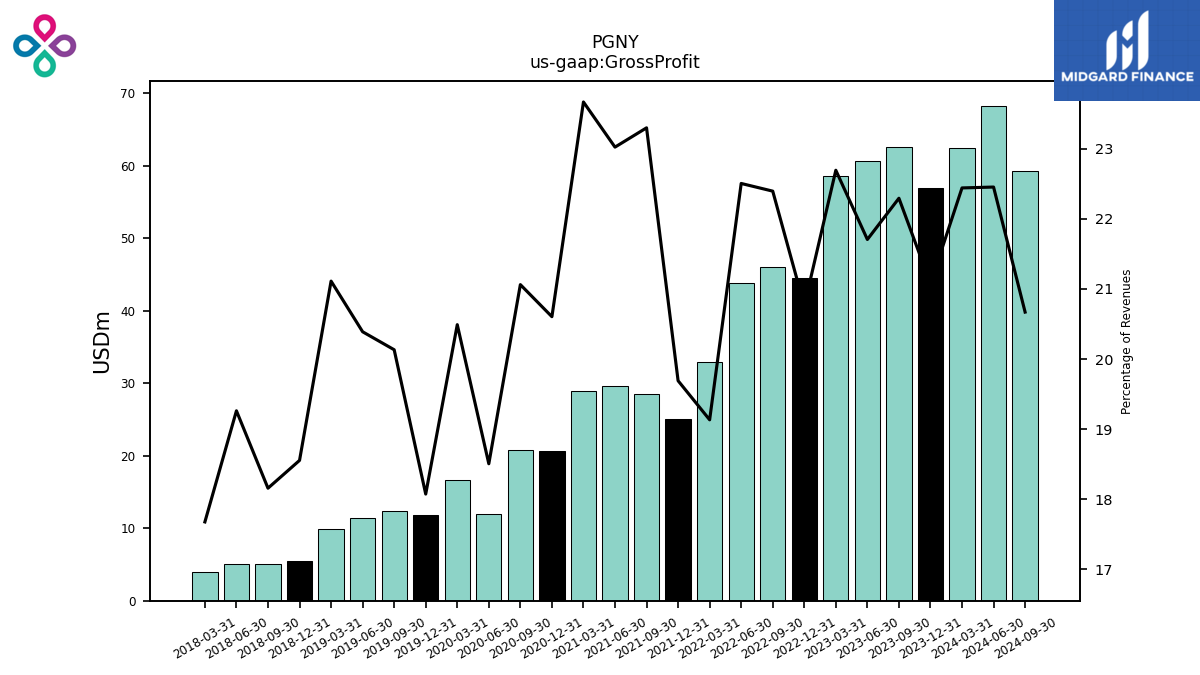
| Gross Profit | 56.89 | 62.62 | 60.64 | 58.64 | 44.49 | 45.99 | 43.89 | 32.95 | 25.11 | 28.49 | 29.62 | 28.91 | 20.67 | 20.84 | 11.96 | 16.60 | 11.77 | 12.32 | 11.45 | 9.96 | 5.42 | 5.05 | 5.04 | 3.93 | |
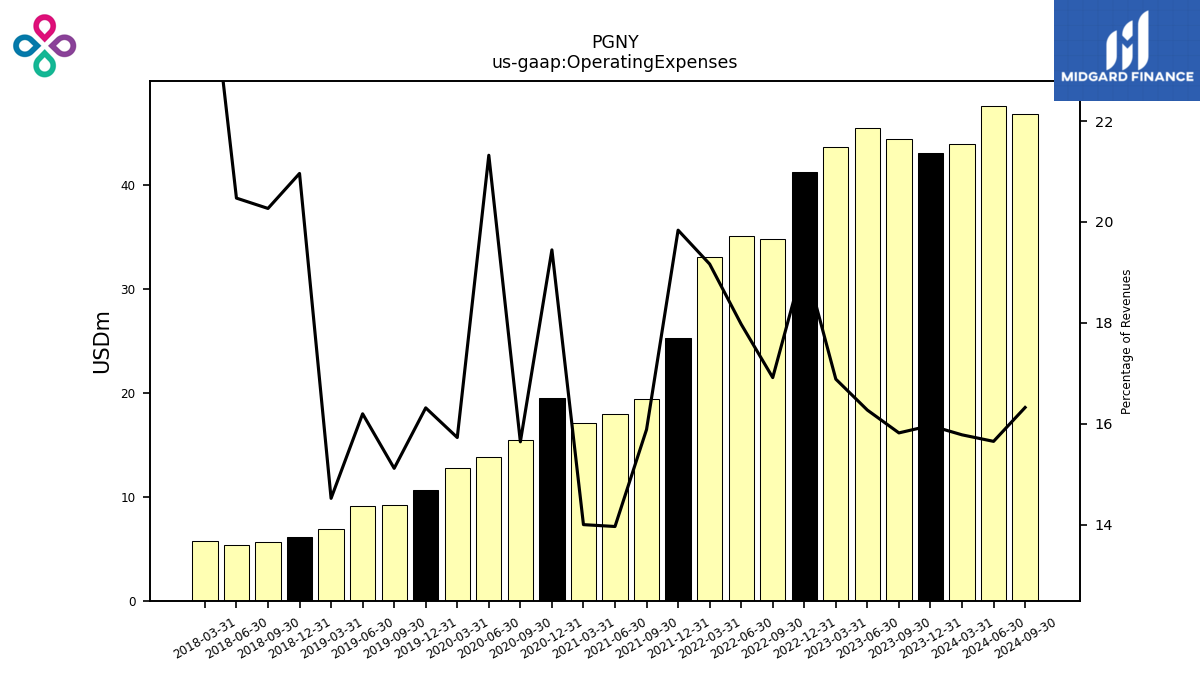
| Operating Expenses | 43.09 | 44.44 | 45.46 | 43.63 | 41.19 | 34.74 | 35.05 | 33.01 | 25.30 | 19.43 | 17.96 | 17.10 | 19.50 | 15.47 | 13.78 | 12.74 | 10.62 | 9.25 | 9.10 | 6.85 | 6.12 | 5.63 | 5.36 | 5.78 | |
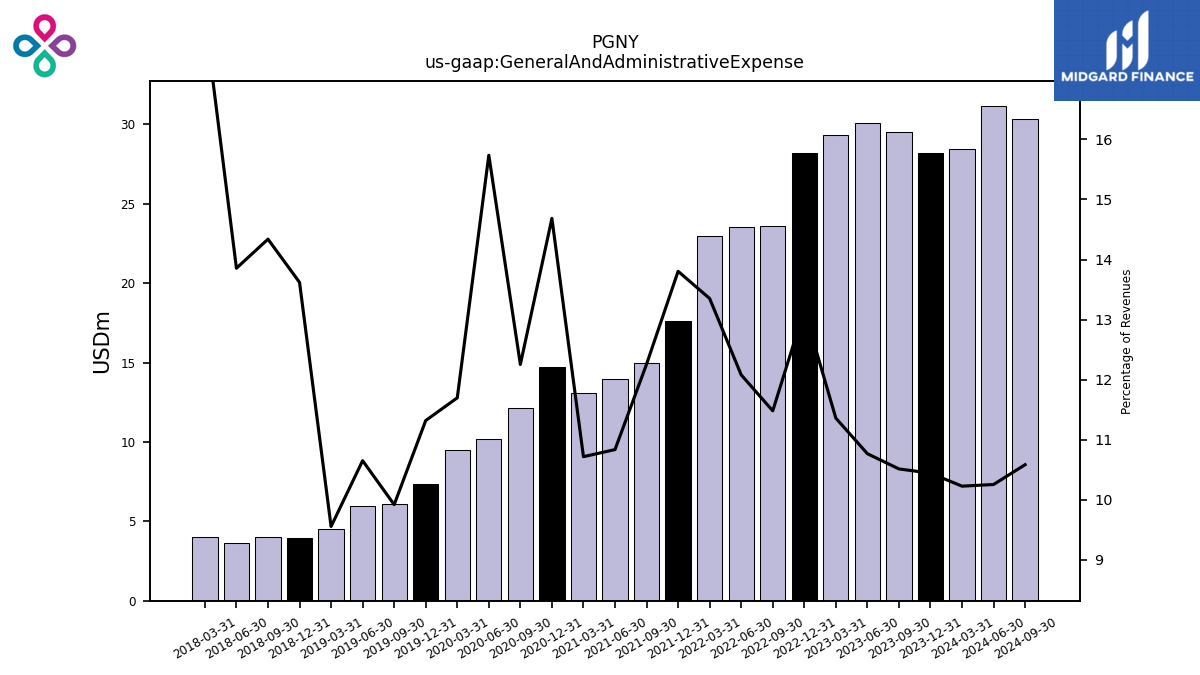
| General And Administrative Expense | 28.18 | 29.52 | 30.07 | 29.35 | 28.21 | 23.57 | 23.55 | 22.99 | 17.61 | 14.99 | 13.94 | 13.09 | 14.73 | 12.12 | 10.17 | 9.48 | 7.37 | 6.07 | 5.98 | 4.51 | 3.98 | 3.99 | 3.62 | 4.02 | |
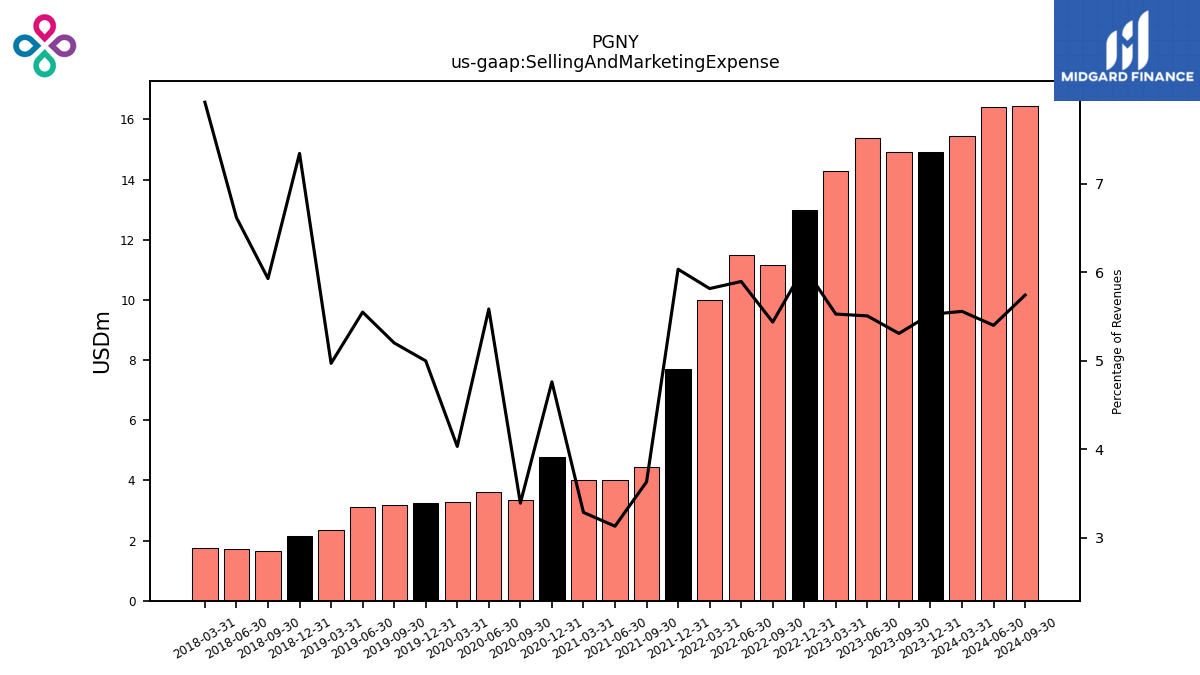
| Selling And Marketing Expense | 14.91 | 14.91 | 15.38 | 14.28 | 12.98 | 11.17 | 11.50 | 10.02 | 7.70 | 4.44 | 4.03 | 4.01 | 4.78 | 3.35 | 3.61 | 3.27 | 3.25 | 3.18 | 3.12 | 2.35 | 2.14 | 1.65 | 1.73 | 1.76 | |
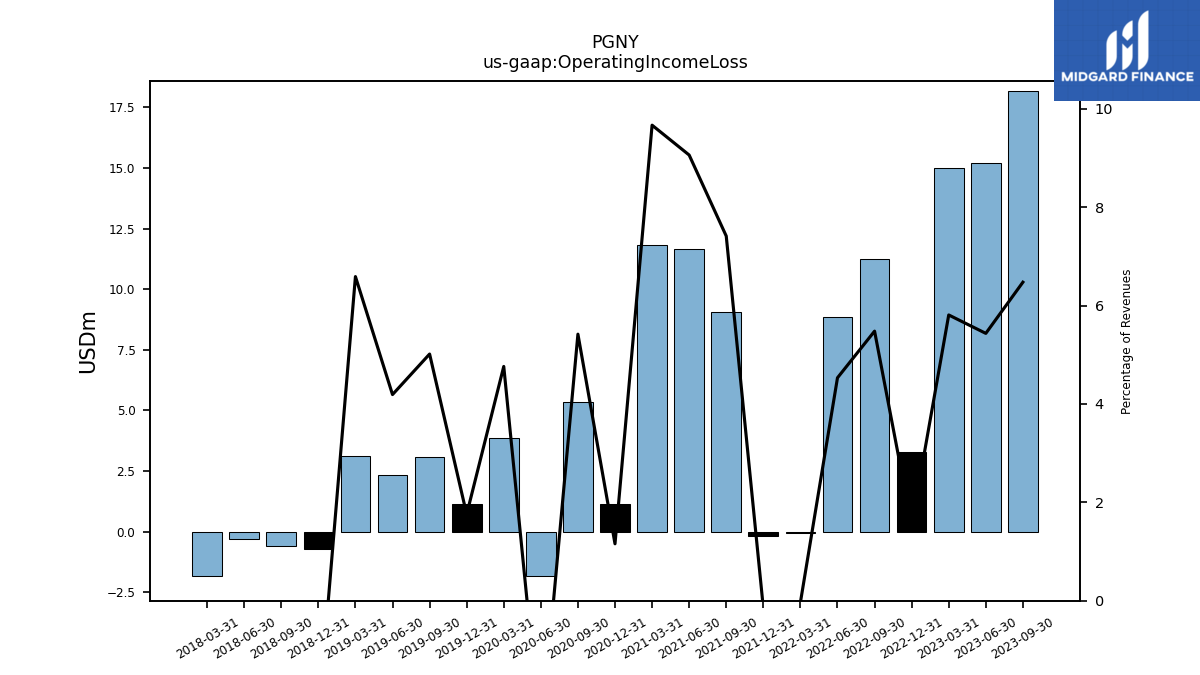
| Operating Income Loss | 13.80 | 18.19 | 15.18 | 15.01 | 3.31 | 11.26 | 8.84 | -0.06 | -0.19 | 9.06 | 11.66 | 11.81 | 1.16 | 5.36 | -1.82 | 3.86 | 1.14 | 3.07 | 2.35 | 3.11 | -0.70 | -0.59 | -0.32 | -1.84 | |
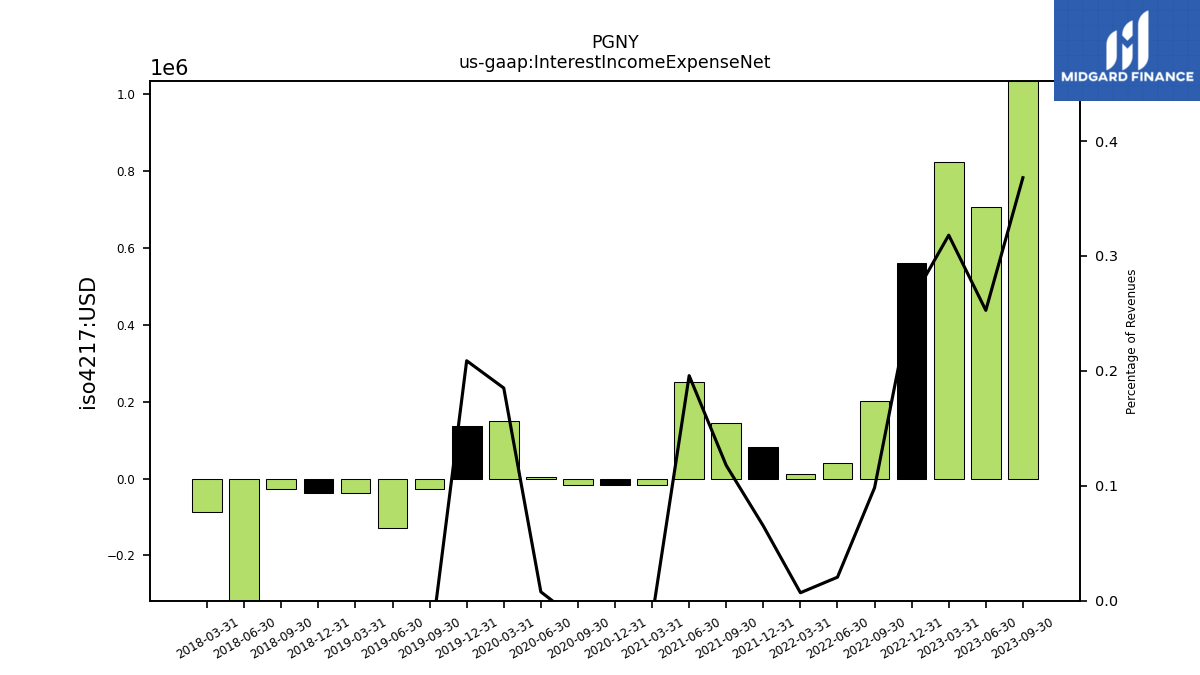
| Interest Income Expense Net | 0.74 | 1.03 | 0.71 | 0.82 | 0.56 | 0.20 | 0.04 | 0.01 | 0.08 | 0.14 | 0.25 | -0.02 | -0.02 | -0.02 | 0.01 | 0.15 | 0.14 | -0.03 | -0.13 | -0.04 | -0.04 | -0.03 | -0.34 | -0.09 | |
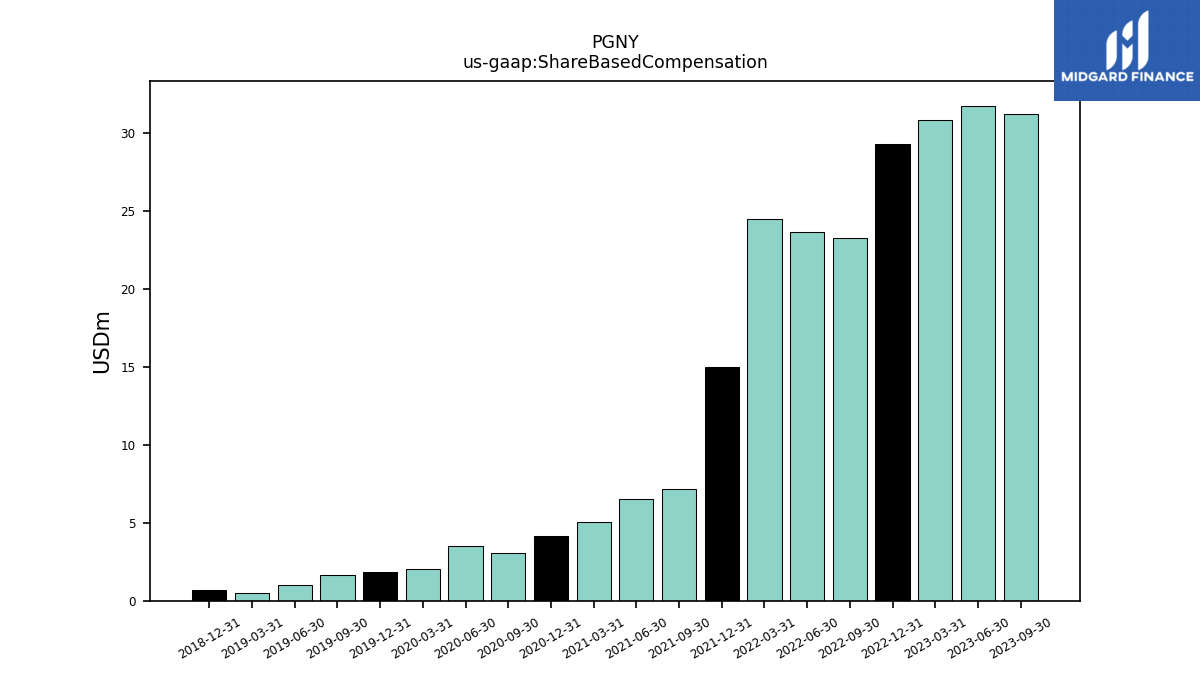
| Allocated Share Based Compensation Expense | 28.80 | 31.25 | 31.75 | 30.81 | 29.30 | 23.30 | 23.65 | 24.50 | 15.01 | 7.15 | 6.52 | 5.03 | 4.16 | 3.07 | 3.54 | 2.05 | 1.85 | 1.68 | 1.01 | 0.52 | 0.69 | 0.80 | NA | NA | |
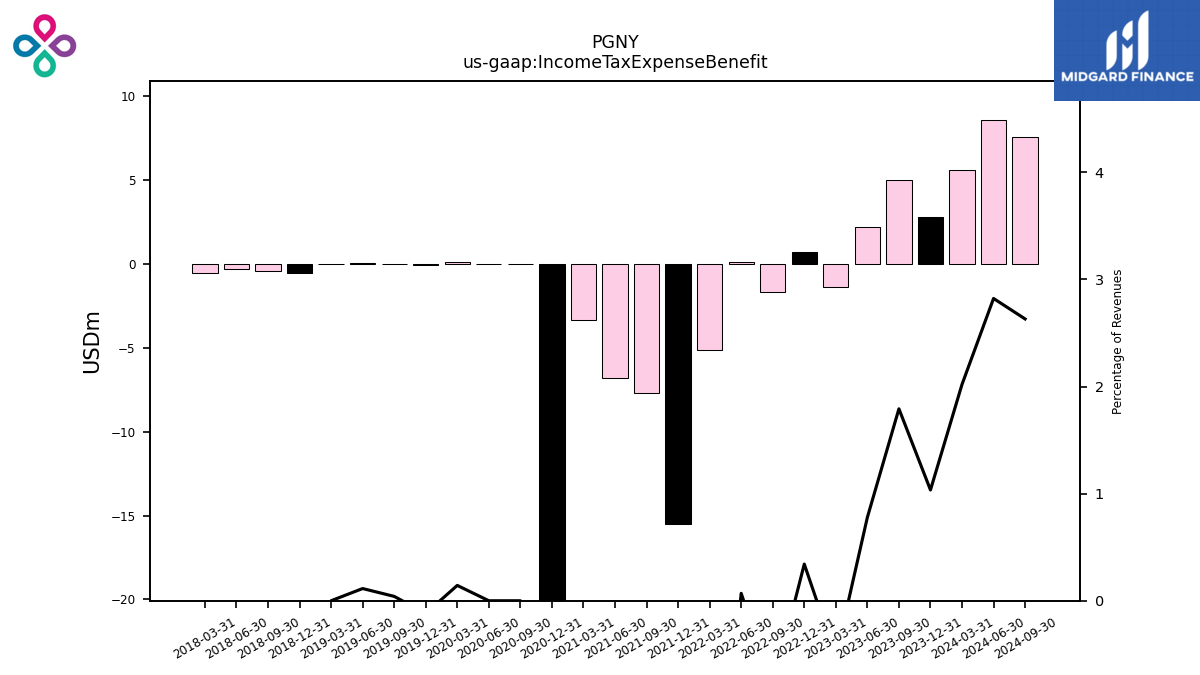
| Income Tax Expense Benefit | 2.79 | 5.03 | 2.18 | -1.35 | 0.73 | -1.67 | 0.14 | -5.11 | -15.48 | -7.68 | -6.81 | -3.37 | -37.90 | 0.00 | 0.00 | 0.12 | -0.08 | 0.03 | 0.06 | 0.00 | -0.55 | -0.40 | -0.29 | -0.55 | |
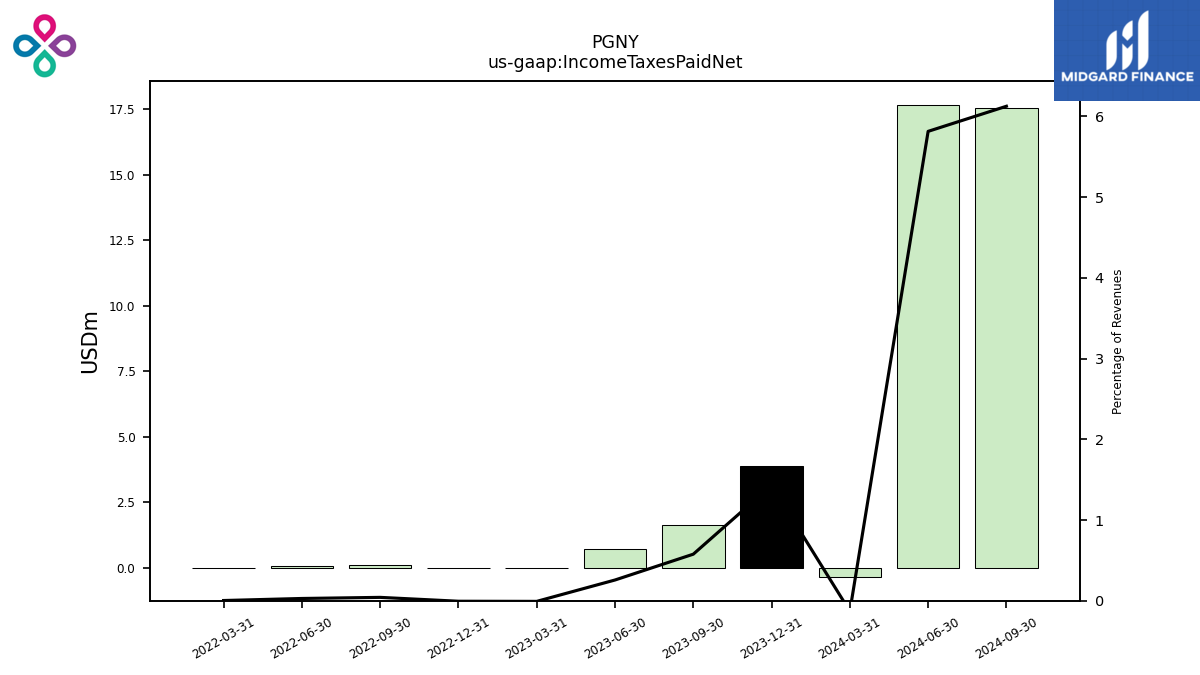
| Income Taxes Paid Net | 3.86 | 1.62 | 0.72 | -0.02 | -0.01 | 0.09 | 0.06 | 0.01 | NA | NA | NA | NA | NA | NA | NA | NA | NA | NA | NA | NA | NA | NA | NA | NA | |
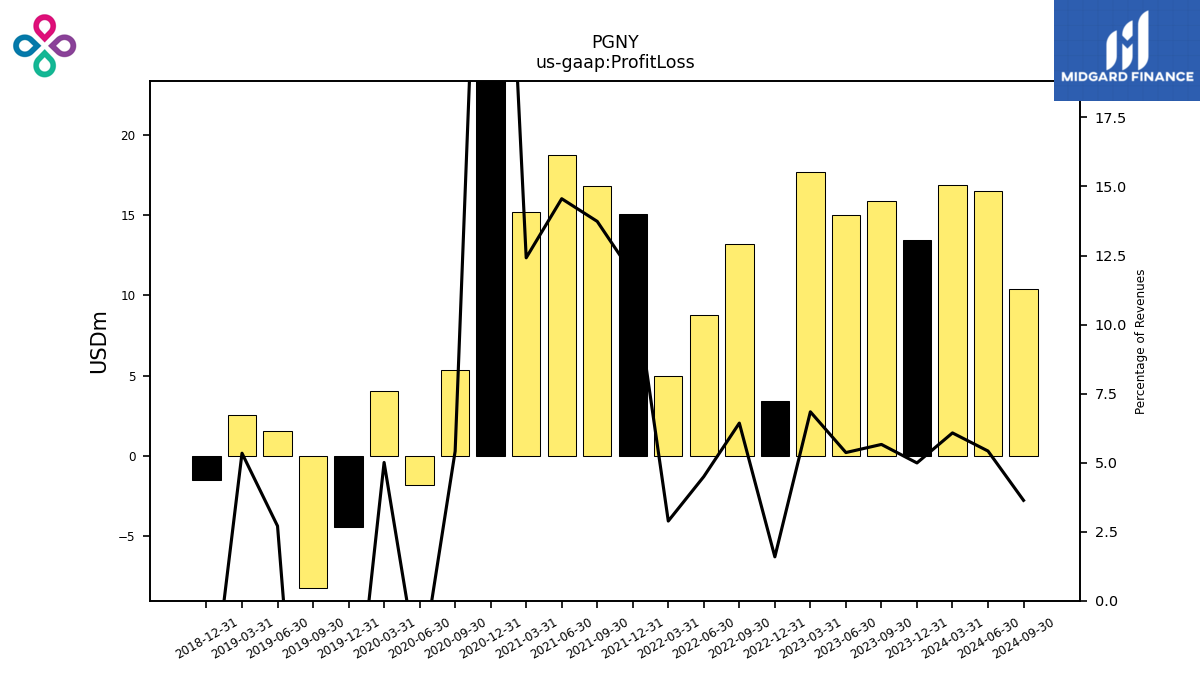
| Profit Loss | 13.47 | 15.90 | 14.99 | 17.68 | 3.41 | 13.21 | 8.77 | 4.97 | 15.08 | 16.80 | 18.73 | 15.17 | 38.86 | 5.36 | -1.81 | 4.06 | -4.40 | -8.21 | 1.52 | 2.52 | -1.52 | NA | NA | NA | |
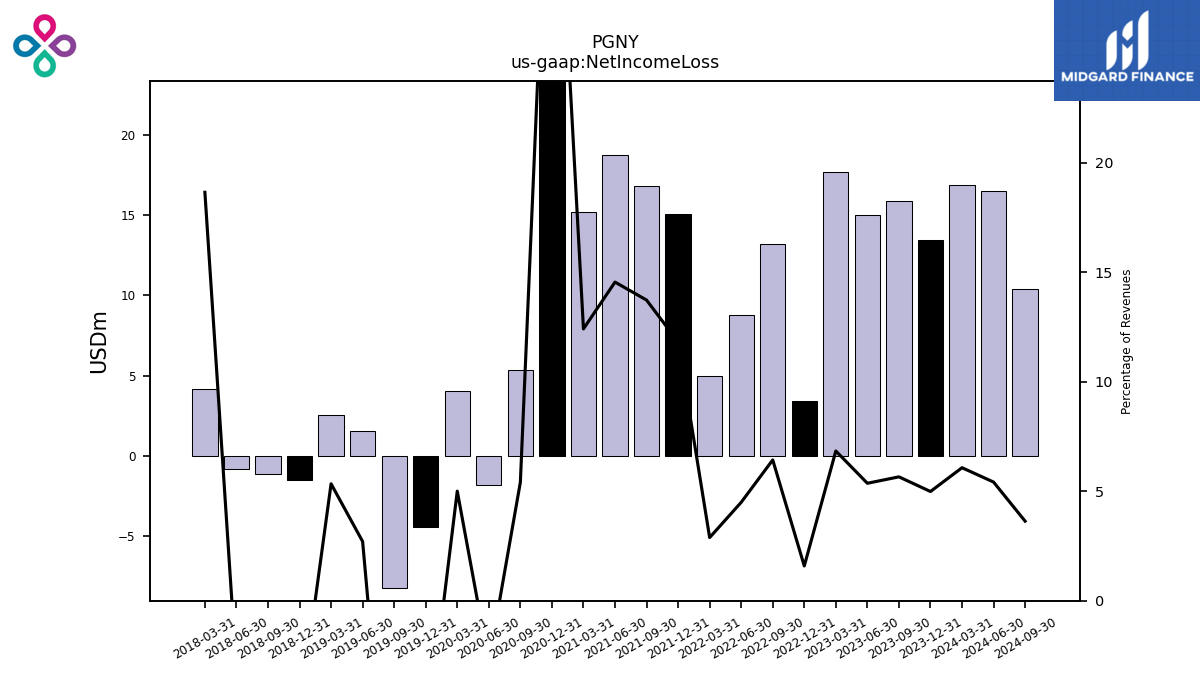
| Net Income Loss | 13.47 | 15.90 | 14.99 | 17.68 | 3.41 | 13.21 | 8.77 | 4.97 | 15.08 | 16.80 | 18.73 | 15.17 | 39.07 | 5.36 | -1.81 | 4.06 | -4.40 | -8.21 | 1.52 | 2.52 | -1.52 | -1.14 | -0.83 | 4.15 | |
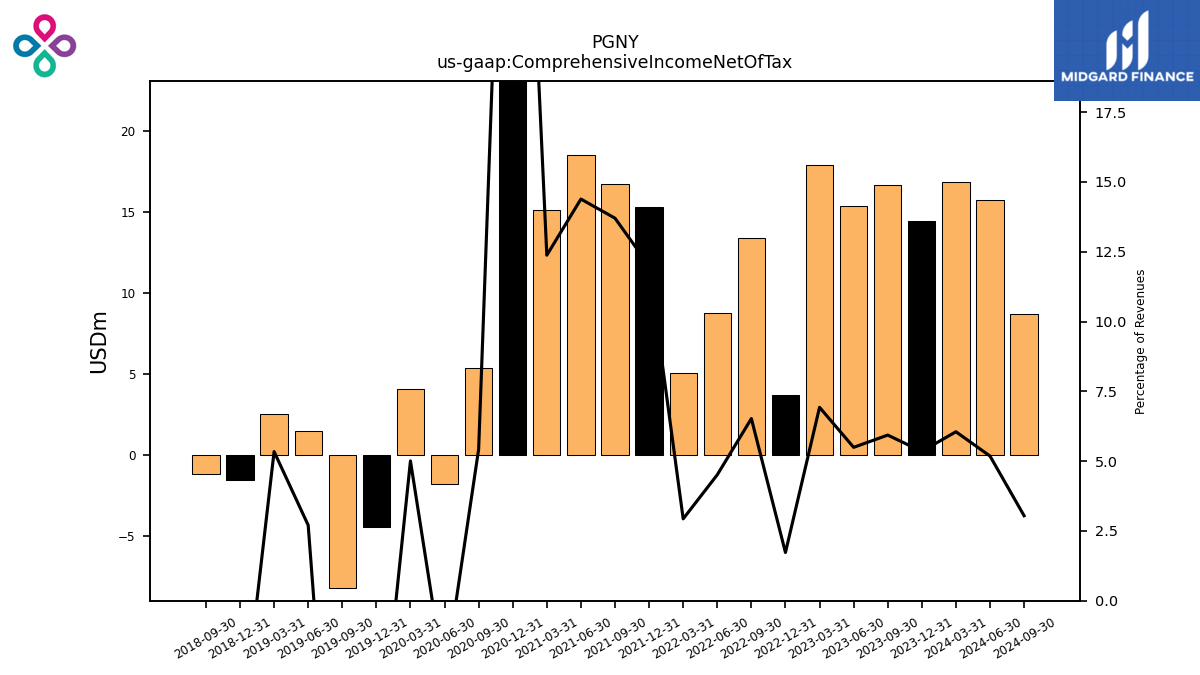
| Comprehensive Income Net Of Tax | 14.44 | 16.66 | 15.35 | 17.90 | 3.70 | 13.40 | 8.80 | 5.05 | 15.30 | 16.75 | 18.51 | 15.12 | 38.84 | 5.37 | -1.81 | 4.06 | -4.40 | -8.21 | 1.52 | 2.52 | -1.52 | -1.14 | NA | NA | |
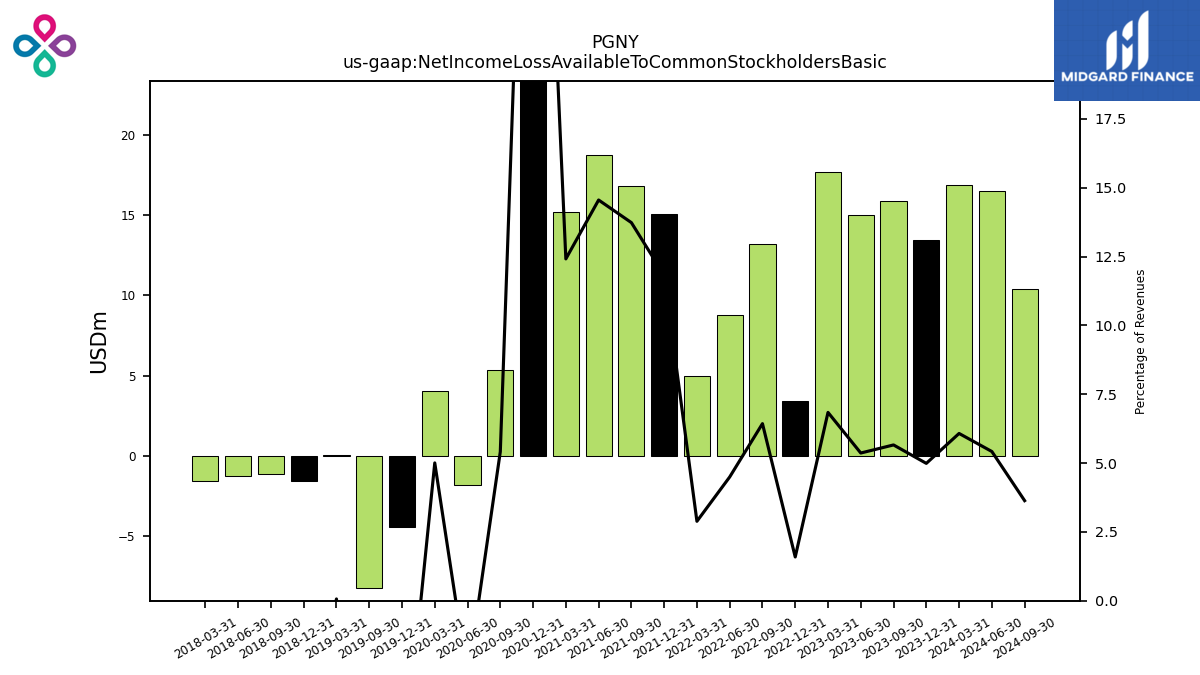
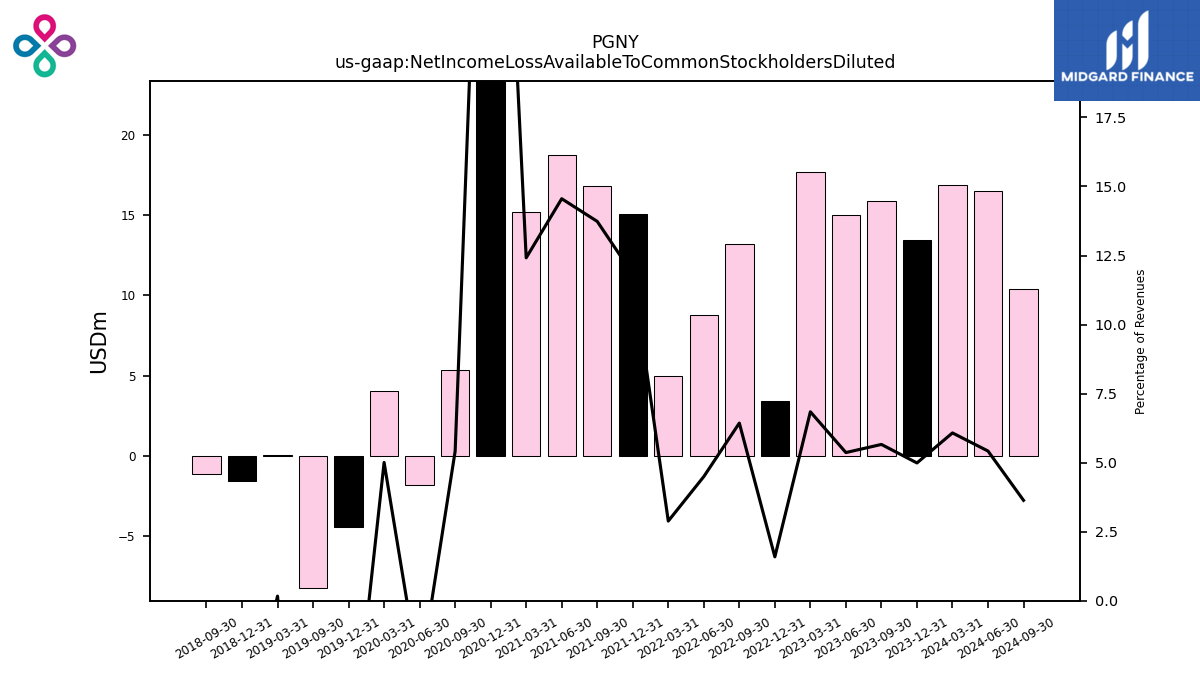
| Net Income Loss Available To Common Stockholders Basic | 13.47 | 15.90 | 14.99 | 17.68 | 3.41 | 13.21 | 8.77 | 4.97 | 15.08 | 16.80 | 18.73 | 15.17 | 39.07 | 5.36 | -1.81 | 4.06 | -4.40 | -8.21 | NA | 0.03 | -1.58 | -1.14 | -1.25 | -1.57 | |
| Net Income Loss Available To Common Stockholders Diluted | 13.47 | 15.90 | 14.99 | 17.68 | 3.41 | 13.21 | 8.77 | 4.97 | 15.08 | 16.80 | 18.73 | 15.17 | 38.86 | 5.36 | -1.81 | 4.06 | -4.40 | -8.21 | NA | 0.08 | -1.58 | -1.14 | NA | NA |
| 2023-12-31 | 2023-09-30 | 2023-06-30 | 2023-03-31 | 2022-12-31 | 2022-09-30 | 2022-06-30 | 2022-03-31 | 2021-12-31 | 2021-09-30 | 2021-06-30 | 2021-03-31 | 2020-12-31 | 2020-09-30 | 2020-06-30 | 2020-03-31 | 2019-12-31 | 2019-09-30 | 2019-06-30 | 2019-03-31 | 2018-12-31 | 2018-09-30 | 2018-06-30 | 2018-03-31 | ||
|---|---|---|---|---|---|---|---|---|---|---|---|---|---|---|---|---|---|---|---|---|---|---|---|---|---|
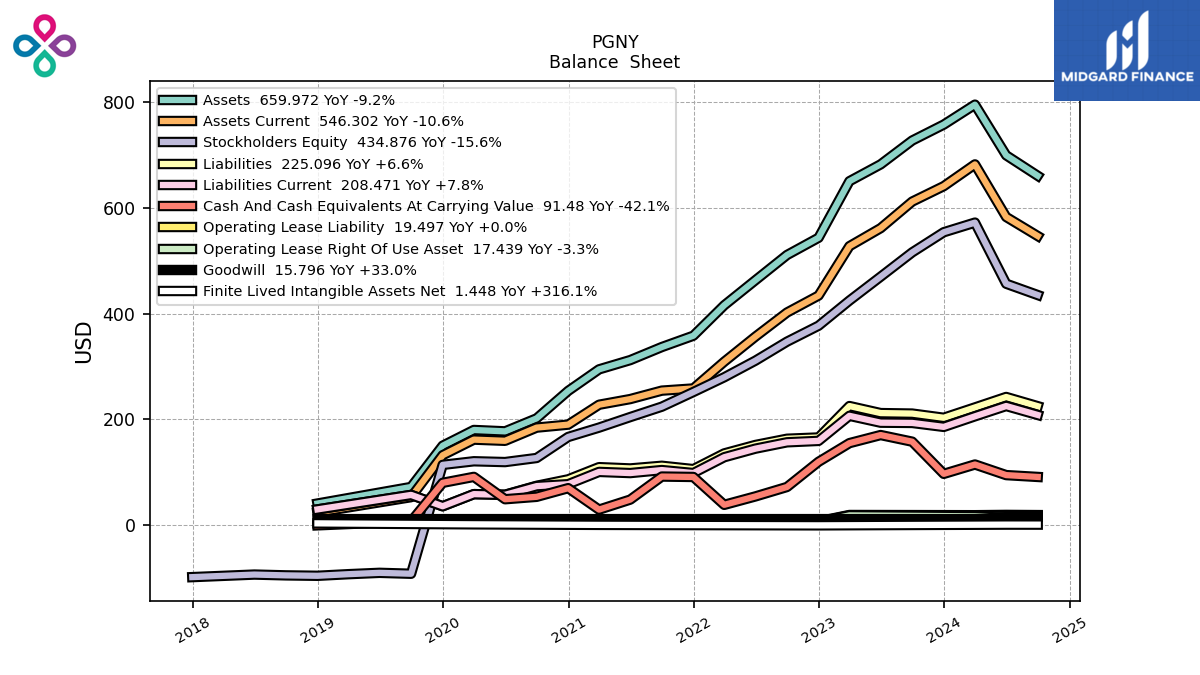
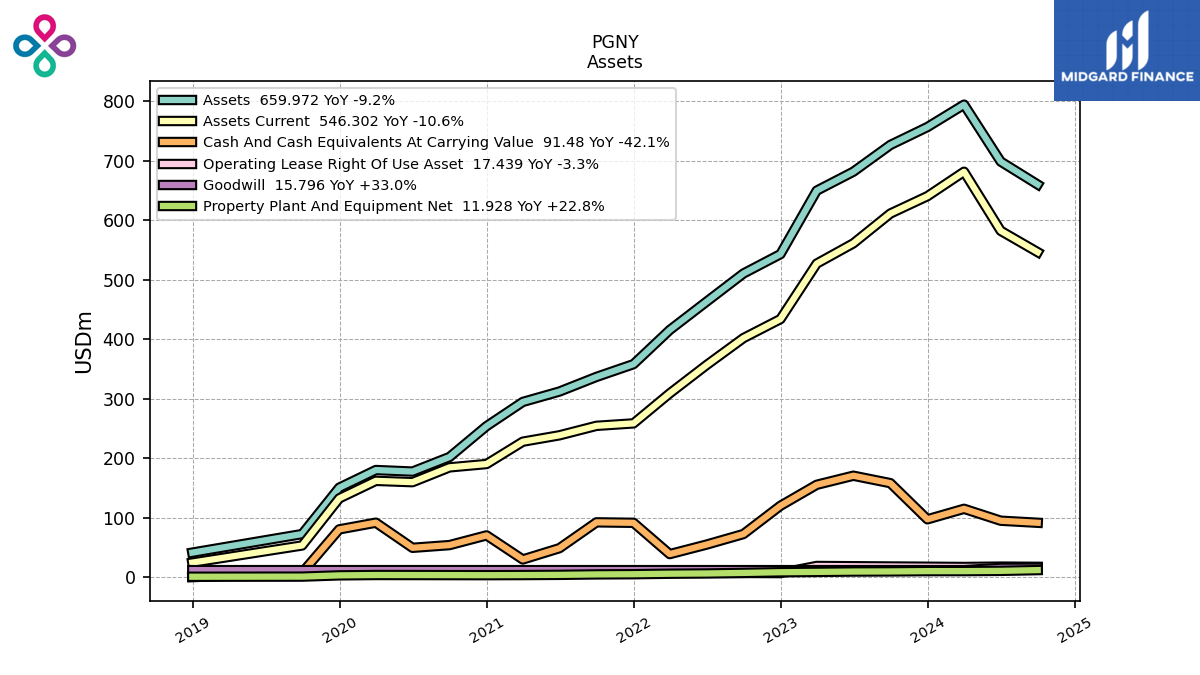
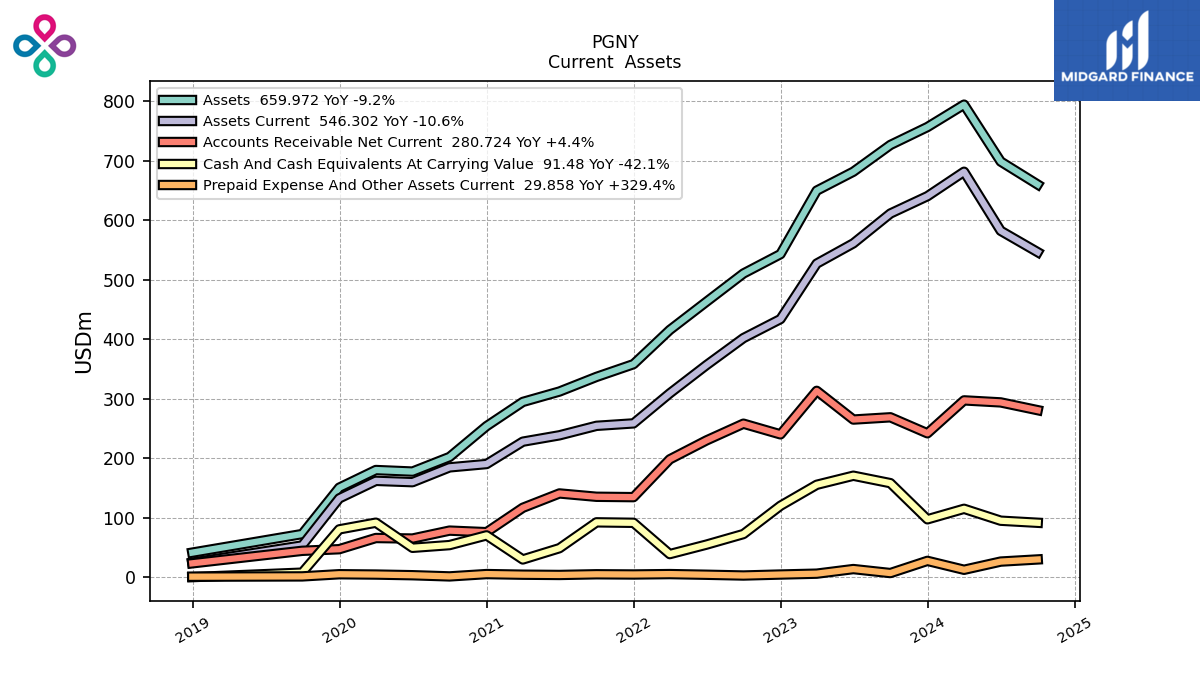
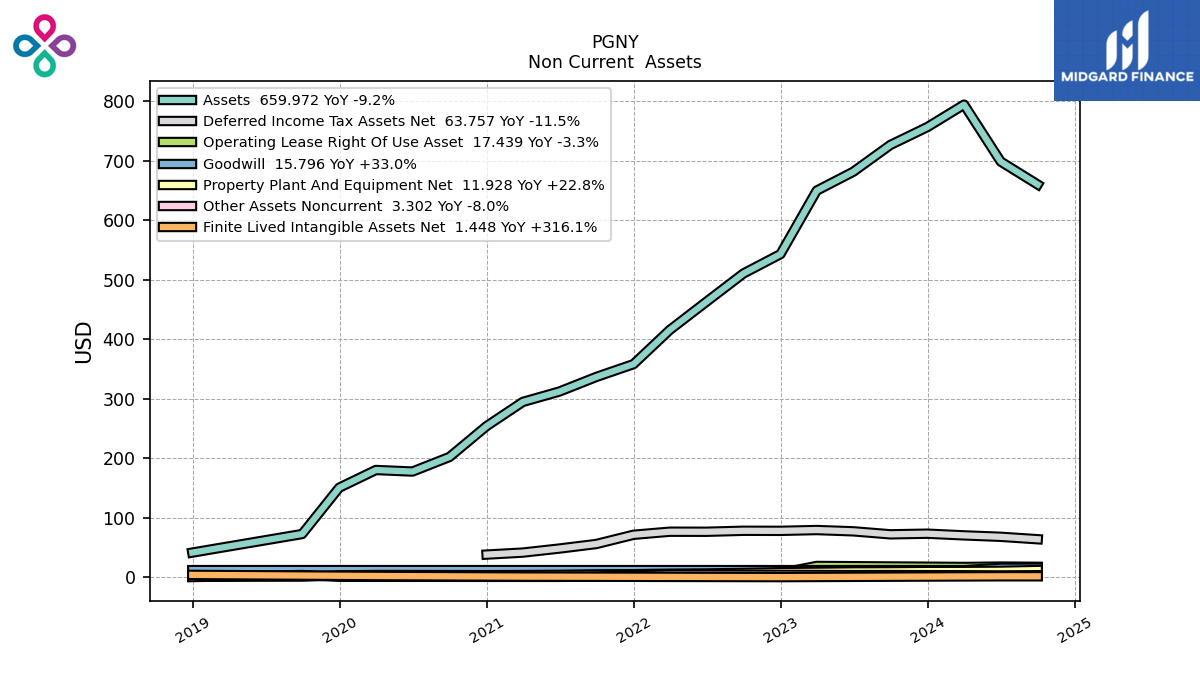
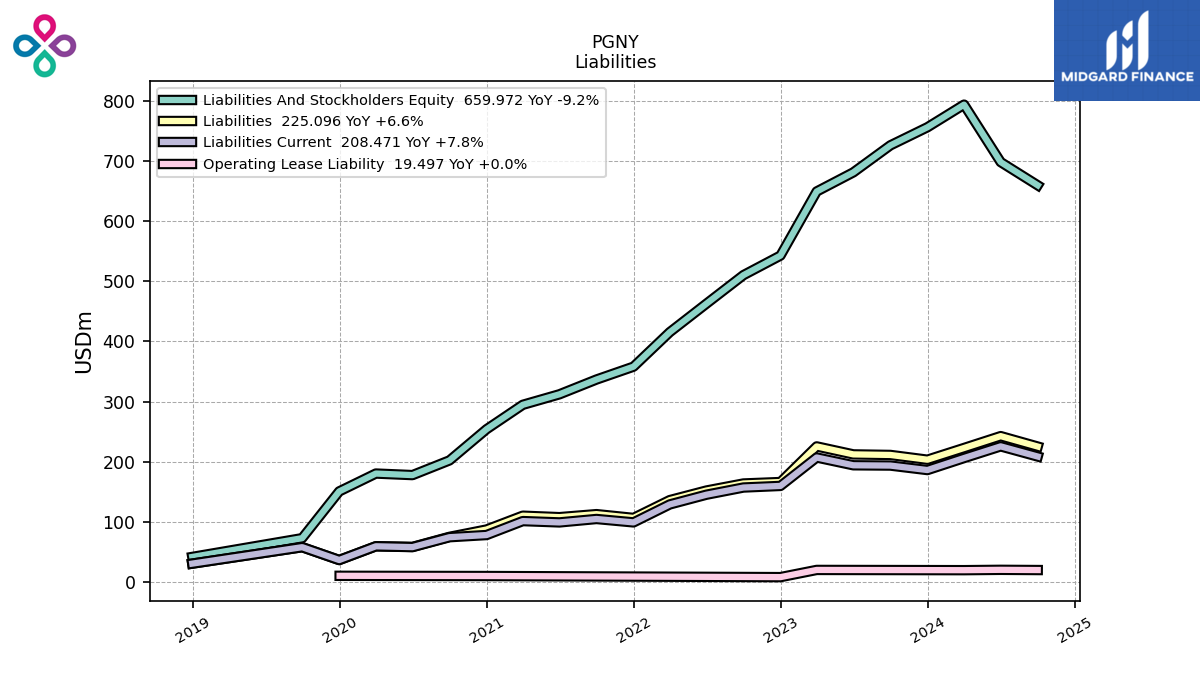
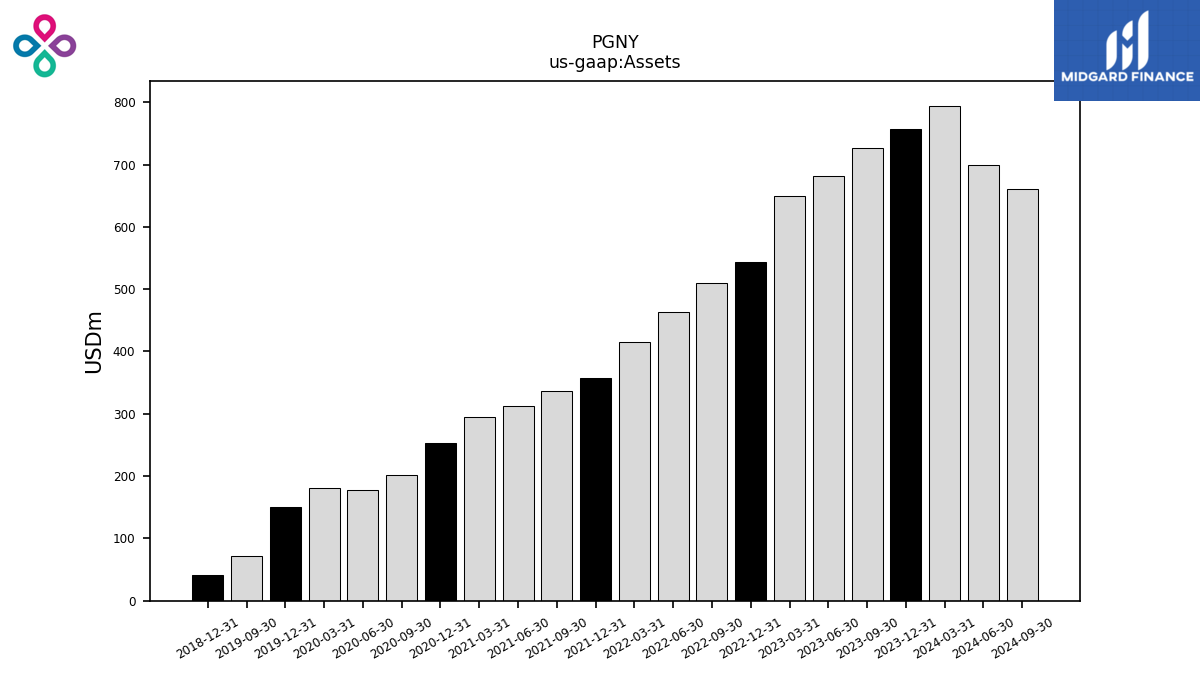
| Assets | 756.62 | 726.51 | 681.54 | 649.72 | 542.99 | 510.44 | 462.88 | 415.52 | 358.06 | 336.68 | 312.07 | 294.59 | 253.93 | 202.05 | 177.55 | 180.15 | 150.43 | 72.55 | NA | NA | 41.32 | NA | NA | NA | |
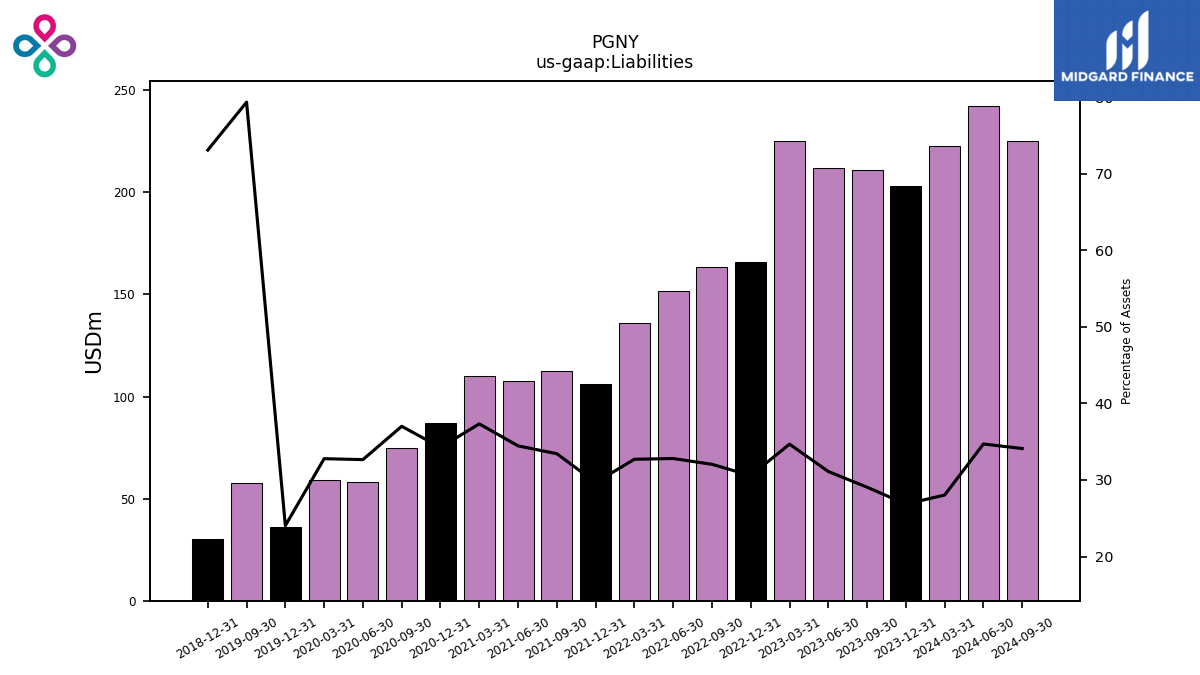
| Liabilities | 203.19 | 211.12 | 212.04 | 225.32 | 166.02 | 163.59 | 151.85 | 135.91 | 106.24 | 112.57 | 107.53 | 109.97 | 86.98 | 74.78 | 57.99 | 59.06 | 36.16 | 57.56 | NA | NA | 30.20 | NA | NA | NA | |
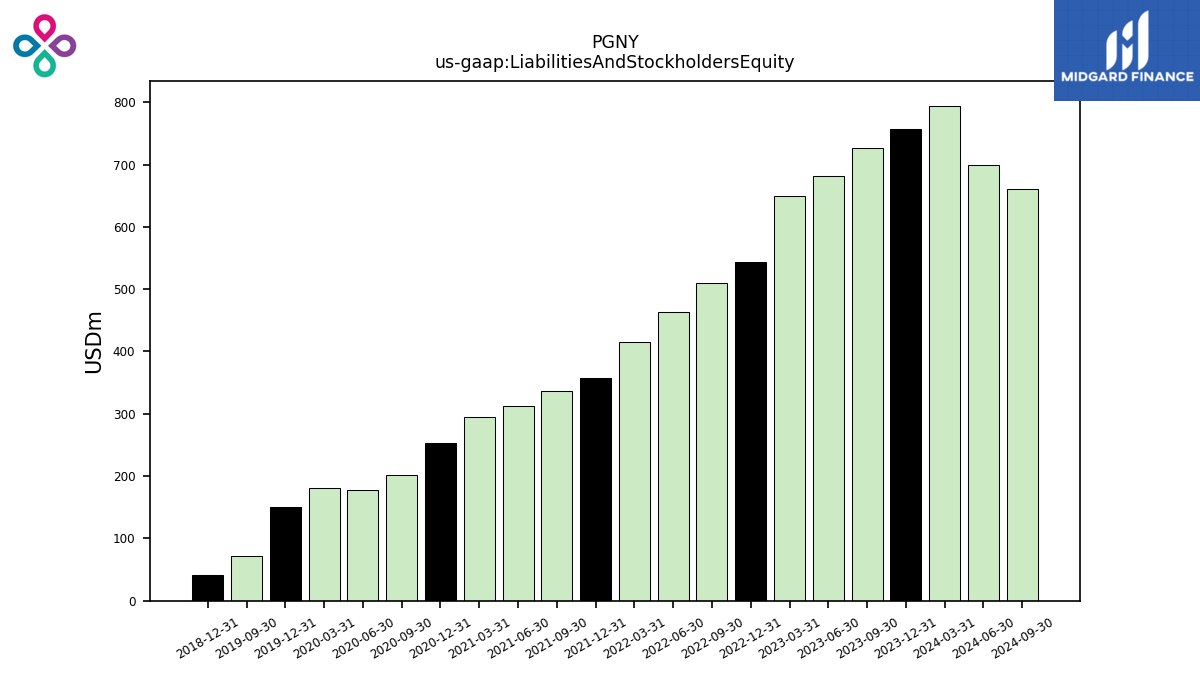
| Liabilities And Stockholders Equity | 756.62 | 726.51 | 681.54 | 649.72 | 542.99 | 510.44 | 462.88 | 415.52 | 358.06 | 336.68 | 312.07 | 294.59 | 253.93 | 202.05 | 177.55 | 180.15 | 150.43 | 72.55 | NA | NA | 41.32 | NA | NA | NA | |
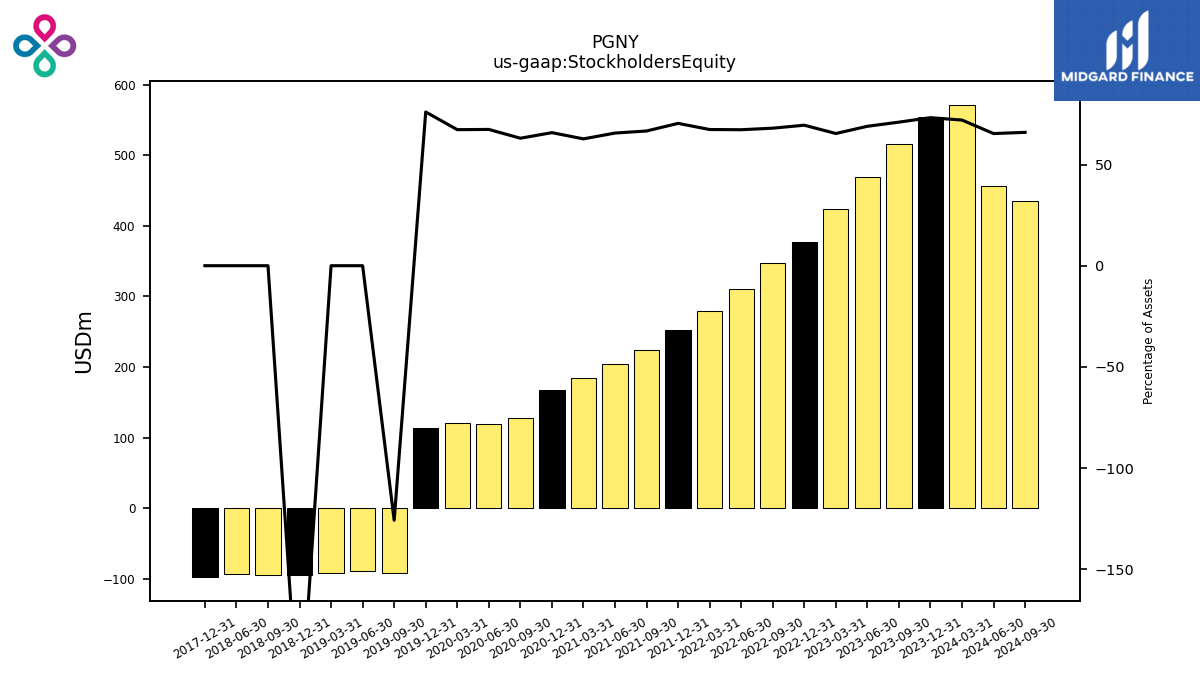
| Stockholders Equity | 553.43 | 515.39 | 469.50 | 424.40 | 376.97 | 346.86 | 311.02 | 279.62 | 251.82 | 224.11 | 204.54 | 184.62 | 166.95 | 127.27 | 119.56 | 121.09 | 114.27 | -91.25 | -89.51 | -92.08 | -95.11 | -94.30 | -92.80 | NA |
| 2023-12-31 | 2023-09-30 | 2023-06-30 | 2023-03-31 | 2022-12-31 | 2022-09-30 | 2022-06-30 | 2022-03-31 | 2021-12-31 | 2021-09-30 | 2021-06-30 | 2021-03-31 | 2020-12-31 | 2020-09-30 | 2020-06-30 | 2020-03-31 | 2019-12-31 | 2019-09-30 | 2019-06-30 | 2019-03-31 | 2018-12-31 | 2018-09-30 | 2018-06-30 | 2018-03-31 | ||
|---|---|---|---|---|---|---|---|---|---|---|---|---|---|---|---|---|---|---|---|---|---|---|---|---|---|
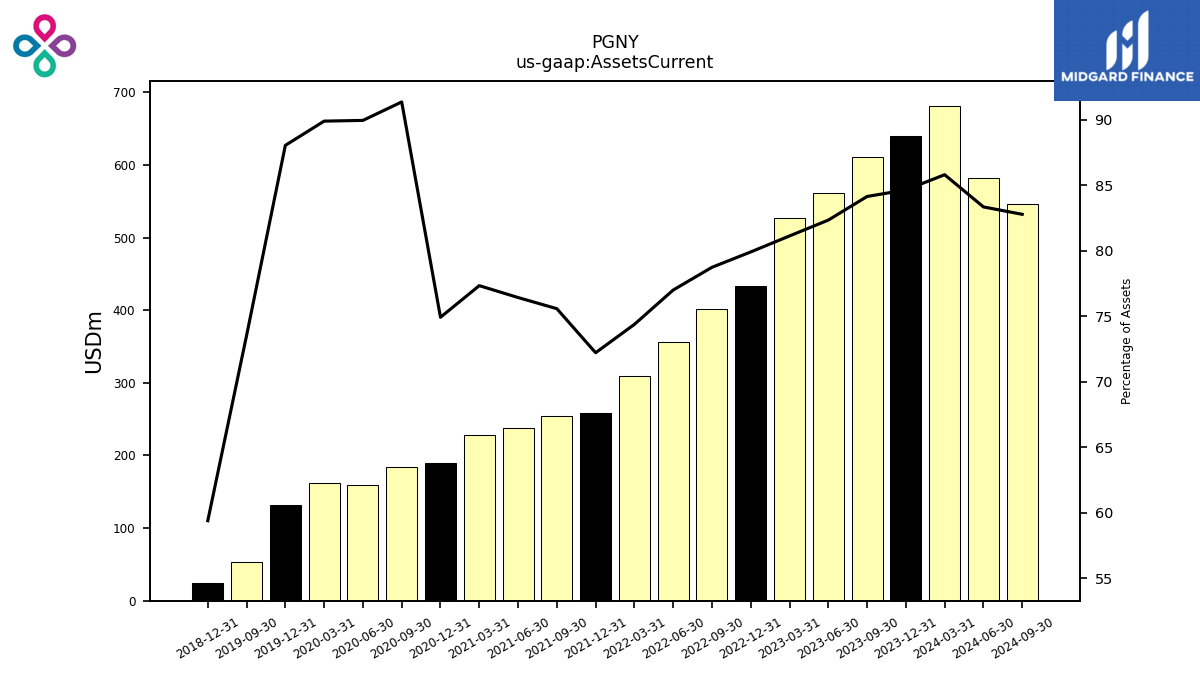
| Assets Current | 640.41 | 611.27 | 561.13 | 527.08 | 433.86 | 401.87 | 356.38 | 309.03 | 258.54 | 254.42 | 238.49 | 227.80 | 190.22 | 184.59 | 159.71 | 161.94 | 132.44 | 53.34 | NA | NA | 24.54 | NA | NA | NA | |
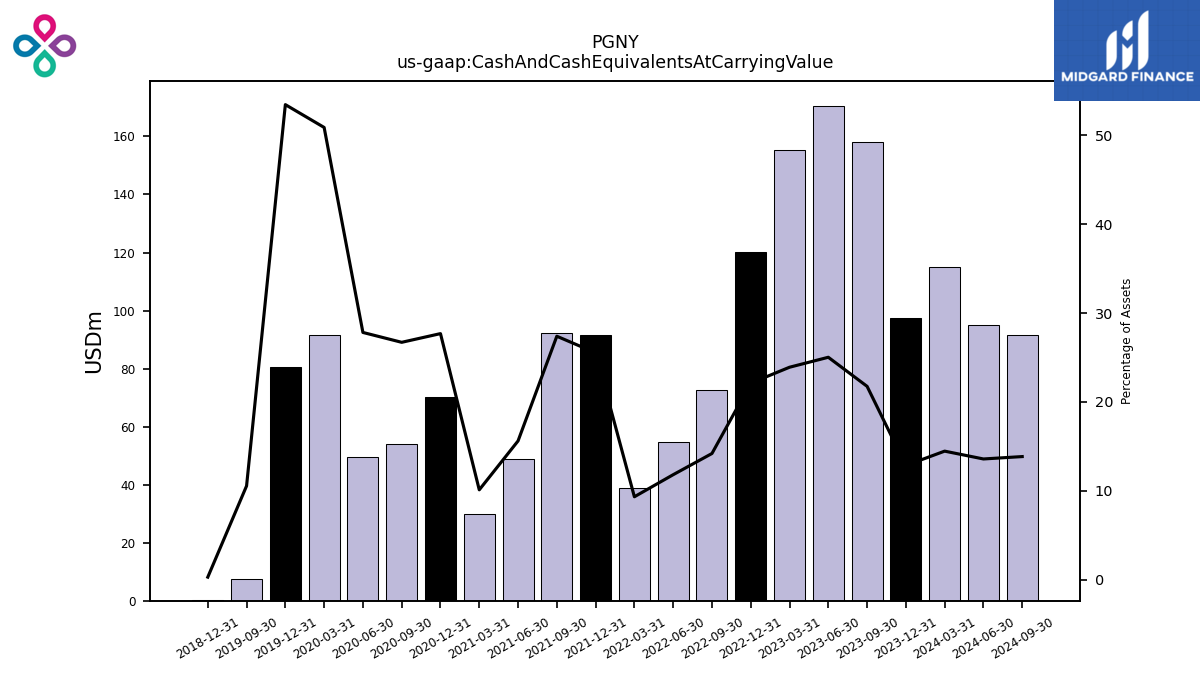
| Cash And Cash Equivalents At Carrying Value | 97.30 | 158.07 | 170.57 | 155.32 | 120.08 | 72.52 | 54.73 | 38.82 | 91.41 | 92.22 | 48.75 | 29.82 | 70.31 | 53.97 | 49.39 | 91.63 | 80.38 | 7.66 | NA | NA | 0.13 | NA | NA | NA | |
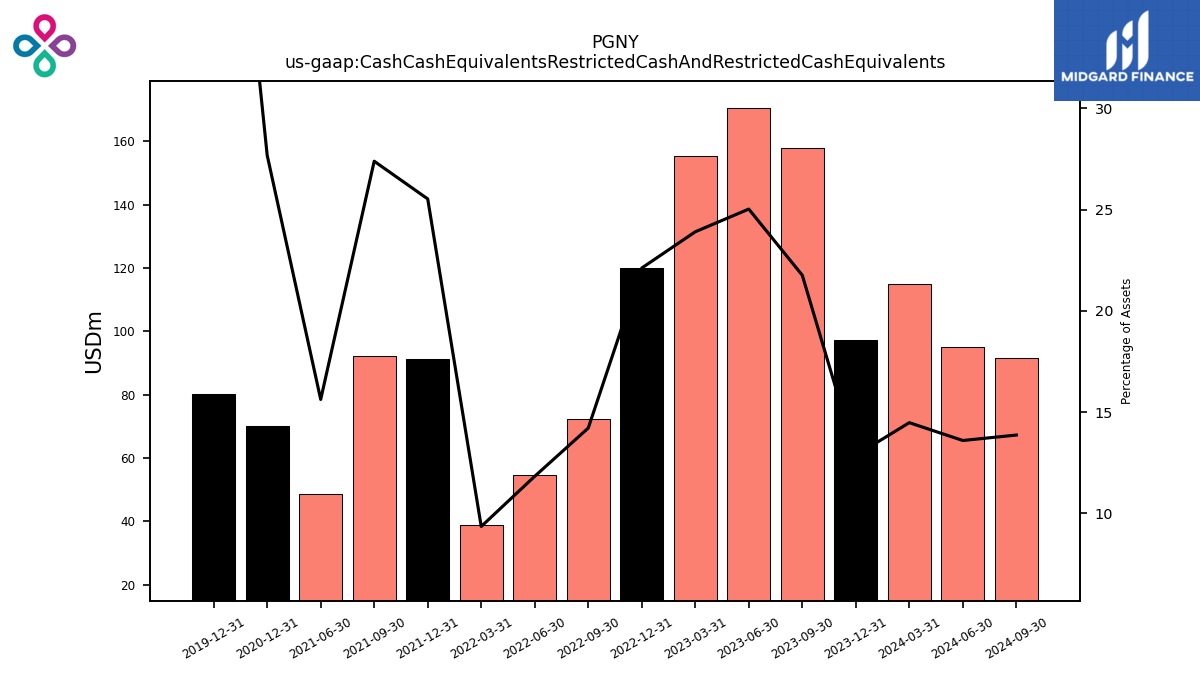
| Cash Cash Equivalents Restricted Cash And Restricted Cash Equivalents | 97.30 | 158.07 | 170.57 | 155.32 | 120.08 | 72.52 | 54.73 | 38.82 | 91.41 | 92.22 | 48.75 | NA | 70.31 | NA | NA | NA | 80.38 | NA | NA | NA | NA | NA | NA | NA | |
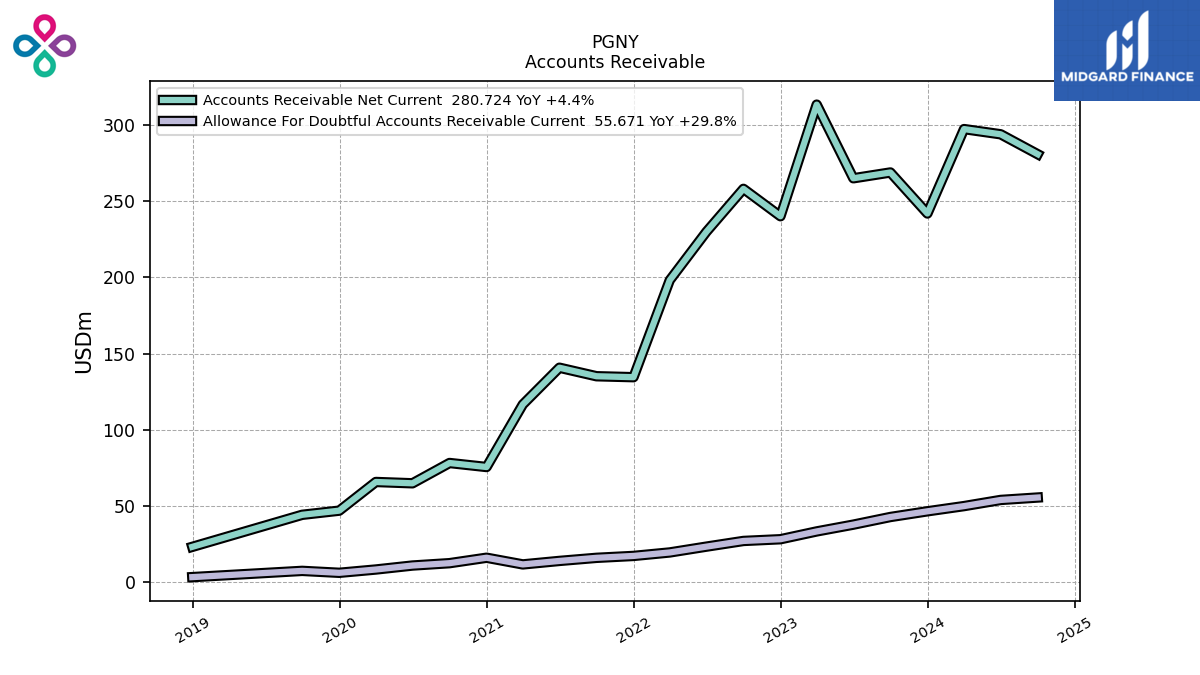
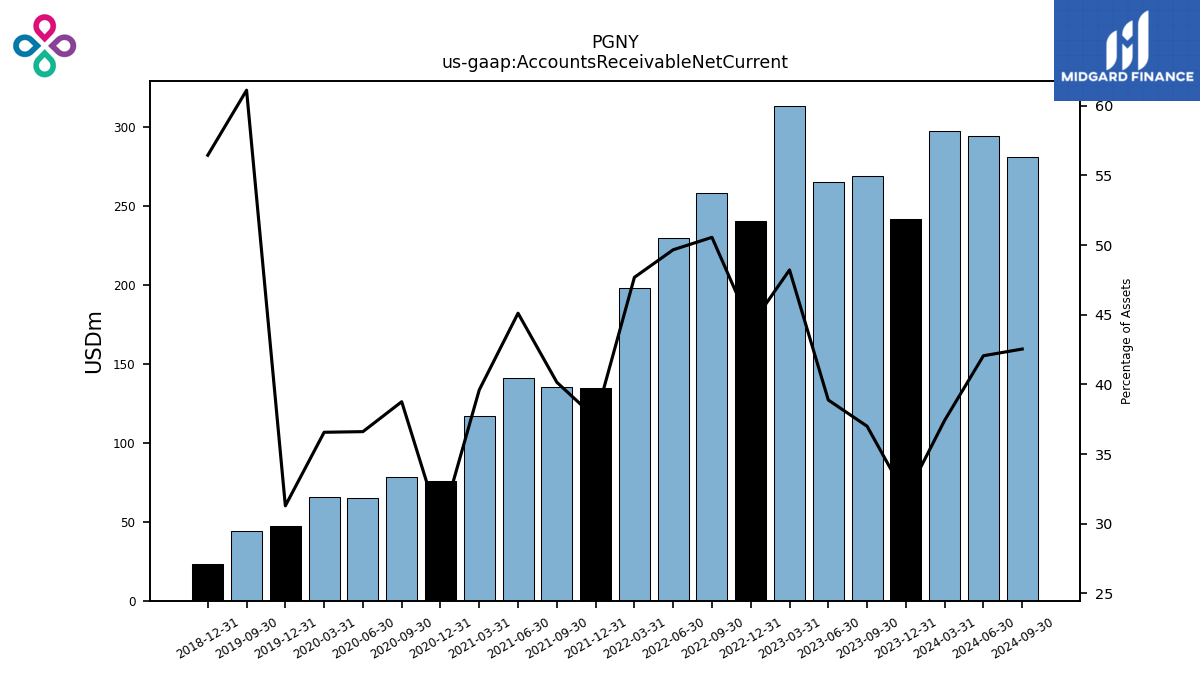
| Accounts Receivable Net Current | 241.87 | 268.77 | 264.96 | 313.25 | 240.07 | 258.04 | 229.86 | 198.12 | 134.56 | 135.18 | 140.77 | 116.67 | 75.66 | 78.30 | 65.00 | 65.86 | 47.06 | 44.34 | NA | NA | 23.32 | NA | NA | NA | |
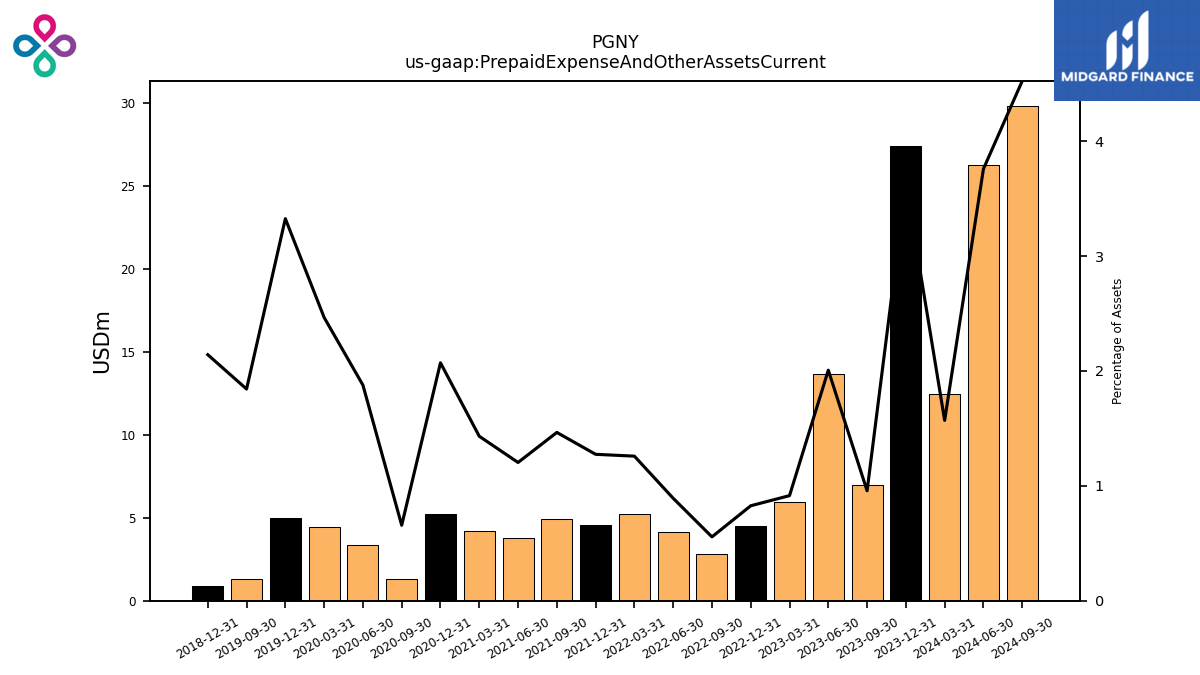
| Prepaid Expense And Other Assets Current | 27.45 | 6.95 | 13.68 | 5.95 | 4.49 | 2.84 | 4.13 | 5.23 | 4.56 | 4.93 | 3.76 | 4.22 | 5.26 | 1.33 | 3.33 | 4.44 | 5.00 | 1.34 | NA | NA | 0.89 | NA | NA | NA |
| 2023-12-31 | 2023-09-30 | 2023-06-30 | 2023-03-31 | 2022-12-31 | 2022-09-30 | 2022-06-30 | 2022-03-31 | 2021-12-31 | 2021-09-30 | 2021-06-30 | 2021-03-31 | 2020-12-31 | 2020-09-30 | 2020-06-30 | 2020-03-31 | 2019-12-31 | 2019-09-30 | 2019-06-30 | 2019-03-31 | 2018-12-31 | 2018-09-30 | 2018-06-30 | 2018-03-31 | ||
|---|---|---|---|---|---|---|---|---|---|---|---|---|---|---|---|---|---|---|---|---|---|---|---|---|---|
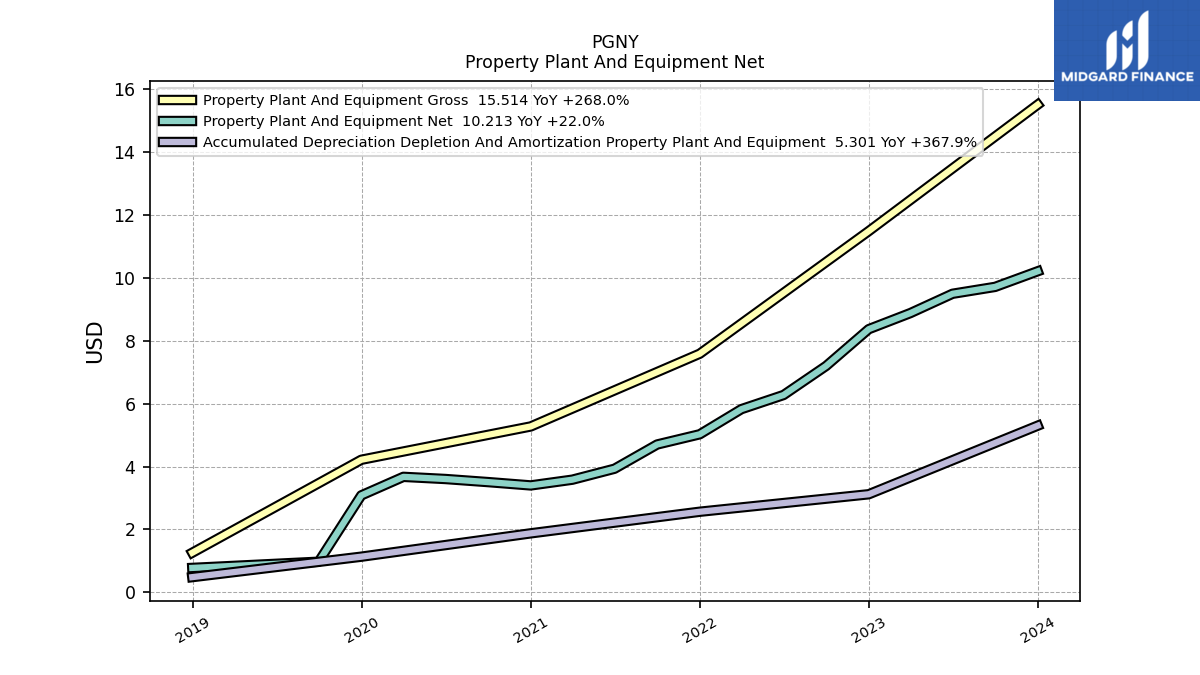
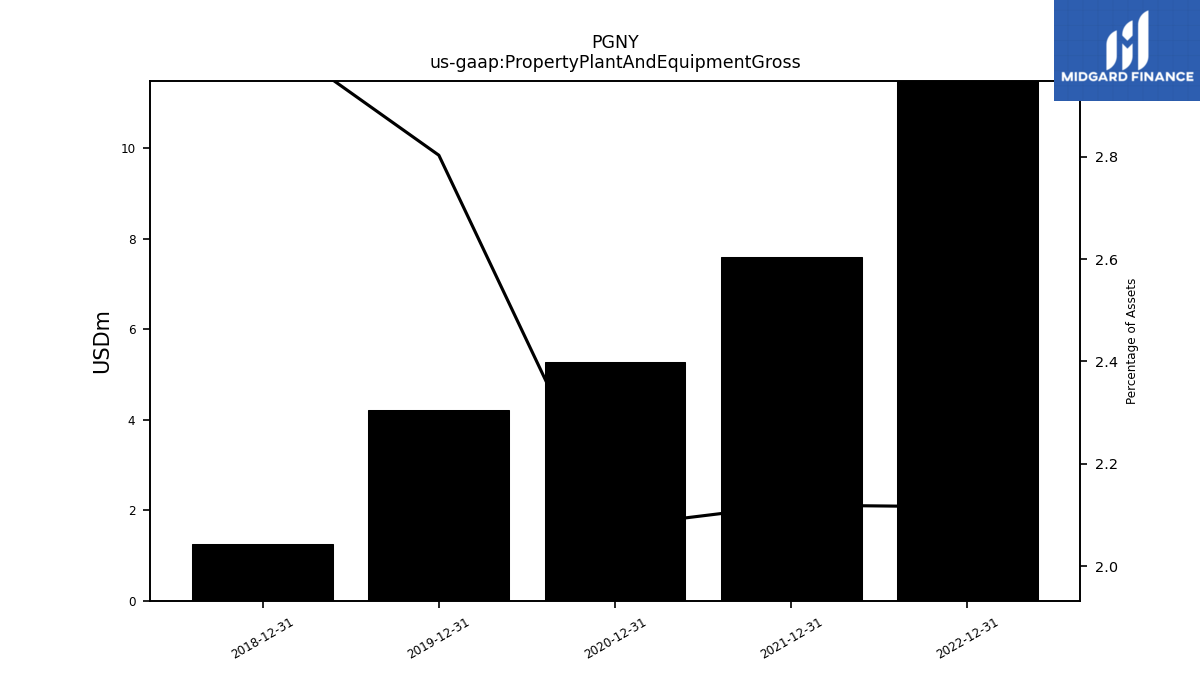
| Property Plant And Equipment Gross | 15.51 | NA | NA | NA | 11.49 | NA | NA | NA | 7.59 | NA | NA | NA | 5.28 | NA | NA | NA | 4.22 | NA | NA | NA | 1.26 | NA | NA | NA | |
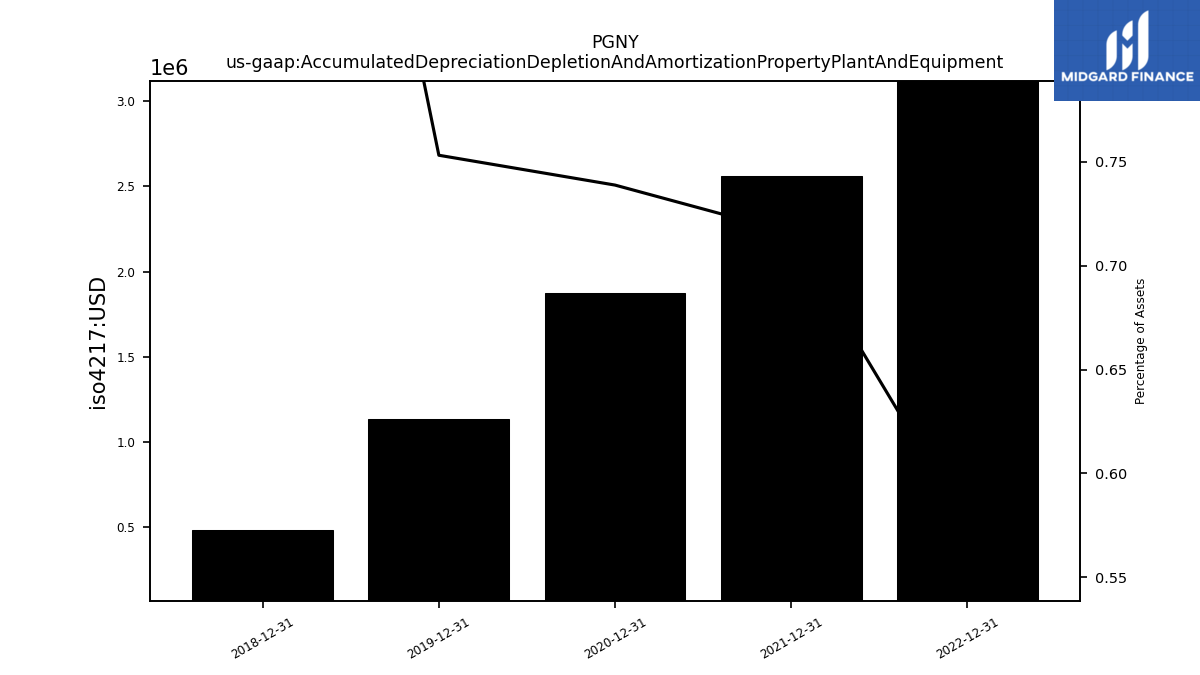
| Accumulated Depreciation Depletion And Amortization Property Plant And Equipment | 5.30 | NA | NA | NA | 3.12 | NA | NA | NA | 2.56 | NA | NA | NA | 1.88 | NA | NA | NA | 1.13 | NA | NA | NA | 0.48 | NA | NA | NA | |
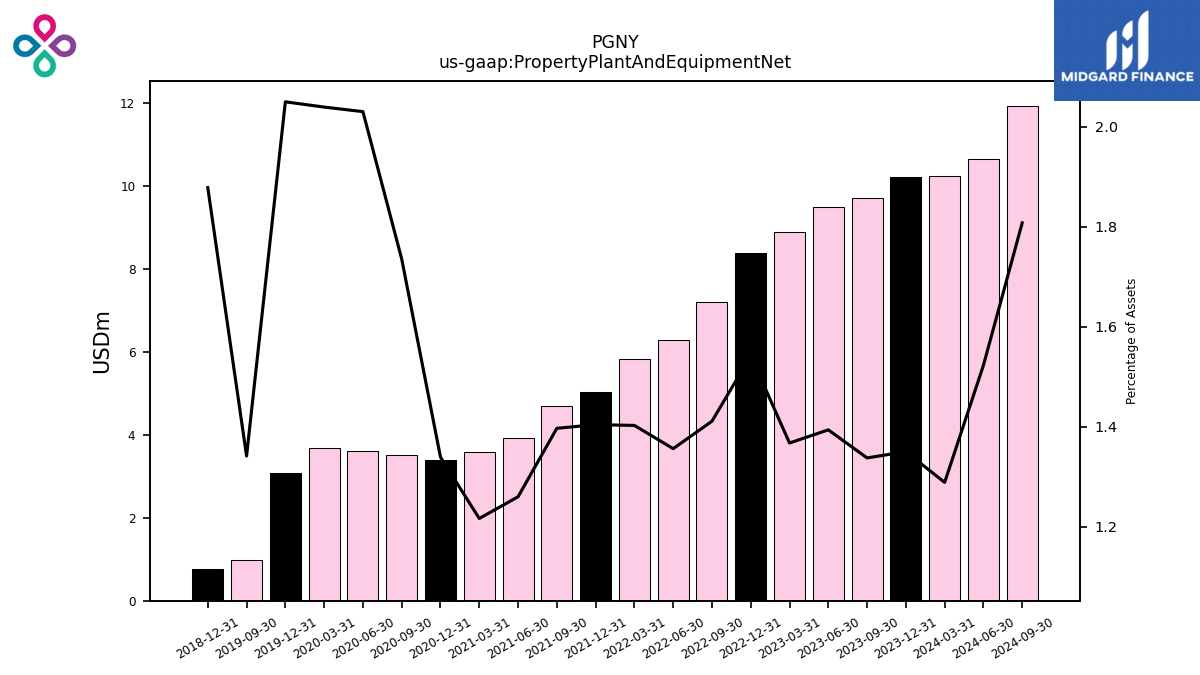
| Property Plant And Equipment Net | 10.21 | 9.72 | 9.50 | 8.88 | 8.37 | 7.20 | 6.28 | 5.83 | 5.03 | 4.70 | 3.93 | 3.58 | 3.40 | 3.51 | 3.60 | 3.67 | 3.08 | 0.97 | NA | NA | 0.78 | NA | NA | NA | |
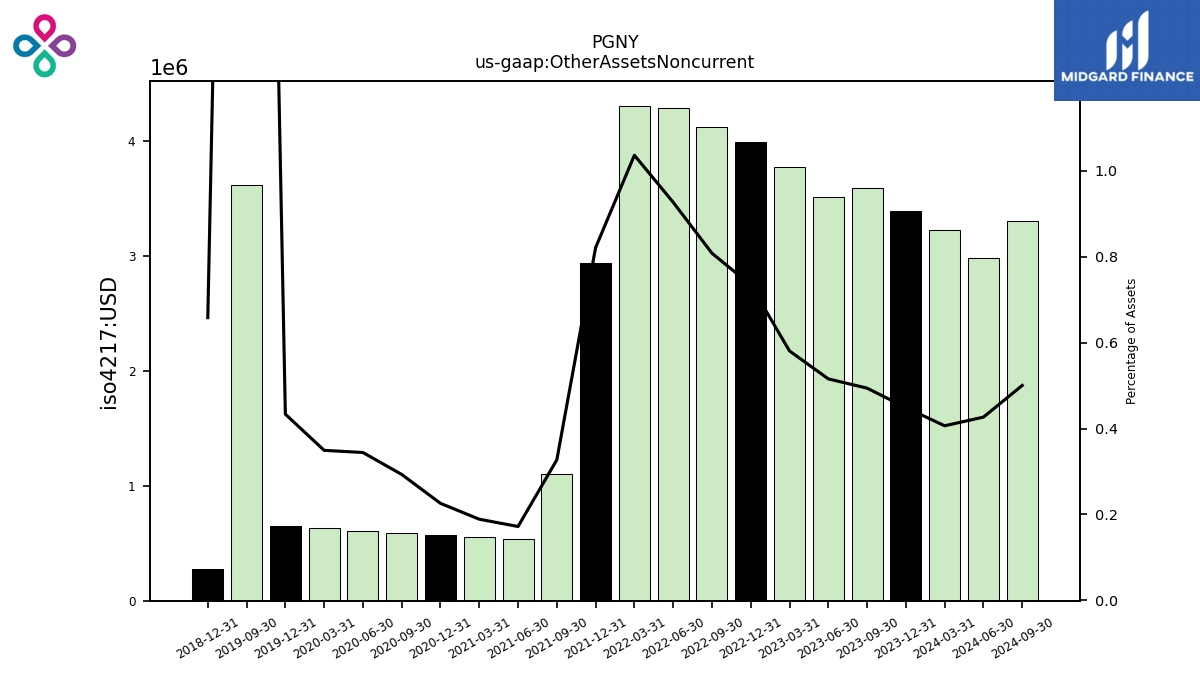
| Other Assets Noncurrent | 3.40 | 3.59 | 3.51 | 3.77 | 3.99 | 4.13 | 4.29 | 4.31 | 2.94 | 1.10 | 0.54 | 0.56 | 0.57 | 0.59 | 0.61 | 0.63 | 0.65 | 3.61 | NA | NA | 0.27 | NA | NA | NA |
| 2023-12-31 | 2023-09-30 | 2023-06-30 | 2023-03-31 | 2022-12-31 | 2022-09-30 | 2022-06-30 | 2022-03-31 | 2021-12-31 | 2021-09-30 | 2021-06-30 | 2021-03-31 | 2020-12-31 | 2020-09-30 | 2020-06-30 | 2020-03-31 | 2019-12-31 | 2019-09-30 | 2019-06-30 | 2019-03-31 | 2018-12-31 | 2018-09-30 | 2018-06-30 | 2018-03-31 | ||
|---|---|---|---|---|---|---|---|---|---|---|---|---|---|---|---|---|---|---|---|---|---|---|---|---|---|
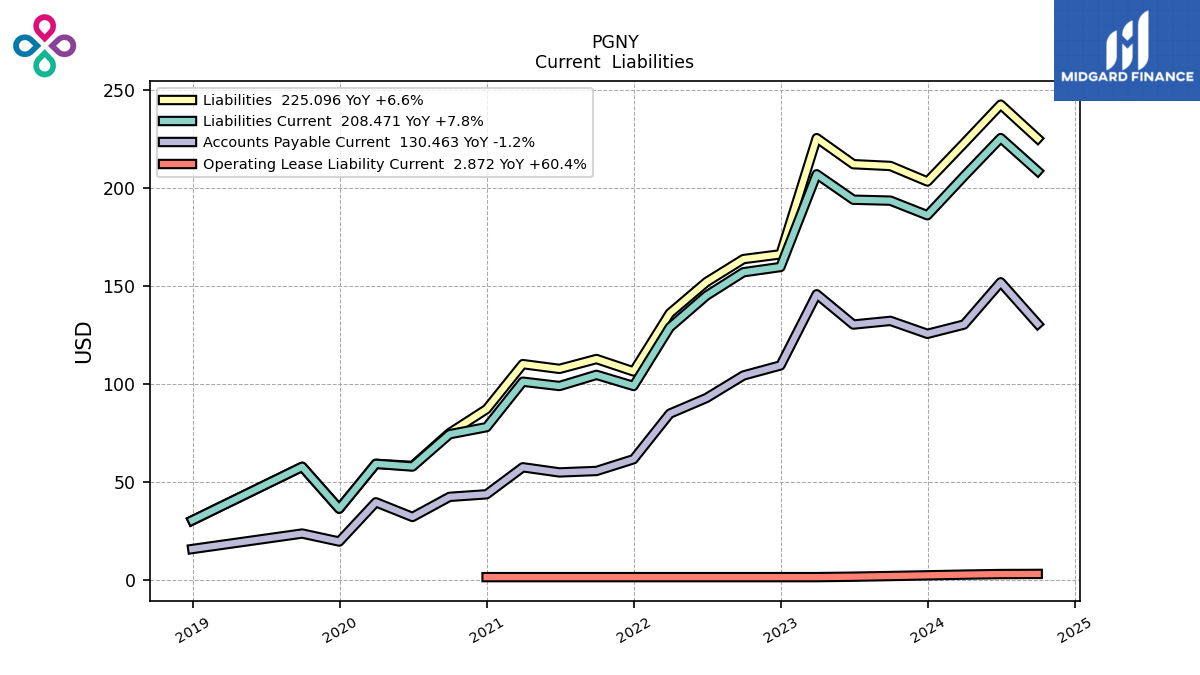
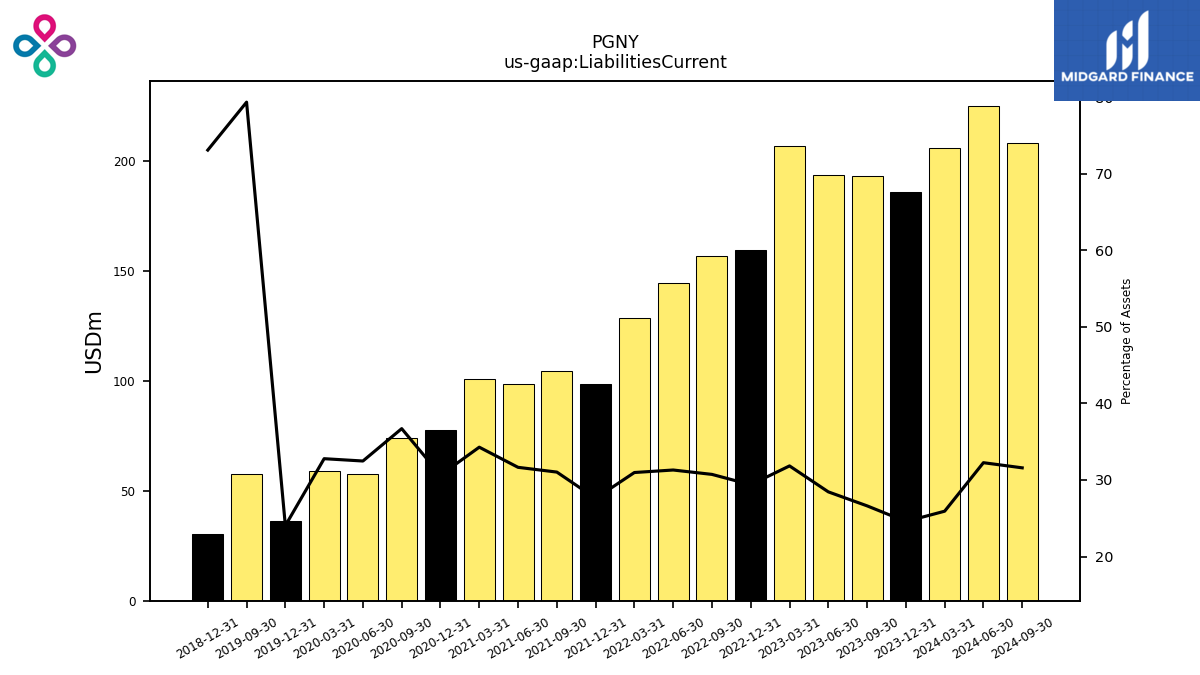
| Liabilities Current | 185.95 | 193.42 | 193.90 | 206.87 | 159.54 | 156.87 | 144.90 | 128.72 | 98.82 | 104.48 | 98.78 | 101.00 | 77.79 | 74.17 | 57.67 | 59.06 | 36.16 | 57.56 | NA | NA | 30.20 | NA | NA | NA | |
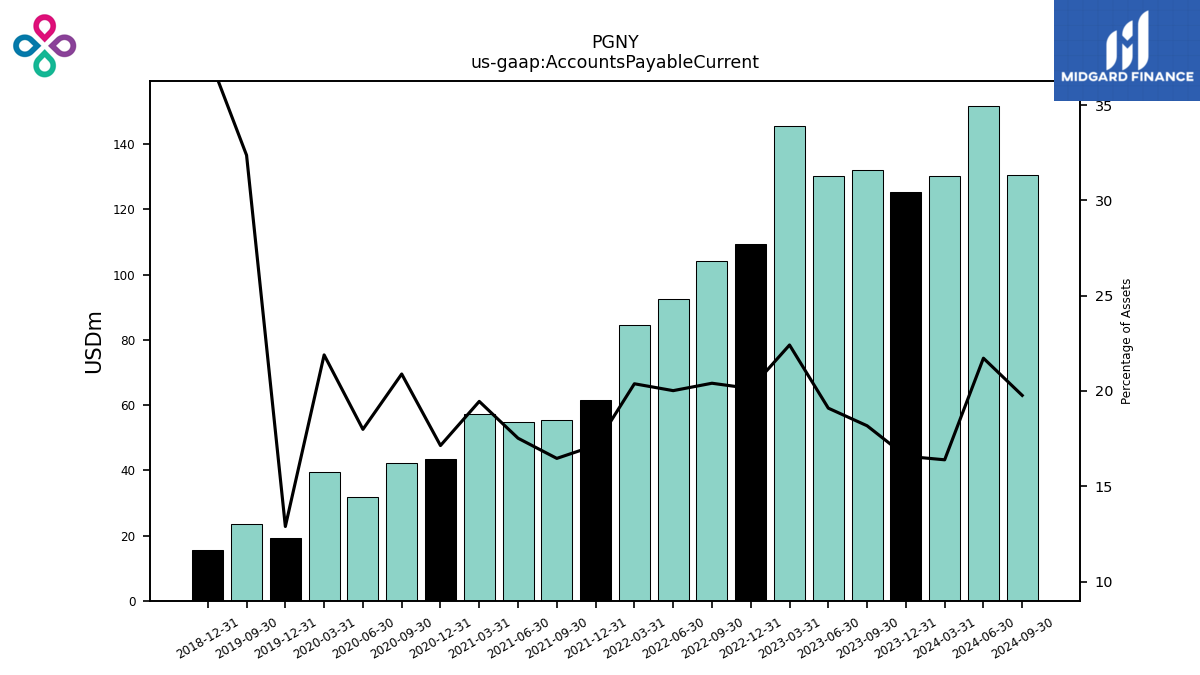
| Accounts Payable Current | 125.43 | 132.04 | 130.16 | 145.62 | 109.29 | 104.16 | 92.66 | 84.68 | 61.40 | 55.42 | 54.68 | 57.31 | 43.51 | 42.21 | 31.93 | 39.44 | 19.39 | 23.48 | NA | NA | 15.58 | NA | NA | NA | |
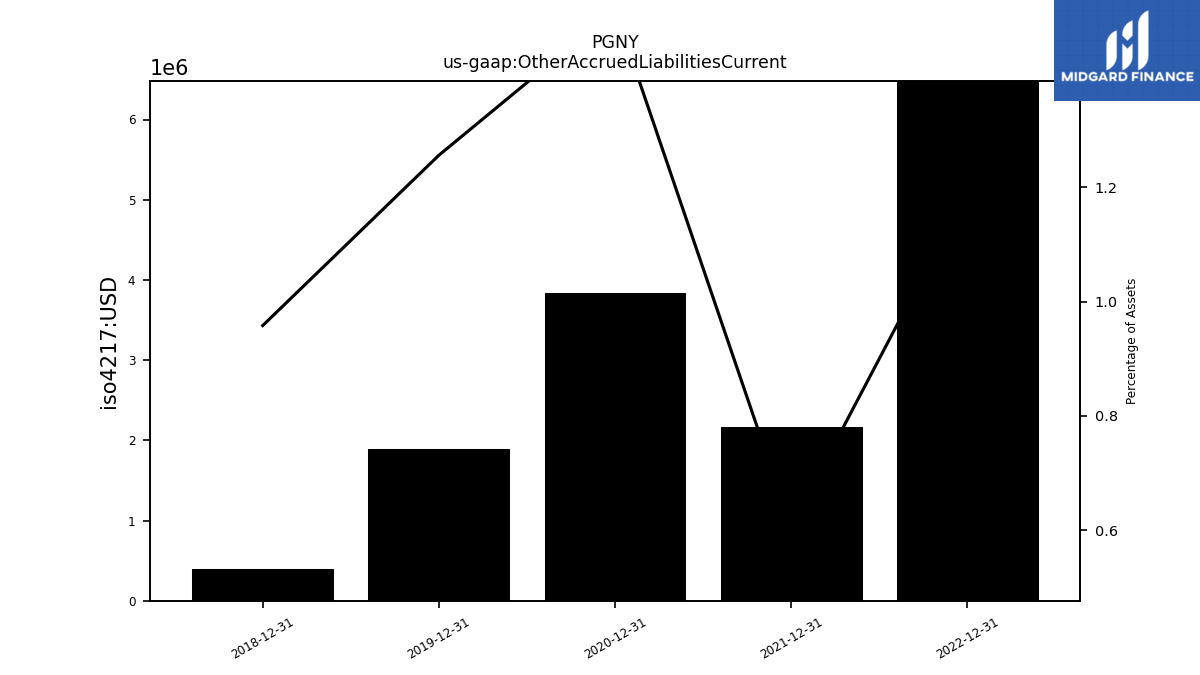
| Other Accrued Liabilities Current | 10.50 | NA | NA | NA | 6.48 | NA | NA | NA | 2.17 | NA | NA | NA | 3.84 | NA | NA | NA | 1.89 | NA | NA | NA | 0.40 | NA | NA | NA | |
| Other Liabilities Current | 1.18 | NA | NA | NA | 1.17 | NA | NA | NA | NA | NA | NA | NA | NA | NA | NA | NA | NA | NA | NA | NA | NA | NA | NA | NA |
| 2023-12-31 | 2023-09-30 | 2023-06-30 | 2023-03-31 | 2022-12-31 | 2022-09-30 | 2022-06-30 | 2022-03-31 | 2021-12-31 | 2021-09-30 | 2021-06-30 | 2021-03-31 | 2020-12-31 | 2020-09-30 | 2020-06-30 | 2020-03-31 | 2019-12-31 | 2019-09-30 | 2019-06-30 | 2019-03-31 | 2018-12-31 | 2018-09-30 | 2018-06-30 | 2018-03-31 | ||
|---|---|---|---|---|---|---|---|---|---|---|---|---|---|---|---|---|---|---|---|---|---|---|---|---|---|
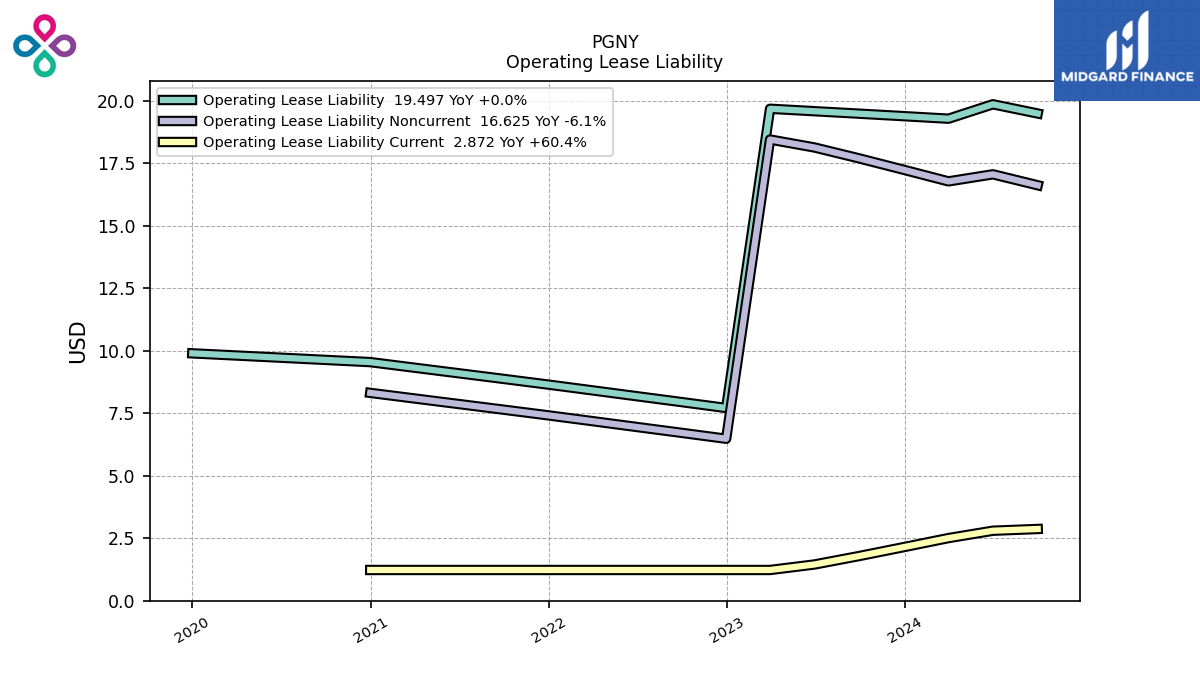
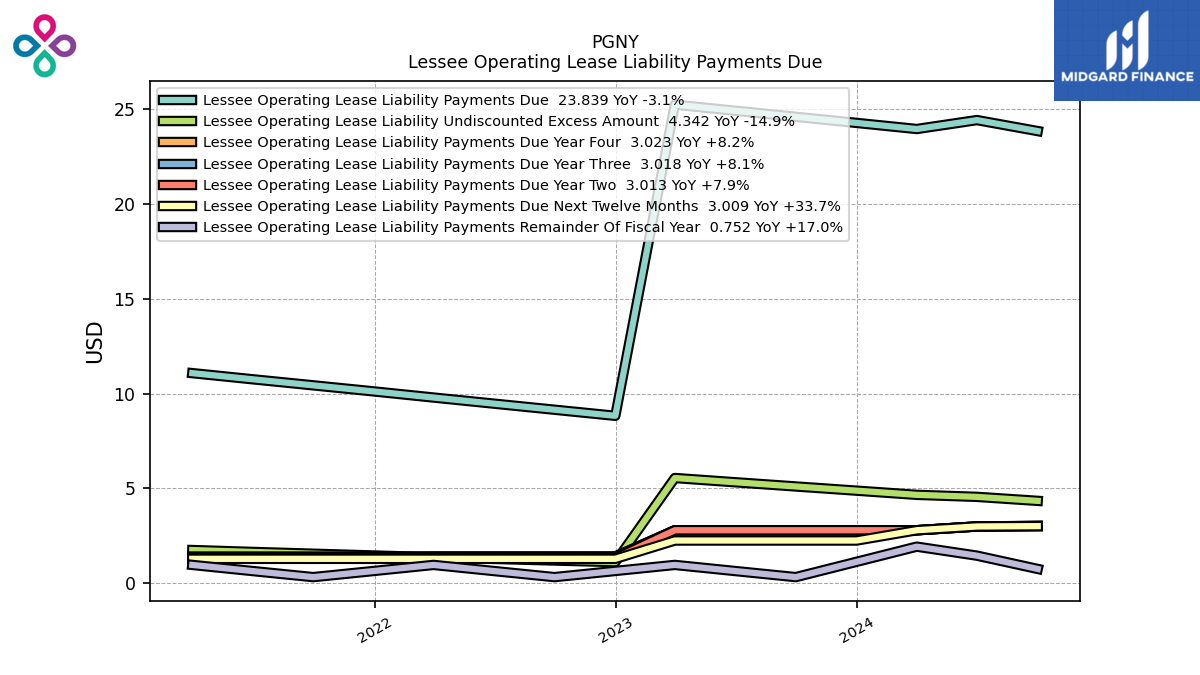
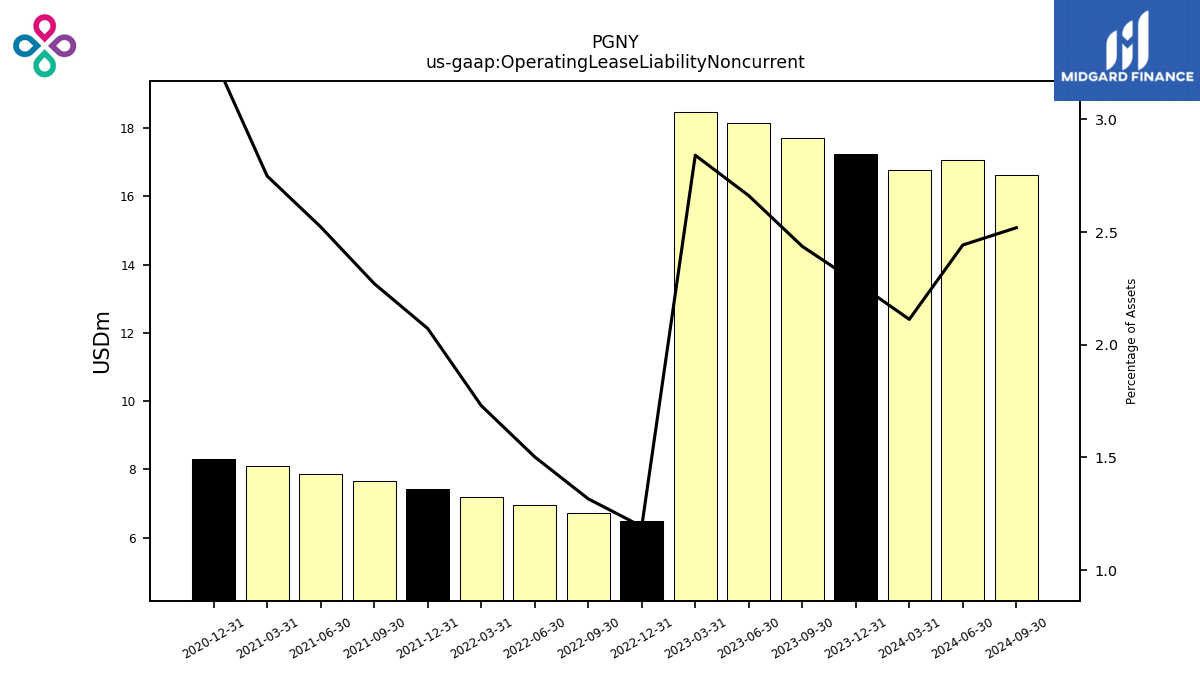
| Operating Lease Liability Noncurrent | 17.24 | 17.70 | 18.14 | 18.46 | 6.48 | 6.72 | 6.96 | 7.19 | 7.42 | 7.65 | 7.87 | 8.10 | 8.32 | NA | NA | NA | NA | NA | NA | NA | NA | NA | NA | NA |
| 2023-12-31 | 2023-09-30 | 2023-06-30 | 2023-03-31 | 2022-12-31 | 2022-09-30 | 2022-06-30 | 2022-03-31 | 2021-12-31 | 2021-09-30 | 2021-06-30 | 2021-03-31 | 2020-12-31 | 2020-09-30 | 2020-06-30 | 2020-03-31 | 2019-12-31 | 2019-09-30 | 2019-06-30 | 2019-03-31 | 2018-12-31 | 2018-09-30 | 2018-06-30 | 2018-03-31 | ||
|---|---|---|---|---|---|---|---|---|---|---|---|---|---|---|---|---|---|---|---|---|---|---|---|---|---|
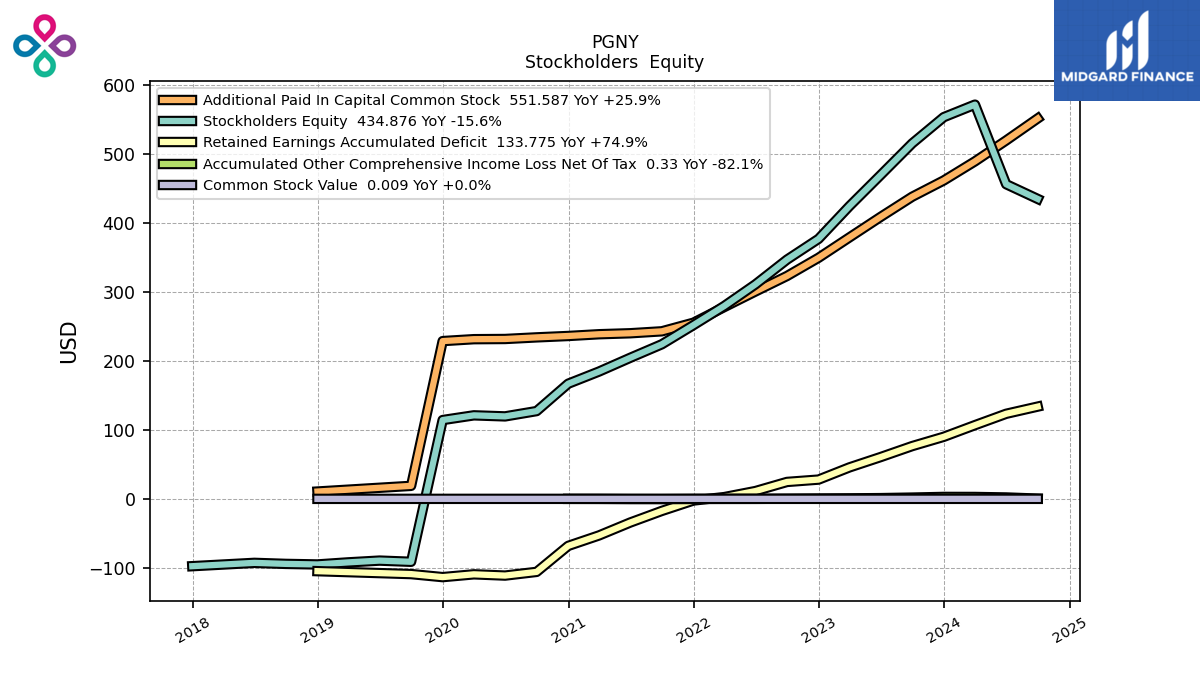
| Stockholders Equity | 553.43 | 515.39 | 469.50 | 424.40 | 376.97 | 346.86 | 311.02 | 279.62 | 251.82 | 224.11 | 204.54 | 184.62 | 166.95 | 127.27 | 119.56 | 121.09 | 114.27 | -91.25 | -89.51 | -92.08 | -95.11 | -94.30 | -92.80 | NA | |
| Common Stock Value | 0.01 | 0.01 | 0.01 | 0.01 | 0.01 | 0.01 | 0.01 | 0.01 | 0.01 | 0.01 | 0.01 | 0.01 | 0.01 | 0.01 | 0.01 | 0.01 | 0.01 | 0.00 | NA | NA | 0.00 | NA | NA | NA | |
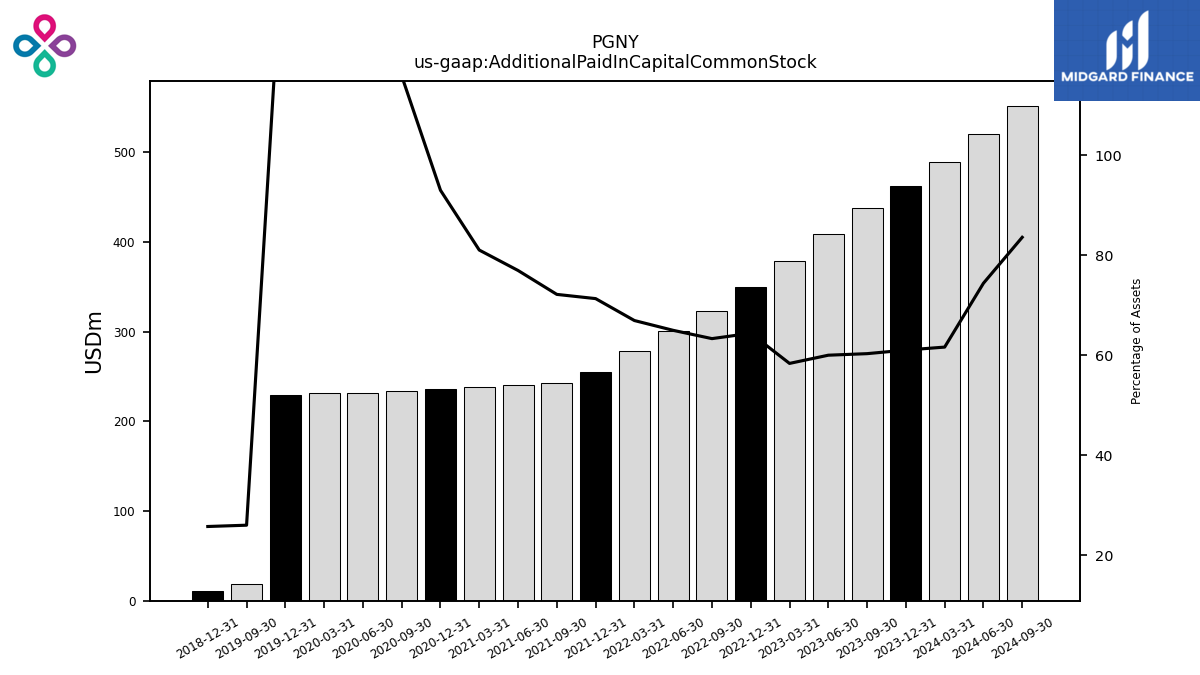
| Additional Paid In Capital Common Stock | 461.64 | 438.04 | 408.81 | 379.06 | 349.53 | 323.12 | 300.69 | 278.08 | 255.34 | 242.93 | 240.11 | 238.69 | 236.14 | 234.13 | 231.79 | 231.52 | 228.75 | 18.84 | NA | NA | 10.62 | NA | NA | NA | |
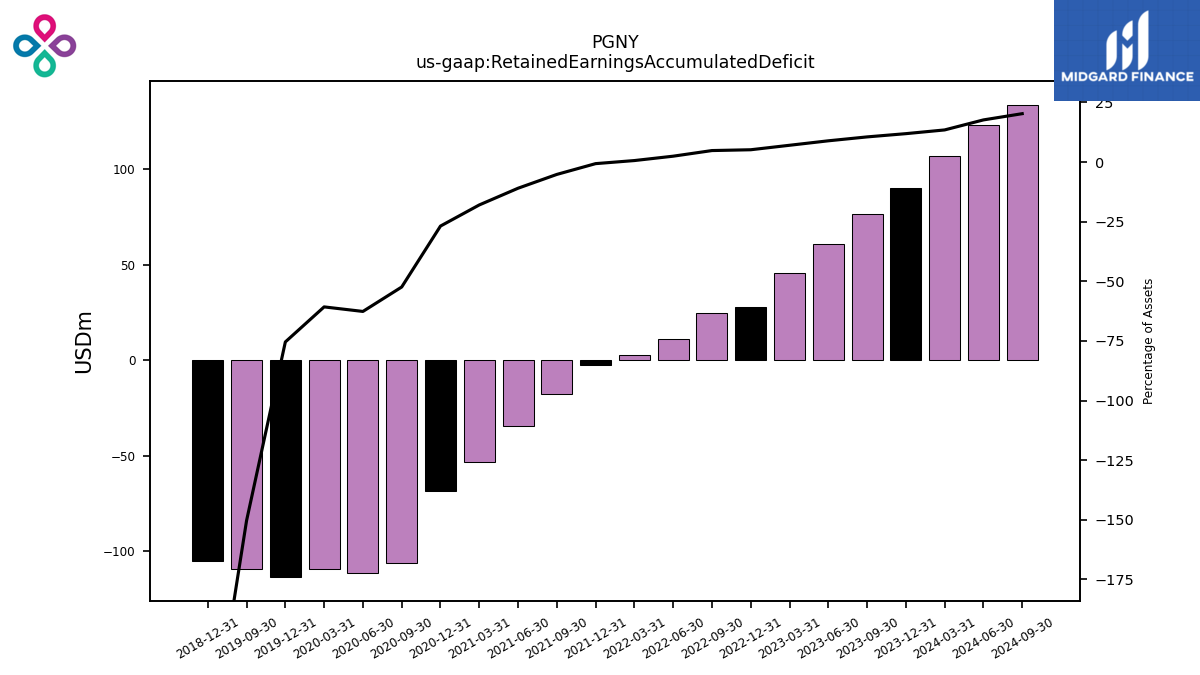
| Retained Earnings Accumulated Deficit | 89.97 | 76.50 | 60.60 | 45.61 | 27.93 | 24.53 | 11.31 | 2.55 | -2.42 | -17.50 | -34.30 | -53.03 | -68.19 | -105.88 | -111.24 | -109.43 | -113.48 | -109.08 | NA | NA | -104.85 | NA | NA | NA | |
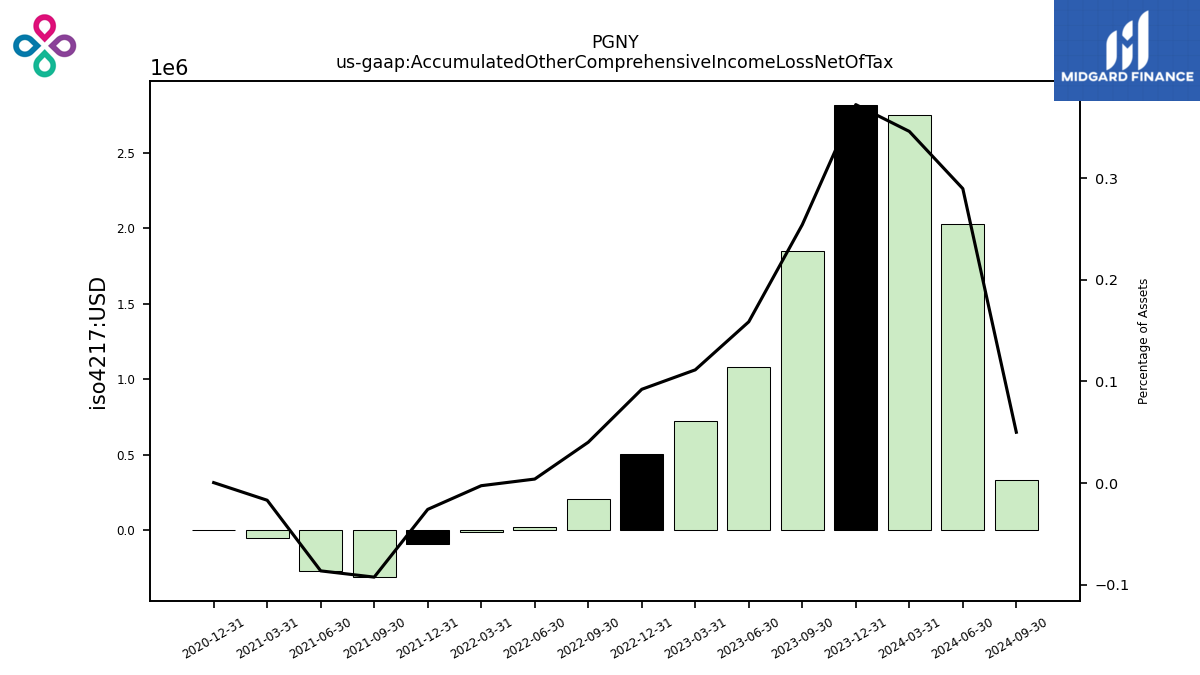
| Accumulated Other Comprehensive Income Loss Net Of Tax | 2.82 | 1.85 | 1.08 | 0.72 | 0.50 | 0.20 | 0.02 | -0.01 | -0.09 | -0.31 | -0.27 | -0.05 | 0.00 | NA | NA | NA | NA | NA | NA | NA | NA | NA | NA | NA | |
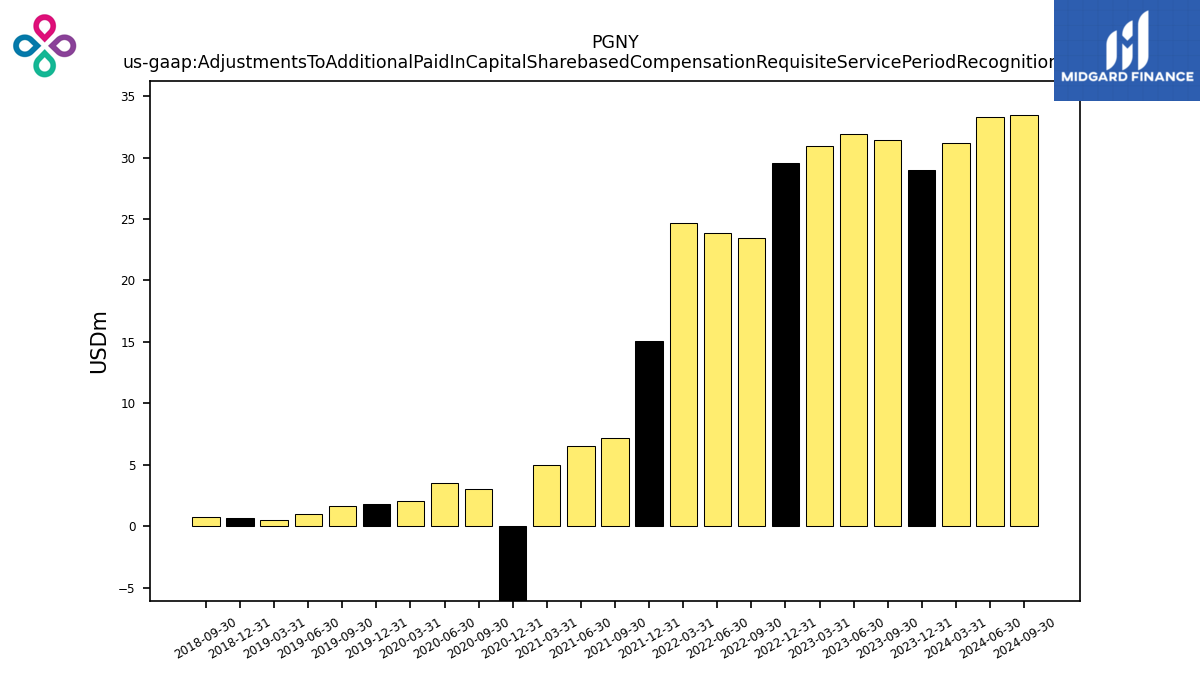
| Adjustments To Additional Paid In Capital Sharebased Compensation Requisite Service Period Recognition Value | 28.96 | 31.41 | 31.90 | 30.95 | 29.58 | 23.42 | 23.82 | 24.70 | 15.05 | 7.18 | 6.53 | 5.03 | -21.48 | 3.07 | 3.54 | 2.05 | 1.85 | 1.68 | 1.01 | 0.52 | 0.69 | 0.80 | NA | NA |
| 2023-12-31 | 2023-09-30 | 2023-06-30 | 2023-03-31 | 2022-12-31 | 2022-09-30 | 2022-06-30 | 2022-03-31 | 2021-12-31 | 2021-09-30 | 2021-06-30 | 2021-03-31 | 2020-12-31 | 2020-09-30 | 2020-06-30 | 2020-03-31 | 2019-12-31 | 2019-09-30 | 2019-06-30 | 2019-03-31 | 2018-12-31 | 2018-09-30 | 2018-06-30 | 2018-03-31 | ||
|---|---|---|---|---|---|---|---|---|---|---|---|---|---|---|---|---|---|---|---|---|---|---|---|---|---|
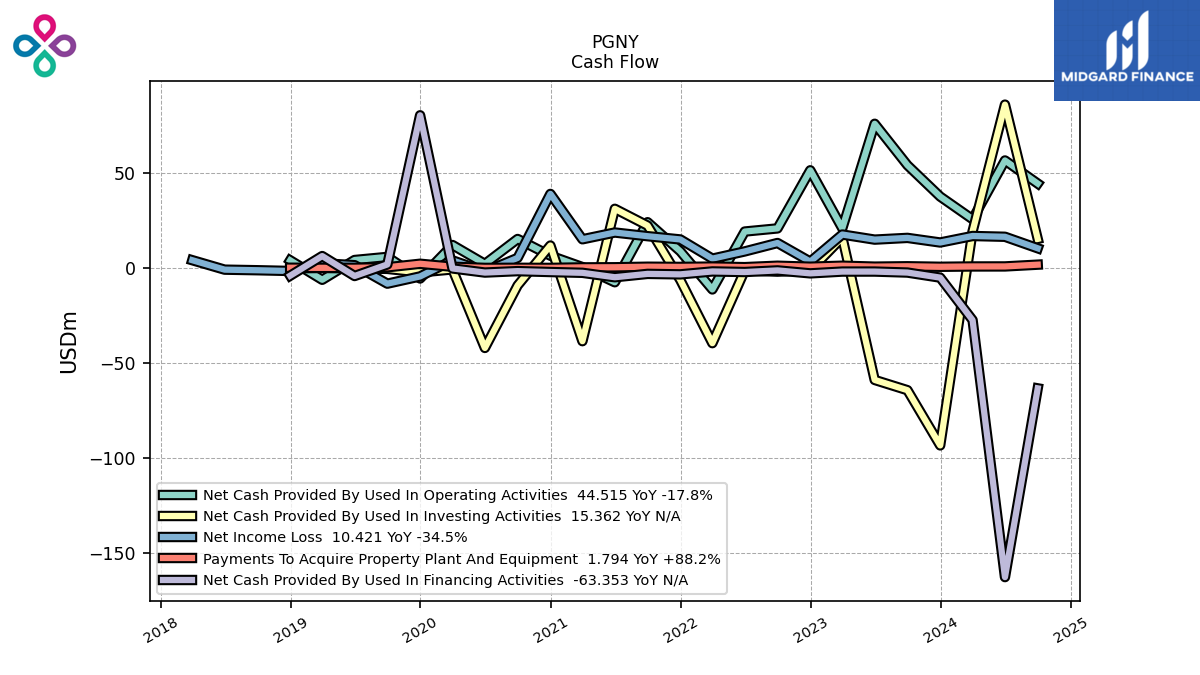
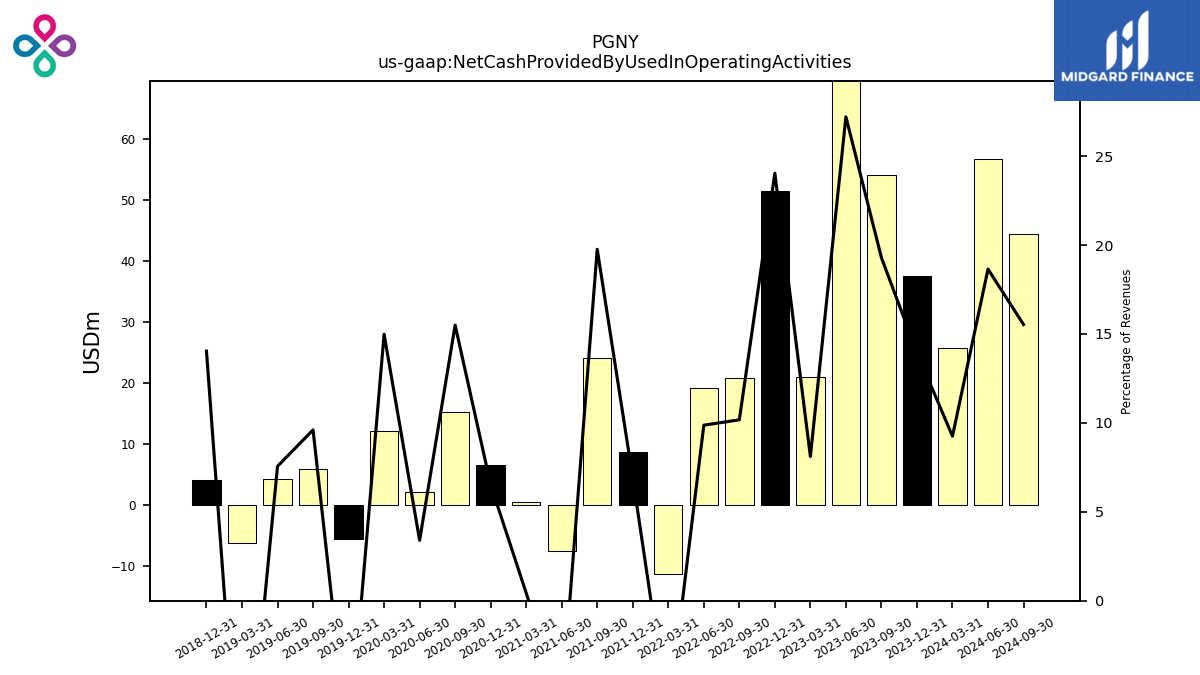
| Net Cash Provided By Used In Operating Activities | 37.66 | 54.18 | 76.01 | 20.96 | 51.52 | 20.89 | 19.25 | -11.26 | 8.81 | 24.16 | -7.47 | 0.53 | 6.54 | 15.33 | 2.20 | 12.14 | -5.49 | 5.88 | 4.25 | -6.17 | 4.10 | NA | NA | NA | |
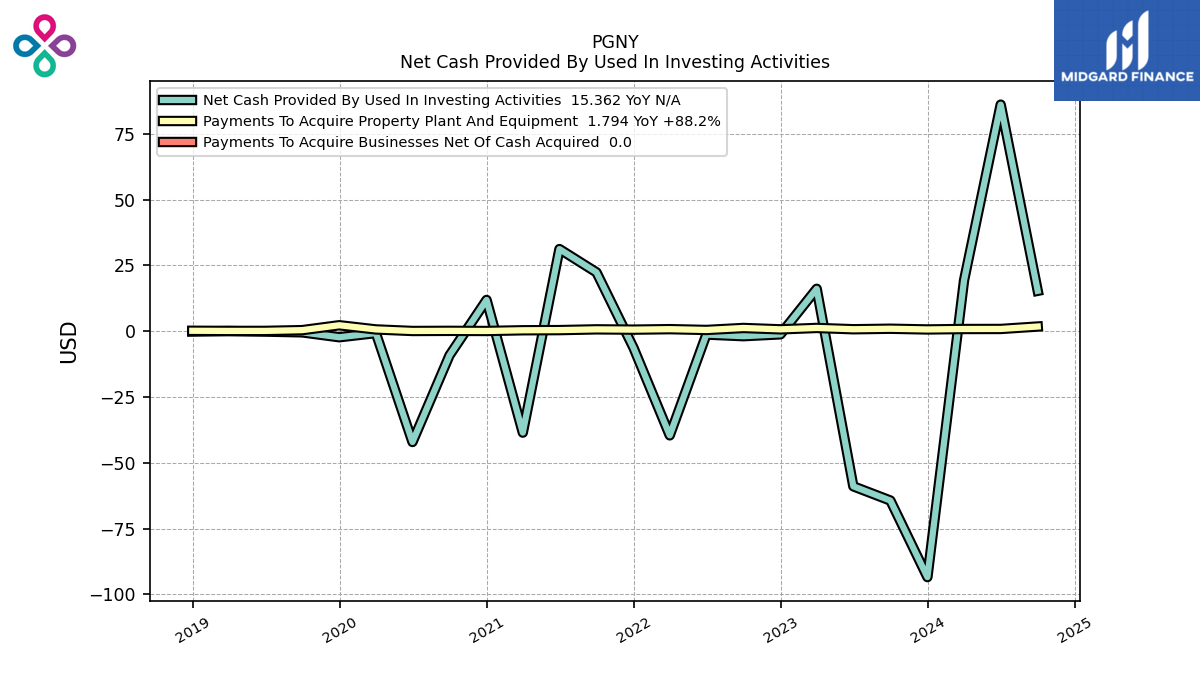
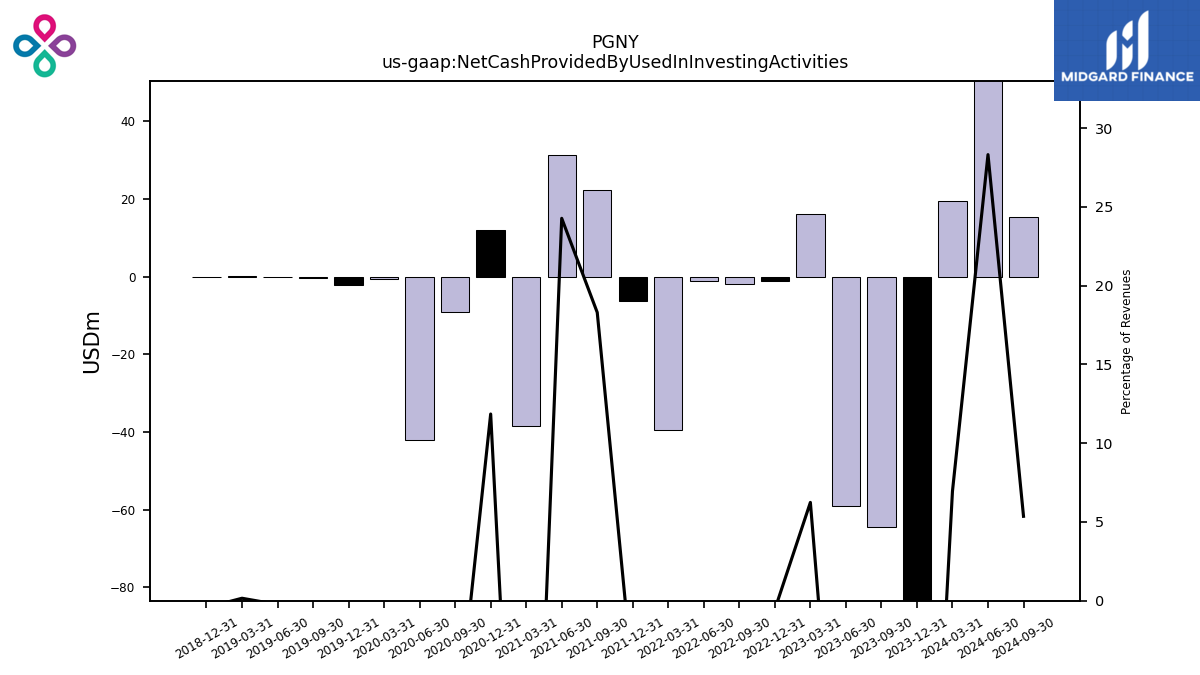
| Net Cash Provided By Used In Investing Activities | -93.41 | -64.31 | -58.92 | 16.13 | -1.17 | -1.88 | -1.26 | -39.56 | -6.31 | 22.37 | 31.22 | -38.52 | 11.89 | -9.15 | -42.08 | -0.69 | -2.28 | -0.42 | -0.13 | 0.07 | -0.12 | NA | NA | NA | |
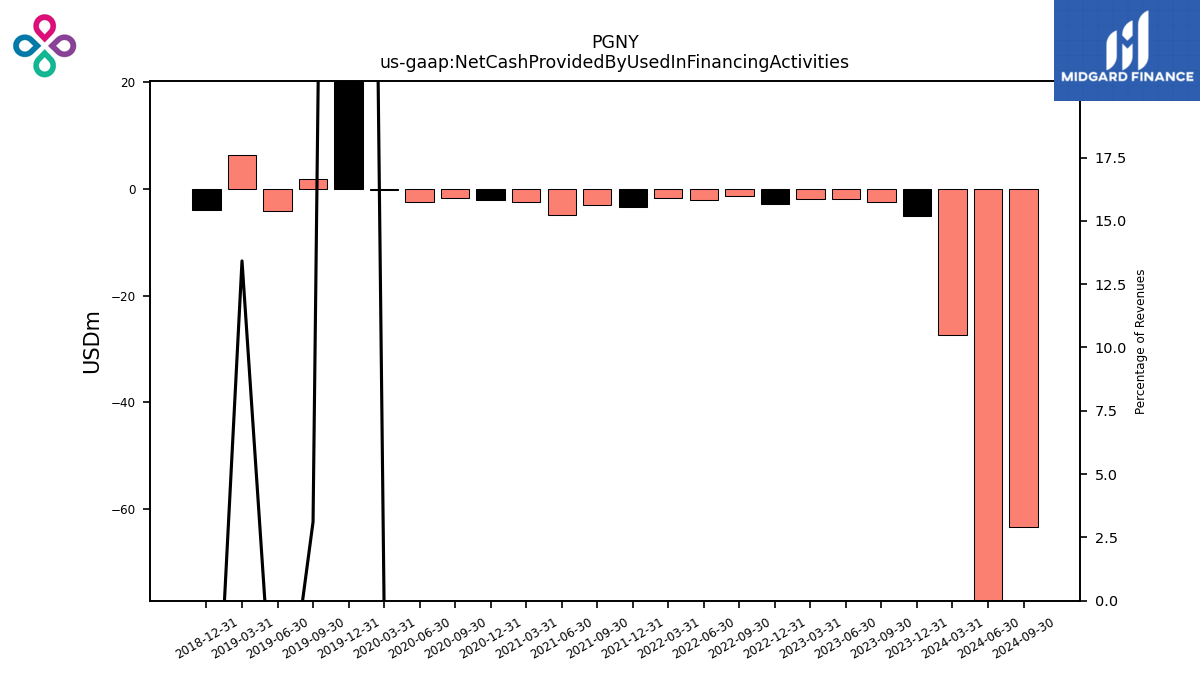
| Net Cash Provided By Used In Financing Activities | -5.03 | -2.36 | -1.84 | -1.85 | -2.79 | -1.23 | -2.08 | -1.77 | -3.31 | -3.06 | -4.82 | -2.50 | -2.08 | -1.61 | -2.36 | -0.19 | 80.48 | 1.91 | -4.18 | 6.33 | -4.02 | NA | NA | NA |
| 2023-12-31 | 2023-09-30 | 2023-06-30 | 2023-03-31 | 2022-12-31 | 2022-09-30 | 2022-06-30 | 2022-03-31 | 2021-12-31 | 2021-09-30 | 2021-06-30 | 2021-03-31 | 2020-12-31 | 2020-09-30 | 2020-06-30 | 2020-03-31 | 2019-12-31 | 2019-09-30 | 2019-06-30 | 2019-03-31 | 2018-12-31 | 2018-09-30 | 2018-06-30 | 2018-03-31 | ||
|---|---|---|---|---|---|---|---|---|---|---|---|---|---|---|---|---|---|---|---|---|---|---|---|---|---|
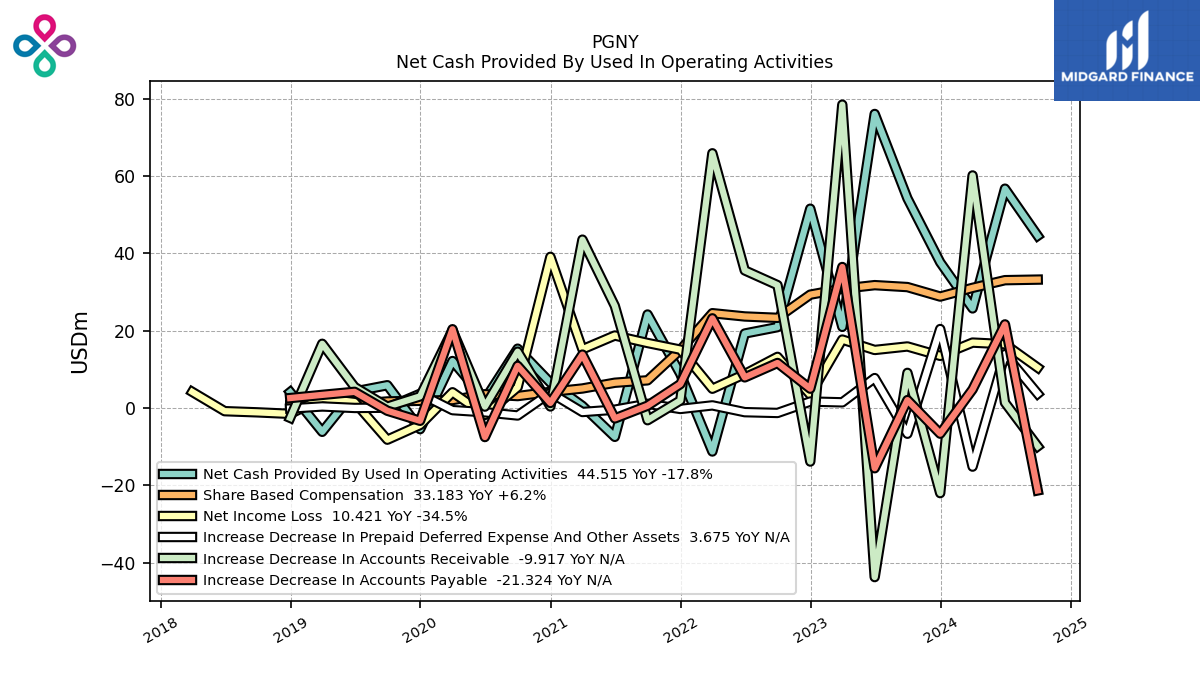
| Net Cash Provided By Used In Operating Activities | 37.66 | 54.18 | 76.01 | 20.96 | 51.52 | 20.89 | 19.25 | -11.26 | 8.81 | 24.16 | -7.47 | 0.53 | 6.54 | 15.33 | 2.20 | 12.14 | -5.49 | 5.88 | 4.25 | -6.17 | 4.10 | NA | NA | NA | |
| Net Income Loss | 13.47 | 15.90 | 14.99 | 17.68 | 3.41 | 13.21 | 8.77 | 4.97 | 15.08 | 16.80 | 18.73 | 15.17 | 39.07 | 5.36 | -1.81 | 4.06 | -4.40 | -8.21 | 1.52 | 2.52 | -1.52 | -1.14 | -0.83 | 4.15 | |
| Profit Loss | 13.47 | 15.90 | 14.99 | 17.68 | 3.41 | 13.21 | 8.77 | 4.97 | 15.08 | 16.80 | 18.73 | 15.17 | 38.86 | 5.36 | -1.81 | 4.06 | -4.40 | -8.21 | 1.52 | 2.52 | -1.52 | NA | NA | NA | |
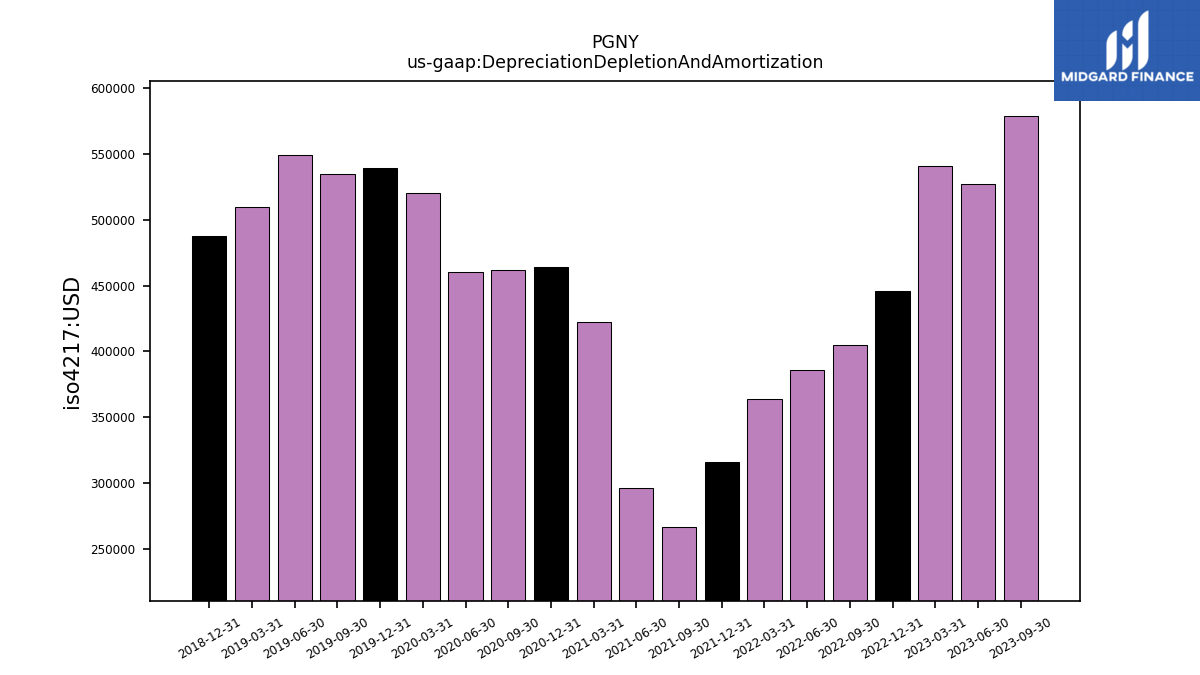
| Depreciation Depletion And Amortization | 0.63 | 0.58 | 0.53 | 0.54 | 0.45 | 0.41 | 0.39 | 0.36 | 0.32 | 0.27 | 0.30 | 0.42 | 0.46 | 0.46 | 0.46 | 0.52 | 0.54 | 0.54 | 0.55 | 0.51 | 0.49 | NA | NA | NA | |
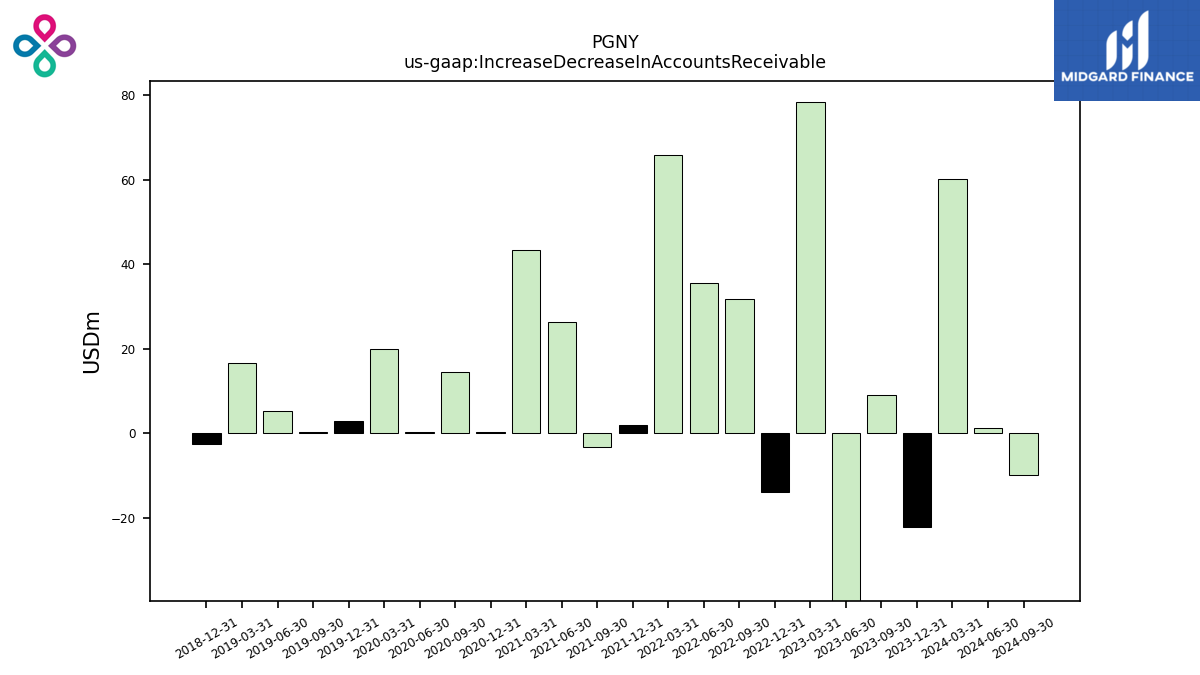
| Increase Decrease In Accounts Receivable | -22.02 | 9.07 | -43.74 | 78.42 | -13.86 | 31.76 | 35.56 | 65.84 | 1.94 | -3.17 | 26.39 | 43.52 | 0.38 | 14.55 | 0.35 | 20.05 | 3.00 | 0.33 | 5.42 | 16.60 | -2.56 | NA | NA | NA | |
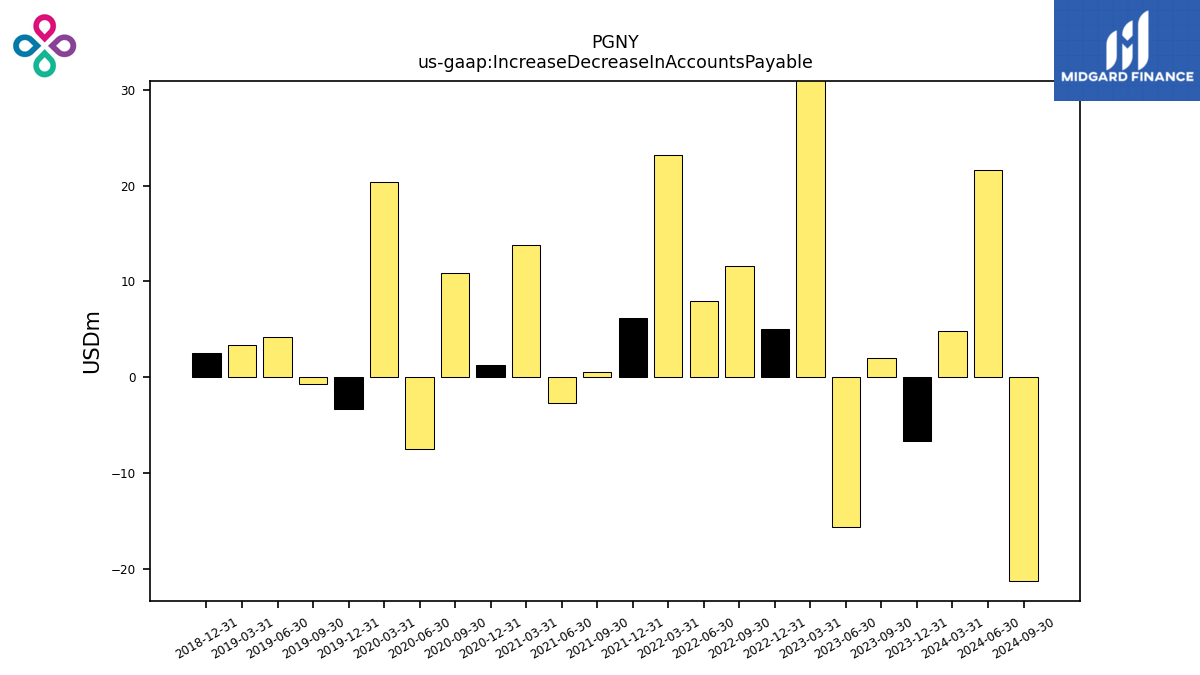
| Increase Decrease In Accounts Payable | -6.65 | 2.03 | -15.59 | 36.45 | 4.98 | 11.63 | 7.90 | 23.17 | 6.17 | 0.58 | -2.71 | 13.80 | 1.29 | 10.89 | -7.53 | 20.36 | -3.32 | -0.72 | 4.17 | 3.38 | 2.56 | NA | NA | NA | |
| Share Based Compensation | 28.80 | 31.25 | 31.75 | 30.81 | 29.30 | 23.30 | 23.65 | 24.50 | 15.01 | 7.15 | 6.52 | 5.03 | 4.16 | 3.07 | 3.54 | 2.05 | 1.85 | 1.68 | 1.01 | 0.52 | 0.69 | NA | NA | NA |
| 2023-12-31 | 2023-09-30 | 2023-06-30 | 2023-03-31 | 2022-12-31 | 2022-09-30 | 2022-06-30 | 2022-03-31 | 2021-12-31 | 2021-09-30 | 2021-06-30 | 2021-03-31 | 2020-12-31 | 2020-09-30 | 2020-06-30 | 2020-03-31 | 2019-12-31 | 2019-09-30 | 2019-06-30 | 2019-03-31 | 2018-12-31 | 2018-09-30 | 2018-06-30 | 2018-03-31 | ||
|---|---|---|---|---|---|---|---|---|---|---|---|---|---|---|---|---|---|---|---|---|---|---|---|---|---|
| Net Cash Provided By Used In Investing Activities | -93.41 | -64.31 | -58.92 | 16.13 | -1.17 | -1.88 | -1.26 | -39.56 | -6.31 | 22.37 | 31.22 | -38.52 | 11.89 | -9.15 | -42.08 | -0.69 | -2.28 | -0.42 | -0.13 | 0.07 | -0.12 | NA | NA | NA | |
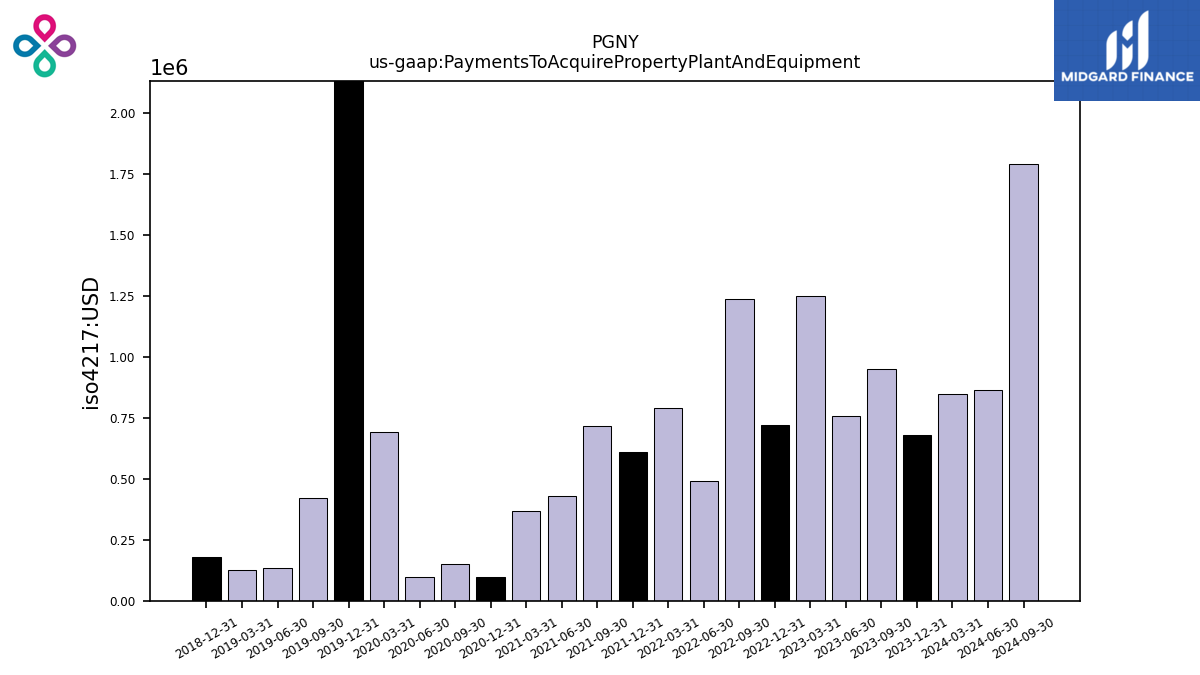
| Payments To Acquire Property Plant And Equipment | 0.68 | 0.95 | 0.76 | 1.25 | 0.72 | 1.24 | 0.49 | 0.79 | 0.61 | 0.72 | 0.43 | 0.37 | 0.10 | 0.15 | 0.10 | 0.69 | 2.28 | 0.42 | 0.13 | 0.12 | 0.18 | NA | NA | NA |
| 2023-12-31 | 2023-09-30 | 2023-06-30 | 2023-03-31 | 2022-12-31 | 2022-09-30 | 2022-06-30 | 2022-03-31 | 2021-12-31 | 2021-09-30 | 2021-06-30 | 2021-03-31 | 2020-12-31 | 2020-09-30 | 2020-06-30 | 2020-03-31 | 2019-12-31 | 2019-09-30 | 2019-06-30 | 2019-03-31 | 2018-12-31 | 2018-09-30 | 2018-06-30 | 2018-03-31 | ||
|---|---|---|---|---|---|---|---|---|---|---|---|---|---|---|---|---|---|---|---|---|---|---|---|---|---|
| Net Cash Provided By Used In Financing Activities | -5.03 | -2.36 | -1.84 | -1.85 | -2.79 | -1.23 | -2.08 | -1.77 | -3.31 | -3.06 | -4.82 | -2.50 | -2.08 | -1.61 | -2.36 | -0.19 | 80.48 | 1.91 | -4.18 | 6.33 | -4.02 | NA | NA | NA |
| 2023-12-31 | 2023-09-30 | 2023-06-30 | 2023-03-31 | 2022-12-31 | 2022-09-30 | 2022-06-30 | 2022-03-31 | 2021-12-31 | 2021-09-30 | 2021-06-30 | 2021-03-31 | 2020-12-31 | 2020-09-30 | 2020-06-30 | 2020-03-31 | 2019-12-31 | 2019-09-30 | 2019-06-30 | 2019-03-31 | 2018-12-31 | 2018-09-30 | 2018-06-30 | 2018-03-31 | ||
|---|---|---|---|---|---|---|---|---|---|---|---|---|---|---|---|---|---|---|---|---|---|---|---|---|---|
| Revenues | 269.94 | 280.89 | 279.37 | 258.39 | 214.32 | 205.37 | 195.00 | 172.22 | 127.55 | 122.28 | 128.65 | 122.13 | 100.30 | 98.93 | 64.61 | 81.02 | 65.12 | 61.20 | 56.17 | 47.20 | 29.19 | 27.80 | 26.16 | 22.26 | |
| Revenue From Contract With Customer Excluding Assessed Tax | 269.94 | 280.89 | 279.37 | 258.39 | 214.32 | 205.37 | 195.00 | 172.22 | 127.55 | 122.28 | 128.65 | 122.13 | 100.30 | 98.93 | 64.61 | 81.02 | 65.12 | 61.20 | 56.17 | 47.20 | 29.19 | 27.80 | 26.16 | 22.26 | |
| Revenue From Contract With Customer Including Assessed Tax | 269.94 | 280.89 | 279.37 | 258.39 | 214.32 | 205.37 | 195.00 | 172.22 | 127.55 | 122.28 | 128.65 | 122.13 | 100.30 | 98.93 | 64.61 | 81.02 | 65.12 | 61.20 | 56.17 | 47.20 | 29.19 | 27.80 | 26.16 | 22.26 | |
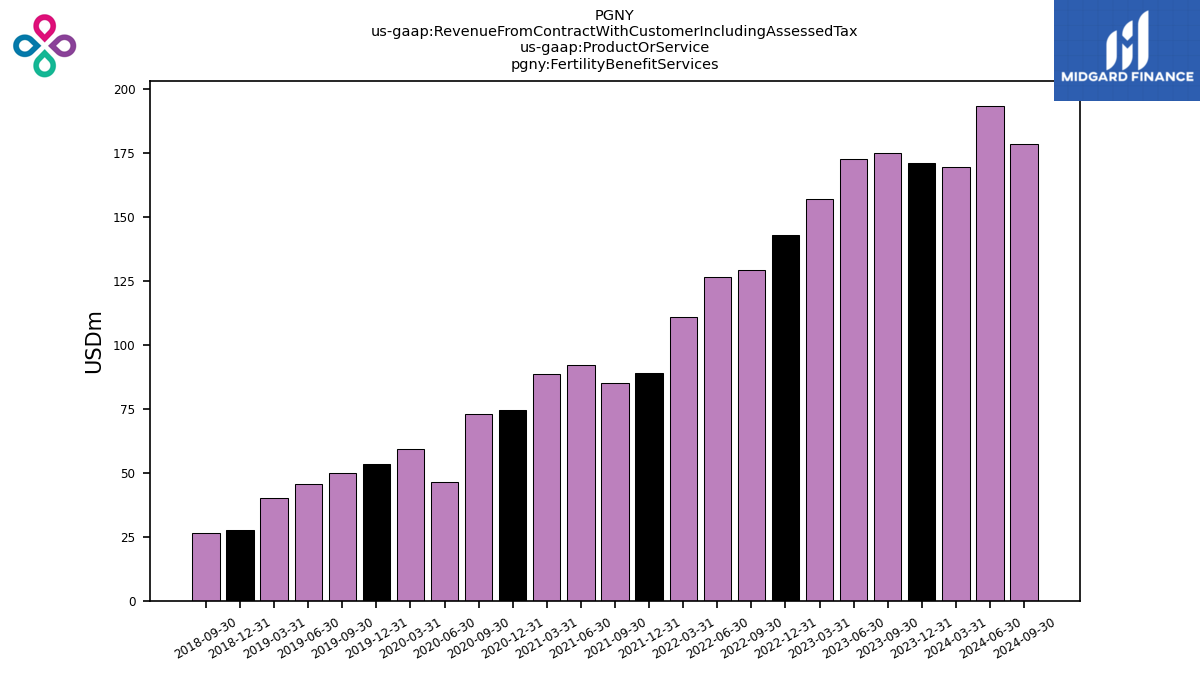
| Fertility Benefit Services | 171.30 | 175.11 | 172.74 | 157.15 | 143.14 | 129.30 | 126.79 | 110.92 | 89.18 | 85.31 | 92.27 | 88.85 | 74.71 | 73.14 | 46.27 | 59.43 | 53.53 | 50.02 | 45.70 | 40.37 | 27.78 | 26.39 | NA | NA | |
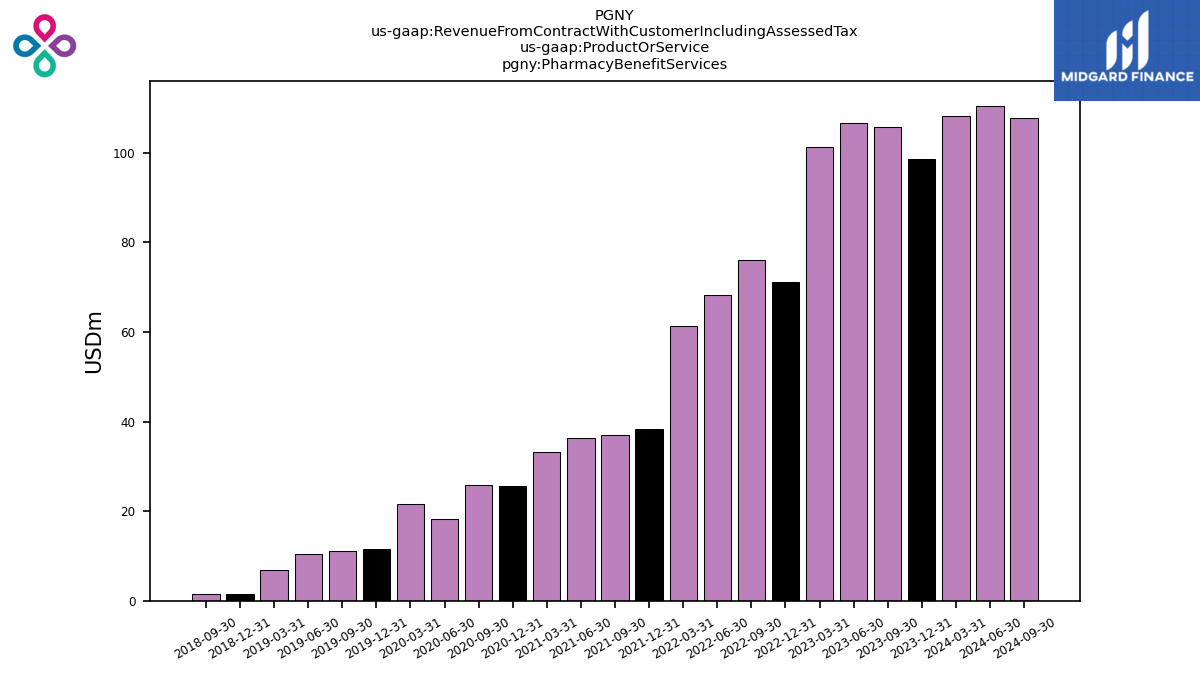
| Pharmacy Benefit Services | 98.64 | 105.78 | 106.64 | 101.25 | 71.19 | 76.07 | 68.21 | 61.30 | 38.37 | 36.97 | 36.38 | 33.28 | 25.59 | 25.79 | 18.33 | 21.59 | 11.59 | 11.17 | 10.47 | 6.83 | 1.41 | 1.41 | NA | NA |