
| 2023-12-31 | 2023-09-30 | 2023-06-30 | 2023-03-31 | 2022-12-31 | 2022-09-30 | 2022-06-30 | 2022-03-31 | 2021-12-31 | 2021-09-30 | 2021-06-30 | 2021-03-31 | 2020-12-31 | 2020-09-30 | 2020-06-30 | 2020-03-31 | 2019-12-31 | 2019-09-30 | 2019-06-30 | 2019-03-31 | 2018-12-31 | 2018-09-30 | 2018-06-30 | 2018-03-31 | 2017-12-31 | 2017-09-30 | 2017-06-30 | 2017-03-31 | 2016-12-31 | 2016-09-30 | 2016-06-30 | 2016-03-31 | ||
|---|---|---|---|---|---|---|---|---|---|---|---|---|---|---|---|---|---|---|---|---|---|---|---|---|---|---|---|---|---|---|---|---|---|
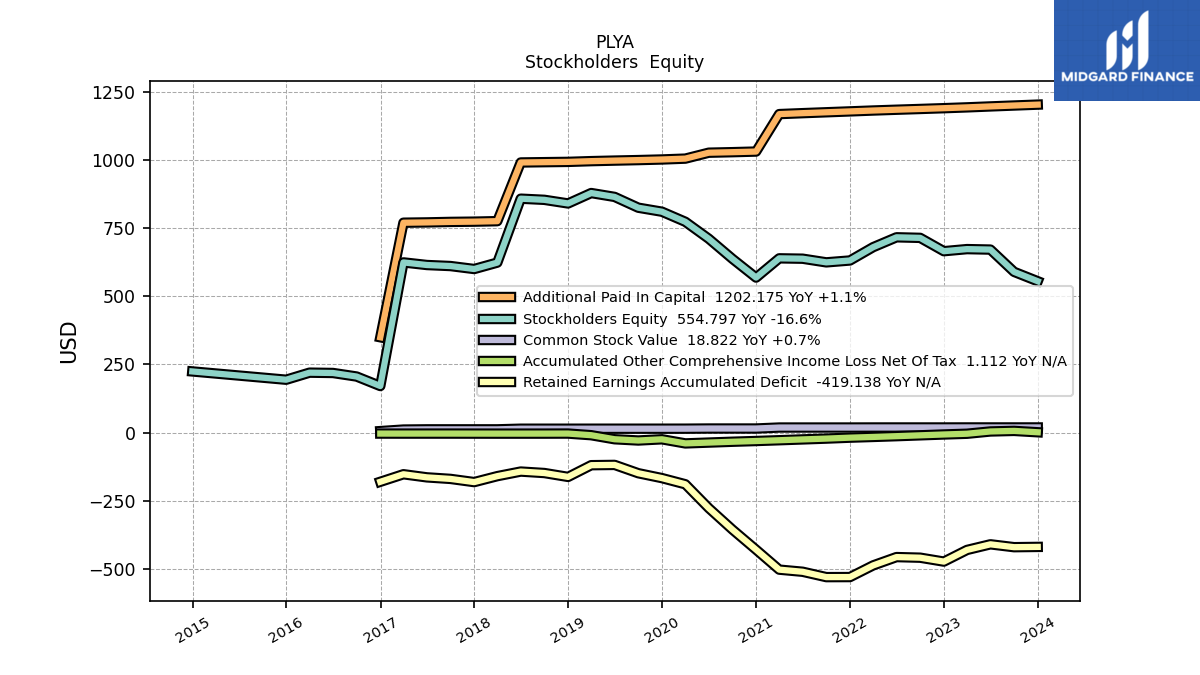
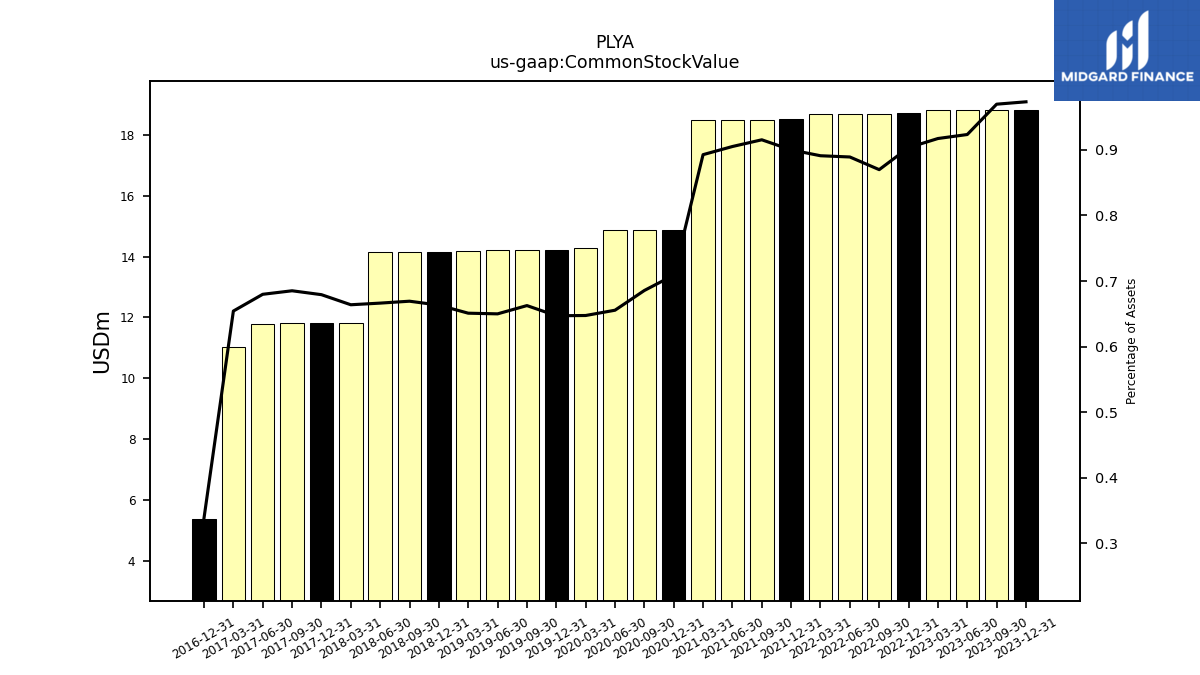
| Common Stock Value | 18.82 | 18.82 | 18.82 | 18.82 | 18.70 | 18.70 | 18.70 | 18.67 | 18.52 | 18.49 | 18.49 | 18.47 | 14.87 | 14.86 | 14.86 | 14.27 | 14.21 | 14.21 | 14.21 | 14.19 | 14.16 | 14.16 | 14.16 | 11.81 | 11.80 | 11.80 | 11.78 | 11.04 | 5.39 | NA | NA | NA | |
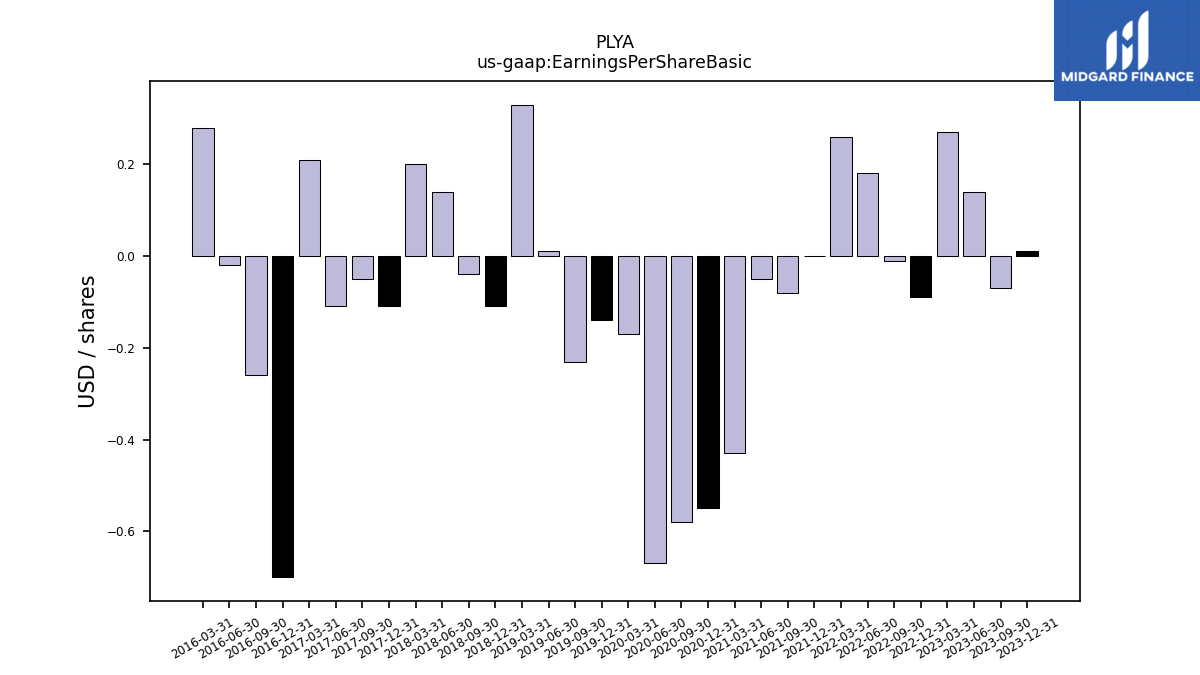
| Earnings Per Share Basic | 0.01 | -0.07 | 0.14 | 0.27 | -0.09 | -0.01 | 0.18 | 0.26 | 0.00 | -0.08 | -0.05 | -0.43 | -0.55 | -0.58 | -0.67 | -0.17 | -0.14 | -0.23 | 0.01 | 0.33 | -0.11 | -0.04 | 0.14 | 0.20 | -0.11 | -0.05 | -0.11 | 0.21 | -0.70 | -0.26 | -0.02 | 0.28 | |
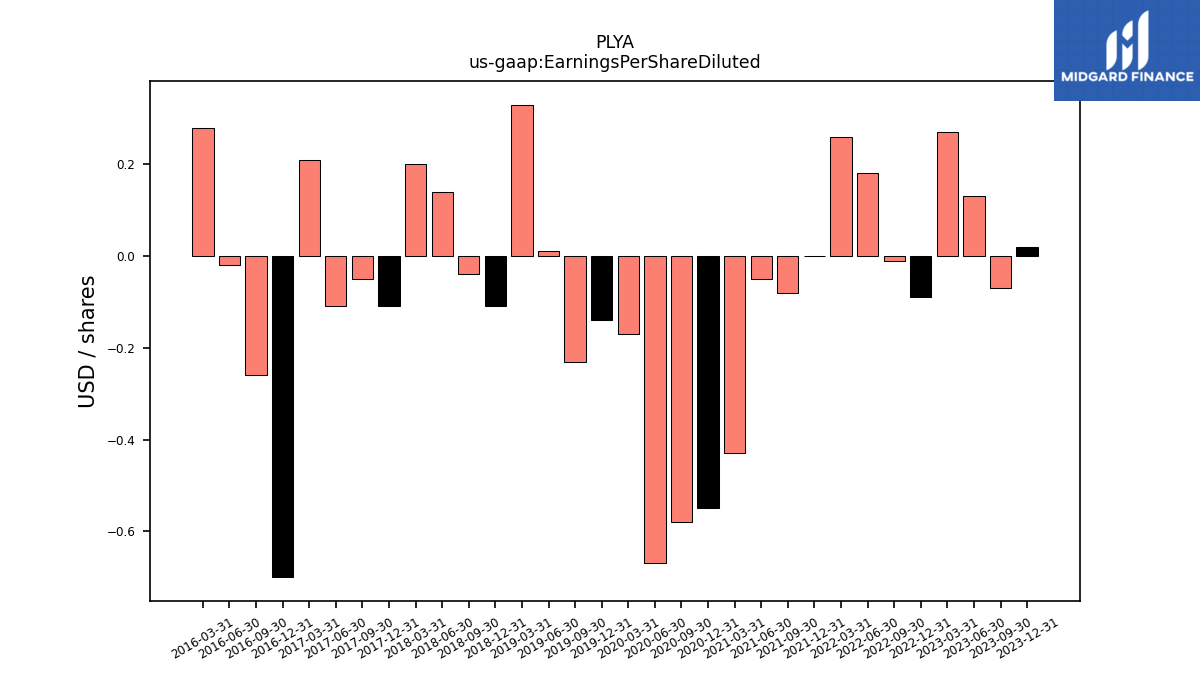
| Earnings Per Share Diluted | 0.02 | -0.07 | 0.13 | 0.27 | -0.09 | -0.01 | 0.18 | 0.26 | 0.00 | -0.08 | -0.05 | -0.43 | -0.55 | -0.58 | -0.67 | -0.17 | -0.14 | -0.23 | 0.01 | 0.33 | -0.11 | -0.04 | 0.14 | 0.20 | -0.11 | -0.05 | -0.11 | 0.21 | -0.70 | -0.26 | -0.02 | 0.28 |
| 2023-12-31 | 2023-09-30 | 2023-06-30 | 2023-03-31 | 2022-12-31 | 2022-09-30 | 2022-06-30 | 2022-03-31 | 2021-12-31 | 2021-09-30 | 2021-06-30 | 2021-03-31 | 2020-12-31 | 2020-09-30 | 2020-06-30 | 2020-03-31 | 2019-12-31 | 2019-09-30 | 2019-06-30 | 2019-03-31 | 2018-12-31 | 2018-09-30 | 2018-06-30 | 2018-03-31 | 2017-12-31 | 2017-09-30 | 2017-06-30 | 2017-03-31 | 2016-12-31 | 2016-09-30 | 2016-06-30 | 2016-03-31 | ||
|---|---|---|---|---|---|---|---|---|---|---|---|---|---|---|---|---|---|---|---|---|---|---|---|---|---|---|---|---|---|---|---|---|---|
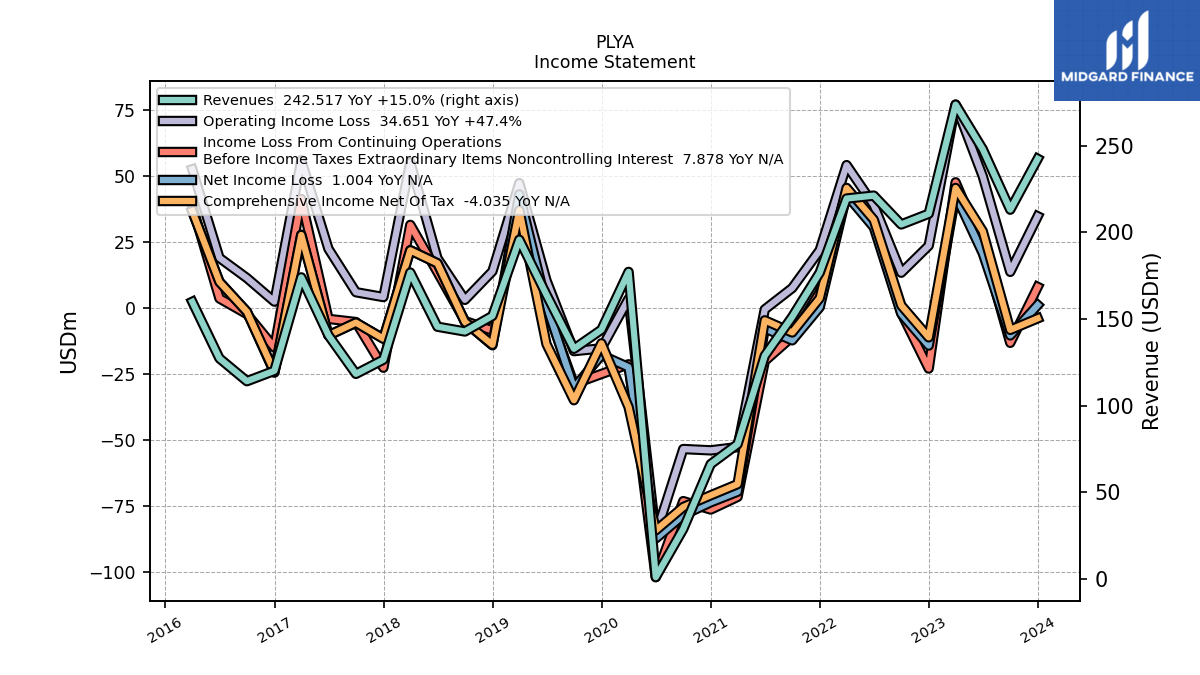
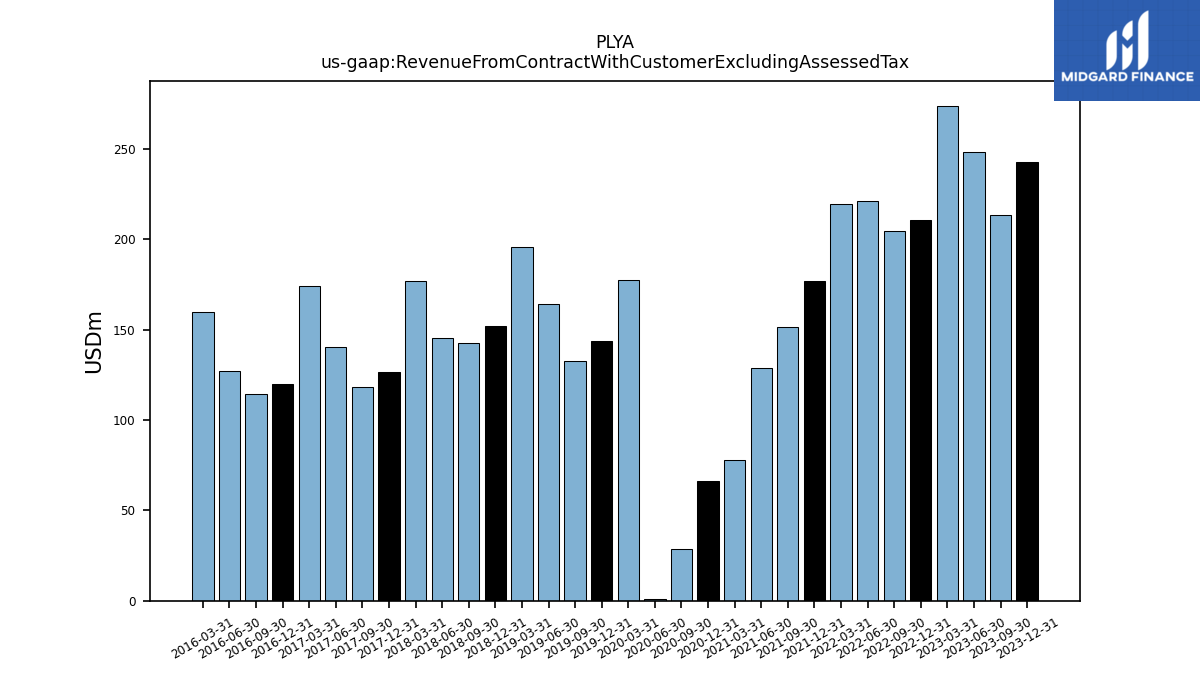
| Revenue From Contract With Customer Excluding Assessed Tax | 242.52 | 213.15 | 248.04 | 273.80 | 210.80 | 204.62 | 221.27 | 219.57 | 176.80 | 151.29 | 128.80 | 77.75 | 66.24 | 28.74 | 0.98 | 177.23 | 143.83 | 132.82 | 164.02 | 195.80 | 151.78 | 142.81 | 145.57 | 176.85 | 126.54 | 118.34 | 140.60 | 174.07 | 120.12 | 114.11 | 127.30 | 159.96 | |
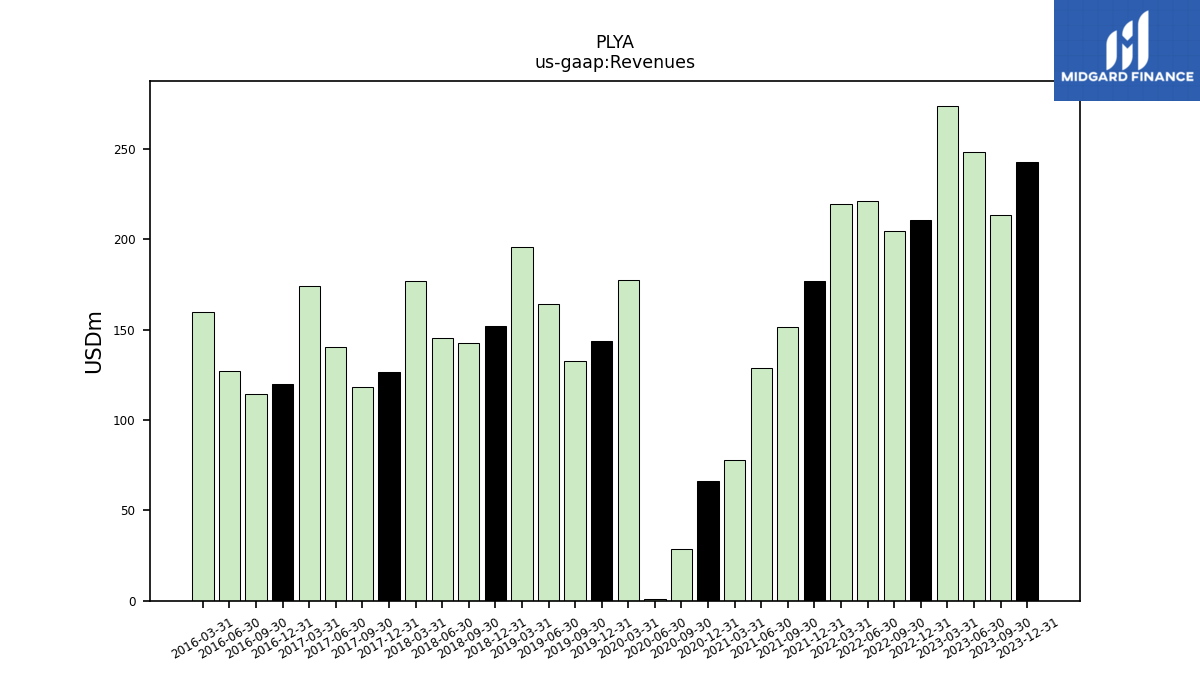
| Revenues | 242.52 | 213.15 | 248.04 | 273.80 | 210.80 | 204.62 | 221.27 | 219.57 | 176.80 | 151.29 | 128.80 | 77.75 | 66.24 | 28.74 | 0.98 | 177.23 | 143.83 | 132.82 | 164.02 | 195.80 | 151.78 | 142.81 | 145.57 | 176.85 | 126.54 | 118.34 | 140.60 | 174.07 | 120.12 | 114.11 | 127.30 | 159.96 | |
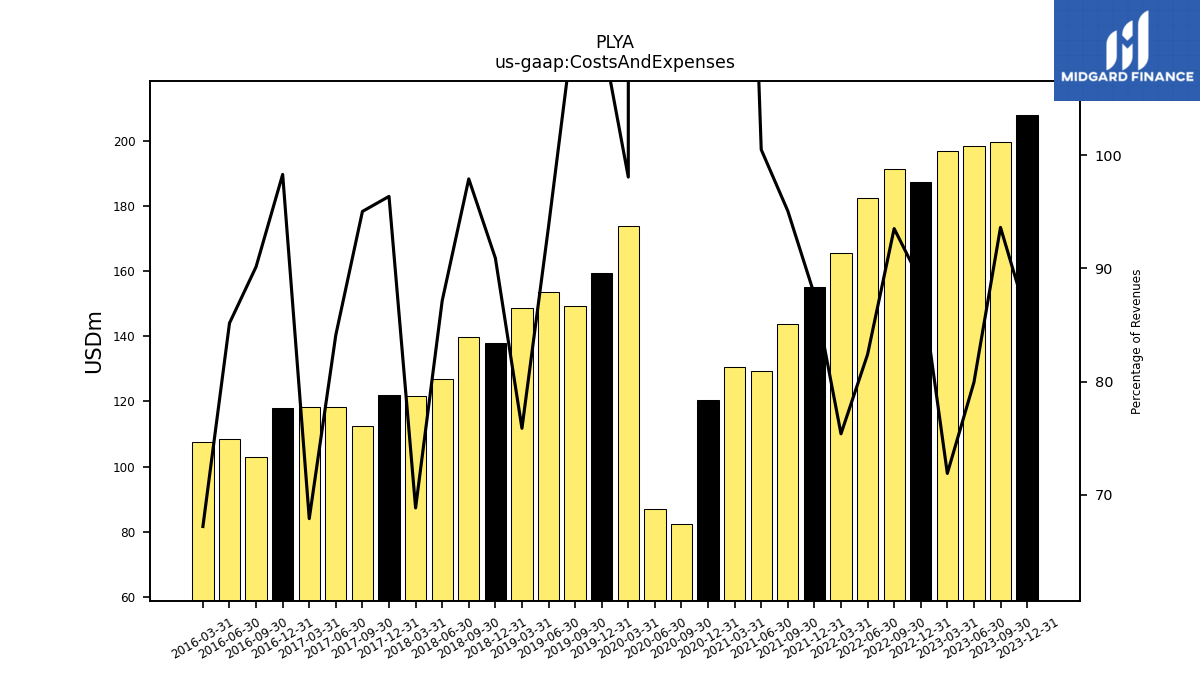
| Costs And Expenses | 207.87 | 199.56 | 198.25 | 196.83 | 187.29 | 191.36 | 182.32 | 165.53 | 155.02 | 143.84 | 129.44 | 130.57 | 120.30 | 82.29 | 87.02 | 173.81 | 159.24 | 149.28 | 153.69 | 148.56 | 137.99 | 139.83 | 126.85 | 121.74 | 121.94 | 112.47 | 118.29 | 118.18 | 118.08 | 102.87 | 108.42 | 107.49 | |
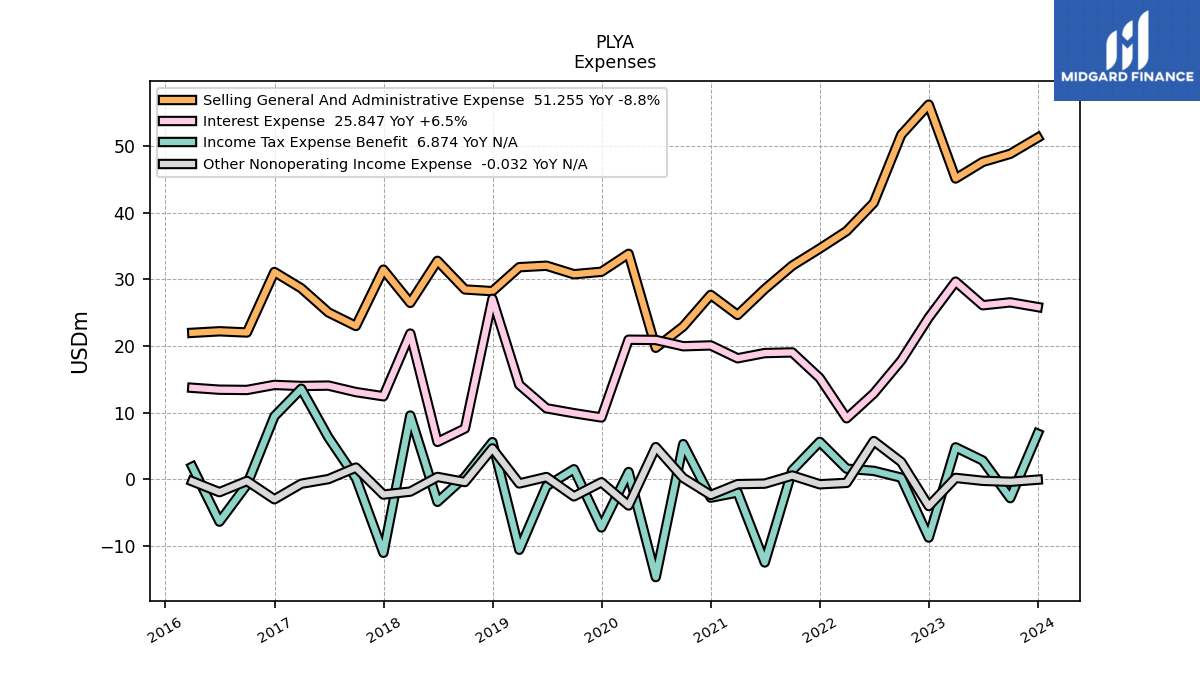
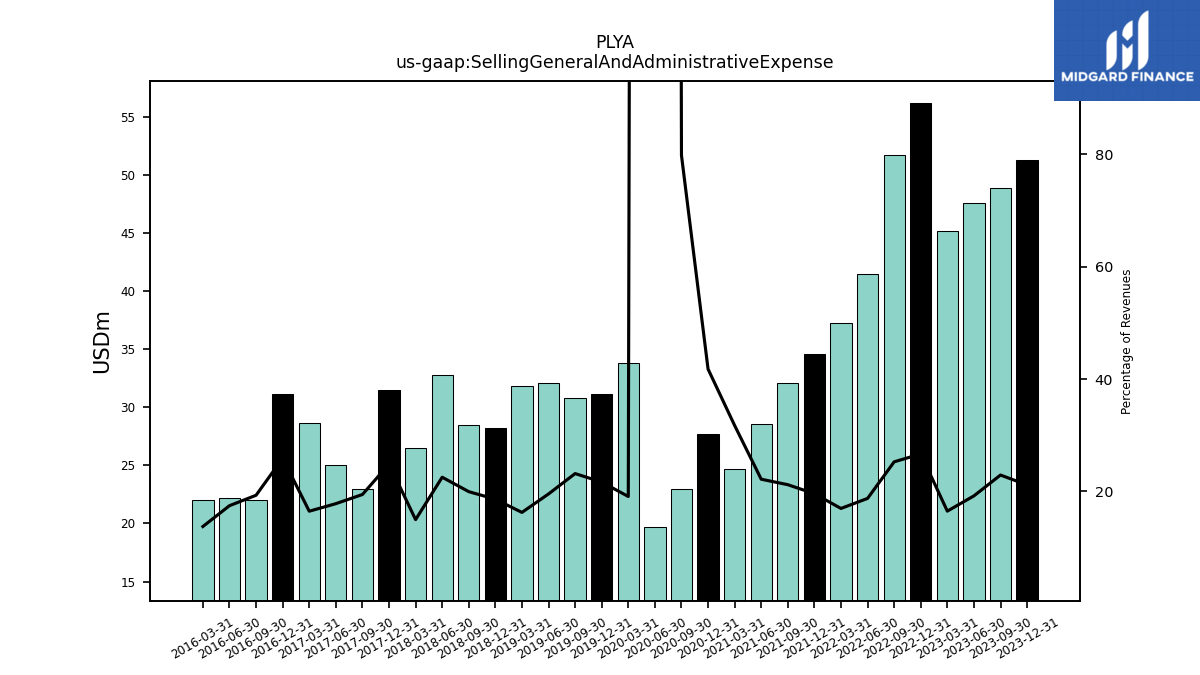
| Selling General And Administrative Expense | 51.26 | 48.83 | 47.61 | 45.13 | 56.20 | 51.69 | 41.48 | 37.24 | 34.62 | 32.05 | 28.55 | 24.67 | 27.67 | 22.94 | 19.74 | 33.83 | 31.14 | 30.77 | 32.05 | 31.83 | 28.23 | 28.49 | 32.78 | 26.47 | 31.46 | 23.01 | 25.04 | 28.66 | 31.11 | 22.03 | 22.22 | 21.99 | |
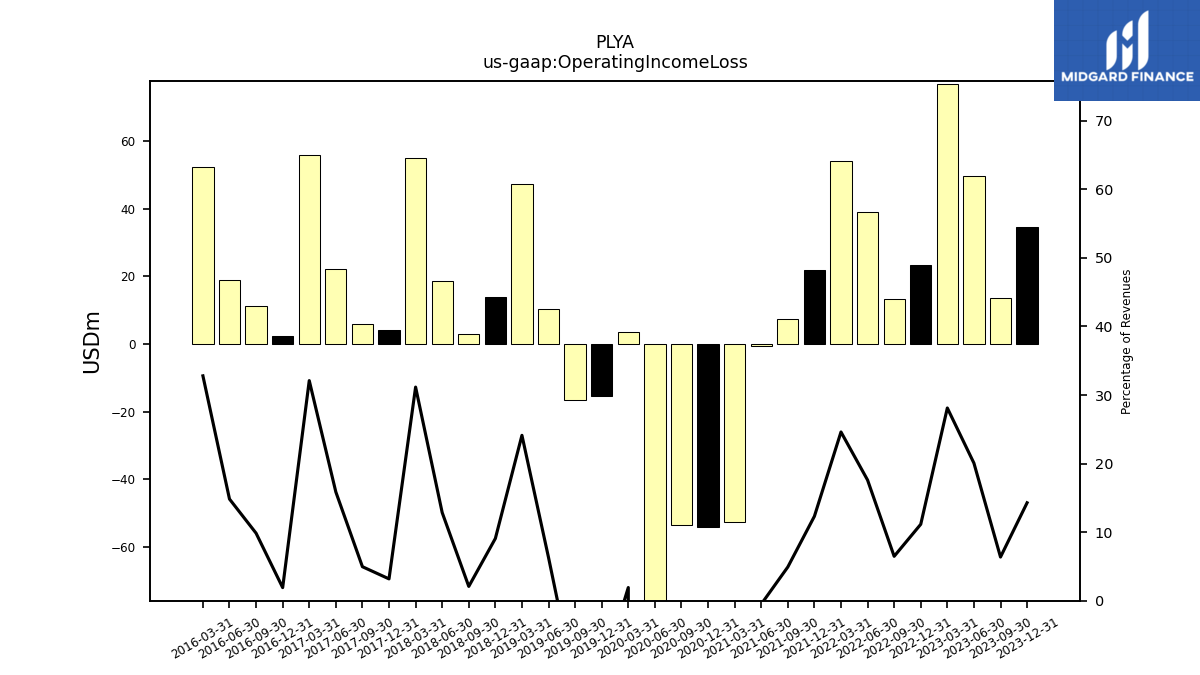
| Operating Income Loss | 34.65 | 13.59 | 49.79 | 76.97 | 23.51 | 13.26 | 38.95 | 54.04 | 21.78 | 7.45 | -0.64 | -52.82 | -54.05 | -53.56 | -86.04 | 3.42 | -15.40 | -16.46 | 10.33 | 47.24 | 13.79 | 2.98 | 18.72 | 55.11 | 4.04 | 5.88 | 22.31 | 55.89 | 2.30 | 11.24 | 18.88 | 52.47 | |
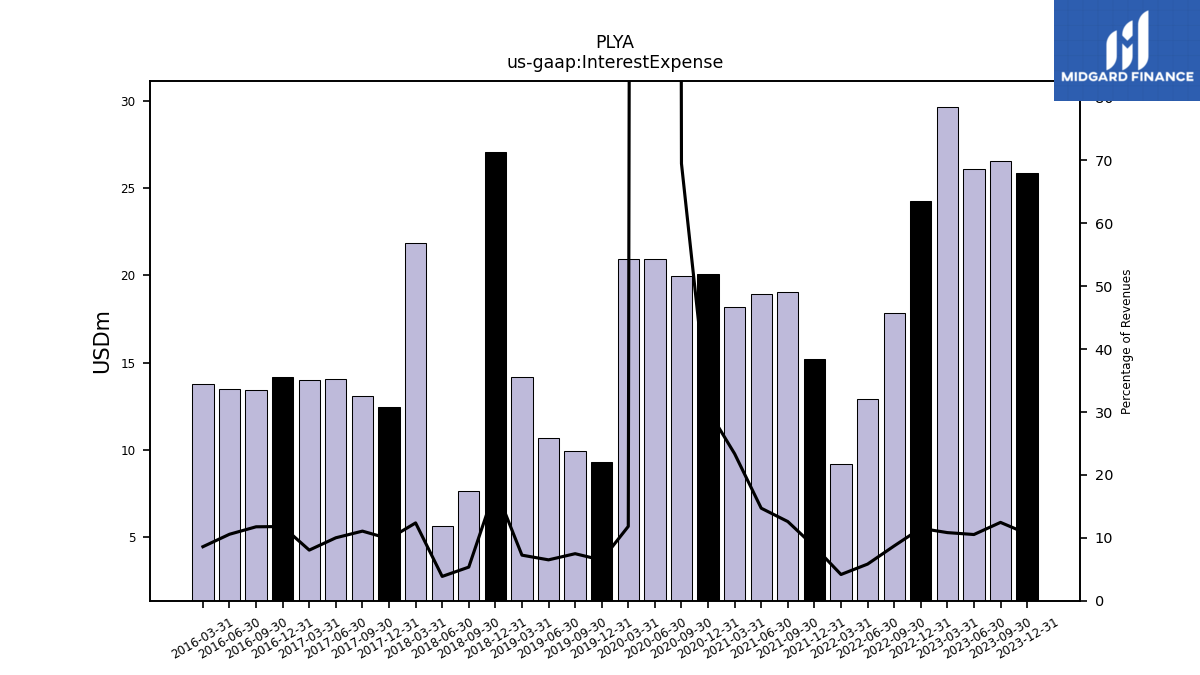
| Interest Expense | 25.85 | 26.55 | 26.12 | 29.67 | 24.27 | 17.83 | 12.89 | 9.17 | 15.21 | 19.05 | 18.95 | 18.17 | 20.10 | 19.97 | 20.92 | 20.95 | 9.29 | 9.94 | 10.67 | 14.19 | 27.09 | 7.64 | 5.63 | 21.88 | 12.47 | 13.10 | 14.07 | 14.02 | 14.17 | 13.42 | 13.46 | 13.74 | |
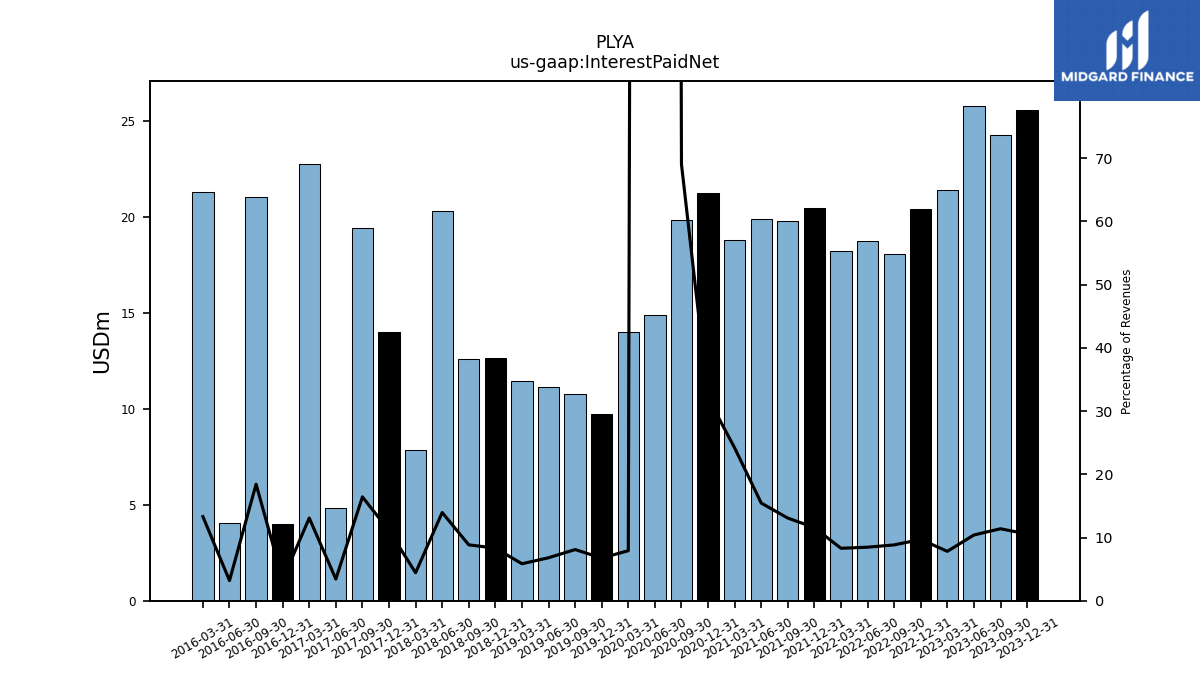
| Interest Paid Net | 25.60 | 24.28 | 25.81 | 21.41 | 20.44 | 18.08 | 18.75 | 18.22 | 20.46 | 19.78 | 19.90 | 18.80 | 21.25 | 19.84 | 14.88 | 14.03 | 9.72 | 10.76 | 11.16 | 11.46 | 12.64 | 12.63 | 20.32 | 7.84 | 14.02 | 19.45 | 4.83 | 22.78 | 4.00 | 21.04 | 4.07 | 21.29 | |
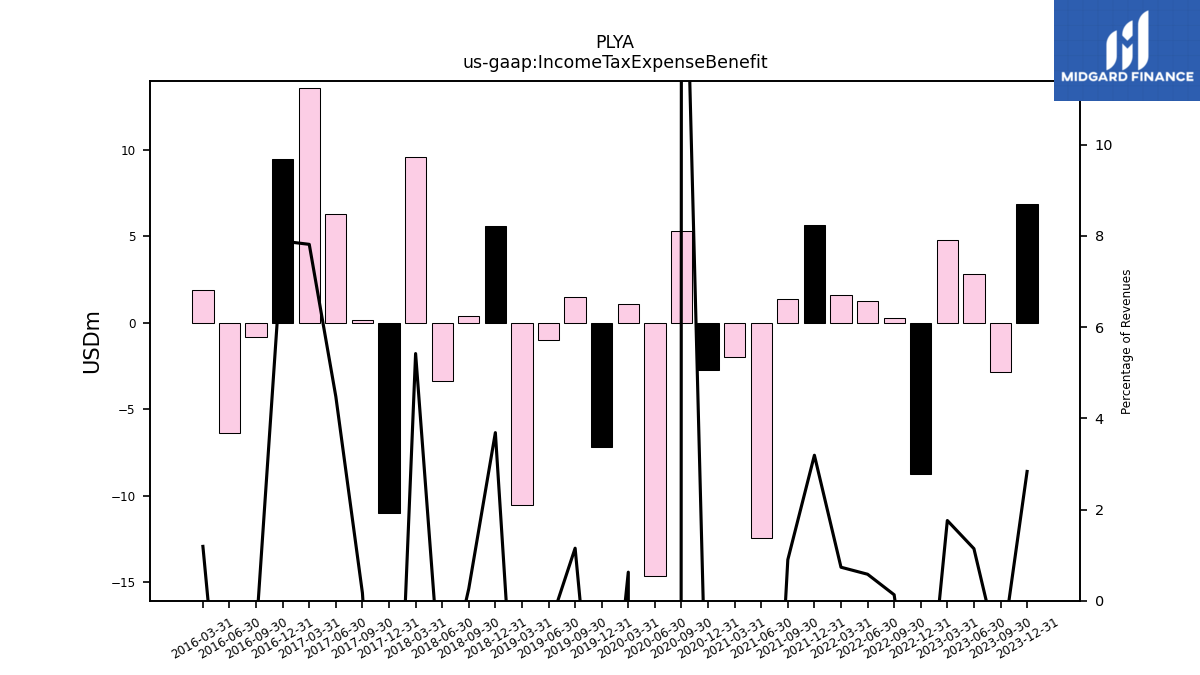
| Income Tax Expense Benefit | 6.87 | -2.81 | 2.83 | 4.82 | -8.72 | 0.27 | 1.29 | 1.61 | 5.64 | 1.36 | -12.45 | -1.95 | -2.74 | 5.30 | -14.65 | 1.11 | -7.20 | 1.53 | -1.01 | -10.55 | 5.59 | 0.38 | -3.36 | 9.58 | -11.01 | 0.20 | 6.29 | 13.60 | 9.47 | -0.80 | -6.33 | 1.91 | |
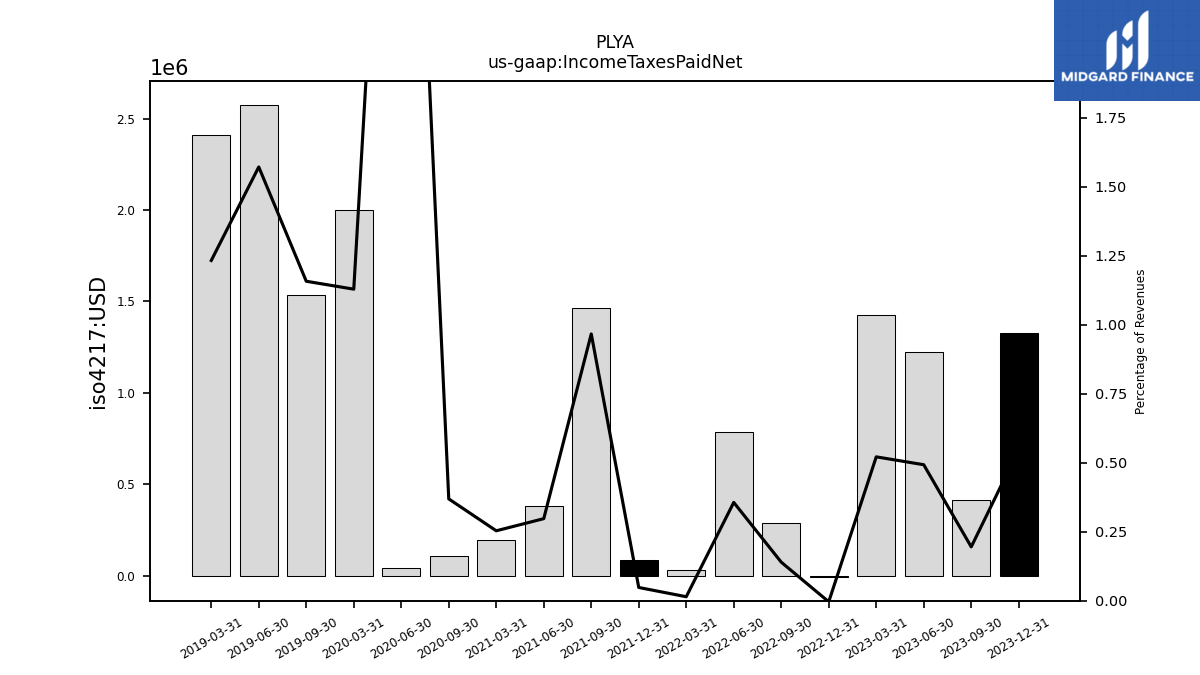
| Income Taxes Paid Net | 1.33 | 0.42 | 1.22 | 1.43 | -0.01 | 0.29 | 0.79 | 0.03 | 0.09 | 1.46 | 0.38 | 0.20 | NA | 0.11 | 0.04 | 2.00 | NA | 1.54 | 2.58 | 2.41 | NA | NA | NA | NA | NA | NA | NA | NA | NA | NA | NA | NA | |
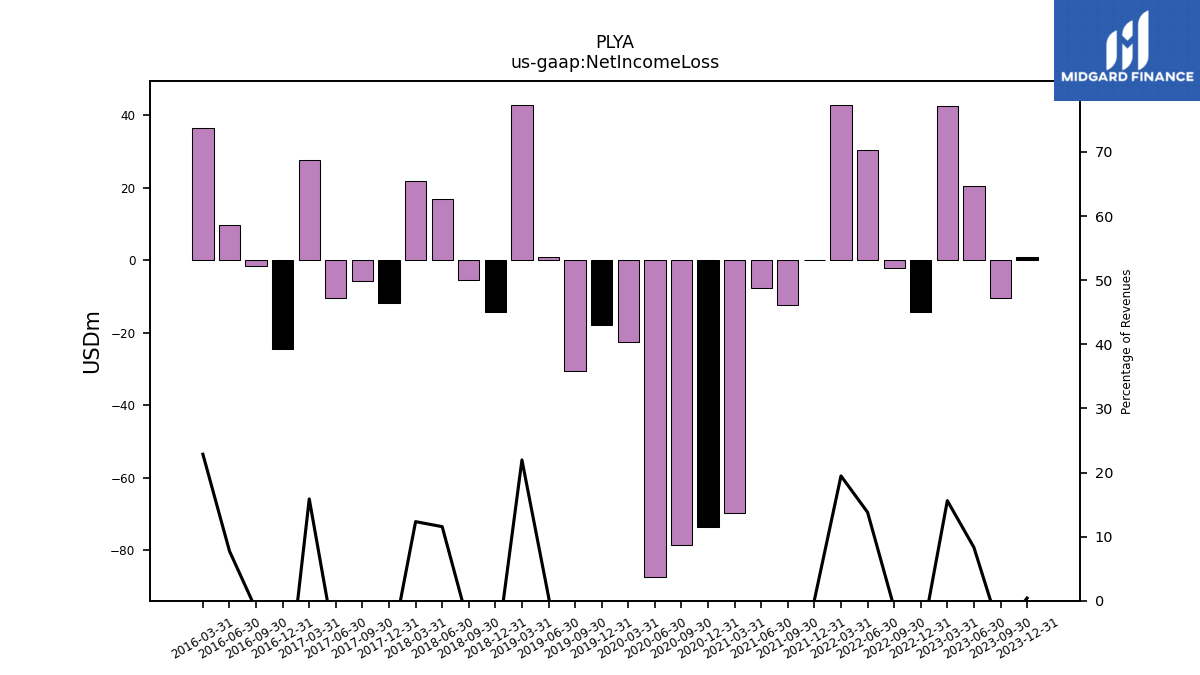
| Net Income Loss | 1.00 | -10.50 | 20.63 | 42.72 | -14.34 | -2.23 | 30.52 | 42.75 | 0.20 | -12.37 | -7.77 | -69.75 | -73.75 | -78.60 | -87.46 | -22.56 | -17.92 | -30.46 | 1.04 | 42.99 | -14.24 | -5.42 | 16.82 | 21.82 | -11.68 | -5.67 | -10.53 | 27.64 | -24.61 | -1.56 | 9.85 | 36.54 | |
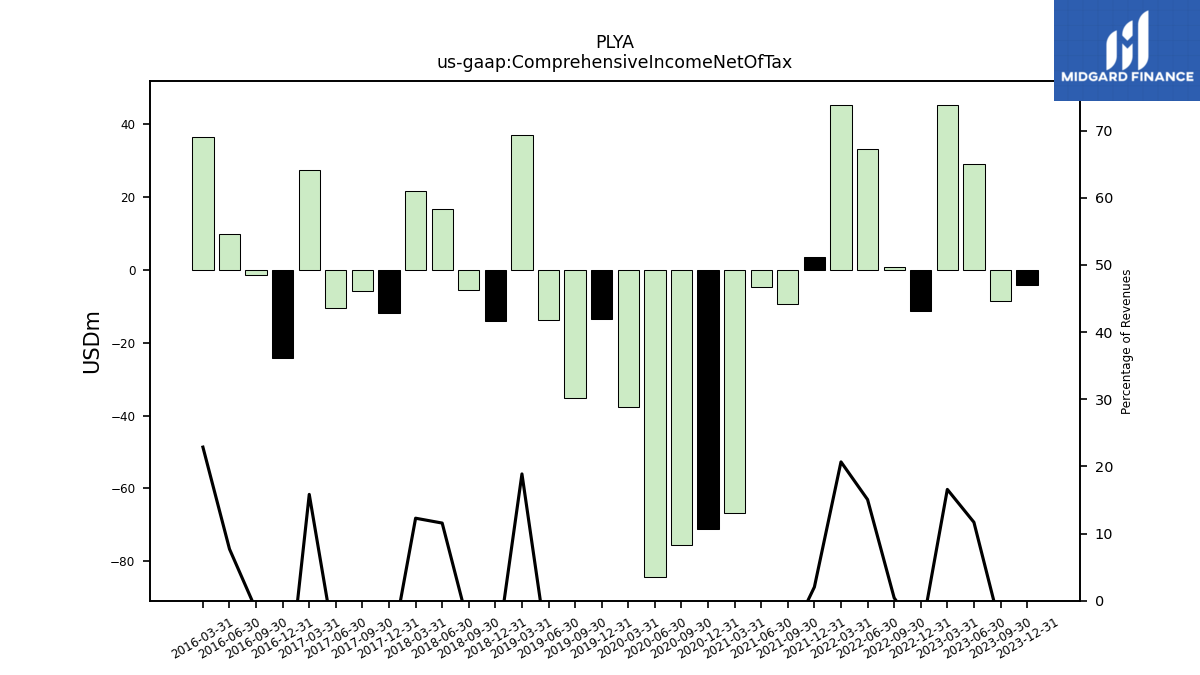
| Comprehensive Income Net Of Tax | -4.04 | -8.40 | 28.99 | 45.40 | -11.23 | 0.88 | 33.34 | 45.41 | 3.62 | -9.38 | -4.78 | -66.86 | -71.09 | -75.55 | -84.38 | -37.66 | -13.50 | -35.05 | -13.77 | 36.98 | -14.04 | -5.38 | 16.84 | 21.74 | -11.76 | -5.66 | -10.50 | 27.57 | -24.31 | -1.52 | 9.80 | 36.59 |
| 2023-12-31 | 2023-09-30 | 2023-06-30 | 2023-03-31 | 2022-12-31 | 2022-09-30 | 2022-06-30 | 2022-03-31 | 2021-12-31 | 2021-09-30 | 2021-06-30 | 2021-03-31 | 2020-12-31 | 2020-09-30 | 2020-06-30 | 2020-03-31 | 2019-12-31 | 2019-09-30 | 2019-06-30 | 2019-03-31 | 2018-12-31 | 2018-09-30 | 2018-06-30 | 2018-03-31 | 2017-12-31 | 2017-09-30 | 2017-06-30 | 2017-03-31 | 2016-12-31 | 2016-09-30 | 2016-06-30 | 2016-03-31 | ||
|---|---|---|---|---|---|---|---|---|---|---|---|---|---|---|---|---|---|---|---|---|---|---|---|---|---|---|---|---|---|---|---|---|---|
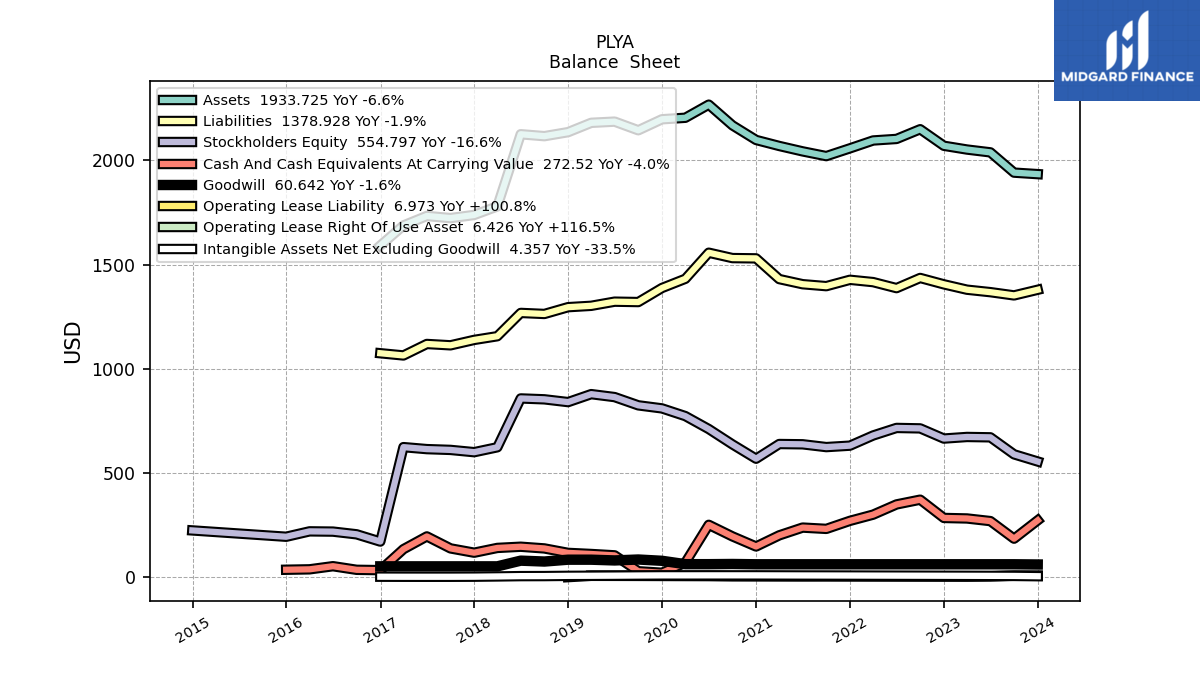
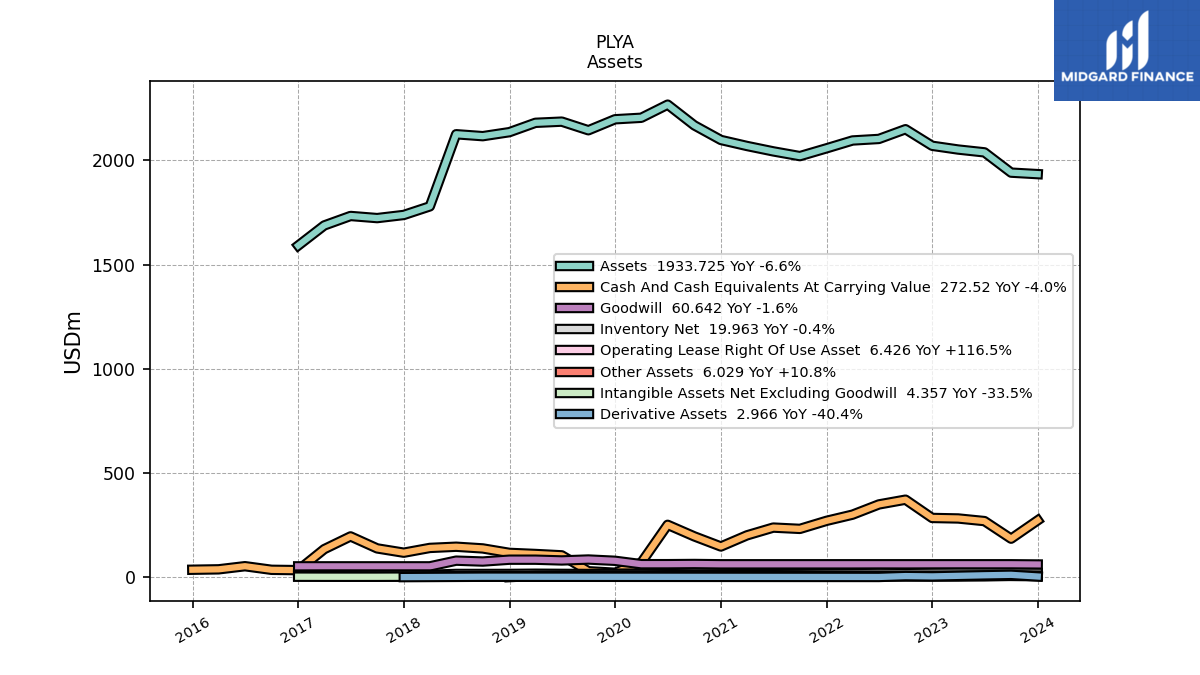
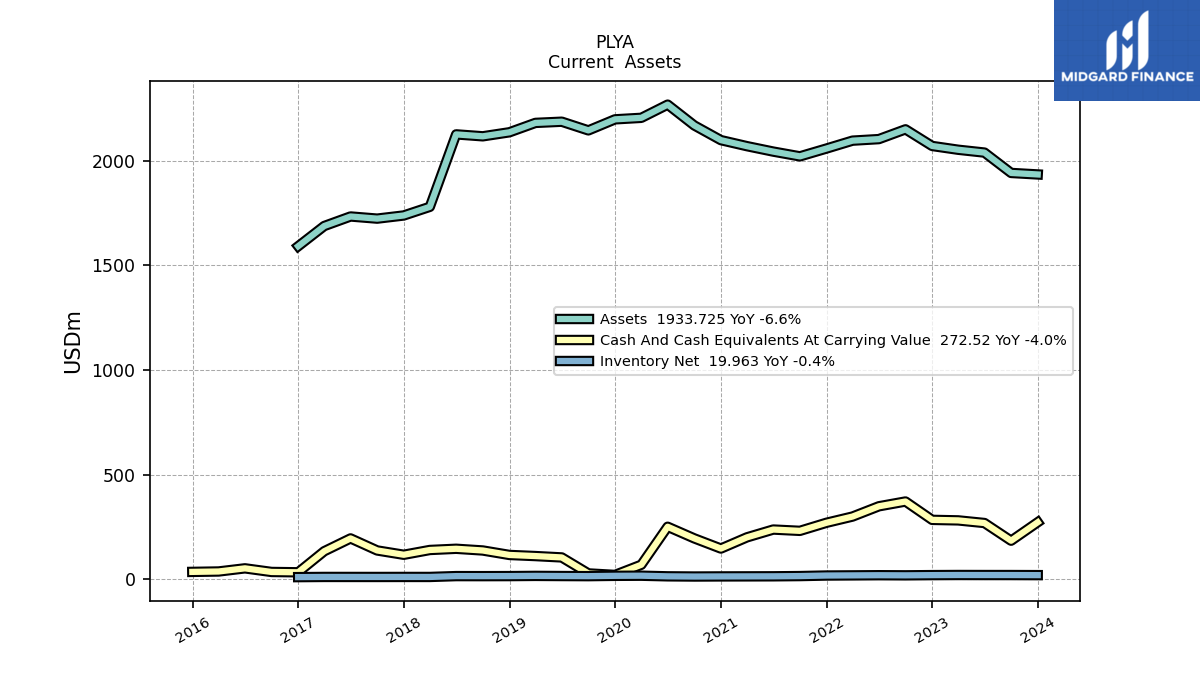
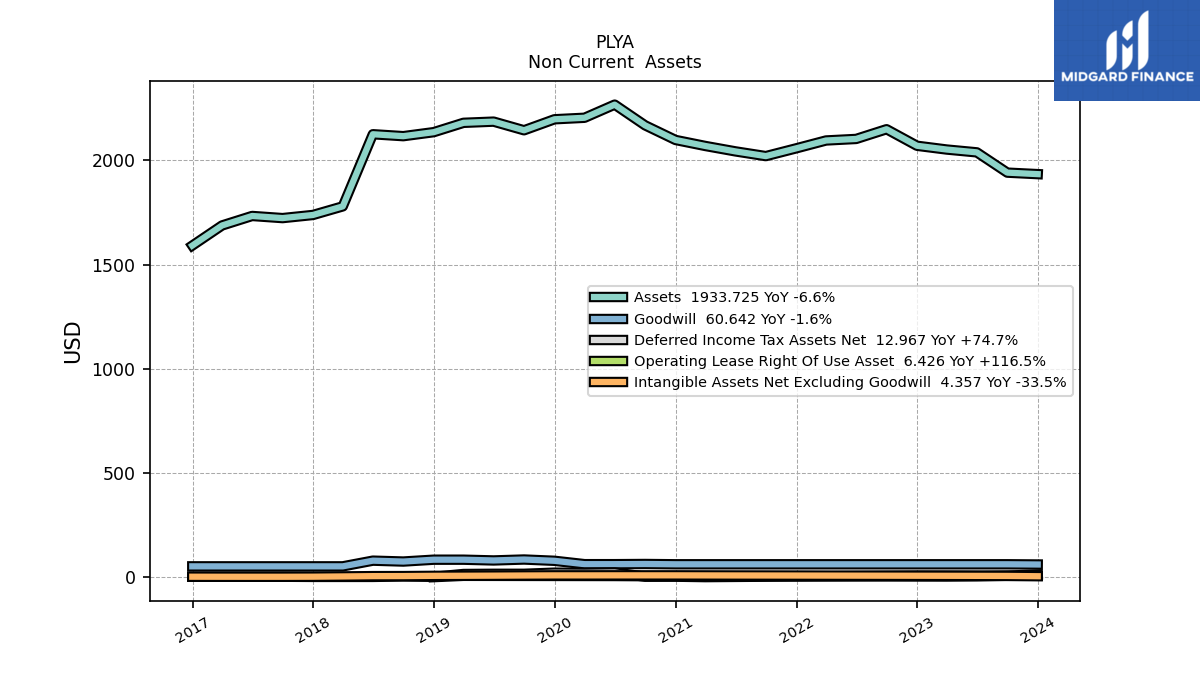
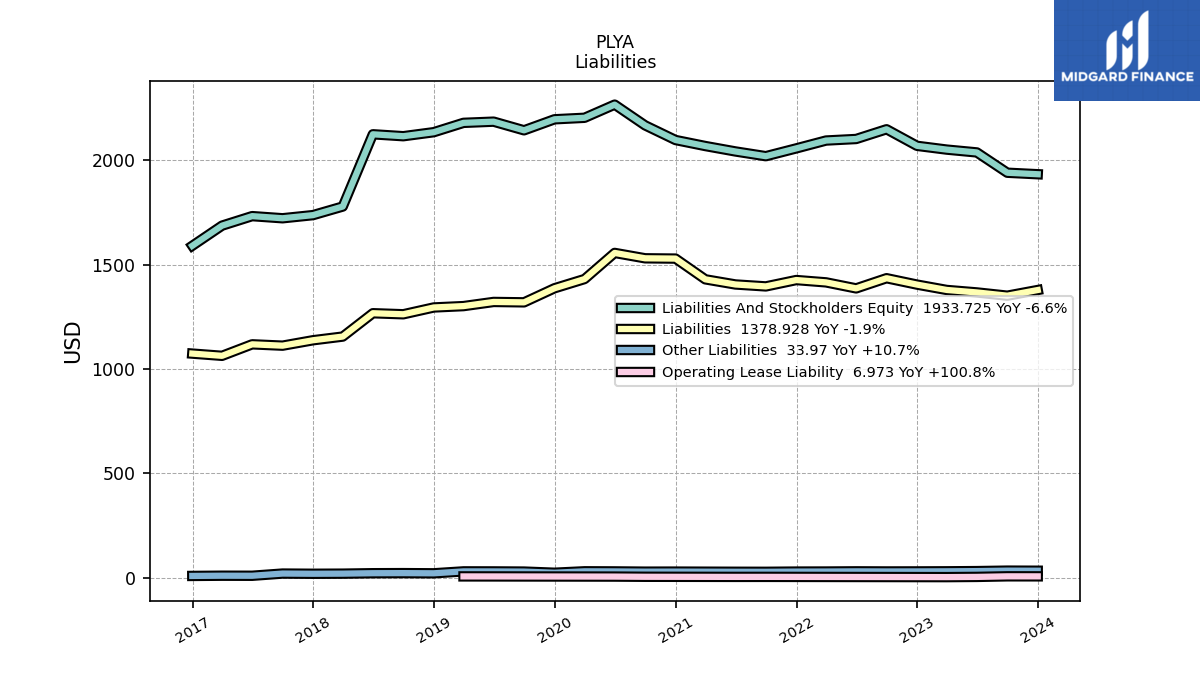
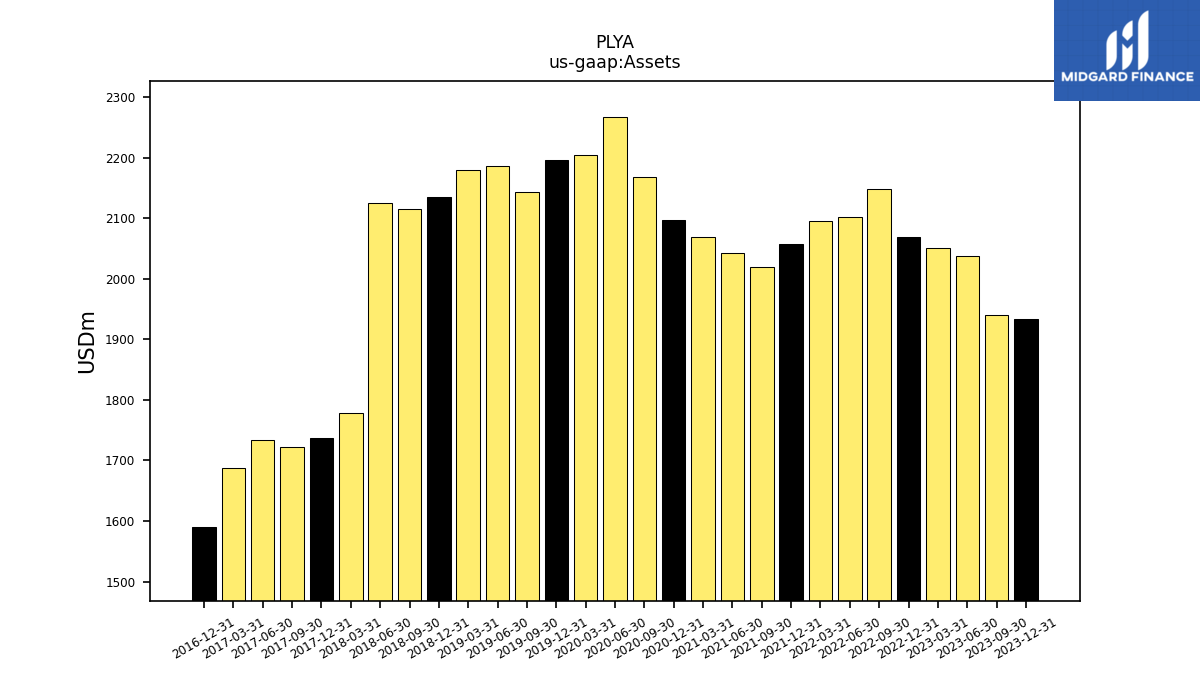
| Assets | 1933.72 | 1940.94 | 2038.19 | 2051.76 | 2069.82 | 2149.25 | 2102.59 | 2095.20 | 2057.58 | 2020.17 | 2042.93 | 2068.88 | 2097.66 | 2167.86 | 2267.26 | 2204.20 | 2196.96 | 2144.20 | 2185.68 | 2179.94 | 2135.16 | 2115.91 | 2125.17 | 1779.00 | 1737.82 | 1722.75 | 1732.99 | 1687.43 | 1590.89 | NA | NA | NA | |
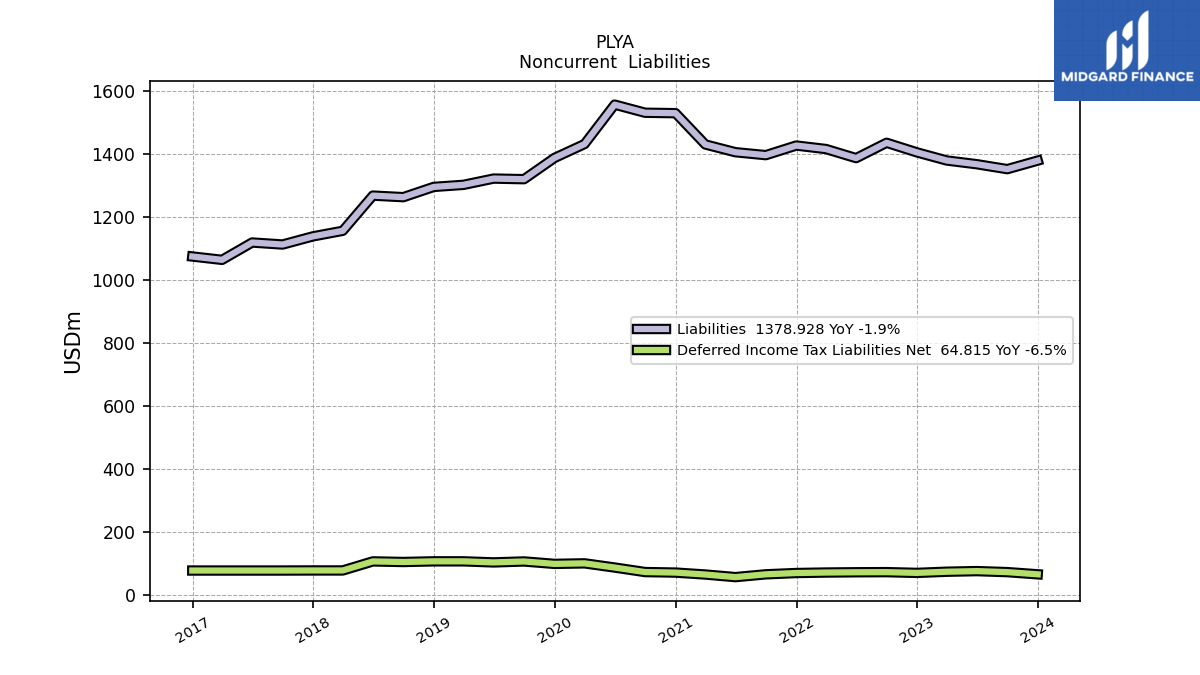
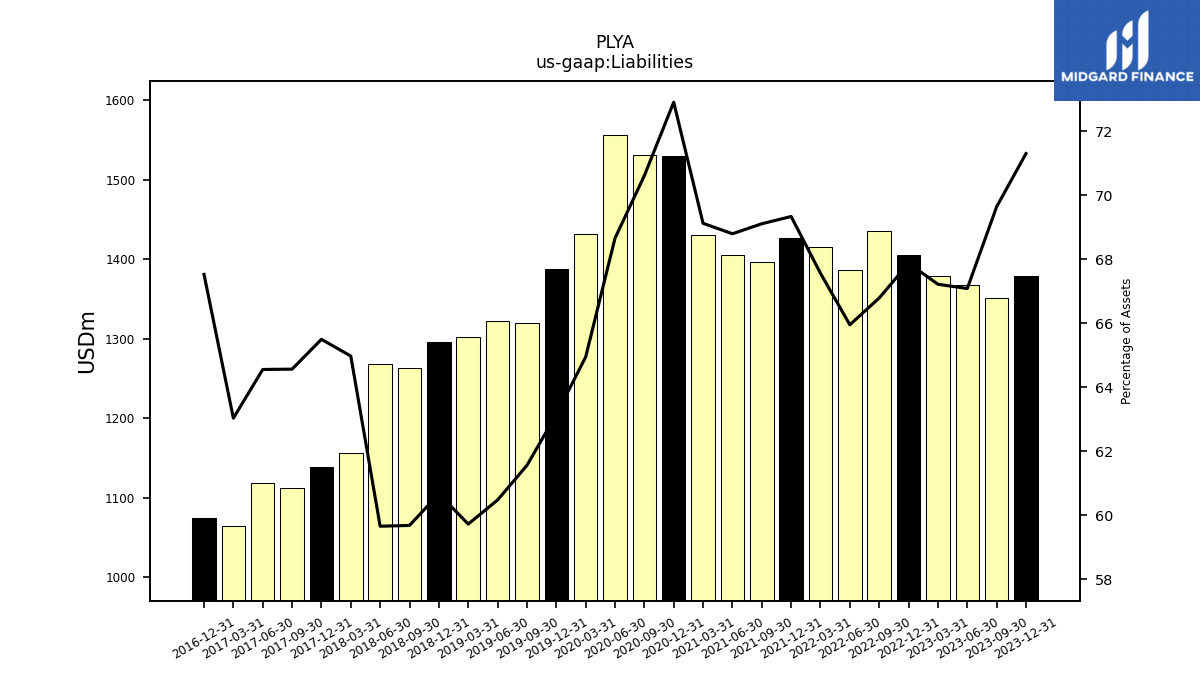
| Liabilities | 1378.93 | 1351.77 | 1367.39 | 1379.23 | 1404.96 | 1435.52 | 1386.75 | 1415.60 | 1426.74 | 1396.21 | 1405.56 | 1430.18 | 1529.53 | 1530.92 | 1556.71 | 1431.52 | 1387.31 | 1319.89 | 1321.79 | 1301.90 | 1295.32 | 1262.75 | 1267.75 | 1155.93 | 1138.27 | 1112.33 | 1118.75 | 1063.65 | 1074.34 | NA | NA | NA | |
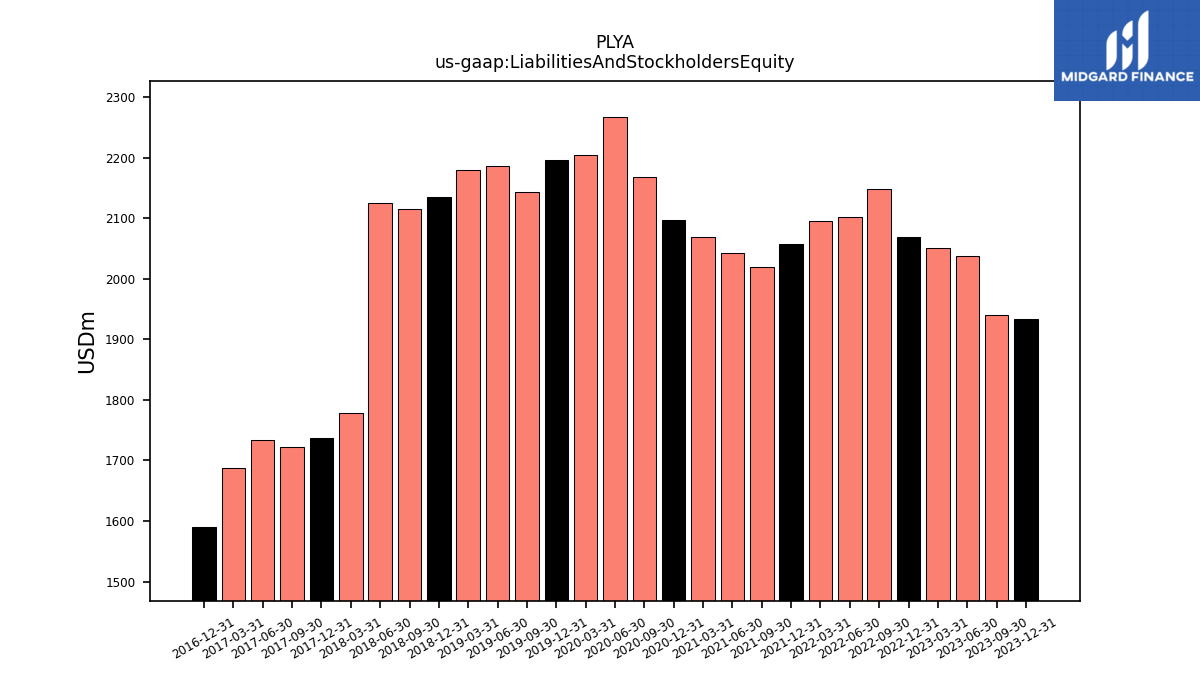
| Liabilities And Stockholders Equity | 1933.72 | 1940.94 | 2038.19 | 2051.76 | 2069.82 | 2149.25 | 2102.59 | 2095.20 | 2057.58 | 2020.17 | 2042.93 | 2068.88 | 2097.66 | 2167.86 | 2267.26 | 2204.20 | 2196.96 | 2144.20 | 2185.68 | 2179.94 | 2135.16 | 2115.91 | 2125.17 | 1779.00 | 1737.82 | 1722.75 | 1732.99 | 1687.43 | 1590.89 | NA | NA | NA | |
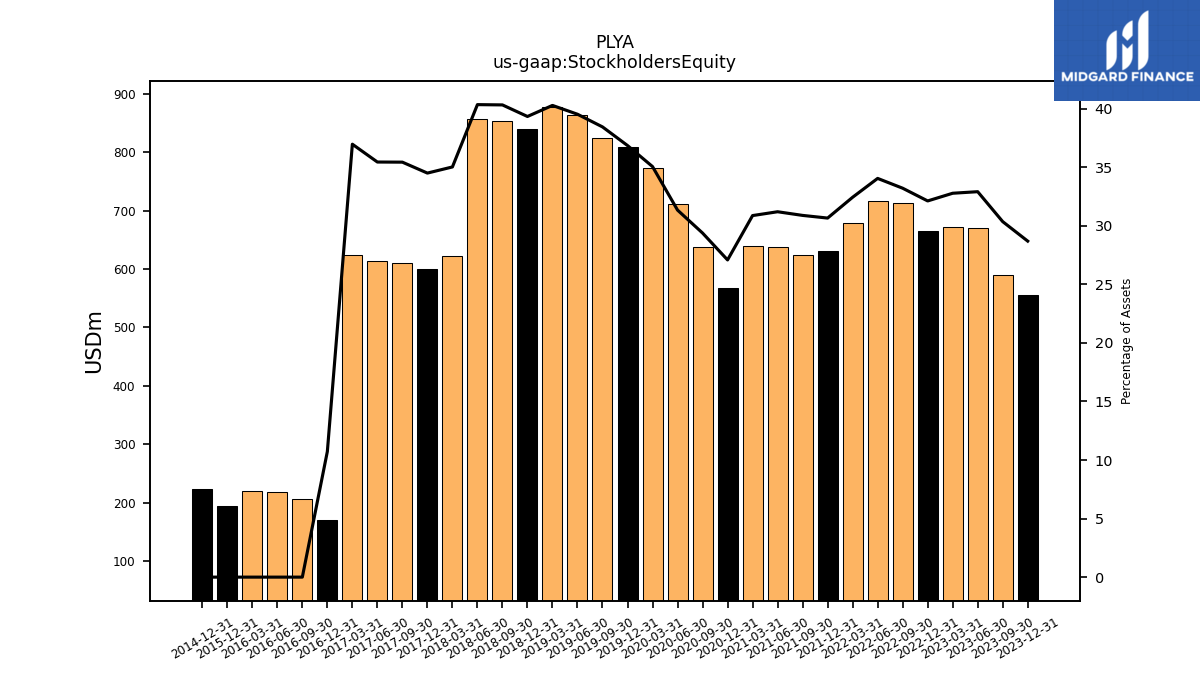
| Stockholders Equity | 554.80 | 589.18 | 670.80 | 672.53 | 664.86 | 713.73 | 715.84 | 679.60 | 630.83 | 623.95 | 637.37 | 638.71 | 568.14 | 636.94 | 710.56 | 772.68 | 809.65 | 824.30 | 863.89 | 878.05 | 839.84 | 853.16 | 857.41 | 623.07 | 599.55 | 610.42 | 614.24 | 623.78 | 170.60 | 205.43 | 218.42 | 219.63 |
| 2023-12-31 | 2023-09-30 | 2023-06-30 | 2023-03-31 | 2022-12-31 | 2022-09-30 | 2022-06-30 | 2022-03-31 | 2021-12-31 | 2021-09-30 | 2021-06-30 | 2021-03-31 | 2020-12-31 | 2020-09-30 | 2020-06-30 | 2020-03-31 | 2019-12-31 | 2019-09-30 | 2019-06-30 | 2019-03-31 | 2018-12-31 | 2018-09-30 | 2018-06-30 | 2018-03-31 | 2017-12-31 | 2017-09-30 | 2017-06-30 | 2017-03-31 | 2016-12-31 | 2016-09-30 | 2016-06-30 | 2016-03-31 | ||
|---|---|---|---|---|---|---|---|---|---|---|---|---|---|---|---|---|---|---|---|---|---|---|---|---|---|---|---|---|---|---|---|---|---|
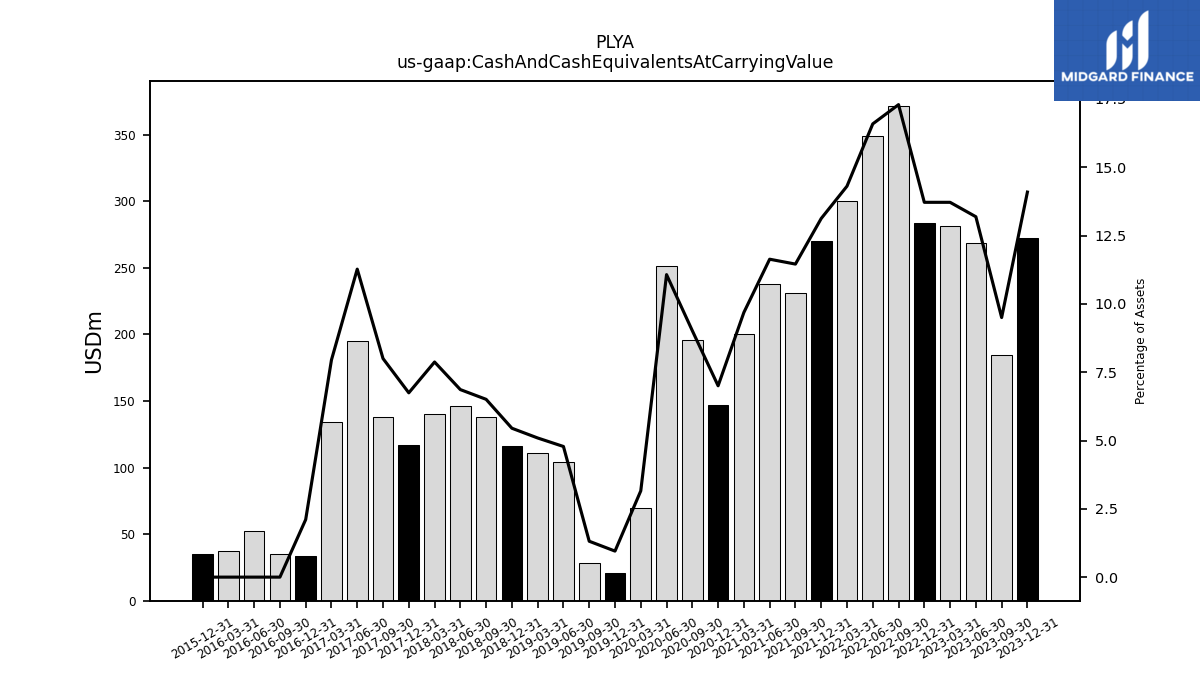
| Cash And Cash Equivalents At Carrying Value | 272.52 | 184.41 | 268.85 | 281.46 | 283.94 | 371.69 | 348.80 | 299.80 | 270.09 | 231.46 | 237.72 | 200.43 | 146.92 | 195.52 | 251.02 | 69.61 | 20.93 | 28.16 | 104.51 | 111.02 | 116.35 | 137.69 | 145.86 | 140.07 | 117.23 | 137.83 | 195.35 | 134.16 | 33.51 | 35.12 | 52.41 | 37.41 | |
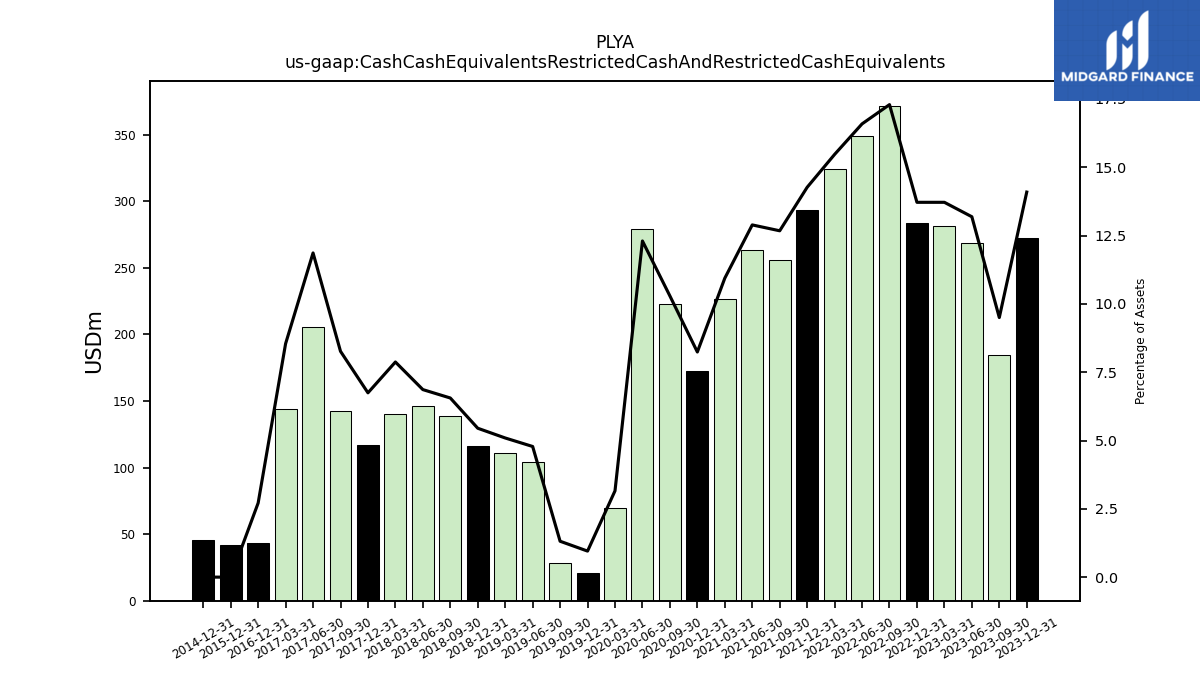
| Cash Cash Equivalents Restricted Cash And Restricted Cash Equivalents | 272.52 | 184.41 | 268.85 | 281.46 | 283.94 | 371.69 | 348.80 | 324.17 | 293.58 | 256.08 | 263.36 | 226.37 | 172.86 | 223.10 | 278.94 | 69.61 | 20.93 | 28.16 | 104.51 | 111.02 | 116.35 | 138.72 | 145.86 | 140.07 | 117.23 | 142.40 | 205.62 | 144.20 | 43.16 | NA | NA | NA | |
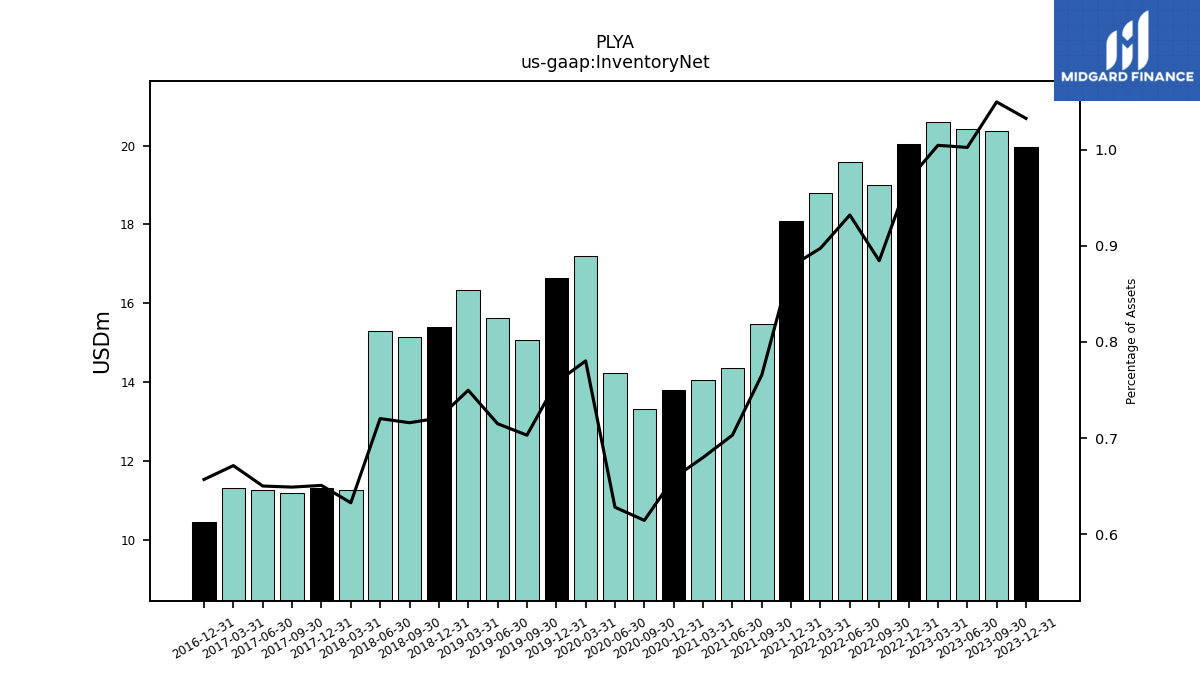
| Inventory Net | 19.96 | 20.37 | 20.43 | 20.61 | 20.05 | 19.01 | 19.59 | 18.80 | 18.08 | 15.47 | 14.36 | 14.06 | 13.81 | 13.32 | 14.24 | 17.20 | 16.65 | 15.07 | 15.62 | 16.34 | 15.39 | 15.15 | 15.31 | 11.26 | 11.31 | 11.18 | 11.27 | 11.33 | 10.45 | NA | NA | NA |
| 2023-12-31 | 2023-09-30 | 2023-06-30 | 2023-03-31 | 2022-12-31 | 2022-09-30 | 2022-06-30 | 2022-03-31 | 2021-12-31 | 2021-09-30 | 2021-06-30 | 2021-03-31 | 2020-12-31 | 2020-09-30 | 2020-06-30 | 2020-03-31 | 2019-12-31 | 2019-09-30 | 2019-06-30 | 2019-03-31 | 2018-12-31 | 2018-09-30 | 2018-06-30 | 2018-03-31 | 2017-12-31 | 2017-09-30 | 2017-06-30 | 2017-03-31 | 2016-12-31 | 2016-09-30 | 2016-06-30 | 2016-03-31 | ||
|---|---|---|---|---|---|---|---|---|---|---|---|---|---|---|---|---|---|---|---|---|---|---|---|---|---|---|---|---|---|---|---|---|---|
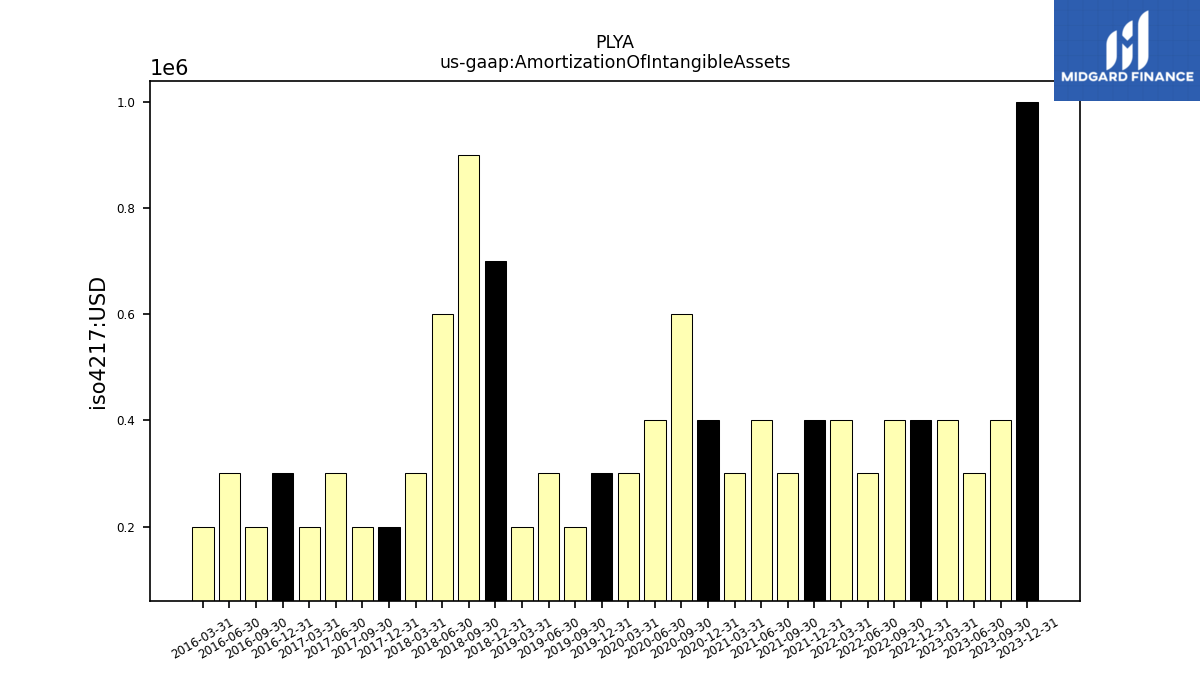
| Amortization Of Intangible Assets | 1.00 | 0.40 | 0.30 | 0.40 | 0.40 | 0.40 | 0.30 | 0.40 | 0.40 | 0.30 | 0.40 | 0.30 | 0.40 | 0.60 | 0.40 | 0.30 | 0.30 | 0.20 | 0.30 | 0.20 | 0.70 | 0.90 | 0.60 | 0.30 | 0.20 | 0.20 | 0.30 | 0.20 | 0.30 | 0.20 | 0.30 | 0.20 | |
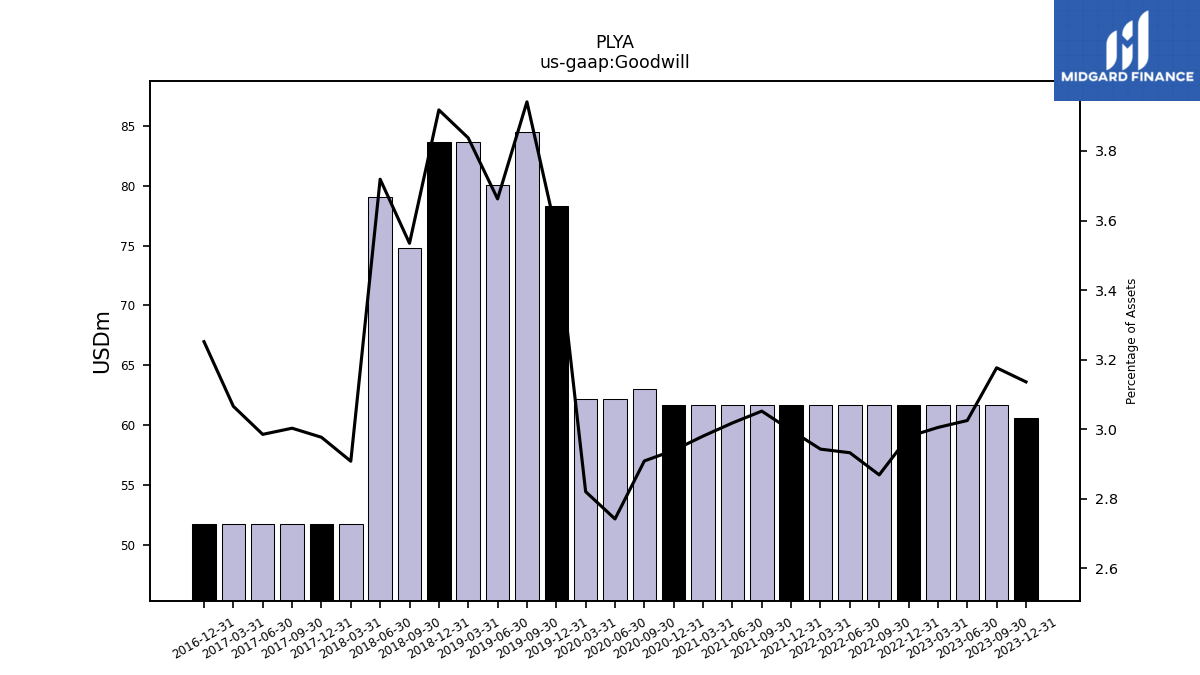
| Goodwill | 60.64 | 61.65 | 61.65 | 61.65 | 61.65 | 61.65 | 61.65 | 61.65 | 61.65 | 61.65 | 61.65 | 61.65 | 61.65 | 63.06 | 62.17 | 62.17 | 78.34 | 84.51 | 80.04 | 83.66 | 83.66 | 74.79 | 79.03 | 51.73 | 51.73 | 51.73 | 51.73 | 51.73 | 51.73 | NA | NA | NA | |
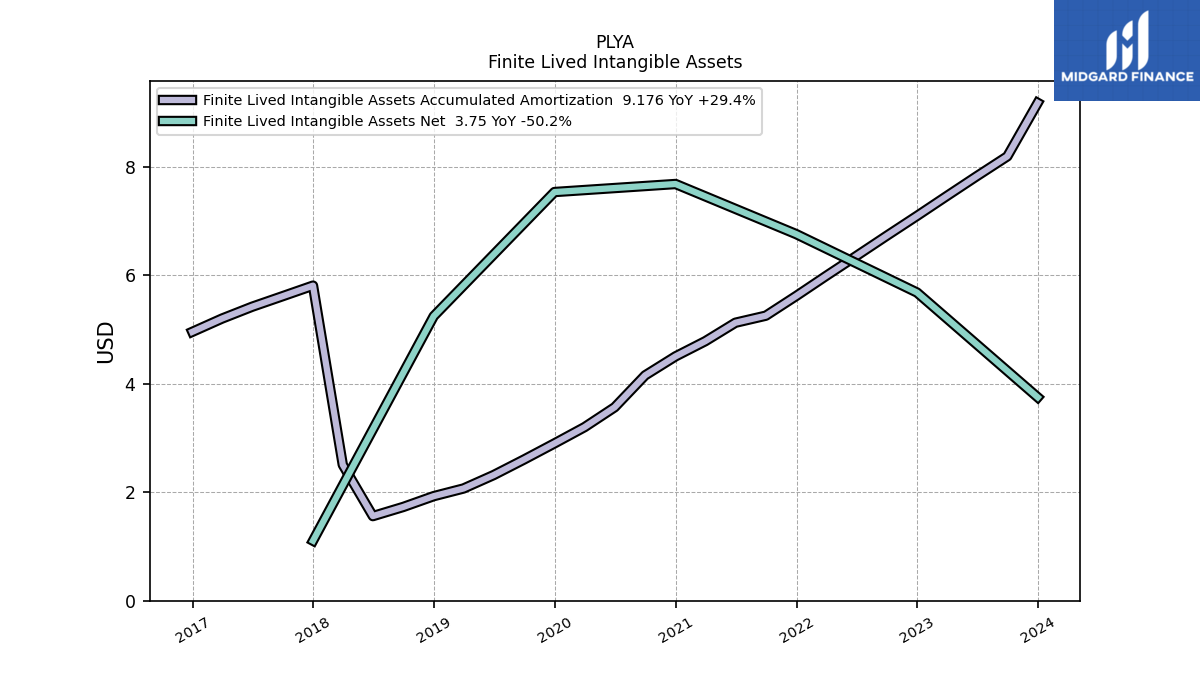
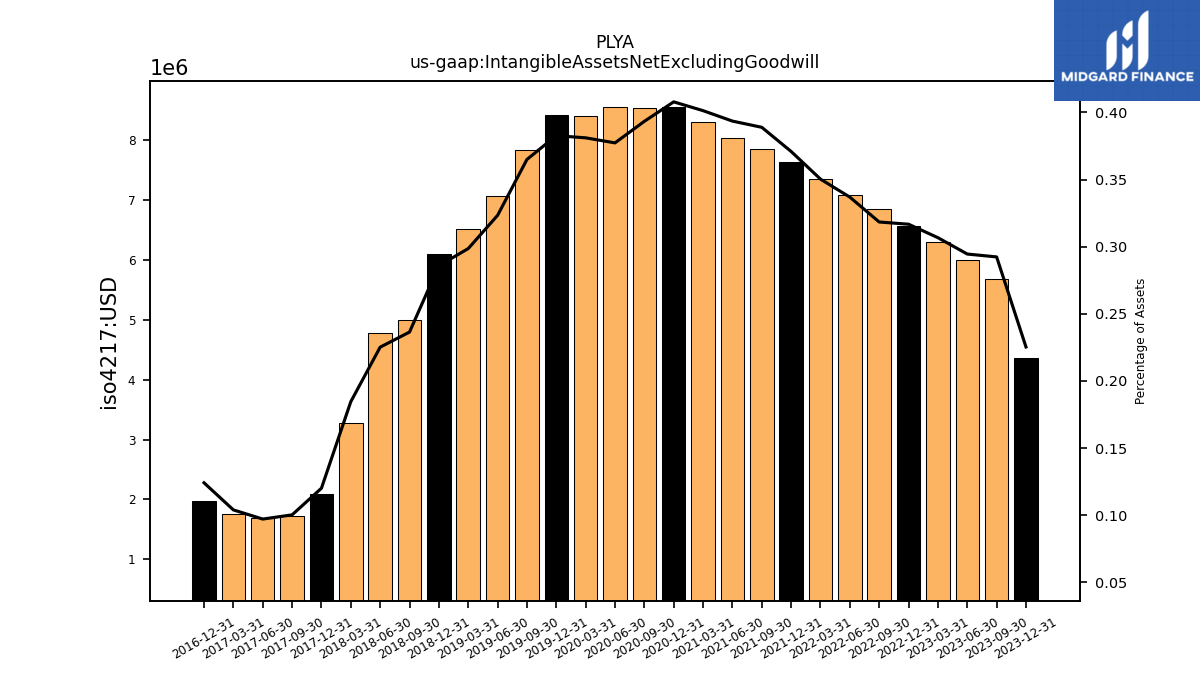
| Intangible Assets Net Excluding Goodwill | 4.36 | 5.67 | 6.00 | 6.29 | 6.56 | 6.84 | 7.08 | 7.34 | 7.63 | 7.86 | 8.04 | 8.30 | 8.56 | 8.53 | 8.55 | 8.40 | 8.41 | 7.83 | 7.07 | 6.51 | 6.10 | 5.00 | 4.79 | 3.28 | 2.09 | 1.73 | 1.68 | 1.75 | 1.98 | NA | NA | NA | |
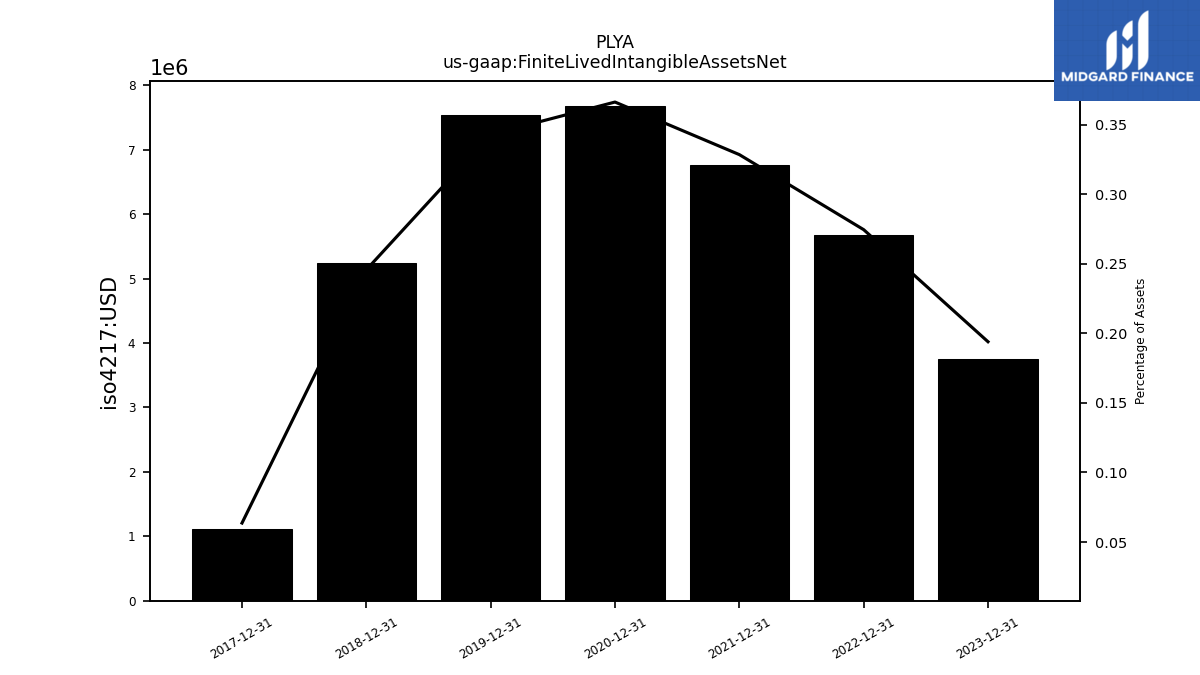
| Finite Lived Intangible Assets Net | 3.75 | NA | NA | NA | 5.68 | NA | NA | NA | 6.76 | NA | NA | NA | 7.68 | NA | NA | NA | 7.53 | NA | NA | NA | 5.25 | NA | NA | NA | 1.11 | NA | NA | NA | NA | NA | NA | NA |
| 2023-12-31 | 2023-09-30 | 2023-06-30 | 2023-03-31 | 2022-12-31 | 2022-09-30 | 2022-06-30 | 2022-03-31 | 2021-12-31 | 2021-09-30 | 2021-06-30 | 2021-03-31 | 2020-12-31 | 2020-09-30 | 2020-06-30 | 2020-03-31 | 2019-12-31 | 2019-09-30 | 2019-06-30 | 2019-03-31 | 2018-12-31 | 2018-09-30 | 2018-06-30 | 2018-03-31 | 2017-12-31 | 2017-09-30 | 2017-06-30 | 2017-03-31 | 2016-12-31 | 2016-09-30 | 2016-06-30 | 2016-03-31 | ||
|---|---|---|---|---|---|---|---|---|---|---|---|---|---|---|---|---|---|---|---|---|---|---|---|---|---|---|---|---|---|---|---|---|---|
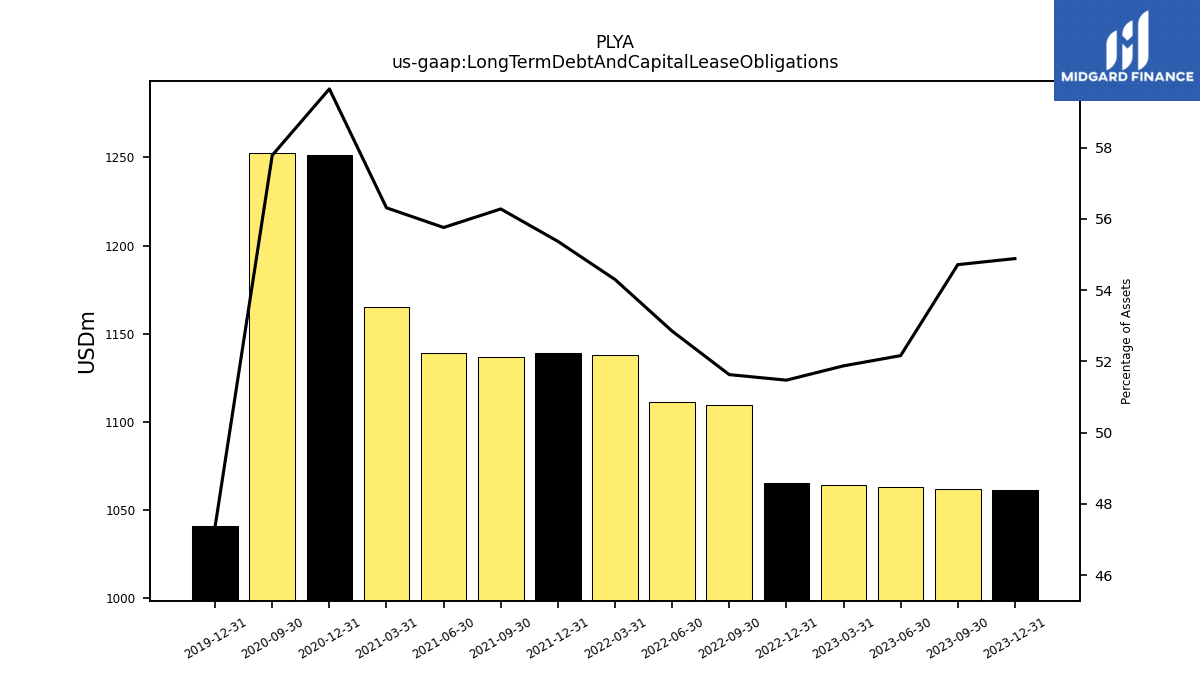
| Long Term Debt And Capital Lease Obligations | 1061.38 | 1062.05 | 1063.21 | 1064.39 | 1065.45 | 1109.68 | 1111.26 | 1137.71 | 1139.32 | 1136.97 | 1139.16 | 1165.06 | 1251.27 | 1252.78 | NA | NA | 1040.66 | NA | NA | NA | NA | NA | NA | NA | NA | NA | NA | NA | NA | NA | NA | NA | |
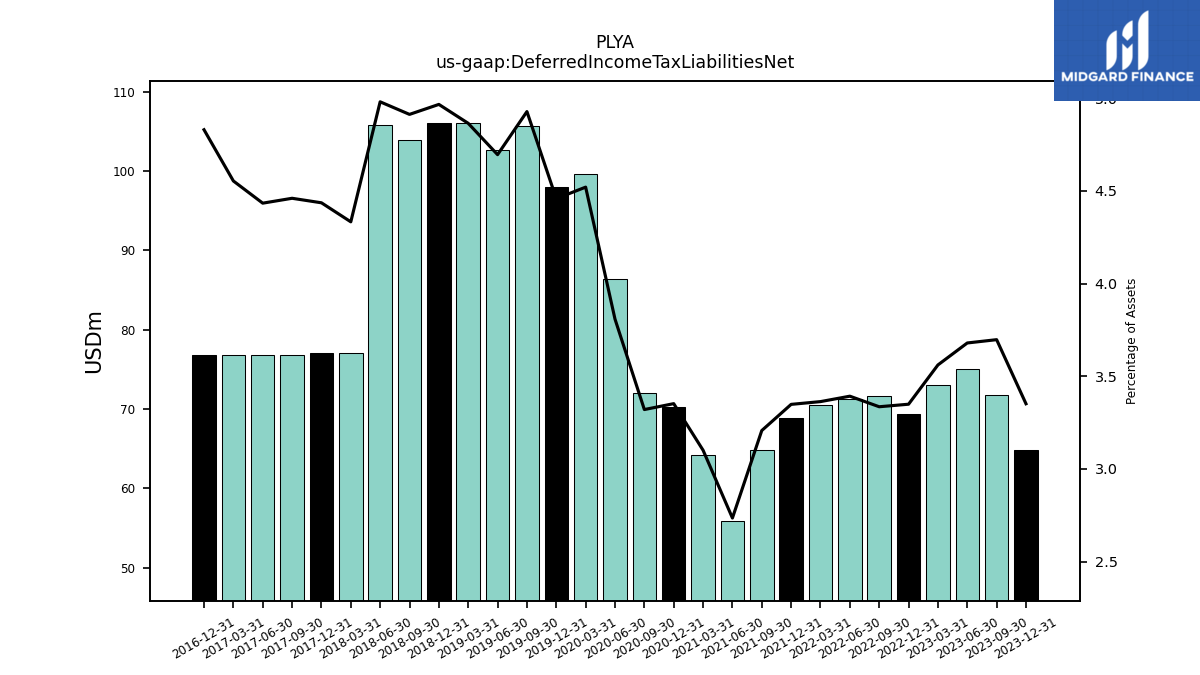
| Deferred Income Tax Liabilities Net | 64.81 | 71.77 | 75.00 | 73.06 | 69.33 | 71.69 | 71.33 | 70.47 | 68.90 | 64.79 | 55.89 | 64.16 | 70.32 | 71.98 | 86.34 | 99.63 | 97.94 | 105.65 | 102.62 | 106.03 | 106.03 | 103.94 | 105.83 | 77.08 | 77.08 | 76.83 | 76.83 | 76.83 | 76.83 | NA | NA | NA |
| 2023-12-31 | 2023-09-30 | 2023-06-30 | 2023-03-31 | 2022-12-31 | 2022-09-30 | 2022-06-30 | 2022-03-31 | 2021-12-31 | 2021-09-30 | 2021-06-30 | 2021-03-31 | 2020-12-31 | 2020-09-30 | 2020-06-30 | 2020-03-31 | 2019-12-31 | 2019-09-30 | 2019-06-30 | 2019-03-31 | 2018-12-31 | 2018-09-30 | 2018-06-30 | 2018-03-31 | 2017-12-31 | 2017-09-30 | 2017-06-30 | 2017-03-31 | 2016-12-31 | 2016-09-30 | 2016-06-30 | 2016-03-31 | ||
|---|---|---|---|---|---|---|---|---|---|---|---|---|---|---|---|---|---|---|---|---|---|---|---|---|---|---|---|---|---|---|---|---|---|
| Stockholders Equity | 554.80 | 589.18 | 670.80 | 672.53 | 664.86 | 713.73 | 715.84 | 679.60 | 630.83 | 623.95 | 637.37 | 638.71 | 568.14 | 636.94 | 710.56 | 772.68 | 809.65 | 824.30 | 863.89 | 878.05 | 839.84 | 853.16 | 857.41 | 623.07 | 599.55 | 610.42 | 614.24 | 623.78 | 170.60 | 205.43 | 218.42 | 219.63 | |
| Common Stock Value | 18.82 | 18.82 | 18.82 | 18.82 | 18.70 | 18.70 | 18.70 | 18.67 | 18.52 | 18.49 | 18.49 | 18.47 | 14.87 | 14.86 | 14.86 | 14.27 | 14.21 | 14.21 | 14.21 | 14.19 | 14.16 | 14.16 | 14.16 | 11.81 | 11.80 | 11.80 | 11.78 | 11.04 | 5.39 | NA | NA | NA | |
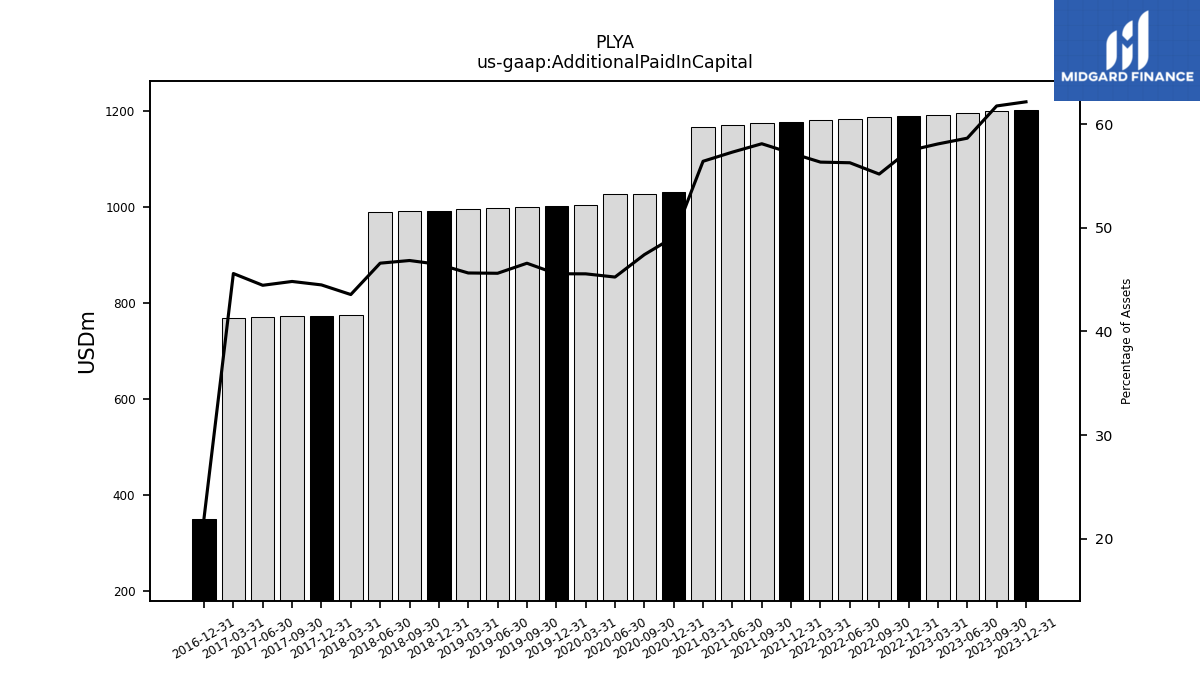
| Additional Paid In Capital | 1202.17 | 1198.92 | 1195.58 | 1192.13 | 1189.09 | 1186.24 | 1183.47 | 1180.58 | 1177.38 | 1174.14 | 1170.87 | 1167.44 | 1030.15 | 1027.87 | 1025.94 | 1004.26 | 1001.09 | 998.86 | 997.01 | 995.02 | 992.30 | 991.25 | 990.13 | 774.97 | 773.19 | 772.23 | 770.41 | 769.31 | 349.36 | NA | NA | NA | |
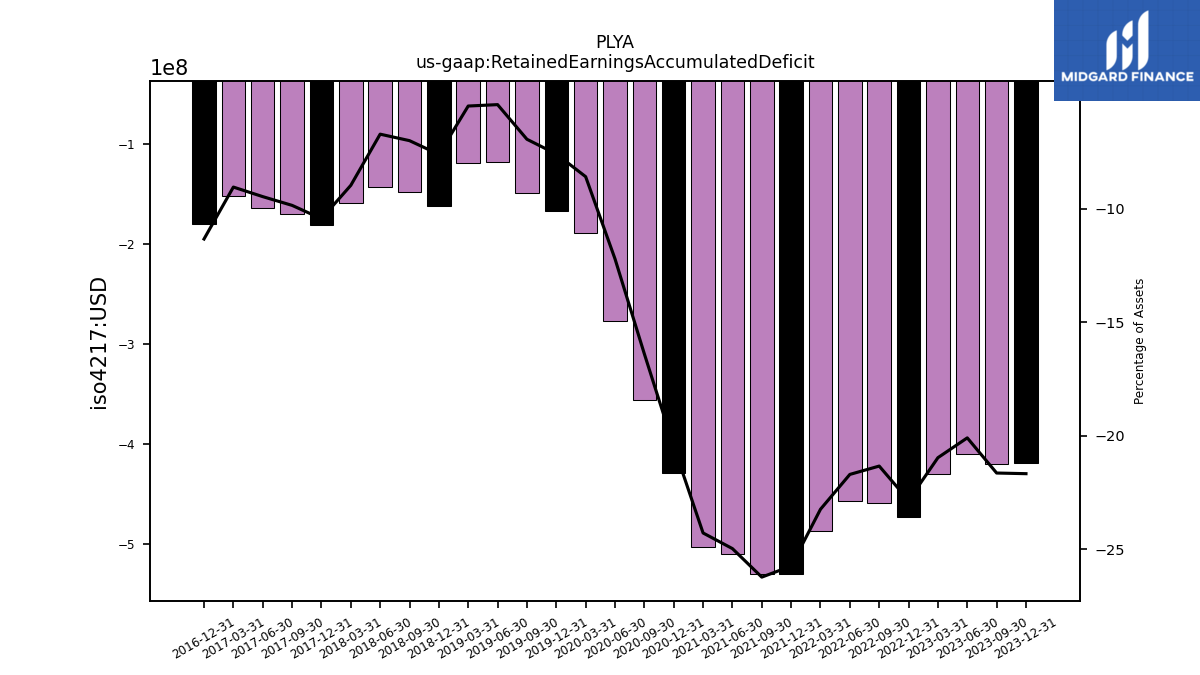
| Retained Earnings Accumulated Deficit | -419.14 | -420.14 | -409.64 | -430.27 | -472.99 | -458.65 | -456.42 | -486.95 | -529.70 | -529.90 | -510.21 | -502.44 | -429.29 | -355.54 | -276.94 | -189.48 | -166.92 | -149.00 | -118.54 | -119.58 | -162.56 | -148.33 | -142.90 | -159.72 | -181.54 | -169.86 | -164.19 | -152.78 | -180.42 | NA | NA | NA | |
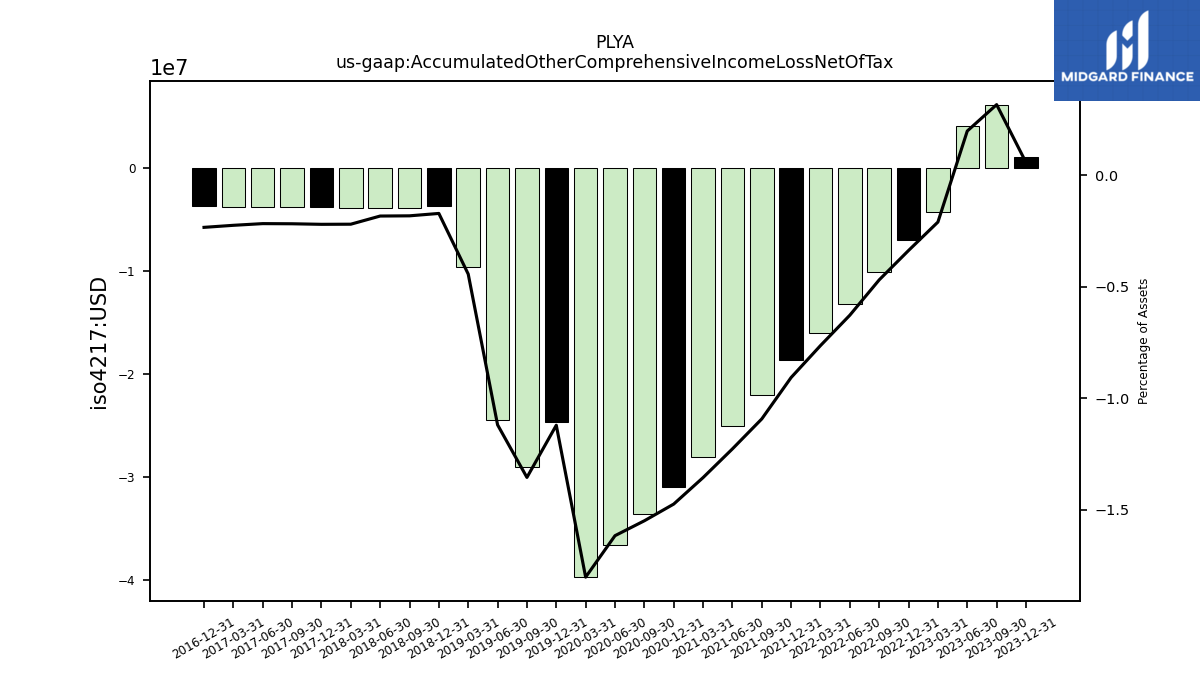
| Accumulated Other Comprehensive Income Loss Net Of Tax | 1.11 | 6.15 | 4.04 | -4.31 | -6.99 | -10.09 | -13.20 | -16.01 | -18.67 | -22.09 | -25.08 | -28.07 | -30.95 | -33.61 | -36.67 | -39.74 | -24.64 | -29.07 | -24.48 | -9.67 | -3.66 | -3.85 | -3.89 | -3.91 | -3.83 | -3.75 | -3.76 | -3.79 | -3.72 | NA | NA | NA |
| 2023-12-31 | 2023-09-30 | 2023-06-30 | 2023-03-31 | 2022-12-31 | 2022-09-30 | 2022-06-30 | 2022-03-31 | 2021-12-31 | 2021-09-30 | 2021-06-30 | 2021-03-31 | 2020-12-31 | 2020-09-30 | 2020-06-30 | 2020-03-31 | 2019-12-31 | 2019-09-30 | 2019-06-30 | 2019-03-31 | 2018-12-31 | 2018-09-30 | 2018-06-30 | 2018-03-31 | 2017-12-31 | 2017-09-30 | 2017-06-30 | 2017-03-31 | 2016-12-31 | 2016-09-30 | 2016-06-30 | 2016-03-31 | ||
|---|---|---|---|---|---|---|---|---|---|---|---|---|---|---|---|---|---|---|---|---|---|---|---|---|---|---|---|---|---|---|---|---|---|
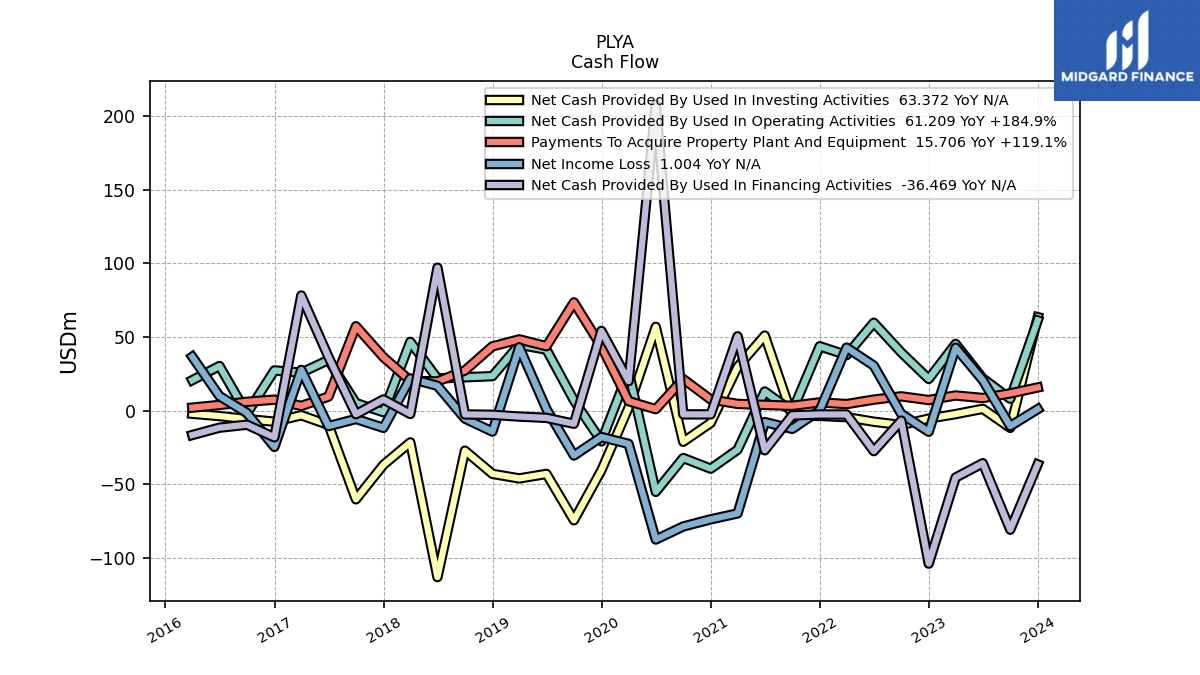
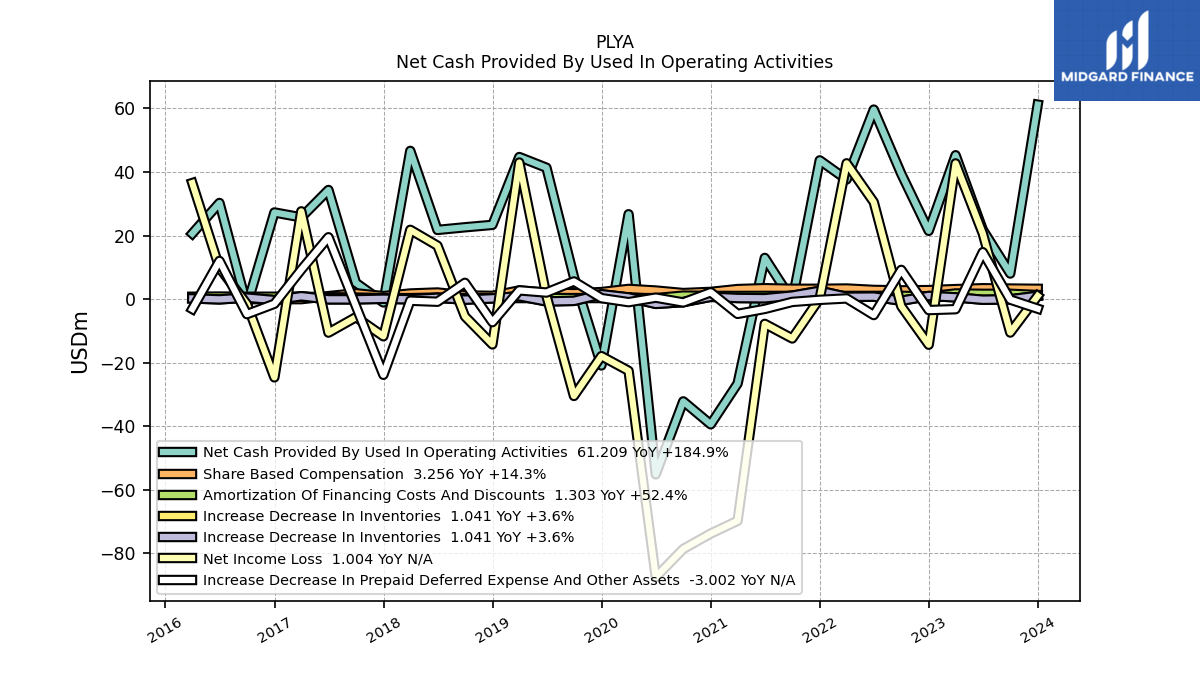
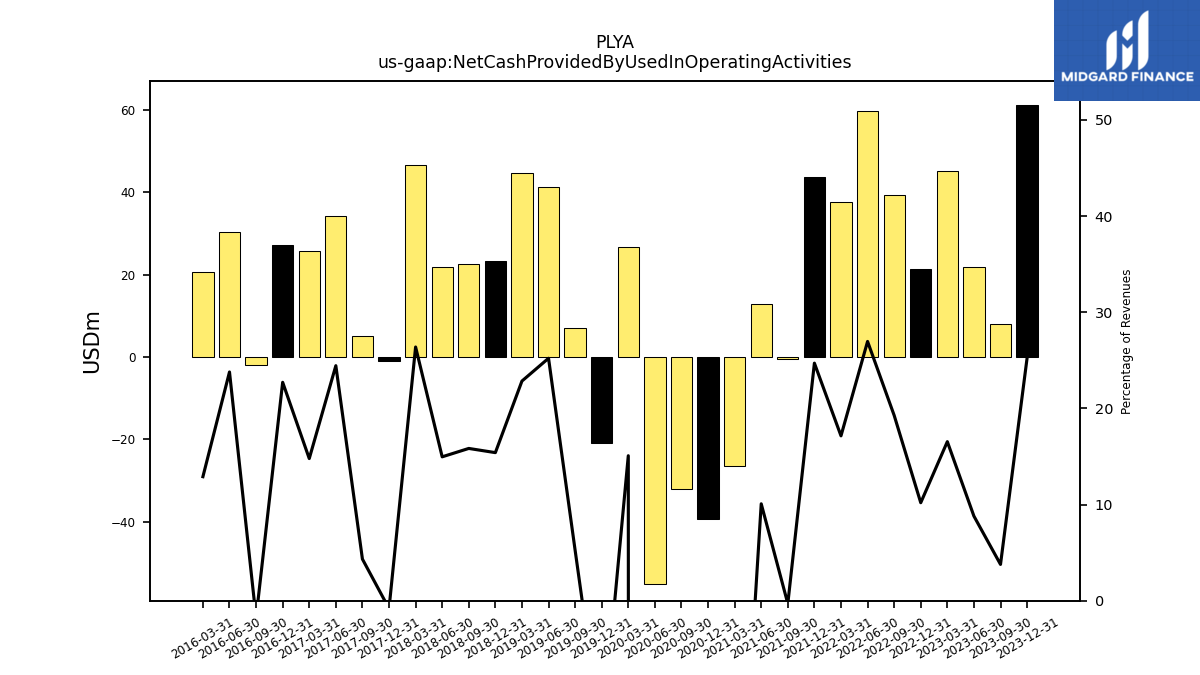
| Net Cash Provided By Used In Operating Activities | 61.21 | 8.05 | 21.82 | 45.29 | 21.49 | 39.44 | 59.65 | 37.65 | 43.68 | -0.46 | 12.98 | -26.56 | -39.39 | -32.16 | -55.12 | 26.73 | -20.86 | 6.97 | 41.35 | 44.72 | 23.37 | 22.62 | 21.78 | 46.66 | -1.03 | 5.12 | 34.36 | 25.73 | 27.28 | -2.01 | 30.28 | 20.63 | |
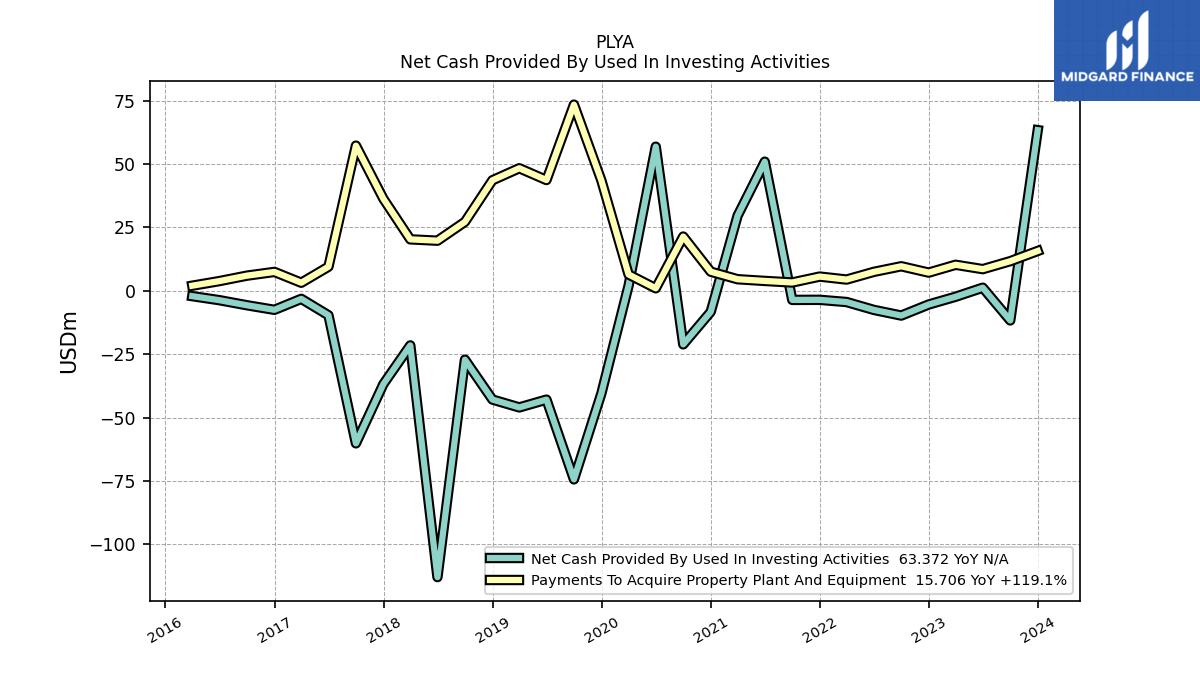
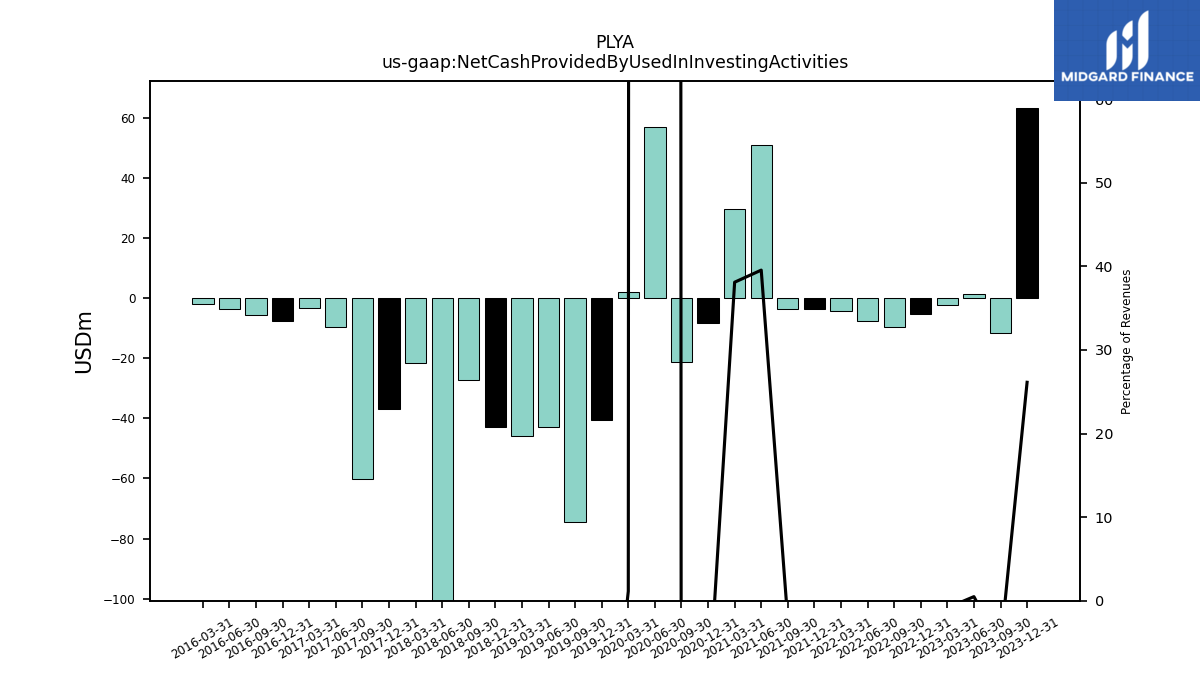
| Net Cash Provided By Used In Investing Activities | 63.37 | -11.71 | 1.22 | -2.35 | -5.41 | -9.77 | -7.53 | -4.44 | -3.56 | -3.60 | 50.94 | 29.62 | -8.31 | -21.14 | 56.85 | 2.01 | -40.46 | -74.41 | -42.94 | -46.01 | -42.90 | -27.18 | -112.97 | -21.54 | -36.80 | -60.20 | -9.65 | -3.18 | -7.51 | -5.71 | -3.71 | -2.12 | |
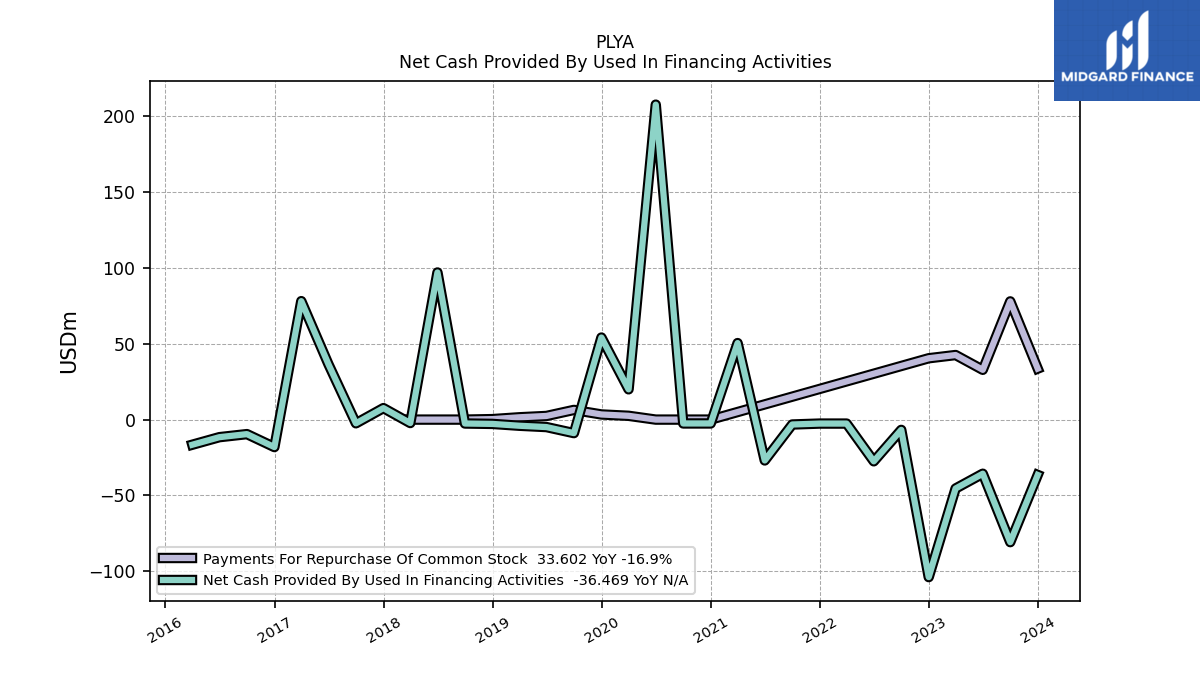
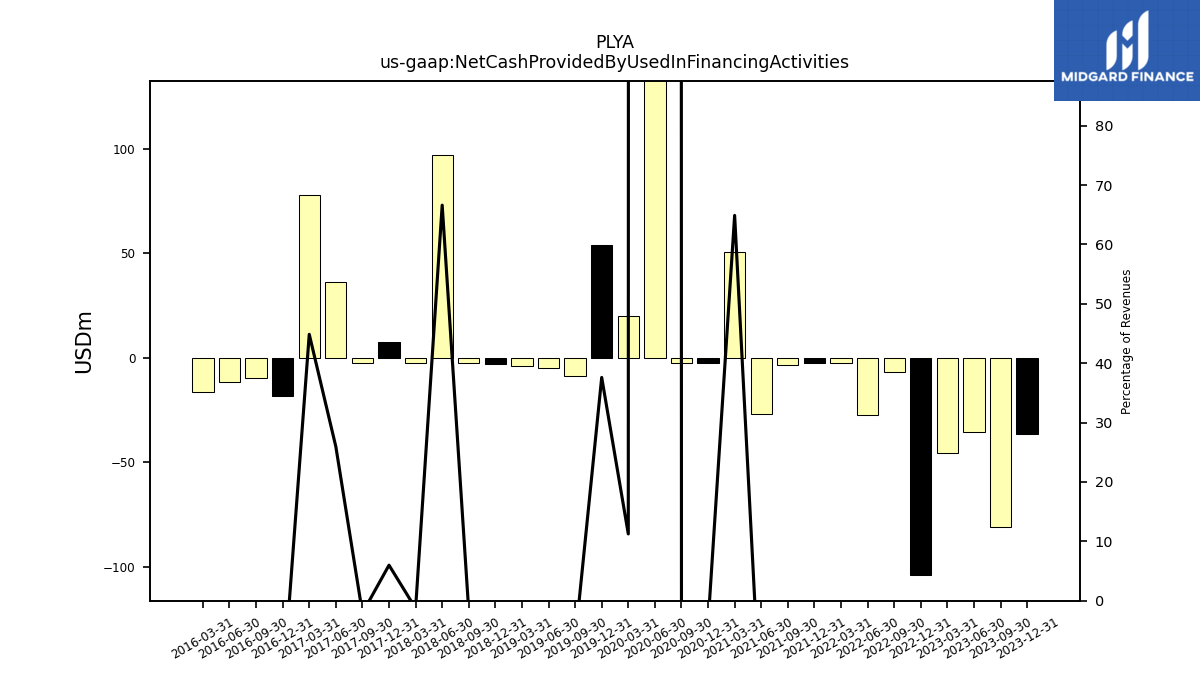
| Net Cash Provided By Used In Financing Activities | -36.47 | -80.78 | -35.66 | -45.41 | -103.83 | -6.78 | -27.49 | -2.62 | -2.62 | -3.23 | -26.93 | 50.45 | -2.54 | -2.54 | 207.60 | 19.94 | 54.09 | -8.91 | -4.92 | -4.05 | -2.84 | -2.58 | 96.97 | -2.27 | 7.58 | -2.45 | 36.48 | 78.09 | -18.11 | -9.57 | -11.57 | -16.56 |
| 2023-12-31 | 2023-09-30 | 2023-06-30 | 2023-03-31 | 2022-12-31 | 2022-09-30 | 2022-06-30 | 2022-03-31 | 2021-12-31 | 2021-09-30 | 2021-06-30 | 2021-03-31 | 2020-12-31 | 2020-09-30 | 2020-06-30 | 2020-03-31 | 2019-12-31 | 2019-09-30 | 2019-06-30 | 2019-03-31 | 2018-12-31 | 2018-09-30 | 2018-06-30 | 2018-03-31 | 2017-12-31 | 2017-09-30 | 2017-06-30 | 2017-03-31 | 2016-12-31 | 2016-09-30 | 2016-06-30 | 2016-03-31 | ||
|---|---|---|---|---|---|---|---|---|---|---|---|---|---|---|---|---|---|---|---|---|---|---|---|---|---|---|---|---|---|---|---|---|---|
| Net Cash Provided By Used In Operating Activities | 61.21 | 8.05 | 21.82 | 45.29 | 21.49 | 39.44 | 59.65 | 37.65 | 43.68 | -0.46 | 12.98 | -26.56 | -39.39 | -32.16 | -55.12 | 26.73 | -20.86 | 6.97 | 41.35 | 44.72 | 23.37 | 22.62 | 21.78 | 46.66 | -1.03 | 5.12 | 34.36 | 25.73 | 27.28 | -2.01 | 30.28 | 20.63 | |
| Net Income Loss | 1.00 | -10.50 | 20.63 | 42.72 | -14.34 | -2.23 | 30.52 | 42.75 | 0.20 | -12.37 | -7.77 | -69.75 | -73.75 | -78.60 | -87.46 | -22.56 | -17.92 | -30.46 | 1.04 | 42.99 | -14.24 | -5.42 | 16.82 | 21.82 | -11.68 | -5.67 | -10.53 | 27.64 | -24.61 | -1.56 | 9.85 | 36.54 | |
| Depreciation Depletion And Amortization | 20.77 | 22.55 | 19.32 | 19.19 | 19.74 | 19.50 | 19.63 | 19.50 | 20.68 | 19.93 | 20.02 | 20.88 | 22.69 | 22.52 | 22.40 | 24.96 | 24.26 | 29.42 | 25.91 | 22.31 | 21.57 | 20.14 | 15.88 | 15.69 | 13.04 | 13.81 | 13.88 | 12.41 | 13.94 | 13.02 | 12.65 | 13.13 | |
| Increase Decrease In Inventories | 1.04 | -0.06 | -0.18 | 0.57 | 1.00 | -0.51 | 0.79 | 0.72 | 2.61 | 1.10 | 0.28 | 0.36 | 0.74 | -0.92 | -1.50 | 0.55 | 1.54 | -0.54 | -0.71 | 0.94 | 0.24 | -0.16 | 0.43 | -0.06 | 0.12 | -0.07 | -0.06 | 0.92 | -0.30 | 0.48 | -0.07 | 0.22 | |
| Deferred Income Tax Expense Benefit | -6.03 | -3.00 | 2.17 | 3.83 | -9.59 | 0.36 | 0.86 | 1.57 | 4.01 | 1.59 | -13.68 | -2.03 | -3.19 | 4.33 | -15.07 | 2.50 | -13.03 | 4.55 | -0.74 | -13.61 | 3.02 | 0.00 | 0.00 | 0.00 | NA | NA | NA | NA | NA | NA | NA | NA | |
| Share Based Compensation | 3.26 | 3.34 | 3.44 | 3.17 | 2.85 | 2.78 | 2.91 | 3.36 | 3.26 | 3.27 | 3.45 | 3.18 | 2.29 | 1.93 | 2.72 | 3.22 | 2.23 | 1.85 | 2.01 | 2.75 | 1.04 | 1.18 | 2.10 | 1.79 | 0.96 | 1.84 | 0.96 | 0.00 | 0.00 | 0.00 | NA | NA |
| 2023-12-31 | 2023-09-30 | 2023-06-30 | 2023-03-31 | 2022-12-31 | 2022-09-30 | 2022-06-30 | 2022-03-31 | 2021-12-31 | 2021-09-30 | 2021-06-30 | 2021-03-31 | 2020-12-31 | 2020-09-30 | 2020-06-30 | 2020-03-31 | 2019-12-31 | 2019-09-30 | 2019-06-30 | 2019-03-31 | 2018-12-31 | 2018-09-30 | 2018-06-30 | 2018-03-31 | 2017-12-31 | 2017-09-30 | 2017-06-30 | 2017-03-31 | 2016-12-31 | 2016-09-30 | 2016-06-30 | 2016-03-31 | ||
|---|---|---|---|---|---|---|---|---|---|---|---|---|---|---|---|---|---|---|---|---|---|---|---|---|---|---|---|---|---|---|---|---|---|
| Net Cash Provided By Used In Investing Activities | 63.37 | -11.71 | 1.22 | -2.35 | -5.41 | -9.77 | -7.53 | -4.44 | -3.56 | -3.60 | 50.94 | 29.62 | -8.31 | -21.14 | 56.85 | 2.01 | -40.46 | -74.41 | -42.94 | -46.01 | -42.90 | -27.18 | -112.97 | -21.54 | -36.80 | -60.20 | -9.65 | -3.18 | -7.51 | -5.71 | -3.71 | -2.12 | |
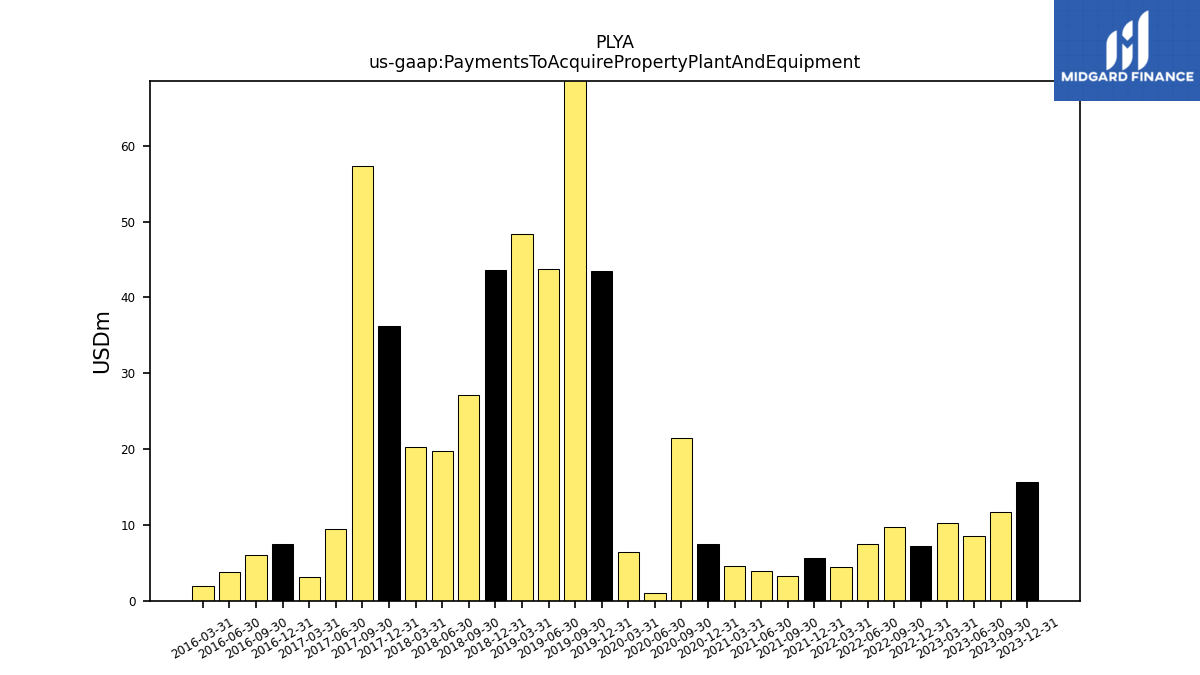
| Payments To Acquire Property Plant And Equipment | 15.71 | 11.68 | 8.54 | 10.26 | 7.17 | 9.67 | 7.46 | 4.43 | 5.61 | 3.28 | 3.89 | 4.56 | 7.54 | 21.40 | 0.98 | 6.43 | 43.49 | 73.45 | 43.69 | 48.35 | 43.60 | 27.19 | 19.77 | 20.29 | 36.28 | 57.27 | 9.50 | 3.17 | 7.45 | 5.97 | 3.83 | 2.01 |
| 2023-12-31 | 2023-09-30 | 2023-06-30 | 2023-03-31 | 2022-12-31 | 2022-09-30 | 2022-06-30 | 2022-03-31 | 2021-12-31 | 2021-09-30 | 2021-06-30 | 2021-03-31 | 2020-12-31 | 2020-09-30 | 2020-06-30 | 2020-03-31 | 2019-12-31 | 2019-09-30 | 2019-06-30 | 2019-03-31 | 2018-12-31 | 2018-09-30 | 2018-06-30 | 2018-03-31 | 2017-12-31 | 2017-09-30 | 2017-06-30 | 2017-03-31 | 2016-12-31 | 2016-09-30 | 2016-06-30 | 2016-03-31 | ||
|---|---|---|---|---|---|---|---|---|---|---|---|---|---|---|---|---|---|---|---|---|---|---|---|---|---|---|---|---|---|---|---|---|---|
| Net Cash Provided By Used In Financing Activities | -36.47 | -80.78 | -35.66 | -45.41 | -103.83 | -6.78 | -27.49 | -2.62 | -2.62 | -3.23 | -26.93 | 50.45 | -2.54 | -2.54 | 207.60 | 19.94 | 54.09 | -8.91 | -4.92 | -4.05 | -2.84 | -2.58 | 96.97 | -2.27 | 7.58 | -2.45 | 36.48 | 78.09 | -18.11 | -9.57 | -11.57 | -16.56 | |
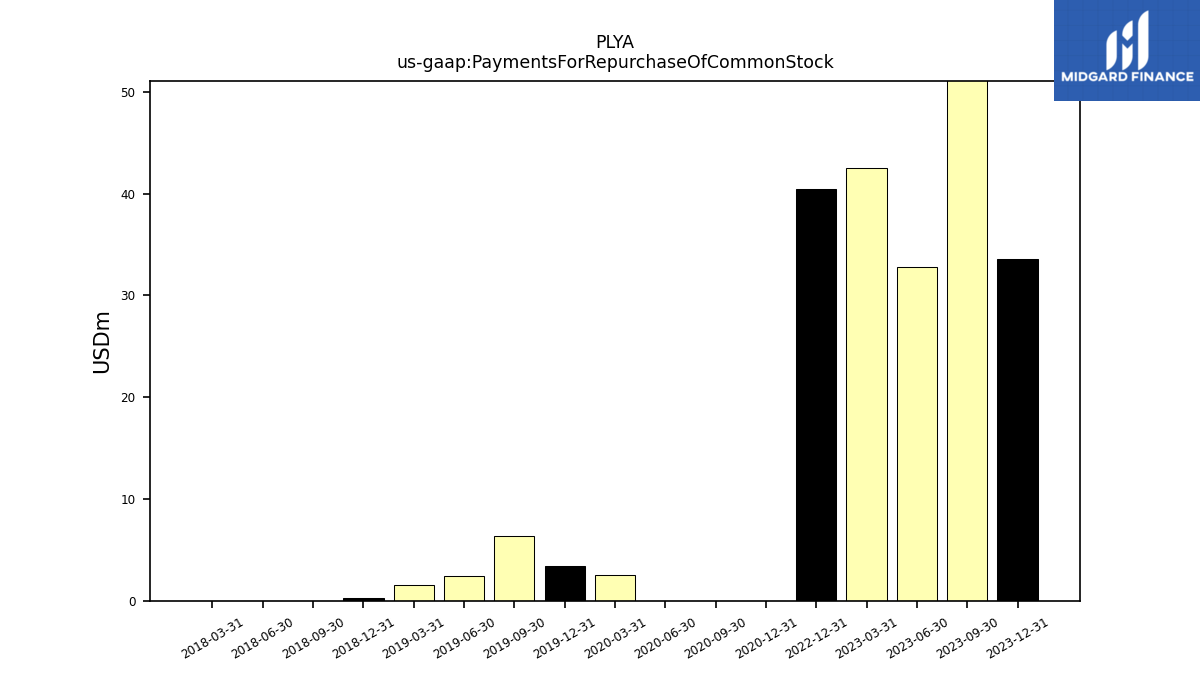
| Payments For Repurchase Of Common Stock | 33.60 | 77.92 | 32.81 | 42.56 | 40.44 | NA | NA | NA | NA | NA | NA | NA | 0.00 | 0.00 | 0.00 | 2.50 | 3.39 | 6.38 | 2.40 | 1.52 | 0.31 | 0.00 | 0.00 | 0.00 | NA | NA | NA | NA | NA | NA | NA | NA |
| 2023-12-31 | 2023-09-30 | 2023-06-30 | 2023-03-31 | 2022-12-31 | 2022-09-30 | 2022-06-30 | 2022-03-31 | 2021-12-31 | 2021-09-30 | 2021-06-30 | 2021-03-31 | 2020-12-31 | 2020-09-30 | 2020-06-30 | 2020-03-31 | 2019-12-31 | 2019-09-30 | 2019-06-30 | 2019-03-31 | 2018-12-31 | 2018-09-30 | 2018-06-30 | 2018-03-31 | 2017-12-31 | 2017-09-30 | 2017-06-30 | 2017-03-31 | 2016-12-31 | 2016-09-30 | 2016-06-30 | 2016-03-31 | ||
|---|---|---|---|---|---|---|---|---|---|---|---|---|---|---|---|---|---|---|---|---|---|---|---|---|---|---|---|---|---|---|---|---|---|
| Revenues | 242.52 | 213.15 | 248.04 | 273.80 | 210.80 | 204.62 | 221.27 | 219.57 | 176.80 | 151.29 | 128.80 | 77.75 | 66.24 | 28.74 | 0.98 | 177.23 | 143.83 | 132.82 | 164.02 | 195.80 | 151.78 | 142.81 | 145.57 | 176.85 | 126.54 | 118.34 | 140.60 | 174.07 | 120.12 | 114.11 | 127.30 | 159.96 | |
| Revenue From Contract With Customer Excluding Assessed Tax | 242.52 | 213.15 | 248.04 | 273.80 | 210.80 | 204.62 | 221.27 | 219.57 | 176.80 | 151.29 | 128.80 | 77.75 | 66.24 | 28.74 | 0.98 | 177.23 | 143.83 | 132.82 | 164.02 | 195.80 | 151.78 | 142.81 | 145.57 | 176.85 | 126.54 | 118.34 | 140.60 | 174.07 | 120.12 | 114.11 | 127.30 | 159.96 | |
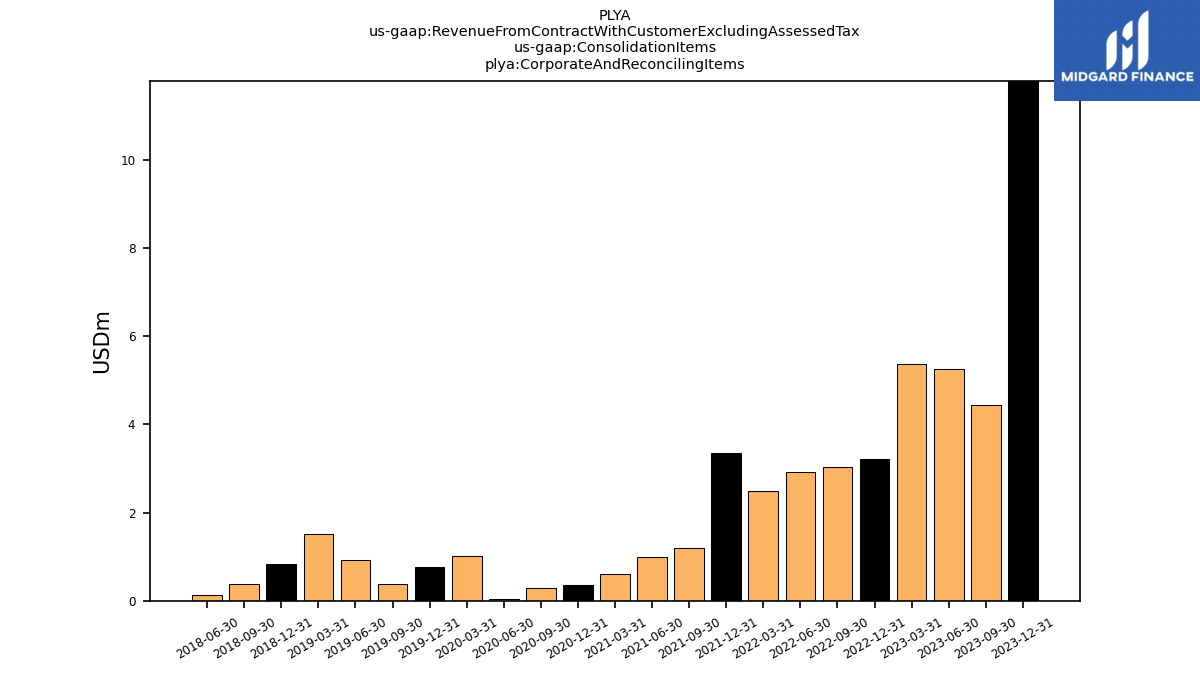
| Corporate And Reconciling Items | 11.79 | 4.44 | 5.25 | 5.38 | 3.21 | 3.05 | 2.91 | 2.49 | 3.35 | 1.19 | 0.99 | 0.60 | 0.35 | 0.30 | 0.05 | 1.01 | 0.76 | 0.37 | 0.93 | 1.52 | 0.84 | 0.38 | 0.12 | NA | NA | NA | NA | NA | NA | NA | NA | NA | |
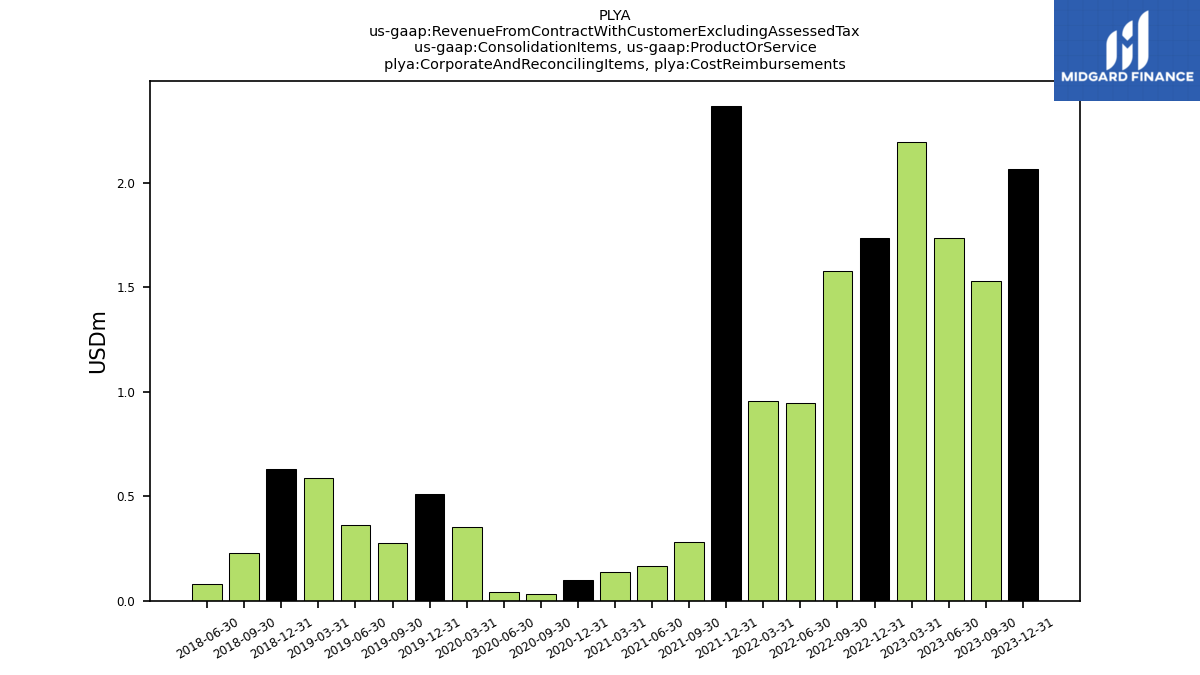
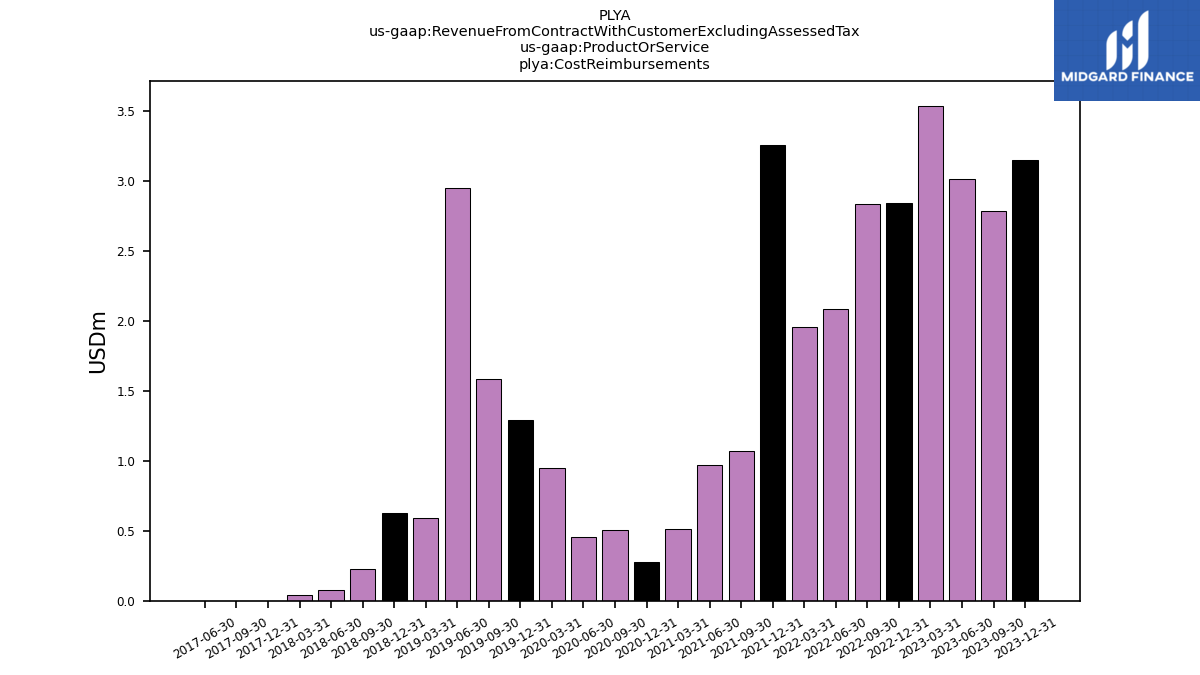
| Corporate And Reconciling Items, Cost Reimbursements | 2.06 | 1.53 | 1.74 | 2.20 | 1.74 | 1.58 | 0.95 | 0.95 | 2.37 | 0.28 | 0.17 | 0.14 | 0.10 | 0.03 | 0.04 | 0.35 | 0.51 | 0.28 | 0.36 | 0.59 | 0.63 | 0.23 | 0.08 | NA | NA | NA | NA | NA | NA | NA | NA | NA | |
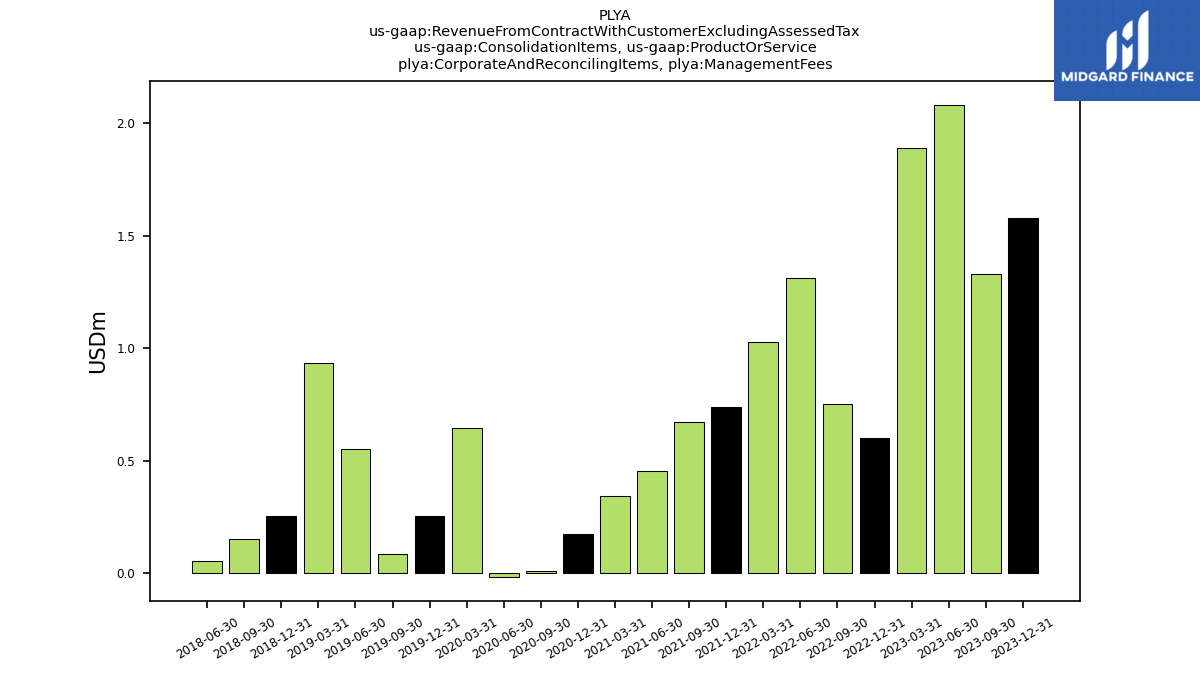
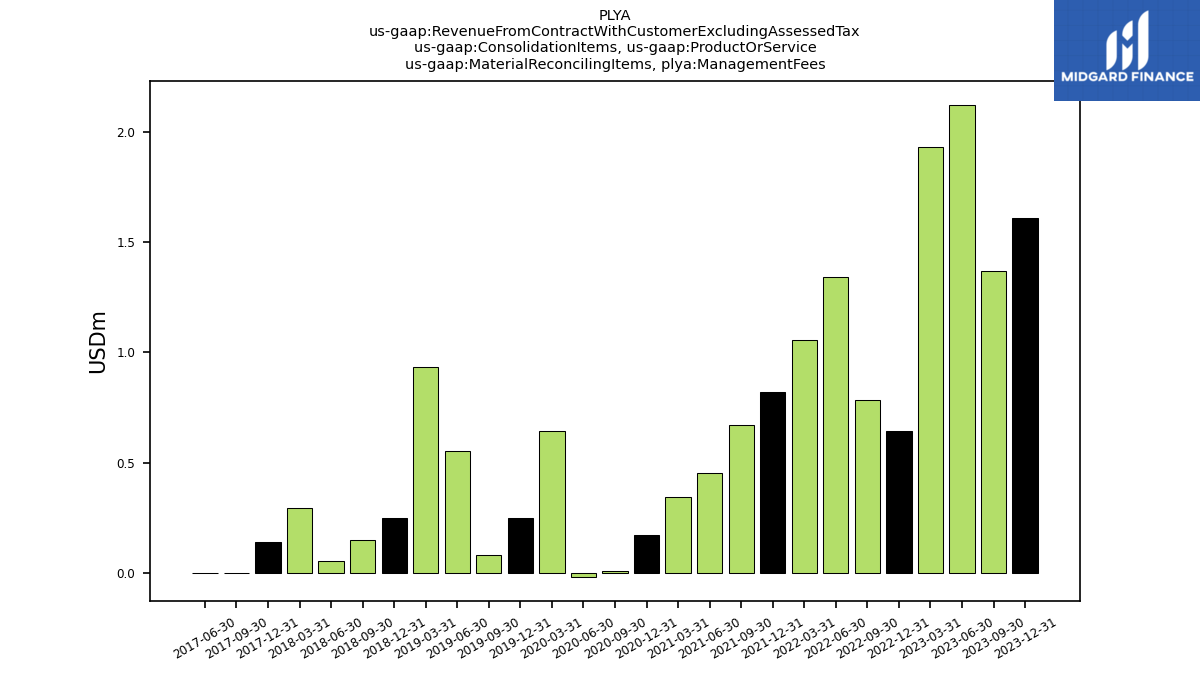
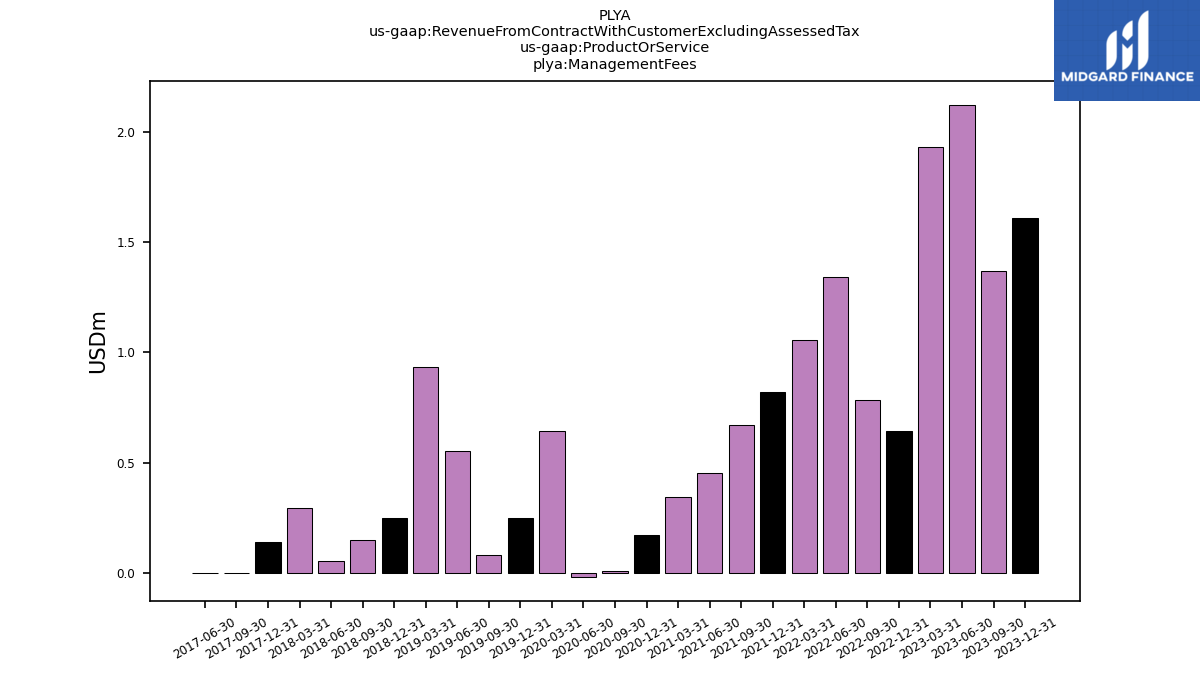
| Corporate And Reconciling Items, Management Fees | 1.58 | 1.33 | 2.08 | 1.89 | 0.60 | 0.75 | 1.31 | 1.03 | 0.74 | 0.67 | 0.45 | 0.34 | 0.17 | 0.01 | -0.02 | 0.65 | 0.25 | 0.08 | 0.55 | 0.93 | 0.25 | 0.15 | 0.06 | NA | NA | NA | NA | NA | NA | NA | NA | NA | |
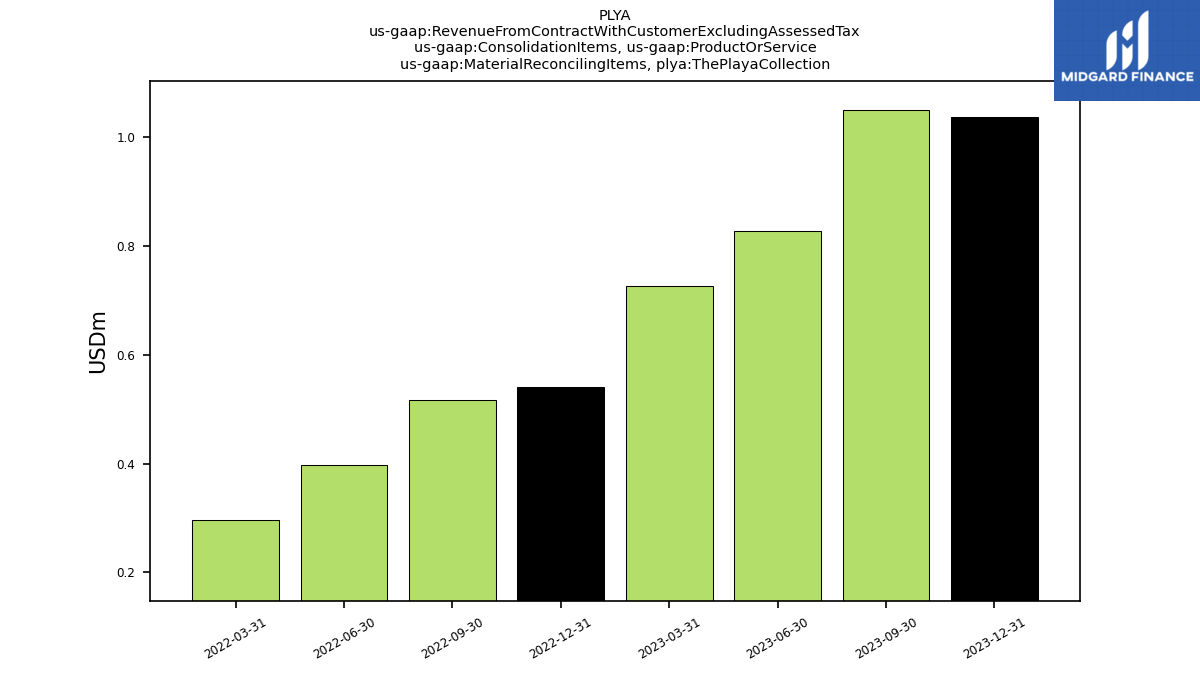
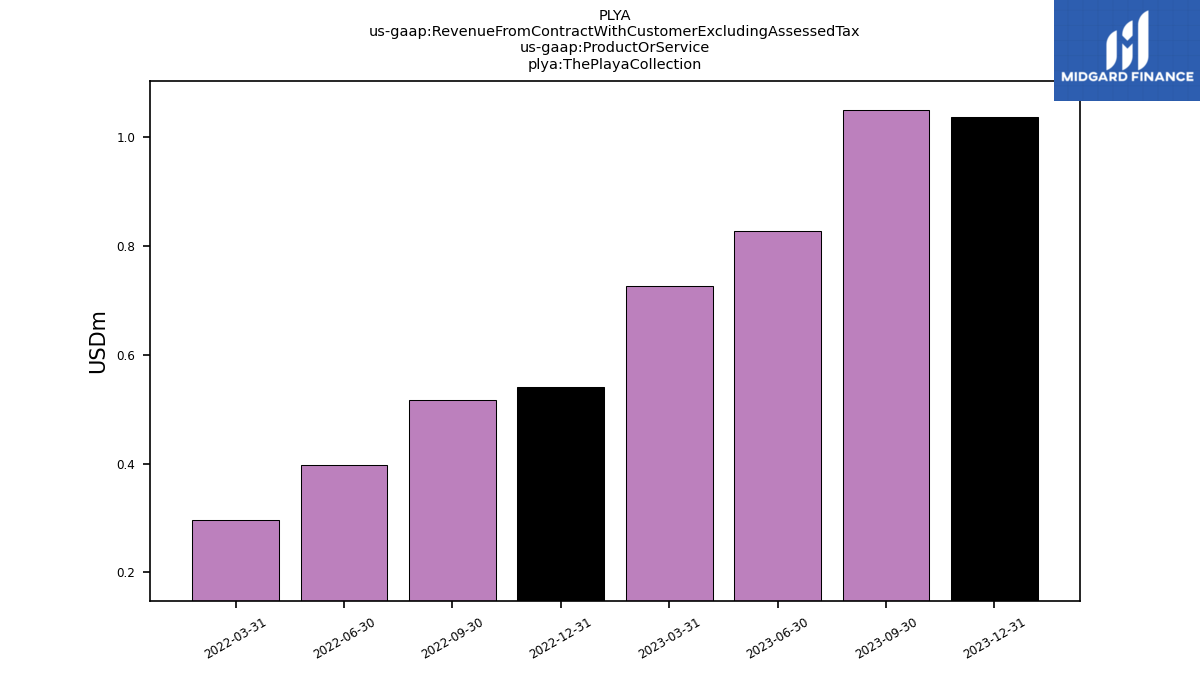
| Corporate And Reconciling Items, The Playa Collection | 1.04 | 1.05 | 0.83 | 0.73 | 0.54 | 0.52 | 0.40 | 0.30 | NA | NA | NA | NA | NA | NA | NA | NA | NA | NA | NA | NA | NA | NA | NA | NA | NA | NA | NA | NA | NA | NA | NA | NA | |
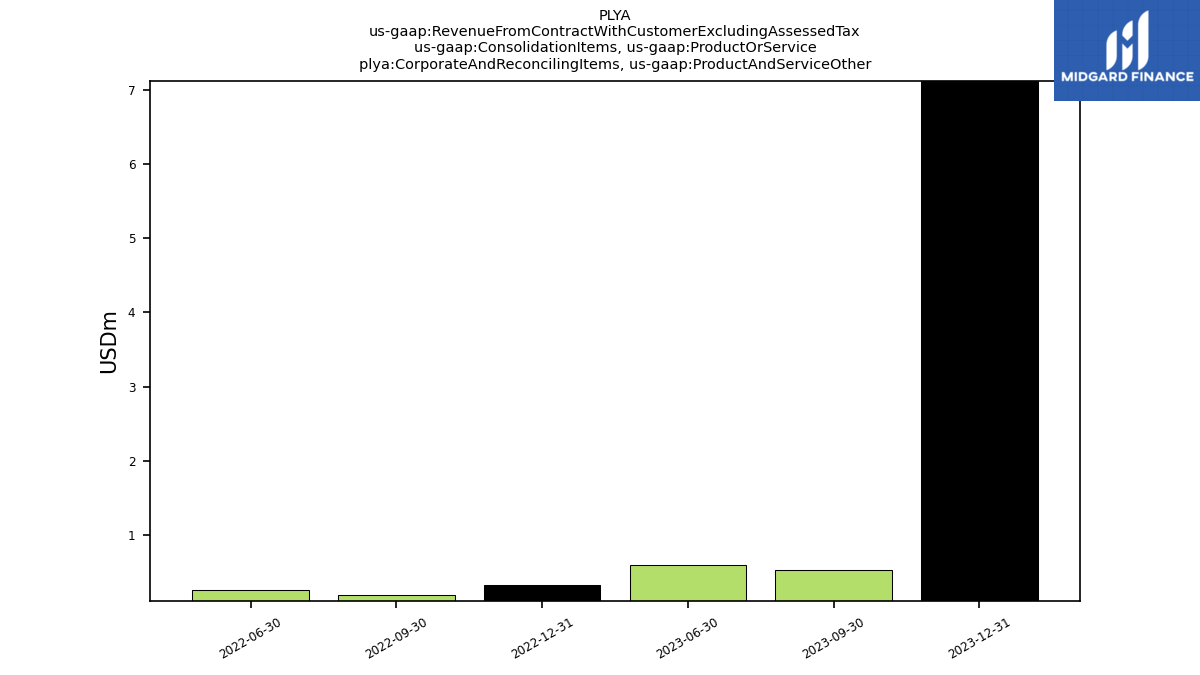
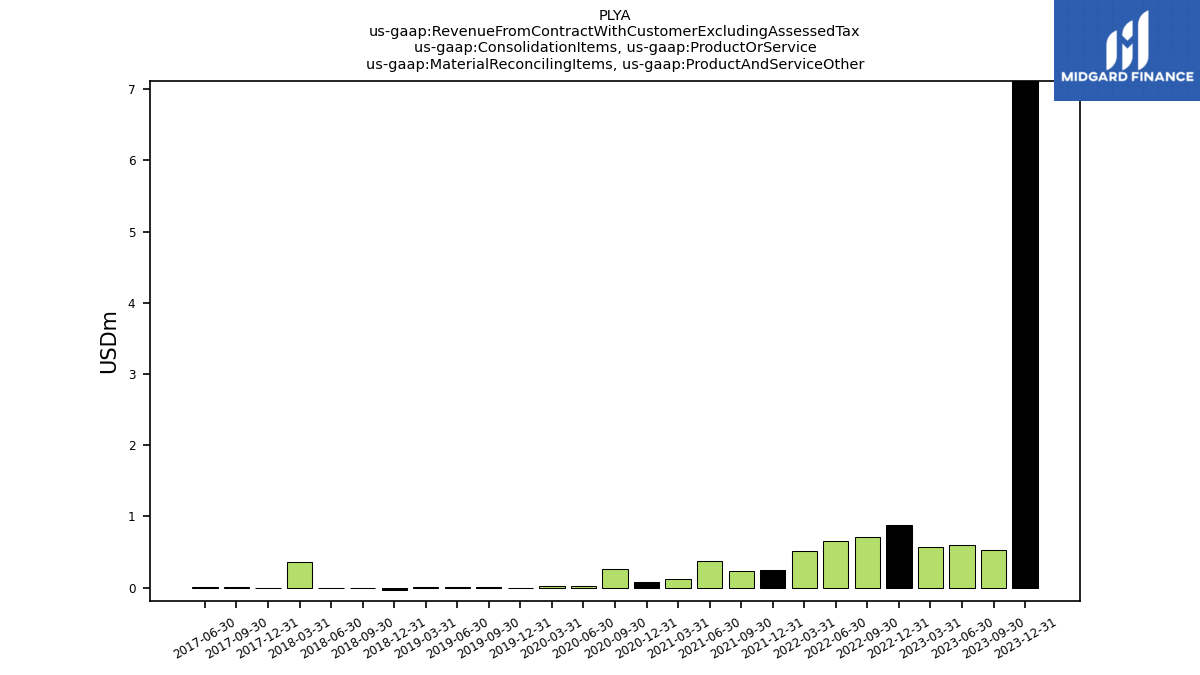
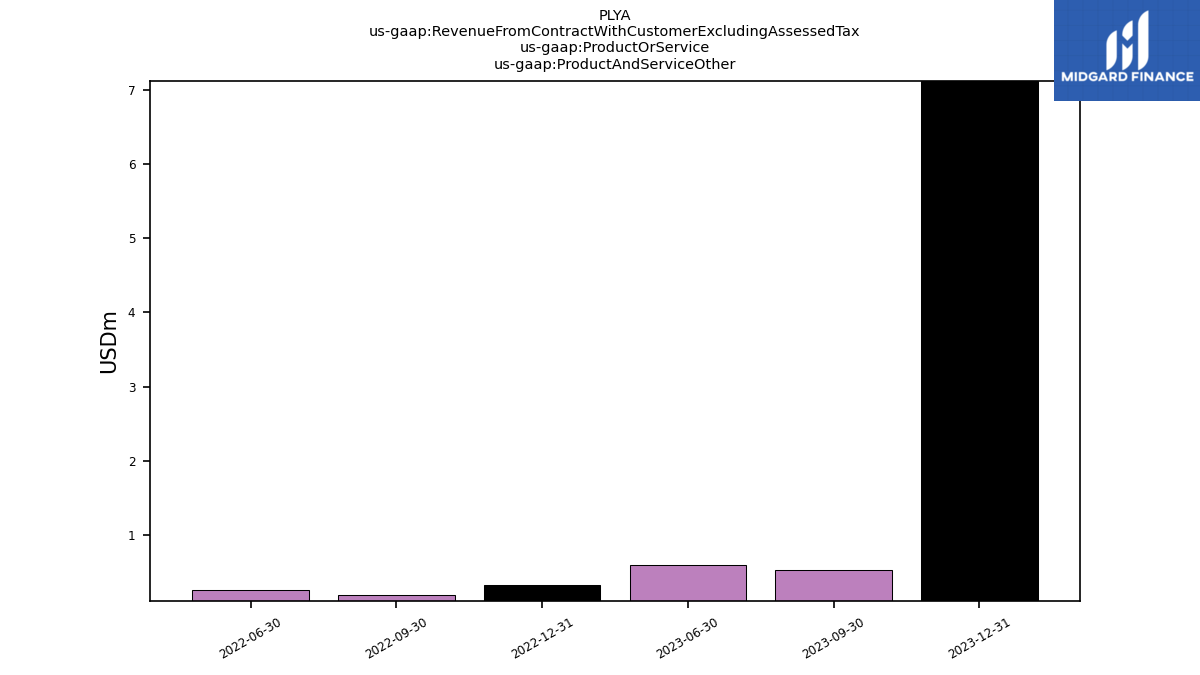
| Corporate And Reconciling Items, Product And Service Other | 7.12 | 0.53 | 0.60 | NA | 0.33 | 0.20 | 0.26 | NA | NA | NA | NA | NA | NA | NA | NA | NA | NA | NA | NA | NA | NA | NA | NA | NA | NA | NA | NA | NA | NA | NA | NA | NA | |
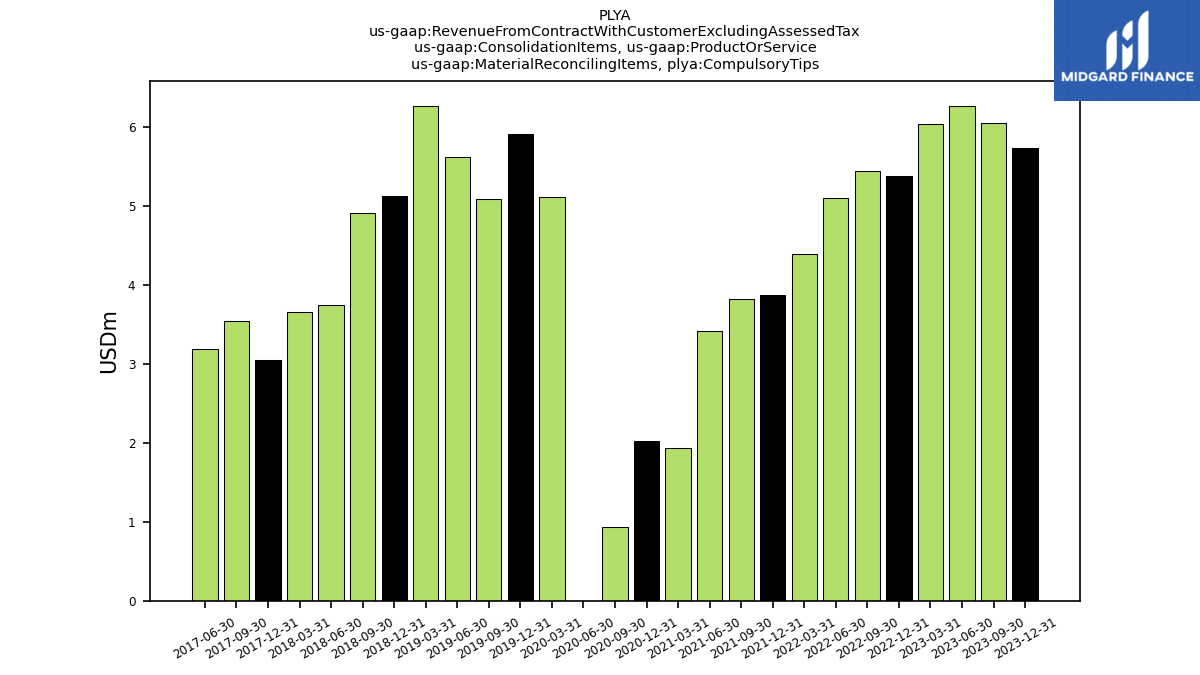
| Material Reconciling Items, Compulsory Tips | 5.74 | 6.05 | 6.27 | 6.04 | 5.38 | 5.44 | 5.10 | 4.40 | 3.87 | 3.82 | 3.41 | 1.94 | 2.02 | 0.93 | 0.00 | 5.11 | 5.91 | 5.08 | 5.62 | 6.27 | 5.13 | 4.90 | 3.74 | 3.65 | 3.05 | 3.55 | 3.18 | NA | NA | NA | NA | NA | |
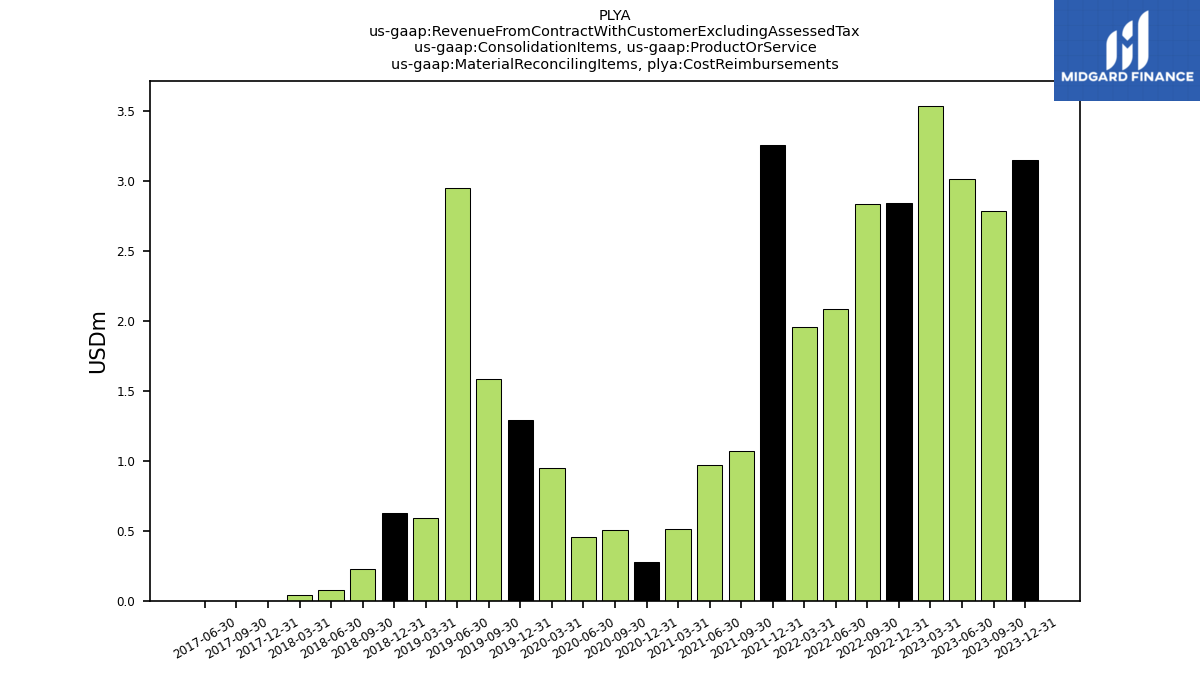
| Material Reconciling Items, Cost Reimbursements | 3.15 | 2.79 | 3.01 | 3.53 | 2.84 | 2.84 | 2.08 | 1.95 | 3.25 | 1.07 | 0.97 | 0.51 | 0.28 | 0.51 | 0.46 | 0.95 | 1.29 | 1.59 | 2.95 | 0.59 | 0.63 | 0.23 | 0.08 | 0.04 | 0.00 | 0.00 | 0.00 | NA | NA | NA | NA | NA | |
| Material Reconciling Items, Management Fees | 1.61 | 1.37 | 2.12 | 1.93 | 0.64 | 0.79 | 1.34 | 1.06 | 0.82 | 0.67 | 0.45 | 0.34 | 0.17 | 0.01 | -0.02 | 0.65 | 0.25 | 0.08 | 0.55 | 0.93 | 0.25 | 0.15 | 0.06 | 0.30 | 0.14 | 0.00 | 0.00 | NA | NA | NA | NA | NA | |
| Material Reconciling Items, The Playa Collection | 1.04 | 1.05 | 0.83 | 0.73 | 0.54 | 0.52 | 0.40 | 0.30 | NA | NA | NA | NA | NA | NA | NA | NA | NA | NA | NA | NA | NA | NA | NA | NA | NA | NA | NA | NA | NA | NA | NA | NA | |
| Material Reconciling Items, Product And Service Other | 7.12 | 0.53 | 0.60 | 0.56 | 0.87 | 0.72 | 0.66 | 0.51 | 0.25 | 0.23 | 0.37 | 0.12 | 0.07 | 0.26 | 0.02 | 0.01 | -0.01 | 0.01 | 0.01 | 0.00 | -0.04 | 0.00 | -0.01 | 0.35 | -0.01 | 0.01 | 0.00 | NA | NA | NA | NA | NA | |
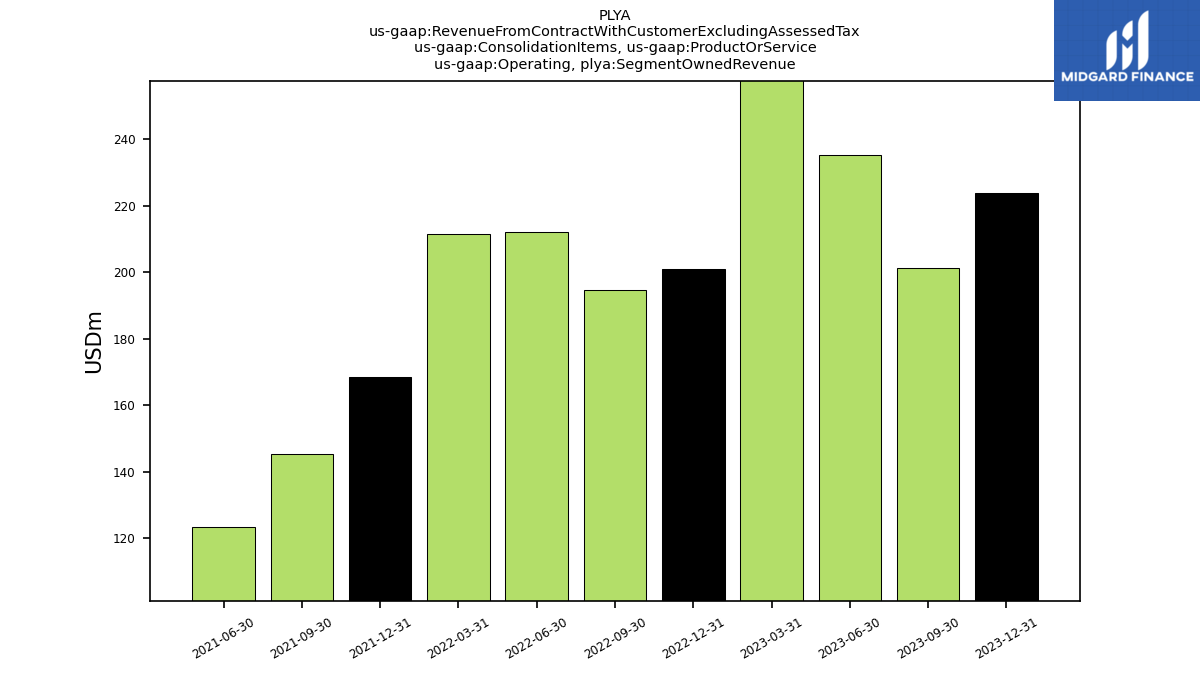
| Operating, Segment Owned Revenue | 223.87 | 201.35 | 235.21 | 261.01 | 201.06 | 194.84 | 212.09 | 211.66 | 168.62 | 145.49 | 123.60 | NA | NA | NA | NA | NA | NA | NA | NA | NA | NA | NA | NA | NA | NA | NA | NA | NA | NA | NA | NA | NA | |
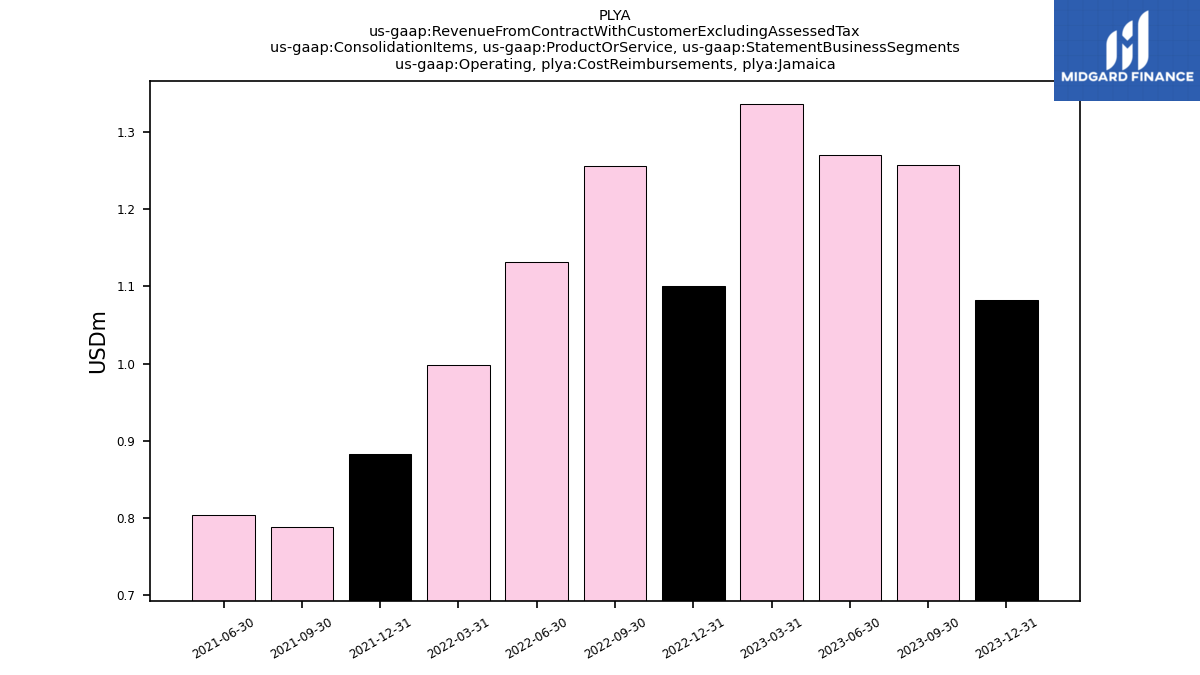
| Operating, Cost Reimbursements, Jamaica | 1.08 | 1.26 | 1.27 | 1.34 | 1.10 | 1.26 | 1.13 | 1.00 | 0.88 | 0.79 | 0.80 | NA | NA | NA | NA | NA | NA | NA | NA | NA | NA | NA | NA | NA | NA | NA | NA | NA | NA | NA | NA | NA | |
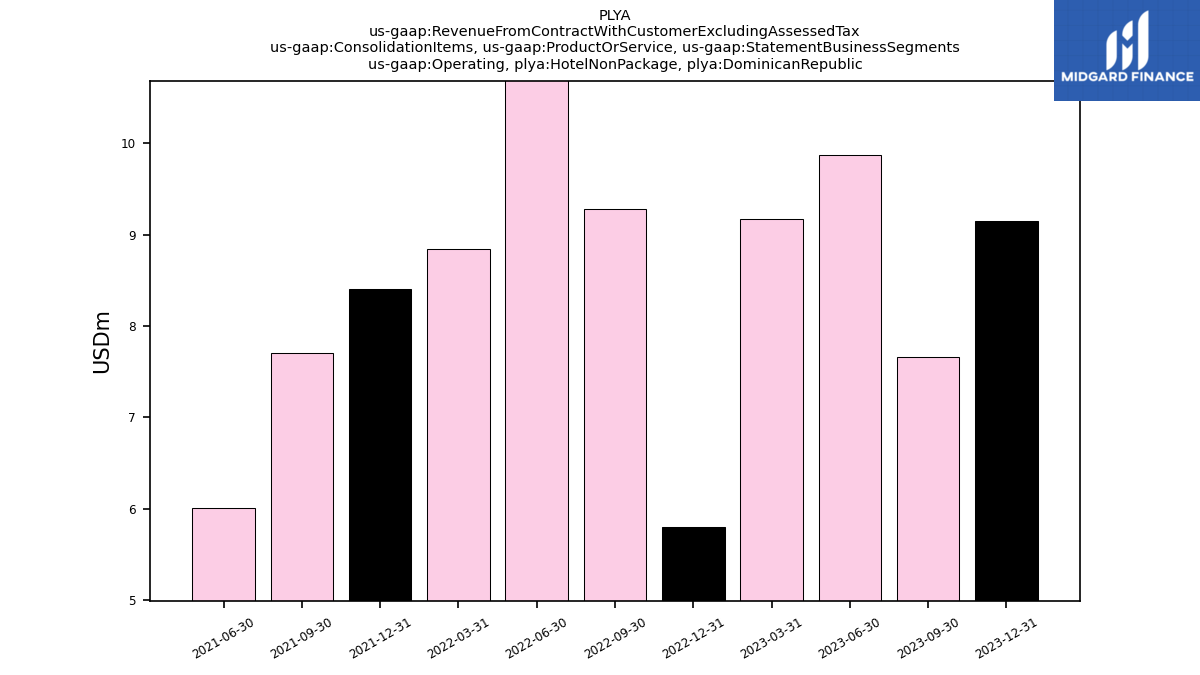
| Operating, Hotel Non Package, Dominican Republic | 9.15 | 7.66 | 9.87 | 9.17 | 5.81 | 9.28 | 12.51 | 8.85 | 8.41 | 7.70 | 6.00 | NA | NA | NA | NA | NA | NA | NA | NA | NA | NA | NA | NA | NA | NA | NA | NA | NA | NA | NA | NA | NA | |
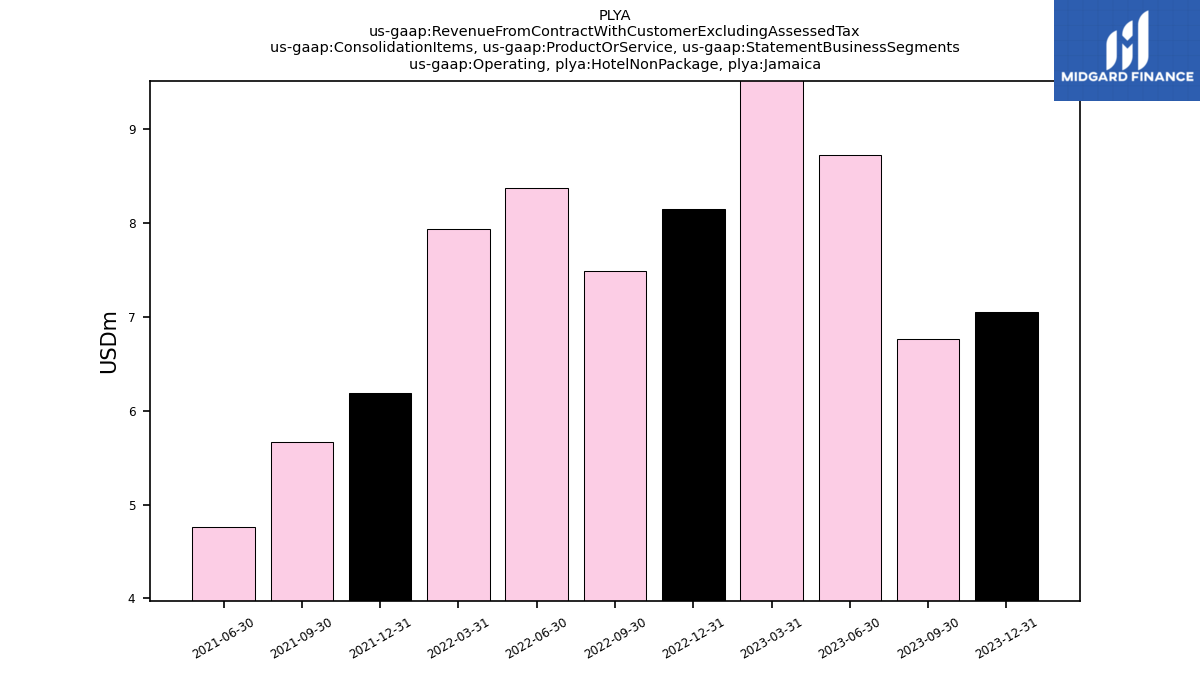
| Operating, Hotel Non Package, Jamaica | 7.06 | 6.76 | 8.72 | 9.87 | 8.15 | 7.49 | 8.37 | 7.93 | 6.19 | 5.67 | 4.77 | NA | NA | NA | NA | NA | NA | NA | NA | NA | NA | NA | NA | NA | NA | NA | NA | NA | NA | NA | NA | NA | |
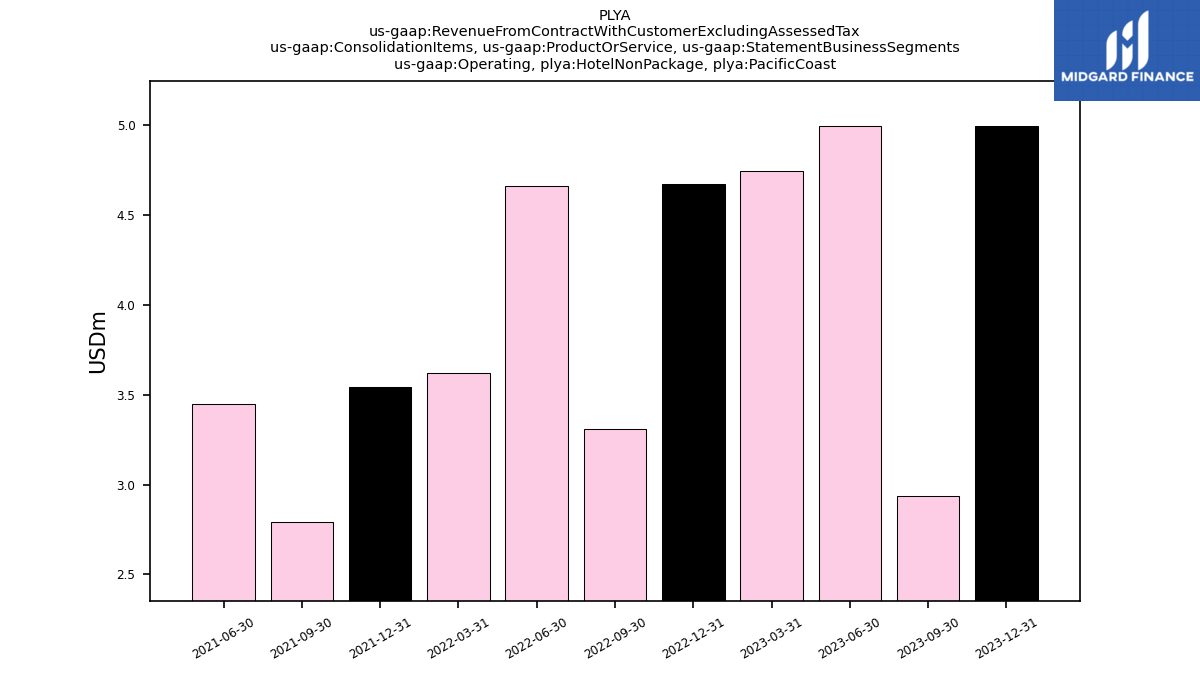
| Operating, Hotel Non Package, Pacific Coast | 5.00 | 2.94 | 5.00 | 4.75 | 4.67 | 3.31 | 4.67 | 3.62 | 3.54 | 2.79 | 3.45 | NA | NA | NA | NA | NA | NA | NA | NA | NA | NA | NA | NA | NA | NA | NA | NA | NA | NA | NA | NA | NA | |
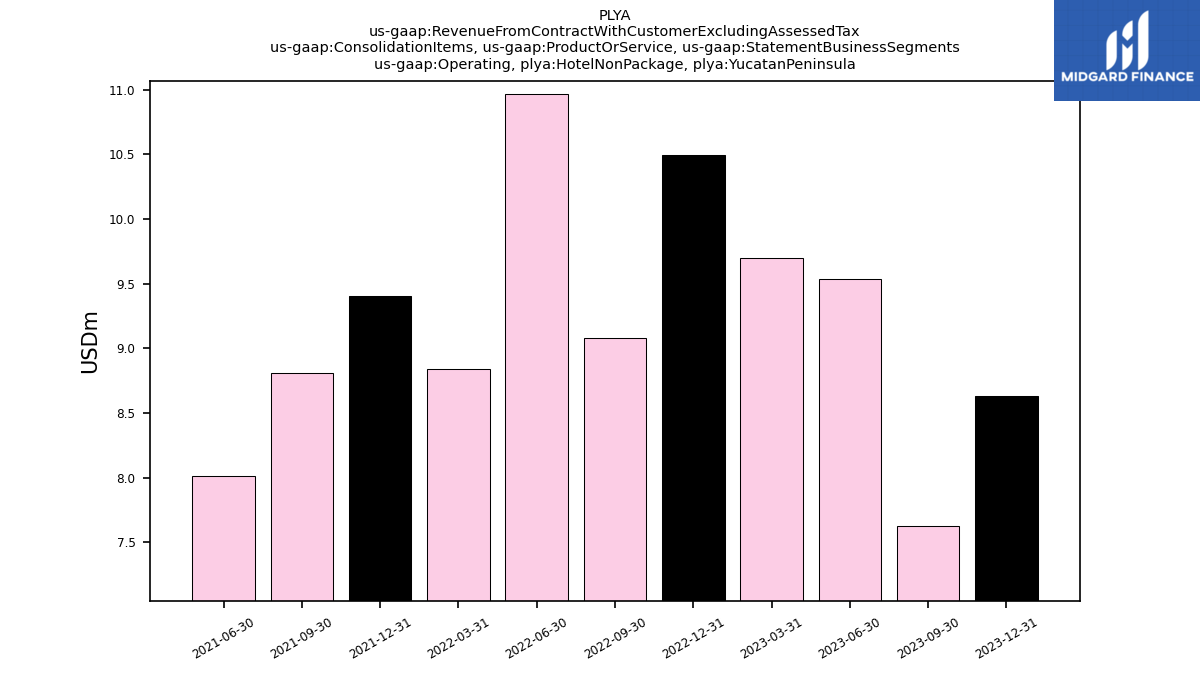
| Operating, Hotel Non Package, Yucatan Peninsula | 8.63 | 7.62 | 9.54 | 9.70 | 10.49 | 9.08 | 10.97 | 8.84 | 9.40 | 8.81 | 8.02 | NA | NA | NA | NA | NA | NA | NA | NA | NA | NA | NA | NA | NA | NA | NA | NA | NA | NA | NA | NA | NA | |
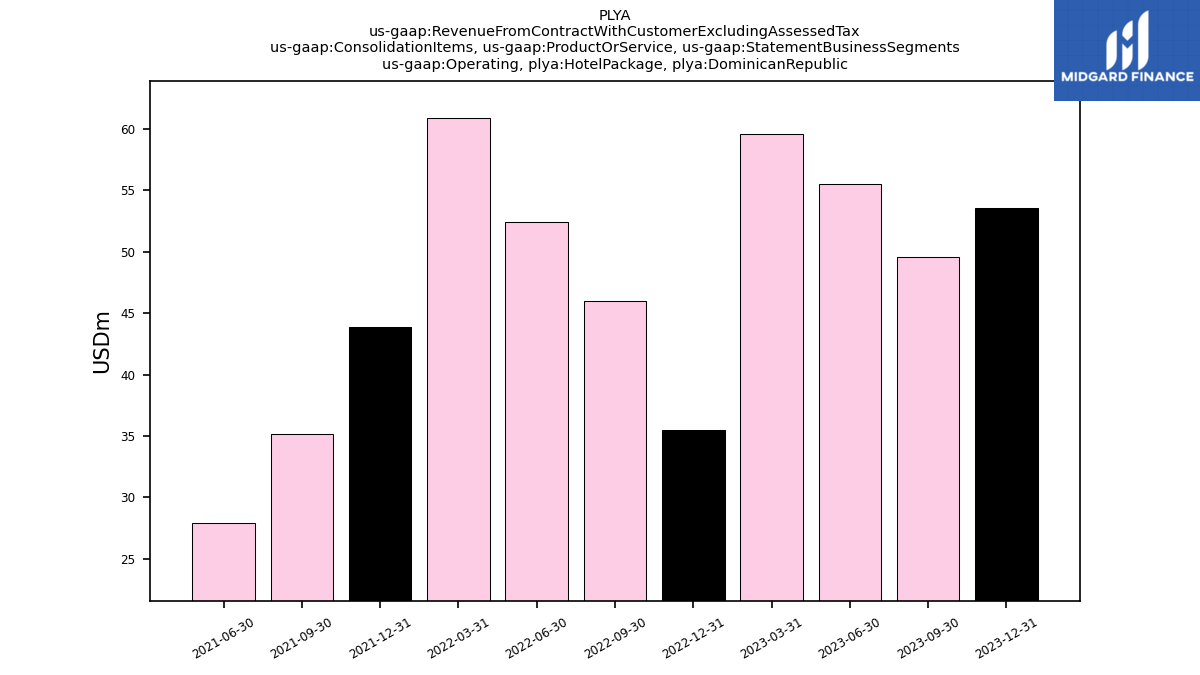
| Operating, Hotel Package, Dominican Republic | 53.59 | 49.56 | 55.56 | 59.60 | 35.48 | 45.95 | 52.40 | 60.86 | 43.84 | 35.13 | 27.92 | NA | NA | NA | NA | NA | NA | NA | NA | NA | NA | NA | NA | NA | NA | NA | NA | NA | NA | NA | NA | NA | |
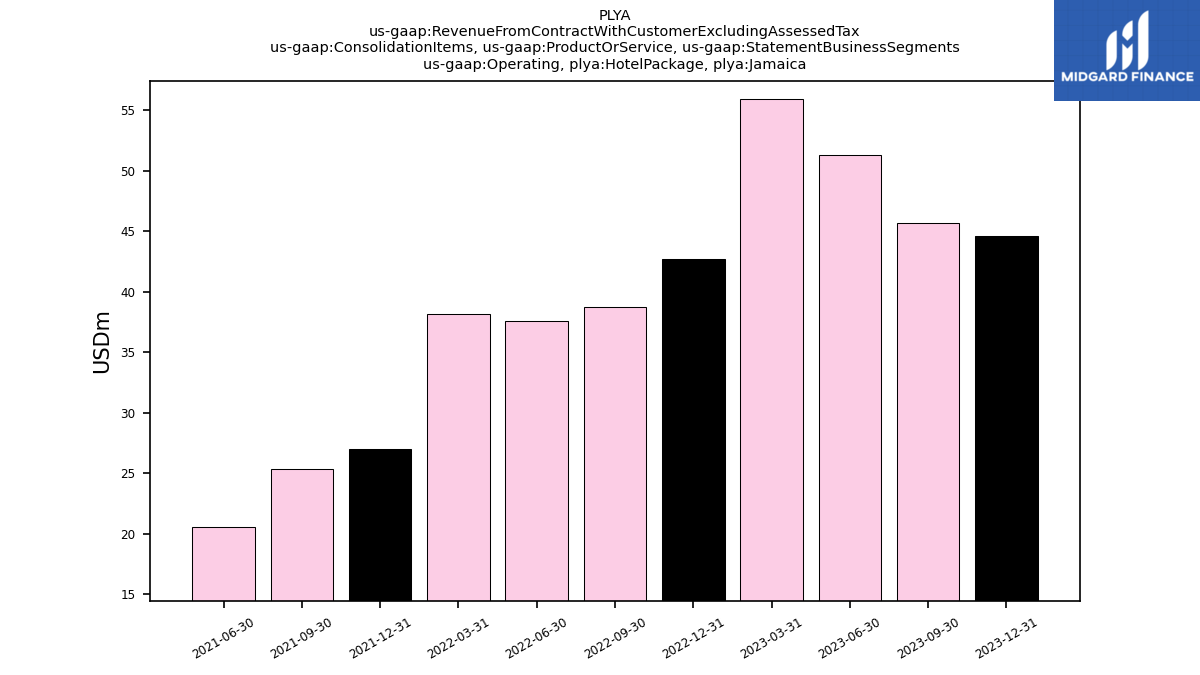
| Operating, Hotel Package, Jamaica | 44.63 | 45.67 | 51.26 | 55.88 | 42.73 | 38.70 | 37.58 | 38.19 | 26.97 | 25.33 | 20.61 | NA | NA | NA | NA | NA | NA | NA | NA | NA | NA | NA | NA | NA | NA | NA | NA | NA | NA | NA | NA | NA | |
| Operating, Hotel Package, Pacific Coast | 30.01 | 27.23 | 33.79 | 36.80 | 31.54 | 27.89 | 29.74 | 26.22 | 22.87 | 19.87 | 17.74 | NA | NA | NA | NA | NA | NA | NA | NA | NA | NA | NA | NA | NA | NA | NA | NA | NA | NA | NA | NA | NA | |
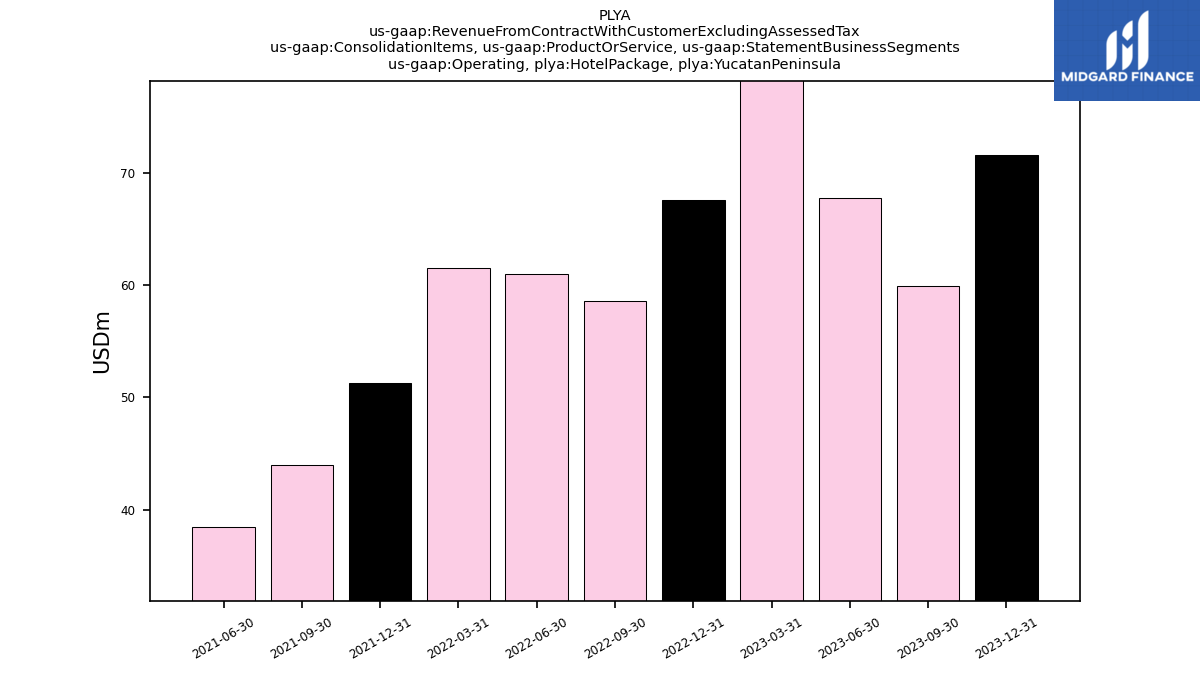
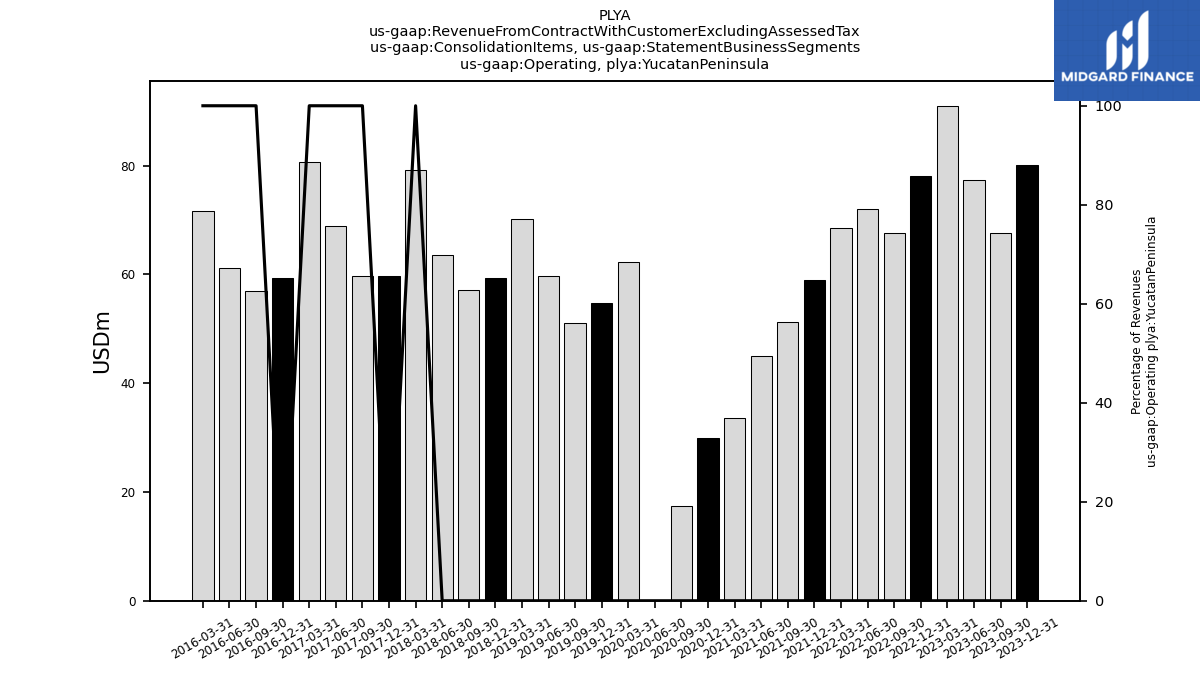
| Operating, Hotel Package, Yucatan Peninsula | 71.55 | 59.96 | 67.75 | 81.29 | 67.57 | 58.59 | 60.96 | 61.54 | 51.27 | 43.99 | 38.52 | NA | NA | NA | NA | NA | NA | NA | NA | NA | NA | NA | NA | NA | NA | NA | NA | NA | NA | NA | NA | NA | |
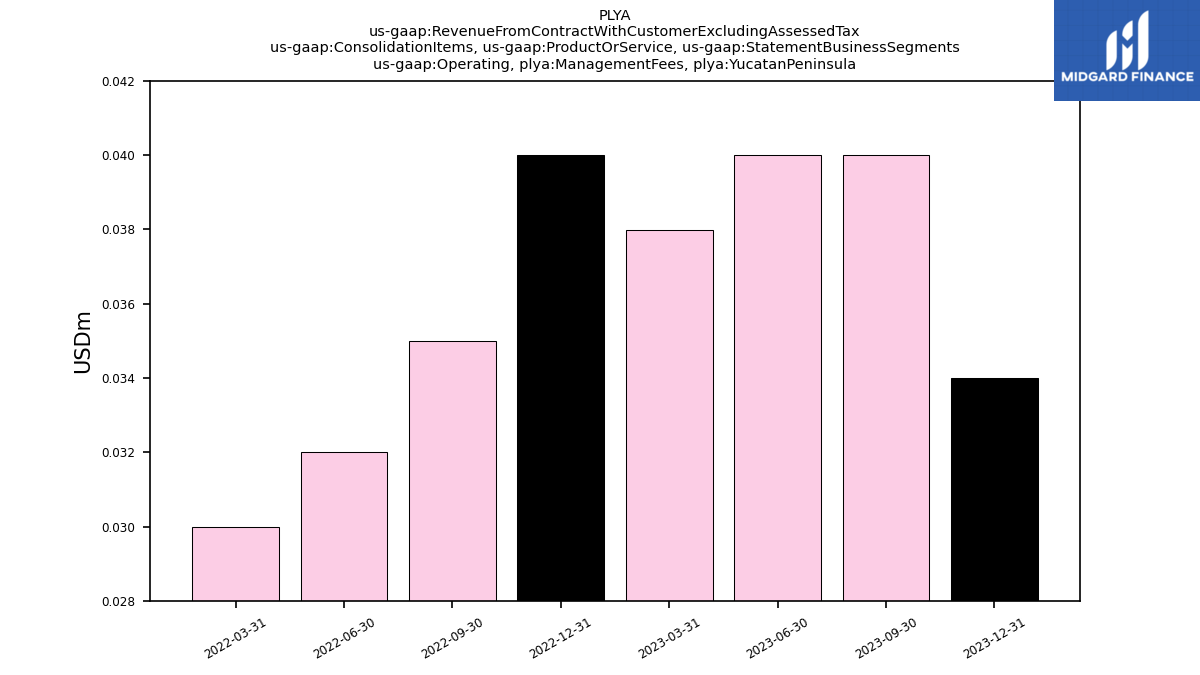
| Operating, Management Fees, Yucatan Peninsula | 0.03 | 0.04 | 0.04 | 0.04 | 0.04 | 0.04 | 0.03 | 0.03 | NA | NA | NA | NA | NA | NA | NA | NA | NA | NA | NA | NA | NA | NA | NA | NA | NA | NA | NA | NA | NA | NA | NA | NA | |
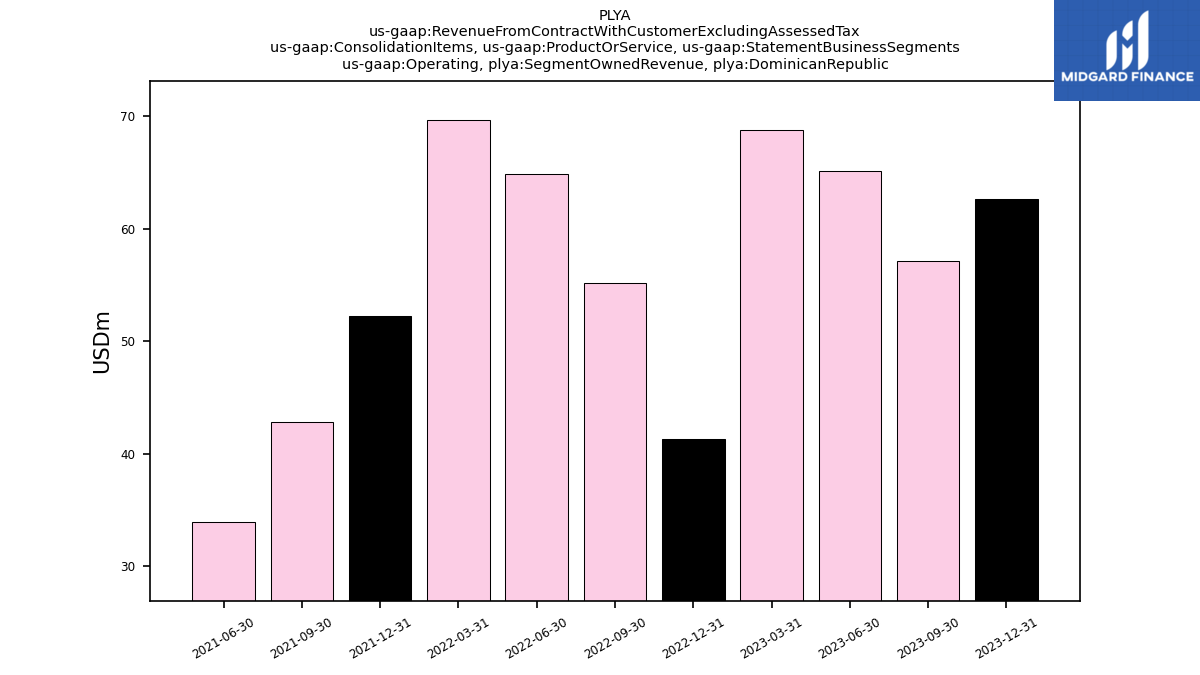
| Operating, Segment Owned Revenue, Dominican Republic | 62.66 | 57.14 | 65.13 | 68.77 | 41.26 | 55.19 | 64.86 | 69.66 | 52.21 | 42.79 | 33.89 | NA | NA | NA | NA | NA | NA | NA | NA | NA | NA | NA | NA | NA | NA | NA | NA | NA | NA | NA | NA | NA | |
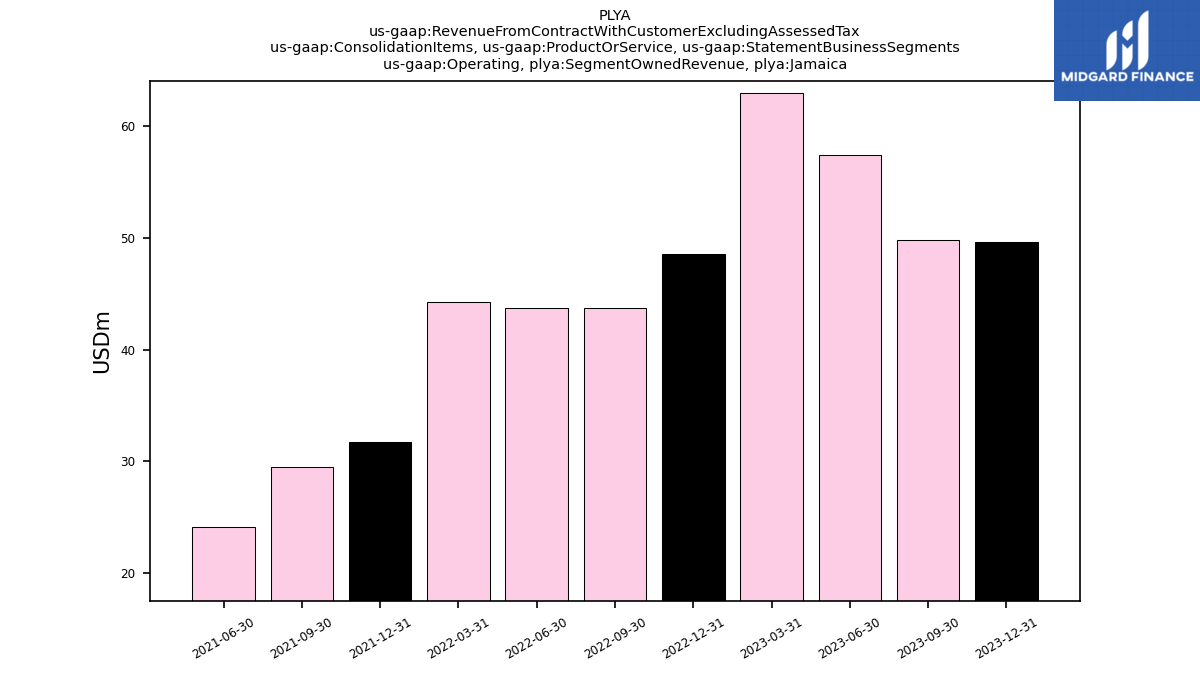
| Operating, Segment Owned Revenue, Jamaica | 49.67 | 49.84 | 57.42 | 62.98 | 48.54 | 43.76 | 43.76 | 44.26 | 31.68 | 29.50 | 24.13 | NA | NA | NA | NA | NA | NA | NA | NA | NA | NA | NA | NA | NA | NA | NA | NA | NA | NA | NA | NA | NA | |
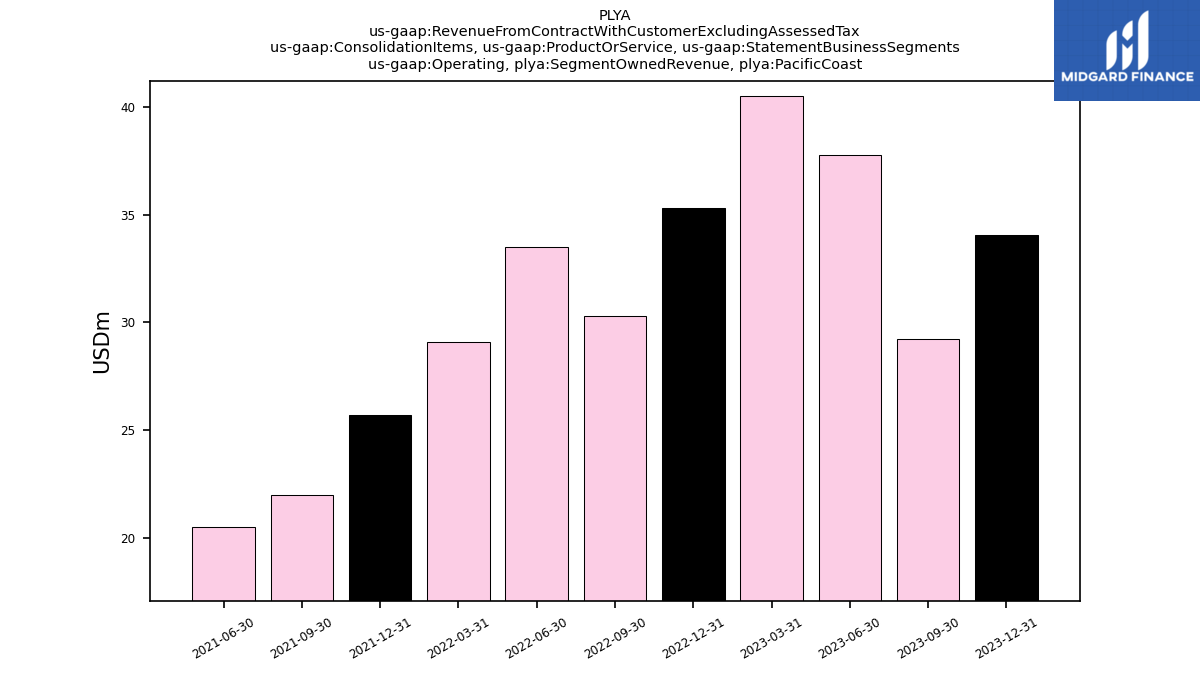
| Operating, Segment Owned Revenue, Pacific Coast | 34.05 | 29.24 | 37.78 | 40.52 | 35.31 | 30.30 | 33.50 | 29.10 | 25.69 | 21.98 | 20.51 | NA | NA | NA | NA | NA | NA | NA | NA | NA | NA | NA | NA | NA | NA | NA | NA | NA | NA | NA | NA | NA | |
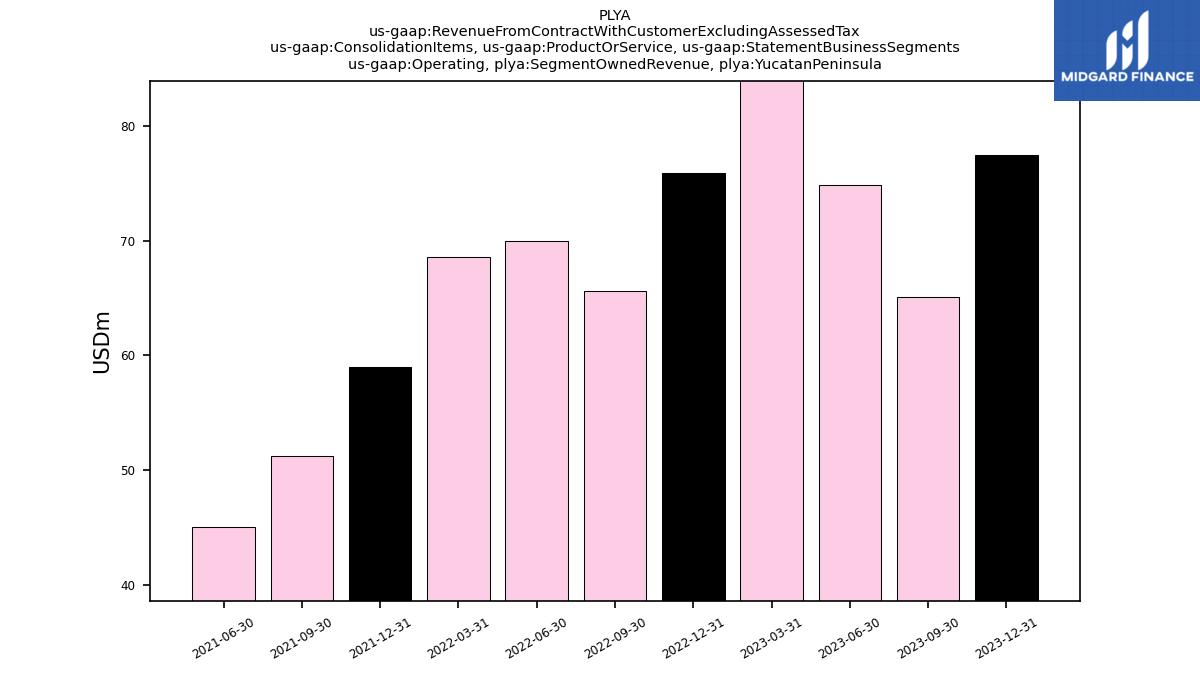
| Operating, Segment Owned Revenue, Yucatan Peninsula | 77.48 | 65.14 | 74.89 | 88.75 | 75.96 | 65.59 | 69.98 | 68.63 | 59.03 | 51.21 | 45.07 | NA | NA | NA | NA | NA | NA | NA | NA | NA | NA | NA | NA | NA | NA | NA | NA | NA | NA | NA | NA | NA | |
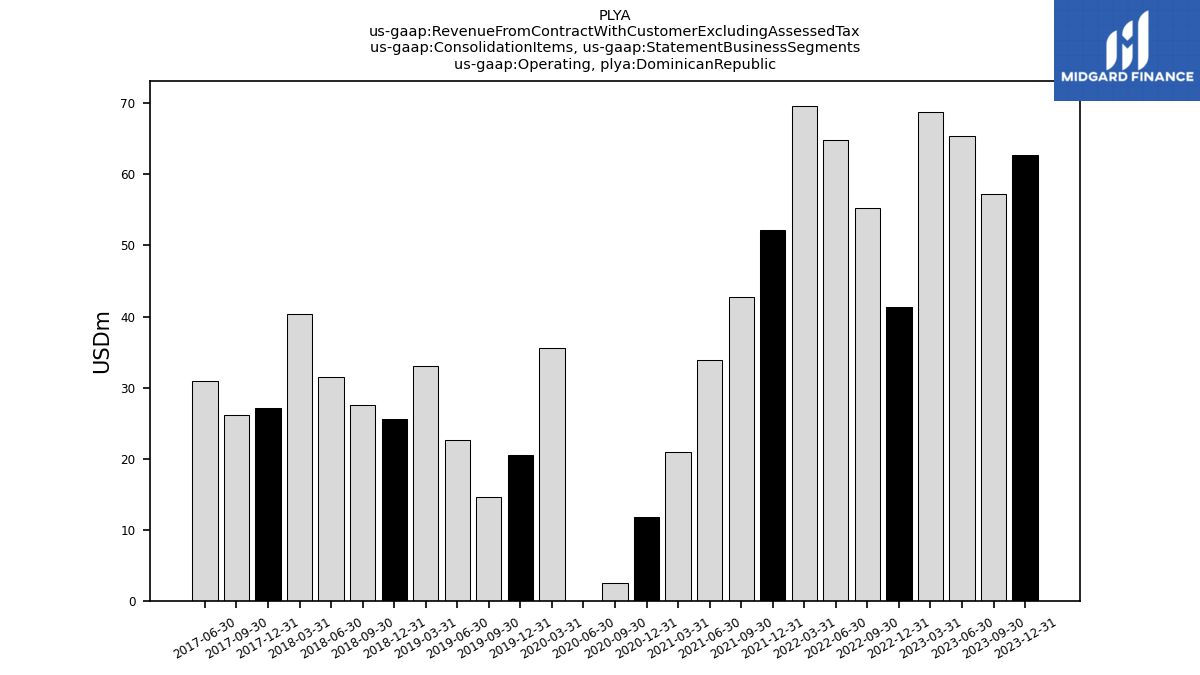
| Operating, Dominican Republic | 62.73 | 57.23 | 65.42 | 68.77 | 41.28 | 55.23 | 64.91 | 69.66 | 52.21 | 42.79 | 33.89 | 20.88 | 11.84 | 2.45 | 0.01 | 35.60 | 20.56 | 14.59 | 22.57 | 33.08 | 25.64 | 27.58 | 31.50 | 40.42 | 27.19 | 26.14 | 30.94 | NA | NA | NA | NA | NA | |
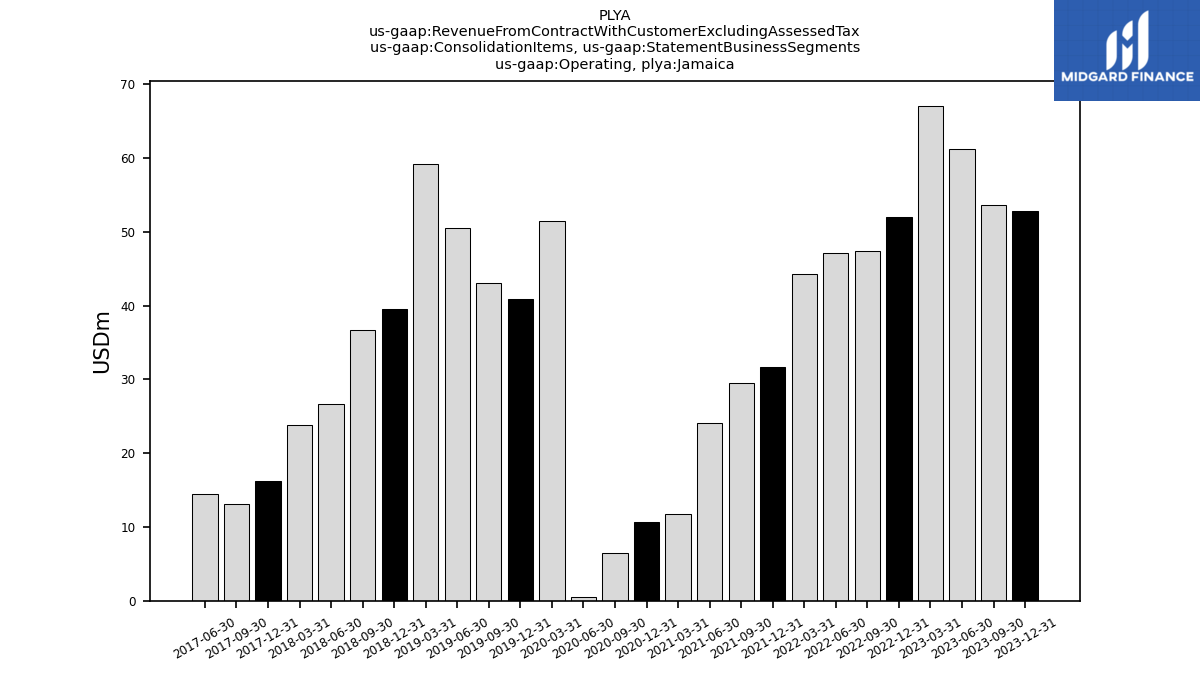
| Operating, Jamaica | 52.77 | 53.69 | 61.26 | 67.08 | 51.98 | 47.45 | 47.08 | 44.26 | 31.68 | 29.50 | 24.13 | 11.72 | 10.71 | 6.46 | 0.56 | 51.44 | 40.87 | 43.08 | 50.46 | 59.15 | 39.56 | 36.65 | 26.73 | 23.76 | 16.29 | 13.14 | 14.47 | NA | NA | NA | NA | NA | |
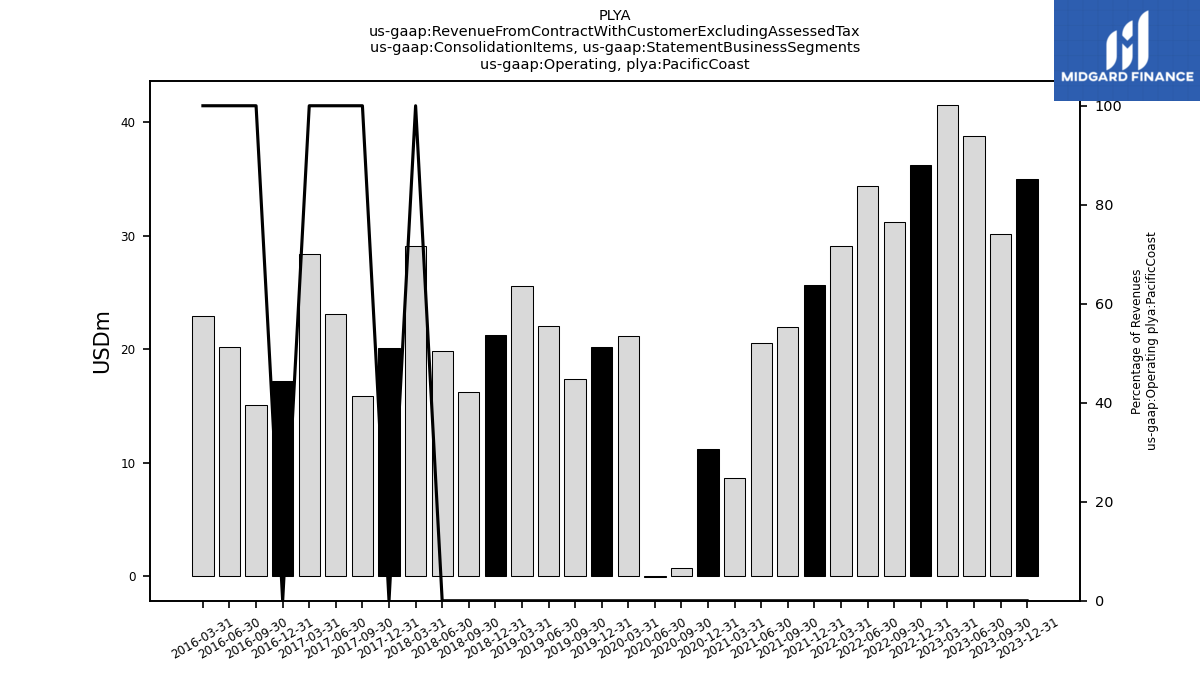
| Operating, Pacific Coast | 35.00 | 30.17 | 38.78 | 41.55 | 36.22 | 31.20 | 34.40 | 29.10 | 25.69 | 21.98 | 20.51 | 8.62 | 11.21 | 0.77 | -0.07 | 21.16 | 20.16 | 17.40 | 22.09 | 25.57 | 21.24 | 16.21 | 19.82 | 29.05 | 20.14 | 15.87 | 23.07 | 28.43 | 17.16 | 15.12 | 20.17 | 22.89 | |
| Operating, Yucatan Peninsula | 80.22 | 67.62 | 77.33 | 91.03 | 78.10 | 67.70 | 71.96 | 68.63 | 59.03 | 51.21 | 45.07 | 33.60 | 29.94 | 17.35 | 0.02 | 62.32 | 54.81 | 51.00 | 59.77 | 70.21 | 59.37 | 57.09 | 63.67 | 79.27 | 59.74 | 59.63 | 68.93 | 80.75 | 59.32 | 56.88 | 61.14 | 71.62 | |
| Cost Reimbursements | 3.15 | 2.79 | 3.01 | 3.53 | 2.84 | 2.84 | 2.08 | 1.95 | 3.25 | 1.07 | 0.97 | 0.51 | 0.28 | 0.51 | 0.46 | 0.95 | 1.29 | 1.59 | 2.95 | 0.59 | 0.63 | 0.23 | 0.08 | 0.04 | 0.00 | 0.00 | 0.00 | NA | NA | NA | NA | NA | |
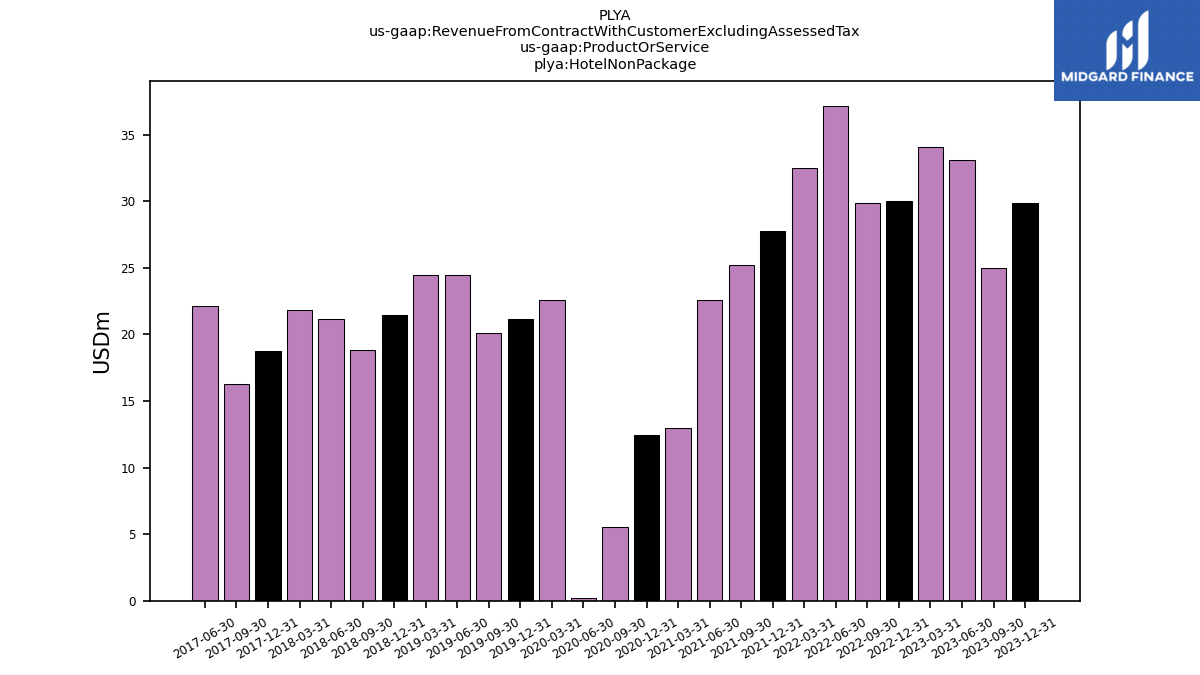
| Hotel Non Package | 29.83 | 24.98 | 33.12 | 34.05 | 30.00 | 29.87 | 37.16 | 32.46 | 27.78 | 25.21 | 22.60 | 12.99 | 12.41 | 5.52 | 0.24 | 22.58 | 21.18 | 20.07 | 24.43 | 24.48 | 21.44 | 18.80 | 21.15 | 21.80 | 18.73 | 16.25 | 22.14 | NA | NA | NA | NA | NA | |
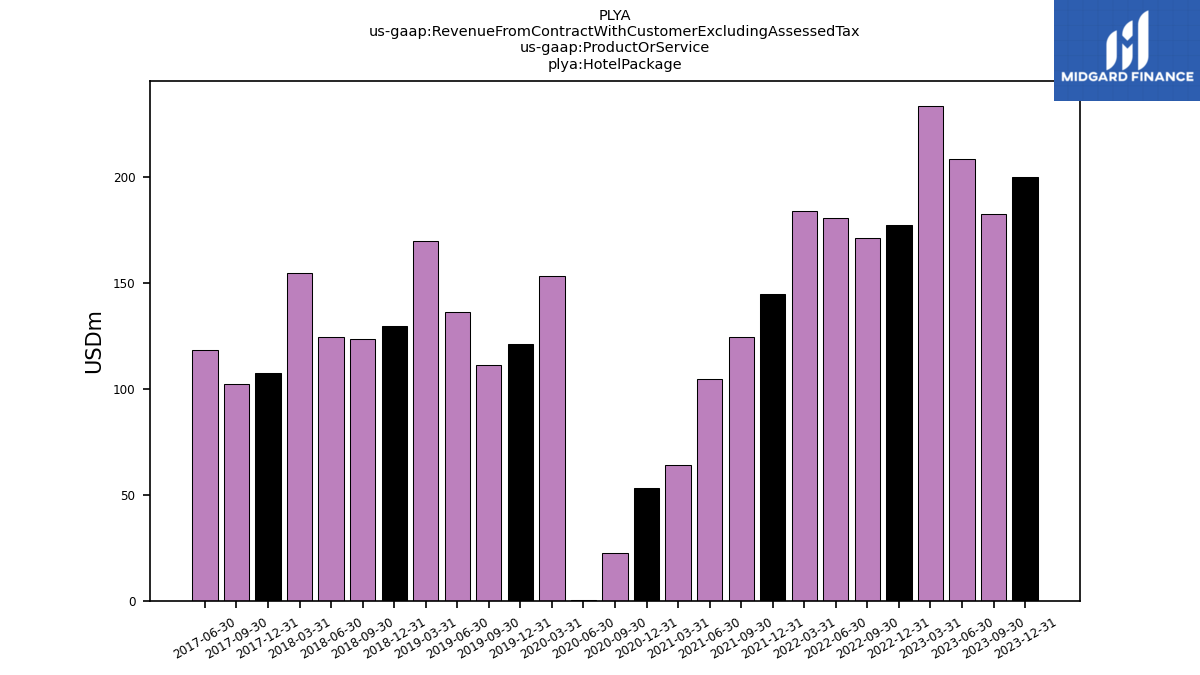
| Hotel Package | 199.77 | 182.43 | 208.36 | 233.57 | 177.32 | 171.13 | 180.68 | 184.11 | 144.94 | 124.33 | 104.78 | 63.89 | 53.38 | 22.70 | 0.30 | 153.06 | 121.11 | 111.09 | 136.09 | 169.79 | 129.46 | 123.63 | 124.29 | 154.71 | 107.67 | 102.09 | 118.45 | NA | NA | NA | NA | NA | |
| Management Fees | 1.61 | 1.37 | 2.12 | 1.93 | 0.64 | 0.79 | 1.34 | 1.06 | 0.82 | 0.67 | 0.45 | 0.34 | 0.17 | 0.01 | -0.02 | 0.65 | 0.25 | 0.08 | 0.55 | 0.93 | 0.25 | 0.15 | 0.06 | 0.30 | 0.14 | 0.00 | 0.00 | NA | NA | NA | NA | NA | |
| The Playa Collection | 1.04 | 1.05 | 0.83 | 0.73 | 0.54 | 0.52 | 0.40 | 0.30 | NA | NA | NA | NA | NA | NA | NA | NA | NA | NA | NA | NA | NA | NA | NA | NA | NA | NA | NA | NA | NA | NA | NA | NA | |
| Product And Service Other | 7.12 | 0.53 | 0.60 | NA | 0.33 | 0.20 | 0.26 | NA | NA | NA | NA | NA | NA | NA | NA | NA | NA | NA | NA | NA | NA | NA | NA | NA | NA | NA | NA | NA | NA | NA | NA | NA |