
| 2024-03-31 | 2023-12-31 | 2023-09-30 | 2023-06-30 | 2023-03-31 | 2022-12-31 | 2022-09-30 | 2022-06-30 | 2022-03-31 | 2021-12-31 | 2021-09-30 | 2021-06-30 | 2021-03-31 | 2020-12-31 | 2020-09-30 | 2020-06-30 | 2020-03-31 | 2019-12-31 | 2019-09-30 | 2019-06-30 | 2019-03-31 | ||
|---|---|---|---|---|---|---|---|---|---|---|---|---|---|---|---|---|---|---|---|---|---|---|
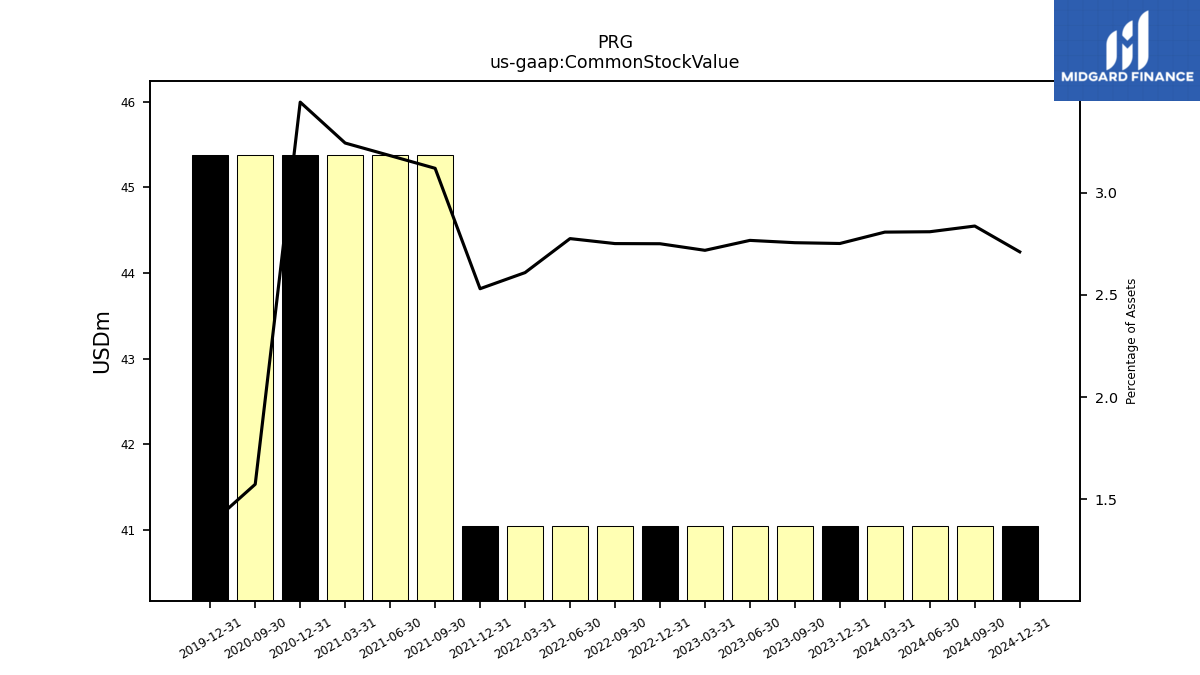
| Common Stock Value | 41.04 | 41.04 | 41.04 | 41.04 | 41.04 | 41.04 | 41.04 | 41.04 | 41.04 | 41.04 | 45.38 | 45.38 | 45.38 | 45.38 | 45.38 | NA | NA | 45.38 | NA | NA | NA | |
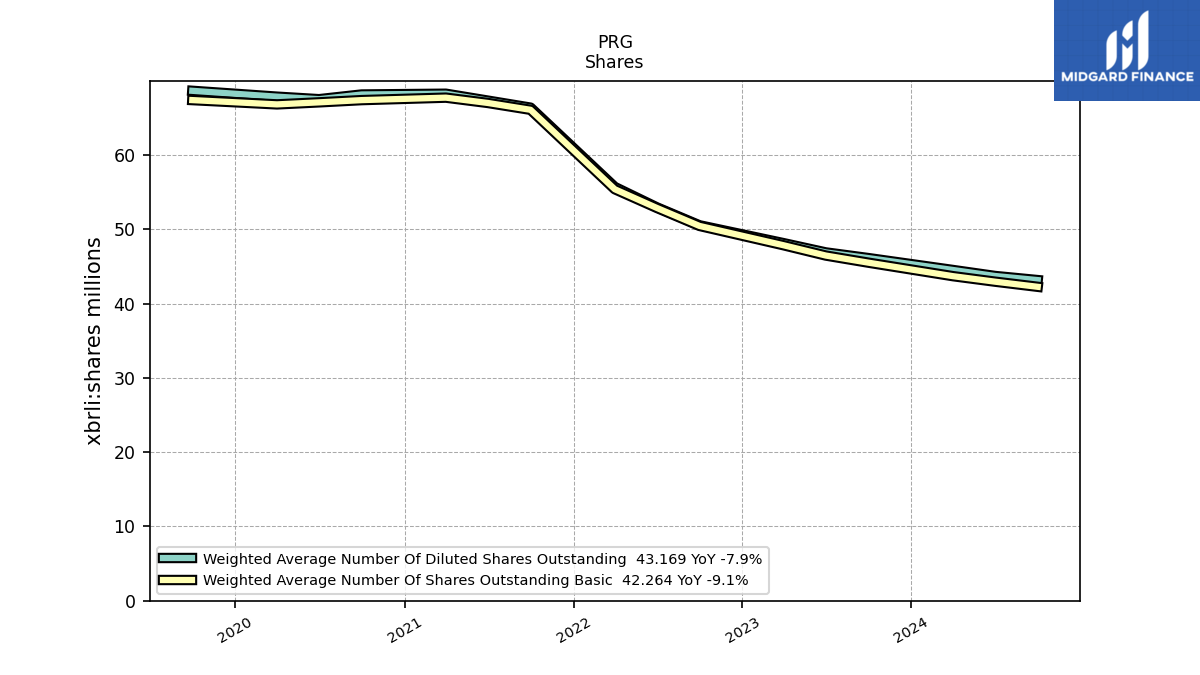
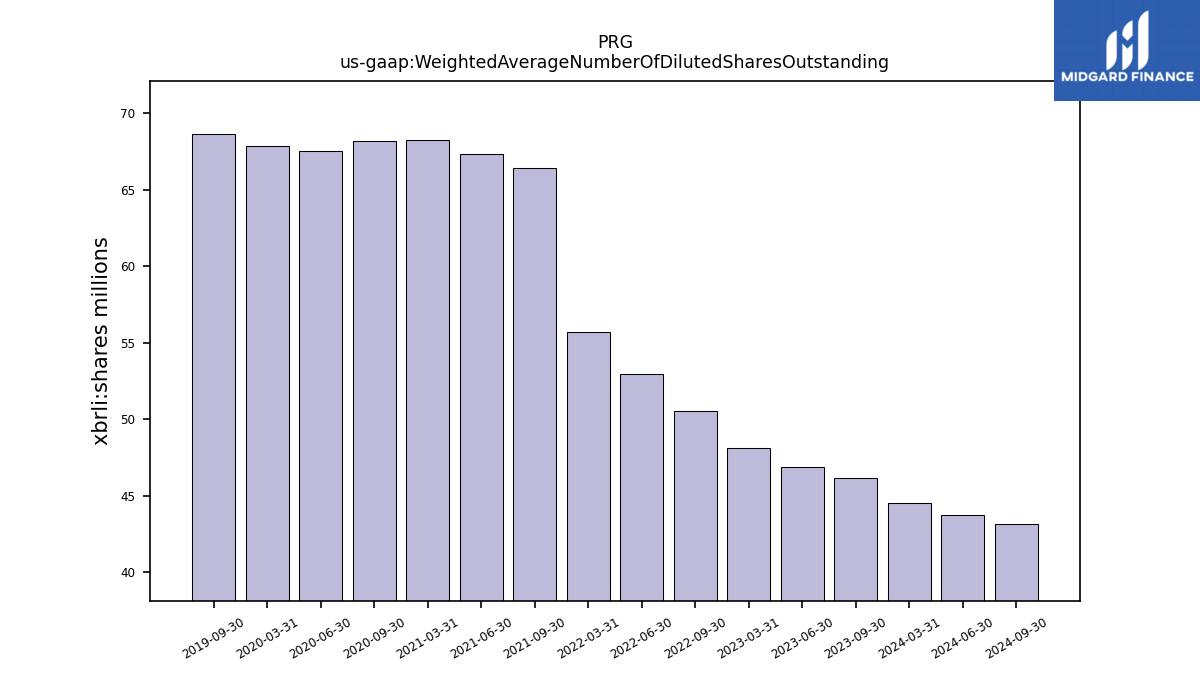
| Weighted Average Number Of Diluted Shares Outstanding | 44.53 | NA | 46.13 | 46.90 | 48.14 | NA | 50.55 | 52.96 | 55.71 | NA | 66.39 | 67.33 | 68.26 | NA | 68.16 | 67.52 | 67.86 | NA | 68.65 | NA | NA | |
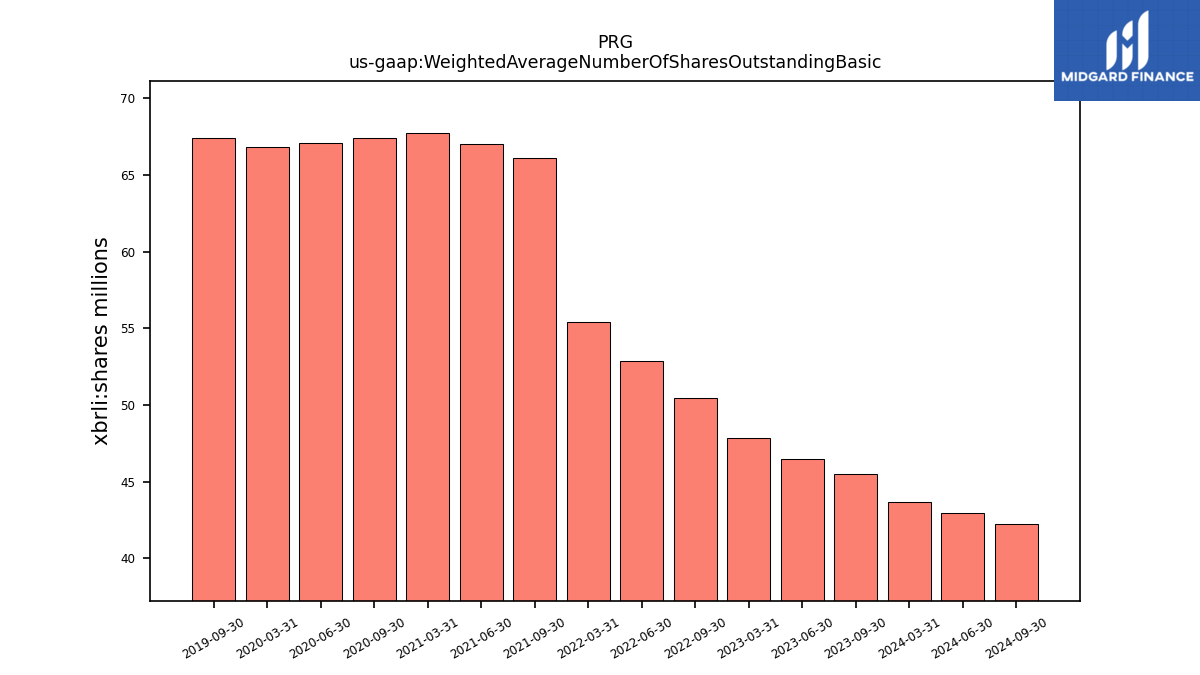
| Weighted Average Number Of Shares Outstanding Basic | 43.70 | NA | 45.52 | 46.47 | 47.85 | NA | 50.46 | 52.88 | 55.40 | NA | 66.09 | 67.01 | 67.73 | NA | 67.40 | 67.10 | 66.82 | NA | 67.40 | NA | NA | |
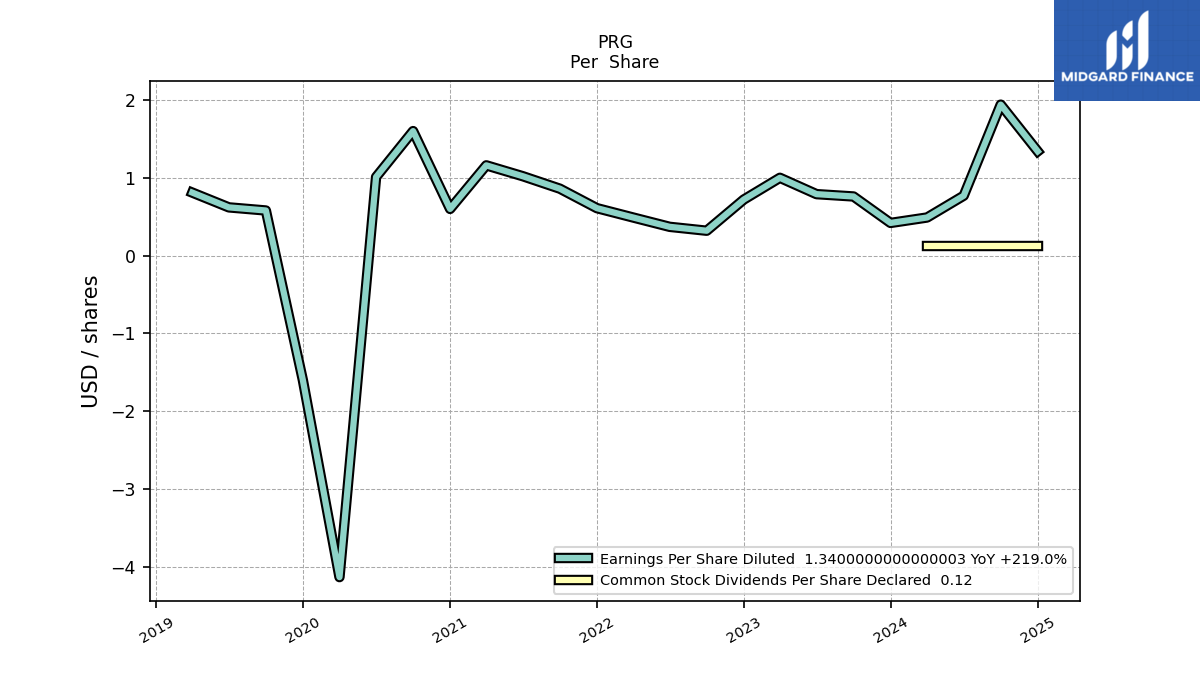
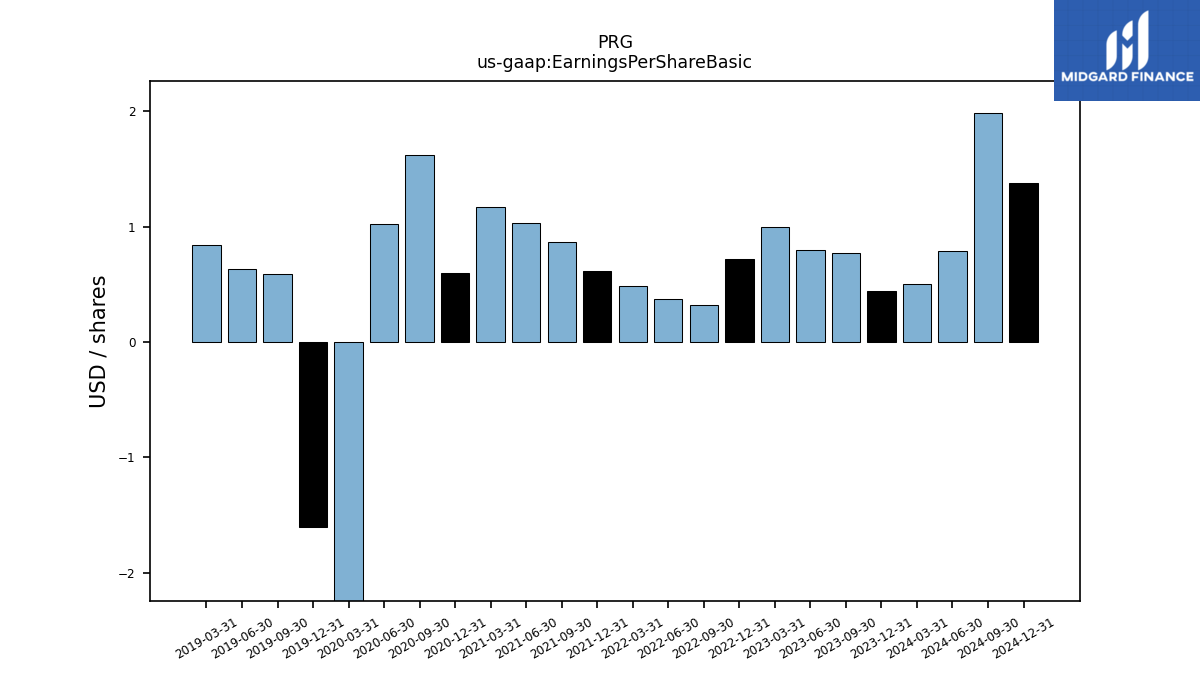
| Earnings Per Share Basic | 0.50 | 0.44 | 0.77 | 0.80 | 1.00 | 0.72 | 0.32 | 0.37 | 0.49 | 0.62 | 0.87 | 1.03 | 1.17 | 0.60 | 1.62 | 1.02 | -4.19 | -1.60 | 0.59 | 0.63 | 0.84 | |
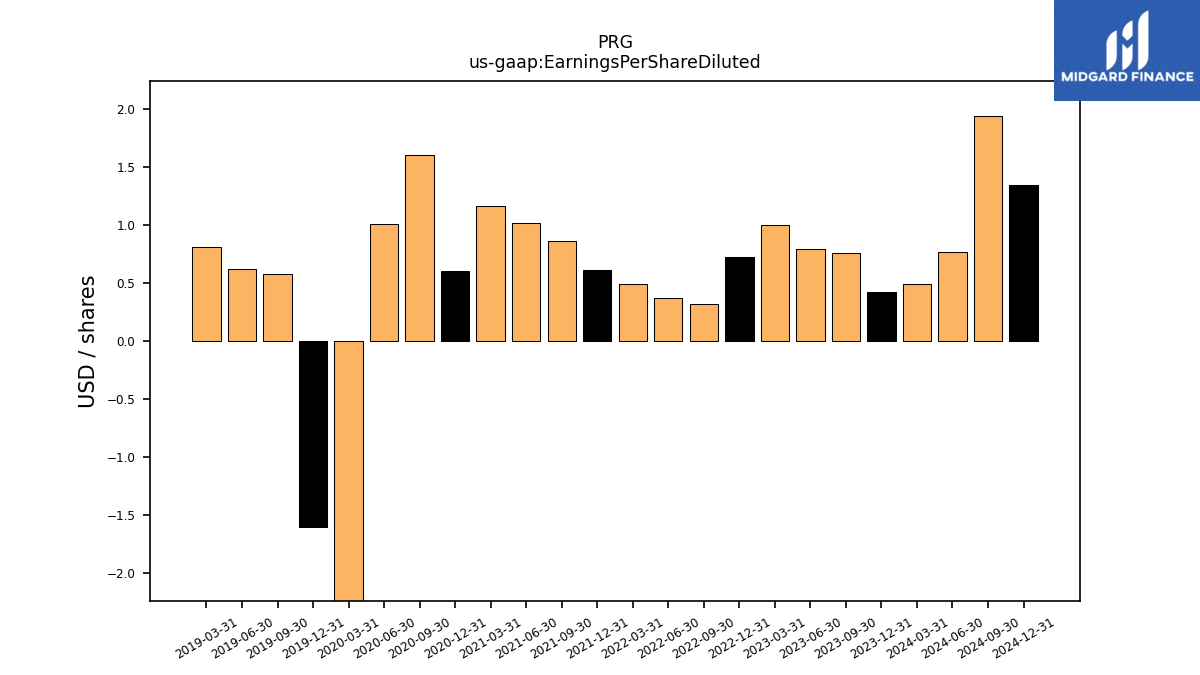
| Earnings Per Share Diluted | 0.49 | 0.42 | 0.76 | 0.79 | 1.00 | 0.72 | 0.32 | 0.37 | 0.49 | 0.61 | 0.86 | 1.02 | 1.16 | 0.60 | 1.60 | 1.01 | -4.13 | -1.60 | 0.58 | 0.62 | 0.81 |
| 2024-03-31 | 2023-12-31 | 2023-09-30 | 2023-06-30 | 2023-03-31 | 2022-12-31 | 2022-09-30 | 2022-06-30 | 2022-03-31 | 2021-12-31 | 2021-09-30 | 2021-06-30 | 2021-03-31 | 2020-12-31 | 2020-09-30 | 2020-06-30 | 2020-03-31 | 2019-12-31 | 2019-09-30 | 2019-06-30 | 2019-03-31 | ||
|---|---|---|---|---|---|---|---|---|---|---|---|---|---|---|---|---|---|---|---|---|---|---|
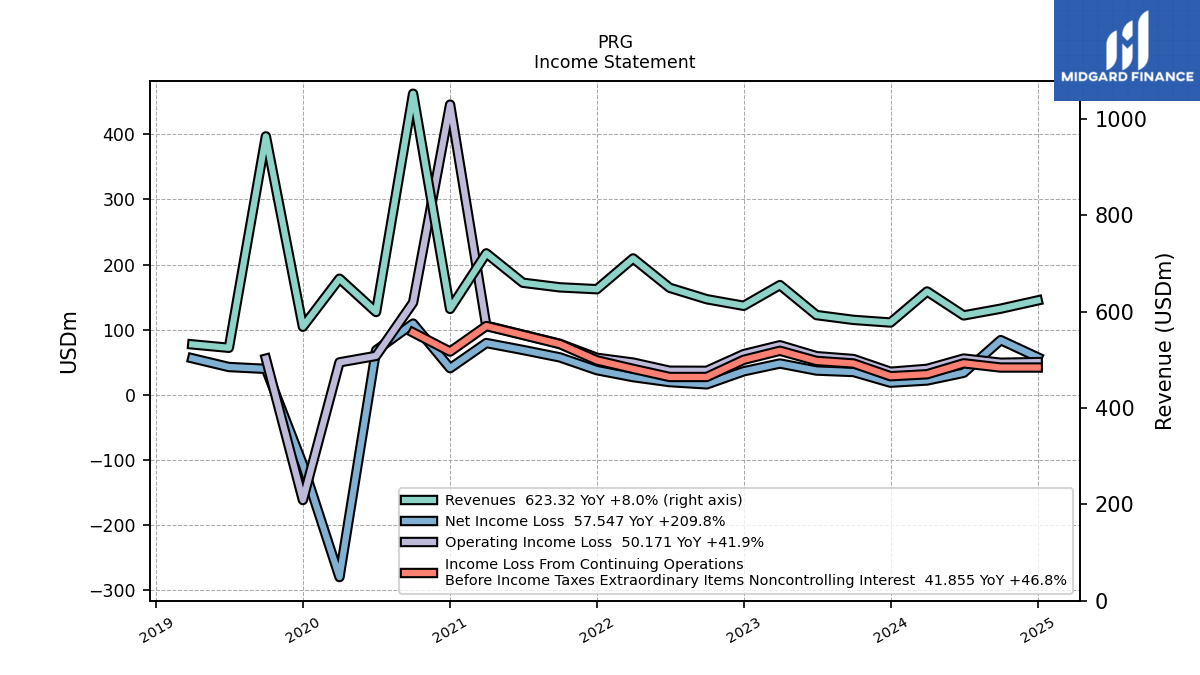
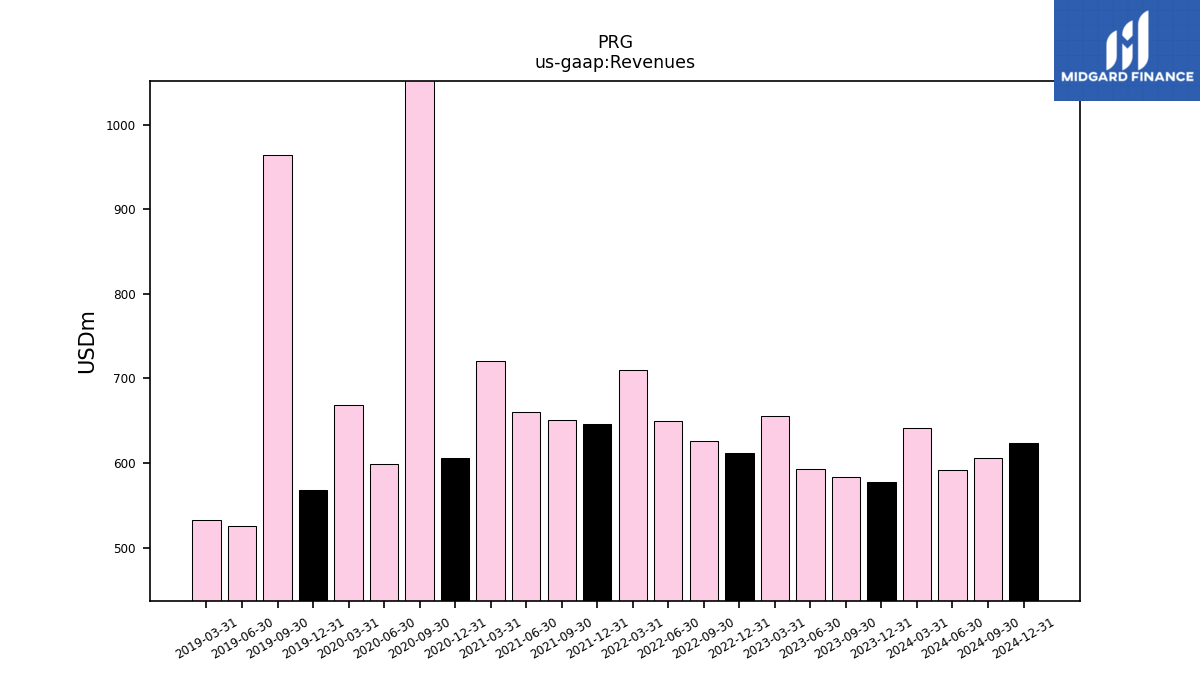
| Revenues | 641.87 | 577.40 | 582.88 | 592.85 | 655.14 | 612.10 | 625.82 | 649.44 | 710.46 | 646.54 | 650.40 | 659.97 | 721.00 | 605.65 | 1052.30 | 599.16 | 668.44 | 568.65 | 963.81 | 524.94 | 532.05 | |
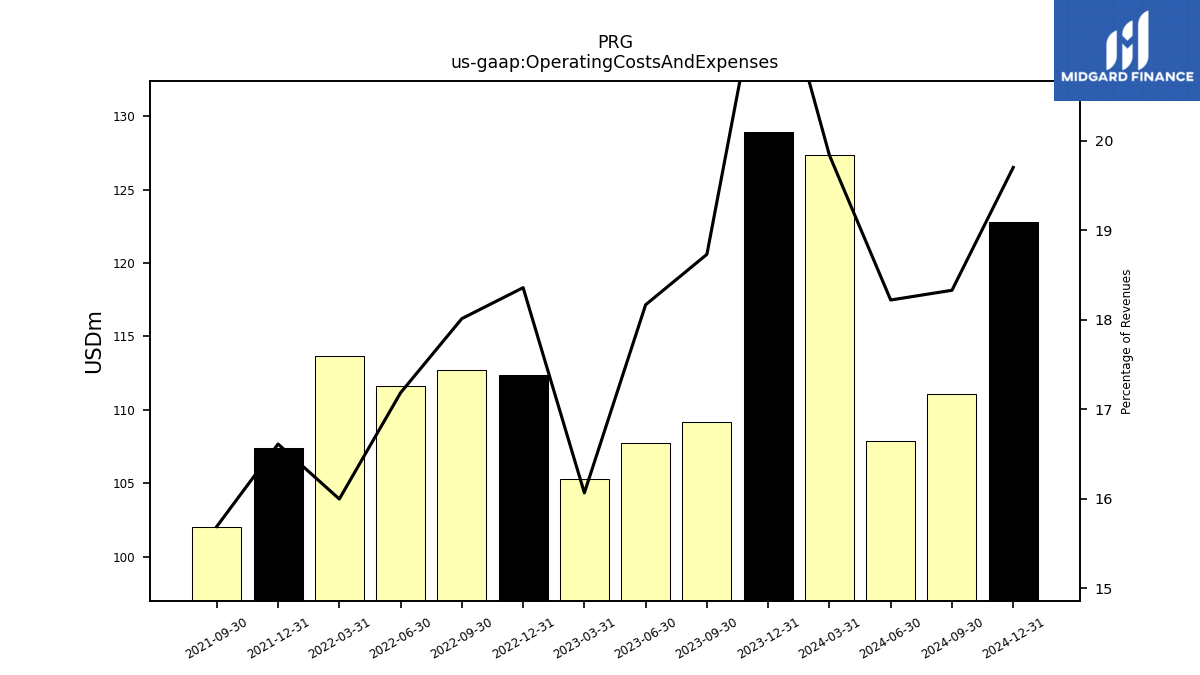
| Operating Costs And Expenses | 127.34 | 128.93 | 109.18 | 107.71 | 105.26 | 112.38 | 112.73 | 111.61 | 113.66 | 107.41 | 102.05 | NA | NA | NA | NA | NA | NA | NA | NA | NA | NA | |
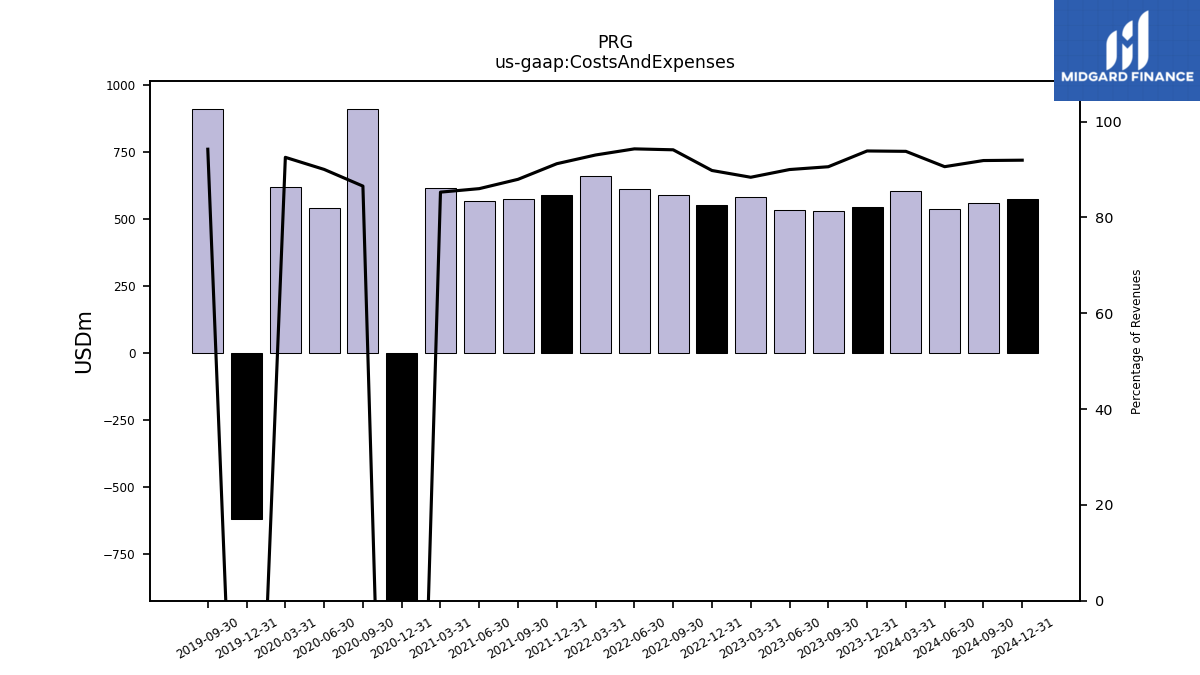
| Costs And Expenses | 602.05 | 542.03 | 527.99 | 533.55 | 579.06 | 549.66 | 589.01 | 612.51 | 661.00 | 589.75 | 572.08 | 567.66 | 614.89 | -1144.70 | 910.68 | 539.40 | 618.62 | -619.28 | 908.30 | NA | NA | |
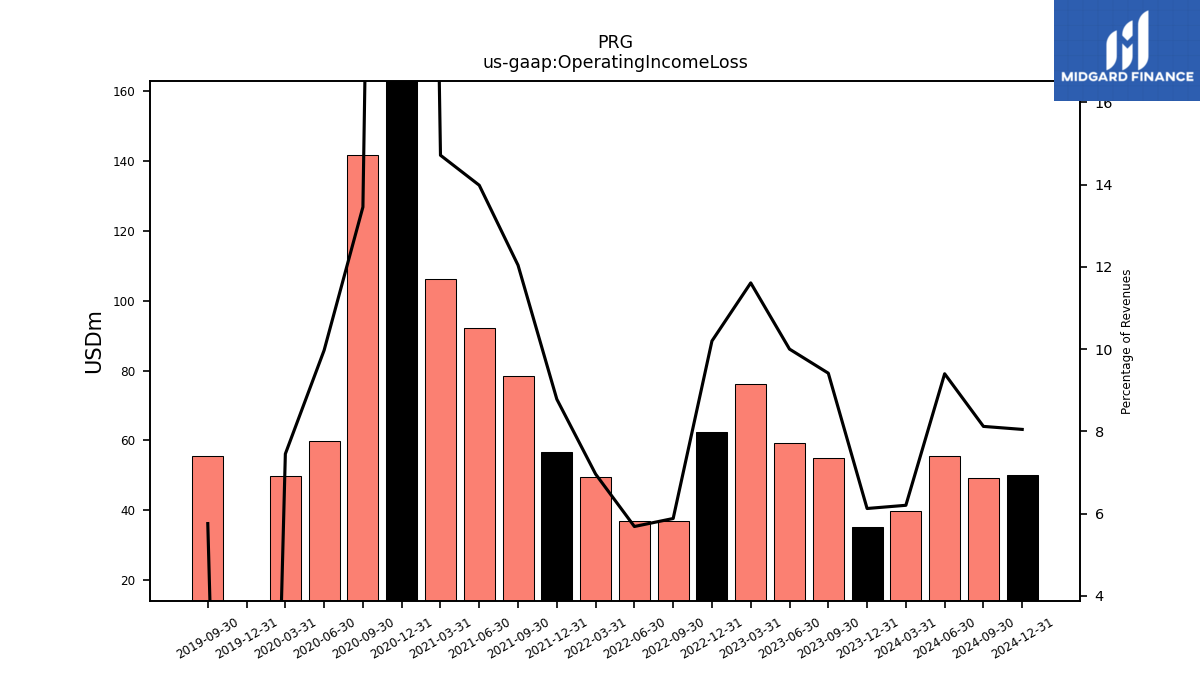
| Operating Income Loss | 39.82 | 35.37 | 54.88 | 59.30 | 76.08 | 62.43 | 36.81 | 36.94 | 49.47 | 56.79 | 78.32 | 92.31 | 106.11 | 445.60 | 141.61 | 59.76 | 49.83 | -161.59 | 55.50 | NA | NA | |
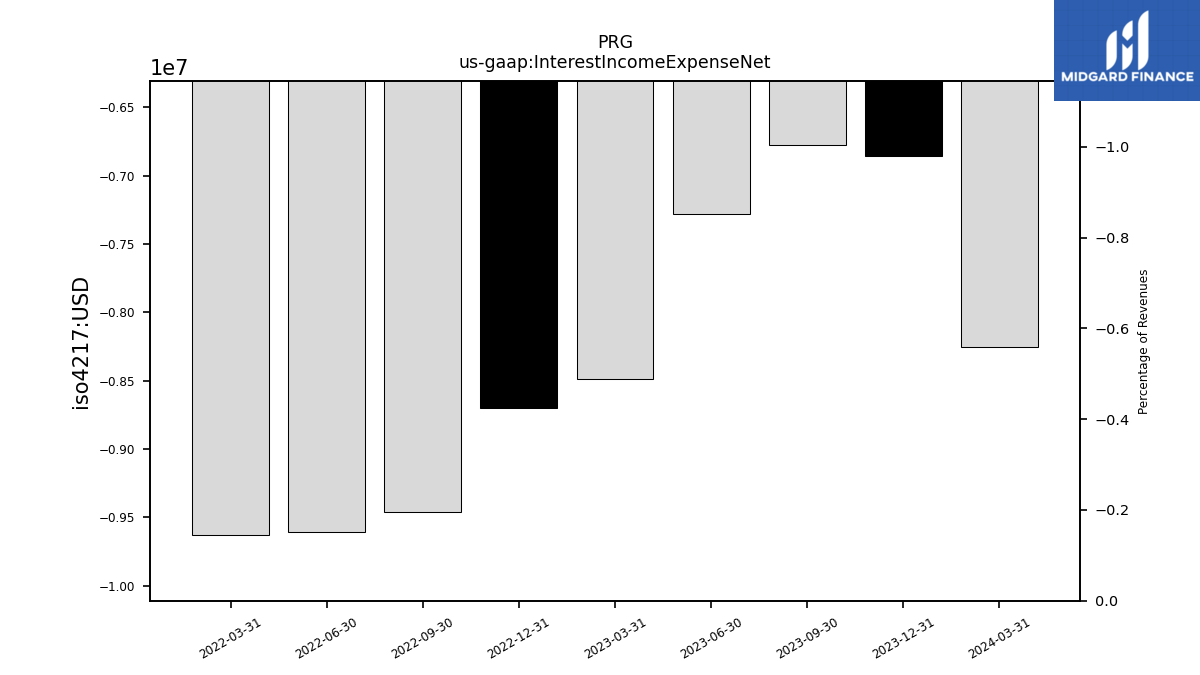
| Interest Income Expense Net | -8.25 | -6.86 | -6.78 | -7.28 | -8.49 | -8.70 | -9.46 | -9.61 | -9.63 | NA | NA | NA | NA | NA | NA | NA | NA | NA | NA | NA | NA | |
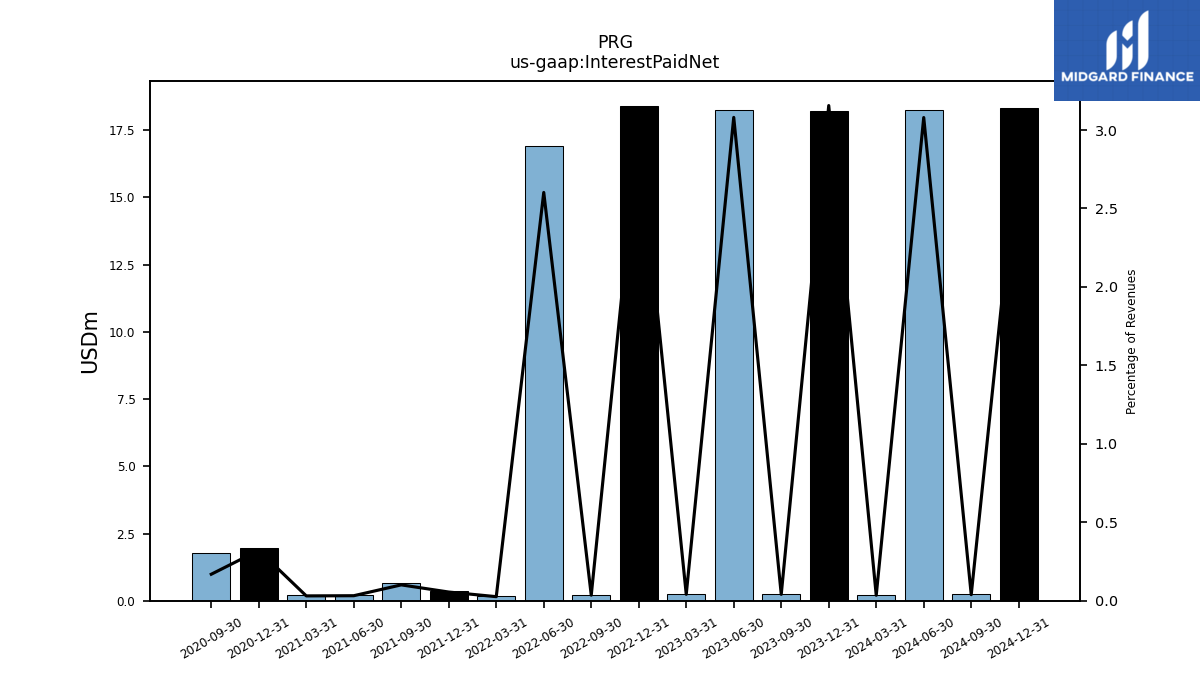
| Interest Paid Net | 0.22 | 18.22 | 0.24 | 18.26 | 0.27 | 18.41 | 0.22 | 16.90 | 0.18 | 0.36 | 0.66 | 0.21 | 0.22 | 1.95 | 1.78 | NA | NA | NA | NA | NA | NA | |
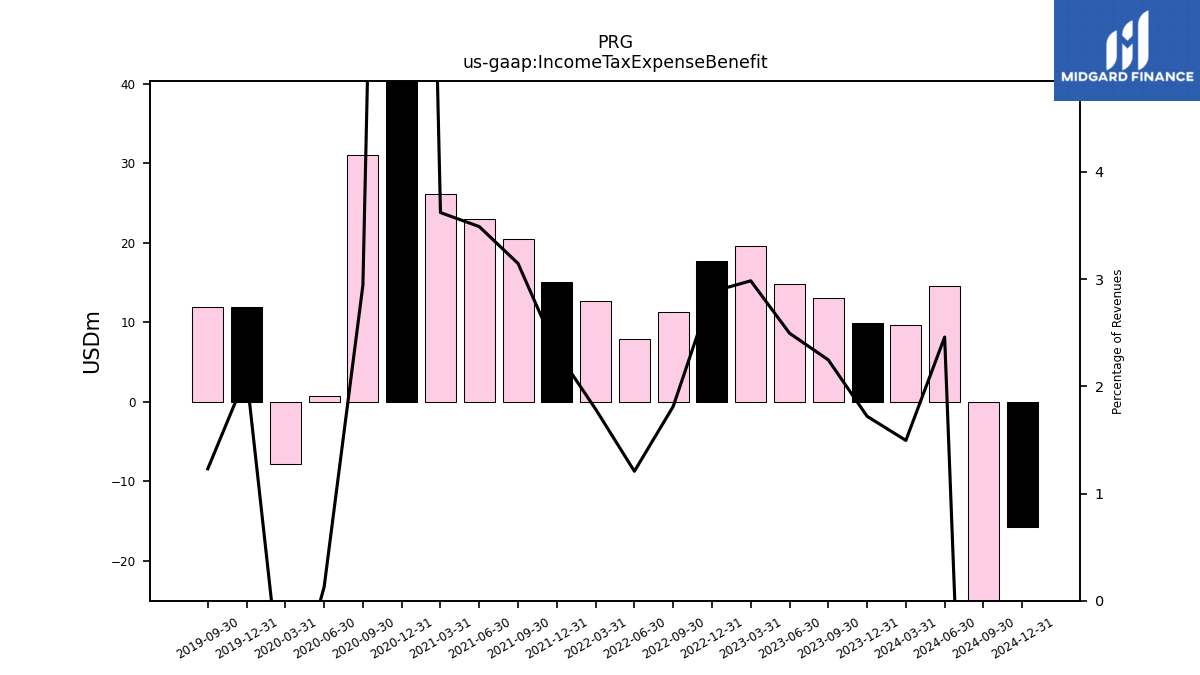
| Income Tax Expense Benefit | 9.60 | 9.94 | 13.10 | 14.80 | 19.55 | 17.65 | 11.34 | 7.84 | 12.70 | 15.04 | 20.46 | 23.04 | 26.11 | 117.25 | 30.99 | 0.77 | -7.86 | 11.96 | 11.86 | NA | NA | |
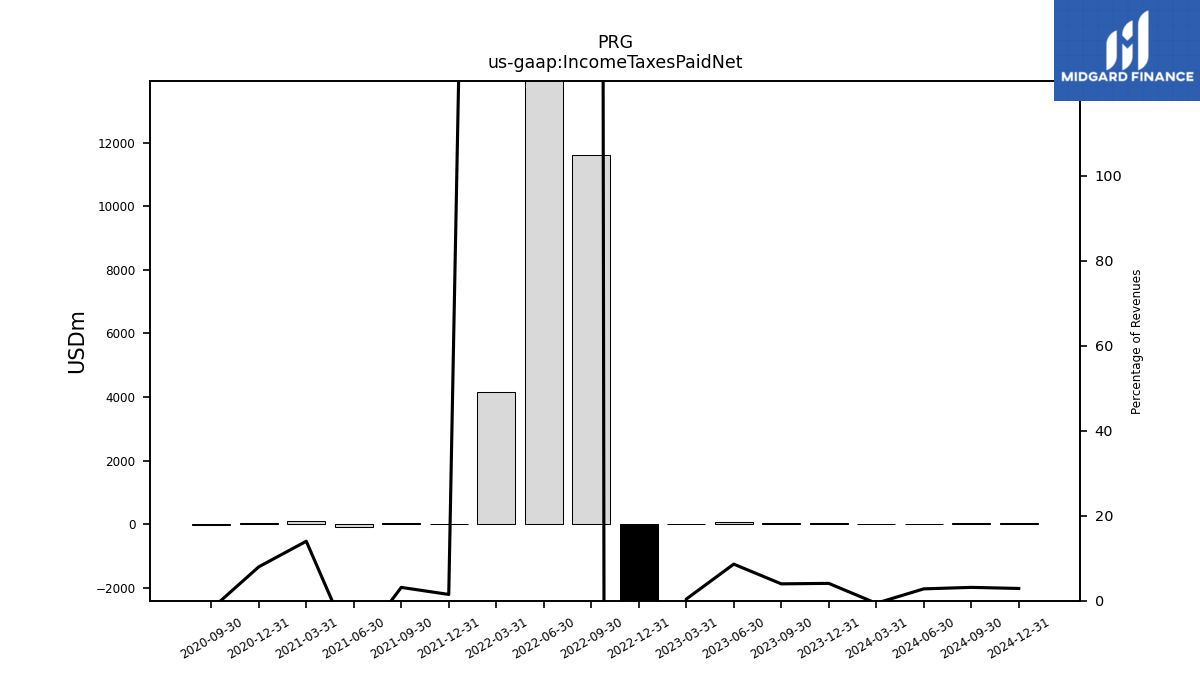
| Income Taxes Paid Net | -3.84 | 23.62 | 23.19 | 51.09 | 2.53 | -31024.83 | 11612.00 | 15318.00 | 4157.00 | 9.62 | 20.45 | -77.46 | 101.00 | 48.36 | -20.80 | NA | NA | NA | NA | NA | NA | |
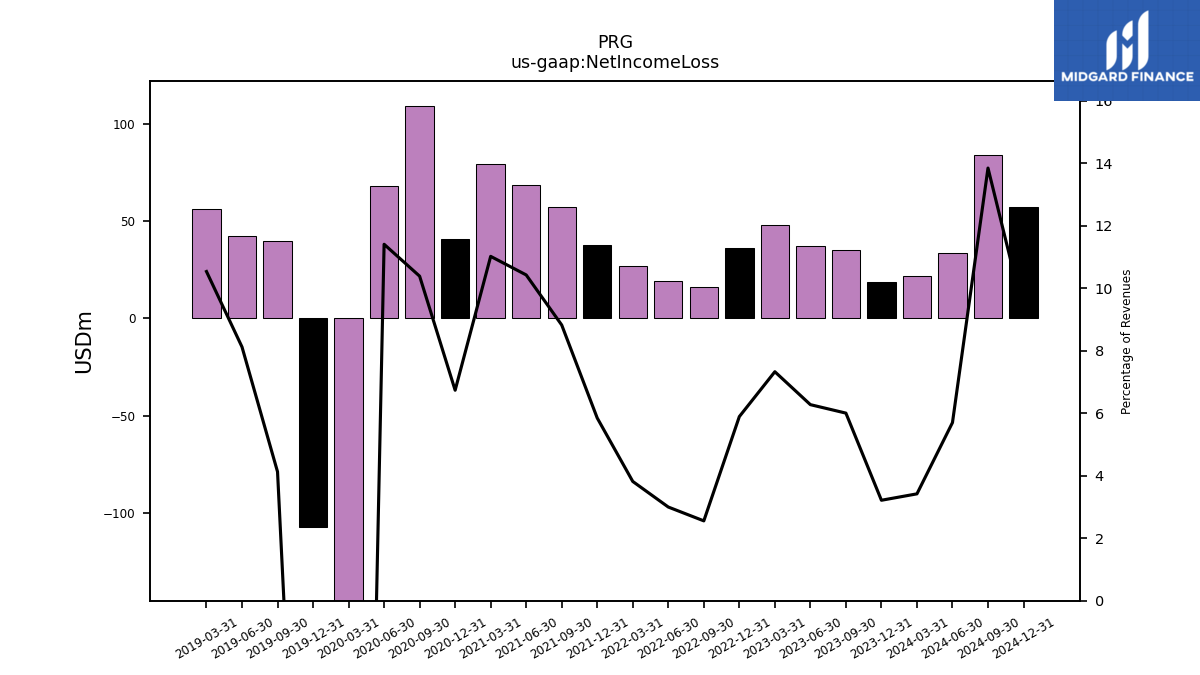
| Net Income Loss | 21.97 | 18.57 | 35.01 | 37.22 | 48.03 | 36.09 | 16.00 | 19.48 | 27.14 | 37.82 | 57.41 | 68.84 | 79.49 | 40.82 | 109.34 | 68.38 | -280.00 | -107.06 | 39.80 | 42.65 | 56.08 |
| 2024-03-31 | 2023-12-31 | 2023-09-30 | 2023-06-30 | 2023-03-31 | 2022-12-31 | 2022-09-30 | 2022-06-30 | 2022-03-31 | 2021-12-31 | 2021-09-30 | 2021-06-30 | 2021-03-31 | 2020-12-31 | 2020-09-30 | 2020-06-30 | 2020-03-31 | 2019-12-31 | 2019-09-30 | 2019-06-30 | 2019-03-31 | ||
|---|---|---|---|---|---|---|---|---|---|---|---|---|---|---|---|---|---|---|---|---|---|---|
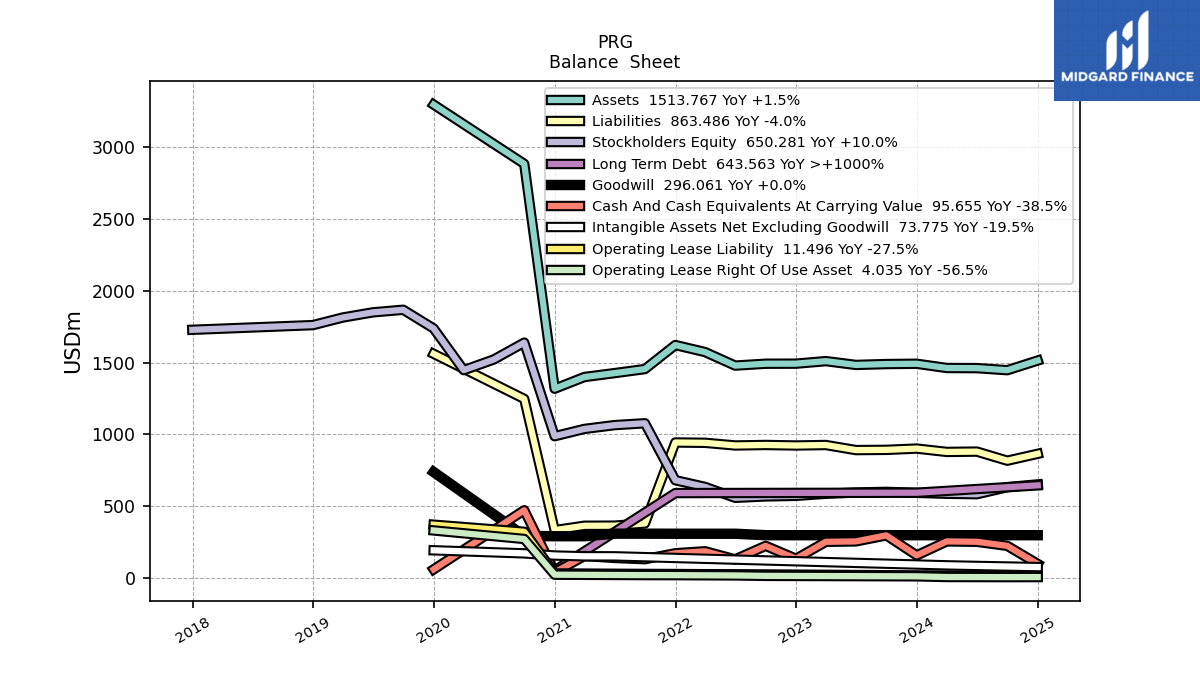
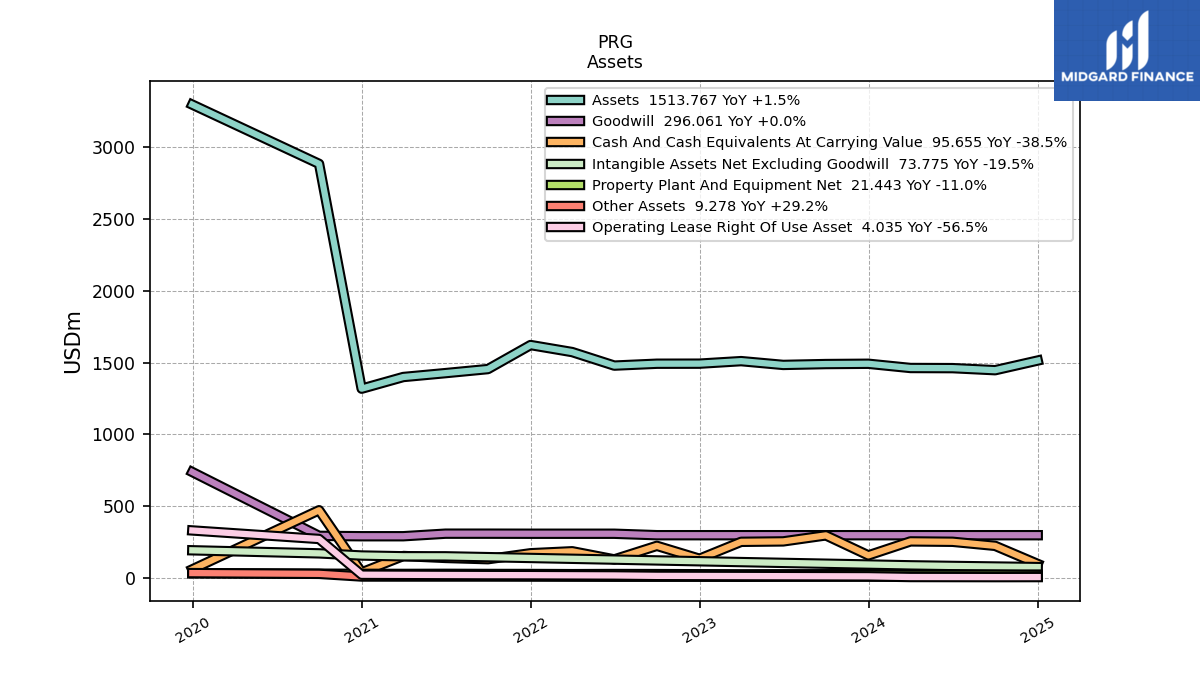
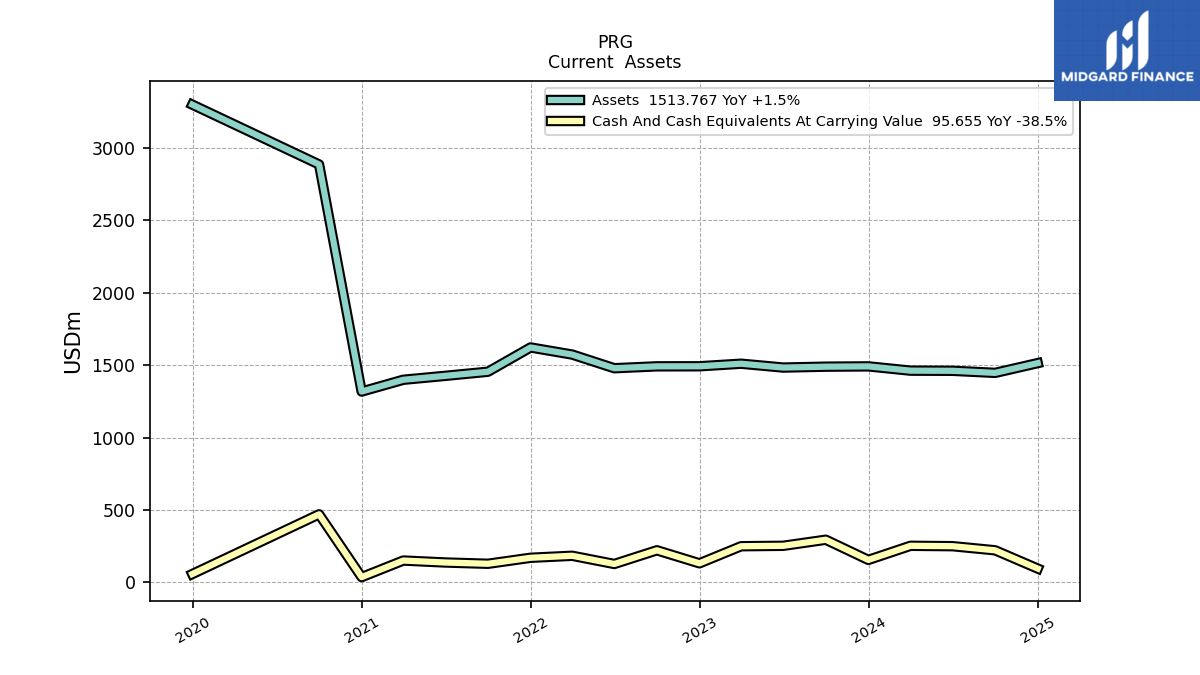
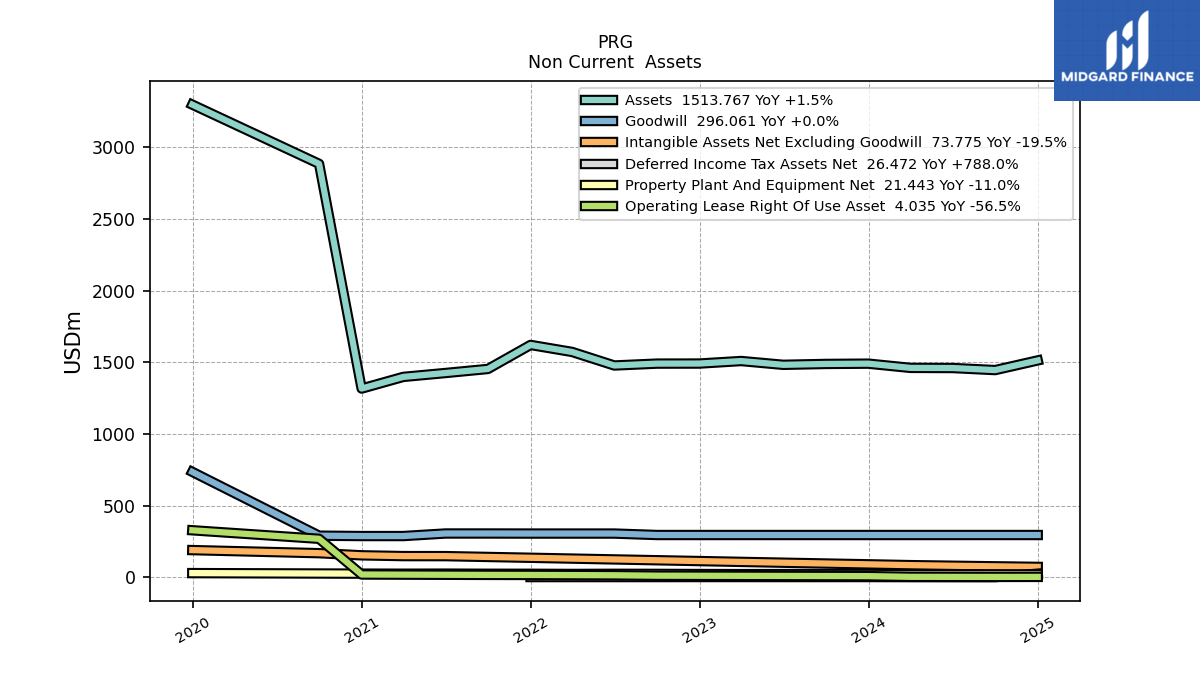
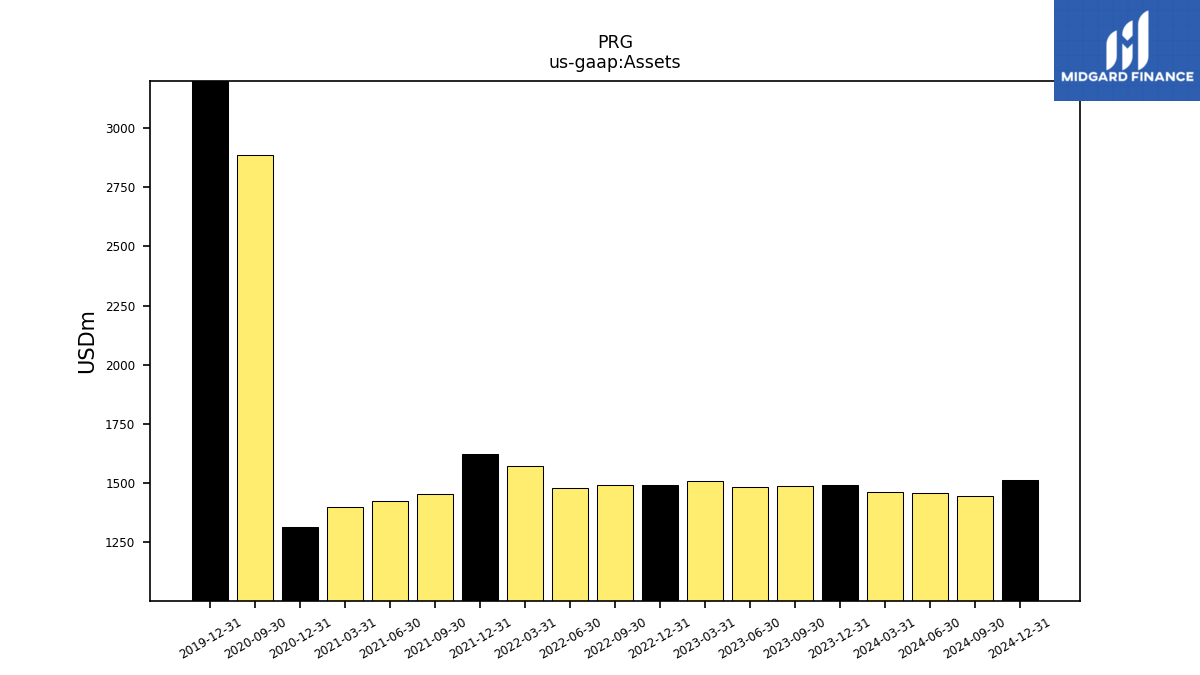
| Assets | 1461.67 | 1491.26 | 1489.16 | 1483.06 | 1509.59 | 1491.91 | 1491.49 | 1478.39 | 1572.72 | 1621.76 | 1454.26 | 1425.92 | 1398.80 | 1317.40 | 2884.93 | NA | NA | 3297.80 | NA | NA | NA | |
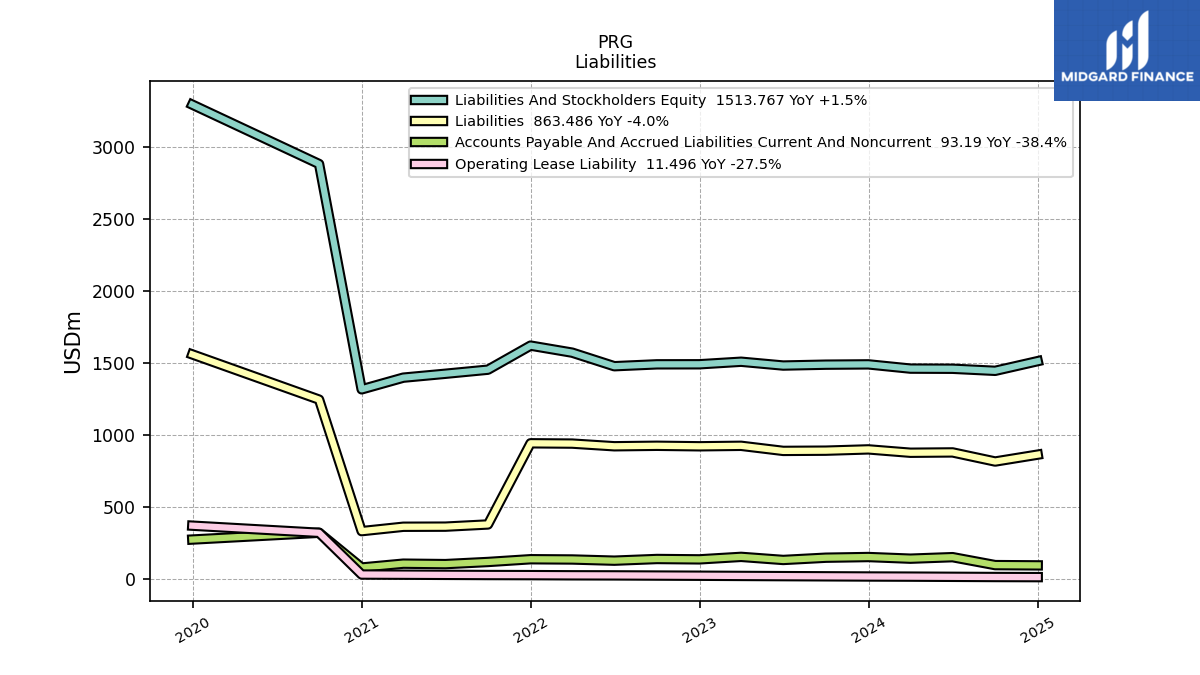
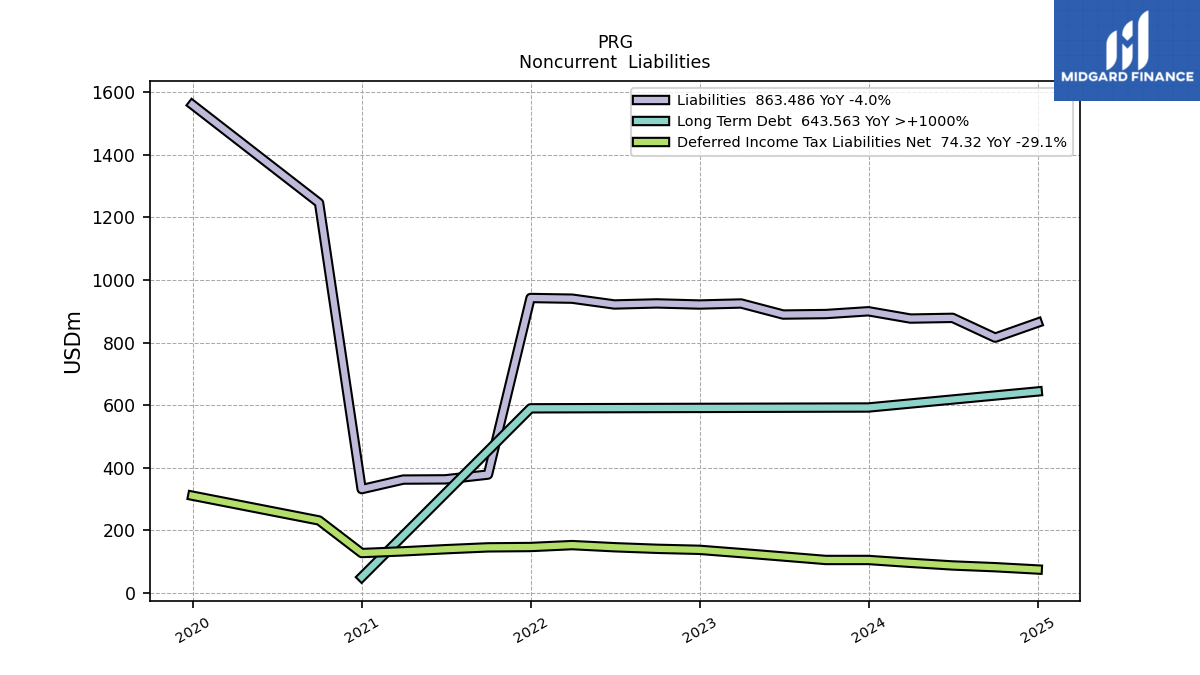
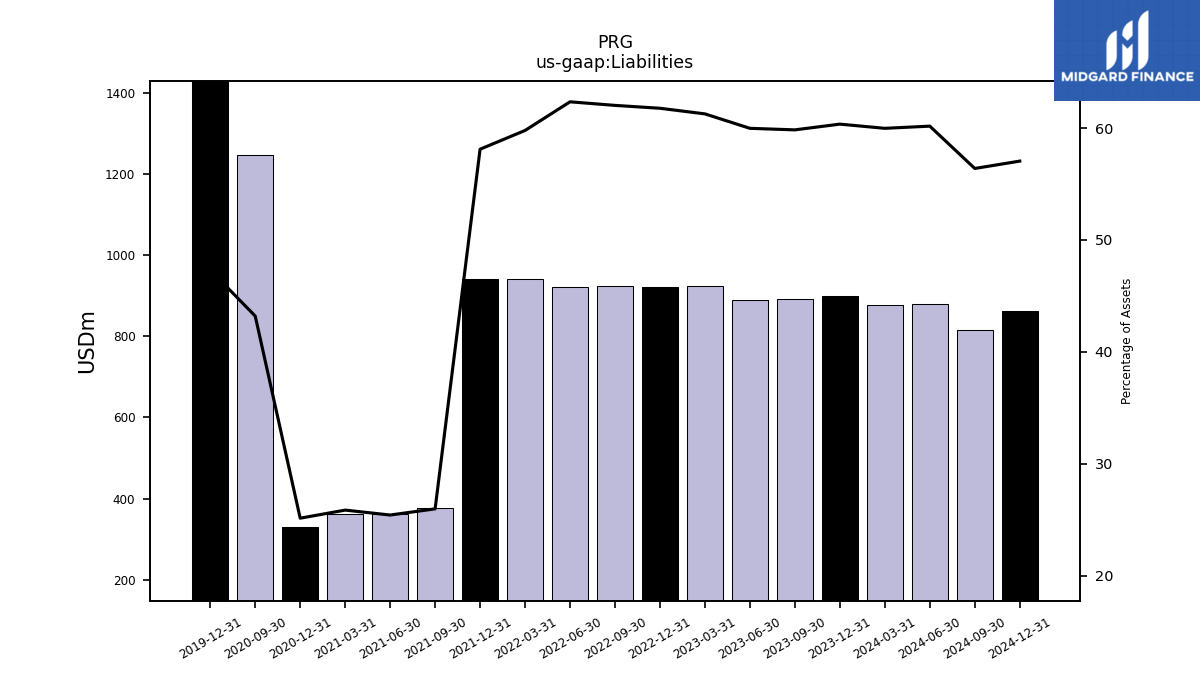
| Liabilities | 876.58 | 899.92 | 891.02 | 889.41 | 924.79 | 921.45 | 925.03 | 921.62 | 940.19 | 942.35 | 377.80 | 362.58 | 361.84 | 331.27 | 1246.25 | NA | NA | 1560.54 | NA | NA | NA | |
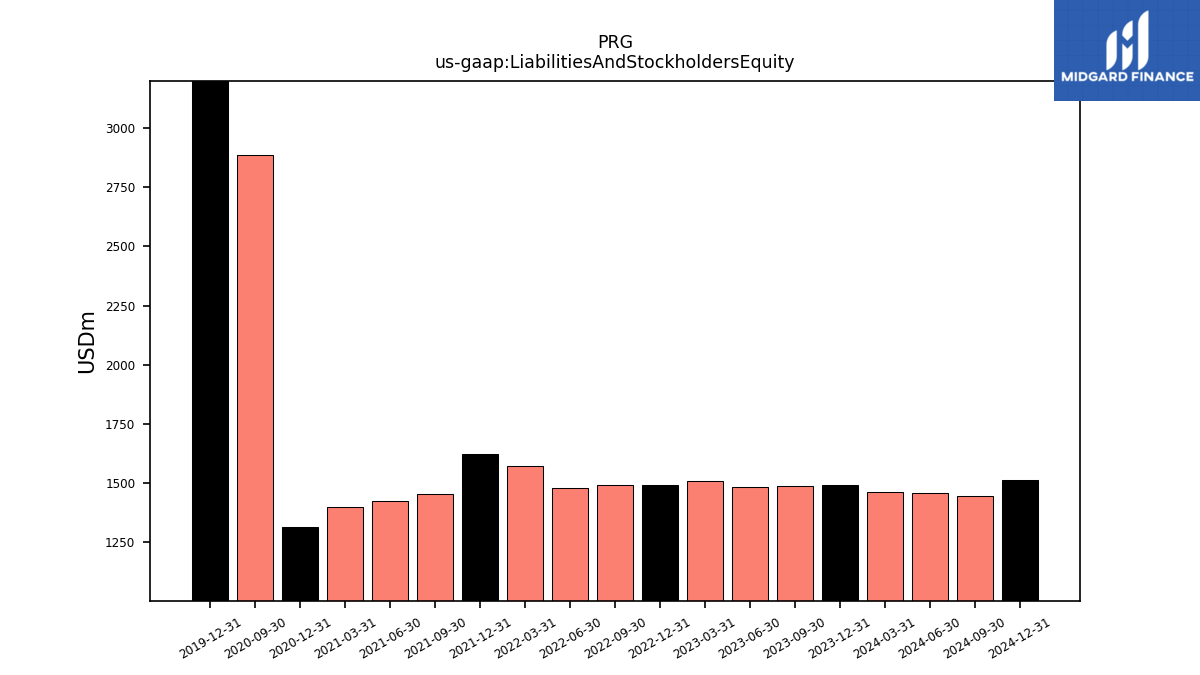
| Liabilities And Stockholders Equity | 1461.67 | 1491.26 | 1489.16 | 1483.06 | 1509.59 | 1491.91 | 1491.49 | 1478.39 | 1572.72 | 1621.76 | 1454.26 | 1425.92 | 1398.80 | 1317.40 | 2884.93 | NA | NA | 3297.80 | NA | NA | NA | |
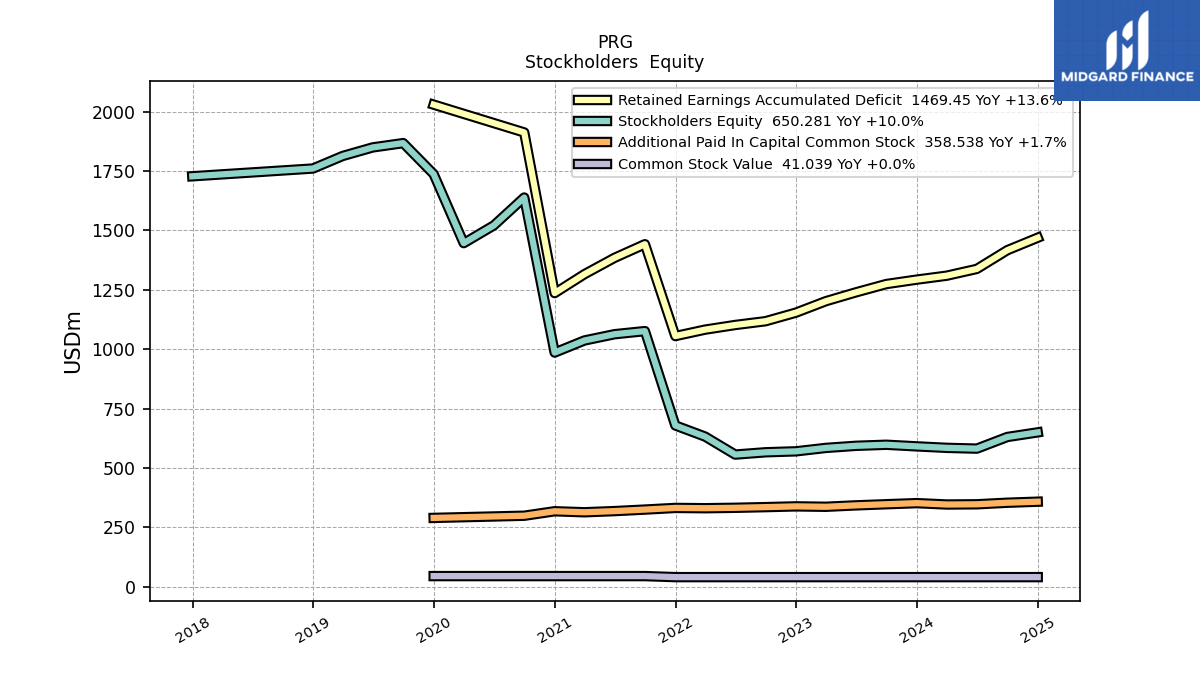
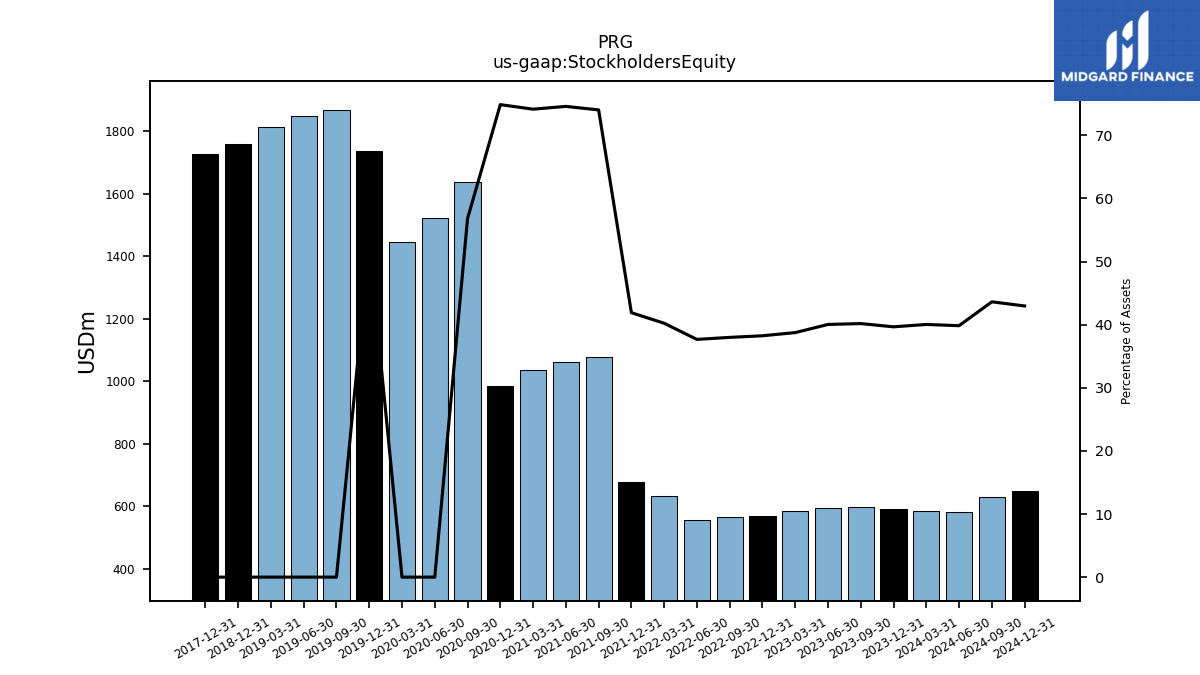
| Stockholders Equity | 585.09 | 591.33 | 598.14 | 593.65 | 584.79 | 570.46 | 566.46 | 556.77 | 632.53 | 679.41 | 1076.46 | 1063.34 | 1036.96 | 986.14 | 1638.68 | 1521.20 | 1446.61 | 1737.26 | 1867.65 | 1849.56 | 1813.51 |
| 2024-03-31 | 2023-12-31 | 2023-09-30 | 2023-06-30 | 2023-03-31 | 2022-12-31 | 2022-09-30 | 2022-06-30 | 2022-03-31 | 2021-12-31 | 2021-09-30 | 2021-06-30 | 2021-03-31 | 2020-12-31 | 2020-09-30 | 2020-06-30 | 2020-03-31 | 2019-12-31 | 2019-09-30 | 2019-06-30 | 2019-03-31 | ||
|---|---|---|---|---|---|---|---|---|---|---|---|---|---|---|---|---|---|---|---|---|---|---|
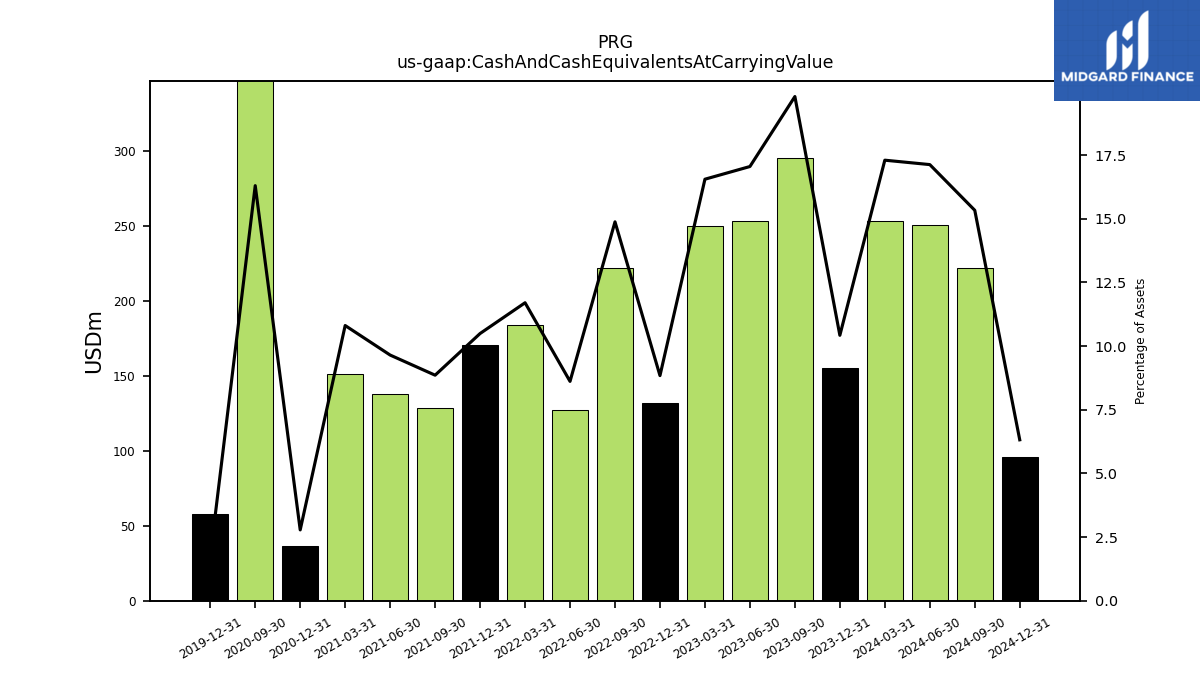
| Cash And Cash Equivalents At Carrying Value | 252.83 | 155.42 | 294.79 | 252.84 | 249.84 | 131.88 | 221.89 | 127.34 | 184.01 | 170.16 | 128.79 | 137.55 | 151.15 | 36.65 | 470.17 | NA | NA | 57.76 | NA | NA | NA | |
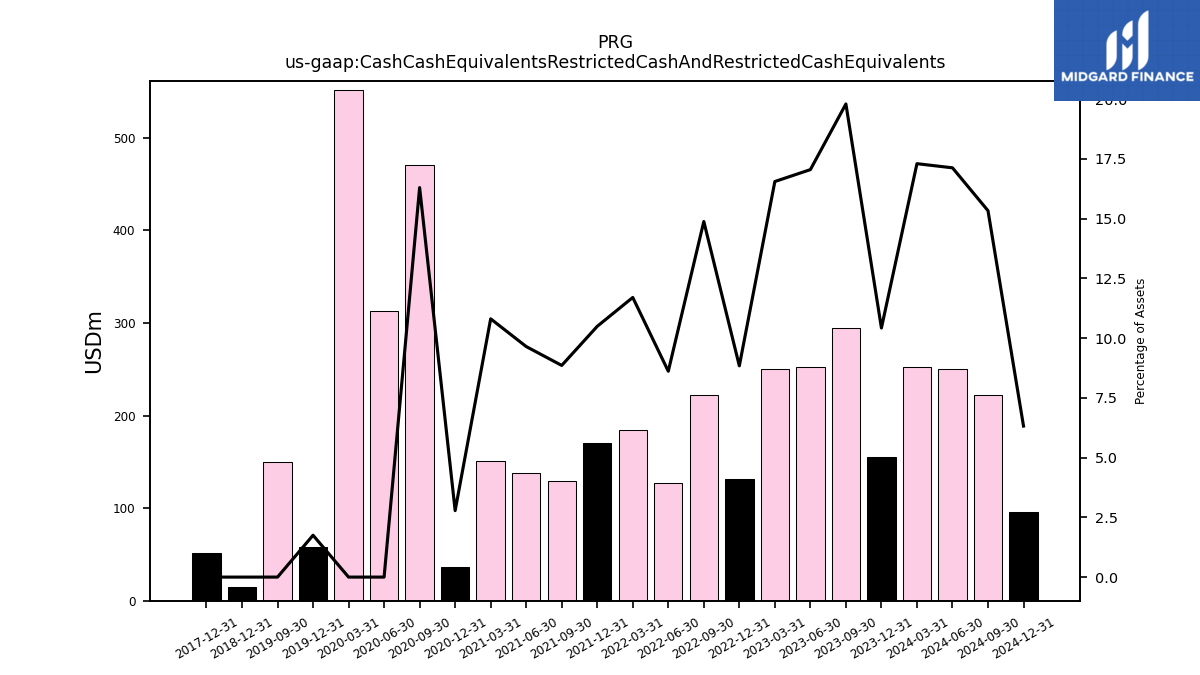
| Cash Cash Equivalents Restricted Cash And Restricted Cash Equivalents | 252.83 | 155.42 | 294.79 | 252.84 | 249.84 | 131.88 | 221.89 | 127.34 | 184.01 | 170.16 | 128.79 | 137.55 | 151.15 | 36.65 | 470.17 | 313.06 | 551.02 | 57.76 | 150.26 | NA | NA |
| 2024-03-31 | 2023-12-31 | 2023-09-30 | 2023-06-30 | 2023-03-31 | 2022-12-31 | 2022-09-30 | 2022-06-30 | 2022-03-31 | 2021-12-31 | 2021-09-30 | 2021-06-30 | 2021-03-31 | 2020-12-31 | 2020-09-30 | 2020-06-30 | 2020-03-31 | 2019-12-31 | 2019-09-30 | 2019-06-30 | 2019-03-31 | ||
|---|---|---|---|---|---|---|---|---|---|---|---|---|---|---|---|---|---|---|---|---|---|---|
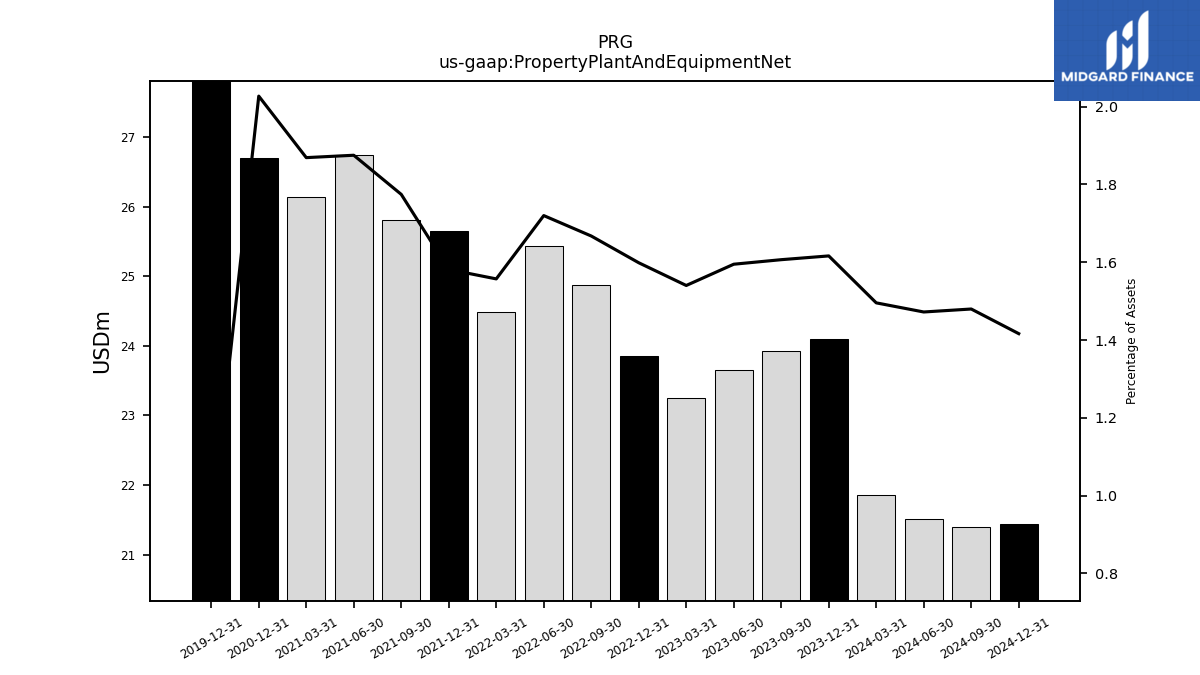
| Property Plant And Equipment Net | 21.86 | 24.10 | 23.93 | 23.66 | 23.25 | 23.85 | 24.87 | 25.43 | 24.49 | 25.65 | 25.81 | 26.74 | 26.14 | 26.70 | NA | NA | NA | 30.36 | NA | NA | NA | |
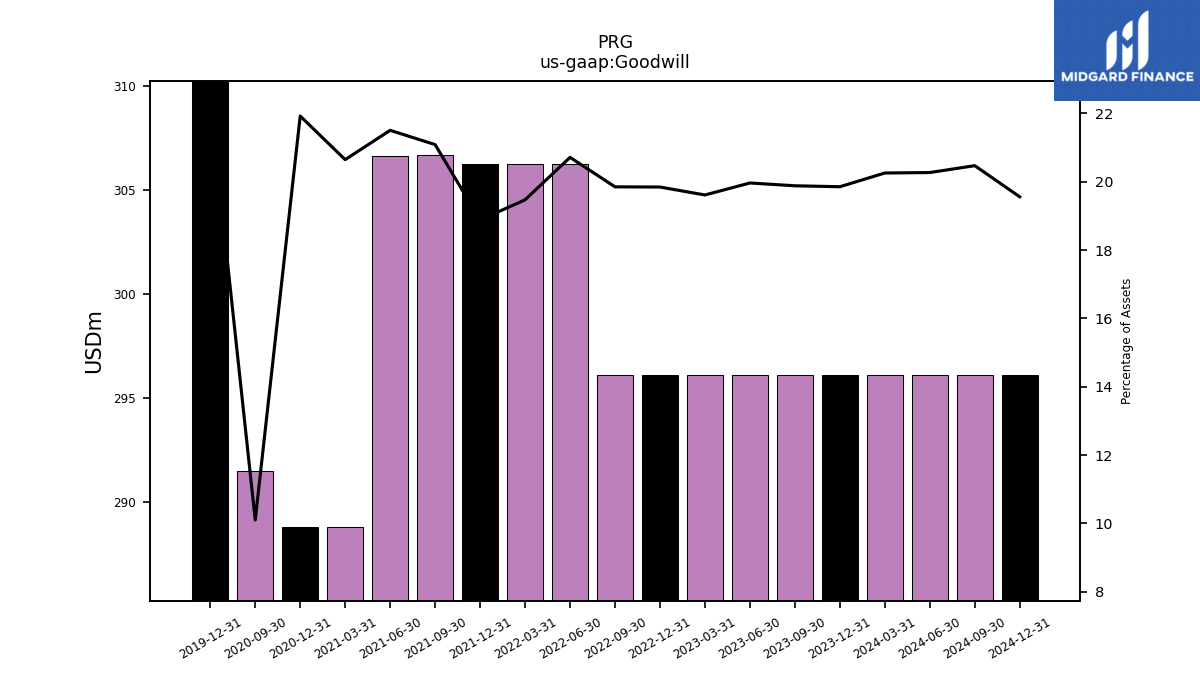
| Goodwill | 296.06 | 296.06 | 296.06 | 296.06 | 296.06 | 296.06 | 296.06 | 306.21 | 306.21 | 306.21 | 306.65 | 306.63 | 288.80 | 288.80 | 291.45 | NA | NA | 736.58 | NA | NA | NA | |
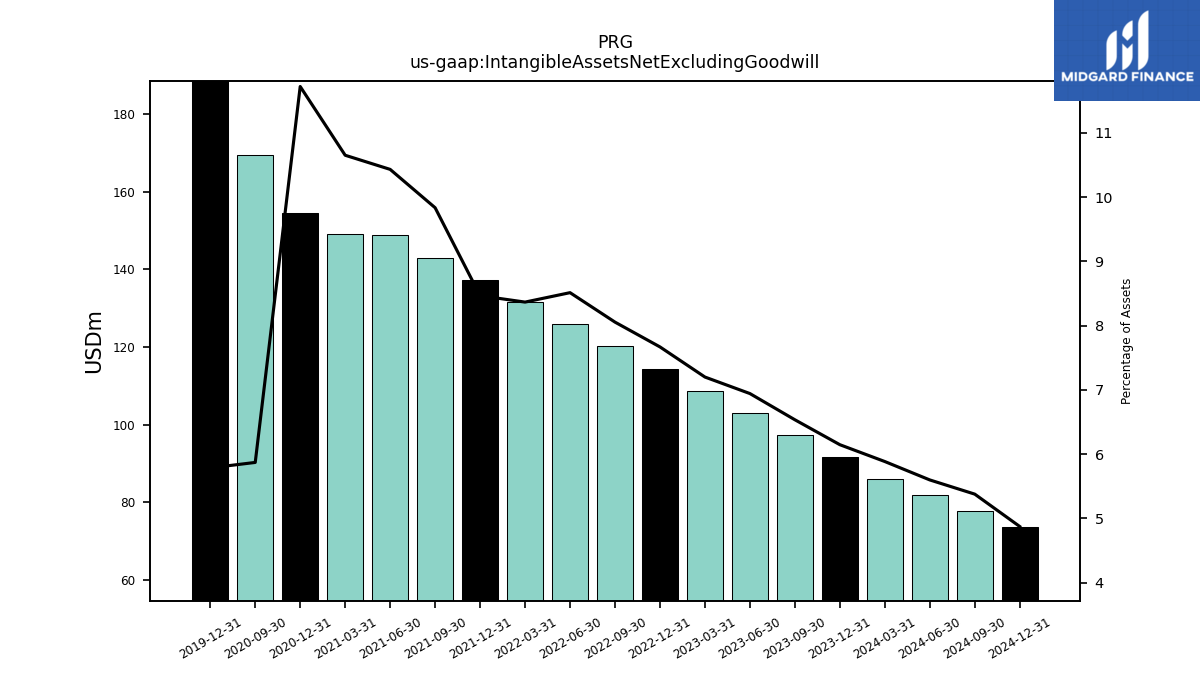
| Intangible Assets Net Excluding Goodwill | 86.01 | 91.66 | 97.31 | 102.96 | 108.69 | 114.41 | 120.14 | 125.86 | 131.58 | 137.31 | 143.03 | 148.75 | 149.00 | 154.42 | 169.37 | NA | NA | 190.80 | NA | NA | NA | |
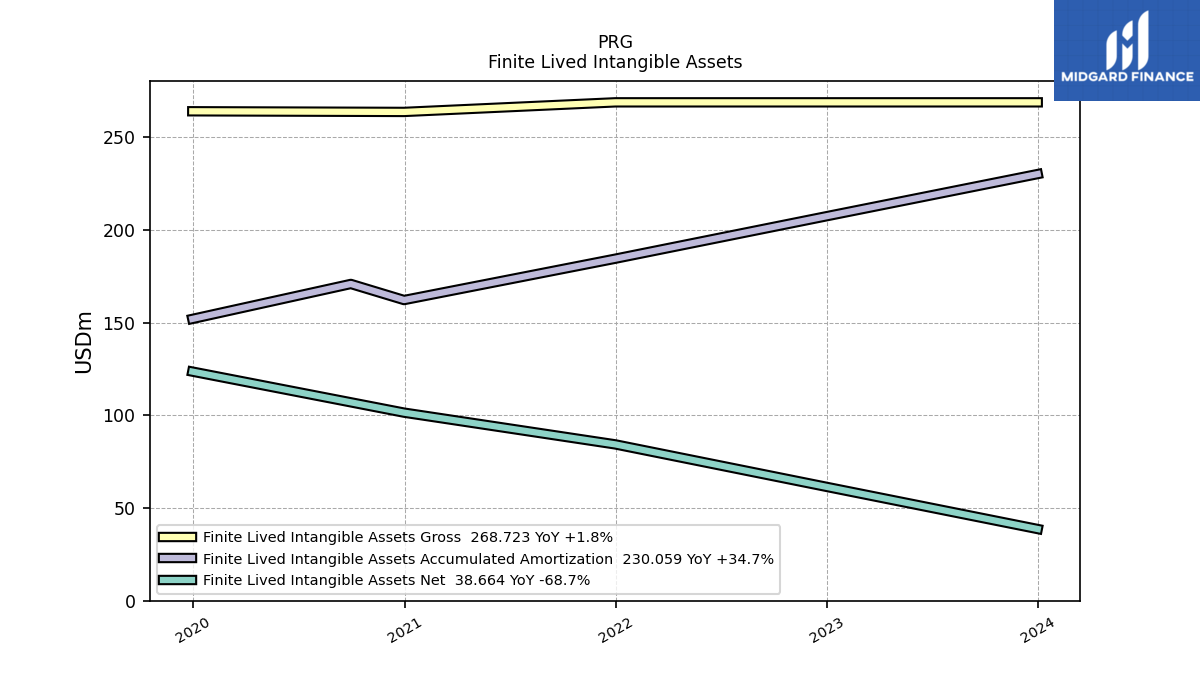
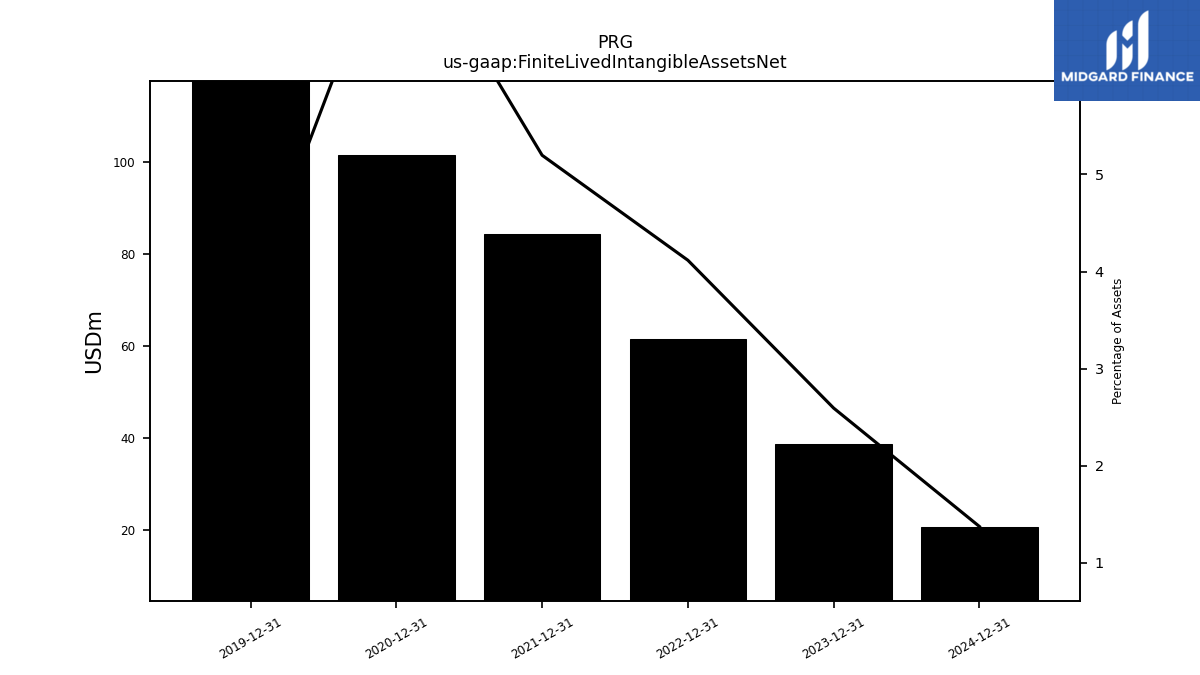
| Finite Lived Intangible Assets Net | NA | 38.66 | NA | NA | NA | 61.41 | NA | NA | NA | 84.31 | NA | NA | NA | 101.42 | NA | NA | NA | 123.56 | NA | NA | NA |
| 2024-03-31 | 2023-12-31 | 2023-09-30 | 2023-06-30 | 2023-03-31 | 2022-12-31 | 2022-09-30 | 2022-06-30 | 2022-03-31 | 2021-12-31 | 2021-09-30 | 2021-06-30 | 2021-03-31 | 2020-12-31 | 2020-09-30 | 2020-06-30 | 2020-03-31 | 2019-12-31 | 2019-09-30 | 2019-06-30 | 2019-03-31 | ||
|---|---|---|---|---|---|---|---|---|---|---|---|---|---|---|---|---|---|---|---|---|---|---|
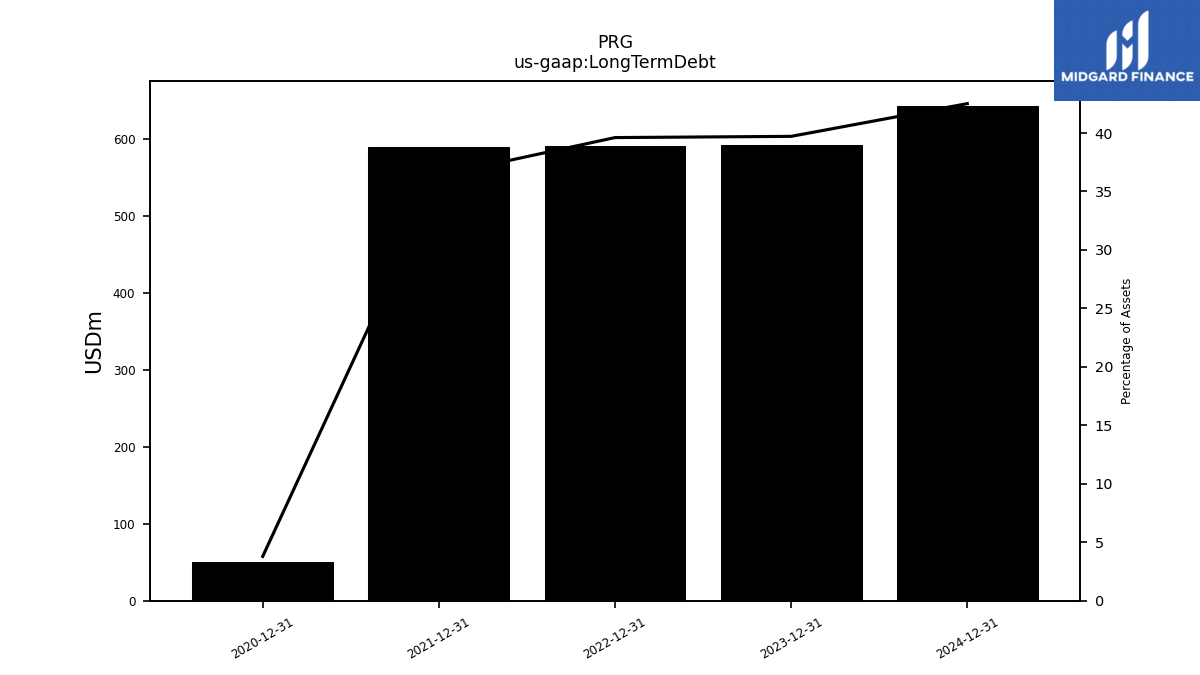
| Long Term Debt | NA | 592.26 | NA | NA | NA | 590.97 | NA | NA | NA | 589.65 | NA | NA | NA | 50.00 | NA | NA | NA | NA | NA | NA | NA | |
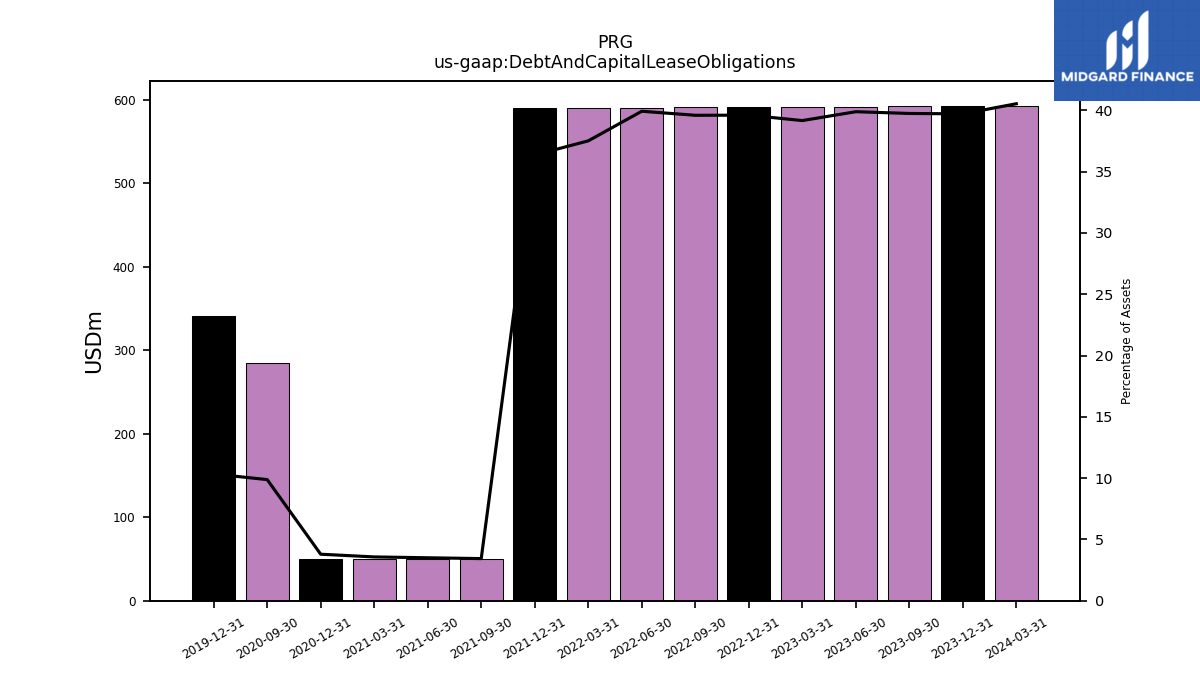
| Debt And Capital Lease Obligations | 592.59 | 592.26 | 591.94 | 591.62 | 591.29 | 590.97 | 590.64 | 590.32 | 589.99 | 589.65 | 50.00 | 50.00 | 50.00 | 50.00 | 285.12 | NA | NA | 341.03 | NA | NA | NA | |
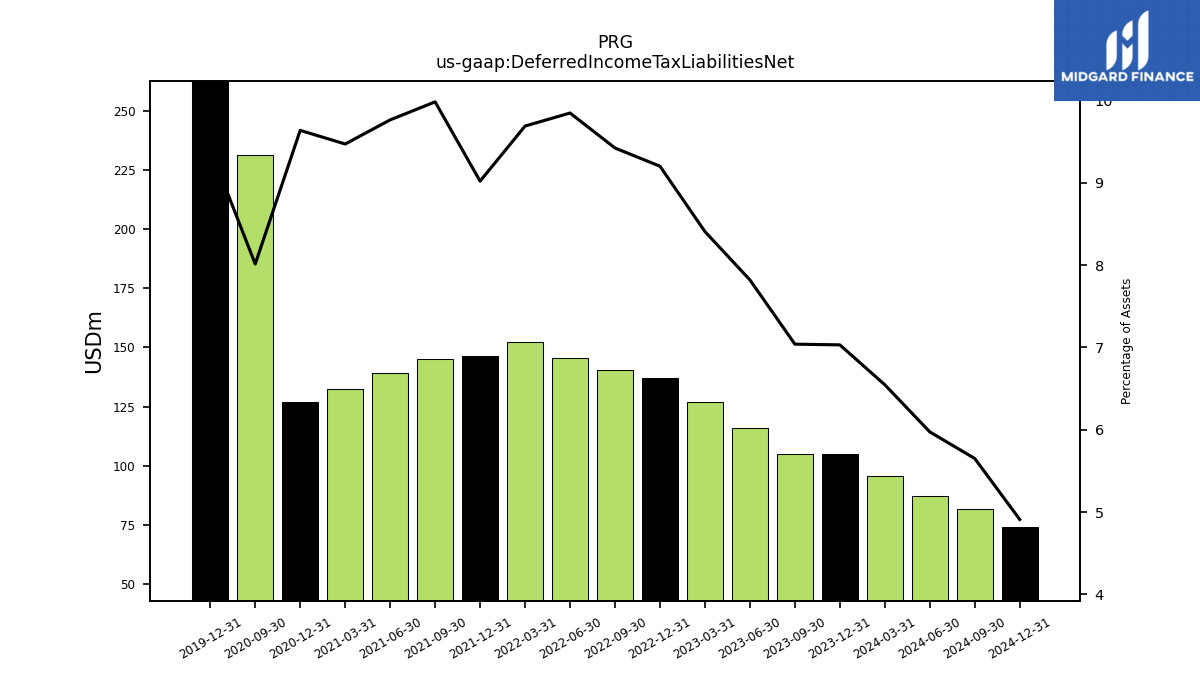
| Deferred Income Tax Liabilities Net | 95.67 | 104.84 | 104.82 | 115.97 | 126.90 | 137.26 | 140.52 | 145.57 | 152.37 | 146.26 | 145.16 | 139.21 | 132.47 | 126.94 | 231.15 | NA | NA | 310.39 | NA | NA | NA |
| 2024-03-31 | 2023-12-31 | 2023-09-30 | 2023-06-30 | 2023-03-31 | 2022-12-31 | 2022-09-30 | 2022-06-30 | 2022-03-31 | 2021-12-31 | 2021-09-30 | 2021-06-30 | 2021-03-31 | 2020-12-31 | 2020-09-30 | 2020-06-30 | 2020-03-31 | 2019-12-31 | 2019-09-30 | 2019-06-30 | 2019-03-31 | ||
|---|---|---|---|---|---|---|---|---|---|---|---|---|---|---|---|---|---|---|---|---|---|---|
| Stockholders Equity | 585.09 | 591.33 | 598.14 | 593.65 | 584.79 | 570.46 | 566.46 | 556.77 | 632.53 | 679.41 | 1076.46 | 1063.34 | 1036.96 | 986.14 | 1638.68 | 1521.20 | 1446.61 | 1737.26 | 1867.65 | 1849.56 | 1813.51 | |
| Common Stock Value | 41.04 | 41.04 | 41.04 | 41.04 | 41.04 | 41.04 | 41.04 | 41.04 | 41.04 | 41.04 | 45.38 | 45.38 | 45.38 | 45.38 | 45.38 | NA | NA | 45.38 | NA | NA | NA | |
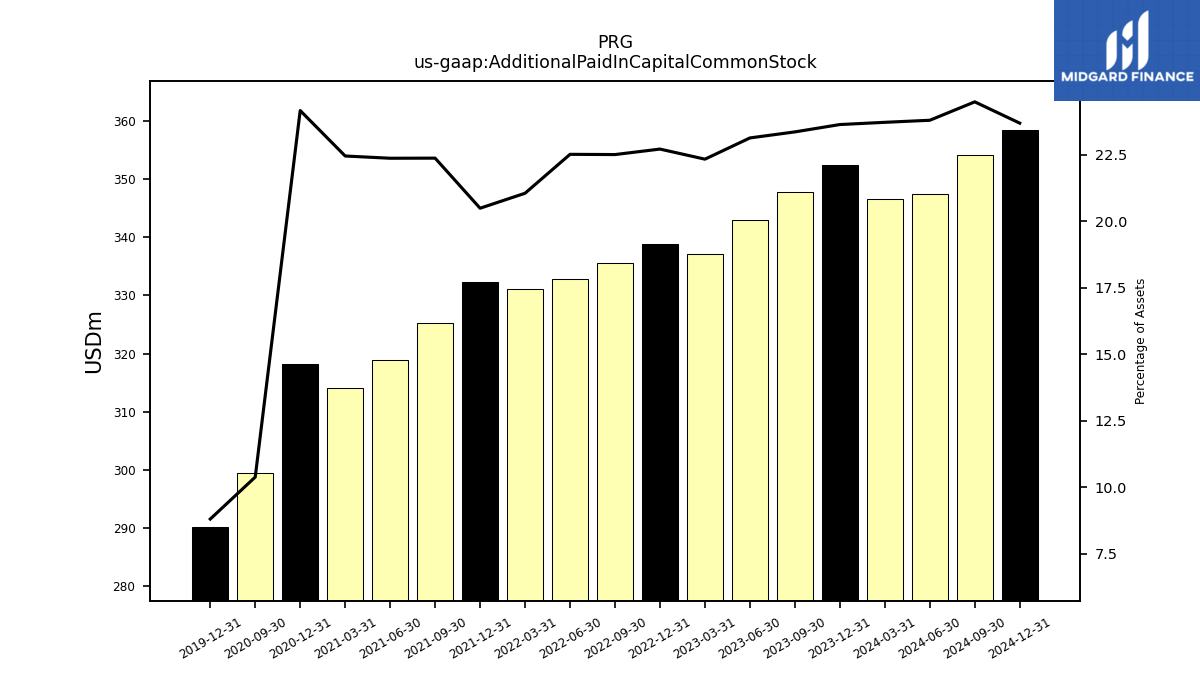
| Additional Paid In Capital Common Stock | 346.65 | 352.42 | 347.81 | 343.02 | 337.10 | 338.81 | 335.64 | 332.82 | 331.06 | 332.24 | 325.31 | 318.91 | 314.03 | 318.26 | 299.42 | NA | NA | 290.23 | NA | NA | NA | |
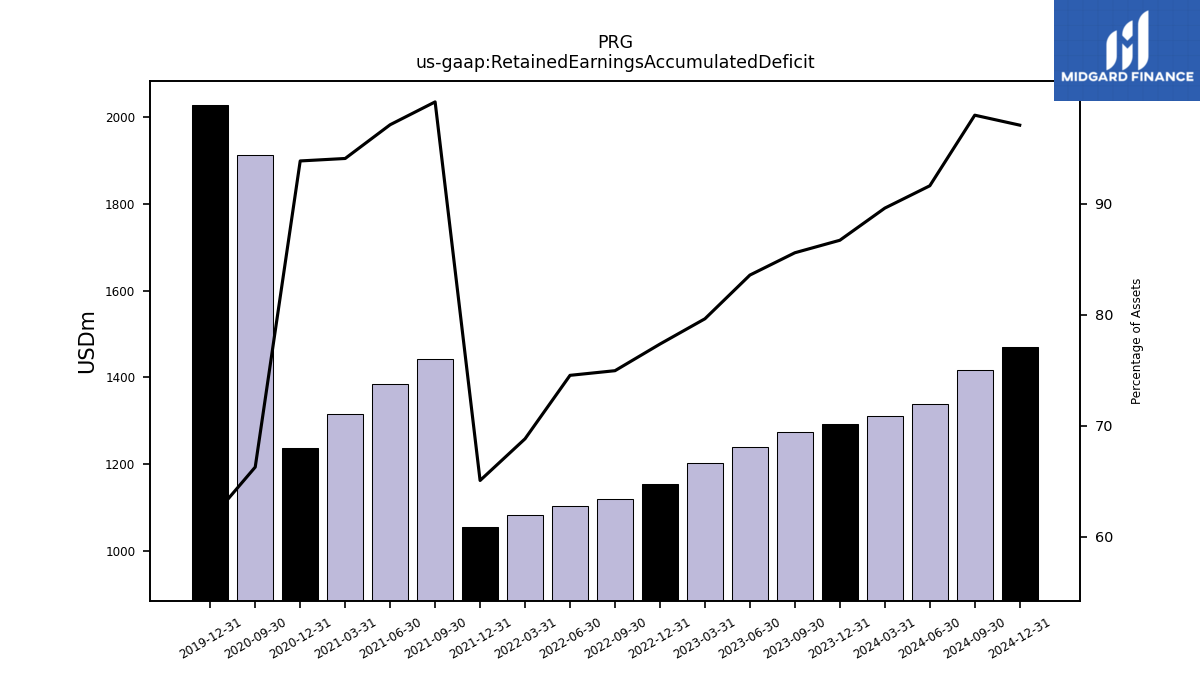
| Retained Earnings Accumulated Deficit | 1309.70 | 1293.07 | 1274.50 | 1239.49 | 1202.27 | 1154.23 | 1118.15 | 1102.14 | 1082.66 | 1055.53 | 1442.12 | 1384.70 | 1315.87 | 1236.38 | 1912.49 | NA | NA | 2029.61 | NA | NA | NA |
| 2024-03-31 | 2023-12-31 | 2023-09-30 | 2023-06-30 | 2023-03-31 | 2022-12-31 | 2022-09-30 | 2022-06-30 | 2022-03-31 | 2021-12-31 | 2021-09-30 | 2021-06-30 | 2021-03-31 | 2020-12-31 | 2020-09-30 | 2020-06-30 | 2020-03-31 | 2019-12-31 | 2019-09-30 | 2019-06-30 | 2019-03-31 | ||
|---|---|---|---|---|---|---|---|---|---|---|---|---|---|---|---|---|---|---|---|---|---|---|
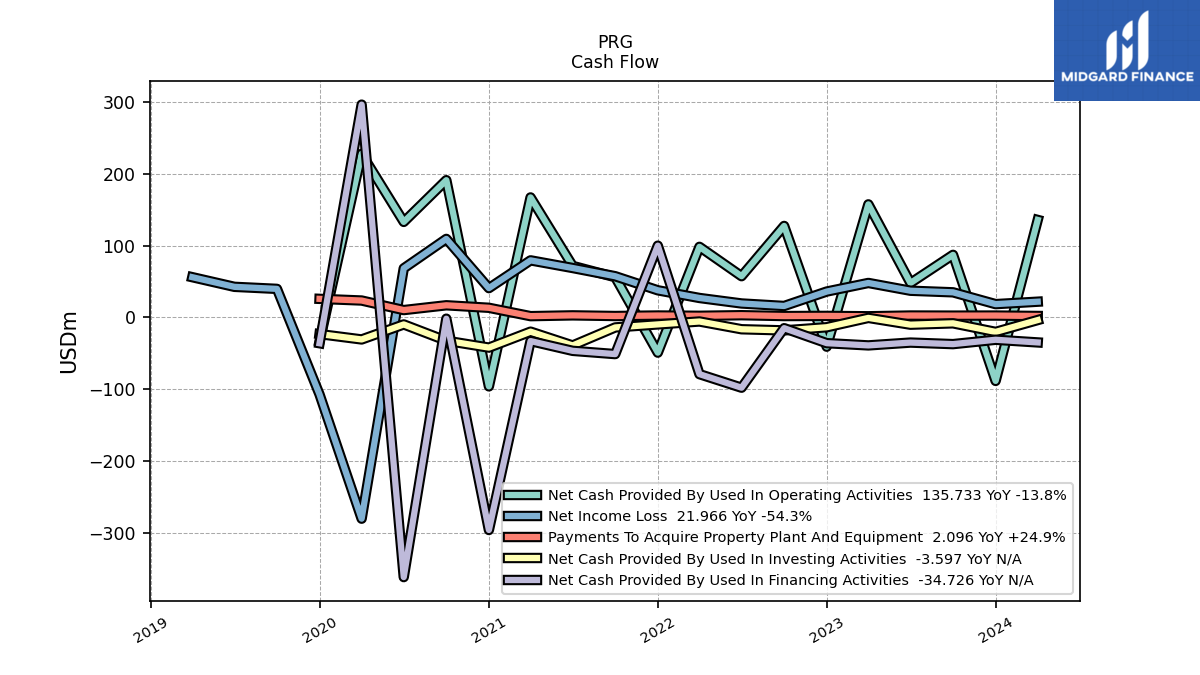
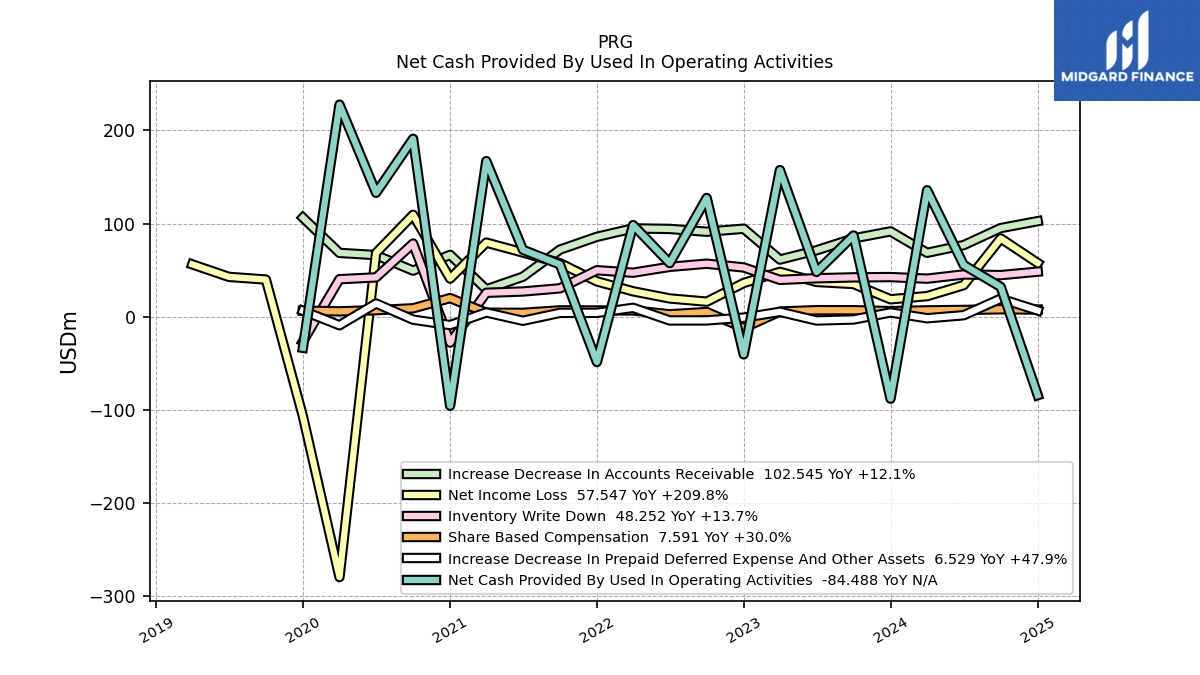
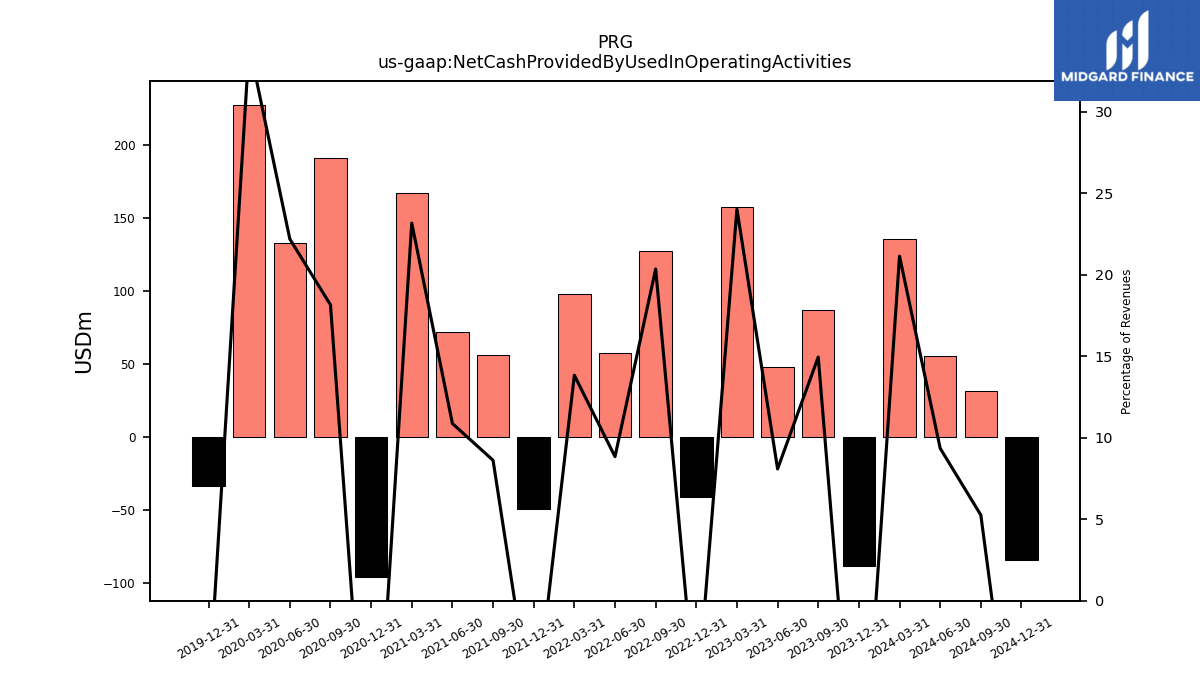
| Net Cash Provided By Used In Operating Activities | 135.73 | -88.31 | 87.16 | 47.96 | 157.42 | -40.67 | 127.41 | 57.44 | 98.30 | -48.93 | 56.05 | 71.77 | 167.07 | -95.88 | 191.09 | 133.00 | 227.76 | -33.58 | NA | NA | NA | |
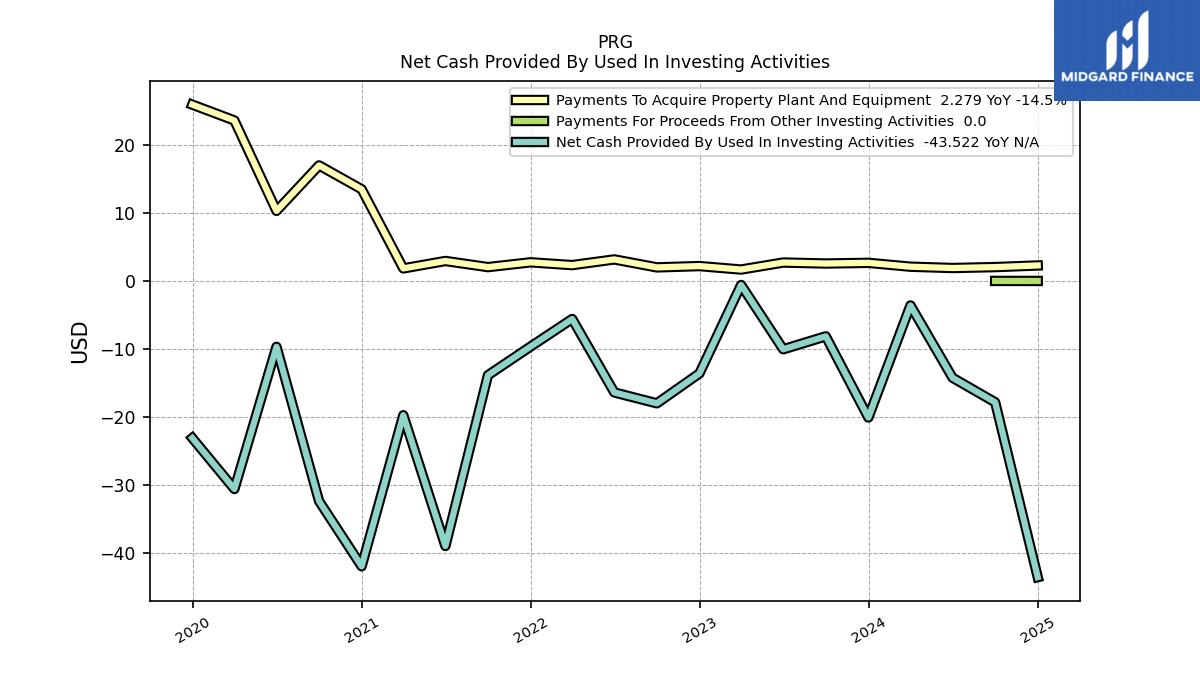
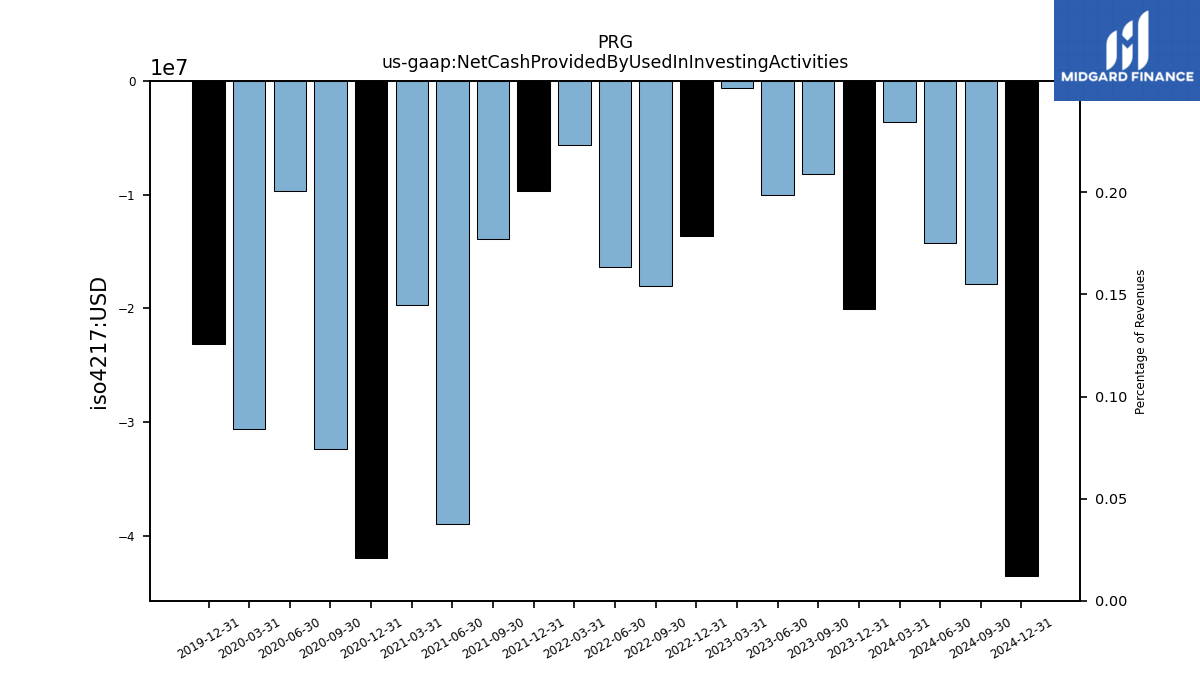
| Net Cash Provided By Used In Investing Activities | -3.60 | -20.07 | -8.13 | -10.04 | -0.59 | -13.59 | -17.98 | -16.38 | -5.59 | -9.64 | -13.85 | -38.95 | -19.73 | -41.93 | -32.35 | -9.68 | -30.58 | -23.08 | NA | NA | NA | |
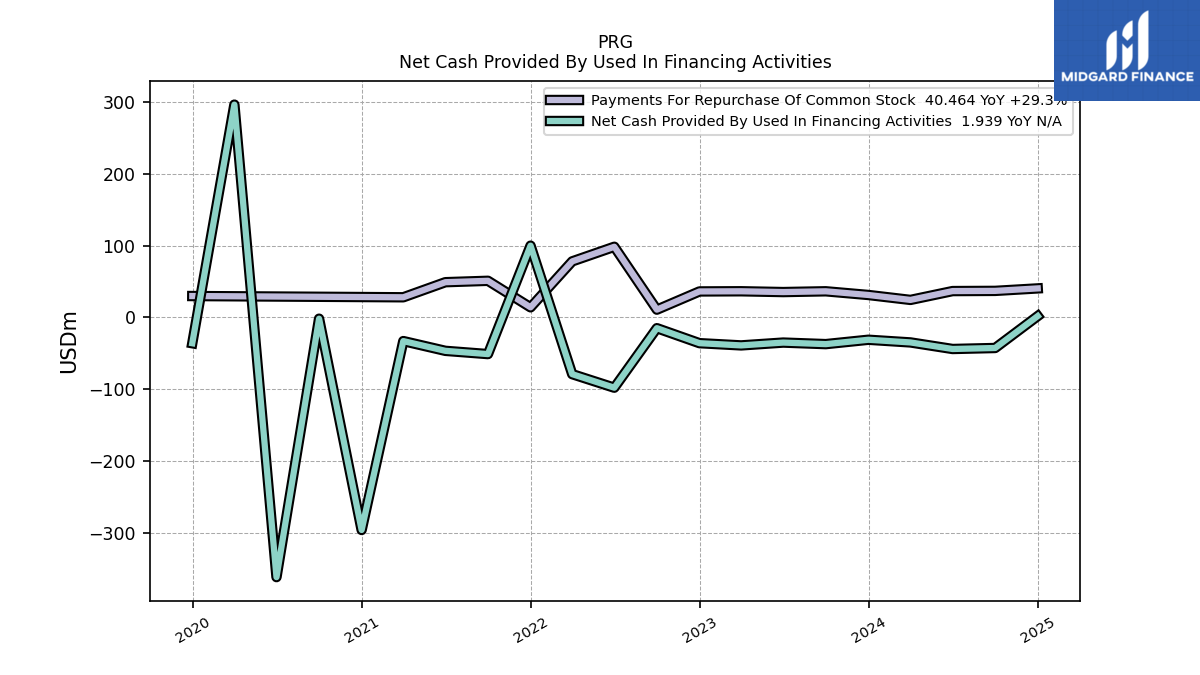
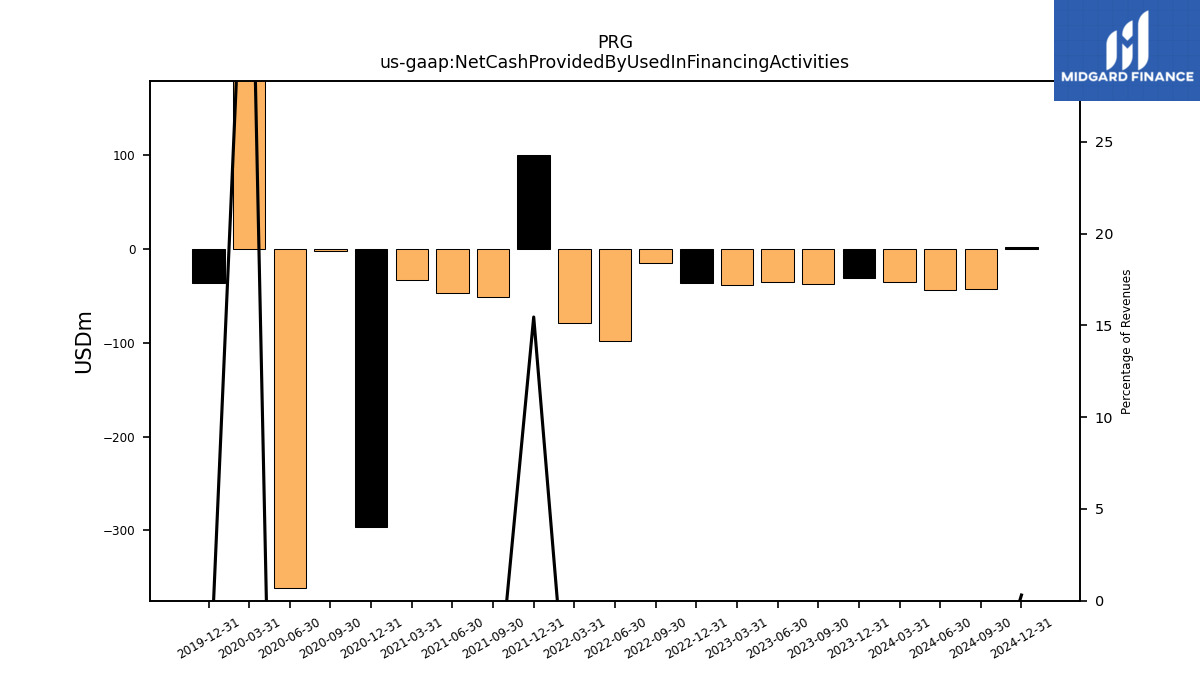
| Net Cash Provided By Used In Financing Activities | -34.73 | -31.00 | -37.08 | -34.93 | -38.87 | -35.75 | -14.88 | -97.73 | -78.86 | 99.94 | -50.96 | -46.43 | -32.83 | -295.75 | -1.68 | -361.32 | 296.20 | -35.87 | NA | NA | NA |
| 2024-03-31 | 2023-12-31 | 2023-09-30 | 2023-06-30 | 2023-03-31 | 2022-12-31 | 2022-09-30 | 2022-06-30 | 2022-03-31 | 2021-12-31 | 2021-09-30 | 2021-06-30 | 2021-03-31 | 2020-12-31 | 2020-09-30 | 2020-06-30 | 2020-03-31 | 2019-12-31 | 2019-09-30 | 2019-06-30 | 2019-03-31 | ||
|---|---|---|---|---|---|---|---|---|---|---|---|---|---|---|---|---|---|---|---|---|---|---|
| Net Cash Provided By Used In Operating Activities | 135.73 | -88.31 | 87.16 | 47.96 | 157.42 | -40.67 | 127.41 | 57.44 | 98.30 | -48.93 | 56.05 | 71.77 | 167.07 | -95.88 | 191.09 | 133.00 | 227.76 | -33.58 | NA | NA | NA | |
| Net Income Loss | 21.97 | 18.57 | 35.01 | 37.22 | 48.03 | 36.09 | 16.00 | 19.48 | 27.14 | 37.82 | 57.41 | 68.84 | 79.49 | 40.82 | 109.34 | 68.38 | -280.00 | -107.06 | 39.80 | 42.65 | 56.08 | |
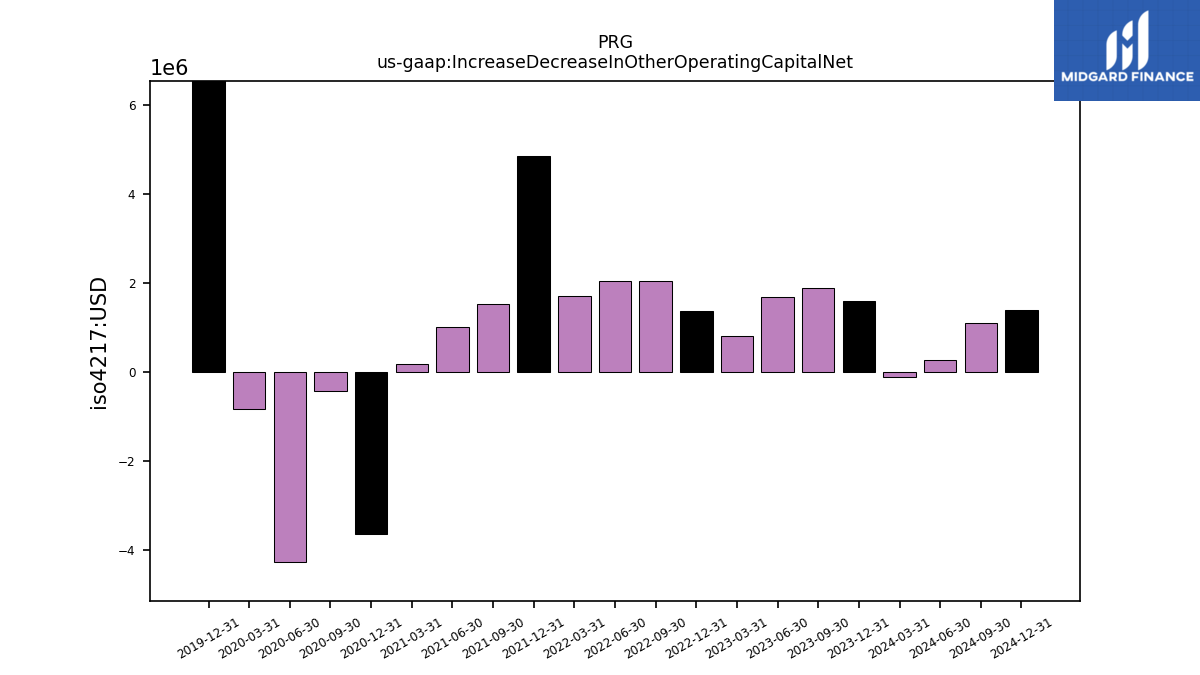
| Increase Decrease In Other Operating Capital Net | -0.12 | 1.59 | 1.89 | 1.69 | 0.81 | 1.38 | 2.04 | 2.04 | 1.71 | 4.85 | 1.53 | 1.00 | 0.18 | -3.64 | -0.42 | -4.27 | -0.84 | 13.31 | NA | NA | NA | |
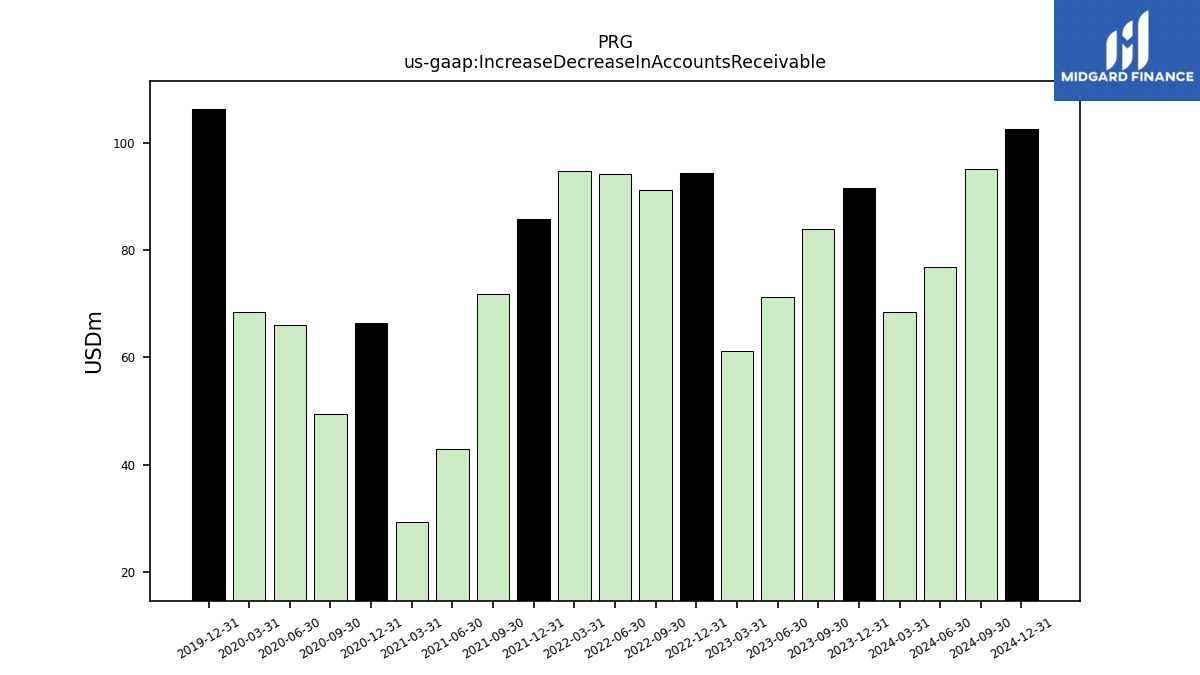
| Increase Decrease In Accounts Receivable | 68.52 | 91.52 | 84.01 | 71.21 | 61.25 | 94.42 | 91.17 | 94.18 | 94.74 | 85.73 | 71.90 | 42.83 | 29.24 | 66.35 | 49.34 | 66.05 | 68.42 | 106.26 | NA | NA | NA | |
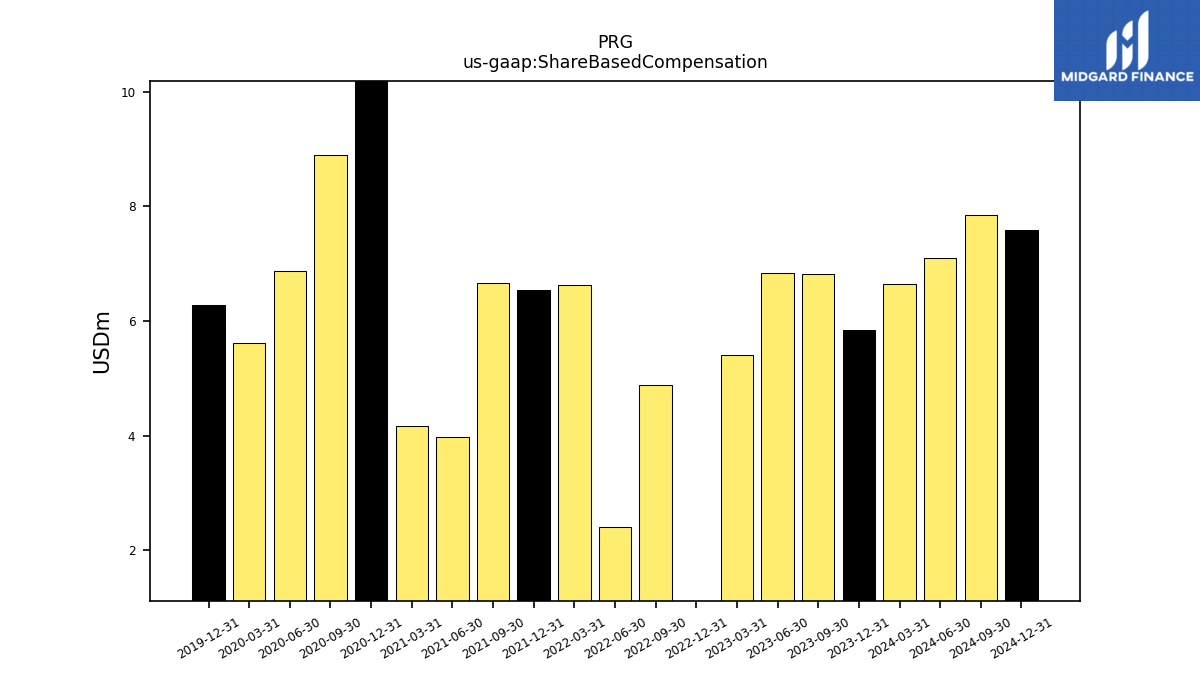
| Share Based Compensation | 6.64 | 5.84 | 6.82 | 6.84 | 5.42 | -12.23 | 4.89 | 2.42 | 6.62 | 6.55 | 6.67 | 3.97 | 4.16 | 19.84 | 8.89 | 6.87 | 5.62 | 6.29 | NA | NA | NA |
| 2024-03-31 | 2023-12-31 | 2023-09-30 | 2023-06-30 | 2023-03-31 | 2022-12-31 | 2022-09-30 | 2022-06-30 | 2022-03-31 | 2021-12-31 | 2021-09-30 | 2021-06-30 | 2021-03-31 | 2020-12-31 | 2020-09-30 | 2020-06-30 | 2020-03-31 | 2019-12-31 | 2019-09-30 | 2019-06-30 | 2019-03-31 | ||
|---|---|---|---|---|---|---|---|---|---|---|---|---|---|---|---|---|---|---|---|---|---|---|
| Net Cash Provided By Used In Investing Activities | -3.60 | -20.07 | -8.13 | -10.04 | -0.59 | -13.59 | -17.98 | -16.38 | -5.59 | -9.64 | -13.85 | -38.95 | -19.73 | -41.93 | -32.35 | -9.68 | -30.58 | -23.08 | NA | NA | NA | |
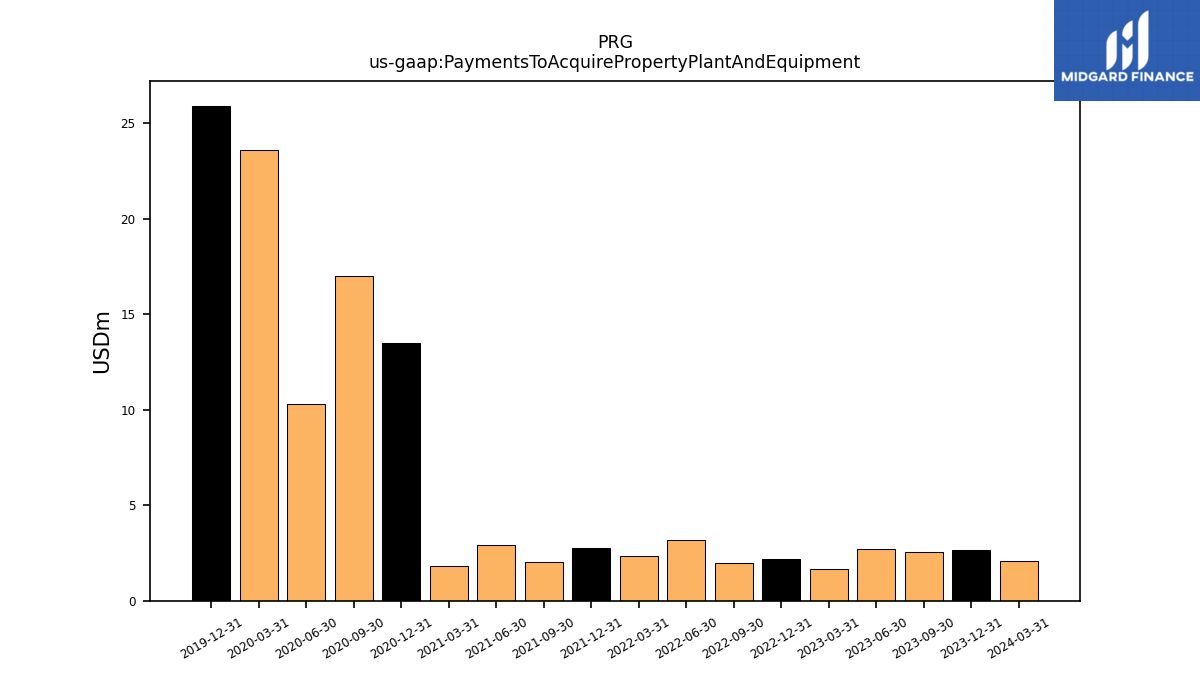
| Payments To Acquire Property Plant And Equipment | 2.10 | 2.66 | 2.56 | 2.71 | 1.68 | 2.19 | 1.99 | 3.17 | 2.33 | 2.74 | 2.03 | 2.94 | 1.84 | 13.48 | 16.98 | 10.30 | 23.59 | 25.91 | NA | NA | NA |
| 2024-03-31 | 2023-12-31 | 2023-09-30 | 2023-06-30 | 2023-03-31 | 2022-12-31 | 2022-09-30 | 2022-06-30 | 2022-03-31 | 2021-12-31 | 2021-09-30 | 2021-06-30 | 2021-03-31 | 2020-12-31 | 2020-09-30 | 2020-06-30 | 2020-03-31 | 2019-12-31 | 2019-09-30 | 2019-06-30 | 2019-03-31 | ||
|---|---|---|---|---|---|---|---|---|---|---|---|---|---|---|---|---|---|---|---|---|---|---|
| Net Cash Provided By Used In Financing Activities | -34.73 | -31.00 | -37.08 | -34.93 | -38.87 | -35.75 | -14.88 | -97.73 | -78.86 | 99.94 | -50.96 | -46.43 | -32.83 | -295.75 | -1.68 | -361.32 | 296.20 | -35.87 | NA | NA | NA | |
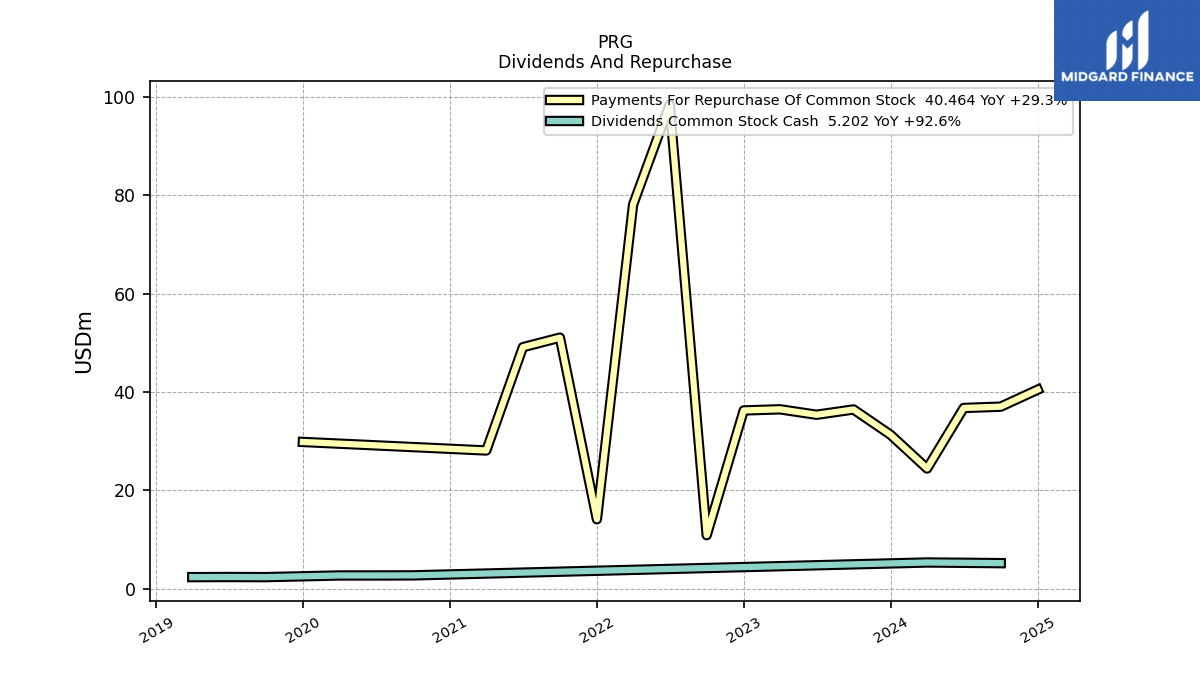
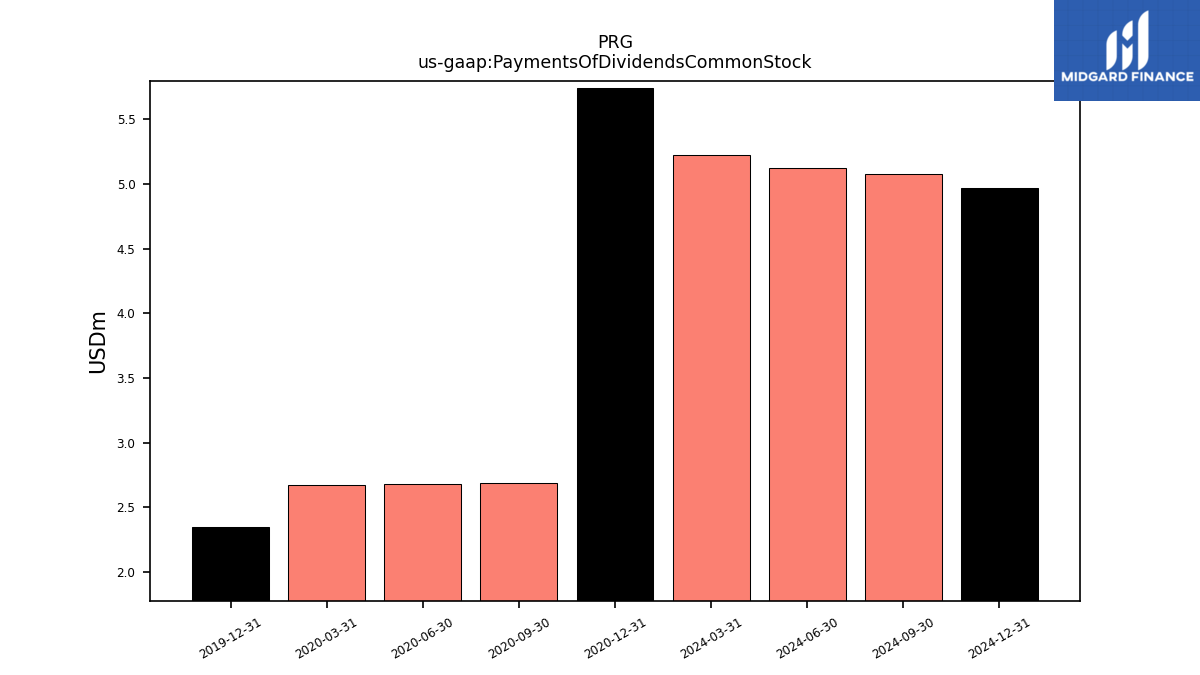
| Payments Of Dividends Common Stock | 5.22 | NA | NA | NA | NA | NA | NA | NA | NA | NA | NA | NA | NA | 5.74 | 2.68 | 2.68 | 2.67 | 2.35 | NA | NA | NA | |
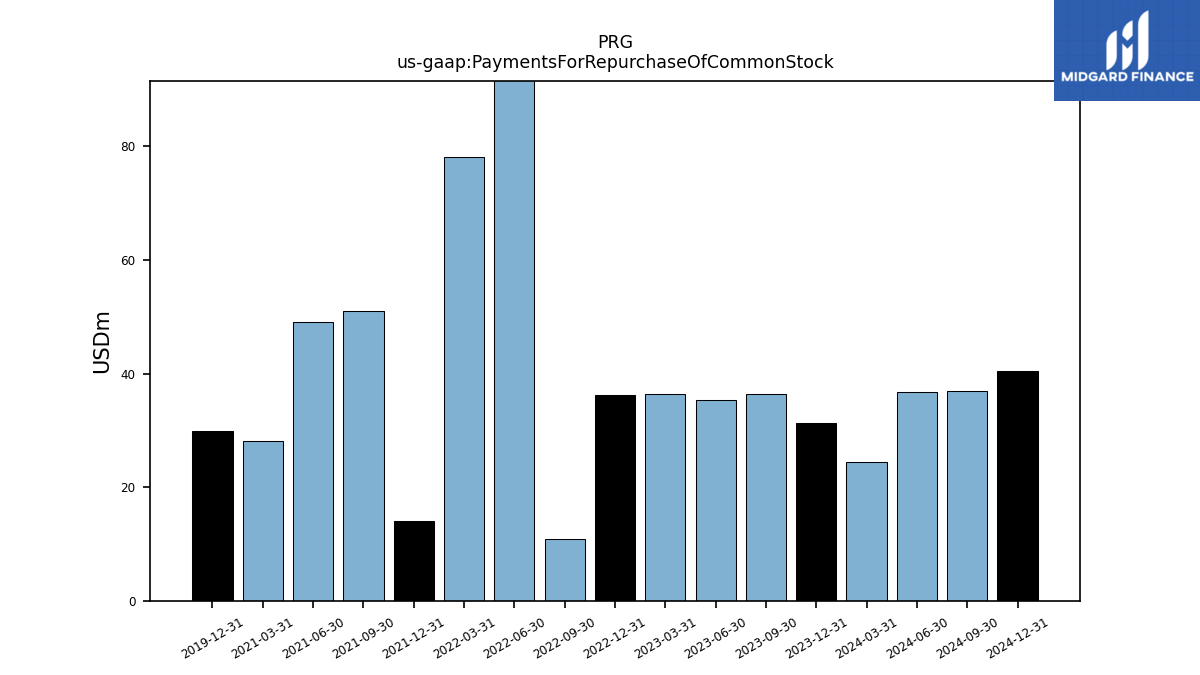
| Payments For Repurchase Of Common Stock | 24.44 | 31.30 | 36.44 | 35.36 | 36.47 | 36.24 | 10.89 | 98.39 | 78.08 | 14.12 | 51.04 | 49.09 | 28.10 | NA | NA | NA | NA | 29.83 | NA | NA | NA |
| 2024-03-31 | 2023-12-31 | 2023-09-30 | 2023-06-30 | 2023-03-31 | 2022-12-31 | 2022-09-30 | 2022-06-30 | 2022-03-31 | 2021-12-31 | 2021-09-30 | 2021-06-30 | 2021-03-31 | 2020-12-31 | 2020-09-30 | 2020-06-30 | 2020-03-31 | 2019-12-31 | 2019-09-30 | 2019-06-30 | 2019-03-31 | ||
|---|---|---|---|---|---|---|---|---|---|---|---|---|---|---|---|---|---|---|---|---|---|---|
| Revenues | 641.87 | 577.40 | 582.88 | 592.85 | 655.14 | 612.10 | 625.82 | 649.44 | 710.46 | 646.54 | 650.40 | 659.97 | 721.00 | 605.65 | 1052.30 | 599.16 | 668.44 | 568.65 | 963.81 | 524.94 | 532.05 | |
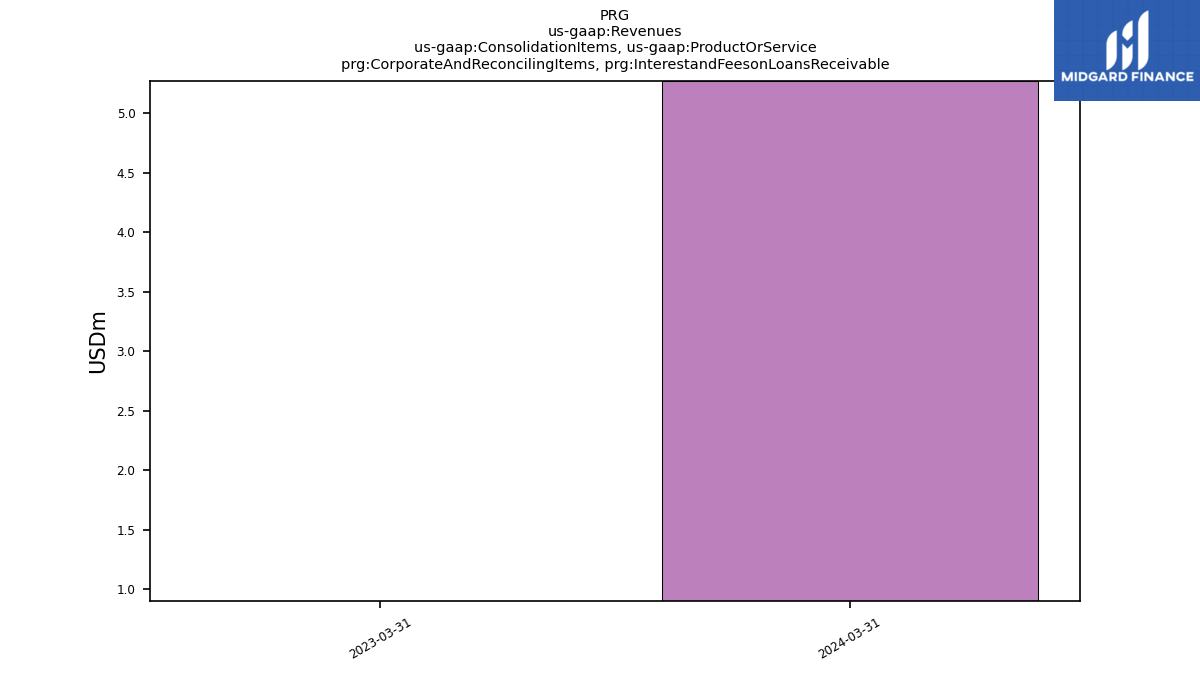
| Corporate And Reconciling Items | 5.27 | NA | NA | NA | 0.91 | NA | NA | NA | NA | NA | NA | NA | NA | NA | NA | NA | NA | NA | NA | NA | NA | |
| Corporate And Reconciling Items, Interestand Feeson Loans Receivable | 5.27 | NA | NA | NA | 0.91 | NA | NA | NA | NA | NA | NA | NA | NA | NA | NA | NA | NA | NA | NA | NA | NA | |
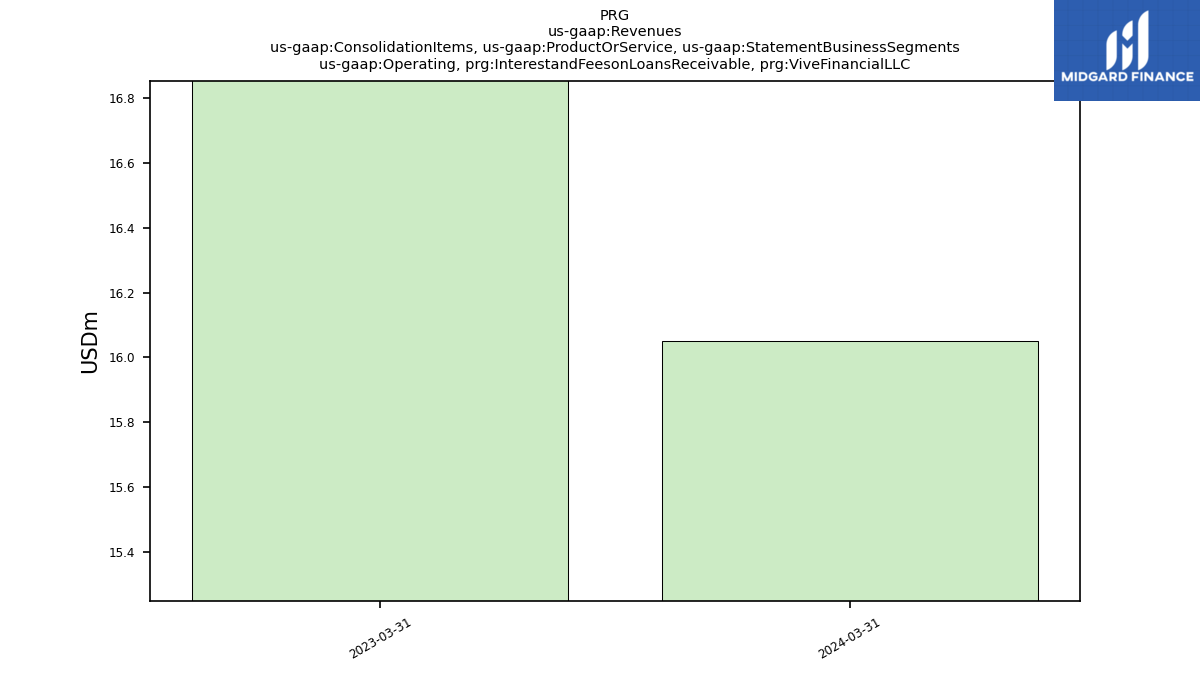
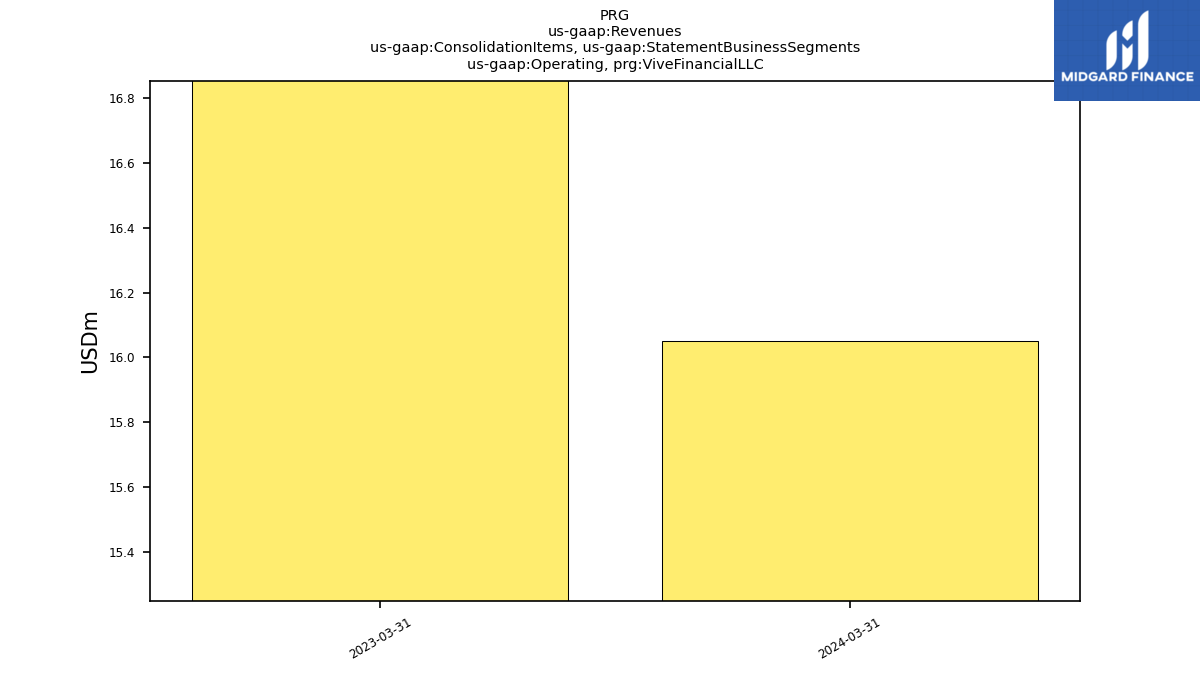
| Operating, Interestand Feeson Loans Receivable, Vive Financial L L C | 16.05 | NA | NA | NA | 17.15 | NA | NA | NA | NA | NA | NA | NA | NA | NA | NA | NA | NA | NA | NA | NA | NA | |
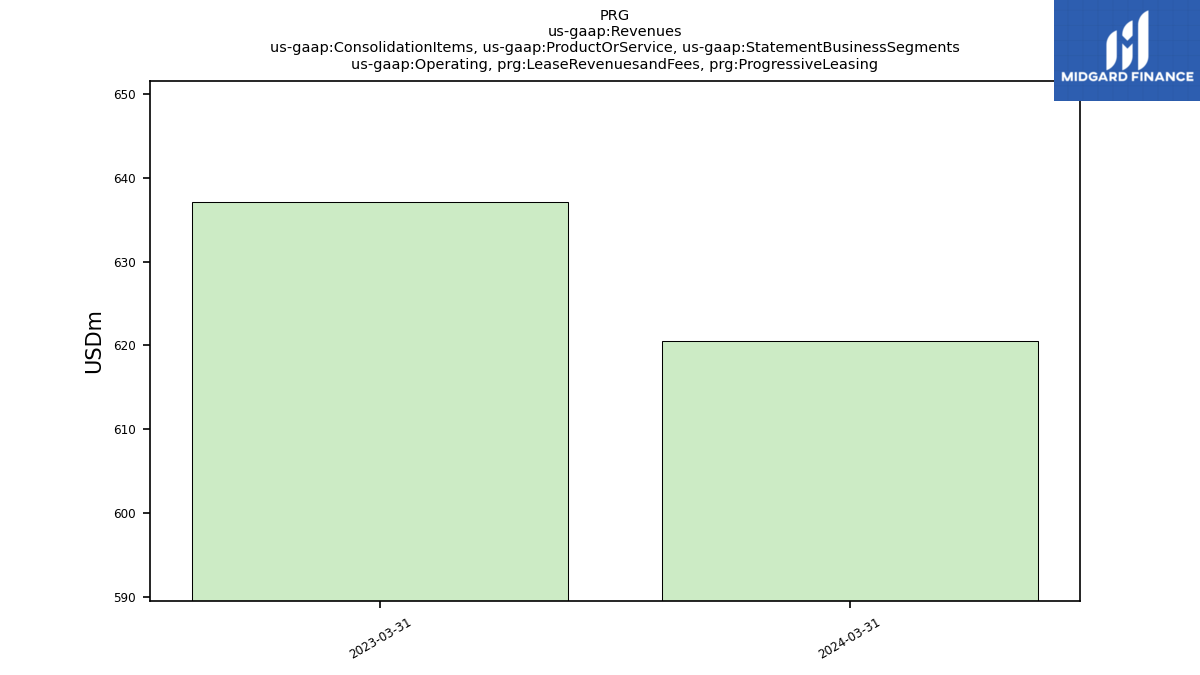
| Operating, Lease Revenuesand Fees, Progressive Leasing | 620.55 | NA | NA | NA | 637.08 | NA | NA | NA | NA | NA | NA | NA | NA | NA | NA | NA | NA | NA | NA | NA | NA | |
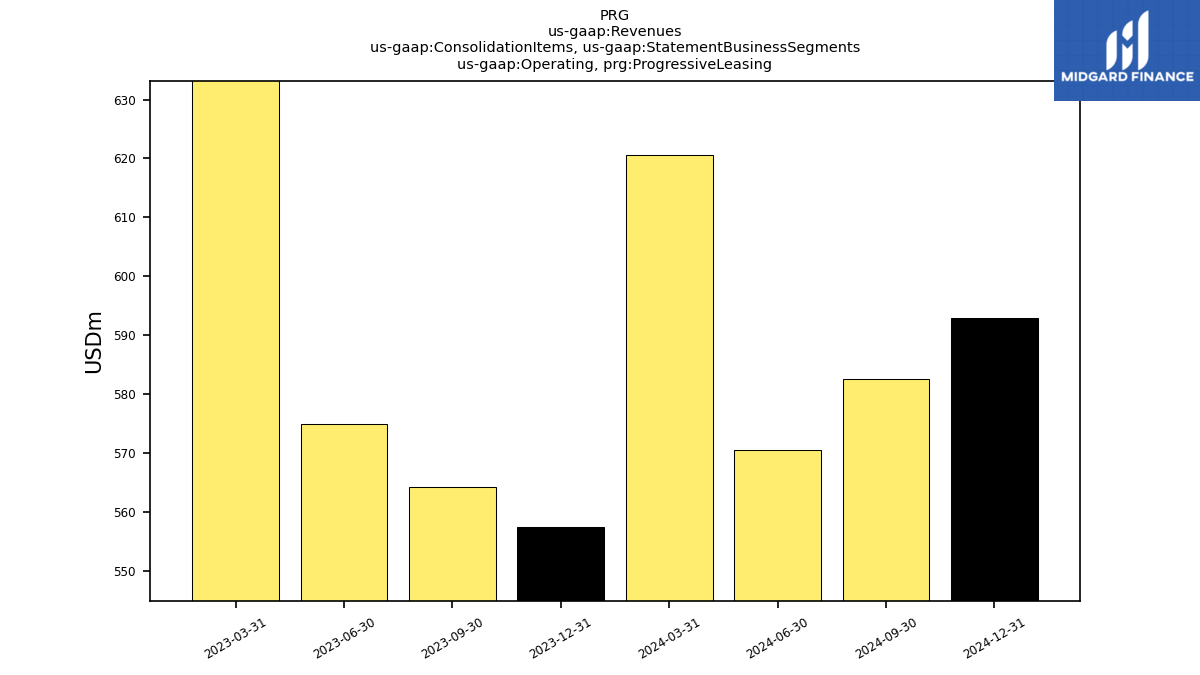
| Operating, Progressive Leasing | 620.55 | NA | NA | NA | 637.08 | NA | NA | NA | NA | NA | NA | NA | NA | NA | NA | NA | NA | NA | NA | NA | NA | |
| Operating, Vive Financial L L C | 16.05 | NA | NA | NA | 17.15 | NA | NA | NA | NA | NA | NA | NA | NA | NA | NA | NA | NA | NA | NA | NA | NA | |
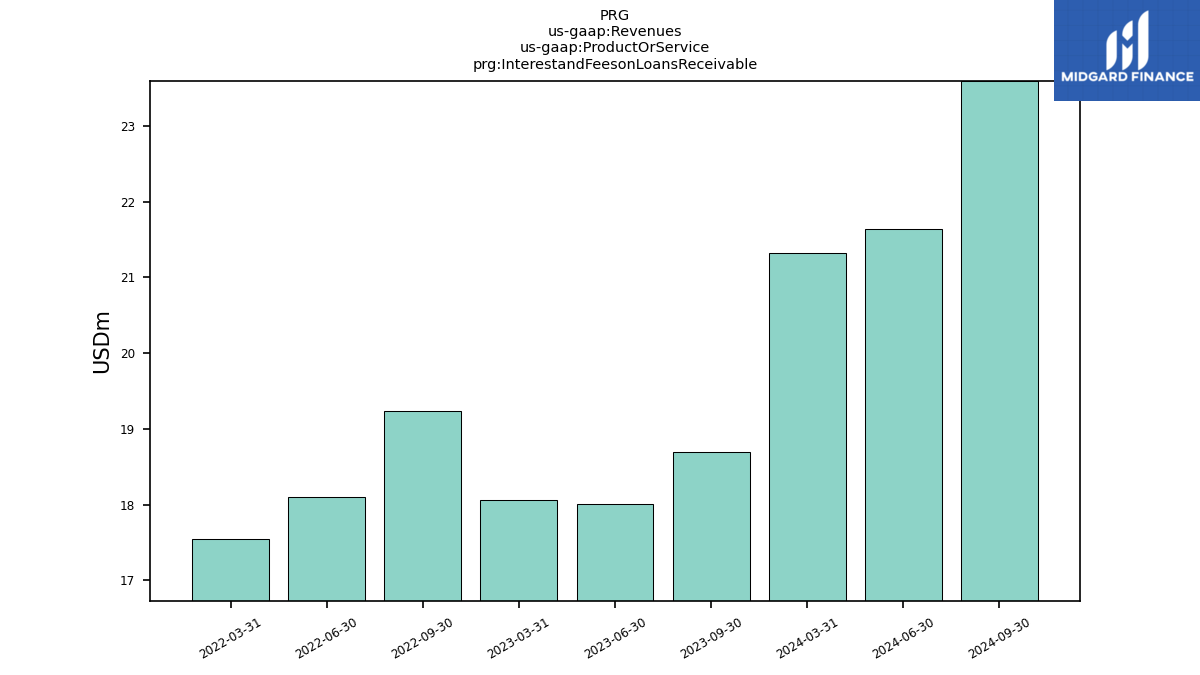
| Interestand Feeson Loans Receivable | 21.32 | NA | 18.69 | 18.01 | 18.06 | NA | 19.24 | 18.10 | 17.55 | NA | NA | NA | NA | NA | NA | NA | NA | NA | NA | NA | NA | |
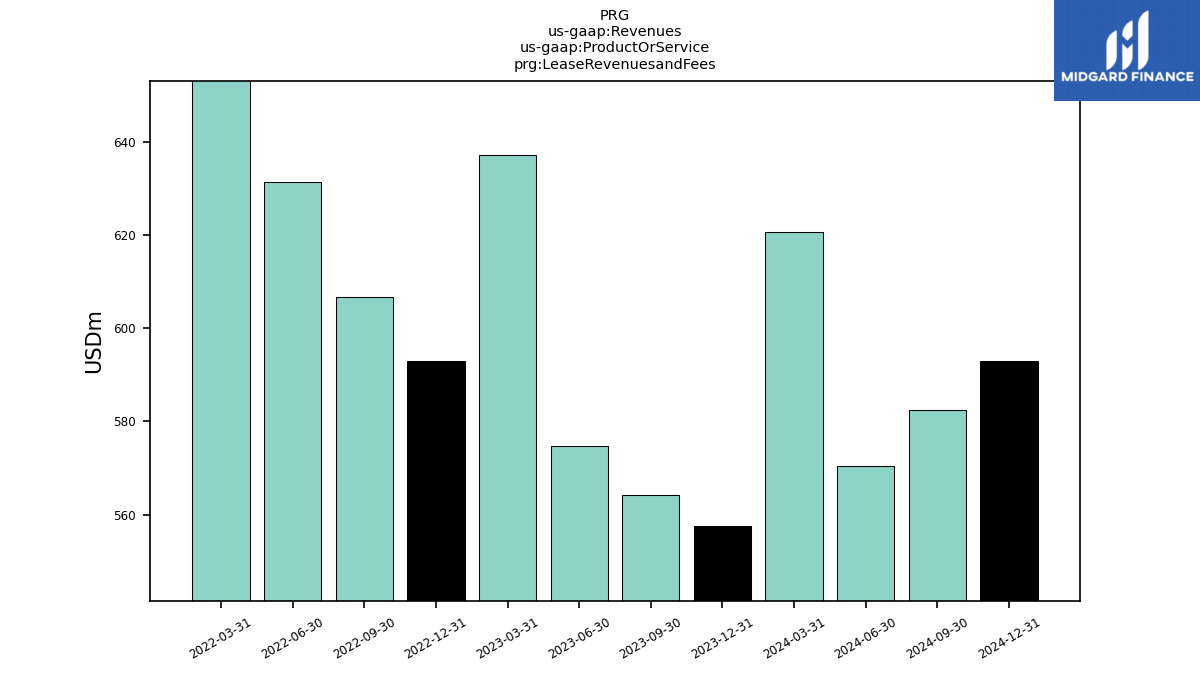
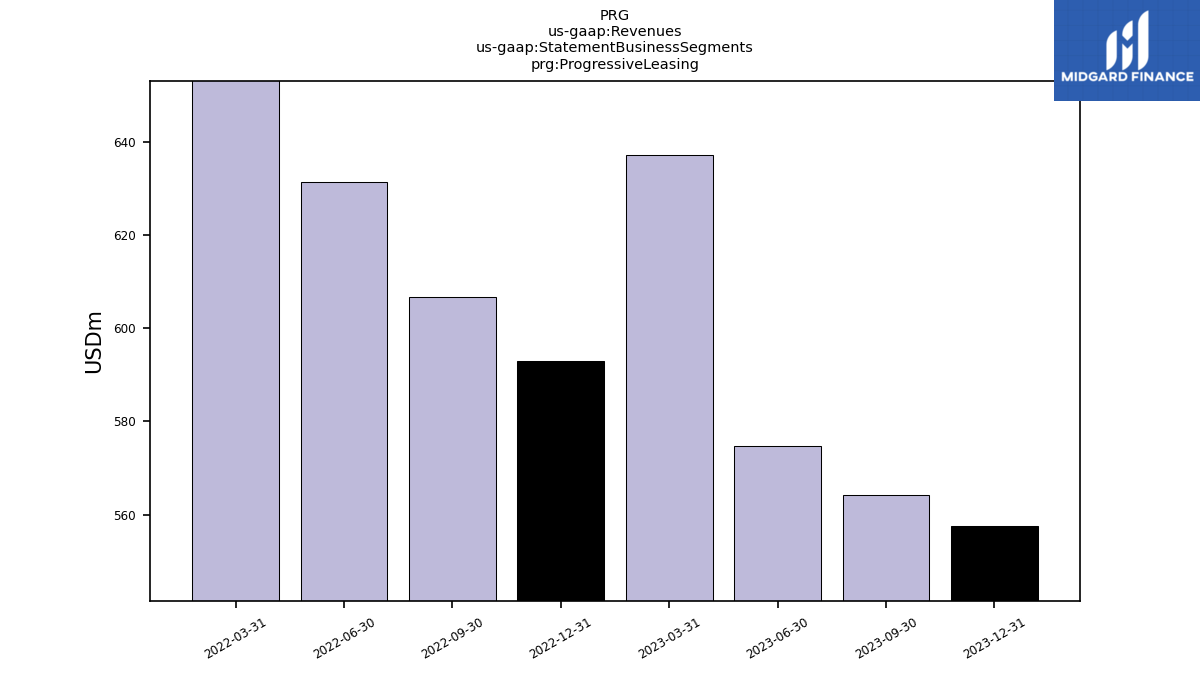
| Lease Revenuesand Fees | 620.55 | 557.48 | 564.18 | 574.84 | 637.08 | 592.94 | 606.59 | 631.34 | 692.91 | NA | NA | NA | NA | NA | NA | NA | NA | NA | NA | NA | NA | |
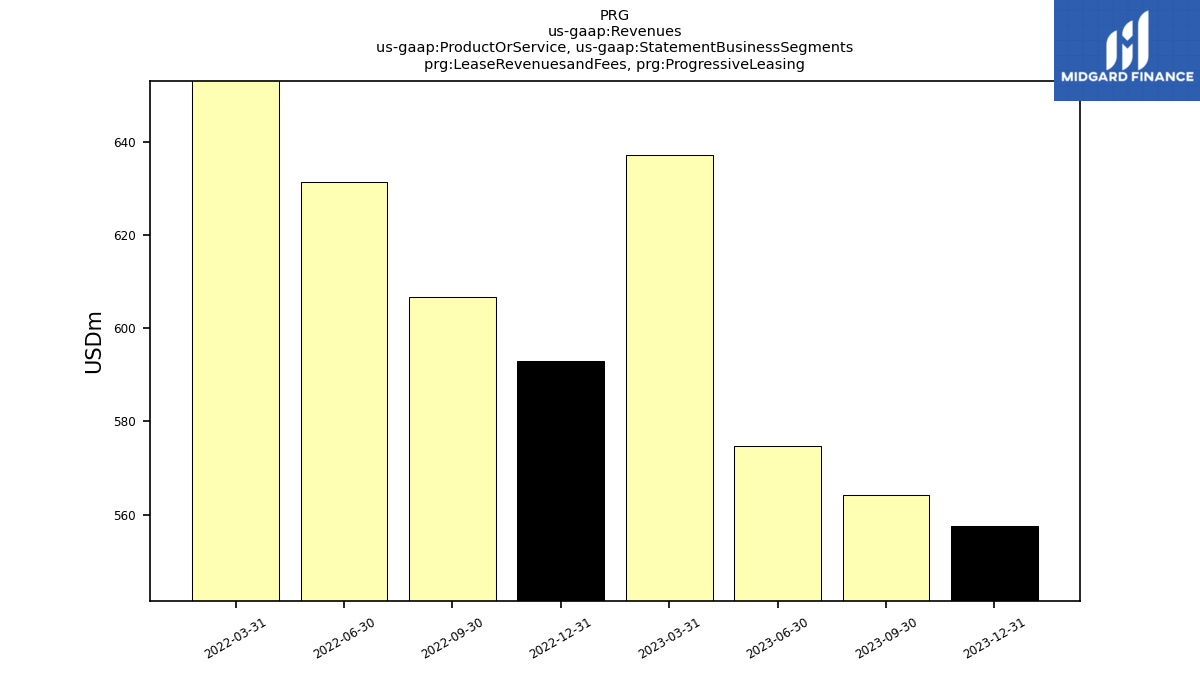
| Lease Revenuesand Fees, Progressive Leasing | NA | 557.48 | 564.18 | 574.84 | 637.08 | 592.94 | 606.59 | 631.34 | 692.91 | NA | NA | NA | NA | NA | NA | NA | NA | NA | NA | NA | NA | |
| Progressive Leasing | NA | 557.48 | 564.18 | 574.84 | 637.08 | 592.94 | 606.59 | 631.34 | 692.91 | NA | NA | NA | NA | NA | NA | NA | NA | NA | NA | NA | NA | |
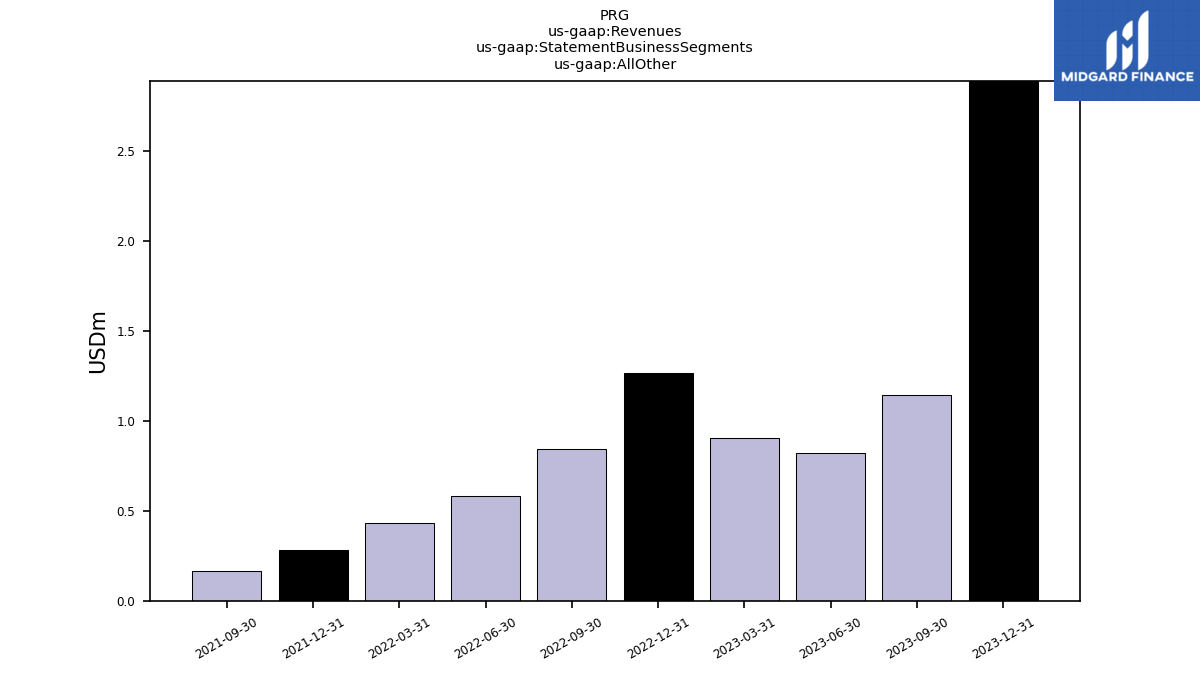
| All Other | NA | 2.89 | 1.15 | 0.82 | 0.91 | 1.27 | 0.84 | 0.58 | 0.43 | 0.28 | 0.17 | NA | NA | NA | NA | NA | NA | NA | NA | NA | NA | |
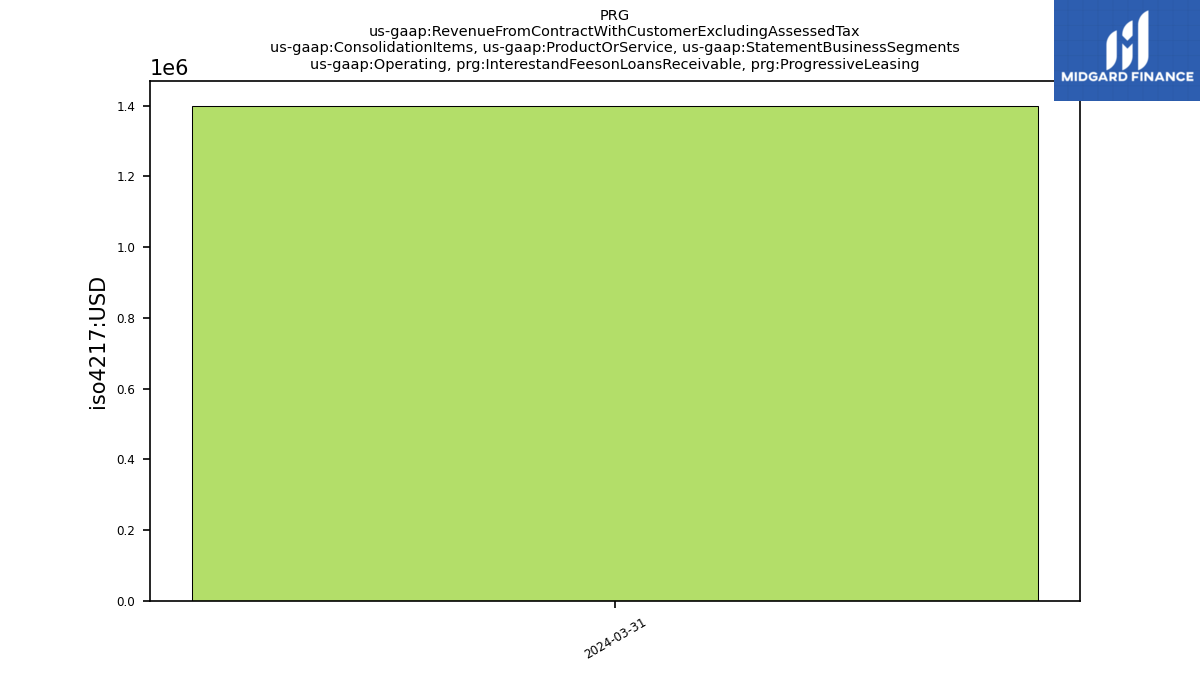
| Operating, Interestand Feeson Loans Receivable, Progressive Leasing | 1.40 | NA | NA | NA | NA | NA | NA | NA | NA | NA | NA | NA | NA | NA | NA | NA | NA | NA | NA | NA | NA |