
| 2024-03-31 | 2023-12-31 | 2023-09-30 | 2023-06-30 | 2023-03-31 | 2022-12-31 | 2022-09-30 | 2022-06-30 | 2022-03-31 | 2021-12-31 | 2021-09-30 | 2021-06-30 | 2021-03-31 | 2020-12-31 | 2020-09-30 | 2020-06-30 | 2020-03-31 | 2019-12-31 | 2019-09-30 | 2019-06-30 | 2019-03-31 | 2018-12-31 | 2018-09-28 | 2018-06-29 | 2018-03-30 | ||
|---|---|---|---|---|---|---|---|---|---|---|---|---|---|---|---|---|---|---|---|---|---|---|---|---|---|---|
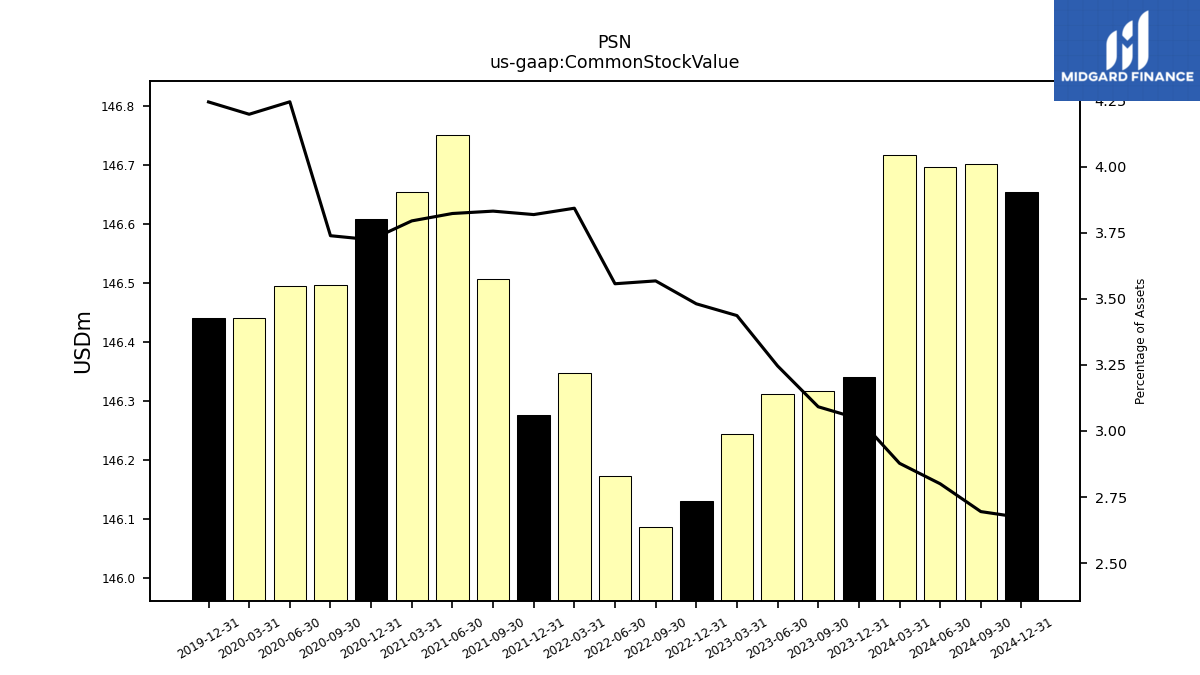
| Common Stock Value | 146.72 | 146.34 | 146.32 | 146.31 | 146.24 | 146.13 | 146.09 | 146.17 | 146.35 | 146.28 | 146.51 | 146.75 | 146.65 | 146.61 | 146.50 | 146.50 | 146.44 | 146.44 | NA | NA | NA | NA | NA | NA | NA | |
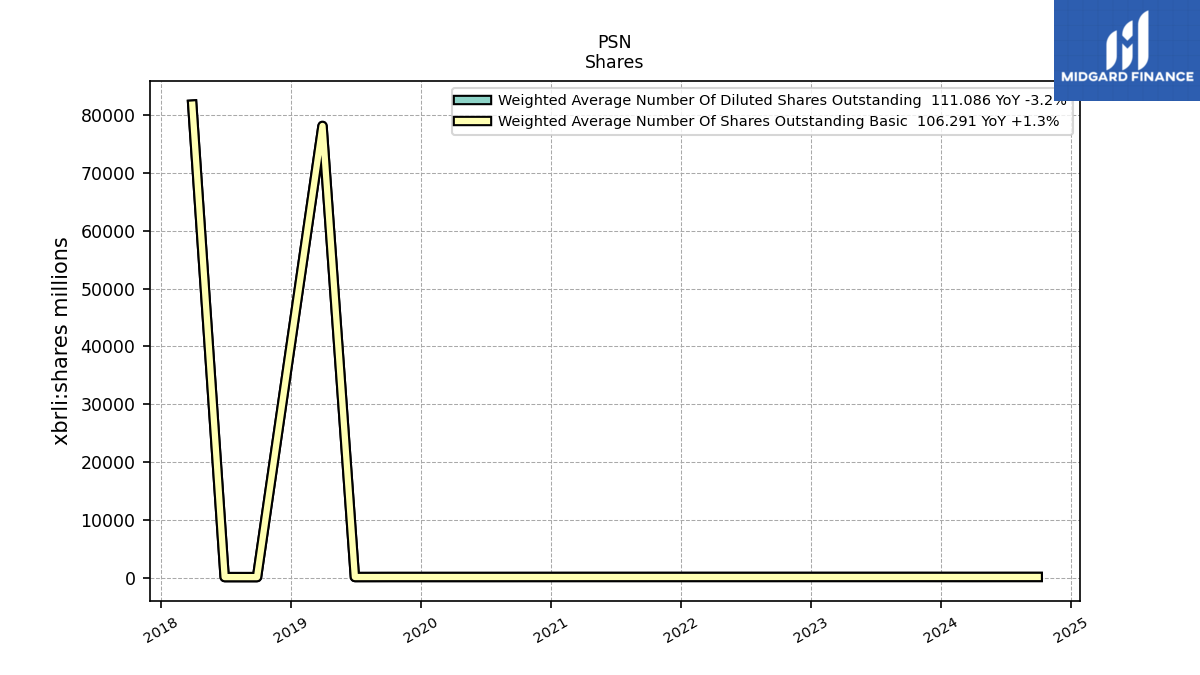
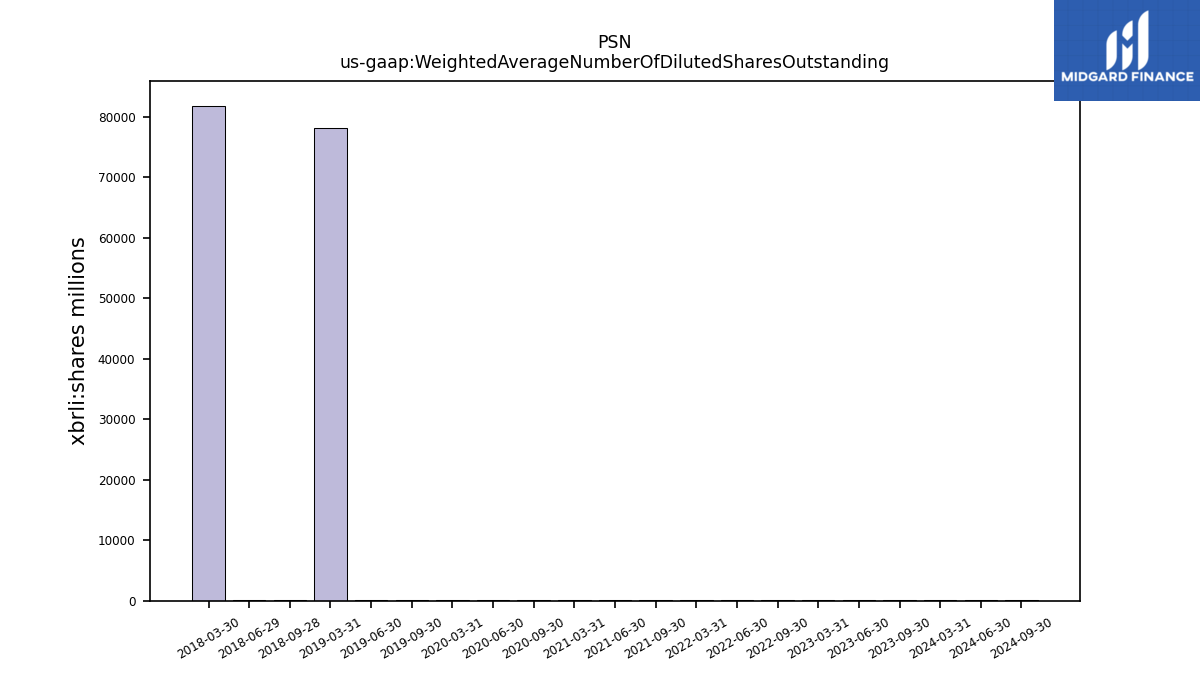
| Weighted Average Number Of Diluted Shares Outstanding | 106.04 | NA | 115.07 | 114.71 | 114.75 | NA | 113.44 | 113.25 | 113.47 | NA | 112.15 | 112.17 | 111.87 | NA | 105.57 | 100.99 | 100.90 | NA | 99.43 | 92.34 | 78161.48 | NA | 79.19 | 81.07 | 81846.30 | |
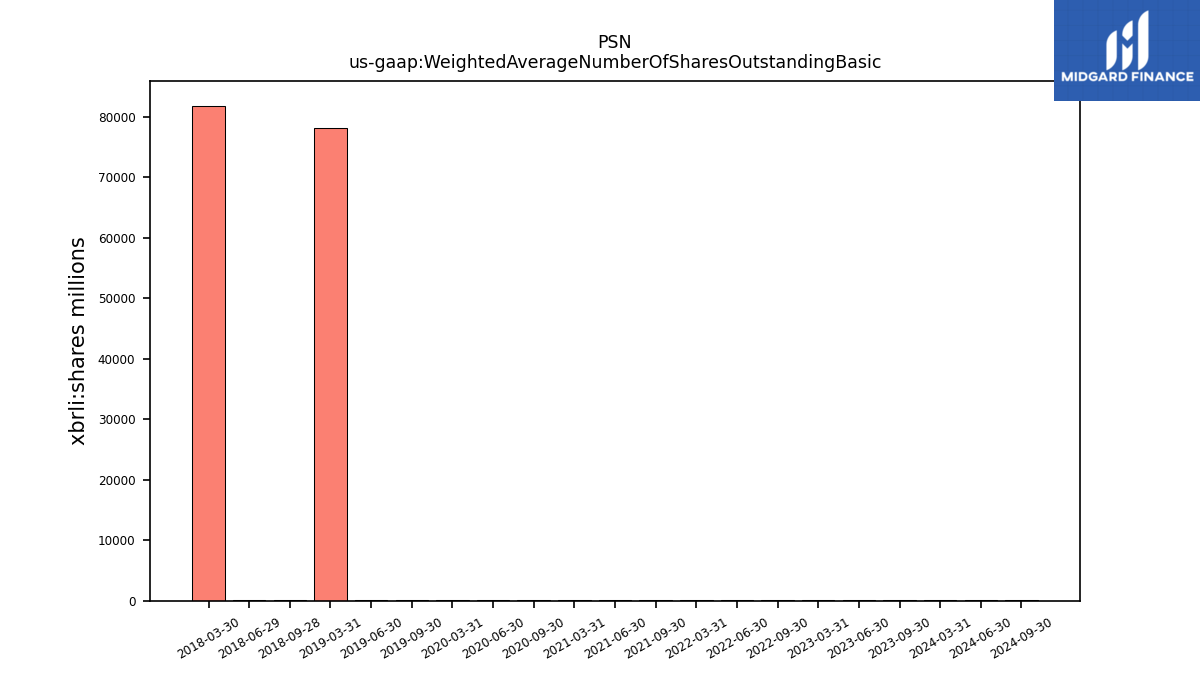
| Weighted Average Number Of Shares Outstanding Basic | 106.04 | NA | 104.97 | 104.91 | 104.81 | NA | 103.61 | 103.68 | 103.77 | NA | 102.48 | 102.51 | 102.38 | NA | 100.74 | 100.69 | 100.67 | NA | 99.43 | 92.34 | 78161.48 | NA | 79.19 | 81.07 | 81846.30 | |
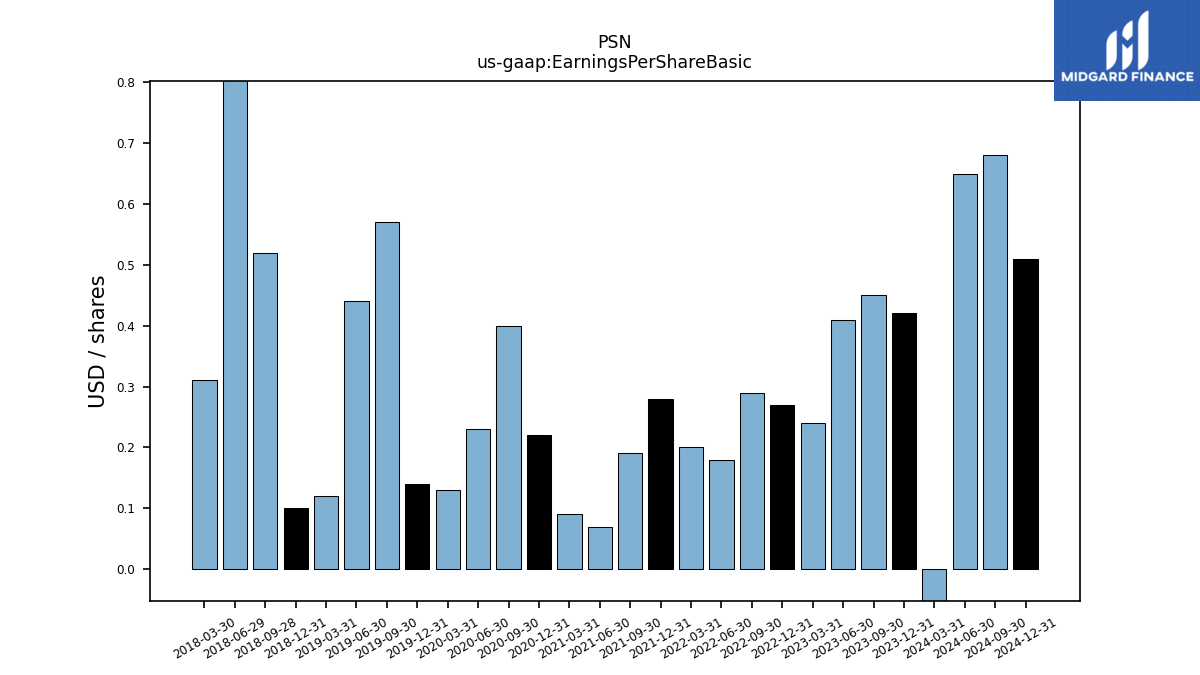
| Earnings Per Share Basic | -1.01 | 0.42 | 0.45 | 0.41 | 0.24 | 0.27 | 0.29 | 0.18 | 0.20 | 0.28 | 0.19 | 0.07 | 0.09 | 0.22 | 0.40 | 0.23 | 0.13 | 0.14 | 0.57 | 0.44 | 0.12 | 0.10 | 0.52 | 1.83 | 0.31 | |
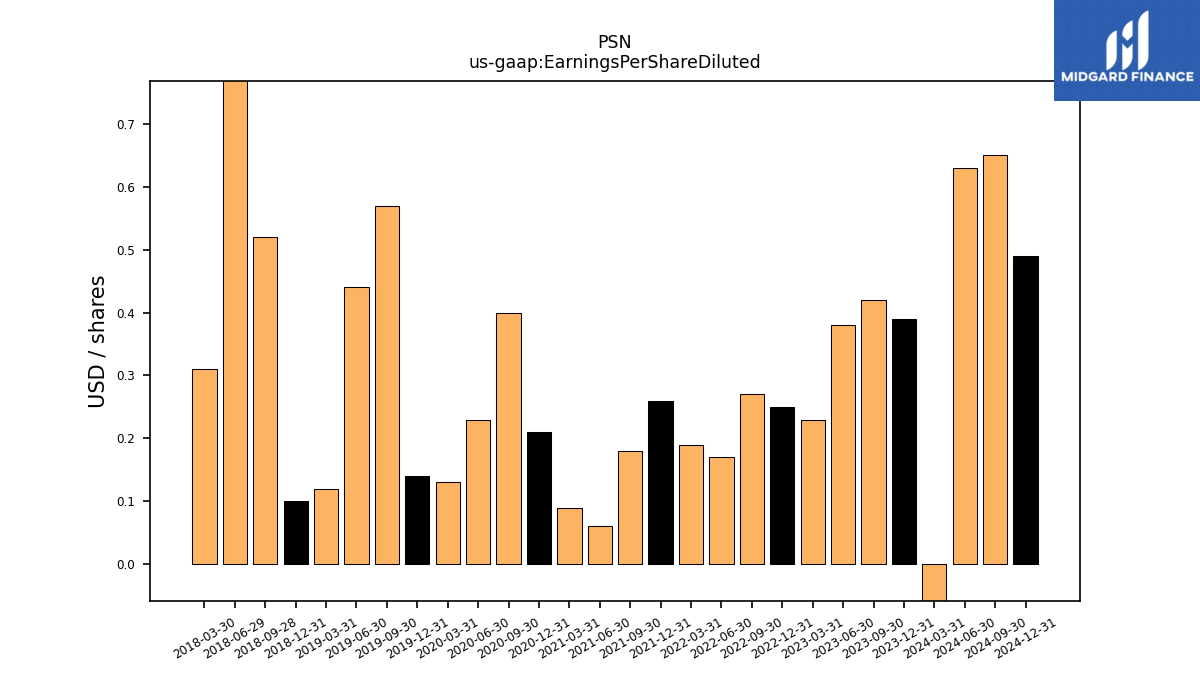
| Earnings Per Share Diluted | -1.01 | 0.39 | 0.42 | 0.38 | 0.23 | 0.25 | 0.27 | 0.17 | 0.19 | 0.26 | 0.18 | 0.06 | 0.09 | 0.21 | 0.40 | 0.23 | 0.13 | 0.14 | 0.57 | 0.44 | 0.12 | 0.10 | 0.52 | 1.83 | 0.31 |
| 2024-03-31 | 2023-12-31 | 2023-09-30 | 2023-06-30 | 2023-03-31 | 2022-12-31 | 2022-09-30 | 2022-06-30 | 2022-03-31 | 2021-12-31 | 2021-09-30 | 2021-06-30 | 2021-03-31 | 2020-12-31 | 2020-09-30 | 2020-06-30 | 2020-03-31 | 2019-12-31 | 2019-09-30 | 2019-06-30 | 2019-03-31 | 2018-12-31 | 2018-09-28 | 2018-06-29 | 2018-03-30 | ||
|---|---|---|---|---|---|---|---|---|---|---|---|---|---|---|---|---|---|---|---|---|---|---|---|---|---|---|
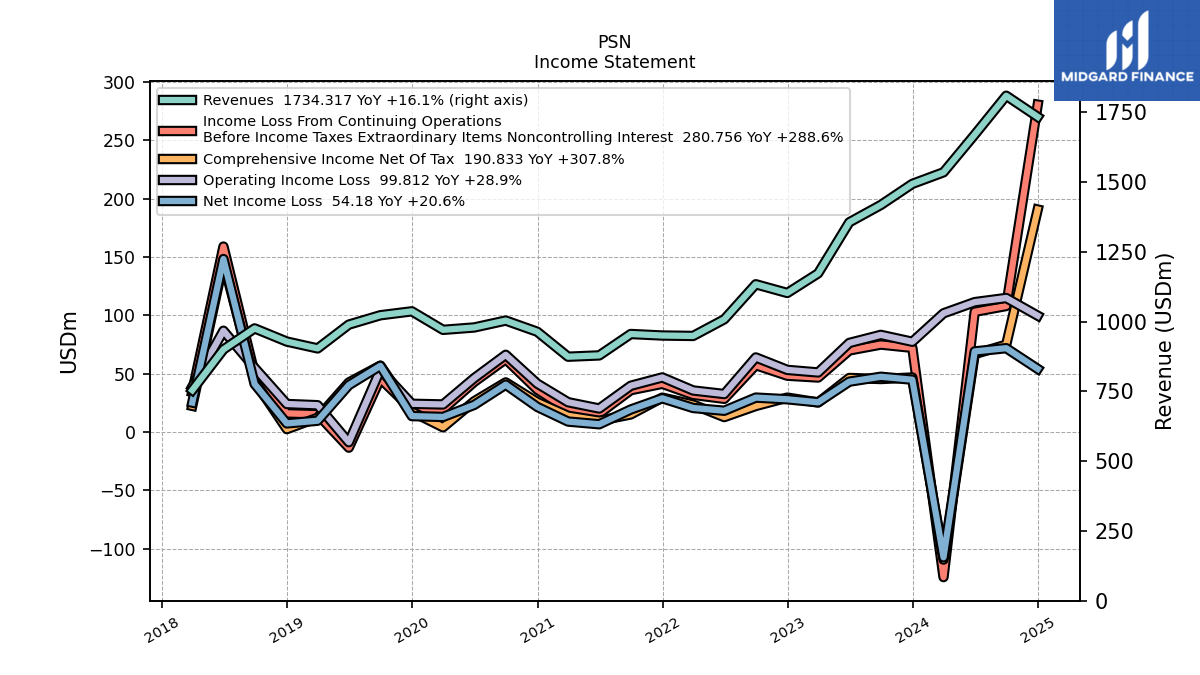
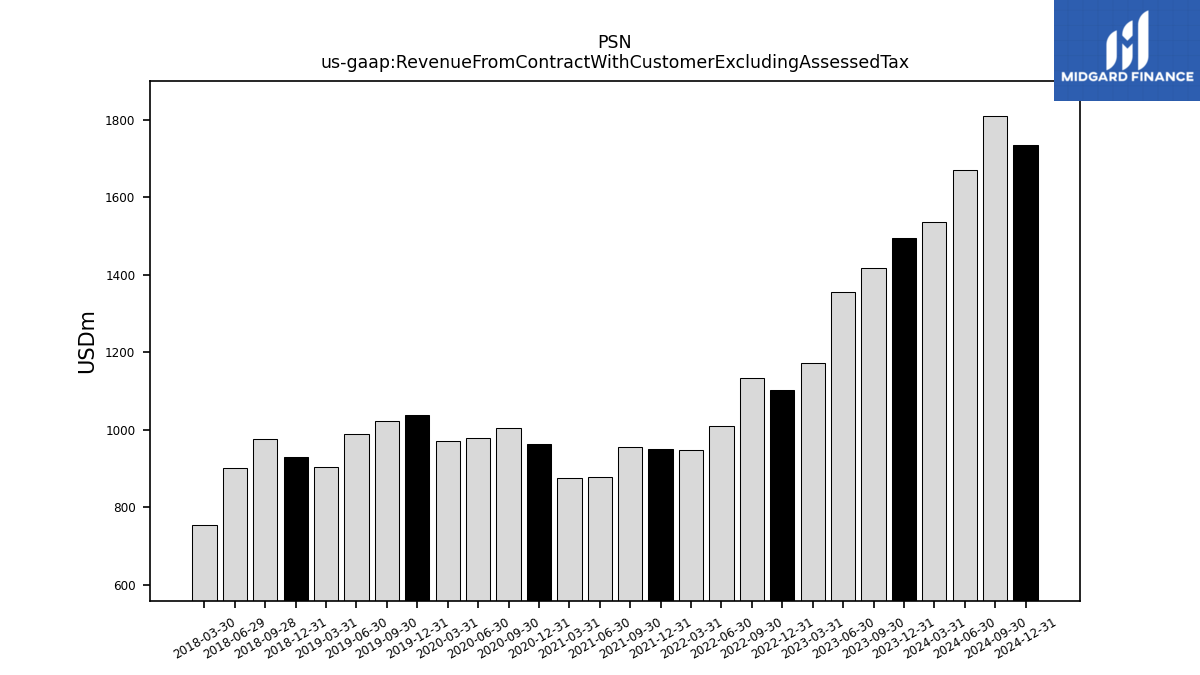
| Revenue From Contract With Customer Excluding Assessed Tax | 1535.68 | 1494.23 | 1418.57 | 1356.49 | 1173.47 | 1103.11 | 1134.37 | 1008.72 | 949.07 | 950.67 | 956.05 | 879.36 | 874.70 | 964.26 | 1004.24 | 979.46 | 970.99 | 1037.39 | 1023.28 | 989.74 | 904.40 | 928.94 | 976.16 | 900.73 | 754.68 | |
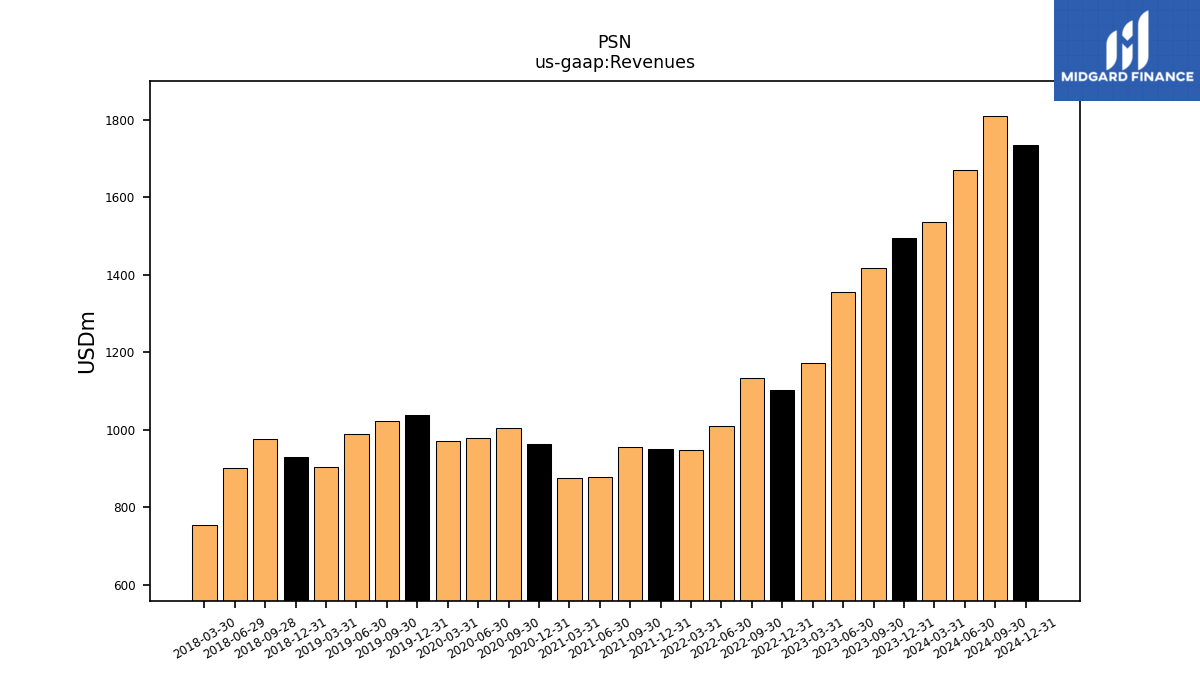
| Revenues | 1535.68 | 1494.23 | 1418.57 | 1356.49 | 1173.47 | 1103.11 | 1134.37 | 1008.72 | 949.07 | 950.67 | 956.05 | 879.36 | 874.70 | 964.26 | 1004.24 | 979.46 | 970.99 | 1037.39 | 1023.28 | 989.74 | 904.40 | 928.94 | 976.16 | 900.73 | 754.68 | |
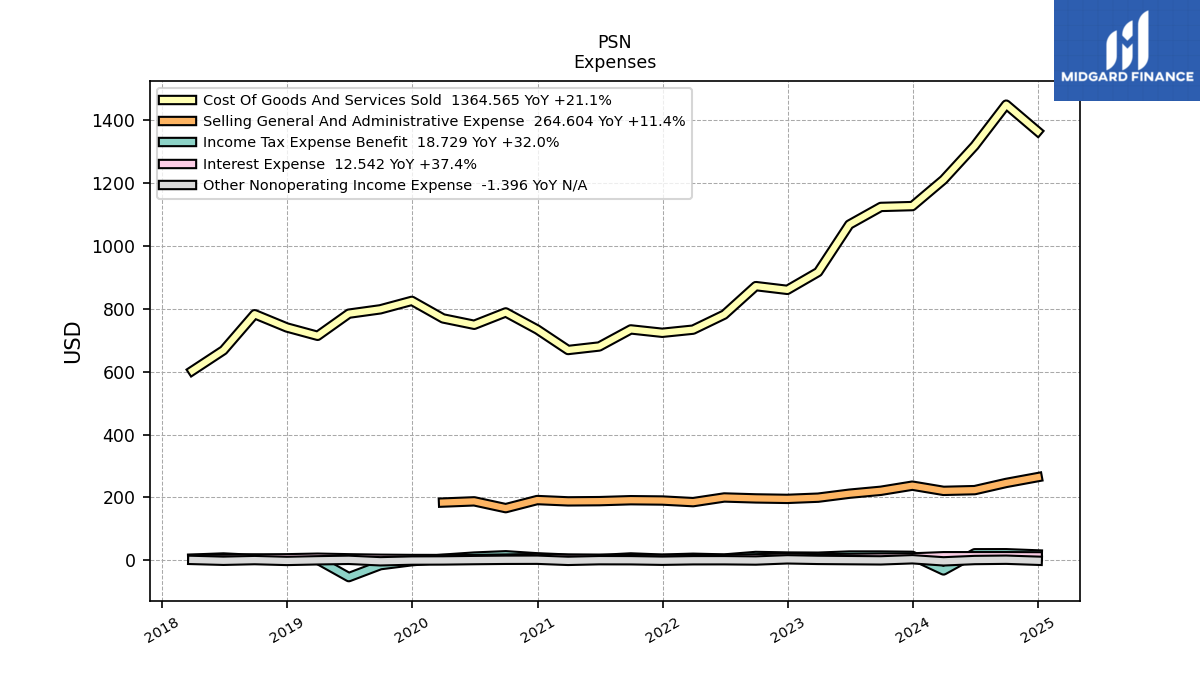
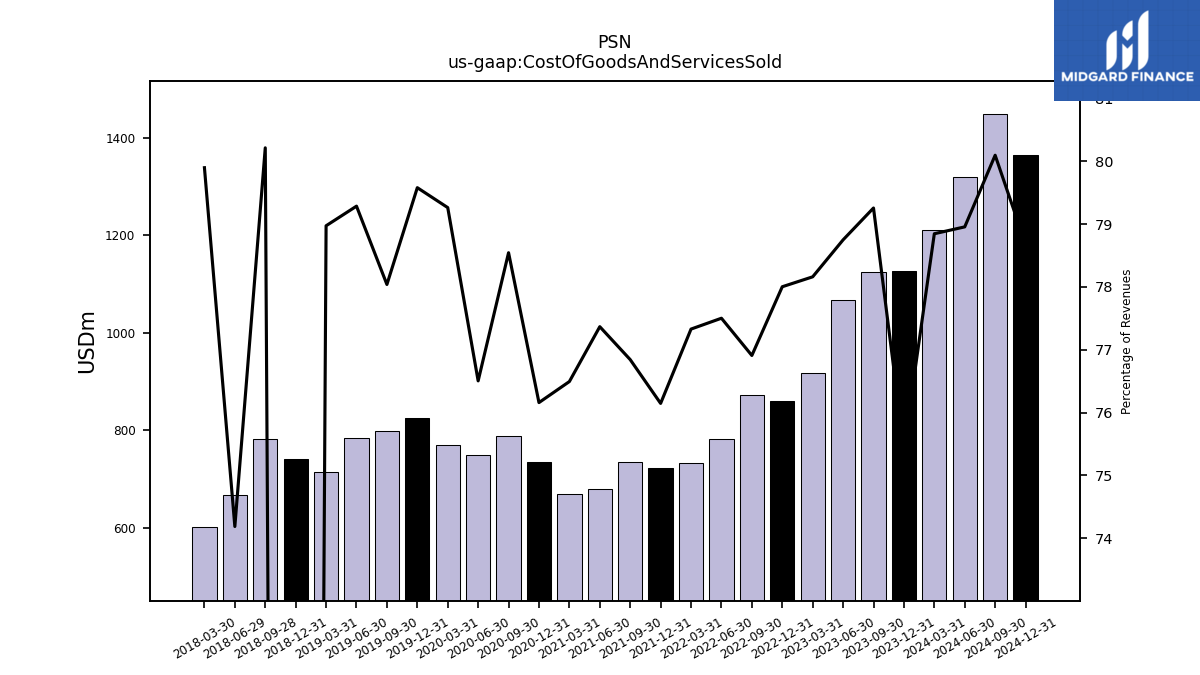
| Cost Of Goods And Services Sold | 1210.83 | 1127.02 | 1124.31 | 1068.22 | 917.19 | 860.46 | 872.42 | 781.77 | 733.90 | 723.89 | 734.65 | 680.33 | 669.08 | 734.36 | 788.77 | 749.32 | 769.63 | 825.55 | 798.55 | 784.72 | 714.24 | 740.80 | 783.02 | 668.21 | 602.97 | |
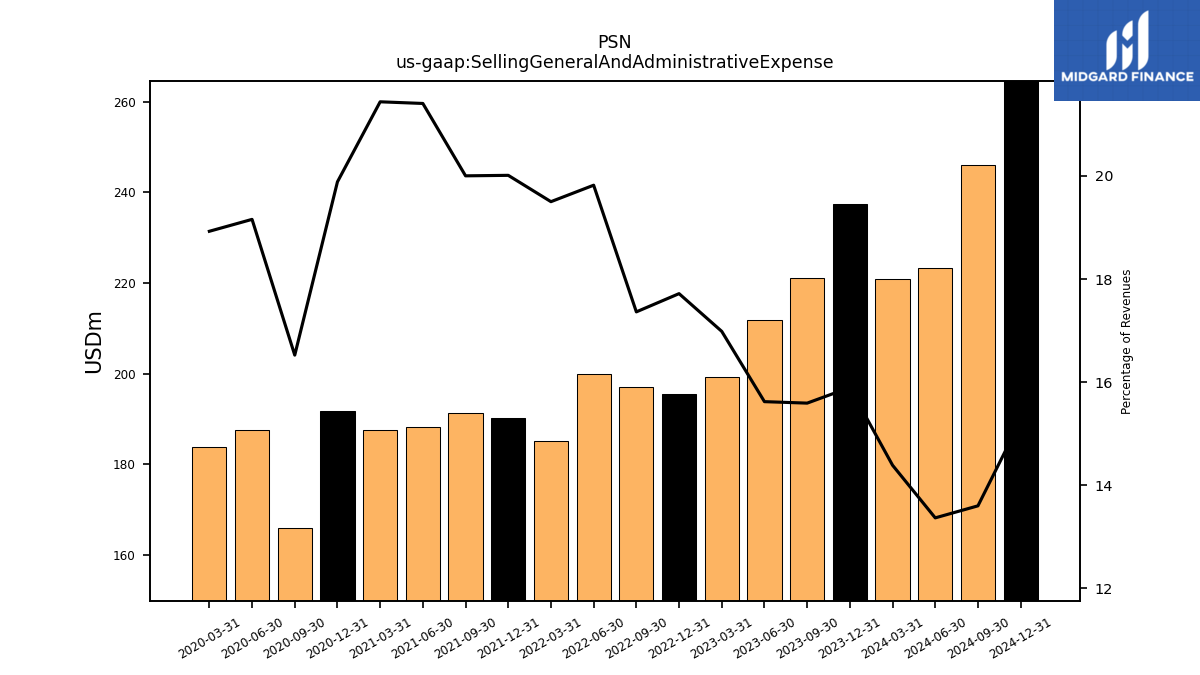
| Selling General And Administrative Expense | 220.94 | 237.51 | 221.19 | 211.90 | 199.31 | 195.43 | 196.96 | 199.93 | 185.08 | 190.25 | 191.23 | 188.24 | 187.52 | 191.75 | 165.94 | 187.64 | 183.77 | NA | NA | NA | NA | NA | NA | NA | NA | |
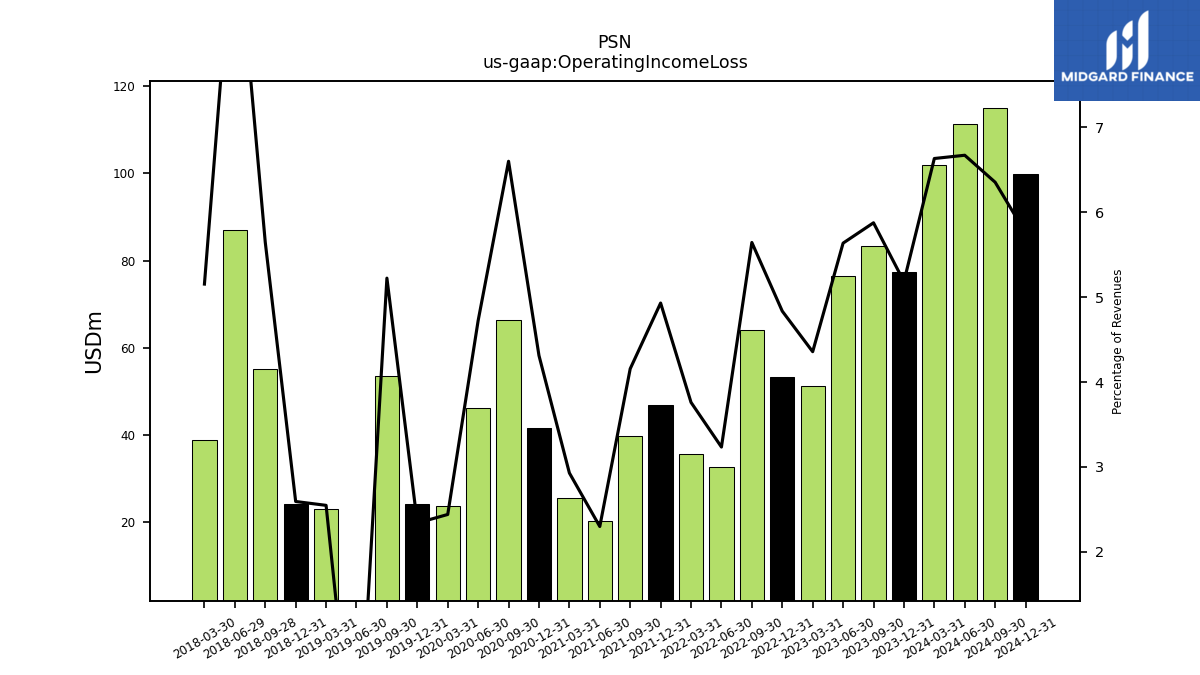
| Operating Income Loss | 101.84 | 77.44 | 83.34 | 76.44 | 51.13 | 53.33 | 64.01 | 32.63 | 35.69 | 46.87 | 39.74 | 20.22 | 25.62 | 41.58 | 66.27 | 46.26 | 23.70 | 24.27 | 53.45 | -8.71 | 23.05 | 24.09 | 55.11 | 86.91 | 38.89 | |
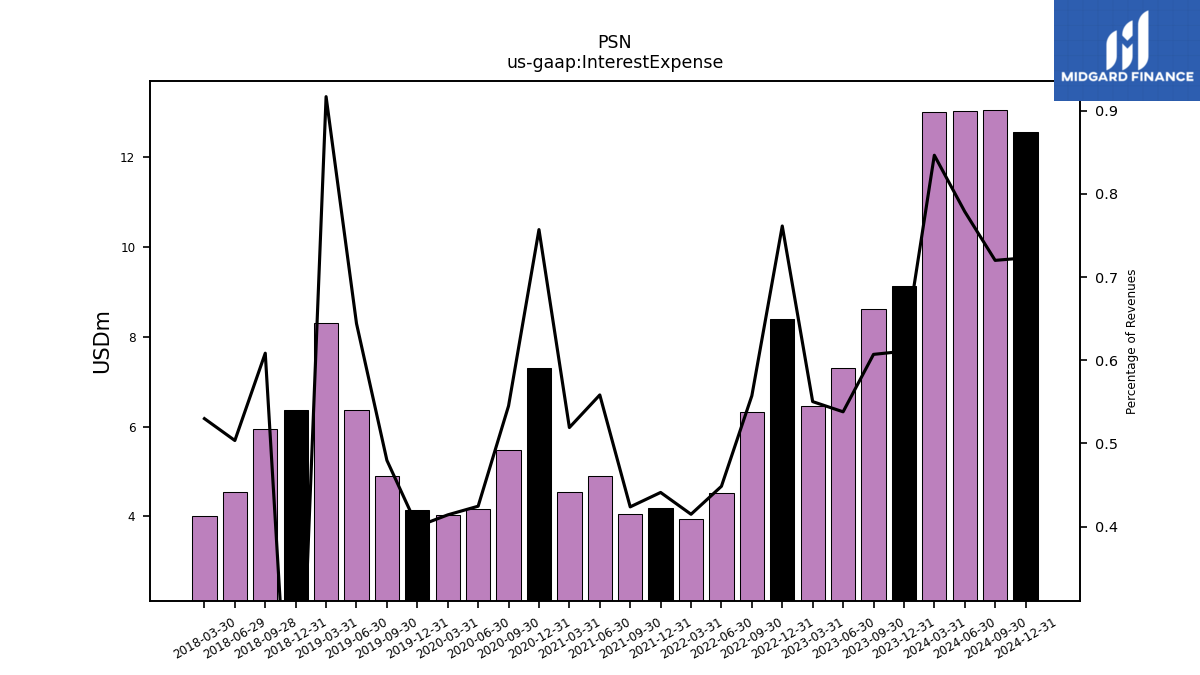
| Interest Expense | 13.00 | 9.13 | 8.61 | 7.30 | 6.46 | 8.40 | 6.32 | 4.53 | 3.94 | 4.19 | 4.05 | 4.91 | 4.54 | 7.30 | 5.47 | 4.16 | 4.02 | 4.15 | 4.91 | 6.38 | 8.29 | 6.37 | 5.94 | 4.54 | 4.00 | |
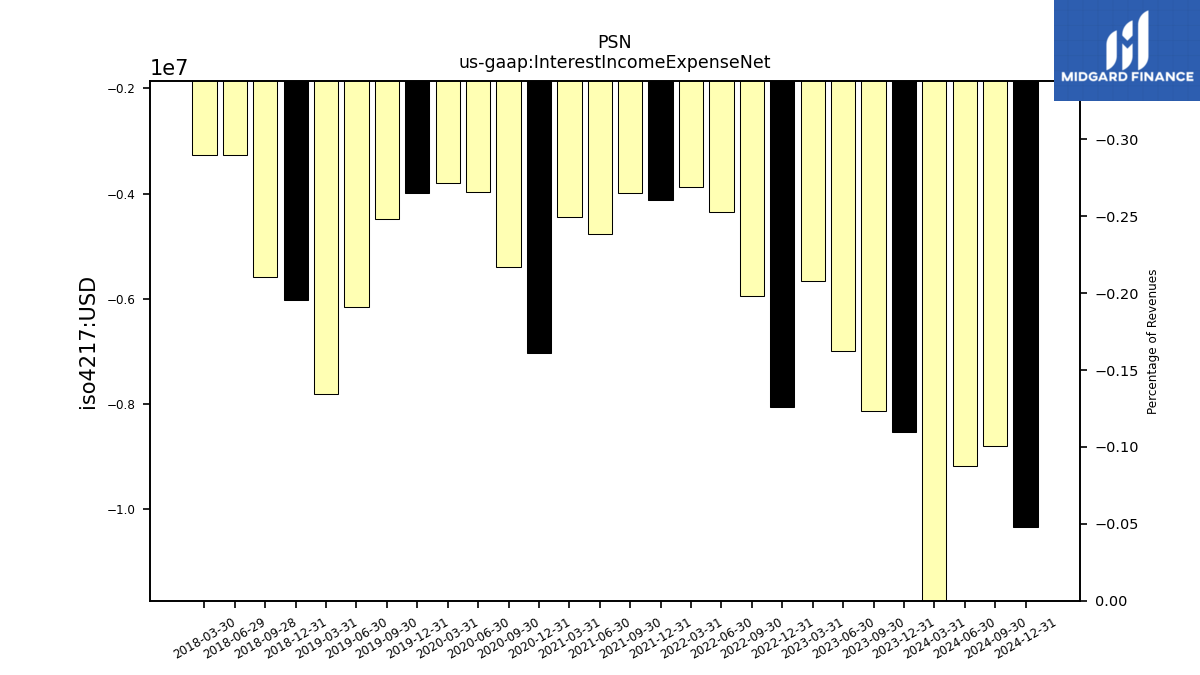
| Interest Income Expense Net | -11.85 | -8.53 | -8.12 | -6.99 | -5.67 | -8.05 | -5.94 | -4.35 | -3.87 | -4.11 | -3.99 | -4.76 | -4.44 | -7.03 | -5.39 | -3.96 | -3.79 | -3.98 | -4.48 | -6.15 | -7.82 | -6.01 | -5.59 | -3.27 | -3.26 | |
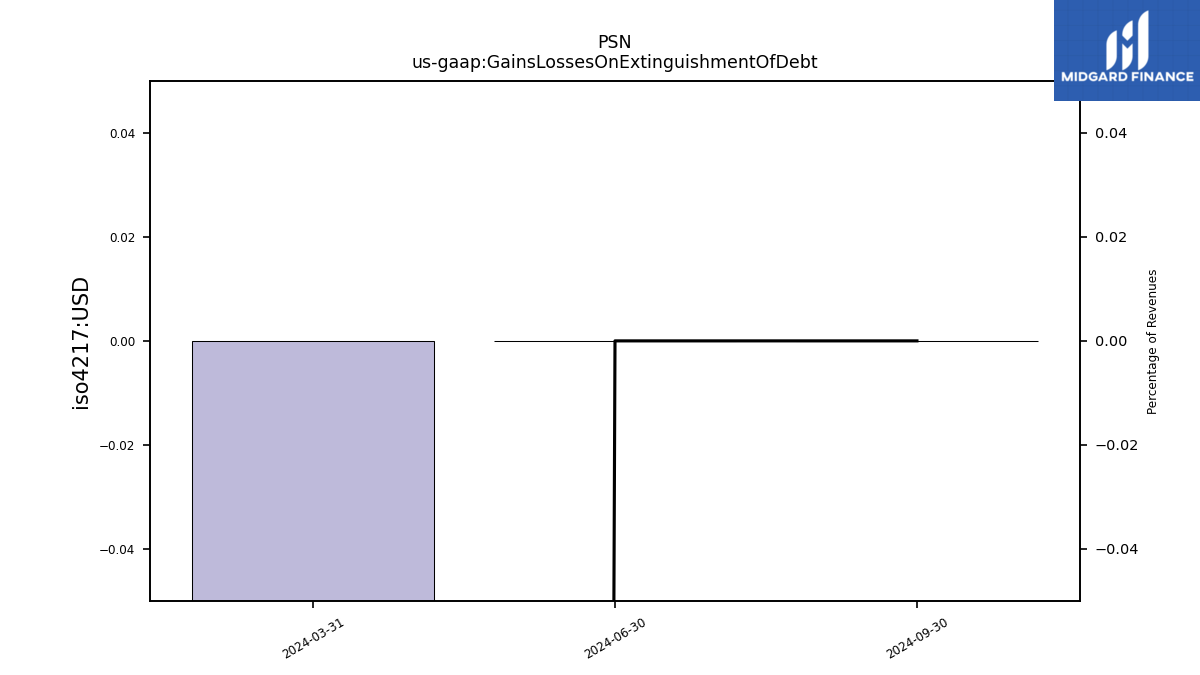
| Gains Losses On Extinguishment Of Debt | -211.02 | NA | NA | NA | NA | NA | NA | NA | NA | NA | NA | NA | NA | NA | NA | NA | NA | NA | NA | NA | NA | NA | NA | NA | NA | |
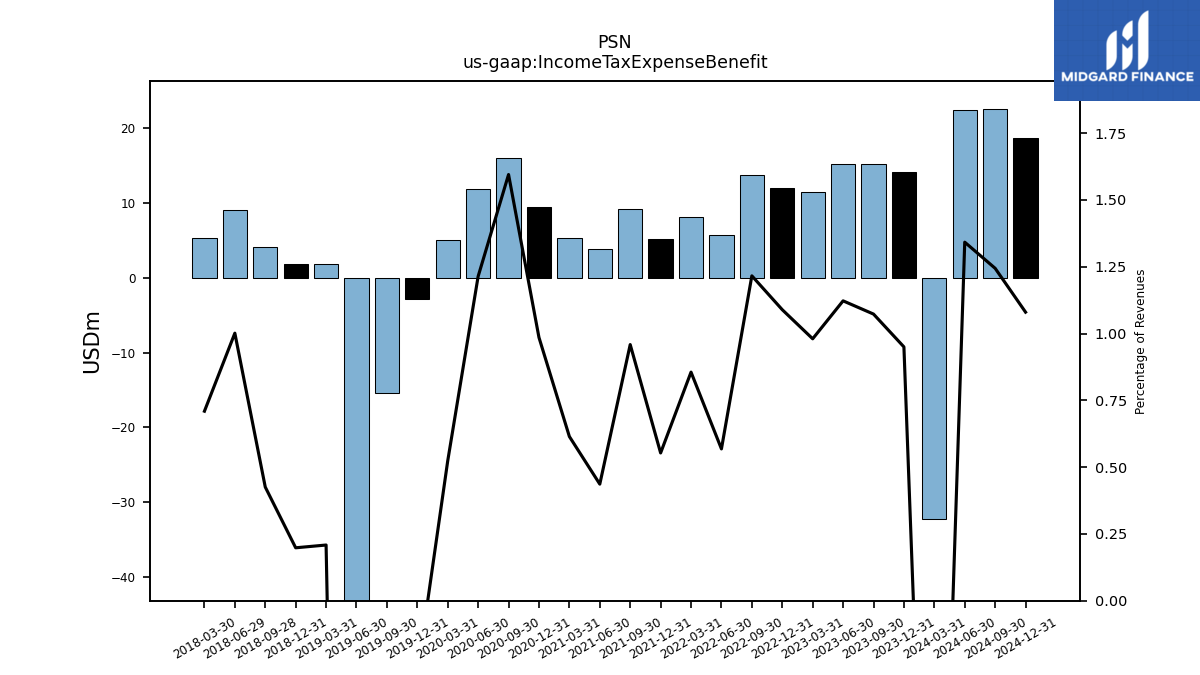
| Income Tax Expense Benefit | -32.23 | 14.19 | 15.22 | 15.22 | 11.50 | 12.01 | 13.79 | 5.73 | 8.12 | 5.26 | 9.16 | 3.84 | 5.38 | 9.50 | 16.02 | 11.89 | 5.08 | -2.82 | -15.45 | -53.50 | 1.89 | 1.84 | 4.15 | 9.02 | 5.35 | |
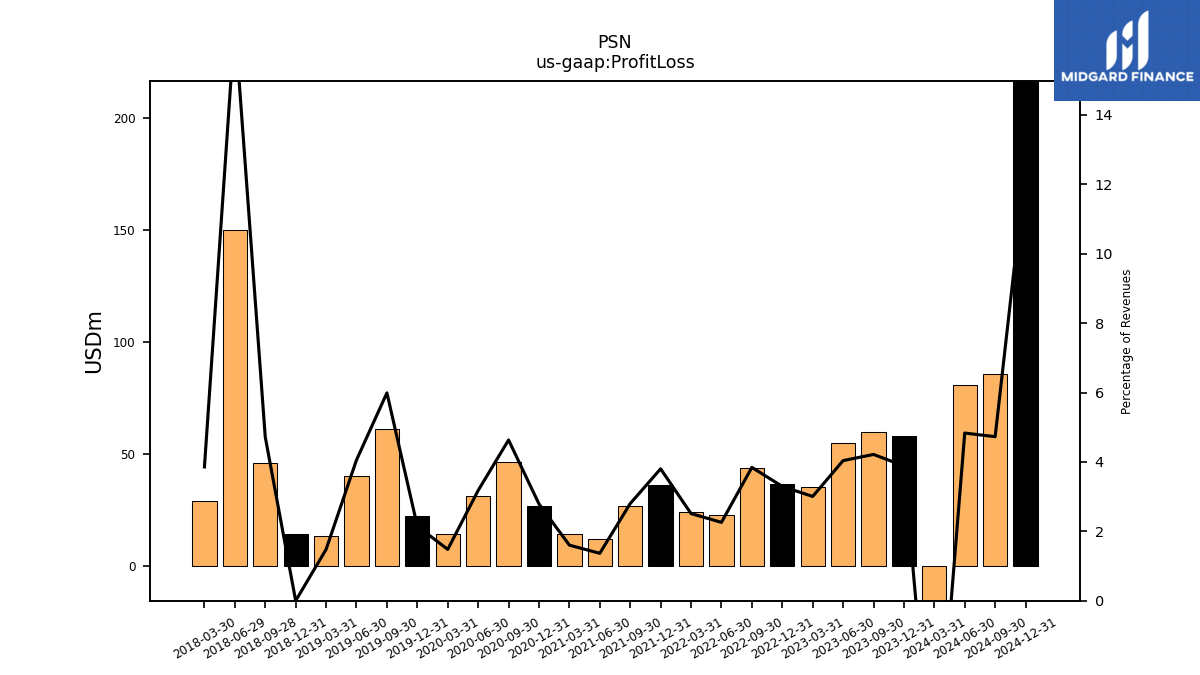
| Profit Loss | -92.11 | 58.06 | 59.81 | 54.77 | 35.28 | 36.35 | 43.59 | 22.78 | 23.84 | 36.14 | 26.77 | 12.03 | 14.01 | 26.91 | 46.52 | 31.12 | 14.37 | 22.30 | 61.29 | 40.15 | 13.39 | 14.23 | 46.07 | 150.04 | 29.10 | |
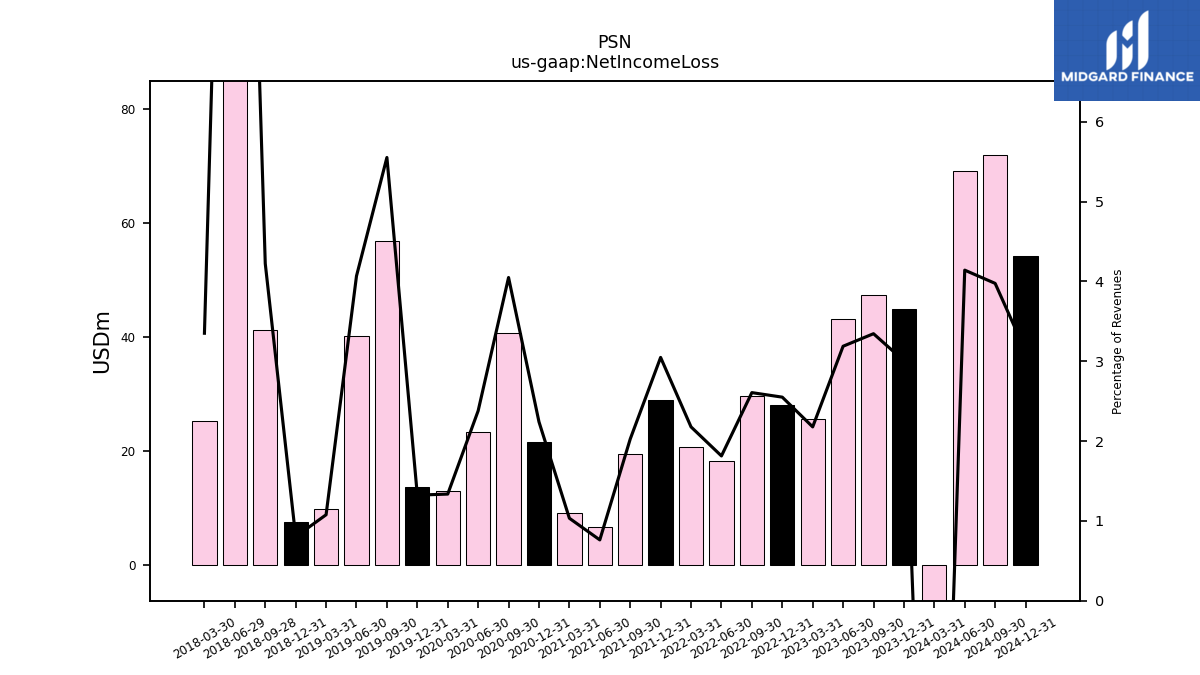
| Net Income Loss | -107.36 | 44.91 | 47.45 | 43.24 | 25.55 | 28.13 | 29.57 | 18.30 | 20.67 | 28.97 | 19.36 | 6.70 | 9.04 | 21.61 | 40.66 | 23.30 | 12.97 | 13.72 | 56.81 | 40.26 | 9.74 | 7.45 | 41.22 | 148.38 | 25.29 | |
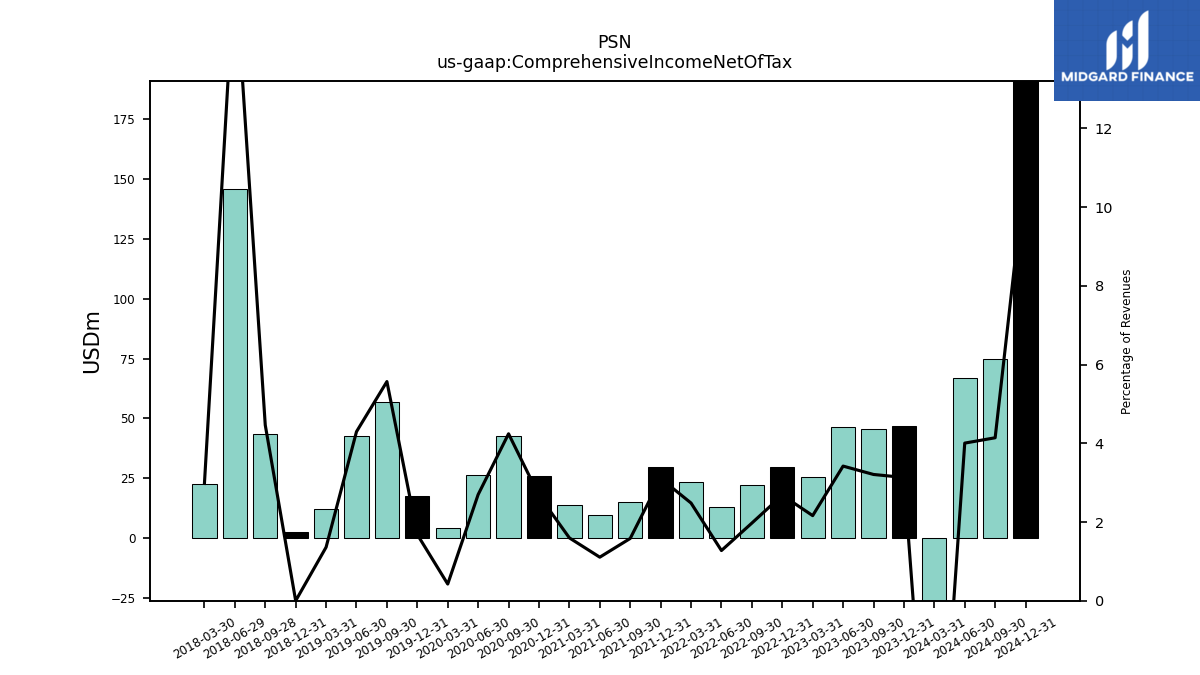
| Comprehensive Income Net Of Tax | -109.31 | 46.80 | 45.51 | 46.41 | 25.38 | 29.57 | 22.38 | 12.87 | 23.56 | 29.54 | 15.13 | 9.73 | 13.97 | 25.80 | 42.60 | 26.42 | 4.12 | 17.44 | 56.97 | 42.52 | 12.30 | 2.55 | 43.56 | 145.76 | 22.48 |
| 2024-03-31 | 2023-12-31 | 2023-09-30 | 2023-06-30 | 2023-03-31 | 2022-12-31 | 2022-09-30 | 2022-06-30 | 2022-03-31 | 2021-12-31 | 2021-09-30 | 2021-06-30 | 2021-03-31 | 2020-12-31 | 2020-09-30 | 2020-06-30 | 2020-03-31 | 2019-12-31 | 2019-09-30 | 2019-06-30 | 2019-03-31 | 2018-12-31 | 2018-09-28 | 2018-06-29 | 2018-03-30 | ||
|---|---|---|---|---|---|---|---|---|---|---|---|---|---|---|---|---|---|---|---|---|---|---|---|---|---|---|
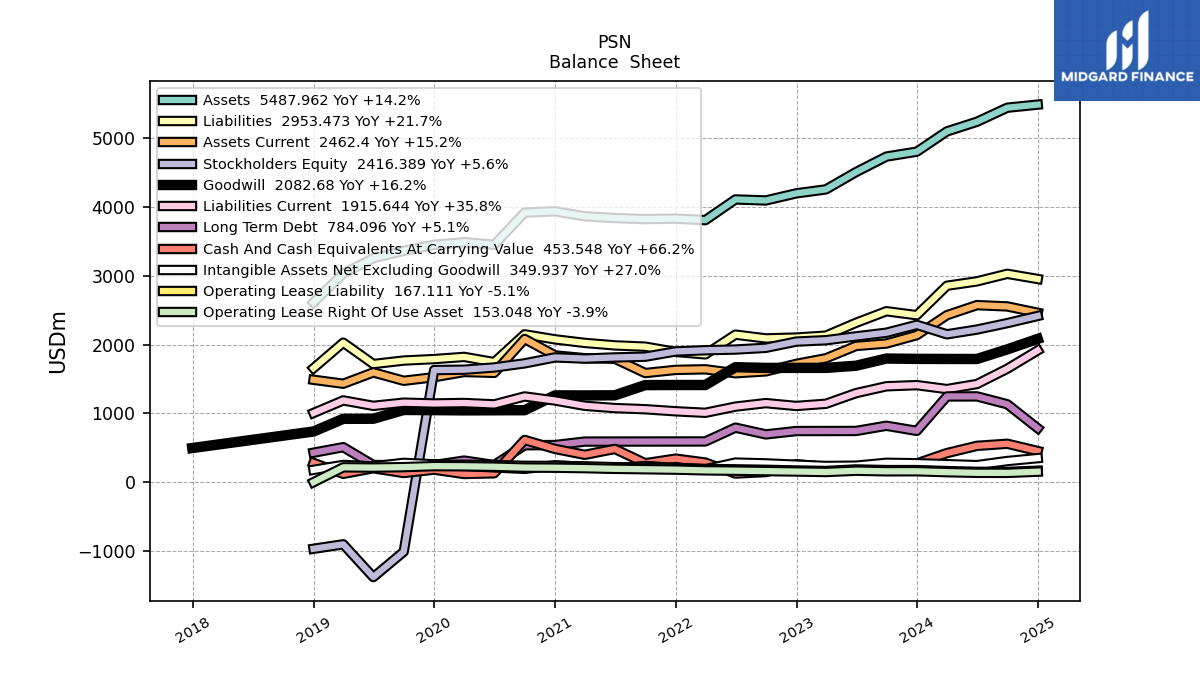
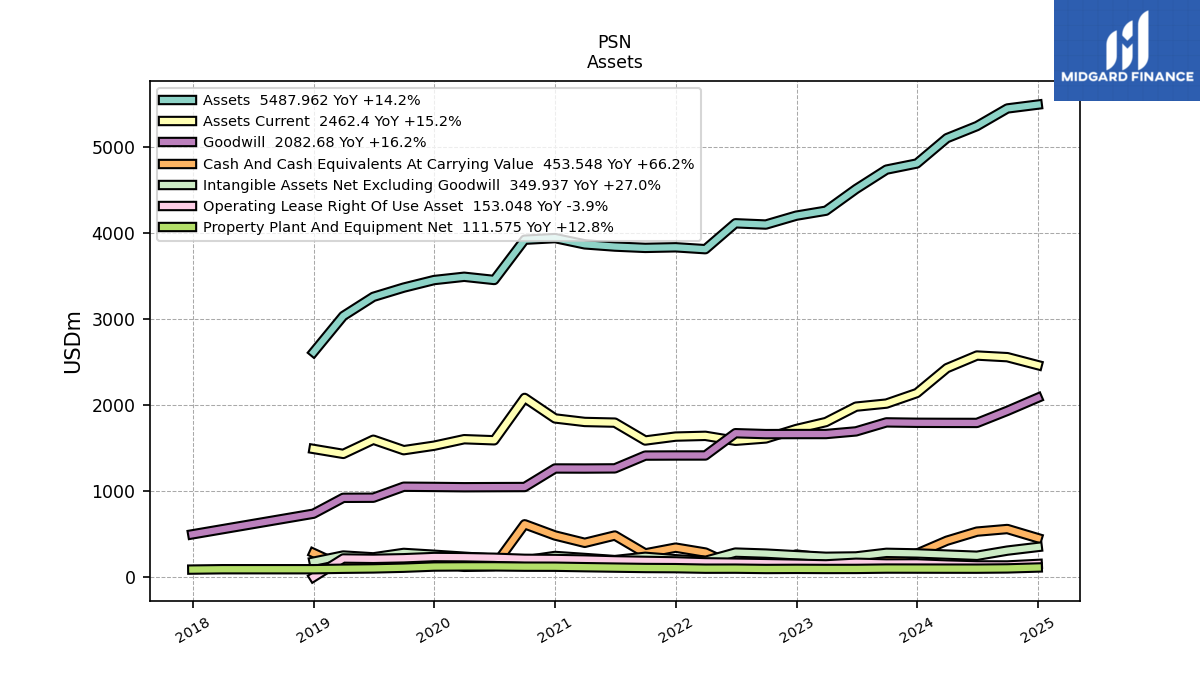
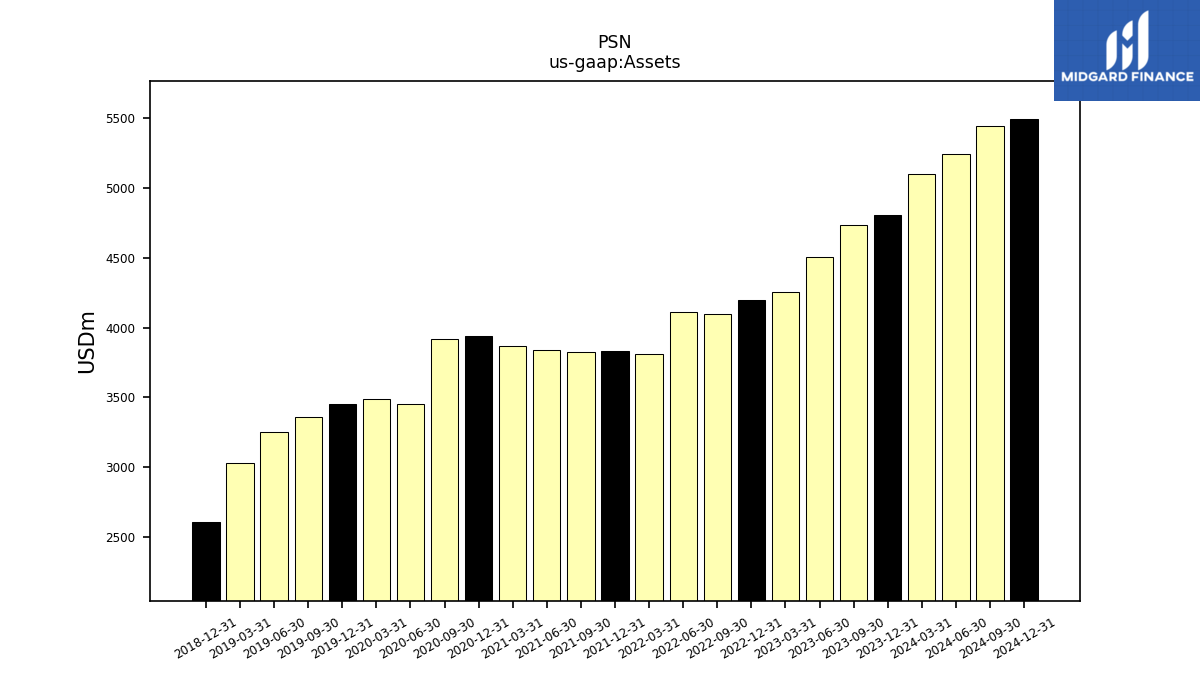
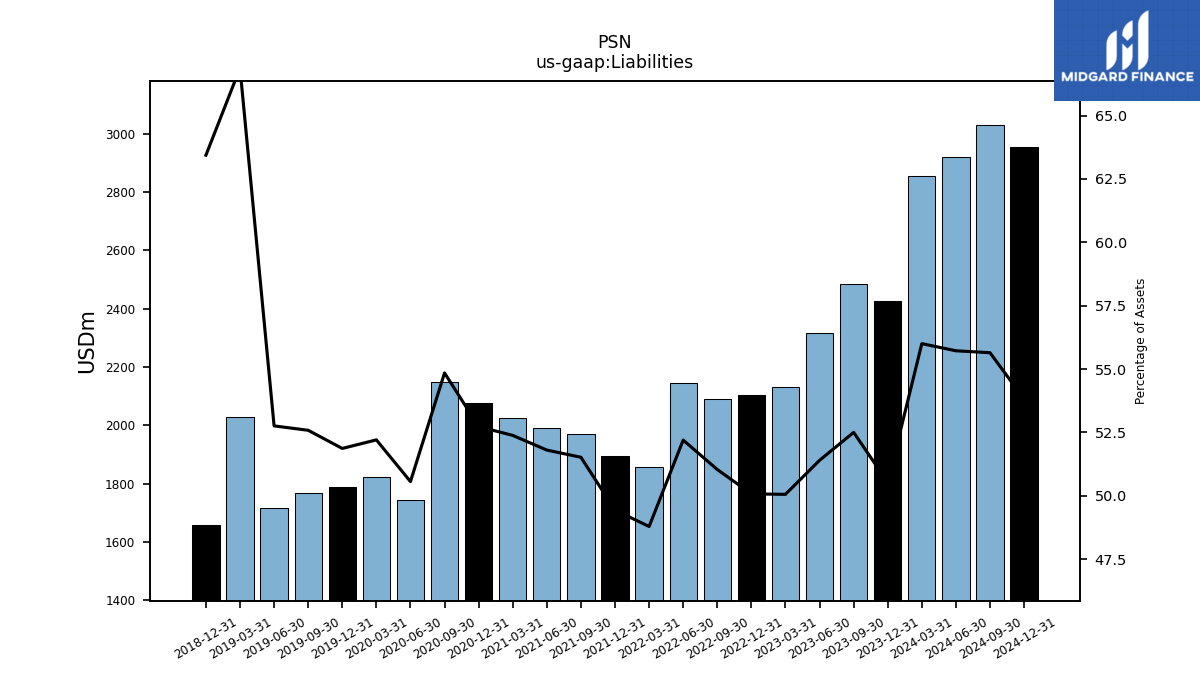
| Assets | 5098.44 | 4804.06 | 4732.99 | 4507.51 | 4255.81 | 4198.14 | 4094.99 | 4109.81 | 3808.84 | 3830.94 | 3823.93 | 3839.30 | 3865.00 | 3937.70 | 3918.76 | 3451.18 | 3488.61 | 3450.37 | 3362.64 | 3255.45 | 3033.00 | 2612.58 | NA | NA | NA | |
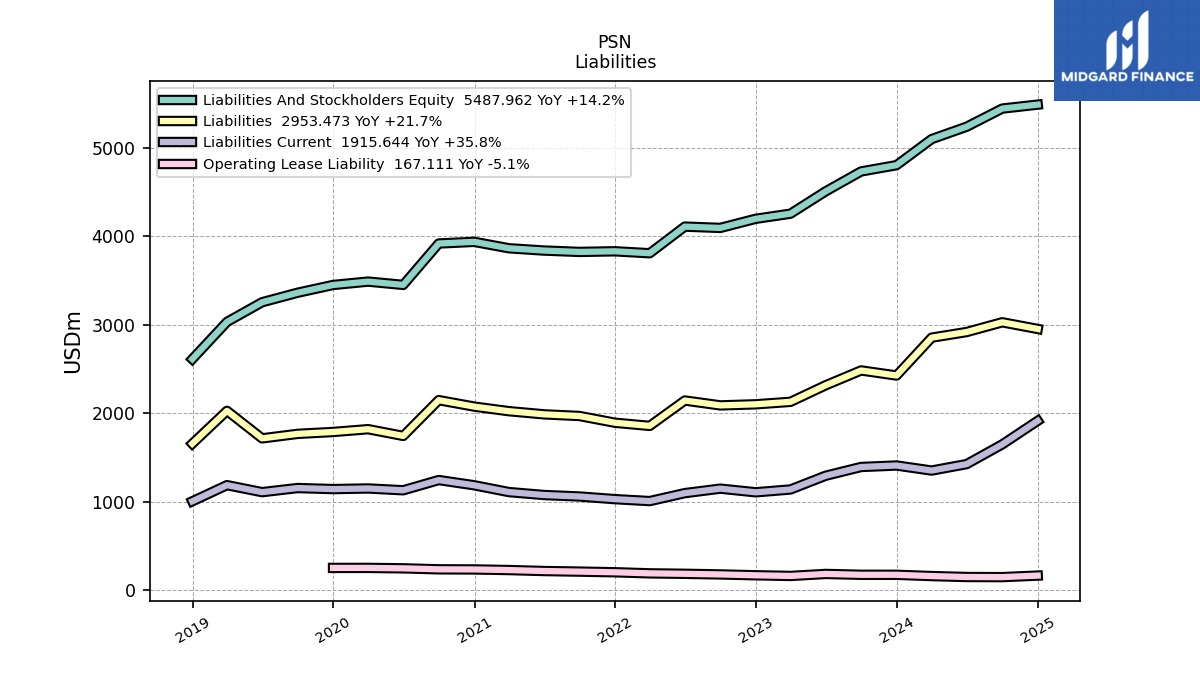
| Liabilities | 2855.29 | 2427.35 | 2484.89 | 2316.74 | 2130.28 | 2102.21 | 2089.90 | 2145.14 | 1858.22 | 1893.83 | 1970.06 | 1988.85 | 2024.56 | 2076.29 | 2149.29 | 1744.93 | 1821.23 | 1789.61 | 1768.19 | 1717.49 | 2028.31 | 1657.35 | NA | NA | NA | |
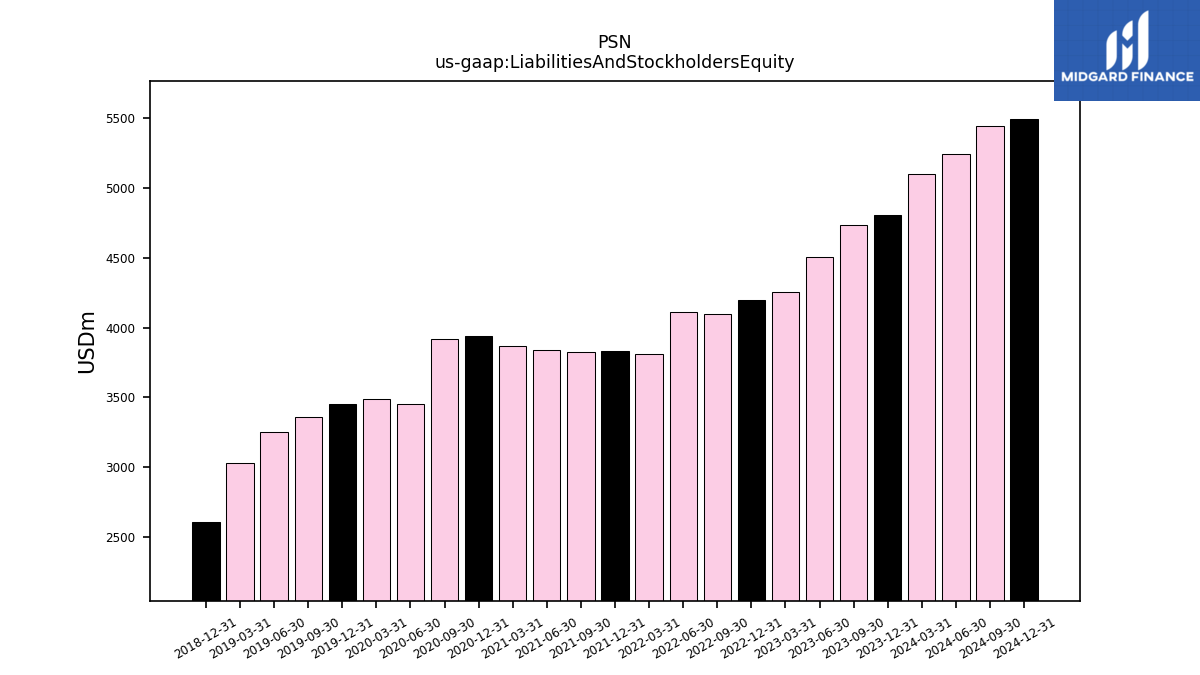
| Liabilities And Stockholders Equity | 5098.44 | 4804.06 | 4732.99 | 4507.51 | 4255.81 | 4198.14 | 4094.99 | 4109.81 | 3808.84 | 3830.94 | 3823.93 | 3839.30 | 3865.00 | 3937.70 | 3918.76 | 3451.18 | 3488.61 | 3450.37 | 3362.64 | 3255.45 | 3033.00 | 2612.58 | NA | NA | NA | |
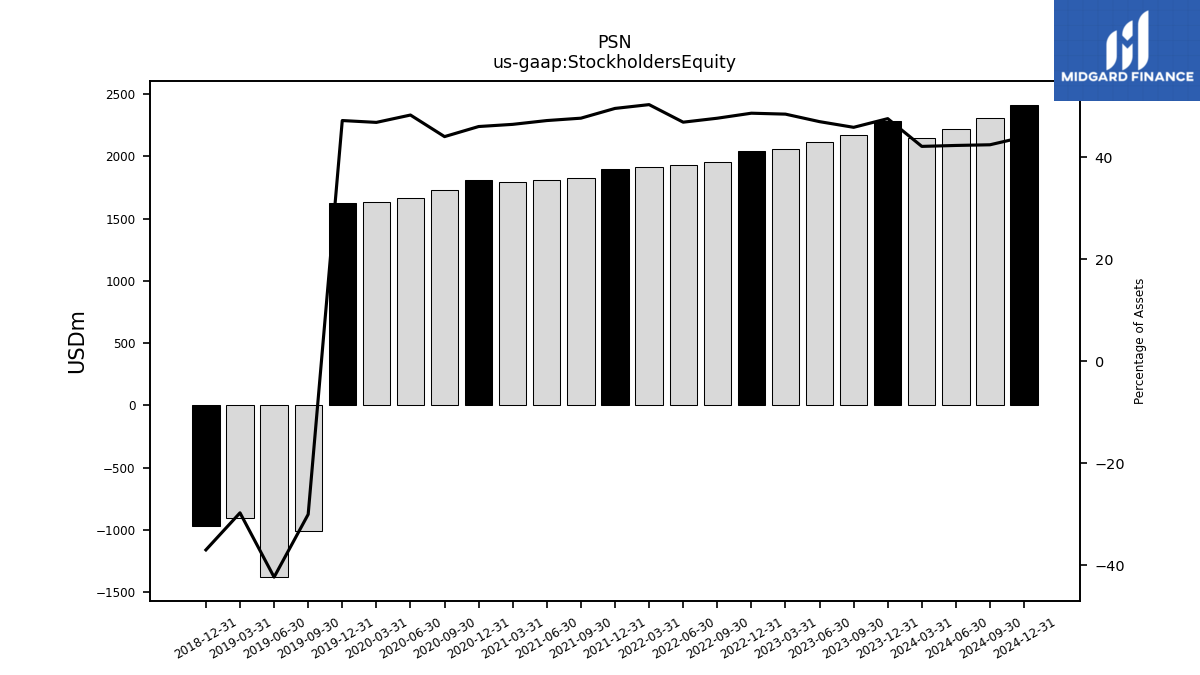
| Stockholders Equity | 2149.67 | 2287.21 | 2172.74 | 2119.43 | 2063.88 | 2043.57 | 1953.07 | 1928.18 | 1918.19 | 1900.77 | 1824.08 | 1813.46 | 1796.80 | 1813.77 | 1727.50 | 1667.55 | 1635.26 | 1629.89 | -1010.65 | -1379.58 | -902.47 | -967.54 | NA | NA | NA |
| 2024-03-31 | 2023-12-31 | 2023-09-30 | 2023-06-30 | 2023-03-31 | 2022-12-31 | 2022-09-30 | 2022-06-30 | 2022-03-31 | 2021-12-31 | 2021-09-30 | 2021-06-30 | 2021-03-31 | 2020-12-31 | 2020-09-30 | 2020-06-30 | 2020-03-31 | 2019-12-31 | 2019-09-30 | 2019-06-30 | 2019-03-31 | 2018-12-31 | 2018-09-28 | 2018-06-29 | 2018-03-30 | ||
|---|---|---|---|---|---|---|---|---|---|---|---|---|---|---|---|---|---|---|---|---|---|---|---|---|---|---|
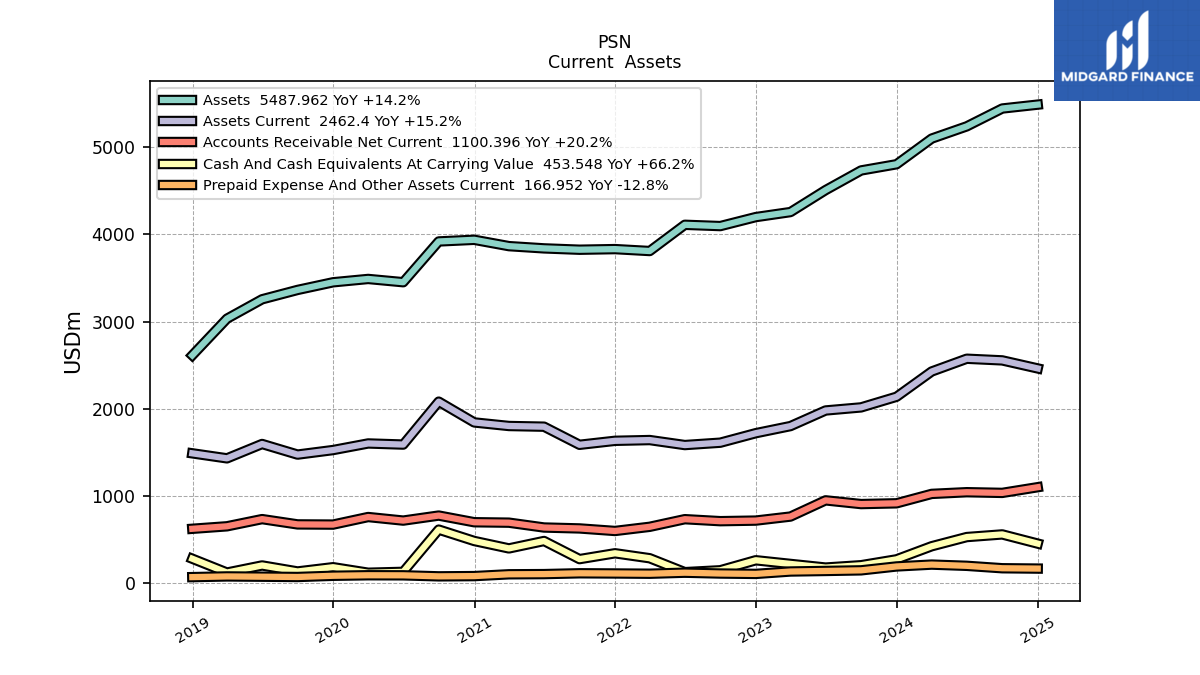
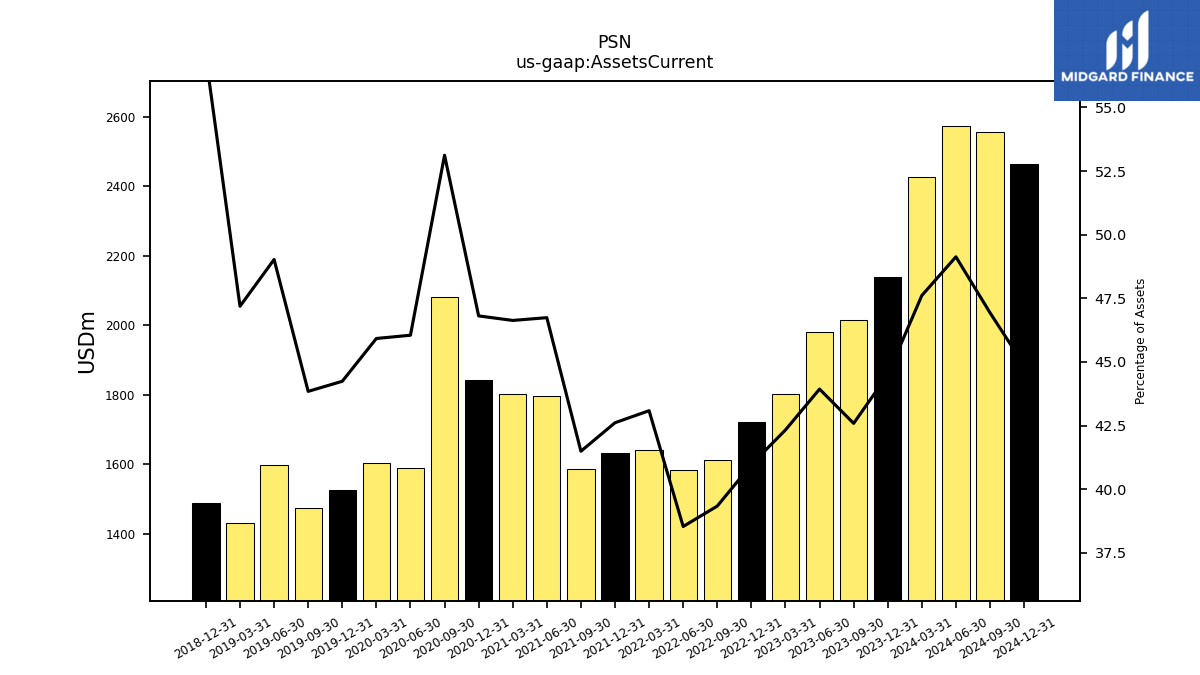
| Assets Current | 2427.25 | 2137.53 | 2015.54 | 1980.21 | 1801.34 | 1719.78 | 1610.80 | 1583.63 | 1640.97 | 1632.35 | 1586.57 | 1794.41 | 1802.21 | 1843.13 | 2081.62 | 1589.20 | 1601.97 | 1526.41 | 1474.26 | 1595.96 | 1431.16 | 1488.81 | NA | NA | NA | |
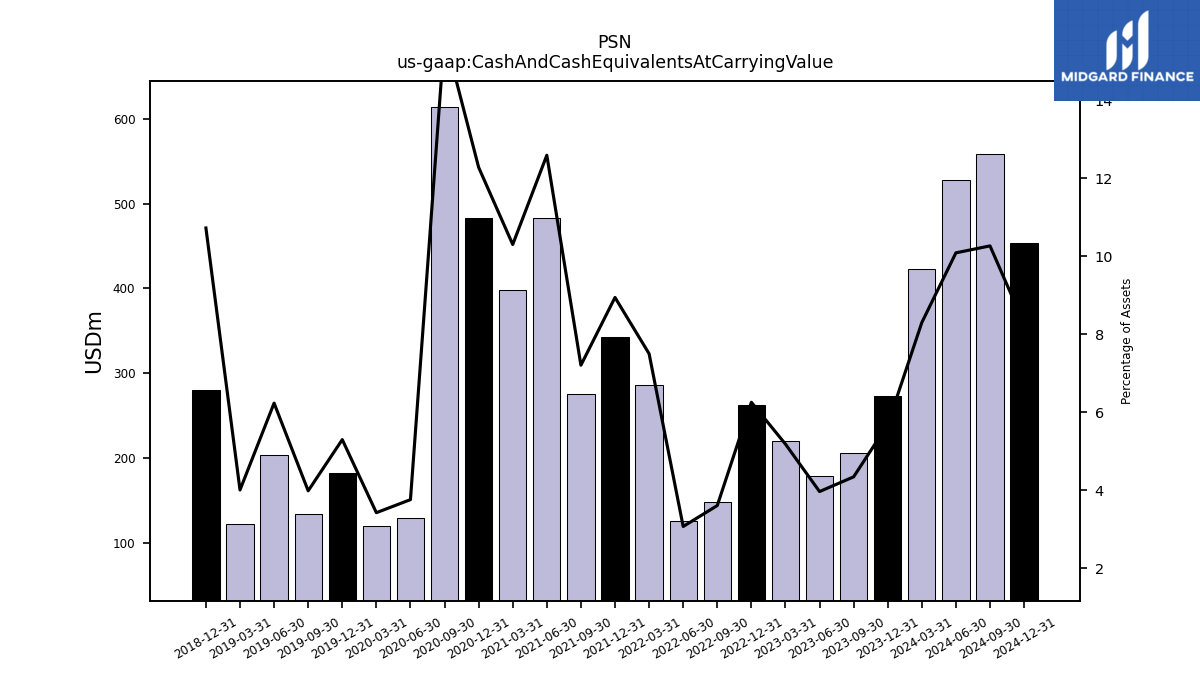
| Cash And Cash Equivalents At Carrying Value | 423.12 | 272.94 | 205.41 | 178.59 | 220.44 | 262.54 | 147.54 | 125.98 | 285.62 | 342.61 | 275.51 | 483.44 | 398.18 | 483.61 | 614.03 | 129.58 | 119.30 | 182.69 | 133.87 | 202.85 | 121.41 | 280.22 | NA | NA | NA | |
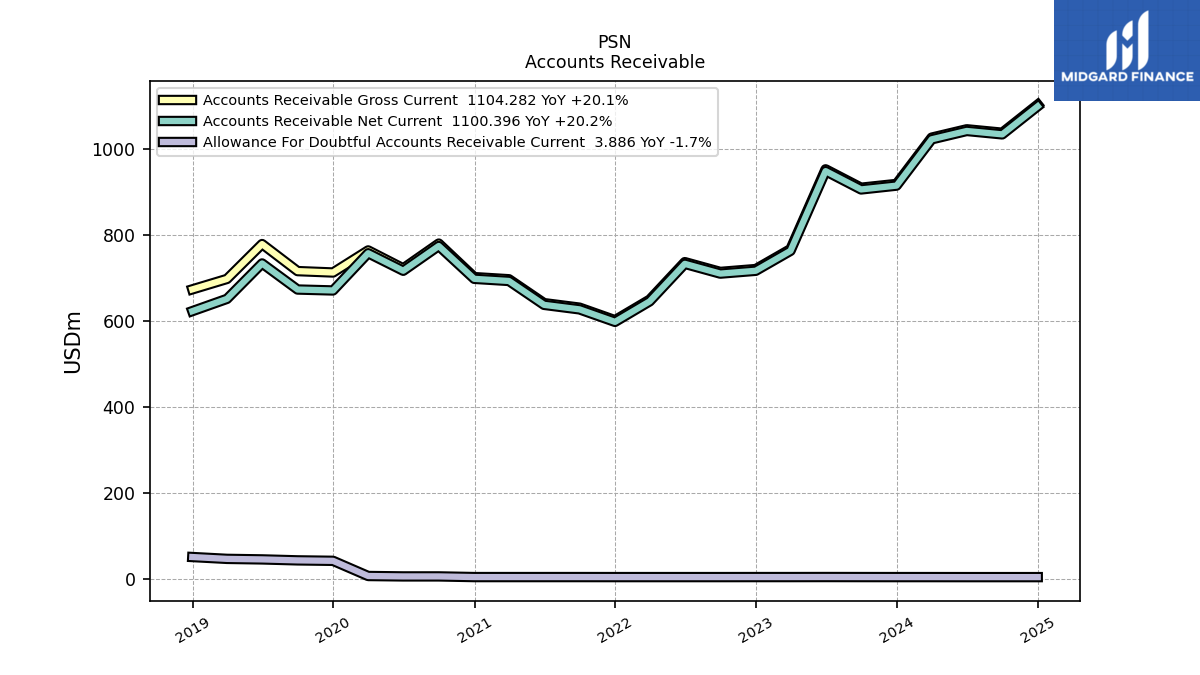
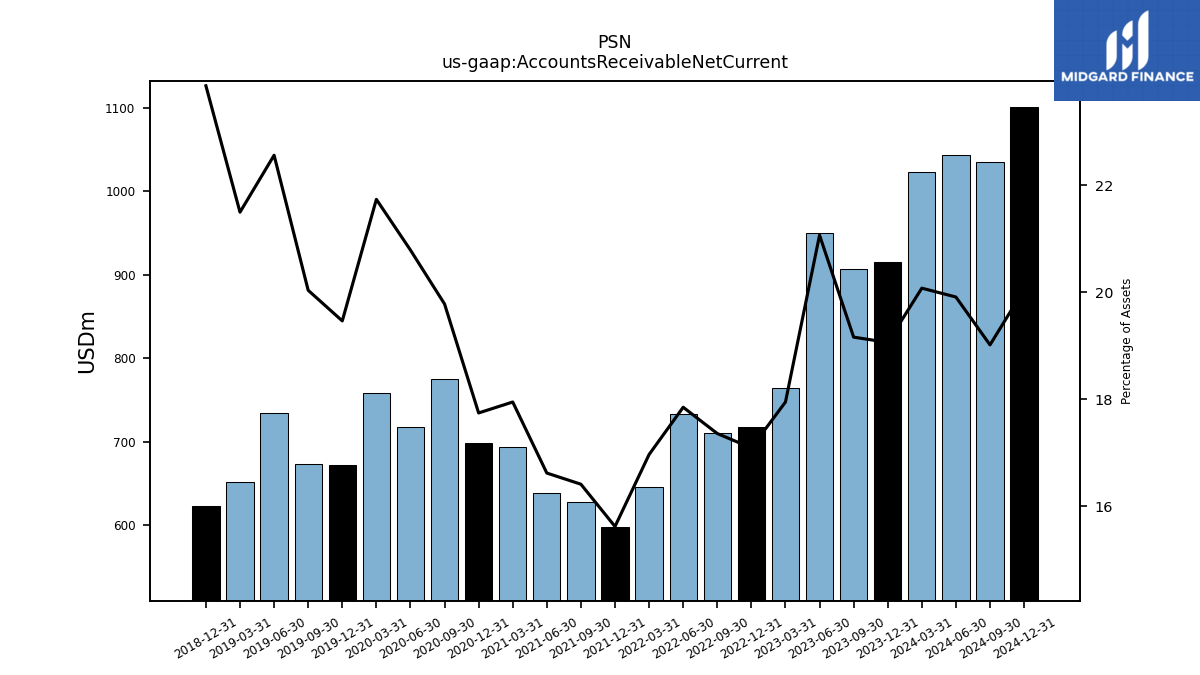
| Accounts Receivable Net Current | 1023.46 | 915.64 | 906.74 | 949.49 | 763.72 | 717.35 | 710.72 | 733.49 | 646.12 | 598.31 | 627.45 | 637.98 | 693.58 | 698.58 | 775.06 | 717.36 | 758.23 | 671.49 | 673.67 | 734.39 | 651.92 | 623.29 | NA | NA | NA | |
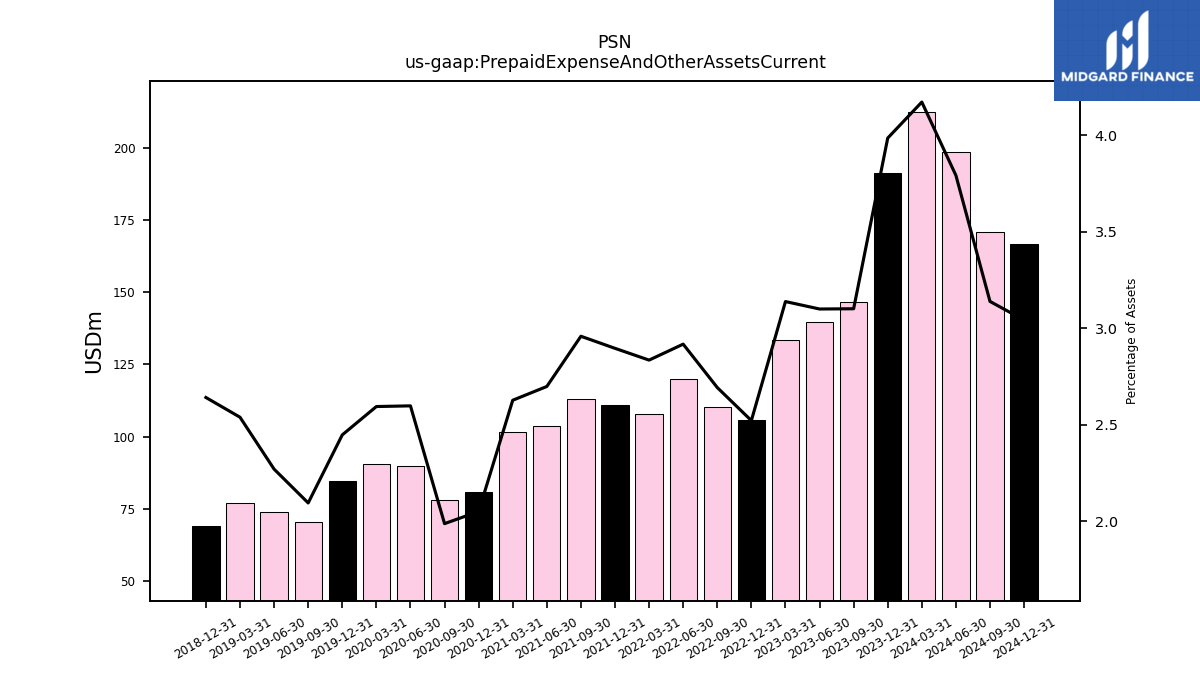
| Prepaid Expense And Other Assets Current | 212.66 | 191.43 | 146.76 | 139.71 | 133.55 | 105.87 | 110.27 | 119.91 | 107.98 | 110.94 | 113.13 | 103.60 | 101.54 | 80.77 | 77.91 | 89.66 | 90.51 | 84.45 | 70.45 | 73.91 | 77.01 | 69.01 | NA | NA | NA |
| 2024-03-31 | 2023-12-31 | 2023-09-30 | 2023-06-30 | 2023-03-31 | 2022-12-31 | 2022-09-30 | 2022-06-30 | 2022-03-31 | 2021-12-31 | 2021-09-30 | 2021-06-30 | 2021-03-31 | 2020-12-31 | 2020-09-30 | 2020-06-30 | 2020-03-31 | 2019-12-31 | 2019-09-30 | 2019-06-30 | 2019-03-31 | 2018-12-31 | 2018-09-28 | 2018-06-29 | 2018-03-30 | ||
|---|---|---|---|---|---|---|---|---|---|---|---|---|---|---|---|---|---|---|---|---|---|---|---|---|---|---|
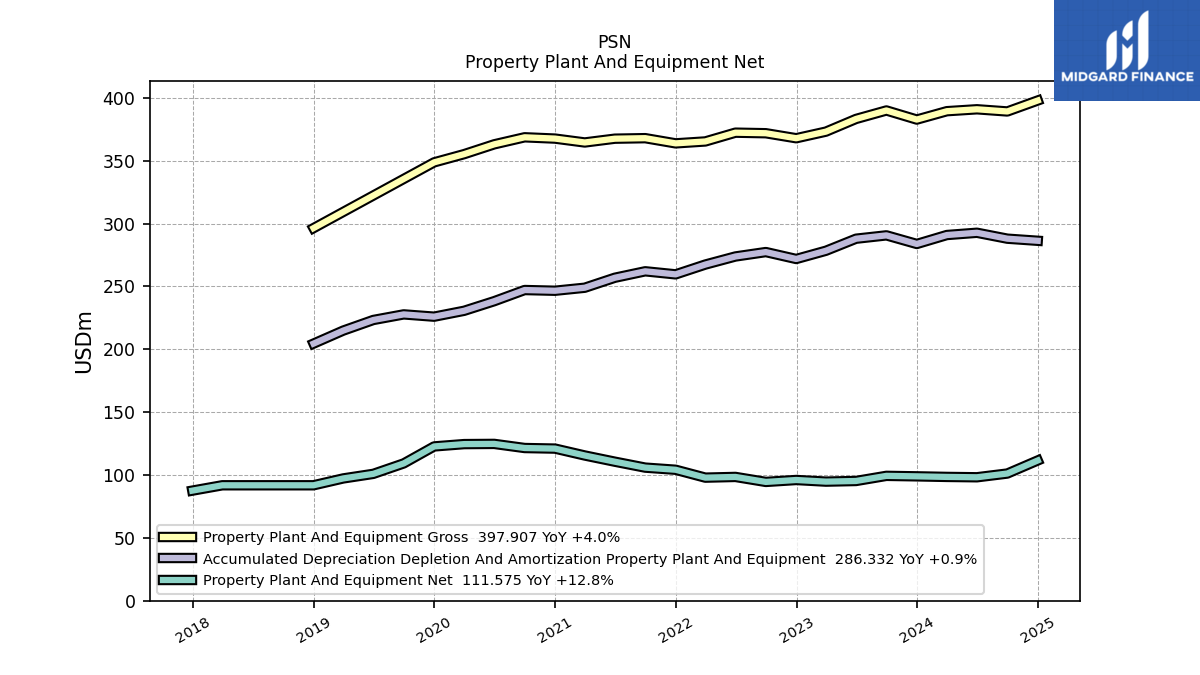
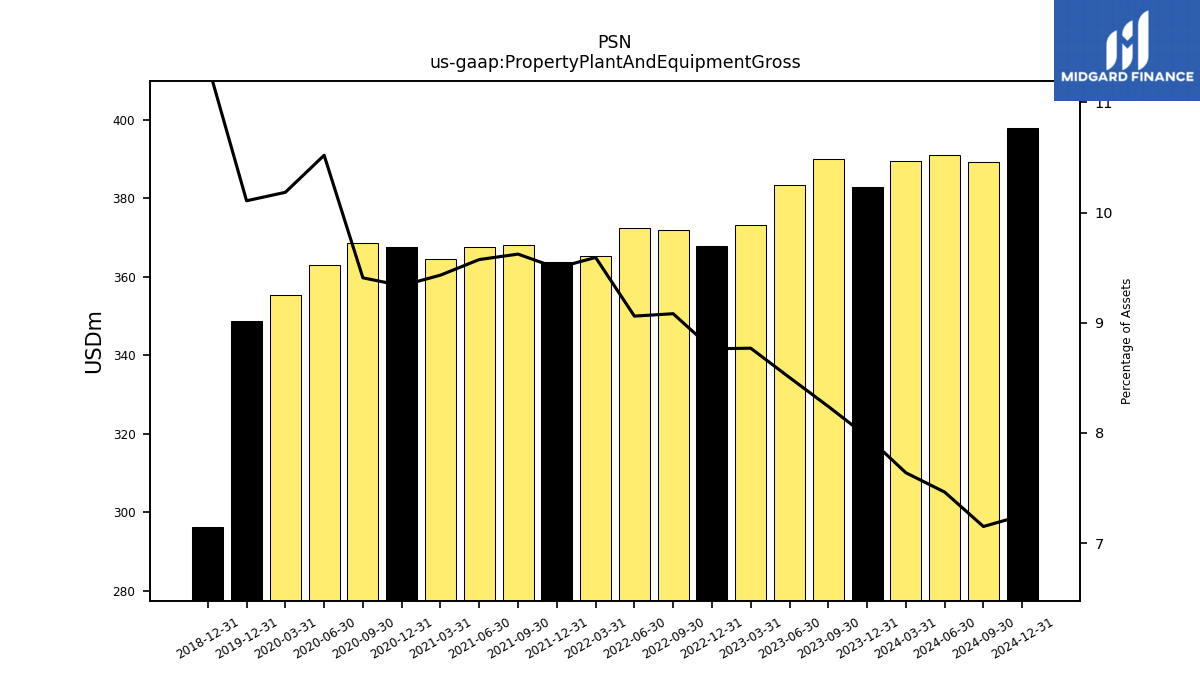
| Property Plant And Equipment Gross | 389.41 | 382.75 | 389.98 | 383.24 | 373.16 | 367.89 | 371.88 | 372.33 | 365.35 | 363.81 | 367.95 | 367.54 | 364.53 | 367.61 | 368.64 | 363.06 | 355.25 | 348.71 | NA | NA | NA | 296.38 | NA | NA | NA | |
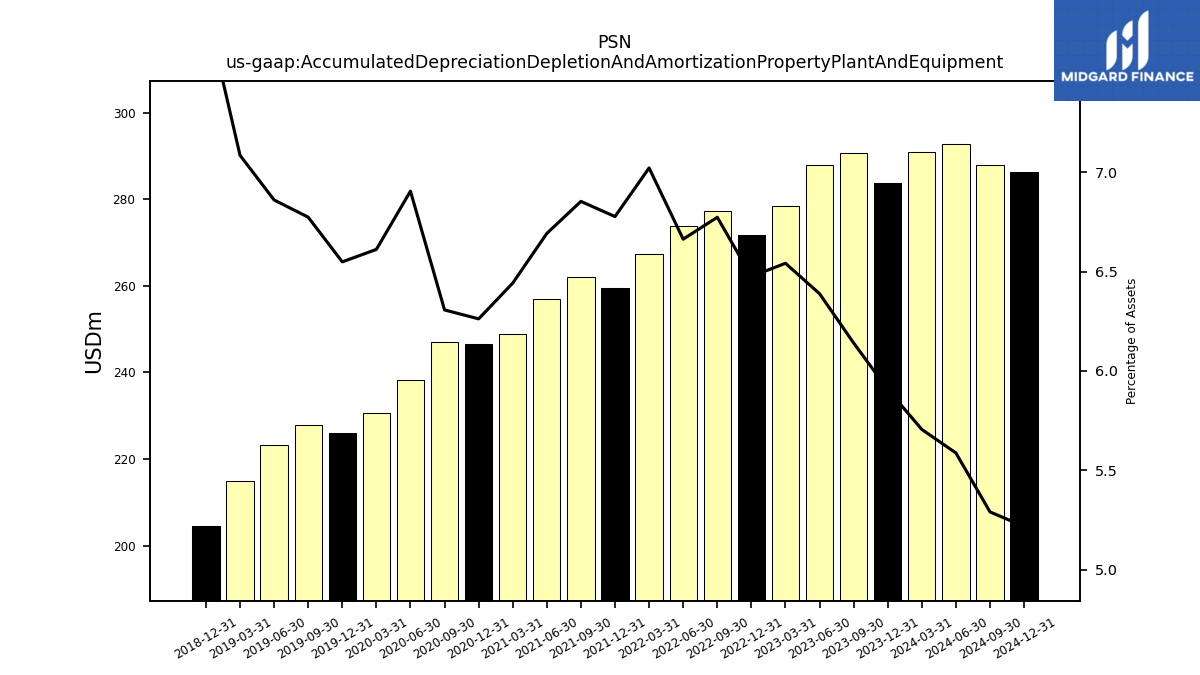
| Accumulated Depreciation Depletion And Amortization Property Plant And Equipment | 290.91 | 283.79 | 290.64 | 287.97 | 278.40 | 271.84 | 277.36 | 273.84 | 267.43 | 259.62 | 262.06 | 256.92 | 248.99 | 246.59 | 247.16 | 238.29 | 230.65 | 225.96 | 227.78 | 223.33 | 214.90 | 204.53 | NA | NA | NA | |
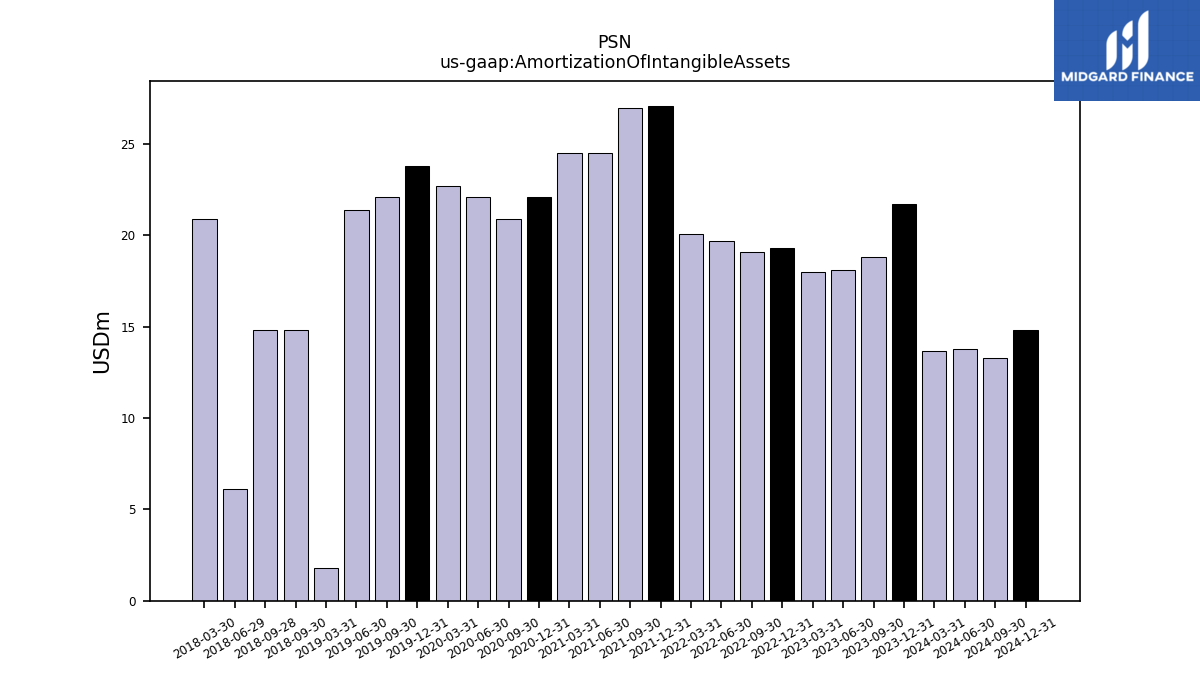
| Amortization Of Intangible Assets | 13.70 | 21.70 | 18.80 | 18.10 | 18.00 | 19.30 | 19.10 | 19.70 | 20.10 | 27.10 | 27.00 | 24.50 | 24.50 | 22.10 | 20.90 | 22.10 | 22.70 | 23.80 | 22.10 | 21.40 | 1.80 | NA | 14.80 | 6.10 | 20.90 | |
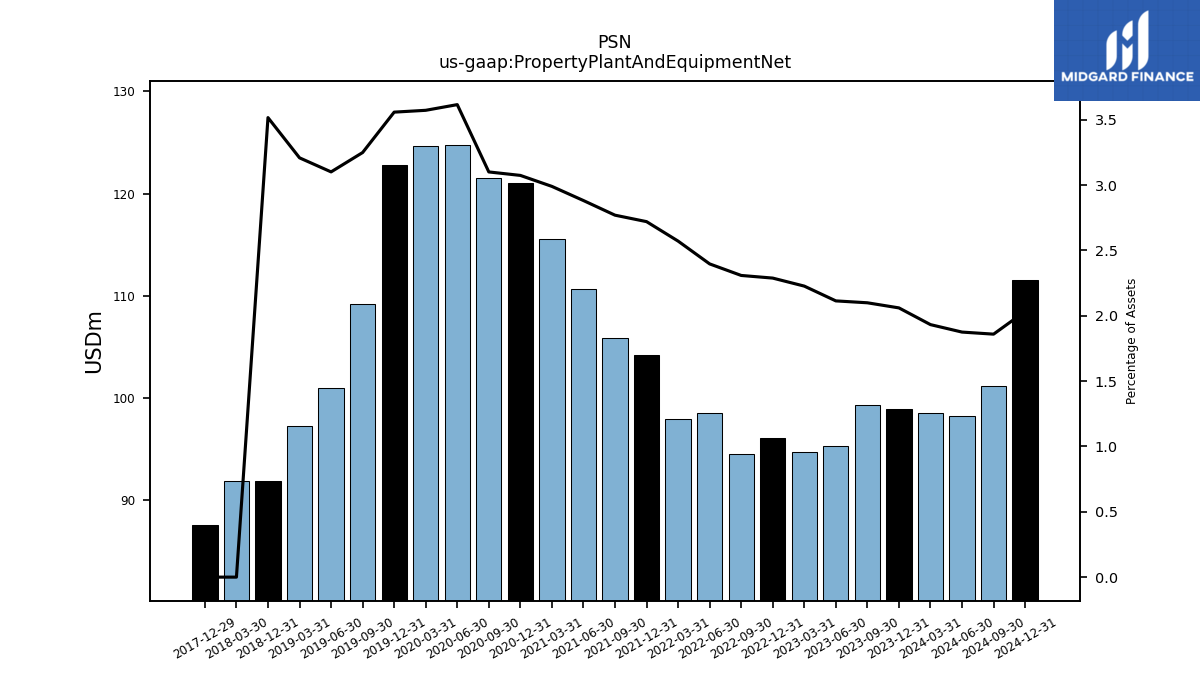
| Property Plant And Equipment Net | 98.50 | 98.96 | 99.34 | 95.27 | 94.76 | 96.05 | 94.52 | 98.49 | 97.92 | 104.20 | 105.89 | 110.62 | 115.54 | 121.03 | 121.49 | 124.76 | 124.60 | 122.75 | 109.24 | 100.93 | 97.30 | 91.85 | NA | NA | 91.85 | |
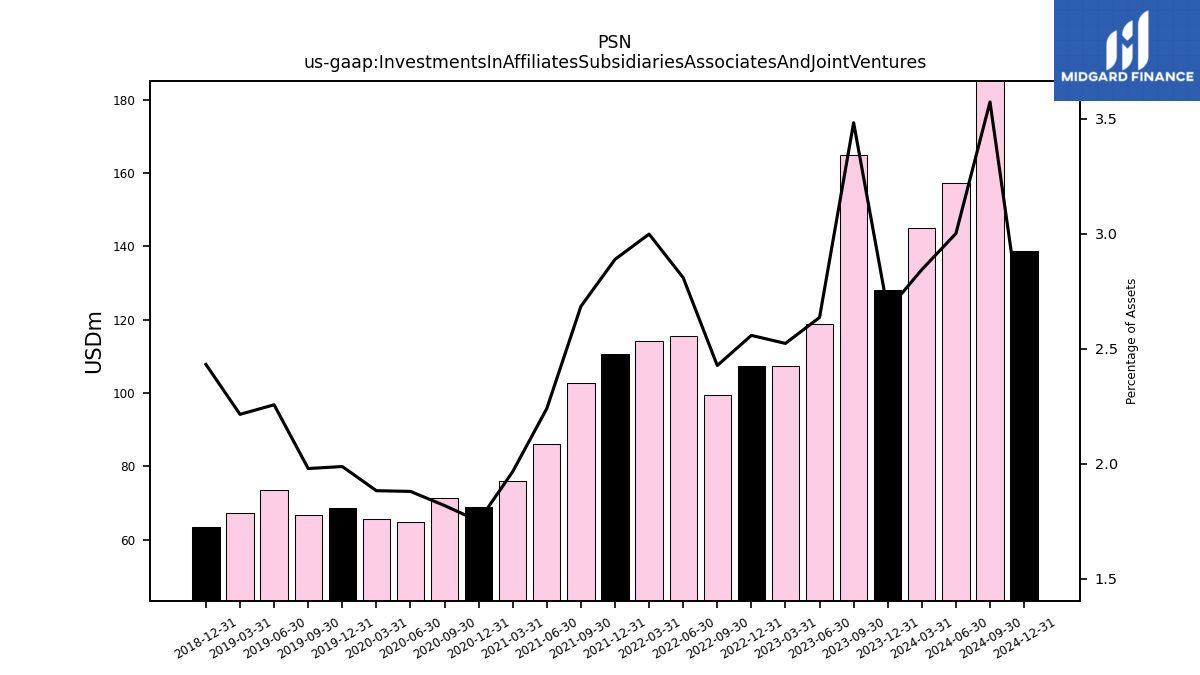
| Investments In Affiliates Subsidiaries Associates And Joint Ventures | 145.04 | 128.20 | 164.86 | 118.86 | 107.42 | 107.42 | 99.42 | 115.48 | 114.23 | 110.69 | 102.68 | 86.05 | 76.02 | 68.97 | 71.29 | 64.91 | 65.72 | 68.62 | 66.58 | 73.48 | 67.20 | 63.56 | NA | NA | NA | |
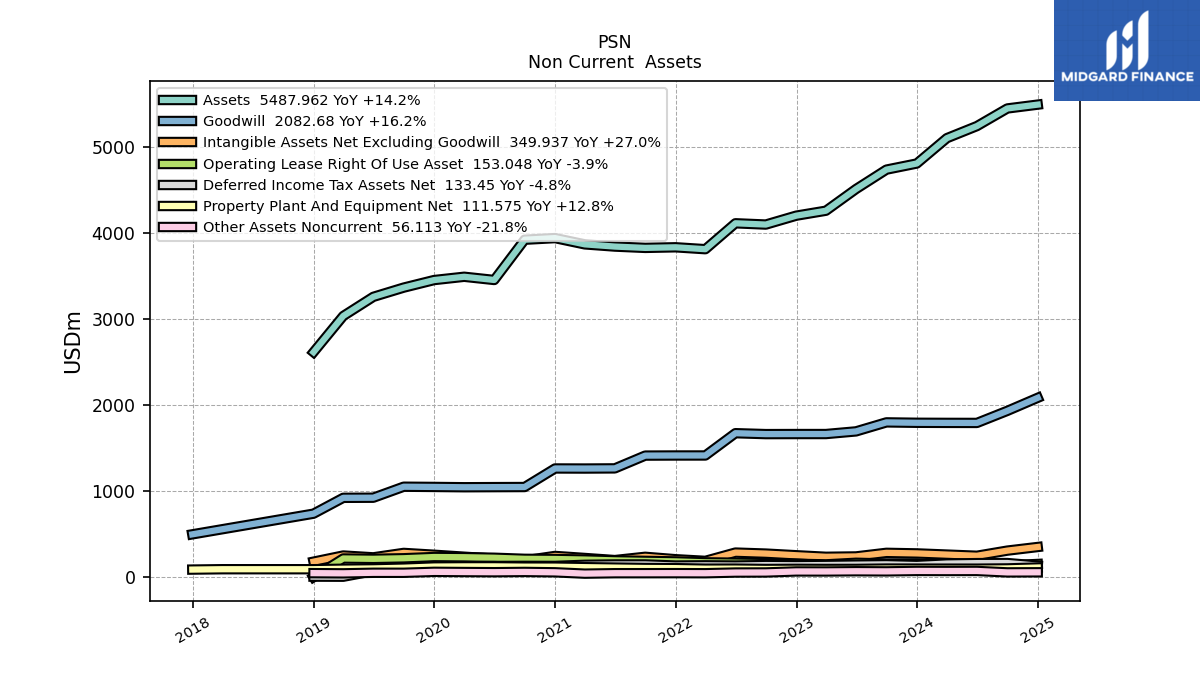
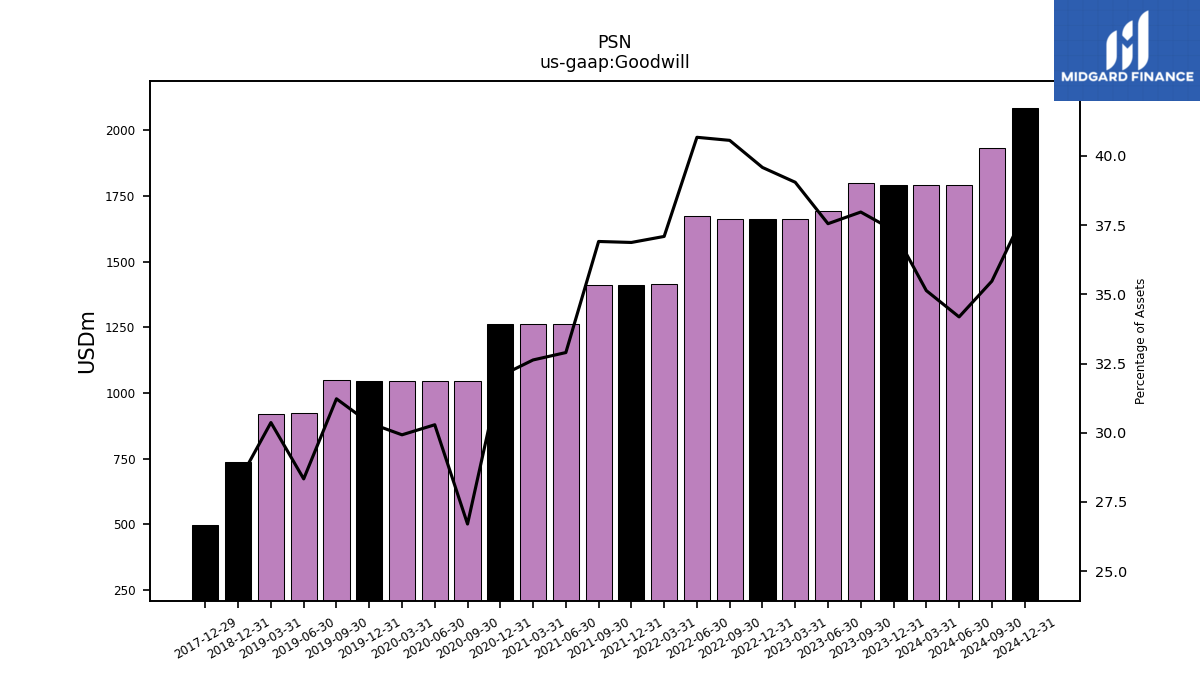
| Goodwill | 1791.44 | 1792.66 | 1797.33 | 1692.72 | 1661.91 | 1661.85 | 1661.11 | 1671.67 | 1412.83 | 1412.69 | 1411.46 | 1263.06 | 1261.19 | 1261.98 | 1046.45 | 1045.34 | 1044.01 | 1047.42 | 1050.08 | 922.40 | 921.10 | 736.94 | NA | NA | NA | |
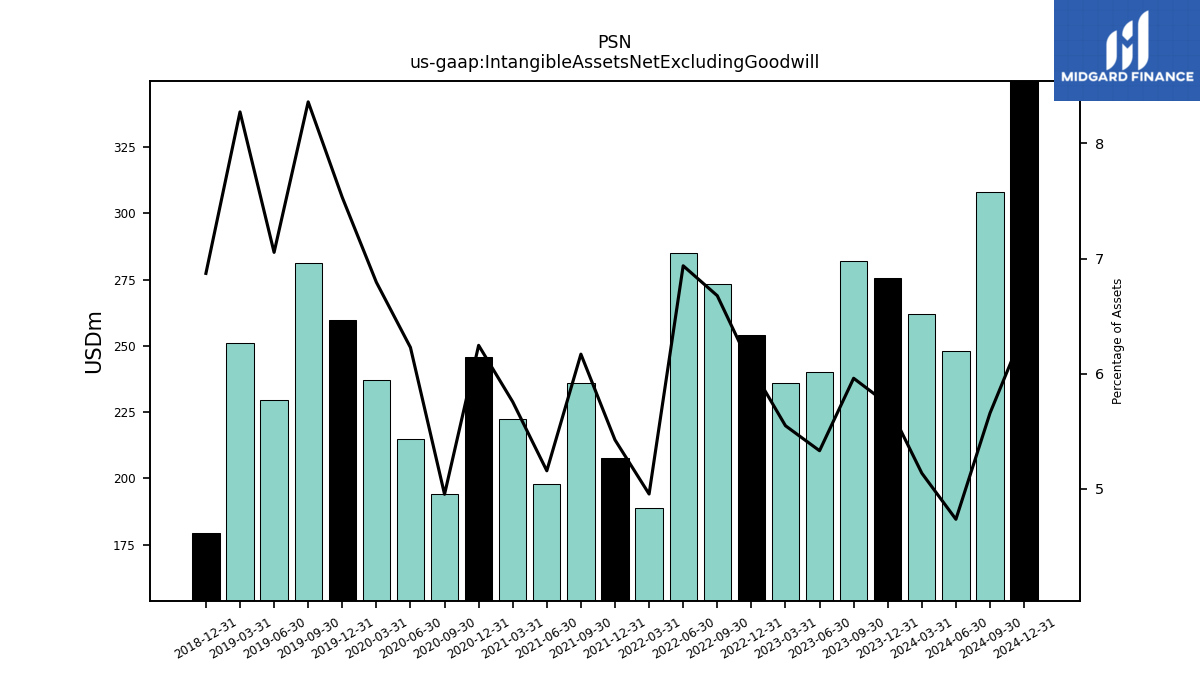
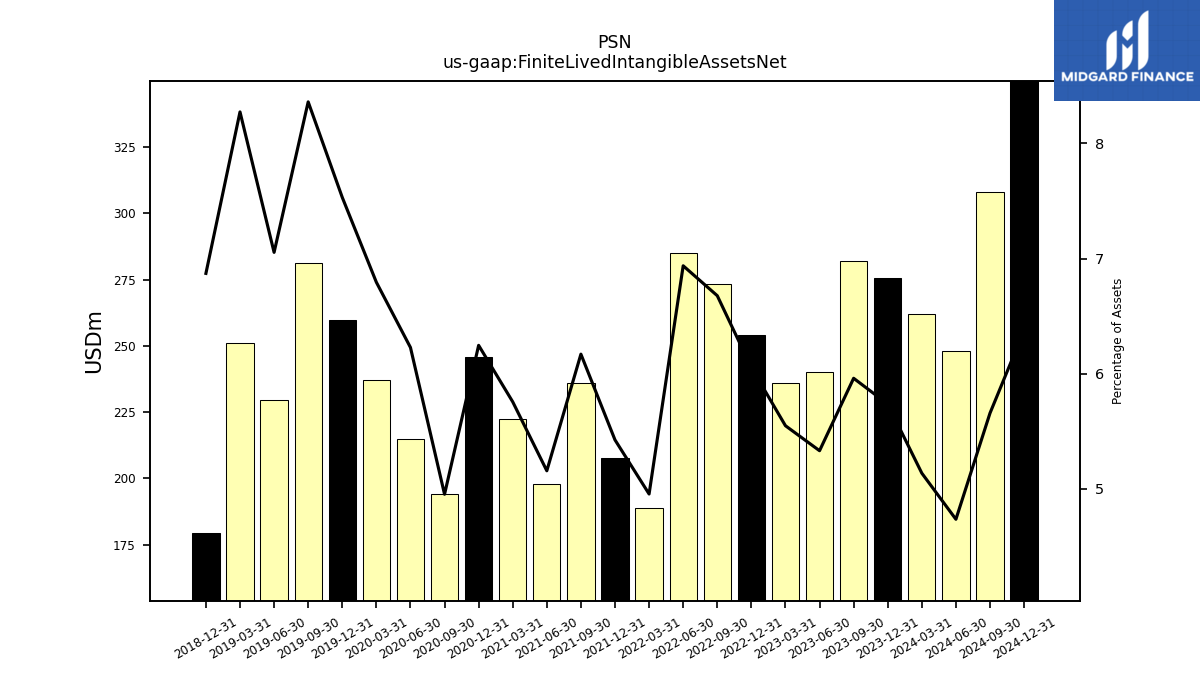
| Intangible Assets Net Excluding Goodwill | 261.86 | 275.57 | 282.10 | 240.30 | 236.12 | 254.13 | 273.44 | 285.12 | 188.73 | 207.82 | 235.93 | 197.99 | 222.45 | 245.96 | 194.08 | 214.94 | 237.03 | 259.86 | 281.16 | 229.64 | 250.95 | 179.52 | NA | NA | NA | |
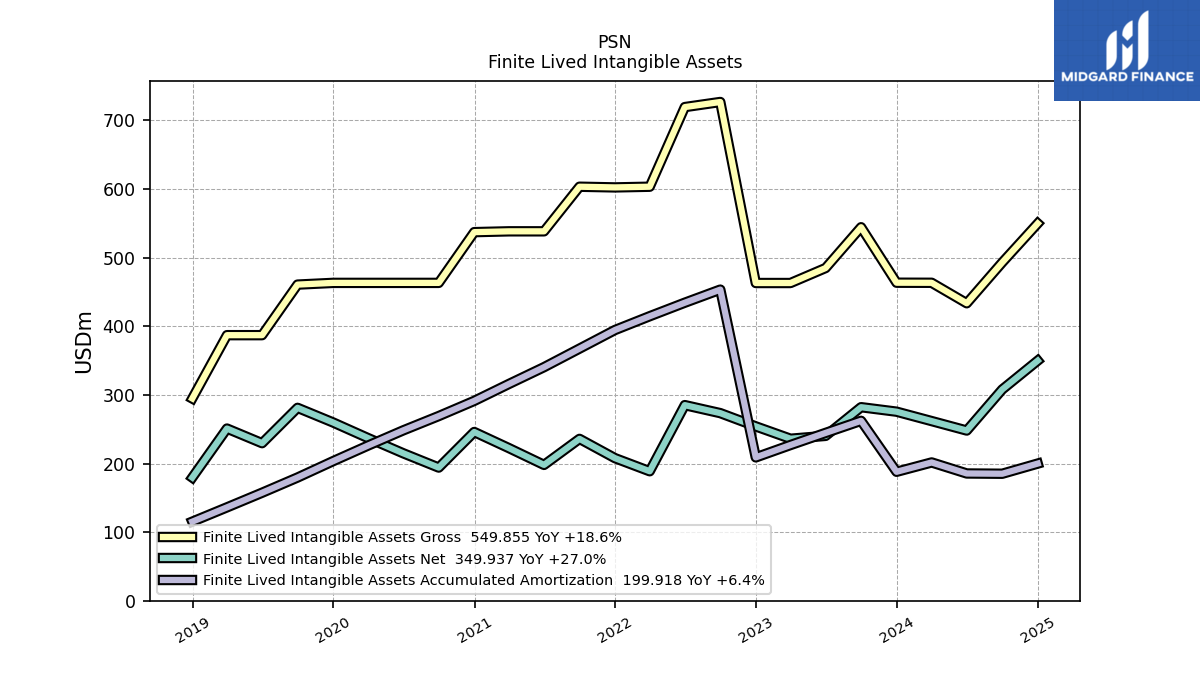
| Finite Lived Intangible Assets Net | 261.86 | 275.57 | 282.10 | 240.30 | 236.12 | 254.13 | 273.44 | 285.12 | 188.73 | 207.82 | 235.93 | 197.99 | 222.45 | 245.96 | 194.08 | 214.94 | 237.03 | 259.86 | 281.16 | 229.64 | 250.95 | 179.52 | NA | NA | NA | |
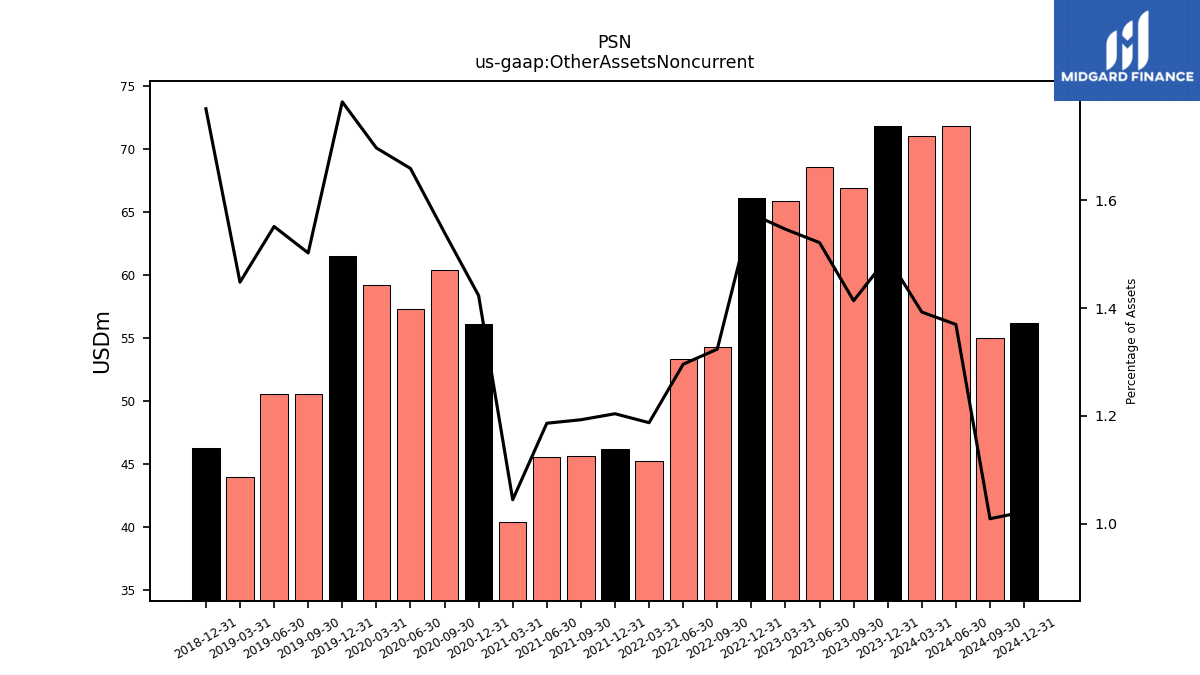
| Other Assets Noncurrent | 71.00 | 71.77 | 66.91 | 68.57 | 65.80 | 66.11 | 54.21 | 53.26 | 45.23 | 46.13 | 45.62 | 45.55 | 40.38 | 56.04 | 60.34 | 57.25 | 59.19 | 61.49 | 50.51 | 50.49 | 43.92 | 46.23 | NA | NA | NA |
| 2024-03-31 | 2023-12-31 | 2023-09-30 | 2023-06-30 | 2023-03-31 | 2022-12-31 | 2022-09-30 | 2022-06-30 | 2022-03-31 | 2021-12-31 | 2021-09-30 | 2021-06-30 | 2021-03-31 | 2020-12-31 | 2020-09-30 | 2020-06-30 | 2020-03-31 | 2019-12-31 | 2019-09-30 | 2019-06-30 | 2019-03-31 | 2018-12-31 | 2018-09-28 | 2018-06-29 | 2018-03-30 | ||
|---|---|---|---|---|---|---|---|---|---|---|---|---|---|---|---|---|---|---|---|---|---|---|---|---|---|---|
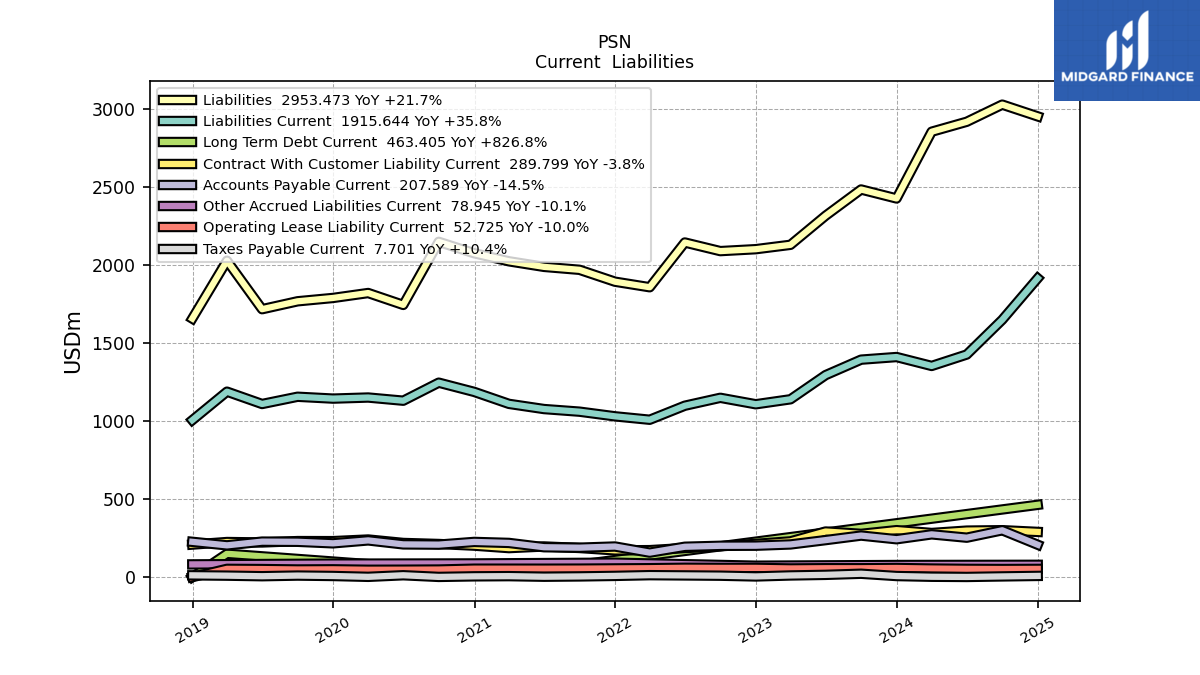
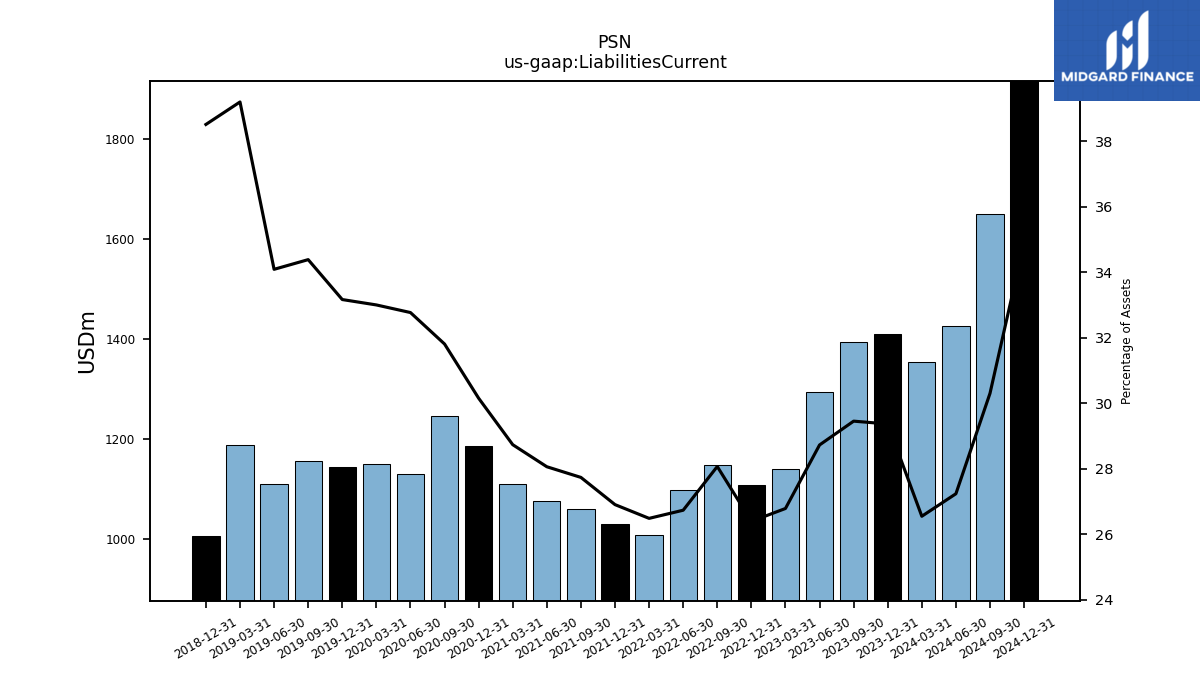
| Liabilities Current | 1353.70 | 1410.88 | 1394.09 | 1294.90 | 1140.07 | 1108.12 | 1149.48 | 1098.79 | 1008.86 | 1030.78 | 1060.66 | 1077.42 | 1110.67 | 1187.41 | 1246.55 | 1130.95 | 1151.32 | 1144.38 | 1156.26 | 1109.78 | 1188.88 | 1006.16 | NA | NA | NA | |
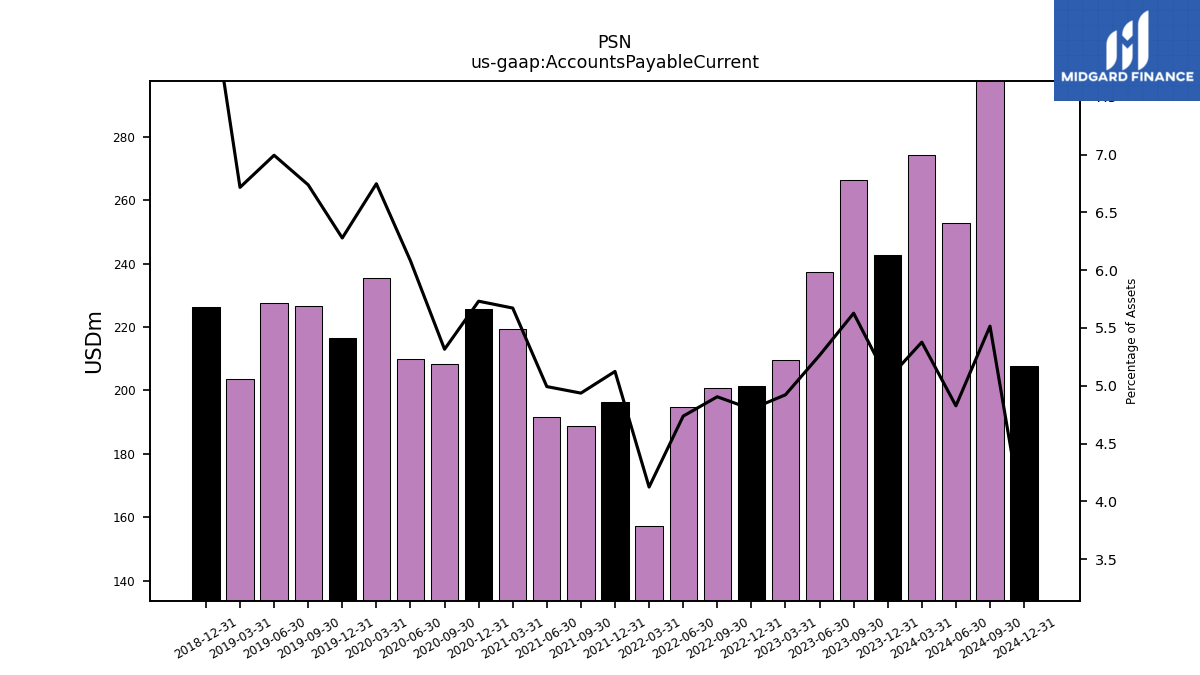
| Accounts Payable Current | 274.14 | 242.82 | 266.35 | 237.23 | 209.46 | 201.43 | 200.85 | 194.70 | 157.08 | 196.29 | 188.76 | 191.69 | 219.22 | 225.68 | 208.31 | 209.86 | 235.38 | 216.61 | 226.56 | 227.67 | 203.68 | 226.34 | NA | NA | NA | |
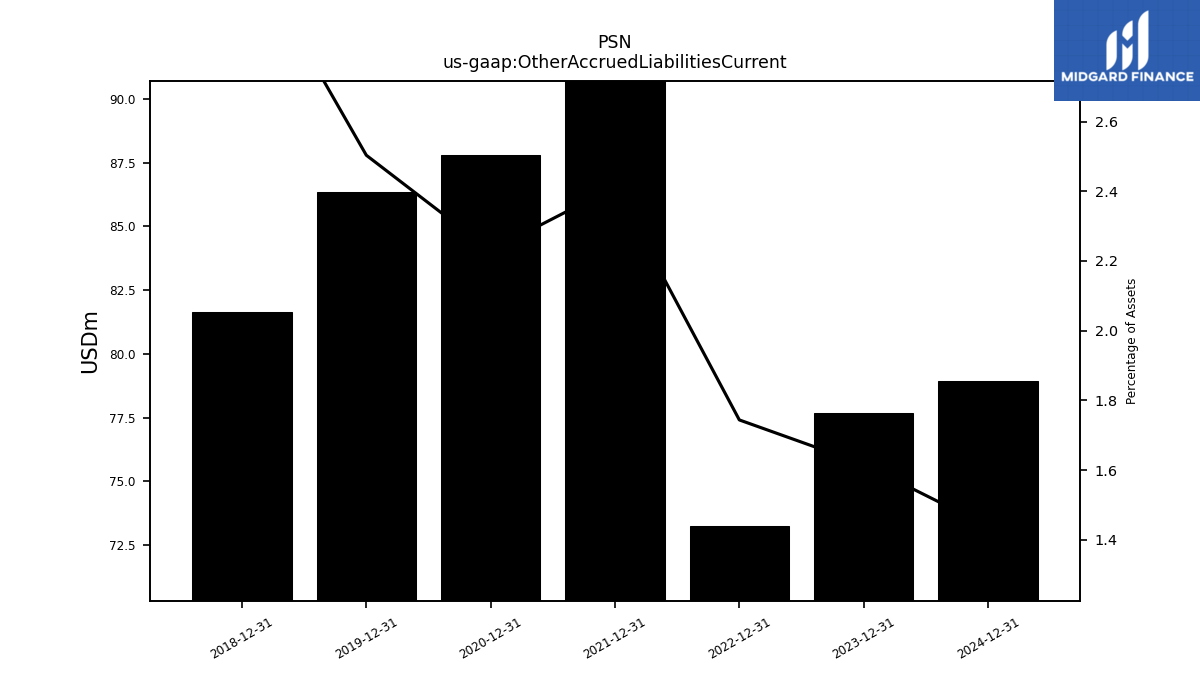
| Other Accrued Liabilities Current | NA | 77.67 | NA | NA | NA | 73.22 | NA | NA | NA | 92.45 | NA | NA | NA | 87.80 | NA | NA | NA | 86.37 | NA | NA | NA | 81.66 | NA | NA | NA | |
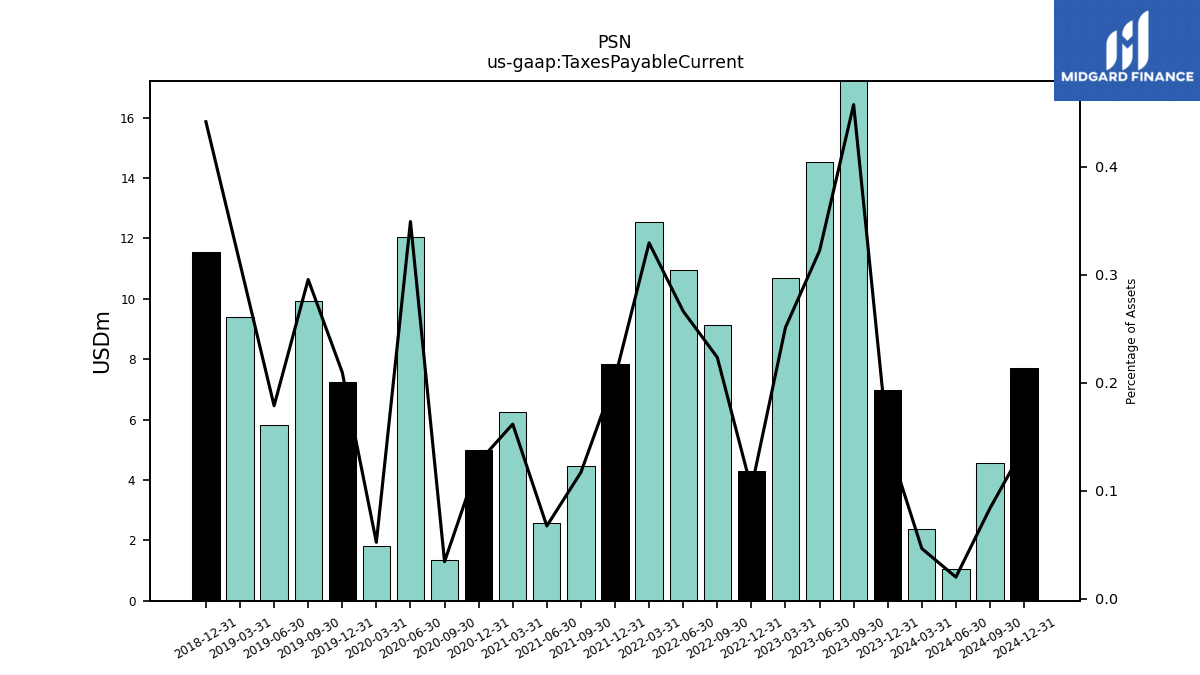
| Taxes Payable Current | 2.37 | 6.98 | 21.66 | 14.52 | 10.69 | 4.29 | 9.15 | 10.94 | 12.55 | 7.84 | 4.47 | 2.58 | 6.25 | 4.98 | 1.34 | 12.05 | 1.82 | 7.23 | 9.94 | 5.82 | 9.41 | 11.54 | NA | NA | NA | |
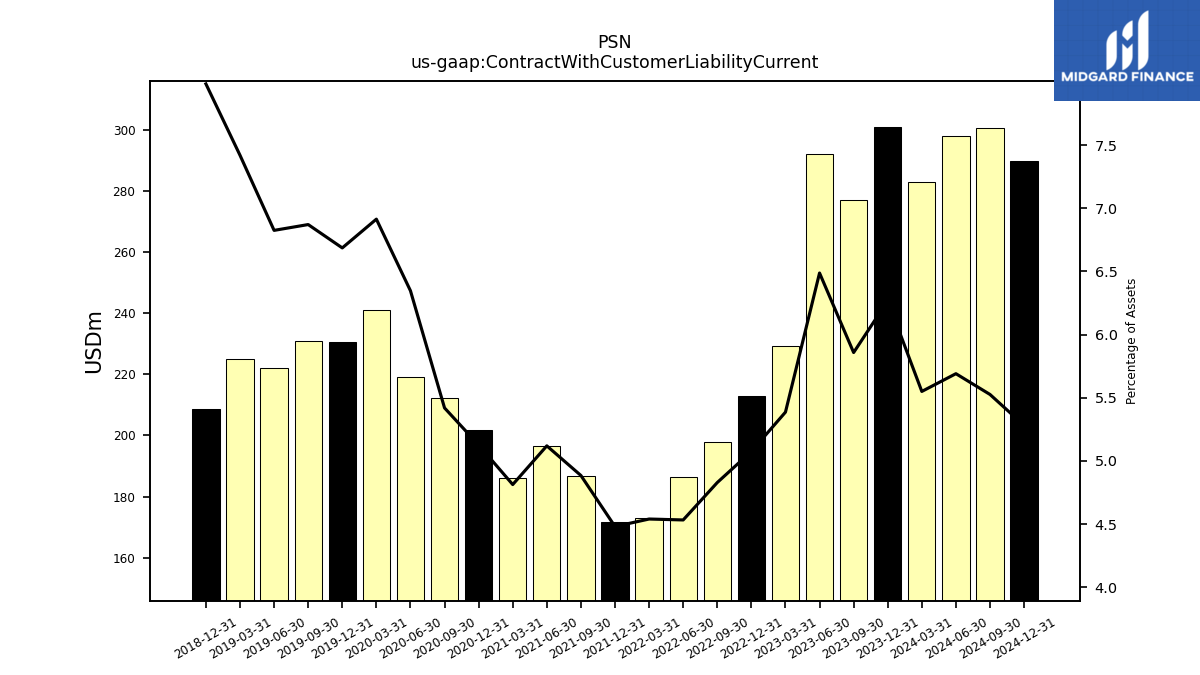
| Contract With Customer Liability Current | 282.96 | 301.11 | 277.25 | 292.40 | 229.22 | 213.06 | 197.75 | 186.29 | 172.93 | 171.67 | 186.79 | 196.55 | 186.03 | 201.86 | 212.37 | 219.04 | 241.18 | 230.68 | 231.03 | 222.17 | 225.02 | 208.58 | NA | NA | NA |
| 2024-03-31 | 2023-12-31 | 2023-09-30 | 2023-06-30 | 2023-03-31 | 2022-12-31 | 2022-09-30 | 2022-06-30 | 2022-03-31 | 2021-12-31 | 2021-09-30 | 2021-06-30 | 2021-03-31 | 2020-12-31 | 2020-09-30 | 2020-06-30 | 2020-03-31 | 2019-12-31 | 2019-09-30 | 2019-06-30 | 2019-03-31 | 2018-12-31 | 2018-09-28 | 2018-06-29 | 2018-03-30 | ||
|---|---|---|---|---|---|---|---|---|---|---|---|---|---|---|---|---|---|---|---|---|---|---|---|---|---|---|
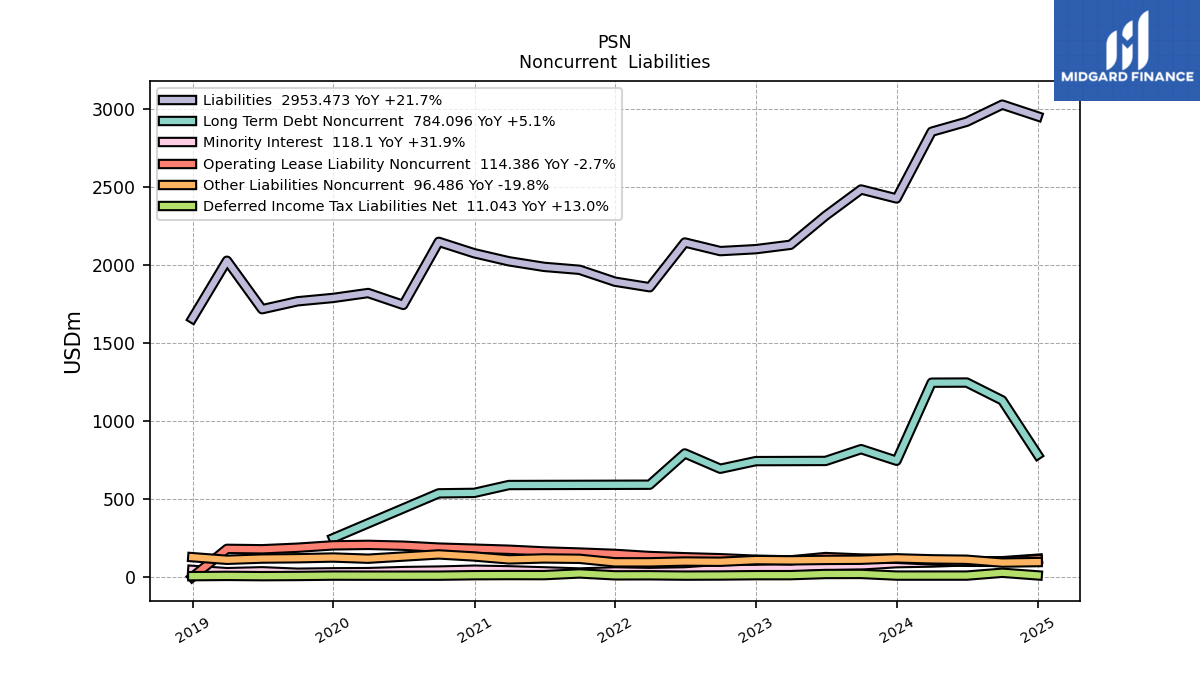
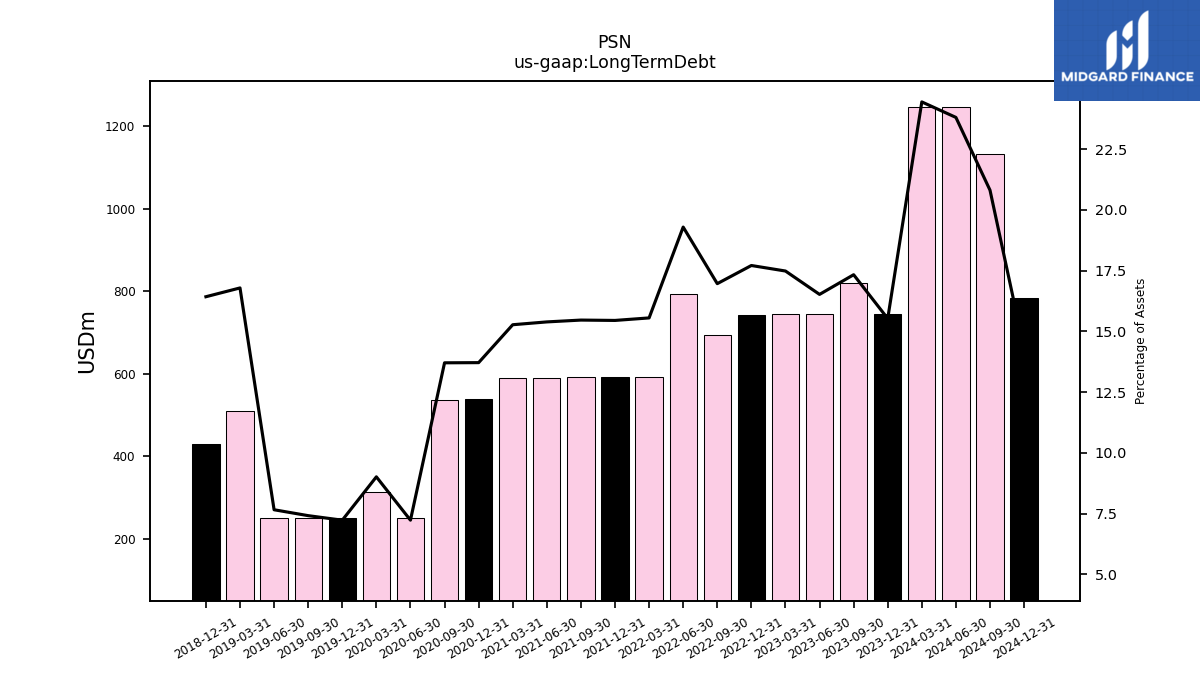
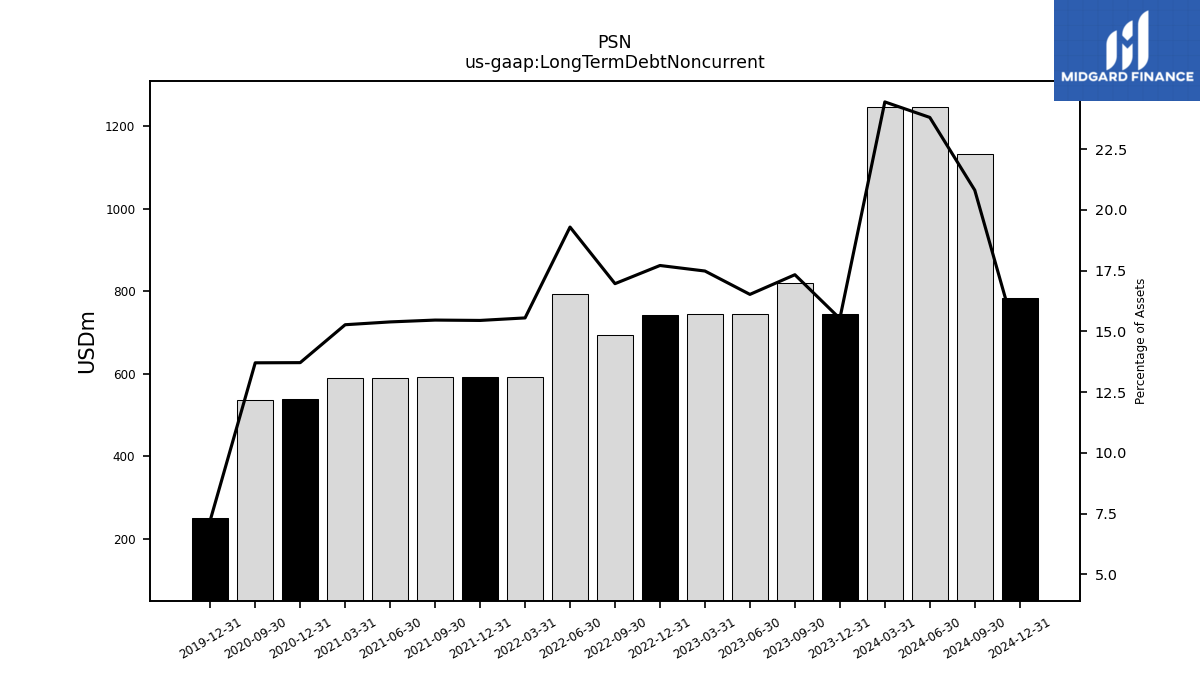
| Long Term Debt | 1246.44 | 745.96 | 820.37 | 744.78 | 744.14 | 743.61 | 694.72 | 792.98 | 592.45 | 591.92 | 591.40 | 590.88 | 590.35 | 540.00 | 537.12 | 249.45 | 314.40 | 249.35 | 249.31 | 249.26 | 509.21 | 429.16 | NA | NA | NA | |
| Long Term Debt Noncurrent | 1246.44 | 745.96 | 820.37 | 744.78 | 744.14 | 743.61 | 694.72 | 792.98 | 592.45 | 591.92 | 591.40 | 590.88 | 590.35 | 540.00 | 537.12 | NA | NA | 249.35 | NA | NA | NA | NA | NA | NA | NA | |
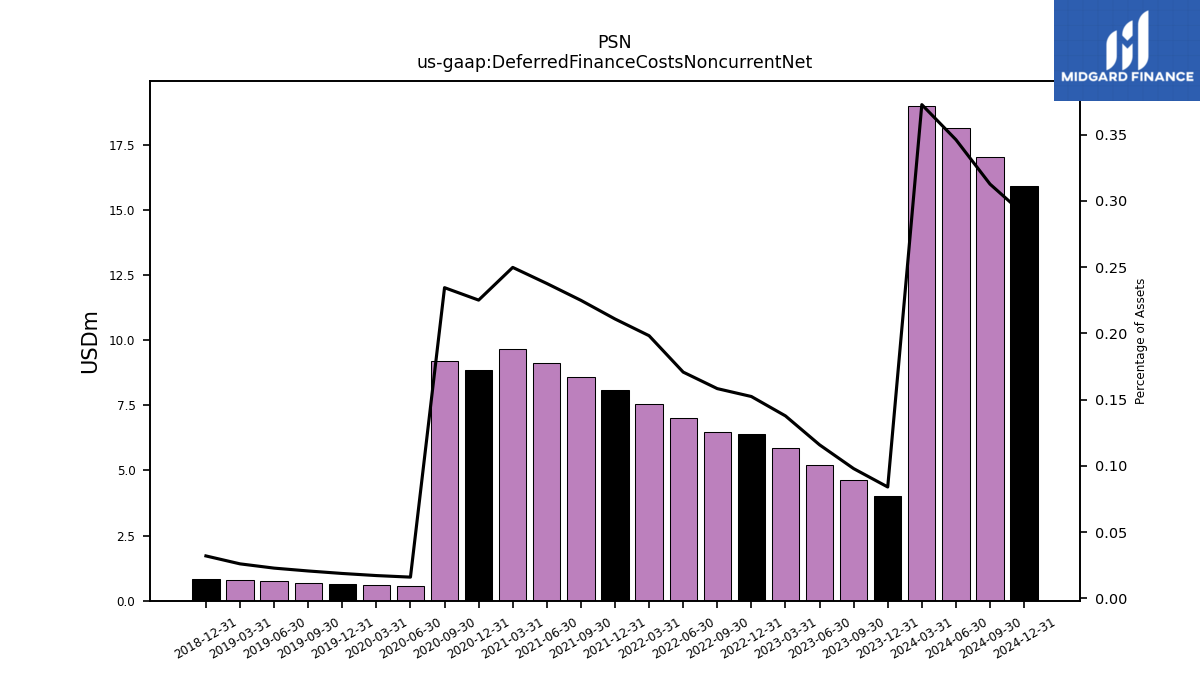
| Deferred Finance Costs Noncurrent Net | 19.00 | 4.04 | 4.63 | 5.22 | 5.86 | 6.39 | 6.48 | 7.02 | 7.55 | 8.08 | 8.60 | 9.12 | 9.65 | 8.86 | 9.19 | 0.55 | 0.60 | 0.65 | 0.69 | 0.74 | 0.79 | 0.84 | NA | NA | NA | |
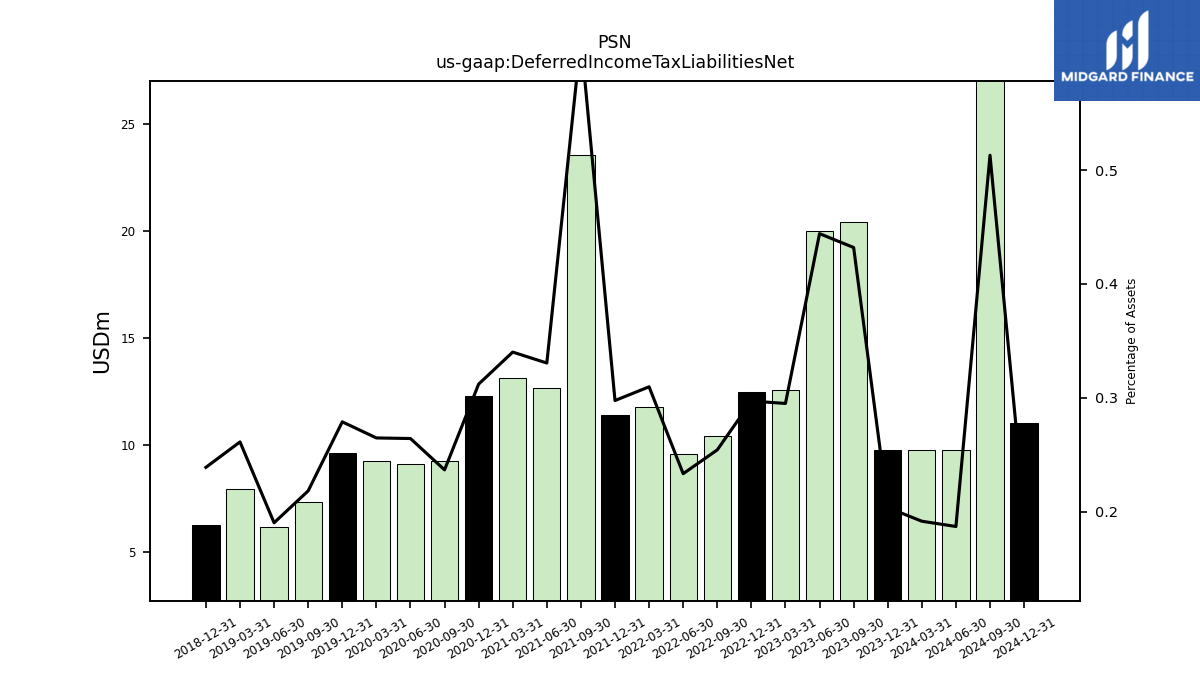
| Deferred Income Tax Liabilities Net | 9.76 | 9.78 | 20.45 | 20.02 | 12.55 | 12.47 | 10.41 | 9.59 | 11.79 | 11.40 | 23.55 | 12.69 | 13.15 | 12.29 | 9.27 | 9.12 | 9.23 | 9.62 | 7.34 | 6.19 | 7.92 | 6.24 | NA | NA | NA | |
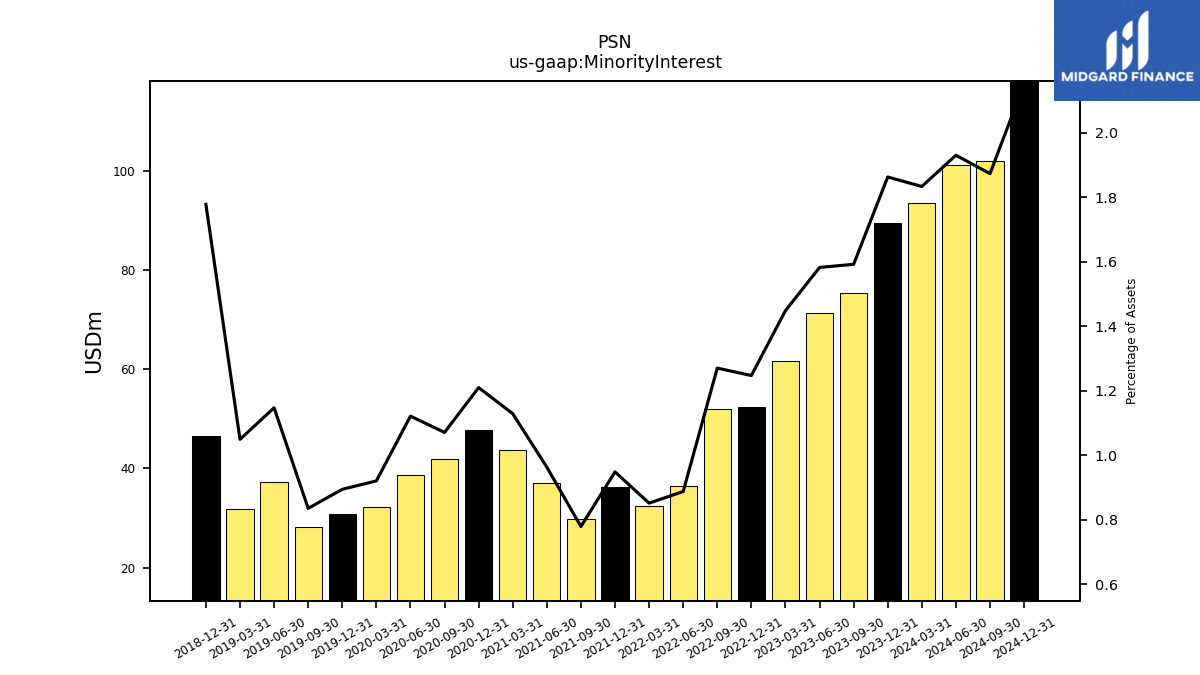
| Minority Interest | 93.49 | 89.50 | 75.36 | 71.33 | 61.65 | 52.37 | 52.03 | 36.49 | 32.44 | 36.34 | 29.80 | 36.98 | 43.64 | 47.65 | 41.97 | 38.70 | 32.12 | 30.87 | 28.09 | 37.35 | 31.83 | 46.46 | NA | NA | NA | |
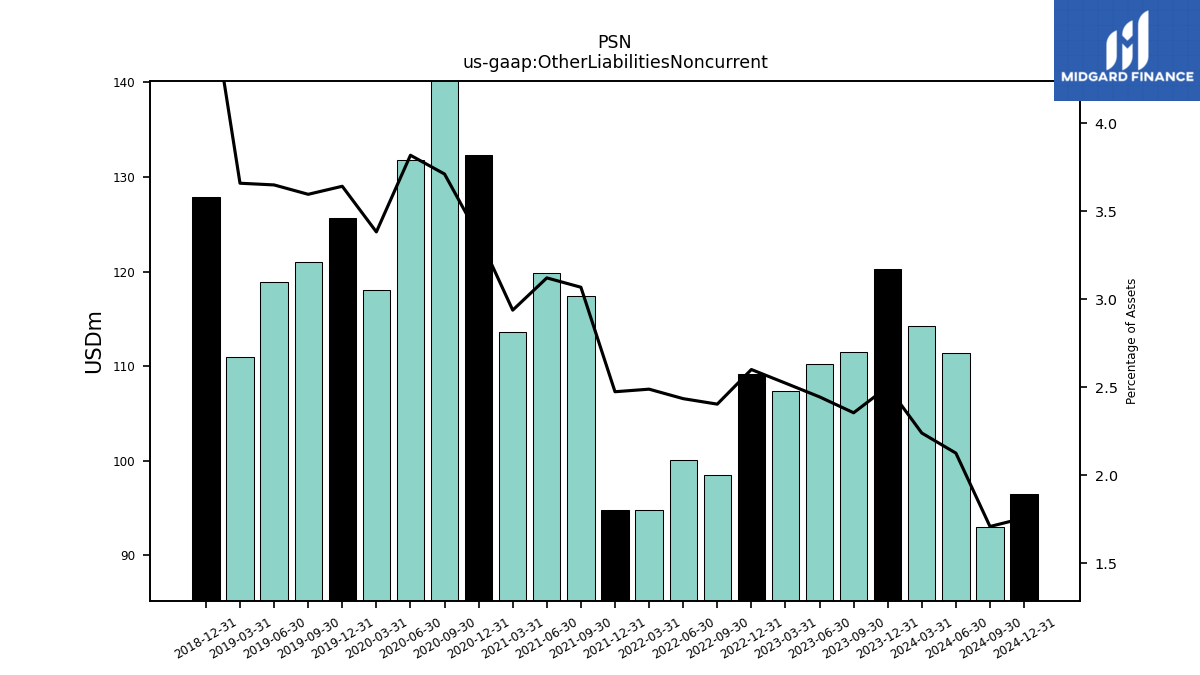
| Other Liabilities Noncurrent | 114.24 | 120.30 | 111.50 | 110.26 | 107.43 | 109.22 | 98.48 | 100.12 | 94.84 | 94.83 | 117.37 | 119.88 | 113.60 | 132.30 | 145.49 | 131.82 | 118.05 | 125.70 | 120.97 | 118.85 | 111.02 | 127.86 | NA | NA | NA | |
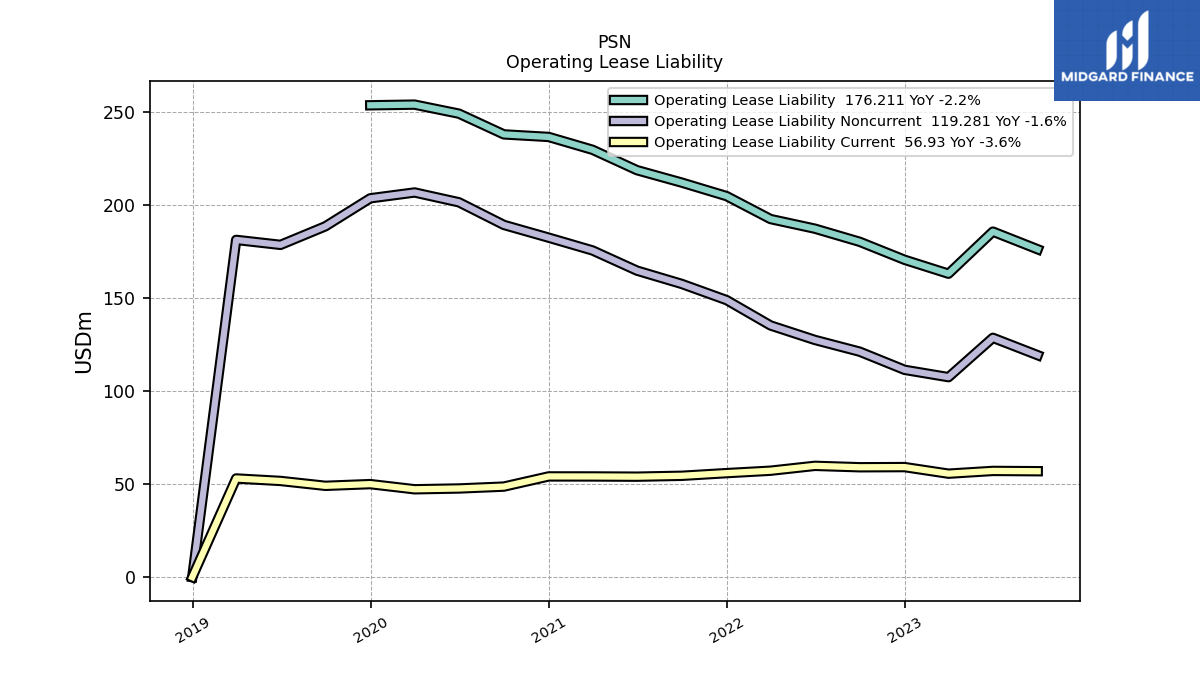
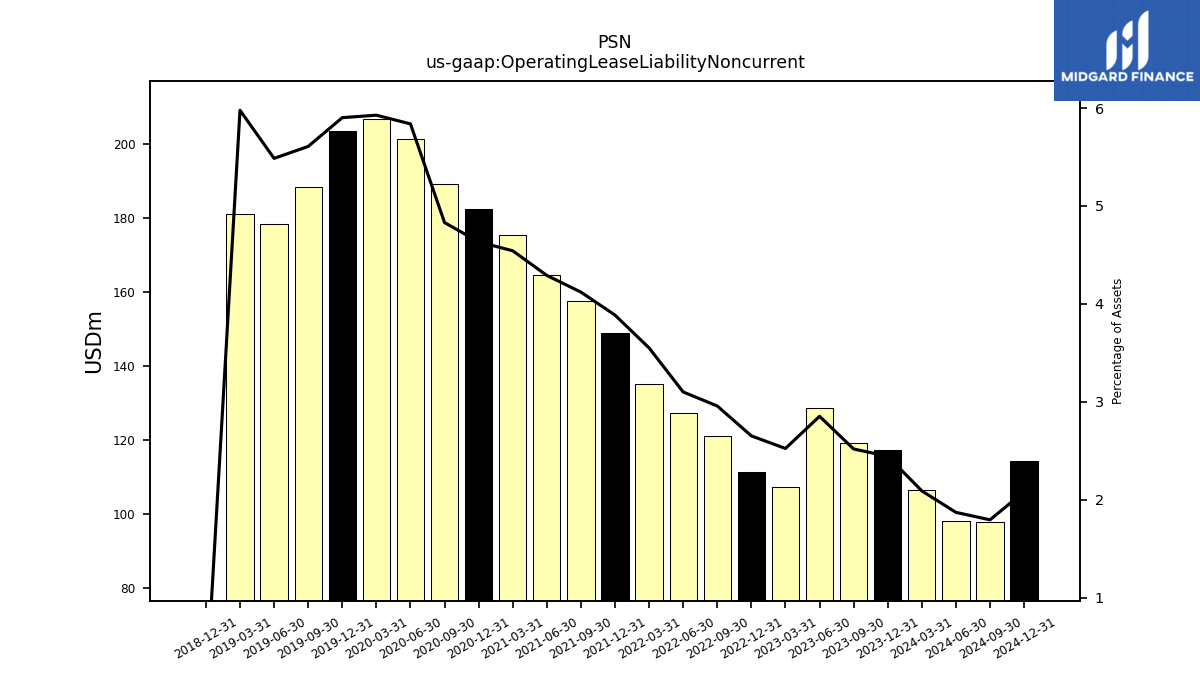
| Operating Lease Liability Noncurrent | 106.69 | 117.50 | 119.28 | 128.63 | 107.48 | 111.42 | 121.17 | 127.49 | 135.28 | 148.89 | 157.59 | 164.75 | 175.58 | 182.47 | 189.32 | 201.47 | 206.76 | 203.62 | 188.57 | 178.59 | 181.27 | 0.00 | NA | NA | NA |
| 2024-03-31 | 2023-12-31 | 2023-09-30 | 2023-06-30 | 2023-03-31 | 2022-12-31 | 2022-09-30 | 2022-06-30 | 2022-03-31 | 2021-12-31 | 2021-09-30 | 2021-06-30 | 2021-03-31 | 2020-12-31 | 2020-09-30 | 2020-06-30 | 2020-03-31 | 2019-12-31 | 2019-09-30 | 2019-06-30 | 2019-03-31 | 2018-12-31 | 2018-09-28 | 2018-06-29 | 2018-03-30 | ||
|---|---|---|---|---|---|---|---|---|---|---|---|---|---|---|---|---|---|---|---|---|---|---|---|---|---|---|
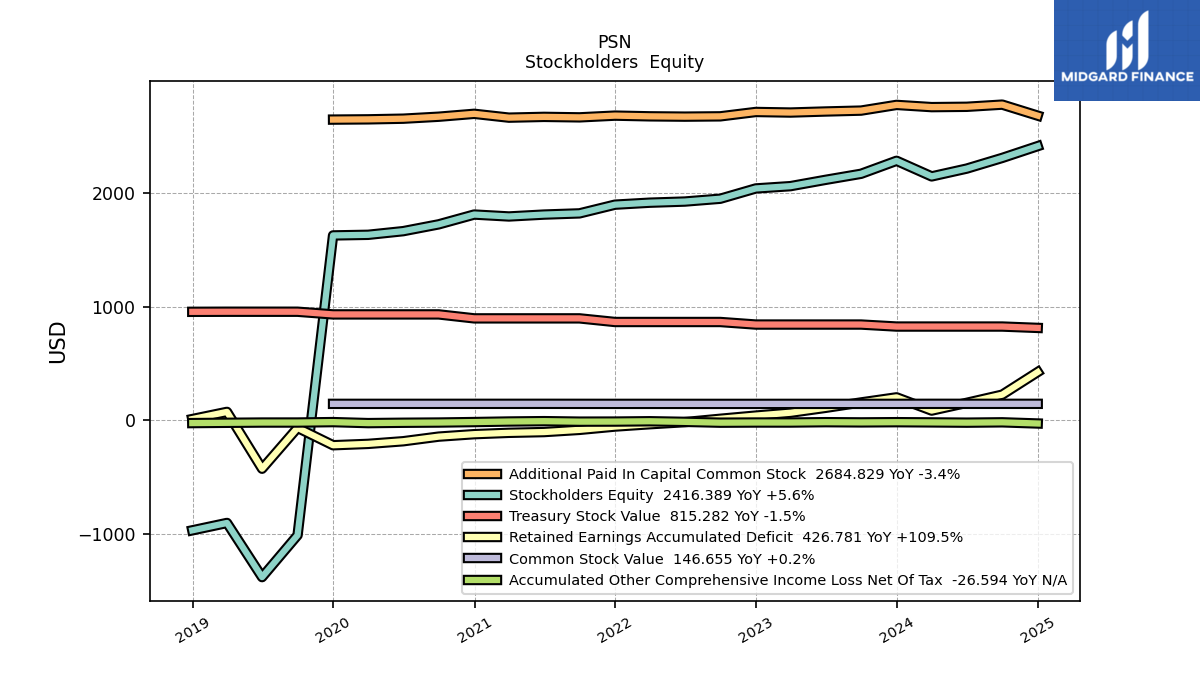
| Stockholders Equity | 2149.67 | 2287.21 | 2172.74 | 2119.43 | 2063.88 | 2043.57 | 1953.07 | 1928.18 | 1918.19 | 1900.77 | 1824.08 | 1813.46 | 1796.80 | 1813.77 | 1727.50 | 1667.55 | 1635.26 | 1629.89 | -1010.65 | -1379.58 | -902.47 | -967.54 | NA | NA | NA | |
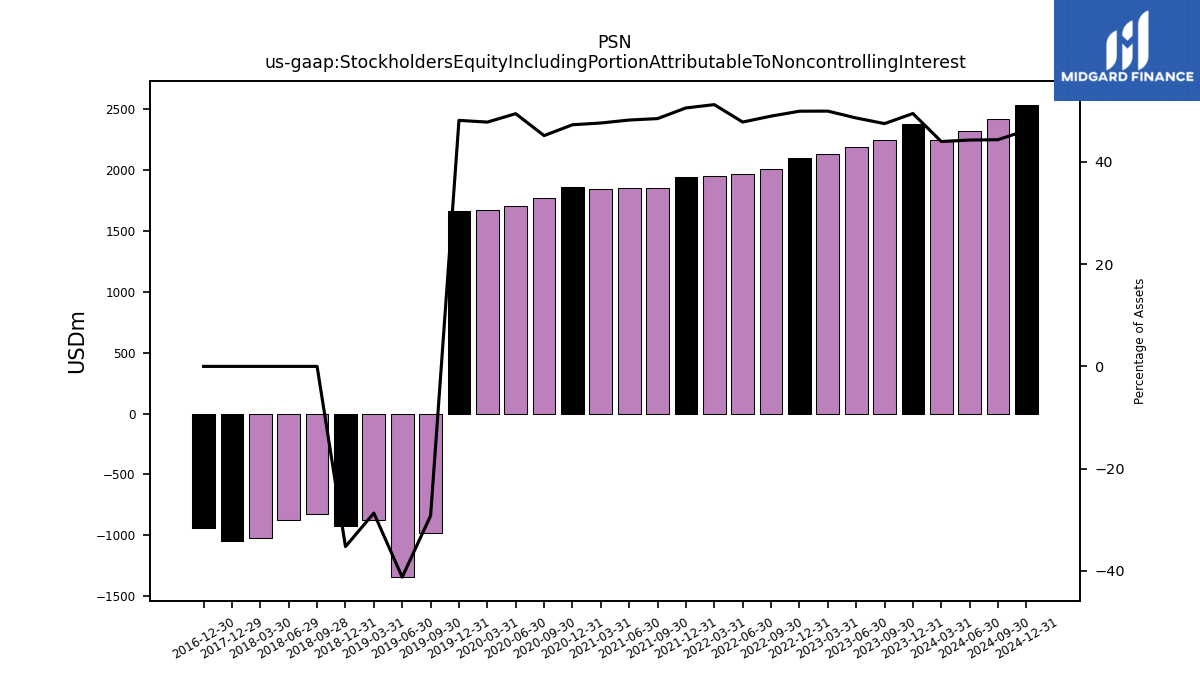
| Stockholders Equity Including Portion Attributable To Noncontrolling Interest | 2243.16 | 2376.72 | 2248.10 | 2190.77 | 2125.53 | 2095.93 | 2005.09 | 1964.67 | 1950.62 | 1937.11 | 1853.88 | 1850.45 | 1840.44 | 1861.42 | 1769.47 | 1706.25 | 1667.38 | 1660.76 | -982.56 | -1342.23 | -870.64 | -921.08 | -825.54 | -869.94 | -1021.75 | |
| Common Stock Value | 146.72 | 146.34 | 146.32 | 146.31 | 146.24 | 146.13 | 146.09 | 146.17 | 146.35 | 146.28 | 146.51 | 146.75 | 146.65 | 146.61 | 146.50 | 146.50 | 146.44 | 146.44 | NA | NA | NA | NA | NA | NA | NA | |
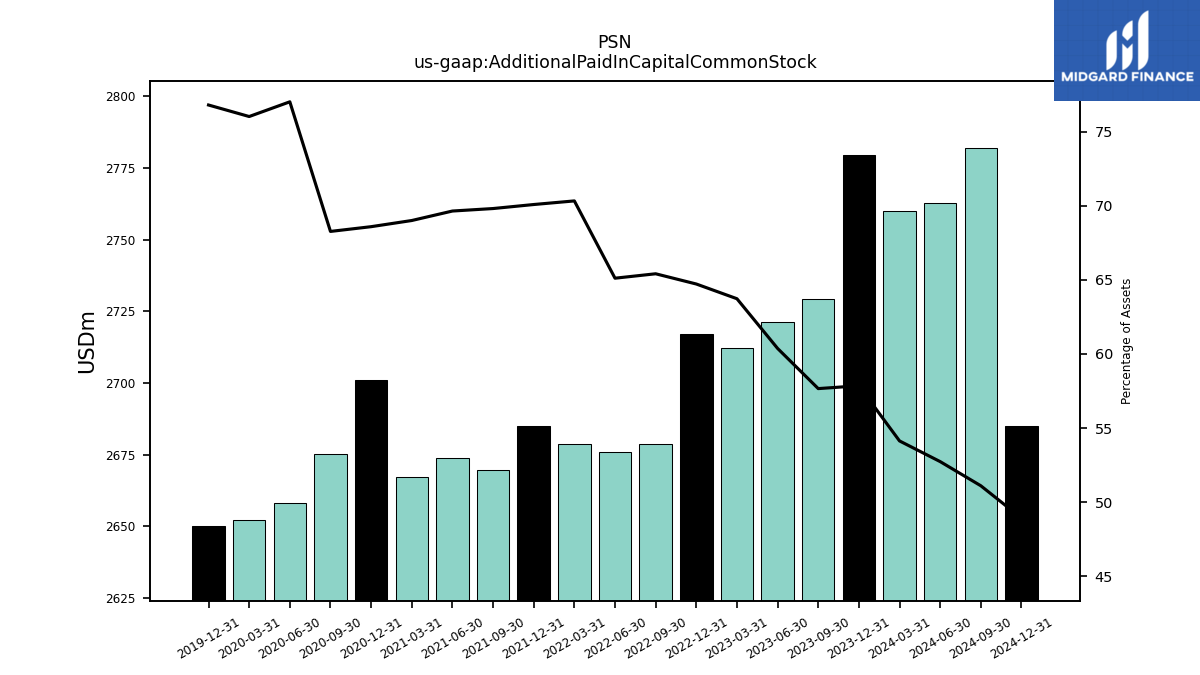
| Additional Paid In Capital Common Stock | 2759.87 | 2779.36 | 2729.21 | 2721.40 | 2712.17 | 2717.13 | 2678.65 | 2676.06 | 2678.76 | 2684.98 | 2669.69 | 2673.97 | 2667.13 | 2700.93 | 2675.38 | 2658.04 | 2652.23 | 2649.97 | NA | NA | NA | NA | NA | NA | NA | |
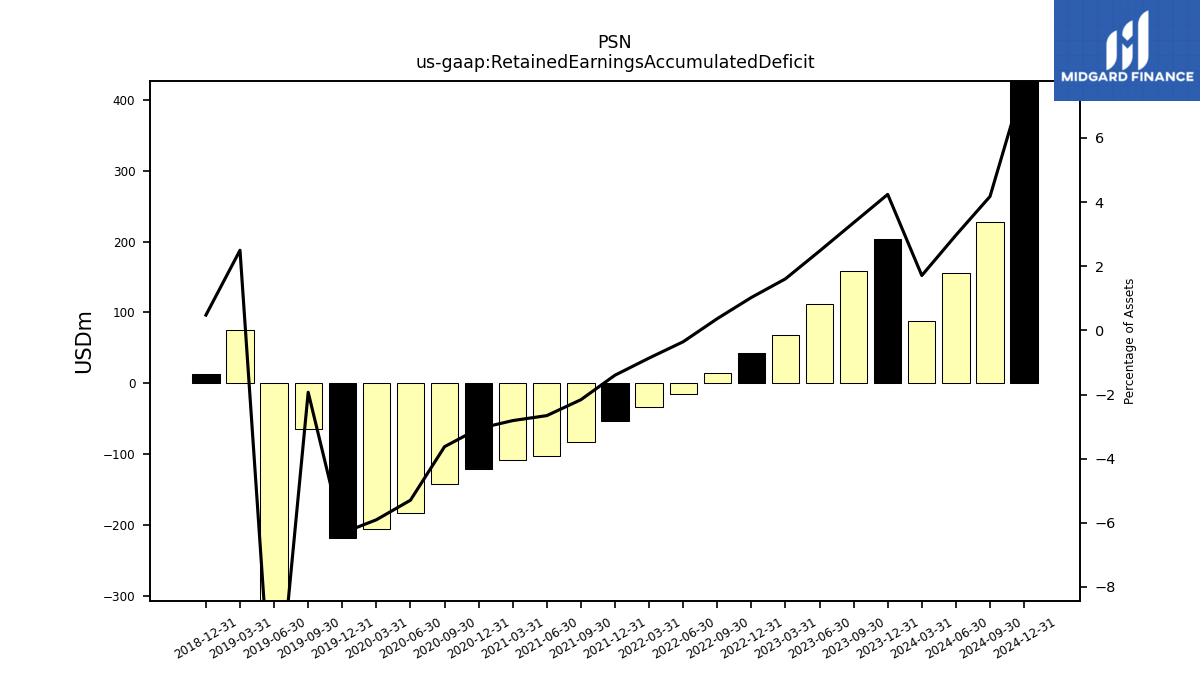
| Retained Earnings Accumulated Deficit | 87.26 | 203.72 | 158.94 | 111.51 | 68.43 | 43.09 | 15.01 | -14.56 | -32.86 | -53.53 | -82.66 | -102.02 | -108.72 | -120.57 | -142.09 | -182.75 | -206.05 | -218.03 | -64.90 | -424.89 | 75.77 | 12.45 | NA | NA | NA | |
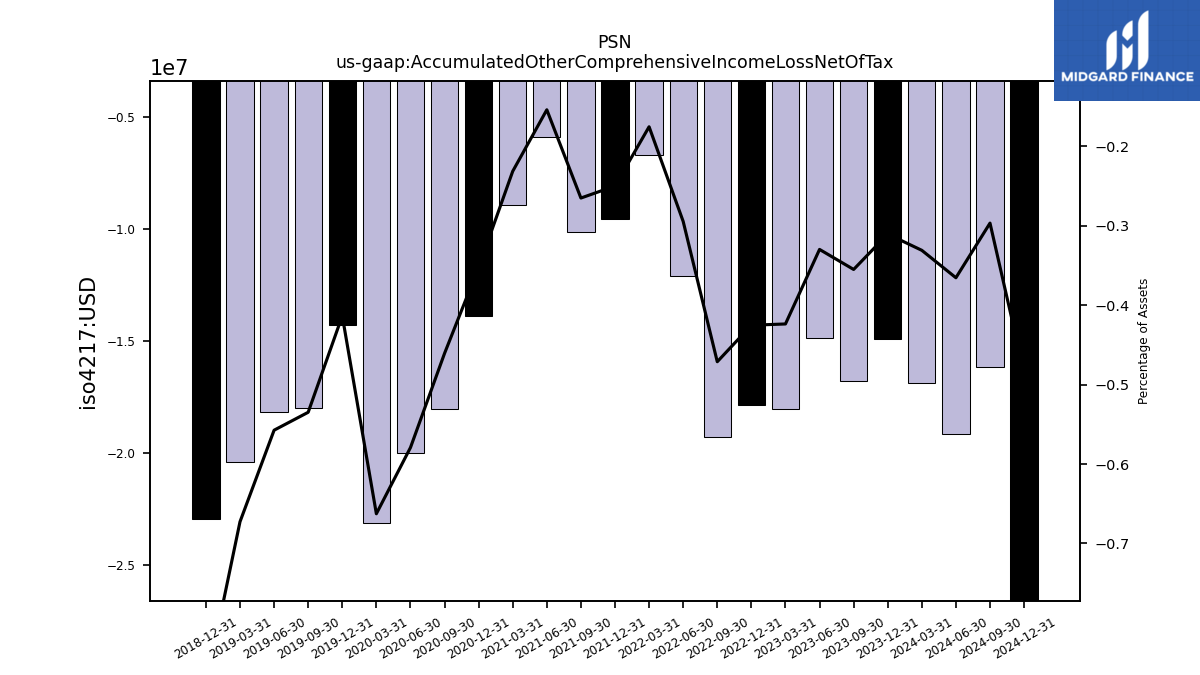
| Accumulated Other Comprehensive Income Loss Net Of Tax | -16.87 | -14.91 | -16.80 | -14.86 | -18.02 | -17.85 | -19.29 | -12.10 | -6.67 | -9.57 | -10.13 | -5.91 | -8.94 | -13.87 | -18.05 | -19.99 | -23.11 | -14.26 | -17.98 | -18.14 | -20.40 | -22.96 | NA | NA | NA | |
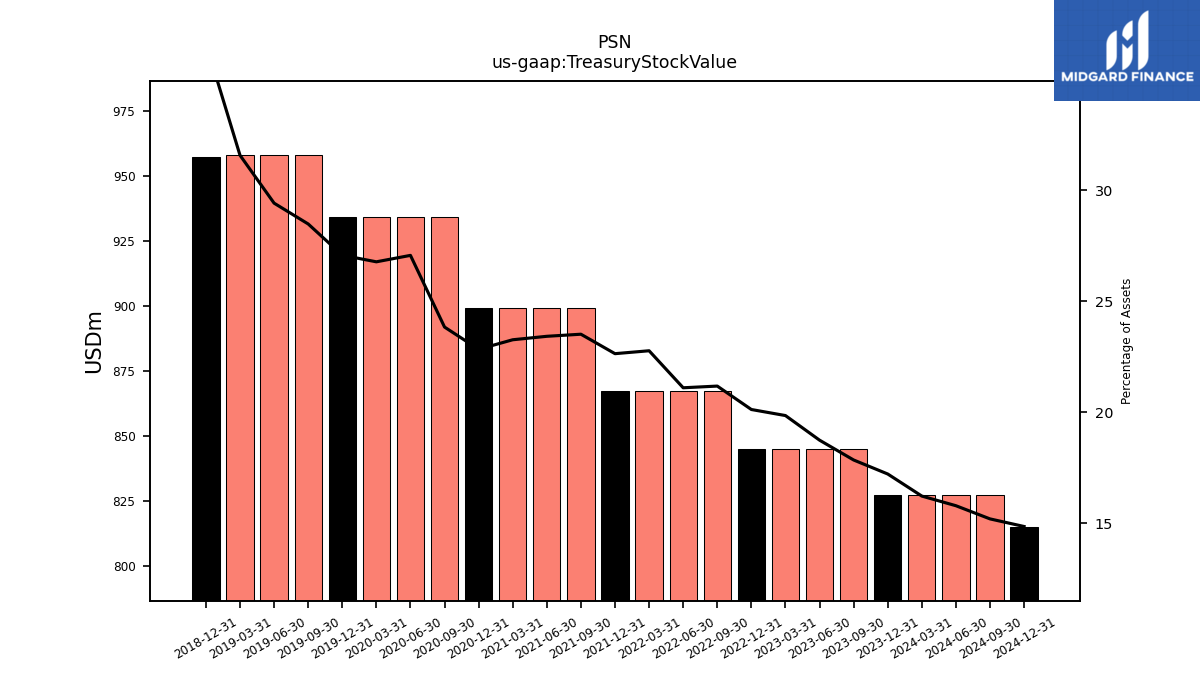
| Treasury Stock Value | 827.31 | 827.31 | 844.94 | 844.94 | 844.94 | 844.94 | 867.39 | 867.39 | 867.39 | 867.39 | 899.33 | 899.33 | 899.33 | 899.33 | 934.24 | 934.24 | 934.24 | 934.24 | 957.84 | 957.84 | 957.84 | 957.02 | NA | NA | NA | |
| Minority Interest | 93.49 | 89.50 | 75.36 | 71.33 | 61.65 | 52.37 | 52.03 | 36.49 | 32.44 | 36.34 | 29.80 | 36.98 | 43.64 | 47.65 | 41.97 | 38.70 | 32.12 | 30.87 | 28.09 | 37.35 | 31.83 | 46.46 | NA | NA | NA | |
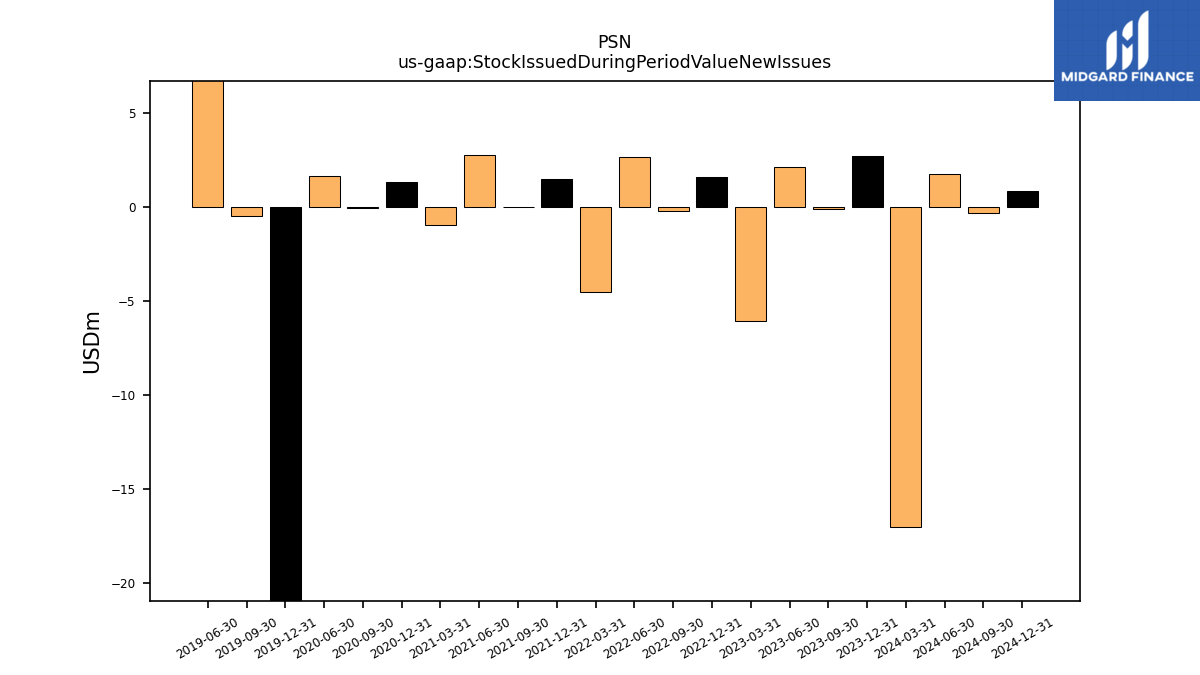
| Stock Issued During Period Value New Issues | -16.99 | 2.76 | -0.10 | 2.16 | -6.06 | 1.61 | -0.17 | 2.67 | -4.49 | 1.51 | 0.00 | 2.78 | -0.93 | 1.37 | -0.01 | 1.68 | NA | -538.03 | -0.45 | 537.33 | NA | NA | NA | NA | NA | |
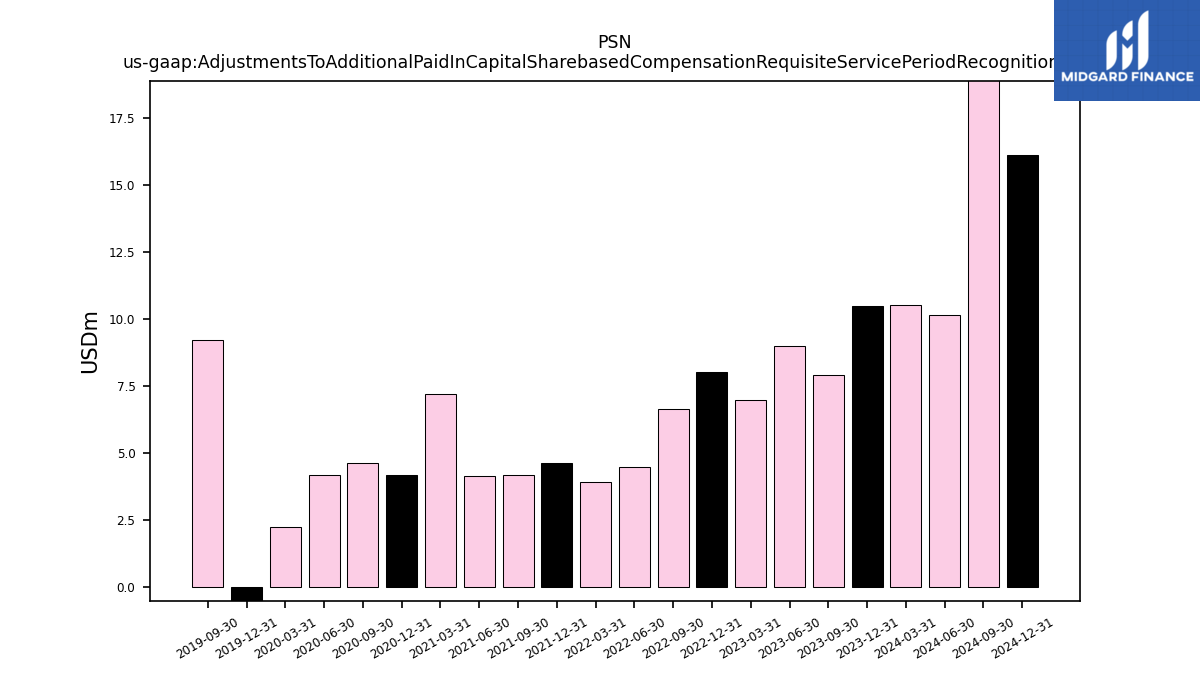
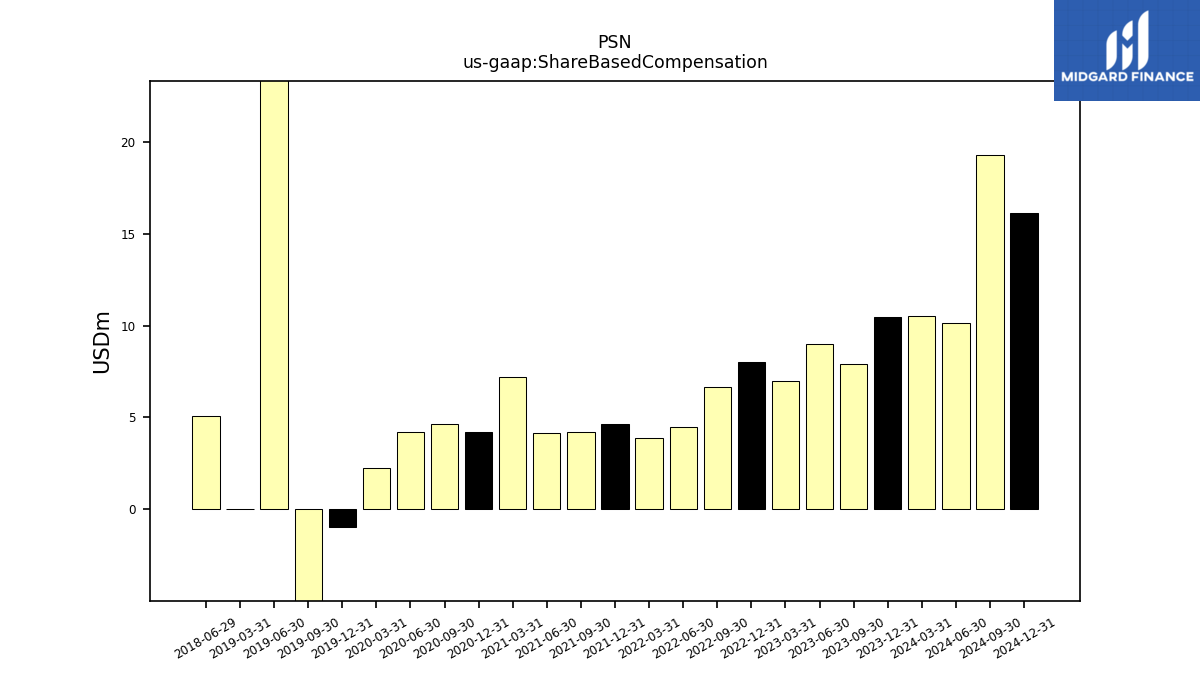
| Adjustments To Additional Paid In Capital Sharebased Compensation Requisite Service Period Recognition Value | 10.52 | 10.49 | 7.89 | 8.99 | 6.99 | 8.02 | 6.63 | 4.46 | 3.90 | 4.64 | 4.18 | 4.16 | 7.21 | 4.19 | 4.61 | 4.18 | 2.25 | -0.95 | 9.22 | NA | NA | NA | NA | NA | NA | |
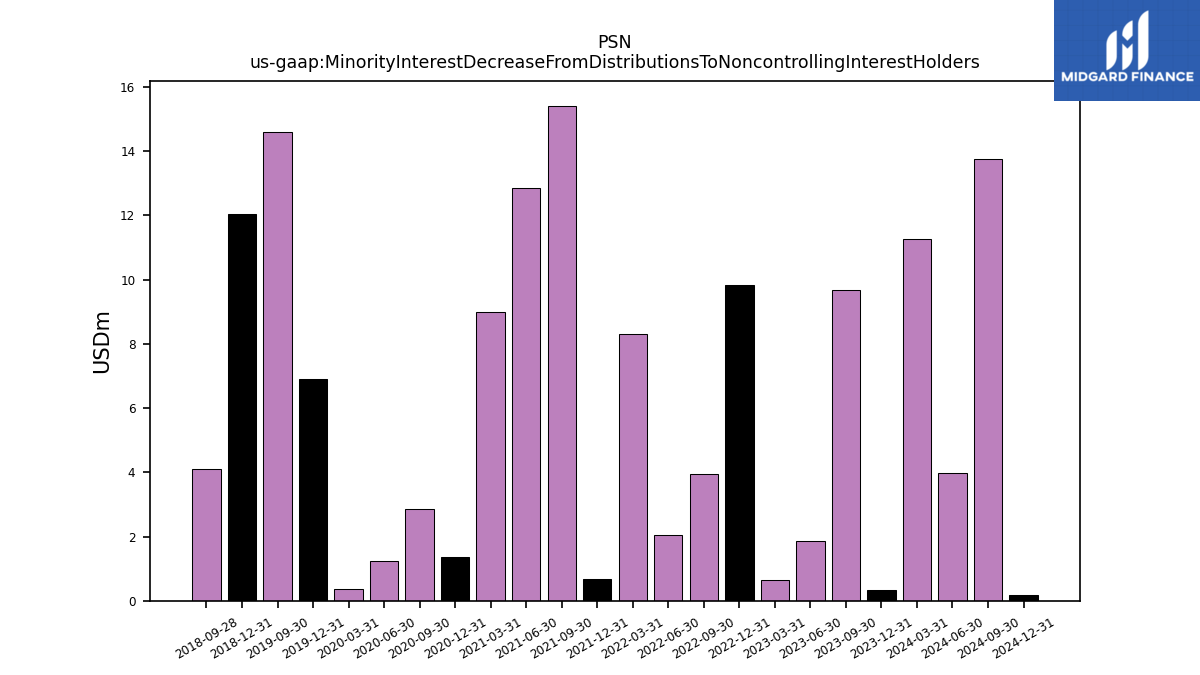
| Minority Interest Decrease From Distributions To Noncontrolling Interest Holders | 11.26 | 0.34 | 9.67 | 1.85 | 0.64 | 9.84 | 3.95 | 2.04 | 8.31 | 0.69 | 15.41 | 12.85 | 8.99 | 1.35 | 2.86 | 1.25 | 0.36 | 6.91 | 14.59 | NA | NA | 12.03 | 4.10 | NA | NA |
| 2024-03-31 | 2023-12-31 | 2023-09-30 | 2023-06-30 | 2023-03-31 | 2022-12-31 | 2022-09-30 | 2022-06-30 | 2022-03-31 | 2021-12-31 | 2021-09-30 | 2021-06-30 | 2021-03-31 | 2020-12-31 | 2020-09-30 | 2020-06-30 | 2020-03-31 | 2019-12-31 | 2019-09-30 | 2019-06-30 | 2019-03-31 | 2018-12-31 | 2018-09-28 | 2018-06-29 | 2018-03-30 | ||
|---|---|---|---|---|---|---|---|---|---|---|---|---|---|---|---|---|---|---|---|---|---|---|---|---|---|---|
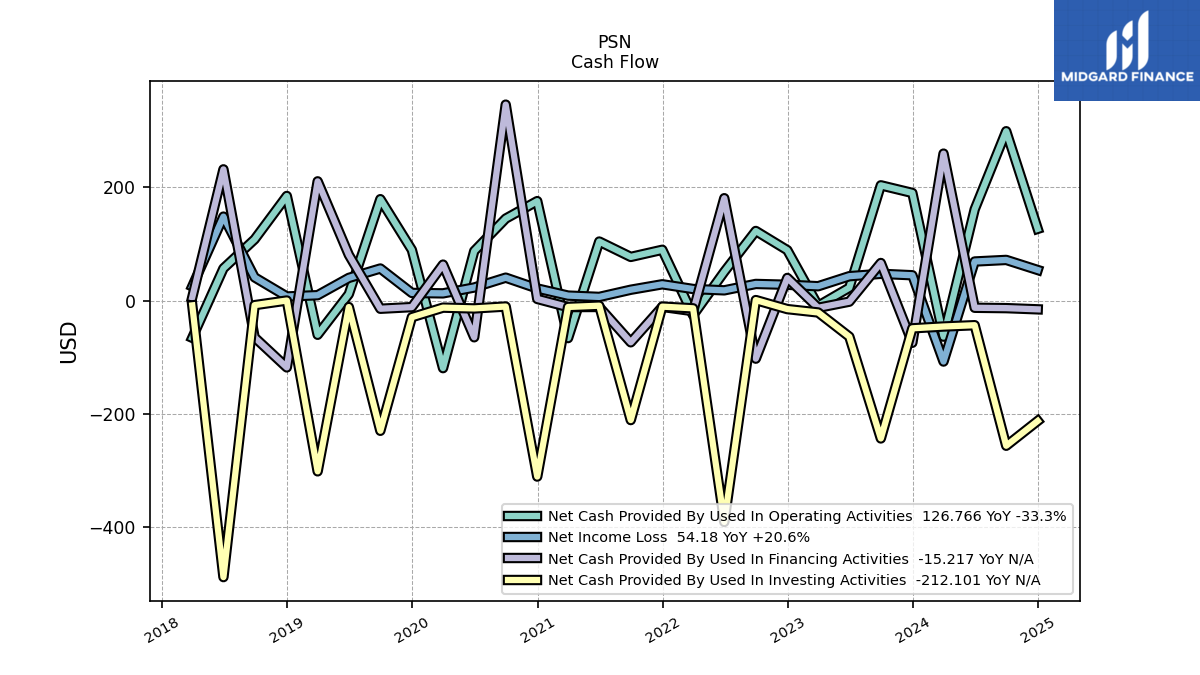
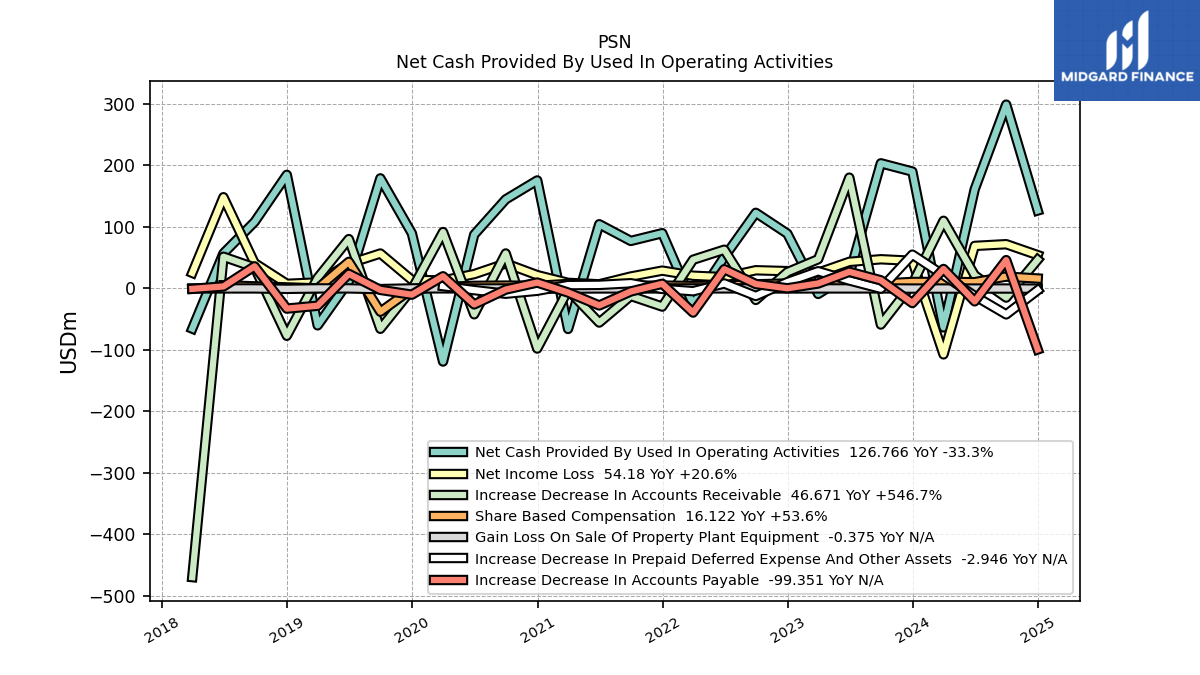
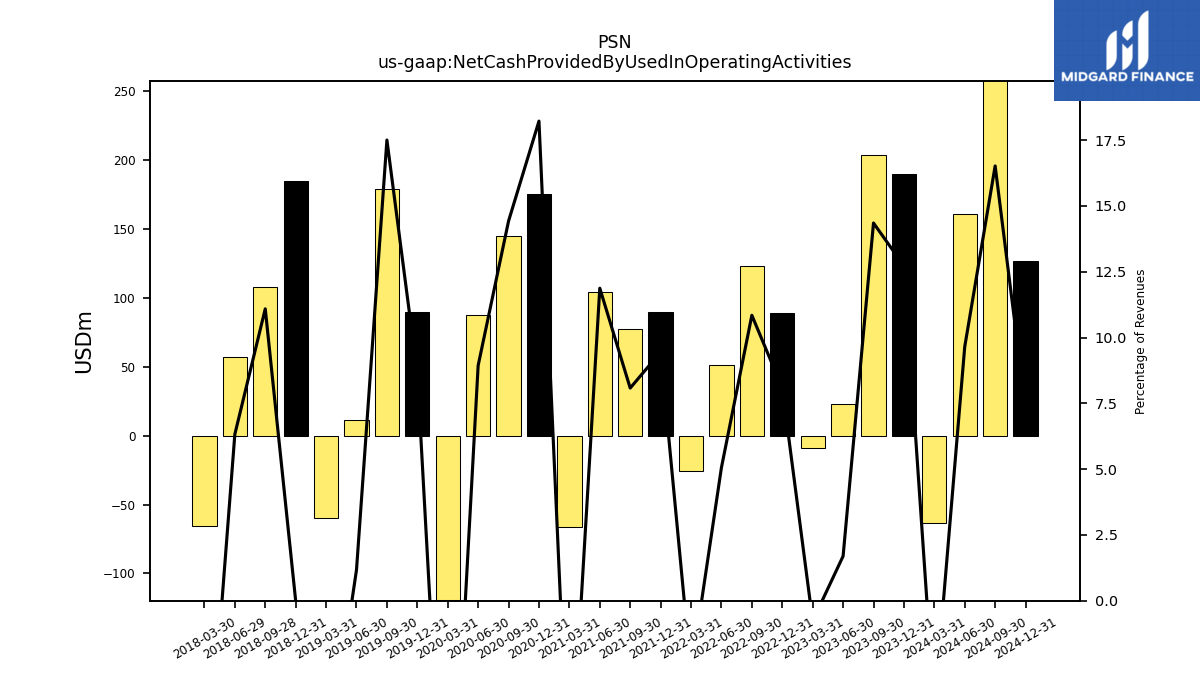
| Net Cash Provided By Used In Operating Activities | -63.42 | 190.13 | 203.58 | 22.98 | -8.99 | 89.16 | 123.03 | 51.05 | -25.71 | 89.86 | 77.25 | 104.43 | -65.97 | 175.72 | 144.88 | 87.54 | -118.98 | 89.61 | 179.12 | 11.61 | -60.11 | 184.81 | 108.27 | 56.99 | -65.43 | |
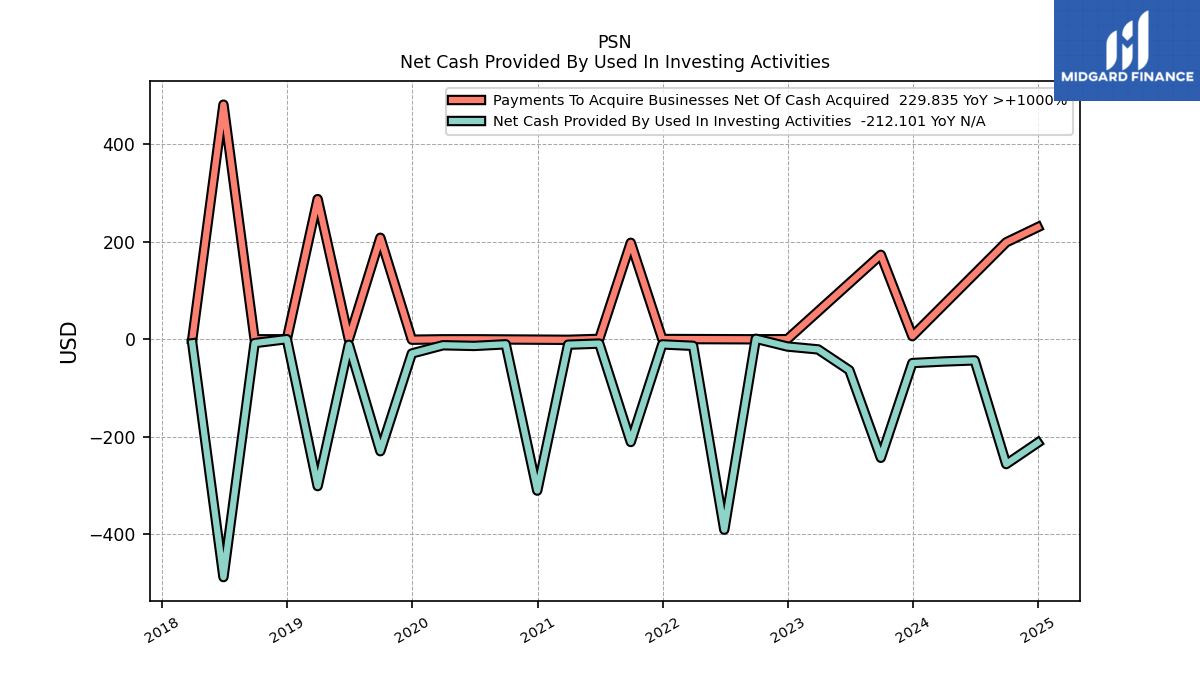
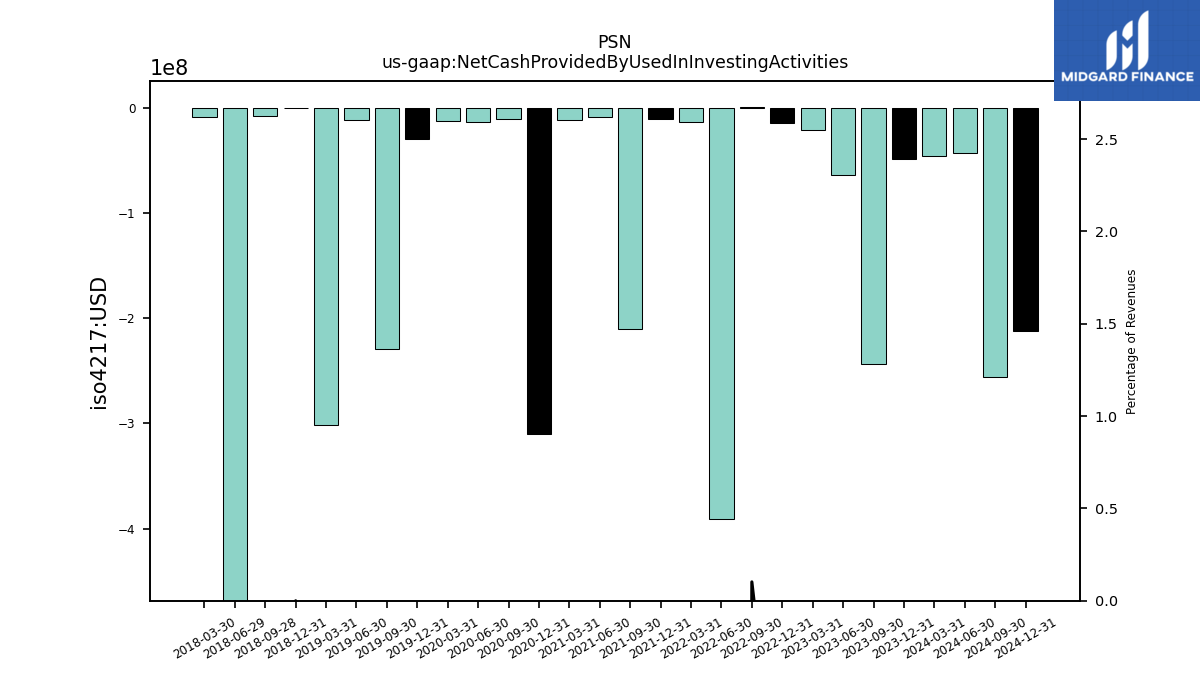
| Net Cash Provided By Used In Investing Activities | -45.51 | -48.73 | -243.03 | -63.46 | -20.76 | -14.79 | 1.16 | -390.41 | -13.43 | -10.44 | -210.62 | -8.80 | -11.04 | -310.29 | -10.26 | -13.62 | -12.20 | -29.09 | -229.50 | -11.15 | -301.06 | 0.34 | -7.81 | -487.65 | -8.18 | |
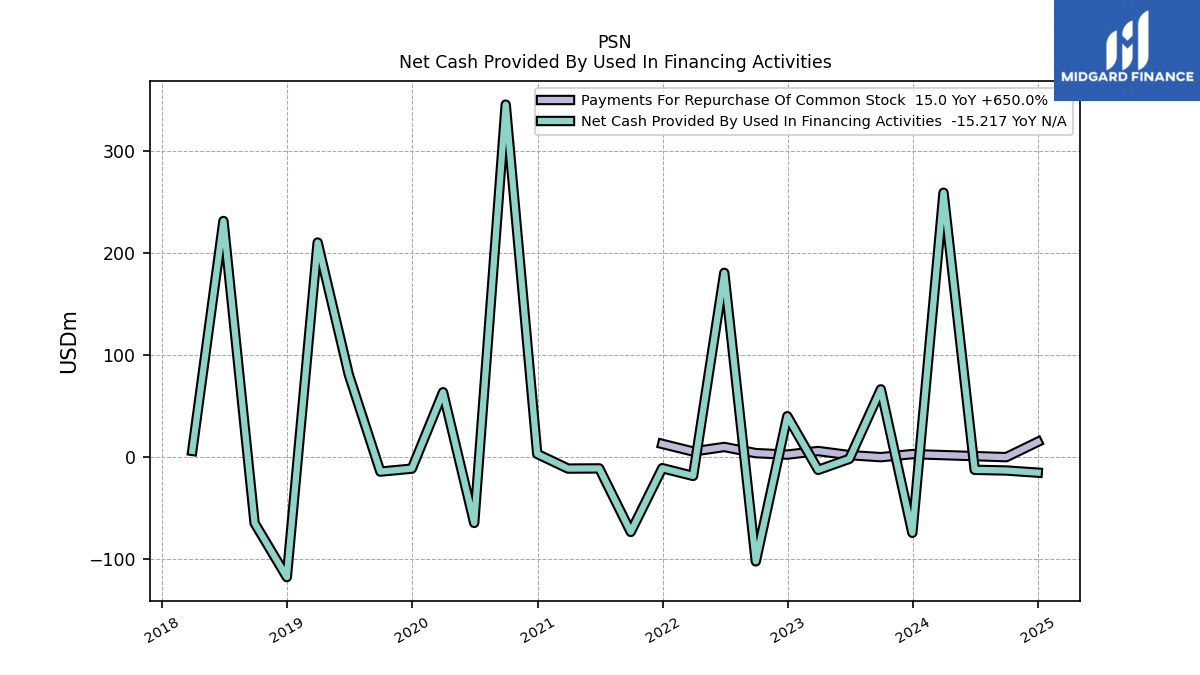
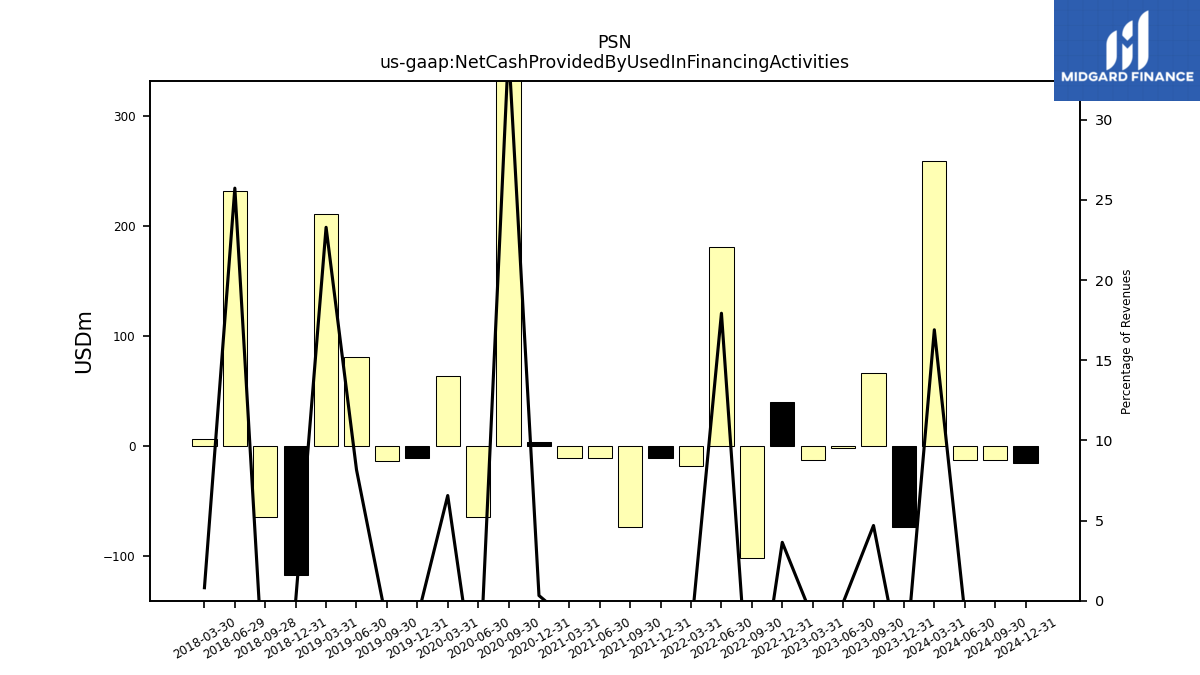
| Net Cash Provided By Used In Financing Activities | 259.51 | -74.25 | 66.56 | -1.68 | -12.50 | 40.18 | -102.27 | 180.85 | -18.40 | -10.84 | -73.41 | -11.04 | -11.22 | 3.14 | 345.94 | -64.56 | 63.71 | -11.27 | -14.19 | 80.87 | 210.62 | -117.72 | -64.76 | 231.76 | 6.13 |
| 2024-03-31 | 2023-12-31 | 2023-09-30 | 2023-06-30 | 2023-03-31 | 2022-12-31 | 2022-09-30 | 2022-06-30 | 2022-03-31 | 2021-12-31 | 2021-09-30 | 2021-06-30 | 2021-03-31 | 2020-12-31 | 2020-09-30 | 2020-06-30 | 2020-03-31 | 2019-12-31 | 2019-09-30 | 2019-06-30 | 2019-03-31 | 2018-12-31 | 2018-09-28 | 2018-06-29 | 2018-03-30 | ||
|---|---|---|---|---|---|---|---|---|---|---|---|---|---|---|---|---|---|---|---|---|---|---|---|---|---|---|
| Net Cash Provided By Used In Operating Activities | -63.42 | 190.13 | 203.58 | 22.98 | -8.99 | 89.16 | 123.03 | 51.05 | -25.71 | 89.86 | 77.25 | 104.43 | -65.97 | 175.72 | 144.88 | 87.54 | -118.98 | 89.61 | 179.12 | 11.61 | -60.11 | 184.81 | 108.27 | 56.99 | -65.43 | |
| Net Income Loss | -107.36 | 44.91 | 47.45 | 43.24 | 25.55 | 28.13 | 29.57 | 18.30 | 20.67 | 28.97 | 19.36 | 6.70 | 9.04 | 21.61 | 40.66 | 23.30 | 12.97 | 13.72 | 56.81 | 40.26 | 9.74 | 7.45 | 41.22 | 148.38 | 25.29 | |
| Profit Loss | -92.11 | 58.06 | 59.81 | 54.77 | 35.28 | 36.35 | 43.59 | 22.78 | 23.84 | 36.14 | 26.77 | 12.03 | 14.01 | 26.91 | 46.52 | 31.12 | 14.37 | 22.30 | 61.29 | 40.15 | 13.39 | 14.23 | 46.07 | 150.04 | 29.10 | |
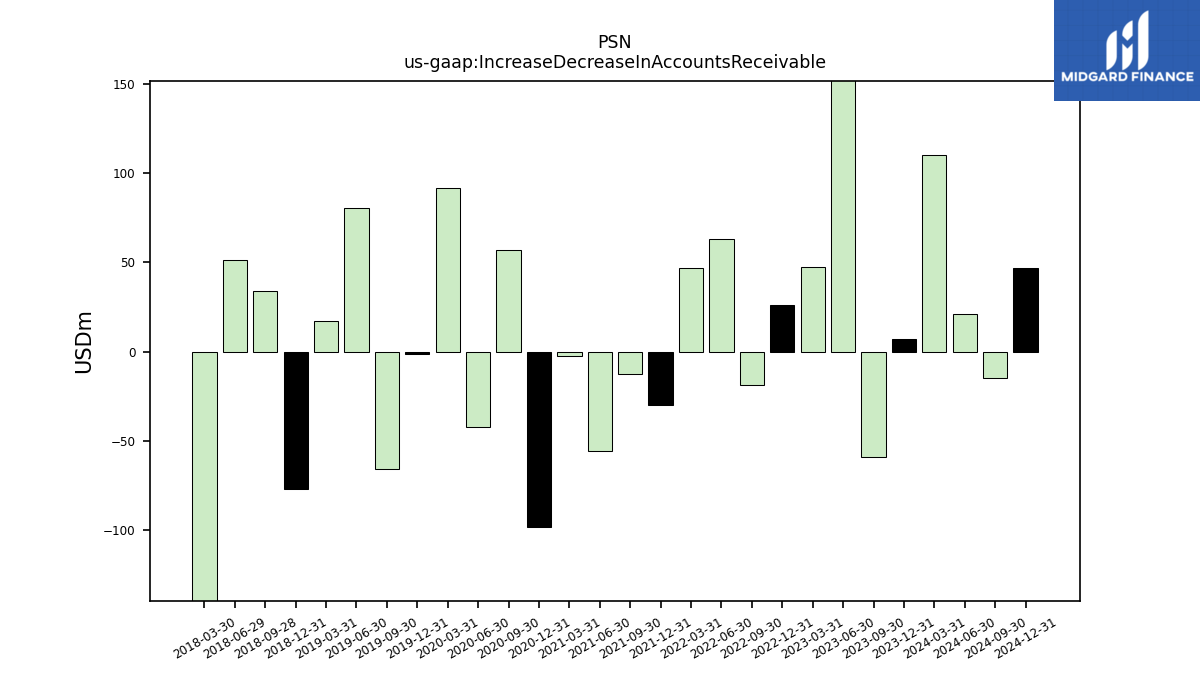
| Increase Decrease In Accounts Receivable | 110.07 | 7.22 | -58.79 | 180.27 | 47.48 | 26.41 | -18.77 | 62.99 | 46.69 | -29.54 | -12.21 | -55.55 | -2.60 | -97.86 | 56.87 | -42.12 | 91.73 | -1.52 | -65.72 | 80.31 | 17.14 | -77.09 | 33.95 | 51.55 | -469.72 | |
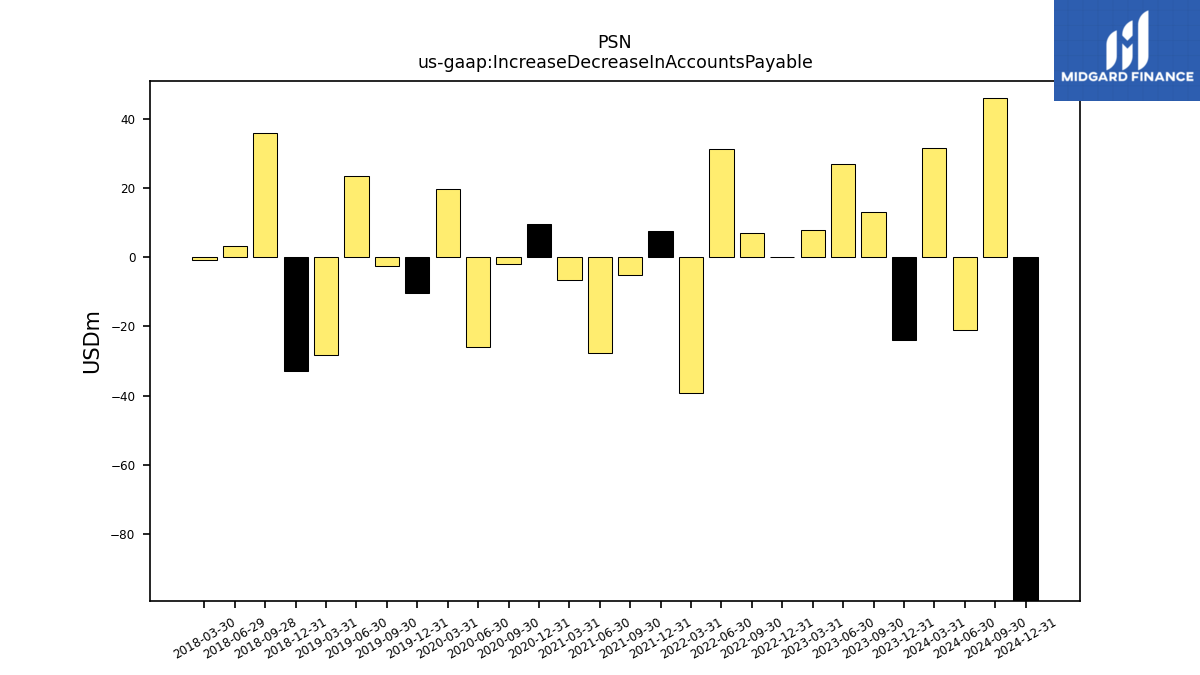
| Increase Decrease In Accounts Payable | 31.68 | -23.80 | 13.25 | 27.03 | 8.01 | 0.20 | 7.16 | 31.26 | -39.34 | 7.58 | -4.97 | -27.71 | -6.66 | 9.57 | -1.85 | -26.02 | 19.79 | -10.18 | -2.43 | 23.66 | -28.18 | -32.86 | 35.95 | 3.19 | -0.72 | |
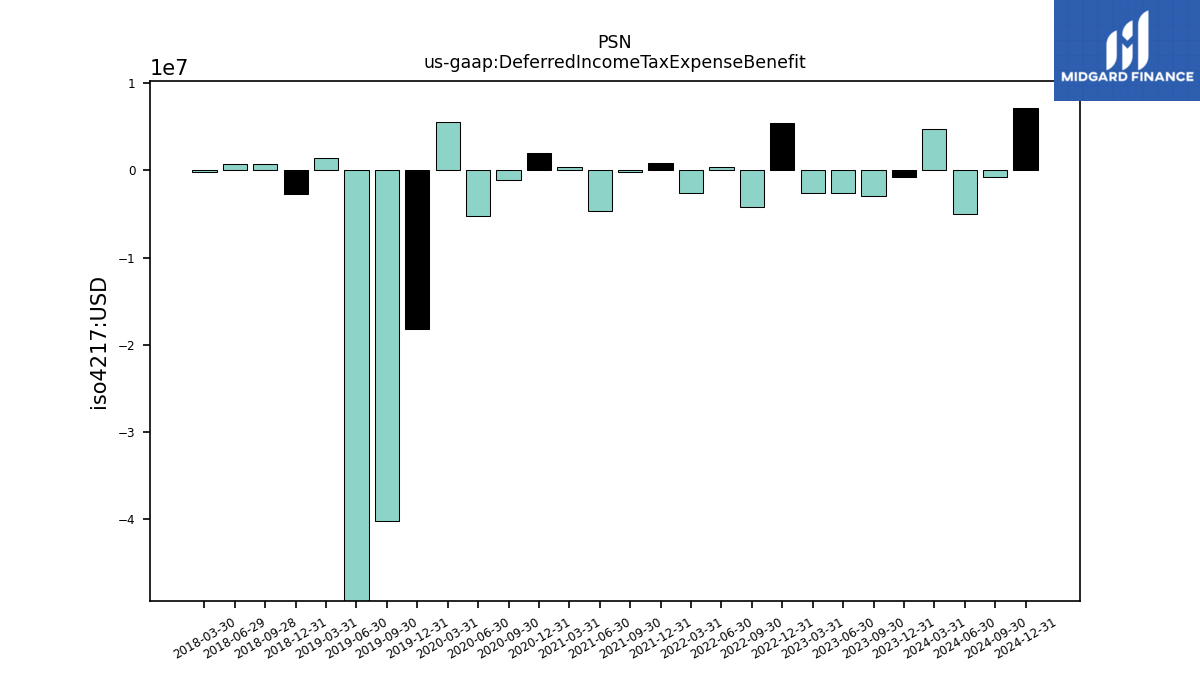
| Deferred Income Tax Expense Benefit | 4.80 | -0.71 | -2.98 | -2.63 | -2.59 | 5.49 | -4.18 | 0.42 | -2.57 | 0.90 | -0.15 | -4.62 | 0.40 | 2.03 | -1.09 | -5.19 | 5.51 | -18.18 | -40.24 | -56.00 | 1.49 | -2.70 | 0.70 | 0.72 | -0.14 | |
| Share Based Compensation | 10.52 | 10.49 | 7.89 | 8.99 | 6.99 | 8.02 | 6.63 | 4.46 | 3.90 | 4.64 | 4.18 | 4.16 | 7.21 | 4.19 | 4.61 | 4.18 | 2.25 | -0.95 | -37.94 | 43.31 | 0.00 | NA | NA | 5.05 | NA | |
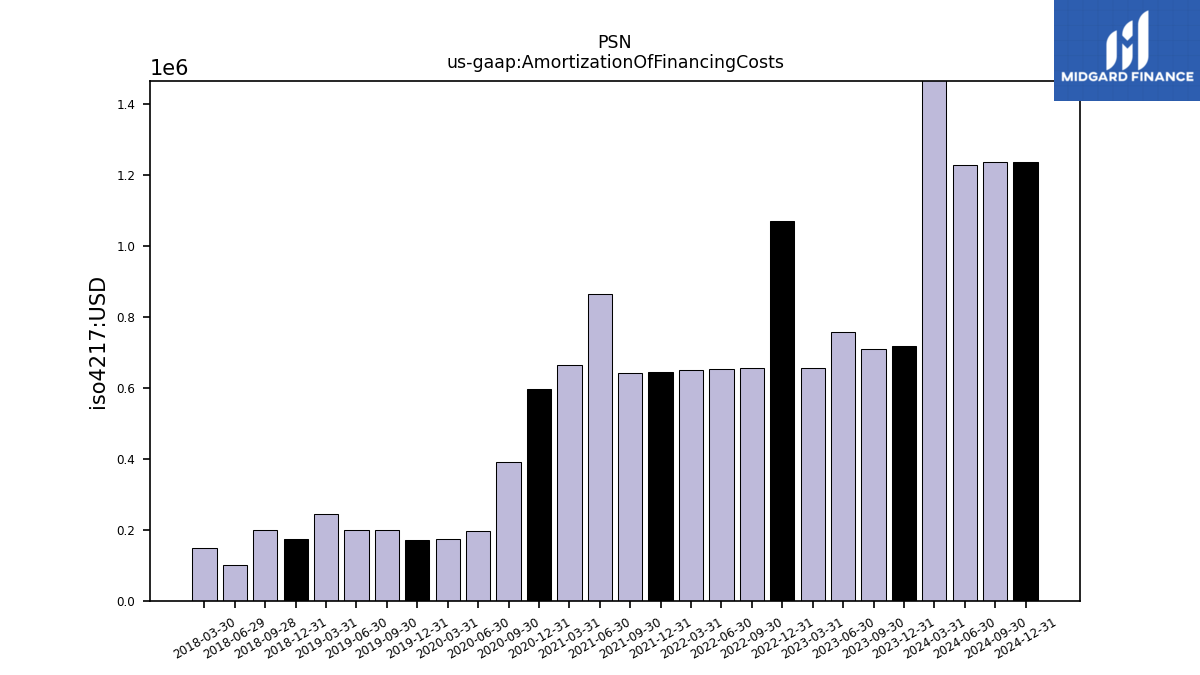
| Amortization Of Financing Costs | 4.10 | 0.72 | 0.71 | 0.76 | 0.66 | 1.07 | 0.66 | 0.65 | 0.65 | 0.64 | 0.64 | 0.86 | 0.67 | 0.60 | 0.39 | 0.20 | 0.17 | 0.17 | 0.20 | 0.20 | 0.24 | 0.17 | 0.20 | 0.10 | 0.15 |
| 2024-03-31 | 2023-12-31 | 2023-09-30 | 2023-06-30 | 2023-03-31 | 2022-12-31 | 2022-09-30 | 2022-06-30 | 2022-03-31 | 2021-12-31 | 2021-09-30 | 2021-06-30 | 2021-03-31 | 2020-12-31 | 2020-09-30 | 2020-06-30 | 2020-03-31 | 2019-12-31 | 2019-09-30 | 2019-06-30 | 2019-03-31 | 2018-12-31 | 2018-09-28 | 2018-06-29 | 2018-03-30 | ||
|---|---|---|---|---|---|---|---|---|---|---|---|---|---|---|---|---|---|---|---|---|---|---|---|---|---|---|
| Net Cash Provided By Used In Investing Activities | -45.51 | -48.73 | -243.03 | -63.46 | -20.76 | -14.79 | 1.16 | -390.41 | -13.43 | -10.44 | -210.62 | -8.80 | -11.04 | -310.29 | -10.26 | -13.62 | -12.20 | -29.09 | -229.50 | -11.15 | -301.06 | 0.34 | -7.81 | -487.65 | -8.18 | |
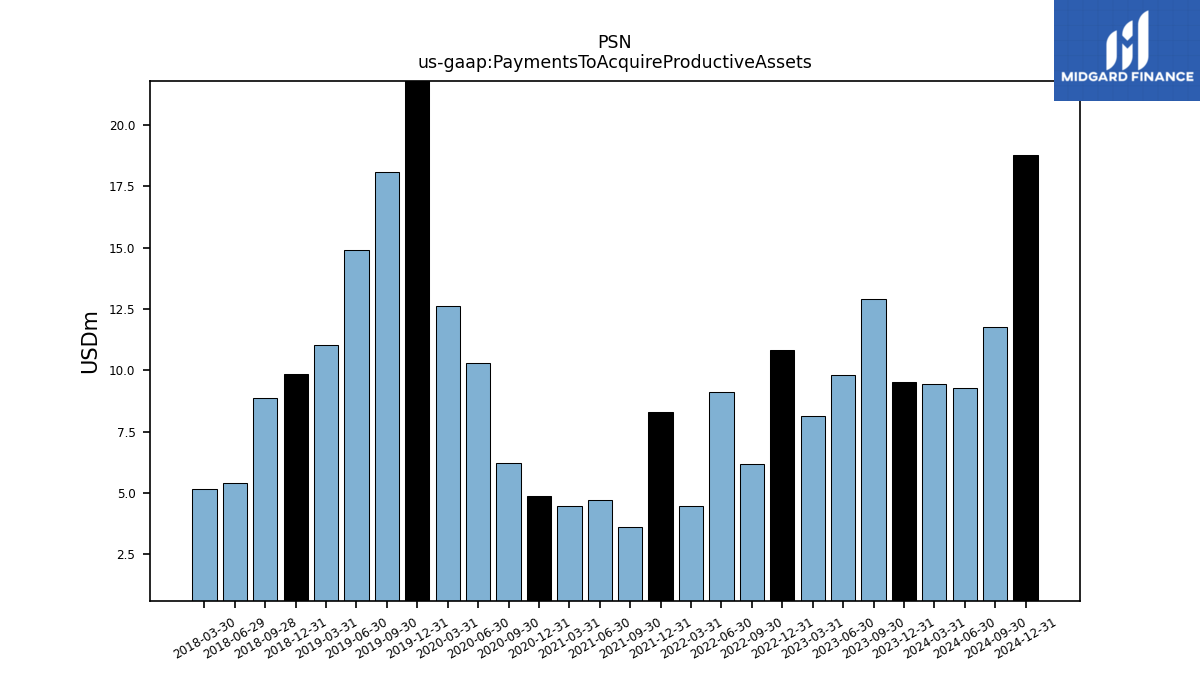
| Payments To Acquire Productive Assets | 9.44 | 9.52 | 12.92 | 9.81 | 8.15 | 10.81 | 6.20 | 9.12 | 4.47 | 8.30 | 3.63 | 4.72 | 4.45 | 4.86 | 6.24 | 10.30 | 12.64 | 23.57 | 18.08 | 14.91 | 11.04 | 9.85 | 8.87 | 5.41 | 5.15 |
| 2024-03-31 | 2023-12-31 | 2023-09-30 | 2023-06-30 | 2023-03-31 | 2022-12-31 | 2022-09-30 | 2022-06-30 | 2022-03-31 | 2021-12-31 | 2021-09-30 | 2021-06-30 | 2021-03-31 | 2020-12-31 | 2020-09-30 | 2020-06-30 | 2020-03-31 | 2019-12-31 | 2019-09-30 | 2019-06-30 | 2019-03-31 | 2018-12-31 | 2018-09-28 | 2018-06-29 | 2018-03-30 | ||
|---|---|---|---|---|---|---|---|---|---|---|---|---|---|---|---|---|---|---|---|---|---|---|---|---|---|---|
| Net Cash Provided By Used In Financing Activities | 259.51 | -74.25 | 66.56 | -1.68 | -12.50 | 40.18 | -102.27 | 180.85 | -18.40 | -10.84 | -73.41 | -11.04 | -11.22 | 3.14 | 345.94 | -64.56 | 63.71 | -11.27 | -14.19 | 80.87 | 210.62 | -117.72 | -64.76 | 231.76 | 6.13 | |
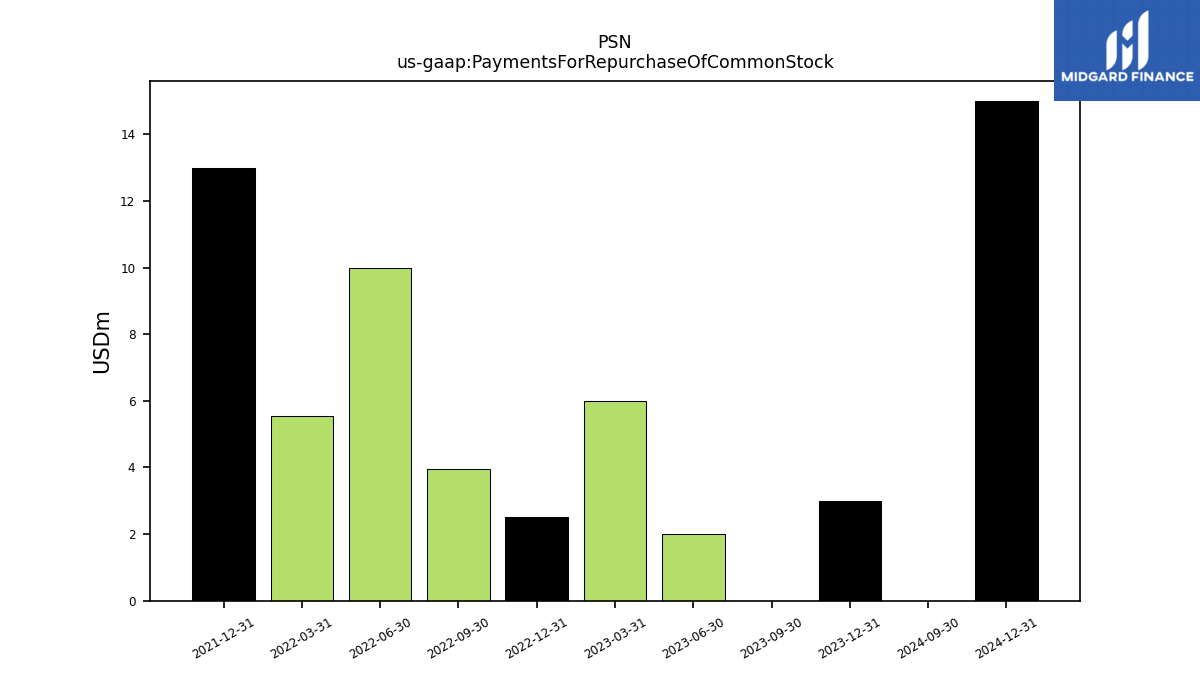
| Payments For Repurchase Of Common Stock | NA | 3.00 | 0.00 | 2.00 | 6.00 | 2.50 | 3.95 | 10.00 | 5.55 | 13.00 | NA | NA | NA | NA | NA | NA | NA | NA | NA | NA | NA | NA | NA | NA | NA |
| 2024-03-31 | 2023-12-31 | 2023-09-30 | 2023-06-30 | 2023-03-31 | 2022-12-31 | 2022-09-30 | 2022-06-30 | 2022-03-31 | 2021-12-31 | 2021-09-30 | 2021-06-30 | 2021-03-31 | 2020-12-31 | 2020-09-30 | 2020-06-30 | 2020-03-31 | 2019-12-31 | 2019-09-30 | 2019-06-30 | 2019-03-31 | 2018-12-31 | 2018-09-28 | 2018-06-29 | 2018-03-30 | ||
|---|---|---|---|---|---|---|---|---|---|---|---|---|---|---|---|---|---|---|---|---|---|---|---|---|---|---|
| Revenues | 1535.68 | 1494.23 | 1418.57 | 1356.49 | 1173.47 | 1103.11 | 1134.37 | 1008.72 | 949.07 | 950.67 | 956.05 | 879.36 | 874.70 | 964.26 | 1004.24 | 979.46 | 970.99 | 1037.39 | 1023.28 | 989.74 | 904.40 | 928.94 | 976.16 | 900.73 | 754.68 | |
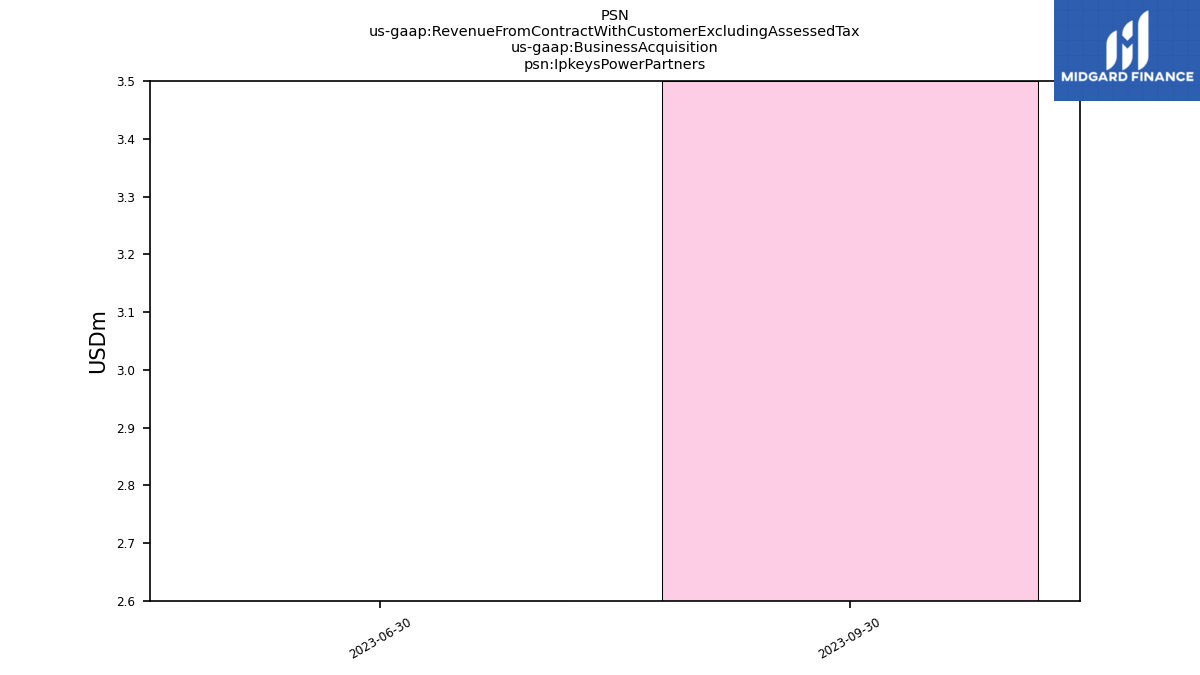
| Ipkeys Power Partners | 3.50 | 3.20 | 3.50 | 2.60 | NA | NA | NA | NA | NA | NA | NA | NA | NA | NA | NA | NA | NA | NA | NA | NA | NA | NA | NA | NA | NA | |
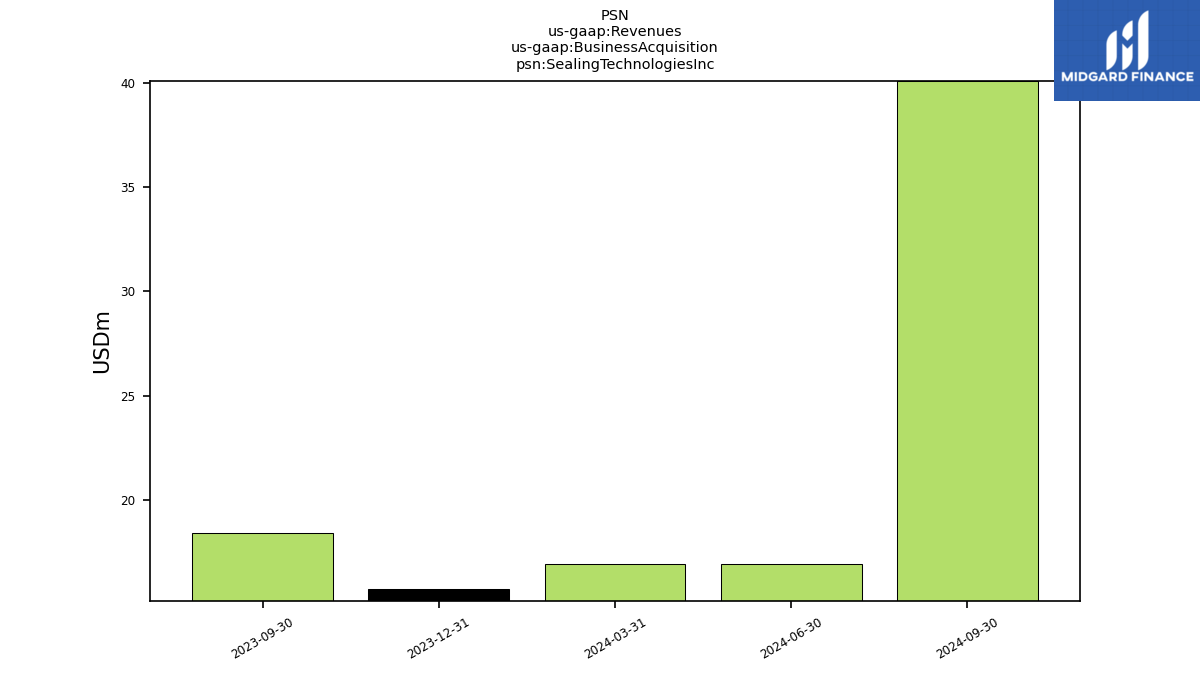
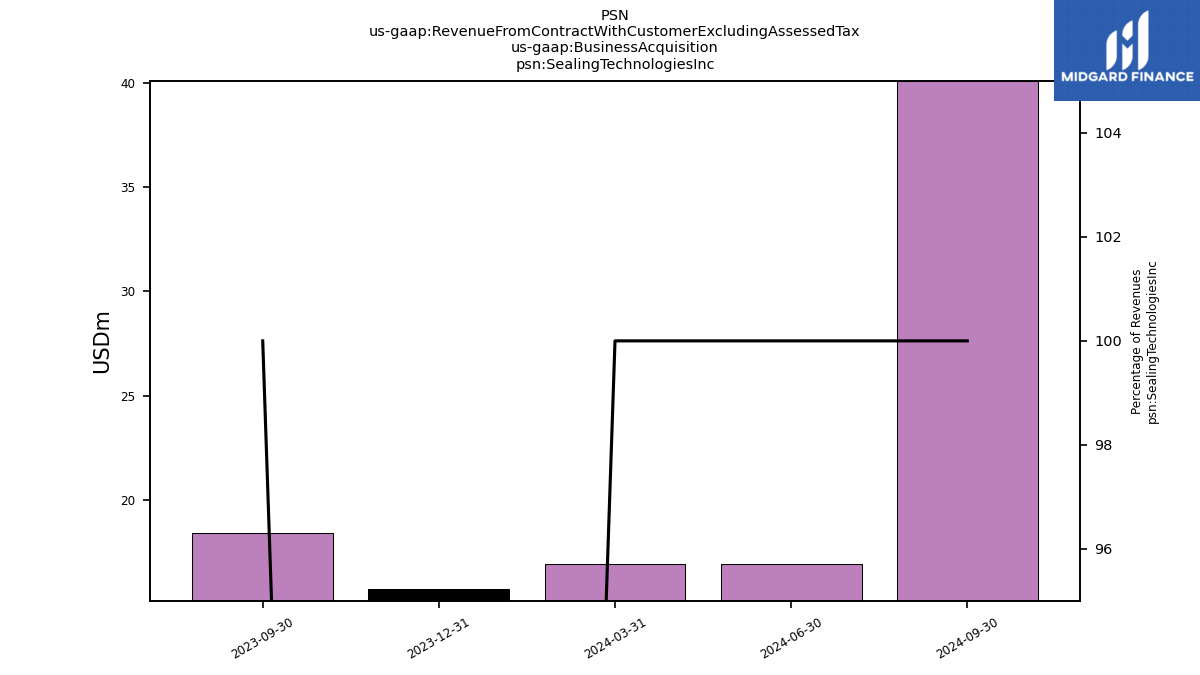
| Sealing Technologies Inc | 16.90 | 15.70 | 18.40 | NA | NA | NA | NA | NA | NA | NA | NA | NA | NA | NA | NA | NA | NA | NA | NA | NA | NA | NA | NA | NA | NA | |
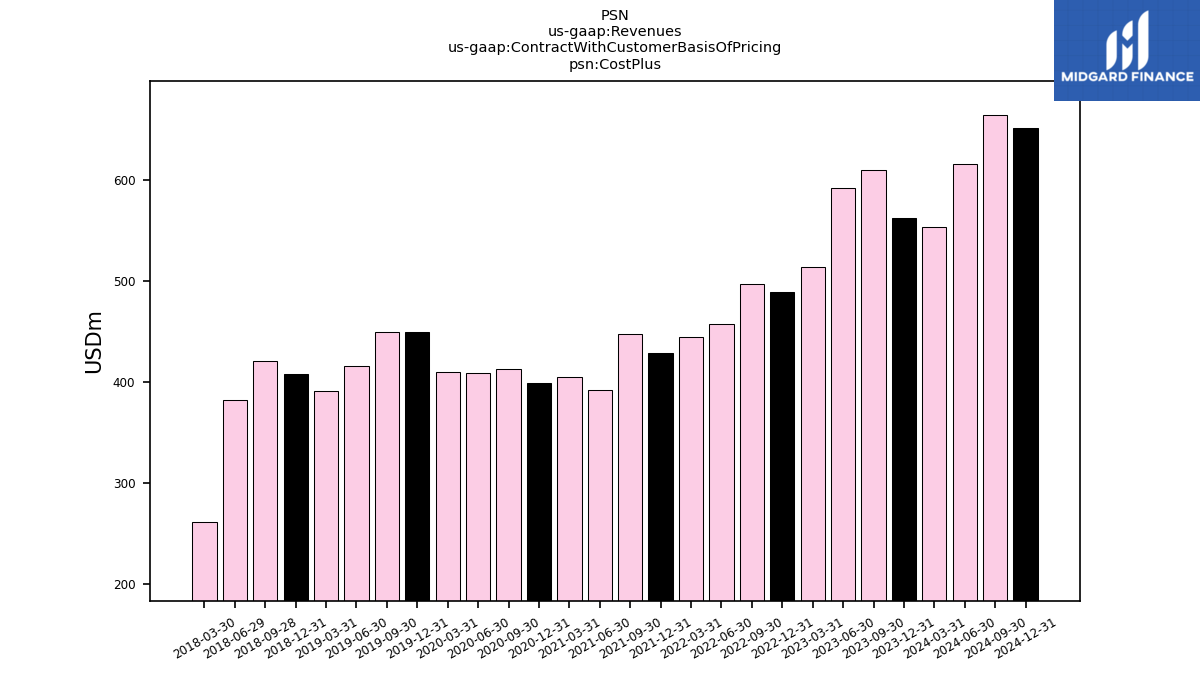
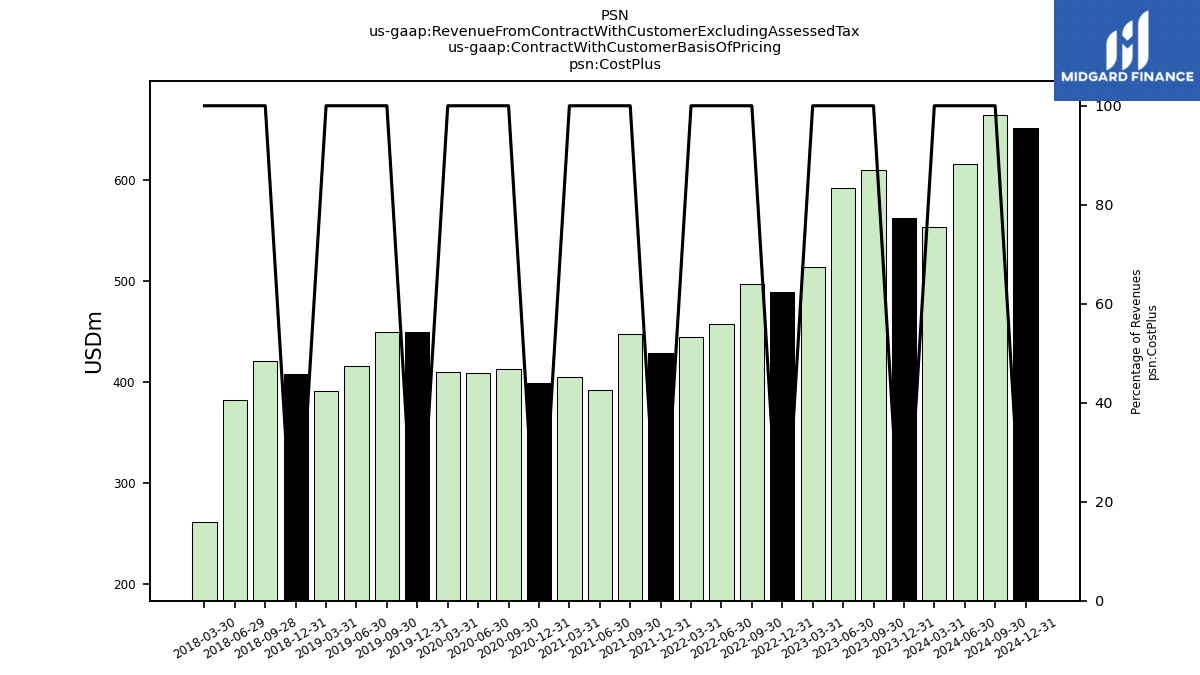
| Cost Plus | 553.81 | 562.61 | 610.28 | 592.36 | 514.14 | 489.80 | 497.28 | 457.98 | 445.18 | 428.84 | 447.59 | 392.76 | 405.09 | 398.84 | 413.35 | 408.71 | 410.25 | 449.72 | 449.38 | 415.73 | 391.00 | 408.03 | 421.50 | 382.76 | 261.53 | |
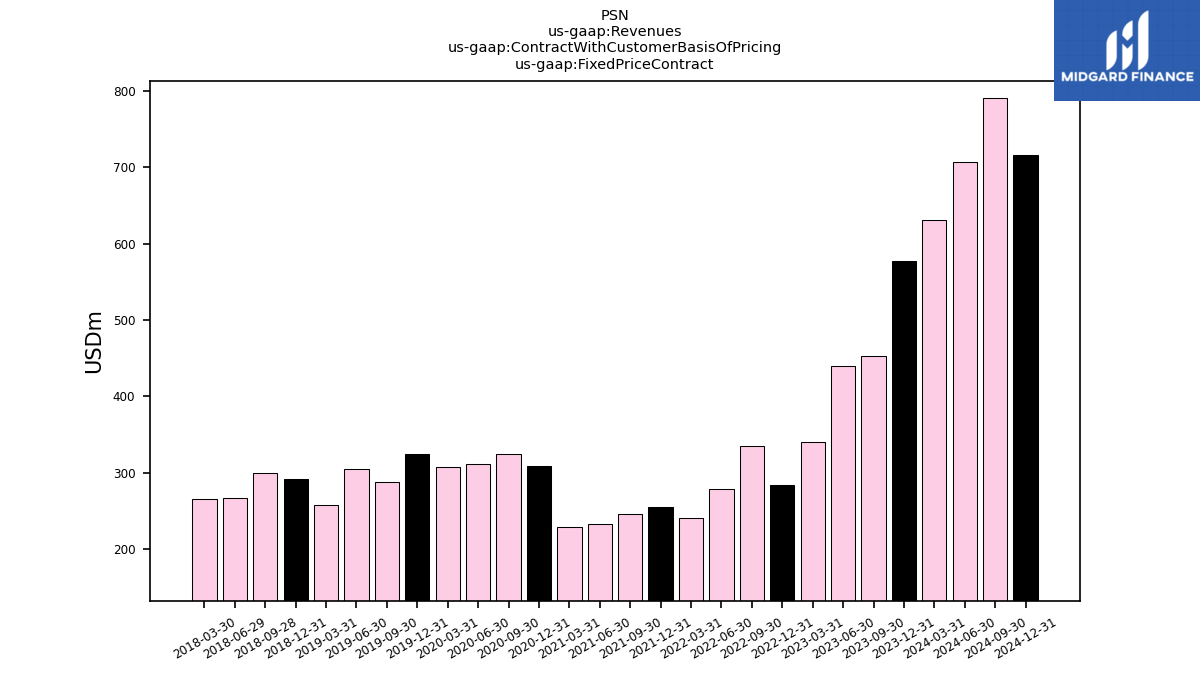
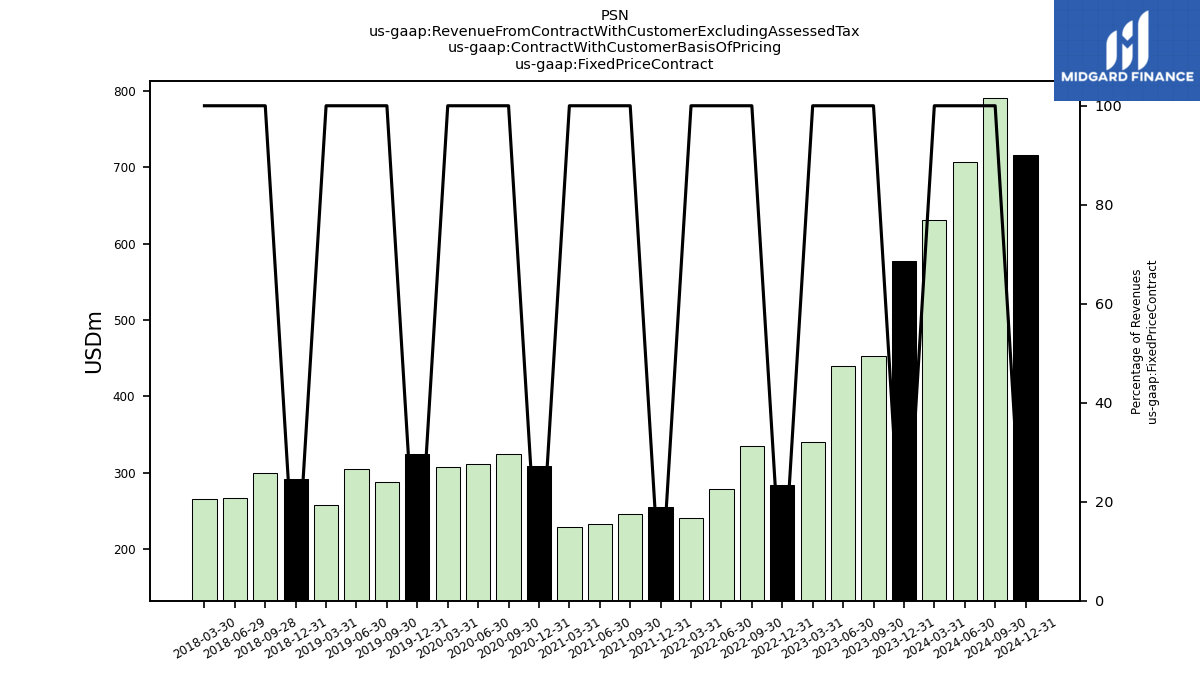
| Fixed Price Contract | 631.22 | 576.79 | 452.61 | 440.09 | 341.01 | 283.65 | 334.85 | 279.41 | 240.57 | 254.86 | 246.89 | 233.23 | 229.94 | 308.63 | 324.90 | 311.37 | 308.31 | 324.29 | 288.32 | 304.65 | 257.69 | 291.71 | 300.23 | 267.59 | 265.41 | |
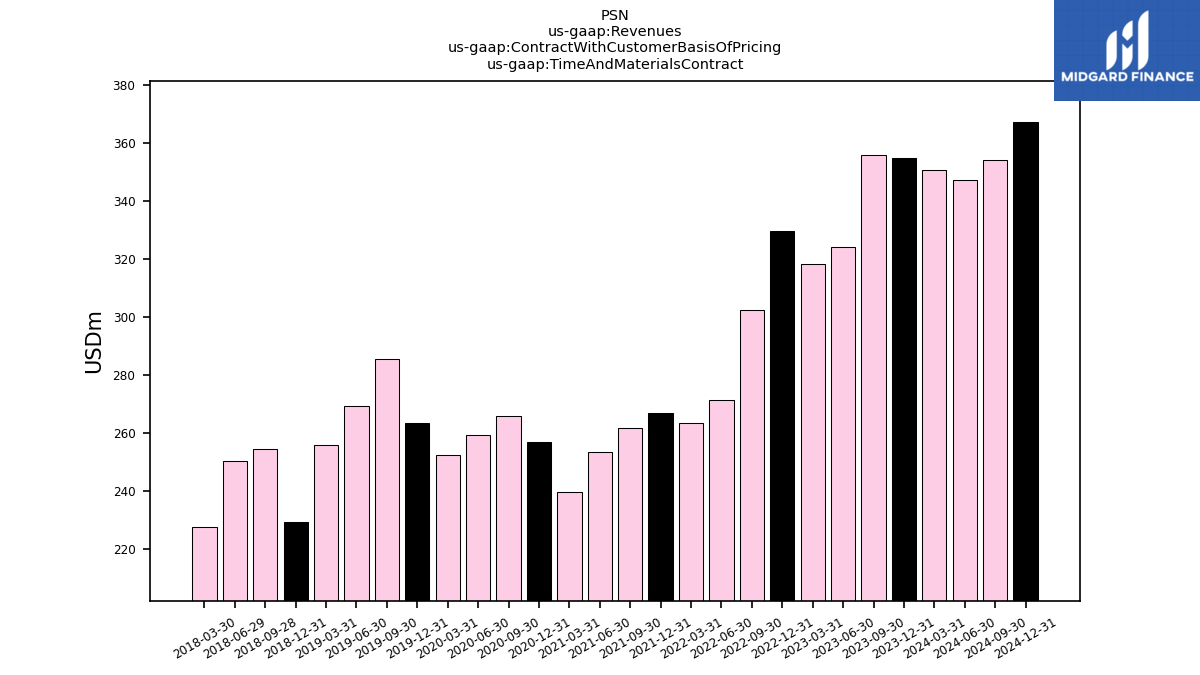
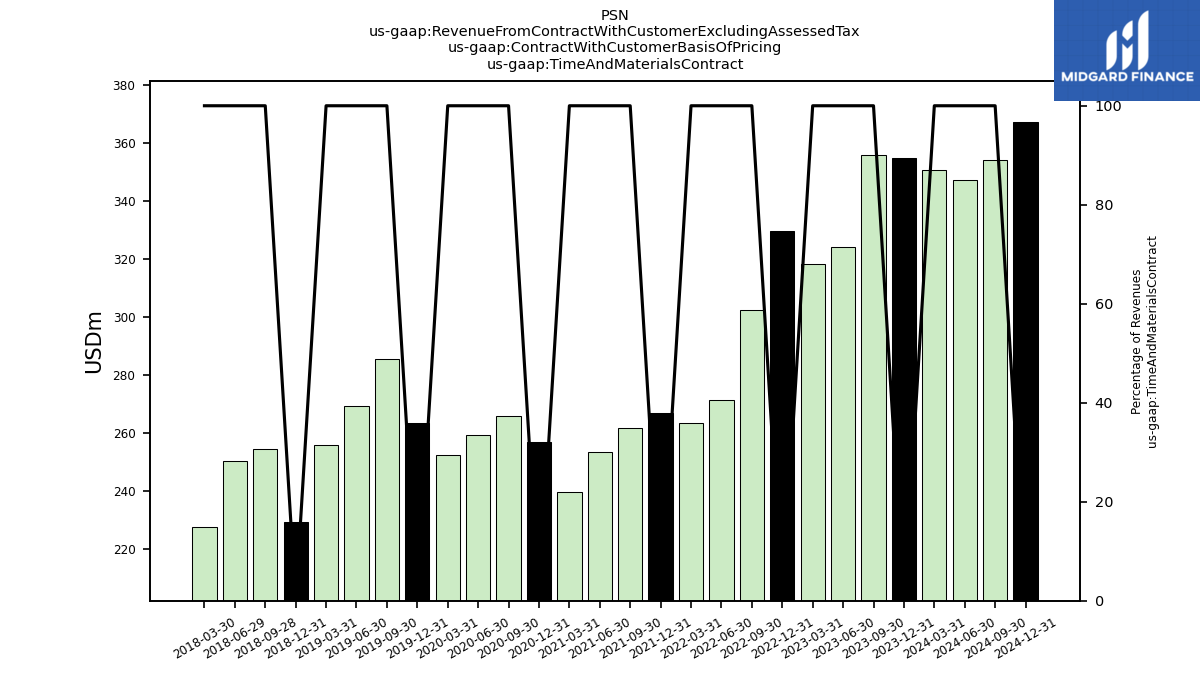
| Time And Materials Contract | 350.65 | 354.83 | 355.69 | 324.03 | 318.31 | 329.67 | 302.24 | 271.33 | 263.31 | 266.97 | 261.57 | 253.37 | 239.66 | 256.79 | 265.99 | 259.38 | 252.44 | 263.38 | 285.59 | 269.36 | 255.71 | 229.20 | 254.44 | 250.38 | 227.74 | |
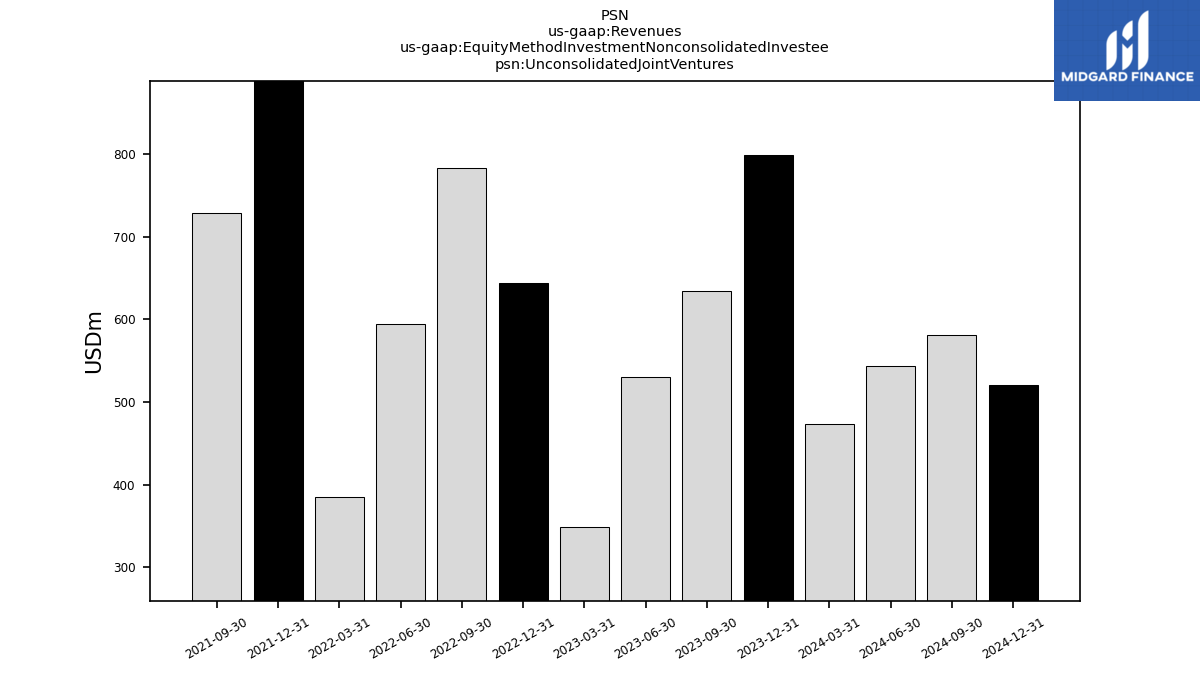
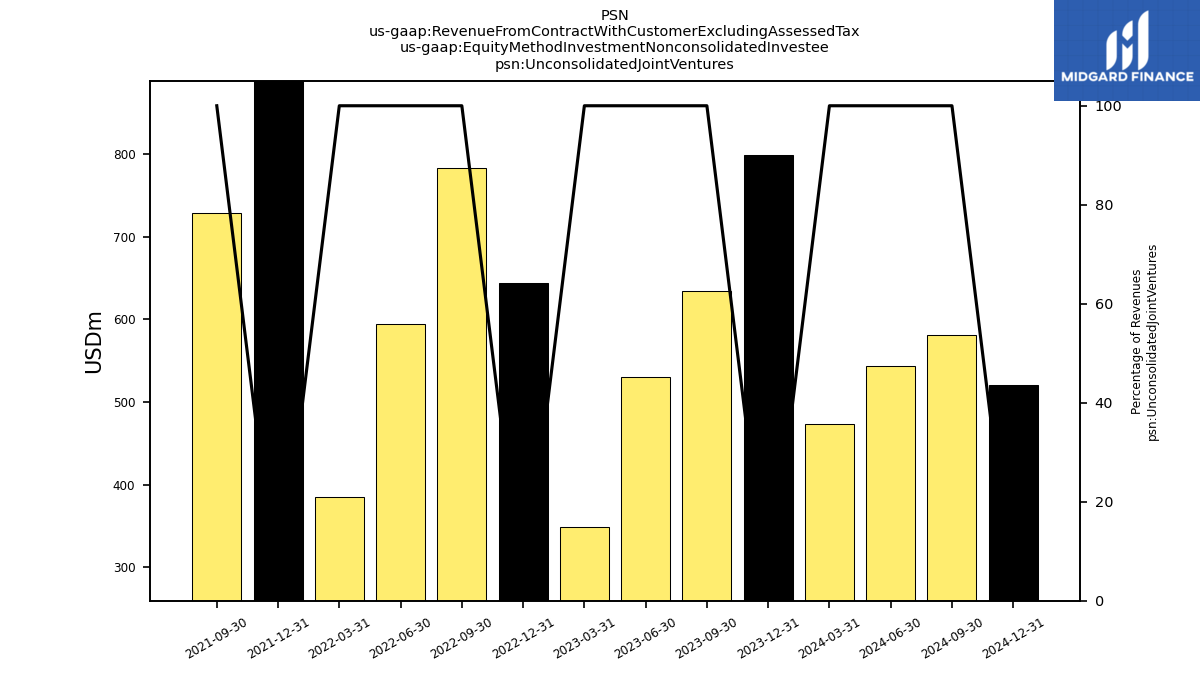
| Unconsolidated Joint Ventures | 473.53 | 798.86 | 634.94 | 530.47 | 349.16 | 643.99 | 782.88 | 594.96 | 384.58 | 1008.04 | 728.46 | NA | NA | NA | NA | NA | NA | NA | NA | NA | NA | NA | NA | NA | NA | |
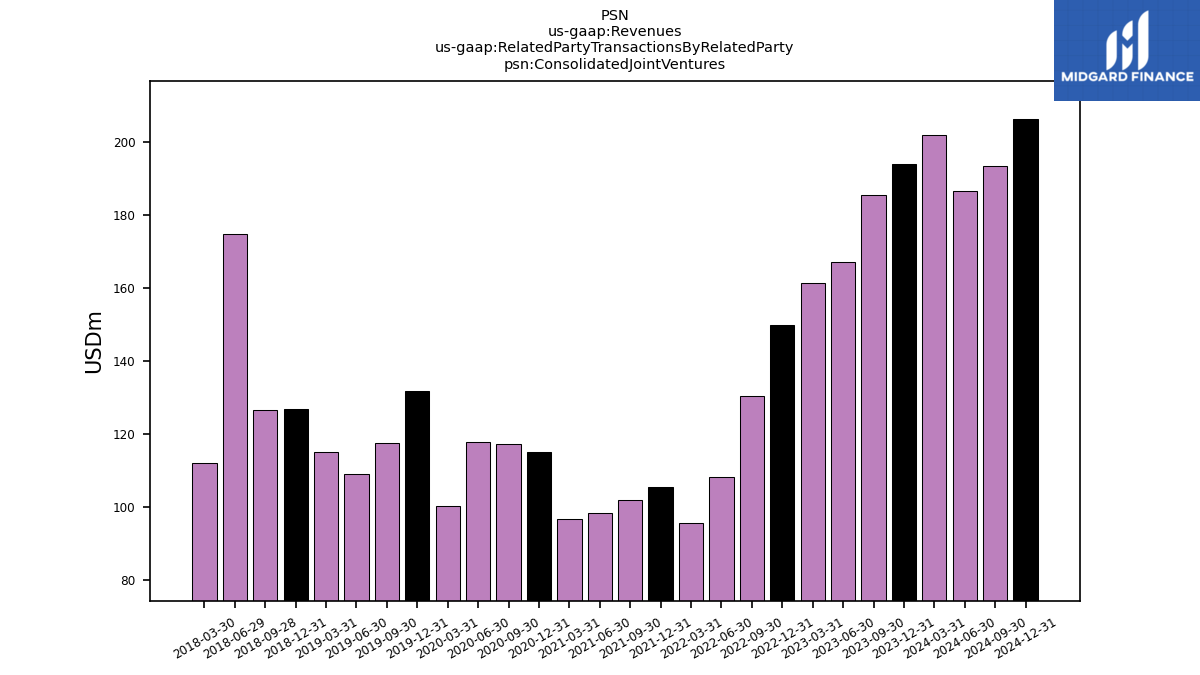
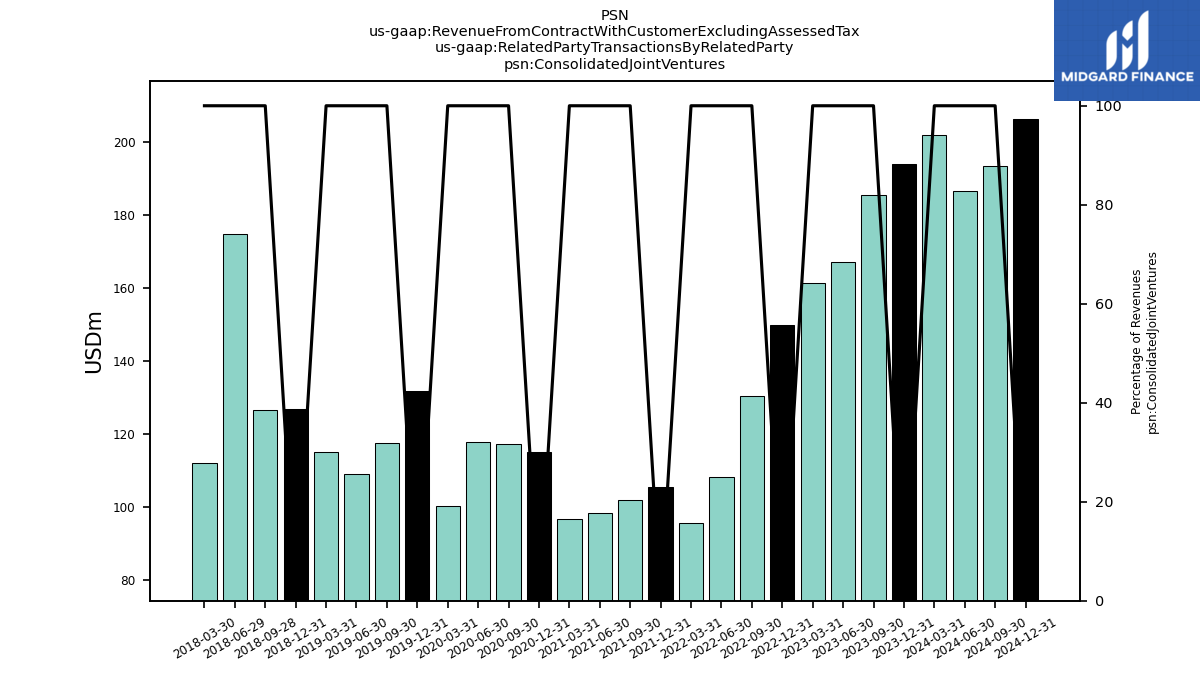
| Consolidated Joint Ventures | 202.02 | 194.05 | 185.60 | 167.25 | 161.48 | 149.92 | 130.34 | 108.09 | 95.53 | 105.39 | 101.82 | 98.25 | 96.62 | 115.02 | 117.34 | 117.89 | 100.28 | 131.77 | 117.61 | 109.00 | 115.10 | 126.80 | 126.48 | 174.95 | 112.12 | |
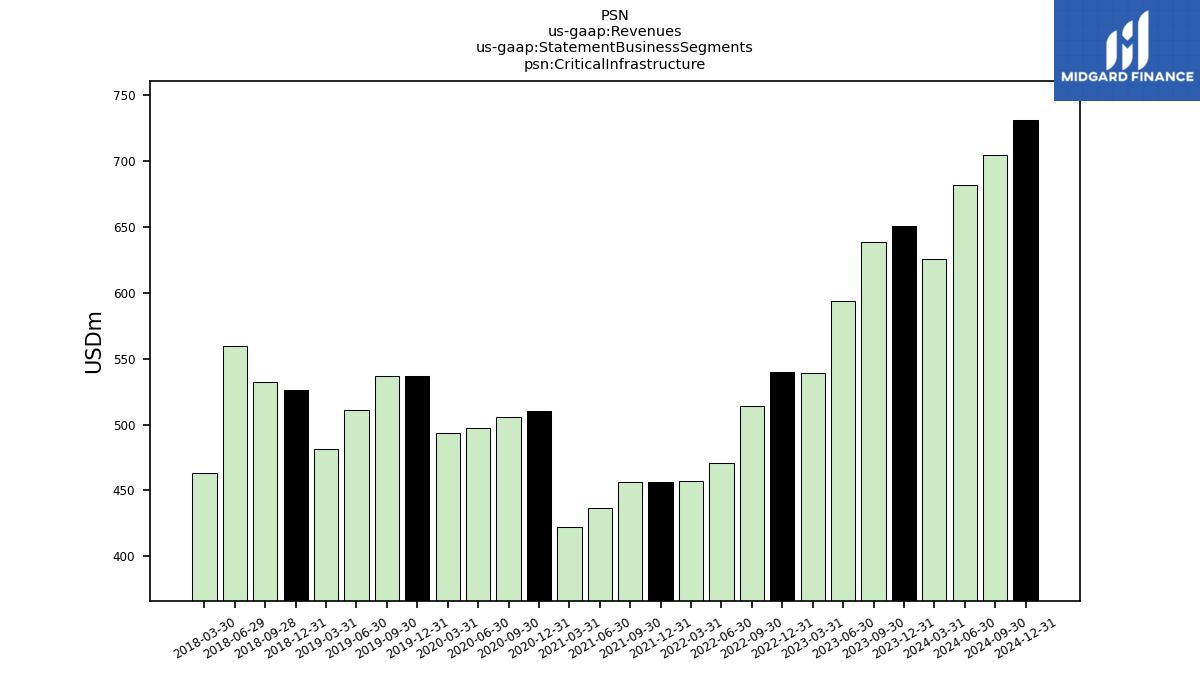
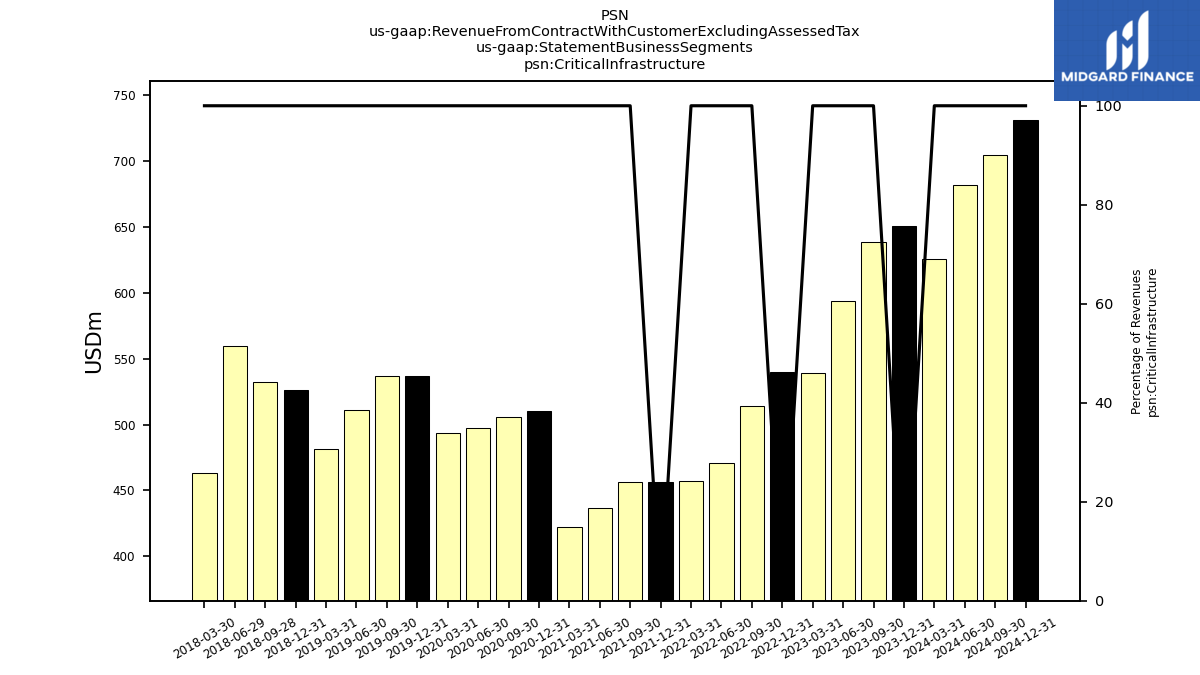
| Critical Infrastructure | 626.07 | 650.98 | 638.46 | 593.69 | 538.92 | 539.73 | 513.95 | 471.17 | 457.44 | 456.65 | 456.76 | 436.68 | 422.63 | 510.29 | 506.08 | 497.25 | 493.42 | 536.97 | 537.10 | 511.25 | 481.59 | 526.06 | 532.43 | 559.67 | 463.34 | |
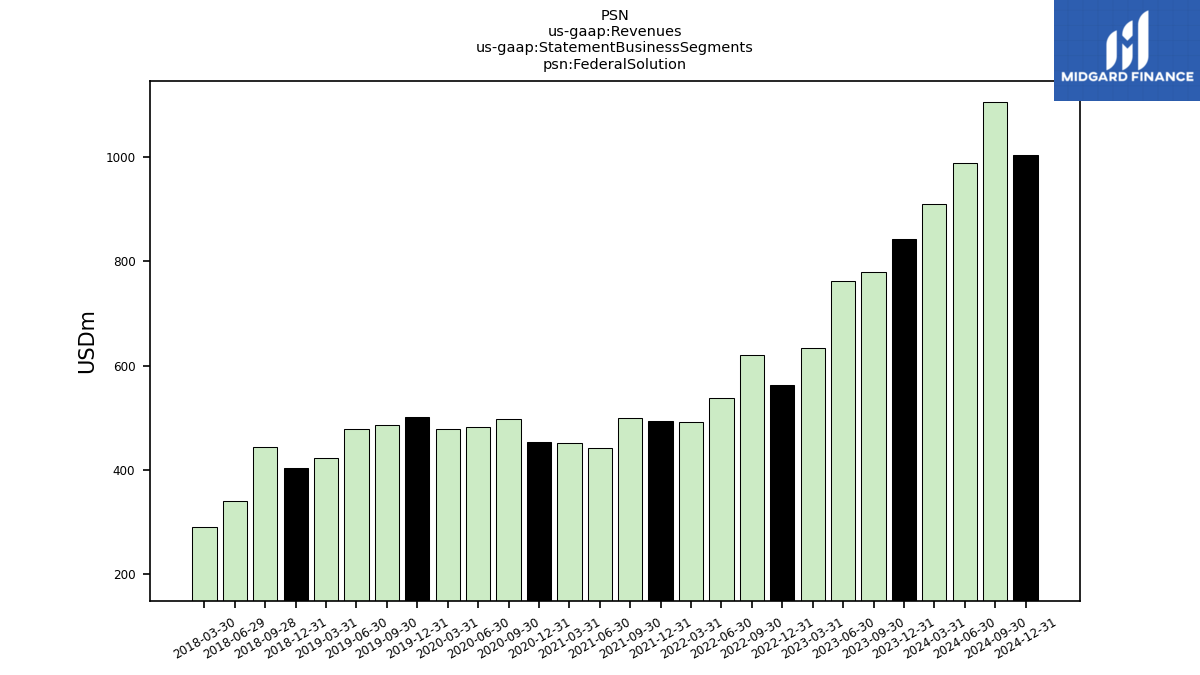
| Federal Solution | 909.61 | 843.24 | 780.11 | 762.80 | 634.55 | 563.39 | 620.42 | 537.56 | 491.63 | 494.01 | 499.29 | 442.68 | 452.07 | 453.97 | 498.16 | 482.21 | 477.57 | 500.42 | 486.18 | 478.50 | 422.81 | 402.88 | 443.73 | 341.06 | 291.33 | |
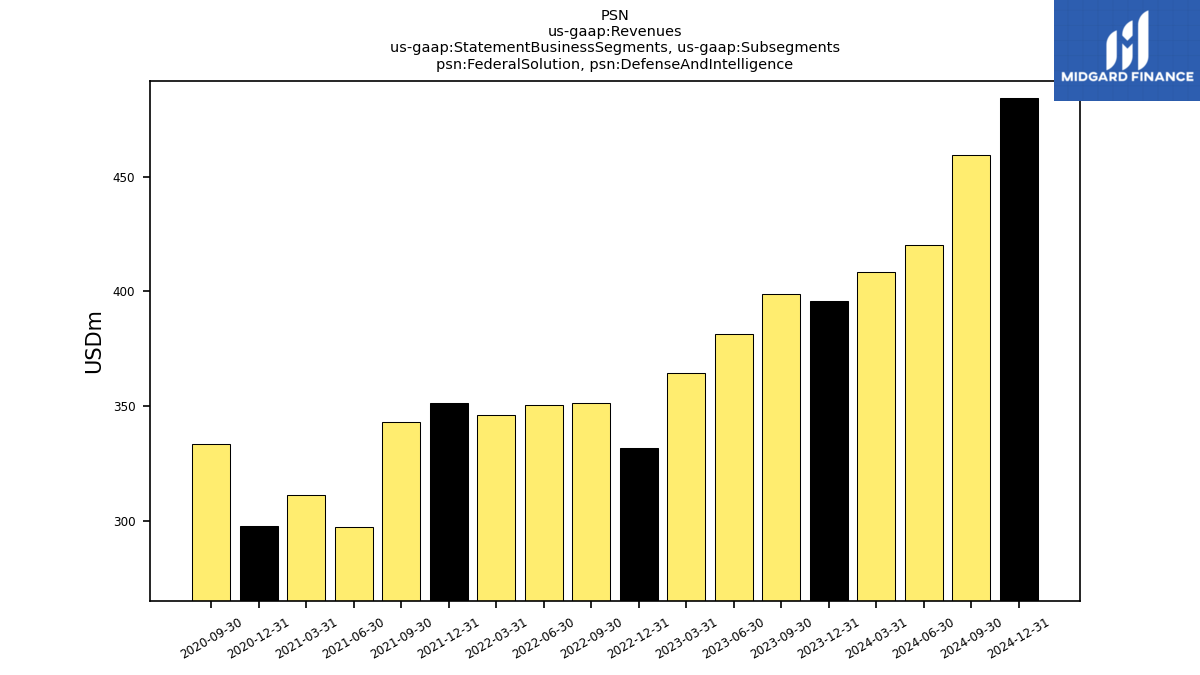
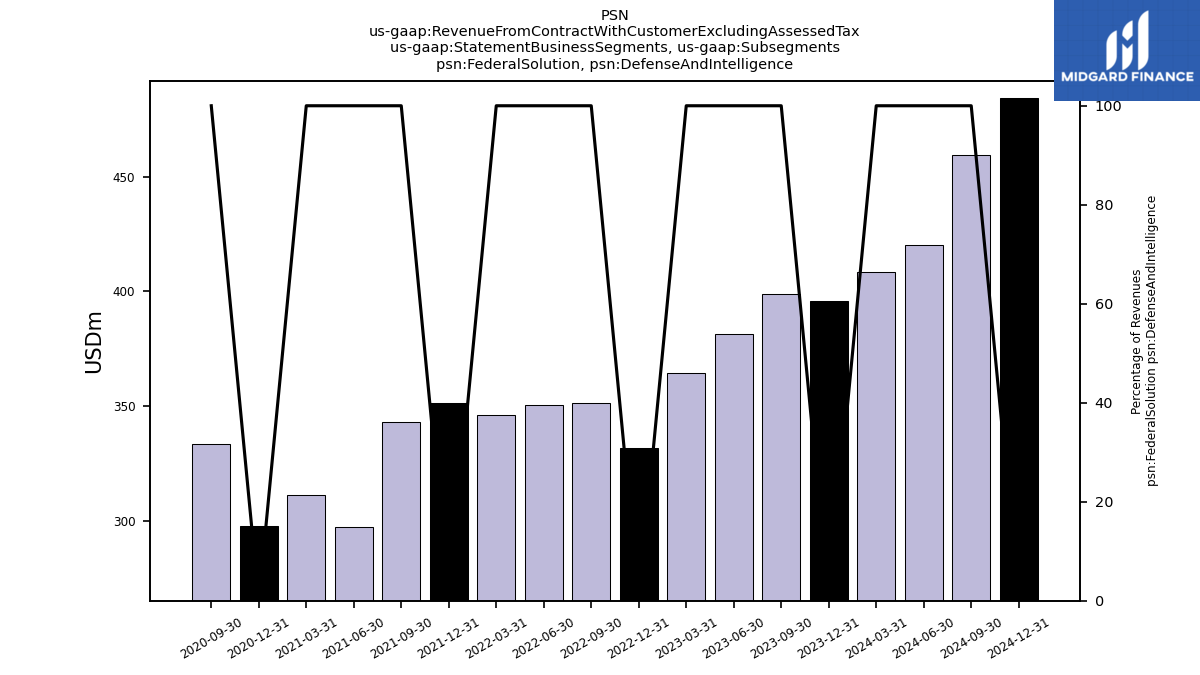
| Federal Solution, Defense And Intelligence | 408.39 | 395.65 | 398.63 | 381.33 | 364.36 | 331.54 | 351.42 | 350.30 | 346.23 | 351.09 | 343.15 | 297.45 | 311.10 | 297.55 | 333.29 | NA | NA | NA | NA | NA | NA | NA | NA | NA | NA | |
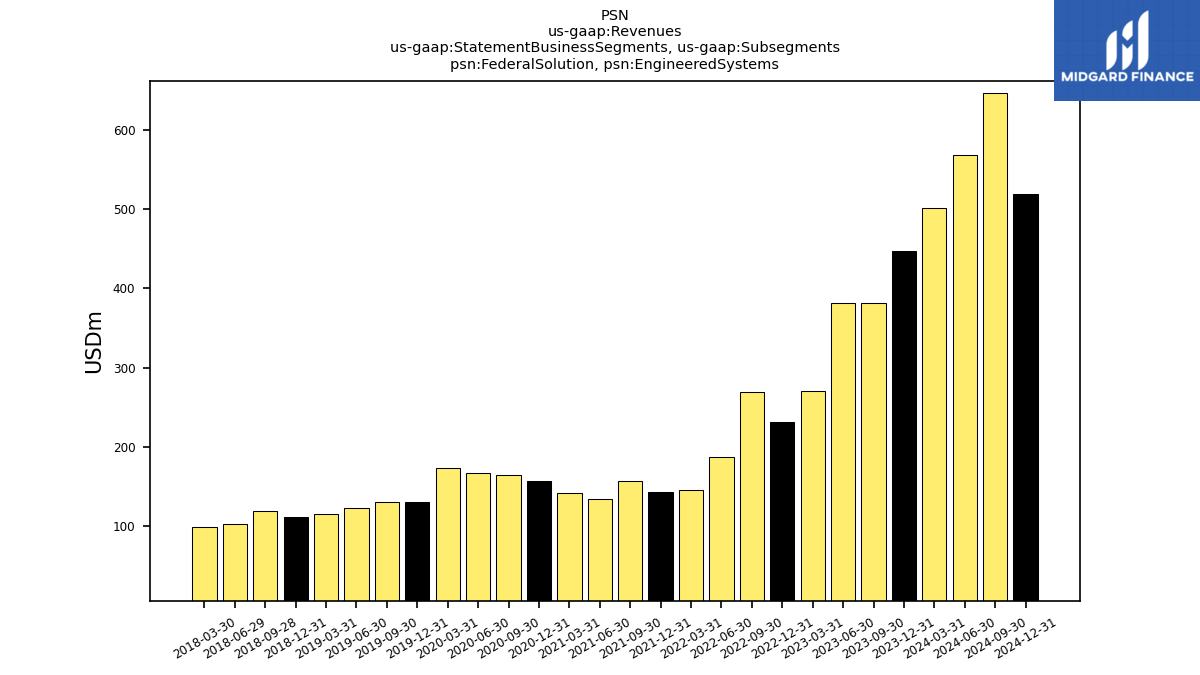
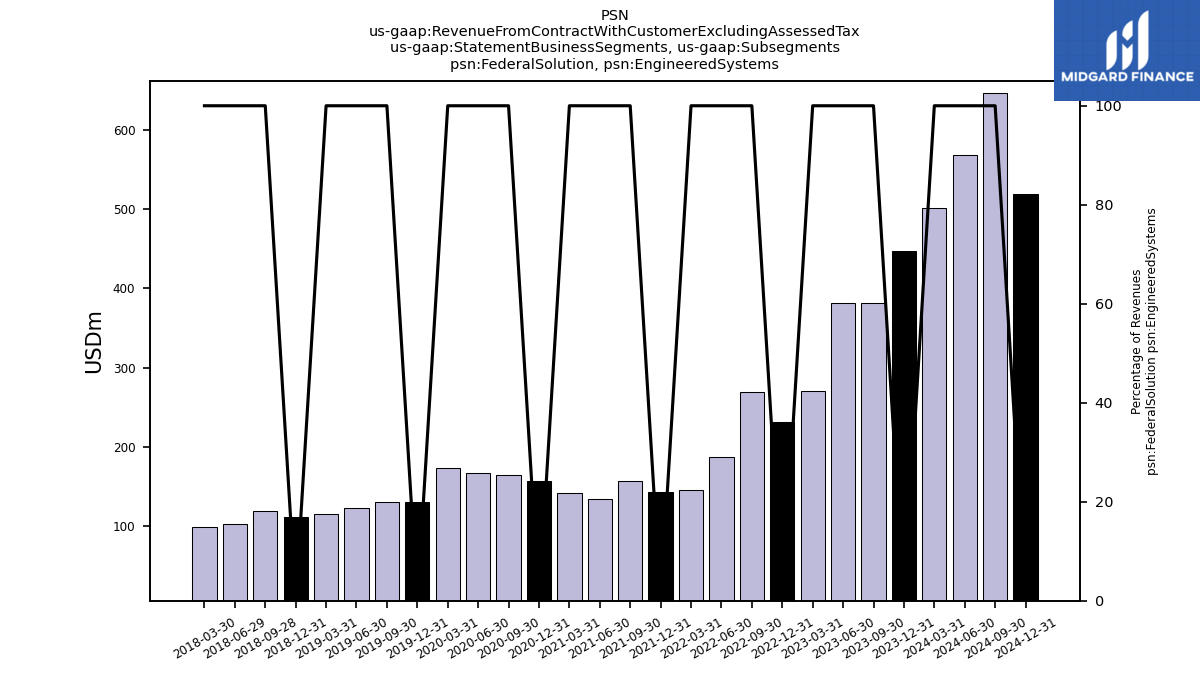
| Federal Solution, Engineered Systems | 501.22 | 447.60 | 381.48 | 381.47 | 270.19 | 231.85 | 269.00 | 187.26 | 145.40 | 142.93 | 156.14 | 134.29 | 140.97 | 156.42 | 164.87 | 166.48 | 172.83 | 130.25 | 129.99 | 122.89 | 114.67 | 111.47 | 118.79 | 102.00 | 99.28 | |
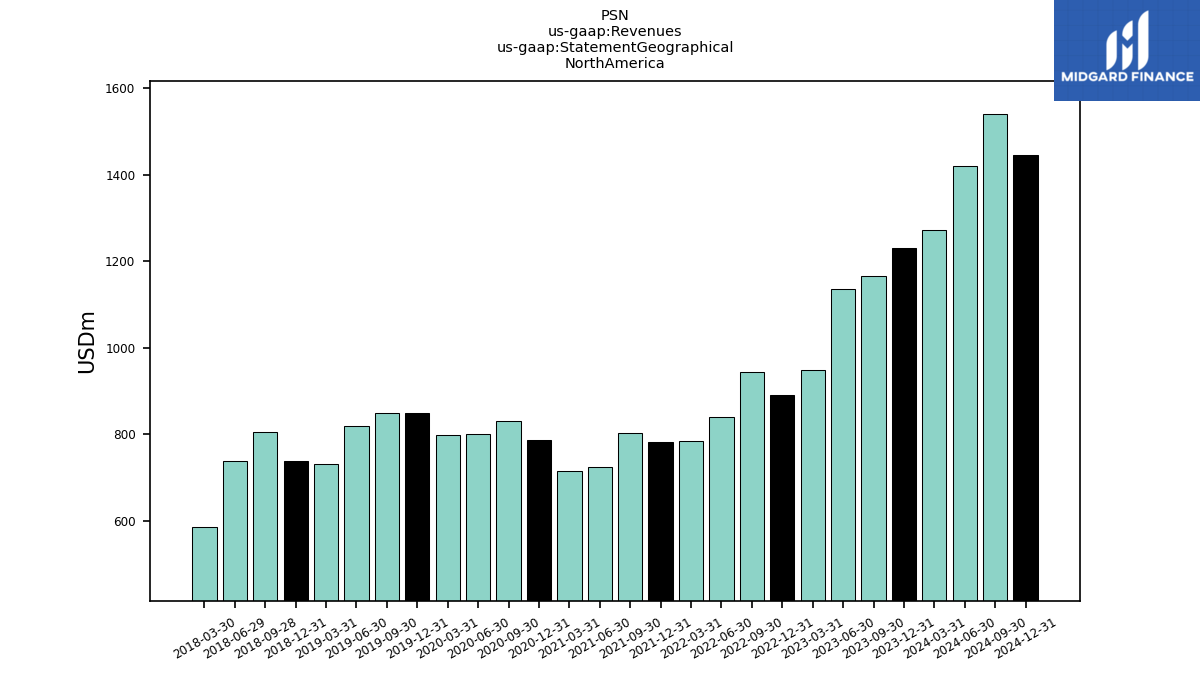
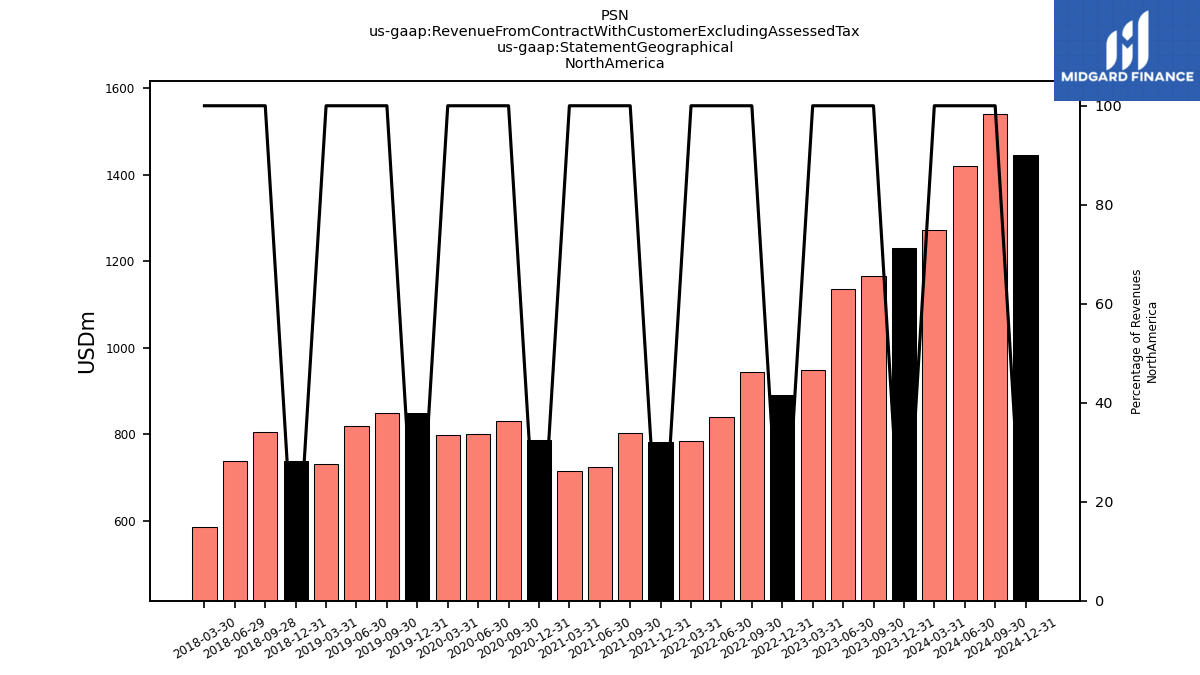
| 1272.25 | 1229.94 | 1166.55 | 1136.29 | 948.72 | 891.39 | 944.94 | 841.09 | 785.71 | 783.25 | 804.12 | 725.05 | 716.35 | 786.52 | 831.37 | 800.04 | 797.95 | 848.93 | 849.84 | 819.25 | 731.03 | 738.93 | 805.32 | 738.93 | 587.31 | ||
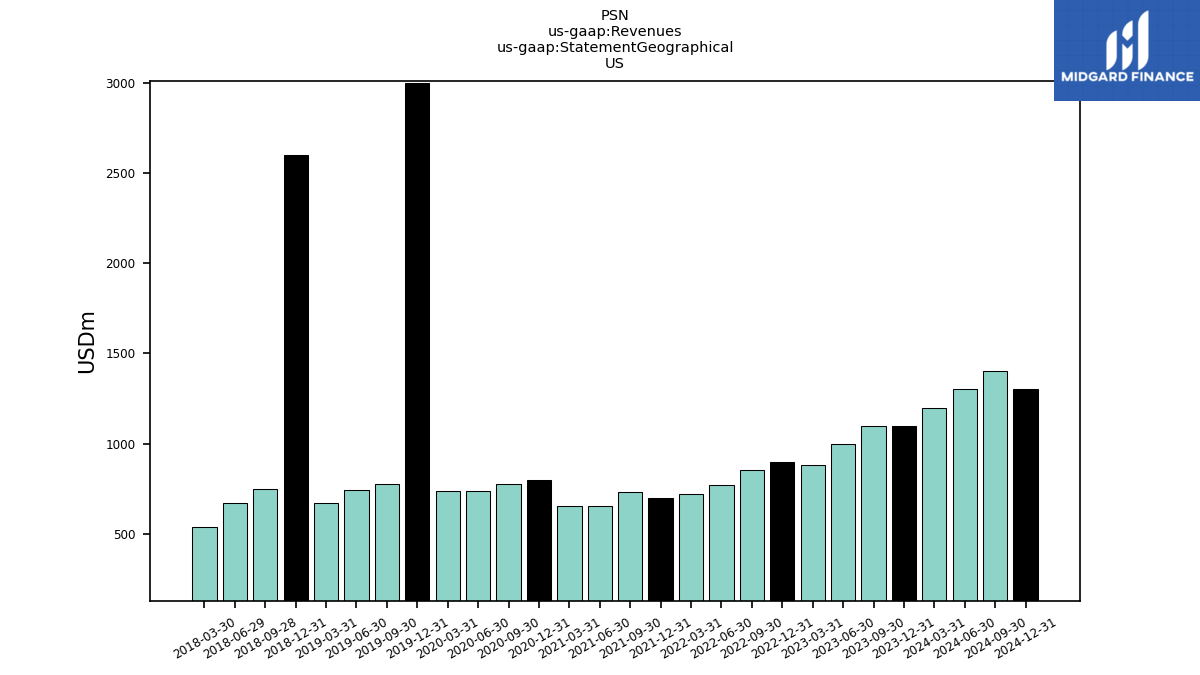
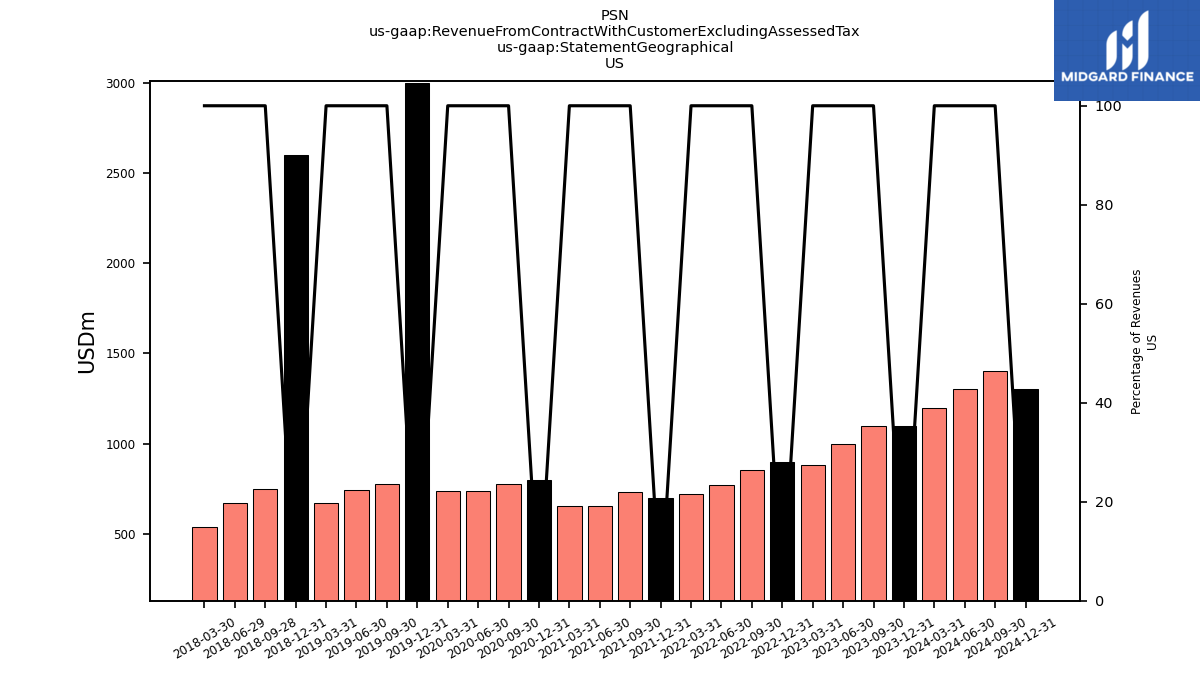
| US | 1200.00 | 1100.00 | 1100.00 | 1000.00 | 882.30 | 900.00 | 851.50 | 767.80 | 718.00 | 700.00 | 730.70 | 656.20 | 652.20 | 800.00 | 774.00 | 737.40 | 735.80 | 2997.80 | 774.20 | 744.30 | 669.20 | 2598.00 | 747.70 | 671.50 | 540.50 | |
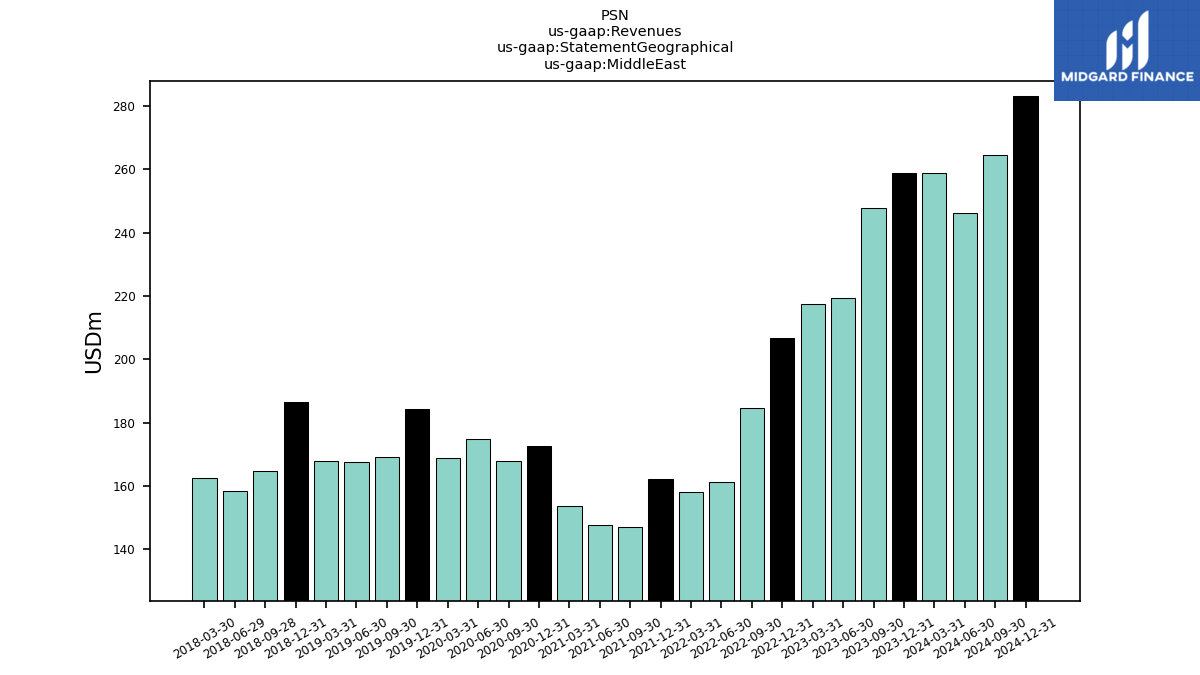
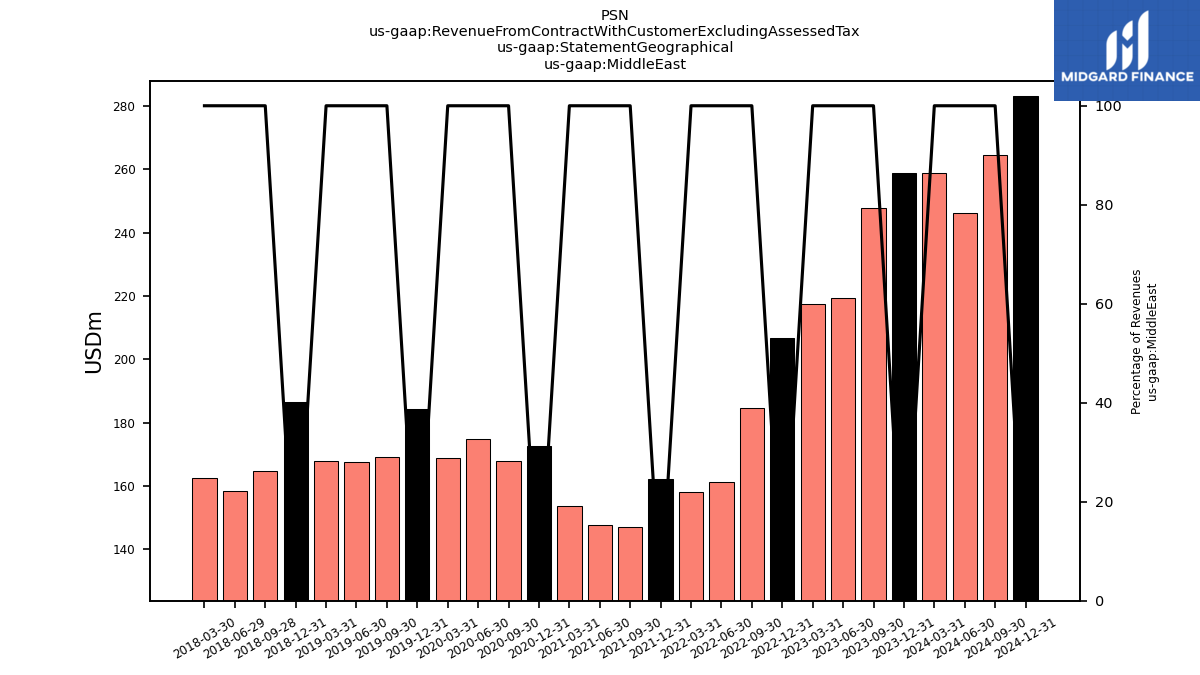
| Middle East | 258.92 | 258.83 | 247.69 | 219.25 | 217.40 | 206.75 | 184.68 | 161.34 | 158.06 | 162.13 | 147.21 | 147.68 | 153.64 | 172.76 | 168.04 | 174.69 | 168.86 | 184.46 | 169.03 | 167.62 | 167.95 | 186.55 | 164.68 | 158.29 | 162.41 | |
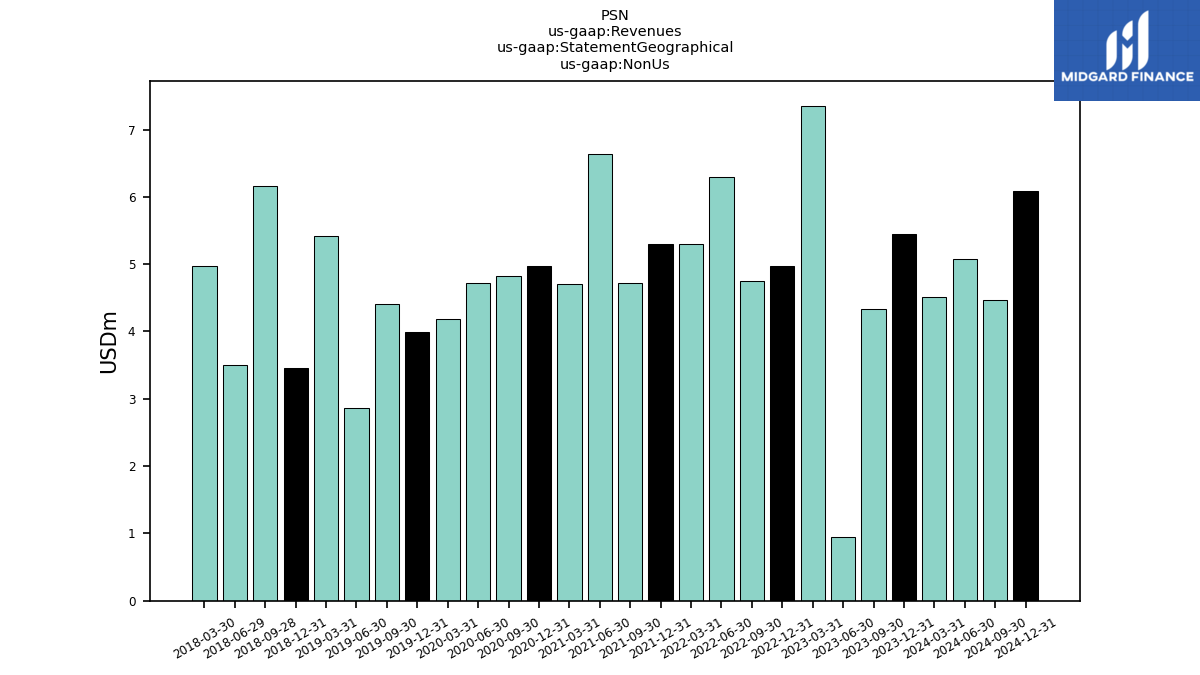
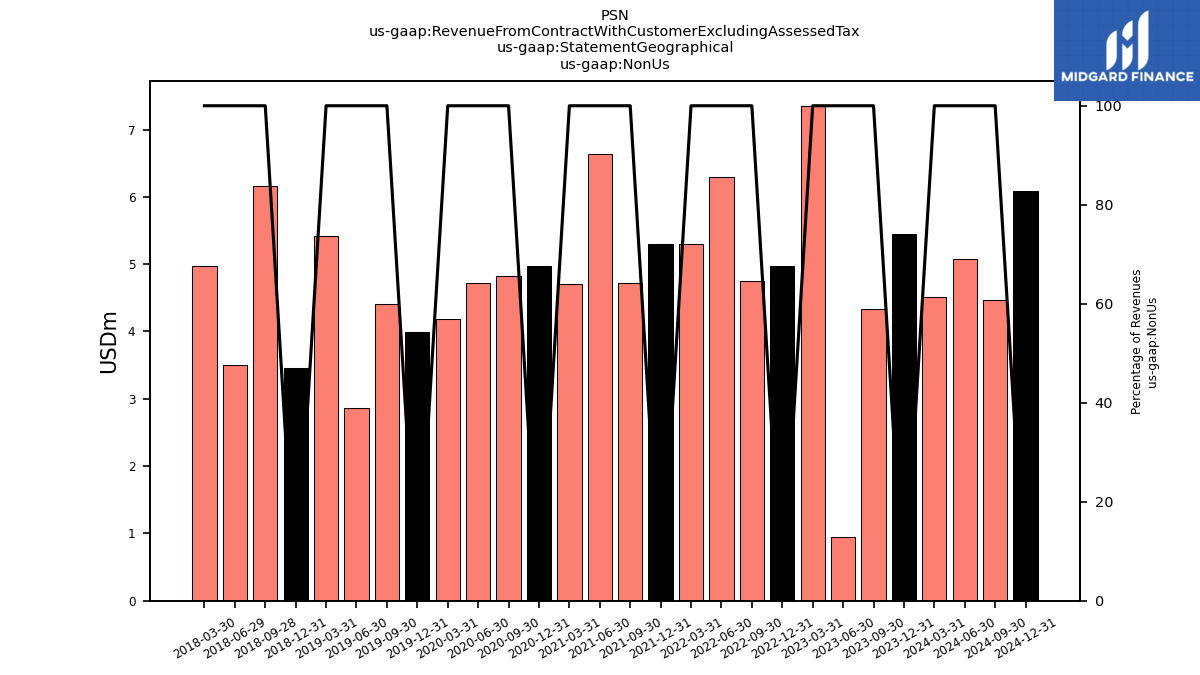
| Non Us | 4.50 | 5.45 | 4.33 | 0.94 | 7.35 | 4.97 | 4.75 | 6.29 | 5.30 | 5.29 | 4.72 | 6.63 | 4.71 | 4.98 | 4.83 | 4.73 | 4.19 | 4.00 | 4.41 | 2.86 | 5.42 | 3.46 | 6.16 | 3.50 | 4.97 | |
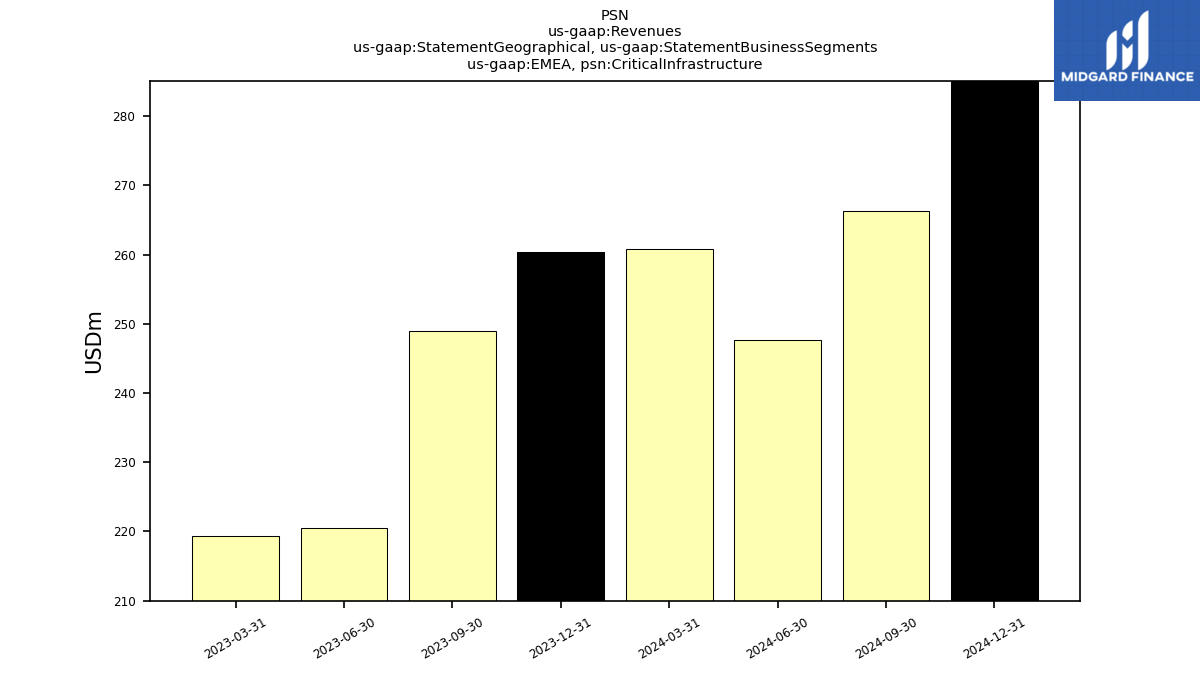
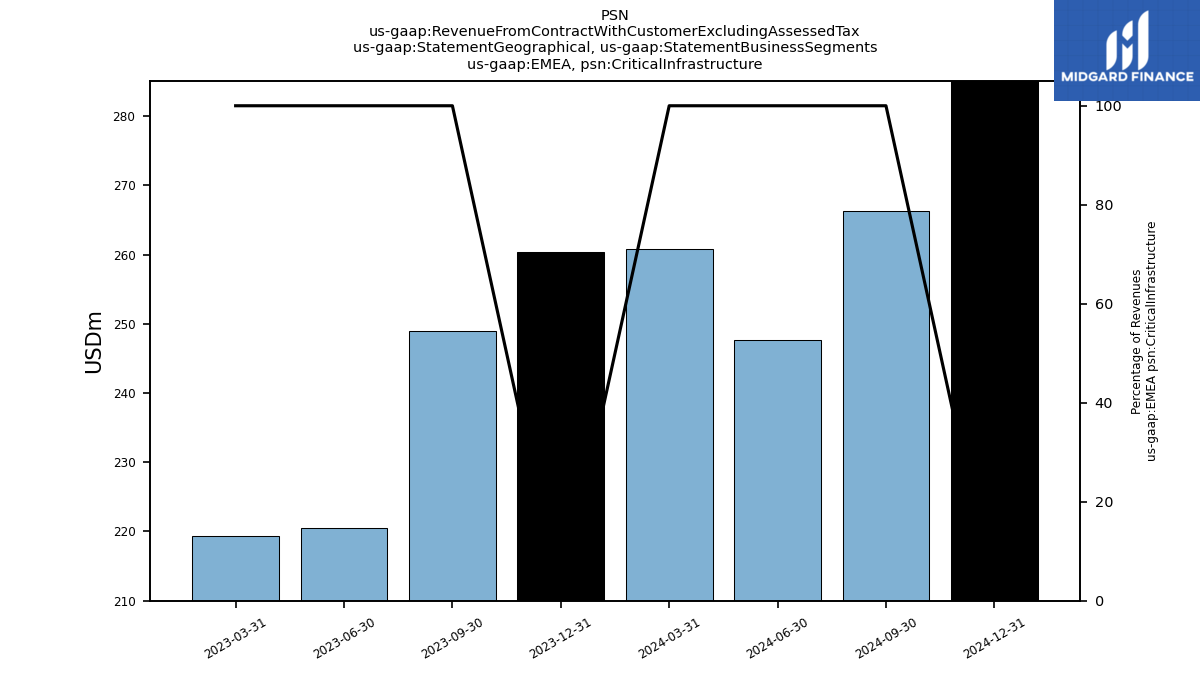
| EMEA, Critical Infrastructure | 260.79 | NA | NA | NA | 219.36 | NA | NA | NA | NA | NA | NA | NA | NA | NA | NA | NA | NA | NA | NA | NA | NA | NA | NA | NA | NA | |
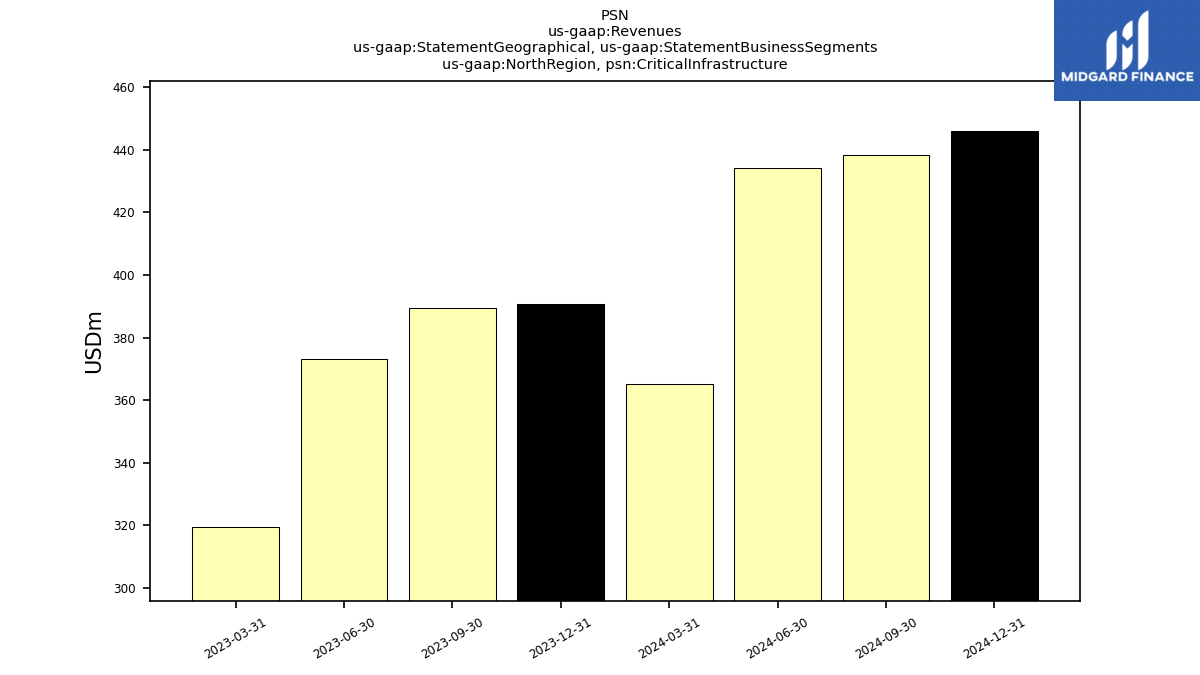
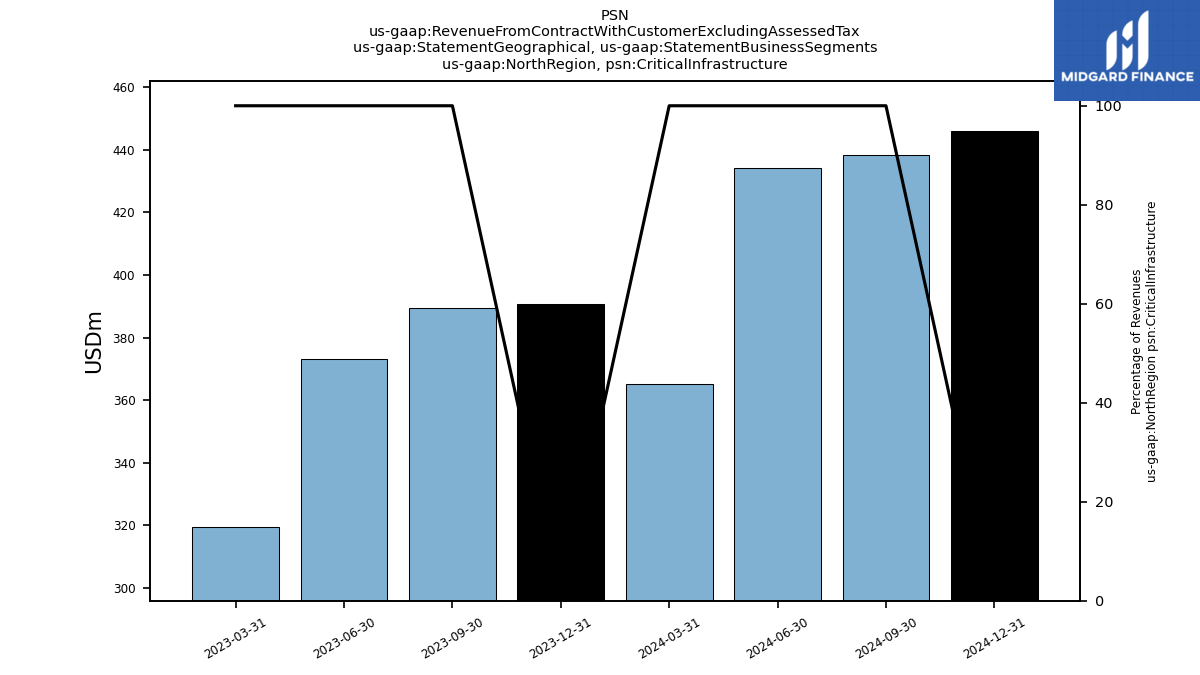
| North Region, Critical Infrastructure | 365.28 | NA | NA | NA | 319.56 | NA | NA | NA | NA | NA | NA | NA | NA | NA | NA | NA | NA | NA | NA | NA | NA | NA | NA | NA | NA | |
| Revenue From Contract With Customer Excluding Assessed Tax | 1535.68 | 1494.23 | 1418.57 | 1356.49 | 1173.47 | 1103.11 | 1134.37 | 1008.72 | 949.07 | 950.67 | 956.05 | 879.36 | 874.70 | 964.26 | 1004.24 | 979.46 | 970.99 | 1037.39 | 1023.28 | 989.74 | 904.40 | 928.94 | 976.16 | 900.73 | 754.68 | |
| Ipkeys Power Partners | 3.50 | 3.20 | 3.50 | 2.60 | NA | NA | NA | NA | NA | NA | NA | NA | NA | NA | NA | NA | NA | NA | NA | NA | NA | NA | NA | NA | NA | |
| Sealing Technologies Inc | 16.90 | 15.70 | 18.40 | NA | NA | NA | NA | NA | NA | NA | NA | NA | NA | NA | NA | NA | NA | NA | NA | NA | NA | NA | NA | NA | NA | |
| Cost Plus | 553.81 | 562.61 | 610.28 | 592.36 | 514.14 | 489.80 | 497.28 | 457.98 | 445.18 | 428.84 | 447.59 | 392.76 | 405.09 | 398.84 | 413.35 | 408.71 | 410.25 | 449.72 | 449.38 | 415.73 | 391.00 | 408.03 | 421.50 | 382.76 | 261.53 | |
| Fixed Price Contract | 631.22 | 576.79 | 452.61 | 440.09 | 341.01 | 283.65 | 334.85 | 279.41 | 240.57 | 254.86 | 246.89 | 233.23 | 229.94 | 308.63 | 324.90 | 311.37 | 308.31 | 324.29 | 288.32 | 304.65 | 257.69 | 291.71 | 300.23 | 267.59 | 265.41 | |
| Time And Materials Contract | 350.65 | 354.83 | 355.69 | 324.03 | 318.31 | 329.67 | 302.24 | 271.33 | 263.31 | 266.97 | 261.57 | 253.37 | 239.66 | 256.79 | 265.99 | 259.38 | 252.44 | 263.38 | 285.59 | 269.36 | 255.71 | 229.20 | 254.44 | 250.38 | 227.74 | |
| Unconsolidated Joint Ventures | 473.53 | 798.86 | 634.94 | 530.47 | 349.16 | 643.99 | 782.88 | 594.96 | 384.58 | 1008.04 | 728.46 | NA | NA | NA | NA | NA | NA | NA | NA | NA | NA | NA | NA | NA | NA | |
| Consolidated Joint Ventures | 202.02 | 194.05 | 185.60 | 167.25 | 161.48 | 149.92 | 130.34 | 108.09 | 95.53 | 105.39 | 101.82 | 98.25 | 96.62 | 115.02 | 117.34 | 117.89 | 100.28 | 131.77 | 117.61 | 109.00 | 115.10 | 126.80 | 126.48 | 174.95 | 112.12 | |
| Critical Infrastructure | 626.07 | 650.98 | 638.46 | 593.69 | 538.92 | 539.73 | 513.95 | 471.17 | 457.44 | 456.65 | 456.76 | 436.68 | 422.63 | 510.29 | 506.08 | 497.25 | 493.42 | 536.97 | 537.10 | 511.25 | 481.59 | 526.06 | 532.43 | 559.67 | 463.34 | |
| Federal Solution | 909.61 | 843.24 | 780.11 | 762.80 | 634.55 | 563.39 | 620.42 | 537.56 | 491.63 | 494.01 | 499.29 | 442.68 | 452.07 | 453.97 | 498.16 | 482.21 | 477.57 | 500.42 | 486.18 | 478.50 | 422.81 | 402.88 | 443.73 | 341.06 | 291.33 | |
| Federal Solution, Defense And Intelligence | 408.39 | 395.65 | 398.63 | 381.33 | 364.36 | 331.54 | 351.42 | 350.30 | 346.23 | 351.09 | 343.15 | 297.45 | 311.10 | 297.55 | 333.29 | NA | NA | NA | NA | NA | NA | NA | NA | NA | NA | |
| Federal Solution, Engineered Systems | 501.22 | 447.60 | 381.48 | 381.47 | 270.19 | 231.85 | 269.00 | 187.26 | 145.40 | 142.93 | 156.14 | 134.29 | 140.97 | 156.42 | 164.87 | 166.48 | 172.83 | 130.25 | 129.99 | 122.89 | 114.67 | 111.47 | 118.79 | 102.00 | 99.28 | |
| 1272.25 | 1229.94 | 1166.55 | 1136.29 | 948.72 | 891.39 | 944.94 | 841.09 | 785.71 | 783.25 | 804.12 | 725.05 | 716.35 | 786.52 | 831.37 | 800.04 | 797.95 | 848.93 | 849.84 | 819.25 | 731.03 | 738.93 | 805.32 | 738.93 | 587.31 | ||
| US | 1200.00 | 1100.00 | 1100.00 | 1000.00 | 882.30 | 900.00 | 851.50 | 767.80 | 718.00 | 700.00 | 730.70 | 656.20 | 652.20 | 800.00 | 774.00 | 737.40 | 735.80 | 2997.80 | 774.20 | 744.30 | 669.20 | 2598.00 | 747.70 | 671.50 | 540.50 | |
| Middle East | 258.92 | 258.83 | 247.69 | 219.25 | 217.40 | 206.75 | 184.68 | 161.34 | 158.06 | 162.13 | 147.21 | 147.68 | 153.64 | 172.76 | 168.04 | 174.69 | 168.86 | 184.46 | 169.03 | 167.62 | 167.95 | 186.55 | 164.68 | 158.29 | 162.41 | |
| Non Us | 4.50 | 5.45 | 4.33 | 0.94 | 7.35 | 4.97 | 4.75 | 6.29 | 5.30 | 5.29 | 4.72 | 6.63 | 4.71 | 4.98 | 4.83 | 4.73 | 4.19 | 4.00 | 4.41 | 2.86 | 5.42 | 3.46 | 6.16 | 3.50 | 4.97 | |
| EMEA, Critical Infrastructure | 260.79 | NA | NA | NA | 219.36 | NA | NA | NA | NA | NA | NA | NA | NA | NA | NA | NA | NA | NA | NA | NA | NA | NA | NA | NA | NA | |
| North Region, Critical Infrastructure | 365.28 | NA | NA | NA | 319.56 | NA | NA | NA | NA | NA | NA | NA | NA | NA | NA | NA | NA | NA | NA | NA | NA | NA | NA | NA | NA |