
| 2022-12-31 | 2022-09-30 | 2022-06-30 | 2022-03-31 | 2021-12-31 | 2021-09-30 | 2021-06-30 | 2021-03-31 | 2020-12-31 | 2020-09-30 | 2019-12-31 | 2019-09-30 | 2019-03-31 | 2018-12-31 | 2018-09-30 | 2018-06-30 | 2018-03-31 | 2017-12-31 | 2017-09-30 | 2016-09-30 | ||
|---|---|---|---|---|---|---|---|---|---|---|---|---|---|---|---|---|---|---|---|---|---|
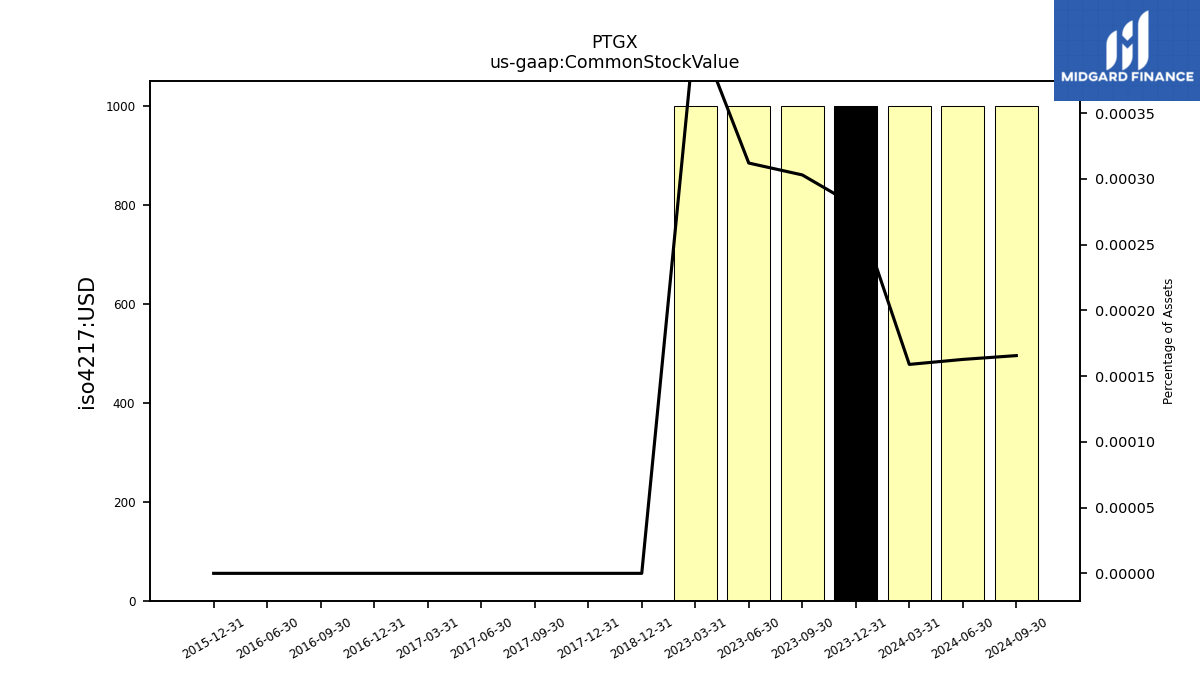
| Common Stock Value | NA | NA | NA | NA | NA | NA | NA | NA | NA | NA | NA | NA | NA | 0.00 | NA | NA | NA | 0.00 | 0.00 | 0.00 | |
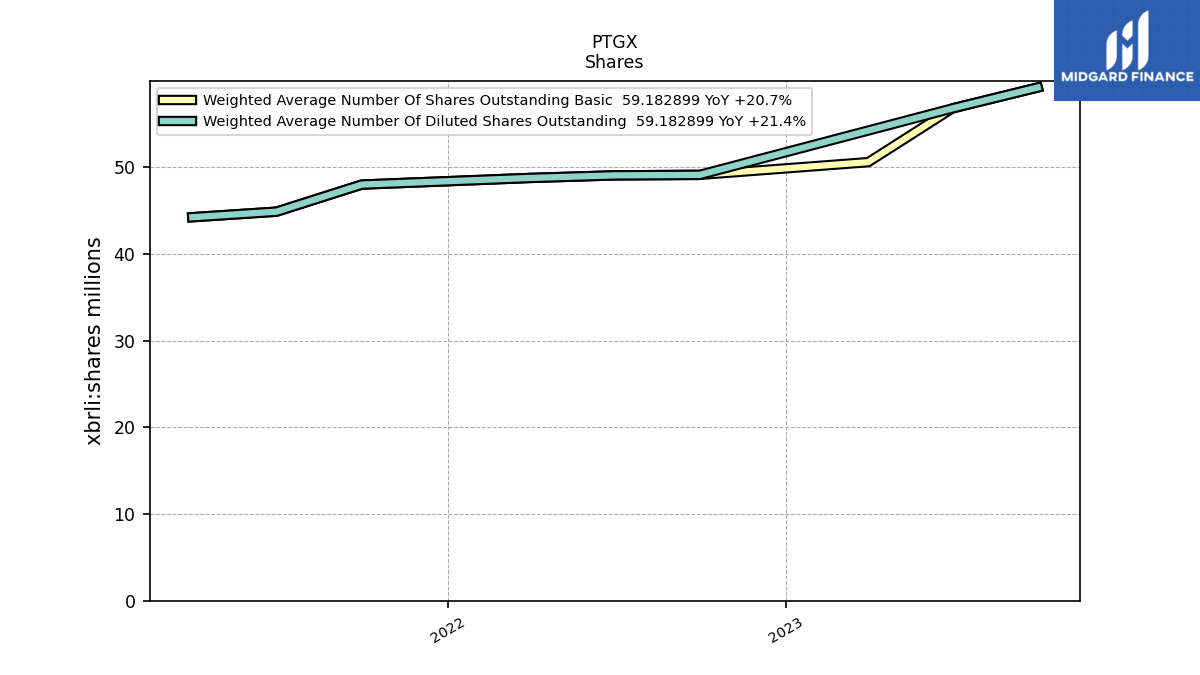
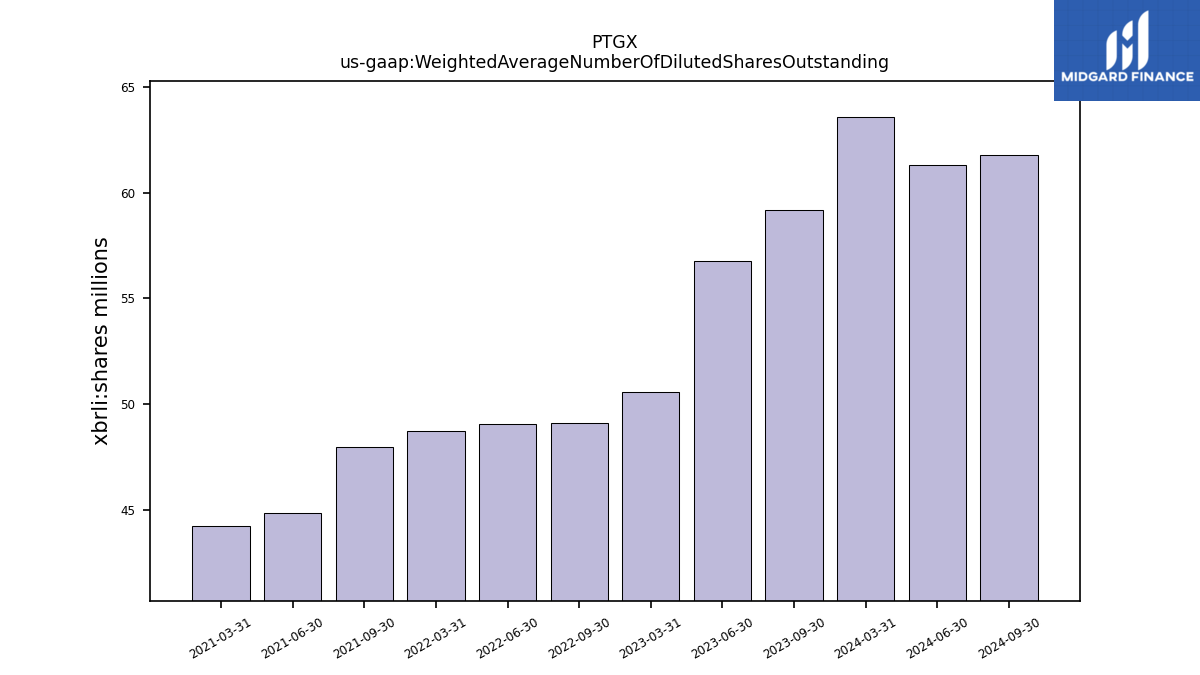
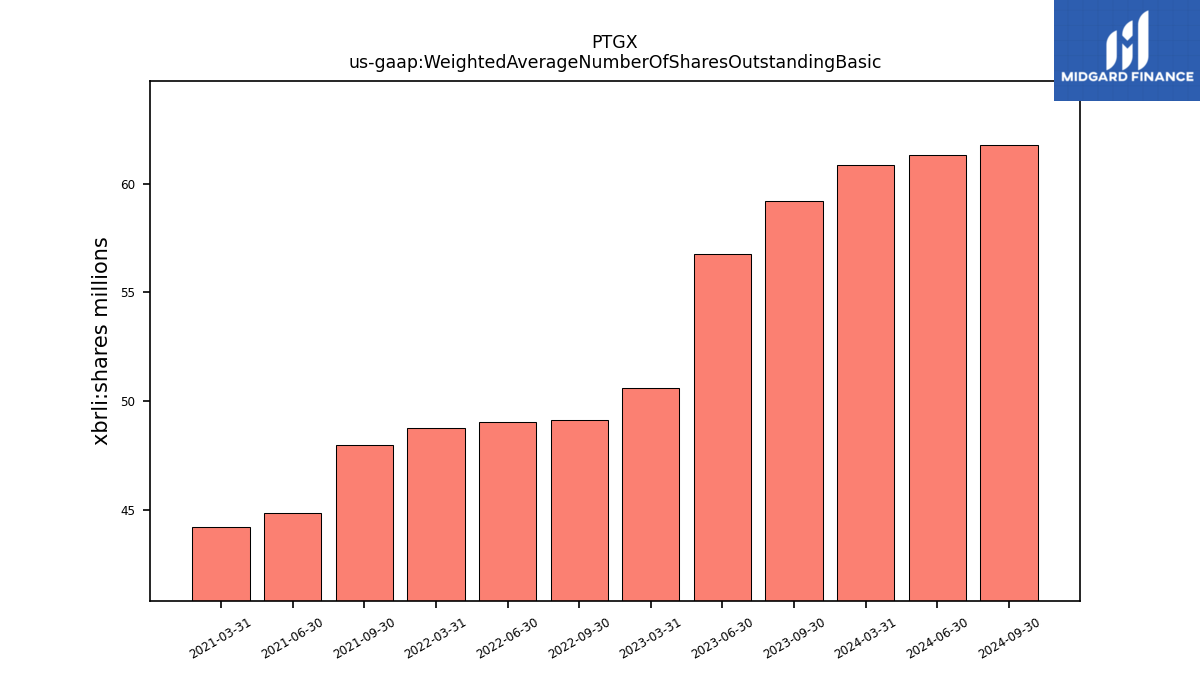
| Weighted Average Number Of Diluted Shares Outstanding | NA | 49.11 | 49.05 | 48.75 | NA | 47.99 | 44.86 | 44.22 | NA | NA | NA | NA | NA | NA | NA | NA | NA | NA | NA | NA | |
| Weighted Average Number Of Shares Outstanding Basic | NA | 49.11 | 49.05 | 48.75 | NA | 47.99 | 44.86 | 44.22 | NA | NA | NA | NA | NA | NA | NA | NA | NA | NA | NA | NA | |
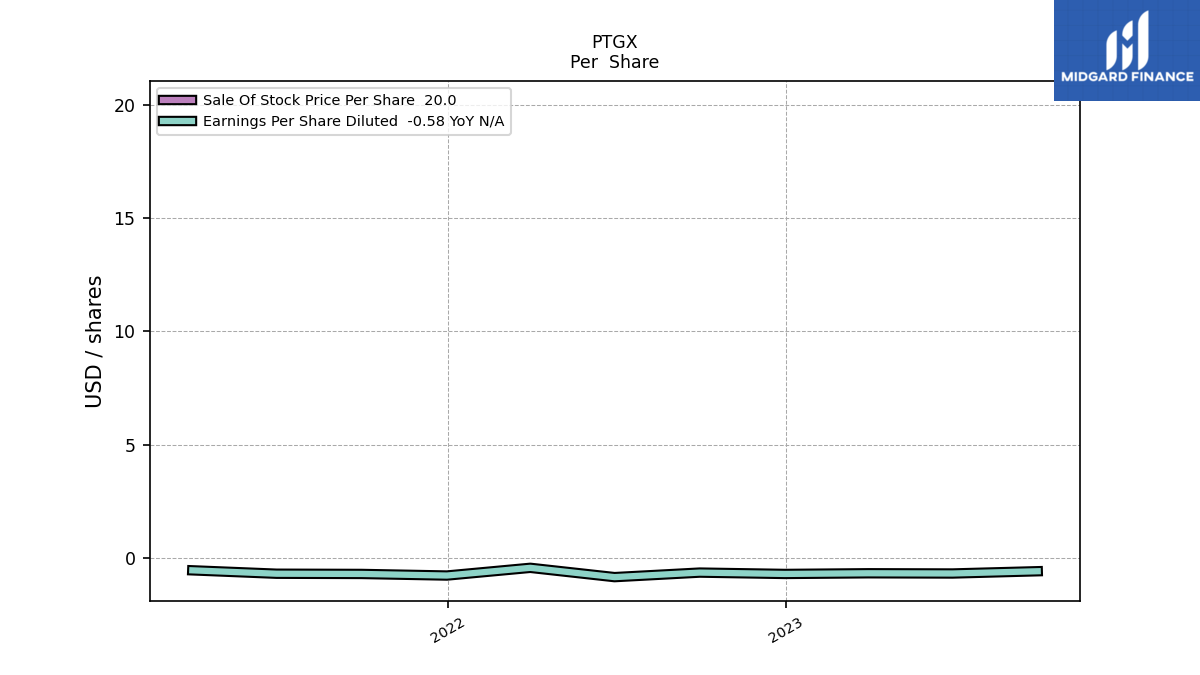
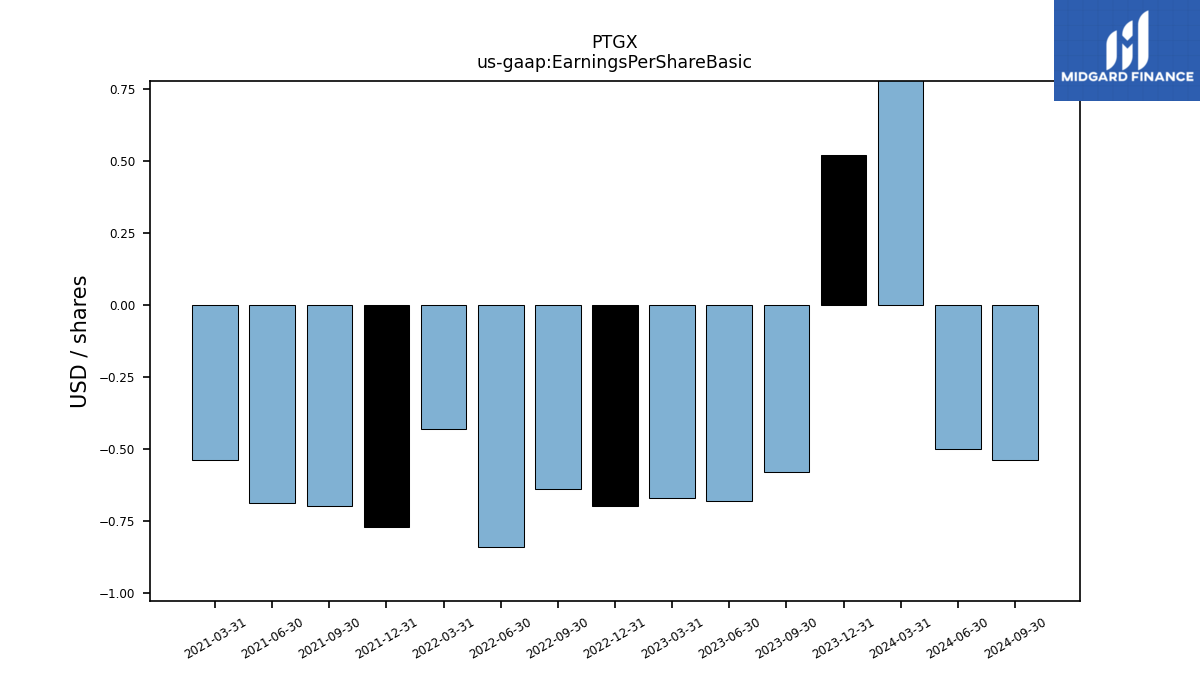
| Earnings Per Share Basic | -0.70 | -0.64 | -0.84 | -0.43 | -0.77 | -0.70 | -0.69 | -0.54 | NA | NA | NA | NA | NA | NA | NA | NA | NA | NA | NA | NA | |
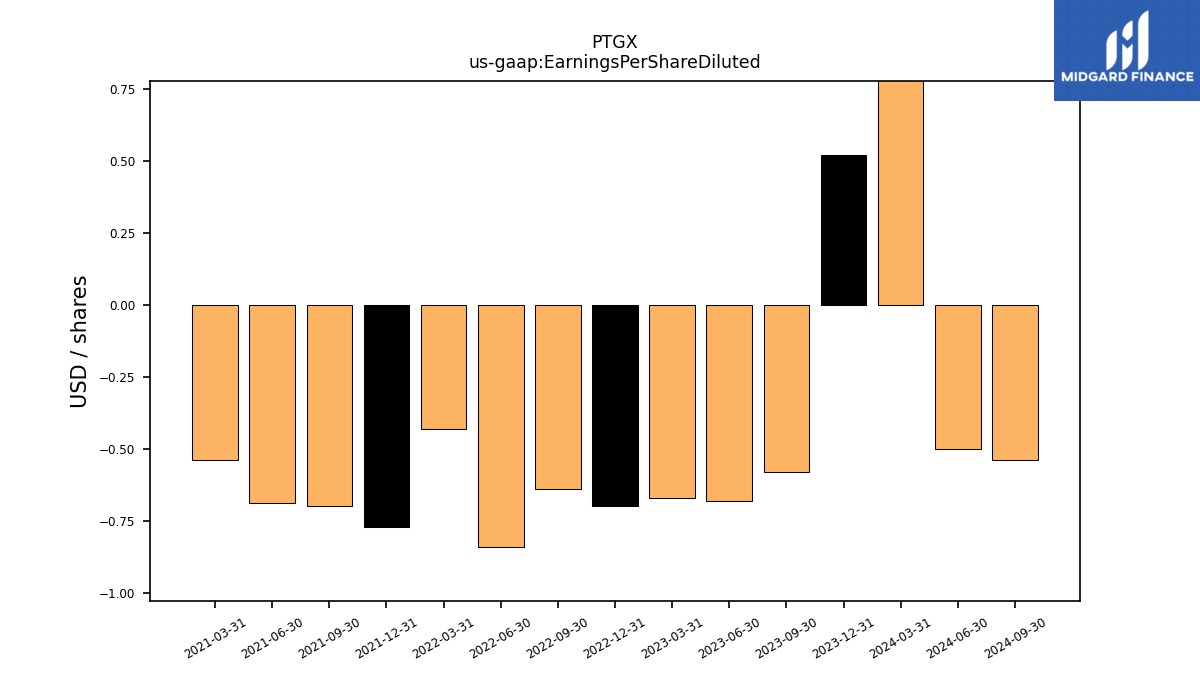
| Earnings Per Share Diluted | -0.70 | -0.64 | -0.84 | -0.43 | -0.77 | -0.70 | -0.69 | -0.54 | NA | NA | NA | NA | NA | NA | NA | NA | NA | NA | NA | NA | |
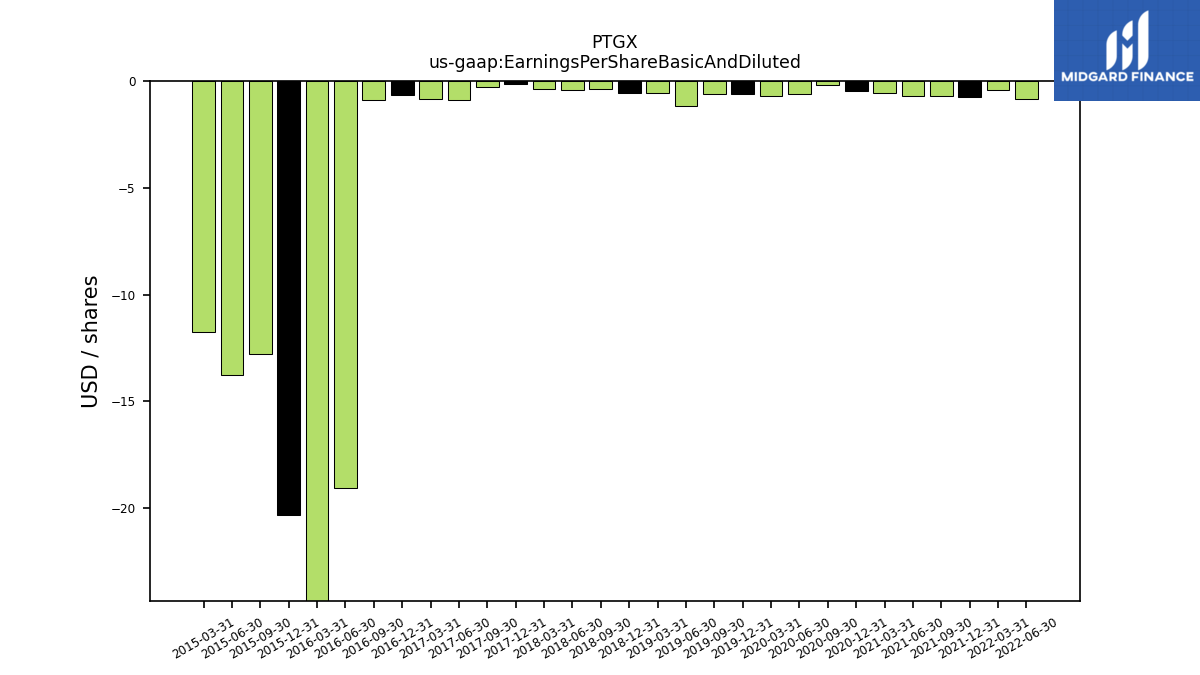
| Earnings Per Share Basic And Diluted | NA | NA | -0.84 | -0.43 | -0.77 | -0.70 | -0.69 | -0.54 | -0.47 | -0.21 | -0.63 | -0.61 | -0.58 | -0.57 | -0.38 | -0.41 | -0.36 | -0.15 | -0.29 | -0.87 |
| 2022-12-31 | 2022-09-30 | 2022-06-30 | 2022-03-31 | 2021-12-31 | 2021-09-30 | 2021-06-30 | 2021-03-31 | 2020-12-31 | 2020-09-30 | 2019-12-31 | 2019-09-30 | 2019-03-31 | 2018-12-31 | 2018-09-30 | 2018-06-30 | 2018-03-31 | 2017-12-31 | 2017-09-30 | 2016-09-30 | ||
|---|---|---|---|---|---|---|---|---|---|---|---|---|---|---|---|---|---|---|---|---|---|
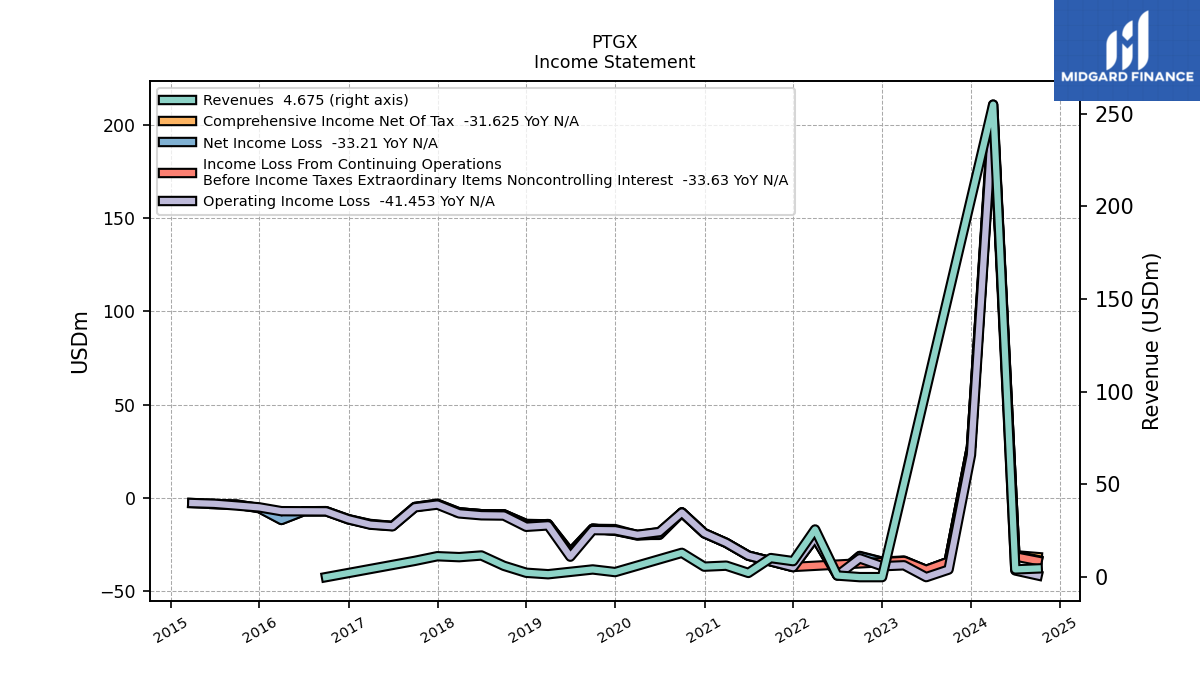
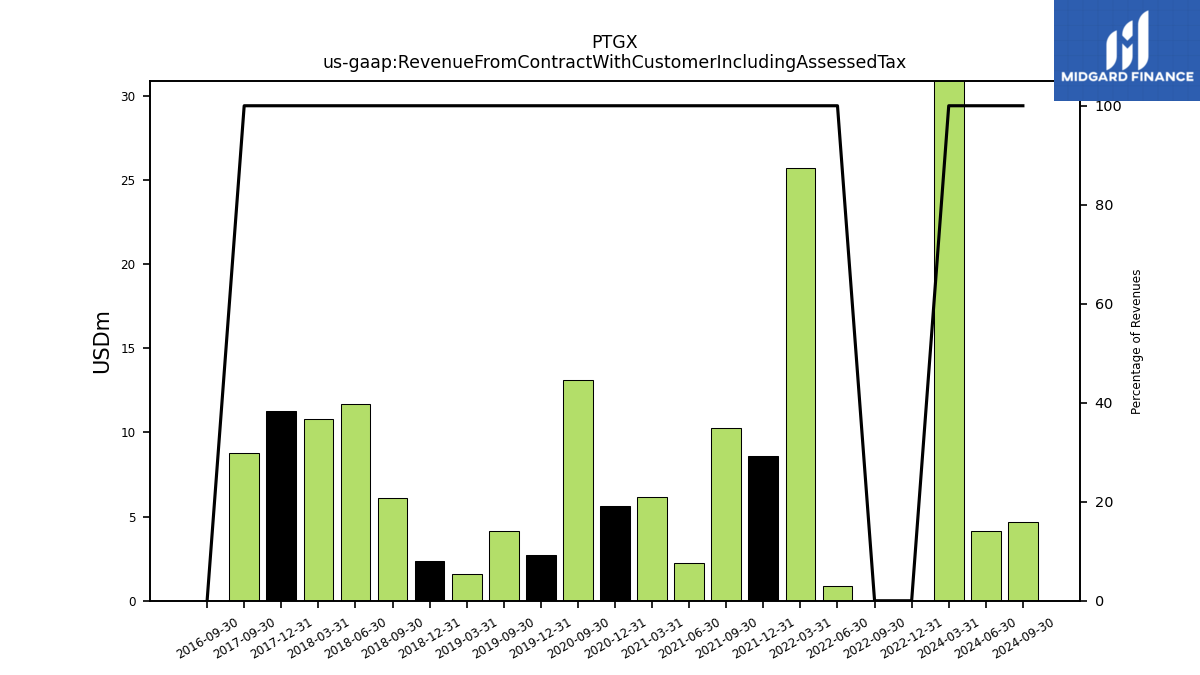
| Revenue From Contract With Customer Including Assessed Tax | 0.00 | 0.00 | 0.86 | 25.72 | 8.62 | 10.29 | 2.27 | 6.19 | 5.65 | 13.11 | 2.72 | 4.14 | 1.56 | 2.35 | 6.12 | 11.67 | 10.78 | 11.28 | 8.78 | 0.00 | |
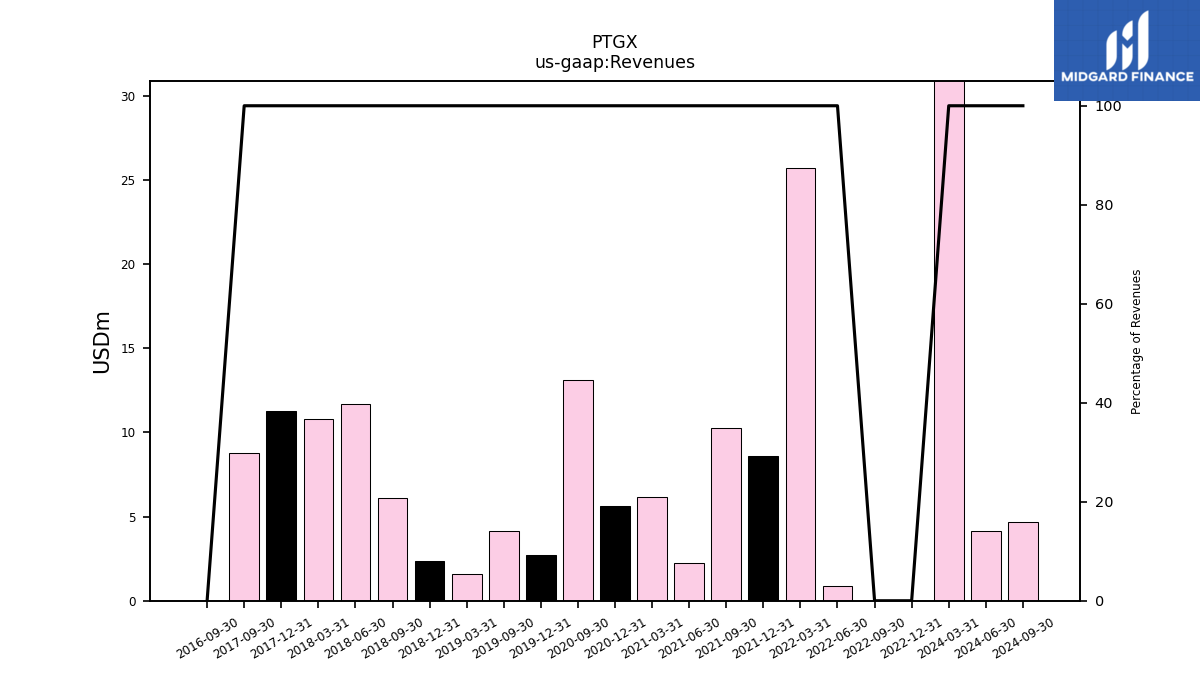
| Revenues | 0.00 | 0.00 | 0.86 | 25.72 | 8.62 | 10.29 | 2.27 | 6.19 | 5.65 | 13.11 | 2.72 | 4.14 | 1.56 | 2.35 | 6.12 | 11.67 | 10.78 | 11.28 | 8.78 | 0.00 | |
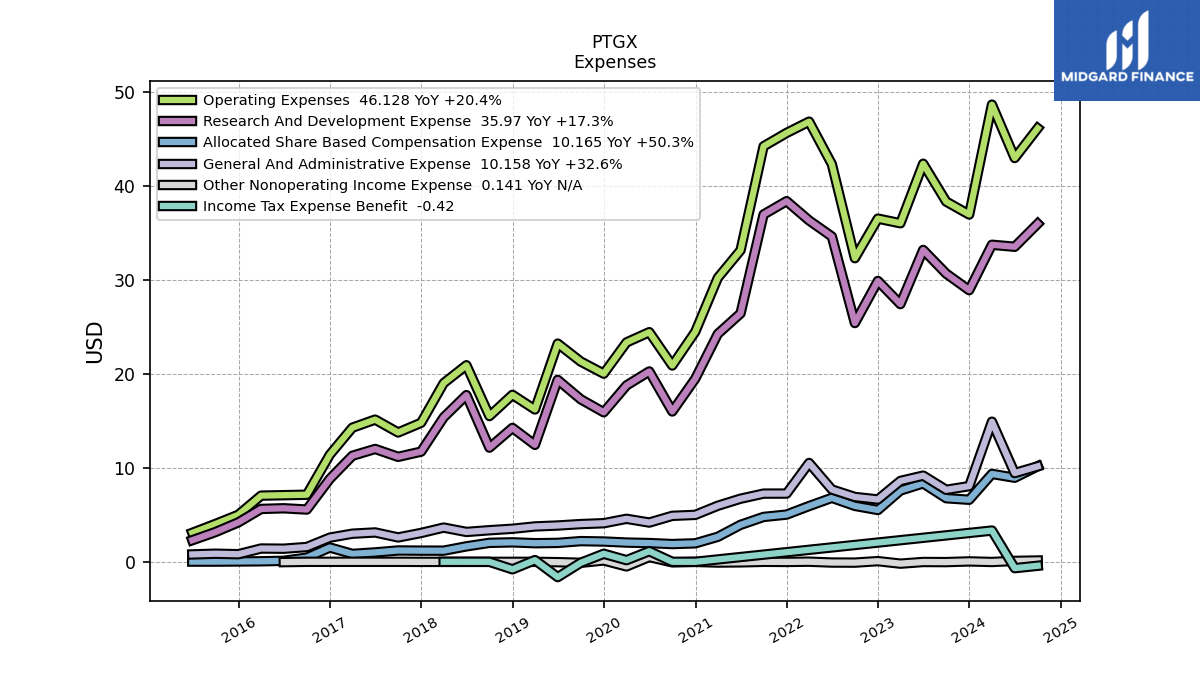
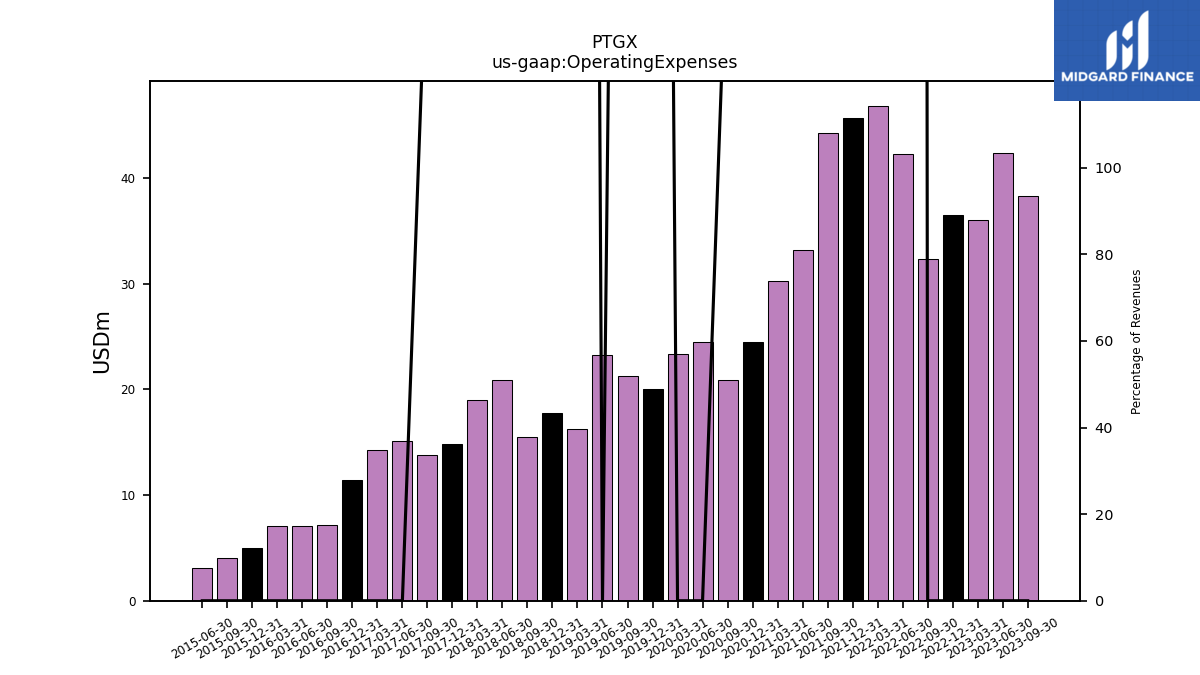
| Operating Expenses | 36.52 | 32.30 | 42.30 | 46.83 | 45.63 | 44.21 | 33.15 | 30.21 | 24.48 | 20.89 | 20.02 | 21.31 | 16.21 | 17.77 | 15.51 | 20.91 | 19.01 | 14.79 | 13.76 | 7.14 | |
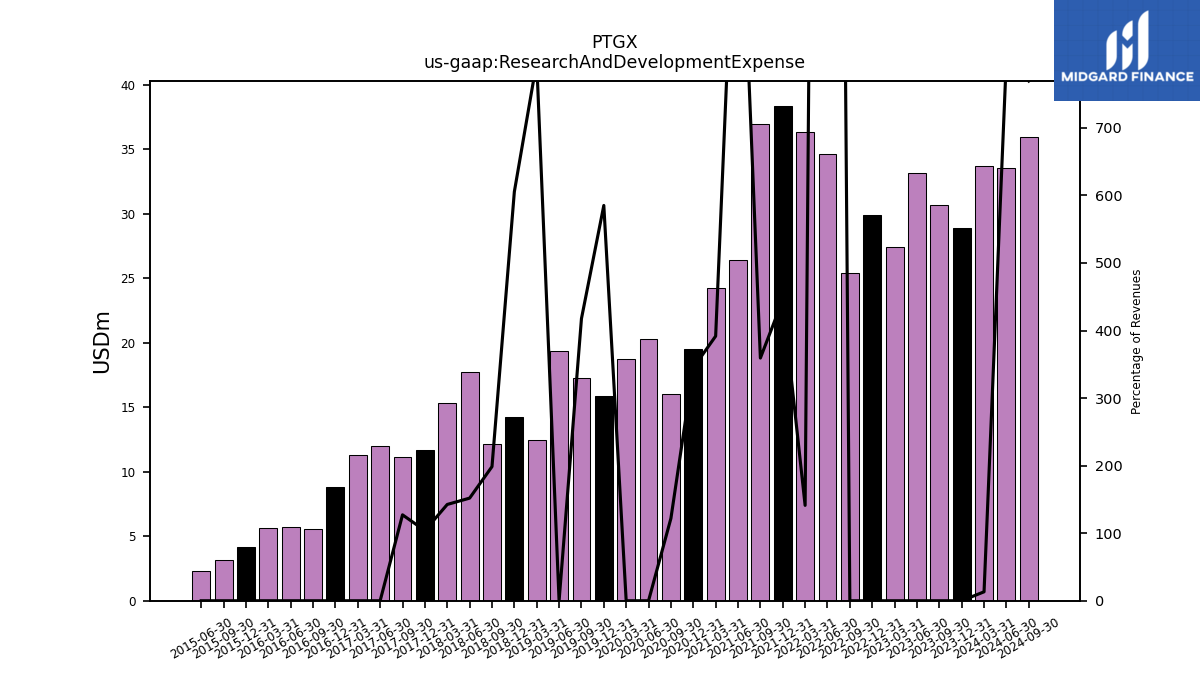
| Research And Development Expense | 29.88 | 25.40 | 34.61 | 36.32 | 38.37 | 36.96 | 26.43 | 24.25 | 19.49 | 15.99 | 15.91 | 17.29 | 12.44 | 14.25 | 12.14 | 17.73 | 15.37 | 11.72 | 11.17 | 5.56 | |
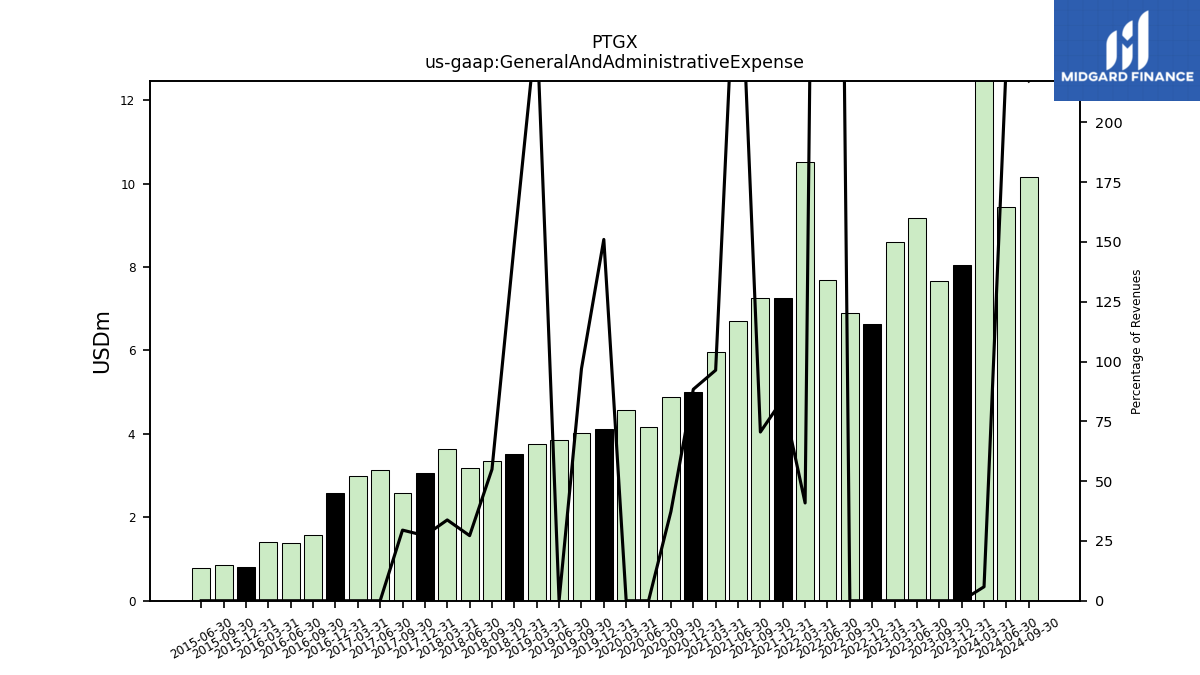
| General And Administrative Expense | 6.63 | 6.90 | 7.69 | 10.52 | 7.26 | 7.26 | 6.71 | 5.96 | 4.99 | 4.89 | 4.11 | 4.01 | 3.76 | 3.52 | 3.36 | 3.18 | 3.64 | 3.07 | 2.59 | 1.58 | |
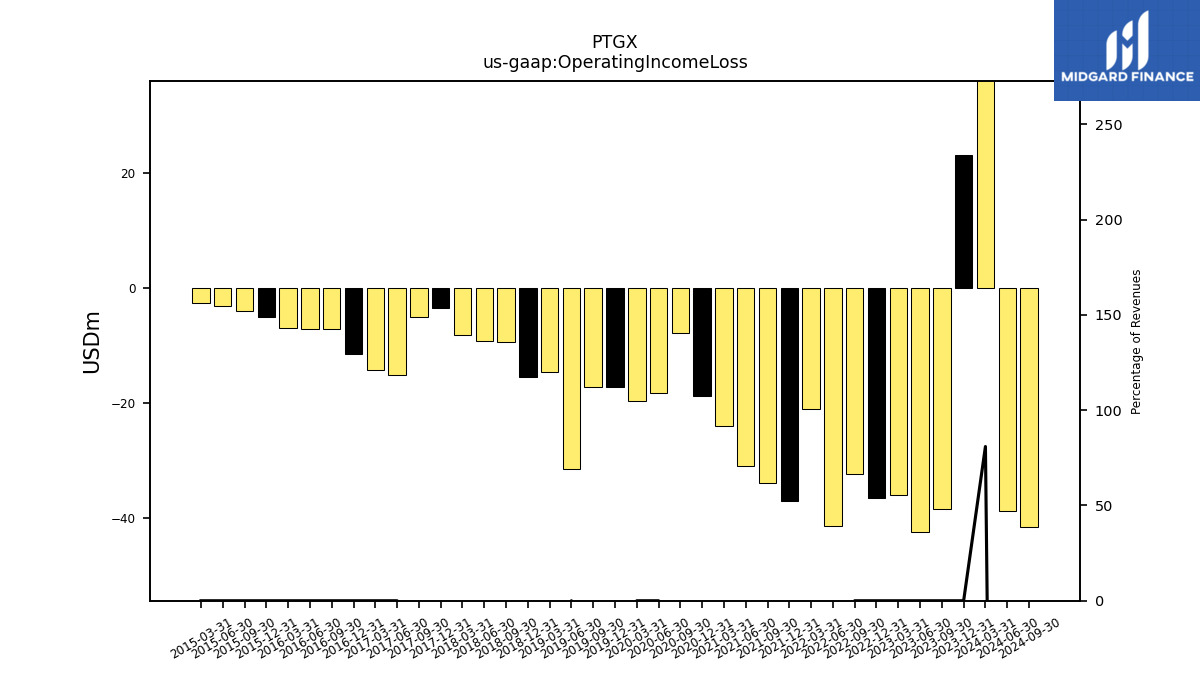
| Operating Income Loss | -36.52 | -32.30 | -41.44 | -21.11 | -37.02 | -33.93 | -30.88 | -24.02 | -18.83 | -7.77 | -17.30 | -17.17 | -14.65 | -15.41 | -9.39 | -9.24 | -8.23 | -3.51 | -4.98 | -7.14 | |
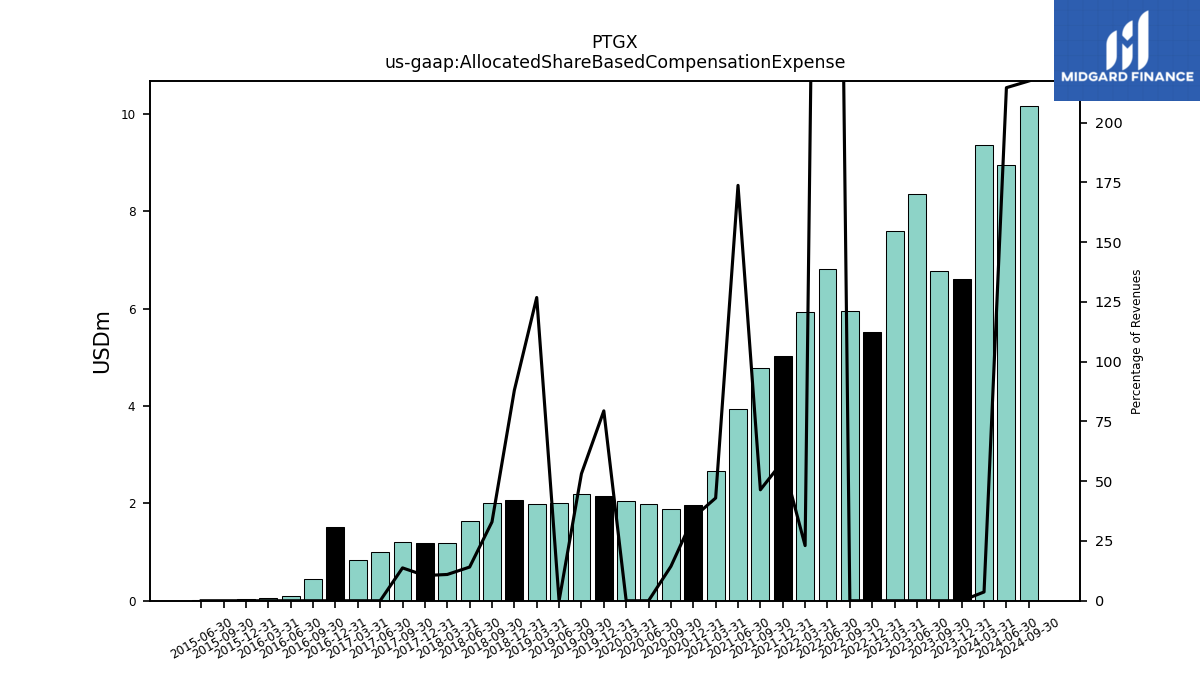
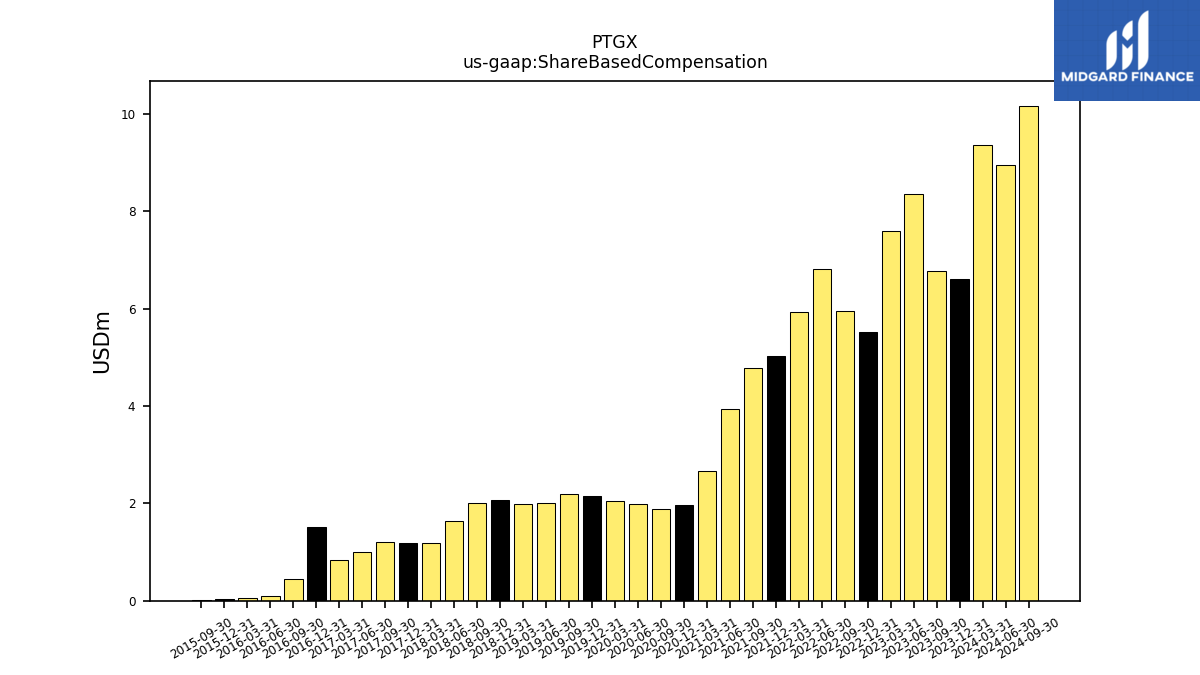
| Allocated Share Based Compensation Expense | 5.51 | 5.95 | 6.80 | 5.93 | 5.02 | 4.78 | 3.94 | 2.66 | 1.97 | 1.89 | 2.16 | 2.20 | 1.98 | 2.07 | 2.02 | 1.65 | 1.19 | 1.19 | 1.21 | 0.45 | |
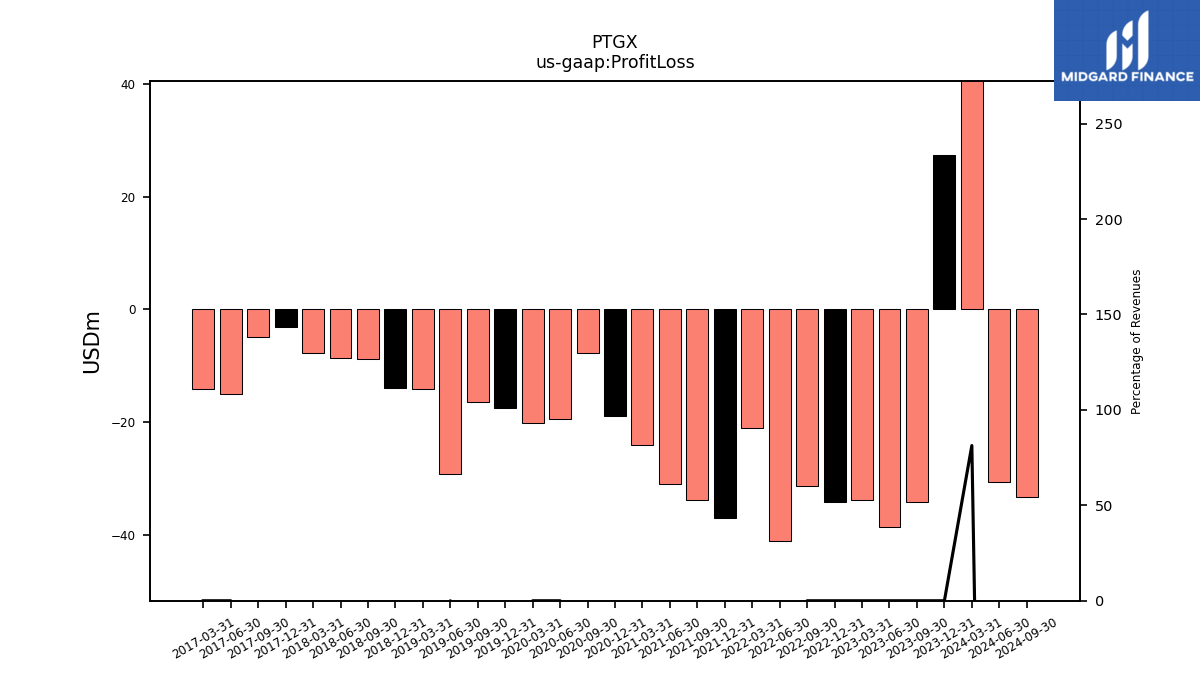
| Profit Loss | -34.19 | -31.23 | -41.04 | -20.93 | -36.91 | -33.80 | -30.84 | -24.00 | -18.89 | -7.76 | -17.50 | -16.41 | -14.10 | -13.87 | -8.73 | -8.66 | -7.66 | -3.05 | -4.83 | NA | |
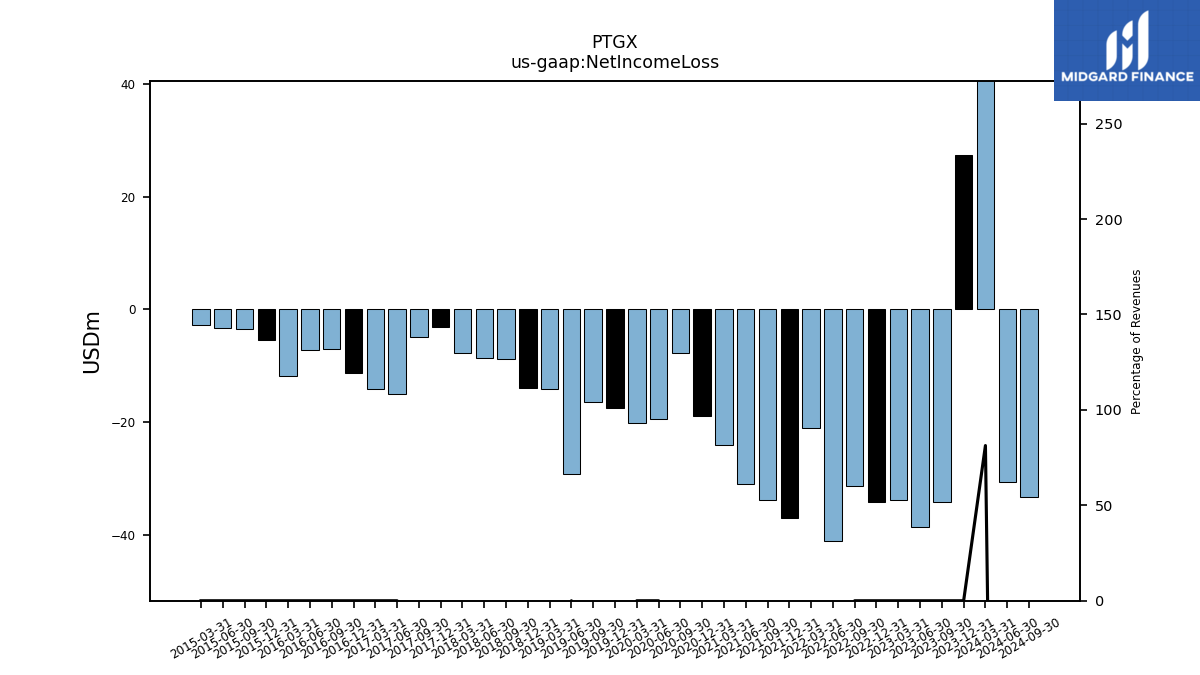
| Net Income Loss | -34.19 | -31.23 | -41.04 | -20.93 | -36.91 | -33.80 | -30.84 | -24.00 | -18.89 | -7.76 | -17.50 | -16.41 | -14.10 | -13.87 | -8.73 | -8.66 | -7.66 | -3.05 | -4.83 | -7.08 | |
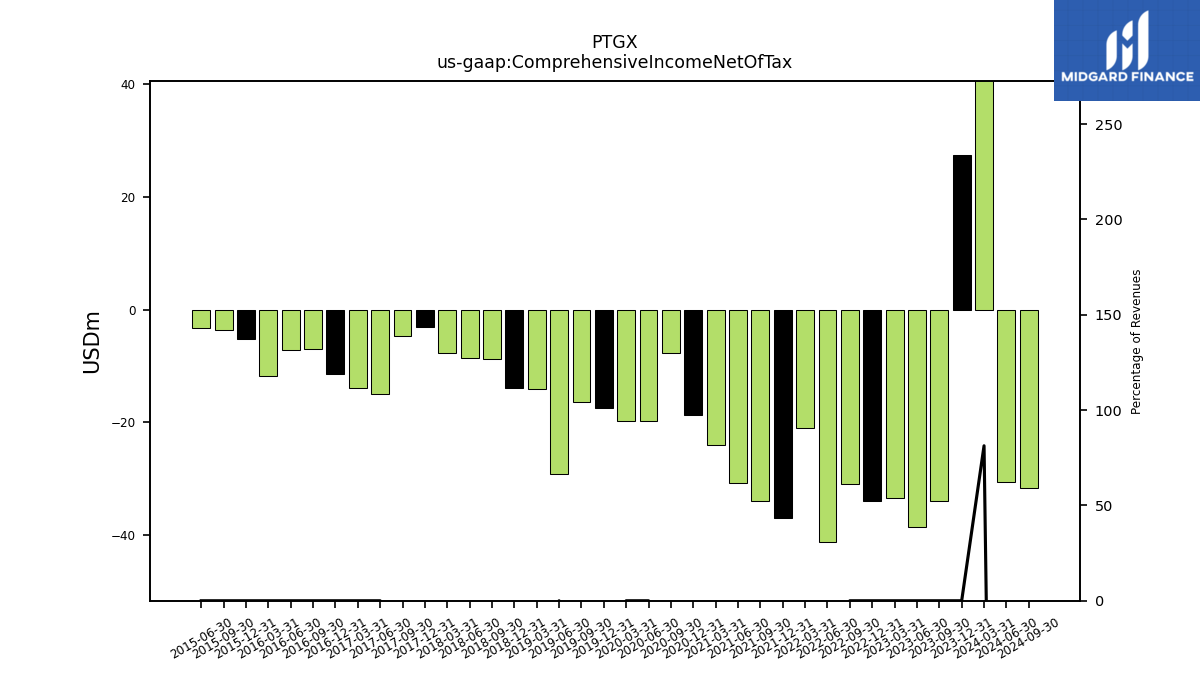
| Comprehensive Income Net Of Tax | -34.07 | -30.99 | -41.28 | -21.10 | -37.00 | -33.95 | -30.87 | -24.06 | -18.77 | -7.64 | -17.57 | -16.40 | -14.06 | -13.99 | -8.75 | -8.68 | -7.73 | -3.16 | -4.73 | -7.01 |
| 2022-12-31 | 2022-09-30 | 2022-06-30 | 2022-03-31 | 2021-12-31 | 2021-09-30 | 2021-06-30 | 2021-03-31 | 2020-12-31 | 2020-09-30 | 2019-12-31 | 2019-09-30 | 2019-03-31 | 2018-12-31 | 2018-09-30 | 2018-06-30 | 2018-03-31 | 2017-12-31 | 2017-09-30 | 2016-09-30 | ||
|---|---|---|---|---|---|---|---|---|---|---|---|---|---|---|---|---|---|---|---|---|---|
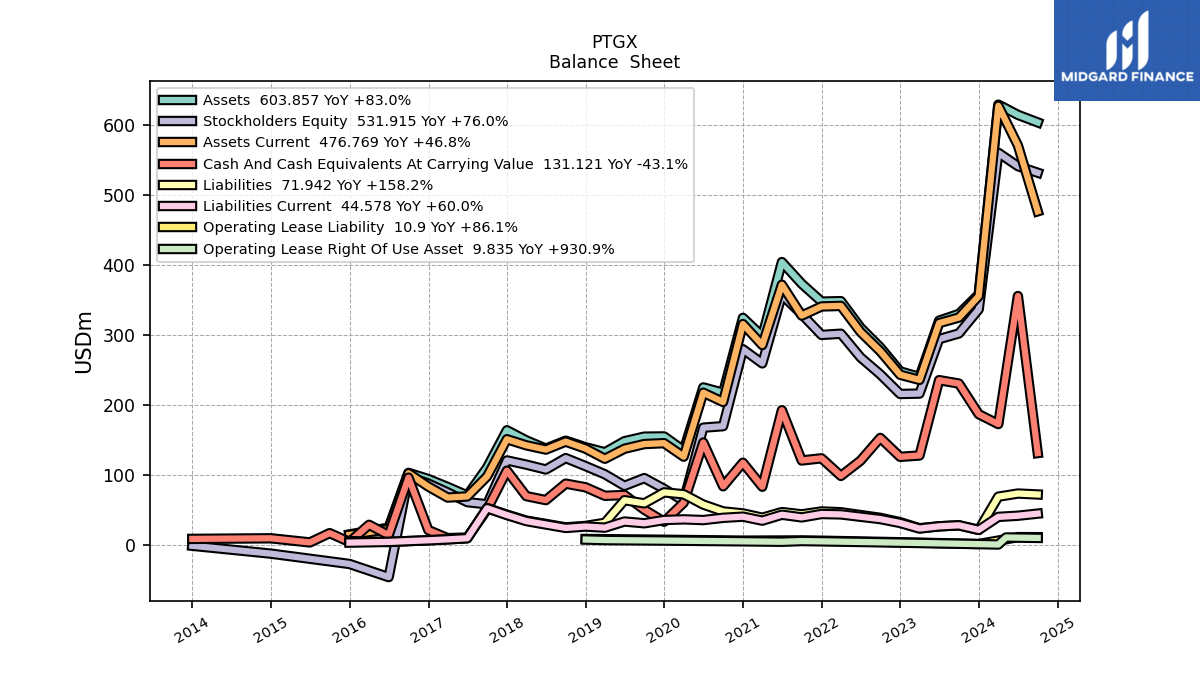
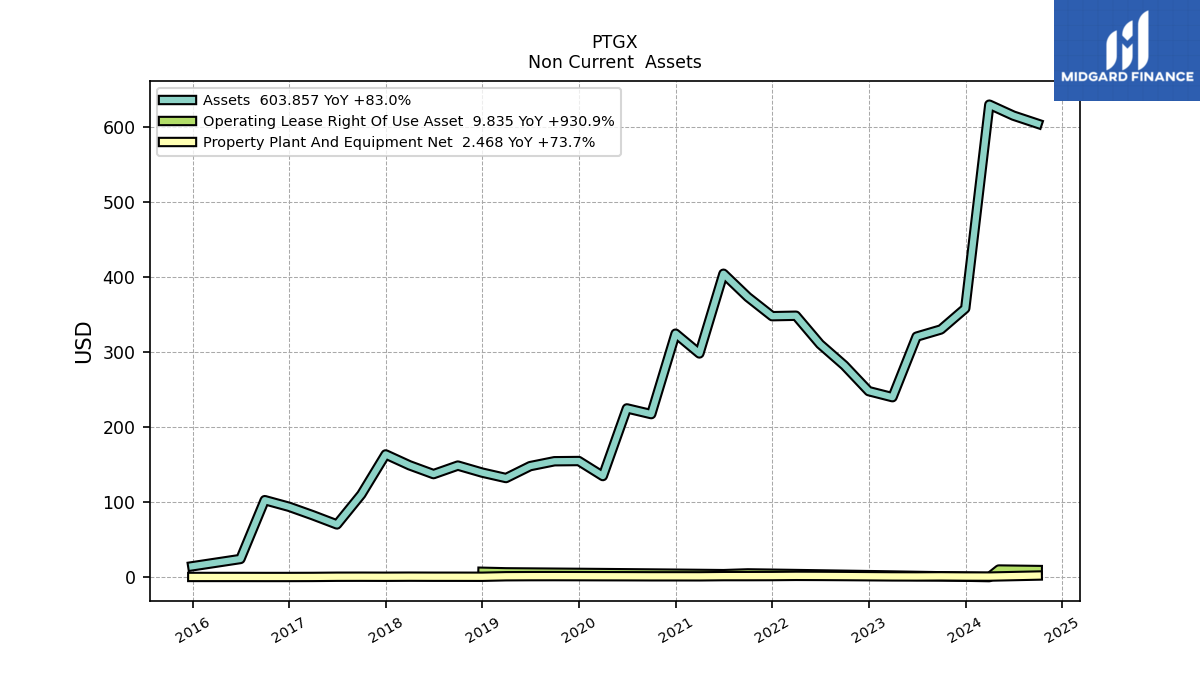
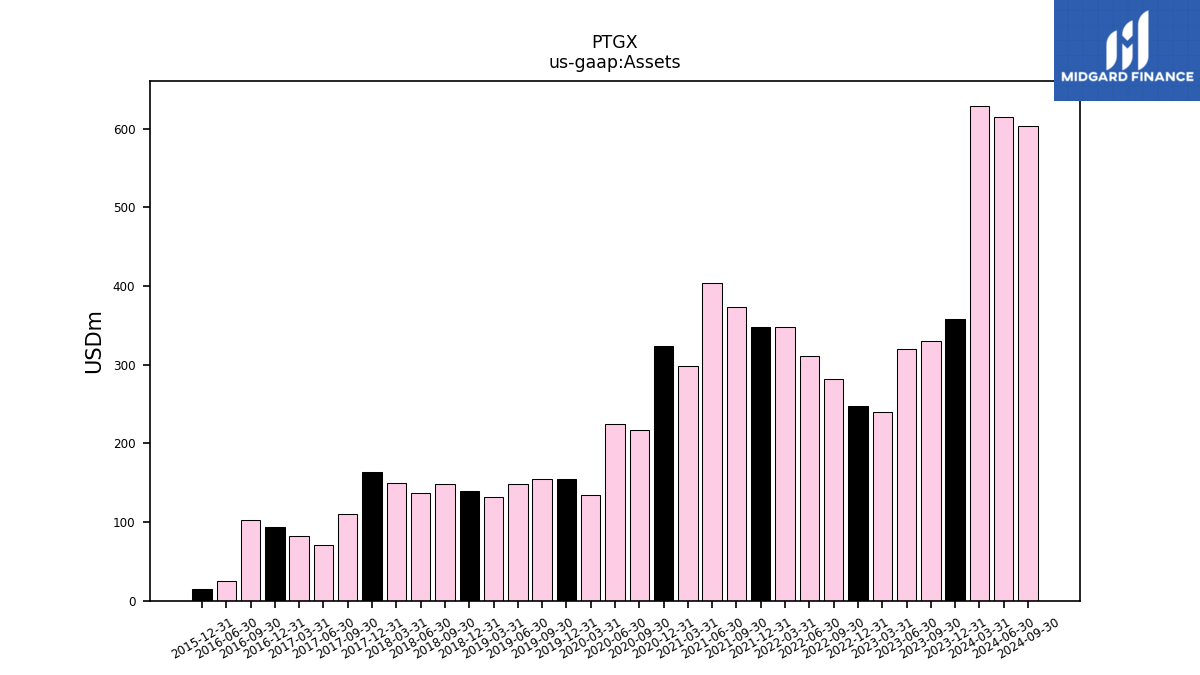
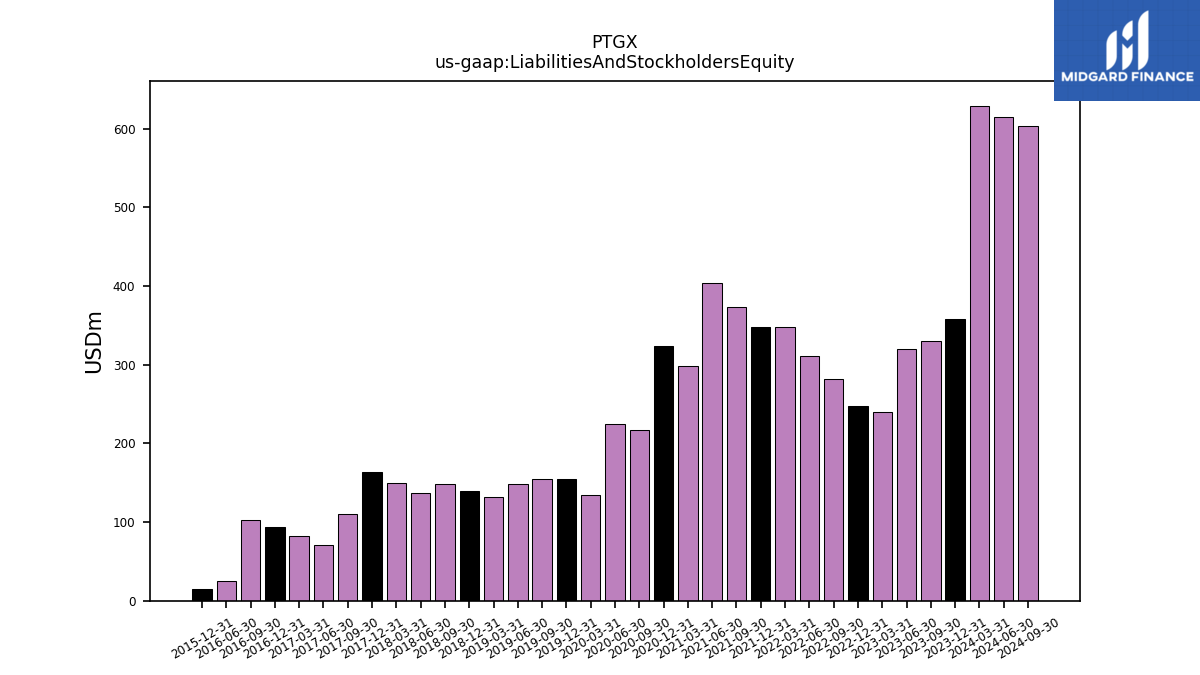
| Assets | 247.93 | 282.17 | 310.51 | 348.30 | 347.69 | 373.18 | 404.23 | 298.07 | 324.47 | 217.32 | 154.92 | 154.63 | 132.25 | 139.47 | 148.86 | 137.47 | 149.24 | 163.73 | 110.42 | 102.84 | |
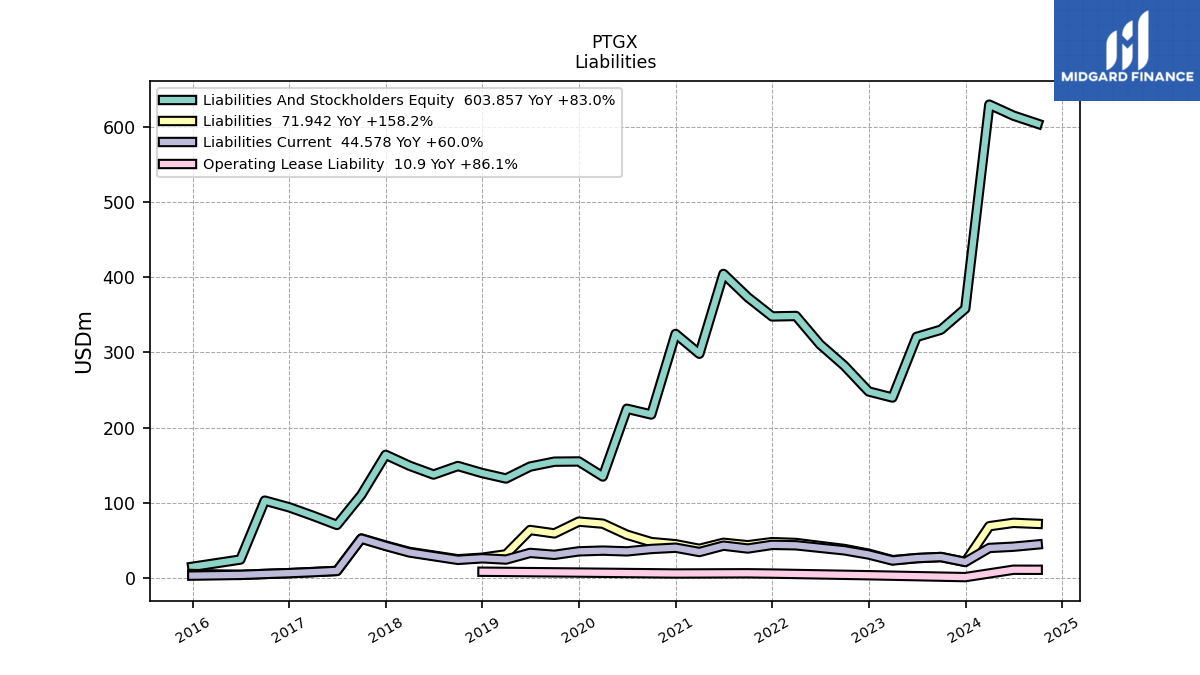
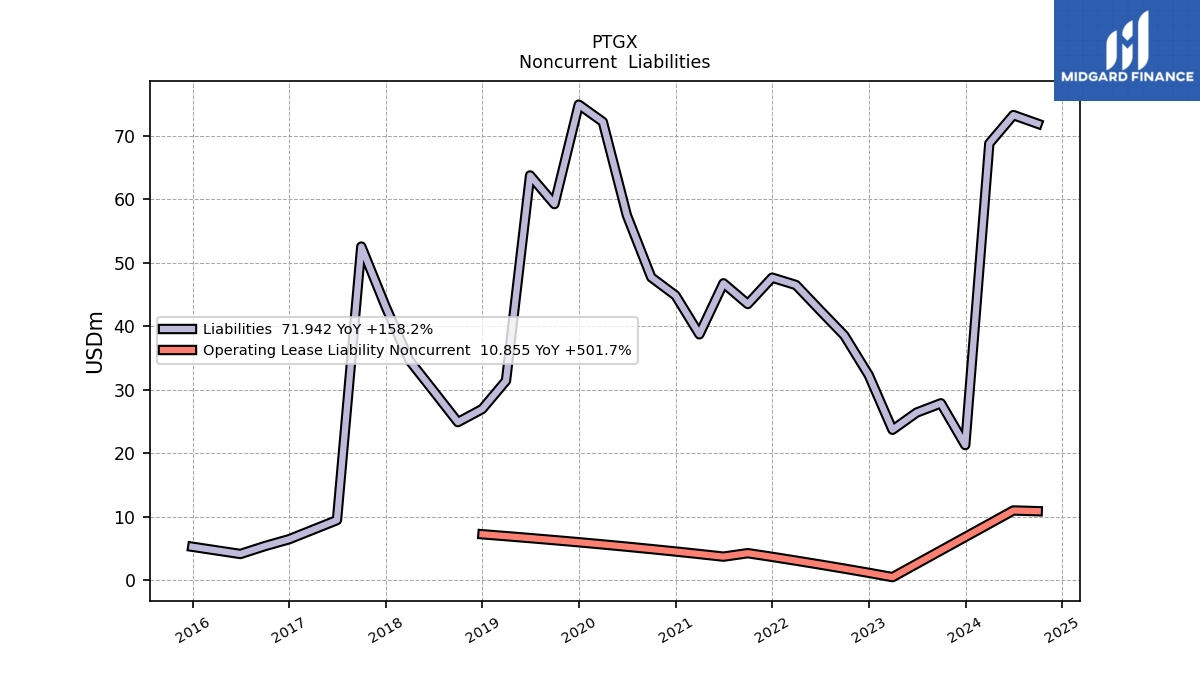
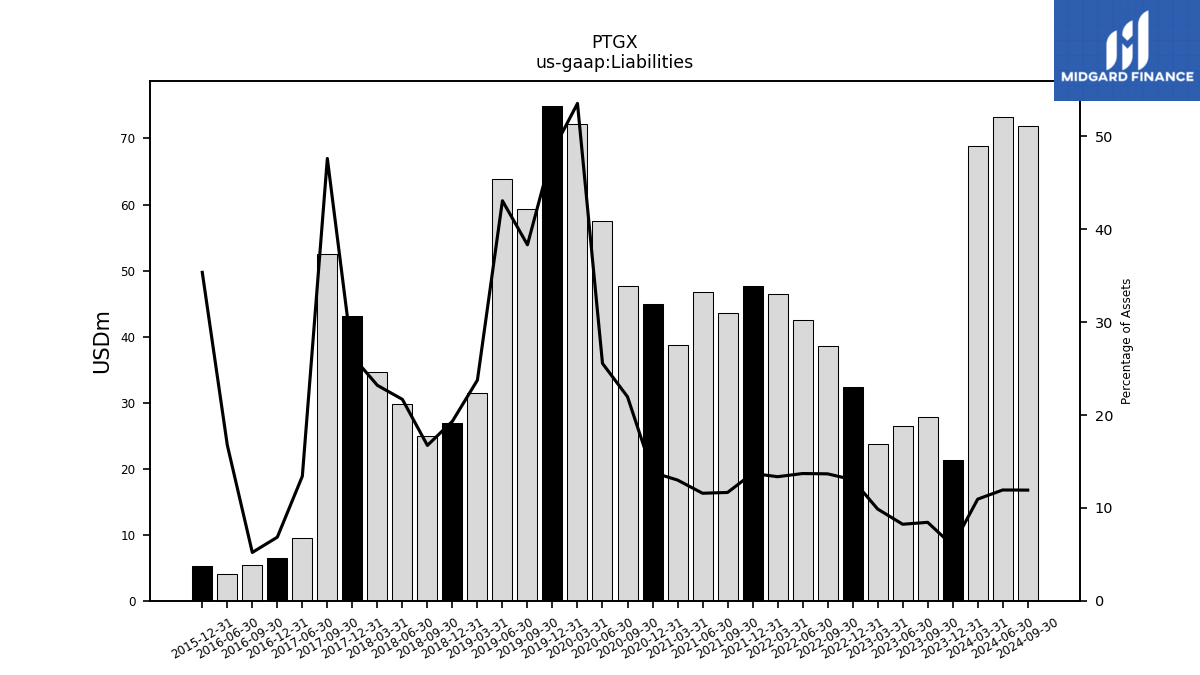
| Liabilities | 32.32 | 38.56 | 42.53 | 46.52 | 47.67 | 43.52 | 46.78 | 38.74 | 44.86 | 47.73 | 74.95 | 59.27 | 31.42 | 26.96 | 24.90 | 29.81 | 34.62 | 43.10 | 52.58 | 5.35 | |
| Liabilities And Stockholders Equity | 247.93 | 282.17 | 310.51 | 348.30 | 347.69 | 373.18 | 404.23 | 298.07 | 324.47 | 217.32 | 154.92 | 154.63 | 132.25 | 139.47 | 148.86 | 137.47 | 149.24 | 163.73 | 110.42 | 102.84 | |
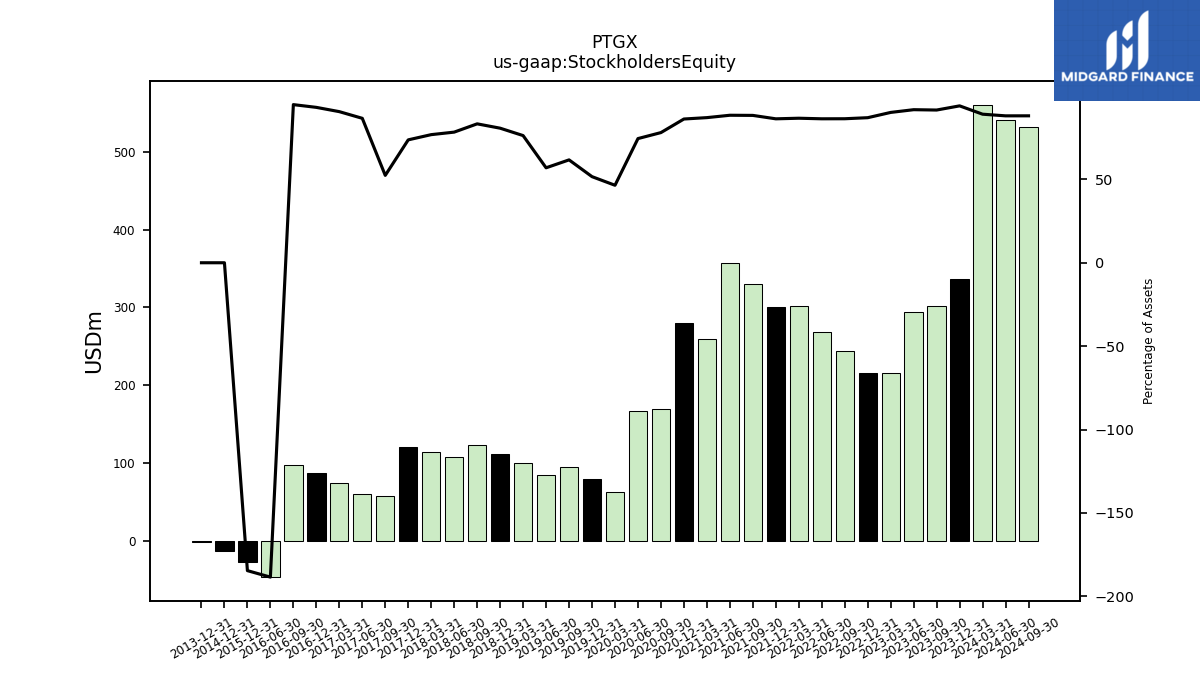
| Stockholders Equity | 215.61 | 243.62 | 267.98 | 301.78 | 300.02 | 329.66 | 357.45 | 259.33 | 279.61 | 169.59 | 79.96 | 95.36 | 100.83 | 112.52 | 123.96 | 107.66 | 114.62 | 120.63 | 57.84 | 97.49 |
| 2022-12-31 | 2022-09-30 | 2022-06-30 | 2022-03-31 | 2021-12-31 | 2021-09-30 | 2021-06-30 | 2021-03-31 | 2020-12-31 | 2020-09-30 | 2019-12-31 | 2019-09-30 | 2019-03-31 | 2018-12-31 | 2018-09-30 | 2018-06-30 | 2018-03-31 | 2017-12-31 | 2017-09-30 | 2016-09-30 | ||
|---|---|---|---|---|---|---|---|---|---|---|---|---|---|---|---|---|---|---|---|---|---|
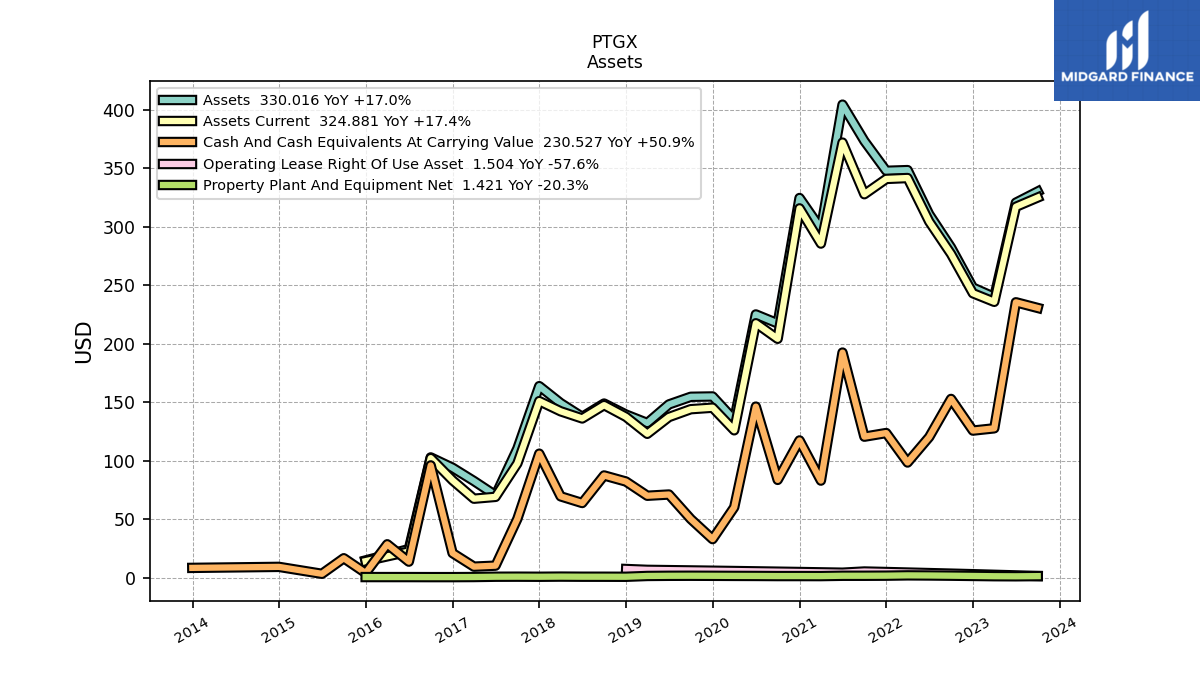
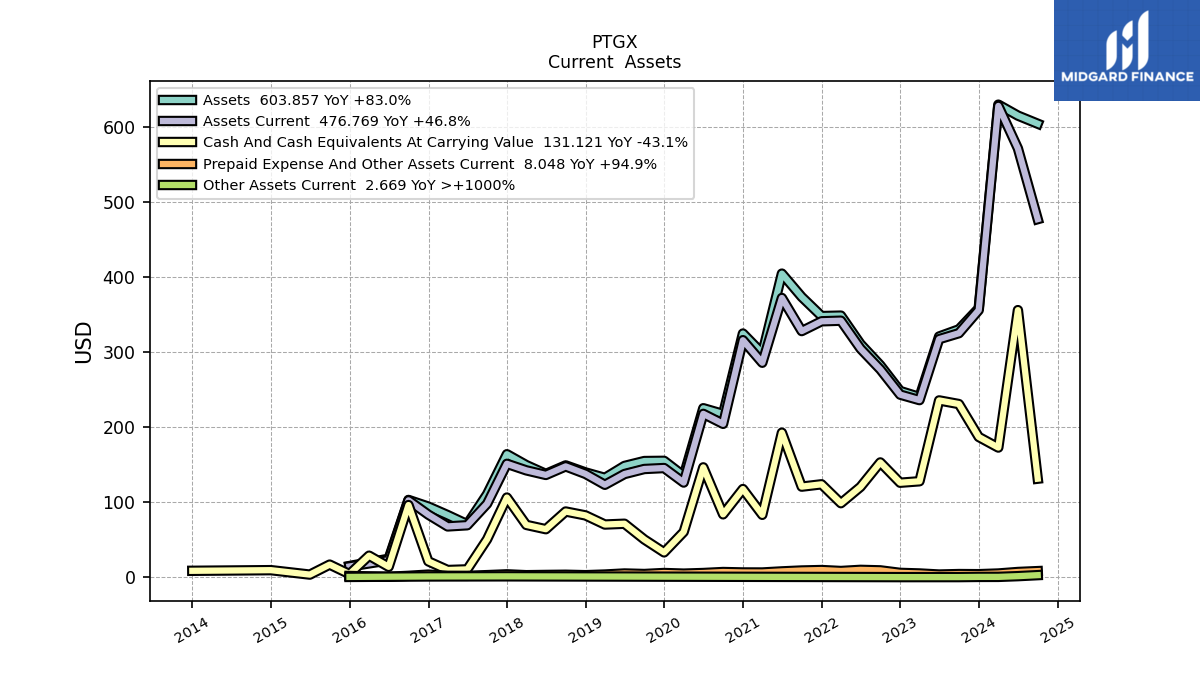
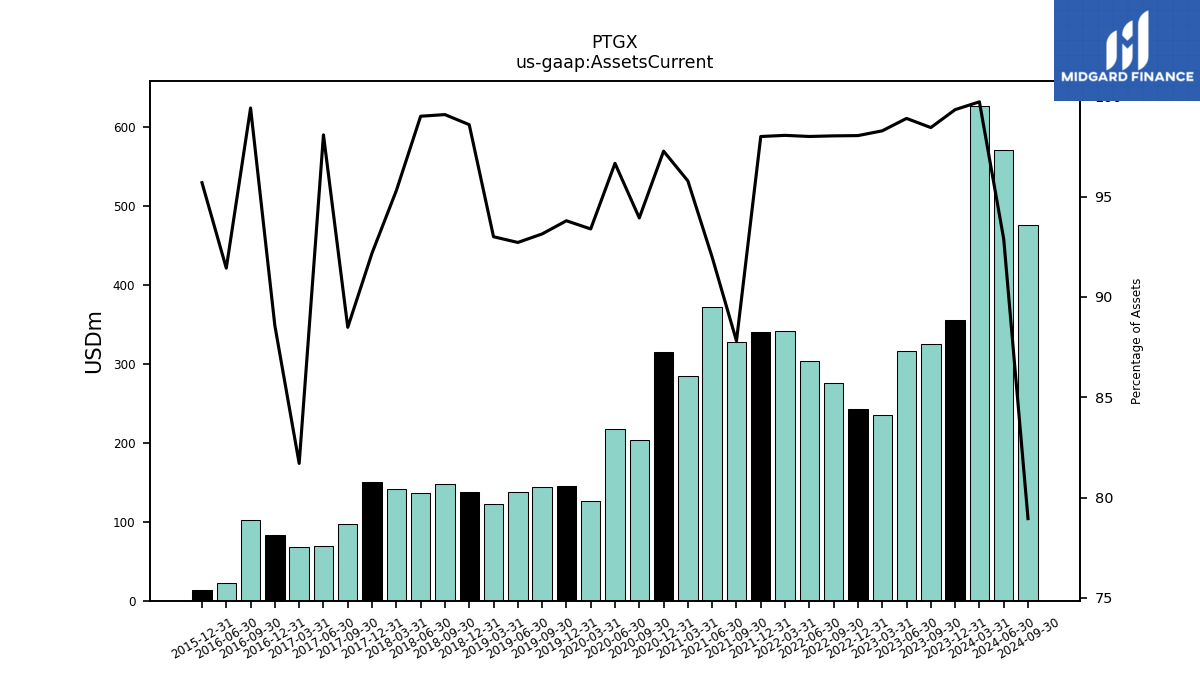
| Assets Current | 243.08 | 276.62 | 304.30 | 341.52 | 340.74 | 327.69 | 371.82 | 285.51 | 315.61 | 204.15 | 145.31 | 144.02 | 123.00 | 137.50 | 147.50 | 136.11 | 142.23 | 150.95 | 97.70 | 102.25 | |
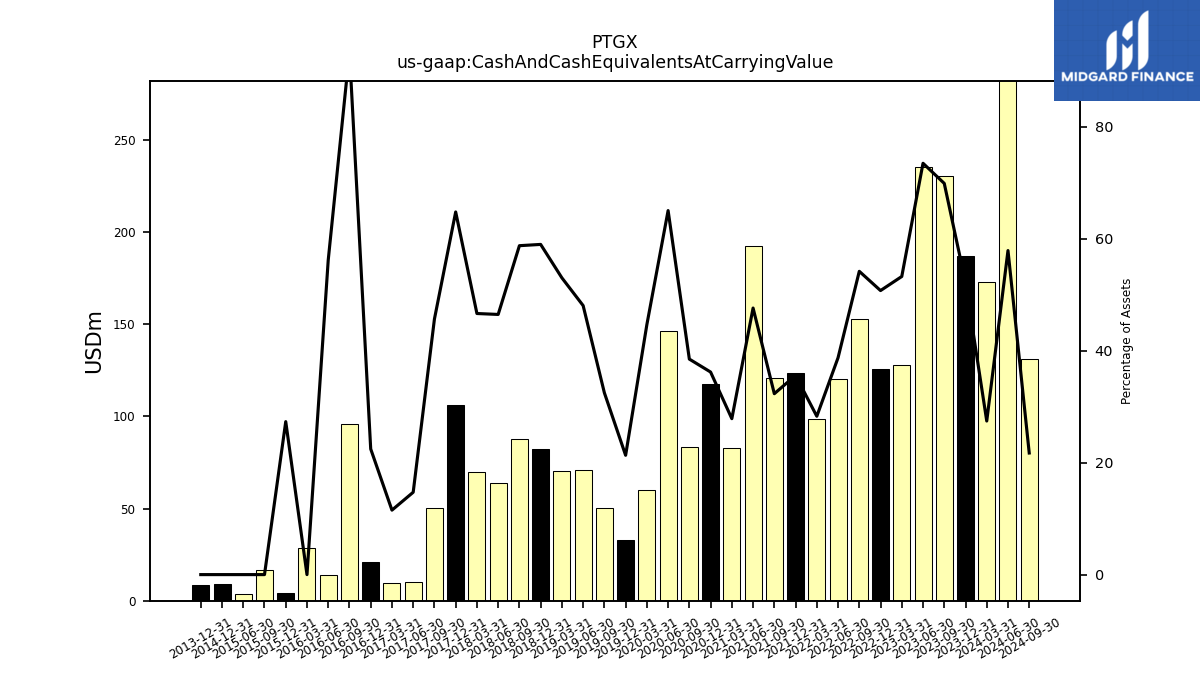
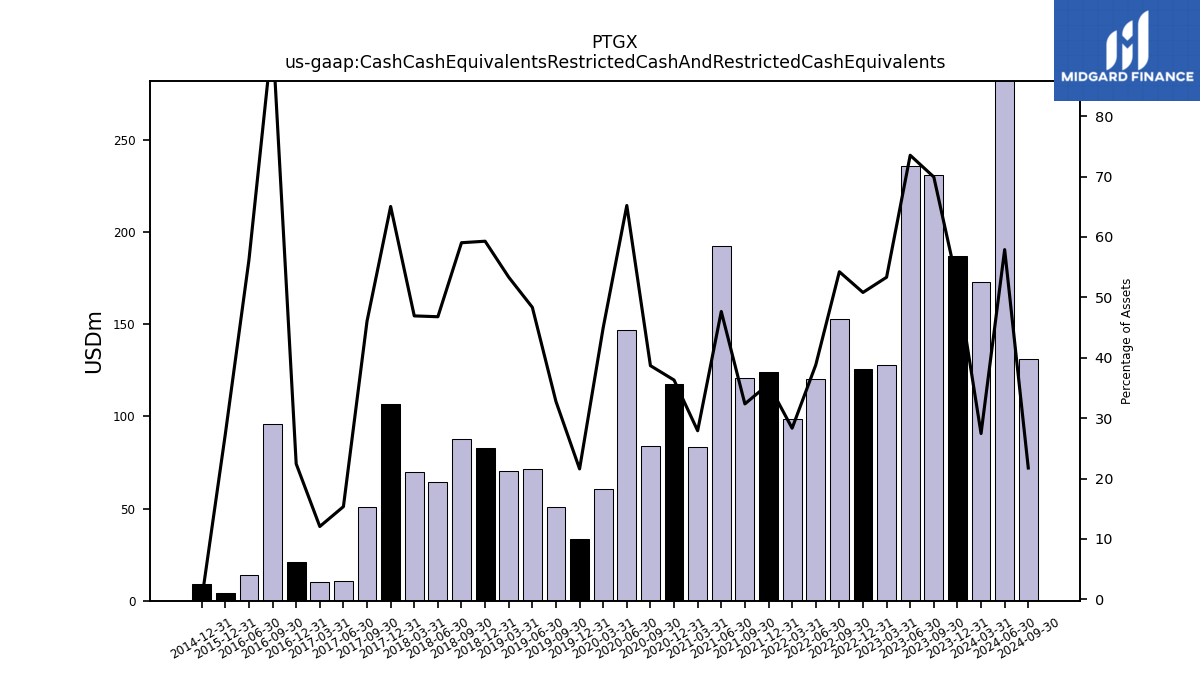
| Cash And Cash Equivalents At Carrying Value | 125.74 | 152.82 | 120.24 | 98.48 | 123.67 | 120.54 | 192.41 | 83.00 | 117.36 | 83.62 | 33.01 | 50.20 | 70.08 | 82.23 | 87.43 | 63.86 | 69.58 | 106.03 | 50.40 | 96.02 | |
| Cash Cash Equivalents Restricted Cash And Restricted Cash Equivalents | 125.97 | 153.04 | 120.46 | 98.70 | 123.89 | 120.77 | 192.64 | 83.22 | 117.82 | 84.08 | 33.47 | 50.66 | 70.54 | 82.69 | 87.89 | 64.32 | 70.04 | 106.49 | 50.85 | 96.03 | |
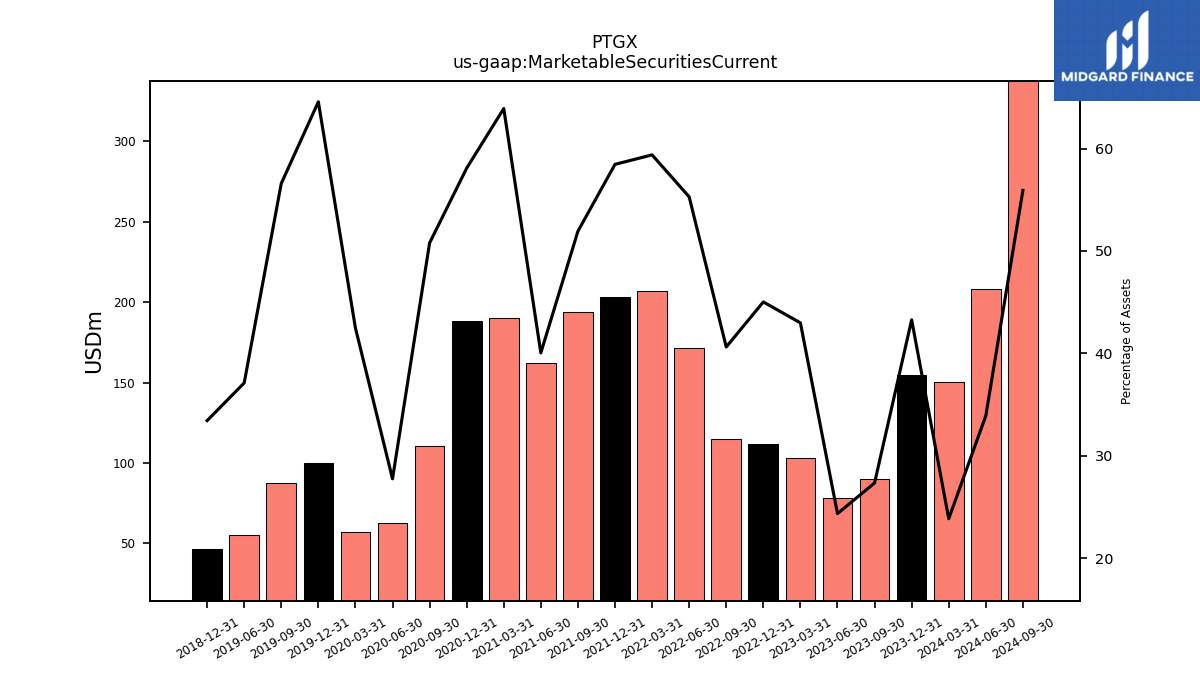
| Marketable Securities Current | 111.61 | 114.62 | 171.65 | 206.81 | 203.24 | 193.76 | 161.87 | 190.48 | 188.45 | 110.35 | 100.01 | 87.50 | NA | 46.62 | NA | NA | NA | NA | NA | NA | |
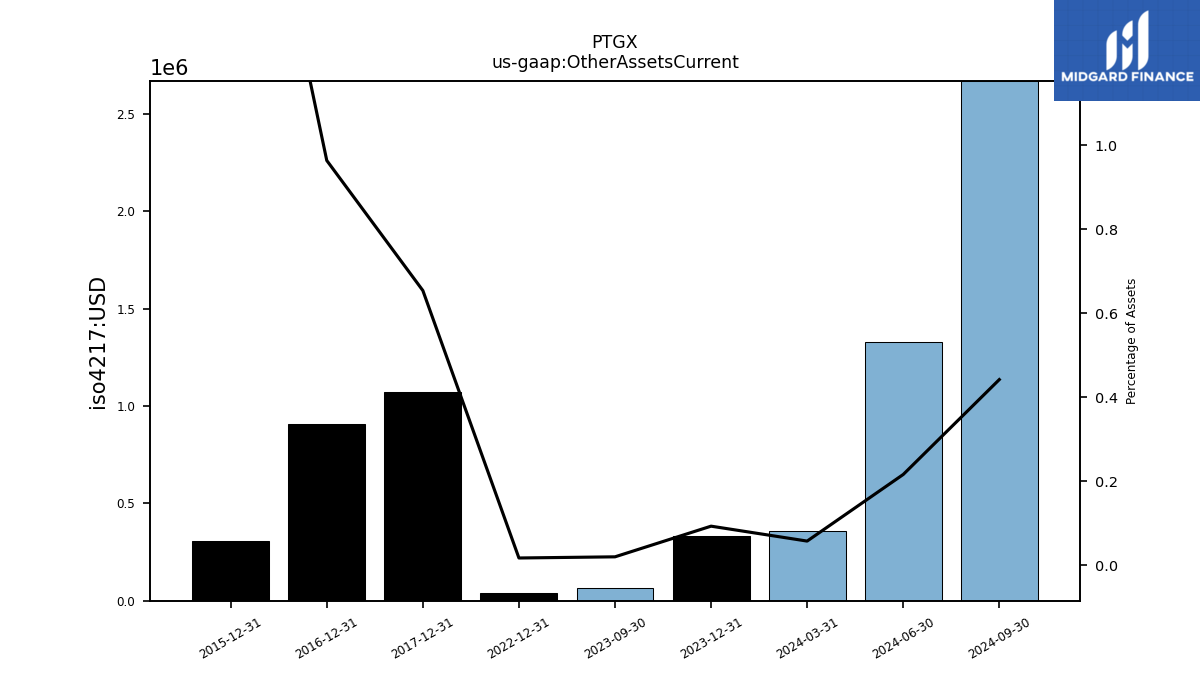
| Other Assets Current | 0.04 | NA | NA | NA | NA | NA | NA | NA | NA | NA | NA | NA | NA | NA | NA | NA | NA | 1.07 | NA | NA | |
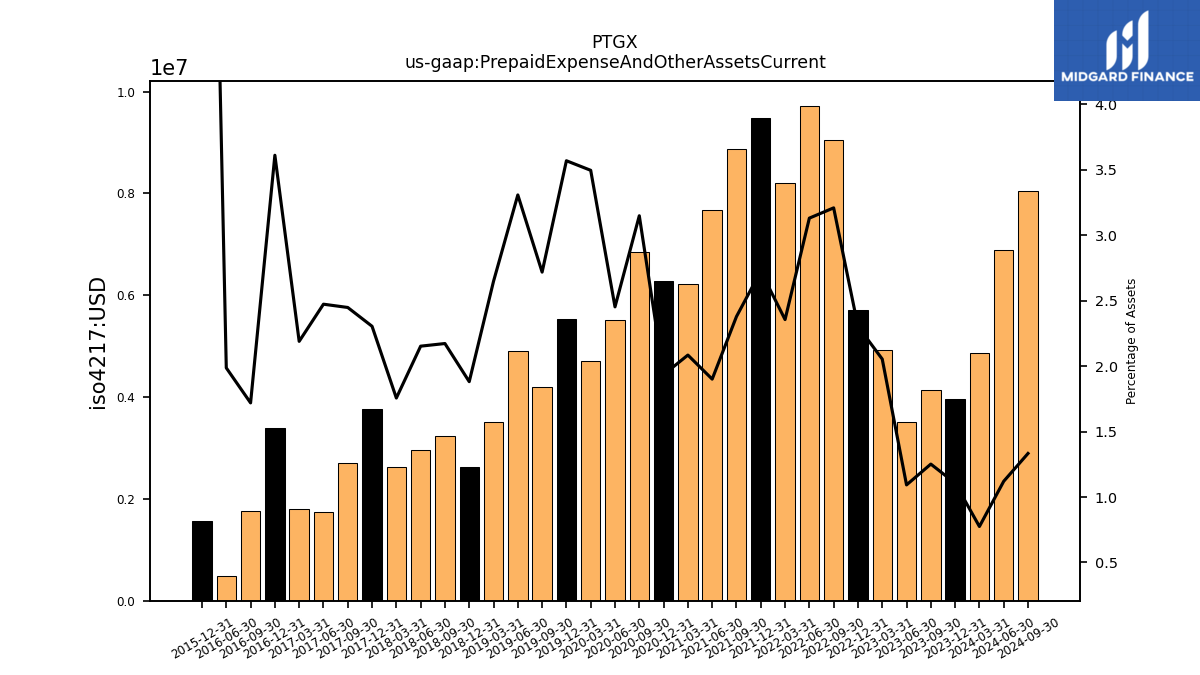
| Prepaid Expense And Other Assets Current | 5.71 | 9.05 | 9.72 | 8.21 | 9.48 | 8.88 | 7.68 | 6.21 | 6.28 | 6.84 | 5.53 | 4.20 | 3.50 | 2.62 | 3.23 | 2.96 | 2.62 | 3.77 | 2.70 | 1.77 |
| 2022-12-31 | 2022-09-30 | 2022-06-30 | 2022-03-31 | 2021-12-31 | 2021-09-30 | 2021-06-30 | 2021-03-31 | 2020-12-31 | 2020-09-30 | 2019-12-31 | 2019-09-30 | 2019-03-31 | 2018-12-31 | 2018-09-30 | 2018-06-30 | 2018-03-31 | 2017-12-31 | 2017-09-30 | 2016-09-30 | ||
|---|---|---|---|---|---|---|---|---|---|---|---|---|---|---|---|---|---|---|---|---|---|
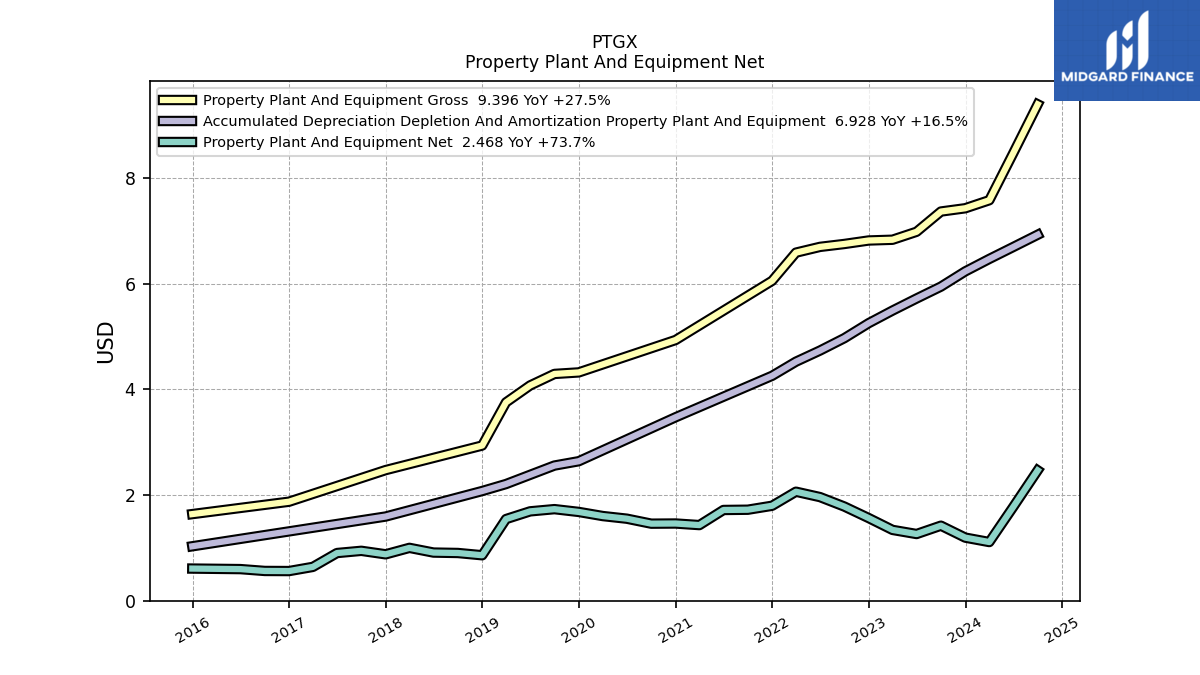
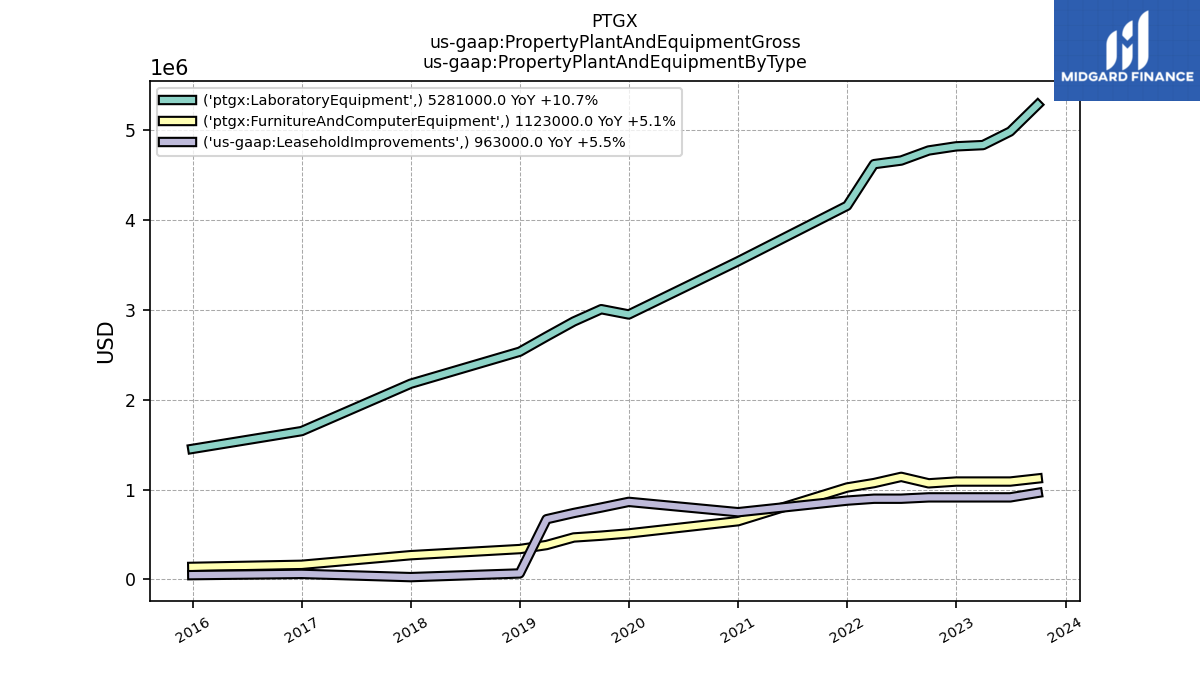
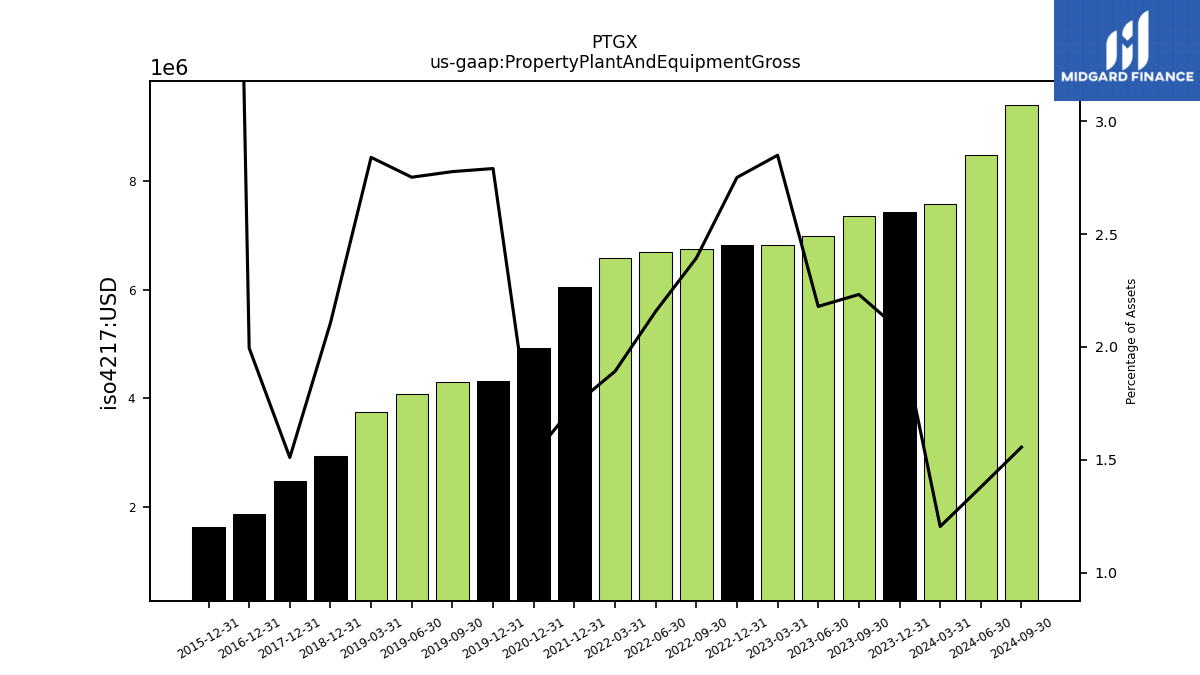
| Property Plant And Equipment Gross | 6.82 | 6.75 | 6.70 | 6.59 | 6.06 | NA | NA | NA | 4.93 | NA | 4.32 | 4.29 | 3.75 | 2.94 | NA | NA | NA | 2.47 | NA | NA | |
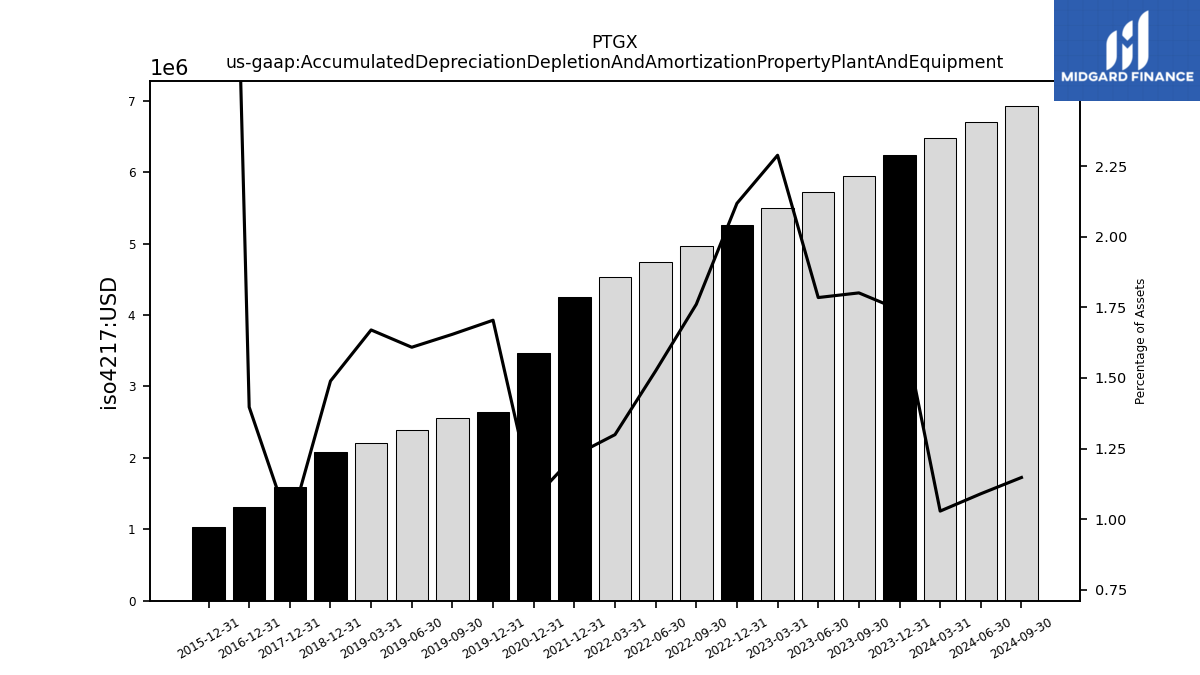
| Accumulated Depreciation Depletion And Amortization Property Plant And Equipment | 5.25 | 4.97 | 4.74 | 4.53 | 4.26 | NA | NA | NA | 3.47 | NA | 2.64 | 2.56 | 2.21 | 2.08 | NA | NA | NA | 1.59 | NA | NA | |
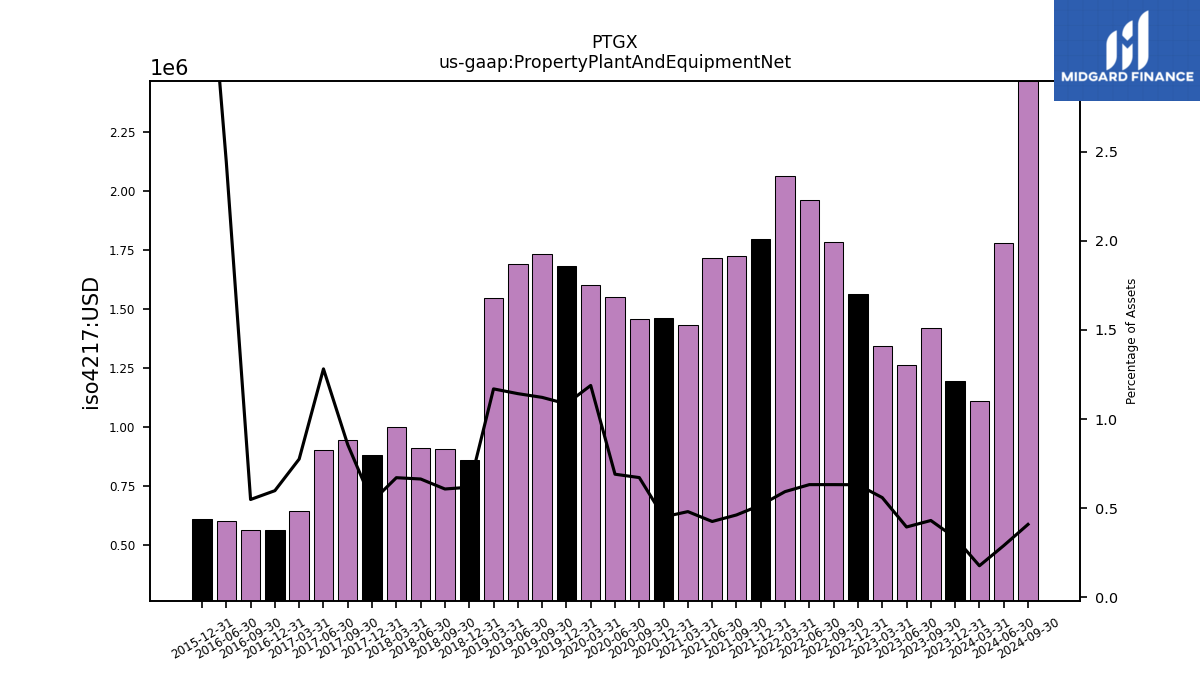
| Property Plant And Equipment Net | 1.56 | 1.78 | 1.96 | 2.06 | 1.80 | 1.72 | 1.72 | 1.43 | 1.46 | 1.46 | 1.68 | 1.73 | 1.55 | 0.86 | 0.90 | 0.91 | 1.00 | 0.88 | 0.94 | 0.56 |
| 2022-12-31 | 2022-09-30 | 2022-06-30 | 2022-03-31 | 2021-12-31 | 2021-09-30 | 2021-06-30 | 2021-03-31 | 2020-12-31 | 2020-09-30 | 2019-12-31 | 2019-09-30 | 2019-03-31 | 2018-12-31 | 2018-09-30 | 2018-06-30 | 2018-03-31 | 2017-12-31 | 2017-09-30 | 2016-09-30 | ||
|---|---|---|---|---|---|---|---|---|---|---|---|---|---|---|---|---|---|---|---|---|---|
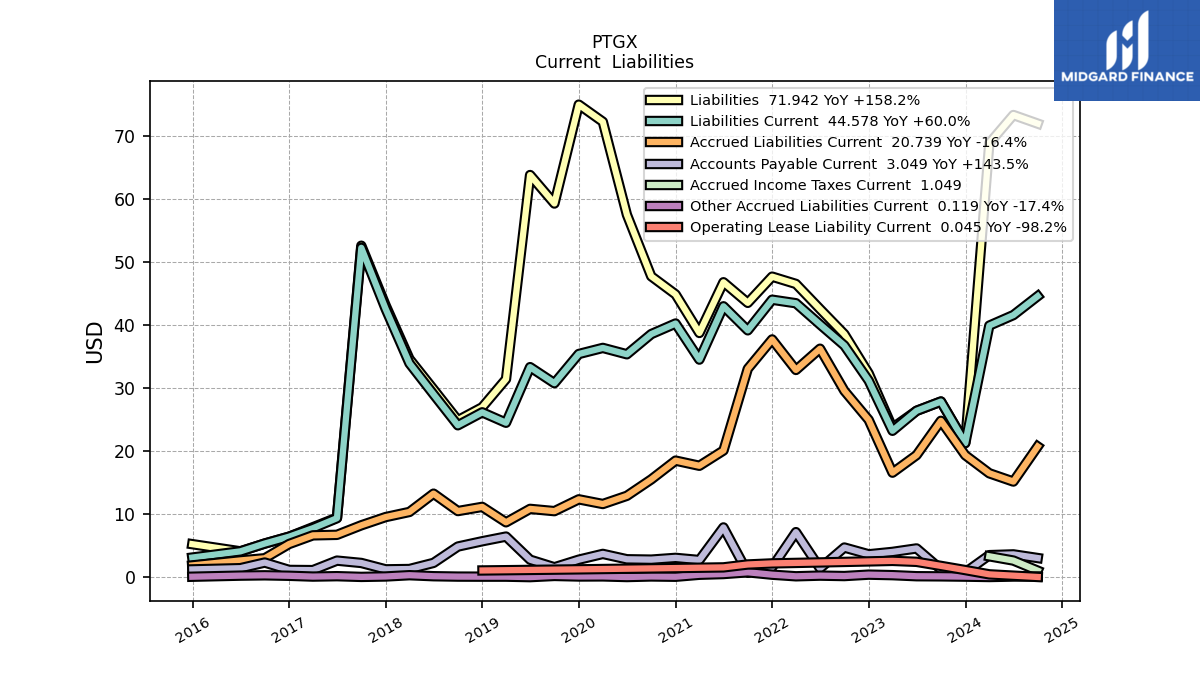
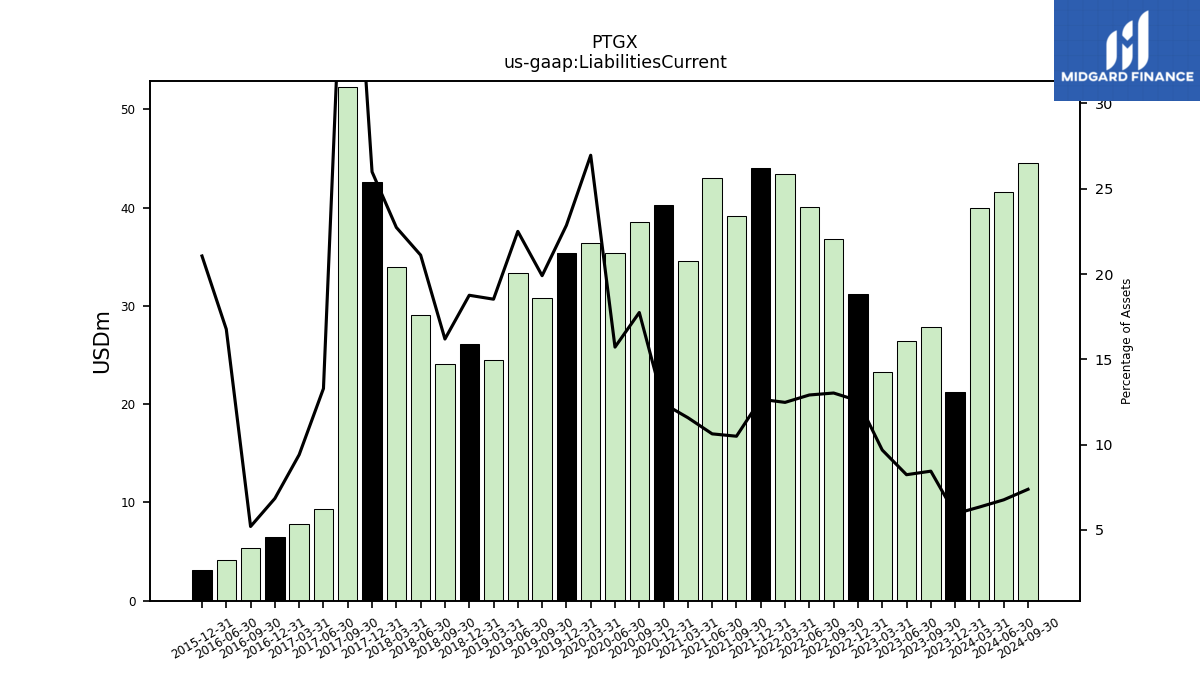
| Liabilities Current | 31.18 | 36.75 | 40.09 | 43.46 | 44.02 | 39.16 | 42.97 | 34.52 | 40.24 | 38.56 | 35.41 | 30.78 | 24.50 | 26.16 | 24.10 | 29.02 | 33.92 | 42.55 | 52.25 | 5.35 | |
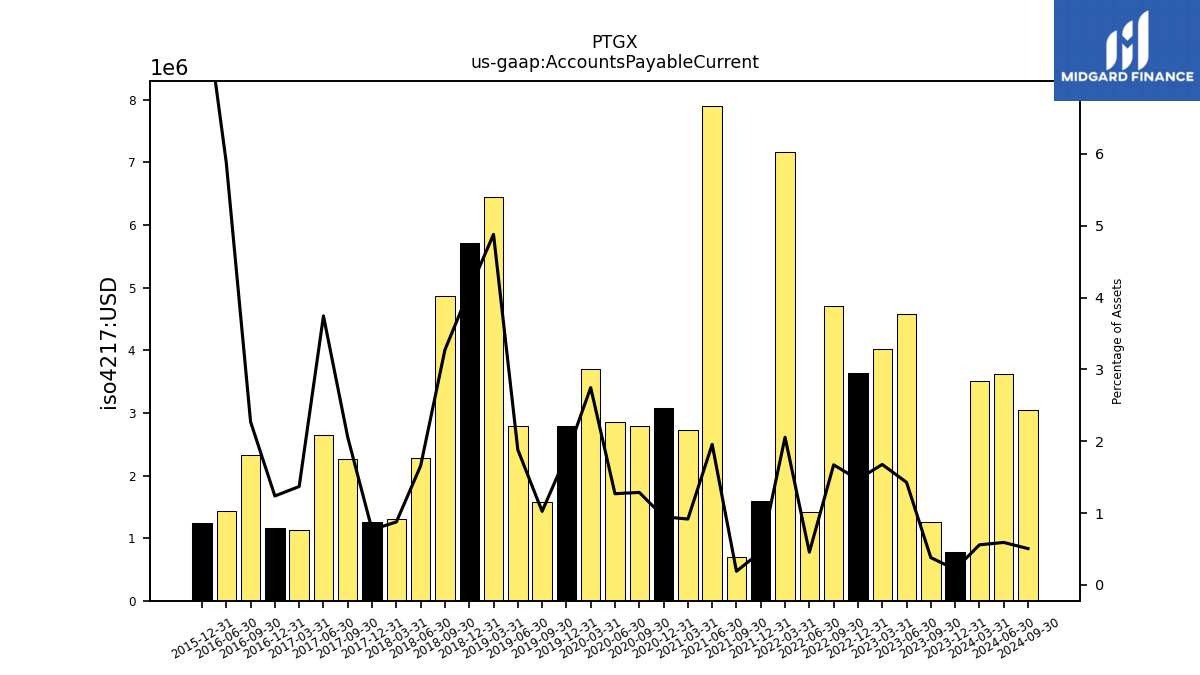
| Accounts Payable Current | 3.64 | 4.71 | 1.41 | 7.16 | 1.60 | 0.71 | 7.91 | 2.73 | 3.08 | 2.80 | 2.79 | 1.58 | 6.45 | 5.71 | 4.87 | 2.28 | 1.31 | 1.26 | 2.27 | 2.33 | |
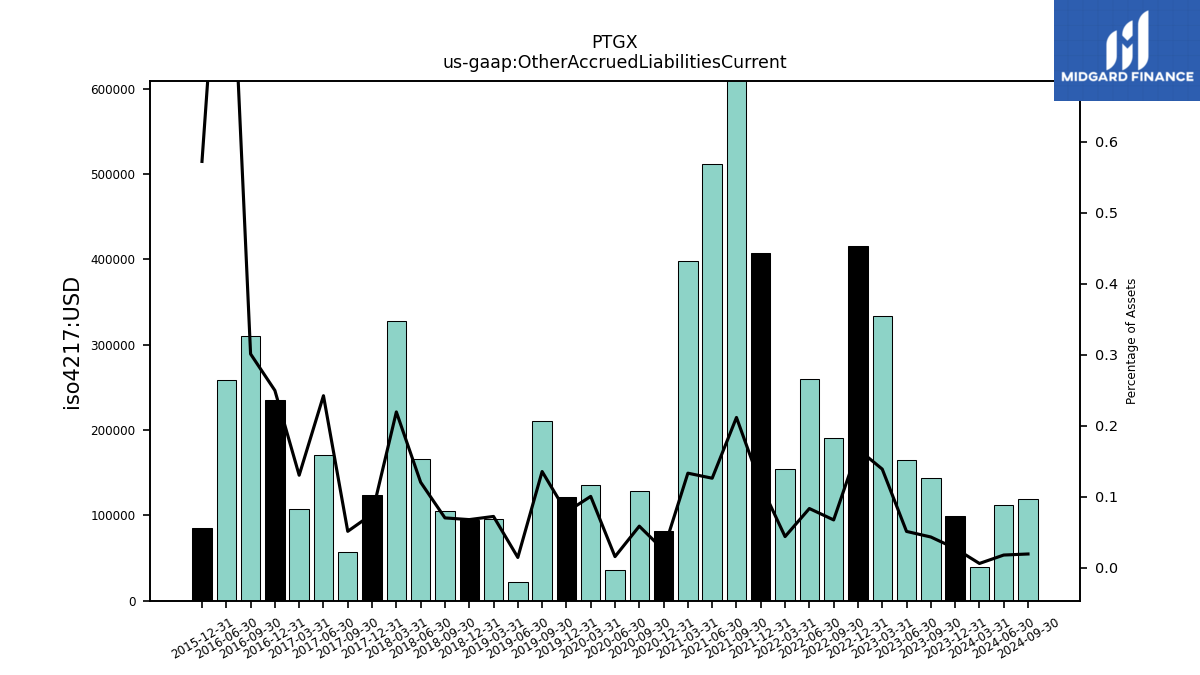
| Other Accrued Liabilities Current | 0.41 | 0.19 | 0.26 | 0.15 | 0.41 | 0.79 | 0.51 | 0.40 | 0.08 | 0.13 | 0.12 | 0.21 | 0.10 | 0.10 | 0.10 | 0.17 | 0.33 | 0.12 | 0.06 | 0.31 | |
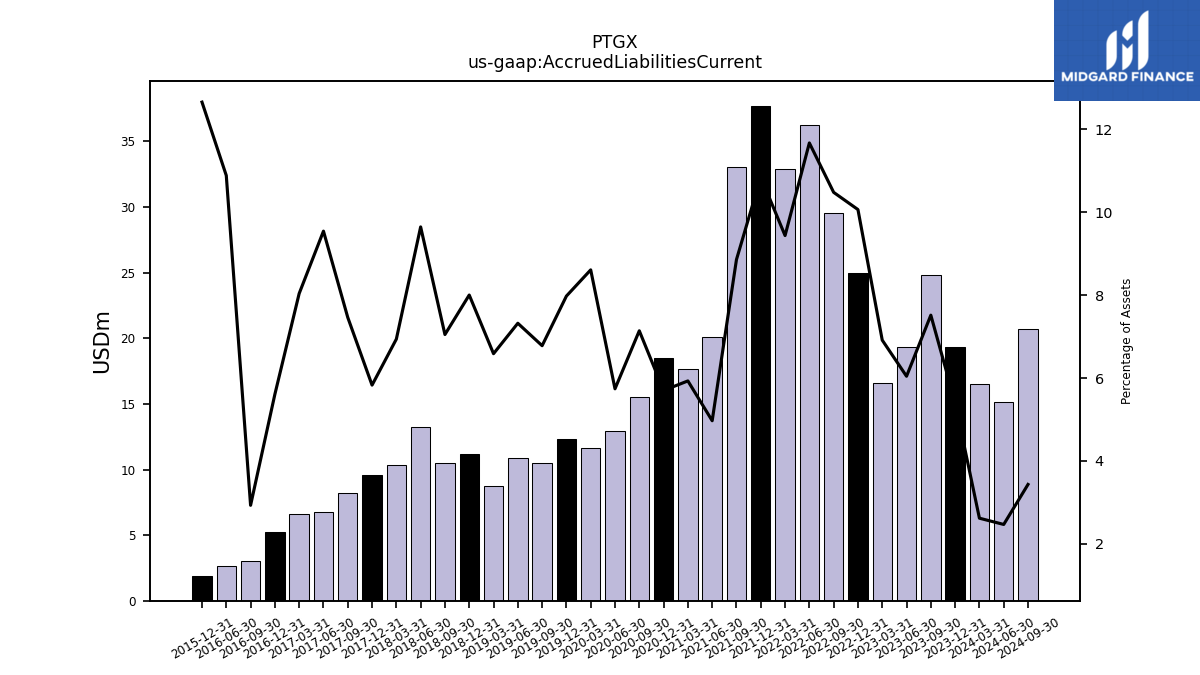
| Accrued Liabilities Current | 24.95 | 29.57 | 36.24 | 32.87 | 37.72 | 33.06 | 20.10 | 17.68 | 18.50 | 15.52 | 12.36 | 10.49 | 8.71 | 11.16 | 10.50 | 13.26 | 10.36 | 9.55 | 8.24 | 3.01 | |
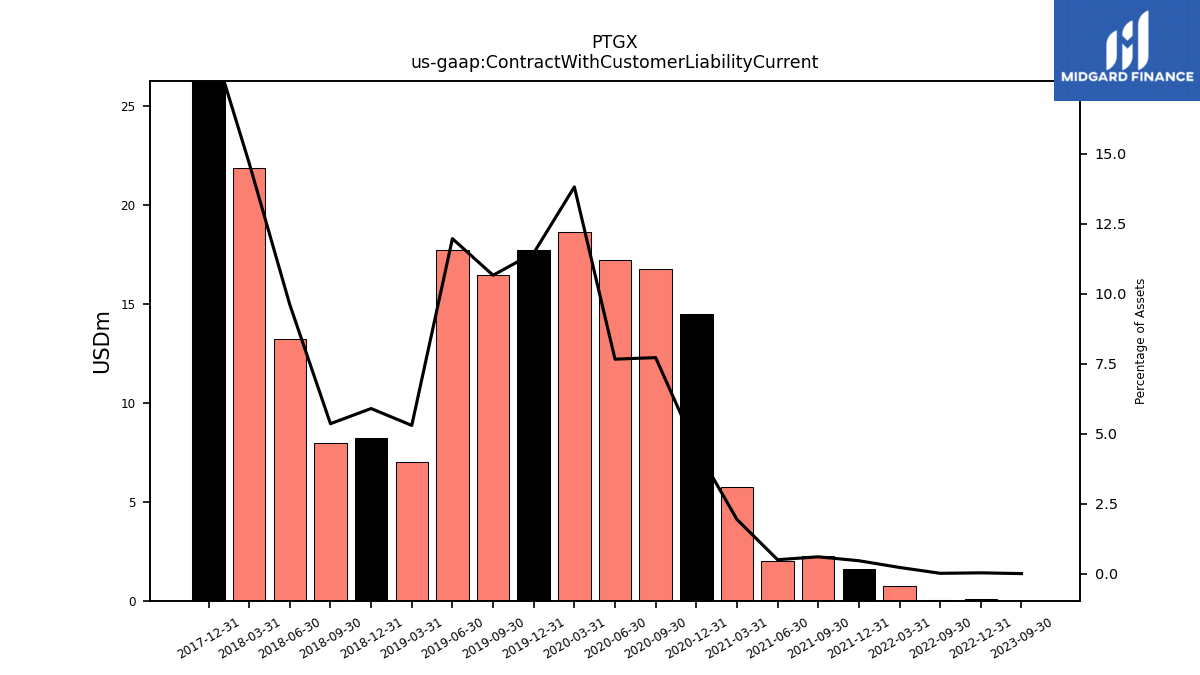
| Contract With Customer Liability Current | 0.07 | 0.03 | NA | 0.77 | 1.60 | 2.24 | 2.01 | 5.77 | 14.48 | 16.77 | 17.74 | 16.48 | 7.00 | 8.22 | 7.97 | 13.20 | 21.88 | 31.75 | NA | NA |
| 2022-12-31 | 2022-09-30 | 2022-06-30 | 2022-03-31 | 2021-12-31 | 2021-09-30 | 2021-06-30 | 2021-03-31 | 2020-12-31 | 2020-09-30 | 2019-12-31 | 2019-09-30 | 2019-03-31 | 2018-12-31 | 2018-09-30 | 2018-06-30 | 2018-03-31 | 2017-12-31 | 2017-09-30 | 2016-09-30 | ||
|---|---|---|---|---|---|---|---|---|---|---|---|---|---|---|---|---|---|---|---|---|---|
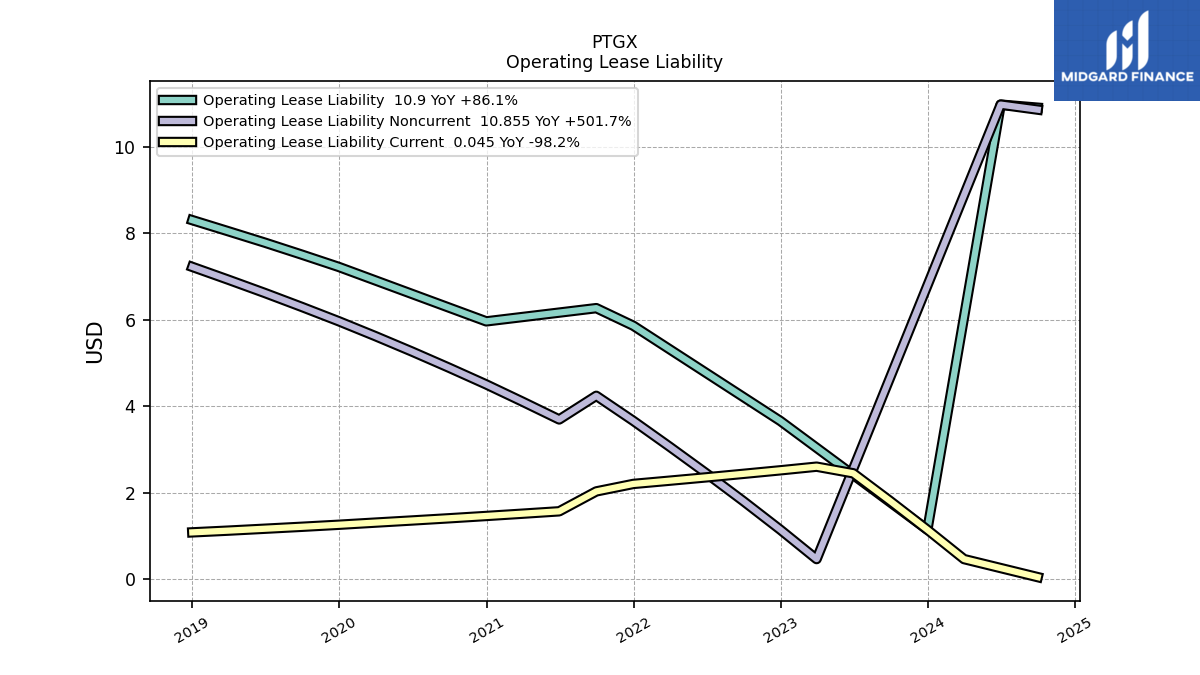
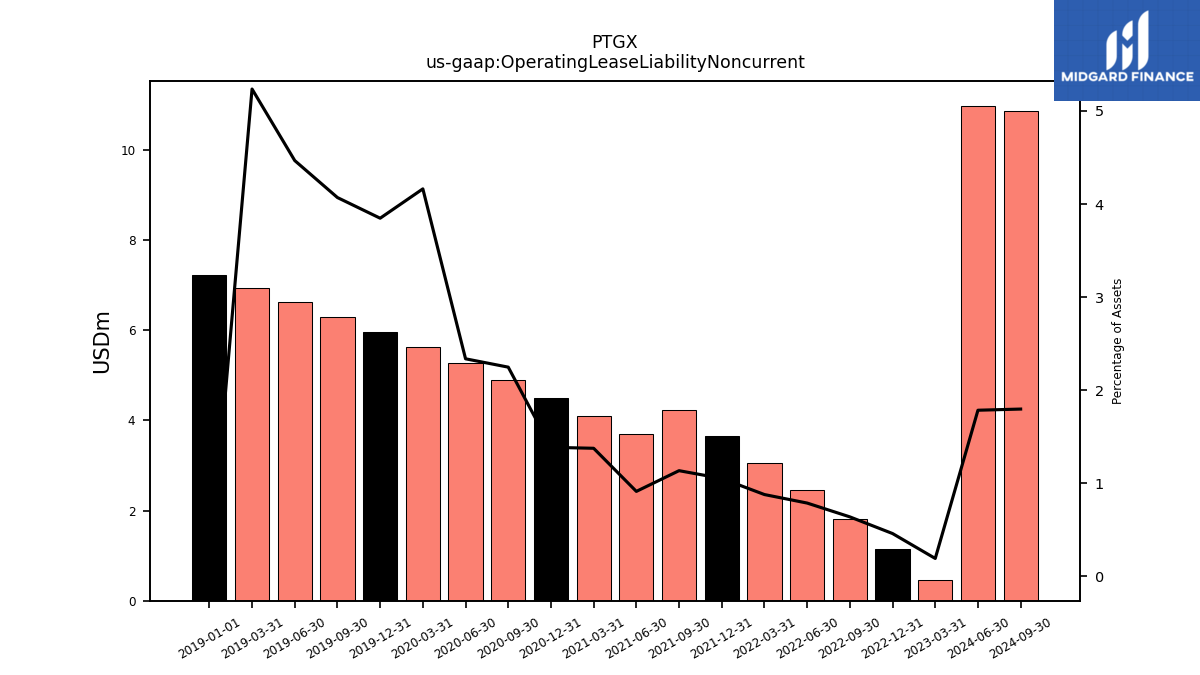
| Operating Lease Liability Noncurrent | 1.14 | 1.80 | 2.45 | 3.06 | 3.66 | 4.24 | 3.69 | 4.10 | 4.50 | 4.88 | 5.96 | 6.29 | 6.92 | NA | NA | NA | NA | NA | NA | NA |
| 2022-12-31 | 2022-09-30 | 2022-06-30 | 2022-03-31 | 2021-12-31 | 2021-09-30 | 2021-06-30 | 2021-03-31 | 2020-12-31 | 2020-09-30 | 2019-12-31 | 2019-09-30 | 2019-03-31 | 2018-12-31 | 2018-09-30 | 2018-06-30 | 2018-03-31 | 2017-12-31 | 2017-09-30 | 2016-09-30 | ||
|---|---|---|---|---|---|---|---|---|---|---|---|---|---|---|---|---|---|---|---|---|---|
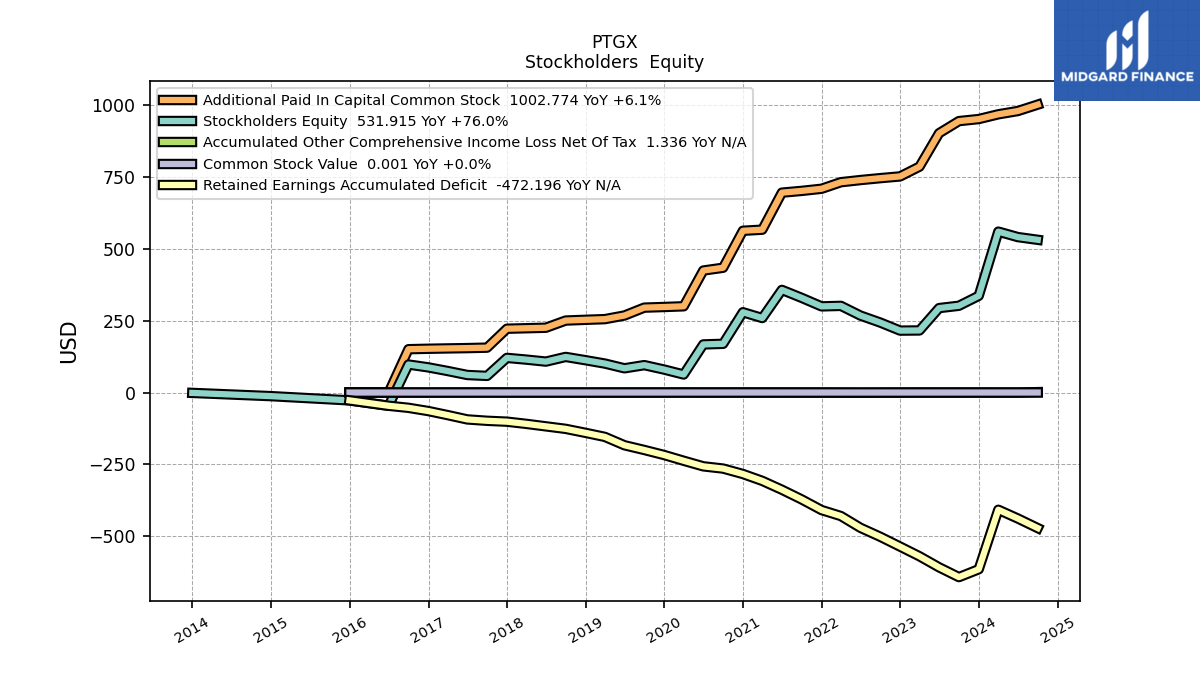
| Stockholders Equity | 215.61 | 243.62 | 267.98 | 301.78 | 300.02 | 329.66 | 357.45 | 259.33 | 279.61 | 169.59 | 79.96 | 95.36 | 100.83 | 112.52 | 123.96 | 107.66 | 114.62 | 120.63 | 57.84 | 97.49 | |
| Common Stock Value | NA | NA | NA | NA | NA | NA | NA | NA | NA | NA | NA | NA | NA | 0.00 | NA | NA | NA | 0.00 | 0.00 | 0.00 | |
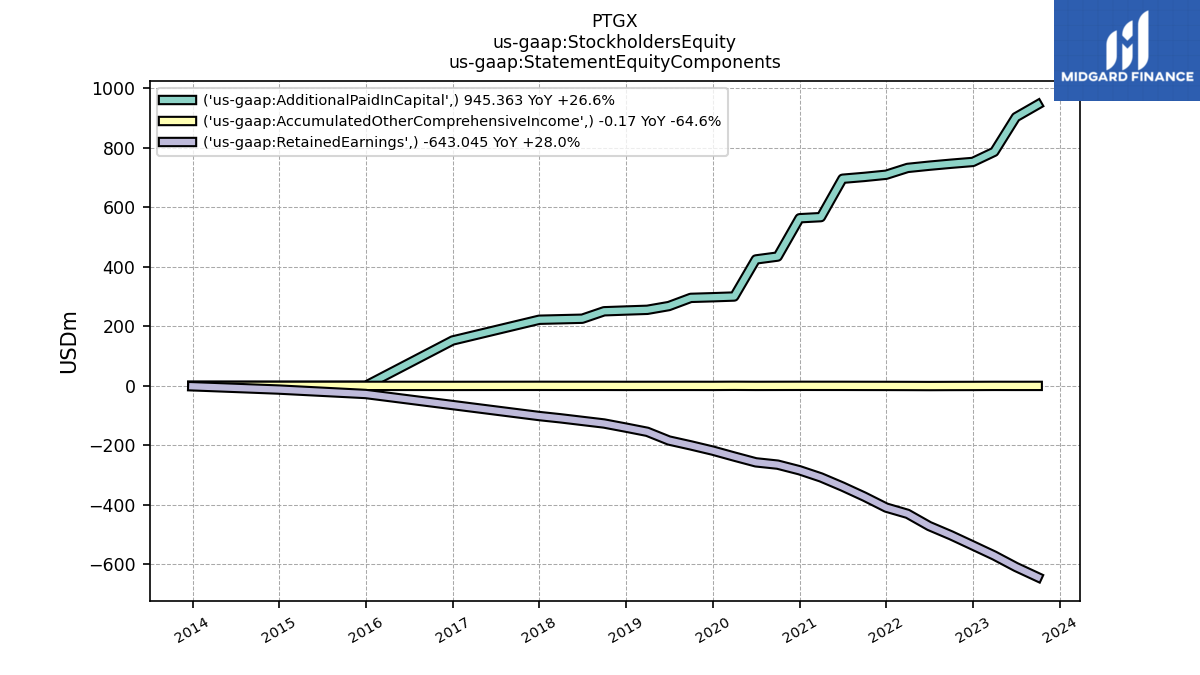
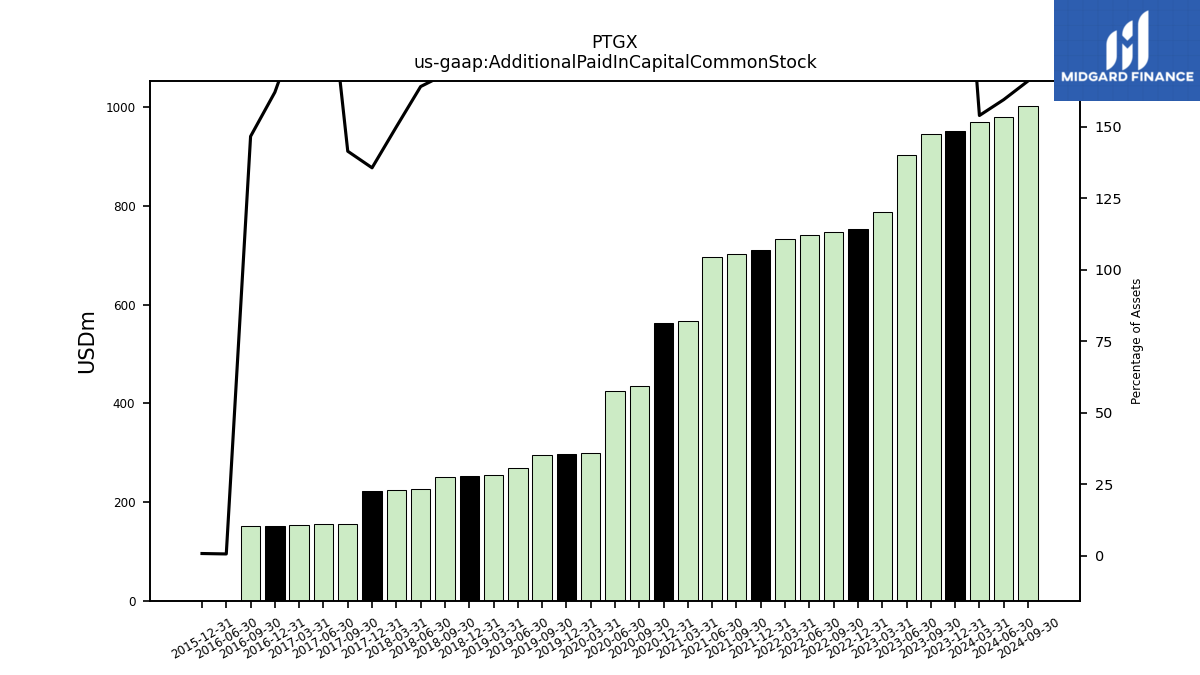
| Additional Paid In Capital Common Stock | 752.72 | 746.66 | 740.03 | 732.54 | 709.68 | 702.32 | 696.16 | 567.18 | 563.39 | 434.60 | 297.85 | 295.67 | 255.59 | 253.22 | 250.67 | 225.62 | 223.90 | 222.19 | 156.23 | 150.86 | |
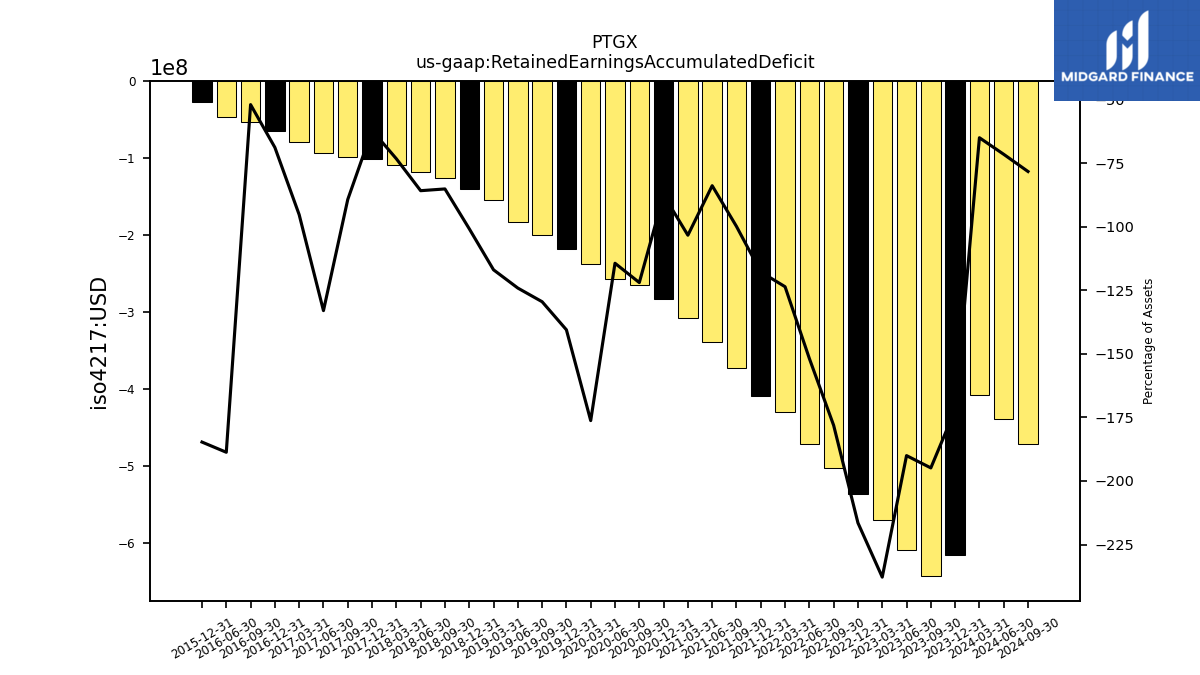
| Retained Earnings Accumulated Deficit | -536.75 | -502.56 | -471.33 | -430.29 | -409.36 | -372.45 | -338.65 | -307.81 | -283.81 | -264.93 | -217.66 | -200.16 | -154.58 | -140.47 | -126.61 | -117.87 | -109.21 | -101.55 | -98.50 | -53.34 | |
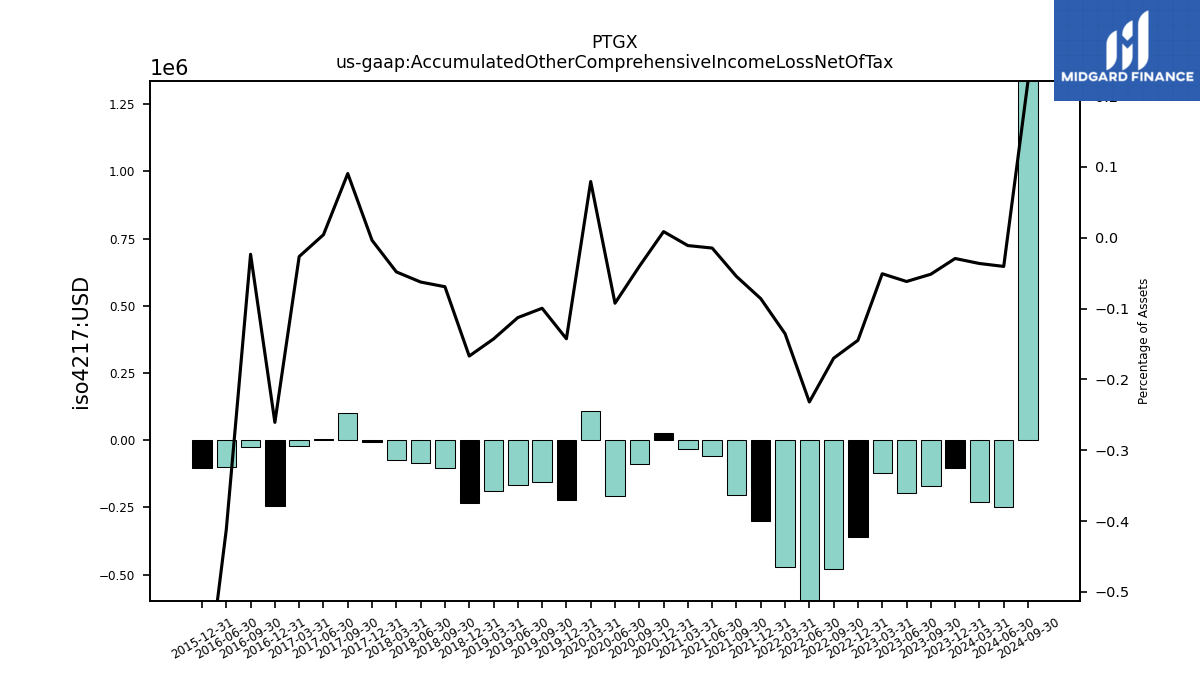
| Accumulated Other Comprehensive Income Loss Net Of Tax | -0.36 | -0.48 | -0.72 | -0.47 | -0.30 | -0.20 | -0.06 | -0.03 | 0.03 | -0.09 | -0.22 | -0.15 | -0.19 | -0.23 | -0.10 | -0.09 | -0.07 | -0.01 | 0.10 | -0.02 | |
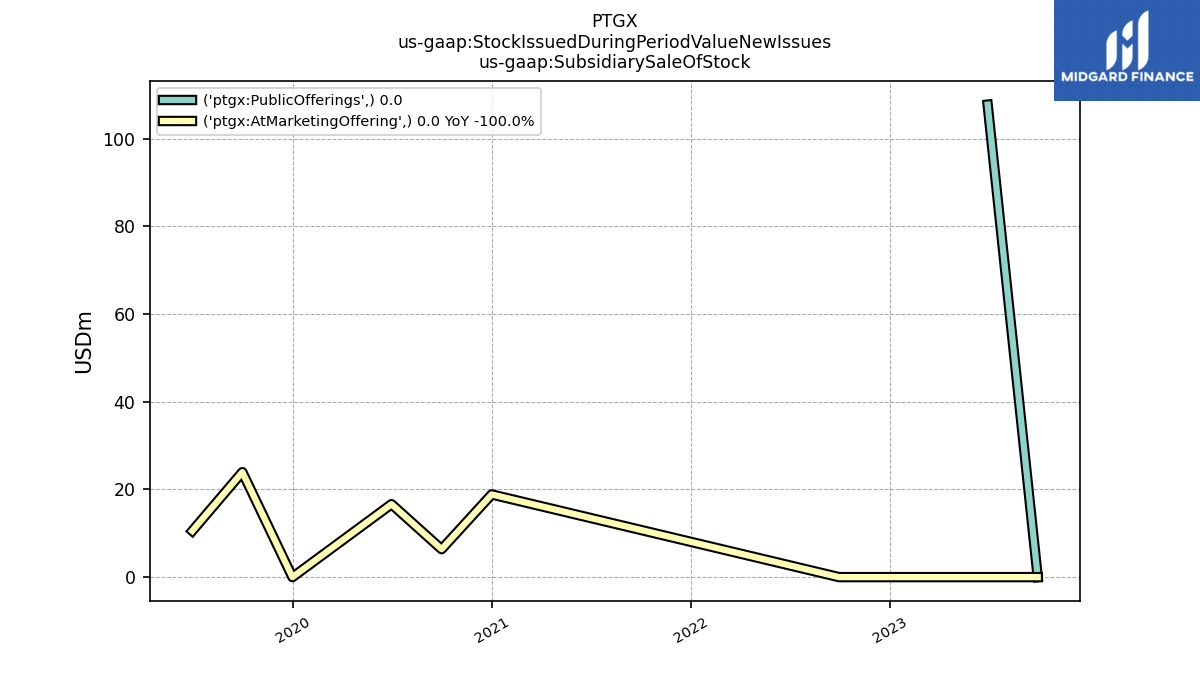
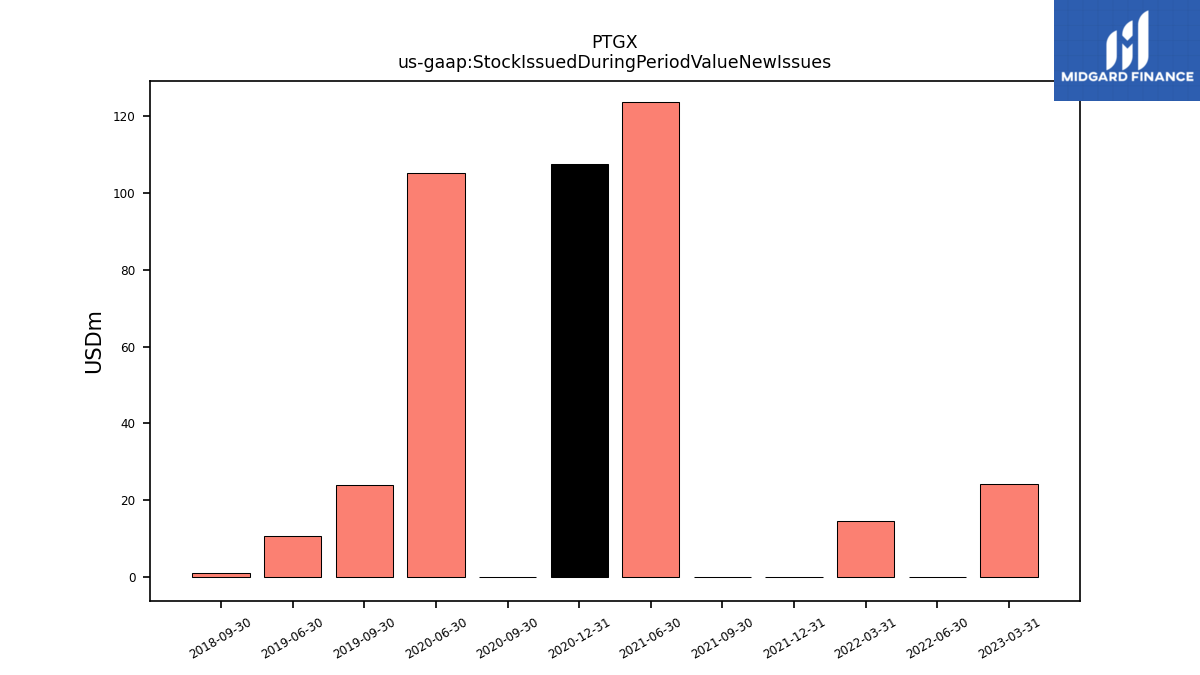
| Stock Issued During Period Value New Issues | NA | NA | 0.00 | 14.55 | 0.00 | 0.01 | 123.80 | NA | 107.65 | -0.00 | NA | 23.95 | NA | NA | 1.02 | NA | NA | NA | NA | NA | |
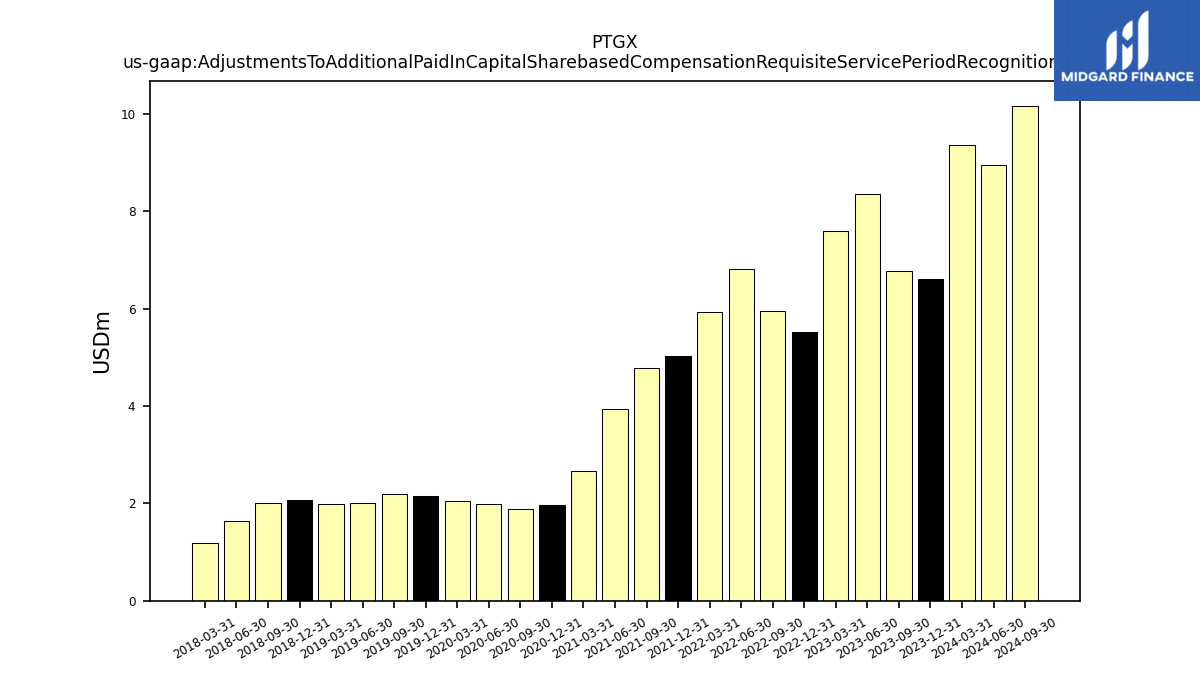
| Adjustments To Additional Paid In Capital Sharebased Compensation Requisite Service Period Recognition Value | 5.51 | 5.95 | 6.80 | 5.93 | 5.02 | 4.78 | 3.94 | 2.66 | 1.97 | 1.89 | 2.16 | 2.20 | 1.98 | 2.07 | 2.02 | 1.65 | 1.19 | NA | NA | NA |
| 2022-12-31 | 2022-09-30 | 2022-06-30 | 2022-03-31 | 2021-12-31 | 2021-09-30 | 2021-06-30 | 2021-03-31 | 2020-12-31 | 2020-09-30 | 2019-12-31 | 2019-09-30 | 2019-03-31 | 2018-12-31 | 2018-09-30 | 2018-06-30 | 2018-03-31 | 2017-12-31 | 2017-09-30 | 2016-09-30 | ||
|---|---|---|---|---|---|---|---|---|---|---|---|---|---|---|---|---|---|---|---|---|---|
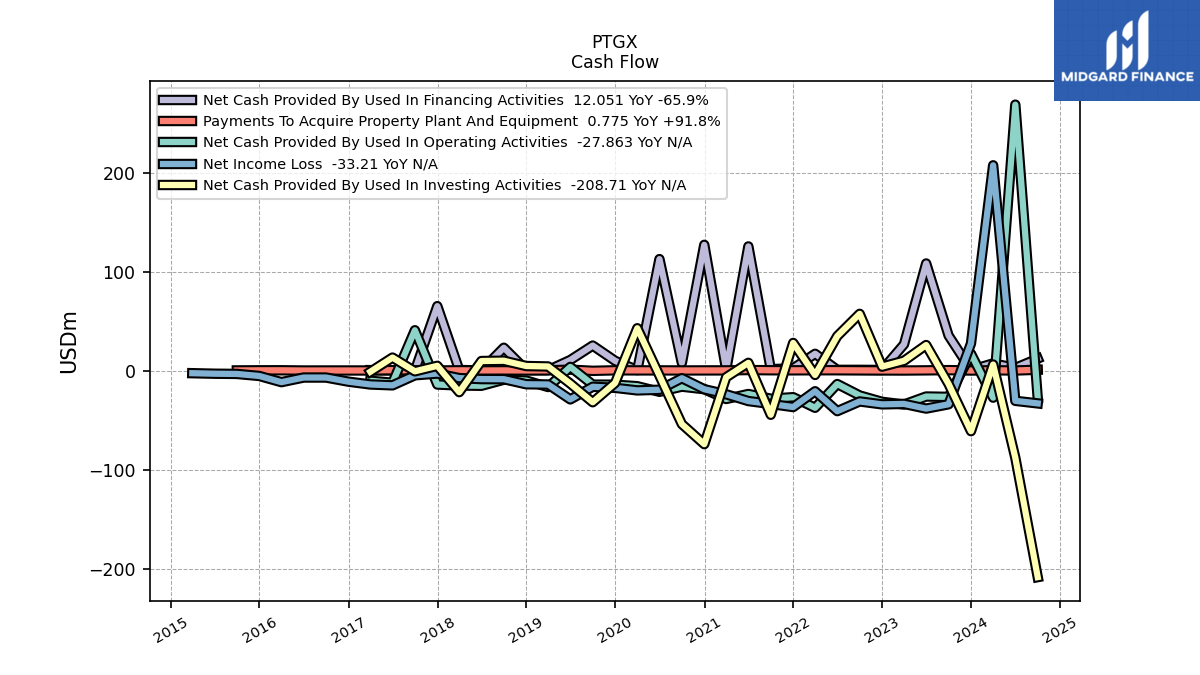
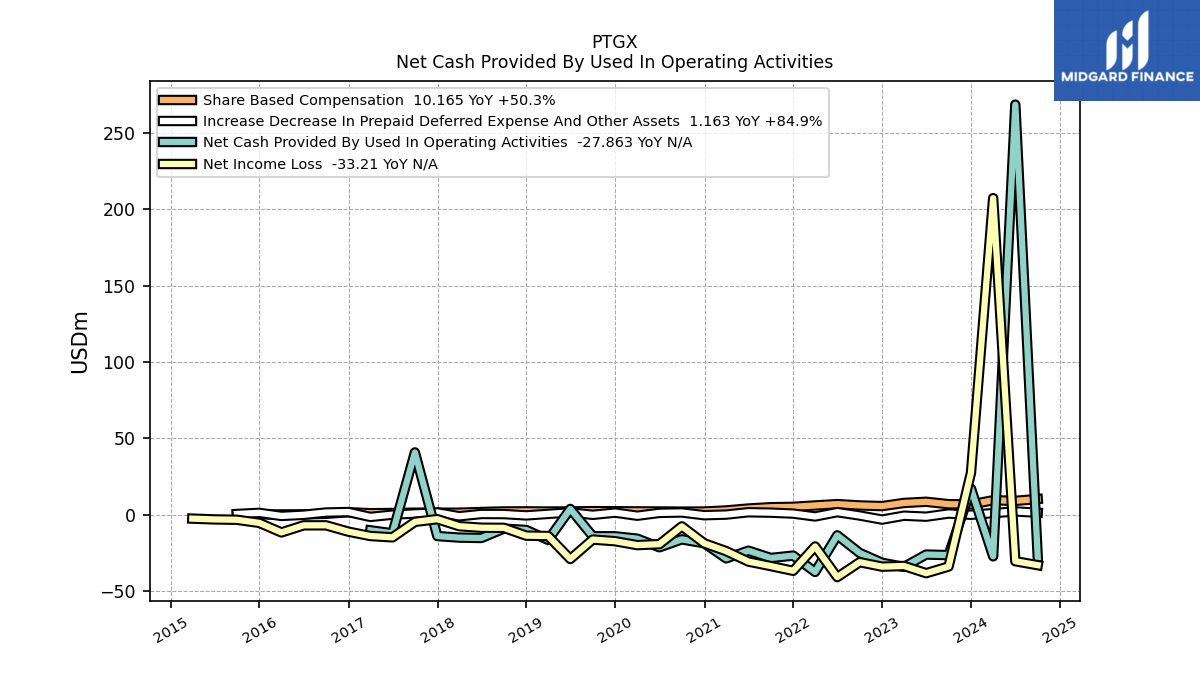
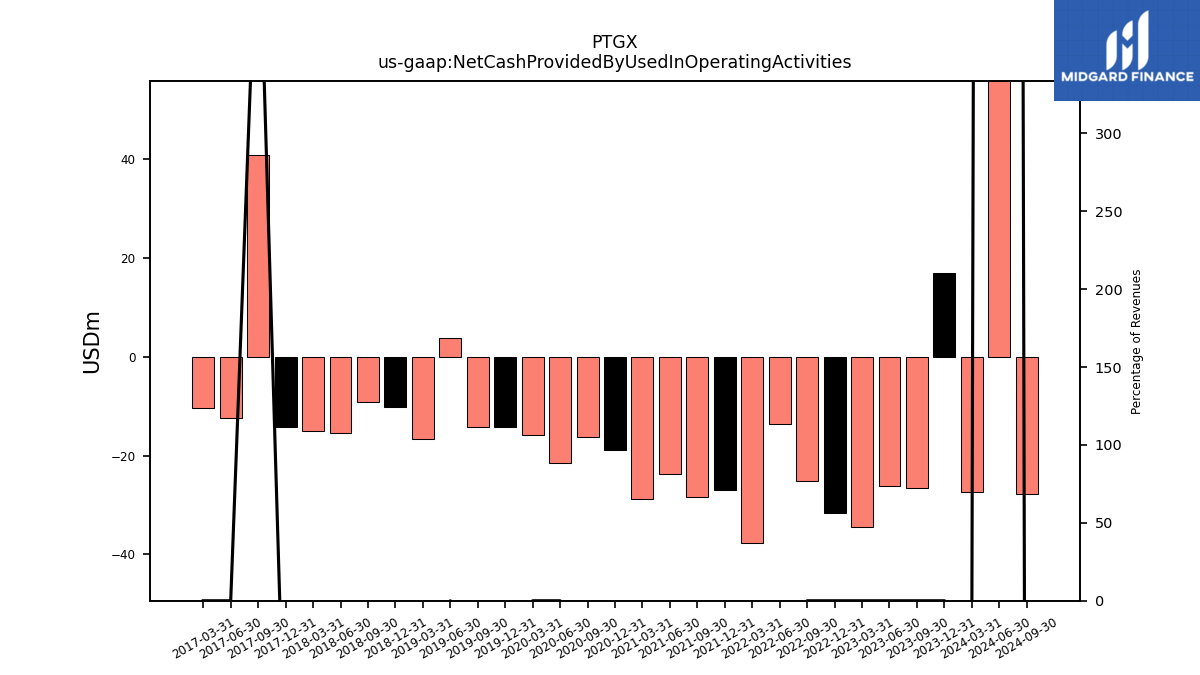
| Net Cash Provided By Used In Operating Activities | -31.64 | -25.20 | -13.63 | -37.67 | -26.94 | -28.47 | -23.70 | -28.76 | -18.87 | -16.29 | -14.29 | -14.25 | -16.66 | -10.13 | -9.28 | -15.40 | -15.14 | -14.15 | 40.70 | NA | |
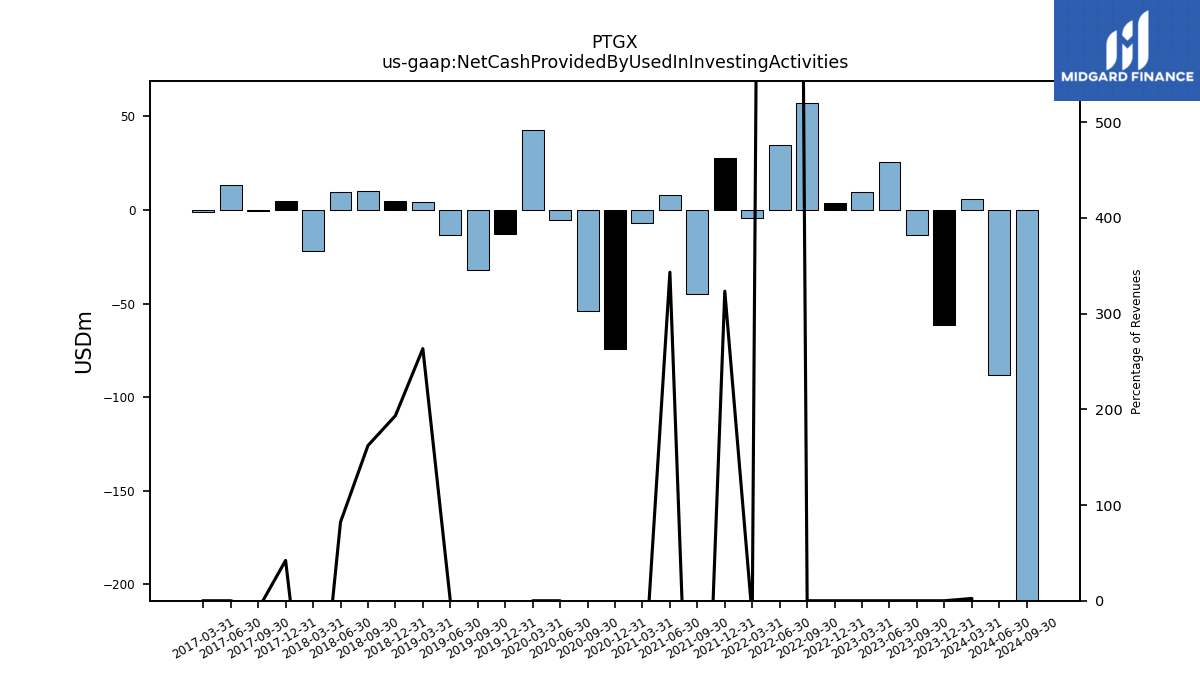
| Net Cash Provided By Used In Investing Activities | 3.94 | 57.27 | 34.73 | -4.48 | 27.87 | -44.71 | 7.77 | -6.79 | -74.40 | -54.12 | -12.55 | -32.04 | 4.11 | 4.55 | 9.92 | 9.59 | -21.84 | 4.75 | -0.77 | NA | |
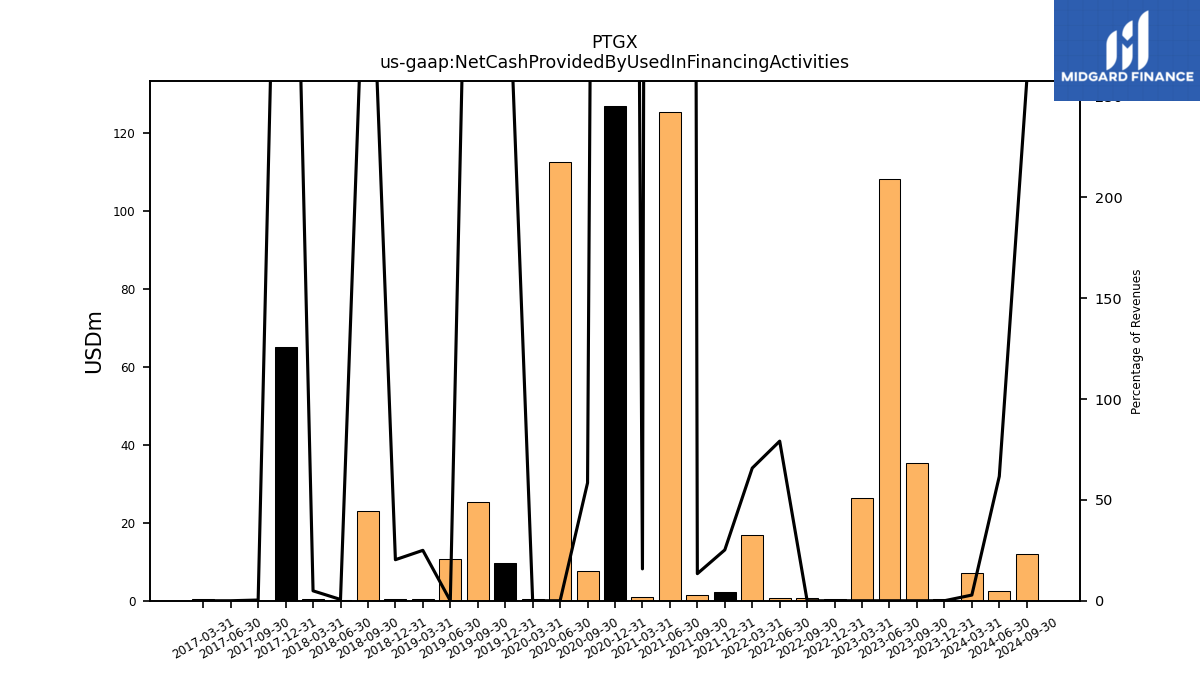
| Net Cash Provided By Used In Financing Activities | 0.55 | 0.68 | 0.68 | 16.93 | 2.17 | 1.38 | 125.39 | 0.98 | 126.98 | 7.67 | 9.78 | 25.24 | 0.39 | 0.48 | 23.03 | 0.07 | 0.53 | 65.06 | 0.03 | NA |
| 2022-12-31 | 2022-09-30 | 2022-06-30 | 2022-03-31 | 2021-12-31 | 2021-09-30 | 2021-06-30 | 2021-03-31 | 2020-12-31 | 2020-09-30 | 2019-12-31 | 2019-09-30 | 2019-03-31 | 2018-12-31 | 2018-09-30 | 2018-06-30 | 2018-03-31 | 2017-12-31 | 2017-09-30 | 2016-09-30 | ||
|---|---|---|---|---|---|---|---|---|---|---|---|---|---|---|---|---|---|---|---|---|---|
| Net Cash Provided By Used In Operating Activities | -31.64 | -25.20 | -13.63 | -37.67 | -26.94 | -28.47 | -23.70 | -28.76 | -18.87 | -16.29 | -14.29 | -14.25 | -16.66 | -10.13 | -9.28 | -15.40 | -15.14 | -14.15 | 40.70 | NA | |
| Net Income Loss | -34.19 | -31.23 | -41.04 | -20.93 | -36.91 | -33.80 | -30.84 | -24.00 | -18.89 | -7.76 | -17.50 | -16.41 | -14.10 | -13.87 | -8.73 | -8.66 | -7.66 | -3.05 | -4.83 | -7.08 | |
| Profit Loss | -34.19 | -31.23 | -41.04 | -20.93 | -36.91 | -33.80 | -30.84 | -24.00 | -18.89 | -7.76 | -17.50 | -16.41 | -14.10 | -13.87 | -8.73 | -8.66 | -7.66 | -3.05 | -4.83 | NA | |
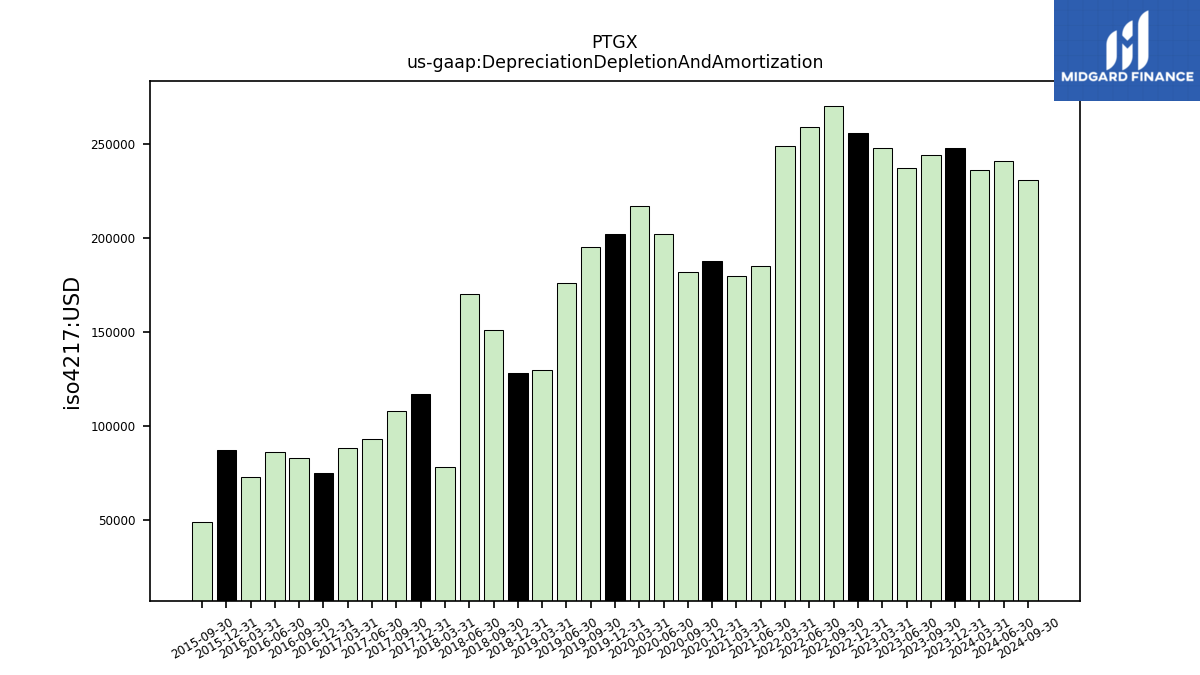
| Depreciation Depletion And Amortization | 0.26 | 0.27 | 0.26 | 0.25 | NA | NA | 0.18 | 0.18 | 0.19 | 0.18 | 0.20 | 0.20 | 0.13 | 0.13 | 0.15 | 0.17 | 0.08 | 0.12 | 0.11 | 0.08 | |
| Share Based Compensation | 5.51 | 5.95 | 6.80 | 5.93 | 5.02 | 4.78 | 3.94 | 2.66 | 1.97 | 1.89 | 2.16 | 2.20 | 1.98 | 2.07 | 2.02 | 1.65 | 1.19 | 1.19 | 1.21 | 0.45 |
| 2022-12-31 | 2022-09-30 | 2022-06-30 | 2022-03-31 | 2021-12-31 | 2021-09-30 | 2021-06-30 | 2021-03-31 | 2020-12-31 | 2020-09-30 | 2019-12-31 | 2019-09-30 | 2019-03-31 | 2018-12-31 | 2018-09-30 | 2018-06-30 | 2018-03-31 | 2017-12-31 | 2017-09-30 | 2016-09-30 | ||
|---|---|---|---|---|---|---|---|---|---|---|---|---|---|---|---|---|---|---|---|---|---|
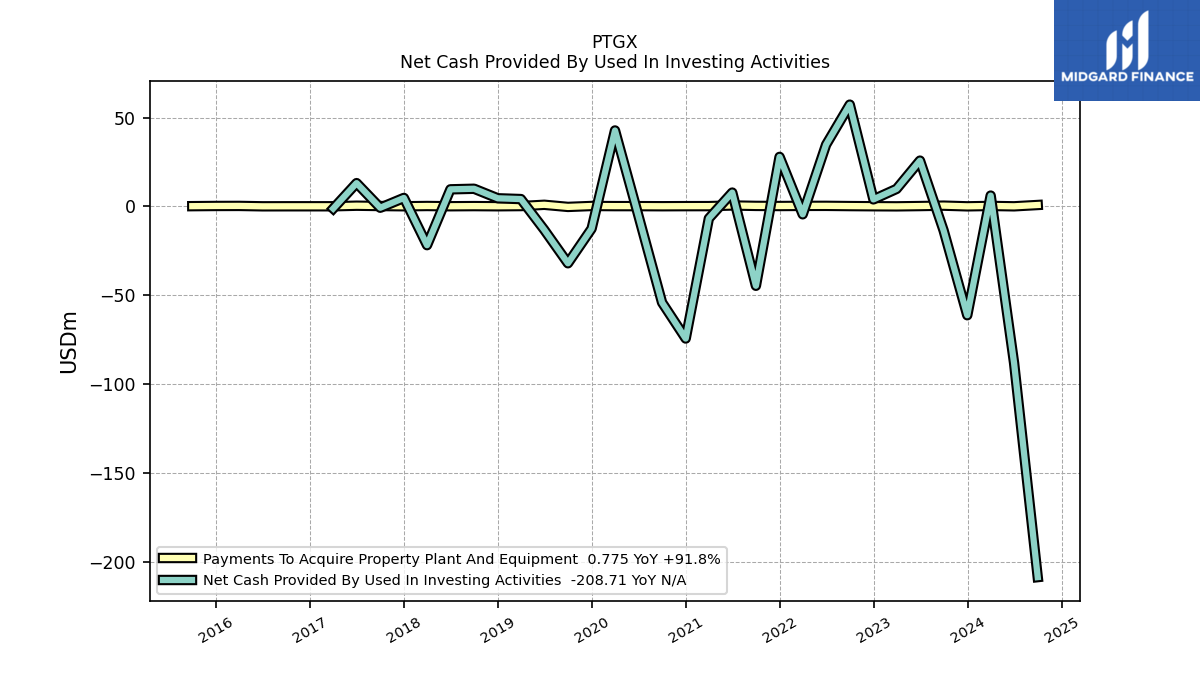
| Net Cash Provided By Used In Investing Activities | 3.94 | 57.27 | 34.73 | -4.48 | 27.87 | -44.71 | 7.77 | -6.79 | -74.40 | -54.12 | -12.55 | -32.04 | 4.11 | 4.55 | 9.92 | 9.59 | -21.84 | 4.75 | -0.77 | NA | |
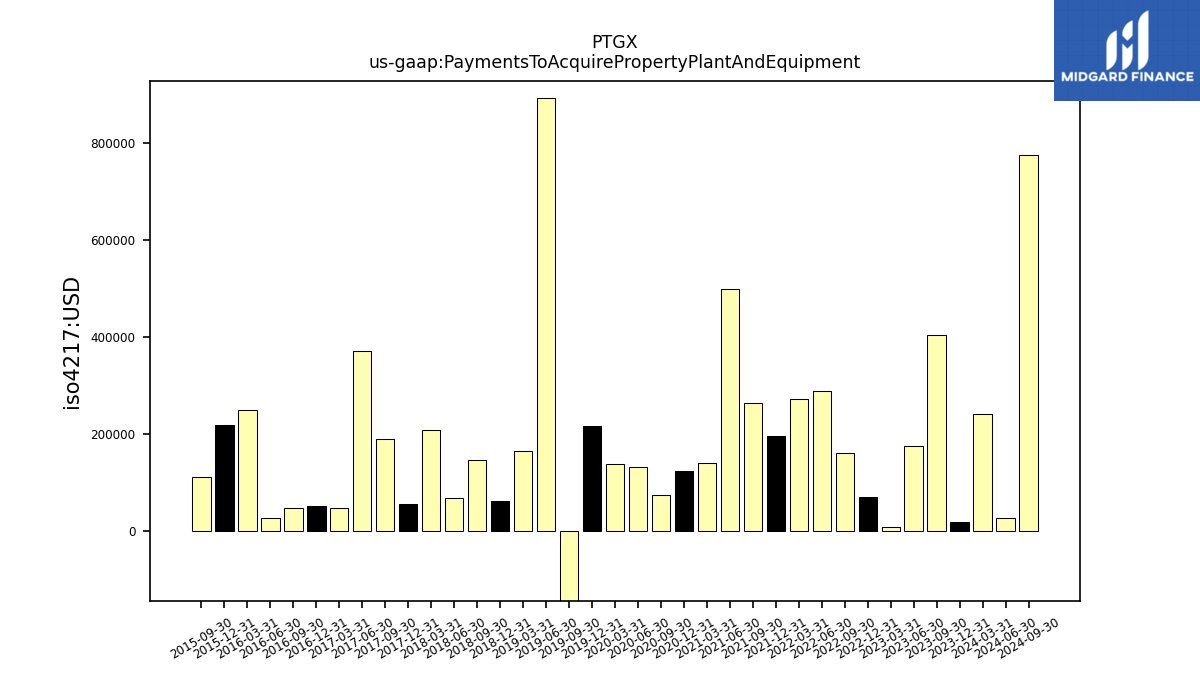
| Payments To Acquire Property Plant And Equipment | 0.07 | 0.16 | 0.29 | 0.27 | 0.20 | 0.27 | 0.50 | 0.14 | 0.12 | 0.07 | 0.22 | -0.31 | 0.17 | 0.06 | 0.15 | 0.07 | 0.21 | 0.06 | 0.19 | 0.05 |
| 2022-12-31 | 2022-09-30 | 2022-06-30 | 2022-03-31 | 2021-12-31 | 2021-09-30 | 2021-06-30 | 2021-03-31 | 2020-12-31 | 2020-09-30 | 2019-12-31 | 2019-09-30 | 2019-03-31 | 2018-12-31 | 2018-09-30 | 2018-06-30 | 2018-03-31 | 2017-12-31 | 2017-09-30 | 2016-09-30 | ||
|---|---|---|---|---|---|---|---|---|---|---|---|---|---|---|---|---|---|---|---|---|---|
| Net Cash Provided By Used In Financing Activities | 0.55 | 0.68 | 0.68 | 16.93 | 2.17 | 1.38 | 125.39 | 0.98 | 126.98 | 7.67 | 9.78 | 25.24 | 0.39 | 0.48 | 23.03 | 0.07 | 0.53 | 65.06 | 0.03 | NA |
| 2022-12-31 | 2022-09-30 | 2022-06-30 | 2022-03-31 | 2021-12-31 | 2021-09-30 | 2021-06-30 | 2021-03-31 | 2020-12-31 | 2020-09-30 | 2019-12-31 | 2019-09-30 | 2019-03-31 | 2018-12-31 | 2018-09-30 | 2018-06-30 | 2018-03-31 | 2017-12-31 | 2017-09-30 | 2016-09-30 | ||
|---|---|---|---|---|---|---|---|---|---|---|---|---|---|---|---|---|---|---|---|---|---|
| Revenues | 0.00 | 0.00 | 0.86 | 25.72 | 8.62 | 10.29 | 2.27 | 6.19 | 5.65 | 13.11 | 2.72 | 4.14 | 1.56 | 2.35 | 6.12 | 11.67 | 10.78 | 11.28 | 8.78 | 0.00 | |
| Revenue From Contract With Customer Including Assessed Tax | 0.00 | 0.00 | 0.86 | 25.72 | 8.62 | 10.29 | 2.27 | 6.19 | 5.65 | 13.11 | 2.72 | 4.14 | 1.56 | 2.35 | 6.12 | 11.67 | 10.78 | 11.28 | 8.78 | 0.00 |

