
| 2023-06-30 | 2023-03-31 | 2022-12-31 | 2022-09-30 | 2022-06-30 | 2022-03-31 | 2021-12-31 | 2021-09-30 | 2021-06-30 | 2021-03-31 | 2020-12-31 | 2020-09-30 | 2020-06-30 | ||
|---|---|---|---|---|---|---|---|---|---|---|---|---|---|---|
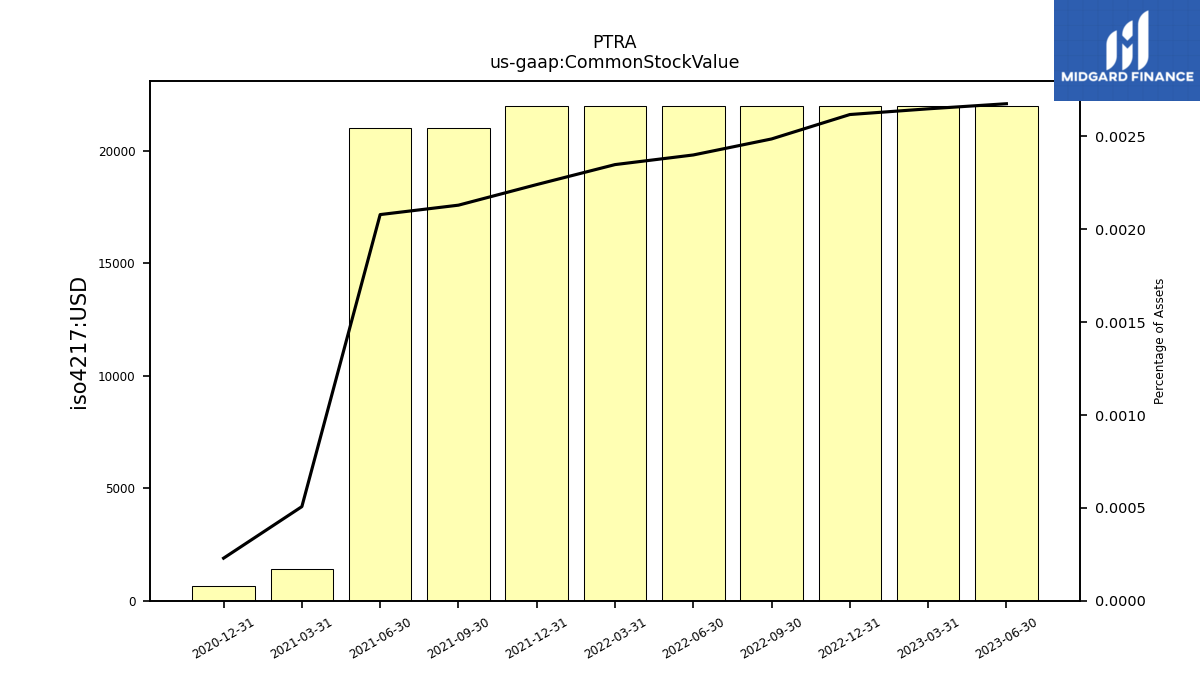
| Common Stock Value | 0.02 | 0.02 | 0.02 | 0.02 | 0.02 | 0.02 | 0.02 | 0.02 | 0.02 | 0.00 | 0.00 | NA | NA | |
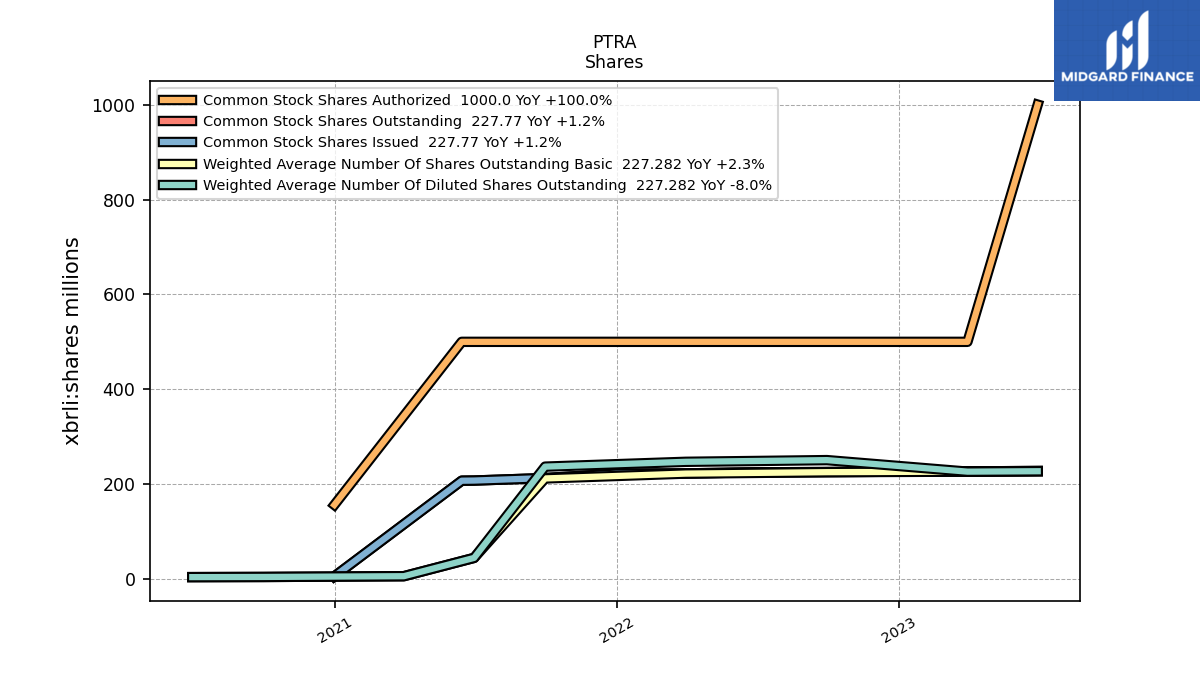
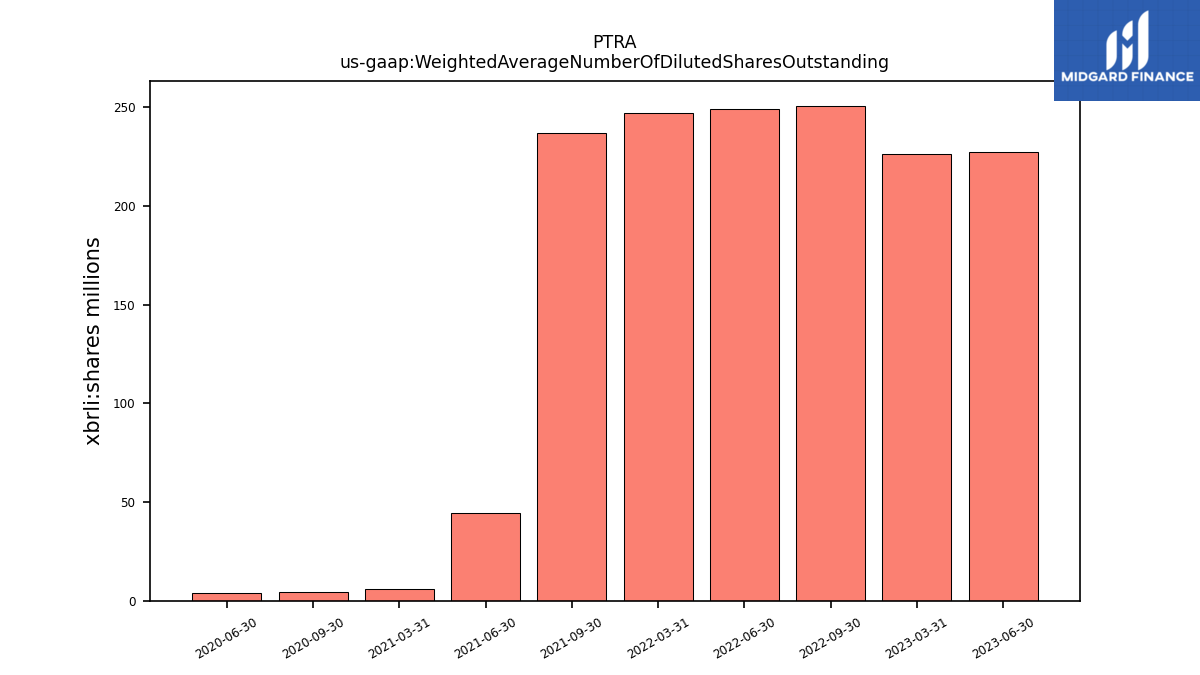
| Weighted Average Number Of Diluted Shares Outstanding | 227.28 | 226.41 | NA | 250.70 | 248.88 | 247.13 | NA | 236.97 | 44.57 | 6.02 | NA | 4.41 | 4.06 | |
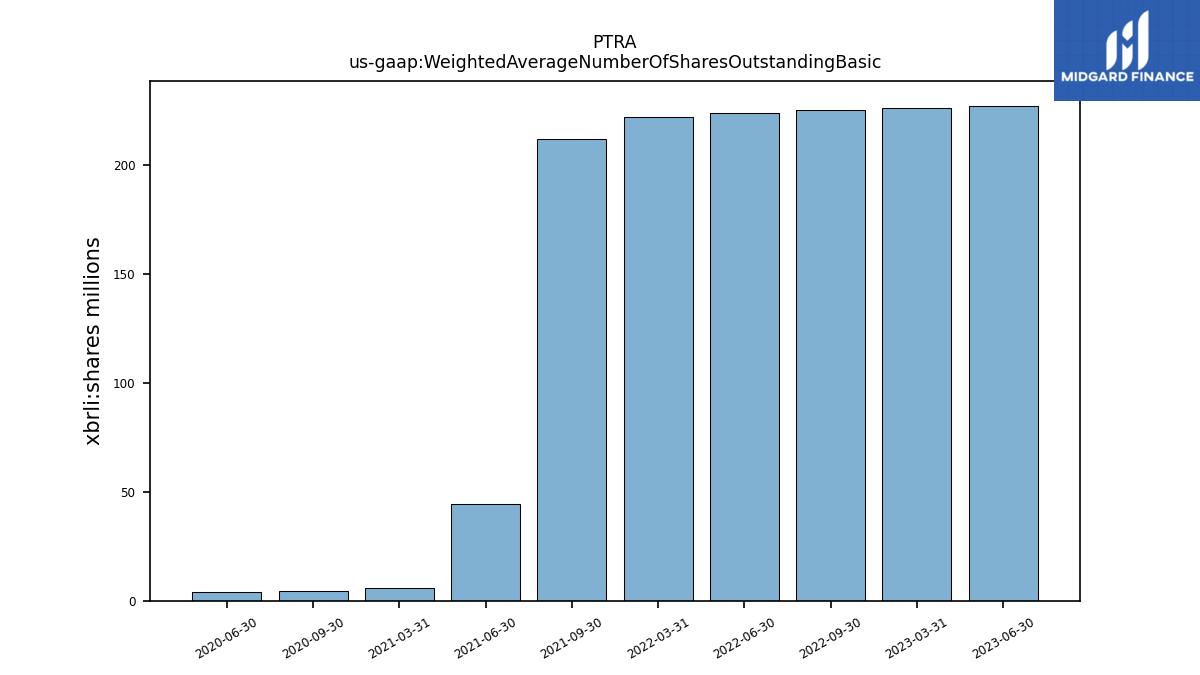
| Weighted Average Number Of Shares Outstanding Basic | 227.28 | 226.41 | NA | 225.29 | 223.75 | 222.28 | NA | 212.07 | 44.57 | 6.02 | NA | 4.41 | 4.06 | |
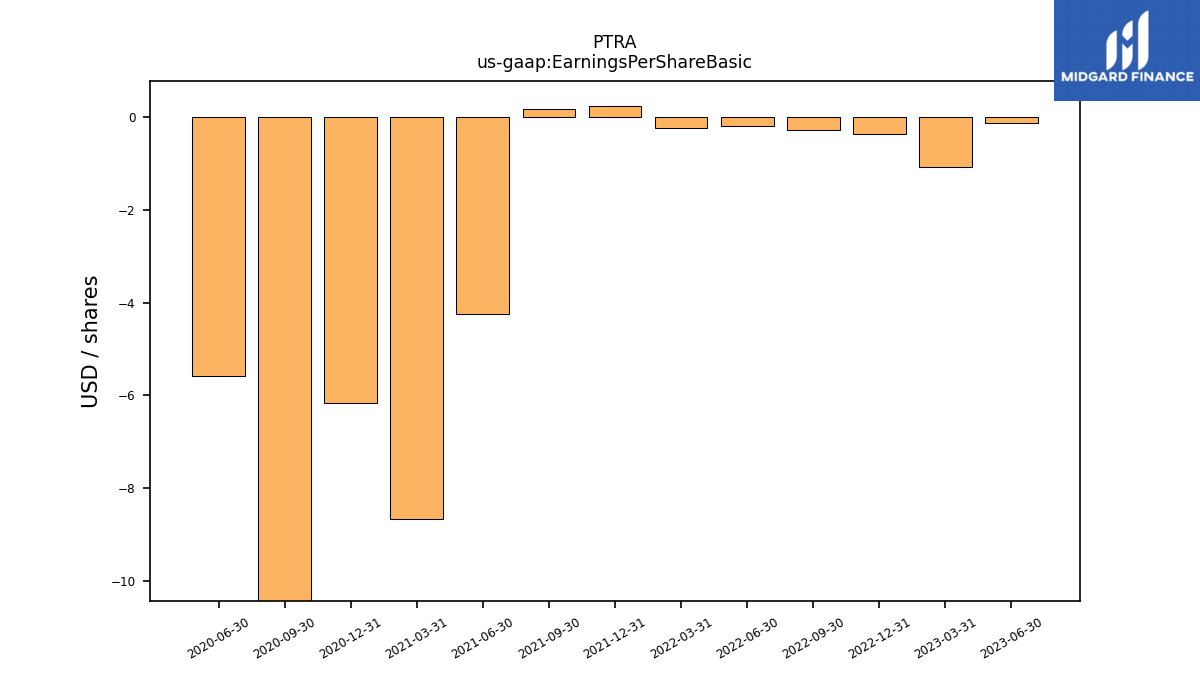
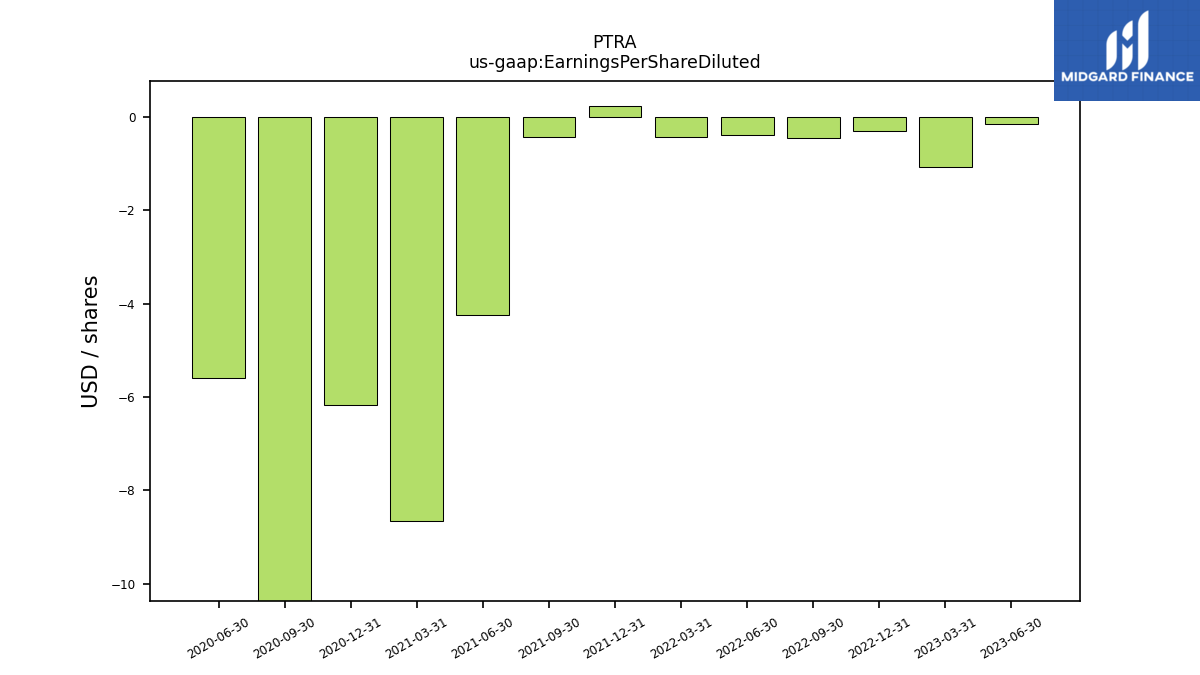
| Earnings Per Share Basic | -0.14 | -1.08 | -0.36 | -0.29 | -0.19 | -0.23 | 0.23 | 0.17 | -4.24 | -8.66 | -6.16 | -10.64 | -5.59 | |
| Earnings Per Share Diluted | -0.14 | -1.08 | -0.29 | -0.45 | -0.38 | -0.43 | 0.23 | -0.42 | -4.24 | -8.66 | -6.16 | -10.64 | -5.59 |
| 2023-06-30 | 2023-03-31 | 2022-12-31 | 2022-09-30 | 2022-06-30 | 2022-03-31 | 2021-12-31 | 2021-09-30 | 2021-06-30 | 2021-03-31 | 2020-12-31 | 2020-09-30 | 2020-06-30 | ||
|---|---|---|---|---|---|---|---|---|---|---|---|---|---|---|
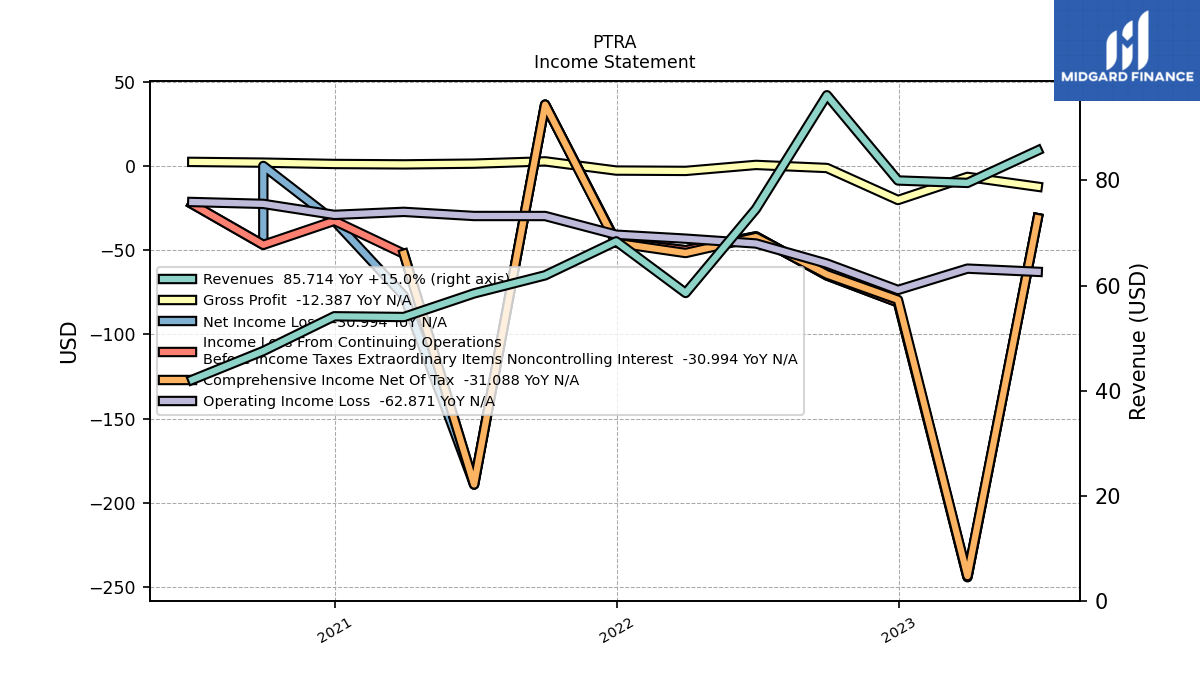
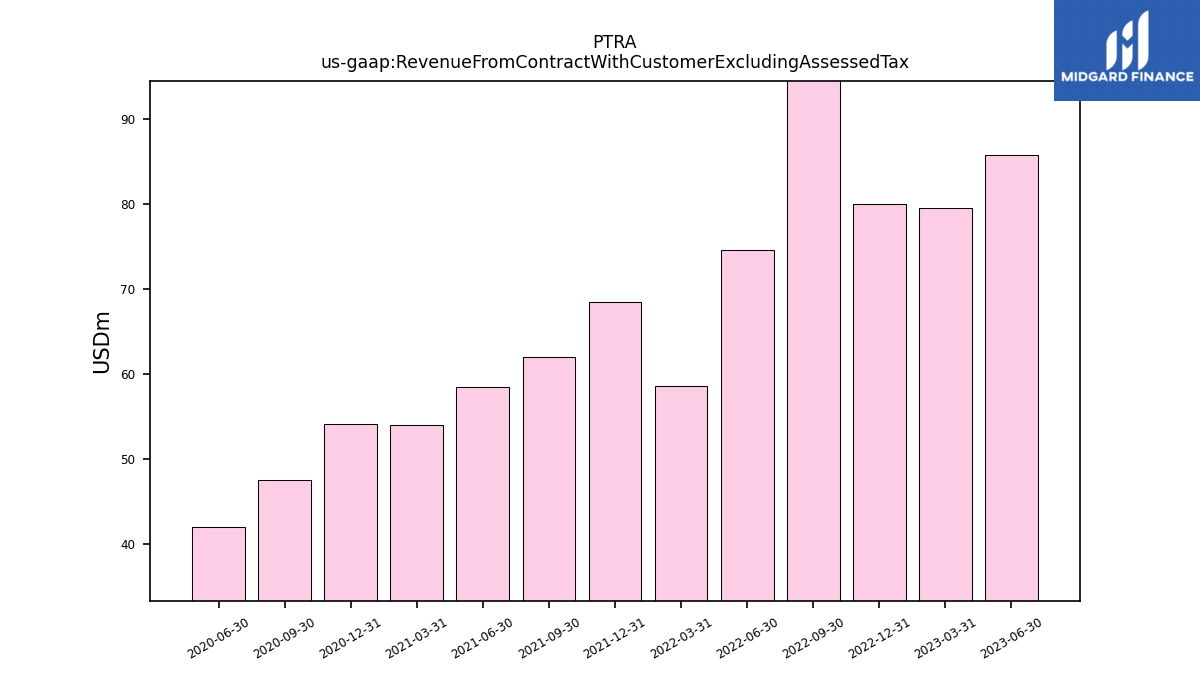
| Revenue From Contract With Customer Excluding Assessed Tax | 85.71 | 79.53 | 80.00 | 96.22 | 74.56 | 58.58 | 68.41 | 61.94 | 58.50 | 54.01 | 54.15 | 47.54 | 42.06 | |
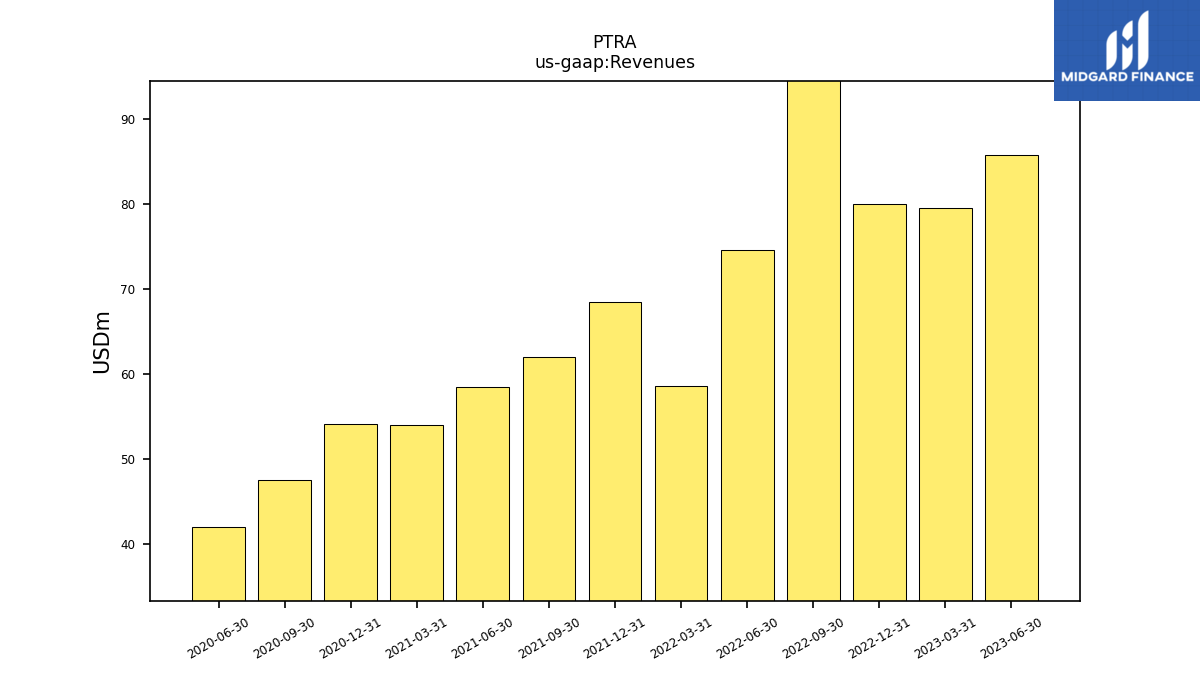
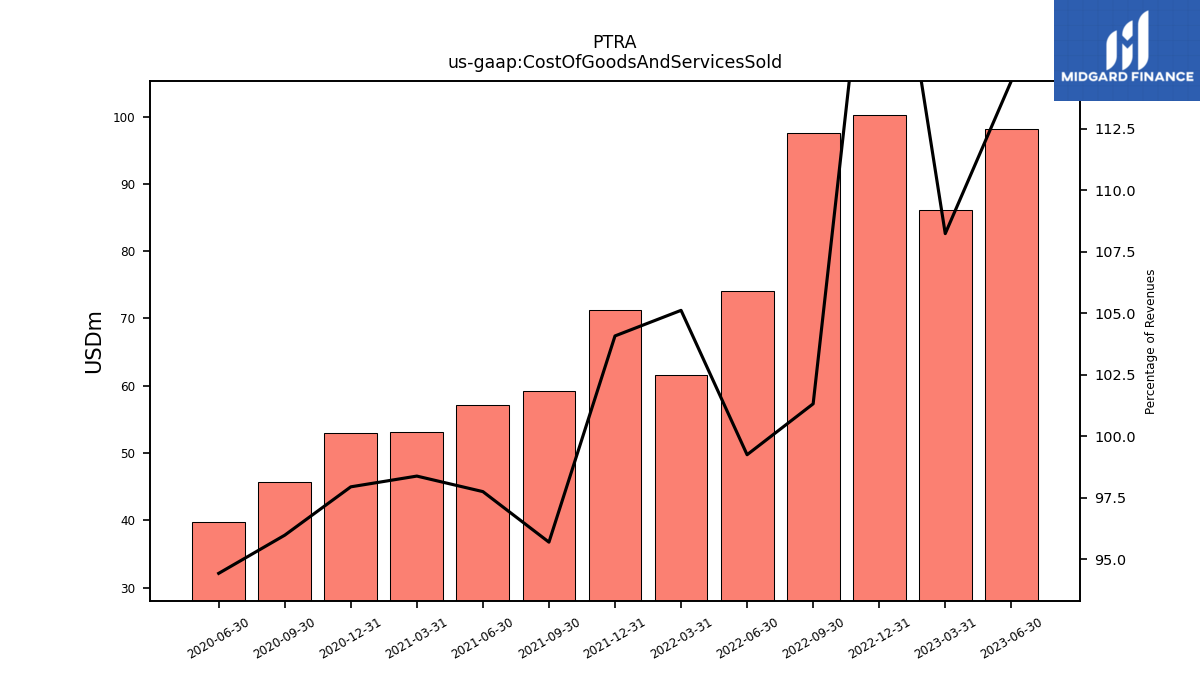
| Revenues | 85.71 | 79.53 | 80.00 | 96.22 | 74.56 | 58.58 | 68.41 | 61.94 | 58.50 | 54.01 | 54.15 | 47.54 | 42.06 | |
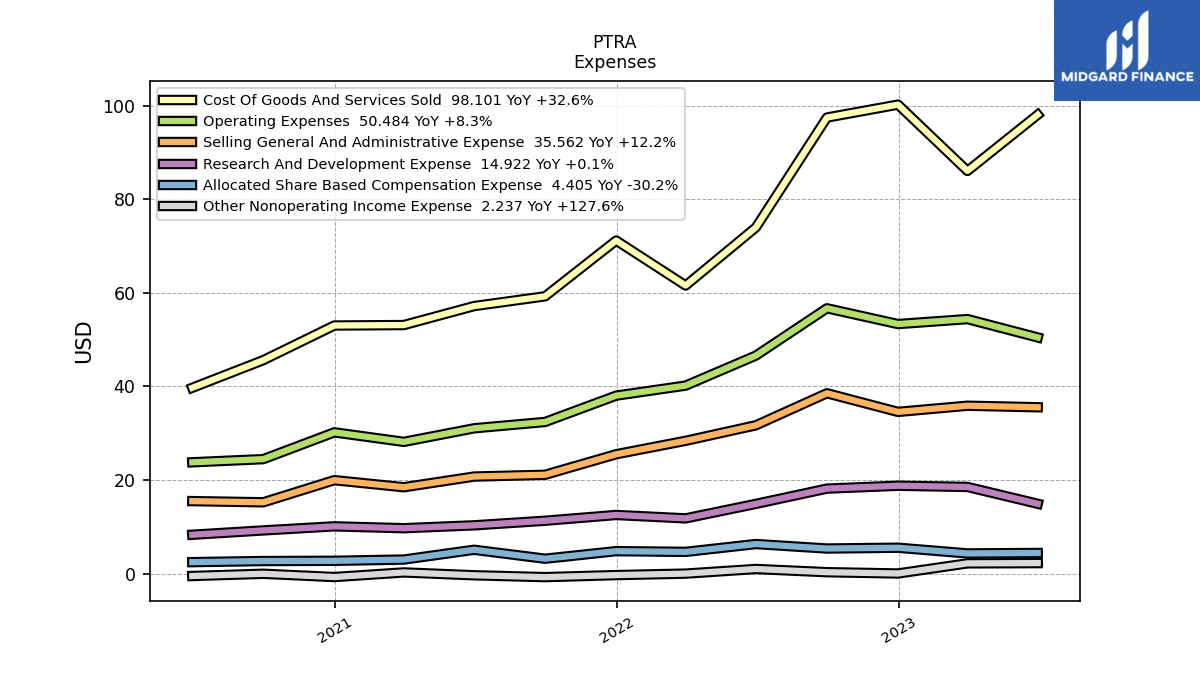
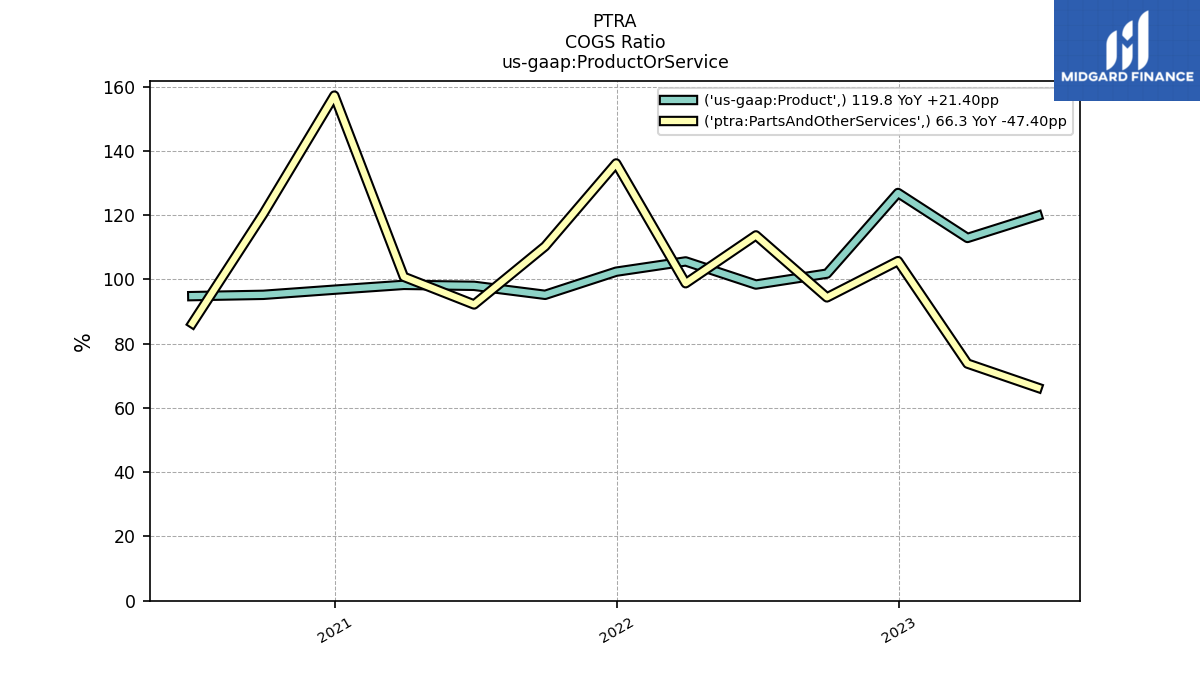
| Cost Of Goods And Services Sold | 98.10 | 86.09 | 100.26 | 97.50 | 74.01 | 61.58 | 71.21 | 59.28 | 57.19 | 53.13 | 53.04 | 45.63 | 39.72 | |
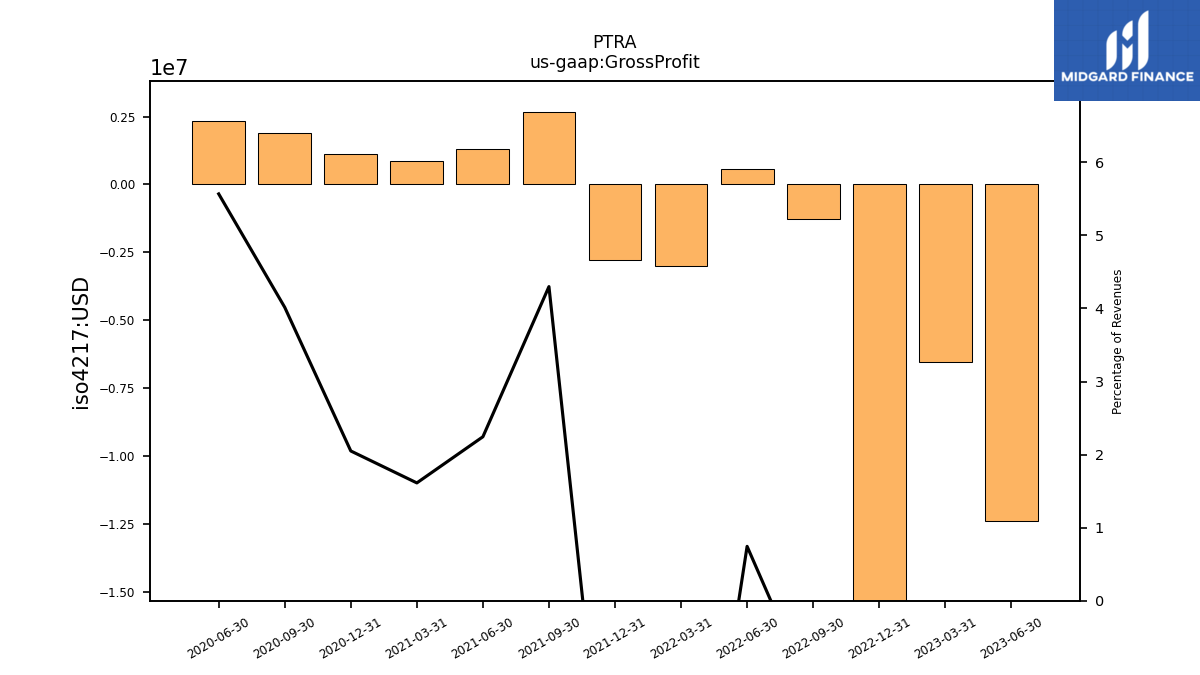
| Gross Profit | -12.39 | -6.56 | -20.27 | -1.28 | 0.56 | -3.00 | -2.79 | 2.66 | 1.31 | 0.87 | 1.11 | 1.91 | 2.34 | |
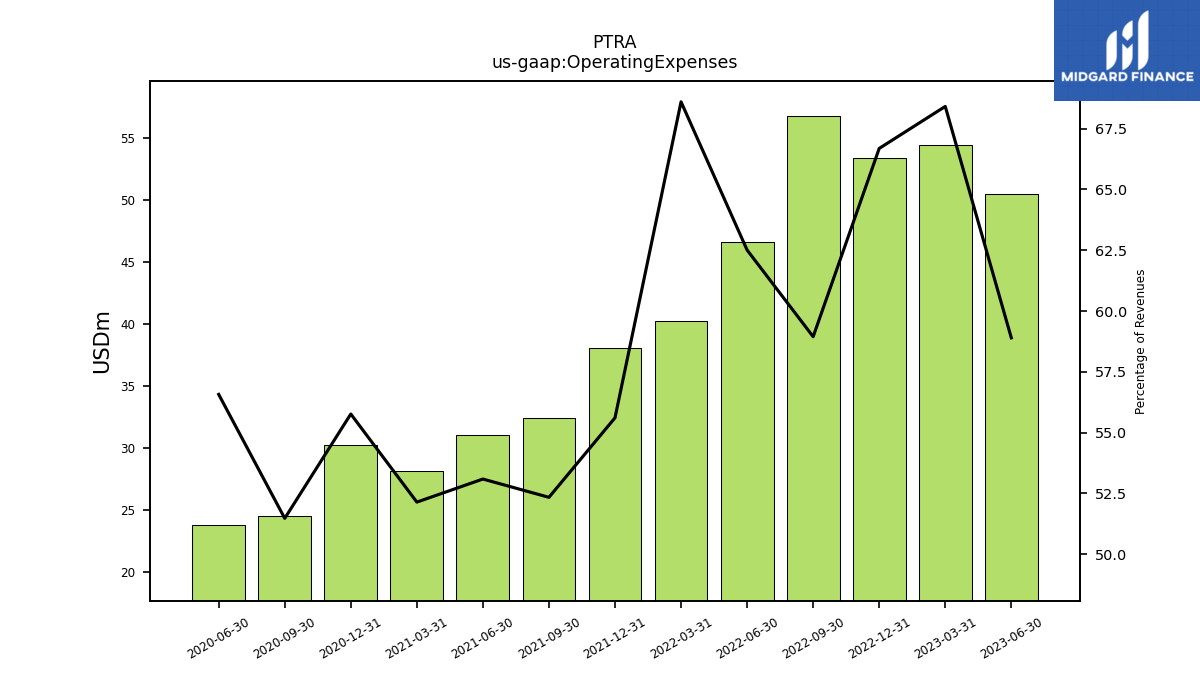
| Operating Expenses | 50.48 | 54.41 | 53.35 | 56.72 | 46.61 | 40.19 | 38.04 | 32.42 | 31.06 | 28.16 | 30.20 | 24.47 | 23.79 | |
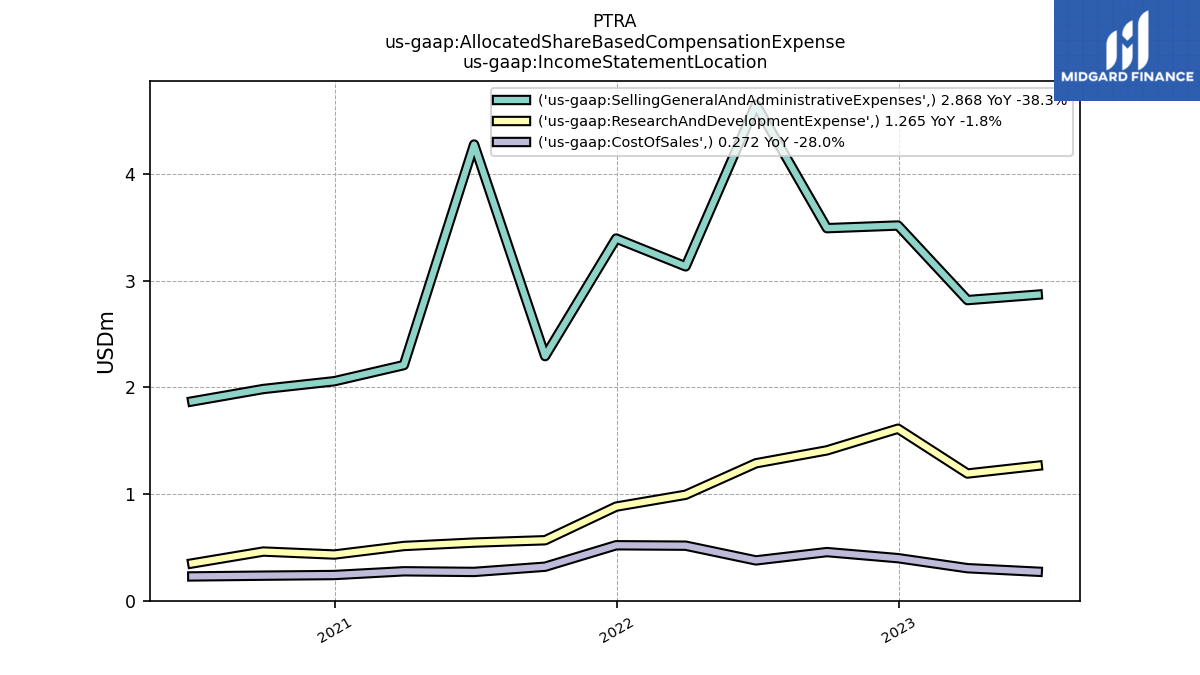
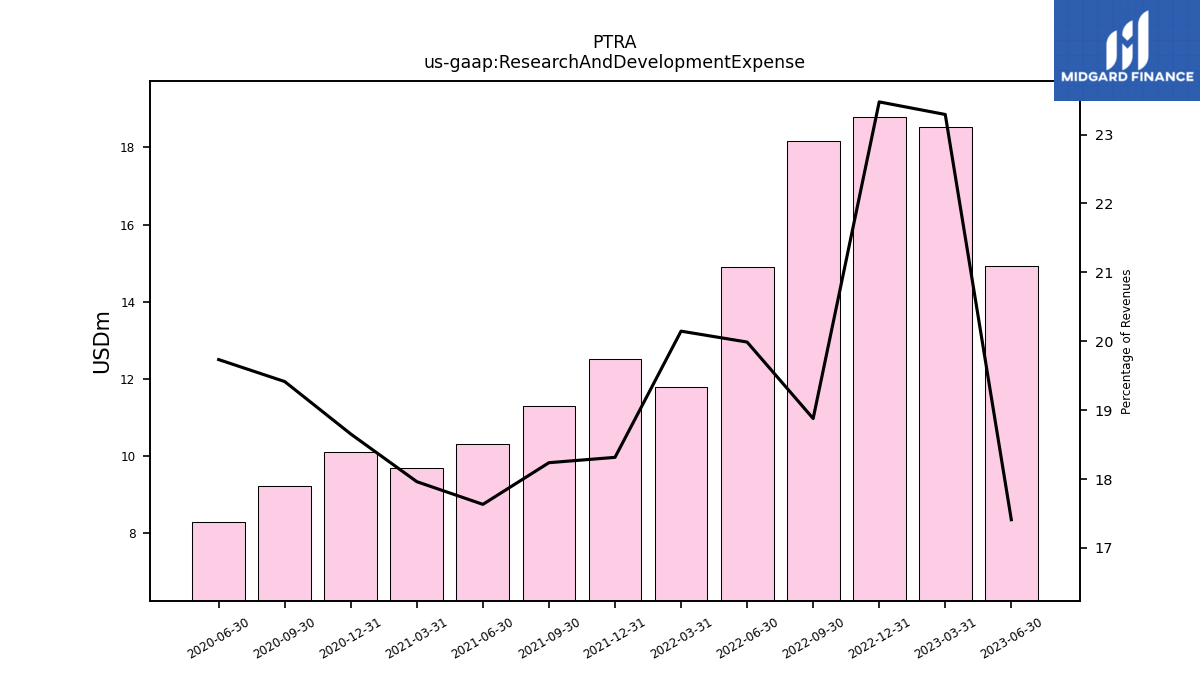
| Research And Development Expense | 14.92 | 18.52 | 18.78 | 18.16 | 14.90 | 11.80 | 12.53 | 11.30 | 10.31 | 9.70 | 10.10 | 9.23 | 8.30 | |
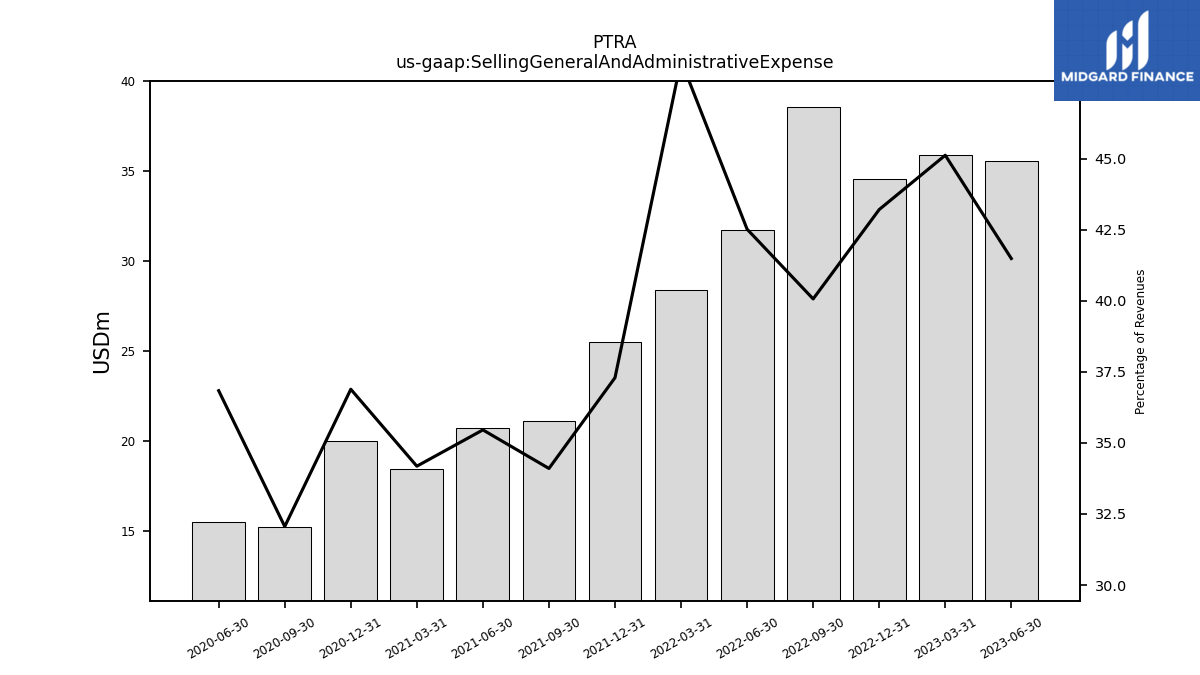
| Selling General And Administrative Expense | 35.56 | 35.89 | 34.57 | 38.55 | 31.70 | 28.39 | 25.51 | 21.12 | 20.74 | 18.46 | 19.97 | 15.24 | 15.49 | |
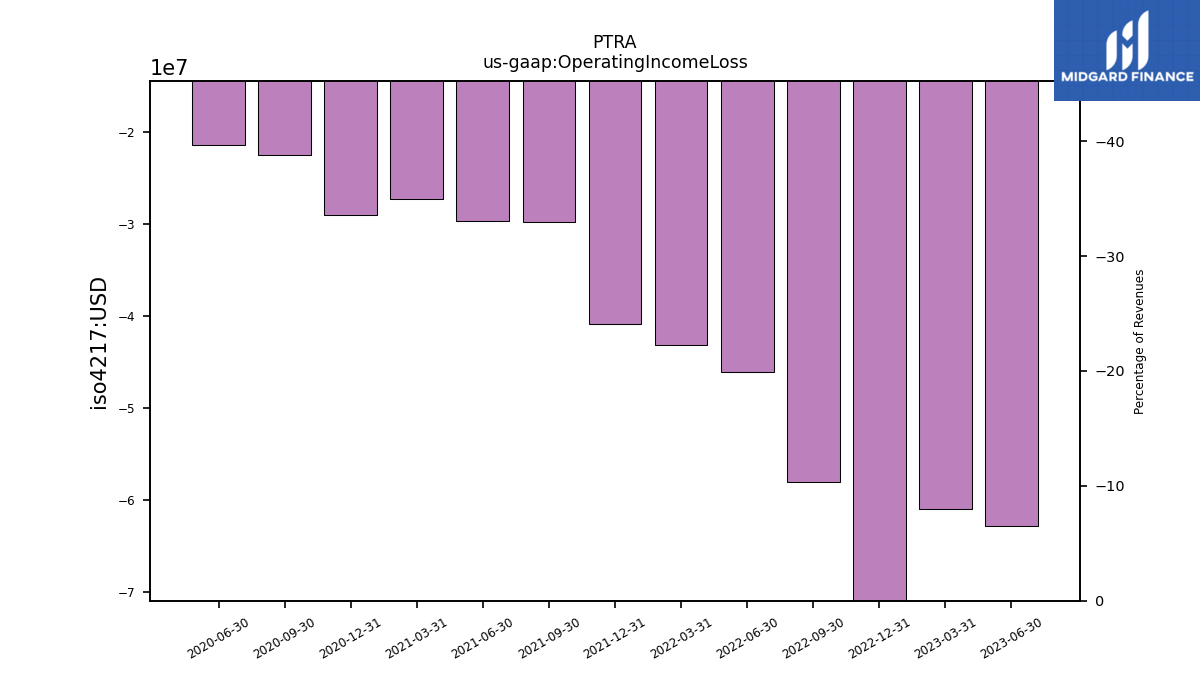
| Operating Income Loss | -62.87 | -60.97 | -73.61 | -57.99 | -46.05 | -43.19 | -40.84 | -29.76 | -29.75 | -27.29 | -29.09 | -22.56 | -21.45 | |
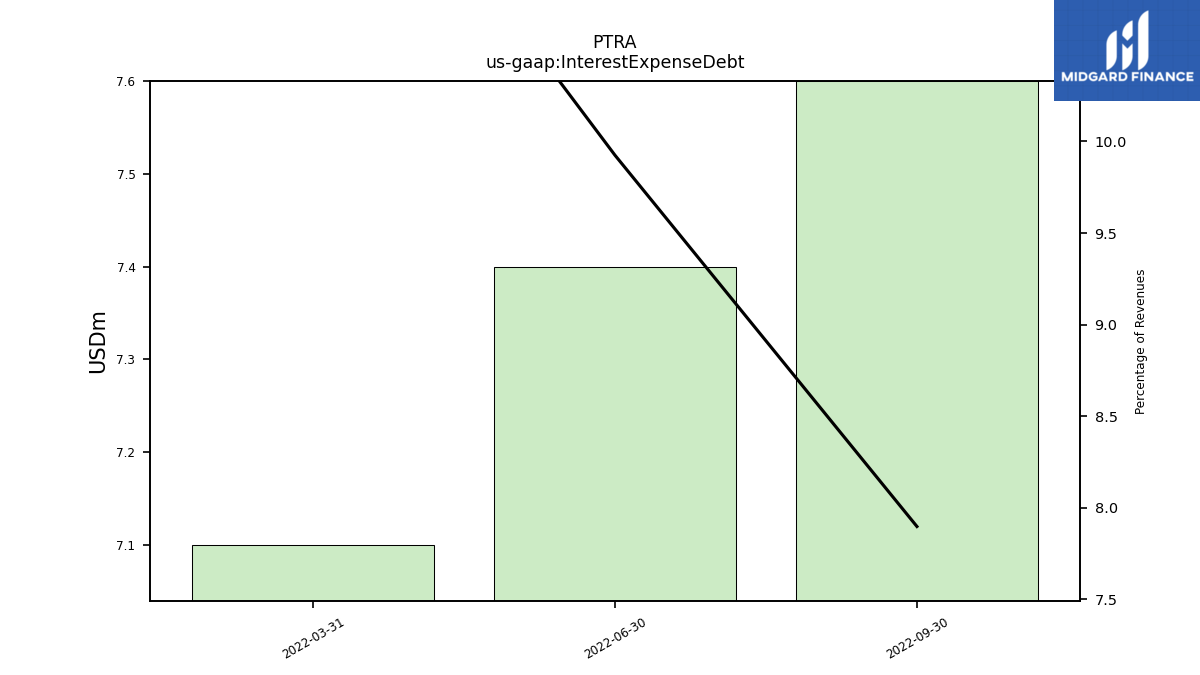
| Interest Expense Debt | NA | NA | NA | 7.60 | 7.40 | 7.10 | NA | NA | NA | NA | NA | NA | NA | |
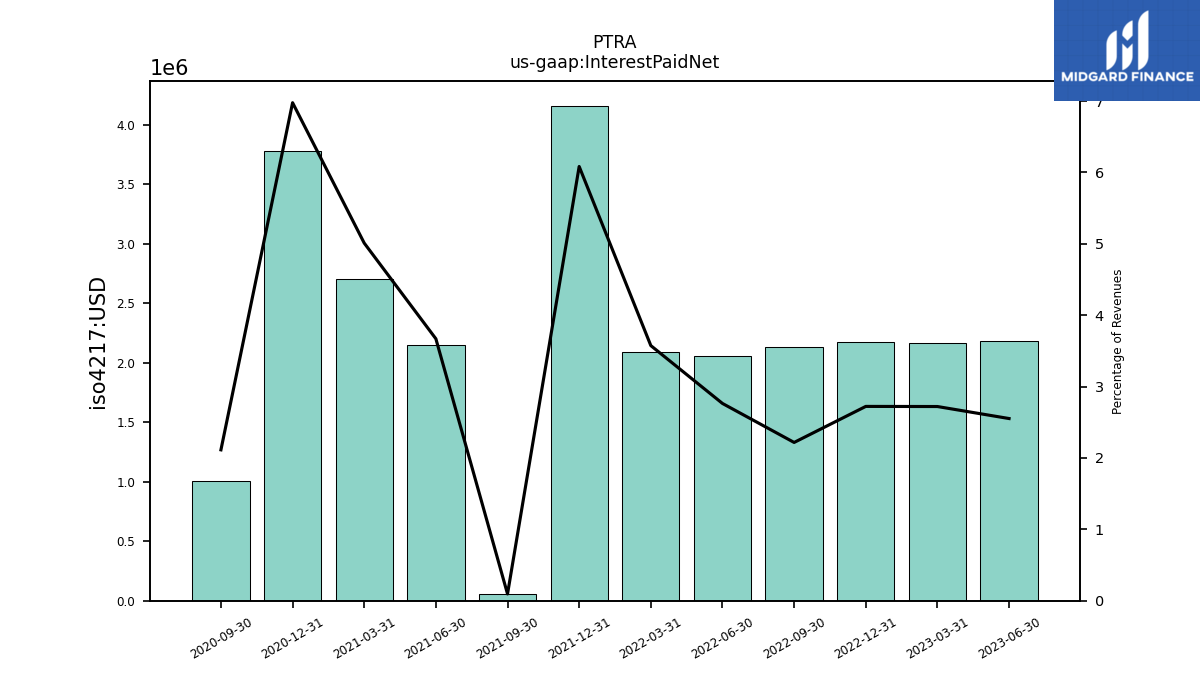
| Interest Paid Net | 2.19 | 2.16 | 2.18 | 2.13 | 2.06 | 2.09 | 4.16 | 0.06 | 2.15 | 2.71 | 3.78 | 1.00 | NA | |
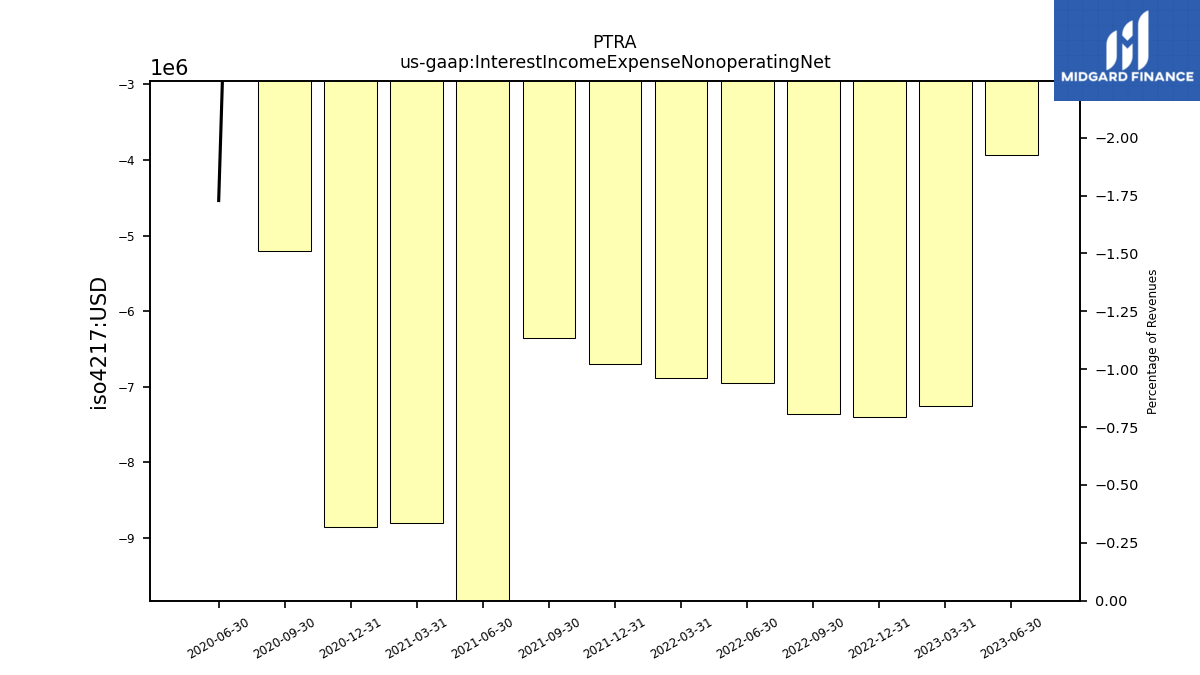
| Interest Income Expense Nonoperating Net | -3.94 | -7.25 | -7.40 | -7.36 | -6.95 | -6.88 | -6.69 | -6.36 | -29.13 | -8.80 | -8.85 | -5.20 | -0.73 | |
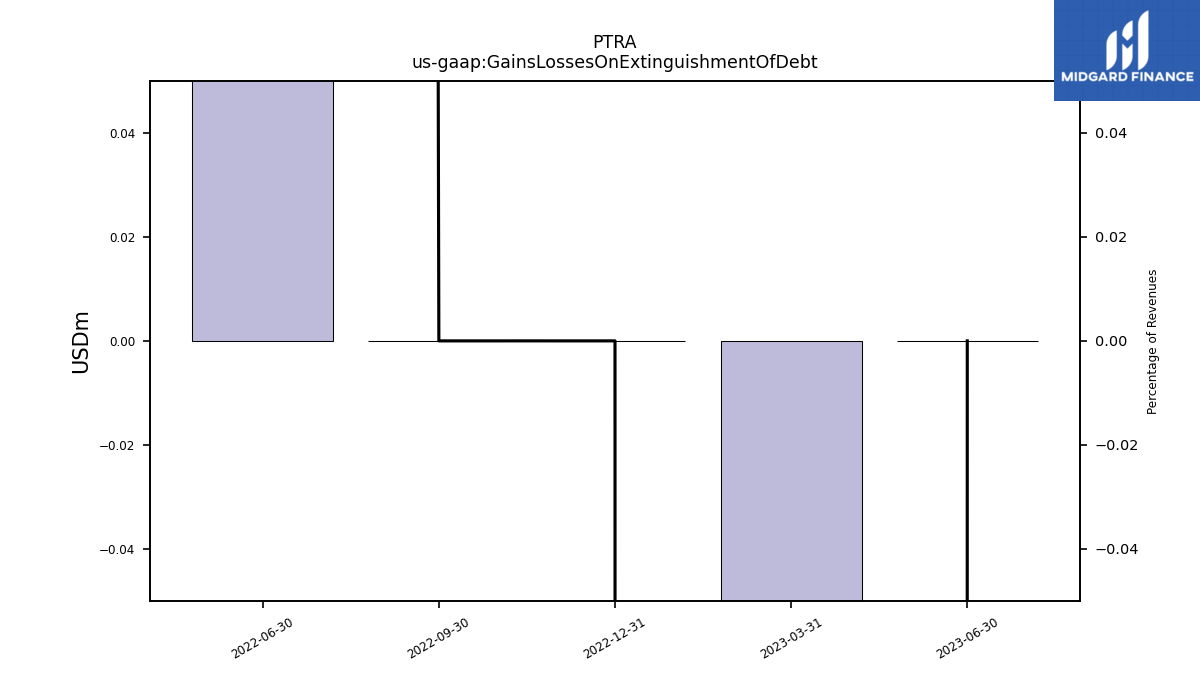
| Gains Losses On Extinguishment Of Debt | 0.00 | -177.94 | 0.00 | 0.00 | 10.20 | NA | NA | NA | NA | NA | NA | NA | NA | |
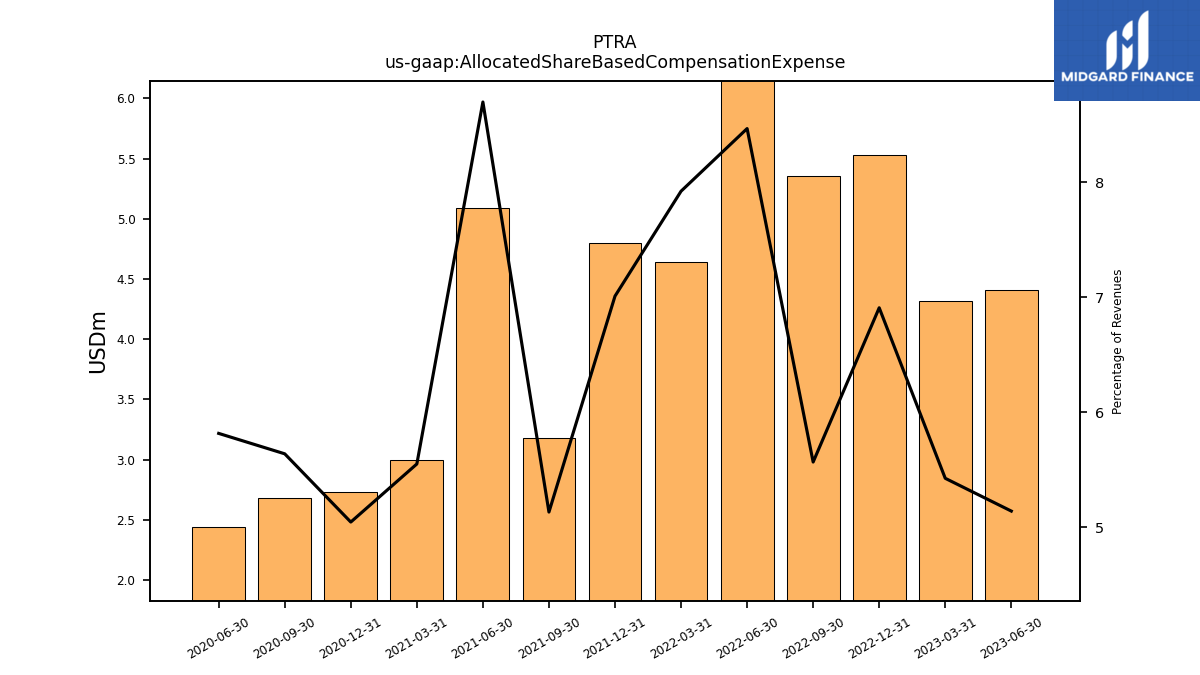
| Allocated Share Based Compensation Expense | 4.41 | 4.31 | 5.53 | 5.36 | 6.32 | 4.64 | 4.80 | 3.18 | 5.09 | 3.00 | 2.73 | 2.68 | 2.45 | |
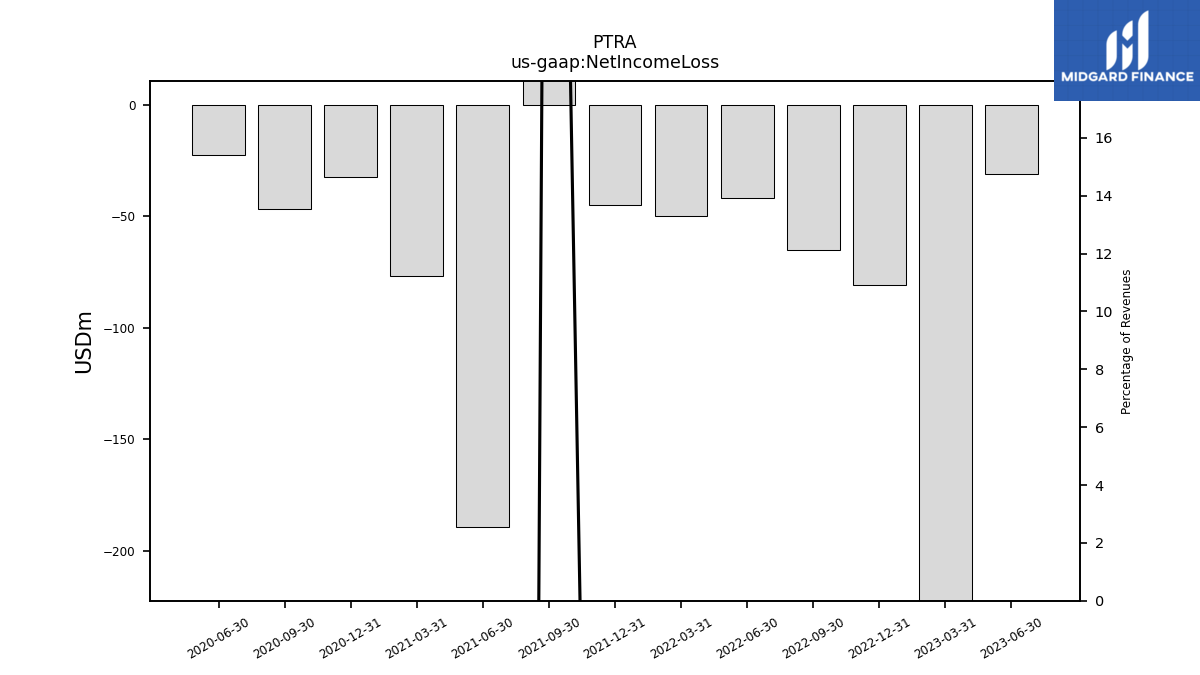
| Net Income Loss | -30.99 | -243.98 | -80.99 | -65.06 | -41.82 | -50.08 | -45.14 | 36.32 | -189.03 | -77.01 | -32.62 | -46.86 | -22.70 | |
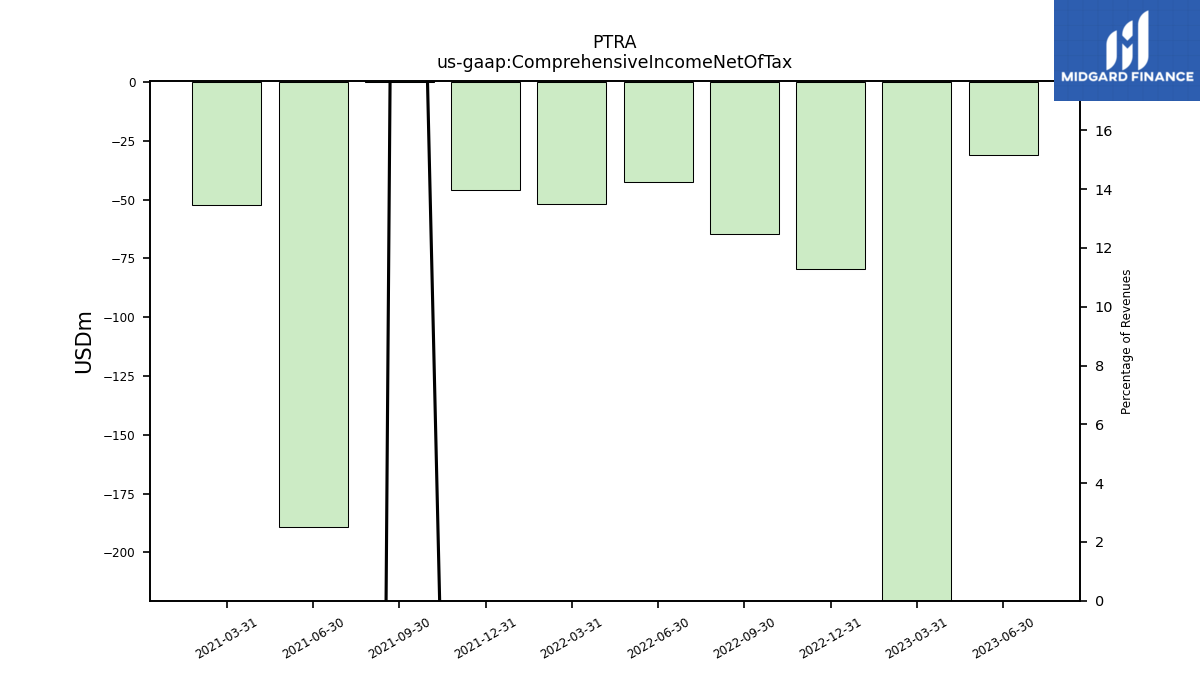
| Comprehensive Income Net Of Tax | -31.09 | -243.37 | -79.47 | -64.44 | -42.29 | -51.72 | -45.73 | 36.32 | -189.03 | -52.16 | NA | NA | NA | |
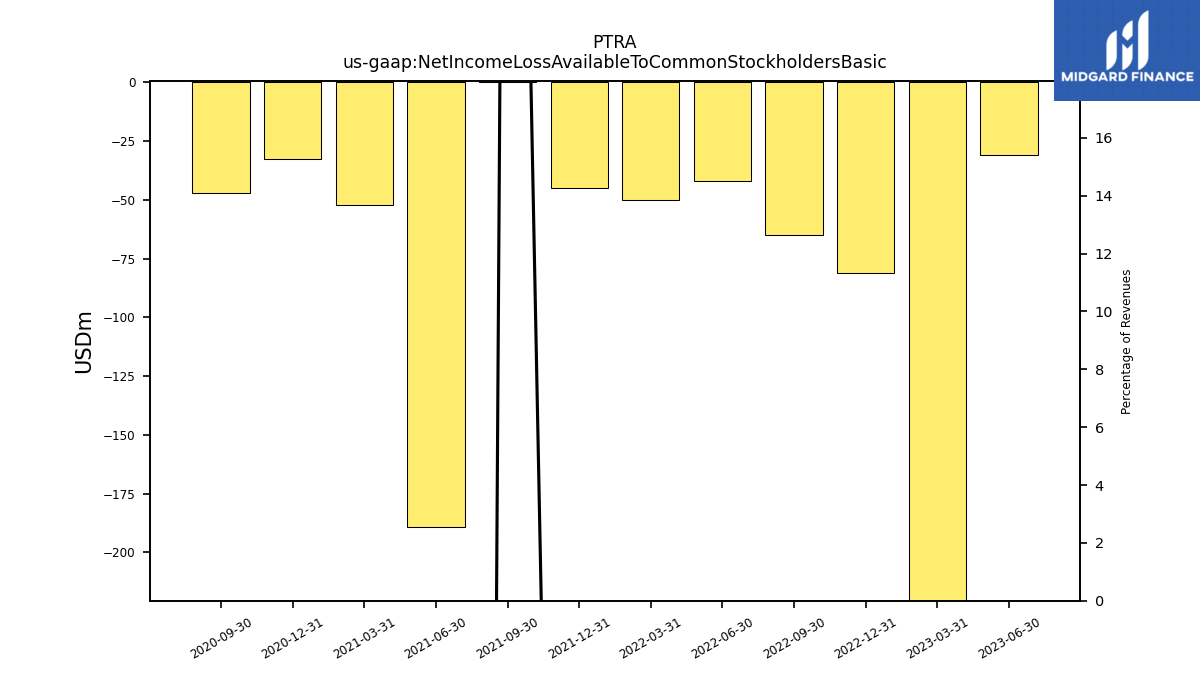
| Net Income Loss Available To Common Stockholders Basic | -30.99 | -243.98 | -80.99 | -65.06 | -41.82 | -50.08 | -45.14 | 36.32 | -189.03 | -52.16 | -32.62 | -46.86 | NA | |
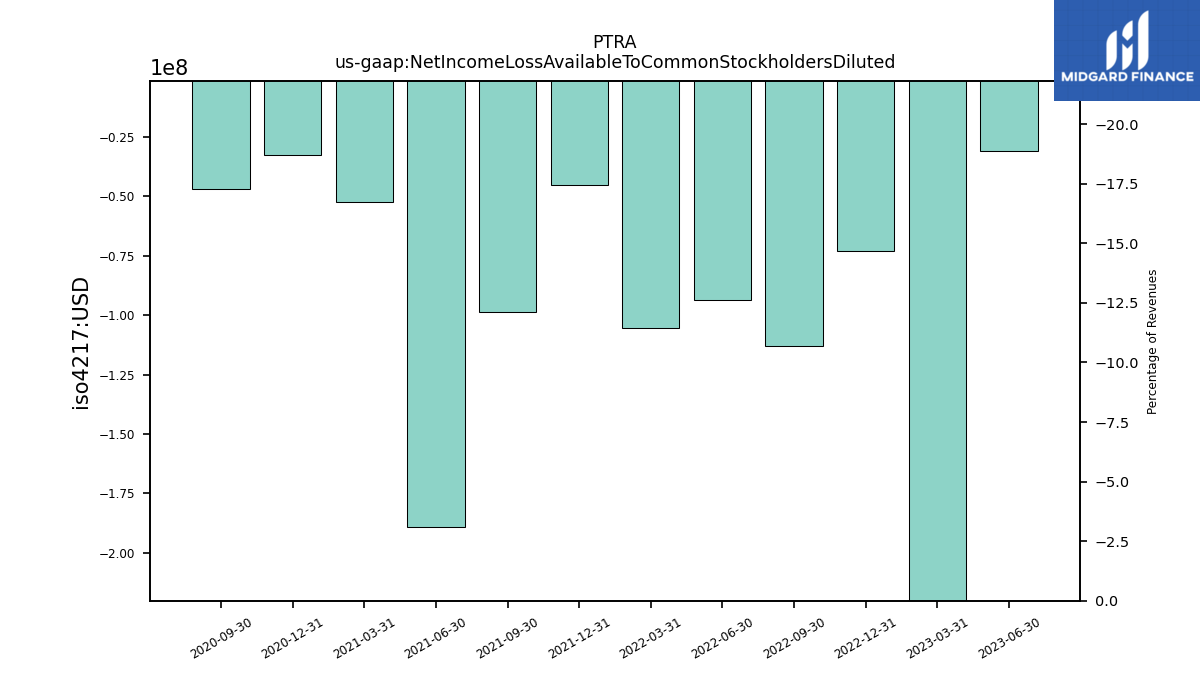
| Net Income Loss Available To Common Stockholders Diluted | -30.99 | -243.98 | -73.17 | -112.95 | -93.44 | -105.26 | -45.14 | -98.65 | -189.03 | -52.16 | -32.62 | -46.86 | NA |
| 2023-06-30 | 2023-03-31 | 2022-12-31 | 2022-09-30 | 2022-06-30 | 2022-03-31 | 2021-12-31 | 2021-09-30 | 2021-06-30 | 2021-03-31 | 2020-12-31 | 2020-09-30 | 2020-06-30 | ||
|---|---|---|---|---|---|---|---|---|---|---|---|---|---|---|
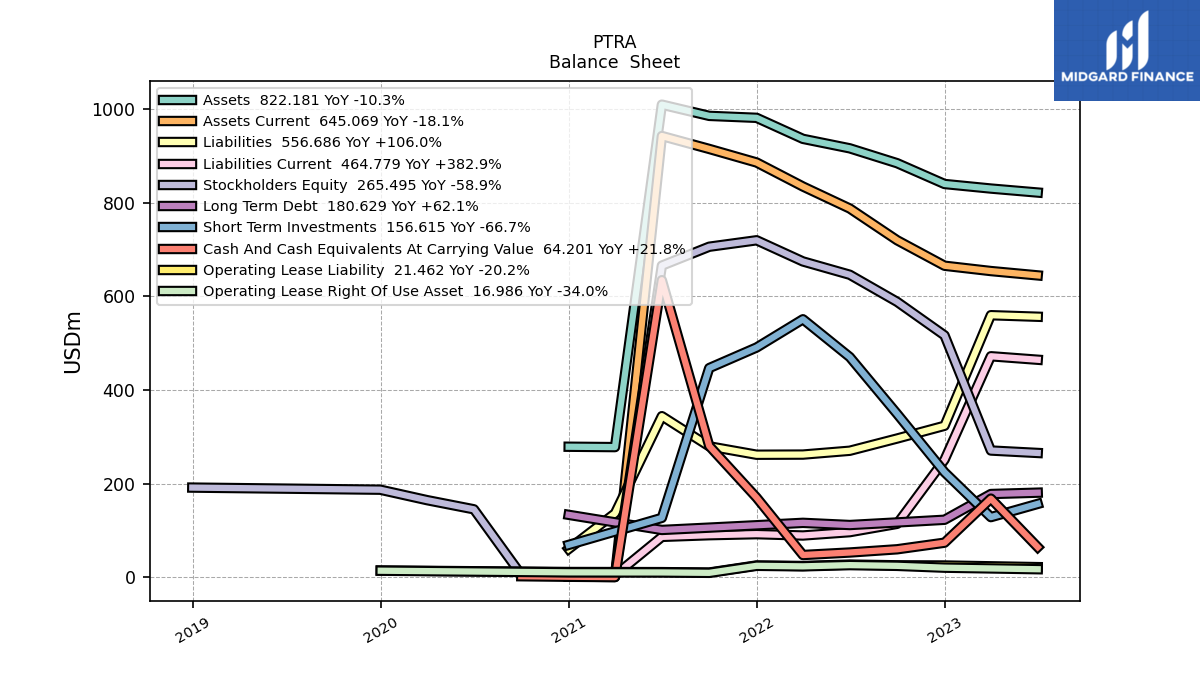
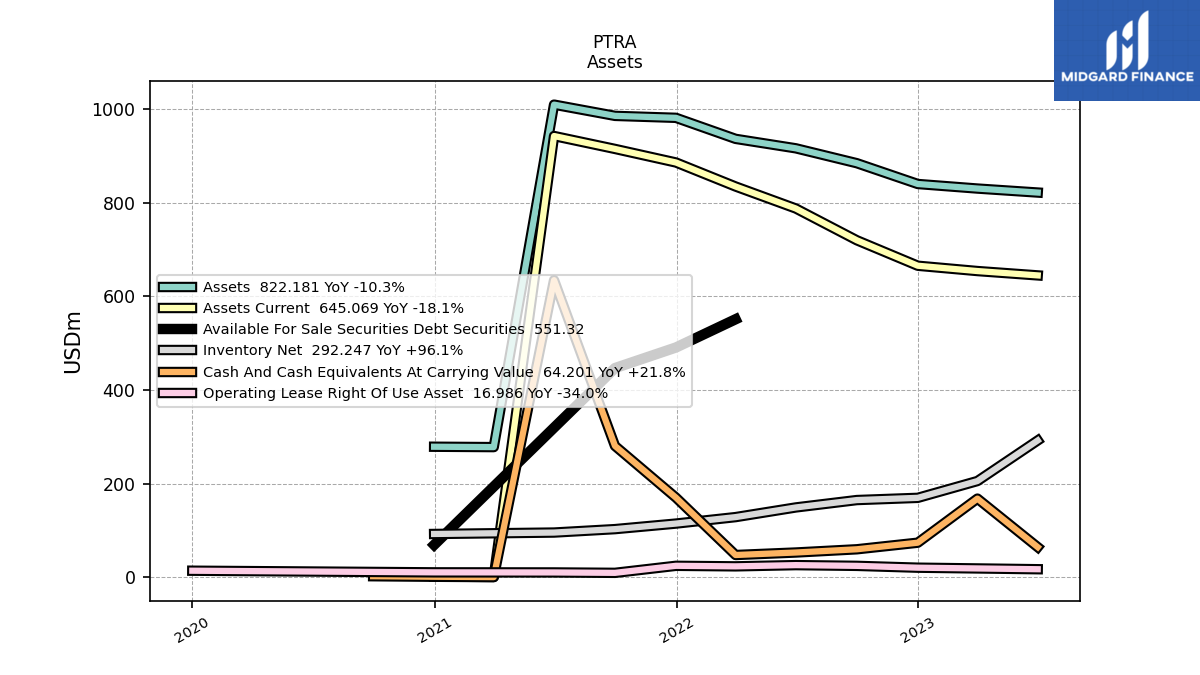
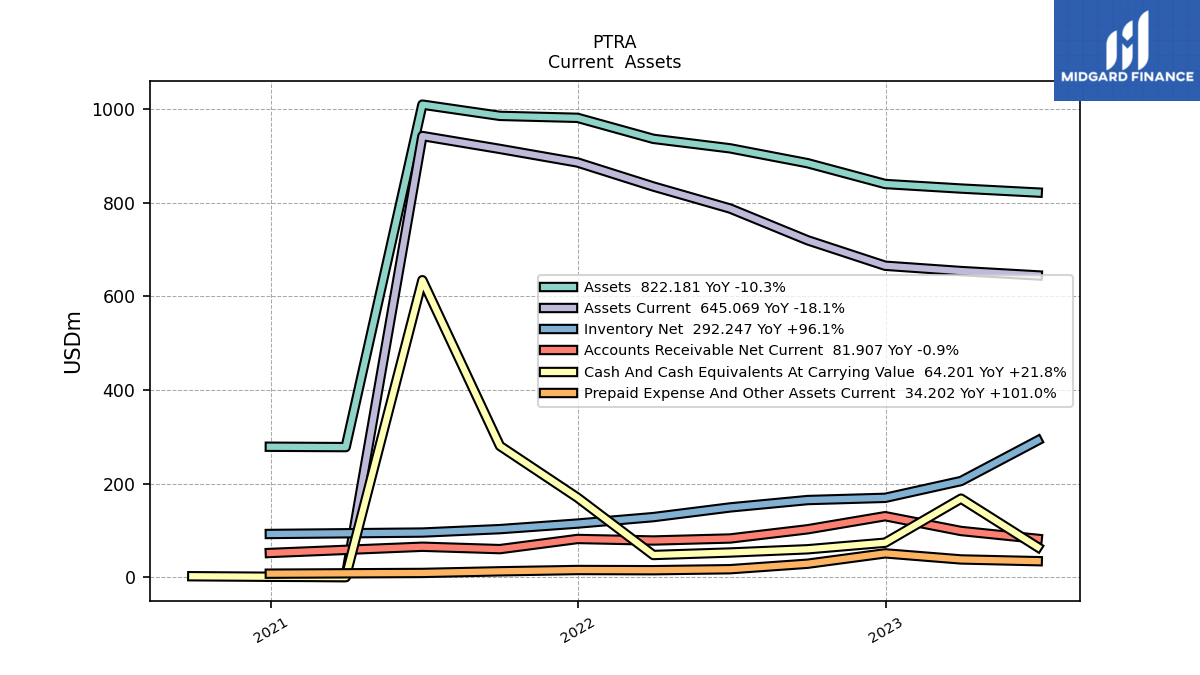
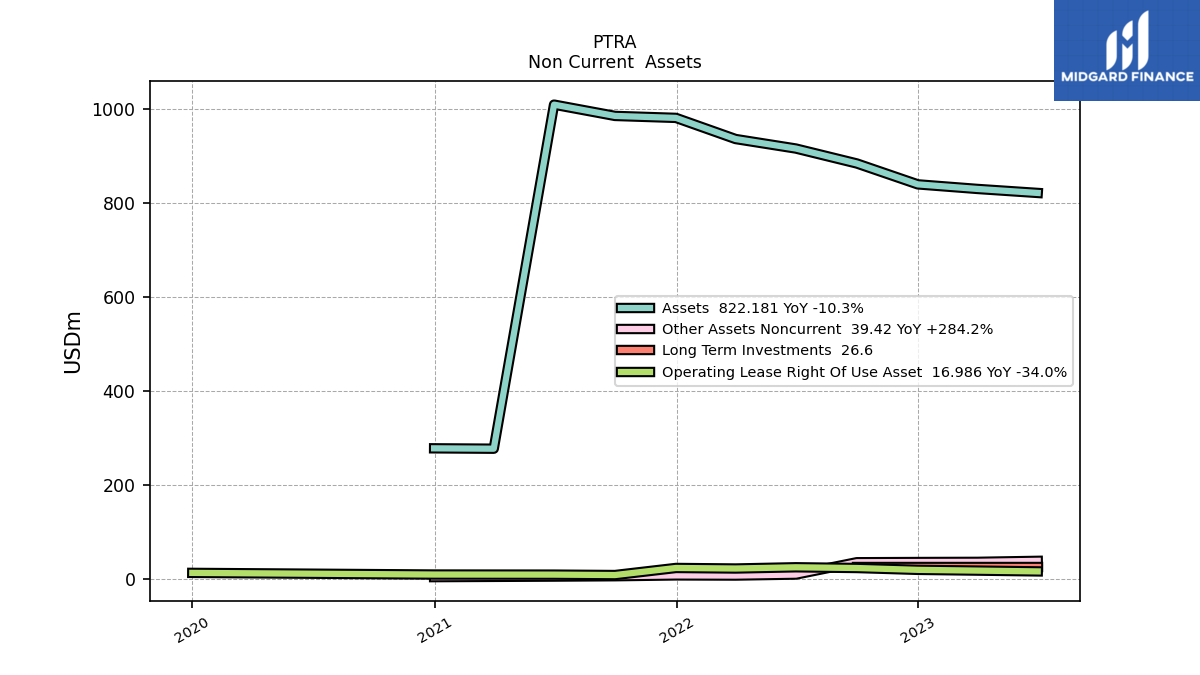
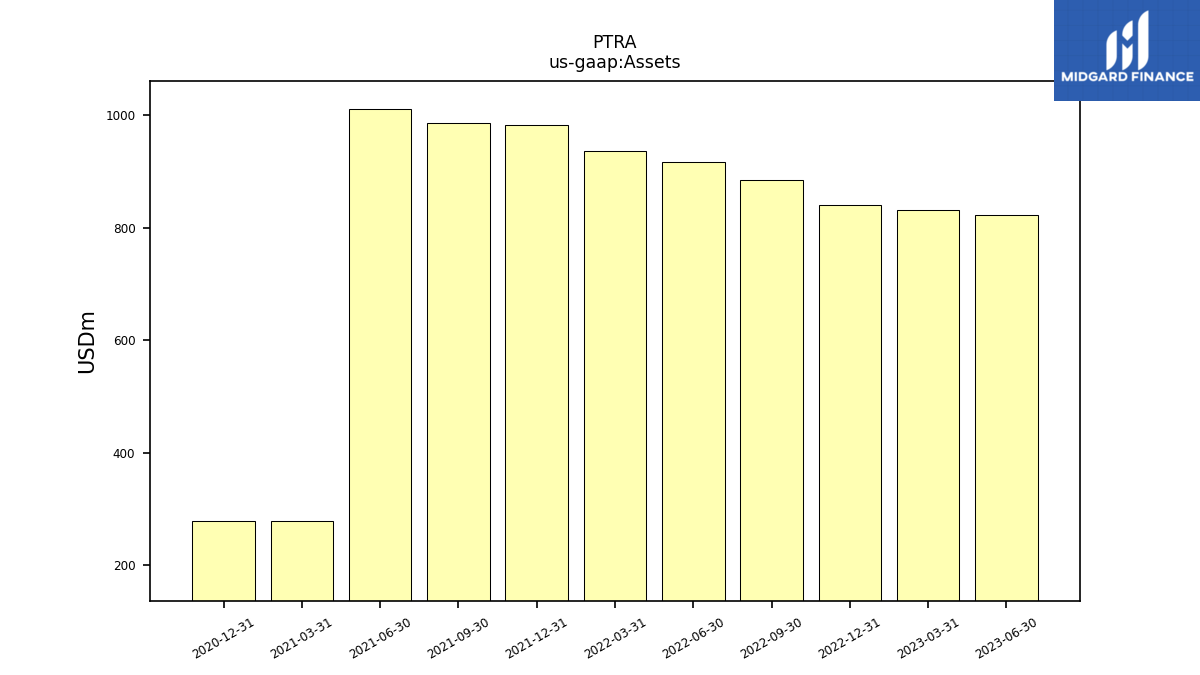
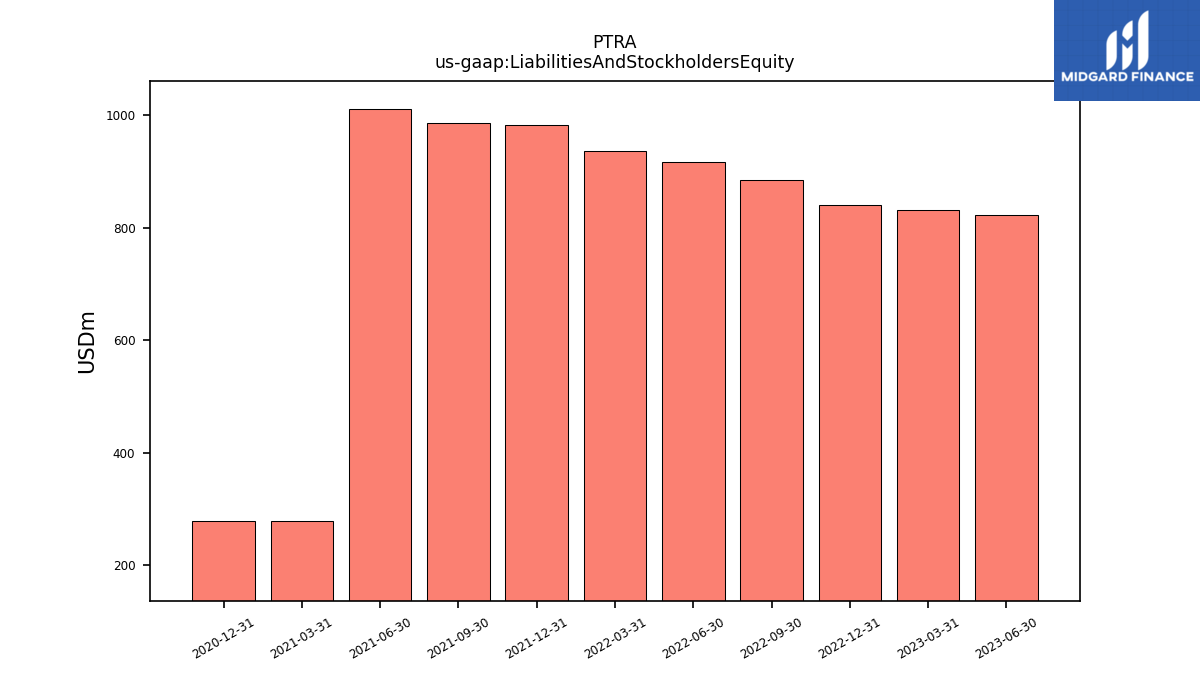
| Assets | 822.18 | 830.72 | 840.46 | 884.89 | 916.69 | 936.95 | 981.89 | 986.07 | 1010.12 | 278.02 | 278.83 | NA | NA | |
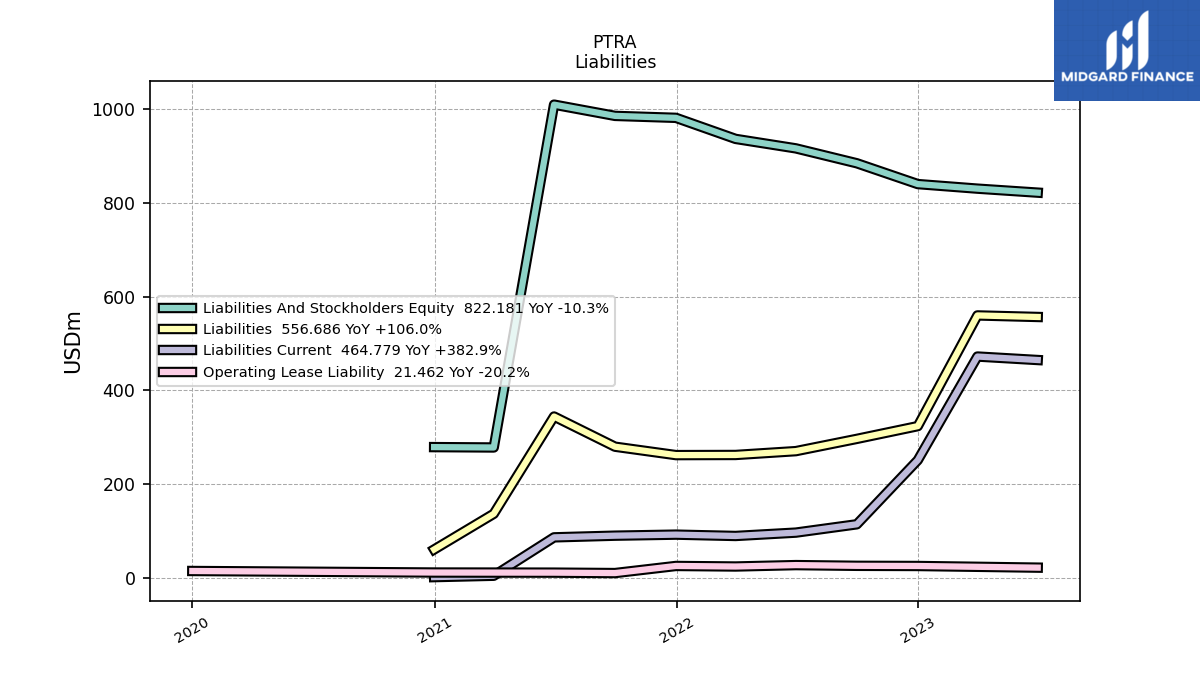
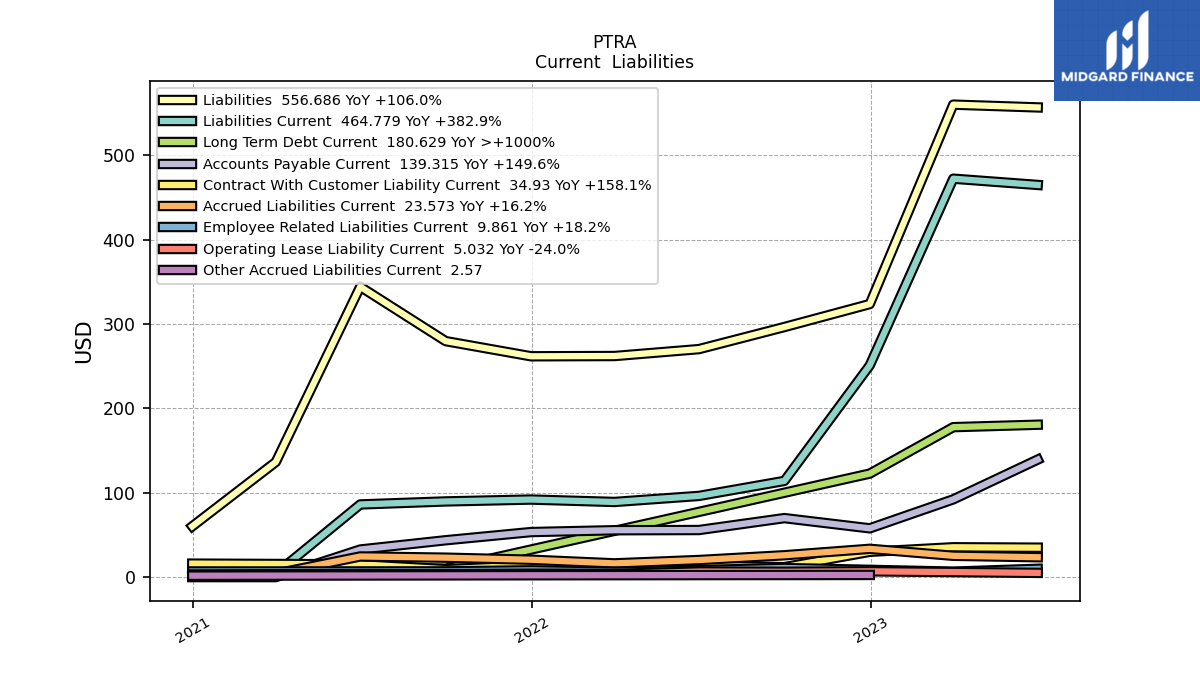
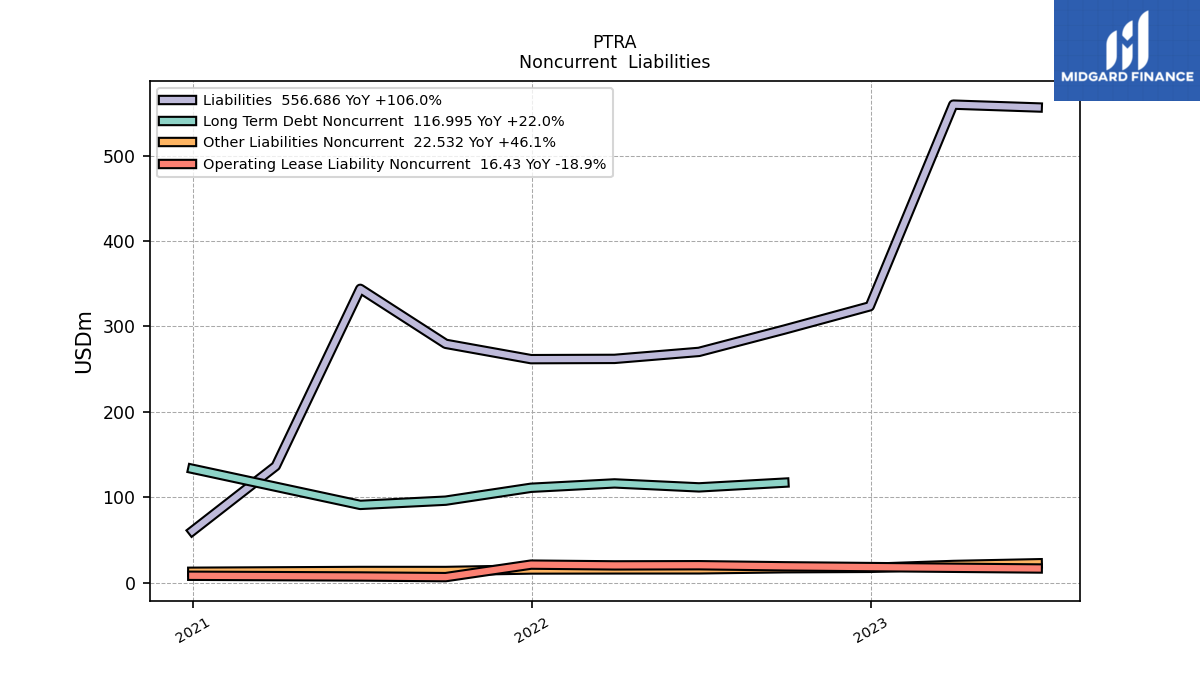
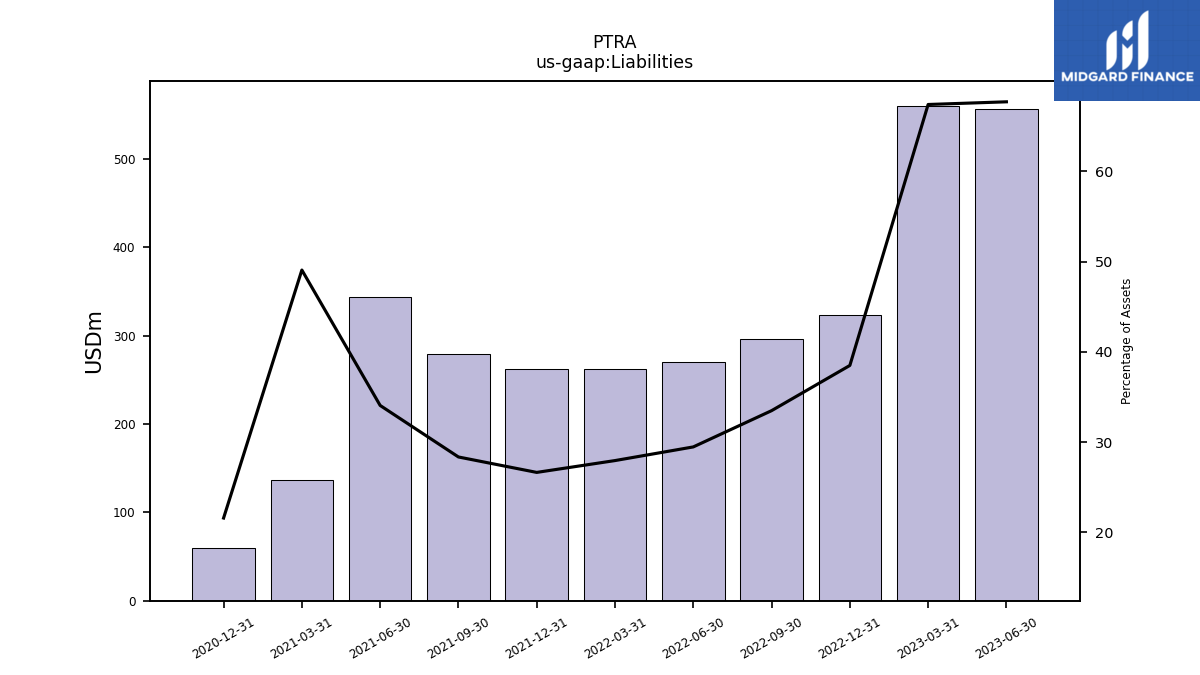
| Liabilities | 556.69 | 560.00 | 323.60 | 296.40 | 270.24 | 262.04 | 261.74 | 279.71 | 344.17 | 136.43 | 60.23 | NA | NA | |
| Liabilities And Stockholders Equity | 822.18 | 830.72 | 840.46 | 884.89 | 916.69 | 936.95 | 981.89 | 986.07 | 1010.12 | 278.02 | 278.83 | NA | NA | |
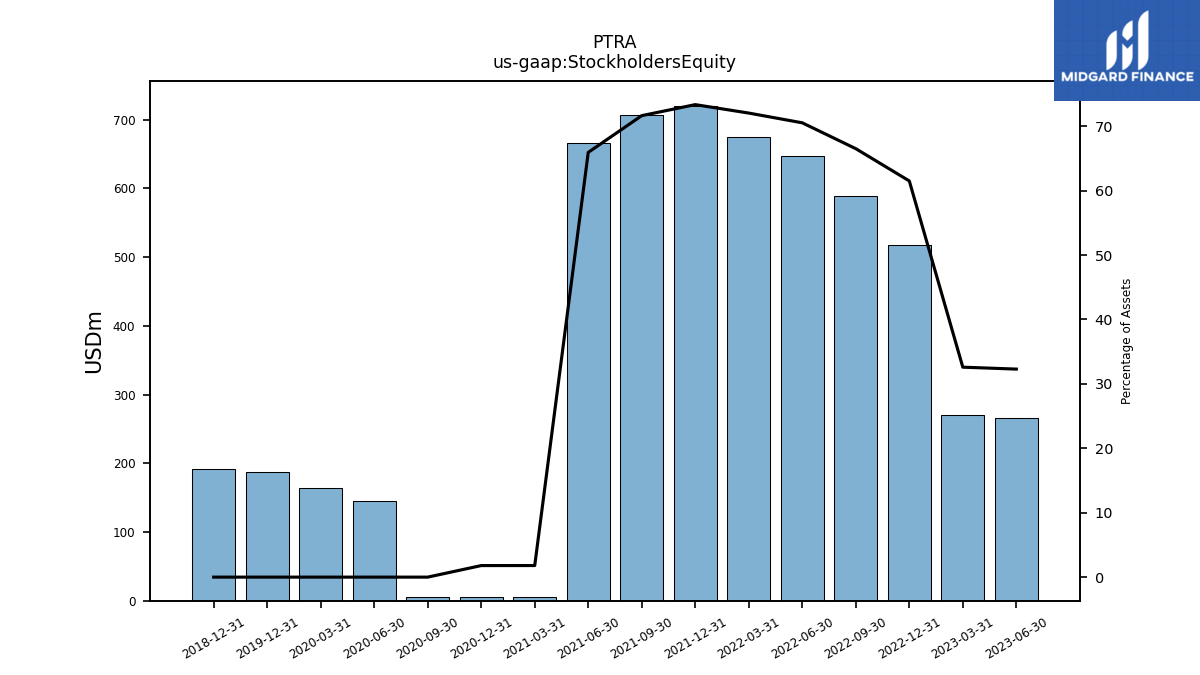
| Stockholders Equity | 265.50 | 270.72 | 516.86 | 588.50 | 646.45 | 674.91 | 720.15 | 706.36 | 665.94 | 5.00 | 5.00 | 5.00 | 145.07 |
| 2023-06-30 | 2023-03-31 | 2022-12-31 | 2022-09-30 | 2022-06-30 | 2022-03-31 | 2021-12-31 | 2021-09-30 | 2021-06-30 | 2021-03-31 | 2020-12-31 | 2020-09-30 | 2020-06-30 | ||
|---|---|---|---|---|---|---|---|---|---|---|---|---|---|---|
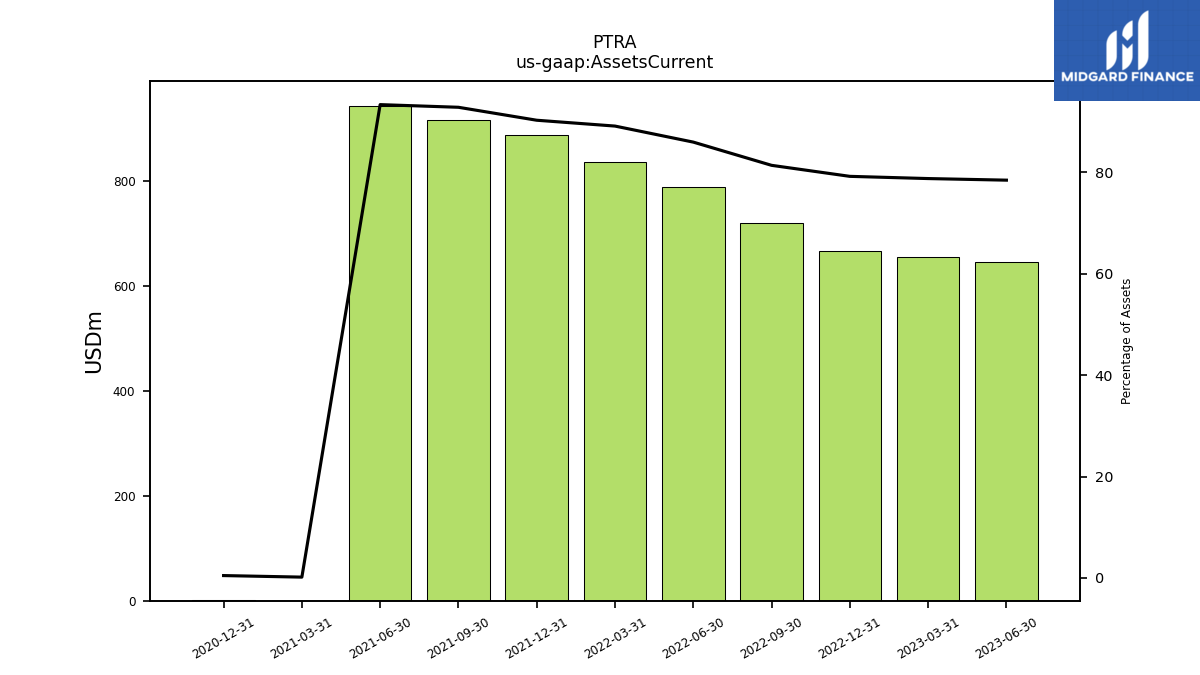
| Assets Current | 645.07 | 654.37 | 665.72 | 720.16 | 788.02 | 835.08 | 886.43 | 915.40 | 943.02 | 0.42 | 1.28 | NA | NA | |
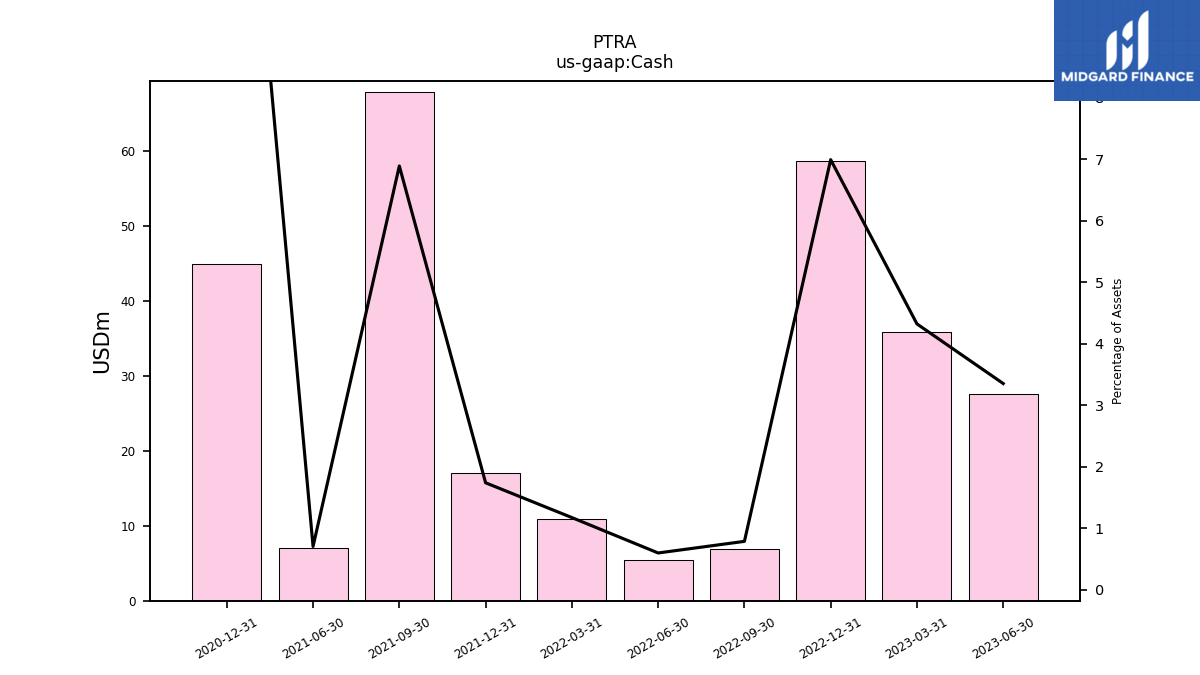
| Cash | 27.55 | 35.89 | 58.75 | 6.95 | 5.47 | 10.98 | 17.07 | 67.92 | 7.10 | NA | 44.98 | NA | NA | |
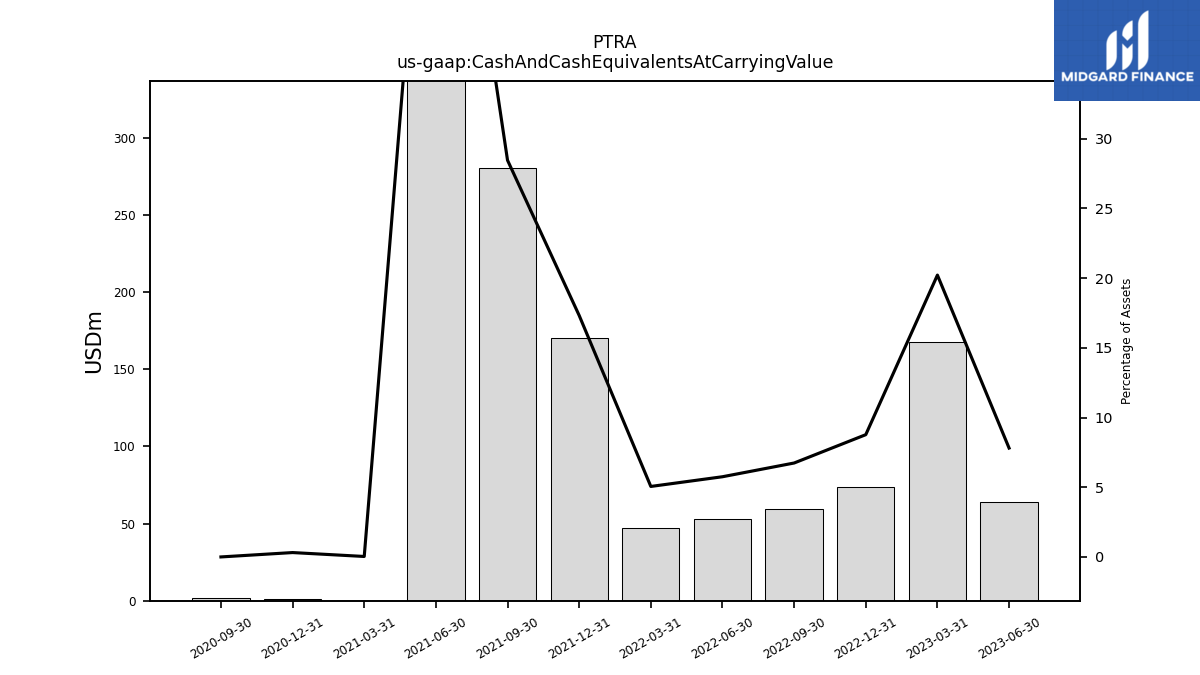
| Cash And Cash Equivalents At Carrying Value | 64.20 | 167.91 | 73.69 | 59.61 | 52.72 | 47.36 | 170.04 | 280.54 | 634.84 | 0.09 | 0.87 | 1.98 | NA | |
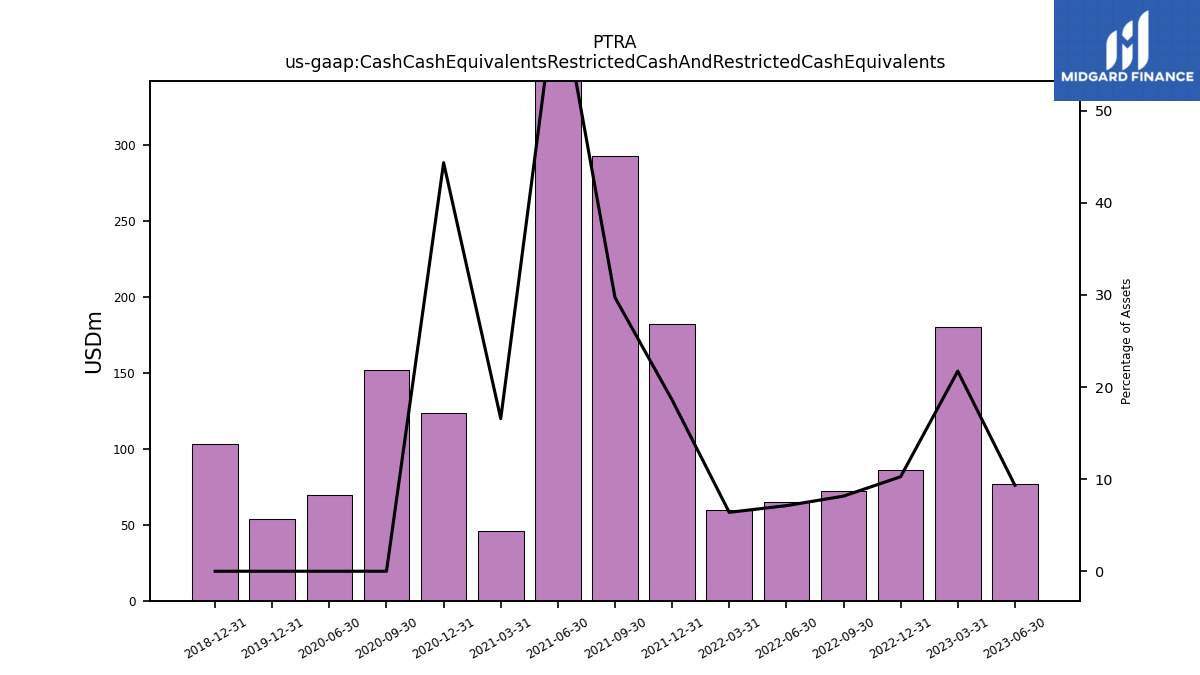
| Cash Cash Equivalents Restricted Cash And Restricted Cash Equivalents | 76.77 | 180.47 | 86.26 | 72.17 | 65.29 | 59.93 | 182.60 | 293.10 | 647.40 | 46.10 | 123.70 | 152.04 | 69.79 | |
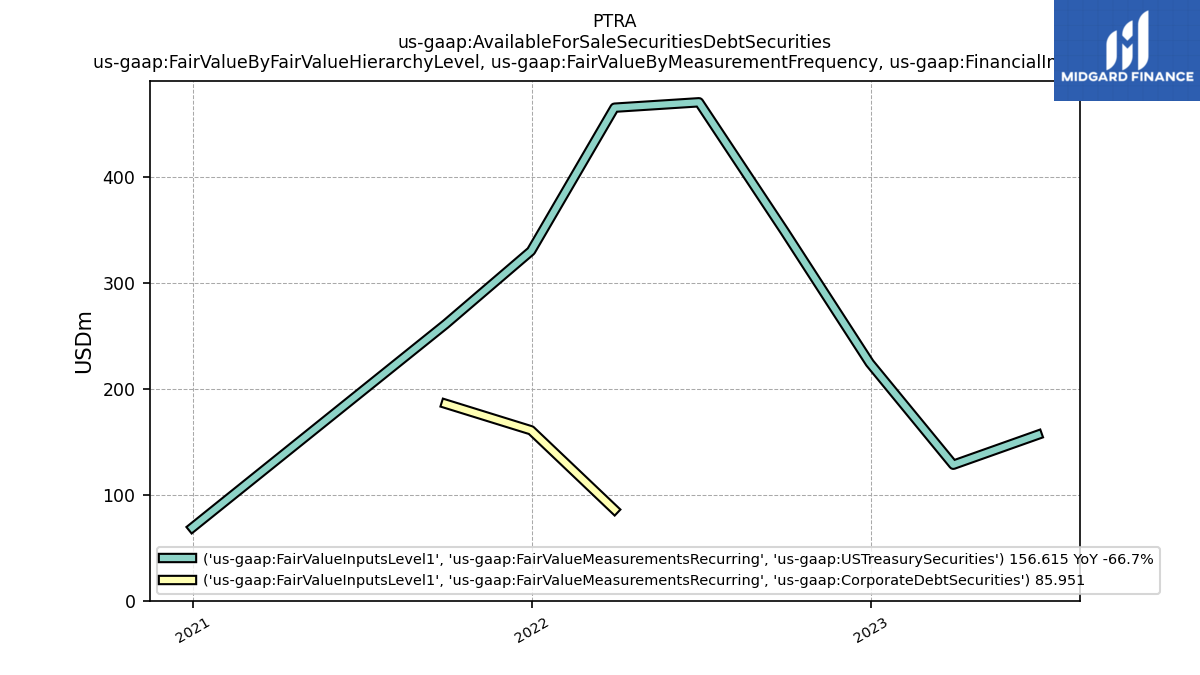
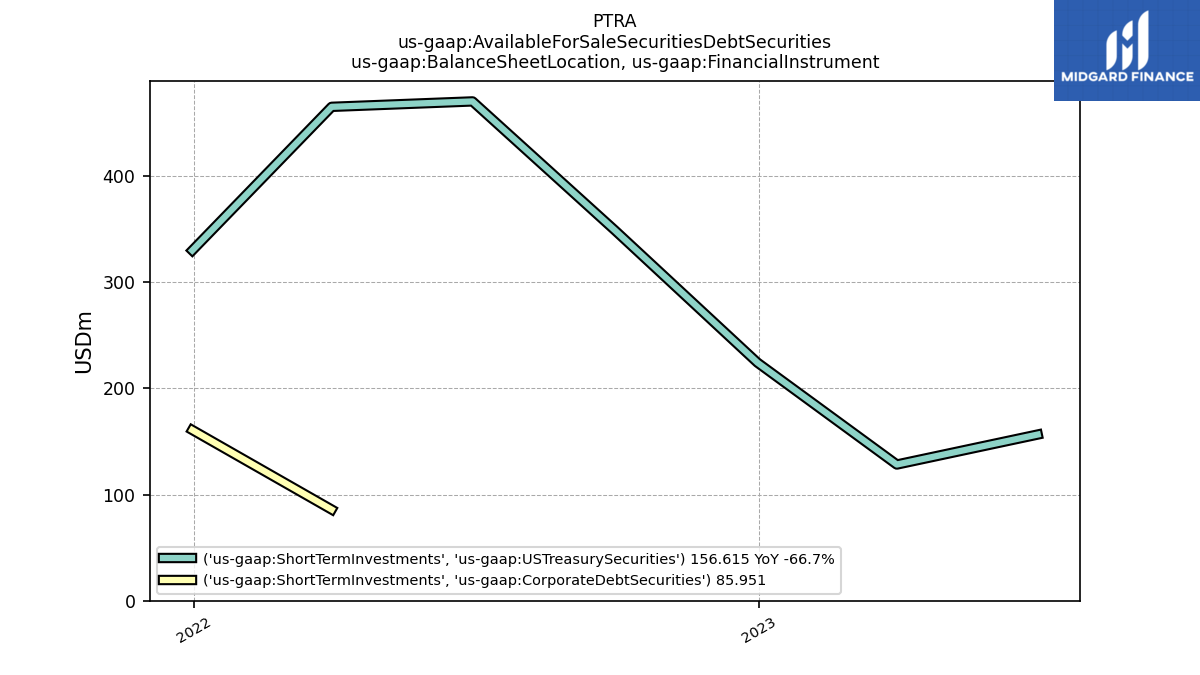
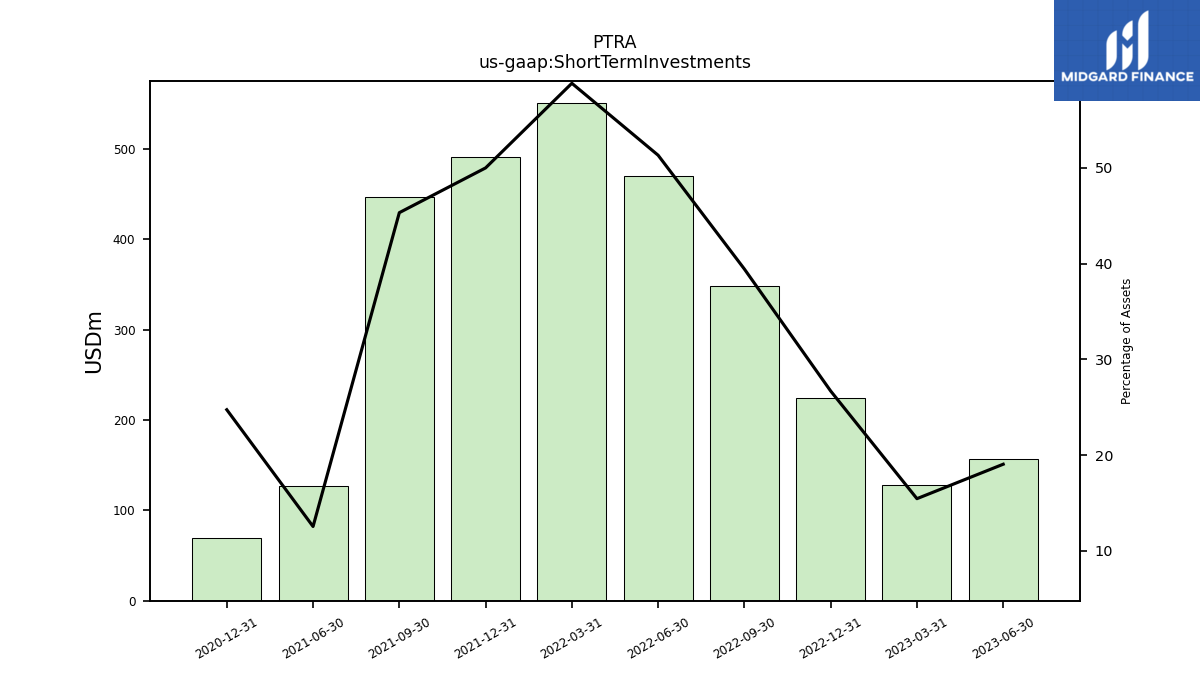
| Short Term Investments | 156.62 | 128.34 | 224.36 | 348.94 | 470.49 | 551.32 | 490.97 | 446.95 | 126.69 | NA | 68.99 | NA | NA | |
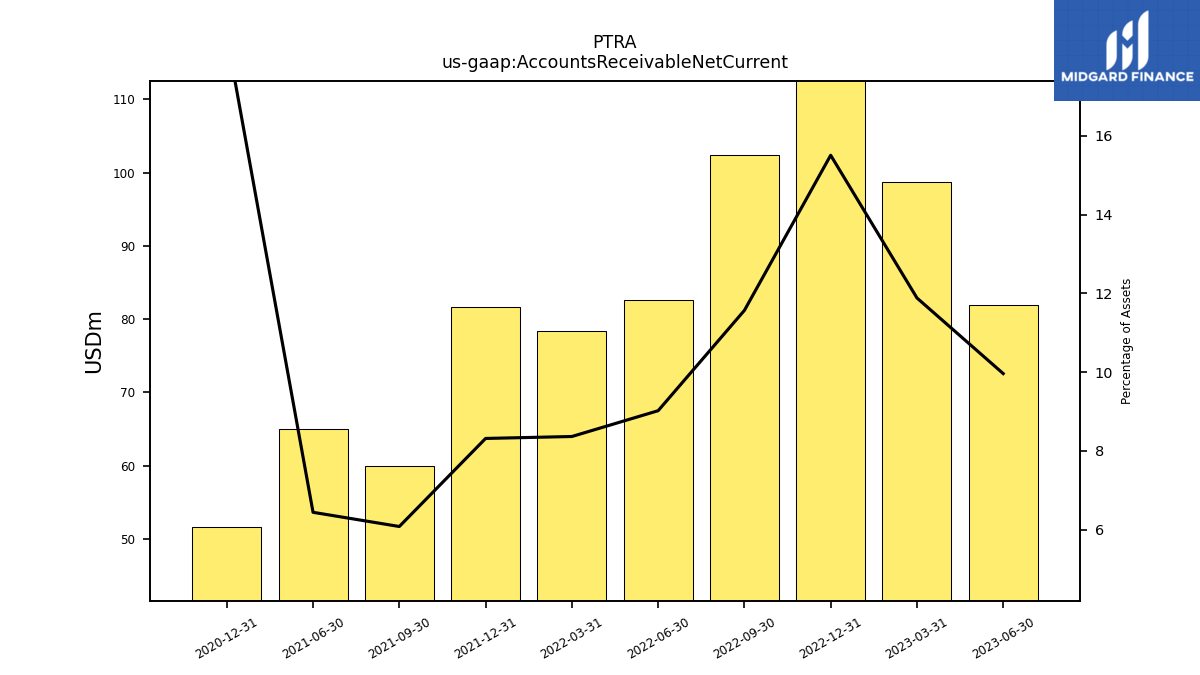
| Accounts Receivable Net Current | 81.91 | 98.72 | 130.34 | 102.36 | 82.68 | 78.37 | 81.64 | 59.94 | 65.04 | NA | 51.72 | NA | NA | |
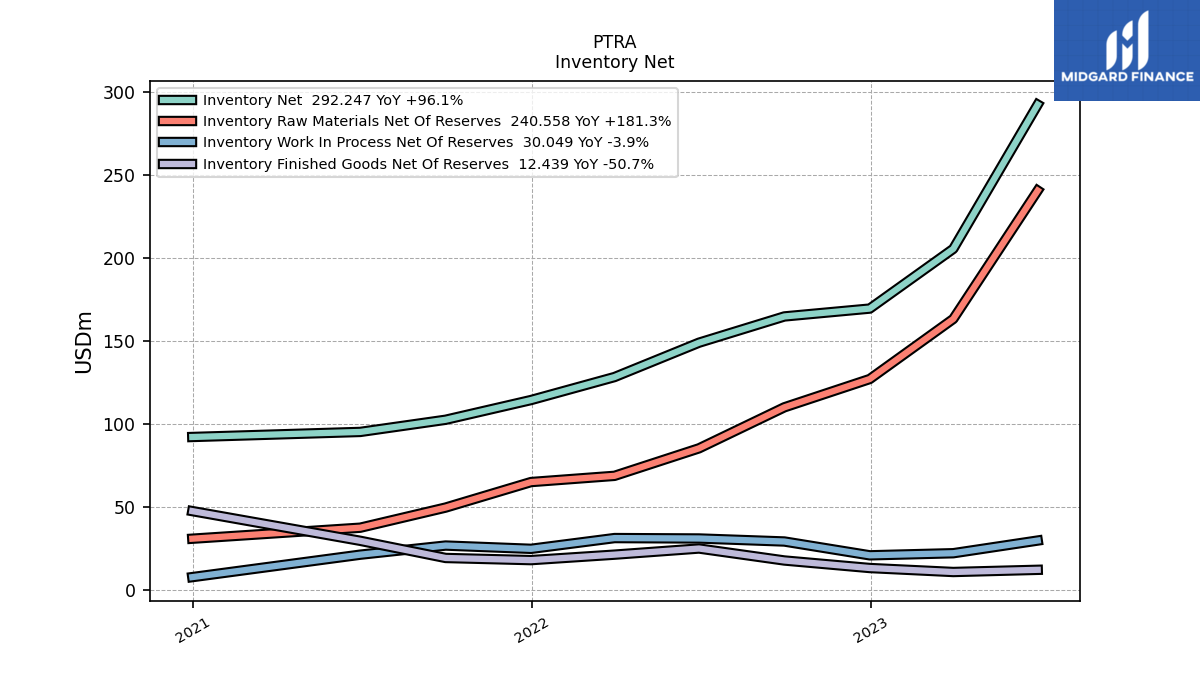
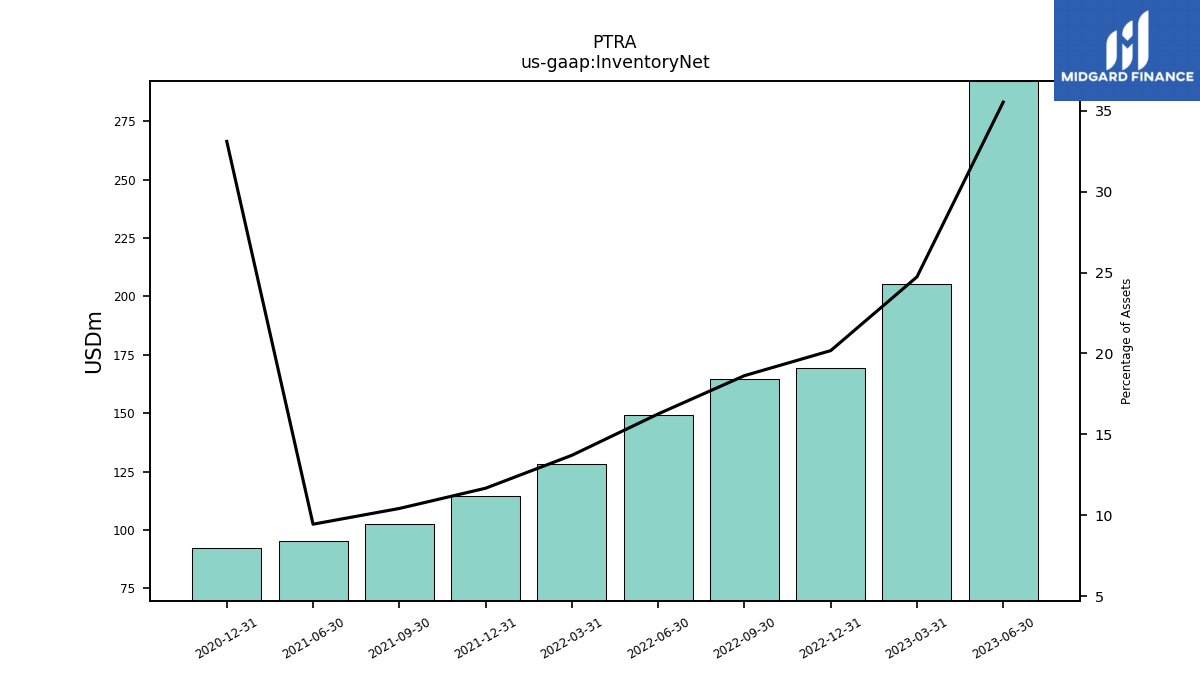
| Inventory Net | 292.25 | 205.49 | 169.57 | 164.83 | 149.05 | 128.39 | 114.56 | 102.69 | 95.38 | NA | 92.33 | NA | NA | |
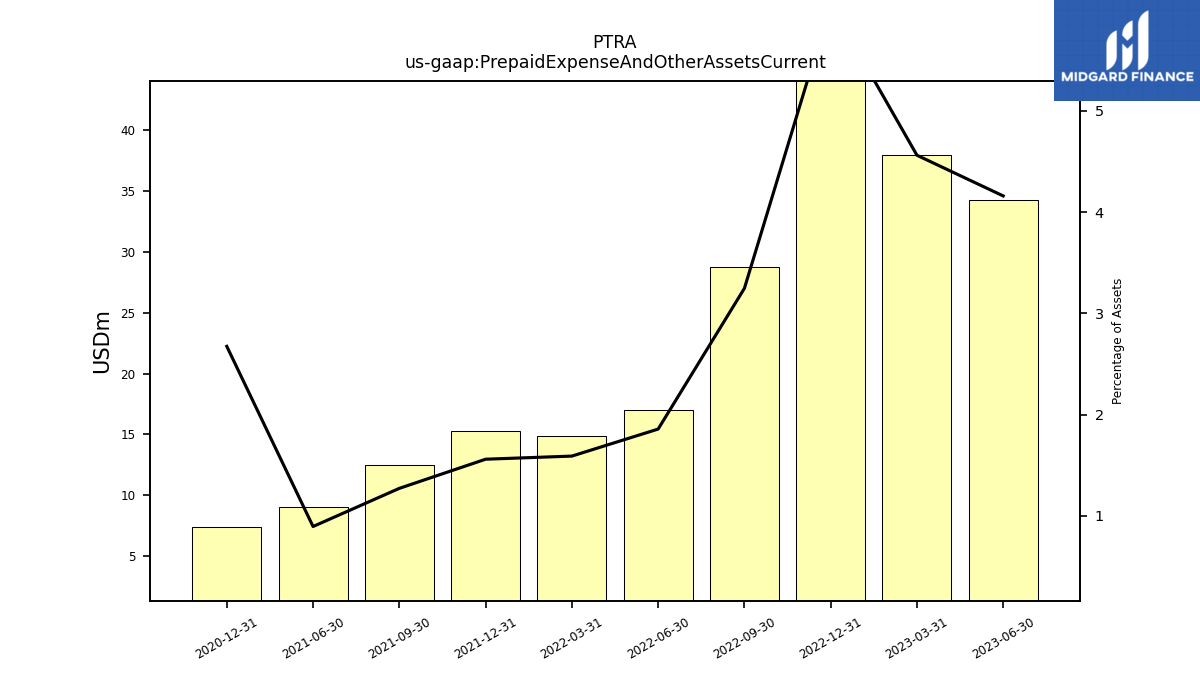
| Prepaid Expense And Other Assets Current | 34.20 | 37.90 | 50.89 | 28.73 | 17.02 | 14.89 | 15.30 | 12.53 | 9.02 | NA | 7.46 | NA | NA | |
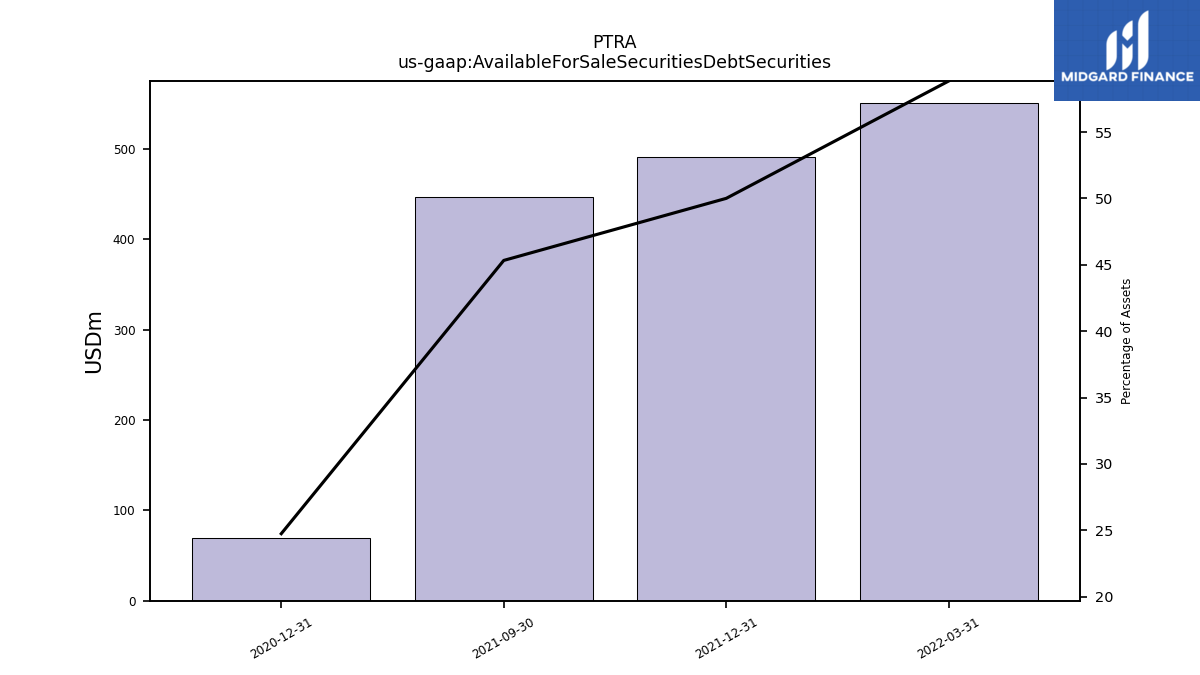
| Available For Sale Securities Debt Securities | NA | NA | NA | NA | NA | 551.32 | 490.97 | 446.95 | NA | NA | 68.99 | NA | NA |
| 2023-06-30 | 2023-03-31 | 2022-12-31 | 2022-09-30 | 2022-06-30 | 2022-03-31 | 2021-12-31 | 2021-09-30 | 2021-06-30 | 2021-03-31 | 2020-12-31 | 2020-09-30 | 2020-06-30 | ||
|---|---|---|---|---|---|---|---|---|---|---|---|---|---|---|
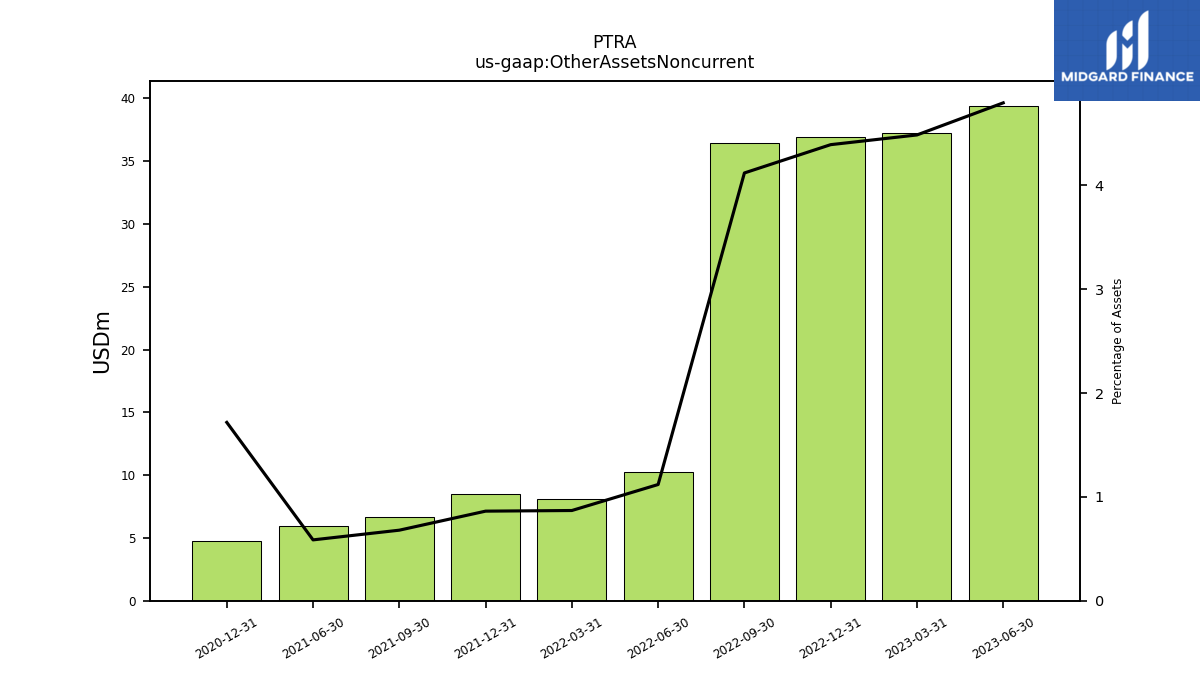
| Other Assets Noncurrent | 39.42 | 37.26 | 36.91 | 36.45 | 10.26 | 8.14 | 8.47 | 6.70 | 5.92 | NA | 4.79 | NA | NA |
| 2023-06-30 | 2023-03-31 | 2022-12-31 | 2022-09-30 | 2022-06-30 | 2022-03-31 | 2021-12-31 | 2021-09-30 | 2021-06-30 | 2021-03-31 | 2020-12-31 | 2020-09-30 | 2020-06-30 | ||
|---|---|---|---|---|---|---|---|---|---|---|---|---|---|---|
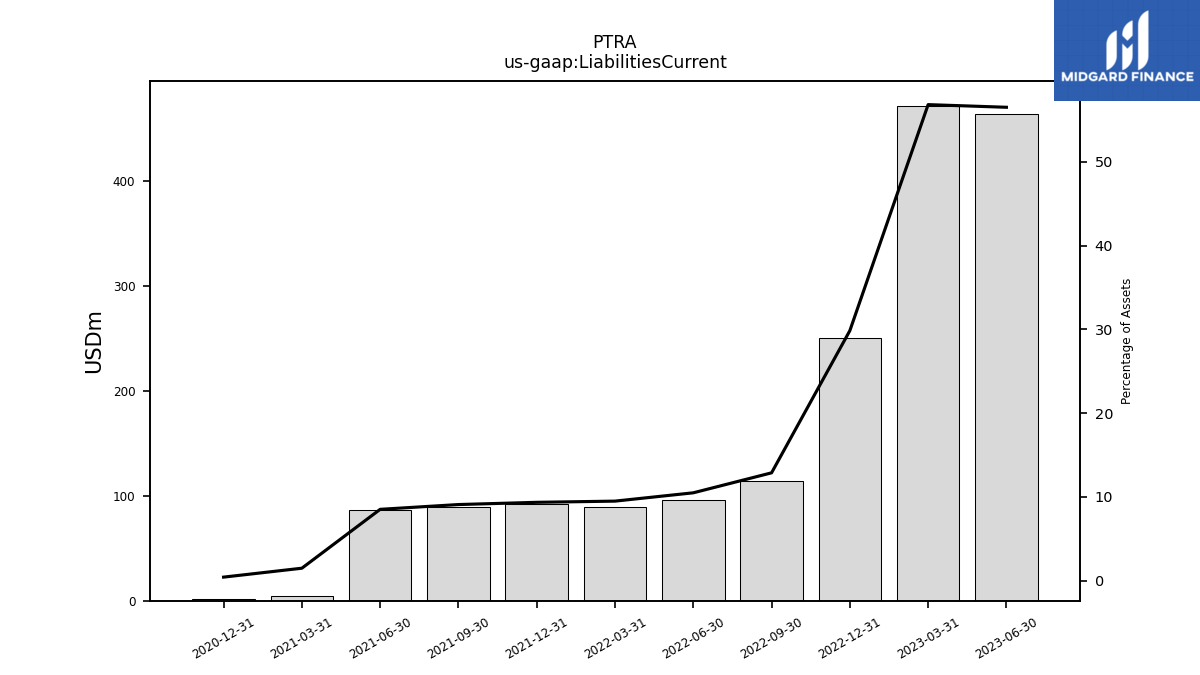
| Liabilities Current | 464.78 | 472.23 | 250.96 | 114.03 | 96.26 | 89.08 | 91.94 | 89.72 | 86.13 | 4.16 | 1.21 | NA | NA | |
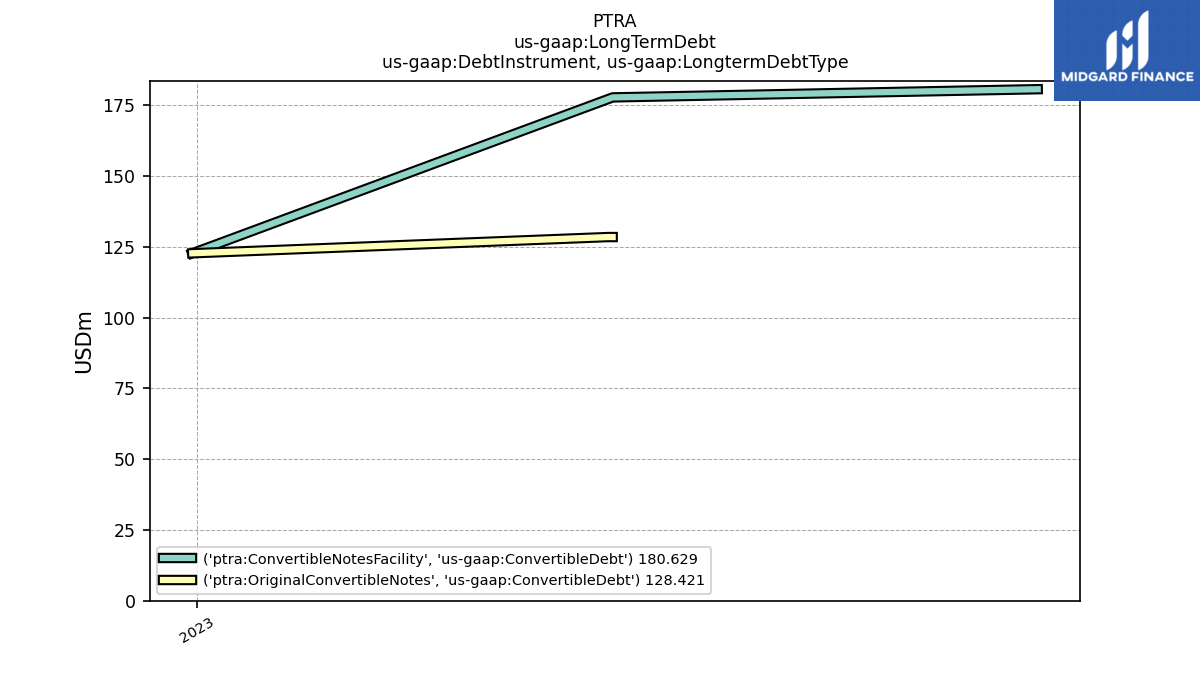
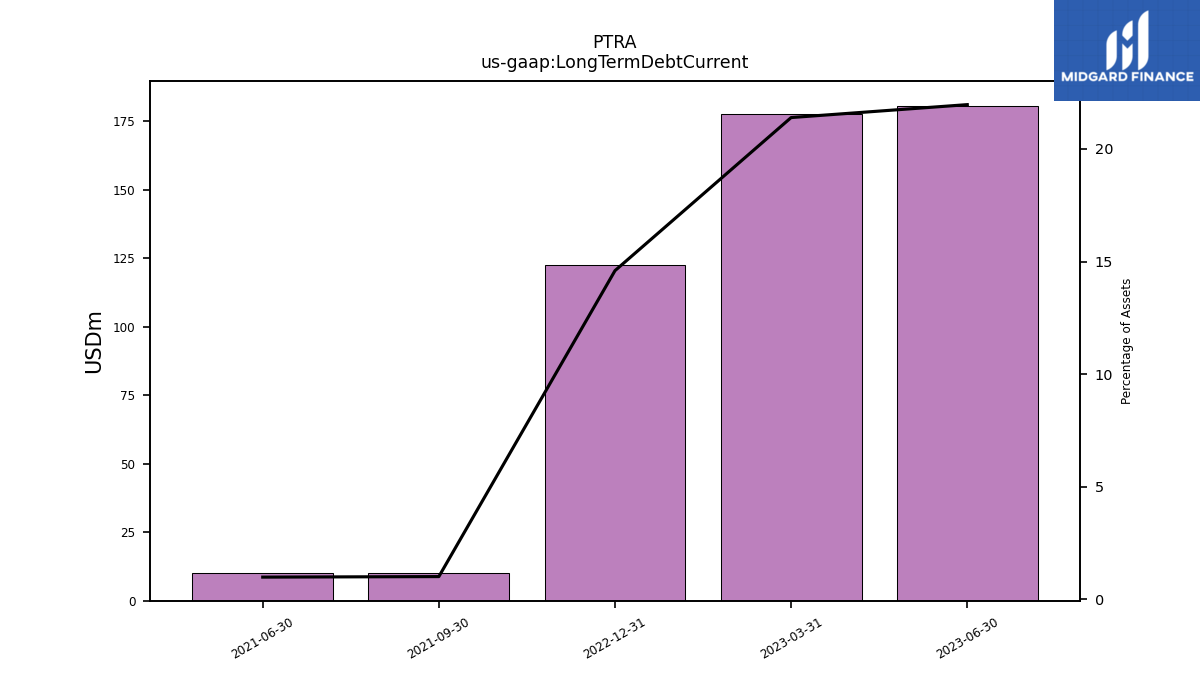
| Long Term Debt Current | 180.63 | 177.74 | 122.69 | NA | NA | NA | NA | 10.00 | 10.00 | NA | NA | NA | NA | |
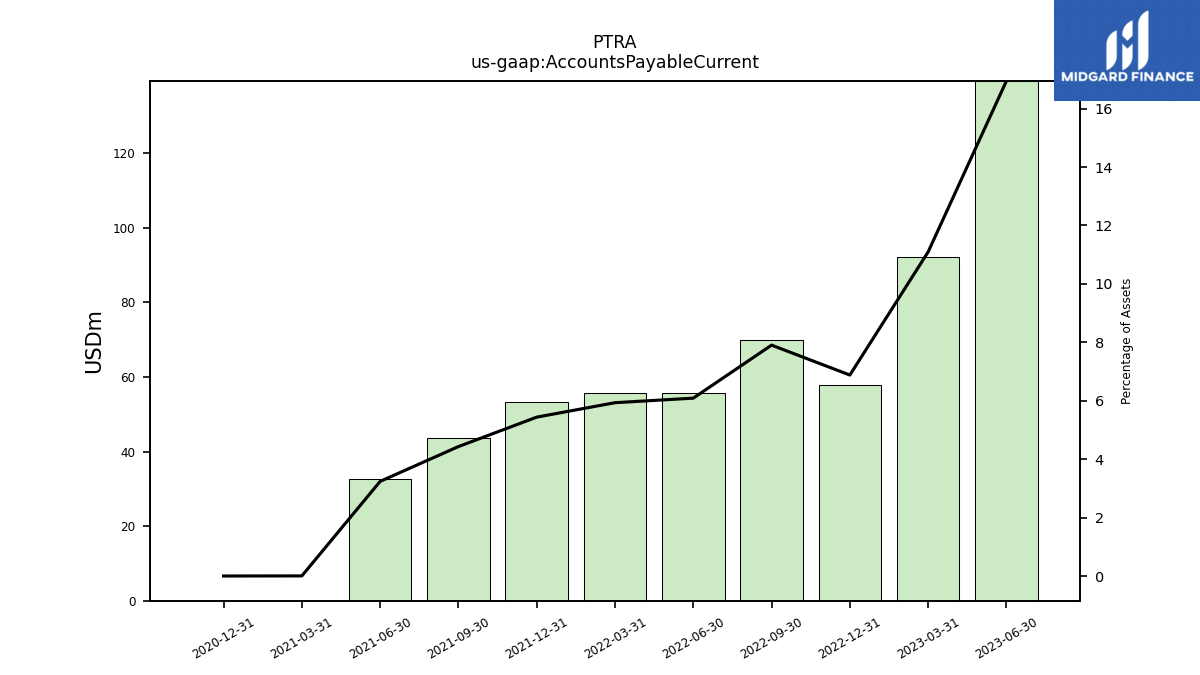
| Accounts Payable Current | 139.31 | 92.16 | 57.82 | 69.94 | 55.82 | 55.59 | 53.40 | 43.69 | 32.73 | 0.01 | 0.00 | NA | NA | |
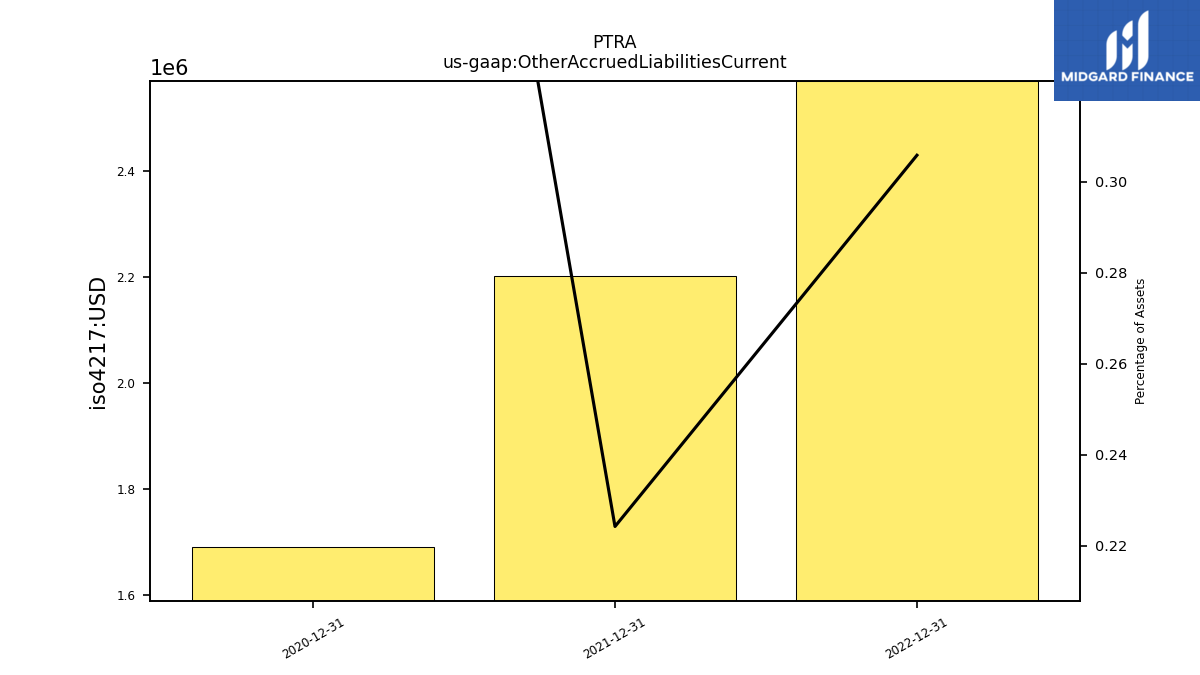
| Other Accrued Liabilities Current | NA | NA | 2.57 | NA | NA | NA | 2.20 | NA | NA | NA | 1.69 | NA | NA | |
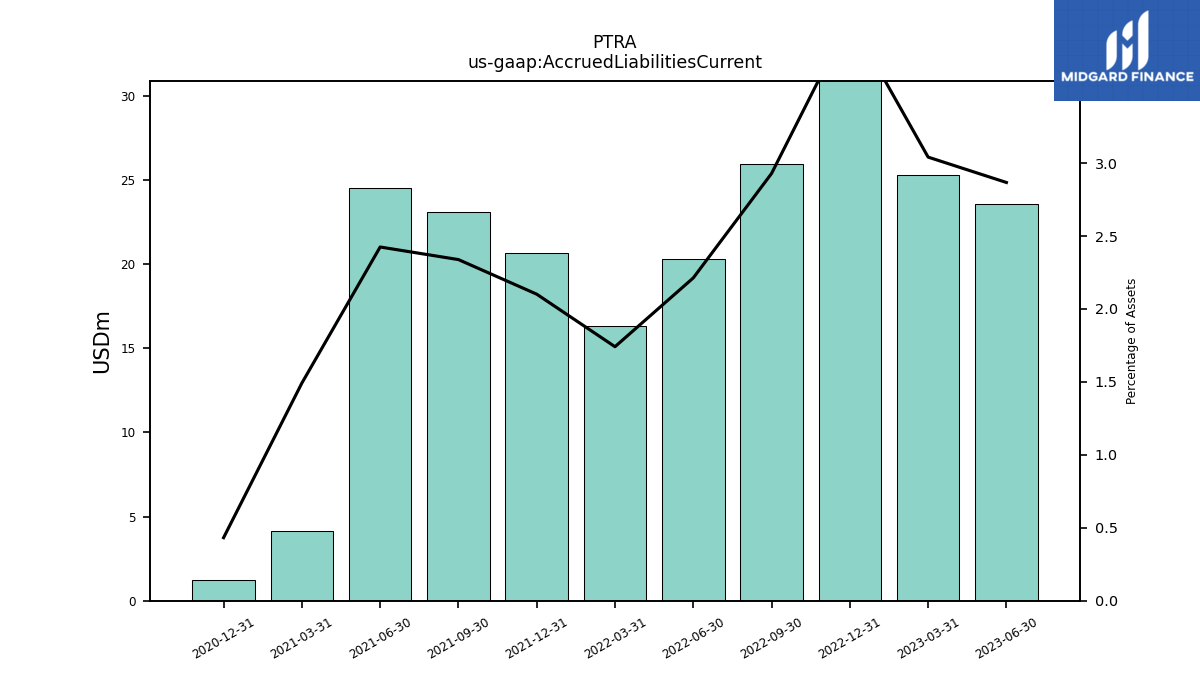
| Accrued Liabilities Current | 23.57 | 25.26 | 33.55 | 25.92 | 20.29 | 16.32 | 20.63 | 23.06 | 24.49 | 4.15 | 1.21 | NA | NA | |
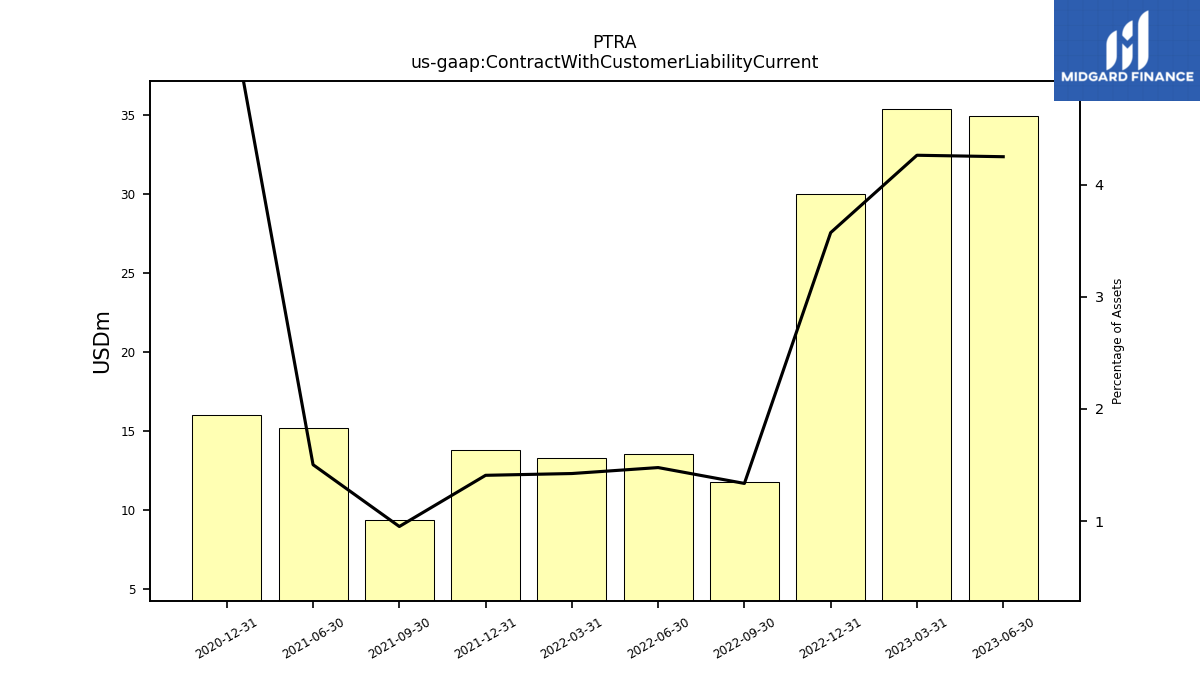
| Contract With Customer Liability Current | 34.93 | 35.40 | 30.02 | 11.81 | 13.54 | 13.34 | 13.82 | 9.38 | 15.17 | NA | 16.02 | NA | NA |
| 2023-06-30 | 2023-03-31 | 2022-12-31 | 2022-09-30 | 2022-06-30 | 2022-03-31 | 2021-12-31 | 2021-09-30 | 2021-06-30 | 2021-03-31 | 2020-12-31 | 2020-09-30 | 2020-06-30 | ||
|---|---|---|---|---|---|---|---|---|---|---|---|---|---|---|
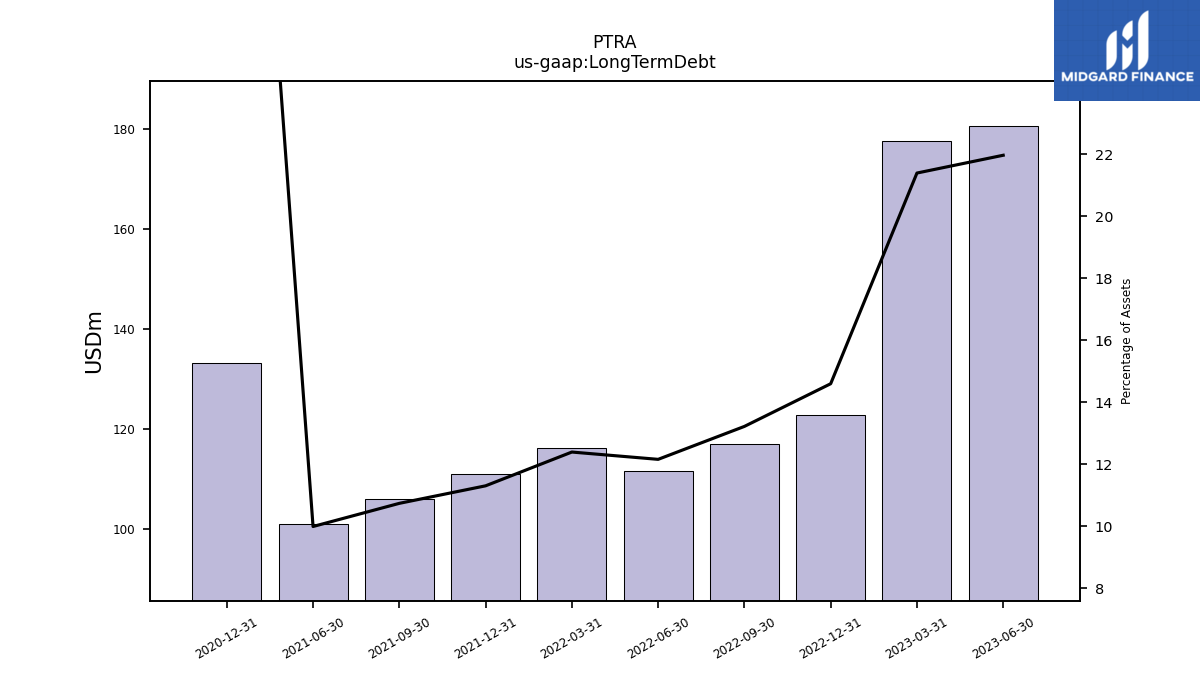
| Long Term Debt | 180.63 | 177.74 | 122.69 | 117.00 | 111.46 | 116.13 | 111.00 | 105.90 | 100.93 | NA | 133.25 | NA | NA | |
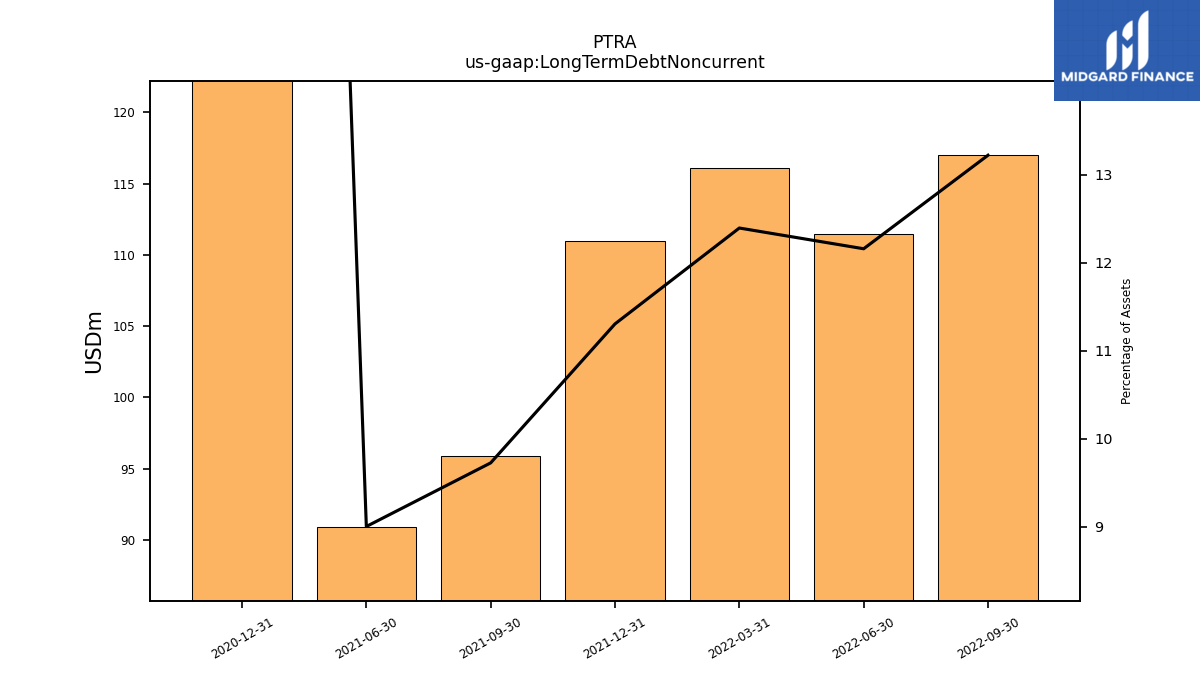
| Long Term Debt Noncurrent | NA | NA | NA | 117.00 | 111.46 | 116.13 | 111.00 | 95.90 | 90.93 | NA | 133.25 | NA | NA | |
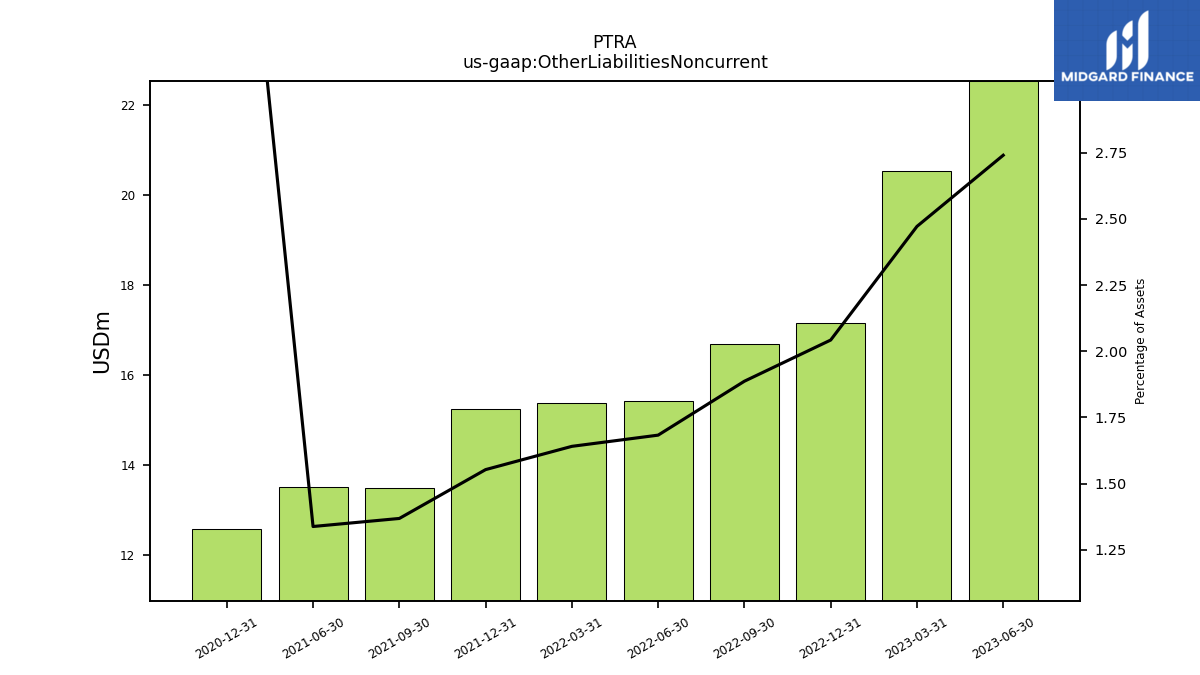
| Other Liabilities Noncurrent | 22.53 | 20.53 | 17.16 | 16.70 | 15.43 | 15.37 | 15.24 | 13.49 | 13.51 | NA | 12.58 | NA | NA | |
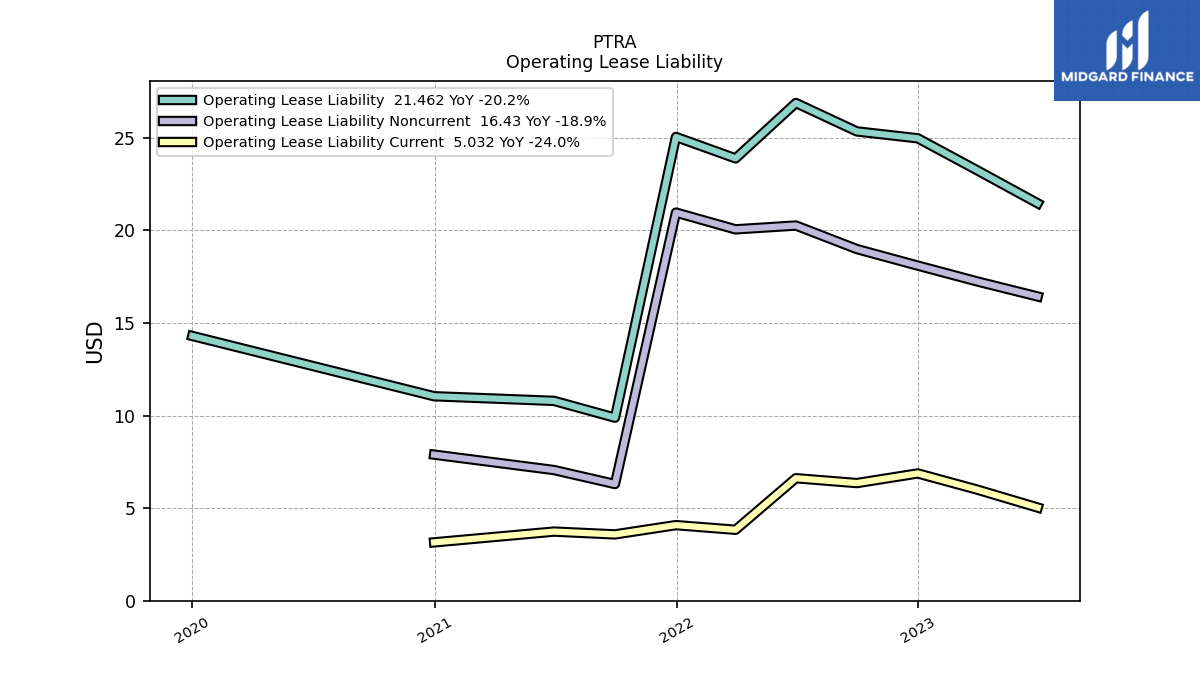
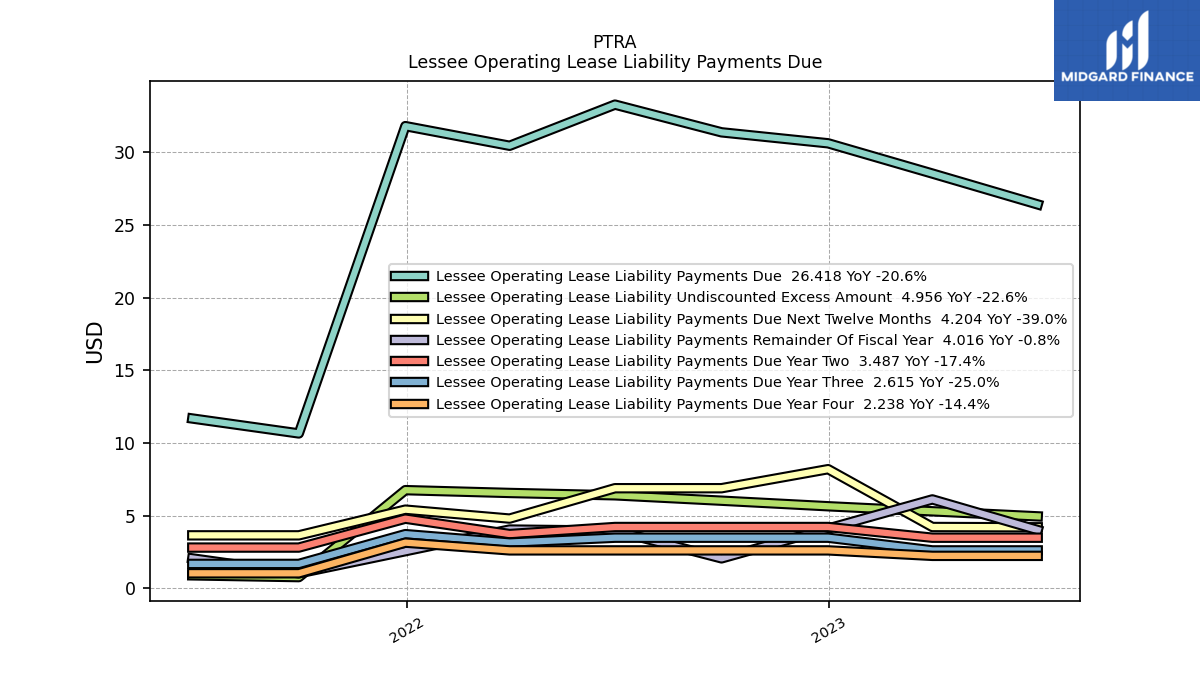
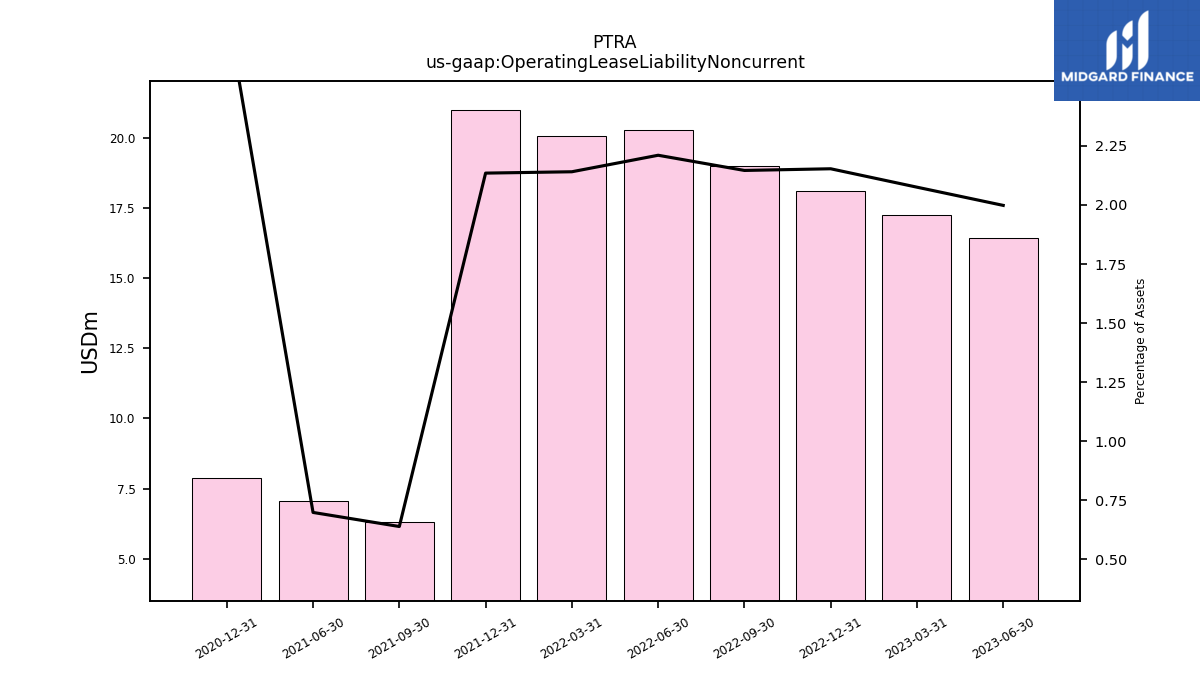
| Operating Lease Liability Noncurrent | 16.43 | 17.24 | 18.10 | 18.99 | 20.26 | 20.06 | 20.96 | 6.30 | 7.06 | NA | 7.89 | NA | NA |
| 2023-06-30 | 2023-03-31 | 2022-12-31 | 2022-09-30 | 2022-06-30 | 2022-03-31 | 2021-12-31 | 2021-09-30 | 2021-06-30 | 2021-03-31 | 2020-12-31 | 2020-09-30 | 2020-06-30 | ||
|---|---|---|---|---|---|---|---|---|---|---|---|---|---|---|
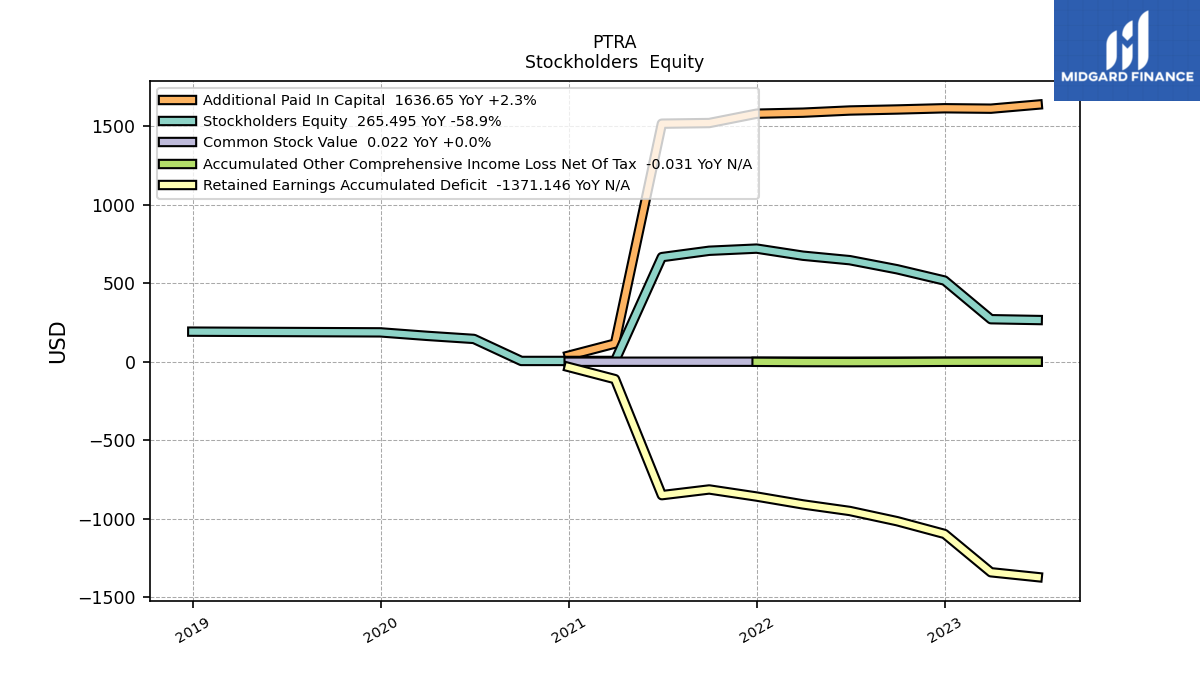
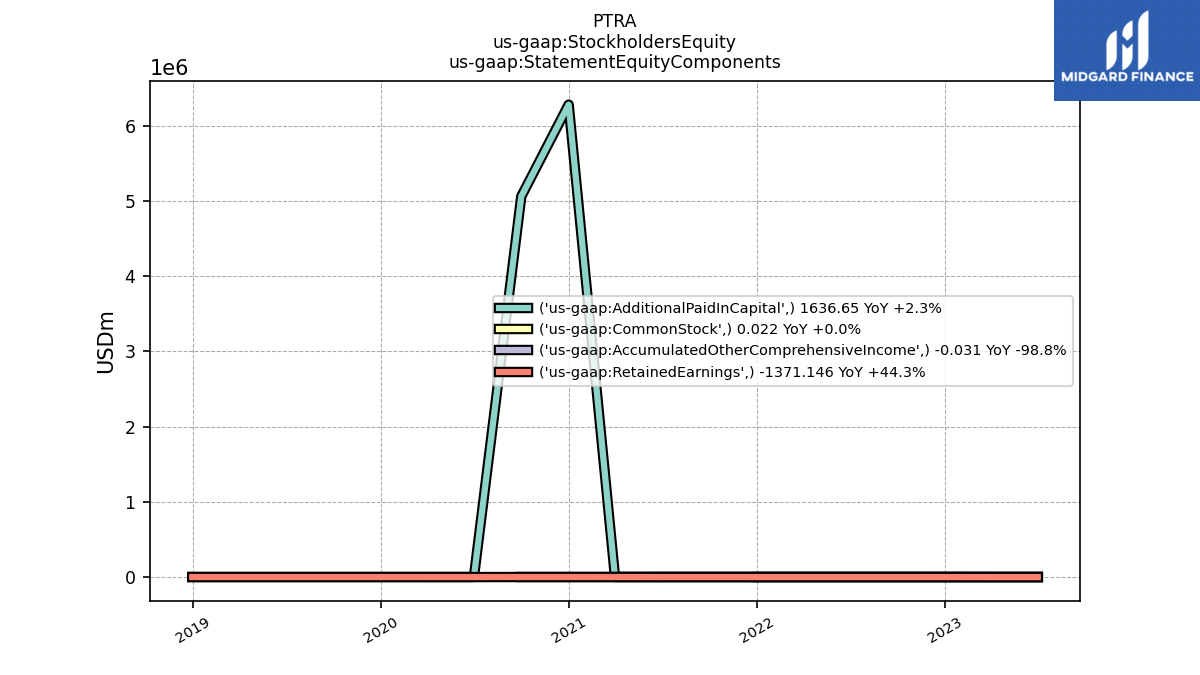
| Stockholders Equity | 265.50 | 270.72 | 516.86 | 588.50 | 646.45 | 674.91 | 720.15 | 706.36 | 665.94 | 5.00 | 5.00 | 5.00 | 145.07 | |
| Common Stock Value | 0.02 | 0.02 | 0.02 | 0.02 | 0.02 | 0.02 | 0.02 | 0.02 | 0.02 | 0.00 | 0.00 | NA | NA | |
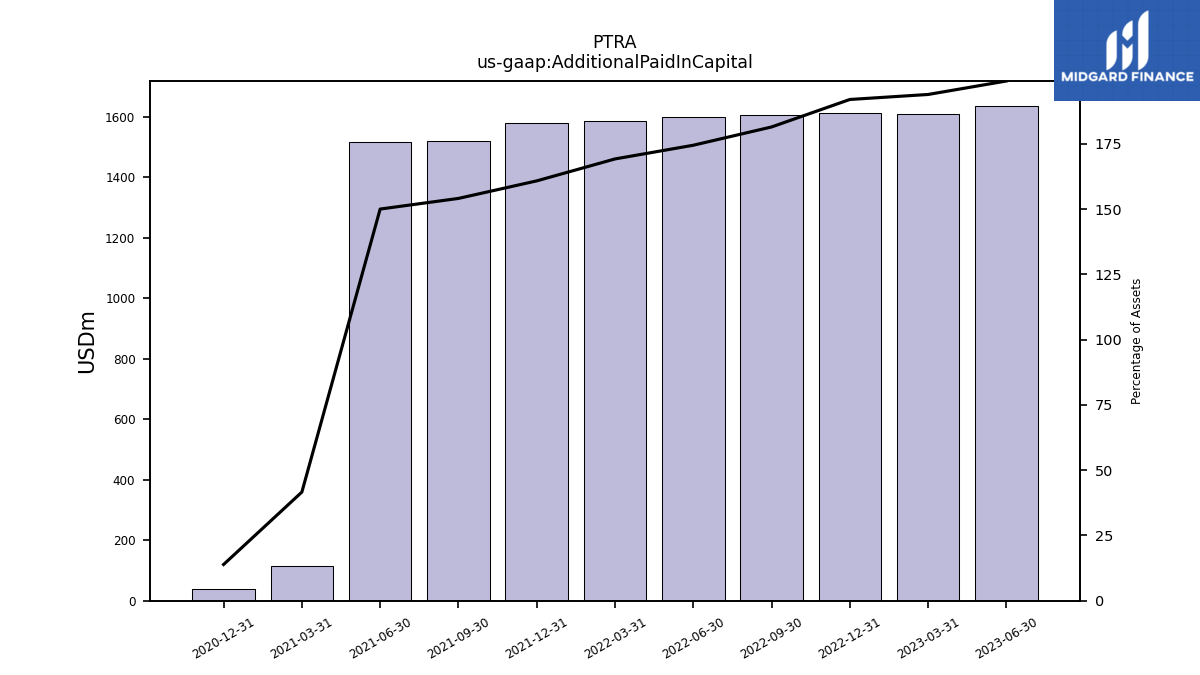
| Additional Paid In Capital | 1636.65 | 1610.78 | 1613.56 | 1605.73 | 1599.25 | 1585.42 | 1578.94 | 1519.43 | 1515.33 | 115.72 | 38.71 | NA | NA | |
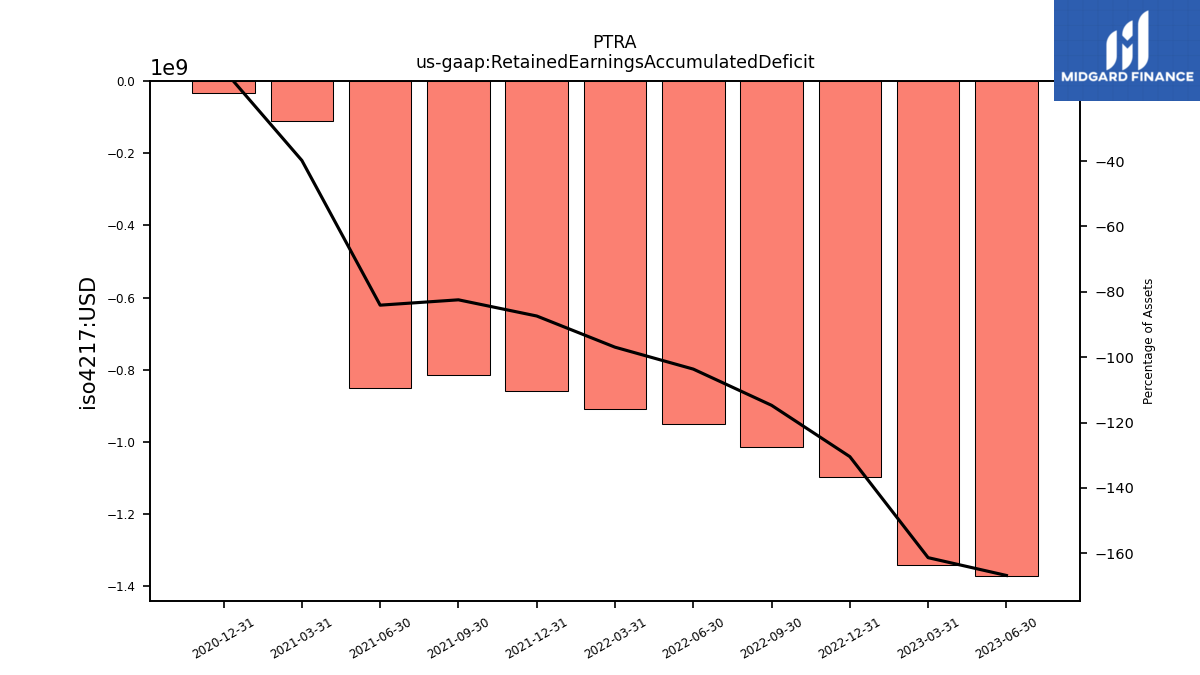
| Retained Earnings Accumulated Deficit | -1371.15 | -1340.15 | -1096.17 | -1015.18 | -950.12 | -908.30 | -858.23 | -813.09 | -849.41 | -110.72 | -33.71 | NA | NA | |
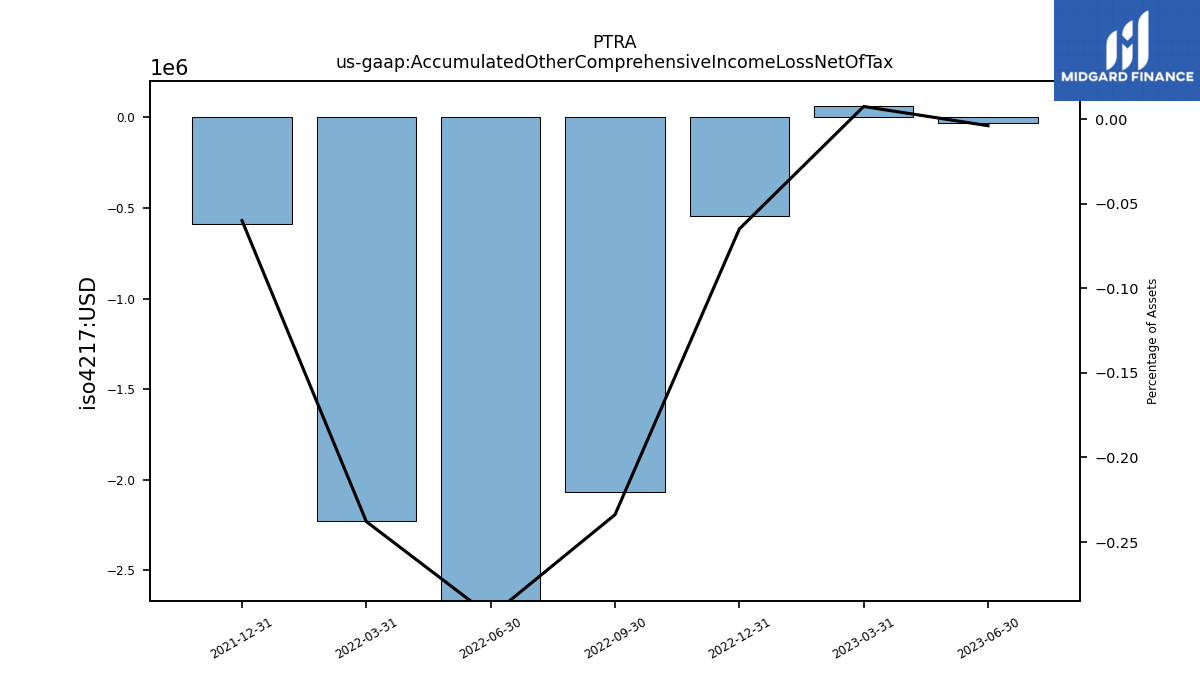
| Accumulated Other Comprehensive Income Loss Net Of Tax | -0.03 | 0.06 | -0.55 | -2.07 | -2.69 | -2.23 | -0.59 | NA | NA | NA | NA | NA | NA | |
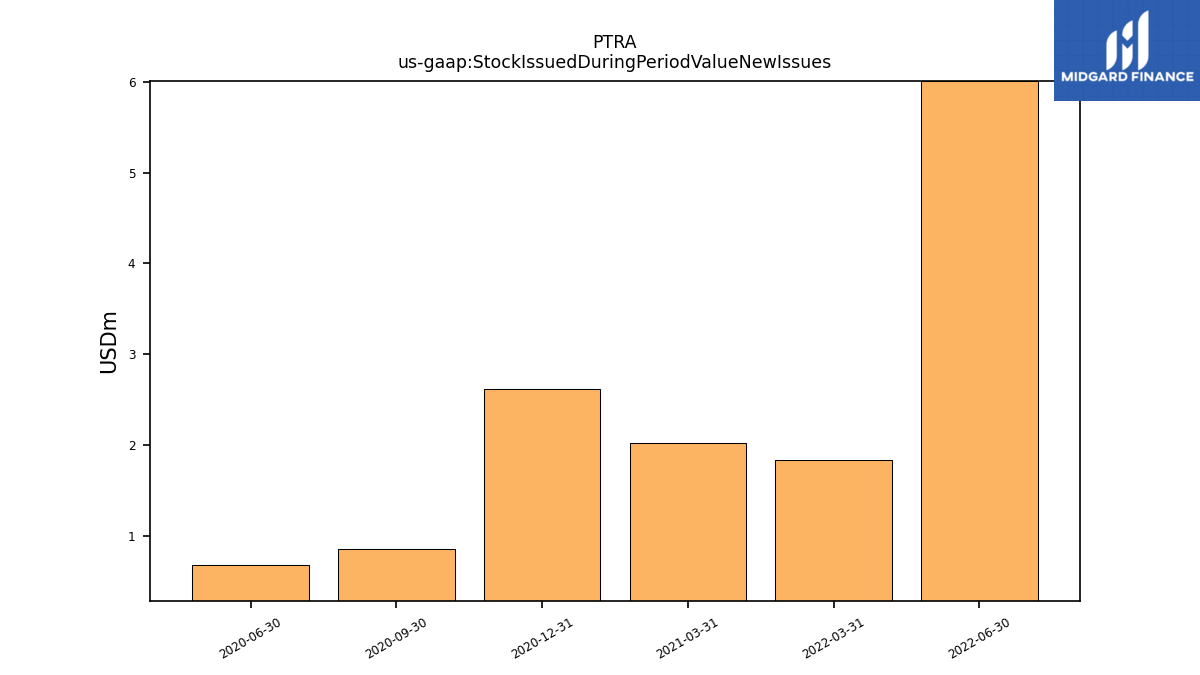
| Stock Issued During Period Value New Issues | NA | NA | NA | NA | 6.01 | 1.83 | NA | NA | NA | 2.02 | 2.62 | 0.85 | 0.67 | |
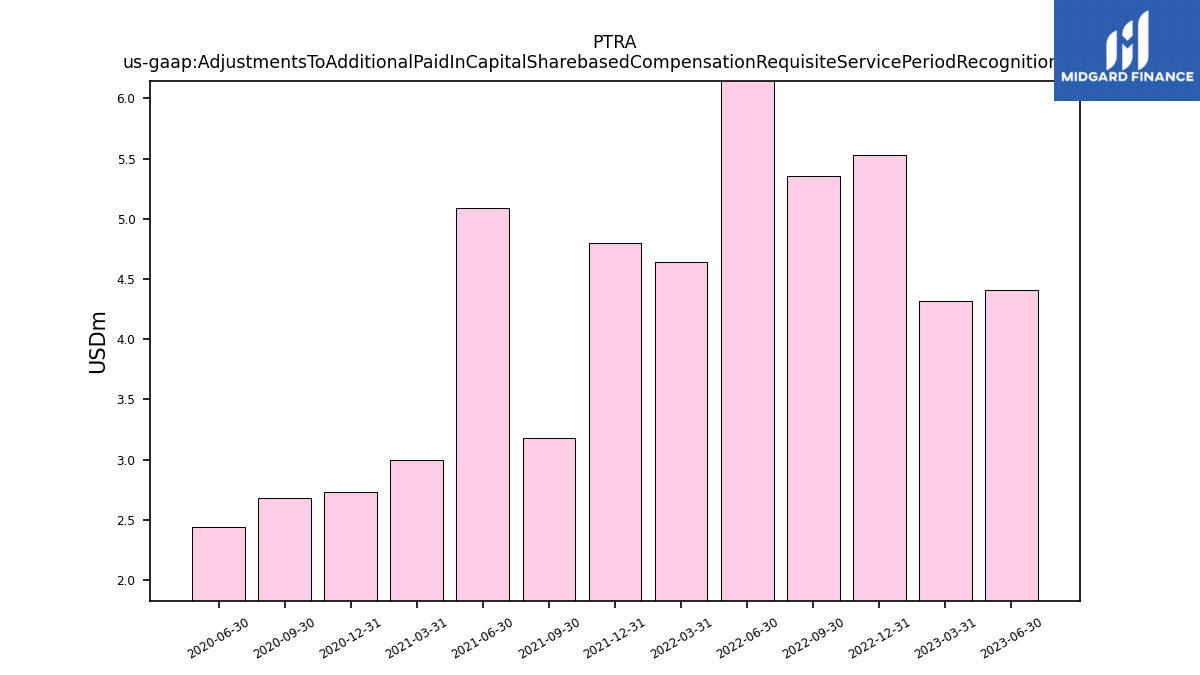
| Adjustments To Additional Paid In Capital Sharebased Compensation Requisite Service Period Recognition Value | 4.41 | 4.31 | 5.53 | 5.36 | 6.32 | 4.64 | 4.80 | 3.18 | 5.09 | 3.00 | 2.73 | 2.68 | 2.45 |
| 2023-06-30 | 2023-03-31 | 2022-12-31 | 2022-09-30 | 2022-06-30 | 2022-03-31 | 2021-12-31 | 2021-09-30 | 2021-06-30 | 2021-03-31 | 2020-12-31 | 2020-09-30 | 2020-06-30 | ||
|---|---|---|---|---|---|---|---|---|---|---|---|---|---|---|
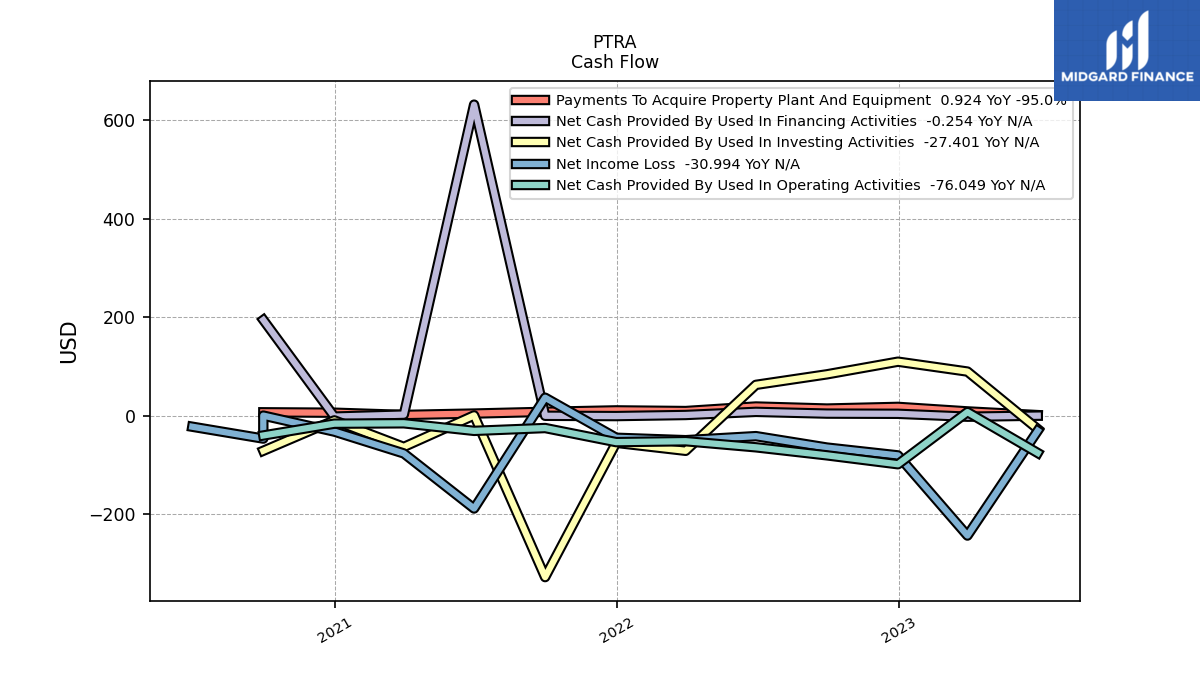
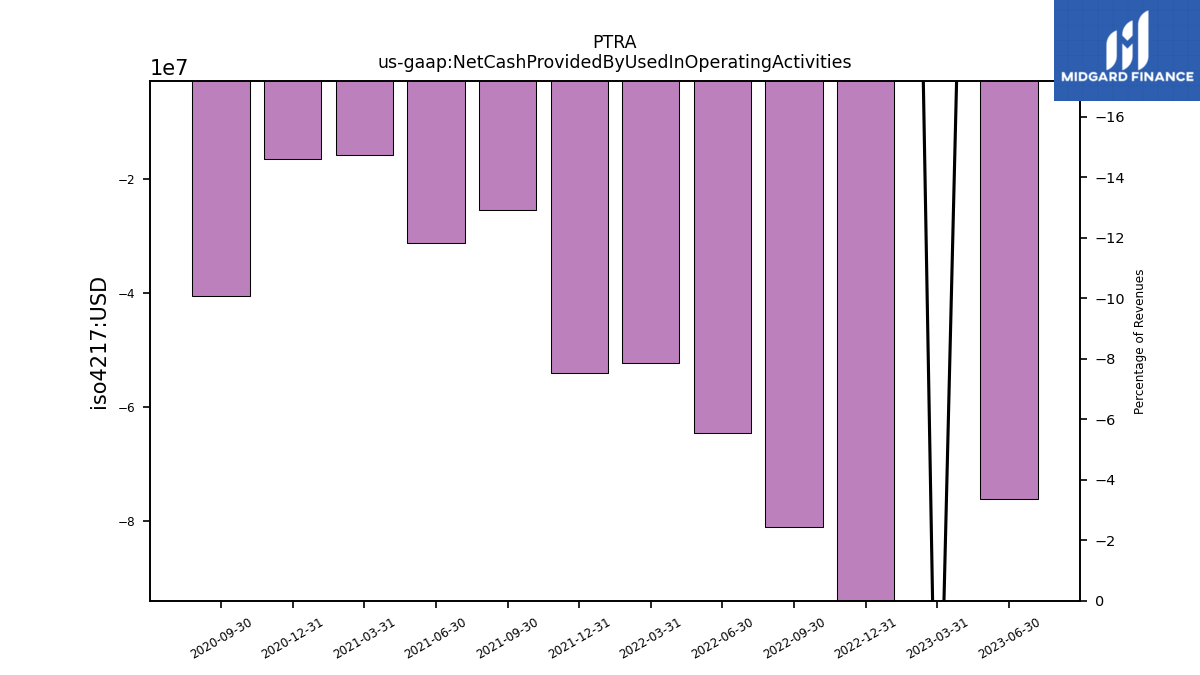
| Net Cash Provided By Used In Operating Activities | -76.05 | 7.11 | -99.02 | -80.89 | -64.55 | -52.15 | -54.01 | -25.37 | -31.14 | -15.75 | -16.48 | -40.51 | NA | |
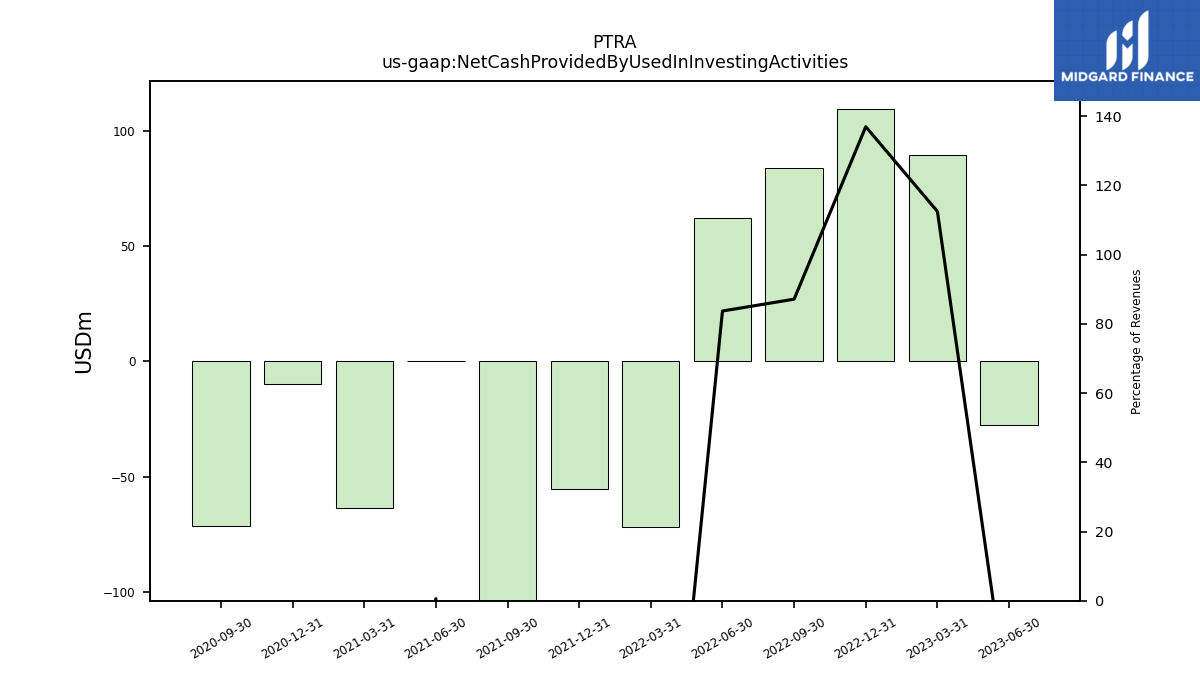
| Net Cash Provided By Used In Investing Activities | -27.40 | 89.43 | 109.54 | 83.82 | 62.40 | -71.65 | -55.42 | -328.46 | 0.35 | -63.76 | -9.78 | -71.60 | NA | |
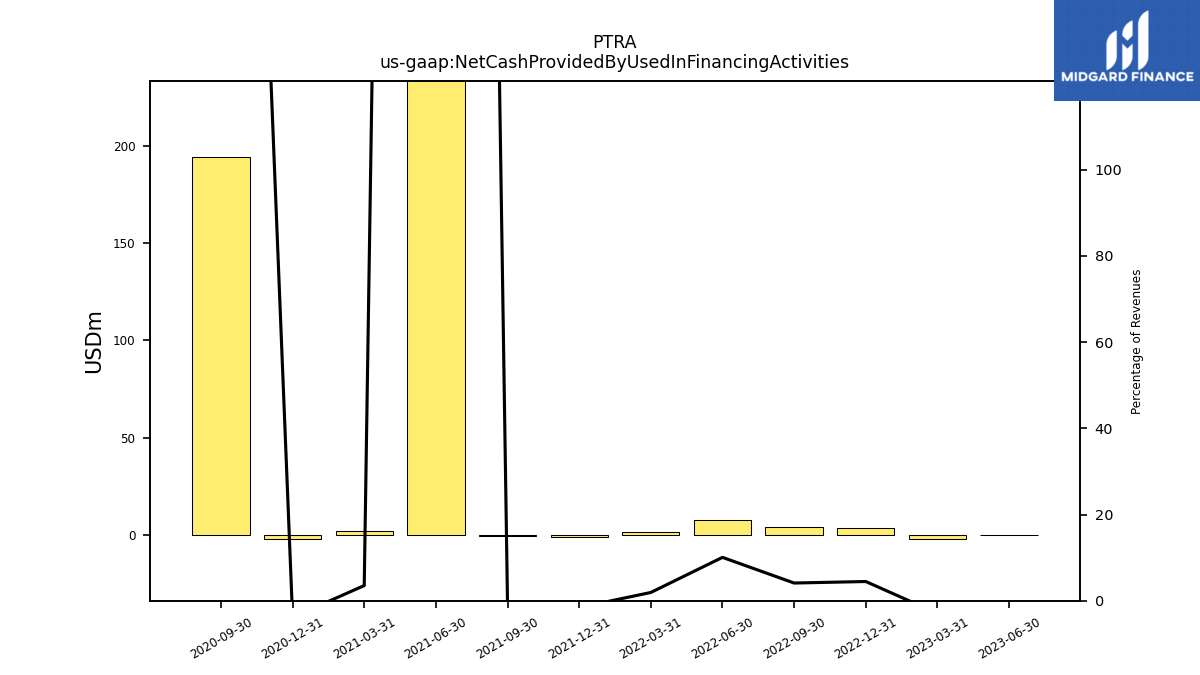
| Net Cash Provided By Used In Financing Activities | -0.25 | -2.33 | 3.57 | 3.96 | 7.50 | 1.12 | -1.07 | -0.48 | 632.09 | 1.90 | -2.08 | 194.35 | NA |
| 2023-06-30 | 2023-03-31 | 2022-12-31 | 2022-09-30 | 2022-06-30 | 2022-03-31 | 2021-12-31 | 2021-09-30 | 2021-06-30 | 2021-03-31 | 2020-12-31 | 2020-09-30 | 2020-06-30 | ||
|---|---|---|---|---|---|---|---|---|---|---|---|---|---|---|
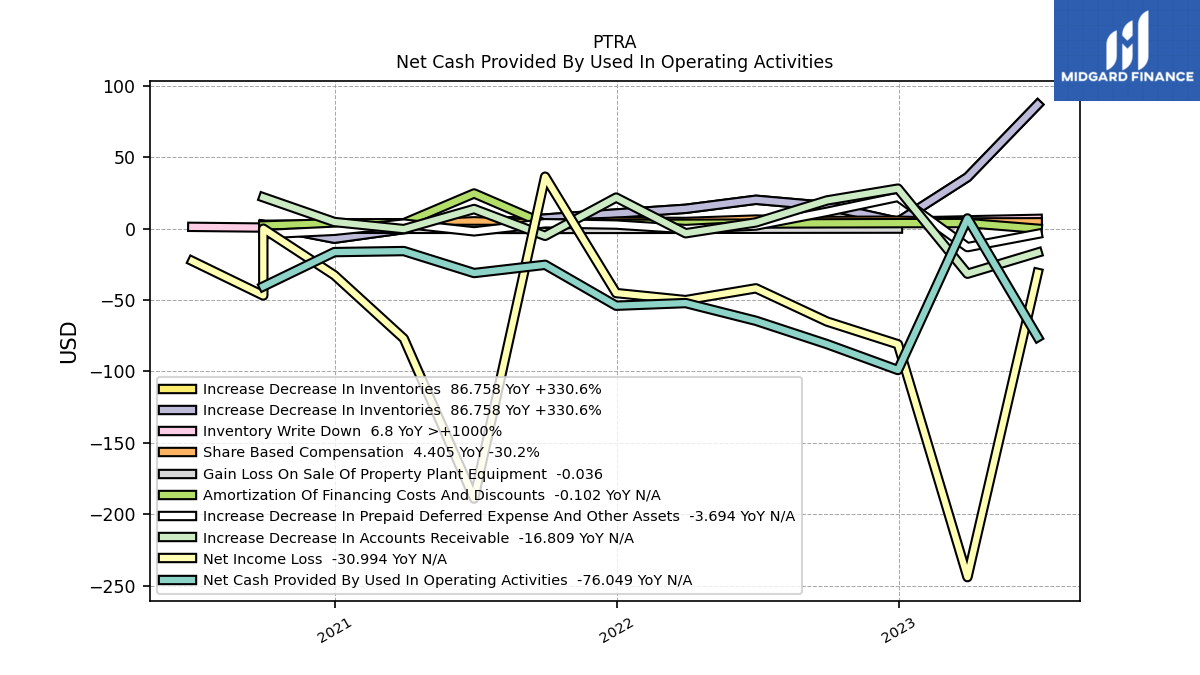
| Net Cash Provided By Used In Operating Activities | -76.05 | 7.11 | -99.02 | -80.89 | -64.55 | -52.15 | -54.01 | -25.37 | -31.14 | -15.75 | -16.48 | -40.51 | NA | |
| Net Income Loss | -30.99 | -243.98 | -80.99 | -65.06 | -41.82 | -50.08 | -45.14 | 36.32 | -189.03 | -77.01 | -32.62 | -46.86 | -22.70 | |
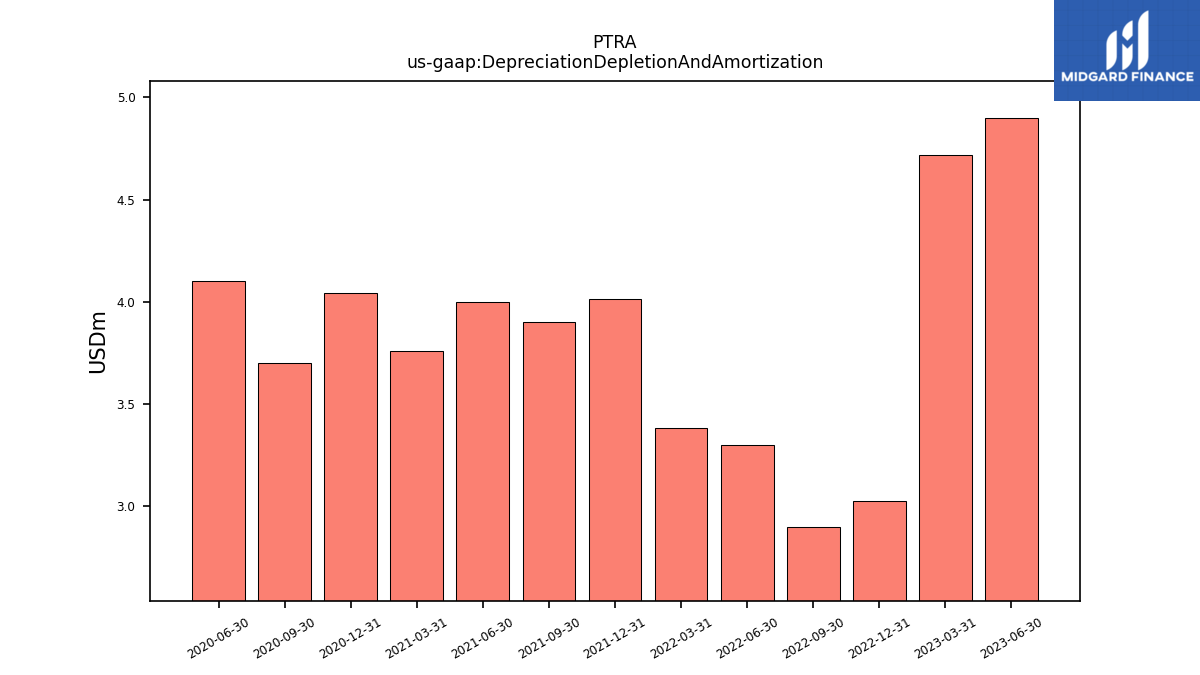
| Depreciation Depletion And Amortization | 4.90 | 4.72 | 3.02 | 2.90 | 3.30 | 3.38 | 4.01 | 3.90 | 4.00 | 3.76 | 4.04 | 3.70 | 4.10 | |
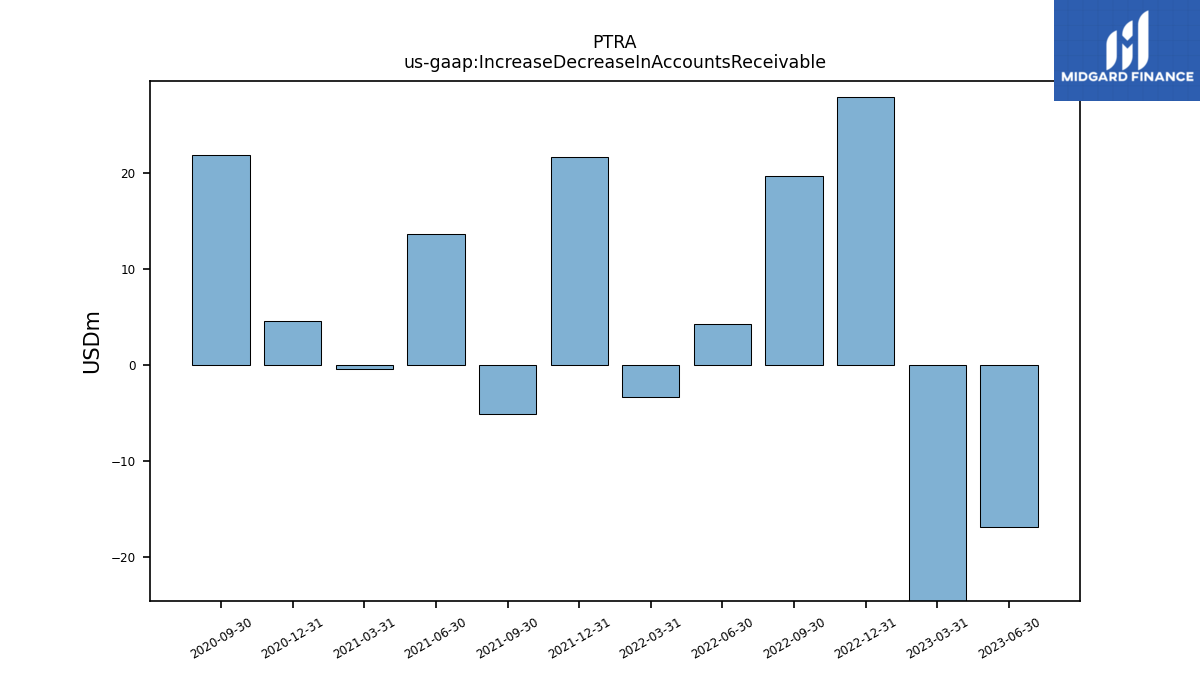
| Increase Decrease In Accounts Receivable | -16.81 | -31.62 | 27.98 | 19.69 | 4.31 | -3.29 | 21.70 | -5.10 | 13.69 | -0.36 | 4.61 | 21.88 | NA | |
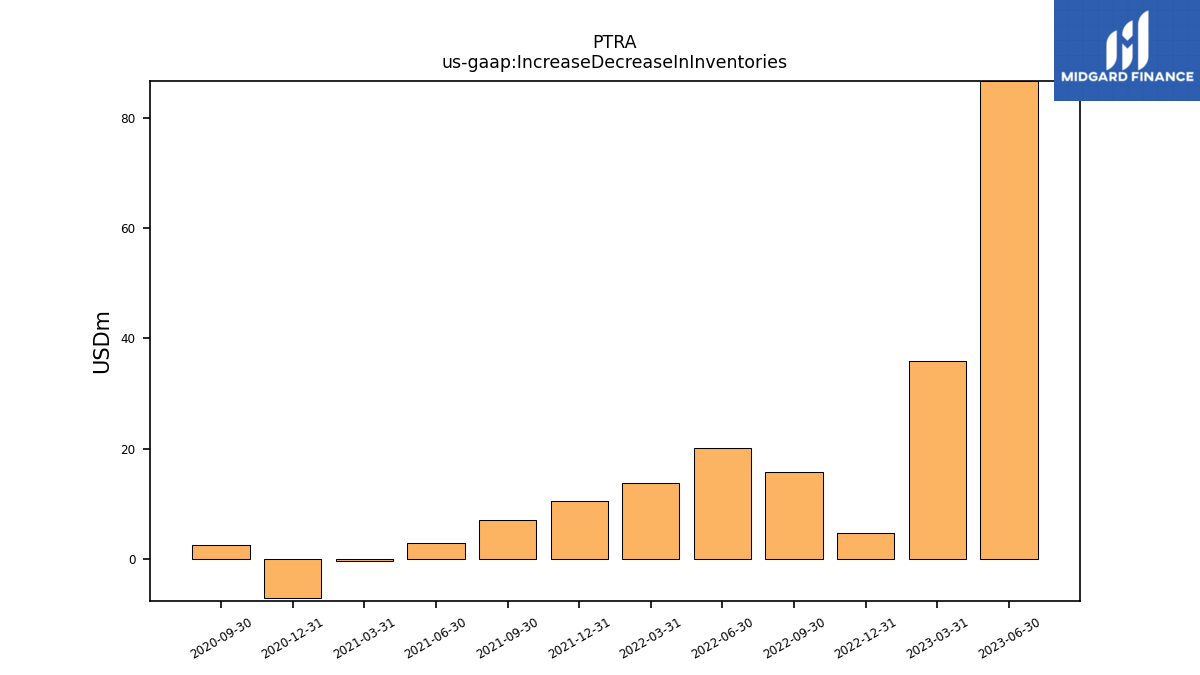
| Increase Decrease In Inventories | 86.76 | 35.92 | 4.73 | 15.78 | 20.15 | 13.83 | 10.56 | 7.04 | 2.95 | -0.36 | -7.11 | 2.57 | NA | |
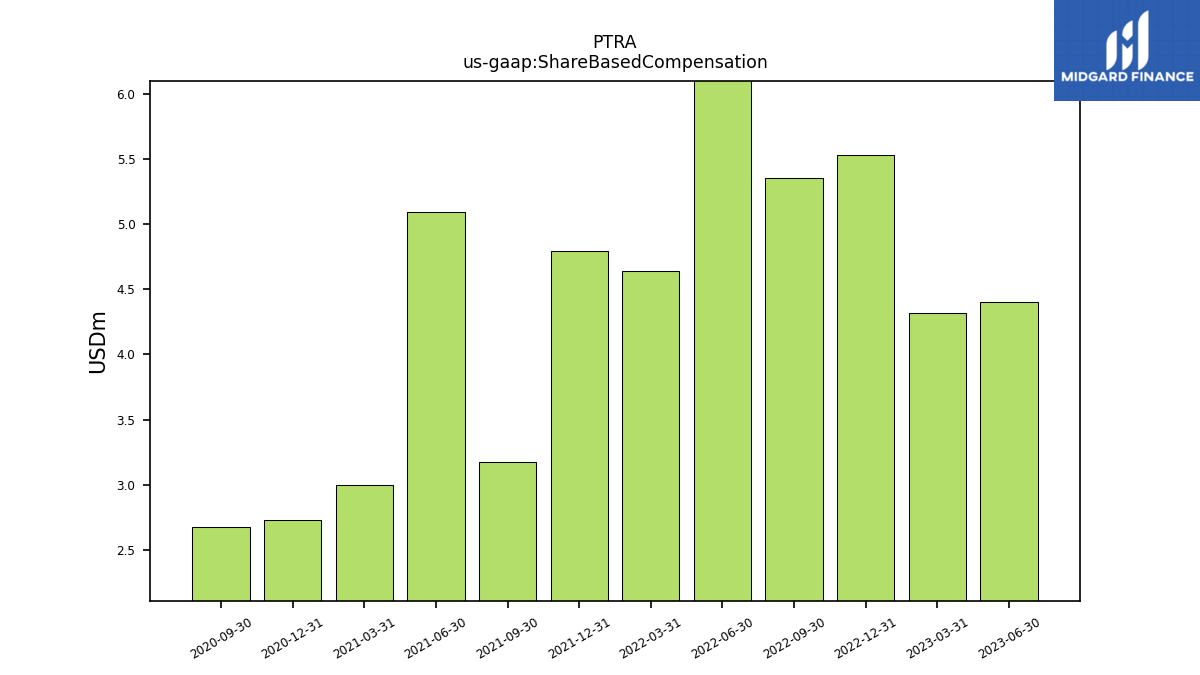
| Share Based Compensation | 4.41 | 4.31 | 5.53 | 5.36 | 6.32 | 4.64 | 4.80 | 3.18 | 5.09 | 3.00 | 2.73 | 2.68 | NA |
| 2023-06-30 | 2023-03-31 | 2022-12-31 | 2022-09-30 | 2022-06-30 | 2022-03-31 | 2021-12-31 | 2021-09-30 | 2021-06-30 | 2021-03-31 | 2020-12-31 | 2020-09-30 | 2020-06-30 | ||
|---|---|---|---|---|---|---|---|---|---|---|---|---|---|---|
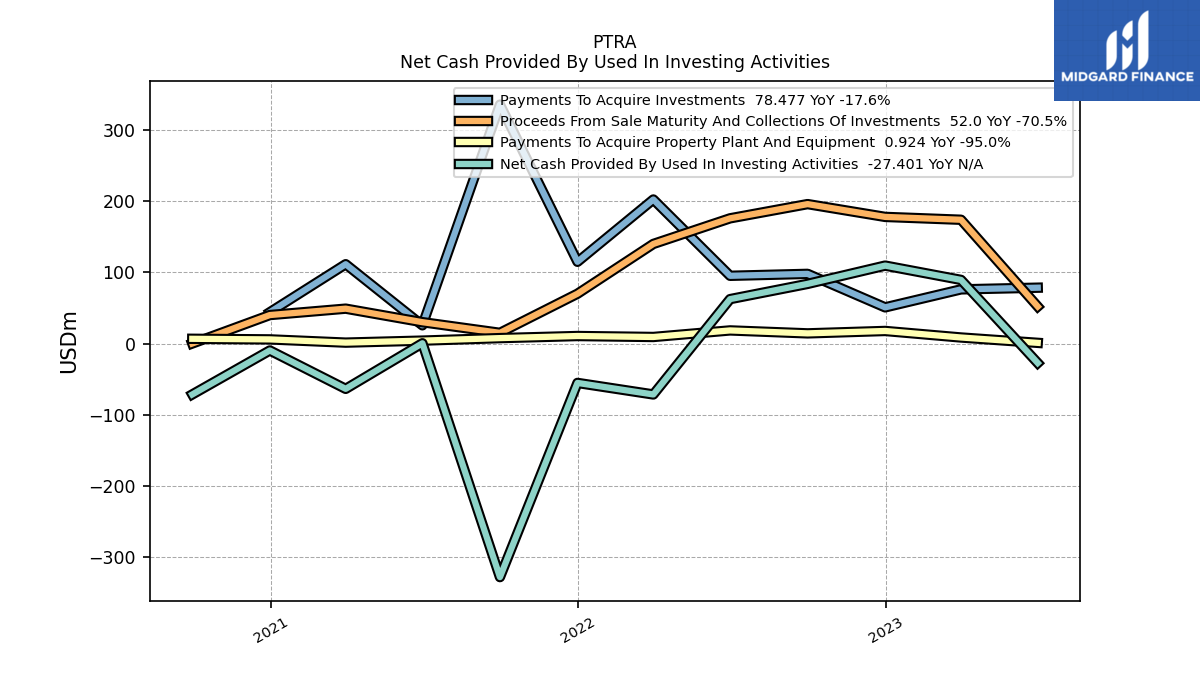
| Net Cash Provided By Used In Investing Activities | -27.40 | 89.43 | 109.54 | 83.82 | 62.40 | -71.65 | -55.42 | -328.46 | 0.35 | -63.76 | -9.78 | -71.60 | NA | |
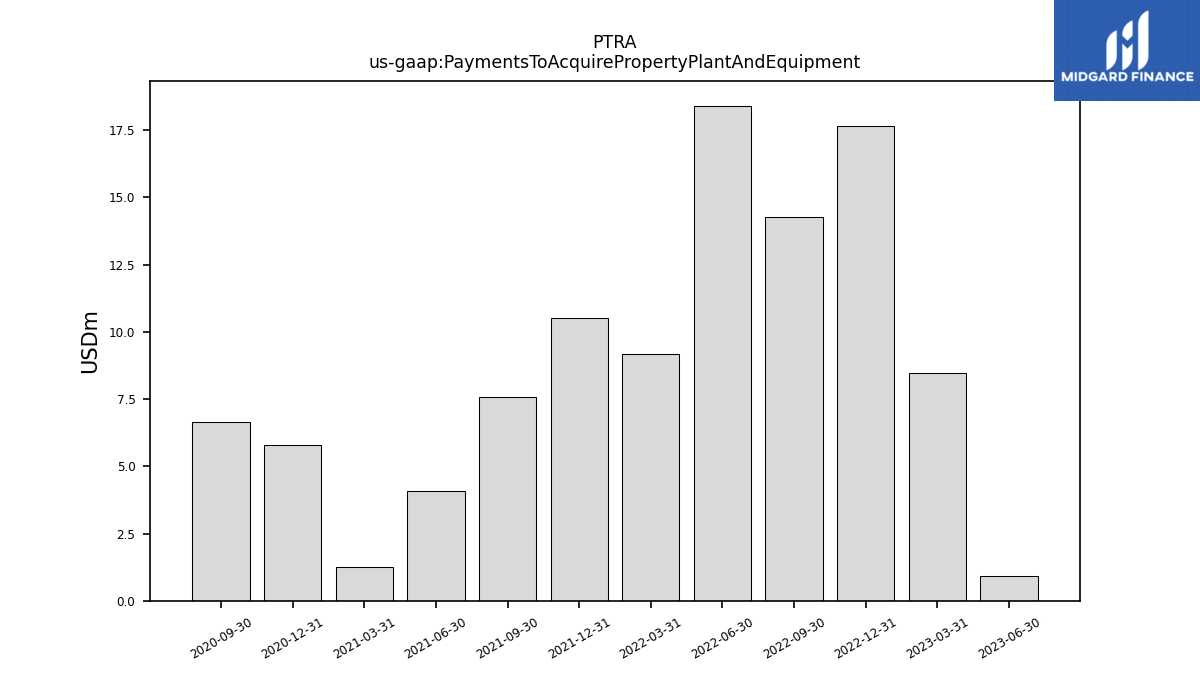
| Payments To Acquire Property Plant And Equipment | 0.92 | 8.45 | 17.64 | 14.26 | 18.40 | 9.17 | 10.52 | 7.59 | 4.07 | 1.25 | 5.80 | 6.63 | NA | |
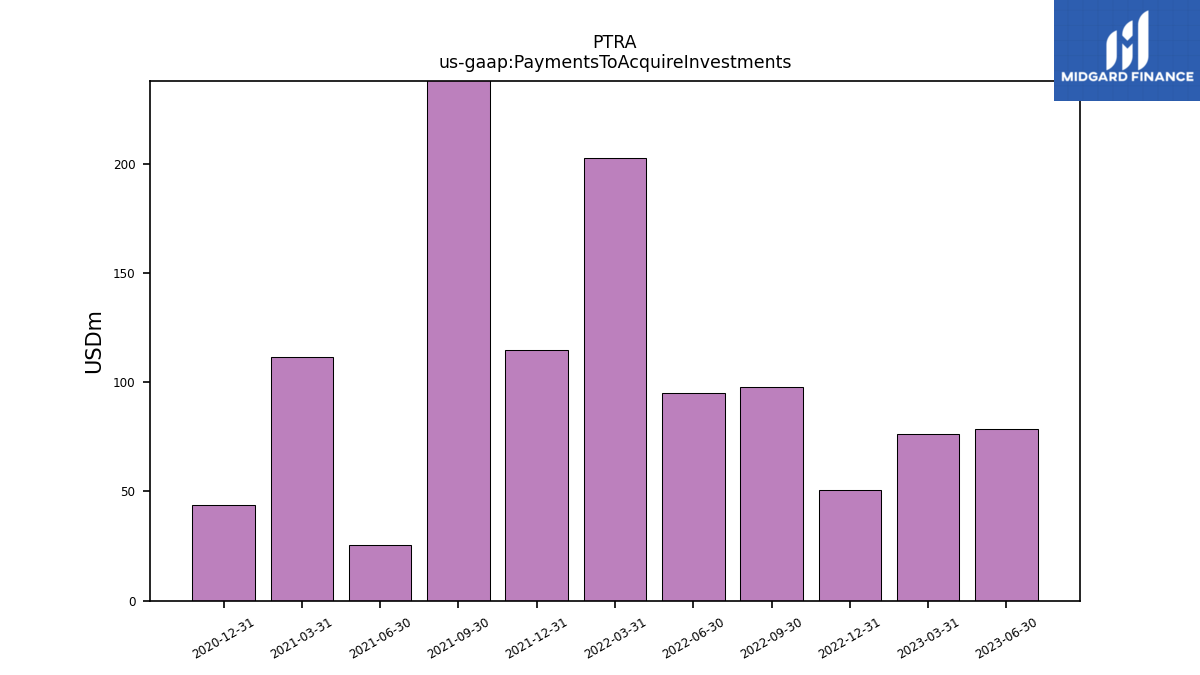
| Payments To Acquire Investments | 78.48 | 76.12 | 50.82 | 97.92 | 95.19 | 202.48 | 114.89 | 335.87 | 25.58 | 111.50 | 43.99 | NA | NA |
| 2023-06-30 | 2023-03-31 | 2022-12-31 | 2022-09-30 | 2022-06-30 | 2022-03-31 | 2021-12-31 | 2021-09-30 | 2021-06-30 | 2021-03-31 | 2020-12-31 | 2020-09-30 | 2020-06-30 | ||
|---|---|---|---|---|---|---|---|---|---|---|---|---|---|---|
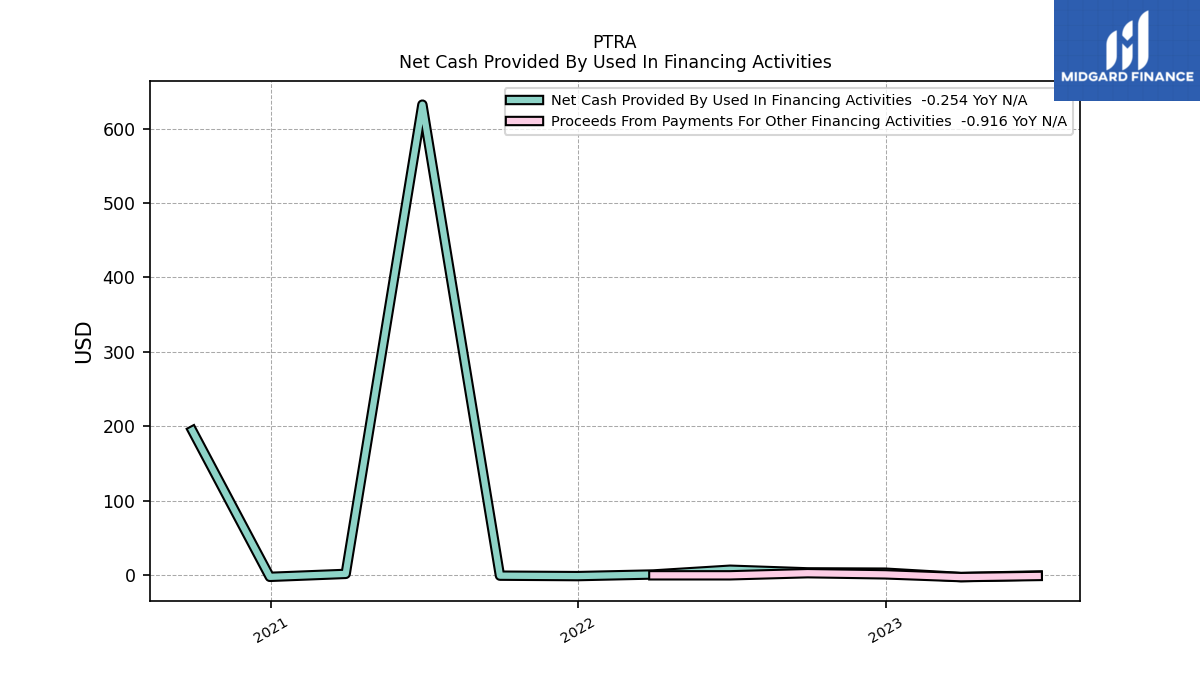
| Net Cash Provided By Used In Financing Activities | -0.25 | -2.33 | 3.57 | 3.96 | 7.50 | 1.12 | -1.07 | -0.48 | 632.09 | 1.90 | -2.08 | 194.35 | NA |
| 2023-06-30 | 2023-03-31 | 2022-12-31 | 2022-09-30 | 2022-06-30 | 2022-03-31 | 2021-12-31 | 2021-09-30 | 2021-06-30 | 2021-03-31 | 2020-12-31 | 2020-09-30 | 2020-06-30 | ||
|---|---|---|---|---|---|---|---|---|---|---|---|---|---|---|
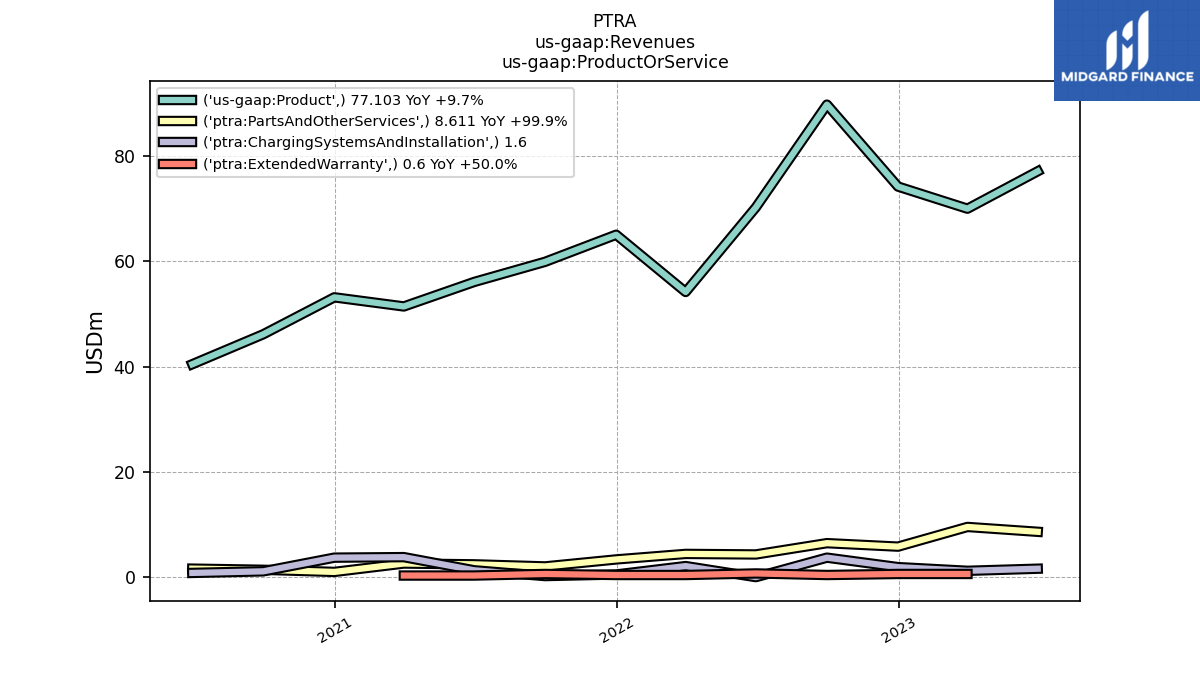
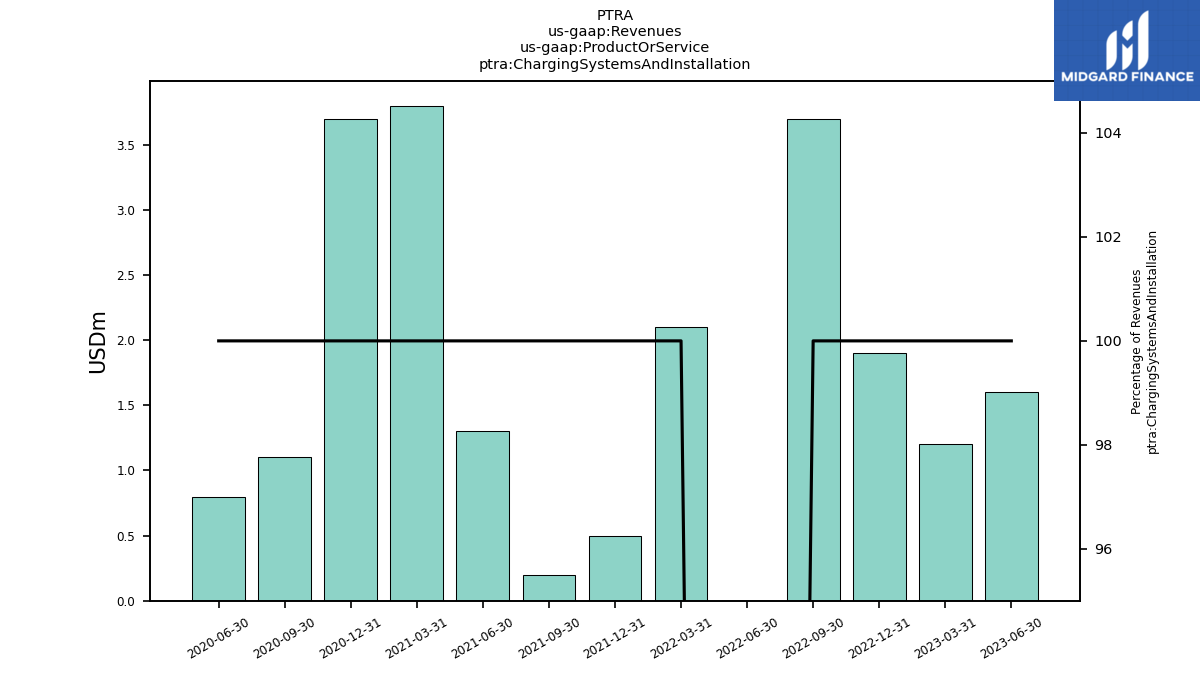
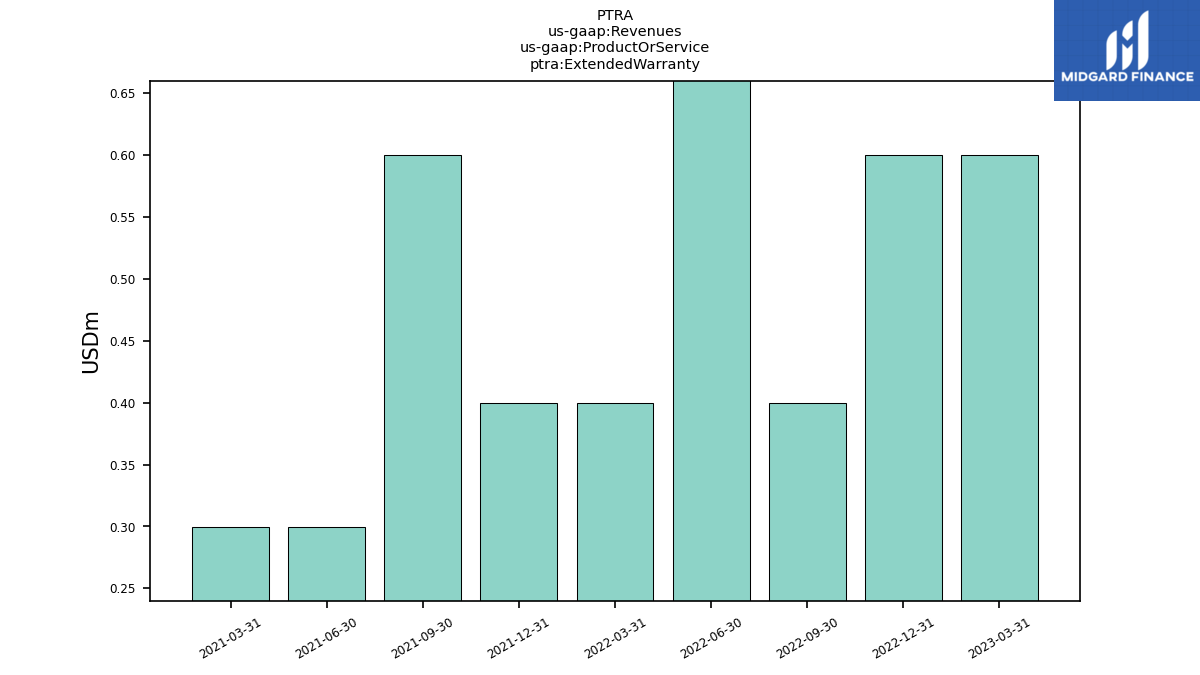
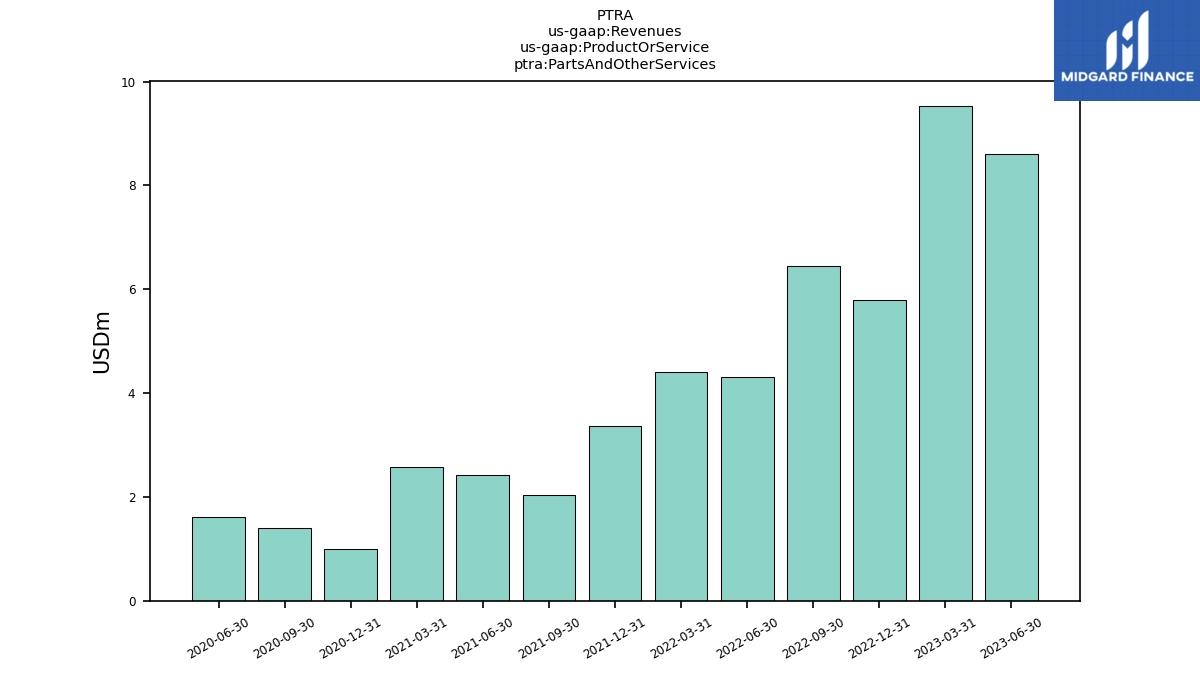
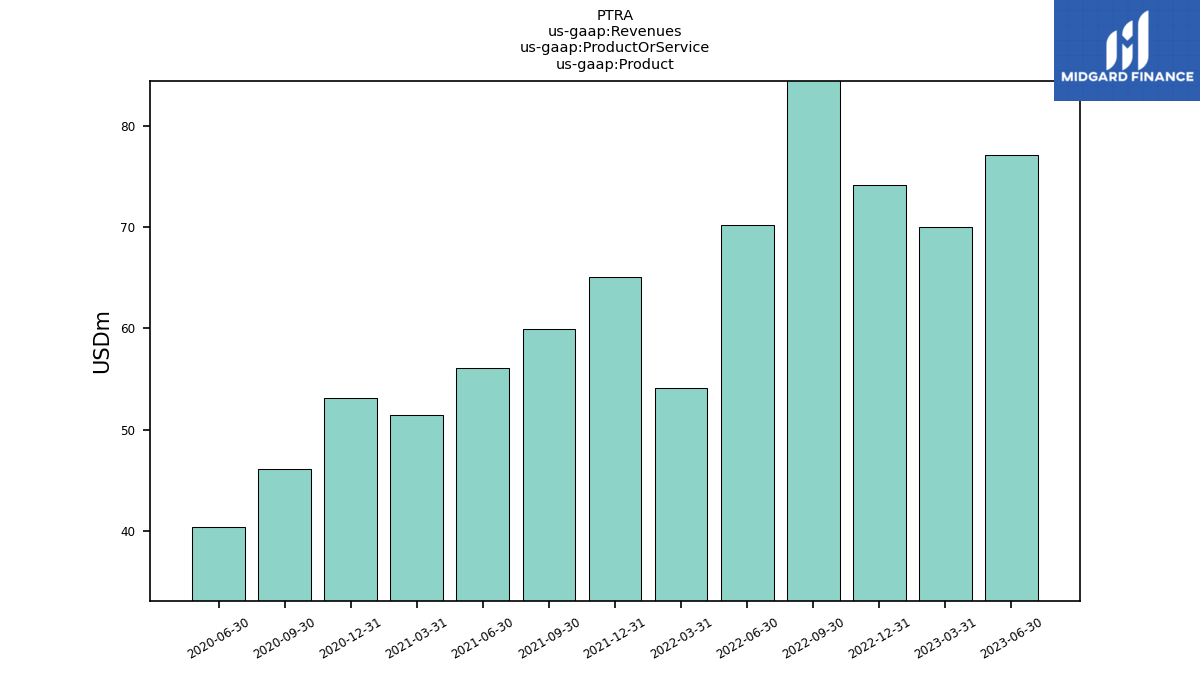
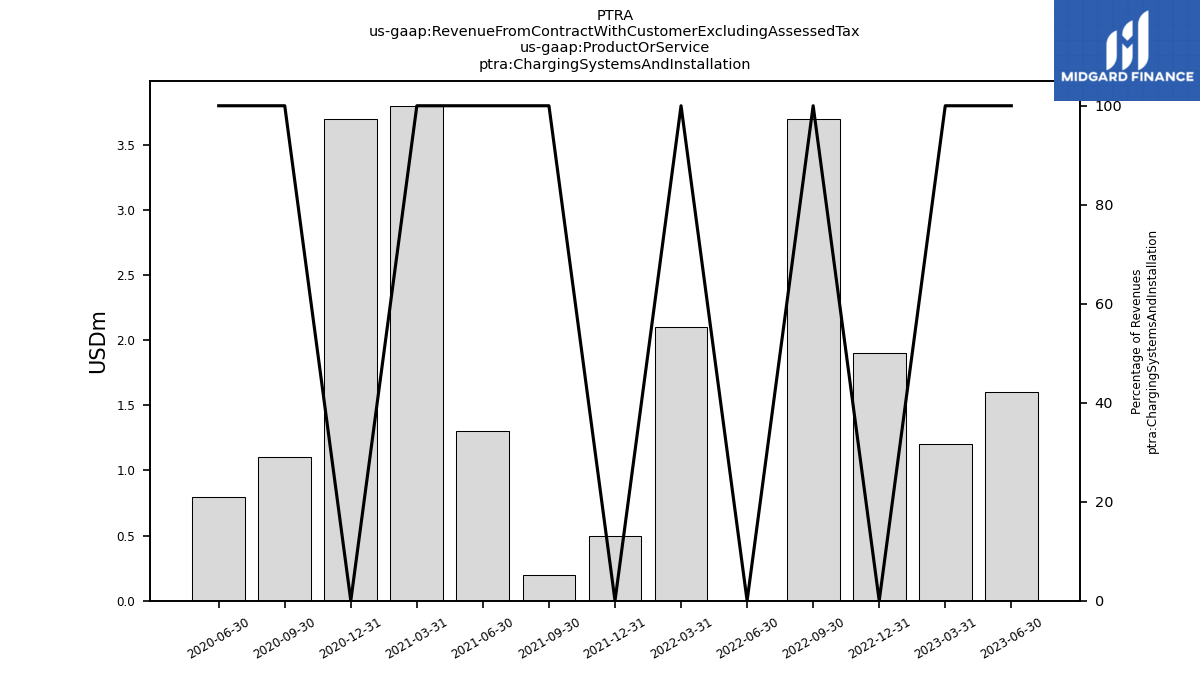
| Revenues | 85.71 | 79.53 | 80.00 | 96.22 | 74.56 | 58.58 | 68.41 | 61.94 | 58.50 | 54.01 | 54.15 | 47.54 | 42.06 | |
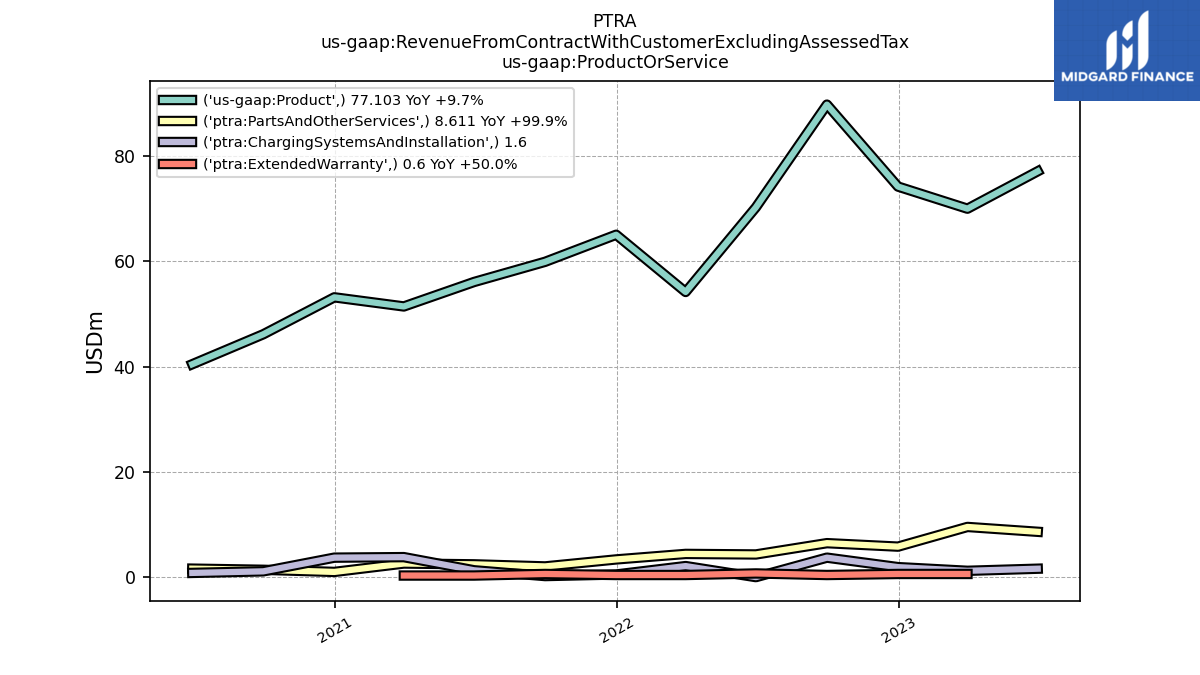
| Charging Systems And Installation | 1.60 | 1.20 | 1.90 | 3.70 | 0.00 | 2.10 | 0.50 | 0.20 | 1.30 | 3.80 | 3.70 | 1.10 | 0.80 | |
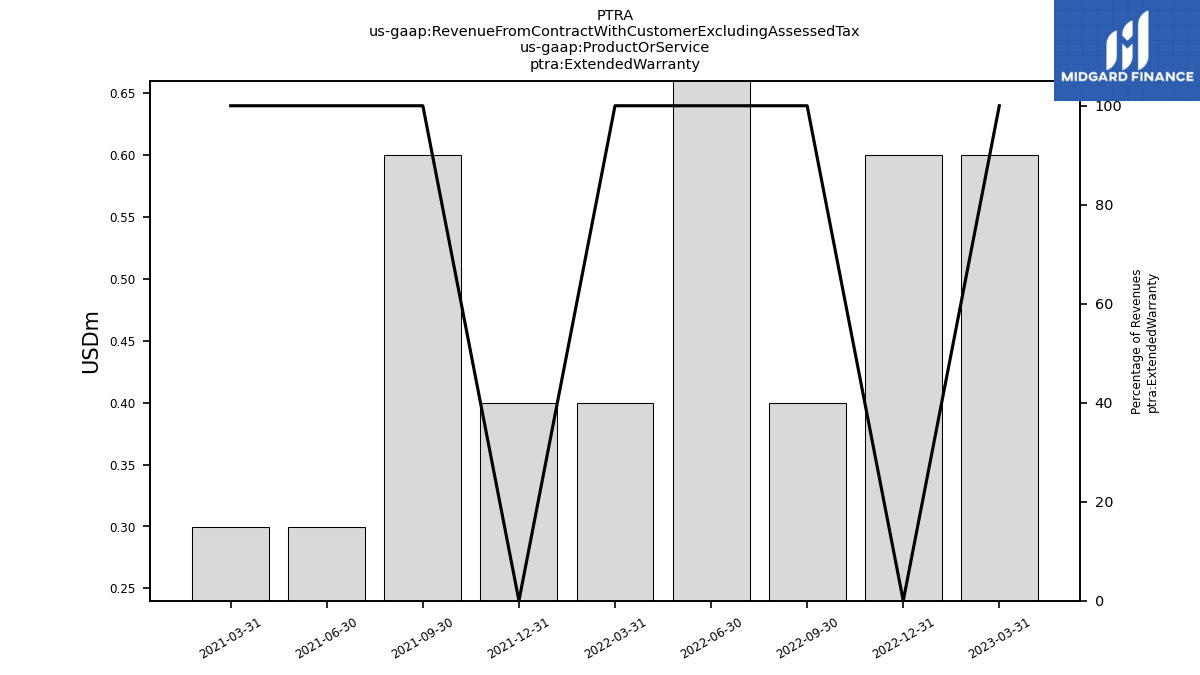
| Extended Warranty | NA | 0.60 | 0.60 | 0.40 | 0.70 | 0.40 | 0.40 | 0.60 | 0.30 | 0.30 | NA | NA | NA | |
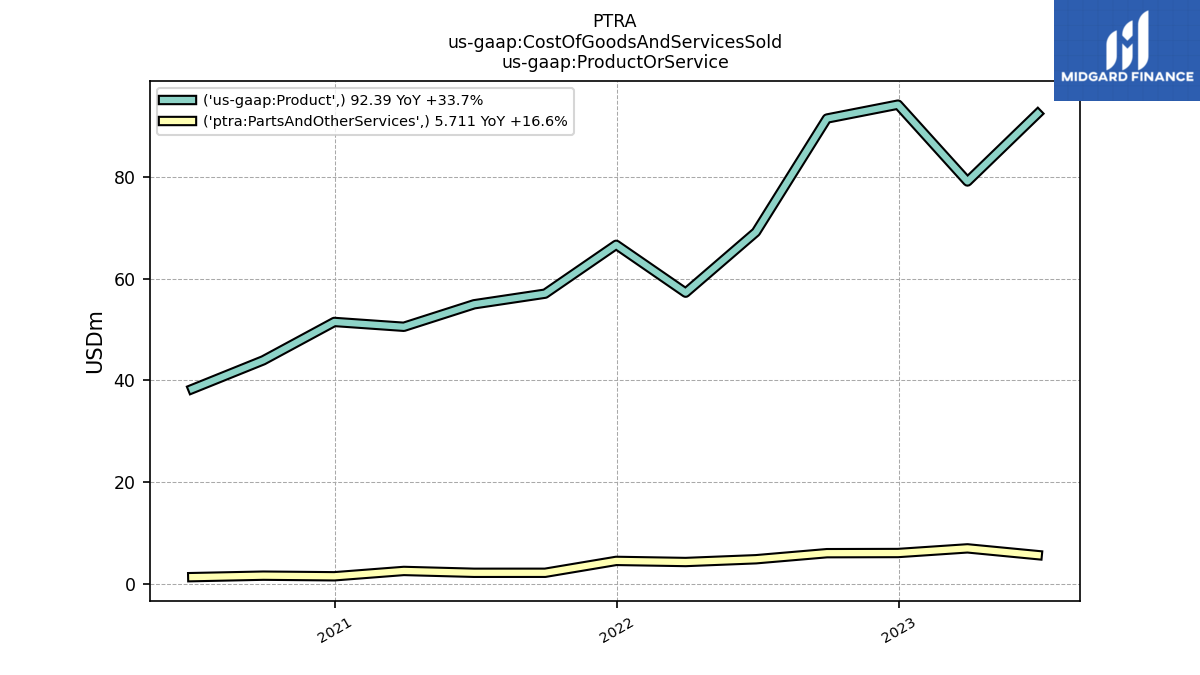
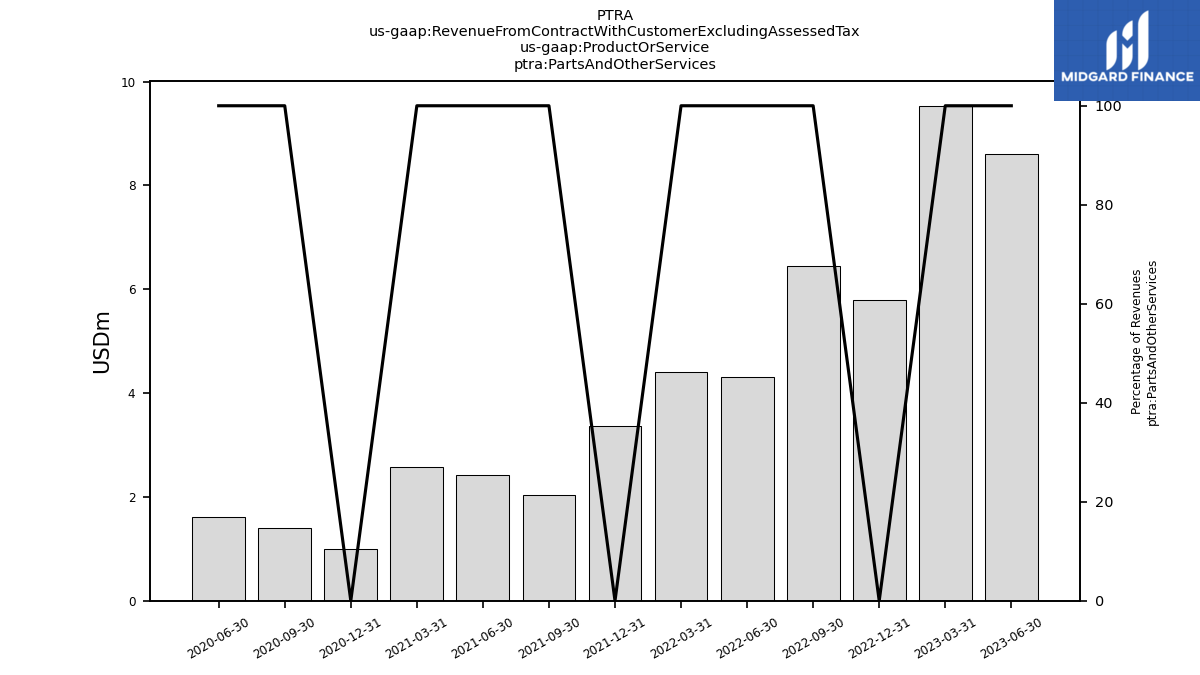
| Parts And Other Services | 8.61 | 9.53 | 5.79 | 6.45 | 4.31 | 4.41 | 3.36 | 2.03 | 2.43 | 2.58 | 0.99 | 1.40 | 1.61 | |
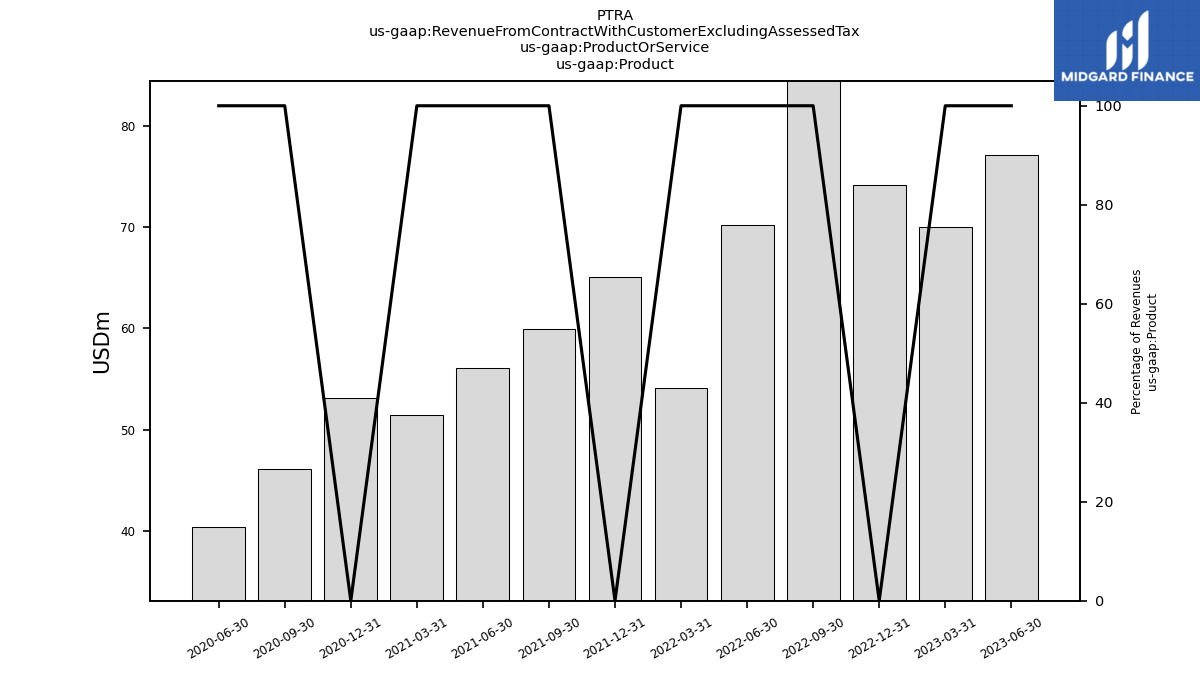
| Product | 77.10 | 70.00 | 74.20 | 89.77 | 70.26 | 54.17 | 65.05 | 59.91 | 56.07 | 51.42 | 53.16 | 46.14 | 40.45 | |
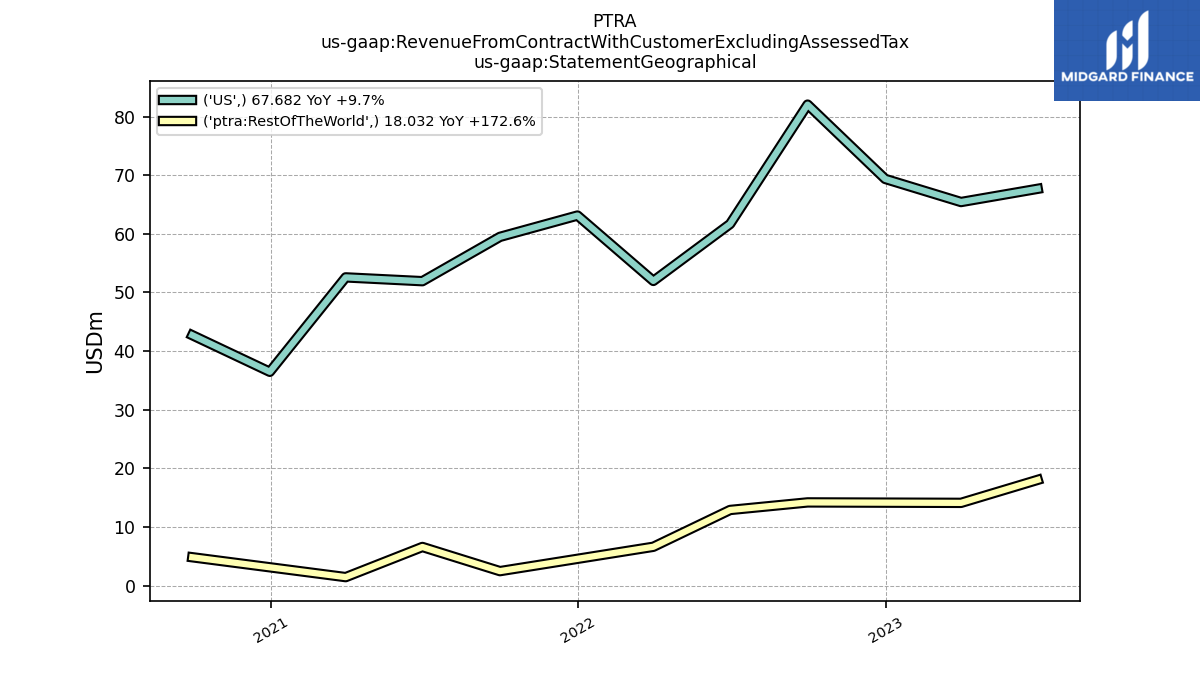
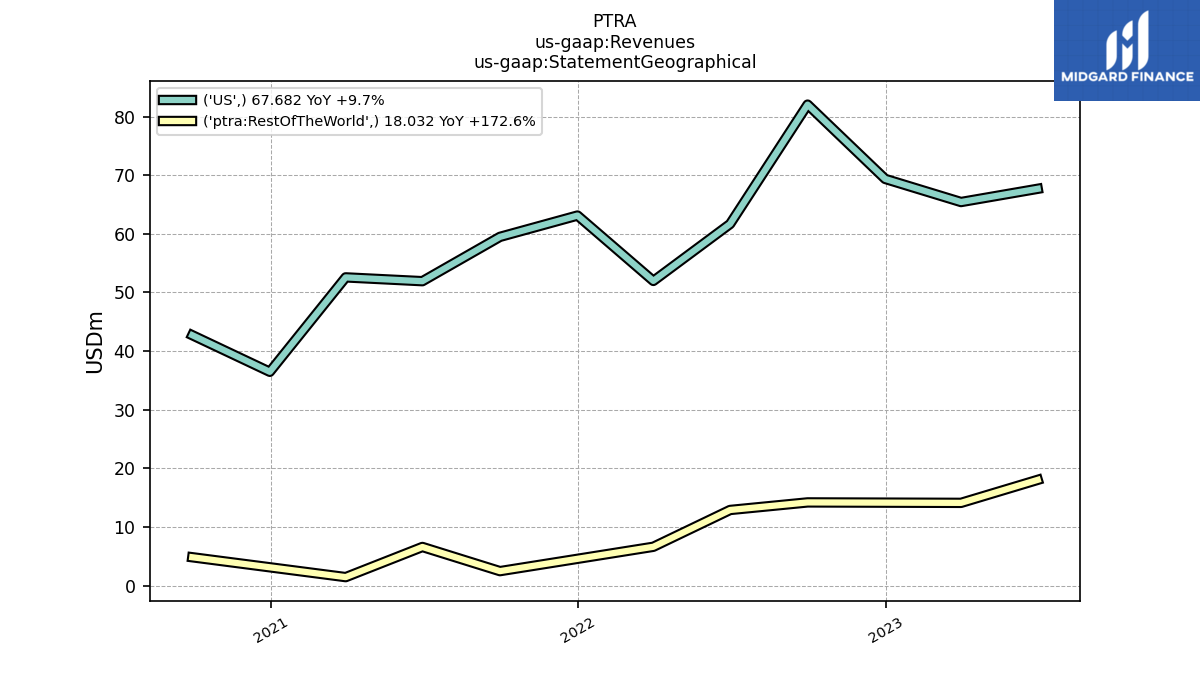
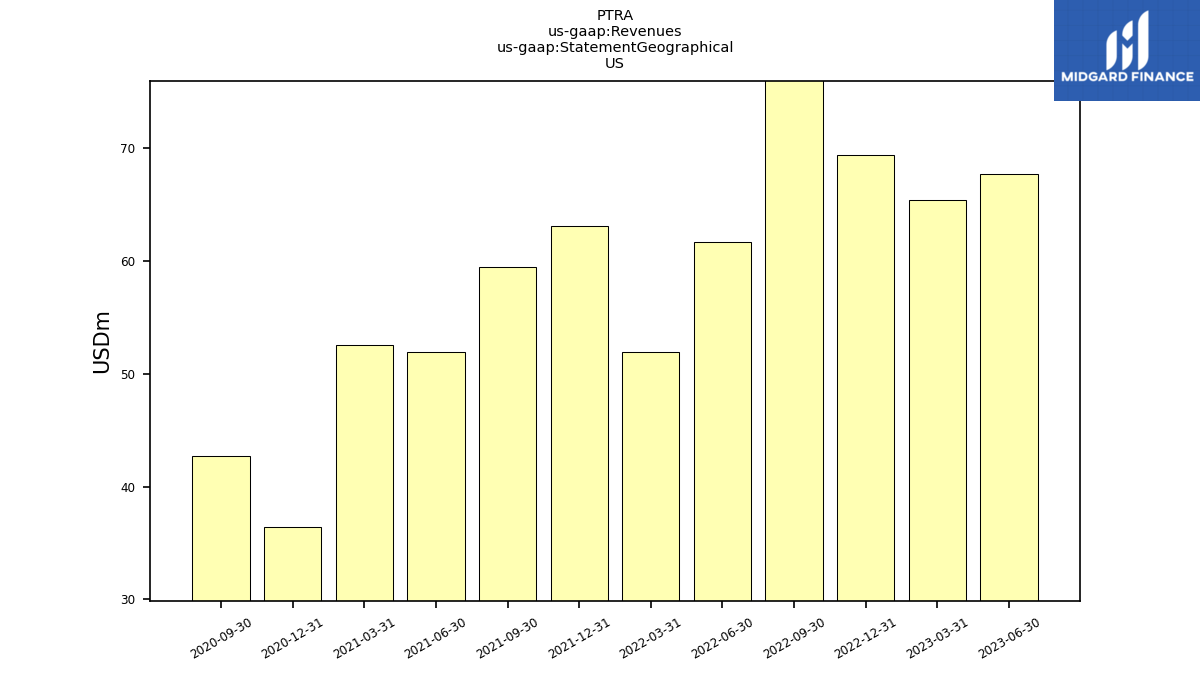
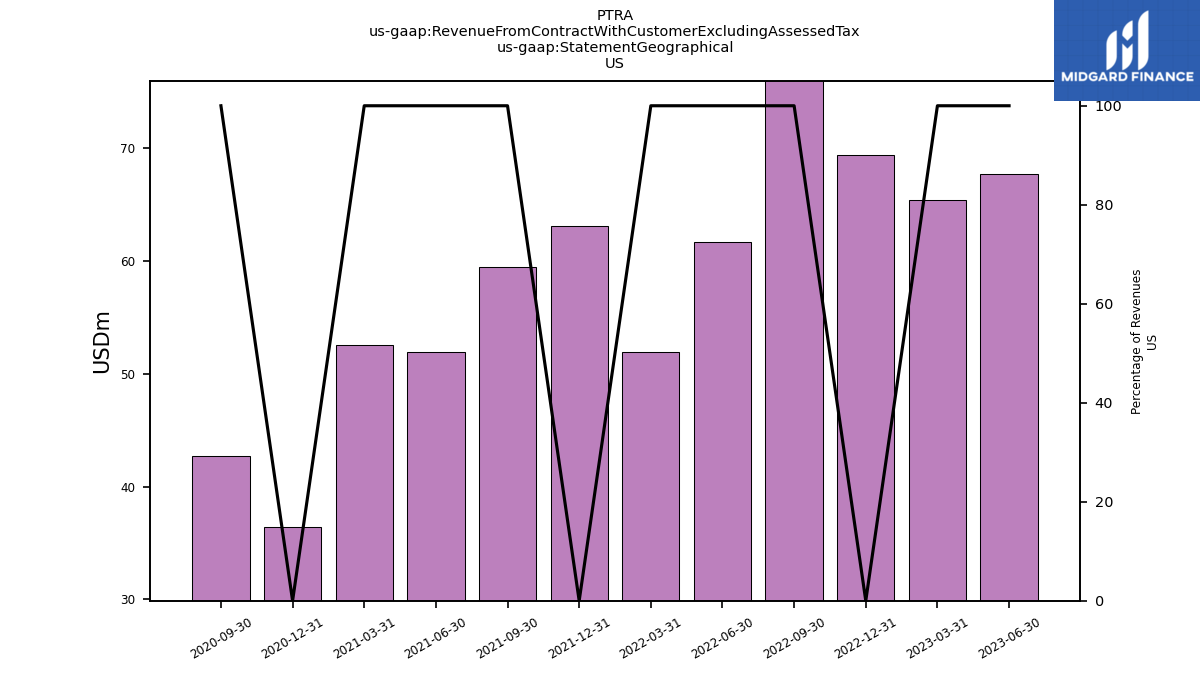
| US | 67.68 | 65.42 | 69.37 | 82.04 | 61.67 | 51.97 | 63.12 | 59.48 | 51.92 | 52.57 | 36.46 | 42.71 | NA | |
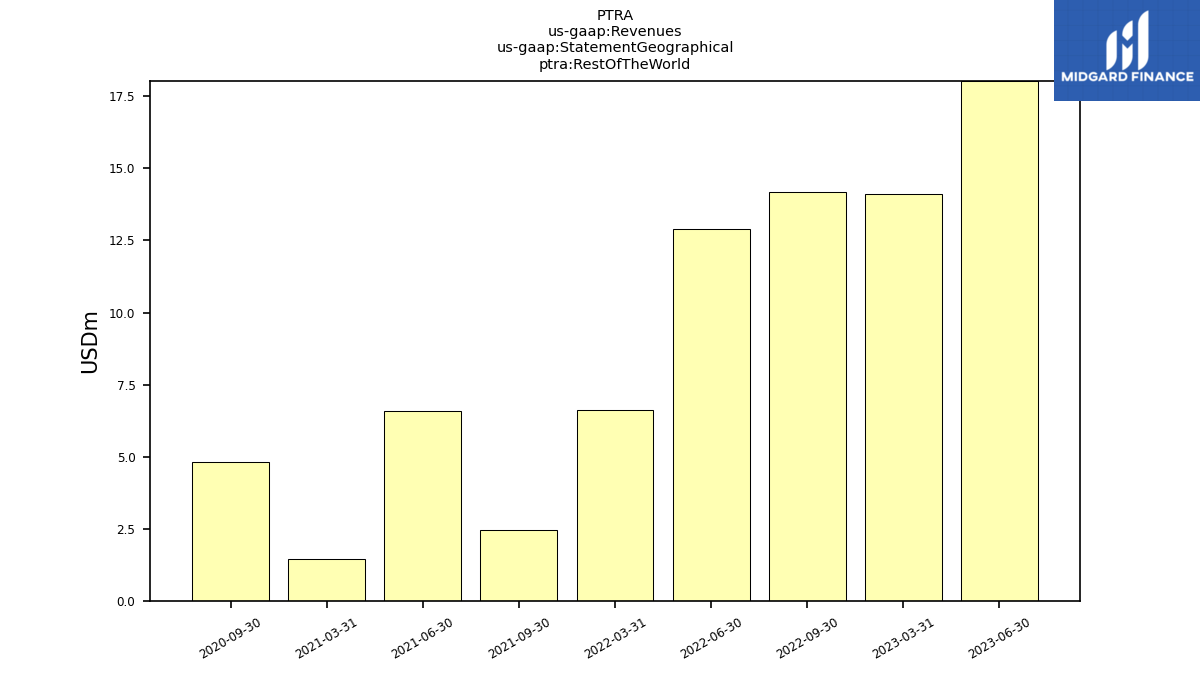
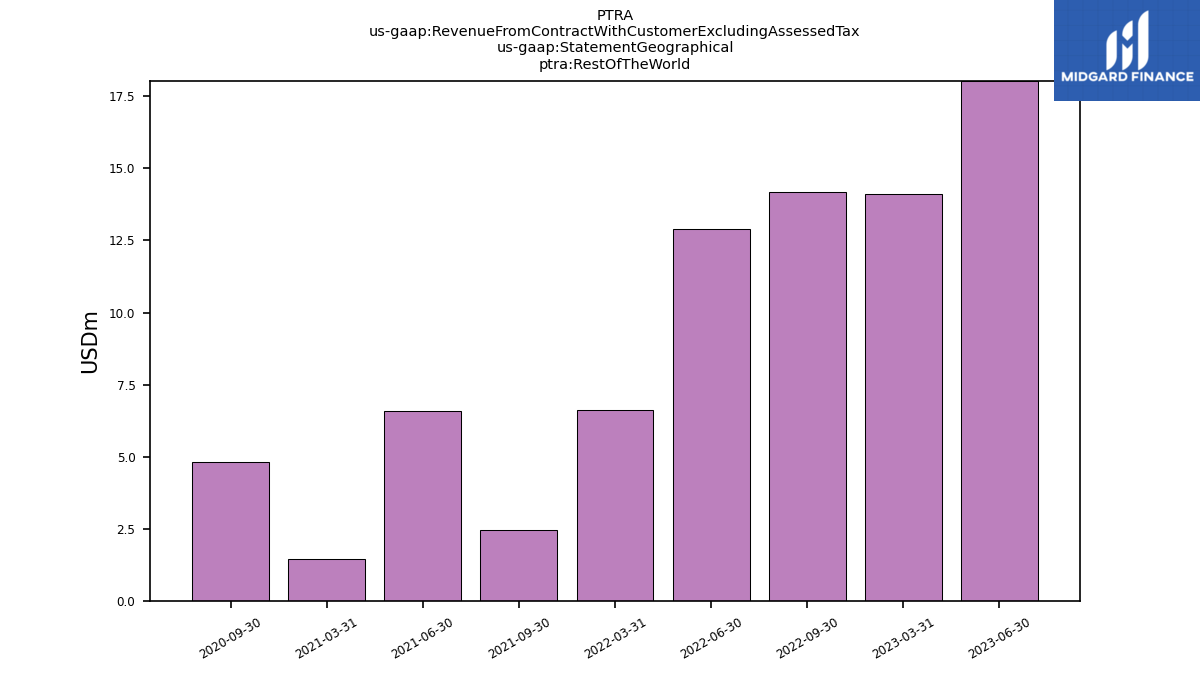
| Rest Of The World | 18.03 | 14.11 | NA | 14.18 | 12.89 | 6.61 | NA | 2.46 | 6.58 | 1.44 | NA | 4.83 | NA | |
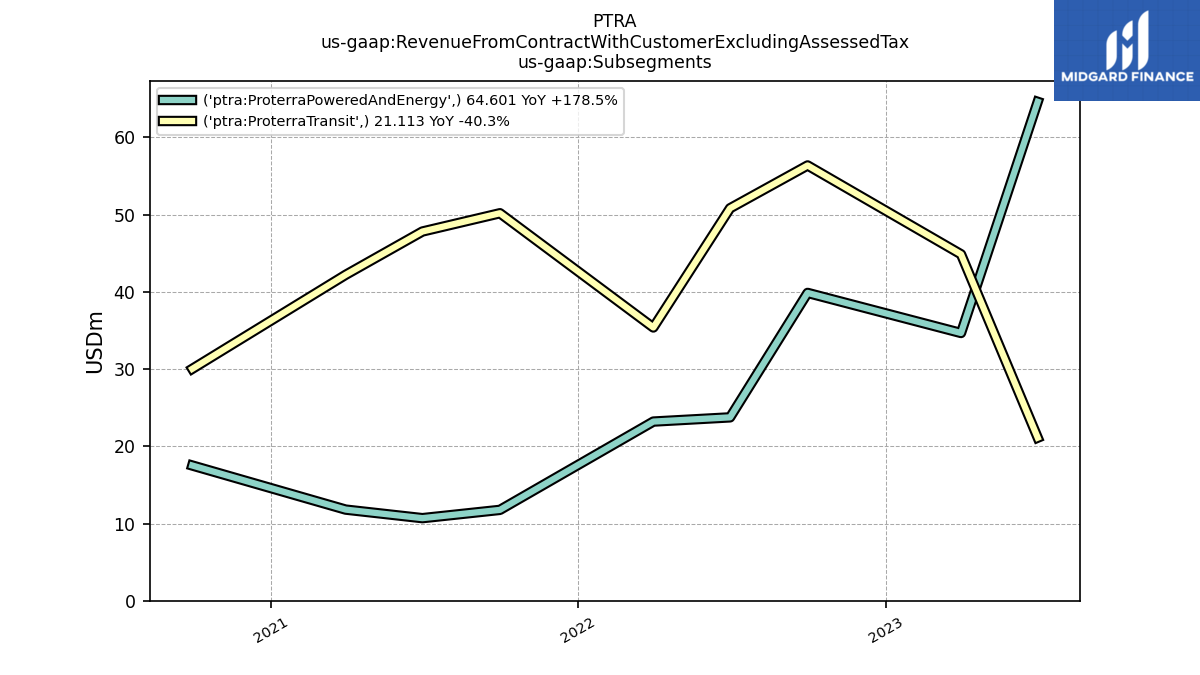
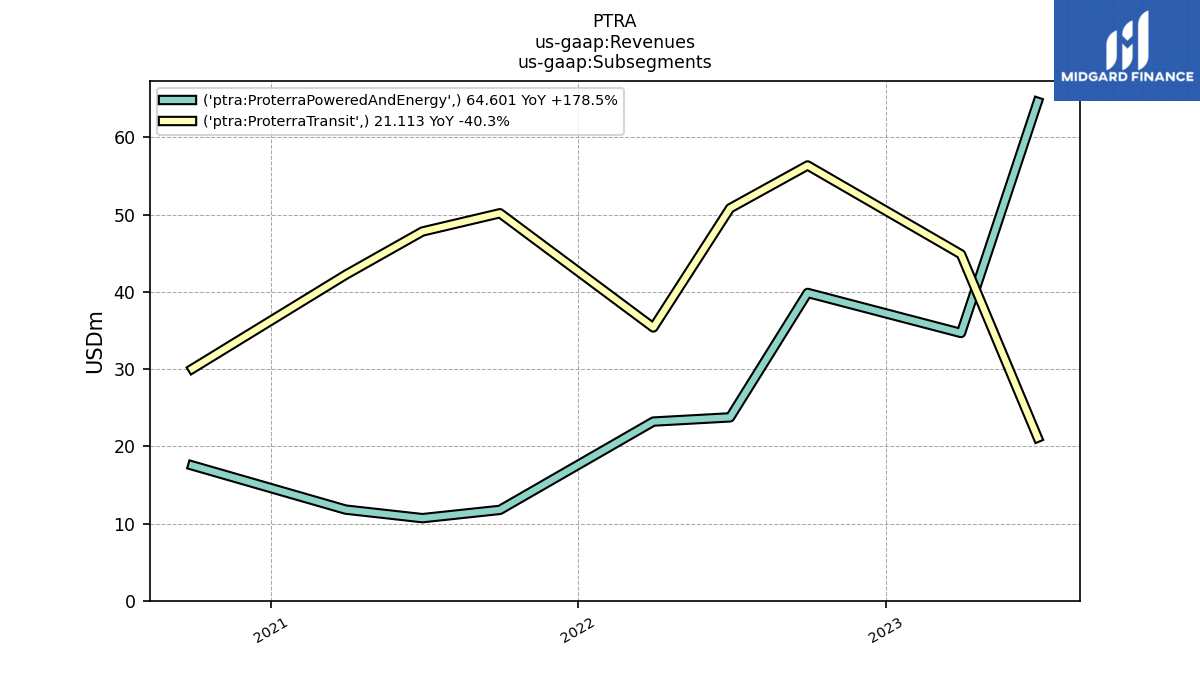
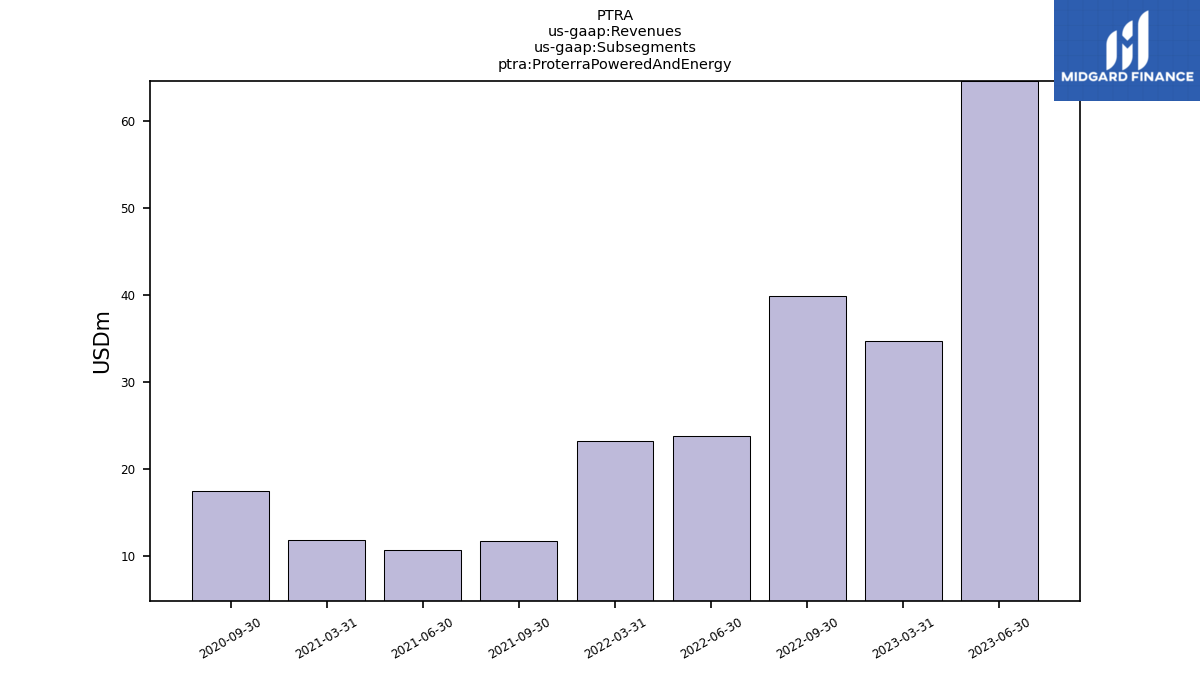
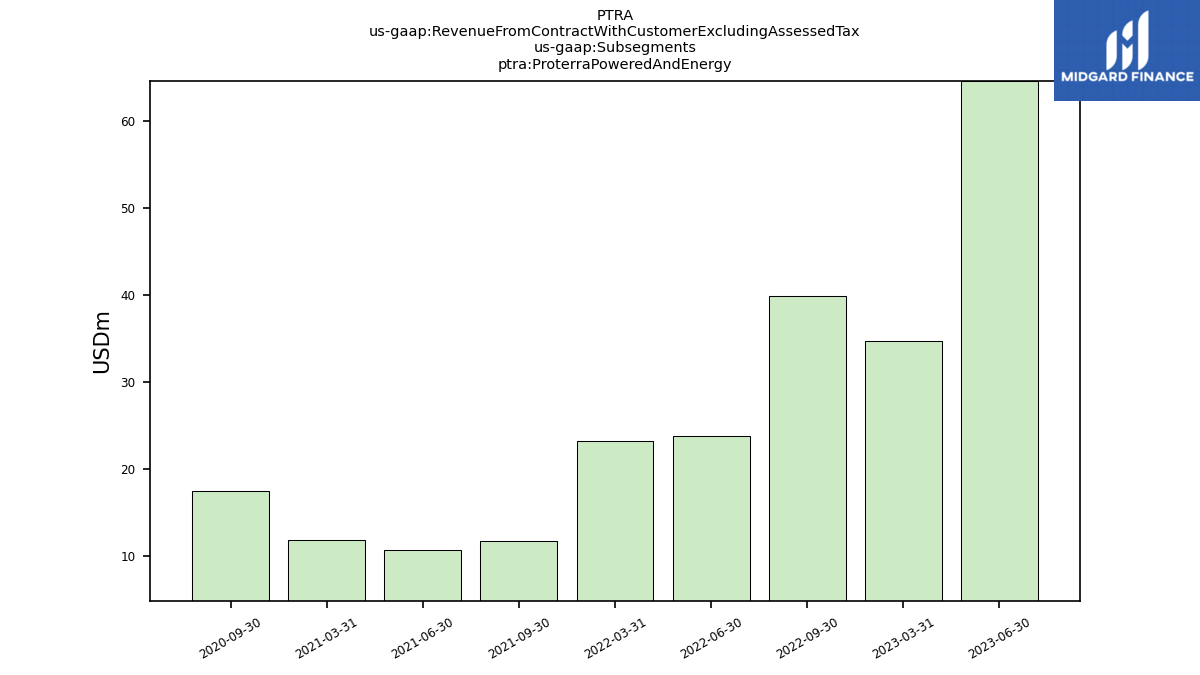
| Proterra Powered And Energy | 64.60 | 34.67 | NA | 39.86 | 23.75 | 23.20 | NA | 11.77 | 10.69 | 11.80 | NA | 17.51 | NA | |
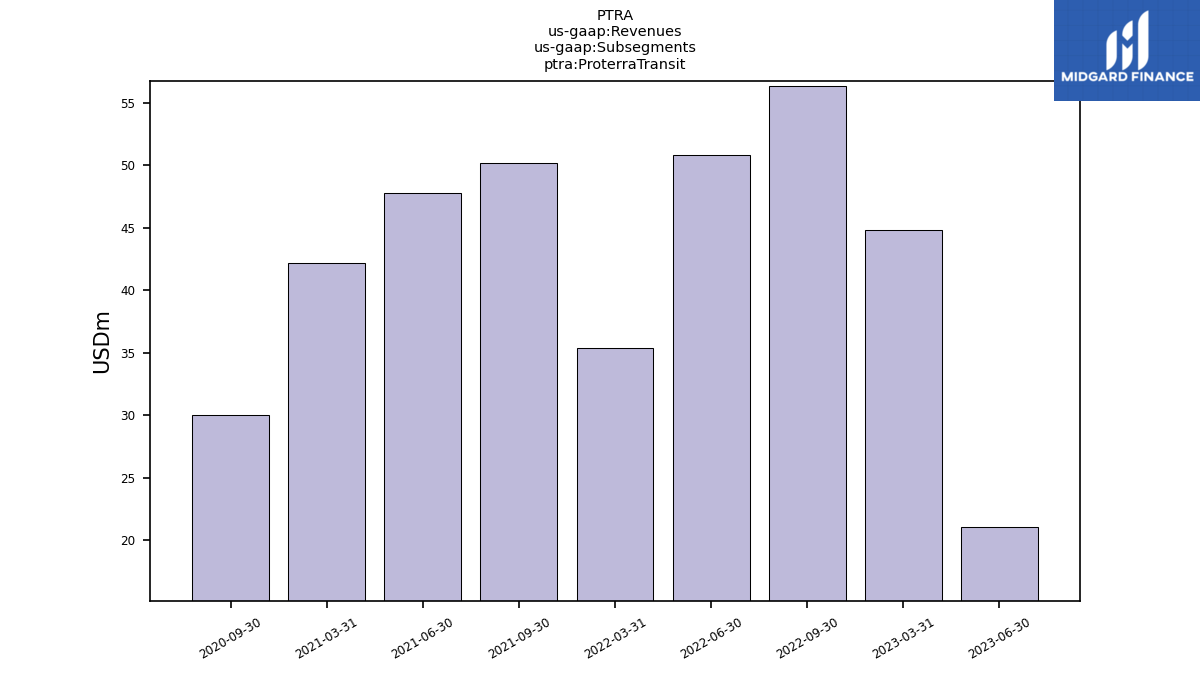
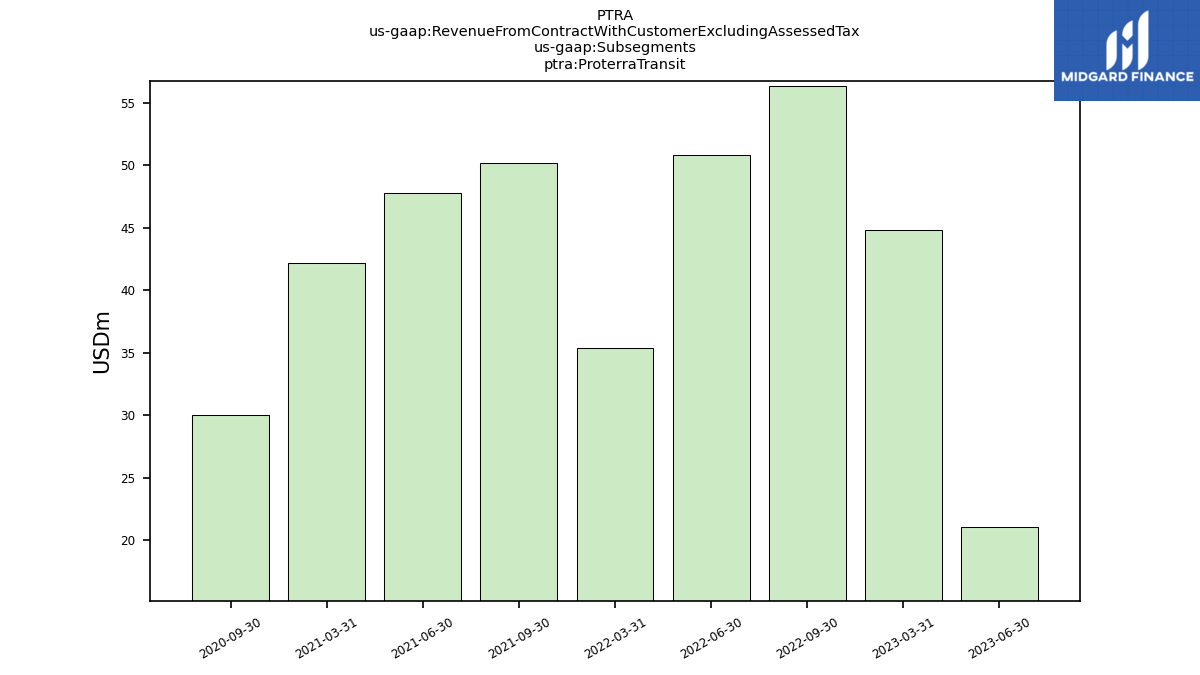
| Proterra Transit | 21.11 | 44.86 | NA | 56.36 | 50.82 | 35.38 | NA | 50.17 | 47.81 | 42.20 | NA | 30.03 | NA | |
| Revenue From Contract With Customer Excluding Assessed Tax | 85.71 | 79.53 | 80.00 | 96.22 | 74.56 | 58.58 | 68.41 | 61.94 | 58.50 | 54.01 | 54.15 | 47.54 | 42.06 | |
| Charging Systems And Installation | 1.60 | 1.20 | 1.90 | 3.70 | 0.00 | 2.10 | 0.50 | 0.20 | 1.30 | 3.80 | 3.70 | 1.10 | 0.80 | |
| Extended Warranty | NA | 0.60 | 0.60 | 0.40 | 0.70 | 0.40 | 0.40 | 0.60 | 0.30 | 0.30 | NA | NA | NA | |
| Parts And Other Services | 8.61 | 9.53 | 5.79 | 6.45 | 4.31 | 4.41 | 3.36 | 2.03 | 2.43 | 2.58 | 0.99 | 1.40 | 1.61 | |
| Product | 77.10 | 70.00 | 74.20 | 89.77 | 70.26 | 54.17 | 65.05 | 59.91 | 56.07 | 51.42 | 53.16 | 46.14 | 40.45 | |
| US | 67.68 | 65.42 | 69.37 | 82.04 | 61.67 | 51.97 | 63.12 | 59.48 | 51.92 | 52.57 | 36.46 | 42.71 | NA | |
| Rest Of The World | 18.03 | 14.11 | NA | 14.18 | 12.89 | 6.61 | NA | 2.46 | 6.58 | 1.44 | NA | 4.83 | NA | |
| Proterra Powered And Energy | 64.60 | 34.67 | NA | 39.86 | 23.75 | 23.20 | NA | 11.77 | 10.69 | 11.80 | NA | 17.51 | NA | |
| Proterra Transit | 21.11 | 44.86 | NA | 56.36 | 50.82 | 35.38 | NA | 50.17 | 47.81 | 42.20 | NA | 30.03 | NA |
