
| 2024-03-31 | 2023-12-31 | 2023-09-30 | 2023-06-30 | 2023-03-31 | 2022-12-31 | 2022-09-30 | 2022-06-30 | 2022-03-31 | 2021-12-31 | 2021-09-30 | 2021-06-30 | 2021-03-31 | 2020-12-31 | 2020-09-30 | 2020-06-30 | 2020-03-31 | 2019-12-31 | 2019-09-30 | ||
|---|---|---|---|---|---|---|---|---|---|---|---|---|---|---|---|---|---|---|---|---|
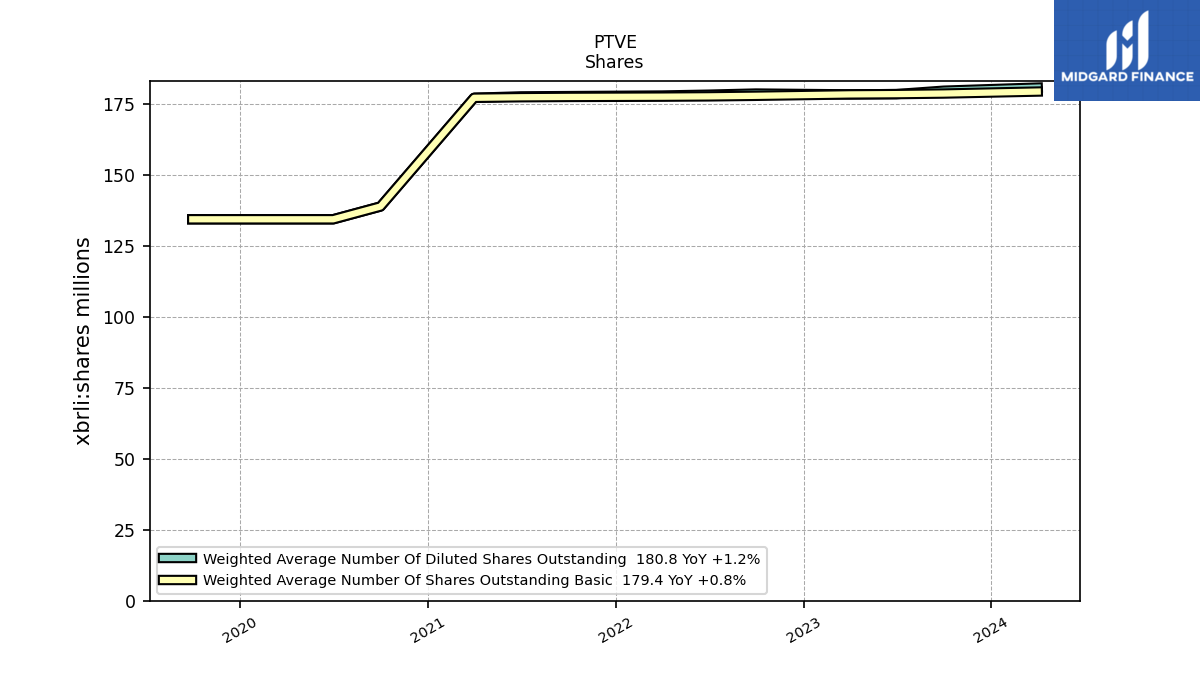
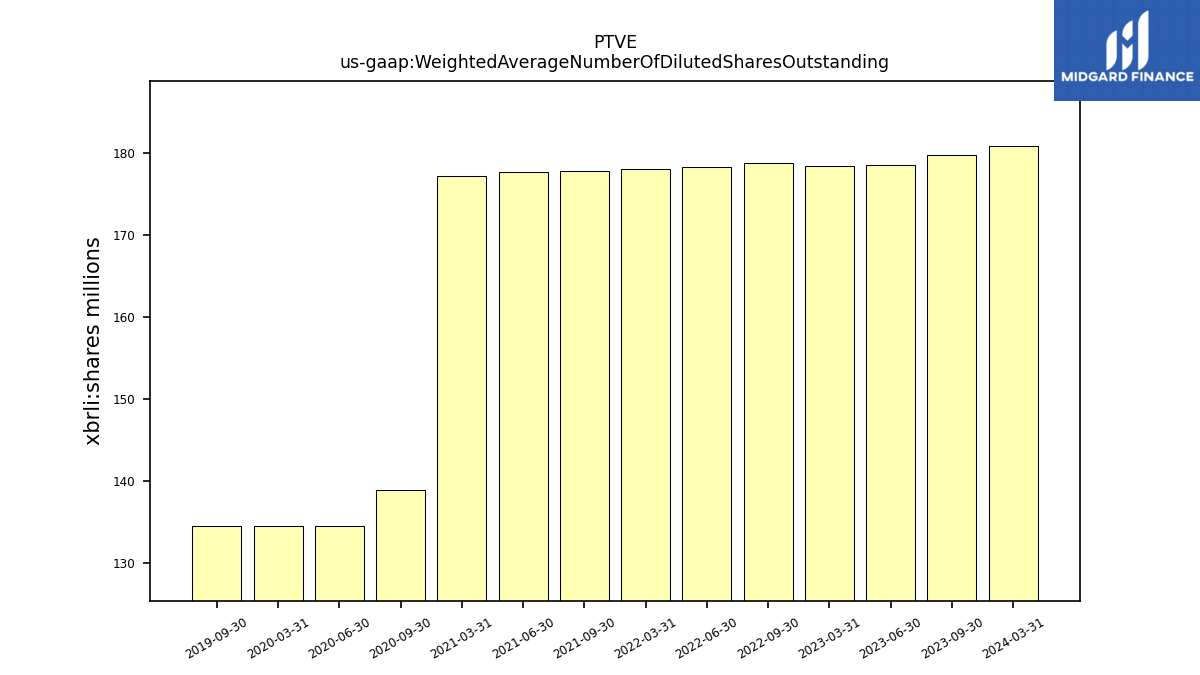
| Weighted Average Number Of Diluted Shares Outstanding | 180.80 | NA | 179.70 | 178.50 | 178.40 | NA | 178.70 | 178.30 | 178.00 | NA | 177.80 | 177.70 | 177.20 | NA | 138.90 | 134.40 | 134.40 | NA | 134.40 | |
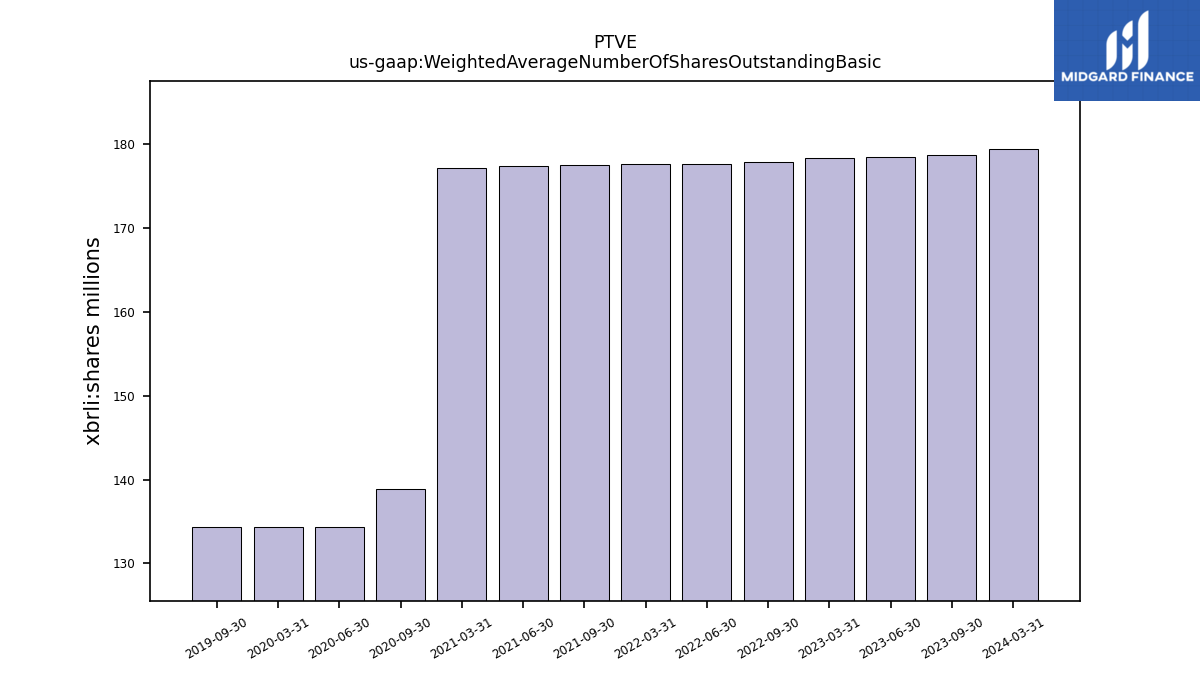
| Weighted Average Number Of Shares Outstanding Basic | 179.40 | NA | 178.70 | 178.50 | 178.40 | NA | 177.90 | 177.70 | 177.60 | NA | 177.50 | 177.40 | 177.20 | NA | 138.90 | 134.40 | 134.40 | NA | 134.40 | |
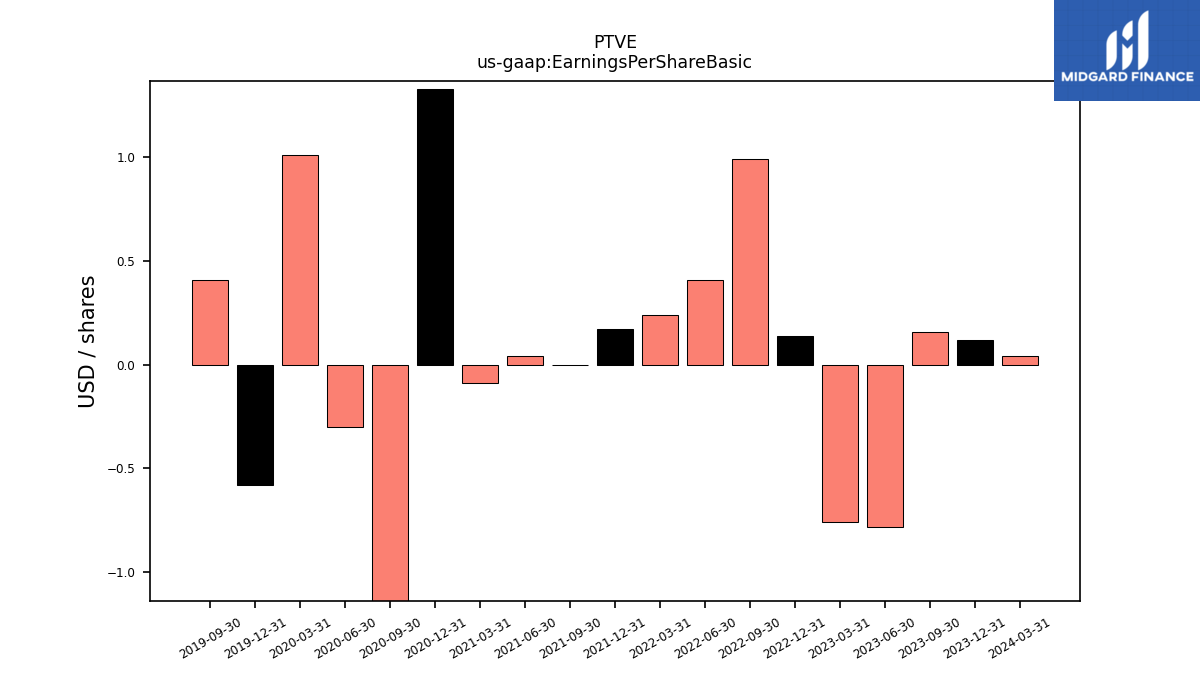
| Earnings Per Share Basic | 0.04 | 0.12 | 0.16 | -0.78 | -0.76 | 0.14 | 0.99 | 0.41 | 0.24 | 0.17 | 0.00 | 0.04 | -0.09 | 1.33 | -2.59 | -0.30 | 1.01 | -0.58 | 0.41 | |
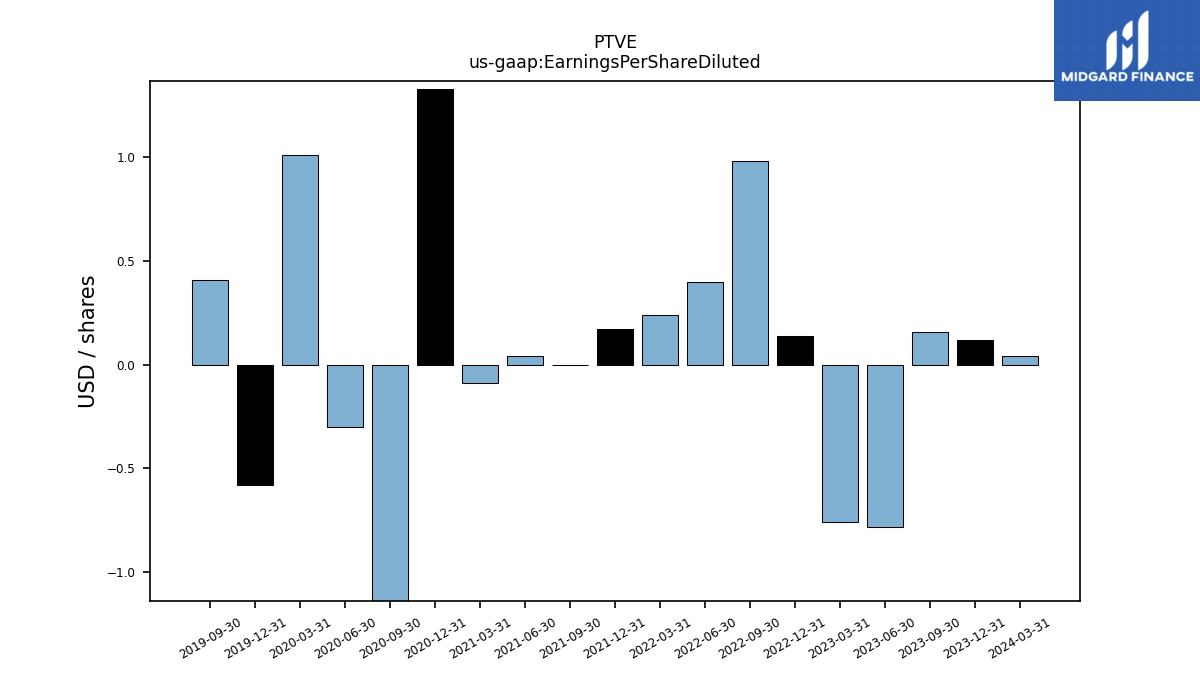
| Earnings Per Share Diluted | 0.04 | 0.12 | 0.16 | -0.78 | -0.76 | 0.14 | 0.98 | 0.40 | 0.24 | 0.17 | 0.00 | 0.04 | -0.09 | 1.33 | -2.59 | -0.30 | 1.01 | -0.58 | 0.41 | |
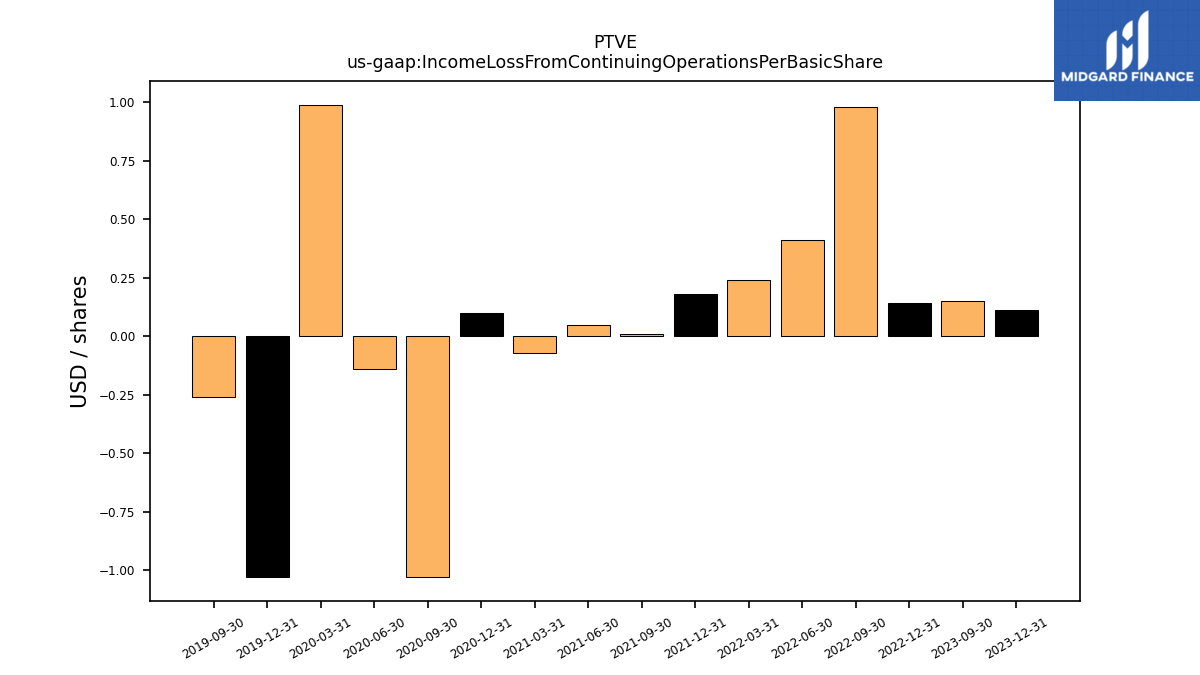
| Income Loss From Continuing Operations Per Basic Share | NA | 0.00 | 0.00 | NA | NA | 0.00 | 0.00 | 0.00 | 0.00 | 0.00 | 0.00 | 0.00 | -0.00 | 0.00 | -0.00 | -0.00 | 0.00 | -0.00 | -0.00 | |
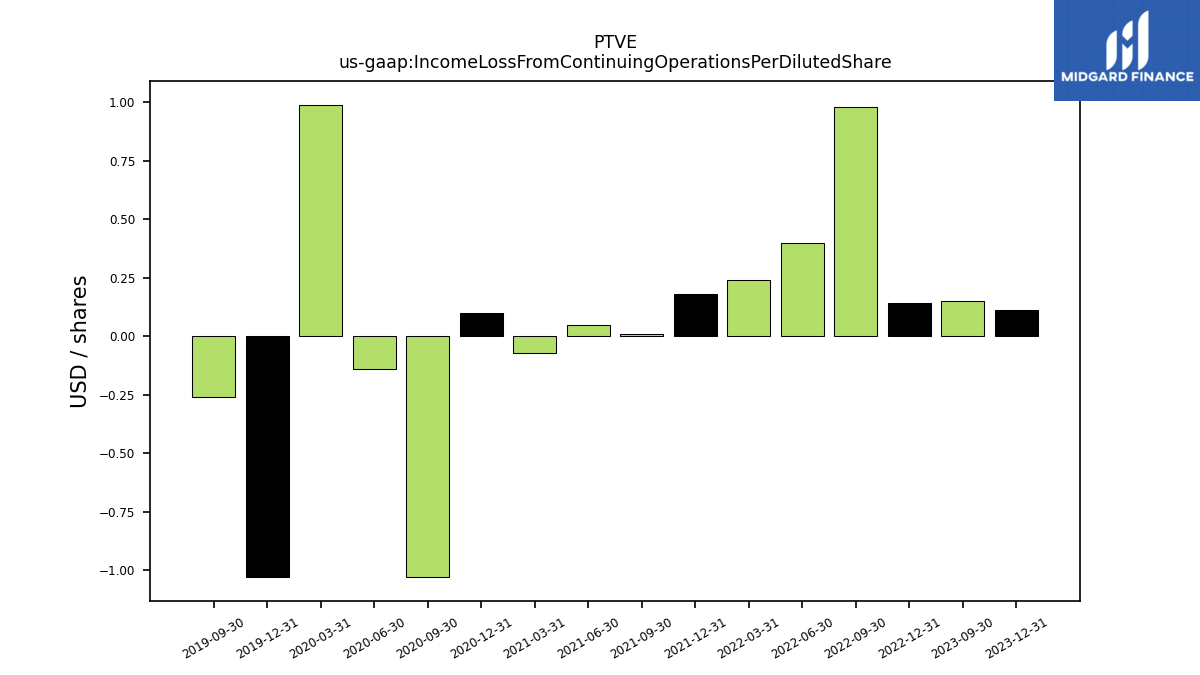
| Income Loss From Continuing Operations Per Diluted Share | NA | 0.00 | 0.00 | NA | NA | 0.00 | 0.00 | 0.00 | 0.00 | 0.00 | 0.00 | 0.00 | -0.00 | 0.00 | -0.00 | -0.00 | 0.00 | -0.00 | -0.00 |
| 2024-03-31 | 2023-12-31 | 2023-09-30 | 2023-06-30 | 2023-03-31 | 2022-12-31 | 2022-09-30 | 2022-06-30 | 2022-03-31 | 2021-12-31 | 2021-09-30 | 2021-06-30 | 2021-03-31 | 2020-12-31 | 2020-09-30 | 2020-06-30 | 2020-03-31 | 2019-12-31 | 2019-09-30 | ||
|---|---|---|---|---|---|---|---|---|---|---|---|---|---|---|---|---|---|---|---|---|
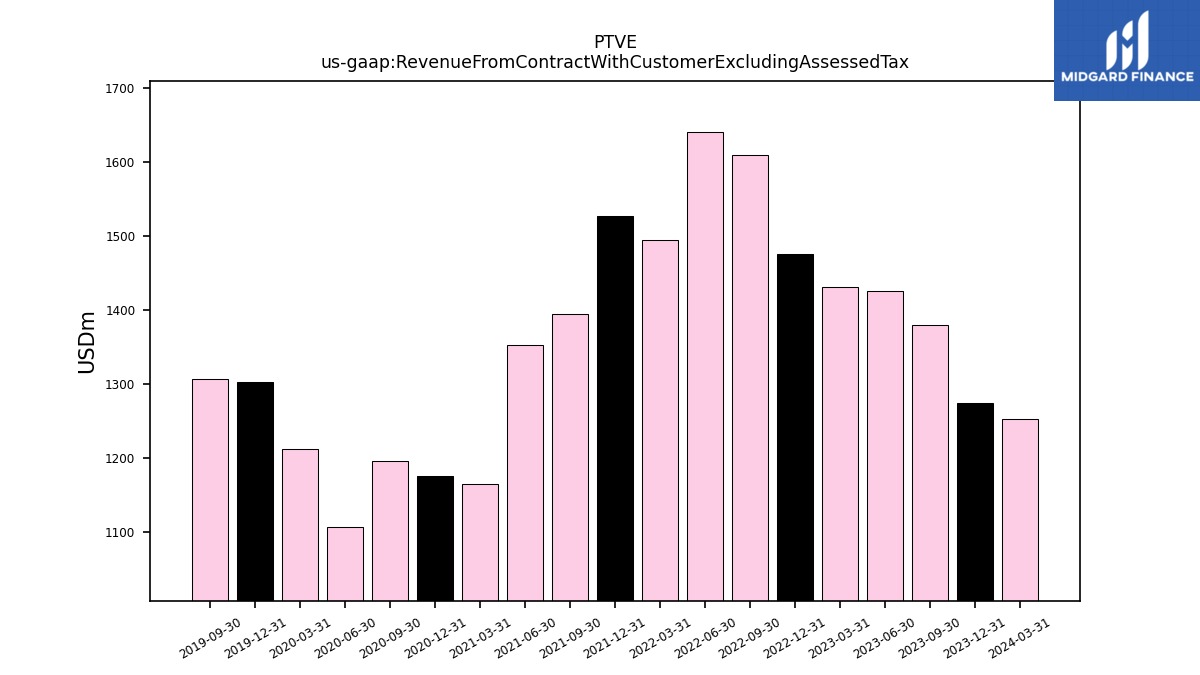
| Revenue From Contract With Customer Excluding Assessed Tax | 1252.00 | 1274.00 | 1379.00 | 1426.00 | 1431.00 | 1476.00 | 1609.00 | 1640.00 | 1495.00 | 1527.00 | 1394.00 | 1352.00 | 1164.00 | 1175.00 | 1195.00 | 1107.00 | 1212.00 | 1303.00 | 1306.00 | |
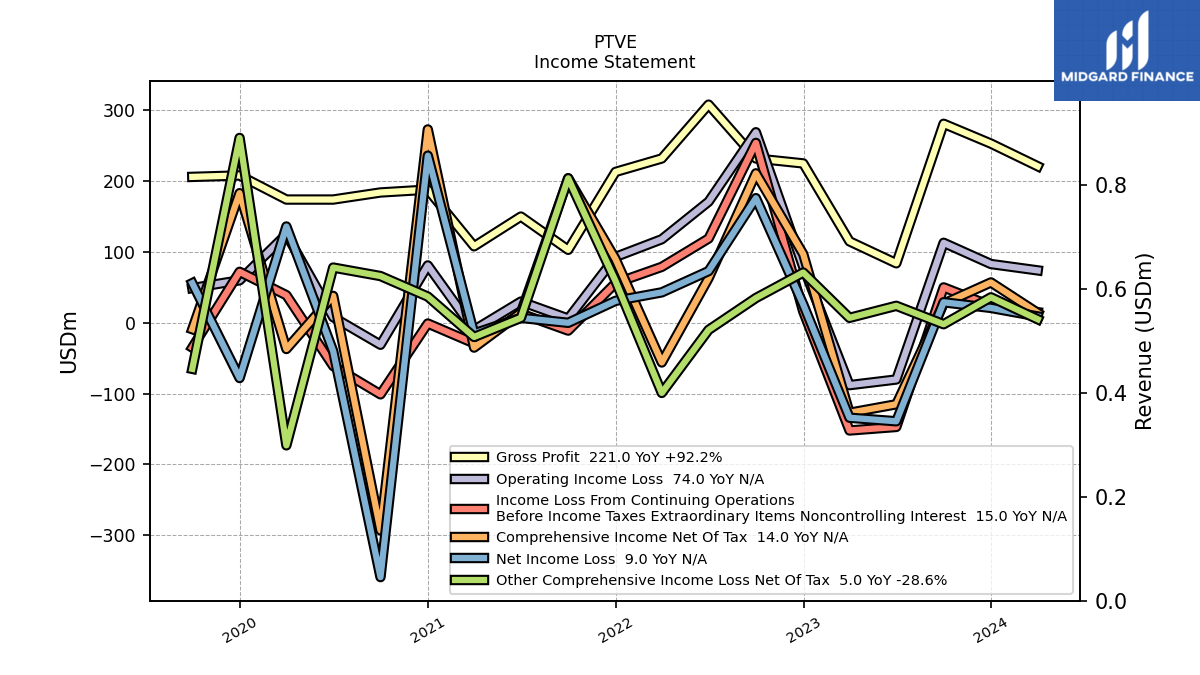
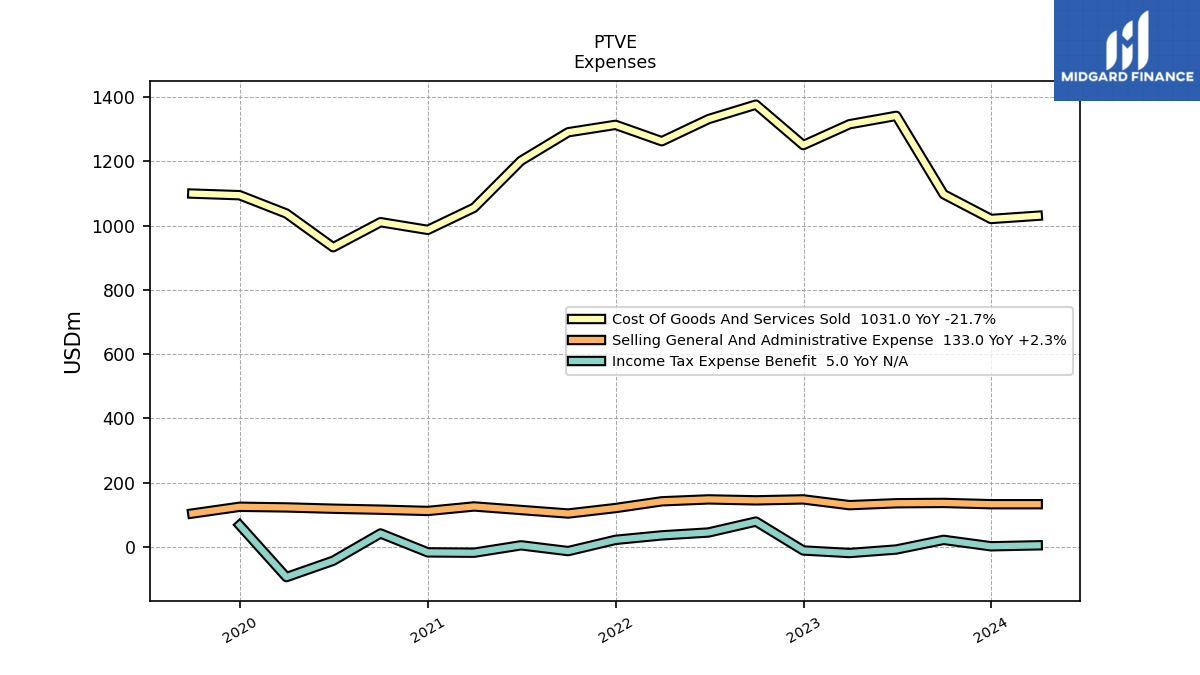
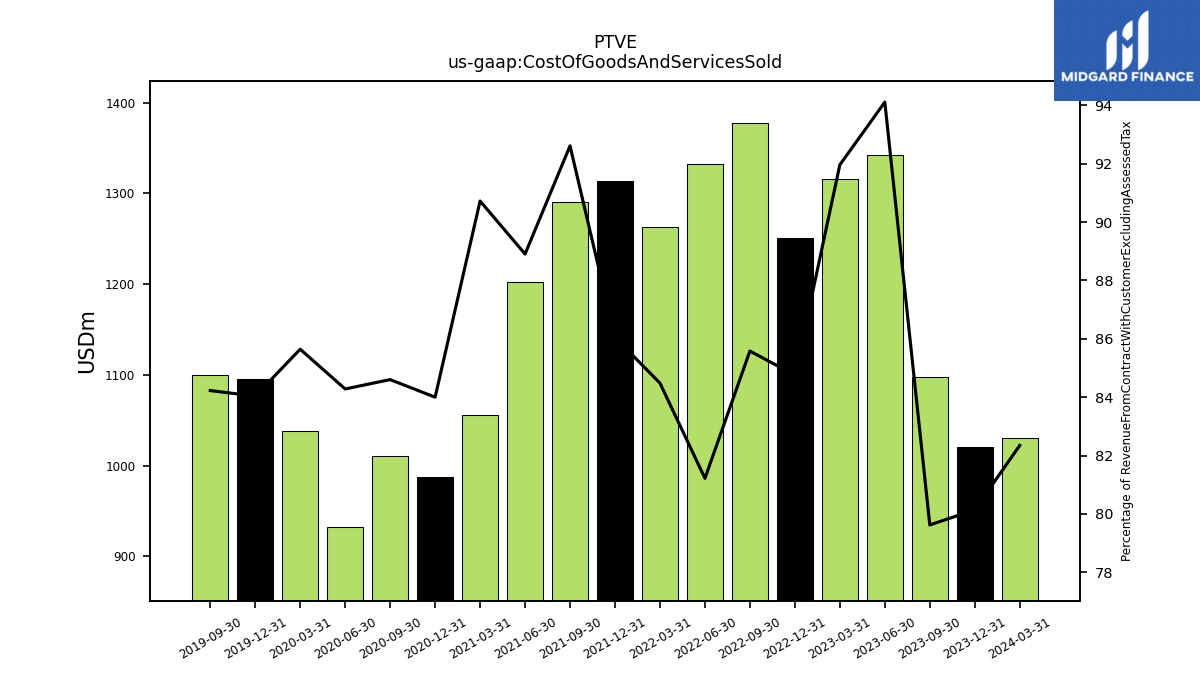
| Cost Of Goods And Services Sold | 1031.00 | 1021.00 | 1098.00 | 1342.00 | 1316.00 | 1251.00 | 1377.00 | 1332.00 | 1263.00 | 1314.00 | 1291.00 | 1202.00 | 1056.00 | 987.00 | 1011.00 | 933.00 | 1038.00 | 1095.00 | 1100.00 | |
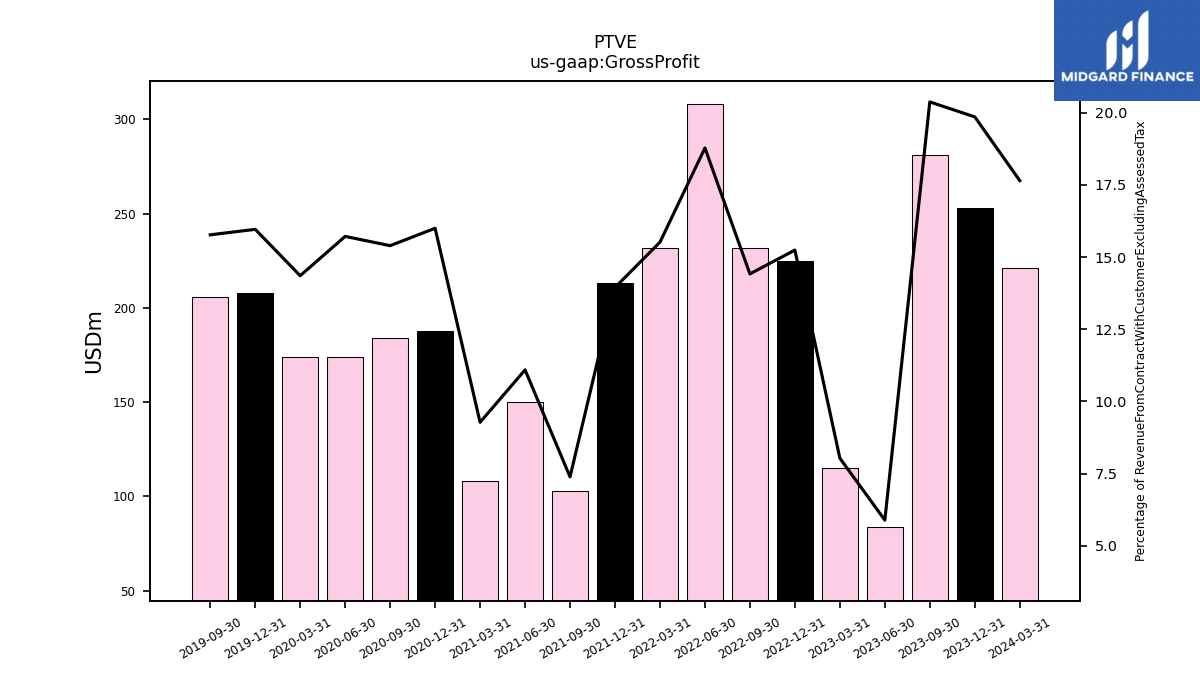
| Gross Profit | 221.00 | 253.00 | 281.00 | 84.00 | 115.00 | 225.00 | 232.00 | 308.00 | 232.00 | 213.00 | 103.00 | 150.00 | 108.00 | 188.00 | 184.00 | 174.00 | 174.00 | 208.00 | 206.00 | |
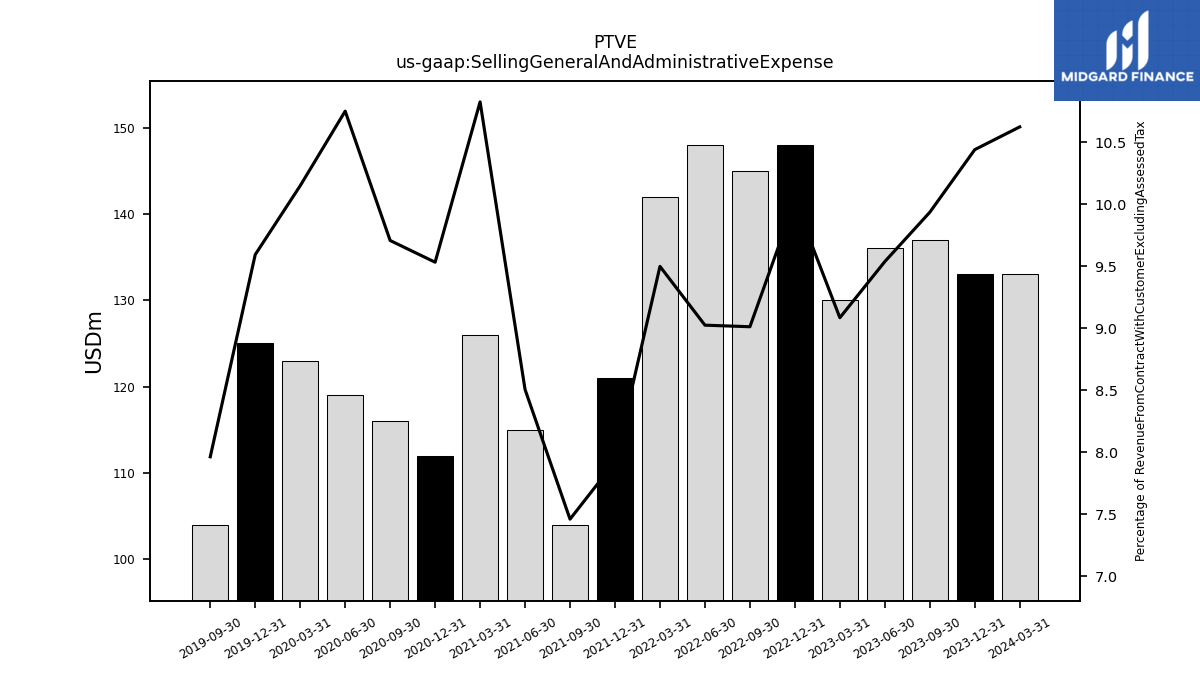
| Selling General And Administrative Expense | 133.00 | 133.00 | 137.00 | 136.00 | 130.00 | 148.00 | 145.00 | 148.00 | 142.00 | 121.00 | 104.00 | 115.00 | 126.00 | 112.00 | 116.00 | 119.00 | 123.00 | 125.00 | 104.00 | |
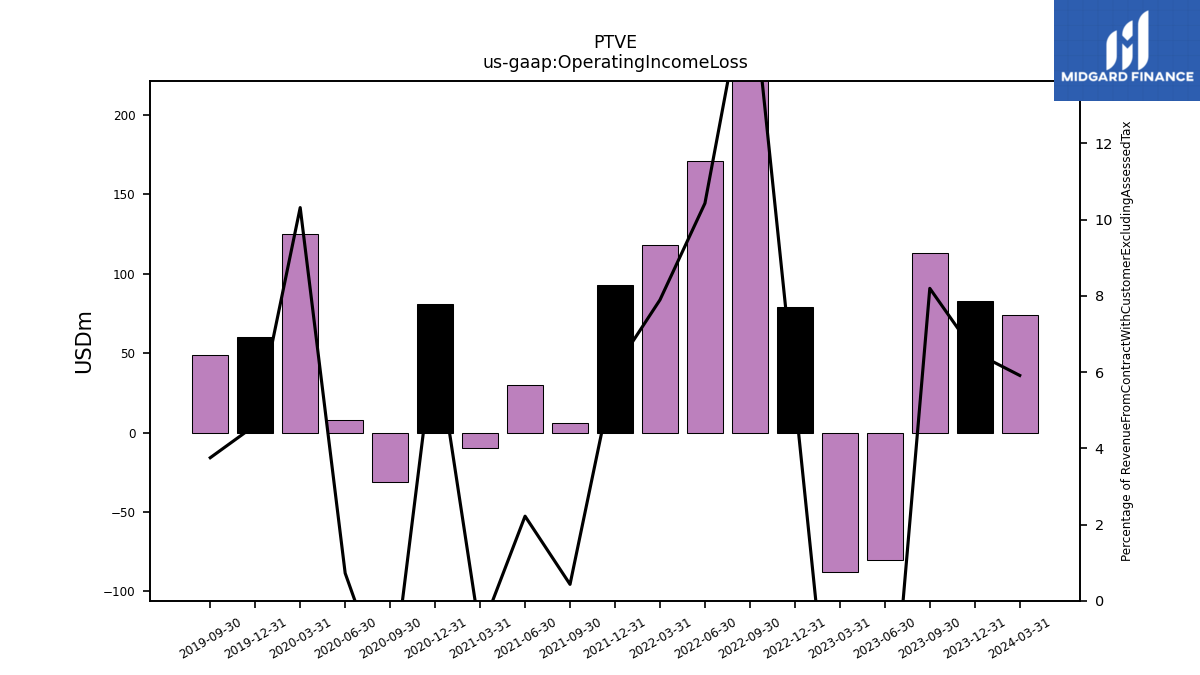
| Operating Income Loss | 74.00 | 83.00 | 113.00 | -80.00 | -88.00 | 79.00 | 269.00 | 171.00 | 118.00 | 93.00 | 6.00 | 30.00 | -10.00 | 81.00 | -31.00 | 8.00 | 125.00 | 60.00 | 49.00 | |
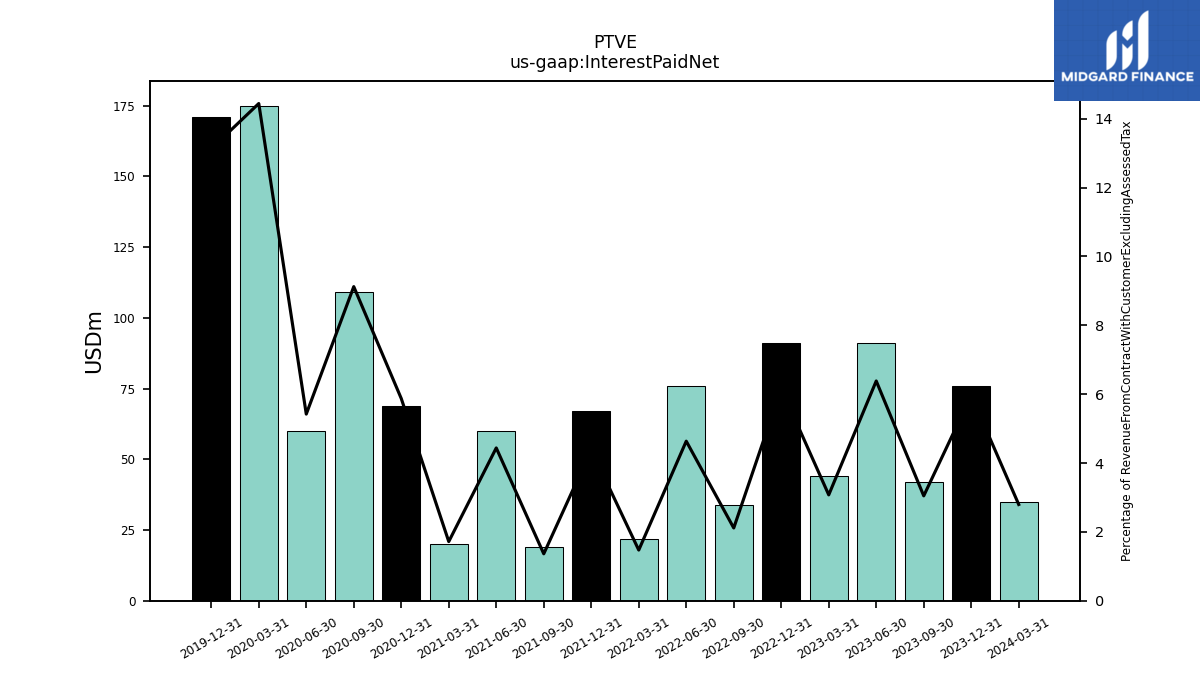
| Interest Paid Net | 35.00 | 76.00 | 42.00 | 91.00 | 44.00 | 91.00 | 34.00 | 76.00 | 22.00 | 67.00 | 19.00 | 60.00 | 20.00 | 69.00 | 109.00 | 60.00 | 175.00 | 171.00 | NA | |
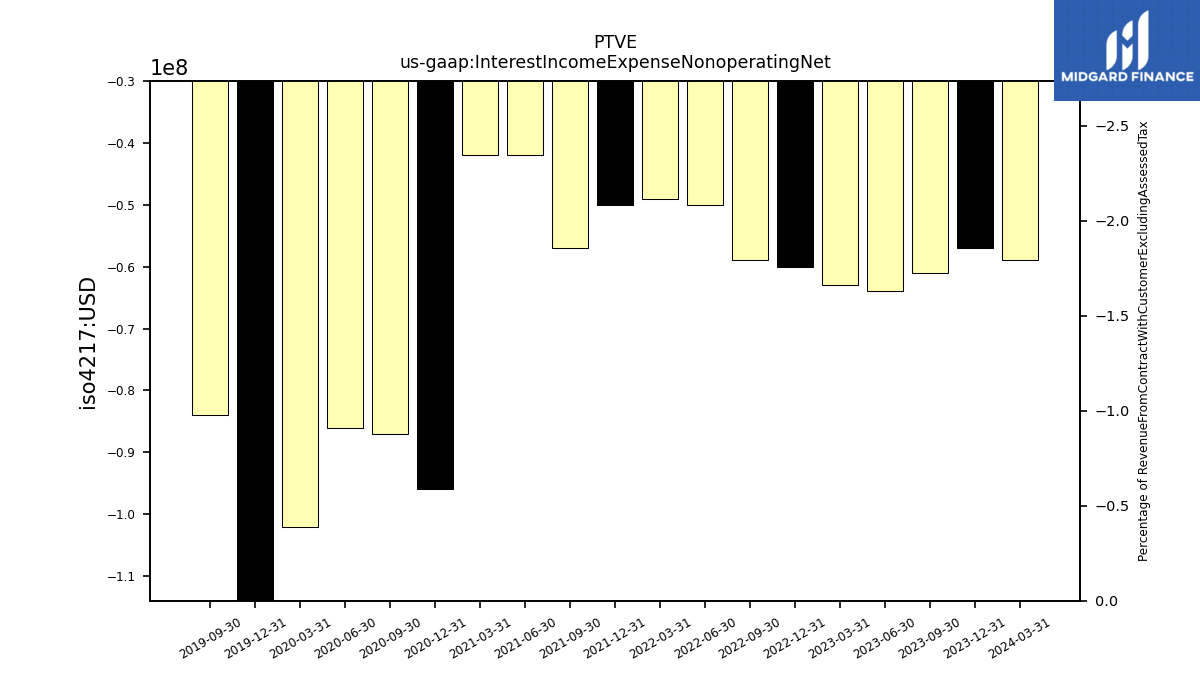
| Interest Income Expense Nonoperating Net | -59.00 | -57.00 | -61.00 | -64.00 | -63.00 | -60.00 | -59.00 | -50.00 | -49.00 | -50.00 | -57.00 | -42.00 | -42.00 | -96.00 | -87.00 | -86.00 | -102.00 | -121.00 | -84.00 | |
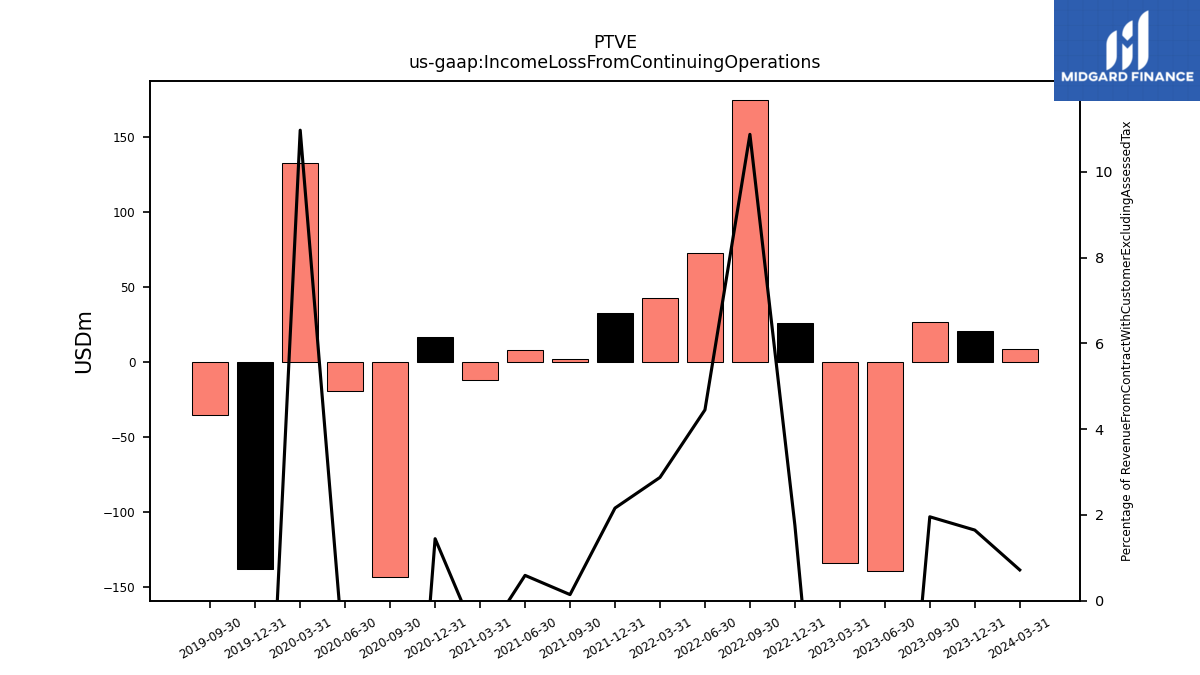
| Income Loss From Continuing Operations | 9.00 | 21.00 | 27.00 | -139.00 | -134.00 | 26.00 | 175.00 | 73.00 | 43.00 | 33.00 | 2.00 | 8.00 | -12.00 | 17.00 | -143.00 | -19.00 | 133.00 | -138.00 | -35.00 | |
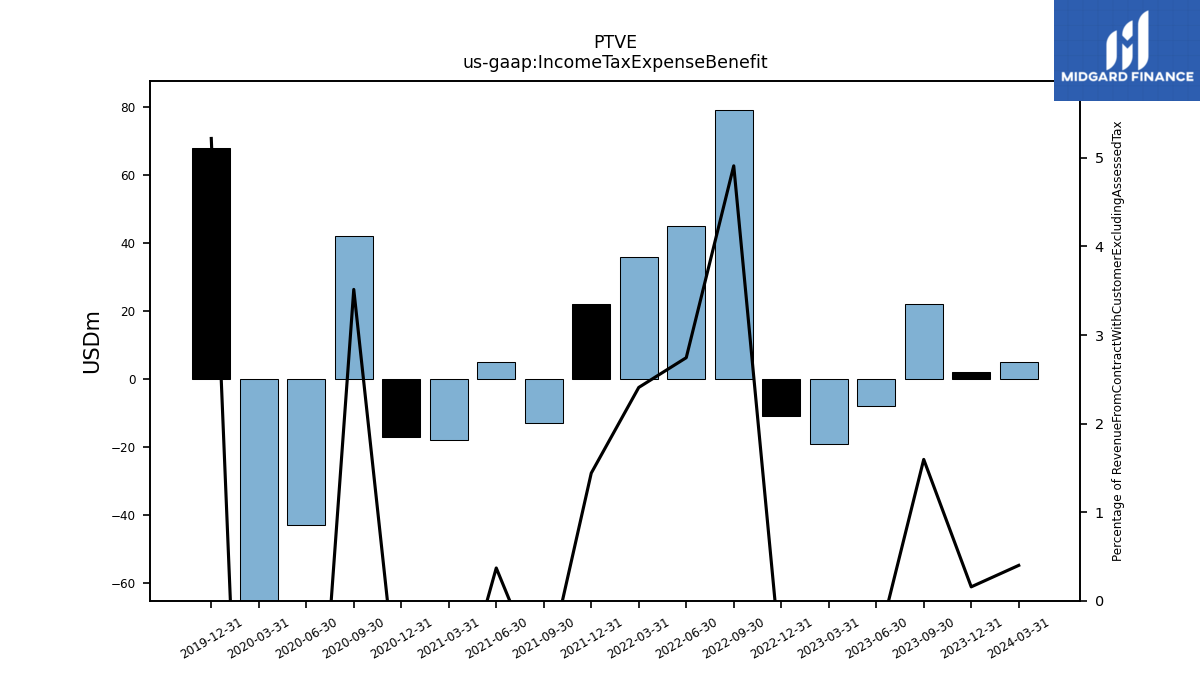
| Income Tax Expense Benefit | 5.00 | 2.00 | 22.00 | -8.00 | -19.00 | -11.00 | 79.00 | 45.00 | 36.00 | 22.00 | -13.00 | 5.00 | -18.00 | -17.00 | 42.00 | -43.00 | -94.00 | 68.00 | NA | |
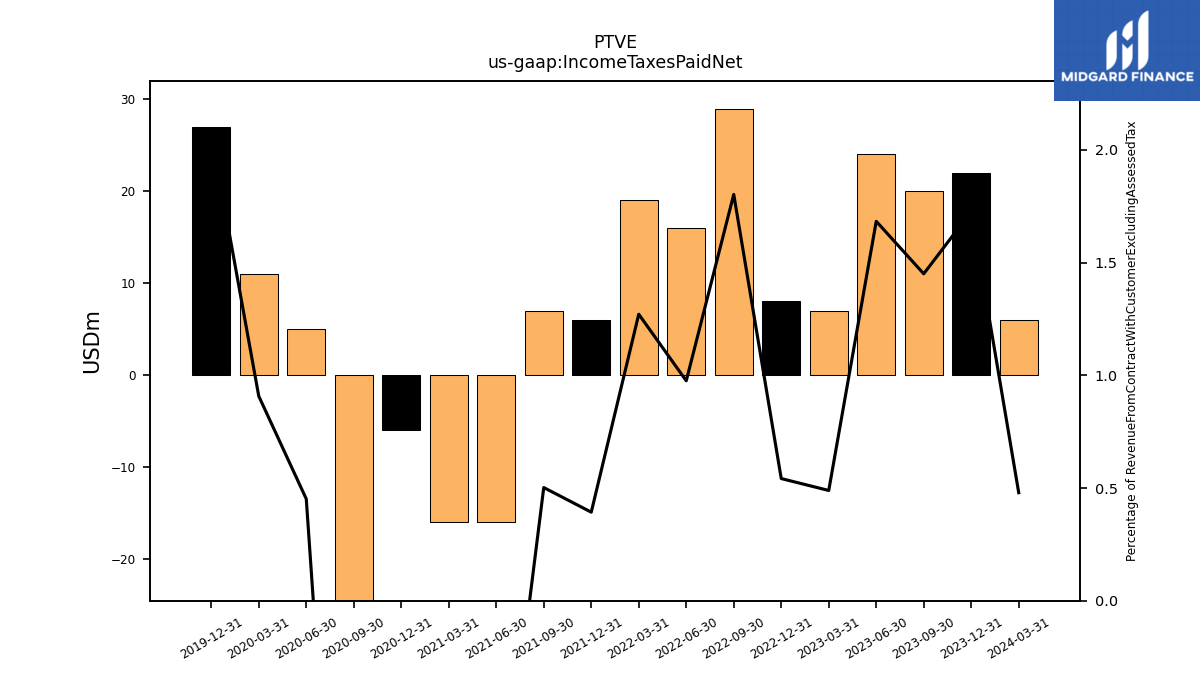
| Income Taxes Paid Net | 6.00 | 22.00 | 20.00 | 24.00 | 7.00 | 8.00 | 29.00 | 16.00 | 19.00 | 6.00 | 7.00 | -16.00 | -16.00 | -6.00 | -31.00 | 5.00 | 11.00 | 27.00 | NA | |
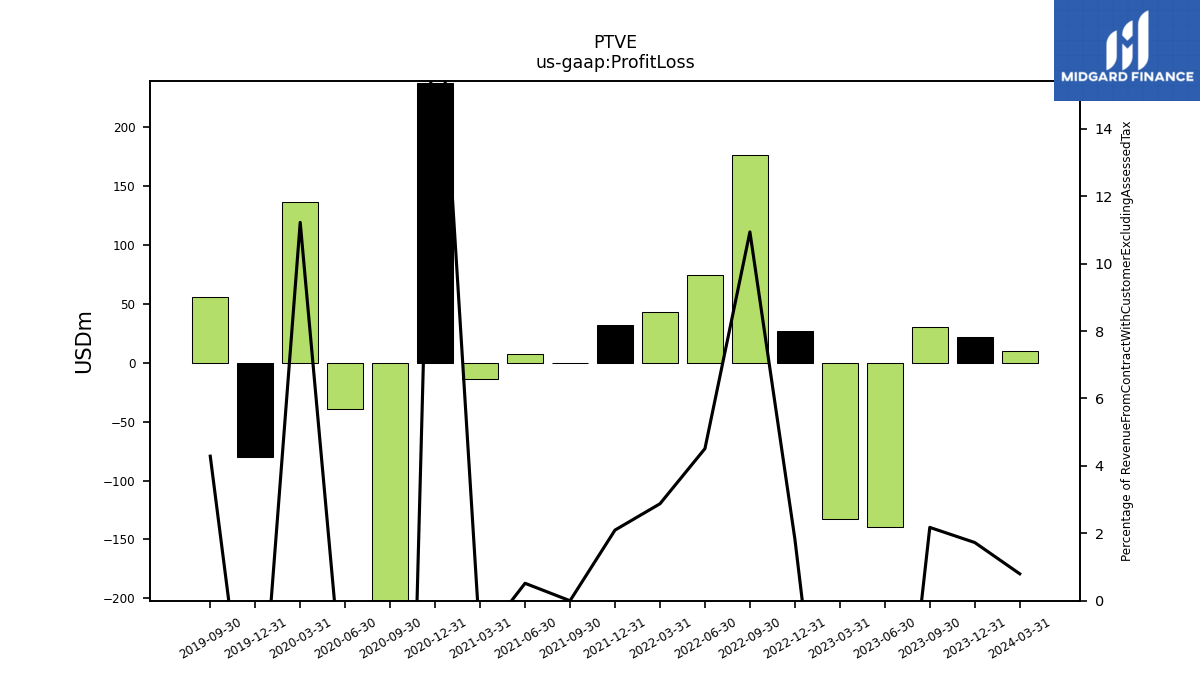
| Profit Loss | 10.00 | 22.00 | 30.00 | -139.00 | -133.00 | 27.00 | 176.00 | 74.00 | 43.00 | 32.00 | 0.00 | 7.00 | -14.00 | 237.00 | -359.00 | -39.00 | 136.00 | -80.00 | 56.00 | |
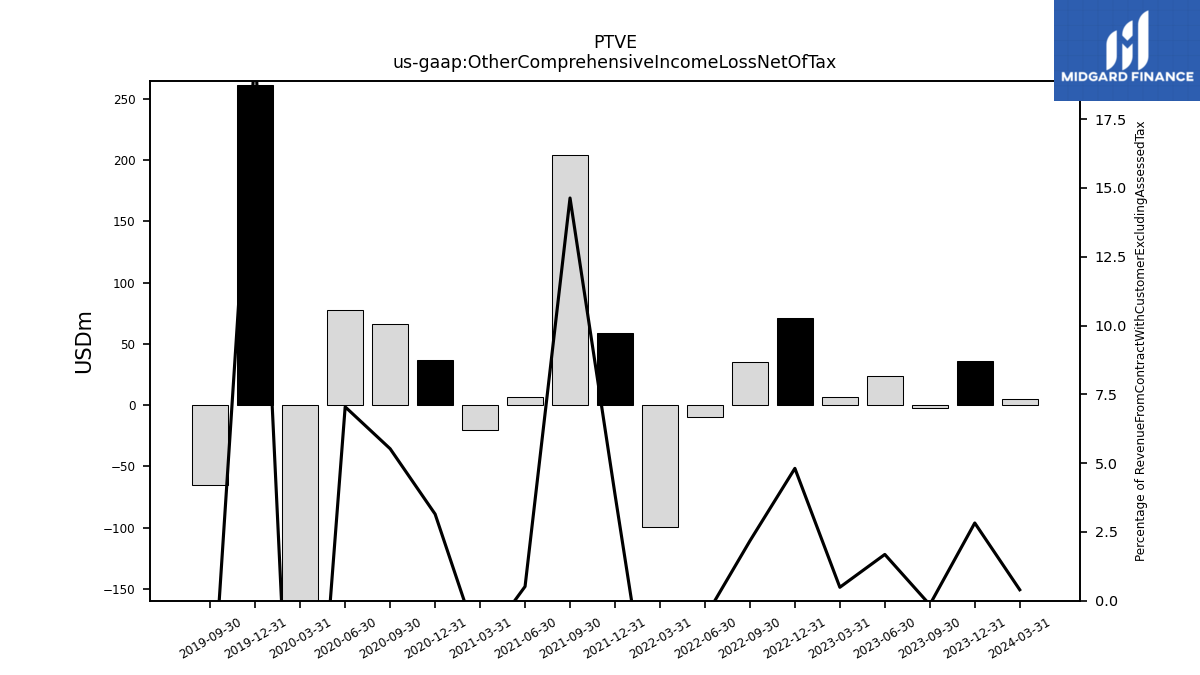
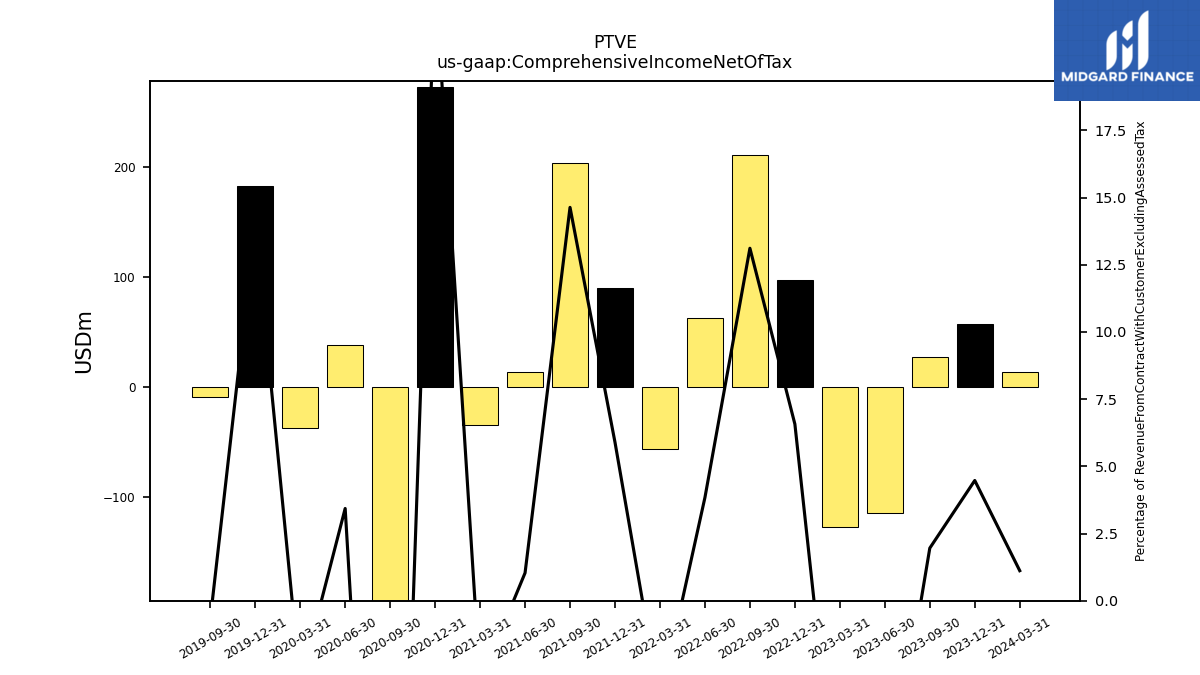
| Other Comprehensive Income Loss Net Of Tax | 5.00 | 36.00 | -2.00 | 24.00 | 7.00 | 71.00 | 35.00 | -10.00 | -99.00 | 59.00 | 204.00 | 7.00 | -20.00 | 37.00 | 66.00 | 78.00 | -173.00 | 261.00 | -65.00 | |
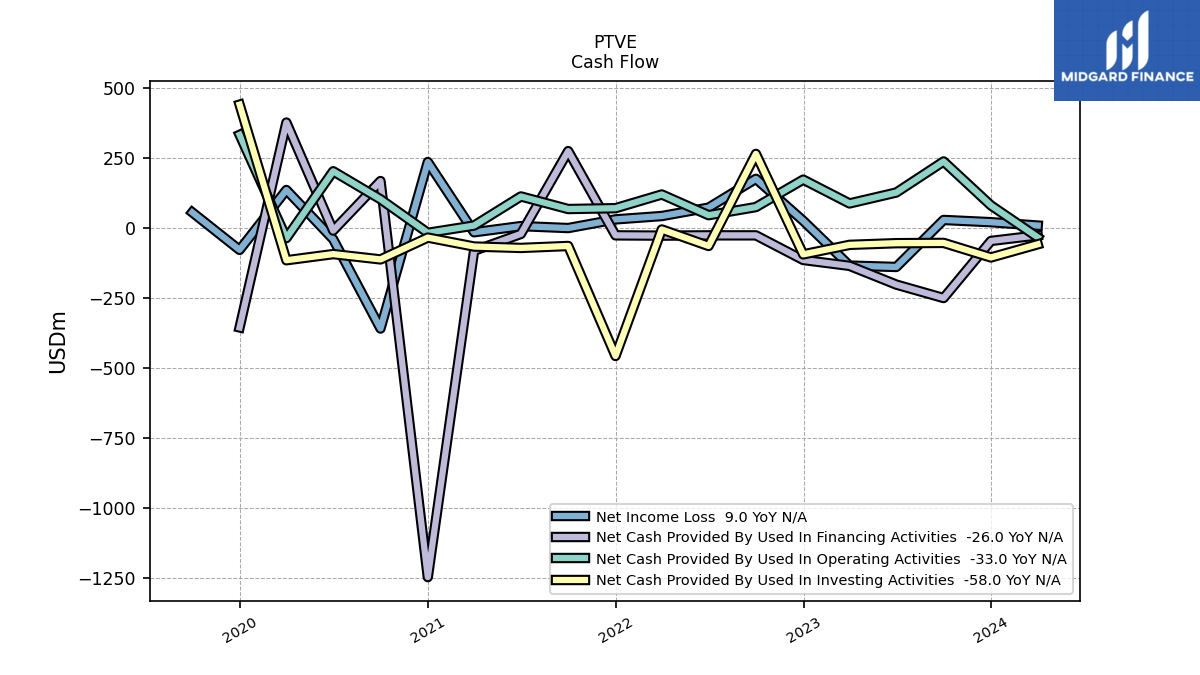
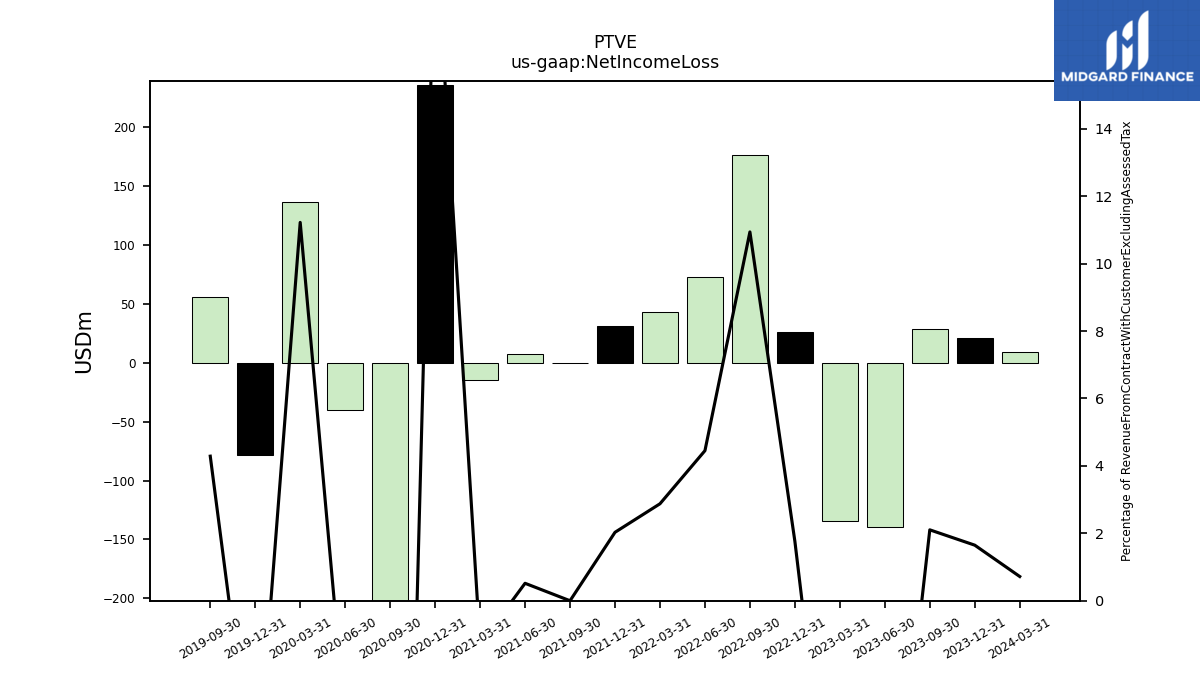
| Net Income Loss | 9.00 | 21.00 | 29.00 | -139.00 | -134.00 | 26.00 | 176.00 | 73.00 | 43.00 | 31.00 | 0.00 | 7.00 | -15.00 | 236.00 | -359.00 | -40.00 | 136.00 | -78.00 | 56.00 | |
| Comprehensive Income Net Of Tax | 14.00 | 57.00 | 27.00 | -115.00 | -127.00 | 97.00 | 211.00 | 63.00 | -56.00 | 90.00 | 204.00 | 14.00 | -35.00 | 273.00 | -293.00 | 38.00 | -37.00 | 183.00 | -9.00 | |
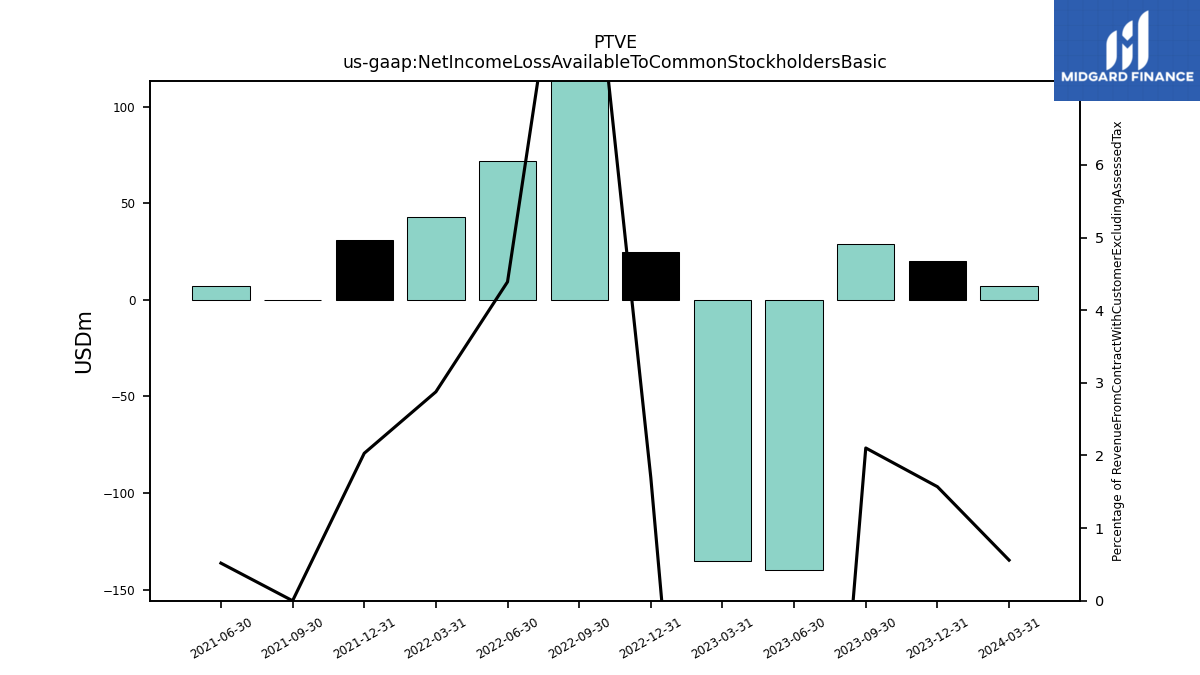
| Net Income Loss Available To Common Stockholders Basic | 7.00 | 20.00 | 29.00 | -140.00 | -135.00 | 25.00 | 176.00 | 72.00 | 43.00 | 31.00 | 0.00 | 7.00 | NA | NA | NA | NA | NA | NA | NA |
| 2024-03-31 | 2023-12-31 | 2023-09-30 | 2023-06-30 | 2023-03-31 | 2022-12-31 | 2022-09-30 | 2022-06-30 | 2022-03-31 | 2021-12-31 | 2021-09-30 | 2021-06-30 | 2021-03-31 | 2020-12-31 | 2020-09-30 | 2020-06-30 | 2020-03-31 | 2019-12-31 | 2019-09-30 | ||
|---|---|---|---|---|---|---|---|---|---|---|---|---|---|---|---|---|---|---|---|---|
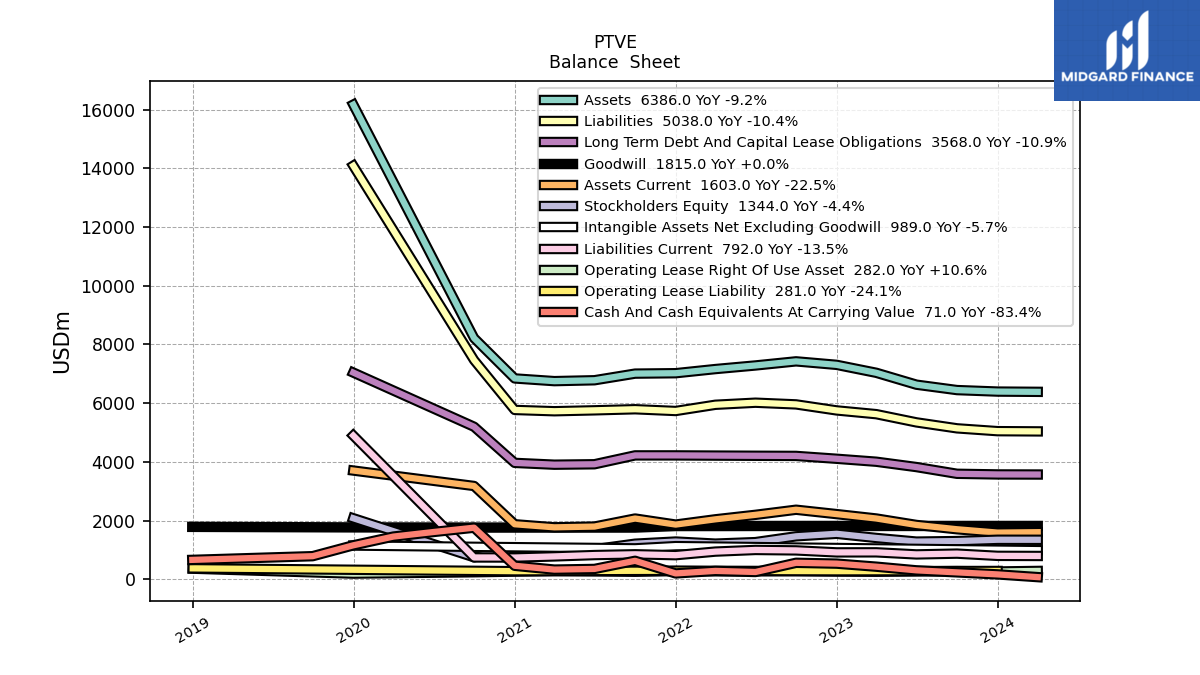
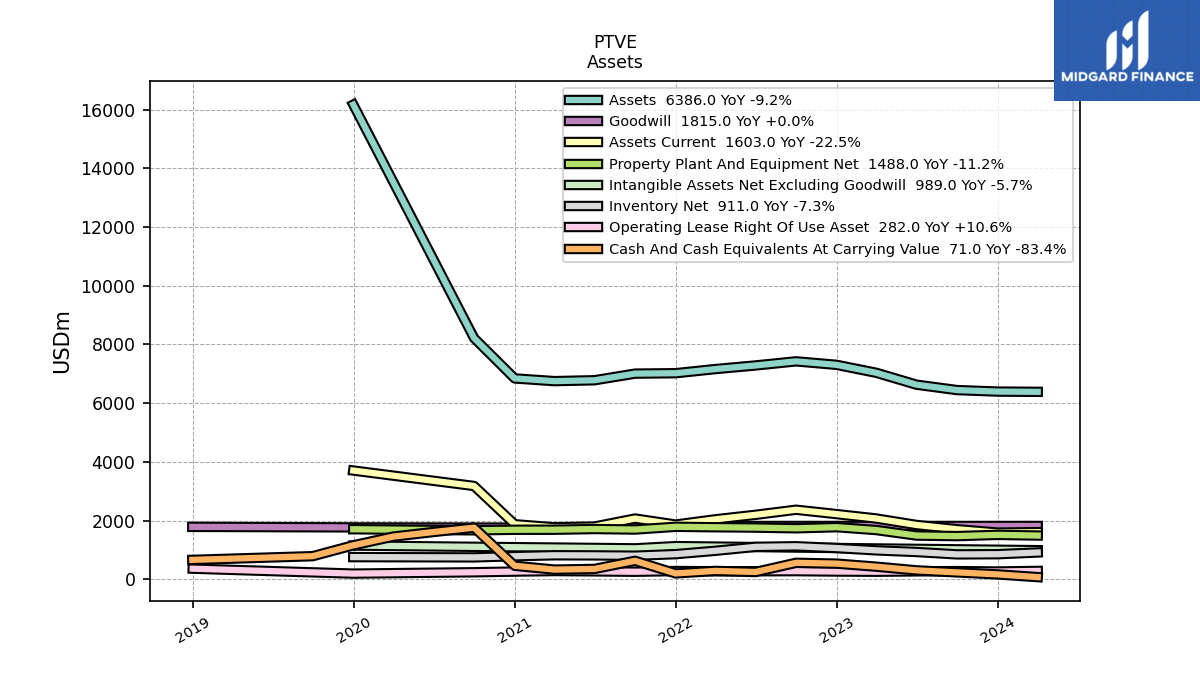
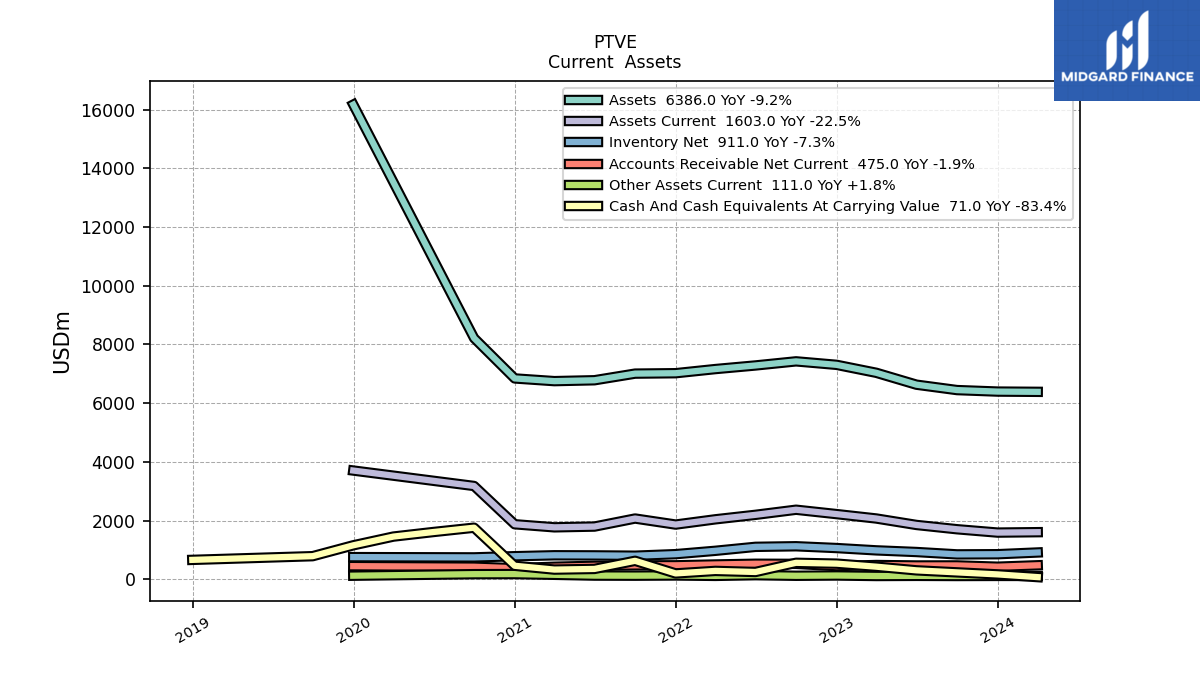
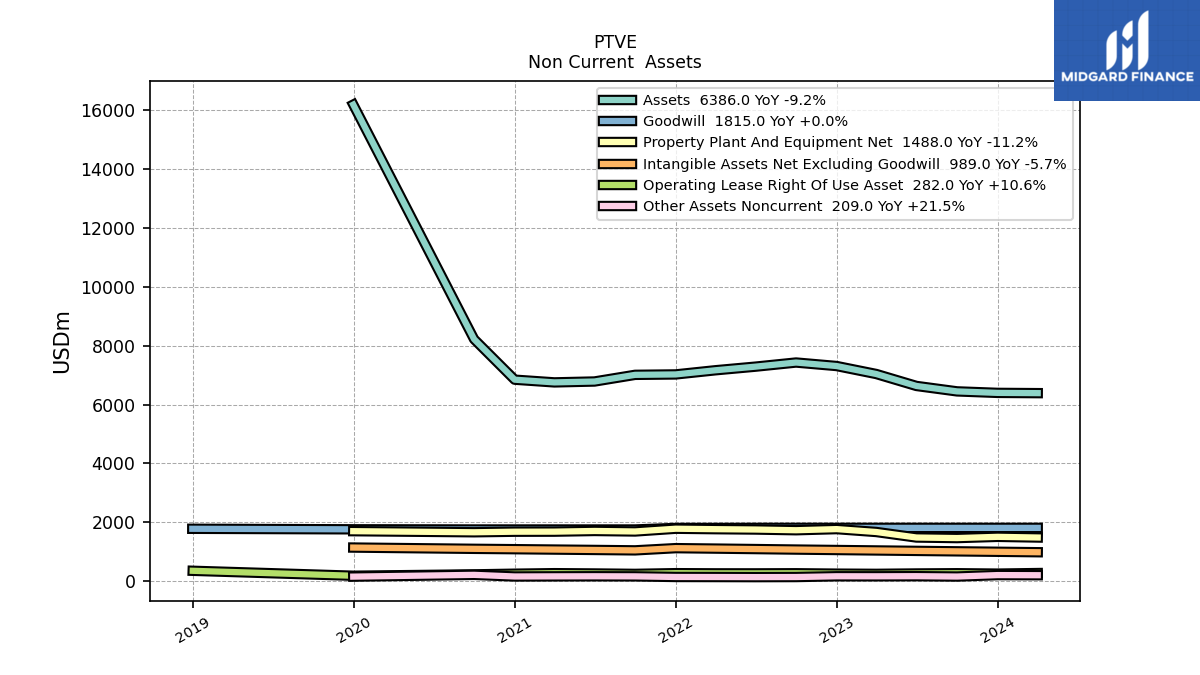
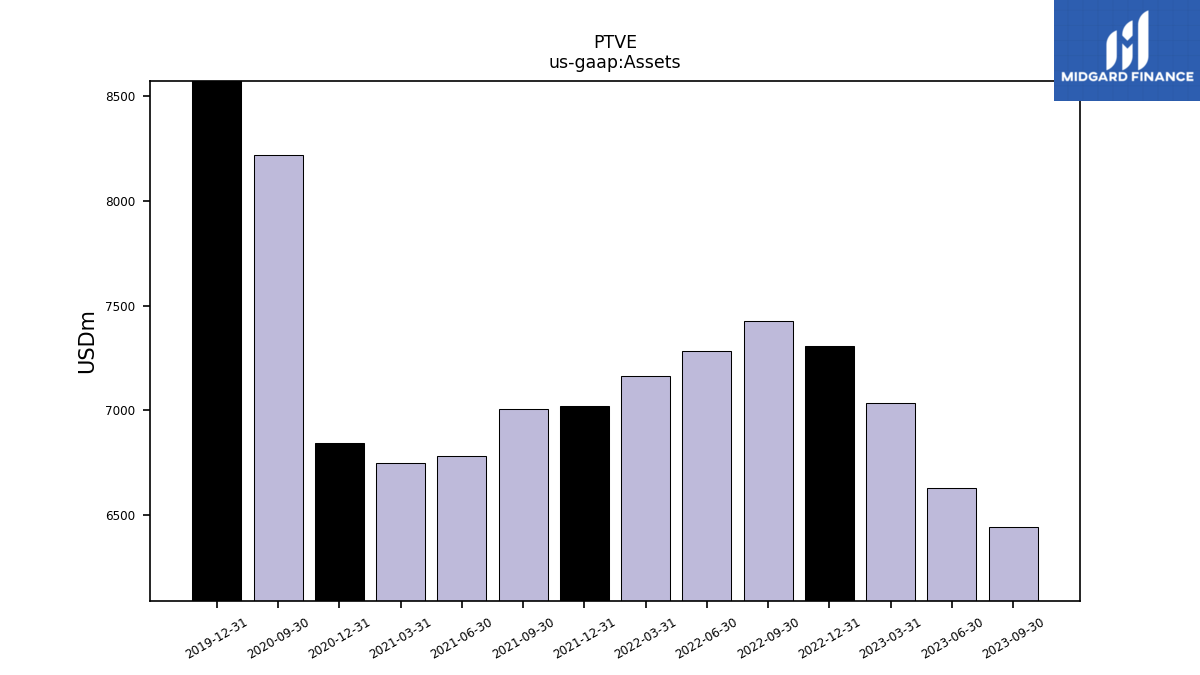
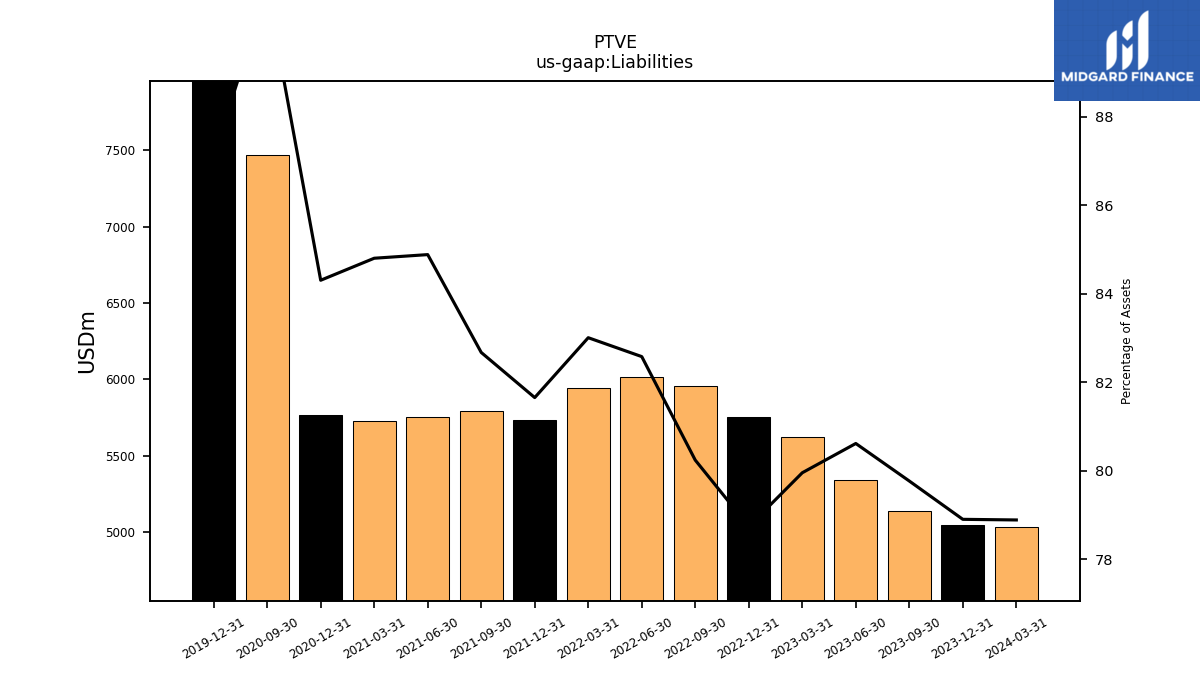
| Assets | 6386.00 | 6395.00 | 6446.00 | 6630.00 | 7035.00 | 7306.00 | 7425.00 | 7285.00 | 7162.00 | 7021.00 | 7007.00 | 6781.00 | 6751.00 | 6843.00 | 8217.00 | NA | NA | 16175.00 | NA | |
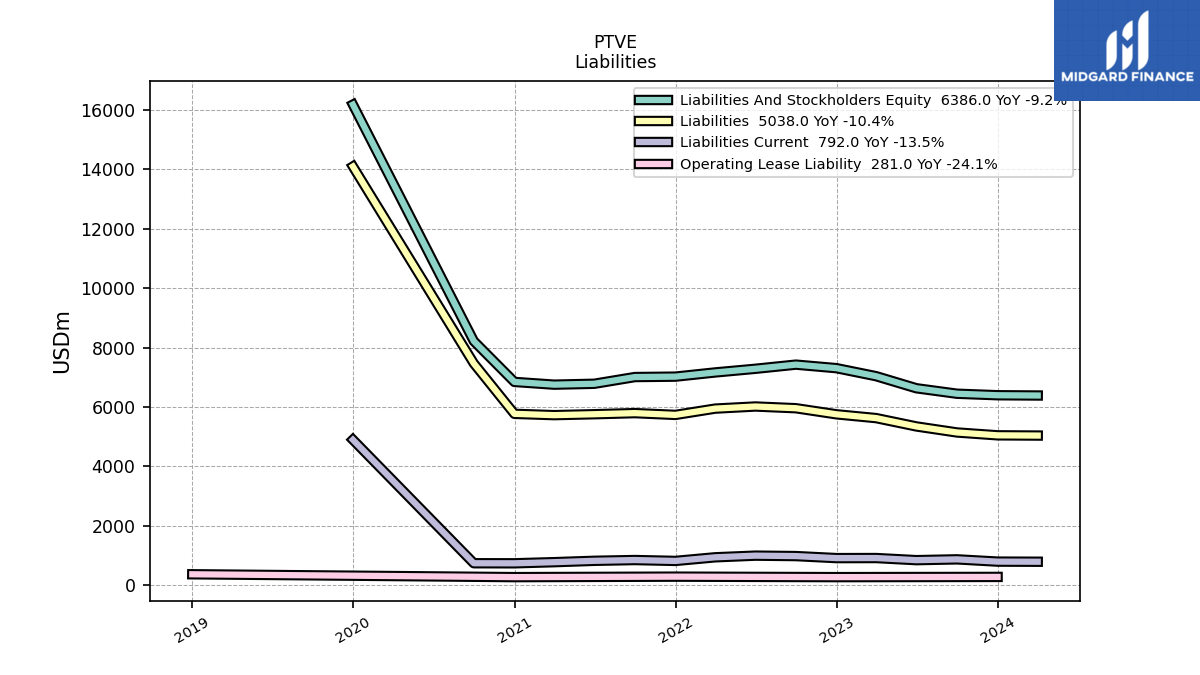
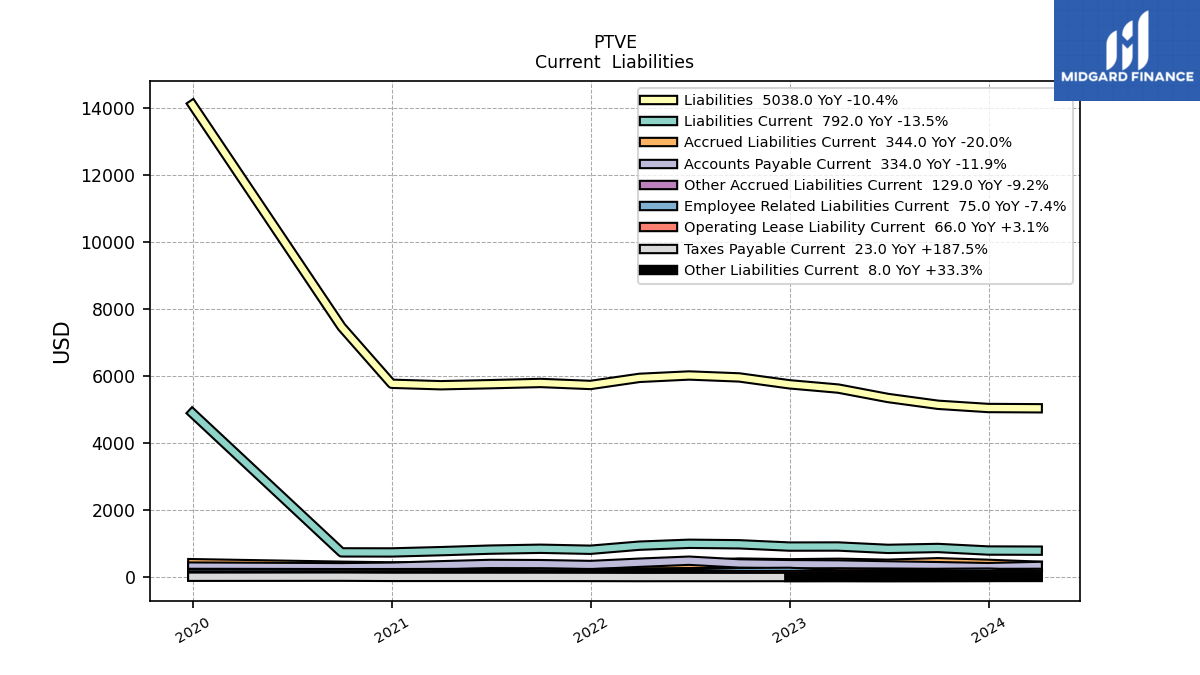
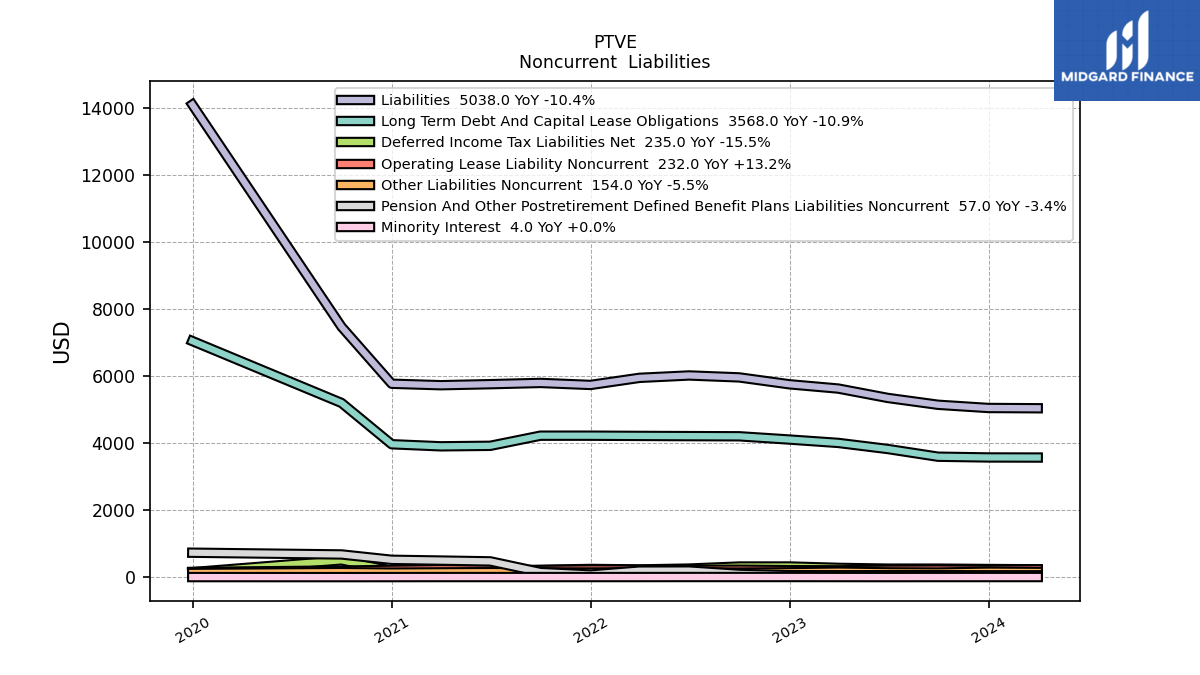
| Liabilities | 5038.00 | 5046.00 | 5142.00 | 5345.00 | 5625.00 | 5753.00 | 5958.00 | 6016.00 | 5945.00 | 5733.00 | 5793.00 | 5756.00 | 5725.00 | 5769.00 | 7467.00 | NA | NA | 14093.00 | NA | |
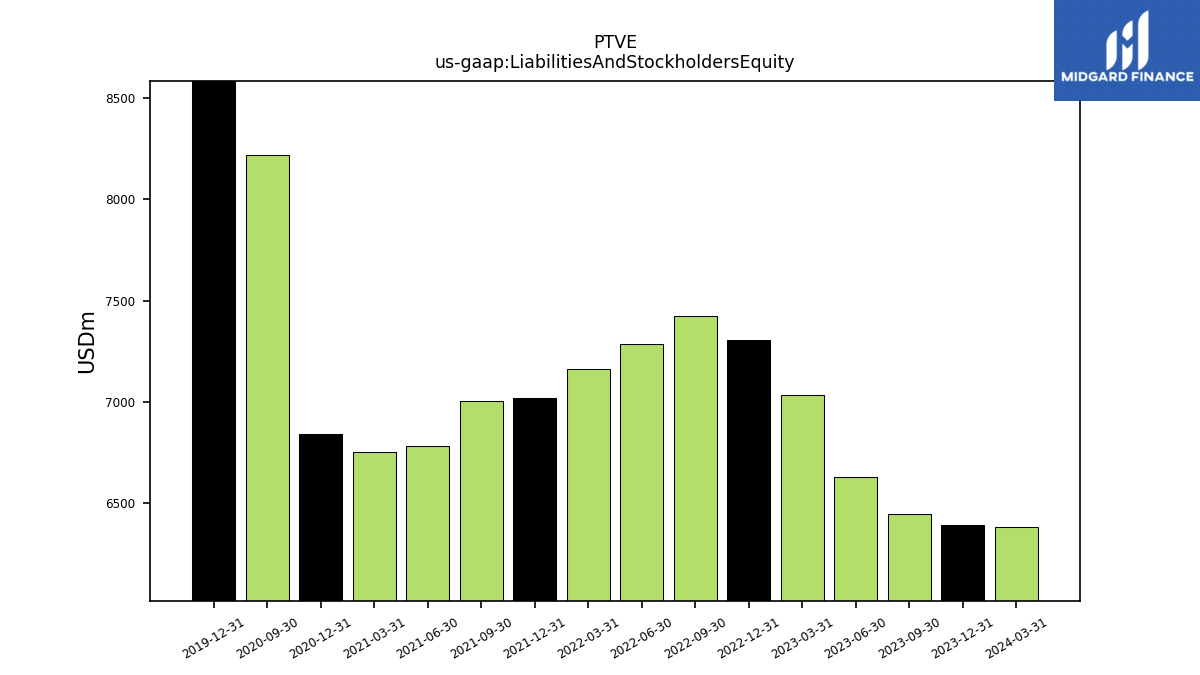
| Liabilities And Stockholders Equity | 6386.00 | 6395.00 | 6446.00 | 6630.00 | 7035.00 | 7306.00 | 7425.00 | 7285.00 | 7162.00 | 7021.00 | 7007.00 | 6781.00 | 6751.00 | 6843.00 | 8217.00 | NA | NA | 16175.00 | NA | |
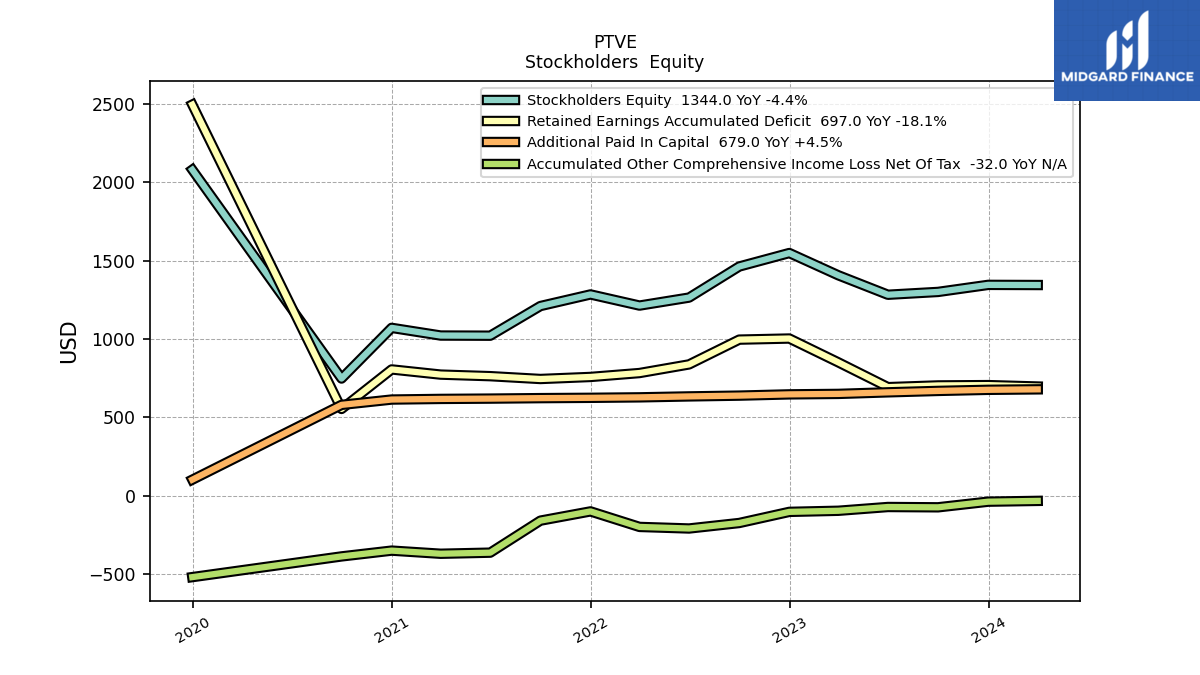
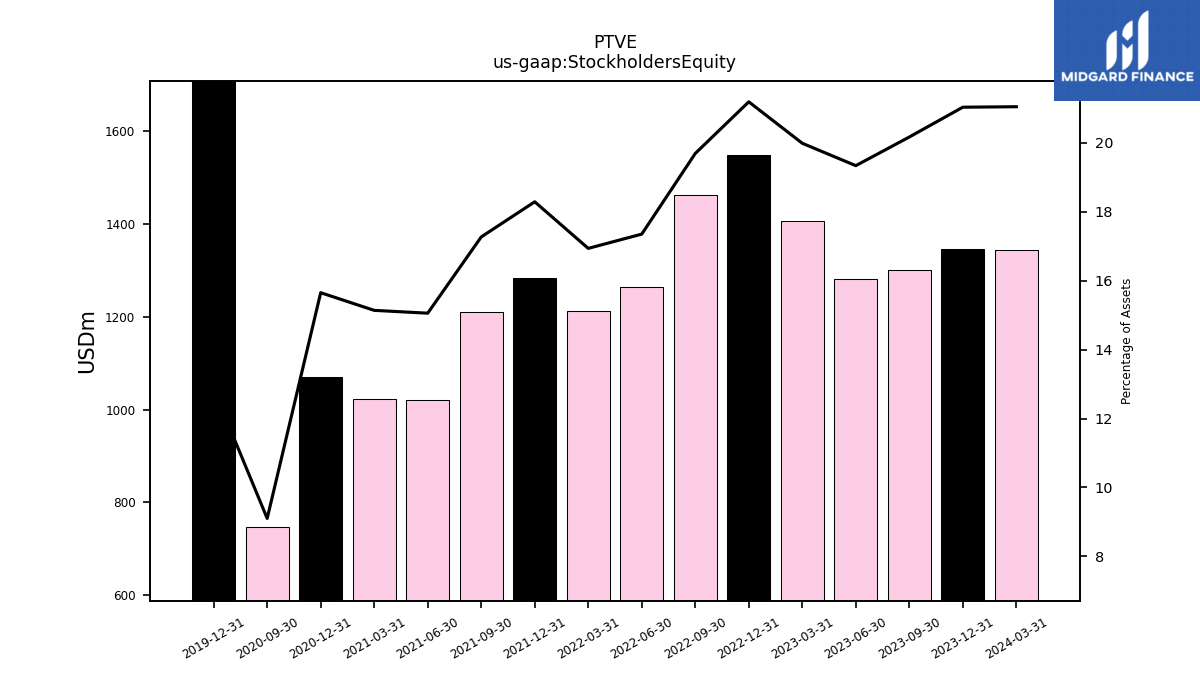
| Stockholders Equity | 1344.00 | 1345.00 | 1300.00 | 1282.00 | 1406.00 | 1548.00 | 1462.00 | 1264.00 | 1213.00 | 1284.00 | 1210.00 | 1021.00 | 1022.00 | 1071.00 | 748.00 | NA | NA | 2079.00 | NA |
| 2024-03-31 | 2023-12-31 | 2023-09-30 | 2023-06-30 | 2023-03-31 | 2022-12-31 | 2022-09-30 | 2022-06-30 | 2022-03-31 | 2021-12-31 | 2021-09-30 | 2021-06-30 | 2021-03-31 | 2020-12-31 | 2020-09-30 | 2020-06-30 | 2020-03-31 | 2019-12-31 | 2019-09-30 | ||
|---|---|---|---|---|---|---|---|---|---|---|---|---|---|---|---|---|---|---|---|---|
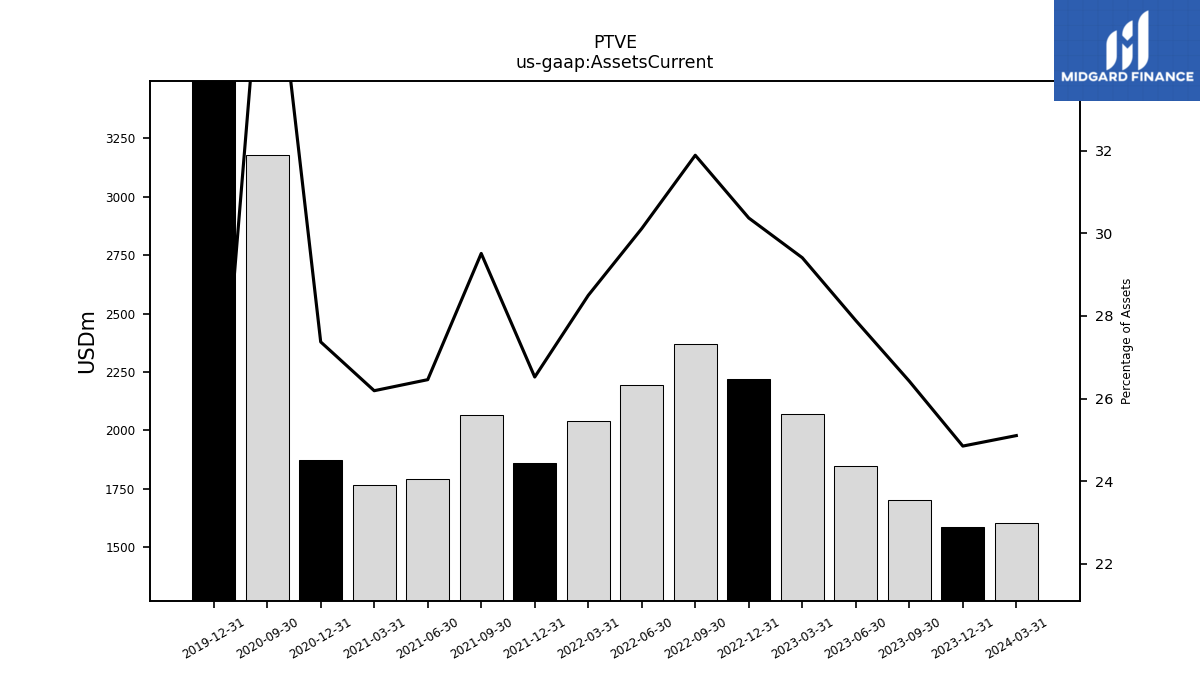
| Assets Current | 1603.00 | 1589.00 | 1703.00 | 1849.00 | 2069.00 | 2219.00 | 2368.00 | 2194.00 | 2041.00 | 1862.00 | 2068.00 | 1794.00 | 1768.00 | 1873.00 | 3177.00 | NA | NA | 3704.00 | NA | |
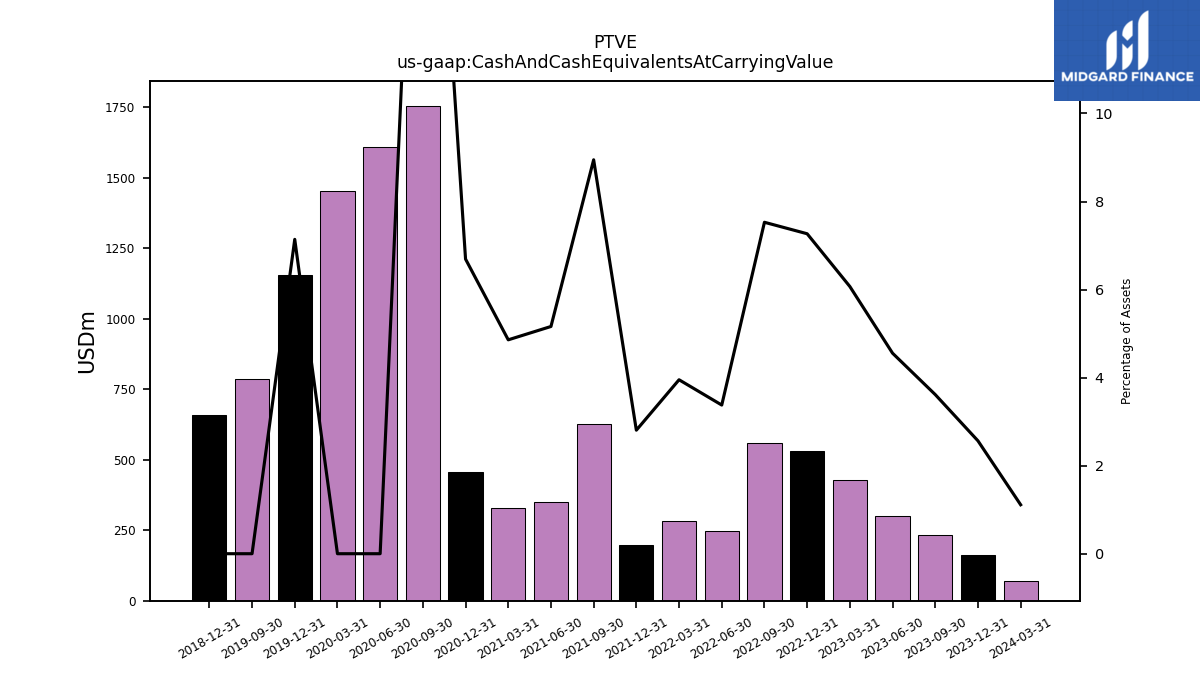
| Cash And Cash Equivalents At Carrying Value | 71.00 | 164.00 | 233.00 | 302.00 | 427.00 | 531.00 | 559.00 | 246.00 | 283.00 | 197.00 | 627.00 | 350.00 | 328.00 | 458.00 | 1756.00 | 1609.00 | 1453.00 | 1155.00 | 785.00 | |
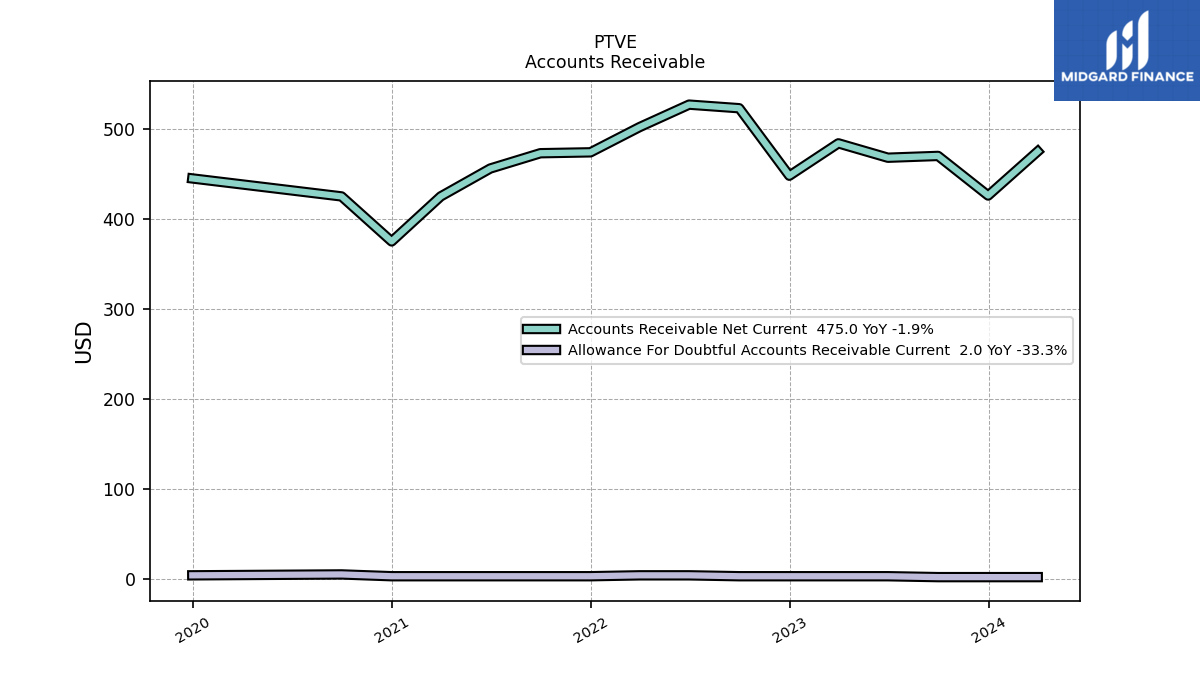
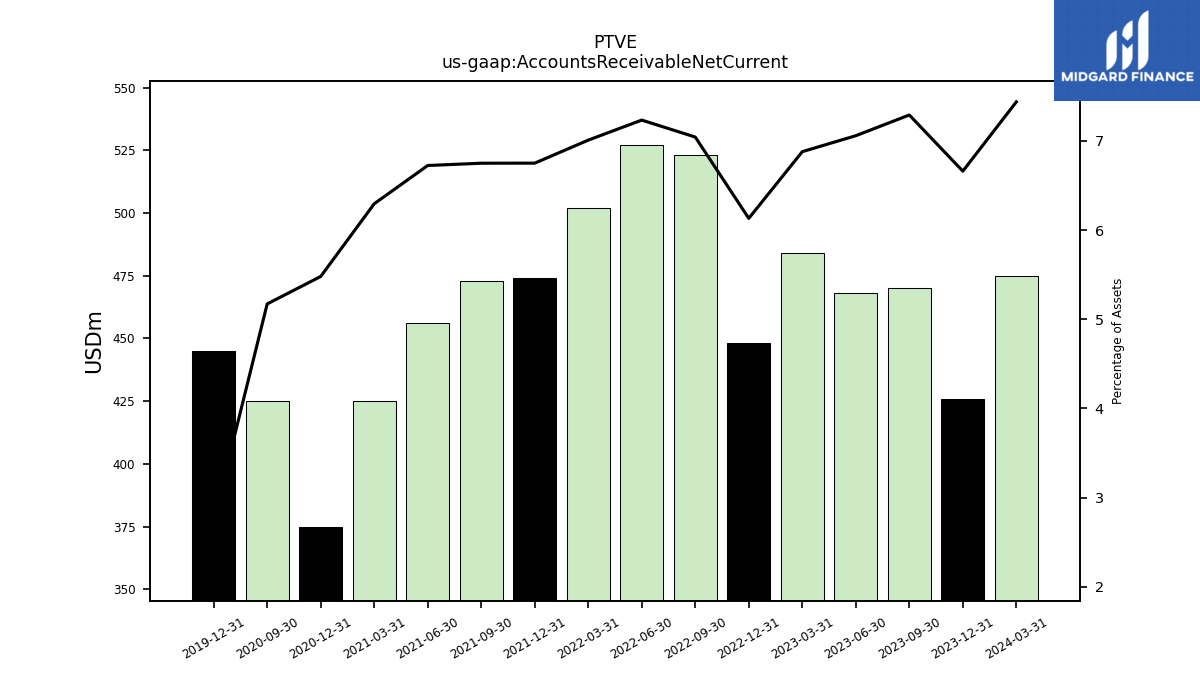
| Accounts Receivable Net Current | 475.00 | 426.00 | 470.00 | 468.00 | 484.00 | 448.00 | 523.00 | 527.00 | 502.00 | 474.00 | 473.00 | 456.00 | 425.00 | 375.00 | 425.00 | NA | NA | 445.00 | NA | |
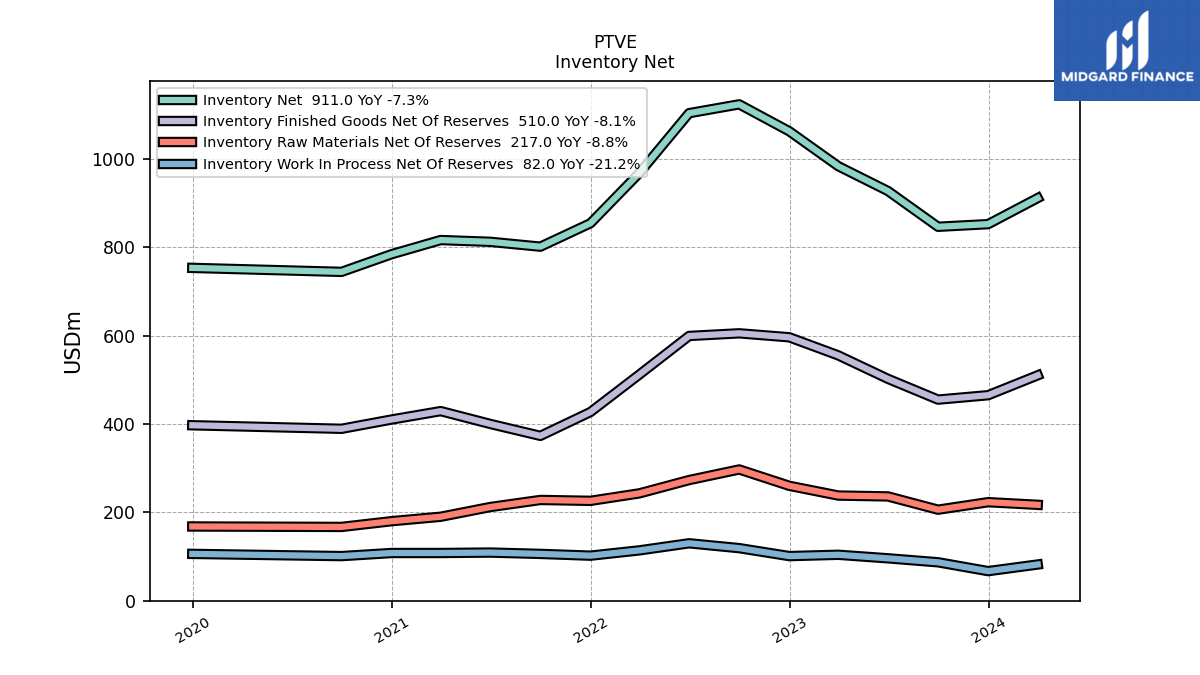
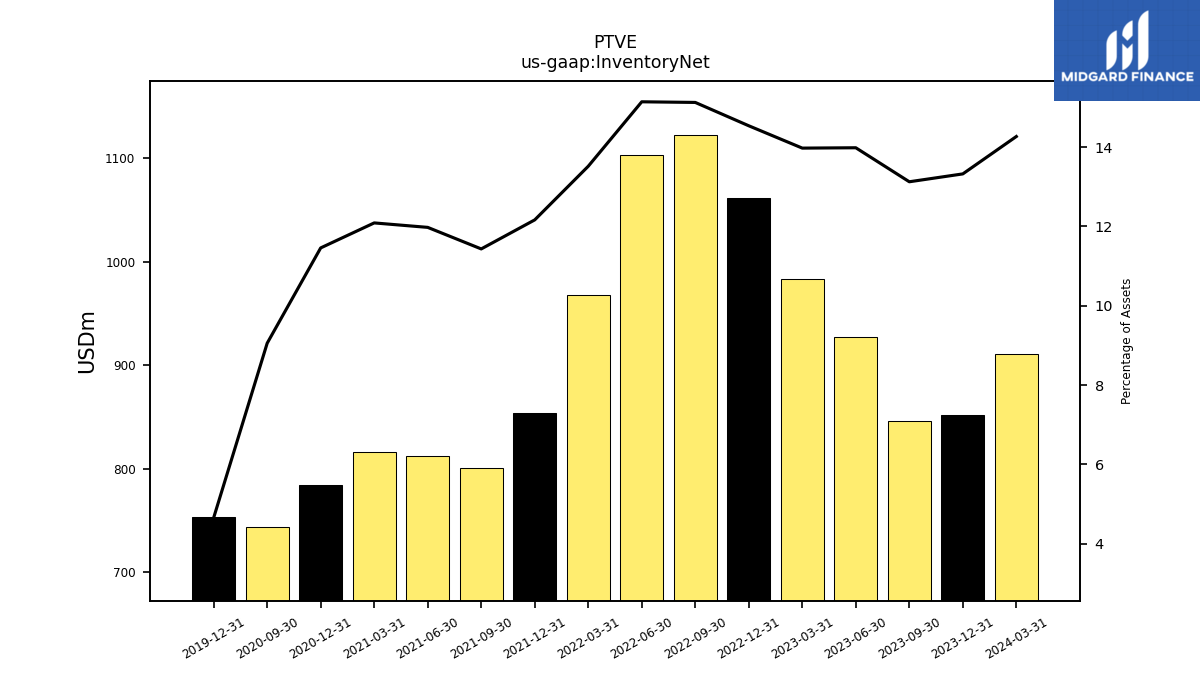
| Inventory Net | 911.00 | 852.00 | 846.00 | 927.00 | 983.00 | 1062.00 | 1123.00 | 1103.00 | 968.00 | 854.00 | 801.00 | 812.00 | 816.00 | 784.00 | 744.00 | NA | NA | 753.00 | NA | |
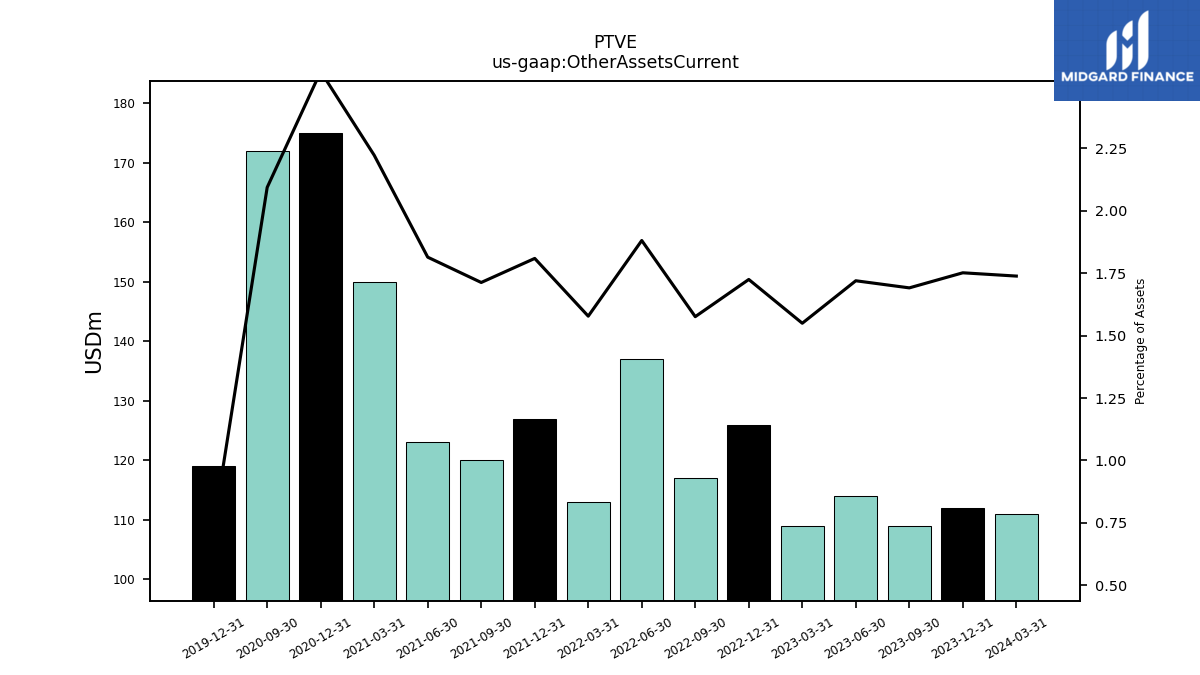
| Other Assets Current | 111.00 | 112.00 | 109.00 | 114.00 | 109.00 | 126.00 | 117.00 | 137.00 | 113.00 | 127.00 | 120.00 | 123.00 | 150.00 | 175.00 | 172.00 | NA | NA | 119.00 | NA |
| 2024-03-31 | 2023-12-31 | 2023-09-30 | 2023-06-30 | 2023-03-31 | 2022-12-31 | 2022-09-30 | 2022-06-30 | 2022-03-31 | 2021-12-31 | 2021-09-30 | 2021-06-30 | 2021-03-31 | 2020-12-31 | 2020-09-30 | 2020-06-30 | 2020-03-31 | 2019-12-31 | 2019-09-30 | ||
|---|---|---|---|---|---|---|---|---|---|---|---|---|---|---|---|---|---|---|---|---|
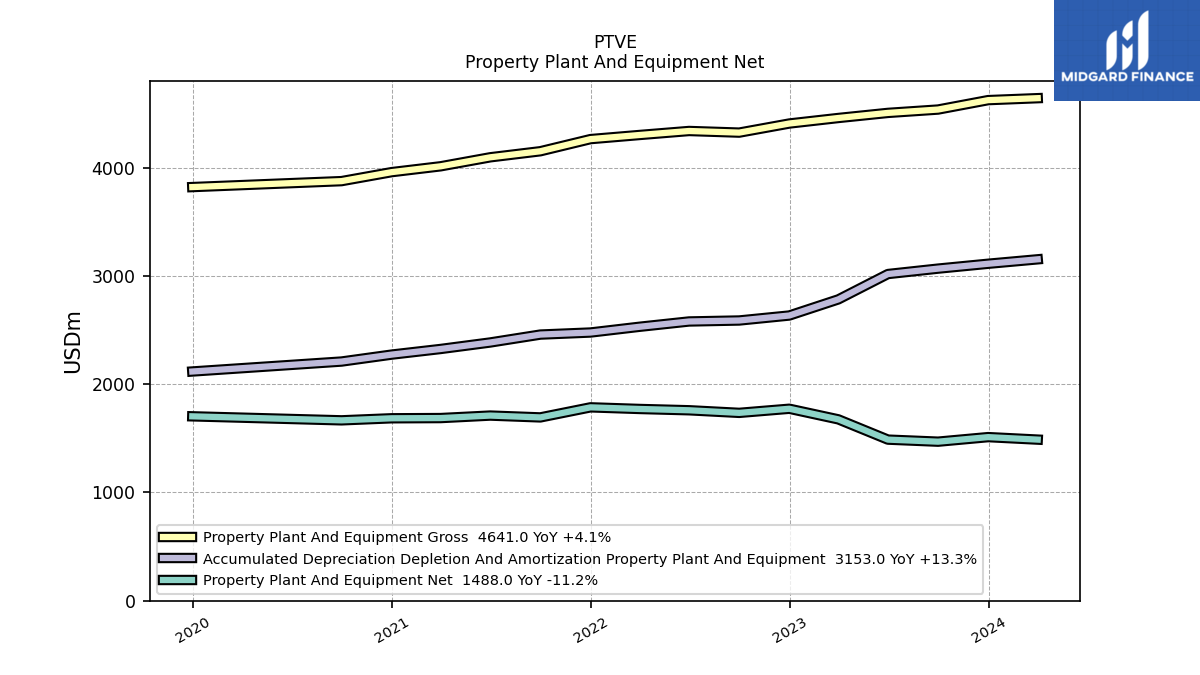
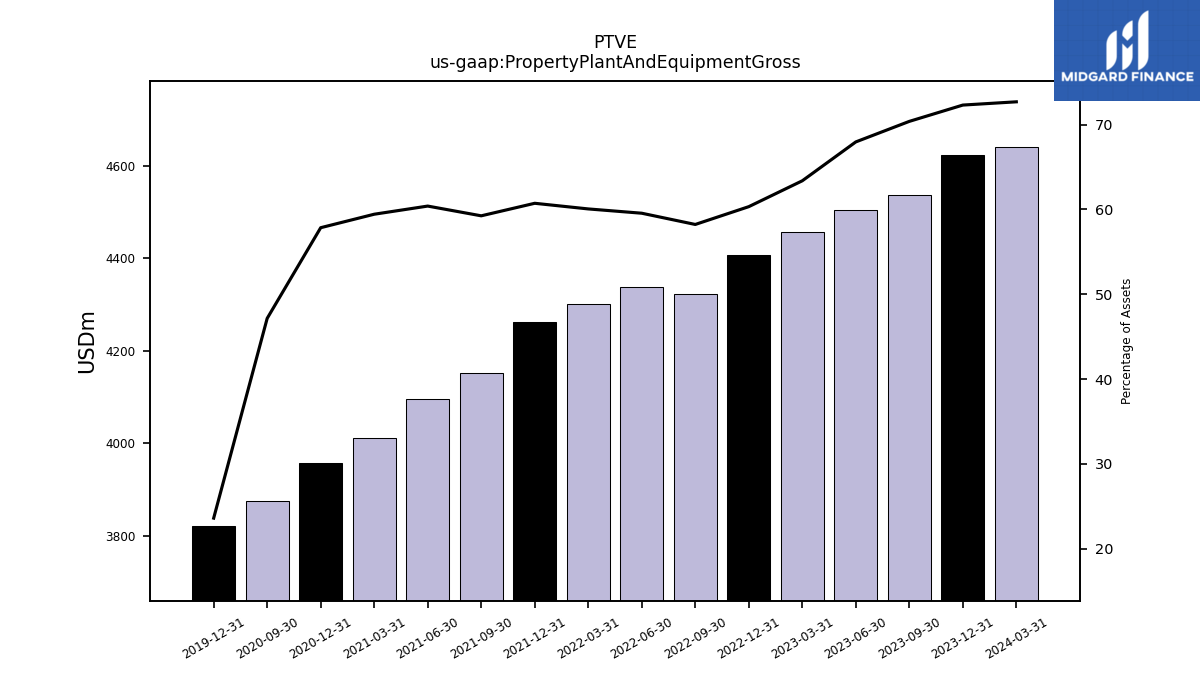
| Property Plant And Equipment Gross | 4641.00 | 4623.00 | 4536.00 | 4505.00 | 4458.00 | 4407.00 | 4323.00 | 4338.00 | 4301.00 | 4263.00 | 4151.00 | 4095.00 | 4012.00 | 3958.00 | 3875.00 | NA | NA | 3820.00 | NA | |
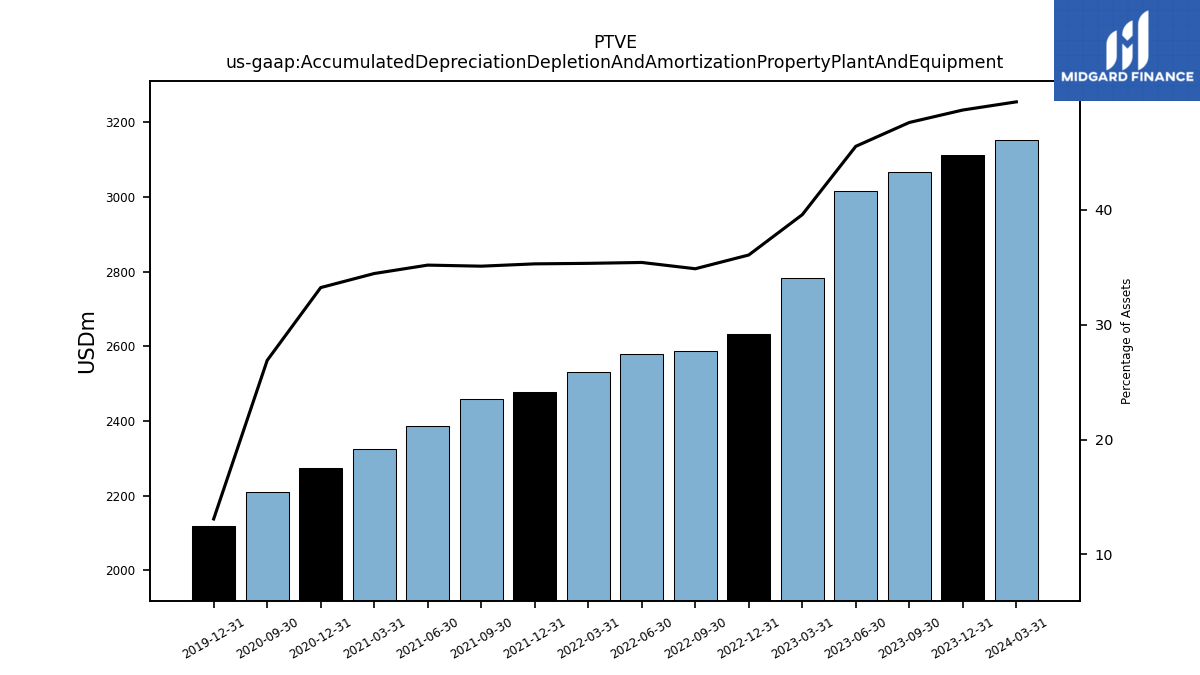
| Accumulated Depreciation Depletion And Amortization Property Plant And Equipment | 3153.00 | 3112.00 | 3067.00 | 3017.00 | 2783.00 | 2634.00 | 2588.00 | 2579.00 | 2530.00 | 2477.00 | 2458.00 | 2385.00 | 2325.00 | 2273.00 | 2209.00 | NA | NA | 2117.00 | NA | |
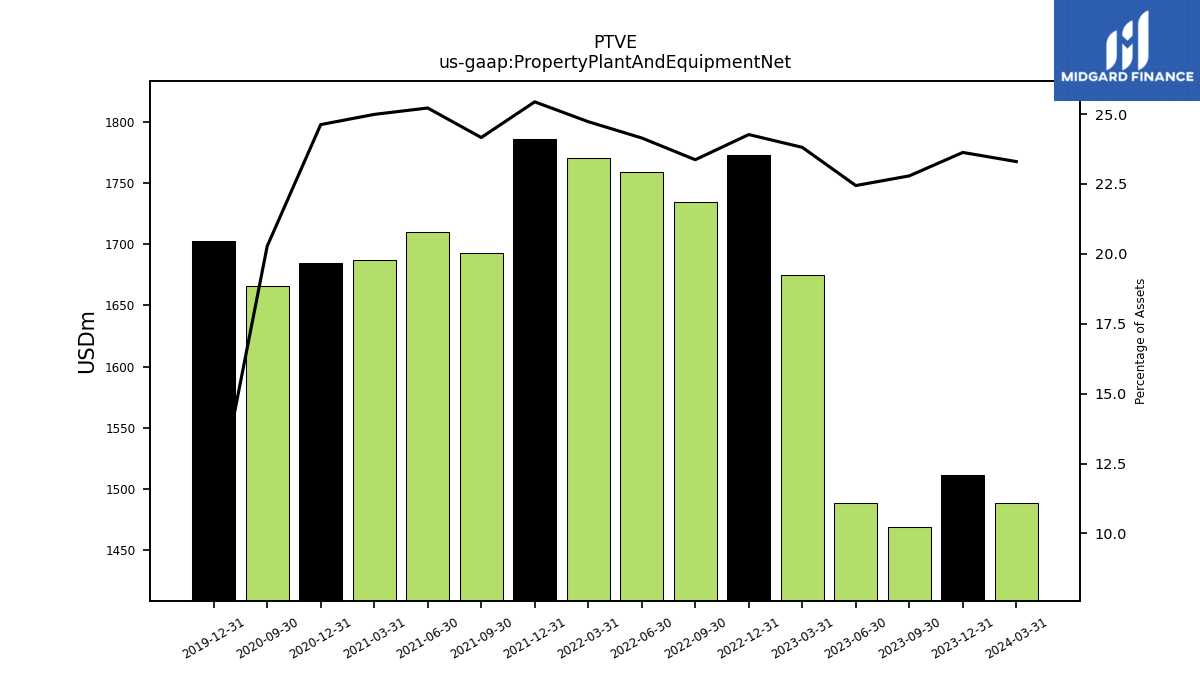
| Property Plant And Equipment Net | 1488.00 | 1511.00 | 1469.00 | 1488.00 | 1675.00 | 1773.00 | 1735.00 | 1759.00 | 1771.00 | 1786.00 | 1693.00 | 1710.00 | 1687.00 | 1685.00 | 1666.00 | NA | NA | 1703.00 | NA | |
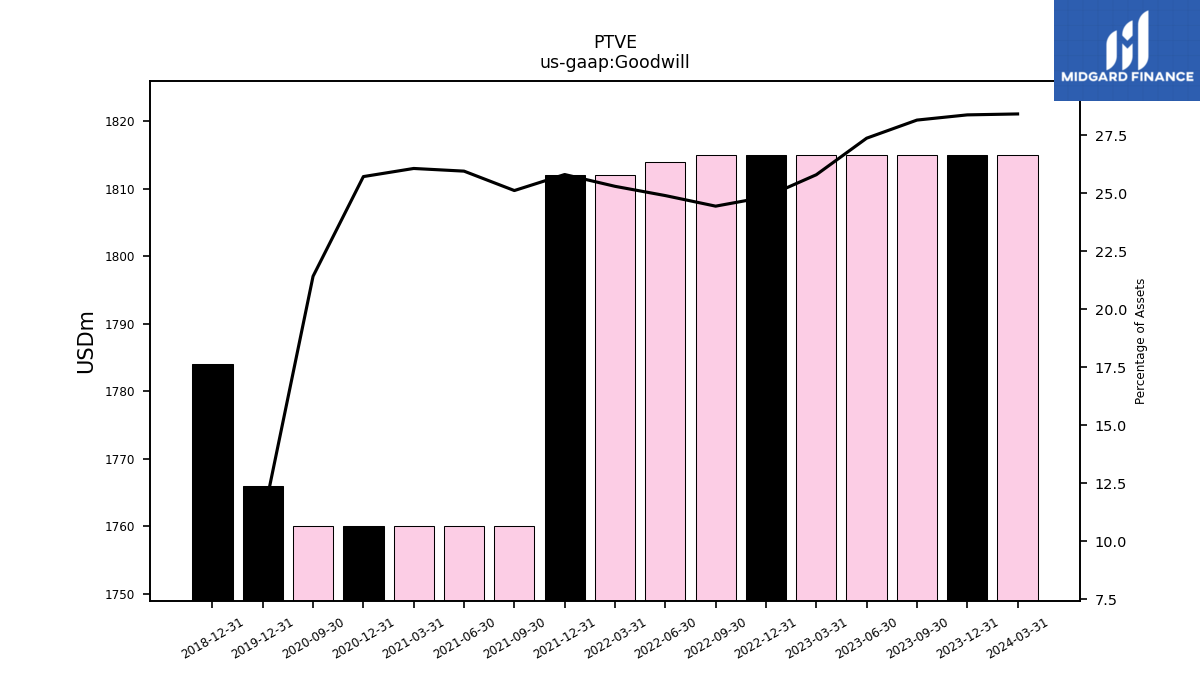
| Goodwill | 1815.00 | 1815.00 | 1815.00 | 1815.00 | 1815.00 | 1815.00 | 1815.00 | 1814.00 | 1812.00 | 1812.00 | 1760.00 | 1760.00 | 1760.00 | 1760.00 | 1760.00 | NA | NA | 1766.00 | NA | |
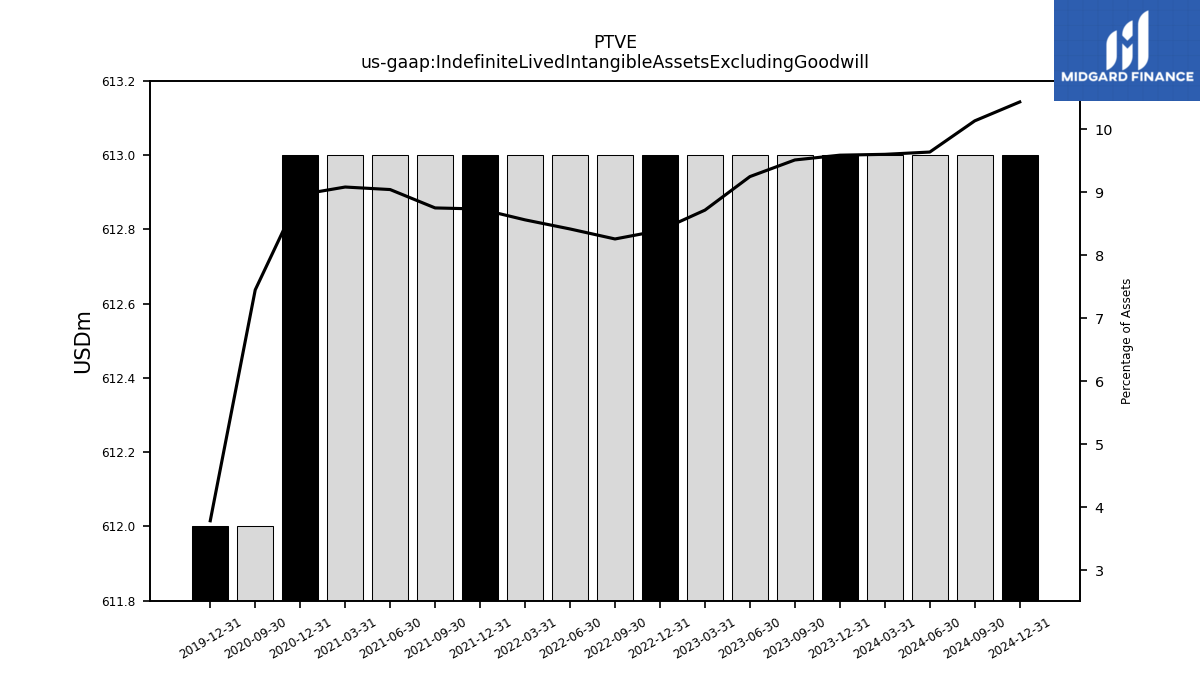
| Indefinite Lived Intangible Assets Excluding Goodwill | 613.00 | 613.00 | 613.00 | 613.00 | 613.00 | 613.00 | 613.00 | 613.00 | 613.00 | 613.00 | 613.00 | 613.00 | 613.00 | 613.00 | 612.00 | NA | NA | 612.00 | NA | |
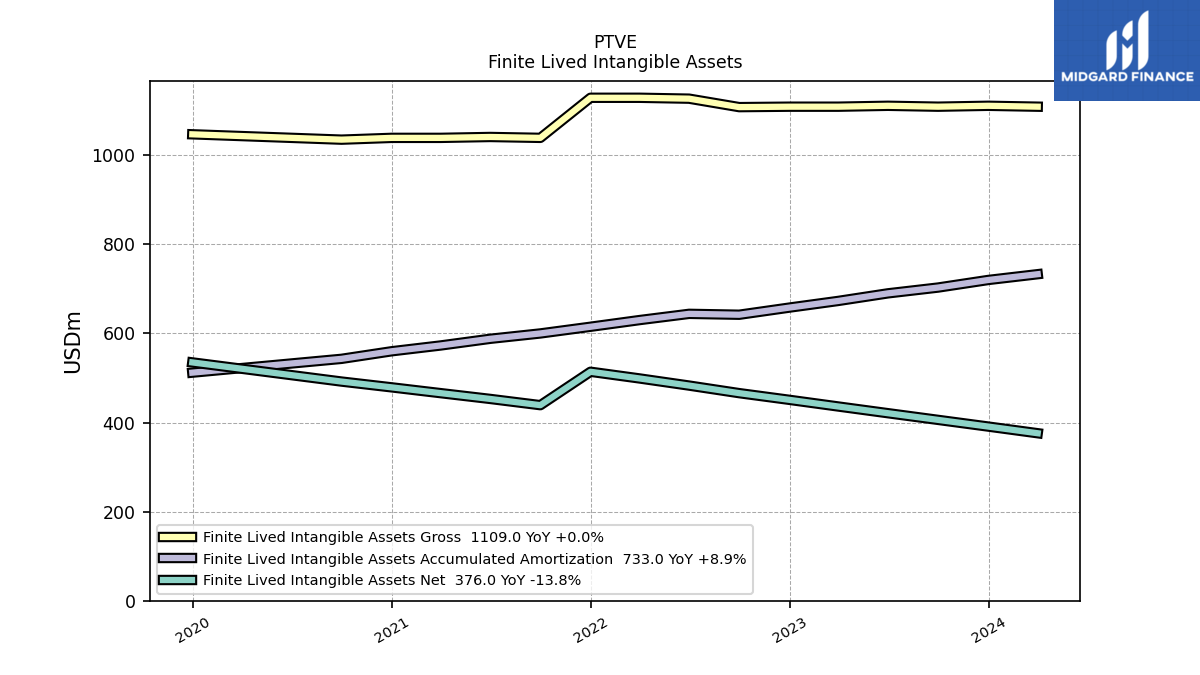
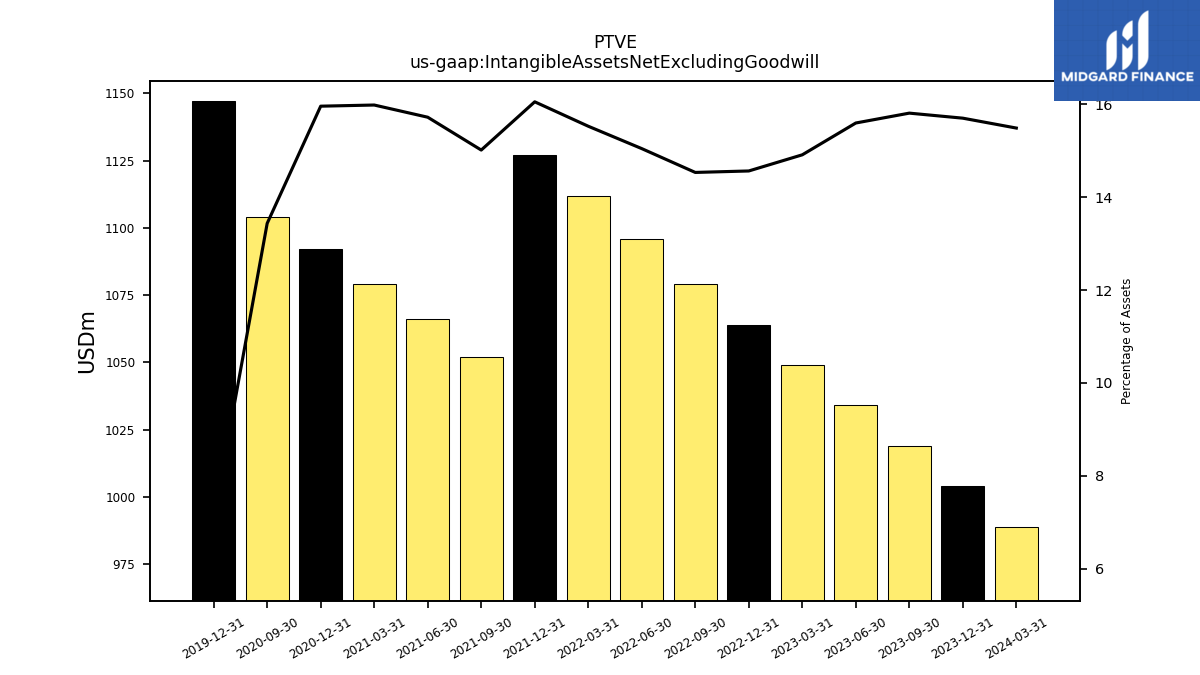
| Intangible Assets Net Excluding Goodwill | 989.00 | 1004.00 | 1019.00 | 1034.00 | 1049.00 | 1064.00 | 1079.00 | 1096.00 | 1112.00 | 1127.00 | 1052.00 | 1066.00 | 1079.00 | 1092.00 | 1104.00 | NA | NA | 1147.00 | NA | |
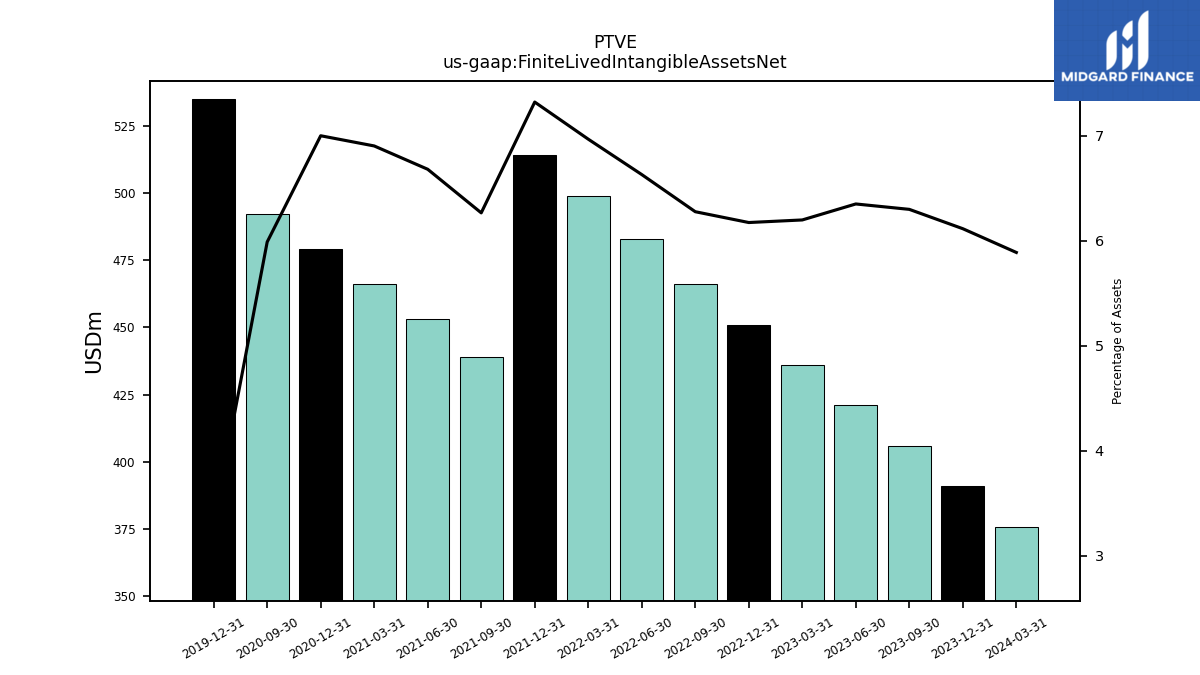
| Finite Lived Intangible Assets Net | 376.00 | 391.00 | 406.00 | 421.00 | 436.00 | 451.00 | 466.00 | 483.00 | 499.00 | 514.00 | 439.00 | 453.00 | 466.00 | 479.00 | 492.00 | NA | NA | 535.00 | NA | |
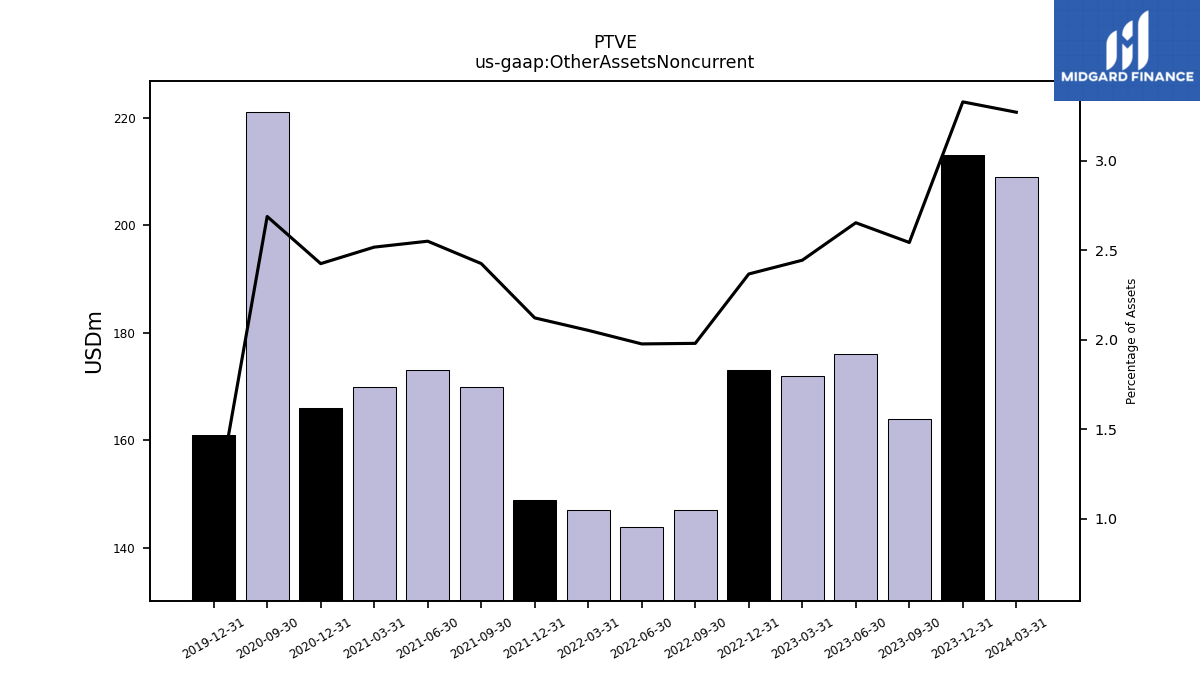
| Other Assets Noncurrent | 209.00 | 213.00 | 164.00 | 176.00 | 172.00 | 173.00 | 147.00 | 144.00 | 147.00 | 149.00 | 170.00 | 173.00 | 170.00 | 166.00 | 221.00 | NA | NA | 161.00 | NA |
| 2024-03-31 | 2023-12-31 | 2023-09-30 | 2023-06-30 | 2023-03-31 | 2022-12-31 | 2022-09-30 | 2022-06-30 | 2022-03-31 | 2021-12-31 | 2021-09-30 | 2021-06-30 | 2021-03-31 | 2020-12-31 | 2020-09-30 | 2020-06-30 | 2020-03-31 | 2019-12-31 | 2019-09-30 | ||
|---|---|---|---|---|---|---|---|---|---|---|---|---|---|---|---|---|---|---|---|---|
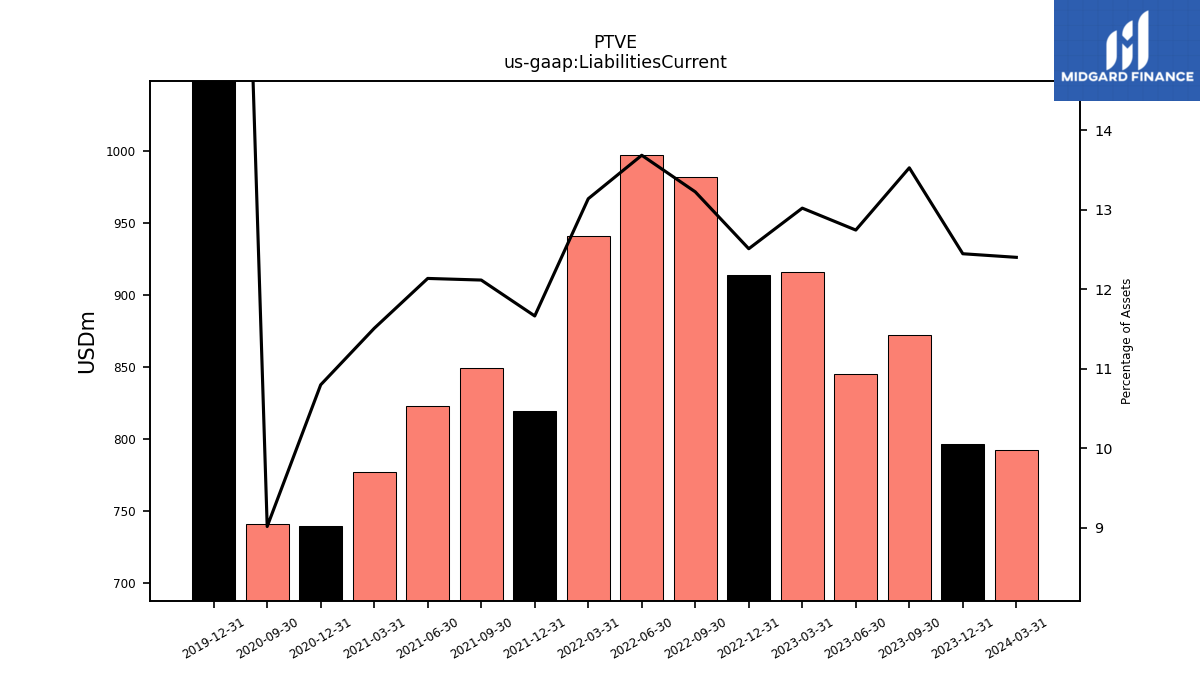
| Liabilities Current | 792.00 | 796.00 | 872.00 | 845.00 | 916.00 | 914.00 | 982.00 | 997.00 | 941.00 | 819.00 | 849.00 | 823.00 | 777.00 | 739.00 | 741.00 | NA | NA | 4897.00 | NA | |
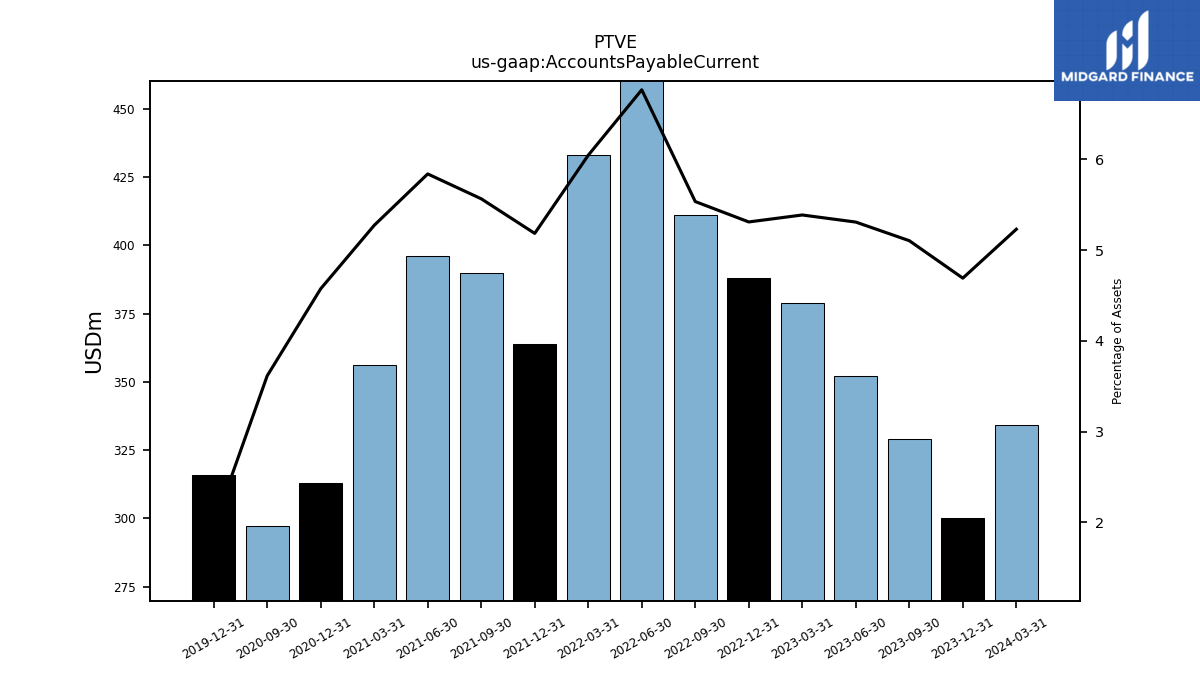
| Accounts Payable Current | 334.00 | 300.00 | 329.00 | 352.00 | 379.00 | 388.00 | 411.00 | 493.00 | 433.00 | 364.00 | 390.00 | 396.00 | 356.00 | 313.00 | 297.00 | NA | NA | 316.00 | NA | |
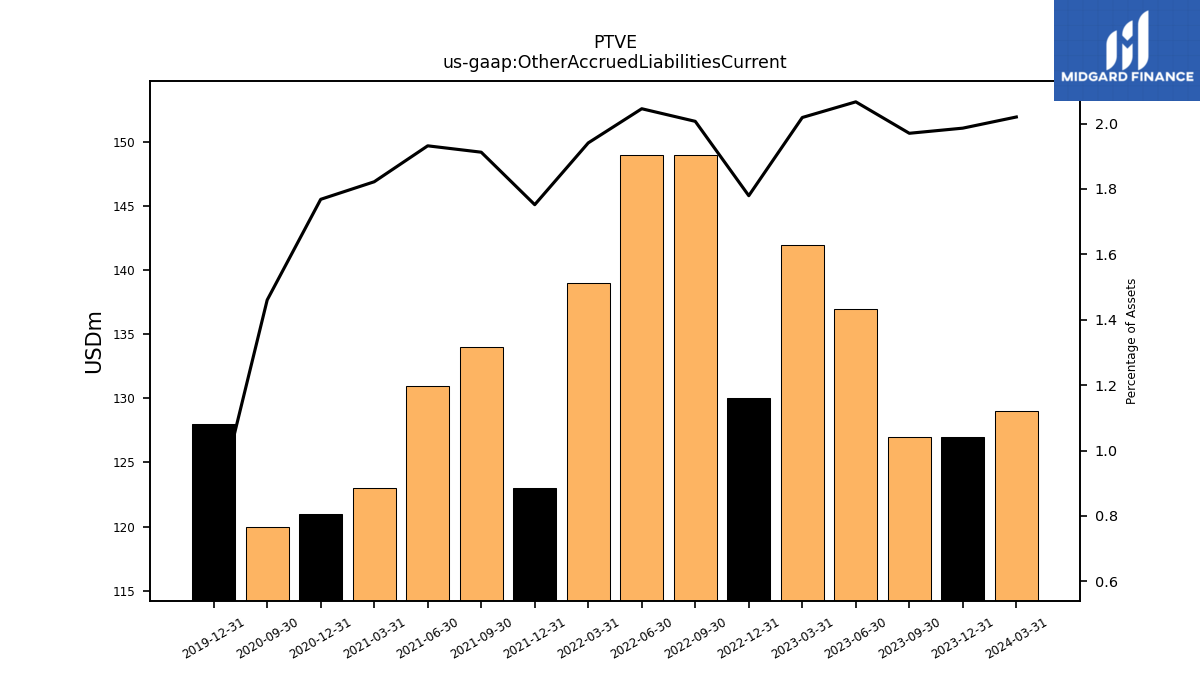
| Other Accrued Liabilities Current | 129.00 | 127.00 | 127.00 | 137.00 | 142.00 | 130.00 | 149.00 | 149.00 | 139.00 | 123.00 | 134.00 | 131.00 | 123.00 | 121.00 | 120.00 | NA | NA | 128.00 | NA | |
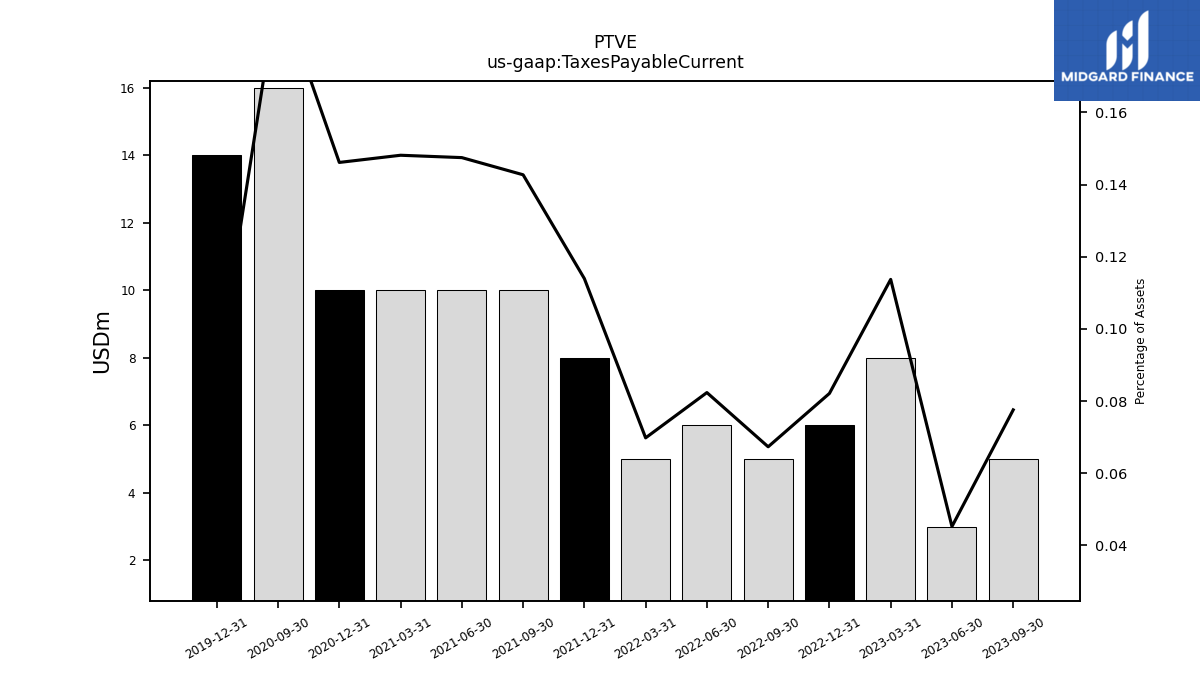
| Taxes Payable Current | 23.00 | 11.00 | 5.00 | 3.00 | 8.00 | 6.00 | 5.00 | 6.00 | 5.00 | 8.00 | 10.00 | 10.00 | 10.00 | 10.00 | 16.00 | NA | NA | 14.00 | NA | |
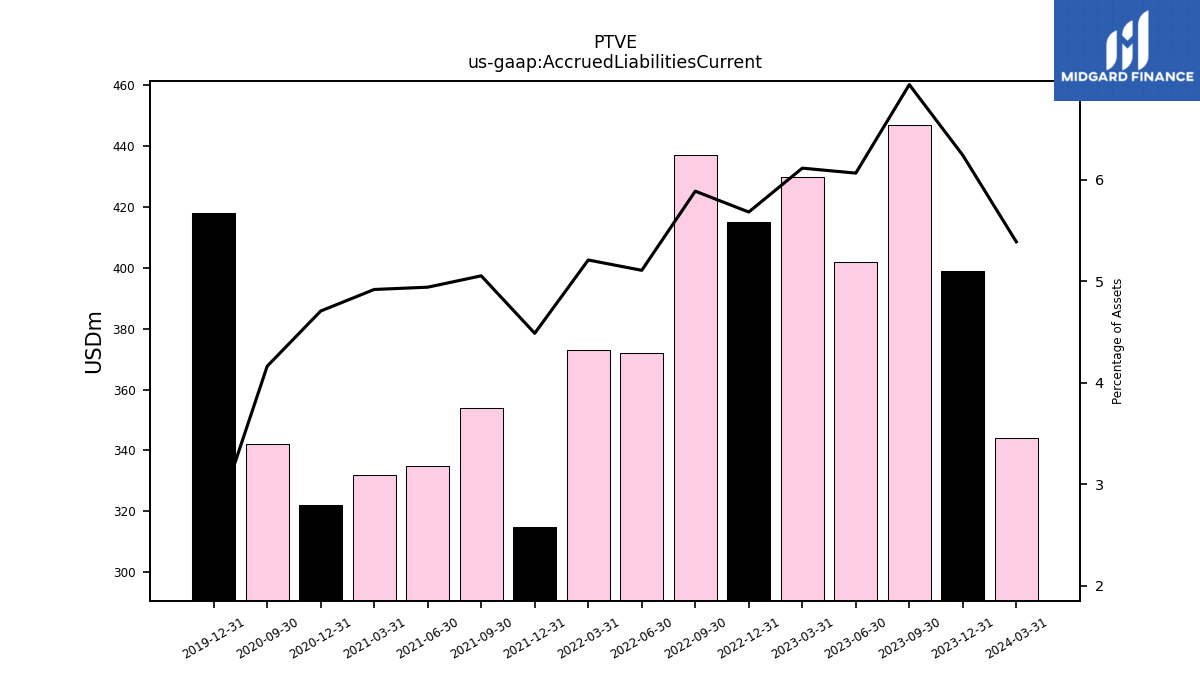
| Accrued Liabilities Current | 344.00 | 399.00 | 447.00 | 402.00 | 430.00 | 415.00 | 437.00 | 372.00 | 373.00 | 315.00 | 354.00 | 335.00 | 332.00 | 322.00 | 342.00 | NA | NA | 418.00 | NA | |
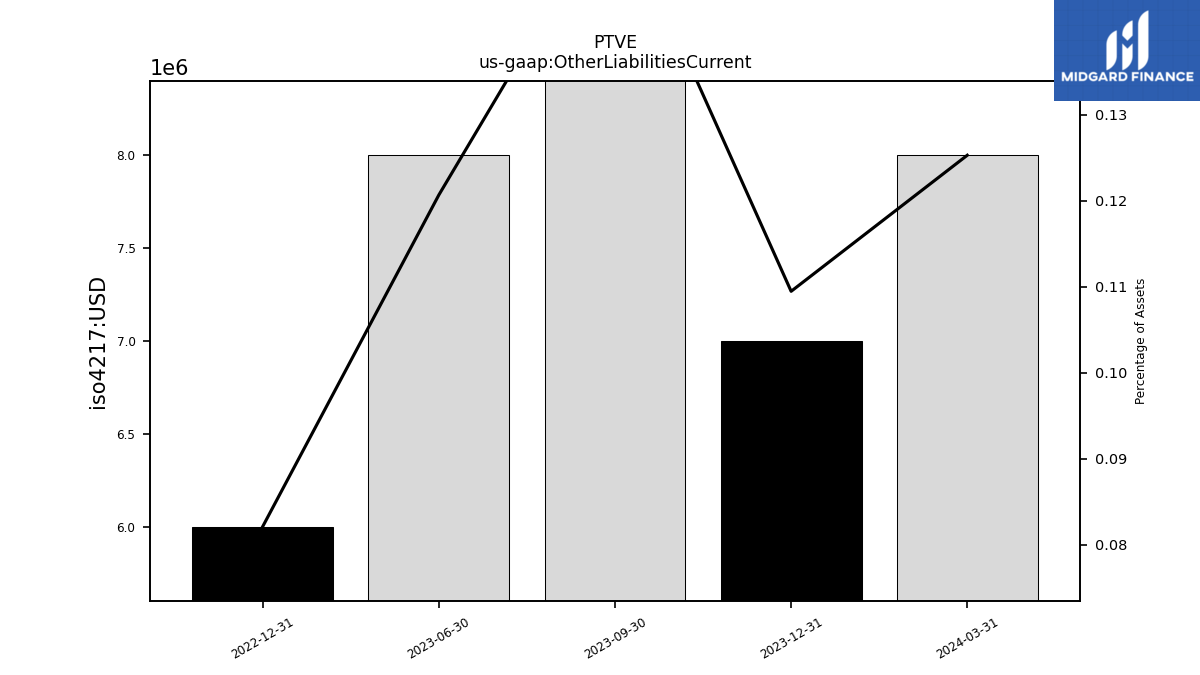
| Other Liabilities Current | 8.00 | 7.00 | 10.00 | 8.00 | NA | 6.00 | NA | NA | NA | NA | NA | NA | NA | NA | NA | NA | NA | NA | NA |
| 2024-03-31 | 2023-12-31 | 2023-09-30 | 2023-06-30 | 2023-03-31 | 2022-12-31 | 2022-09-30 | 2022-06-30 | 2022-03-31 | 2021-12-31 | 2021-09-30 | 2021-06-30 | 2021-03-31 | 2020-12-31 | 2020-09-30 | 2020-06-30 | 2020-03-31 | 2019-12-31 | 2019-09-30 | ||
|---|---|---|---|---|---|---|---|---|---|---|---|---|---|---|---|---|---|---|---|---|
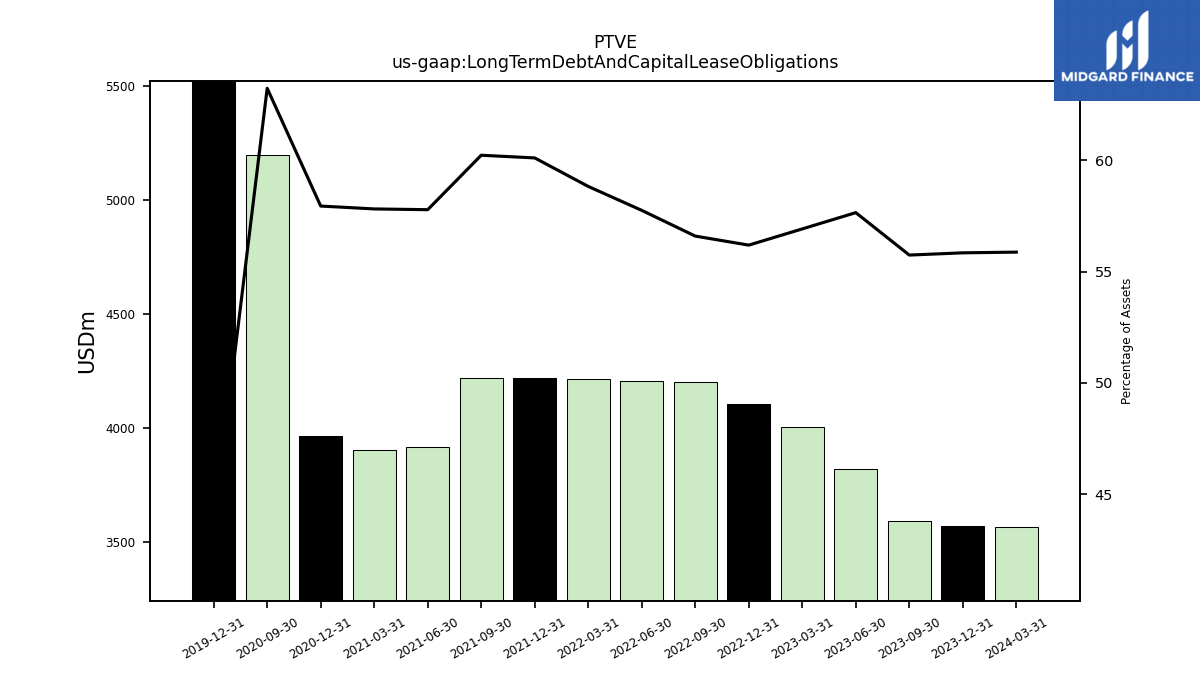
| Long Term Debt And Capital Lease Obligations | 3568.00 | 3571.00 | 3593.00 | 3822.00 | 4004.00 | 4105.00 | 4202.00 | 4207.00 | 4213.00 | 4220.00 | 4220.00 | 3918.00 | 3903.00 | 3965.00 | 5196.00 | NA | NA | 7043.00 | NA | |
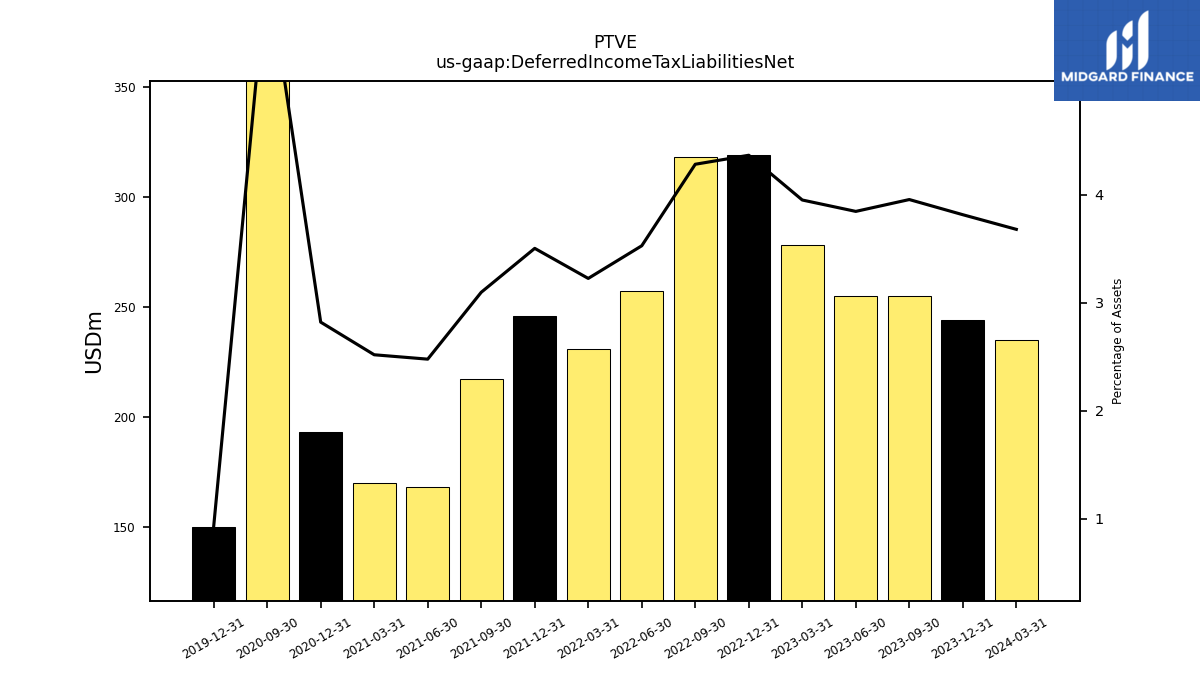
| Deferred Income Tax Liabilities Net | 235.00 | 244.00 | 255.00 | 255.00 | 278.00 | 319.00 | 318.00 | 257.00 | 231.00 | 246.00 | 217.00 | 168.00 | 170.00 | 193.00 | 504.00 | NA | NA | 150.00 | NA | |
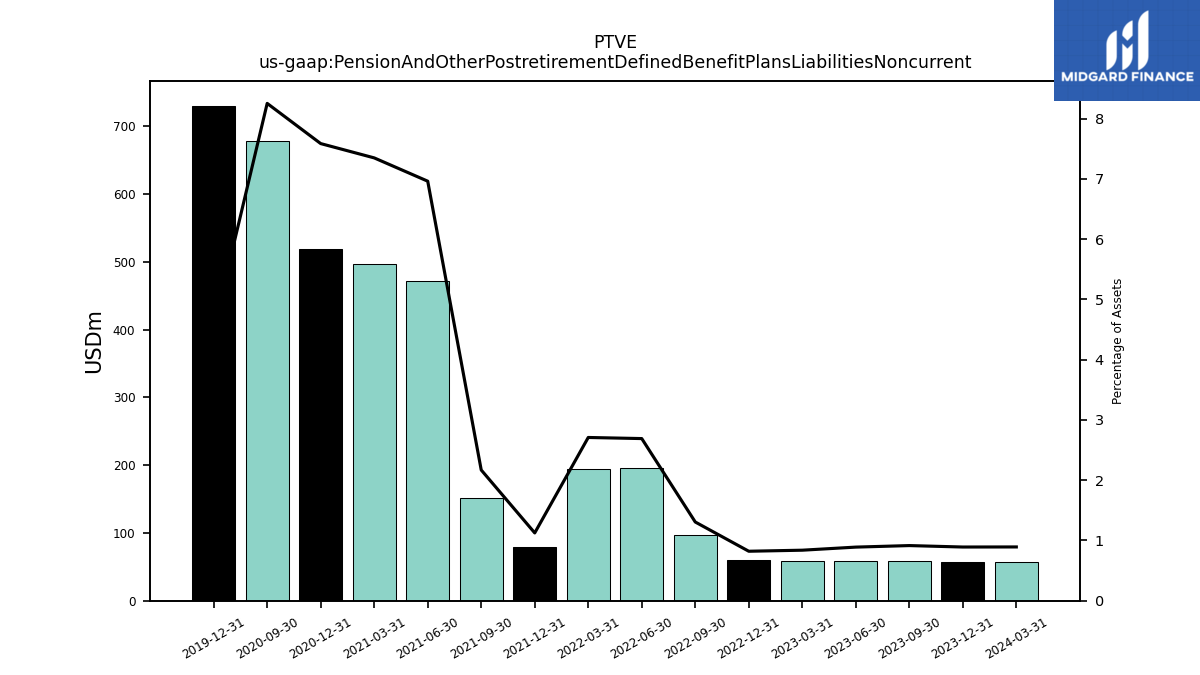
| Pension And Other Postretirement Defined Benefit Plans Liabilities Noncurrent | 57.00 | 57.00 | 59.00 | 59.00 | 59.00 | 60.00 | 97.00 | 196.00 | 194.00 | 79.00 | 152.00 | 472.00 | 496.00 | 519.00 | 678.00 | NA | NA | 730.00 | NA | |
| Minority Interest | 4.00 | 4.00 | 4.00 | 3.00 | 4.00 | 5.00 | 5.00 | 5.00 | 4.00 | 4.00 | 4.00 | 4.00 | 4.00 | 3.00 | 2.00 | NA | NA | 3.00 | NA | |
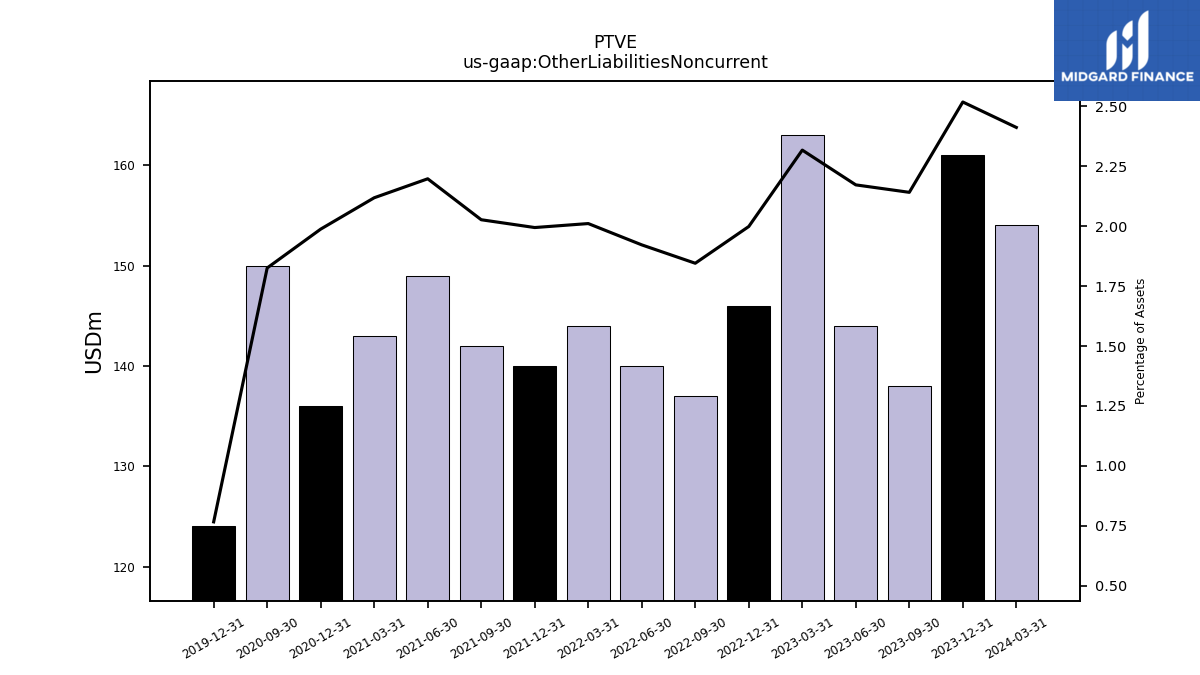
| Other Liabilities Noncurrent | 154.00 | 161.00 | 138.00 | 144.00 | 163.00 | 146.00 | 137.00 | 140.00 | 144.00 | 140.00 | 142.00 | 149.00 | 143.00 | 136.00 | 150.00 | NA | NA | 124.00 | NA | |
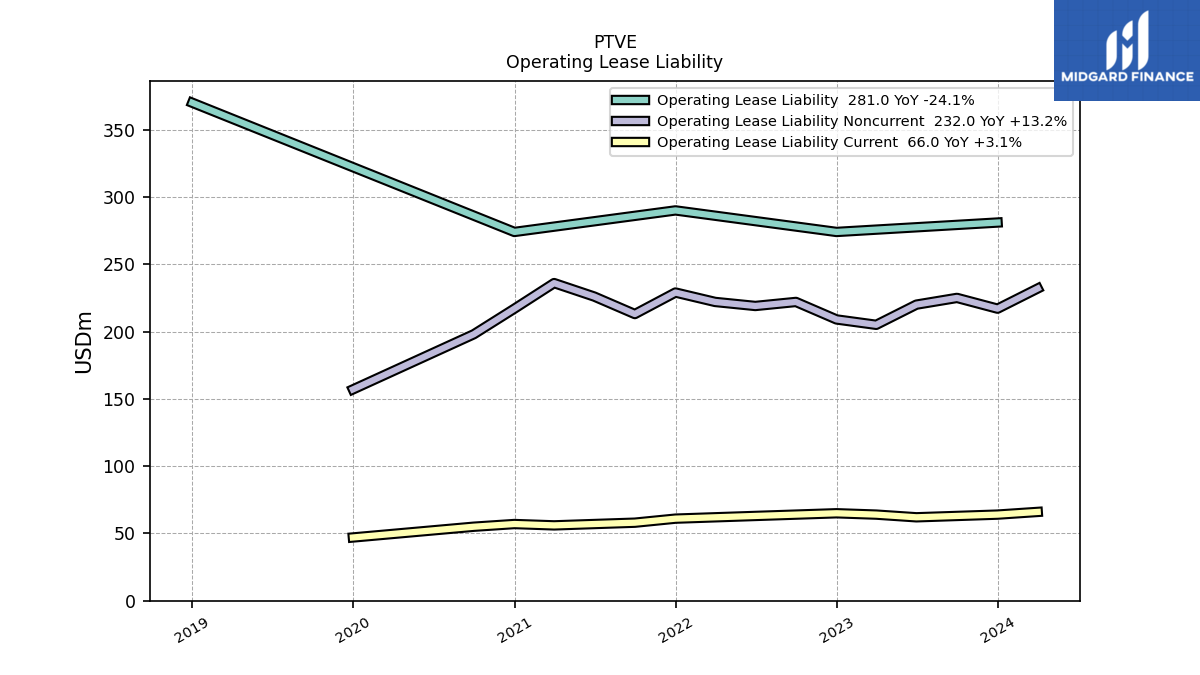
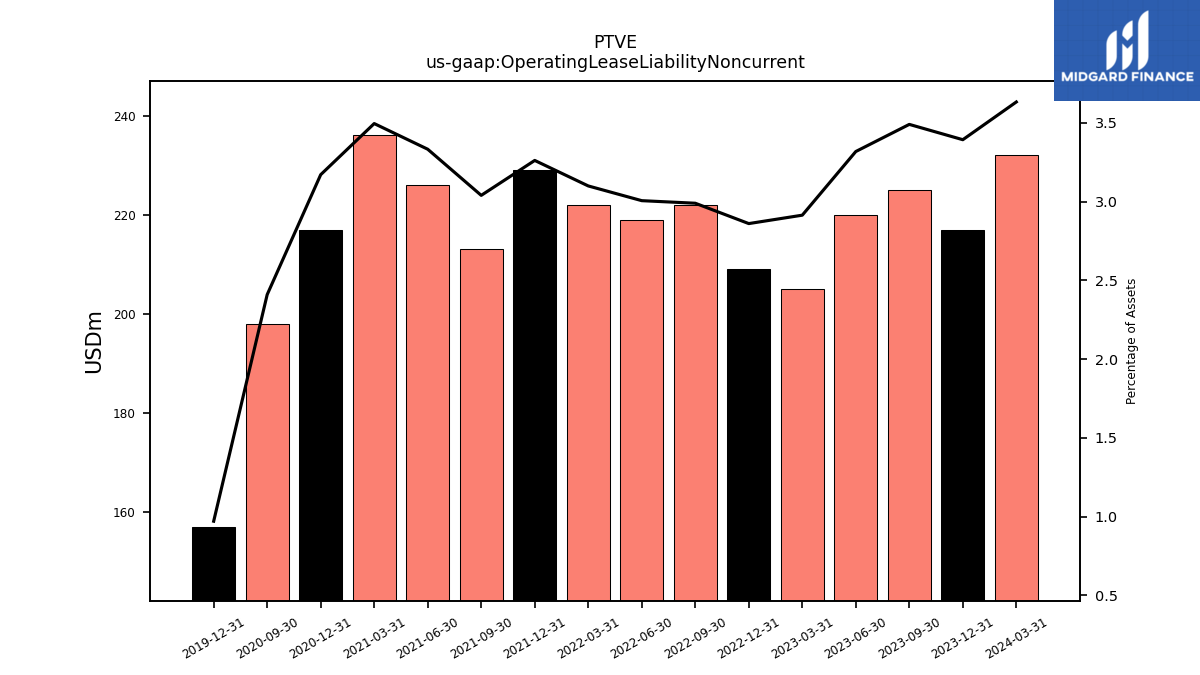
| Operating Lease Liability Noncurrent | 232.00 | 217.00 | 225.00 | 220.00 | 205.00 | 209.00 | 222.00 | 219.00 | 222.00 | 229.00 | 213.00 | 226.00 | 236.00 | 217.00 | 198.00 | NA | NA | 157.00 | NA |
| 2024-03-31 | 2023-12-31 | 2023-09-30 | 2023-06-30 | 2023-03-31 | 2022-12-31 | 2022-09-30 | 2022-06-30 | 2022-03-31 | 2021-12-31 | 2021-09-30 | 2021-06-30 | 2021-03-31 | 2020-12-31 | 2020-09-30 | 2020-06-30 | 2020-03-31 | 2019-12-31 | 2019-09-30 | ||
|---|---|---|---|---|---|---|---|---|---|---|---|---|---|---|---|---|---|---|---|---|
| Stockholders Equity | 1344.00 | 1345.00 | 1300.00 | 1282.00 | 1406.00 | 1548.00 | 1462.00 | 1264.00 | 1213.00 | 1284.00 | 1210.00 | 1021.00 | 1022.00 | 1071.00 | 748.00 | NA | NA | 2079.00 | NA | |
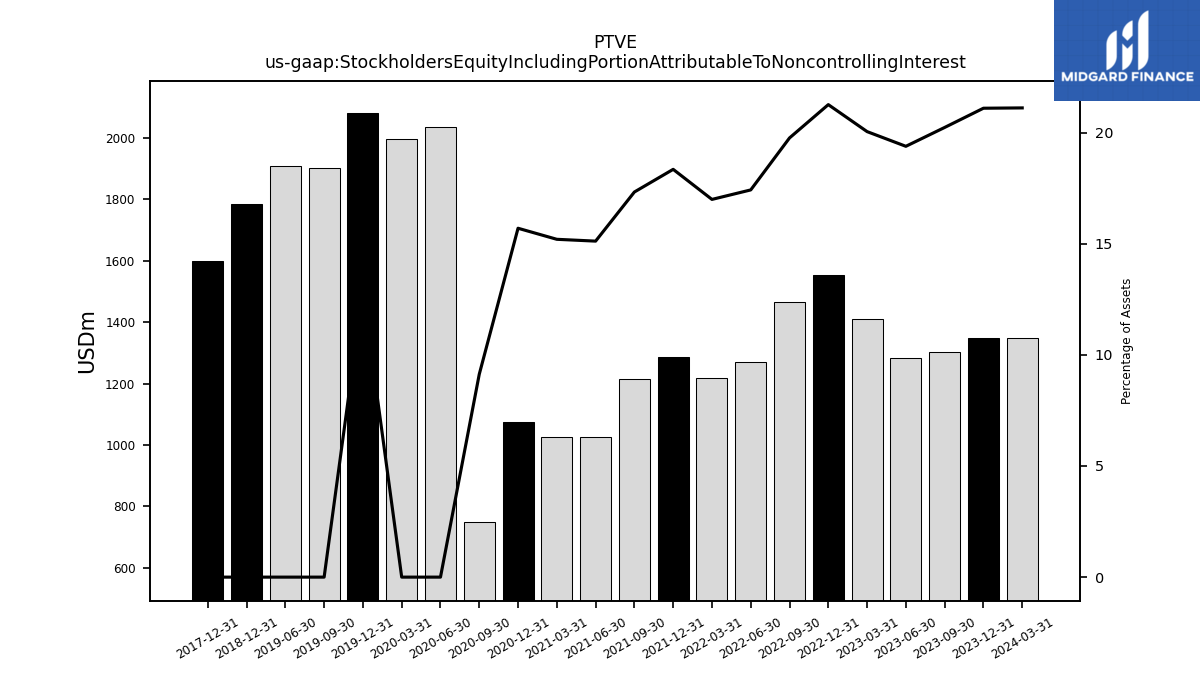
| Stockholders Equity Including Portion Attributable To Noncontrolling Interest | 1348.00 | 1349.00 | 1304.00 | 1285.00 | 1410.00 | 1553.00 | 1467.00 | 1269.00 | 1217.00 | 1288.00 | 1214.00 | 1025.00 | 1026.00 | 1074.00 | 750.00 | 2037.00 | 1998.00 | 2082.00 | 1901.00 | |
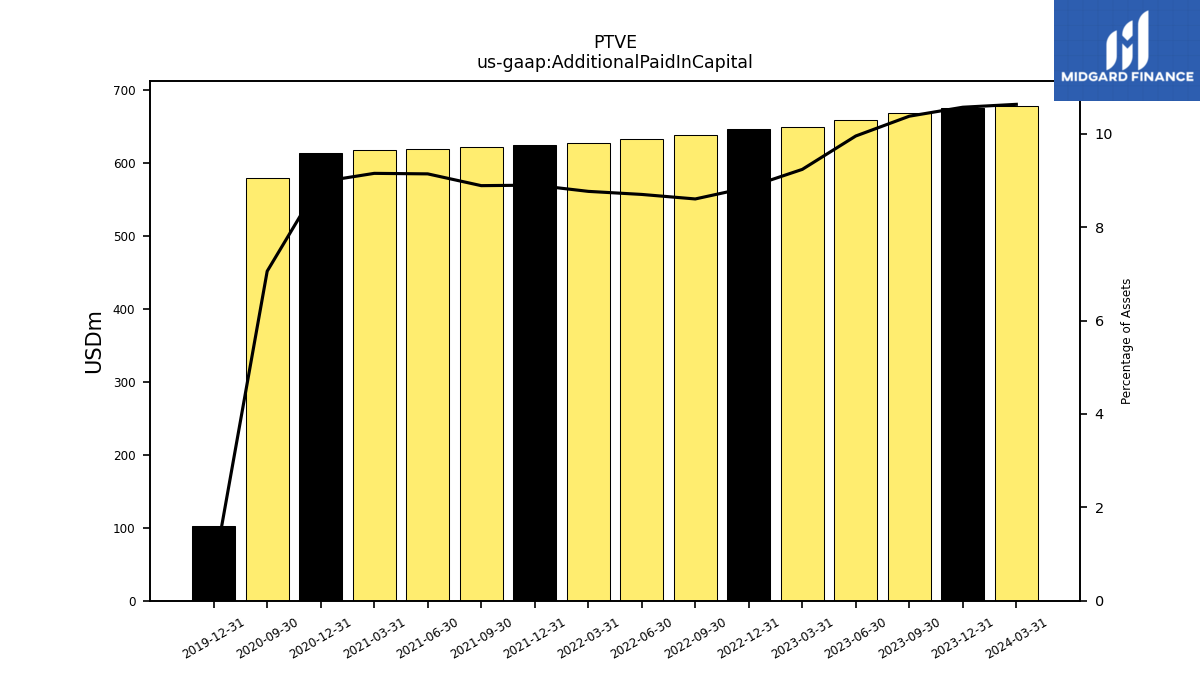
| Additional Paid In Capital | 679.00 | 676.00 | 669.00 | 660.00 | 650.00 | 647.00 | 639.00 | 634.00 | 628.00 | 625.00 | 623.00 | 620.00 | 618.00 | 614.00 | 580.00 | NA | NA | 103.00 | NA | |
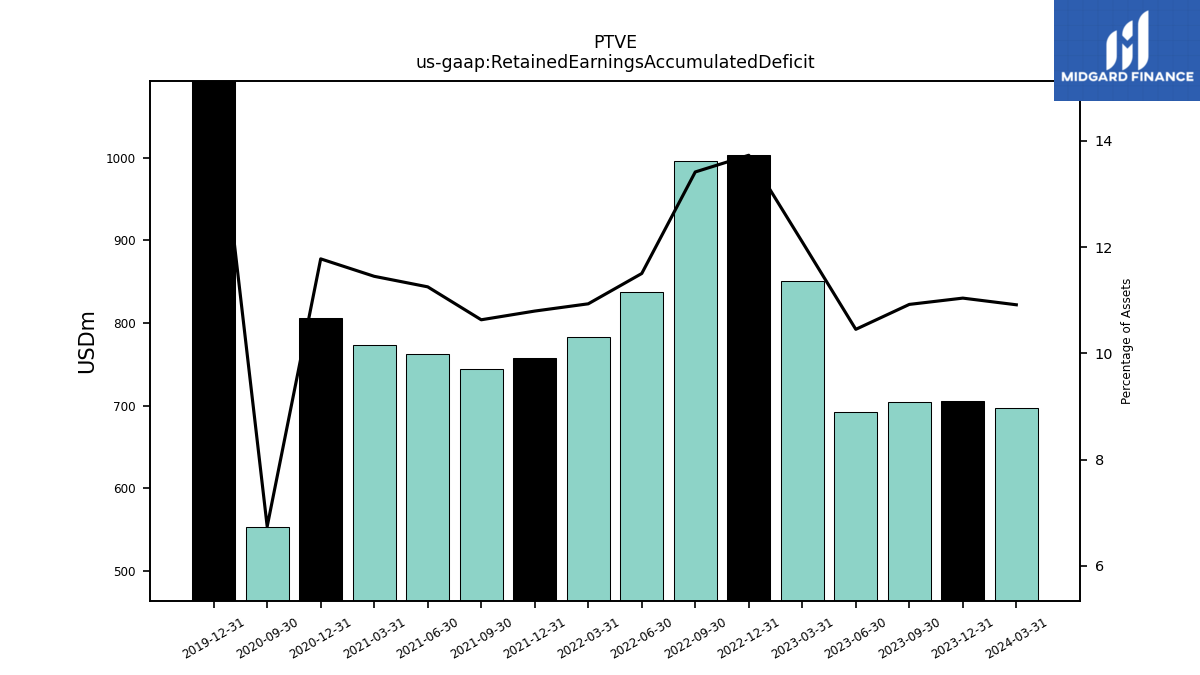
| Retained Earnings Accumulated Deficit | 697.00 | 706.00 | 704.00 | 693.00 | 851.00 | 1003.00 | 996.00 | 838.00 | 783.00 | 758.00 | 745.00 | 763.00 | 773.00 | 806.00 | 554.00 | NA | NA | 2494.00 | NA | |
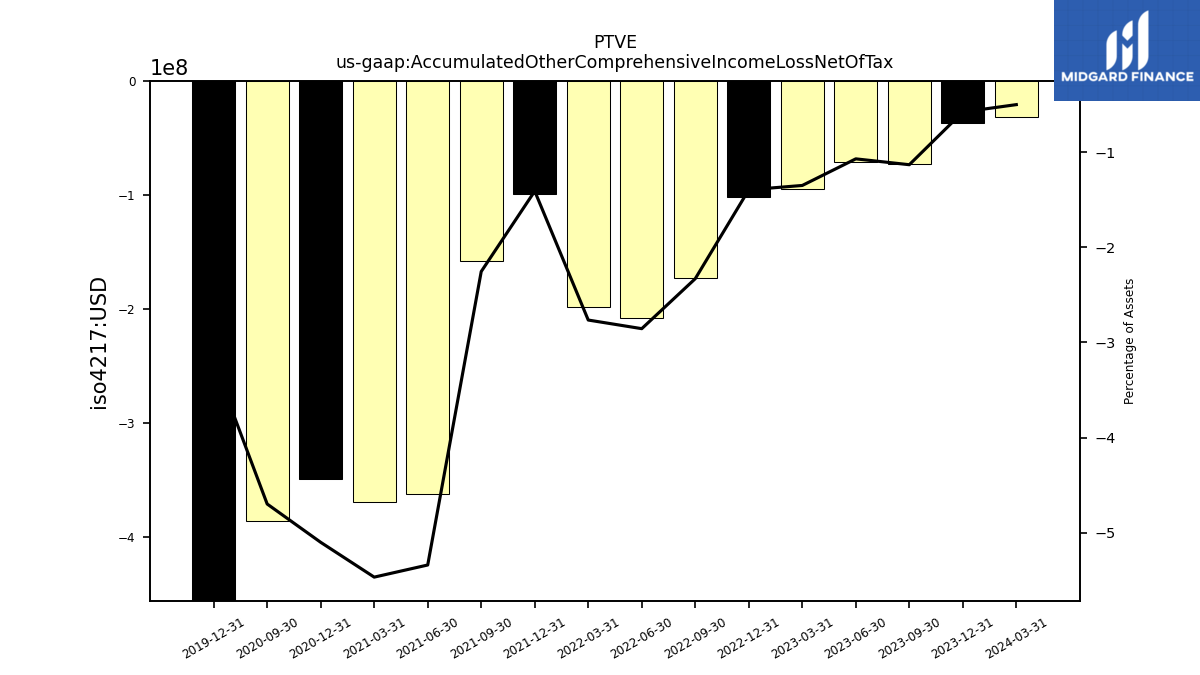
| Accumulated Other Comprehensive Income Loss Net Of Tax | -32.00 | -37.00 | -73.00 | -71.00 | -95.00 | -102.00 | -173.00 | -208.00 | -198.00 | -99.00 | -158.00 | -362.00 | -369.00 | -349.00 | -386.00 | NA | NA | -518.00 | NA | |
| Minority Interest | 4.00 | 4.00 | 4.00 | 3.00 | 4.00 | 5.00 | 5.00 | 5.00 | 4.00 | 4.00 | 4.00 | 4.00 | 4.00 | 3.00 | 2.00 | NA | NA | 3.00 | NA | |
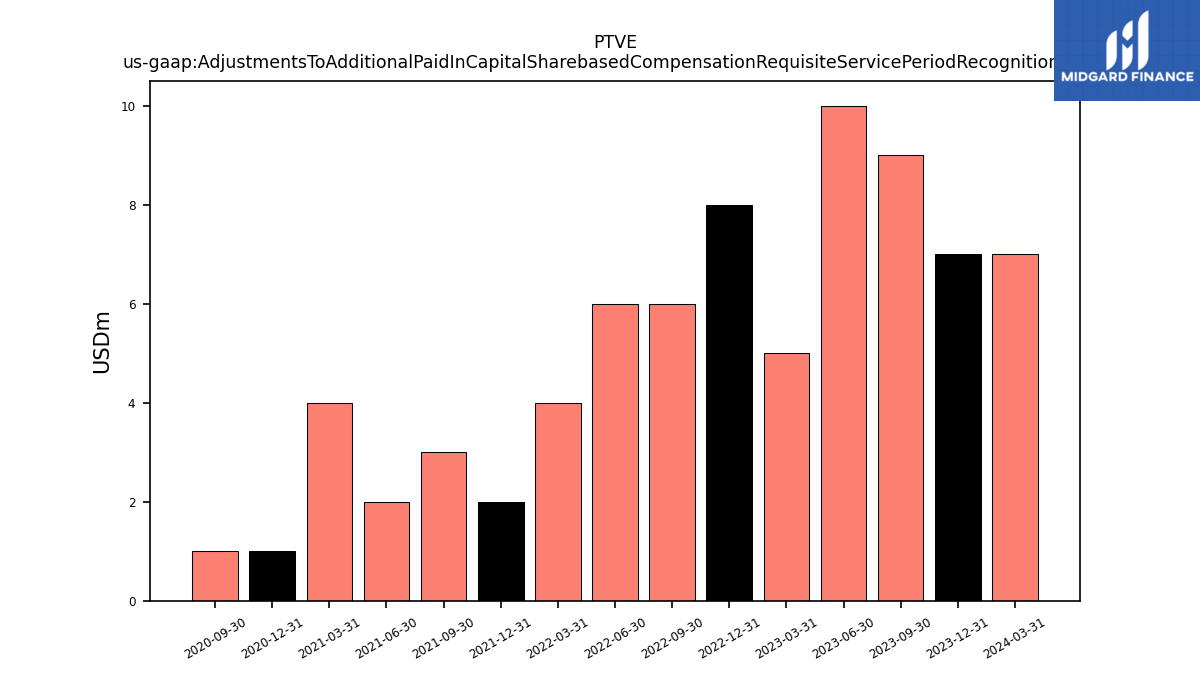
| Adjustments To Additional Paid In Capital Sharebased Compensation Requisite Service Period Recognition Value | 7.00 | 7.00 | 9.00 | 10.00 | 5.00 | 8.00 | 6.00 | 6.00 | 4.00 | 2.00 | 3.00 | 2.00 | 4.00 | 1.00 | 1.00 | NA | NA | NA | NA | |
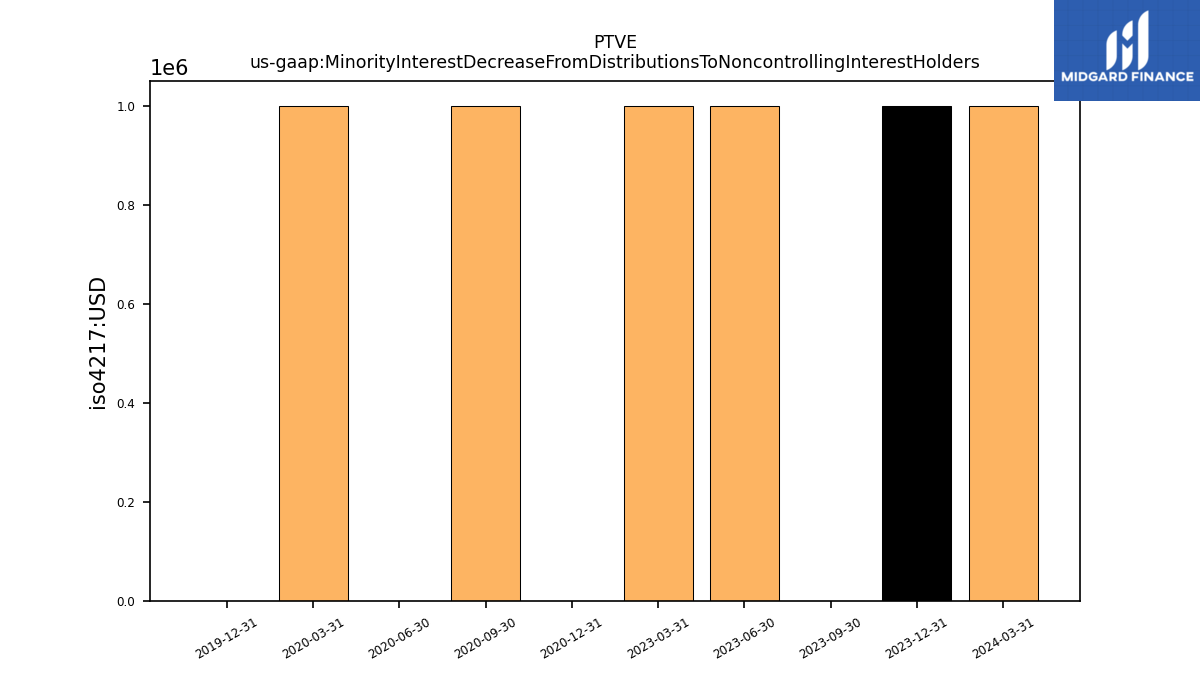
| Minority Interest Decrease From Distributions To Noncontrolling Interest Holders | 1.00 | 1.00 | 0.00 | 1.00 | 1.00 | NA | NA | NA | NA | NA | NA | NA | NA | 0.00 | 1.00 | 0.00 | 1.00 | 0.00 | NA |
| 2024-03-31 | 2023-12-31 | 2023-09-30 | 2023-06-30 | 2023-03-31 | 2022-12-31 | 2022-09-30 | 2022-06-30 | 2022-03-31 | 2021-12-31 | 2021-09-30 | 2021-06-30 | 2021-03-31 | 2020-12-31 | 2020-09-30 | 2020-06-30 | 2020-03-31 | 2019-12-31 | 2019-09-30 | ||
|---|---|---|---|---|---|---|---|---|---|---|---|---|---|---|---|---|---|---|---|---|
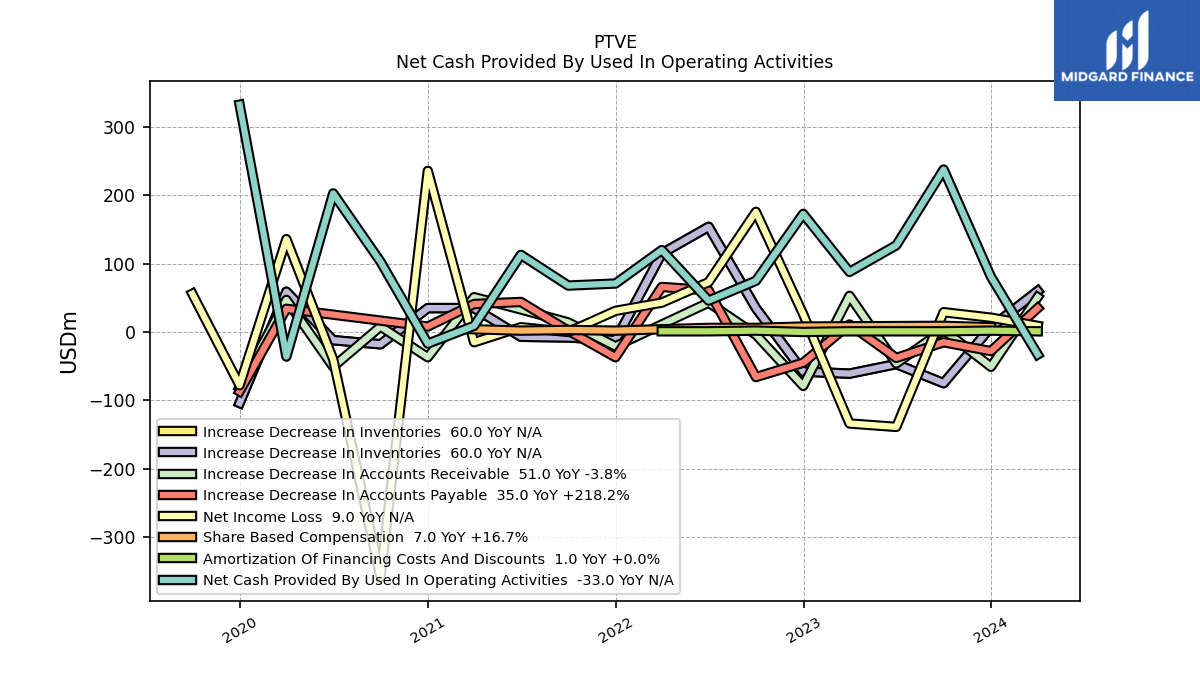
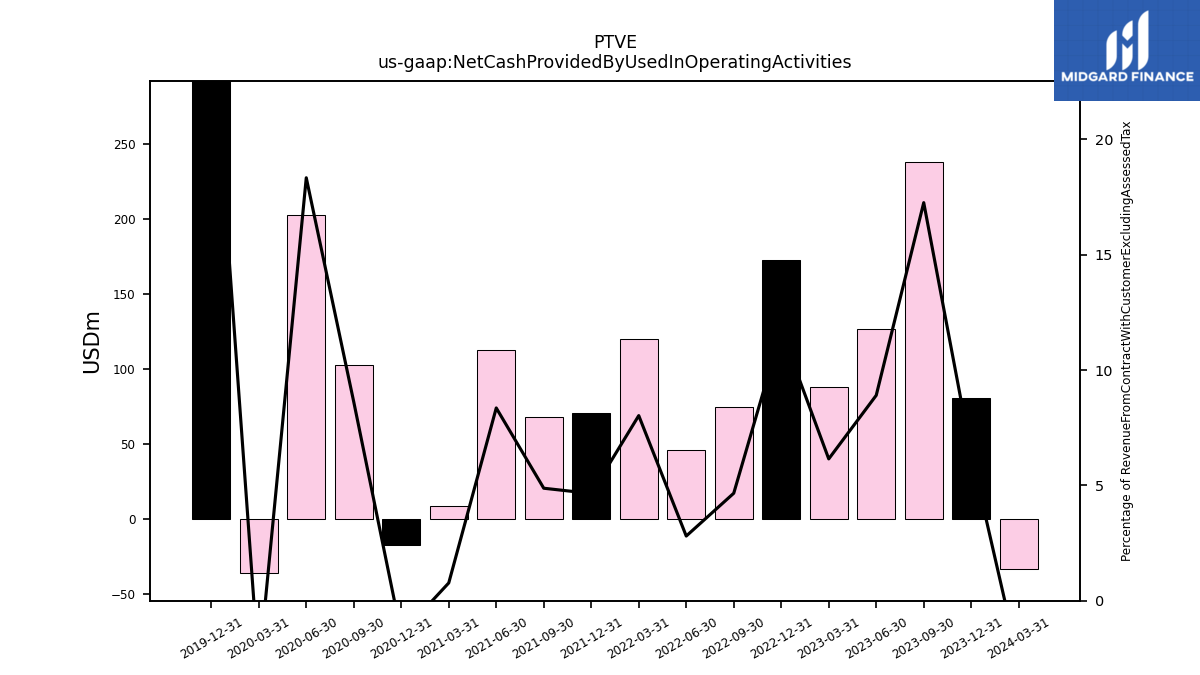
| Net Cash Provided By Used In Operating Activities | -33.00 | 81.00 | 238.00 | 127.00 | 88.00 | 173.00 | 75.00 | 46.00 | 120.00 | 71.00 | 68.00 | 113.00 | 9.00 | -17.00 | 103.00 | 203.00 | -36.00 | 333.00 | NA | |
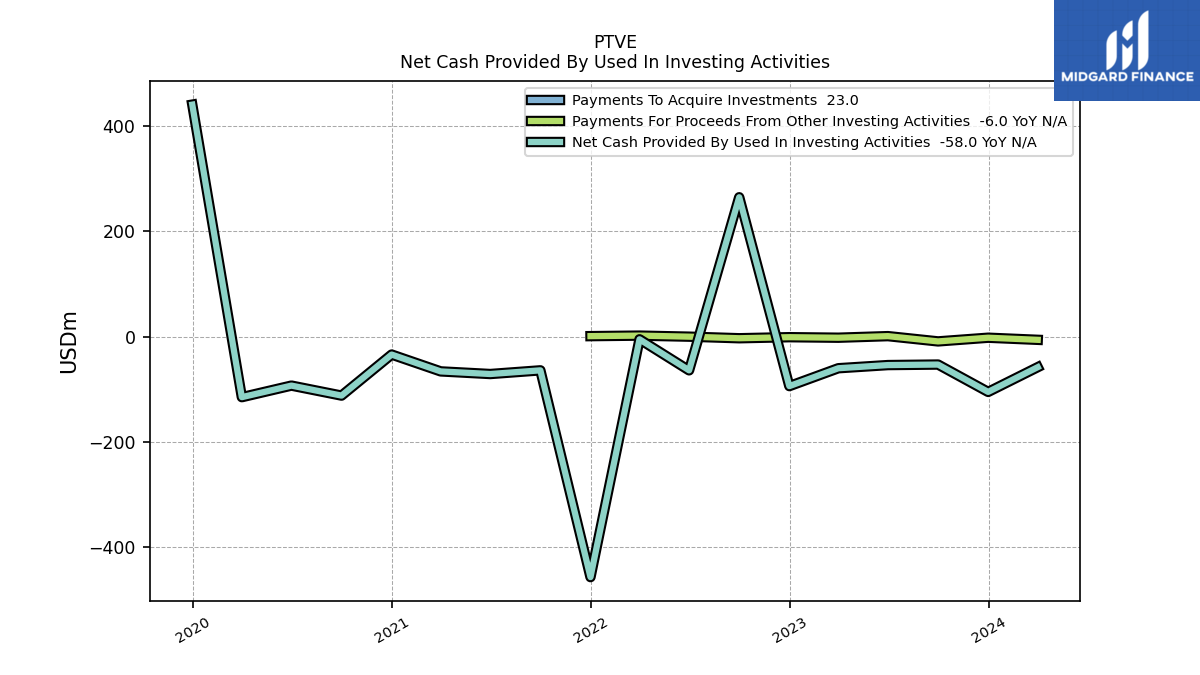
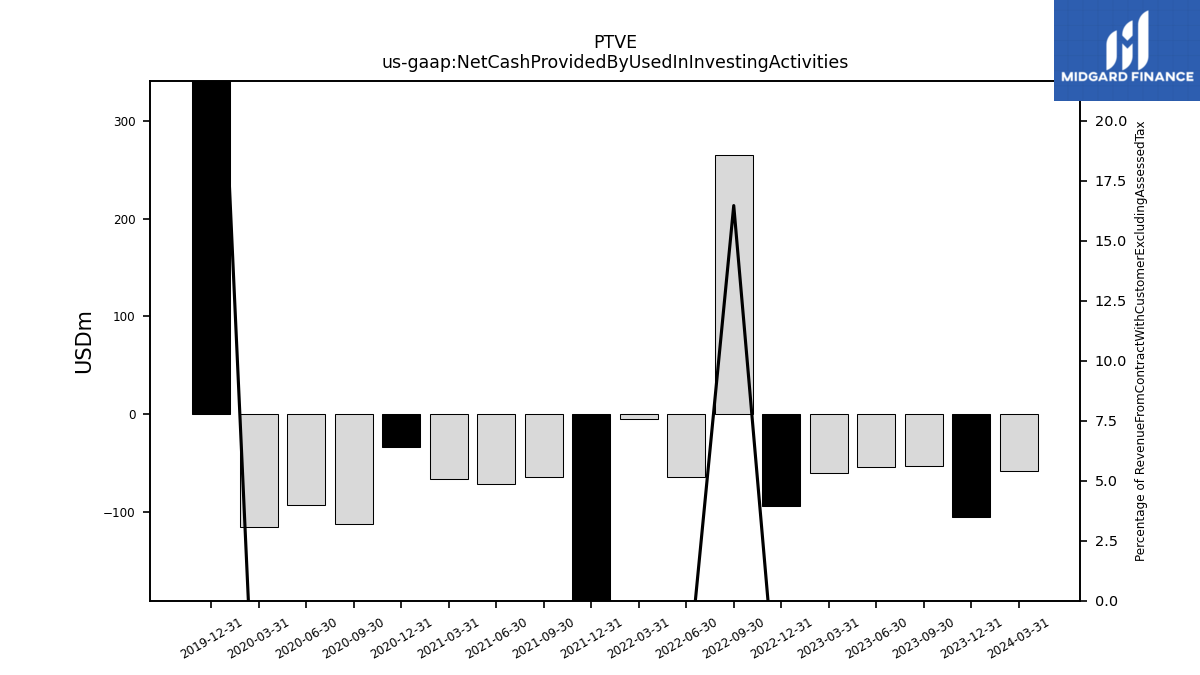
| Net Cash Provided By Used In Investing Activities | -58.00 | -105.00 | -53.00 | -54.00 | -60.00 | -94.00 | 265.00 | -64.00 | -5.00 | -457.00 | -64.00 | -71.00 | -66.00 | -34.00 | -112.00 | -93.00 | -115.00 | 441.00 | NA | |
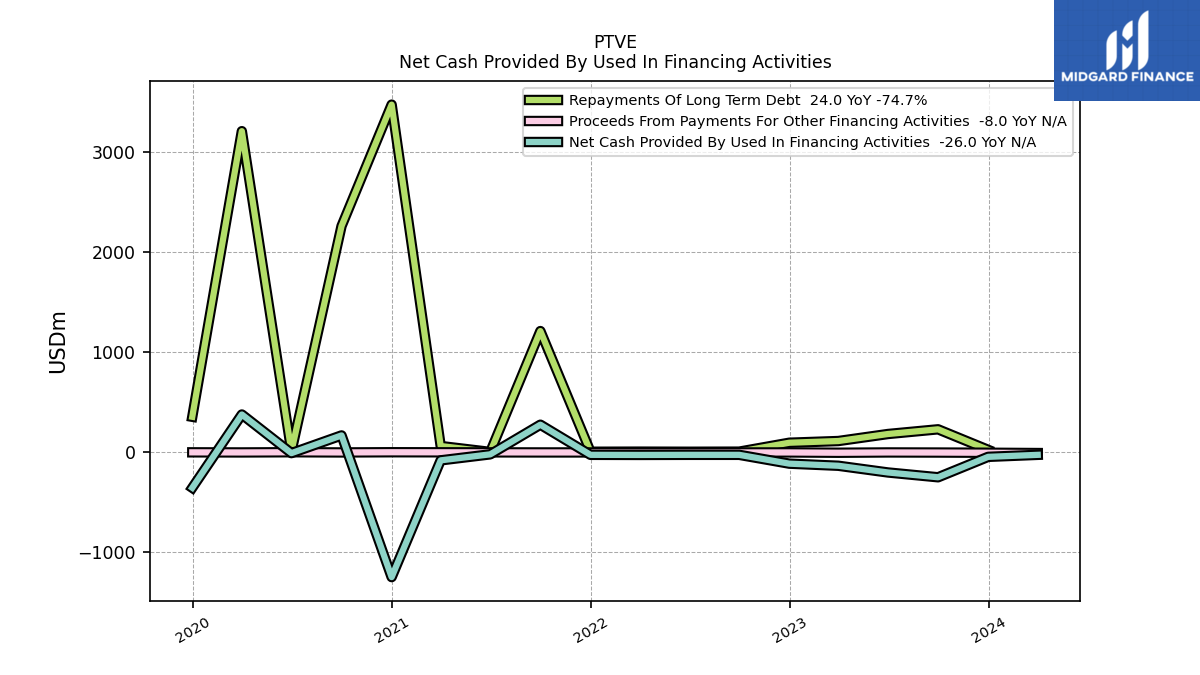
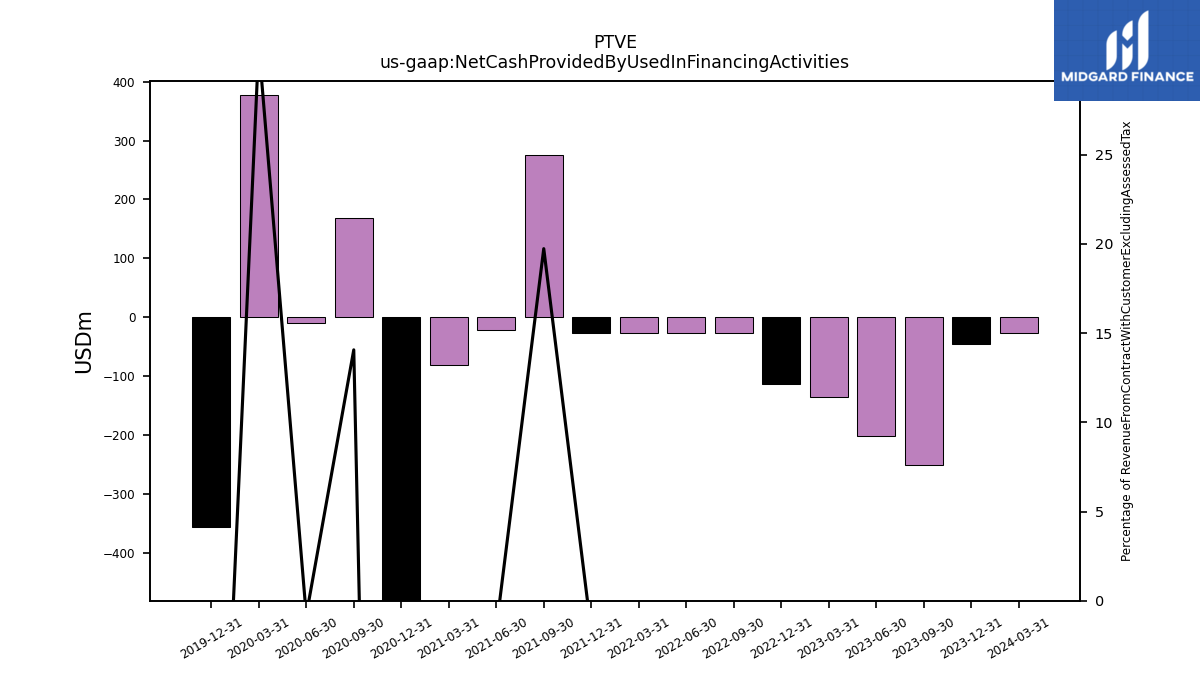
| Net Cash Provided By Used In Financing Activities | -26.00 | -46.00 | -250.00 | -202.00 | -135.00 | -114.00 | -26.00 | -26.00 | -27.00 | -26.00 | 275.00 | -21.00 | -81.00 | -1247.00 | 168.00 | -9.00 | 377.00 | -355.00 | NA |
| 2024-03-31 | 2023-12-31 | 2023-09-30 | 2023-06-30 | 2023-03-31 | 2022-12-31 | 2022-09-30 | 2022-06-30 | 2022-03-31 | 2021-12-31 | 2021-09-30 | 2021-06-30 | 2021-03-31 | 2020-12-31 | 2020-09-30 | 2020-06-30 | 2020-03-31 | 2019-12-31 | 2019-09-30 | ||
|---|---|---|---|---|---|---|---|---|---|---|---|---|---|---|---|---|---|---|---|---|
| Net Cash Provided By Used In Operating Activities | -33.00 | 81.00 | 238.00 | 127.00 | 88.00 | 173.00 | 75.00 | 46.00 | 120.00 | 71.00 | 68.00 | 113.00 | 9.00 | -17.00 | 103.00 | 203.00 | -36.00 | 333.00 | NA | |
| Net Income Loss | 9.00 | 21.00 | 29.00 | -139.00 | -134.00 | 26.00 | 176.00 | 73.00 | 43.00 | 31.00 | 0.00 | 7.00 | -15.00 | 236.00 | -359.00 | -40.00 | 136.00 | -78.00 | 56.00 | |
| Profit Loss | 10.00 | 22.00 | 30.00 | -139.00 | -133.00 | 27.00 | 176.00 | 74.00 | 43.00 | 32.00 | 0.00 | 7.00 | -14.00 | 237.00 | -359.00 | -39.00 | 136.00 | -80.00 | 56.00 | |
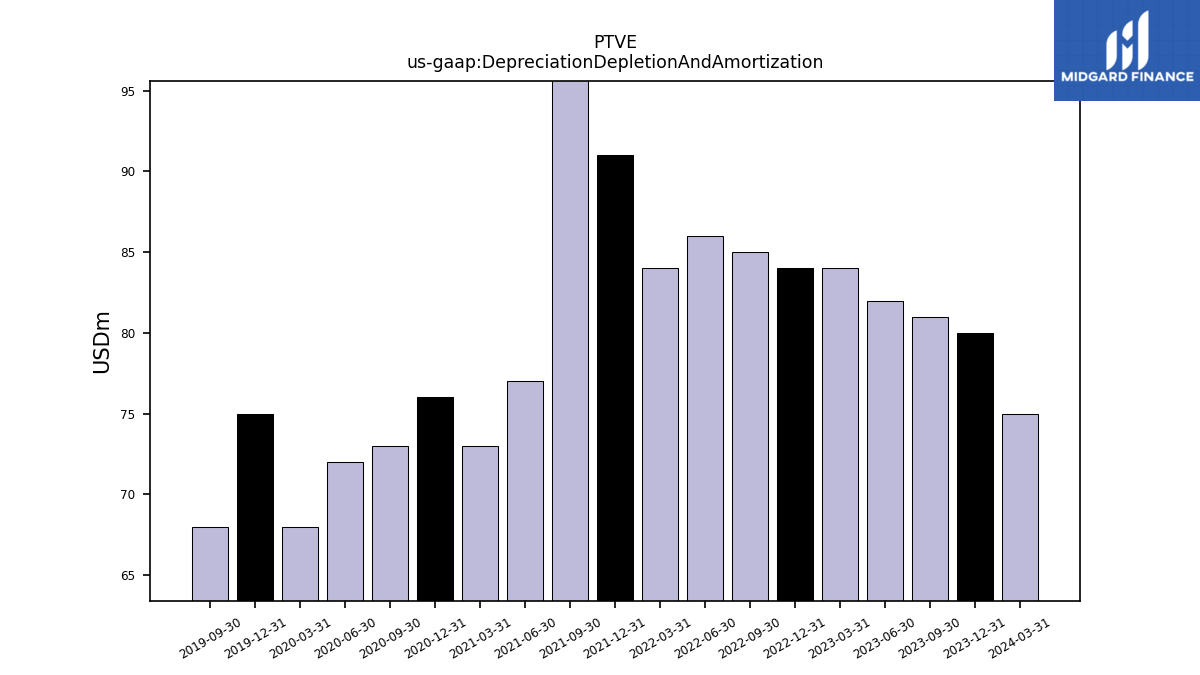
| Depreciation Depletion And Amortization | 75.00 | 80.00 | 81.00 | 82.00 | 84.00 | 84.00 | 85.00 | 86.00 | 84.00 | 91.00 | 103.00 | 77.00 | 73.00 | 76.00 | 73.00 | 72.00 | 68.00 | 75.00 | 68.00 | |
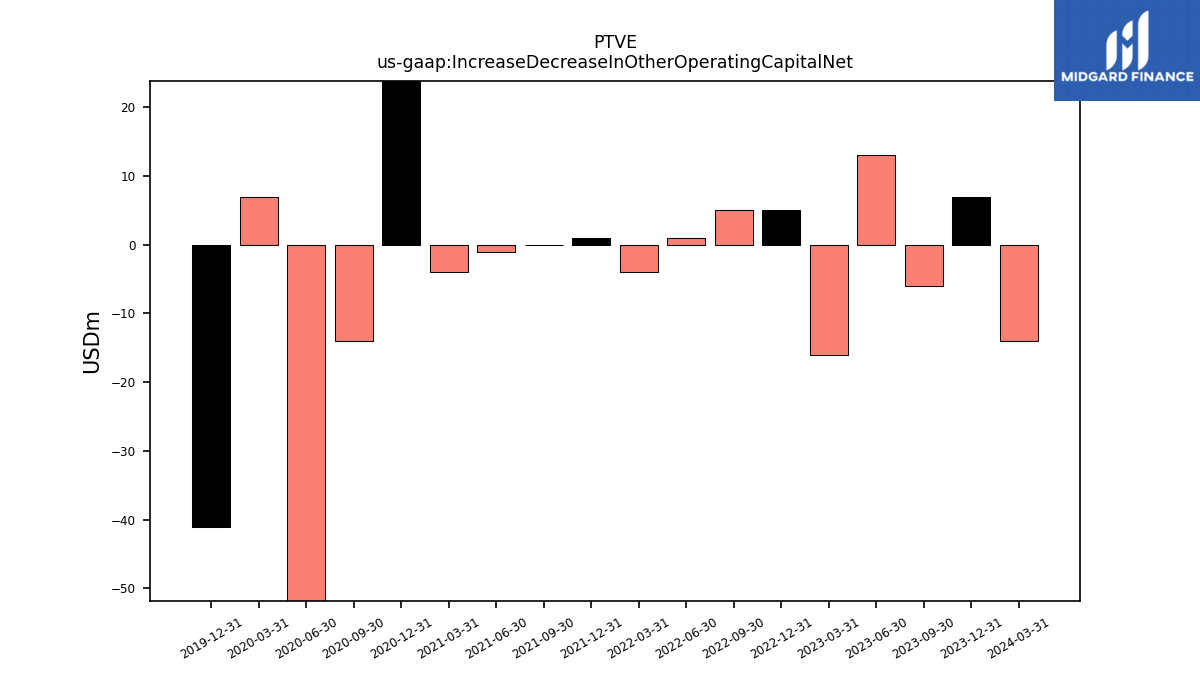
| Increase Decrease In Other Operating Capital Net | -14.00 | 7.00 | -6.00 | 13.00 | -16.00 | 5.00 | 5.00 | 1.00 | -4.00 | 1.00 | 0.00 | -1.00 | -4.00 | 64.00 | -14.00 | -63.00 | 7.00 | -41.00 | NA | |
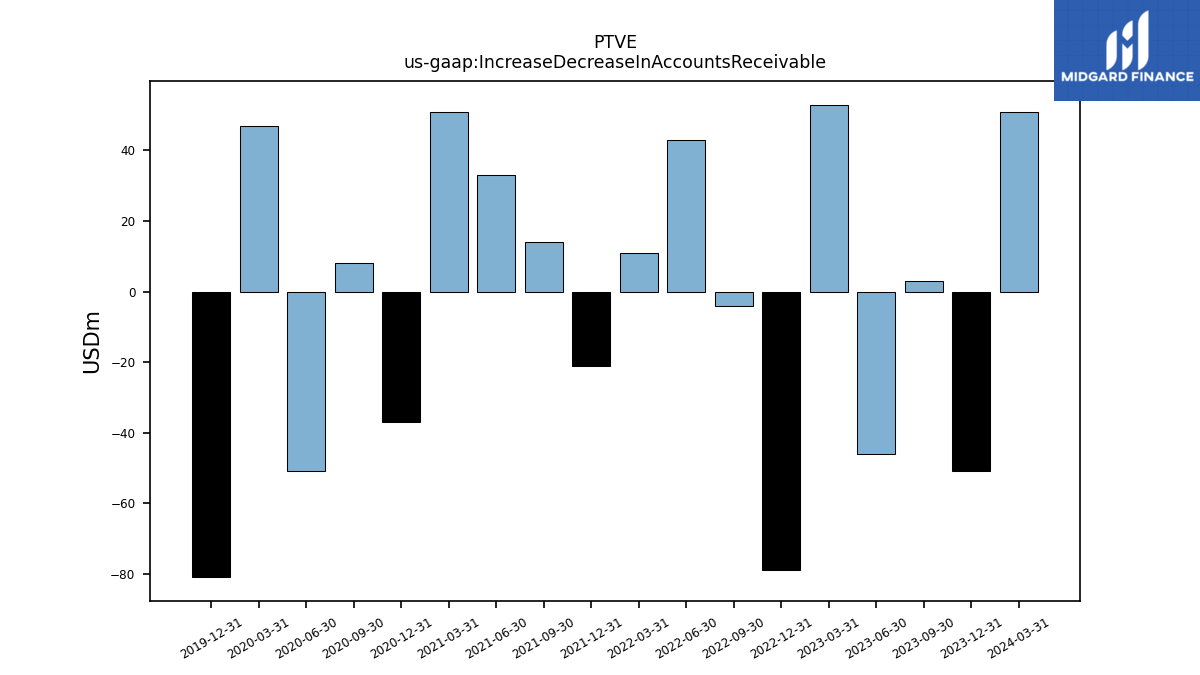
| Increase Decrease In Accounts Receivable | 51.00 | -51.00 | 3.00 | -46.00 | 53.00 | -79.00 | -4.00 | 43.00 | 11.00 | -21.00 | 14.00 | 33.00 | 51.00 | -37.00 | 8.00 | -51.00 | 47.00 | -81.00 | NA | |
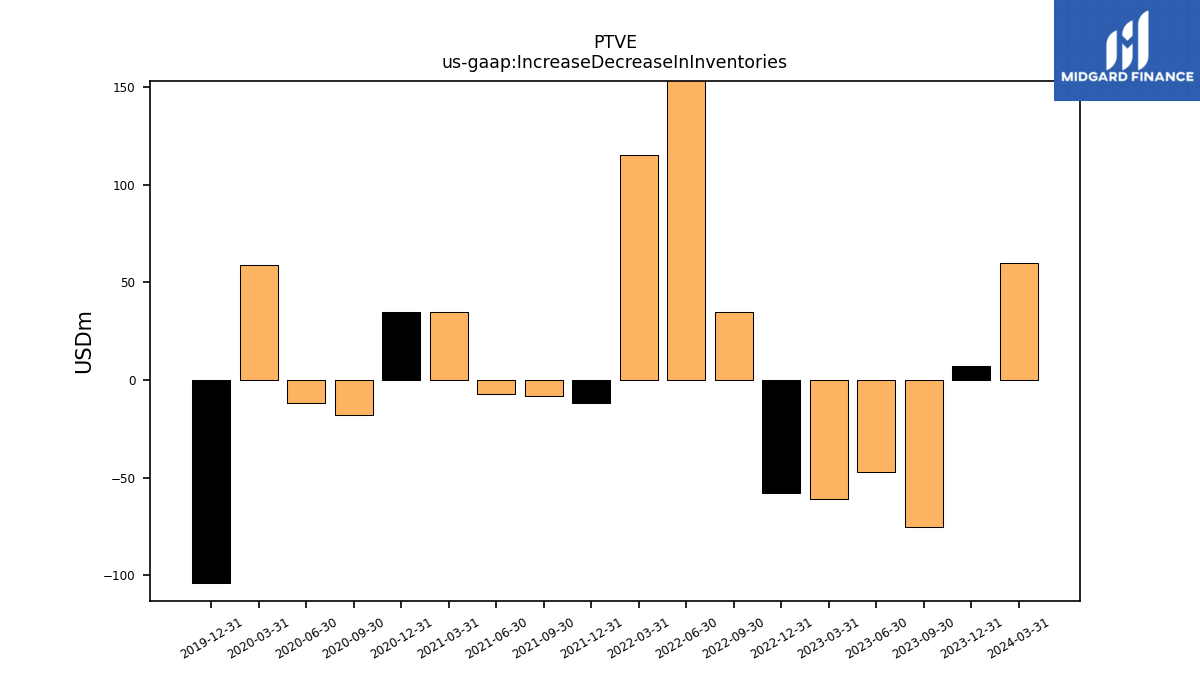
| Increase Decrease In Inventories | 60.00 | 7.00 | -75.00 | -47.00 | -61.00 | -58.00 | 35.00 | 154.00 | 115.00 | -12.00 | -8.00 | -7.00 | 35.00 | 35.00 | -18.00 | -12.00 | 59.00 | -104.00 | NA | |
| Increase Decrease In Accounts Payable | 35.00 | -28.00 | -15.00 | -38.00 | 11.00 | -45.00 | -66.00 | 61.00 | 66.00 | -37.00 | 2.00 | 44.00 | 41.00 | 8.00 | NA | NA | 34.00 | -87.00 | NA | |
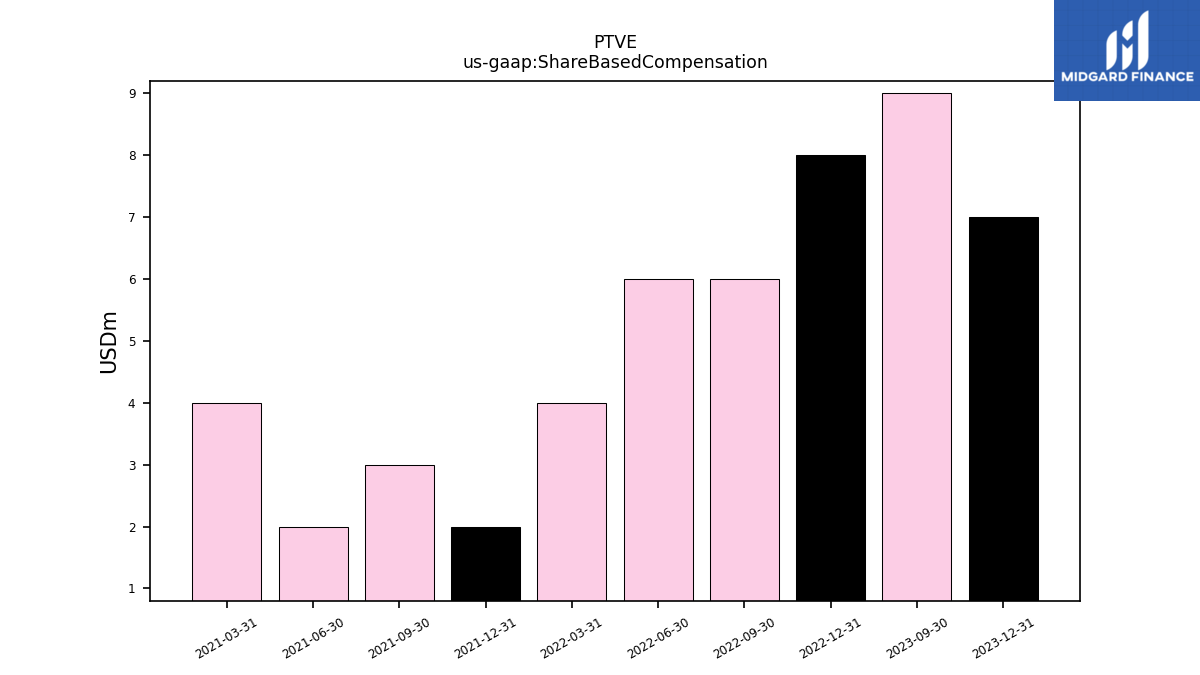
| Share Based Compensation | NA | 7.00 | 9.00 | NA | NA | 8.00 | 6.00 | 6.00 | 4.00 | 2.00 | 3.00 | 2.00 | 4.00 | NA | NA | NA | NA | NA | NA |
| 2024-03-31 | 2023-12-31 | 2023-09-30 | 2023-06-30 | 2023-03-31 | 2022-12-31 | 2022-09-30 | 2022-06-30 | 2022-03-31 | 2021-12-31 | 2021-09-30 | 2021-06-30 | 2021-03-31 | 2020-12-31 | 2020-09-30 | 2020-06-30 | 2020-03-31 | 2019-12-31 | 2019-09-30 | ||
|---|---|---|---|---|---|---|---|---|---|---|---|---|---|---|---|---|---|---|---|---|
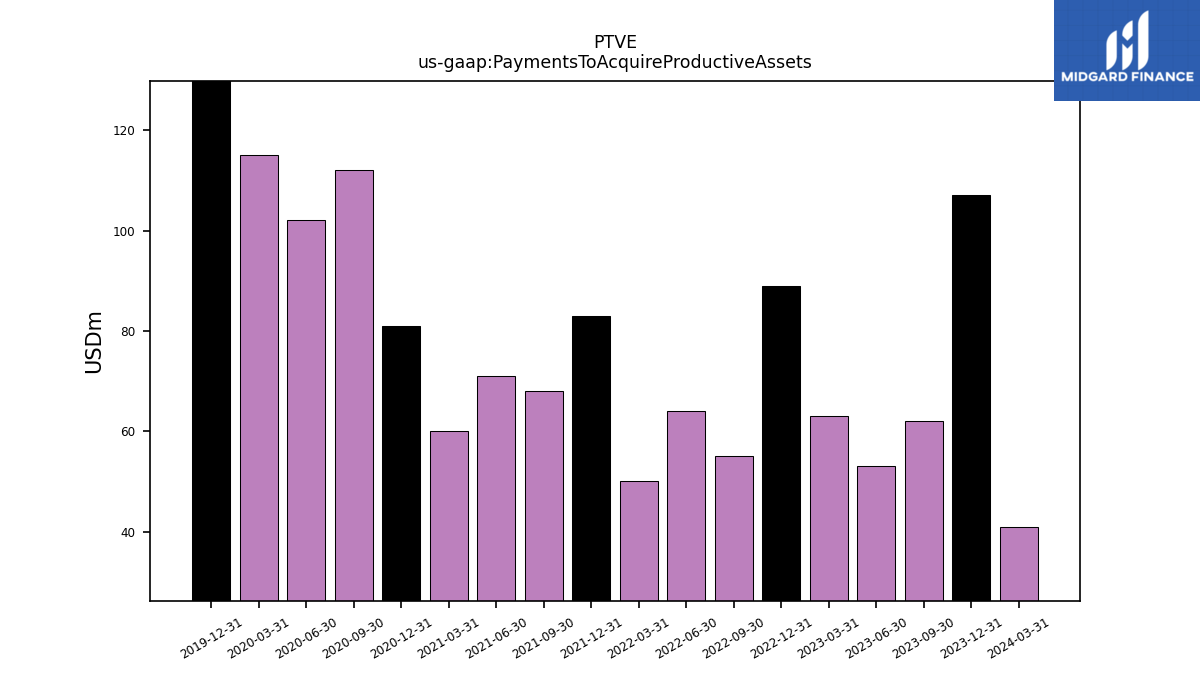
| Net Cash Provided By Used In Investing Activities | -58.00 | -105.00 | -53.00 | -54.00 | -60.00 | -94.00 | 265.00 | -64.00 | -5.00 | -457.00 | -64.00 | -71.00 | -66.00 | -34.00 | -112.00 | -93.00 | -115.00 | 441.00 | NA | |
| Payments To Acquire Productive Assets | 41.00 | 107.00 | 62.00 | 53.00 | 63.00 | 89.00 | 55.00 | 64.00 | 50.00 | 83.00 | 68.00 | 71.00 | 60.00 | 81.00 | 112.00 | 102.00 | 115.00 | 162.00 | NA | |
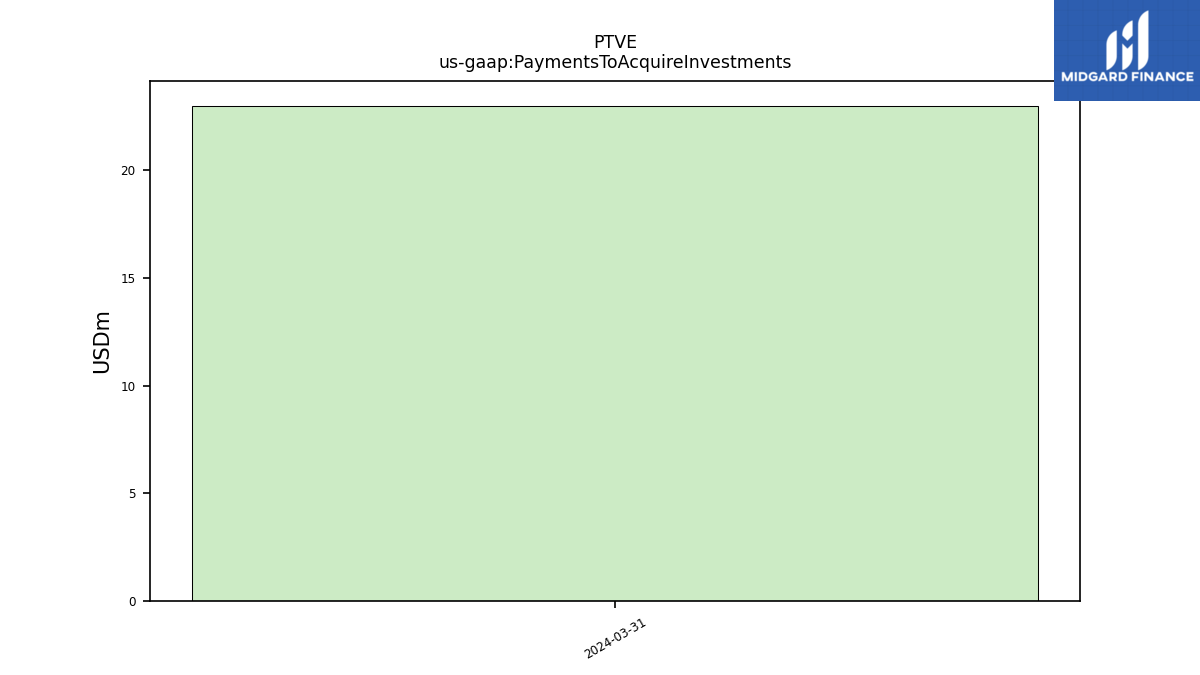
| Payments To Acquire Investments | 23.00 | NA | NA | NA | NA | NA | NA | NA | NA | NA | NA | NA | NA | NA | NA | NA | NA | NA | NA |
| 2024-03-31 | 2023-12-31 | 2023-09-30 | 2023-06-30 | 2023-03-31 | 2022-12-31 | 2022-09-30 | 2022-06-30 | 2022-03-31 | 2021-12-31 | 2021-09-30 | 2021-06-30 | 2021-03-31 | 2020-12-31 | 2020-09-30 | 2020-06-30 | 2020-03-31 | 2019-12-31 | 2019-09-30 | ||
|---|---|---|---|---|---|---|---|---|---|---|---|---|---|---|---|---|---|---|---|---|
| Net Cash Provided By Used In Financing Activities | -26.00 | -46.00 | -250.00 | -202.00 | -135.00 | -114.00 | -26.00 | -26.00 | -27.00 | -26.00 | 275.00 | -21.00 | -81.00 | -1247.00 | 168.00 | -9.00 | 377.00 | -355.00 | NA | |
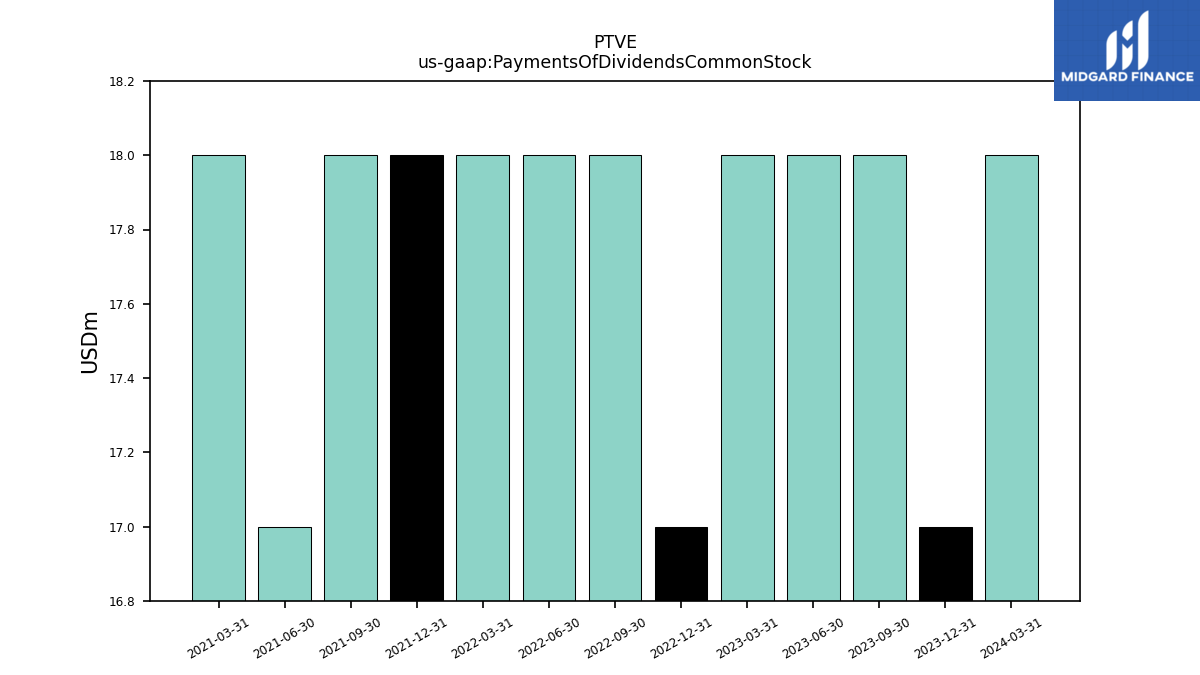
| Payments Of Dividends Common Stock | 18.00 | 17.00 | 18.00 | 18.00 | 18.00 | 17.00 | 18.00 | 18.00 | 18.00 | 18.00 | 18.00 | 17.00 | 18.00 | NA | NA | NA | NA | NA | NA |
| 2024-03-31 | 2023-12-31 | 2023-09-30 | 2023-06-30 | 2023-03-31 | 2022-12-31 | 2022-09-30 | 2022-06-30 | 2022-03-31 | 2021-12-31 | 2021-09-30 | 2021-06-30 | 2021-03-31 | 2020-12-31 | 2020-09-30 | 2020-06-30 | 2020-03-31 | 2019-12-31 | 2019-09-30 | ||
|---|---|---|---|---|---|---|---|---|---|---|---|---|---|---|---|---|---|---|---|---|
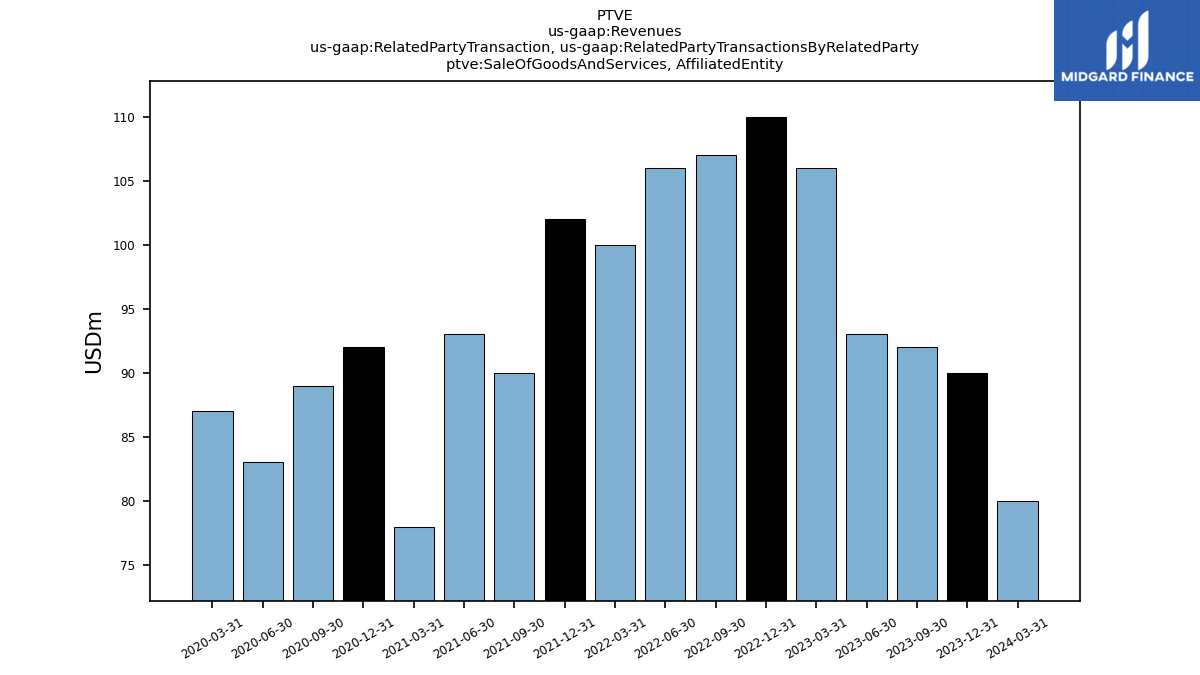
| Sale Of Goods And Services, | 80.00 | 90.00 | 92.00 | 93.00 | 106.00 | 110.00 | 107.00 | 106.00 | 100.00 | 102.00 | 90.00 | 93.00 | 78.00 | 92.00 | 89.00 | 83.00 | 87.00 | NA | NA | |
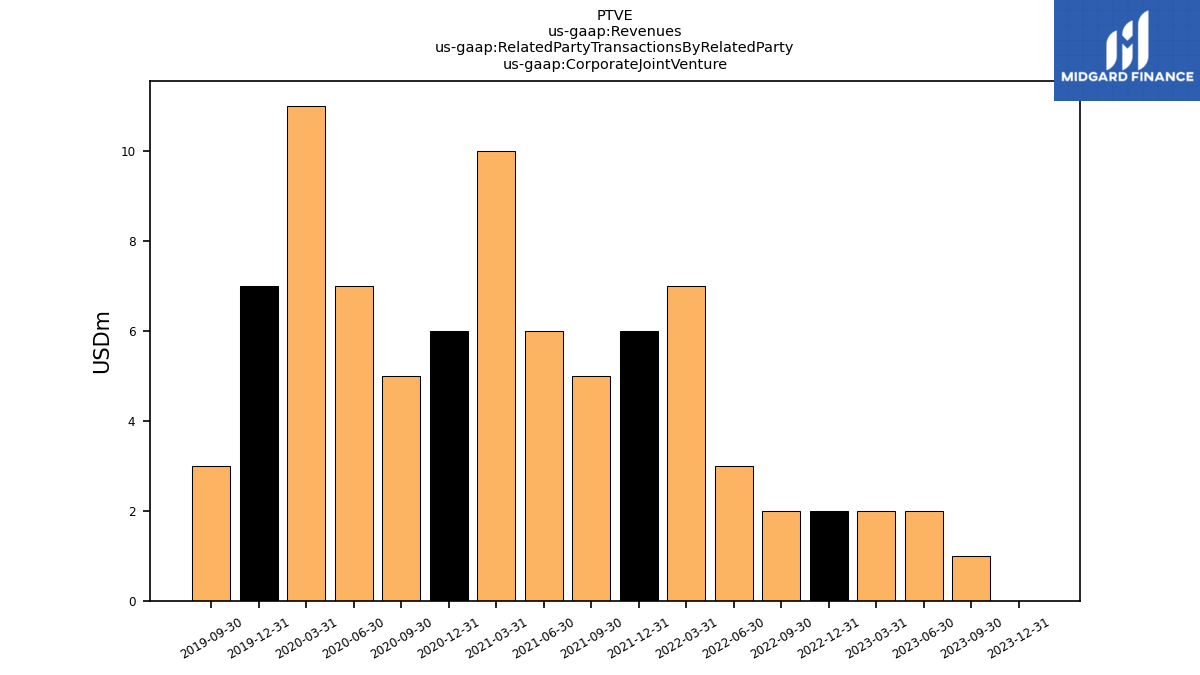
| Corporate Joint Venture | NA | 0.00 | 1.00 | 2.00 | 2.00 | 2.00 | 2.00 | 3.00 | 7.00 | 6.00 | 5.00 | 6.00 | 10.00 | 6.00 | 5.00 | 7.00 | 11.00 | 7.00 | 3.00 | |
| Revenue From Contract With Customer Excluding Assessed Tax | 1252.00 | 1274.00 | 1379.00 | 1426.00 | 1431.00 | 1476.00 | 1609.00 | 1640.00 | 1495.00 | 1527.00 | 1394.00 | 1352.00 | 1164.00 | 1175.00 | 1195.00 | 1107.00 | 1212.00 | 1303.00 | 1306.00 | |
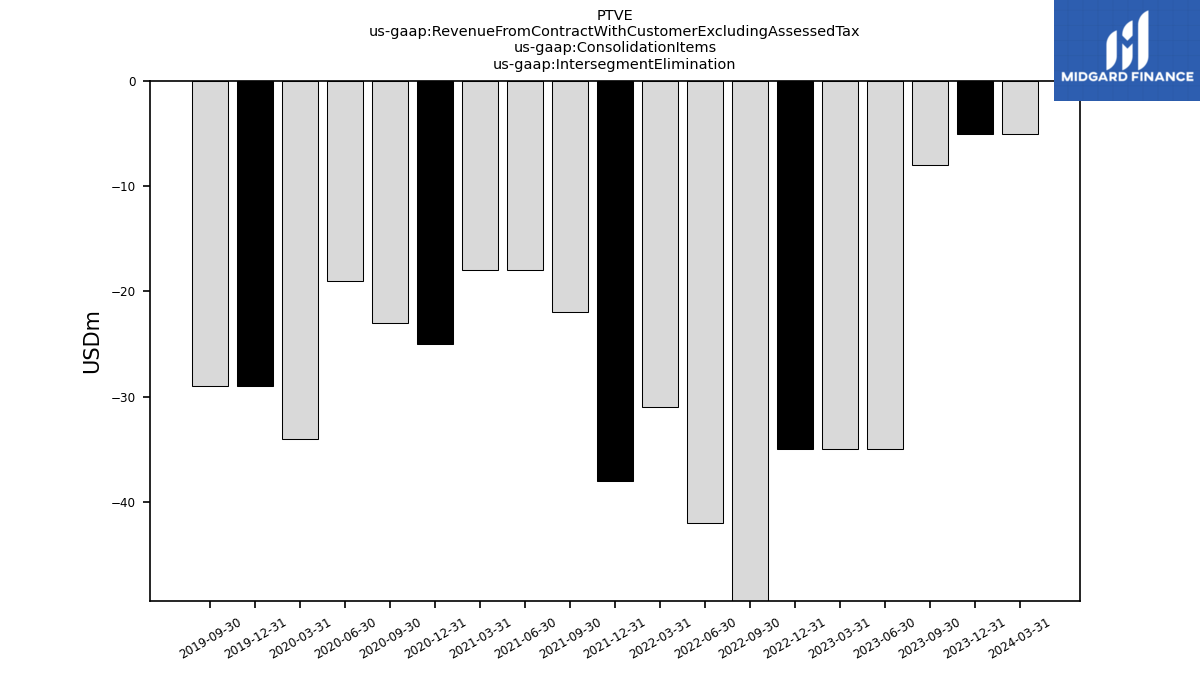
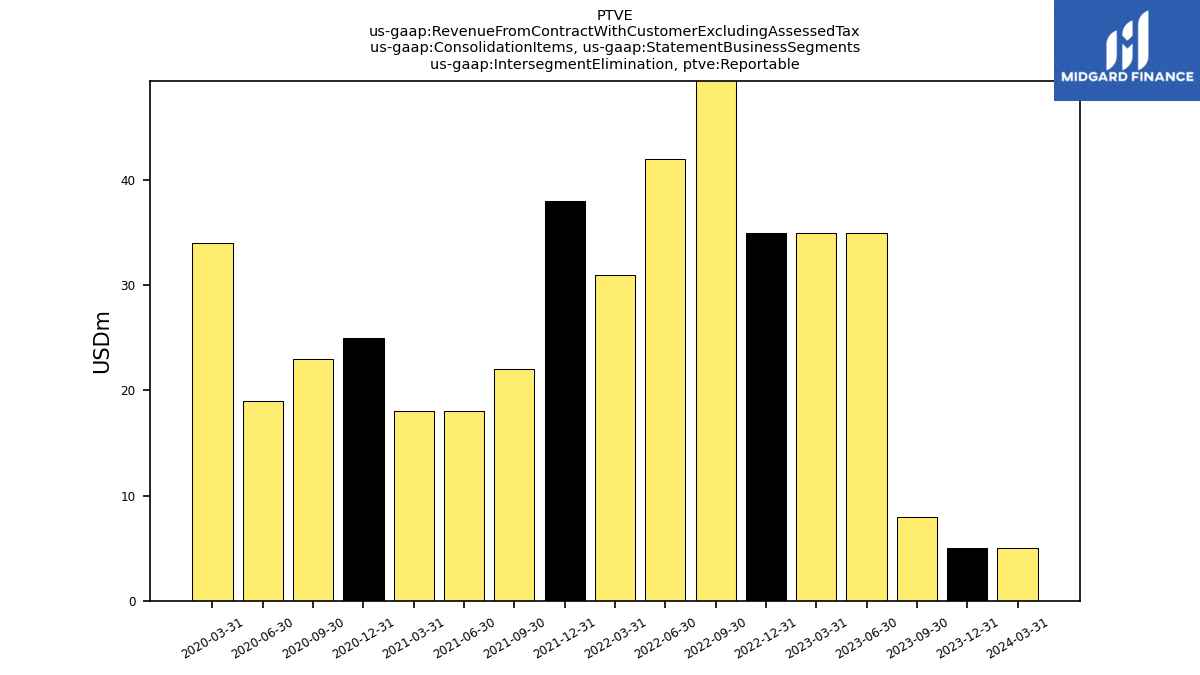
| Intersegment Elimination | -5.00 | -5.00 | -8.00 | -35.00 | -35.00 | -35.00 | -50.00 | -42.00 | -31.00 | -38.00 | -22.00 | -18.00 | -18.00 | -25.00 | -23.00 | -19.00 | -34.00 | -29.00 | -29.00 | |
| Operating, Bakery Snack Produce Fruit Containers, Reportable, Food And Beverage Merchandising | NA | 105.00 | 123.00 | NA | NA | 130.00 | 148.00 | NA | NA | NA | NA | NA | NA | NA | NA | NA | NA | NA | NA | |
| Operating, Cartonsfor Fresh Beverage Products, Reportable, Food And Beverage Merchandising | NA | 160.00 | 177.00 | NA | NA | 178.00 | 197.00 | NA | NA | NA | NA | NA | NA | NA | NA | NA | NA | NA | NA | |
| Operating, Containers Foodservice, Reportable, Foodservice | NA | 229.00 | 233.00 | NA | NA | 236.00 | 256.00 | NA | NA | NA | NA | NA | NA | NA | NA | NA | NA | NA | NA | |
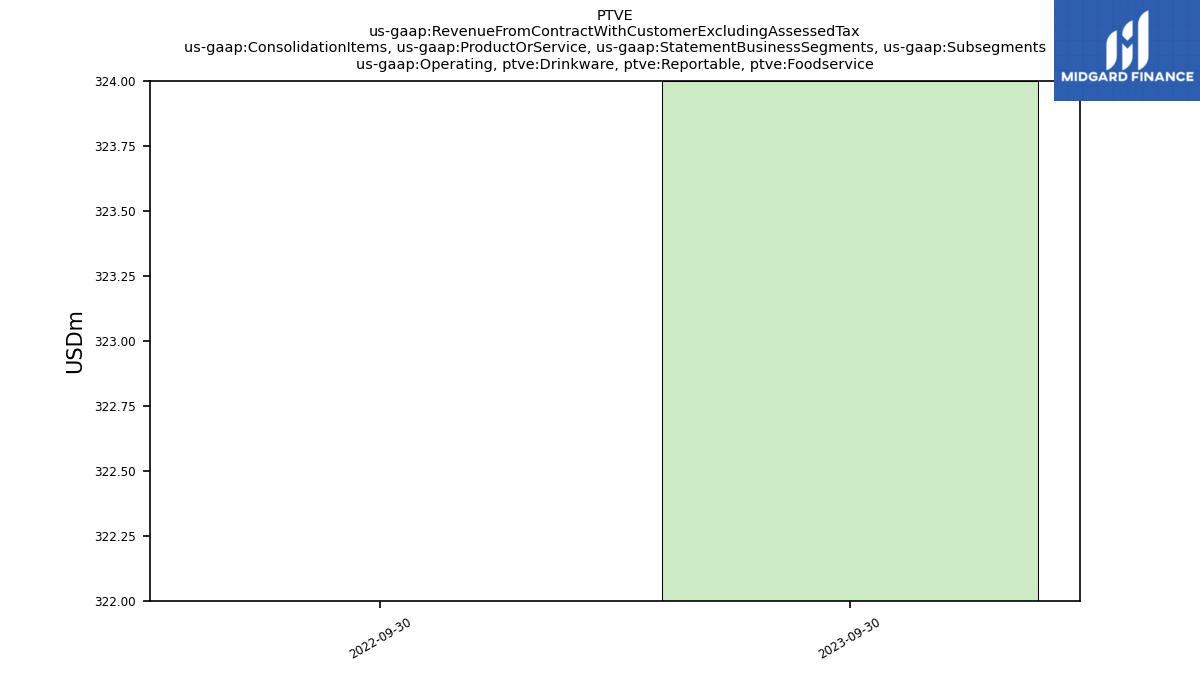
| Operating, Drinkware, Reportable, Foodservice | NA | 282.00 | 324.00 | NA | NA | 275.00 | 322.00 | NA | NA | NA | NA | NA | NA | NA | NA | NA | NA | NA | NA | |
| Operating, Egg Cartons, Reportable, Food And Beverage Merchandising | NA | 33.00 | 33.00 | NA | NA | 32.00 | 30.00 | NA | NA | NA | NA | NA | NA | NA | NA | NA | NA | NA | NA | |
| Operating, Liquid Packaging Board, Reportable, Food And Beverage Merchandising | NA | 61.00 | 68.00 | NA | NA | 145.00 | 152.00 | NA | NA | NA | NA | NA | NA | NA | NA | NA | NA | NA | NA | |
| Operating, Meat Trays, Reportable, Food And Beverage Merchandising | NA | 100.00 | 108.00 | NA | NA | 105.00 | 103.00 | NA | NA | NA | NA | NA | NA | NA | NA | NA | NA | NA | NA | |
| Operating, Other, Reportable, Food And Beverage Merchandising | NA | 55.00 | 62.00 | NA | NA | 62.00 | 63.00 | NA | NA | NA | NA | NA | NA | NA | NA | NA | NA | NA | NA | |
| Operating, Paper Products, Reportable, Food And Beverage Merchandising | NA | -1.00 | NA | NA | NA | 62.00 | 73.00 | NA | NA | NA | NA | NA | NA | NA | NA | NA | NA | NA | NA | |
| Operating, Prepared Food Trays, Reportable, Food And Beverage Merchandising | NA | 38.00 | 38.00 | NA | NA | 44.00 | 42.00 | NA | NA | NA | NA | NA | NA | NA | NA | NA | NA | NA | NA | |
| Operating, Serviceware And Other, Reportable, Foodservice | NA | 46.00 | 46.00 | NA | NA | 50.00 | 59.00 | NA | NA | NA | NA | NA | NA | NA | NA | NA | NA | NA | NA | |
| Operating, Tableware, Reportable, Food And Beverage Merchandising | NA | 102.00 | 103.00 | NA | NA | 114.00 | 112.00 | NA | NA | NA | NA | NA | NA | NA | NA | NA | NA | NA | NA | |
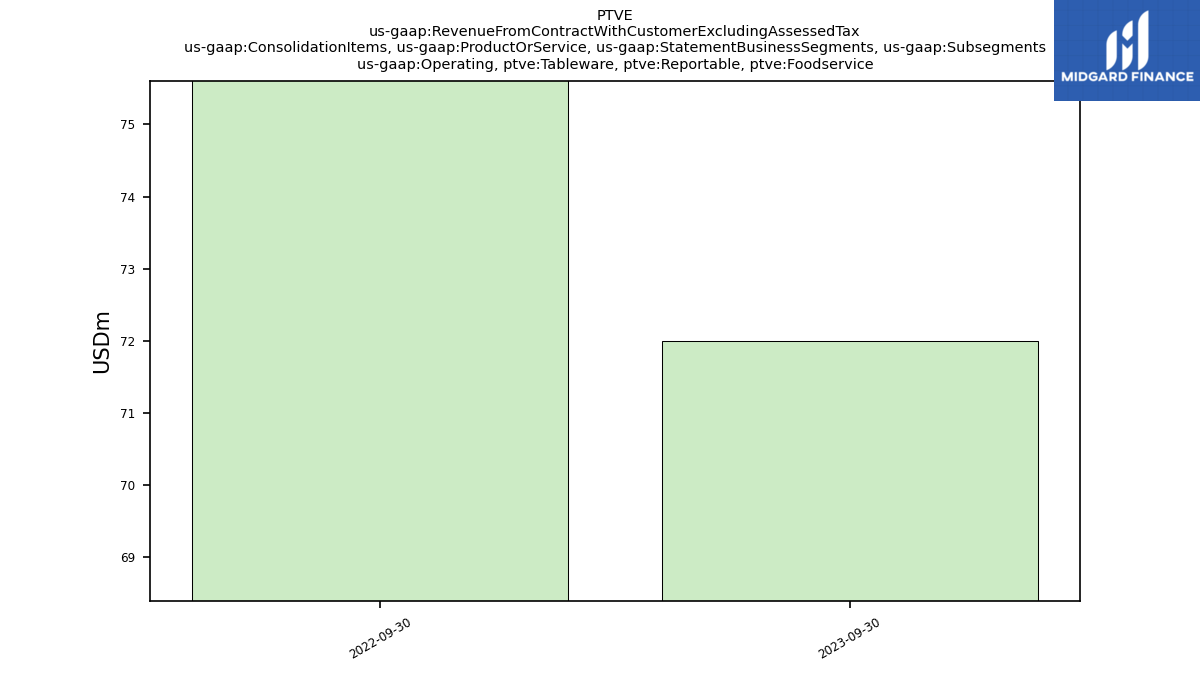
| Operating, Tableware, Reportable, Foodservice | NA | 69.00 | 72.00 | NA | NA | 72.00 | 76.00 | NA | NA | NA | NA | NA | NA | NA | NA | NA | NA | NA | NA | |
| Operating, Bakery Snack Produce Fruit Containers, Food And Beverage Merchandising | 108.00 | NA | NA | NA | 128.00 | NA | NA | NA | NA | NA | NA | NA | NA | NA | NA | NA | NA | NA | NA | |
| Operating, Cartonsfor Fresh Beverage Products, Food And Beverage Merchandising | 184.00 | NA | NA | NA | 195.00 | NA | NA | NA | NA | NA | NA | NA | NA | NA | NA | NA | NA | NA | NA | |
| Operating, Containers Foodservice, Foodservice | 225.00 | NA | NA | NA | 229.00 | NA | NA | NA | NA | NA | NA | NA | NA | NA | NA | NA | NA | NA | NA | |
| Operating, Drinkware, Foodservice | 260.00 | NA | NA | NA | 264.00 | NA | NA | NA | NA | NA | NA | NA | NA | NA | NA | NA | NA | NA | NA | |
| Operating, Liquid Packaging Board, Food And Beverage Merchandising | 55.00 | NA | NA | NA | 128.00 | NA | NA | NA | NA | NA | NA | NA | NA | NA | NA | NA | NA | NA | NA | |
| Operating, Meat Trays, Food And Beverage Merchandising | 104.00 | NA | NA | NA | 106.00 | NA | NA | NA | NA | NA | NA | NA | NA | NA | NA | NA | NA | NA | NA | |
| Operating, Other, Food And Beverage Merchandising | 52.00 | NA | NA | NA | 69.00 | NA | NA | NA | NA | NA | NA | NA | NA | NA | NA | NA | NA | NA | NA | |
| Operating, Prepared Food Trays, Food And Beverage Merchandising | 27.00 | NA | NA | NA | 36.00 | NA | NA | NA | NA | NA | NA | NA | NA | NA | NA | NA | NA | NA | NA | |
| Operating, Serviceware And Other, Foodservice | 44.00 | NA | NA | NA | 46.00 | NA | NA | NA | NA | NA | NA | NA | NA | NA | NA | NA | NA | NA | NA | |
| Operating, Tableware, Food And Beverage Merchandising | 92.00 | NA | NA | NA | 103.00 | NA | NA | NA | NA | NA | NA | NA | NA | NA | NA | NA | NA | NA | NA | |
| Operating, Tableware, Foodservice | 68.00 | NA | NA | NA | 75.00 | NA | NA | NA | NA | NA | NA | NA | NA | NA | NA | NA | NA | NA | NA | |
| Intersegment Elimination, Reportable | 5.00 | 5.00 | 8.00 | 35.00 | 35.00 | 35.00 | 50.00 | 42.00 | 31.00 | 38.00 | 22.00 | 18.00 | 18.00 | 25.00 | 23.00 | 19.00 | 34.00 | NA | NA | |
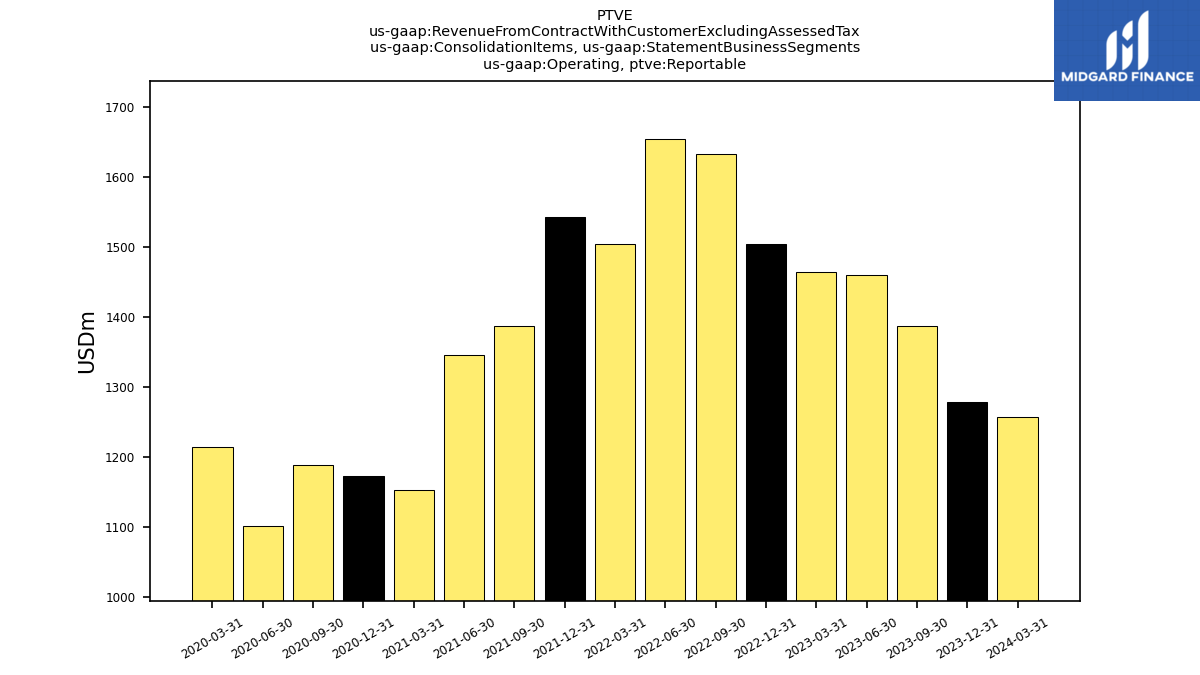
| Operating, Reportable | 1257.00 | 1279.00 | 1387.00 | 1461.00 | 1464.00 | 1505.00 | 1633.00 | 1655.00 | 1504.00 | 1544.00 | 1388.00 | 1346.00 | 1153.00 | 1173.00 | 1188.00 | 1101.00 | 1214.00 | NA | NA | |
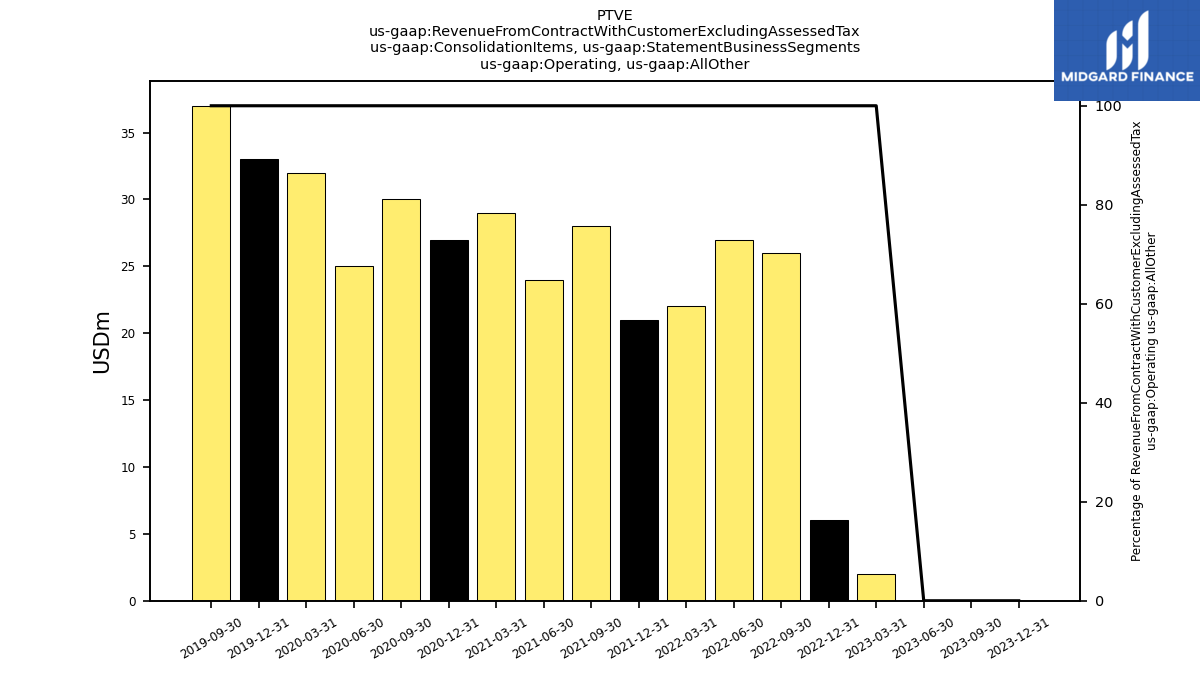
| Operating, All Other | NA | 0.00 | 0.00 | 0.00 | 2.00 | 6.00 | 26.00 | 27.00 | 22.00 | 21.00 | 28.00 | 24.00 | 29.00 | 27.00 | 30.00 | 25.00 | 32.00 | 33.00 | 37.00 | |
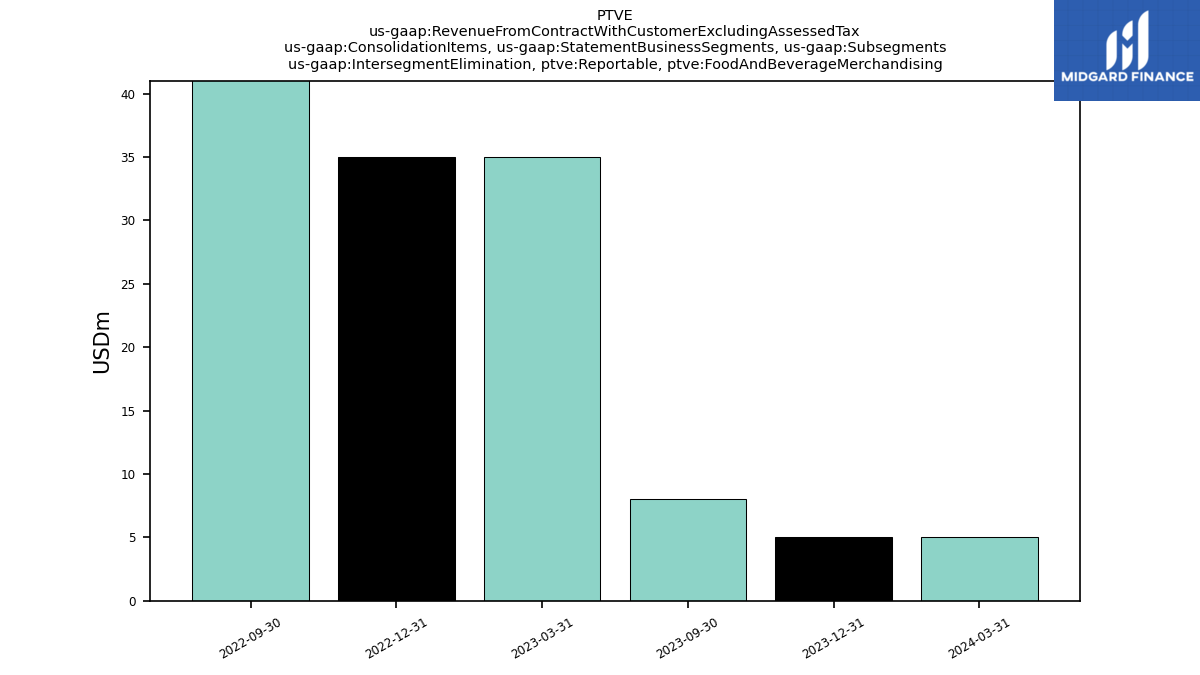
| Intersegment Elimination, Reportable, Food And Beverage Merchandising | 5.00 | 5.00 | 8.00 | NA | 35.00 | 35.00 | 50.00 | NA | NA | NA | NA | NA | NA | NA | NA | NA | NA | NA | NA | |
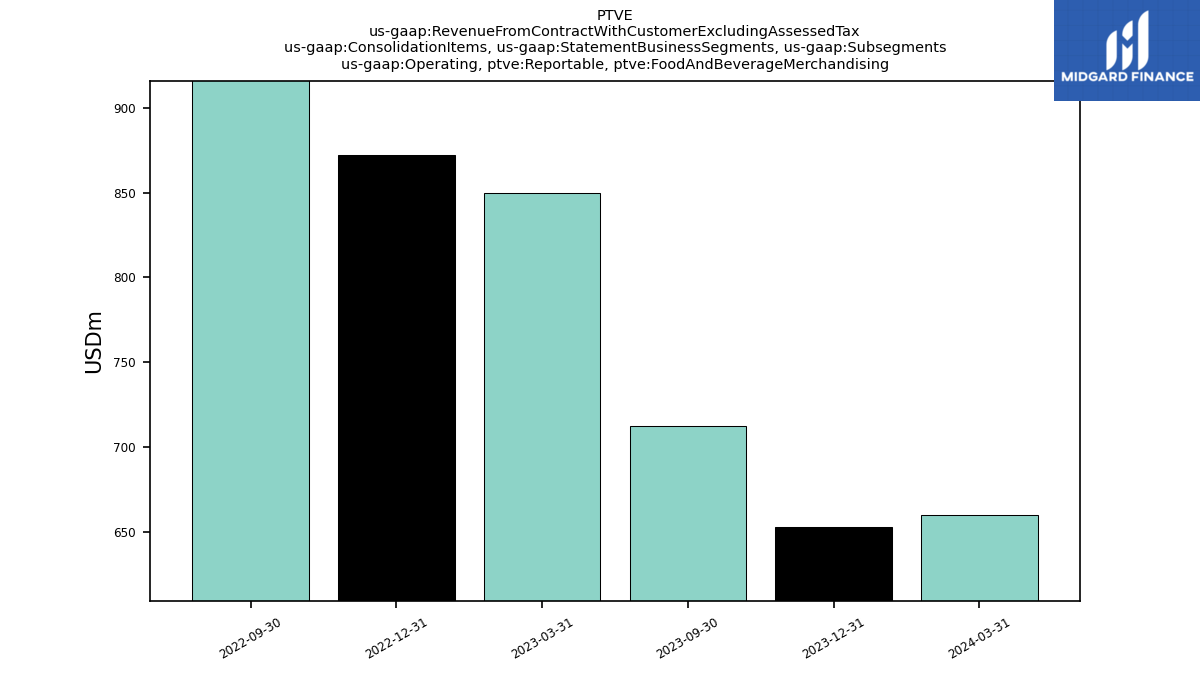
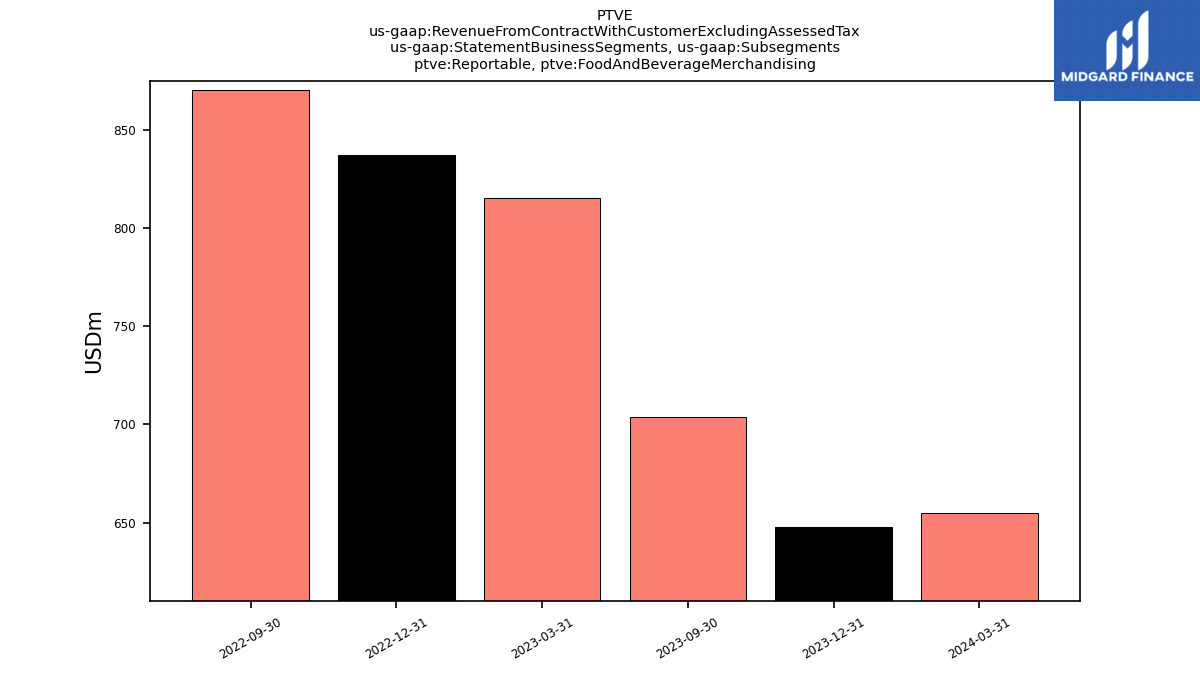
| Operating, Reportable, Food And Beverage Merchandising | 660.00 | 653.00 | 712.00 | NA | 850.00 | 872.00 | 920.00 | NA | NA | NA | NA | NA | NA | NA | NA | NA | NA | NA | NA | |
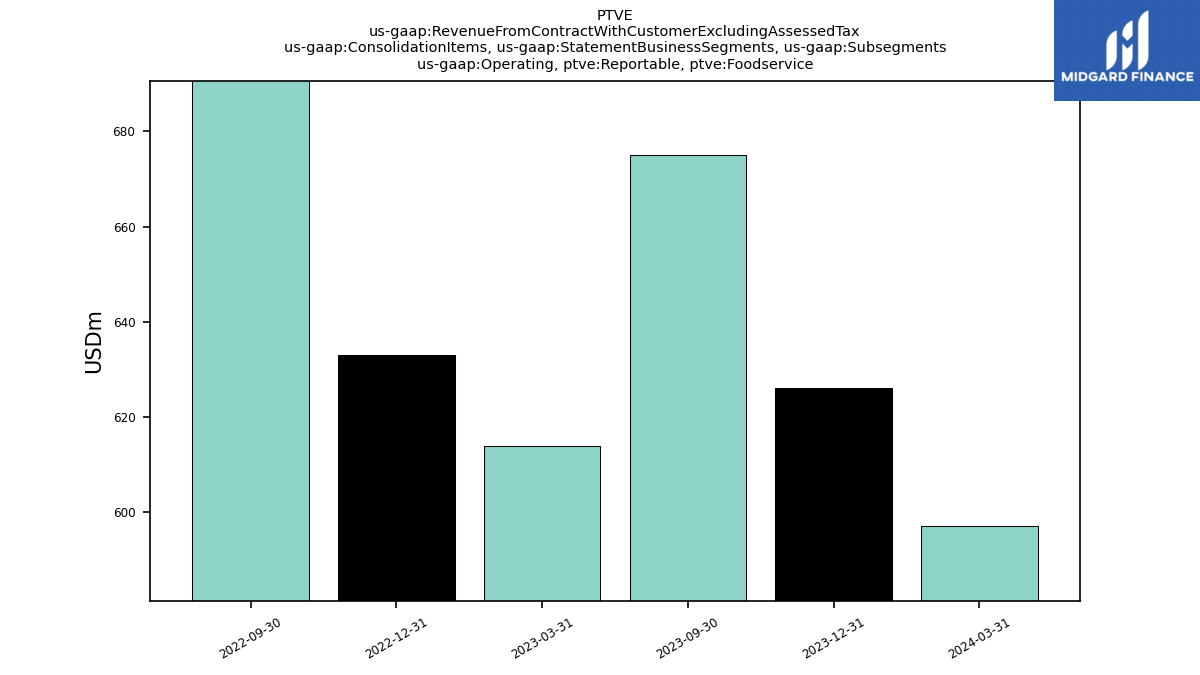
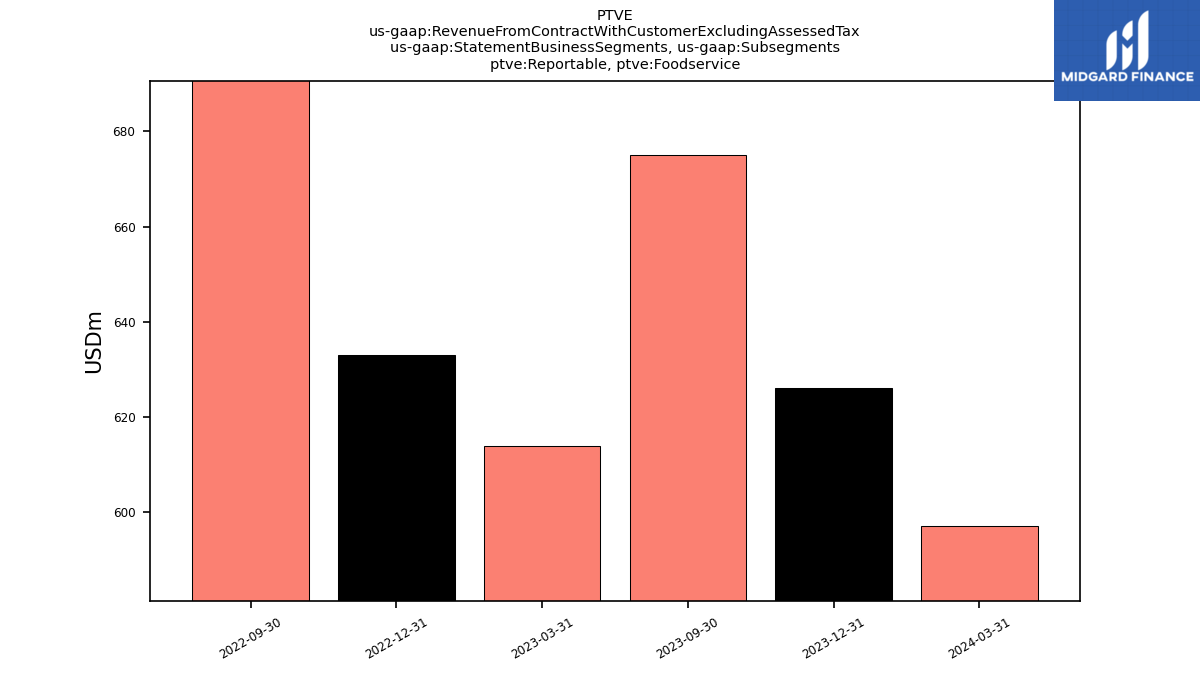
| Operating, Reportable, Foodservice | 597.00 | 626.00 | 675.00 | NA | 614.00 | 633.00 | 713.00 | NA | NA | NA | NA | NA | NA | NA | NA | NA | NA | NA | NA | |
| Nonrelated Party | 1172.00 | NA | NA | NA | 1323.00 | NA | NA | NA | NA | NA | NA | NA | NA | NA | NA | NA | NA | NA | NA | |
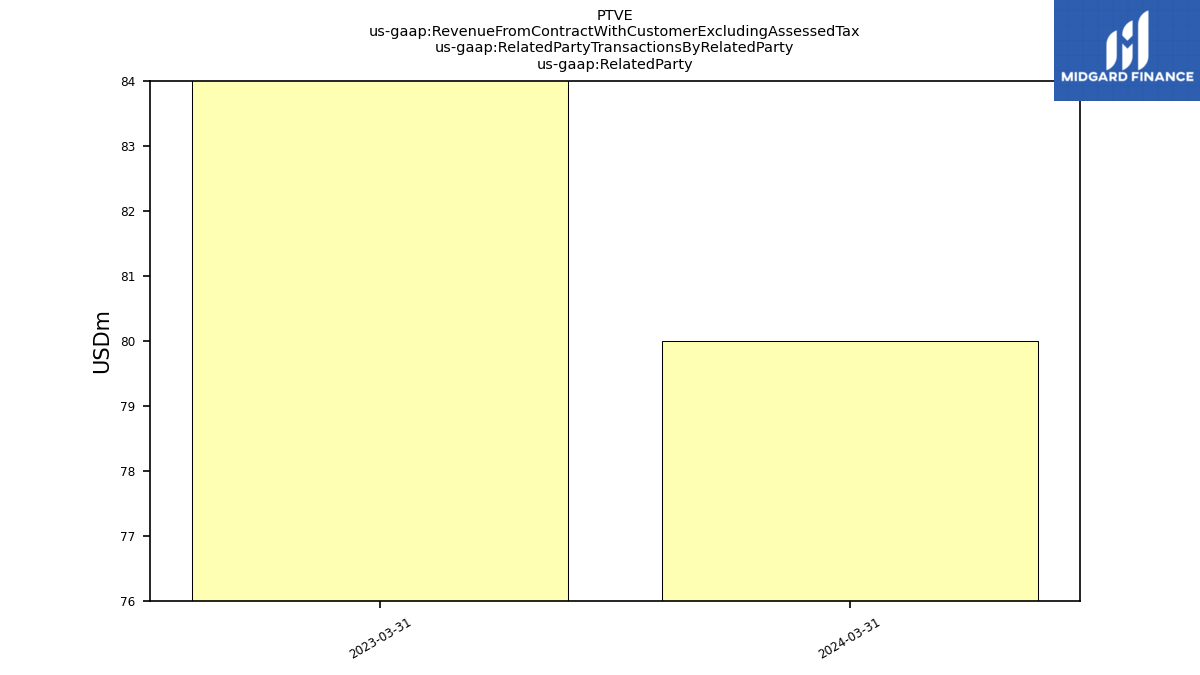
| Related Party | 80.00 | NA | NA | NA | 108.00 | NA | NA | NA | NA | NA | NA | NA | NA | NA | NA | NA | NA | NA | NA | |
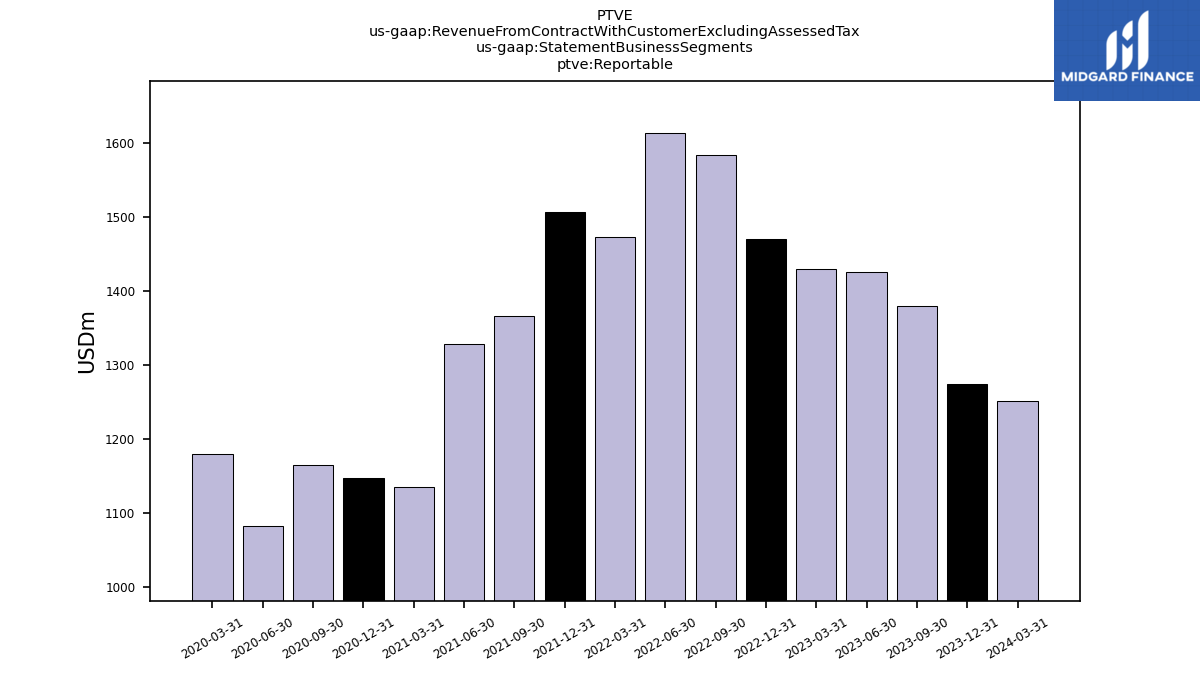
| Reportable | 1252.00 | 1274.00 | 1379.00 | 1426.00 | 1429.00 | 1470.00 | 1583.00 | 1613.00 | 1473.00 | 1506.00 | 1366.00 | 1328.00 | 1135.00 | 1148.00 | 1165.00 | 1082.00 | 1180.00 | NA | NA | |
| Reportable, Food And Beverage Merchandising | 655.00 | 648.00 | 704.00 | NA | 815.00 | 837.00 | 870.00 | NA | NA | NA | NA | NA | NA | NA | NA | NA | NA | NA | NA | |
| Reportable, Foodservice | 597.00 | 626.00 | 675.00 | NA | 614.00 | 633.00 | 713.00 | NA | NA | NA | NA | NA | NA | NA | NA | NA | NA | NA | NA |