
| 2024-03-31 | 2023-12-31 | 2023-09-30 | 2023-06-30 | 2023-03-31 | 2022-12-31 | 2022-09-30 | 2022-06-30 | 2022-03-31 | 2021-12-31 | 2021-09-30 | 2021-06-30 | 2021-03-31 | 2020-12-31 | 2020-09-30 | ||
|---|---|---|---|---|---|---|---|---|---|---|---|---|---|---|---|---|
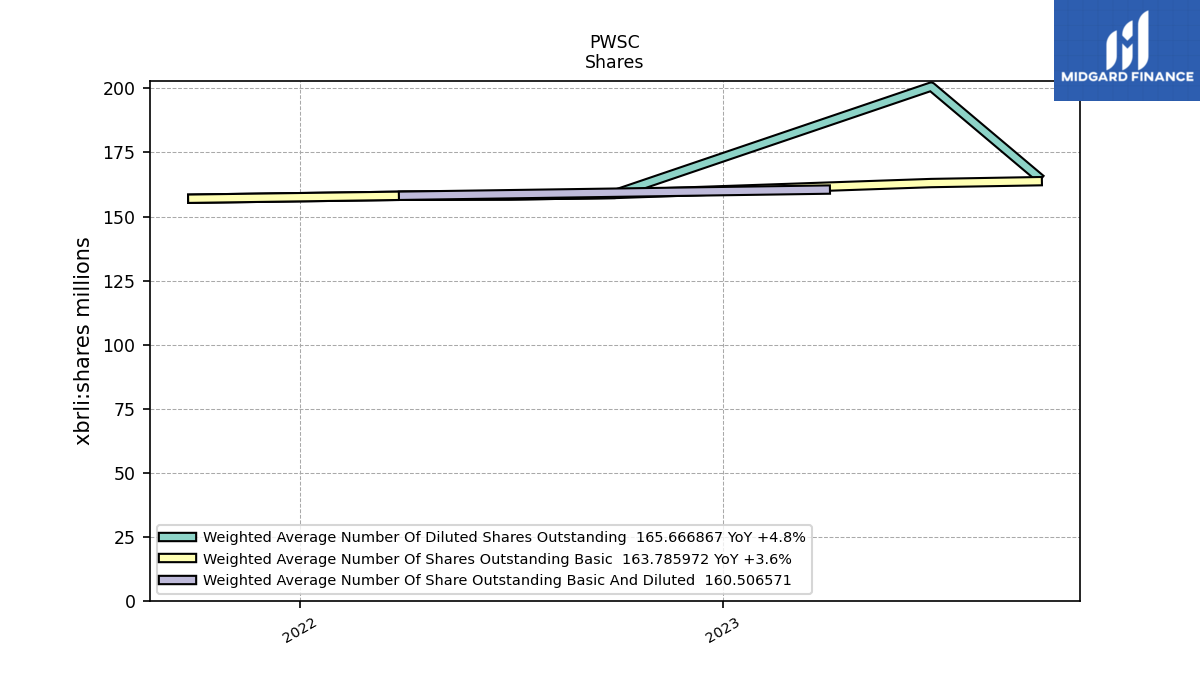
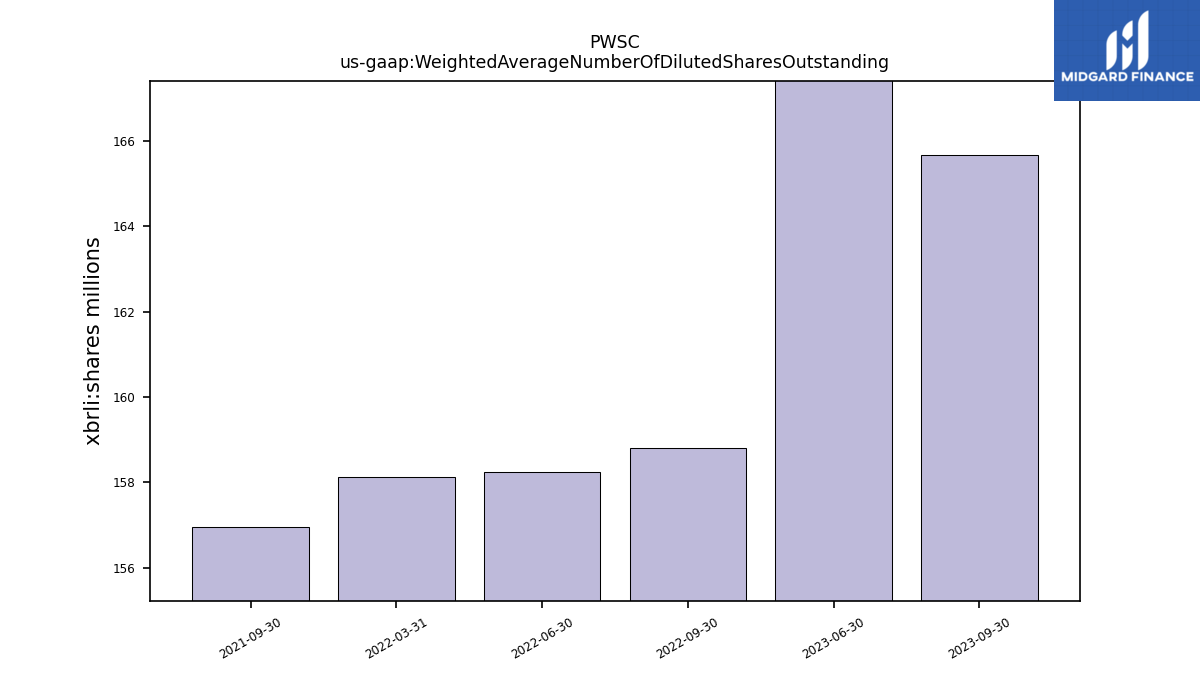
| Weighted Average Number Of Diluted Shares Outstanding | 202.69 | NA | 165.67 | 200.72 | 160.51 | NA | 158.81 | 158.23 | 158.11 | NA | 156.96 | NA | NA | NA | NA | |
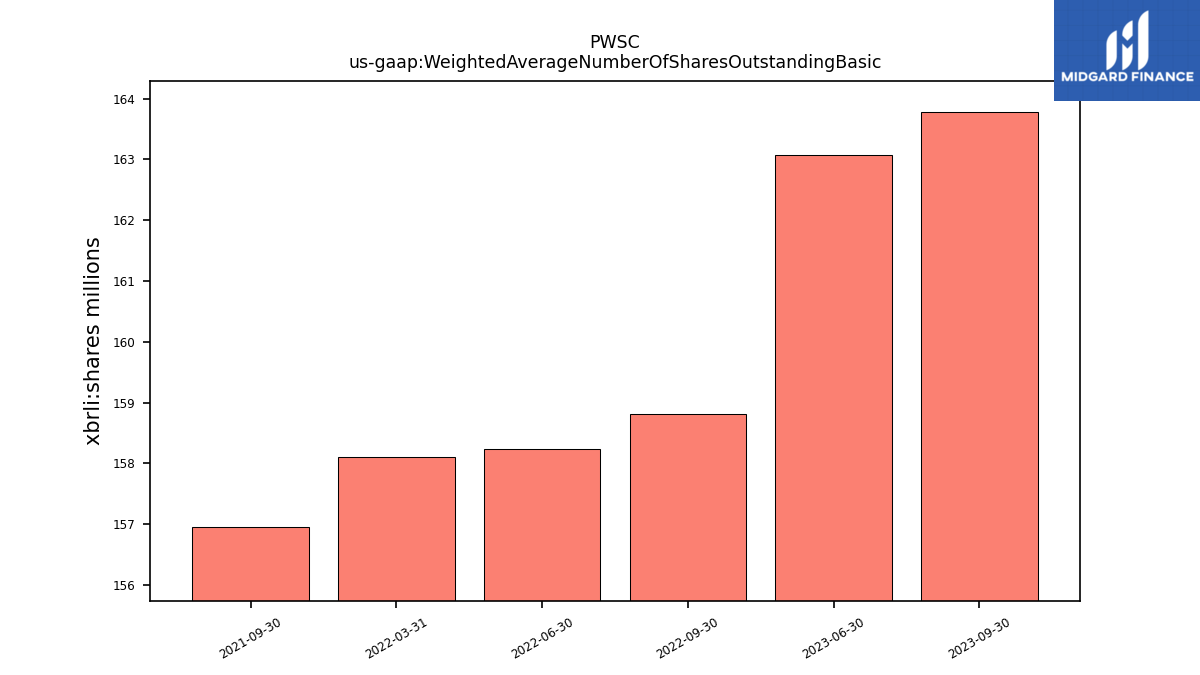
| Weighted Average Number Of Shares Outstanding Basic | 165.04 | NA | 163.79 | 163.07 | 160.51 | NA | 158.81 | 158.23 | 158.11 | NA | 156.96 | NA | NA | NA | NA | |
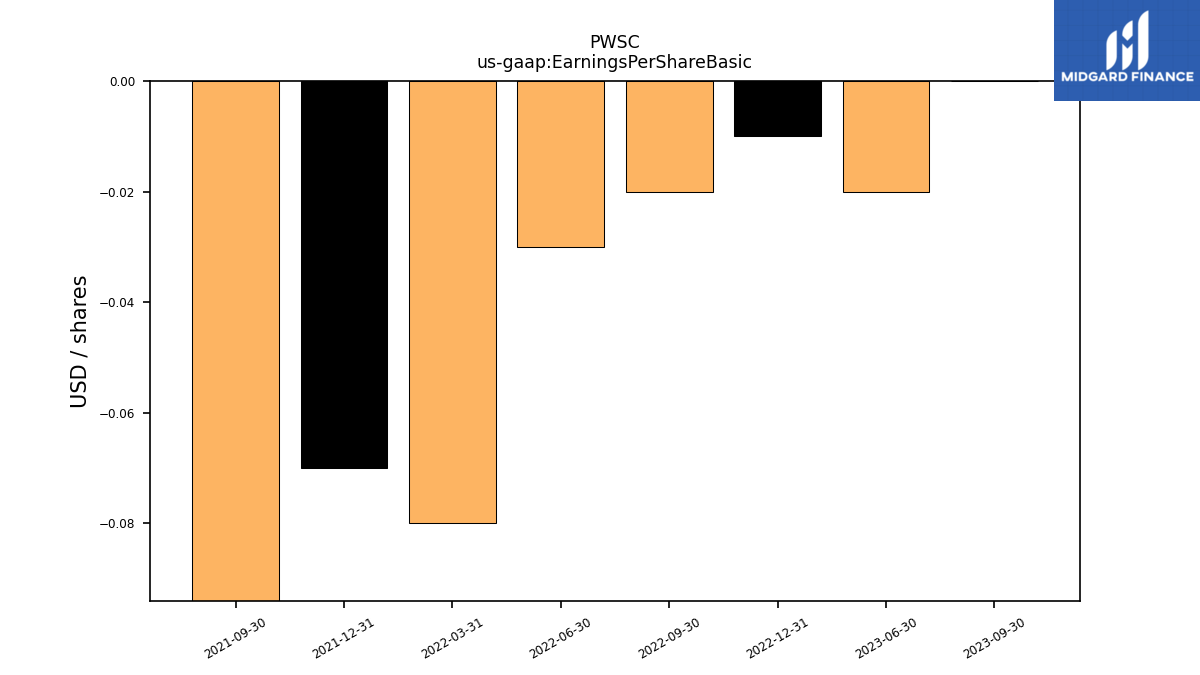
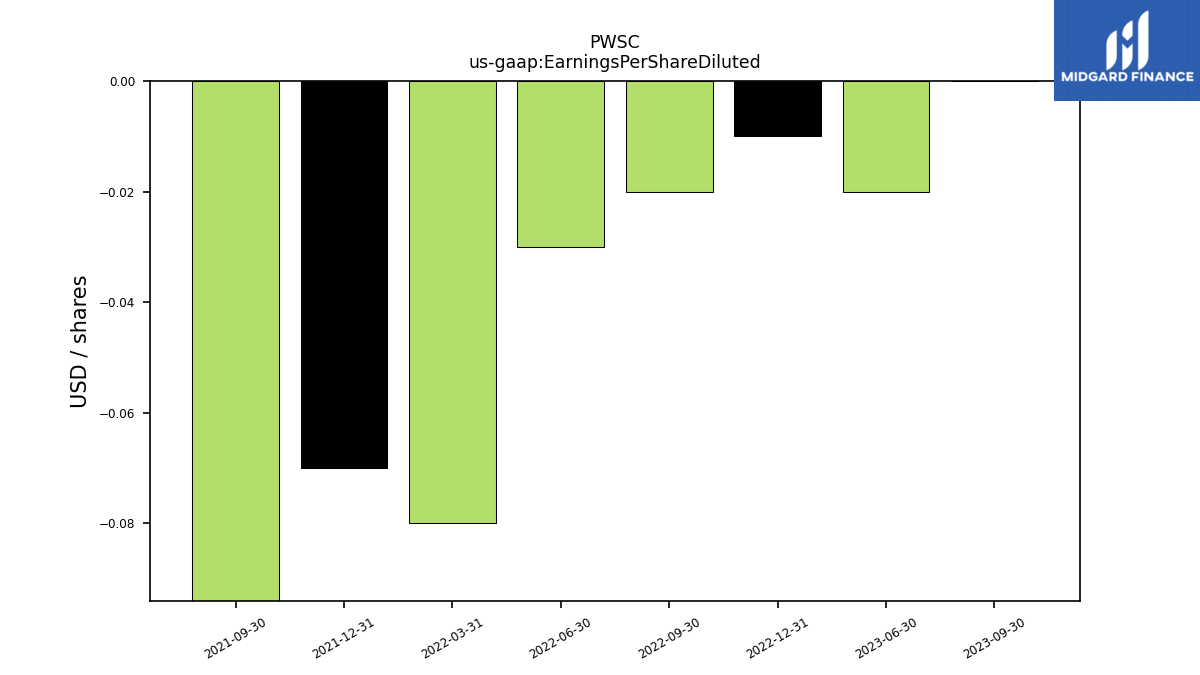
| Earnings Per Share Basic | -0.12 | -0.09 | -0.00 | -0.02 | -0.07 | -0.01 | -0.02 | -0.03 | -0.08 | -0.07 | -0.12 | NA | NA | NA | NA | |
| Earnings Per Share Diluted | -0.12 | -0.09 | -0.00 | -0.02 | -0.07 | -0.01 | -0.02 | -0.03 | -0.08 | -0.07 | -0.12 | NA | NA | NA | NA |
| 2024-03-31 | 2023-12-31 | 2023-09-30 | 2023-06-30 | 2023-03-31 | 2022-12-31 | 2022-09-30 | 2022-06-30 | 2022-03-31 | 2021-12-31 | 2021-09-30 | 2021-06-30 | 2021-03-31 | 2020-12-31 | 2020-09-30 | ||
|---|---|---|---|---|---|---|---|---|---|---|---|---|---|---|---|---|
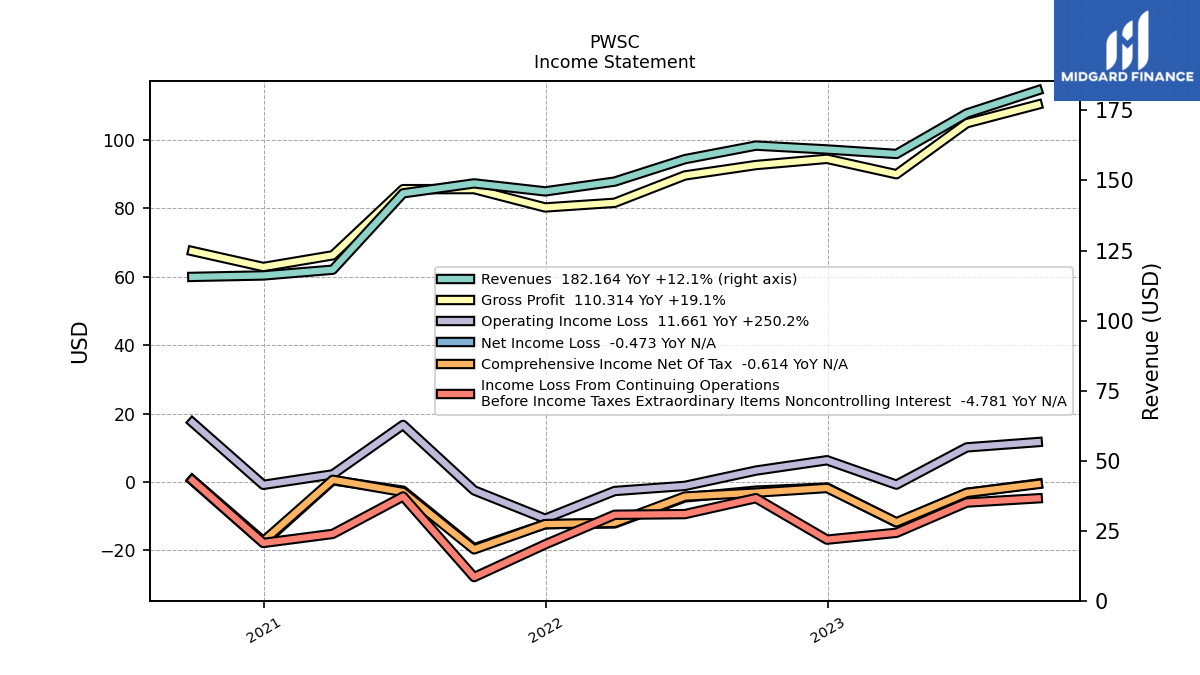
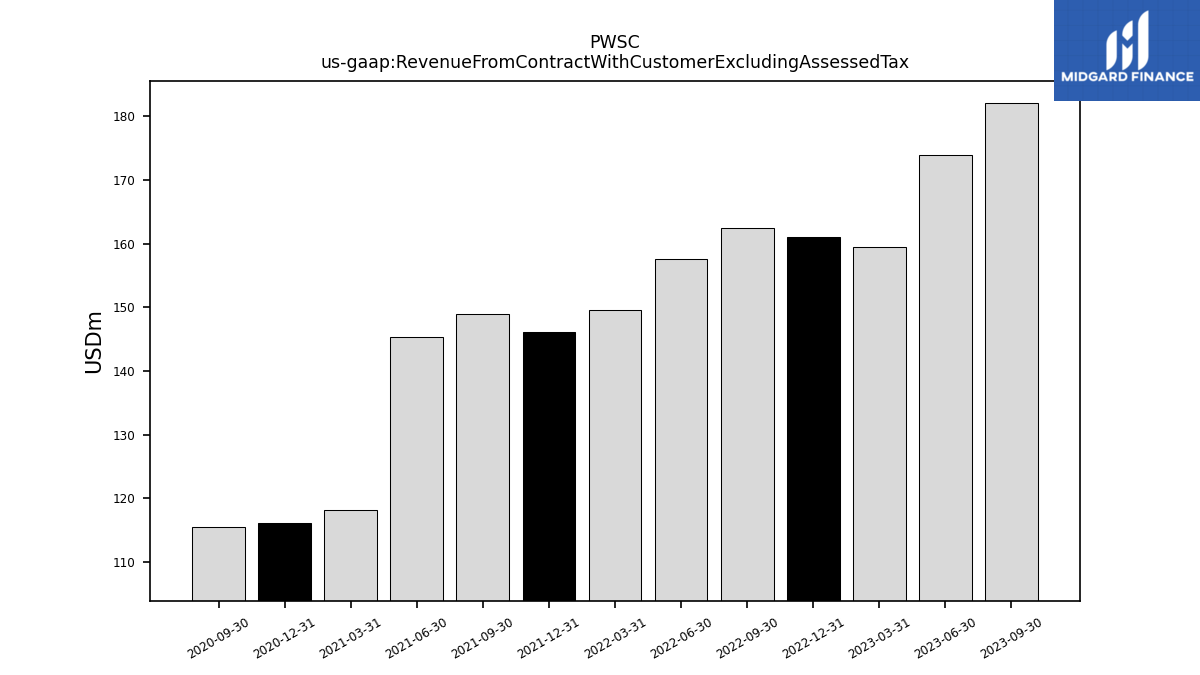
| Revenue From Contract With Customer Excluding Assessed Tax | 184.97 | 182.14 | 182.16 | 173.90 | 159.45 | 161.07 | 162.43 | 157.59 | 149.59 | 146.10 | 148.95 | 145.40 | 118.15 | 116.09 | 115.58 | |
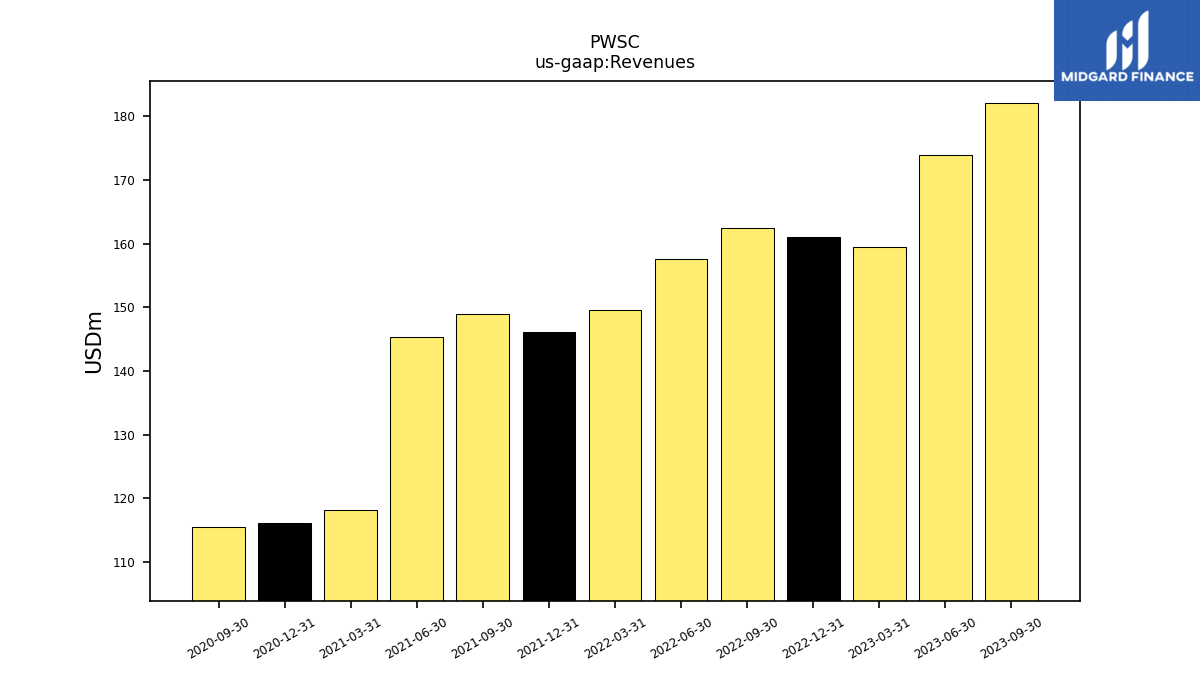
| Revenues | 184.97 | 182.14 | 182.16 | 173.90 | 159.45 | 161.07 | 162.43 | 157.59 | 149.59 | 146.10 | 148.95 | 145.40 | 118.15 | 116.09 | 115.58 | |
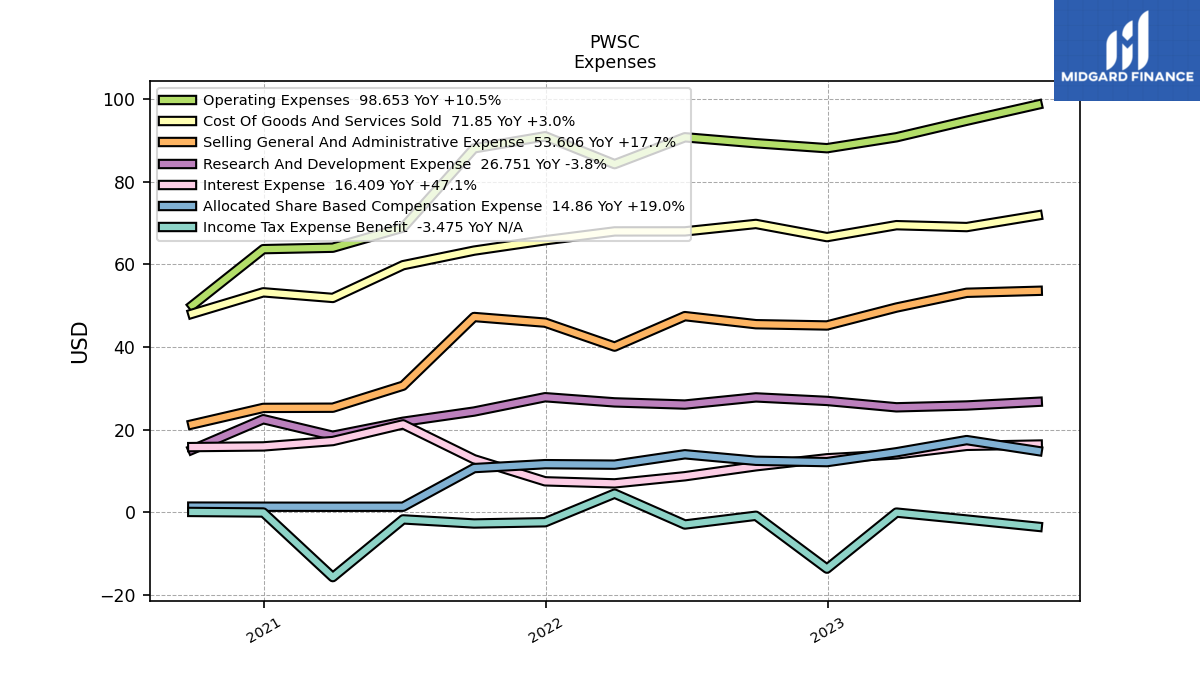
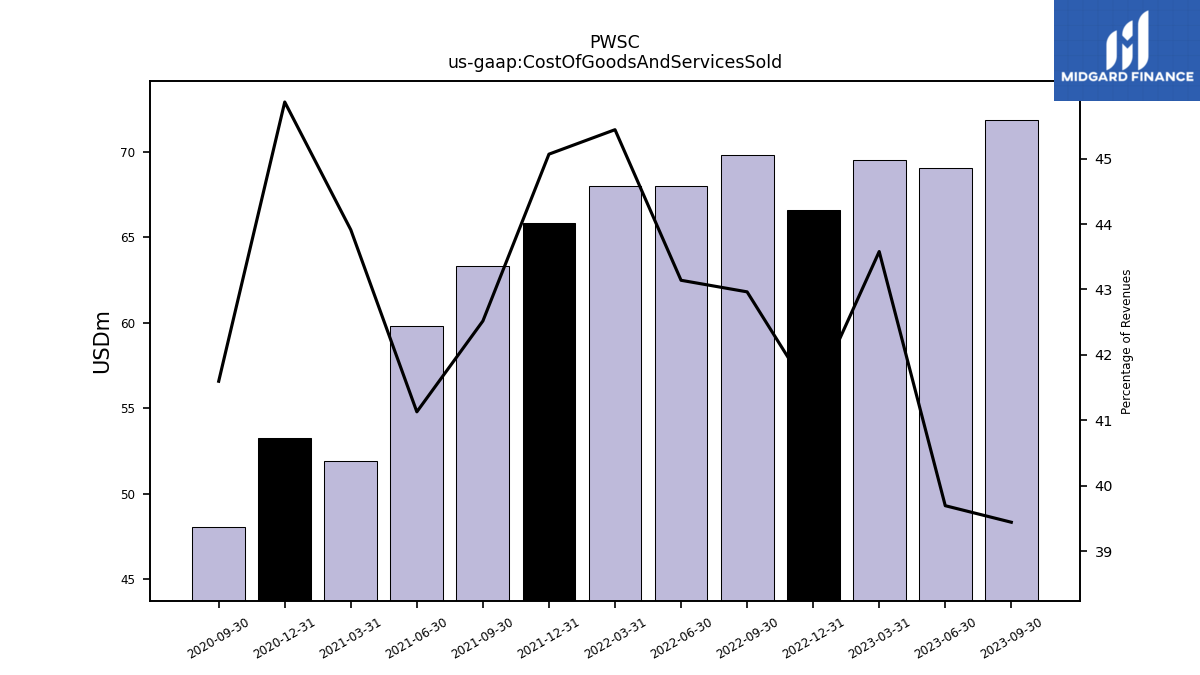
| Cost Of Goods And Services Sold | 79.86 | 73.50 | 71.85 | 69.03 | 69.49 | 66.60 | 69.79 | 67.98 | 67.98 | 65.84 | 63.33 | 59.80 | 51.88 | 53.25 | 48.08 | |
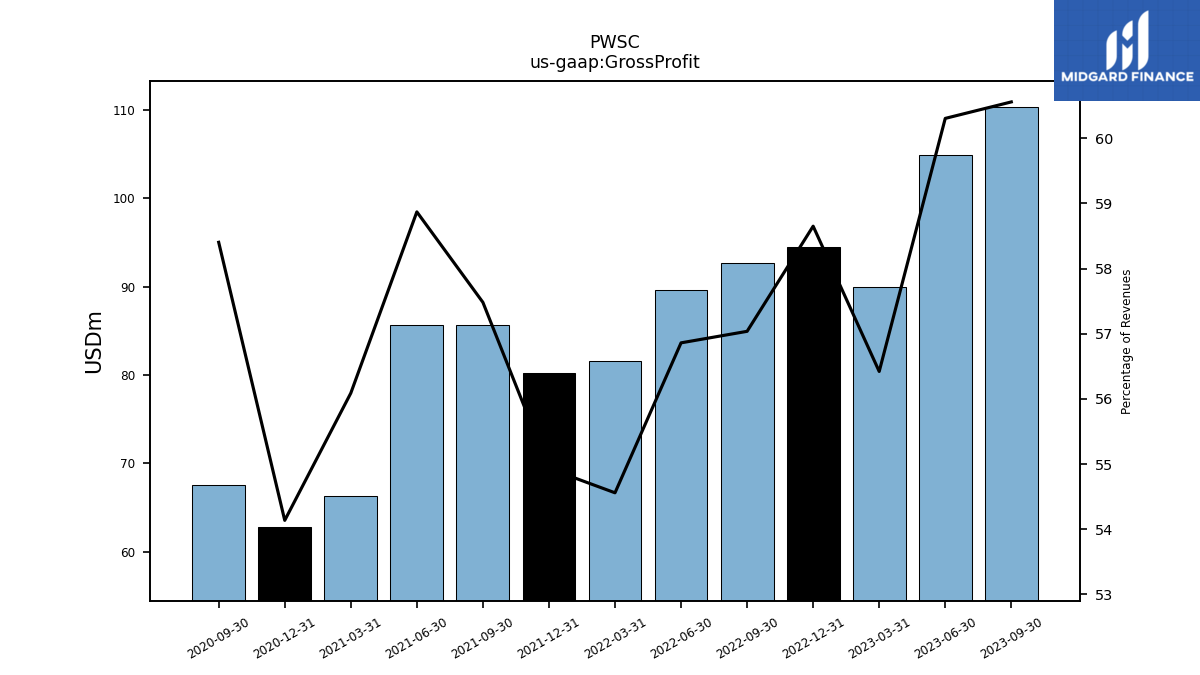
| Gross Profit | 105.11 | 108.63 | 110.31 | 104.87 | 89.97 | 94.47 | 92.65 | 89.61 | 81.61 | 80.25 | 85.62 | 85.60 | 66.27 | 62.85 | 67.50 | |
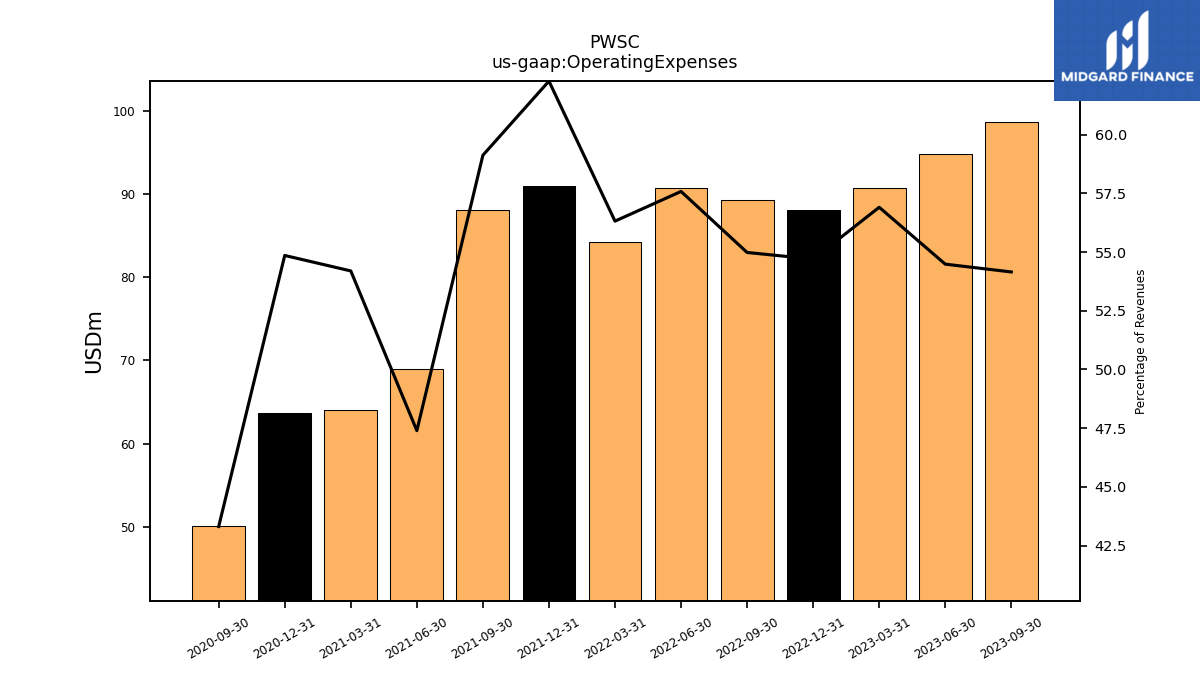
| Operating Expenses | 102.19 | 105.30 | 98.65 | 94.75 | 90.75 | 88.11 | 89.32 | 90.75 | 84.25 | 91.00 | 88.07 | 68.91 | 64.04 | 63.69 | 50.06 | |
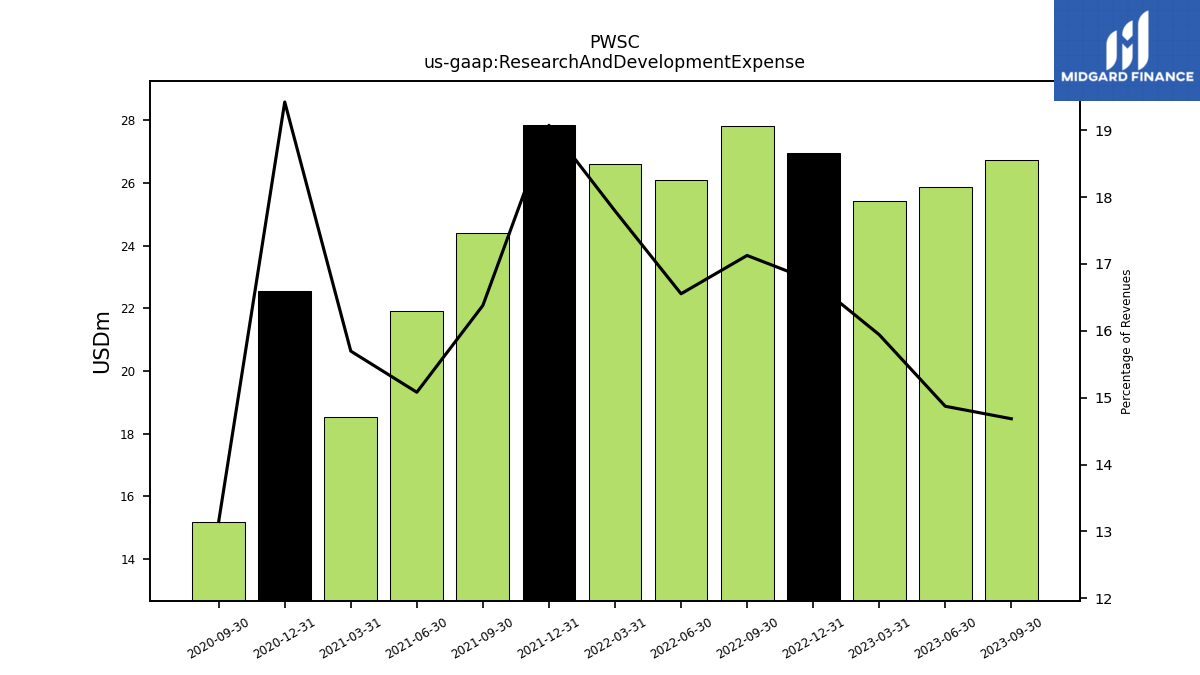
| Research And Development Expense | 31.65 | 27.87 | 26.75 | 25.86 | 25.42 | 26.97 | 27.82 | 26.09 | 26.62 | 27.87 | 24.40 | 21.93 | 18.55 | 22.55 | 15.20 | |
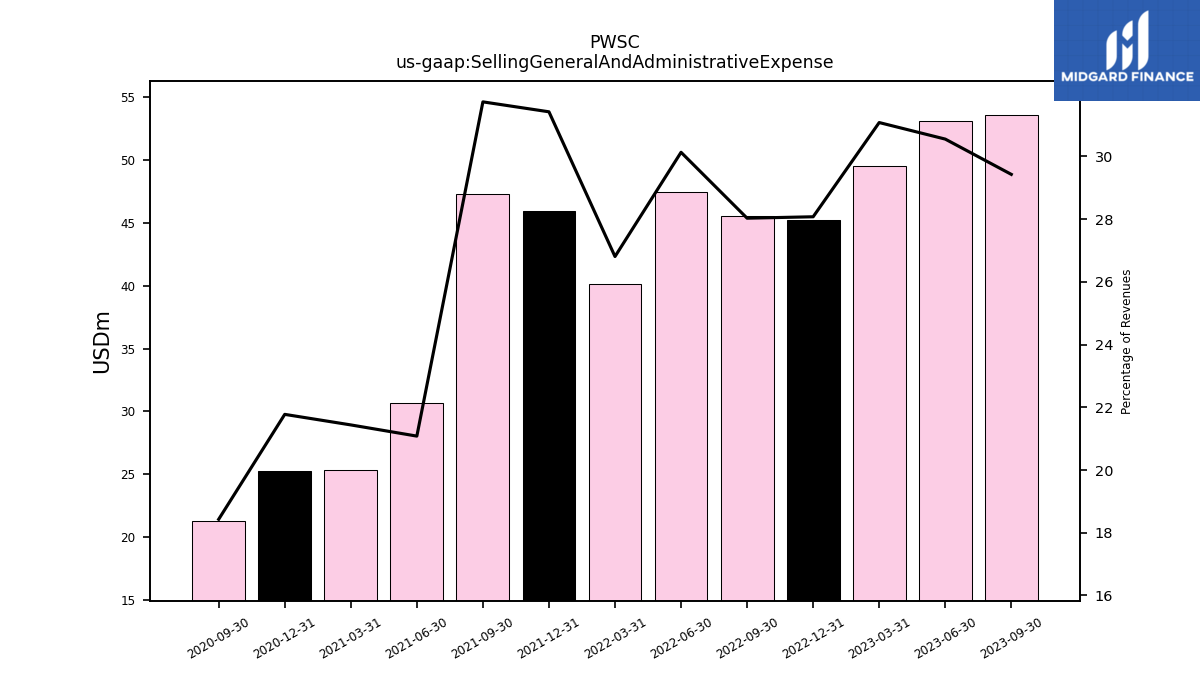
| Selling General And Administrative Expense | 52.43 | 58.51 | 53.61 | 53.13 | 49.56 | 45.22 | 45.53 | 47.48 | 40.10 | 45.91 | 47.28 | 30.65 | 25.33 | 25.28 | 21.30 | |
| Operating Income Loss | 2.92 | 3.33 | 11.66 | 10.11 | -0.79 | 6.36 | 3.33 | -1.15 | -2.64 | -10.75 | -2.45 | 16.69 | 2.23 | -0.84 | 17.45 | |
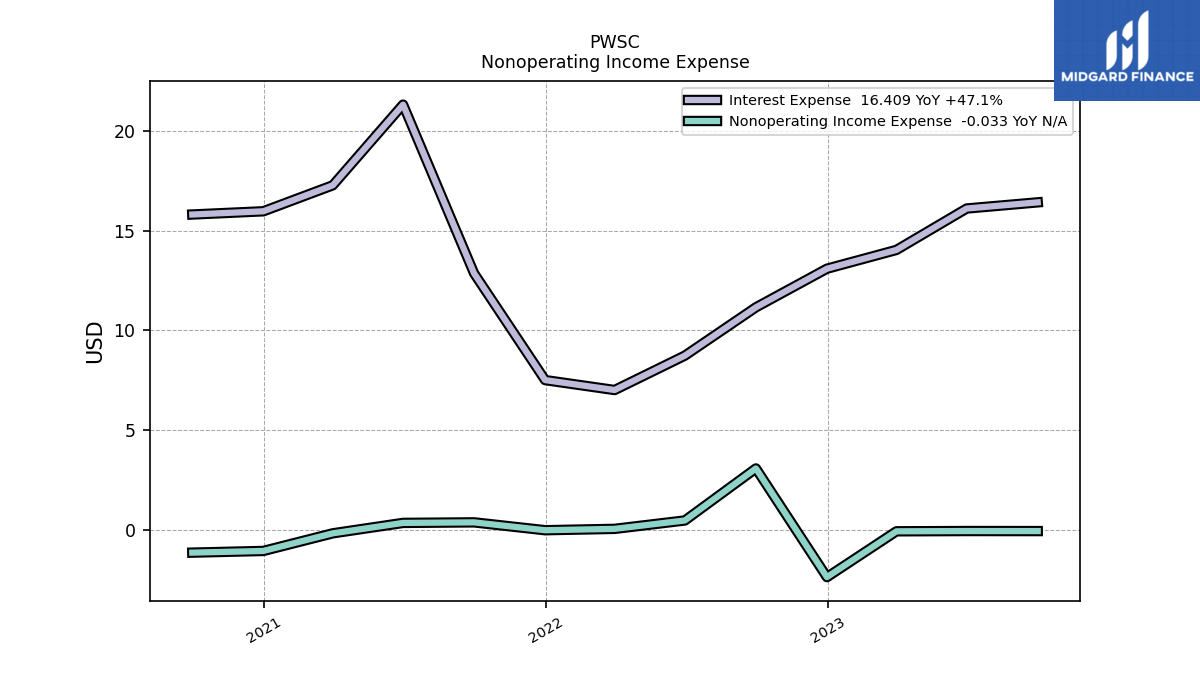
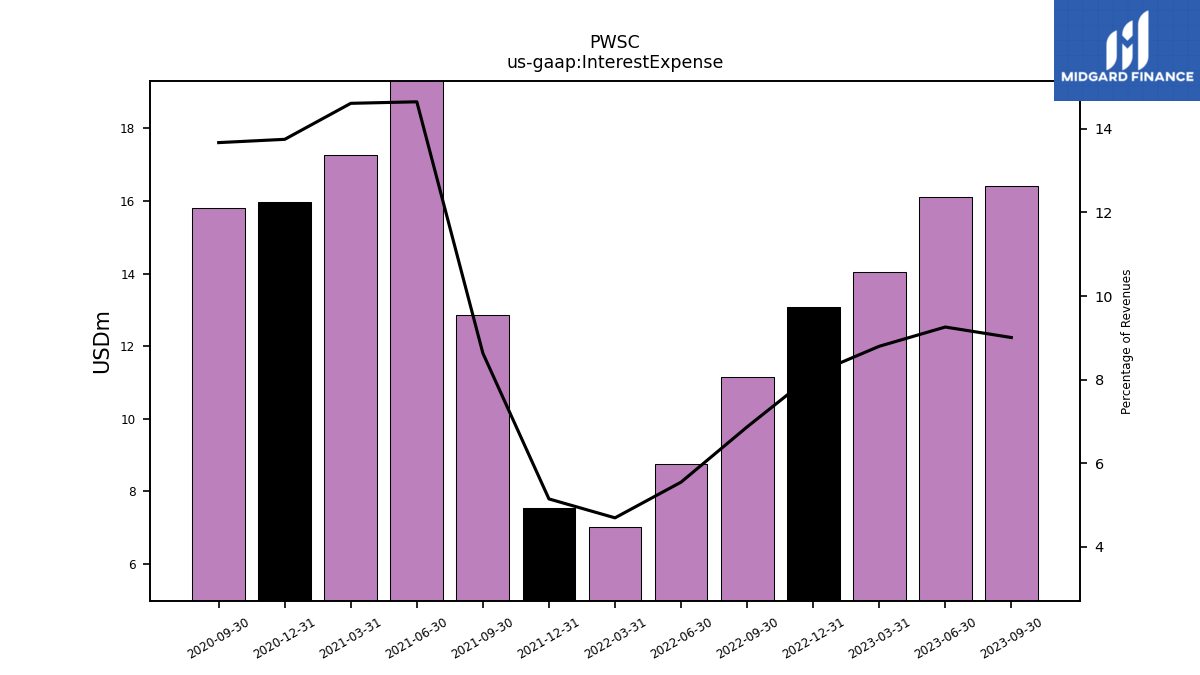
| Interest Expense | 21.00 | 20.18 | 16.41 | 16.10 | 14.03 | 13.09 | 11.16 | 8.74 | 7.02 | 7.52 | 12.86 | 21.30 | 17.26 | 15.96 | 15.80 | |
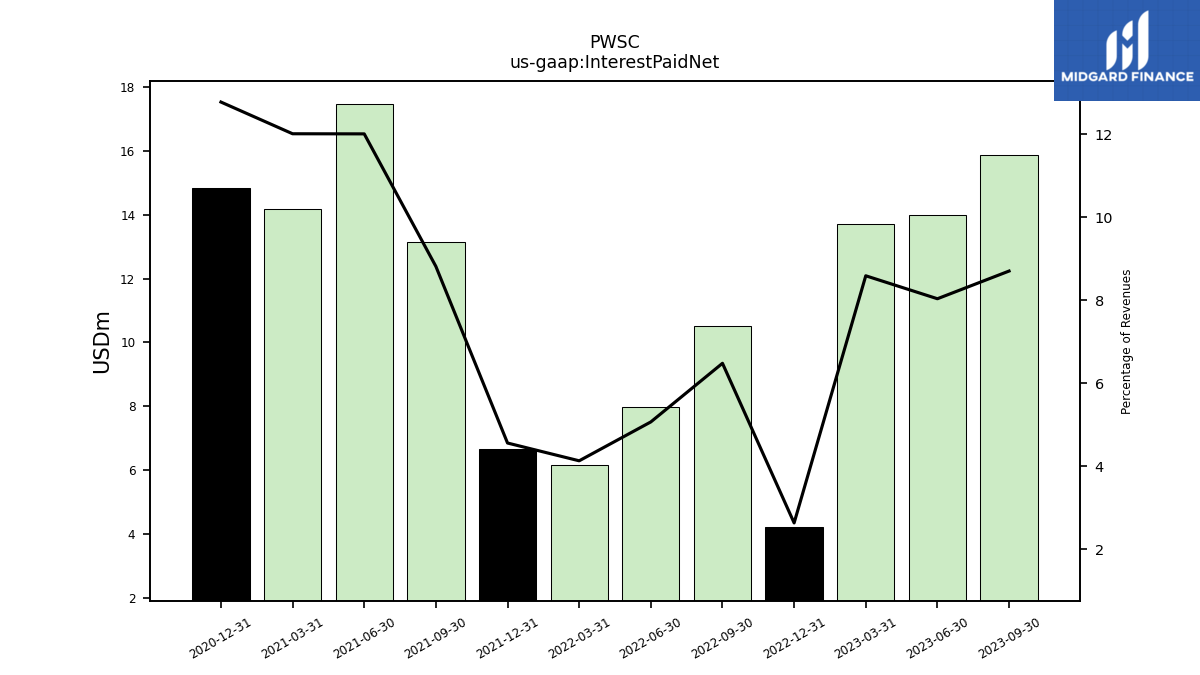
| Interest Paid Net | 19.13 | 18.14 | 15.85 | 13.97 | 13.70 | 4.25 | 10.53 | 7.99 | 6.18 | 6.66 | 13.13 | 17.46 | 14.19 | 14.83 | NA | |
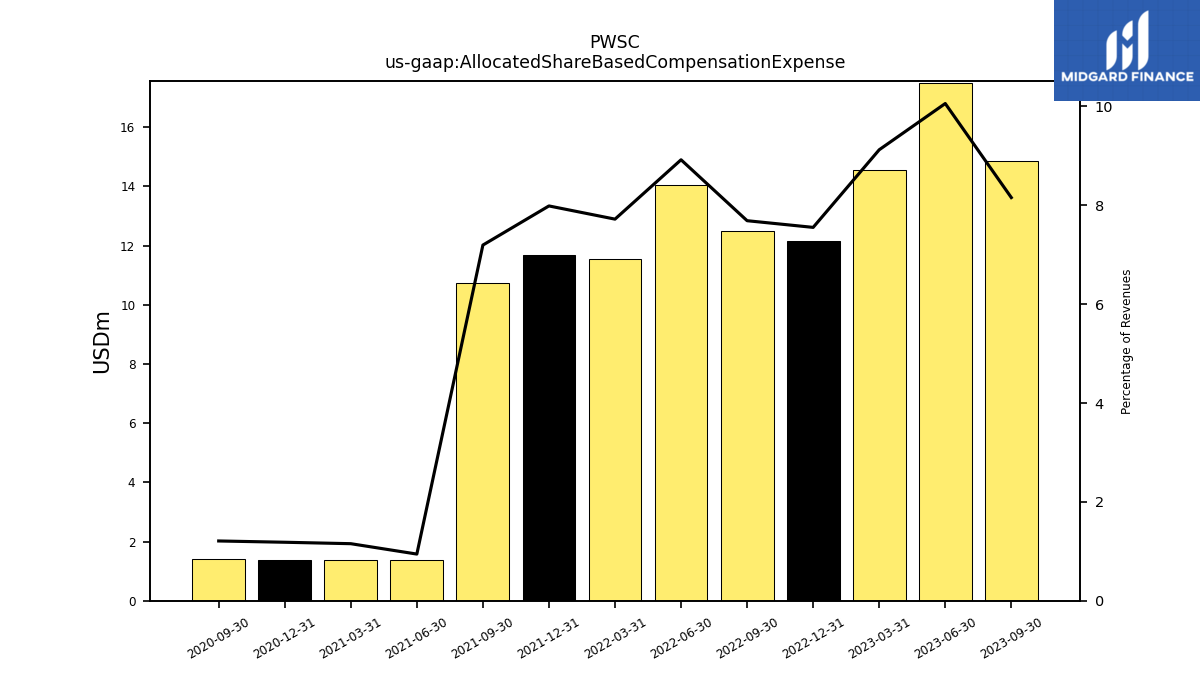
| Allocated Share Based Compensation Expense | 14.15 | 14.24 | 14.86 | 17.49 | 14.55 | 12.17 | 12.49 | 14.06 | 11.55 | 11.67 | 10.72 | 1.37 | 1.36 | 1.37 | 1.40 | |
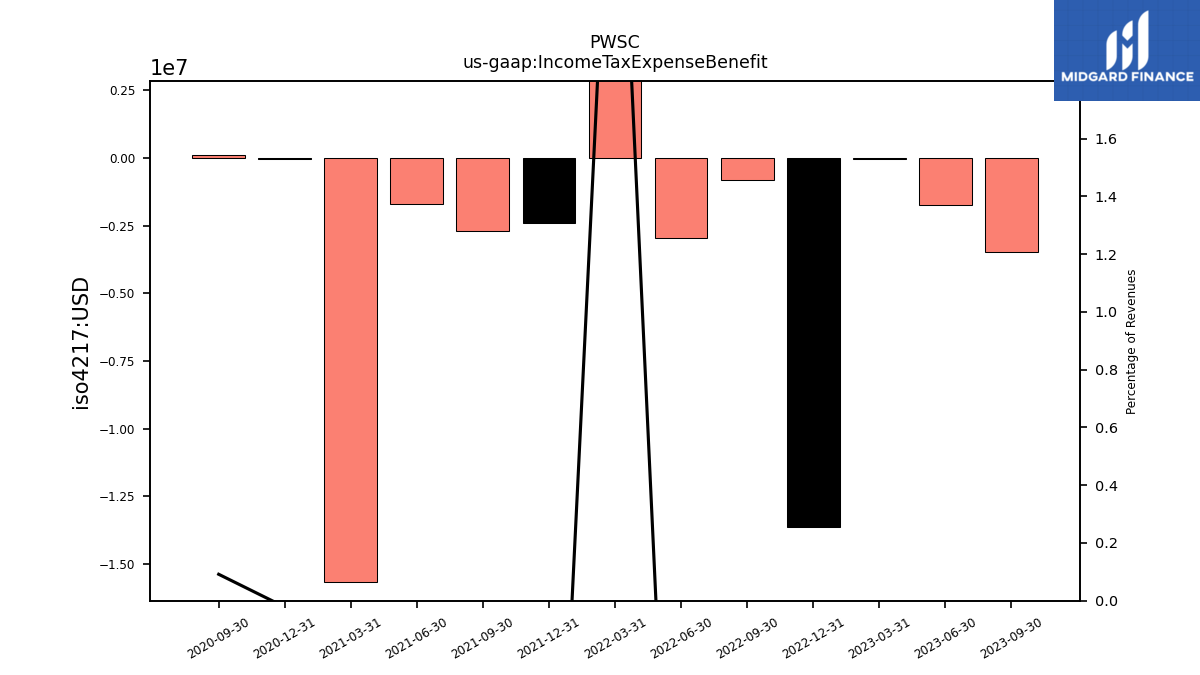
| Income Tax Expense Benefit | 4.87 | 4.77 | -3.48 | -1.72 | -0.04 | -13.61 | -0.81 | -2.93 | 4.54 | -2.38 | -2.69 | -1.69 | -15.66 | -0.03 | 0.11 | |
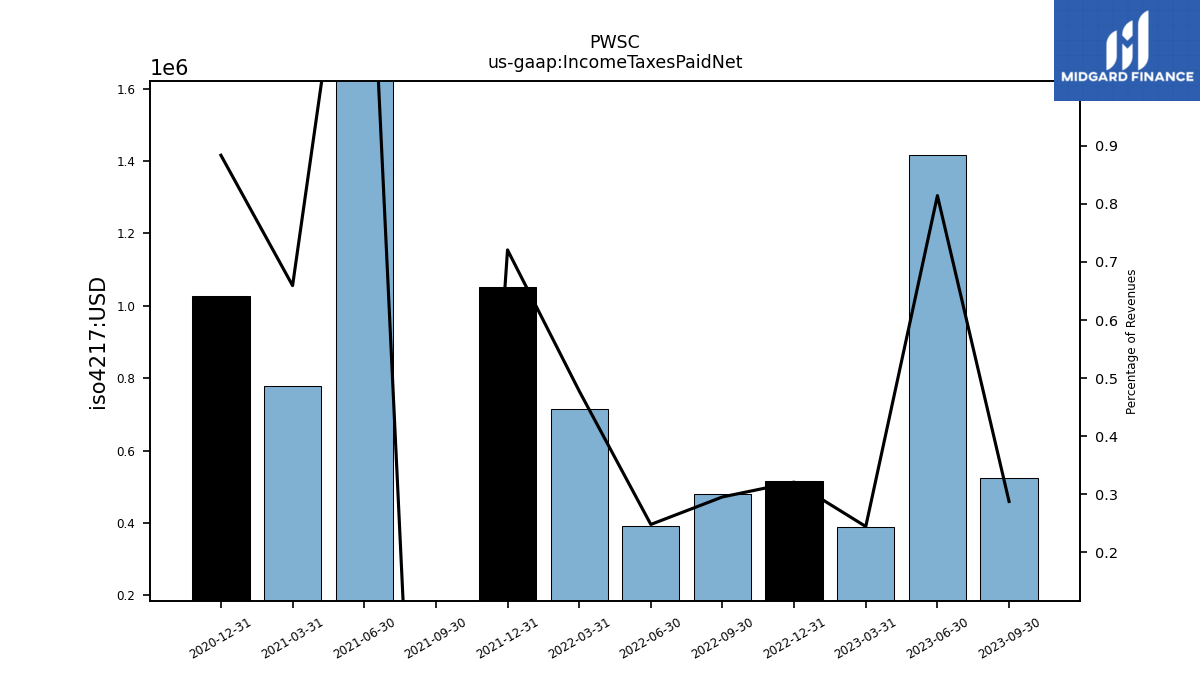
| Income Taxes Paid Net | 0.89 | 1.08 | 0.52 | 1.42 | 0.39 | 0.52 | 0.48 | 0.39 | 0.71 | 1.05 | -1.60 | 2.22 | 0.78 | 1.03 | NA | |
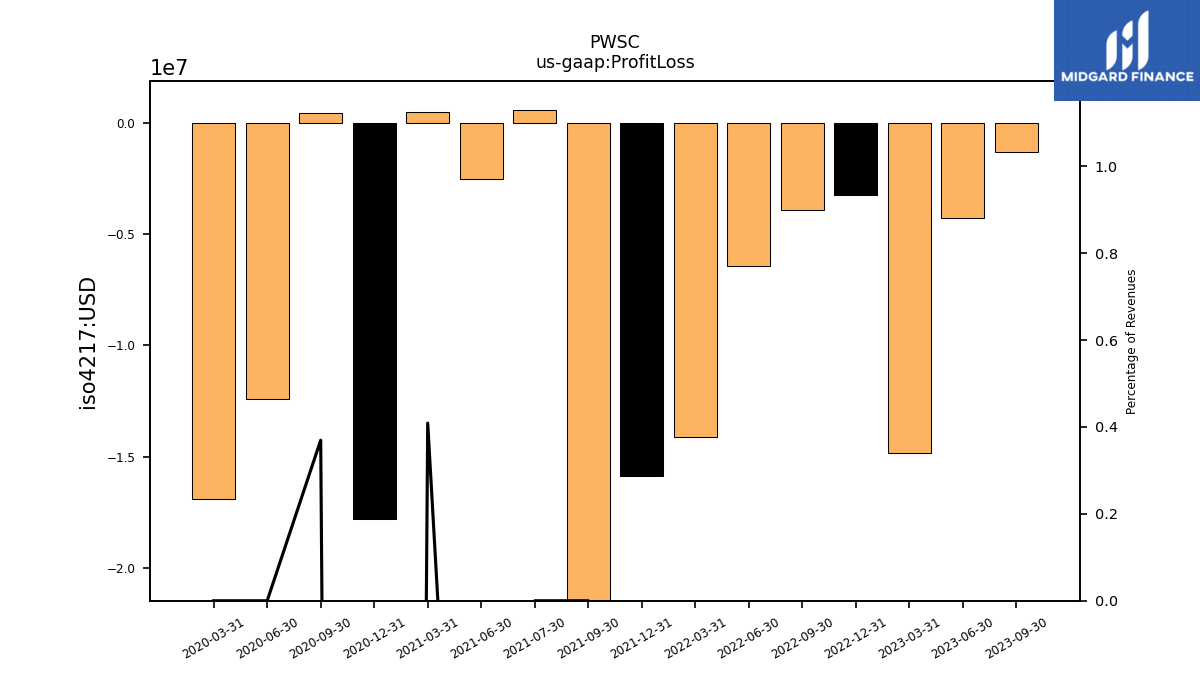
| Profit Loss | -22.85 | -18.66 | -1.31 | -4.29 | -14.81 | -3.25 | -3.92 | -6.46 | -14.12 | -15.88 | -25.68 | -2.54 | 0.48 | -17.80 | 0.43 | |
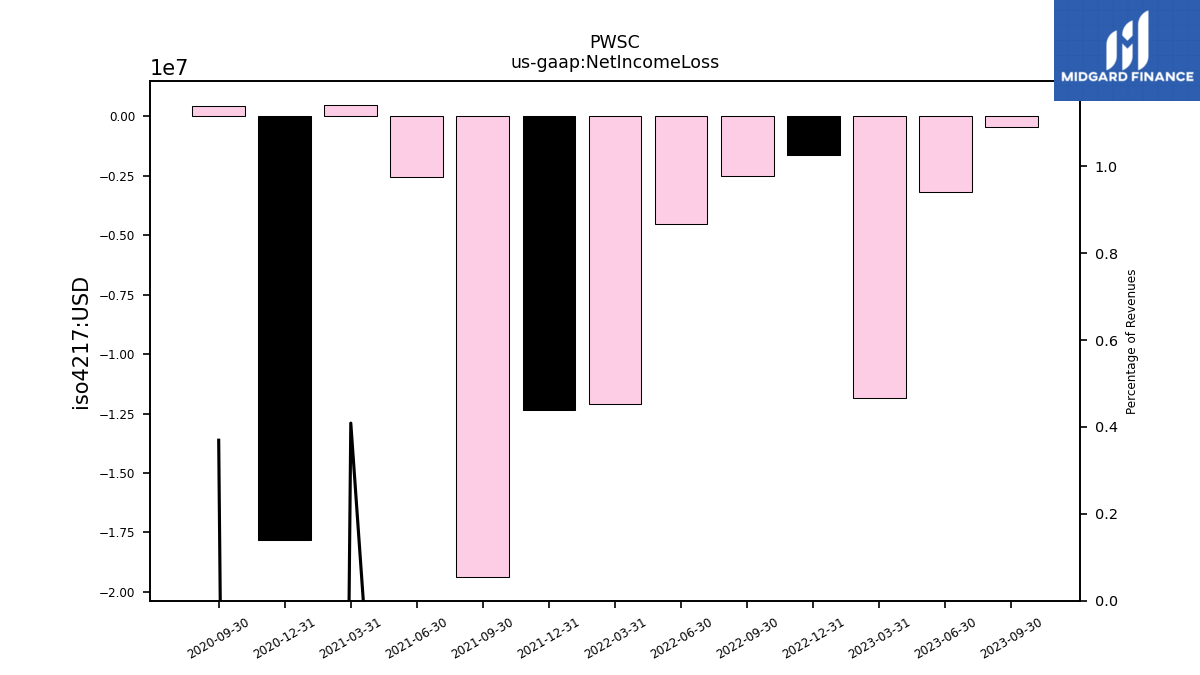
| Net Income Loss | -19.56 | -15.62 | -0.47 | -3.19 | -11.85 | -1.62 | -2.53 | -4.53 | -12.11 | -12.33 | -19.38 | -2.54 | 0.48 | -17.80 | 0.43 | |
| Comprehensive Income Net Of Tax | -20.16 | -15.54 | -0.61 | -3.18 | -11.78 | -1.75 | -3.12 | -4.25 | -11.95 | -12.32 | -19.70 | -2.93 | 0.64 | -17.31 | 0.63 | |
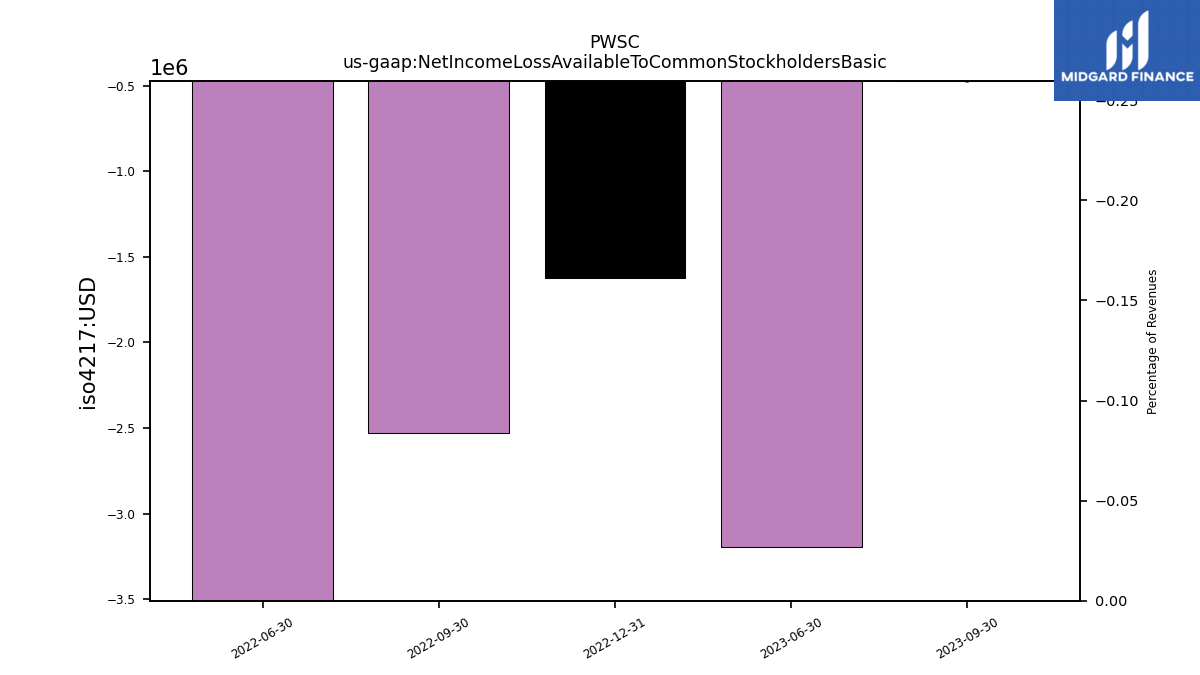
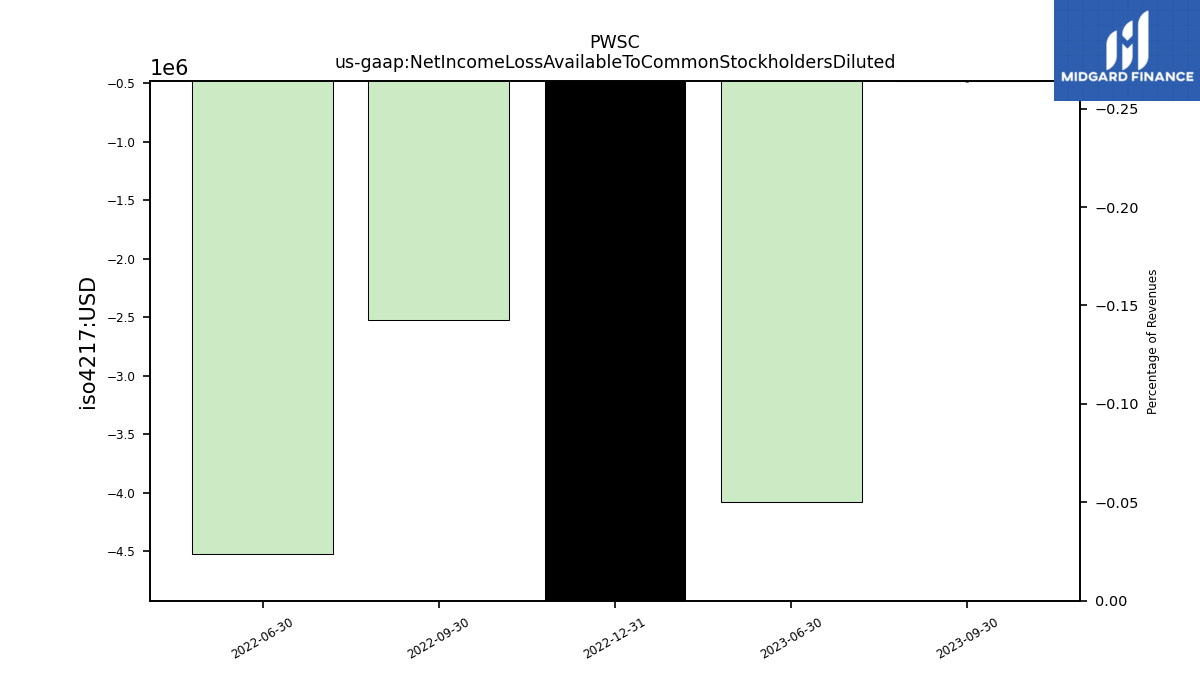
| Net Income Loss Available To Common Stockholders Basic | -19.56 | -15.62 | -0.47 | -3.19 | -11.85 | -1.62 | -2.53 | -4.53 | NA | NA | NA | NA | NA | NA | NA | |
| Net Income Loss Available To Common Stockholders Diluted | -24.13 | -15.62 | -0.48 | -4.08 | -11.85 | -7.64 | -2.53 | -4.53 | NA | NA | NA | NA | NA | NA | NA |
| 2024-03-31 | 2023-12-31 | 2023-09-30 | 2023-06-30 | 2023-03-31 | 2022-12-31 | 2022-09-30 | 2022-06-30 | 2022-03-31 | 2021-12-31 | 2021-09-30 | 2021-06-30 | 2021-03-31 | 2020-12-31 | 2020-09-30 | ||
|---|---|---|---|---|---|---|---|---|---|---|---|---|---|---|---|---|
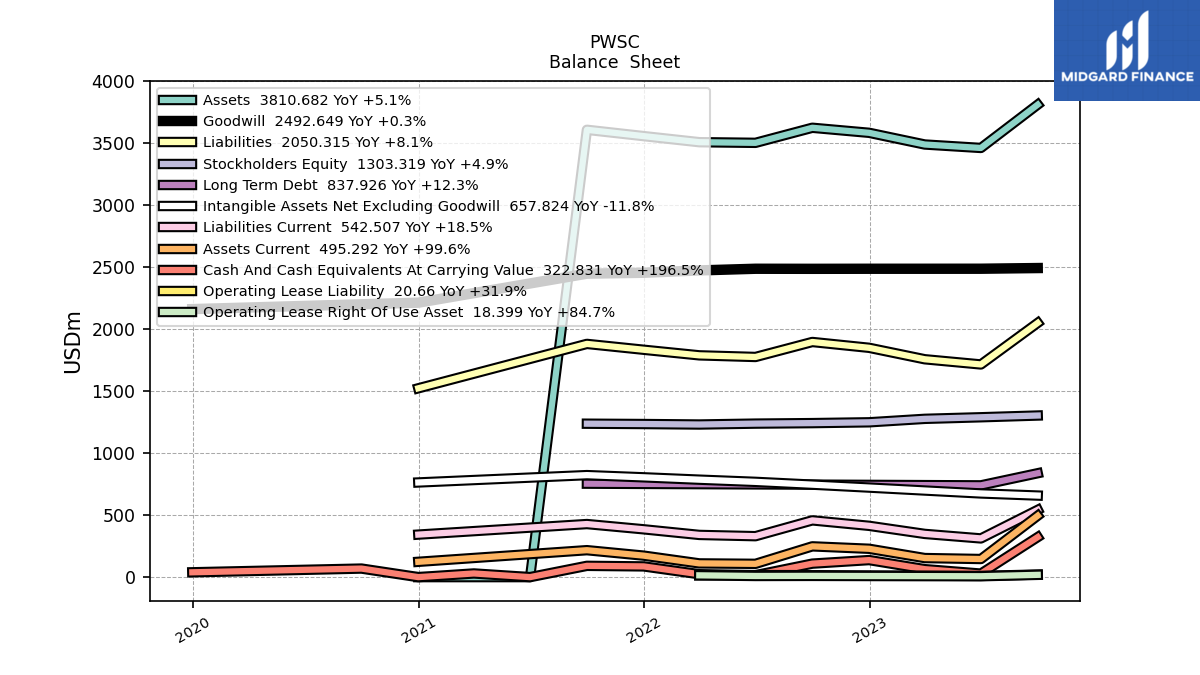
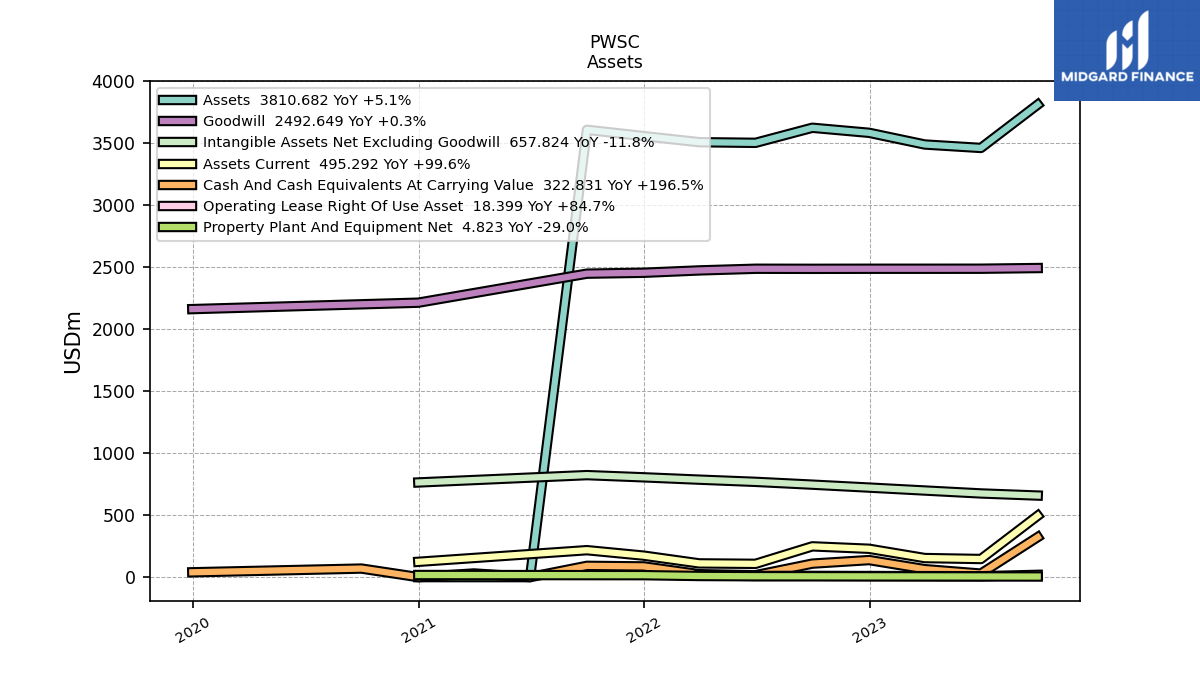
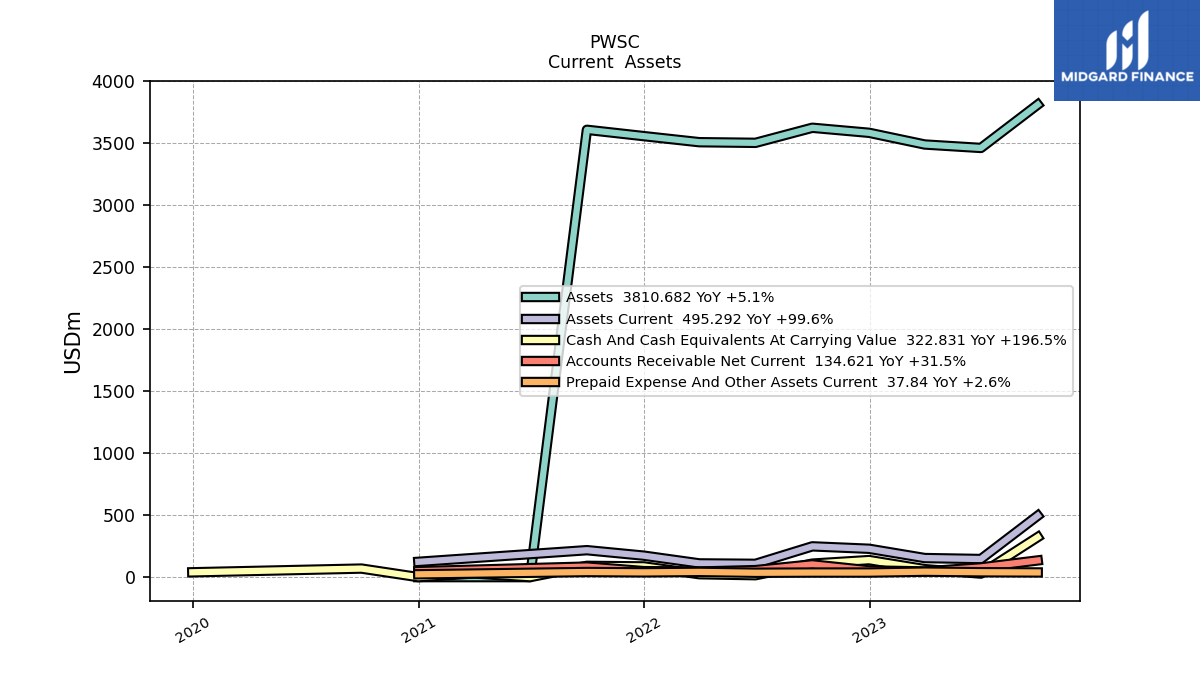
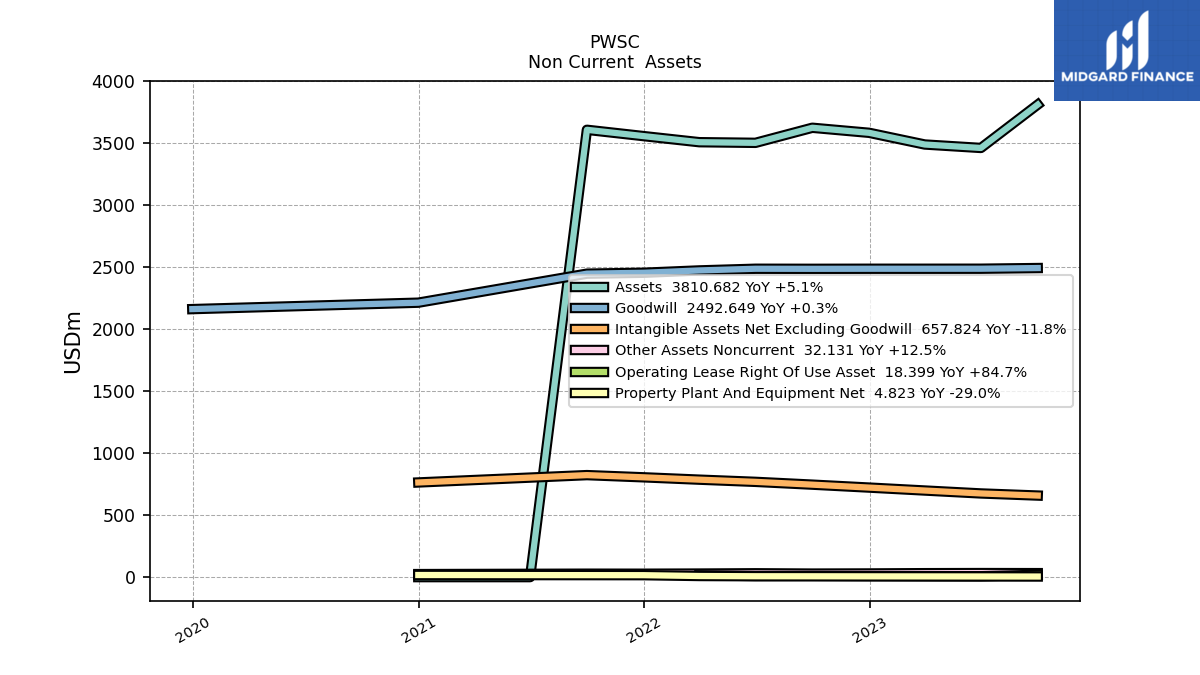
| Assets | NA | 3776.88 | 3810.68 | 3461.16 | 3489.11 | 3583.39 | 3624.05 | 3502.46 | 3507.70 | 3556.68 | 3607.69 | 0.00 | NA | 0.00 | NA | |
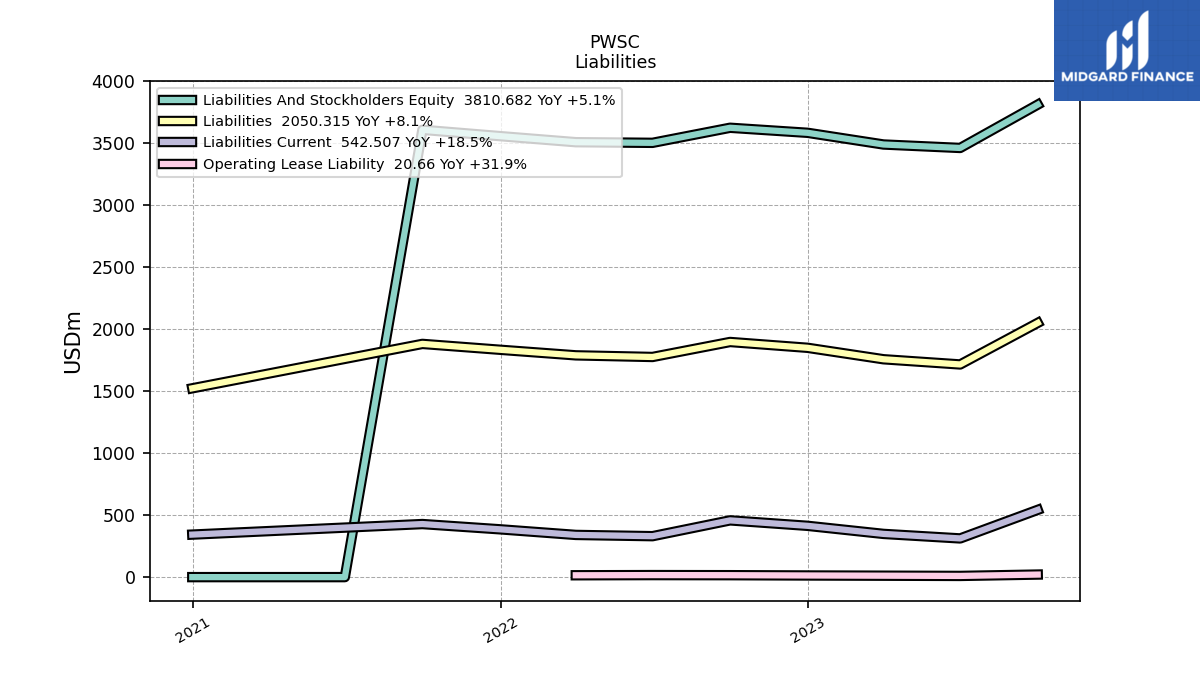
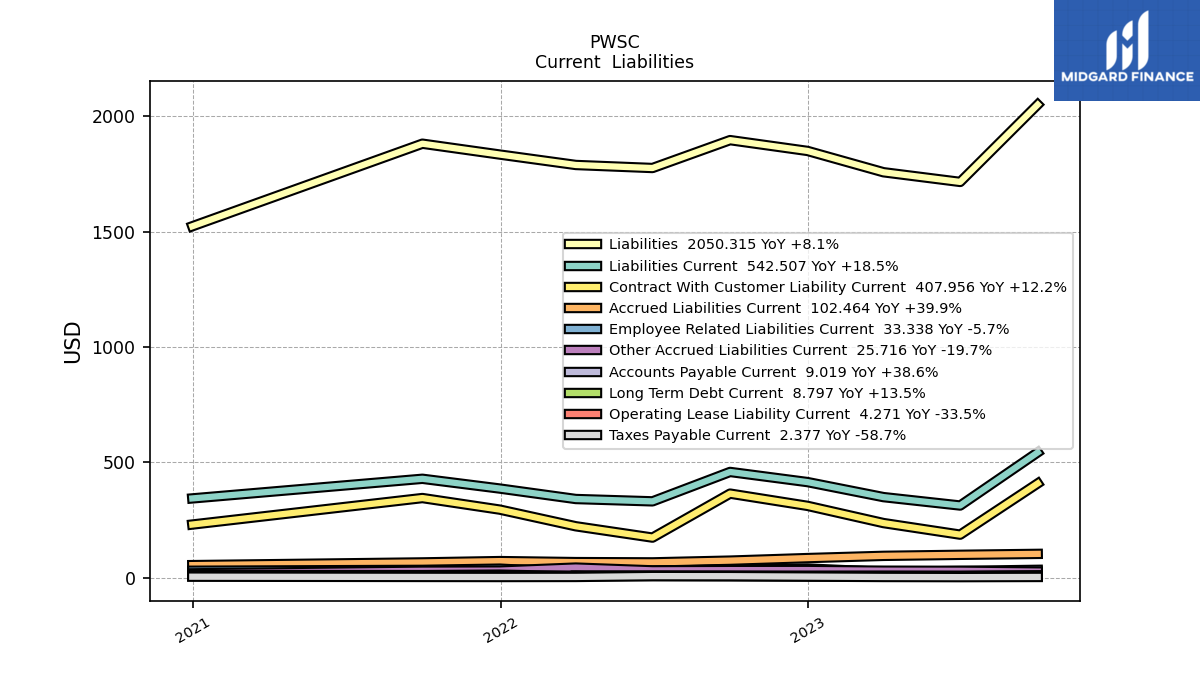
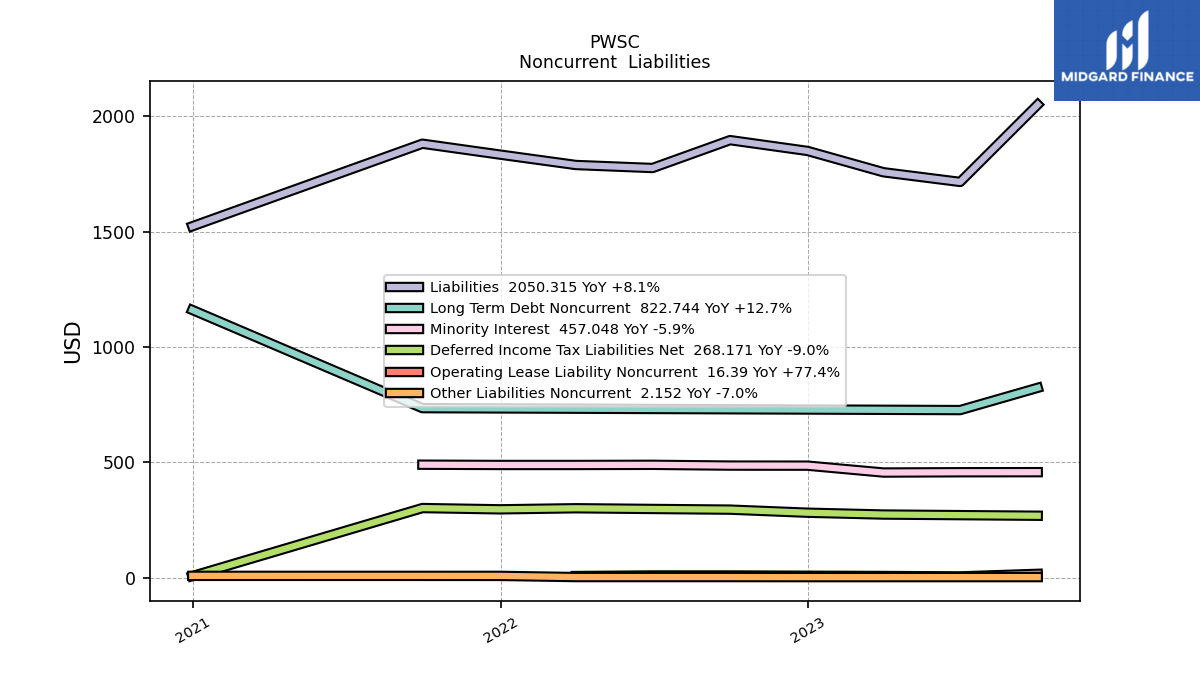
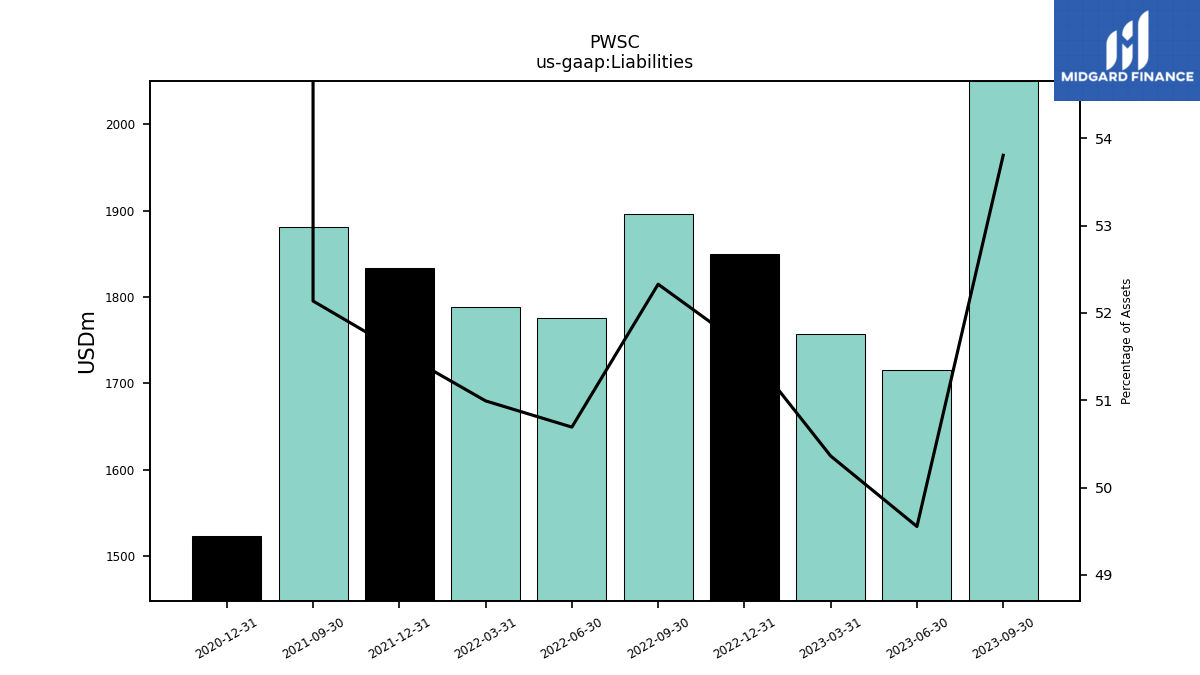
| Liabilities | NA | 2021.60 | 2050.32 | 1715.13 | 1757.14 | 1849.45 | 1896.38 | 1775.46 | 1788.64 | 1833.72 | 1880.89 | NA | NA | 1522.83 | NA | |
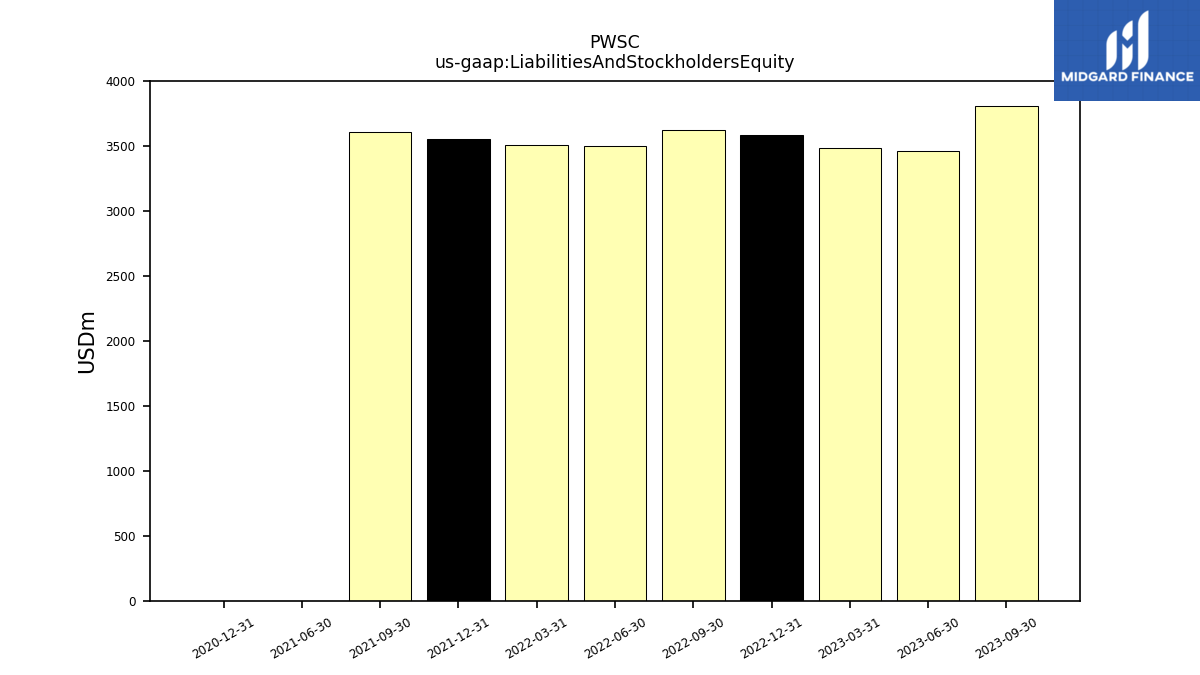
| Liabilities And Stockholders Equity | NA | 3776.88 | 3810.68 | 3461.16 | 3489.11 | 3583.39 | 3624.05 | 3502.46 | 3507.70 | 3556.68 | 3607.69 | 0.00 | NA | 0.00 | NA | |
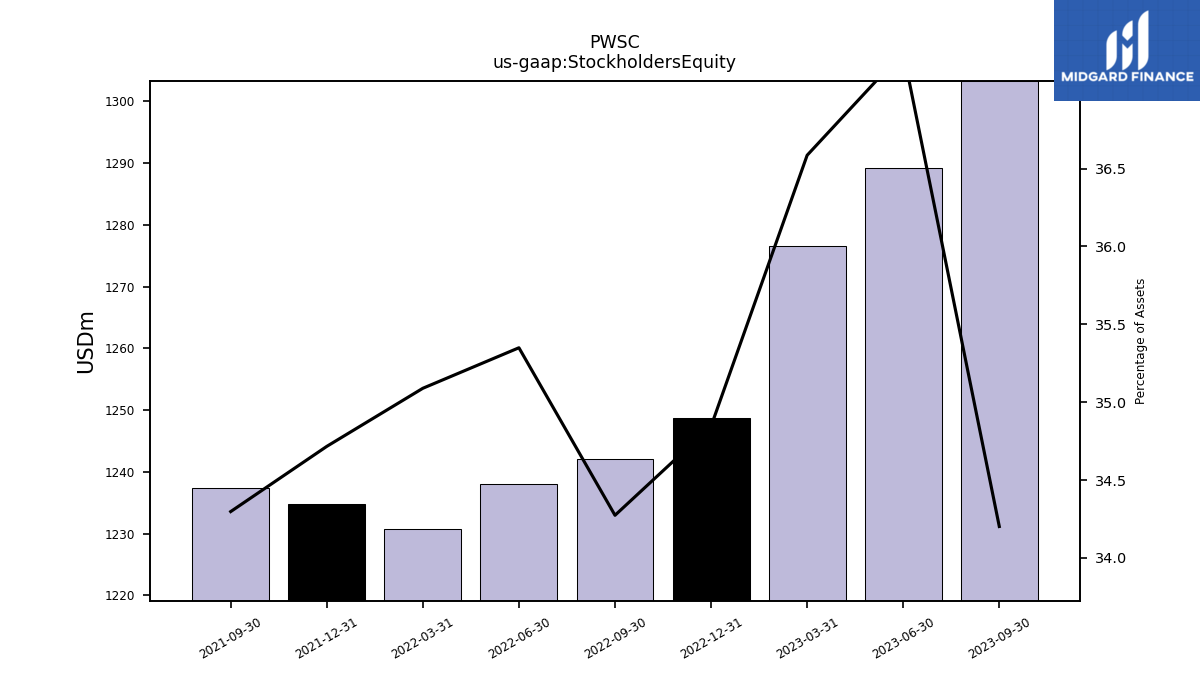
| Stockholders Equity | NA | 1299.83 | 1303.32 | 1289.30 | 1276.51 | 1248.67 | 1242.10 | 1238.10 | 1230.83 | 1234.74 | 1237.35 | NA | NA | NA | NA |
| 2024-03-31 | 2023-12-31 | 2023-09-30 | 2023-06-30 | 2023-03-31 | 2022-12-31 | 2022-09-30 | 2022-06-30 | 2022-03-31 | 2021-12-31 | 2021-09-30 | 2021-06-30 | 2021-03-31 | 2020-12-31 | 2020-09-30 | ||
|---|---|---|---|---|---|---|---|---|---|---|---|---|---|---|---|---|
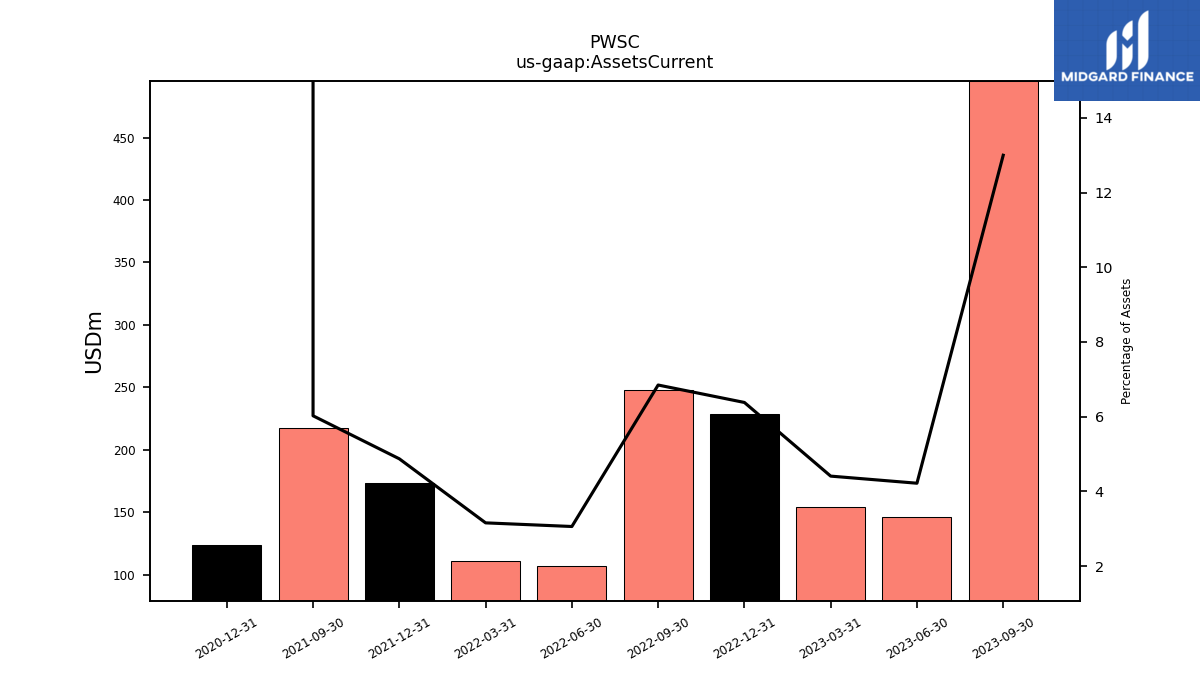
| Assets Current | NA | 156.12 | 495.29 | 146.04 | 153.85 | 228.65 | 248.16 | 107.21 | 110.79 | 173.31 | 217.34 | NA | NA | 123.51 | NA | |
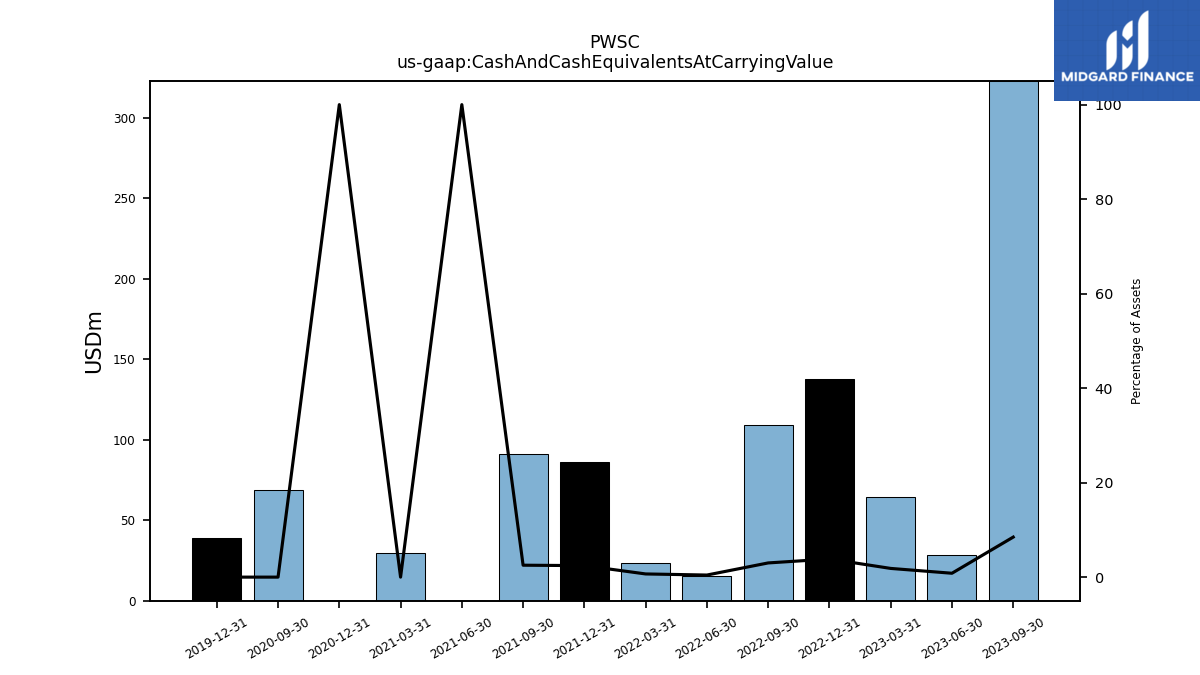
| Cash And Cash Equivalents At Carrying Value | NA | 39.05 | 322.83 | 28.39 | 64.27 | 137.47 | 108.87 | 15.45 | 23.59 | 86.48 | 91.01 | 0.00 | 29.60 | 0.00 | 69.00 | |
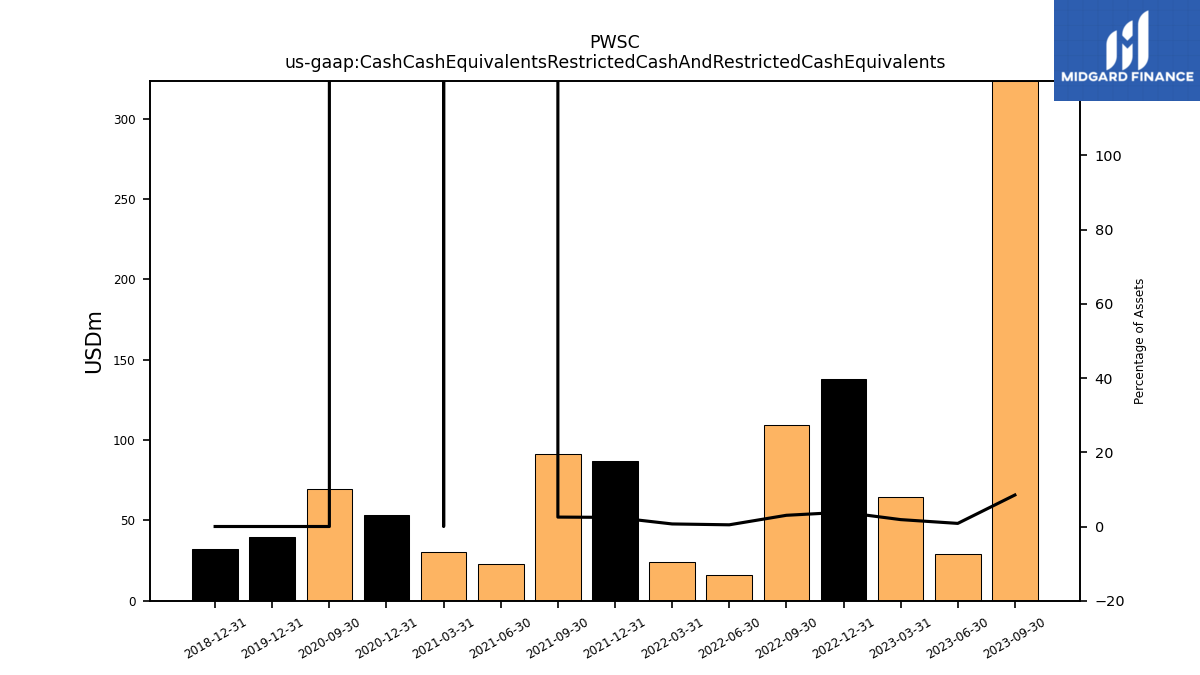
| Cash Cash Equivalents Restricted Cash And Restricted Cash Equivalents | NA | 39.55 | 323.33 | 28.89 | 64.77 | 137.98 | 109.38 | 15.96 | 24.10 | 86.99 | 91.53 | 23.05 | 30.11 | 53.25 | 69.50 | |
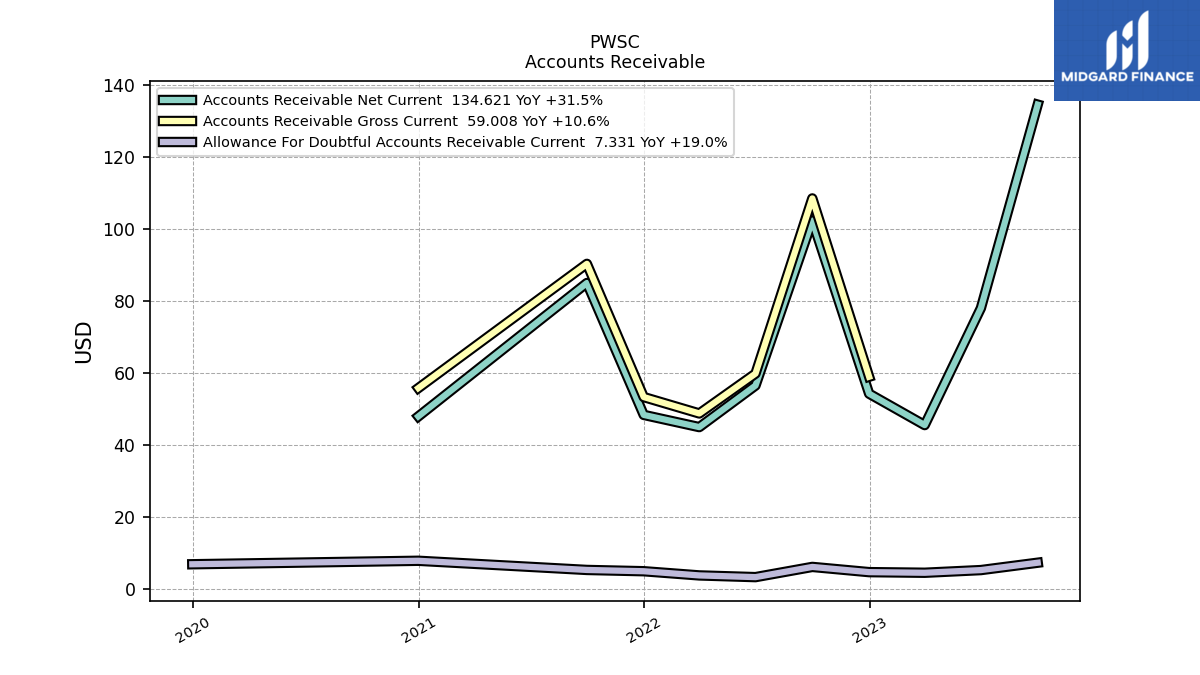
| Accounts Receivable Net Current | NA | 76.62 | 134.62 | 78.08 | 45.57 | 54.30 | 102.40 | 56.56 | 45.01 | 48.40 | 85.06 | NA | NA | 47.98 | NA | |
| Prepaid Expense And Other Assets Current | NA | 40.45 | 37.84 | 39.56 | 44.01 | 36.89 | 36.89 | 35.21 | 42.20 | 38.42 | 41.27 | NA | NA | 22.80 | NA |
| 2024-03-31 | 2023-12-31 | 2023-09-30 | 2023-06-30 | 2023-03-31 | 2022-12-31 | 2022-09-30 | 2022-06-30 | 2022-03-31 | 2021-12-31 | 2021-09-30 | 2021-06-30 | 2021-03-31 | 2020-12-31 | 2020-09-30 | ||
|---|---|---|---|---|---|---|---|---|---|---|---|---|---|---|---|---|
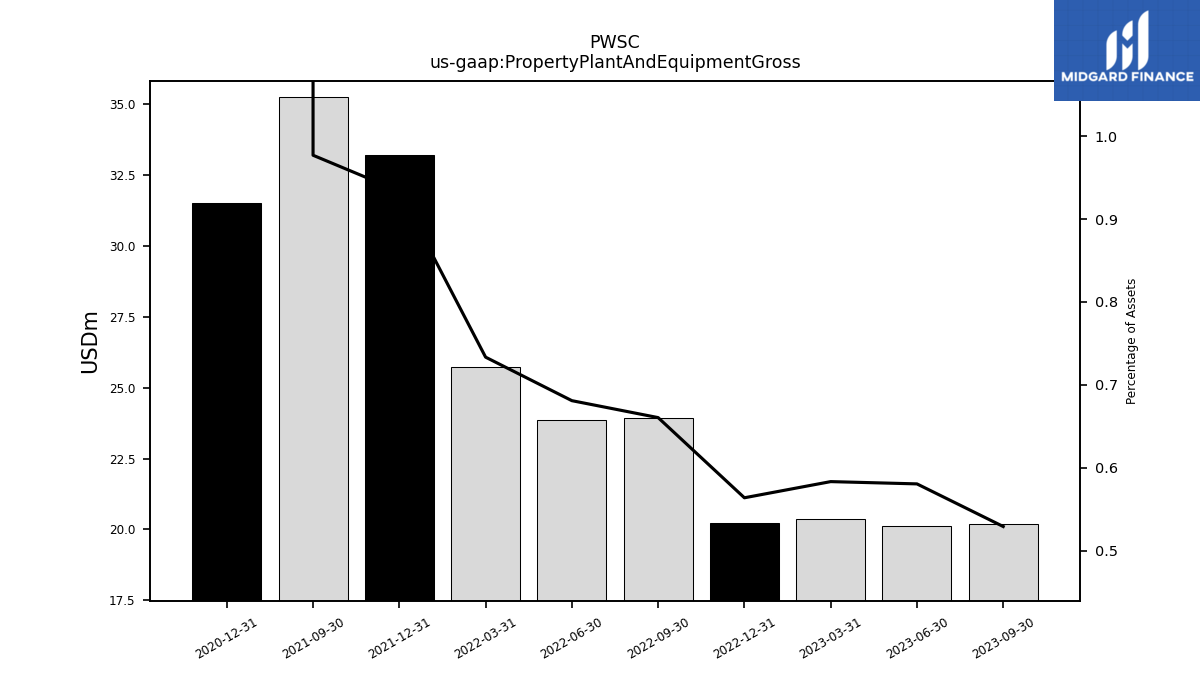
| Property Plant And Equipment Gross | NA | 20.10 | 20.18 | 20.10 | 20.36 | 20.21 | 23.94 | 23.86 | 25.73 | 33.20 | 35.24 | NA | NA | 31.52 | NA | |
| Accumulated Depreciation Depletion And Amortization Property Plant And Equipment | NA | 15.10 | 15.35 | 14.82 | 14.61 | 14.04 | 17.15 | 16.77 | 16.73 | 17.52 | 19.21 | NA | NA | 14.45 | NA | |
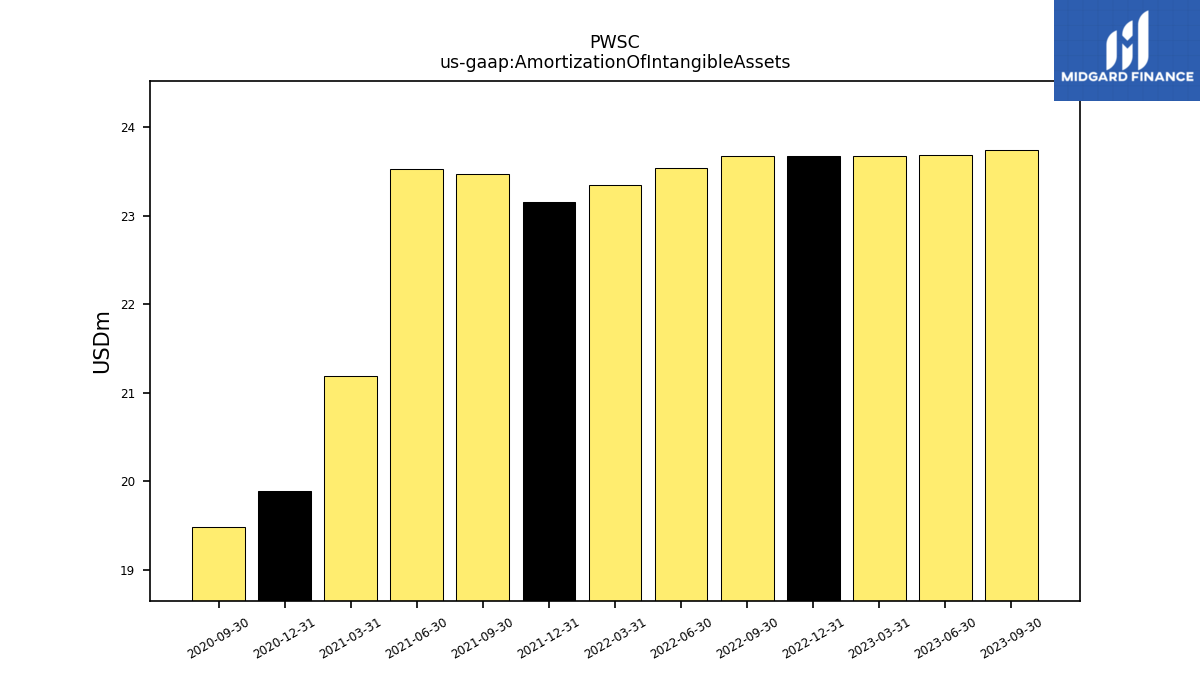
| Amortization Of Intangible Assets | 26.43 | 25.79 | 23.74 | 23.68 | 23.68 | 23.68 | 23.68 | 23.54 | 23.35 | 23.15 | 23.48 | 23.53 | 21.19 | 19.89 | 19.49 | |
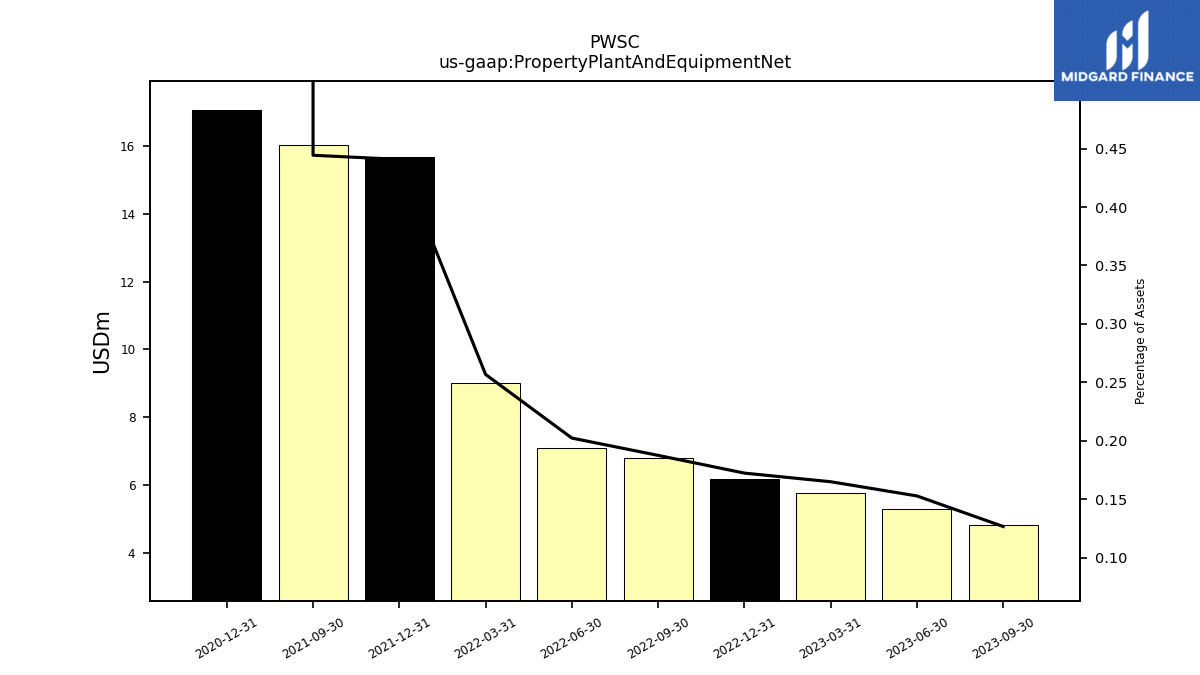
| Property Plant And Equipment Net | NA | 5.00 | 4.82 | 5.29 | 5.75 | 6.17 | 6.79 | 7.08 | 9.01 | 15.68 | 16.03 | NA | NA | 17.07 | NA | |
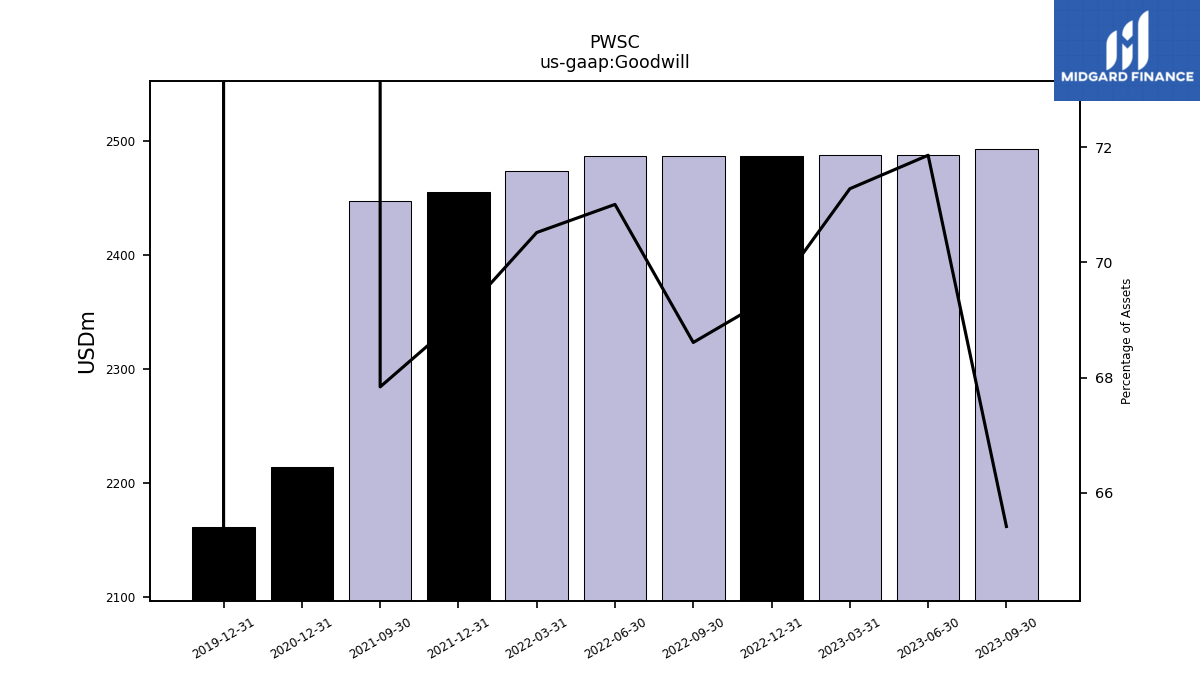
| Goodwill | 2770.97 | 2740.72 | 2492.65 | 2487.24 | 2487.02 | 2487.01 | 2486.42 | 2487.00 | 2473.59 | 2454.69 | 2447.36 | NA | NA | 2213.37 | NA | |
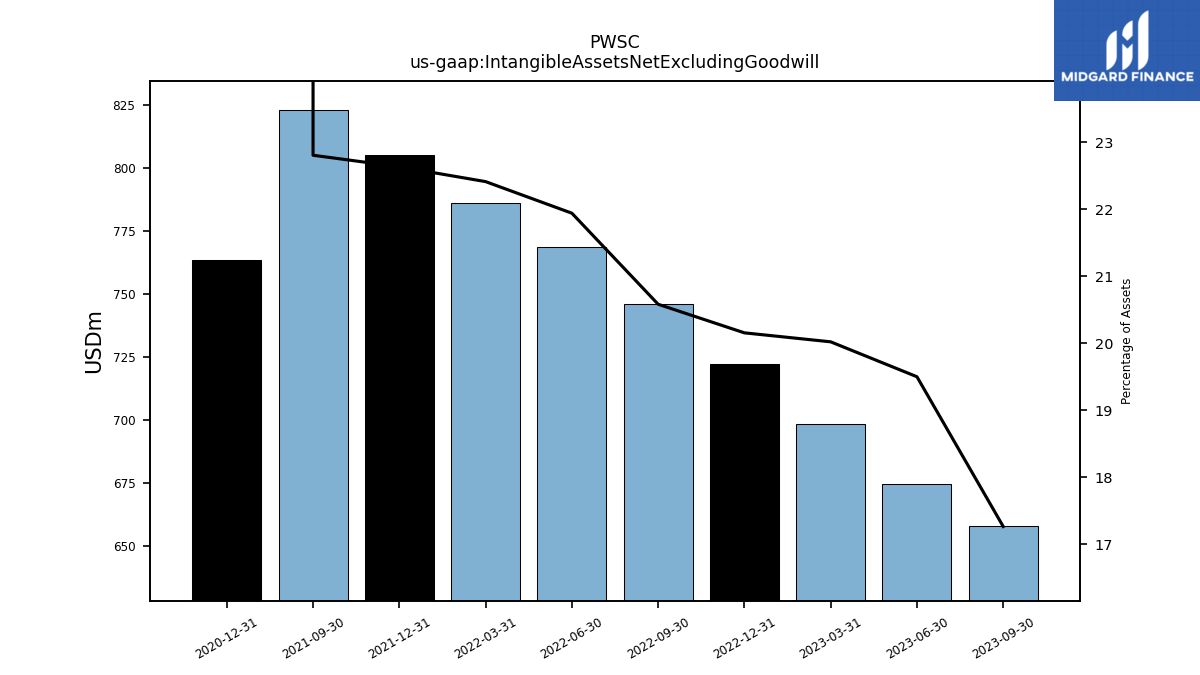
| Intangible Assets Net Excluding Goodwill | NA | 710.63 | 657.82 | 674.84 | 698.47 | 722.15 | 745.80 | 768.38 | 786.06 | 804.91 | 822.66 | NA | NA | 763.46 | NA | |
| Finite Lived Intangible Assets Net | NA | 710.63 | 657.82 | 674.84 | 698.47 | 722.15 | 745.80 | 768.38 | 786.06 | 804.91 | 822.66 | NA | NA | 763.46 | NA | |
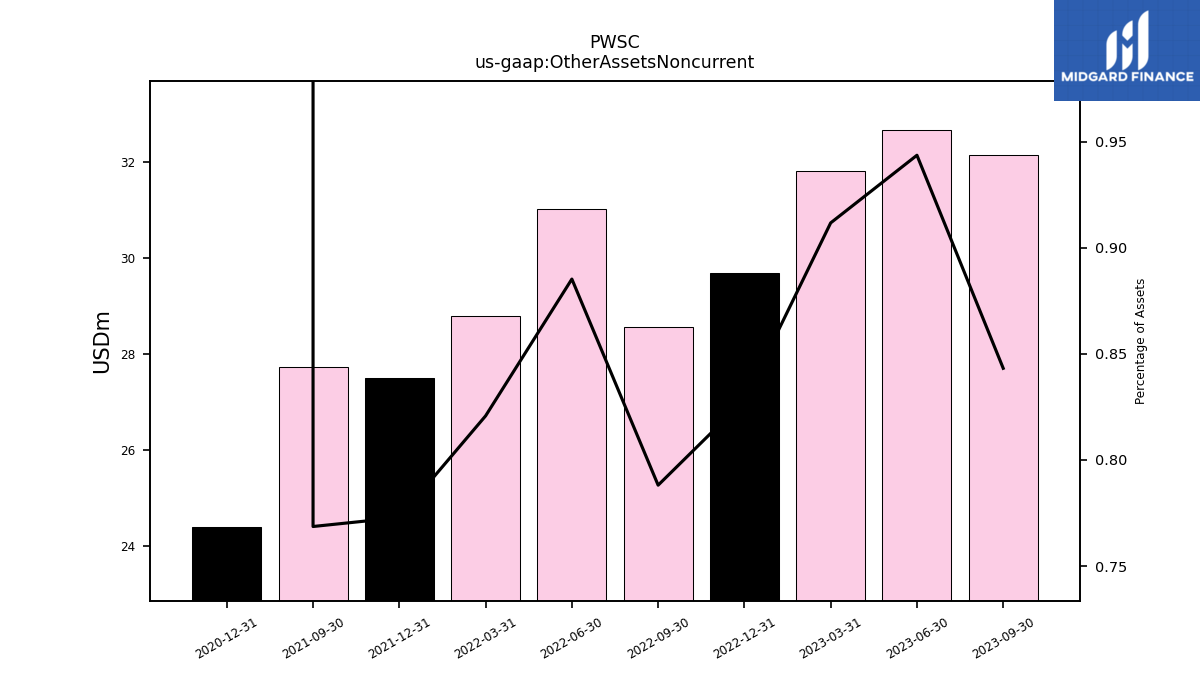
| Other Assets Noncurrent | NA | 36.31 | 32.13 | 32.66 | 31.81 | 29.68 | 28.56 | 31.00 | 28.79 | 27.49 | 27.73 | NA | NA | 24.40 | NA |
| 2024-03-31 | 2023-12-31 | 2023-09-30 | 2023-06-30 | 2023-03-31 | 2022-12-31 | 2022-09-30 | 2022-06-30 | 2022-03-31 | 2021-12-31 | 2021-09-30 | 2021-06-30 | 2021-03-31 | 2020-12-31 | 2020-09-30 | ||
|---|---|---|---|---|---|---|---|---|---|---|---|---|---|---|---|---|
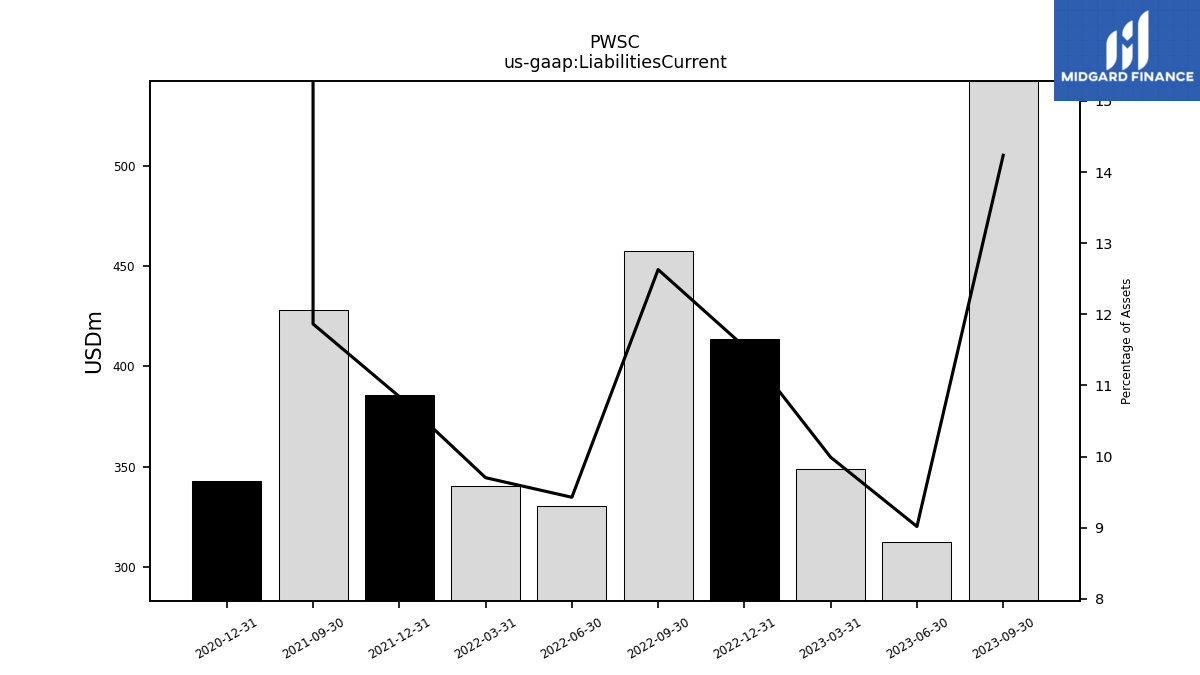
| Liabilities Current | NA | 516.91 | 542.51 | 312.08 | 348.57 | 413.70 | 457.69 | 330.20 | 340.35 | 385.64 | 428.05 | NA | NA | 342.92 | NA | |
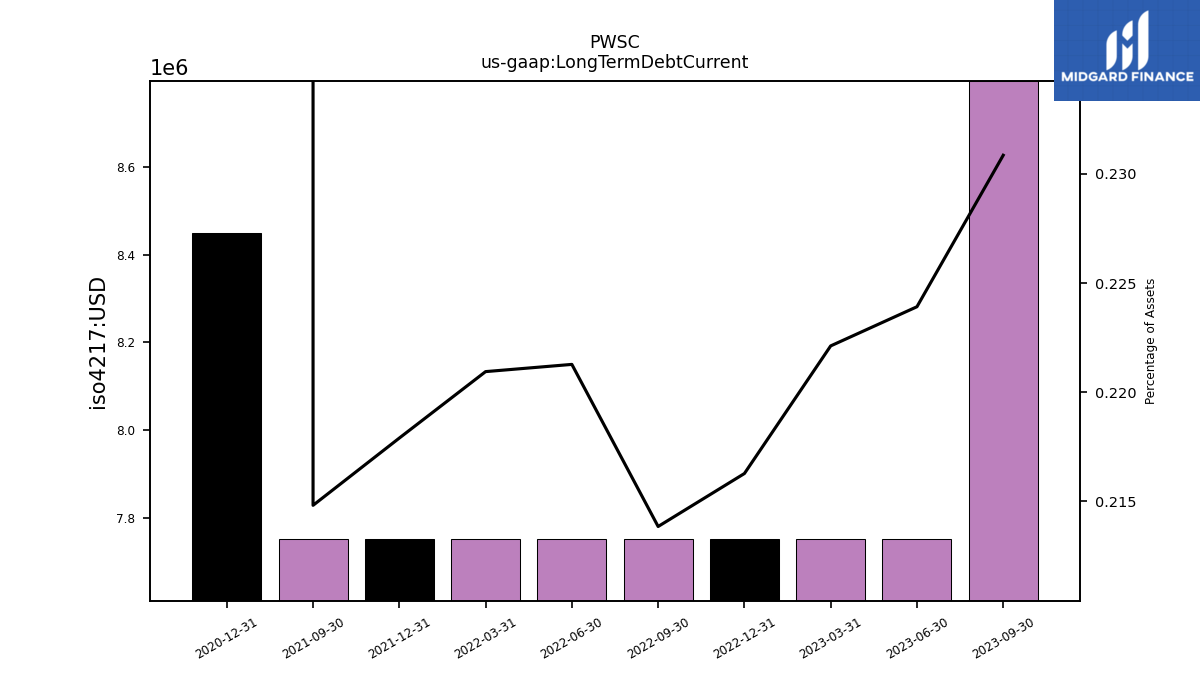
| Long Term Debt Current | NA | 8.38 | 8.80 | 7.75 | 7.75 | 7.75 | 7.75 | 7.75 | 7.75 | 7.75 | 7.75 | NA | NA | 8.45 | NA | |
| Accounts Payable Current | NA | 13.63 | 9.02 | 5.65 | 6.32 | 5.88 | 6.51 | 6.77 | 5.45 | 12.45 | 10.28 | NA | NA | 11.14 | NA | |
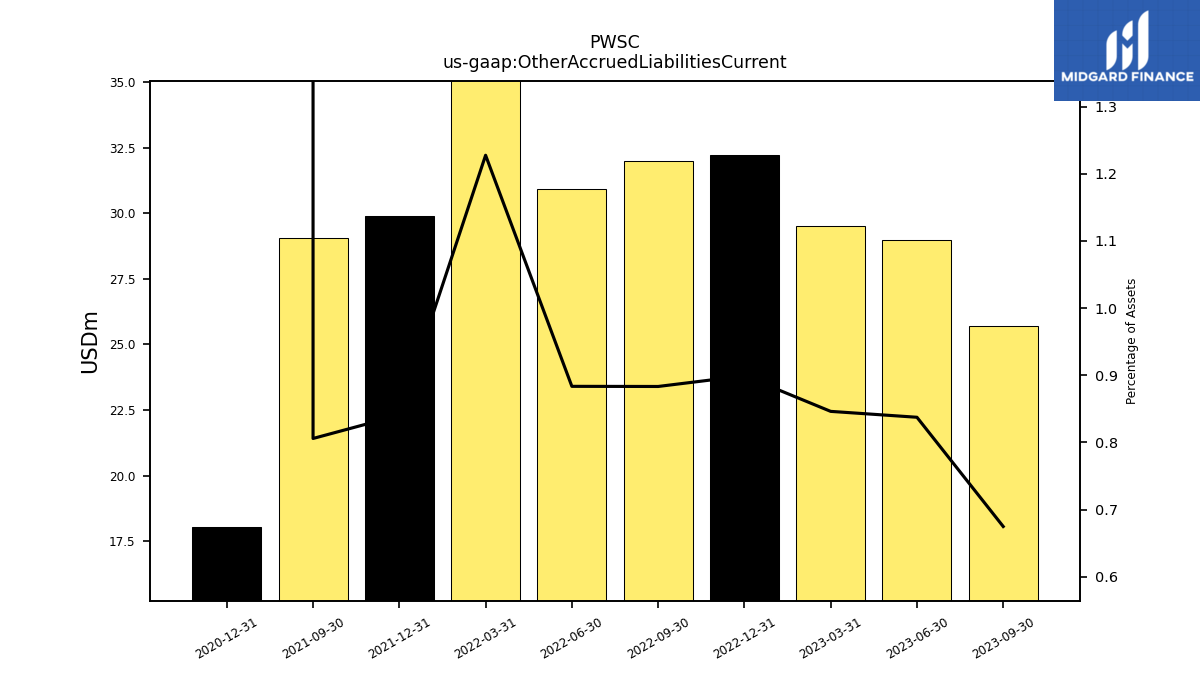
| Other Accrued Liabilities Current | NA | 37.05 | 25.72 | 28.98 | 29.52 | 32.22 | 32.01 | 30.94 | 43.05 | 29.89 | 29.07 | NA | NA | 18.06 | NA | |
| Taxes Payable Current | NA | 1.53 | 2.38 | 1.67 | 2.27 | 3.99 | 5.75 | 6.06 | 2.44 | 2.13 | 2.46 | NA | NA | 3.52 | NA | |
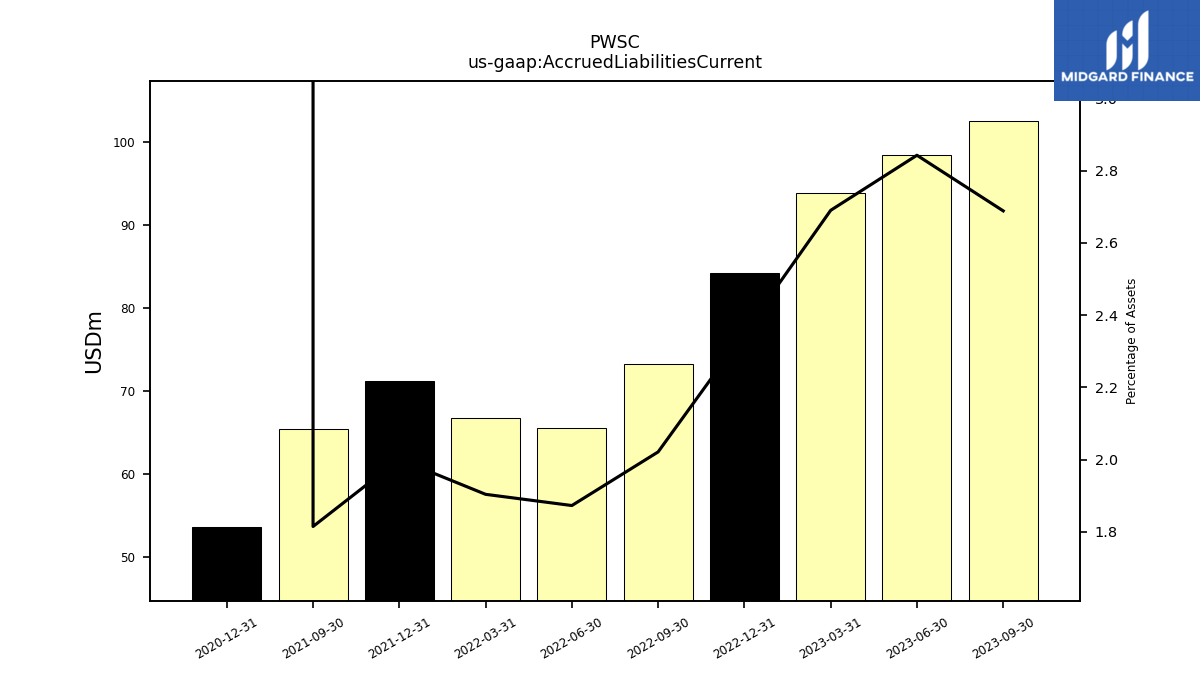
| Accrued Liabilities Current | NA | 116.27 | 102.46 | 98.40 | 93.87 | 84.27 | 73.25 | 65.59 | 66.78 | 71.17 | 65.47 | NA | NA | 53.70 | NA | |
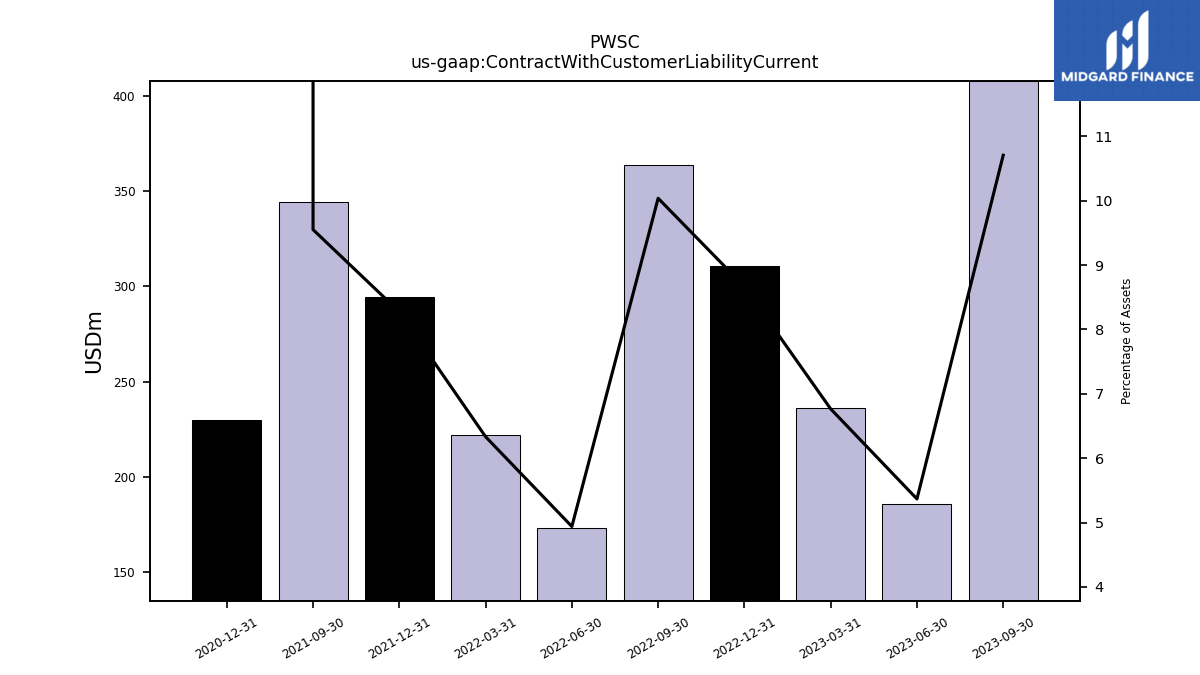
| Contract With Customer Liability Current | NA | 373.67 | 407.96 | 185.78 | 236.07 | 310.54 | 363.75 | 172.99 | 222.15 | 294.28 | 344.55 | NA | NA | 229.62 | NA |
| 2024-03-31 | 2023-12-31 | 2023-09-30 | 2023-06-30 | 2023-03-31 | 2022-12-31 | 2022-09-30 | 2022-06-30 | 2022-03-31 | 2021-12-31 | 2021-09-30 | 2021-06-30 | 2021-03-31 | 2020-12-31 | 2020-09-30 | ||
|---|---|---|---|---|---|---|---|---|---|---|---|---|---|---|---|---|
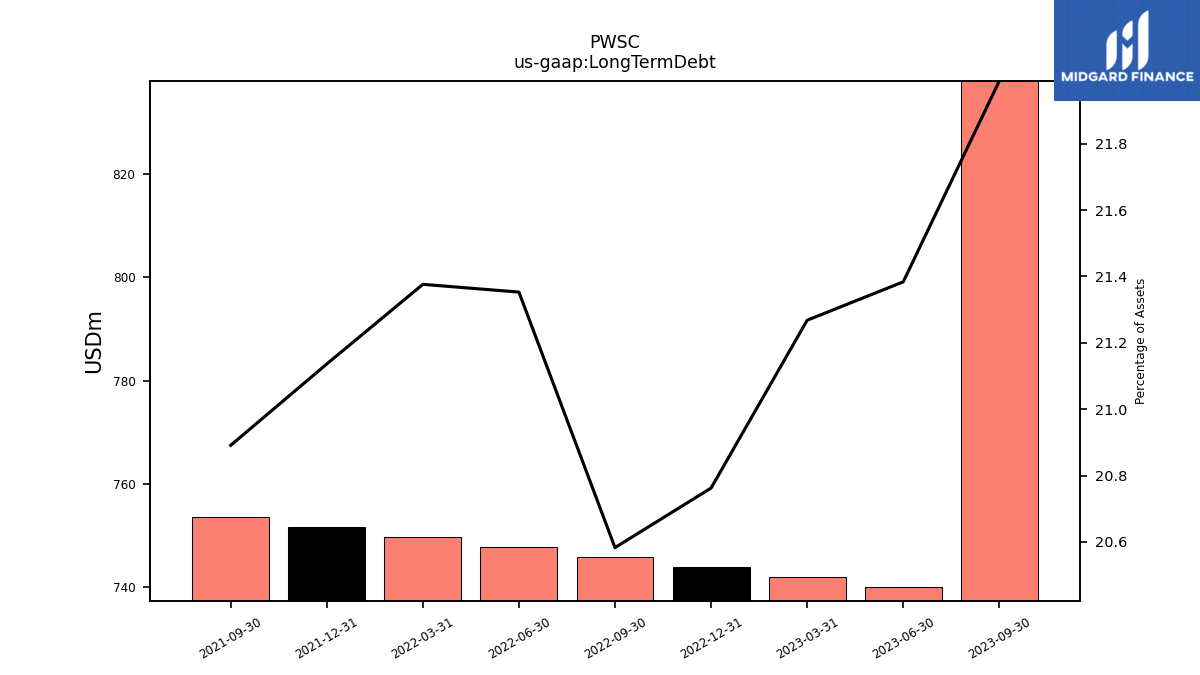
| Long Term Debt | 835.83 | 837.93 | 837.93 | 740.12 | 742.06 | 744.00 | 745.94 | 747.88 | 749.81 | 751.75 | 753.69 | NA | NA | NA | NA | |
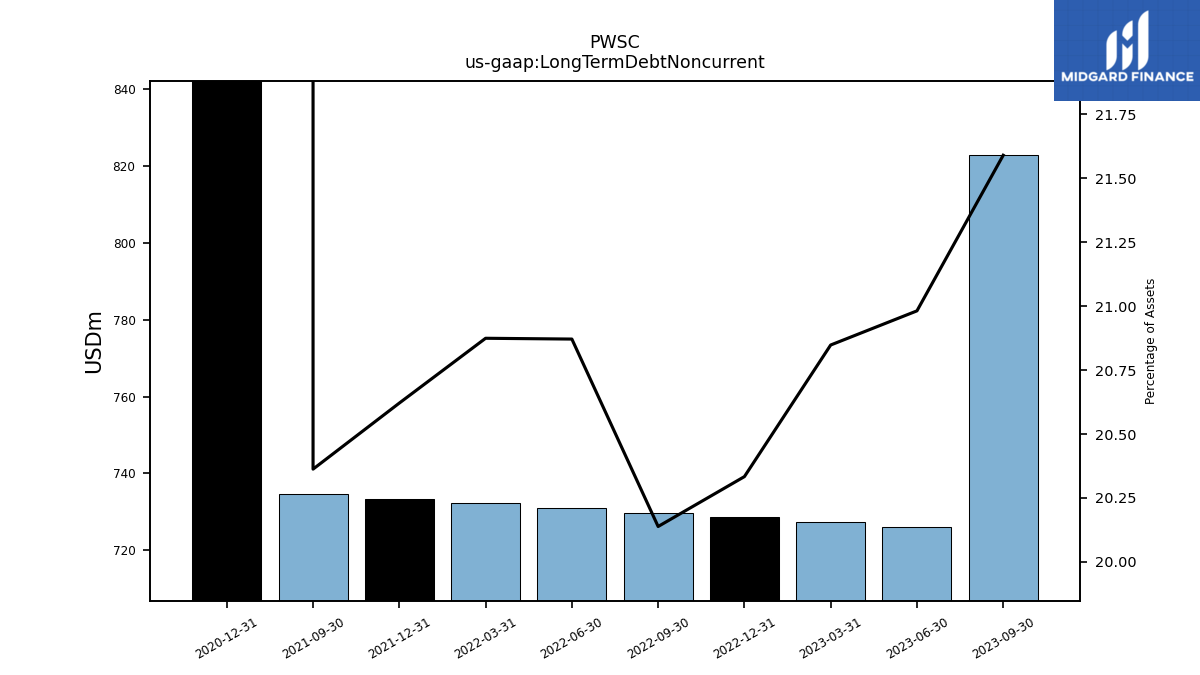
| Long Term Debt Noncurrent | NA | 811.33 | 822.74 | 726.21 | 727.41 | 728.62 | 729.82 | 731.01 | 732.22 | 733.42 | 734.62 | NA | NA | 1160.33 | NA | |
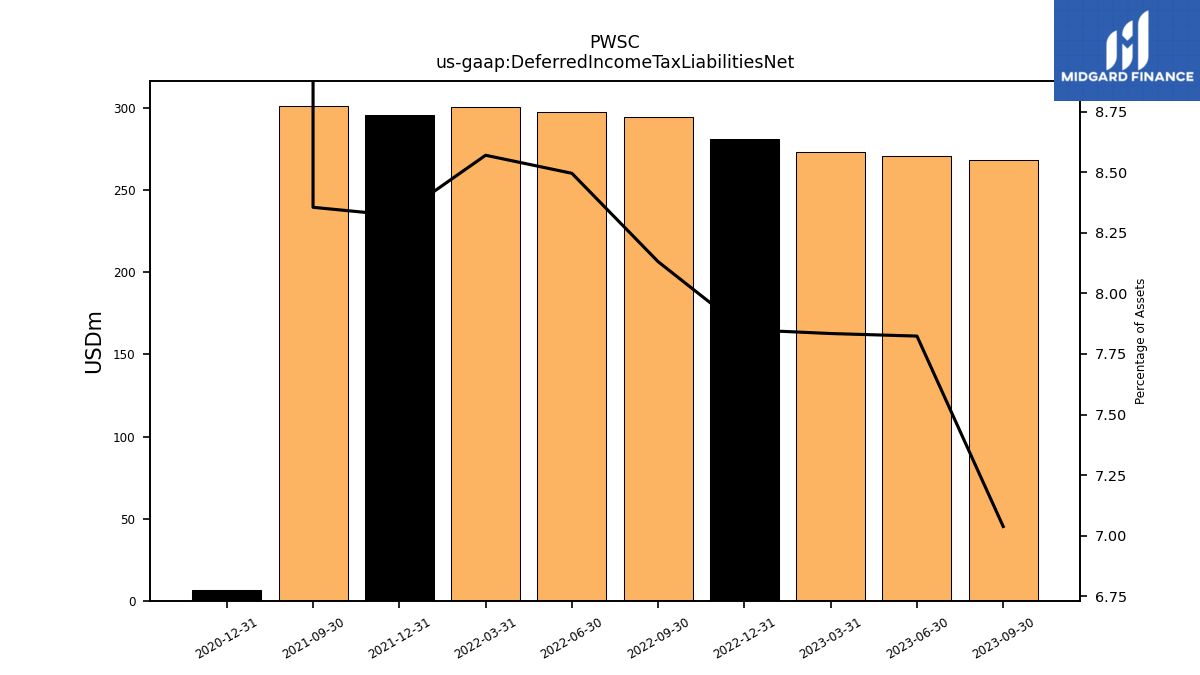
| Deferred Income Tax Liabilities Net | NA | 275.32 | 268.17 | 270.80 | 273.36 | 281.31 | 294.68 | 297.58 | 300.64 | 295.96 | 301.46 | NA | NA | 6.48 | NA | |
| Minority Interest | NA | 455.46 | 457.05 | 456.73 | 455.45 | 485.28 | 485.57 | 488.90 | 488.23 | 488.21 | 489.45 | NA | NA | NA | NA | |
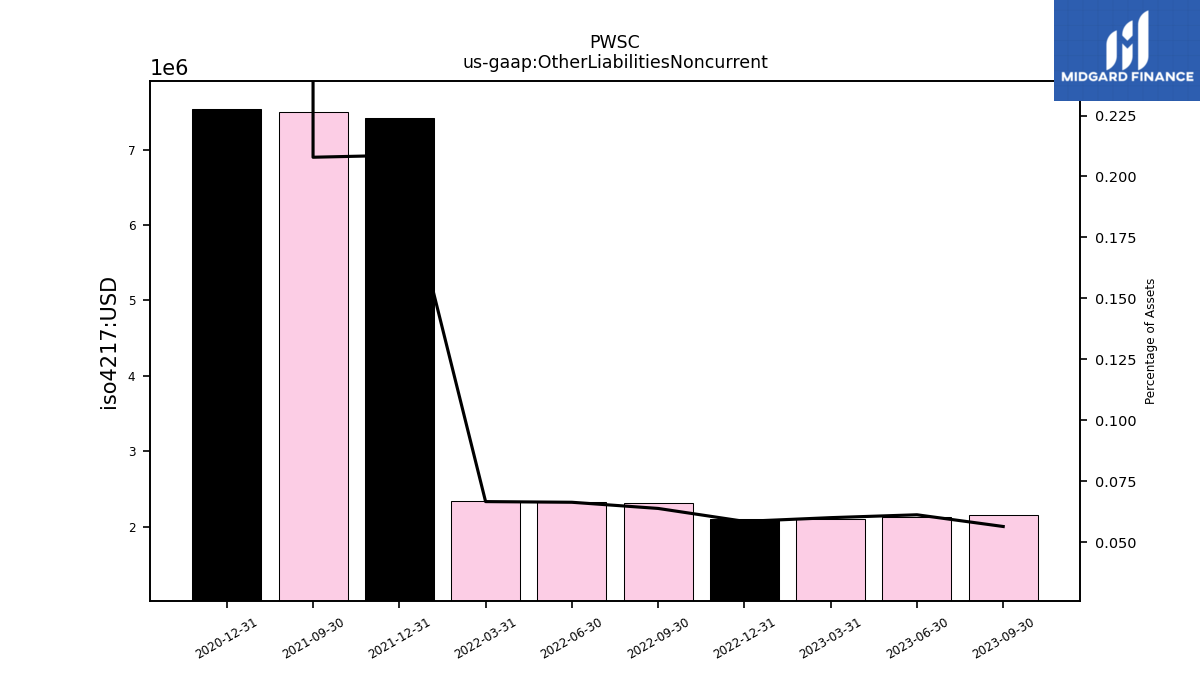
| Other Liabilities Noncurrent | NA | 2.18 | 2.15 | 2.12 | 2.10 | 2.10 | 2.31 | 2.33 | 2.34 | 7.42 | 7.50 | NA | NA | 7.54 | NA | |
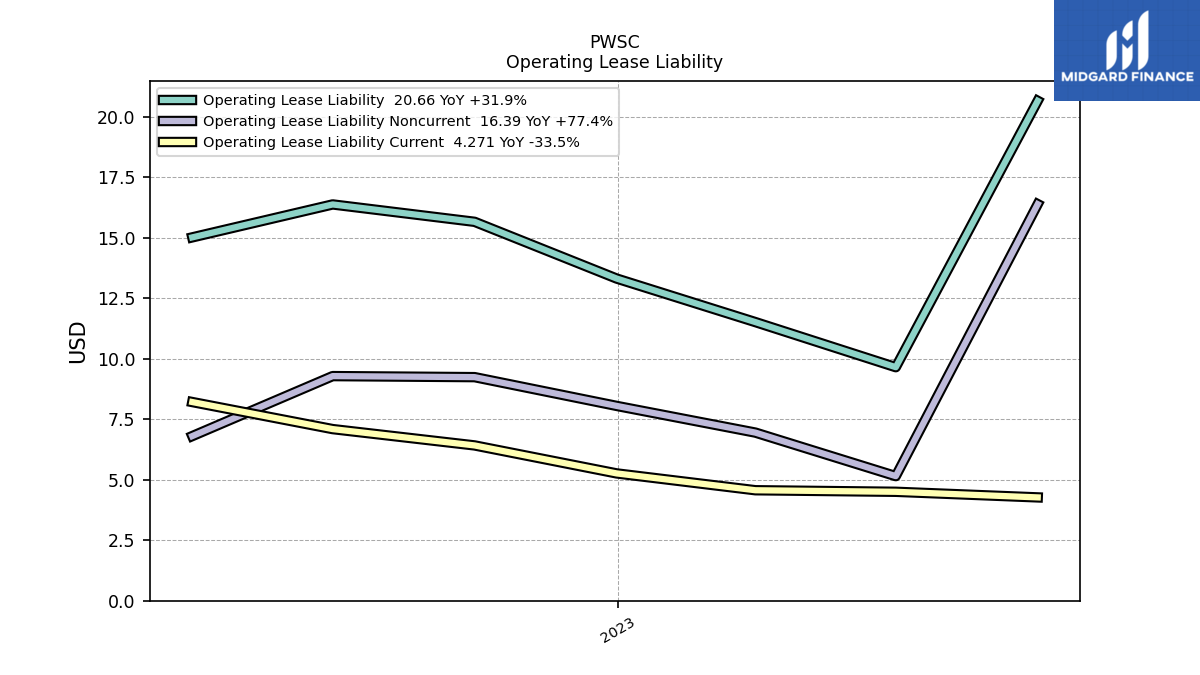
| Operating Lease Liability Noncurrent | NA | 13.36 | 16.39 | 5.15 | 6.95 | 8.05 | 9.24 | 9.28 | 6.80 | NA | NA | NA | NA | NA | NA |
| 2024-03-31 | 2023-12-31 | 2023-09-30 | 2023-06-30 | 2023-03-31 | 2022-12-31 | 2022-09-30 | 2022-06-30 | 2022-03-31 | 2021-12-31 | 2021-09-30 | 2021-06-30 | 2021-03-31 | 2020-12-31 | 2020-09-30 | ||
|---|---|---|---|---|---|---|---|---|---|---|---|---|---|---|---|---|
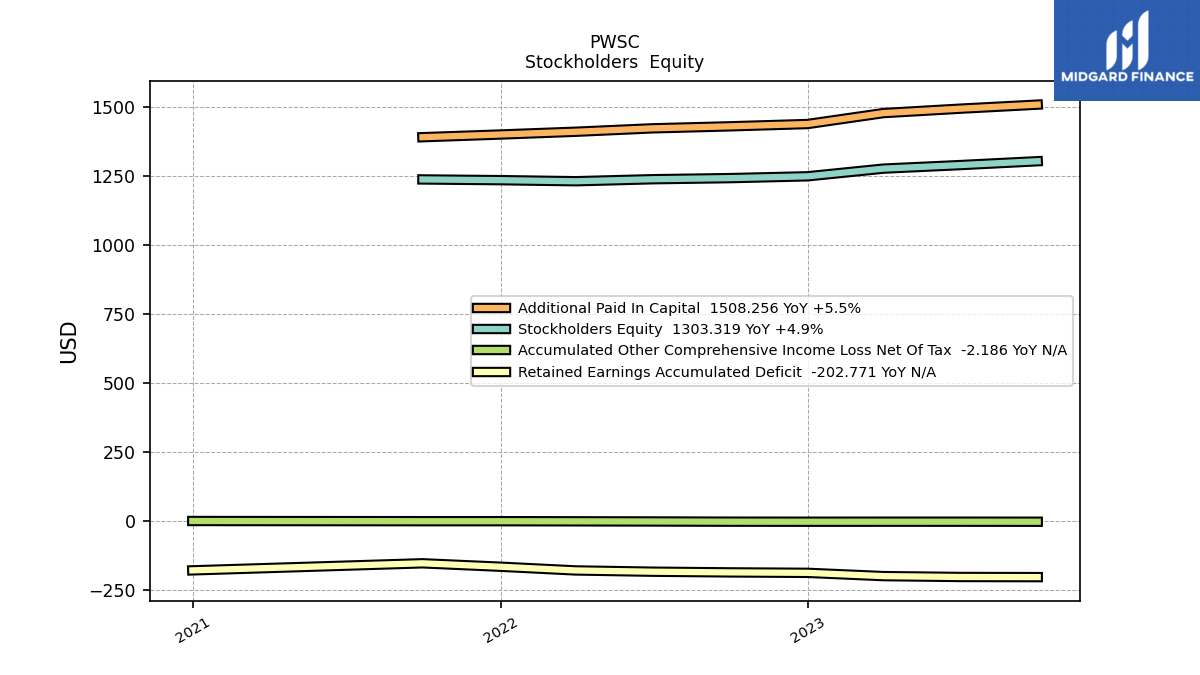
| Stockholders Equity | NA | 1299.83 | 1303.32 | 1289.30 | 1276.51 | 1248.67 | 1242.10 | 1238.10 | 1230.83 | 1234.74 | 1237.35 | NA | NA | NA | NA | |
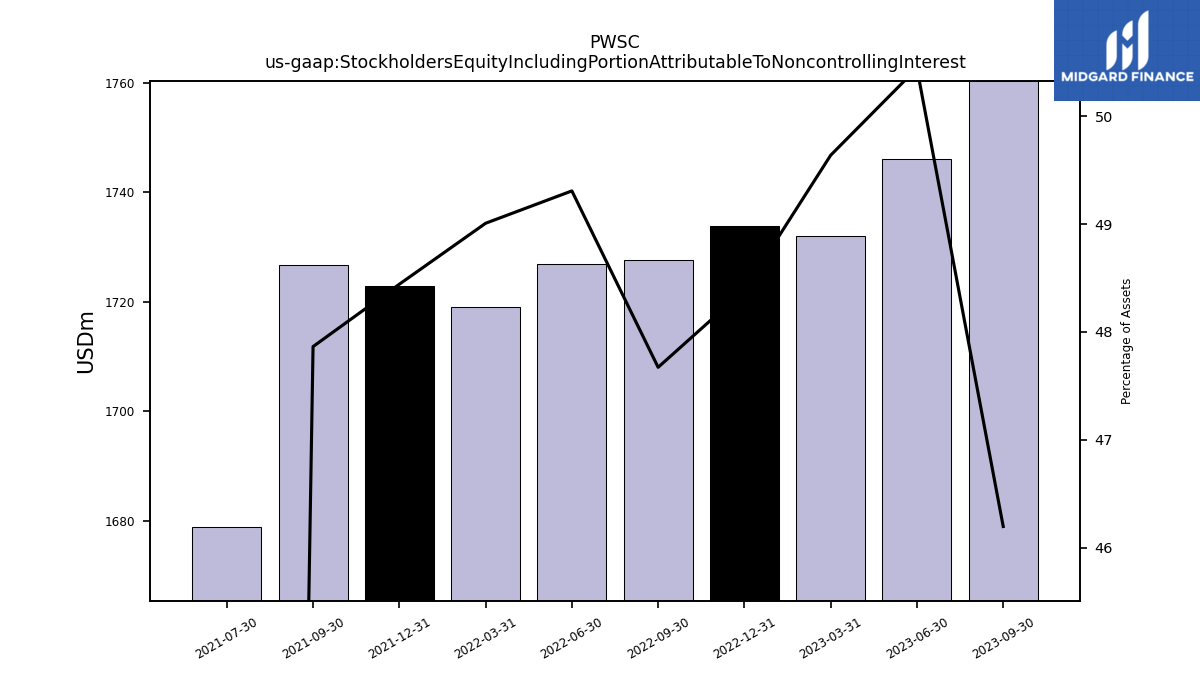
| Stockholders Equity Including Portion Attributable To Noncontrolling Interest | 1744.31 | 1755.29 | 1760.37 | 1746.03 | 1731.96 | 1733.94 | 1727.66 | 1727.00 | 1719.06 | 1722.96 | 1726.80 | NA | NA | NA | NA | |
| Additional Paid In Capital | NA | 1520.29 | 1508.26 | 1493.59 | 1477.63 | 1438.02 | 1429.66 | 1422.40 | 1410.07 | 1399.97 | 1390.25 | NA | NA | NA | NA | |
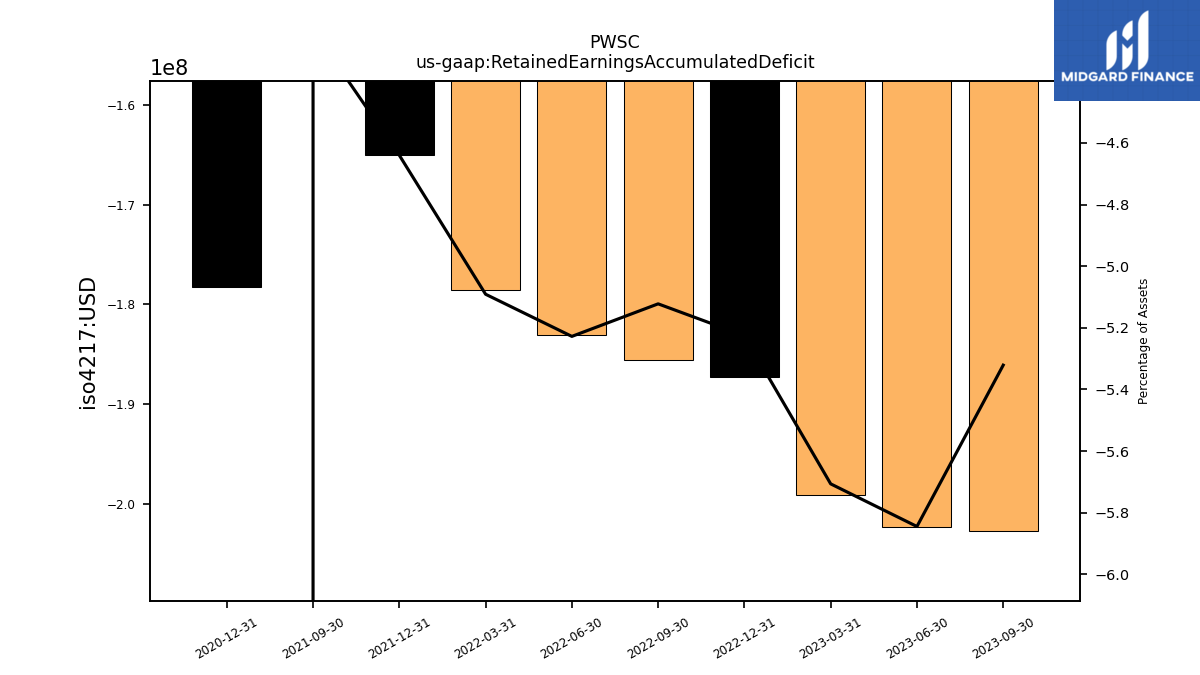
| Retained Earnings Accumulated Deficit | NA | -218.39 | -202.77 | -202.30 | -199.10 | -187.25 | -185.63 | -183.10 | -178.58 | -165.03 | -152.69 | NA | NA | -178.30 | NA | |
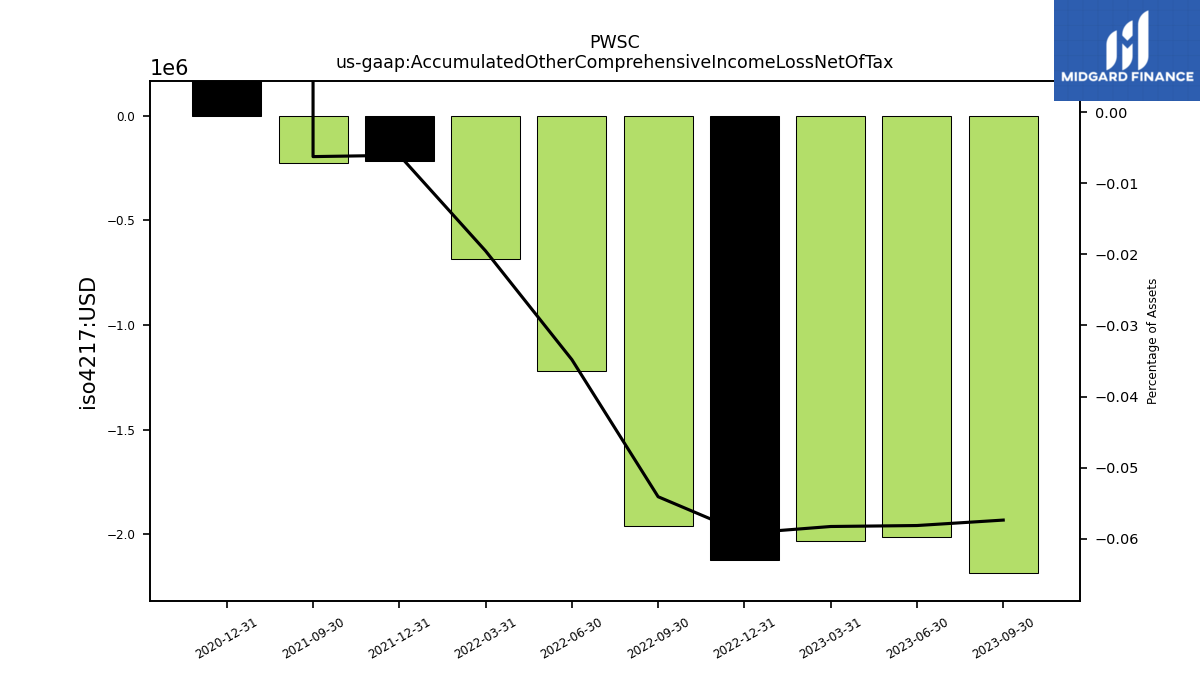
| Accumulated Other Comprehensive Income Loss Net Of Tax | NA | -2.09 | -2.19 | -2.01 | -2.03 | -2.12 | -1.96 | -1.22 | -0.69 | -0.22 | -0.23 | NA | NA | 0.44 | NA | |
| Minority Interest | NA | 455.46 | 457.05 | 456.73 | 455.45 | 485.28 | 485.57 | 488.90 | 488.23 | 488.21 | 489.45 | NA | NA | NA | NA | |
| Adjustments To Additional Paid In Capital Sharebased Compensation Requisite Service Period Recognition Value | 14.84 | NA | 15.54 | 18.26 | 15.28 | NA | 13.30 | 14.94 | 12.21 | 12.51 | 10.91 | 1.37 | 1.36 | NA | 1.40 |
| 2024-03-31 | 2023-12-31 | 2023-09-30 | 2023-06-30 | 2023-03-31 | 2022-12-31 | 2022-09-30 | 2022-06-30 | 2022-03-31 | 2021-12-31 | 2021-09-30 | 2021-06-30 | 2021-03-31 | 2020-12-31 | 2020-09-30 | ||
|---|---|---|---|---|---|---|---|---|---|---|---|---|---|---|---|---|
| Net Cash Provided By Used In Operating Activities | -89.69 | 42.94 | 220.39 | -32.71 | -60.03 | 42.23 | 187.10 | -15.78 | -64.54 | 20.22 | 173.82 | 0.13 | -51.06 | 23.17 | NA | |
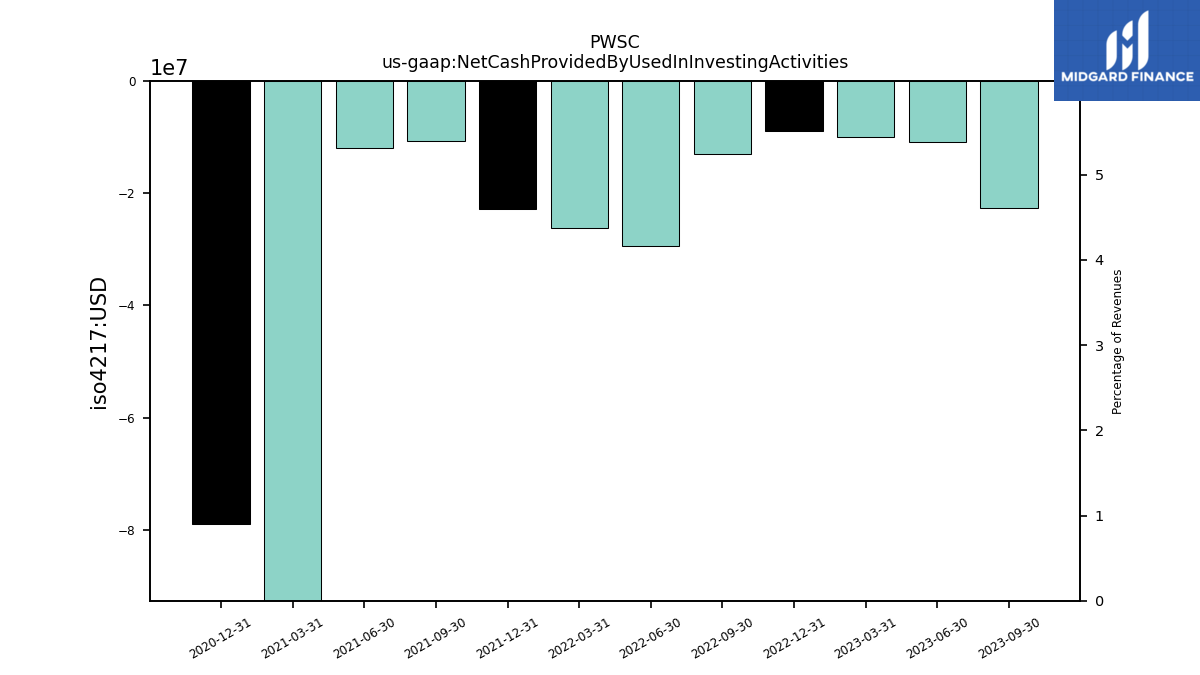
| Net Cash Provided By Used In Investing Activities | -54.70 | -300.92 | -22.68 | -10.85 | -10.03 | -8.97 | -13.00 | -29.46 | -26.21 | -22.77 | -10.61 | -11.98 | -328.14 | -78.89 | NA | |
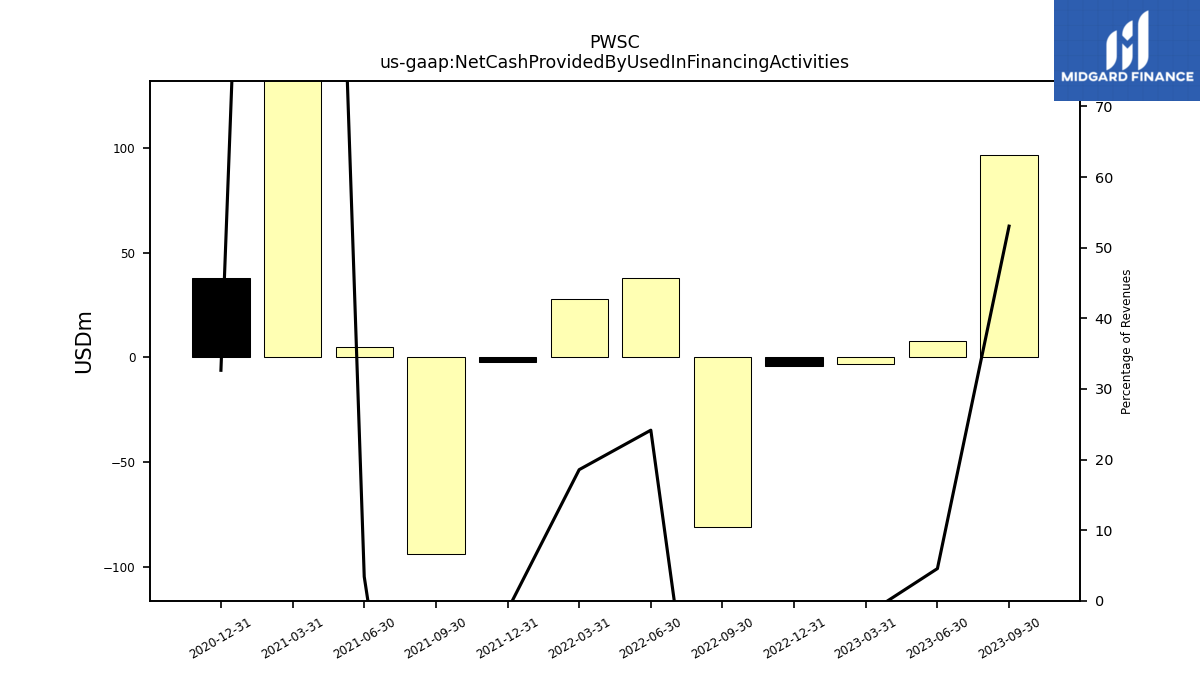
| Net Cash Provided By Used In Financing Activities | 122.59 | -25.46 | 96.64 | 7.92 | -3.22 | -4.30 | -80.76 | 38.06 | 27.77 | -1.94 | -94.03 | 4.96 | 355.71 | 37.89 | NA |
| 2024-03-31 | 2023-12-31 | 2023-09-30 | 2023-06-30 | 2023-03-31 | 2022-12-31 | 2022-09-30 | 2022-06-30 | 2022-03-31 | 2021-12-31 | 2021-09-30 | 2021-06-30 | 2021-03-31 | 2020-12-31 | 2020-09-30 | ||
|---|---|---|---|---|---|---|---|---|---|---|---|---|---|---|---|---|
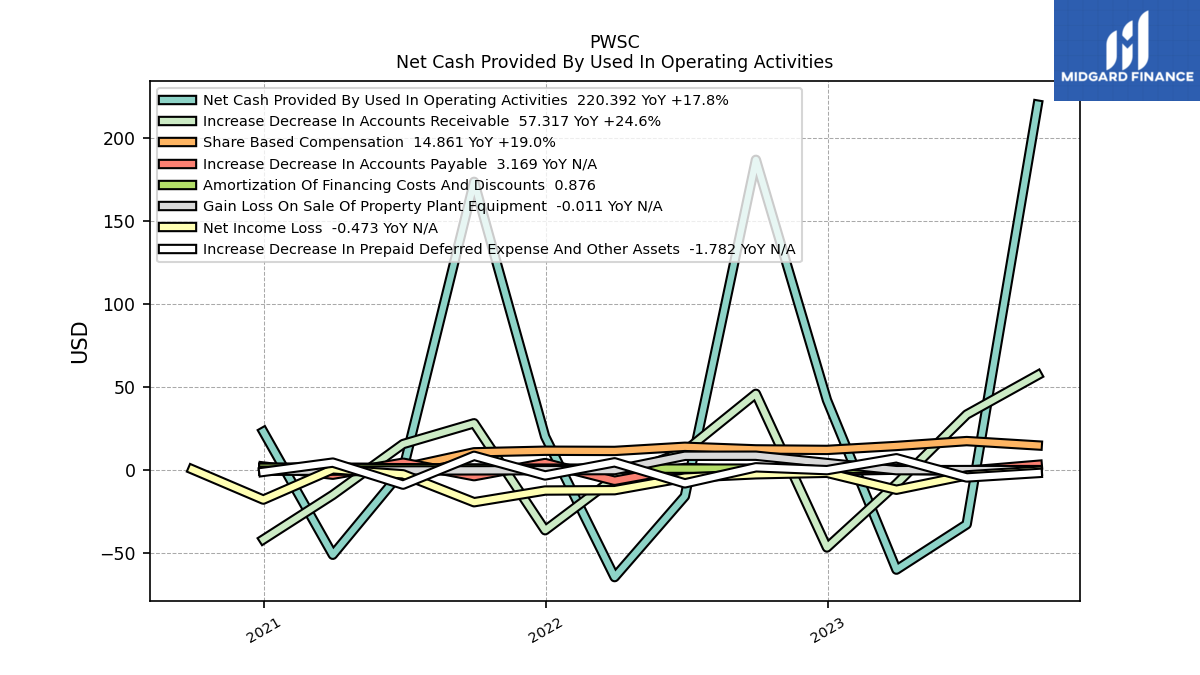
| Net Cash Provided By Used In Operating Activities | -89.69 | 42.94 | 220.39 | -32.71 | -60.03 | 42.23 | 187.10 | -15.78 | -64.54 | 20.22 | 173.82 | 0.13 | -51.06 | 23.17 | NA | |
| Net Income Loss | -19.56 | -15.62 | -0.47 | -3.19 | -11.85 | -1.62 | -2.53 | -4.53 | -12.11 | -12.33 | -19.38 | -2.54 | 0.48 | -17.80 | 0.43 | |
| Profit Loss | -22.85 | -18.66 | -1.31 | -4.29 | -14.81 | -3.25 | -3.92 | -6.46 | -14.12 | -15.88 | -25.68 | -2.54 | 0.48 | -17.80 | 0.43 | |
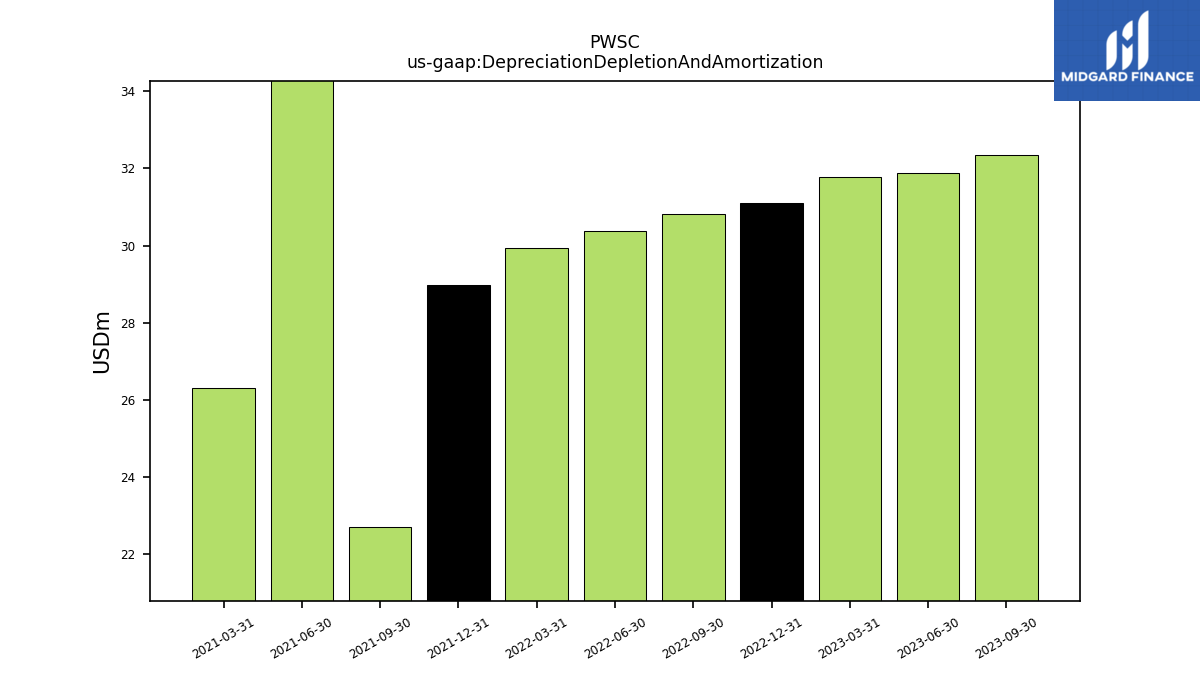
| Depreciation Depletion And Amortization | 36.43 | 34.66 | 32.34 | 31.87 | 31.79 | 31.10 | 30.81 | 30.37 | 29.93 | 28.98 | 22.72 | 35.46 | 26.32 | NA | NA | |
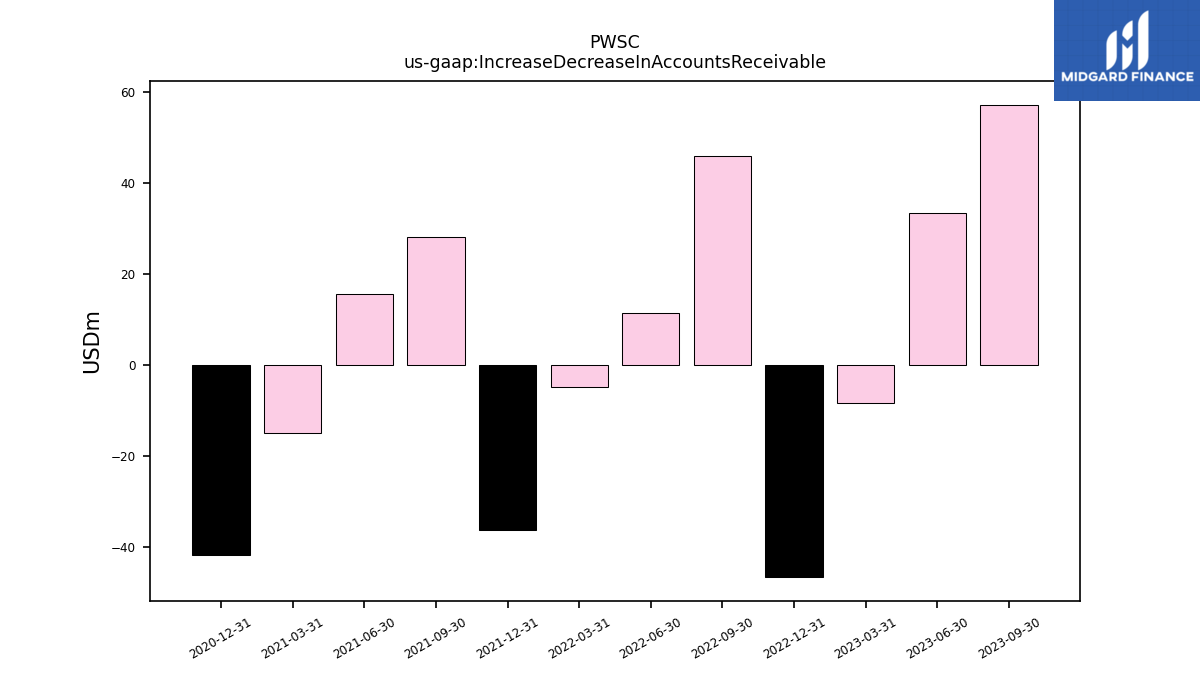
| Increase Decrease In Accounts Receivable | -17.75 | -70.15 | 57.32 | 33.51 | -8.36 | -46.68 | 46.01 | 11.42 | -4.78 | -36.28 | 28.25 | 15.70 | -14.96 | -41.84 | NA | |
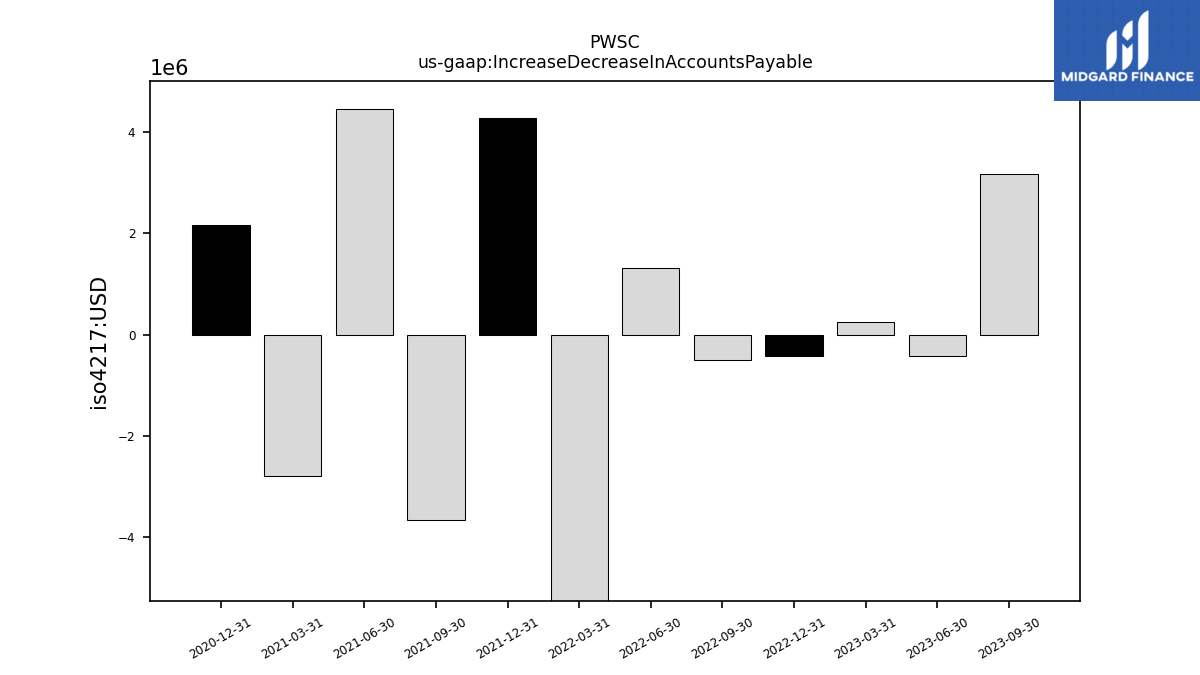
| Increase Decrease In Accounts Payable | -0.65 | 1.59 | 3.17 | -0.43 | 0.25 | -0.43 | -0.51 | 1.31 | -6.42 | 4.26 | -3.66 | 4.46 | -2.79 | 2.17 | NA | |
| Share Based Compensation | 14.15 | 14.24 | 14.86 | 17.49 | 14.55 | 12.17 | 12.49 | 14.06 | 11.55 | 11.68 | 10.72 | 1.37 | 1.36 | 1.37 | NA | |
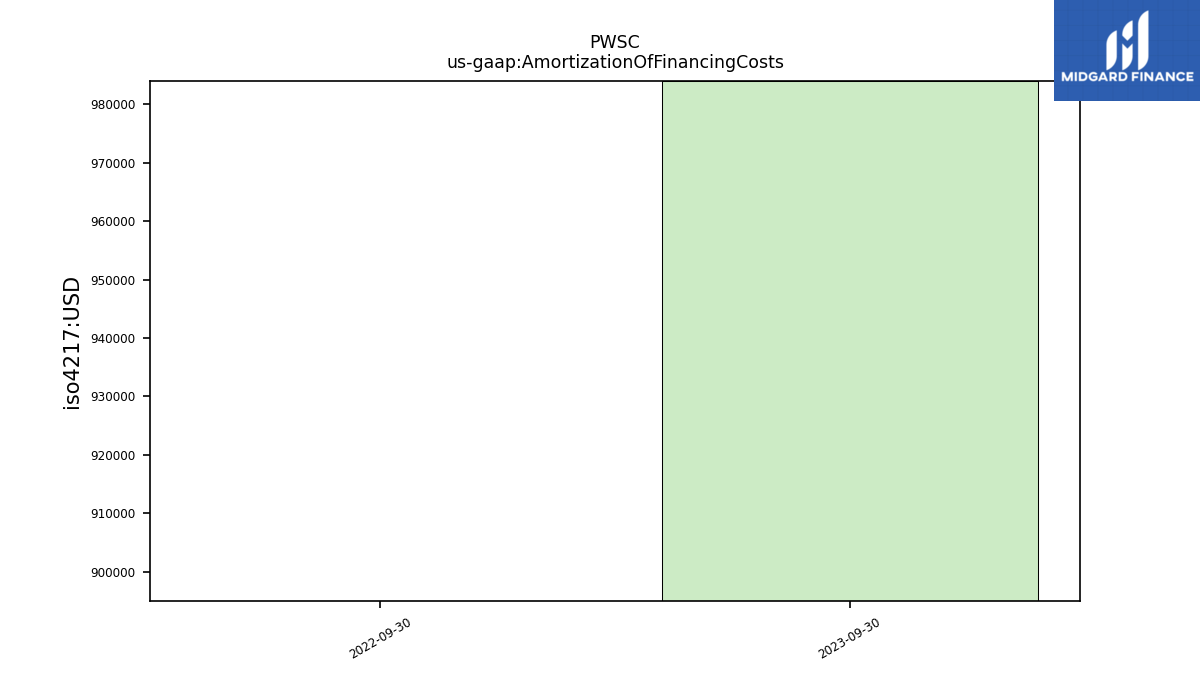
| Amortization Of Financing Costs | 1.49 | 1.47 | 0.98 | 0.89 | 0.88 | 0.90 | 0.90 | NA | NA | NA | NA | NA | NA | NA | NA |
| 2024-03-31 | 2023-12-31 | 2023-09-30 | 2023-06-30 | 2023-03-31 | 2022-12-31 | 2022-09-30 | 2022-06-30 | 2022-03-31 | 2021-12-31 | 2021-09-30 | 2021-06-30 | 2021-03-31 | 2020-12-31 | 2020-09-30 | ||
|---|---|---|---|---|---|---|---|---|---|---|---|---|---|---|---|---|
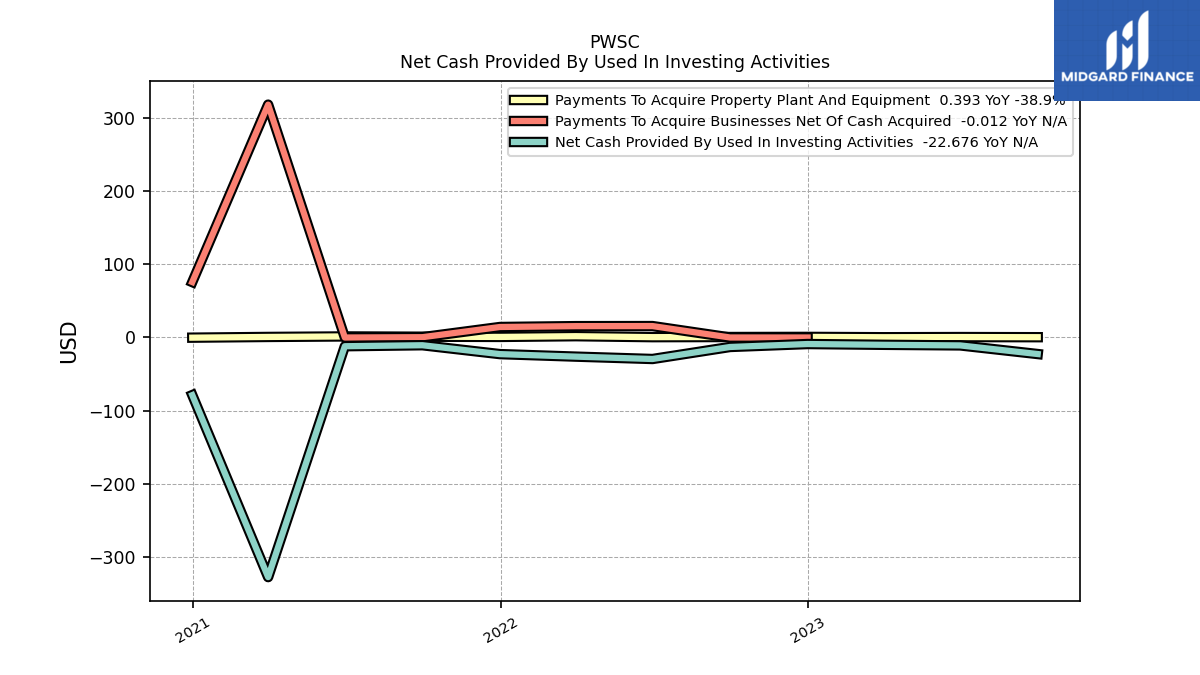
| Net Cash Provided By Used In Investing Activities | -54.70 | -300.92 | -22.68 | -10.85 | -10.03 | -8.97 | -13.00 | -29.46 | -26.21 | -22.77 | -10.61 | -11.98 | -328.14 | -78.89 | NA | |
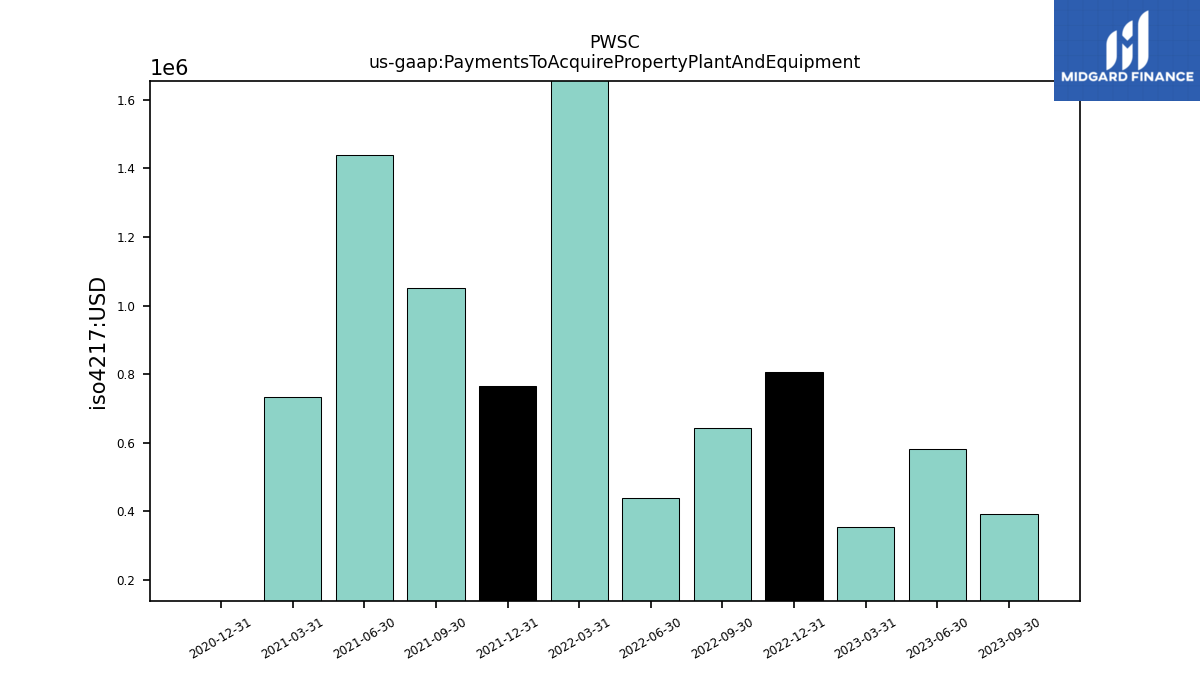
| Payments To Acquire Property Plant And Equipment | 3.89 | 0.84 | 0.39 | 0.58 | 0.36 | 0.81 | 0.64 | 0.44 | 1.76 | 0.77 | 1.05 | 1.44 | 0.73 | -0.25 | NA |
| 2024-03-31 | 2023-12-31 | 2023-09-30 | 2023-06-30 | 2023-03-31 | 2022-12-31 | 2022-09-30 | 2022-06-30 | 2022-03-31 | 2021-12-31 | 2021-09-30 | 2021-06-30 | 2021-03-31 | 2020-12-31 | 2020-09-30 | ||
|---|---|---|---|---|---|---|---|---|---|---|---|---|---|---|---|---|
| Net Cash Provided By Used In Financing Activities | 122.59 | -25.46 | 96.64 | 7.92 | -3.22 | -4.30 | -80.76 | 38.06 | 27.77 | -1.94 | -94.03 | 4.96 | 355.71 | 37.89 | NA |
| 2024-03-31 | 2023-12-31 | 2023-09-30 | 2023-06-30 | 2023-03-31 | 2022-12-31 | 2022-09-30 | 2022-06-30 | 2022-03-31 | 2021-12-31 | 2021-09-30 | 2021-06-30 | 2021-03-31 | 2020-12-31 | 2020-09-30 | ||
|---|---|---|---|---|---|---|---|---|---|---|---|---|---|---|---|---|
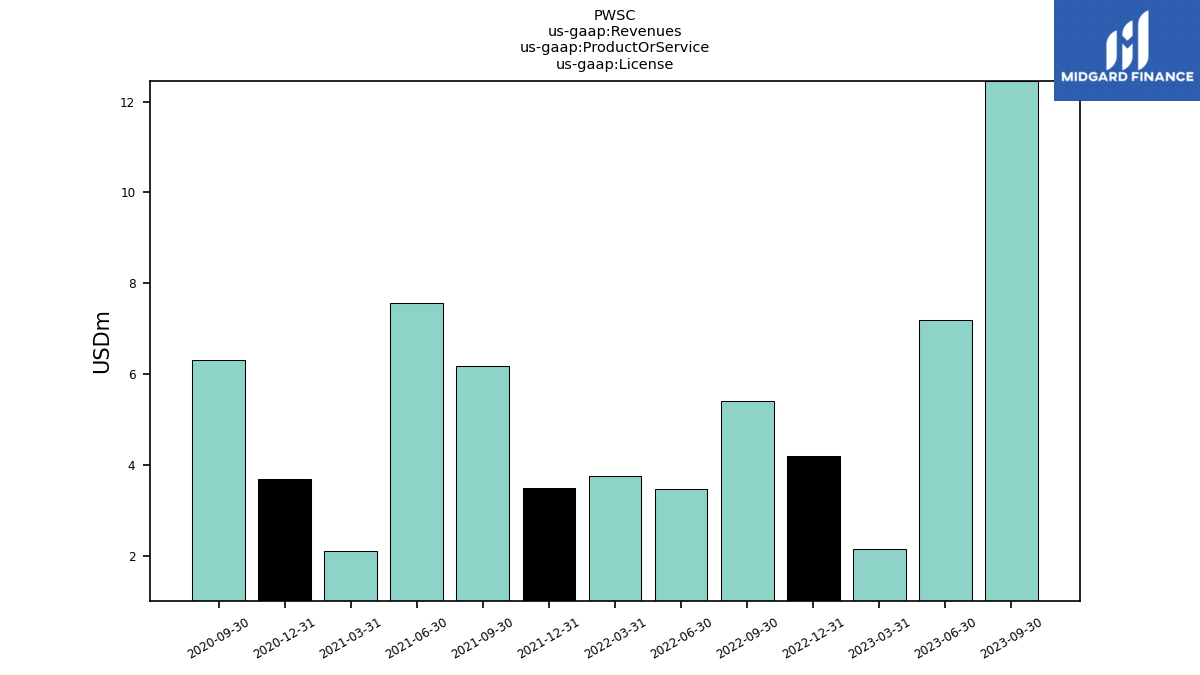
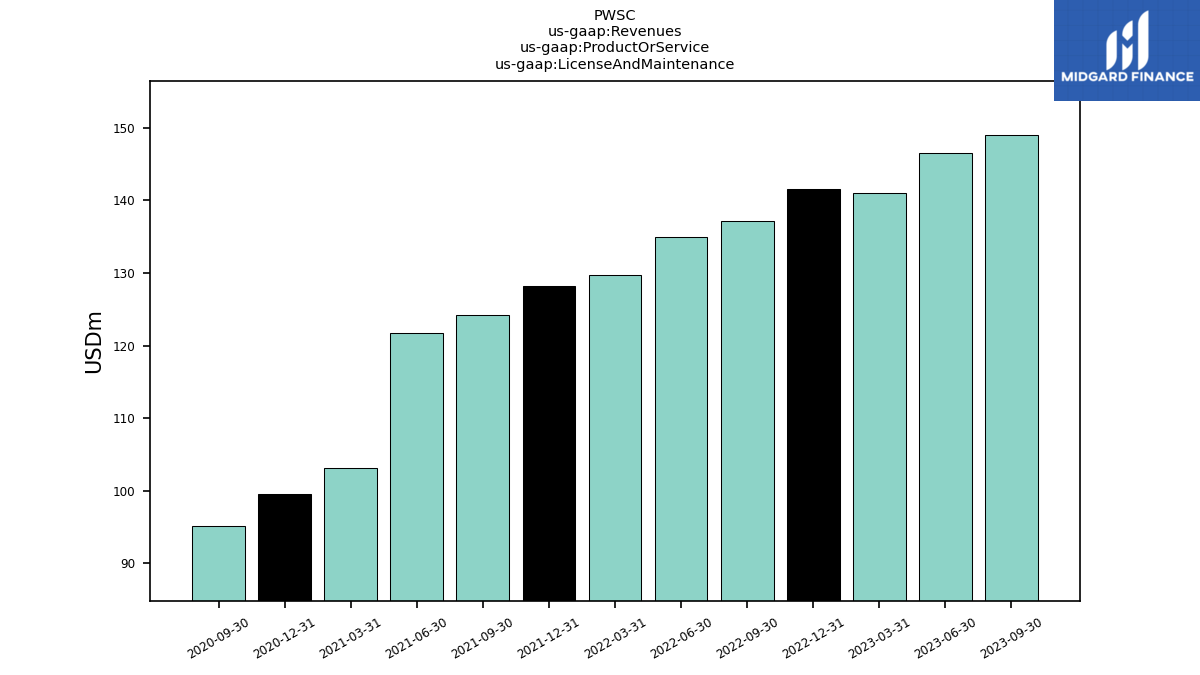
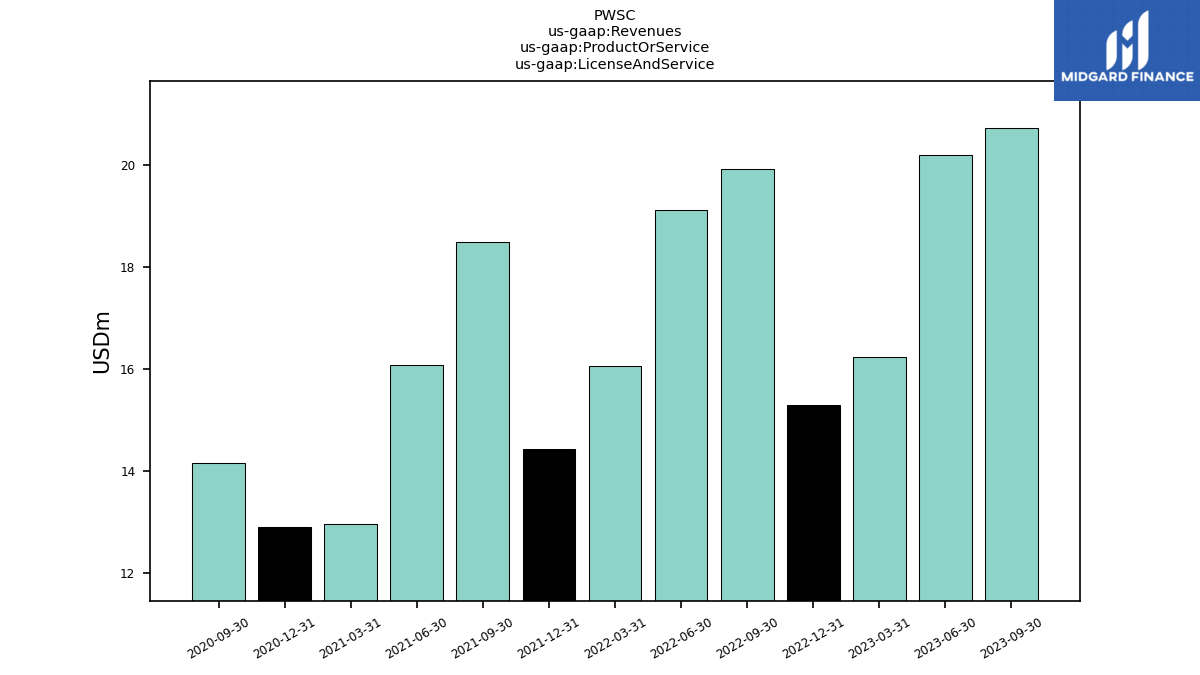
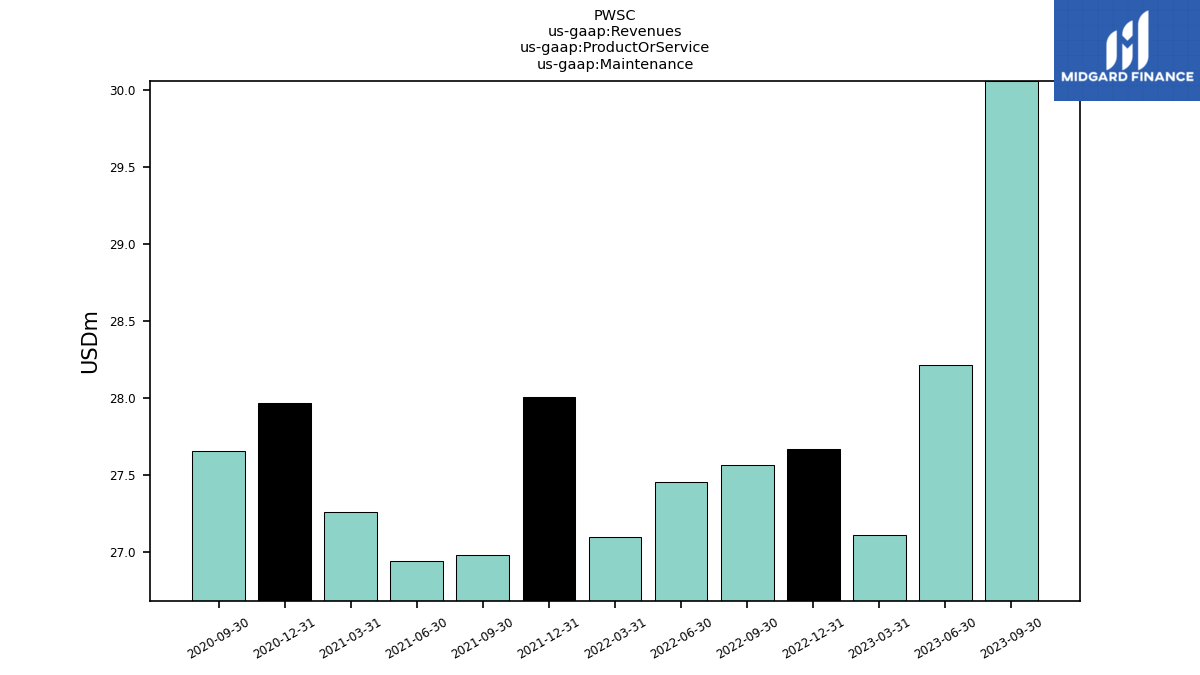
| Revenues | 184.97 | 182.14 | 182.16 | 173.90 | 159.45 | 161.07 | 162.43 | 157.59 | 149.59 | 146.10 | 148.95 | 145.40 | 118.15 | 116.09 | 115.58 | |
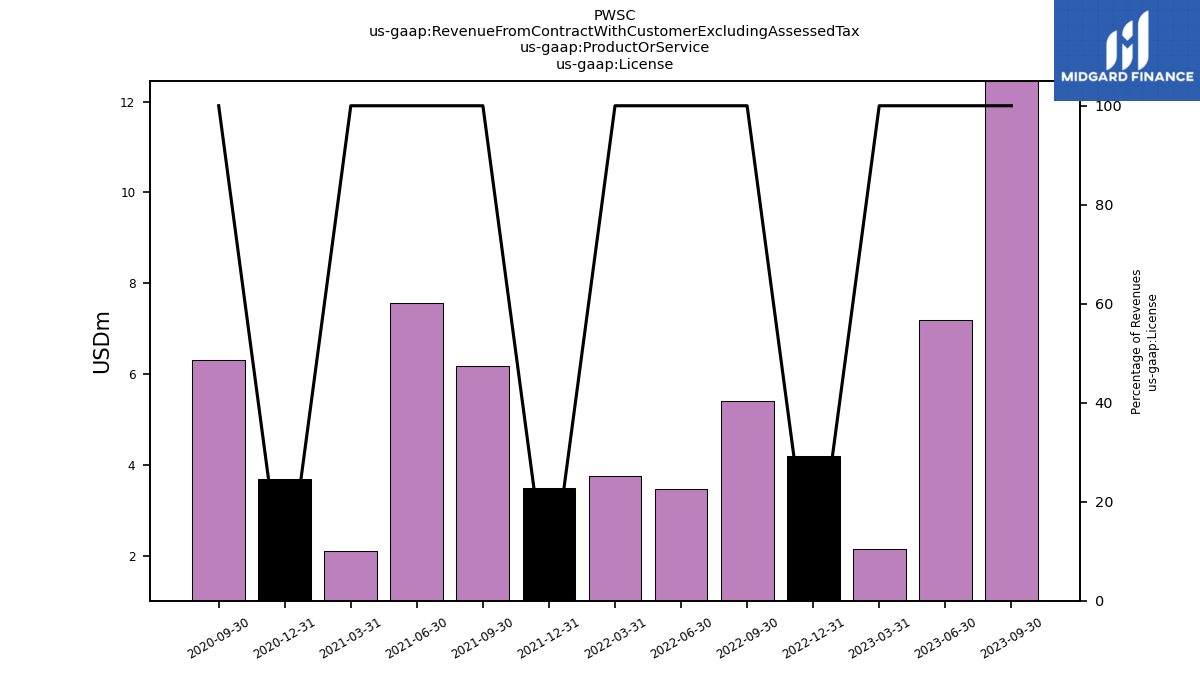
| License | 1.35 | 3.11 | 12.45 | 7.20 | 2.15 | 4.20 | 5.41 | 3.46 | 3.76 | 3.48 | 6.18 | 7.56 | 2.10 | 3.70 | 6.31 | |
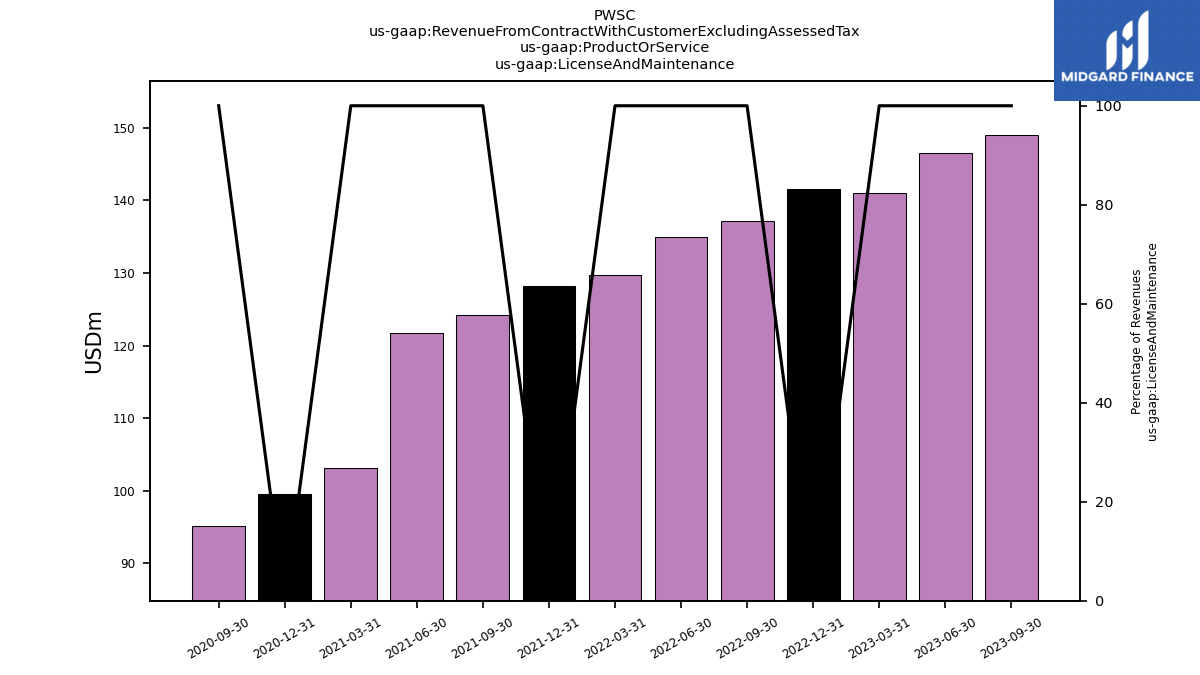
| License And Maintenance | 166.93 | 163.62 | 148.99 | 146.50 | 141.07 | 141.57 | 137.09 | 135.01 | 129.76 | 128.17 | 124.27 | 121.76 | 103.09 | 99.48 | 95.12 | |
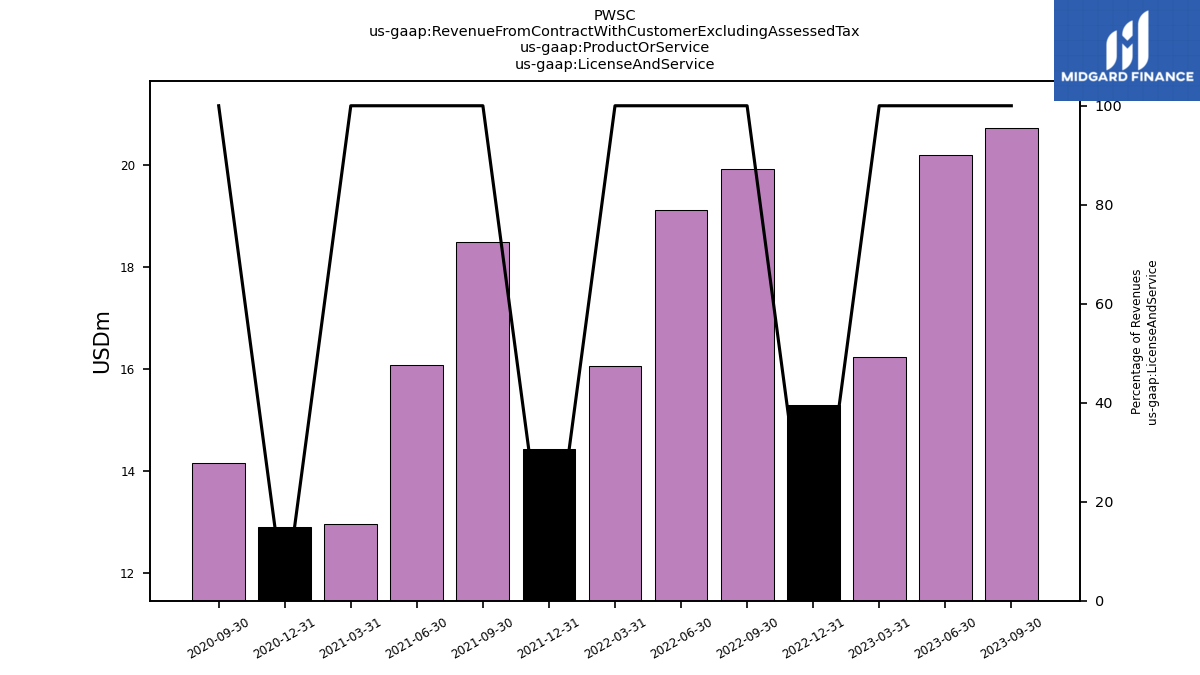
| License And Service | 16.69 | 15.40 | 20.72 | 20.20 | 16.23 | 15.29 | 19.93 | 19.12 | 16.06 | 14.44 | 18.50 | 16.08 | 12.95 | 12.91 | 14.15 | |
| Maintenance | 28.61 | 28.89 | 30.06 | 28.21 | 27.11 | 27.67 | 27.57 | 27.46 | 27.10 | 28.01 | 26.98 | 26.94 | 27.26 | 27.97 | 27.66 | |
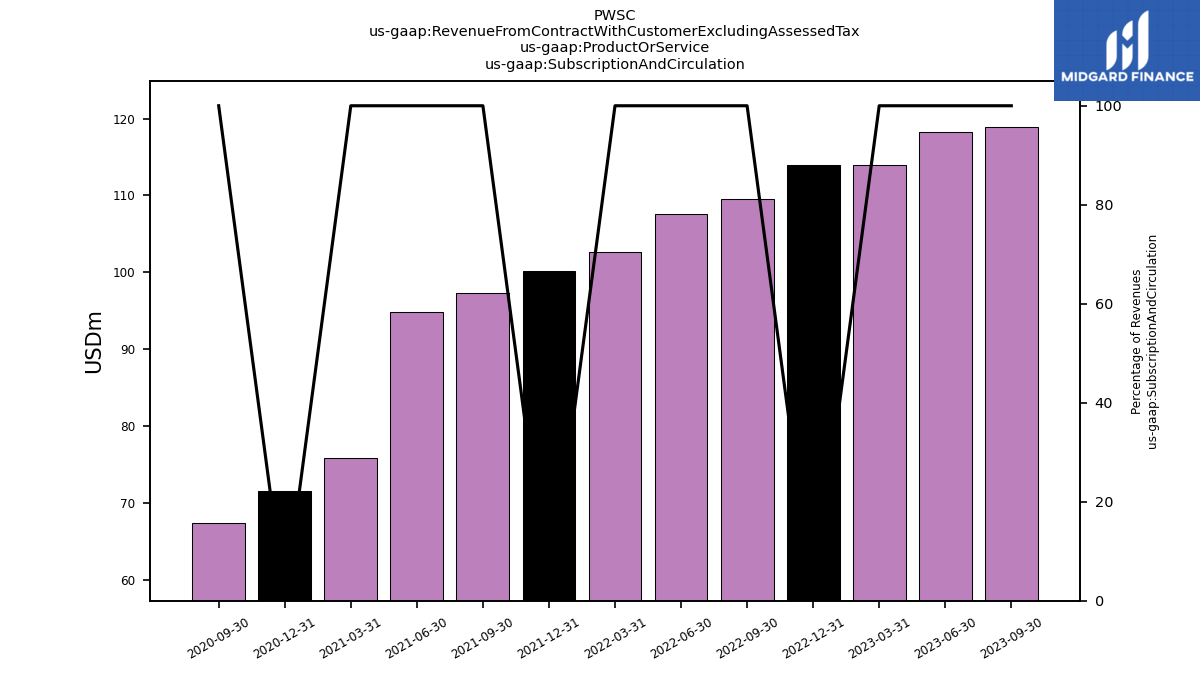
| Subscription And Circulation | 138.32 | 134.73 | 118.93 | 118.29 | 113.96 | 113.90 | 109.53 | 107.55 | 102.66 | 100.16 | 97.29 | 94.82 | 75.83 | 71.52 | 67.46 | |
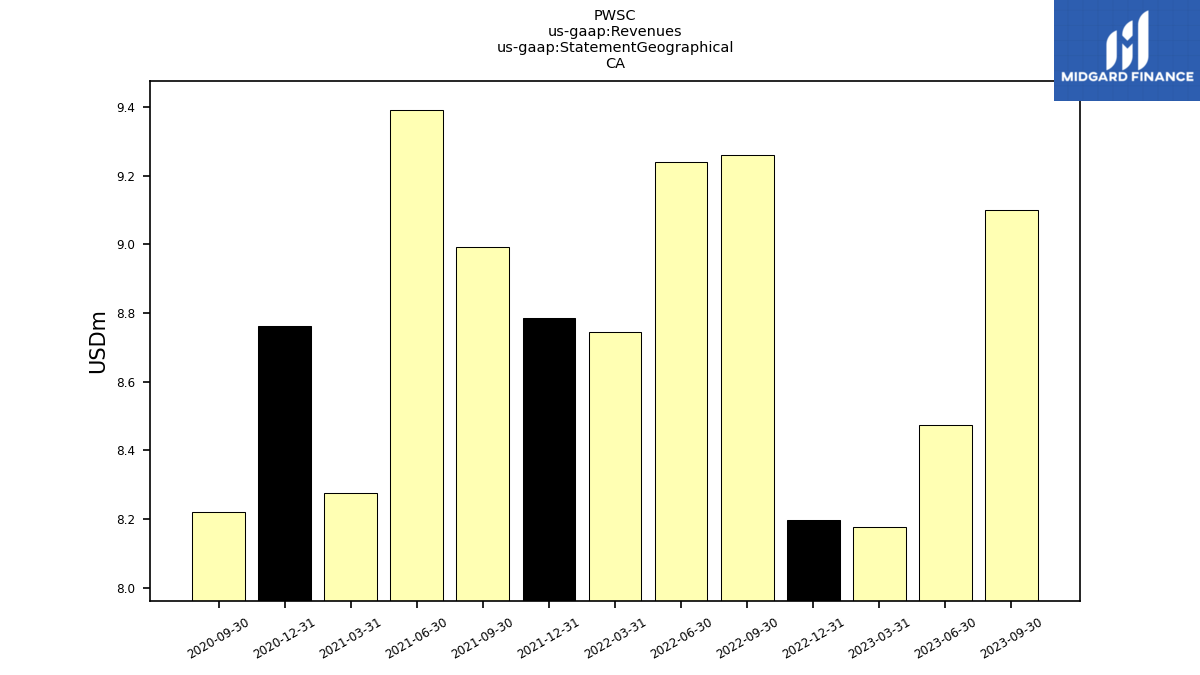
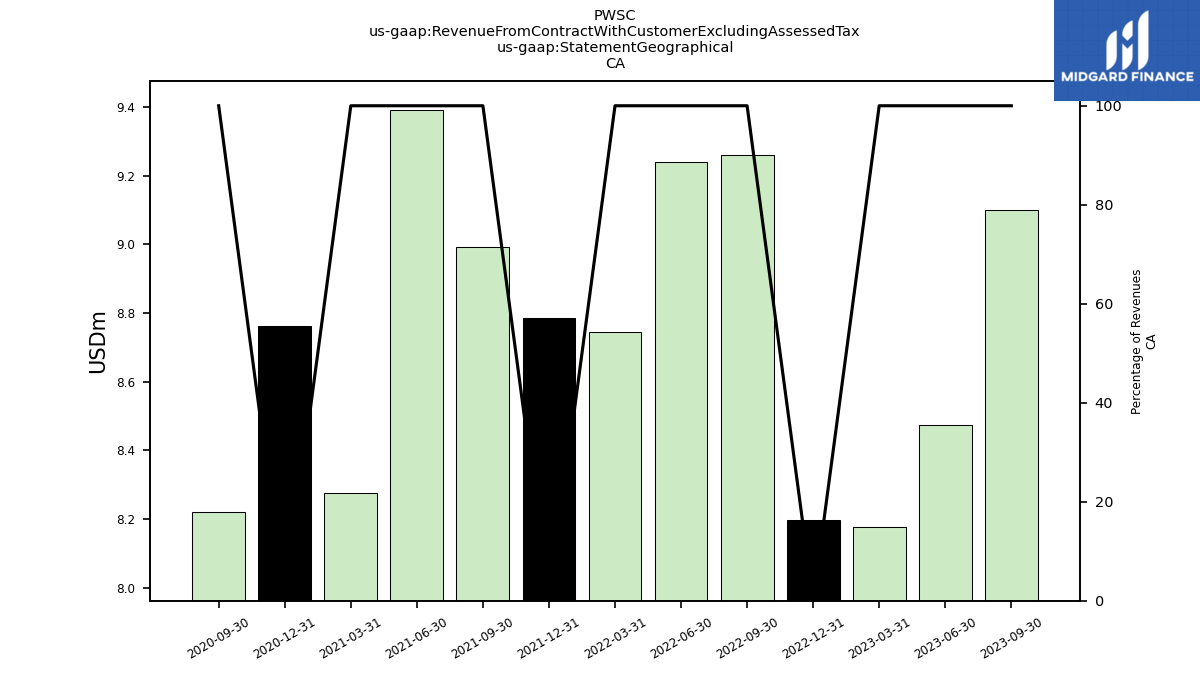
| 11.00 | 10.52 | 9.10 | 8.47 | 8.18 | 8.20 | 9.26 | 9.24 | 8.74 | 8.79 | 8.99 | 9.39 | 8.28 | 8.76 | 8.22 | ||
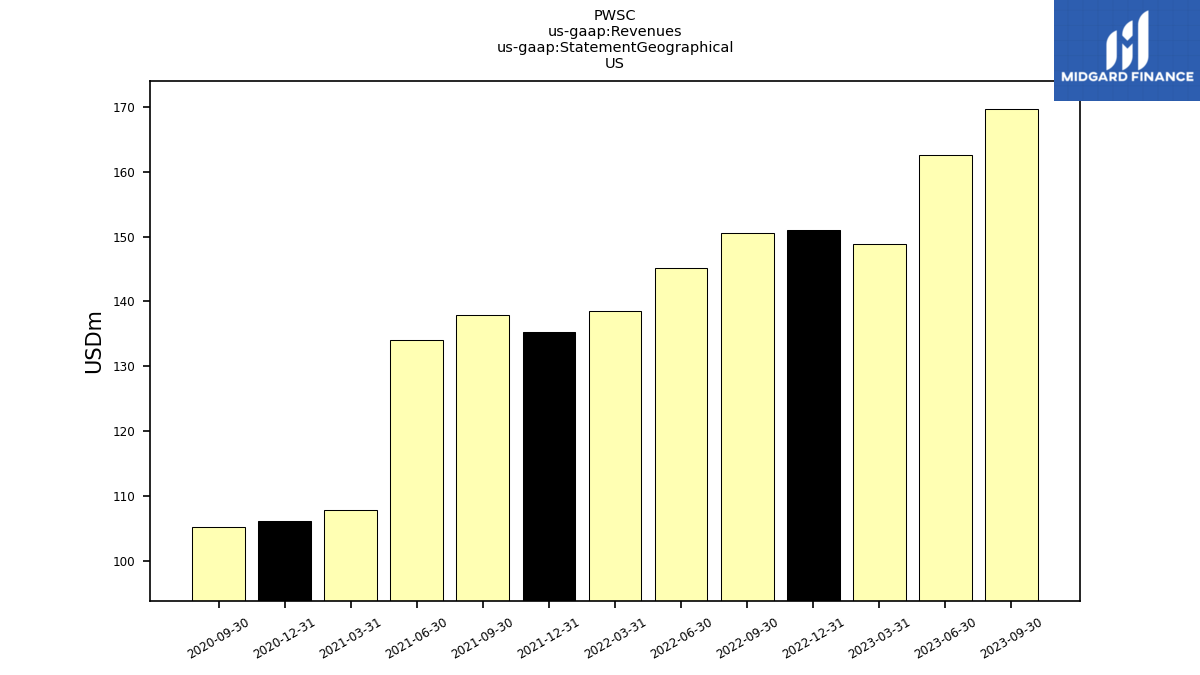
| US | 170.17 | 167.49 | 169.73 | 162.58 | 148.81 | 151.06 | 150.63 | 145.11 | 138.46 | 135.26 | 137.97 | 134.06 | 107.75 | 106.11 | 105.25 | |
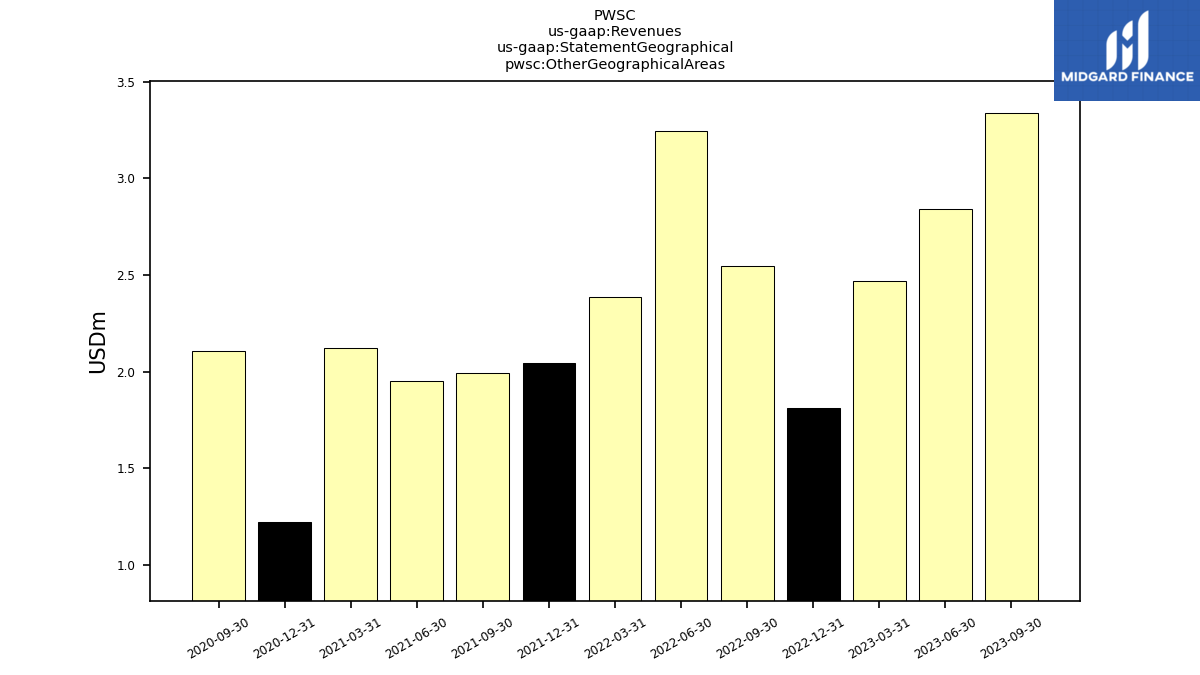
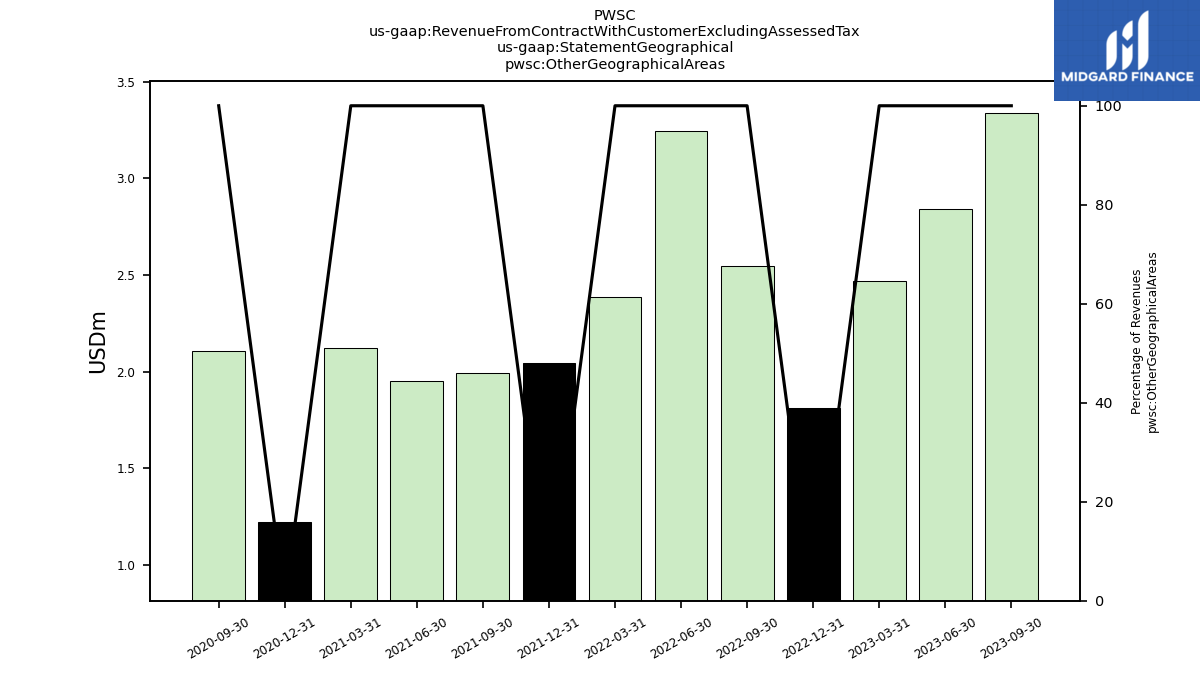
| Other Geographical Areas | 3.79 | 4.13 | 3.34 | 2.84 | 2.47 | 1.81 | 2.55 | 3.25 | 2.39 | 2.04 | 1.99 | 1.95 | 2.12 | 1.22 | 2.11 | |
| Revenue From Contract With Customer Excluding Assessed Tax | 184.97 | 182.14 | 182.16 | 173.90 | 159.45 | 161.07 | 162.43 | 157.59 | 149.59 | 146.10 | 148.95 | 145.40 | 118.15 | 116.09 | 115.58 | |
| License | 1.35 | 3.11 | 12.45 | 7.20 | 2.15 | 4.20 | 5.41 | 3.46 | 3.76 | 3.48 | 6.18 | 7.56 | 2.10 | 3.70 | 6.31 | |
| License And Maintenance | 166.93 | 163.62 | 148.99 | 146.50 | 141.07 | 141.57 | 137.09 | 135.01 | 129.76 | 128.17 | 124.27 | 121.76 | 103.09 | 99.48 | 95.12 | |
| License And Service | 16.69 | 15.40 | 20.72 | 20.20 | 16.23 | 15.29 | 19.93 | 19.12 | 16.06 | 14.44 | 18.50 | 16.08 | 12.95 | 12.91 | 14.15 | |
| Maintenance | 28.61 | 28.89 | 30.06 | 28.21 | 27.11 | 27.67 | 27.57 | 27.46 | 27.10 | 28.01 | 26.98 | 26.94 | 27.26 | 27.97 | 27.66 | |
| Subscription And Circulation | 138.32 | 134.73 | 118.93 | 118.29 | 113.96 | 113.90 | 109.53 | 107.55 | 102.66 | 100.16 | 97.29 | 94.82 | 75.83 | 71.52 | 67.46 | |
| 11.00 | 10.52 | 9.10 | 8.47 | 8.18 | 8.20 | 9.26 | 9.24 | 8.74 | 8.79 | 8.99 | 9.39 | 8.28 | 8.76 | 8.22 | ||
| US | 170.17 | 167.49 | 169.73 | 162.58 | 148.81 | 151.06 | 150.63 | 145.11 | 138.46 | 135.26 | 137.97 | 134.06 | 107.75 | 106.11 | 105.25 | |
| Other Geographical Areas | 3.79 | 4.13 | 3.34 | 2.84 | 2.47 | 1.81 | 2.55 | 3.25 | 2.39 | 2.04 | 1.99 | 1.95 | 2.12 | 1.22 | 2.11 |


