
| 2024-03-31 | 2023-12-31 | 2023-09-24 | 2023-06-25 | 2023-03-26 | 2022-12-25 | 2022-09-25 | 2022-06-26 | 2022-03-27 | 2021-12-26 | 2021-09-26 | 2021-06-27 | 2021-03-28 | 2020-12-27 | 2020-09-27 | 2020-06-28 | 2020-03-29 | 2019-12-29 | 2019-09-29 | 2019-06-30 | 2019-03-31 | 2018-12-30 | 2018-09-30 | 2018-07-01 | 2018-04-01 | 2017-12-31 | 2017-09-24 | 2017-06-25 | 2017-03-26 | 2016-12-25 | 2016-09-25 | 2016-06-26 | 2016-03-27 | 2015-12-27 | 2015-09-27 | 2015-06-28 | 2015-03-29 | 2014-12-28 | 2014-09-28 | 2014-06-29 | 2014-03-30 | 2013-12-29 | 2013-09-29 | 2013-06-30 | 2013-03-31 | 2012-12-30 | 2012-09-23 | 2012-06-24 | 2012-03-25 | 2011-12-25 | 2011-09-25 | 2011-06-26 | 2011-03-27 | 2010-12-26 | 2010-09-26 | 2010-06-27 | 2010-03-28 | ||
|---|---|---|---|---|---|---|---|---|---|---|---|---|---|---|---|---|---|---|---|---|---|---|---|---|---|---|---|---|---|---|---|---|---|---|---|---|---|---|---|---|---|---|---|---|---|---|---|---|---|---|---|---|---|---|---|---|---|---|
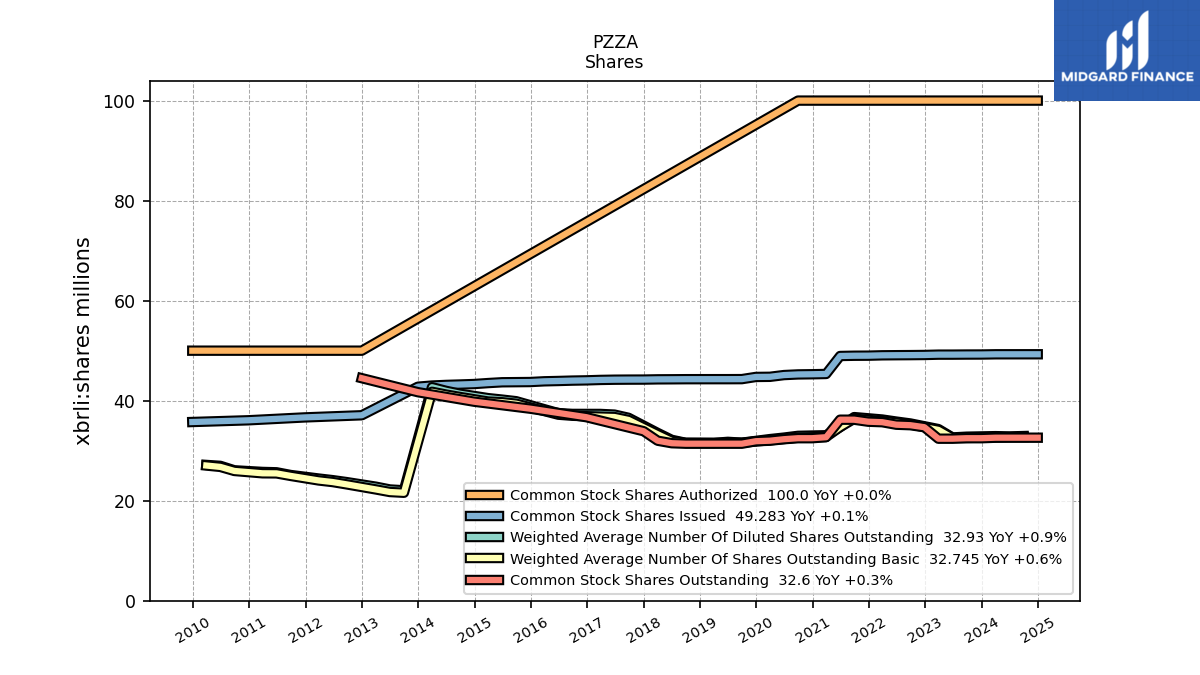
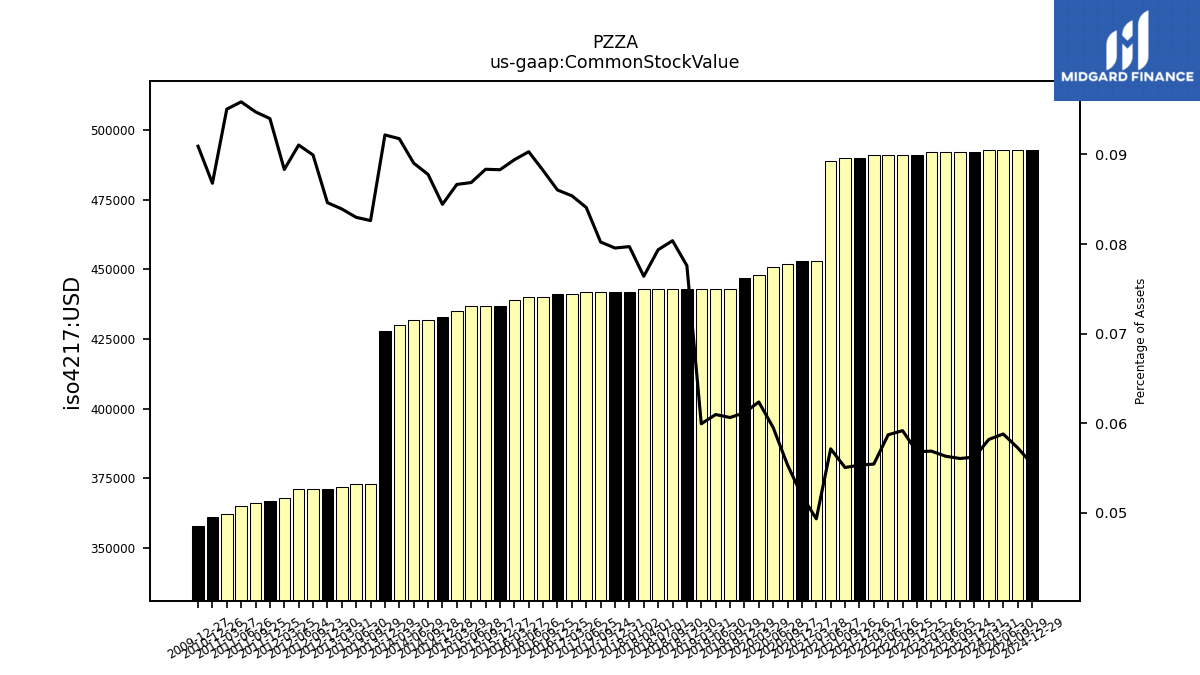
| Common Stock Value | 0.49 | 0.49 | 0.49 | 0.49 | 0.49 | 0.49 | 0.49 | 0.49 | 0.49 | 0.49 | 0.49 | 0.49 | 0.45 | 0.45 | 0.45 | 0.45 | 0.45 | 0.45 | 0.44 | 0.44 | 0.44 | 0.44 | 0.44 | 0.44 | 0.44 | 0.44 | 0.44 | 0.44 | 0.44 | 0.44 | 0.44 | 0.44 | 0.44 | 0.44 | 0.44 | 0.44 | 0.43 | 0.43 | 0.43 | 0.43 | 0.43 | 0.43 | 0.37 | 0.37 | 0.37 | 0.37 | 0.37 | 0.37 | 0.37 | 0.37 | 0.37 | 0.36 | 0.36 | 0.36 | NA | NA | NA | |
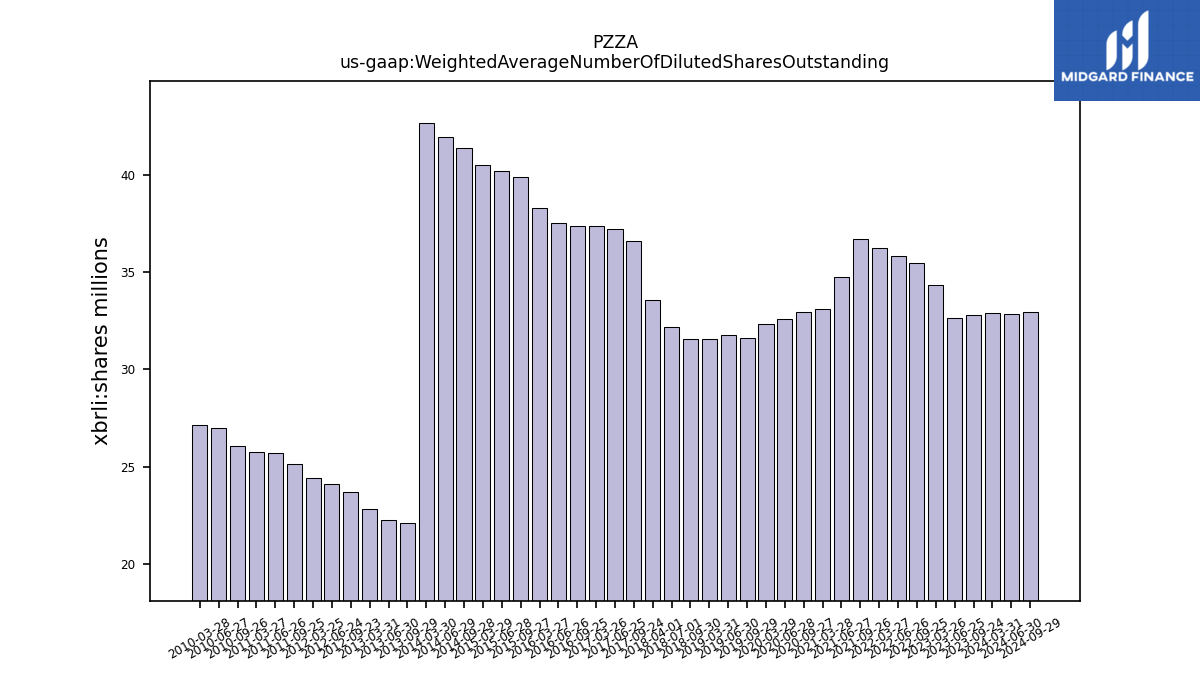
| Weighted Average Number Of Diluted Shares Outstanding | 32.91 | NA | 32.80 | 32.65 | 34.32 | NA | 35.45 | 35.82 | 36.24 | NA | 36.72 | 34.73 | 33.09 | NA | 32.97 | 32.62 | 32.32 | NA | 31.60 | 31.77 | 31.55 | NA | 31.57 | 32.17 | 33.55 | NA | 36.58 | 37.22 | 37.35 | NA | 37.36 | 37.51 | 38.30 | NA | 39.90 | 40.22 | 40.51 | NA | 41.39 | 41.97 | 42.70 | NA | 22.08 | 22.25 | 22.81 | NA | 23.72 | 24.11 | 24.44 | NA | 25.15 | 25.68 | 25.76 | NA | 26.08 | 26.97 | 27.15 | |
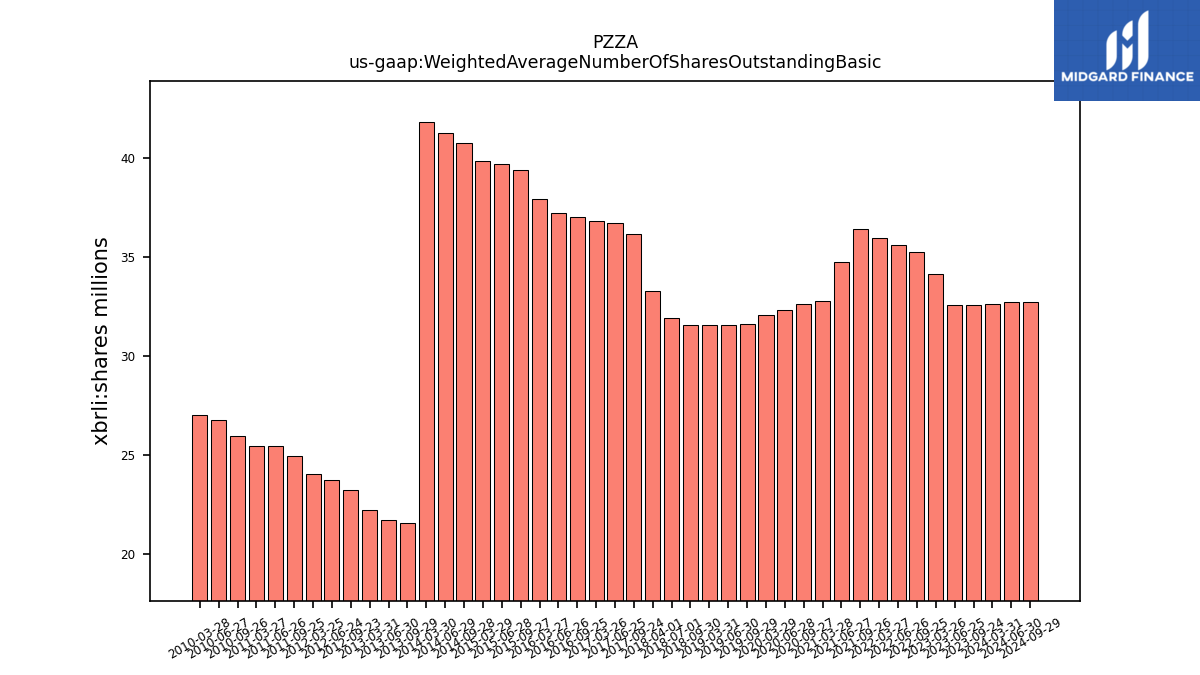
| Weighted Average Number Of Shares Outstanding Basic | 32.64 | NA | 32.56 | 32.56 | 34.16 | NA | 35.26 | 35.62 | 35.93 | NA | 36.39 | 34.73 | 32.76 | NA | 32.62 | 32.34 | 32.09 | NA | 31.60 | 31.59 | 31.55 | NA | 31.57 | 31.94 | 33.28 | NA | 36.15 | 36.73 | 36.81 | NA | 36.99 | 37.20 | 37.93 | NA | 39.39 | 39.69 | 39.83 | NA | 40.74 | 41.23 | 41.78 | NA | 21.59 | 21.74 | 22.26 | NA | 23.27 | 23.73 | 24.05 | NA | 24.96 | 25.46 | 25.48 | NA | 25.95 | 26.76 | 27.04 | |
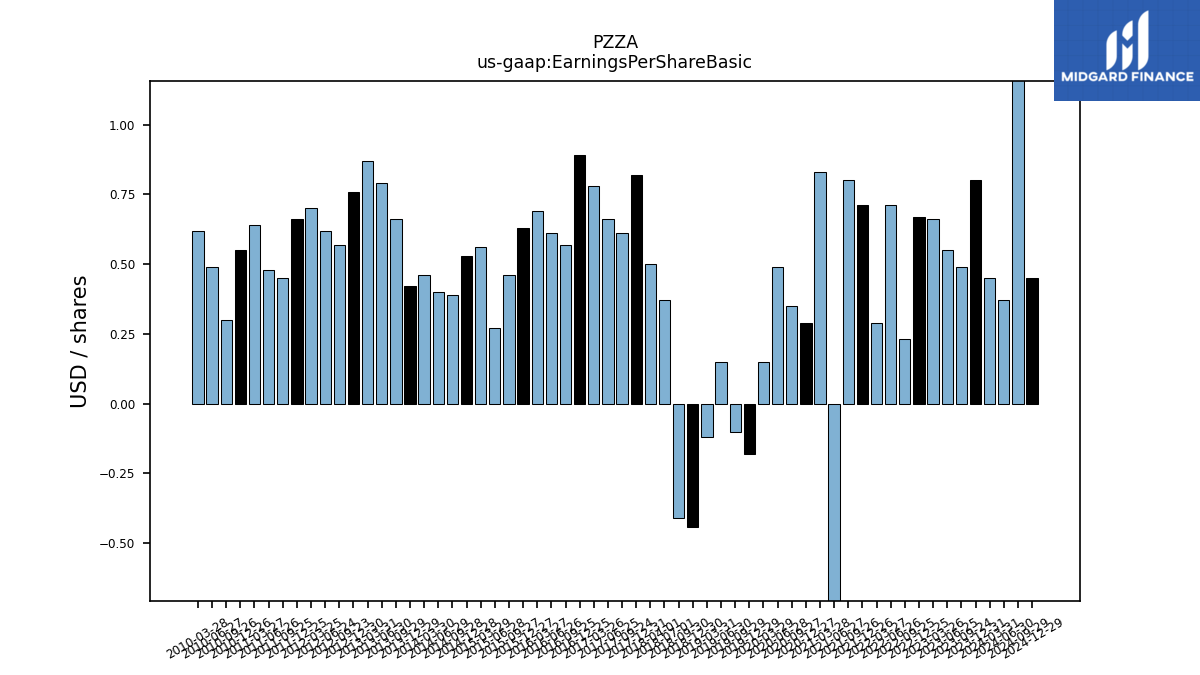
| Earnings Per Share Basic | 0.45 | 0.80 | 0.49 | 0.55 | 0.66 | 0.67 | 0.23 | 0.71 | 0.29 | 0.71 | 0.80 | -2.30 | 0.83 | 0.29 | 0.35 | 0.49 | 0.15 | -0.18 | -0.10 | 0.15 | -0.12 | -0.44 | -0.41 | 0.37 | 0.50 | 0.82 | 0.61 | 0.66 | 0.78 | 0.89 | 0.57 | 0.61 | 0.69 | 0.63 | 0.46 | 0.27 | 0.56 | 0.53 | 0.39 | 0.40 | 0.46 | 0.42 | 0.66 | 0.79 | 0.87 | 0.76 | 0.57 | 0.62 | 0.70 | 0.66 | 0.45 | 0.48 | 0.64 | 0.55 | 0.30 | 0.49 | 0.62 | |
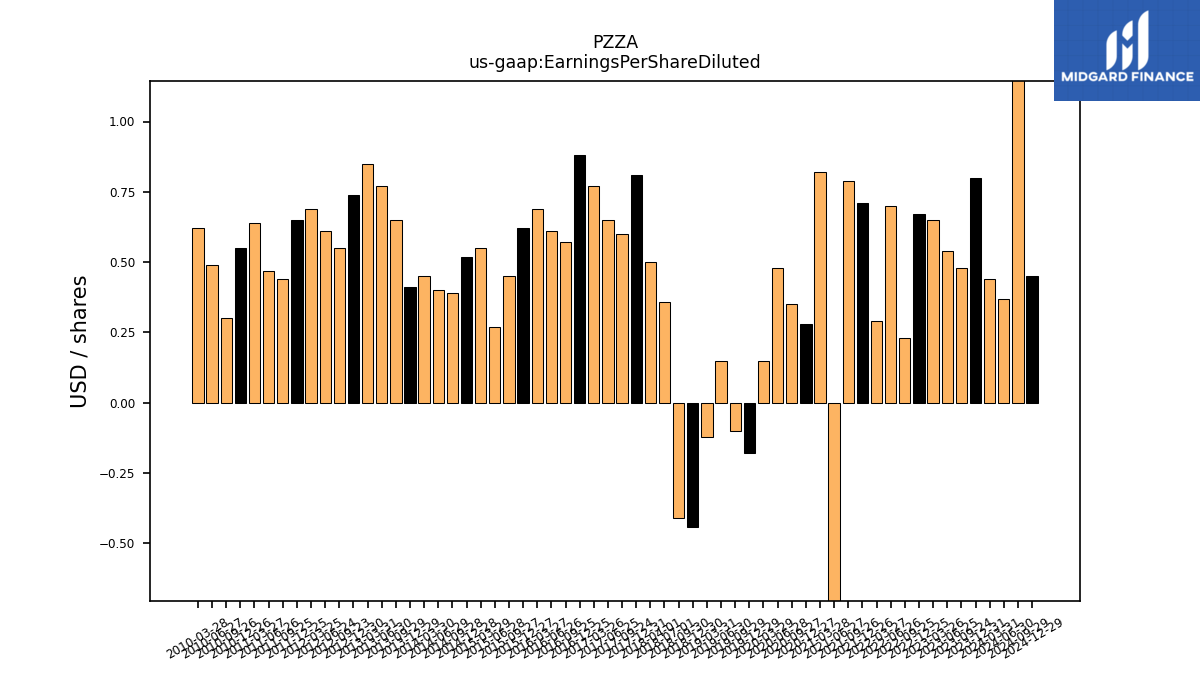
| Earnings Per Share Diluted | 0.44 | 0.80 | 0.48 | 0.54 | 0.65 | 0.67 | 0.23 | 0.70 | 0.29 | 0.71 | 0.79 | -2.30 | 0.82 | 0.28 | 0.35 | 0.48 | 0.15 | -0.18 | -0.10 | 0.15 | -0.12 | -0.44 | -0.41 | 0.36 | 0.50 | 0.81 | 0.60 | 0.65 | 0.77 | 0.88 | 0.57 | 0.61 | 0.69 | 0.62 | 0.45 | 0.27 | 0.55 | 0.52 | 0.39 | 0.40 | 0.45 | 0.41 | 0.65 | 0.77 | 0.85 | 0.74 | 0.55 | 0.61 | 0.69 | 0.65 | 0.44 | 0.47 | 0.64 | 0.55 | 0.30 | 0.49 | 0.62 |
| 2024-03-31 | 2023-12-31 | 2023-09-24 | 2023-06-25 | 2023-03-26 | 2022-12-25 | 2022-09-25 | 2022-06-26 | 2022-03-27 | 2021-12-26 | 2021-09-26 | 2021-06-27 | 2021-03-28 | 2020-12-27 | 2020-09-27 | 2020-06-28 | 2020-03-29 | 2019-12-29 | 2019-09-29 | 2019-06-30 | 2019-03-31 | 2018-12-30 | 2018-09-30 | 2018-07-01 | 2018-04-01 | 2017-12-31 | 2017-09-24 | 2017-06-25 | 2017-03-26 | 2016-12-25 | 2016-09-25 | 2016-06-26 | 2016-03-27 | 2015-12-27 | 2015-09-27 | 2015-06-28 | 2015-03-29 | 2014-12-28 | 2014-09-28 | 2014-06-29 | 2014-03-30 | 2013-12-29 | 2013-09-29 | 2013-06-30 | 2013-03-31 | 2012-12-30 | 2012-09-23 | 2012-06-24 | 2012-03-25 | 2011-12-25 | 2011-09-25 | 2011-06-26 | 2011-03-27 | 2010-12-26 | 2010-09-26 | 2010-06-27 | 2010-03-28 | ||
|---|---|---|---|---|---|---|---|---|---|---|---|---|---|---|---|---|---|---|---|---|---|---|---|---|---|---|---|---|---|---|---|---|---|---|---|---|---|---|---|---|---|---|---|---|---|---|---|---|---|---|---|---|---|---|---|---|---|---|
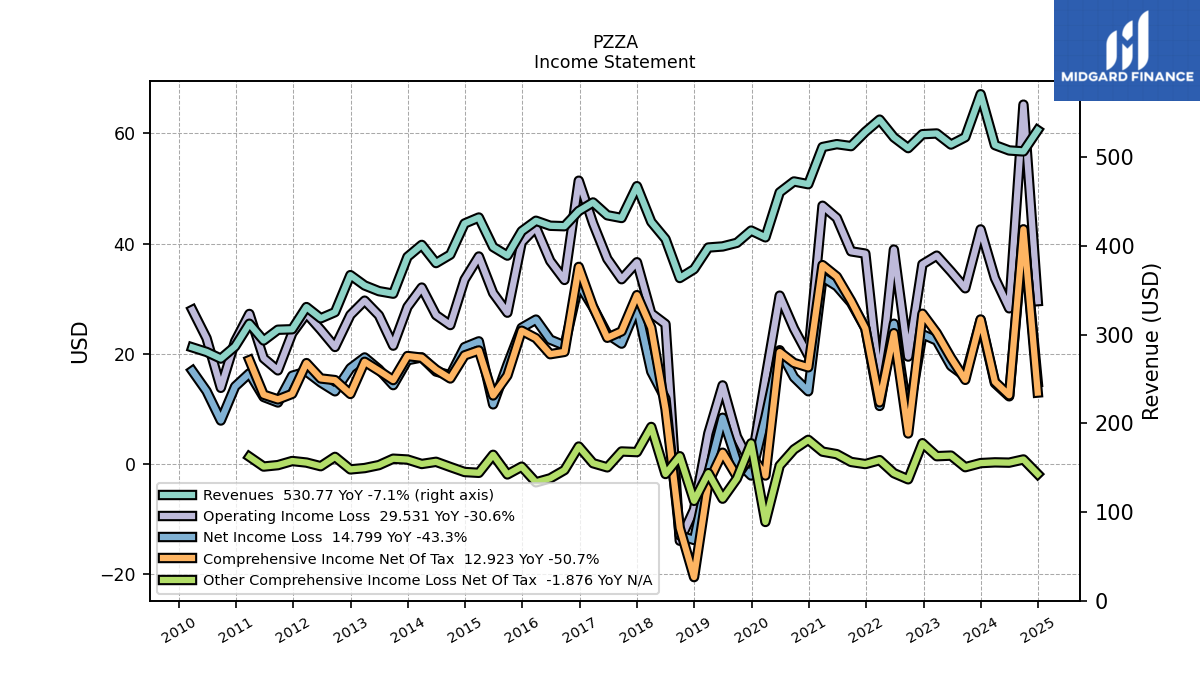
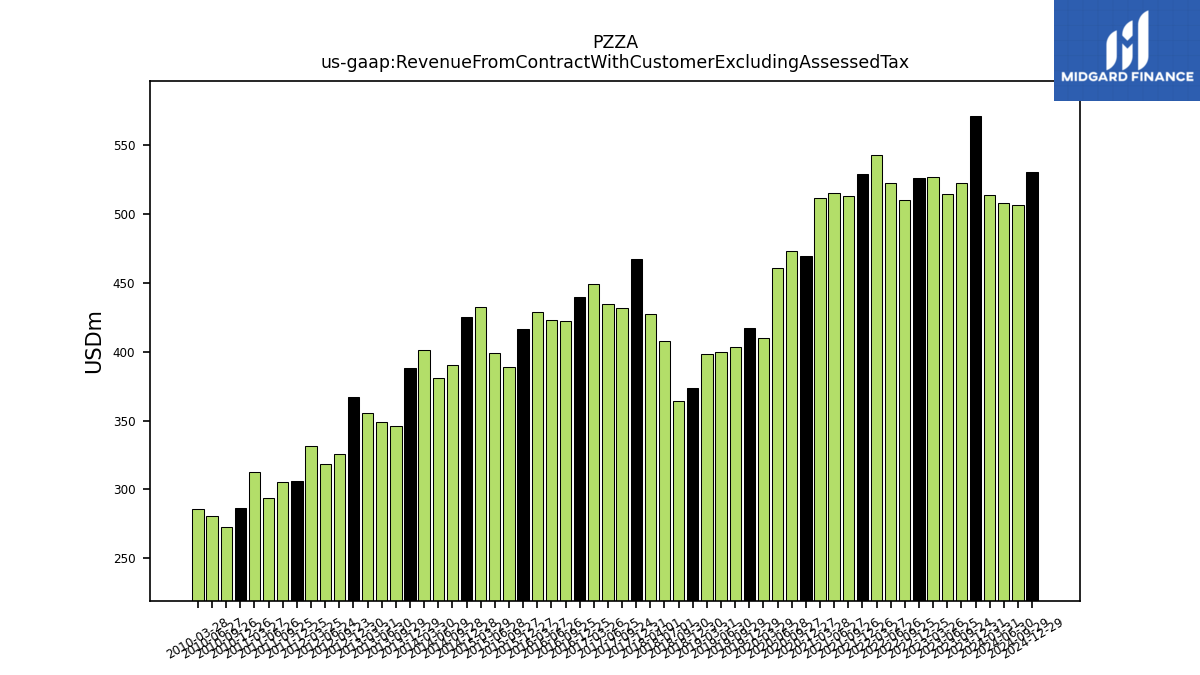
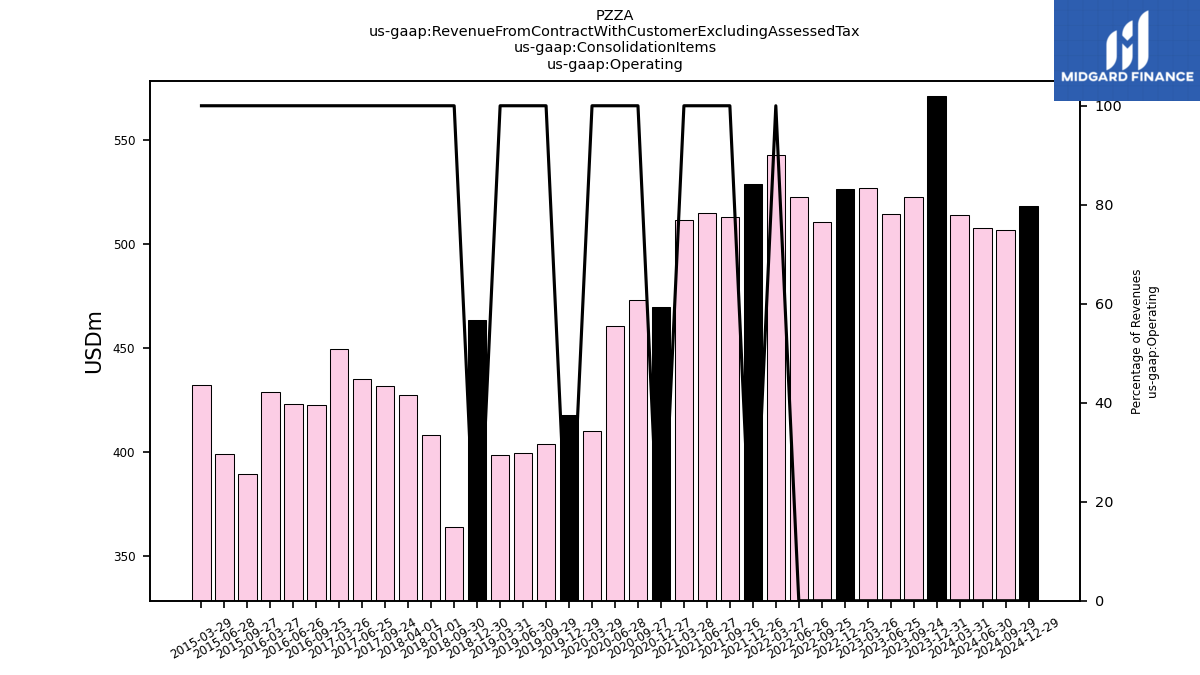
| Revenue From Contract With Customer Excluding Assessed Tax | 513.92 | 571.32 | 522.81 | 514.53 | 527.05 | 526.23 | 510.51 | 522.66 | 542.69 | 528.88 | 512.78 | 515.01 | 511.75 | 469.81 | 472.94 | 460.62 | 409.86 | 417.51 | 403.71 | 399.62 | 398.40 | 373.98 | 364.01 | 407.96 | 427.37 | 467.61 | 431.71 | 434.78 | 449.27 | 439.62 | 422.44 | 422.96 | 428.60 | 416.82 | 389.28 | 398.99 | 432.28 | 425.51 | 390.40 | 380.86 | 401.38 | 387.89 | 346.34 | 349.19 | 355.60 | 367.28 | 325.51 | 318.58 | 331.28 | 306.21 | 305.67 | 293.53 | 312.47 | 286.84 | 273.13 | 280.65 | 285.79 | |
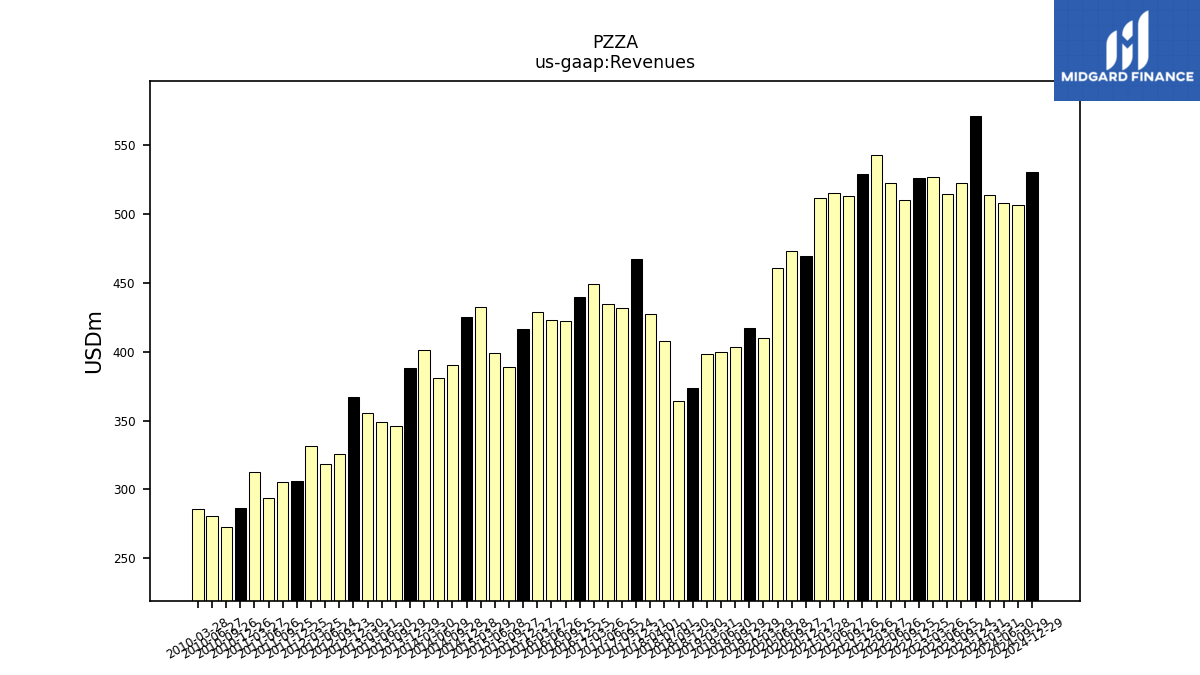
| Revenues | 513.92 | 571.32 | 522.81 | 514.53 | 527.05 | 526.23 | 510.51 | 522.66 | 542.69 | 528.88 | 512.78 | 515.01 | 511.75 | 469.81 | 472.94 | 460.62 | 409.86 | 417.51 | 403.71 | 399.62 | 398.40 | 373.98 | 364.01 | 407.96 | 427.37 | 467.61 | 431.71 | 434.78 | 449.27 | 439.62 | 422.44 | 422.96 | 428.60 | 416.82 | 389.28 | 398.99 | 432.28 | 425.51 | 390.40 | 380.86 | 401.38 | 387.89 | 346.34 | 349.19 | 355.60 | 367.28 | 325.51 | 318.58 | 331.28 | 306.21 | 305.67 | 293.53 | 312.47 | 286.84 | 273.13 | 280.65 | 285.79 | |
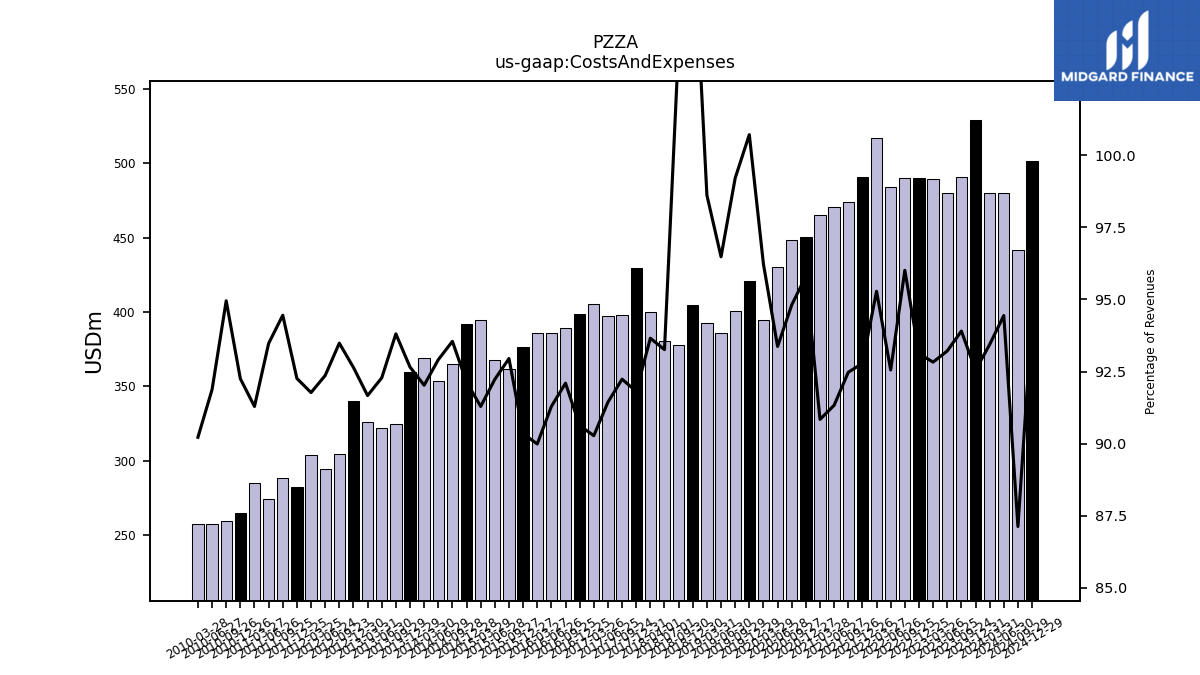
| Costs And Expenses | 480.20 | 528.76 | 490.94 | 479.62 | 489.25 | 490.00 | 490.15 | 483.76 | 517.10 | 490.72 | 474.20 | 470.37 | 464.88 | 450.11 | 448.39 | 430.09 | 394.39 | 420.50 | 400.50 | 385.56 | 392.90 | 404.79 | 378.00 | 380.47 | 400.26 | 429.33 | 398.19 | 397.56 | 405.58 | 398.43 | 389.06 | 386.13 | 385.70 | 376.59 | 361.85 | 368.00 | 394.64 | 392.07 | 365.21 | 353.87 | 369.38 | 359.41 | 324.89 | 322.24 | 325.98 | 340.26 | 304.31 | 294.25 | 304.02 | 282.52 | 288.71 | 274.38 | 285.26 | 264.62 | 259.34 | 257.85 | 257.84 | |
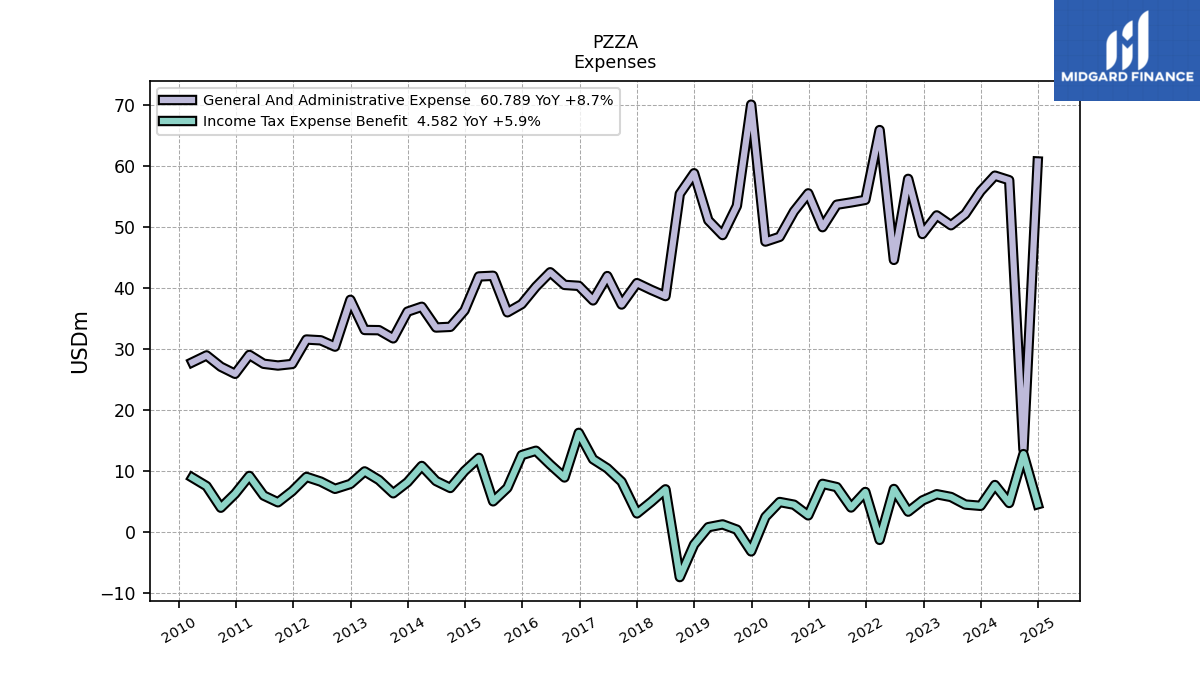
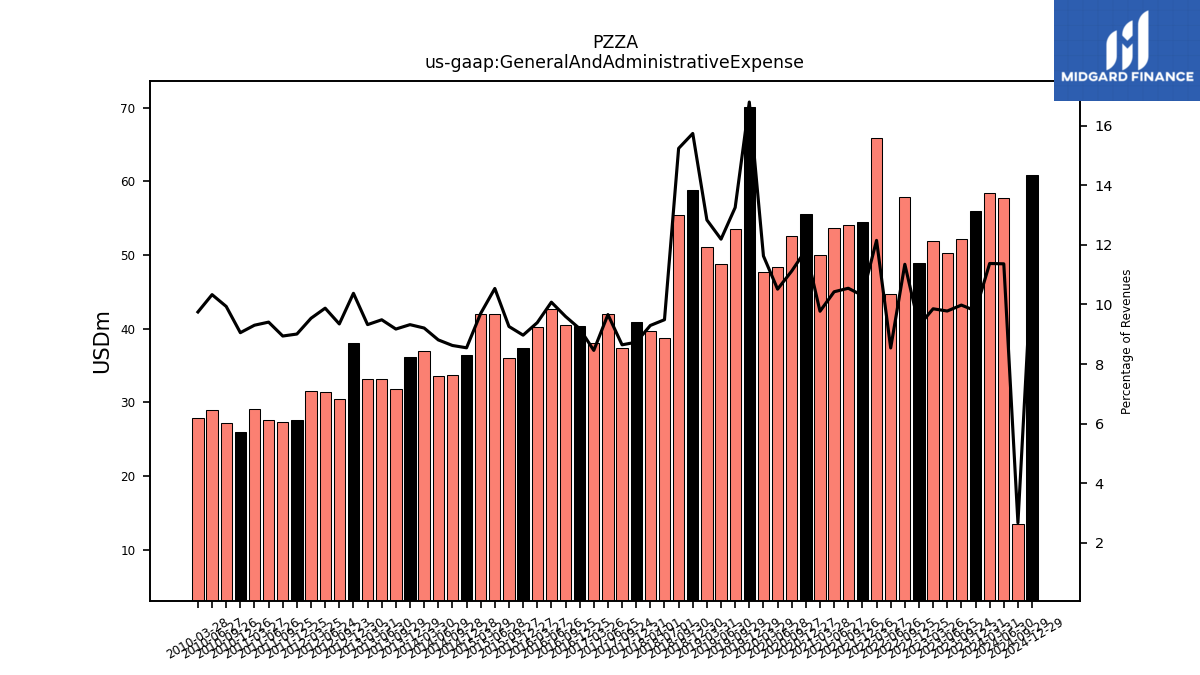
| General And Administrative Expense | 58.46 | 55.92 | 52.17 | 50.32 | 51.94 | 48.89 | 57.94 | 44.65 | 65.94 | 54.49 | 54.07 | 53.70 | 50.01 | 55.56 | 52.60 | 48.43 | 47.65 | 70.10 | 53.50 | 48.72 | 51.13 | 58.85 | 55.46 | 38.71 | 39.73 | 40.84 | 37.33 | 42.00 | 38.01 | 40.39 | 40.55 | 42.62 | 40.25 | 37.39 | 36.05 | 42.04 | 41.93 | 36.37 | 33.67 | 33.56 | 36.97 | 36.16 | 31.78 | 33.13 | 33.16 | 38.11 | 30.43 | 31.46 | 31.60 | 27.59 | 27.33 | 27.62 | 29.07 | 25.97 | 27.13 | 28.99 | 27.86 | |
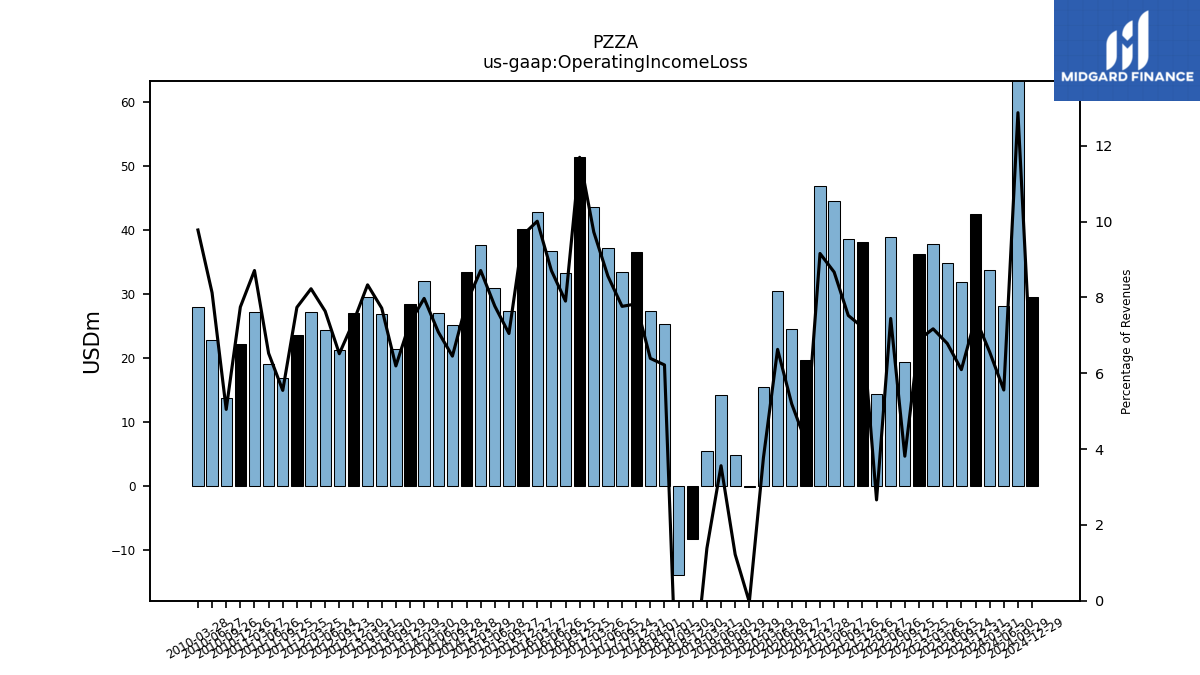
| Operating Income Loss | 33.72 | 42.57 | 31.87 | 34.91 | 37.80 | 36.23 | 19.46 | 38.90 | 14.44 | 38.16 | 38.58 | 44.64 | 46.86 | 19.70 | 24.55 | 30.53 | 15.47 | -0.13 | 4.93 | 14.23 | 5.51 | -8.31 | -13.99 | 25.37 | 27.32 | 36.60 | 33.52 | 37.22 | 43.68 | 51.41 | 33.38 | 36.83 | 42.90 | 40.23 | 27.44 | 31.00 | 37.65 | 33.44 | 25.19 | 27.00 | 32.00 | 28.48 | 21.45 | 26.95 | 29.62 | 27.02 | 21.20 | 24.33 | 27.26 | 23.69 | 16.96 | 19.16 | 27.21 | 22.22 | 13.78 | 22.80 | 27.94 | |
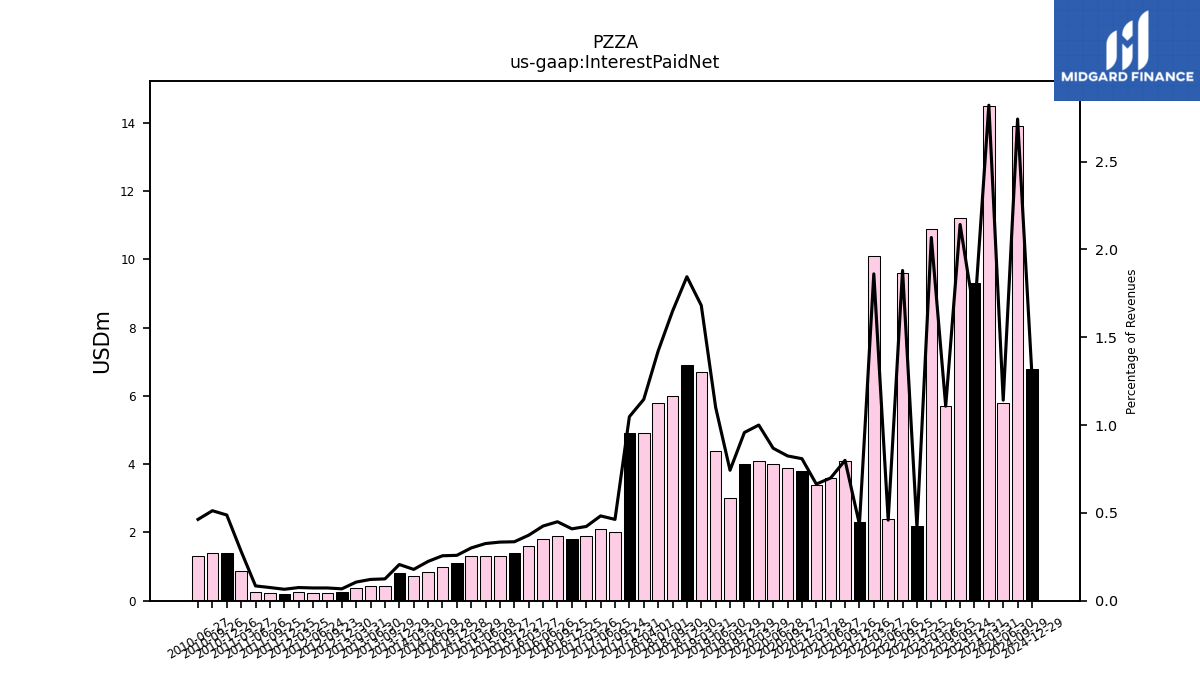
| Interest Paid Net | 14.50 | 9.30 | 11.20 | 5.70 | 10.90 | 2.20 | 9.60 | 2.40 | 10.10 | 2.30 | 4.10 | 3.60 | 3.40 | 3.80 | 3.90 | 4.00 | 4.10 | 4.00 | 3.00 | 4.40 | 6.70 | 6.90 | 6.00 | 5.80 | 4.90 | 4.90 | 2.00 | 2.10 | 1.90 | 1.80 | 1.90 | 1.80 | 1.60 | 1.40 | 1.30 | 1.30 | 1.30 | 1.10 | 1.00 | 0.85 | 0.72 | 0.80 | 0.43 | 0.42 | 0.38 | 0.25 | 0.24 | 0.23 | 0.25 | 0.20 | 0.23 | 0.25 | 0.88 | 1.40 | 1.40 | 1.30 | NA | |
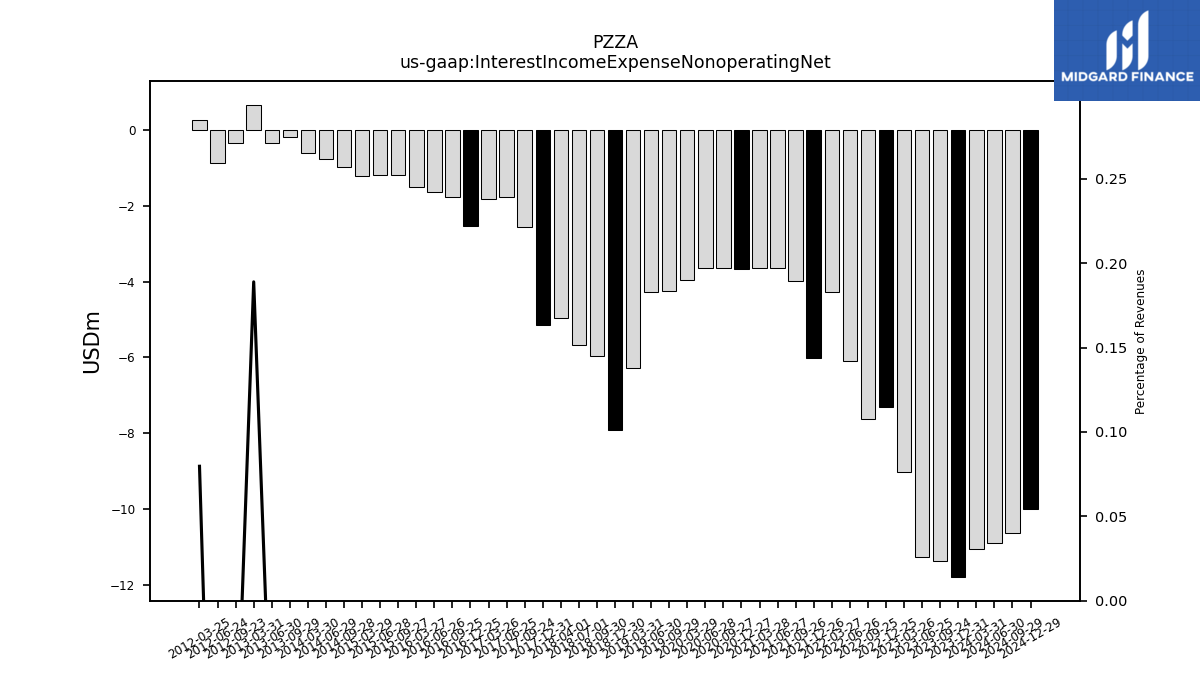
| Interest Income Expense Nonoperating Net | -11.06 | -11.79 | -11.38 | -11.28 | -9.02 | -7.29 | -7.62 | -6.08 | -4.26 | -6.02 | -3.98 | -3.65 | -3.65 | -3.66 | -3.64 | -3.63 | -3.97 | NA | -4.25 | -4.27 | -6.28 | -7.93 | -5.96 | -5.66 | -4.96 | -5.15 | -2.57 | -1.76 | -1.81 | -2.52 | -1.76 | -1.63 | -1.49 | NA | -1.18 | -1.19 | -1.21 | NA | -0.97 | -0.76 | -0.59 | NA | -0.18 | -0.34 | 0.67 | NA | -0.34 | -0.86 | 0.26 | NA | NA | NA | NA | NA | NA | NA | NA | |
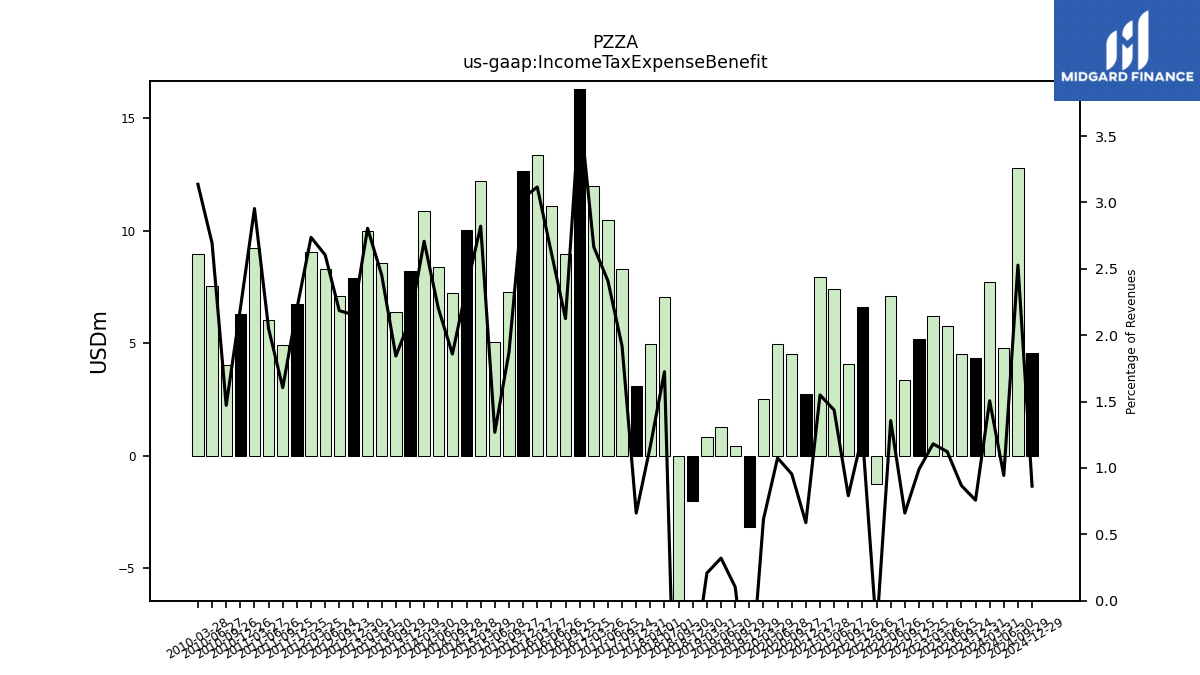
| Income Tax Expense Benefit | 7.74 | 4.33 | 4.54 | 5.78 | 6.23 | 5.21 | 3.37 | 7.09 | -1.26 | 6.61 | 4.06 | 7.40 | 7.93 | 2.76 | 4.52 | 4.96 | 2.51 | -3.15 | 0.42 | 1.28 | 0.83 | -2.03 | -7.36 | 7.04 | 4.98 | 3.09 | 8.28 | 10.48 | 11.97 | 16.29 | 8.98 | 11.09 | 13.36 | 12.64 | 7.28 | 5.06 | 12.20 | 10.04 | 7.26 | 8.40 | 10.87 | 8.20 | 6.38 | 8.56 | 9.98 | 7.91 | 7.11 | 8.30 | 9.07 | 6.74 | 4.91 | 6.01 | 9.23 | 6.31 | 4.02 | 7.56 | 8.96 | |
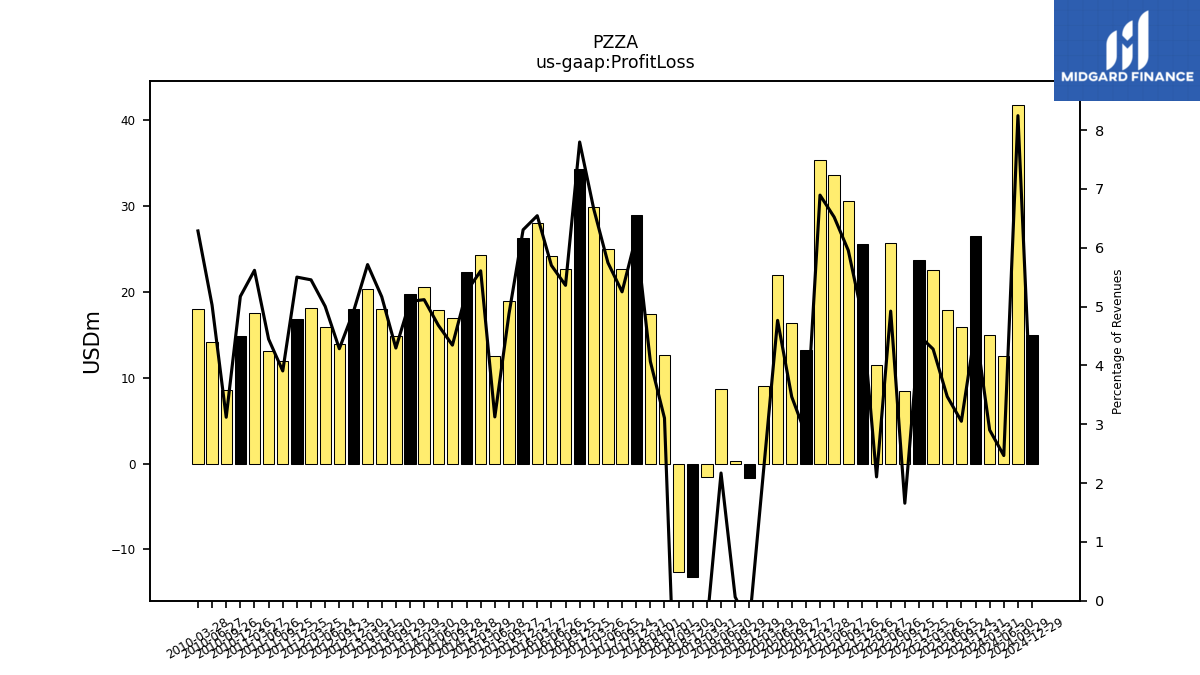
| Profit Loss | 14.91 | 26.44 | 15.95 | 17.86 | 22.55 | 23.73 | 8.46 | 25.73 | 11.43 | 25.54 | 30.54 | 33.59 | 35.28 | 13.27 | 16.40 | 21.95 | 8.99 | -1.68 | 0.26 | 8.68 | -1.60 | -13.22 | -12.59 | 12.66 | 17.38 | 28.98 | 22.67 | 24.98 | 29.90 | 34.28 | 22.65 | 24.11 | 28.05 | 26.28 | 18.98 | 12.47 | 24.24 | 22.36 | 16.96 | 17.84 | 20.54 | 19.74 | 14.88 | 18.05 | 20.32 | 18.05 | 13.95 | 15.94 | 18.07 | 16.84 | 11.94 | 13.05 | 17.55 | 14.84 | 8.52 | 14.10 | 17.96 | |
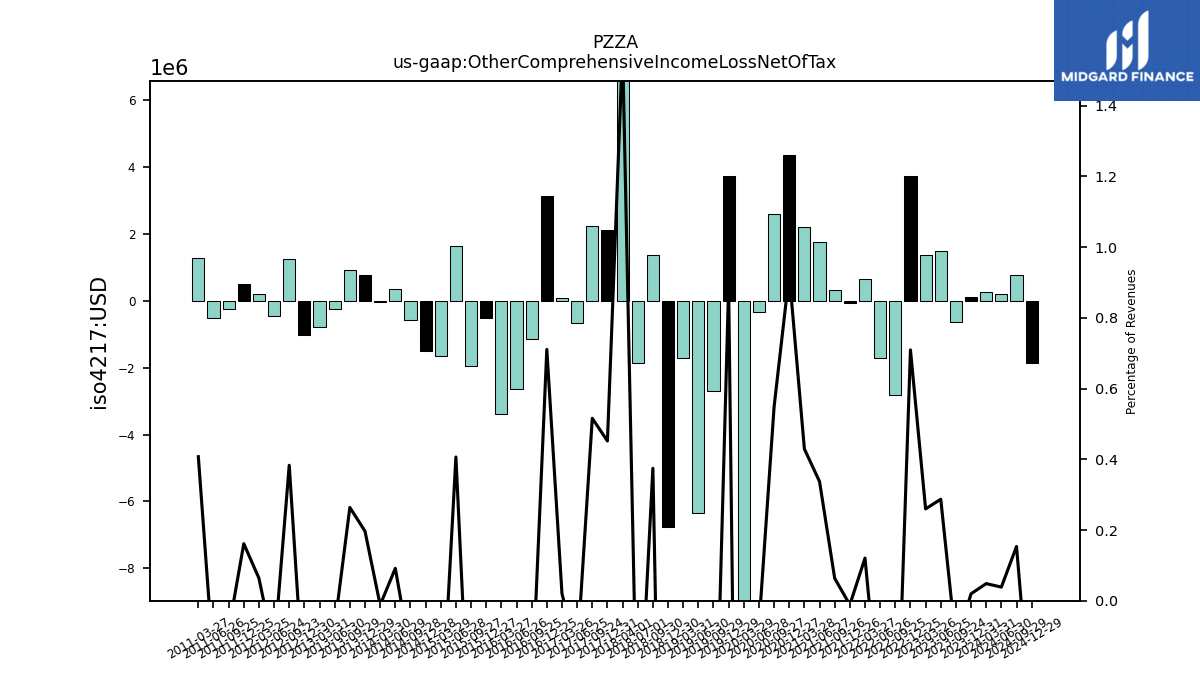
| Other Comprehensive Income Loss Net Of Tax | 0.25 | 0.11 | -0.63 | 1.48 | 1.37 | 3.73 | -2.83 | -1.72 | 0.66 | -0.06 | 0.33 | 1.74 | 2.20 | 4.34 | 2.59 | -0.34 | -10.58 | 3.71 | -2.70 | -6.35 | -1.70 | -6.75 | 1.36 | -1.87 | 6.68 | 2.11 | 2.23 | -0.66 | 0.09 | 3.12 | -1.15 | -2.65 | -3.38 | -0.53 | -1.94 | 1.62 | -1.65 | -1.50 | -0.59 | 0.35 | -0.05 | 0.76 | 0.91 | -0.25 | -0.79 | -1.03 | 1.25 | -0.45 | 0.21 | 0.49 | -0.25 | -0.51 | 1.27 | NA | NA | NA | NA | |
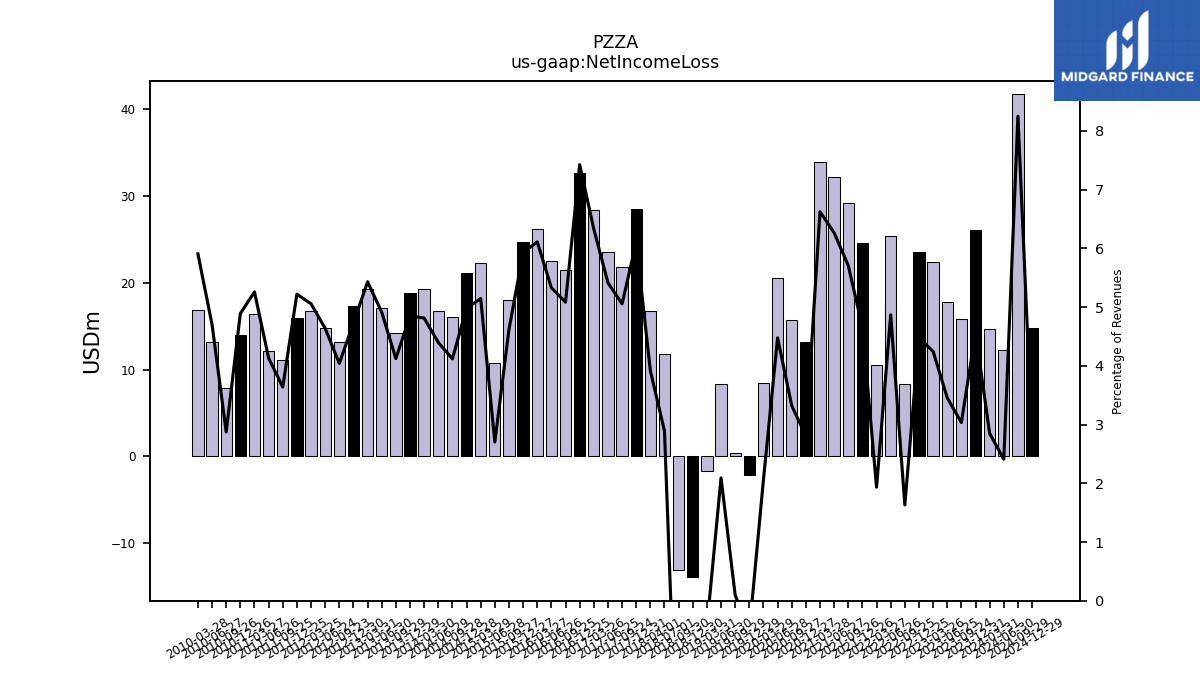
| Net Income Loss | 14.64 | 26.09 | 15.86 | 17.77 | 22.38 | 23.51 | 8.33 | 25.43 | 10.49 | 24.62 | 29.26 | 32.25 | 33.88 | 13.17 | 15.71 | 20.61 | 8.44 | -2.14 | 0.39 | 8.35 | -1.73 | -13.85 | -13.03 | 11.79 | 16.74 | 28.51 | 21.82 | 23.54 | 28.43 | 32.63 | 21.47 | 22.54 | 26.18 | 24.70 | 17.97 | 10.78 | 22.24 | 21.18 | 16.07 | 16.75 | 19.31 | 18.80 | 14.28 | 17.15 | 19.31 | 17.36 | 13.15 | 14.77 | 16.74 | 15.98 | 11.12 | 12.12 | 16.43 | 14.03 | 7.85 | 13.19 | 16.88 | |
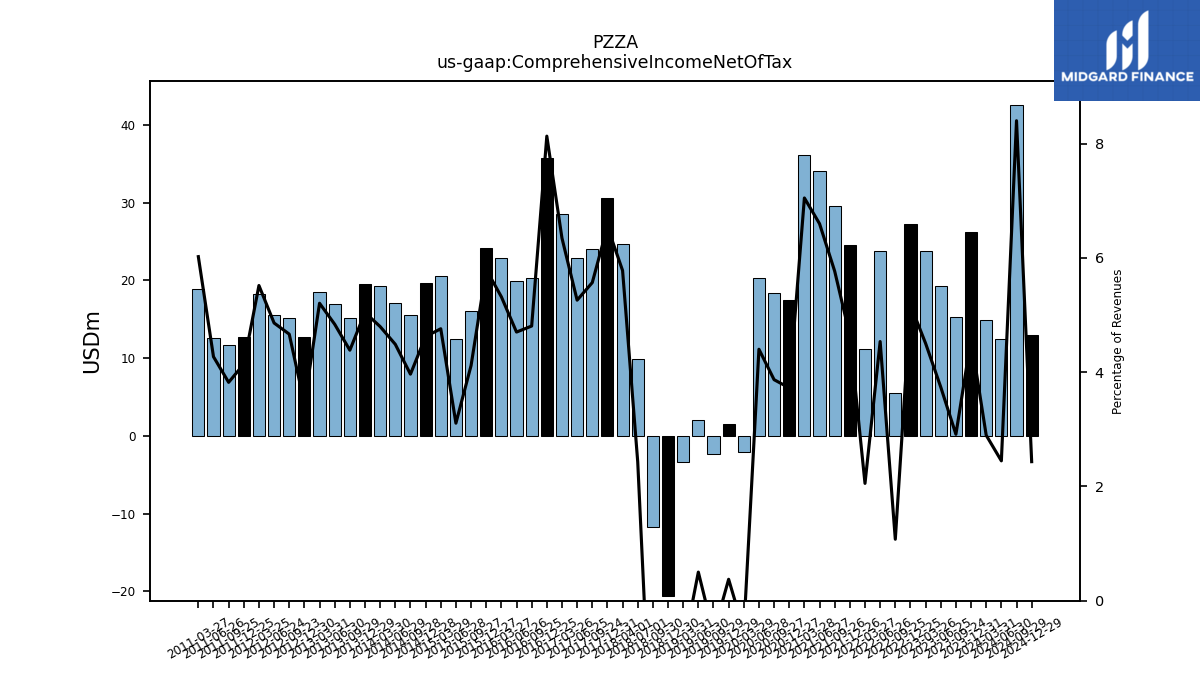
| Comprehensive Income Net Of Tax | 14.88 | 26.21 | 15.23 | 19.25 | 23.75 | 27.25 | 5.50 | 23.71 | 11.15 | 24.56 | 29.58 | 33.99 | 36.08 | 17.51 | 18.30 | 20.28 | -2.14 | 1.57 | -2.31 | 2.00 | -3.43 | -20.60 | -11.67 | 9.92 | 24.71 | 30.62 | 24.04 | 22.88 | 28.52 | 35.76 | 20.32 | 19.89 | 22.80 | 24.16 | 16.03 | 12.40 | 20.58 | 19.68 | 15.48 | 17.10 | 19.26 | 19.57 | 15.19 | 16.90 | 18.52 | 12.67 | 15.19 | 15.49 | 18.28 | 12.69 | 11.69 | 12.54 | 18.82 | NA | NA | NA | NA | |
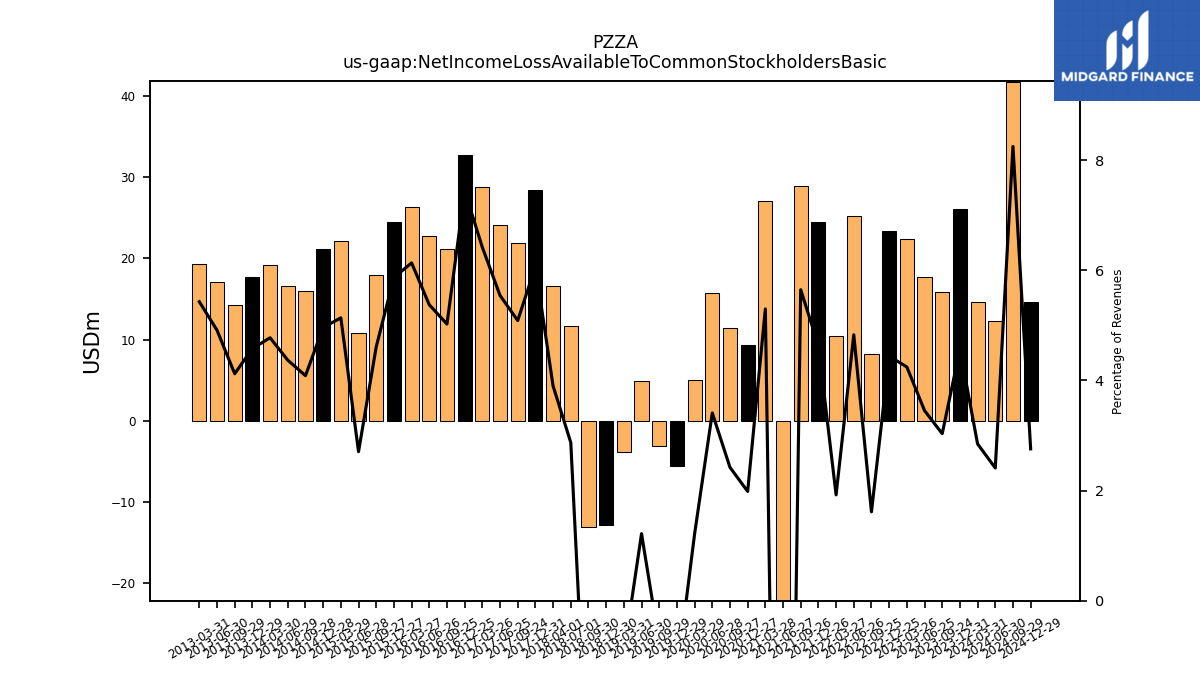
| Net Income Loss Available To Common Stockholders Basic | 14.64 | 26.09 | 15.86 | 17.77 | 22.38 | 23.37 | 8.24 | 25.24 | 10.43 | 24.50 | 28.96 | -79.90 | 27.11 | 9.33 | 11.46 | 15.71 | 4.97 | -5.61 | -3.09 | 4.87 | -3.80 | -12.87 | -13.03 | 11.72 | 16.66 | 28.39 | 21.96 | 24.10 | 28.83 | 32.72 | 21.22 | 22.73 | 26.29 | 24.47 | 17.95 | 10.80 | 22.21 | 21.11 | 15.96 | 16.64 | 19.17 | 17.77 | 14.28 | 17.15 | 19.31 | NA | NA | NA | NA | NA | NA | NA | NA | NA | NA | NA | NA | |
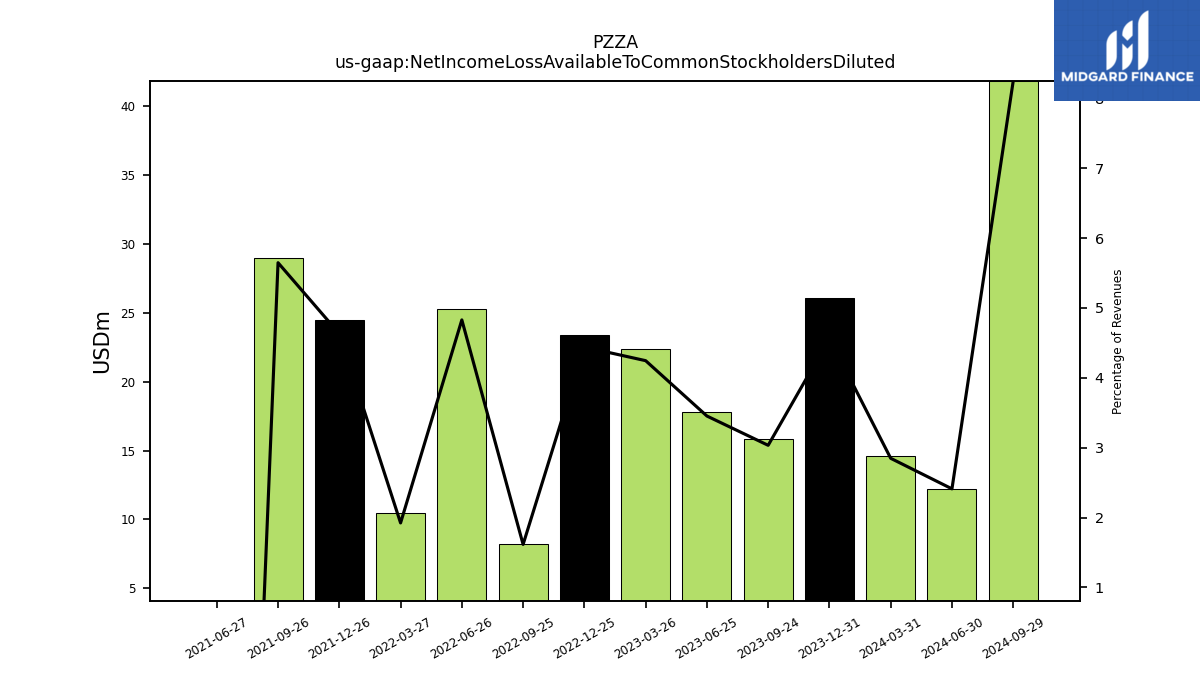
| Net Income Loss Available To Common Stockholders Diluted | 14.64 | 26.09 | 15.86 | 17.77 | 22.38 | 23.37 | 8.24 | 25.24 | 10.43 | 24.50 | 28.96 | -79.90 | NA | NA | NA | NA | NA | NA | NA | NA | NA | NA | NA | NA | NA | NA | NA | NA | NA | NA | NA | NA | NA | NA | NA | NA | NA | NA | NA | NA | NA | NA | NA | NA | NA | NA | NA | NA | NA | NA | NA | NA | NA | NA | NA | NA | NA |
| 2024-03-31 | 2023-12-31 | 2023-09-24 | 2023-06-25 | 2023-03-26 | 2022-12-25 | 2022-09-25 | 2022-06-26 | 2022-03-27 | 2021-12-26 | 2021-09-26 | 2021-06-27 | 2021-03-28 | 2020-12-27 | 2020-09-27 | 2020-06-28 | 2020-03-29 | 2019-12-29 | 2019-09-29 | 2019-06-30 | 2019-03-31 | 2018-12-30 | 2018-09-30 | 2018-07-01 | 2018-04-01 | 2017-12-31 | 2017-09-24 | 2017-06-25 | 2017-03-26 | 2016-12-25 | 2016-09-25 | 2016-06-26 | 2016-03-27 | 2015-12-27 | 2015-09-27 | 2015-06-28 | 2015-03-29 | 2014-12-28 | 2014-09-28 | 2014-06-29 | 2014-03-30 | 2013-12-29 | 2013-09-29 | 2013-06-30 | 2013-03-31 | 2012-12-30 | 2012-09-23 | 2012-06-24 | 2012-03-25 | 2011-12-25 | 2011-09-25 | 2011-06-26 | 2011-03-27 | 2010-12-26 | 2010-09-26 | 2010-06-27 | 2010-03-28 | ||
|---|---|---|---|---|---|---|---|---|---|---|---|---|---|---|---|---|---|---|---|---|---|---|---|---|---|---|---|---|---|---|---|---|---|---|---|---|---|---|---|---|---|---|---|---|---|---|---|---|---|---|---|---|---|---|---|---|---|---|
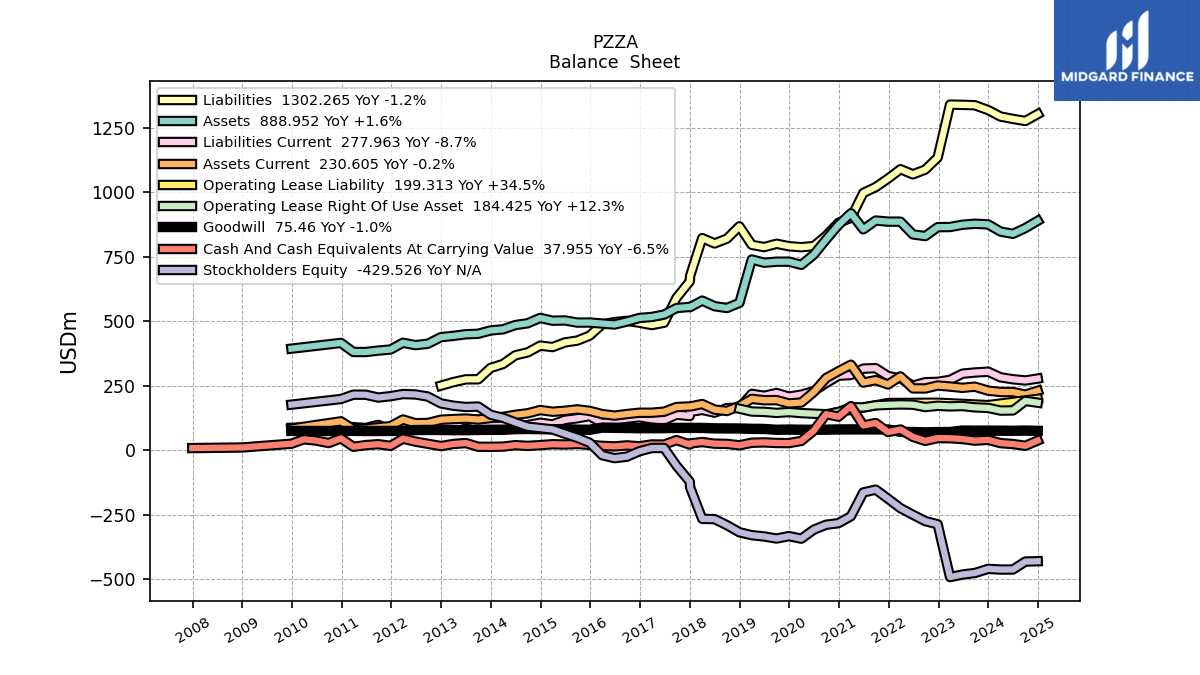
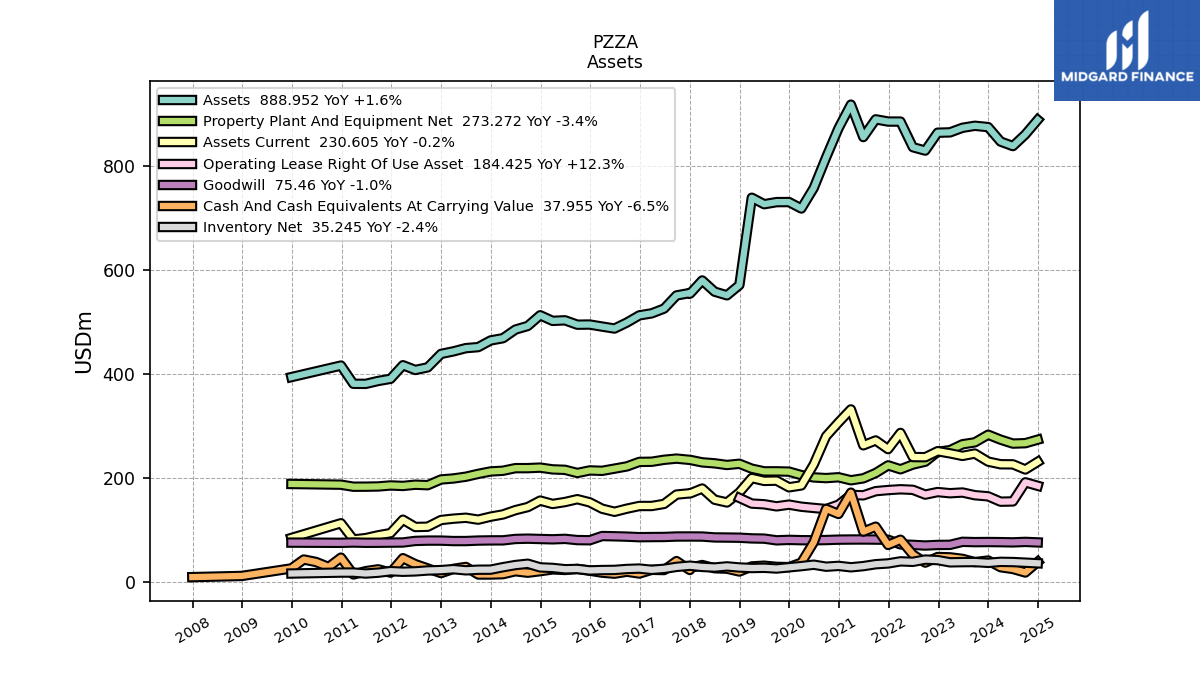
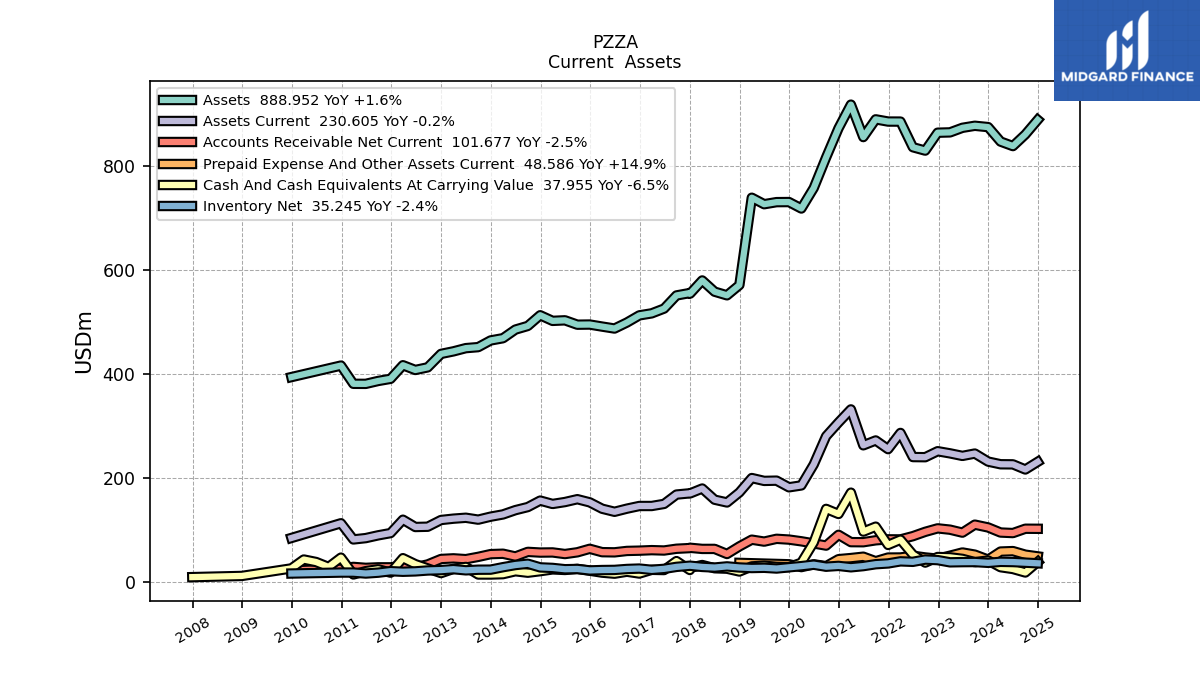
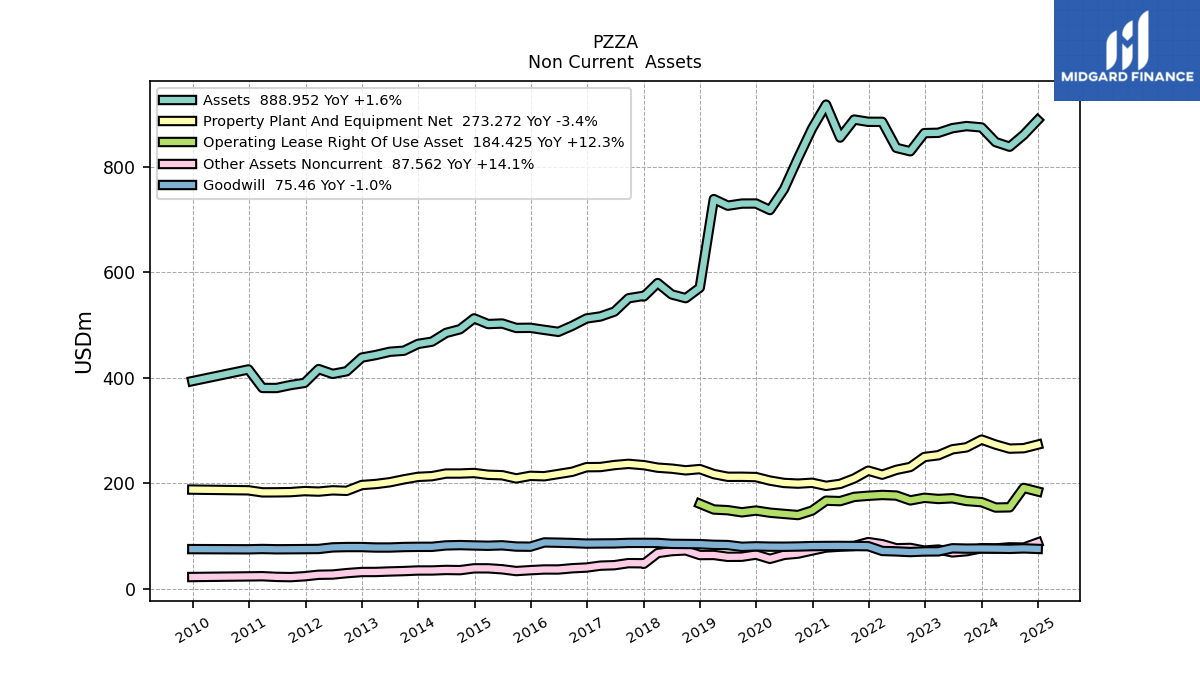
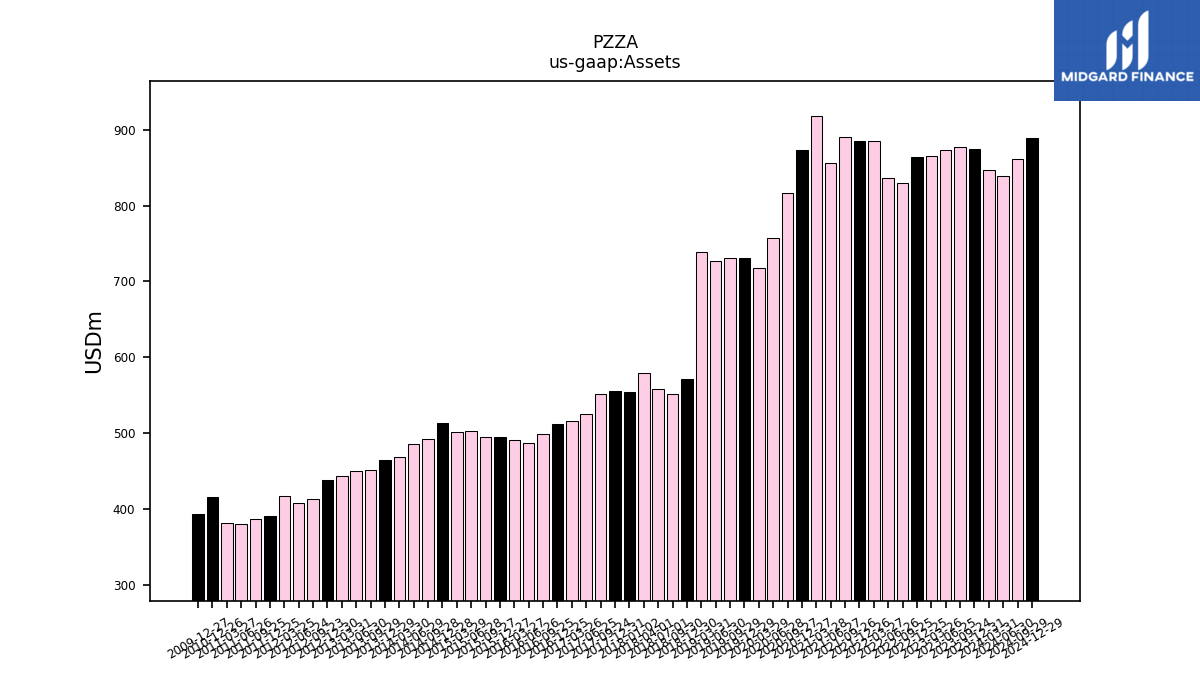
| Assets | 847.17 | 875.00 | 877.57 | 873.64 | 864.86 | 864.23 | 829.75 | 836.27 | 885.63 | 885.70 | 889.95 | 855.74 | 918.28 | 872.77 | 816.67 | 757.74 | 718.27 | 730.72 | 730.57 | 726.56 | 739.07 | 570.95 | 551.16 | 558.17 | 579.82 | 555.55 | 550.93 | 525.64 | 516.45 | 512.57 | 498.79 | 487.22 | 490.98 | 494.91 | 494.62 | 503.04 | 501.98 | 512.80 | 492.18 | 485.20 | 468.60 | 464.29 | 451.44 | 449.48 | 443.29 | 438.41 | 412.48 | 407.44 | 416.61 | 390.38 | 386.25 | 380.69 | 380.80 | 415.94 | NA | NA | NA | |
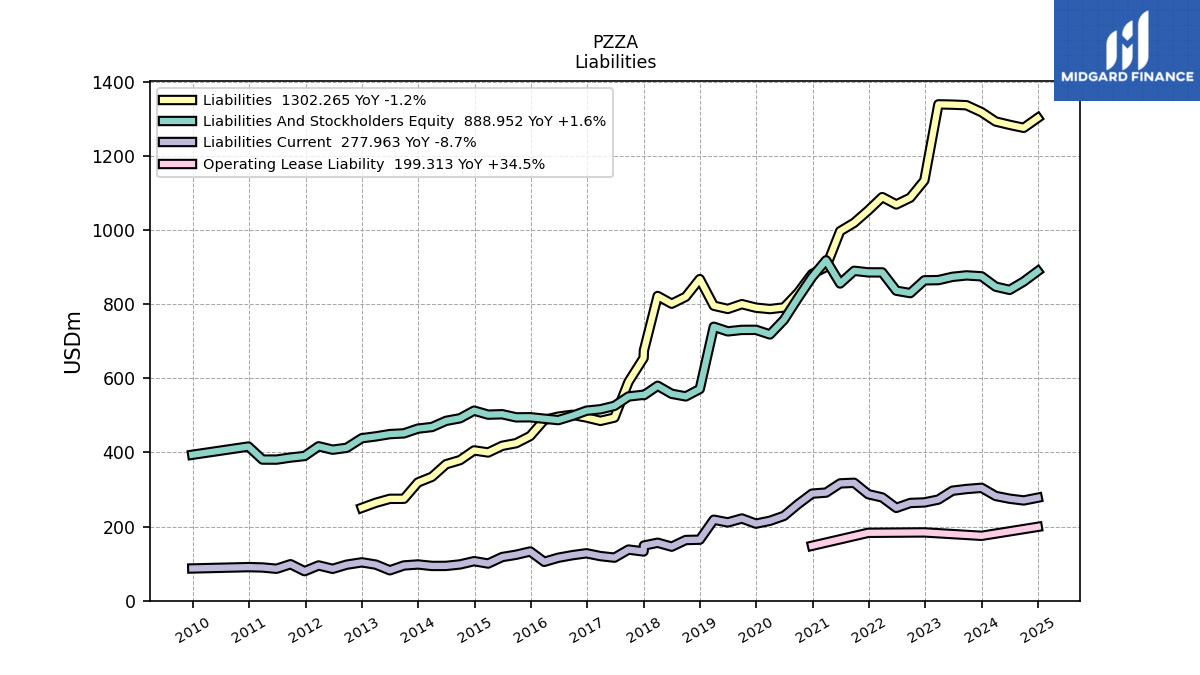
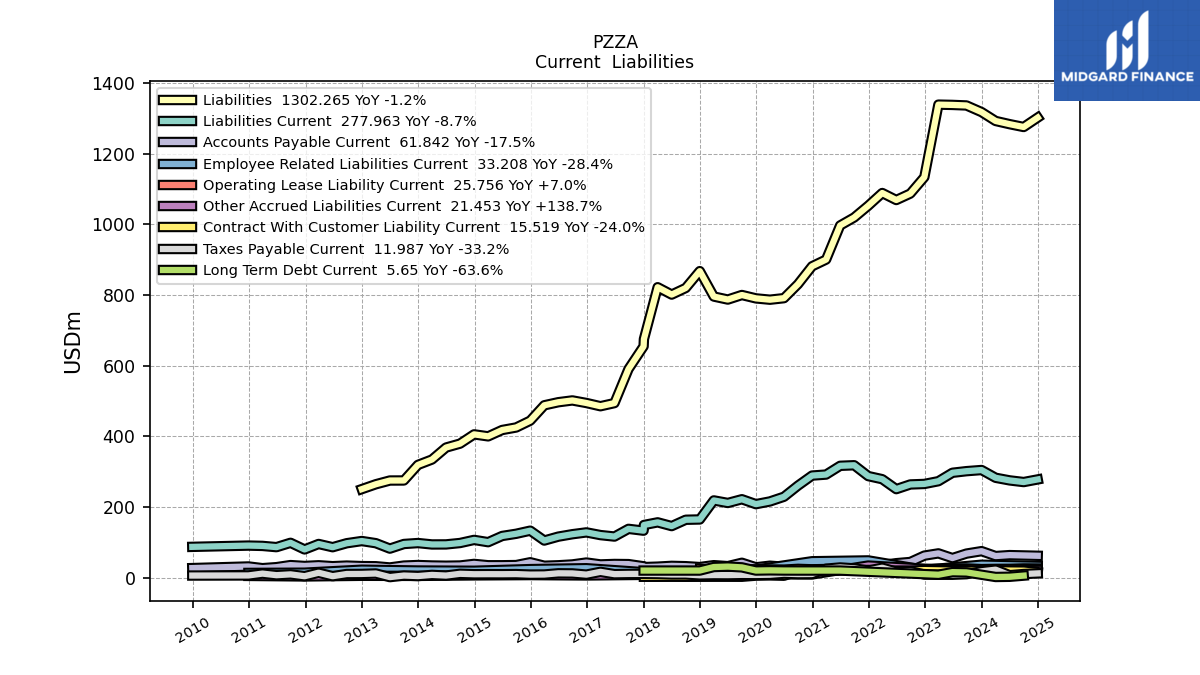
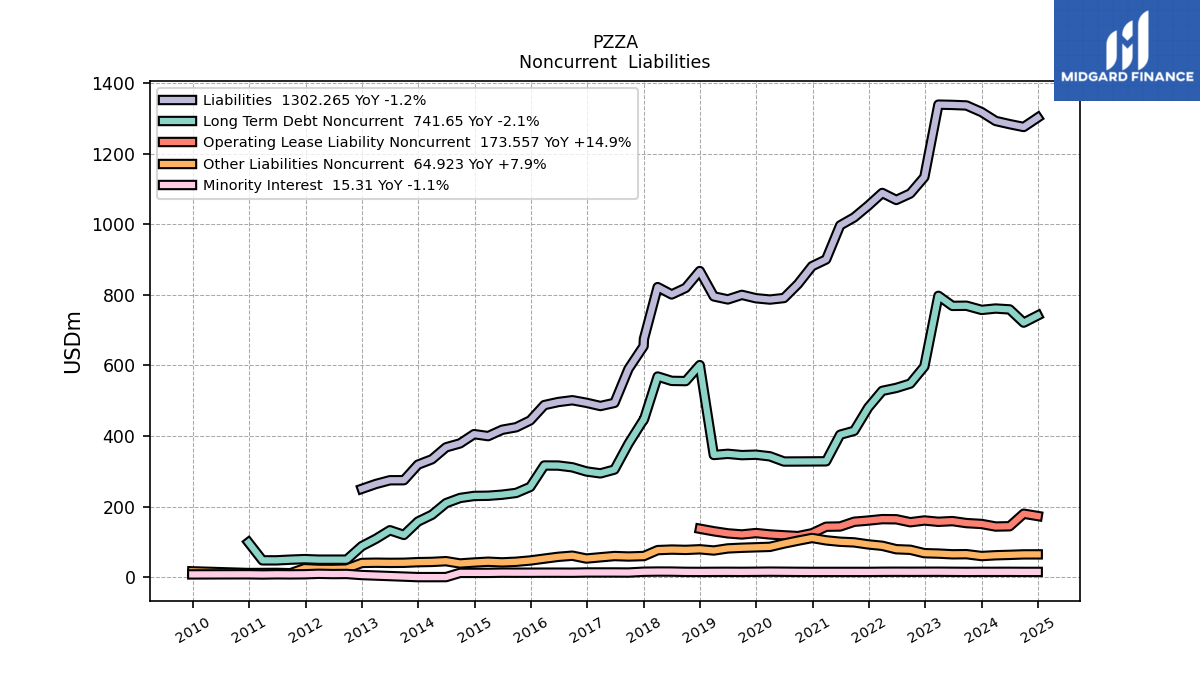
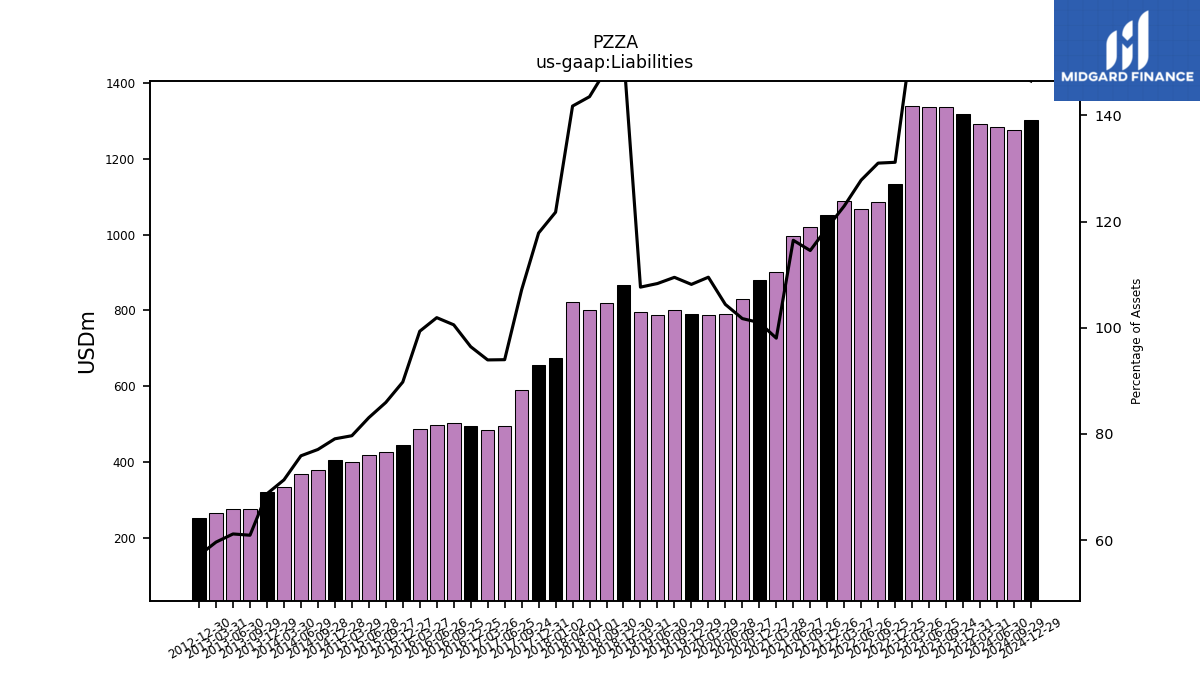
| Liabilities | 1292.65 | 1317.77 | 1336.55 | 1338.10 | 1338.92 | 1133.67 | 1087.16 | 1068.90 | 1088.75 | 1052.66 | 1019.47 | 996.80 | 900.32 | 881.33 | 830.82 | 791.09 | 786.71 | 790.46 | 800.01 | 787.12 | 795.68 | 867.62 | 819.91 | 801.21 | 822.01 | 654.77 | 590.31 | 494.04 | 485.18 | 494.30 | 501.58 | 496.52 | 487.79 | 444.34 | 425.03 | 417.88 | 399.88 | 405.53 | 379.33 | 368.16 | 334.32 | 319.08 | 275.00 | 274.88 | 264.29 | 250.51 | NA | NA | NA | NA | NA | NA | NA | NA | NA | NA | NA | |
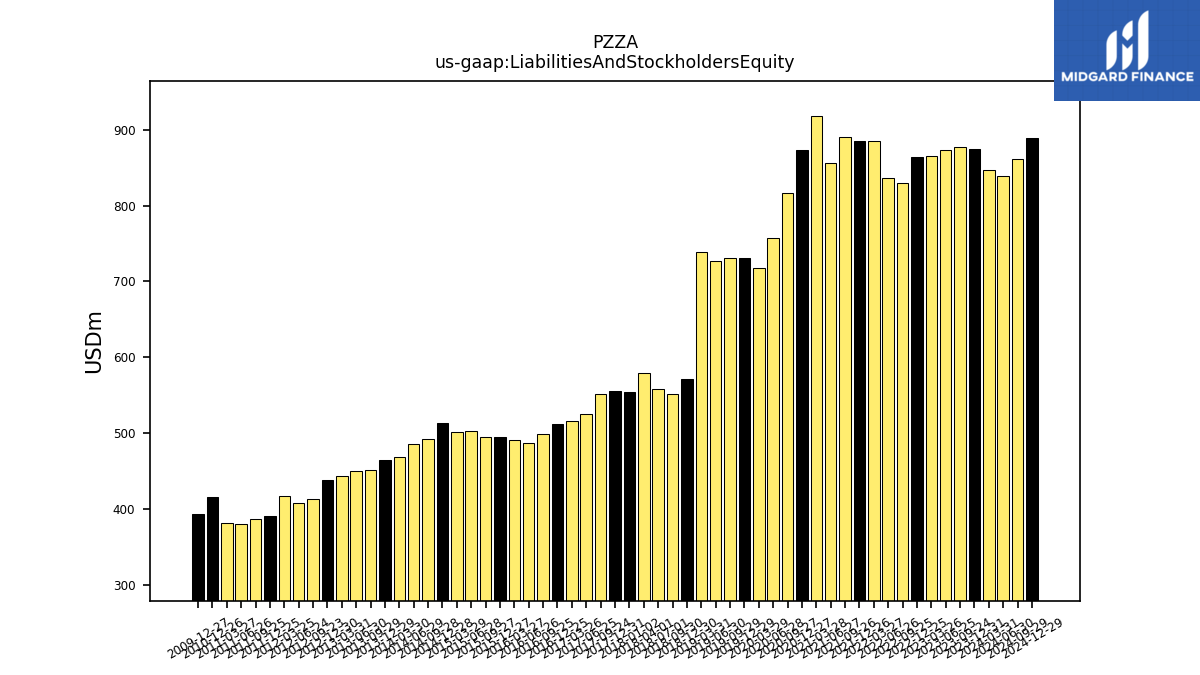
| Liabilities And Stockholders Equity | 847.17 | 875.00 | 877.57 | 873.64 | 864.86 | 864.23 | 829.75 | 836.27 | 885.63 | 885.70 | 889.95 | 855.74 | 918.28 | 872.77 | 816.67 | 757.74 | 718.27 | 730.72 | 730.57 | 726.56 | 739.07 | 570.95 | 551.16 | 558.17 | 579.82 | 555.55 | 550.93 | 525.64 | 516.45 | 512.57 | 498.79 | 487.22 | 490.98 | 494.91 | 494.62 | 503.04 | 501.98 | 512.80 | 492.18 | 485.20 | 468.60 | 464.29 | 451.44 | 449.48 | 443.29 | 438.41 | 412.48 | 407.44 | 416.61 | 390.38 | 386.25 | 380.69 | 380.80 | 415.94 | NA | NA | NA | |
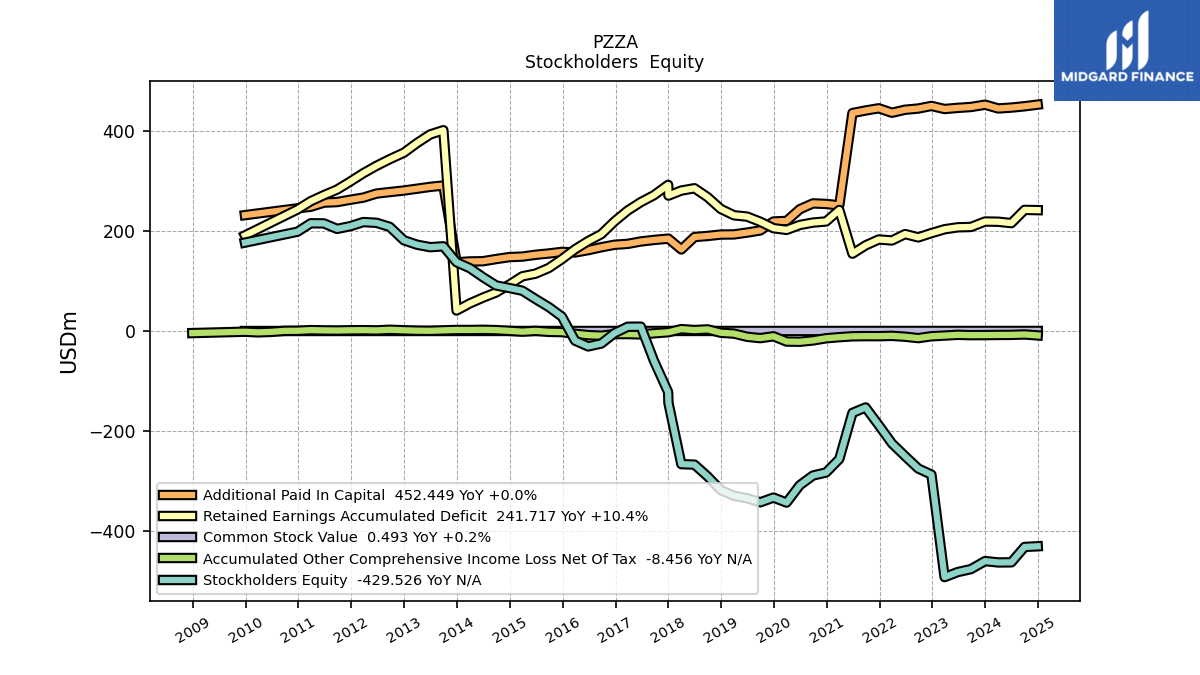
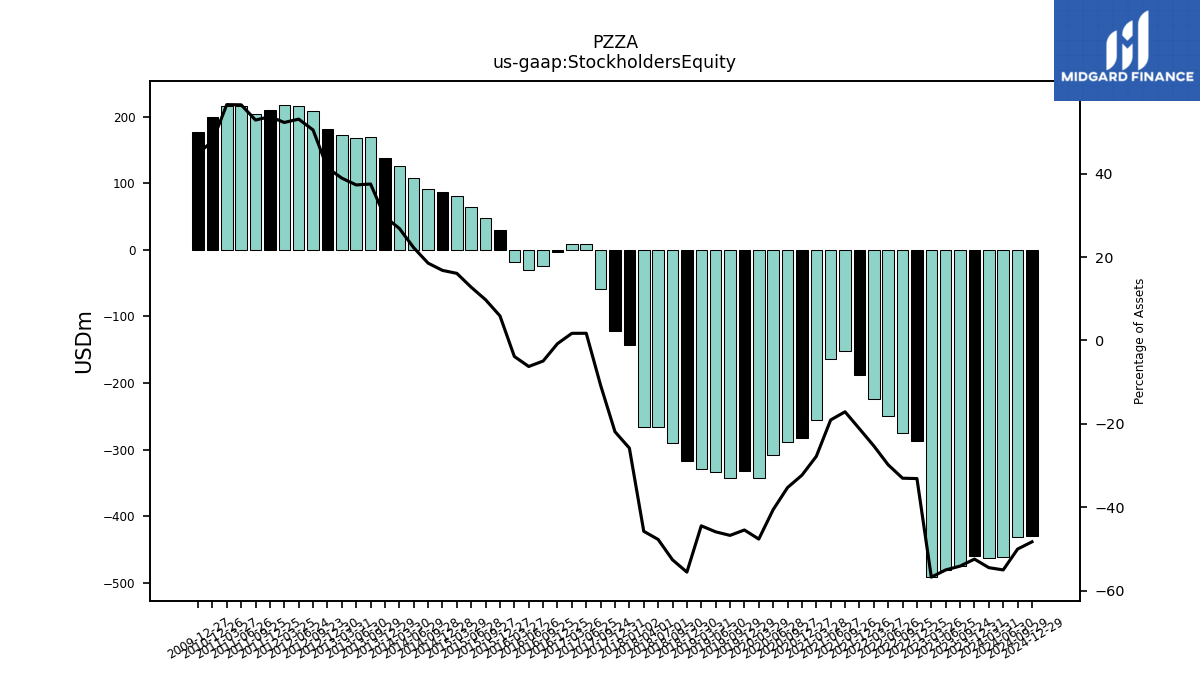
| Stockholders Equity | -461.86 | -459.09 | -475.19 | -481.04 | -491.15 | -286.39 | -274.27 | -249.56 | -224.08 | -187.67 | -152.34 | -163.19 | -255.38 | -282.18 | -288.26 | -307.57 | -342.31 | -332.32 | -341.73 | -333.65 | -328.72 | -317.36 | -290.13 | -266.53 | -265.49 | -121.71 | -59.30 | 9.08 | 8.85 | -3.91 | -24.63 | -30.42 | -18.86 | 29.18 | 48.31 | 64.24 | 80.83 | 86.23 | 91.35 | 108.02 | 126.00 | 137.67 | 169.50 | 167.76 | 172.71 | 181.51 | 208.38 | 216.41 | 217.94 | 209.65 | 204.31 | 215.27 | 215.52 | 198.69 | NA | NA | NA |
| 2024-03-31 | 2023-12-31 | 2023-09-24 | 2023-06-25 | 2023-03-26 | 2022-12-25 | 2022-09-25 | 2022-06-26 | 2022-03-27 | 2021-12-26 | 2021-09-26 | 2021-06-27 | 2021-03-28 | 2020-12-27 | 2020-09-27 | 2020-06-28 | 2020-03-29 | 2019-12-29 | 2019-09-29 | 2019-06-30 | 2019-03-31 | 2018-12-30 | 2018-09-30 | 2018-07-01 | 2018-04-01 | 2017-12-31 | 2017-09-24 | 2017-06-25 | 2017-03-26 | 2016-12-25 | 2016-09-25 | 2016-06-26 | 2016-03-27 | 2015-12-27 | 2015-09-27 | 2015-06-28 | 2015-03-29 | 2014-12-28 | 2014-09-28 | 2014-06-29 | 2014-03-30 | 2013-12-29 | 2013-09-29 | 2013-06-30 | 2013-03-31 | 2012-12-30 | 2012-09-23 | 2012-06-24 | 2012-03-25 | 2011-12-25 | 2011-09-25 | 2011-06-26 | 2011-03-27 | 2010-12-26 | 2010-09-26 | 2010-06-27 | 2010-03-28 | ||
|---|---|---|---|---|---|---|---|---|---|---|---|---|---|---|---|---|---|---|---|---|---|---|---|---|---|---|---|---|---|---|---|---|---|---|---|---|---|---|---|---|---|---|---|---|---|---|---|---|---|---|---|---|---|---|---|---|---|---|
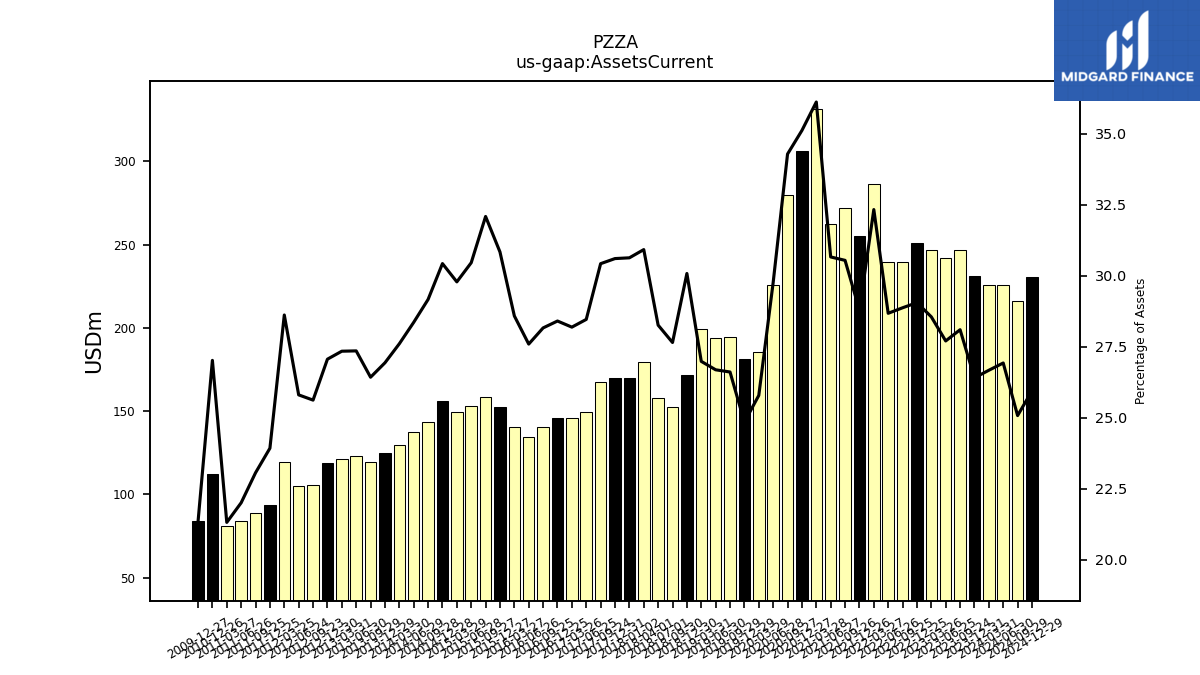
| Assets Current | 225.93 | 231.02 | 246.56 | 242.00 | 246.90 | 251.04 | 239.52 | 239.79 | 286.27 | 255.01 | 271.76 | 262.34 | 331.58 | 306.41 | 279.94 | 225.47 | 185.19 | 181.55 | 194.38 | 193.88 | 199.41 | 171.71 | 152.37 | 157.72 | 179.25 | 169.99 | 167.59 | 149.59 | 145.57 | 145.57 | 140.45 | 134.43 | 140.32 | 152.59 | 158.68 | 153.19 | 149.49 | 156.01 | 143.52 | 137.58 | 129.34 | 125.04 | 119.29 | 122.93 | 121.19 | 118.63 | 105.67 | 105.13 | 119.20 | 93.40 | 89.07 | 83.77 | 81.17 | 112.37 | NA | NA | NA | |
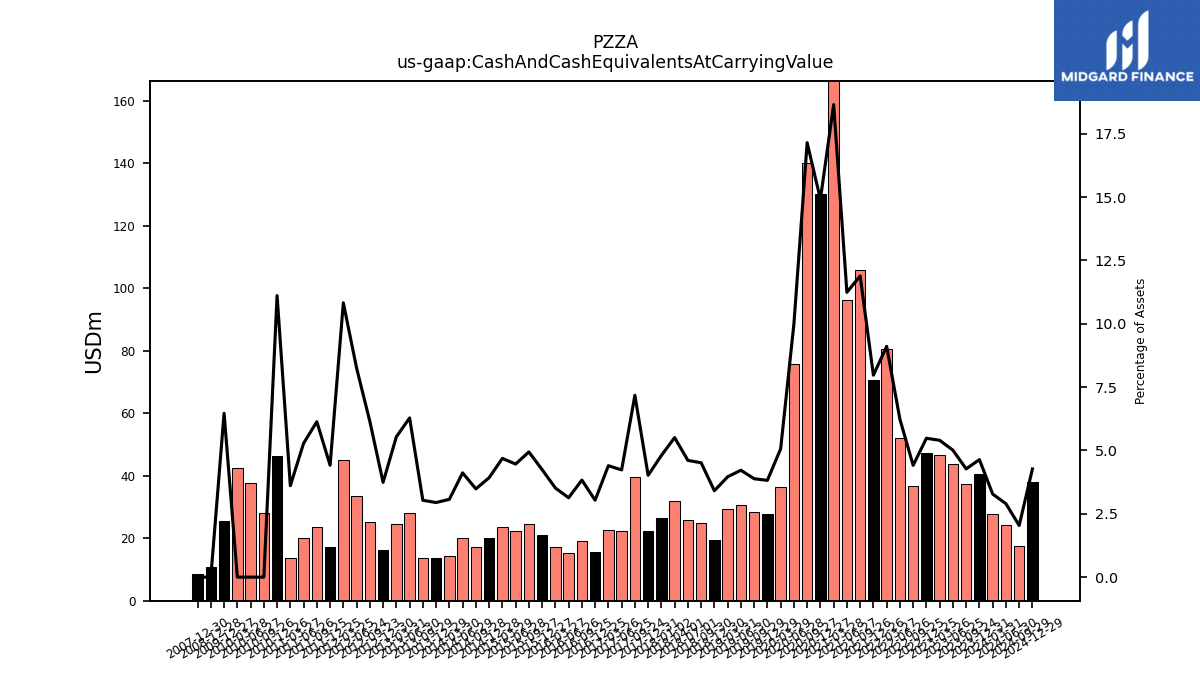
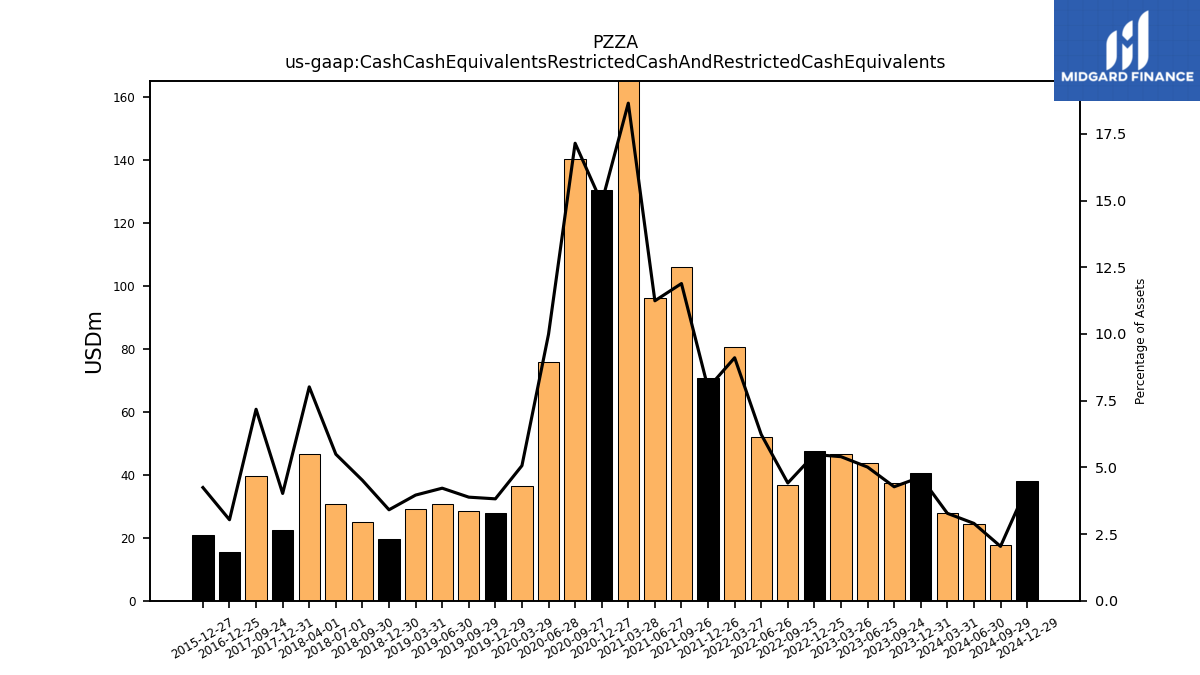
| Cash And Cash Equivalents At Carrying Value | 27.77 | 40.59 | 37.49 | 43.77 | 46.71 | 47.37 | 36.62 | 52.12 | 80.67 | 70.61 | 105.81 | 96.21 | 171.27 | 130.20 | 140.05 | 75.70 | 36.38 | 27.91 | 28.37 | 30.66 | 29.27 | 19.47 | 24.88 | 25.72 | 31.93 | 22.34 | 39.54 | 22.25 | 22.71 | 15.56 | 19.11 | 15.27 | 17.27 | 21.01 | 24.44 | 22.45 | 23.52 | 20.12 | 17.15 | 19.97 | 14.39 | 13.67 | 13.69 | 28.24 | 24.55 | 16.40 | 25.35 | 33.62 | 45.11 | 17.24 | 23.70 | 20.11 | 13.74 | 46.23 | 28.18 | 37.71 | 42.55 | |
| Cash Cash Equivalents Restricted Cash And Restricted Cash Equivalents | 27.77 | 40.59 | 37.49 | 43.77 | 46.71 | 47.37 | 36.62 | 52.12 | 80.67 | 70.61 | 105.81 | 96.21 | 171.27 | 130.20 | 140.05 | 75.70 | 36.38 | 27.91 | 28.37 | 30.66 | 29.27 | 19.47 | 24.88 | 30.66 | 46.48 | 22.34 | 39.54 | NA | NA | 15.56 | NA | NA | NA | 21.01 | NA | NA | NA | NA | NA | NA | NA | NA | NA | NA | NA | NA | NA | NA | NA | NA | NA | NA | NA | NA | NA | NA | NA | |
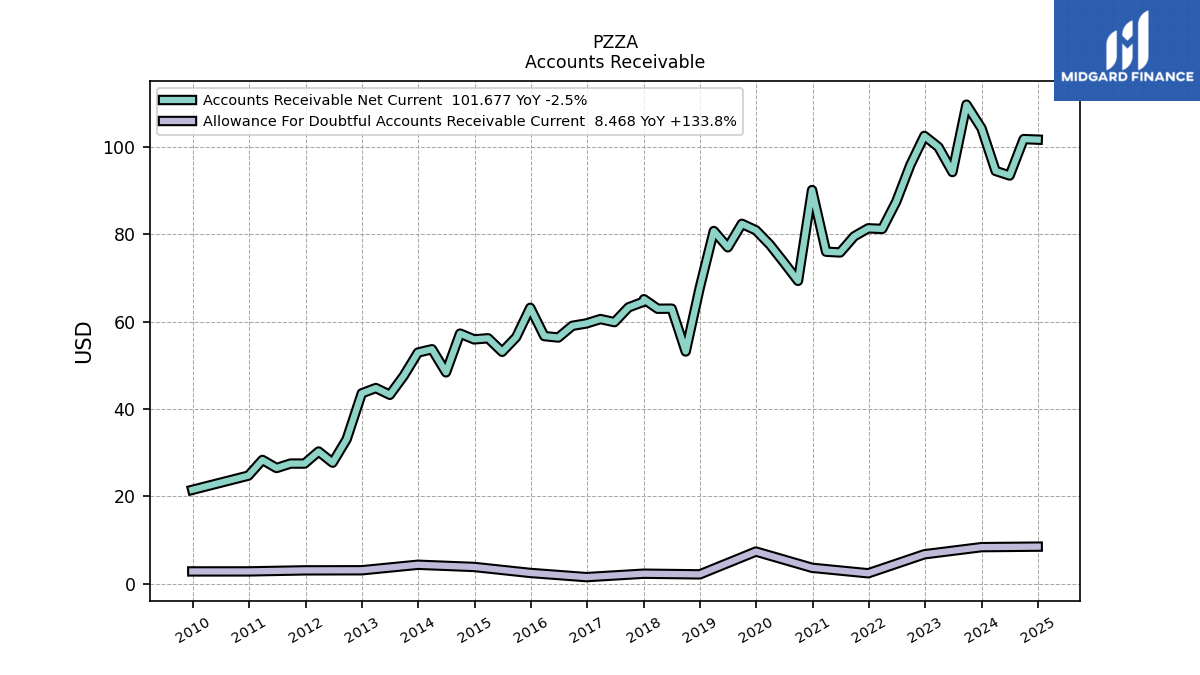
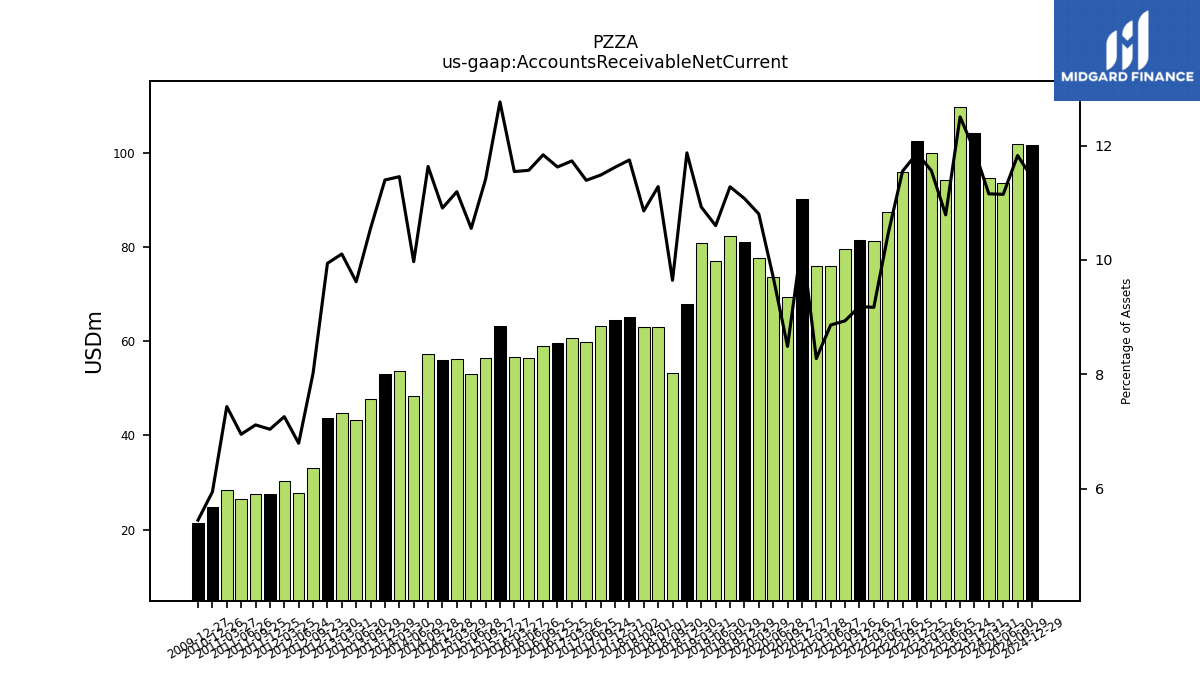
| Accounts Receivable Net Current | 94.51 | 104.24 | 109.70 | 94.25 | 100.00 | 102.53 | 95.86 | 87.50 | 81.23 | 81.37 | 79.53 | 75.84 | 76.01 | 90.14 | 69.33 | 73.53 | 77.61 | 80.92 | 82.40 | 77.02 | 80.75 | 67.78 | 53.16 | 62.97 | 62.95 | 64.56 | 63.27 | 59.88 | 60.59 | 59.59 | 59.05 | 56.36 | 56.68 | 63.16 | 56.45 | 53.08 | 56.19 | 55.93 | 57.26 | 48.38 | 53.68 | 52.92 | 47.64 | 43.23 | 44.79 | 43.59 | 33.07 | 27.69 | 30.25 | 27.49 | 27.49 | 26.47 | 28.32 | 24.73 | NA | NA | NA | |
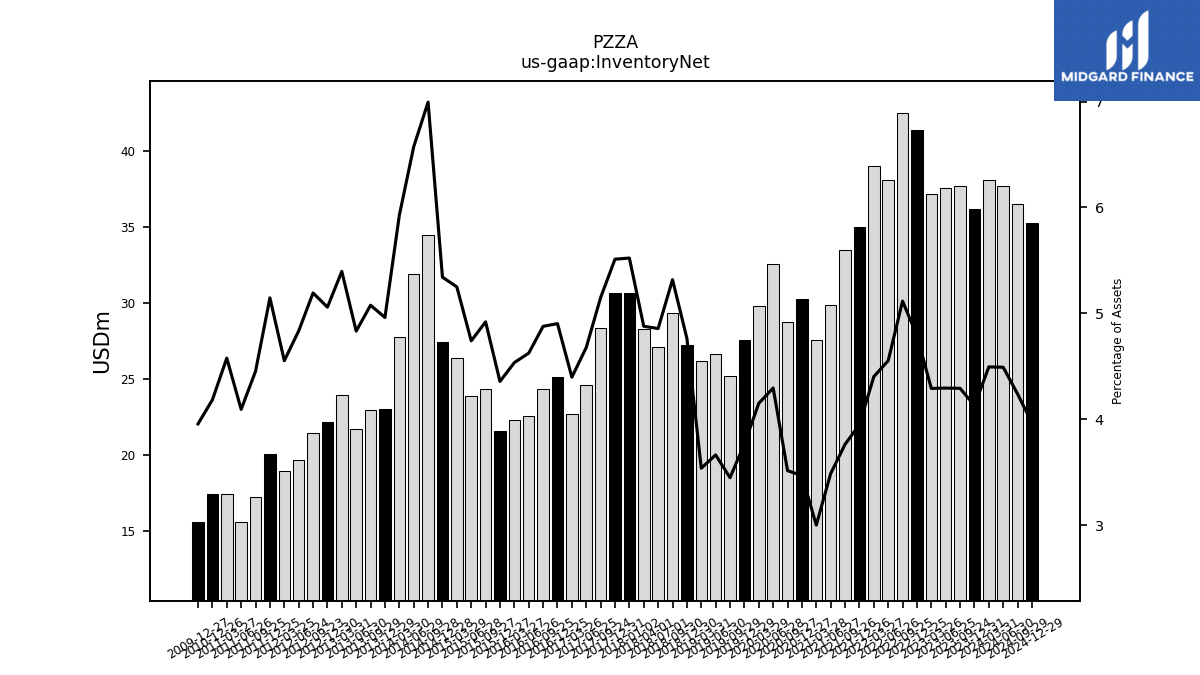
| Inventory Net | 38.07 | 36.13 | 37.67 | 37.52 | 37.11 | 41.38 | 42.45 | 38.08 | 38.99 | 34.98 | 33.49 | 29.84 | 27.55 | 30.27 | 28.70 | 32.55 | 29.81 | 27.53 | 25.19 | 26.61 | 26.14 | 27.20 | 29.31 | 27.11 | 28.29 | 30.62 | 28.37 | 24.59 | 22.71 | 25.13 | 24.33 | 22.53 | 22.27 | 21.56 | 24.34 | 23.85 | 26.35 | 27.39 | 34.43 | 31.89 | 27.77 | 23.04 | 22.92 | 21.72 | 23.92 | 22.18 | 21.42 | 19.70 | 18.97 | 20.09 | 17.20 | 15.58 | 17.43 | 17.40 | NA | NA | NA | |
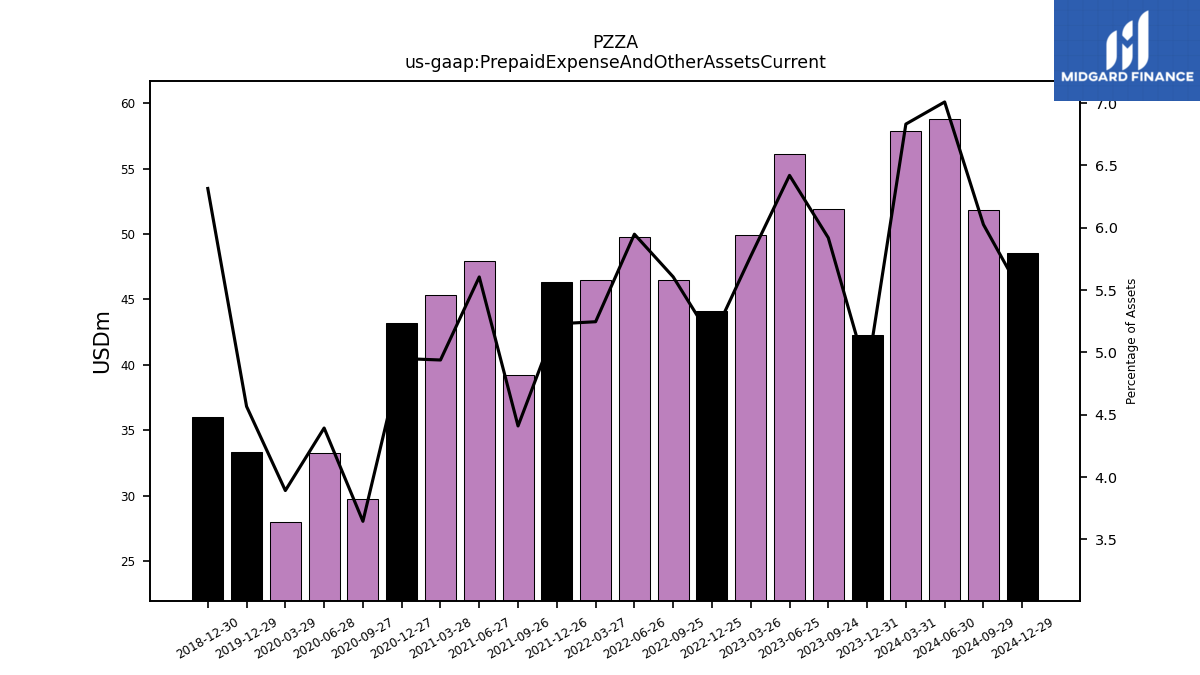
| Prepaid Expense And Other Assets Current | 57.87 | 42.28 | 51.94 | 56.09 | 49.92 | 44.12 | 46.51 | 49.74 | 46.46 | 46.31 | 39.25 | 47.97 | 45.35 | 43.21 | 29.77 | 33.29 | 27.96 | 33.37 | NA | NA | NA | 36.05 | NA | NA | NA | NA | NA | NA | NA | NA | NA | NA | NA | NA | NA | NA | NA | NA | NA | NA | NA | NA | NA | NA | NA | NA | NA | NA | NA | NA | NA | NA | NA | NA | NA | NA | NA |
| 2024-03-31 | 2023-12-31 | 2023-09-24 | 2023-06-25 | 2023-03-26 | 2022-12-25 | 2022-09-25 | 2022-06-26 | 2022-03-27 | 2021-12-26 | 2021-09-26 | 2021-06-27 | 2021-03-28 | 2020-12-27 | 2020-09-27 | 2020-06-28 | 2020-03-29 | 2019-12-29 | 2019-09-29 | 2019-06-30 | 2019-03-31 | 2018-12-30 | 2018-09-30 | 2018-07-01 | 2018-04-01 | 2017-12-31 | 2017-09-24 | 2017-06-25 | 2017-03-26 | 2016-12-25 | 2016-09-25 | 2016-06-26 | 2016-03-27 | 2015-12-27 | 2015-09-27 | 2015-06-28 | 2015-03-29 | 2014-12-28 | 2014-09-28 | 2014-06-29 | 2014-03-30 | 2013-12-29 | 2013-09-29 | 2013-06-30 | 2013-03-31 | 2012-12-30 | 2012-09-23 | 2012-06-24 | 2012-03-25 | 2011-12-25 | 2011-09-25 | 2011-06-26 | 2011-03-27 | 2010-12-26 | 2010-09-26 | 2010-06-27 | 2010-03-28 | ||
|---|---|---|---|---|---|---|---|---|---|---|---|---|---|---|---|---|---|---|---|---|---|---|---|---|---|---|---|---|---|---|---|---|---|---|---|---|---|---|---|---|---|---|---|---|---|---|---|---|---|---|---|---|---|---|---|---|---|---|
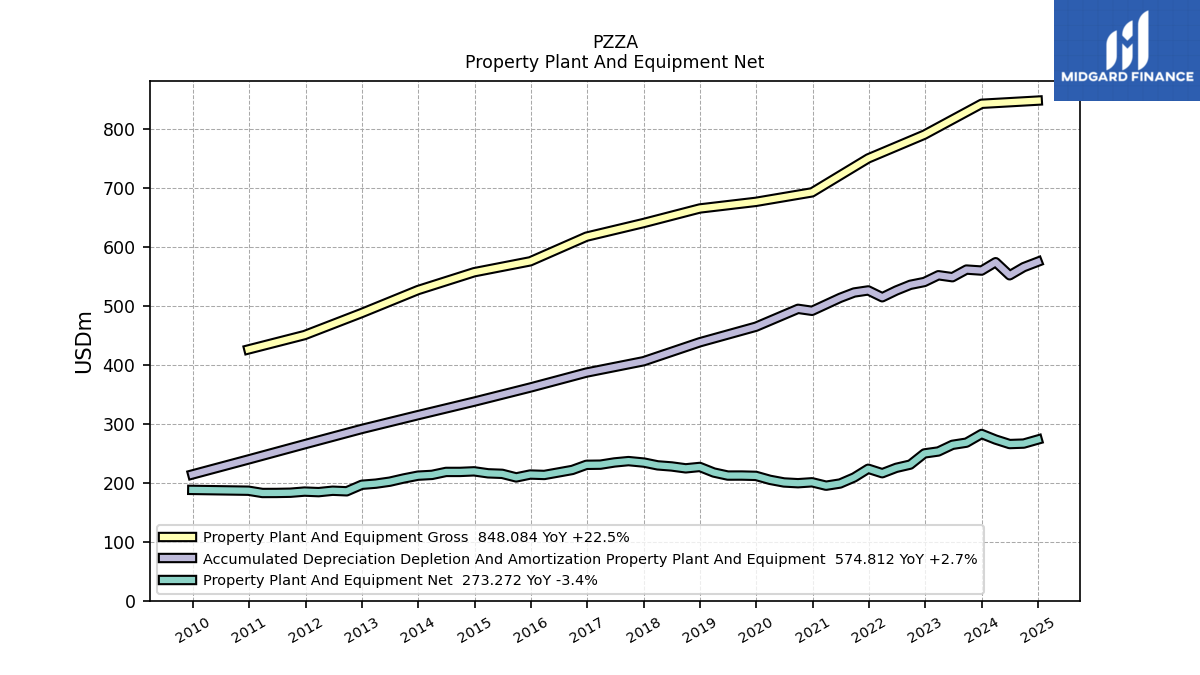
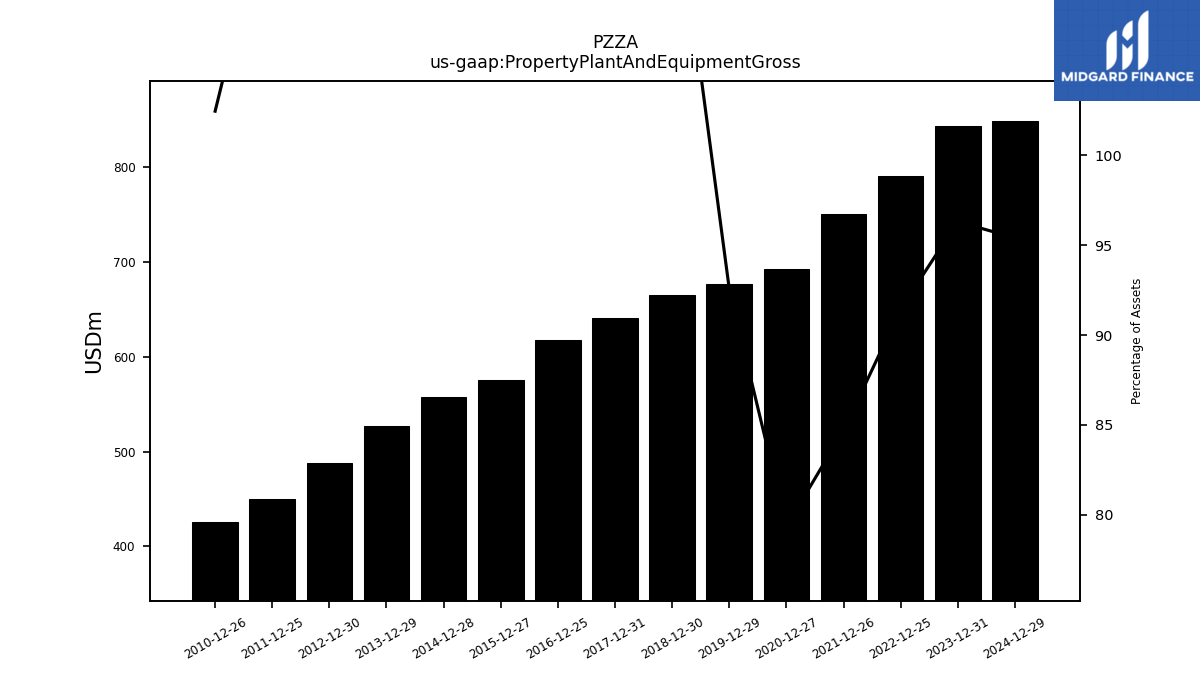
| Property Plant And Equipment Gross | NA | 842.69 | NA | NA | NA | 790.29 | NA | NA | NA | 750.09 | NA | NA | NA | 692.51 | NA | NA | NA | 676.41 | NA | NA | NA | 665.17 | NA | NA | NA | 640.50 | NA | NA | NA | 617.36 | NA | NA | NA | 575.56 | NA | NA | NA | 557.04 | NA | NA | NA | 526.79 | NA | NA | NA | 487.96 | NA | NA | NA | 450.48 | NA | NA | NA | 426.14 | NA | NA | NA | |
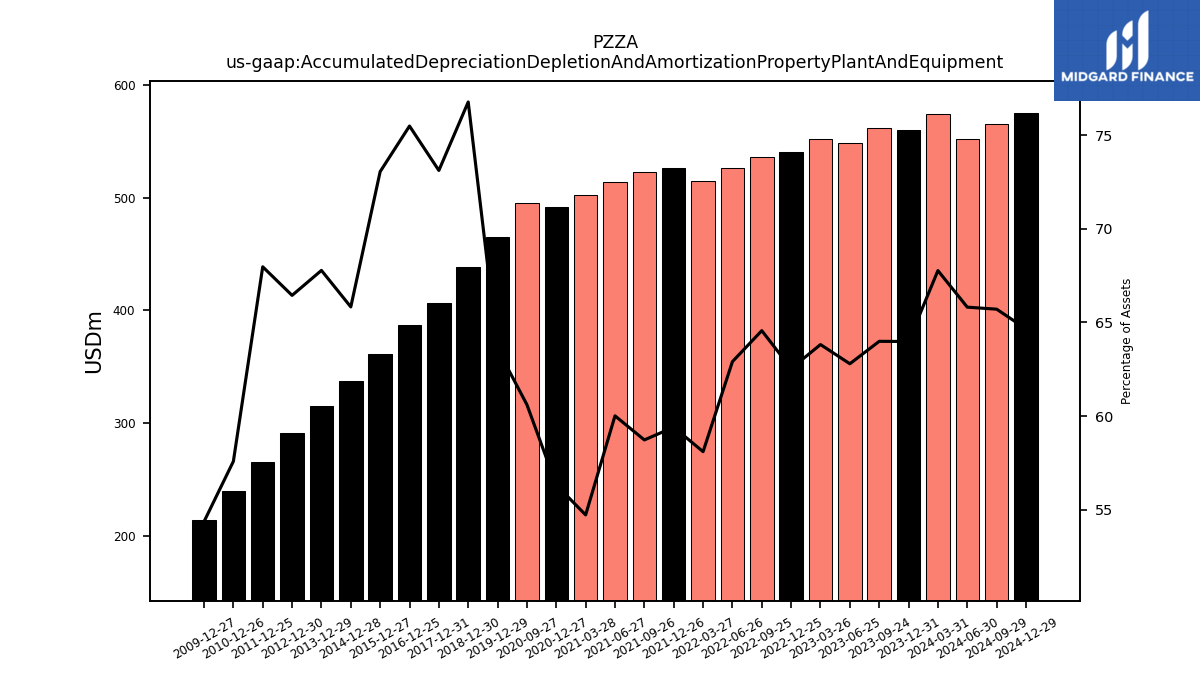
| Accumulated Depreciation Depletion And Amortization Property Plant And Equipment | 574.11 | 559.88 | 561.59 | 548.63 | 551.98 | 540.50 | 535.72 | 526.11 | 514.62 | 526.24 | 522.71 | 513.61 | 502.63 | 491.62 | 495.01 | NA | NA | 464.67 | NA | NA | NA | 438.28 | NA | NA | NA | 406.17 | NA | NA | NA | 386.88 | NA | NA | NA | 361.52 | NA | NA | NA | 337.58 | NA | NA | NA | 314.69 | NA | NA | NA | 291.30 | NA | NA | NA | 265.35 | NA | NA | NA | 239.55 | NA | NA | NA | |
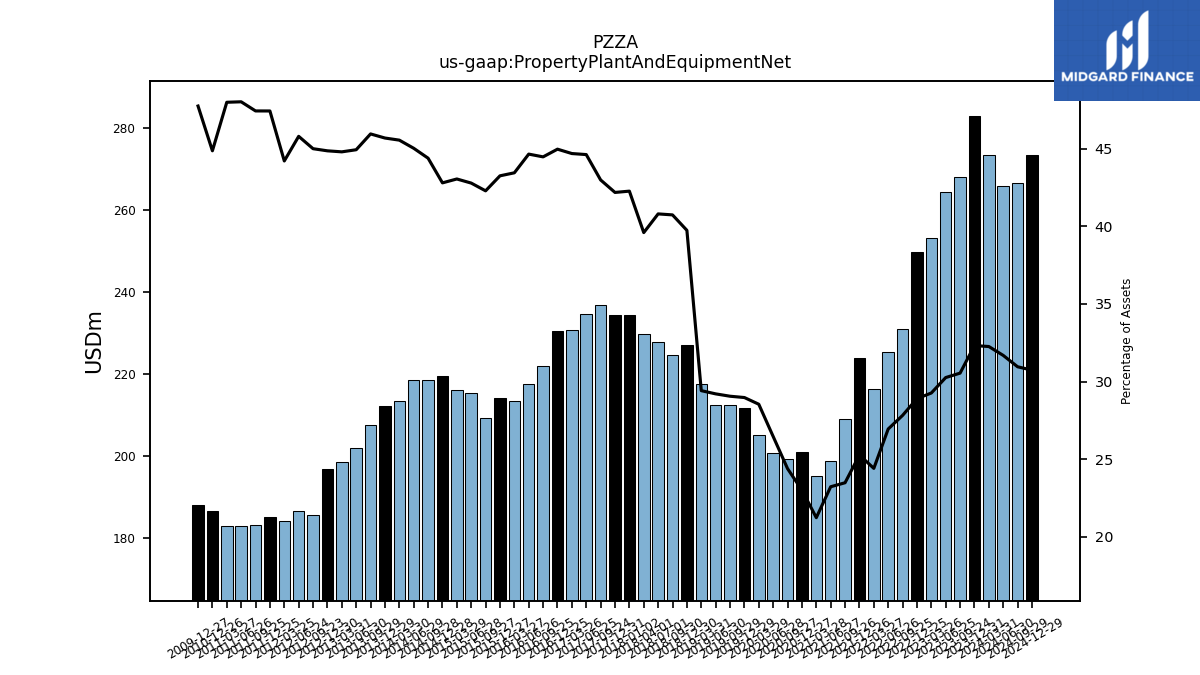
| Property Plant And Equipment Net | 273.30 | 282.81 | 268.09 | 264.39 | 253.14 | 249.79 | 230.89 | 225.38 | 216.25 | 223.86 | 209.07 | 198.82 | 195.08 | 200.90 | 199.29 | 200.58 | 205.03 | 211.74 | 212.31 | 212.26 | 217.44 | 226.89 | 224.51 | 227.72 | 229.58 | 234.33 | 236.81 | 234.52 | 230.76 | 230.47 | 221.81 | 217.53 | 213.30 | 214.04 | 209.14 | 215.21 | 216.08 | 219.46 | 218.45 | 218.45 | 213.43 | 212.10 | 207.41 | 201.94 | 198.56 | 196.66 | 185.60 | 186.57 | 184.17 | 185.13 | 183.18 | 182.79 | 182.72 | 186.59 | NA | NA | NA | |
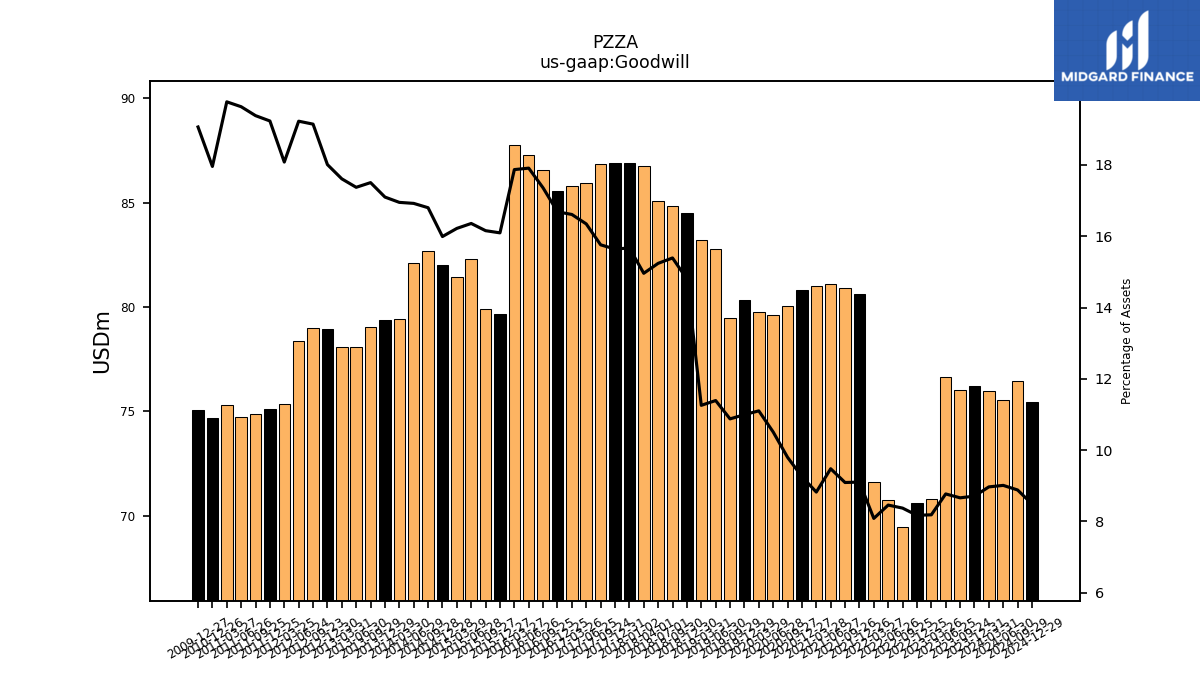
| Goodwill | 75.97 | 76.21 | 76.01 | 76.62 | 70.79 | 70.62 | 69.48 | 70.73 | 71.59 | 80.63 | 80.91 | 81.10 | 81.02 | 80.79 | 80.02 | 79.63 | 79.74 | 80.34 | 79.46 | 82.76 | 83.19 | 84.52 | 84.83 | 85.06 | 86.75 | 86.89 | 86.83 | 85.92 | 85.79 | 85.53 | 86.57 | 87.27 | 87.74 | 79.66 | 79.91 | 82.29 | 81.42 | 82.01 | 82.69 | 82.11 | 79.43 | 79.39 | 79.02 | 78.09 | 78.06 | 78.96 | 78.97 | 78.34 | 75.33 | 75.08 | 74.87 | 74.75 | 75.29 | 74.70 | NA | NA | NA | |
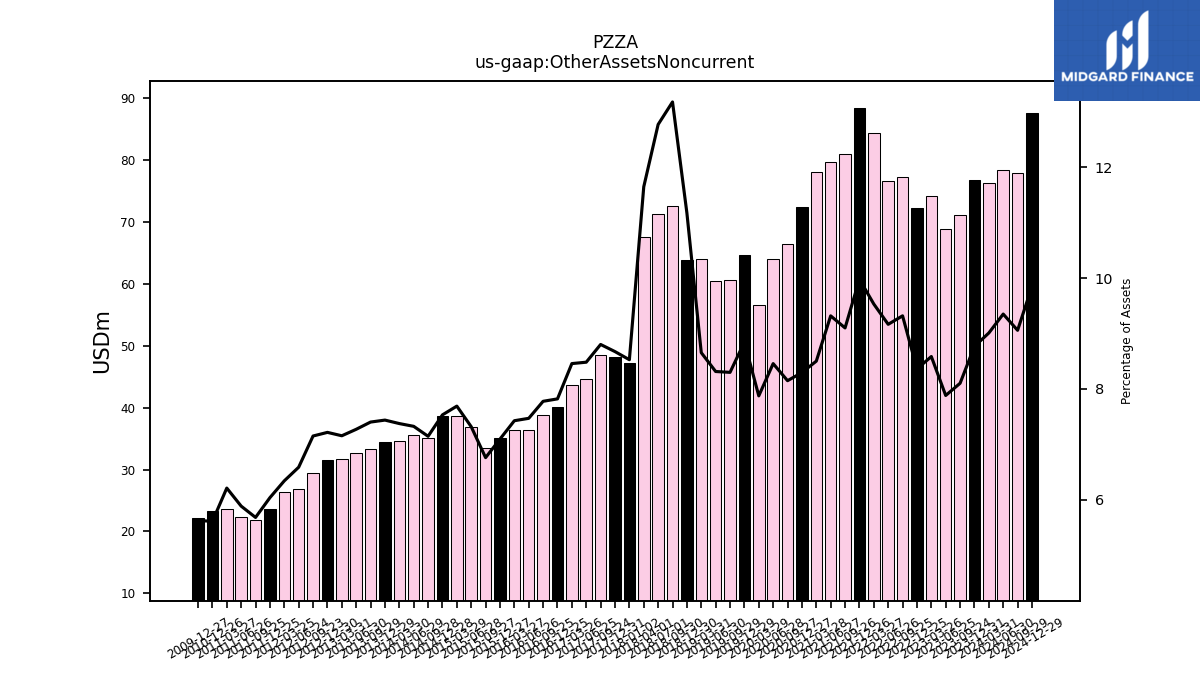
| Other Assets Noncurrent | 76.33 | 76.72 | 71.09 | 68.85 | 74.24 | 72.25 | 77.33 | 76.65 | 84.42 | 88.38 | 80.99 | 79.74 | 78.06 | 72.39 | 66.54 | 64.07 | 56.55 | 64.63 | 60.62 | 60.40 | 63.96 | 63.81 | 72.65 | 71.31 | 67.55 | 48.18 | 48.49 | 44.58 | 43.67 | 40.08 | 38.78 | 36.38 | 36.45 | 35.10 | 33.43 | 36.80 | 38.59 | 38.62 | 35.16 | 35.53 | 34.55 | 34.52 | 33.41 | 32.67 | 31.71 | 31.63 | 29.48 | 26.83 | 26.41 | 23.56 | 21.93 | 22.39 | 23.64 | 23.32 | NA | NA | NA |
| 2024-03-31 | 2023-12-31 | 2023-09-24 | 2023-06-25 | 2023-03-26 | 2022-12-25 | 2022-09-25 | 2022-06-26 | 2022-03-27 | 2021-12-26 | 2021-09-26 | 2021-06-27 | 2021-03-28 | 2020-12-27 | 2020-09-27 | 2020-06-28 | 2020-03-29 | 2019-12-29 | 2019-09-29 | 2019-06-30 | 2019-03-31 | 2018-12-30 | 2018-09-30 | 2018-07-01 | 2018-04-01 | 2017-12-31 | 2017-09-24 | 2017-06-25 | 2017-03-26 | 2016-12-25 | 2016-09-25 | 2016-06-26 | 2016-03-27 | 2015-12-27 | 2015-09-27 | 2015-06-28 | 2015-03-29 | 2014-12-28 | 2014-09-28 | 2014-06-29 | 2014-03-30 | 2013-12-29 | 2013-09-29 | 2013-06-30 | 2013-03-31 | 2012-12-30 | 2012-09-23 | 2012-06-24 | 2012-03-25 | 2011-12-25 | 2011-09-25 | 2011-06-26 | 2011-03-27 | 2010-12-26 | 2010-09-26 | 2010-06-27 | 2010-03-28 | ||
|---|---|---|---|---|---|---|---|---|---|---|---|---|---|---|---|---|---|---|---|---|---|---|---|---|---|---|---|---|---|---|---|---|---|---|---|---|---|---|---|---|---|---|---|---|---|---|---|---|---|---|---|---|---|---|---|---|---|---|
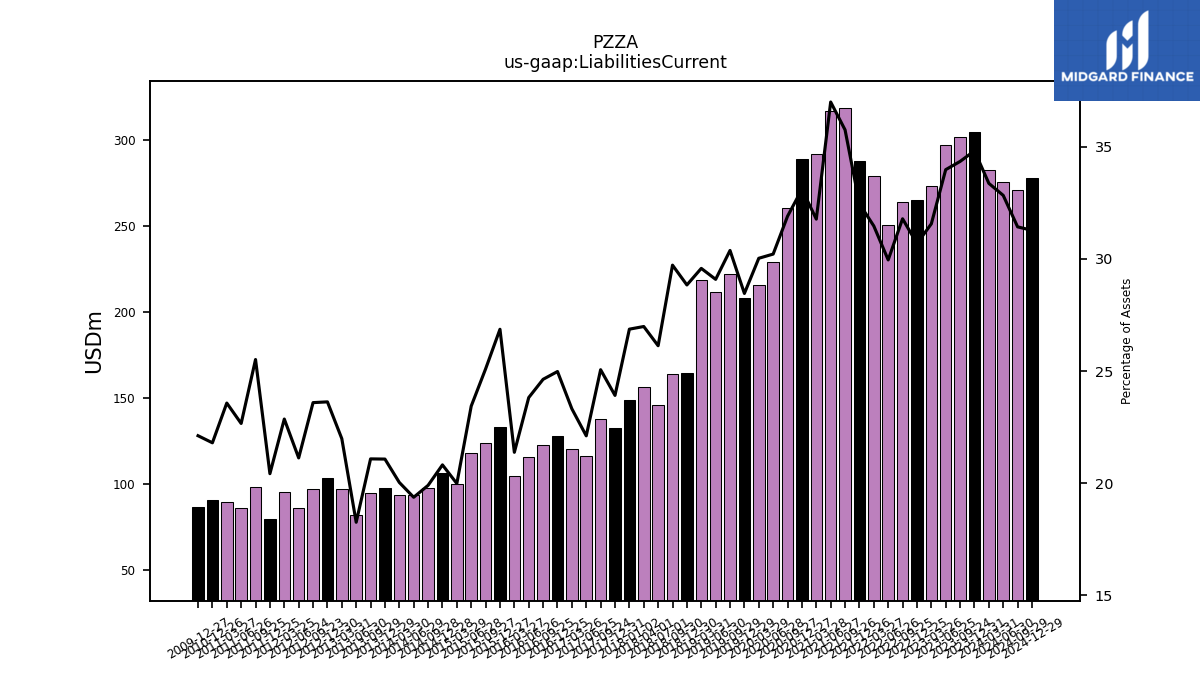
| Liabilities Current | 282.63 | 304.60 | 301.34 | 296.79 | 272.93 | 265.16 | 263.73 | 250.48 | 278.63 | 287.42 | 318.12 | 316.50 | 291.72 | 288.87 | 260.49 | 228.92 | 215.65 | 207.94 | 221.89 | 211.32 | 218.57 | 164.64 | 163.79 | 145.83 | 156.46 | 132.86 | 138.05 | 116.24 | 120.42 | 128.03 | 122.86 | 116.05 | 104.97 | 132.94 | 124.12 | 117.90 | 100.33 | 106.76 | 97.98 | 94.01 | 93.89 | 97.86 | 95.19 | 82.08 | 97.47 | 103.58 | 97.31 | 86.09 | 95.24 | 79.74 | 98.55 | 86.28 | 89.77 | 90.69 | NA | NA | NA | |
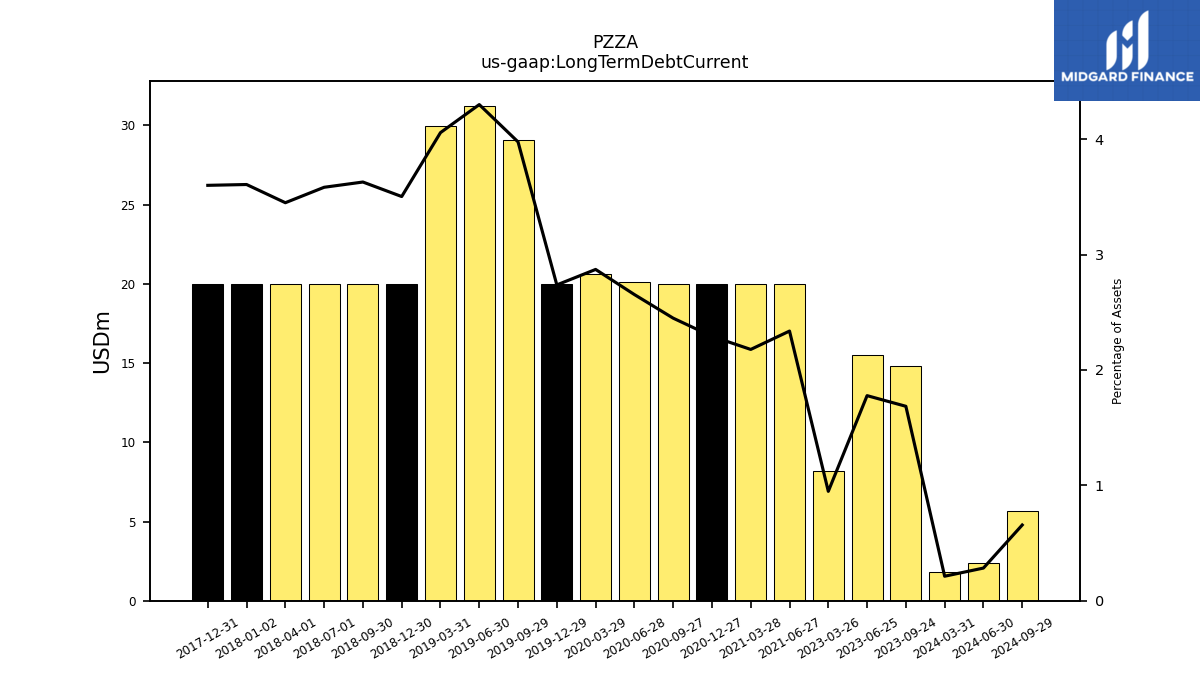
| Long Term Debt Current | 1.80 | NA | 14.79 | 15.53 | 8.20 | NA | NA | NA | NA | NA | NA | 20.00 | 20.00 | 20.00 | 20.00 | 20.11 | 20.62 | 20.00 | 29.05 | 31.24 | 29.98 | 20.00 | 20.00 | 20.00 | 20.00 | 20.00 | NA | NA | NA | NA | NA | NA | NA | NA | NA | NA | NA | NA | NA | NA | NA | NA | NA | NA | NA | NA | NA | NA | NA | NA | NA | NA | NA | NA | NA | NA | NA | |
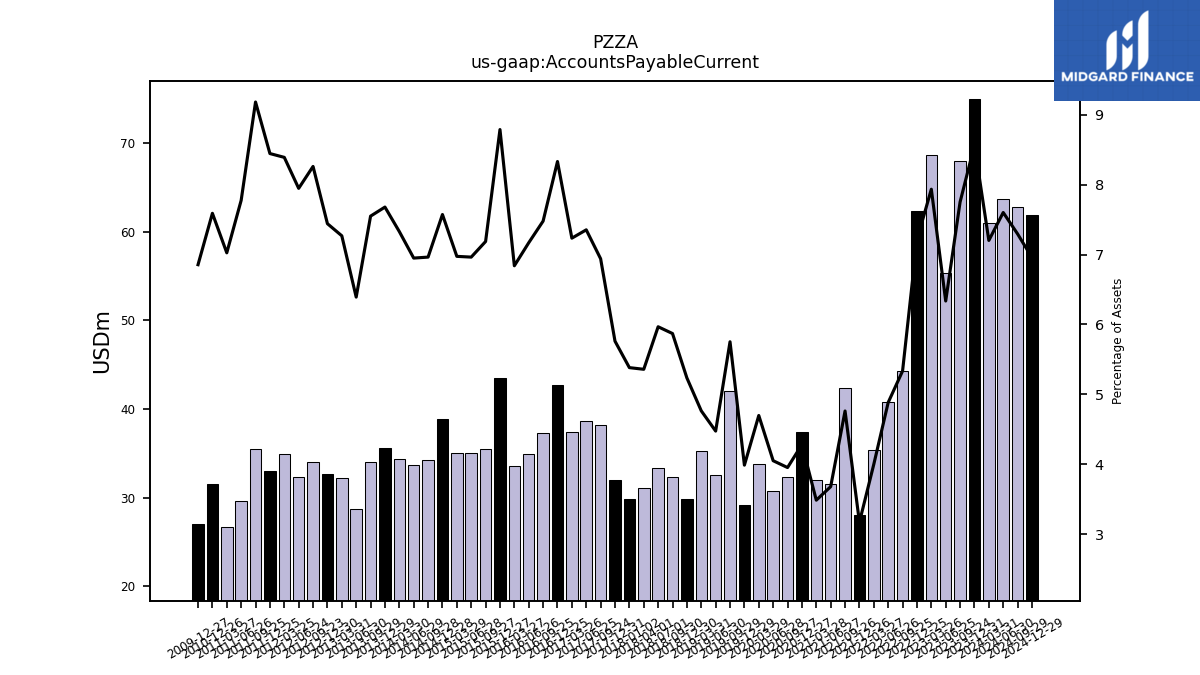
| Accounts Payable Current | 61.01 | 74.95 | 68.02 | 55.35 | 68.62 | 62.32 | 44.26 | 40.84 | 35.43 | 28.09 | 42.38 | 31.50 | 32.02 | 37.37 | 32.29 | 30.70 | 33.74 | 29.14 | 42.03 | 32.52 | 35.21 | 29.89 | 32.35 | 33.31 | 31.07 | 32.01 | 38.23 | 38.65 | 37.36 | 42.70 | 37.30 | 34.93 | 33.58 | 43.49 | 35.55 | 35.03 | 35.01 | 38.83 | 34.27 | 33.72 | 34.34 | 35.65 | 34.08 | 28.73 | 32.22 | 32.62 | 34.07 | 32.38 | 34.95 | 32.97 | 35.47 | 29.60 | 26.75 | 31.57 | NA | NA | NA | |
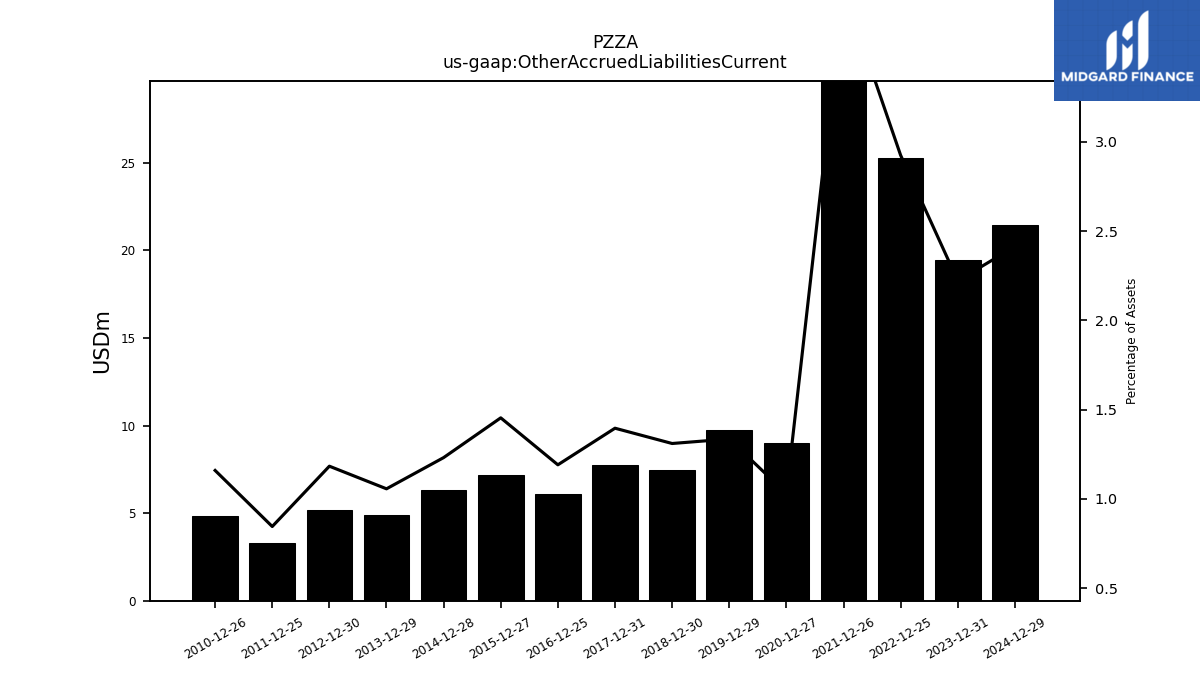
| Other Accrued Liabilities Current | NA | 19.44 | NA | NA | NA | 25.28 | NA | NA | NA | 34.16 | NA | NA | NA | 8.99 | NA | NA | NA | 9.76 | NA | NA | NA | 7.48 | NA | NA | NA | 7.75 | NA | NA | NA | 6.10 | NA | NA | NA | 7.20 | NA | NA | NA | 6.31 | NA | NA | NA | 4.91 | NA | NA | NA | 5.19 | NA | NA | NA | 3.30 | NA | NA | NA | 4.82 | NA | NA | NA | |
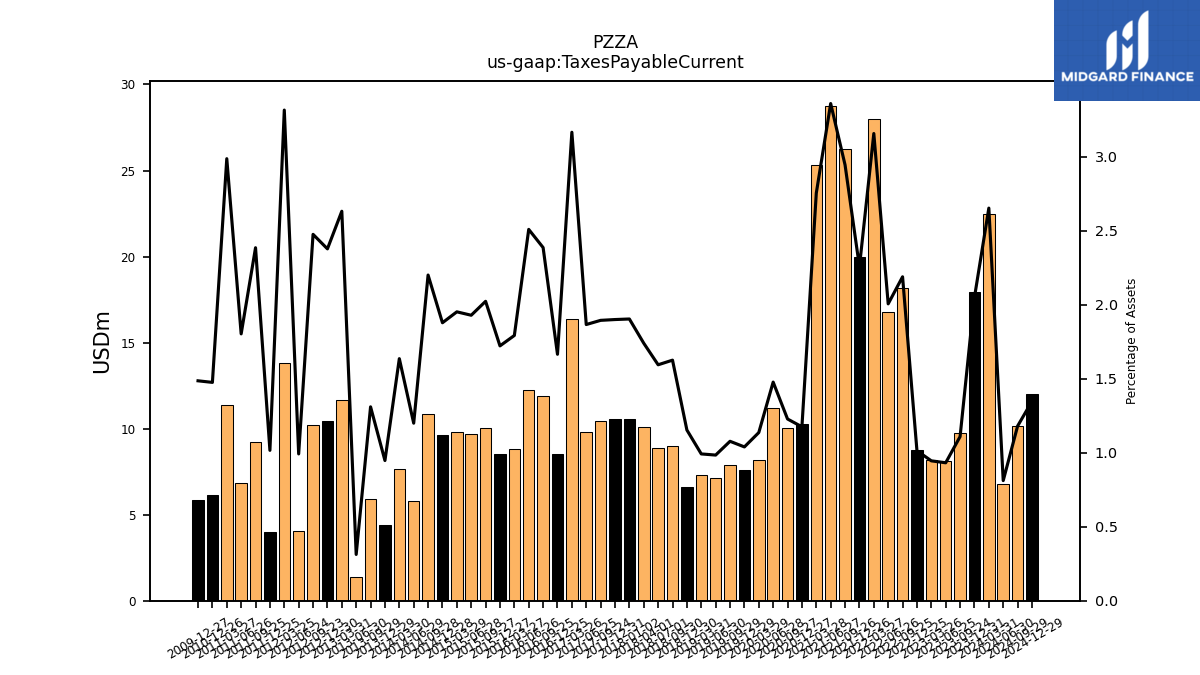
| Taxes Payable Current | 22.49 | 17.95 | 9.74 | 8.15 | 8.18 | 8.77 | 18.17 | 16.79 | 27.97 | 20.00 | 26.22 | 28.76 | 25.31 | 10.26 | 10.03 | 11.20 | 8.17 | 7.60 | 7.88 | 7.16 | 7.34 | 6.59 | 8.96 | 8.90 | 10.09 | 10.56 | 10.44 | 9.81 | 16.36 | 8.54 | 11.91 | 12.23 | 8.80 | 8.53 | 10.01 | 9.71 | 9.80 | 9.64 | 10.84 | 5.82 | 7.67 | 4.40 | 5.92 | 1.41 | 11.67 | 10.43 | 10.22 | 4.04 | 13.82 | 3.97 | 9.22 | 6.87 | 11.38 | 6.14 | NA | NA | NA | |
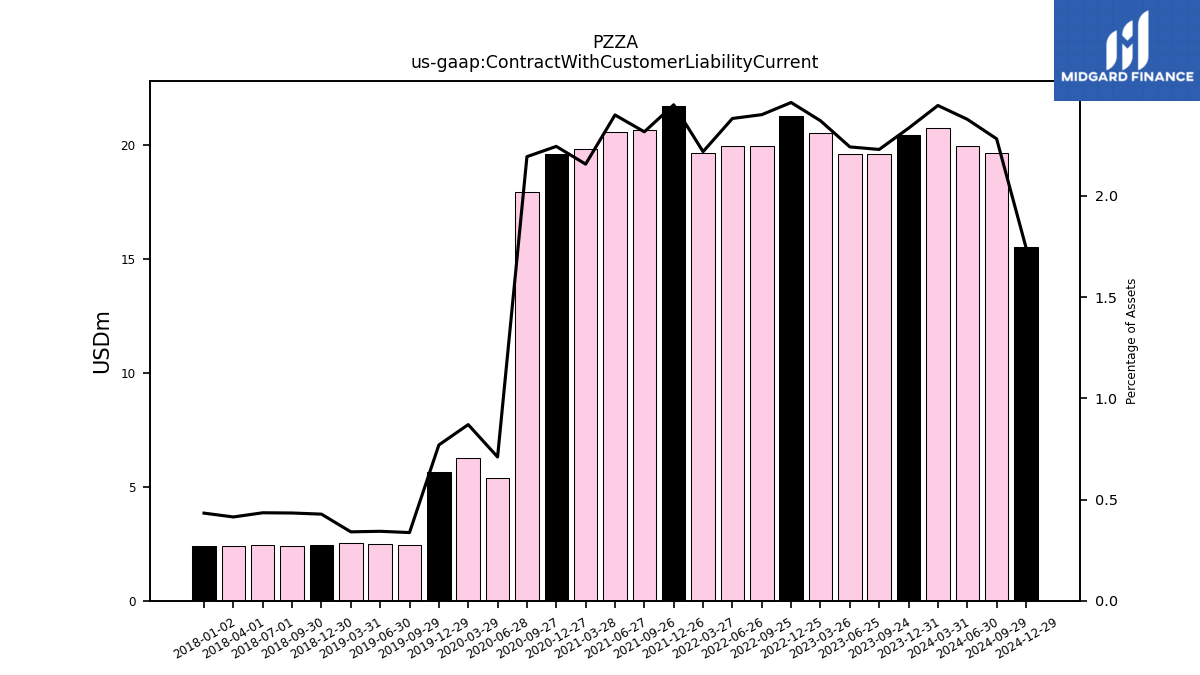
| Contract With Customer Liability Current | 20.73 | 20.43 | 19.57 | 19.59 | 20.51 | 21.27 | 19.93 | 19.93 | 19.65 | 21.70 | 20.62 | 20.54 | 19.81 | 19.59 | 17.92 | 5.38 | 6.25 | 5.62 | 2.46 | 2.49 | 2.52 | 2.44 | 2.39 | 2.43 | 2.40 | NA | NA | NA | NA | NA | NA | NA | NA | NA | NA | NA | NA | NA | NA | NA | NA | NA | NA | NA | NA | NA | NA | NA | NA | NA | NA | NA | NA | NA | NA | NA | NA |
| 2024-03-31 | 2023-12-31 | 2023-09-24 | 2023-06-25 | 2023-03-26 | 2022-12-25 | 2022-09-25 | 2022-06-26 | 2022-03-27 | 2021-12-26 | 2021-09-26 | 2021-06-27 | 2021-03-28 | 2020-12-27 | 2020-09-27 | 2020-06-28 | 2020-03-29 | 2019-12-29 | 2019-09-29 | 2019-06-30 | 2019-03-31 | 2018-12-30 | 2018-09-30 | 2018-07-01 | 2018-04-01 | 2017-12-31 | 2017-09-24 | 2017-06-25 | 2017-03-26 | 2016-12-25 | 2016-09-25 | 2016-06-26 | 2016-03-27 | 2015-12-27 | 2015-09-27 | 2015-06-28 | 2015-03-29 | 2014-12-28 | 2014-09-28 | 2014-06-29 | 2014-03-30 | 2013-12-29 | 2013-09-29 | 2013-06-30 | 2013-03-31 | 2012-12-30 | 2012-09-23 | 2012-06-24 | 2012-03-25 | 2011-12-25 | 2011-09-25 | 2011-06-26 | 2011-03-27 | 2010-12-26 | 2010-09-26 | 2010-06-27 | 2010-03-28 | ||
|---|---|---|---|---|---|---|---|---|---|---|---|---|---|---|---|---|---|---|---|---|---|---|---|---|---|---|---|---|---|---|---|---|---|---|---|---|---|---|---|---|---|---|---|---|---|---|---|---|---|---|---|---|---|---|---|---|---|---|
| Long Term Debt Noncurrent | 761.32 | 757.42 | 769.21 | 768.82 | 797.36 | 597.07 | 548.75 | 536.45 | 528.09 | 480.73 | 414.92 | 403.81 | 328.54 | 328.29 | 328.08 | 327.93 | 342.61 | 347.29 | 346.06 | 349.75 | 346.43 | 601.13 | 555.75 | 556.39 | 568.77 | 446.56 | 378.55 | 305.15 | 294.33 | 299.82 | 311.57 | 316.48 | 316.72 | 256.00 | 239.00 | 234.00 | 231.00 | 230.45 | 224.68 | 210.00 | 177.17 | 157.90 | 120.00 | 133.24 | 108.91 | 88.26 | 50.00 | 50.00 | 50.00 | 51.49 | 50.00 | 48.00 | 48.01 | 99.02 | NA | NA | NA | |
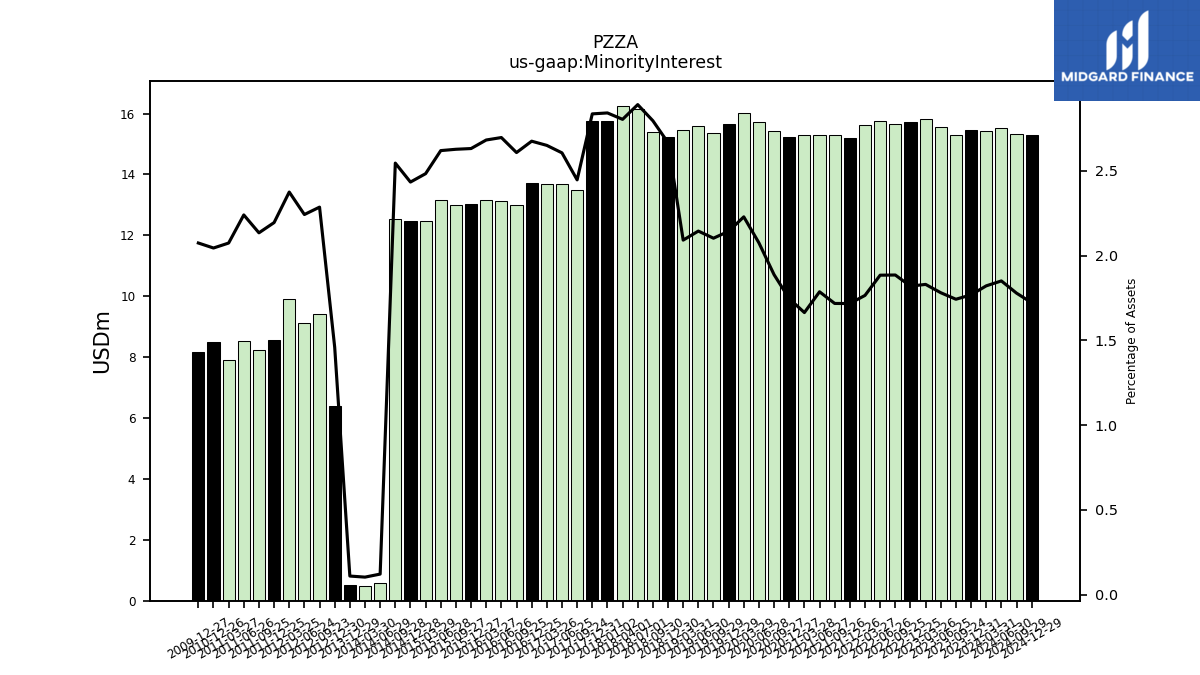
| Minority Interest | 15.43 | 15.48 | 15.29 | 15.56 | 15.83 | 15.73 | 15.65 | 15.76 | 15.63 | 15.21 | 15.29 | 15.29 | 15.28 | 15.24 | 15.41 | 15.72 | 16.01 | 15.66 | 15.36 | 15.58 | 15.46 | 15.22 | 15.41 | 16.14 | 16.26 | 15.76 | 13.48 | 13.70 | 13.69 | 13.71 | 13.01 | 13.14 | 13.17 | 13.03 | 13.00 | 13.18 | 12.47 | 12.48 | 12.53 | 0.59 | 0.48 | 0.51 | NA | NA | NA | 6.40 | 9.43 | 9.14 | 9.89 | 8.57 | 8.24 | 8.53 | 7.90 | 8.51 | NA | NA | NA | |
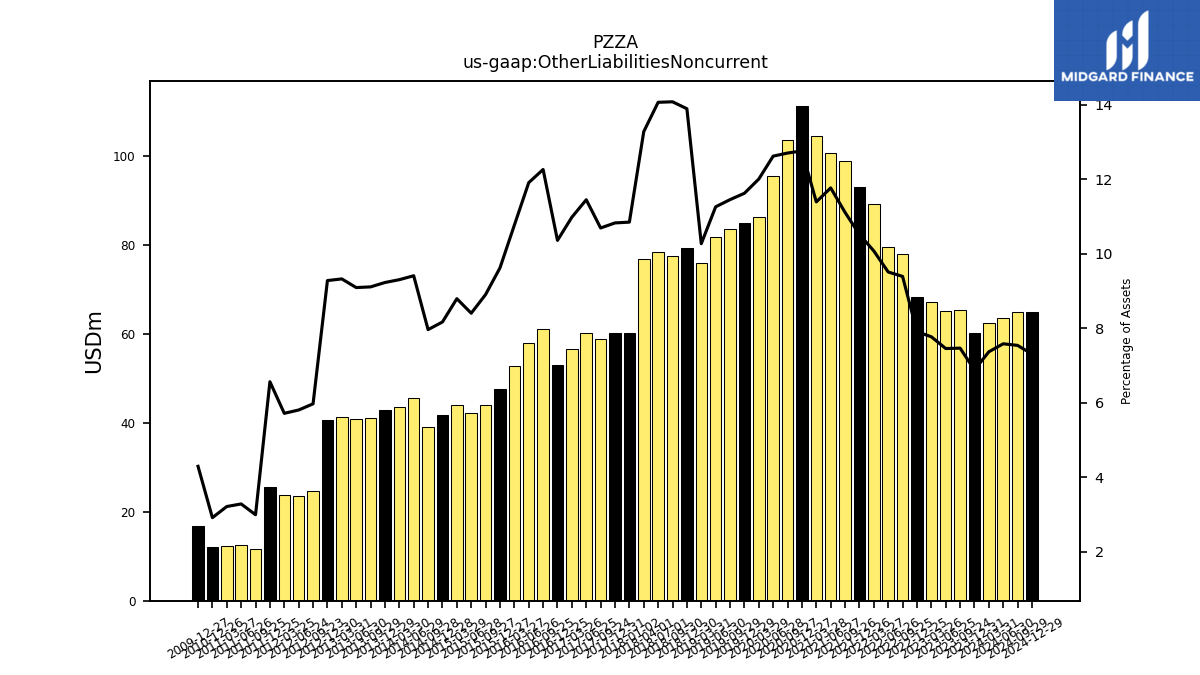
| Other Liabilities Noncurrent | 62.40 | 60.19 | 65.49 | 65.11 | 67.18 | 68.32 | 77.91 | 79.52 | 89.21 | 93.15 | 98.87 | 100.70 | 104.60 | 111.36 | 103.74 | 95.63 | 86.23 | 84.93 | 83.66 | 81.81 | 75.89 | 79.32 | 77.60 | 78.52 | 76.99 | 60.15 | 58.90 | 60.18 | 56.70 | 53.09 | 61.16 | 58.02 | 52.86 | 47.61 | 44.03 | 42.26 | 44.13 | 41.88 | 39.18 | 45.64 | 43.59 | 42.84 | 41.12 | 40.86 | 41.33 | 40.67 | 24.61 | 23.64 | 23.80 | 25.61 | 11.54 | 12.48 | 12.22 | 12.10 | NA | NA | NA | |
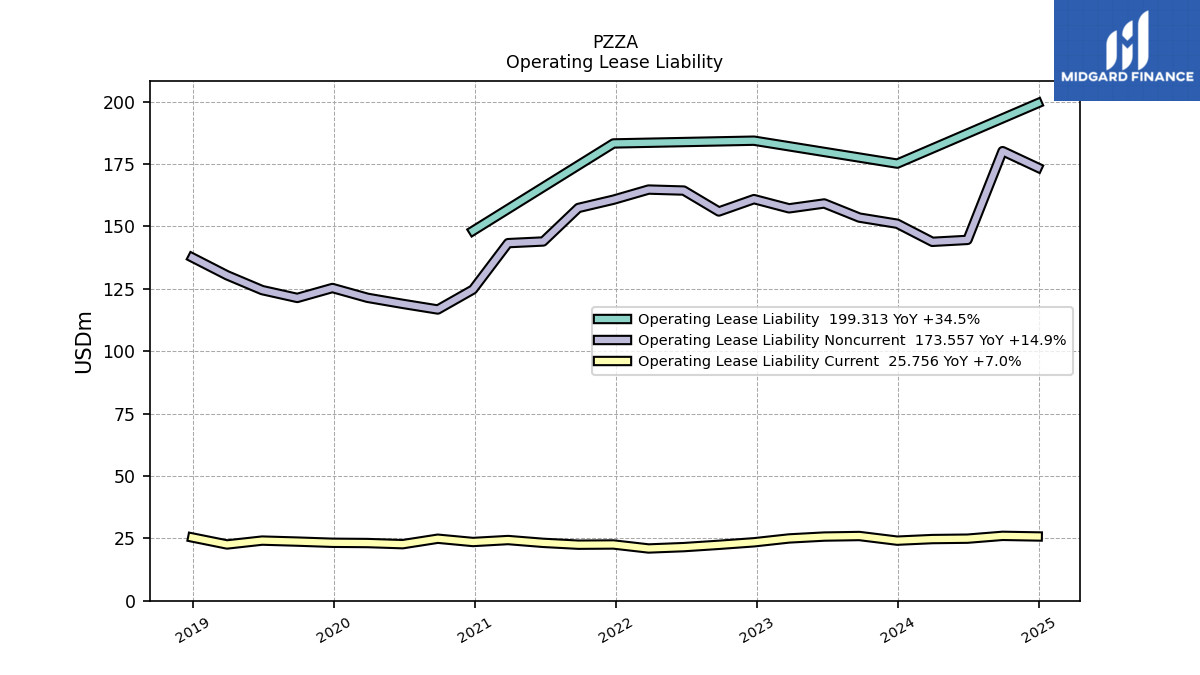
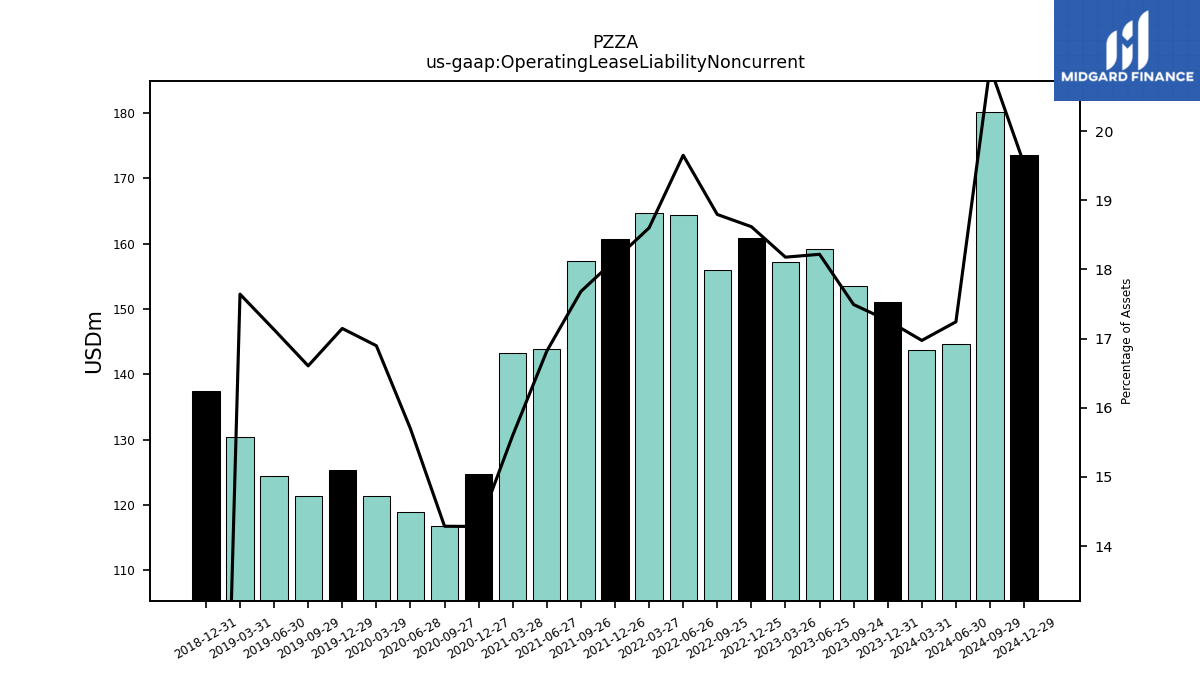
| Operating Lease Liability Noncurrent | 143.80 | 151.05 | 153.51 | 159.17 | 157.21 | 160.91 | 155.95 | 164.34 | 164.74 | 160.67 | 157.36 | 143.94 | 143.27 | 124.67 | 116.68 | 118.95 | 121.37 | 125.30 | 121.32 | 124.46 | 130.39 | NA | NA | NA | NA | NA | NA | NA | NA | NA | NA | NA | NA | NA | NA | NA | NA | NA | NA | NA | NA | NA | NA | NA | NA | NA | NA | NA | NA | NA | NA | NA | NA | NA | NA | NA | NA |
| 2024-03-31 | 2023-12-31 | 2023-09-24 | 2023-06-25 | 2023-03-26 | 2022-12-25 | 2022-09-25 | 2022-06-26 | 2022-03-27 | 2021-12-26 | 2021-09-26 | 2021-06-27 | 2021-03-28 | 2020-12-27 | 2020-09-27 | 2020-06-28 | 2020-03-29 | 2019-12-29 | 2019-09-29 | 2019-06-30 | 2019-03-31 | 2018-12-30 | 2018-09-30 | 2018-07-01 | 2018-04-01 | 2017-12-31 | 2017-09-24 | 2017-06-25 | 2017-03-26 | 2016-12-25 | 2016-09-25 | 2016-06-26 | 2016-03-27 | 2015-12-27 | 2015-09-27 | 2015-06-28 | 2015-03-29 | 2014-12-28 | 2014-09-28 | 2014-06-29 | 2014-03-30 | 2013-12-29 | 2013-09-29 | 2013-06-30 | 2013-03-31 | 2012-12-30 | 2012-09-23 | 2012-06-24 | 2012-03-25 | 2011-12-25 | 2011-09-25 | 2011-06-26 | 2011-03-27 | 2010-12-26 | 2010-09-26 | 2010-06-27 | 2010-03-28 | ||
|---|---|---|---|---|---|---|---|---|---|---|---|---|---|---|---|---|---|---|---|---|---|---|---|---|---|---|---|---|---|---|---|---|---|---|---|---|---|---|---|---|---|---|---|---|---|---|---|---|---|---|---|---|---|---|---|---|---|---|
| Stockholders Equity | -461.86 | -459.09 | -475.19 | -481.04 | -491.15 | -286.39 | -274.27 | -249.56 | -224.08 | -187.67 | -152.34 | -163.19 | -255.38 | -282.18 | -288.26 | -307.57 | -342.31 | -332.32 | -341.73 | -333.65 | -328.72 | -317.36 | -290.13 | -266.53 | -265.49 | -121.71 | -59.30 | 9.08 | 8.85 | -3.91 | -24.63 | -30.42 | -18.86 | 29.18 | 48.31 | 64.24 | 80.83 | 86.23 | 91.35 | 108.02 | 126.00 | 137.67 | 169.50 | 167.76 | 172.71 | 181.51 | 208.38 | 216.41 | 217.94 | 209.65 | 204.31 | 215.27 | 215.52 | 198.69 | NA | NA | NA | |
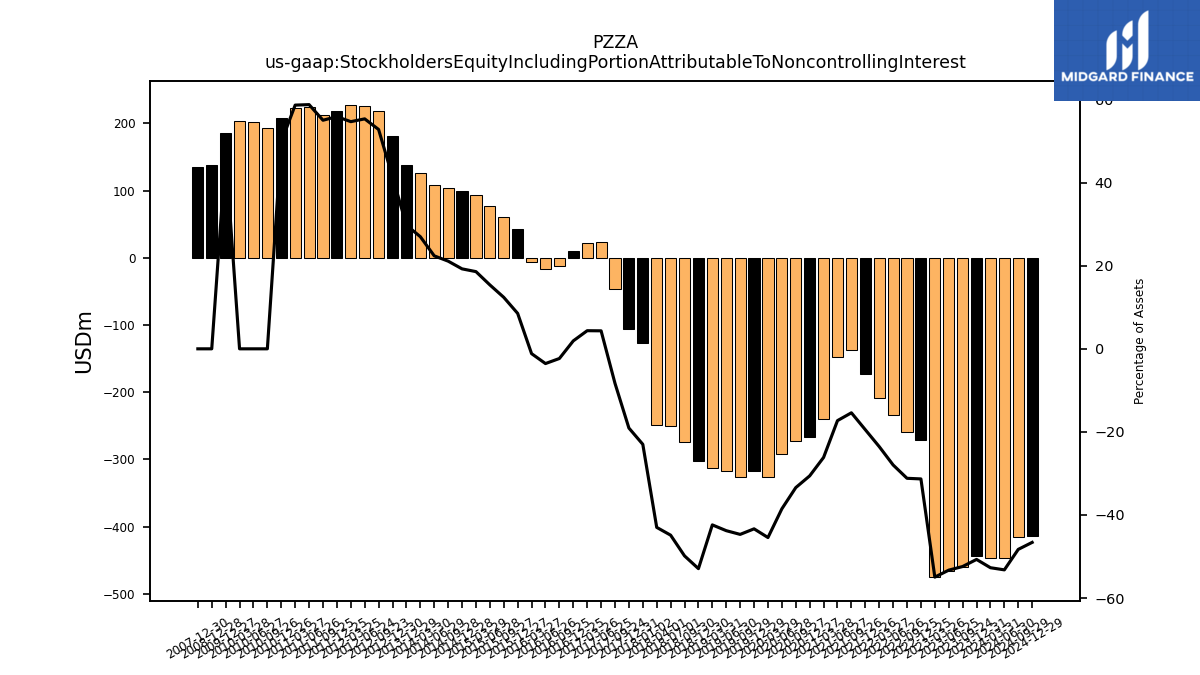
| Stockholders Equity Including Portion Attributable To Noncontrolling Interest | -446.42 | -443.62 | -459.90 | -465.48 | -475.32 | -270.66 | -258.62 | -233.80 | -208.44 | -172.46 | -137.05 | -147.90 | -240.10 | -266.94 | -272.85 | -291.85 | -326.30 | -316.66 | -326.37 | -318.07 | -313.26 | -302.13 | -274.72 | -250.39 | -249.24 | -105.95 | -45.82 | 22.78 | 22.54 | 9.80 | -11.62 | -17.28 | -5.69 | 42.21 | 61.31 | 77.42 | 93.30 | 98.72 | 103.88 | 108.61 | 126.48 | 138.18 | NA | NA | NA | 181.51 | 217.81 | 225.55 | 227.84 | 218.22 | 212.55 | 223.80 | 223.42 | 207.20 | 193.26 | 202.50 | 204.10 | |
| Common Stock Value | 0.49 | 0.49 | 0.49 | 0.49 | 0.49 | 0.49 | 0.49 | 0.49 | 0.49 | 0.49 | 0.49 | 0.49 | 0.45 | 0.45 | 0.45 | 0.45 | 0.45 | 0.45 | 0.44 | 0.44 | 0.44 | 0.44 | 0.44 | 0.44 | 0.44 | 0.44 | 0.44 | 0.44 | 0.44 | 0.44 | 0.44 | 0.44 | 0.44 | 0.44 | 0.44 | 0.44 | 0.43 | 0.43 | 0.43 | 0.43 | 0.43 | 0.43 | 0.37 | 0.37 | 0.37 | 0.37 | 0.37 | 0.37 | 0.37 | 0.37 | 0.37 | 0.36 | 0.36 | 0.36 | NA | NA | NA | |
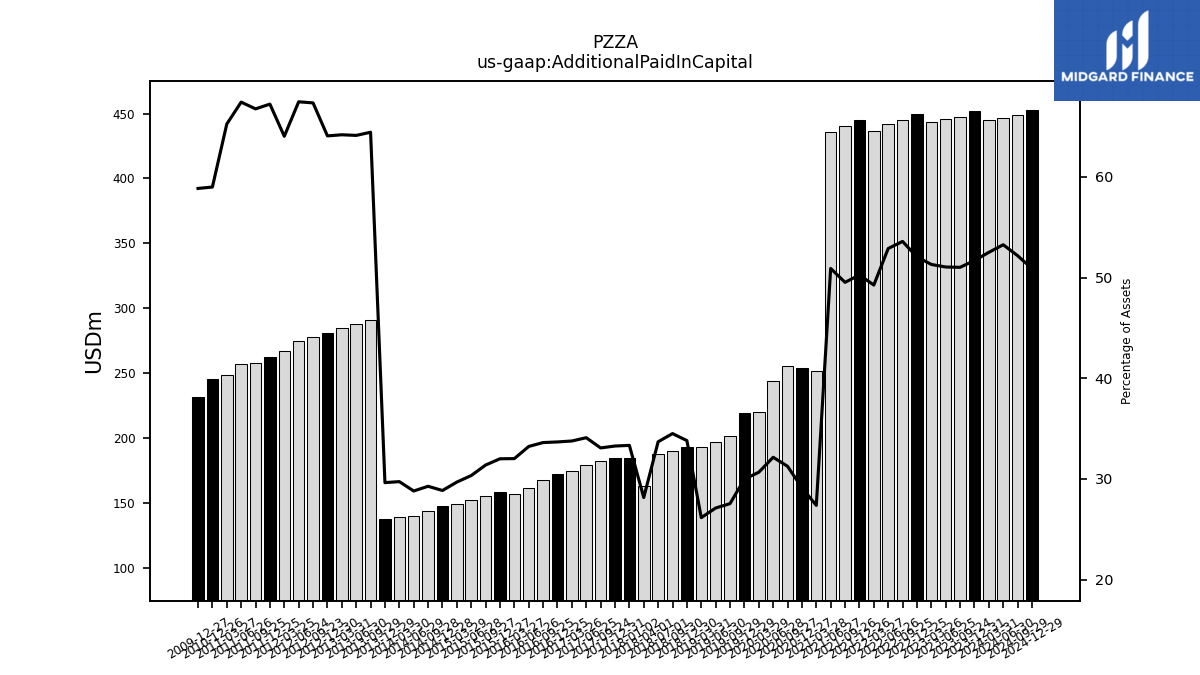
| Additional Paid In Capital | 444.79 | 452.29 | 447.70 | 445.96 | 443.69 | 449.83 | 444.64 | 442.25 | 436.23 | 445.13 | 440.74 | 435.61 | 251.28 | 254.10 | 255.21 | 243.58 | 220.19 | 219.05 | 201.19 | 196.93 | 193.24 | 192.98 | 190.13 | 188.03 | 163.20 | 184.78 | 182.21 | 179.18 | 174.36 | 172.57 | 167.63 | 161.85 | 157.18 | 158.35 | 155.17 | 152.57 | 148.98 | 147.91 | 144.02 | 139.71 | 139.29 | 137.55 | 290.89 | 288.21 | 284.52 | 280.90 | 277.81 | 274.86 | 266.78 | 262.46 | 257.85 | 256.70 | 248.47 | 245.38 | NA | NA | NA | |
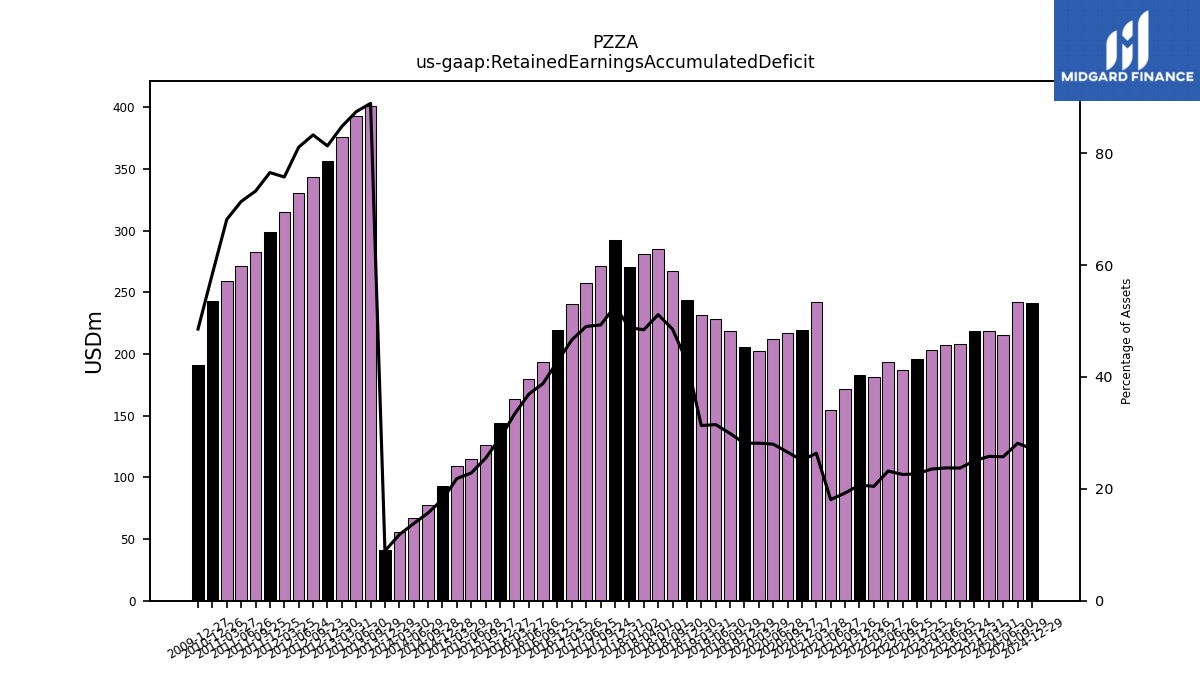
| Retained Earnings Accumulated Deficit | 218.61 | 219.03 | 208.13 | 207.46 | 203.57 | 195.86 | 187.29 | 193.93 | 181.12 | 183.16 | 171.38 | 154.77 | 242.12 | 219.16 | 216.91 | 212.10 | 202.29 | 205.70 | 218.52 | 228.83 | 231.44 | 244.06 | 267.58 | 285.46 | 280.85 | 292.25 | 271.60 | 257.74 | 240.87 | 219.28 | 193.80 | 179.88 | 163.56 | 143.79 | 126.05 | 114.91 | 109.62 | 92.88 | 77.27 | 66.94 | 55.38 | 41.30 | 401.35 | 392.92 | 375.77 | 356.46 | 343.47 | 330.32 | 315.55 | 298.81 | 282.83 | 271.70 | 259.58 | 243.15 | NA | NA | NA | |
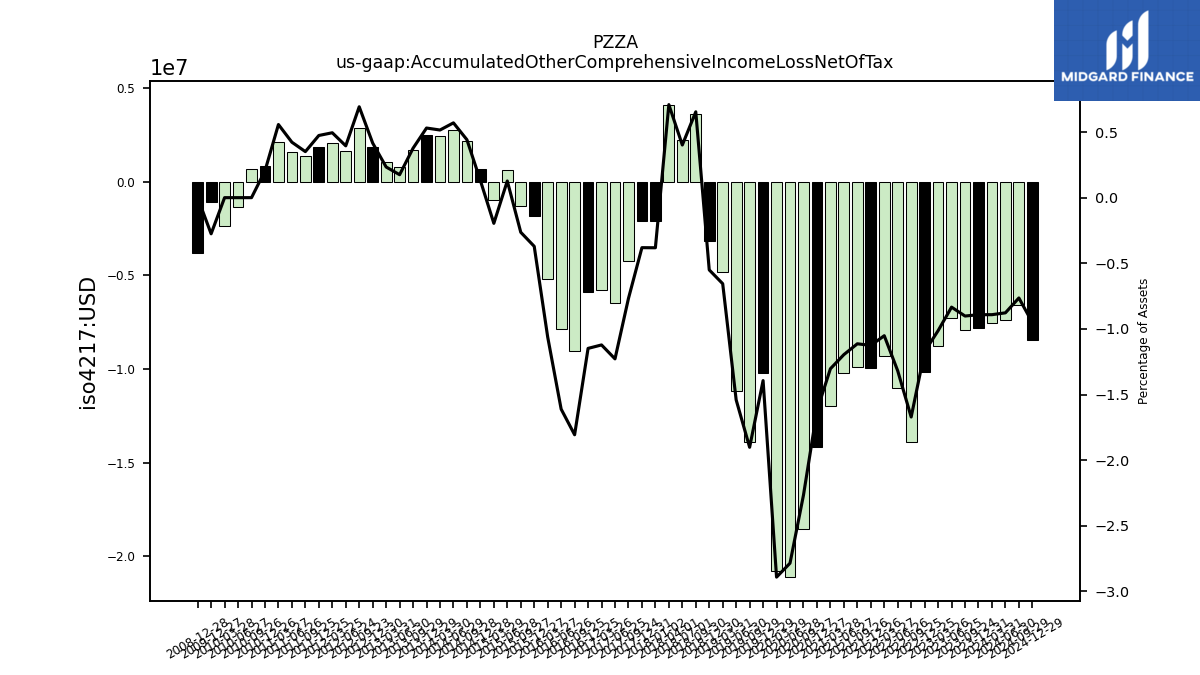
| Accumulated Other Comprehensive Income Loss Net Of Tax | -7.55 | -7.80 | -7.92 | -7.29 | -8.77 | -10.13 | -13.87 | -11.03 | -9.32 | -9.97 | -9.91 | -10.23 | -11.97 | -14.17 | -18.51 | -21.10 | -20.77 | -10.19 | -13.90 | -11.20 | -4.85 | -3.14 | 3.60 | 2.24 | 4.11 | -2.12 | -4.23 | -6.46 | -5.80 | -5.89 | -9.01 | -7.85 | -5.21 | -1.84 | -1.30 | 0.64 | -0.98 | 0.67 | 2.17 | 2.77 | 2.42 | 2.46 | 1.70 | 0.79 | 1.04 | 1.82 | 2.86 | 1.61 | 2.06 | 1.85 | 1.35 | 1.61 | 2.12 | 0.85 | 0.68 | -1.37 | -2.34 | |
| Minority Interest | 15.43 | 15.48 | 15.29 | 15.56 | 15.83 | 15.73 | 15.65 | 15.76 | 15.63 | 15.21 | 15.29 | 15.29 | 15.28 | 15.24 | 15.41 | 15.72 | 16.01 | 15.66 | 15.36 | 15.58 | 15.46 | 15.22 | 15.41 | 16.14 | 16.26 | 15.76 | 13.48 | 13.70 | 13.69 | 13.71 | 13.01 | 13.14 | 13.17 | 13.03 | 13.00 | 13.18 | 12.47 | 12.48 | 12.53 | 0.59 | 0.48 | 0.51 | NA | NA | NA | 6.40 | 9.43 | 9.14 | 9.89 | 8.57 | 8.24 | 8.53 | 7.90 | 8.51 | NA | NA | NA | |
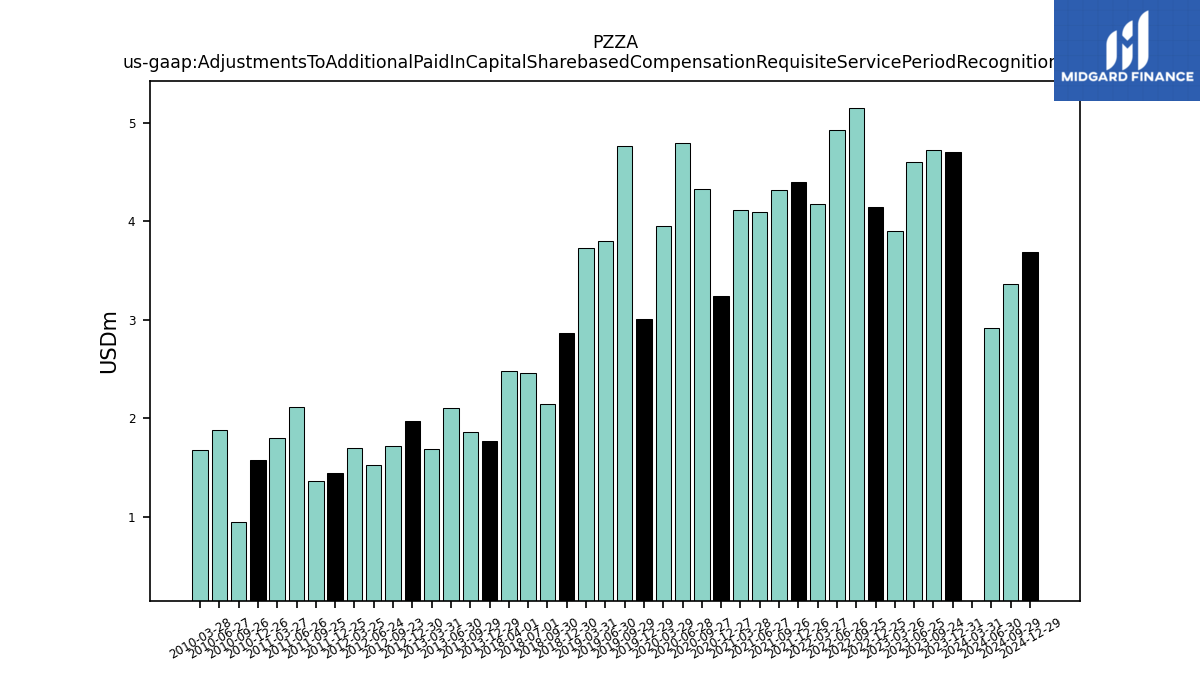
| Adjustments To Additional Paid In Capital Sharebased Compensation Requisite Service Period Recognition Value | -0.37 | 4.70 | 4.73 | 4.60 | 3.90 | 4.14 | 5.15 | 4.92 | 4.18 | 4.40 | 4.32 | 4.09 | 4.11 | 3.24 | 4.33 | 4.79 | 3.95 | 3.01 | 4.76 | 3.80 | 3.73 | 2.86 | 2.14 | 2.45 | 2.48 | NA | NA | NA | NA | NA | NA | NA | NA | NA | NA | NA | NA | NA | NA | NA | NA | 1.77 | 1.86 | 2.10 | 1.68 | 1.97 | 1.71 | 1.52 | 1.69 | 1.44 | 1.36 | 2.11 | 1.79 | 1.57 | 0.94 | 1.88 | 1.67 |
| 2024-03-31 | 2023-12-31 | 2023-09-24 | 2023-06-25 | 2023-03-26 | 2022-12-25 | 2022-09-25 | 2022-06-26 | 2022-03-27 | 2021-12-26 | 2021-09-26 | 2021-06-27 | 2021-03-28 | 2020-12-27 | 2020-09-27 | 2020-06-28 | 2020-03-29 | 2019-12-29 | 2019-09-29 | 2019-06-30 | 2019-03-31 | 2018-12-30 | 2018-09-30 | 2018-07-01 | 2018-04-01 | 2017-12-31 | 2017-09-24 | 2017-06-25 | 2017-03-26 | 2016-12-25 | 2016-09-25 | 2016-06-26 | 2016-03-27 | 2015-12-27 | 2015-09-27 | 2015-06-28 | 2015-03-29 | 2014-12-28 | 2014-09-28 | 2014-06-29 | 2014-03-30 | 2013-12-29 | 2013-09-29 | 2013-06-30 | 2013-03-31 | 2012-12-30 | 2012-09-23 | 2012-06-24 | 2012-03-25 | 2011-12-25 | 2011-09-25 | 2011-06-26 | 2011-03-27 | 2010-12-26 | 2010-09-26 | 2010-06-27 | 2010-03-28 | ||
|---|---|---|---|---|---|---|---|---|---|---|---|---|---|---|---|---|---|---|---|---|---|---|---|---|---|---|---|---|---|---|---|---|---|---|---|---|---|---|---|---|---|---|---|---|---|---|---|---|---|---|---|---|---|---|---|---|---|---|
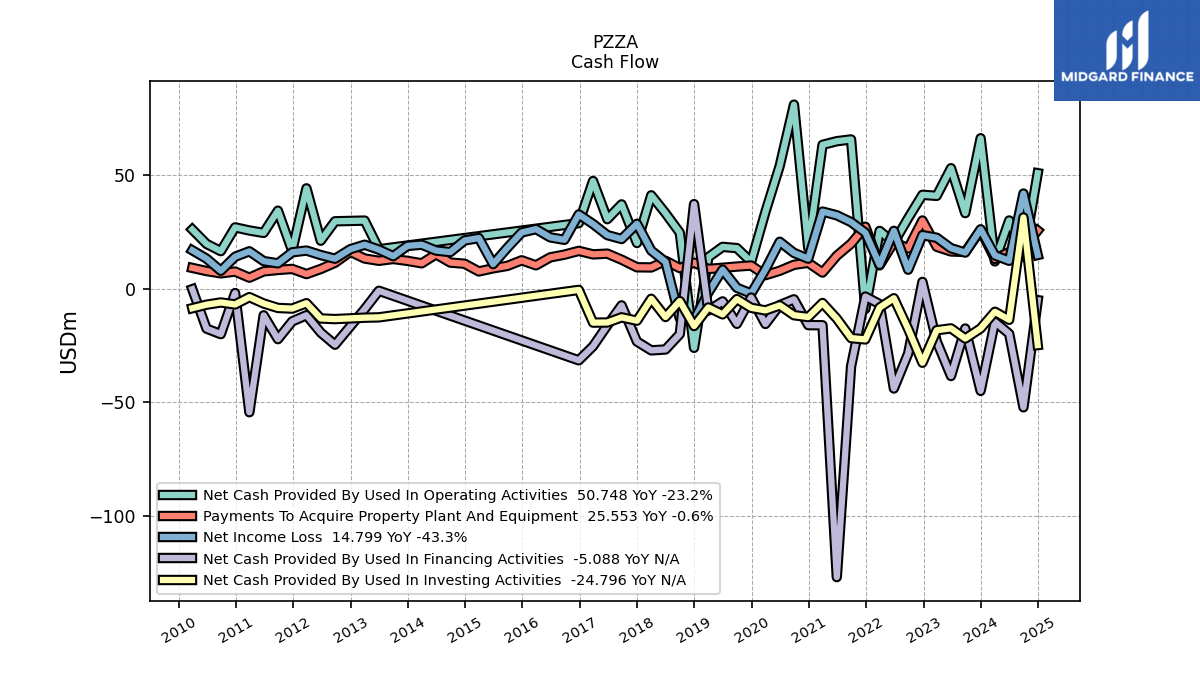
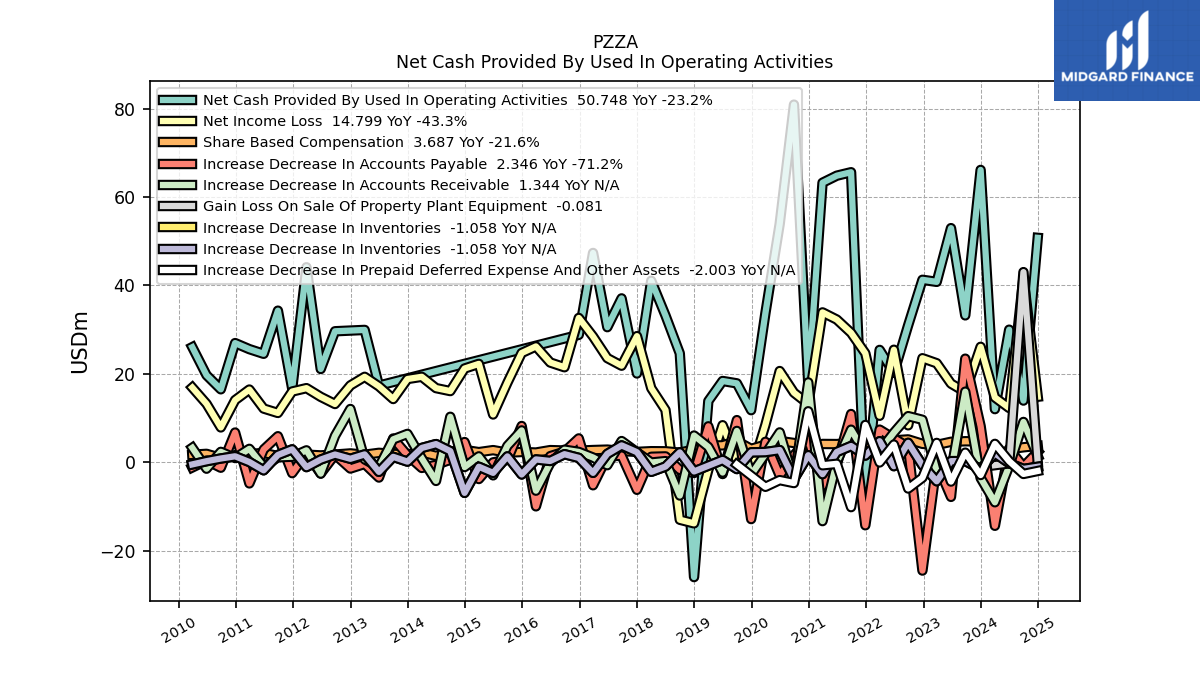
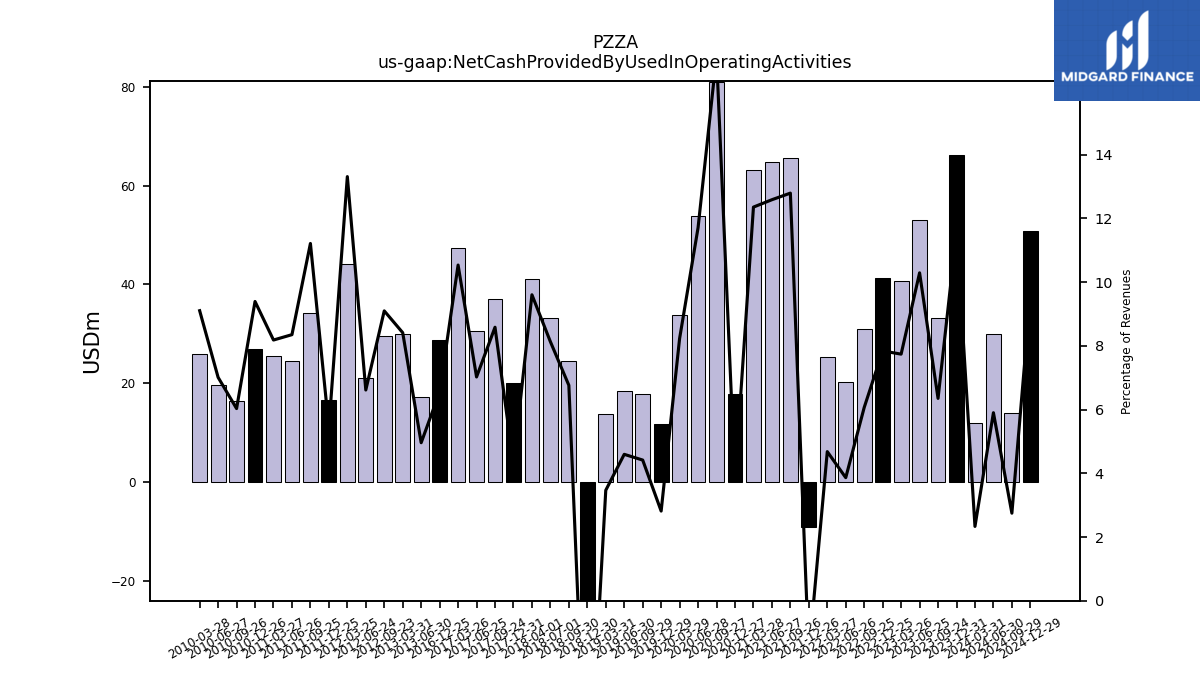
| Net Cash Provided By Used In Operating Activities | 11.99 | 66.12 | 33.20 | 52.95 | 40.79 | 41.26 | 30.97 | 20.19 | 25.39 | -8.95 | 65.59 | 64.81 | 63.22 | 17.89 | 80.89 | 53.92 | 33.73 | 11.75 | 17.82 | 18.36 | 13.81 | -26.02 | 24.61 | 33.16 | 41.04 | 20.06 | 37.05 | 30.53 | 47.33 | 28.80 | NA | NA | NA | NA | NA | NA | NA | NA | NA | NA | NA | NA | NA | 17.32 | 29.91 | NA | 29.61 | 21.07 | 44.09 | 16.66 | 34.27 | 24.51 | 25.57 | 26.94 | 16.47 | 19.67 | 26.01 | |
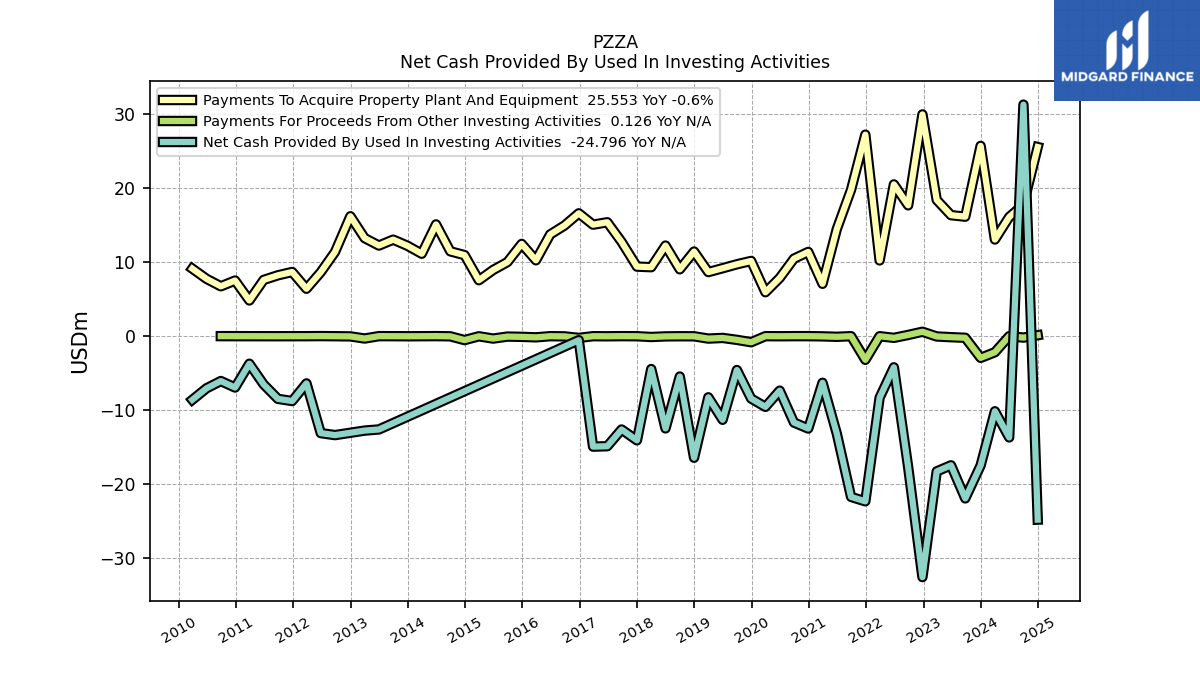
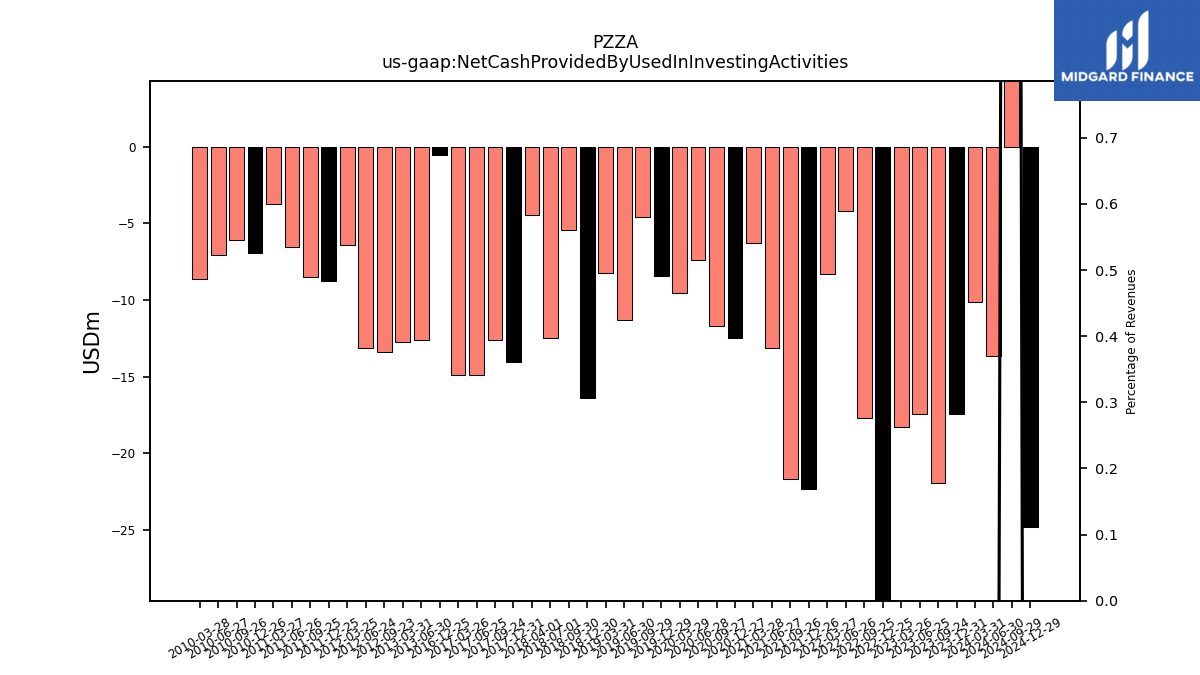
| Net Cash Provided By Used In Investing Activities | -10.15 | -17.47 | -21.93 | -17.45 | -18.27 | -32.56 | -17.71 | -4.21 | -8.31 | -22.32 | -21.72 | -13.17 | -6.30 | -12.48 | -11.67 | -7.36 | -9.55 | -8.43 | -4.58 | -11.30 | -8.26 | -16.43 | -5.46 | -12.47 | -4.44 | -14.08 | -12.61 | -14.87 | -14.93 | -0.54 | NA | NA | NA | NA | NA | NA | NA | NA | NA | NA | NA | NA | NA | -12.61 | -12.76 | NA | -13.37 | -13.10 | -6.38 | -8.77 | -8.47 | -6.52 | -3.73 | -6.94 | -6.07 | -7.04 | -8.61 | |
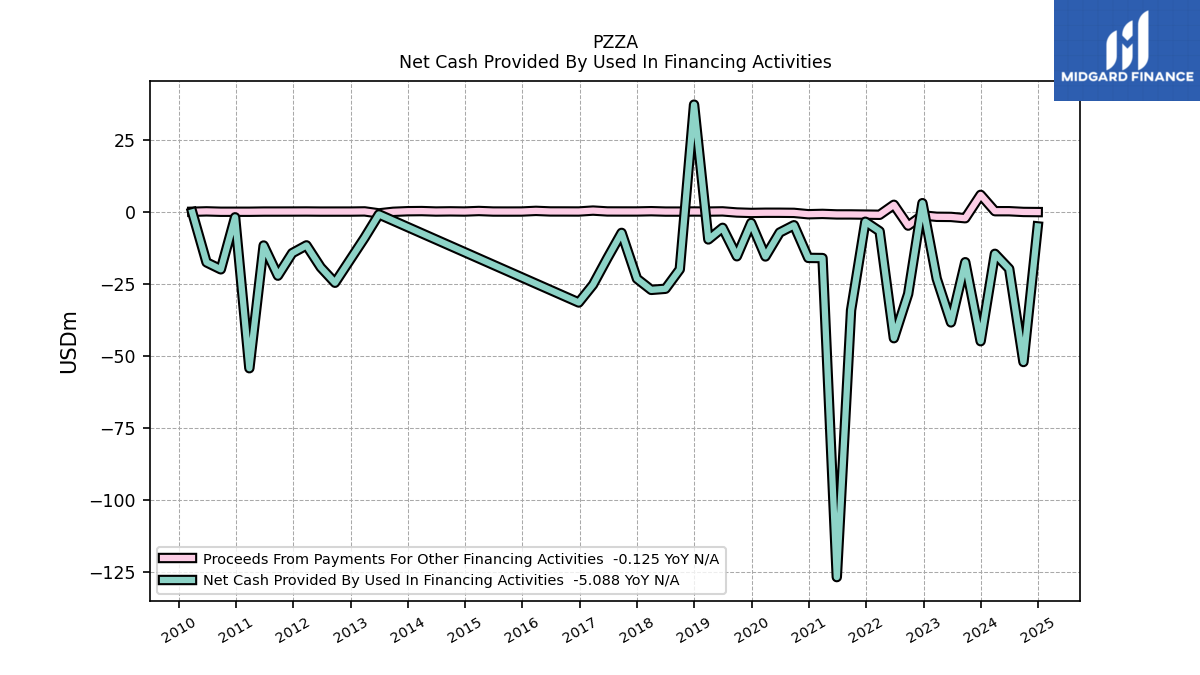
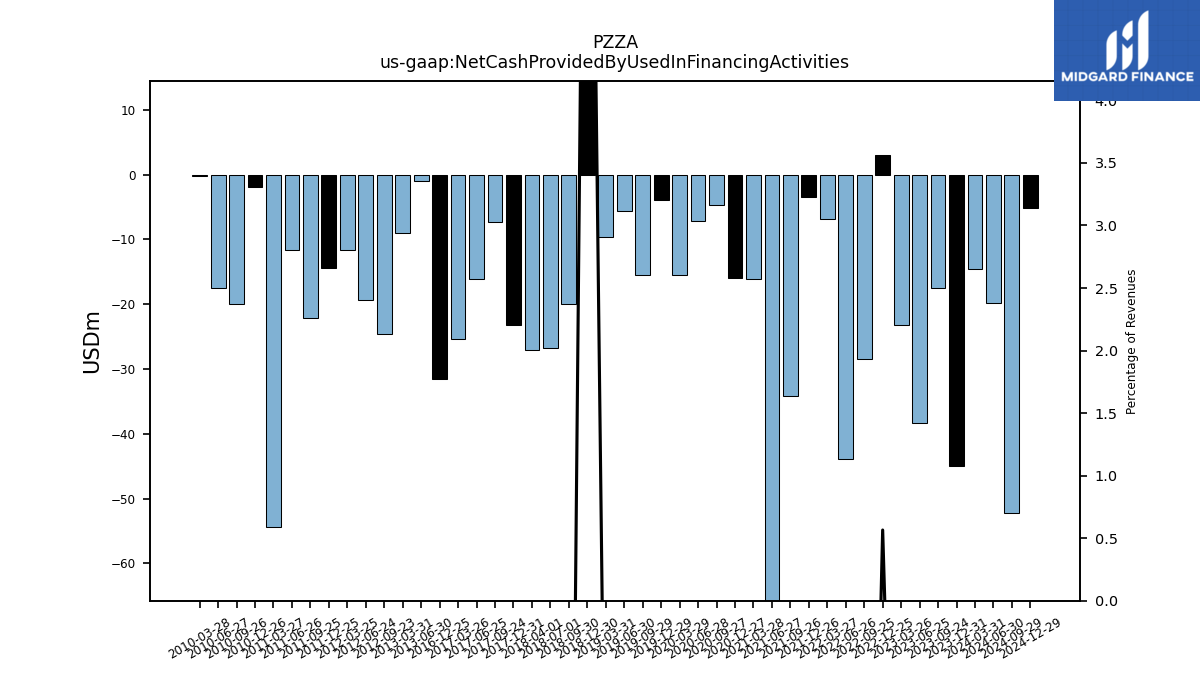
| Net Cash Provided By Used In Financing Activities | -14.60 | -44.94 | -17.52 | -38.41 | -23.21 | 2.98 | -28.54 | -43.89 | -6.79 | -3.47 | -34.19 | -126.79 | -16.08 | -16.02 | -4.68 | -7.22 | -15.53 | -3.90 | -15.46 | -5.58 | -9.63 | 37.16 | -19.99 | -26.73 | -27.12 | -23.25 | -7.34 | -16.15 | -25.32 | -31.50 | NA | NA | NA | NA | NA | NA | NA | NA | NA | NA | NA | NA | NA | -0.93 | -9.01 | NA | -24.65 | -19.30 | -11.67 | -14.37 | -22.20 | -11.72 | -54.31 | -1.93 | -19.99 | -17.58 | -0.23 |
| 2024-03-31 | 2023-12-31 | 2023-09-24 | 2023-06-25 | 2023-03-26 | 2022-12-25 | 2022-09-25 | 2022-06-26 | 2022-03-27 | 2021-12-26 | 2021-09-26 | 2021-06-27 | 2021-03-28 | 2020-12-27 | 2020-09-27 | 2020-06-28 | 2020-03-29 | 2019-12-29 | 2019-09-29 | 2019-06-30 | 2019-03-31 | 2018-12-30 | 2018-09-30 | 2018-07-01 | 2018-04-01 | 2017-12-31 | 2017-09-24 | 2017-06-25 | 2017-03-26 | 2016-12-25 | 2016-09-25 | 2016-06-26 | 2016-03-27 | 2015-12-27 | 2015-09-27 | 2015-06-28 | 2015-03-29 | 2014-12-28 | 2014-09-28 | 2014-06-29 | 2014-03-30 | 2013-12-29 | 2013-09-29 | 2013-06-30 | 2013-03-31 | 2012-12-30 | 2012-09-23 | 2012-06-24 | 2012-03-25 | 2011-12-25 | 2011-09-25 | 2011-06-26 | 2011-03-27 | 2010-12-26 | 2010-09-26 | 2010-06-27 | 2010-03-28 | ||
|---|---|---|---|---|---|---|---|---|---|---|---|---|---|---|---|---|---|---|---|---|---|---|---|---|---|---|---|---|---|---|---|---|---|---|---|---|---|---|---|---|---|---|---|---|---|---|---|---|---|---|---|---|---|---|---|---|---|---|
| Net Cash Provided By Used In Operating Activities | 11.99 | 66.12 | 33.20 | 52.95 | 40.79 | 41.26 | 30.97 | 20.19 | 25.39 | -8.95 | 65.59 | 64.81 | 63.22 | 17.89 | 80.89 | 53.92 | 33.73 | 11.75 | 17.82 | 18.36 | 13.81 | -26.02 | 24.61 | 33.16 | 41.04 | 20.06 | 37.05 | 30.53 | 47.33 | 28.80 | NA | NA | NA | NA | NA | NA | NA | NA | NA | NA | NA | NA | NA | 17.32 | 29.91 | NA | 29.61 | 21.07 | 44.09 | 16.66 | 34.27 | 24.51 | 25.57 | 26.94 | 16.47 | 19.67 | 26.01 | |
| Net Income Loss | 14.64 | 26.09 | 15.86 | 17.77 | 22.38 | 23.51 | 8.33 | 25.43 | 10.49 | 24.62 | 29.26 | 32.25 | 33.88 | 13.17 | 15.71 | 20.61 | 8.44 | -2.14 | 0.39 | 8.35 | -1.73 | -13.85 | -13.03 | 11.79 | 16.74 | 28.51 | 21.82 | 23.54 | 28.43 | 32.63 | 21.47 | 22.54 | 26.18 | 24.70 | 17.97 | 10.78 | 22.24 | 21.18 | 16.07 | 16.75 | 19.31 | 18.80 | 14.28 | 17.15 | 19.31 | 17.36 | 13.15 | 14.77 | 16.74 | 15.98 | 11.12 | 12.12 | 16.43 | 14.03 | 7.85 | 13.19 | 16.88 | |
| Profit Loss | 14.91 | 26.44 | 15.95 | 17.86 | 22.55 | 23.73 | 8.46 | 25.73 | 11.43 | 25.54 | 30.54 | 33.59 | 35.28 | 13.27 | 16.40 | 21.95 | 8.99 | -1.68 | 0.26 | 8.68 | -1.60 | -13.22 | -12.59 | 12.66 | 17.38 | 28.98 | 22.67 | 24.98 | 29.90 | 34.28 | 22.65 | 24.11 | 28.05 | 26.28 | 18.98 | 12.47 | 24.24 | 22.36 | 16.96 | 17.84 | 20.54 | 19.74 | 14.88 | 18.05 | 20.32 | 18.05 | 13.95 | 15.94 | 18.07 | 16.84 | 11.94 | 13.05 | 17.55 | 14.84 | 8.52 | 14.10 | 17.96 | |
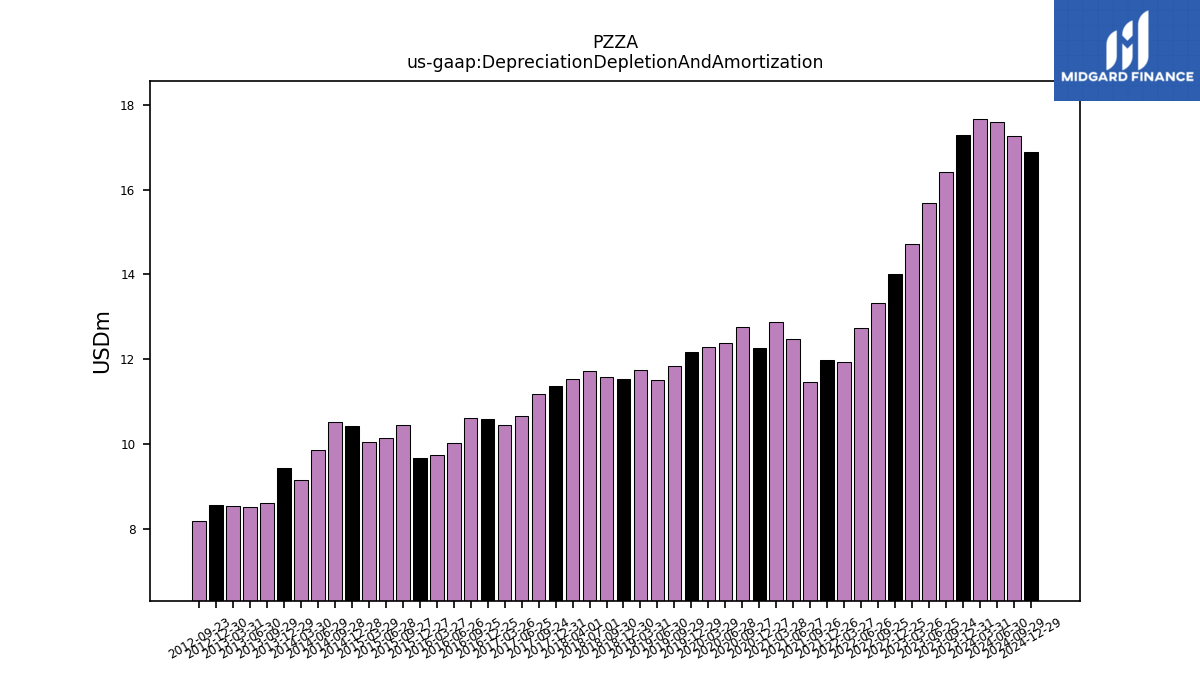
| Depreciation Depletion And Amortization | 17.67 | 17.27 | 16.40 | 15.69 | 14.72 | 14.02 | 13.34 | 12.73 | 11.94 | 11.99 | 11.48 | 12.48 | 12.88 | 12.27 | 12.76 | 12.38 | 12.29 | 12.18 | 11.83 | 11.52 | 11.75 | 11.55 | 11.59 | 11.73 | 11.54 | 11.38 | 11.18 | 10.65 | 10.46 | 10.60 | 10.61 | 10.03 | 9.74 | 9.67 | 10.46 | 10.14 | 10.04 | 10.43 | 10.52 | 9.86 | 9.16 | 9.43 | 8.61 | 8.53 | 8.54 | 8.57 | 8.19 | NA | NA | NA | NA | NA | NA | NA | NA | NA | NA | |
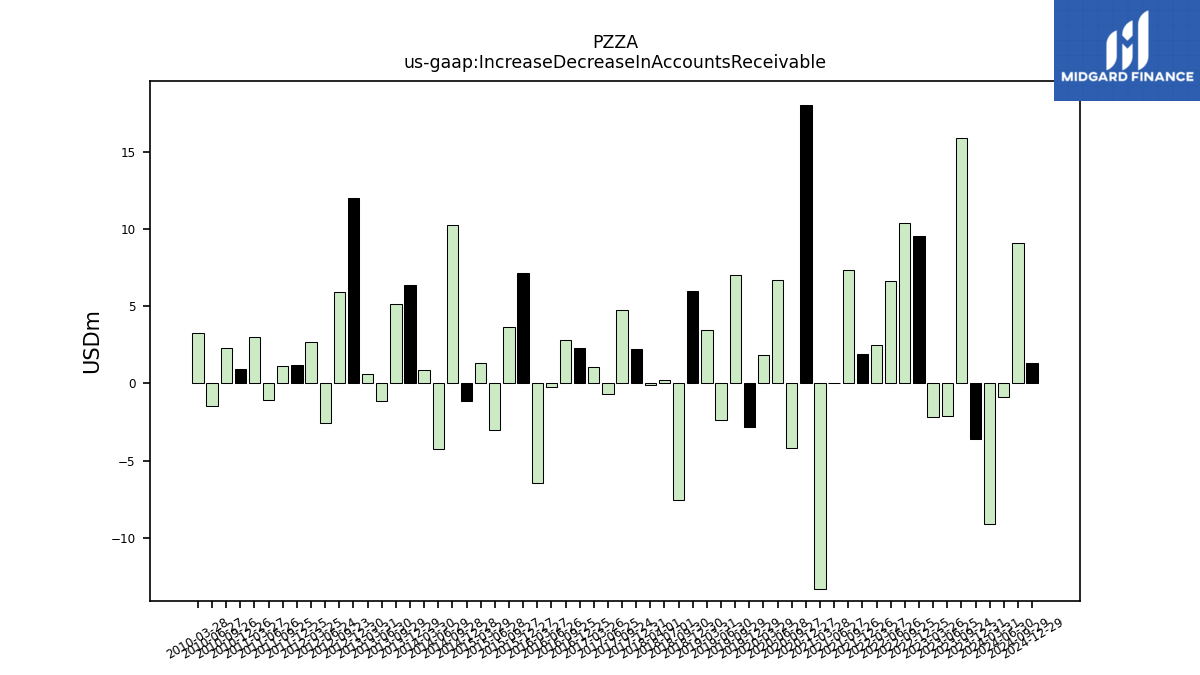
| Increase Decrease In Accounts Receivable | -9.08 | -3.59 | 15.94 | -2.12 | -2.18 | 9.58 | 10.41 | 6.67 | 2.50 | 1.93 | 7.34 | 0.05 | -13.35 | 18.04 | -4.19 | 6.73 | 1.84 | -2.83 | 7.06 | -2.35 | 3.44 | 6.02 | -7.56 | 0.23 | -0.09 | 2.23 | 4.78 | -0.69 | 1.05 | 2.31 | 2.81 | -0.22 | -6.46 | 7.18 | 3.68 | -2.99 | 1.31 | -1.12 | 10.26 | -4.25 | 0.85 | 6.39 | 5.16 | -1.12 | 0.63 | 12.03 | 5.94 | -2.60 | 2.67 | 1.23 | 1.11 | -1.05 | 3.01 | 0.93 | 2.33 | -1.48 | 3.25 | |
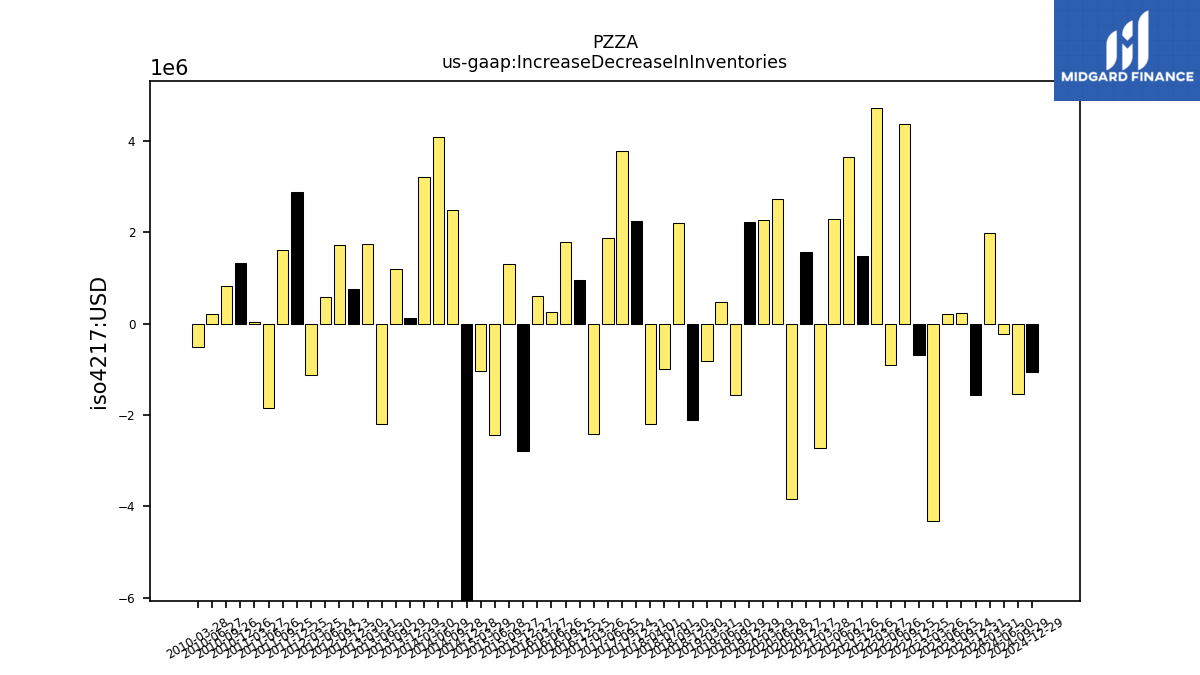
| Increase Decrease In Inventories | 1.98 | -1.57 | 0.23 | 0.22 | -4.33 | -0.69 | 4.37 | -0.92 | 4.73 | 1.49 | 3.65 | 2.29 | -2.72 | 1.56 | -3.84 | 2.74 | 2.28 | 2.22 | -1.56 | 0.48 | -0.81 | -2.11 | 2.20 | -0.99 | -2.19 | 2.25 | 3.78 | 1.88 | -2.42 | 0.97 | 1.80 | 0.27 | 0.61 | -2.79 | 1.30 | -2.43 | -1.04 | -6.95 | 2.50 | 4.08 | 3.21 | 0.12 | 1.20 | -2.20 | 1.74 | 0.76 | 1.72 | 0.59 | -1.12 | 2.89 | 1.62 | -1.85 | 0.03 | 1.32 | 0.82 | 0.22 | -0.51 | |
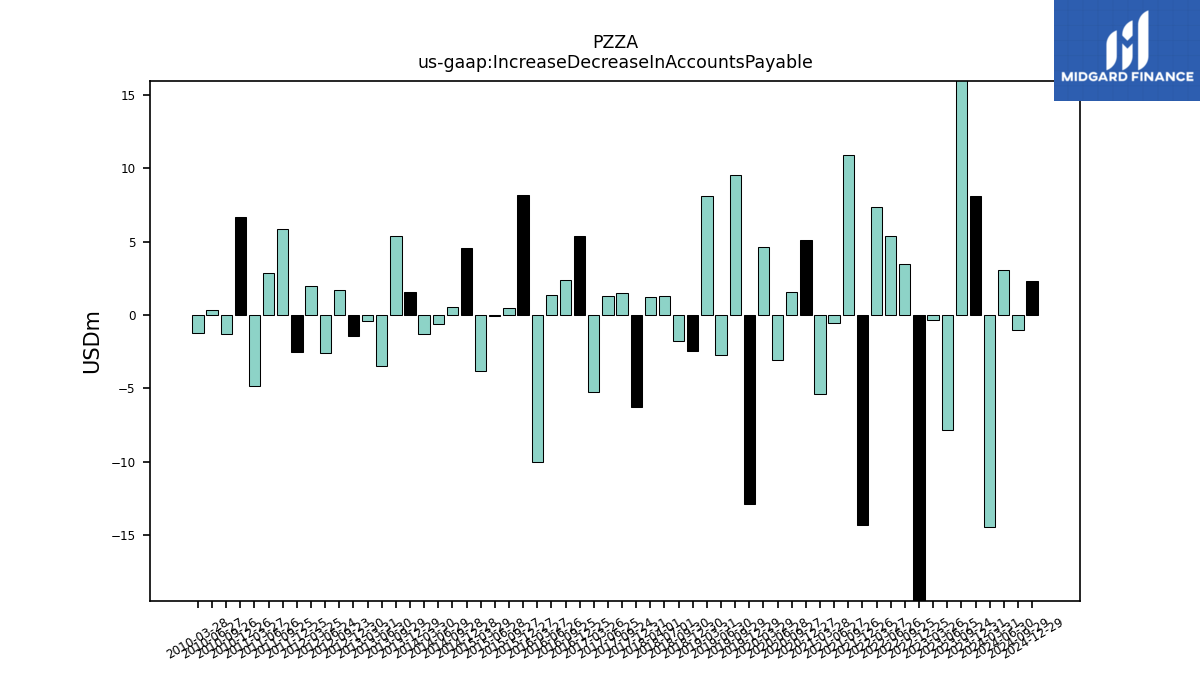
| Increase Decrease In Accounts Payable | -14.41 | 8.13 | 23.41 | -7.86 | -0.31 | -24.54 | 3.45 | 5.38 | 7.36 | -14.29 | 10.89 | -0.52 | -5.35 | 5.08 | 1.59 | -3.05 | 4.60 | -12.89 | 9.51 | -2.70 | 8.11 | -2.46 | -1.74 | 1.30 | 1.21 | -6.26 | 1.47 | 1.29 | -5.24 | 5.37 | 2.36 | 1.35 | -10.01 | 8.18 | 0.50 | -0.05 | -3.83 | 4.55 | 0.55 | -0.62 | -1.31 | 1.57 | 5.35 | -3.49 | -0.41 | -1.45 | 1.69 | -2.57 | 1.99 | -2.50 | 5.87 | 2.85 | -4.82 | 6.70 | -1.27 | 0.35 | -1.21 | |
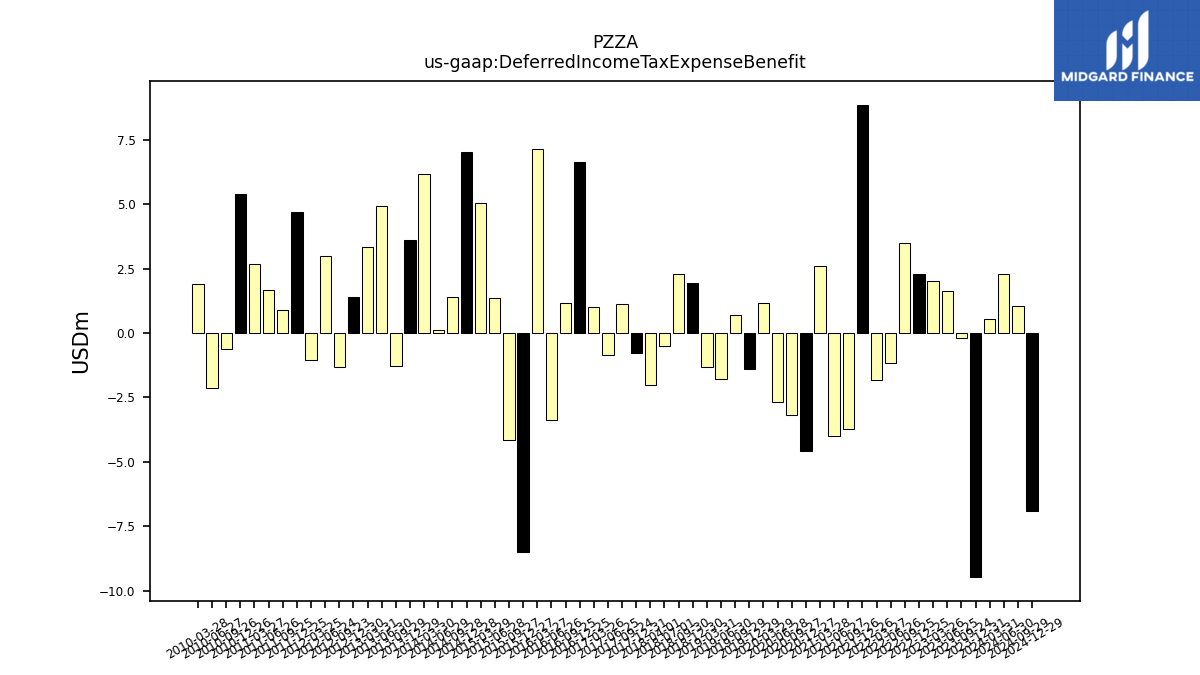
| Deferred Income Tax Expense Benefit | 0.53 | -9.47 | -0.18 | 1.63 | 2.03 | 2.28 | 3.51 | -1.18 | -1.82 | 8.87 | -3.72 | -3.98 | 2.59 | -4.57 | -3.19 | -2.69 | 1.19 | -1.38 | 0.71 | -1.79 | -1.31 | 1.93 | 2.28 | -0.51 | -2.00 | -0.79 | 1.12 | -0.86 | 1.01 | 6.66 | 1.18 | -3.35 | 7.14 | -8.51 | -4.17 | 1.37 | 5.05 | 7.02 | 1.39 | 0.13 | 6.17 | 3.61 | -1.26 | 4.93 | 3.33 | 1.39 | -1.30 | 3.00 | -1.06 | 4.69 | 0.89 | 1.67 | 2.66 | 5.40 | -0.60 | -2.15 | 1.90 | |
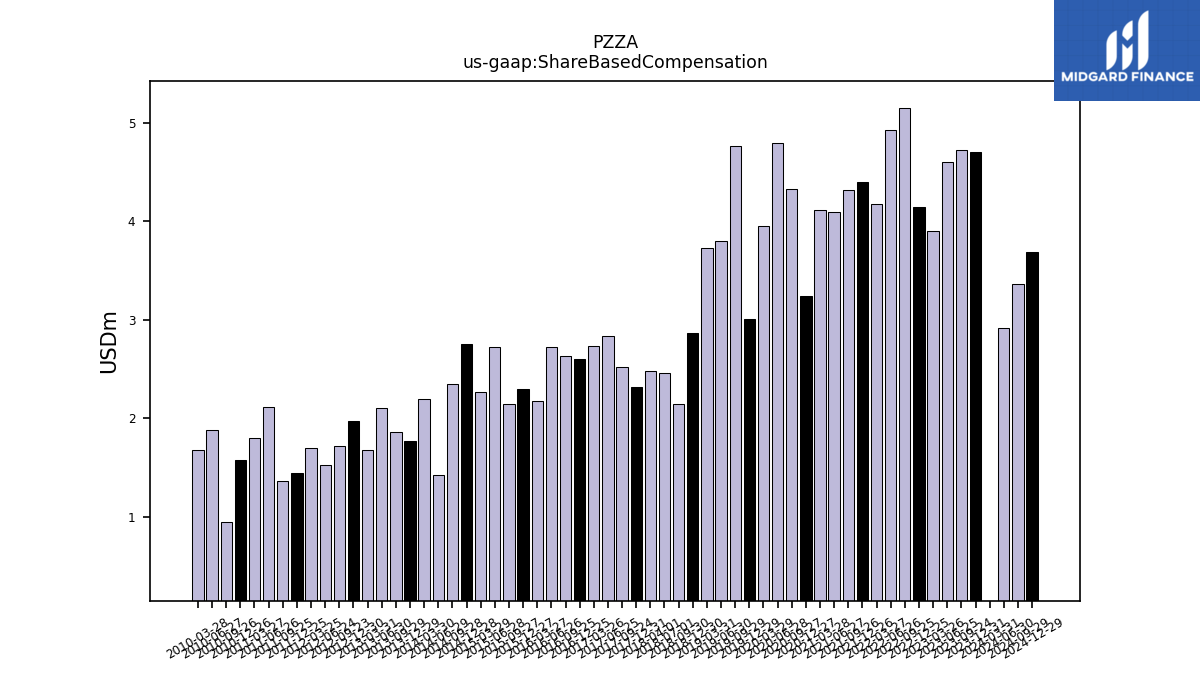
| Share Based Compensation | -0.37 | 4.70 | 4.73 | 4.60 | 3.90 | 4.14 | 5.15 | 4.92 | 4.18 | 4.40 | 4.32 | 4.09 | 4.11 | 3.24 | 4.33 | 4.79 | 3.95 | 3.01 | 4.76 | 3.80 | 3.73 | 2.86 | 2.14 | 2.45 | 2.48 | 2.32 | 2.52 | 2.83 | 2.74 | 2.60 | 2.63 | 2.72 | 2.17 | 2.30 | 2.14 | 2.72 | 2.26 | 2.75 | 2.35 | 1.42 | 2.19 | 1.77 | 1.86 | 2.10 | 1.68 | 1.97 | 1.71 | 1.52 | 1.69 | 1.44 | 1.36 | 2.11 | 1.79 | 1.57 | 0.94 | 1.88 | 1.67 |
| 2024-03-31 | 2023-12-31 | 2023-09-24 | 2023-06-25 | 2023-03-26 | 2022-12-25 | 2022-09-25 | 2022-06-26 | 2022-03-27 | 2021-12-26 | 2021-09-26 | 2021-06-27 | 2021-03-28 | 2020-12-27 | 2020-09-27 | 2020-06-28 | 2020-03-29 | 2019-12-29 | 2019-09-29 | 2019-06-30 | 2019-03-31 | 2018-12-30 | 2018-09-30 | 2018-07-01 | 2018-04-01 | 2017-12-31 | 2017-09-24 | 2017-06-25 | 2017-03-26 | 2016-12-25 | 2016-09-25 | 2016-06-26 | 2016-03-27 | 2015-12-27 | 2015-09-27 | 2015-06-28 | 2015-03-29 | 2014-12-28 | 2014-09-28 | 2014-06-29 | 2014-03-30 | 2013-12-29 | 2013-09-29 | 2013-06-30 | 2013-03-31 | 2012-12-30 | 2012-09-23 | 2012-06-24 | 2012-03-25 | 2011-12-25 | 2011-09-25 | 2011-06-26 | 2011-03-27 | 2010-12-26 | 2010-09-26 | 2010-06-27 | 2010-03-28 | ||
|---|---|---|---|---|---|---|---|---|---|---|---|---|---|---|---|---|---|---|---|---|---|---|---|---|---|---|---|---|---|---|---|---|---|---|---|---|---|---|---|---|---|---|---|---|---|---|---|---|---|---|---|---|---|---|---|---|---|---|
| Net Cash Provided By Used In Investing Activities | -10.15 | -17.47 | -21.93 | -17.45 | -18.27 | -32.56 | -17.71 | -4.21 | -8.31 | -22.32 | -21.72 | -13.17 | -6.30 | -12.48 | -11.67 | -7.36 | -9.55 | -8.43 | -4.58 | -11.30 | -8.26 | -16.43 | -5.46 | -12.47 | -4.44 | -14.08 | -12.61 | -14.87 | -14.93 | -0.54 | NA | NA | NA | NA | NA | NA | NA | NA | NA | NA | NA | NA | NA | -12.61 | -12.76 | NA | -13.37 | -13.10 | -6.38 | -8.77 | -8.47 | -6.52 | -3.73 | -6.94 | -6.07 | -7.04 | -8.61 | |
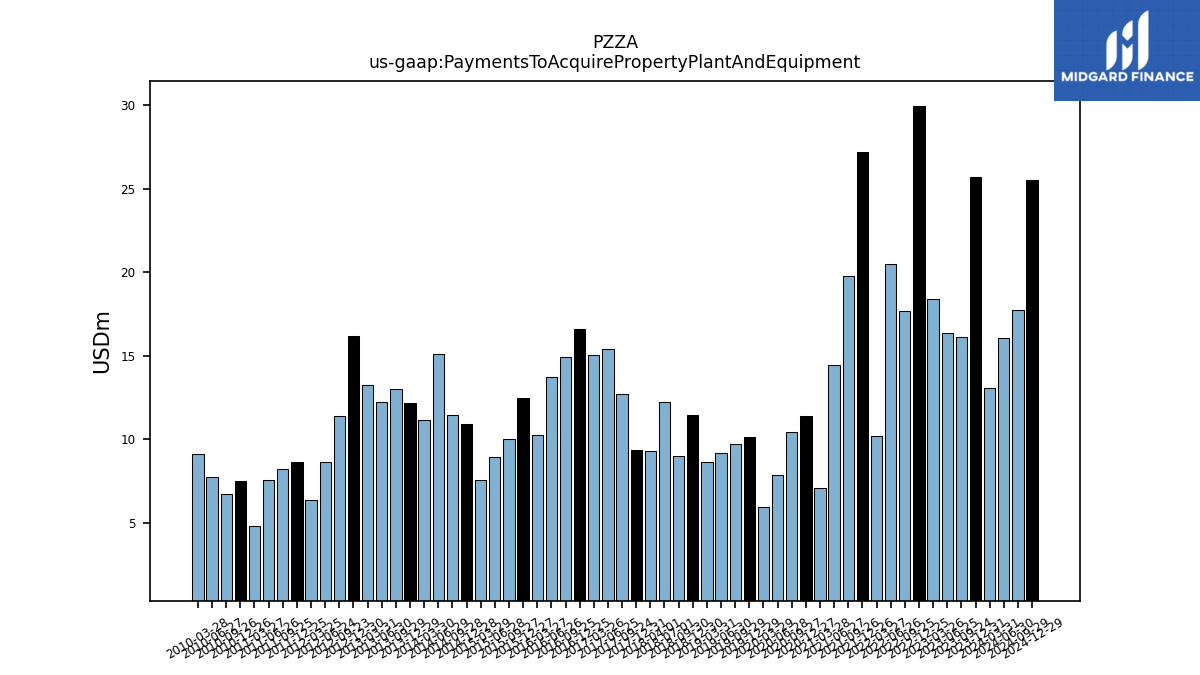
| Payments To Acquire Property Plant And Equipment | 13.06 | 25.71 | 16.15 | 16.35 | 18.41 | 29.97 | 17.68 | 20.51 | 10.23 | 27.23 | 19.79 | 14.47 | 7.08 | 11.38 | 10.47 | 7.86 | 5.93 | 10.16 | 9.71 | 9.18 | 8.66 | 11.44 | 9.03 | 12.24 | 9.32 | 9.40 | 12.74 | 15.39 | 15.06 | 16.60 | 14.95 | 13.75 | 10.25 | 12.46 | 10.01 | 8.94 | 7.56 | 10.96 | 11.46 | 15.10 | 11.14 | 12.21 | 13.04 | 12.24 | 13.25 | 16.20 | 11.38 | 8.64 | 6.40 | 8.67 | 8.22 | 7.60 | 4.82 | 7.52 | 6.74 | 7.75 | 9.12 |
| 2024-03-31 | 2023-12-31 | 2023-09-24 | 2023-06-25 | 2023-03-26 | 2022-12-25 | 2022-09-25 | 2022-06-26 | 2022-03-27 | 2021-12-26 | 2021-09-26 | 2021-06-27 | 2021-03-28 | 2020-12-27 | 2020-09-27 | 2020-06-28 | 2020-03-29 | 2019-12-29 | 2019-09-29 | 2019-06-30 | 2019-03-31 | 2018-12-30 | 2018-09-30 | 2018-07-01 | 2018-04-01 | 2017-12-31 | 2017-09-24 | 2017-06-25 | 2017-03-26 | 2016-12-25 | 2016-09-25 | 2016-06-26 | 2016-03-27 | 2015-12-27 | 2015-09-27 | 2015-06-28 | 2015-03-29 | 2014-12-28 | 2014-09-28 | 2014-06-29 | 2014-03-30 | 2013-12-29 | 2013-09-29 | 2013-06-30 | 2013-03-31 | 2012-12-30 | 2012-09-23 | 2012-06-24 | 2012-03-25 | 2011-12-25 | 2011-09-25 | 2011-06-26 | 2011-03-27 | 2010-12-26 | 2010-09-26 | 2010-06-27 | 2010-03-28 | ||
|---|---|---|---|---|---|---|---|---|---|---|---|---|---|---|---|---|---|---|---|---|---|---|---|---|---|---|---|---|---|---|---|---|---|---|---|---|---|---|---|---|---|---|---|---|---|---|---|---|---|---|---|---|---|---|---|---|---|---|
| Net Cash Provided By Used In Financing Activities | -14.60 | -44.94 | -17.52 | -38.41 | -23.21 | 2.98 | -28.54 | -43.89 | -6.79 | -3.47 | -34.19 | -126.79 | -16.08 | -16.02 | -4.68 | -7.22 | -15.53 | -3.90 | -15.46 | -5.58 | -9.63 | 37.16 | -19.99 | -26.73 | -27.12 | -23.25 | -7.34 | -16.15 | -25.32 | -31.50 | NA | NA | NA | NA | NA | NA | NA | NA | NA | NA | NA | NA | NA | -0.93 | -9.01 | NA | -24.65 | -19.30 | -11.67 | -14.37 | -22.20 | -11.72 | -54.31 | -1.93 | -19.99 | -17.58 | -0.23 | |
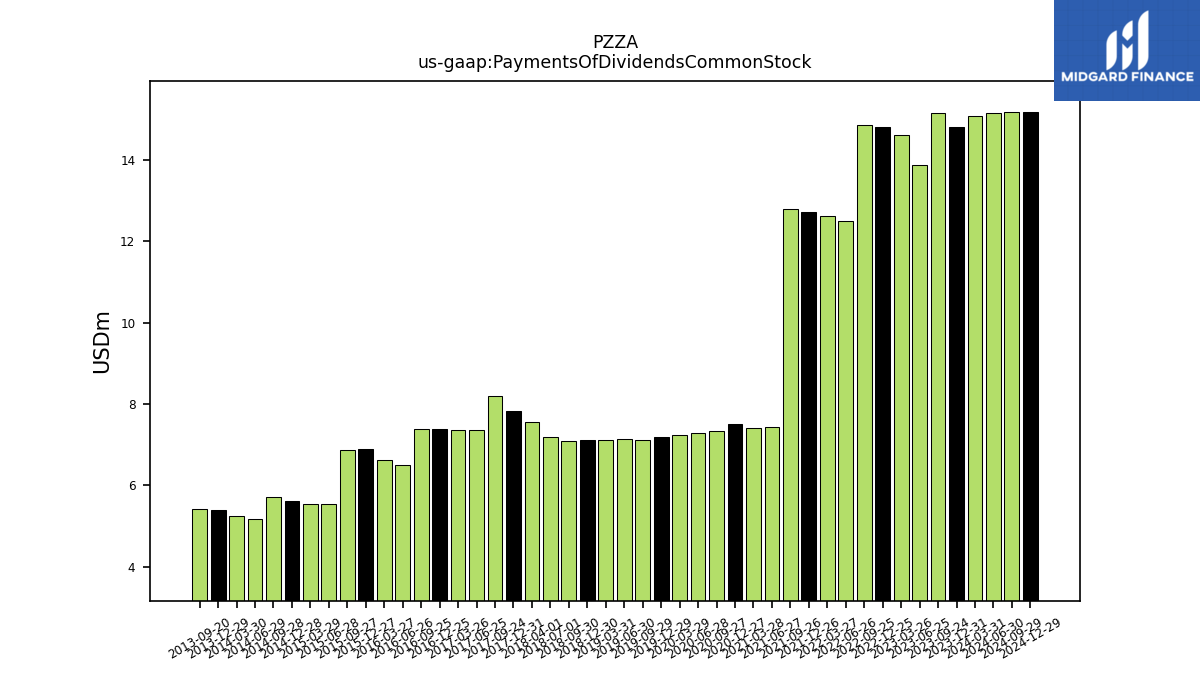
| Payments Of Dividends Common Stock | 15.07 | 14.81 | 15.16 | 13.88 | 14.60 | 14.82 | 14.85 | 12.49 | 12.61 | 12.72 | 12.80 | 7.44 | 7.40 | 7.51 | 7.34 | 7.28 | 7.24 | 7.18 | 7.10 | 7.14 | 7.12 | 7.12 | 7.10 | 7.20 | 7.57 | 7.83 | 8.18 | 7.35 | 7.35 | 7.37 | 7.39 | 6.50 | 6.63 | 6.89 | 6.87 | 5.54 | 5.54 | 5.62 | 5.71 | 5.16 | 5.24 | 5.38 | NA | NA | NA | NA | NA | NA | NA | NA | NA | NA | NA | NA | NA | NA | NA | |
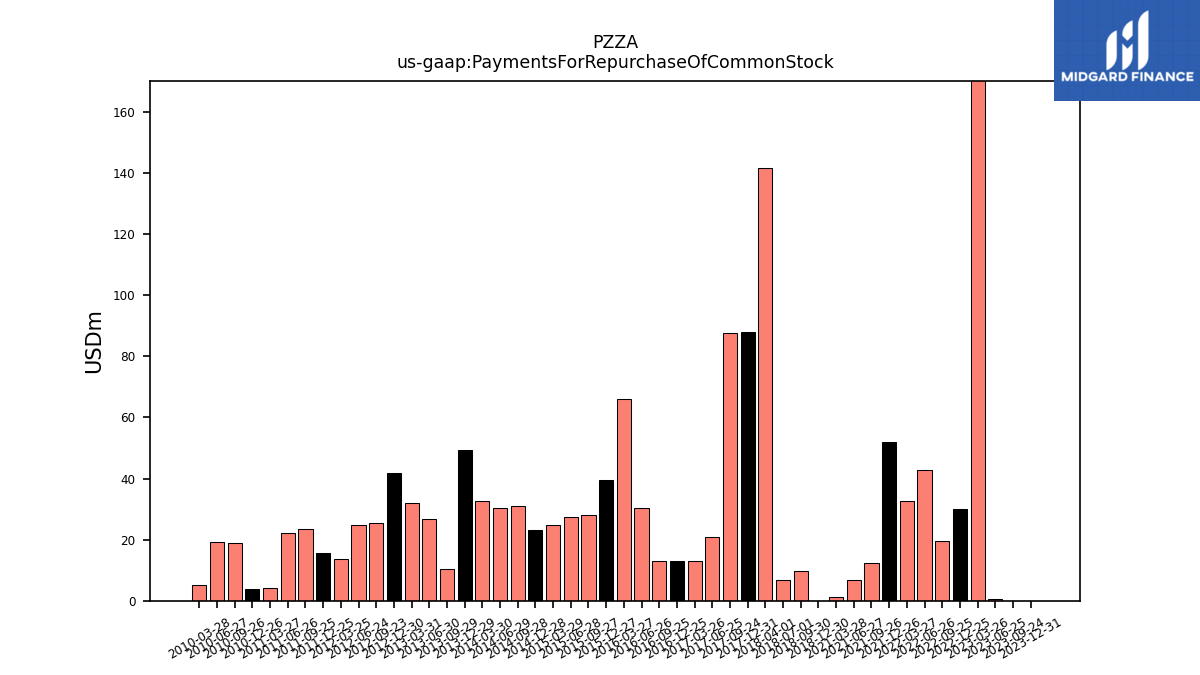
| Payments For Repurchase Of Common Stock | NA | 0.00 | 0.00 | 0.71 | 209.64 | 30.00 | 19.53 | 42.76 | 32.71 | 51.94 | 12.37 | 6.92 | 1.27 | NA | NA | NA | NA | NA | NA | NA | NA | 0.00 | 9.61 | 6.70 | 141.74 | 87.88 | 87.74 | 20.89 | 13.07 | 12.97 | 13.05 | 30.32 | 66.03 | 39.63 | 28.08 | 27.32 | 24.77 | 23.25 | 30.85 | 30.50 | 32.80 | 49.43 | 10.33 | 26.68 | 32.12 | 41.95 | 25.42 | 24.91 | 13.82 | 15.74 | 23.42 | 22.04 | 4.12 | 3.72 | 18.80 | 19.15 | 5.27 |
| 2024-03-31 | 2023-12-31 | 2023-09-24 | 2023-06-25 | 2023-03-26 | 2022-12-25 | 2022-09-25 | 2022-06-26 | 2022-03-27 | 2021-12-26 | 2021-09-26 | 2021-06-27 | 2021-03-28 | 2020-12-27 | 2020-09-27 | 2020-06-28 | 2020-03-29 | 2019-12-29 | 2019-09-29 | 2019-06-30 | 2019-03-31 | 2018-12-30 | 2018-09-30 | 2018-07-01 | 2018-04-01 | 2017-12-31 | 2017-09-24 | 2017-06-25 | 2017-03-26 | 2016-12-25 | 2016-09-25 | 2016-06-26 | 2016-03-27 | 2015-12-27 | 2015-09-27 | 2015-06-28 | 2015-03-29 | 2014-12-28 | 2014-09-28 | 2014-06-29 | 2014-03-30 | 2013-12-29 | 2013-09-29 | 2013-06-30 | 2013-03-31 | 2012-12-30 | 2012-09-23 | 2012-06-24 | 2012-03-25 | 2011-12-25 | 2011-09-25 | 2011-06-26 | 2011-03-27 | 2010-12-26 | 2010-09-26 | 2010-06-27 | 2010-03-28 | ||
|---|---|---|---|---|---|---|---|---|---|---|---|---|---|---|---|---|---|---|---|---|---|---|---|---|---|---|---|---|---|---|---|---|---|---|---|---|---|---|---|---|---|---|---|---|---|---|---|---|---|---|---|---|---|---|---|---|---|---|
| Revenues | 513.92 | 571.32 | 522.81 | 514.53 | 527.05 | 526.23 | 510.51 | 522.66 | 542.69 | 528.88 | 512.78 | 515.01 | 511.75 | 469.81 | 472.94 | 460.62 | 409.86 | 417.51 | 403.71 | 399.62 | 398.40 | 373.98 | 364.01 | 407.96 | 427.37 | 467.61 | 431.71 | 434.78 | 449.27 | 439.62 | 422.44 | 422.96 | 428.60 | 416.82 | 389.28 | 398.99 | 432.28 | 425.51 | 390.40 | 380.86 | 401.38 | 387.89 | 346.34 | 349.19 | 355.60 | 367.28 | 325.51 | 318.58 | 331.28 | 306.21 | 305.67 | 293.53 | 312.47 | 286.84 | 273.13 | 280.65 | 285.79 | |
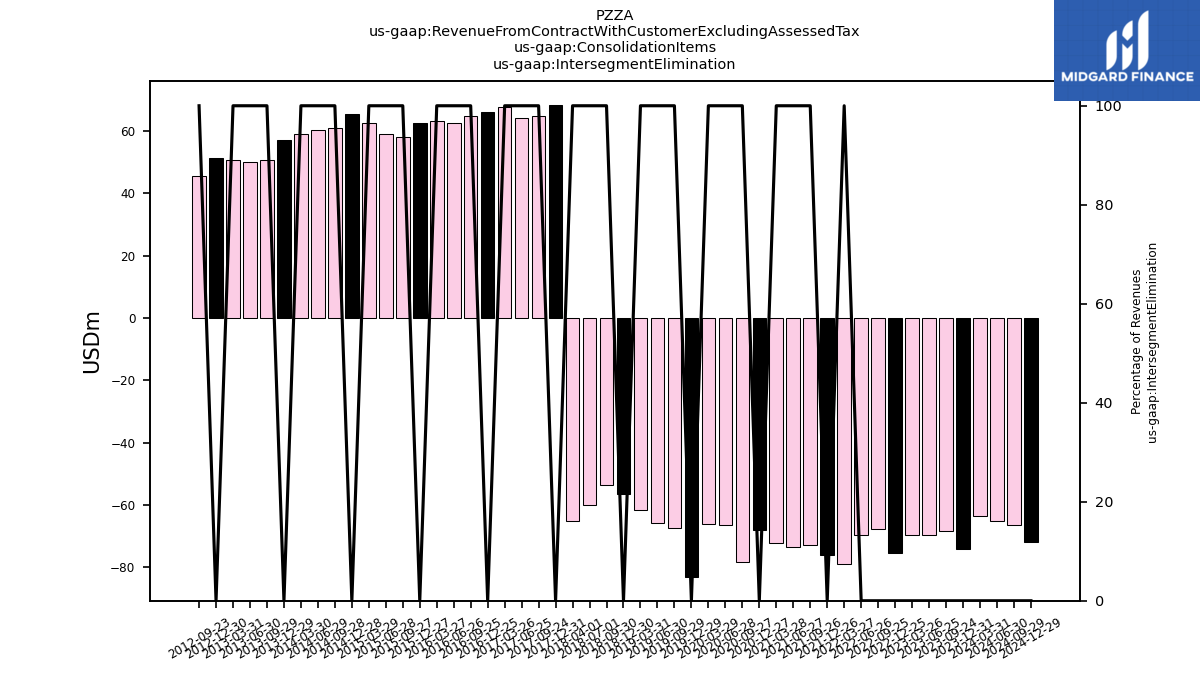
| Revenue From Contract With Customer Excluding Assessed Tax | 513.92 | 571.32 | 522.81 | 514.53 | 527.05 | 526.23 | 510.51 | 522.66 | 542.69 | 528.88 | 512.78 | 515.01 | 511.75 | 469.81 | 472.94 | 460.62 | 409.86 | 417.51 | 403.71 | 399.62 | 398.40 | 373.98 | 364.01 | 407.96 | 427.37 | 467.61 | 431.71 | 434.78 | 449.27 | 439.62 | 422.44 | 422.96 | 428.60 | 416.82 | 389.28 | 398.99 | 432.28 | 425.51 | 390.40 | 380.86 | 401.38 | 387.89 | 346.34 | 349.19 | 355.60 | 367.28 | 325.51 | 318.58 | 331.28 | 306.21 | 305.67 | 293.53 | 312.47 | 286.84 | 273.13 | 280.65 | 285.79 | |
| Intersegment Elimination | -63.49 | -74.25 | -68.46 | -69.83 | -69.70 | -75.46 | -67.89 | -69.69 | -78.94 | -76.23 | -73.01 | -73.41 | -72.28 | -68.23 | -78.30 | -66.54 | -66.14 | -83.19 | -67.57 | -65.83 | -61.74 | -56.57 | -53.51 | -60.16 | -65.04 | 68.47 | 64.86 | 64.11 | 67.59 | 65.95 | 64.69 | 62.60 | 63.20 | 62.46 | 57.95 | 58.90 | 62.56 | 65.60 | 60.90 | 60.35 | 59.12 | 57.09 | 50.73 | 50.06 | 50.59 | 51.24 | 45.68 | NA | NA | NA | NA | NA | NA | NA | NA | NA | NA | |
| Operating | 513.92 | 571.32 | 522.81 | 514.53 | 527.05 | 526.23 | 510.51 | 522.66 | 542.69 | 528.88 | 512.78 | 515.01 | 511.75 | 469.81 | 472.94 | 460.62 | 409.86 | 417.51 | 403.71 | 399.62 | 398.40 | 463.54 | 364.01 | 407.96 | 427.37 | NA | 431.71 | 434.78 | 449.27 | NA | 422.44 | 422.96 | 428.60 | NA | 389.28 | 398.99 | 432.28 | NA | NA | NA | NA | NA | NA | NA | NA | NA | NA | NA | NA | NA | NA | NA | NA | NA | NA | NA | NA | |
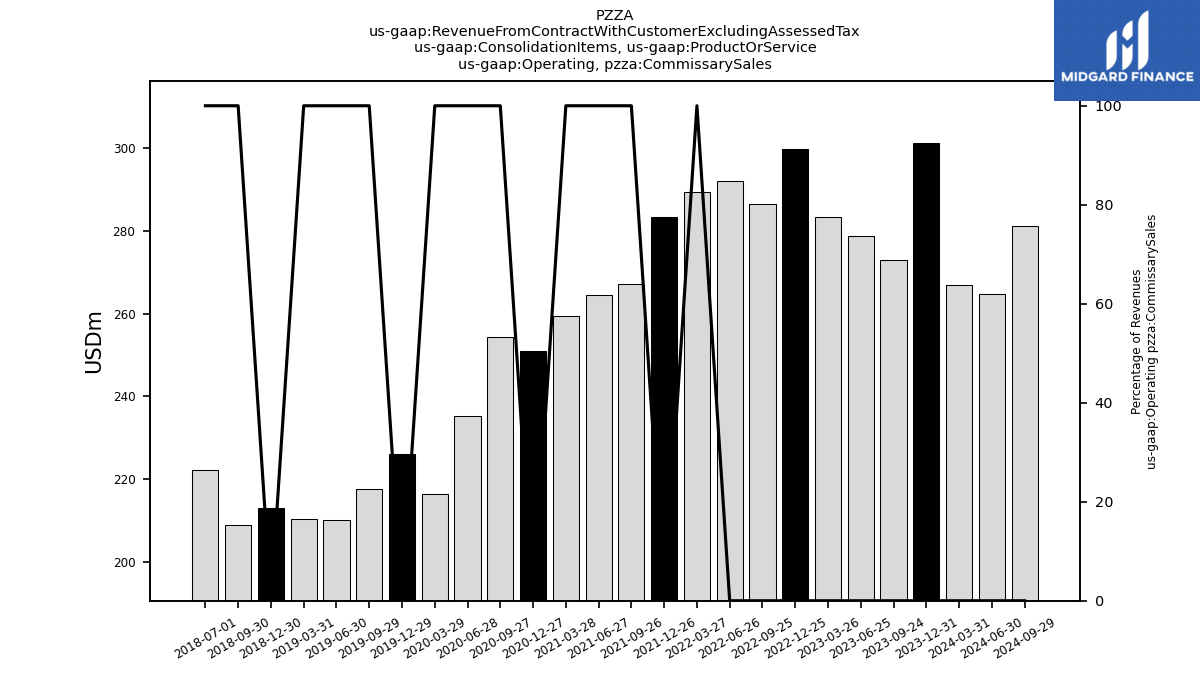
| Operating, Commissary Sales | 266.78 | 301.13 | 272.82 | 278.83 | 283.36 | 299.70 | 286.56 | 292.05 | 289.37 | 283.39 | 267.06 | 264.53 | 259.35 | 250.99 | 254.38 | 235.33 | 216.47 | 226.04 | 217.50 | 210.04 | 210.32 | 213.03 | 208.78 | 222.25 | NA | NA | NA | NA | NA | NA | NA | NA | NA | NA | NA | NA | NA | NA | NA | NA | NA | NA | NA | NA | NA | NA | NA | NA | NA | NA | NA | NA | NA | NA | NA | NA | NA | |
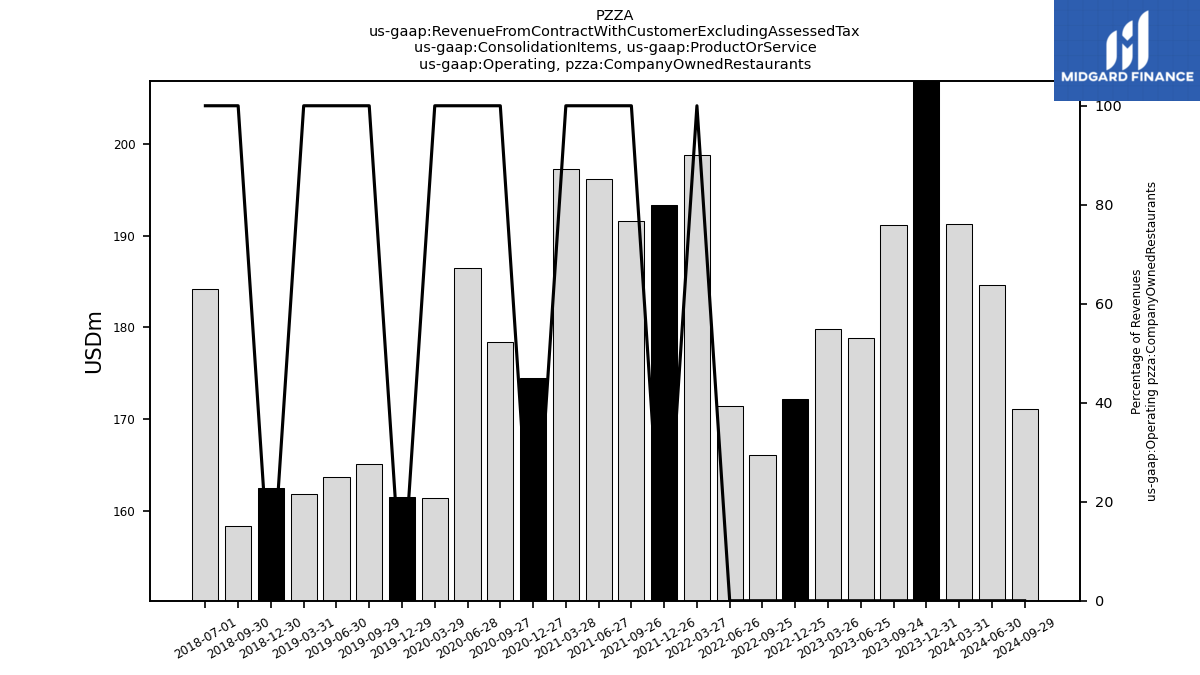
| Operating, Company Owned Restaurants | 191.25 | 210.95 | 191.21 | 178.80 | 179.87 | 172.16 | 166.05 | 171.41 | 198.76 | 193.38 | 191.58 | 196.12 | 197.23 | 174.44 | 178.37 | 186.51 | 161.44 | 161.46 | 165.13 | 163.66 | 161.80 | 162.47 | 158.28 | 184.16 | NA | NA | NA | NA | NA | NA | NA | NA | NA | NA | NA | NA | NA | NA | NA | NA | NA | NA | NA | NA | NA | NA | NA | NA | NA | NA | NA | NA | NA | NA | NA | NA | NA | |
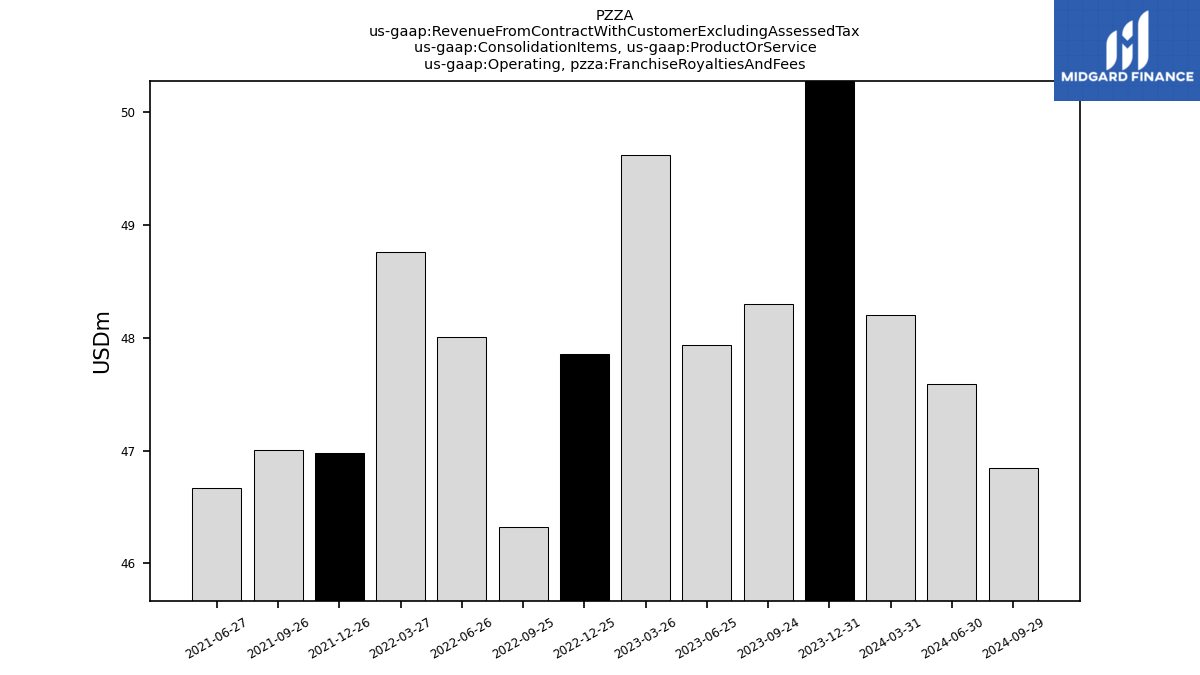
| Operating, Franchise Royalties And Fees | 48.20 | 53.41 | 48.30 | 47.93 | 49.62 | 47.85 | 46.33 | 48.01 | 48.76 | 46.98 | 47.00 | 46.67 | NA | NA | NA | NA | NA | NA | NA | NA | NA | NA | NA | NA | NA | NA | NA | NA | NA | NA | NA | NA | NA | NA | NA | NA | NA | NA | NA | NA | NA | NA | NA | NA | NA | NA | NA | NA | NA | NA | NA | NA | NA | NA | NA | NA | NA | |
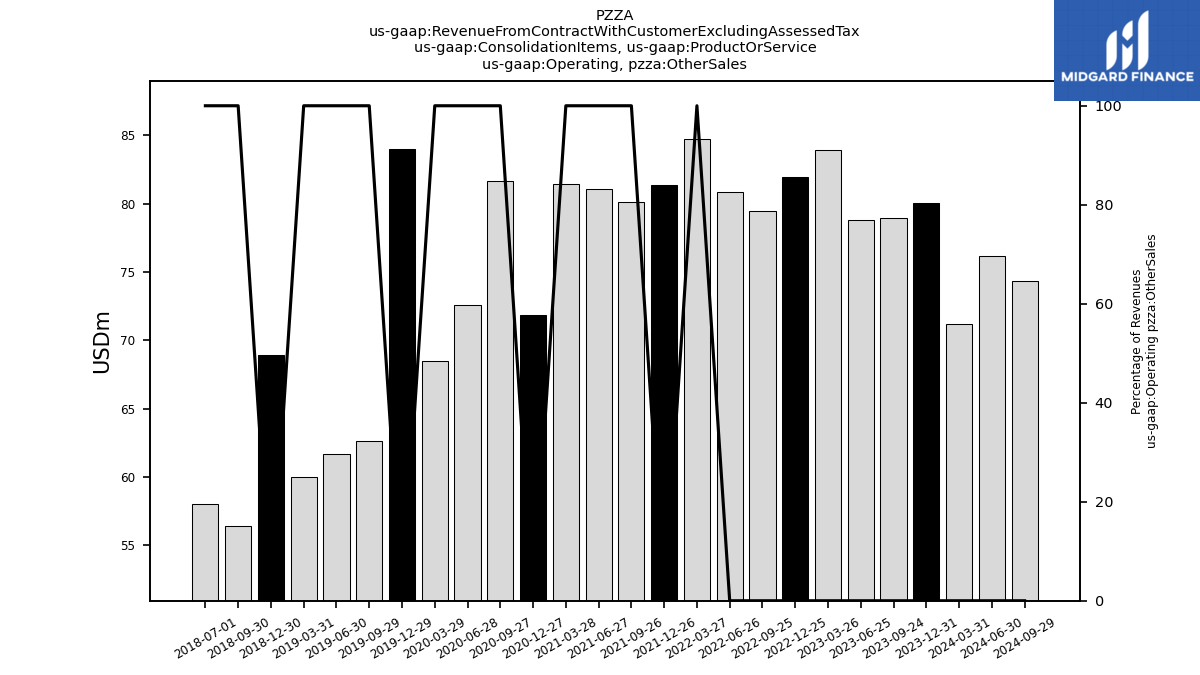
| Operating, Other Sales | 71.17 | 80.08 | 78.94 | 78.80 | 83.92 | 81.97 | 79.46 | 80.89 | 84.74 | 81.37 | 80.16 | 81.10 | 81.46 | 71.88 | 81.68 | 72.62 | 68.45 | 83.97 | 62.63 | 61.66 | 60.01 | 68.89 | 56.44 | 58.01 | NA | NA | NA | NA | NA | NA | NA | NA | NA | NA | NA | NA | NA | NA | NA | NA | NA | NA | NA | NA | NA | NA | NA | NA | NA | NA | NA | NA | NA | NA | NA | NA | NA | |
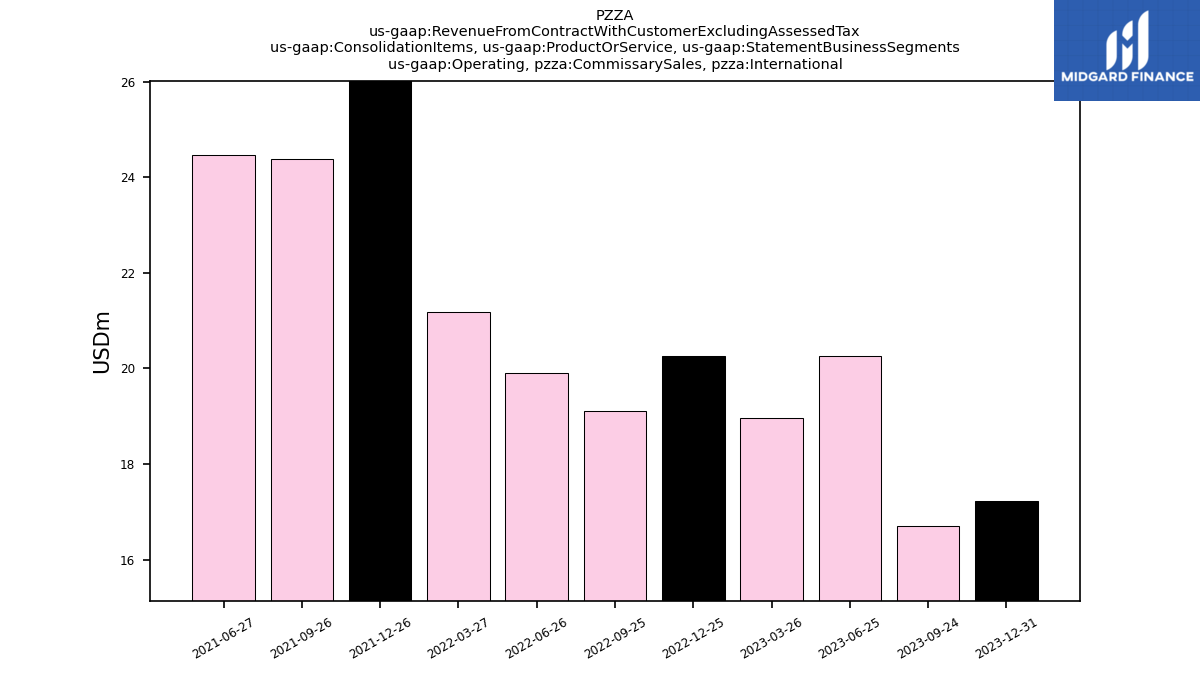
| Operating, Commissary Sales, International | 14.22 | 17.23 | 16.70 | 20.26 | 18.97 | 20.27 | 19.12 | 19.91 | 21.18 | 26.39 | 24.38 | 24.46 | NA | NA | NA | NA | NA | NA | NA | NA | NA | NA | NA | NA | NA | NA | NA | NA | NA | NA | NA | NA | NA | NA | NA | NA | NA | NA | NA | NA | NA | NA | NA | NA | NA | NA | NA | NA | NA | NA | NA | NA | NA | NA | NA | NA | NA | |
| Operating, Commissary Sales, North America Commissary | 252.55 | 283.90 | 256.12 | 258.57 | 264.38 | 279.44 | 267.44 | 272.14 | 268.19 | 257.00 | 242.68 | 240.07 | NA | NA | NA | NA | NA | NA | NA | NA | NA | NA | NA | NA | NA | NA | NA | NA | NA | NA | NA | NA | NA | NA | NA | NA | NA | NA | NA | NA | NA | NA | NA | NA | NA | NA | NA | NA | NA | NA | NA | NA | NA | NA | NA | NA | NA | |
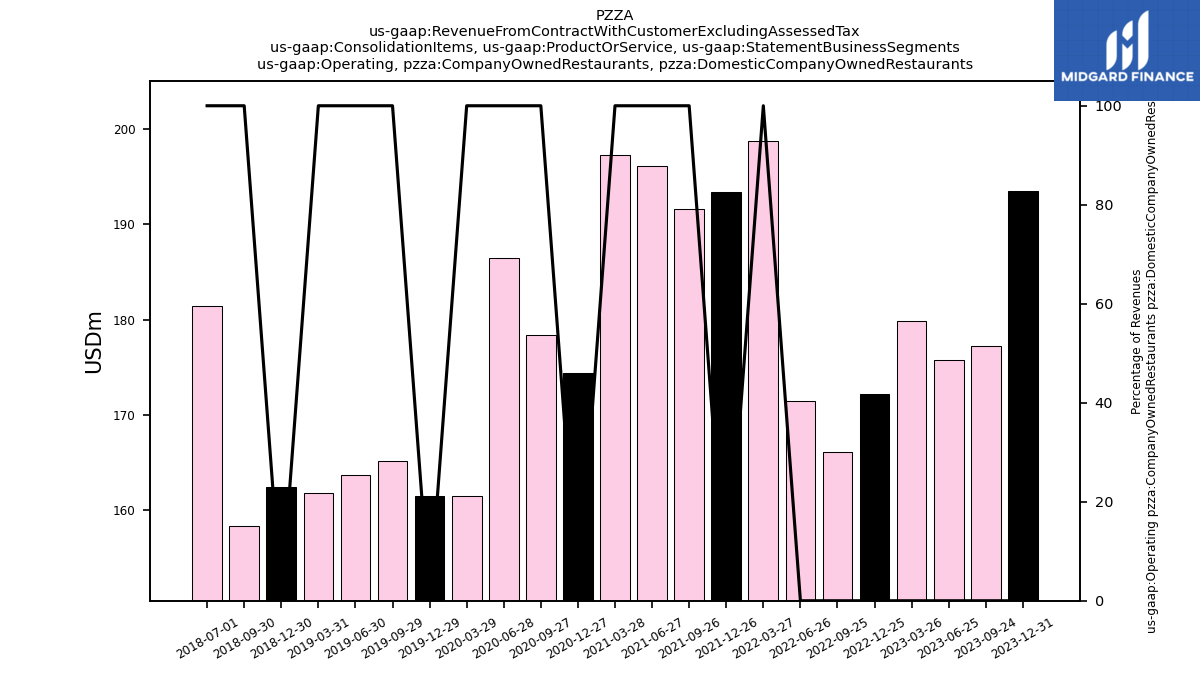
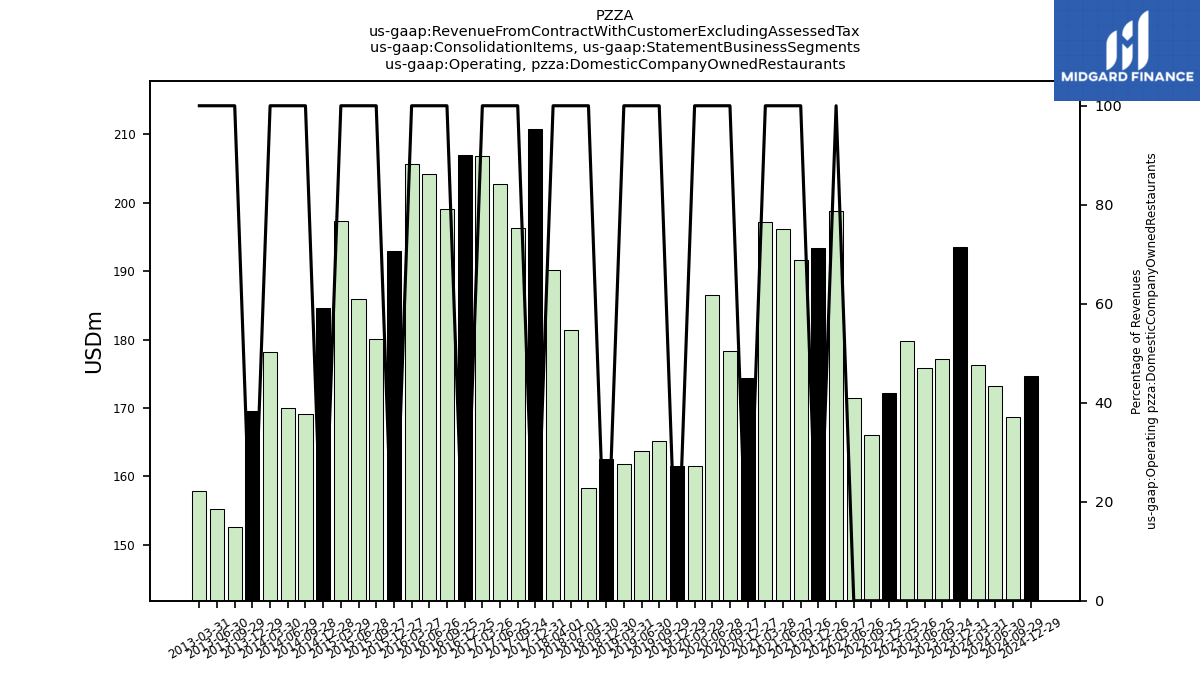
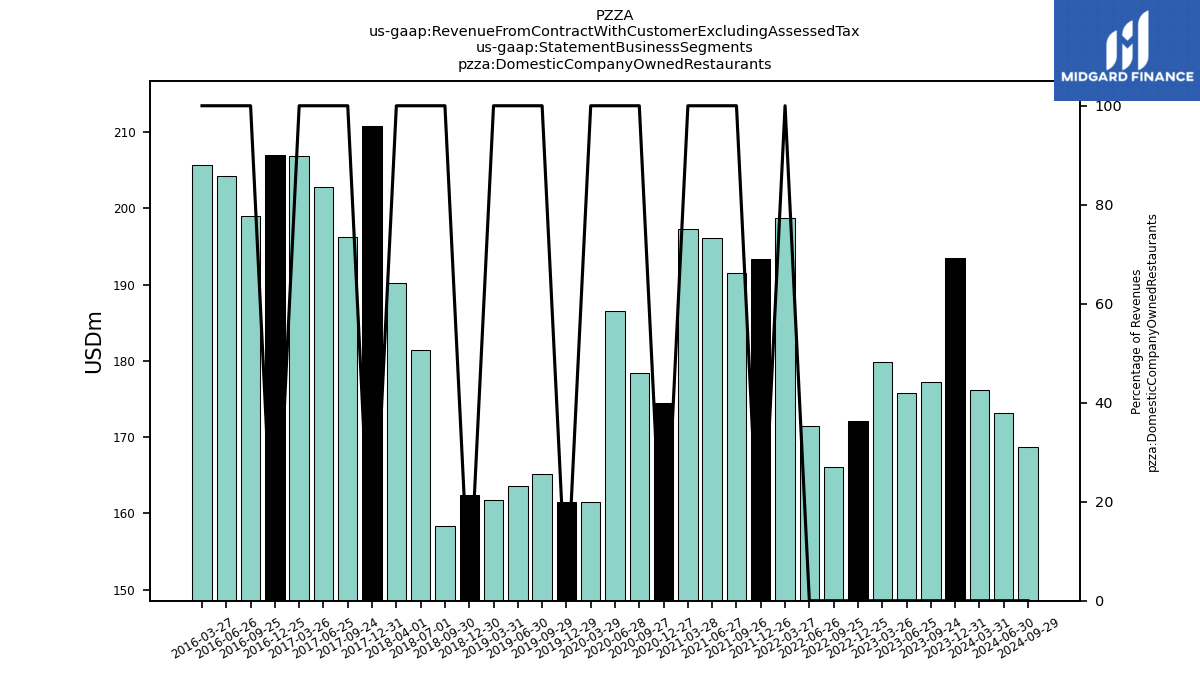
| Operating, Company Owned Restaurants, Domestic Company Owned Restaurants | 176.22 | 193.52 | 177.19 | 175.78 | 179.87 | 172.16 | 166.05 | 171.41 | 198.76 | 193.38 | 191.58 | 196.12 | 197.23 | 174.44 | 178.37 | 186.51 | 161.44 | 161.46 | 165.13 | 163.66 | 161.80 | 162.47 | 158.28 | 181.38 | NA | NA | NA | NA | NA | NA | NA | NA | NA | NA | NA | NA | NA | NA | NA | NA | NA | NA | NA | NA | NA | NA | NA | NA | NA | NA | NA | NA | NA | NA | NA | NA | NA | |
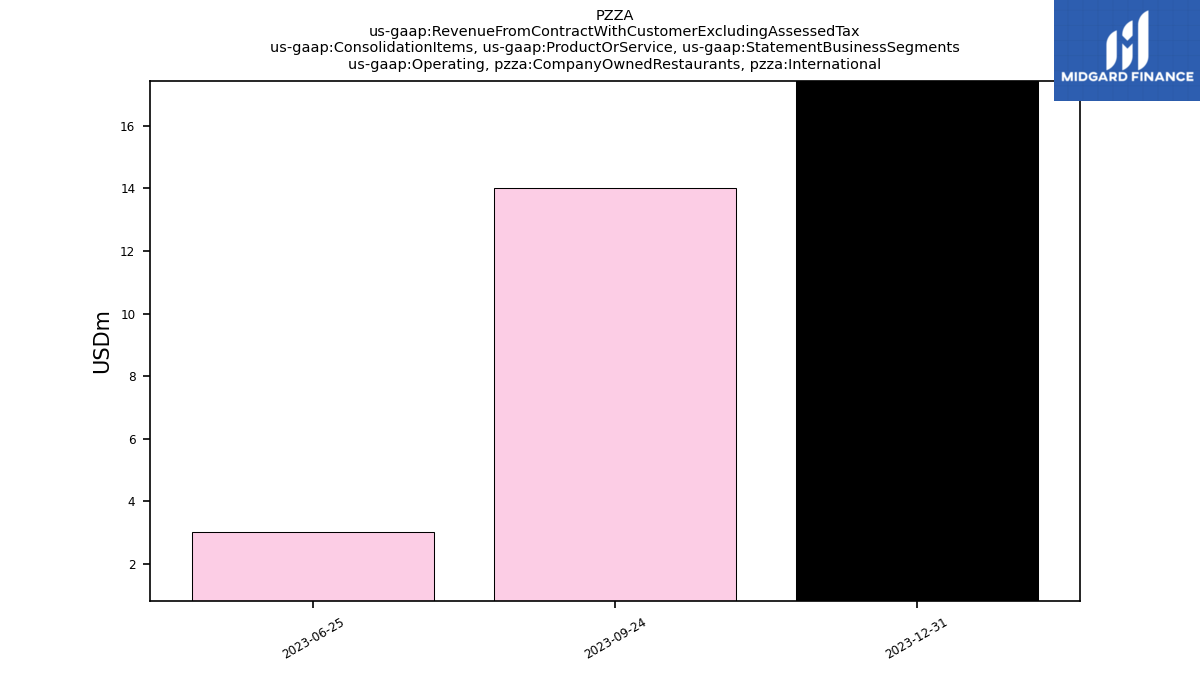
| Operating, Company Owned Restaurants, International | 15.03 | 17.43 | 14.01 | 3.02 | NA | NA | NA | NA | NA | NA | NA | NA | NA | NA | NA | NA | NA | NA | NA | NA | NA | NA | NA | NA | NA | NA | NA | NA | NA | NA | NA | NA | NA | NA | NA | NA | NA | NA | NA | NA | NA | NA | NA | NA | NA | NA | NA | NA | NA | NA | NA | NA | NA | NA | NA | NA | NA | |
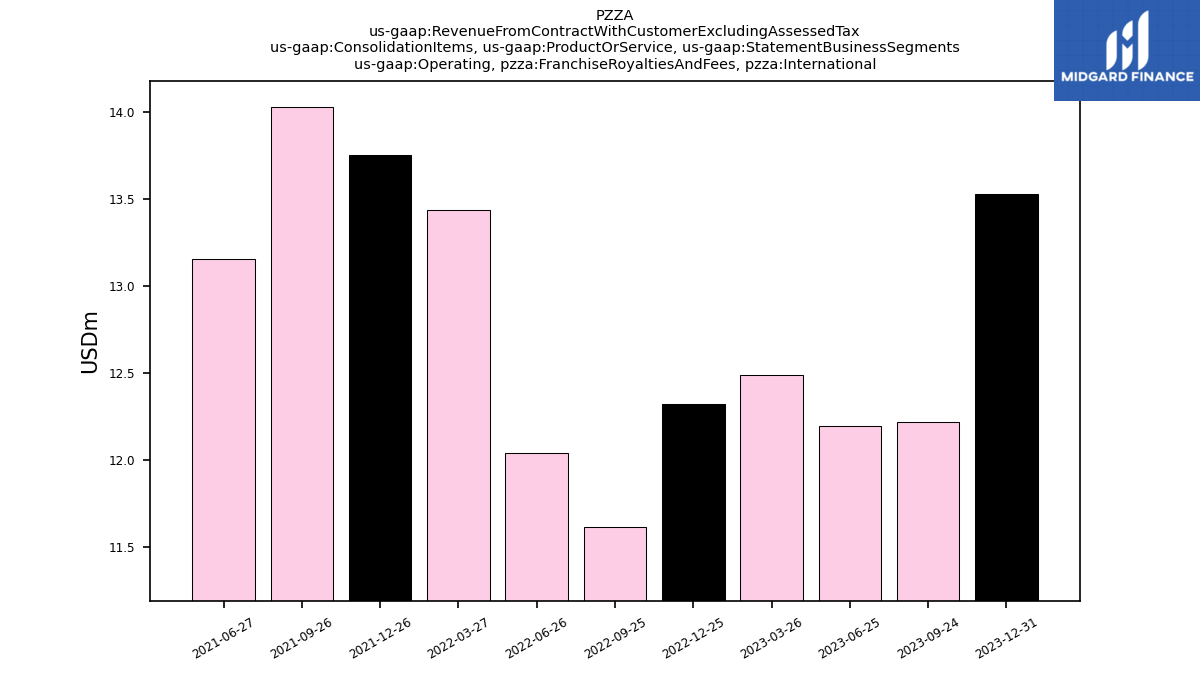
| Operating, Franchise Royalties And Fees, International | 11.46 | 13.53 | 12.22 | 12.20 | 12.49 | 12.32 | 11.62 | 12.04 | 13.44 | 13.75 | 14.03 | 13.16 | NA | NA | NA | NA | NA | NA | NA | NA | NA | NA | NA | NA | NA | NA | NA | NA | NA | NA | NA | NA | NA | NA | NA | NA | NA | NA | NA | NA | NA | NA | NA | NA | NA | NA | NA | NA | NA | NA | NA | NA | NA | NA | NA | NA | NA | |
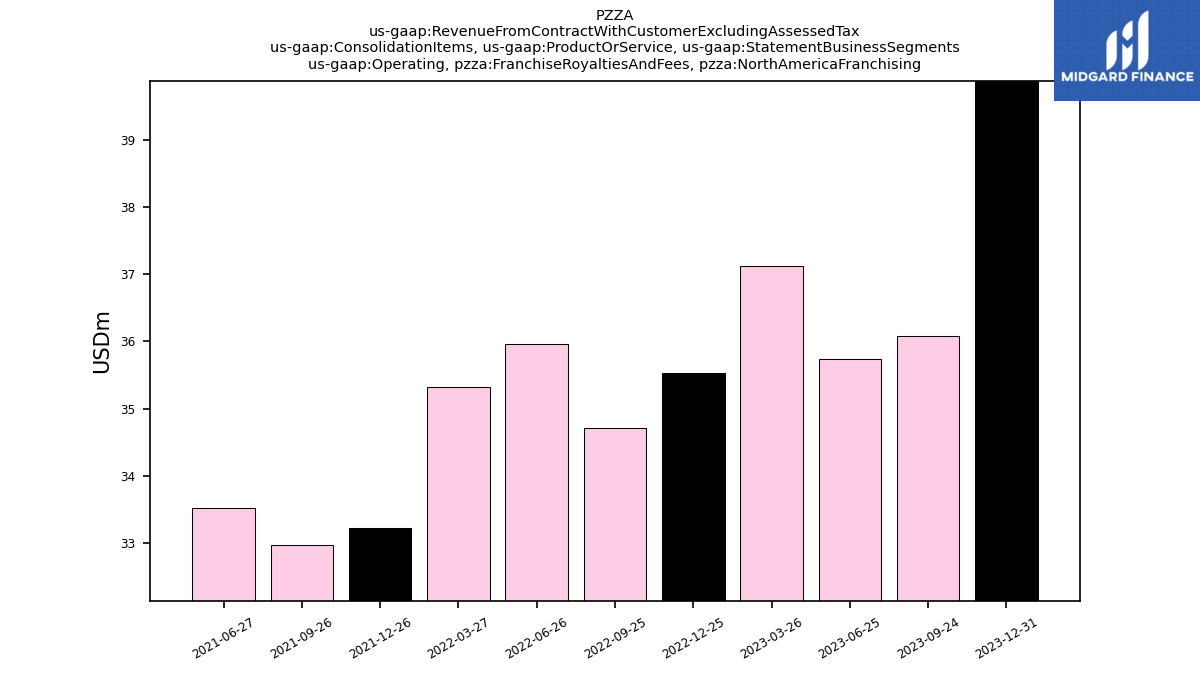
| Operating, Franchise Royalties And Fees, North America Franchising | 36.75 | 39.88 | 36.08 | 35.74 | 37.12 | 35.53 | 34.71 | 35.97 | 35.32 | 33.23 | 32.97 | 33.52 | NA | NA | NA | NA | NA | NA | NA | NA | NA | NA | NA | NA | NA | NA | NA | NA | NA | NA | NA | NA | NA | NA | NA | NA | NA | NA | NA | NA | NA | NA | NA | NA | NA | NA | NA | NA | NA | NA | NA | NA | NA | NA | NA | NA | NA | |
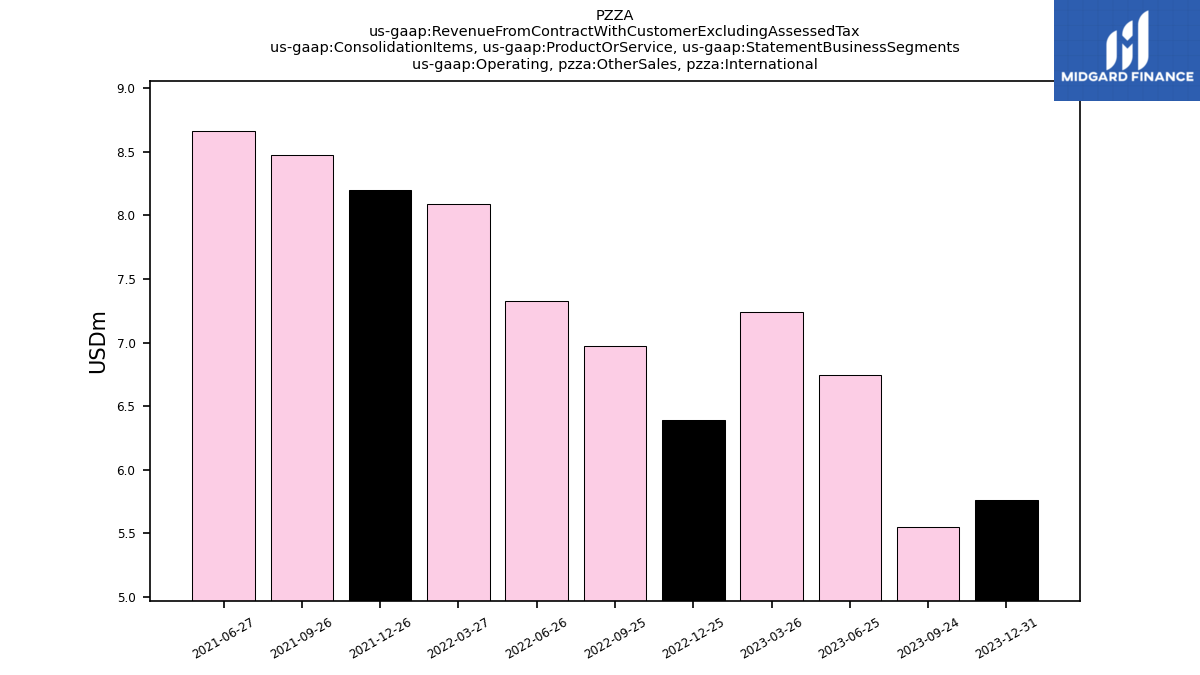
| Operating, Other Sales, International | 5.96 | 5.76 | 5.55 | 6.75 | 7.24 | 6.39 | 6.97 | 7.32 | 8.09 | 8.20 | 8.47 | 8.66 | NA | NA | NA | NA | NA | NA | NA | NA | NA | NA | NA | NA | NA | NA | NA | NA | NA | NA | NA | NA | NA | NA | NA | NA | NA | NA | NA | NA | NA | NA | NA | NA | NA | NA | NA | NA | NA | NA | NA | NA | NA | NA | NA | NA | NA | |
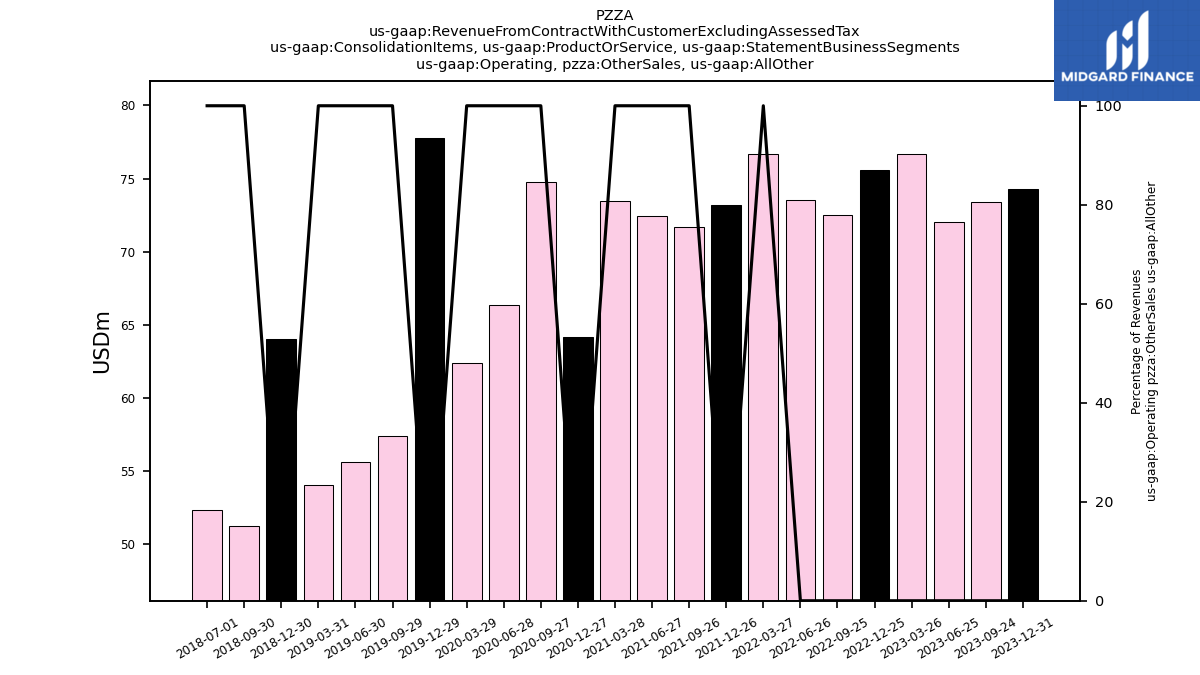
| Operating, Other Sales, All Other | 65.21 | 74.32 | 73.39 | 72.05 | 76.68 | 75.58 | 72.49 | 73.56 | 76.65 | 73.17 | 71.68 | 72.43 | 73.46 | 64.15 | 74.79 | 66.34 | 62.36 | 77.78 | 57.42 | 55.64 | 54.08 | 64.04 | 51.23 | 52.35 | NA | NA | NA | NA | NA | NA | NA | NA | NA | NA | NA | NA | NA | NA | NA | NA | NA | NA | NA | NA | NA | NA | NA | NA | NA | NA | NA | NA | NA | NA | NA | NA | NA | |
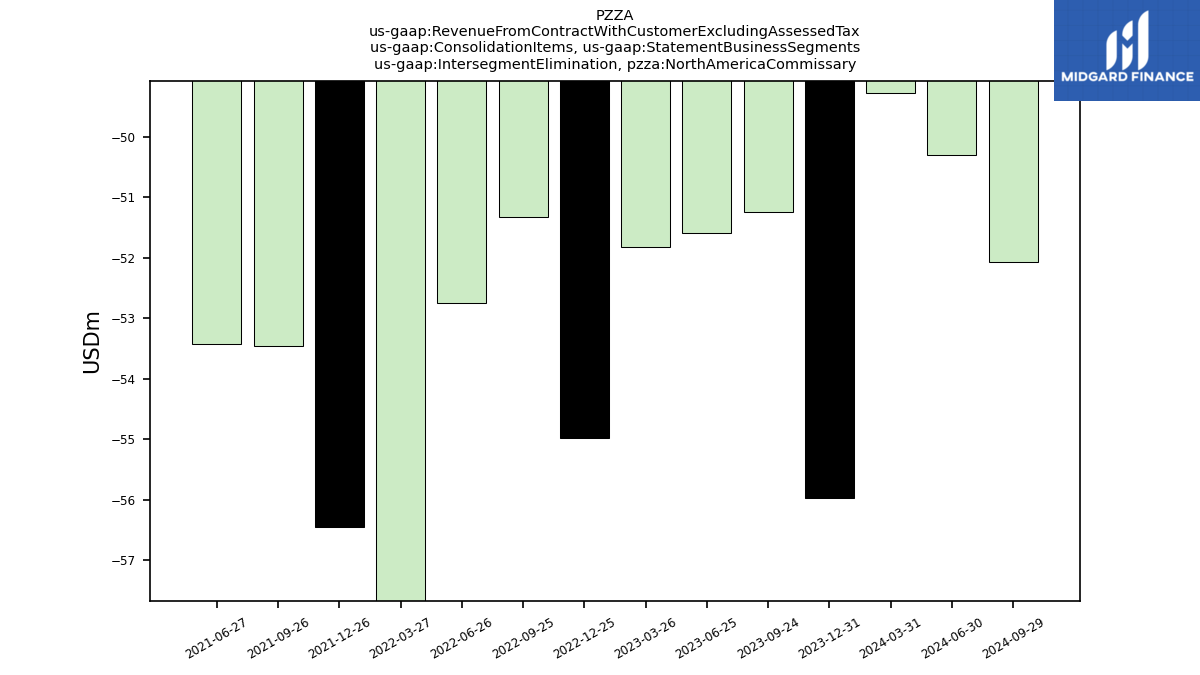
| Intersegment Elimination, North America Commissary | -49.27 | -55.97 | -51.24 | -51.59 | -51.82 | -54.98 | -51.33 | -52.75 | -58.51 | -56.44 | -53.45 | -53.43 | NA | NA | NA | NA | NA | NA | NA | NA | NA | NA | NA | NA | NA | NA | NA | NA | NA | NA | NA | NA | NA | NA | NA | NA | NA | NA | NA | NA | NA | NA | NA | NA | NA | NA | NA | NA | NA | NA | NA | NA | NA | NA | NA | NA | NA | |
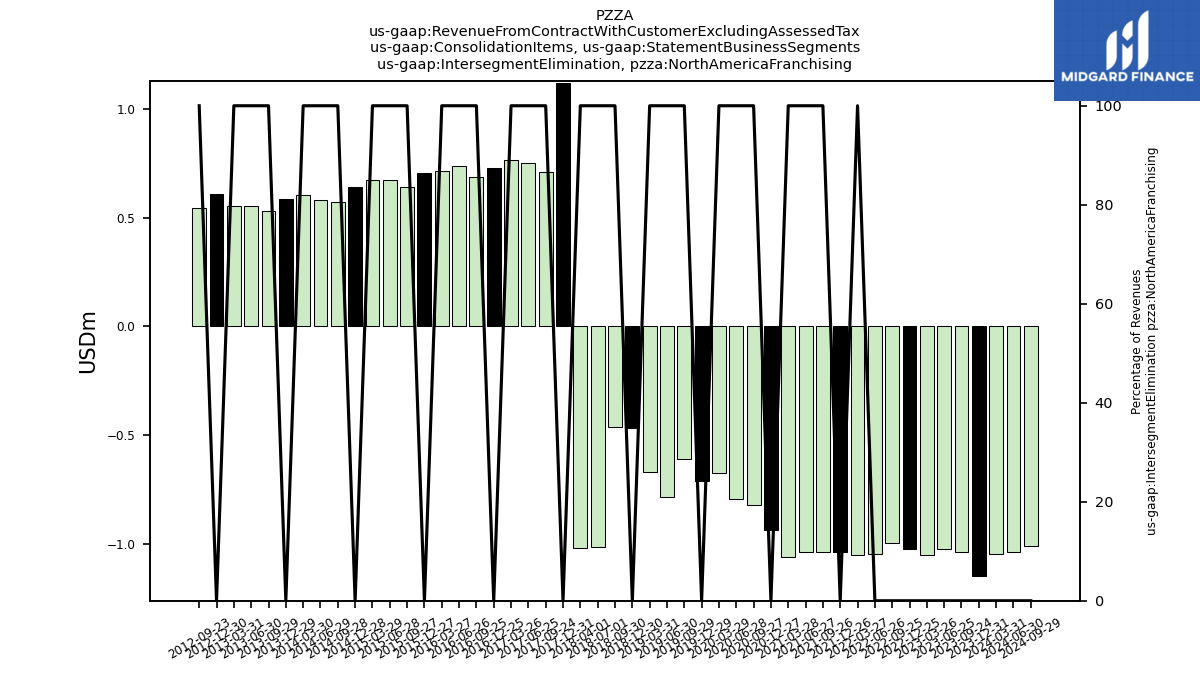
| Intersegment Elimination, North America Franchising | -1.05 | -1.15 | -1.04 | -1.02 | -1.05 | -1.02 | -1.00 | -1.05 | -1.05 | -1.04 | -1.04 | -1.04 | -1.06 | -0.94 | -0.82 | -0.79 | -0.67 | -0.71 | -0.61 | -0.79 | -0.67 | -0.47 | -0.46 | -1.02 | -1.02 | 1.12 | 0.71 | 0.75 | 0.76 | 0.73 | 0.69 | 0.74 | 0.71 | 0.70 | 0.64 | 0.67 | 0.67 | 0.64 | 0.57 | 0.58 | 0.60 | 0.59 | 0.53 | 0.55 | 0.55 | 0.61 | 0.55 | NA | NA | NA | NA | NA | NA | NA | NA | NA | NA | |
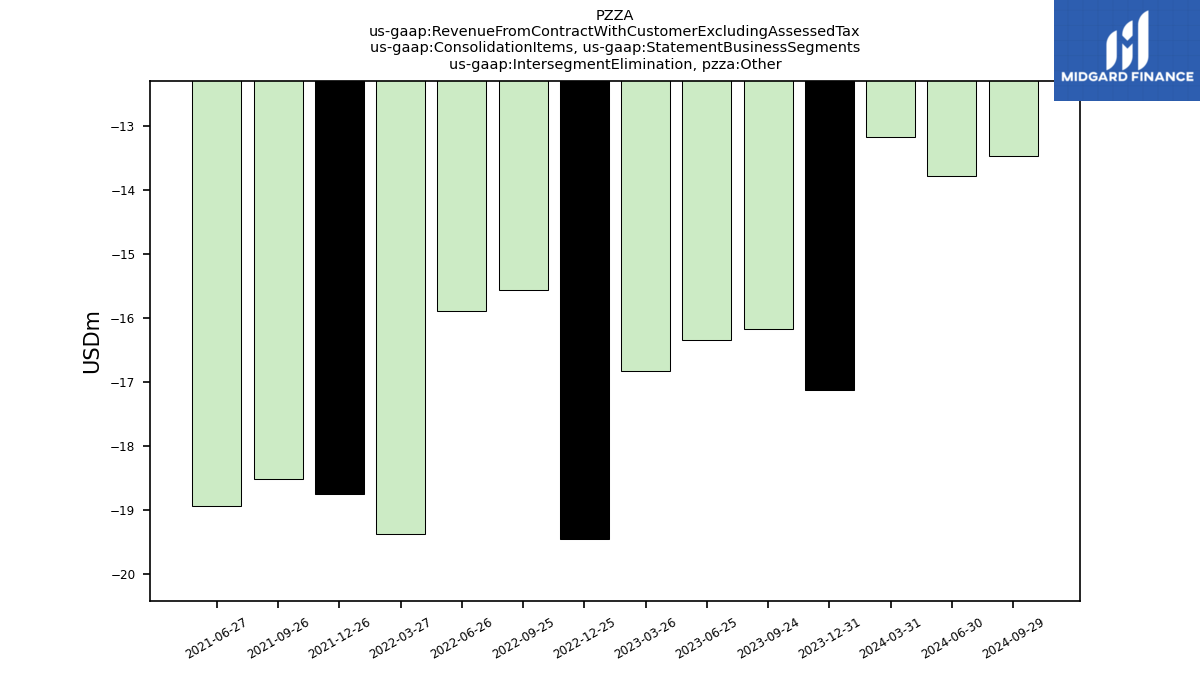
| Intersegment Elimination, Other | -13.17 | -17.12 | -16.18 | -16.35 | -16.84 | -19.45 | -15.56 | -15.89 | -19.38 | -18.75 | -18.52 | -18.94 | NA | NA | NA | NA | NA | NA | NA | NA | NA | NA | NA | NA | NA | NA | NA | NA | NA | NA | NA | NA | NA | NA | NA | NA | NA | NA | NA | NA | NA | NA | NA | NA | NA | NA | NA | NA | NA | NA | NA | NA | NA | NA | NA | NA | NA | |
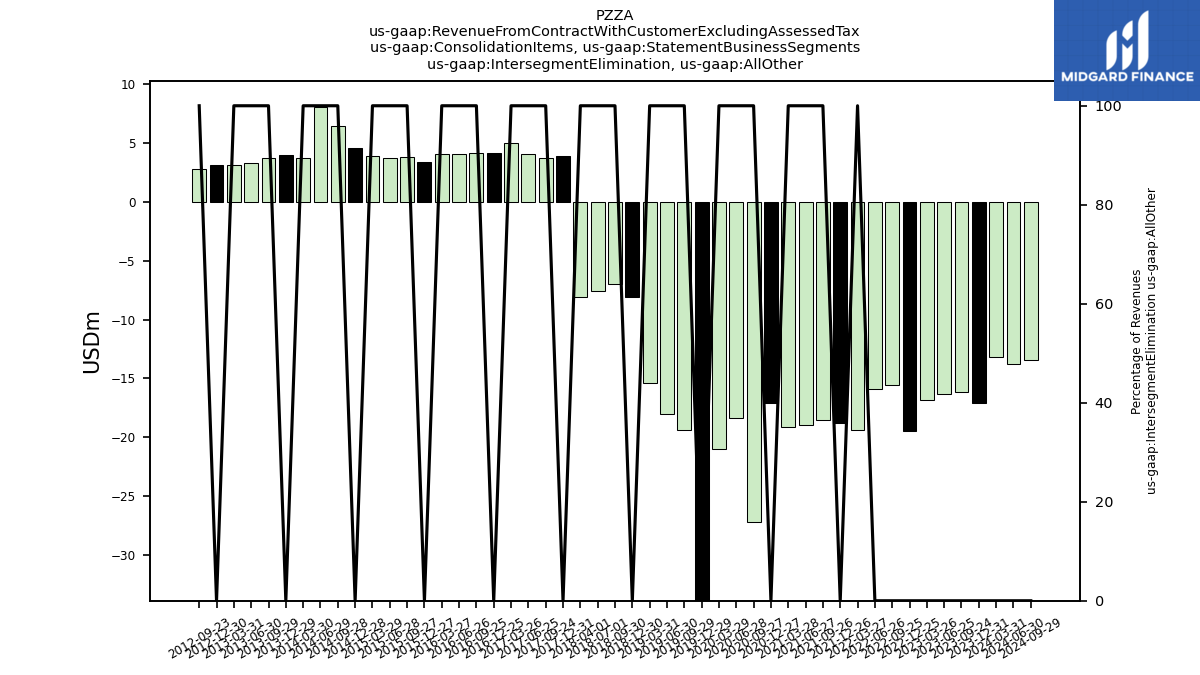
| Intersegment Elimination, All Other | -13.17 | -17.12 | -16.18 | -16.35 | -16.84 | -19.45 | -15.56 | -15.89 | -19.38 | -18.75 | -18.52 | -18.94 | -19.15 | -17.13 | -27.17 | -18.39 | -20.95 | -35.53 | -19.36 | -17.98 | -15.41 | -8.10 | -6.95 | -7.58 | -8.07 | 3.89 | 3.72 | 4.08 | 5.03 | 4.11 | 4.13 | 4.08 | 4.10 | 3.36 | 3.83 | 3.69 | 3.93 | 4.61 | 6.42 | 8.09 | 3.73 | 3.99 | 3.72 | 3.32 | 3.17 | 3.16 | 2.76 | NA | NA | NA | NA | NA | NA | NA | NA | NA | NA | |
| Operating, Domestic Company Owned Restaurants | 176.22 | 193.52 | 177.19 | 175.78 | 179.87 | 172.16 | 166.05 | 171.41 | 198.76 | 193.38 | 191.58 | 196.12 | 197.23 | 174.44 | 178.37 | 186.51 | 161.44 | 161.46 | 165.13 | 163.66 | 161.80 | 162.47 | 158.28 | 181.38 | 190.24 | 210.80 | 196.27 | 202.76 | 206.90 | 206.96 | 199.04 | 204.25 | 205.68 | 193.00 | 180.06 | 185.96 | 197.29 | 184.59 | 169.08 | 170.00 | 178.19 | 169.60 | 152.66 | 155.15 | 157.90 | NA | NA | NA | NA | NA | NA | NA | NA | NA | NA | NA | NA | |
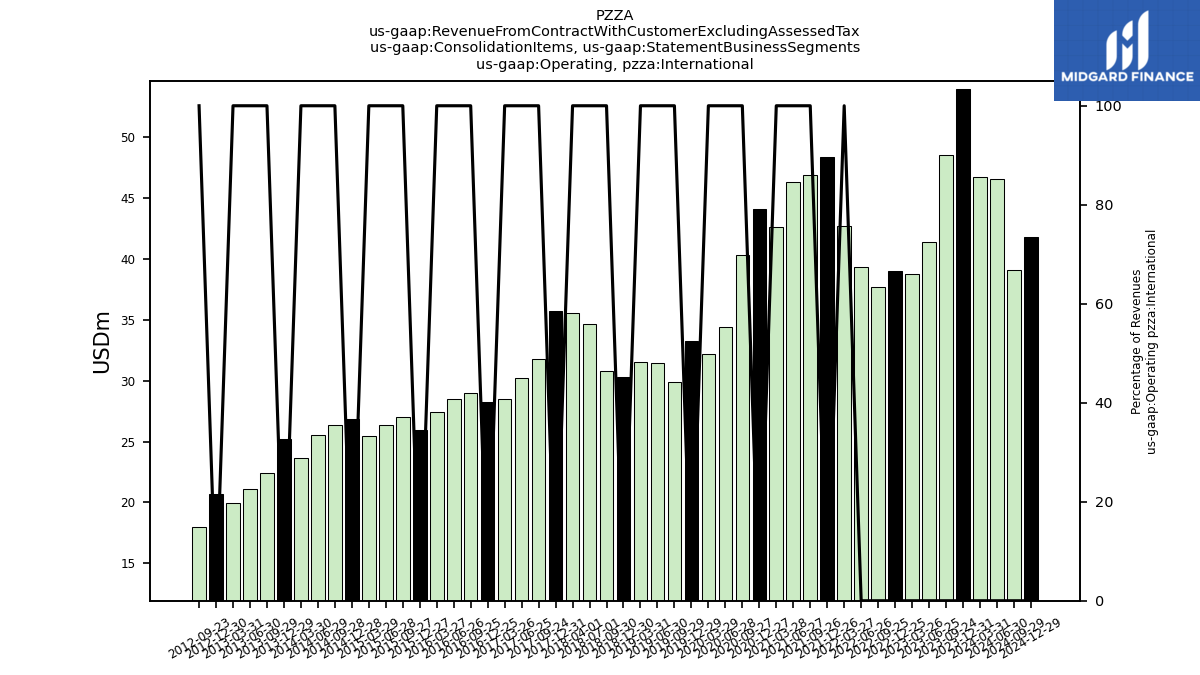
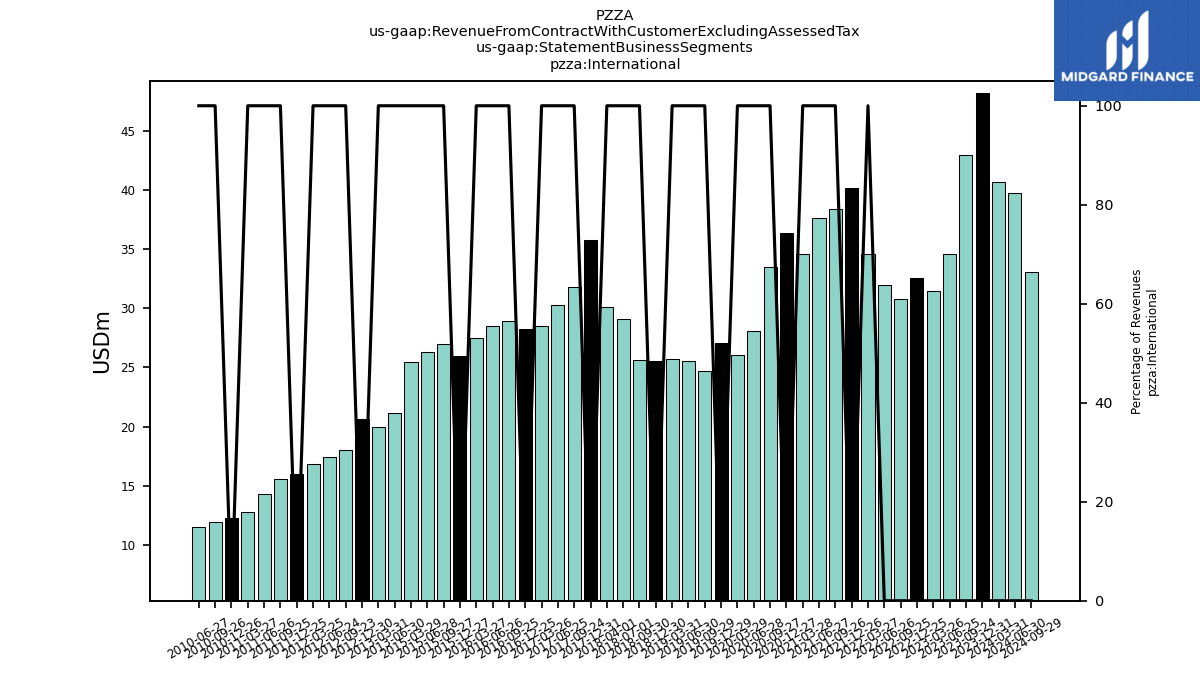
| Operating, International | 46.67 | 53.95 | 48.48 | 41.35 | 38.70 | 38.99 | 37.71 | 39.28 | 42.71 | 48.34 | 46.88 | 46.28 | 42.60 | 44.09 | 40.33 | 34.37 | 32.15 | 33.27 | 29.89 | 31.42 | 31.50 | 30.29 | 30.79 | 34.65 | 35.53 | 35.74 | 31.79 | 30.23 | 28.52 | 28.25 | 28.94 | 28.46 | 27.45 | 25.94 | 27.00 | 26.33 | 25.43 | 26.86 | 26.39 | 25.57 | 23.63 | 25.19 | 22.39 | 21.14 | 19.93 | 20.66 | 18.03 | NA | NA | NA | NA | NA | NA | NA | NA | NA | NA | |
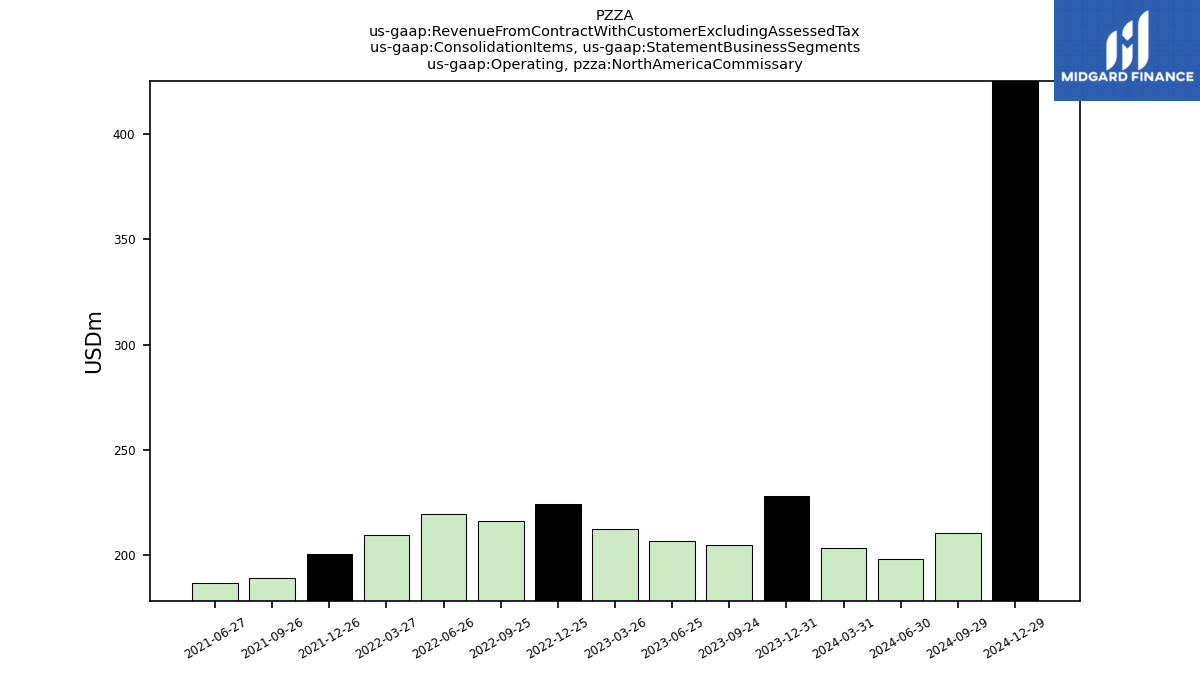
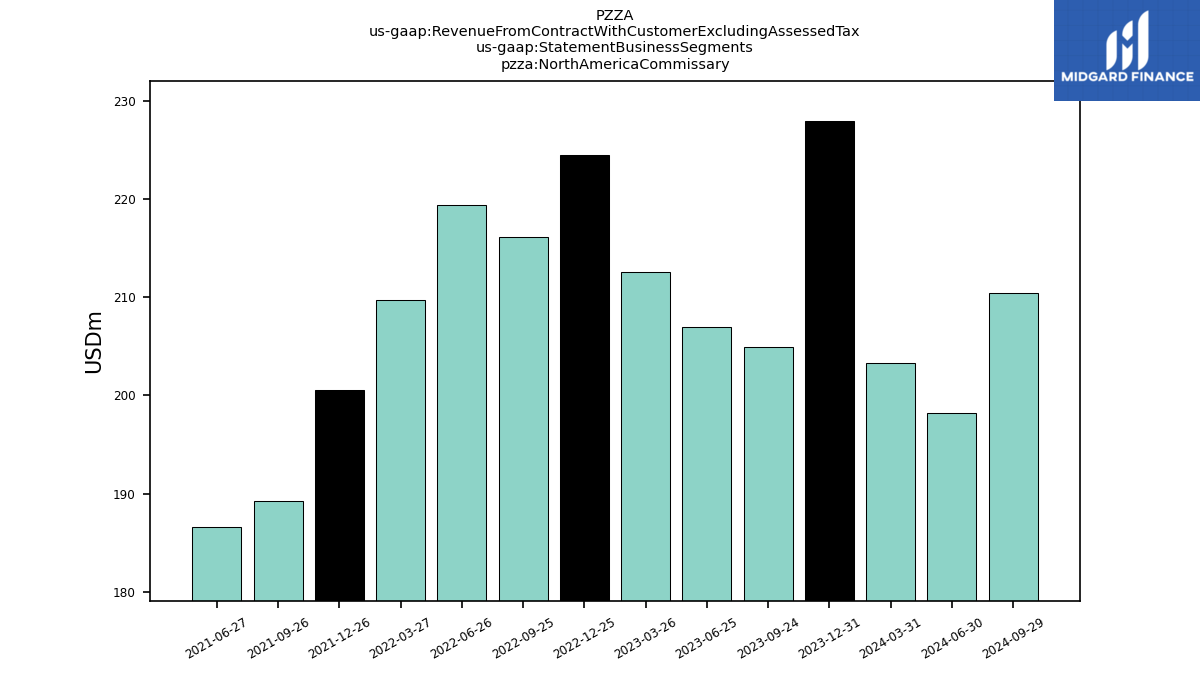
| Operating, North America Commissary | 203.29 | 227.93 | 204.89 | 206.98 | 212.57 | 224.46 | 216.12 | 219.38 | 209.68 | 200.56 | 189.22 | 186.64 | NA | NA | NA | NA | NA | NA | NA | NA | NA | NA | NA | NA | NA | NA | NA | NA | NA | NA | NA | NA | NA | NA | NA | NA | NA | NA | NA | NA | NA | NA | NA | NA | NA | NA | NA | NA | NA | NA | NA | NA | NA | NA | NA | NA | NA | |
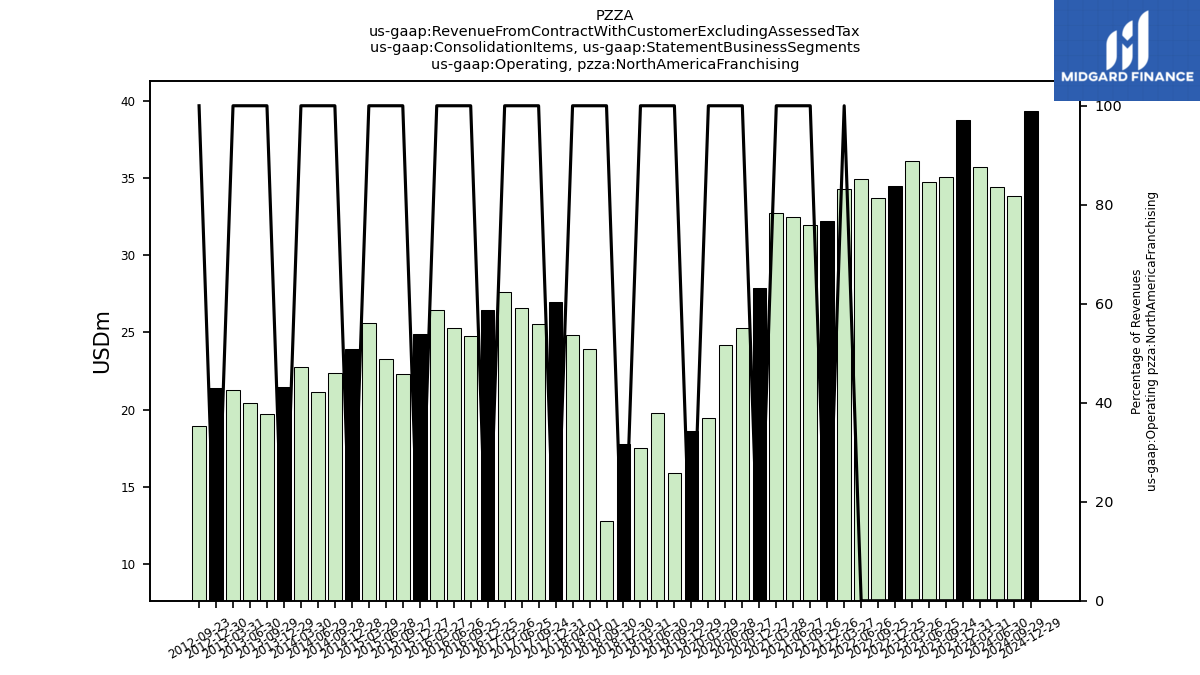
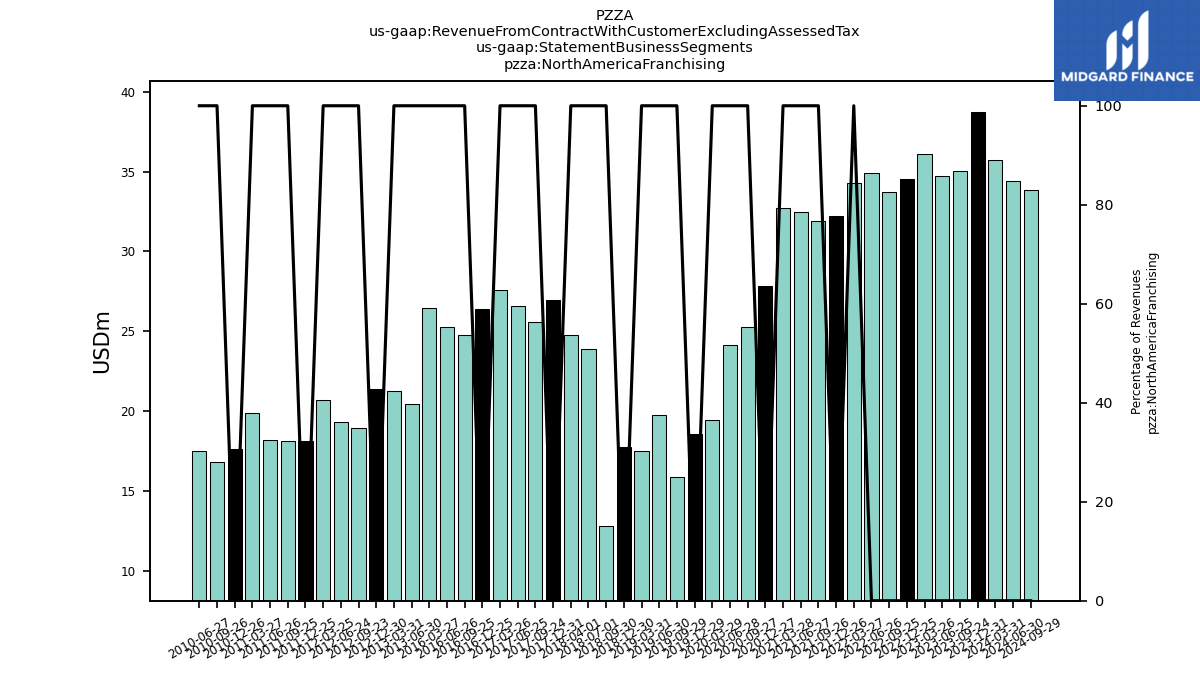
| Operating, North America Franchising | 35.70 | 38.73 | 35.04 | 34.71 | 36.07 | 34.50 | 33.71 | 34.92 | 34.27 | 32.19 | 31.93 | 32.48 | 32.72 | 27.84 | 25.28 | 24.17 | 19.44 | 18.61 | 15.92 | 19.76 | 17.53 | 17.77 | 12.81 | 23.91 | 24.81 | 26.97 | 25.57 | 26.59 | 27.61 | 26.43 | 24.78 | 25.30 | 26.48 | 24.87 | 22.29 | 23.28 | 25.62 | 23.95 | 22.35 | 21.11 | 22.76 | 21.46 | 19.68 | 20.45 | 21.28 | 21.39 | 18.94 | NA | NA | NA | NA | NA | NA | NA | NA | NA | NA | |
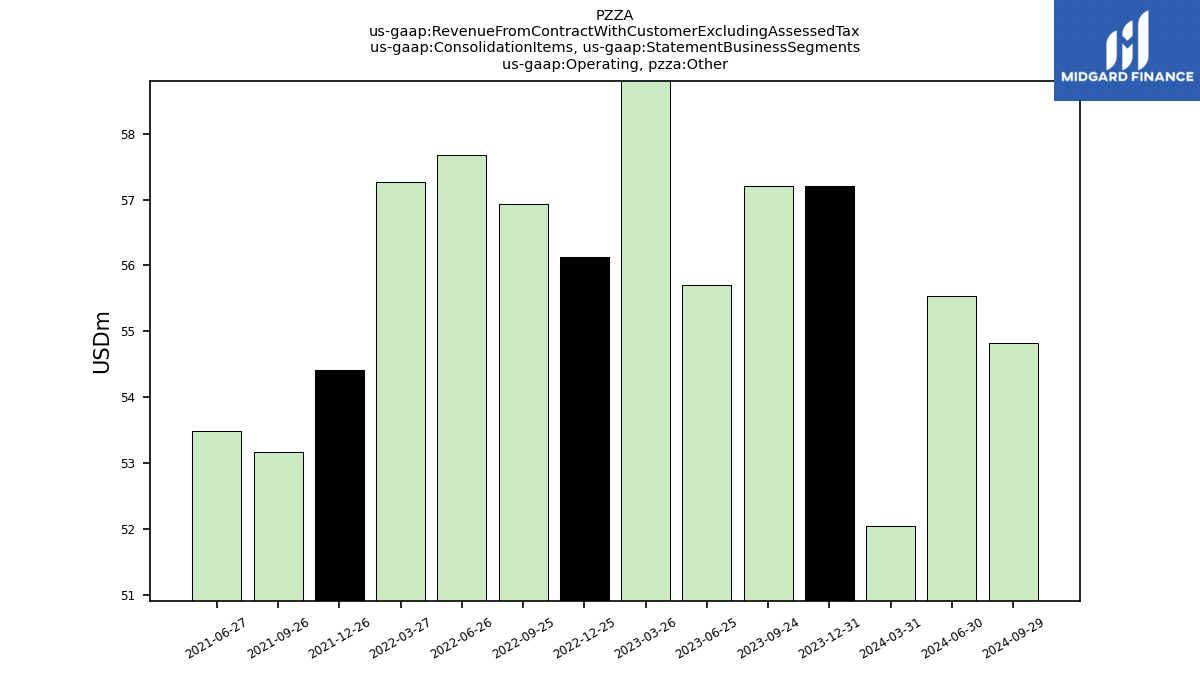
| Operating, Other | 52.03 | 57.20 | 57.21 | 55.70 | 59.84 | 56.13 | 56.93 | 57.67 | 57.27 | 54.42 | 53.16 | 53.49 | NA | NA | NA | NA | NA | NA | NA | NA | NA | NA | NA | NA | NA | NA | NA | NA | NA | NA | NA | NA | NA | NA | NA | NA | NA | NA | NA | NA | NA | NA | NA | NA | NA | NA | NA | NA | NA | NA | NA | NA | NA | NA | NA | NA | NA | |
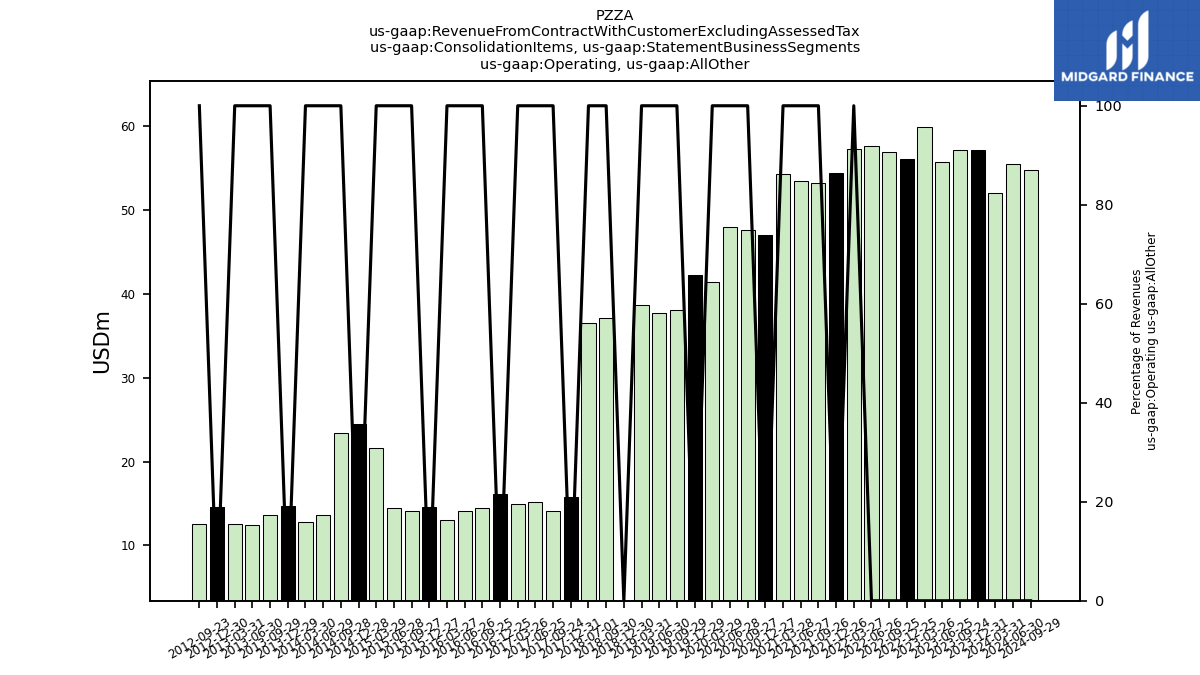
| Operating, All Other | 52.03 | 57.20 | 57.21 | 55.70 | 59.84 | 56.13 | 56.93 | 57.67 | 57.27 | 54.42 | 53.16 | 53.49 | 54.31 | 47.03 | 47.62 | 47.96 | 41.41 | 42.26 | 38.06 | 37.66 | 38.67 | -50.98 | 37.11 | 36.55 | NA | 15.81 | 14.05 | 15.14 | 14.90 | 16.16 | 14.48 | 14.06 | 13.03 | 14.60 | 14.08 | 14.42 | 21.61 | 24.48 | 23.36 | 13.60 | 12.75 | 14.71 | 13.57 | 12.44 | 12.61 | 14.61 | 12.58 | NA | NA | NA | NA | NA | NA | NA | NA | NA | NA | |
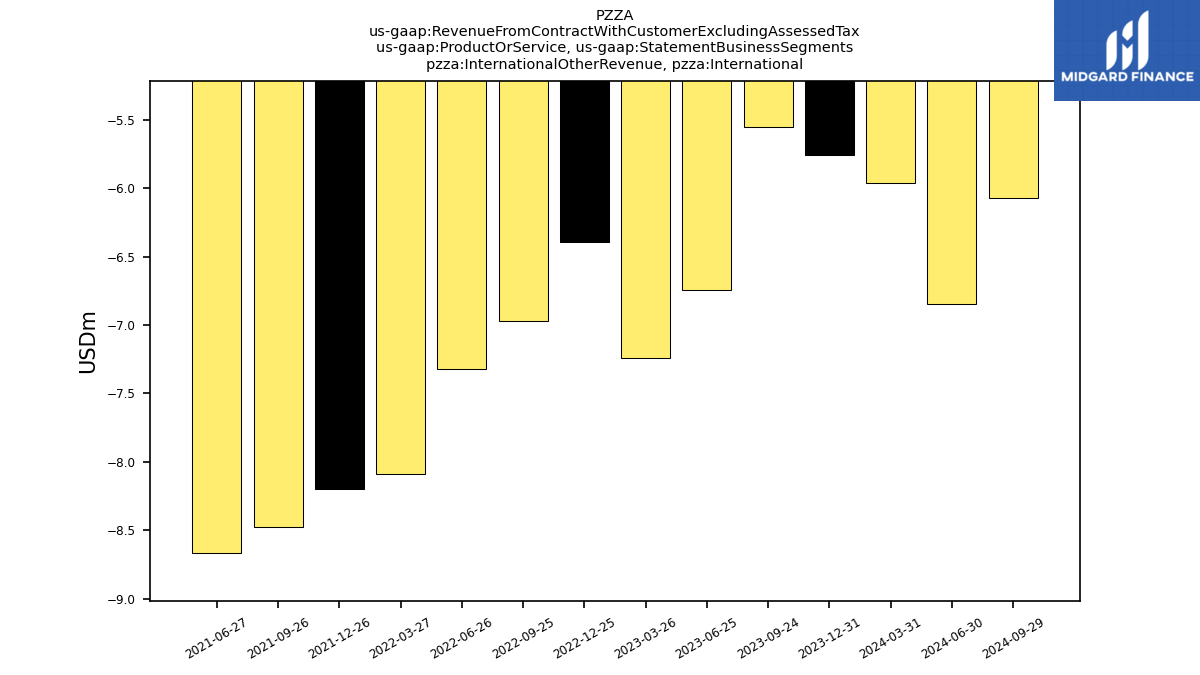
| International Other Revenue, International | -5.96 | -5.76 | -5.55 | -6.75 | -7.24 | -6.39 | -6.97 | -7.32 | -8.09 | -8.20 | -8.47 | -8.66 | NA | NA | NA | NA | NA | NA | NA | NA | NA | NA | NA | NA | NA | NA | NA | NA | NA | NA | NA | NA | NA | NA | NA | NA | NA | NA | NA | NA | NA | NA | NA | NA | NA | NA | NA | NA | NA | NA | NA | NA | NA | NA | NA | NA | NA | |
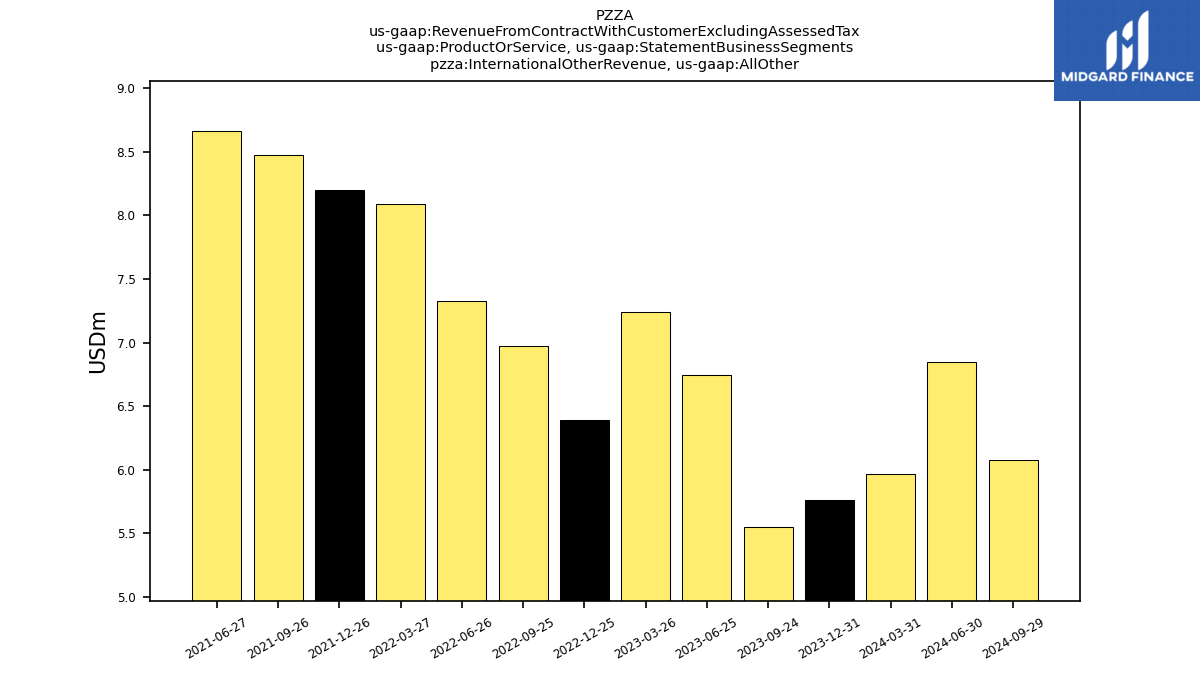
| International Other Revenue, All Other | 5.96 | 5.76 | 5.55 | 6.75 | 7.24 | 6.39 | 6.97 | 7.32 | 8.09 | 8.20 | 8.47 | 8.66 | NA | NA | NA | NA | NA | NA | NA | NA | NA | NA | NA | NA | NA | NA | NA | NA | NA | NA | NA | NA | NA | NA | NA | NA | NA | NA | NA | NA | NA | NA | NA | NA | NA | NA | NA | NA | NA | NA | NA | NA | NA | NA | NA | NA | NA | |
| Domestic Company Owned Restaurants | 176.22 | 193.52 | 177.19 | 175.78 | 179.87 | 172.16 | 166.05 | 171.41 | 198.76 | 193.38 | 191.58 | 196.12 | 197.23 | 174.44 | 178.37 | 186.51 | 161.44 | 161.46 | 165.13 | 163.66 | 161.80 | 162.47 | 158.28 | 181.38 | 190.24 | 210.80 | 196.27 | 202.76 | 206.90 | 206.96 | 199.04 | 204.25 | 205.68 | NA | NA | NA | NA | NA | NA | NA | NA | NA | NA | NA | NA | NA | NA | NA | NA | NA | NA | NA | NA | NA | NA | NA | NA | |
| International | 40.71 | 48.19 | 42.93 | 34.61 | 31.46 | 32.59 | 30.73 | 31.96 | 34.62 | 40.14 | 38.41 | 37.61 | 34.61 | 36.37 | 33.44 | 28.09 | 26.06 | 27.08 | 24.68 | 25.50 | 25.67 | 25.51 | 25.65 | 29.07 | 30.11 | 35.74 | 31.79 | 30.23 | 28.52 | 28.25 | 28.94 | 28.46 | 27.45 | 25.94 | 27.00 | 26.33 | 25.43 | NA | NA | NA | NA | NA | NA | 21.14 | 19.93 | 20.66 | 18.03 | 17.38 | 16.85 | 16.01 | 15.52 | 14.27 | 12.76 | 12.25 | 11.89 | 11.55 | NA | |
| North America Commissary | 203.29 | 227.93 | 204.89 | 206.98 | 212.57 | 224.46 | 216.12 | 219.38 | 209.68 | 200.56 | 189.22 | 186.64 | NA | NA | NA | NA | NA | NA | NA | NA | NA | NA | NA | NA | NA | NA | NA | NA | NA | NA | NA | NA | NA | NA | NA | NA | NA | NA | NA | NA | NA | NA | NA | NA | NA | NA | NA | NA | NA | NA | NA | NA | NA | NA | NA | NA | NA | |
| North America Franchising | 35.70 | 38.73 | 35.04 | 34.71 | 36.07 | 34.50 | 33.71 | 34.92 | 34.27 | 32.19 | 31.93 | 32.48 | 32.72 | 27.84 | 25.28 | 24.17 | 19.44 | 18.61 | 15.92 | 19.76 | 17.53 | 17.77 | 12.81 | 23.91 | 24.81 | 26.97 | 25.57 | 26.59 | 27.61 | 26.43 | 24.78 | 25.30 | 26.48 | NA | NA | NA | NA | NA | NA | NA | NA | NA | NA | 20.45 | 21.28 | 21.39 | 18.94 | 19.31 | 20.74 | 18.15 | 18.12 | 18.23 | 19.92 | 17.64 | 16.80 | 17.55 | NA | |
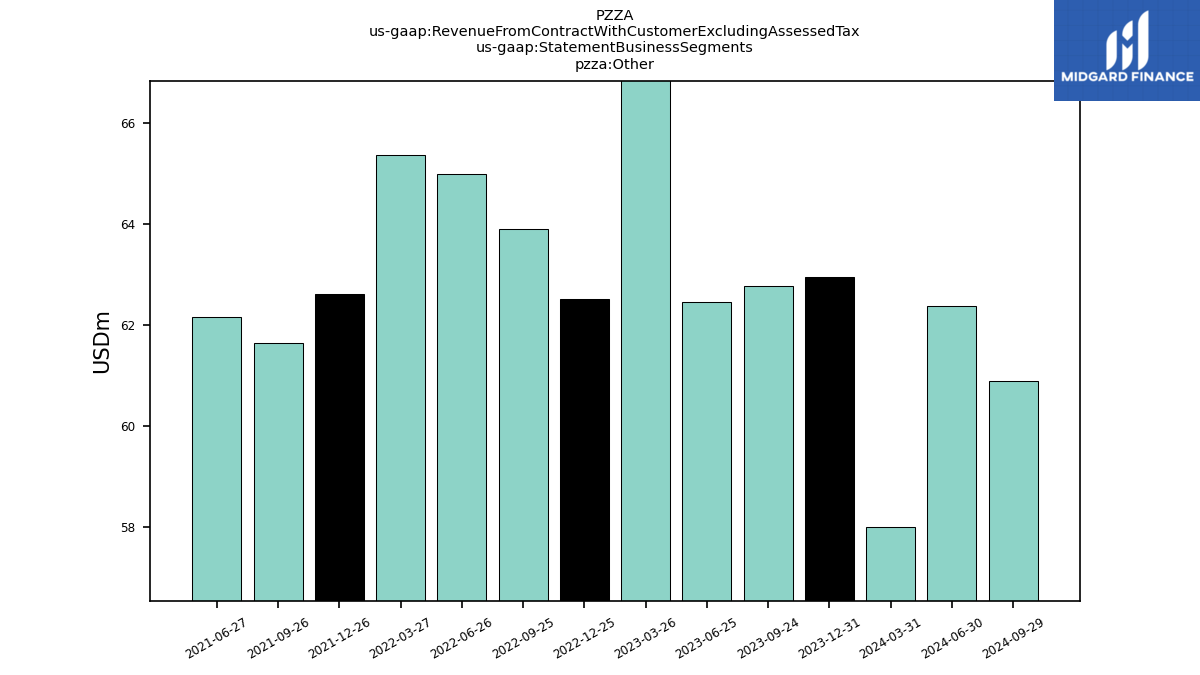
| Other | 58.00 | 62.96 | 62.76 | 62.45 | 67.08 | 62.52 | 63.90 | 65.00 | 65.36 | 62.61 | 61.63 | 62.15 | NA | NA | NA | NA | NA | NA | NA | NA | NA | NA | NA | NA | NA | NA | NA | NA | NA | NA | NA | NA | NA | NA | NA | NA | NA | NA | NA | NA | NA | NA | NA | NA | NA | NA | NA | NA | NA | NA | NA | NA | NA | NA | NA | NA | NA | |
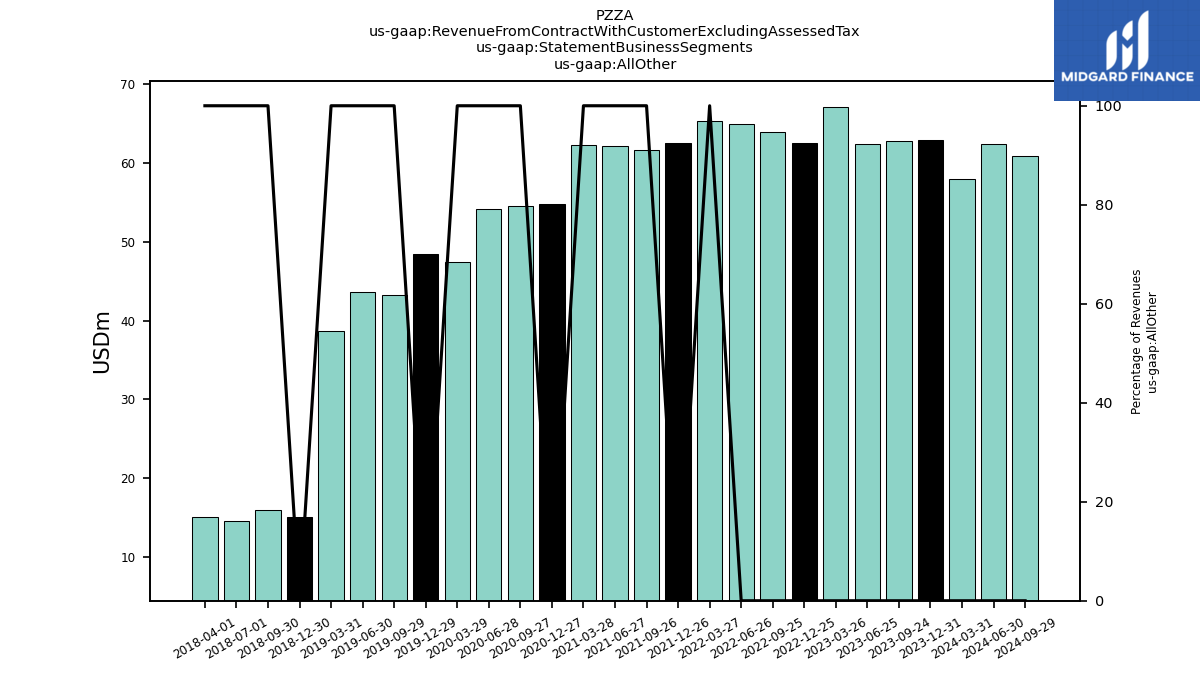
| All Other | 58.00 | 62.96 | 62.76 | 62.45 | 67.08 | 62.52 | 63.90 | 65.00 | 65.36 | 62.61 | 61.63 | 62.15 | 62.31 | 54.75 | 54.51 | 54.23 | 47.50 | 48.44 | 43.27 | 43.58 | 38.67 | 14.99 | 15.88 | 14.56 | 15.08 | NA | NA | NA | NA | NA | NA | NA | NA | NA | NA | NA | NA | NA | NA | NA | NA | NA | NA | NA | NA | NA | NA | NA | NA | NA | NA | NA | NA | NA | NA | NA | NA |