
| 2023-09-30 | 2023-06-30 | 2023-03-31 | 2022-12-31 | 2022-09-30 | 2022-06-30 | 2022-03-31 | 2021-12-31 | 2021-09-30 | 2021-06-30 | 2021-03-31 | 2020-12-31 | 2020-09-30 | 2020-06-30 | 2020-03-31 | ||
|---|---|---|---|---|---|---|---|---|---|---|---|---|---|---|---|---|
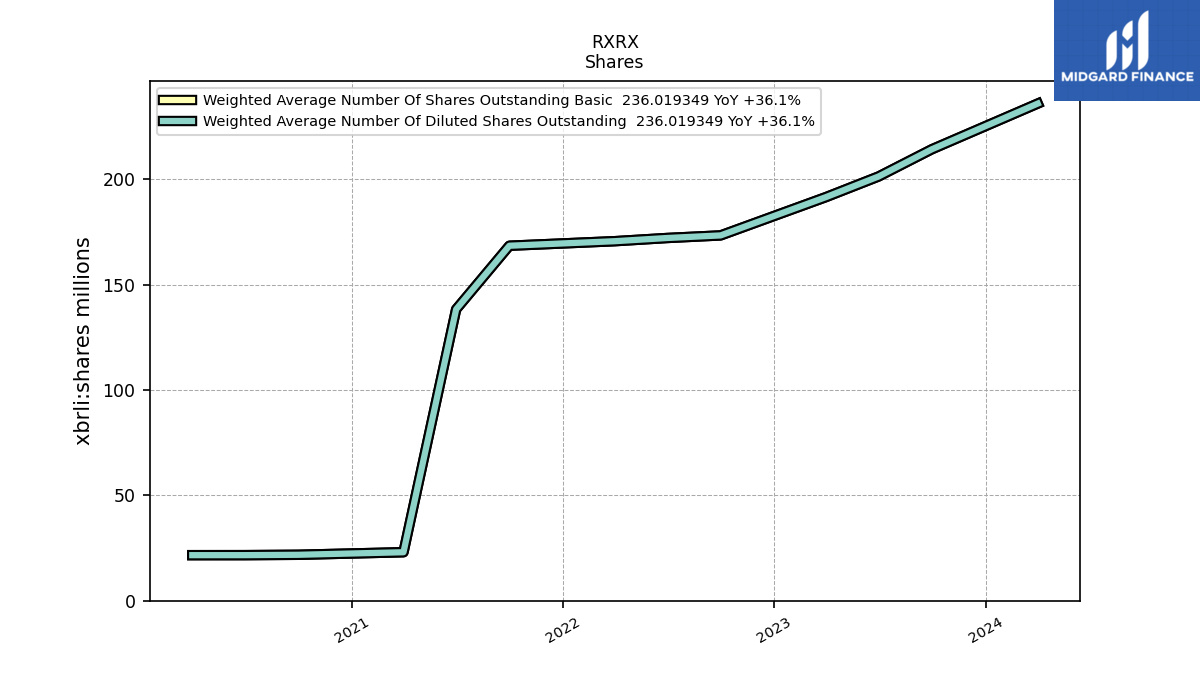
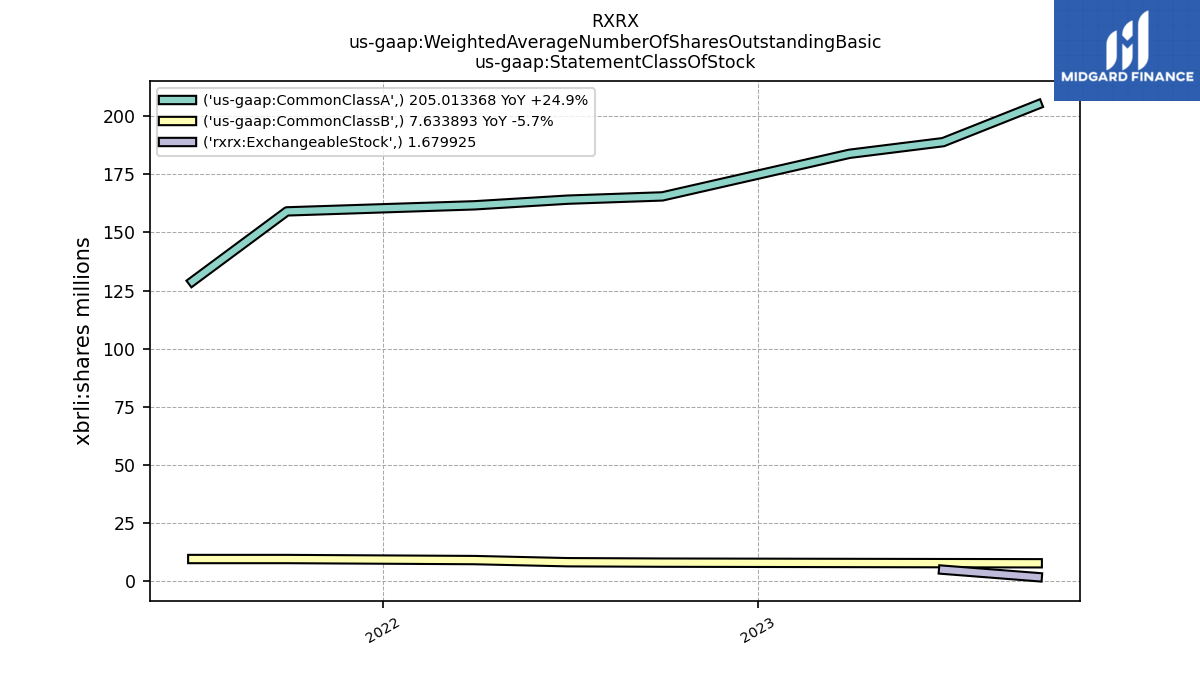
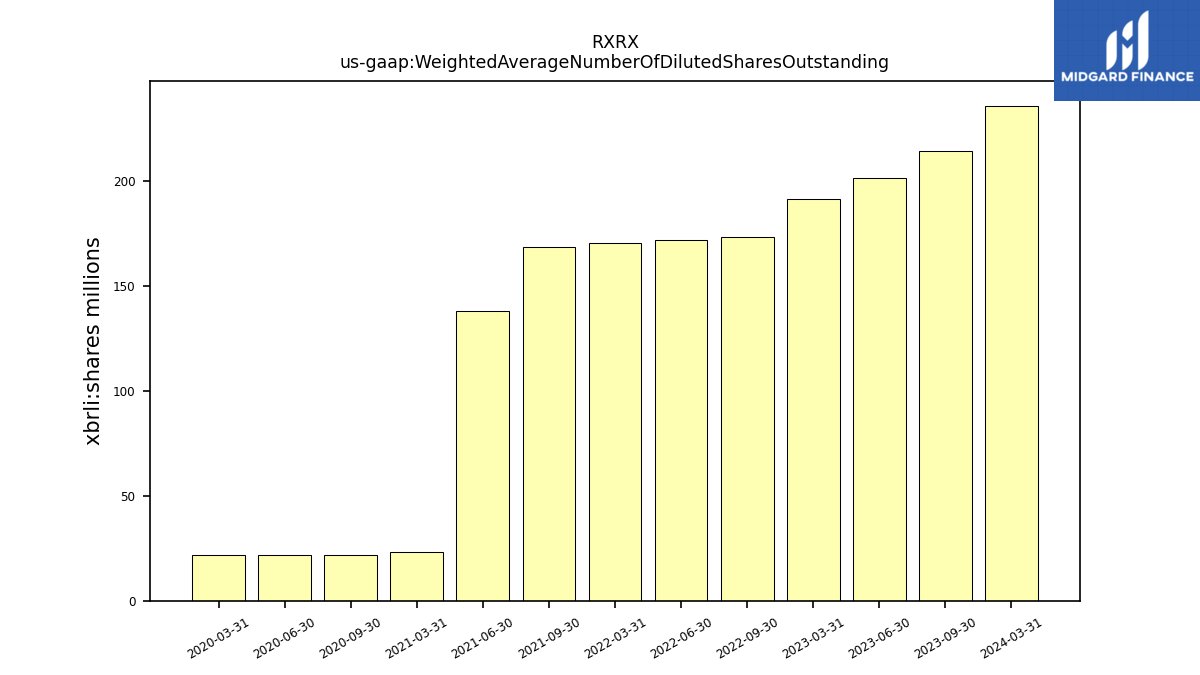
| Weighted Average Number Of Diluted Shares Outstanding | 214.33 | 201.42 | 191.62 | NA | 173.44 | 172.21 | 170.69 | NA | 168.53 | 138.36 | 23.04 | NA | 21.82 | 21.65 | 21.64 | |
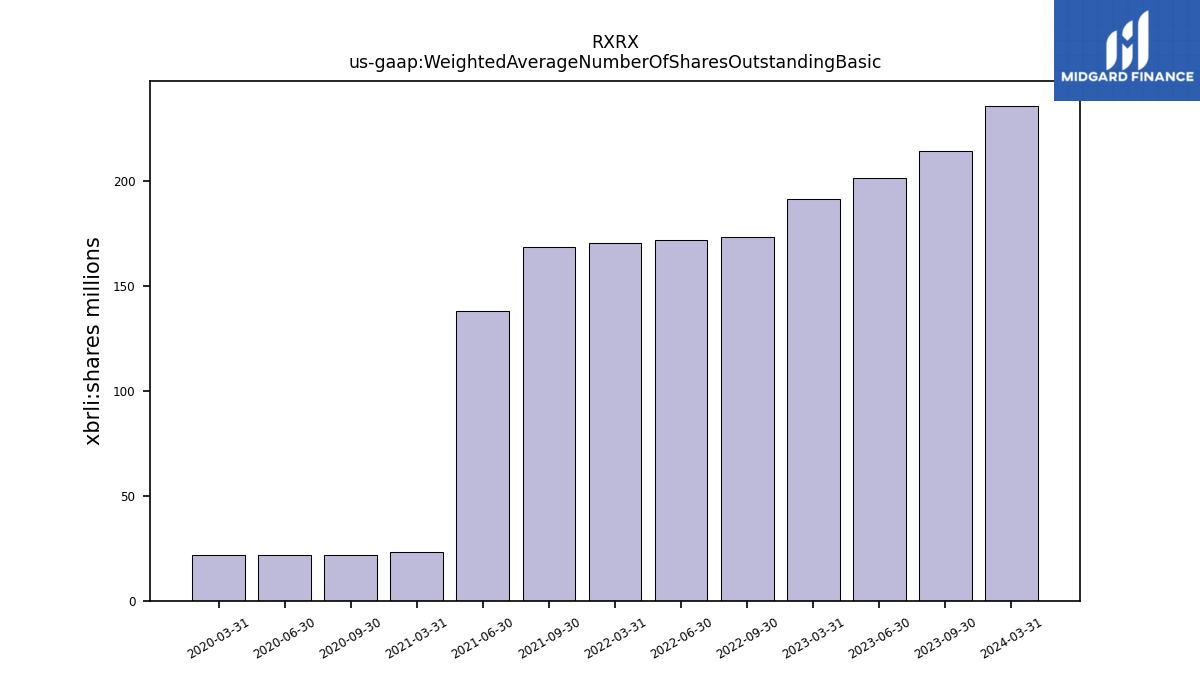
| Weighted Average Number Of Shares Outstanding Basic | 214.33 | 201.42 | 191.62 | NA | 173.44 | 172.21 | 170.69 | NA | 168.53 | 138.36 | 23.04 | NA | 21.82 | 21.65 | 21.64 | |
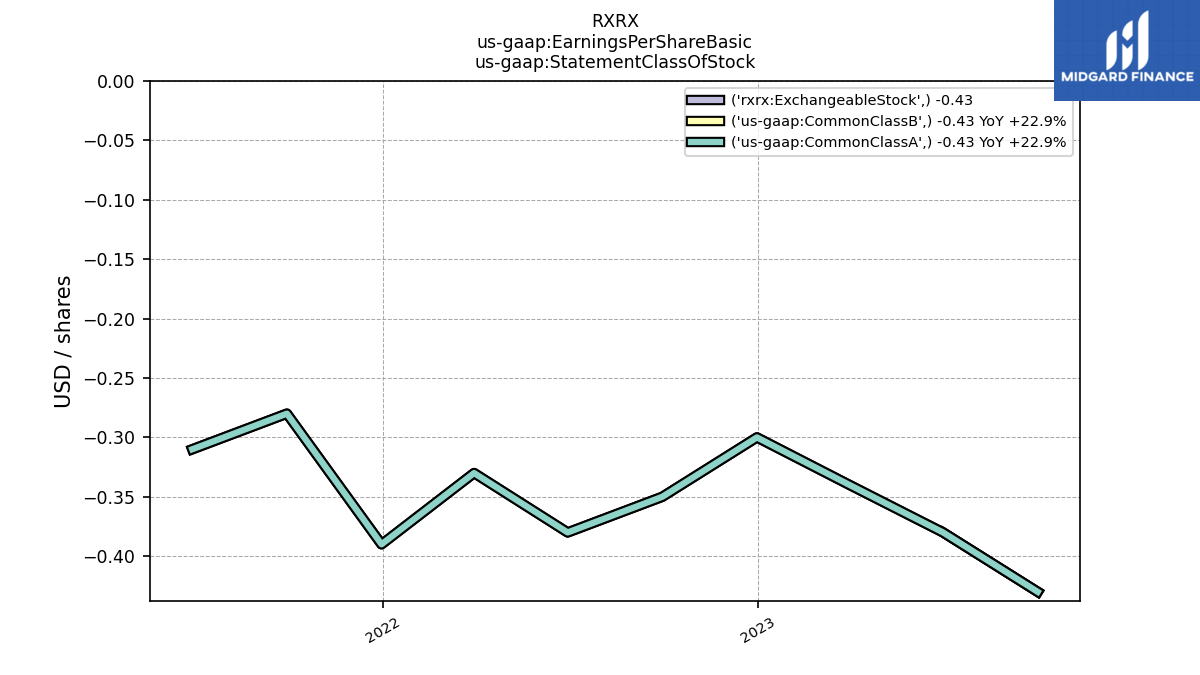
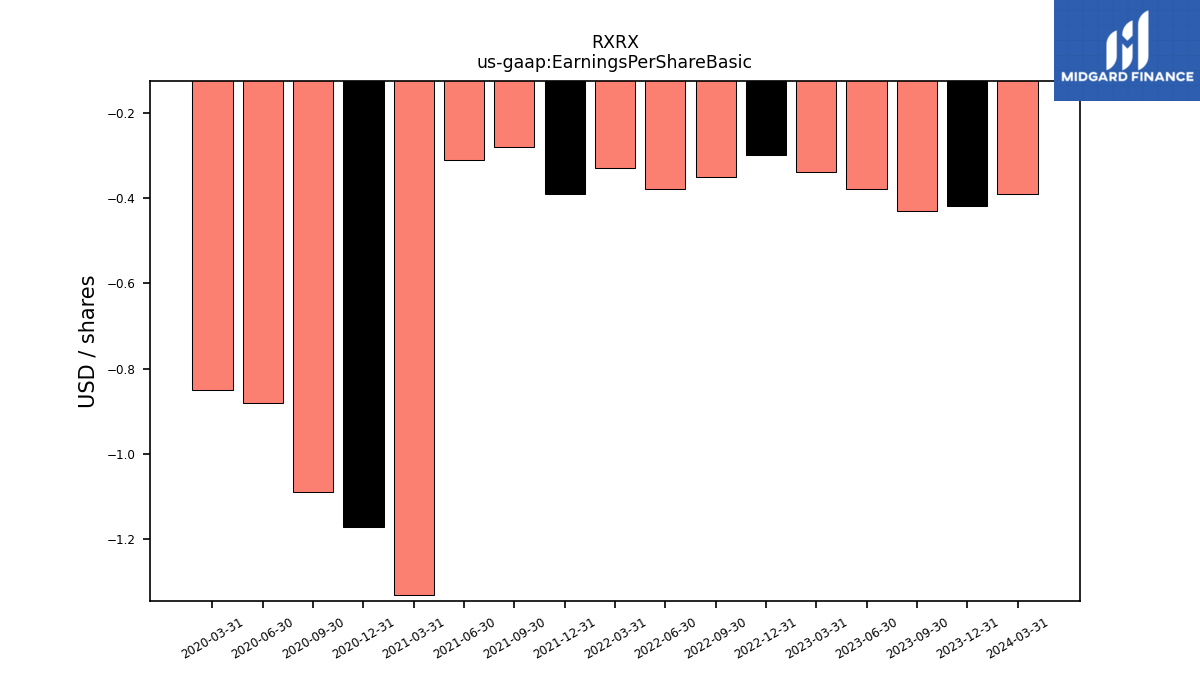
| Earnings Per Share Basic | -0.43 | -0.38 | -0.34 | -0.30 | -0.35 | -0.38 | -0.33 | -0.39 | -0.28 | -0.31 | -1.33 | -1.17 | -1.09 | -0.88 | -0.85 | |
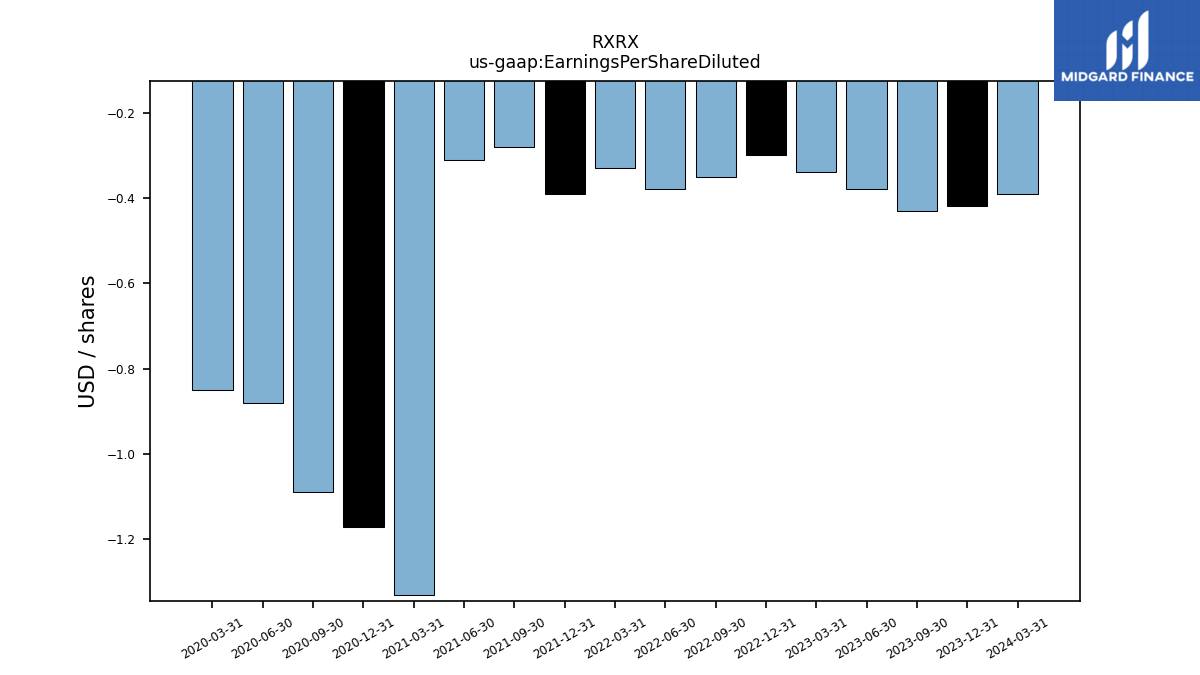
| Earnings Per Share Diluted | -0.43 | -0.38 | -0.34 | -0.30 | -0.35 | -0.38 | -0.33 | -0.39 | -0.28 | -0.31 | -1.33 | -1.17 | -1.09 | -0.88 | -0.85 |
| 2023-09-30 | 2023-06-30 | 2023-03-31 | 2022-12-31 | 2022-09-30 | 2022-06-30 | 2022-03-31 | 2021-12-31 | 2021-09-30 | 2021-06-30 | 2021-03-31 | 2020-12-31 | 2020-09-30 | 2020-06-30 | 2020-03-31 | ||
|---|---|---|---|---|---|---|---|---|---|---|---|---|---|---|---|---|
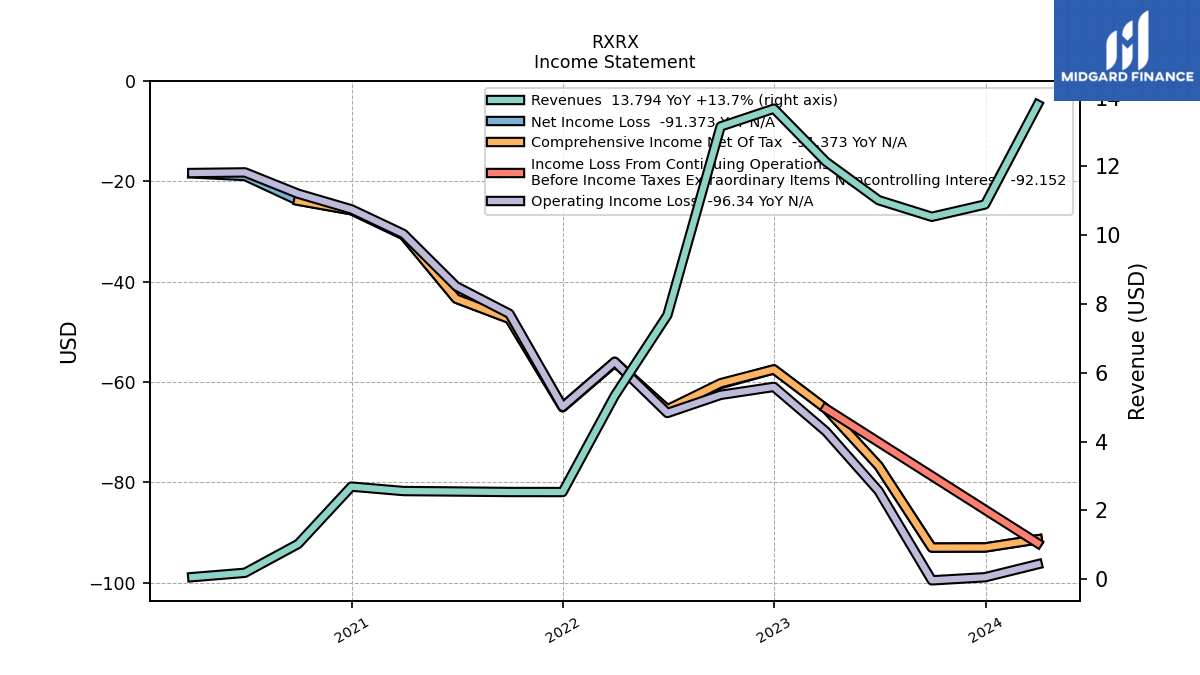
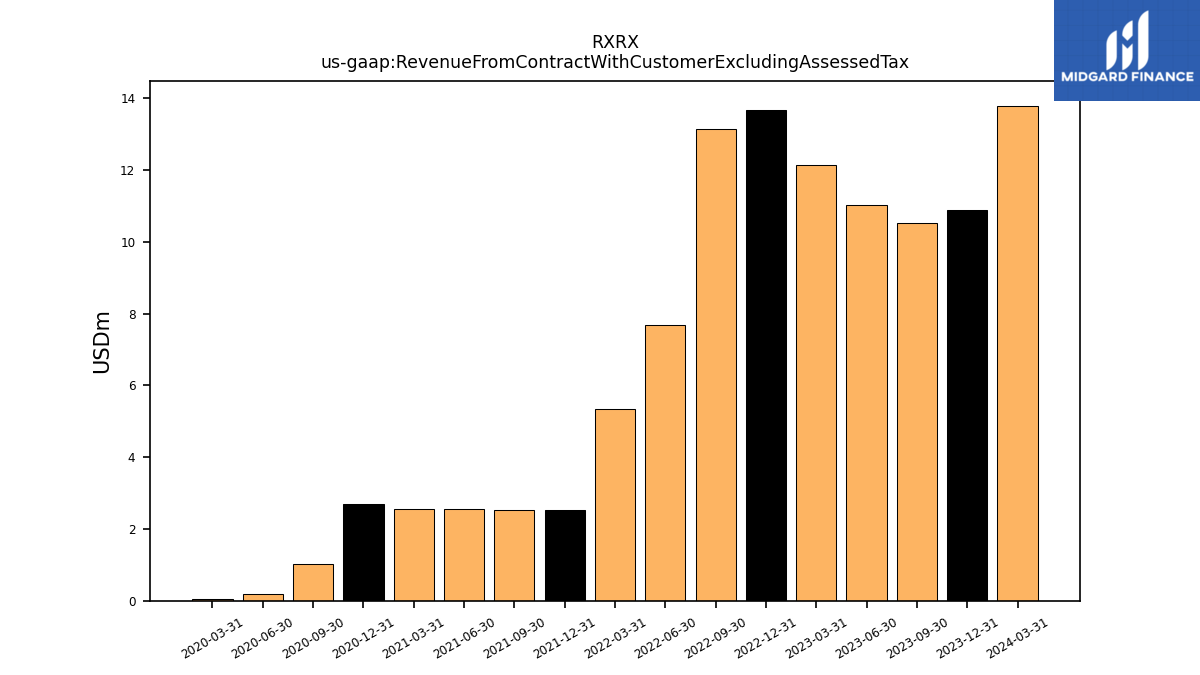
| Revenue From Contract With Customer Excluding Assessed Tax | 10.53 | 11.02 | 12.13 | 13.68 | 13.16 | 7.67 | 5.33 | 2.53 | 2.53 | 2.55 | 2.56 | 2.69 | 1.02 | 0.19 | 0.06 | |
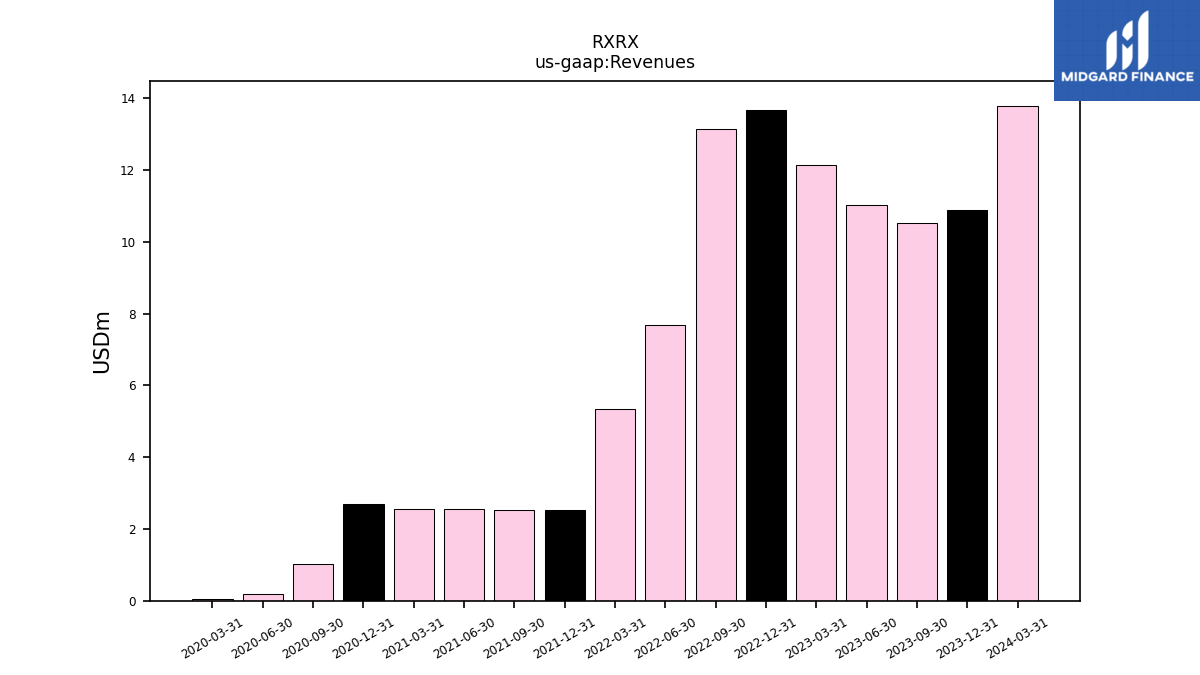
| Revenues | 10.53 | 11.02 | 12.13 | 13.68 | 13.16 | 7.67 | 5.33 | 2.53 | 2.53 | 2.55 | 2.56 | 2.69 | 1.02 | 0.19 | 0.06 | |
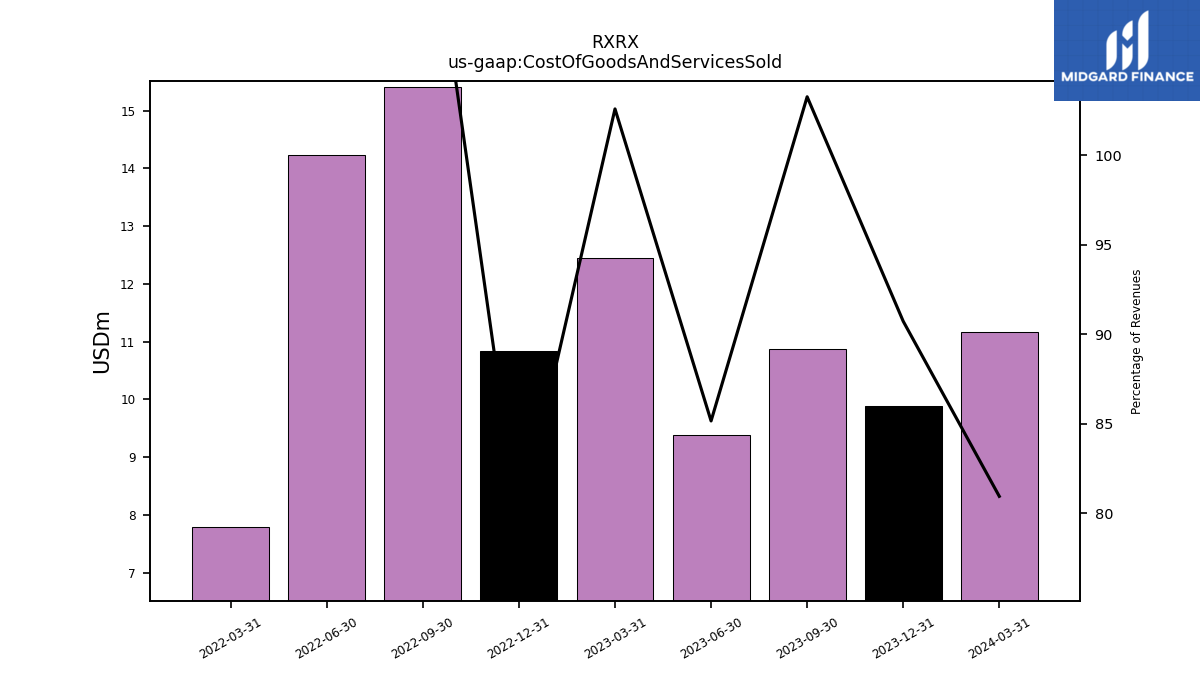
| Cost Of Goods And Services Sold | 10.88 | 9.38 | 12.45 | 10.84 | 15.41 | 14.23 | 7.80 | NA | NA | NA | NA | NA | NA | NA | NA | |
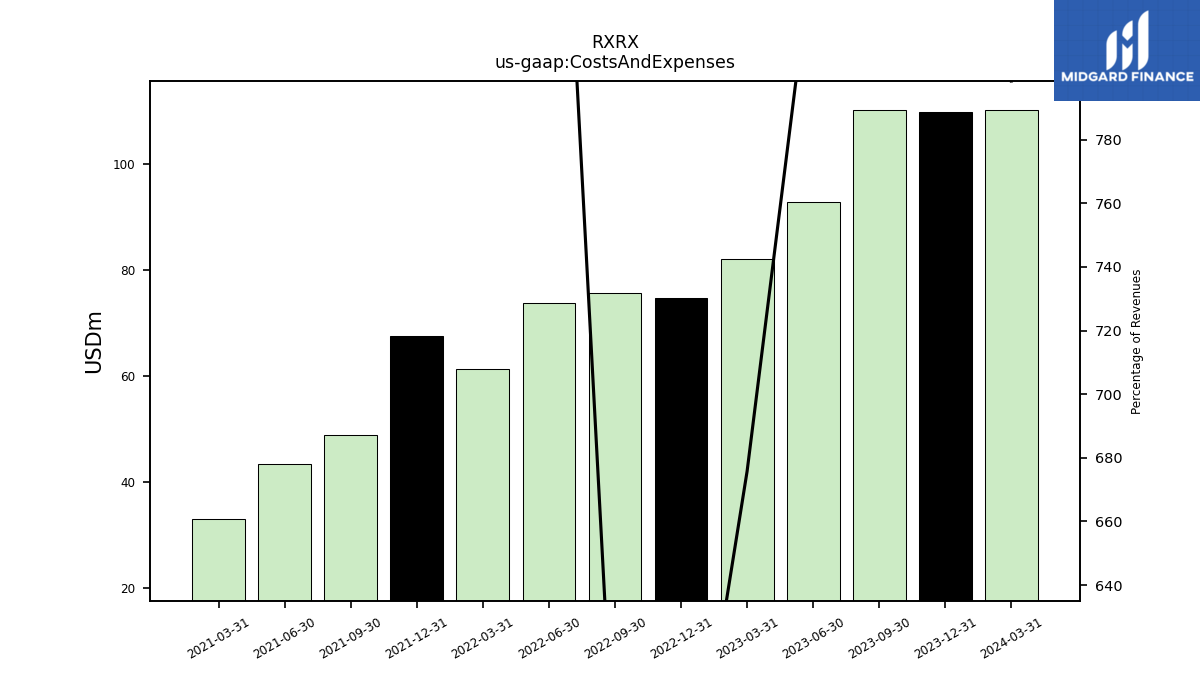
| Costs And Expenses | 110.08 | 92.73 | 82.00 | 74.66 | 75.73 | 73.86 | 61.31 | 67.49 | 48.94 | 43.48 | 33.05 | NA | NA | NA | NA | |
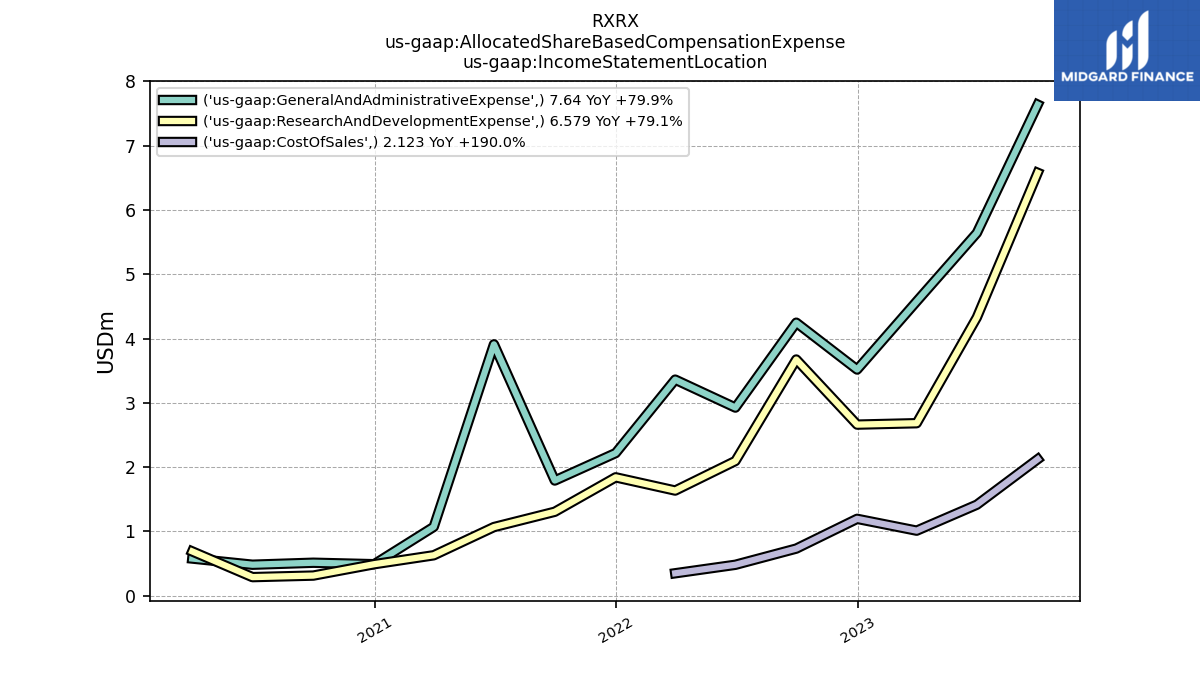
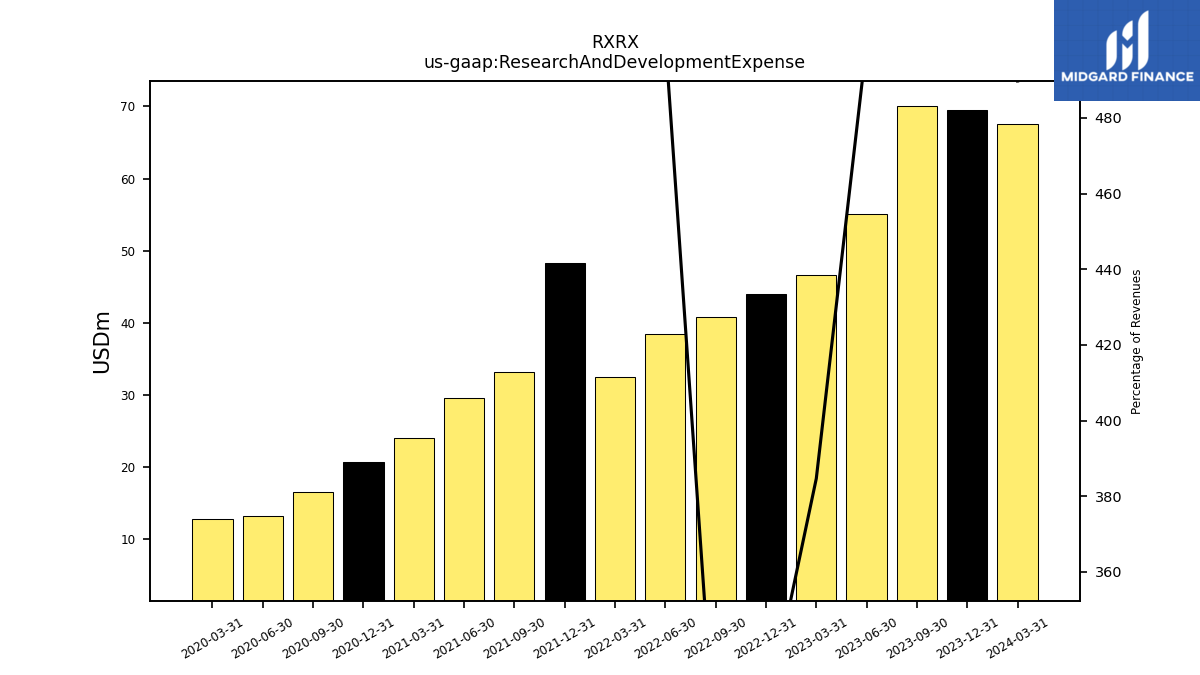
| Research And Development Expense | 70.01 | 55.06 | 46.68 | 43.98 | 40.84 | 38.44 | 32.44 | 48.29 | 33.25 | 29.62 | 24.11 | 20.70 | 16.54 | 13.24 | 12.84 | |
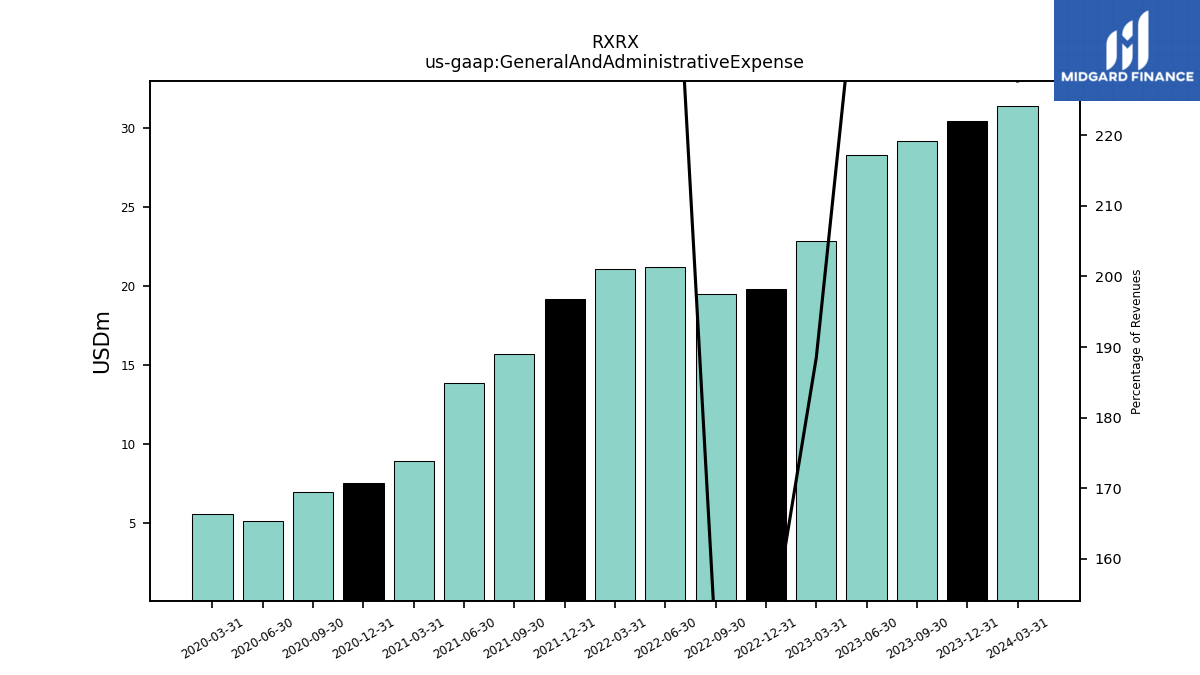
| General And Administrative Expense | 29.20 | 28.29 | 22.87 | 19.84 | 19.49 | 21.20 | 21.07 | 19.20 | 15.69 | 13.85 | 8.94 | 7.57 | 6.96 | 5.16 | 5.56 | |
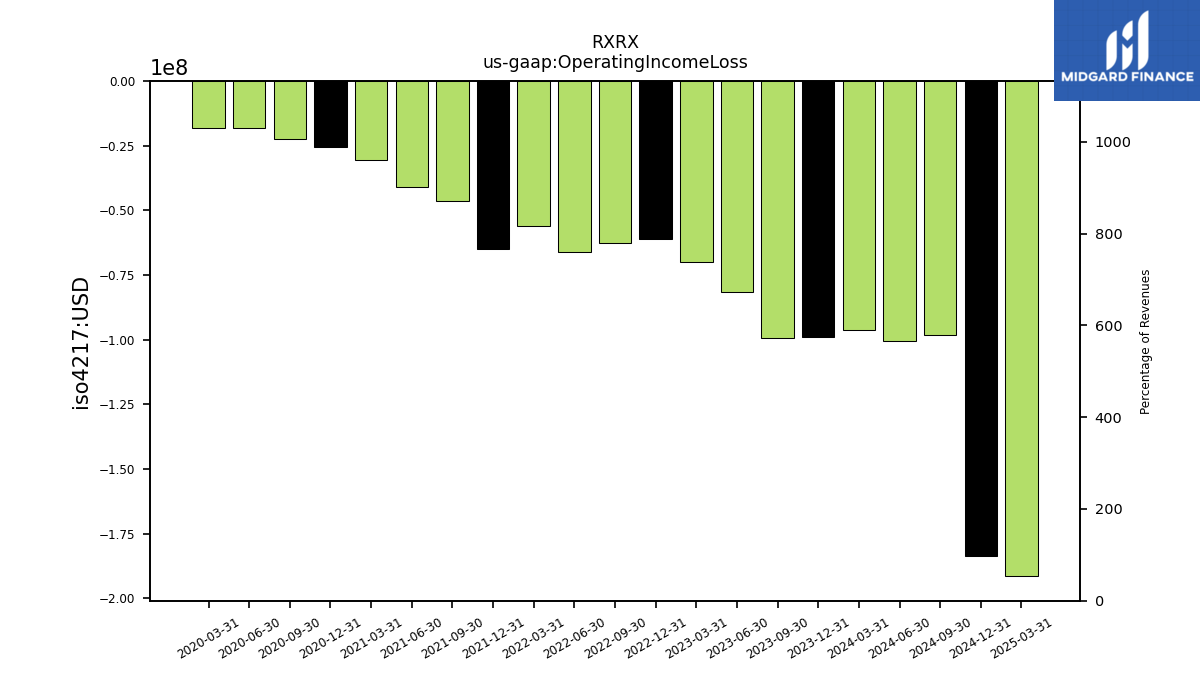
| Operating Income Loss | -99.55 | -81.72 | -69.86 | -60.98 | -62.57 | -66.19 | -55.98 | -64.96 | -46.40 | -40.93 | -30.48 | -25.58 | -22.47 | -18.22 | -18.34 | |
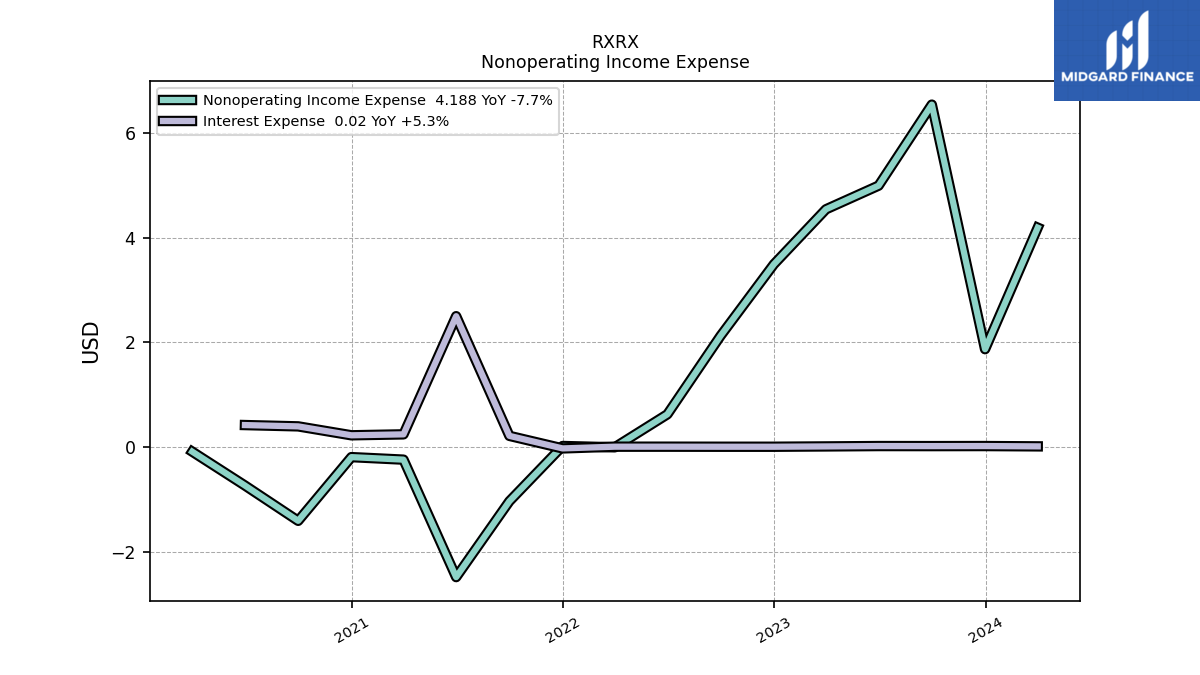
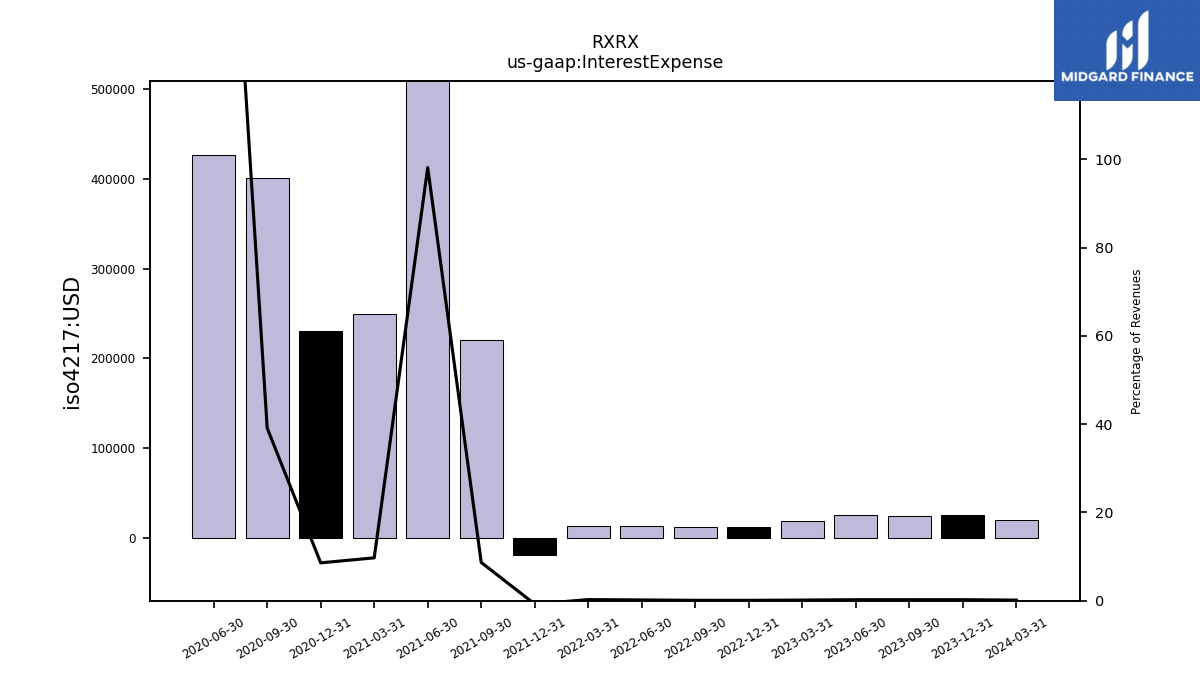
| Interest Expense | 0.03 | 0.03 | 0.02 | 0.01 | 0.01 | 0.01 | 0.01 | -0.02 | 0.22 | 2.50 | 0.25 | 0.23 | 0.40 | 0.43 | NA | |
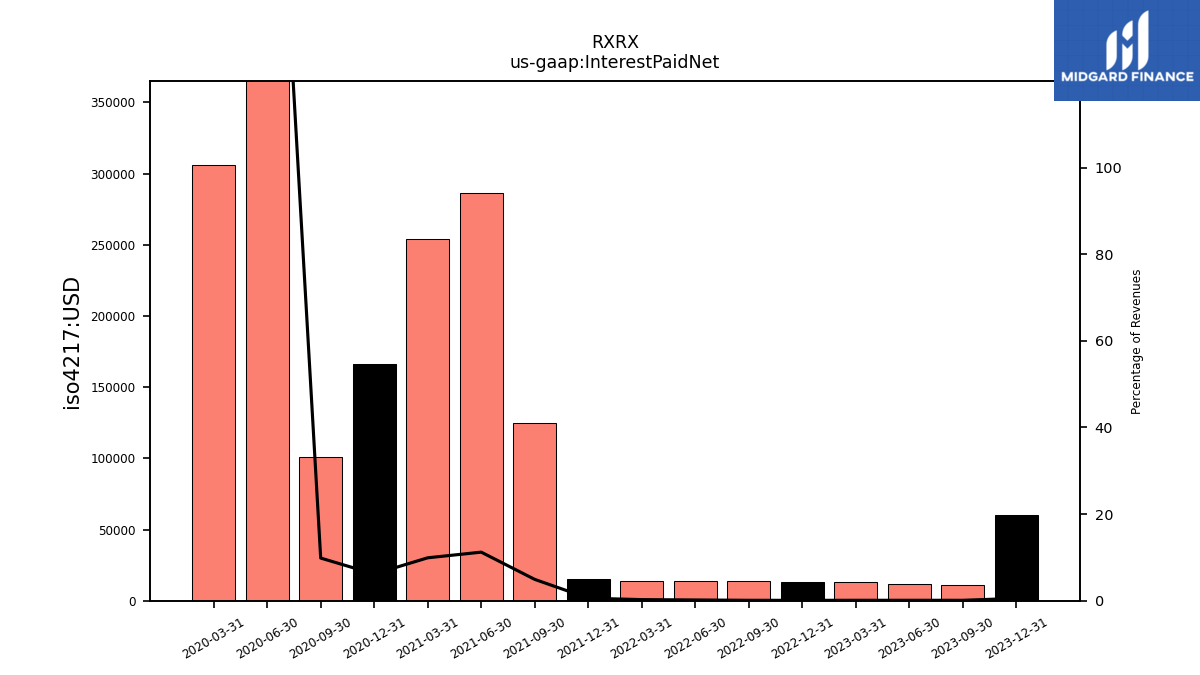
| Interest Paid Net | 0.01 | 0.01 | 0.01 | 0.01 | 0.01 | 0.01 | 0.01 | 0.01 | 0.12 | 0.29 | 0.25 | 0.17 | 0.10 | 0.42 | 0.31 | |
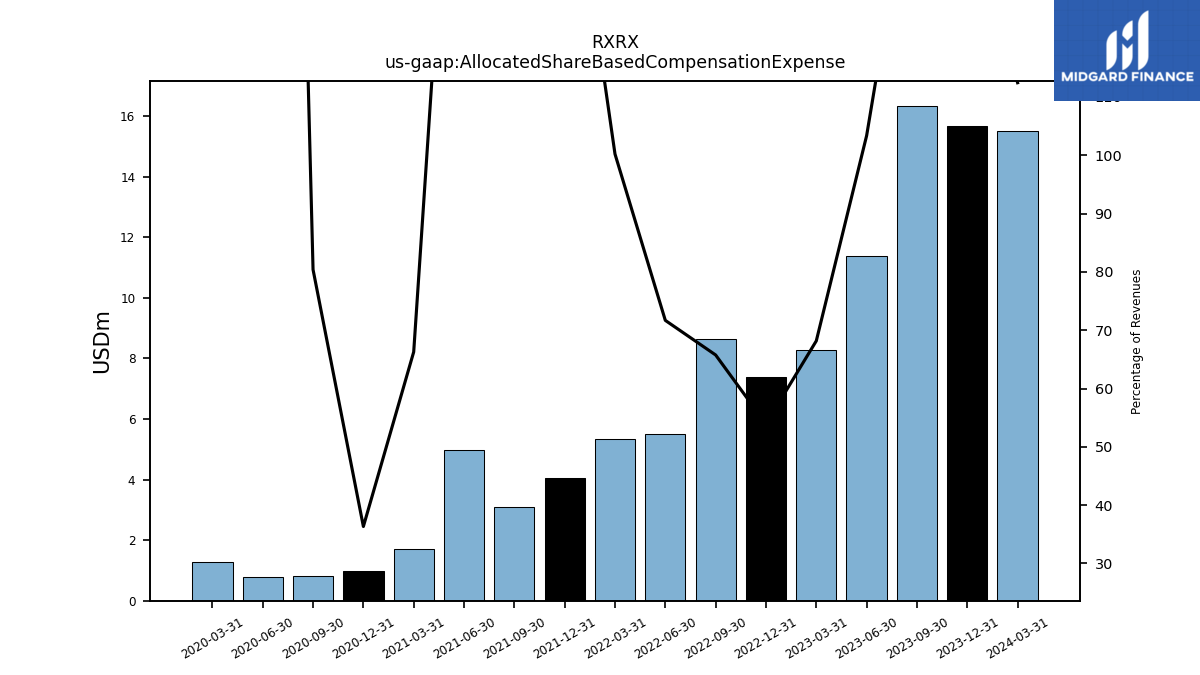
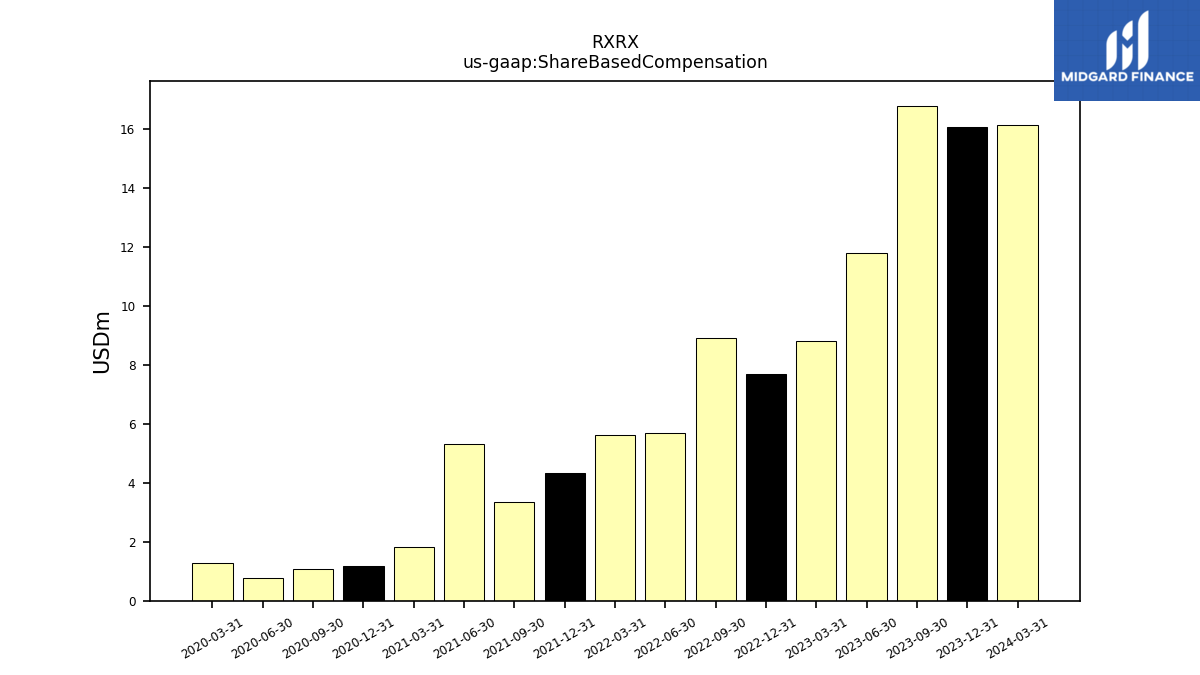
| Allocated Share Based Compensation Expense | 16.34 | 11.39 | 8.27 | 7.37 | 8.65 | 5.50 | 5.34 | 4.06 | 3.10 | 4.98 | 1.70 | 0.98 | 0.82 | 0.77 | 1.26 | |
| Net Income Loss | -93.02 | -76.73 | -65.33 | -57.49 | -60.45 | -65.56 | -55.98 | -64.93 | -47.43 | -43.40 | -30.72 | -25.77 | -23.87 | -18.94 | -18.42 | |
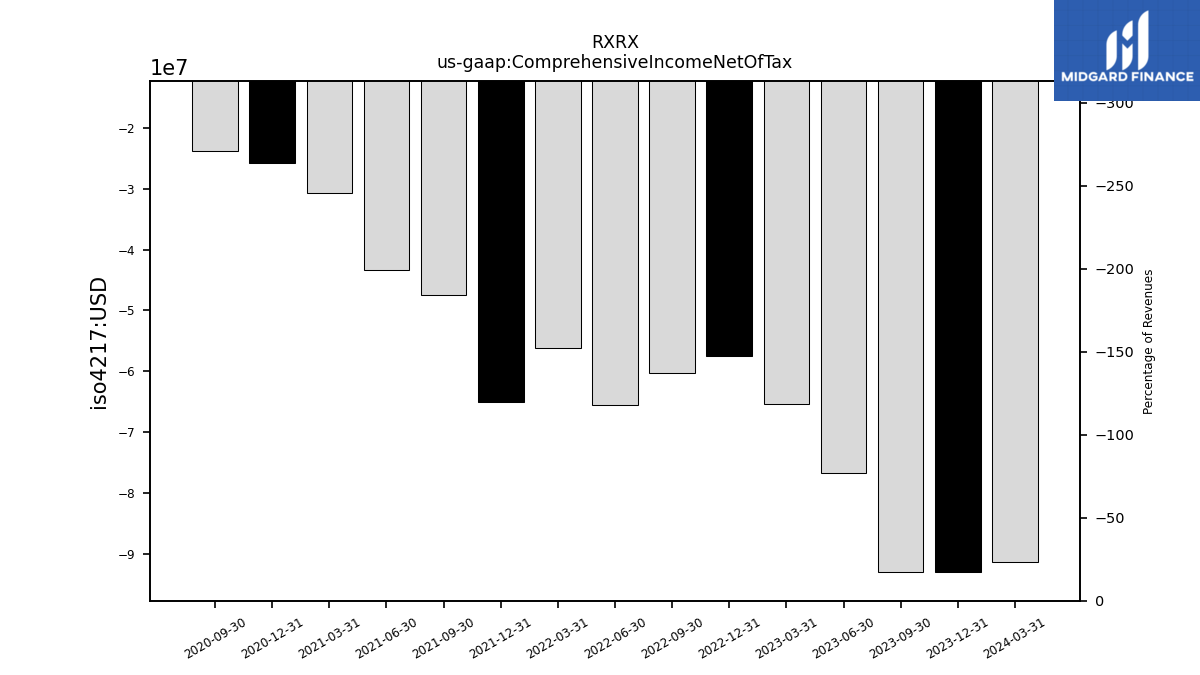
| Comprehensive Income Net Of Tax | -93.02 | -76.73 | -65.33 | -57.49 | -60.25 | -65.45 | -56.16 | -65.06 | -47.43 | -43.40 | -30.72 | -25.77 | -23.87 | NA | NA |
| 2023-09-30 | 2023-06-30 | 2023-03-31 | 2022-12-31 | 2022-09-30 | 2022-06-30 | 2022-03-31 | 2021-12-31 | 2021-09-30 | 2021-06-30 | 2021-03-31 | 2020-12-31 | 2020-09-30 | 2020-06-30 | 2020-03-31 | ||
|---|---|---|---|---|---|---|---|---|---|---|---|---|---|---|---|---|
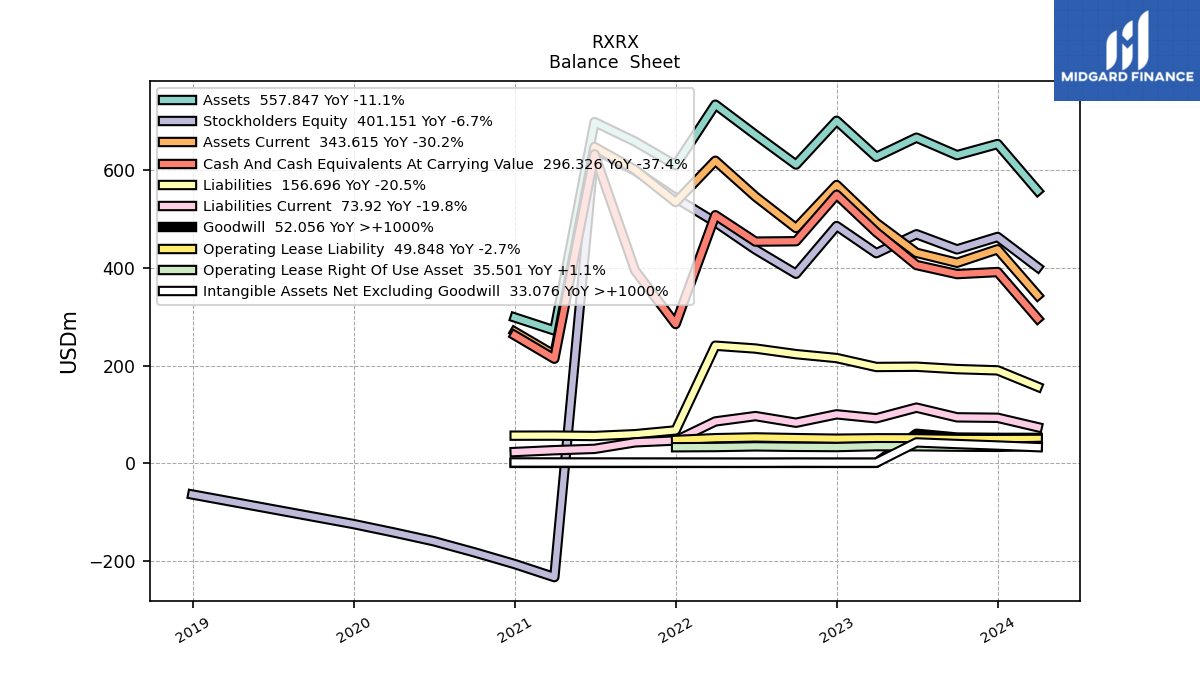
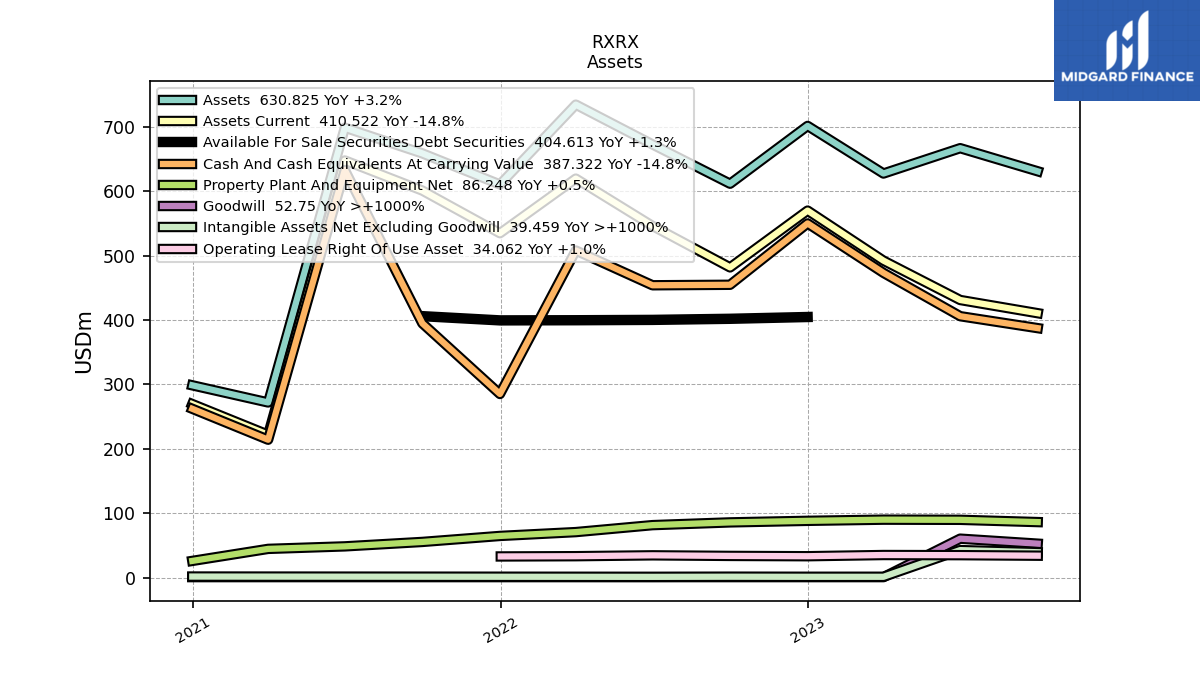
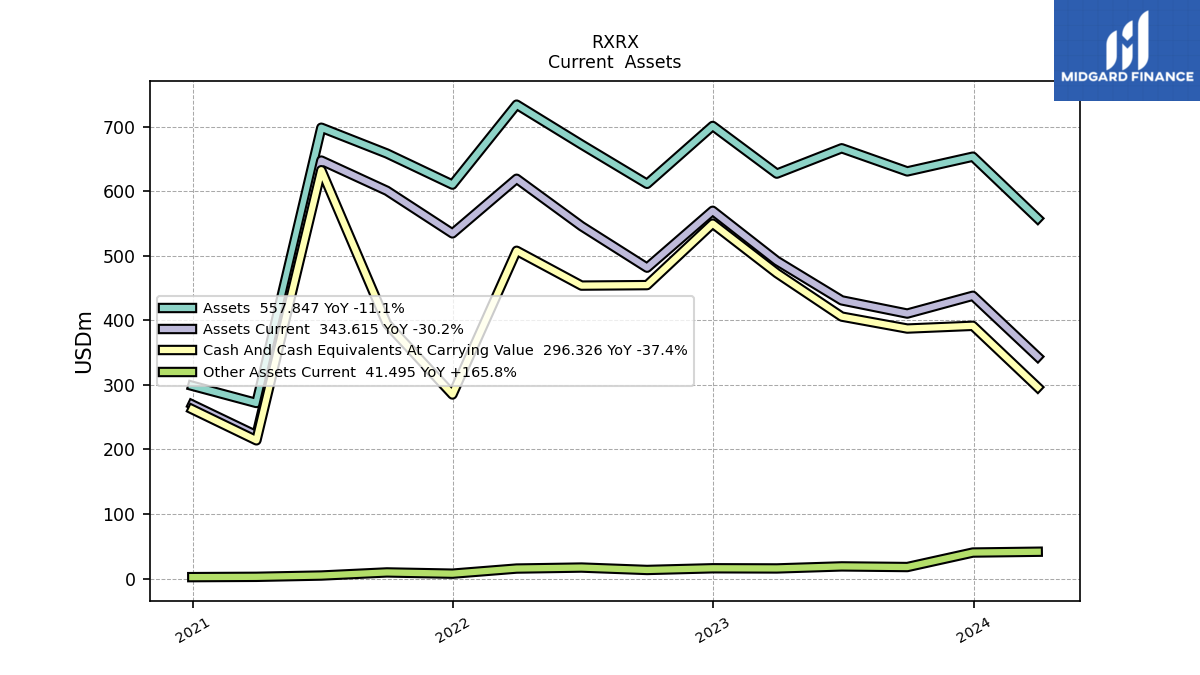
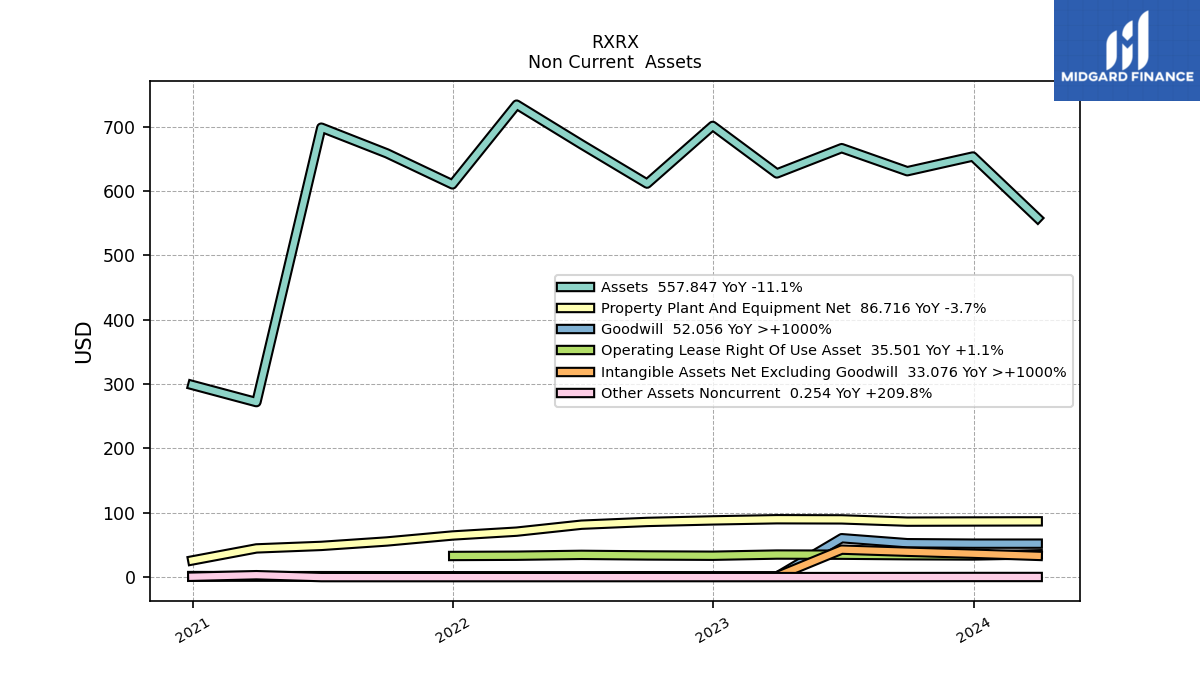
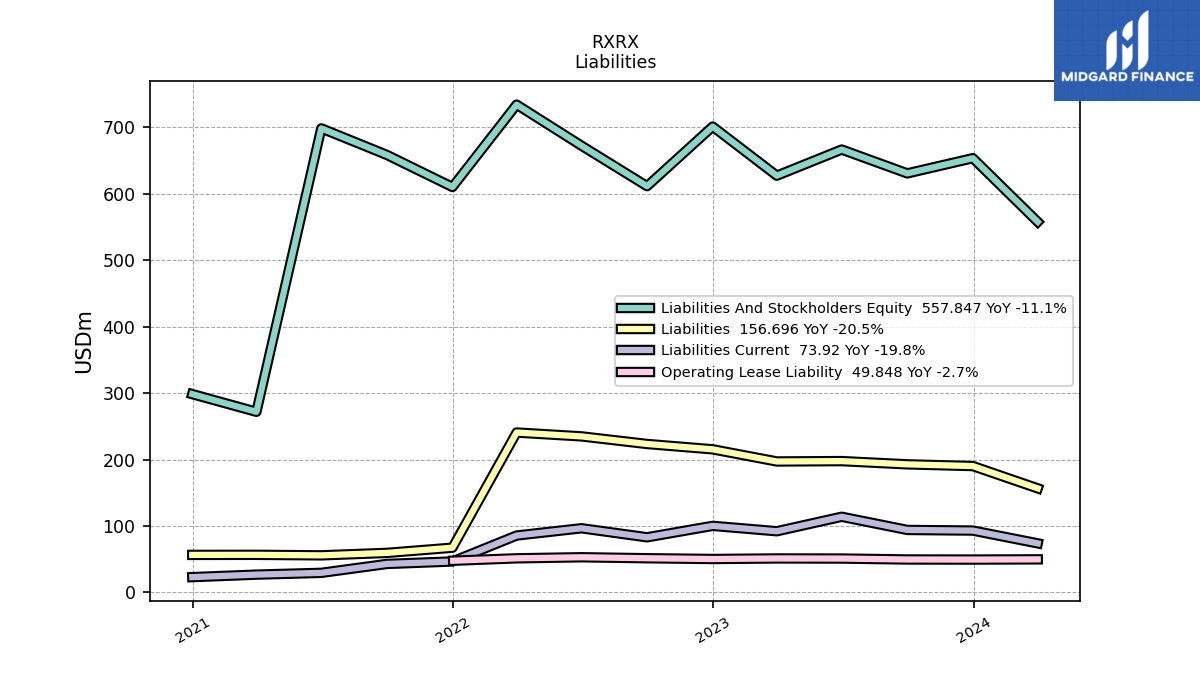
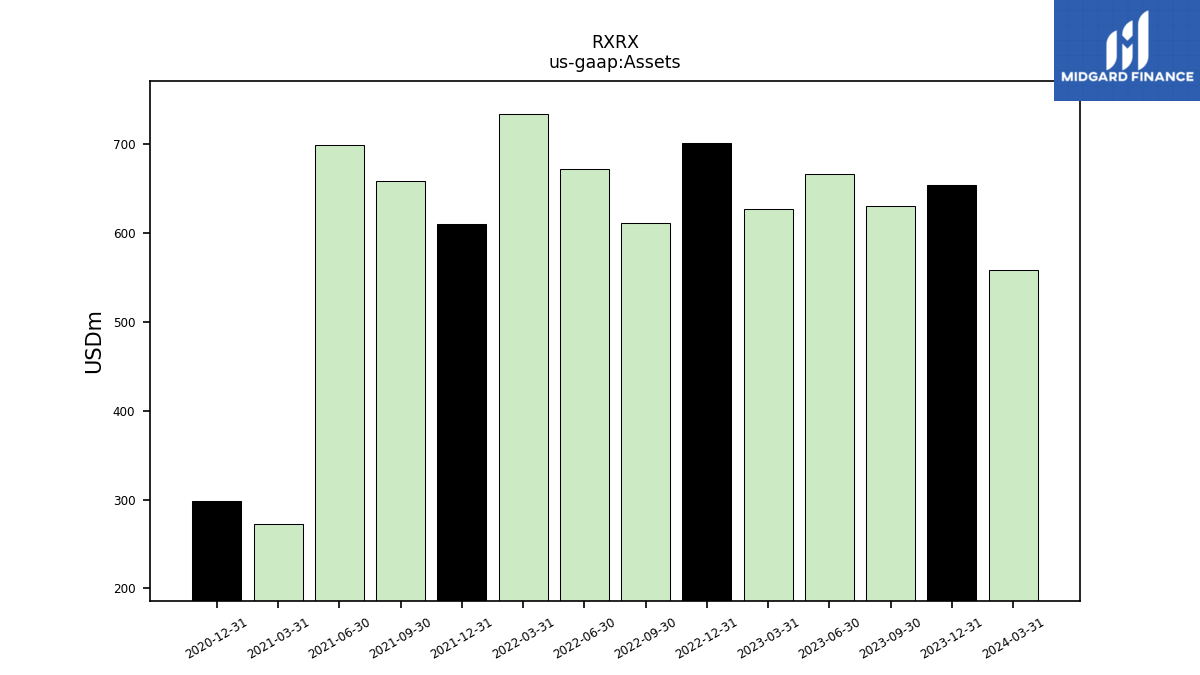
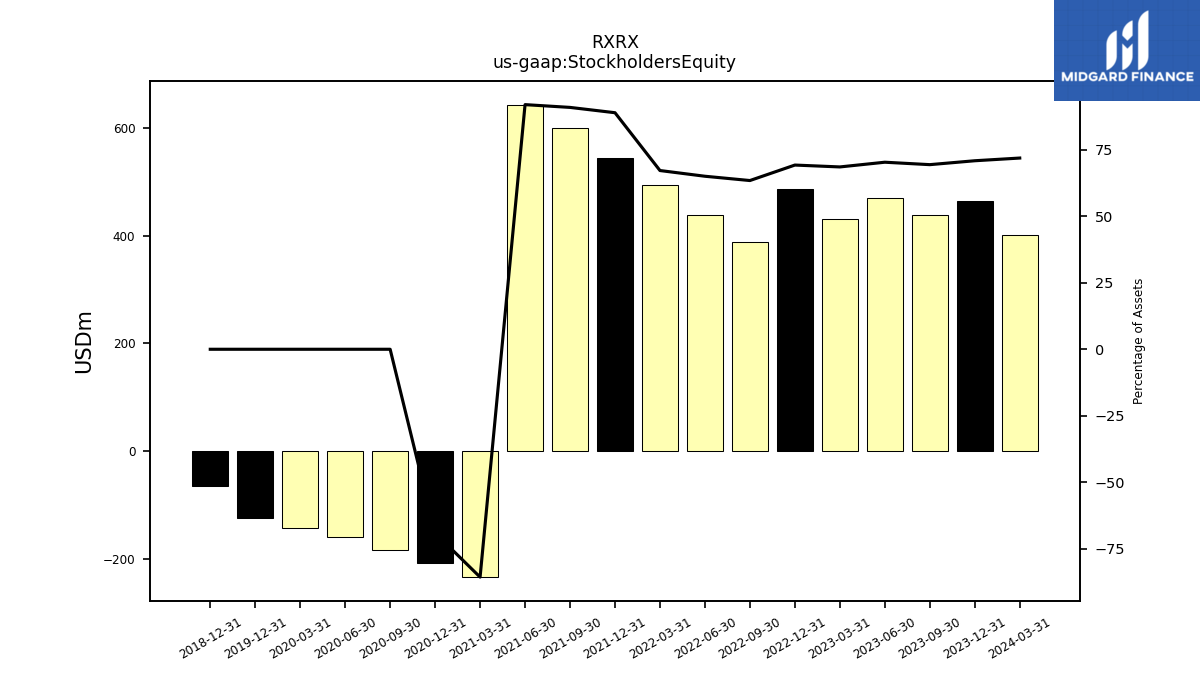
| Assets | 630.83 | 666.70 | 627.37 | 701.29 | 611.53 | 672.51 | 734.32 | 610.35 | 658.61 | 698.59 | 271.94 | 298.58 | NA | NA | NA | |
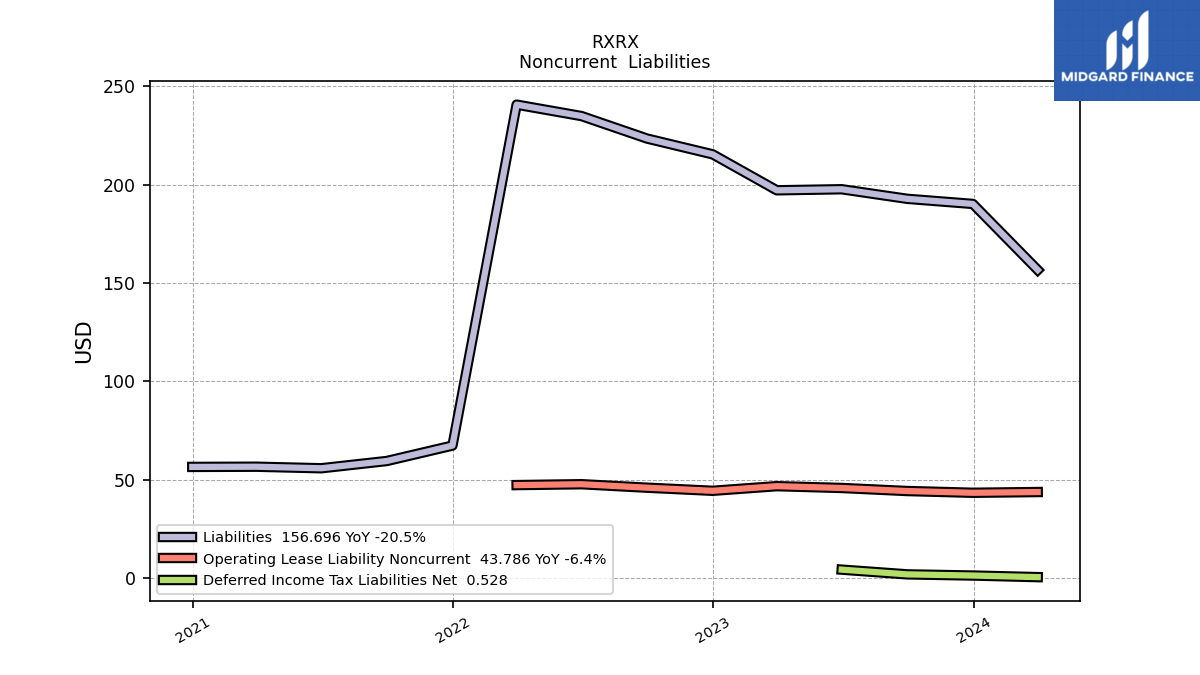
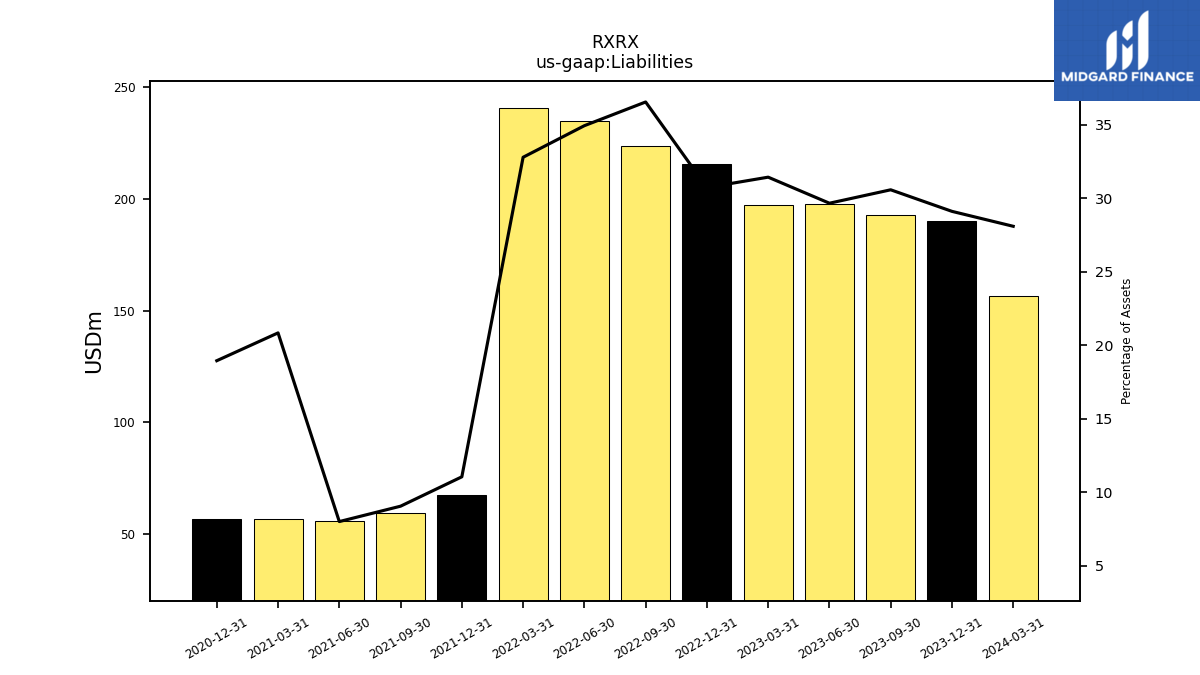
| Liabilities | 192.86 | 197.74 | 197.19 | 215.48 | 223.50 | 234.94 | 240.75 | 67.41 | 59.57 | 55.88 | 56.66 | 56.56 | NA | NA | NA | |
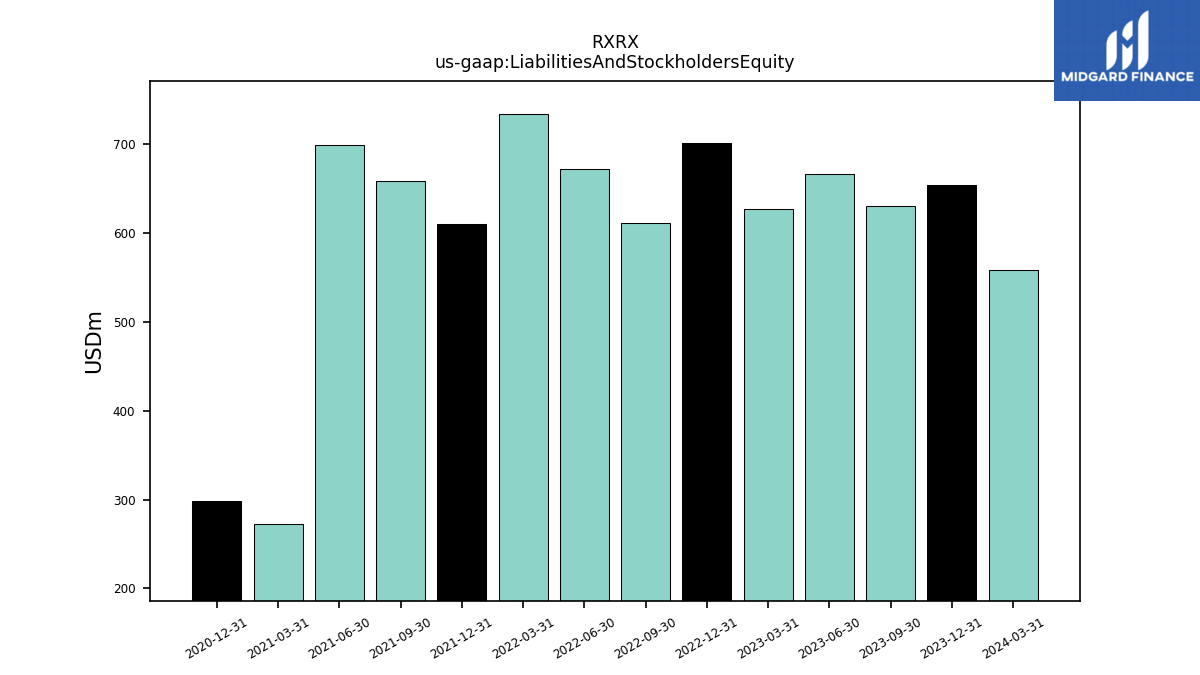
| Liabilities And Stockholders Equity | 630.83 | 666.70 | 627.37 | 701.29 | 611.53 | 672.51 | 734.32 | 610.35 | 658.61 | 698.59 | 271.94 | 298.58 | NA | NA | NA | |
| Stockholders Equity | 437.97 | 468.96 | 430.18 | 485.81 | 388.03 | 437.58 | 493.57 | 542.94 | 599.03 | 642.71 | -233.03 | -206.29 | -182.07 | -159.44 | -141.39 |
| 2023-09-30 | 2023-06-30 | 2023-03-31 | 2022-12-31 | 2022-09-30 | 2022-06-30 | 2022-03-31 | 2021-12-31 | 2021-09-30 | 2021-06-30 | 2021-03-31 | 2020-12-31 | 2020-09-30 | 2020-06-30 | 2020-03-31 | ||
|---|---|---|---|---|---|---|---|---|---|---|---|---|---|---|---|---|
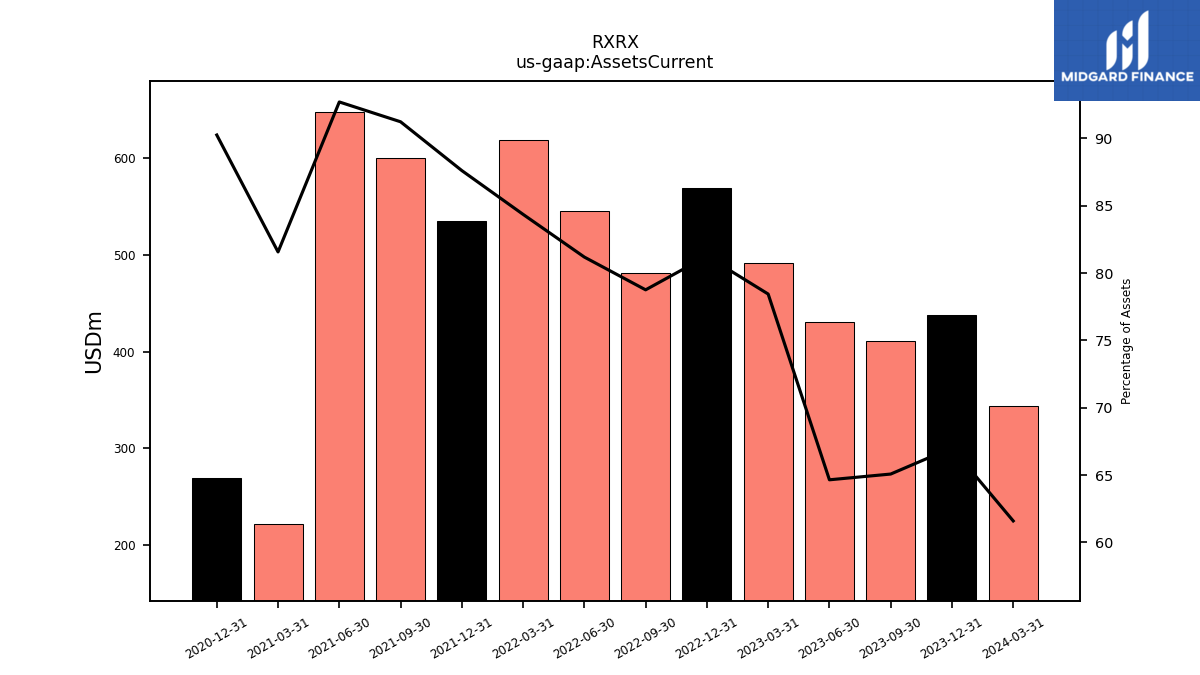
| Assets Current | 410.52 | 431.02 | 492.12 | 569.81 | 481.62 | 546.00 | 619.46 | 534.72 | 600.87 | 647.63 | 221.82 | 269.48 | NA | NA | NA | |
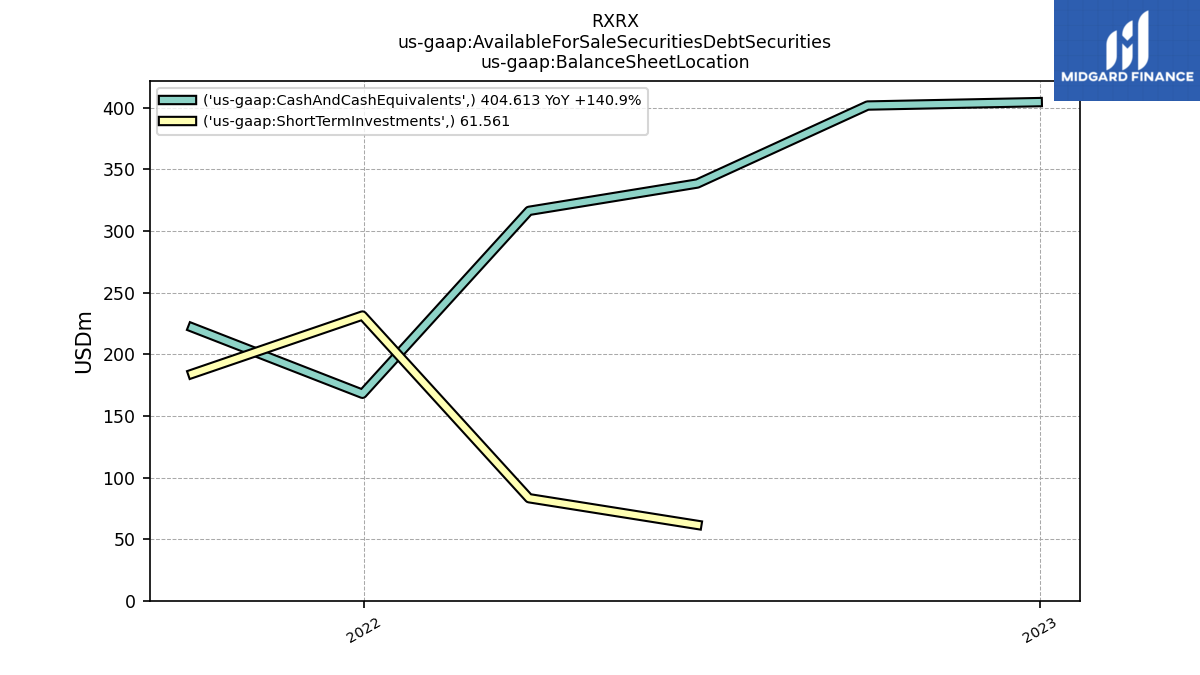
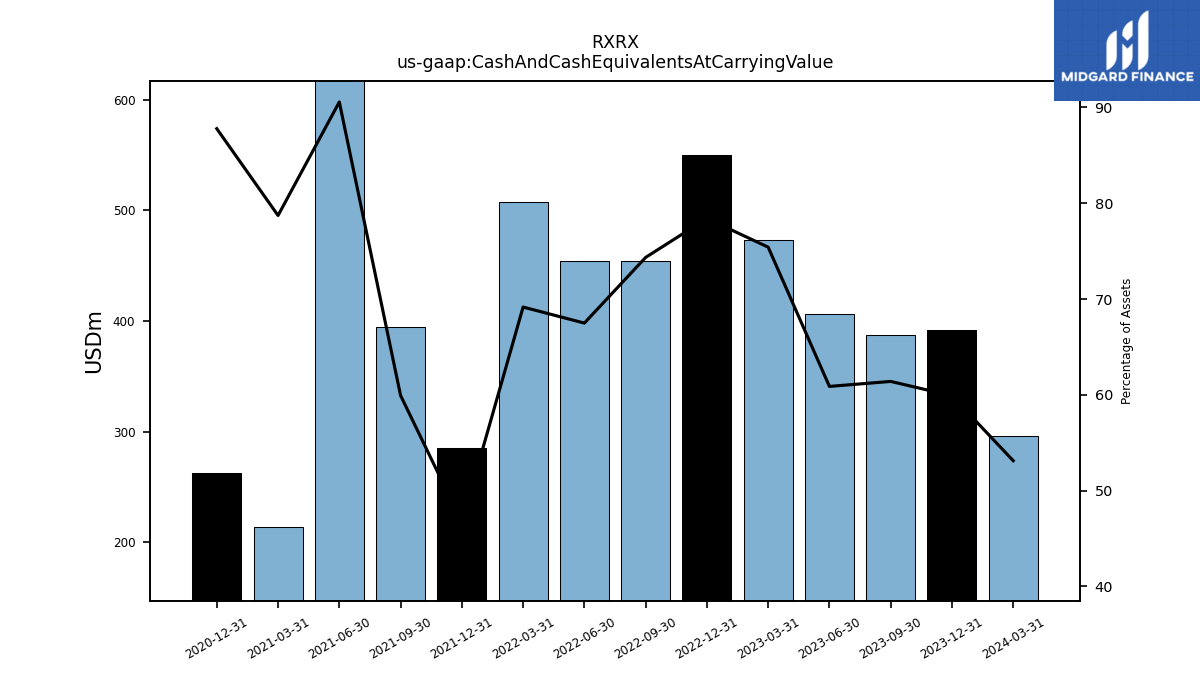
| Cash And Cash Equivalents At Carrying Value | 387.32 | 405.87 | 473.14 | 549.91 | 454.65 | 453.88 | 507.89 | 285.12 | 394.72 | 632.74 | 214.09 | 262.13 | NA | NA | NA | |
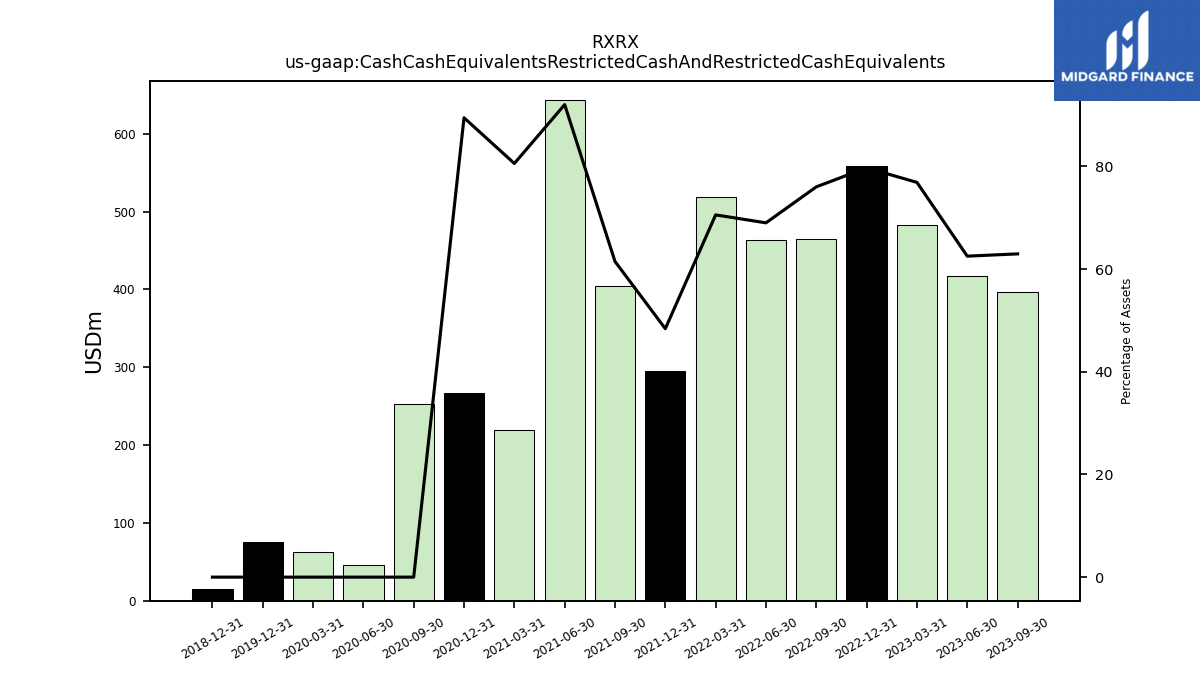
| Cash Cash Equivalents Restricted Cash And Restricted Cash Equivalents | 397.21 | 416.82 | 482.38 | 559.11 | 464.89 | 464.11 | 518.12 | 295.35 | 404.95 | 642.97 | 219.13 | 267.17 | 253.15 | 46.31 | 62.67 | |
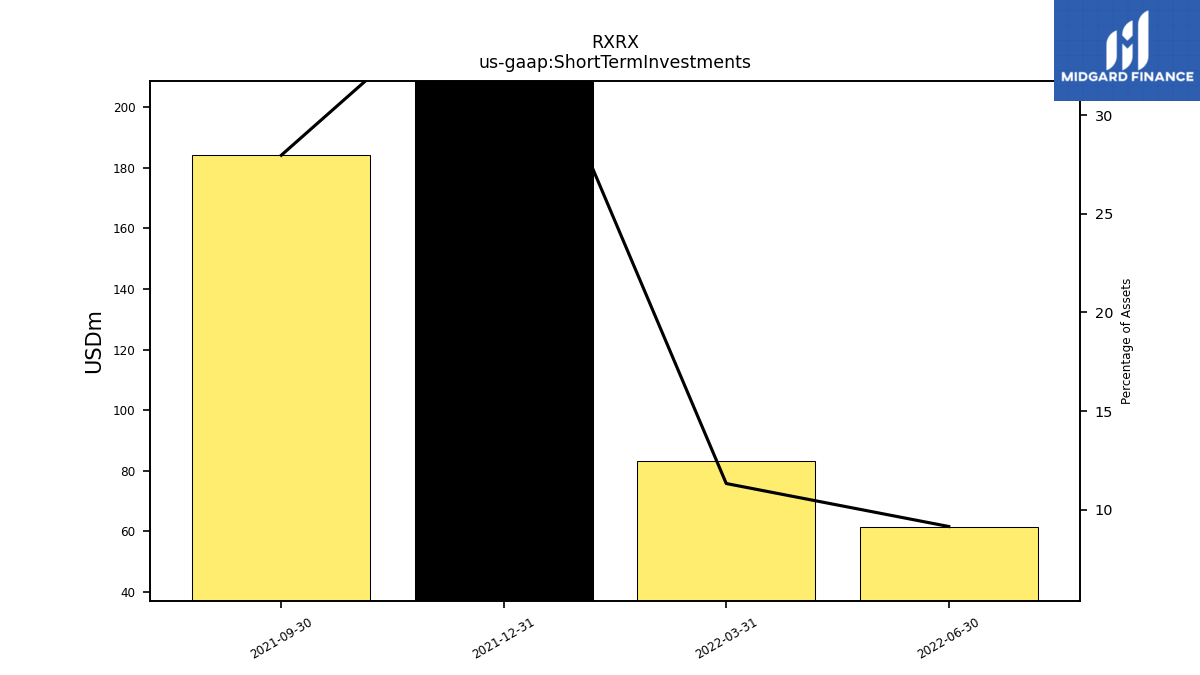
| Short Term Investments | NA | NA | NA | NA | NA | 61.56 | 83.21 | 231.45 | 184.19 | NA | NA | NA | NA | NA | NA | |
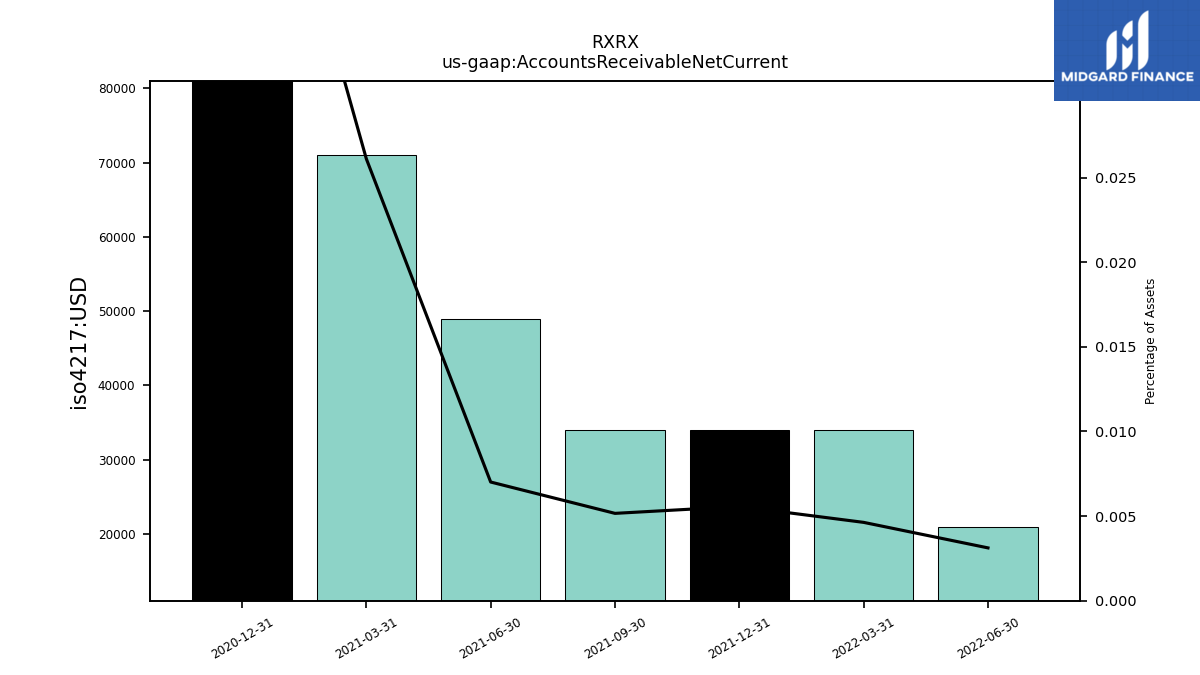
| Accounts Receivable Net Current | NA | NA | NA | NA | NA | 0.02 | 0.03 | 0.03 | 0.03 | 0.05 | 0.07 | 0.16 | NA | NA | NA | |
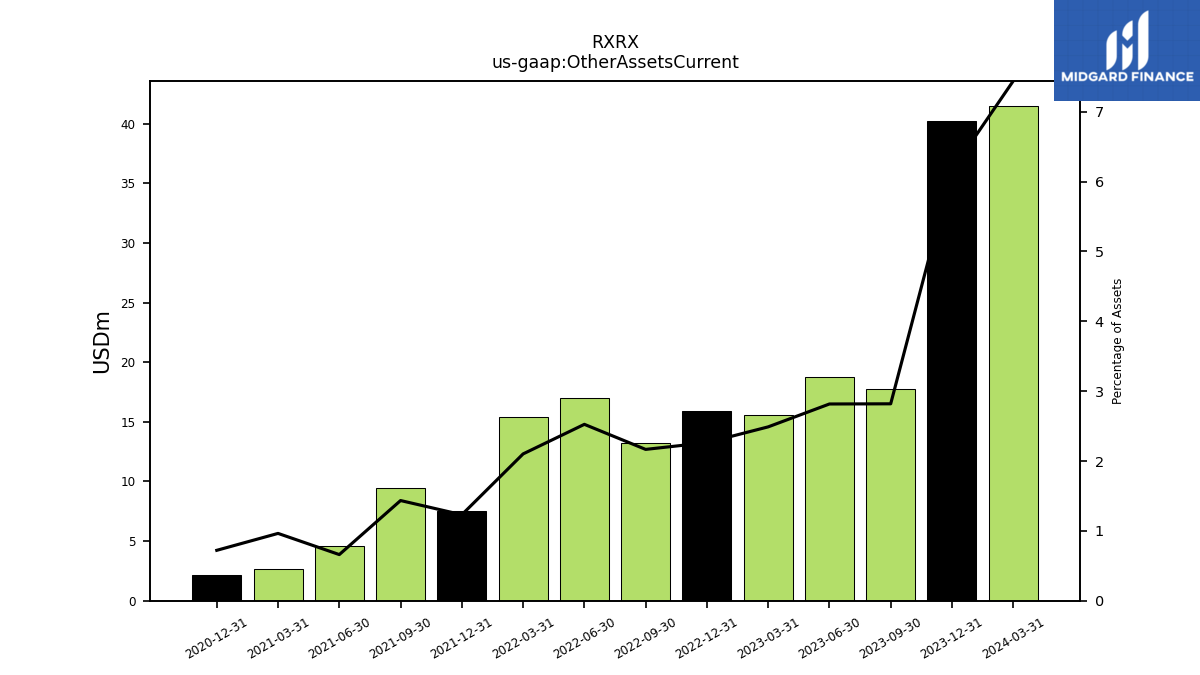
| Other Assets Current | 17.78 | 18.77 | 15.61 | 15.87 | 13.25 | 16.98 | 15.43 | 7.51 | 9.45 | 4.62 | 2.62 | 2.15 | NA | NA | NA | |
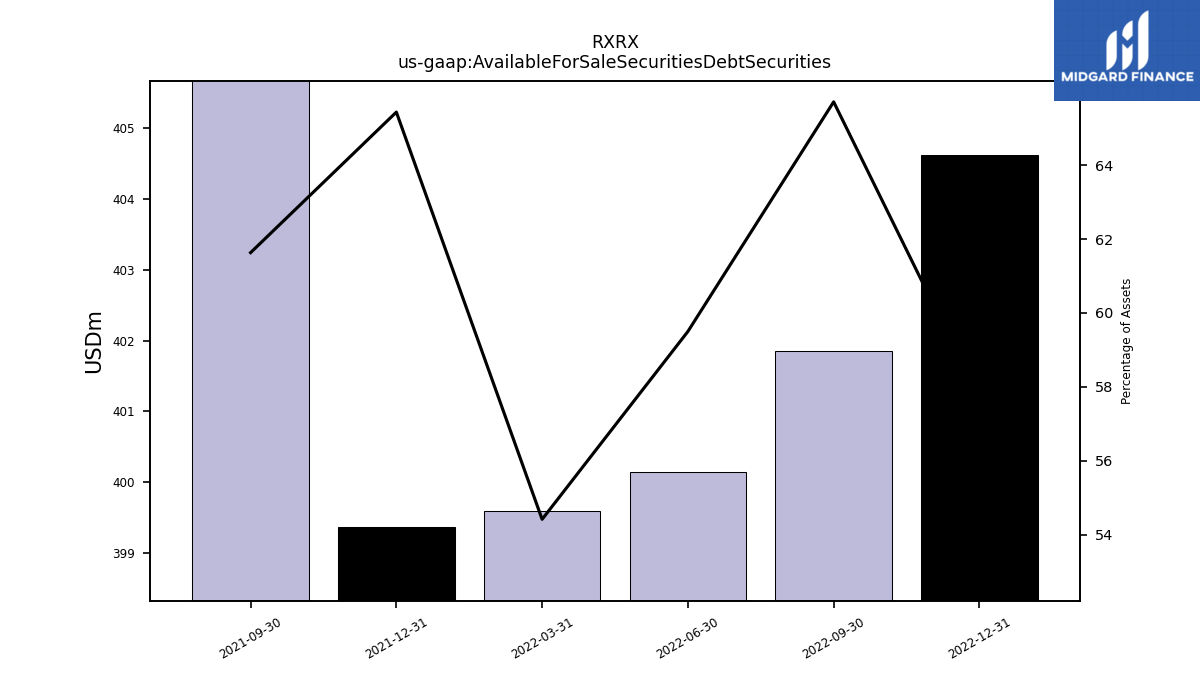
| Available For Sale Securities Debt Securities | NA | NA | NA | 404.61 | 401.85 | 400.14 | 399.60 | 399.38 | 405.91 | NA | NA | NA | NA | NA | NA |
| 2023-09-30 | 2023-06-30 | 2023-03-31 | 2022-12-31 | 2022-09-30 | 2022-06-30 | 2022-03-31 | 2021-12-31 | 2021-09-30 | 2021-06-30 | 2021-03-31 | 2020-12-31 | 2020-09-30 | 2020-06-30 | 2020-03-31 | ||
|---|---|---|---|---|---|---|---|---|---|---|---|---|---|---|---|---|
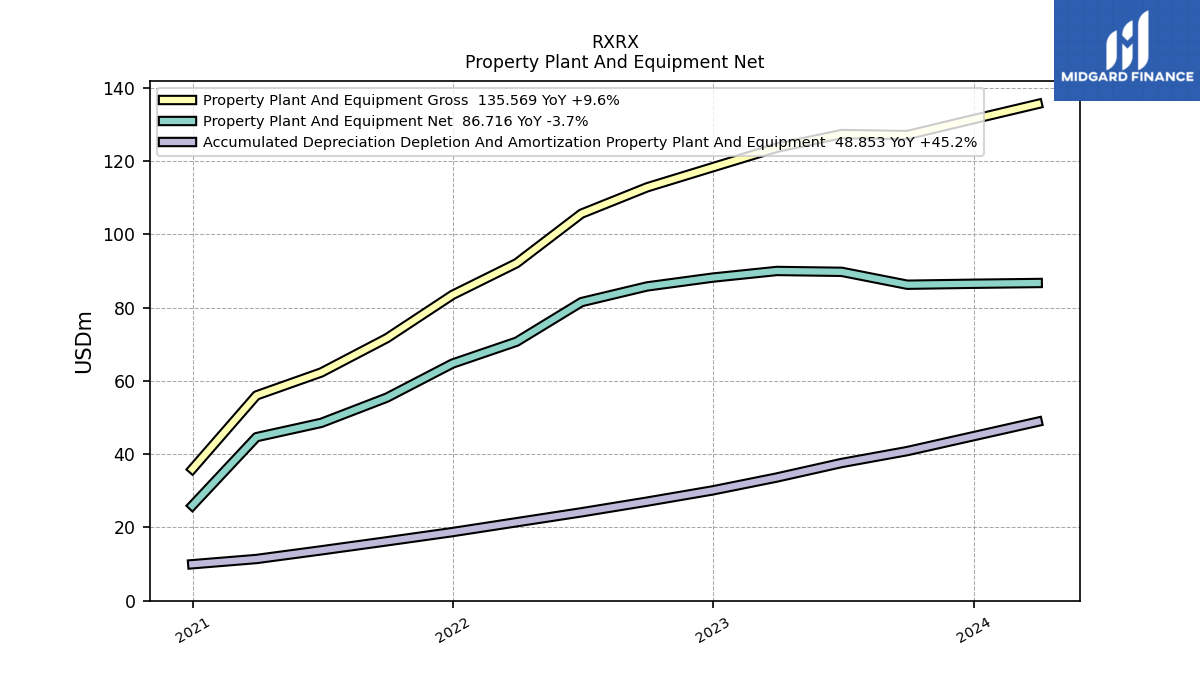
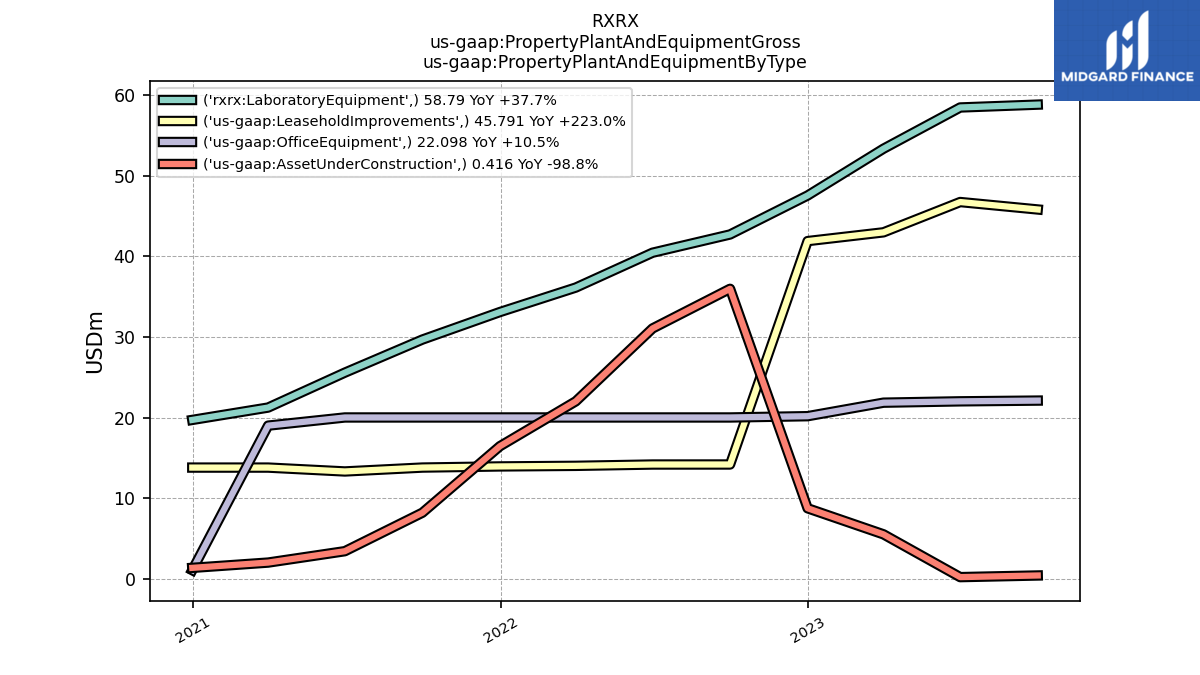
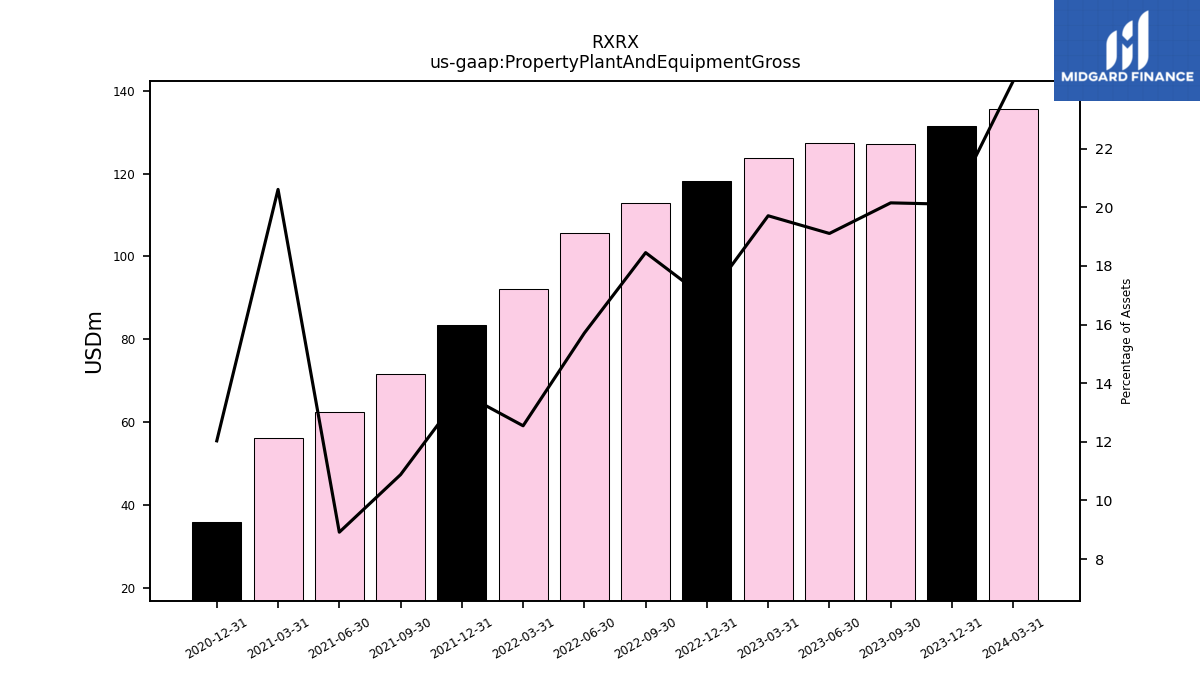
| Property Plant And Equipment Gross | 127.09 | 127.37 | 123.64 | 118.31 | 112.83 | 105.65 | 92.13 | 83.46 | 71.66 | 62.31 | 56.04 | 35.93 | NA | NA | NA | |
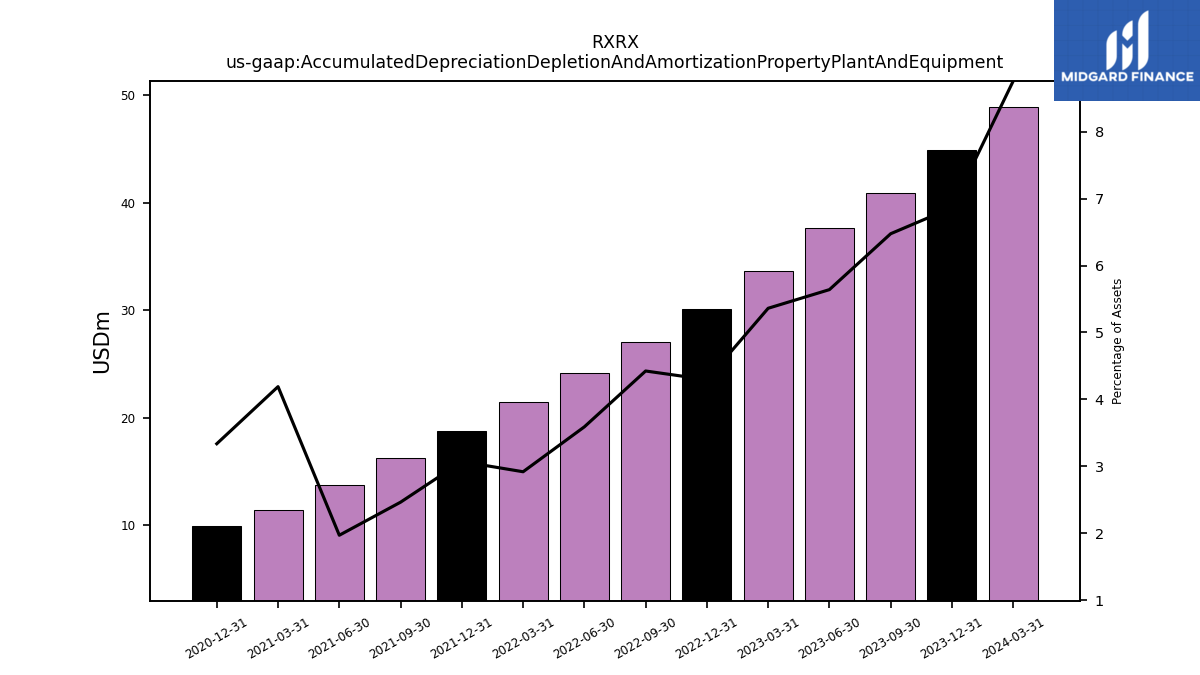
| Accumulated Depreciation Depletion And Amortization Property Plant And Equipment | 40.85 | 37.60 | 33.63 | 30.11 | 27.05 | 24.14 | 21.43 | 18.74 | 16.22 | 13.76 | 11.39 | 9.96 | NA | NA | NA | |
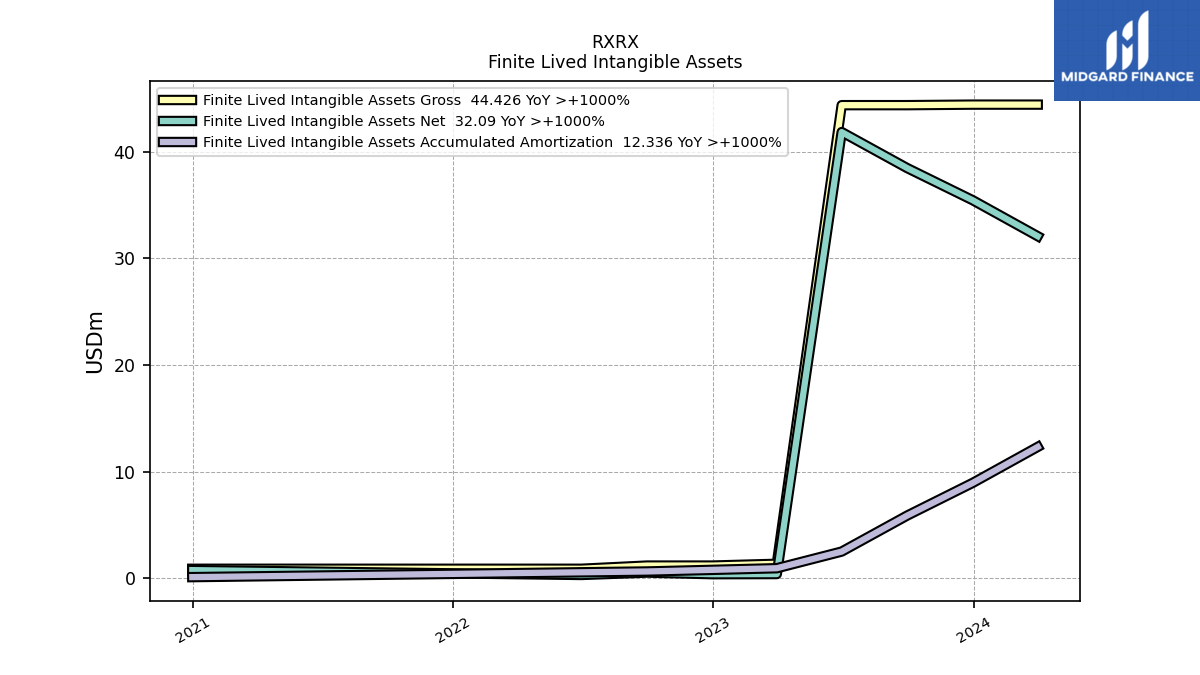
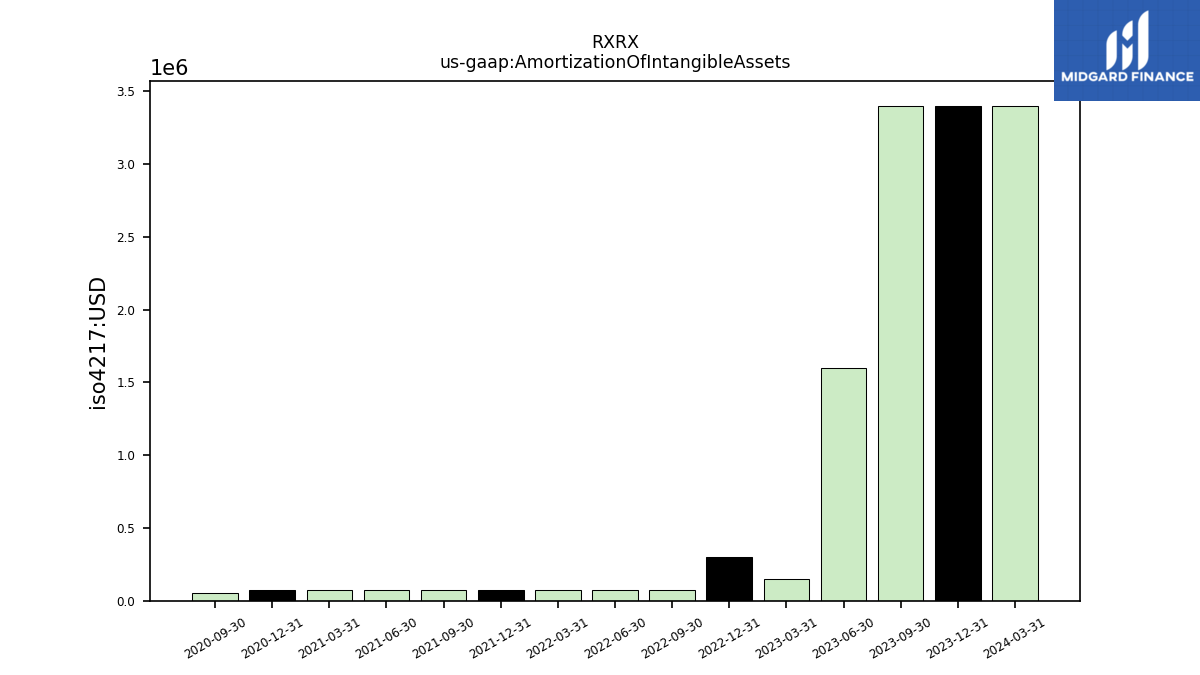
| Amortization Of Intangible Assets | 3.40 | 1.60 | 0.15 | 0.30 | 0.08 | 0.08 | 0.08 | 0.08 | 0.08 | 0.08 | 0.08 | 0.07 | 0.05 | NA | NA | |
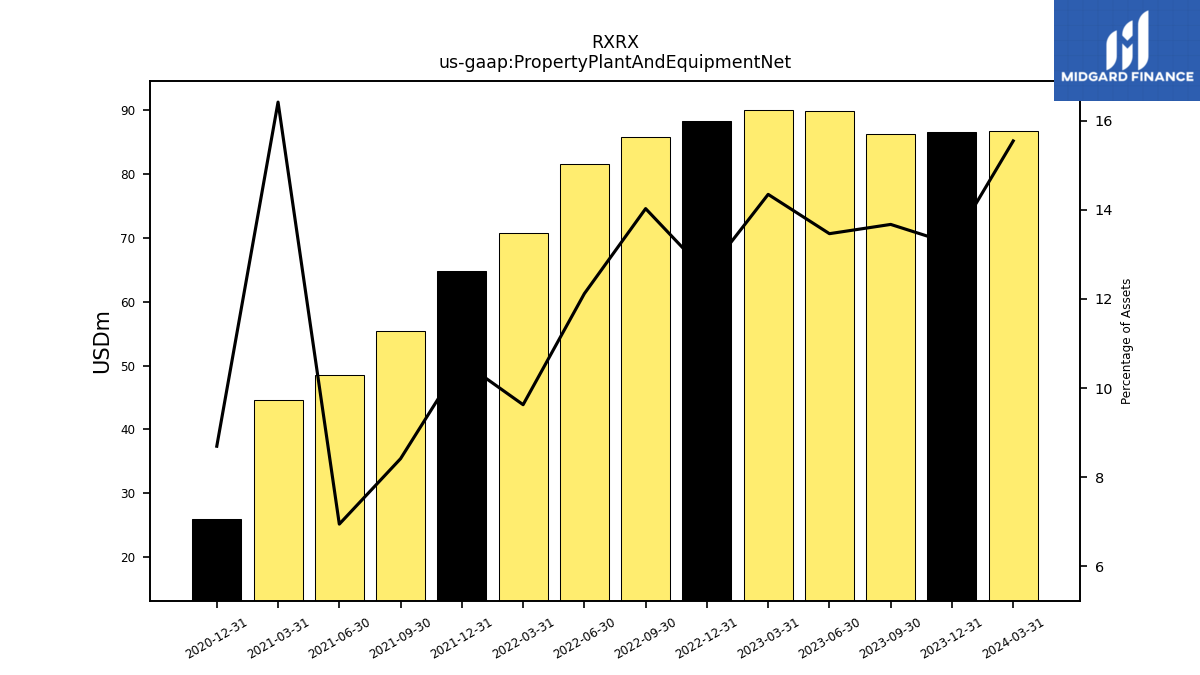
| Property Plant And Equipment Net | 86.25 | 89.77 | 90.00 | 88.19 | 85.78 | 81.51 | 70.70 | 64.72 | 55.44 | 48.55 | 44.64 | 25.97 | NA | NA | NA | |
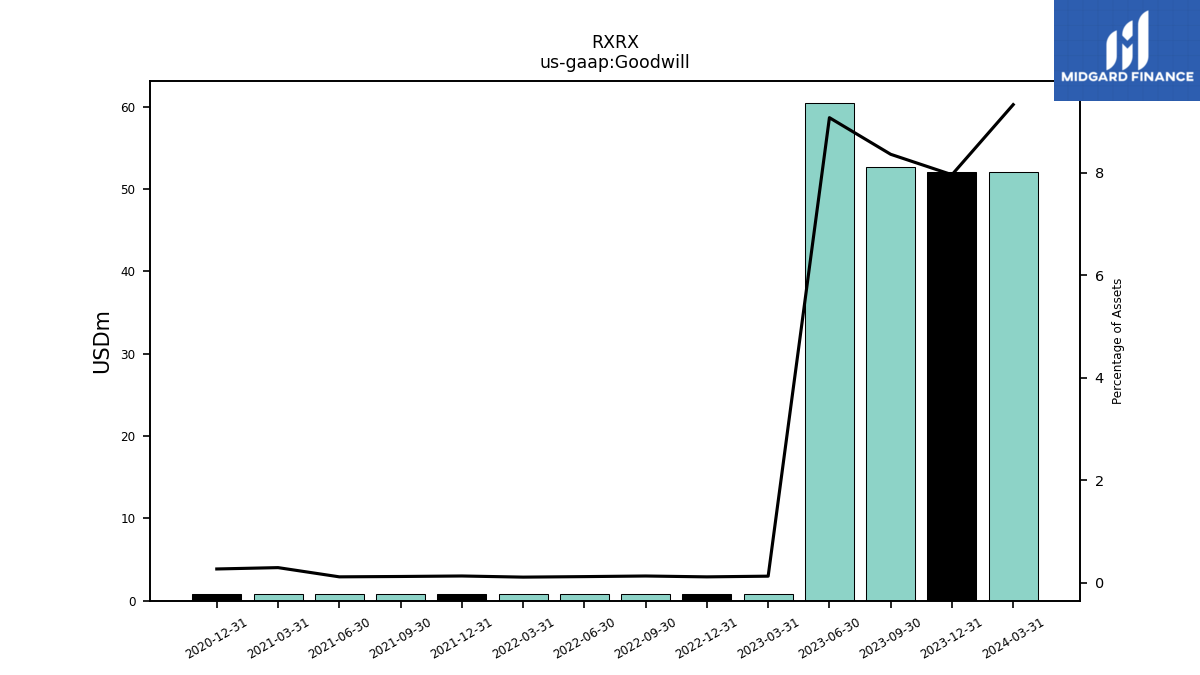
| Goodwill | 52.75 | 60.52 | 0.80 | 0.80 | 0.80 | 0.80 | 0.80 | 0.80 | 0.80 | 0.80 | 0.80 | 0.80 | NA | NA | NA | |
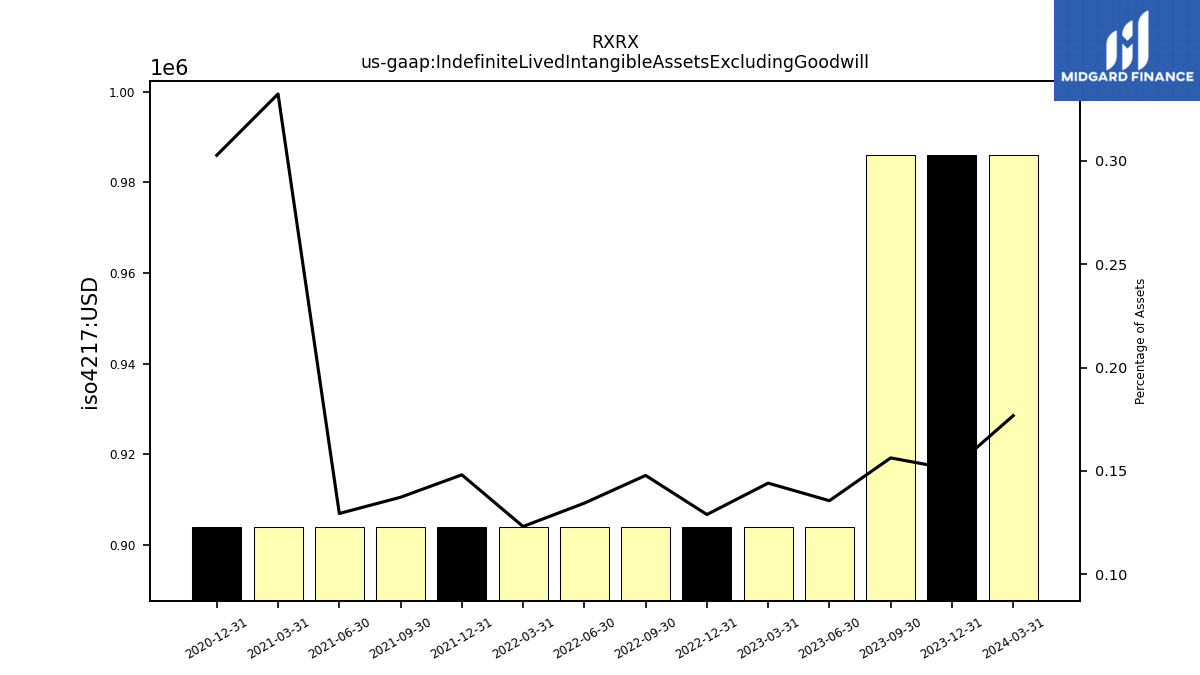
| Indefinite Lived Intangible Assets Excluding Goodwill | 0.99 | 0.90 | 0.90 | 0.90 | 0.90 | 0.90 | 0.90 | 0.90 | 0.90 | 0.90 | 0.90 | 0.90 | NA | NA | NA | |
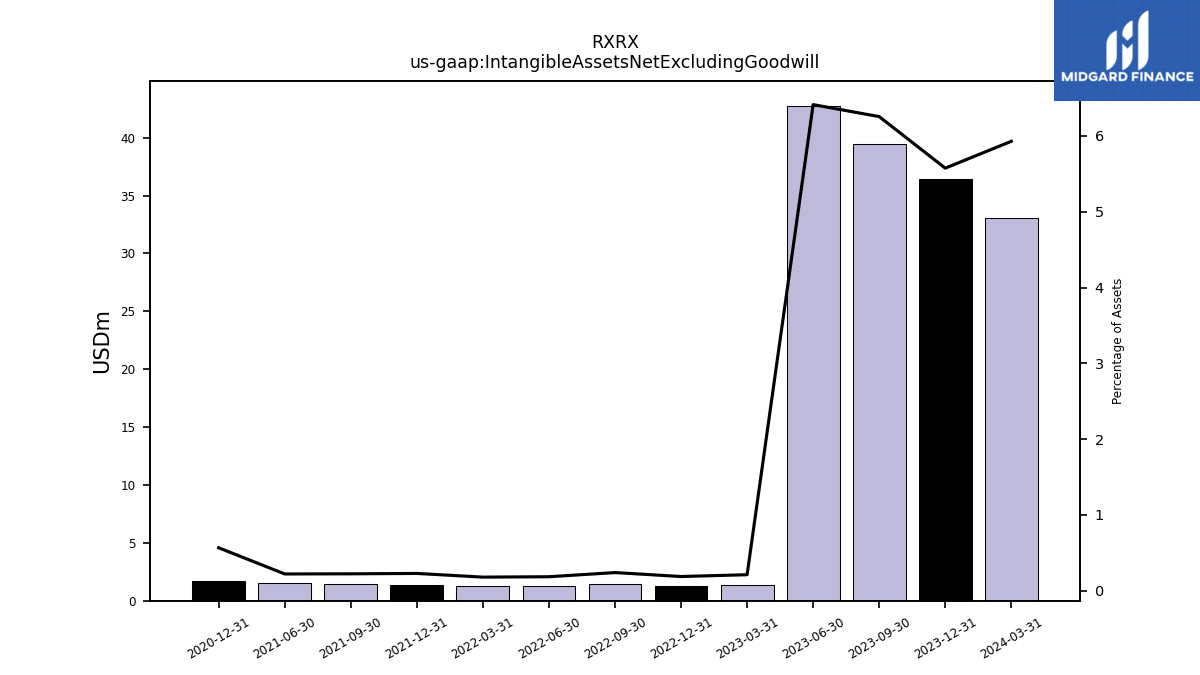
| Intangible Assets Net Excluding Goodwill | 39.46 | 42.76 | 1.32 | 1.31 | 1.46 | 1.23 | 1.31 | 1.39 | 1.46 | 1.54 | NA | 1.69 | NA | NA | NA | |
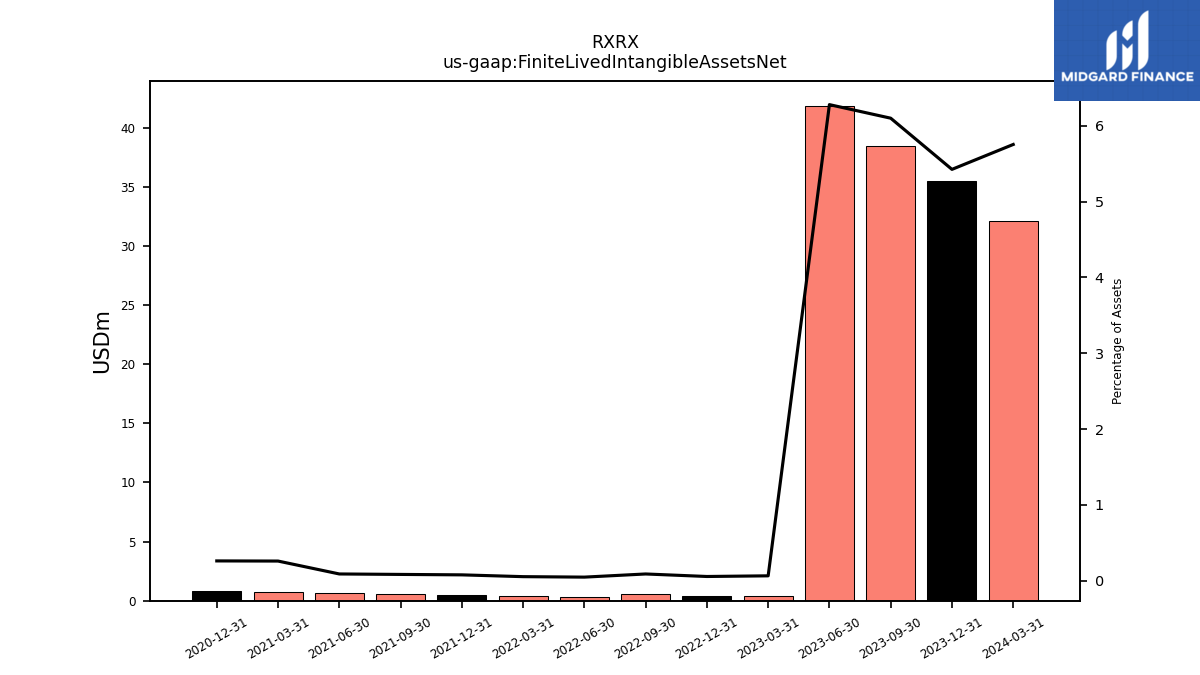
| Finite Lived Intangible Assets Net | 38.47 | 41.85 | 0.41 | 0.40 | 0.55 | 0.33 | 0.41 | 0.48 | 0.56 | 0.63 | 0.71 | 0.78 | NA | NA | NA | |
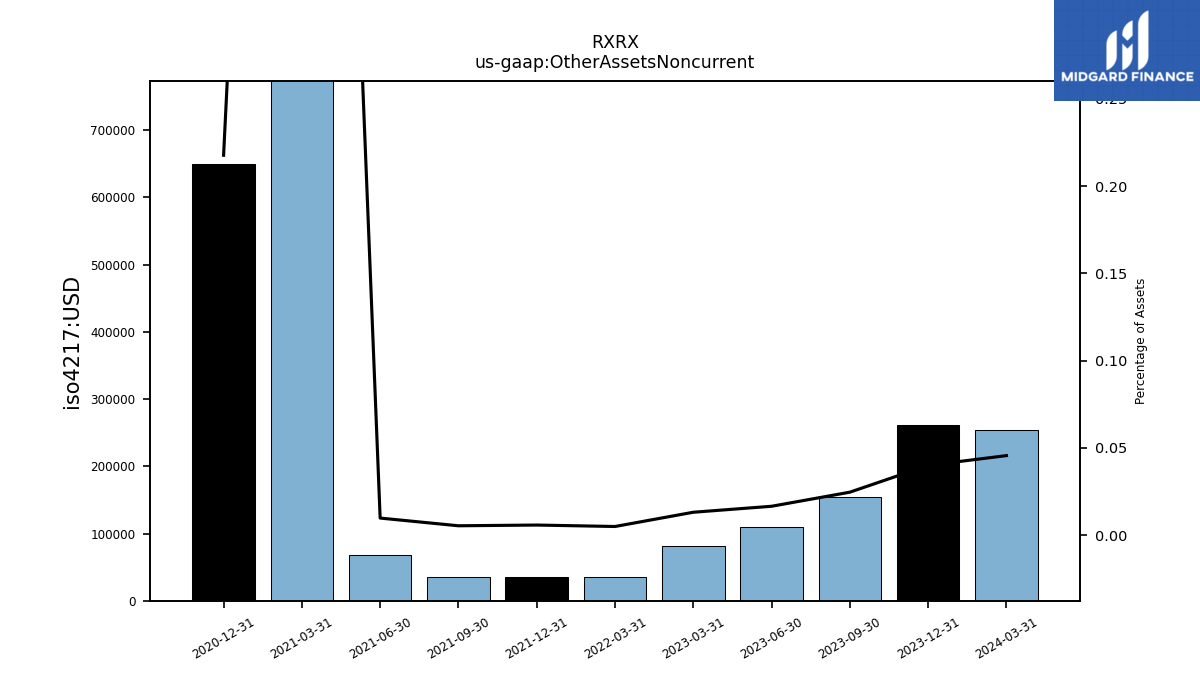
| Other Assets Noncurrent | 0.15 | 0.11 | 0.08 | NA | NA | NA | 0.04 | 0.04 | 0.04 | 0.07 | 3.06 | 0.65 | NA | NA | NA | |
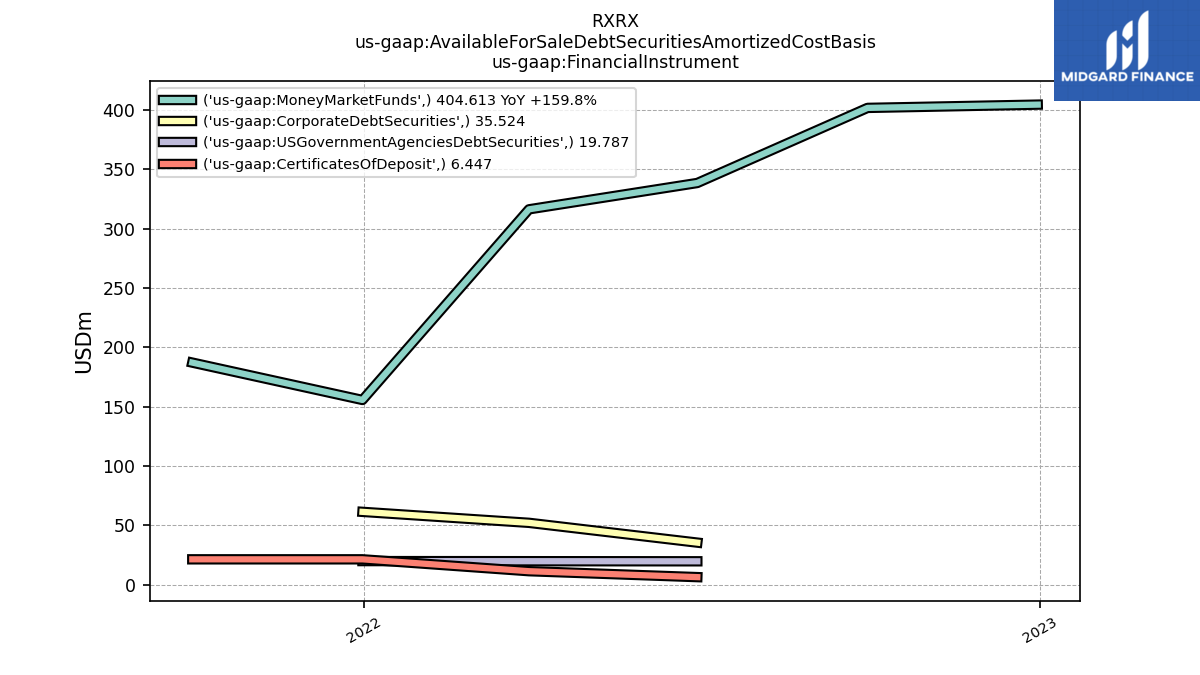
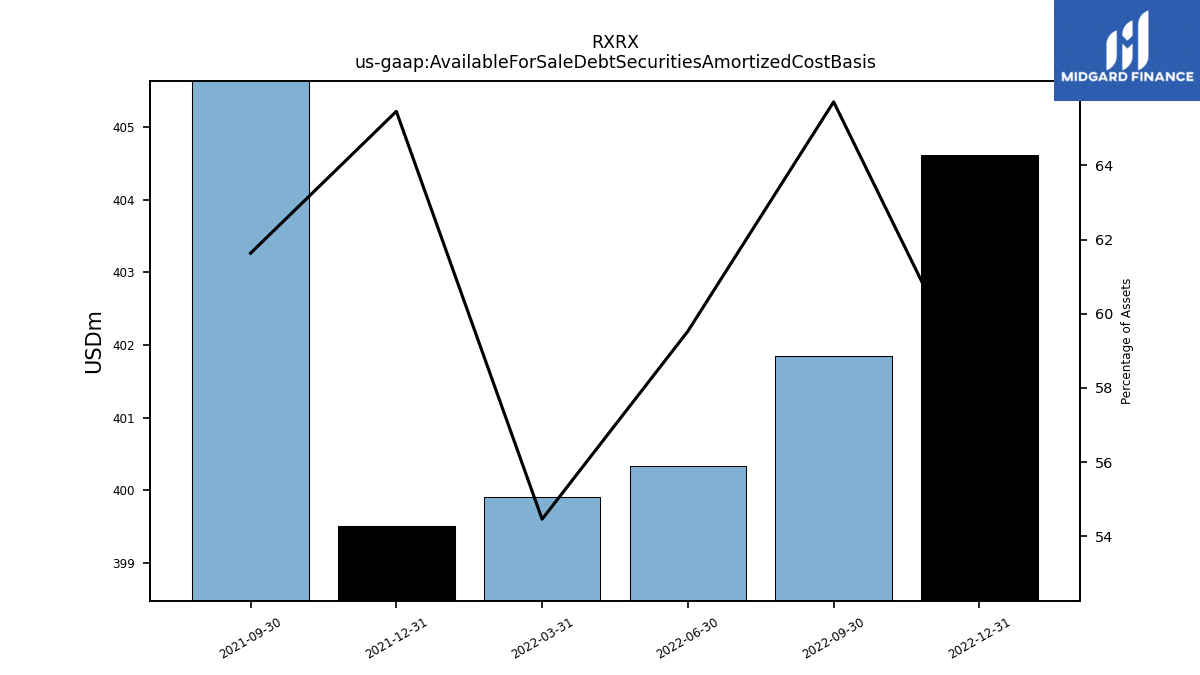
| Available For Sale Debt Securities Amortized Cost Basis | NA | NA | NA | 404.61 | 401.85 | 400.34 | 399.91 | 399.50 | 405.91 | NA | NA | NA | NA | NA | NA |
| 2023-09-30 | 2023-06-30 | 2023-03-31 | 2022-12-31 | 2022-09-30 | 2022-06-30 | 2022-03-31 | 2021-12-31 | 2021-09-30 | 2021-06-30 | 2021-03-31 | 2020-12-31 | 2020-09-30 | 2020-06-30 | 2020-03-31 | ||
|---|---|---|---|---|---|---|---|---|---|---|---|---|---|---|---|---|
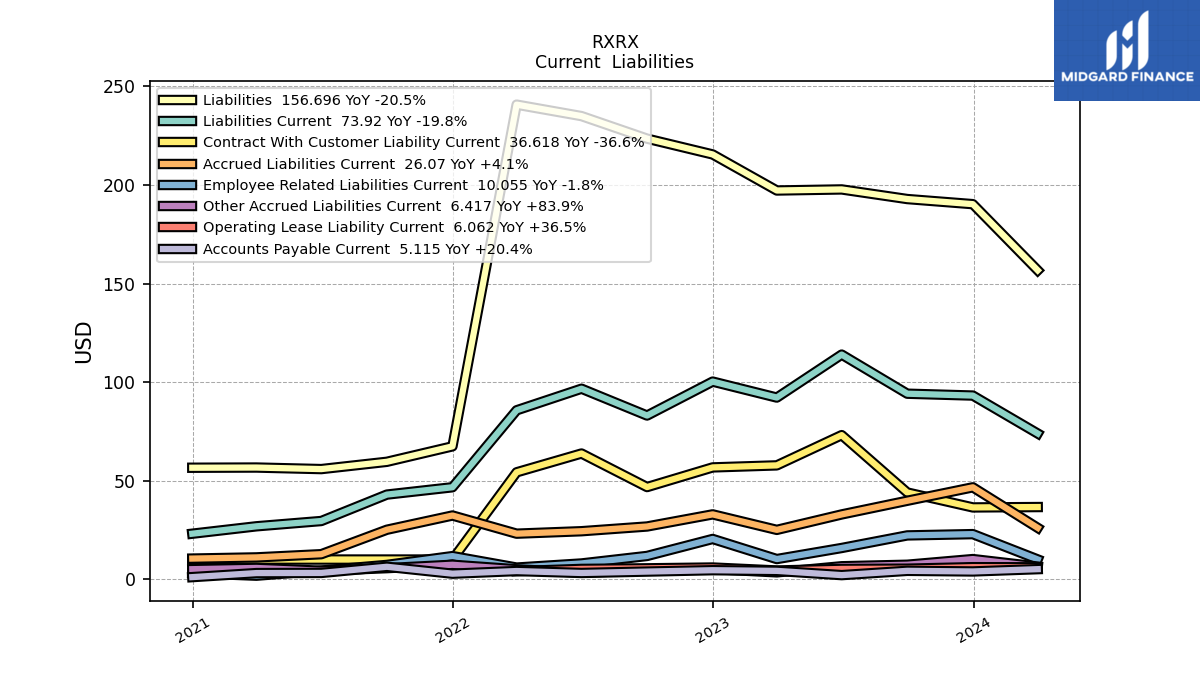
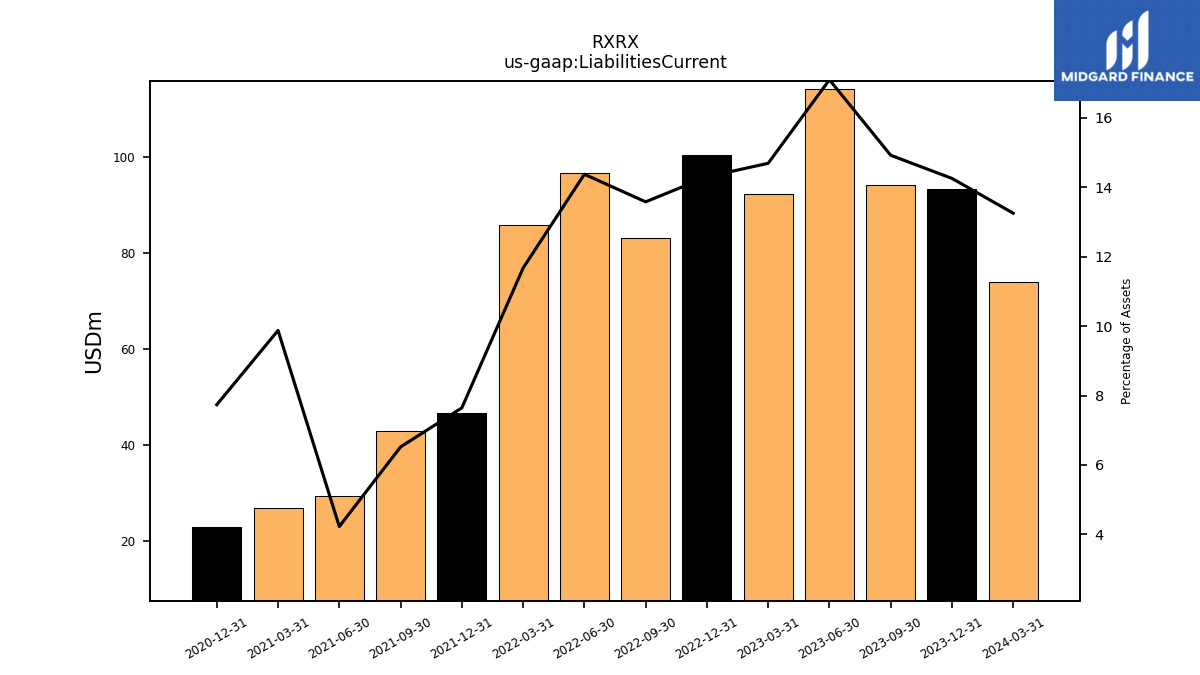
| Liabilities Current | 94.12 | 113.96 | 92.15 | 100.27 | 83.04 | 96.65 | 85.70 | 46.66 | 42.94 | 29.54 | 26.85 | 23.10 | NA | NA | NA | |
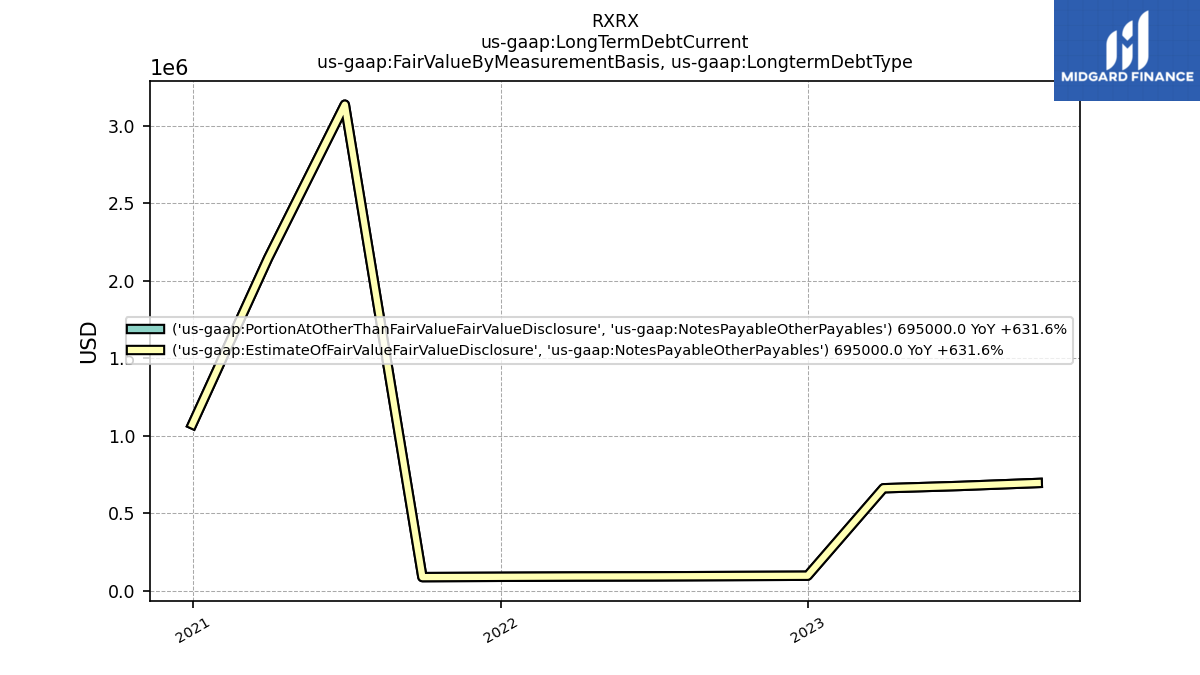
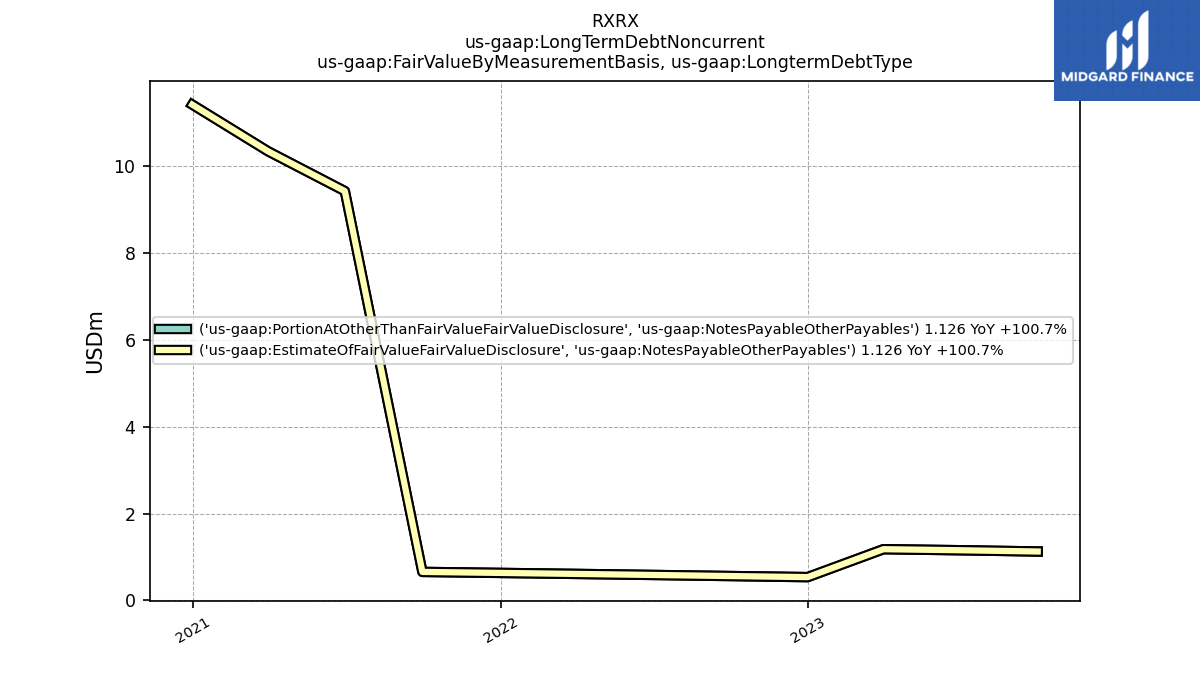
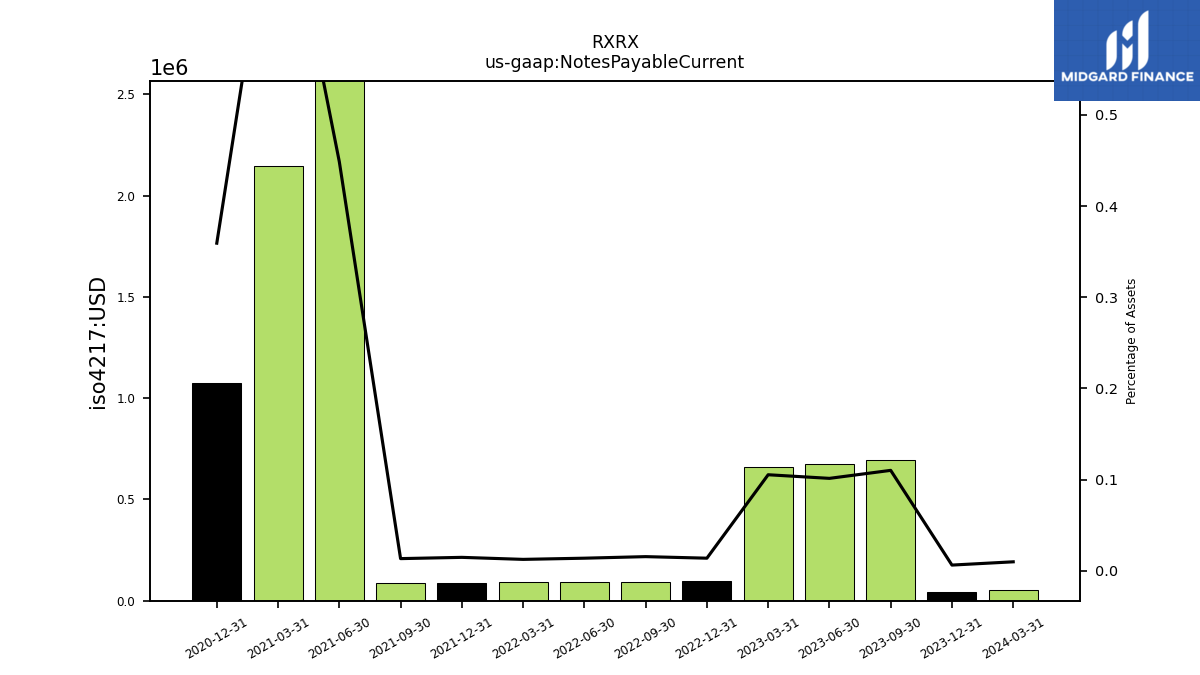
| Notes Payable Current | 0.69 | 0.68 | 0.66 | 0.10 | 0.10 | 0.09 | 0.09 | 0.09 | 0.09 | 3.13 | 2.15 | 1.07 | NA | NA | NA | |
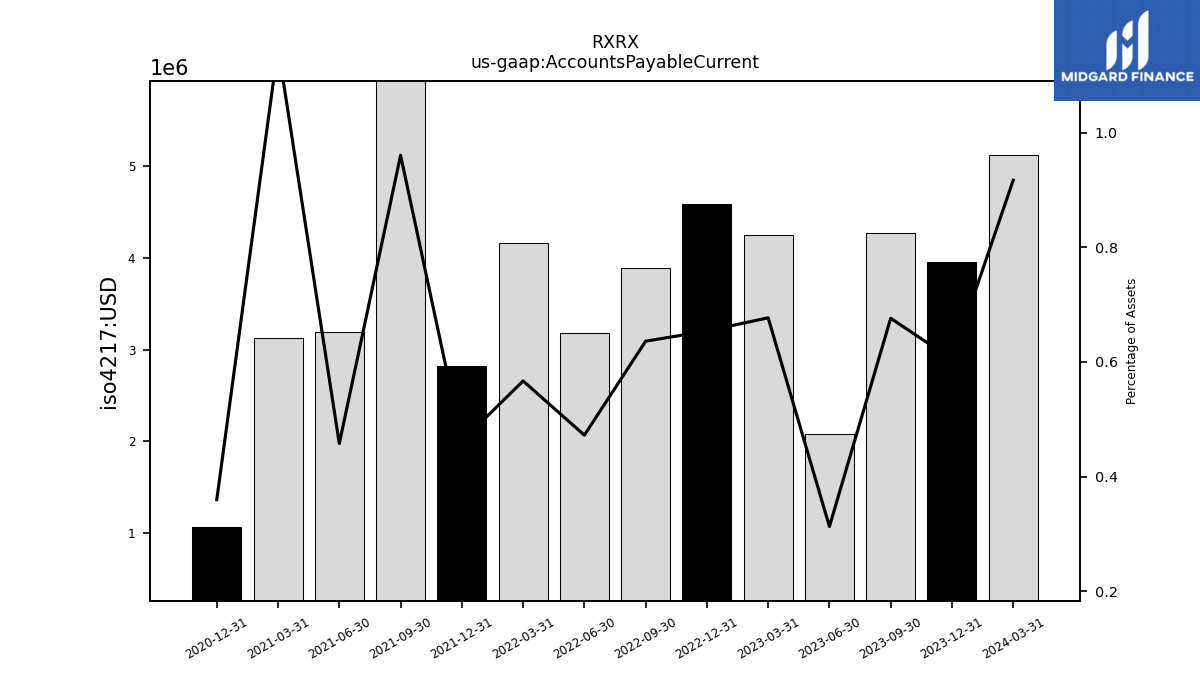
| Accounts Payable Current | 4.26 | 2.09 | 4.25 | 4.59 | 3.89 | 3.18 | 4.16 | 2.82 | 6.33 | 3.20 | 3.12 | 1.07 | NA | NA | NA | |
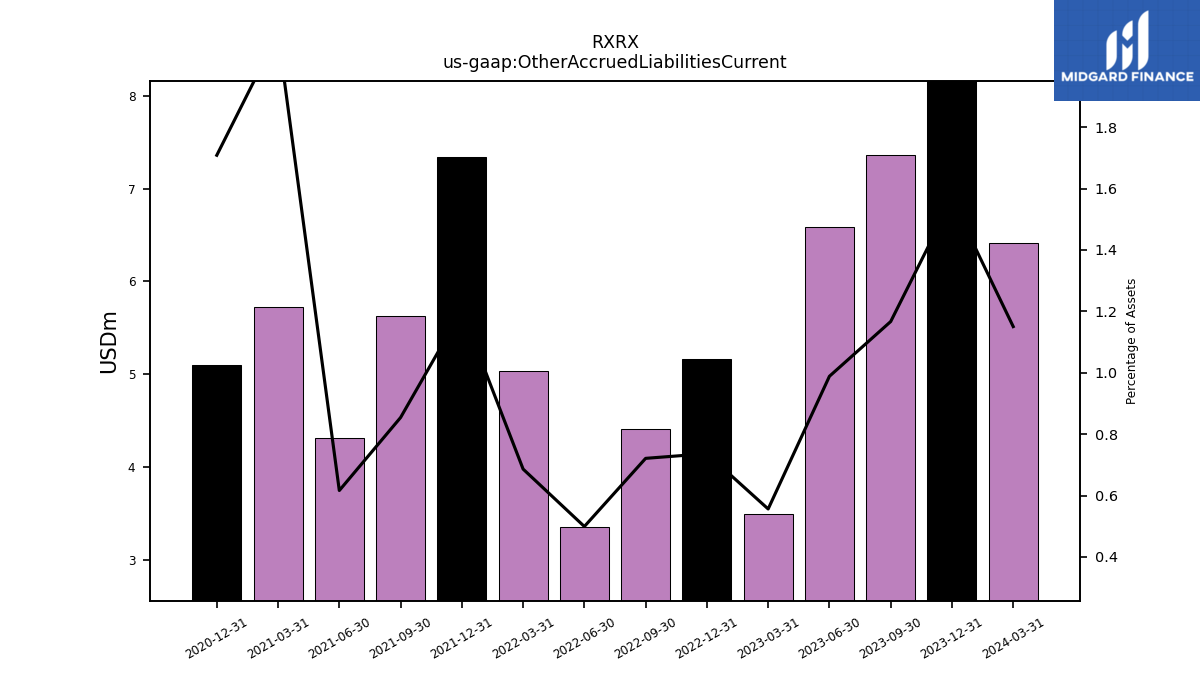
| Other Accrued Liabilities Current | 7.36 | 6.59 | 3.49 | 5.17 | 4.41 | 3.36 | 5.04 | 7.34 | 5.62 | 4.31 | 5.72 | 5.10 | NA | NA | NA | |
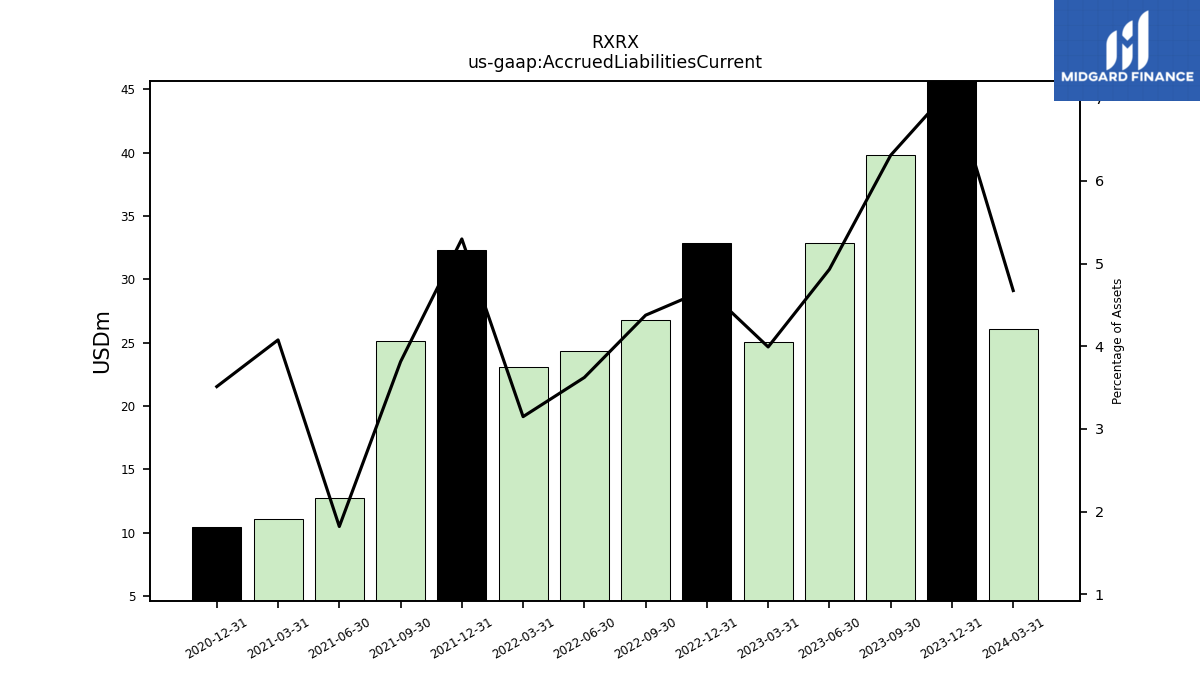
| Accrued Liabilities Current | 39.81 | 32.87 | 25.04 | 32.90 | 26.76 | 24.36 | 23.12 | 32.33 | 25.11 | 12.71 | 11.09 | 10.48 | NA | NA | NA | |
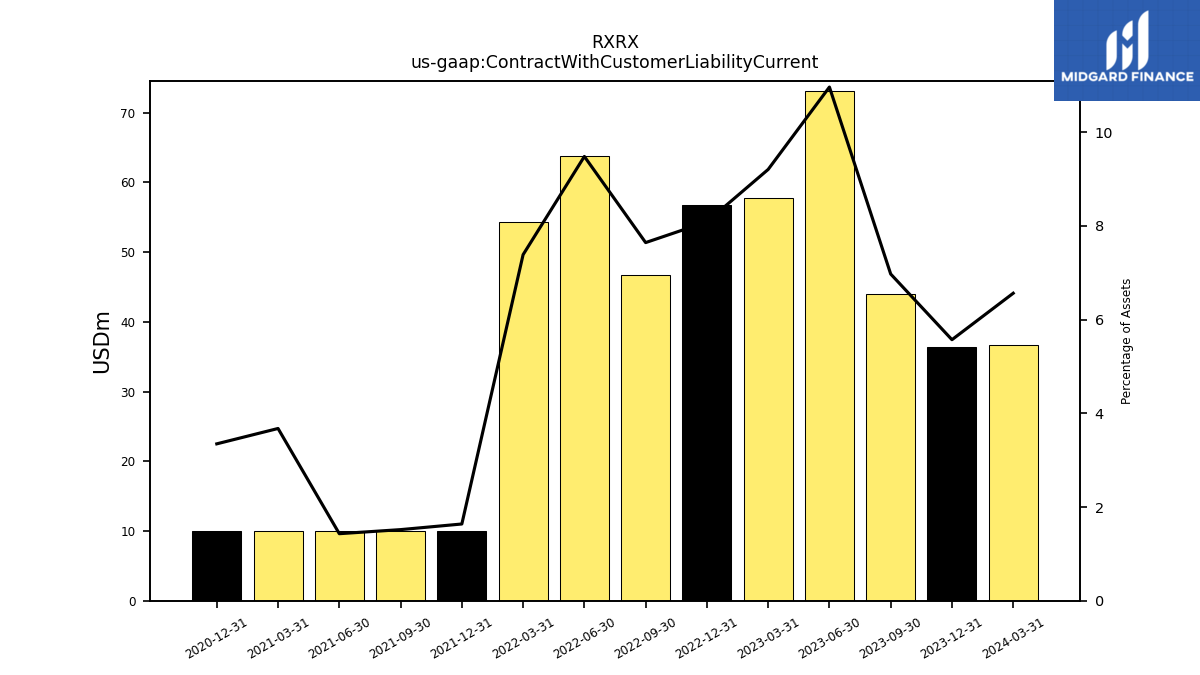
| Contract With Customer Liability Current | 44.00 | 73.11 | 57.76 | 56.73 | 46.75 | 63.78 | 54.25 | 10.00 | 10.00 | 10.00 | 10.00 | 10.00 | NA | NA | NA |
| 2023-09-30 | 2023-06-30 | 2023-03-31 | 2022-12-31 | 2022-09-30 | 2022-06-30 | 2022-03-31 | 2021-12-31 | 2021-09-30 | 2021-06-30 | 2021-03-31 | 2020-12-31 | 2020-09-30 | 2020-06-30 | 2020-03-31 | ||
|---|---|---|---|---|---|---|---|---|---|---|---|---|---|---|---|---|
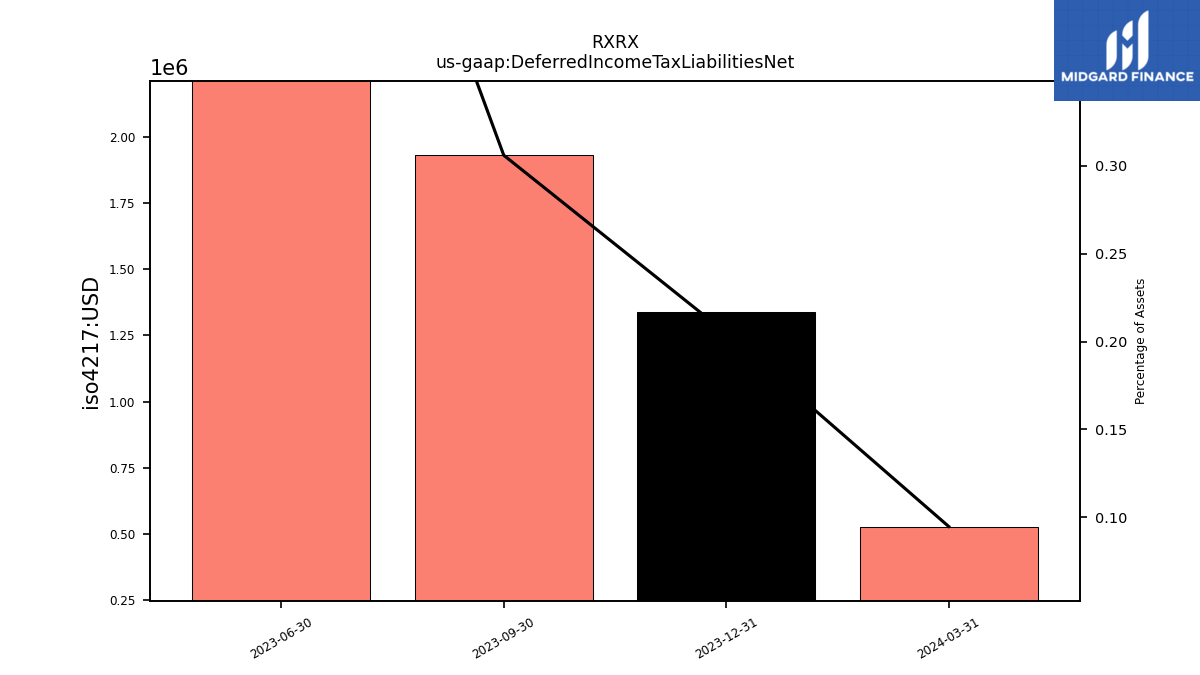
| Deferred Income Tax Liabilities Net | 1.93 | 4.34 | NA | NA | NA | NA | NA | NA | NA | NA | NA | NA | NA | NA | NA | |
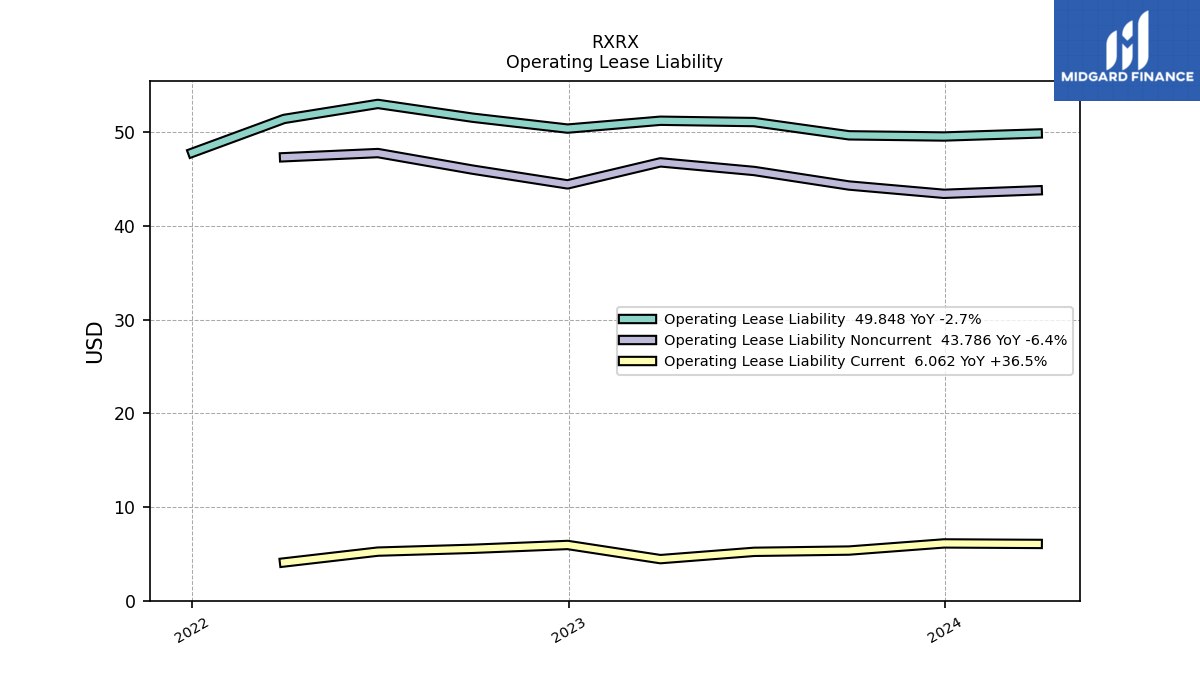
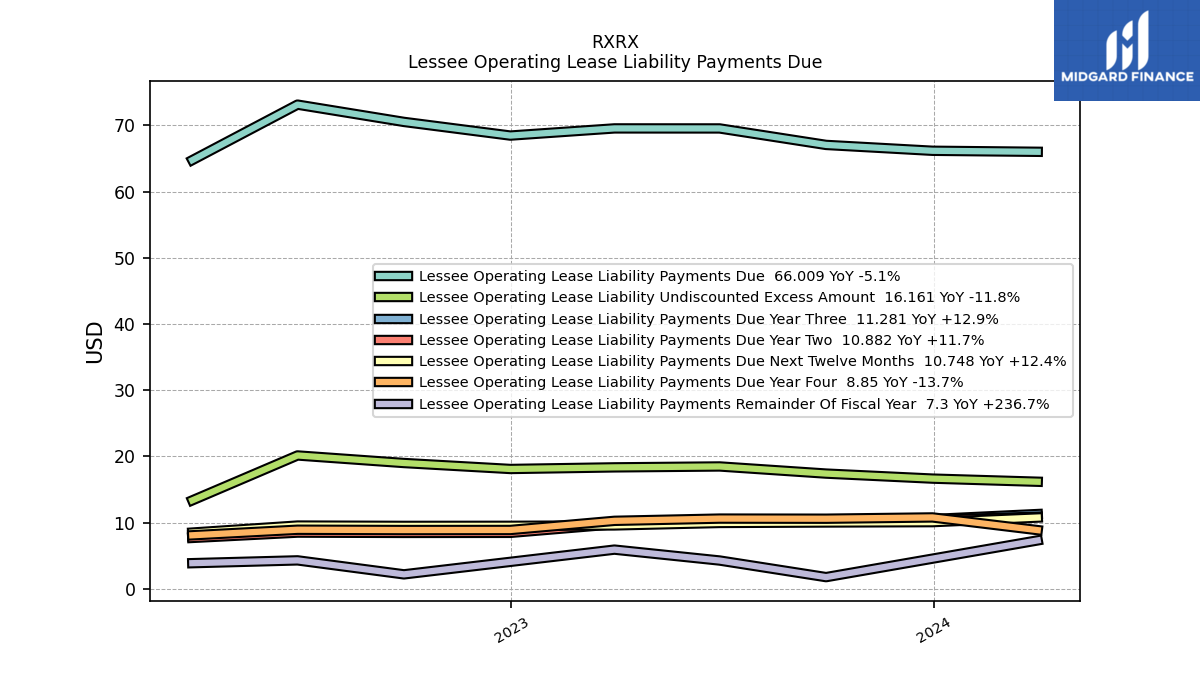
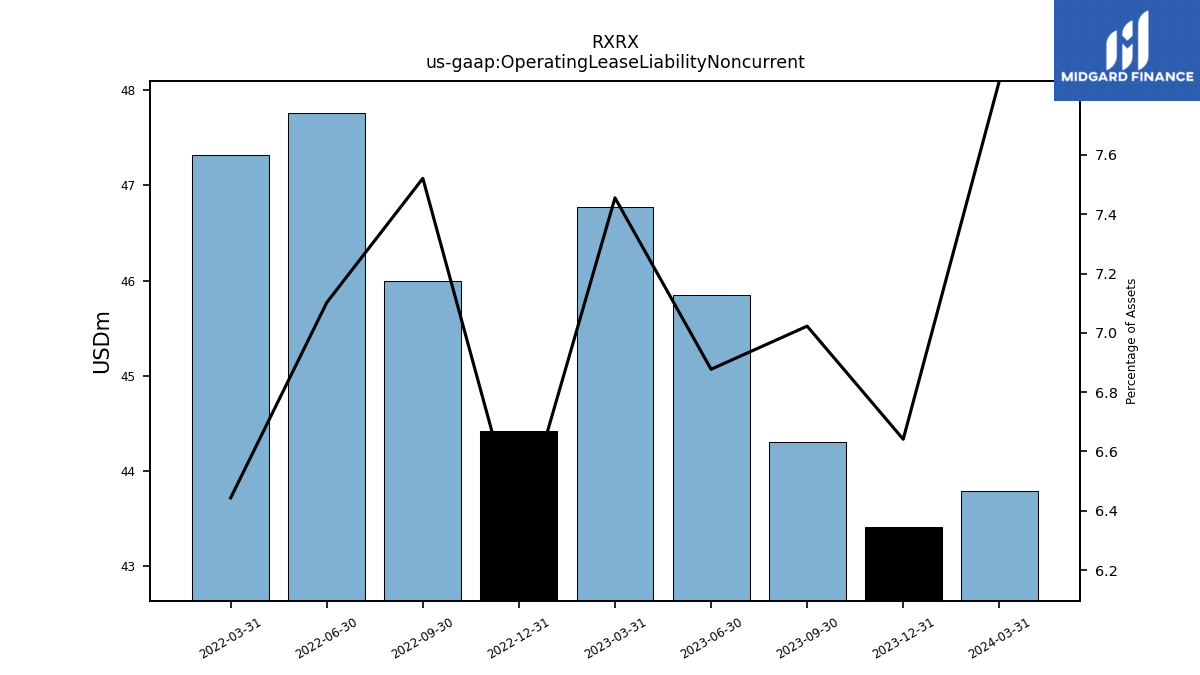
| Operating Lease Liability Noncurrent | 44.30 | 45.85 | 46.77 | 44.42 | 45.99 | 47.76 | 47.32 | NA | NA | NA | NA | NA | NA | NA | NA |
| 2023-09-30 | 2023-06-30 | 2023-03-31 | 2022-12-31 | 2022-09-30 | 2022-06-30 | 2022-03-31 | 2021-12-31 | 2021-09-30 | 2021-06-30 | 2021-03-31 | 2020-12-31 | 2020-09-30 | 2020-06-30 | 2020-03-31 | ||
|---|---|---|---|---|---|---|---|---|---|---|---|---|---|---|---|---|
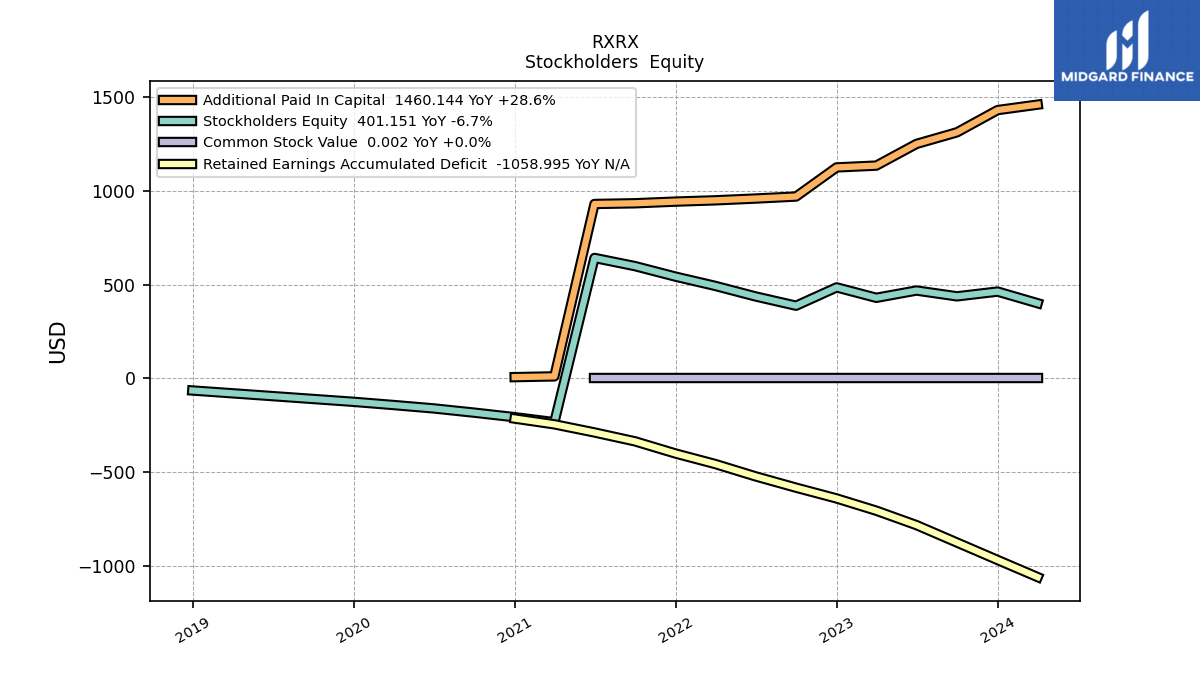
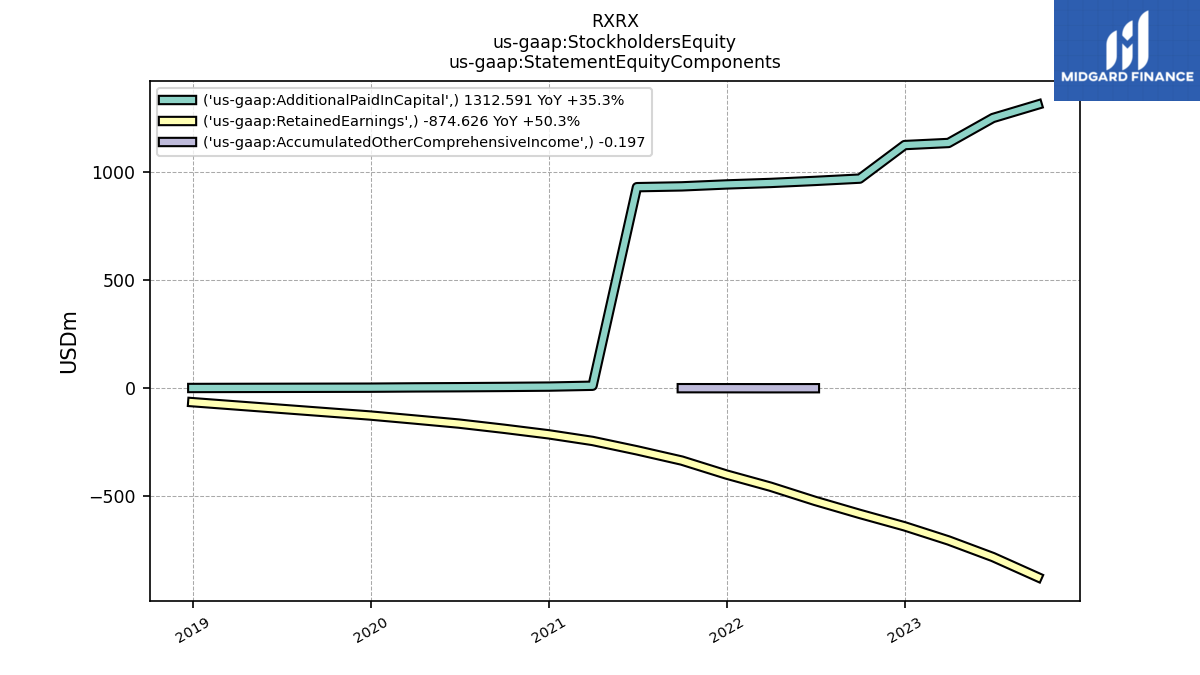
| Stockholders Equity | 437.97 | 468.96 | 430.18 | 485.81 | 388.03 | 437.58 | 493.57 | 542.94 | 599.03 | 642.71 | -233.03 | -206.29 | -182.07 | -159.44 | -141.39 | |
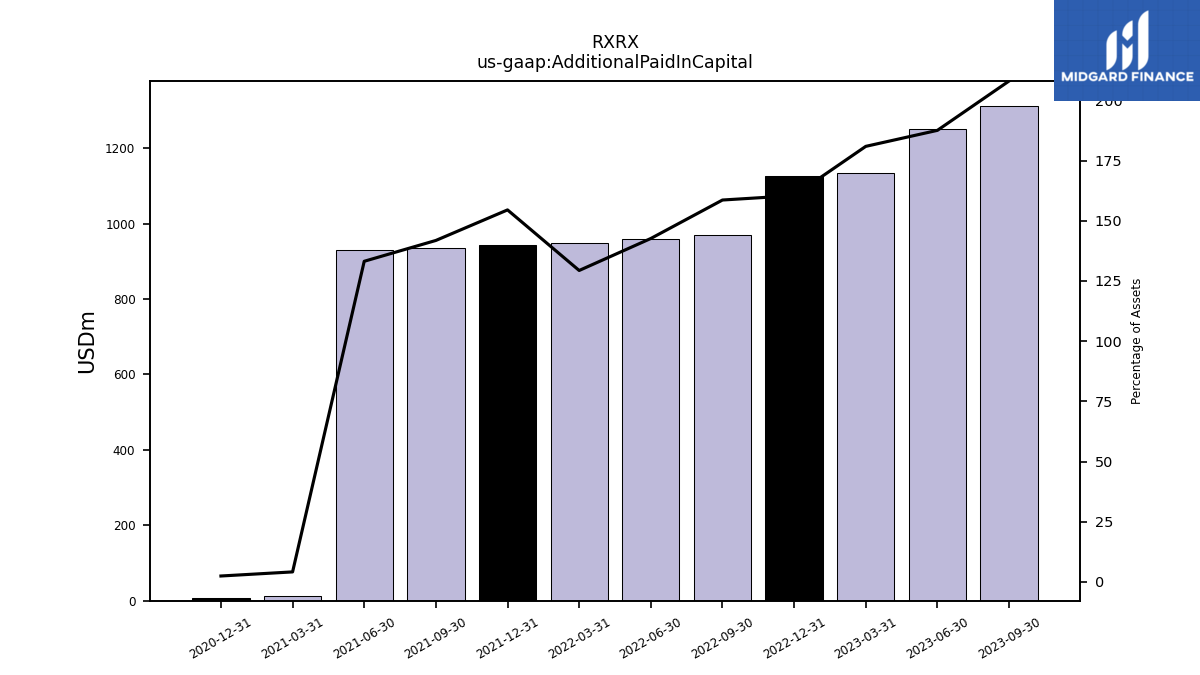
| Additional Paid In Capital | 1312.59 | 1250.57 | 1135.06 | 1125.36 | 970.10 | 959.39 | 949.93 | 943.14 | 934.17 | 930.43 | 11.29 | 7.31 | NA | NA | NA | |
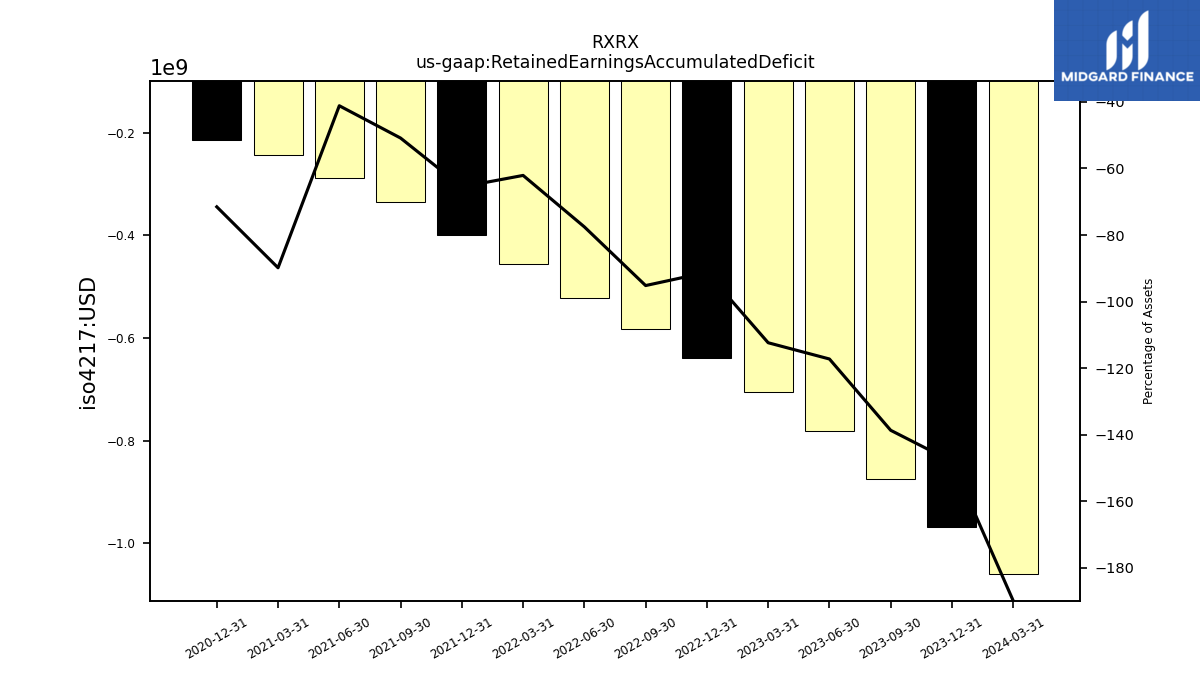
| Retained Earnings Accumulated Deficit | -874.63 | -781.61 | -704.88 | -639.56 | -582.06 | -521.62 | -456.06 | -400.08 | -335.15 | -287.72 | -244.32 | -213.60 | NA | NA | NA | |
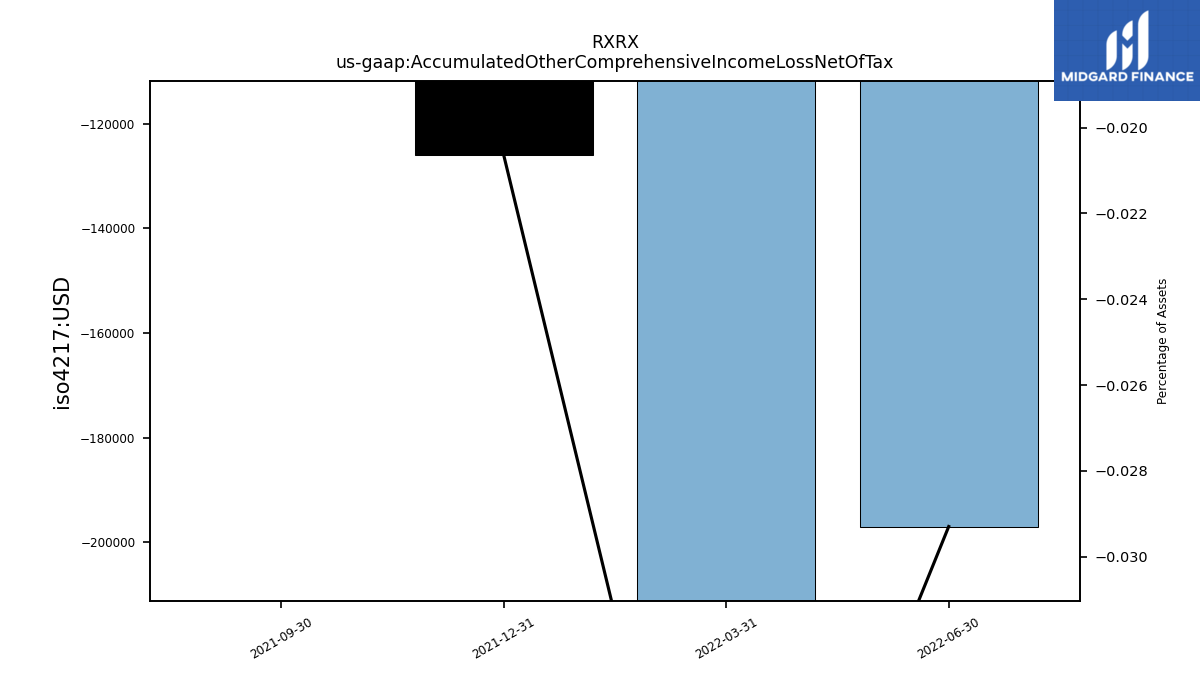
| Accumulated Other Comprehensive Income Loss Net Of Tax | NA | NA | NA | NA | NA | -0.20 | -0.31 | -0.13 | 0.00 | NA | NA | NA | NA | NA | NA | |
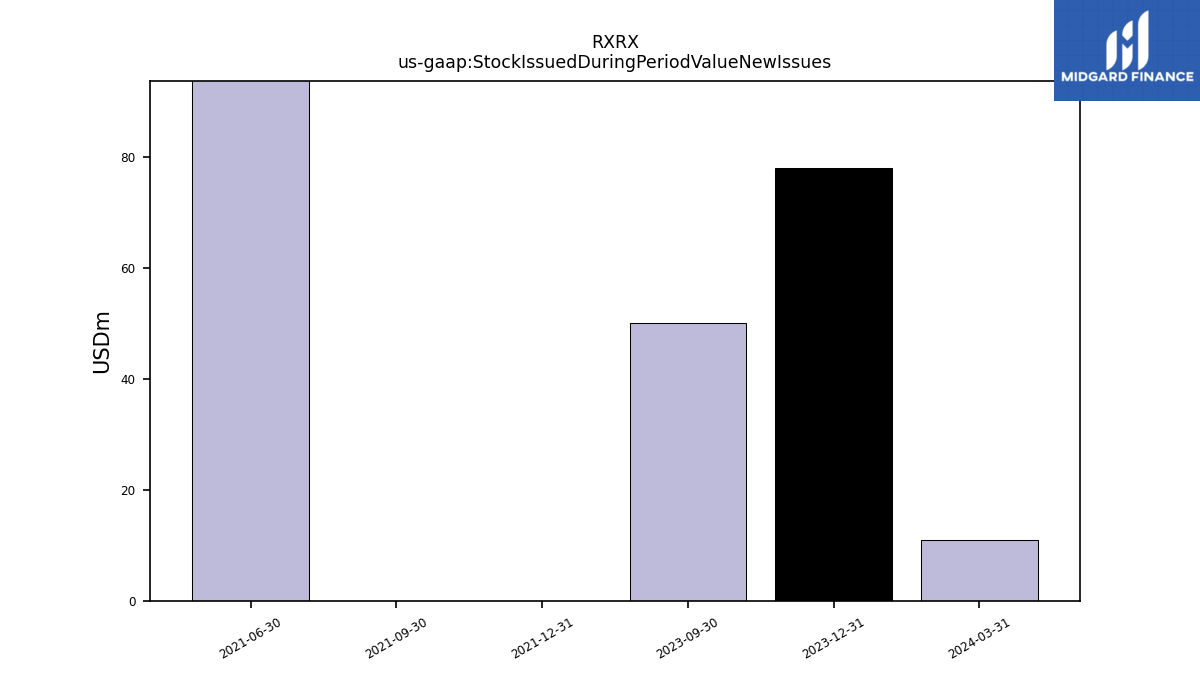
| Stock Issued During Period Value New Issues | 50.00 | NA | NA | NA | NA | NA | NA | 0.00 | 0.00 | 462.35 | NA | NA | NA | NA | NA | |
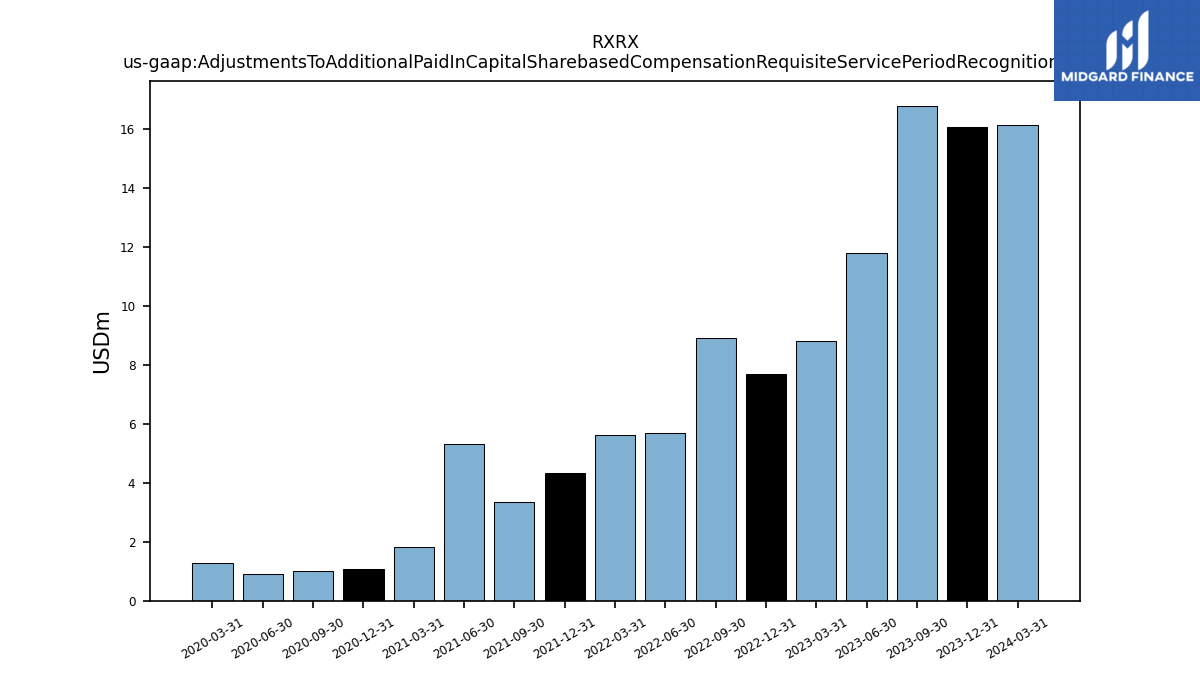
| Adjustments To Additional Paid In Capital Sharebased Compensation Requisite Service Period Recognition Value | 16.79 | 11.81 | 8.81 | 7.70 | 8.91 | 5.67 | 5.63 | 4.34 | 3.36 | 5.32 | 1.82 | 1.09 | 1.02 | 0.89 | 1.29 |
| 2023-09-30 | 2023-06-30 | 2023-03-31 | 2022-12-31 | 2022-09-30 | 2022-06-30 | 2022-03-31 | 2021-12-31 | 2021-09-30 | 2021-06-30 | 2021-03-31 | 2020-12-31 | 2020-09-30 | 2020-06-30 | 2020-03-31 | ||
|---|---|---|---|---|---|---|---|---|---|---|---|---|---|---|---|---|
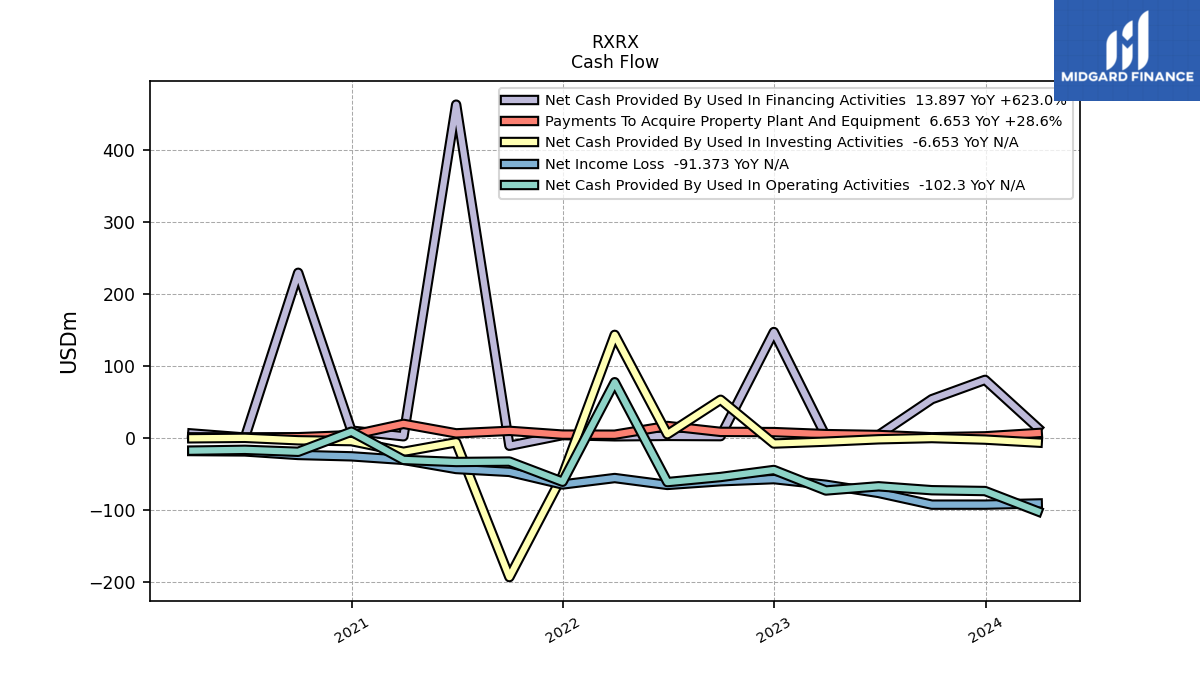
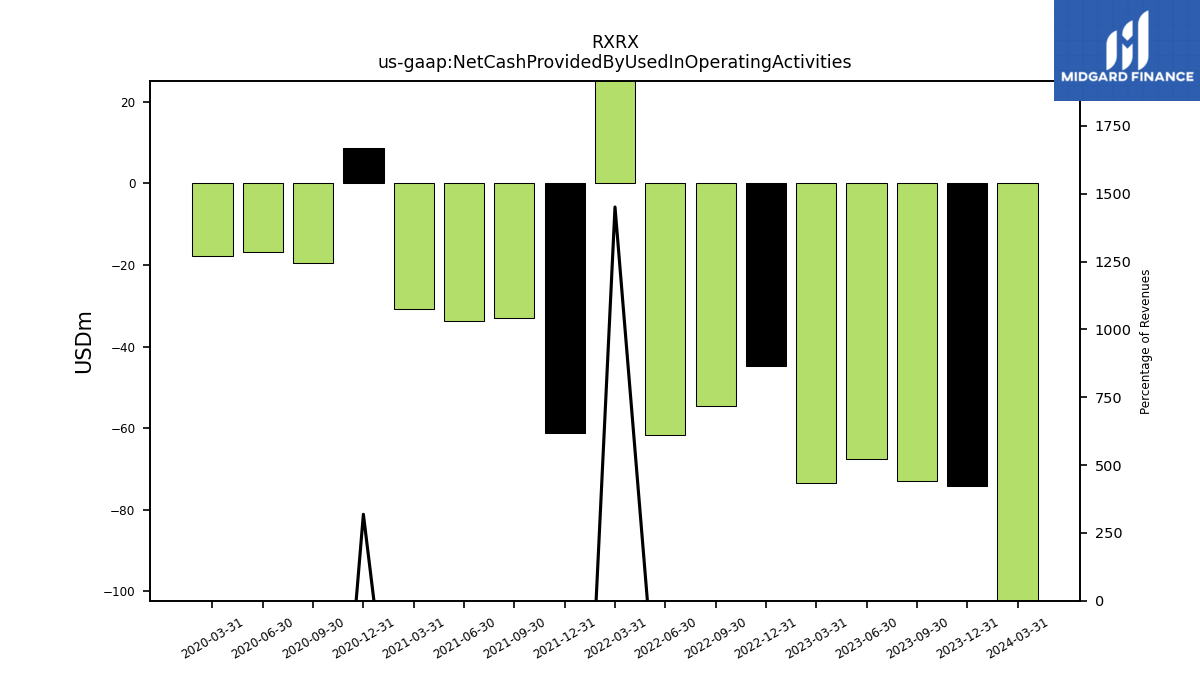
| Net Cash Provided By Used In Operating Activities | -72.92 | -67.47 | -73.32 | -44.75 | -54.54 | -61.62 | 77.39 | -61.16 | -33.05 | -33.65 | -30.75 | 8.57 | -19.46 | -16.70 | -17.82 | |
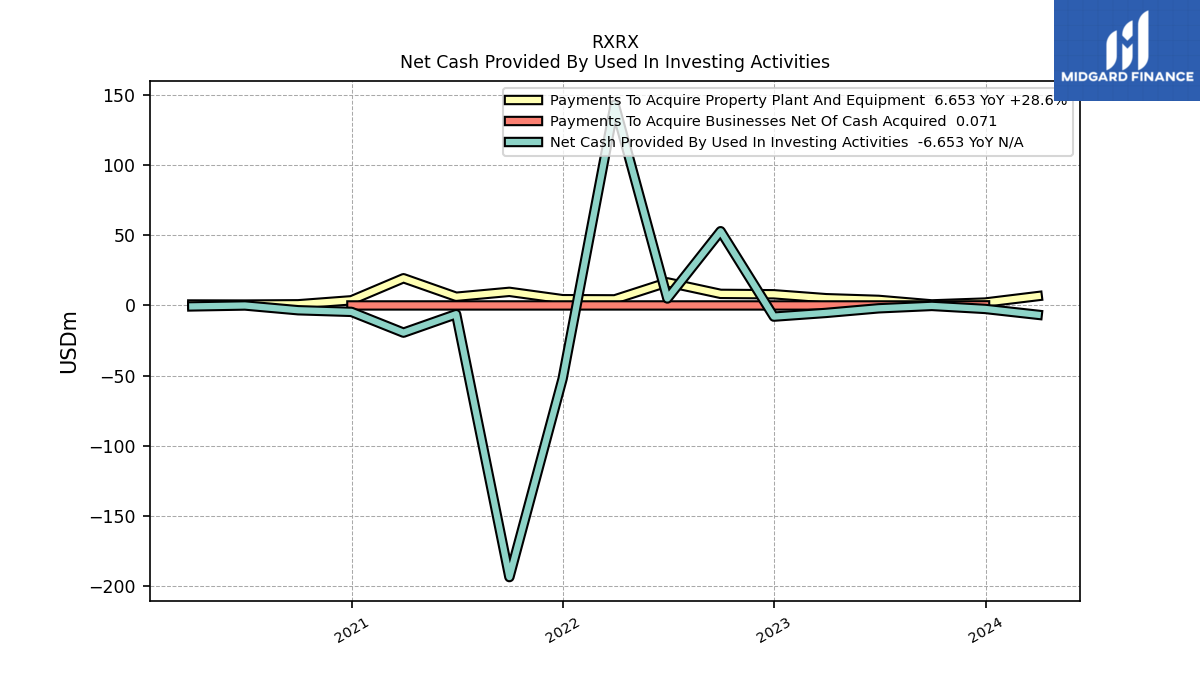
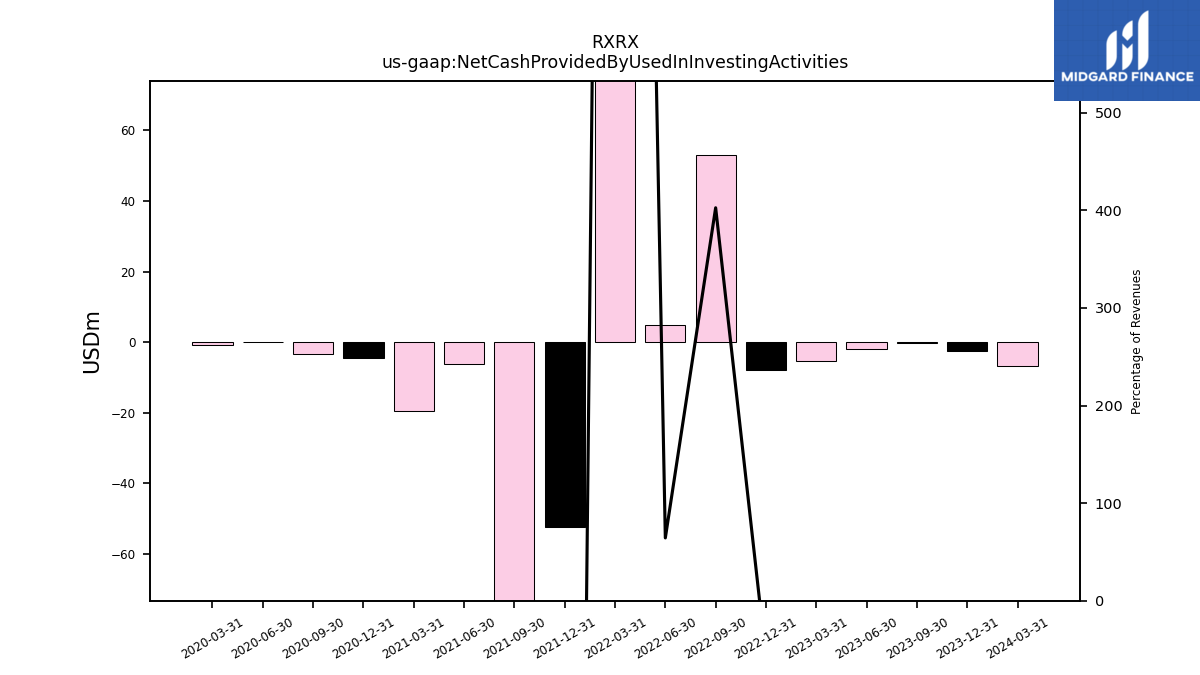
| Net Cash Provided By Used In Investing Activities | -0.35 | -2.05 | -5.34 | -7.98 | 52.98 | 4.94 | 143.30 | -52.24 | -193.87 | -6.21 | -19.42 | -4.59 | -3.43 | -0.04 | -0.68 | |
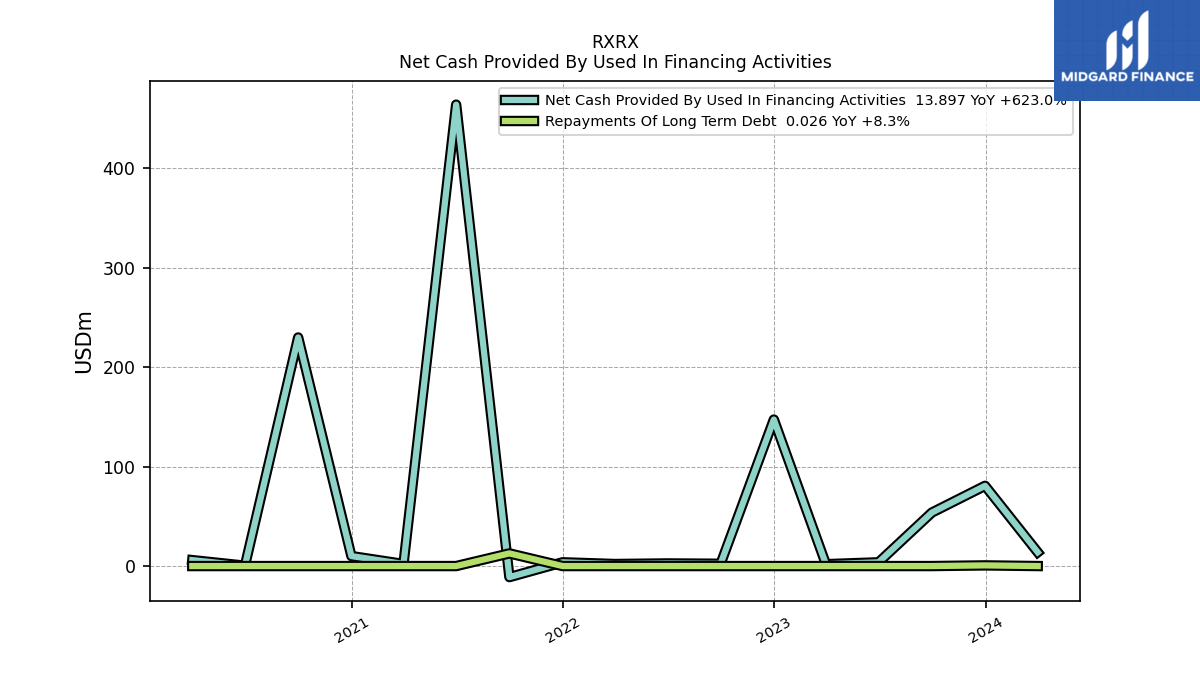
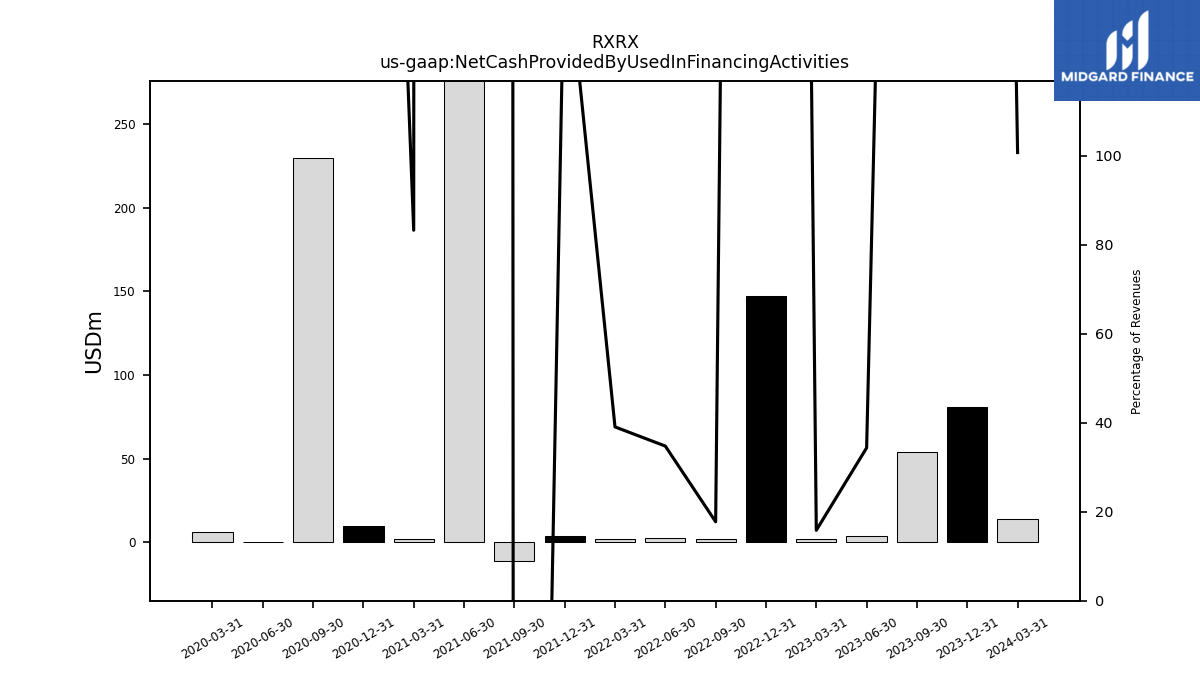
| Net Cash Provided By Used In Financing Activities | 53.77 | 3.79 | 1.92 | 147.26 | 2.34 | 2.67 | 2.08 | 3.80 | -11.10 | 463.70 | 2.13 | 10.04 | 229.72 | 0.38 | 6.00 |
| 2023-09-30 | 2023-06-30 | 2023-03-31 | 2022-12-31 | 2022-09-30 | 2022-06-30 | 2022-03-31 | 2021-12-31 | 2021-09-30 | 2021-06-30 | 2021-03-31 | 2020-12-31 | 2020-09-30 | 2020-06-30 | 2020-03-31 | ||
|---|---|---|---|---|---|---|---|---|---|---|---|---|---|---|---|---|
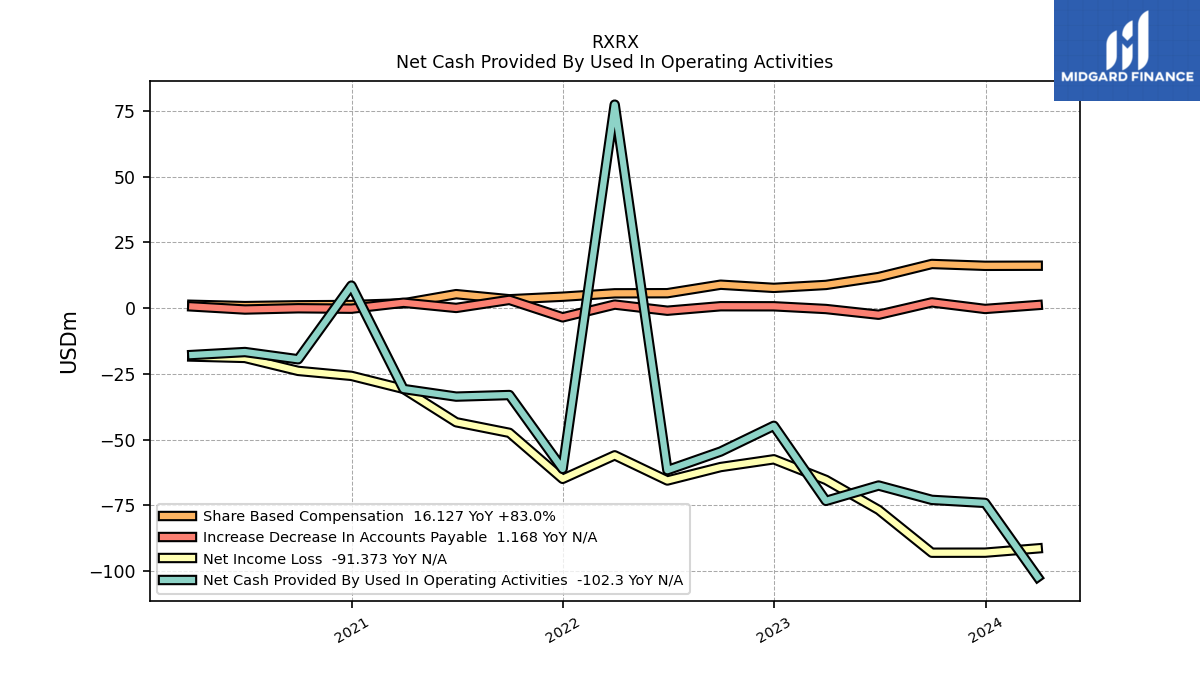
| Net Cash Provided By Used In Operating Activities | -72.92 | -67.47 | -73.32 | -44.75 | -54.54 | -61.62 | 77.39 | -61.16 | -33.05 | -33.65 | -30.75 | 8.57 | -19.46 | -16.70 | -17.82 | |
| Net Income Loss | -93.02 | -76.73 | -65.33 | -57.49 | -60.45 | -65.56 | -55.98 | -64.93 | -47.43 | -43.40 | -30.72 | -25.77 | -23.87 | -18.94 | -18.42 | |
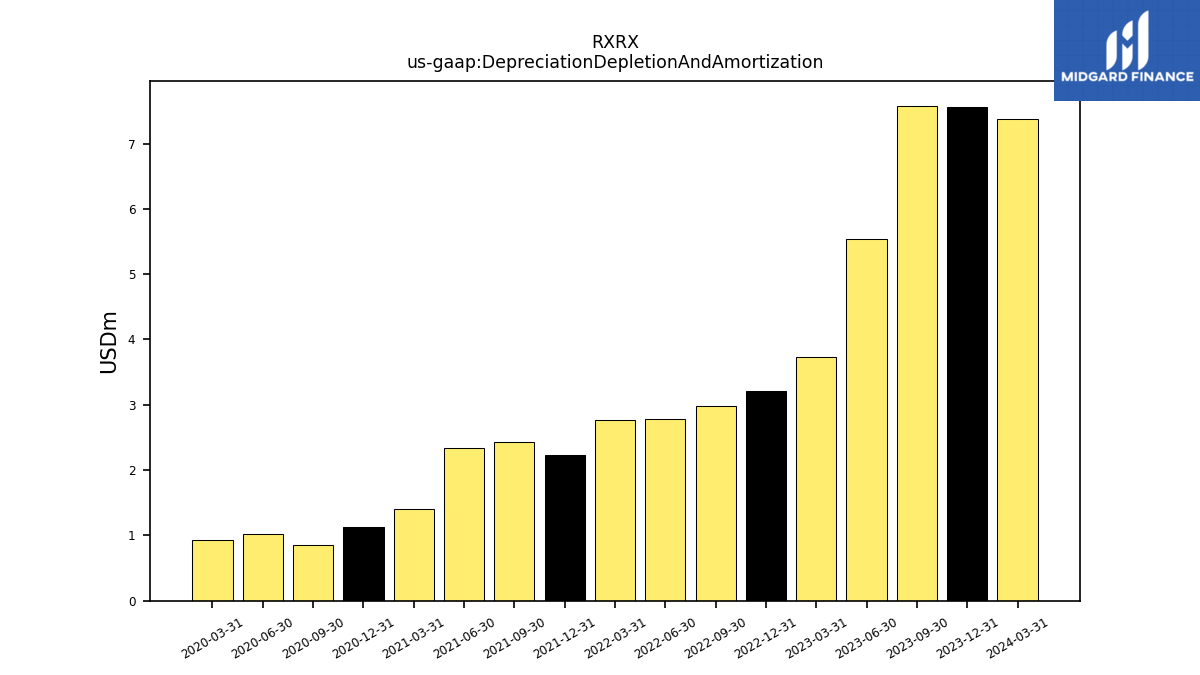
| Depreciation Depletion And Amortization | 7.58 | 5.54 | 3.73 | 3.21 | 2.99 | 2.79 | 2.77 | 2.24 | 2.44 | 2.33 | 1.40 | 1.12 | 0.86 | 1.02 | 0.94 | |
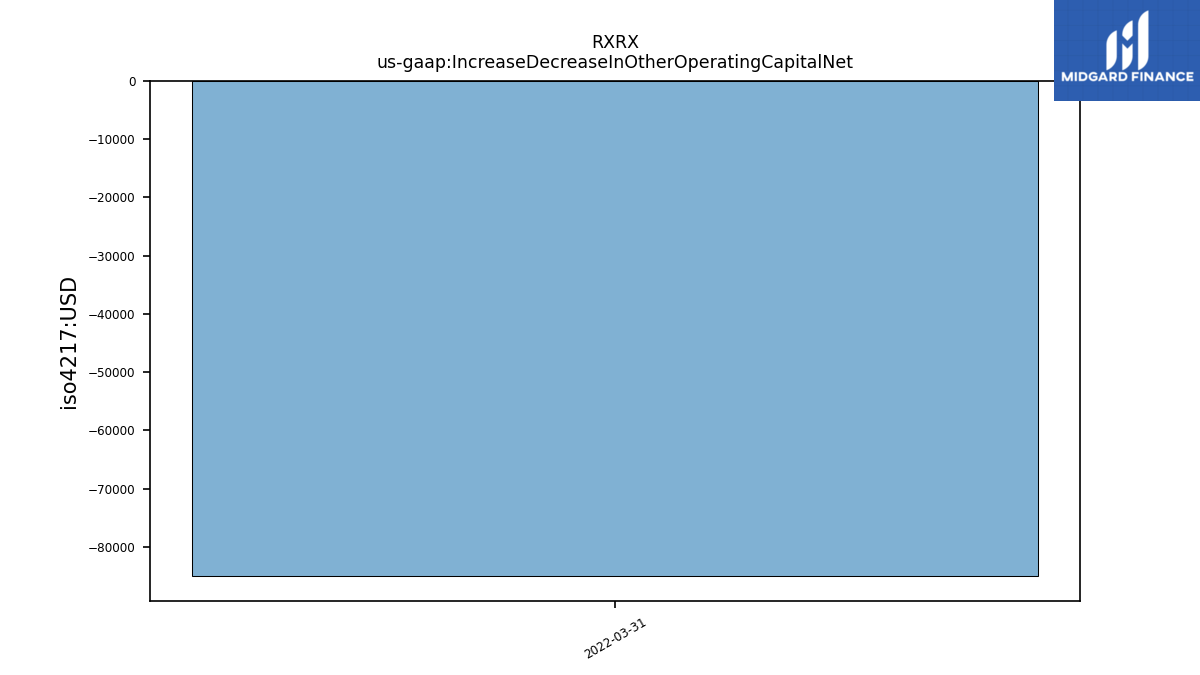
| Increase Decrease In Other Operating Capital Net | NA | NA | NA | NA | NA | NA | -0.09 | NA | NA | NA | NA | NA | NA | NA | NA | |
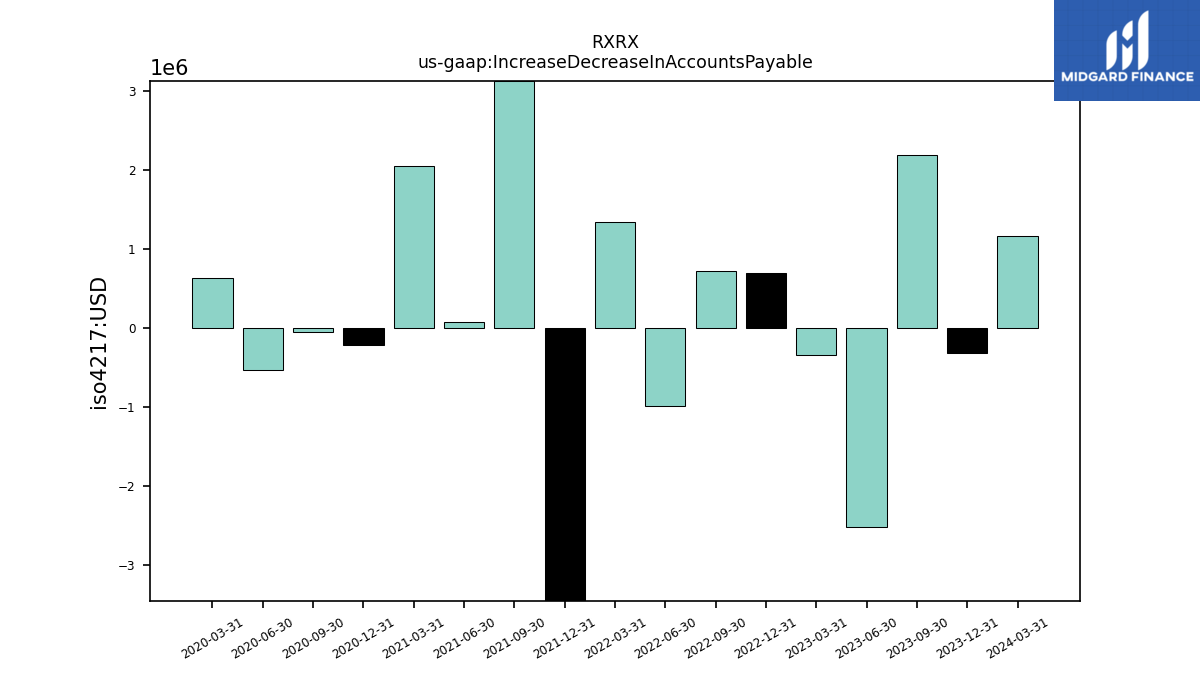
| Increase Decrease In Accounts Payable | 2.19 | -2.52 | -0.34 | 0.69 | 0.71 | -0.99 | 1.34 | -3.51 | 3.13 | 0.07 | 2.05 | -0.22 | -0.06 | -0.53 | 0.62 | |
| Share Based Compensation | 16.79 | 11.81 | 8.81 | 7.70 | 8.91 | 5.67 | 5.63 | 4.34 | 3.36 | 5.32 | 1.82 | 1.19 | 1.07 | 0.77 | 1.26 |
| 2023-09-30 | 2023-06-30 | 2023-03-31 | 2022-12-31 | 2022-09-30 | 2022-06-30 | 2022-03-31 | 2021-12-31 | 2021-09-30 | 2021-06-30 | 2021-03-31 | 2020-12-31 | 2020-09-30 | 2020-06-30 | 2020-03-31 | ||
|---|---|---|---|---|---|---|---|---|---|---|---|---|---|---|---|---|
| Net Cash Provided By Used In Investing Activities | -0.35 | -2.05 | -5.34 | -7.98 | 52.98 | 4.94 | 143.30 | -52.24 | -193.87 | -6.21 | -19.42 | -4.59 | -3.43 | -0.04 | -0.68 | |
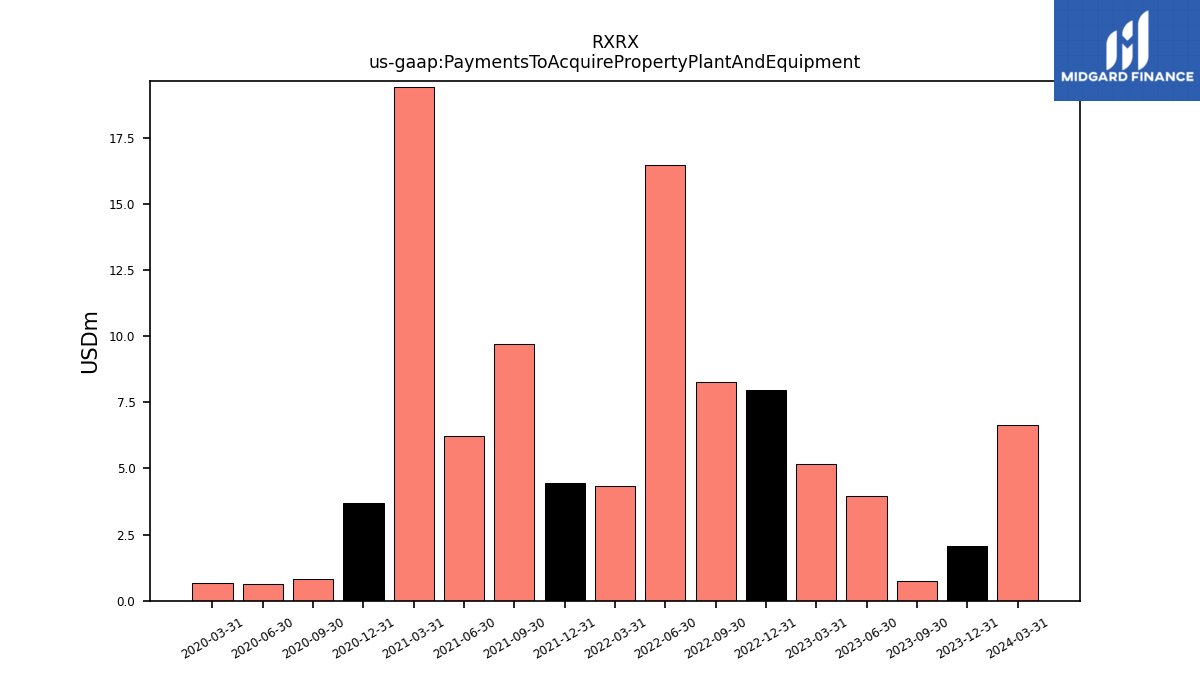
| Payments To Acquire Property Plant And Equipment | 0.74 | 3.97 | 5.17 | 7.98 | 8.26 | 16.48 | 4.34 | 4.46 | 9.71 | 6.21 | 19.42 | 3.69 | 0.83 | 0.63 | 0.68 |
| 2023-09-30 | 2023-06-30 | 2023-03-31 | 2022-12-31 | 2022-09-30 | 2022-06-30 | 2022-03-31 | 2021-12-31 | 2021-09-30 | 2021-06-30 | 2021-03-31 | 2020-12-31 | 2020-09-30 | 2020-06-30 | 2020-03-31 | ||
|---|---|---|---|---|---|---|---|---|---|---|---|---|---|---|---|---|
| Net Cash Provided By Used In Financing Activities | 53.77 | 3.79 | 1.92 | 147.26 | 2.34 | 2.67 | 2.08 | 3.80 | -11.10 | 463.70 | 2.13 | 10.04 | 229.72 | 0.38 | 6.00 |
| 2023-09-30 | 2023-06-30 | 2023-03-31 | 2022-12-31 | 2022-09-30 | 2022-06-30 | 2022-03-31 | 2021-12-31 | 2021-09-30 | 2021-06-30 | 2021-03-31 | 2020-12-31 | 2020-09-30 | 2020-06-30 | 2020-03-31 | ||
|---|---|---|---|---|---|---|---|---|---|---|---|---|---|---|---|---|
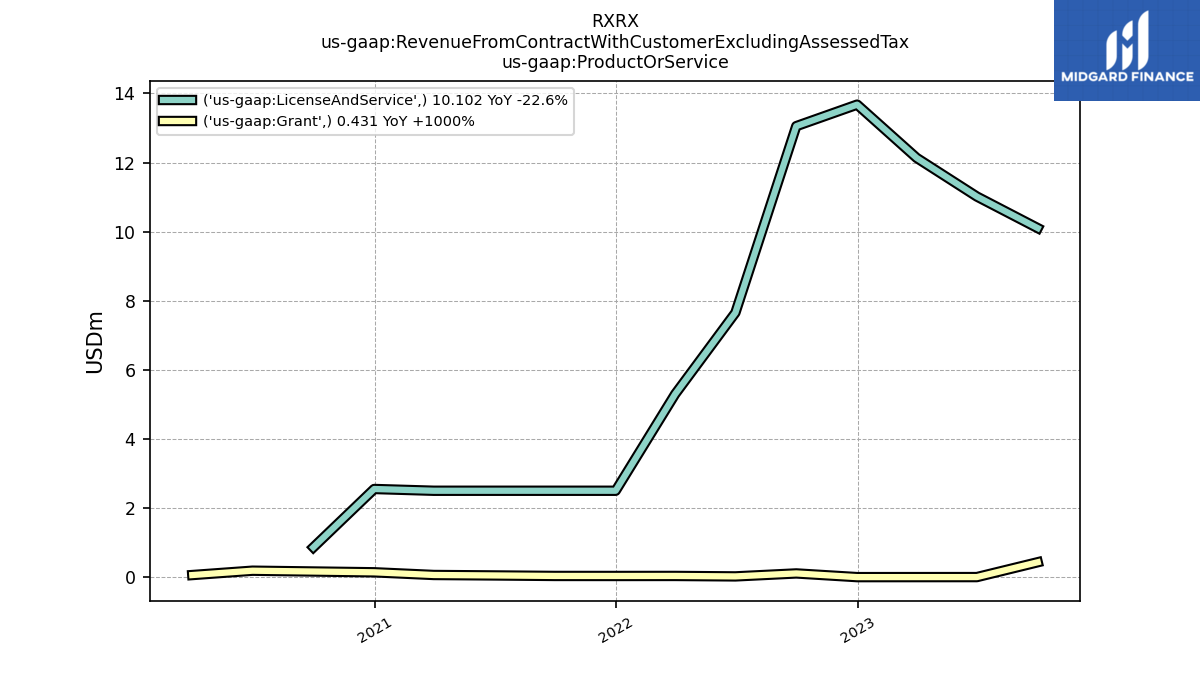
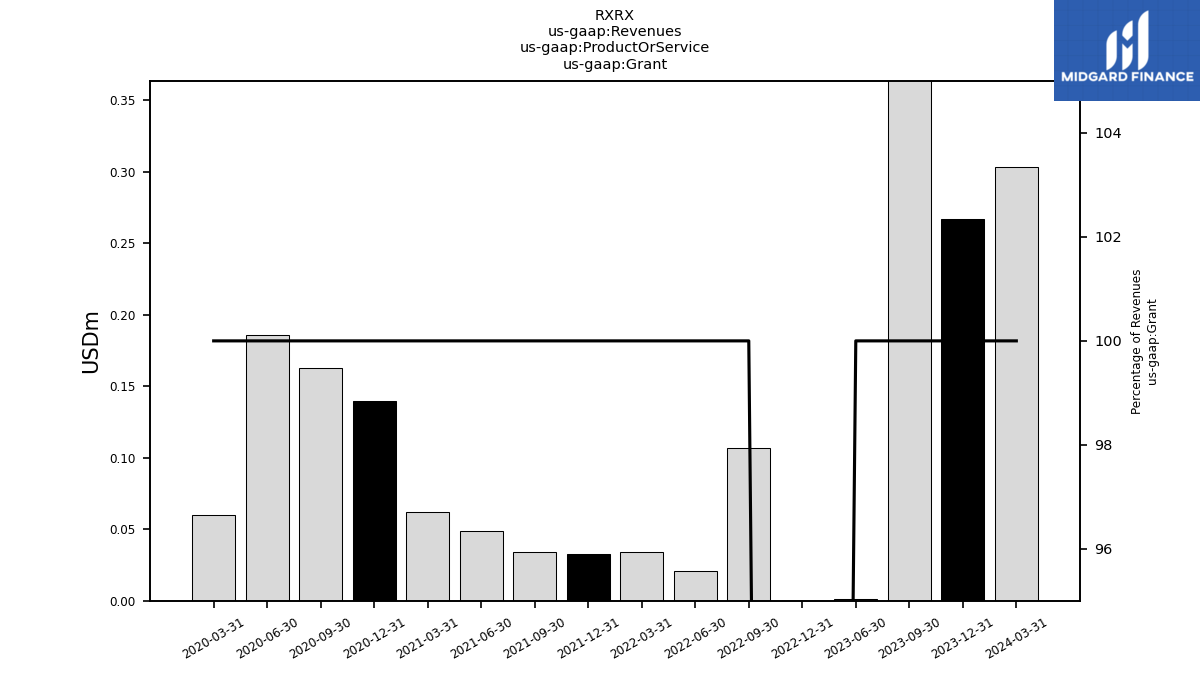
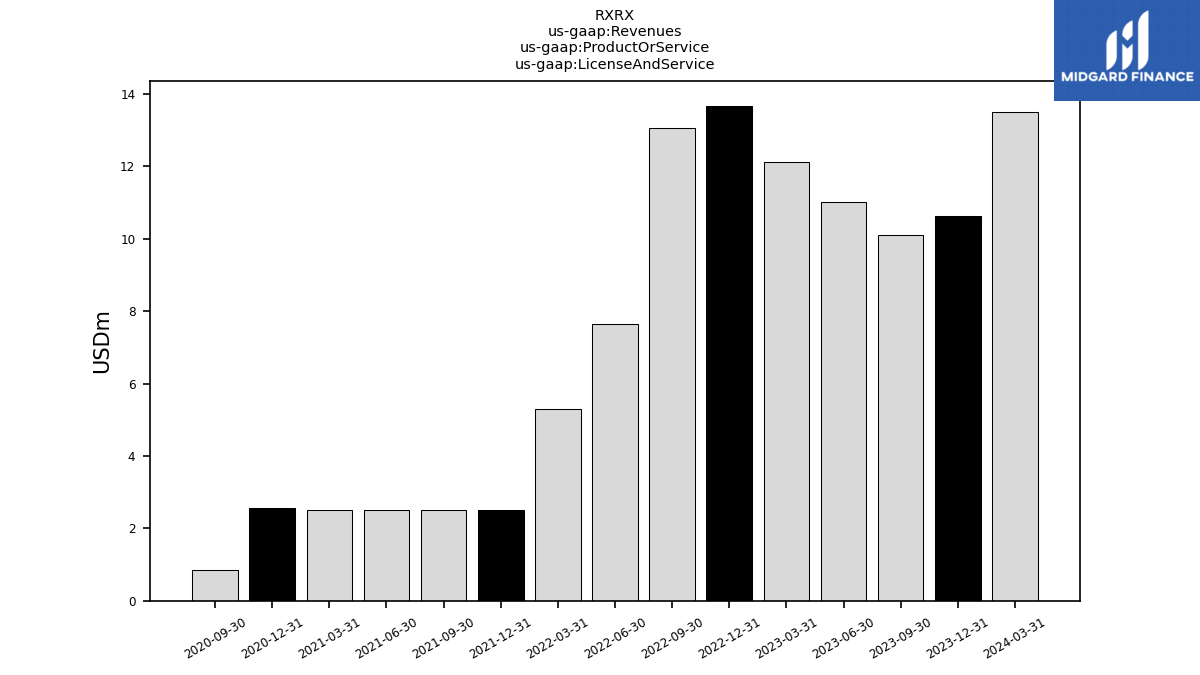
| Revenues | 10.53 | 11.02 | 12.13 | 13.68 | 13.16 | 7.67 | 5.33 | 2.53 | 2.53 | 2.55 | 2.56 | 2.69 | 1.02 | 0.19 | 0.06 | |
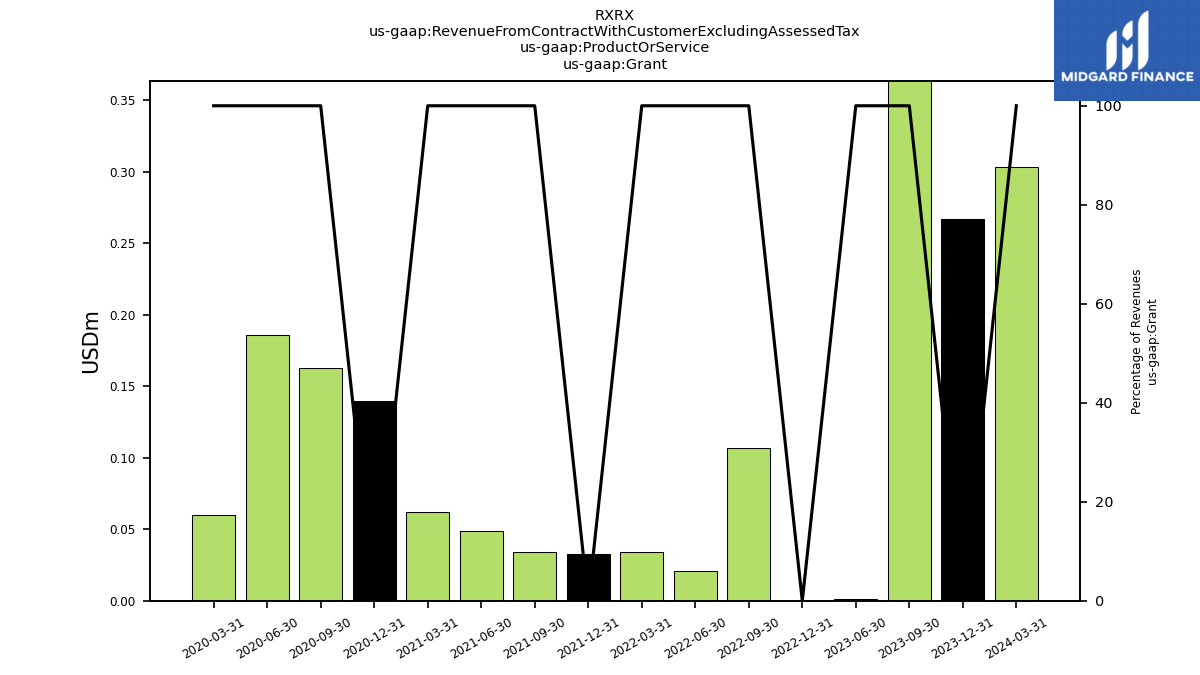
| Grant | 0.43 | 0.00 | NA | 0.00 | 0.11 | 0.02 | 0.03 | 0.03 | 0.03 | 0.05 | 0.06 | 0.14 | 0.16 | 0.19 | 0.06 | |
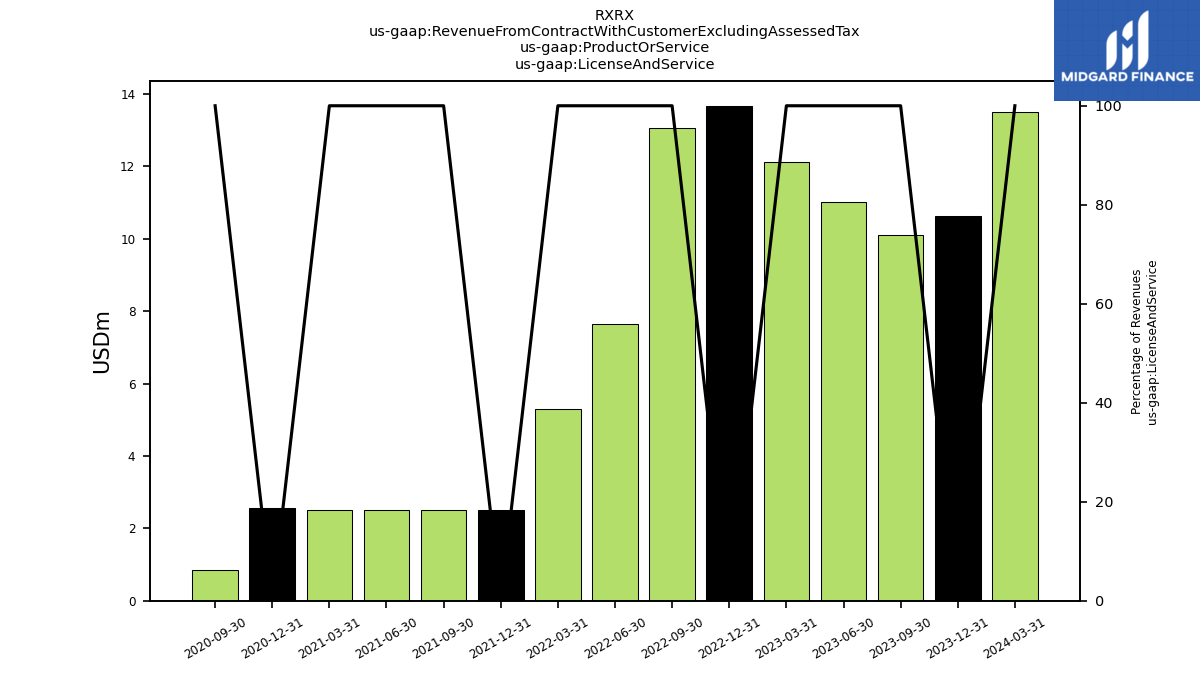
| License And Service | 10.10 | 11.02 | 12.13 | 13.68 | 13.05 | 7.65 | 5.30 | 2.50 | 2.50 | 2.50 | 2.50 | 2.55 | 0.86 | NA | NA | |
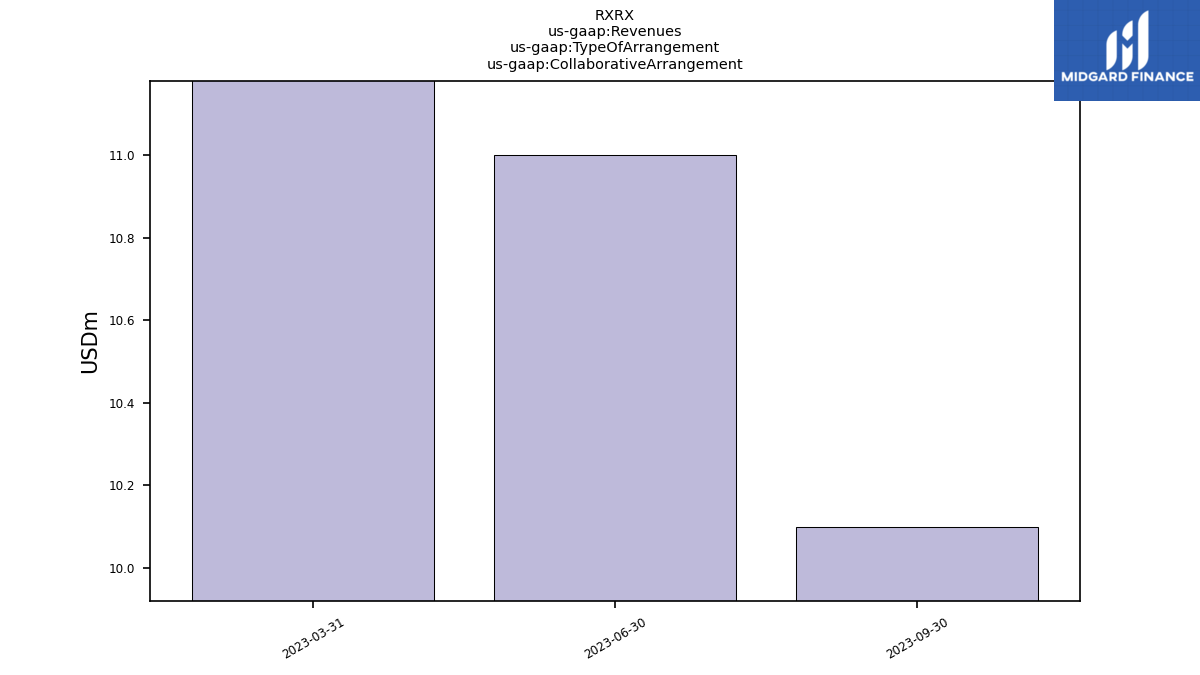
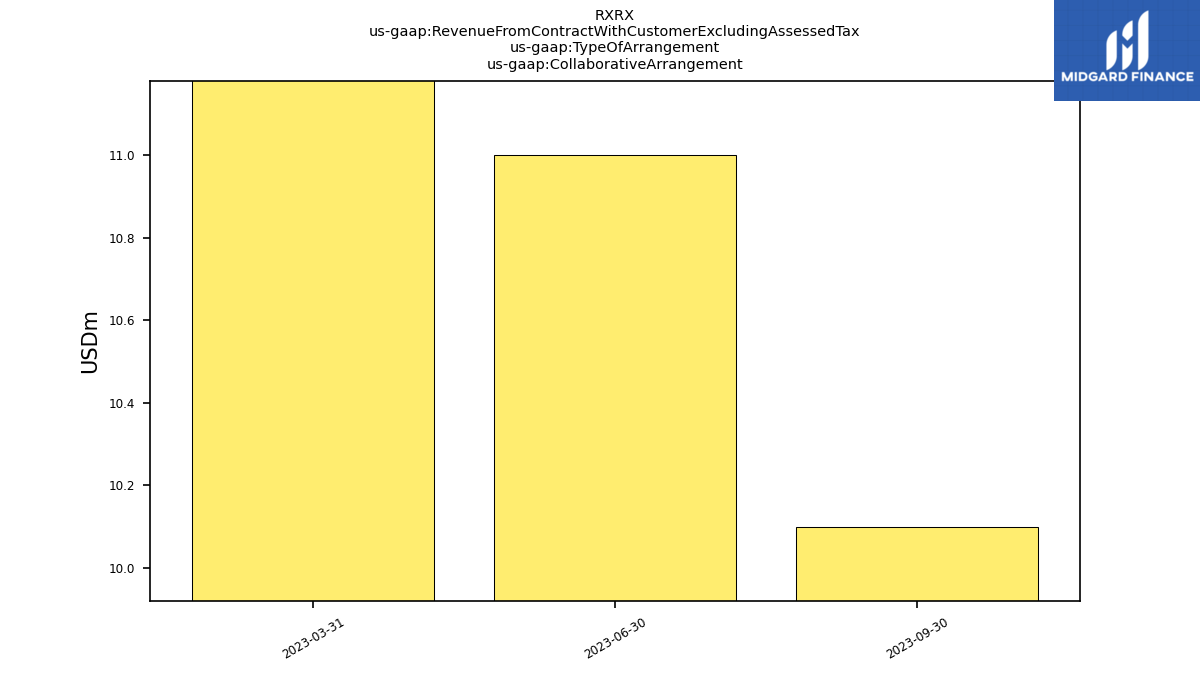
| Collaborative Arrangement | 10.10 | 11.00 | 12.10 | NA | NA | NA | NA | NA | NA | NA | NA | NA | NA | NA | NA | |
| Revenue From Contract With Customer Excluding Assessed Tax | 10.53 | 11.02 | 12.13 | 13.68 | 13.16 | 7.67 | 5.33 | 2.53 | 2.53 | 2.55 | 2.56 | 2.69 | 1.02 | 0.19 | 0.06 | |
| Grant | 0.43 | 0.00 | NA | 0.00 | 0.11 | 0.02 | 0.03 | 0.03 | 0.03 | 0.05 | 0.06 | 0.14 | 0.16 | 0.19 | 0.06 | |
| License And Service | 10.10 | 11.02 | 12.13 | 13.68 | 13.05 | 7.65 | 5.30 | 2.50 | 2.50 | 2.50 | 2.50 | 2.55 | 0.86 | NA | NA | |
| Collaborative Arrangement | 10.10 | 11.00 | 12.10 | NA | NA | NA | NA | NA | NA | NA | NA | NA | NA | NA | NA |


