
| 2024-03-31 | 2023-12-31 | 2023-09-30 | 2023-06-30 | 2023-03-31 | 2022-12-31 | 2022-09-30 | 2022-06-30 | 2022-03-31 | 2021-12-31 | 2021-09-30 | 2021-06-30 | 2021-03-31 | 2020-12-31 | 2020-09-30 | 2020-06-30 | 2020-03-31 | 2019-12-31 | 2019-09-30 | 2019-06-30 | 2019-03-31 | 2018-12-31 | 2018-09-30 | 2018-06-30 | ||
|---|---|---|---|---|---|---|---|---|---|---|---|---|---|---|---|---|---|---|---|---|---|---|---|---|---|
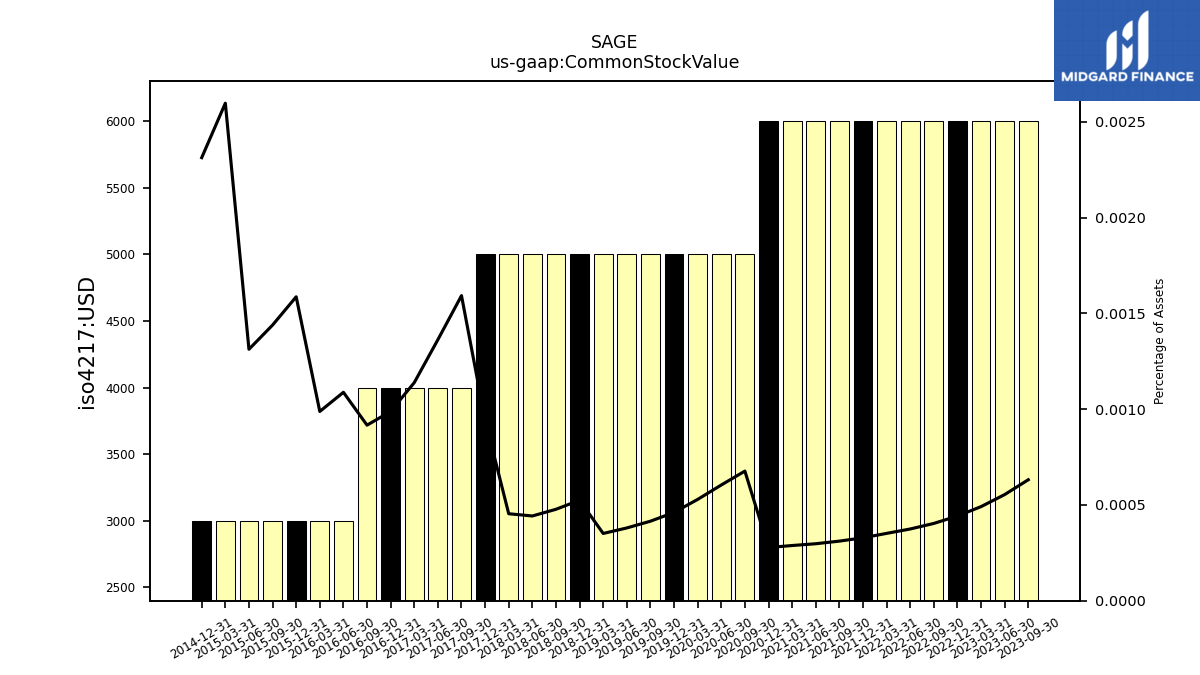
| Common Stock Value | 0.01 | 0.01 | 0.01 | 0.01 | 0.01 | 0.01 | 0.01 | 0.01 | 0.01 | 0.01 | 0.01 | 0.01 | 0.01 | 0.01 | 0.01 | 0.01 | 0.01 | 0.01 | 0.01 | 0.01 | 0.01 | 0.01 | 0.01 | 0.01 | |
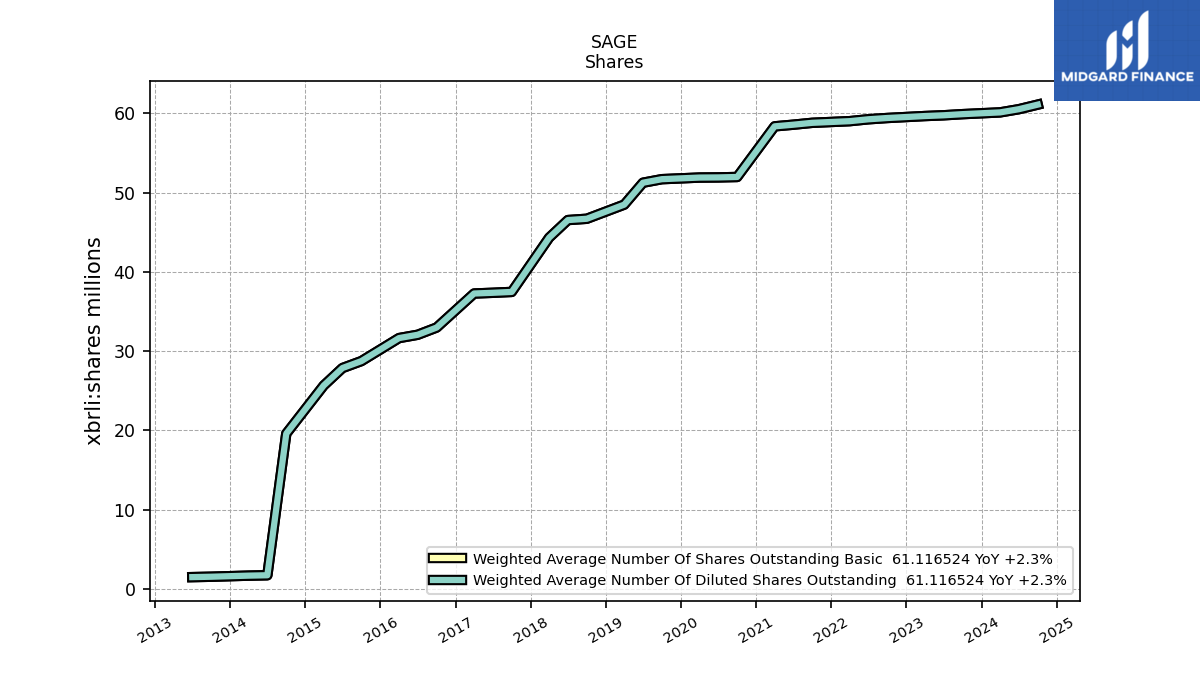
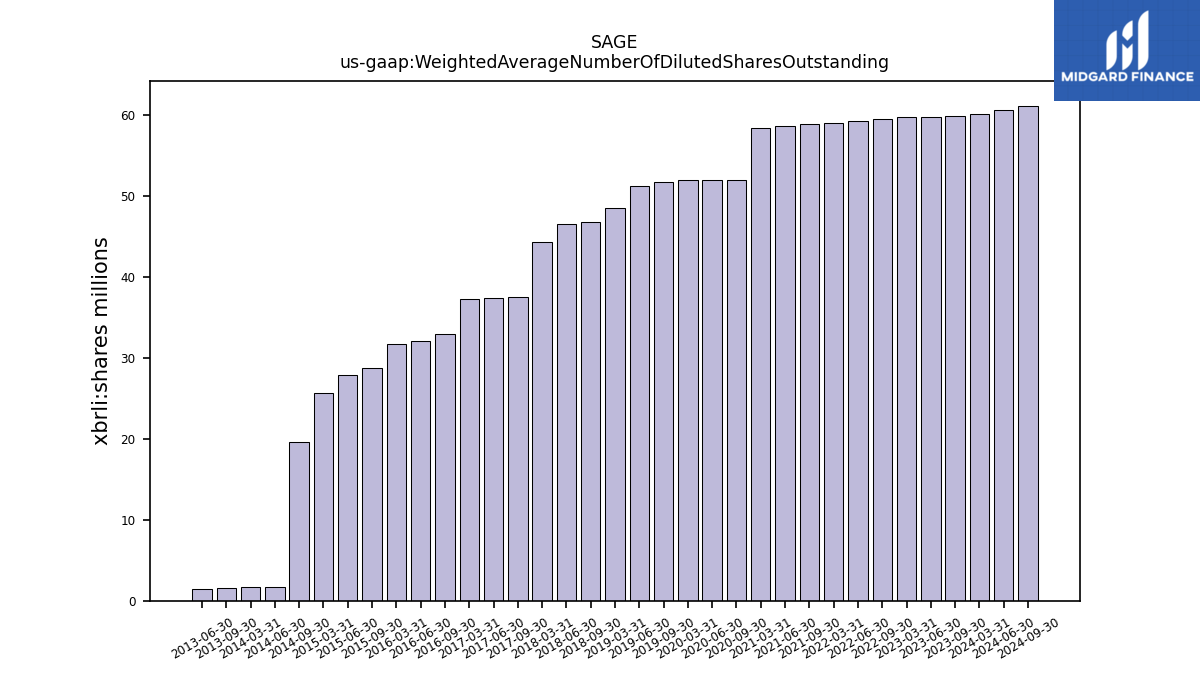
| Weighted Average Number Of Diluted Shares Outstanding | 60.14 | NA | 59.91 | 59.77 | 59.67 | NA | 59.43 | 59.27 | 59.03 | NA | 58.82 | 58.58 | 58.37 | NA | 51.98 | 51.93 | 51.91 | NA | 51.70 | 51.26 | 48.49 | NA | 46.71 | 46.54 | |
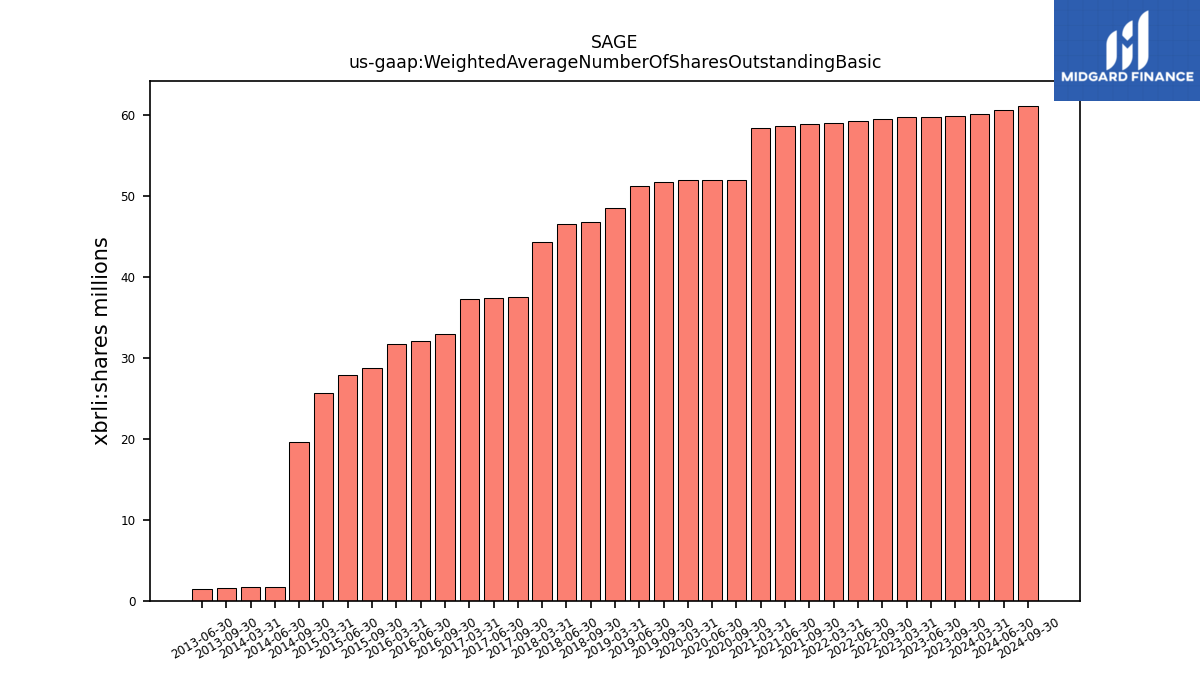
| Weighted Average Number Of Shares Outstanding Basic | 60.14 | NA | 59.91 | 59.77 | 59.67 | NA | 59.43 | 59.27 | 59.03 | NA | 58.82 | 58.58 | 58.37 | NA | 51.98 | 51.93 | 51.91 | NA | 51.70 | 51.26 | 48.49 | NA | 46.71 | 46.54 | |
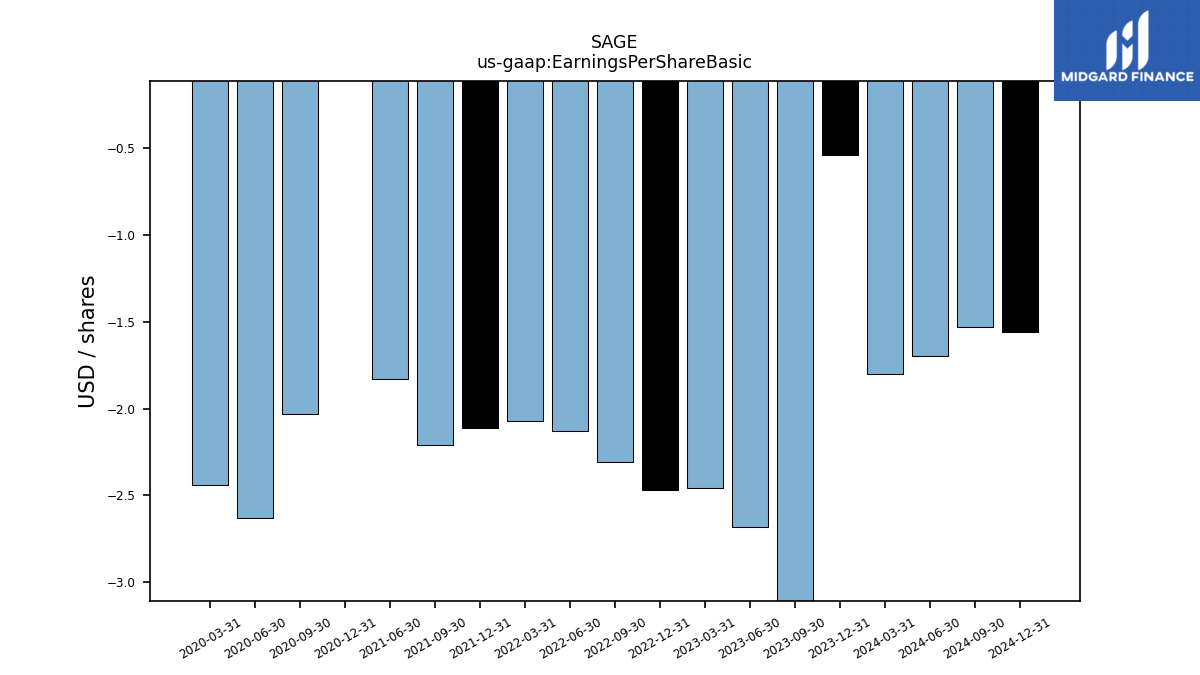
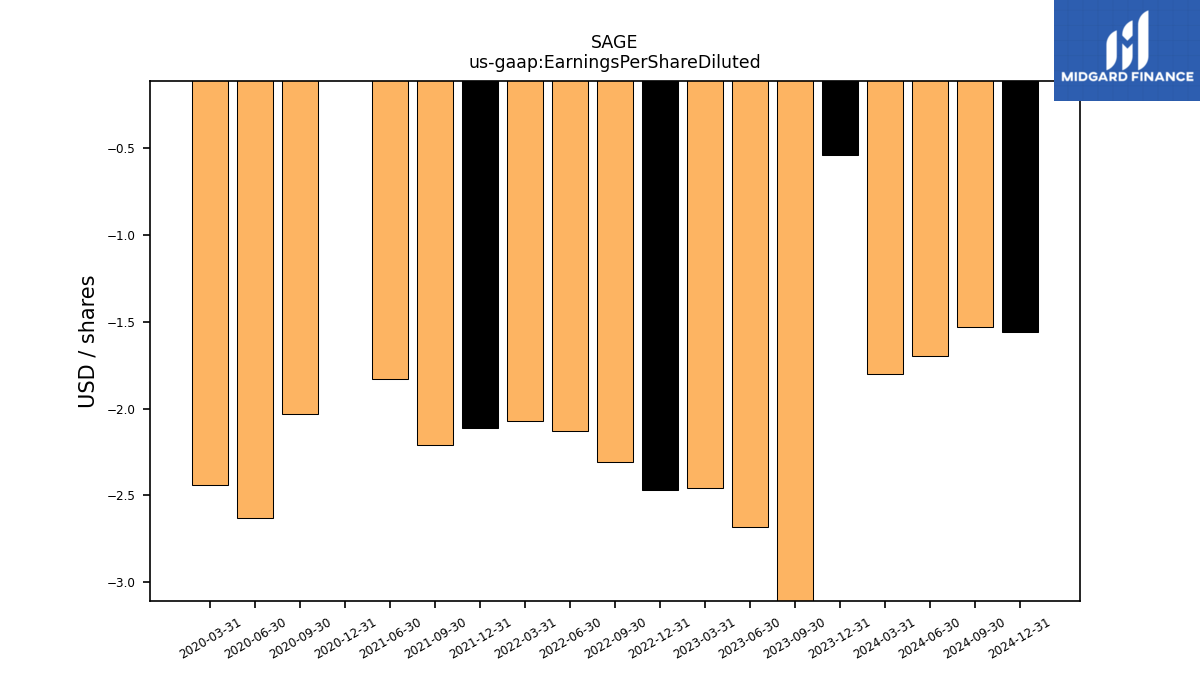
| Earnings Per Share Basic | -1.80 | -0.54 | -3.37 | -2.68 | -2.46 | -2.47 | -2.31 | -2.13 | -2.07 | -2.11 | -2.21 | -1.83 | NA | 18.71 | -2.03 | -2.63 | -2.44 | NA | NA | NA | NA | NA | NA | NA | |
| Earnings Per Share Diluted | -1.80 | -0.54 | -3.37 | -2.68 | -2.46 | -2.47 | -2.31 | -2.13 | -2.07 | -2.11 | -2.21 | -1.83 | NA | 18.19 | -2.03 | -2.63 | -2.44 | NA | NA | NA | NA | NA | NA | NA |
| 2024-03-31 | 2023-12-31 | 2023-09-30 | 2023-06-30 | 2023-03-31 | 2022-12-31 | 2022-09-30 | 2022-06-30 | 2022-03-31 | 2021-12-31 | 2021-09-30 | 2021-06-30 | 2021-03-31 | 2020-12-31 | 2020-09-30 | 2020-06-30 | 2020-03-31 | 2019-12-31 | 2019-09-30 | 2019-06-30 | 2019-03-31 | 2018-12-31 | 2018-09-30 | 2018-06-30 | ||
|---|---|---|---|---|---|---|---|---|---|---|---|---|---|---|---|---|---|---|---|---|---|---|---|---|---|
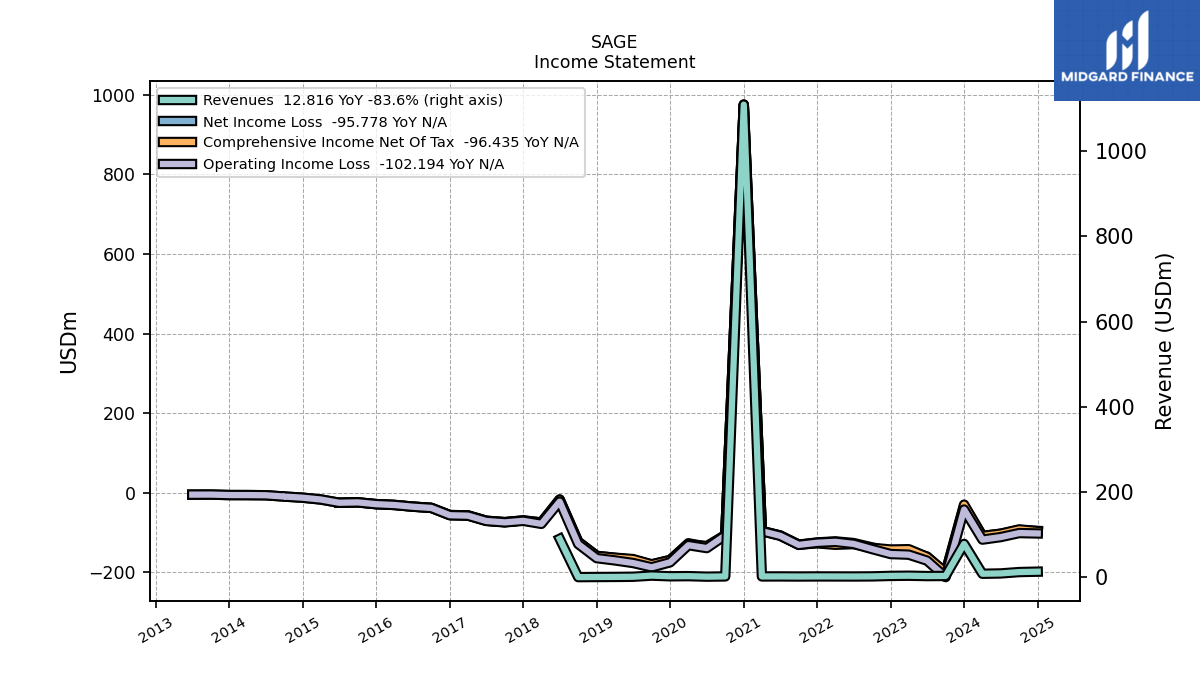
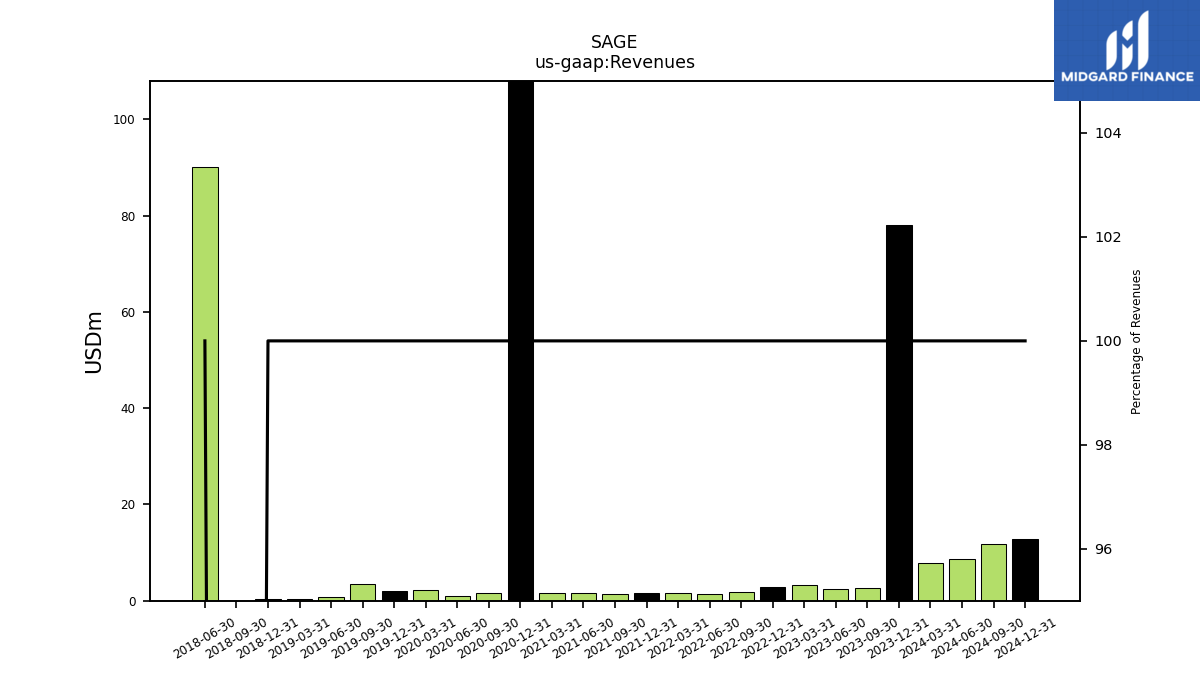
| Revenues | 7.90 | 77.97 | 2.72 | 2.47 | 3.29 | 2.87 | 1.74 | 1.50 | 1.58 | 1.64 | 1.44 | 1.64 | 1.58 | 1109.19 | 1.64 | 1.09 | 2.29 | 1.96 | 3.57 | 0.87 | 0.47 | 0.27 | 0.00 | 90.00 | |
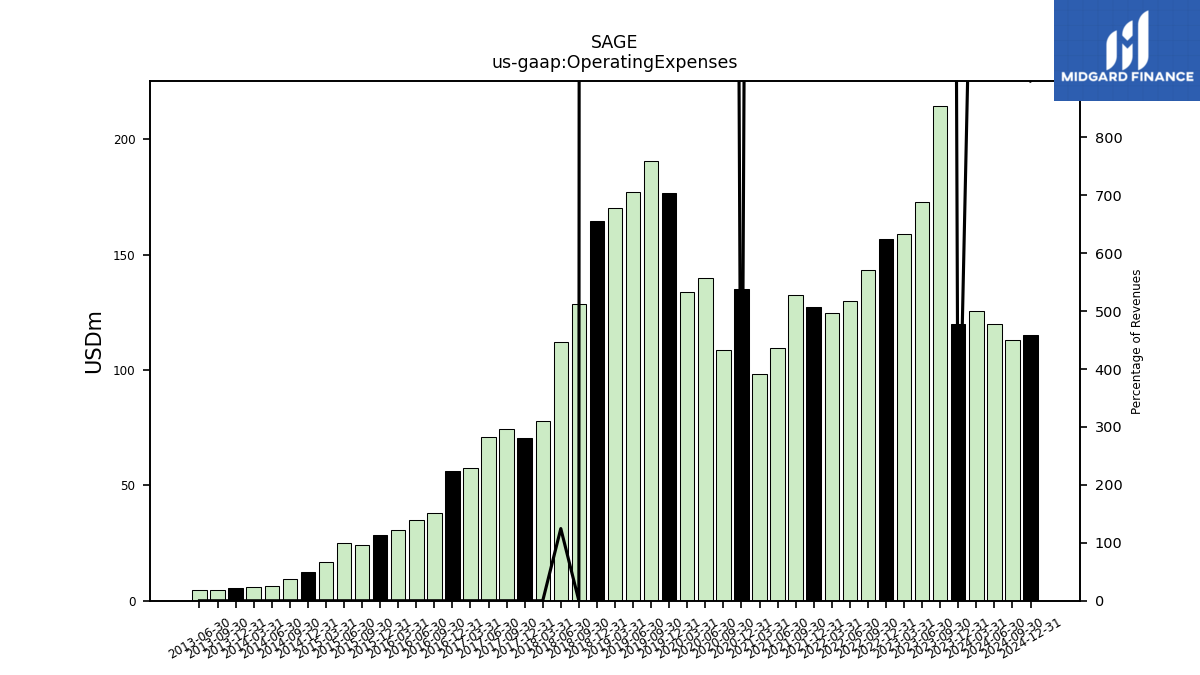
| Operating Expenses | 125.58 | 120.05 | 214.56 | 172.93 | 158.76 | 156.77 | 143.22 | 129.91 | 124.78 | 127.13 | 132.33 | 109.66 | 98.09 | 135.21 | 108.80 | 140.06 | 133.91 | 176.60 | 190.75 | 177.33 | 170.32 | 164.50 | 128.75 | 112.15 | |
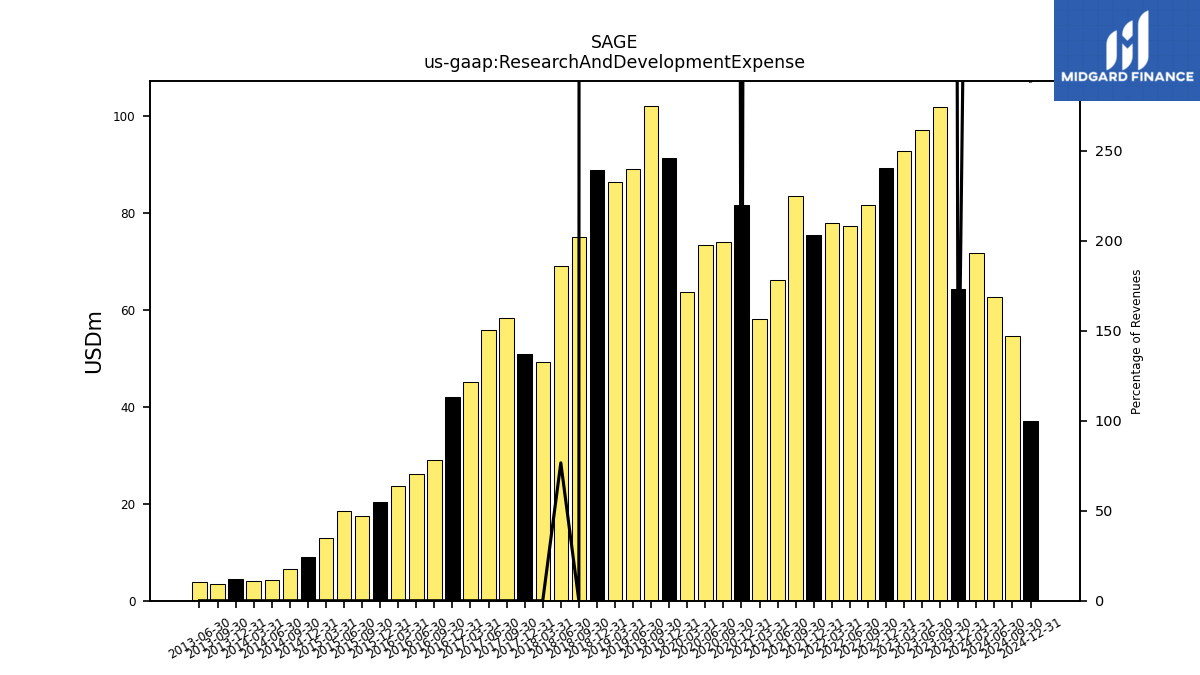
| Research And Development Expense | 71.73 | 64.33 | 101.92 | 97.16 | 92.83 | 89.30 | 81.55 | 77.30 | 78.02 | 75.44 | 83.50 | 66.17 | 58.06 | 81.71 | 74.08 | 73.32 | 63.61 | 91.25 | 102.11 | 89.06 | 86.40 | 88.81 | 75.05 | 68.98 | |
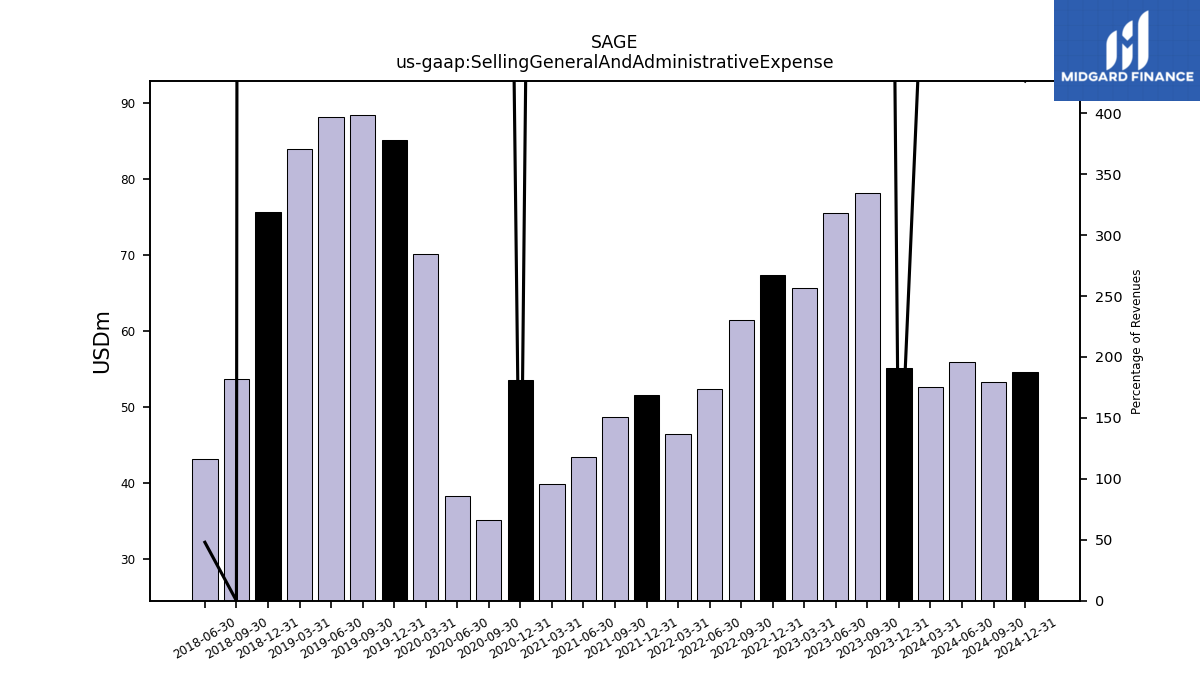
| Selling General And Administrative Expense | 52.57 | 55.11 | 78.14 | 75.56 | 65.71 | 67.33 | 61.48 | 52.41 | 46.48 | 51.60 | 48.71 | 43.35 | 39.85 | 53.50 | 35.10 | 38.22 | 70.13 | 85.13 | 88.50 | 88.23 | 83.92 | 75.69 | 53.69 | 43.17 | |
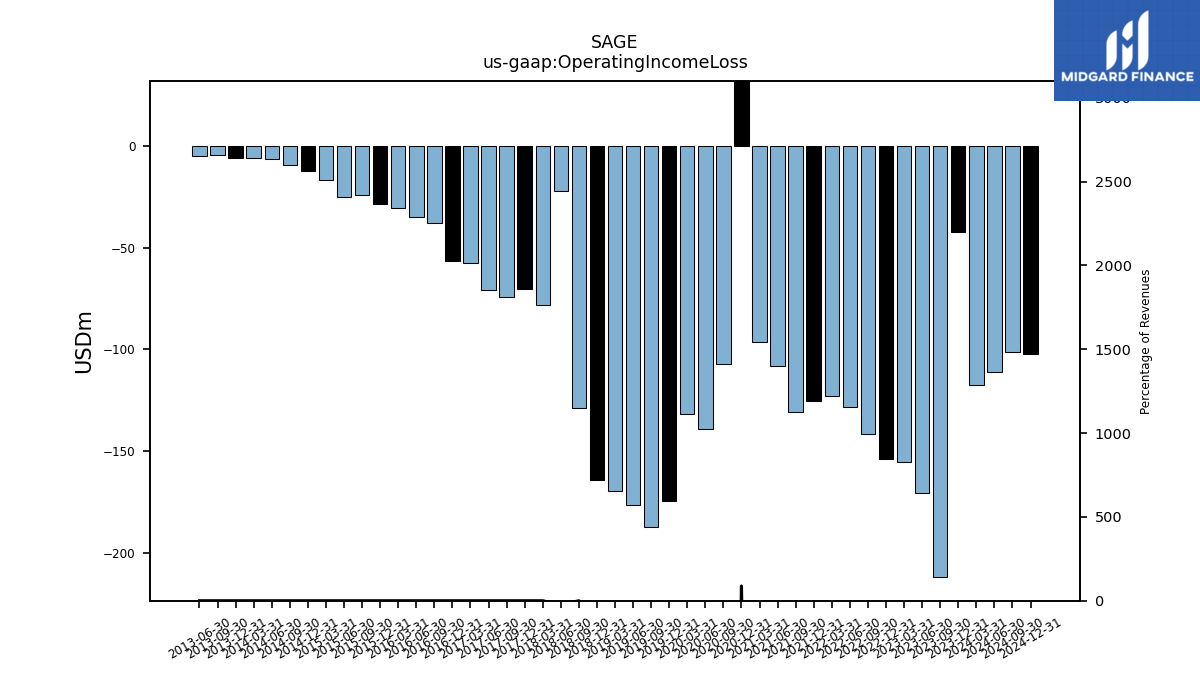
| Operating Income Loss | -117.67 | -42.07 | -211.85 | -170.46 | -155.47 | -153.90 | -141.48 | -128.41 | -123.20 | -125.49 | -130.89 | -108.02 | -96.51 | 973.98 | -107.16 | -138.97 | -131.62 | -174.64 | -187.18 | -176.46 | -169.85 | -164.23 | -128.75 | -22.15 | |
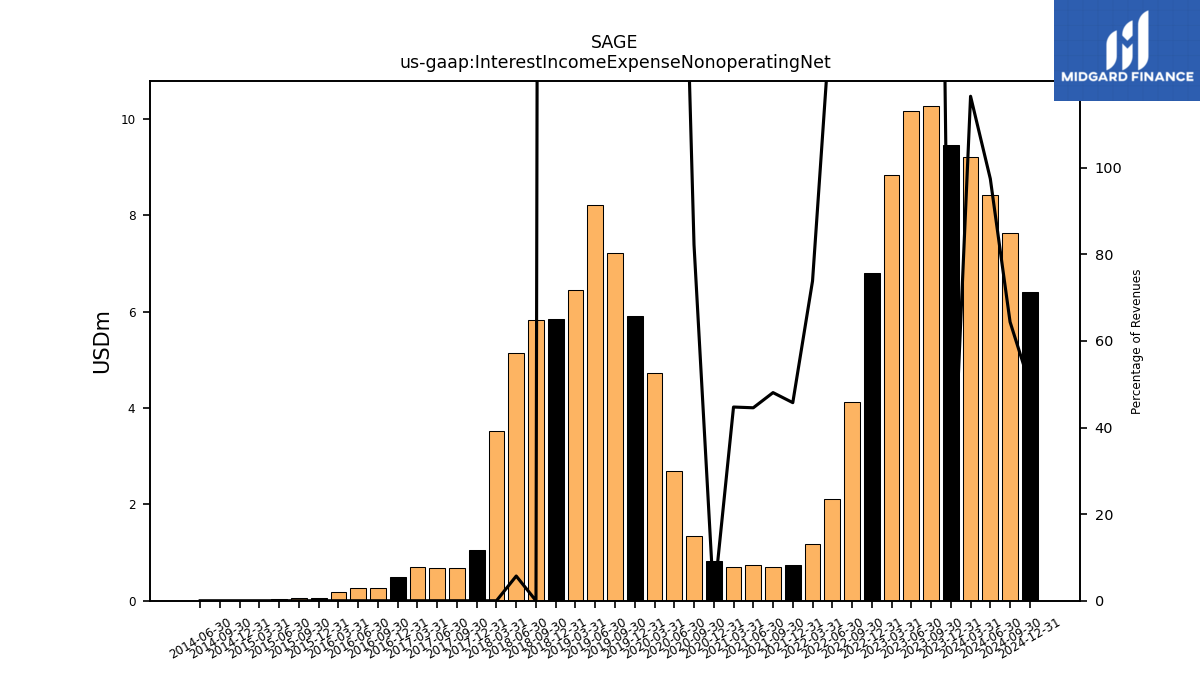
| Interest Income Expense Nonoperating Net | 9.20 | 9.47 | 10.27 | 10.17 | 8.83 | 6.79 | 4.13 | 2.10 | 1.17 | 0.75 | 0.69 | 0.73 | 0.71 | 0.83 | 1.35 | 2.69 | 4.73 | 5.92 | 7.23 | 8.22 | 6.44 | 5.85 | 5.82 | 5.14 | |
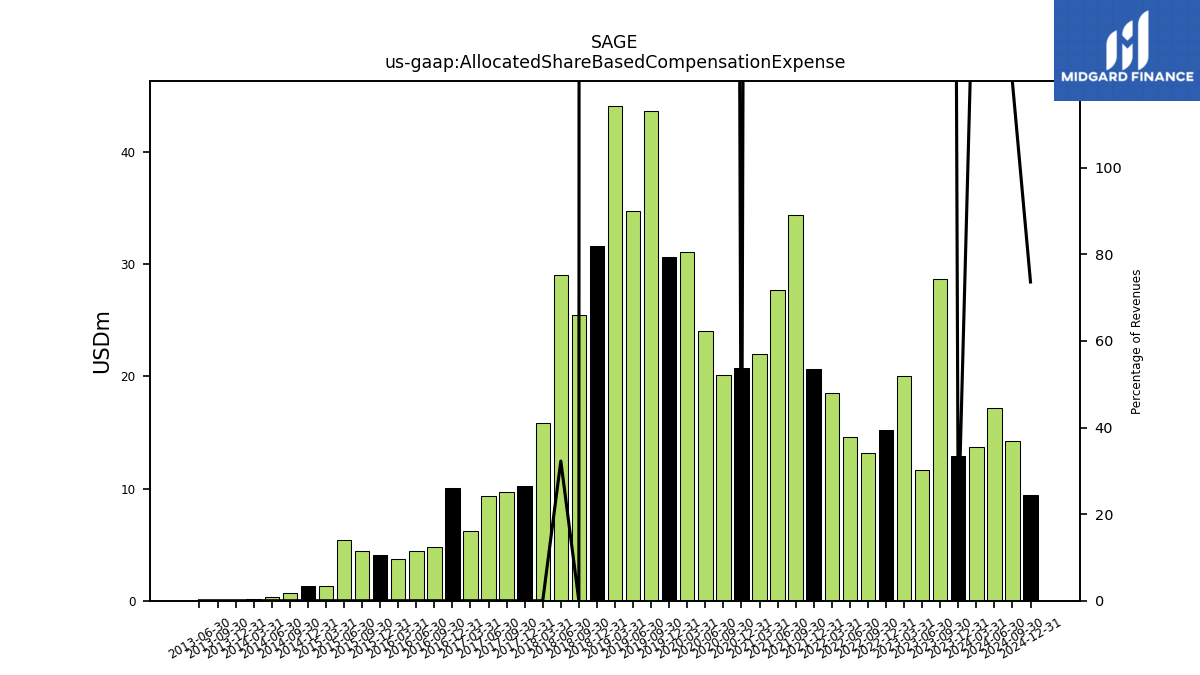
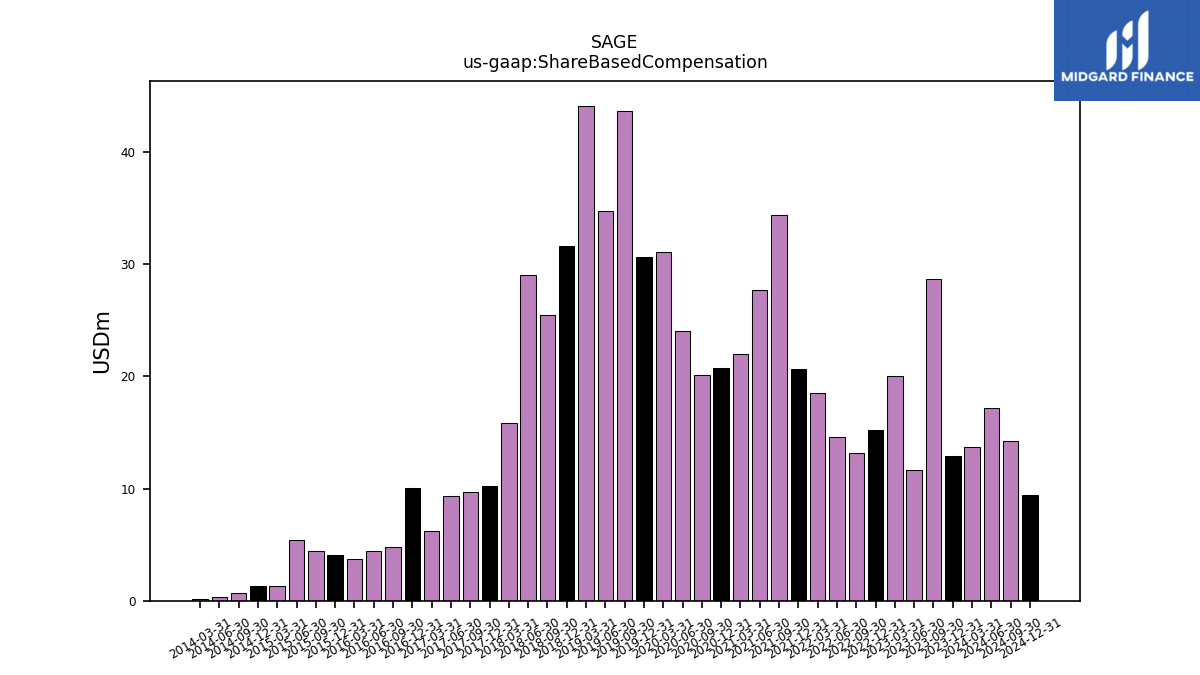
| Allocated Share Based Compensation Expense | 13.70 | 12.95 | 28.69 | 11.69 | 20.04 | 15.24 | 13.17 | 14.64 | 18.55 | 20.65 | 34.34 | 27.66 | 21.98 | 20.74 | 20.11 | 24.03 | 31.11 | 30.68 | 43.67 | 34.77 | 44.12 | 31.64 | 25.48 | 29.03 | |
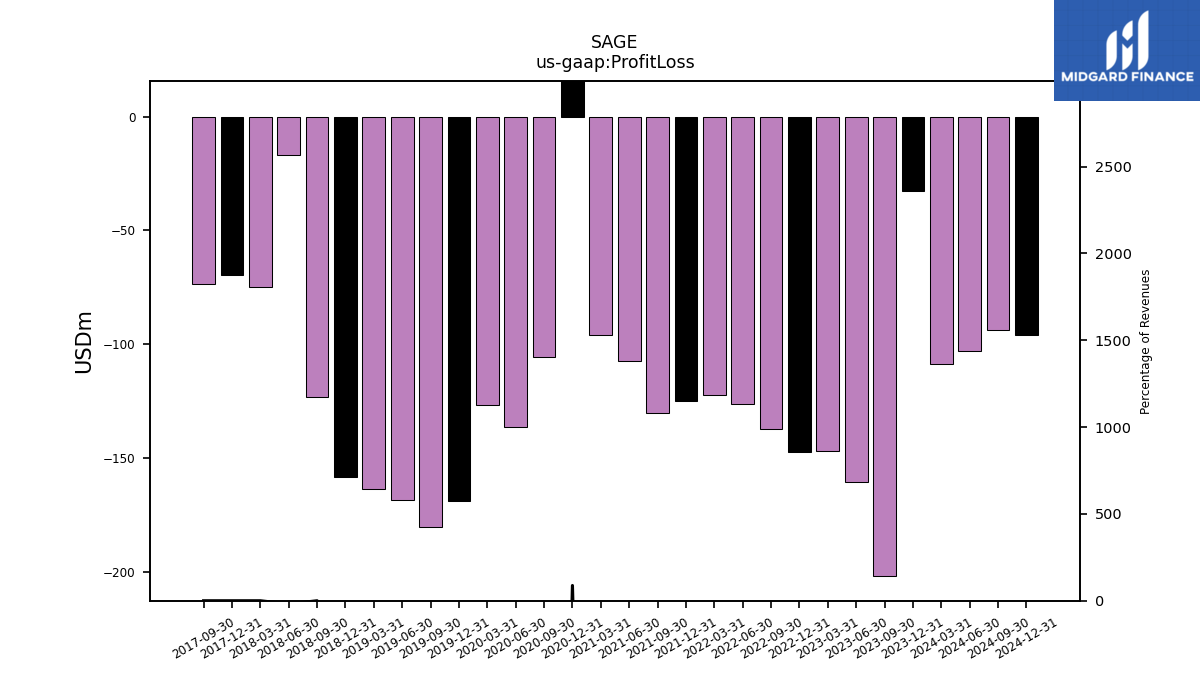
| Profit Loss | -108.48 | -32.71 | -201.63 | -160.32 | -146.83 | -147.15 | -137.32 | -126.26 | -122.06 | -124.71 | -130.17 | -107.25 | -95.76 | 974.89 | -105.73 | -136.35 | -126.74 | -168.65 | -179.96 | -168.22 | -163.41 | -158.39 | -122.92 | -16.98 | |
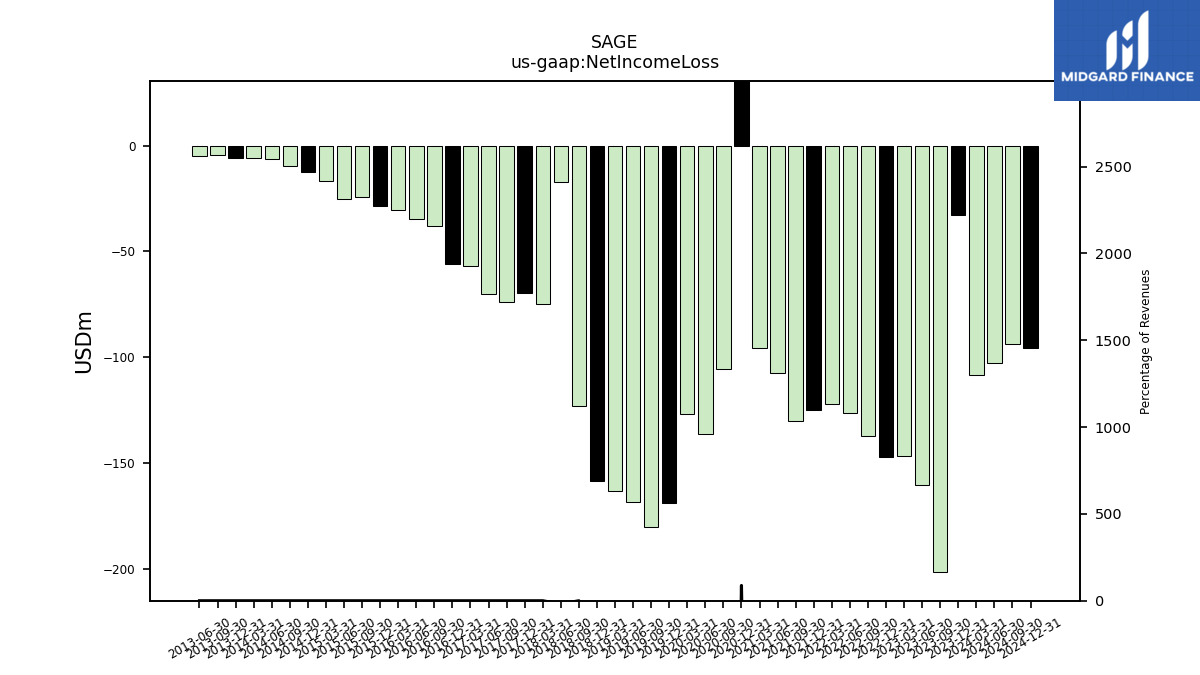
| Net Income Loss | -108.48 | -32.71 | -201.63 | -160.32 | -146.83 | -147.15 | -137.32 | -126.26 | -122.06 | -124.71 | -130.17 | -107.25 | -95.76 | 974.89 | -105.73 | -136.35 | -126.74 | -168.65 | -179.96 | -168.22 | -163.41 | -158.39 | -122.92 | -16.98 | |
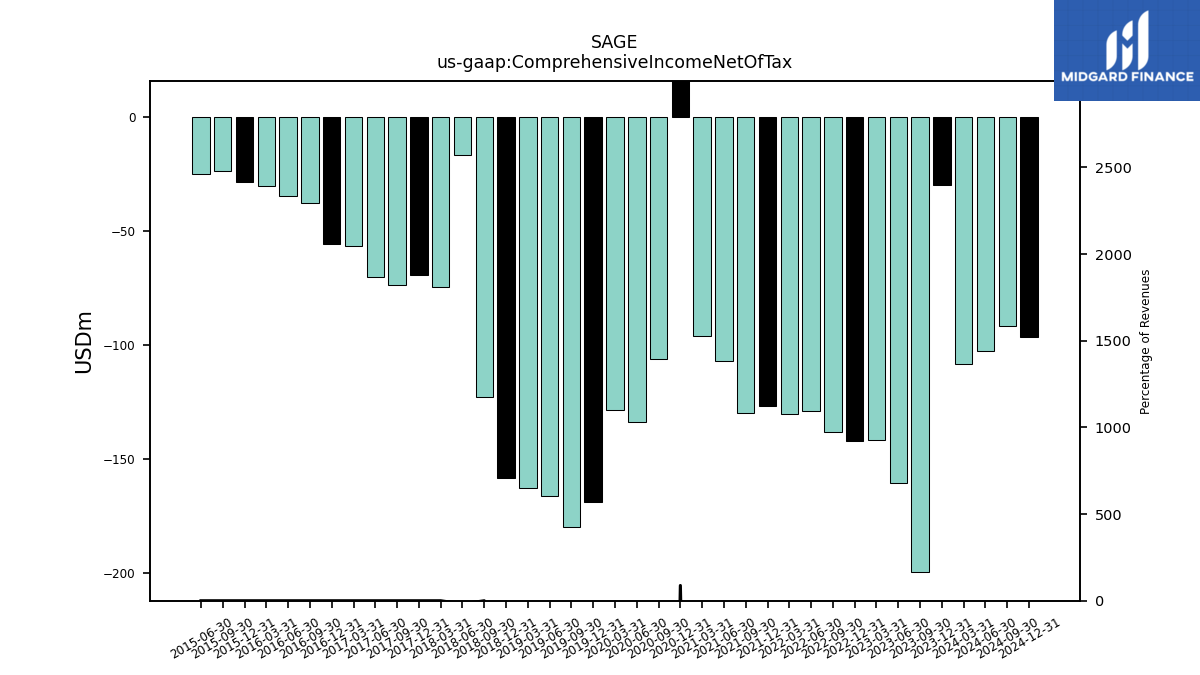
| Comprehensive Income Net Of Tax | -108.46 | -29.79 | -199.72 | -160.88 | -141.71 | -142.47 | -138.33 | -128.93 | -130.60 | -127.07 | -130.19 | -107.29 | -96.42 | 974.36 | -106.50 | -133.85 | -128.83 | -169.13 | -179.76 | -166.54 | -163.00 | -158.65 | -123.03 | -16.94 |
| 2024-03-31 | 2023-12-31 | 2023-09-30 | 2023-06-30 | 2023-03-31 | 2022-12-31 | 2022-09-30 | 2022-06-30 | 2022-03-31 | 2021-12-31 | 2021-09-30 | 2021-06-30 | 2021-03-31 | 2020-12-31 | 2020-09-30 | 2020-06-30 | 2020-03-31 | 2019-12-31 | 2019-09-30 | 2019-06-30 | 2019-03-31 | 2018-12-31 | 2018-09-30 | 2018-06-30 | ||
|---|---|---|---|---|---|---|---|---|---|---|---|---|---|---|---|---|---|---|---|---|---|---|---|---|---|
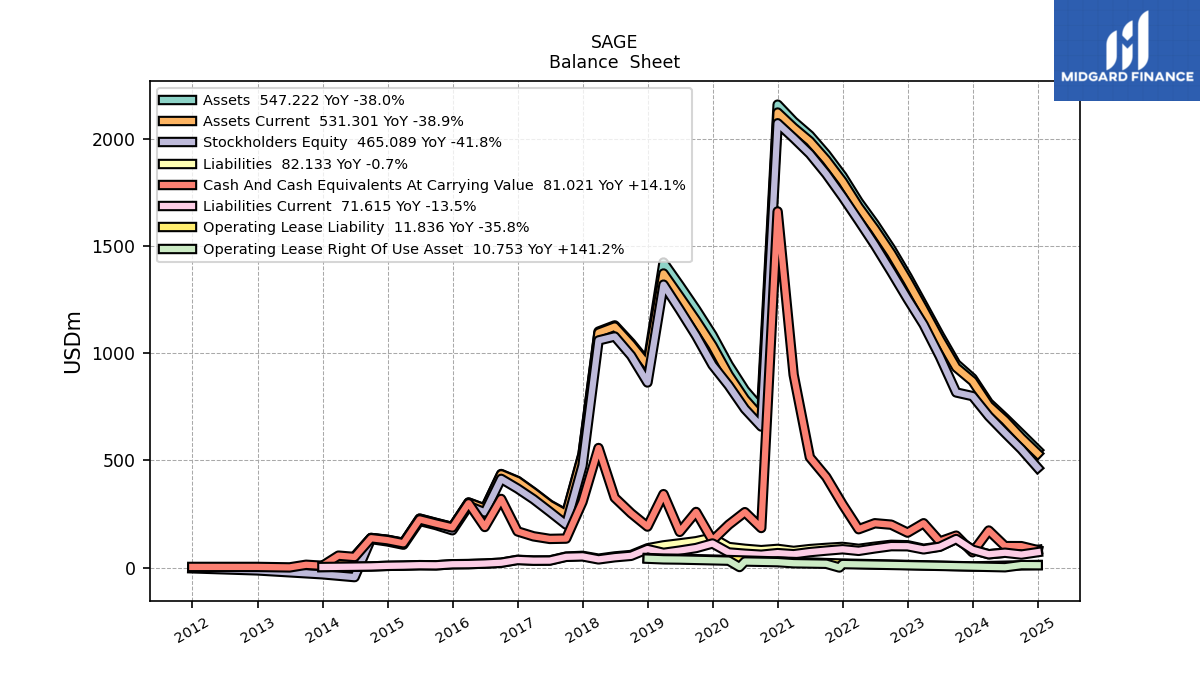
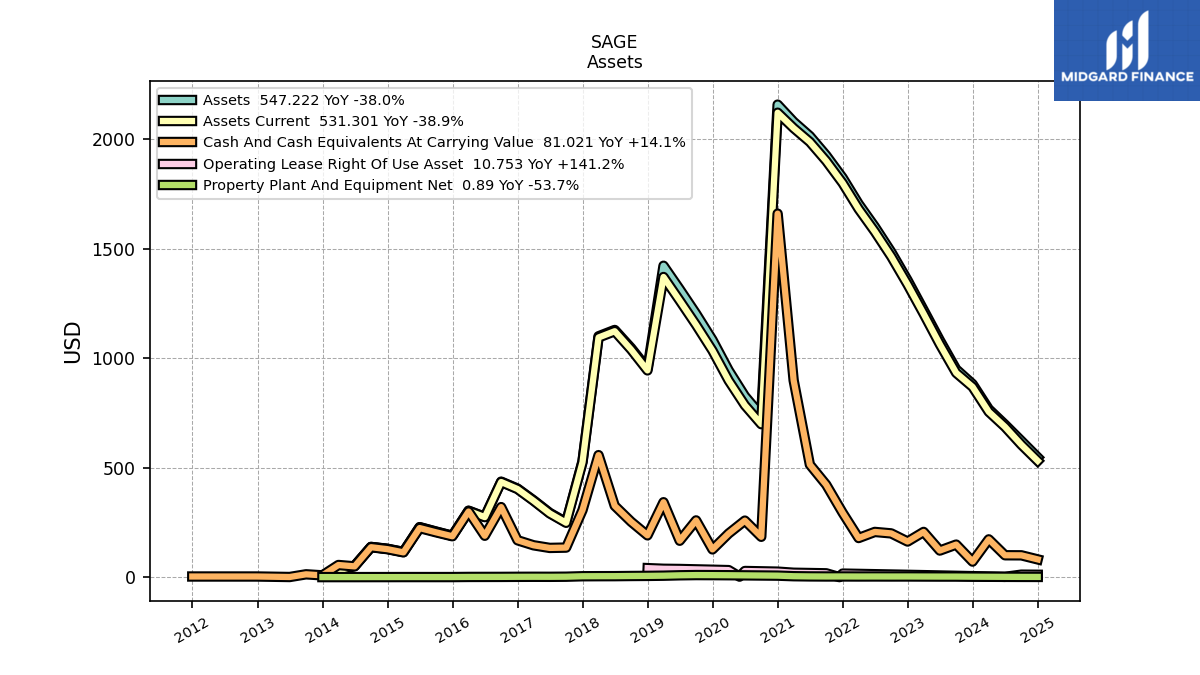
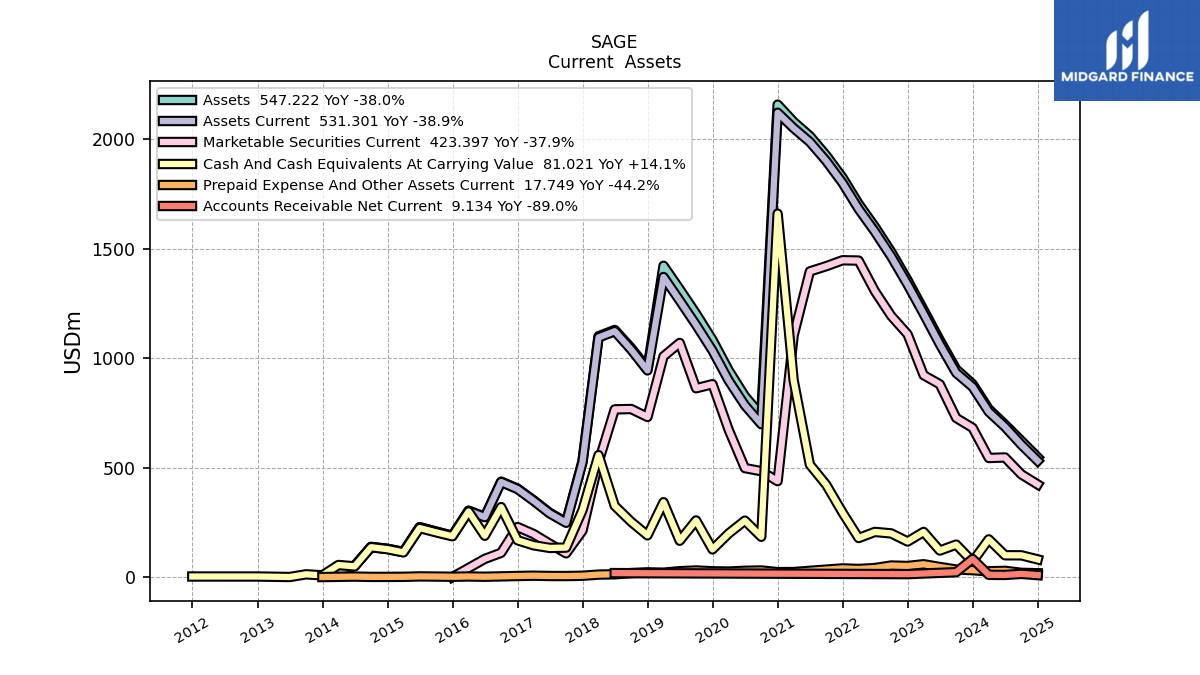
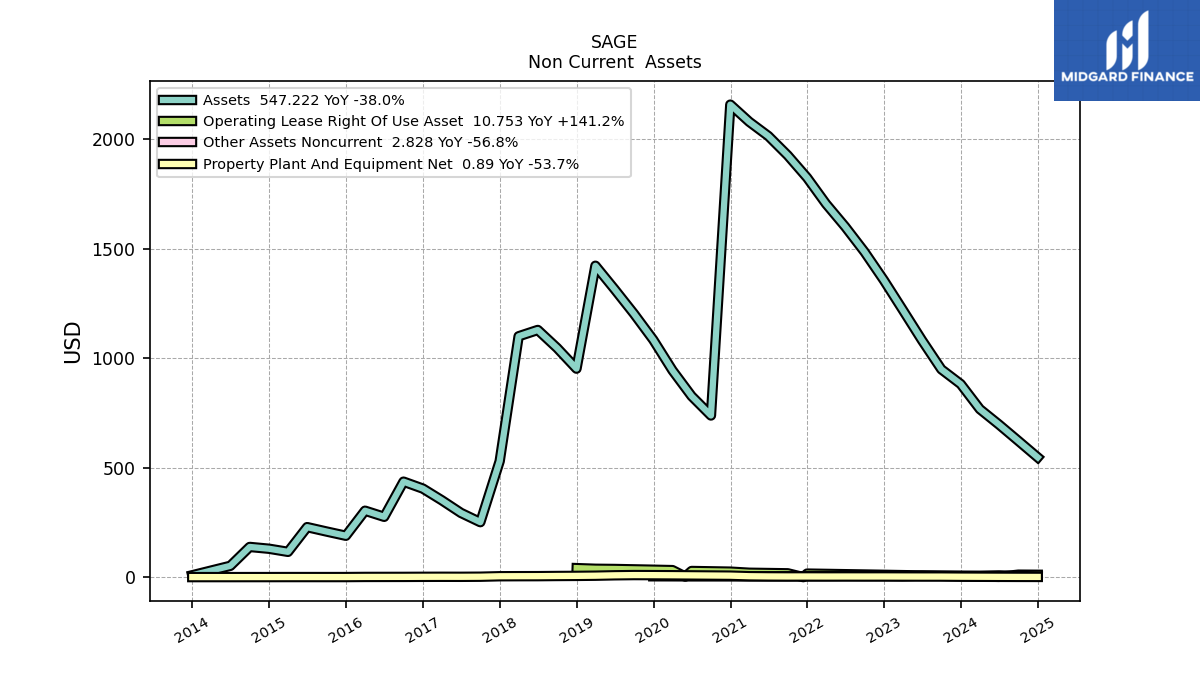
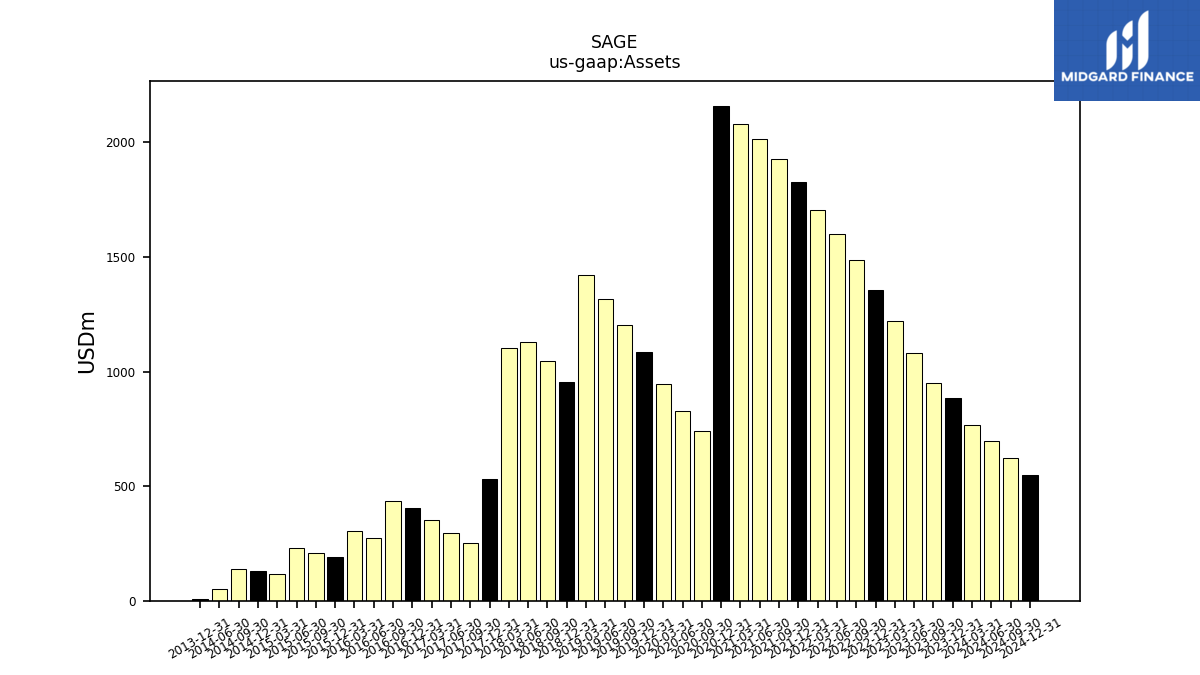
| Assets | 767.60 | 882.28 | 949.66 | 1082.29 | 1220.69 | 1356.45 | 1486.07 | 1601.38 | 1705.70 | 1825.29 | 1927.18 | 2015.47 | 2080.70 | 2159.25 | 738.63 | 827.24 | 944.97 | 1084.15 | 1203.73 | 1315.55 | 1422.91 | 952.71 | 1047.00 | 1129.48 | |
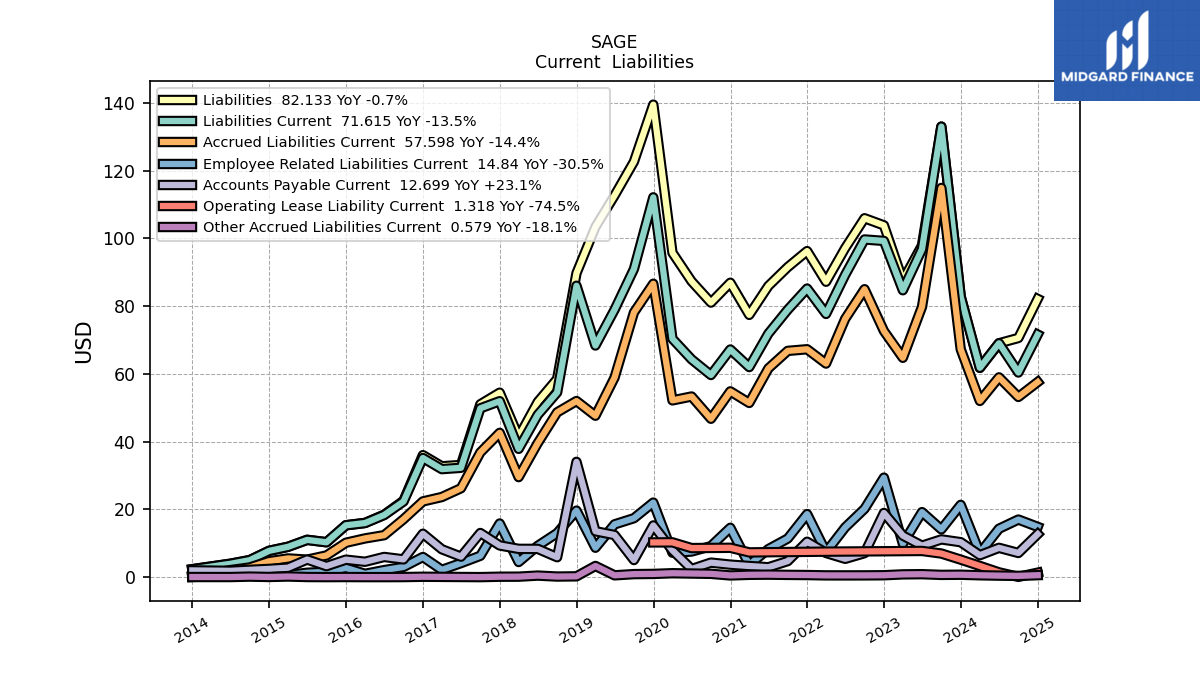
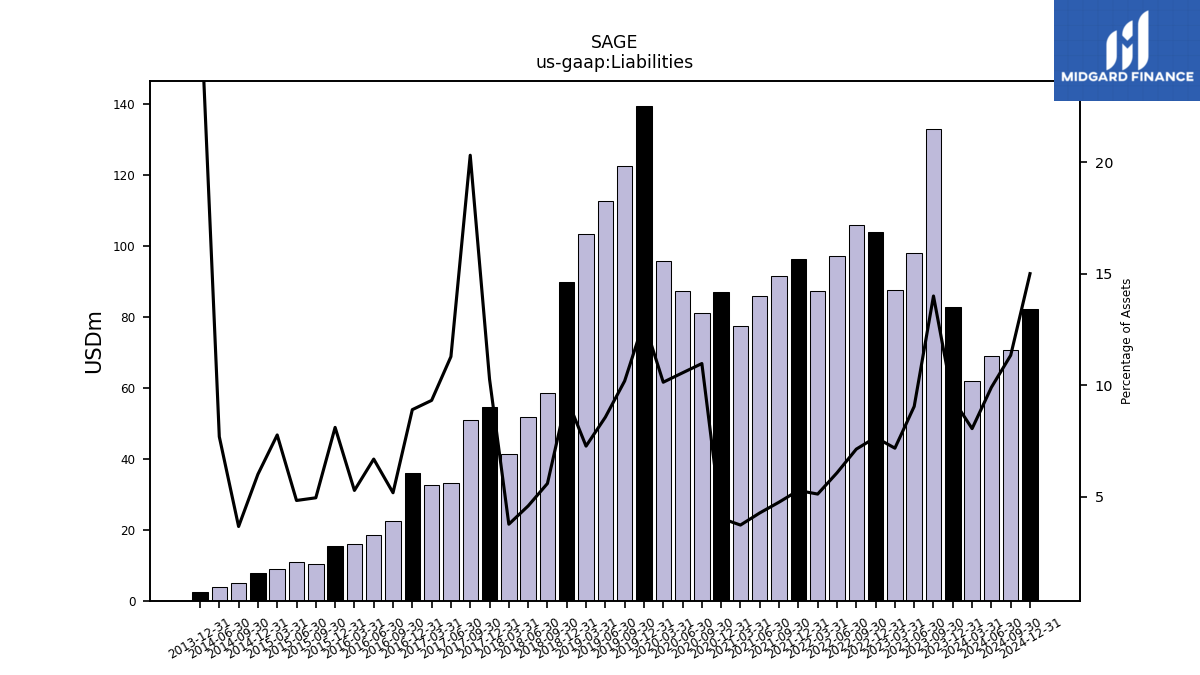
| Liabilities | 61.80 | 82.75 | 133.00 | 97.91 | 87.56 | 103.85 | 105.95 | 97.14 | 87.20 | 96.26 | 91.53 | 85.96 | 77.42 | 86.91 | 81.05 | 87.33 | 95.77 | 139.50 | 122.66 | 112.67 | 103.38 | 89.73 | 58.49 | 51.72 | |
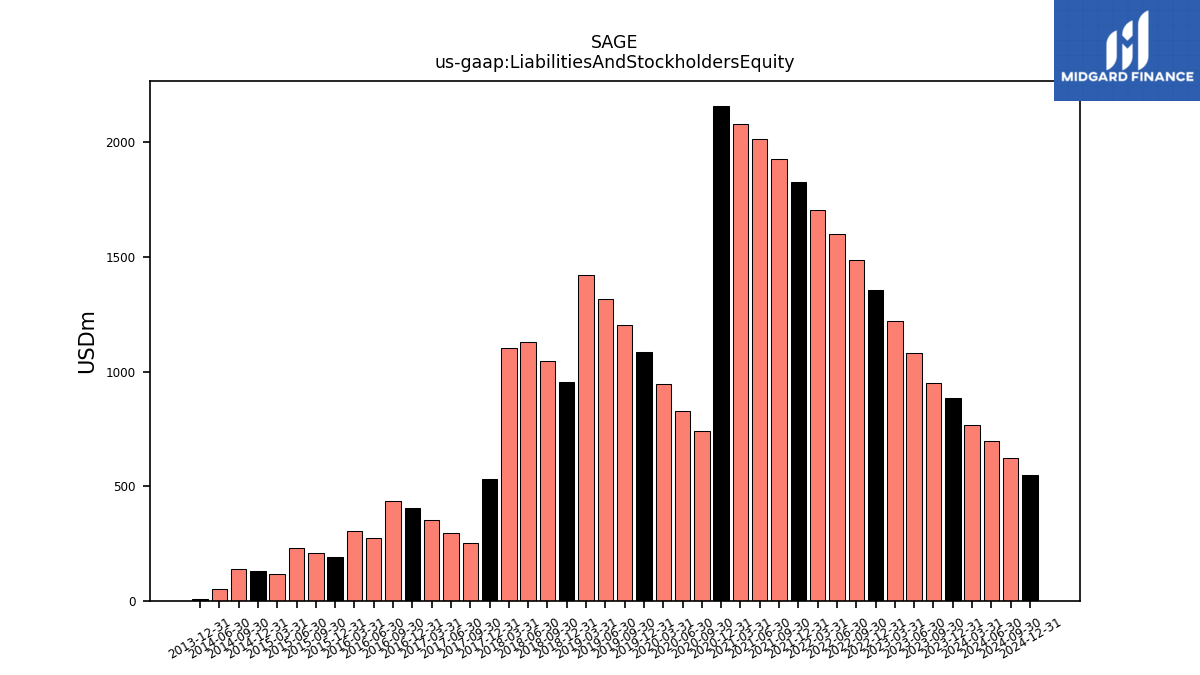
| Liabilities And Stockholders Equity | 767.60 | 882.28 | 949.66 | 1082.29 | 1220.69 | 1356.45 | 1486.07 | 1601.38 | 1705.70 | 1825.29 | 1927.18 | 2015.47 | 2080.70 | 2159.25 | 738.63 | 827.24 | 944.97 | 1084.15 | 1203.73 | 1315.55 | 1422.91 | 952.71 | 1047.00 | 1129.48 | |
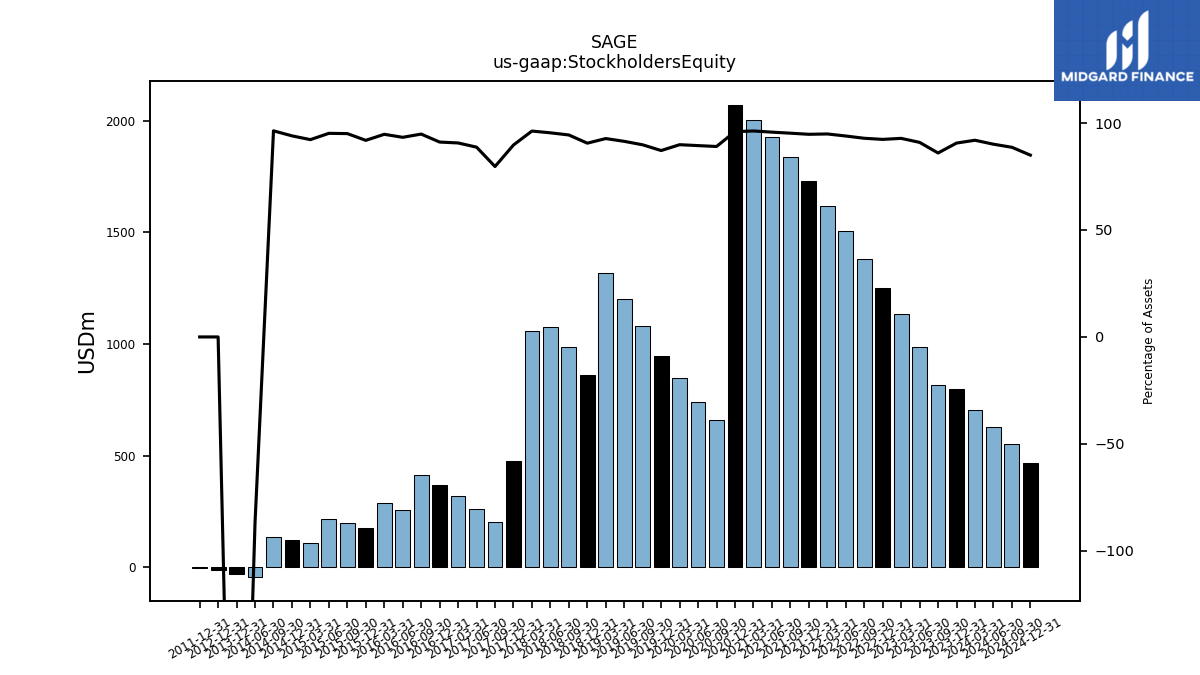
| Stockholders Equity | 705.80 | 799.53 | 816.66 | 984.38 | 1133.13 | 1252.60 | 1380.12 | 1504.24 | 1618.50 | 1729.03 | 1835.65 | 1929.51 | 2003.28 | 2072.33 | 657.58 | 739.91 | 849.21 | 944.65 | 1081.07 | 1202.88 | 1319.53 | 862.97 | 988.50 | 1077.76 |
| 2024-03-31 | 2023-12-31 | 2023-09-30 | 2023-06-30 | 2023-03-31 | 2022-12-31 | 2022-09-30 | 2022-06-30 | 2022-03-31 | 2021-12-31 | 2021-09-30 | 2021-06-30 | 2021-03-31 | 2020-12-31 | 2020-09-30 | 2020-06-30 | 2020-03-31 | 2019-12-31 | 2019-09-30 | 2019-06-30 | 2019-03-31 | 2018-12-31 | 2018-09-30 | 2018-06-30 | ||
|---|---|---|---|---|---|---|---|---|---|---|---|---|---|---|---|---|---|---|---|---|---|---|---|---|---|
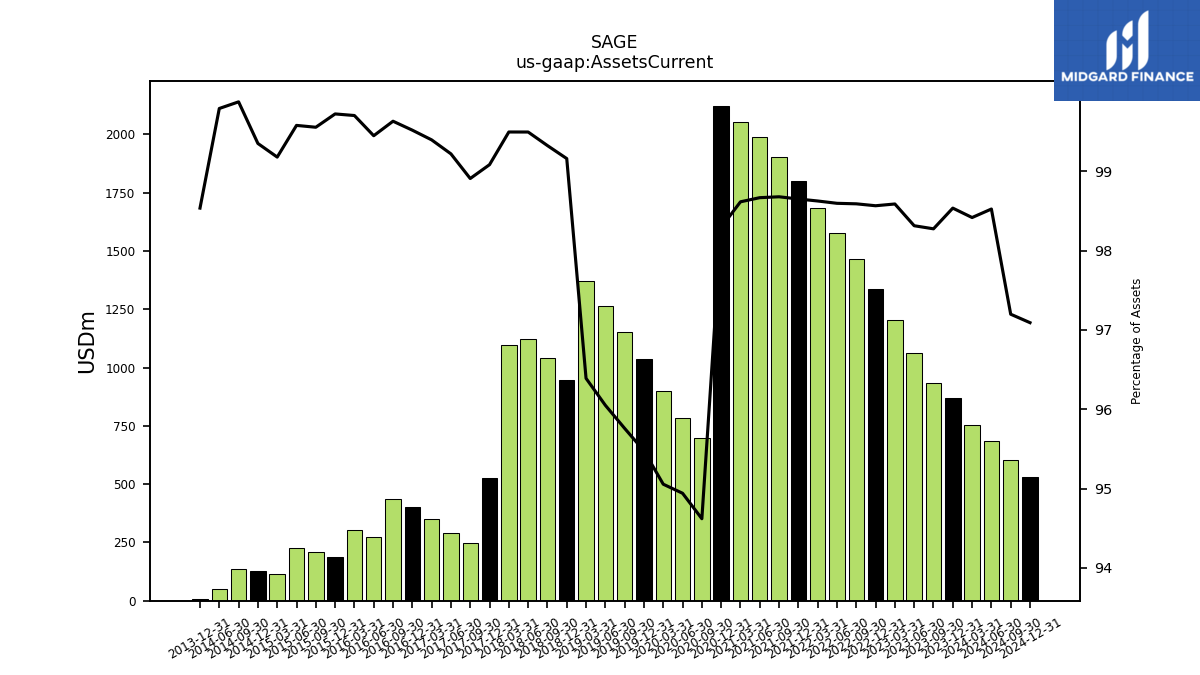
| Assets Current | 755.44 | 869.35 | 933.27 | 1064.03 | 1203.44 | 1336.98 | 1465.10 | 1578.88 | 1682.24 | 1800.64 | 1901.70 | 1988.60 | 2051.87 | 2122.37 | 698.88 | 785.38 | 898.24 | 1035.09 | 1152.66 | 1263.57 | 1371.53 | 944.70 | 1039.91 | 1123.77 | |
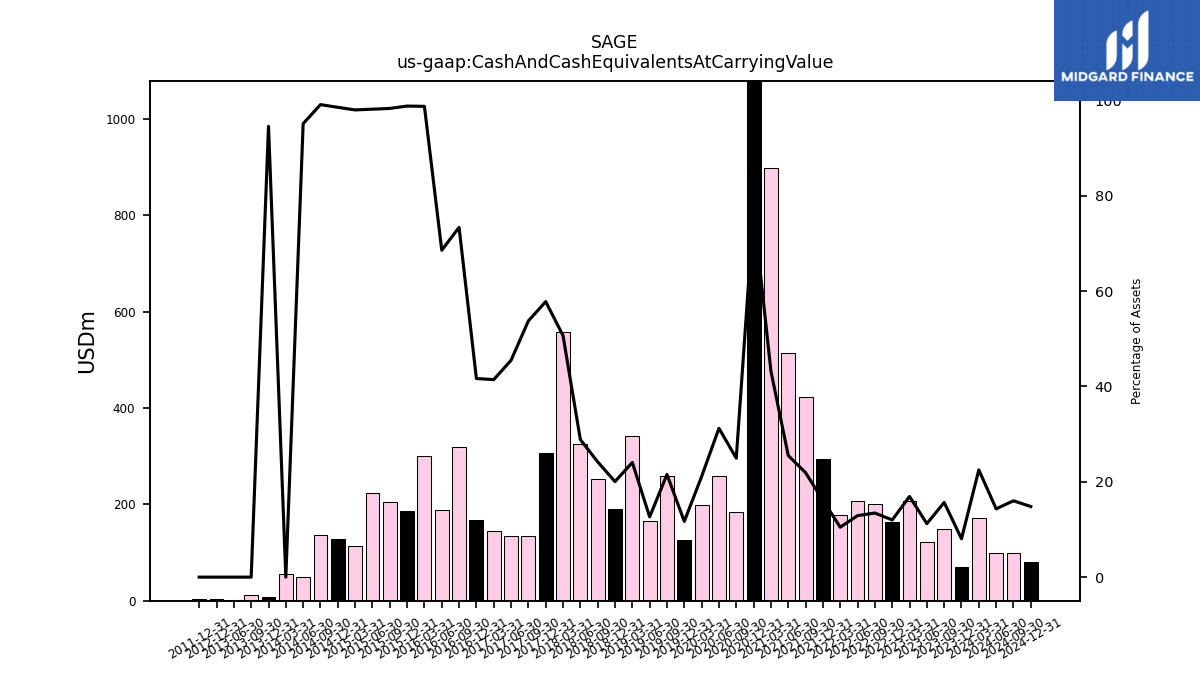
| Cash And Cash Equivalents At Carrying Value | 172.65 | 70.99 | 148.71 | 121.42 | 206.56 | 162.70 | 199.83 | 206.51 | 178.67 | 294.23 | 422.17 | 514.16 | 899.25 | 1661.08 | 184.27 | 258.23 | 199.44 | 126.70 | 259.18 | 166.19 | 342.30 | 190.94 | 253.12 | 325.83 | |
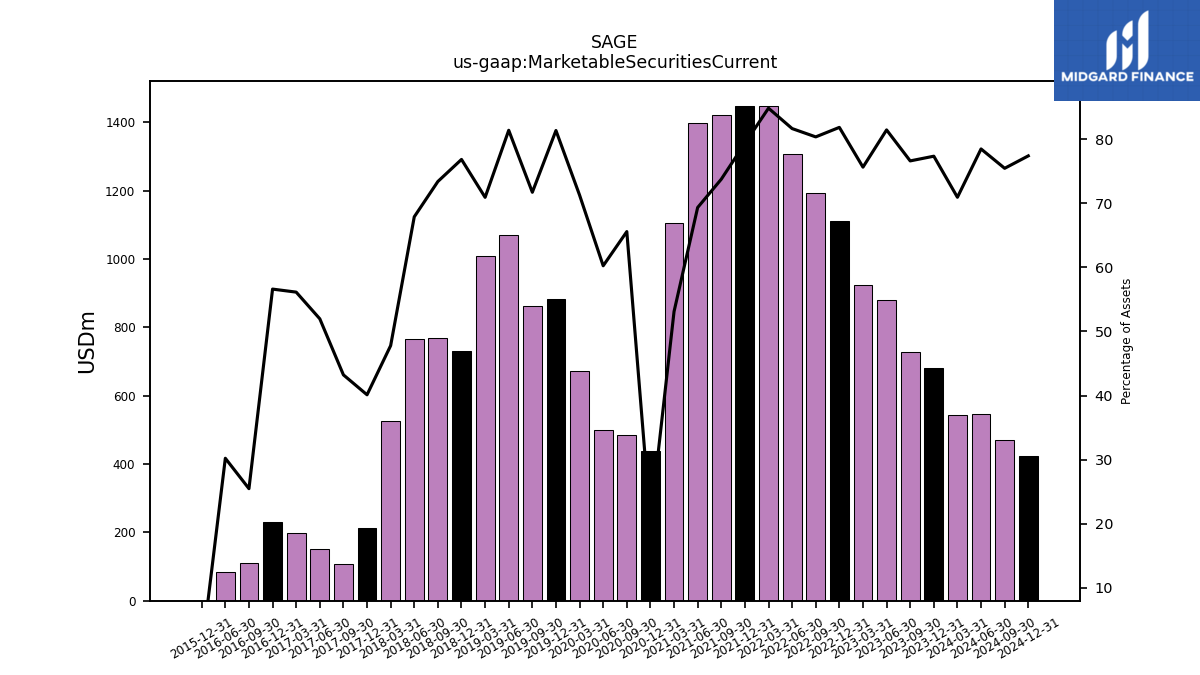
| Marketable Securities Current | 544.36 | 682.19 | 727.34 | 881.20 | 923.03 | 1109.79 | 1193.81 | 1307.20 | 1446.57 | 1448.06 | 1421.00 | 1397.16 | 1104.77 | 438.47 | 484.27 | 498.29 | 673.31 | 881.69 | 863.07 | 1070.36 | 1008.96 | 731.83 | 768.28 | 766.60 | |
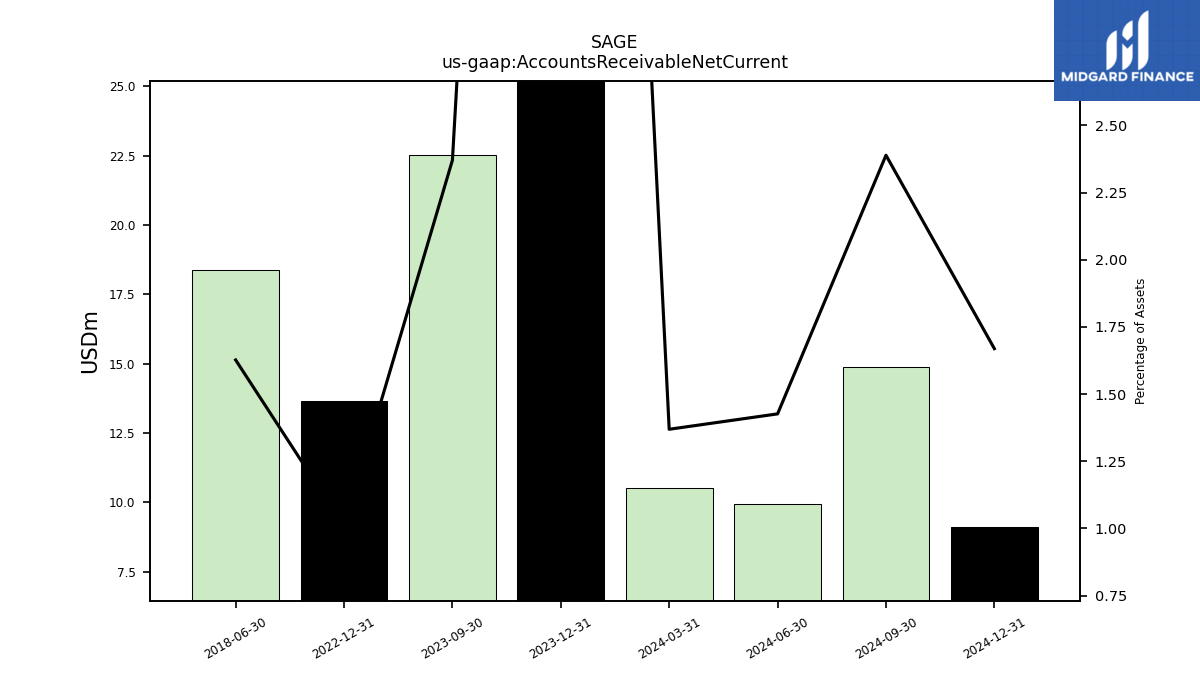
| Accounts Receivable Net Current | 10.51 | 83.01 | 22.51 | NA | NA | 13.66 | NA | NA | NA | NA | NA | NA | NA | NA | NA | NA | NA | NA | NA | NA | NA | NA | NA | 18.38 | |
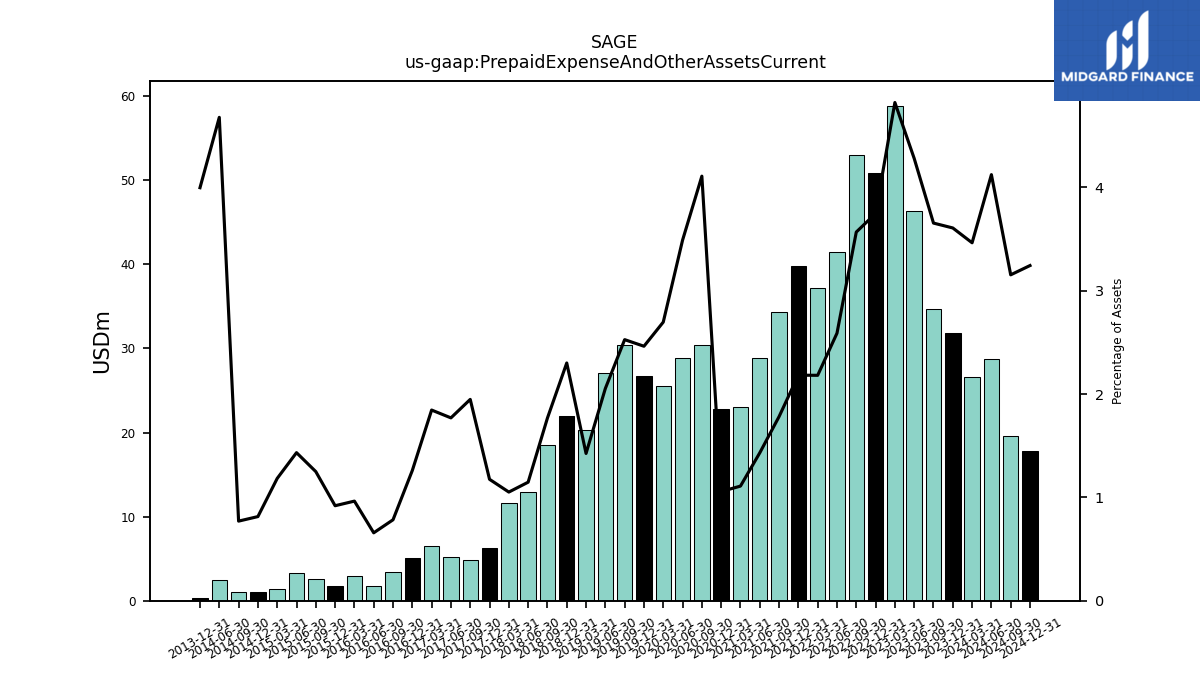
| Prepaid Expense And Other Assets Current | 26.59 | 31.82 | 34.70 | 46.32 | 58.85 | 50.83 | 53.02 | 41.45 | 37.21 | 39.84 | 34.34 | 28.85 | 23.08 | 22.82 | 30.35 | 28.86 | 25.48 | 26.70 | 30.41 | 27.02 | 20.28 | 21.92 | 18.51 | 12.96 |
| 2024-03-31 | 2023-12-31 | 2023-09-30 | 2023-06-30 | 2023-03-31 | 2022-12-31 | 2022-09-30 | 2022-06-30 | 2022-03-31 | 2021-12-31 | 2021-09-30 | 2021-06-30 | 2021-03-31 | 2020-12-31 | 2020-09-30 | 2020-06-30 | 2020-03-31 | 2019-12-31 | 2019-09-30 | 2019-06-30 | 2019-03-31 | 2018-12-31 | 2018-09-30 | 2018-06-30 | ||
|---|---|---|---|---|---|---|---|---|---|---|---|---|---|---|---|---|---|---|---|---|---|---|---|---|---|
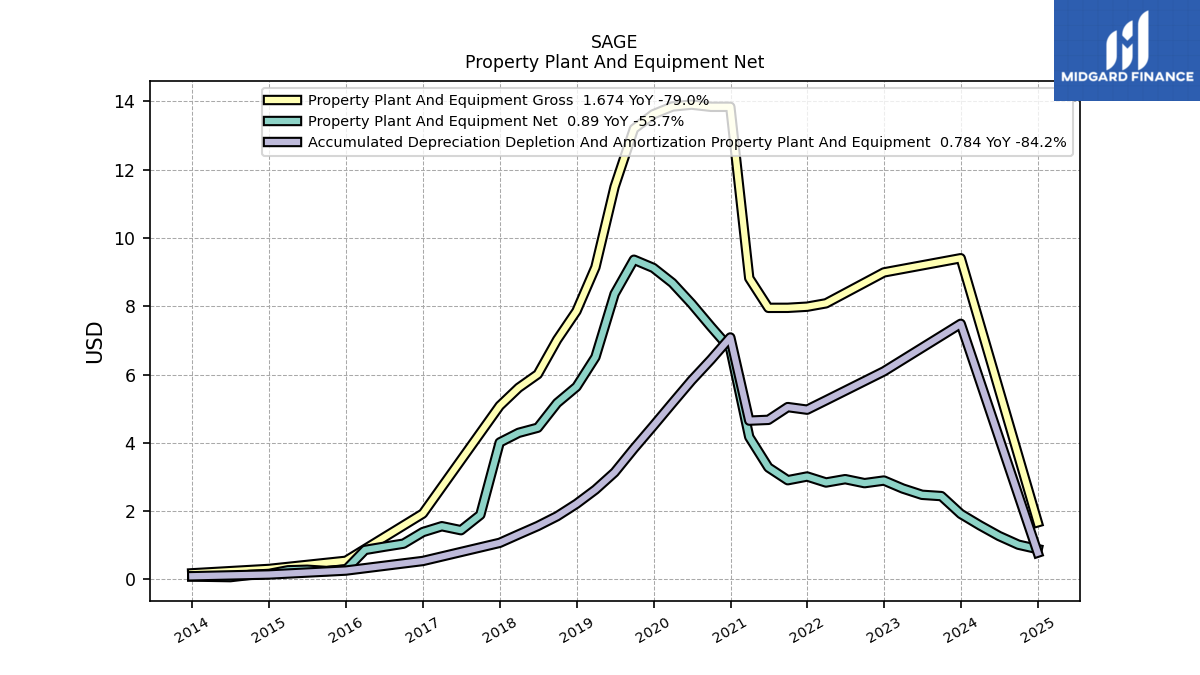
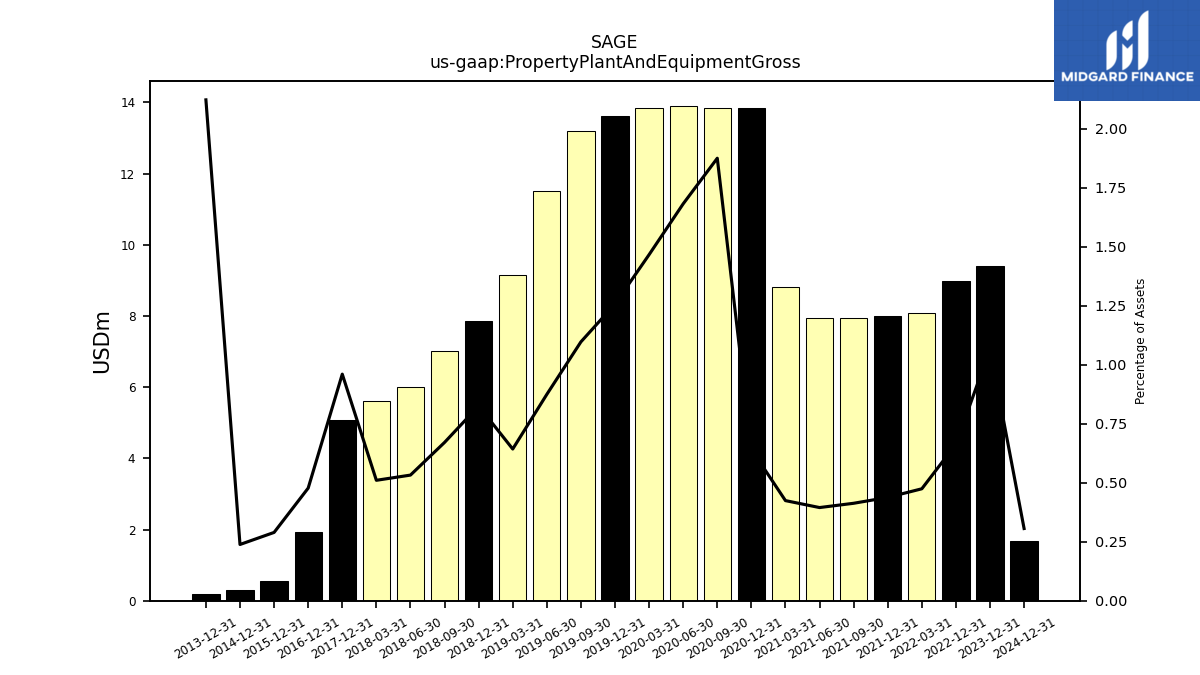
| Property Plant And Equipment Gross | NA | 9.41 | NA | NA | NA | 8.99 | NA | NA | 8.09 | 7.99 | 7.96 | 7.96 | 8.82 | 13.84 | 13.84 | 13.91 | 13.85 | 13.62 | 13.20 | 11.50 | 9.14 | 7.86 | 7.02 | 6.01 | |
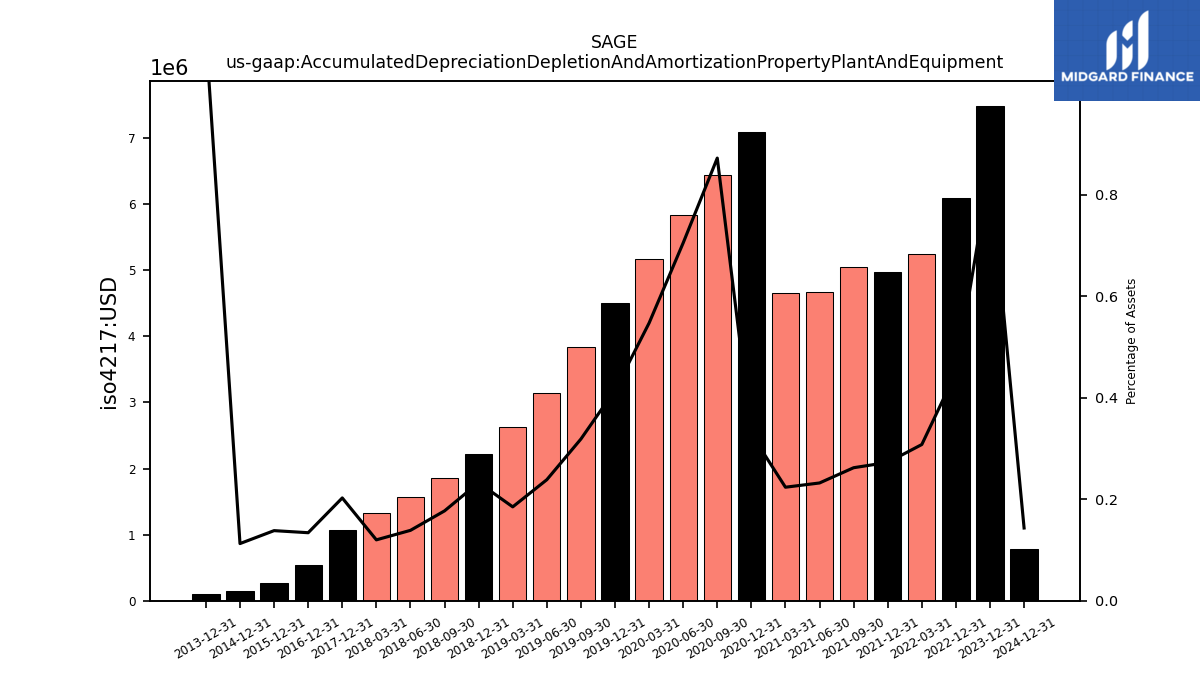
| Accumulated Depreciation Depletion And Amortization Property Plant And Equipment | NA | 7.49 | NA | NA | NA | 6.09 | NA | NA | 5.25 | 4.97 | 5.05 | 4.67 | 4.65 | 7.09 | 6.44 | 5.83 | 5.17 | 4.50 | 3.83 | 3.14 | 2.63 | 2.22 | 1.85 | 1.57 | |
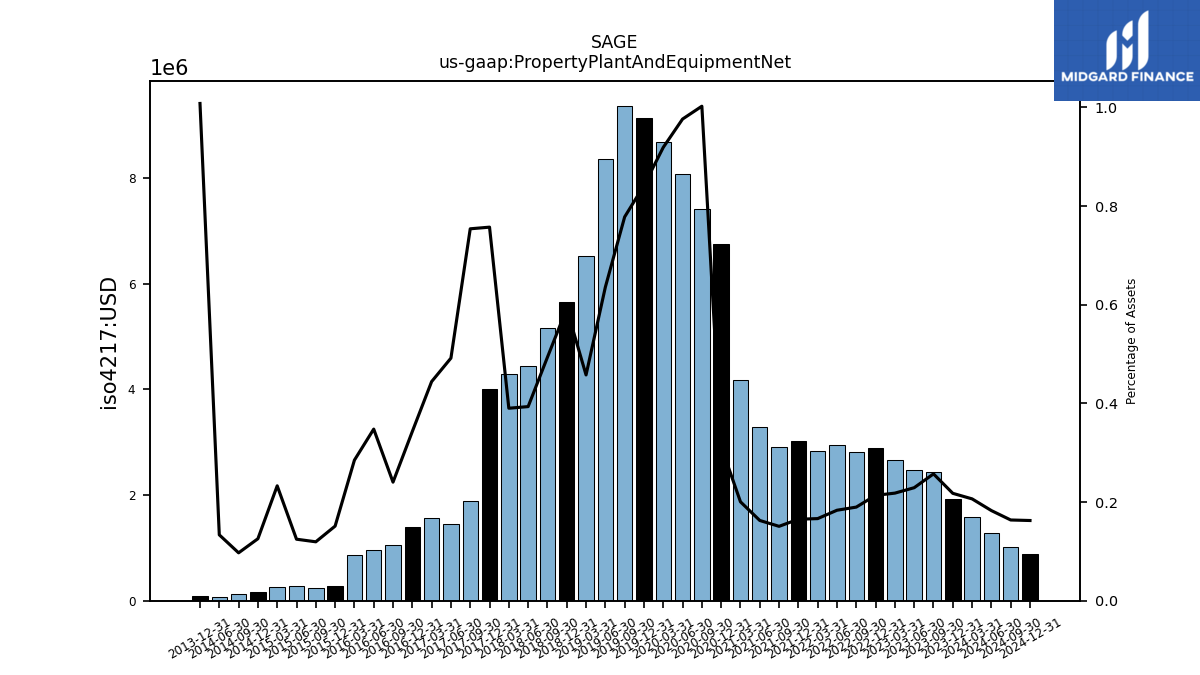
| Property Plant And Equipment Net | 1.58 | 1.92 | 2.44 | 2.48 | 2.66 | 2.90 | 2.82 | 2.94 | 2.84 | 3.02 | 2.91 | 3.28 | 4.17 | 6.75 | 7.40 | 8.08 | 8.68 | 9.13 | 9.37 | 8.36 | 6.51 | 5.64 | 5.17 | 4.45 | |
| Other Assets Noncurrent | 6.22 | 6.55 | 6.59 | 6.89 | 4.25 | 4.77 | 4.91 | 4.91 | 4.59 | 4.25 | 3.88 | 3.60 | 3.39 | 3.34 | 3.43 | 3.42 | 3.69 | 3.79 | NA | NA | NA | NA | NA | NA | |
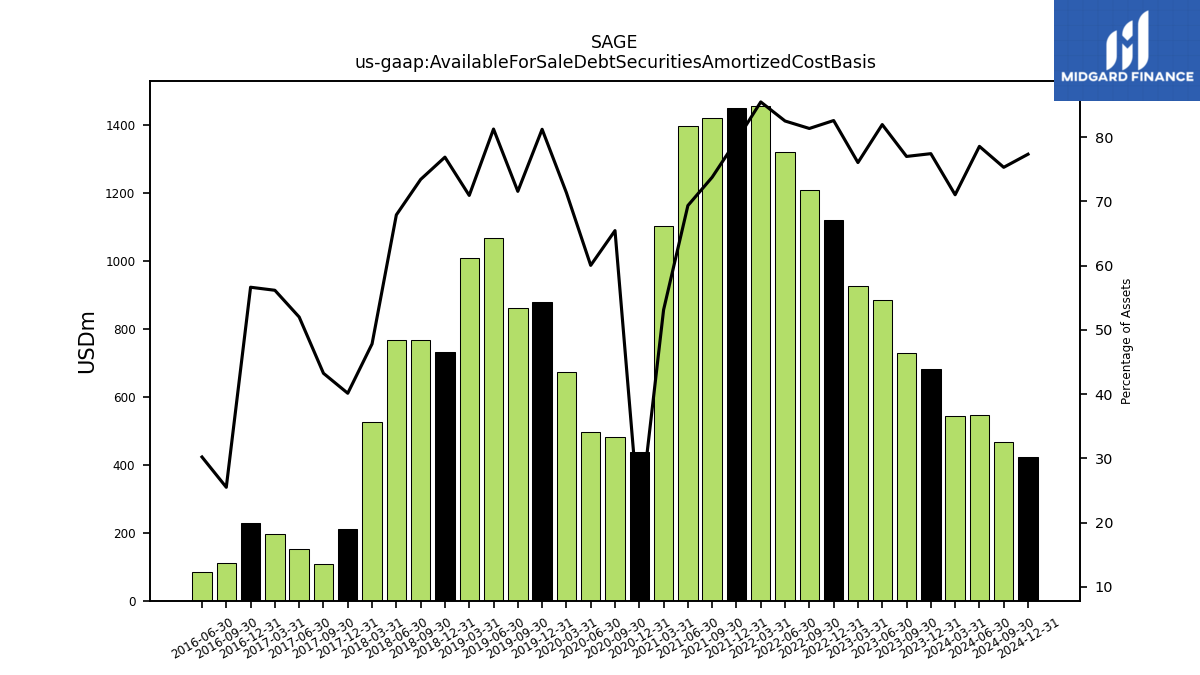
| Available For Sale Debt Securities Amortized Cost Basis | 545.15 | 683.01 | 731.08 | 886.84 | 928.11 | 1120.00 | 1208.70 | 1321.07 | 1457.77 | 1450.72 | 1421.31 | 1397.44 | 1105.00 | 438.05 | 483.32 | 496.58 | 674.11 | 880.39 | 861.29 | 1068.79 | 1009.06 | 732.35 | 768.53 | 766.75 |
| 2024-03-31 | 2023-12-31 | 2023-09-30 | 2023-06-30 | 2023-03-31 | 2022-12-31 | 2022-09-30 | 2022-06-30 | 2022-03-31 | 2021-12-31 | 2021-09-30 | 2021-06-30 | 2021-03-31 | 2020-12-31 | 2020-09-30 | 2020-06-30 | 2020-03-31 | 2019-12-31 | 2019-09-30 | 2019-06-30 | 2019-03-31 | 2018-12-31 | 2018-09-30 | 2018-06-30 | ||
|---|---|---|---|---|---|---|---|---|---|---|---|---|---|---|---|---|---|---|---|---|---|---|---|---|---|
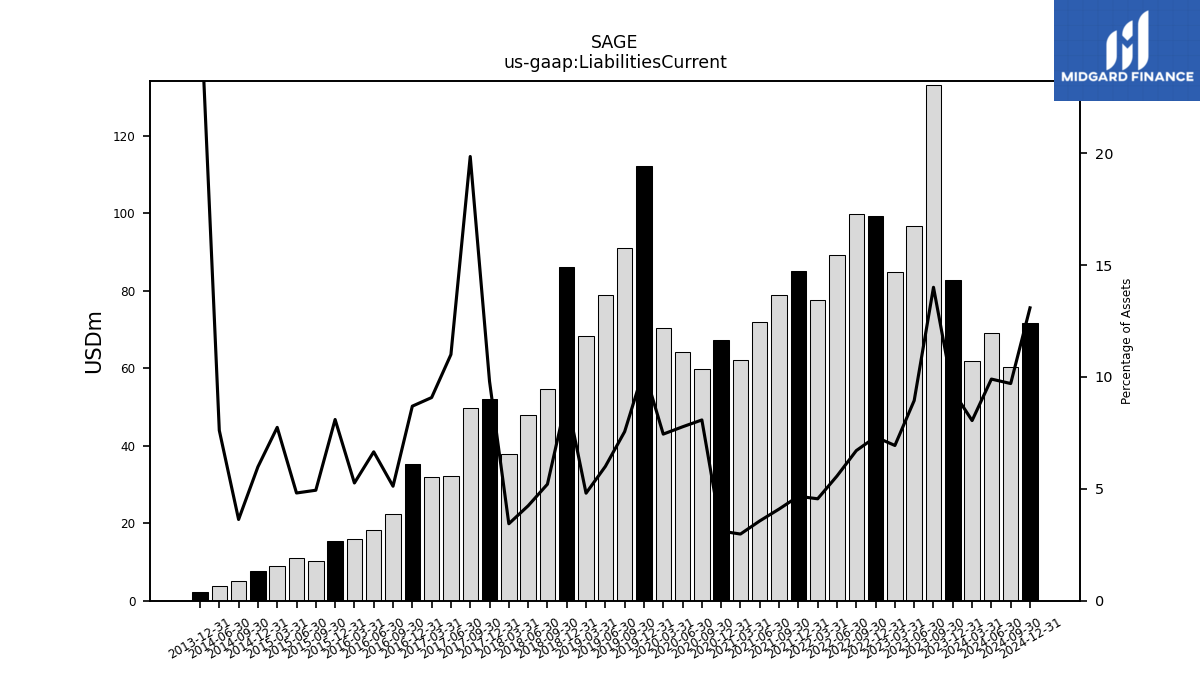
| Liabilities Current | 61.80 | 82.75 | 133.00 | 96.81 | 84.69 | 99.26 | 99.69 | 89.24 | 77.70 | 85.19 | 78.94 | 71.90 | 62.01 | 67.20 | 59.66 | 64.29 | 70.36 | 112.13 | 90.96 | 78.95 | 68.38 | 86.03 | 54.53 | 47.92 | |
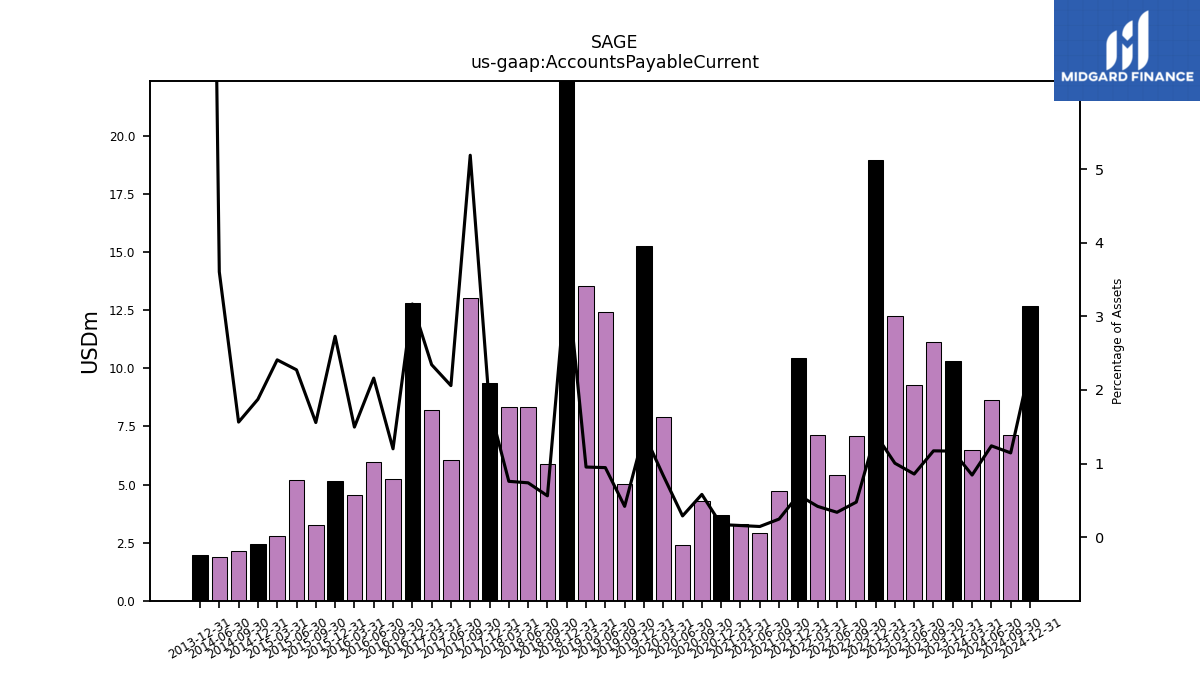
| Accounts Payable Current | 6.48 | 10.32 | 11.14 | 9.28 | 12.26 | 18.95 | 7.08 | 5.41 | 7.13 | 10.45 | 4.73 | 2.92 | 3.29 | 3.69 | 4.29 | 2.39 | 7.91 | 15.27 | 5.04 | 12.43 | 13.56 | 34.04 | 5.88 | 8.34 | |
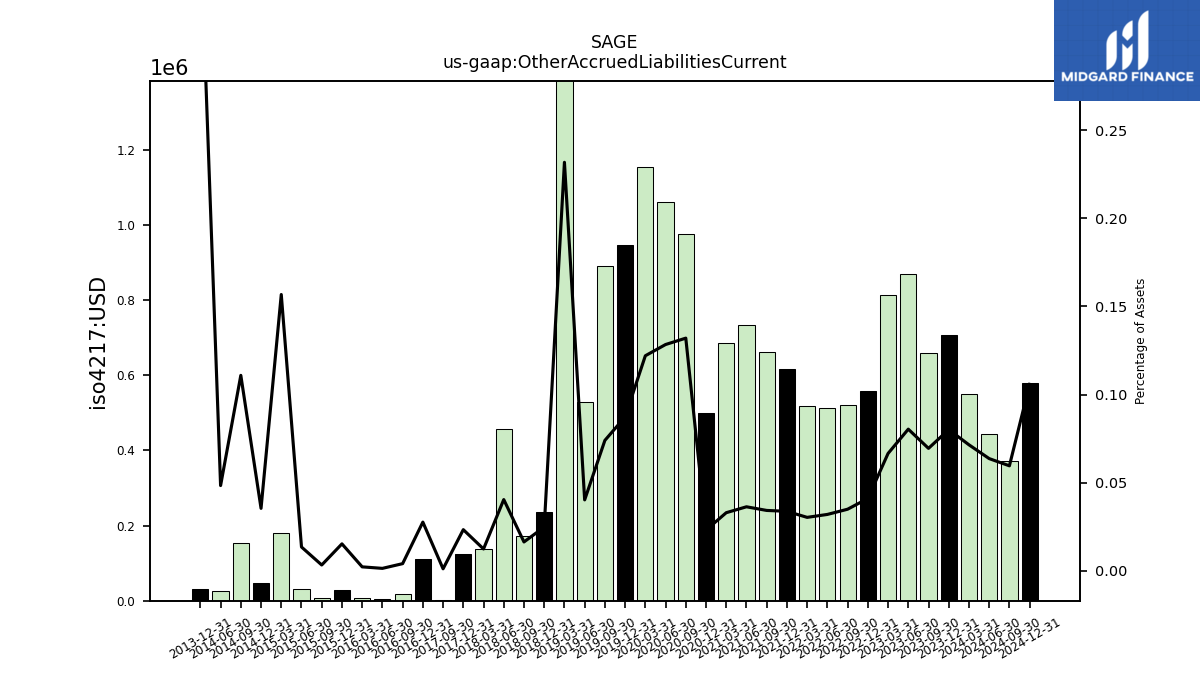
| Other Accrued Liabilities Current | 0.55 | 0.71 | 0.66 | 0.87 | 0.81 | 0.56 | 0.52 | 0.51 | 0.52 | 0.62 | 0.66 | 0.73 | 0.69 | 0.50 | 0.97 | 1.06 | 1.15 | 0.95 | 0.89 | 0.53 | 3.30 | 0.24 | 0.17 | 0.46 | |
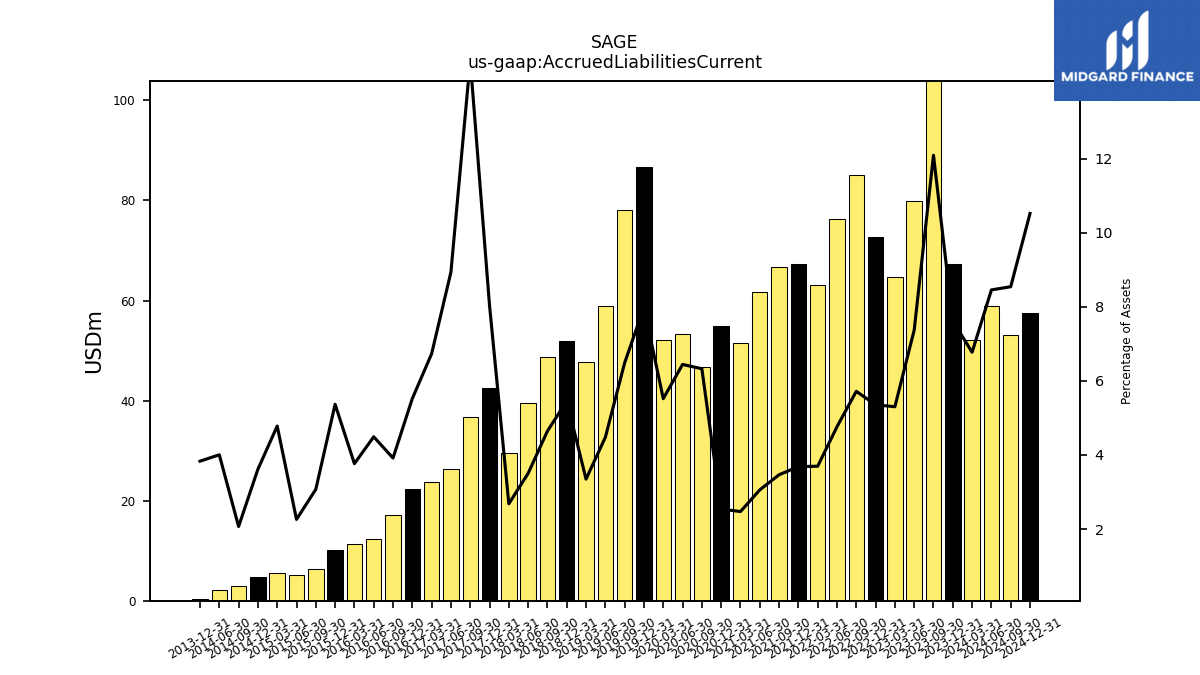
| Accrued Liabilities Current | 52.01 | 67.26 | 114.90 | 79.80 | 64.75 | 72.67 | 85.01 | 76.27 | 63.05 | 67.28 | 66.80 | 61.62 | 51.42 | 54.85 | 46.76 | 53.33 | 52.18 | 86.62 | 78.13 | 58.91 | 47.65 | 51.99 | 48.65 | 39.58 |
| 2024-03-31 | 2023-12-31 | 2023-09-30 | 2023-06-30 | 2023-03-31 | 2022-12-31 | 2022-09-30 | 2022-06-30 | 2022-03-31 | 2021-12-31 | 2021-09-30 | 2021-06-30 | 2021-03-31 | 2020-12-31 | 2020-09-30 | 2020-06-30 | 2020-03-31 | 2019-12-31 | 2019-09-30 | 2019-06-30 | 2019-03-31 | 2018-12-31 | 2018-09-30 | 2018-06-30 | ||
|---|---|---|---|---|---|---|---|---|---|---|---|---|---|---|---|---|---|---|---|---|---|---|---|---|---|
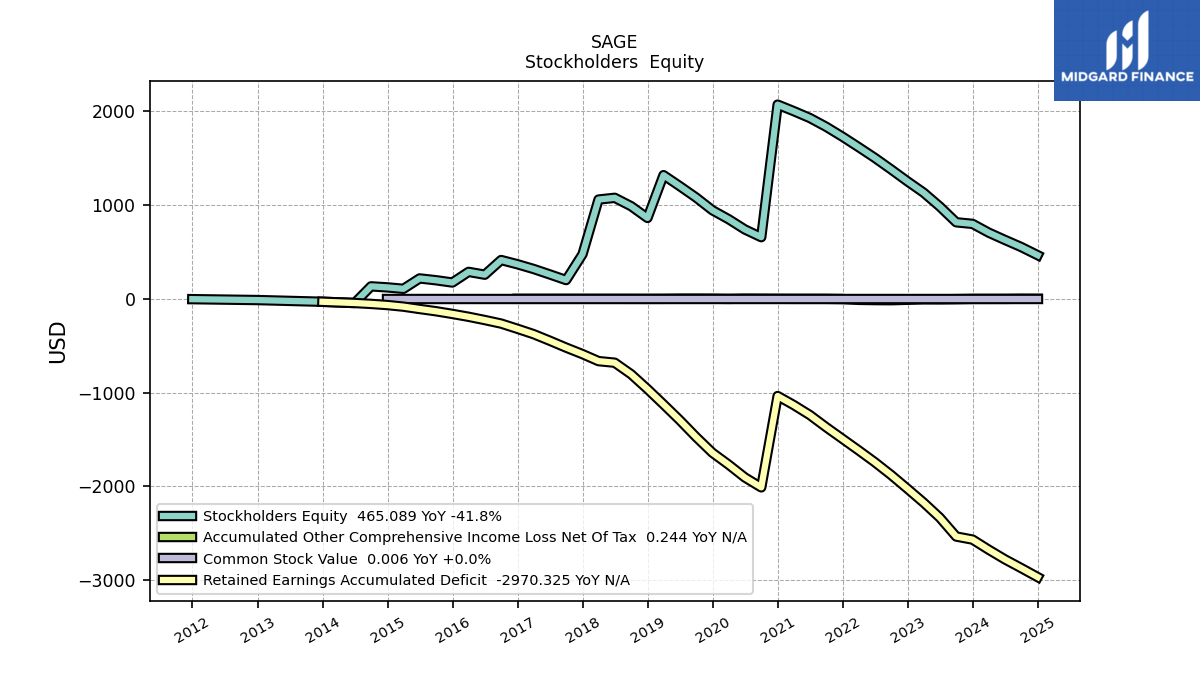
| Stockholders Equity | 705.80 | 799.53 | 816.66 | 984.38 | 1133.13 | 1252.60 | 1380.12 | 1504.24 | 1618.50 | 1729.03 | 1835.65 | 1929.51 | 2003.28 | 2072.33 | 657.58 | 739.91 | 849.21 | 944.65 | 1081.07 | 1202.88 | 1319.53 | 862.97 | 988.50 | 1077.76 | |
| Common Stock Value | 0.01 | 0.01 | 0.01 | 0.01 | 0.01 | 0.01 | 0.01 | 0.01 | 0.01 | 0.01 | 0.01 | 0.01 | 0.01 | 0.01 | 0.01 | 0.01 | 0.01 | 0.01 | 0.01 | 0.01 | 0.01 | 0.01 | 0.01 | 0.01 | |
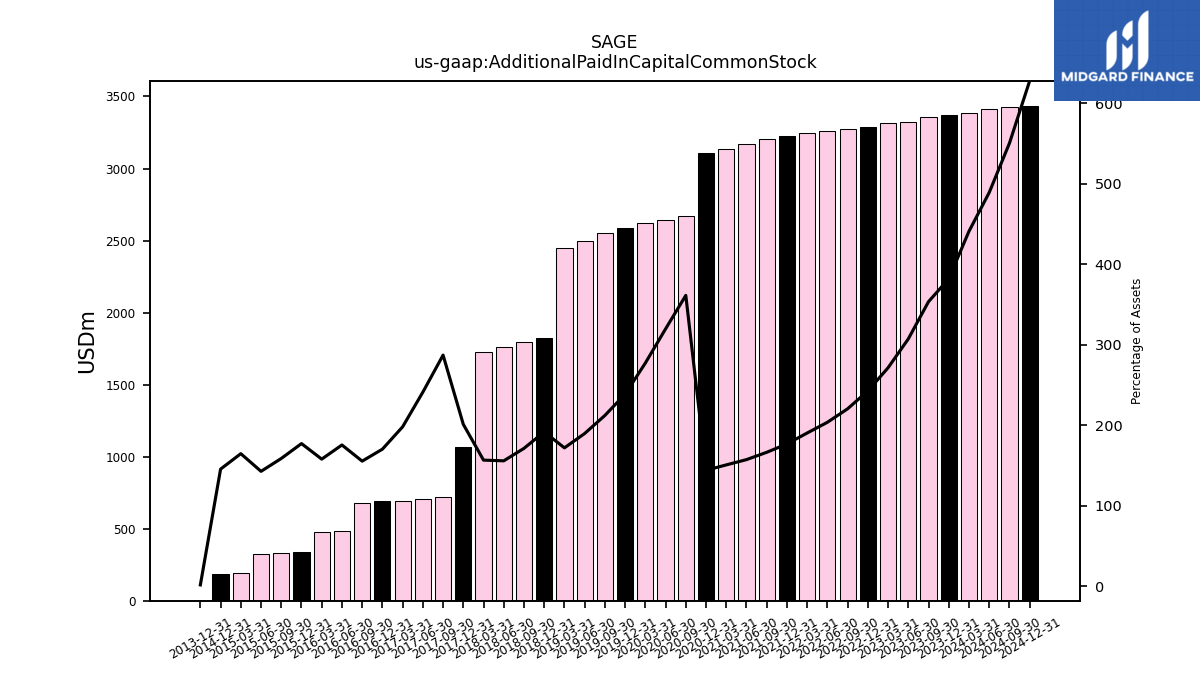
| Additional Paid In Capital Common Stock | 3385.12 | 3370.40 | 3357.74 | 3325.74 | 3313.61 | 3291.37 | 3276.42 | 3262.20 | 3247.54 | 3227.47 | 3207.03 | 3170.69 | 3137.16 | 3109.81 | 2669.42 | 2645.26 | 2620.70 | 2587.32 | 2554.60 | 2496.65 | 2446.77 | 1827.02 | 1793.91 | 1760.14 | |
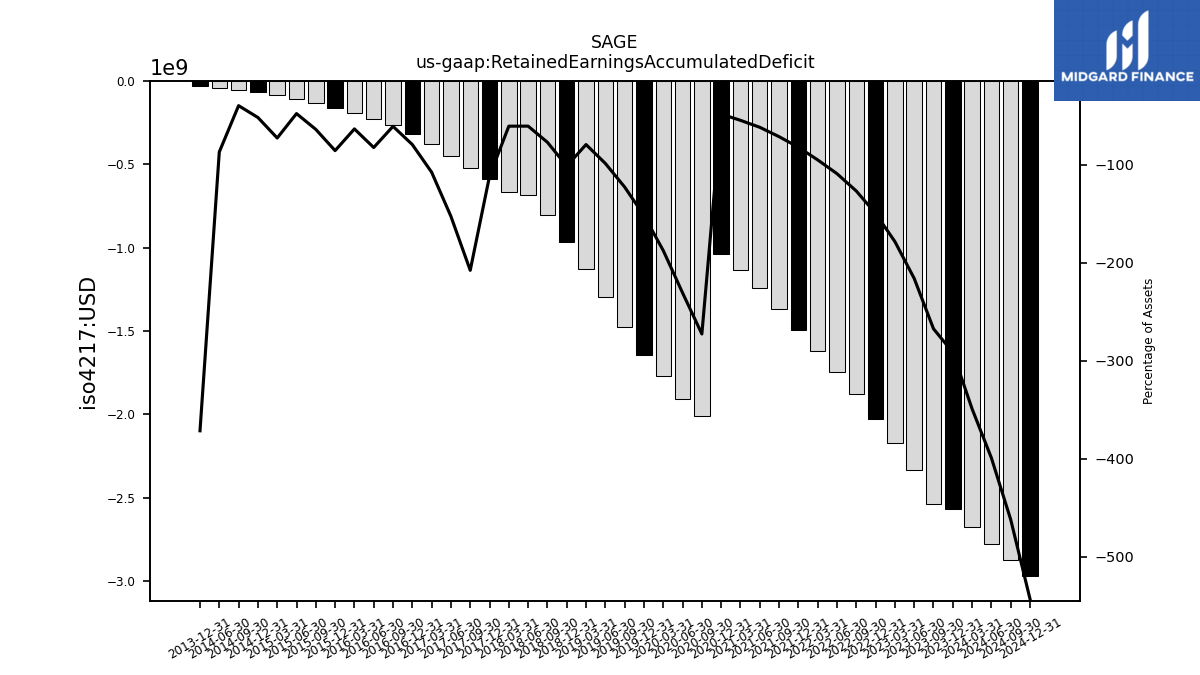
| Retained Earnings Accumulated Deficit | -2678.14 | -2569.66 | -2536.95 | -2335.32 | -2175.00 | -2028.17 | -1881.02 | -1743.70 | -1617.44 | -1495.39 | -1370.67 | -1240.50 | -1133.26 | -1037.49 | -2012.39 | -1906.65 | -1770.31 | -1643.57 | -1474.91 | -1294.96 | -1126.73 | -963.33 | -804.94 | -682.02 | |
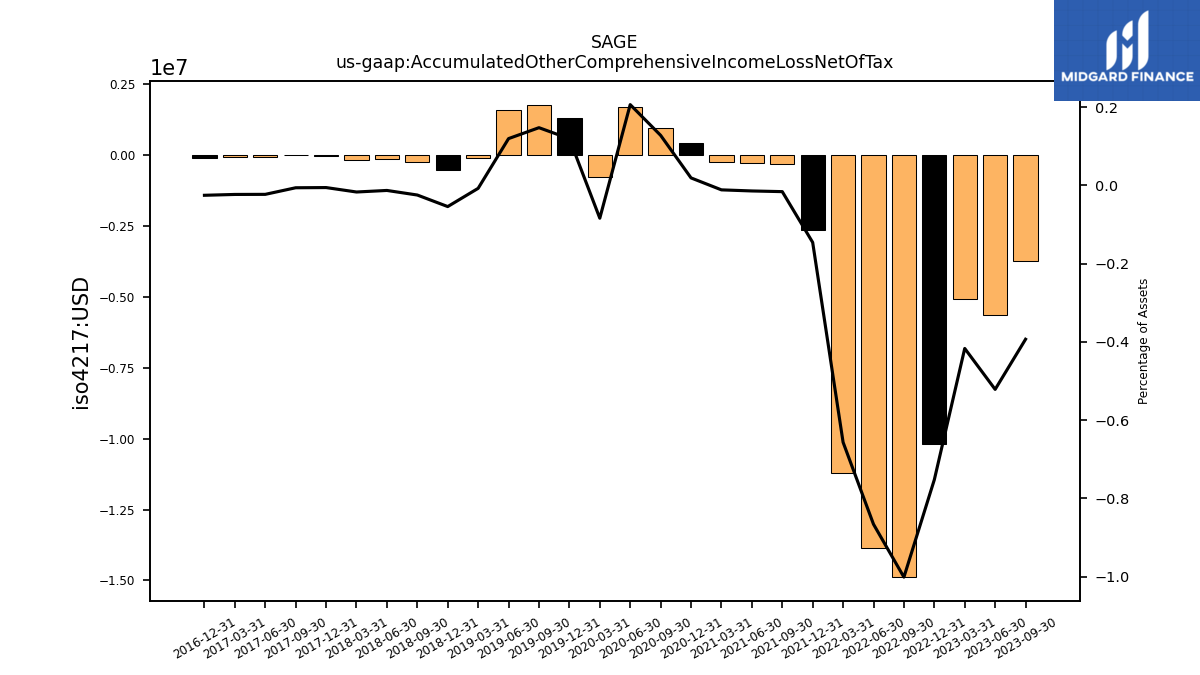
| Accumulated Other Comprehensive Income Loss Net Of Tax | -0.79 | -0.81 | -3.73 | -5.64 | -5.09 | -10.21 | -14.88 | -13.87 | -11.20 | -2.66 | -0.31 | -0.28 | -0.24 | 0.41 | 0.95 | 1.71 | -0.79 | 1.29 | 1.78 | 1.57 | -0.11 | -0.52 | -0.26 | -0.14 | |
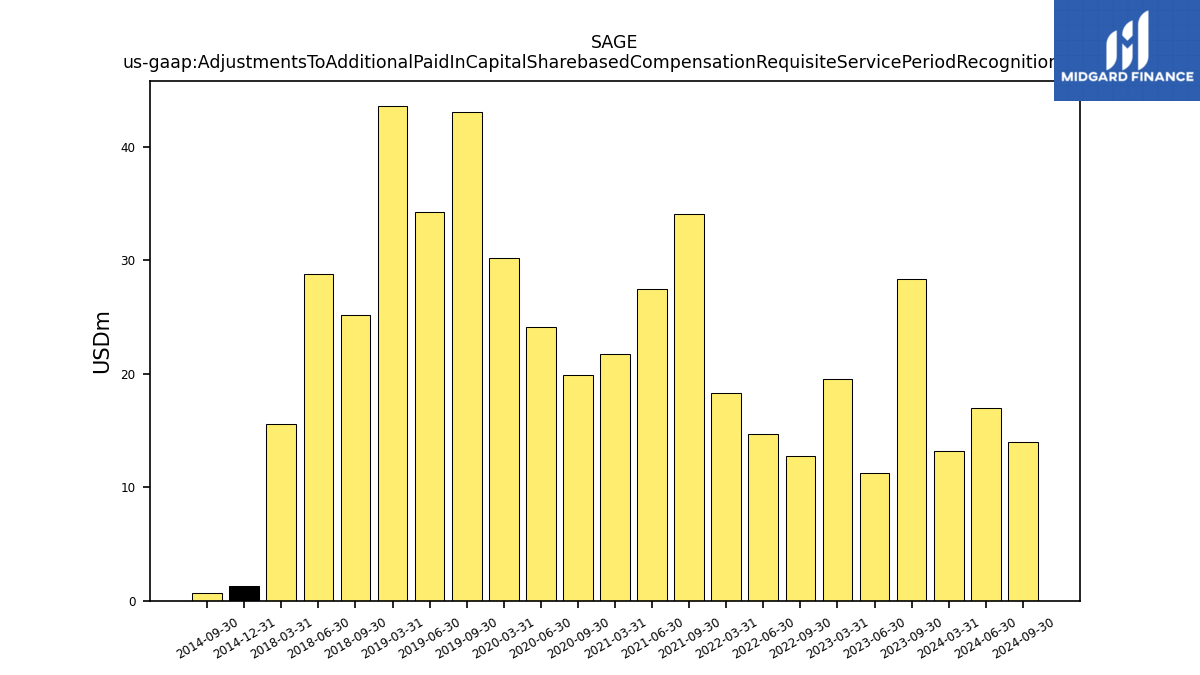
| Adjustments To Additional Paid In Capital Sharebased Compensation Requisite Service Period Recognition Value | 13.17 | NA | 28.35 | 11.28 | 19.57 | NA | 12.72 | 14.65 | 18.27 | NA | 34.08 | 27.46 | 21.73 | NA | 19.86 | 24.17 | 30.22 | NA | 43.05 | 34.28 | 43.62 | NA | 25.18 | 28.78 |
| 2024-03-31 | 2023-12-31 | 2023-09-30 | 2023-06-30 | 2023-03-31 | 2022-12-31 | 2022-09-30 | 2022-06-30 | 2022-03-31 | 2021-12-31 | 2021-09-30 | 2021-06-30 | 2021-03-31 | 2020-12-31 | 2020-09-30 | 2020-06-30 | 2020-03-31 | 2019-12-31 | 2019-09-30 | 2019-06-30 | 2019-03-31 | 2018-12-31 | 2018-09-30 | 2018-06-30 | ||
|---|---|---|---|---|---|---|---|---|---|---|---|---|---|---|---|---|---|---|---|---|---|---|---|---|---|
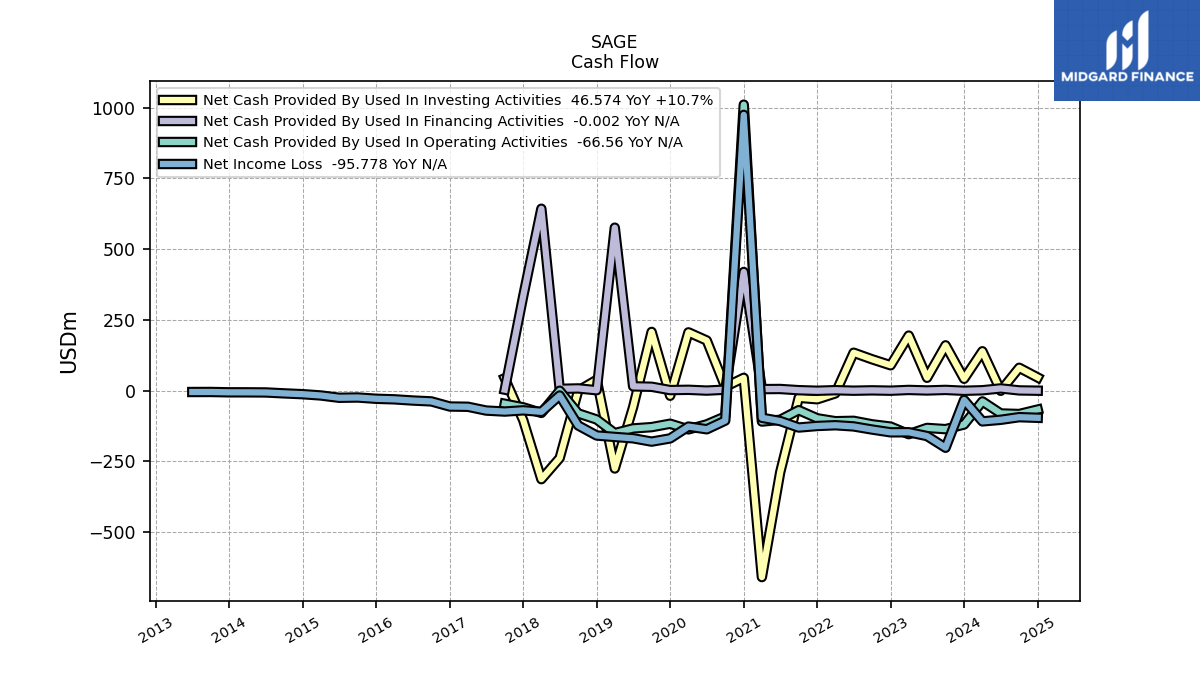
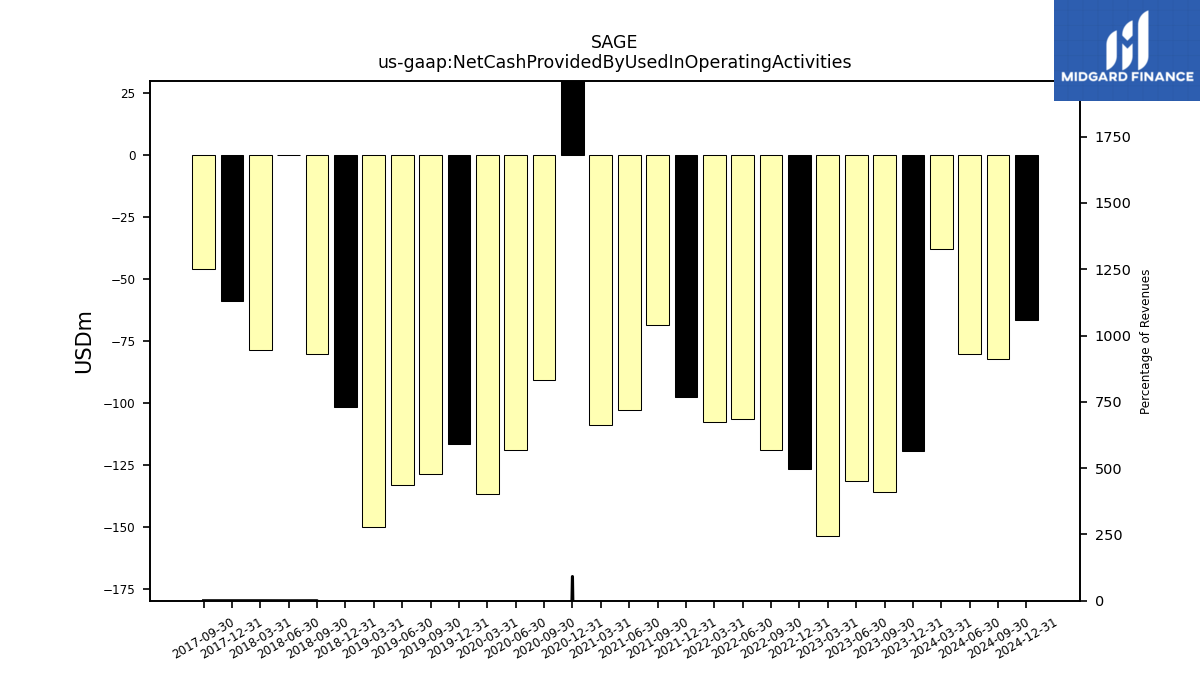
| Net Cash Provided By Used In Operating Activities | -37.83 | -119.52 | -135.87 | -131.52 | -153.68 | -126.93 | -118.86 | -106.44 | -107.80 | -97.50 | -68.83 | -102.77 | -109.09 | 1010.97 | -91.02 | -118.98 | -136.69 | -116.73 | -128.70 | -133.34 | -149.93 | -101.78 | -80.19 | -0.14 | |
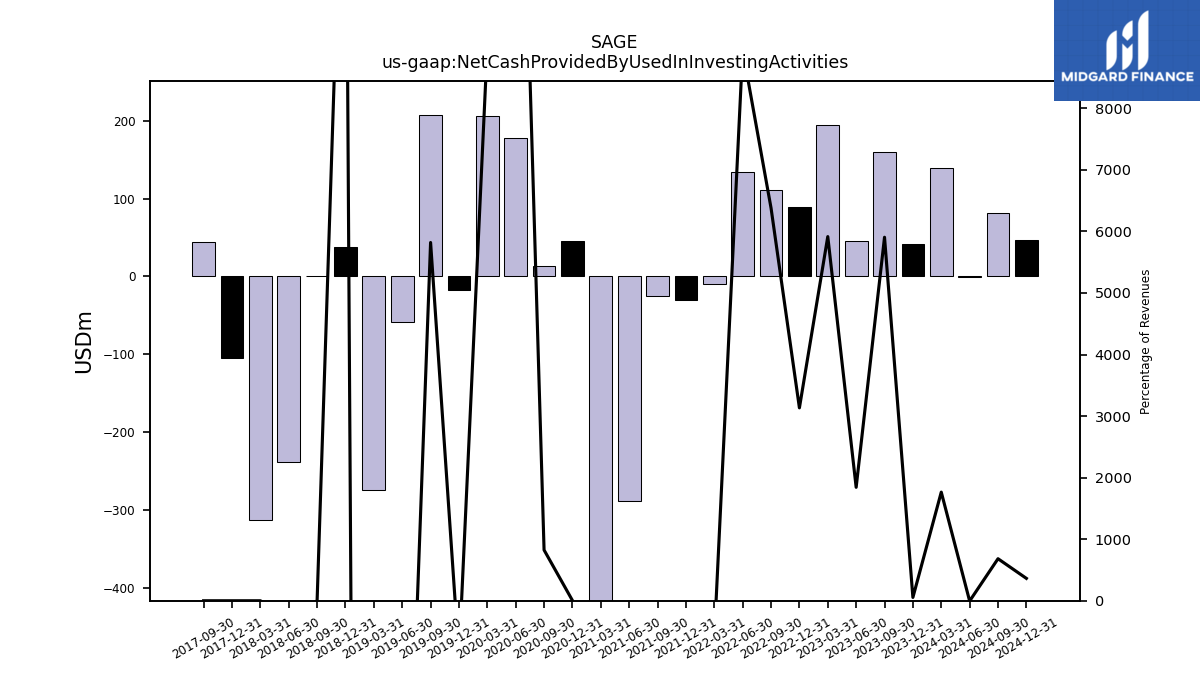
| Net Cash Provided By Used In Investing Activities | 139.44 | 42.06 | 160.39 | 45.59 | 194.87 | 89.78 | 110.95 | 134.26 | -9.56 | -30.26 | -24.98 | -288.39 | -658.82 | 45.52 | 13.51 | 177.38 | 206.27 | -17.92 | 207.78 | -58.11 | -274.91 | 38.42 | 0.05 | -238.13 | |
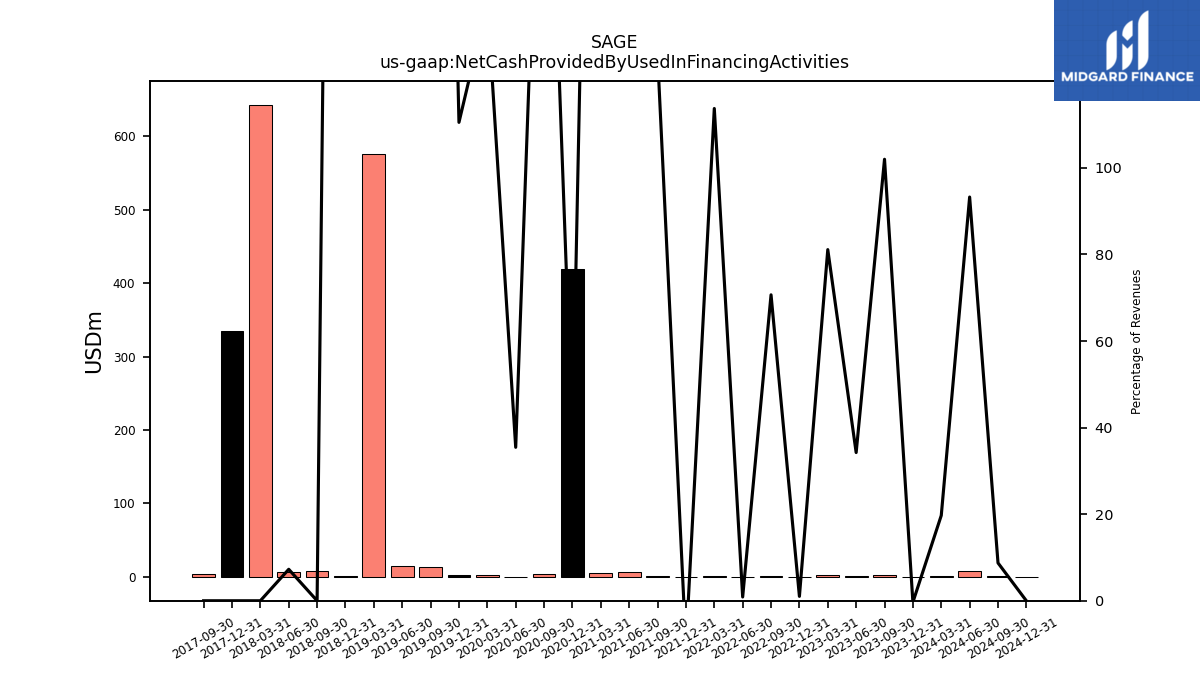
| Net Cash Provided By Used In Financing Activities | 1.56 | -0.26 | 2.77 | 0.85 | 2.67 | 0.03 | 1.23 | 0.01 | 1.80 | -0.17 | 1.82 | 6.07 | 5.62 | 419.67 | 3.54 | 0.39 | 3.16 | 2.17 | 13.92 | 15.34 | 576.20 | 1.63 | 8.08 | 6.54 |
| 2024-03-31 | 2023-12-31 | 2023-09-30 | 2023-06-30 | 2023-03-31 | 2022-12-31 | 2022-09-30 | 2022-06-30 | 2022-03-31 | 2021-12-31 | 2021-09-30 | 2021-06-30 | 2021-03-31 | 2020-12-31 | 2020-09-30 | 2020-06-30 | 2020-03-31 | 2019-12-31 | 2019-09-30 | 2019-06-30 | 2019-03-31 | 2018-12-31 | 2018-09-30 | 2018-06-30 | ||
|---|---|---|---|---|---|---|---|---|---|---|---|---|---|---|---|---|---|---|---|---|---|---|---|---|---|
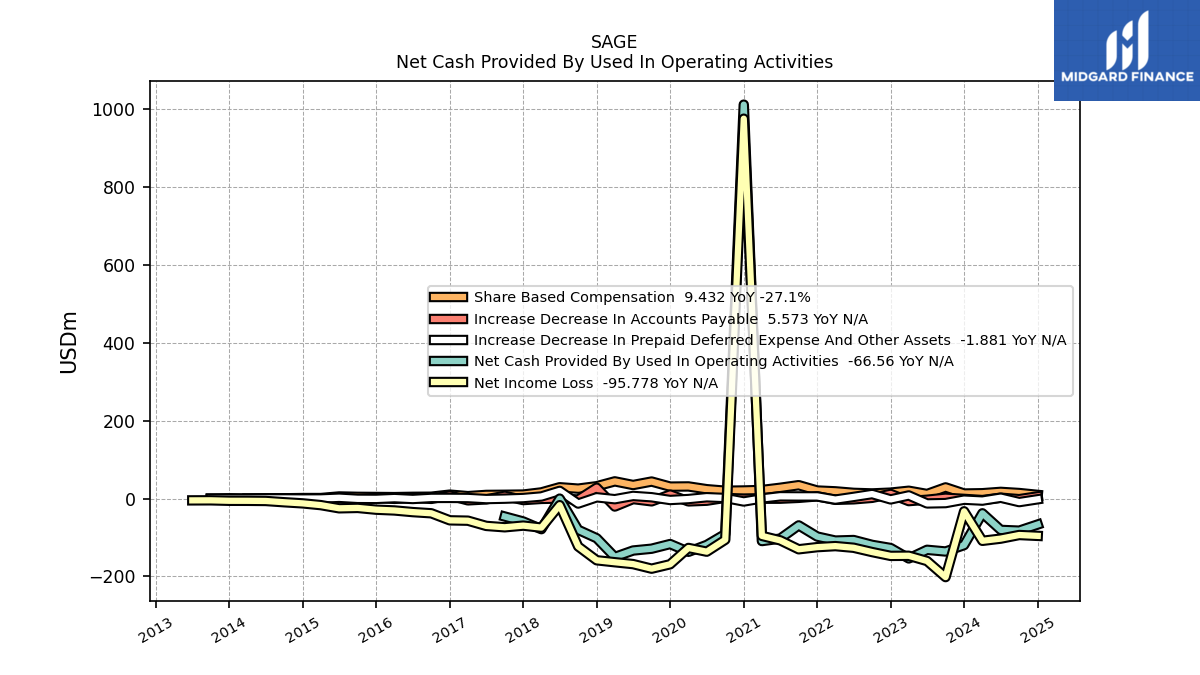
| Net Cash Provided By Used In Operating Activities | -37.83 | -119.52 | -135.87 | -131.52 | -153.68 | -126.93 | -118.86 | -106.44 | -107.80 | -97.50 | -68.83 | -102.77 | -109.09 | 1010.97 | -91.02 | -118.98 | -136.69 | -116.73 | -128.70 | -133.34 | -149.93 | -101.78 | -80.19 | -0.14 | |
| Net Income Loss | -108.48 | -32.71 | -201.63 | -160.32 | -146.83 | -147.15 | -137.32 | -126.26 | -122.06 | -124.71 | -130.17 | -107.25 | -95.76 | 974.89 | -105.73 | -136.35 | -126.74 | -168.65 | -179.96 | -168.22 | -163.41 | -158.39 | -122.92 | -16.98 | |
| Profit Loss | -108.48 | -32.71 | -201.63 | -160.32 | -146.83 | -147.15 | -137.32 | -126.26 | -122.06 | -124.71 | -130.17 | -107.25 | -95.76 | 974.89 | -105.73 | -136.35 | -126.74 | -168.65 | -179.96 | -168.22 | -163.41 | -158.39 | -122.92 | -16.98 | |
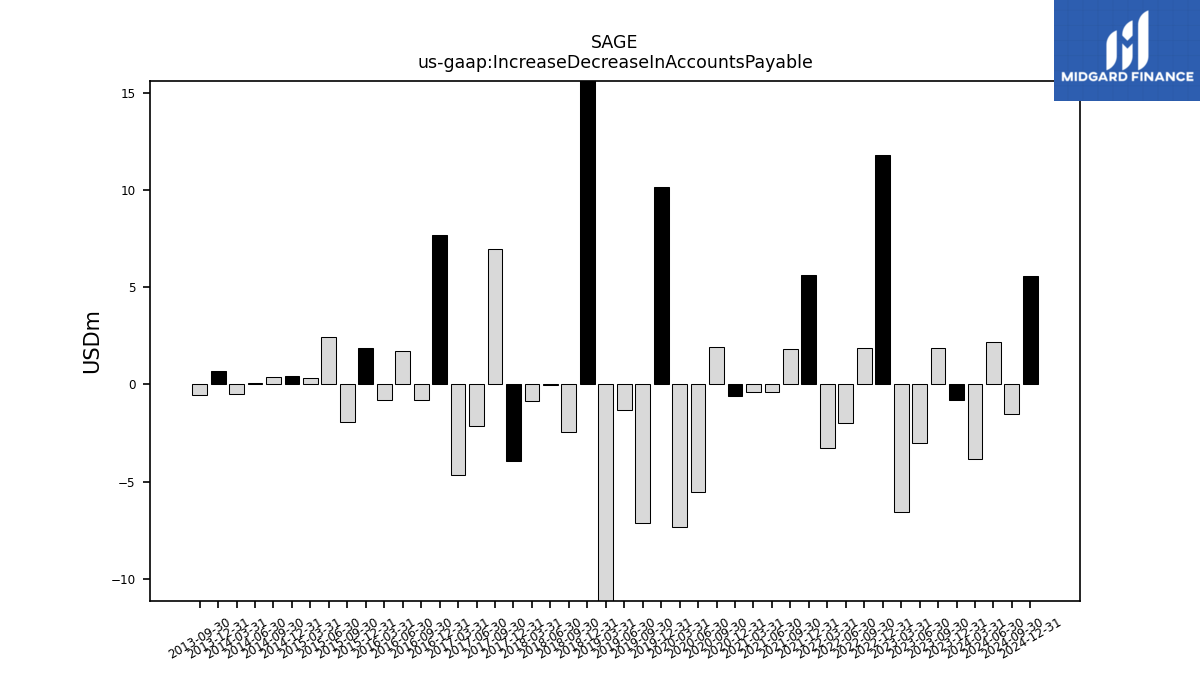
| Increase Decrease In Accounts Payable | -3.84 | -0.82 | 1.89 | -3.02 | -6.55 | 11.79 | 1.87 | -1.97 | -3.25 | 5.65 | 1.82 | -0.37 | -0.41 | -0.60 | 1.90 | -5.51 | -7.31 | 10.17 | -7.15 | -1.30 | -20.51 | 27.91 | -2.47 | -0.03 | |
| Share Based Compensation | 13.70 | 12.95 | 28.69 | 11.69 | 20.04 | 15.24 | 13.17 | 14.64 | 18.55 | 20.65 | 34.34 | 27.66 | 21.98 | 20.74 | 20.11 | 24.03 | 31.11 | 30.68 | 43.67 | 34.77 | 44.12 | 31.64 | 25.48 | 29.03 |
| 2024-03-31 | 2023-12-31 | 2023-09-30 | 2023-06-30 | 2023-03-31 | 2022-12-31 | 2022-09-30 | 2022-06-30 | 2022-03-31 | 2021-12-31 | 2021-09-30 | 2021-06-30 | 2021-03-31 | 2020-12-31 | 2020-09-30 | 2020-06-30 | 2020-03-31 | 2019-12-31 | 2019-09-30 | 2019-06-30 | 2019-03-31 | 2018-12-31 | 2018-09-30 | 2018-06-30 | ||
|---|---|---|---|---|---|---|---|---|---|---|---|---|---|---|---|---|---|---|---|---|---|---|---|---|---|
| Net Cash Provided By Used In Investing Activities | 139.44 | 42.06 | 160.39 | 45.59 | 194.87 | 89.78 | 110.95 | 134.26 | -9.56 | -30.26 | -24.98 | -288.39 | -658.82 | 45.52 | 13.51 | 177.38 | 206.27 | -17.92 | 207.78 | -58.11 | -274.91 | 38.42 | 0.05 | -238.13 | |
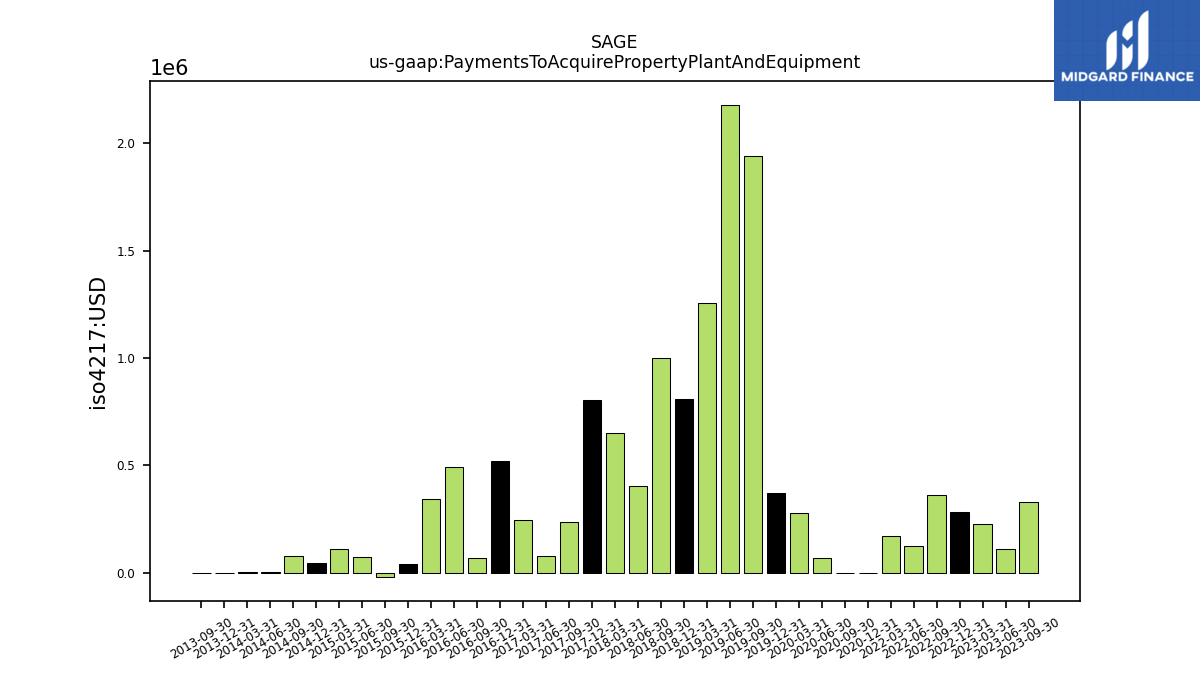
| Payments To Acquire Property Plant And Equipment | NA | -0.11 | 0.33 | 0.11 | 0.23 | 0.28 | 0.36 | 0.12 | 0.17 | NA | NA | NA | NA | 0.00 | -0.00 | 0.07 | 0.28 | 0.37 | 1.94 | 2.18 | 1.26 | 0.81 | 1.00 | 0.40 |
| 2024-03-31 | 2023-12-31 | 2023-09-30 | 2023-06-30 | 2023-03-31 | 2022-12-31 | 2022-09-30 | 2022-06-30 | 2022-03-31 | 2021-12-31 | 2021-09-30 | 2021-06-30 | 2021-03-31 | 2020-12-31 | 2020-09-30 | 2020-06-30 | 2020-03-31 | 2019-12-31 | 2019-09-30 | 2019-06-30 | 2019-03-31 | 2018-12-31 | 2018-09-30 | 2018-06-30 | ||
|---|---|---|---|---|---|---|---|---|---|---|---|---|---|---|---|---|---|---|---|---|---|---|---|---|---|
| Net Cash Provided By Used In Financing Activities | 1.56 | -0.26 | 2.77 | 0.85 | 2.67 | 0.03 | 1.23 | 0.01 | 1.80 | -0.17 | 1.82 | 6.07 | 5.62 | 419.67 | 3.54 | 0.39 | 3.16 | 2.17 | 13.92 | 15.34 | 576.20 | 1.63 | 8.08 | 6.54 |
| 2024-03-31 | 2023-12-31 | 2023-09-30 | 2023-06-30 | 2023-03-31 | 2022-12-31 | 2022-09-30 | 2022-06-30 | 2022-03-31 | 2021-12-31 | 2021-09-30 | 2021-06-30 | 2021-03-31 | 2020-12-31 | 2020-09-30 | 2020-06-30 | 2020-03-31 | 2019-12-31 | 2019-09-30 | 2019-06-30 | 2019-03-31 | 2018-12-31 | 2018-09-30 | 2018-06-30 | ||
|---|---|---|---|---|---|---|---|---|---|---|---|---|---|---|---|---|---|---|---|---|---|---|---|---|---|
| Revenues | 7.90 | 77.97 | 2.72 | 2.47 | 3.29 | 2.87 | 1.74 | 1.50 | 1.58 | 1.64 | 1.44 | 1.64 | 1.58 | 1109.19 | 1.64 | 1.09 | 2.29 | 1.96 | 3.57 | 0.87 | 0.47 | 0.27 | 0.00 | 90.00 | |
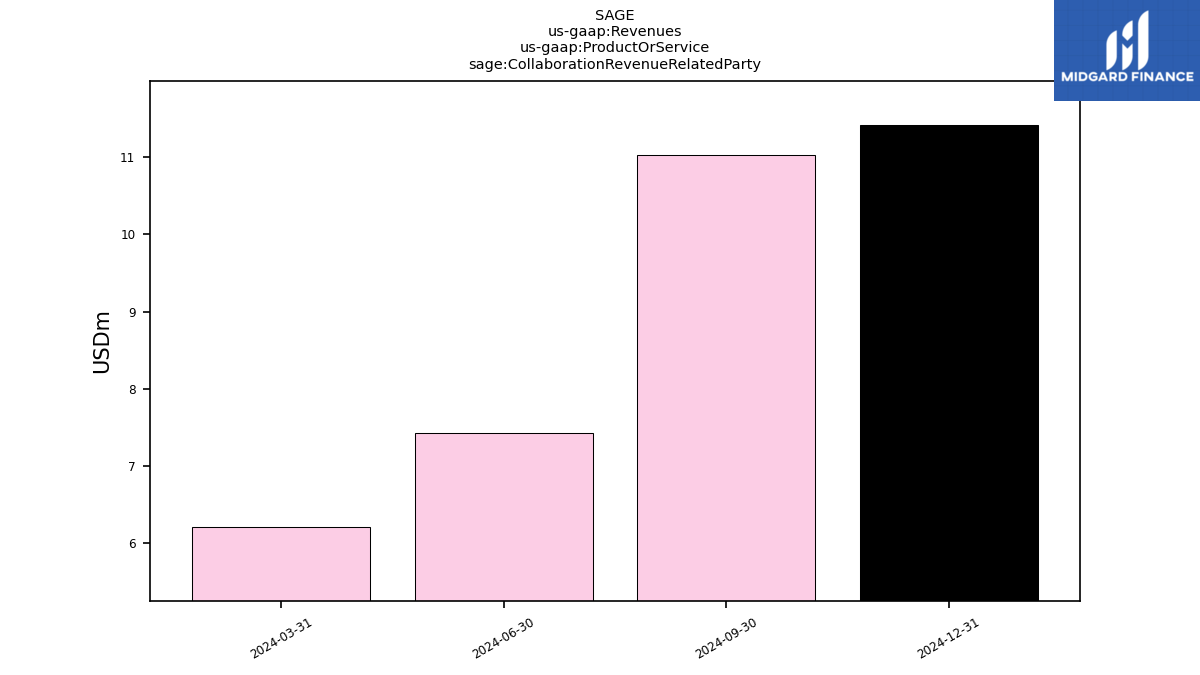
| Collaboration Revenue Related Party | 6.21 | NA | NA | NA | NA | NA | NA | NA | NA | NA | NA | NA | NA | NA | NA | NA | NA | NA | NA | NA | NA | NA | NA | NA | |
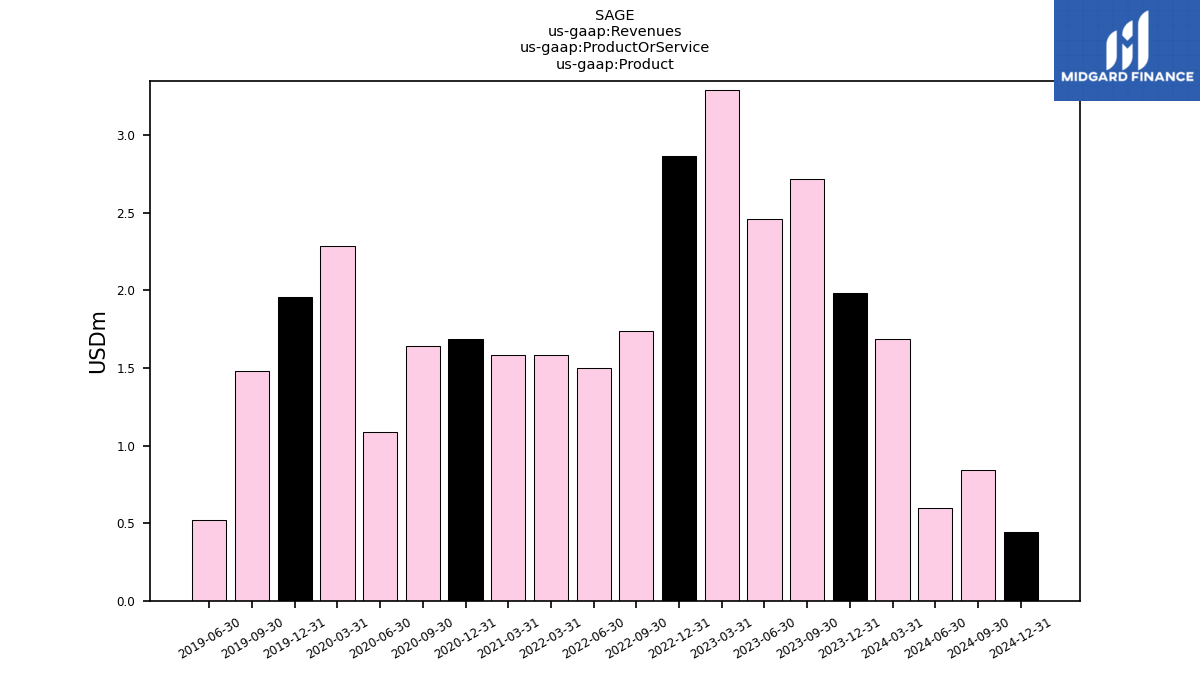
| Product | 1.69 | 1.99 | 2.72 | 2.46 | 3.29 | 2.87 | 1.74 | 1.50 | 1.58 | NA | NA | NA | 1.58 | 1.69 | 1.64 | 1.09 | 2.29 | 1.96 | 1.48 | 0.52 | NA | NA | NA | NA | |
| Collaboration Revenue, Shionogi Collaboration Agreement | NA | -13.80 | NA | NA | NA | NA | NA | NA | NA | NA | NA | NA | NA | NA | NA | NA | NA | NA | NA | NA | NA | NA | NA | NA | |
| Collaboration Revenue Related Party, Biogen Collaboration Agreement | 6.21 | NA | NA | NA | NA | NA | NA | NA | NA | NA | NA | NA | NA | NA | NA | NA | NA | NA | NA | NA | NA | NA | NA | NA |

