
| 2023-12-31 | 2023-09-30 | 2023-06-30 | 2023-03-31 | 2022-12-31 | 2022-09-30 | 2022-06-30 | 2022-03-31 | 2021-12-31 | 2021-09-30 | 2021-06-30 | 2021-03-31 | 2020-12-31 | 2020-09-30 | 2020-06-30 | 2020-03-31 | 2019-12-31 | 2019-09-30 | 2019-06-30 | 2019-03-31 | 2018-12-31 | 2018-09-30 | 2018-06-30 | 2018-03-31 | 2017-12-31 | 2017-09-30 | 2017-06-30 | 2017-03-31 | 2016-12-31 | 2016-09-30 | 2016-06-30 | 2016-03-31 | 2015-12-31 | 2015-09-30 | 2015-06-30 | 2015-03-31 | 2014-12-31 | 2014-09-30 | 2014-06-30 | 2014-03-31 | 2013-12-31 | 2013-09-30 | 2013-06-30 | 2013-03-31 | 2012-12-31 | 2012-09-30 | 2012-06-30 | 2012-03-31 | 2011-12-31 | 2011-09-30 | 2011-06-30 | 2011-03-31 | 2010-12-31 | ||
|---|---|---|---|---|---|---|---|---|---|---|---|---|---|---|---|---|---|---|---|---|---|---|---|---|---|---|---|---|---|---|---|---|---|---|---|---|---|---|---|---|---|---|---|---|---|---|---|---|---|---|---|---|---|---|
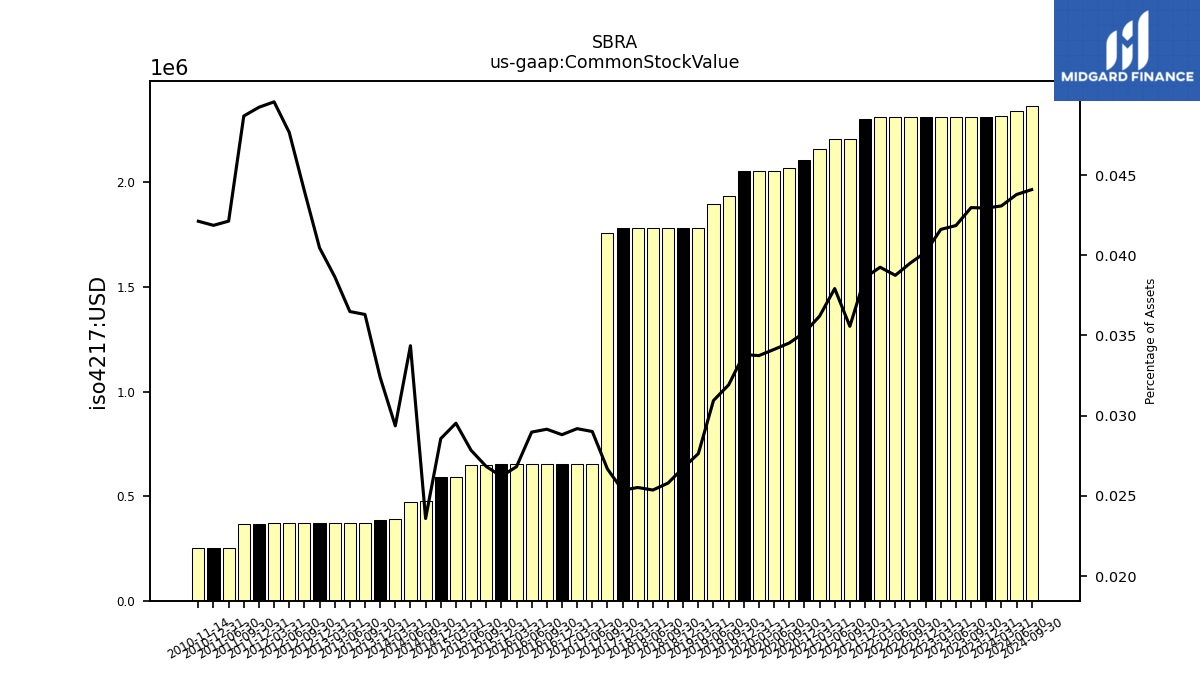
| Common Stock Value | 2.31 | 2.31 | 2.31 | 2.31 | 2.31 | 2.31 | 2.31 | 2.31 | 2.30 | 2.21 | 2.21 | 2.16 | 2.11 | 2.07 | 2.06 | 2.06 | 2.05 | 1.94 | 1.90 | 1.78 | 1.78 | 1.78 | 1.78 | 1.78 | 1.78 | 1.76 | 0.65 | 0.65 | 0.65 | 0.65 | 0.65 | 0.65 | 0.65 | 0.65 | 0.65 | 0.59 | 0.59 | 0.48 | 0.47 | 0.39 | 0.39 | 0.37 | 0.37 | 0.37 | 0.37 | 0.37 | 0.37 | 0.37 | 0.37 | 0.37 | 0.25 | NA | 0.25 | |
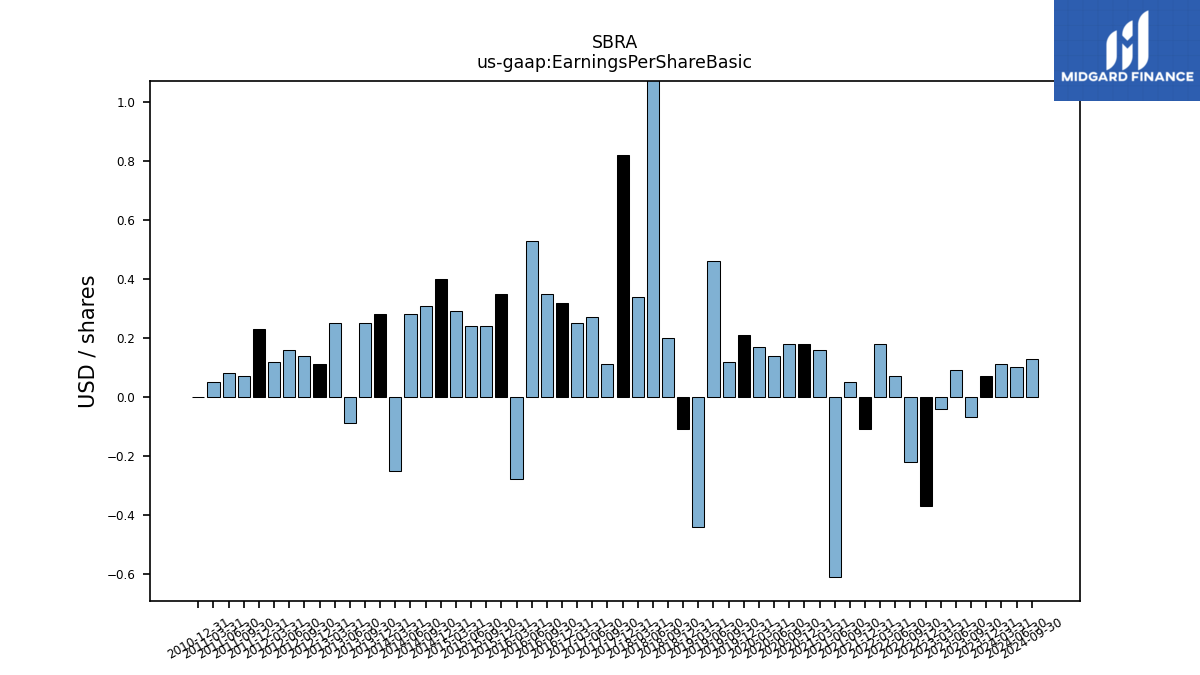
| Earnings Per Share Basic | 0.07 | -0.07 | 0.09 | -0.04 | -0.37 | -0.22 | 0.07 | 0.18 | -0.11 | 0.05 | -0.61 | 0.16 | 0.18 | 0.18 | 0.14 | 0.17 | 0.21 | 0.12 | 0.46 | -0.44 | -0.11 | 0.20 | 1.09 | 0.34 | 0.82 | 0.11 | 0.27 | 0.25 | 0.32 | 0.35 | 0.53 | -0.28 | 0.35 | 0.24 | 0.24 | 0.29 | 0.40 | 0.31 | 0.28 | -0.25 | 0.28 | 0.25 | -0.09 | 0.25 | 0.11 | 0.14 | 0.16 | 0.12 | 0.23 | 0.07 | 0.08 | 0.05 | 0.00 | |
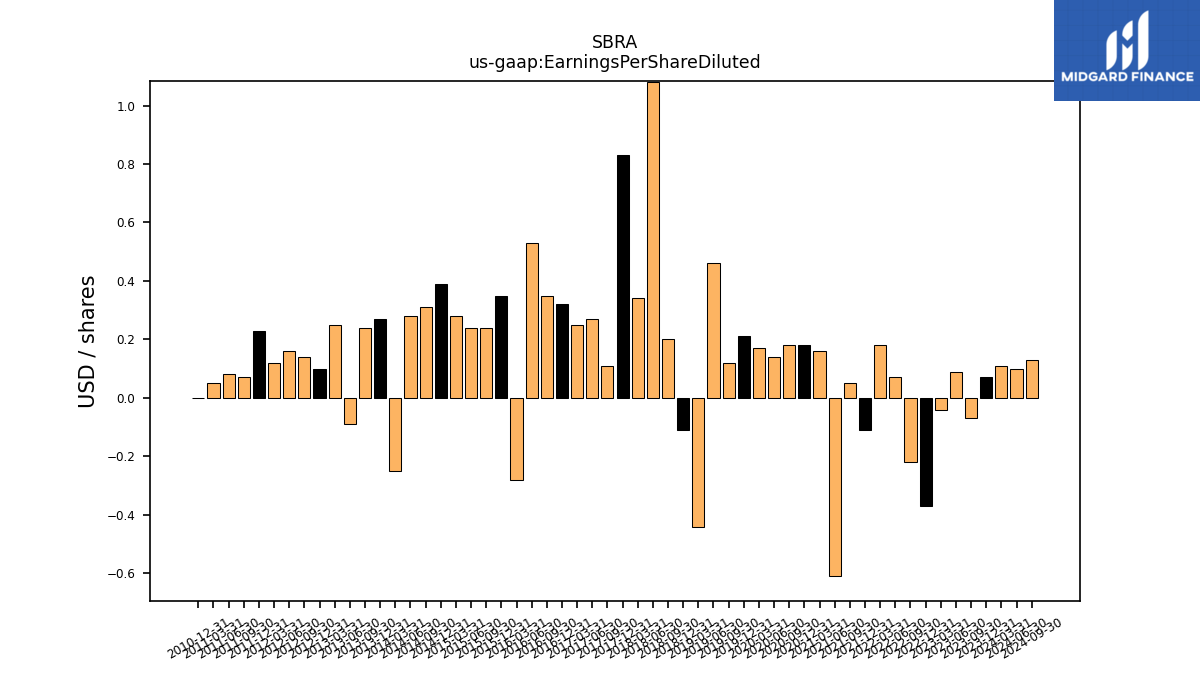
| Earnings Per Share Diluted | 0.07 | -0.07 | 0.09 | -0.04 | -0.37 | -0.22 | 0.07 | 0.18 | -0.11 | 0.05 | -0.61 | 0.16 | 0.18 | 0.18 | 0.14 | 0.17 | 0.21 | 0.12 | 0.46 | -0.44 | -0.11 | 0.20 | 1.08 | 0.34 | 0.83 | 0.11 | 0.27 | 0.25 | 0.32 | 0.35 | 0.53 | -0.28 | 0.35 | 0.24 | 0.24 | 0.28 | 0.39 | 0.31 | 0.28 | -0.25 | 0.27 | 0.24 | -0.09 | 0.25 | 0.10 | 0.14 | 0.16 | 0.12 | 0.23 | 0.07 | 0.08 | 0.05 | 0.00 |
| 2023-12-31 | 2023-09-30 | 2023-06-30 | 2023-03-31 | 2022-12-31 | 2022-09-30 | 2022-06-30 | 2022-03-31 | 2021-12-31 | 2021-09-30 | 2021-06-30 | 2021-03-31 | 2020-12-31 | 2020-09-30 | 2020-06-30 | 2020-03-31 | 2019-12-31 | 2019-09-30 | 2019-06-30 | 2019-03-31 | 2018-12-31 | 2018-09-30 | 2018-06-30 | 2018-03-31 | 2017-12-31 | 2017-09-30 | 2017-06-30 | 2017-03-31 | 2016-12-31 | 2016-09-30 | 2016-06-30 | 2016-03-31 | 2015-12-31 | 2015-09-30 | 2015-06-30 | 2015-03-31 | 2014-12-31 | 2014-09-30 | 2014-06-30 | 2014-03-31 | 2013-12-31 | 2013-09-30 | 2013-06-30 | 2013-03-31 | 2012-12-31 | 2012-09-30 | 2012-06-30 | 2012-03-31 | 2011-12-31 | 2011-09-30 | 2011-06-30 | 2011-03-31 | 2010-12-31 | ||
|---|---|---|---|---|---|---|---|---|---|---|---|---|---|---|---|---|---|---|---|---|---|---|---|---|---|---|---|---|---|---|---|---|---|---|---|---|---|---|---|---|---|---|---|---|---|---|---|---|---|---|---|---|---|---|
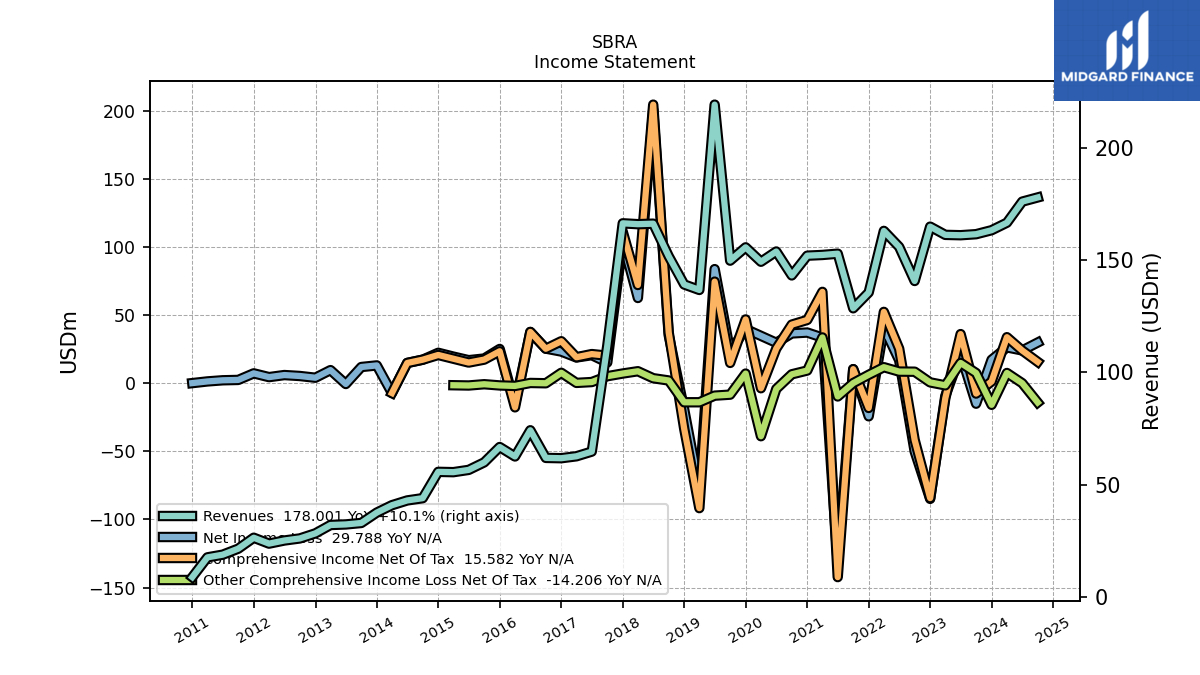
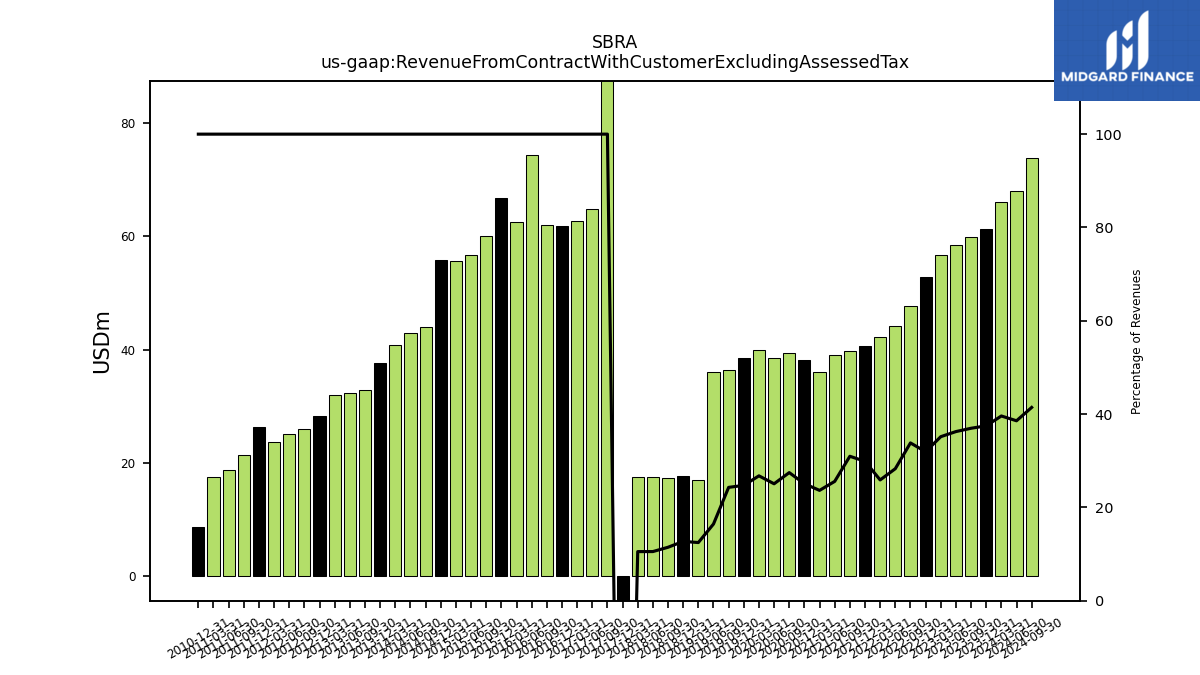
| Revenue From Contract With Customer Excluding Assessed Tax | 61.26 | 59.75 | 58.43 | 56.72 | 52.70 | 47.61 | 44.14 | 42.23 | 40.53 | 39.82 | 39.12 | 36.04 | 38.14 | 39.34 | 38.58 | 39.98 | 38.52 | 36.41 | 36.07 | 17.06 | 17.71 | 17.40 | 17.53 | 17.49 | -212.75 | 111.79 | 64.74 | 62.65 | 61.79 | 61.93 | 74.25 | 62.56 | 66.77 | 59.93 | 56.59 | 55.57 | 55.71 | 43.98 | 42.97 | 40.85 | 37.56 | 32.93 | 32.27 | 32.02 | 28.29 | 26.04 | 25.12 | 23.73 | 26.35 | 21.47 | 18.80 | 17.60 | 8.79 | |
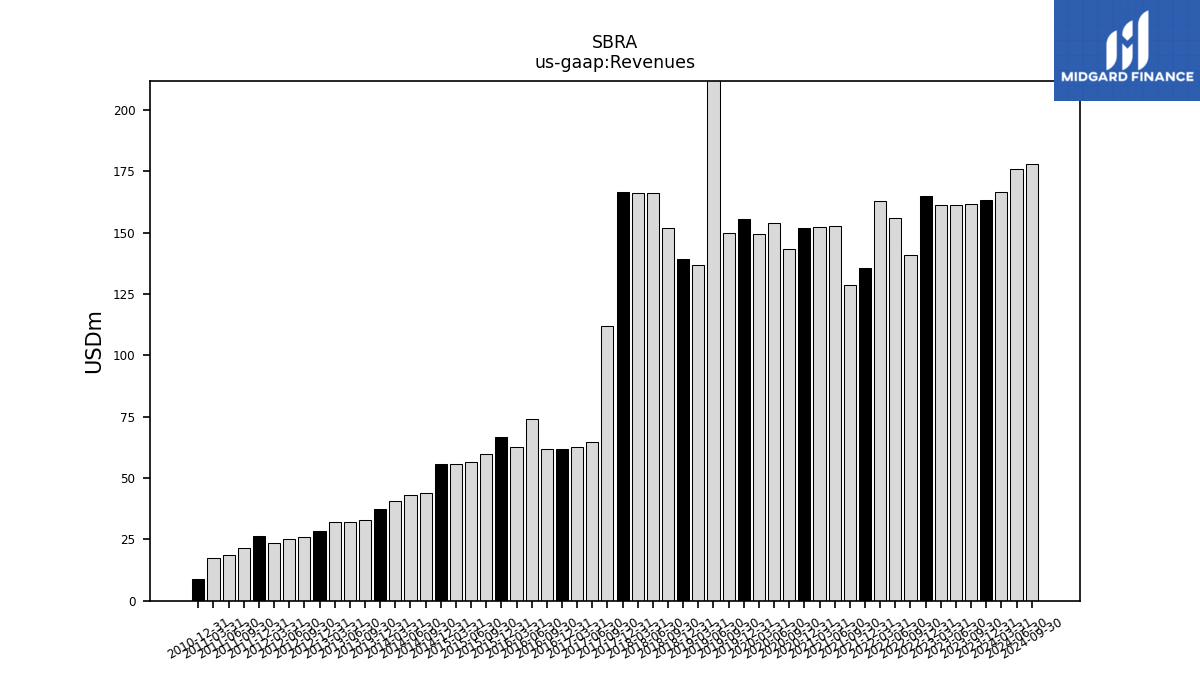
| Revenues | 163.40 | 161.63 | 161.17 | 161.32 | 164.99 | 140.76 | 155.96 | 163.10 | 135.66 | 128.59 | 152.93 | 152.37 | 152.05 | 143.25 | 153.92 | 149.35 | 155.76 | 149.83 | 219.37 | 136.77 | 139.21 | 151.80 | 166.31 | 166.09 | 166.47 | 111.79 | 64.74 | 62.65 | 61.79 | 61.93 | 74.25 | 62.56 | 66.77 | 59.93 | 56.59 | 55.57 | 55.71 | 43.98 | 42.97 | 40.85 | 37.56 | 32.93 | 32.27 | 32.02 | 28.29 | 26.04 | 25.12 | 23.73 | 26.35 | 21.47 | 18.80 | 17.60 | 8.79 | |
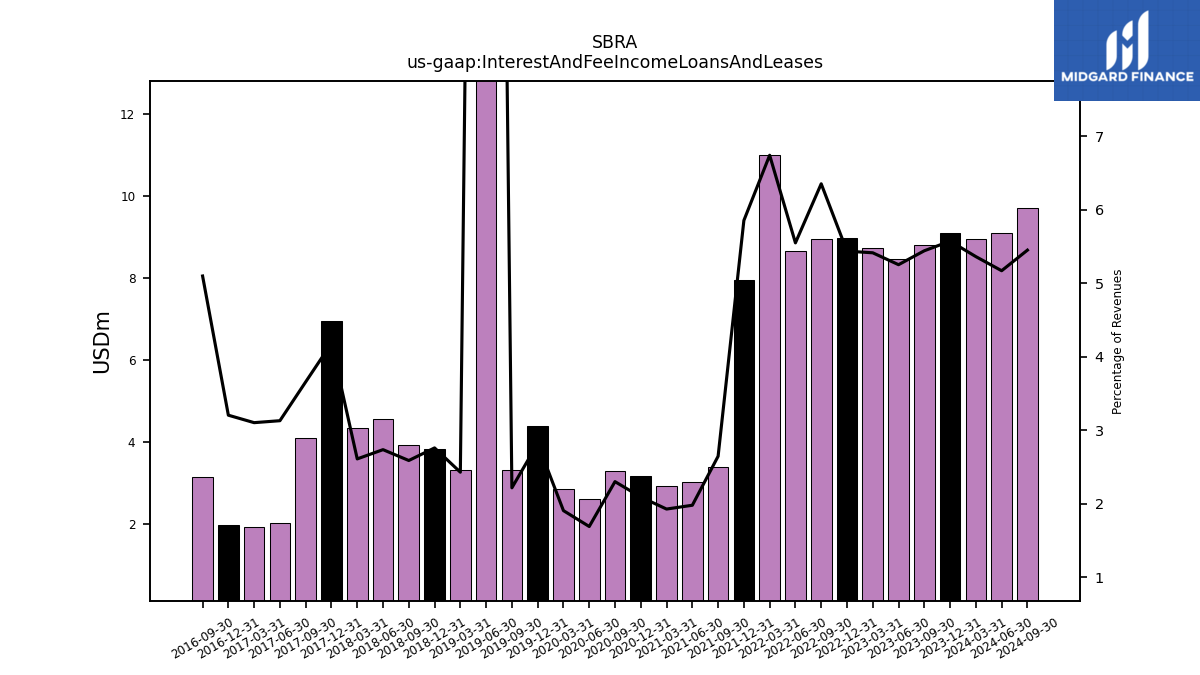
| Interest And Fee Income Loans And Leases | 9.10 | 8.79 | 8.46 | 8.73 | 8.97 | 8.94 | 8.65 | 10.99 | 7.94 | 3.40 | 3.03 | 2.94 | 3.18 | 3.30 | 2.61 | 2.85 | 4.39 | 3.33 | 70.50 | 3.33 | 3.84 | 3.93 | 4.55 | 4.34 | 6.96 | 4.09 | 2.03 | 1.95 | 1.98 | 3.16 | NA | NA | NA | NA | NA | NA | NA | NA | NA | NA | NA | NA | NA | NA | NA | NA | NA | NA | NA | NA | NA | NA | NA | |
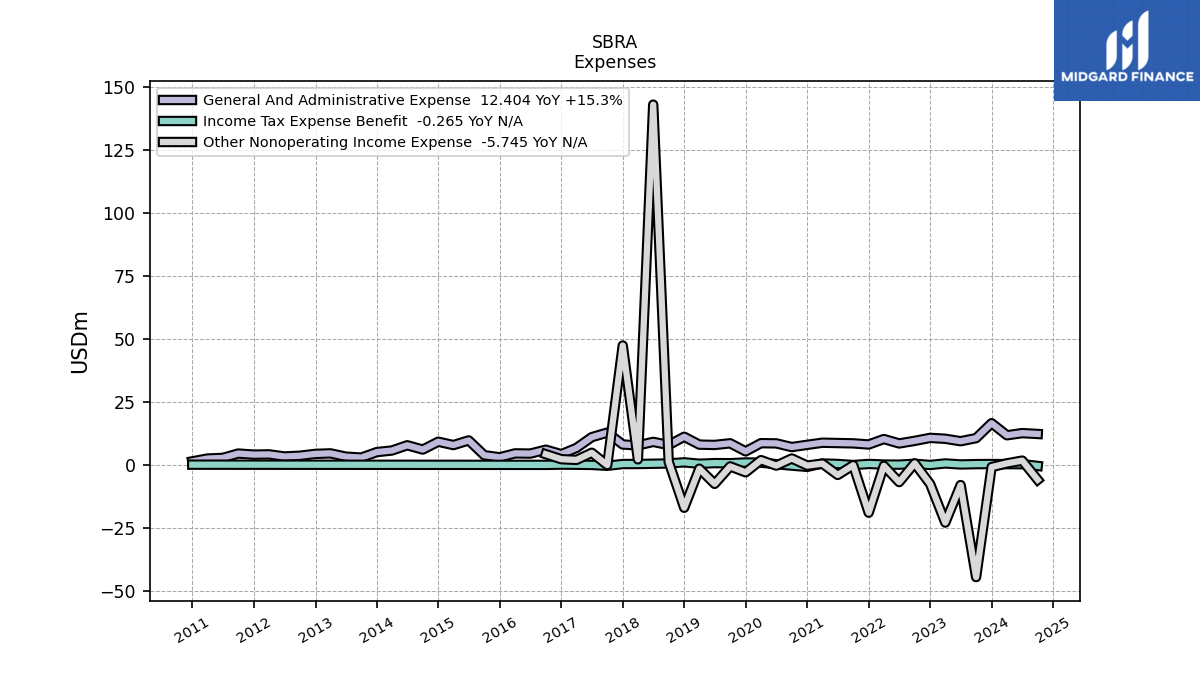
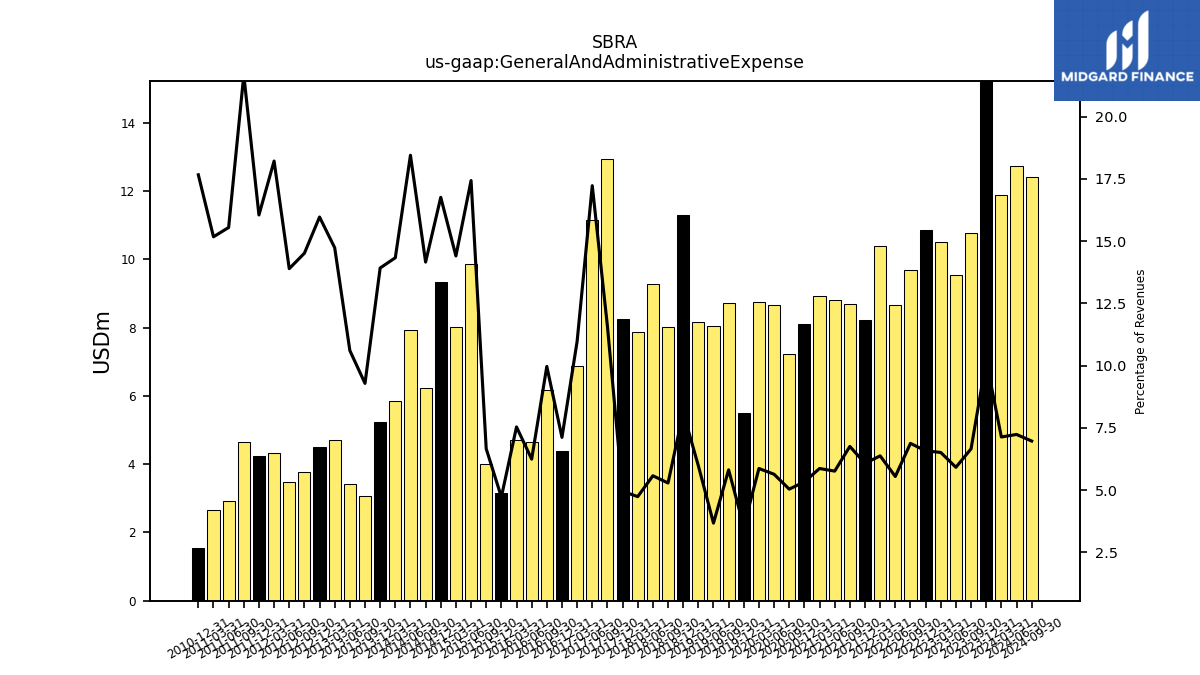
| General And Administrative Expense | 16.68 | 10.76 | 9.53 | 10.50 | 10.85 | 9.68 | 8.65 | 10.40 | 8.24 | 8.68 | 8.81 | 8.94 | 8.11 | 7.22 | 8.67 | 8.76 | 5.51 | 8.71 | 8.06 | 8.18 | 11.30 | 8.02 | 9.27 | 7.87 | 8.24 | 12.94 | 11.15 | 6.87 | 4.40 | 6.17 | 4.64 | 4.71 | 3.15 | 3.99 | 9.86 | 8.00 | 9.33 | 6.23 | 7.93 | 5.85 | 5.23 | 3.06 | 3.42 | 4.72 | 4.52 | 3.78 | 3.49 | 4.32 | 4.23 | 4.65 | 2.92 | 2.67 | 1.55 | |
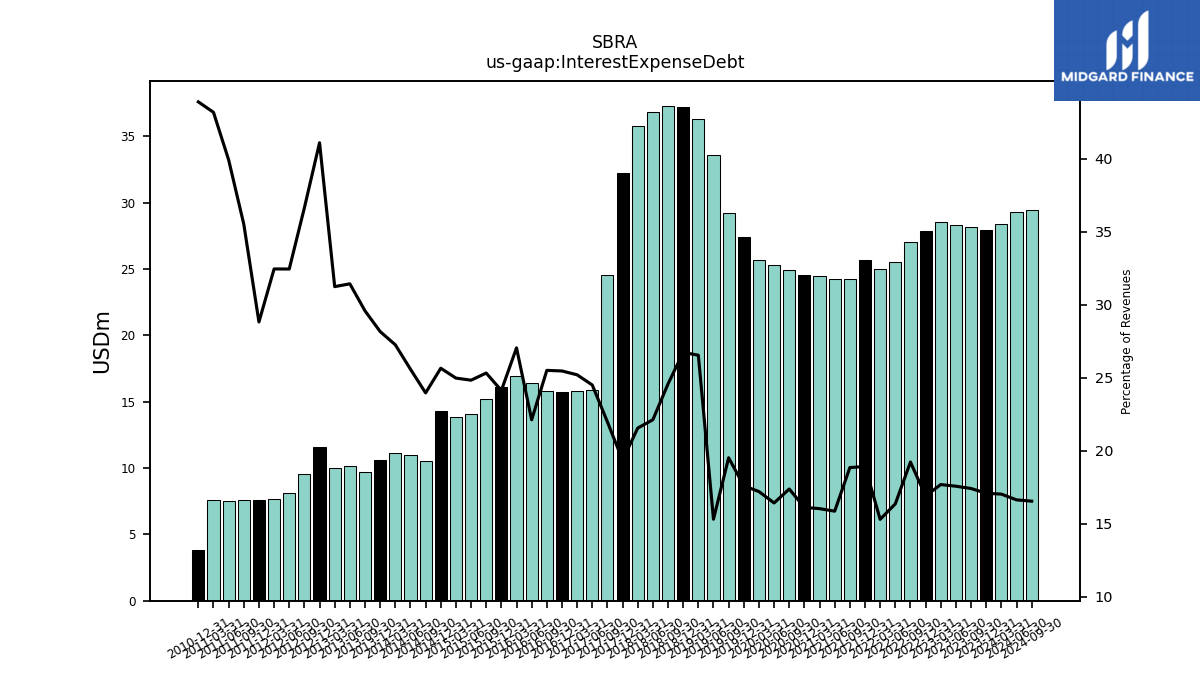
| Interest Expense Debt | 27.94 | 28.16 | 28.33 | 28.54 | 27.90 | 27.07 | 25.53 | 24.97 | 25.68 | 24.24 | 24.27 | 24.44 | 24.52 | 24.90 | 25.29 | 25.70 | 27.43 | 29.25 | 33.61 | 36.30 | 37.22 | 37.30 | 36.80 | 35.80 | 32.22 | 24.57 | 15.86 | 15.79 | 15.73 | 15.79 | 16.43 | 16.92 | 16.11 | 15.18 | 14.05 | 13.88 | 14.29 | 10.54 | 10.99 | 11.13 | 10.58 | 9.74 | 10.14 | 10.00 | 11.62 | 9.54 | 8.15 | 7.70 | 7.59 | 7.62 | 7.50 | 7.60 | 3.86 | |
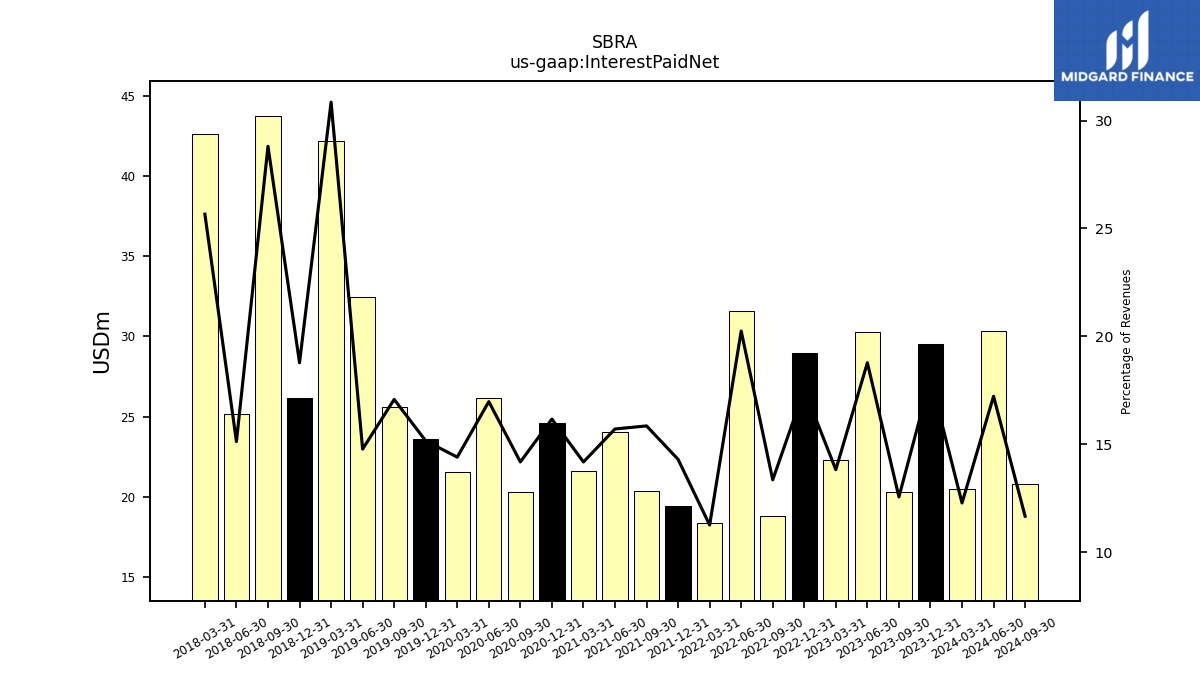
| Interest Paid Net | 29.50 | 20.32 | 30.27 | 22.32 | 28.95 | 18.81 | 31.59 | 18.38 | 19.41 | 20.39 | 24.04 | 21.62 | 24.59 | 20.33 | 26.14 | 21.53 | 23.62 | 25.60 | 32.44 | 42.20 | 26.15 | 43.73 | 25.17 | 42.62 | NA | NA | NA | NA | NA | NA | NA | NA | NA | NA | NA | NA | NA | NA | NA | NA | NA | NA | NA | NA | NA | NA | NA | NA | NA | NA | NA | NA | NA | |
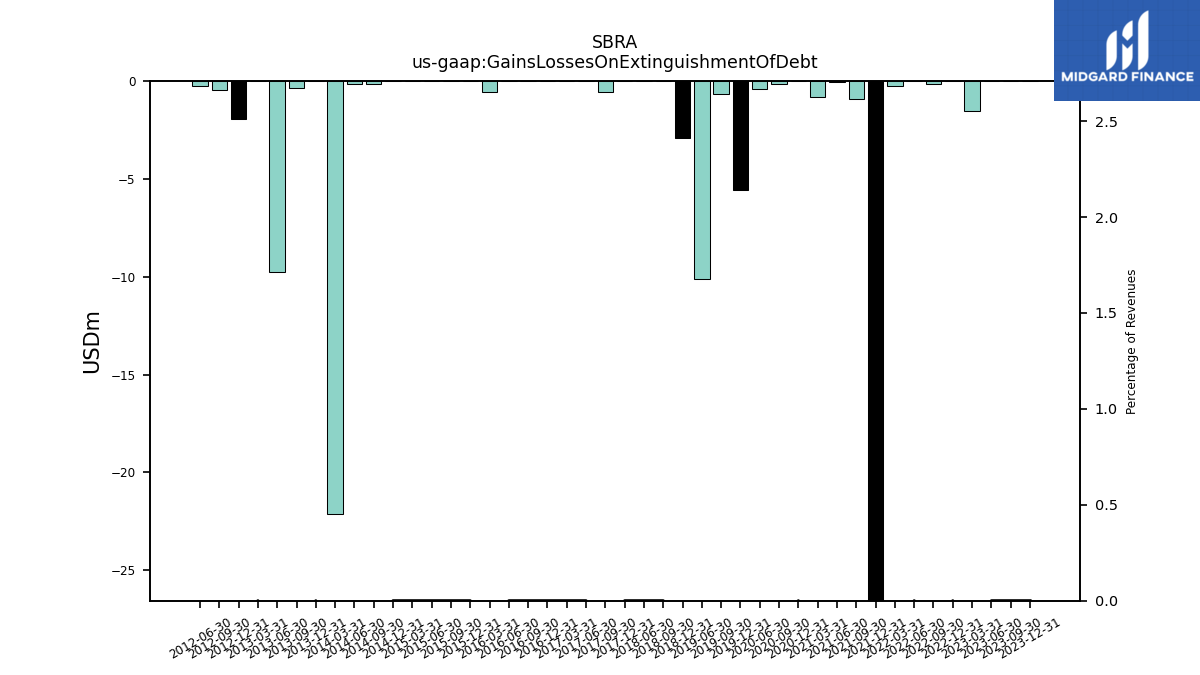
| Gains Losses On Extinguishment Of Debt | 0.00 | 0.00 | 0.00 | -1.54 | 0.00 | -0.14 | 0.00 | -0.27 | -32.86 | -0.91 | -0.05 | -0.79 | 0.00 | -0.14 | -0.39 | NA | -5.58 | -0.64 | -10.12 | NA | -2.92 | 0.00 | 0.00 | NA | 0.00 | -0.55 | 0.00 | 0.00 | 0.00 | 0.00 | 0.00 | -0.56 | 0.00 | 0.00 | 0.00 | 0.00 | 0.00 | -0.16 | -0.16 | -22.13 | 0.00 | -0.35 | -9.75 | 0.00 | -1.97 | -0.45 | -0.25 | NA | NA | NA | NA | NA | NA | |
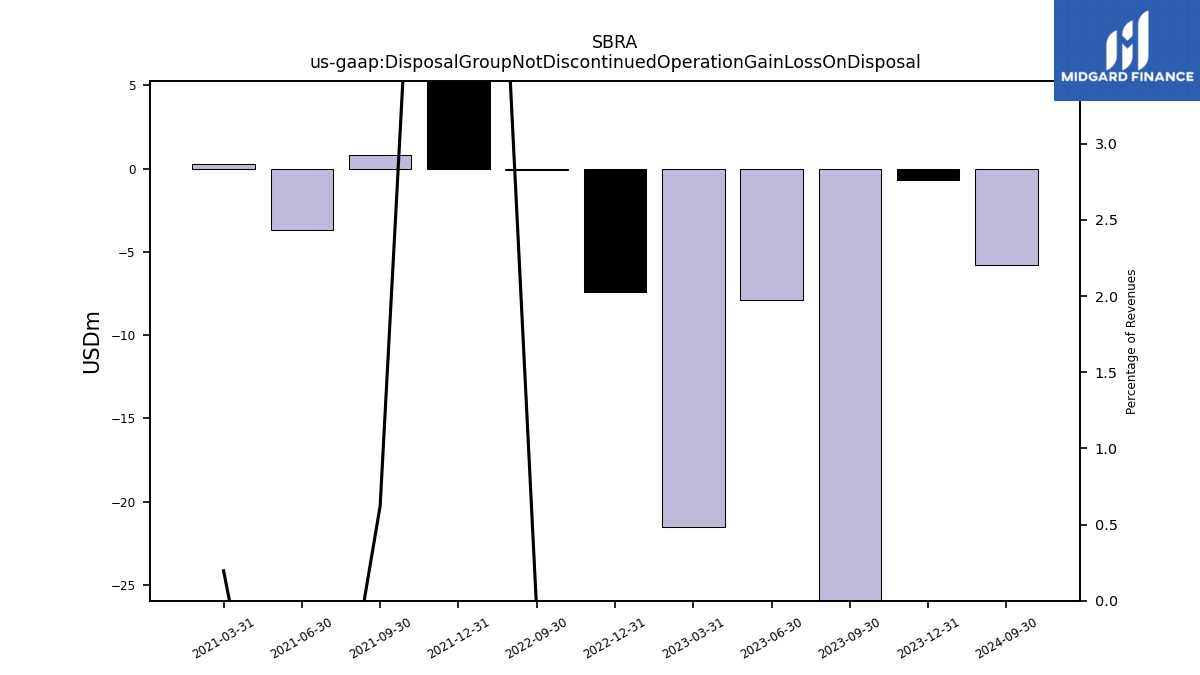
| Disposal Group Not Discontinued Operation Gain Loss On Disposal | -0.70 | -46.50 | -7.90 | -21.50 | -7.40 | -0.10 | NA | NA | 13.90 | 0.80 | -3.70 | 0.30 | NA | NA | NA | NA | NA | NA | NA | NA | NA | NA | NA | NA | NA | NA | NA | NA | NA | NA | NA | NA | NA | NA | NA | NA | NA | NA | NA | NA | NA | NA | NA | NA | NA | NA | NA | NA | NA | NA | NA | NA | NA | |
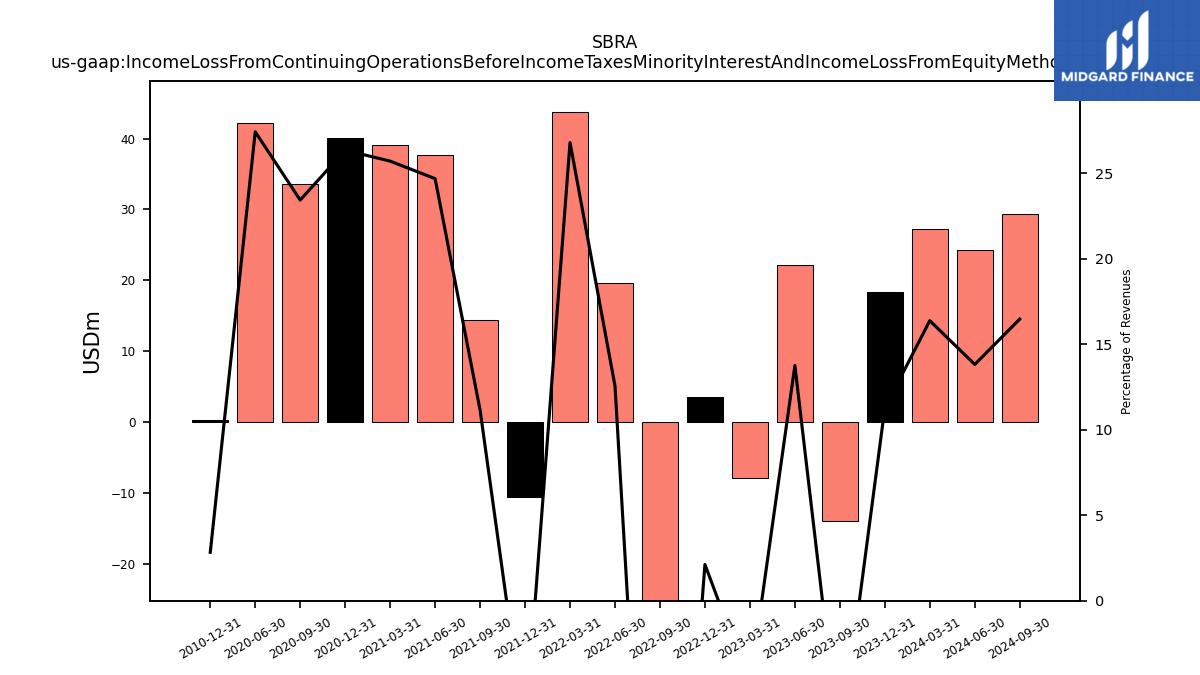
| Income Loss From Continuing Operations Before Income Taxes Minority Interest And Income Loss From Equity Method Investments | 18.41 | -14.00 | 22.17 | -7.92 | 3.49 | -45.10 | 19.59 | 43.69 | -10.56 | 14.33 | 37.74 | 39.16 | 40.05 | 33.56 | 42.19 | NA | NA | NA | NA | NA | NA | NA | NA | NA | NA | NA | NA | NA | NA | NA | NA | NA | NA | NA | NA | NA | NA | NA | NA | NA | NA | NA | NA | NA | NA | NA | NA | NA | NA | NA | NA | NA | 0.25 | |
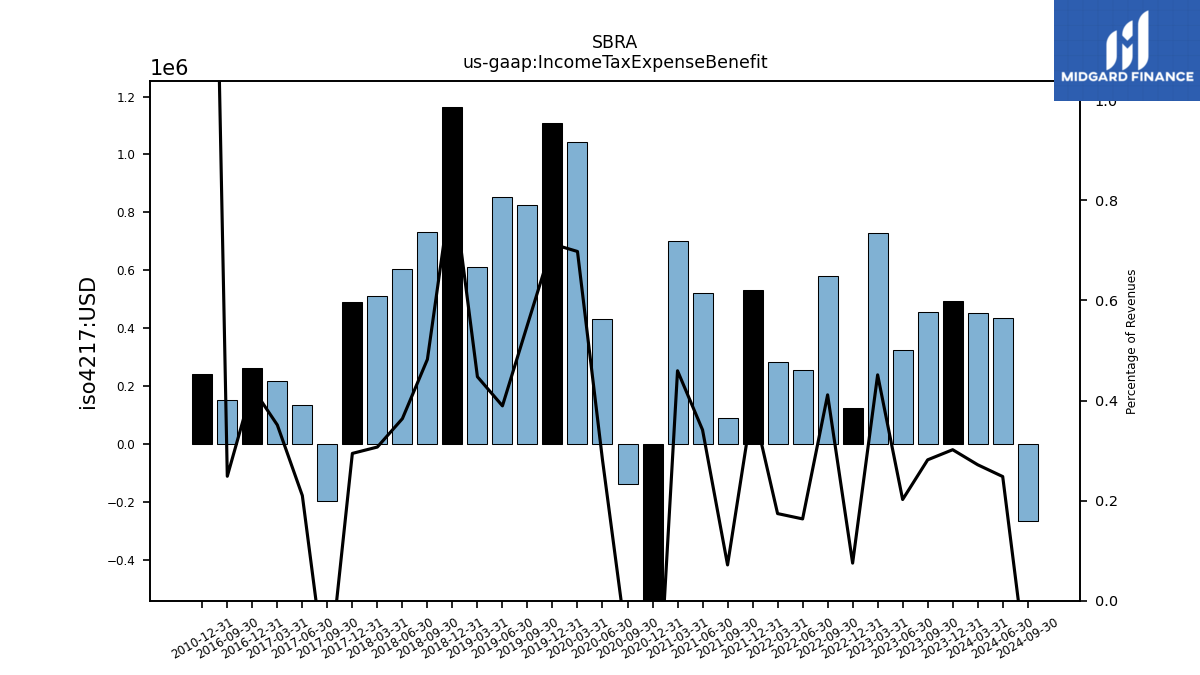
| Income Tax Expense Benefit | 0.49 | 0.46 | 0.33 | 0.73 | 0.12 | 0.58 | 0.26 | 0.28 | 0.53 | 0.09 | 0.52 | 0.70 | -0.63 | -0.14 | 0.43 | 1.04 | 1.11 | 0.83 | 0.85 | 0.61 | 1.16 | 0.73 | 0.60 | 0.51 | 0.49 | -0.20 | 0.14 | 0.22 | 0.26 | 0.15 | NA | NA | NA | NA | NA | NA | NA | NA | NA | NA | NA | NA | NA | NA | NA | NA | NA | NA | NA | NA | NA | NA | 0.24 | |
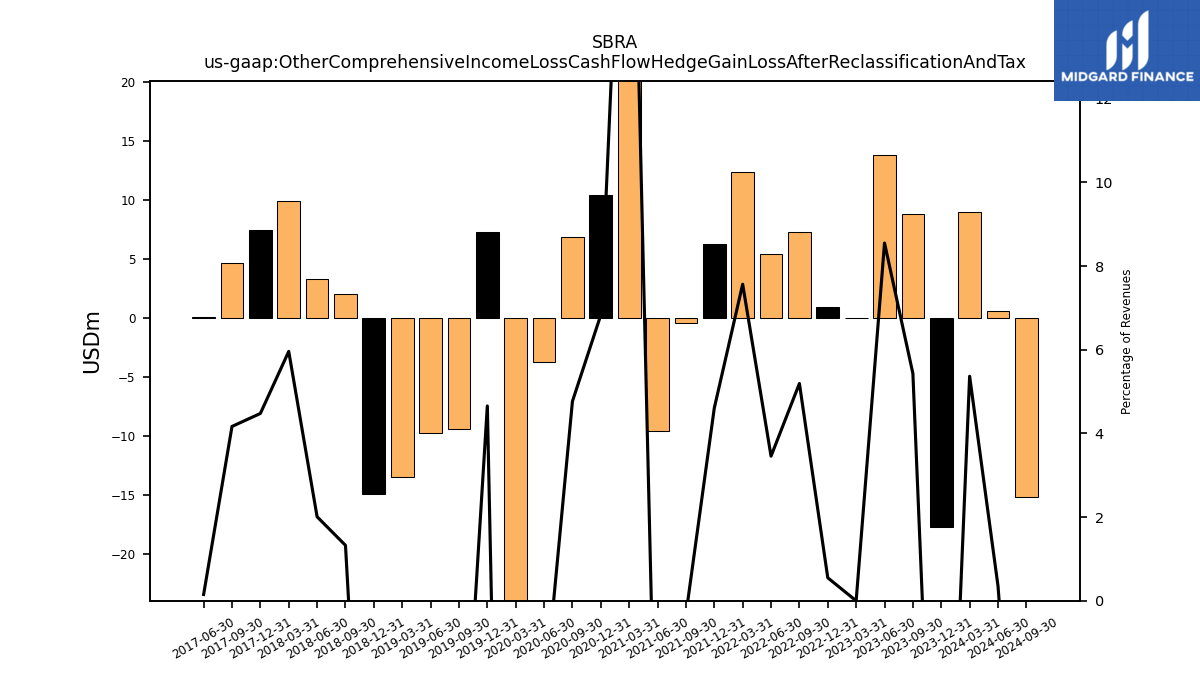
| Other Comprehensive Income Loss Cash Flow Hedge Gain Loss After Reclassification And Tax | -17.67 | 8.78 | 13.78 | -0.00 | 0.91 | 7.31 | 5.39 | 12.34 | 6.25 | -0.42 | -9.58 | 33.79 | 10.39 | 6.83 | -3.73 | -40.69 | 7.25 | -9.38 | -9.76 | -13.49 | -14.95 | 2.01 | 3.34 | 9.90 | 7.45 | 4.66 | 0.10 | NA | NA | NA | NA | NA | NA | NA | NA | NA | NA | NA | NA | NA | NA | NA | NA | NA | NA | NA | NA | NA | NA | NA | NA | NA | NA | |
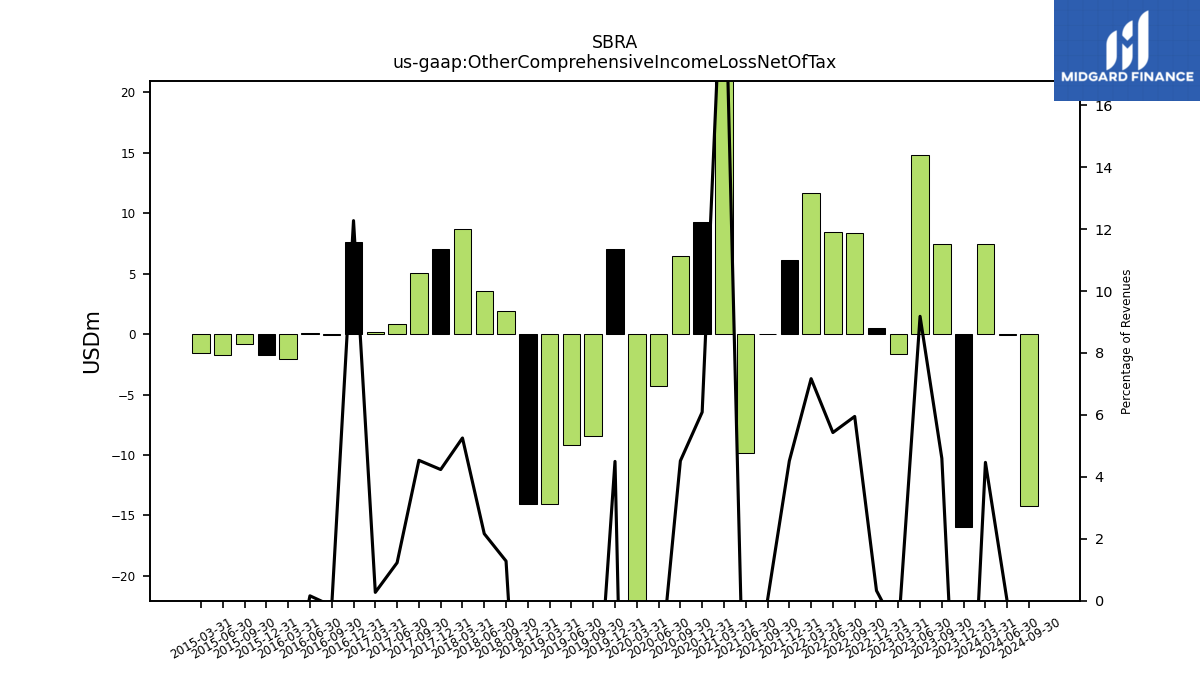
| Other Comprehensive Income Loss Net Of Tax | -15.92 | 7.43 | 14.80 | -1.62 | 0.54 | 8.38 | 8.47 | 11.70 | 6.12 | 0.03 | -9.80 | 33.54 | 9.26 | 6.47 | -4.27 | -38.98 | 7.01 | -8.46 | -9.19 | -14.05 | -14.06 | 1.95 | 3.60 | 8.73 | 7.05 | 5.07 | 0.80 | 0.17 | 7.58 | -0.10 | 0.12 | -2.06 | -1.70 | -0.81 | -1.74 | -1.54 | NA | NA | NA | NA | NA | NA | NA | NA | NA | NA | NA | NA | NA | NA | NA | NA | NA | |
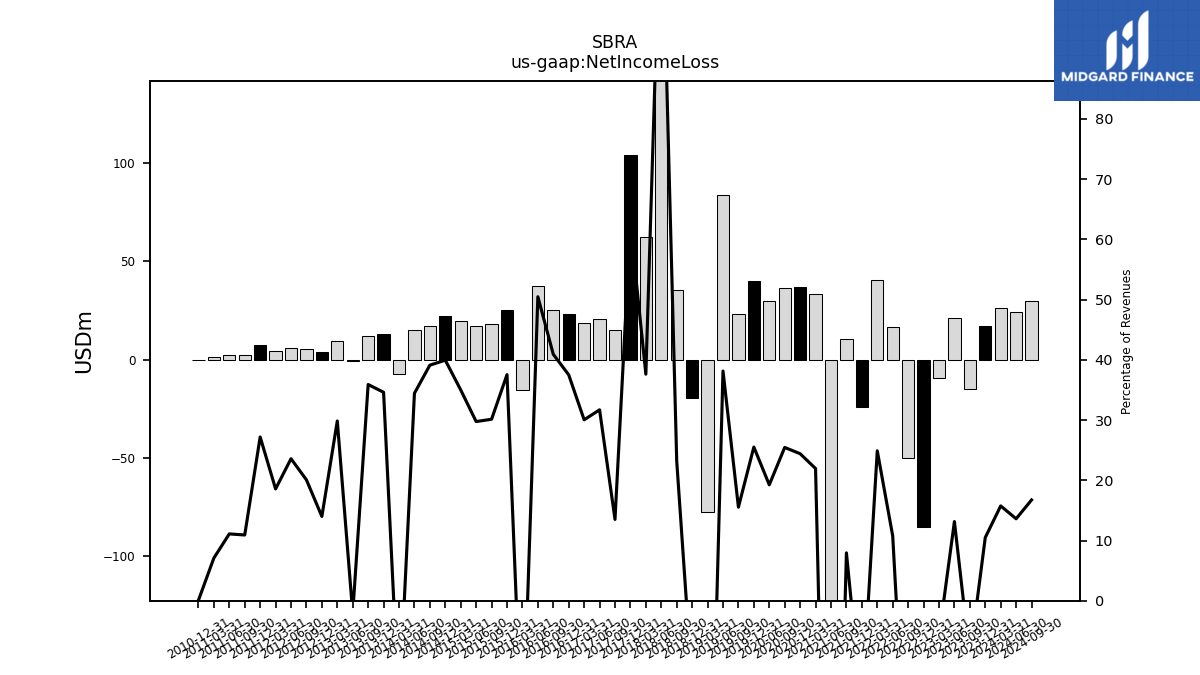
| Net Income Loss | 17.16 | -15.10 | 21.19 | -9.49 | -84.95 | -50.06 | 16.80 | 40.60 | -24.35 | 10.22 | -132.57 | 33.45 | 37.12 | 36.46 | 29.62 | NA | 39.74 | 23.28 | 83.68 | -77.70 | -19.39 | 35.22 | 200.79 | 62.47 | 103.94 | 15.10 | 20.52 | 18.82 | 23.18 | 25.34 | 37.48 | -15.71 | 25.07 | 18.06 | 16.84 | 19.45 | 22.25 | 17.20 | 14.80 | -7.30 | 13.00 | 11.82 | -0.66 | 9.56 | 3.96 | 5.23 | 5.92 | 4.41 | 7.16 | 2.34 | 2.09 | 1.25 | 0.01 | |
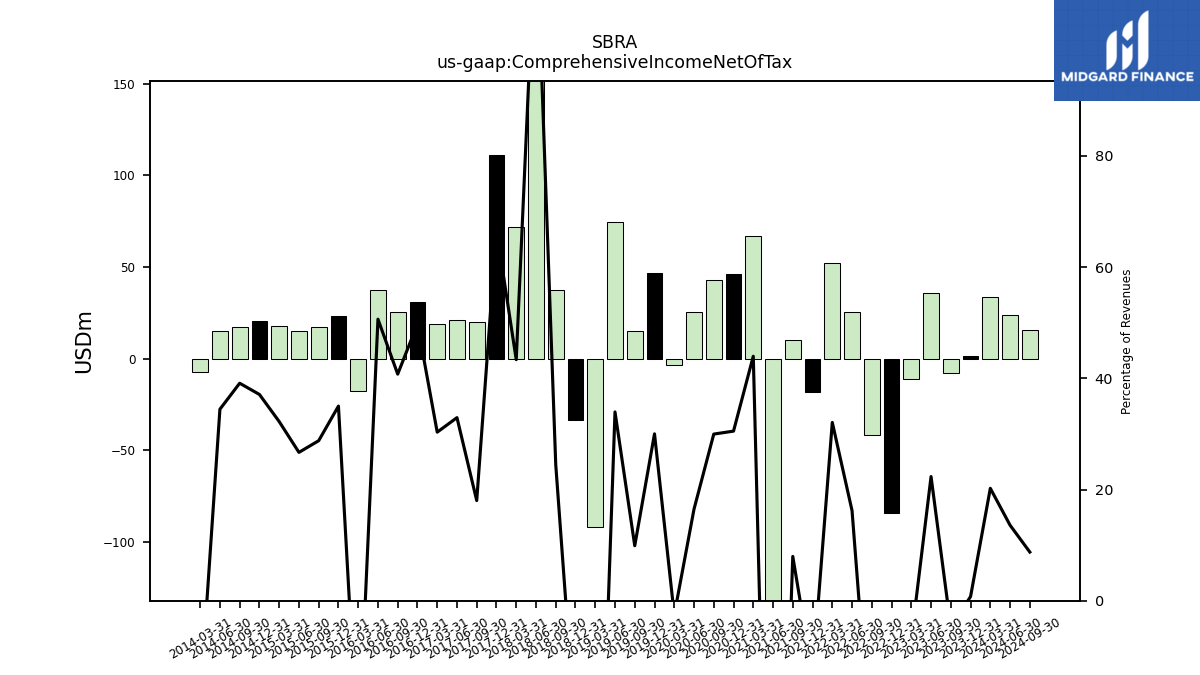
| Comprehensive Income Net Of Tax | 1.23 | -7.67 | 35.99 | -11.11 | -84.41 | -41.69 | 25.28 | 52.30 | -18.23 | 10.25 | -142.37 | 66.98 | 46.38 | 42.93 | 25.36 | -3.77 | 46.75 | 14.82 | 74.49 | -91.75 | -33.45 | 37.16 | 204.39 | 72.00 | 111.04 | 20.14 | 21.32 | 18.99 | 30.76 | 25.23 | 37.59 | -17.78 | 23.37 | 17.25 | 15.10 | 17.91 | 20.66 | 17.20 | 14.80 | -7.30 | NA | NA | NA | NA | NA | NA | NA | NA | NA | NA | NA | NA | NA |
| 2023-12-31 | 2023-09-30 | 2023-06-30 | 2023-03-31 | 2022-12-31 | 2022-09-30 | 2022-06-30 | 2022-03-31 | 2021-12-31 | 2021-09-30 | 2021-06-30 | 2021-03-31 | 2020-12-31 | 2020-09-30 | 2020-06-30 | 2020-03-31 | 2019-12-31 | 2019-09-30 | 2019-06-30 | 2019-03-31 | 2018-12-31 | 2018-09-30 | 2018-06-30 | 2018-03-31 | 2017-12-31 | 2017-09-30 | 2017-06-30 | 2017-03-31 | 2016-12-31 | 2016-09-30 | 2016-06-30 | 2016-03-31 | 2015-12-31 | 2015-09-30 | 2015-06-30 | 2015-03-31 | 2014-12-31 | 2014-09-30 | 2014-06-30 | 2014-03-31 | 2013-12-31 | 2013-09-30 | 2013-06-30 | 2013-03-31 | 2012-12-31 | 2012-09-30 | 2012-06-30 | 2012-03-31 | 2011-12-31 | 2011-09-30 | 2011-06-30 | 2011-03-31 | 2010-12-31 | ||
|---|---|---|---|---|---|---|---|---|---|---|---|---|---|---|---|---|---|---|---|---|---|---|---|---|---|---|---|---|---|---|---|---|---|---|---|---|---|---|---|---|---|---|---|---|---|---|---|---|---|---|---|---|---|---|
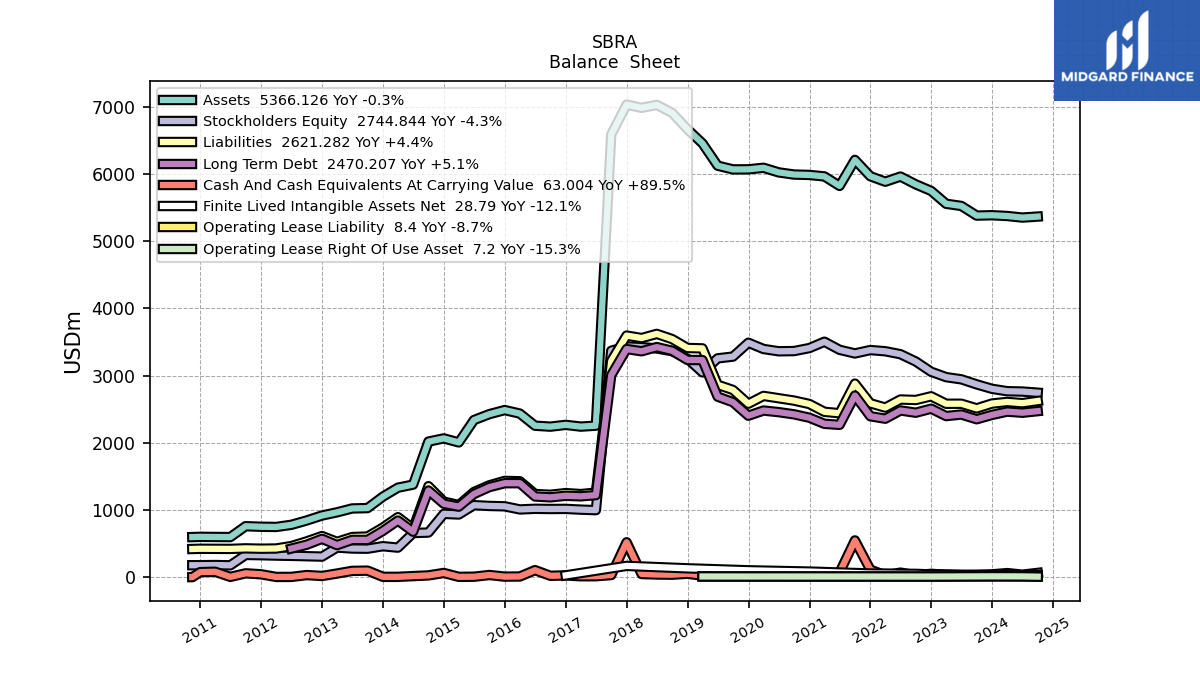
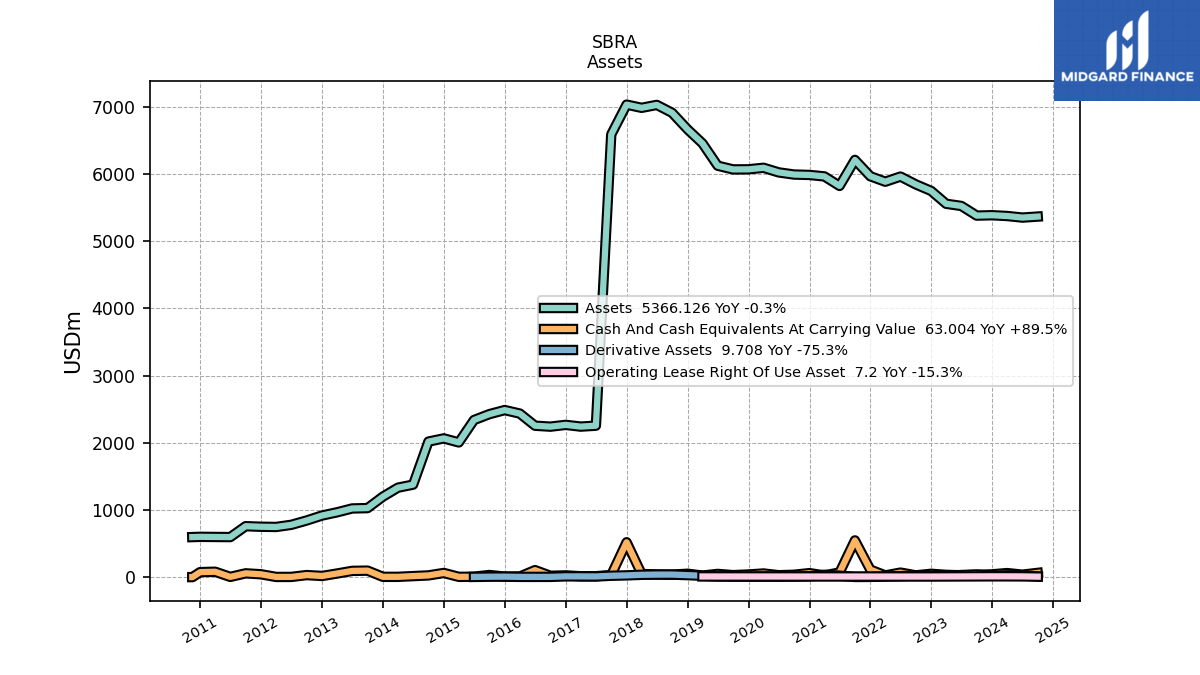
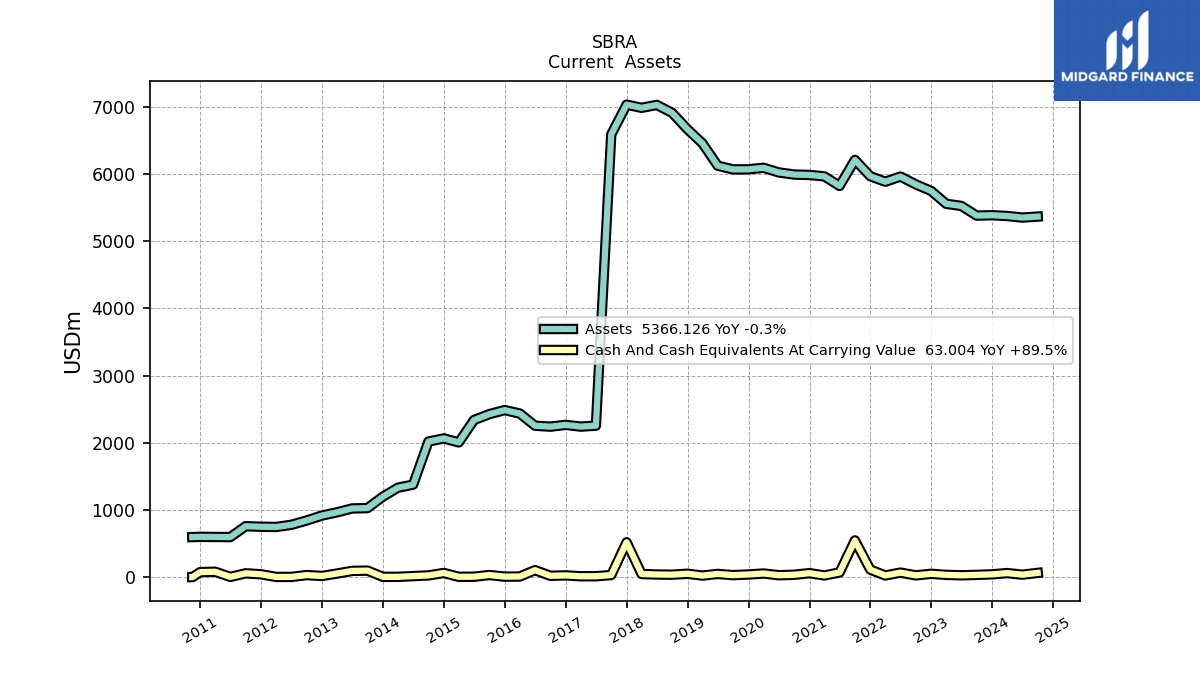
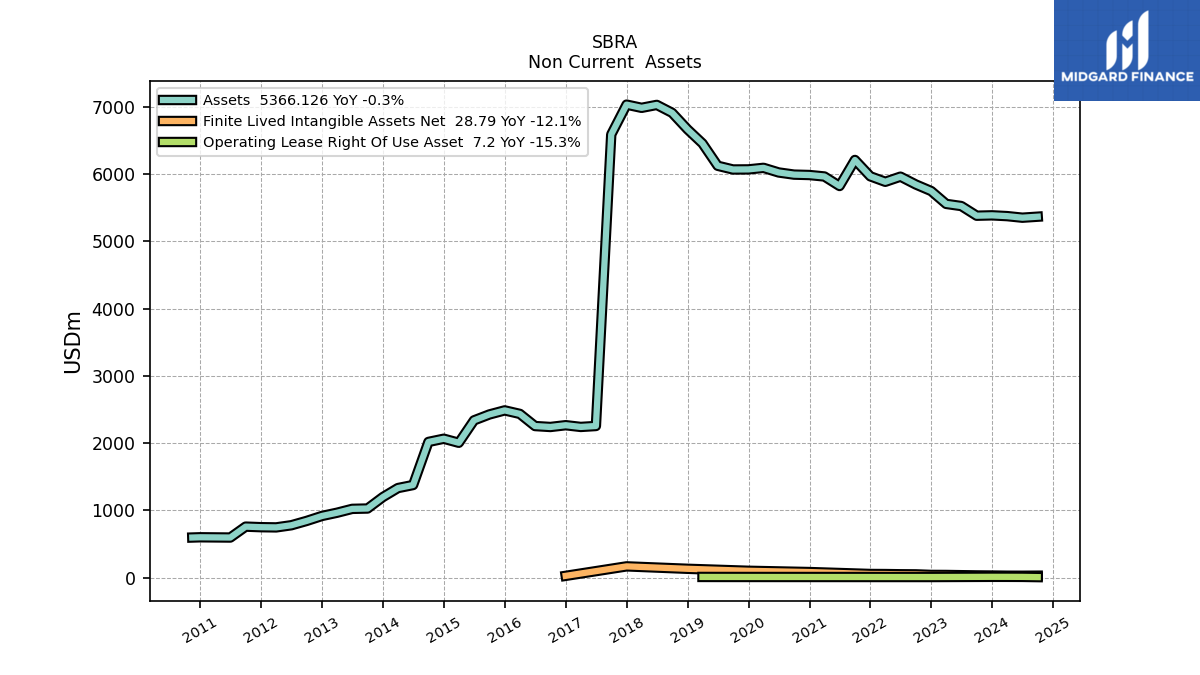
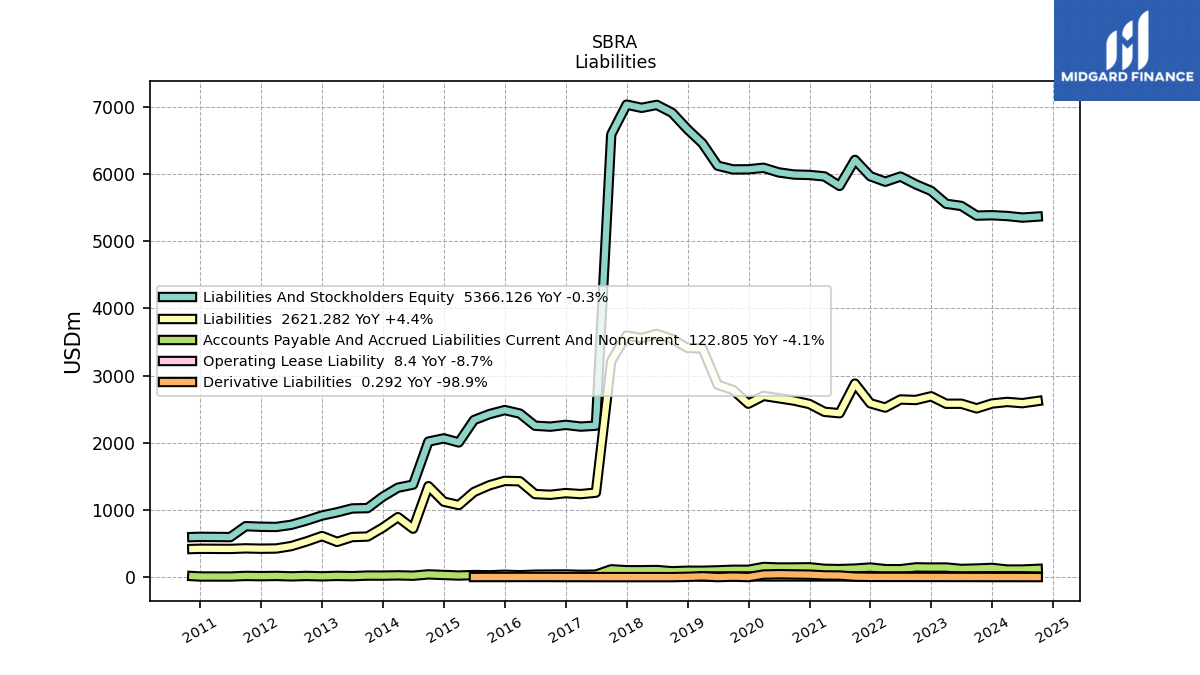
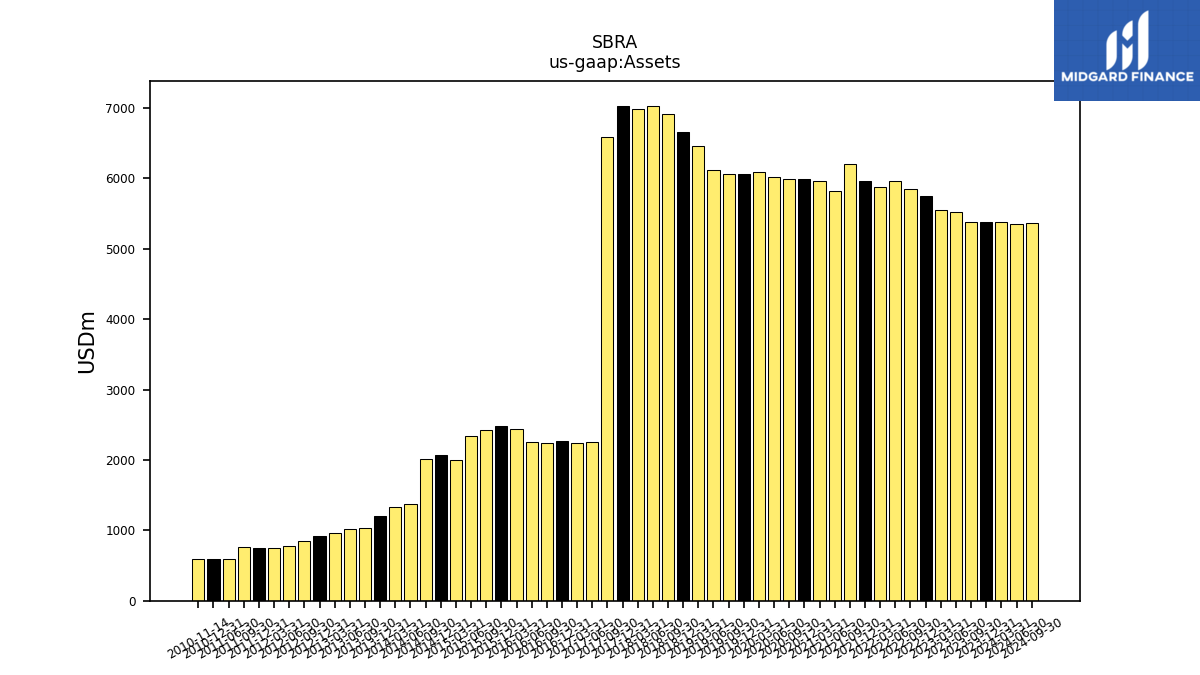
| Assets | 5386.15 | 5380.56 | 5524.33 | 5556.31 | 5747.67 | 5844.91 | 5961.43 | 5884.93 | 5966.71 | 6209.55 | 5822.14 | 5963.84 | 5985.60 | 5991.62 | 6023.55 | 6092.30 | 6069.30 | 6068.00 | 6123.18 | 6455.15 | 6665.30 | 6910.34 | 7028.14 | 6984.57 | 7032.28 | 6588.31 | 2253.96 | 2240.13 | 2265.92 | 2239.42 | 2253.35 | 2434.16 | 2486.17 | 2425.45 | 2337.80 | 2004.50 | 2064.89 | 2017.37 | 1376.51 | 1331.36 | 1197.84 | 1027.25 | 1022.10 | 964.57 | 916.88 | 843.01 | 778.52 | 746.54 | 749.65 | 758.04 | 595.80 | NA | 599.56 | |
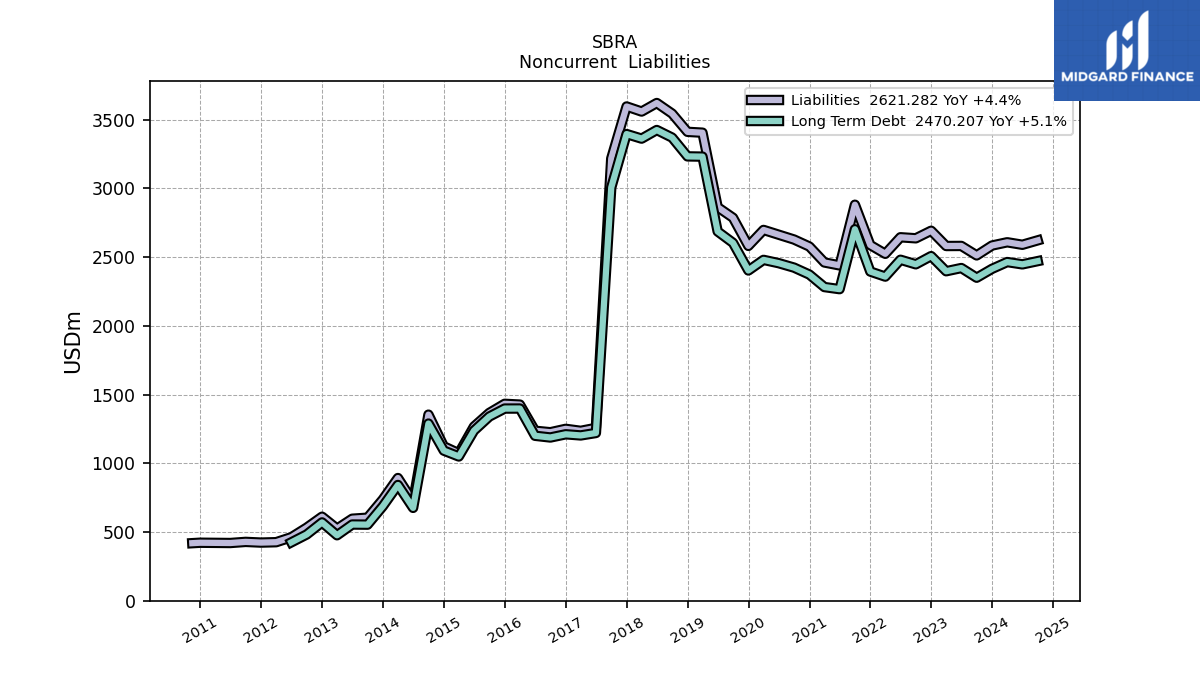
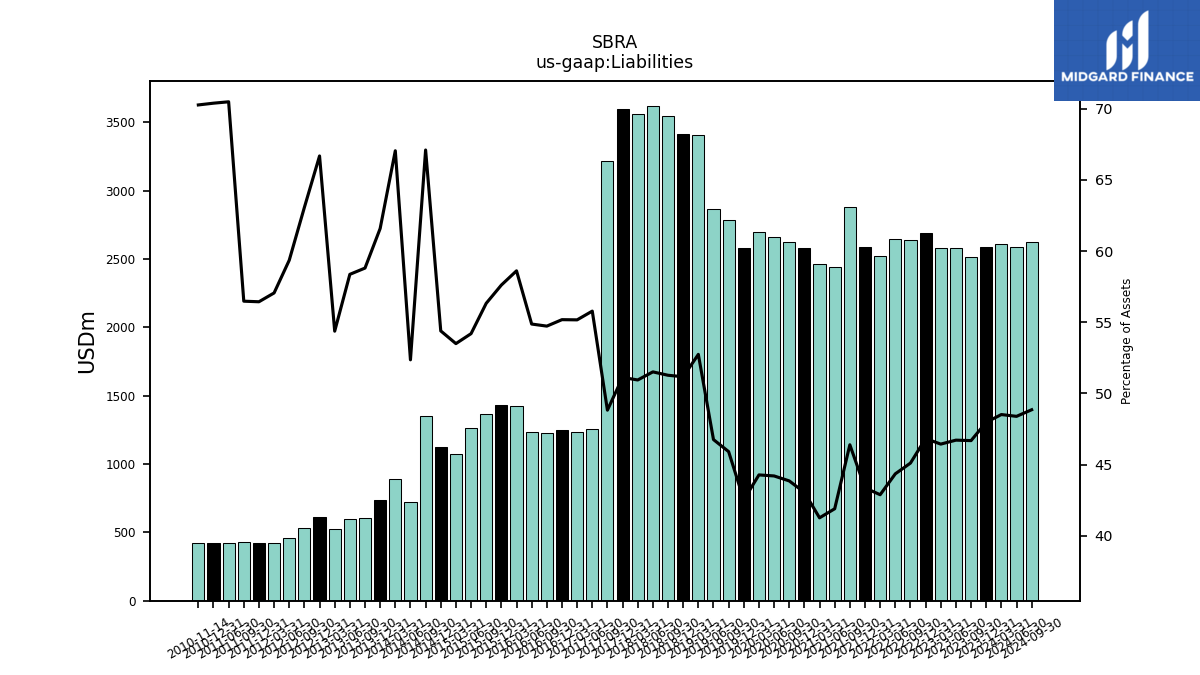
| Liabilities | 2583.62 | 2511.71 | 2580.59 | 2580.08 | 2691.28 | 2636.18 | 2643.71 | 2523.41 | 2587.18 | 2880.45 | 2439.08 | 2460.43 | 2576.38 | 2627.28 | 2662.30 | 2697.09 | 2580.84 | 2785.59 | 2862.80 | 3404.37 | 3410.56 | 3543.08 | 3620.22 | 3558.00 | 3595.03 | 3216.48 | 1257.24 | 1235.77 | 1250.31 | 1225.53 | 1236.43 | 1426.66 | 1432.30 | 1366.21 | 1266.99 | 1072.34 | 1123.07 | 1353.64 | 720.70 | 892.63 | 737.67 | 604.06 | 596.53 | 524.43 | 611.39 | 531.69 | 462.09 | 425.95 | 423.08 | 428.12 | 419.96 | NA | 422.03 | |
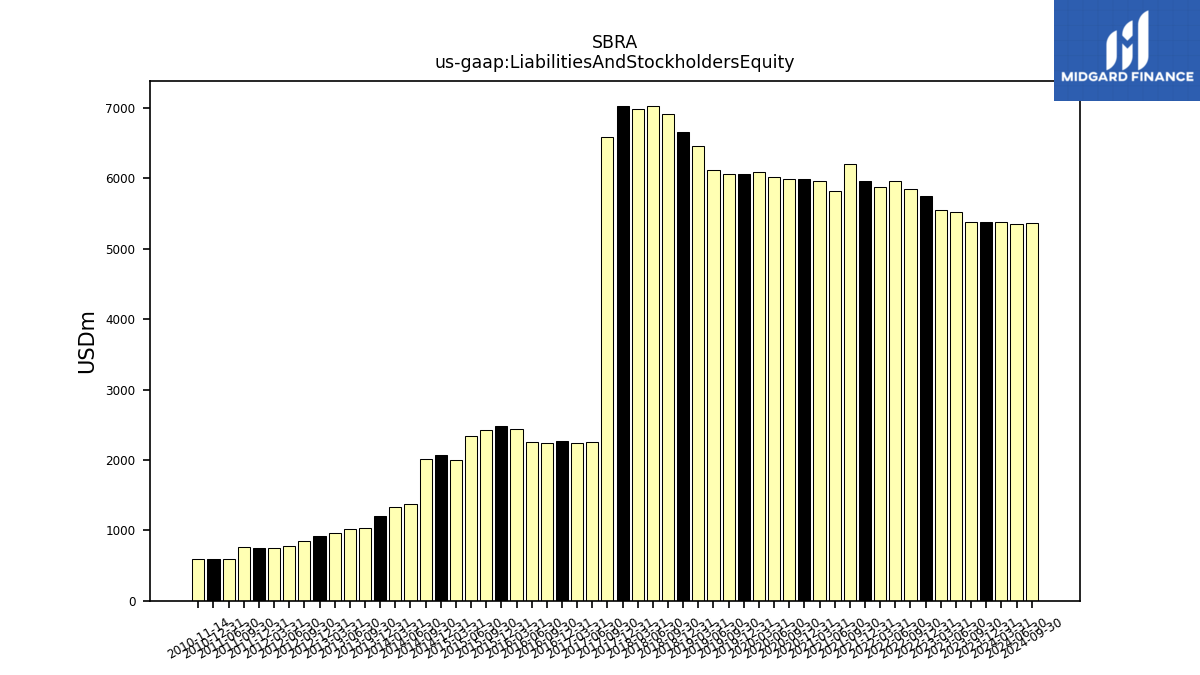
| Liabilities And Stockholders Equity | 5386.15 | 5380.56 | 5524.33 | 5556.31 | 5747.67 | 5844.91 | 5961.43 | 5884.93 | 5966.71 | 6209.55 | 5822.14 | 5963.84 | 5985.60 | 5991.62 | 6023.55 | 6092.30 | 6069.30 | 6068.00 | 6123.18 | 6455.15 | 6665.30 | 6910.34 | 7028.14 | 6984.57 | 7032.28 | 6588.31 | 2253.96 | 2240.13 | 2265.92 | 2239.42 | 2253.35 | 2434.16 | 2486.17 | 2425.45 | 2337.80 | 2004.50 | 2064.89 | 2017.37 | 1376.51 | 1331.36 | 1197.84 | 1027.25 | 1022.10 | 964.57 | 916.88 | 843.01 | 778.52 | 746.54 | 749.65 | 758.04 | 595.80 | NA | 599.56 | |
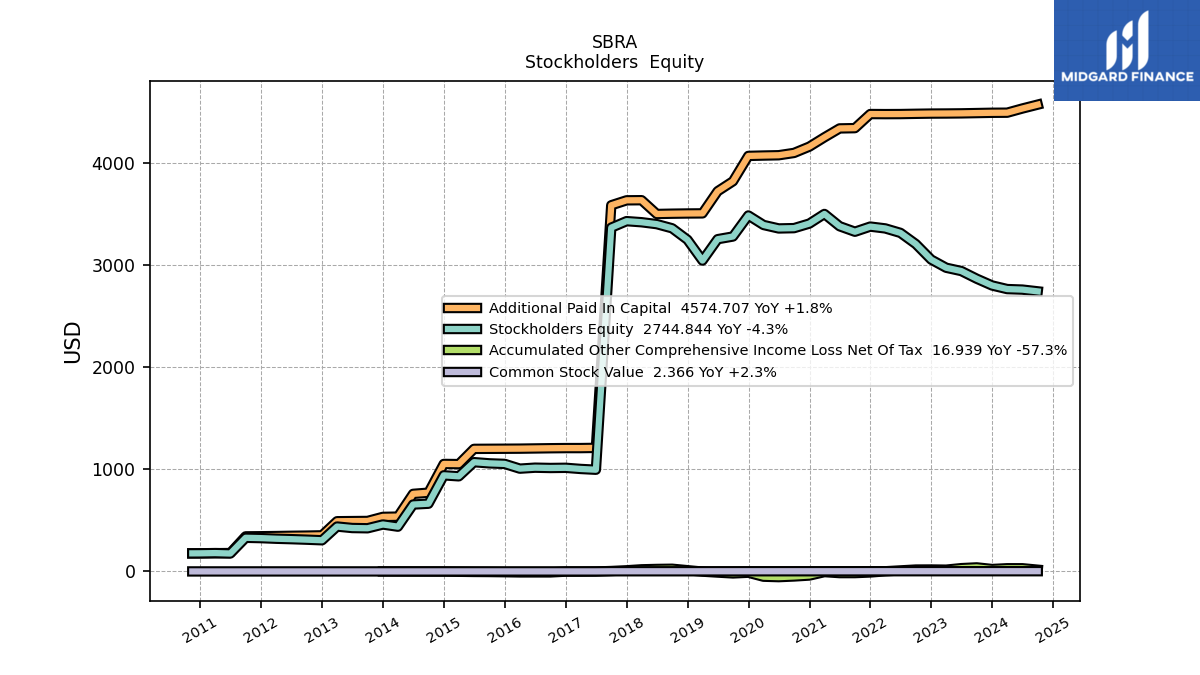
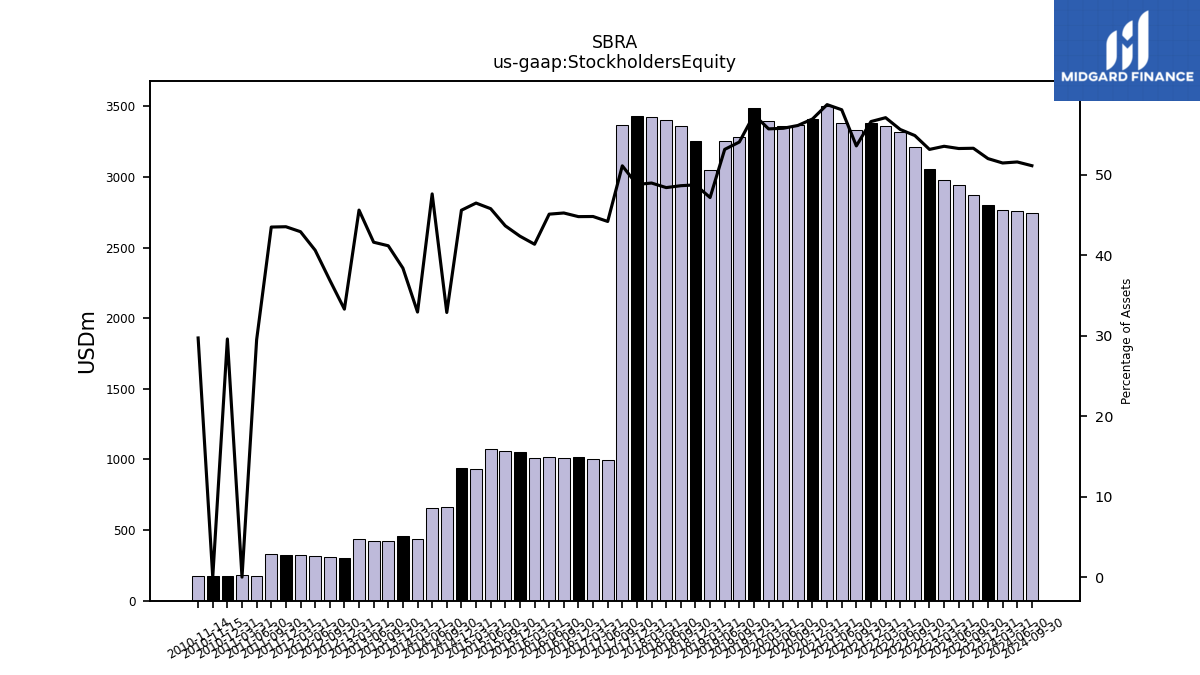
| Stockholders Equity | 2802.53 | 2868.85 | 2943.74 | 2976.23 | 3056.39 | 3208.73 | 3317.73 | 3361.52 | 3379.53 | 3329.10 | 3383.06 | 3503.40 | 3409.23 | 3364.34 | 3361.25 | 3395.21 | 3488.46 | 3282.42 | 3256.10 | 3046.47 | 3250.41 | 3362.90 | 3403.54 | 3422.15 | 3432.81 | 3369.10 | 996.70 | 1004.35 | 1015.57 | 1013.85 | 1016.85 | 1007.42 | 1053.88 | 1059.33 | 1070.87 | 932.21 | 941.87 | 663.75 | 655.84 | 438.74 | 460.16 | 423.19 | 425.57 | 440.14 | 305.49 | 311.32 | 316.43 | 320.60 | 326.57 | 329.92 | 175.84 | 179.92 | 177.53 |
| 2023-12-31 | 2023-09-30 | 2023-06-30 | 2023-03-31 | 2022-12-31 | 2022-09-30 | 2022-06-30 | 2022-03-31 | 2021-12-31 | 2021-09-30 | 2021-06-30 | 2021-03-31 | 2020-12-31 | 2020-09-30 | 2020-06-30 | 2020-03-31 | 2019-12-31 | 2019-09-30 | 2019-06-30 | 2019-03-31 | 2018-12-31 | 2018-09-30 | 2018-06-30 | 2018-03-31 | 2017-12-31 | 2017-09-30 | 2017-06-30 | 2017-03-31 | 2016-12-31 | 2016-09-30 | 2016-06-30 | 2016-03-31 | 2015-12-31 | 2015-09-30 | 2015-06-30 | 2015-03-31 | 2014-12-31 | 2014-09-30 | 2014-06-30 | 2014-03-31 | 2013-12-31 | 2013-09-30 | 2013-06-30 | 2013-03-31 | 2012-12-31 | 2012-09-30 | 2012-06-30 | 2012-03-31 | 2011-12-31 | 2011-09-30 | 2011-06-30 | 2011-03-31 | 2010-12-31 | ||
|---|---|---|---|---|---|---|---|---|---|---|---|---|---|---|---|---|---|---|---|---|---|---|---|---|---|---|---|---|---|---|---|---|---|---|---|---|---|---|---|---|---|---|---|---|---|---|---|---|---|---|---|---|---|---|
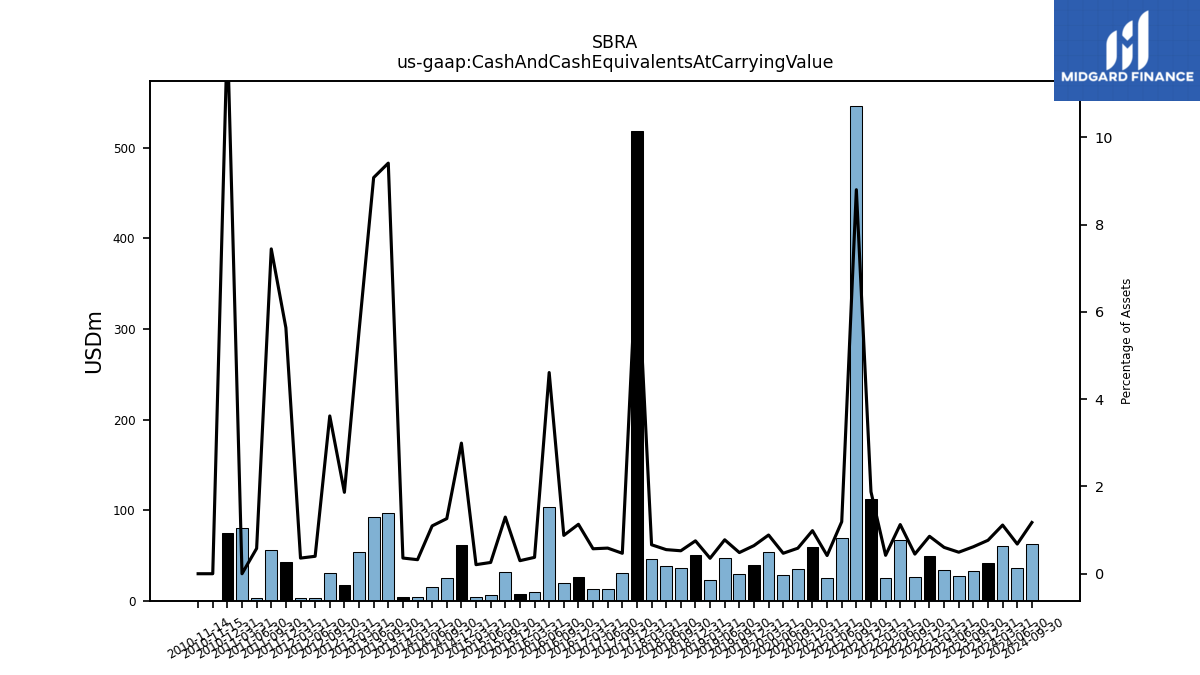
| Cash And Cash Equivalents At Carrying Value | 41.28 | 33.26 | 27.23 | 33.53 | 49.31 | 26.29 | 67.15 | 24.84 | 112.00 | 546.34 | 69.35 | 24.88 | 59.08 | 35.03 | 28.25 | 54.05 | 39.10 | 29.43 | 47.59 | 22.87 | 50.23 | 36.35 | 38.81 | 46.35 | 518.63 | 30.87 | 13.23 | 12.81 | 25.66 | 19.67 | 103.87 | 9.13 | 7.43 | 31.47 | 6.04 | 4.17 | 61.79 | 25.48 | 15.09 | 4.29 | 4.31 | 96.64 | 92.77 | 53.56 | 17.10 | 30.48 | 3.11 | 2.67 | 42.25 | 56.42 | 3.45 | 80.21 | 74.23 | |
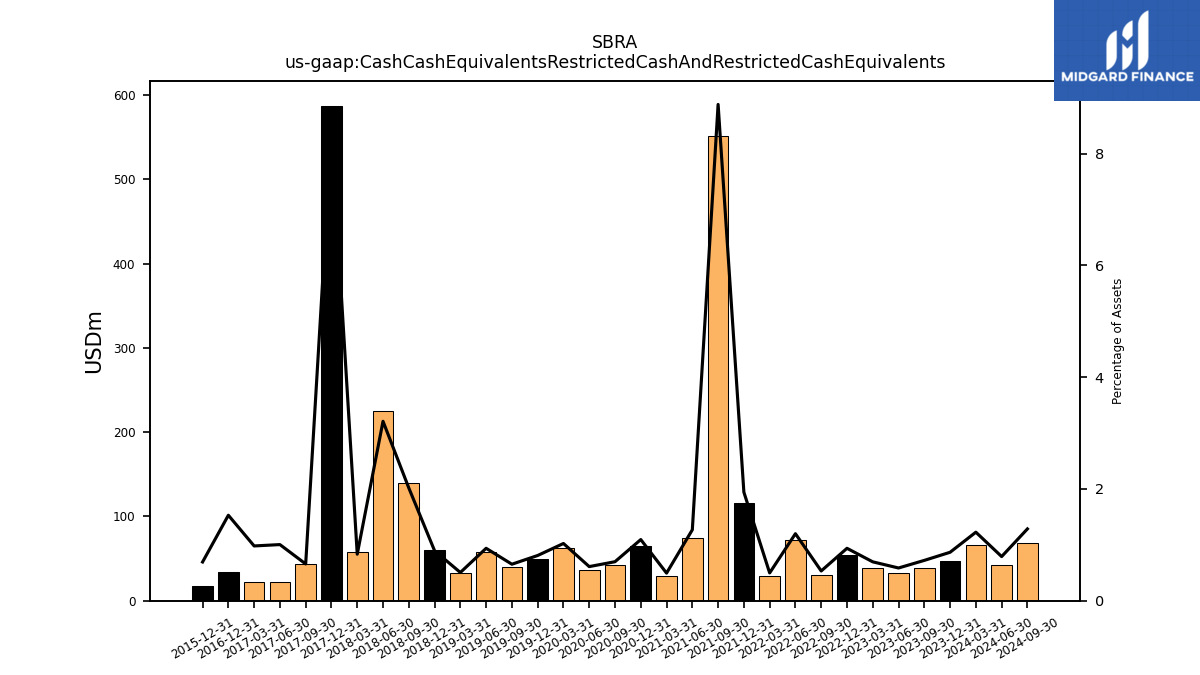
| Cash Cash Equivalents Restricted Cash And Restricted Cash Equivalents | 46.72 | 38.86 | 32.38 | 38.68 | 53.93 | 31.15 | 71.52 | 29.28 | 115.89 | 551.42 | 73.94 | 29.49 | 65.52 | 41.85 | 36.80 | 62.43 | 49.14 | 39.66 | 57.47 | 32.64 | 59.66 | 139.52 | 225.65 | 58.17 | 587.45 | 43.36 | 22.65 | 21.96 | 34.66 | NA | NA | NA | 17.25 | NA | NA | NA | NA | NA | NA | NA | NA | NA | NA | NA | NA | NA | NA | NA | NA | NA | NA | NA | NA | |
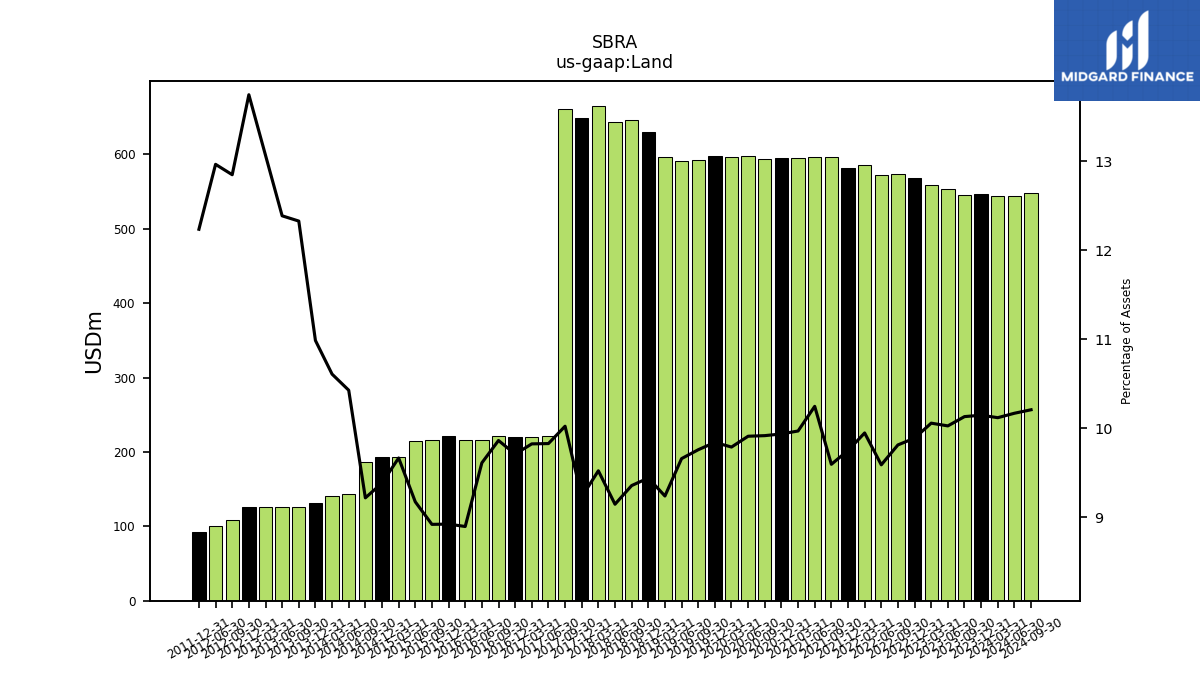
| Land | 546.60 | 545.18 | 553.98 | 558.90 | 568.49 | 573.65 | 571.76 | 585.48 | 581.85 | 595.91 | 596.63 | 594.65 | 594.84 | 594.28 | 597.05 | 596.46 | 597.38 | 592.25 | 591.53 | 596.49 | 629.38 | 646.66 | 642.95 | 665.21 | 649.10 | 660.44 | 221.55 | 220.12 | 220.04 | 220.90 | 216.61 | 216.59 | 221.89 | 216.40 | 214.50 | 193.79 | 193.79 | 186.00 | 143.55 | 141.25 | 131.61 | 126.64 | 126.61 | 126.05 | 126.05 | 108.32 | 100.94 | NA | 91.73 | NA | NA | NA | NA |
| 2023-12-31 | 2023-09-30 | 2023-06-30 | 2023-03-31 | 2022-12-31 | 2022-09-30 | 2022-06-30 | 2022-03-31 | 2021-12-31 | 2021-09-30 | 2021-06-30 | 2021-03-31 | 2020-12-31 | 2020-09-30 | 2020-06-30 | 2020-03-31 | 2019-12-31 | 2019-09-30 | 2019-06-30 | 2019-03-31 | 2018-12-31 | 2018-09-30 | 2018-06-30 | 2018-03-31 | 2017-12-31 | 2017-09-30 | 2017-06-30 | 2017-03-31 | 2016-12-31 | 2016-09-30 | 2016-06-30 | 2016-03-31 | 2015-12-31 | 2015-09-30 | 2015-06-30 | 2015-03-31 | 2014-12-31 | 2014-09-30 | 2014-06-30 | 2014-03-31 | 2013-12-31 | 2013-09-30 | 2013-06-30 | 2013-03-31 | 2012-12-31 | 2012-09-30 | 2012-06-30 | 2012-03-31 | 2011-12-31 | 2011-09-30 | 2011-06-30 | 2011-03-31 | 2010-12-31 | ||
|---|---|---|---|---|---|---|---|---|---|---|---|---|---|---|---|---|---|---|---|---|---|---|---|---|---|---|---|---|---|---|---|---|---|---|---|---|---|---|---|---|---|---|---|---|---|---|---|---|---|---|---|---|---|---|
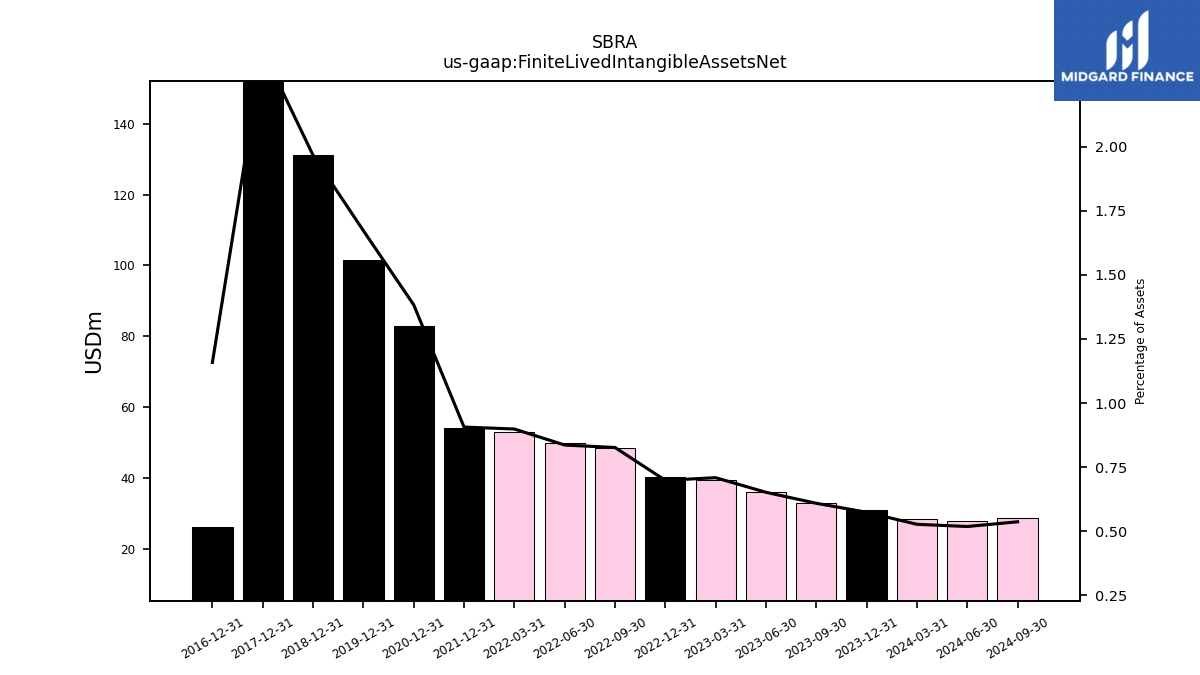
| Finite Lived Intangible Assets Net | 30.90 | 32.75 | 35.99 | 39.37 | 40.13 | 48.30 | 49.84 | 52.88 | 54.06 | NA | NA | NA | 82.80 | NA | NA | NA | 101.51 | NA | NA | NA | 131.10 | NA | NA | NA | 167.12 | NA | NA | NA | 26.25 | NA | NA | NA | NA | NA | NA | NA | NA | NA | NA | NA | NA | NA | NA | NA | NA | NA | NA | NA | NA | NA | NA | NA | NA |
| 2023-12-31 | 2023-09-30 | 2023-06-30 | 2023-03-31 | 2022-12-31 | 2022-09-30 | 2022-06-30 | 2022-03-31 | 2021-12-31 | 2021-09-30 | 2021-06-30 | 2021-03-31 | 2020-12-31 | 2020-09-30 | 2020-06-30 | 2020-03-31 | 2019-12-31 | 2019-09-30 | 2019-06-30 | 2019-03-31 | 2018-12-31 | 2018-09-30 | 2018-06-30 | 2018-03-31 | 2017-12-31 | 2017-09-30 | 2017-06-30 | 2017-03-31 | 2016-12-31 | 2016-09-30 | 2016-06-30 | 2016-03-31 | 2015-12-31 | 2015-09-30 | 2015-06-30 | 2015-03-31 | 2014-12-31 | 2014-09-30 | 2014-06-30 | 2014-03-31 | 2013-12-31 | 2013-09-30 | 2013-06-30 | 2013-03-31 | 2012-12-31 | 2012-09-30 | 2012-06-30 | 2012-03-31 | 2011-12-31 | 2011-09-30 | 2011-06-30 | 2011-03-31 | 2010-12-31 | ||
|---|---|---|---|---|---|---|---|---|---|---|---|---|---|---|---|---|---|---|---|---|---|---|---|---|---|---|---|---|---|---|---|---|---|---|---|---|---|---|---|---|---|---|---|---|---|---|---|---|---|---|---|---|---|---|
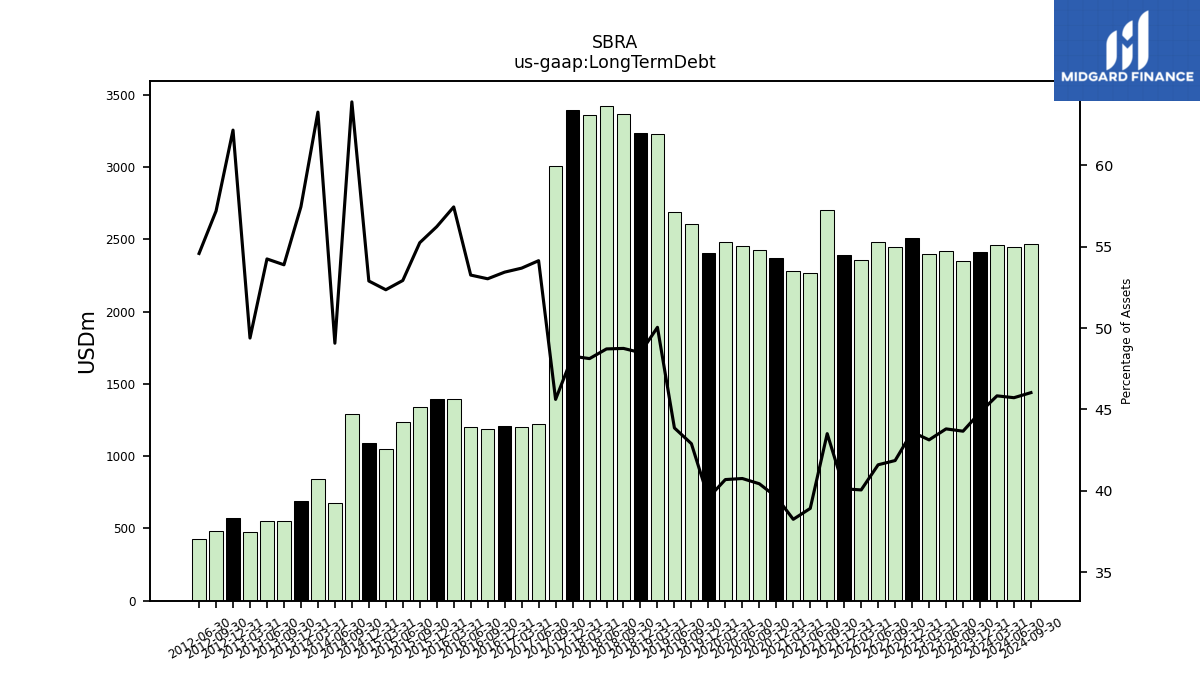
| Long Term Debt | 2414.10 | 2349.48 | 2420.04 | 2396.62 | 2506.77 | 2446.94 | 2480.22 | 2357.53 | 2394.47 | 2702.09 | 2266.31 | 2281.58 | 2372.37 | 2422.98 | 2455.29 | 2479.35 | 2402.10 | 2603.11 | 2685.97 | 3230.23 | 3232.00 | 3368.59 | 3423.81 | 3361.11 | 3394.49 | 3005.45 | 1220.12 | 1202.38 | 1210.67 | 1187.38 | 1199.88 | 1398.01 | 1397.74 | 1339.72 | 1237.10 | 1049.33 | 1092.02 | 1288.71 | 675.40 | 842.11 | 688.08 | 553.49 | 554.38 | 476.33 | 569.82 | 482.02 | 424.88 | NA | NA | NA | NA | NA | NA |
| 2023-12-31 | 2023-09-30 | 2023-06-30 | 2023-03-31 | 2022-12-31 | 2022-09-30 | 2022-06-30 | 2022-03-31 | 2021-12-31 | 2021-09-30 | 2021-06-30 | 2021-03-31 | 2020-12-31 | 2020-09-30 | 2020-06-30 | 2020-03-31 | 2019-12-31 | 2019-09-30 | 2019-06-30 | 2019-03-31 | 2018-12-31 | 2018-09-30 | 2018-06-30 | 2018-03-31 | 2017-12-31 | 2017-09-30 | 2017-06-30 | 2017-03-31 | 2016-12-31 | 2016-09-30 | 2016-06-30 | 2016-03-31 | 2015-12-31 | 2015-09-30 | 2015-06-30 | 2015-03-31 | 2014-12-31 | 2014-09-30 | 2014-06-30 | 2014-03-31 | 2013-12-31 | 2013-09-30 | 2013-06-30 | 2013-03-31 | 2012-12-31 | 2012-09-30 | 2012-06-30 | 2012-03-31 | 2011-12-31 | 2011-09-30 | 2011-06-30 | 2011-03-31 | 2010-12-31 | ||
|---|---|---|---|---|---|---|---|---|---|---|---|---|---|---|---|---|---|---|---|---|---|---|---|---|---|---|---|---|---|---|---|---|---|---|---|---|---|---|---|---|---|---|---|---|---|---|---|---|---|---|---|---|---|---|
| Stockholders Equity | 2802.53 | 2868.85 | 2943.74 | 2976.23 | 3056.39 | 3208.73 | 3317.73 | 3361.52 | 3379.53 | 3329.10 | 3383.06 | 3503.40 | 3409.23 | 3364.34 | 3361.25 | 3395.21 | 3488.46 | 3282.42 | 3256.10 | 3046.47 | 3250.41 | 3362.90 | 3403.54 | 3422.15 | 3432.81 | 3369.10 | 996.70 | 1004.35 | 1015.57 | 1013.85 | 1016.85 | 1007.42 | 1053.88 | 1059.33 | 1070.87 | 932.21 | 941.87 | 663.75 | 655.84 | 438.74 | 460.16 | 423.19 | 425.57 | 440.14 | 305.49 | 311.32 | 316.43 | 320.60 | 326.57 | 329.92 | 175.84 | 179.92 | 177.53 | |
| Common Stock Value | 2.31 | 2.31 | 2.31 | 2.31 | 2.31 | 2.31 | 2.31 | 2.31 | 2.30 | 2.21 | 2.21 | 2.16 | 2.11 | 2.07 | 2.06 | 2.06 | 2.05 | 1.94 | 1.90 | 1.78 | 1.78 | 1.78 | 1.78 | 1.78 | 1.78 | 1.76 | 0.65 | 0.65 | 0.65 | 0.65 | 0.65 | 0.65 | 0.65 | 0.65 | 0.65 | 0.59 | 0.59 | 0.48 | 0.47 | 0.39 | 0.39 | 0.37 | 0.37 | 0.37 | 0.37 | 0.37 | 0.37 | 0.37 | 0.37 | 0.37 | 0.25 | NA | 0.25 | |
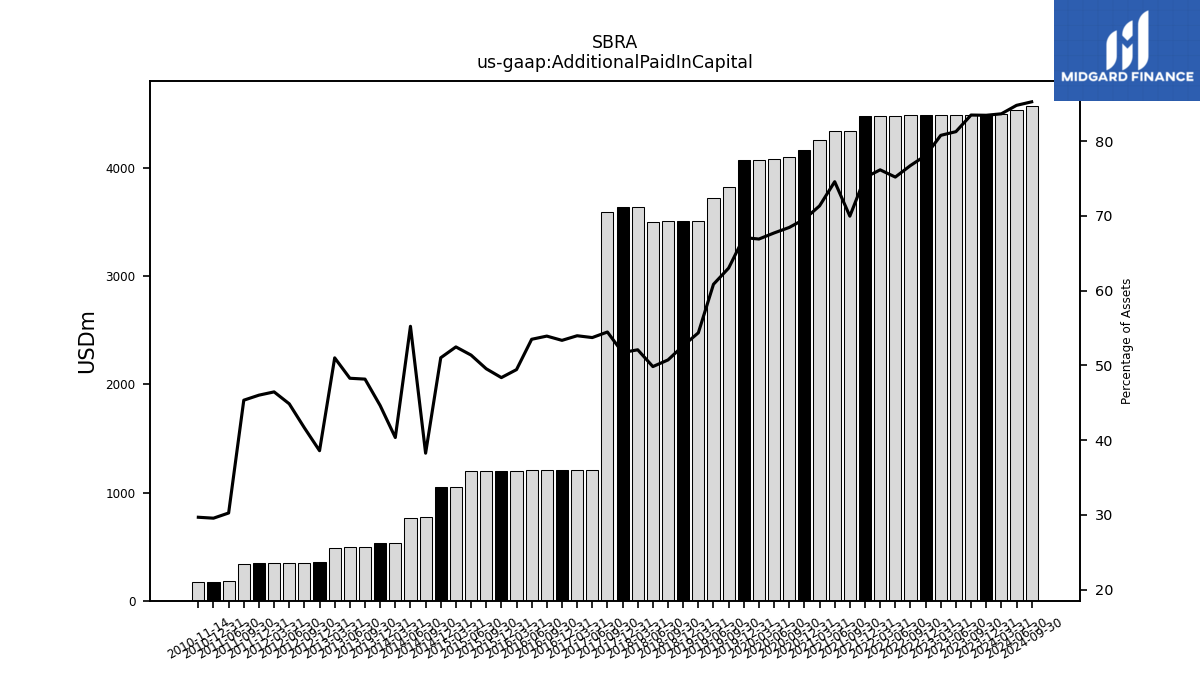
| Additional Paid In Capital | 4494.76 | 4491.92 | 4489.11 | 4487.71 | 4486.97 | 4484.77 | 4482.24 | 4481.63 | 4482.45 | 4344.27 | 4341.53 | 4254.13 | 4163.23 | 4101.27 | 4078.74 | 4075.78 | 4072.08 | 3823.58 | 3725.97 | 3508.99 | 3507.93 | 3505.88 | 3502.95 | 3638.11 | 3636.91 | 3588.51 | 1210.89 | 1208.91 | 1208.86 | 1207.49 | 1205.42 | 1203.39 | 1202.54 | 1201.86 | 1201.15 | 1051.81 | 1053.60 | 771.84 | 760.26 | 537.29 | 534.64 | 494.80 | 493.48 | 492.01 | 353.86 | 351.11 | 349.27 | 346.83 | 345.00 | 343.75 | 180.30 | NA | 177.28 | |
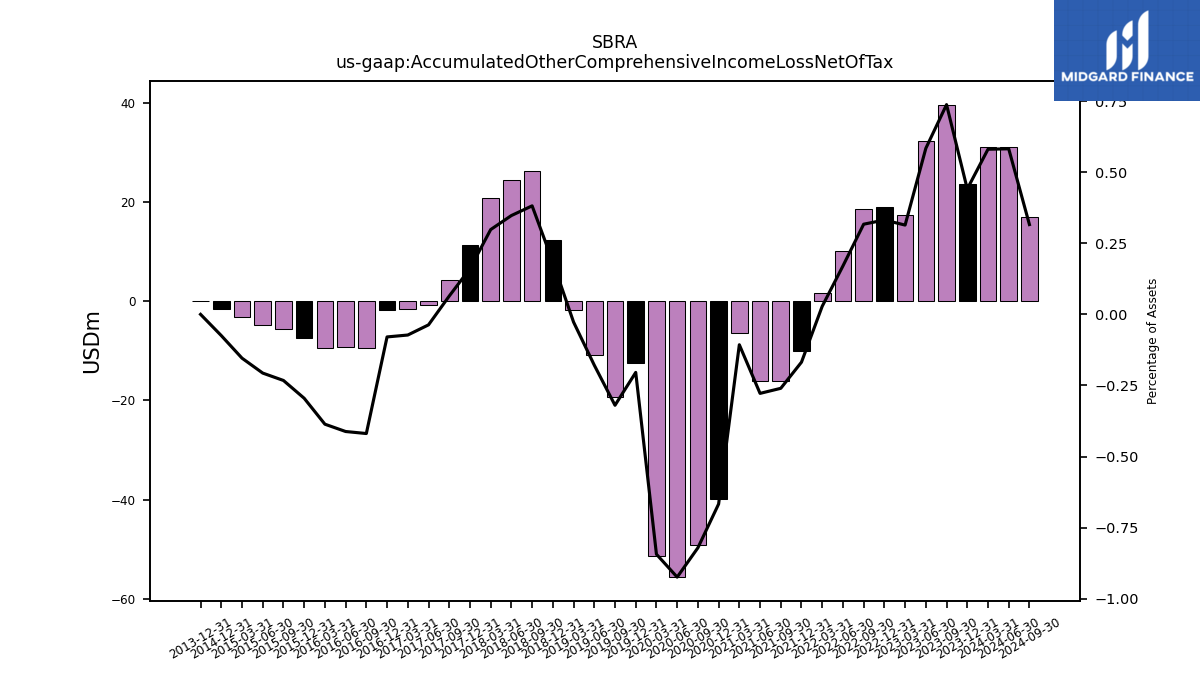
| Accumulated Other Comprehensive Income Loss Net Of Tax | 23.75 | 39.67 | 32.24 | 17.44 | 19.06 | 18.52 | 10.14 | 1.67 | -10.02 | -16.14 | -16.17 | -6.37 | -39.91 | -49.17 | -55.64 | -51.37 | -12.39 | -19.39 | -10.94 | -1.75 | 12.30 | 26.36 | 24.41 | 20.81 | 11.29 | 4.24 | -0.83 | -1.63 | -1.80 | -9.38 | -9.28 | -9.40 | -7.33 | -5.64 | -4.83 | -3.09 | -1.54 | NA | NA | NA | 0.00 | NA | NA | NA | NA | NA | NA | NA | NA | NA | NA | NA | NA | |
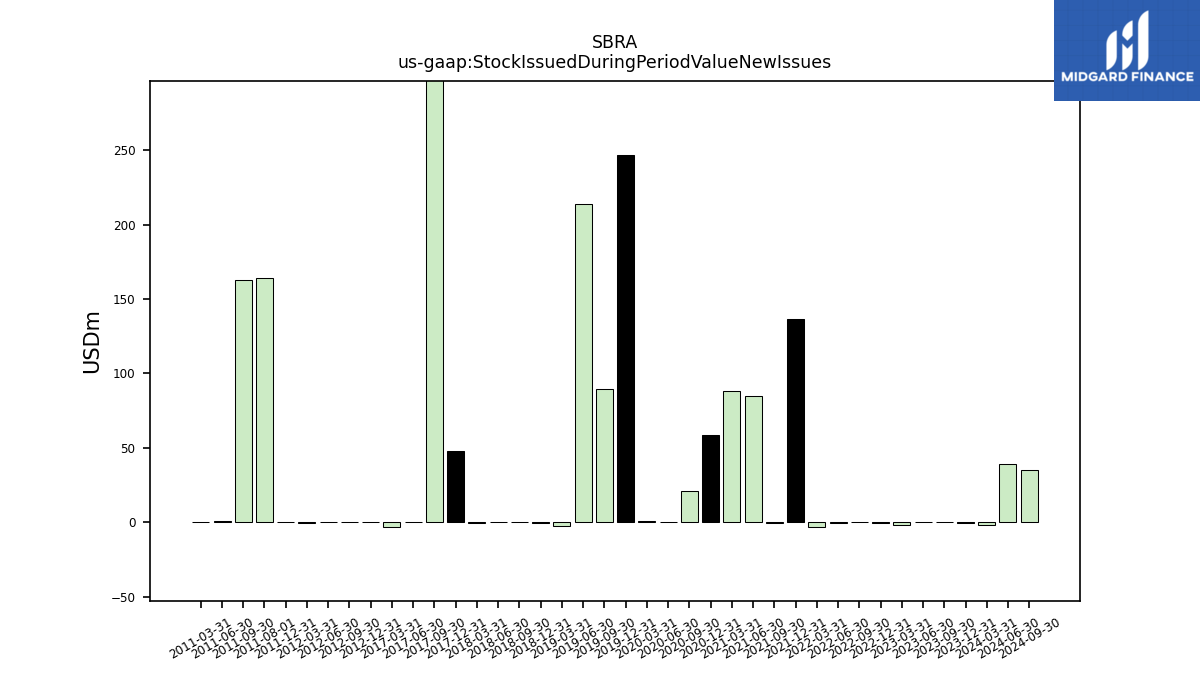
| Stock Issued During Period Value New Issues | -0.63 | -0.09 | -0.12 | -1.93 | -0.72 | -0.13 | -0.58 | -3.48 | 136.34 | -0.38 | 84.59 | 88.12 | 58.81 | 20.92 | -0.01 | 0.72 | 246.52 | 89.69 | 213.82 | -2.21 | -0.17 | 0.00 | 0.00 | -0.20 | 47.95 | 2374.80 | 0.00 | -2.81 | NA | NA | NA | NA | NA | NA | NA | NA | NA | NA | NA | NA | NA | NA | NA | NA | -0.09 | 0.00 | 0.51 | -0.37 | -0.10 | 162.79 | 0.55 | 0.00 | NA | |
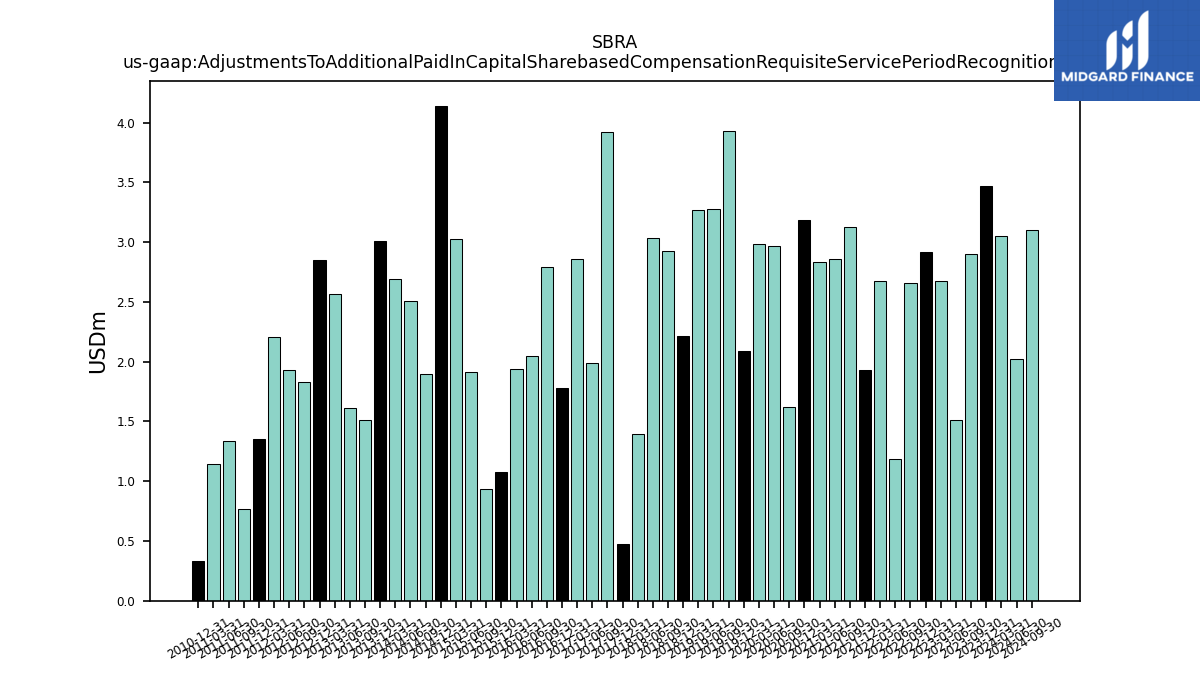
| Adjustments To Additional Paid In Capital Sharebased Compensation Requisite Service Period Recognition Value | 3.47 | 2.90 | 1.51 | 2.67 | 2.92 | 2.66 | 1.18 | 2.67 | 1.93 | 3.12 | 2.86 | 2.83 | 3.19 | 1.62 | 2.97 | 2.99 | 2.09 | 3.93 | 3.27 | 3.27 | 2.22 | 2.92 | 3.04 | 1.40 | 0.48 | 3.92 | 1.99 | 2.86 | 1.78 | 2.79 | 2.04 | 1.94 | 1.07 | 0.93 | 1.92 | 3.02 | 4.14 | 1.90 | 2.51 | 2.69 | 3.01 | 1.51 | 1.61 | 2.57 | 2.85 | 1.83 | 1.93 | 2.20 | 1.35 | 0.77 | 1.34 | 1.14 | 0.34 |
| 2023-12-31 | 2023-09-30 | 2023-06-30 | 2023-03-31 | 2022-12-31 | 2022-09-30 | 2022-06-30 | 2022-03-31 | 2021-12-31 | 2021-09-30 | 2021-06-30 | 2021-03-31 | 2020-12-31 | 2020-09-30 | 2020-06-30 | 2020-03-31 | 2019-12-31 | 2019-09-30 | 2019-06-30 | 2019-03-31 | 2018-12-31 | 2018-09-30 | 2018-06-30 | 2018-03-31 | 2017-12-31 | 2017-09-30 | 2017-06-30 | 2017-03-31 | 2016-12-31 | 2016-09-30 | 2016-06-30 | 2016-03-31 | 2015-12-31 | 2015-09-30 | 2015-06-30 | 2015-03-31 | 2014-12-31 | 2014-09-30 | 2014-06-30 | 2014-03-31 | 2013-12-31 | 2013-09-30 | 2013-06-30 | 2013-03-31 | 2012-12-31 | 2012-09-30 | 2012-06-30 | 2012-03-31 | 2011-12-31 | 2011-09-30 | 2011-06-30 | 2011-03-31 | 2010-12-31 | ||
|---|---|---|---|---|---|---|---|---|---|---|---|---|---|---|---|---|---|---|---|---|---|---|---|---|---|---|---|---|---|---|---|---|---|---|---|---|---|---|---|---|---|---|---|---|---|---|---|---|---|---|---|---|---|---|
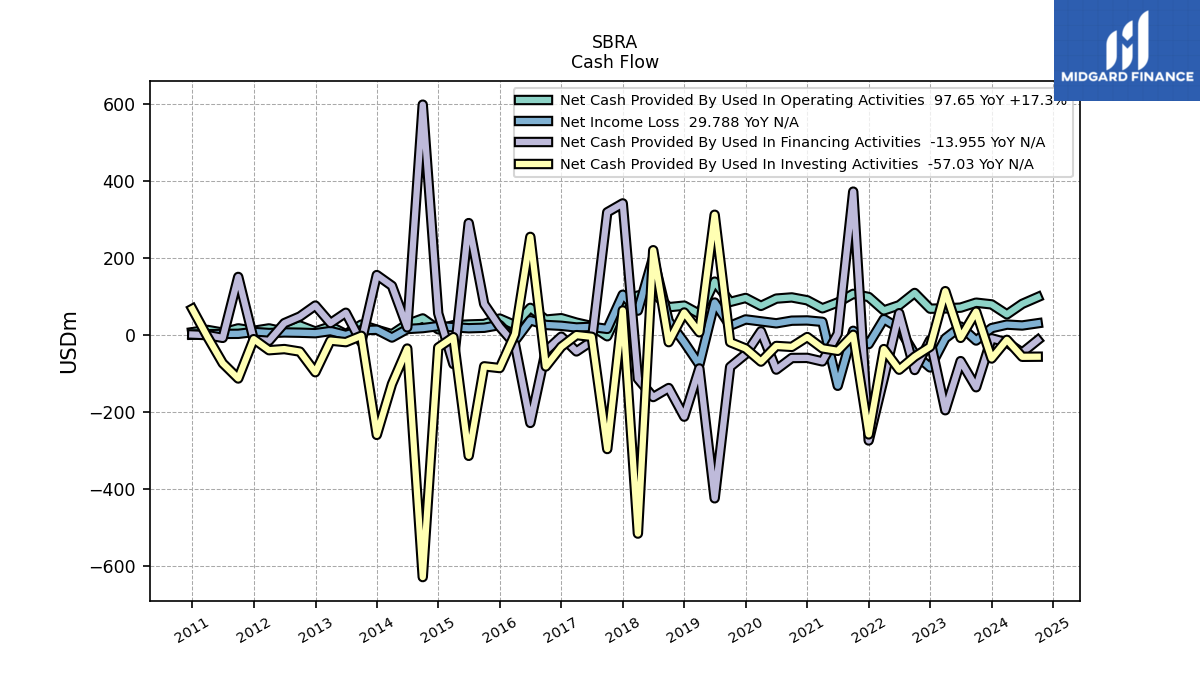
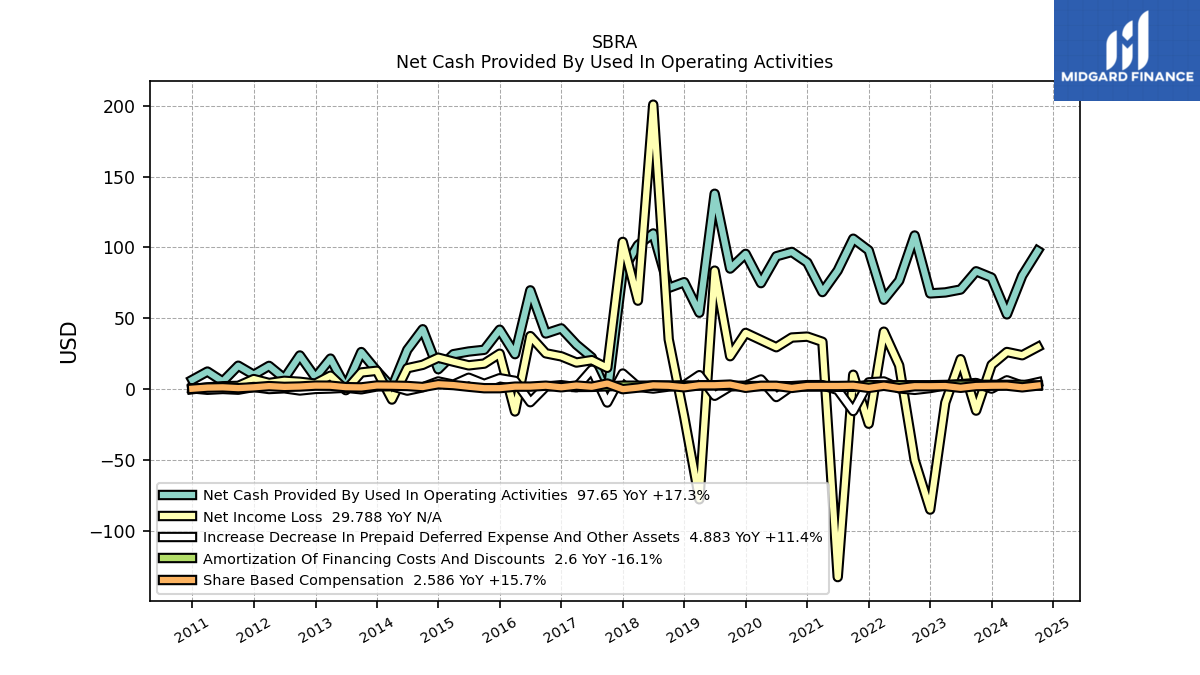
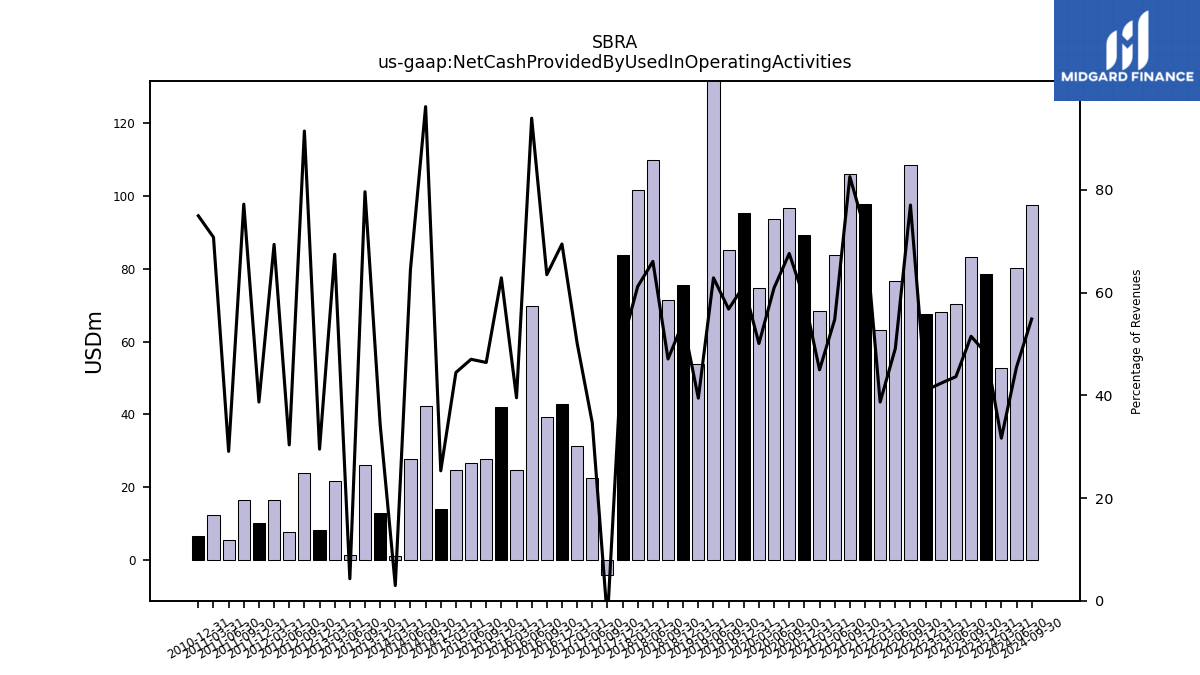
| Net Cash Provided By Used In Operating Activities | 78.74 | 83.22 | 70.33 | 68.29 | 67.59 | 108.46 | 76.57 | 63.11 | 97.93 | 106.19 | 83.73 | 68.53 | 89.40 | 96.85 | 93.79 | 74.82 | 95.49 | 85.10 | 137.92 | 53.96 | 75.52 | 71.47 | 109.91 | 101.65 | 83.72 | -4.10 | 22.43 | 31.44 | 42.92 | 39.32 | 69.77 | 24.73 | 41.99 | 27.81 | 26.61 | 24.70 | 14.10 | 42.32 | 27.71 | 1.21 | 12.89 | 26.23 | 1.38 | 21.60 | 8.35 | 23.82 | 7.62 | 16.46 | 10.20 | 16.58 | 5.47 | 12.46 | 6.59 | |
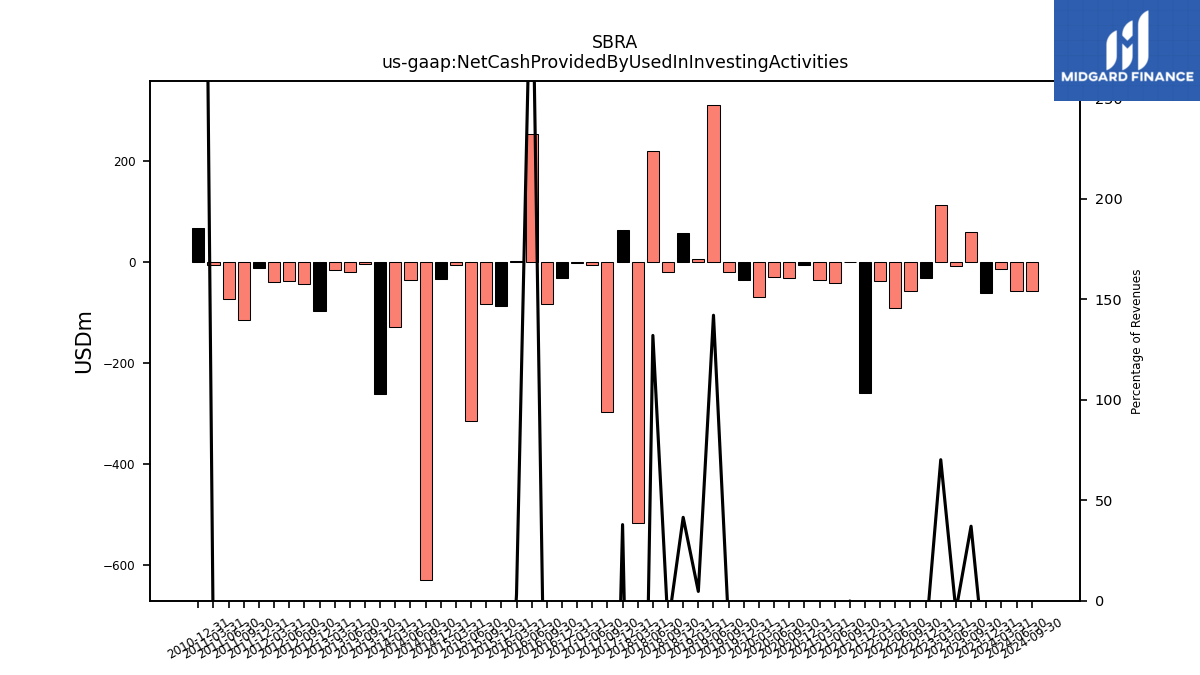
| Net Cash Provided By Used In Investing Activities | -61.78 | 59.93 | -8.19 | 113.17 | -31.16 | -56.99 | -90.86 | -37.24 | -258.83 | -0.16 | -41.85 | -35.36 | -5.93 | -31.55 | -29.14 | -69.82 | -35.70 | -19.34 | 311.54 | 6.35 | 57.76 | -19.35 | 219.48 | -516.38 | 63.05 | -296.78 | -5.38 | -0.96 | -31.19 | -82.47 | 254.06 | 1.96 | -86.55 | -82.02 | -314.42 | -6.24 | -33.17 | -629.30 | -35.86 | -128.14 | -260.14 | -2.79 | -19.27 | -15.31 | -97.45 | -43.74 | -37.25 | -40.21 | -11.45 | -113.70 | -74.02 | -5.42 | 67.12 | |
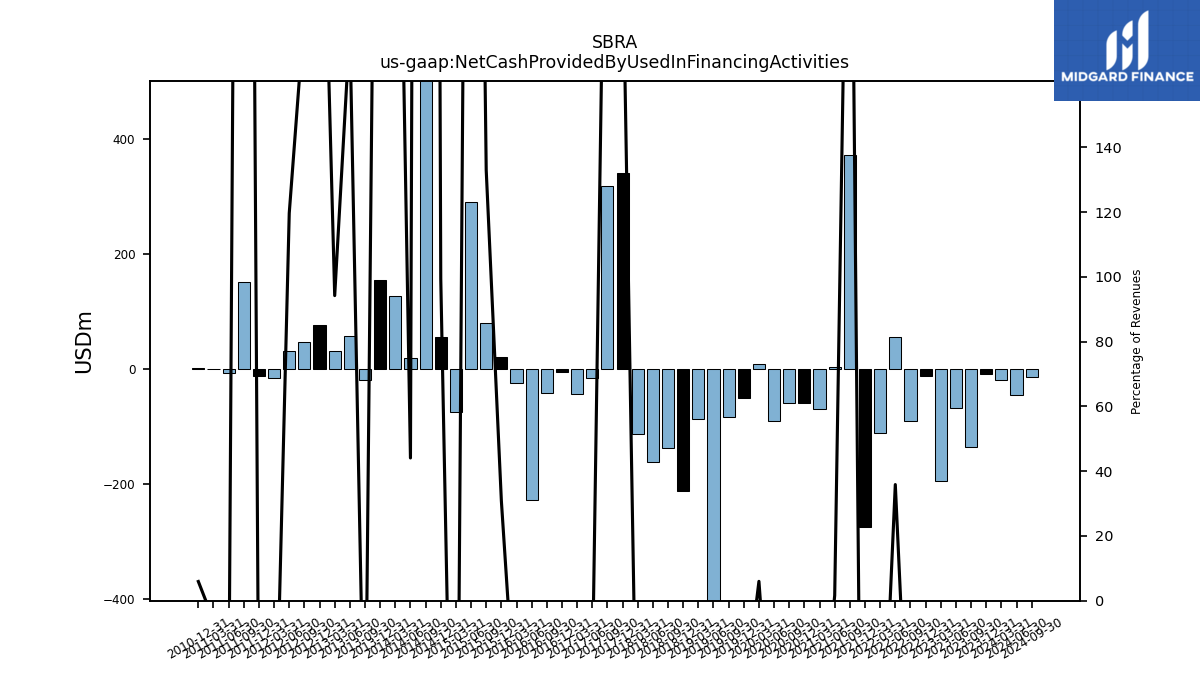
| Net Cash Provided By Used In Financing Activities | -9.36 | -136.39 | -68.47 | -196.07 | -13.52 | -91.62 | 55.95 | -112.52 | -274.63 | 371.57 | 2.47 | -69.28 | -60.11 | -60.40 | -90.55 | 8.95 | -50.45 | -83.49 | -424.77 | -87.47 | -212.75 | -138.35 | -161.81 | -114.39 | 341.01 | 317.89 | -16.74 | -43.35 | -5.00 | -41.69 | -229.09 | -25.12 | 20.60 | 79.69 | 289.87 | -76.09 | 55.39 | 597.37 | 18.95 | 126.91 | 154.92 | -19.56 | 57.09 | 30.17 | 75.72 | 47.30 | 30.06 | -15.83 | -12.91 | 150.08 | -8.21 | -1.07 | 0.52 |
| 2023-12-31 | 2023-09-30 | 2023-06-30 | 2023-03-31 | 2022-12-31 | 2022-09-30 | 2022-06-30 | 2022-03-31 | 2021-12-31 | 2021-09-30 | 2021-06-30 | 2021-03-31 | 2020-12-31 | 2020-09-30 | 2020-06-30 | 2020-03-31 | 2019-12-31 | 2019-09-30 | 2019-06-30 | 2019-03-31 | 2018-12-31 | 2018-09-30 | 2018-06-30 | 2018-03-31 | 2017-12-31 | 2017-09-30 | 2017-06-30 | 2017-03-31 | 2016-12-31 | 2016-09-30 | 2016-06-30 | 2016-03-31 | 2015-12-31 | 2015-09-30 | 2015-06-30 | 2015-03-31 | 2014-12-31 | 2014-09-30 | 2014-06-30 | 2014-03-31 | 2013-12-31 | 2013-09-30 | 2013-06-30 | 2013-03-31 | 2012-12-31 | 2012-09-30 | 2012-06-30 | 2012-03-31 | 2011-12-31 | 2011-09-30 | 2011-06-30 | 2011-03-31 | 2010-12-31 | ||
|---|---|---|---|---|---|---|---|---|---|---|---|---|---|---|---|---|---|---|---|---|---|---|---|---|---|---|---|---|---|---|---|---|---|---|---|---|---|---|---|---|---|---|---|---|---|---|---|---|---|---|---|---|---|---|
| Net Cash Provided By Used In Operating Activities | 78.74 | 83.22 | 70.33 | 68.29 | 67.59 | 108.46 | 76.57 | 63.11 | 97.93 | 106.19 | 83.73 | 68.53 | 89.40 | 96.85 | 93.79 | 74.82 | 95.49 | 85.10 | 137.92 | 53.96 | 75.52 | 71.47 | 109.91 | 101.65 | 83.72 | -4.10 | 22.43 | 31.44 | 42.92 | 39.32 | 69.77 | 24.73 | 41.99 | 27.81 | 26.61 | 24.70 | 14.10 | 42.32 | 27.71 | 1.21 | 12.89 | 26.23 | 1.38 | 21.60 | 8.35 | 23.82 | 7.62 | 16.46 | 10.20 | 16.58 | 5.47 | 12.46 | 6.59 | |
| Net Income Loss | 17.16 | -15.10 | 21.19 | -9.49 | -84.95 | -50.06 | 16.80 | 40.60 | -24.35 | 10.22 | -132.57 | 33.45 | 37.12 | 36.46 | 29.62 | NA | 39.74 | 23.28 | 83.68 | -77.70 | -19.39 | 35.22 | 200.79 | 62.47 | 103.94 | 15.10 | 20.52 | 18.82 | 23.18 | 25.34 | 37.48 | -15.71 | 25.07 | 18.06 | 16.84 | 19.45 | 22.25 | 17.20 | 14.80 | -7.30 | 13.00 | 11.82 | -0.66 | 9.56 | 3.96 | 5.23 | 5.92 | 4.41 | 7.16 | 2.34 | 2.09 | 1.25 | 0.01 | |
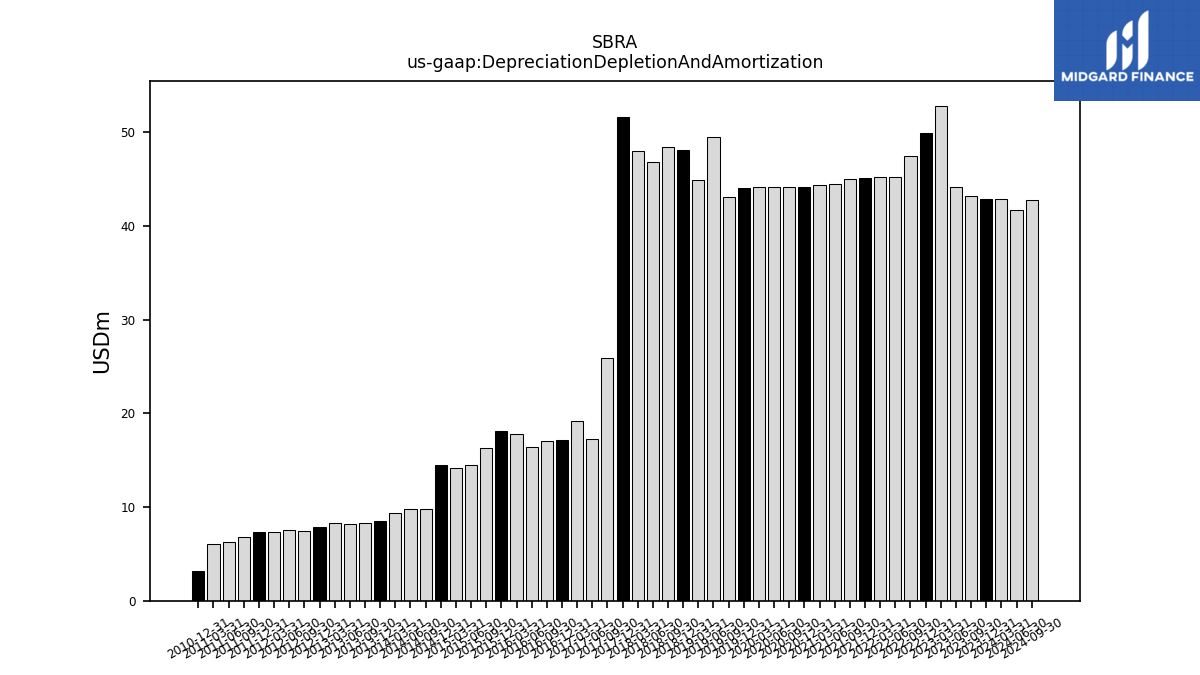
| Depreciation Depletion And Amortization | 42.88 | 43.24 | 44.14 | 52.83 | 49.93 | 47.43 | 45.17 | 45.26 | 45.08 | 45.05 | 44.49 | 44.38 | 44.16 | 44.21 | 44.20 | 44.17 | 44.03 | 43.09 | 49.48 | 44.95 | 48.08 | 48.47 | 46.83 | 48.01 | 51.59 | 25.93 | 17.22 | 19.14 | 17.20 | 17.10 | 16.41 | 17.77 | 18.13 | 16.31 | 14.50 | 14.15 | 14.46 | 9.76 | 9.76 | 9.35 | 8.55 | 8.26 | 8.22 | 8.25 | 7.91 | 7.50 | 7.56 | 7.30 | 7.36 | 6.85 | 6.29 | 6.09 | 3.13 | |
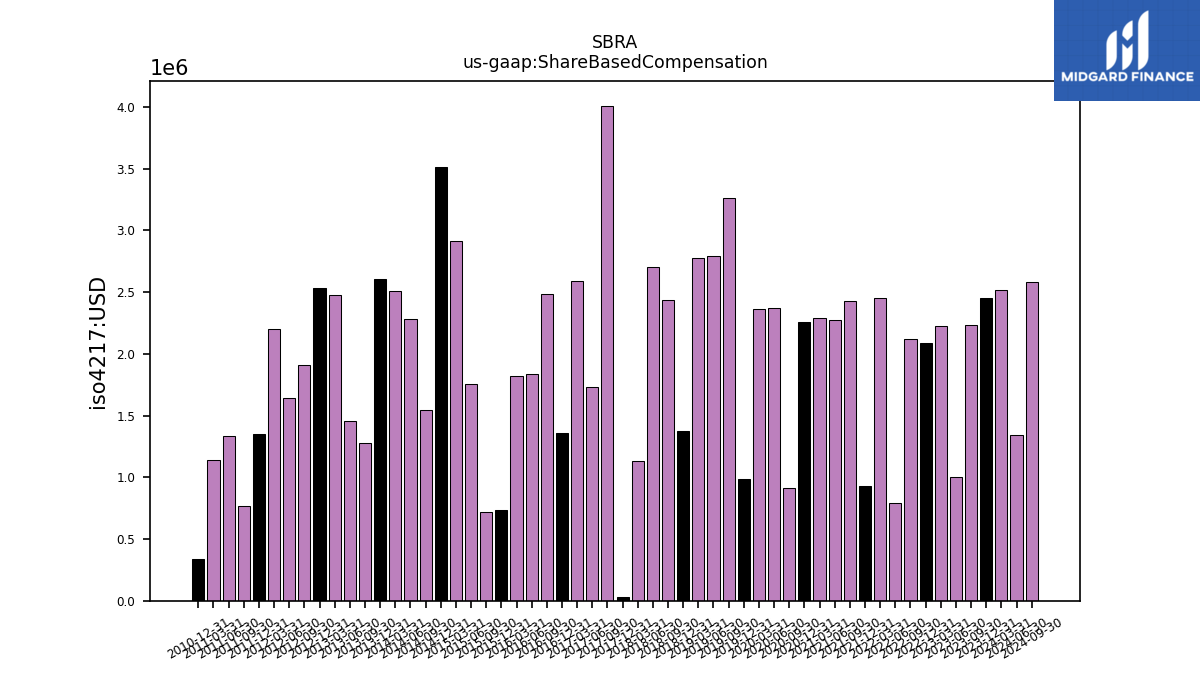
| Share Based Compensation | 2.45 | 2.23 | 1.00 | 2.23 | 2.09 | 2.12 | 0.79 | 2.46 | 0.93 | 2.43 | 2.27 | 2.29 | 2.26 | 0.92 | 2.38 | 2.36 | 0.99 | 3.26 | 2.79 | 2.77 | 1.37 | 2.44 | 2.70 | 1.14 | 0.03 | 4.01 | 1.73 | 2.59 | 1.36 | 2.48 | 1.83 | 1.82 | 0.73 | 0.72 | 1.75 | 2.92 | 3.51 | 1.54 | 2.28 | 2.51 | 2.61 | 1.28 | 1.46 | 2.47 | 2.53 | 1.91 | 1.64 | 2.20 | 1.35 | 0.77 | 1.34 | 1.14 | 0.34 |
| 2023-12-31 | 2023-09-30 | 2023-06-30 | 2023-03-31 | 2022-12-31 | 2022-09-30 | 2022-06-30 | 2022-03-31 | 2021-12-31 | 2021-09-30 | 2021-06-30 | 2021-03-31 | 2020-12-31 | 2020-09-30 | 2020-06-30 | 2020-03-31 | 2019-12-31 | 2019-09-30 | 2019-06-30 | 2019-03-31 | 2018-12-31 | 2018-09-30 | 2018-06-30 | 2018-03-31 | 2017-12-31 | 2017-09-30 | 2017-06-30 | 2017-03-31 | 2016-12-31 | 2016-09-30 | 2016-06-30 | 2016-03-31 | 2015-12-31 | 2015-09-30 | 2015-06-30 | 2015-03-31 | 2014-12-31 | 2014-09-30 | 2014-06-30 | 2014-03-31 | 2013-12-31 | 2013-09-30 | 2013-06-30 | 2013-03-31 | 2012-12-31 | 2012-09-30 | 2012-06-30 | 2012-03-31 | 2011-12-31 | 2011-09-30 | 2011-06-30 | 2011-03-31 | 2010-12-31 | ||
|---|---|---|---|---|---|---|---|---|---|---|---|---|---|---|---|---|---|---|---|---|---|---|---|---|---|---|---|---|---|---|---|---|---|---|---|---|---|---|---|---|---|---|---|---|---|---|---|---|---|---|---|---|---|---|
| Net Cash Provided By Used In Investing Activities | -61.78 | 59.93 | -8.19 | 113.17 | -31.16 | -56.99 | -90.86 | -37.24 | -258.83 | -0.16 | -41.85 | -35.36 | -5.93 | -31.55 | -29.14 | -69.82 | -35.70 | -19.34 | 311.54 | 6.35 | 57.76 | -19.35 | 219.48 | -516.38 | 63.05 | -296.78 | -5.38 | -0.96 | -31.19 | -82.47 | 254.06 | 1.96 | -86.55 | -82.02 | -314.42 | -6.24 | -33.17 | -629.30 | -35.86 | -128.14 | -260.14 | -2.79 | -19.27 | -15.31 | -97.45 | -43.74 | -37.25 | -40.21 | -11.45 | -113.70 | -74.02 | -5.42 | 67.12 |
| 2023-12-31 | 2023-09-30 | 2023-06-30 | 2023-03-31 | 2022-12-31 | 2022-09-30 | 2022-06-30 | 2022-03-31 | 2021-12-31 | 2021-09-30 | 2021-06-30 | 2021-03-31 | 2020-12-31 | 2020-09-30 | 2020-06-30 | 2020-03-31 | 2019-12-31 | 2019-09-30 | 2019-06-30 | 2019-03-31 | 2018-12-31 | 2018-09-30 | 2018-06-30 | 2018-03-31 | 2017-12-31 | 2017-09-30 | 2017-06-30 | 2017-03-31 | 2016-12-31 | 2016-09-30 | 2016-06-30 | 2016-03-31 | 2015-12-31 | 2015-09-30 | 2015-06-30 | 2015-03-31 | 2014-12-31 | 2014-09-30 | 2014-06-30 | 2014-03-31 | 2013-12-31 | 2013-09-30 | 2013-06-30 | 2013-03-31 | 2012-12-31 | 2012-09-30 | 2012-06-30 | 2012-03-31 | 2011-12-31 | 2011-09-30 | 2011-06-30 | 2011-03-31 | 2010-12-31 | ||
|---|---|---|---|---|---|---|---|---|---|---|---|---|---|---|---|---|---|---|---|---|---|---|---|---|---|---|---|---|---|---|---|---|---|---|---|---|---|---|---|---|---|---|---|---|---|---|---|---|---|---|---|---|---|---|
| Net Cash Provided By Used In Financing Activities | -9.36 | -136.39 | -68.47 | -196.07 | -13.52 | -91.62 | 55.95 | -112.52 | -274.63 | 371.57 | 2.47 | -69.28 | -60.11 | -60.40 | -90.55 | 8.95 | -50.45 | -83.49 | -424.77 | -87.47 | -212.75 | -138.35 | -161.81 | -114.39 | 341.01 | 317.89 | -16.74 | -43.35 | -5.00 | -41.69 | -229.09 | -25.12 | 20.60 | 79.69 | 289.87 | -76.09 | 55.39 | 597.37 | 18.95 | 126.91 | 154.92 | -19.56 | 57.09 | 30.17 | 75.72 | 47.30 | 30.06 | -15.83 | -12.91 | 150.08 | -8.21 | -1.07 | 0.52 | |
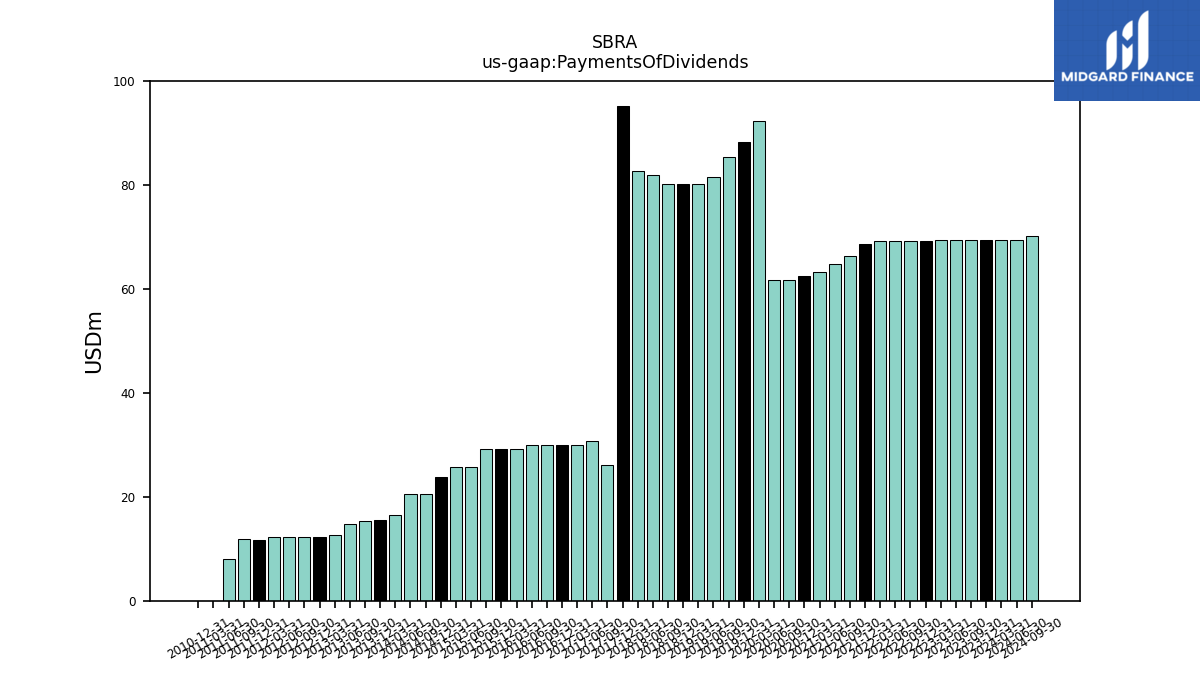
| Payments Of Dividends | 69.37 | 69.37 | 69.36 | 69.35 | 69.30 | 69.30 | 69.29 | 69.28 | 68.61 | 66.26 | 64.83 | 63.22 | 62.55 | 61.68 | 61.68 | 92.39 | 88.21 | 85.49 | 81.47 | 80.26 | 80.24 | 80.24 | 81.95 | 82.79 | 95.28 | 26.12 | 30.70 | 29.99 | 29.98 | 30.00 | 29.99 | 29.30 | 29.28 | 29.28 | 25.67 | 25.67 | 23.84 | 20.53 | 20.53 | 16.60 | 15.47 | 15.27 | 14.69 | 12.72 | 12.23 | 12.24 | 12.25 | 12.21 | 11.76 | 11.83 | 8.05 | 0.00 | 0.00 |
| 2023-12-31 | 2023-09-30 | 2023-06-30 | 2023-03-31 | 2022-12-31 | 2022-09-30 | 2022-06-30 | 2022-03-31 | 2021-12-31 | 2021-09-30 | 2021-06-30 | 2021-03-31 | 2020-12-31 | 2020-09-30 | 2020-06-30 | 2020-03-31 | 2019-12-31 | 2019-09-30 | 2019-06-30 | 2019-03-31 | 2018-12-31 | 2018-09-30 | 2018-06-30 | 2018-03-31 | 2017-12-31 | 2017-09-30 | 2017-06-30 | 2017-03-31 | 2016-12-31 | 2016-09-30 | 2016-06-30 | 2016-03-31 | 2015-12-31 | 2015-09-30 | 2015-06-30 | 2015-03-31 | 2014-12-31 | 2014-09-30 | 2014-06-30 | 2014-03-31 | 2013-12-31 | 2013-09-30 | 2013-06-30 | 2013-03-31 | 2012-12-31 | 2012-09-30 | 2012-06-30 | 2012-03-31 | 2011-12-31 | 2011-09-30 | 2011-06-30 | 2011-03-31 | 2010-12-31 | ||
|---|---|---|---|---|---|---|---|---|---|---|---|---|---|---|---|---|---|---|---|---|---|---|---|---|---|---|---|---|---|---|---|---|---|---|---|---|---|---|---|---|---|---|---|---|---|---|---|---|---|---|---|---|---|---|
| Revenues | 163.40 | 161.63 | 161.17 | 161.32 | 164.99 | 140.76 | 155.96 | 163.10 | 135.66 | 128.59 | 152.93 | 152.37 | 152.05 | 143.25 | 153.92 | 149.35 | 155.76 | 149.83 | 219.37 | 136.77 | 139.21 | 151.80 | 166.31 | 166.09 | 166.47 | 111.79 | 64.74 | 62.65 | 61.79 | 61.93 | 74.25 | 62.56 | 66.77 | 59.93 | 56.59 | 55.57 | 55.71 | 43.98 | 42.97 | 40.85 | 37.56 | 32.93 | 32.27 | 32.02 | 28.29 | 26.04 | 25.12 | 23.73 | 26.35 | 21.47 | 18.80 | 17.60 | 8.79 | |
| Revenue From Contract With Customer Excluding Assessed Tax | 61.26 | 59.75 | 58.43 | 56.72 | 52.70 | 47.61 | 44.14 | 42.23 | 40.53 | 39.82 | 39.12 | 36.04 | 38.14 | 39.34 | 38.58 | 39.98 | 38.52 | 36.41 | 36.07 | 17.06 | 17.71 | 17.40 | 17.53 | 17.49 | -212.75 | 111.79 | 64.74 | 62.65 | 61.79 | 61.93 | 74.25 | 62.56 | 66.77 | 59.93 | 56.59 | 55.57 | 55.71 | 43.98 | 42.97 | 40.85 | 37.56 | 32.93 | 32.27 | 32.02 | 28.29 | 26.04 | 25.12 | 23.73 | 26.35 | 21.47 | 18.80 | 17.60 | 8.79 | |
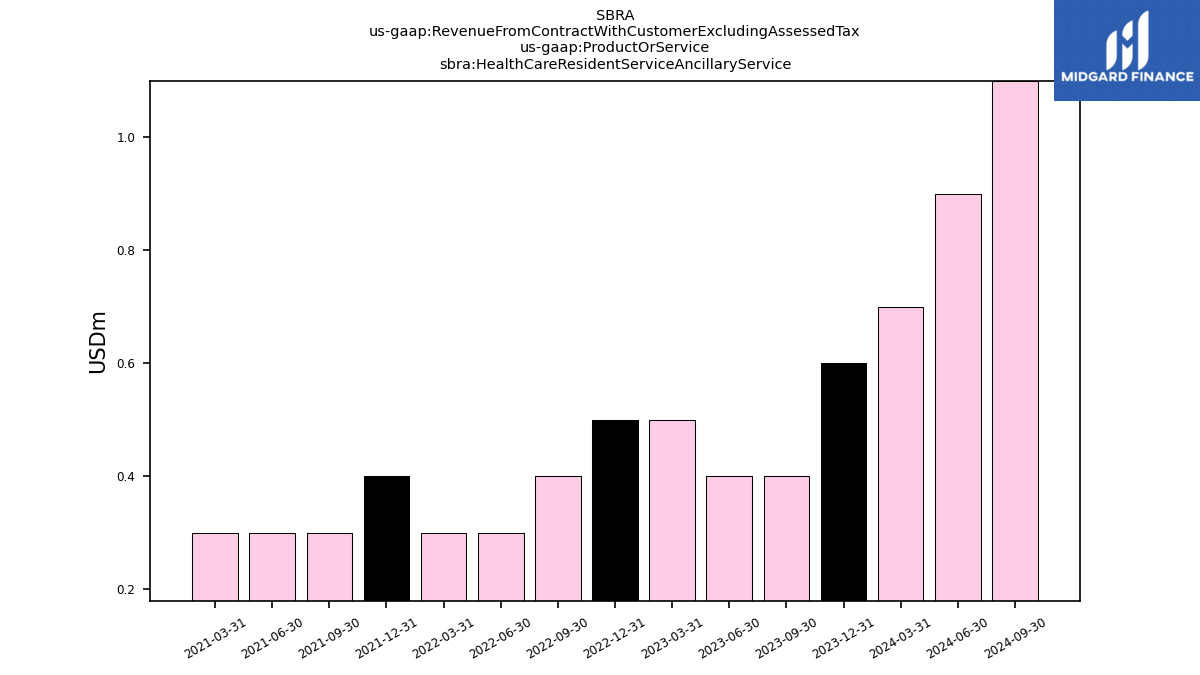
| Health Care Resident Service Ancillary Service | 0.60 | 0.40 | 0.40 | 0.50 | 0.50 | 0.40 | 0.30 | 0.30 | 0.40 | 0.30 | 0.30 | 0.30 | NA | NA | NA | NA | NA | NA | NA | NA | NA | NA | NA | NA | NA | NA | NA | NA | NA | NA | NA | NA | NA | NA | NA | NA | NA | NA | NA | NA | NA | NA | NA | NA | NA | NA | NA | NA | NA | NA | NA | NA | NA |
