
| 2024-03-31 | 2023-12-31 | 2023-09-30 | 2023-06-30 | 2023-03-31 | 2022-12-31 | 2022-09-30 | 2022-06-30 | 2022-03-31 | 2021-12-31 | 2021-09-30 | 2021-06-30 | 2021-03-31 | 2020-12-31 | 2020-09-30 | 2020-06-30 | 2020-03-31 | 2019-12-31 | 2019-09-30 | 2019-06-30 | 2019-03-31 | ||
|---|---|---|---|---|---|---|---|---|---|---|---|---|---|---|---|---|---|---|---|---|---|---|
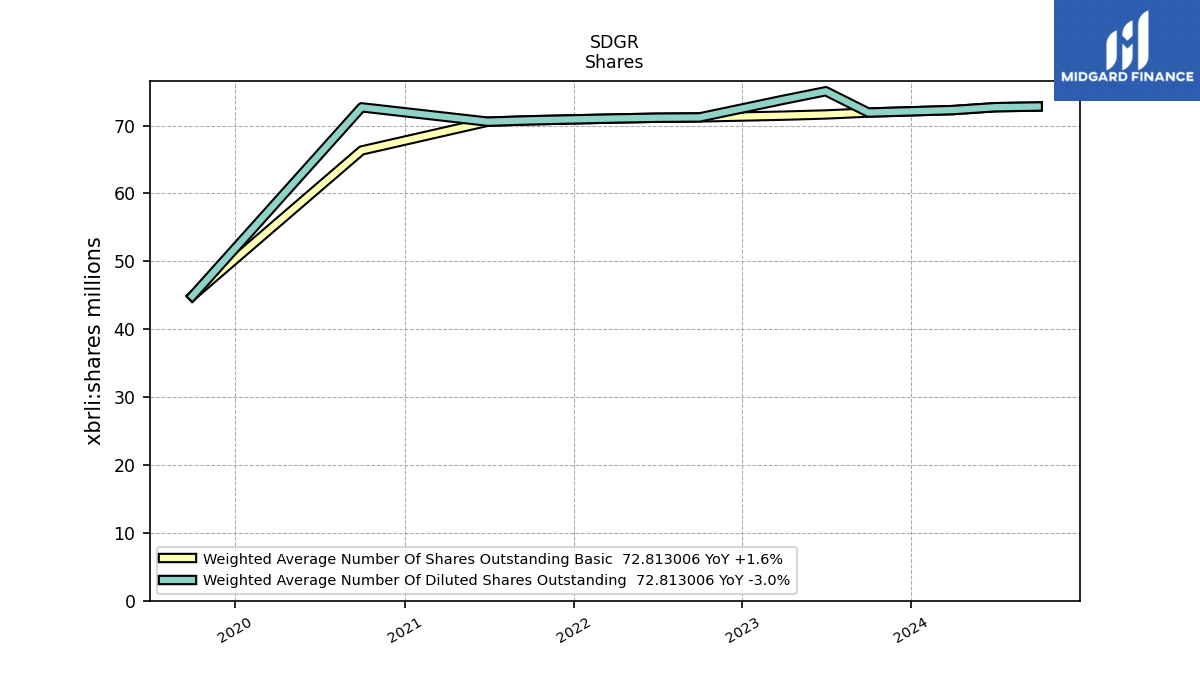
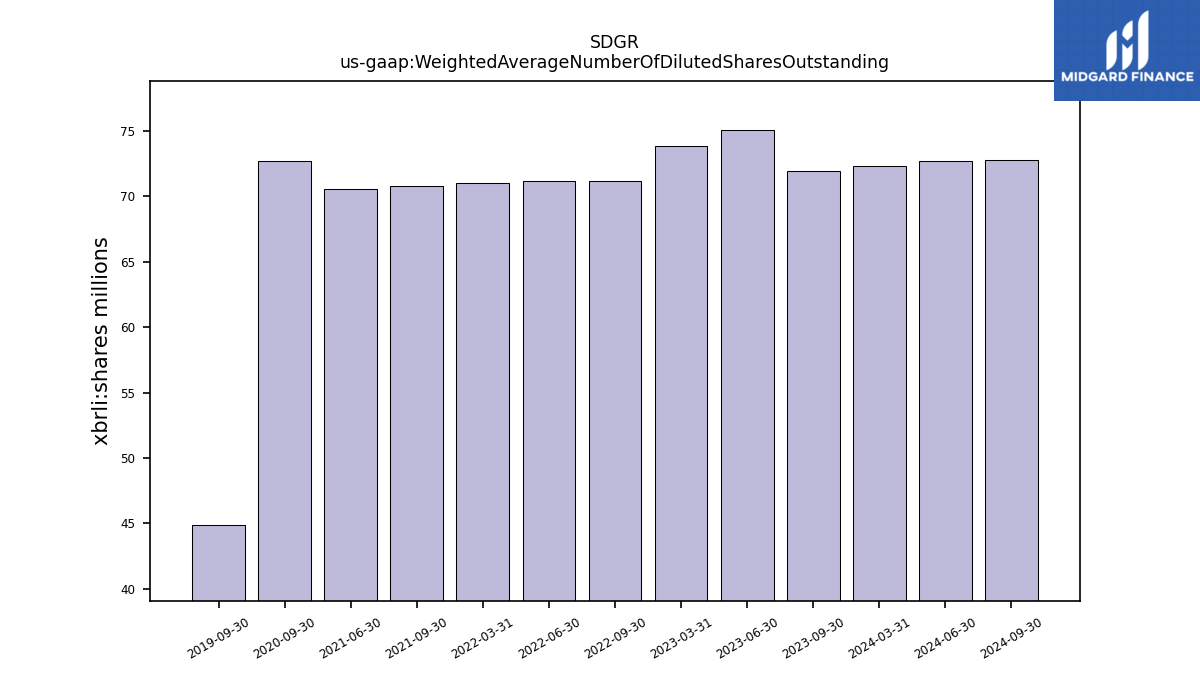
| Weighted Average Number Of Diluted Shares Outstanding | 72.29 | NA | 71.92 | 75.06 | 73.82 | NA | 71.21 | 71.16 | 71.05 | NA | 70.78 | 70.58 | NA | NA | 72.69 | NA | NA | NA | 44.88 | NA | NA | |
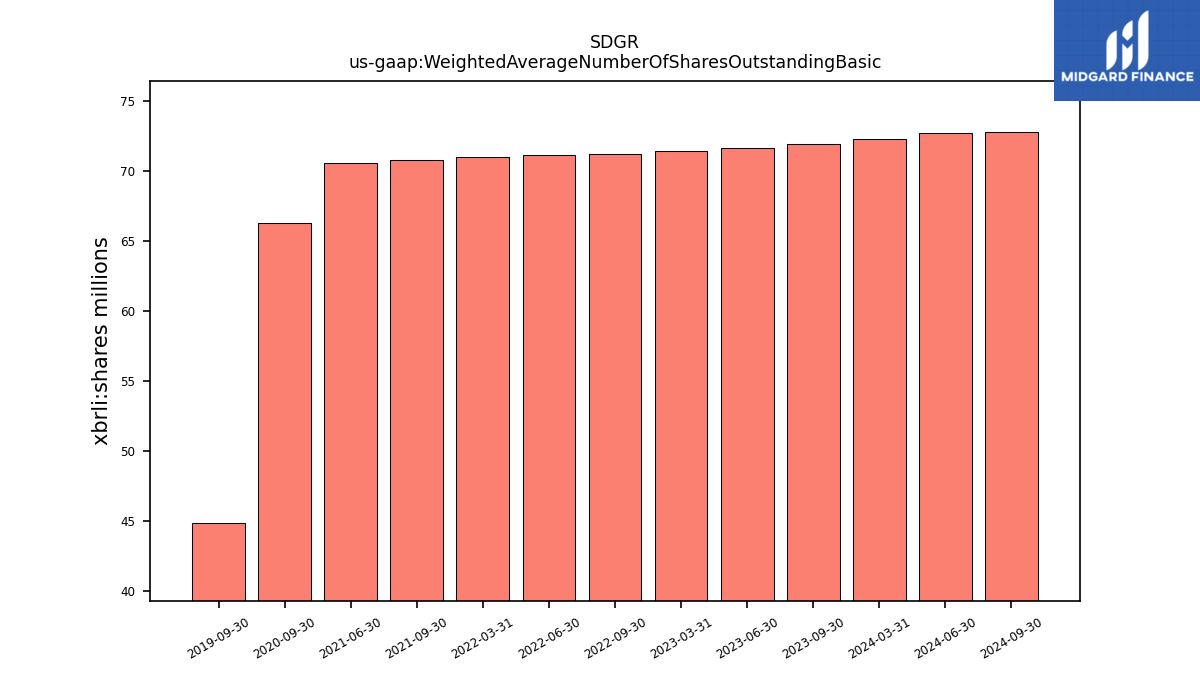
| Weighted Average Number Of Shares Outstanding Basic | 72.29 | NA | 71.92 | 71.64 | 71.47 | NA | 71.21 | 71.16 | 71.05 | NA | 70.78 | 70.58 | NA | NA | 66.34 | NA | NA | NA | 44.88 | NA | NA | |
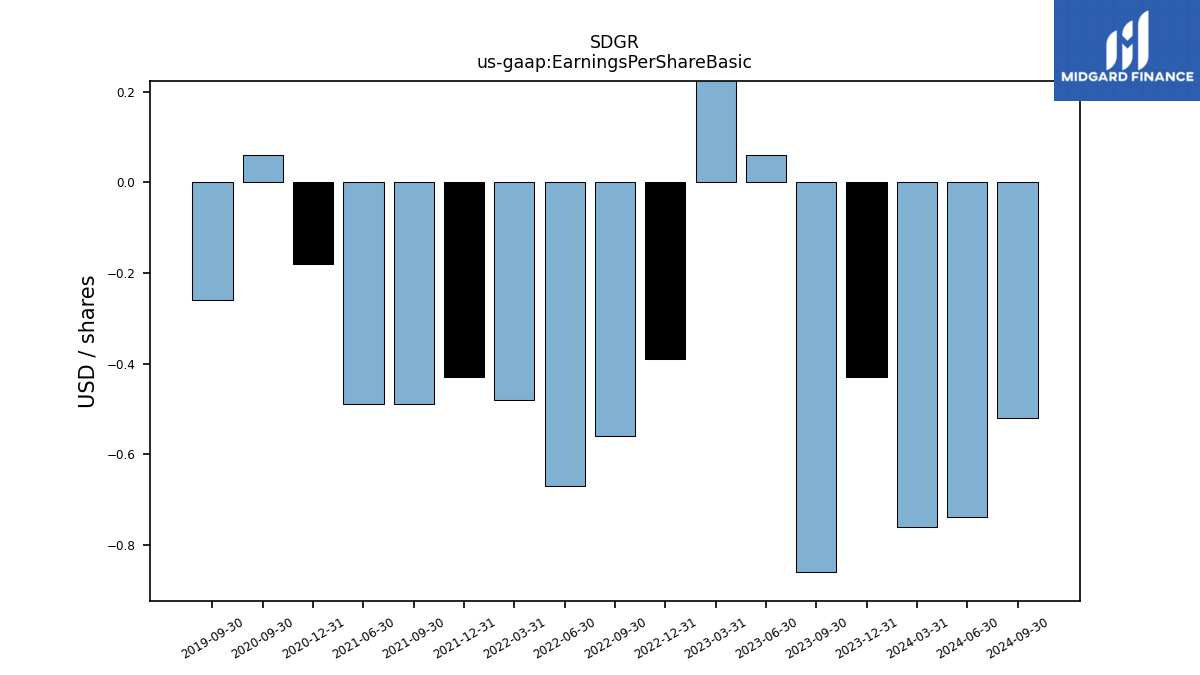
| Earnings Per Share Basic | -0.76 | -0.43 | -0.86 | 0.06 | 1.81 | -0.39 | -0.56 | -0.67 | -0.48 | -0.43 | -0.49 | -0.49 | NA | -0.18 | 0.06 | NA | NA | NA | -0.26 | NA | NA | |
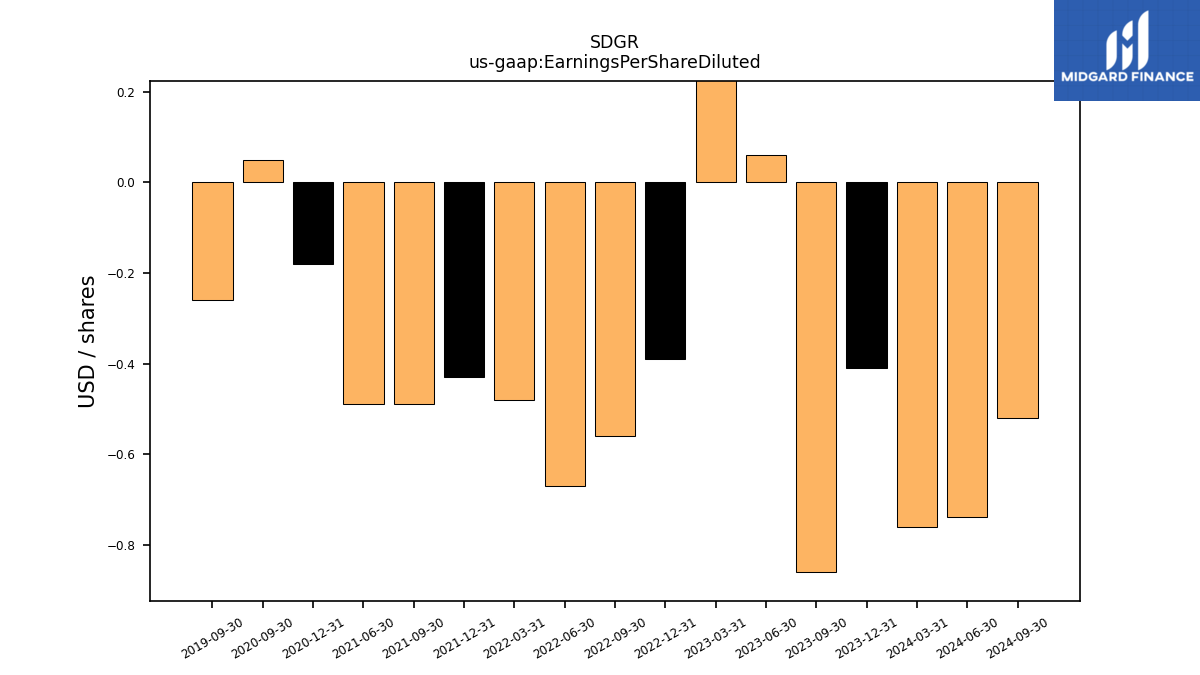
| Earnings Per Share Diluted | -0.76 | -0.41 | -0.86 | 0.06 | 1.75 | -0.39 | -0.56 | -0.67 | -0.48 | -0.43 | -0.49 | -0.49 | NA | -0.18 | 0.05 | NA | NA | NA | -0.26 | NA | NA |
| 2024-03-31 | 2023-12-31 | 2023-09-30 | 2023-06-30 | 2023-03-31 | 2022-12-31 | 2022-09-30 | 2022-06-30 | 2022-03-31 | 2021-12-31 | 2021-09-30 | 2021-06-30 | 2021-03-31 | 2020-12-31 | 2020-09-30 | 2020-06-30 | 2020-03-31 | 2019-12-31 | 2019-09-30 | 2019-06-30 | 2019-03-31 | ||
|---|---|---|---|---|---|---|---|---|---|---|---|---|---|---|---|---|---|---|---|---|---|---|
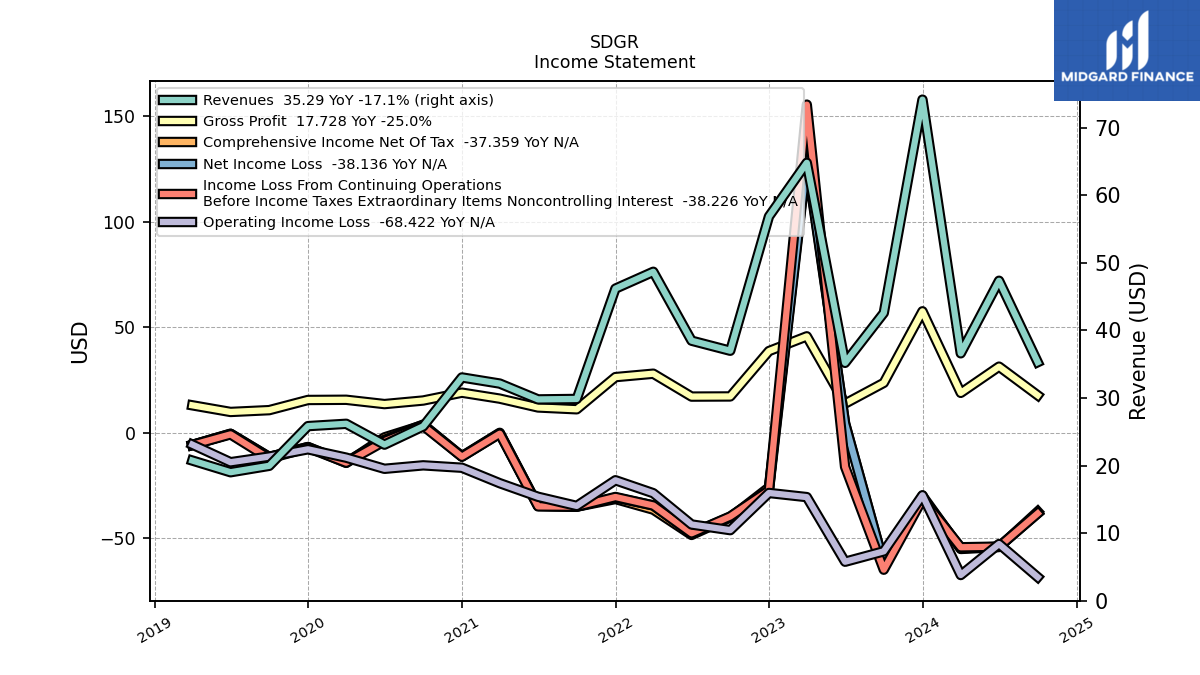
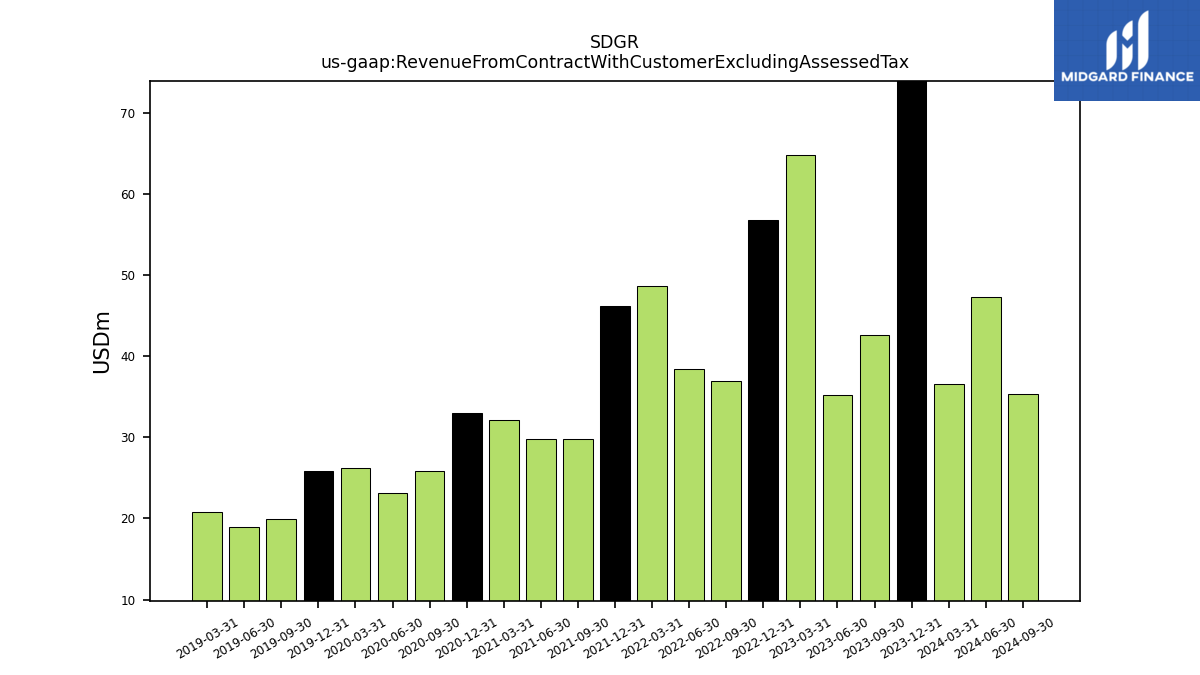
| Revenue From Contract With Customer Excluding Assessed Tax | 36.60 | 74.13 | 42.57 | 35.19 | 64.78 | 56.84 | 36.98 | 38.47 | 48.66 | 46.17 | 29.85 | 29.78 | 32.13 | 33.03 | 25.80 | 23.09 | 26.17 | 25.83 | 19.96 | 19.01 | 20.74 | |
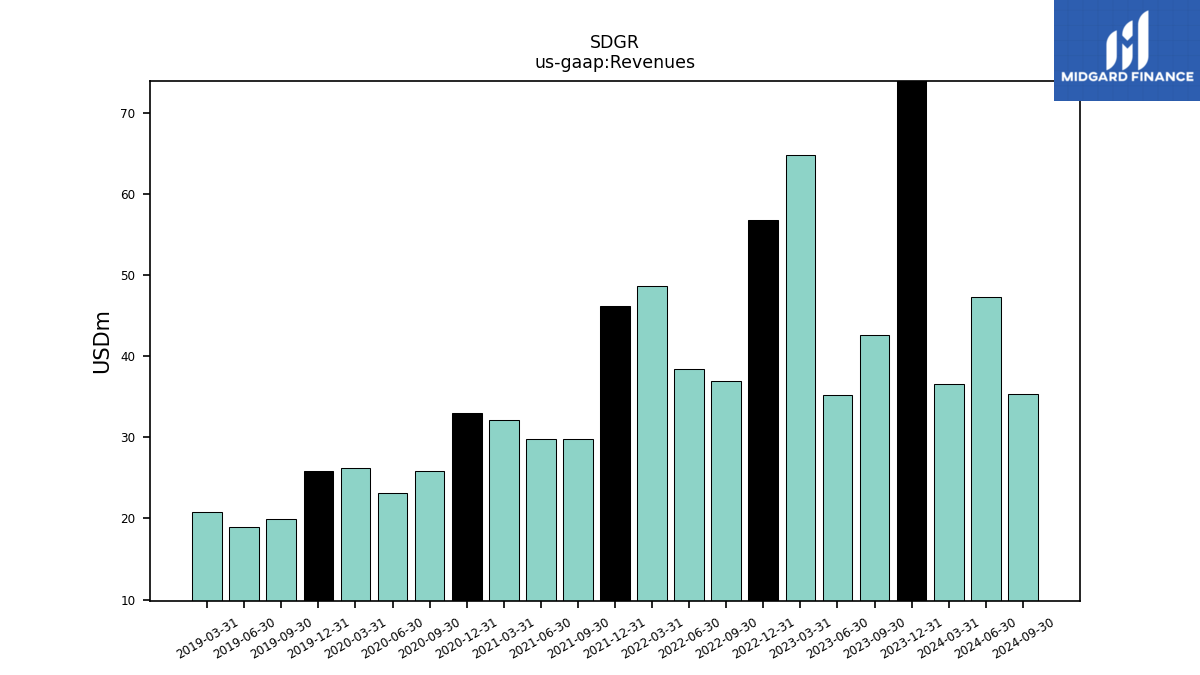
| Revenues | 36.60 | 74.13 | 42.57 | 35.19 | 64.78 | 56.84 | 36.98 | 38.47 | 48.66 | 46.17 | 29.85 | 29.78 | 32.13 | 33.03 | 25.80 | 23.09 | 26.17 | 25.83 | 19.96 | 19.01 | 20.74 | |
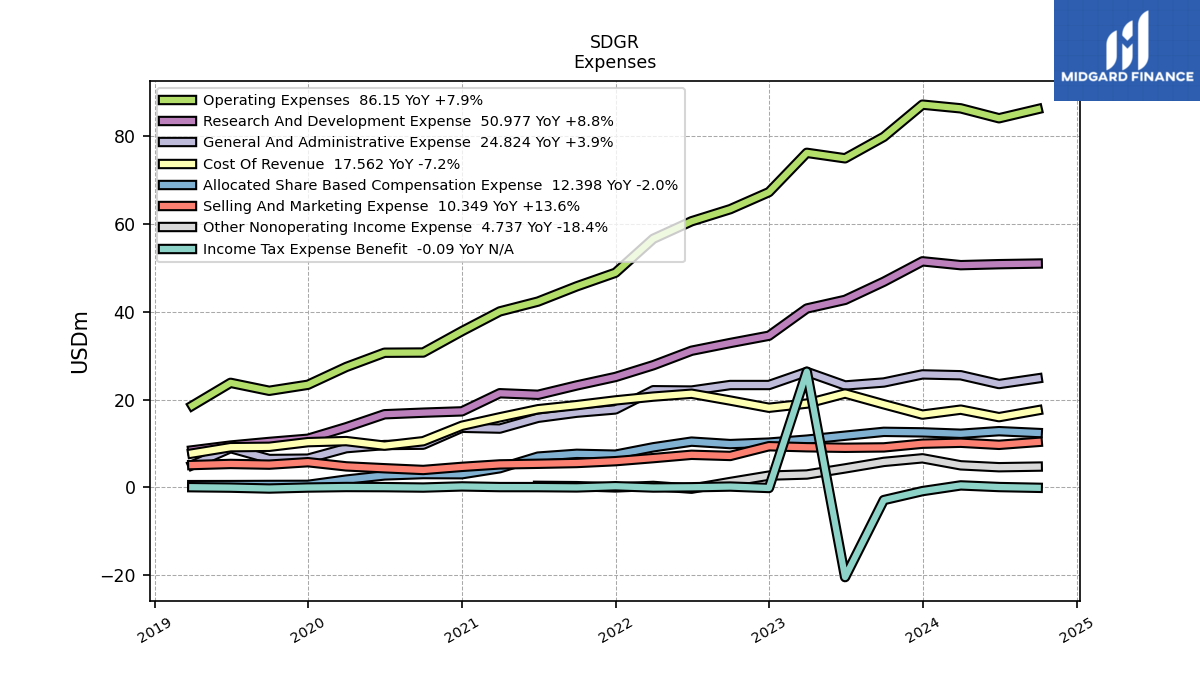
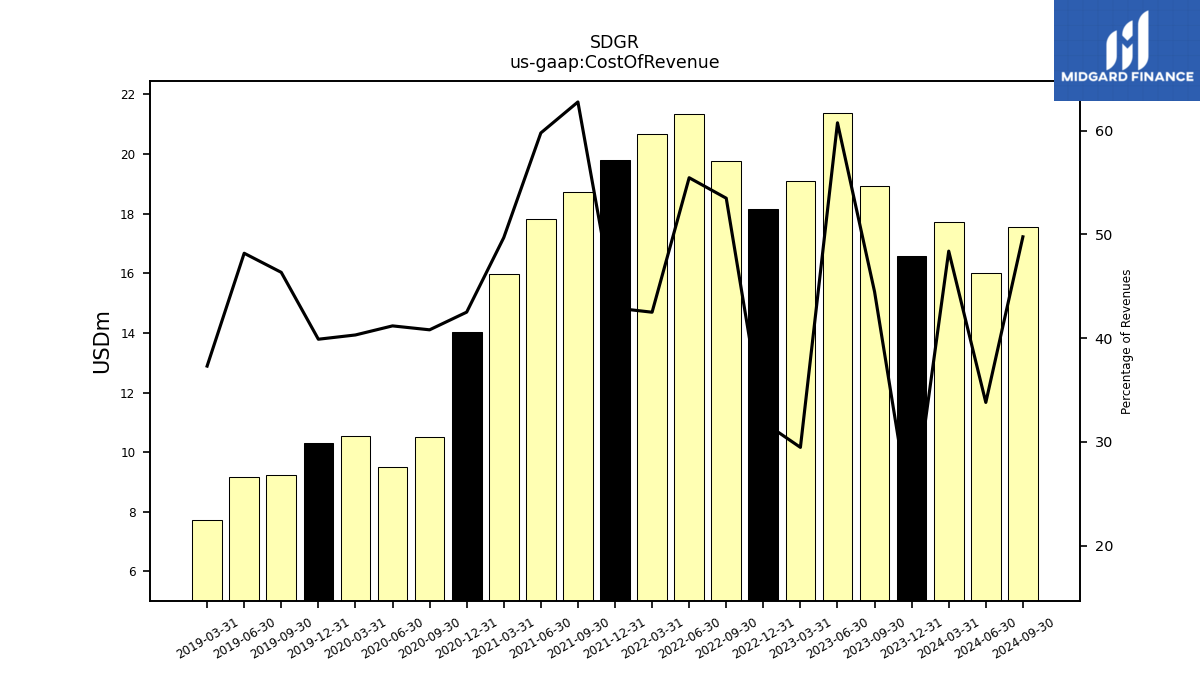
| Cost Of Revenue | 17.71 | 16.58 | 18.93 | 21.38 | 19.09 | 18.14 | 19.78 | 21.34 | 20.68 | 19.81 | 18.73 | 17.80 | 15.96 | 14.04 | 10.53 | 9.51 | 10.55 | 10.30 | 9.25 | 9.16 | 7.74 | |
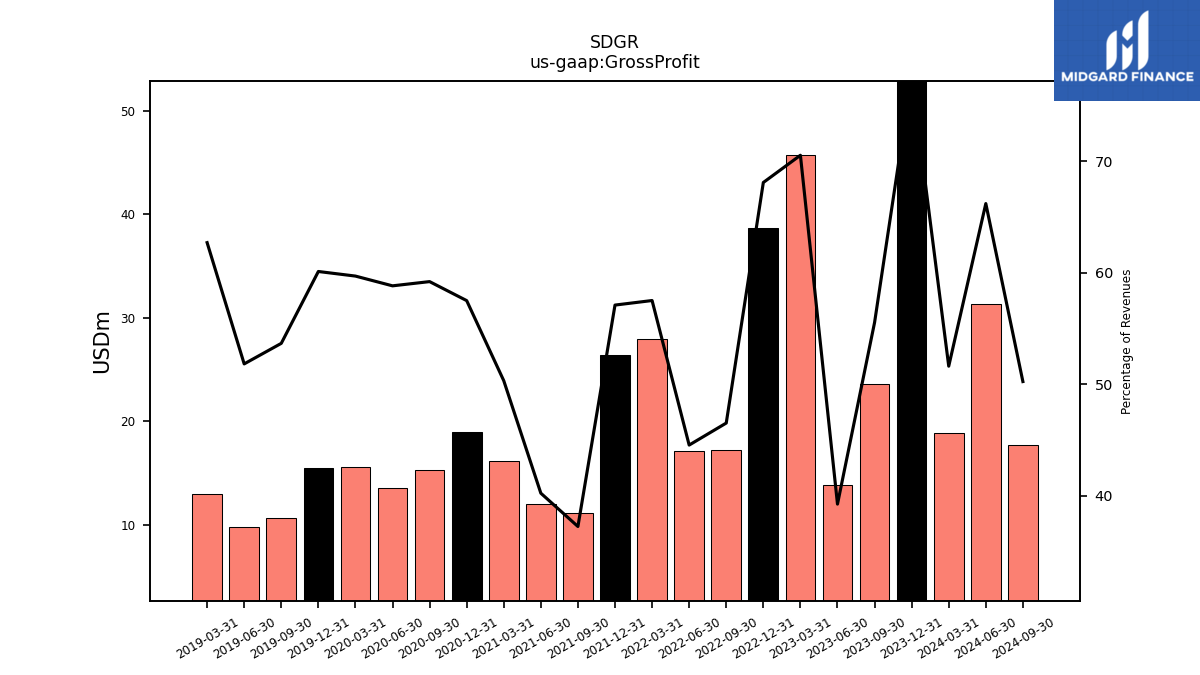
| Gross Profit | 18.89 | 57.55 | 23.64 | 13.81 | 45.69 | 38.70 | 17.20 | 17.13 | 27.98 | 26.36 | 11.12 | 11.98 | 16.16 | 18.99 | 15.27 | 13.58 | 15.62 | 15.53 | 10.71 | 9.85 | 13.00 | |
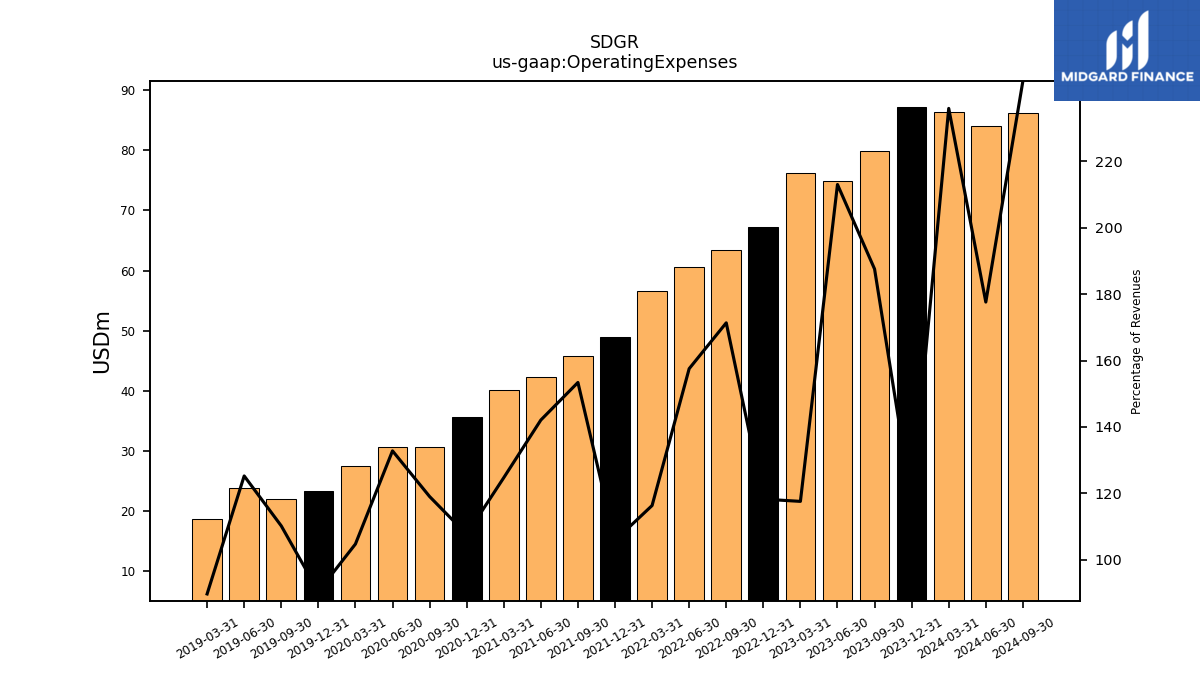
| Operating Expenses | 86.32 | 87.17 | 79.83 | 74.94 | 76.19 | 67.24 | 63.36 | 60.61 | 56.63 | 48.88 | 45.79 | 42.32 | 40.08 | 35.58 | 30.72 | 30.67 | 27.43 | 23.37 | 22.00 | 23.81 | 18.62 | |
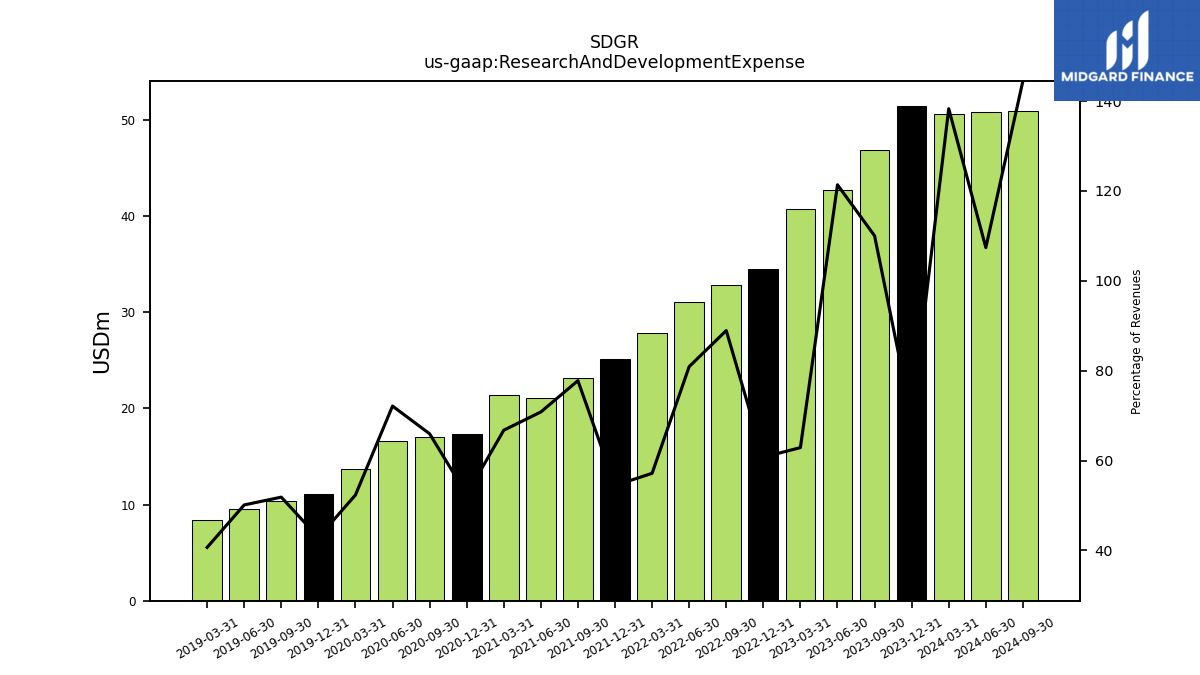
| Research And Development Expense | 50.61 | 51.49 | 46.83 | 42.70 | 40.74 | 34.54 | 32.88 | 31.12 | 27.82 | 25.14 | 23.22 | 21.09 | 21.45 | 17.32 | 17.02 | 16.66 | 13.70 | 11.08 | 10.35 | 9.53 | 8.44 | |
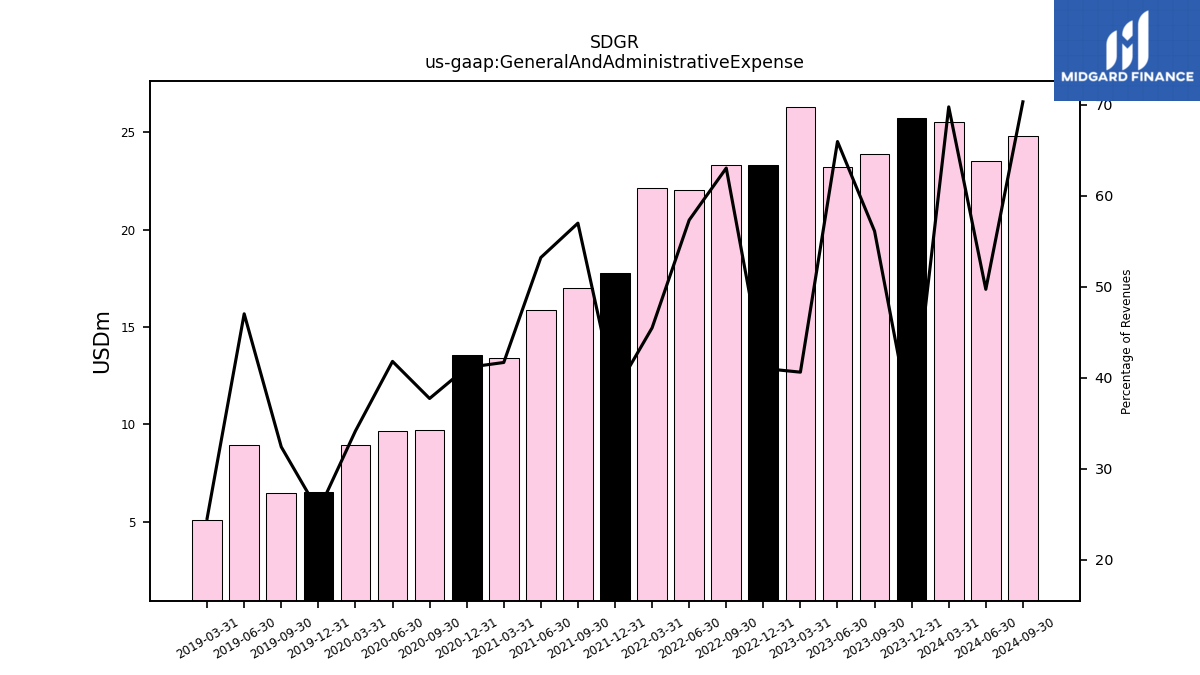
| General And Administrative Expense | 25.54 | 25.73 | 23.89 | 23.22 | 26.31 | 23.32 | 23.32 | 22.06 | 22.13 | 17.76 | 17.01 | 15.85 | 13.39 | 13.58 | 9.73 | 9.65 | 8.94 | 6.55 | 6.46 | 8.94 | 5.09 | |
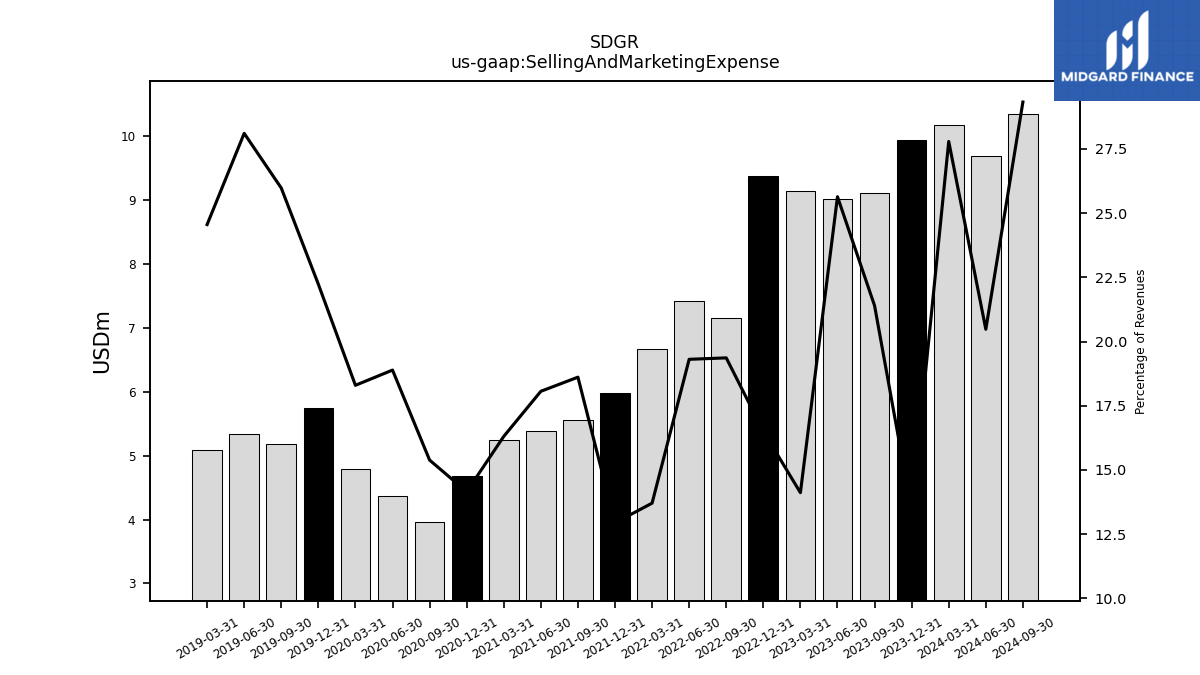
| Selling And Marketing Expense | 10.17 | 9.95 | 9.11 | 9.02 | 9.14 | 9.38 | 7.16 | 7.43 | 6.67 | 5.97 | 5.56 | 5.38 | 5.24 | 4.67 | 3.97 | 4.36 | 4.79 | 5.74 | 5.18 | 5.34 | 5.09 | |
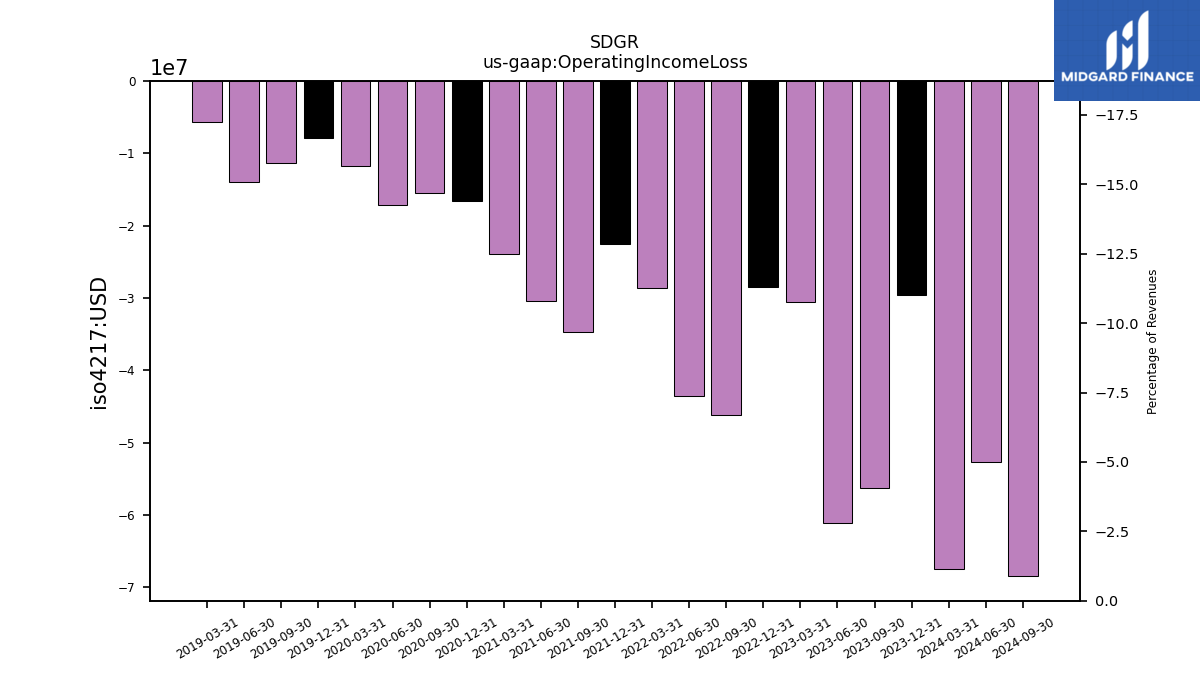
| Operating Income Loss | -67.43 | -29.62 | -56.19 | -61.13 | -30.50 | -28.54 | -46.16 | -43.47 | -28.64 | -22.52 | -34.67 | -30.34 | -23.91 | -16.58 | -15.45 | -17.09 | -11.80 | -7.85 | -11.29 | -13.96 | -5.61 | |
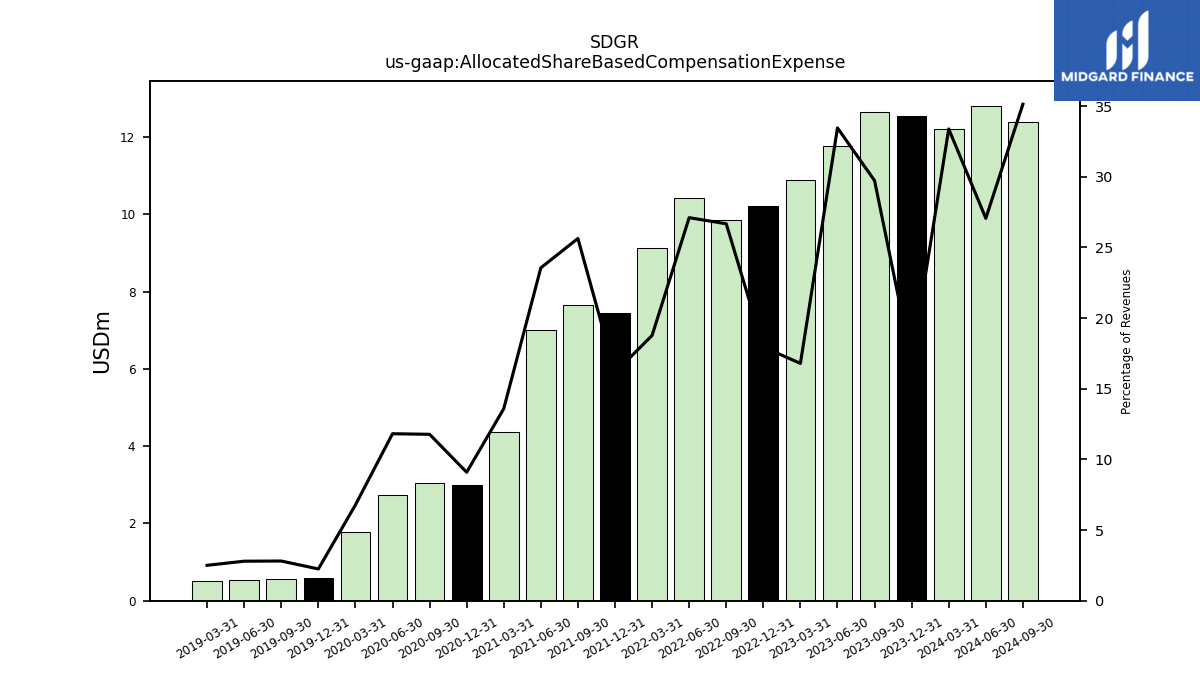
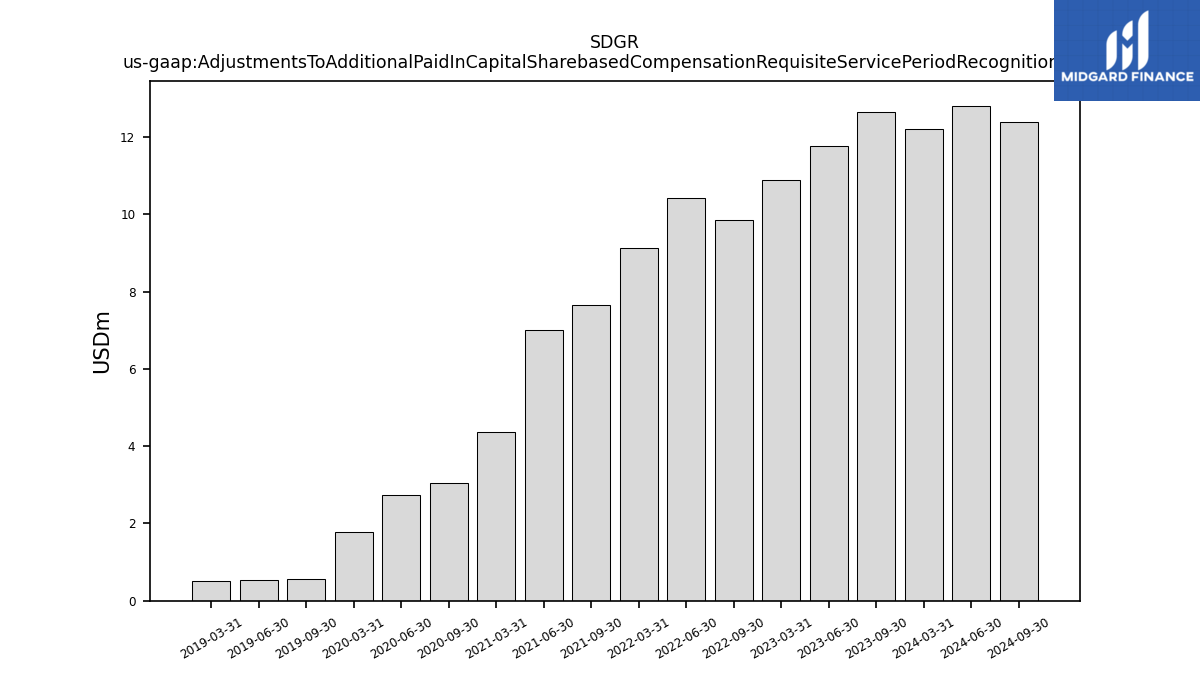
| Allocated Share Based Compensation Expense | 12.22 | 12.53 | 12.65 | 11.77 | 10.88 | 10.21 | 9.86 | 10.43 | 9.13 | 7.46 | 7.65 | 7.02 | 4.37 | 3.00 | 3.04 | 2.73 | 1.77 | 0.58 | 0.56 | 0.53 | 0.52 | |
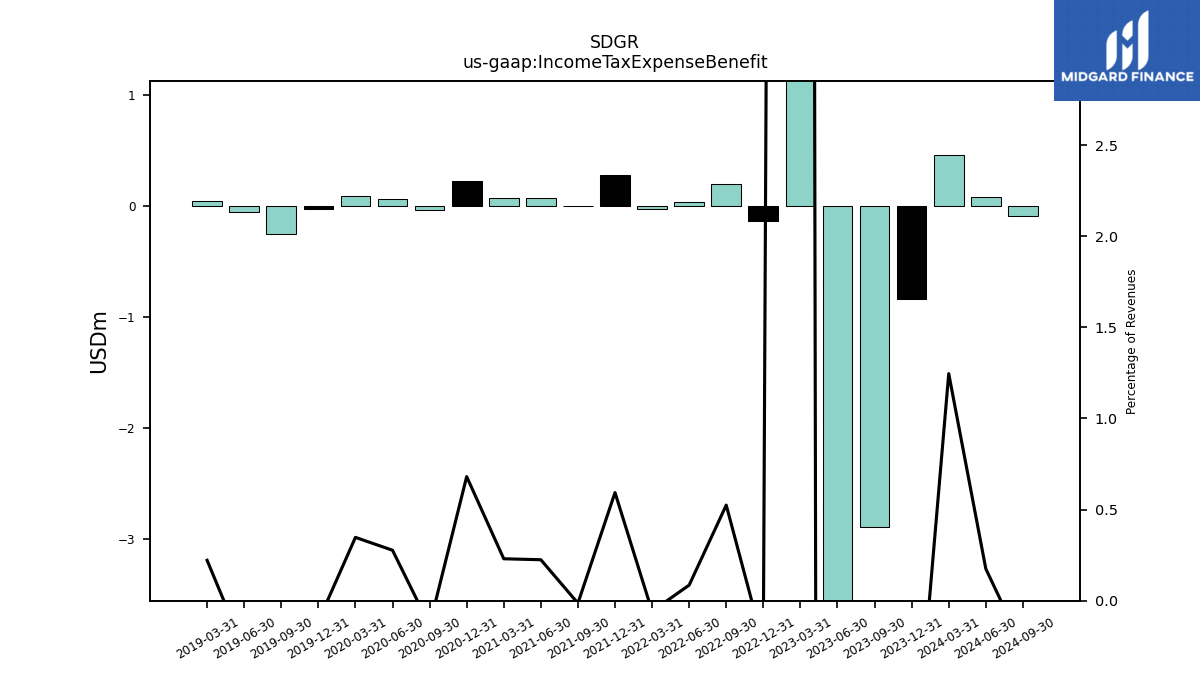
| Income Tax Expense Benefit | 0.46 | -0.84 | -2.89 | -20.43 | 26.36 | -0.14 | 0.19 | 0.03 | -0.03 | 0.27 | -0.00 | 0.07 | 0.07 | 0.23 | -0.04 | 0.06 | 0.09 | -0.03 | -0.26 | -0.05 | 0.05 | |
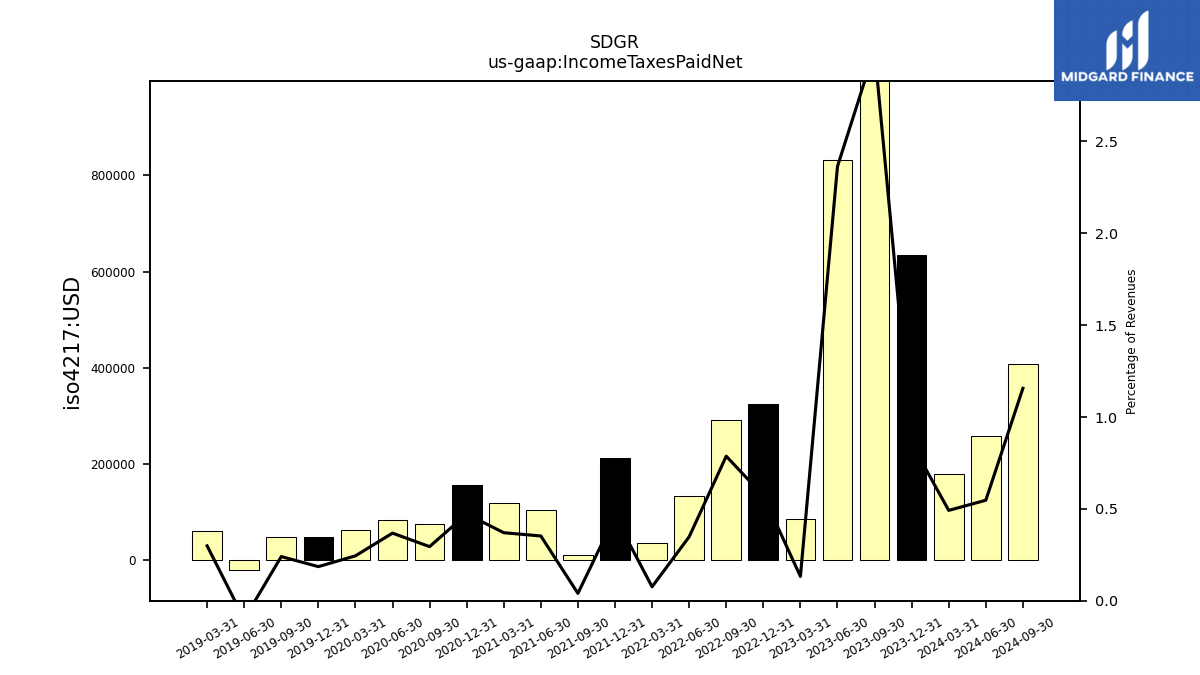
| Income Taxes Paid Net | 0.18 | 0.63 | 1.28 | 0.83 | 0.09 | 0.33 | 0.29 | 0.13 | 0.04 | 0.21 | 0.01 | 0.10 | 0.12 | 0.16 | 0.08 | 0.09 | 0.06 | 0.05 | 0.05 | -0.02 | 0.06 | |
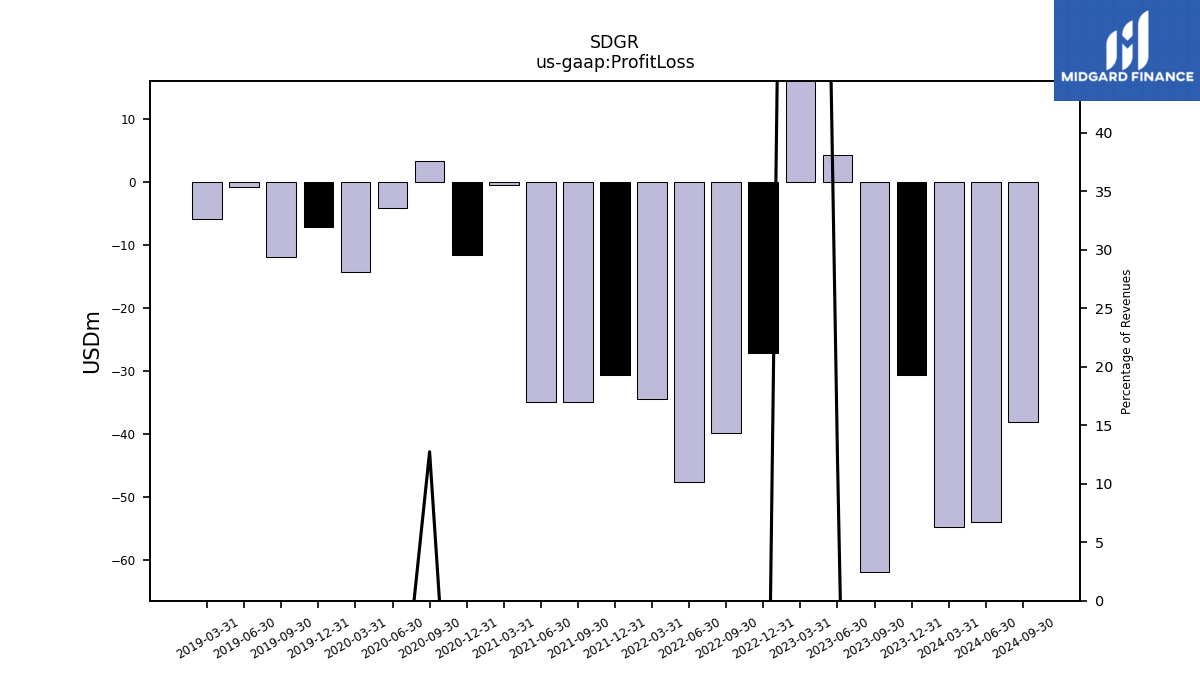
| Profit Loss | -54.72 | -30.67 | -62.02 | 4.28 | 129.14 | -27.21 | -39.86 | -47.67 | -34.45 | -30.71 | -35.01 | -34.97 | -0.52 | -11.59 | 3.29 | -4.07 | -14.27 | -7.14 | -11.96 | -0.73 | -5.85 | |
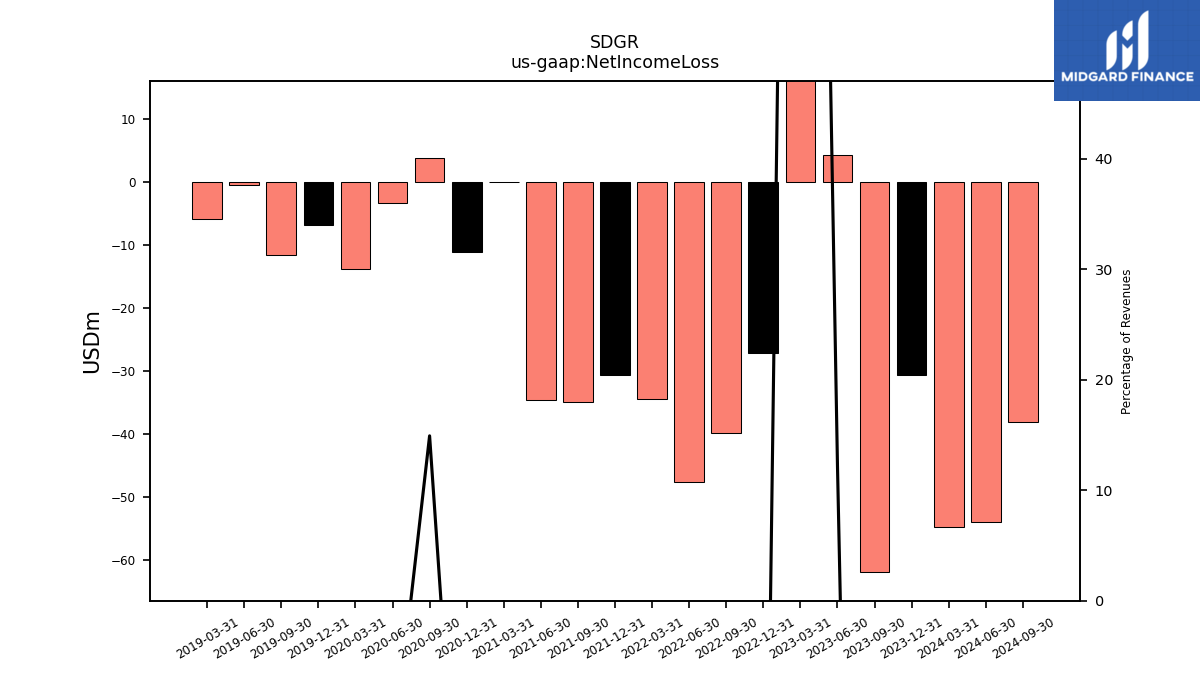
| Net Income Loss | -54.72 | -30.67 | -62.02 | 4.28 | 129.14 | -27.21 | -39.85 | -47.69 | -34.44 | -30.71 | -35.01 | -34.64 | -0.03 | -11.14 | 3.85 | -3.35 | -13.83 | -6.77 | -11.51 | -0.50 | -5.79 | |
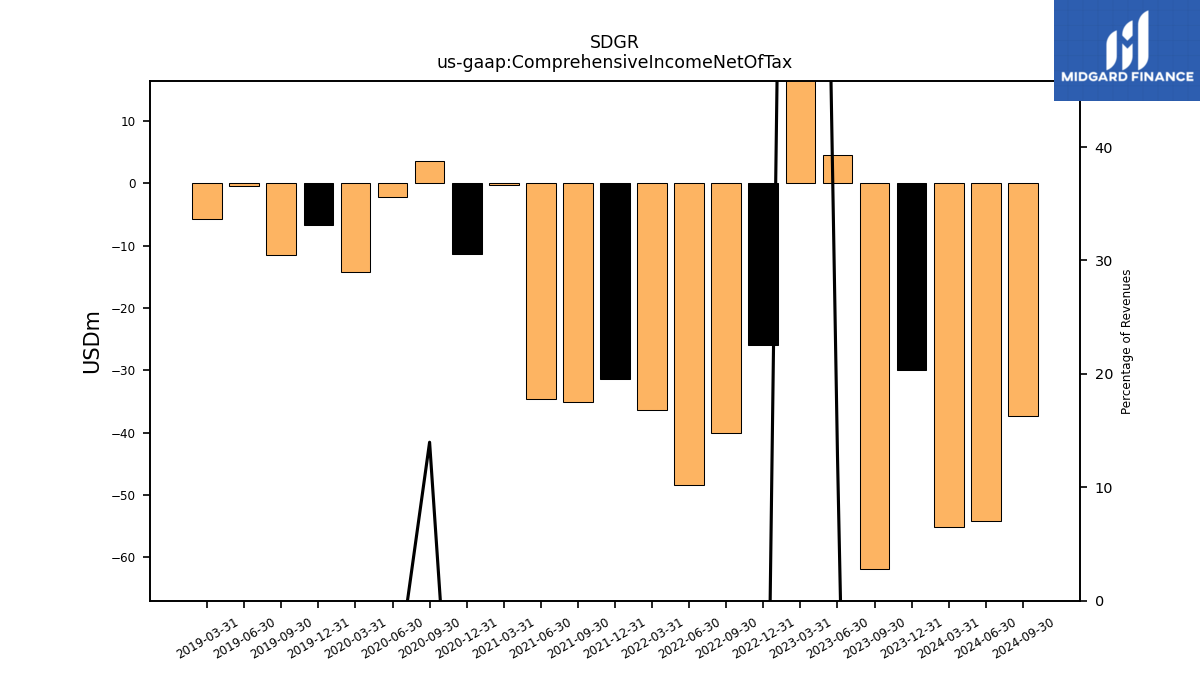
| Comprehensive Income Net Of Tax | -55.08 | -29.90 | -61.83 | 4.49 | 130.62 | -25.90 | -40.14 | -48.43 | -36.45 | -31.41 | -35.04 | -34.65 | -0.27 | -11.30 | 3.60 | -2.18 | -14.28 | -6.78 | -11.50 | -0.48 | -5.78 |
| 2024-03-31 | 2023-12-31 | 2023-09-30 | 2023-06-30 | 2023-03-31 | 2022-12-31 | 2022-09-30 | 2022-06-30 | 2022-03-31 | 2021-12-31 | 2021-09-30 | 2021-06-30 | 2021-03-31 | 2020-12-31 | 2020-09-30 | 2020-06-30 | 2020-03-31 | 2019-12-31 | 2019-09-30 | 2019-06-30 | 2019-03-31 | ||
|---|---|---|---|---|---|---|---|---|---|---|---|---|---|---|---|---|---|---|---|---|---|---|
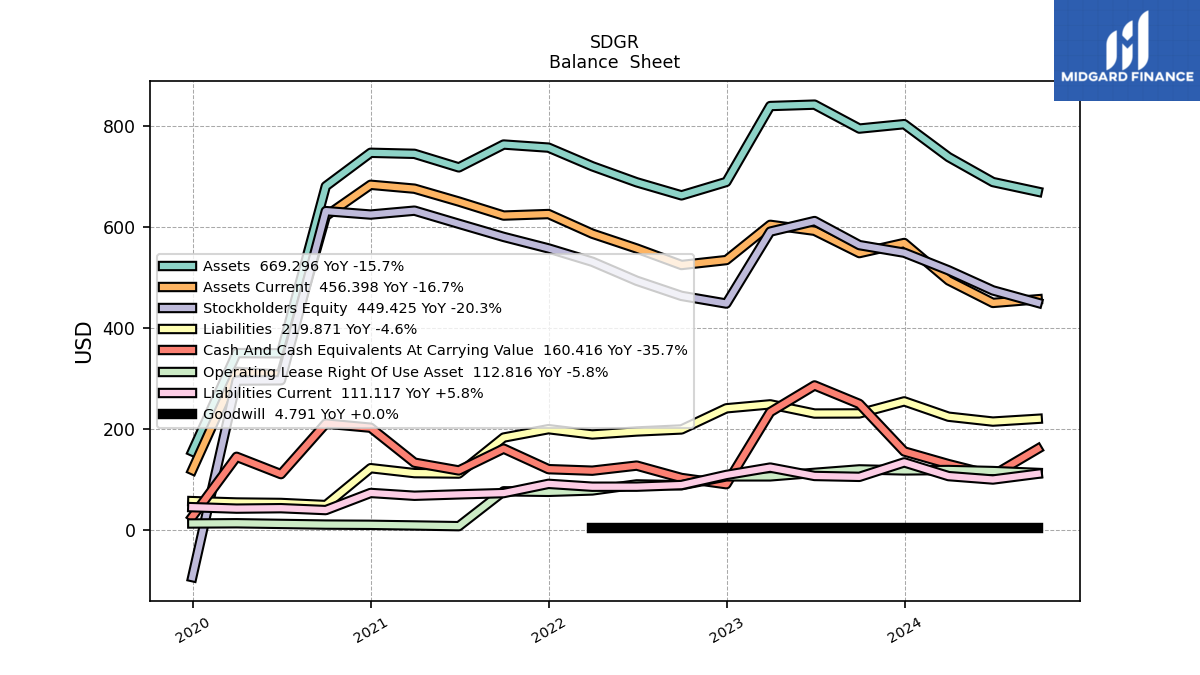
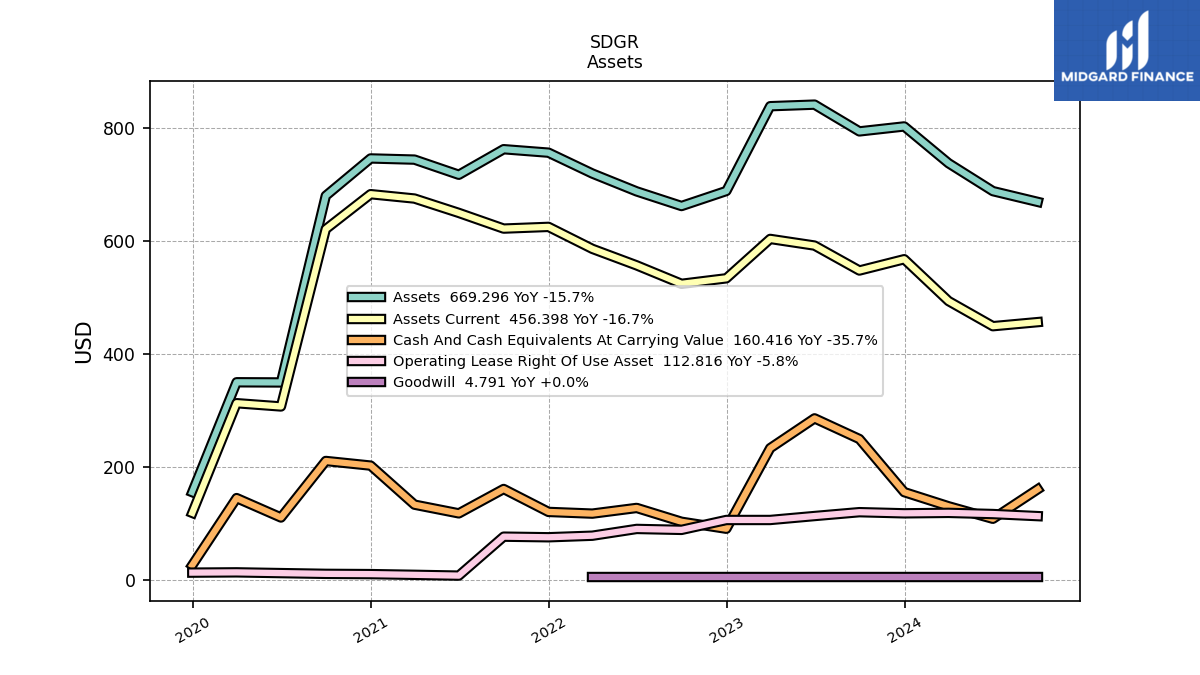
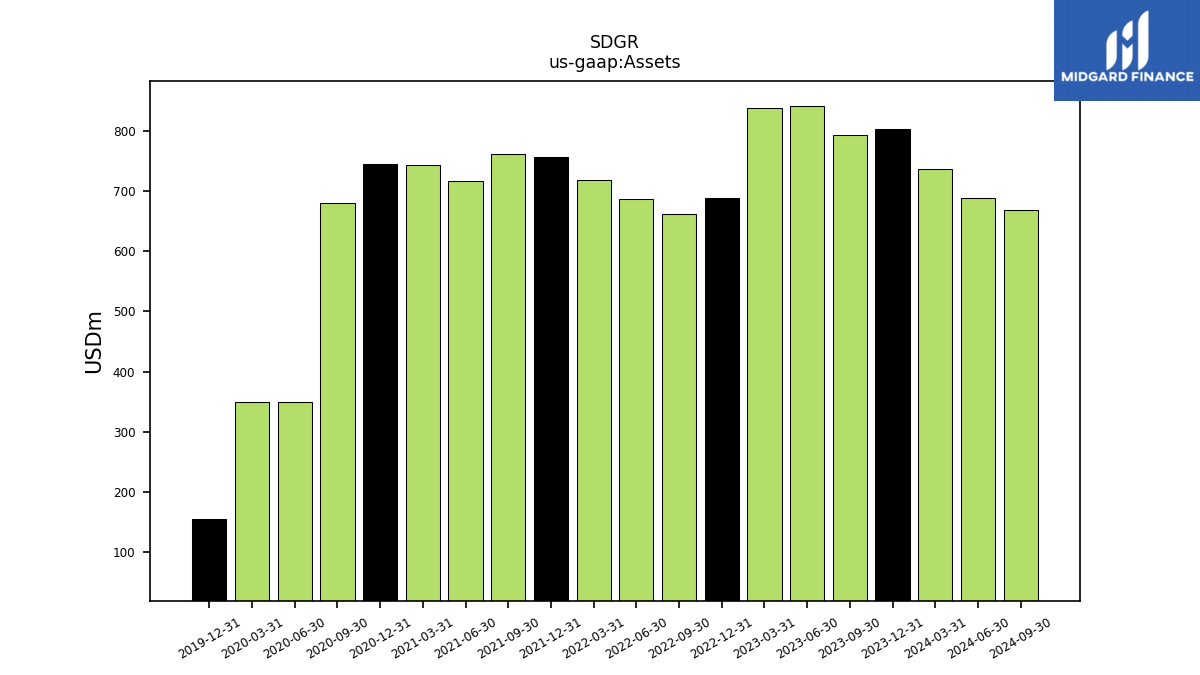
| Assets | 737.76 | 802.96 | 794.15 | 841.57 | 838.77 | 688.59 | 661.99 | 687.88 | 719.54 | 756.49 | 762.62 | 717.33 | 744.19 | 746.26 | 680.12 | 349.55 | 349.87 | 155.27 | NA | NA | NA | |
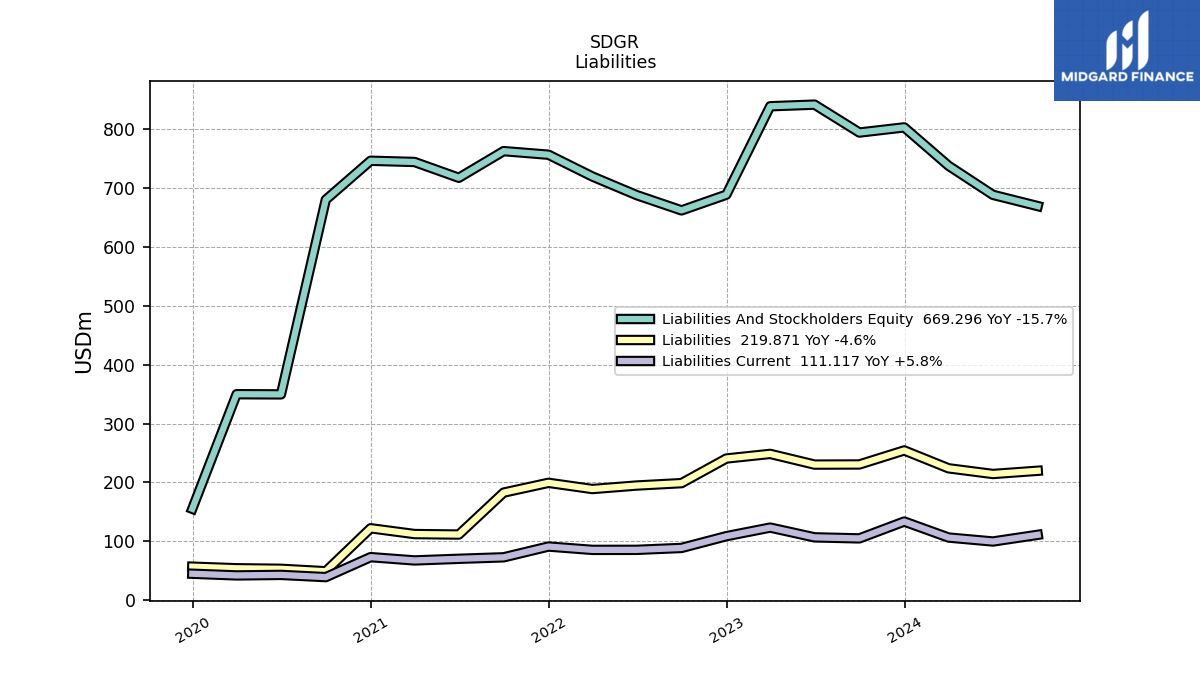
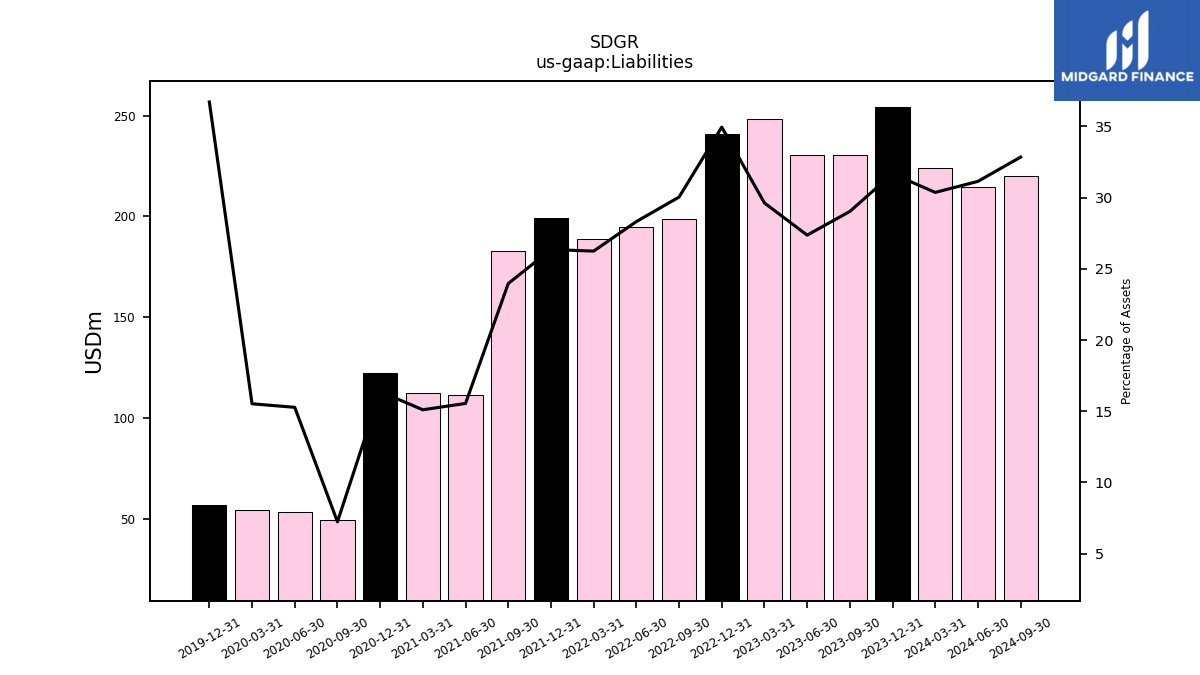
| Liabilities | 224.06 | 254.40 | 230.57 | 230.34 | 248.51 | 240.68 | 198.86 | 194.81 | 188.87 | 199.40 | 182.79 | 111.56 | 112.41 | 122.24 | 49.23 | 53.40 | 54.32 | 57.01 | NA | NA | NA | |
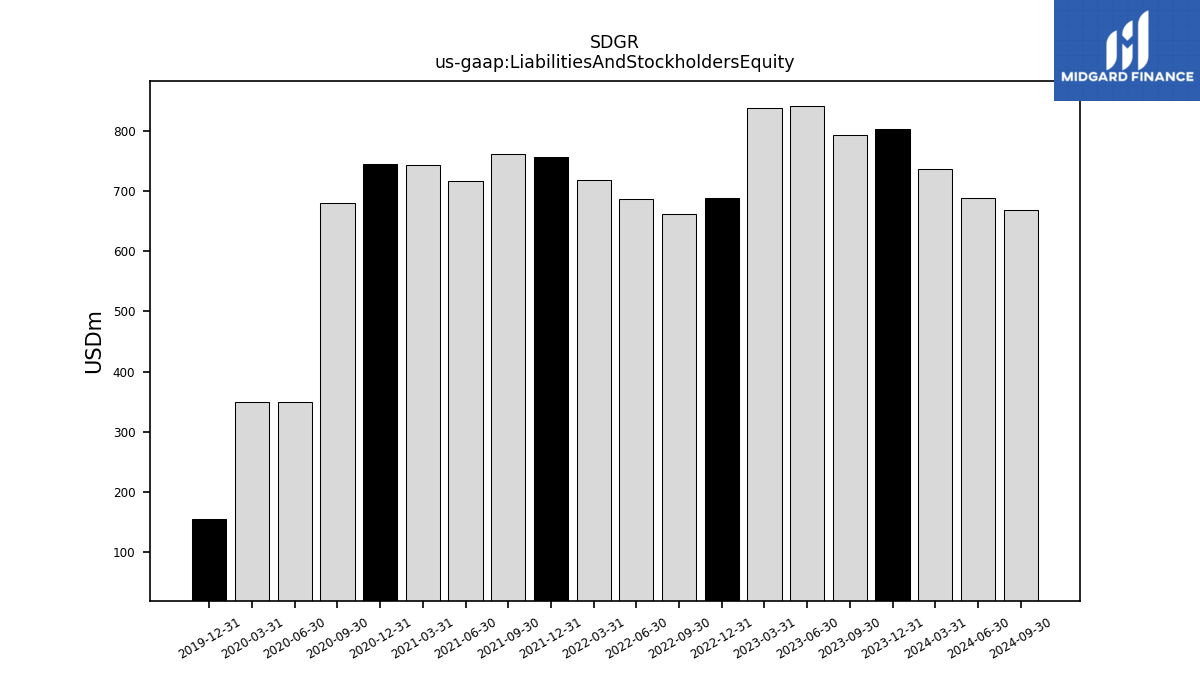
| Liabilities And Stockholders Equity | 737.76 | 802.96 | 794.15 | 841.57 | 838.77 | 688.59 | 661.99 | 687.88 | 719.54 | 756.49 | 762.62 | 717.33 | 744.19 | 746.26 | 680.12 | 349.55 | 349.87 | 155.27 | NA | NA | NA | |
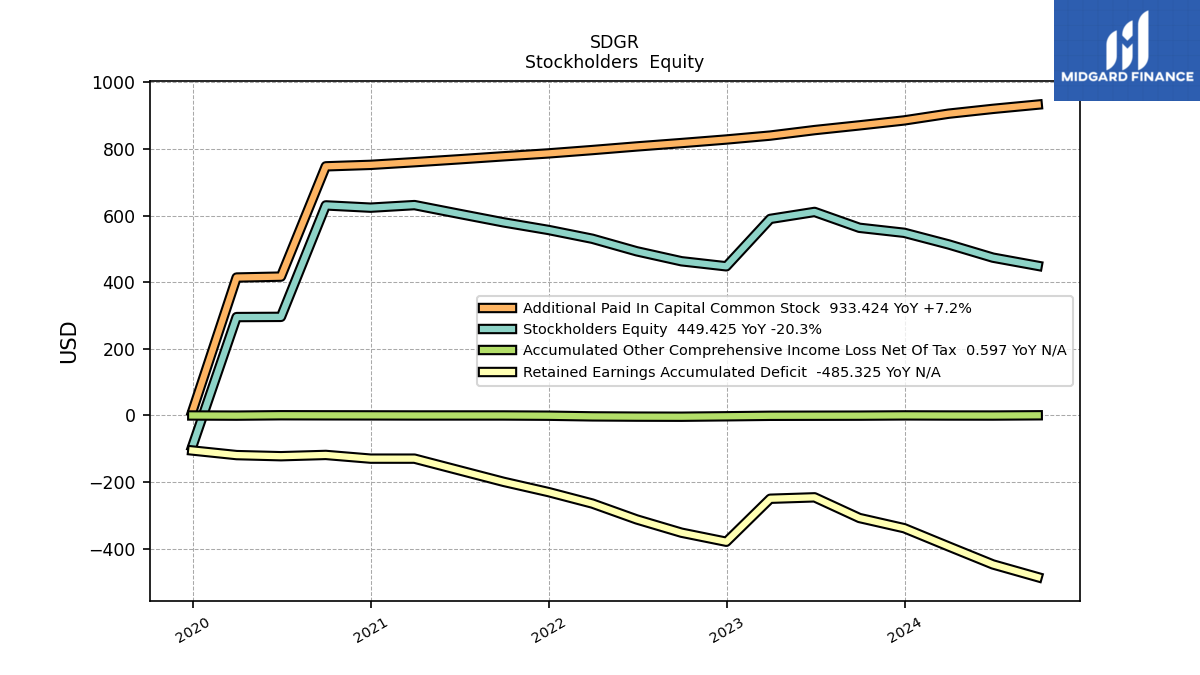
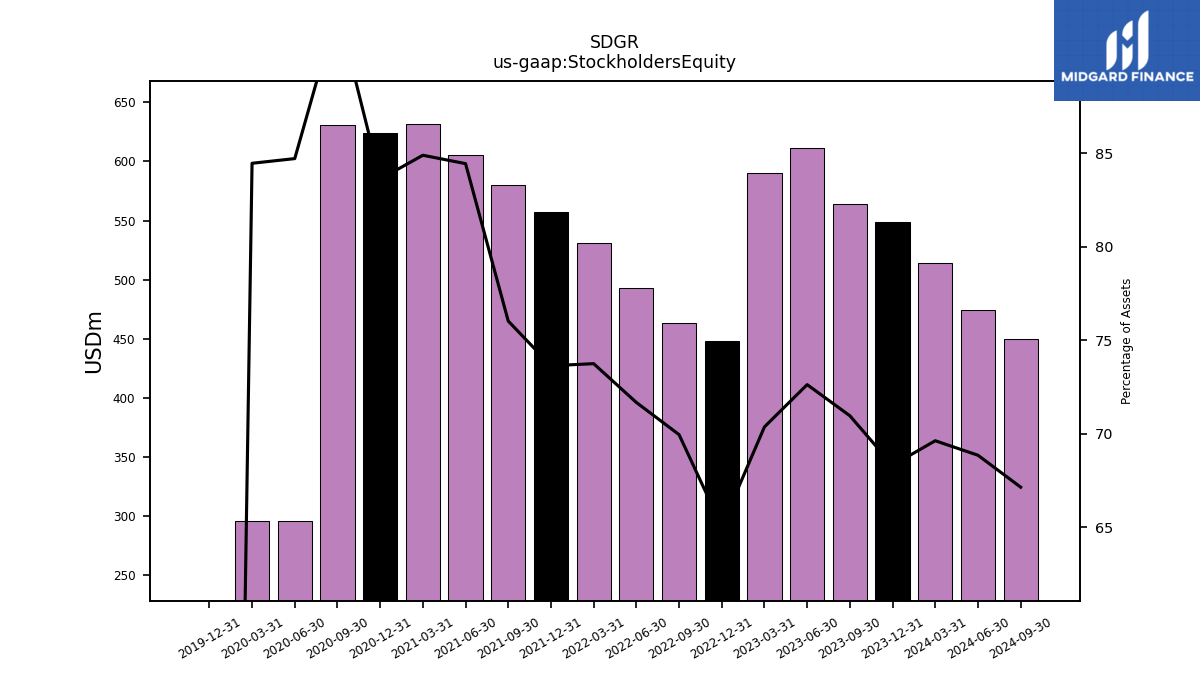
| Stockholders Equity | 513.71 | 548.56 | 563.58 | 611.23 | 590.26 | 447.89 | 463.11 | 493.06 | 530.67 | 557.07 | 579.81 | 605.75 | 631.77 | 624.01 | 630.88 | 296.12 | 295.52 | -93.36 | NA | NA | NA |
| 2024-03-31 | 2023-12-31 | 2023-09-30 | 2023-06-30 | 2023-03-31 | 2022-12-31 | 2022-09-30 | 2022-06-30 | 2022-03-31 | 2021-12-31 | 2021-09-30 | 2021-06-30 | 2021-03-31 | 2020-12-31 | 2020-09-30 | 2020-06-30 | 2020-03-31 | 2019-12-31 | 2019-09-30 | 2019-06-30 | 2019-03-31 | ||
|---|---|---|---|---|---|---|---|---|---|---|---|---|---|---|---|---|---|---|---|---|---|---|
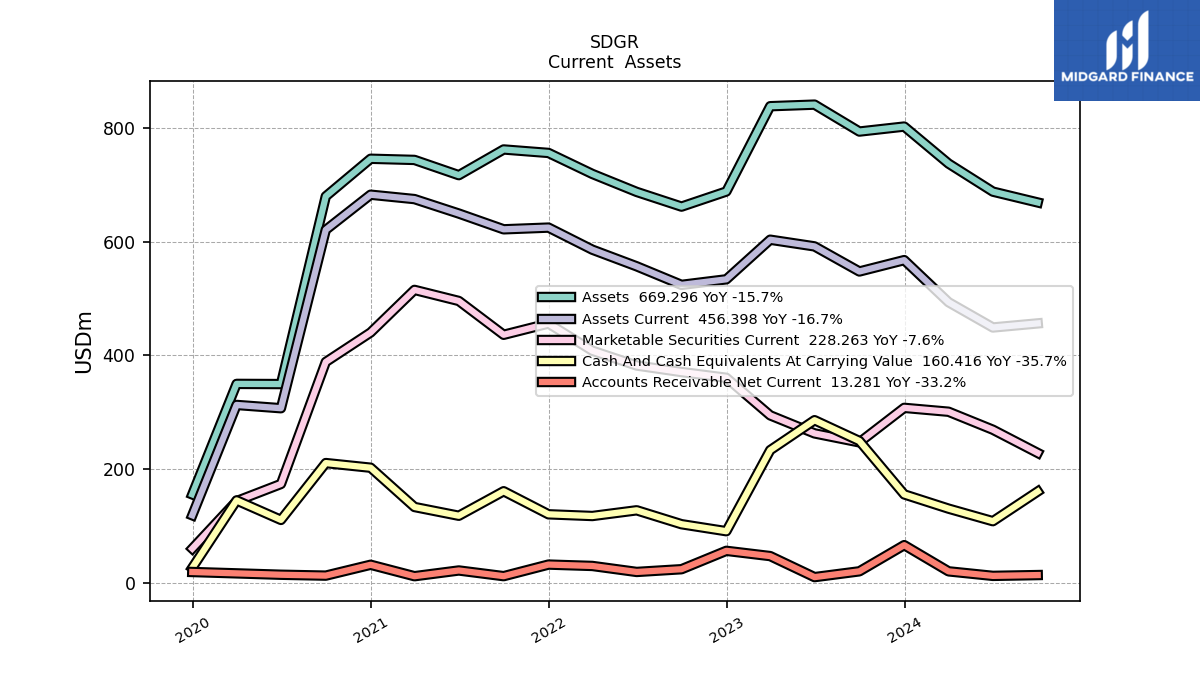
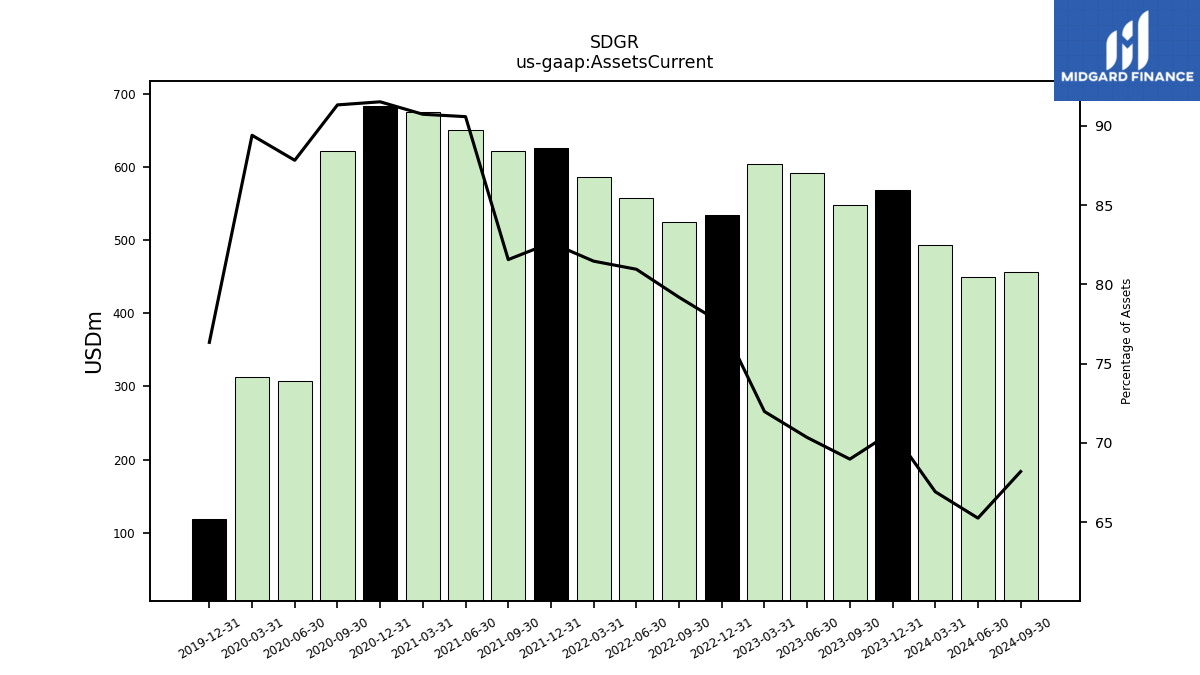
| Assets Current | 493.69 | 567.80 | 547.76 | 591.96 | 603.73 | 533.99 | 524.20 | 556.87 | 586.17 | 625.06 | 622.02 | 649.79 | 675.24 | 682.98 | 621.11 | 307.01 | 312.81 | 118.54 | NA | NA | NA | |
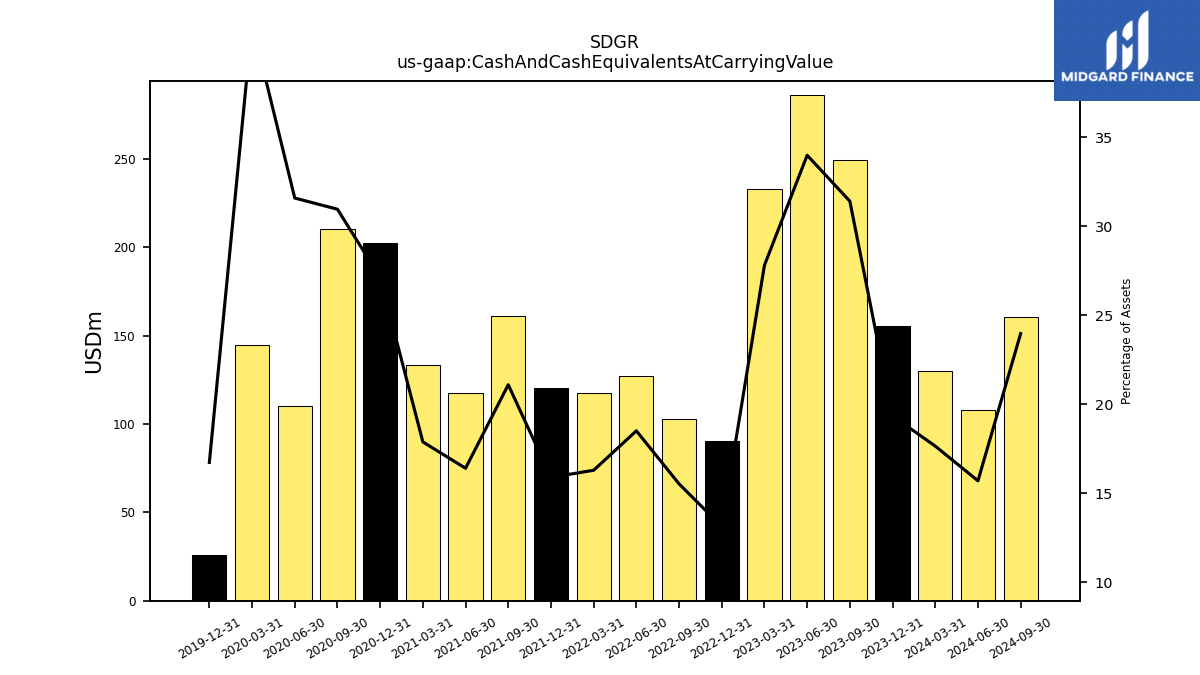
| Cash And Cash Equivalents At Carrying Value | 130.24 | 155.31 | 249.38 | 285.96 | 233.21 | 90.47 | 102.82 | 127.32 | 117.26 | 120.27 | 160.88 | 117.70 | 133.12 | 202.30 | 210.49 | 110.38 | 144.75 | 25.99 | NA | NA | NA | |
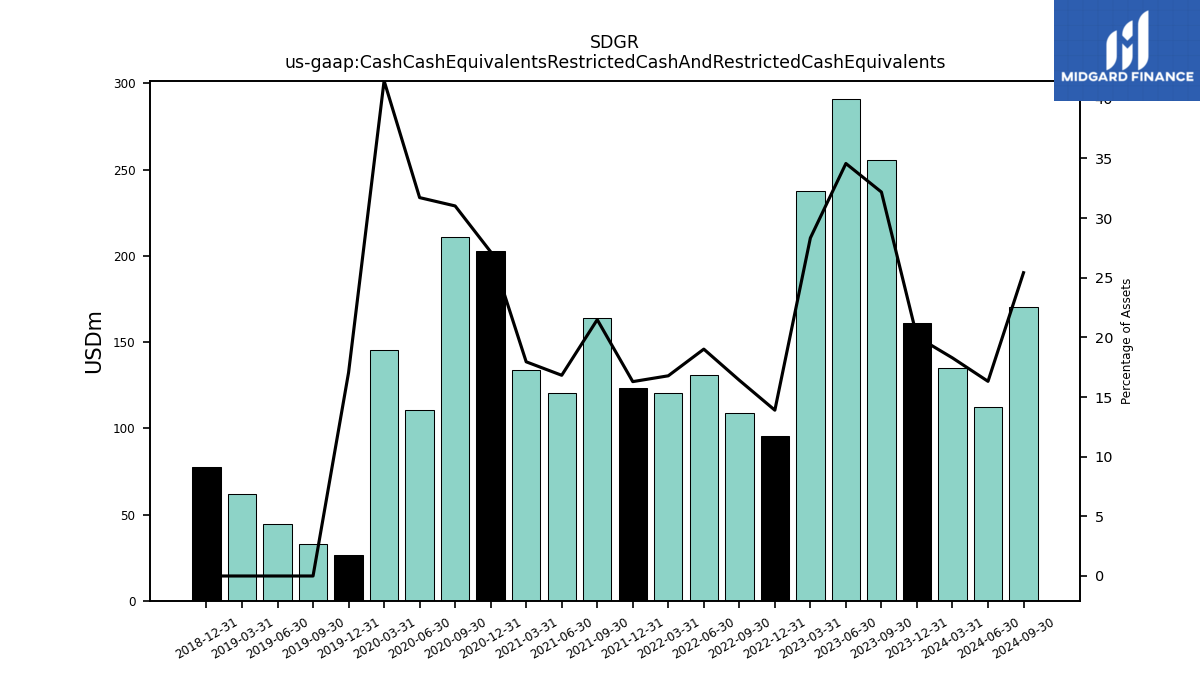
| Cash Cash Equivalents Restricted Cash And Restricted Cash Equivalents | 134.87 | 161.07 | 255.61 | 291.02 | 237.69 | 95.72 | 108.62 | 130.82 | 120.76 | 123.27 | 163.88 | 120.70 | 133.62 | 202.80 | 210.99 | 110.88 | 145.25 | 26.49 | 33.09 | 44.45 | 62.18 | |
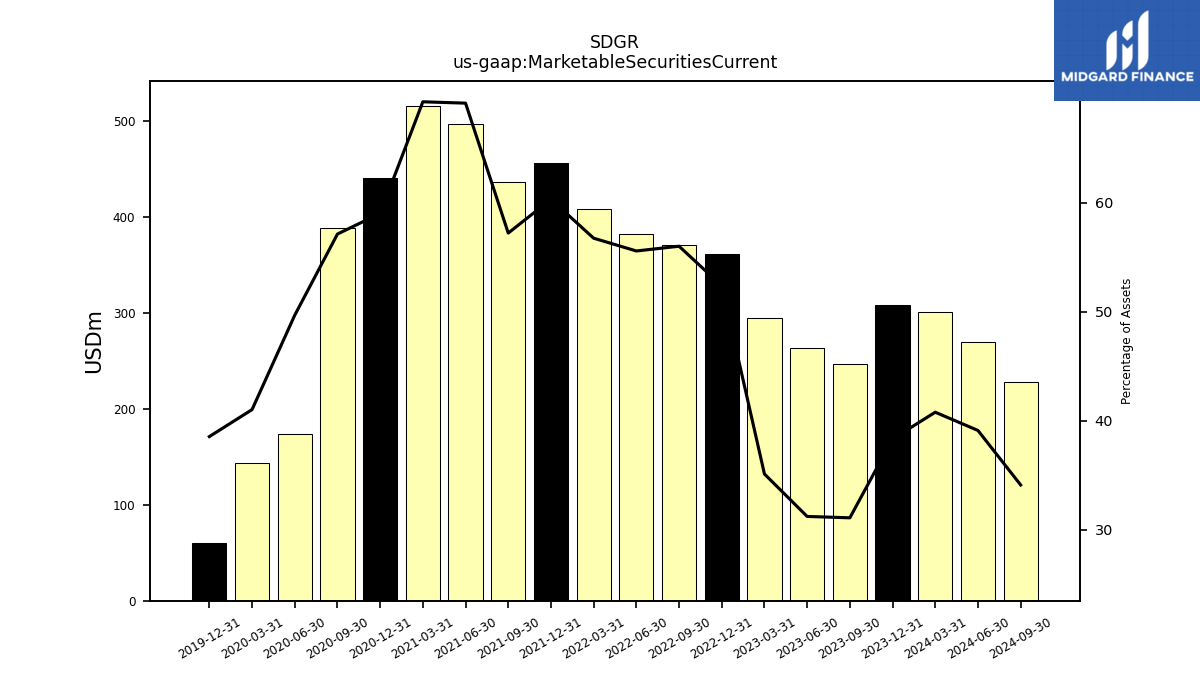
| Marketable Securities Current | 300.84 | 307.69 | 246.91 | 262.71 | 294.48 | 360.61 | 370.74 | 382.25 | 408.27 | 456.21 | 436.31 | 495.89 | 515.37 | 440.39 | 388.49 | 173.65 | 143.50 | 59.84 | NA | NA | NA | |
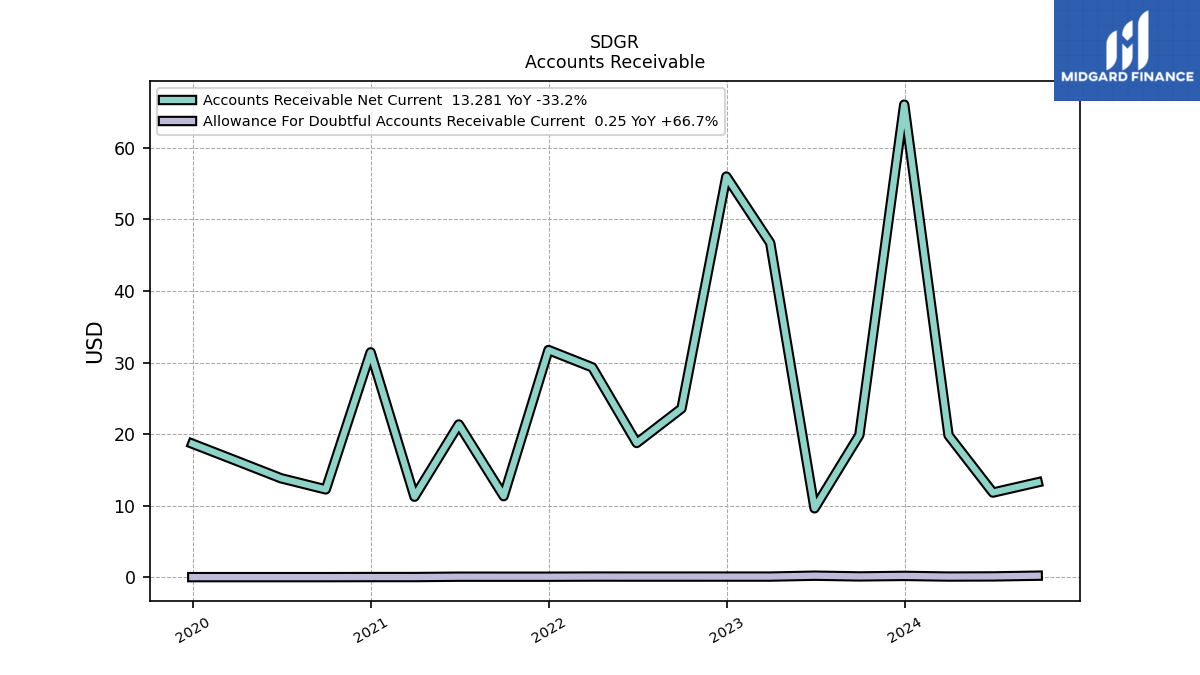
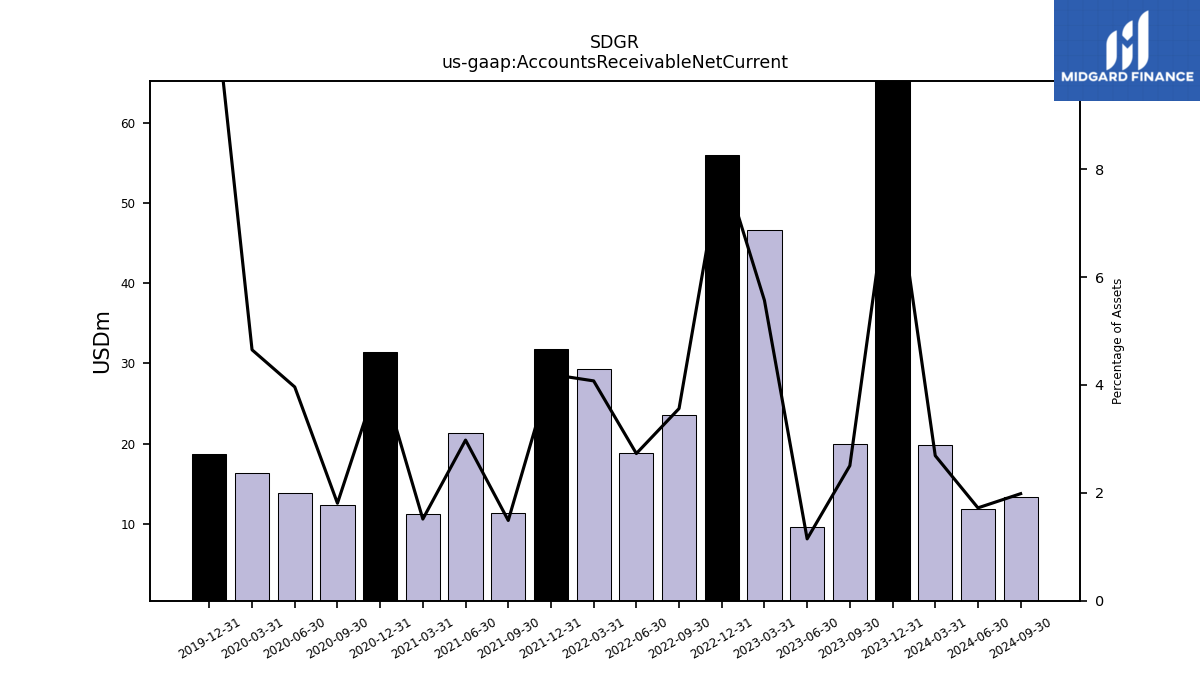
| Accounts Receivable Net Current | 19.84 | 65.99 | 19.88 | 9.65 | 46.69 | 55.95 | 23.58 | 18.77 | 29.32 | 31.74 | 11.35 | 21.36 | 11.27 | 31.42 | 12.29 | 13.85 | 16.27 | 18.68 | NA | NA | NA |
| 2024-03-31 | 2023-12-31 | 2023-09-30 | 2023-06-30 | 2023-03-31 | 2022-12-31 | 2022-09-30 | 2022-06-30 | 2022-03-31 | 2021-12-31 | 2021-09-30 | 2021-06-30 | 2021-03-31 | 2020-12-31 | 2020-09-30 | 2020-06-30 | 2020-03-31 | 2019-12-31 | 2019-09-30 | 2019-06-30 | 2019-03-31 | ||
|---|---|---|---|---|---|---|---|---|---|---|---|---|---|---|---|---|---|---|---|---|---|---|
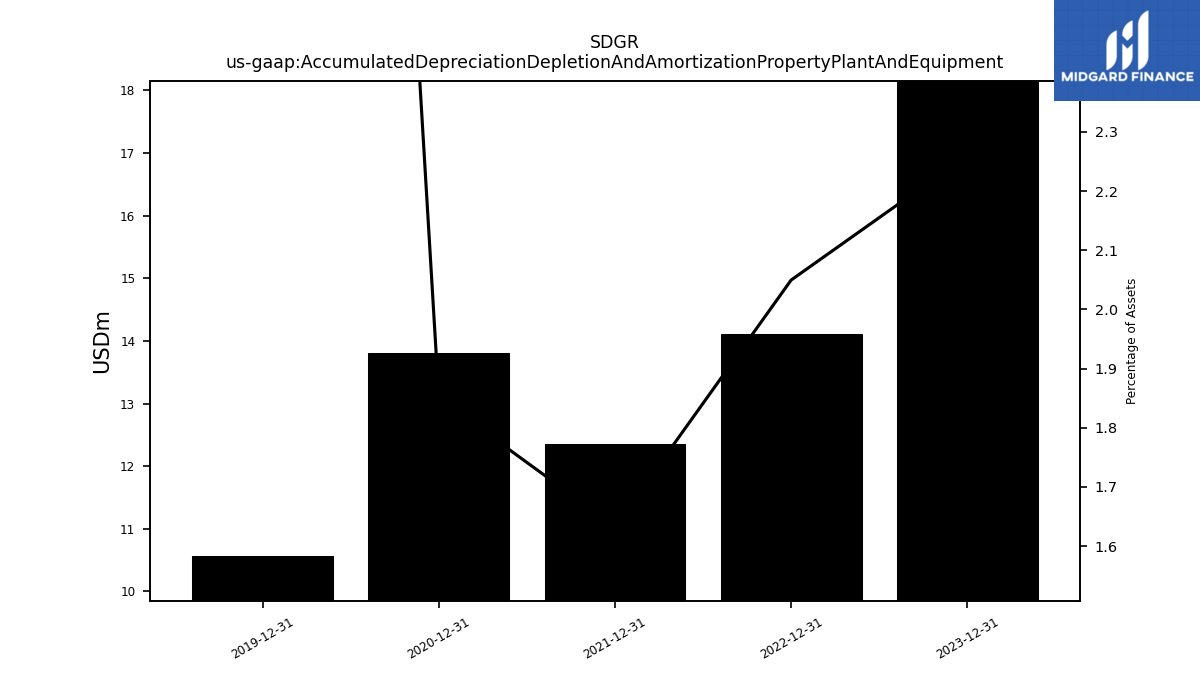
| Accumulated Depreciation Depletion And Amortization Property Plant And Equipment | NA | 18.15 | NA | NA | NA | 14.11 | NA | NA | NA | 12.36 | NA | NA | NA | 13.80 | NA | NA | NA | 10.56 | NA | NA | NA | |
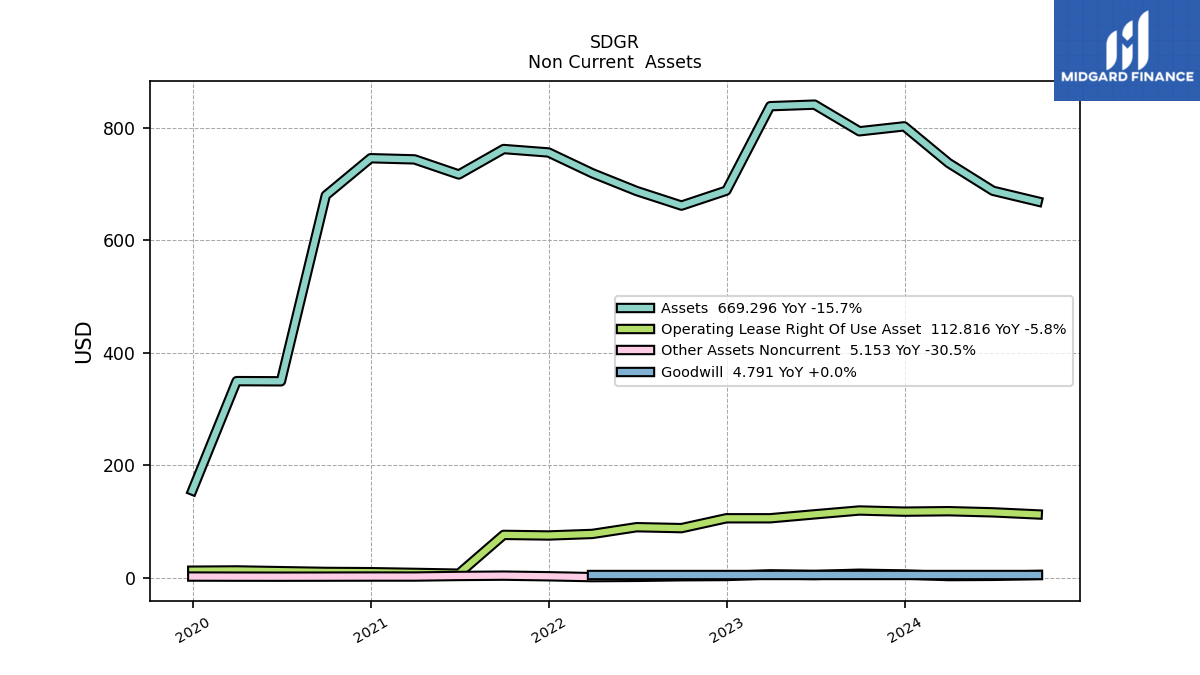
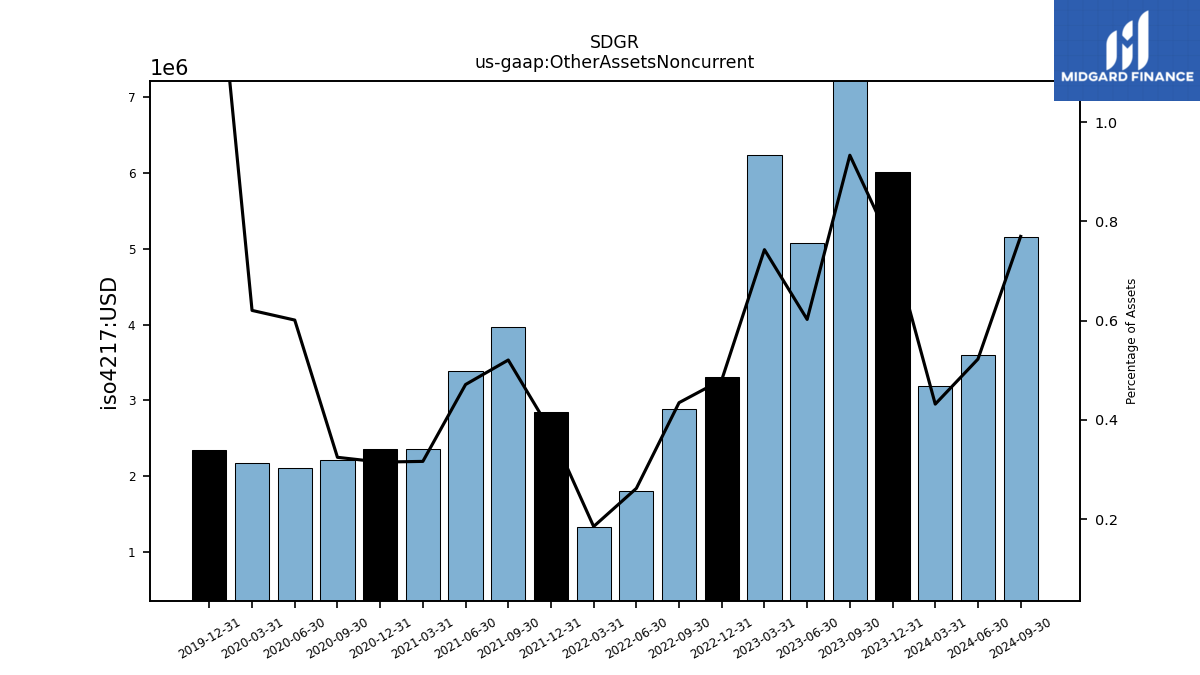
| Other Assets Noncurrent | 3.19 | 6.01 | 7.41 | 5.07 | 6.23 | 3.31 | 2.88 | 1.80 | 1.33 | 2.85 | 3.97 | 3.38 | 2.36 | 2.35 | 2.21 | 2.10 | 2.17 | 2.34 | NA | NA | NA |
| 2024-03-31 | 2023-12-31 | 2023-09-30 | 2023-06-30 | 2023-03-31 | 2022-12-31 | 2022-09-30 | 2022-06-30 | 2022-03-31 | 2021-12-31 | 2021-09-30 | 2021-06-30 | 2021-03-31 | 2020-12-31 | 2020-09-30 | 2020-06-30 | 2020-03-31 | 2019-12-31 | 2019-09-30 | 2019-06-30 | 2019-03-31 | ||
|---|---|---|---|---|---|---|---|---|---|---|---|---|---|---|---|---|---|---|---|---|---|---|
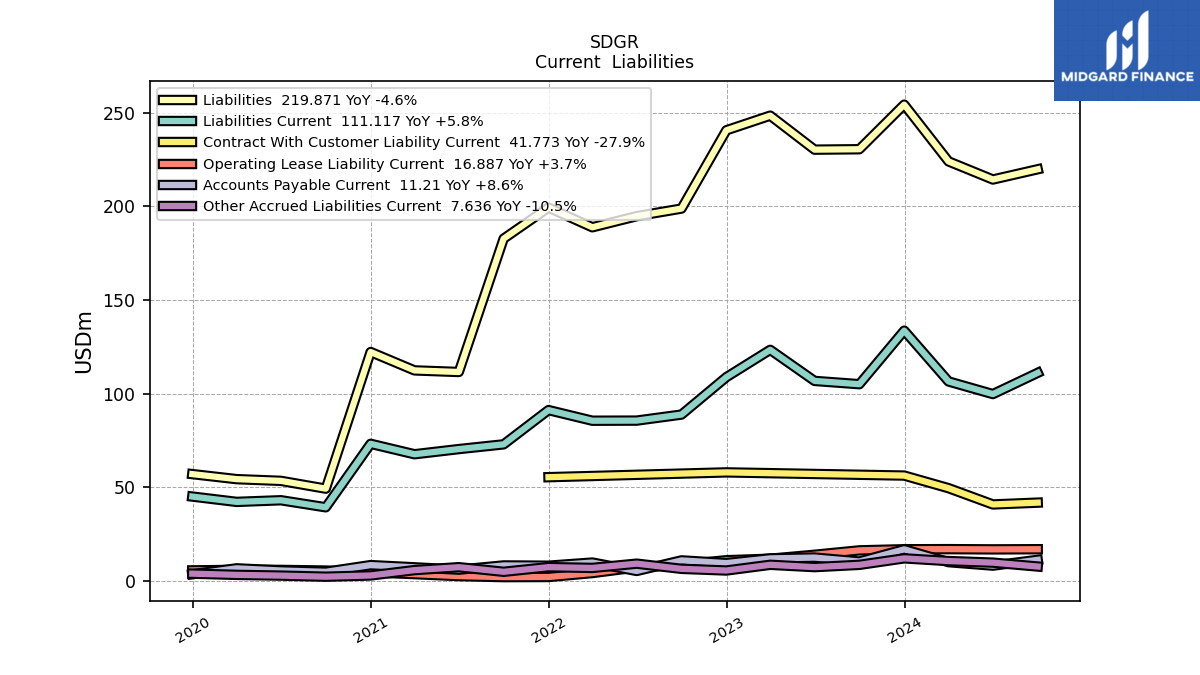
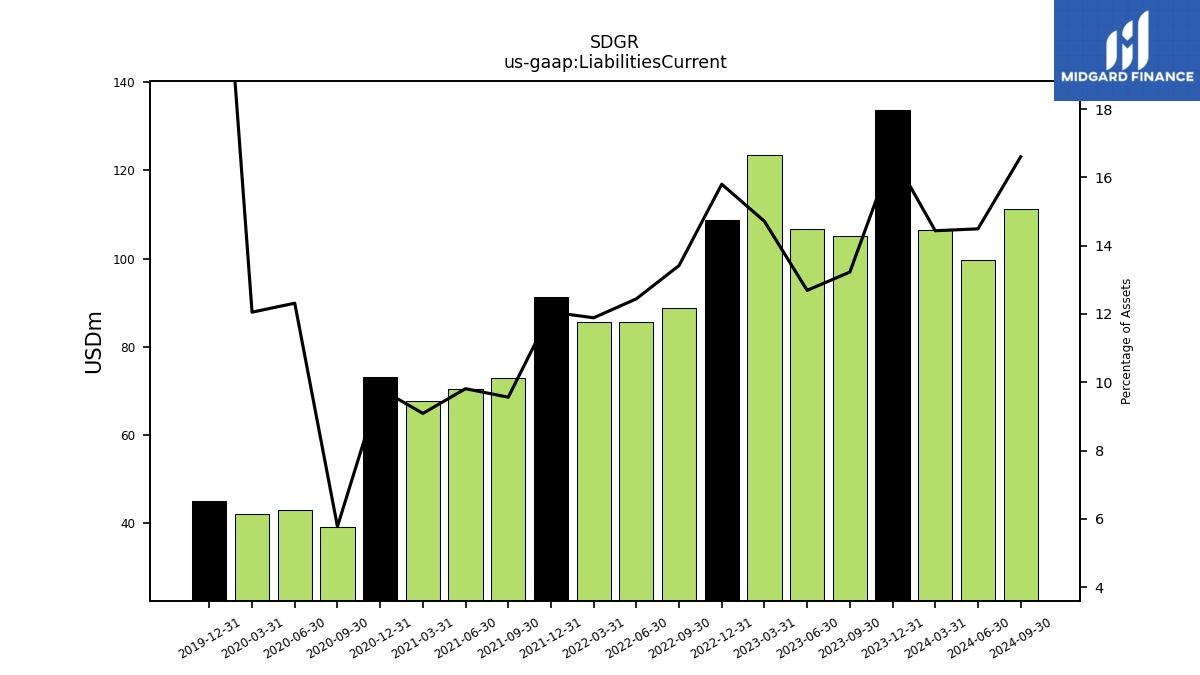
| Liabilities Current | 106.51 | 133.67 | 105.04 | 106.80 | 123.41 | 108.80 | 88.82 | 85.59 | 85.53 | 91.21 | 72.92 | 70.38 | 67.62 | 73.20 | 39.28 | 43.05 | 42.17 | 45.02 | NA | NA | NA | |
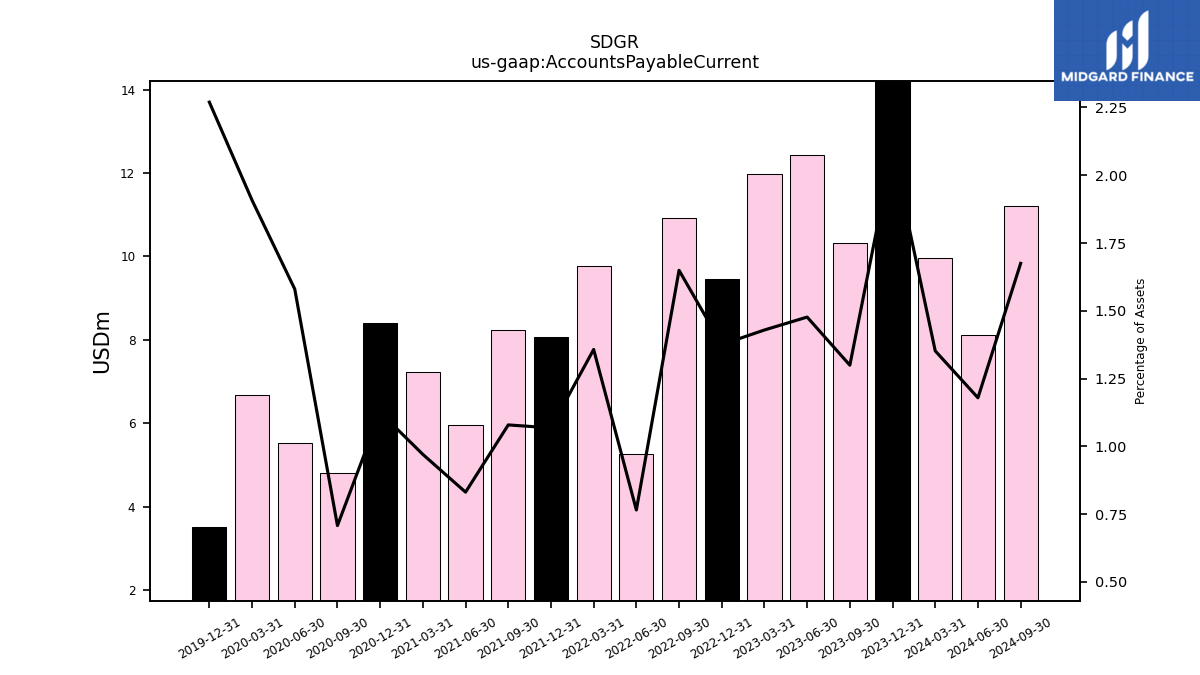
| Accounts Payable Current | 9.97 | 16.82 | 10.32 | 12.43 | 11.99 | 9.47 | 10.92 | 5.26 | 9.77 | 8.08 | 8.23 | 5.96 | 7.22 | 8.40 | 4.81 | 5.52 | 6.67 | 3.52 | NA | NA | NA | |
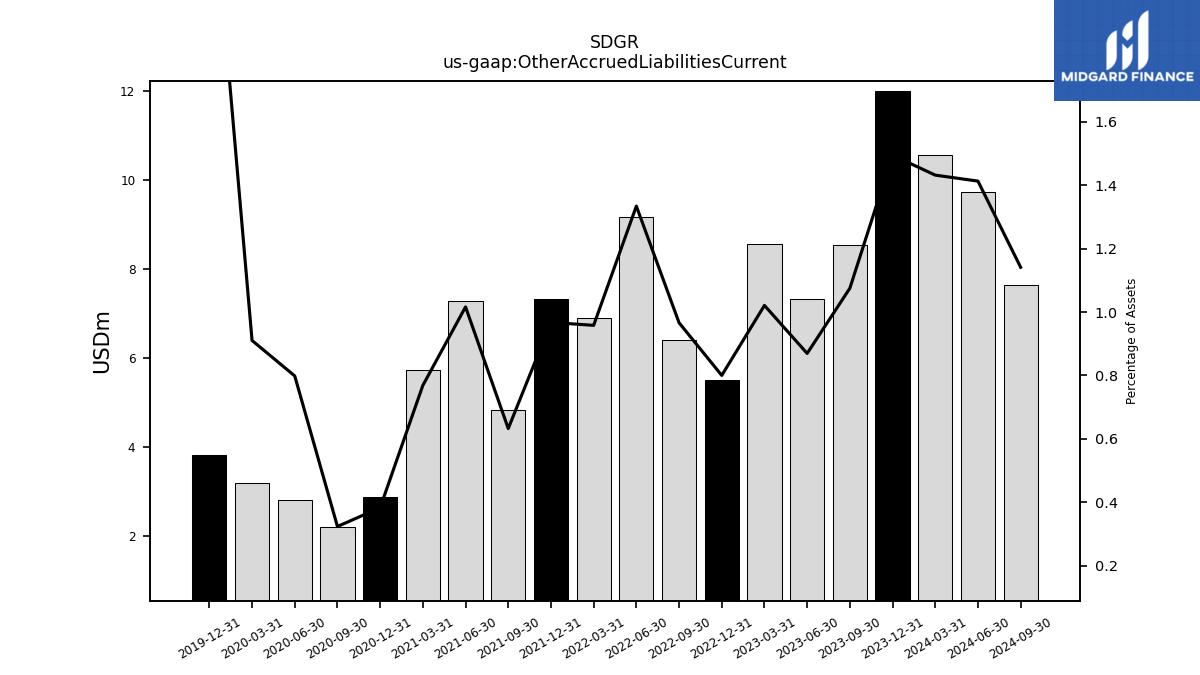
| Other Accrued Liabilities Current | 10.56 | 12.00 | 8.54 | 7.32 | 8.56 | 5.51 | 6.40 | 9.17 | 6.89 | 7.32 | 4.83 | 7.29 | 5.72 | 2.86 | 2.20 | 2.79 | 3.19 | 3.82 | NA | NA | NA | |
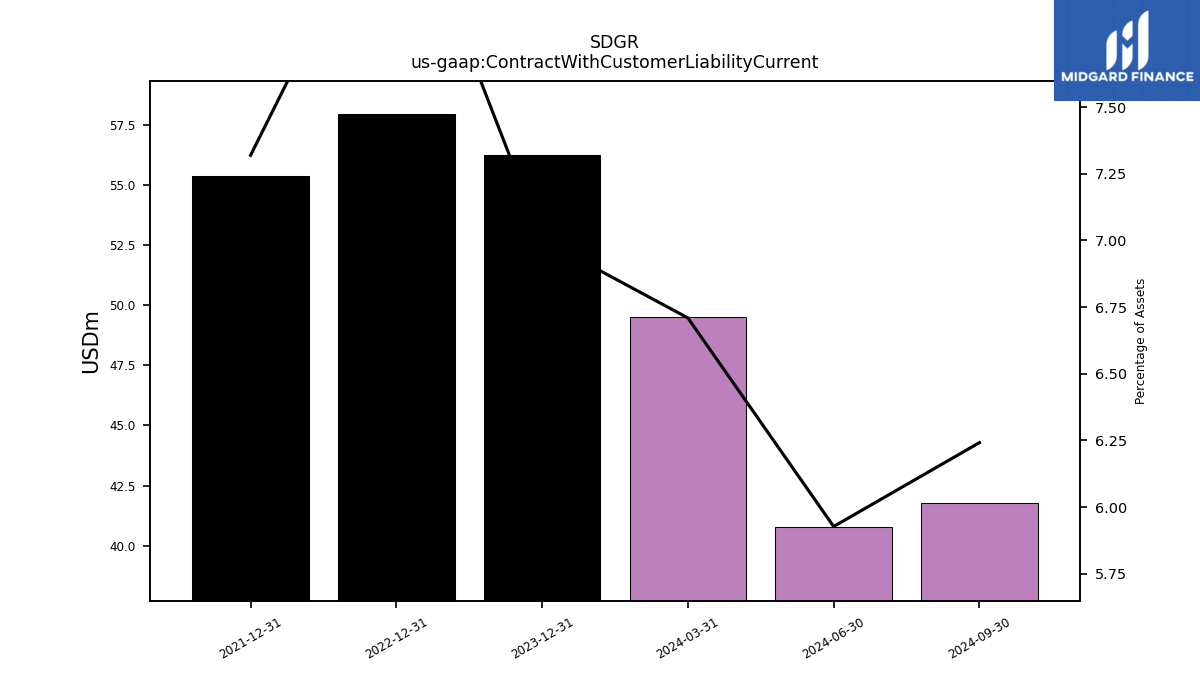
| Contract With Customer Liability Current | 49.50 | 56.23 | NA | NA | NA | 57.93 | NA | NA | NA | 55.37 | NA | NA | NA | NA | NA | NA | NA | NA | NA | NA | NA |
| 2024-03-31 | 2023-12-31 | 2023-09-30 | 2023-06-30 | 2023-03-31 | 2022-12-31 | 2022-09-30 | 2022-06-30 | 2022-03-31 | 2021-12-31 | 2021-09-30 | 2021-06-30 | 2021-03-31 | 2020-12-31 | 2020-09-30 | 2020-06-30 | 2020-03-31 | 2019-12-31 | 2019-09-30 | 2019-06-30 | 2019-03-31 | ||
|---|---|---|---|---|---|---|---|---|---|---|---|---|---|---|---|---|---|---|---|---|---|---|
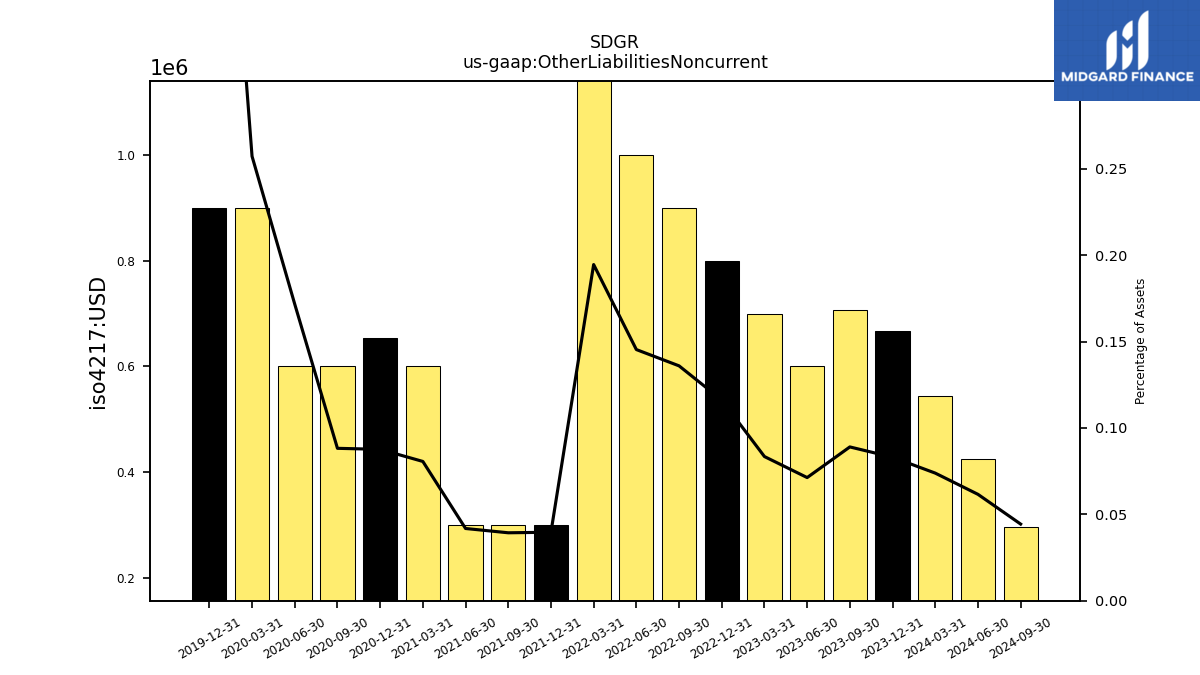
| Other Liabilities Noncurrent | 0.55 | 0.67 | 0.71 | 0.60 | 0.70 | 0.80 | 0.90 | 1.00 | 1.40 | 0.30 | 0.30 | 0.30 | 0.60 | 0.65 | 0.60 | 0.60 | 0.90 | 0.90 | NA | NA | NA | |
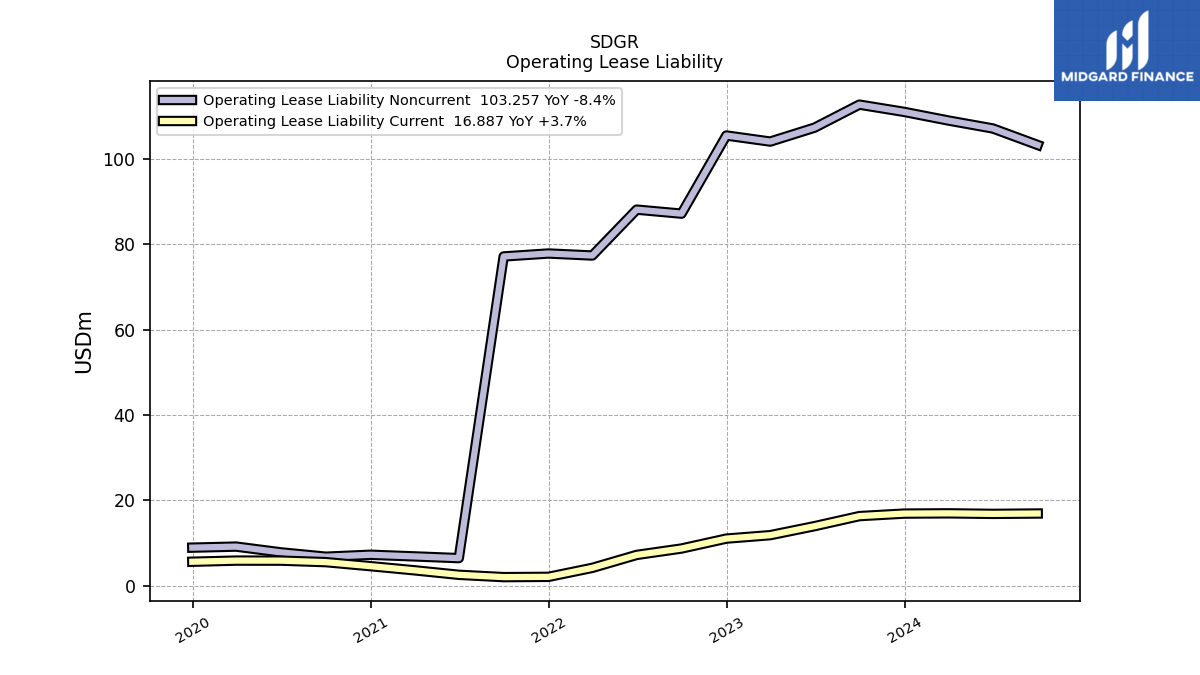
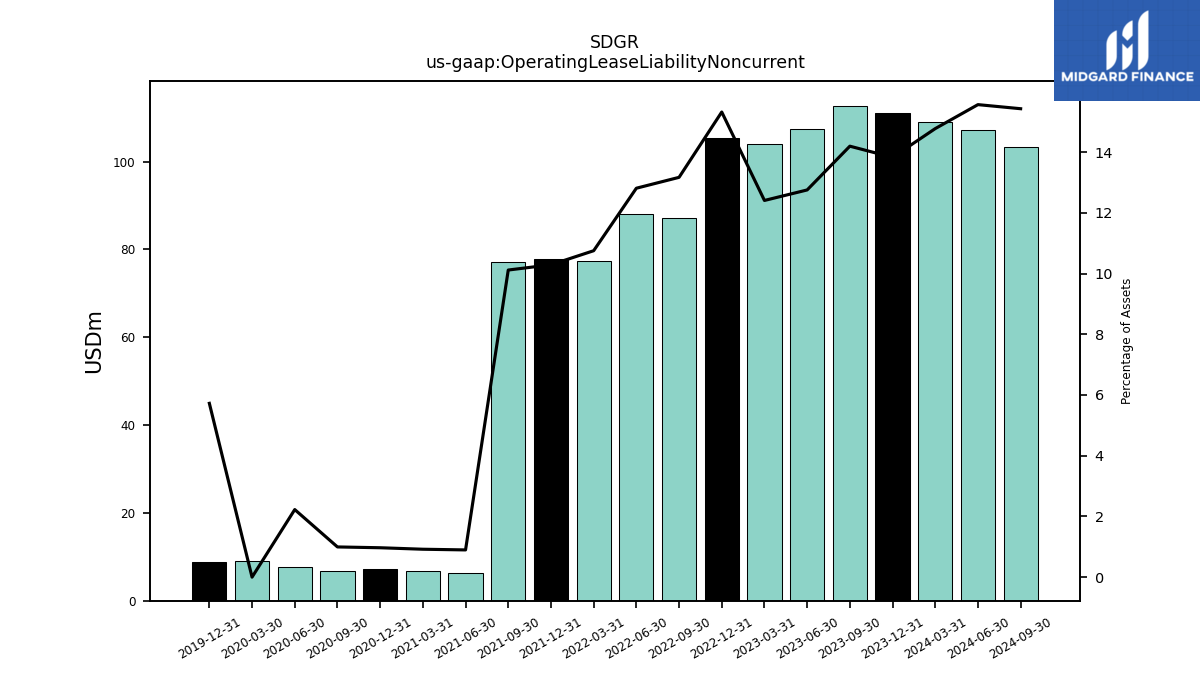
| Operating Lease Liability Noncurrent | 108.99 | 111.01 | 112.72 | 107.32 | 104.06 | 105.48 | 87.17 | 88.11 | 77.35 | 77.83 | 77.14 | 6.43 | 6.84 | 7.22 | 6.76 | 7.78 | NA | 8.89 | NA | NA | NA |
| 2024-03-31 | 2023-12-31 | 2023-09-30 | 2023-06-30 | 2023-03-31 | 2022-12-31 | 2022-09-30 | 2022-06-30 | 2022-03-31 | 2021-12-31 | 2021-09-30 | 2021-06-30 | 2021-03-31 | 2020-12-31 | 2020-09-30 | 2020-06-30 | 2020-03-31 | 2019-12-31 | 2019-09-30 | 2019-06-30 | 2019-03-31 | ||
|---|---|---|---|---|---|---|---|---|---|---|---|---|---|---|---|---|---|---|---|---|---|---|
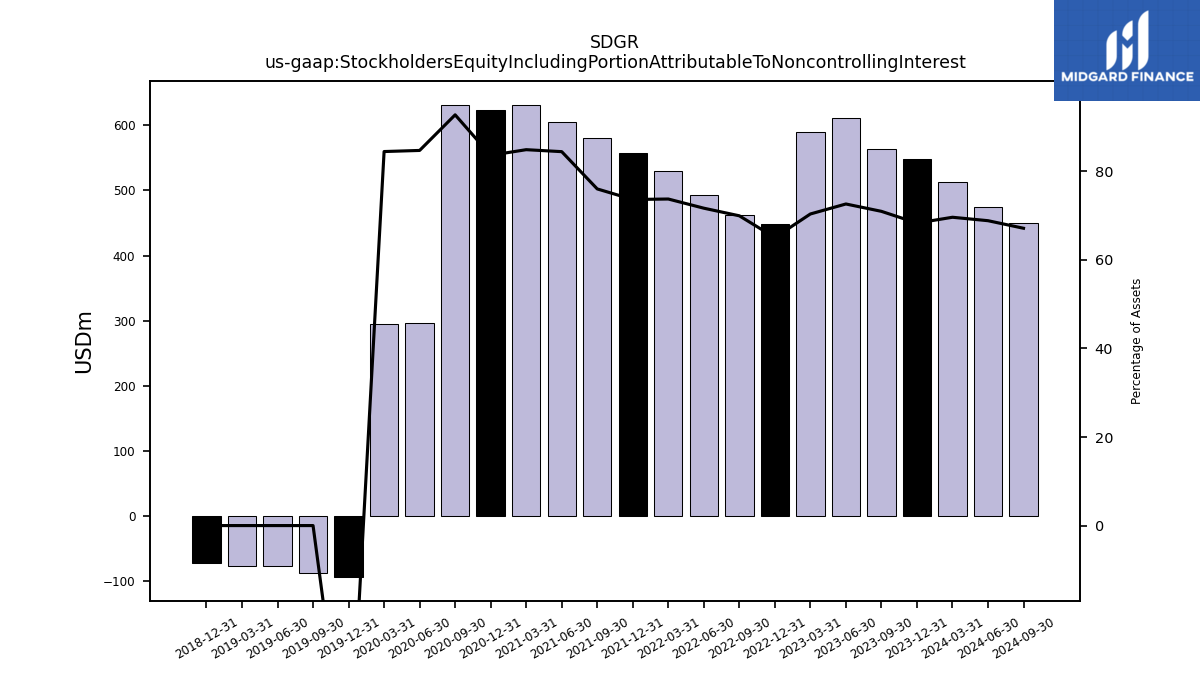
| Stockholders Equity | 513.71 | 548.56 | 563.58 | 611.23 | 590.26 | 447.89 | 463.11 | 493.06 | 530.67 | 557.07 | 579.81 | 605.75 | 631.77 | 624.01 | 630.88 | 296.12 | 295.52 | -93.36 | NA | NA | NA | |
| Stockholders Equity Including Portion Attributable To Noncontrolling Interest | 513.71 | 548.56 | 563.58 | 611.23 | 590.26 | 447.90 | 463.12 | 493.07 | 530.67 | 557.09 | 579.82 | 605.77 | 631.78 | 624.02 | 630.89 | 296.15 | 295.55 | -93.32 | -87.25 | -76.55 | -76.66 | |
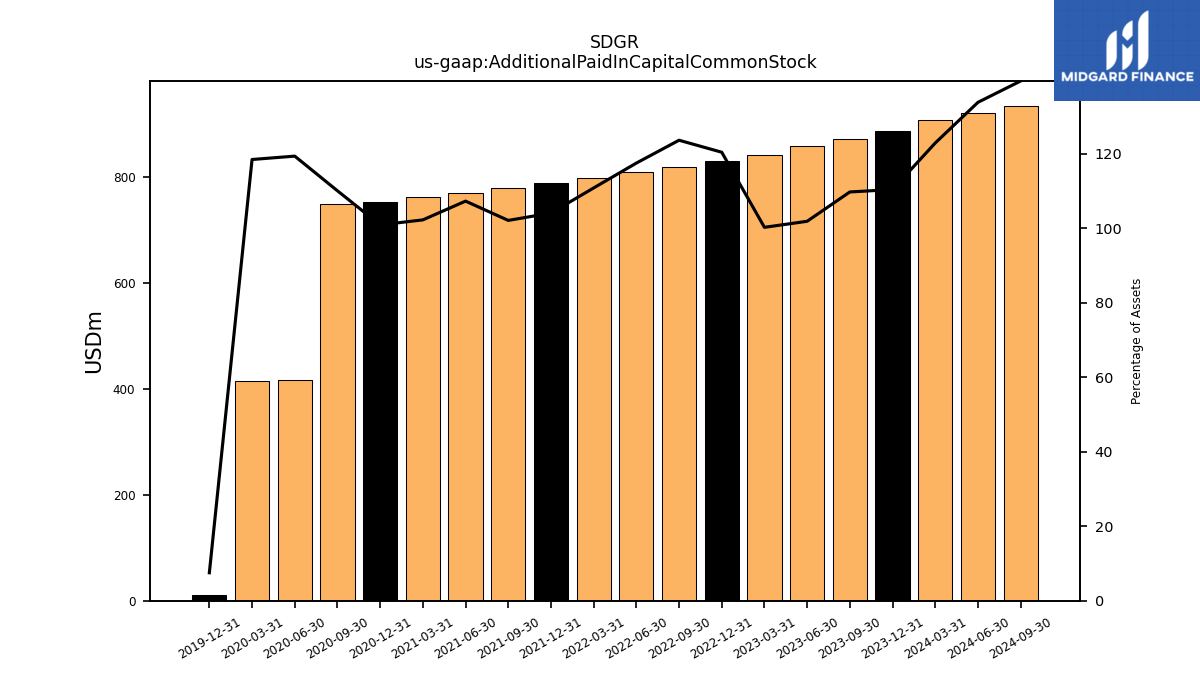
| Additional Paid In Capital Common Stock | 906.19 | 885.97 | 871.10 | 856.91 | 840.45 | 828.70 | 818.01 | 807.83 | 797.00 | 786.96 | 778.29 | 769.20 | 760.57 | 752.56 | 748.12 | 417.03 | 414.25 | 11.65 | NA | NA | NA | |
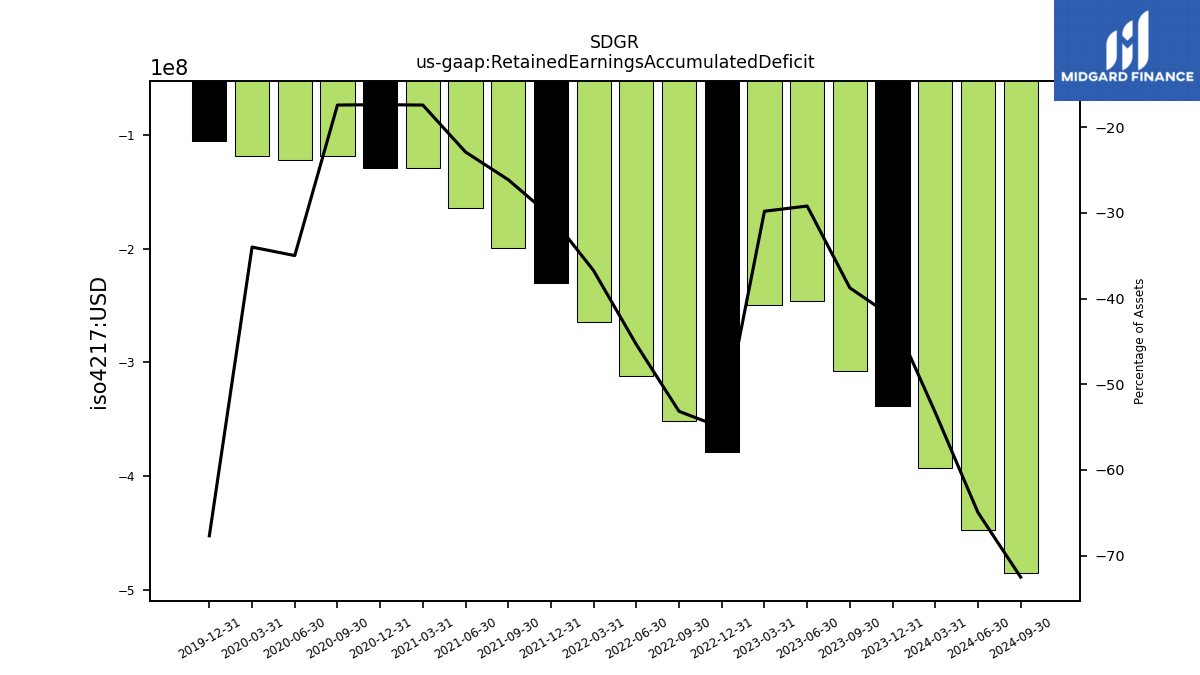
| Retained Earnings Accumulated Deficit | -393.14 | -338.42 | -307.75 | -245.72 | -250.00 | -379.14 | -351.93 | -312.08 | -264.39 | -229.95 | -199.24 | -164.23 | -129.59 | -129.56 | -118.42 | -122.27 | -118.92 | -105.10 | NA | NA | NA | |
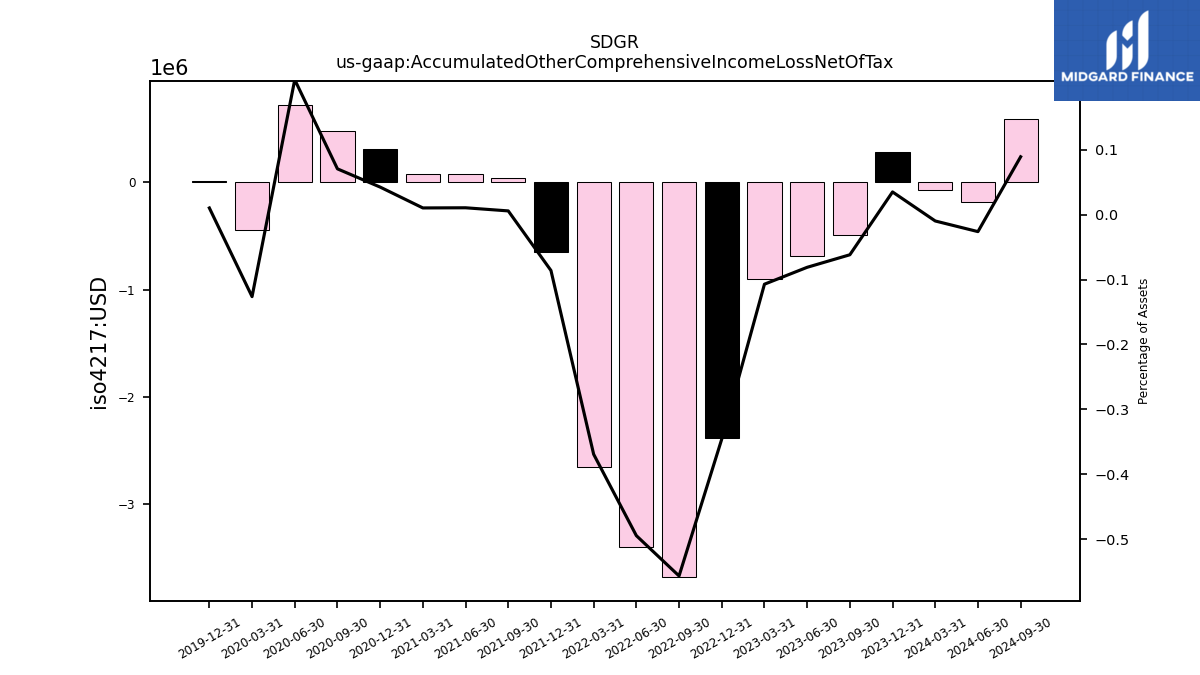
| Accumulated Other Comprehensive Income Loss Net Of Tax | -0.07 | 0.28 | -0.49 | -0.68 | -0.90 | -2.38 | -3.69 | -3.40 | -2.66 | -0.65 | 0.04 | 0.08 | 0.08 | 0.32 | 0.48 | 0.73 | -0.44 | 0.02 | NA | NA | NA | |
| Stock Issued During Period Value New Issues | 7.62 | NA | NA | NA | NA | NA | NA | NA | NA | NA | NA | NA | NA | NA | 325.60 | NA | 209.63 | NA | NA | NA | NA | |
| Adjustments To Additional Paid In Capital Sharebased Compensation Requisite Service Period Recognition Value | 12.22 | NA | 12.65 | 11.77 | 10.88 | NA | 9.86 | 10.43 | 9.13 | NA | 7.65 | 7.02 | 4.37 | NA | 3.04 | 2.73 | 1.77 | NA | 0.56 | 0.53 | 0.52 |
| 2024-03-31 | 2023-12-31 | 2023-09-30 | 2023-06-30 | 2023-03-31 | 2022-12-31 | 2022-09-30 | 2022-06-30 | 2022-03-31 | 2021-12-31 | 2021-09-30 | 2021-06-30 | 2021-03-31 | 2020-12-31 | 2020-09-30 | 2020-06-30 | 2020-03-31 | 2019-12-31 | 2019-09-30 | 2019-06-30 | 2019-03-31 | ||
|---|---|---|---|---|---|---|---|---|---|---|---|---|---|---|---|---|---|---|---|---|---|---|
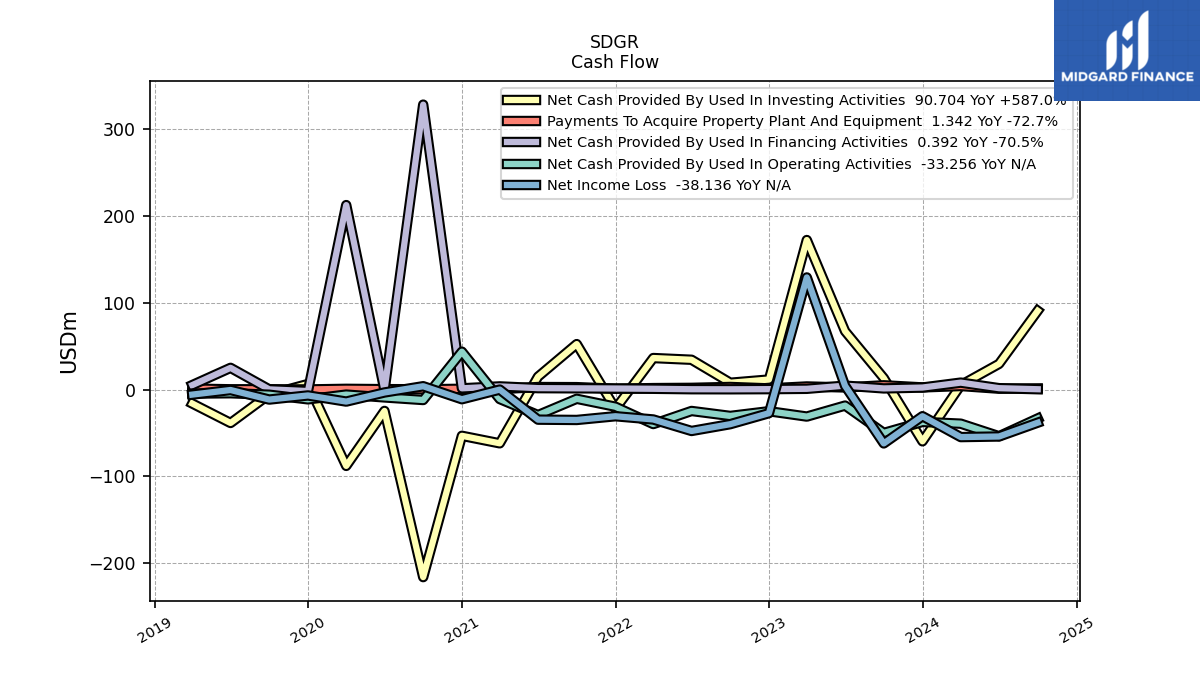
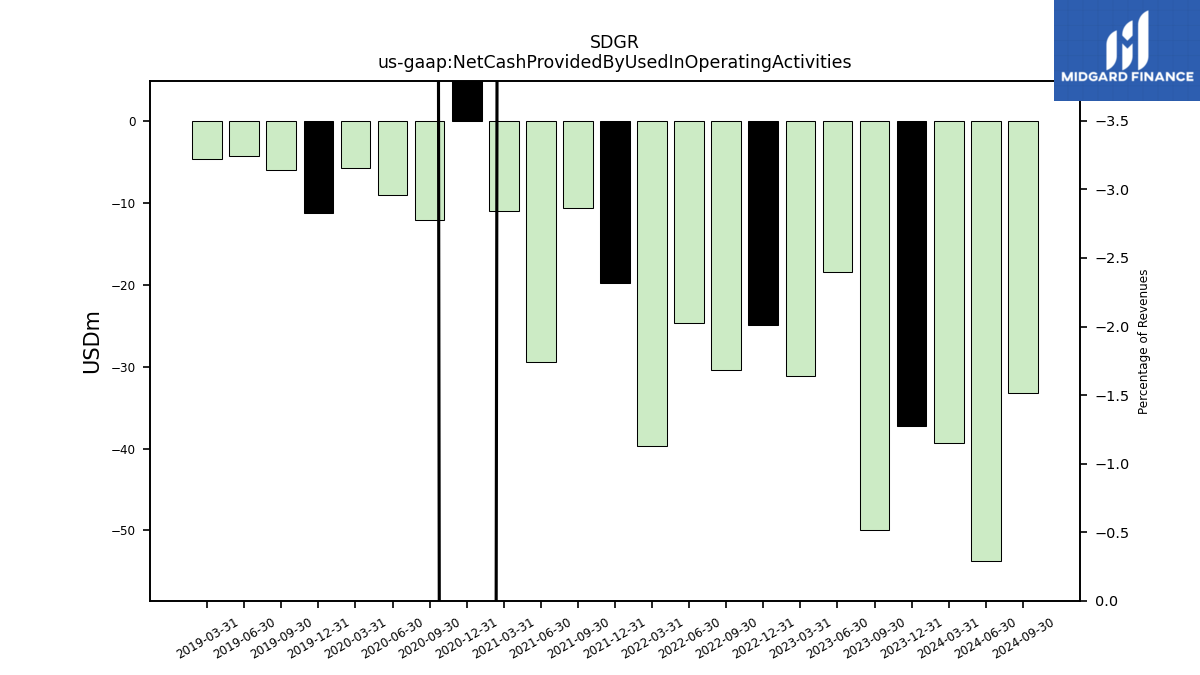
| Net Cash Provided By Used In Operating Activities | -39.28 | -37.26 | -49.94 | -18.44 | -31.09 | -24.94 | -30.36 | -24.66 | -39.72 | -19.74 | -10.64 | -29.37 | -10.92 | 43.62 | -12.03 | -9.05 | -5.78 | -11.27 | -5.93 | -4.24 | -4.62 | |
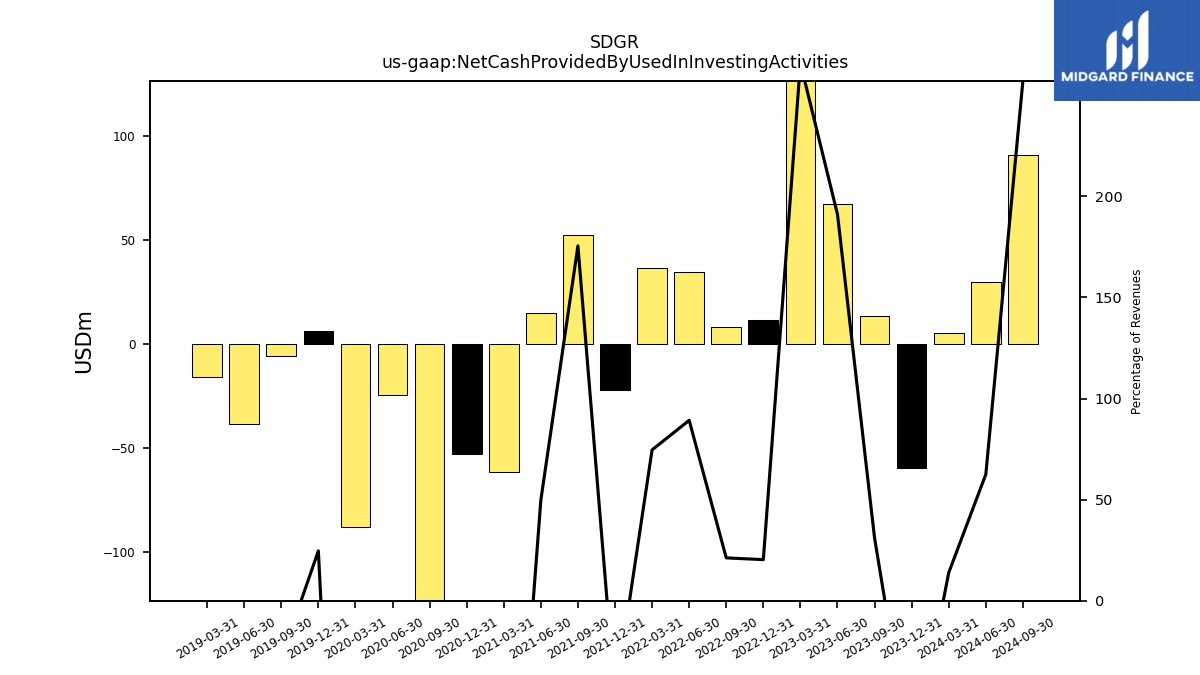
| Net Cash Provided By Used In Investing Activities | 5.08 | -59.61 | 13.20 | 67.24 | 172.20 | 11.56 | 7.84 | 34.32 | 36.30 | -22.09 | 52.38 | 14.81 | -61.91 | -53.24 | -215.98 | -24.59 | -87.91 | 6.38 | -5.66 | -38.49 | -16.08 | |
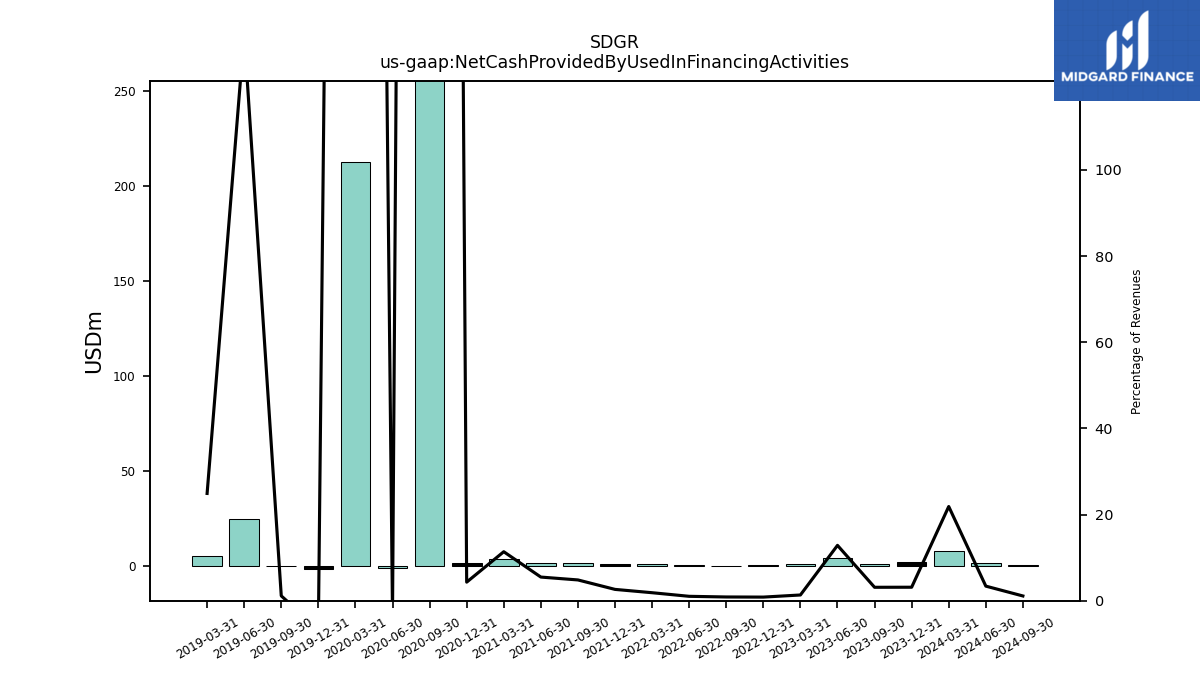
| Net Cash Provided By Used In Financing Activities | 8.01 | 2.33 | 1.33 | 4.52 | 0.87 | 0.48 | 0.32 | 0.40 | 0.91 | 1.22 | 1.44 | 1.64 | 3.66 | 1.43 | 328.12 | -0.73 | 212.45 | -1.72 | 0.23 | 25.01 | 5.17 |
| 2024-03-31 | 2023-12-31 | 2023-09-30 | 2023-06-30 | 2023-03-31 | 2022-12-31 | 2022-09-30 | 2022-06-30 | 2022-03-31 | 2021-12-31 | 2021-09-30 | 2021-06-30 | 2021-03-31 | 2020-12-31 | 2020-09-30 | 2020-06-30 | 2020-03-31 | 2019-12-31 | 2019-09-30 | 2019-06-30 | 2019-03-31 | ||
|---|---|---|---|---|---|---|---|---|---|---|---|---|---|---|---|---|---|---|---|---|---|---|
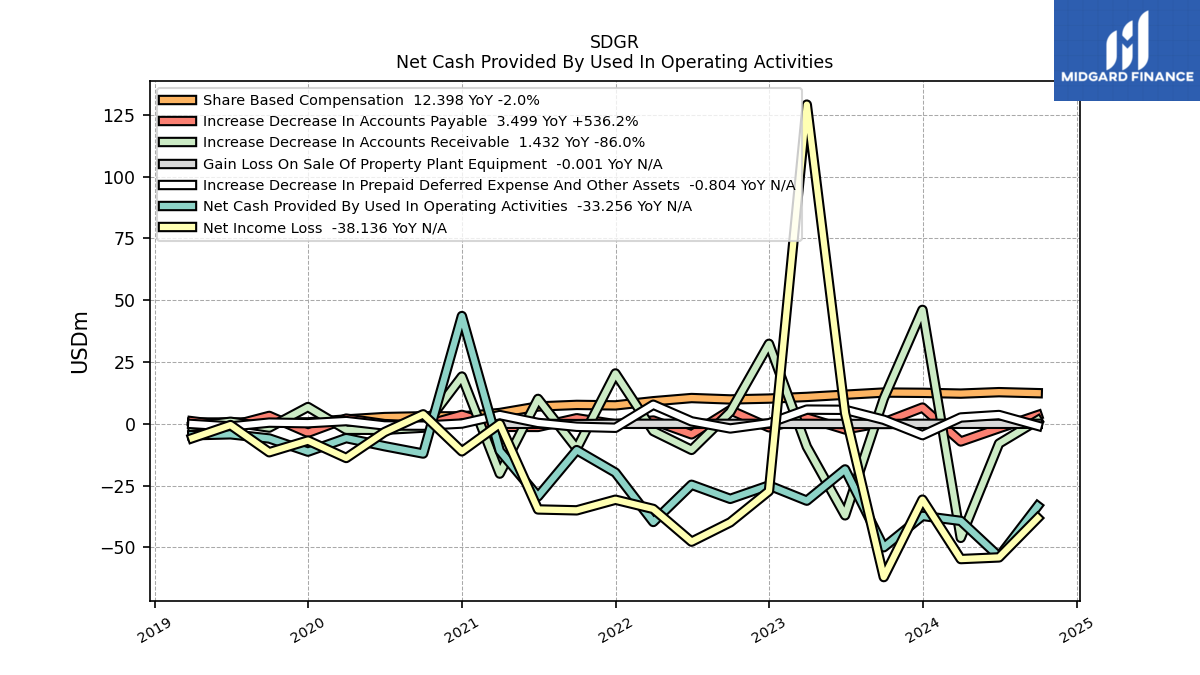
| Net Cash Provided By Used In Operating Activities | -39.28 | -37.26 | -49.94 | -18.44 | -31.09 | -24.94 | -30.36 | -24.66 | -39.72 | -19.74 | -10.64 | -29.37 | -10.92 | 43.62 | -12.03 | -9.05 | -5.78 | -11.27 | -5.93 | -4.24 | -4.62 | |
| Net Income Loss | -54.72 | -30.67 | -62.02 | 4.28 | 129.14 | -27.21 | -39.85 | -47.69 | -34.44 | -30.71 | -35.01 | -34.64 | -0.03 | -11.14 | 3.85 | -3.35 | -13.83 | -6.77 | -11.51 | -0.50 | -5.79 | |
| Profit Loss | -54.72 | -30.67 | -62.02 | 4.28 | 129.14 | -27.21 | -39.86 | -47.67 | -34.45 | -30.71 | -35.01 | -34.97 | -0.52 | -11.59 | 3.29 | -4.07 | -14.27 | -7.14 | -11.96 | -0.73 | -5.85 | |
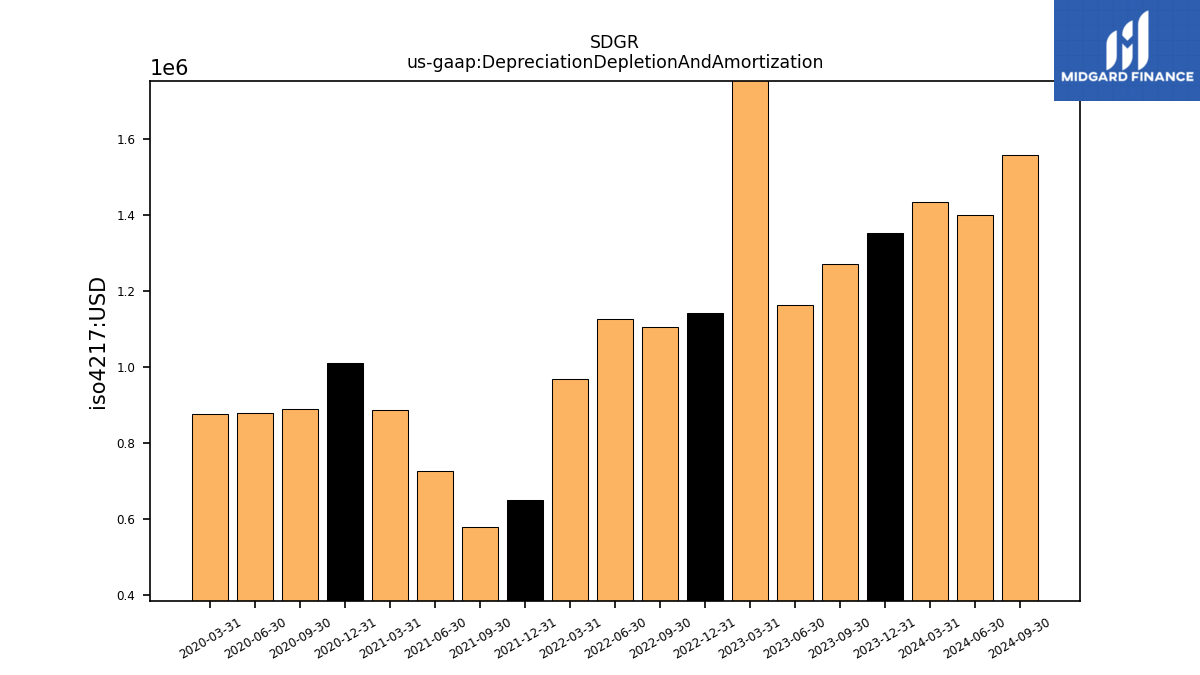
| Depreciation Depletion And Amortization | 1.44 | 1.35 | 1.27 | 1.17 | 1.76 | 1.14 | 1.11 | 1.13 | 0.97 | 0.65 | 0.58 | 0.73 | 0.89 | 1.01 | 0.89 | 0.88 | 0.88 | NA | NA | NA | NA | |
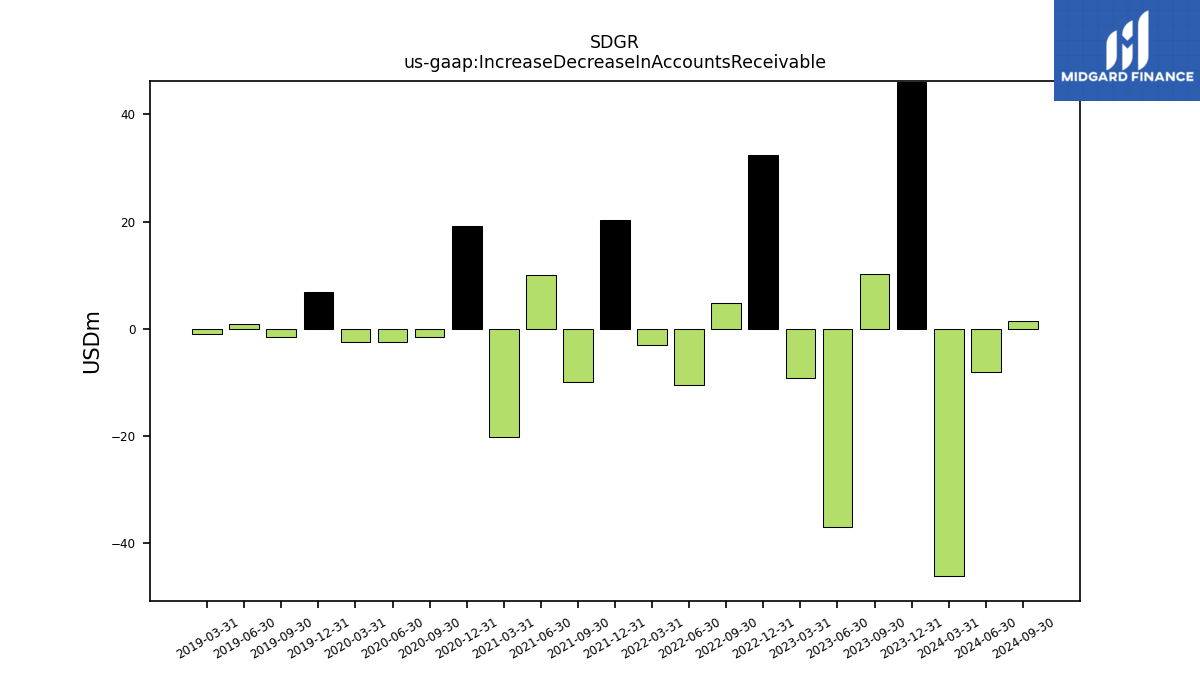
| Increase Decrease In Accounts Receivable | -46.15 | 46.11 | 10.23 | -37.04 | -9.26 | 32.37 | 4.82 | -10.55 | -2.94 | 20.39 | -10.01 | 10.09 | -20.15 | 19.13 | -1.56 | -2.42 | -2.40 | 6.80 | -1.53 | 0.83 | -1.06 | |
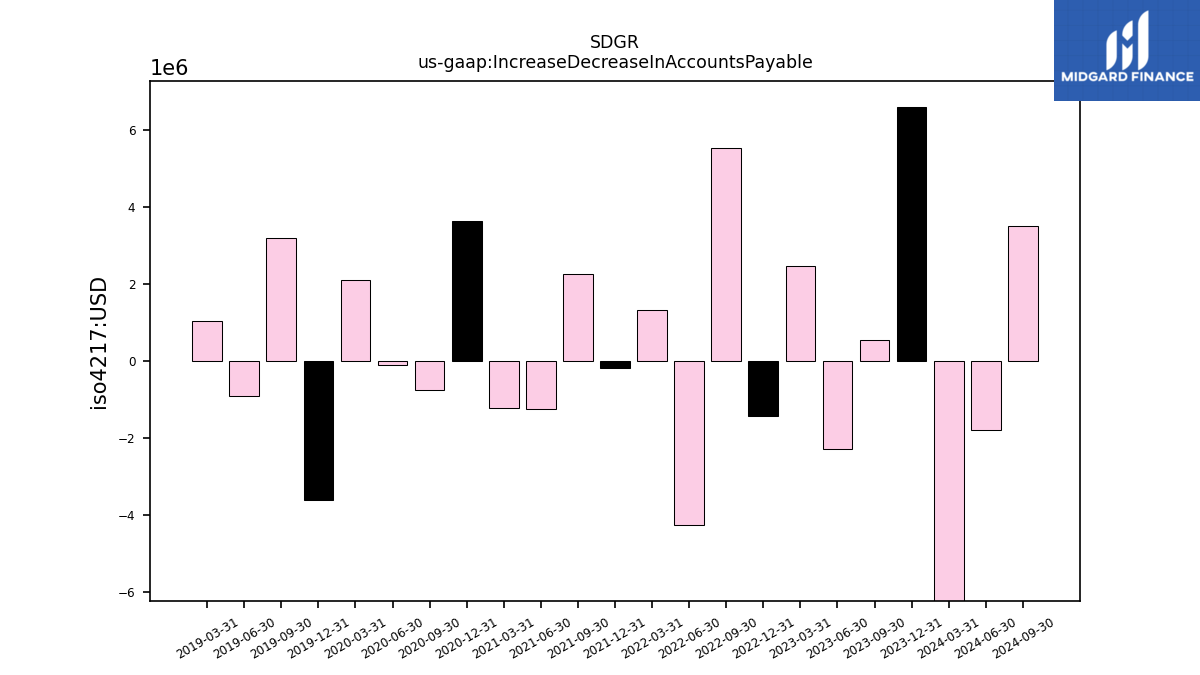
| Increase Decrease In Accounts Payable | -7.15 | 6.58 | 0.55 | -2.28 | 2.47 | -1.42 | 5.54 | -4.27 | 1.33 | -0.18 | 2.26 | -1.26 | -1.23 | 3.63 | -0.74 | -0.11 | 2.11 | -3.62 | 3.20 | -0.91 | 1.03 | |
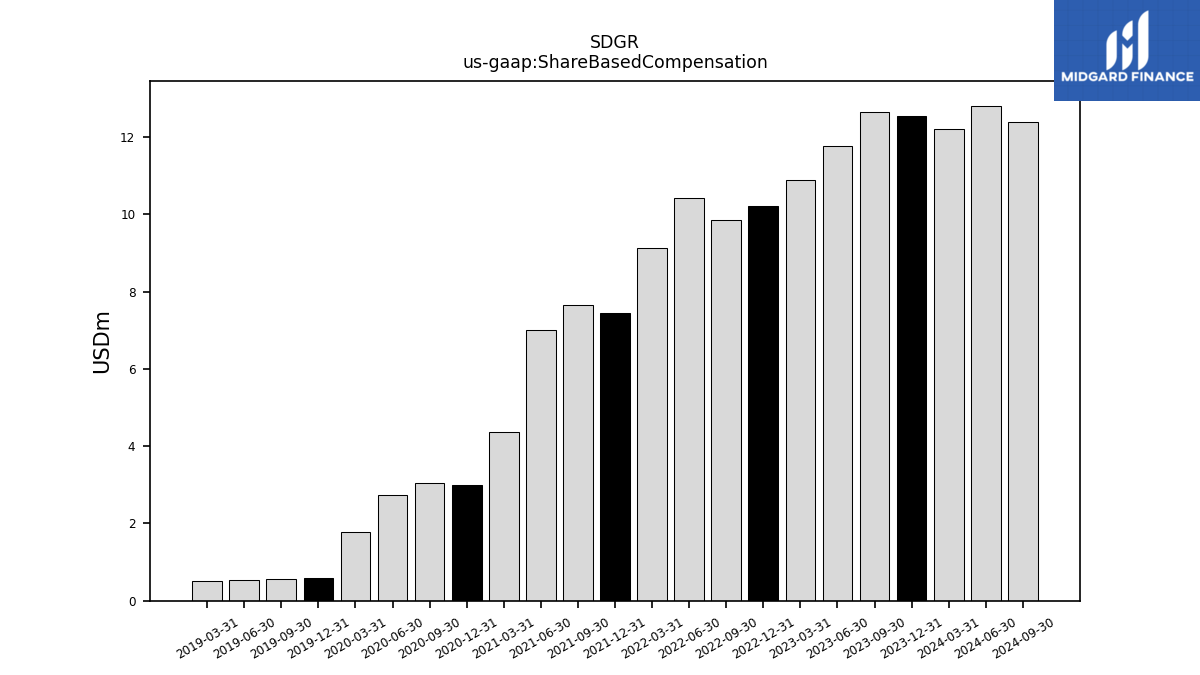
| Share Based Compensation | 12.22 | 12.53 | 12.65 | 11.77 | 10.88 | 10.21 | 9.86 | 10.43 | 9.13 | 7.46 | 7.65 | 7.02 | 4.37 | 3.00 | 3.04 | 2.73 | 1.77 | 0.58 | 0.56 | 0.53 | 0.52 |
| 2024-03-31 | 2023-12-31 | 2023-09-30 | 2023-06-30 | 2023-03-31 | 2022-12-31 | 2022-09-30 | 2022-06-30 | 2022-03-31 | 2021-12-31 | 2021-09-30 | 2021-06-30 | 2021-03-31 | 2020-12-31 | 2020-09-30 | 2020-06-30 | 2020-03-31 | 2019-12-31 | 2019-09-30 | 2019-06-30 | 2019-03-31 | ||
|---|---|---|---|---|---|---|---|---|---|---|---|---|---|---|---|---|---|---|---|---|---|---|
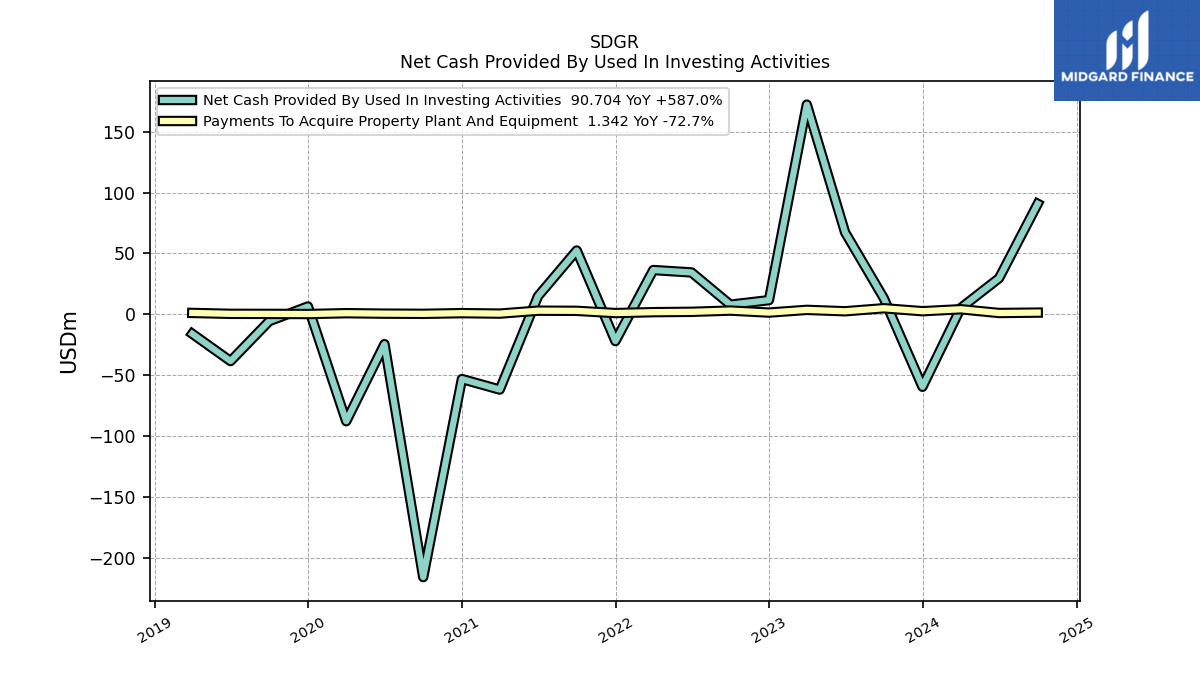
| Net Cash Provided By Used In Investing Activities | 5.08 | -59.61 | 13.20 | 67.24 | 172.20 | 11.56 | 7.84 | 34.32 | 36.30 | -22.09 | 52.38 | 14.81 | -61.91 | -53.24 | -215.98 | -24.59 | -87.91 | 6.38 | -5.66 | -38.49 | -16.08 | |
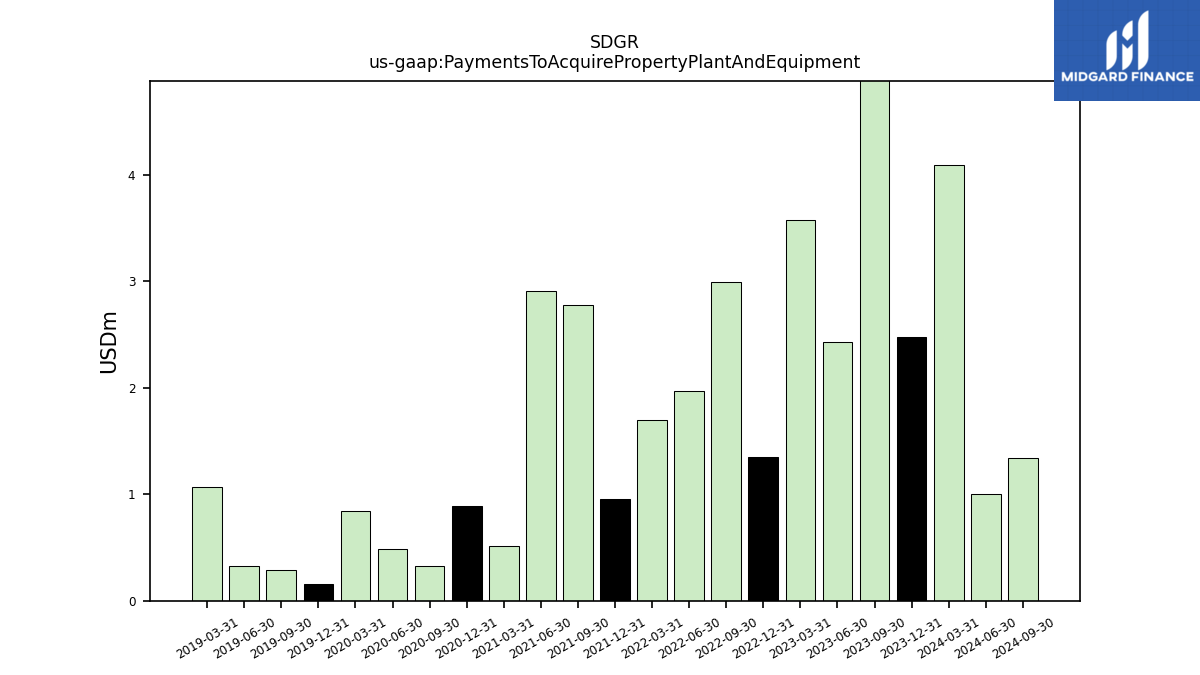
| Payments To Acquire Property Plant And Equipment | 4.09 | 2.48 | 4.92 | 2.43 | 3.58 | 1.35 | 3.00 | 1.97 | 1.70 | 0.96 | 2.78 | 2.91 | 0.51 | 0.89 | 0.33 | 0.48 | 0.84 | 0.16 | 0.29 | 0.33 | 1.06 |
| 2024-03-31 | 2023-12-31 | 2023-09-30 | 2023-06-30 | 2023-03-31 | 2022-12-31 | 2022-09-30 | 2022-06-30 | 2022-03-31 | 2021-12-31 | 2021-09-30 | 2021-06-30 | 2021-03-31 | 2020-12-31 | 2020-09-30 | 2020-06-30 | 2020-03-31 | 2019-12-31 | 2019-09-30 | 2019-06-30 | 2019-03-31 | ||
|---|---|---|---|---|---|---|---|---|---|---|---|---|---|---|---|---|---|---|---|---|---|---|
| Net Cash Provided By Used In Financing Activities | 8.01 | 2.33 | 1.33 | 4.52 | 0.87 | 0.48 | 0.32 | 0.40 | 0.91 | 1.22 | 1.44 | 1.64 | 3.66 | 1.43 | 328.12 | -0.73 | 212.45 | -1.72 | 0.23 | 25.01 | 5.17 |
| 2024-03-31 | 2023-12-31 | 2023-09-30 | 2023-06-30 | 2023-03-31 | 2022-12-31 | 2022-09-30 | 2022-06-30 | 2022-03-31 | 2021-12-31 | 2021-09-30 | 2021-06-30 | 2021-03-31 | 2020-12-31 | 2020-09-30 | 2020-06-30 | 2020-03-31 | 2019-12-31 | 2019-09-30 | 2019-06-30 | 2019-03-31 | ||
|---|---|---|---|---|---|---|---|---|---|---|---|---|---|---|---|---|---|---|---|---|---|---|
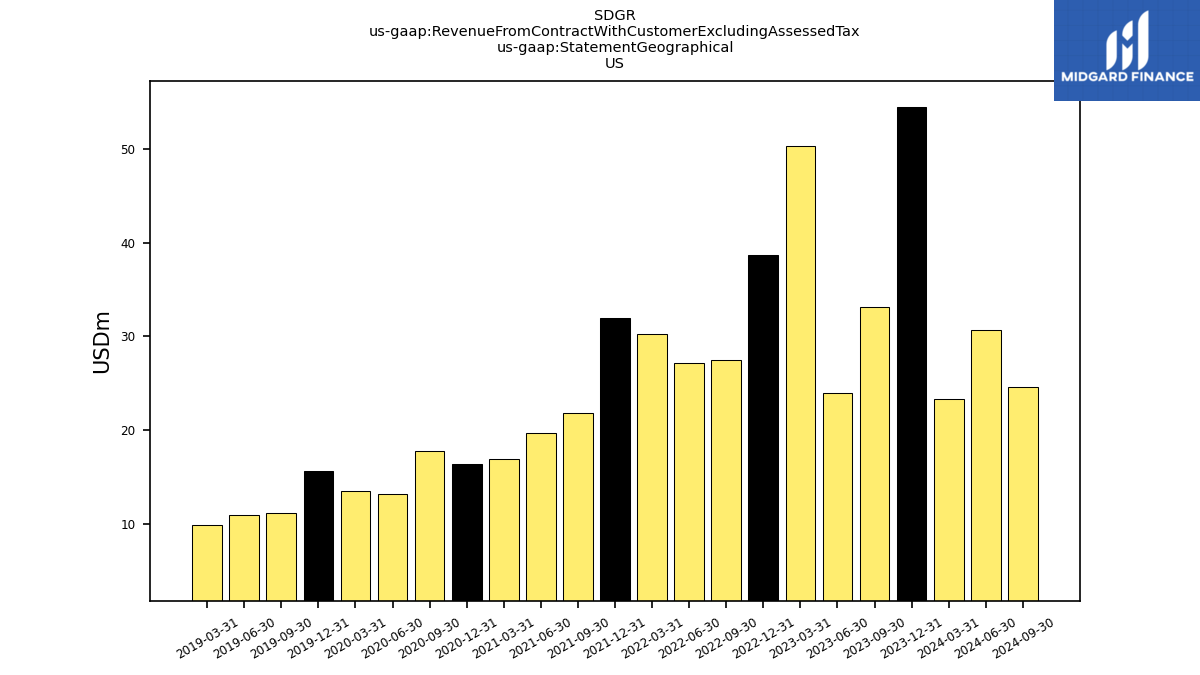
| Revenues | 36.60 | 74.13 | 42.57 | 35.19 | 64.78 | 56.84 | 36.98 | 38.47 | 48.66 | 46.17 | 29.85 | 29.78 | 32.13 | 33.03 | 25.80 | 23.09 | 26.17 | 25.83 | 19.96 | 19.01 | 20.74 | |
| Revenue From Contract With Customer Excluding Assessed Tax | 36.60 | 74.13 | 42.57 | 35.19 | 64.78 | 56.84 | 36.98 | 38.47 | 48.66 | 46.17 | 29.85 | 29.78 | 32.13 | 33.03 | 25.80 | 23.09 | 26.17 | 25.83 | 19.96 | 19.01 | 20.74 | |
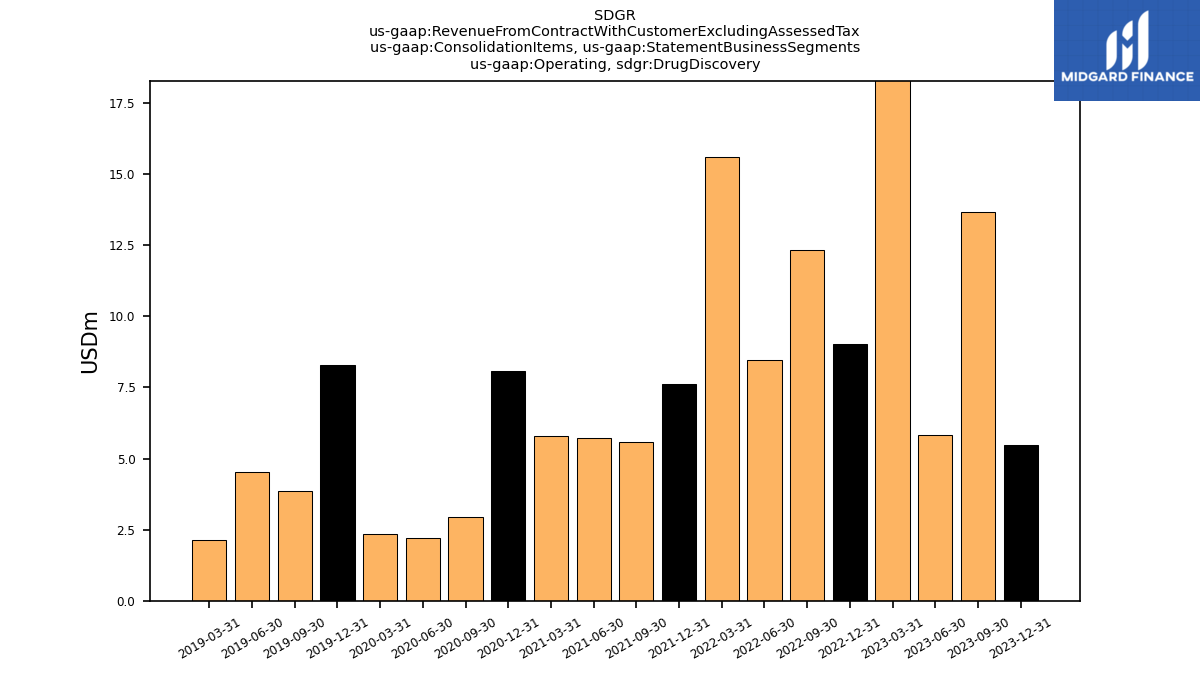
| Operating, Drug Discovery | 3.18 | 5.47 | 13.66 | 5.84 | 32.57 | 9.02 | 12.31 | 8.46 | 15.58 | 7.61 | 5.57 | 5.73 | 5.79 | 8.07 | 2.94 | 2.19 | 2.36 | 8.30 | 3.84 | 4.53 | 2.14 | |
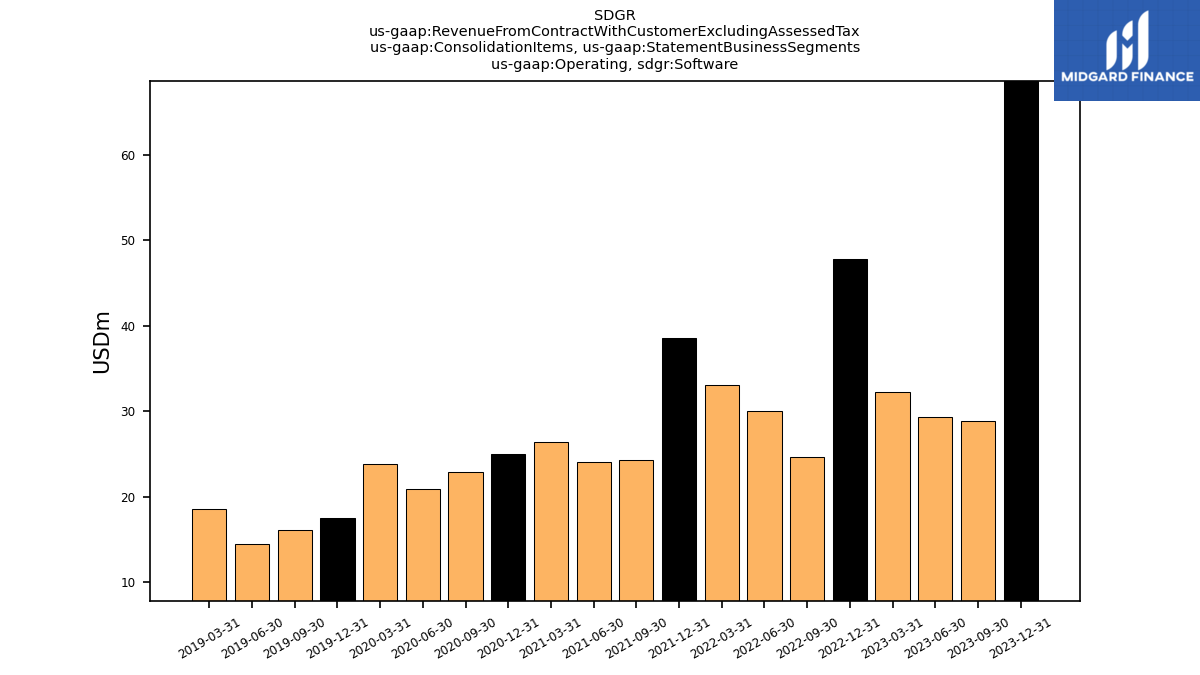
| Operating, Software | 33.41 | 68.66 | 28.90 | 29.35 | 32.21 | 47.82 | 24.67 | 30.01 | 33.08 | 38.56 | 24.28 | 24.05 | 26.34 | 24.96 | 22.86 | 20.90 | 23.81 | 17.53 | 16.12 | 14.48 | 18.61 | |
| Bill And Melinda Gates Foundation Trust, Drug Discovery Services, Related Party | 0.49 | NA | NA | NA | 0.77 | NA | NA | NA | NA | NA | NA | NA | NA | NA | NA | NA | NA | NA | NA | NA | NA | |
| Bill And Melinda Gates Foundation Trust, S W Services, Related Party | 0.01 | NA | NA | NA | 0.03 | NA | NA | NA | NA | NA | NA | NA | NA | NA | NA | NA | NA | NA | NA | NA | NA | |
| Bristol Myers Squibb, Collaboration And License Agreement | 1.50 | NA | NA | NA | 28.10 | NA | NA | NA | NA | NA | NA | NA | NA | NA | NA | NA | NA | NA | NA | NA | NA | |
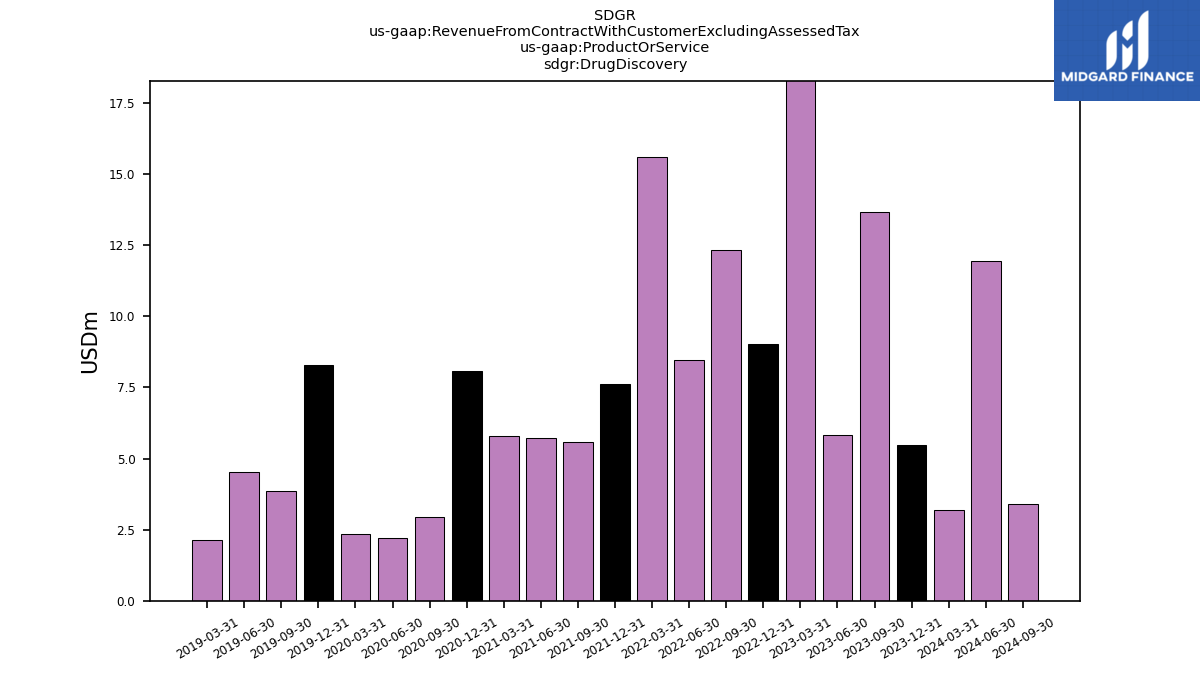
| Drug Discovery | 3.18 | 5.47 | 13.66 | 5.84 | 32.57 | 9.02 | 12.31 | 8.46 | 15.58 | 7.61 | 5.57 | 5.73 | 5.79 | 8.07 | 2.94 | 2.19 | 2.36 | 8.30 | 3.84 | 4.53 | 2.14 | |
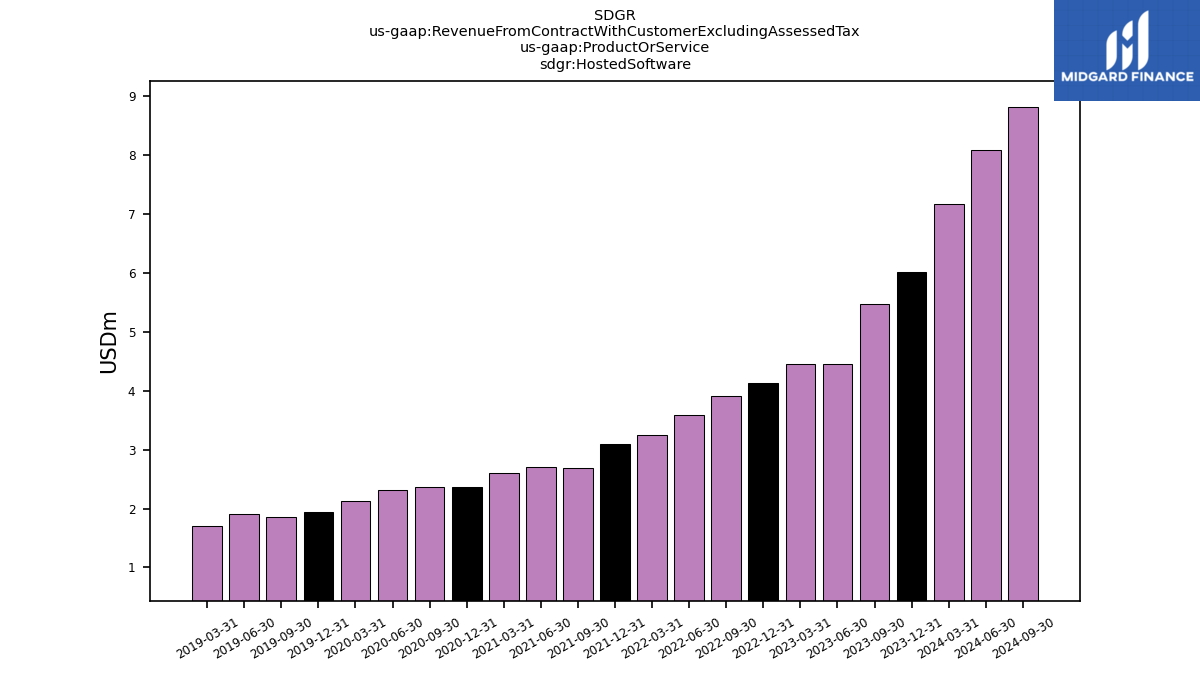
| Hosted Software | 7.18 | 6.01 | 5.46 | 4.45 | 4.45 | 4.12 | 3.91 | 3.60 | 3.25 | 3.09 | 2.68 | 2.70 | 2.60 | 2.37 | 2.37 | 2.31 | 2.13 | 1.93 | 1.86 | 1.91 | 1.71 | |
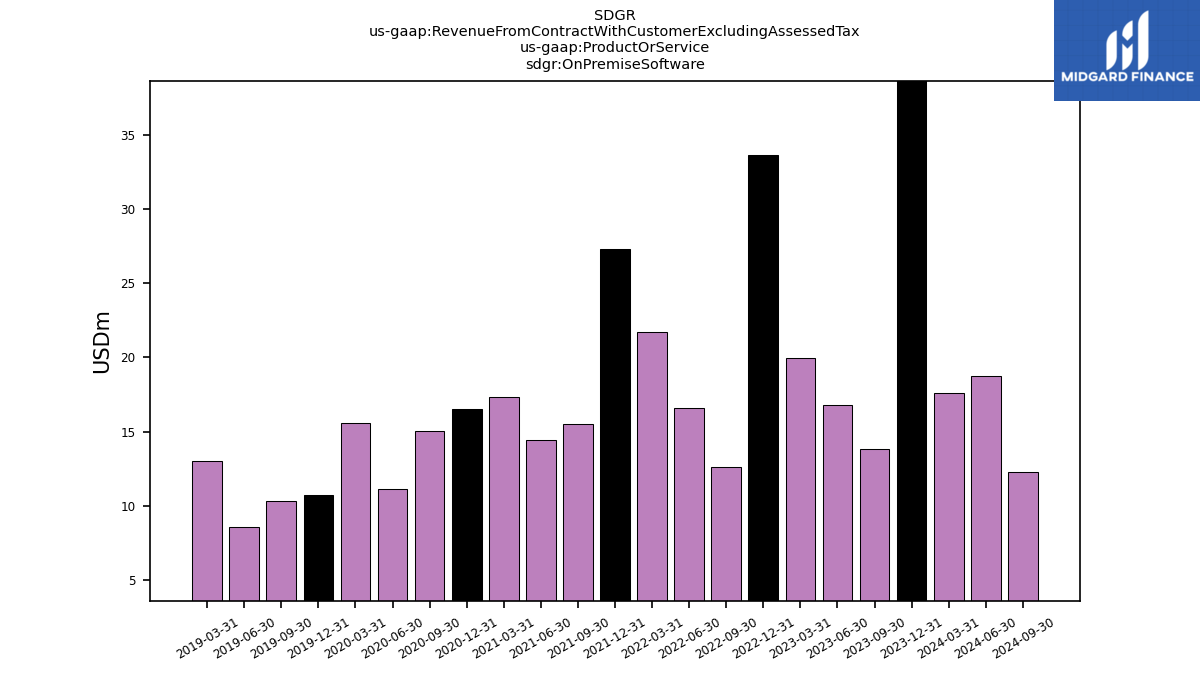
| On Premise Software | 17.62 | 53.95 | 13.81 | 16.81 | 19.94 | 33.63 | 12.58 | 16.59 | 21.69 | 27.30 | 15.50 | 14.45 | 17.36 | 16.54 | 15.06 | 11.11 | 15.60 | 10.72 | 10.30 | 8.60 | 13.02 | |
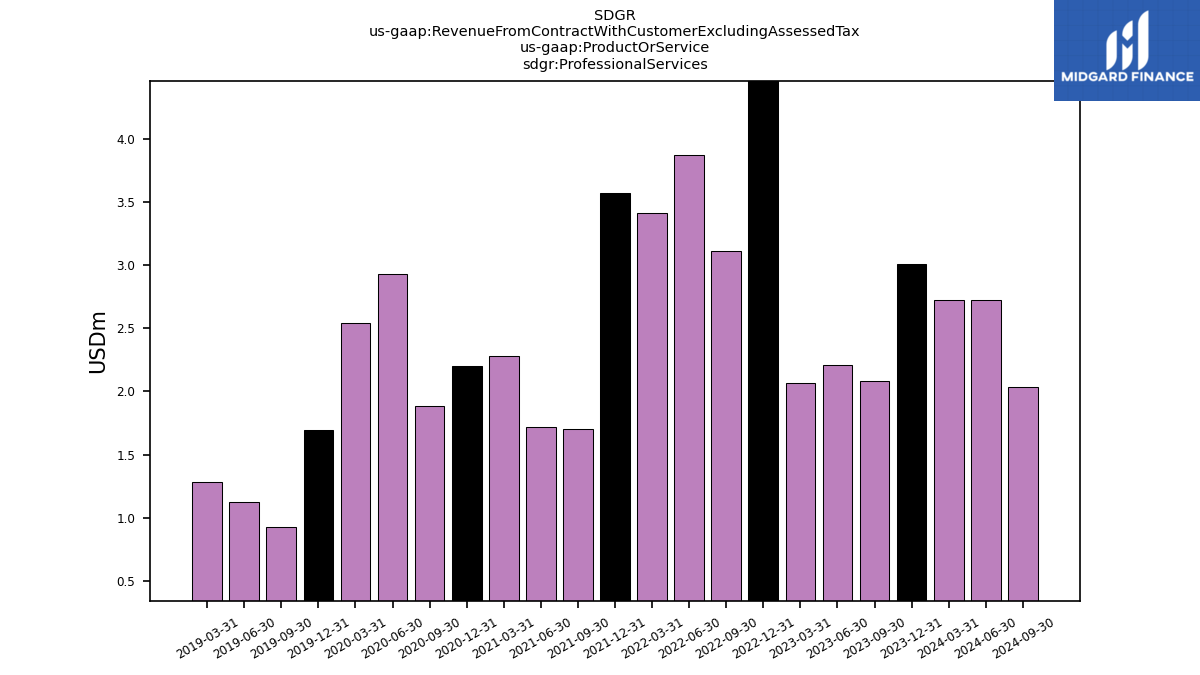
| Professional Services | 2.73 | 3.00 | 2.08 | 2.21 | 2.07 | 4.81 | 3.11 | 3.87 | 3.41 | 3.57 | 1.70 | 1.72 | 2.28 | 2.20 | 1.89 | 2.93 | 2.54 | 1.69 | 0.93 | 1.12 | 1.28 | |
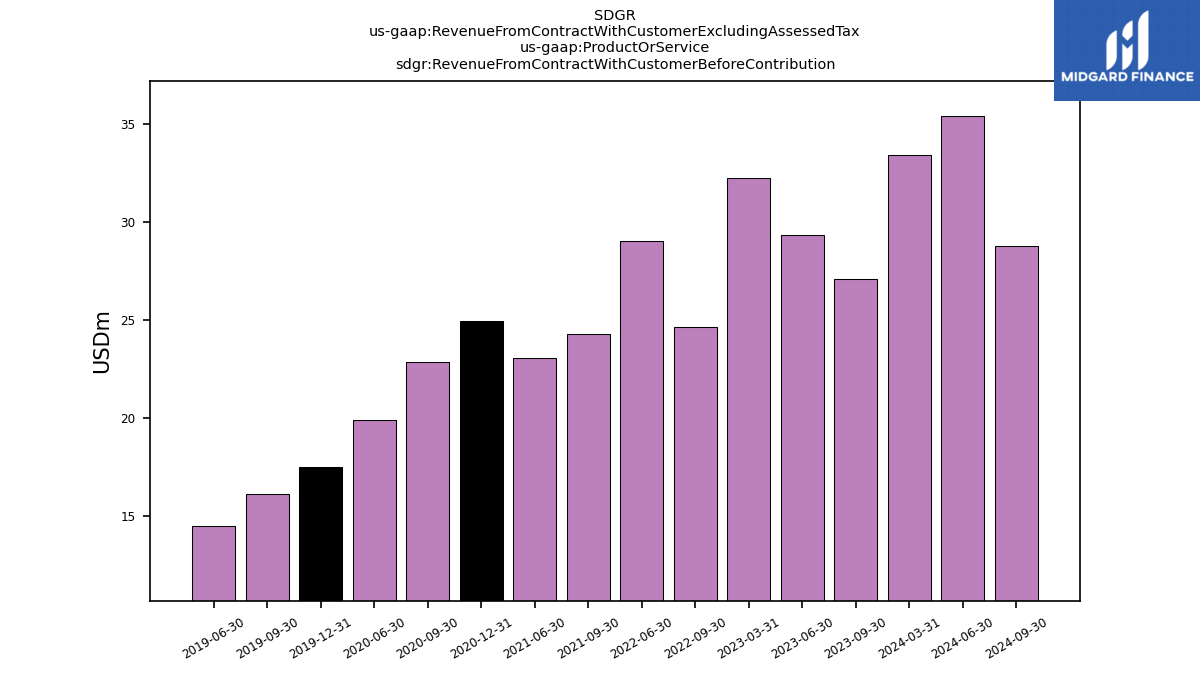
| Revenue From Contract With Customer Before Contribution | 33.41 | NA | 27.10 | 29.35 | 32.21 | NA | 24.67 | 29.01 | NA | NA | 24.28 | 23.05 | NA | 24.96 | 22.86 | 19.90 | NA | 17.53 | 16.12 | 14.48 | NA | |
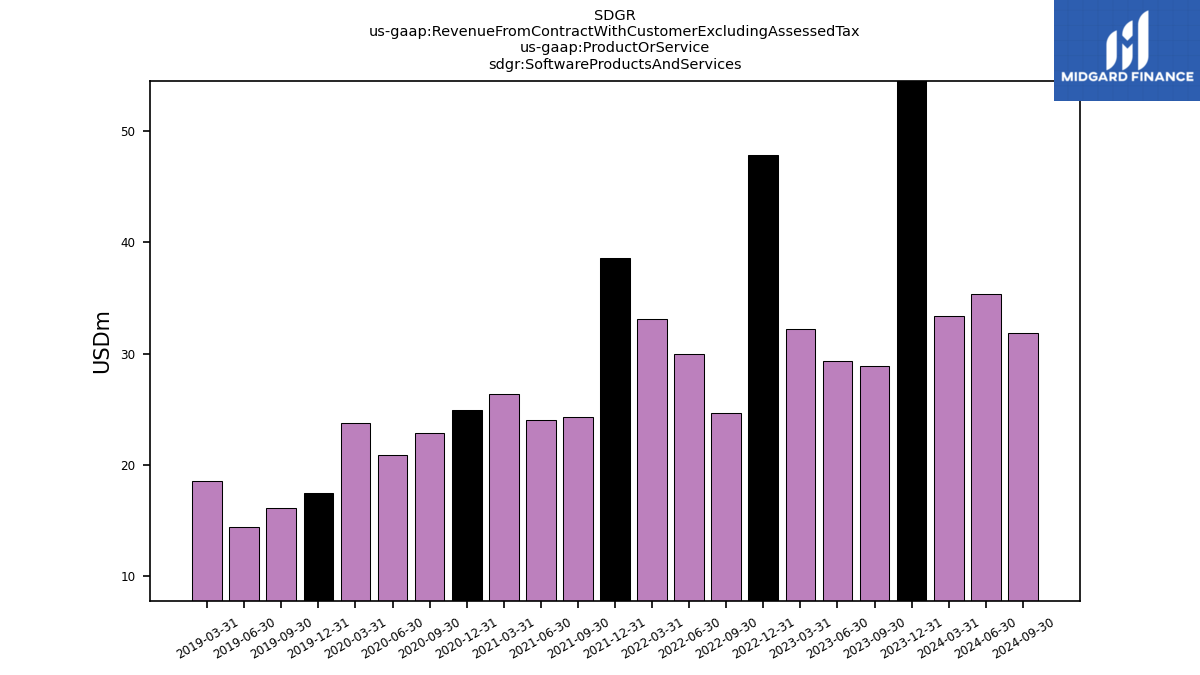
| Software Products And Services | 33.41 | 68.66 | 28.90 | 29.35 | 32.21 | 47.82 | 24.67 | 30.01 | 33.08 | 38.56 | 24.28 | 24.05 | 26.34 | 24.96 | 22.86 | 20.90 | 23.81 | 17.53 | 16.12 | 14.48 | 18.61 | |
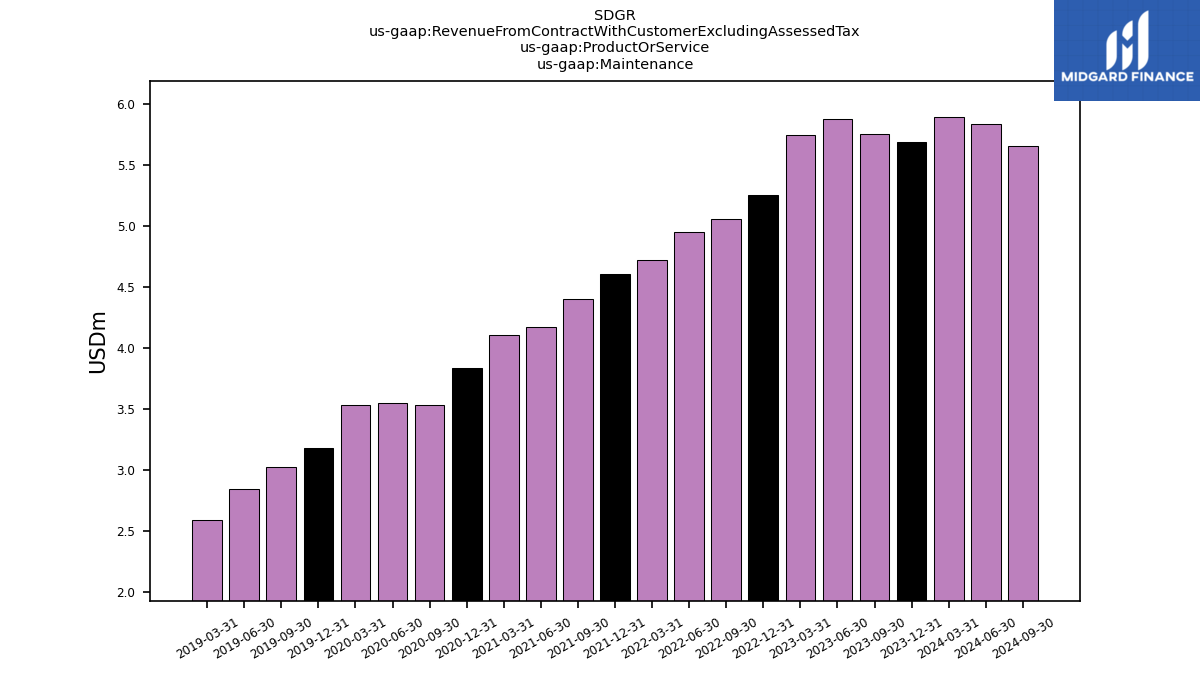
| Maintenance | 5.89 | 5.69 | 5.75 | 5.88 | 5.75 | 5.25 | 5.06 | 4.95 | 4.73 | 4.61 | 4.40 | 4.18 | 4.11 | 3.84 | 3.54 | 3.55 | 3.54 | 3.18 | 3.02 | 2.85 | 2.59 | |
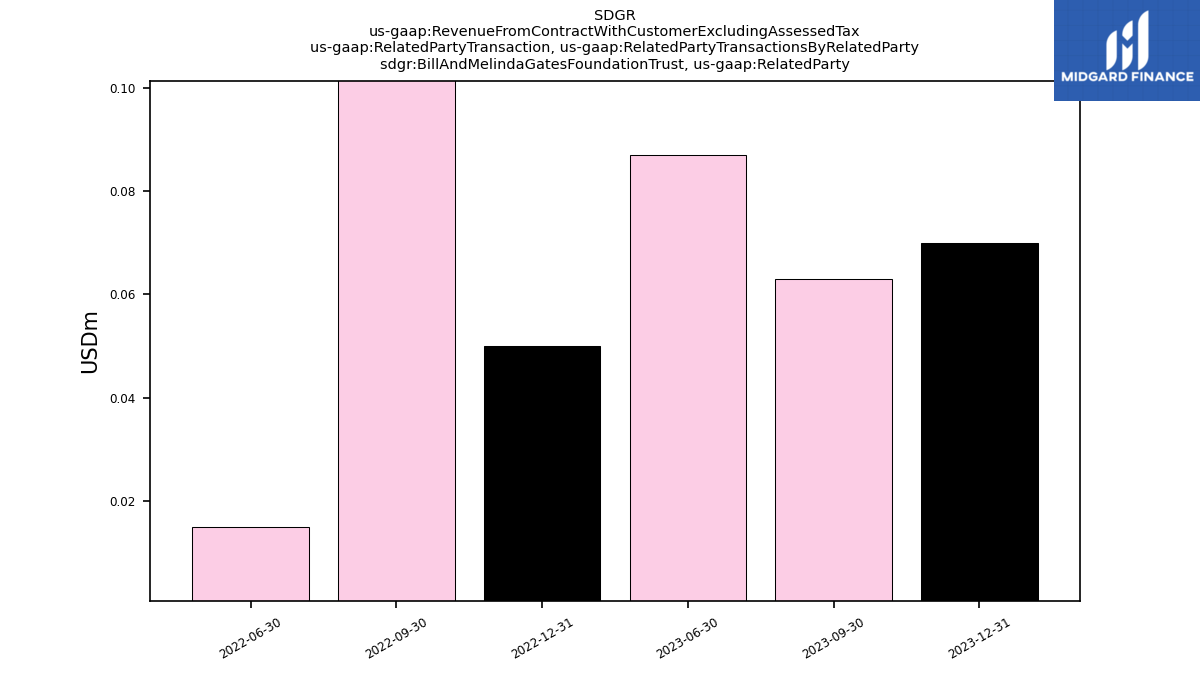
| Bill And Melinda Gates Foundation Trust, Related Party | NA | 0.07 | 0.06 | 0.09 | NA | 0.05 | 0.12 | 0.01 | NA | NA | NA | NA | NA | NA | NA | NA | NA | NA | NA | NA | NA | |
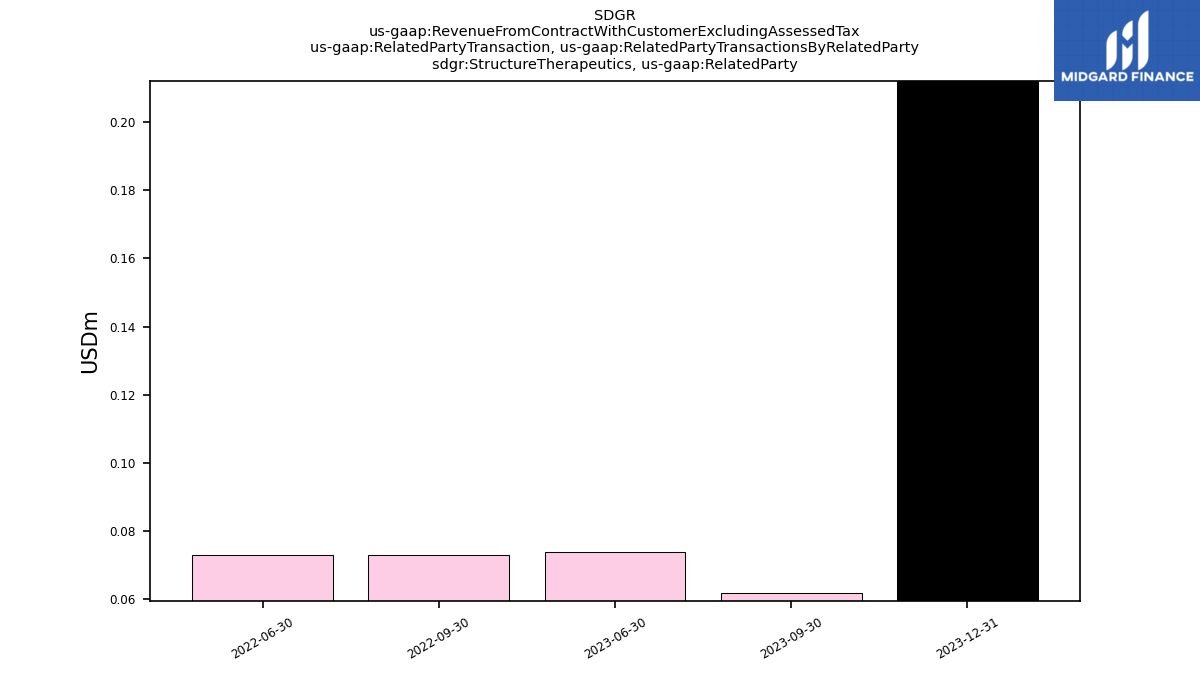
| Structure Therapeutics, Related Party | NA | 0.21 | 0.06 | 0.07 | NA | NA | 0.07 | 0.07 | NA | NA | NA | NA | NA | NA | NA | NA | NA | NA | NA | NA | NA | |
| US | 23.30 | 54.53 | 33.13 | 23.96 | 50.34 | 38.71 | 27.47 | 27.10 | 30.27 | 31.99 | 21.82 | 19.68 | 16.91 | 16.34 | 17.77 | 13.14 | 13.49 | 15.66 | 11.15 | 10.94 | 9.87 | |
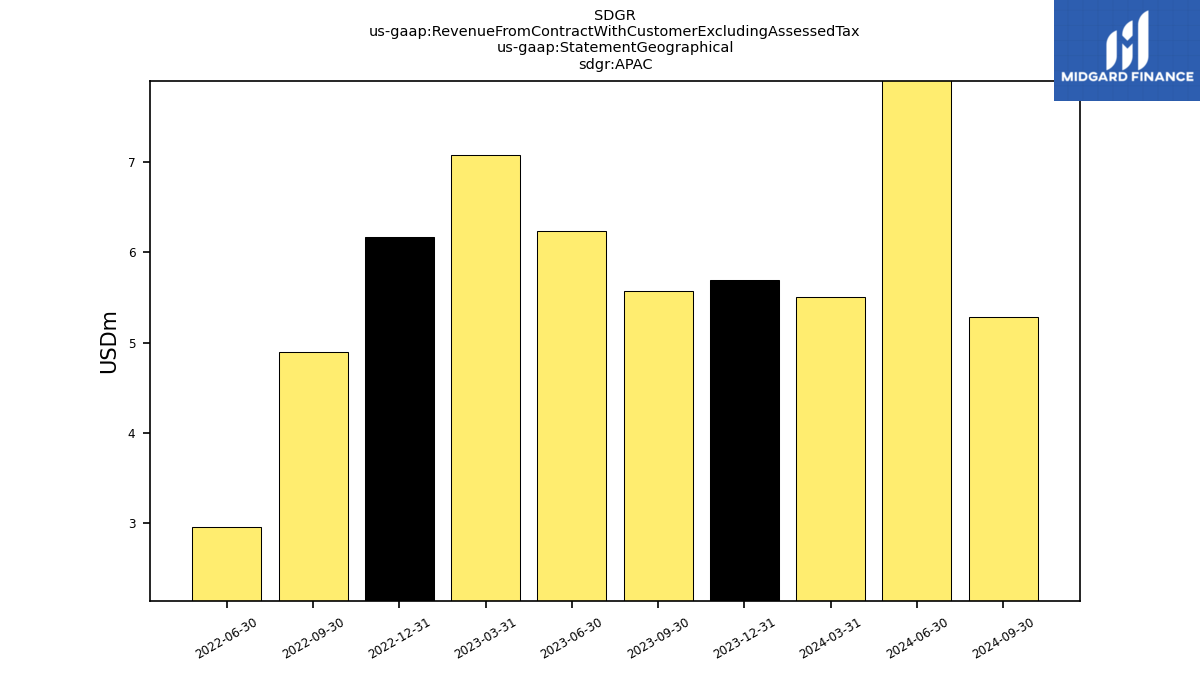
| APAC | 5.50 | 5.69 | 5.57 | 6.24 | 7.07 | 6.17 | 4.89 | 2.97 | NA | NA | NA | NA | NA | NA | NA | NA | NA | NA | NA | NA | NA | |
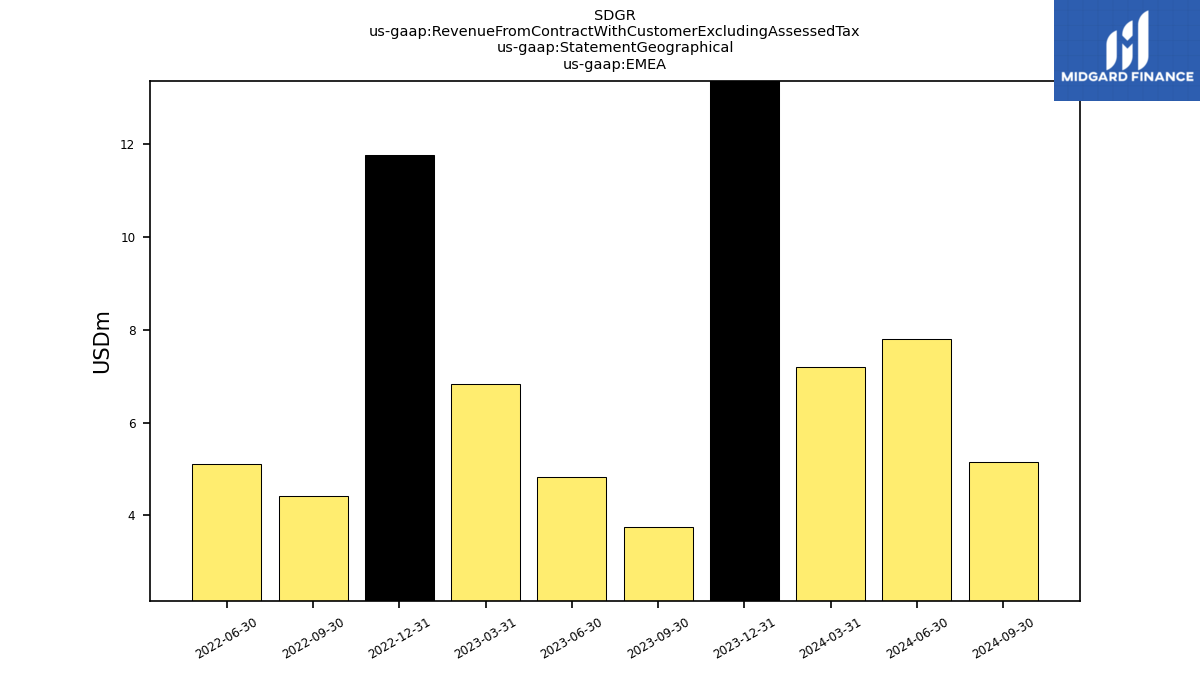
| EMEA | 7.20 | 13.72 | 3.76 | 4.83 | 6.83 | 11.76 | 4.42 | 5.11 | NA | NA | NA | NA | NA | NA | NA | NA | NA | NA | NA | NA | NA | |
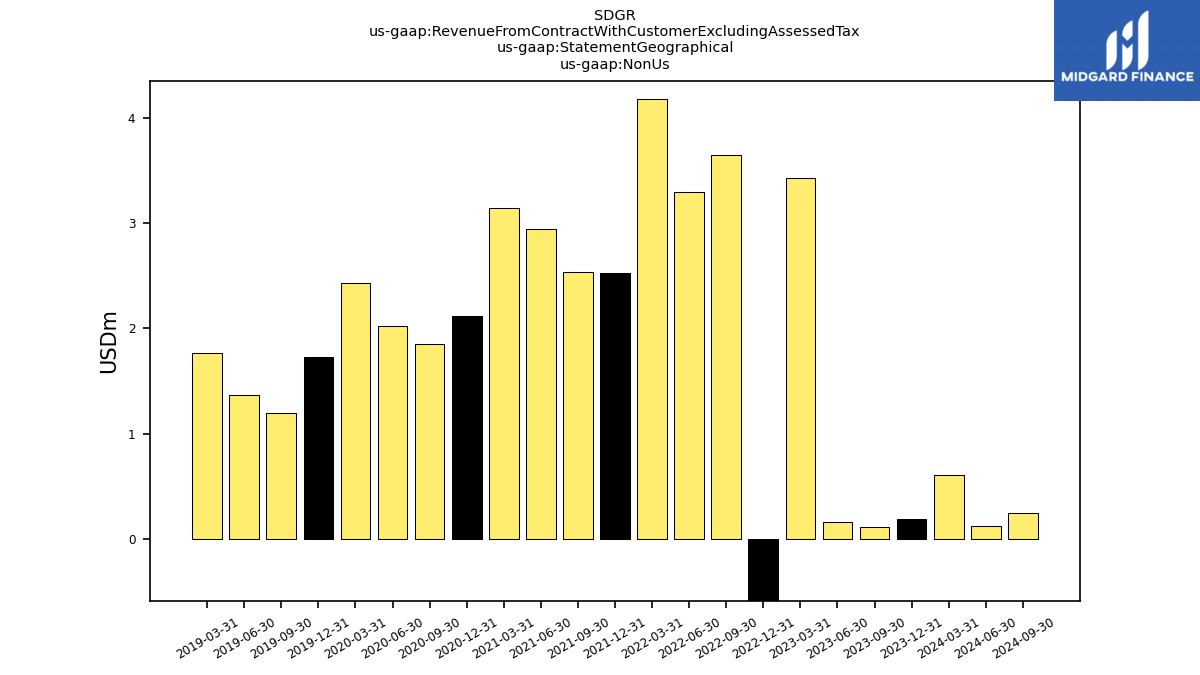
| Non Us | 0.60 | 0.19 | 0.12 | 0.16 | 3.43 | -9.86 | 3.65 | 3.29 | 4.19 | 2.53 | 2.54 | 2.95 | 3.14 | 2.12 | 1.85 | 2.03 | 2.44 | 1.73 | 1.19 | 1.36 | 1.76 |